SECURITIES AND EXCHANGE COMMISSION
WASHINGTON, D.C. 20549
OF THE SECURITIES EXCHANGE ACT OF 1934; or
THE SECURITIES EXCHANGE ACT OF 1934
For the fiscal year ended August 31, 2019; or
THE SECURITIES EXCHANGE ACT OF 1934; or
THE SECURITIES EXCHANGE ACT OF 1934
(Jurisdiction of incorporation or organization)
|
Title of each class
|
Name of each exchange on which registered
|
|
Subordinate Voting Shares without par value
|
NASDAQ
|
|
Subordinate Voting Shares without par value
|
TSX
|
|
Large accelerated filer □
|
Accelerated filer ⌧
|
Non-accelerated filer □
|
|
Emerging growth company □
|
|
U.S. GAAP □
|
International Financial Reporting Standards as issued by the ⌧
International Accounting Standards Board
|
Other □
|
|
Years ended August 31,
|
||||||||||||||||||||
|
2019
|
2018
|
2017
|
2016
|
2015
|
||||||||||||||||
|
(in thousands of US dollars, except share and per share data)
|
||||||||||||||||||||
|
Consolidated Statements of Earnings Data:
|
||||||||||||||||||||
|
Sales
|
$
|
286,890
|
$
|
269,546
|
$
|
243,301
|
$
|
232,583
|
$
|
222,089
|
||||||||||
|
Cost of sales (1)
|
118,677
|
105,004
|
94,329
|
87,066
|
85,039
|
|||||||||||||||
|
Selling and administrative (2)
|
98,646
|
98,794
|
86,256
|
82,169
|
82,200
|
|||||||||||||||
|
Net research and development
|
50,553
|
57,154
|
47,168
|
42,687
|
44,003
|
|||||||||||||||
|
Depreciation of property, plant and equipment
|
5,469
|
5,444
|
3,902
|
3,814
|
4,835
|
|||||||||||||||
|
Amortization of intangible assets
|
9,012
|
10,327
|
3,289
|
1,172
|
2,883
|
|||||||||||||||
|
Changes in fair value of cash contingent consideration
|
–
|
(670
|
)
|
(383
|
)
|
–
|
–
|
|||||||||||||
|
Interest and other (income) expense
|
718
|
1,378
|
303
|
(828
|
)
|
(155
|
)
|
|||||||||||||
|
Foreign exchange (gain) loss
|
949
|
(1,309
|
)
|
978
|
(161
|
)
|
(7,212
|
)
|
||||||||||||
|
Unusual charge (2)
|
–
|
–
|
–
|
–
|
603
|
|||||||||||||||
|
Share in net loss of an associate
|
–
|
2,080
|
–
|
–
|
–
|
|||||||||||||||
|
Gain on deemed disposal of the investment in an associate
|
–
|
(2,080
|
)
|
–
|
–
|
–
|
||||||||||||||
|
Earnings (loss) before income taxes
|
2,866
|
(6,576
|
)
|
7,459
|
16,664
|
9,893
|
||||||||||||||
|
Income taxes
|
5,346
|
5,678
|
6,608
|
7,764
|
5,036
|
|||||||||||||||
|
Net earnings (loss) for the year
|
(2,480
|
)
|
(12,254
|
)
|
851
|
8,900
|
4,857
|
|||||||||||||
|
Net loss for the year attributable to non-controlling interest
|
–
|
(352
|
)
|
–
|
–
|
–
|
||||||||||||||
|
Net earnings (loss) for the year attributable to parent interest
|
$
|
(2,480
|
)
|
$
|
(11,902
|
)
|
$
|
851
|
$
|
8,900
|
$
|
4,857
|
||||||||
|
Basic net earnings (loss) attributable to parent interest per share
|
$
|
(0.04
|
)
|
$
|
(0.22
|
)
|
$
|
0.02
|
$
|
0.17
|
$
|
0.09
|
||||||||
|
Diluted net earnings (loss) attributable to parent interest per share
|
$
|
(0.04
|
)
|
$
|
(0.22
|
)
|
$
|
0.02
|
$
|
0.16
|
$
|
0.08
|
||||||||
|
Basic weighted average number of shares used in per share calculations (000’s)
|
55,325
|
54,998
|
54,423
|
53,863
|
56,804
|
|||||||||||||||
|
Diluted weighted average number of shares used in per share calculations (000’s)
|
55,325
|
54,998
|
55,555
|
54,669
|
57,457
|
|||||||||||||||
|
Other Consolidated Statements of Earnings Data:
|
||||||||||||||||||||
|
Gross research and development
|
$
|
57,972
|
$
|
65,243
|
$
|
53,124
|
$
|
47,875
|
$
|
50,148
|
||||||||||
|
As at August 31,
|
||||||||||||||||||||
|
2019
|
2018
|
2017
|
2016
|
2015
|
||||||||||||||||
|
(in thousands of US dollars)
|
||||||||||||||||||||
|
Consolidated Balance Sheets Data:
|
||||||||||||||||||||
|
Cash
|
$
|
16,518
|
$
|
12,758
|
$
|
38,435
|
$
|
43,208
|
$
|
25,864
|
||||||||||
|
Short-term investments
|
2,918
|
2,282
|
775
|
4,087
|
1,487
|
|||||||||||||||
|
Total assets
|
277,602
|
284,544
|
259,241
|
237,793
|
217,478
|
|||||||||||||||
|
Long-term debt (excluding current portion)
|
3,293
|
5,907
|
–
|
–
|
–
|
|||||||||||||||
|
Share capital
|
92,706
|
91,937
|
90,411
|
85,516
|
86,045
|
|||||||||||||||
|
Shareholders’ equity
|
$
|
172,564
|
$
|
177,921
|
$
|
196,790
|
$
|
181,401
|
$
|
169,227
|
||||||||||
|
(1)
|
The cost of sales is exclusive of depreciation and amortization, shown separately.
|
|
(2)
|
Selling and administrative is exclusive of unusual charge, shown separately, which represents bad debt expenses.
|
|
•
|
difficulty in forecasting, budgeting and planning due to the uncertain spending plans of current or prospective customers;
|
|
•
|
increased competition for fewer network projects and sales opportunities;
|
|
•
|
increased pricing pressure that may adversely affect revenue and gross margin;
|
|
•
|
higher cost structure compared to revenue level;
|
|
•
|
increased risk of charges related to excess and obsolete inventories, write-offs of deferred tax assets and tax credits, and impairment of
intangible assets and goodwill;
|
|
•
|
customers’ financial difficulties and increased difficulty in collecting accounts receivable;
|
|
•
|
additional restructuring costs; and
|
|
•
|
increased protectionism or international trade barriers.
|
|
•
|
issue shares that would dilute individual shareholder percentage ownership;
|
|
•
|
incur additional debt, be subject to additional debt covenants, and incur additional interest expense;
|
|
•
|
assume liabilities and commitments;
|
|
•
|
incur significant expenses related to acquisition costs;
|
|
•
|
incur significant expenses related to amortization of additional intangible assets;
|
|
•
|
incur significant impairment losses of goodwill and intangible assets related to such acquisitions; and
|
|
•
|
incur losses from operations.
|
|
•
|
problems integrating the acquired operations, technologies, products and personnel;
|
|
•
|
risks associated with the transfer of acquired know-how and technology;
|
|
•
|
unanticipated costs or liabilities;
|
|
•
|
diversion of management’s attention from our core business;
|
|
•
|
adverse effects on existing business relationships with suppliers and customers;
|
|
•
|
risks associated with entering markets in which we have no or limited prior experience; and
|
|
•
|
potential loss of key employees, particularly those of acquired organizations.
|
|
•
|
challenges in staffing and managing foreign operations due to the limited number of qualified candidates, employment laws and business
practices in foreign countries, any of which could increase the cost and reduce the efficiency of operating in foreign countries;
|
|
•
|
fluctuations among currencies;
|
|
•
|
our inability to comply with import/export, environmental and other trade compliance regulations of the countries in which we do
business, together with unexpected changes in such regulations and bilateral trade agreements between countries;
|
|
•
|
measures to ensure that we design, implement and maintain adequate and effective controls over our financial processes and reporting in
the future;
|
|
•
|
failure to adhere to laws, regulations and contractual obligations relating to customer contracts in various countries;
|
|
•
|
difficulties in establishing and enforcing our intellectual property rights;
|
|
•
|
inability to maintain a competitive list of distributors for indirect sales;
|
|
•
|
tariffs and other trade barriers, including those between the US and China;
|
|
•
|
economic instability in foreign markets, including Britain’s decision to exit the European Union, and the impact this choice may have on
doing business in Europe;
|
|
•
|
wars, acts of terrorism and political unrest;
|
|
•
|
language and cultural barriers;
|
|
•
|
lack of integration of foreign operations;
|
|
•
|
potential foreign and domestic tax consequences;
|
|
•
|
technology standards that differ from those on which our products are based, which could require expensive redesign and retention of
personnel familiar with those standards;
|
|
•
|
longer accounts receivable payment cycles and possible difficulties in collecting payments which may increase our operating costs and
hurt our financial performance; and
|
|
•
|
failure to meet certification requirements.
|
|
•
|
difficulty in hiring and retaining appropriate engineering and manufacturing resources due to intense competition for such resources and
resulting wage inflation;
|
|
•
|
exposure to misappropriation of intellectual property and proprietary information;
|
|
•
|
heightened exposure to changes in the economic, regulatory, security, and political conditions of these countries;
|
|
•
|
fluctuations in currency exchange rates;
|
|
•
|
changes in tax laws and regulations in India and China, including transfer pricing policies;
|
|
•
|
cash management and repatriation of profit; and
|
|
•
|
high inflation rates which could increase our operating costs and render these operations too expensive.
|
|
•
|
properly identify and anticipate customer needs;
|
|
•
|
innovate and develop new products on a timely basis;
|
|
•
|
gain timely market acceptance for new products;
|
|
•
|
manufacture and deliver our new products on time, in sufficient volume and with adequate quality;
|
|
•
|
price our products competitively;
|
|
•
|
continue investing in our research and development programs;
|
|
•
|
anticipate competitors’ announcements of new products; and
|
|
•
|
successfully transform the company into an end-to-end monitoring and analytics supplier.
|
|
•
|
increased competition for business;
|
|
•
|
reduced demand;
|
|
•
|
limited number of potential customers;
|
|
•
|
competition from companies with lower production costs, including companies operating in lower-cost environments;
|
|
•
|
introduction of new products by competitors;
|
|
•
|
greater economies of scale for higher-volume competitors;
|
|
•
|
large customers, who buy in high volumes, can exert substantial negotiating leverage over us; and
|
|
•
|
resale of used equipment.
|
|
•
|
costly repairs;
|
|
•
|
additional development and support costs;
|
|
•
|
product returns or recalls;
|
|
•
|
sales cancellations;
|
|
•
|
damage to our brand reputation;
|
|
•
|
loss of customers, failure to attract new customers or achieve market acceptance;
|
|
•
|
diversion of development and engineering resources;
|
|
•
|
legal actions by our customers, including claims for consequential damages and loss of profits; and
|
|
•
|
legal actions by governmental entities, including actions to impose product recalls and/or forfeitures.
|
|
•
|
length of the sales cycle for certain products, especially those that are higher priced and more complex;
|
|
•
|
sales cycle prolonged by lengthy customer acceptance;
|
|
•
|
timing of product launches and market acceptance of our new products as well as those of our competitors;
|
|
•
|
our ability to sustain product volumes and high levels of quality across all product lines;
|
|
•
|
timing of shipments for large orders;
|
|
•
|
effect of seasonality on sales and bookings; and
|
|
•
|
losing key accounts and not successfully developing new ones.
|
|
•
|
fluctuating demand for test, monitoring and analytics solutions;
|
|
•
|
changes in the capital spending and operating budgets of our customers, which may cause seasonal or other fluctuations in product mix,
volume, timing and number of orders we receive from our customers;
|
|
•
|
order cancellations or rescheduled delivery dates;
|
|
•
|
pricing changes by our competitors or suppliers;
|
|
•
|
insufficient or excess inventory;
|
|
•
|
variations in the mix between higher and lower-margin products and services;
|
|
•
|
customer bankruptcies and difficulties in collecting accounts receivable;
|
|
•
|
restructuring and impairment charges;
|
|
•
|
foreign exchange rate fluctuations;
|
|
•
|
general economic conditions, including a slowdown or recession;
|
|
•
|
distorted effective tax rate due to non-taxable/deductible elements and unrecognized deferred tax assets; and
|
|
•
|
effects of recent acquisitions of businesses.
|
|
•
|
requiring a portion of our cash flows from operations to make interest payments on this debt;
|
|
•
|
increasing our vulnerability to general adverse economic and industry conditions;
|
|
•
|
reducing cash flows available to fund capital expenditures and other corporate purposes and to grow our business; and
|
|
•
|
limiting our flexibility in planning for, or reacting to, changes in our business and the industry.
|
|
•
|
Layer 2-7 service performance monitoring and analysis for business and residential services;
|
|
•
|
Mobile backhaul and metro Ethernet service activation and assurance;
|
|
•
|
IP/MPLS core monitoring and analysis;
|
|
•
|
IP video service assurance;
|
|
•
|
Advanced data correlation and analysis engine with comprehensive northbound APIs;
|
|
•
|
Advanced analytics and reports; and
|
|
•
|
Custom solutions and back-office integration services.
|
|
•
|
Radio access network (RAN) optimization;
|
|
•
|
Geolocation capabilities;
|
|
•
|
Vendor independence;
|
|
•
|
Data agnostic (call traces, probe data, third party);
|
|
•
|
End-to-end, from radio to core;
|
|
•
|
Big data based; and
|
|
•
|
Fully virtualized.
|
|
•
|
market study and research feasibility;
|
|
•
|
product definition;
|
|
•
|
development feasibility;
|
|
•
|
development;
|
|
•
|
qualification; and
|
|
•
|
transfer to production.
|
|
•
|
Digital Marketing: Achieving marketing objectives through applying digital technologies and media;
|
|
•
|
Marketing Campaign Management: Marketing campaign planning and execution for all EXFO’s portfolios,
collaborating closely with product management;
|
|
•
|
Commercial Insights: Generating and ensuring adoption of commercial insights to support our sales
organization and partners; analyst relations; and our e-learning and training platform;
|
|
•
|
Field Marketing and Communications: Shining the spotlight on EXFO across the globe, showcasing
our expertise and depth of portfolio at industry events, in the media, and other targeted external and internal audiences; and
|
|
•
|
In-house agency: Producing marketing and corporate communications collateral (graphic design,
writing, etc.).
|
|
•
|
Sales Support – Leverage the effectiveness of our sales force by providing pre-sales and demo
support, as well as guiding customers in purchasing the correct equipment for their respective applications, issuing quotations, and promoting our extended warranty service and support program;
|
|
•
|
Order Management – Accurately process customer orders from entry through fulfillment and delivery,
and manage order changes;
|
|
•
|
Customer Service – Serve as a primary interface for inbound and outbound customer communication.
Provide customers with one central point of contact and work with the customer from purchasing equipment to helping them arrange for service, if necessary;
|
|
•
|
Technical Support – Provide post-sales technical support to Test & Measurement product
end-users, by providing software fixes and upgrades, troubleshooting malfunction or wrong usage of equipment and suggesting ways to improve equipment productivity and performance;
|
|
•
|
Field Support – Provide expert technical support and deliver product service worldwide. Support
our Worldwide Service Centers and directly manage the Service Partner Program. Where applicable, furnish installation and on-site servicing for more complex equipment and applications;
|
|
•
|
Customer Care Services – Provide pre-sale, delivery, post-sale technical support, and systems
actualization of customer’s network monitoring and converged service assurance systems;
|
|
•
|
Education Services – Aggregate expertise, develop material, and deliver free and fee-based training;
|
|
•
|
Professional Services – Provide value-added solution services for our test and system customers.
|
|
•
|
Production. From production planning to product shipment, our production
department is responsible for manufacturing high-quality products on time. Factories are organized in work cells; each cell consists of specialized technicians with equipment and has full responsibility over a product family. Technicians
are cross-trained and versatile enough, so that they can carry out specific functions in more than one cell. This allows shorter lead times by alleviating bottlenecks.
|
|
•
|
Manufacturing and Test Engineering. This department, which supports our
production cells, acts like a gatekeeper to ensure the quality of our products and the effectiveness of our manufacturing processes. It is responsible for the transfer of products from research and development to manufacturing, product
improvement, documentation, metrology, and the quality control and regulatory compliance process. Quality control represents a key element in our manufacturing operations. Quality is assured through product testing at numerous stages in
the manufacturing process to ensure that our products meet both stringent industry and customer performance requirements.
|
|
•
|
Supply-Chain Management. This department is responsible for sales forecasting,
raw material procurement, material-cost reduction and vendor performance management. Our products consist of optical, electronic and mechanical parts, which are purchased from suppliers around the world. Approximately one-third of our parts
are manufactured to our specifications. Materials represent the largest portion of our cost of goods. Our performance is tightly linked to vendor performance, requiring greater emphasis on this critical aspect of our business.
|
|
•
|
level of technical compliance and alignment to use-case;
|
|
•
|
product performance and reliability;
|
|
•
|
solution’s contribution to productivity;
|
|
•
|
price and quality of products;
|
|
•
|
level of technological innovation;
|
|
•
|
product lead times;
|
|
•
|
breadth of product offerings;
|
|
•
|
ease of use;
|
|
•
|
brand-name recognition;
|
|
•
|
customer service and technical support;
|
|
•
|
strength of sales and distribution relationships; and
|
|
•
|
financial stability of supplier.
|
|
•
|
a method and apparatus for improved characterization of loss-inducing “events” along an optical fiber using an Optical Time Domain
Reflectometer (OTDR). By a judicious combination of OTDR data corresponding to different optical-pulse durations, the location and loss characteristics of an event can be quantified with much better accuracy and/or more rapidly than via
conventional approaches;
|
|
•
|
a method for determining the optical signal-to-noise ratio on polarization-multiplexed signals used in high-bandwidth DWDM optical networks
by employing an optical spectrum analyzer (OSA). It employs a reference trace acquired with one channel being turned off;
|
|
•
|
a scalable system for monitoring network elements, for which only a non-redundant subset of the identified network information is stored,
thereby enabling monitoring of a much larger group of network elements than is possible with conventional memory-constrained monitoring systems. Furthermore, this system employs a multi-threaded architecture that dynamically spawns an
array of multi-technology monitoring sub-systems. The user can leverage data from a multitude of sources and define a sequence of activities based on templates in order to accomplish a given task;
|
|
•
|
a method for actively analyzing a data packet delivery path to provide diagnostics and root cause analysis of network delivery path issues;
|
|
•
|
a communication methodology used to perform independent bi-directional protocol testing over a connection or connectionless network between
two test instruments, wherein the transfer mechanism of status and intermediate test results during an active test and the transmission of the final results to one of the instruments enables the user to perform a bidirectional
single-ended test.
|
|
Location
|
Use of Space
|
Square Footage
|
% of Utilization
|
Type of Interest
|
|
|
400 Godin Avenue
Quebec (Quebec) G1M 2K2 |
Occupied for research and development, customer services, repair/calibration services, manufacturing, management and
administration
|
129,000
|
(1)
|
95%
|
Owned
|
|
2500 Alfred-Nobel
Montreal (Quebec) H4S 2C3 |
Occupied for research and development, management and administration
|
75,000
|
70%
|
Owned
|
|
|
2500 Alfred-Nobel
Montreal (Quebec) H4S 2C3 |
Leased to third parties
|
23,736
|
100%
|
Owned
|
|
|
2500 Alfred-Nobel
Montreal (Quebec) H4S 2C3 |
Available for rent
|
26,264
|
0%
|
Owned
|
|
|
F1 to F3, No. 71-3, Xintian Avenue,
Xintian Community
Fuhai Subdistrict, Bao’an District
Shenzhen, Guangdong 518103 China |
Occupied for manufacturing of products, repair/calibration services
|
64,000
|
90%
|
Leased
|
|
|
ZAC Airlande
2, rue Jacqueline Auriol CS 69123 Saint-Jacques-de-la-Lande 35091 Rennes Cedex 9 France |
Occupied for research and development, customer services, manufacturing, management and administration
|
50,235
|
90%
|
Leased
|
|
|
436 Nolin Street
Quebec (Quebec) G1M 1E7 |
Occupied for manufacturing of products
|
44,000
|
95%
|
Owned
|
|
|
Location
|
Use of Space
|
Square Footage
|
% of Utilization
|
Type of Interest
|
|
|
Offices No 602, 603, 604, 701 and 702,
Tower S-4 Cybercity
Magarpatta, Hadapsar
Pune 411 013 India |
Occupied for research and development
|
33,981
|
85%
|
Owned
|
|
|
250 Apollo Drive
Chelmsford, MA 01824 United States |
Unoccupied
|
25,400
|
0%
|
Leased
|
|
|
4 rue de Louis de Broglie
Lannion 22300 France |
Occupied for research and development, manufacturing, management and administration
|
24,800
|
50%
|
Leased
|
|
|
Elektroniikkatie 2
FI-90590 Oulu Finland |
Occupied for research and development, manufacturing, management and administration
|
13,380
|
100%
|
Leased
|
|
|
Winchester House
School Lane Chandlers Ford, Eastleigh Hampshire SO53 4DG United Kingdom |
Occupied for European customer service, repair/calibration services, sales management and administration
|
13,000
|
85%
|
Leased
|
|
|
Ronda Narciso Monturiol 6
Oficina 110B, 111B, 112B and
113B, Parque Technologico
Paterna, Valencia 46980
Spain |
Occupied for research and development and customer services
|
10,398
|
100%
|
Leased
|
|
|
Offices No 102
Tower S-4 Cybercity Magarpatta, Hadapsar Pune 411 013 India |
Leased to a third party
|
5,979
|
100%
|
Owned
|
|
|
Phoenix Yard
65-69 Kings Cross Road London WC1X 9LW United Kingdom |
Occupied for research and development, management and administration
|
5,000
|
100%
|
Leased
|
|
|
(1)
|
Including the warehouse space. Premises without the warehouse are approximately 115,000 square feet.
|
|
Consolidated statement of earnings data: (1)
|
2019
|
2018
|
2017
|
2019
|
2018
|
2017
|
||||||||||||||||||
|
Sales
|
$
|
286,890
|
$
|
269,546
|
$
|
243,301
|
100.0
|
%
|
100.0
|
%
|
100.0
|
%
|
||||||||||||
|
Cost of sales (2)
|
118,677
|
105,004
|
94,329
|
41.4
|
39.0
|
38.8
|
||||||||||||||||||
|
Selling and administrative
|
98,646
|
98,794
|
86,256
|
34.4
|
36.7
|
35.5
|
||||||||||||||||||
|
Net research and development
|
50,553
|
57,154
|
47,168
|
17.6
|
21.2
|
19.4
|
||||||||||||||||||
|
Depreciation of property, plant and equipment
|
5,469
|
5,444
|
3,902
|
1.9
|
2.0
|
1.6
|
||||||||||||||||||
|
Amortization of intangible assets
|
9,012
|
10,327
|
3,289
|
3.1
|
3.8
|
1.4
|
||||||||||||||||||
|
Change in fair value of cash contingent consideration
|
–
|
(670
|
)
|
(383
|
)
|
–
|
(0.3
|
)
|
(0.2
|
)
|
||||||||||||||
|
Interest and other expense
|
718
|
1,378
|
303
|
0.3
|
0.5
|
0.1
|
||||||||||||||||||
|
Foreign exchange (gain) loss
|
949
|
(1,309
|
)
|
978
|
0.3
|
(0.5
|
)
|
0.4
|
||||||||||||||||
|
Share in net loss of an associate
|
–
|
2,080
|
–
|
–
|
0.8
|
–
|
||||||||||||||||||
|
Gain on deemed disposal of the investment in an associate
|
–
|
(2,080
|
)
|
–
|
–
|
(0.8
|
)
|
–
|
||||||||||||||||
|
Earnings (loss) before income taxes
|
2,866
|
(6,576
|
)
|
7,459
|
1.0
|
(2.4
|
)
|
3.0
|
||||||||||||||||
|
Income taxes
|
5,346
|
5,678
|
6,608
|
1.9
|
2.1
|
2.7
|
||||||||||||||||||
|
Net earnings (loss) for the year
|
(2,480
|
)
|
(12,254
|
)
|
851
|
(0.9
|
)
|
(4.5
|
)
|
0.3
|
||||||||||||||
|
Net loss for the year attributable to non-controlling interest
|
–
|
(352
|
)
|
–
|
–
|
(0.1
|
)
|
–
|
||||||||||||||||
|
Net earnings (loss) for the year attributable to the parent interest
|
$
|
(2,480
|
)
|
$
|
(11,902
|
)
|
$
|
851
|
(0.9
|
)%
|
(4.4
|
)%
|
0.3
|
%
|
||||||||||
|
Basic and diluted net earnings (loss) attributable to the parent interest per share
|
$
|
(0.04
|
)
|
$
|
(0.22
|
)
|
$
|
0.02
|
||||||||||||||||
|
Other selected information:
|
||||||||||||||||||||||||
|
Gross margin before depreciation and amortization (3)
|
$
|
168,213
|
$
|
164,542
|
$
|
148,972
|
58.6
|
%
|
61.0
|
%
|
61.2
|
%
|
||||||||||||
|
Research and development data:
|
||||||||||||||||||||||||
|
Gross research and development
|
$
|
57,972
|
$
|
65,243
|
$
|
53,124
|
20.2
|
%
|
24.2
|
%
|
21.8
|
%
|
||||||||||||
|
Restructuring charges included in:
|
||||||||||||||||||||||||
|
Cost of sales
|
$
|
304
|
$
|
517
|
$
|
1,697
|
0.1
|
%
|
0.2
|
%
|
0.7
|
%
|
||||||||||||
|
Selling and administrative expenses
|
$
|
495
|
$
|
673
|
$
|
1,150
|
0.2
|
%
|
0.2
|
%
|
0.5
|
%
|
||||||||||||
|
Net research and development expenses
|
$
|
2,506
|
$
|
3,219
|
$
|
2,232
|
0.9
|
%
|
1.2
|
%
|
0.9
|
%
|
||||||||||||
|
Adjusted EBITDA (3, 4)
|
$
|
25,585
|
$
|
17,198
|
$
|
22,041
|
8.9
|
%
|
6.4
|
%
|
9.1
|
%
|
||||||||||||
|
Consolidated balance sheet data: (1)
|
||||||||||||||||||||||||
|
Total assets
|
$
|
277,602
|
$
|
284,544
|
$
|
259,241
|
||||||||||||||||||
|
(1)
|
Consolidated statement of earnings and balance sheet data has been derived from our consolidated financial statements
prepared according with IFRS, as issued by the IASB, except for non-IFRS measures.
|
|
(2)
|
The cost of sales is exclusive of depreciation and amortization, shown separately.
|
|
(3)
|
Refer to page 55 for non-IFRS measures.
|
|
(4)
|
Includes acquisition-related costs of $2.2 million or 0.8% of sales in fiscal 2018 and $1.1 million or 0.4% of sales in
2017 (nil in 2019).
|
|
Years ended August 31,
|
||||||||||||
|
2019
|
2018
|
2017
|
||||||||||
|
Test and measurement
|
$
|
204,693
|
$
|
197,423
|
$
|
193,863
|
||||||
|
Service assurance, systems and services
|
82,788
|
71,248
|
49,906
|
|||||||||
|
287,481
|
268,671
|
243,769
|
||||||||||
|
Foreign exchange gains (losses) on forward exchange contracts
|
(591
|
)
|
875
|
(468
|
)
|
|||||||
|
Total sales
|
$
|
286,890
|
$
|
269,546
|
$
|
243,301
|
||||||
|
Years ended August 31,
|
||||||||||||
|
2019
|
2018
|
2017
|
||||||||||
|
Test and measurement
|
$
|
210,055
|
$
|
193,836
|
$
|
198,583
|
||||||
|
Service assurance, systems and services
|
88,341
|
72,982
|
53,651
|
|||||||||
|
298,396
|
266,818
|
252,234
|
||||||||||
|
Foreign exchange gains (losses) on forward exchange contracts
|
(591
|
)
|
875
|
(468
|
)
|
|||||||
|
Total bookings
|
$
|
297,805
|
$
|
267,693
|
$
|
251,766
|
||||||
|
Years ended August 31,
|
||||||||||||
|
2019
|
2018
|
2017
|
||||||||||
|
Americas
|
50
|
%
|
50
|
%
|
55
|
%
|
||||||
|
Europe, Middle East and Africa (EMEA)
|
32
|
32
|
26
|
|||||||||
|
Asia-Pacific (APAC)
|
18
|
18
|
19
|
|||||||||
|
100
|
%
|
100
|
%
|
100
|
%
|
|||||||
|
Cash flows provided by operating activities
|
$
|
17,242
|
||
|
Proceeds from disposal of capital assets
|
3,318
|
|||
|
Purchases of capital assets
|
(7,498
|
)
|
||
|
Repayment of bank loan
|
(5,195
|
)
|
||
|
Repayment of long-term debt and other liabilities
|
(2,817
|
)
|
||
|
Redemption of share capital
|
(312
|
)
|
||
|
Unrealized foreign exchange loss on cash and short-term investments
|
(342
|
)
|
||
|
$
|
4,396
|
|
Long-term
debt
|
Operating
leases
|
Licensing
agreements
|
Total
|
|||||||||||||
|
No later than one year
|
$
|
2,449
|
$
|
2,895
|
$
|
2,289
|
$
|
7,633
|
||||||||
|
Later than one year and no later than five years
|
3,237
|
6,323
|
2,444
|
12,004
|
||||||||||||
|
Later than five years
|
56
|
23
|
–
|
79
|
||||||||||||
|
$
|
5,742
|
$
|
9,241
|
$
|
4,733
|
$
|
19,716
|
|||||||||
|
Expiry dates
|
Contractual
amounts
|
Weighted average
contractual
forward rates
|
||||||
|
September 2019 to August 2020
|
$
|
35,500,000
|
1.3013
|
|||||
|
September 2020 to August 2021
|
19,900,000
|
1.3107
|
||||||
|
September 2021 to July 2022
|
6,000,000
|
1.3216
|
||||||
|
Total
|
$
|
61,400,000
|
1.3063
|
|||||
|
Expiry dates
|
Contractual
amount
|
Weighted average
contractual
forward rate
|
||||||
|
September 2019 to August 2020
|
$
|
3,500,000
|
71.48
|
|||||
|
(a)
|
Determination of functional currency
|
|
(b)
|
Determination of cash generating units and allocation of goodwill
|
|
(a)
|
Inventories
|
|
(b)
|
Income taxes
|
|
(c)
|
Tax credits recoverable
|
|
(d)
|
Impairment of non-financial assets
|
|
EXFO CGU
|
$
|
12,949,000
|
|||
|
EXFO Optics CGU
|
3,376,000
|
||||
|
Service assurance, systems and services (SASS) CGU
|
22,323,000
|
||||
|
Total
|
$
|
38,648,000
|
|
(e)
|
Purchase price allocation in business combinations
|
|
i)
|
Growth rates
|
|
ii)
|
Discount rate
|
|
(f)
|
Identification of performance obligations
|
|
As reported
as at
August 31, 2018
|
Adjustments
|
As adjusted
as at
September 1, 2018
|
||||||||||
|
Accounts receivables – Trade
|
$
|
47,273
|
$
|
(303
|
)
|
$
|
46,970
|
|||||
|
Income taxes and tax credits recoverable
|
$
|
4,790
|
$
|
50
|
$
|
4,840
|
||||||
|
Total assets
|
$
|
284,544
|
$
|
(253
|
)
|
$
|
284,291
|
|||||
|
Retained earnings
|
$
|
114,906
|
$
|
(253
|
)
|
$
|
114,653
|
|||||
|
Shareholders’ equity
|
$
|
177,921
|
$
|
(253
|
)
|
$
|
177,668
|
|||||
|
Financial assets
|
Classification – IAS 39
|
Classification – IFRS 9
|
|
Cash
|
Loans and receivables
|
Amortized cost
|
|
Short-term investments
|
Available for sale
|
Fair value through other comprehensive income
|
|
Accounts receivable
|
Loans and receivables
|
Amortized cost
|
|
Forward exchange contracts
|
Derivatives used for hedging
|
Fair value through other comprehensive income
|
|
Financial liabilities
|
Classification – IAS 39
|
Classification – IFRS 9
|
|
Bank loan
|
Other financial liabilities
|
Amortized cost
|
|
Accounts payable and accrued liabilities
|
Other financial liabilities
|
Amortized cost
|
|
Other liabilities
|
Other financial liabilities
|
Amortized cost
|
|
Long-term debt
|
Other financial liabilities
|
Amortized cost
|
|
Forward exchange contracts
|
Derivatives used for hedging
|
Fair value through other comprehensive income
|
|
Years ended August 31,
|
||||||||||||
|
2019
|
2018
|
2017
|
||||||||||
|
IFRS net earnings (loss) attributable to the parent interest for the year
|
$
|
(2,480
|
)
|
$
|
(11,902
|
)
|
$
|
851
|
||||
|
Add (deduct):
|
||||||||||||
|
Depreciation of property, plant and equipment
|
5,469
|
5,444
|
3,902
|
|||||||||
|
Amortization of intangible assets
|
9,012
|
10,327
|
3,289
|
|||||||||
|
Interest and other expense
|
718
|
1,378
|
303
|
|||||||||
|
Income taxes
|
5,346
|
5,678
|
6,608
|
|||||||||
|
Stock-based compensation costs
|
1,831
|
1,748
|
1,414
|
|||||||||
|
Restructuring charges
|
3,305
|
4,409
|
5,079
|
|||||||||
|
Change in fair value of cash contingent consideration
|
–
|
(670
|
)
|
(383
|
)
|
|||||||
|
Acquisition-related deferred revenue fair value adjustment
|
1,435
|
2,095
|
–
|
|||||||||
|
Foreign exchange (gain) loss
|
949
|
(1,309
|
)
|
978
|
||||||||
|
Adjusted EBITDA for the year (1)
|
$
|
25,585
|
$
|
17,198
|
$
|
22,041
|
||||||
|
Adjusted EBITDA in percentage of total sales
|
8.9
|
%
|
6.4
|
%
|
9.1
|
%
|
||||||
|
(1)
|
Includes acquisition-related costs of $1.1 million and $2.2 million in fiscal 2017 and 2018 respectively (nil in fiscal 2019).
|
|
Name and Municipality of Residence
|
Position with EXFO
|
|
|
ABDELKRIM BENAMAR
Le Raincy, France |
Vice President, Service Assurance, Systems and Services
|
|
|
STEPHEN BULL
Quebec City, Quebec |
Vice President, Research and Development
|
|
|
STÉPHANE CHABOT
Quebec City, Quebec |
Vice President, Test and Measurement
|
|
|
FRANÇOIS CÔTÉ
Montreal, Quebec |
Independent Director
|
|
|
SUZANNE DANEAU
Beauharnois, Quebec |
Vice President, Human Resources
|
|
|
ETIENNE GAGNON
Quebec, City, Quebec |
Vice President, Commercial Transformation
|
|
|
LUC GAGNON
St-Augustin-de-Desmaures, Quebec |
Vice President, Manufacturing Operations and Customer Service
|
|
|
FLOYD ALLEN JOHNSTON
Richardson, Texas |
Vice President, Sales — Americas
|
|
|
GERMAIN LAMONDE
St-Augustin-de-Desmaures, Quebec |
Executive Chairman of the Board
|
|
|
ANGELA LOGOTHETIS
Bath, United Kingdom |
Independent Director
|
|
|
CLAUDIO MAZZUCA
LaSalle, Quebec |
Vice President, Strategic Partnerships and Alliance
|
|
|
PHILIPPE MORIN
Senneville, Quebec |
Chief Executive Officer
|
|
|
PIERRE PLAMONDON
Quebec City, Quebec |
Chief Financial Officer and Vice President, Finance
|
|
|
BENOIT RINGUETTE
Boischatel, Quebec |
General Counsel and Corporate Secretary
|
|
|
MICHAEL SCHEPPKE
Singapore, Singapore |
Vice President, Sales — Asia-Pacific
|
|
|
CLAUDE SÉGUIN
Westmount, Quebec |
Independent Director
|
|
|
WILLEM JAN TE NIET
Harfsen, Netherlands |
Vice President, Sales — Europe Middle East and Africa
|
|
|
RANDY E. TORNES
Frisco, Texas |
Independent Director
|
|
•
|
Mr. François Côté (Chairman)
|
|
•
|
Ms. Angela Logothetis
|
|
•
|
Mr. Claude Séguin
|
|
•
|
Mr. Randy E. Tornes
|
|
Meeting
|
Main Activities of the Human Resources Committee
|
|
|
October 11, 2018
|
●
|
Review of the Business Performance Measures results for the financial year ended
August 31, 2018;
|
|
●
|
Review of the Business Performance Measures for the financial year started
September 1, 2018;
|
|
|
●
|
Review of the Short-Term Incentive Plan results for the financial year ended
August 31, 2018;
|
|
|
●
|
Update on the Short-Term Incentive Plan for the financial year started September
1, 2018;
|
|
|
●
|
Review of the proposed salary scales and salary increases for the year started
September 1, 2018;
|
|
|
●
|
Review of the compensation plans of executive officers for the financial year
started September 1, 2018 being the Base Salary, the Short-Term Incentive Plan and the stock-based compensation delivered through the Long-Term Incentive Plan;
|
|
|
●
|
Review and approval of the executive compensation section of the Management proxy
circular for the financial year ended August 31, 2018;
|
|
|
●
|
Review and approval of the CEO and Executive Chairman objectives and compensation
plan;
|
|
|
●
|
Human Resources Key Accomplishments;
|
|
|
●
|
Annual Sales Force Achievement;
|
|
|
●
|
Annual Review of the Human Resources Committee Charter;
|
|
|
●
|
Review and approval of the stock-based compensation for
executive officers delivered through the Long-Term Incentive Plan for the financial year started September 1, 2018.
|
|
|
January 9, 2019
|
●
|
Review of the Short-Term Incentive Plan results of
some executive officers for the financial year ended August 31, 2018;
|
|
●
|
Review and approval of the Short-Term Incentive Plan of some executive officers
for the financial year started September 1, 2018, including the CEO and Executive Chairman;
|
|
|
●
|
Review of the quarterly results under the Short-Term Incentive Plan for the
financial year started September 1, 2018 and being part of the Short-Term Incentive Plan;
|
|
|
●
|
Review and approval of the stock-based compensation for performing employees
delivered through the Long-Term Incentive Plan for the financial year started September 1, 2018;
|
|
|
●
|
Leadership program and Talent Management;
|
|
|
●
|
Review of the Risk Assessment of Executive Compensation.
|
|
|
April 10, 2019
|
●
|
Review of the quarterly results under the Short-Term Incentive Plan for the
financial year started September 1, 2018 and being part of the Short-Term Incentive Plan;
|
|
●
|
Succession Planning;
|
|
|
●
|
Review of the Key Human Resources Initiatives;
|
|
|
●
|
Compensation Review;
|
|
|
●
|
Review of the stock-based compensation for performing and critical employees;
|
|
|
●
|
Review of the Talent Management and Leadership program.
|
|
|
July 10, 2019
|
●
|
Review of the quarterly results under the Short-Term Incentive Plan for the
financial year started September 1, 2018 and being part of the Short-Term Incentive Plan;
|
|
●
|
Global Employment Status;
|
|
|
●
|
Review and approval of the compensation package of recently hired executive
officer;
|
|
|
●
|
Review of the Talent Management and Leadership program;
|
|
|
●
|
Review of the Key Human Resources Initiatives.
|
|
|
Meeting
|
Main Activities of the Human Resources Committee
|
|
|
October 9, 2019
|
●
|
Review of the Business Performance Measures results for the financial year ended
August 31, 2019;
|
|
●
|
Review of the Business Performance Measures for the financial year started
September 1, 2019;
|
|
|
●
|
Review of the Short-Term Incentive Plan results for the financial year ended
August 31, 2019;
|
|
|
●
|
Review of the Short-Term Incentive Plan for the financial year started September
1, 2019;
|
|
|
●
|
Review of the proposed salary scales and salary increases for the year started
September 1, 2019;
|
|
|
●
|
Review of the compensation plans of executive officers for the financial year
started September 1, 2019 being the Base Salary, the Short-Term Incentive Plan and the stock-based compensation delivered through the Long-Term Incentive Plan;
|
|
|
●
|
Review and approval of the executive compensation section of the Management proxy
circular for the financial year ended August 31, 2019;
|
|
|
●
|
Review and approval of the CEO and Executive Chairman objectives and compensation
plan;
|
|
|
●
|
Review and approval of the stock-based compensation for senior management and
officers delivered through the Long-Term Incentive Plan for the financial year started September 1, 2019;
|
|
|
●
|
Annual Sales Force Achievement;
|
|
|
●
|
Annual Review of the Human Resources Committee Charter;
|
|
|
●
|
Review of the Directors’ Compensation;
|
|
|
●
|
Review of the Key Human Resources Initiatives;
|
|
|
●
|
Review of the Risk Assessment of Executive Compensation.
|
|
Type of Fee
|
Financial 2018 Fees
|
Percentage of
Financial 2018 Fees |
Financial 2019 Fees
|
Percentage of
Financial 2019 Fees |
||||
|
Executive Compensation – Related Fees
|
CA$5,736
|
7%
|
CA$807
|
2%
|
||||
|
All Other Fees
|
CA$76,774
|
93%
|
CA$39,793
|
98%
|
||||
|
Total
|
CA$82,510
|
100%
|
CA$40,600
|
100%
|
||||
|
•
|
Canada executives: For the executives based in Canada, the Corporation used the following
comparator group: 5N Plus Inc., ACCEO Solutions, AgJunction Inc, Atos IT Services and Solutions, Inc., Avigilon Corporation, Callian Technologies Ltd., Ciena, COM DEV International Ltd., Constellation Software inc., Evertz
Technologies Ltd., GTECH, Open Text Corporation, Redline Communications Group Inc., Sandvine Corporation, Sierra Wireless Inc., Smart Technologies Inc., Vecima Networks Inc., Vidéotron Ltée and Wi-Lan Inc.
|
|
•
|
United States executives: For the executives based in the United States, the Corporation used
the following comparator group: AMETEK, Avangate, BMC Software, CDK Global, Communications Systems, Crown Castle, Intelsat, Itron, Keysight Technologies, Laird Technologies, MTS Systems, Plexus, SAS Institute, SunGard Data Systems,
Teradata, TomTom, Total System Services, Truphone and Verint Systems.
|
|
•
|
United Kingdom executives: For the executives based in the United Kingdom, the Corporation
used the following comparator group: BAE Systems Applied Intelligence, COLT Telecom, Flextronics, Fujitsu, Irdeto, McCain Foods, PepsiCo, Premier Food Group, QinetiQ, Qualcomm, Rentokil Initial, Talk Talk Group and Viacom.
|
|
•
|
Asia executives: For the executives based in Asia, the Corporation used a broader comparator
group, based on general industry data: A.Menarini Asia-Pacific, Abbott Laboratories, AbbVie, Accenture, ACE Asia Pacific Services, ACE Insurance, ACE Life Insurance Company Ltd, ACR Capital Holdings, AIA Company, Aimia, Alcatel-Lucent,
Amazon.com, ANZ Banking Group, ASML, AstraZeneca, Avanade, Aviva Ltd, AXA Insurance Singapore, AXA Life Insurance Singapore, Bank of New York Mellon, Baxter, Beckman Coulter, Becton Dickinson, BHP Billiton, Bio-Rad Laboratories,
Biosensors, BT Global Services, Cerebos Pacific Limited, Chubb Pacific Underwriting, Cigna, CommScope, DHL, DHL Express, DHL GBS, DHL Global Forwarding, DHL Mail, DHL Supply Chain, Discovery Communications, Experian, Federal Insurance
Company, Fujitsu, GE Energy, GE Healthcare, General Electric, Great Eastern Life Insurance, Hap Seng Consolidated, HSBC Holdings, IHS Global, IMI, Ingenico, Intel, Intercontinental Hotels Group, International Flavors & Fragrances,
ITT Corporation, Johnson & Johnson, Lexmark, Liberty Insurance, M1 Limited, Manulife, MasterCard, Merck KgaA, Microsoft, Molex, MSD International GMBH (Singapore Branch), National Australia Bank, NBC Universal, NCR, Overseas
Assurance Corporation, Pfizer, Pramerica Financial Asia HQ, Proximus, Prudential Assurance Company, Prudential Services, QBE Insurance, Qualcomm, Reinsurance Group of America, RELX Group, Rio Tinto, Roche Pharmaceuticals, Sabre
Holdings, Sealed Air, Smiths Group, Spirax Sarco, Standard Chartered Bank, StarHub, Starwood Hotels & Resorts, Straits Developments, Swiss Reinsurance International, Teva Pharmaceutical Industries, Thermo Fisher Scientific,
Trayport, TUI, UBS, Unilever, United Overseas Bank, Verizon, Zurich Insurance Company and Zurich Life Insurance.
|
|
a)
|
Similar industry: Technology Hardware and Equipment, Telecommunications Equipment and Services or Software and Services; and
|
|
b)
|
Comparable in size: revenues under CA$1 billion. Only one publicly traded company had revenues above the equivalent of CA$1 billion. The
compensation market comparison is done using the regression analysis which is a method to predict the “size-adjusted” competitive level of compensation to reflect the size of the Corporation in relation to that of the other companies of
the reference group. This method mitigates the impact that larger companies may have on the competitive compensation levels for the Corporation.
|
|
•
|
Performance-based: Executive compensation levels reflect both the results of the Corporation
and individual results based on specific quantitative and qualitative objectives established at the beginning of each financial year in keeping with the Corporation’s long-term strategic objectives.
|
|
•
|
Aligned with shareholder interests: An important portion of incentive compensation for
executives is composed of equity awards to ensure that executives are aligned with the principles of sustained long-term shareholder value growth.
|
|
•
|
Market competitive: Compensation of executives is designed to be externally competitive
when compared against executives of comparable peer companies, and in consideration of the Corporation’s results.
|
|
•
|
Individually equitable: Compensation levels are also designed to reflect individual factors
such as scope of responsibility, experience, and performance against individual measures.
|
|
Name & Position
|
Annual Incentive Target as % of Base Salary
|
|
Germain Lamonde, Executive Chairman
|
65.0%
|
|
Philippe Morin, CEO
|
52.5%
|
|
Pierre Plamondon, CFO and Vice President, Finance
|
45.0%
|
|
Willem Jan te Niet, Vice President, Sales — EMEA
|
73.0%
|
|
Dana Yearian, Vice President, Sales — Americas
|
90.0%
|
|
Base Salary
|
X
|
Annual Incentive Target (%)
|
X
|
Business Performance Measures (%)
|
X
|
Individual Performance Measures (%)
|
|
Business Performance Measures (1)
|
Weight
|
Result in % of the Weight
|
Result of the Metrics
|
|||
|
Consolidated revenues (2)
|
30%
|
20.56%
|
US$286.9 million
|
|||
|
Profitability (3)
|
45%
|
28.75%
|
US$25.6 million
|
|||
|
Quality (4)
|
18%
|
22.50%
|
115.0%
|
|||
|
Net Promoter Score (5)
|
7%
|
7.59%
|
73.00
|
|||
|
Total
|
100%
|
79.40%
|
||||
|
(1)
|
The corporate Profitability result for the year must be positive (above 0) for the whole Business Performance Measure to
trigger a payout. The corporate Profitability represents net earnings before interest, income taxes, depreciation and amortization, restructuring charges, stock-based compensation costs, foreign exchange gain and certain one-time items.
|
|
(2)
|
For consolidated revenues metric, results will range from 40% to 100% of the weight upon attainment of a minimum threshold
(US$275.0 million) up to the target defined at the beginning of the financial year (US$286.9 million) and from 100% to 125% of the weight from such annual target to the maximum threshold (US$310.0 million).
|
|
(3)
|
For Profitability metric, results will range from 40% to 100% of the weight upon attainment of a minimum threshold
(US$22.0 million) up to the target defined at the beginning of the financial year (US$31.0 million) and from 100% to 125% of the weight from such annual target to the maximum threshold (US$35.5 million).
|
|
(4)
|
For quality, results will range from 25% to 100% of the weight upon attainment of a minimum threshold of 50% up to the
annual target defined at the beginning of the financial year (100%) and from 100% to 125% of the weight from such annual target to the maximum threshold of 115%.
|
|
(5)
|
For Net Promoter Score metrics, results will range from 25% to 100% of the weight upon attainment of a minimum threshold
of 62 up to the annual target defined at the beginning of the financial year (72) and from 100% to 125% of the weight from such annual target to the maximum threshold of 75.
|
|
Germain Lamonde, Executive Chairman
|
||||
|
Elements of Individual
Performance Measures (1)
|
Weight
(from 0% to 120%) (2) |
Result
(%) |
||
|
Financial objectives
|
||||
|
Corporate EBITDA
|
From 0% to 30%
|
19.76%
|
||
|
Corporate revenues
|
From 0% to 30%
|
26.32%
|
||
|
Strategic contribution
|
||||
|
Positioning and transforming the Corporation’s divisions as set
forth in the Corporation’s strategic plan, Maximizing the value from the Corporation’s Mergers & Acquisitions activities
|
From 0% to 30%
|
19.88%
|
||
|
Corporate Development & Governance
|
From 0% to 30%
|
25.65%
|
||
|
Total
|
91.61%
|
|||
|
Total of Business Performance Measures
(79.40%) X Individual Performance Measures (91.61%)
|
72.74%
|
|||
|
(1)
|
If the minimum level of the Corporate EBITDA, as determined at the beginning of the financial year, is not achieved,
payment of any variable compensation to the Executive Chairman will be at the discretion of the Human Resources Committee.
|
|
(2)
|
The weight of each individual objective is not capped but the total is capped at 150%.
|
|
Philippe Morin, CEO
|
||||
|
Elements of Individual
Performance Measures (1)
|
Weight
(from 0% to 120%) (2) |
Result
(%) |
||
|
Financial objectives
|
||||
|
Corporate EBITDA
|
From 0% to 30%
|
19.76%
|
||
|
Corporate revenues
|
From 0% to 20%
|
14.76%
|
||
|
Corporate cash flow from operations (3)
|
From 0% to 10%
|
15.00%
|
||
|
Strategic contribution
|
||||
|
Positioning and transforming the Corporation’s divisions as set
forth in the Corporation’s strategic plan, Maximizing the value from the Corporation’s Mergers & Acquisitions activities
|
From 0% to 40%
|
18.57%
|
||
|
Delivering the strategic transformation imperatives as set forth
in the Corporation’s strategic plan and strengthening the Corporation’s strategic capabilities
|
From 0% to 20%
|
17.39%
|
||
|
Total
|
85.48%
|
|||
|
Total of Business Performance Measures
(79.40%) X Individual Performance Measures (85.48%)
|
67.87%
|
|||
|
(1)
|
If the minimum level of the Corporate EBITDA, as determined at the beginning of the financial year, is not achieved,
payment of any variable compensation to the CEO will be at the discretion of the Human Resources Committee.
|
|
(2)
|
The weight of each individual objective, with the exception of the corporate cash flow from operations objective, is not
capped but the total is capped at 150%.
|
|
(3)
|
This objective is capped.
|
|
Pierre Plamondon, CFO and Vice President of
Finance
|
||||
|
Elements of Individual
Performance Measures (1)
|
Weight
(from 0% to 120%) (2) |
Result
(%) |
||
|
Financial objectives
|
||||
|
Corporate EBITDA
|
From 0% to 30%
|
19.76%
|
||
|
Corporate revenues
|
From 0% to 20%
|
14.76%
|
||
|
Corporate cash flow from operations
|
From 0% to 10%
|
17.24%
|
||
|
Strategic contribution
|
||||
|
Contribute to the Corporation’s finance function transformation
set forth in the Corporation’s strategic plan
|
From 0% to 30%
|
26.00%
|
||
|
Contribute to the Corporation’s digital transformation set forth
in the Corporation’s strategic plan
|
From 0% to 20%
|
17.00%
|
||
|
Leadership performance
|
From 0% to 10%
|
8.00%
|
||
|
Total
|
102.76%
|
|||
|
Total of Business Performance Measures
(79.40%) X Individual Performance Measures (102.76%)
|
81.59%
|
|||
|
(1)
|
If the minimum level of the Corporate EBITDA, as determined at the beginning of the financial year, is not achieved,
payment of any variable compensation to the CFO and Vice President of Finance will be at the discretion of the Human Resources Committee.
|
|
(2)
|
The weight of each individual objective is not capped but the total is capped at 150%.
|
|
Willem Jan te Niet, Vice President, Sales — EMEA
|
||||
|
Business Performance Measures
|
Incentive Targets (US$)
|
Results (US$)
|
||
|
Contribution Margin Bonus (1)
|
107,616
|
94,135
|
||
|
Bonus on Bookings Achievement (2)
|
35,872
|
26,498
|
||
|
Corporate EBITDA (3)
|
35,872
|
19,687
|
||
|
Total
|
179,360
|
140,320
|
||
|
(1)
|
The amount of bonus for the attainment of the quarterly contribution margin targets for the territory of EMEA is based on
the percentage of achievement up to 100% of the quarterly and annual contribution margin targets defined at the beginning of the financial year. An accelerated amount of bonus based on the percentage of attainment of the quarterly and
annual contribution margin targets above 100% is also payable.
|
|
(2)
|
The amount of bonus for the attainment of the bookings’ targets for the territory of EMEA is based on the percentage of
achievement up to 100% of the quarterly and annual bookings targets defined at the beginning of the financial year. An accelerated amount of bonus based on the percentage of attainment from above 100%, 150% and 200% of the annual
bookings target is also payable.
|
|
(3)
|
If the minimum level of the Corporate EBITDA, as determined at the beginning of the financial year, is achieved then 25%
up to 100% of achievement is payable and capped at 125% but if it is not achieved, payment of any variable compensation to the NEO will be at the discretion of the Human Resources Committee.
|
|
Dana Yearian, Vice President, Sales — Americas
|
||||
|
Business Performance Measures
|
Incentive Targets (US$)
|
Results (US$)
|
||
|
Contribution Margin Bonus (1)
|
131,094
|
115,328
|
||
|
Bonus on Bookings Achievement (2)
|
43,698
|
39,182
|
||
|
Corporate EBITDA (3)
|
43,698
|
23,974
|
||
|
Total
|
218,490
|
178,484
|
||
|
(1)
|
The amount of bonus for the attainment of the quarterly contribution margin targets for the territory of the Americas is
based on the percentage of achievement up to 100% of the quarterly and annual contribution margin targets defined at the beginning of the financial year. An accelerated amount of bonus based on the percentage of attainment of the
quarterly and annual contribution margin targets above 100% is also payable.
|
|
(2)
|
The amount of bonus for the attainment of the bookings’ targets for the territory of the Americas is based on the
percentage of achievement up to 100% of the quarterly and annual bookings targets defined at the beginning of the financial year. An accelerated amount of bonus based on the percentage of attainment from above 100%, 150% and 200% of the
annual bookings target is also payable.
|
|
(3)
|
If the minimum level of the Corporate EBITDA, as determined at the beginning of the financial year, is achieved then 25%
up to 100% of achievement is payable and capped at 125% but if it is not achieved, payment of any variable compensation to the NEO will be at the discretion of the Human Resources Committee.
|
|
•
|
amendments of a general housekeeping or clerical nature that, among others, clarify, correct or rectify any ambiguity, defective
provision, error or omission in the LTIP or the DSU Plan;
|
|
•
|
amendments necessary to comply with applicable laws or the requirements of any securities regulatory authority or stock exchange;
|
|
•
|
changing the eligibility for, and limitations on, participation in the LTIP and the DSU Plan;
|
|
•
|
modifying the terms and conditions of any options, PSUs, RSUs and DSUs, including restrictions, not inconsistent with the terms of the
LTIP and the DSU Plan, which terms and conditions may differ among individual grants and holders of such securities;
|
|
•
|
modifying the periods referred to in the LTIP during which vested options may be exercised, provided that the option period is not
extended beyond ten years after the date of the granting of the option;
|
|
•
|
amendments with respect to the vesting period, with respect to circumstances that would accelerate the vesting of options, PSUs or RSUs,
or the redemption of DSUs;
|
|
•
|
any amendment resulting from or due to the alteration of share capital as more fully set out in the LTIP and the DSU Plan;
|
|
•
|
amendments to the provisions relating to the administration of the LTIP and the DSU Plan; and
|
|
•
|
suspending or terminating the LTIP and the DSU Plan.
|
|
•
|
a reduction in the exercise price of options held by an insider;
|
|
•
|
an extension of the exercise period of options held by an insider;
|
|
•
|
any amendment to remove or to exceed the limits on insider participation;
|
|
•
|
an increase to the maximum number of Subordinate Voting Shares issuable under the LTIP and the DSU Plan; and
|
|
•
|
any amendment to the amendment provisions of the LTIP and the DSU Plan.
|
|
Name & Position
|
Grant Levels (1) (% of Previous Year Base Salary)
|
||
|
Philippe Morin, CEO
|
55.0%
|
||
|
Pierre Plamondon, CFO and Vice President, Finance
|
45.0%
|
||
|
Willem Jan te Niet, Vice President, Sales ─ EMEA
|
35.0%
|
||
|
Dana Yearian, Vice President, Sales ─ Americas
|
42.5%
|
||
|
(1)
|
Actual grant value may differ from the grant level guidelines as the stock price may vary between the time of the grant
and its approval.
|
|
Financial
Year Ended |
Grant Date
|
RSUs
Granted (#) |
Fair Value
at the Time of Grant (US$/RSU) |
Vesting Schedule
|
|
|
August 31, 2019
|
October 18, 2018
|
166,161
|
3.17
|
100% on the third anniversary date of the grant.
|
|
|
January 15, 2019
|
238,500
|
3.42
|
|||
|
July 17, 2019
|
30,571
|
3.85
|
|||
|
October 18, 2018
|
197,699
|
3.17
|
100% on the third
anniversary date of the grant if performance objectives related to long-term growth of revenue and profitability, as determined by the Board of Directors of the Corporation, are fully attained.
|
||
|
Total
|
632,931
|
||||
|
Financial
Year Ended |
Grant Date
|
RSUs
Granted (#) |
Fair Value
at the Time of Grant (US$/RSU) |
Vesting Schedule
|
|
|
August 31, 2018
|
October 19, 2017
|
15,000
|
4.00
|
50% on each of the third and fourth anniversary dates of the grant.
|
|
|
January 16, 2018
|
154,833
|
4.45
|
|||
|
February 2, 2018
|
30,000
|
4.62
|
|||
|
October 19, 2017
|
211 155
|
4.00
|
100% on the fifth
anniversary date of the grant subject to early vesting of up to 1/3 on the third anniversary date of the grant and up to 50% of the remaining units on the fourth anniversary date of the grant if performance objectives namely related
to long-term growth of revenue and profitability, as determined by the Board of Directors of the Corporation, are fully attained.
|
||
|
November 13, 2017
|
9,633
|
4.30
|
|||
|
Total
|
420,621
|
||||
|
August 31, 2017
|
October 19, 2016
|
38,300
|
4.01
|
50% on each of the third and fourth anniversary dates of the grant.
|
|
|
January 18, 2017
|
153,700
|
5.10
|
|||
|
April 5, 2017
|
123,110
|
4.89
|
|||
|
October 19, 2016
|
207,269
|
4.01
|
100% on the fifth
anniversary date of the grant subject to early vesting of up to 1/3 on the third anniversary date of the grant and up to 50% of the remaining units on the fourth anniversary date of the grant if performance objectives namely related
to long-term growth of revenue and profitability, as determined by the Board of Directors of the Corporation, are fully attained.
|
||
|
April 5, 2017
|
4,764
|
4.89
|
|||
|
Total
|
527,143
|
||||
|
August 31, 2016
|
October 15, 2015
|
36,900
|
3.23
|
50% on each of the third and fourth anniversary dates of the grant.
|
|
|
November 9, 2015
|
109,890
|
3.43
|
|||
|
January 13, 2016
|
151,400
|
3.00
|
|||
|
July 7, 2016
|
2,500
|
3.30
|
|||
|
August 15, 2016
|
10,000
|
3.33
|
|||
|
October 15, 2015
|
206,373
|
3.23
|
100% on the fifth
anniversary date of the grant subject to early vesting of up to 1/3 on the third anniversary date of the grant and up to 50% of the remaining units on the fourth anniversary date of the grant if performance objectives namely related
to long-term growth of revenue and profitability, as determined by the Board of Directors of the Corporation, are fully attained.
|
||
|
November 9, 2015
|
54,945
|
3.43
|
|||
|
Total
|
572,008
|
||||
|
August 31, 2015
|
October 16, 2014
|
29,150
|
3.71
|
50% on each of the third and fourth anniversary dates of the grant.
|
|
|
January 14, 2015
|
163,400
|
3.55
|
|||
|
March 31, 2015
|
5,000
|
3.78
|
|||
|
July 2, 2015
|
12,299
|
3.27
|
|||
|
October 16, 2014
|
197,726
|
3.71
|
100% on the fifth
anniversary date of the grant subject to early vesting of up to 1/3 on the third anniversary date of the grant and up to 50% of the remaining units on the fourth anniversary date of the grant if performance objectives namely related
to long-term growth of revenue and profitability, as determined by the Board of Directors of the Corporation, are fully attained.
|
||
|
July 2, 2015
|
1,946
|
3.27
|
|||
|
Total
|
409,521
|
||||
|
Name
|
RSUs
Granted (#) |
Percentage of Total
RSUs Granted to Employees in Financial Year (%) (1) |
Fair Value
at the Time of Grant (US$/RSU) (2) |
Grant Date
|
Vesting Schedule (3)
|
||
|
Philippe Morin
|
34,892
|
12.40%
|
3.17
|
October 18, 2018
|
100% on the third
anniversary date of the grant.
|
||
|
43,615
|
100% on the third
anniversary date of the grant if performance objectives namely related to long-term growth of revenue and profitability, as determined by the Board of Directors of the Corporation are fully attained. (4)
|
||||||
|
Pierre Plamondon
|
16,842
|
5.99%
|
3.17
|
October 18, 2018
|
100% on the third
anniversary date of the grant.
|
||
|
21,052
|
100% on the third
anniversary date of the grant if performance objectives namely related to long-term growth of revenue and profitability, as determined by the Board of Directors of the Corporation are fully attained. (4)
|
||||||
|
Willem Jan te Niet
|
13,117
|
4.66%
|
3.17
|
October 18, 2018
|
100% on the third
anniversary date of the grant.
|
||
|
16,397
|
100% on the third
anniversary date of the grant if performance objectives namely related to long-term growth of revenue and profitability, as determined by the Board of Directors of the Corporation are fully attained. (4)
|
||||||
|
Dana Yearian
|
16,282
|
5.79%
|
3.17
|
October 18, 2018
|
100% on the third
anniversary date of the grant.
|
||
|
20,353
|
100% on the third
anniversary date of the grant if performance objectives namely related to long-term growth of revenue and profitability, as determined by the Board of Directors of the Corporation are fully attained. (4)
|
||||||
|
(1)
|
Such percentage does not include any cancelled RSUs.
|
|
(2)
|
The fair value at the time of grant of a RSU is equal to the market value of Subordinate Voting Shares at the time RSUs
are granted. The grant date market value is equal to the highest of the closing prices of the Subordinate Voting Shares on the Toronto Stock Exchange and the NASDAQ Global Select Market on the last trading day preceding the grant
date, using the daily exchange rate of the Bank of Canada on the last trading day preceding the grant date to convert either the NASDAQ Global Select Market closing price to Canadian dollars or the Toronto
Stock Exchange closing price to United States dollars as required.
|
|
(3)
|
All RSUs first vesting cannot be earlier than the third anniversary date of their grant.
|
|
(4)
|
Those RSUs granted in the financial year ended August 31, 2019 vest on the third anniversary date of the grant but are
subject to the attainment of performance objectives, as determined by the Board of Directors of the Corporation. Such performance objectives are based on the attainment of a profitability metric target for the upcoming three fiscal
years. The profitability metric is determined as the upcoming three fiscal year ‘s cumulative Corporation’s IFRS net earnings (loss) before interest and other expense, income taxes, and amortization, stock-based compensation costs,
restructuring charges, acquisition-related deferred revenue fair value adjustment and foreign exchange gain or loss, change in fair value of cash contingent consideration, and extraordinary gain or loss (“LTIP EBITDA”). Accordingly,
the vesting performance objectives will be attained, calculated on a pro-rated basis as follows: i) 0% for a LTIP EBITDA below target for the three-year period ending on August 31, 2021; ii) 50% to 100% for a LTIP EBITDA at target or
above and caped at two times the target for the three-year period ending on August 31, 2021.
|
|
Number of
RSUs (#) |
% of Issued and
Outstanding RSUs |
Weighted Average Fair Value at
the Time of Grant ($US/RSU) |
||||
|
Executive Chairman (one (1) individual)
|
–
|
–
|
–
|
|||
|
CEO (one (1) individual)
|
327,039
|
17.81%
|
3.73
|
|||
|
Board of Directors (four (4) individuals)
|
–
|
–
|
–
|
|||
|
Management and Corporate Officers (ten (10) individuals)
|
844,544
|
45.99%
|
3.58
|
|||
|
DSUs
Granted (#) |
Weighted Average Fair Value
at the Time of Grant (US$/DSU) |
Total of the Fair Value
at the Time of Grant (US$) |
Vesting
|
|
69,818
|
3.63
|
253,439
|
At the time director ceases to be a member of the Board of Directors of the Corporation
|
|
DSUs
Granted (#) |
% of Issued and
Outstanding DSUs |
Total of the Fair Value at
the Time of Grant (US$) |
Weighted Average Fair Value
at the Time of Grant (US$/DSU) |
|
|
Board of Directors (four (4) individuals)
|
251,507
|
100%
|
980,877
|
3.90
|
|
Long-Term Incentive Plan (LTIP) - RSUs
|
|||
|
Date of Grant
|
Vesting Date
|
% of Early Vesting Achievement (1)
|
|
|
October 15, 2015
|
October 15, 2019
|
8%
|
|
|
October 19, 2016
|
October 21, 2019
|
11%
|
|
|
(1)
|
The vesting schedules are provided in the table under the heading “Long-Term Incentive Plan”.
|
|
Compensation Elements
|
2019
|
2018
|
2017 (1)
|
Three-Year Total
|
|||||
|
Cash
|
|||||||||
|
Base Salary
|
CA$486,735
|
CA$588,350
|
CA$717,500
|
CA$1,792,585
|
|||||
|
Short-Term Incentive
|
CA$230,128
|
CA$160,800
|
CA$262,962
|
CA$653,890
|
|||||
|
Equity
|
|||||||||
|
Long-Term Incentive
|
–
|
–
|
–
|
–
|
|||||
|
Total Direct Compensation
|
CA$716,863
|
CA$749,150
|
CA$980,462
|
CA$2,446,475
|
|||||
|
Contribution to DPSP
|
–
|
–
|
–
|
–
|
|||||
|
All Other Compensation
|
–
|
–
|
–
|
–
|
|||||
|
Total Compensation
|
CA$716,863
|
CA$749,150
|
CA$980,462
|
CA$2,446,475
|
|||||
|
Annual Average
|
–
|
–
|
–
|
CA$815,492
|
|||||
|
Total Market Capitalization (CA$ millions) as at August 31
|
268.4
|
318.0
|
322.3
|
302.9
|
|||||
|
Total Cost as a % of Market Capitalization
|
0.27%
|
0.24%
|
0.31%
|
0.27%
|
|||||
|
(1)
|
On April 1, 2017, Mr. Germain Lamonde stepped down as CEO and became Executive Chairman of the Corporation.
|
|
Compensation Elements
|
2019
|
2018
|
2017 (1)
|
Three-Year Total
|
|||||
|
Cash
|
|||||||||
|
Base Salary
|
CA$531,898
|
CA$522,750
|
CA$512,500
|
CA$1,567,148
|
|||||
|
Short-Term Incentive
|
CA$189,528
|
CA$115,396
|
CA$118,531
|
CA$423,455
|
|||||
|
Equity
|
|||||||||
|
Long-Term Incentive
|
CA$323,449
|
CA$256,251
|
CA$531,256
|
CA$1,110,956
|
|||||
|
Total Direct Compensation
|
CA$1,044,875
|
CA$894,397
|
CA$1,162,287
|
CA$3,101,559
|
|||||
|
Contribution to DPSP
|
CA$24,156
|
CA$986
|
CA$14,346
|
CA$39,488
|
|||||
|
All Other Compensation
|
–
|
–
|
–
|
–
|
|||||
|
Total Compensation
|
CA$1,069,031
|
CA$895,383
|
CA$1,176,633
|
CA$3,141,047
|
|||||
|
Annual Average
|
–
|
–
|
–
|
CA$1,047,016
|
|||||
|
Total Market Capitalization (CA$ millions) as at August 31
|
268.4
|
318.0
|
322.3
|
302.9
|
|||||
|
Total Cost as a % of Market Capitalization
|
0.40%
|
0.28%
|
0.37%
|
0.35%
|
|||||
|
(1)
|
Mr. Philippe Morin was nominated CEO on April 1, 2017.
|
|
Name and
Principal Position |
Financial
Year |
Salary (1) (2)
($) |
Share-Based
Awards (2) (3) ($) |
Option-
Based Awards ($) |
Non-Equity Incentive
Plan Compensation ($) |
Pension
Value ($) |
All Other
Compensation ($) (2) (5) |
Total
Compensation ($) |
||||||
|
Annual
Incentive Plans (2) (4) |
Long-Term
Incentive Plan |
|||||||||||||
|
Germain Lamonde,
Executive Chairman (6) |
2019
|
367,430 (US)
486,735 (CA) |
─
─ |
(US)
(CA) |
–
|
173,721
230,128 |
(US)
(CA) |
–
|
–
|
–
|
541,151
716,863 |
(US)
(CA) |
||
|
2018
|
460,800 (US)
588,350 (CA) |
─
─ |
(US)
(CA) |
–
|
125,940
160,800 |
(US)
(CA) |
–
|
–
|
–
|
586,740
749,150 |
(US)
(CA) |
|||
|
2017
|
543,067 (US)
717,500 (CA) |
─
─ |
(US)
(CA) |
–
|
199,032
262,962 |
(US)
(CA) |
–
|
–
|
–
|
742,099
980,462 |
(US)
(CA) |
|||
|
Philippe Morin,
CEO (7) |
2019
|
401,523 (US)
531,898 (CA) |
244,168
323,449 |
(US)
(CA)
|
–
|
143,072
189,528 |
(US)
(CA) |
–
|
–
|
18,235
24,156 |
(US)
(CA) |
806,998
1,069,031 |
(US)
(CA) |
|
|
2018
|
409,422 (US)
522,750 (CA) |
200,698
256,251
|
(US)
(CA)
|
–
|
90,379
115,396 |
(US)
(CA) |
–
|
–
|
772
986 |
(US)
(CA) |
701,271
895,383 |
(US)
(CA) |
||
|
2017
|
387,905 (US)
512,500 (CA) |
402,101
531,256 |
(US)
(CA) |
–
|
89,715
118,531 |
(US)
(CA) |
–
|
–
|
10,858
14,346 |
(US)
(CA) |
890,579
1,176,633 |
(US)
(CA) |
||
|
Pierre Plamondon,
CFO and Vice President, Finance |
2019
|
235,129 (US)
311,476 (CA) |
117,856
156,123 |
(US)
(CA) |
–
|
86,330
114,362 |
(US)
(CA) |
–
|
–
|
10,368
13,734 |
(US)
(CA) |
449,683
595,695 |
(US)
(CA) |
|
|
2018
|
241,535 (US)
308,392 (CA) |
106,561
136,057 |
(US)
(CA) |
–
|
60,189
76,850 |
(US)
(CA) (8) |
–
|
–
|
7,833
10,002 |
(US)
(CA) |
416,118
531,301 |
(US)
(CA) |
||
|
2017
|
228,841 (US)
302,345 (CA) |
100,176
132,352 |
(US)
(CA) |
–
|
46,116
60,928 |
(US)
(CA) |
–
|
–
|
11,006
14,541 |
(US)
(CA) |
386,139
510,166 |
(US)
(CA) |
||
|
Name and
Principal Position |
Financial
Year |
Salary (1) (2)
($) |
Share-Based
Awards (2) (3) ($) |
Option-
Based Awards ($) |
Non-Equity Incentive
Plan Compensation ($) |
Pension
Value ($) |
All Other
Compensation ($) (2) (5) |
Total
Compensation ($) |
||||||
|
Annual
Incentive Plans (2) (4) |
Long-Term
Incentive Plan |
|||||||||||||
|
Willem Jan te Niet,
Vice President, Sales — EMEA |
2019
|
235,956 (US)
312,571 (CA) 208,019 (€) |
93,559
123,938 82,482 |
(US)
(CA) (€) |
–
|
140,320
185,882 123,706 |
(US)
(CA) (€) |
–
|
–
|
18,877
25,006 16,642 |
(US)
(CA) (€) |
488,712
647,397 430,849 |
(US)
(CA) (€) |
|
|
2018
|
243,191 (US)
310,506 (CA) 203,940 (€) |
80,612
102,925 67,601 |
(US)
(CA) (€) |
–
|
141,296
180,406 118,491 |
(US)
(CA) (€) |
–
|
–
|
19,455
24,841 16,315 |
(US)
(CA) (€) |
484,554
618,678 406,347 |
(US)
(CA) (€) |
||
|
2017
|
226,587 (US)
299,367 (CA) 206,625 (€) |
66,891
88,376 60,998 |
(US)
(CA) (€) |
–
|
104,094
137,529 94,923 |
(US)
(CA) (€) |
–
|
–
|
7,912
10,454 7,215 |
(US)
(CA) (€) |
405,484
535,726 369,761 |
(US)
(CA) (€) |
||
|
Dana Yearian,
Vice President, Sales — Americas |
2019
|
242,897 (US)
321,766 (CA) |
116,133
153,841 |
(US)
(CA) |
–
|
178,484
236,438 |
(US)
(CA) |
–
|
–
|
8,400
11,127 |
(US)
(CA) |
545,914
723,172 |
(US)
(CA) |
|
|
2018
|
242,897 (US)
310,131 (CA) |
101,208
129,222 |
(US)
(CA) |
–
|
152,285
194,438 |
(US)
(CA) |
–
|
–
|
7,667
9,789 |
(US)
(CA) |
504,057
643,580 |
(US)
(CA) |
||
|
2017
|
238,134 (US)
314,623 (CA) |
99,223
131,094 |
(US)
(CA) |
–
|
156,675
206,999 |
(US)
(CA) |
–
|
–
|
7,049
9,314 |
(US)
(CA) |
501,081
662,030 |
(US)
(CA) |
||
|
|
|
|
(1)
|
Base salary earned in the financial year, regardless when paid.
|
|
(2)
|
The compensation information for Canadian residents has been converted from Canadian dollars to US dollars based upon an
average foreign exchange rate of CA$ 1.3247 = US$1.00 for the financial year ended August 31, 2019, CA$1.2768 = US$1.00 for the financial year ended August 31, 2018 and CA$1.3212 = US$1.00 for the financial year ended August 31, 2017.
The compensation information for the Netherlands resident has been converted from Euros to US dollars based upon an average foreign exchange rate of €0.8816 = US$1.00 for the financial year ended August 31, 2019, €0.8386 = US$1.00 for
the financial year ended August 31, 2018 and €0.9119 = US$1.00 for the financial year ended August 31, 2017 and the conversion from US dollars to Canadian dollars is made as described above.
|
|
(3)
|
Indicates the dollar amount based on the grant date fair value of the RSUs awarded under the LTIP for the financial
year. The fair value at the time of grant of a RSU is equal to the market value of Subordinate Voting Shares at the time RSUs are granted. The grant date market value is equal to the highest of the closing prices of the Subordinate
Voting Shares on the Toronto Stock Exchange and the NASDAQ Global Select Market on the last trading day preceding the grant date, using the daily exchange rate of the Bank of Canada on the last trading day preceding the grant date to
convert either the NASDAQ Global Select Market closing price to Canadian dollars or the Toronto Stock Exchange closing price to United States dollars as required. Grants of RSUs to NEOs are
detailed under section “Compensation Discussion and Analysis – Long-Term Incentive Plan”.
|
|
(4)
|
Indicates the total bonus earned during the financial year whether paid during the financial year or
payable on a later date:
|
|
Name
|
Paid during the
Financial Year Ended August 31, 2019 (i) ($) |
Paid in the First Quarter
of the Financial Year Ending on August 31, 2020 (i) ($) |
Total Bonus Earned during
the Financial Year Ended August 31, 2019 (i) ($) |
|||||
|
Germain Lamonde
|
–
– |
(US)
(CA) |
173,721
230,128 |
(US)
(CA) |
173,721
230,128 |
(US)
(CA) |
||
|
Philippe Morin
|
–
– |
(US)
(CA) |
143,072
189,528 |
(US)
(CA) |
143,072
189,528 |
(US)
(CA) |
||
|
Pierre Plamondon
|
–
– |
(US)
(CA) |
86,330
114,362 |
(US)
(CA) |
86,330
114,362 |
(US)
(CA) |
||
|
Willem Jan te Niet
|
85,619
113,419 75,482 |
(US)
(CA) (€) |
54,701
72,463 48,224 |
(US)
(CA) (€) |
140,320
185,882 123,706 |
(US)
(CA) (€) |
||
|
Dana Yearian
|
109,973
145,681 |
(US)
(CA) |
68,511
90,757 |
(US)
(CA) |
178,484
236,438 |
(US)
(CA) |
||
|
(i)
|
Refer to note 2 above.
|
|
(5)
|
Indicates the amount contributed by the Corporation during the financial year to the DPSP as detailed under section
“Compensation Discussion and Analysis – Deferred Profit-Sharing Plan”, the 401K plan as detailed under section “Compensation Discussion and Analysis – 401K plan”, as applicable, for the benefit of the NEOs. Mr. Lamonde is not eligible
to participate in the DPSP.
|
|
(6)
|
Mr. Lamonde stepped down as CEO as of April 1, 2017 and was nominated Executive Chairman of the Corporation.
|
|
(7)
|
Mr. Morin was promoted from Chief Operating Officer of the Corporation to CEO of the Corporation as of April 1, 2017.
|
|
(8)
|
Including a discretionary bonus of CA$10,000 (US$7,832).
|
|
Name
|
Outstanding Option-Based Awards (Options)
|
Outstanding Share-Based Awards (PSUs or RSUs)
|
||||||||
|
Number of
Securities Underlying Unexercised Options (#) |
Option
Exercise Price |
Option
Expiration Date |
Value of
Unexercised “in-the-money” Options |
Number of
Shares or Units of Shares that Have Not Vested (#) |
Market or
Payout Value of Share-Based Awards that Have Not Vested (US$) (1) |
Market or
Payout Value of Vested Share- Based Awards Not Paid Out or Distributed (US$) |
||||
|
Germain Lamonde
|
–
|
–
|
–
|
–
|
–
|
–
|
–
|
|||
|
Philippe Morin
|
–
|
–
|
–
|
–
|
327,039
|
1,193,692
|
–
|
|||
|
Pierre Plamondon
|
–
|
–
|
–
|
–
|
143,945
|
525,399
|
–
|
|||
|
Willem Jan te Niet
|
–
|
–
|
–
|
–
|
71,348
|
260,420
|
–
|
|||
|
Dana Yearian
|
–
|
–
|
–
|
–
|
139,346
|
508,613
|
–
|
|||
|
(1)
|
The value of unvested PSUs or RSUs at the financial year-end is the market value of the Subordinate Voting Shares on
August 31, 2019, which was US$3.65 (CA$4.85). The market value of the Subordinate Voting Shares was calculated by using the highest of the closing prices of the Subordinate Voting Shares on the Toronto Stock Exchange and on the NASDAQ
Global Select Market on August 30, 2019 using the daily exchange rate of the Bank of Canada to convert either the NASDAQ Global Select Market closing price to Canadian dollars or the Toronto Stock Exchange closing price to United States
dollars as required. The actual gains on vesting will depend on the value of the Subordinate Voting Shares on the date of vesting. There can be no assurance that these values will be realized.
|
|
Name
|
Share-Based Awards – Value
Vested during the Year (US$) (1) |
Non-Equity Incentive Plan Compensation –
Value Earned during the Year (US$) (2) |
|||
|
Germain Lamonde
|
–
|
173,721
|
|||
|
Philippe Morin
|
171,020
|
143,072
|
|||
|
Pierre Plamondon
|
66,009
|
86,330
|
|||
|
Willem Jan te Niet
|
32,775
|
140,320
|
|||
|
Dana Yearian
|
60,382
|
178,484
|
|||
|
(1)
|
The aggregate dollar value realized is equivalent to the market value of the Subordinate Voting Shares underlying the
PSUs or RSUs at vesting. This value, as the case may be, has been converted from Canadian dollars to US dollars based upon the daily exchange rate of the Bank of Canada on the day of vesting.
|
|
(2)
|
Includes total non-equity incentive plan compensation earned by each NEO in respect to the financial year ended on
August 31, 2019 (as indicated under the “Summary Compensation Table”).
|
|
Named Executive Officer
|
Termination Payment Event
|
||||||
|
Without Cause ($) (1) (2)
|
Change of Control ($) (2) (3)
|
Voluntary ($)
|
|||||
|
Germain Lamonde
|
986,740
1,295,070 |
(US) (4)
(CA) |
986,740
1,295,070 |
(US)
(CA) |
0
|
(5)
|
|
|
Philippe Morin (6)
|
1,094,815
1,453,122 |
(US)
(CA) |
1,595,215
2,118,037 |
(US)
(CA) |
–
|
||
|
Pierre Plamondon (6)
|
535,834
711,043 |
(US)
(CA) |
968,376
1,280,622 |
(US)
(CA) |
–
|
||
|
Willem Jan te Niet (6)
|
284,405
377,188 250,731 |
(US)
(CA) (€) |
437,387
580,466 385,600 |
(US)
(CA) (€) |
–
|
||
|
Dana Yearian (6)
|
534,616
709,393 |
(US)
(CA) |
1,101,386
1,450,134 |
(US)
(CA) |
–
|
||
|
(1)
|
The aggregate amount disclosed includes an evaluation of the amount that the NEO would have been entitled to should a
termination of employment without cause have occurred on August 31, 2019 and includes, as the case may be for each NEO, the base salary that would have been received and total value of PSUs, RSUs and options that would have vested
(with the exception of Mr. Lamonde’s evaluation which is described in note 6 below and includes: the base salary, STIP compensation, and total value of PSUs, RSUs and options that would have vested). The amount for base salary
compensation is calculated according to those amounts provided under the section entitled “Summary Compensation Table” included in this Annual Report. The amount for the total value attached to the vesting of PSUs, RSUs and options
determined pursuant to the LTIP as described in the section entitled “Long-Term Incentive Compensation – Long-Term Incentive Plan” for termination without cause.
|
|
(2)
|
The aggregate amount for Canadian residents has been converted from Canadian dollars to US dollars based upon a
foreign exchange rate of CA$1.3247 = US$1.00 as of August 31, 2019. The aggregate amount for Netherlands resident has been converted from Euros to US dollars based upon a foreign exchange rate of €0.8816 = US$1.00 as of August 31,
2019.
|
|
(3)
|
The aggregate amount disclosed includes, as the case may be for each NEO, an evaluation of the amount that the NEO would
have been entitled to should a termination of employment for Change of Control have occurred on August 31, 2019 and includes, as the case may be, namely, the base salary, STIP or SIP compensation and total value of PSUs, RSUs and
options that would have vested. The amount for base salary and STIP or SIP compensation are calculated according to those amounts provided under the section entitled “Summary Compensation Table” included in this Annual Report, the
total value attached to the vesting of PSUs, RSUs and options is calculated according to those amounts provided in the columns named “Value of unexercised “in-the-money” options” and “Market or payout value of share-based awards that
have not vested” of the table included under the heading entitled “Outstanding share-based awards and option-based awards”.
|
|
(4)
|
The aggregate amount disclosed includes an evaluation of the amount that Mr. Lamonde would have been entitled to should
a termination of employment without cause have occurred on August 31, 2019 and includes: the base salary, STIP compensation, and total value of PSUs, RSUs and options that would have vested. The amount for base salary and STIP
compensation are calculated according to those amounts provided under the section entitled “Summary Compensation Table” included in this Annual Report; the total value attached to the vesting of PSUs or RSUs and options are calculated
according to those amounts provided in the columns named “Value of unexercised “in-the-money” options” and “Market or payout value of share-based awards that have not vested” of the table included under the heading entitled –
“Outstanding share-based awards and option-based awards”.
|
|
(5)
|
Mr. Lamonde did not hold any PSUs, RSUs or options on August 31, 2019.
|
|
(6)
|
None of these NEOs held any PSUs or options on August 31, 2019.
|
|
From September 1, 2018
to August 31, 2019 |
|||||
|
Annual Retainer for Directors (1)
|
CA$70,000
|
(2)
|
US$52,842
|
(3)
|
|
|
Annual Retainer for Lead Director
|
CA$10,000
|
US$7,549
|
(3)
|
||
|
Annual Retainer for Audit Committee Chairman
|
CA$12,000
|
US$9,059
|
(3)
|
||
|
Annual Retainer for Audit Committee Members
|
CA$4,500
|
(4)
|
US$3,397
|
(3)
|
|
|
Annual Retainer for Human Resources Committee Chairman
|
CA$7,000
|
US$5,284
|
(3)
|
||
|
Annual Retainer for Human Resources Committee Members
|
CA$4,500
|
(4)
|
US$3,397
|
(3)
|
|
|
(1)
|
All the Directors elected to receive 100% of their Annual Retainer for Directors in form of DSUs except Mr. François
Côté, who elected to receive 75% of his Annual Retainer in form of DSUs.
|
|
(2)
|
The Annual Retainer for Mr. François Côté and Mr. Claude Séguin is CA$70,000 (US$52,842). The Annual Retainer for Ms.
Angela Logothetis and Mr. Randy E. Tornes is US$70,000 (CA$92,729).
|
|
(3)
|
The compensation information has been converted from Canadian dollars to US dollars based upon an average foreign
exchange rate of CA$1.3247 = US$1.00 for the financial year ended August 31, 2019.
|
|
(4)
|
The Annual Retainer for Audit Committee Members and Human Resources Committee Members is CA$4,500 (US$3,397) for Mr.
François Côté and Mr. Claude Séguin and US$4,500 (CA$5,961) for Ms. Angela Logothetis and Mr. Randy Tornes.
|
|
Name
|
Fees
Earned (1) ($) |
Share-Based
Awards ($) |
Option-
Based Awards ($) |
Non-Equity
Incentive Plan Compensation ($) |
Pension
Value ($) |
All Other
Compensation ($) |
Total
($) |
|||
|
François Côté
|
69,073
91,500 |
(US)
(CA) |
–
|
–
|
–
|
–
|
–
|
69,073
91,500 |
(US)
(CA) |
|
|
Angela Logothetis
|
79,000
104,651 |
(US)
(CA) |
–
|
–
|
–
|
–
|
–
|
79,000
104,651 |
(US)
(CA) |
|
|
Claude Séguin
|
65,298
86,500 |
(US)
(CA) |
–
|
–
|
–
|
–
|
–
|
65,298
86,500 |
(US)
(CA) |
|
|
Randy E. Tornes
|
79,000
104,651 |
(US)
(CA) |
–
|
–
|
–
|
–
|
–
|
79,000
104,651 |
(US)
(CA) |
|
|
(1)
|
The compensation information has been converted from Canadian dollars to US dollars based upon an average foreign
exchange rate of CA$1.3247 = US$1.00 for the financial year ended August 31, 2019 except for compensation amounts paid to Ms. Angela Logothetis and Mr. Randy E. Tornes which were paid in US dollars. Subject to our internal policy,
the fees are always payable in cash, but executives are provided the opportunity to elect to exchange all or a portion of their Annual Retainer for Directors into DSUs. The following table identifies the portion of the fees earned
by the directors that were paid in DSUs and the portion that were paid in cash.
|
|
Name
|
Fees Earned
|
|||||||
|
DSUs ($) (i)
|
Cash ($)
|
Total ($)
|
||||||
|
François Côté
|
39,632
52,500 |
(US)
(CA) |
29,441
39,000 |
(US)
(CA) |
69,073
91,500 |
(US)
(CA) |
||
|
Angela Logothetis
|
79,000
104,651 |
(US)
(CA) |
–
– |
(US)
(CA) |
79,000
104,651 |
(US)
(CA) |
||
|
Claude Séguin
|
65,298
86,500 |
(US)
(CA) |
–
– |
(US)
(CA) |
65,298
86,500 |
(US)
(CA) |
||
|
Randy E. Tornes
|
70,000
92,729 |
(US)
(CA) |
9,000
11,922 |
(US)
(CA) |
79,000
104,651 |
(US)
(CA) |
||
|
(i)
|
The estimated value at the time of grant of a DSU is determined based on the highest of the closing prices of the
Subordinate Voting Shares on the Toronto Stock Exchange and the NASDAQ Global Select Market on the last trading day preceding the grant date, using the daily exchange rate of the Bank of Canada on the last trading day preceding the
grant date to convert either the NASDAQ Global Select Market closing price to Canadian dollars or the Toronto Stock Exchange closing price to United States dollars, as required. The value at vesting of a DSU is equivalent to the
market value of a Subordinate Voting Share when a DSU is converted to such Subordinate Voting Share.
|
|
Name
|
Outstanding Share-Based Awards (DSUs)
|
|||||
|
Number of Shares or Units of
Shares that Have Not Vested (#) |
Market or Payout Value of
Share-Based Awards that Have Not Vested (US$) (1) |
Market or Payout Value of
Vested Share-Based Awards Not Paid Out or Distributed (US$) |
||||
|
François Côté
|
38,582
|
140,824
|
–
|
|||
|
Angela Logothetis
|
49,714
|
181,456
|
–
|
|||
|
Claude Séguin
|
64,211
|
234,370
|
–
|
|||
|
Randy E. Tornes
|
99,000
|
361,350
|
–
|
|||
|
(1)
|
The value of unvested DSUs at the financial year-end is the market value of the Subordinate Voting Shares on August
30, 2019, which was US$3.65 (CA$4.85). The market value of the Subordinate Voting Shares was calculated by using the highest of the closing prices of the Subordinate Voting Shares on the Toronto Stock Exchange and on the NASDAQ
Global Select Market on August 30, 2019 using the daily exchange rate of the Bank of Canada to convert either the NASDAQ Global Select Market closing price to Canadian dollars or the Toronto Stock Exchange closing price to United
States dollars as required. The actual gains on vesting will depend on the value of the Subordinate Voting Shares on the date of vesting. There can be no assurance that these values will be realized.
|
|
Plan Category
|
Number of Securities to Be
Issued upon Exercise of Outstanding DSUs, Options, PSU and RSUs (#) (a) |
Weighted-Average Exercise
Price of Outstanding DSUs, Options, PSU and RSUs (US$) (b) |
Number of Securities Remaining
Available for Future Issuance under Equity Compensation Plans (Excluding Securities Reflected in Column (a)) (#) (c) |
|||
|
DSU Plan – DSUs
|
251,507
|
n/a (1)
|
4,898,130
|
|||
|
LTIP – Options
|
–
|
–
|
||||
|
LTIP - PSUs
|
–
|
–
|
||||
|
LTIP – RSUs
|
1,836,446
|
n/a (1)
|
||||
|
(1)
|
The value of DSUs, PSUs and RSUs will be equal to the market value of the Subordinate Voting Shares of the Corporation
on the date of vesting.
|
|
Year ended
August 31, 2019 |
Year ended
August 31, 2018 |
Year ended
August 31, 2017 |
||||
|
Number of DSUs granted
|
69,818
|
65,745
|
45,058
|
|||
|
Number of Options granted
|
–
|
–
|
–
|
|||
|
Number of PSUs granted
|
–
|
–
|
–
|
|||
|
Number of RSUs granted
|
632,931
|
420,621
|
527,143
|
|||
|
Weighted average number of securities outstanding for the applicable year
|
55,325,000
|
54,998,000
|
54,423,000
|
|||
|
Annual burn rate of the DSUs
|
0.1%
|
0.1%
|
0.1%
|
|||
|
Annual burn rate of Options
|
–
|
–
|
–
|
|||
|
Annual burn rate of PSUs
|
–
|
–
|
–
|
|||
|
Annual burn rate of RSUs
|
1.1%
|
0.8%
|
1.0%
|
|||
(September 1, 2014 to August 31, 2019)
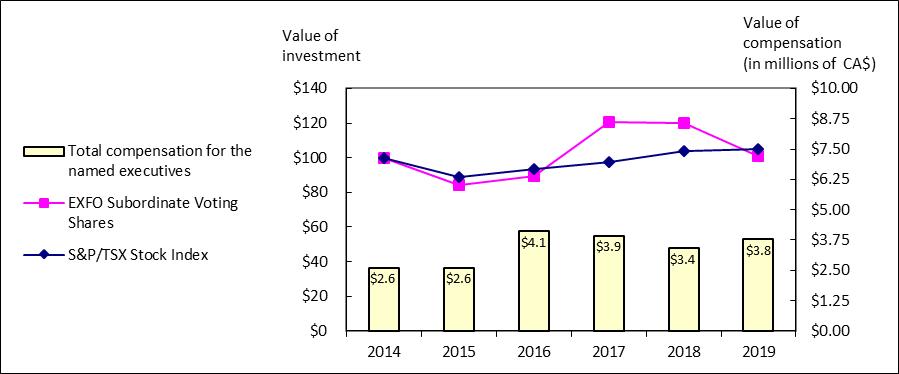
|
August 31,
|
||||||||||||||||||||||||
|
2014
|
2015
|
2016
|
2017
|
2018
|
2019
|
|||||||||||||||||||
|
EXFO Subordinate Voting Shares (CA$)
|
$
|
100
|
$
|
84
|
$
|
89
|
$
|
121
|
$
|
120
|
$
|
101
|
||||||||||||
|
S&P/TSX Composite Index (CA$)
|
$
|
100
|
$
|
89
|
$
|
93
|
$
|
97
|
$
|
104
|
$
|
105
|
||||||||||||
|
NEOs’ total compensation (in millions of CA$)
|
$
|
2.6
|
$
|
2.6
|
$
|
4.1
|
$
|
3.9
|
$
|
3.4
|
$
|
3.8
|
||||||||||||
|
•
|
The Corporation’s share price decreased as at August 31, 2015 compared to the previous financial year, while total NEO compensation as
expressed in Canadian dollars remained flat for the same period. It should be noted, however, three out of five NEOs were remunerated in currencies other than the Canadian dollar. On a constant currency basis, total NEO compensation
would have decreased by about CA$100,000 year-over-year. As a result, total compensation received by the NEOs for this period was aligned with share price performance.
|
|
•
|
The Corporation’s share performance increased from September 1, 2015 to August 31, 2016. Total compensation received by the NEOs during
this period also increased but at a higher rate than the Corporation’s share price. It should be noted that the Corporation hired an executive to the newly created position of Chief Operating Officer in the early part of the financial
year, which contributed to the increase in total compensation received by the NEOs during this period.
|
|
•
|
The Corporation’s share performance increased from September 1, 2016 to August 31, 2017. Total compensation received by the NEOs
decreased during this period as certain financial targets were not met, which consequently was aligned with shareholders’ interests.
|
|
•
|
The Corporation’s share price remained relatively flat as at August 31, 2018 compared to the previous financial year, while total
compensation received by the NEOs decreased during that period as certain financial targets were not met. In addition, fewer Restricted Share Units (RSUs) were attributed to the CEO in 2018 than in the previous year, while the
Executive Chairman accepted a reduced compensation plan after transitioning from his former role as CEO.
|
|
•
|
The Corporation’s share performance decreased from September 1, 2018 to August 31, 2019. Total compensation received by the NEOs
increased during this period since most financial targets were met with revenues, bookings, IFRS net loss, adjusted EBITDA and cash flows from operations improving year-over-year.
|
|
GERMAIN LAMONDE
|
||||||||
 |
St-Augustin-de-Desmaures,
Quebec, Canada Director since
September 1985 Not Independent
(Management) Principal Occupation:
Executive Chairman of the Board of Directors |
Germain
Lamonde, founder of EXFO, is Executive Chairman of the Board and served as the company’s Chief Executive Officer (CEO) for over 30 years. During his tenure as CEO, Mr. Lamonde grew the company from the ground up, turning it
into a global leader in the communications test, monitoring and analytics market and the world’s #1 fiber/highspeed testing company, with customers in over one hundred countries. Today as Executive Chairman, Mr. Lamonde leads EXFO’s
acquisitions strategy and is actively involved in defining the company’s growth and investment strategies, strategic direction and corporate governance policies. Mr. Lamonde has served on the board of directors of several public and
private organizations, fulfilled numerous speaking engagements, and received several industry awards for his leadership, innovation and global development and was named EY Entrepreneur of the Year 2018 Canada. Mr. Lamonde is presently
Chairman of ENCQOR, the Canada–Quebec-Ontario partnership focused on research and innovation in the field of 5G/IoT innovation and serves on the Board of QG100 – a CEO development forum. Mr. Lamonde holds a bachelor’s degree in
engineering physics from Polytechnique Montréal and a master’s degree in optics from Université Laval in Québec City. He is a graduate of the Ivey Executive Program at Western University in London, Ontario, and is also a Fellow of the
Canadian Academy of Engineering.
|
||||||
|
Board/Committee Membership
|
Attendance (1)
|
Board Memberships of Another Reporting Issuer
|
||||||
|
Board of Directors
|
5/6
|
83%
|
–
|
|||||
|
Securities Held
|
||||||||
|
As at
|
Subordinate
Voting Shares (#) |
Multiple Voting
Shares (#) |
PSUs (#)
|
RSUs (#)
|
Total Shares (2)
and PSUs, RSUs (#) |
Total Market Value (3)
of Shares (2) and PSUs, RSUs (US$) |
||
|
August 31, 2019
|
3,672,474 (4)
|
31,643,000 (5)
|
–
|
–
|
35,315,474
|
128,901,480
|
||
|
(1)
|
From September 1, 2018 until November 1, 2019, Mr. Lamonde attended four (4) board meetings in person and one (1) board
meeting by telephone.
|
|
(2)
|
Includes both Subordinate Voting Shares and Multiple Voting Shares.
|
|
(3)
|
The value of unvested PSUs or RSUs at the financial year-end is the market value of the Subordinate Voting Shares on
August 31, 2019, which was US$3.65 (CA$4.85). The market value of the Subordinate Voting Shares and Multiple Voting Shares was calculated by using the highest of the closing prices of the Subordinate Voting Shares on the Toronto Stock
Exchange and on the NASDAQ Global Select Market on August 30, 2019 using the daily exchange rate of the Bank of Canada to convert either the NASDAQ Global Select Market closing price to Canadian dollars or the Toronto Stock Exchange
closing price to United States dollars as required. The actual gains on vesting of PSUs or RSUs will depend on the value of the Subordinate Voting Shares on the date of vesting. There can be no assurance that these values will be
realized.
|
|
(4)
|
Mr. Lamonde exercises control over 3,191,666 Subordinate Voting Shares through G. Lamonde Investissements Financiers
Inc., a company controlled by Mr. Lamonde. Mr. Lamonde exercises control over 316,247 Subordinate Voting Shares through 9356-8988 Québec Inc., a company controlled by Mr. Lamonde. Mr. Lamonde exercises direct control over 164,561
Subordinate Voting Shares.
|
|
(5)
|
Mr. Lamonde exercises control over 29,743,000 Multiple Voting Shares through G. Lamonde Investissements Financiers Inc.,
a company controlled by Mr. Lamonde. Mr. Lamonde exercises control over 1,900,000 Multiple Voting Shares through 9356-8988 Québec Inc., a company controlled by Mr. Lamonde.
|
|
FRANÇOIS CÔTÉ
|
||
 |
Montreal, Quebec, Canada
Director since
January 2015 Lead Director
Independent
Principal Occupation:
Director
|
François
Côté was appointed a member of our Board of Directors in January 2015. Mr. Côté is a director as a full-time occupation, for corporations in the public, private and non-profit sectors, bringing his expertise in strategy,
M&A, governance and passion for growth. Mr. Côté held a variety of executive positions at Bell Canada prior to becoming President and Chief Executive Officer of Emergis. Following the acquisition of Emergis by TELUS in January 2008,
he was appointed President of TELUS Quebec, TELUS Health and TELUS Ventures. In this role, Mr. Côté was responsible for broadening TELUS Quebec’s presence and driving the company’s national health strategy through timely investments in
information technology and innovative wireless solutions. Mr. Côté holds a bachelor’s degree in Industrial Relations from Laval University. In 2007, he was named Entrepreneur of the Year by Ernst & Young, in the Corporate
Restructuring category for the province of Quebec. Mr. Côté serves on the boards of Purkinje, a Montreal health IT growth company as Chairman, Aspire Food Group, HZB Pharma Canada also as Chairman and Diagnos Inc. a new publicly listed
company on the TSX Venture Exchange. Mr. Côté also serves on the Advisor Committee of Groupe Morneau.
|
|
Board/Committee Membership
|
Attendance (1)
|
Board Memberships of Another Reporting Issuer
|
|
|
Board of Directors
Audit Committee Human Resources Committee Independent Board of Directors |
6/6
5/5 5/5 5/5 |
100%
100% 100% 100% |
Diagnos Inc.
|
|
Securities Held
|
||||
|
As at
|
Subordinate
Voting Shares (#) |
DSUs (#)
|
Total Shares (2)
and DSUs (#) |
Total Market Value (3)
of Shares (2) and DSUs (US$) |
|
August 31, 2019
|
6,500
|
38,582
|
45,082
|
164,549
|
|
(1)
|
From September 1, 2018 until November 1, 2019, Mr. Côté attended five (5) board meetings in person and one (1) board
meeting by telephone.
|
|
(2)
|
Refers to Subordinate Voting Shares.
|
|
(3)
|
The value of unvested DSUs at the financial year-end is the market value of the Subordinate Voting Shares on August
31, 2019, which was US$3.65 (CA$4.85). The market value of the Subordinate Voting Shares was calculated by using the highest of the closing prices of the Subordinate Voting Shares on the Toronto Stock Exchange and on the NASDAQ
Global Select Market on August 30, 2019 using the daily exchange rate of the Bank of Canada to convert either the NASDAQ Global Select Market closing price to Canadian dollars or the Toronto Stock Exchange closing price to United
States dollars as required. The actual gains on vesting of DSUs will depend on the value of the Subordinate Voting Shares on the date of vesting. There can be no assurance that these values will be realized.
|
|
ANGELA LOGOTHETIS
|
||
 |
Bath
United Kingdom Director since
January 2017 Independent
Principal Occupation:
Vice President and CTO,
Amdocs Open Network (1)
|
Angela
Logothetis has more than twenty-five (25) years of international experience in the telecommunications industry. She has been strategically engaged in the industry’s major network transformations.
Ms. Logothetis has an outstanding software pedigree having worked for market-leading software companies including Amdocs, Cramer, PricewaterhouseCoopers and Accenture as well as start-up software companies Clarity and Time Quantum
Technology. She has held senior leadership positions in ANZ, APAC and EMEA and has held global responsibility for the past ten (10) years. Ms. Logothetis is the CTO for Amdocs Open Network. Amdocs is the market leader in customer
experience software solutions and services for the world’s largest communications, entertainment and media service providers. Ms. Logothetis has held several senior leadership positions at Amdocs including Head of OSS Product and
Technology, Vice President of OSS Product Management and Executive Site Lead for Amdocs Bath. She has chaired high-caliber software forums in Amdocs including the Divisional Leadership Team, the Technical Advisory Council, and has
served as an executive on the Product Business Management Team and the Product Leadership Forum. Ms. Logothetis holds a Bachelor of Science degree, with first class honors, in Business Information Technology from the University of New
South Wales, Australia. She completed dual majors in accountancy and information technology.
|
|
Board/Committee Membership
|
Attendance (2)
|
Board Memberships of Another Reporting Issuer
|
|
|
Board of Directors
Audit Committee Human Resources Committee Independent Board of Directors |
6/6
5/5 5/5 5/5 |
100%
100% 100% 100% |
–
|
|
Securities Held
|
||||
|
As at
|
Subordinate
Voting Shares (#) |
DSUs (#)
|
Total Shares (3)
and DSUs (#) |
Total Market Value (4)
of Shares (3) and DSUs (US$) |
|
August 31, 2019
|
–
|
49,714
|
49,714
|
181,456
|
|
(1)
|
Amdocs is a market leader in software solutions and services for
communications, media and entertainment service providers.
|
|
(2)
|
From September 1, 2018 until November 1, 2019, Ms. Logothetis attended five (5) board meetings in person and one (1)
board meeting by telephone.
|
|
(3)
|
Refers to Subordinate Voting Shares.
|
|
(4)
|
The value of unvested DSUs at the financial year-end is the market value of the Subordinate Voting Shares on August 31,
2019, which was US$3.65 (CA$4.85). The market value of the Subordinate Voting Shares was calculated by using the highest of the closing prices of the Subordinate Voting Shares on the Toronto Stock Exchange and on the NASDAQ Global
Select Market on August 30, 2019 using the daily exchange rate of the Bank of Canada to convert either the NASDAQ Global Select Market closing price to Canadian dollars or the Toronto Stock Exchange closing price to United States
dollars as required. The actual gains on vesting of DSUs will depend on the value of the Subordinate Voting Shares on the date of vesting. There can be no assurance that these values will be realized.
|
|
PHILIPPE MORIN
|
||||||||||
 |
Montreal, Quebec
Canada Director since
January 2018 Not Independent
(Management) Principal Occupation:
CEO of the Corporation |
Philippe
Morin was appointed Chief Executive Officer (CEO) of EXFO in April 2017 and is responsible for the Corporation’s strategy and financial directions, goals and results. He has more than thirty (30) years of experience in the
telecommunications industry and joined EXFO in November 2015 as Chief Operating Officer (COO) leading the company’s global sales leadership, market development, and product strategy. Before joining EXFO, Mr. Morin was Senior Vice
President of Worldwide Sales and Field Operations at Ciena. He previously held senior leadership roles at Nortel Networks, including President of Metro Ethernet Networks and Vice President and General Manager of Optical Networks.
Philippe Morin holds a bachelor’s degree in electrical engineering from Université Laval in Quebec City, Canada, and a master’s degree in business administration (MBA) from McGill University in Montreal, Canada.
|
||||||||
|
Board/Committee Membership
|
Attendance (1)
|
Board Memberships of Another Reporting Issuer
|
||||||||
|
Board of Directors
|
6/6
|
100%
|
–
|
|||||||
|
Securities Held
|
||||||||||
|
As at
|
Subordinate
Voting Shares (#) |
PSUs (#)
|
RSUs (#)
|
Total Shares (2)
and PSUs, RSUs (#) |
Total Market Value (3)
of Shares (2) and PSUs, RSUs (US$) |
|||||
|
August 31, 2019
|
658,059
|
–
|
327,039
|
985,098
|
3,595,608
|
|||||
|
(1)
|
From September 1, 2018 until November 1, 2019, Mr. Morin attended five (5) board meetings in person and one (1) board
meeting by telephone.
|
|
(2)
|
Refers to Subordinate Voting Shares.
|
|
(3)
|
The value of unvested PSUs or RSUs at the financial year-end is the market value of the Subordinate Voting Shares on
August 31, 2019, which was US$3.65 (CA$4.85). The market value of the Subordinate Voting Shares and Multiple Voting Shares was calculated by using the highest of the closing prices of the Subordinate Voting Shares on the Toronto Stock
Exchange and on the NASDAQ Global Select Market on August 30, 2019 using the daily exchange rate of the Bank of Canada to convert either the NASDAQ Global Select Market closing price to Canadian dollars or the Toronto Stock Exchange
closing price to United States dollars as required. The actual gains on vesting of PSUs or RSUs will depend on the value of the Subordinate Voting Shares on the date of vesting. There can be no assurance that these values will be
realized.
|
|
CLAUDE SÉGUIN
|
||
 |
Westmount, Quebec,
Canada Director since
February 2013 Independent
Principal Occupation:
Director |
Claude
Séguin was appointed a member of EXFO’s Board of Directors in February 2013. He brings to EXFO nearly forty (40) years of corporate, financial, executive and provincial government experience gained through senior management
positions in major corporations and government departments. Mr. Séguin was Special advisor to the Founder and Executive Chairman at CGI Group Inc., a global leader in information technology and business process services, until March
2018. He was, until November 2016, Senior Vice President, Corporate Development and Strategic Investments. In this position, he was responsible for all merger and acquisition activities. Prior to joining CGI in 2003, he served
as President of CDP Capital—Private Equity, and prior to this position, he served as Teleglobe Inc.’s Executive Vice President, Finance and Chief Financial Officer, a position that he held from 1992 to 2000. Mr. Séguin also has
extensive senior-level government experience, having served as Deputy Finance Minister of the Province of Quebec from 1987 to 1992, in addition to Assistant Deputy Finance Minister in prior years. Prior to that, he held senior positions
at the Province of Quebec Treasury Board. Mr. Séguin is a member of the board of HEC-Montréal. He also chairs the Boards of Centraide of Greater Montreal Foundation and of Fonds de solidarité FTQ, a $15B Labour Sponsored Investment Fund
in Québec. Claude Séguin graduated from HEC-Montréal and earned a master’s and a Ph.D. in public administration from Syracuse University in New York State. He also followed the Advanced Management Program at Harvard Business School.
|
|
Board/Committee Membership
|
Attendance (1)
|
Board Memberships of Another Reporting Issuer
|
|
|
Board of Directors
Audit Committee Human Resources Committee Independent Board of Directors |
5/6
5/5 4/5 4/5 |
83%
100% 80% 80% |
Fonds de solidarité FTQ
|
|
Securities Held
|
||||
|
As at
|
Subordinate
Voting Shares (#) |
DSUs (#)
|
Total Shares (2)
and DSUs (#) |
Total Market Value (3)
of Shares (2) and DSUs (US$) |
|
August 31, 2019
|
5,000
|
64,211
|
69,211
|
252,620
|
|
(1)
|
From September 1, 2018 until November 1, 2019, Mr. Séguin attended four (4) board meetings in person and one (1) board meeting by telephone.
|
|
(2)
|
Refers to Subordinate Voting Shares.
|
|
(3)
|
The value of unvested DSUs at the financial year-end is the market value of the Subordinate Voting
Shares on August 31, 2019, which was US$3.65 (CA$4.85). The market value of the Subordinate Voting Shares was calculated by using the highest of the closing prices of the Subordinate Voting Shares on the Toronto Stock Exchange and on
the NASDAQ Global Select Market on August 30, 2019 using the daily exchange rate of the Bank of Canada to convert either the NASDAQ Global Select Market closing price to Canadian dollars or the Toronto Stock Exchange closing price to
United States dollars as required. The actual gains on vesting of DSUs will depend on the value of the Subordinate Voting Shares on the date of vesting. There can be no assurance that these values will be realized.
|
|
RANDY E. TORNES
|
||||
 |
Frisco, Texas, USA
Director since
February 2013 Independent
Principal Occupation:
Vice President, Client Partner
for AT&T at Aricent (1)
|
Randy E. Tornes was appointed a member of EXFO’s Board of Directors in February 2013. He brings to EXFO over thirty (30) years of telecommunications experience gained through senior management positions at leading
network equipment manufacturers. Mr. Tornes is Vice President, Client Partner for AT&T at Aricent, An Altran Company. Prior to joining Aricent, Mr. Tornes was Vice President Strategic Alliances at Juniper Networks, a worldwide
leader in high-performance networking and telecommunications equipment. Mr. Tornes has also worked as the Operating Area Leader for AT&T and responsible for all sales, service and support of Juniper products and services. Prior to
joining Juniper Networks in May 2012, he spent two (2) years at Ericsson, where he was Vice President Sales (AT&T account). Previous to that position, he worked for Nortel for twenty-six (26) years, holding various sales management
positions, including Vice President Sales, GSM Americas. Mr. Tornes also served as member of the Board of Governors at 3G Americas LLC. Randy E. Tornes holds a Bachelor of Science degree in business—organizational development and
production and operations management, from the University of Colorado in Colorado Springs.
|
||
|
Board/Committee Membership
|
Attendance (2)
|
Board Memberships of Another Reporting Issuer
|
||
|
Board of Directors
Audit Committee Human Resources Committee Independent Board of Directors |
6/6
5/5 5/5 5/5 |
100%
100% 100% 100% |
–
|
|
|
Securities Held
|
||||
|
As at
|
Subordinate
Voting Shares (#) |
DSUs (#)
|
Total Shares (3)
and DSUs (#) |
Total Market Value (4)
of Shares (3) and DSUs (US$) |
|
August 31, 2019
|
–
|
99,000
|
99,000
|
361,350
|
|
(1)
|
Aricent is a global design and engineering company.
|
|
(2)
|
From September 1, 2018 until November 1, 2019, Mr. Tornes attended five (5) board
meetings in person and one (1) board meeting by telephone.
|
|
(3)
|
Refers to Subordinate Voting Shares.
|
|
(4)
|
The value of unvested DSUs at the financial year-end is the market value of the Subordinate Voting Shares on August 31,
2019, which was US$3.65 (CA$4.85). The market value of the Subordinate Voting Shares was calculated by using the highest of the closing prices of the Subordinate Voting Shares on the Toronto Stock Exchange and on the NASDAQ Global
Select Market on August 30, 2019 using the daily exchange rate of the Bank of Canada to convert either the NASDAQ Global Select Market closing price to Canadian dollars or the Toronto Stock Exchange closing price to United States
dollars as required. The actual gains on vesting of DSUs will depend on the value of the Subordinate Voting Shares on the date of vesting. There can be no assurance that these values will be realized.
|
With the exception of Mr. Philippe Morin (as disclosed below), none of the individuals who are proposed to be nominated at the Meeting for election as a director of the Corporation:
|
a)
|
is, as at the date hereof, or has been, within ten (10) years before the date hereof, a director, chief executive officer or chief financial officer of any company that (i) was subject to an order that
was issued while such individual was acting in the capacity as director, chief executive officer or chief financial officer, or (ii) was subject to an order that was issued after such individual ceased to be a director, chief executive
officer or chief financial officer and which resulted from an event that occurred while that person was acting in the capacity as director, chief executive officer or chief financial officer;
|
|
b)
|
is, as at the date hereof, or has been within ten (10) years before the date hereof, a director or executive officer of any company that, while such individual was acting in that capacity, or within a year of that individual ceasing to act in that capacity, became bankrupt, made a proposal under any legislation relating to bankruptcy or insolvency or was subject to or instituted any proceedings, arrangement or compromise with creditors or had a receiver, receiver manager or trustee appointed to hold its assets; |
|
c)
|
has, within the ten (10) years before the date hereof, become bankrupt, made a proposal under any legislation relating to bankruptcy or insolvency, or become subject to or instituted any proceedings, arrangement or compromise with creditors, or had a receiver, receiver manager or trustee appointed to hold his assets; or |
|
d)
|
has been subject to (i) any penalties or sanctions imposed by a court relating to securities legislation or by a securities regulatory authority or has entered into a settlement agreement with a securities regulatory authority, or (ii) any other penalties or sanctions imposed by a court or regulatory body that would likely be considered important to a reasonable security holder in deciding whether to vote for such individual. |
Mr. Philippe Morin acted as an executive officer of Nortel Networks Corporation (“Nortel”) and its affiliates from 2006 to 2010 as President Metro Ethernet Networks. Nortel and certain of its affiliates filed for bankruptcy protection in a number of jurisdictions in January 2009.
From September 1, 2018 through November 1, 2019, the Board met a total of six (6) times. Each member attended all meetings, except for Mr. Lamonde and Mr. Séguin who were absent at one (1) meeting.
Committees of the Board of Directors
Our Board of Directors has established an audit committee, a human resources committee and a disclosure committee.
Our audit committee will recommend a firm to be appointed as independent auditors to audit financial statements and to perform services related to the audit, review the scope and results of the audit with the independent auditors, review with management and the independent auditors our annual operating results and consider the adequacy of the internal accounting procedures and the effect of the procedures relating to the auditors’ independence. Further to changes to NASDAQ corporate governance rules and Securities and Exchange Act rules flowing from the adoption of the Sarbanes-Oxley Act, we review our audit committee charter annually to ensure that we comply with all new requirements. Accordingly, in October 2019, the Audit Committee reviewed the Audit Committee Charter, a copy of which is filed as Exhibit 11.5 to this Annual Report and is also readily available from EXFO’s website at www.EXFO.com. Information on our Web site is not incorporated by reference in this Annual Report. As at November 1, 2019, the audit committee is composed of four independent Directors: François Côté, Angela Logothetis, Claude Séguin and Randy E. Tornes. The chairperson of the audit committee is Claude Séguin.
From September 1, 2018 through November 1, 2019, the Audit Committee met a total of five (5) times. Each member attended all meetings.
Our human resources committee will evaluate, review and supervise our procedures with regards to human resources and will assess the performance of our executive officers and the chief executive officer. This committee will also review annually the remuneration of the Directors and will recommend to the Board of Directors general remuneration policies regarding salaries, bonuses and other forms of remuneration for our Directors, executive officers and employees as a whole. Finally, the human resources committee will review our organizational structure annually and the development and maintenance of a succession plan. In October 2014 and in October 2017, the Human Resources Committee reviewed and amended the Human Resources Committee Charter which integrates the Compensation Committee Charter and the Nominating and Governance Committee Charter, copy of which is filed as Exhibit 11.6 to our 2014 Annual Report and as Exhibit 11.15 to our 2017 Annual Report, the Human Resources Committee reviewed and amended the Human Resources Committee Charter in order to specifically add the compensation review of the Executive Chairman which is also readily available from EXFO’s website at www.EXFO.com. Information on our Web site is not incorporated by reference in this Annual Report. As at November 1, 2019, the Human Resources Committee is composed of four (4) independent Directors: François Côté, Angela Logothetis, Claude Séguin and Randy E. Tornes. The chairperson of the Human Resources Committee is François Côté.
From September 1, 2018 through November 1, 2019, the Human Resources committee met a total of five (5) times and all members attended all meetings except for Mr. Séguin who was absent at one (1) meeting.
The disclosure committee is responsible for overseeing our disclosure practices. This committee consists of the executive chairman, the chief executive officer, the chief financial officer, the director of investor relations, the director of financial reporting and accounting as well as our general counsel and corporate secretary.
Furthermore, our independent Directors hold regularly scheduled meetings at which non-independent directors and members of management are not in attendance. The independent Directors hold as many meetings, as needed, annually and any Director may request such meeting at any time. From September 1, 2018 through November 1, 2019, five (5) meetings of independent Directors without management occurred and all members attended all meetings except Mr. Séguin who was absent at one (1) meeting. In June 2011, an Independent Members Committee Charter was adopted. A copy of this Independent Members Committee Charter has been filed as Exhibit 11.9 to our 2011 Annual Report.
|
Name
|
Subordinate Voting
Shares Owned |
Currently Exercisable Options
Owned as at November 1, 2019 |
Total Subordinate
Voting Shares Beneficially Owned (1) |
Multiple Voting Shares
Beneficially Owned (1) |
Total Percentage
of Voting Power
|
||||||||
|
“In-the-money”
|
“Out-of-
the-money” |
||||||||||||
|
Number
|
Percent
|
Number
|
Percent
|
Number
|
Percent
|
Number
|
Percent
|
Number
|
Percent
|
Percent
|
|||
|
Germain Lamonde
|
3,672,474
|
(2)
|
15.38
|
–
|
*
|
–
|
*
|
3,672,474
|
15.38
|
31,643,000
|
(3)
|
100
|
94.06
|
|
Philippe Morin
|
658,835
|
2.76
|
–
|
*
|
–
|
*
|
658,835
|
2.76
|
–
|
–
|
*
|
||
|
Pierre Plamondon
|
112,505
|
*
|
–
|
*
|
–
|
*
|
112,505
|
*
|
–
|
–
|
*
|
||
|
François Côté
|
6,500
|
*
|
–
|
*
|
–
|
*
|
6,500
|
*
|
–
|
–
|
*
|
||
|
Angela Logothetis
|
–
|
*
|
–
|
*
|
–
|
*
|
–
|
*
|
–
|
–
|
*
|
||
|
Claude Séguin
|
5,000
|
*
|
–
|
*
|
–
|
*
|
5,000
|
*
|
–
|
–
|
*
|
||
|
Randy E. Tornes
|
–
|
*
|
–
|
*
|
–
|
*
|
–
|
*
|
–
|
–
|
*
|
||
|
Willem Jan te Niet
|
2,635
|
*
|
–
|
*
|
–
|
*
|
2,635
|
*
|
–
|
–
|
*
|
||
|
Dana Yearian
|
–
|
*
|
–
|
*
|
–
|
*
|
–
|
*
|
–
|
–
|
*
|
||
|
Other executive officers as a group
|
88,903
|
*
|
–
|
*
|
–
|
*
|
88,903
|
*
|
–
|
–
|
*
|
||
|
All of our Directors and executive officers as a group
|
4,546,852
|
19.04
|
–
|
*
|
–
|
*
|
4,546,852
|
19.04
|
31,643,000
|
100
|
94.32
|
||
| * |
Less than 1%.
|
| (1) |
Beneficial ownership is determined in accordance with the rules of the SEC and generally includes voting or investment power with respect to securities.
Options that are currently exercisable or exercisable within sixty (60) days as at November 1, 2019 (including options that have an exercise price above the market price) are deemed to be outstanding and to be beneficially owned by
the person holding such options for the purpose of computing the percentage ownership of such person, but are not treated as outstanding for the purpose of computing the percentage ownership of any other person. Accordingly, DSUs,
PSUs and RSUs are not included.
|
| (2) |
The number of shares held by Germain Lamonde includes 3,191,666 subordinate voting shares held of record G. Lamonde Investissements Financiers Inc., 316,247
subordinate voting shares held of record by 9356-8988 Québec Inc. and 164,561 subordinate voting shares held by Germain Lamonde.
|
| (3) |
The number of shares held by Germain Lamonde includes 29,743,000 multiple voting shares held of record by G. Lamonde Investissements Financiers Inc. and
1,900,000 multiple voting shares held of record by 9356-8988 Québec Inc.
|
|
Name
|
DSUs
|
PSUs
|
RSUs
|
|||||||||||||||||
|
Number
|
Percentage
|
Estimated Average Value at the time
of grant US$/DSU (1)
|
Number
|
Percentage
|
Fair Value
at the time
of grant US$/PSU (2)
|
Number
|
Percentage
|
Fair Value
at the time
of grant US$/RSU (3)
|
||||||||||||
|
Germain Lamonde
|
–
|
–
|
–
|
–
|
–
|
–
|
–
|
–
|
–
|
|||||||||||
|
Philippe Morin
|
–
|
–
|
–
|
28,965
|
(4)
|
20.54
|
%
|
3.83
|
54,945
|
(5)
|
3.11
|
%
|
3.43
|
|||||||
|
–
|
–
|
–
|
51,831
|
(6)
|
2.93
|
%
|
3.43
|
|||||||||||||
|
–
|
–
|
–
|
45,786
|
(7)
|
2.59
|
%
|
4.01
|
|||||||||||||
|
–
|
–
|
–
|
38,110
|
(8)
|
2.16
|
%
|
4.89
|
|||||||||||||
|
–
|
–
|
–
|
4,764
|
(9)
|
0.27
|
%
|
4.89
|
|||||||||||||
|
–
|
–
|
–
|
51,353
|
(10)
|
2.91
|
%
|
4.00
|
|||||||||||||
|
–
|
–
|
–
|
34,892
|
(11)
|
1.98
|
%
|
3.17
|
|||||||||||||
|
–
|
–
|
–
|
43,615
|
(12)
|
2.47
|
%
|
3.17
|
|||||||||||||
|
–
|
–
|
–
|
28,965
|
(13)
|
1.64
|
%
|
3.83
|
|||||||||||||
|
–
|
–
|
–
|
15,000
|
(14)
|
0.85
|
%
|
3.83
|
|||||||||||||
|
Pierre Plamondon
|
–
|
–
|
–
|
13,878
|
(4)
|
9.84
|
%
|
3.83
|
27,140
|
(15)
|
1.54
|
%
|
3.23
|
|||||||
|
–
|
–
|
–
|
24,239
|
(7)
|
1.37
|
%
|
4.01
|
|||||||||||||
|
–
|
–
|
–
|
27,266
|
(10)
|
1.54
|
%
|
4.00
|
|||||||||||||
|
–
|
–
|
–
|
16,842
|
(11)
|
0.95
|
%
|
3.17
|
|||||||||||||
|
–
|
–
|
–
|
21,052
|
(12)
|
1.19
|
%
|
3.17
|
|||||||||||||
|
–
|
–
|
–
|
13,878
|
(13)
|
0.79
|
%
|
3.83
|
|||||||||||||
|
François Côté
|
38,582
|
(16)
|
15.34
|
%
|
3.82
|
–
|
–
|
–
|
–
|
–
|
–
|
|||||||||
|
Angela Logothetis
|
49,714
|
(16)
|
19.77
|
%
|
3.96
|
–
|
–
|
–
|
–
|
–
|
–
|
|||||||||
|
Claude Séguin
|
64,211
|
(16)
|
25.53
|
%
|
3.93
|
–
|
–
|
–
|
–
|
–
|
–
|
|||||||||
|
Randy E. Tornes
|
99,000
|
(16)
|
39.36
|
%
|
3.90
|
–
|
–
|
–
|
–
|
–
|
–
|
|||||||||
|
Willem Jan te Niet
|
–
|
–
|
–
|
11,553
|
(4)
|
8.19
|
%
|
3.83
|
5,000
|
(17)
|
0.28
|
%
|
3.33
|
|||||||
|
–
|
–
|
–
|
16,069
|
(7)
|
0.91
|
%
|
4.01
|
|||||||||||||
|
–
|
–
|
–
|
20,153
|
(10)
|
1.14
|
%
|
4.00
|
|||||||||||||
|
–
|
–
|
–
|
13,117
|
(11)
|
0.74
|
%
|
3.17
|
|||||||||||||
|
–
|
–
|
–
|
16,397
|
(12)
|
0.93
|
%
|
3.17
|
|||||||||||||
|
–
|
–
|
–
|
11,553
|
(13)
|
0.65
|
%
|
3.83
|
|||||||||||||
|
–
|
–
|
–
|
15,000
|
(14)
|
0.85
|
%
|
3.83
|
|||||||||||||
|
Dana Yearian
|
–
|
–
|
–
|
–
|
–
|
–
|
–
|
–
|
–
|
|||||||||||
|
Name
|
DSUs
|
PSUs
|
RSUs
|
|||||||||||||||||
|
Number
|
Percentage
|
Estimated Average Value at the time
of grant US$/DSU (1)
|
Number
|
Percentage
|
Fair Value
at the time
of grant US$/PSU (2)
|
Number
|
Percentage
|
Fair Value
at the time
of grant US$/RSU (3)
|
||||||||||||
|
Other executive officers as a group
|
–
|
–
|
–
|
86,599
|
(4)
|
61.42
|
%
|
3.83
|
1,840
|
(18)
|
0.10
|
%
|
3.27
|
|||||||
|
–
|
–
|
–
|
69,376
|
(15)
|
3.93
|
%
|
3.23
|
|||||||||||||
|
–
|
–
|
–
|
1,250
|
(19)
|
0.07
|
%
|
3.00
|
|||||||||||||
|
–
|
–
|
–
|
74,679
|
(7)
|
4.23
|
%
|
4.01
|
|||||||||||||
|
–
|
–
|
–
|
2,000
|
(20)
|
0.11
|
%
|
4.01
|
|||||||||||||
|
–
|
–
|
–
|
2,500
|
(21)
|
0.14
|
%
|
5.10
|
|||||||||||||
|
–
|
–
|
–
|
87,081
|
(10)
|
4.93
|
%
|
4.00
|
|||||||||||||
|
–
|
–
|
–
|
7,233
|
(22)
|
0.41
|
%
|
4.45
|
|||||||||||||
|
–
|
–
|
–
|
69,892
|
(11)
|
3.96
|
%
|
3.17
|
|||||||||||||
|
–
|
–
|
–
|
87,362
|
(12)
|
4.95
|
%
|
3.17
|
|||||||||||||
|
–
|
–
|
–
|
88,678
|
(13)
|
5.02
|
%
|
3.83
|
|||||||||||||
|
–
|
–
|
–
|
51,742
|
(14)
|
2.93
|
%
|
3.83
|
|||||||||||||
|
Total
|
251,507
|
100.00
|
%
|
3.90
|
140,995
|
100.00
|
%
|
3.83
|
1,140,600
|
64.57
|
%
|
3.66
|
||||||||
|
All of the directors and
executive officers as a group
|
–
|
–
|
–
|
140,995
|
100.00
|
%
|
3.83
|
54,945
|
(5)
|
3.11
|
%
|
3.43
|
||||||||
|
–
|
–
|
–
|
–
|
–
|
–
|
51,831
|
(6)
|
2.93
|
%
|
3.43
|
||||||||||
|
–
|
–
|
–
|
–
|
–
|
–
|
160,773
|
(7)
|
9.10
|
%
|
4.01
|
||||||||||
|
–
|
–
|
–
|
–
|
–
|
–
|
38,110
|
(8)
|
2.16
|
%
|
4.89
|
||||||||||
|
–
|
–
|
–
|
–
|
–
|
–
|
4,764
|
(9)
|
0.27
|
%
|
4.89
|
||||||||||
|
–
|
–
|
–
|
–
|
–
|
–
|
185,853
|
(10)
|
10.52
|
%
|
4.00
|
||||||||||
|
–
|
–
|
–
|
–
|
–
|
–
|
134,743
|
(11)
|
7.63
|
%
|
3.17
|
||||||||||
|
–
|
–
|
–
|
–
|
–
|
–
|
168,426
|
(12)
|
9.53
|
%
|
3.17
|
||||||||||
|
–
|
–
|
–
|
–
|
–
|
–
|
143,074
|
(13)
|
8.10
|
%
|
3.83
|
||||||||||
|
–
|
–
|
–
|
–
|
–
|
–
|
81,742
|
(14)
|
4.63
|
%
|
3.83
|
||||||||||
|
–
|
–
|
–
|
–
|
–
|
–
|
96,516
|
(15)
|
5.46
|
%
|
3.23
|
||||||||||
|
–
|
–
|
–
|
–
|
–
|
–
|
5,000
|
(17)
|
0.28
|
%
|
3.33
|
||||||||||
|
–
|
–
|
–
|
–
|
–
|
–
|
1,840
|
(18)
|
0.10
|
%
|
3.27
|
||||||||||
|
–
|
–
|
–
|
–
|
–
|
–
|
1,250
|
(19)
|
0.07
|
%
|
3.00
|
||||||||||
|
–
|
–
|
–
|
–
|
–
|
–
|
2,000
|
(20)
|
0.11
|
%
|
4.01
|
||||||||||
|
–
|
–
|
–
|
–
|
–
|
–
|
2,500
|
(21)
|
0.14
|
%
|
5.10
|
||||||||||
|
–
|
–
|
–
|
–
|
–
|
–
|
7,233
|
(22)
|
0.41
|
%
|
4.45
|
||||||||||
|
Total
|
251,507
|
100.00
|
%
|
3.90
|
140,995
|
100.00
|
%
|
3.83
|
1,140,600
|
64.57
|
%
|
3.66
|
||||||||
|
(1)
|
The estimated average value at the time of grant of a DSU is the average of the estimated value at the time of grant of
a DSU which is determined based on the highest of the closing prices of the Subordinate Voting Shares on the Toronto Stock Exchange and the NASDAQ Global Select Market on the last trading day preceding the grant date, using the daily
exchange rate of the Bank of Canada on the last trading day preceding the grant date to convert either the NASDAQ Global Select Market closing price to Canadian dollars or the Toronto Stock Exchange closing price to United States
dollars, as required. The value at vesting of a DSU is equivalent to the market value of a Subordinate Voting Share when a DSU is converted to such Subordinate Voting Share.
|
|
(2)
|
The fair value at the time of grant of a PSU is equal to the market value of Subordinate Voting Shares at the time PSUs
are granted.
|
|
(3)
|
The fair value at the time of grant of a RSU is equal to the market value of Subordinate Voting Shares at the time RSUs
are granted.
|
|
(4)
|
Those PSUs will vest on the third anniversary date of the grant in October 2019 on the attainment of performance
objectives as determined by the Board of Directors.
|
|
(5)
|
Those RSUs will vest at a rate of 1/2 annually commencing on the third anniversary date of the grant in November 2015.
|
|
(6)
|
Those RSUs will vest on the fifth anniversary date of the grant in November 2015 but are subject to early vesting on the
third and fourth anniversary date of the grant on the attainment of performance objectives as determined by the Board of Directors. Accordingly, subject to the attainment of performance objectives, the first early vesting is up to 1/3
of the units on the third anniversary date of the grant and the second early vesting is up to 50% of the remaining units on the fourth anniversary date of the grant.
|
|
(7)
|
Those RSUs will vest on the fifth anniversary date of the grant in October 2016 but are subject to early vesting on the
third and fourth anniversary date of the grant on the attainment of performance objectives as determined by the Board of Directors. Accordingly, subject to the attainment of performance objectives, the first early vesting is up to 1/3
of the units on the third anniversary date of the grant and the second early vesting is up to 50% of the remaining units on the fourth anniversary date of the grant.
|
|
(8)
|
Those RSUs will vest at a rate of 1/2 annually commencing on the third anniversary date of the grant in April 2017.
|
|
(9)
|
Those RSUs will vest on the fifth anniversary date of the grant in April 2017 but are subject to early vesting on the
third and fourth anniversary date of the grant on the attainment of performance objectives as determined by the Board of Directors. Accordingly, subject to the attainment of performance objectives, the first early vesting is up to 1/3
of the units on the third anniversary date of the grant and the second early vesting is up to 50% of the remaining units on the fourth anniversary date of the grant.
|
|
(10)
|
Those RSUs will vest on the fifth anniversary date of the grant in October 2017 but are subject to early vesting on
the third and fourth anniversary date of the grant on the attainment of performance objectives as determined by the Board of Directors. Accordingly, subject to the attainment of performance objectives, the first early vesting is up
to 1/3 of the units on the third anniversary date of the grant and the second early vesting is up to 50% of the remaining units on the fourth anniversary date of the grant.
|
|
(11)
|
Those RSUs will vest on the third anniversary date of the grant in October 2018.
|
|
(12)
|
Those RSUs will vest on the third anniversary date of the grant in October 2018 on the attainment of performance
objectives as determined by the Board of Directors.
|
|
(13)
|
Those RSUs will vest on the third anniversary date of the grant in October 2019.
|
|
(14)
|
Those RSUs will vest on the third anniversary date of the grant in October 2019.
|
|
(15)
|
Those RSUs will vest on the fifth anniversary date of the grant in October 2015 but are subject to early vesting on
the third and fourth anniversary date of the grant on the attainment of performance objectives as determined by the Board of Directors. Accordingly, subject to the attainment of performance objectives, the first early vesting is up
to 1/3 of the units on the third anniversary date of the grant and the second early vesting is up to 50% of the remaining units on the fourth anniversary date of the grant.
|
|
(16)
|
Those DSUs will vest at the time Director ceases to be a member of the Board of the Corporation.
|
|
(17)
|
Those RSUs will vest at a rate of 1/2 annually commencing on the third anniversary date of the grant in August 2016.
|
|
(18)
|
Those RSUs will vest on the fifth anniversary date of the grant in July 2015 but are subject to early vesting on the
third and fourth anniversary date of the grant on the attainment of performance objectives as determined by the Board of Directors. Accordingly, subject to the attainment of performance objectives, the first early vesting is up to
1/3 of the units on the third anniversary date of the grant and the second early vesting is up to 50% of the remaining units on the fourth anniversary date of the grant.
|
|
(19)
|
Those RSUs will vest at a rate of 1/2 annually commencing on the third anniversary date of the grant in January 2016.
|
|
(20)
|
Those RSUs will vest at a rate of 1/2 annually commencing on the third anniversary date of the grant in October 2016.
|
|
(21)
|
Those RSUs will vest at a rate of 1/2 annually commencing on the third anniversary date of the grant in January 2017.
|
|
(22)
|
Those RSUs will vest at a rate of 1/2 annually commencing on the third anniversary date of the grant in January 2018.
|
|
Multiple Voting Shares Beneficially Owned (1)
|
Subordinate Voting Shares Beneficially Owned (1)
|
Total Percentage of Voting Power
|
||||||||||||||||||
|
Name
|
Number
|
Percent
|
Number
|
Percent
|
Percent
|
|||||||||||||||
|
Germain Lamonde (2)
|
31,643,000
|
100.00
|
%
|
3,672,474
|
15.38
|
%
|
94.06
|
%
|
||||||||||||
|
9356-8988 Quebec Inc. (3)
|
1,900,000
|
6.00
|
%
|
316,247
|
1.32
|
%
|
5.68
|
%
|
||||||||||||
|
G. Lamonde Investissements Financiers Inc. (3)
|
29,743,000
|
94.00
|
%
|
3,191,666
|
13.37
|
%
|
88.34
|
%
|
||||||||||||
|
Graham Partners LP (Harber Capital)
|
–
|
–
|
1,295,345
|
5.43
|
%
|
*
|
||||||||||||||
| * |
Less than 1%
|
|
(1)
|
Beneficial ownership is determined in accordance with the rules of the SEC and generally includes voting or investment
power with respect to securities. Options that are currently exercisable within 60 days of November 1, 2019 (including options that have an exercise price above the market price) are deemed to be outstanding and to be beneficially
owned by the person holding such options for the purpose of computing the percentage ownership of such person, but are not treated as outstanding for the purpose of computing the percentage ownership of any other person.
|
|
(2)
|
The number of shares held by Germain Lamonde includes 1,900,000 multiple voting shares held of record by 9356-8988
Quebec Inc., 29,743,000 multiple voting shares held of record by G. Lamonde Investissements Financiers Inc., 316,247 subordinate voting shares held of record by 9356-8988 Quebec Inc., 3,191,666 subordinate voting shares held of
record by G. Lamonde Investissements Financiers Inc. and 164,561 subordinate voting shares held directly by Germain Lamonde.
|
|
(3)
|
9356-8988 Quebec Inc. and G. Lamonde Investissements Financiers Inc. are companies controlled by Mr. Lamonde.
|
|
Years ended August 31,
|
||||||||||||||||||||||||
|
2019
|
2018
|
2017
|
||||||||||||||||||||||
|
Export Sales
|
$
|
270,977
|
94
|
%
|
$
|
251,121
|
93
|
%
|
$
|
220,715
|
91
|
%
|
||||||||||||
|
Domestic Sales
|
15,913
|
6
|
18,425
|
7
|
22,586
|
9
|
||||||||||||||||||
|
$
|
286,890
|
100
|
%
|
$
|
269,546
|
100
|
%
|
$
|
243,301
|
100
|
%
|
|||||||||||||
|
NASDAQ (US$)
|
TSX (CA$)
|
|||
|
High
|
Low
|
High
|
Low
|
|
|
September 1, 2014 to August 31, 2015
|
4.40
|
2.45
|
4.92
|
3.32
|
|
September 1, 2015 to August 31, 2016
|
4.32
|
2.57
|
5.44
|
3.61
|
|
September 1, 2016 to August 31, 2017
|
6.05
|
3.42
|
7.99
|
4.41
|
|
September 1, 2017 to August 31, 2018
|
4.70
|
3.20
|
5.81
|
4.29
|
|
September 1, 2018 to August 31, 2019
|
4.97
|
2.66
|
6.70
|
3.51
|
|
September 1, 2017 to November 30, 2017 (2018 1st Quarter)
|
4.45
|
3.75
|
5.61
|
4.79
|
|
December 1, 2017 to February 28, 2018 (2018 2nd Quarter)
|
4.70
|
4.06
|
5.81
|
5.25
|
|
March 1, 2018 to May 31, 2018 (2018 3rd Quarter)
|
4.40
|
3.35
|
5.63
|
4.35
|
|
June 1, 2018 to August 31, 2018 (2018 4th Quarter)
|
4.41
|
3.20
|
5.77
|
4.29
|
|
September 1, 2018 to November 30, 2018 (2019 1st Quarter)
|
4.45
|
2.66
|
5.77
|
3.51
|
|
December 1, 2019 to February 28, 2019 (2019 2nd Quarter)
|
3.90
|
2.74
|
5.16
|
3.66
|
|
March 1, 2019 to May 31, 2019 (2019 3rd Quarter)
|
4.97
|
3.20
|
6.70
|
4.30
|
|
June 1, 2019 to August 31, 2019 (2019 4th Quarter)
|
4.30
|
3.41
|
5.61
|
4.53
|
|
May 2019
|
4.80
|
3.86
|
6.47
|
5.20
|
|
June 2019
|
4.25
|
3.51
|
5.61
|
4.77
|
|
July 2019
|
4.30
|
3.47
|
5.47
|
4.53
|
|
August 2019
|
3.89
|
3.41
|
5.20
|
4.67
|
|
September 2019
|
3.99
|
3.47
|
5.27
|
4.80
|
|
October 2019
|
4.30
|
3.61
|
5.59
|
4.81
|
|
November 2019 (until November 11)
|
4.38
|
4.03
|
5.75
|
5.35
|
|
(a)
|
an individual citizen or resident of the United States;
|
|
(b)
|
a corporation created or organized under the laws of the United States or any state thereof and the District of Columbia;
|
|
(c)
|
an estate the income of which is subject to United States federal income taxation regardless of its source;
|
|
(d)
|
a trust if (1) a court within the United States is able to exercise primary supervision over its administration and one or more U.S.
persons as described in Section 7701 (a) (30) of the Code have authority to control all substantial decisions of the trust or (2) the trust has a valid election in effect under applicable U.S. Treasury regulations to be treated as a
U.S. person; or
|
|
(e)
|
any other person whose worldwide income or gain is otherwise subject to U.S. federal income taxation on a net income basis.
|
|
•
|
the Code;
|
|
•
|
U.S. judicial decisions;
|
|
•
|
administrative pronouncements;
|
|
•
|
existing and proposed Treasury regulations; and
|
|
•
|
the Canada – U.S. Income Tax Treaty.
|
|
•
|
the holder’s holding period for the subordinate voting shares, with a preferential rate available for subordinate voting shares held
for more than one year; and
|
|
•
|
the holder’s marginal tax rate for ordinary income.
|
|
•
|
such gain is effectively connected with the conduct by such Non-U.S. Holder of a trade or business in the United States; or
|
|
•
|
in the case of any gain realized by an individual Non-U.S. Holder, such Non-U.S. Holder is present in the United States for 183 days or
more in the taxable year of such sale and certain other conditions are met.
|
|
•
|
at least 75% of our gross income for the taxable year is passive income; or
|
|
•
|
at least 50% of the average value of our assets is attributable to assets that produce or are held for the production of passive
income.
|
|
•
|
dividends;
|
|
•
|
interest;
|
|
•
|
rents or royalties, other than certain rents or royalties derived from the active conduct of trade or business;
|
|
•
|
annuities; and
|
|
•
|
gains from assets that produce passive income.
|
|
•
|
any gain realized on the sale or other disposition of subordinate voting shares; and
|
|
•
|
any “excess distribution” by us to the U.S. Holder.
|
|
•
|
the gain or excess distribution would be allocated ratably over the U.S. Holder’s holding period for the subordinate voting shares;
|
|
•
|
the amount allocated to the taxable year in which the gain or excess distribution was realized and to taxable years prior to the first
year in which we were classified as a PFIC would be taxable as ordinary income; and
|
|
•
|
the amount allocated to each other prior year would be subject to tax as ordinary income at the highest tax rate in effect for that tax
year, and the interest charge generally applicable to underpayments of tax would be imposed in respect of the tax attributable to each such year.
|
|
•
|
is resident in the United States and not resident in Canada;
|
|
•
|
holds the subordinate voting shares as capital property;
|
|
•
|
does not have a “permanent establishment” or “fixed base” in Canada, as defined in the Convention; and
|
|
•
|
deals at arm’s length with us. Special rules, which are not discussed below, may apply to “financial institutions”, as defined in the
ITA, and to non-resident insurers carrying on an insurance business in Canada and elsewhere.
|
|
Years ending August 31,
|
||||||||||||
|
2020
|
2021
|
2022
|
||||||||||
|
Forward exchange contracts to sell US dollars in exchange for Canadian dollars
|
||||||||||||
|
Contractual amounts
|
$
|
35,500
|
$
|
19,900
|
$
|
6,000
|
||||||
|
Weighted average contractual forward rates
|
1.3013
|
1.3107
|
1.3216
|
|||||||||
|
Year ending
August 31, 2020
|
||||
|
Forward exchange contracts to sell US dollars in exchange for Indian rupees
|
||||
|
Contractual amount
|
$
|
3,500
|
||
|
Weighted average contractual forward rate
|
71.48
|
|||
|
Carrying/nominal
amount
(in thousands
of US dollars)
|
Carrying/nominal
amount
(in thousands
of euros)
|
|||||||
|
Financial assets
|
||||||||
|
Cash
|
$
|
5,531
|
€
|
3,129
|
||||
|
Accounts receivable
|
30,451
|
6,389
|
||||||
|
35,982
|
9,518
|
|||||||
|
Financial liabilities
|
||||||||
|
Bank loan
|
5,000
|
–
|
||||||
|
Accounts payable and accrued liabilities
|
12,563
|
2,218
|
||||||
|
Forward exchange contracts (nominal value)
|
5,800
|
–
|
||||||
|
23,363
|
2,218
|
|||||||
|
Net exposure
|
$
|
12,619
|
€
|
7,300
|
||||
|
•
|
An increase (decrease) of 10% in the period-end value of the Canadian dollar compared to the US dollar would decrease (increase) net
earnings by $1.2 million, or $0.02 per diluted share, as at August 31, 2019.
|
|
•
|
An increase (decrease) of 10% in the period-end value of the Canadian dollar compared to the euro would decrease (increase) net
earnings by $0.8 million or $0.01 per diluted share, as at August 31, 2019.
|
|
•
|
An increase (decrease) of 10% in the period-end value of the Canadian dollar compared to the US dollar would increase (decrease)
other comprehensive income by $4.1 million as at August 31, 2019.
|
|
Current
|
$
|
39,054
|
||
|
Past due, 0 to 30 days
|
3,529
|
|||
|
Past due, 31 to 60 days
|
2,006
|
|||
|
Past due, more than 60 days
|
6,928
|
|||
|
Total trade accounts receivable
|
$
|
51,517
|
|
Balance – Beginning of year
|
$
|
772
|
||
|
IFRS 9 adoption initial adjustment
|
303
|
|||
|
Addition charged to earnings
|
864
|
|||
|
Writeoff of uncollectible accounts
|
(404
|
)
|
||
|
Balance – End of year
|
$
|
1,535
|
|
No later
than one year |
Later than
1 year and no later than 5 years |
Later than
5 years |
||||||||||
|
Bank loan
|
$
|
5,000
|
$
|
–
|
$
|
–
|
||||||
|
Accounts payable and accrued liabilities
|
49,945
|
–
|
–
|
|||||||||
|
Forward exchange contracts
|
||||||||||||
|
Outflow
|
39,000
|
25,900
|
–
|
|||||||||
|
Inflow
|
(38,252
|
)
|
(25,585
|
)
|
–
|
|||||||
|
Long-term debt
|
2,449
|
3,237
|
56
|
|||||||||
|
Other liabilities
|
1,606
|
–
|
–
|
|||||||||
|
Total
|
$
|
59,748
|
$
|
3,552
|
$
|
56
|
||||||
|
(a)
|
Disclosure Controls and Procedures
|
|
(b)
|
Management’s Annual Report on Internal Control over Financial Reporting
|
|
(c)
|
Attestation Report of the Independent Registered Public Accounting Firm
|
|
(d)
|
Changes in Internal Control over Financial Reporting
|
|
•
|
Code of Ethics for our Principal Executive Officer and Senior Financial Officers;
|
|
•
|
Board of Directors Corporate Governance Guidelines;
|
|
•
|
Ethics and Business Conduct Policy;
|
|
•
|
Statement of Reporting Ethical Violations (Whistleblower).
|
|
Period
|
(a) Total Number
of Shares (or Units)
Purchased
(#)
|
(b) Average Price Paid
per Share (or Units) |
(c) Total Number of
Shares (or Units)
Purchased as Part of
Publicly Announced
Plans or Programs
(#) |
(d) Maximum Number of
Shares (or Units) that
May Yet Be Purchased
Under the Plans or Programs
(#) |
||||||
|
NASDAQ
(US$) |
TSX
(CA$) |
|||||||||
|
From September 1, 2018
|
–
|
–
|
–
|
–
|
–
|
|||||
|
To September 30, 2018
|
||||||||||
|
From October 1, 2018
|
–
|
–
|
–
|
–
|
–
|
|||||
|
To October 31, 2018
|
||||||||||
|
From November 1, 2018
|
–
|
–
|
–
|
–
|
–
|
|||||
|
To November 30, 2018
|
||||||||||
|
From December 1, 2018
|
–
|
–
|
–
|
–
|
–
|
|||||
|
To December 31, 2018
|
||||||||||
|
From January 1, 2019
|
–
|
–
|
–
|
–
|
–
|
|||||
|
To January 13, 2019
|
||||||||||
|
From January 14, 2019
|
32,032
|
3.23
|
4.37
|
32,032
|
1,200,000
|
|||||
|
To January 31, 2019
|
||||||||||
|
From February 1, 2019
|
200
|
3.25
|
4.25
|
200
|
1,167,968
|
|||||
|
To February 28, 2019
|
||||||||||
|
From March 1, 2019
|
–
|
–
|
–
|
–
|
1,167,768
|
|||||
|
To March 31, 2019
|
||||||||||
|
From April 1, 2019
|
–
|
–
|
–
|
–
|
1,167,768
|
|||||
|
To April 30, 2019
|
||||||||||
|
From May 1, 2019
|
–
|
–
|
–
|
–
|
1,167,768
|
|||||
|
To May 31, 2019
|
||||||||||
|
From June 1, 2019
|
–
|
–
|
–
|
–
|
1,167,768
|
|||||
|
To June 30, 2019
|
||||||||||
|
From July 1, 2019
|
29,396
|
–
|
5.02
|
29,396
|
1,138,372
|
|||||
|
To July 31, 2019
|
||||||||||
|
From August 1, 2019
|
24,764
|
–
|
5.06
|
24,764
|
1,113,608
|
|||||
|
To August 31, 2019
|
||||||||||
|
From September 1, 2019
|
–
|
–
|
–
|
–
|
1,113,608
|
|||||
|
To September 30, 2019
|
||||||||||
|
From October 1, 2019
|
28,522
|
–
|
5.28
|
28,522
|
1,085,086
|
|||||
|
To October 31, 2019
|
||||||||||
|
From November 1, 2019
|
12,690
|
–
|
5.59
|
12,690
|
1,072,396
|
|||||
|
To November 11, 2019
|
||||||||||
|
Total
|
127,604
|
127,604
|
1,072,396
|
|||||||
|
Number
|
Exhibit
|
|
1.1
|
|
|
1.2
|
|
|
1.3
|
|
|
1.4
|
|
|
1.5
|
|
|
2.1
|
|
|
2.2
|
|
|
3.1
|
|
|
4.1
|
|
|
4.2
|
|
|
4.3
|
|
|
4.4
|
|
|
4.5
|
|
|
4.6
|
|
|
Number
|
Exhibit
|
|
4.7
|
|
|
4.8
|
|
|
4.9
|
|
|
4.10
|
|
|
4.11
|
|
|
4.12
|
|
|
4.13
|
|
|
4.14
|
|
|
4.15
|
|
|
4.16
|
|
|
4.17
|
|
|
4.18
|
|
|
4.19
|
|
|
4.20
|
|
|
Number
|
Exhibit
|
|
4.21
|
|
|
4.22
|
|
|
4.23
|
|
|
4.24
|
|
|
4.25
|
|
|
4.26
|
|
|
4.27
|
|
|
4.28
|
|
|
4.29
|
|
|
4.30
|
|
|
4.31
|
|
|
4.32
|
|
|
4.33
|
|
|
4.34
|
|
|
4.35
|
|
|
4.36
|
|
|
Number
|
Exhibit
|
|
4.37
|
|
|
4.38
|
|
|
4.39
|
|
|
4.40
|
|
|
4.41
|
|
|
4.42
|
|
|
4.43
|
|
|
4.44
|
|
|
4.45
|
|
|
4.46
|
|
|
4.47
|
|
|
4.48
|
|
|
4.49
|
|
|
4.50
|
|
|
4.51
|
|
|
Number
|
Exhibit
|
|
4.52
|
|
|
4.53
|
|
|
4.54
|
|
|
4.55
|
|
|
4.56
|
|
|
4.57
|
|
|
4.58
|
|
|
4.59
|
|
|
4.60
|
|
|
8.1
|
Subsidiaries of EXFO (list included in Item 4C of this Annual Report).
|
|
11.1
|
|
|
11.2
|
|
|
11.3
|
|
|
11.4
|
|
|
11.5
|
Audit Committee Charter (incorporated by reference to Exhibit 11.5 of EXFO’s Annual Report on Form 20-F dated
November 26, 2019, File No. 000-30895).
|
|
11.6
|
|
|
11.7
|
Corporate Governance Practices (incorporated by reference to Exhibit 11.7 of EXFO’s Annual Report on Form 20-F
dated November 26, 2019, File No. 000-30895).
|
|
11.8
|
|
|
11.9
|
|
|
11.10
|
|
|
Number
|
Exhibit
|
|
11.11
|
|
|
11.12
|
|
|
11.13
|
|
|
11.14
|
|
|
11.15
|
|
|
11.16
|
|
|
11.17
|
|
|
11.18
|
Policy Regarding Conflict Minerals dated January 9, 2013 and amended on December 12, 2018 (incorporated by
reference to Exhibit 11.18 of EXFO’s annual report on Form 20-F dated November 26, 2019, File No. 000-30895).
|
|
12.1
|
Certification of the Chief Executive Officer Pursuant to Section 302 of the Sarbanes-Oxley Act of 2002.
|
|
12.2
|
Certification of the Chief Executive Officer Pursuant to Section 906 of the Sarbanes-Oxley Act of 2002.
|
|
13.1
|
Certification of the Chief Financial Officer Pursuant to Section 302 of the Sarbanes-Oxley Act of 2002.
|
|
13.2
|
Certification of the Chief Financial Officer Pursuant to Section 906 of the Sarbanes-Oxley Act of 2002.
|
Title: Chief Executive Officer
|
Montréal, Canada
November 26, 2019
|
|
As at August 31,
|
||||||||
|
2019
|
2018
|
|||||||
|
Assets
|
||||||||
|
Current assets
|
||||||||
|
Cash
|
$
|
16,518
|
$
|
12,758
|
||||
|
Short-term investments (note 6)
|
2,918
|
2,282
|
||||||
|
Accounts receivable (note 6)
|
||||||||
|
Trade
|
51,517
|
47,273
|
||||||
|
Other
|
3,396
|
4,137
|
||||||
|
Income taxes and tax credits recoverable (note 20)
|
3,159
|
4,790
|
||||||
|
Inventories (note 7)
|
38,017
|
38,589
|
||||||
|
Prepaid expenses
|
6,510
|
5,291
|
||||||
|
Other assets (note 19)
|
3,083
|
2,279
|
||||||
|
125,118
|
117,399
|
|||||||
|
Tax credits recoverable (note 20)
|
46,704
|
47,677
|
||||||
|
Property, plant and equipment (notes 8 and 22)
|
39,364
|
44,310
|
||||||
|
Intangible assets (notes 9 and 22)
|
21,654
|
29,866
|
||||||
|
Goodwill (notes 9 and 22)
|
38,648
|
39,892
|
||||||
|
Deferred income tax assets (note 20)
|
4,821
|
4,714
|
||||||
|
Other assets
|
1,293
|
686
|
||||||
|
$
|
277,602
|
$
|
284,544
|
|||||
|
Liabilities
|
||||||||
|
Current liabilities
|
||||||||
|
Bank loan (note 10)
|
$
|
5,000
|
$
|
10,692
|
||||
|
Accounts payable and accrued liabilities (note 11)
|
50,790
|
47,898
|
||||||
|
Provisions (note 11)
|
1,065
|
2,954
|
||||||
|
Income taxes payable
|
704
|
873
|
||||||
|
Deferred revenue (note 19)
|
24,422
|
16,556
|
||||||
|
Other liabilities
|
1,606
|
3,197
|
||||||
|
Current portion of long-term debt (note 12)
|
2,449
|
2,921
|
||||||
|
86,036
|
85,091
|
|||||||
|
Provisions (note 11)
|
2,737
|
2,347
|
||||||
|
Deferred revenue (note 19)
|
9,056
|
6,947
|
||||||
|
Long-term debt (note 12)
|
3,293
|
5,907
|
||||||
|
Deferred income tax liabilities (note 20)
|
3,598
|
5,910
|
||||||
|
Other liabilities
|
318
|
421
|
||||||
|
105,038
|
106,623
|
|||||||
|
Commitments (note 13)
|
||||||||
|
Shareholders’ equity
|
||||||||
|
Share capital (note 14)
|
92,706
|
91,937
|
||||||
|
Contributed surplus
|
19,196
|
18,428
|
||||||
|
Retained earnings
|
112,173
|
114,906
|
||||||
|
Accumulated other comprehensive loss (note 15)
|
(51,511
|
)
|
(47,350
|
)
|
||||
|
172,564
|
177,921
|
|||||||
|
$
|
277,602
|
$
|
284,544
|
|||||
| On behalf of the Board | |
|
/s/ Philippe Morin
PHILIPPE MORIN, Chief Executive Officer
|
/s/ Claude Séguin
CLAUDE SÉGUIN, Chairman, Audit Committee
|
|
Years ended August 31,
|
||||||||||||
|
2019
|
2018
|
2017
|
||||||||||
|
Sales (note 22)
|
$
|
286,890
|
$
|
269,546
|
$
|
243,301
|
||||||
|
Cost of sales (1)
|
118,677
|
105,004
|
94,329
|
|||||||||
|
Selling and administrative
|
98,646
|
98,794
|
86,256
|
|||||||||
|
Net research and development
|
50,553
|
57,154
|
47,168
|
|||||||||
|
Depreciation of property, plant and equipment
|
5,469
|
5,444
|
3,902
|
|||||||||
|
Amortization of intangible assets
|
9,012
|
10,327
|
3,289
|
|||||||||
|
Change in fair value of cash contingent consideration
|
–
|
(670
|
)
|
(383
|
)
|
|||||||
|
Interest and other expense
|
718
|
1,378
|
303
|
|||||||||
|
Foreign exchange (gain) loss
|
949
|
(1,309
|
)
|
978
|
||||||||
|
Share in net loss of an associate (note 3)
|
–
|
2,080
|
–
|
|||||||||
|
Gain on deemed disposal of the investment in an associate (note 3)
|
–
|
(2,080
|
)
|
–
|
||||||||
|
Earnings (loss) before income taxes
|
2,866
|
(6,576
|
)
|
7,459
|
||||||||
|
Income taxes (note 20)
|
5,346
|
5,678
|
6,608
|
|||||||||
|
Net earnings (loss) for the year
|
(2,480
|
)
|
(12,254
|
)
|
851
|
|||||||
|
Net loss for the year attributable to non-controlling interest
|
–
|
(352
|
)
|
–
|
||||||||
|
Net earnings (loss) for the year attributable to parent interest
|
$
|
(2,480
|
)
|
$
|
(11,902
|
)
|
$
|
851
|
||||
|
Basic and diluted net earnings (loss) attributable to parent interest per share
|
$
|
(0.04
|
)
|
$
|
(0.22
|
)
|
$
|
0.02
|
||||
|
Basic weighted average number of shares outstanding (000’s)
|
55,325
|
54,998
|
54,423
|
|||||||||
|
Diluted weighted average number of shares
outstanding (000’s) (note 21)
|
55,325
|
54,998
|
55,555
|
|||||||||
|
(1)
|
The cost of sales is exclusive of depreciation and amortization, shown separately.
|
|
Years ended August 31,
|
||||||||||||
|
2019
|
2018
|
2017
|
||||||||||
|
Net earnings (loss) for the year
|
$
|
(2,480
|
)
|
$
|
(12,254
|
)
|
$
|
851
|
||||
|
Other comprehensive income (loss), net of income taxes
|
||||||||||||
|
Items that may be reclassified subsequently to net earnings
|
||||||||||||
|
Foreign currency translation adjustment
|
(4,177
|
)
|
(6,491
|
)
|
8,262
|
|||||||
|
Unrealized gains/losses on forward exchange contracts
|
(795
|
)
|
(1,476
|
)
|
1,403
|
|||||||
|
Reclassification of realized gains/losses on forward exchange contracts in net earnings
|
744
|
(972
|
)
|
423
|
||||||||
|
Deferred income tax effect of gains/losses on forward exchange contracts
|
67
|
554
|
(479
|
)
|
||||||||
|
Other comprehensive income (loss)
|
(4,161
|
)
|
(8,385
|
)
|
9,609
|
|||||||
|
Comprehensive income (loss) for the year
|
(6,641
|
)
|
(20,639
|
)
|
10,460
|
|||||||
|
Comprehensive loss for the year attributable to non-controlling interest
|
–
|
(352
|
)
|
–
|
||||||||
|
Comprehensive income (loss) for the year attributable to parent interest
|
$
|
(6,641
|
)
|
$
|
(20,287
|
)
|
$
|
10,460
|
||||
|
Year ended August 31, 2017
|
||||||||||||||||||||
|
Share
capital |
Contributed
surplus |
Retained
earnings |
Accumulated
other comprehensive loss |
Total
shareholders’ equity |
||||||||||||||||
|
Balance as at September 1, 2016
|
$
|
85,516
|
$
|
18,150
|
$
|
126,309
|
$
|
(48,574
|
)
|
$
|
181,401
|
|||||||||
|
Issuance of share capital (note 14)
|
3,490
|
–
|
–
|
–
|
3,490
|
|||||||||||||||
|
Reclassification of stock-based compensation costs (note 14)
|
1,405
|
(1,405
|
)
|
–
|
–
|
–
|
||||||||||||||
|
Stock-based compensation costs
|
–
|
1,439
|
–
|
–
|
1,439
|
|||||||||||||||
|
Net earnings for the year
|
–
|
–
|
851
|
–
|
851
|
|||||||||||||||
|
Other comprehensive income
|
||||||||||||||||||||
|
Foreign currency translation adjustment
|
–
|
–
|
–
|
8,262
|
8,262
|
|||||||||||||||
|
Changes in unrealized gains/losses on forward exchange contracts, net of
deferred income taxes of $479
|
–
|
–
|
–
|
1,347
|
1,347
|
|||||||||||||||
|
Total comprehensive income for the year
|
10,460
|
|||||||||||||||||||
|
Balance as at August 31, 2017
|
$
|
90,411
|
$
|
18,184
|
$
|
127,160
|
$
|
(38,965
|
)
|
$
|
196,790
|
|||||||||
|
Year ended August 31, 2018
|
||||||||||||||||||||||||
|
Share
capital |
Contributed
surplus |
Retained
earnings |
Accumulated
other comprehensive loss |
Non-controlling
interest |
Total
shareholders’ equity |
|||||||||||||||||||
|
Balance as at September 1, 2017
|
$
|
90,411
|
$
|
18,184
|
$
|
127,160
|
$
|
(38,965
|
)
|
$
|
–
|
$
|
196,790
|
|||||||||||
|
Reclassification of stock-based compensation costs (note 14)
|
1,526
|
(1,526
|
)
|
–
|
–
|
–
|
–
|
|||||||||||||||||
|
Stock-based compensation costs
|
–
|
1,770
|
–
|
–
|
–
|
1,770
|
||||||||||||||||||
|
Business combination (note 3)
|
–
|
–
|
–
|
–
|
(3,662
|
)
|
(3,662
|
)
|
||||||||||||||||
|
Acquisition of non-controlling interest on acquisition of subsidiary (note 3)
|
–
|
–
|
(352
|
)
|
–
|
4,014
|
3,662
|
|||||||||||||||||
|
Net loss for the year
|
–
|
–
|
(11,902
|
)
|
–
|
(352
|
)
|
(12,254
|
)
|
|||||||||||||||
|
Other comprehensive loss
|
||||||||||||||||||||||||
|
Foreign currency translation adjustment
|
–
|
–
|
–
|
(6,491
|
)
|
–
|
(6,491
|
)
|
||||||||||||||||
|
Changes in unrealized gains/losses on forward exchange contracts, net of deferred income
taxes of $554
|
–
|
–
|
–
|
(1,894
|
)
|
–
|
(1,894
|
)
|
||||||||||||||||
|
Total comprehensive loss for the year
|
(20,639
|
)
|
||||||||||||||||||||||
|
Balance as at August 31, 2018
|
$
|
91,937
|
$
|
18,428
|
$
|
114,906
|
$
|
(47,350
|
)
|
$
|
–
|
$
|
177,921
|
|||||||||||
|
Year ended August 31, 2019
|
||||||||||||||||||||
|
Share
capital |
Contributed
surplus |
Retained
earnings |
Accumulated
other comprehensive loss |
Total
shareholders’ equity |
||||||||||||||||
|
Balance as at August 31, 2018
|
$
|
91,937
|
$
|
18,428
|
$
|
114,906
|
$
|
(47,350
|
)
|
$
|
177,921
|
|||||||||
|
Adoption of IFRS 9 (note 2)
|
–
|
–
|
(253
|
)
|
–
|
(253
|
)
|
|||||||||||||
|
Adjusted balance as at September 1, 2018
|
91,937
|
18,428
|
114,653
|
(47,350
|
)
|
177,668
|
||||||||||||||
|
Reclassification of stock-based compensation costs (note 14)
|
1,106
|
(1,106
|
)
|
–
|
–
|
–
|
||||||||||||||
|
Redemption of share capital (note 14)
|
(337
|
)
|
25
|
–
|
–
|
(312
|
)
|
|||||||||||||
|
Stock-based compensation costs
|
–
|
1,849
|
–
|
–
|
1,849
|
|||||||||||||||
|
Net loss for the year
|
–
|
–
|
(2,480
|
)
|
–
|
(2,480
|
)
|
|||||||||||||
|
Other comprehensive income (loss)
|
||||||||||||||||||||
|
Foreign currency translation adjustment
|
–
|
–
|
–
|
(4,177
|
)
|
(4,177
|
)
|
|||||||||||||
|
Changes in unrealized gains/losses on forward exchange contracts, net of deferred income
taxes of $67
|
–
|
–
|
–
|
16
|
16
|
|||||||||||||||
|
Total comprehensive loss for the year
|
(6,641
|
)
|
||||||||||||||||||
|
Balance as at August 31, 2019
|
$
|
92,706
|
$
|
19,196
|
$
|
112,173
|
$
|
(51,511
|
)
|
$
|
172,564
|
|||||||||
|
Years ended August 31,
|
||||||||||||
|
2019
|
2018
|
2017
|
||||||||||
|
Cash flows from operating activities
|
||||||||||||
|
Net earnings (loss) for the year
|
$
|
(2,480
|
)
|
$
|
(12,254
|
)
|
$
|
851
|
||||
|
Add (deduct) items not affecting cash
|
||||||||||||
|
Stock-based compensation costs
|
1,831
|
1,748
|
1,477
|
|||||||||
|
Depreciation and amortization
|
14,481
|
15,771
|
7,191
|
|||||||||
|
Gain on disposal of capital assets (note 4)
|
(1,732
|
)
|
–
|
–
|
||||||||
|
Writeoff of capital assets
|
1,386
|
592
|
–
|
|||||||||
|
Change in fair value of cash contingent consideration
|
–
|
(670
|
)
|
(383
|
)
|
|||||||
|
Deferred revenue
|
10,477
|
1,998
|
1,723
|
|||||||||
|
Deferred income taxes
|
(2,103
|
)
|
1,368
|
1,054
|
||||||||
|
Share in net loss of an associate
|
–
|
2,080
|
–
|
|||||||||
|
Gain on deemed disposal of the investment in an associate
|
–
|
(2,080
|
)
|
–
|
||||||||
|
Changes in foreign exchange gain/loss
|
(46
|
)
|
(181
|
)
|
1,096
|
|||||||
|
21,814
|
8,372
|
13,009
|
||||||||||
|
Changes in non-cash operating items
|
||||||||||||
|
Accounts receivable
|
(4,786
|
)
|
7,275
|
3,955
|
||||||||
|
Income taxes and tax credits
|
1,536
|
86
|
(2,386
|
)
|
||||||||
|
Inventories
|
(134
|
)
|
(1,020
|
)
|
911
|
|||||||
|
Prepaid expenses
|
(1,307
|
)
|
57
|
(918
|
)
|
|||||||
|
Other assets
|
(1,459
|
)
|
(1,311
|
)
|
(121
|
)
|
||||||
|
Accounts payable and accrued liabilities and provisions
|
3,184
|
1,033
|
(1,745
|
)
|
||||||||
|
Other liabilities
|
(1,606
|
)
|
(122
|
)
|
165
|
|||||||
|
17,242
|
14,370
|
12,870
|
||||||||||
|
Cash flows from investing activities
|
||||||||||||
|
Additions to short-term investments
|
(1,879
|
)
|
(1,550
|
)
|
(2,910
|
)
|
||||||
|
Proceeds from disposal and maturity of short-term investments
|
1,168
|
234
|
6,374
|
|||||||||
|
Purchases of capital assets (notes 8 and 9)
|
(7,498
|
)
|
(10,452
|
)
|
(7,175
|
)
|
||||||
|
Proceeds from disposal of capital assets (note 4)
|
3,318
|
–
|
–
|
|||||||||
|
Investment in an associate (note 3)
|
–
|
(12,530
|
)
|
–
|
||||||||
|
Business combinations, net of cash acquired (note 3)
|
–
|
(19,600
|
)
|
(12,792
|
)
|
|||||||
|
(4,891
|
)
|
(43,898
|
)
|
(16,503
|
)
|
|||||||
|
Cash flows from financing activities
|
||||||||||||
|
Bank loan
|
(5,195
|
)
|
11,061
|
–
|
||||||||
|
Repayment of long-term debt
|
(2,817
|
)
|
(1,688
|
)
|
(1,480
|
)
|
||||||
|
Redemption of share capital (note 14)
|
(312
|
)
|
–
|
–
|
||||||||
|
Other liabilities
|
–
|
(1,449
|
)
|
–
|
||||||||
|
Acquisition of non-controlling interest (note 3)
|
–
|
(3,657
|
)
|
–
|
||||||||
|
(8,324
|
)
|
4,267
|
(1,480
|
)
|
||||||||
|
Effect of foreign exchange rate changes on cash
|
(267
|
)
|
(416
|
)
|
340
|
|||||||
|
Change in cash
|
3,760
|
(25,677
|
)
|
(4,773
|
)
|
|||||||
|
Cash – Beginning of year
|
12,758
|
38,435
|
43,208
|
|||||||||
|
Cash – End of year
|
$
|
16,518
|
$
|
12,758
|
$
|
38,435
|
||||||
|
Supplementary information
|
||||||||||||
|
Income taxes paid
|
$
|
2,577
|
$
|
2,376
|
$
|
2,866
|
||||||
|
1
|
Nature of Activities and Incorporation
|
|
2
|
Basis of Presentation
|
|
As reported
as at August 31, 2018
|
Adjustments
|
As adjusted
as at September 1, 2018
|
||||||||||
|
Accounts receivable – Trade (note 6)
|
$
|
47,273
|
$
|
(303
|
)
|
$
|
46,970
|
|||||
|
Income taxes recoverable
|
$
|
4,790
|
$
|
50
|
$
|
4,840
|
||||||
|
Total assets
|
$
|
284,544
|
$
|
(253
|
)
|
$
|
284,291
|
|||||
|
Retained earnings
|
$
|
114,906
|
$
|
(253
|
)
|
$
|
114,653
|
|||||
|
Shareholders’ equity
|
$
|
177,921
|
$
|
(253
|
)
|
$
|
177,668
|
|||||
|
Financial assets
|
Classification – IAS 39
|
Classification – IFRS 9
|
|
Cash
|
Loans and receivables
|
Amortized cost
|
|
Short-term investments
|
Available for sale
|
Fair value through other comprehensive income
|
|
Accounts receivable
|
Loans and receivables
|
Amortized cost
|
|
Forward exchange contracts
|
Derivatives used for hedging
|
Fair value through other comprehensive income
|
|
Financial liabilities
|
||
|
Bank loan
|
Other financial liabilities
|
Amortized cost
|
|
Accounts payable and accrued liabilities
|
Other financial liabilities
|
Amortized cost
|
|
Other liabilities
|
Other financial liabilities
|
Amortized cost
|
|
Long-term debt
|
Other financial liabilities
|
Amortized cost
|
|
Forward exchange contracts
|
Derivatives used for hedging
|
Fair value through other comprehensive income
|
|
(a)
|
Foreign currency transactions
|
|
(b)
|
Foreign operations
|
| Level 1: |
Quoted prices (unadjusted) in an active market for identical assets or liabilities;
|
| Level 2: |
Inputs other than quoted prices included within Level 1 that are observable for the asset and liability, either directly or indirectly; and
|
| Level 3: |
Unobservable inputs for the asset or liability.
|
|
Term
|
|
|
Land improvements
|
15 years
|
|
Buildings
|
20 to 60 years
|
|
Equipment
|
3 to 15 years
|
|
Leasehold improvements
|
The lesser of useful life and remaining lease term
|
|
(a)
|
Determination of functional currency
|
|
(b)
|
Determination of cash generating units and allocation of goodwill
|
|
(a)
|
Inventories
|
|
(b)
|
Income taxes
|
|
(c)
|
Tax credits recoverable
|
|
(d)
|
Impairment of non-financial assets
|
|
(e)
|
Purchase price allocation in business combinations
|
|
(f)
|
Identification of performance obligations
|
|
3
|
Business Combinations
|
|
Sales (1)
|
$
|
16,377
|
||
|
Net loss attributable to the parent interest (1, 2)
|
$
|
12,850
|
|
(1)
|
Includes acquisition-related deferred revenue fair value adjustment of $2,095,000.
|
|
(2)
|
Includes amortization of acquired intangible assets of $5,077,000.
|
|
Assets acquired
|
||||
|
Accounts receivable
|
$
|
16,374
|
||
|
Income taxes and tax credits recoverable
|
11,259
|
|||
|
Inventories
|
3,045
|
|||
|
Prepaid expenses
|
1,229
|
|||
|
Property, plant and equipment
|
1,944
|
|||
|
Core technologies
|
12,869
|
|||
|
Customer relationships
|
8,381
|
|||
|
Brand name
|
846
|
|||
|
Other intangible assets
|
498
|
|||
|
Other assets
|
1,402
|
|||
|
57,847
|
||||
|
Liabilities assumed
|
||||
|
Accounts payable and accrued liabilities
|
11,068
|
|||
|
Deferred revenue
|
4,748
|
|||
|
Long-term debt (note 12)
|
8,888
|
|||
|
Deferred income tax liabilities
|
2,692
|
|||
|
Other liabilities
|
6,715
|
|||
|
Net identifiable assets acquired
|
23,736
|
|||
|
Goodwill
|
2,505
|
|||
|
Fair value of the total consideration, net of cash acquired
|
$
|
26,241
|
||
|
Cash paid net of cash acquired
|
$
|
9,580
|
||
|
Fair value of shares held
|
12,967
|
|||
|
Non-controlling interest (purchased in February 2018)
|
3,694
|
|||
|
$
|
26,241
|
|
Assets acquired
|
||||
|
Accounts receivable
|
$
|
1,889
|
||
|
Inventories
|
2,384
|
|||
|
Property, plant and equipment
|
1,424
|
|||
|
Core technologies
|
3,686
|
|||
|
Customer relationships
|
811
|
|||
|
In-process research and development
|
305
|
|||
|
Other intangible assets
|
132
|
|||
|
Prepaid expenses
|
171
|
|||
|
10,802
|
||||
|
Liabilities assumed
|
||||
|
Accounts payable and accrued liabilities
|
1,035
|
|||
|
Long-term debt (note 12)
|
2,143
|
|||
|
Deferred income taxes
|
1,510
|
|||
|
Net identifiable assets acquired
|
6,114
|
|||
|
Goodwill
|
3,426
|
|||
|
Fair value of the total consideration, net of cash acquired
|
$
|
9,540
|
||
|
4
|
Restructuring Charges
|
|
Years ended August 31,
|
||||||||
|
2019
|
2018
|
|||||||
|
Balance – Beginning of year
|
$
|
3,167
|
$
|
2,477
|
||||
|
Addition
|
3,305
|
3,209
|
||||||
|
Payments
|
(5,339
|
)
|
(2,052
|
)
|
||||
|
Reversal
|
–
|
(467
|
)
|
|||||
|
Balance – End of year (note 11)
|
$
|
1,133
|
$
|
3,167
|
||||
|
5
|
Capital Disclosures
|
|
•
|
To maintain a flexible capital structure that optimizes the cost of capital at acceptable risk;
|
|
•
|
To sustain future development of the company, including research and development activities, market development and potential
acquisitions of complementary businesses or products; and
|
|
•
|
To provide the company’s shareholders with an appropriate return on their investment.
|
|
6
|
Financial Instruments
|
|
As at August 31, 2019
|
||||||||||||
|
Amortized
cost |
Fair value
through other comprehensive income |
Total
|
||||||||||
|
Financial assets
|
||||||||||||
|
Cash
|
$
|
16,518
|
$
|
–
|
$
|
16,518
|
||||||
|
Short-term investments
|
$
|
–
|
$
|
2,918
|
$
|
2,918
|
||||||
|
Accounts receivable
|
$
|
54,834
|
$
|
–
|
$
|
54,834
|
||||||
|
Forward exchange contracts
|
$
|
–
|
$
|
79
|
$
|
79
|
||||||
|
Financial liabilities
|
||||||||||||
|
Bank loan
|
$
|
5,000
|
$
|
–
|
$
|
5,000
|
||||||
|
Accounts payable and accrued liabilities
|
$
|
49,945
|
$
|
–
|
$
|
49,945
|
||||||
|
Other liabilities
|
$
|
1,606
|
$
|
–
|
$
|
1,606
|
||||||
|
Long-term debt
|
$
|
5,742
|
$
|
–
|
$
|
5,742
|
||||||
|
Forward exchange contracts
|
$
|
–
|
$
|
1,057
|
$
|
1,057
|
||||||
|
As at August 31, 2018 – IAS 39
|
||||||||||||||||||||
|
Loans and
receivables |
Available
for sale |
Other
financial liabilities |
Derivatives
used for hedging |
Total
|
||||||||||||||||
|
Financial assets
|
||||||||||||||||||||
|
Cash
|
$
|
12,758
|
$
|
–
|
$
|
–
|
$
|
–
|
$
|
12,758
|
||||||||||
|
Short-term investments
|
$
|
–
|
$
|
2,282
|
$
|
–
|
$
|
–
|
$
|
2,282
|
||||||||||
|
Accounts receivable
|
$
|
46,955
|
$
|
–
|
$
|
–
|
$
|
–
|
$
|
46,955
|
||||||||||
|
Other assets
|
$
|
352
|
$
|
–
|
$
|
–
|
$
|
–
|
$
|
352
|
||||||||||
|
Forward exchange contracts
|
$
|
–
|
$
|
–
|
$
|
–
|
$
|
318
|
$
|
318
|
||||||||||
|
Financial liabilities
|
||||||||||||||||||||
|
Bank loan
|
$
|
–
|
$
|
–
|
$
|
10,692
|
$
|
–
|
$
|
10,692
|
||||||||||
|
Accounts payable and accrued liabilities
|
$
|
–
|
$
|
–
|
$
|
47,308
|
$
|
–
|
$
|
47,308
|
||||||||||
|
Other liabilities
|
$
|
–
|
$
|
–
|
$
|
3,197
|
$
|
–
|
$
|
3,197
|
||||||||||
|
Long-term debt
|
$
|
–
|
$
|
–
|
$
|
8,828
|
$
|
–
|
$
|
8,828
|
||||||||||
|
Forward exchange contracts
|
$
|
–
|
$
|
–
|
$
|
–
|
$
|
807
|
$
|
807
|
||||||||||
|
As at August 31, 2019
|
As at August 31, 2018
|
|||||||||||||||
|
Level 1
|
Level 2
|
Level 1
|
Level 2
|
|||||||||||||
|
Financial assets
|
||||||||||||||||
|
Short-term investments
|
$
|
2,918
|
$
|
–
|
$
|
2,282
|
$
|
–
|
||||||||
|
Forward exchange contracts
|
$
|
–
|
$
|
79
|
$
|
–
|
$
|
318
|
||||||||
|
Financial liabilities
|
||||||||||||||||
|
Forward exchange contracts
|
$
|
–
|
$
|
1,057
|
$
|
–
|
$
|
807
|
||||||||
|
Expiry dates
|
Contractual
amounts |
Weighted average
contractual forward rates |
|||||||
|
As at August 31, 2018
|
|||||||||
|
September 2018 to August 2019
|
$
|
26,400
|
1.3029
|
||||||
|
September 2019 to August 2020
|
15,700
|
1.2756
|
|||||||
|
September 2020 to May 2021
|
3,700
|
1.2703
|
|||||||
|
Total
|
$
|
45,800
|
1.2909
|
||||||
|
As at August 31, 2019
|
|||||||||
|
September 2019 to August 2020
|
$
|
35,500
|
1.3013
|
||||||
|
September 2020 to August 2021
|
19,900
|
1.3107
|
|||||||
|
September 2021 to July 2022
|
6,000
|
1.3216
|
|||||||
|
Total
|
$
|
61,400
|
1.3063
|
||||||
|
Expiry dates
|
Contractual
amounts |
Weighted average
contractual forward rates |
|||||||
|
As at August 31, 2018
|
|||||||||
|
September 2018 to May 2019
|
$
|
4,600
|
67.68
|
||||||
|
As at August 31, 2019
|
|||||||||
|
September 2019 to August 2020
|
$
|
3,500
|
71.48
|
||||||
|
Years ended August 31,
|
||||||||||||
|
2019
|
2018
|
2017
|
||||||||||
|
Gains (losses) on forward exchange contracts
|
$
|
(591
|
)
|
$
|
875
|
$
|
(468
|
)
|
||||
|
As at August 31,
|
||||||||||||||||
|
2019
|
2018
|
|||||||||||||||
|
Carrying/nominal
amount (in thousands
of US dollars)
|
Carrying/nominal
amount (in thousands
of euros)
|
Carrying/nominal
amount (in thousands
of US dollars)
|
Carrying/nominal
amount (in thousands
of euros)
|
|||||||||||||
|
Financial assets
|
||||||||||||||||
|
Cash
|
$
|
5,531
|
€
|
3,129
|
$
|
2,790
|
€
|
3,352
|
||||||||
|
Accounts receivable
|
30,451
|
6,389
|
30,306
|
3,787
|
||||||||||||
|
35,982
|
9,518
|
33,096
|
7,139
|
|||||||||||||
|
Financial liabilities
|
||||||||||||||||
|
Bank loan
|
5,000
|
–
|
7,197
|
3,000
|
||||||||||||
|
Accounts payable and accrued liabilities
|
12,563
|
2,218
|
13,017
|
2,107
|
||||||||||||
|
Forward exchange contracts (nominal value)
|
5,800
|
–
|
5,000
|
–
|
||||||||||||
|
23,363
|
2,218
|
25,214
|
5,107
|
|||||||||||||
|
Net exposure
|
$
|
12,619
|
€
|
7,300
|
$
|
7,882
|
€
|
2,032
|
||||||||
|
•
|
An increase (decrease) of 10% in the period-end value of the Canadian dollar compared to the US dollar would decrease
(increase) net earnings by $844,000, or $0.02 per diluted share, and $1,166,000, or $0.02 per diluted share, as at August 31, 2018 and 2019 respectively.
|
|
•
|
An increase (decrease) of 10% in the period-end value of the Canadian dollar compared to the euro would decrease (increase)
net earnings by $335,000, or $0.01 per diluted share, and $769,000 or $0.01 per diluted share, as at August 31, 2018 and 2019 respectively.
|
|
•
|
An increase (decrease) of 10% in the period-end value of the Canadian dollar compared to the US dollar would increase
(decrease) other comprehensive income by $2,956,000 and $4,072,000 as at August 31, 2018 and 2019 respectively.
|
|
As at August 31,
|
||||||||
|
2019
|
2018
|
|||||||
|
Term deposits denominated in Indian rupees, bearing interest at annual rates of 5.0%
to 6.8% in 2018 and 5.1% to 7.0% in 2019, maturing on different dates between October 2018 and August 2019 in 2018 and September 2019 and May 2020 in 2019
|
$
|
2,548
|
$
|
1,909
|
||||
|
Other
|
370
|
373
|
||||||
|
$
|
2,918
|
$
|
2,282
|
|||||
|
As at August 31,
|
||||||||
|
2019
|
2018
|
|||||||
|
Current
|
$
|
39,054
|
$
|
34,344
|
||||
|
Past due, 0 to 30 days
|
3,529
|
6,011
|
||||||
|
Past due, 31 to 60 days
|
2,006
|
2,556
|
||||||
|
Past due, more than 60 days
|
6,928
|
4,362
|
||||||
|
$
|
51,517
|
$
|
47,273
|
|||||
|
Years ended August 31,
|
||||||||
|
2019
|
2018
|
|||||||
|
Balance – Beginning of year
|
$
|
772
|
$
|
2,960
|
||||
|
IFRS 9 adoption initial adjustment (note 2)
|
303
|
–
|
||||||
|
Addition charged to earnings
|
864
|
834
|
||||||
|
Writeoff of uncollectible accounts and reversal
|
(404
|
)
|
(3,022
|
)
|
||||
|
Balance – End of year
|
$
|
1,535
|
$
|
772
|
||||
|
As at August 31, 2019
|
||||||||||||
|
No later
than one year |
Later than
1 year and no later than 5 years |
Later than
5 years |
||||||||||
|
Bank loan
|
$
|
5,000
|
$
|
–
|
$
|
–
|
||||||
|
Accounts payable and accrued liabilities
|
49,945
|
–
|
–
|
|||||||||
|
Forward exchange contracts
|
||||||||||||
|
Outflow
|
39,000
|
25,900
|
–
|
|||||||||
|
Inflow
|
(38,252
|
)
|
(25,585
|
)
|
–
|
|||||||
|
Long-term debt
|
2,449
|
3,237
|
56
|
|||||||||
|
Other liabilities
|
1,606
|
–
|
–
|
|||||||||
|
Total
|
$
|
59,748
|
$
|
3,552
|
$
|
56
|
||||||
|
As at August 31, 2018
|
||||||||||||
|
No later
than one year |
Later than
1 year and no later than 5 years |
Later than
5 years |
||||||||||
|
Bank loan
|
$
|
10,692
|
$
|
–
|
$
|
–
|
||||||
|
Accounts payable and accrued liabilities
|
47,308
|
–
|
–
|
|||||||||
|
Forward exchange contracts
|
||||||||||||
|
Outflow
|
31,000
|
19,400
|
–
|
|||||||||
|
Inflow
|
(30,738
|
)
|
(18,940
|
)
|
–
|
|||||||
|
Long-term debt
|
2,921
|
5,745
|
162
|
|||||||||
|
Other liabilities
|
3,197
|
–
|
–
|
|||||||||
|
Total
|
$
|
64,380
|
$
|
6,205
|
$
|
162
|
||||||
|
7
|
Inventories
|
|
As at August 31,
|
||||||||
|
2019
|
2018
|
|||||||
|
Raw materials
|
$
|
24,115
|
$
|
24,561
|
||||
|
Work in progress
|
1,009
|
869
|
||||||
|
Finished goods
|
12,893
|
13,159
|
||||||
|
$
|
38,017
|
$
|
38,589
|
|||||
|
8
|
Property, Plant and Equipment
|
|
Land and land
improvements |
Buildings
|
Equipment
|
Leasehold
improvements |
Total
|
||||||||||||||||
|
Cost as at September 1, 2017
|
$
|
4,522
|
$
|
31,951
|
$
|
35,574
|
$
|
3,048
|
$
|
75,095
|
||||||||||
|
Additions
|
17
|
3,048
|
5,677
|
46
|
8,788
|
|||||||||||||||
|
Business combinations (note 3)
|
–
|
–
|
3,105
|
263
|
3,368
|
|||||||||||||||
|
Disposals
|
–
|
(1,413
|
)
|
(3,651
|
)
|
(175
|
)
|
(5,239
|
)
|
|||||||||||
|
Foreign currency translation adjustment
|
(180
|
)
|
(1,240
|
)
|
(1,617
|
)
|
(134
|
)
|
(3,171
|
)
|
||||||||||
|
Cost as at August 31, 2018
|
4,359
|
32,346
|
39,088
|
3,048
|
78,841
|
|||||||||||||||
|
Additions
|
–
|
1,116
|
3,700
|
164
|
4,980
|
|||||||||||||||
|
Disposals
|
(192
|
)
|
(3,378
|
)
|
(4,623
|
)
|
(164
|
)
|
(8,357
|
)
|
||||||||||
|
Foreign currency translation adjustment
|
(76
|
)
|
(592
|
)
|
(1,329
|
)
|
(153
|
)
|
(2,150
|
)
|
||||||||||
|
Cost as at August 31, 2019
|
$
|
4,091
|
$
|
29,492
|
$
|
36,836
|
$
|
2,895
|
$
|
73,314
|
||||||||||
|
Accumulated depreciation as at September 1, 2017
|
$
|
1,295
|
$
|
7,333
|
$
|
25,207
|
$
|
1,128
|
$
|
34,963
|
||||||||||
|
Depreciation for the year
|
48
|
604
|
4,420
|
372
|
5,444
|
|||||||||||||||
|
Disposals
|
–
|
(994
|
)
|
(3,440
|
)
|
(30
|
)
|
(4,464
|
)
|
|||||||||||
|
Foreign currency translation adjustment
|
(53
|
)
|
(282
|
)
|
(1,024
|
)
|
(53
|
)
|
(1,412
|
)
|
||||||||||
|
Accumulated depreciation as at August 31, 2018
|
1,290
|
6,661
|
25,163
|
1,417
|
34,531
|
|||||||||||||||
|
Depreciation for the year
|
47
|
667
|
4,391
|
364
|
5,469
|
|||||||||||||||
|
Disposals
|
–
|
(1,452
|
)
|
(3,673
|
)
|
(114
|
)
|
(5,239
|
)
|
|||||||||||
|
Foreign currency translation adjustment
|
(53
|
)
|
(120
|
)
|
(602
|
)
|
(36
|
)
|
(811
|
)
|
||||||||||
|
Accumulated depreciation as at August 31, 2019
|
$
|
1,284
|
$
|
5,756
|
$
|
25,279
|
$
|
1,631
|
$
|
33,950
|
||||||||||
|
Net carrying value as at:
|
||||||||||||||||||||
|
August 31, 2018
|
$
|
3,069
|
$
|
25,685
|
$
|
13,925
|
$
|
1,631
|
$
|
44,310
|
||||||||||
|
August 31, 2019
|
$
|
2,807
|
$
|
23,736
|
$
|
11,557
|
$
|
1,264
|
$
|
39,364
|
||||||||||
|
9
|
Intangible Assets and Goodwill
|
|
Core
technology |
Customer
relationships |
In-process
research and development |
Brand
name |
Software
|
Total
|
|||||||||||||||||||
|
Cost as at September 1, 2017
|
$
|
12,893
|
$
|
1,689
|
$
|
–
|
$
|
–
|
$
|
11,901
|
$
|
26,483
|
||||||||||||
|
Additions
|
89
|
–
|
–
|
–
|
3,049
|
3,138
|
||||||||||||||||||
|
Business combinations (note 3)
|
16,555
|
9,192
|
305
|
846
|
630
|
27,528
|
||||||||||||||||||
|
Disposal
|
(60
|
)
|
–
|
–
|
–
|
(2,474
|
)
|
(2,534
|
)
|
|||||||||||||||
|
Foreign currency translation adjustment
|
(1,419
|
)
|
(590
|
)
|
(13
|
)
|
(50
|
)
|
(446
|
)
|
(2,518
|
)
|
||||||||||||
|
Cost as at August 31, 2018
|
28,058
|
10,291
|
292
|
796
|
12,660
|
52,097
|
||||||||||||||||||
|
Additions
|
363
|
–
|
–
|
–
|
1,719
|
2,082
|
||||||||||||||||||
|
Disposal
|
(27
|
)
|
–
|
(293
|
)
|
–
|
(222
|
)
|
(542
|
)
|
||||||||||||||
|
Foreign currency translation adjustment
|
(1,955
|
)
|
(618
|
)
|
1
|
(46
|
)
|
(240
|
)
|
(2,858
|
)
|
|||||||||||||
|
Cost as at August 31, 2019
|
$
|
26,439
|
$
|
9,673
|
$
|
–
|
$
|
750
|
$
|
13,917
|
$
|
50,779
|
||||||||||||
|
Accumulated amortization as at September 1, 2017
|
$
|
5,130
|
$
|
169
|
$
|
–
|
$
|
–
|
$
|
10,001
|
$
|
15,300
|
||||||||||||
|
Amortization for the year
|
4,878
|
3,949
|
–
|
519
|
981
|
10,327
|
||||||||||||||||||
|
Disposal
|
(45
|
)
|
–
|
–
|
–
|
(2,462
|
)
|
(2,507
|
)
|
|||||||||||||||
|
Foreign currency translation adjustment
|
(353
|
)
|
(185
|
)
|
–
|
(7
|
)
|
(344
|
)
|
(889
|
)
|
|||||||||||||
|
Accumulated amortization as at August 31, 2018
|
9,610
|
3,933
|
–
|
512
|
8,176
|
22,231
|
||||||||||||||||||
|
Amortization for the year
|
4,926
|
2,372
|
–
|
284
|
1,430
|
9,012
|
||||||||||||||||||
|
Disposal
|
(19
|
)
|
–
|
–
|
–
|
(219
|
)
|
(238
|
)
|
|||||||||||||||
|
Foreign currency translation adjustment
|
(1,080
|
)
|
(424
|
)
|
–
|
(46
|
)
|
(330
|
)
|
(1,880
|
)
|
|||||||||||||
|
Accumulated amortization as at August 31, 2019
|
$
|
13,437
|
$
|
5,881
|
$
|
–
|
$
|
750
|
$
|
9,057
|
$
|
29,125
|
||||||||||||
|
Net carrying value as at:
|
||||||||||||||||||||||||
|
August 31, 2018
|
$
|
18,448
|
$
|
6,358
|
$
|
292
|
$
|
284
|
$
|
4,484
|
$
|
29,866
|
||||||||||||
|
August 31, 2019
|
$
|
13,002
|
$
|
3,792
|
$
|
–
|
$
|
–
|
$
|
4,860
|
$
|
21,654
|
||||||||||||
|
Remaining amortization period as at August 31, 2019
|
4 years
|
2 years
|
–
|
–
|
3 years
|
|||||||||||||||||||
|
Years ended August 31,
|
||||||||
|
2019
|
2018
|
|||||||
|
Balance – Beginning of year
|
$
|
39,892
|
$
|
35,077
|
||||
|
Business combinations (note 3)
|
–
|
5,931
|
||||||
|
Foreign currency translation adjustment
|
(1,244
|
)
|
(1,116
|
)
|
||||
|
Balance – End of year
|
$
|
38,648
|
$
|
39,892
|
||||
|
As at August 31,
|
||||||||
|
2019
|
2018
|
|||||||
|
EXFO CGU
|
$
|
12,949
|
$
|
13,185
|
||||
|
EXFO Optics CGU (note 3)
|
3,376
|
3,562
|
||||||
|
Service assurance, systems and services CGU
|
22,323
|
–
|
||||||
|
Brix CGU
|
–
|
13,327
|
||||||
|
Ontology CGU (note 3)
|
–
|
7,471
|
||||||
|
EXFO Solutions CGU (note 3)
|
–
|
2,347
|
||||||
|
Total
|
$
|
38,648
|
$
|
39,892
|
||||
|
10
|
Credit Facilities
|
|
11
|
Accounts Payable and Accrued Liabilities and Provisions
|
|
As at August 31,
|
||||||||
|
2019
|
2018
|
|||||||
|
Trade
|
$
|
27,996
|
$
|
26,052
|
||||
|
Salaries and social benefits
|
19,716
|
18,101
|
||||||
|
Forward exchange contracts (note 6)
|
845
|
590
|
||||||
|
Other
|
2,233
|
3,155
|
||||||
|
$
|
50,790
|
$
|
47,898
|
|||||
|
As at August 31,
|
||||||||
|
2019
|
2018
|
|||||||
|
Warranty
|
$
|
356
|
$
|
417
|
||||
|
Restructuring charges (note 4)
|
1,133
|
3,167
|
||||||
|
Other
|
2,313
|
1,717
|
||||||
|
$
|
3,802
|
$
|
5,301
|
|||||
|
12
|
Long-Term Debt
|
|
As at August 31,
|
||||||||
|
2019
|
2018
|
|||||||
|
Unsecured, non-interest-bearing loans, denominated in euros,
repayable in quarterly instalments, maturing in March 2024 and March 2025
|
$
|
866
|
$
|
883
|
||||
|
Unsecured loans, denominated in euros, repayable in monthly,
quarterly or bi‑annual instalments, bearing interest at annual rates of nil to 5.0%, maturing at different dates between December 2018 and September 2023 in 2018 and March 2020 and September 2023 in 2019
|
3,111
|
4,853
|
||||||
|
Loans, secured by the universality of the assets of a subsidiary,
denominated in euros, repayable in monthly instalments, bearing interest at annual rates of 0.7% to 2.0%, maturing at different dates between December 2018 and August 2022 in 2018 and April 2020 and August 2022 in 2019
|
459
|
828
|
||||||
|
Loans, secured by the universality of the assets of a subsidiary,
denominated in euros, repayable in monthly or quarterly instalments, bearing interest at annual rates of 1.1% to 2.9%, maturing at different dates between March 2020 and July 2022
|
1,306
|
2,264
|
||||||
|
5,742
|
8,828
|
|||||||
|
Current portion of long-term debt
|
2,449
|
2,921
|
||||||
|
$
|
3,293
|
$
|
5,907
|
|||||
|
No later than one year
|
$
|
2,449
|
||
|
Later than one year and no later than five years
|
3,237
|
|||
|
Later than five years
|
56
|
|||
|
$
|
5,742
|
|
13
|
Commitments
|
|
As at August 31,
|
||||||||
|
2019
|
2018
|
|||||||
|
No later than 1 year
|
$
|
2,895
|
$
|
3,365
|
||||
|
Later than 1 year and no later than 5 years
|
6,323
|
9,519
|
||||||
|
Later than 5 years
|
23
|
502
|
||||||
|
$
|
9,241
|
$
|
13,386
|
|||||
|
As at August 31,
|
||||||||
|
2019
|
2018
|
|||||||
|
No later than 1 year
|
$
|
2,289
|
$
|
1,492
|
||||
|
Later than 1 year and no later than 5 years
|
2,444
|
1,982
|
||||||
|
$
|
4,733
|
$
|
3,474
|
|||||
|
14
|
Share Capital
|
|
Authorized – unlimited as to number, without par value
|
|
|
Subordinate voting and participating, bearing a non-cumulative dividend to be determined
by the Board of Directors, ranking pari passu with multiple voting shares
|
|
|
Multiple voting and participating, entitling to 10 votes each, bearing a non-cumulative
dividend to be determined by the Board of Directors, convertible at the holder’s option into subordinate voting shares on a one-for-one basis, ranking pari passu with subordinate
voting shares
|
|
|
Multiple Voting Shares
|
Subordinate Voting Shares
|
|||||||||||||||||||
|
Number
|
Amount
|
Number
|
Amount
|
Total
amount
|
||||||||||||||||
|
Balance as at September 1, 2016
|
31,643,000
|
$
|
1
|
21,917,942
|
$
|
85,515
|
$
|
85,516
|
||||||||||||
|
Issuance of share capital
|
–
|
–
|
793,070
|
3,490
|
3,490
|
|||||||||||||||
|
Redemption of restricted share units (note 16)
|
–
|
–
|
327,859
|
–
|
–
|
|||||||||||||||
|
Redemption of deferred share units (note 16)
|
–
|
–
|
29,906
|
–
|
–
|
|||||||||||||||
|
Reclassification of stock-based compensation costs to share capital upon exercise of stock awards
|
–
|
–
|
–
|
1,405
|
1,405
|
|||||||||||||||
|
Balance as at August 31, 2017
|
31,643,000
|
1
|
23,068,777
|
90,410
|
90,411
|
|||||||||||||||
|
Redemption of restricted share units (note 16)
|
–
|
–
|
345,883
|
–
|
–
|
|||||||||||||||
|
Redemption of deferred share units (note 16)
|
–
|
–
|
58,335
|
–
|
–
|
|||||||||||||||
|
Reclassification of stock-based compensation costs to share capital upon exercise of stock awards
|
–
|
–
|
–
|
1,526
|
1,526
|
|||||||||||||||
|
Balance as at August 31, 2018
|
31,643,000
|
1
|
23,472,995
|
91,936
|
91,937
|
|||||||||||||||
|
Redemption of restricted share units (note 16)
|
–
|
–
|
317,072
|
–
|
–
|
|||||||||||||||
|
Redemption of share capital
|
–
|
–
|
(86,392
|
)
|
(337
|
)
|
(337
|
)
|
||||||||||||
|
Reclassification of stock-based compensation costs to share capital upon exercise of stock awards
|
–
|
–
|
–
|
1,106
|
1,106
|
|||||||||||||||
|
Balance as at August 31, 2019
|
31,643,000
|
$
|
1
|
23,703,675
|
$
|
92,705
|
$
|
92,706
|
||||||||||||
|
a)
|
On January 8, 2019, the company announced that its Board of Directors had approved a share repurchase program, by way of a
normal course issued bid on the open market of up to 6.3% of the issued and outstanding subordinate voting shares, representing 1,200,000 subordinate voting shares at the prevailing market price. The normal course issuer bid
started on January 14, 2019 and will end on January 13, 2020 or earlier if the company repurchases the maximum number of shares permitted. All shares repurchased under the bid will be cancelled.
|
|
15
|
Accumulated Other Comprehensive Loss
|
|
Foreign
currency translation adjustment |
Cash-flow
hedge |
Accumulated
other comprehensive loss |
||||||||||
|
Balance as at September 1, 2016
|
$
|
(49,136
|
)
|
$
|
562
|
$
|
(48,574
|
)
|
||||
|
Foreign currency translation adjustment
|
8,262
|
–
|
8,262
|
|||||||||
|
Changes in unrealized gains/losses on forward exchange contracts, net of deferred income taxes
|
–
|
1,347
|
1,347
|
|||||||||
|
Balance as at August 31, 2017
|
(40,874
|
)
|
1,909
|
(38,965
|
)
|
|||||||
|
Foreign currency translation adjustment
|
(6,491
|
)
|
–
|
(6,491
|
)
|
|||||||
|
Changes in unrealized gains/losses on forward exchange contracts, net of deferred income taxes
|
–
|
(1,894
|
)
|
(1,894
|
)
|
|||||||
|
Balance as at August 31, 2018
|
(47,365
|
)
|
15
|
(47,350
|
)
|
|||||||
|
Foreign currency translation adjustment
|
(4,177
|
)
|
–
|
(4,177
|
)
|
|||||||
|
Changes in unrealized gains/losses on forward exchange contracts, net of deferred income taxes
|
–
|
16
|
16
|
|||||||||
|
Balance as at August 31, 2019
|
$
|
(51,542
|
)
|
$
|
31
|
$
|
(51,511
|
)
|
||||
|
16
|
Stock-Based Compensation Plans
|
|
Years ended August 31,
|
||||||||||||
|
2019
|
2018
|
2017
|
||||||||||
|
Stock-based compensation costs arising from
equity-settled awards |
$
|
1,849
|
$
|
1,770
|
$
|
1,439
|
||||||
|
Stock-based compensation costs arising from
cash-settled awards |
(18
|
)
|
(22
|
)
|
38
|
|||||||
|
$
|
1,831
|
$
|
1,748
|
$
|
1,477
|
|||||||
|
Years ended August 31,
|
||||||||||||
|
2019
|
2018
|
2017
|
||||||||||
|
Outstanding – Beginning of year
|
1,615,152
|
1,611,330
|
1,551,555
|
|||||||||
|
Granted
|
632,931
|
420,621
|
527,143
|
|||||||||
|
Redeemed
|
(317,072
|
)
|
(345,883
|
)
|
(327,859
|
)
|
||||||
|
Forfeited
|
(94,565
|
)
|
(70,916
|
)
|
(139,509
|
)
|
||||||
|
Outstanding – End of year
|
1,836,446
|
1,615,152
|
1,611,330
|
|||||||||
|
Years ended August 31,
|
||||||||||||
|
2019
|
2018
|
2017
|
||||||||||
|
Outstanding – Beginning of year
|
181,689
|
174,279
|
159,127
|
|||||||||
|
Granted
|
69,818
|
65,745
|
45,058
|
|||||||||
|
Redeemed
|
–
|
(58,335
|
)
|
(29,906
|
)
|
|||||||
|
Outstanding – End of year
|
251,507
|
181,689
|
174,279
|
|||||||||
|
17
|
Related-Party Disclosures
|
|
Years ended August 31,
|
||||||||||||
|
2019
|
2018
|
2017
|
||||||||||
|
Salaries and short-term employee benefits
|
$
|
4,029
|
$
|
3,985
|
$
|
3,715
|
||||||
|
Stock-based compensation costs
|
1,175
|
1,047
|
775
|
|||||||||
|
$
|
5,204
|
$
|
5,032
|
$
|
4,490
|
|||||||
|
18
|
Statements of Earnings
|
|
Years ended August 31,
|
||||||||||||
|
2019
|
2018
|
2017
|
||||||||||
|
Test and measurement
|
$
|
204,693
|
$
|
197,423
|
$
|
193,863
|
||||||
|
Service assurance, systems and services
|
82,788
|
71,248
|
49,906
|
|||||||||
|
Foreign exchange gains (losses) on forward exchange contracts
|
(591
|
)
|
875
|
(468
|
)
|
|||||||
|
Total sales for the year
|
$
|
286,890
|
$
|
269,546
|
$
|
243,301
|
||||||
|
Years ended August 31,
|
||||||||||||
|
2019
|
2018
|
2017
|
||||||||||
|
Gross research and development expenses
|
$
|
57,972
|
$
|
65,243
|
$
|
53,124
|
||||||
|
Research and development tax credits and grants
|
(7,419
|
)
|
(8,089
|
)
|
(5,956
|
)
|
||||||
|
Net research and development expenses for the year
|
$
|
50,553
|
$
|
57,154
|
$
|
47,168
|
||||||
|
Years ended August 31,
|
||||||||||||
|
2019
|
2018
|
2017
|
||||||||||
|
Cost of sales
|
||||||||||||
|
Depreciation of property, plant and equipment
|
$
|
1,862
|
$
|
2,077
|
$
|
1,522
|
||||||
|
Amortization of intangible assets
|
7,186
|
9,212
|
2,652
|
|||||||||
|
9,048
|
11,289
|
4,174
|
||||||||||
|
Selling and administrative expenses
|
||||||||||||
|
Depreciation of property, plant and equipment
|
1,354
|
902
|
530
|
|||||||||
|
Amortization of intangible assets
|
1,043
|
592
|
251
|
|||||||||
|
2,397
|
1,494
|
781
|
||||||||||
|
Net research and development expenses
|
||||||||||||
|
Depreciation of property, plant and equipment
|
2,253
|
2,465
|
1,850
|
|||||||||
|
Amortization of intangible assets
|
783
|
523
|
386
|
|||||||||
|
3,036
|
2,988
|
2,236
|
||||||||||
|
$
|
14,481
|
$
|
15,771
|
$
|
7,191
|
|||||||
|
Depreciation of property, plant and equipment
|
$
|
5,469
|
$
|
5,444
|
$
|
3,902
|
||||||
|
Amortization of intangible assets
|
9,012
|
10,327
|
3,289
|
|||||||||
|
Total depreciation and amortization expenses for the year
|
$
|
14,481
|
$
|
15,771
|
$
|
7,191
|
||||||
|
Years ended August 31,
|
||||||||||||
|
2019
|
2018
|
2017
|
||||||||||
|
Salaries and benefits
|
$
|
136,059
|
$
|
134,453
|
$
|
115,832
|
||||||
|
Restructuring charges
|
3,305
|
2,072
|
3,509
|
|||||||||
|
Stock-based compensation costs
|
1,831
|
1,748
|
1,414
|
|||||||||
|
Total employee compensation for the year
|
$
|
141,195
|
$
|
138,273
|
$
|
120,755
|
||||||
|
Years ended August 31,
|
||||||||||||
|
2019
|
2018
|
2017
|
||||||||||
|
Cost of sales
|
$
|
304
|
$
|
517
|
$
|
1,697
|
||||||
|
Selling and administrative expenses
|
495
|
673
|
1,150
|
|||||||||
|
Net research and development costs
|
2,506
|
3,219
|
2,232
|
|||||||||
|
Interest and other expense
|
–
|
150
|
–
|
|||||||||
|
Income taxes
|
(63
|
)
|
(1,150
|
)
|
–
|
|||||||
|
Total restructuring charges for the year
|
$
|
3,242
|
$
|
3,409
|
$
|
5,079
|
||||||
|
Years ended August 31,
|
||||||||||||
|
2019
|
2018
|
2017
|
||||||||||
|
Cost of sales
|
$
|
136
|
$
|
143
|
$
|
121
|
||||||
|
Selling and administrative expenses
|
1,375
|
1,217
|
1,052
|
|||||||||
|
Net research and development expenses
|
320
|
388
|
304
|
|||||||||
|
Total stock-based compensation costs for the year
|
$
|
1,831
|
$
|
1,748
|
$
|
1,477
|
||||||
|
19
|
Other Disclosures
|
|
•
|
Canadian defined contribution pension plan
|
|
•
|
US defined contribution pension plan (401K plan)
|
|
20
|
Income Taxes
|
|
Years ended August 31,
|
||||||||||||
|
2019
|
2018
|
2017
|
||||||||||
|
Income tax provision (recovery) at combined Canadian federal and provincial statutory tax rate (27%)
|
$
|
774
|
$
|
(1,775
|
)
|
$
|
2,014
|
|||||
|
Increase (decrease) due to:
|
||||||||||||
|
Foreign income/loss taxed at different rates
|
13
|
452
|
(900
|
)
|
||||||||
|
Non-deductible loss (non-taxable income)
|
10
|
(69
|
)
|
(245
|
)
|
|||||||
|
Non-deductible expenses
|
594
|
1,285
|
981
|
|||||||||
|
Change in tax rates
|
–
|
167
|
(10
|
)
|
||||||||
|
Effect of the US tax reform (1)
|
–
|
1,528
|
–
|
|||||||||
|
Foreign exchange effect of translation of foreign subsidiaries in the functional currency
|
63
|
(16
|
)
|
176
|
||||||||
|
Recognition of previously unrecognized deferred income tax assets (note 4)
|
(2,383
|
)
|
(560
|
)
|
–
|
|||||||
|
Utilization of previously unrecognized deferred income tax assets
|
(964
|
)
|
(627
|
)
|
(46
|
)
|
||||||
|
Unrecognized deferred income tax assets on temporary deductible differences and unused tax losses
|
5,761
|
6,100
|
4,659
|
|||||||||
|
Other
|
1,478
|
(807
|
)
|
(21
|
)
|
|||||||
|
Income tax provision for the year
|
$
|
5,346
|
$
|
5,678
|
$
|
6,608
|
||||||
|
(1)
|
On December 22, 2017, the US tax reform (“Tax Cuts and Jobs Act”) was substantively enacted and reduces the maximum corporate
income tax rate from 35% to 21%, effective January 1, 2018. Based on management’s estimate of deferred tax assets expected to be used in fiscal 2018 and beyond against taxable income in the United States, the company
recorded a deferred income tax expense of $1,528,000 in the consolidated statement of earnings for the year ended August 31, 2018 to account for the effect of this substantively enacted tax rate.
|
|
Years ended August 31,
|
||||||||||||
|
2019
|
2018
|
2017
|
||||||||||
|
The income tax provision consists of the following:
|
||||||||||||
|
Current
|
||||||||||||
|
Current income taxes
|
$
|
7,449
|
$
|
4,310
|
$
|
5,554
|
||||||
|
Deferred
|
||||||||||||
|
Deferred income taxes relating to the origination and reversal of temporary differences
|
(4,517
|
)
|
(3,545
|
)
|
(3,559
|
)
|
||||||
|
Benefit arising from previously unrecognized tax losses and deductible temporary differences
|
(2,383
|
)
|
(560
|
)
|
–
|
|||||||
|
Utilization of previously unrecognized deferred income tax assets
|
(964
|
)
|
(627
|
)
|
(46
|
)
|
||||||
|
(7,864
|
)
|
(4,732
|
)
|
(3,605
|
)
|
|||||||
|
Unrecognized deferred income tax assets on temporary deductible differences and unused tax losses
|
5,761
|
6,100
|
4,659
|
|||||||||
|
(2,103
|
)
|
1,368
|
1,054
|
|||||||||
|
Income tax provision for the year
|
$
|
5,346
|
$
|
5,678
|
$
|
6,608
|
||||||
|
Balance
as at September 1, 2017 |
Credited
(charged) to the statement of earnings |
Credited
(charged) to shareholders’ equity |
Business
combinations |
Foreign
currency translation adjustment |
Balance
as at August 31, 2018 |
|||||||||||||||||||
|
Deferred income tax assets
|
||||||||||||||||||||||||
|
Long-lived assets
|
$
|
1,802
|
$
|
200
|
$
|
–
|
$
|
–
|
$
|
(77
|
)
|
$
|
1,925
|
|||||||||||
|
Provisions and accruals
|
3,772
|
(250
|
)
|
554
|
–
|
(113
|
)
|
3,963
|
||||||||||||||||
|
Deferred revenue
|
2,890
|
(101
|
)
|
–
|
–
|
(73
|
)
|
2,716
|
||||||||||||||||
|
Research and development expenses
|
2,731
|
(101
|
)
|
–
|
–
|
(106
|
)
|
2,524
|
||||||||||||||||
|
Losses carried forward
|
4,241
|
(2,633
|
)
|
–
|
3,687
|
(222
|
)
|
5,073
|
||||||||||||||||
|
Deferred income tax liabilities
|
||||||||||||||||||||||||
|
Long-lived assets
|
(1,002
|
)
|
1,903
|
–
|
(7,889
|
)
|
527
|
(6,461
|
)
|
|||||||||||||||
|
Research and development tax credits
|
(10,995
|
)
|
(386
|
)
|
–
|
–
|
445
|
(10,936
|
)
|
|||||||||||||||
|
Total
|
$
|
3,439
|
$
|
(1,368
|
)
|
$
|
554
|
$
|
(4,202
|
)
|
$
|
381
|
$
|
(1,196
|
)
|
|||||||||
|
Classified as follows:
|
||||||||||||||||||||||||
|
Deferred income tax assets
|
$
|
6,555
|
$
|
4,714
|
||||||||||||||||||||
|
Deferred income tax liabilities
|
(3,116
|
)
|
(5,910
|
)
|
||||||||||||||||||||
|
$
|
3,439
|
$
|
(1,196
|
)
|
||||||||||||||||||||
|
Balance
as at September 1, 2018 |
Credited
(charged) to the statement of earnings |
Credited
(charged) to shareholders’ equity |
Foreign
currency translation adjustment |
Balance
as at August 31, 2019 |
||||||||||||||||
|
Deferred income tax assets
|
||||||||||||||||||||
|
Long-lived assets
|
$
|
1,925
|
$
|
2,695
|
$
|
–
|
$
|
(52
|
)
|
$
|
4,568
|
|||||||||
|
Provisions and accruals
|
3,963
|
446
|
67
|
15
|
4,491
|
|||||||||||||||
|
Deferred revenue
|
2,716
|
490
|
–
|
(36
|
)
|
3,170
|
||||||||||||||
|
Research and development expenses
|
2,524
|
(149
|
)
|
–
|
(45
|
)
|
2,330
|
|||||||||||||
|
Losses carried forward
|
5,073
|
(2,751
|
)
|
–
|
(176
|
)
|
2,146
|
|||||||||||||
| |
||||||||||||||||||||
|
Deferred income tax liabilities
|
||||||||||||||||||||
|
Long-lived assets
|
(6,461
|
)
|
1,710
|
–
|
345
|
(4,406
|
)
|
|||||||||||||
|
Research and development tax credits
|
(10,936
|
)
|
(338
|
)
|
–
|
198
|
(11,076
|
)
|
||||||||||||
|
Total
|
$
|
(1,196
|
)
|
$
|
2,103
|
$
|
67
|
$
|
249
|
$
|
1,223
|
|||||||||
|
Classified as follows:
|
||||||||||||||||||||
|
Deferred income tax assets
|
$
|
4,714
|
$
|
4,821
|
||||||||||||||||
|
Deferred income tax liabilities
|
(5,910
|
)
|
(3,598
|
)
|
||||||||||||||||
|
$
|
(1,196
|
)
|
$
|
1,223
|
||||||||||||||||
|
As at August 31,
|
||||||||
|
2019
|
2018
|
|||||||
|
Temporary deductible differences
|
$
|
241
|
$
|
1,435
|
||||
|
Losses carried forward
|
39,721
|
42,361
|
||||||
|
$
|
39,962
|
$
|
43,796
|
|||||
|
Year of expiry
|
Finland
|
France
|
Spain
|
United States
|
United Kingdom
|
|||||||||||||||
|
2020
|
$
|
3,397
|
$
|
–
|
$
|
–
|
$
|
–
|
$
|
–
|
||||||||||
|
2021
|
6,345
|
–
|
–
|
1,958
|
–
|
|||||||||||||||
|
2022
|
11,001
|
–
|
–
|
7,435
|
–
|
|||||||||||||||
|
2023
|
7,127
|
–
|
–
|
1,972
|
–
|
|||||||||||||||
|
2024
|
5,502
|
–
|
–
|
1,351
|
–
|
|||||||||||||||
|
2025
|
6,859
|
–
|
–
|
1,351
|
–
|
|||||||||||||||
|
2026
|
235
|
–
|
–
|
1,351
|
–
|
|||||||||||||||
|
2027
|
1,425
|
–
|
–
|
1,351
|
–
|
|||||||||||||||
|
2028
|
–
|
–
|
–
|
2,447
|
–
|
|||||||||||||||
|
2030
|
–
|
–
|
–
|
2,713
|
–
|
|||||||||||||||
|
2031
|
–
|
–
|
–
|
109
|
–
|
|||||||||||||||
|
2033
|
–
|
–
|
–
|
4,681
|
–
|
|||||||||||||||
|
2034
|
–
|
–
|
–
|
4,851
|
–
|
|||||||||||||||
|
2035
|
–
|
–
|
–
|
2,616
|
–
|
|||||||||||||||
|
2036
|
–
|
–
|
–
|
8,501
|
–
|
|||||||||||||||
|
2037
|
–
|
–
|
–
|
9,660
|
–
|
|||||||||||||||
|
2038
|
–
|
–
|
–
|
7,997
|
–
|
|||||||||||||||
|
Indefinite
|
–
|
35,839
|
6,100
|
–
|
4,461
|
|||||||||||||||
|
$
|
41,891
|
$
|
35,839
|
$
|
6,100
|
$
|
60,344
|
$
|
4,461
|
|||||||||||
|
(1)
|
Undistributed profits of its foreign subsidiaries will not be distributed in the foreseeable future; and
|
|
(2)
|
Undistributed profits of its domestic subsidiaries will not be taxable when distributed.
|
|
21
|
Earnings per Share
|
|
Years ended August 31,
|
||||||||||||
|
2019
|
2018
|
2017
|
||||||||||
|
Basic weighted average number of shares outstanding (000’s)
|
55,325
|
54,998
|
54,423
|
|||||||||
|
Plus dilutive effect of (000’s):
|
||||||||||||
|
Restricted share units
|
–
|
–
|
979
|
|||||||||
|
Deferred share units
|
–
|
–
|
153
|
|||||||||
|
Diluted weighted average number of shares outstanding (000’s)
|
55,325
|
54,998
|
55,555
|
|||||||||
|
Stock awards excluded from the calculation of the diluted weighted average number of shares outstanding
because their exercise price was greater than the average market price of the common shares, or their inclusion would be antidilutive (000’s)
|
1,701
|
1,799
|
–
|
|||||||||
|
22
|
Segment Information
|
|
Years ended August 31,
|
||||||||||||
|
2019
|
2018
|
2017
|
||||||||||
|
United States
|
$
|
106,607
|
$
|
100,225
|
$
|
97,186
|
||||||
|
Canada
|
15,913
|
18,425
|
22,586
|
|||||||||
|
Other
|
21,391
|
16,743
|
14,951
|
|||||||||
|
Americas
|
143,911
|
135,393
|
134,723
|
|||||||||
|
United Kingdom
|
16,438
|
17,508
|
11,799
|
|||||||||
|
Other
|
76,285
|
67,169
|
50,302
|
|||||||||
|
Europe, Middle East and Africa
|
92,723
|
84,677
|
62,101
|
|||||||||
|
China
|
27,620
|
20,724
|
22,312
|
|||||||||
|
Other
|
22,636
|
28,752
|
24,165
|
|||||||||
|
Asia-Pacific
|
50,256
|
49,476
|
46,477
|
|||||||||
|
$
|
286,890
|
$
|
269,546
|
$
|
243,301
|
|||||||
|
As at August 31, 2019
|
As at August 31, 2018
|
|||||||||||||||||||||||
|
Property,
plant and equipment |
Intangible
assets |
Goodwill
|
Property,
plant and equipment |
Intangible
assets |
Goodwill
|
|||||||||||||||||||
|
Canada
|
$
|
29,517
|
$
|
5,675
|
$
|
17,487
|
$
|
32,107
|
$
|
5,668
|
$
|
4,481
|
||||||||||||
|
United States
|
7
|
–
|
–
|
1,677
|
435
|
13,327
|
||||||||||||||||||
|
Finland
|
331
|
446
|
8,547
|
473
|
380
|
8,704
|
||||||||||||||||||
|
France
|
1,896
|
12,788
|
5,600
|
2,401
|
19,330
|
5,909
|
||||||||||||||||||
|
United Kingdom
|
640
|
2,706
|
7,014
|
755
|
4,005
|
7,471
|
||||||||||||||||||
|
India
|
4,249
|
23
|
–
|
4,021
|
28
|
–
|
||||||||||||||||||
|
China
|
2,667
|
16
|
–
|
2,822
|
20
|
–
|
||||||||||||||||||
|
Other
|
57
|
–
|
–
|
54
|
–
|
–
|
||||||||||||||||||
|
$
|
39,364
|
$
|
21,654
|
$
|
38,648
|
$
|
44,310
|
$
|
29,866
|
$
|
39,892
|
|||||||||||||