Issuer Free Writing
Prospectus
Filed Pursuant to Rule
433
File No.
333-248546
File No.
333-241569
File No.
333-230623
File No.
333-223943
December 30,
2020
FWP
NOTICE
The Teucrium Commodity Trust has filed a
registration statement (including a prospectus) with the SEC for
the offering to which this communication relates. Before you
invest, you should read the prospectus in that registration
statement and other documents that the Teucrium Commodity Trust has
filed with the SEC for more complete information about the issuer
and this offering. You may get these documents for free by visiting
EDGAR on the SEC Website at www.sec.gov. Alternatively, a copy of
the prospectus for each Fund may be obtained at
https://teucrium.com/ or
by calling (802) 540-0019.
____________________________________
2021 Grain
Outlook
The Big
Shift
Jake Hanley, Portfolio
Manager
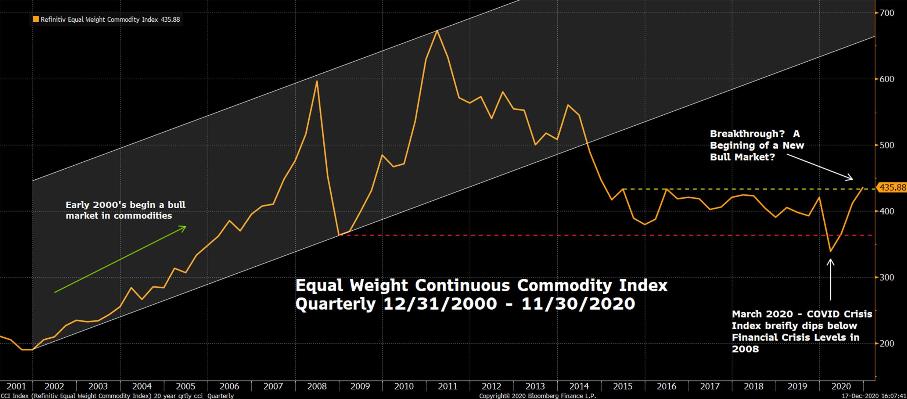
Last year we wrote that the 2020s
could possibly mark the resurgence of a commodity bull market. That
thesis was put to test early this year as pandemic fears gripped
markets and initially caused assets across the globe to head lower.
The Refinitiv Equal Weight Commodity Index briefly dipped below the
2008 financial crisis low, before reversing higher. Now the index
looks poised to break through 5-year highs, a move that could
potentially validate our commodity bull market
thesis.
Chart 1
Chart created by Teucrium using
Bloomberg Finance LP on 12/17/2020
Refinitiv Equal Weight Continuous
Commodity Futures Price Index
Quarterly Price Chart
12/31/2000–11/30/2020
Past performance is not indicative
of future results
Taking the grains specifically, we
might one day point back to 2020 as the year that began the
Big Shift. The Big Shift would mark the transition to
a secular bull market. Price trends are indicating that the
Big Shift in grains may
already be underway. As the market picture becomes clear over the
course of 2021, we will be looking to the fundamentals for
confirmation of the Big
Shift.
Ultimately, whether or not grains
and commodity prices continue to move higher is anyone’s
guess. Still, one trend remains clear: increasing investor appetite
for exposure to alternative asset classes. Having lived through
periods of high stock and bond price correlation, one can
understand investor desire for “non-correlated” assets.
That is, investments that tend to zig when others
zag.
What follows is an investigation of
the key drivers that may be leading to the Big Shift.
We begin our analysis by looking at
current and historic price patterns. We then explore supply and
demand fundamentals and review potential weather-related production
issues. At a high level, we discuss geopolitics, a weakening US
dollar, inflation on grain prices, and the potential
diversification benefits of including grains in a portfolio.
Finally, we conclude by relating our analysis back to the
investor.
We hope you find this information
interesting and valuable. Please do not hesitate to contact us with
questions or ideas you would like to discuss.
On behalf of all of us at Teucrium,
thank you for your continued interest in our
funds.
We wish you a Merry Christmas,
Happy Holidays, and a HAPPY NEW YEAR!
Prices Pointing
to a Big
Shift
Prices trend. When the price of an
asset is rising, it is likely to continue rising for some period.
Of course, the opposite is also true: when the price of an asset is
declining, it will likely continue its decline for some period. The
trick therefore is to identify, and determine the stage of, the
prevailing trend. Identifying a price trend and trend stage is not
easy to do. Even the best “trend followers” admit that
it is an imperfect science. Still, the recognition that prices
trend, and the potential to accurately identify the trend, has
captivated analysts and traders for centuries.1
Similar to the exercise of
predicting short-term weather versus long-term climate patterns, it
is difficult to predict a daily, weekly, or even monthly price
move. However, it can be much easier to accurately forecast
longer-range price trends.
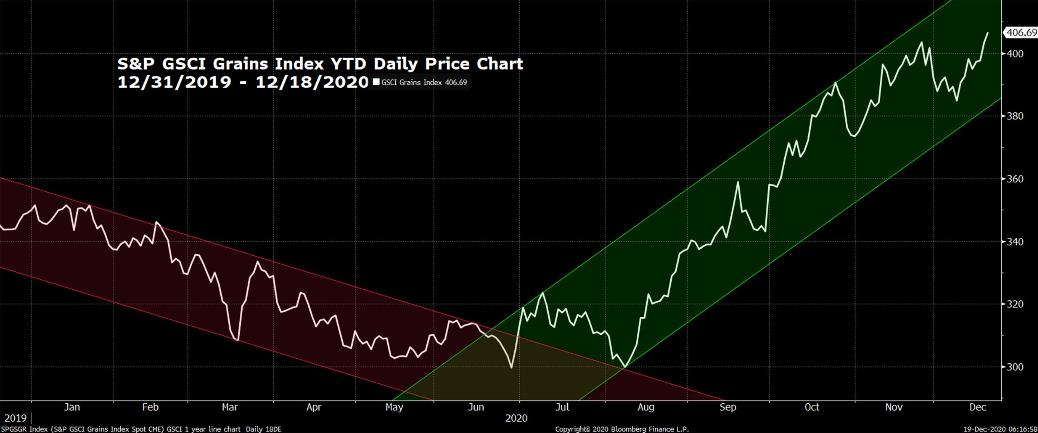
For example, take the following
one-year daily line chart on the S&P GSCI Grains Index. Notice
that the line is squiggly, even jagged, in some instances on a
shorter-term basis. It would be exceedingly difficult to predict
the price movement on any given day. Yet when you take a
longer-term perspective, you can see two very distinct trends that
occurred over two separate (approximate) six-month periods. There
is a downtrend that begins at the start of the year and an uptrend
beginning in early August.
Chart 2
Chart created by Teucrium using
Bloomberg Finance LP on 12/19/2020
S&P GSCI Grains
Index
Daily Price Chart
12/31/2019–12/11/2020
Past performance is not indicative
of future results
While the grain rally of 2020 has
been impressive, it may prove to be nothing more than a short-term
little shift in market
sentiment. Evidence for the Big
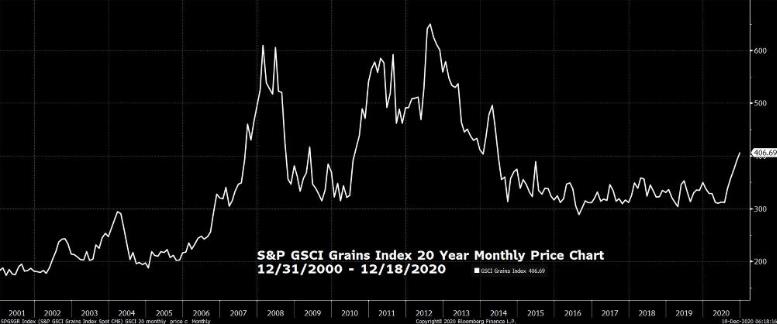
Shift must be derived from a longer-term analysis. For this
we’ve examined the 20 year monthly price chart for the GSCI
Grains Index.
Chart 3
Chart created by Teucrium using
Bloomberg Finance LP on 12/19/2020
S&P GSCI Grains
Index
Monthly Price Chart
12/31/2000–12/18/2020
Past performance is not indicative
of future results
Chart 3 is a simple line chart
showing the monthly closing price of the GSCI Grains Index over the
last 20 years. Note the price spikes in the middle of the chart in
2008, 2011, and 2013. Those price rallies occurred during periods
of tighter supplies resulting from decreased production or
extraordinarily strong demand. Also, note the recent rally on the
far right of the chart depicting the monthly price action for
grains in 2020.
A quick glance reveals that the
price advance appears to be coming off a price base that began in
2016. The recent highs also look to be testing price highs last
seen in 2015. A test of the 2015 highs confirms that grain prices
have moved to the upper end of their price range, but this alone is
not confirmation of a Big
Shift. A convincing monthly close above the 2015 highs,
however, would be considered supporting evidence that the
Big Shift is
underway.
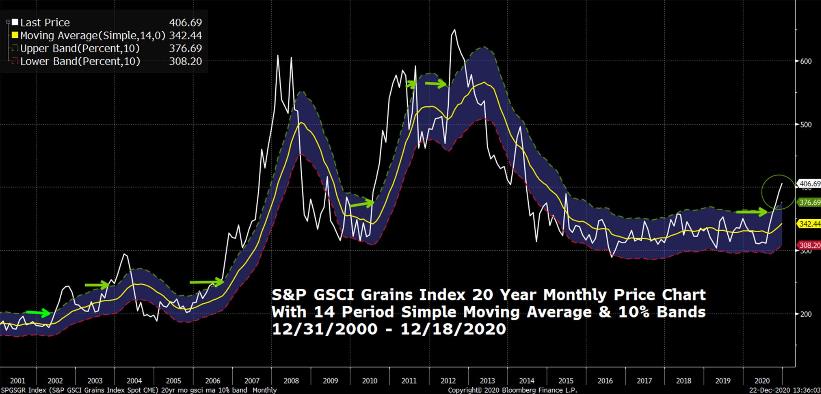
Additional context presents us with
another view of the longer-term trend. Using the same monthly price
chart, we’ve added a moving average line (yellow) as well as
percentage bands to show when prices are 10% above or below the
moving average.
Chart 4
Chart created by Teucrium using
Bloomberg Finance LP on 12/22/2020
S&P GSCI Grains
Index
Monthly Price Chart
12/31/2000–12/18/2020
With 14 period simple moving
average & 10% Bands2
Past performance is not indicative
of future results
Notice that the downtrend beginning
in 2012 and identified by the moving average in 2013 continued
through 2016. The moving average appears to have transitioned from
a clear decline to a sideways pattern beginning in 2017. As grain
prices advanced in 2020, the moving average has once again begun
trending higher.
Moving averages are lagging
indicators, and this positive trajectory does not confirm that a
new uptrend is likely to continue. Still, market participants are
likely to view this as a positive development.
Furthermore, prices are now more
than 10% above the moving average for the first time since
2012.3The green arrows point to all periods
since 2001 where this occurred. The chart shows that a break above
this 10% line has historically preceded additional price
appreciation without exception since 2001. Note too that a break
below the 10% moving average band (red dotted line) has
historically, but not always, preceded additional price declines.
On both sides of the spectrum, about 50% of the moves above and
below the 10% channel led to longer-term price rallies and
longer-term price declines. The big question remains: where do we
go from here?
Historical performance is not
necessarily indicative of future results. Which way prices head
from here is anyone’s guess. One thing is certain: the market
will be keying in on supply and demand dynamics over the next year.
The fundamentals will either confirm or dispel the theory of the
Big
Shift.
“Charts are a picture of the
fundamentals.”—Sal Gilbertie
Fundamentals:
Supporting Prices (for now)
Commodity markets are primarily
driven by supply and demand. Grain market supply and demand is
estimated and reported monthly by the USDA in their World
Agricultural Supply and Demand Estimate report (WASDE). The supply
and demand data as presented is referred to as the “balance
sheet.” A balance sheet is said to be
“tightening” when supplies are declining relative to
demand, and “expanding” when supplies are increasing
relative to demand.
In general, US and global corn,
wheat, and soybean balance sheets have been tightening the last few
years. As part of that, the USDA is estimating all three grains
will have record high demand for the current production year. In
the past, we have learned that as the world builds a larger demand
base, it is difficult to deviate from this demand going forward,
even in years when there are production
shortfalls.
Importantly, the prices of corn,
wheat, and soybeans are highly correlated. This is due in large
part to the common and sometimes interchangeable uses for grains.
For example, the number one global use of corn and soybeans is to
feed animals. Wheat is also used as animal feed, though to a much
smaller extent. Corn, soybeans, and wheat can all also be used to
create biofuels. Given their interchangeability, a meaningful price
move in one of the grains can “pull” the prices of the
other two in the same direction. Perhaps this is one reason why we
continue to see relatively high wheat prices despite the expanding
global balance sheet.
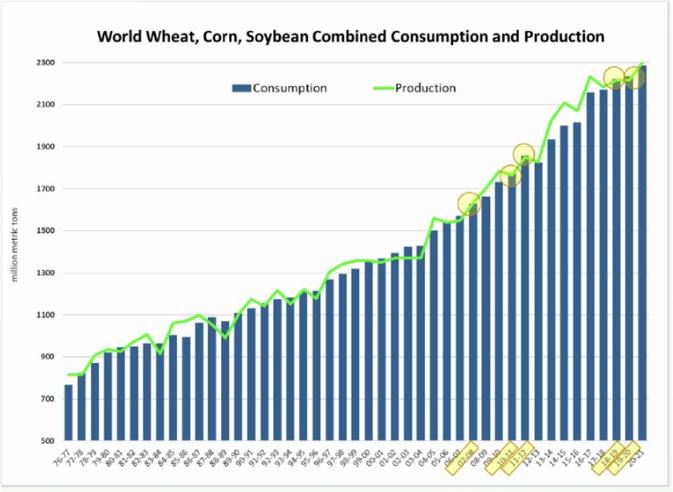
Chart 5
This is for illustrative purposes
only and not indicative of any investment. Past performance is no
guarantee of future results.
Chart: DC Analysis, LLC, using data
from USDA through Sep. 30, 2020. Used with permission from DC
Analysis.
https://apps.fas.usda.gov/psdonline/app/index.html#/app/home
The information and data contained
herein do not constitute investment advice offered by Teucrium
Trading, LLC and are provided solely for informational
purposes.
Fundamentally, the move in grain
prices this year appears to be justified. Current US
Stocks/Use4
ratios for corn and soybeans are as low as they have been in the
last five years or more.
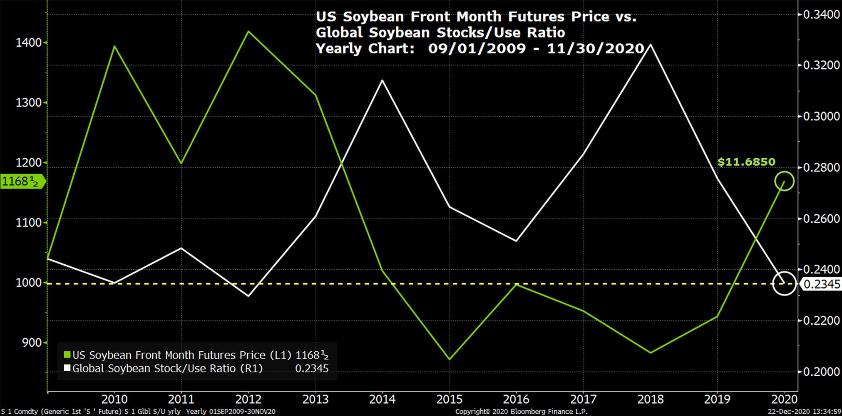
SOYBEANS
The US soybean balance sheet is
currently tighter than corn and the Stocks/Use ratio is the lowest
it’s been since the 2013–14 crop year. Globally, the
soybean Stocks/Use ratio is as low as it has been since the
2015–16 crop year. See Chart 6.
Chart 6
Chart created by Teucrium using
Bloomberg Finance LP on 12/22/2020
Front Month Soybean Futures vs
Global Stocks/Use Ratio
Monthly Price Chart
09/01/2009–11/30/2020
Past performance is not indicative
of future results
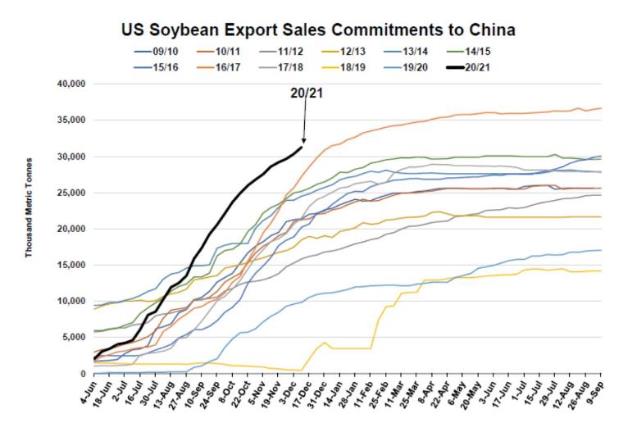
U.S. soybean supplies have dwindled
as Chinese soybean imports have soared over the last two years. In
the 2018–19 crop year, the Chinese imported a total of 82.54
million metric tons (MMT) of soybeans, equivalent to approximately
3 billion bushels. The 2020–21 crop year estimates show China
importing 100 MMT, or nearly 3.7 billion bushels. That jump, if
realized, would represent a 23% increase in just two years. The
growth in Chinese soybean demand appears to be tied to the
rebuilding of their hog herd and the stockpiling of strategic
reserves.5 What’s more, the Chinese are
relying heavily on US soybean exports, reflected by the historic
amount of U.S. soybean sales commitments already made this crop
year (see Chart 7).
Chart 7
This is for illustrative purposes
only and not indicative of any investment. Past performance is no
guarantee of future results. Chart: DC Analysis, LLC, using data
from USDA through December 17, 2020. Used with permission from DC
Analysis. The information and data contained herein do not
constitute investment advice offered by Teucrium Trading, LLC and
are provided solely for informational purposes
Currently, attention is on the
South American soybean crop, specifically in Brazil and Argentina
as various degrees of drought continue to persist across large
portions of those countries. Brazilian and US combined soybean
exports represent over 85% of total global soybean exports. Brazil
alone accounts for about one-half of global soybean exports, and
any significant impact on production will impact the overall
balance sheet and place even more importance on the 2021–22
US crop. Brazilian soybean famers typically finish planting in
December and harvest through March and April. Despite weather
challenges, it is possible that Brazil could produce a record
soybean crop even if the USDA reduces their current crop estimate
of 133 MMT down to analysts’ estimate of around 130 MMT. Note
that Brazilian production of 133 MMT is already reflected in the
global balance sheet. Anything less than that would likely be
viewed by the trade as supportive for prices.
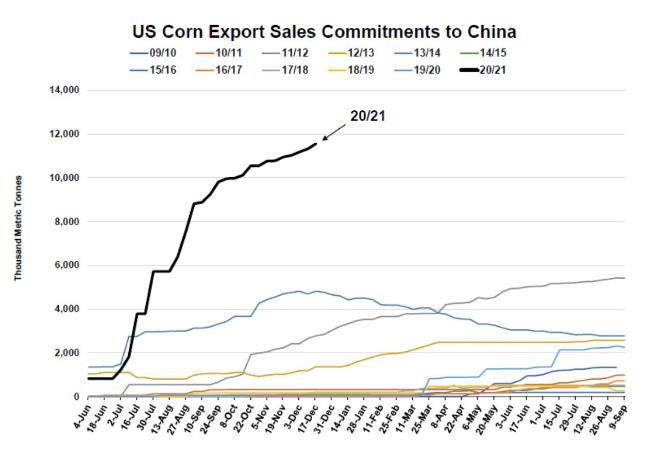
CORN
Importantly, the Chinese are also
poised to import a record amount of US corn. As of December 17,
2020, U.S. corn export sales commitments to China stand at a record
11.55 MMT for the 2020–21 crop year, which began on September
1, 2020. China, until this year, has never imported more than 6 MMT
from the world market.
Chart 8
This is for illustrative purposes
only and not indicative of any investment. Past performance is no
guarantee of future results. Chart: DC Analysis, LLC, using data
from USDA through December 17, 2020. Used with permission from DC
Analysis. The information and data contained herein do not
constitute investment advice offered by Teucrium Trading, LLC and
are provided solely for informational purposes
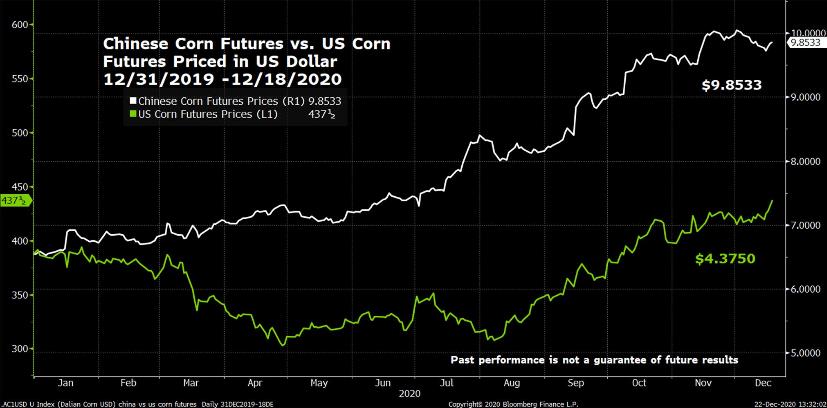
Internal Chinese corn demand
appears to be robust, with domestic Chinese corn prices trading
near 5-year highs. The Chinese aggressively auctioned off corn
inventories this year to both alleviate price inflation and
maintain freshness of state reserves. Presumably, China is
replenishing their reserves and is taking advantage of pricing
arbitrage, buying US corn for around $4 and selling older domestic
reserves for as much as double that amount.
Chart 9
Chart created by Teucrium using
Bloomberg Finance LP on 12/22/2020
Front Month Dalian Corn Futures vs
Front Month Corn Futures
Daily Price Chart
12/31/2019–12/18/2020
Past performance is not indicative
of future results
Robust global demand and tighter
balance sheets have helped push corn prices to their current
levels, testing the 5-year highs. However, to confirm the
Big Shift we will likely
need to see continued tightening of the global corn balance sheet
through the 2021–22 crop year.
Potential
Weather Challenges
Weather challenges appear likely to
extend beyond 2020 and confront farmers across the globe again in
2021. Furthermore, these challenges may be exacerbated if the
current La Niña weather pattern
strengthens.
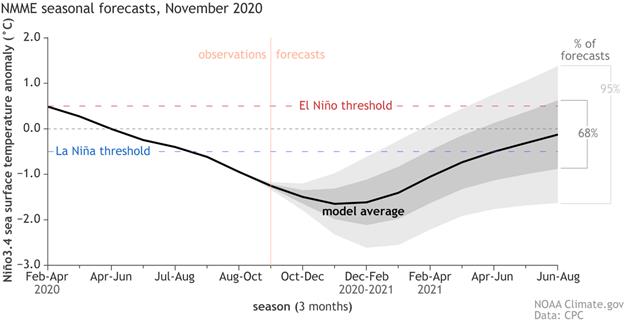
NOAA confirmed La Niña in
September 2020 and recent forecasts show that the pattern is likely
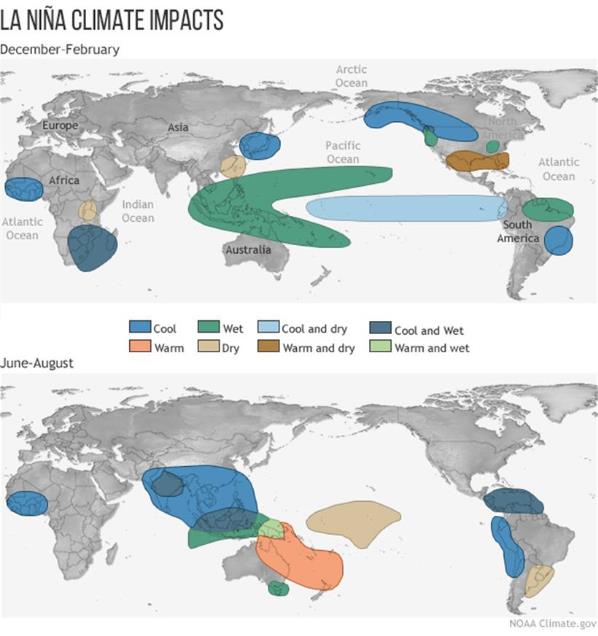
to remain in place through spring 2021. Typically, La Niña
occurring between June and August leads to drier weather in
southern Brazil and northern Argentina (see Charts 8–9). La
Niña occurring between December and February results in cooler
but not necessarily dryer weather for Brazil. However, should La
Niña continue on through June and August 2021, we would expect
continued dry conditions in Brazil and Argentina which could
negatively impact grain production in both
countries.
Chart 10
Chart 11
The La Niña weather pattern is
also likely responsible for dryness impacting US winter wheat
farmers as well. Remember, impacts during the winter months when
winter crops are in dormancy can be minimal but will grow in
importance once those crops start their final growth stages in the
spring. That said, current drought conditions extend far beyond the
areas typically affected by La Niña in the
US.
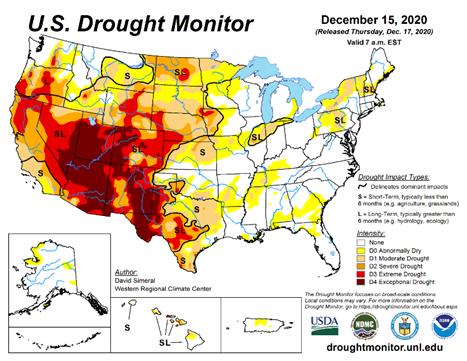
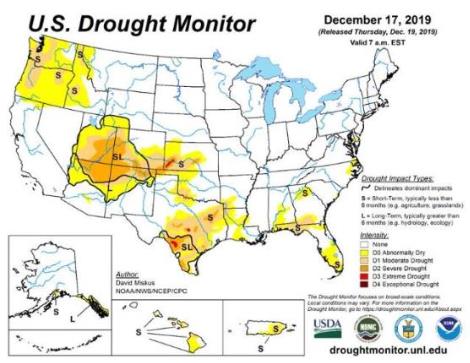
The most recent US Drought Monitor
shows severe, extreme, and exceptional drought across midwestern
states stretching down from North Dakota through Texas. The
December 17th, 2019 map is shown
below for the sake of comparison.
Chart 12
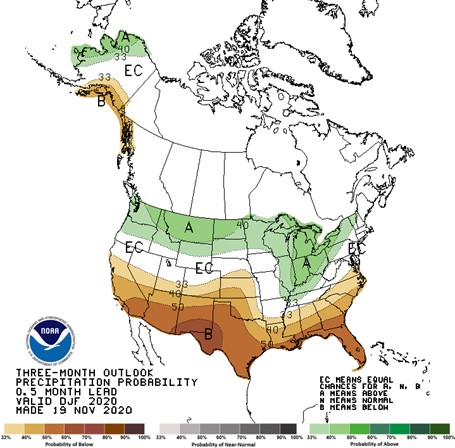
NOAA is forecasting above normal
precipitation for northern states this winter, and below normal
precipitation for southern states. If realized, this means states
such as Kansas, Oklahoma, and Texas, which are already experiencing
drought, will only get drier over the next few
months.
Chart 13
As mentioned, the most immediate La
Niña-influenced weather impact is on US winter wheat farmers.
The US winter wheat crop condition ratings have taken a hit with
43% of the crop rated “Good to Excellent” versus 52%
rated “Good to Excellent” last year.6 Wheat prices, however, are as likely to
be heavily influenced by production in Russia, the world’s
largest wheat exporter. The wheat trade is watching weather
conditions in Russia and the Black Sea region more broadly as
dryness has been a concern in key growing areas. According to the
Russian agricultural consultancy Sovecon, 22% of the Russian wheat
crop is in poor condition and in the worst shape since
2009–10.7 Despite all of this, global wheat
production is forecast to exceed demand for the 2020–21 crop
year.
International
Relations and Trade
While weather may be the critical
factor impacting grain prices in the year ahead, one cannot
overlook the potential impact of geopolitics.
During the spring of 2020, wheat
prices outperformed stocks as consumers and nations alike rushed to
procure pastas, breads, and wheat. Russia, in an attempt to shore
up their domestic supply, signaled that they would be capping their
exports. This was a significant development for wheat importers and
highlighted the need for sovereign nations to fortify both their
food stocks and their international supply chains for all
grains.
Case in point, a portion of Chinese
grain purchases, including corn, soybeans, wheat, and rice appears
to be tied to an effort to restock and increase domestic grain
reserves. China’s consumption needs and/or its desire to
stockpile grains inextricably ties China to the US and other global
grain exporters for the foreseeable future. While the relationship
between China and the US is volatile, we do not see a scenario
where the Chinese can turn away from American grain markets any
time soon.
China accounts for approximately
two-thirds of the world’s global soybean imports. Recall that
the US and Brazil account for over 85% of global soybean exports.
The US, Brazil, and Argentina are three of China’s largest
markets for soybeans. China would not be able to meet its soybean
demand without these three countries. What’s more, Brazil
recently purchased soybeans from the US. Presumably, Brazilian
farmers have “oversold” their crop and are importing in
order to meet domestic demand. The point here is that China needs
US soybeans, and they will likely continue to purchase from the US
regardless of political tensions.
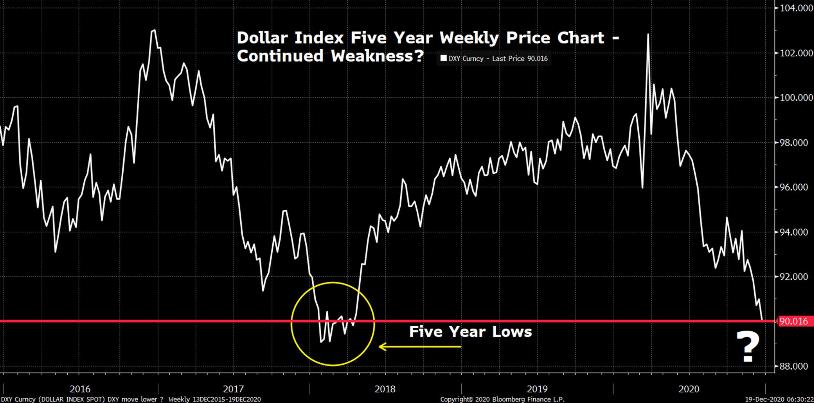
A Weakening US
Dollar
Having recently dipped to around
90, the Dollar Index (DXY)8 is now approaching 5-year lows around
89.
Chart 14
Chart created by Teucrium using
Bloomberg Finance LP on 12/19/2020
Dollar Index (DXY) Weekly Price
Chart 12/31/2015–12/18/2020
Past performance is not indicative
of future results
We see a weakening US dollar as
providing additional incentive for China and other countries to
purchase US grains. A weak US dollar has historically been a
tailwind for US grain exports as well as for global grain prices.
The dollar/grain commodity relationship is relatively
straightforward. Globally, commodities are priced in dollars. A
weakening US dollar means that commodities in general, and US
exports in particular, become more competitive relative to other
non-dollar currencies. For example, if the US dollar depreciates
against the euro, then it will take fewer euros to purchase the
same amount of goods priced in dollars. All else being equal, the
increase in demand for dollar-denominated US goods would generally
be supportive of prices.
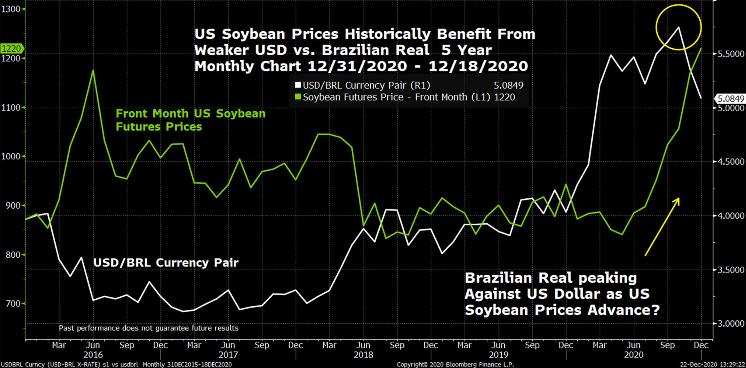
While the Dollar Index (DXY)
provides a quick read on dollar strength/weakness, the dollar/real
and dollar/ruble currency pairs are more important indicators
relating to global grain prices. Historically, global soybean
prices have moved higher as the dollar weakens versus the Brazilian
real because Brazilian soybean farmers are less likely to export
soybeans versus selling soybeans domestically.
Chart 15
Chart created by Teucrium using
Bloomberg Finance LP on 12/22/2020
Front Month Soybean Futures vs
USD/BRL Currency Pair
Monthly Price Chart
12/31/2015–12/18/2020
Past performance is not indicative
of future results
The same relationship exists
between the dollar/ruble currency pair and US wheat prices. Note,
however, that the US is among a handful of large global wheat
exporters. While a weaker dollar vs. the ruble makes US wheat
“cheaper” vs. Russian wheat, global importers still
have a multitude of options. Even so, given that Russia is the
world’s largest wheat exporter, dollar weakness against the
ruble is seen as being supportive for global wheat
prices.
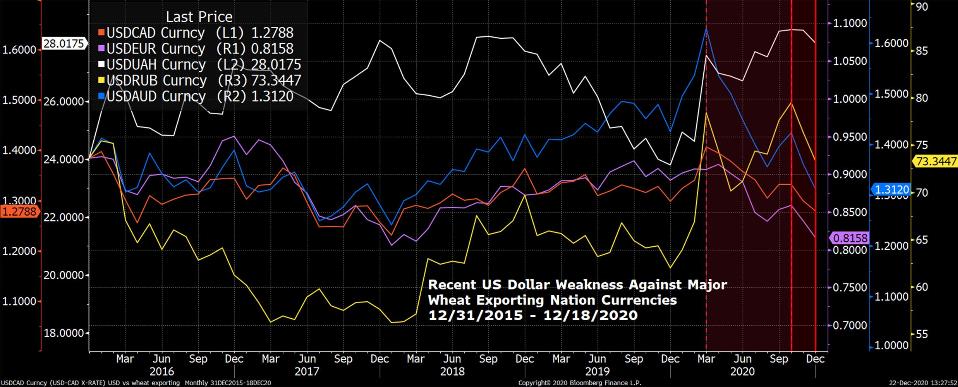
Note that the USD is simultaneously
weakening against currencies of some of the world’s largest
wheat exporting nations. The US dollar declining across the board
could provide a tailwind for global wheat
prices.
The world’s top wheat
exporting nations according to the USDA are as follows: Argentina,
Australia, Canada, European Union, Russia, and the Ukraine. The
appreciation of the USD vs the Argentinian peso is beyond the chart
and is not depicted in Chart 16. Argentina is the smallest of the
seven major global wheat exporters.
Chart 16
Chart created by Teucrium using
Bloomberg Finance LP on 12/22/2020
USDCAD, USDEUR, USDUAH, USDRUB,
USDAUD Currency Pairs
Monthly Price Chart
12/31/2015–12/18/2020
Past performance is not indicative
of future results
Inflated
Inflation Expectations?
Many are pointing to the
unprecedented US fiscal and monetary response to the COVID-19
pandemic as the key driver for a weaker dollar globally.
Additionally, market participants seem to be increasingly weary of
the potential for inflation in the US. Caution is warranted,
however, as we do not believe that security purchases by the
Federal Reserve (i.e., Quantitative Easing or QE) alone are enough
to spark broad based inflation in the US.9 Consider that 12 years after QE 1 was
announced, headline CPI remains below 2% year over
year.
We do think inflation concerns are
warranted when considering the Federal Reserve’s potential to
adopt Modern Monetary
Policy combined with fiscal experimentation with some level
of Universal Basic Income.
The combination of these two policies would amount to something new
that we will call Monetary
Spending.10 Monetary spending could lead to a
scenario where demand for consumer goods outpaces the supply of
those goods thereby sparking broad based
inflation.
More immediately and far more
likely in our opinion, is the effect rising crude oil and natural
gas prices will have on future moves in headline inflation. New
policy shifts in the U.S., and indeed throughout the globe, toward
the “greening” of the current carbon-based energy
industry will accelerate the already developing inflationary trends
in crude oil and natural gas. New administrative, environmental,
and tax policy burdens that disincentivize the production of fossil
fuels will cause crude oil and gas prices to rise, raising overall
inflation rates across the globe. In the end, this could create
more demand for grains via increased usage of alternative fuels
like ethanol and biodiesel.
While broad-based inflation would
likely provide an additional tailwind to grain prices, food prices
are already running far north of headline CPI. As of November 30,
food prices are up 3.94% year over year versus a headline CPI of
1.175%.
We believe investors who are
actively positioning their portfolios for future inflation might do well to
consider current
opportunities in grains, especially if the trend of a weaker dollar
continues well into 2021.
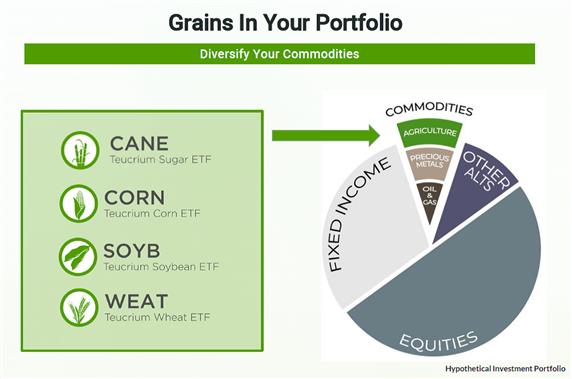
Grains in Your
Portfolio
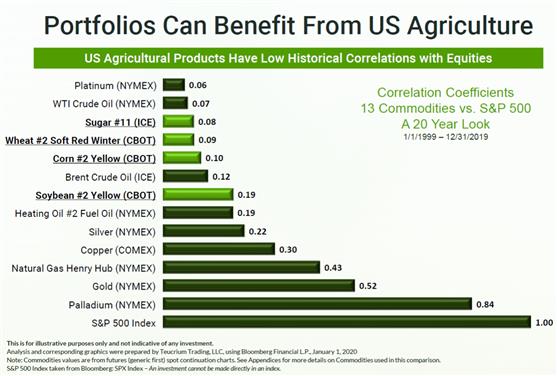
Grains historically have low
correlations to equities. Low correlations have the potential to
improve portfolio outcomes during periods of stock market
volatility.
Chart 17
In our 2020 Outlook, we shared the
view that investors would likely be looking to commodities as an
alternative asset class, specifically looking at grains to further
diversify their commodity exposure.
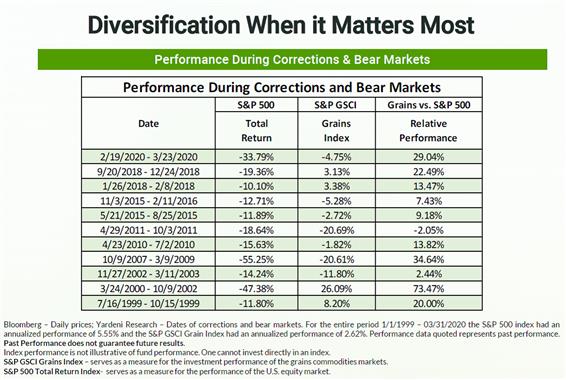
In fact, the GSCI Grains Index has
outperformed the S&P 500 in 10 out of the last 11 stock market
corrections of 10% or more. We included this data point in our 2020
Outlook last December. At that time, we had no idea that the next
equity bear market was just around the corner. The S&P 500 fell
nearly 35% peak to trough through March 2009. During that time the
GSCI Grains declined by 4.75%, outperforming stocks once again by
approximately 29%.
Chart 18
The historical tendency for grain
prices to outperform equity prices during stock market corrections
suggests that investors may benefit from an allocation to grains
precisely when it matters most, i.e., during significant stock
market declines.
While an investment in grains comes
with upside potential and downside risks, the potential portfolio
diversification benefits should not be overlooked. In 2020, grains
investors have experienced both portfolio diversification benefits
and upside price moves.
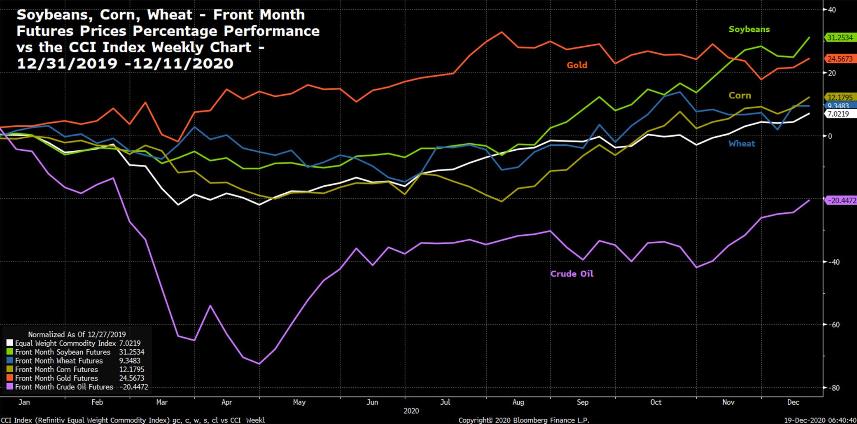
Stressing the importance of
diversification may be cliché, yet too many investors tend to
overlook the importance of diversifying their commodity exposure.
Our experience has shown that many investors’ commodity
allocations remain overweight in gold and oil. The chart below
shows the percentage performance of corn, wheat, soybeans, gold,
and oil versus the Refinitiv Equal Weight Commodity Index this year
(through 12/11/2020). Note that gold, soybeans, corn, and wheat all
outperformed the index while oil trailed significantly. Markets in
2020 clearly demonstrated why it’s important to diversify
one’s commodity exposure beyond the most commonly held
commodities of precious metals and energy by also considering an
allocation to grains. We are confident in this view and point to
the 67% increase in shares outstanding for Teucrium’s
grain-based ETFs over the past 11 months.
Chart 19
Chart created by Teucrium using
Bloomberg Finance LP on 12/19/2020
Front Month: Soybean Futures, Wheat
Futures, Corn Futures, Gold Futures, Crude Oil Futures and the
Refinitiv Equal Weight Continuous Commodity Futures Price
Index
Weekly Price Chart
12/31/2019–12/18/2020
Past performance is not indicative
of future results
Chart 20
Calling The
Big
Shift
Price performance of commodities in
general, and grains specifically, is pointing to the potential
shift to a secular bull market. Macro drivers, such as a weakening
US dollar, increasing annual grain demand, and production
uncertainties, seem to be providing tailwinds at the moment.
Ultimately, the fundamental drivers of supply and demand will
dictate where grain prices go from here. Weather is largely
unpredictable and appears to be the biggest threat to production
and therefore supply. Global demand appears to be steady and
Chinese demand is expected to remain robust through the
2020–21 crop year.
A Big Shift in grain prices may
ultimately be realized in a scenario where production struggles to
keep pace with growing global demand.
Of course, production increases
and/or a decrease in demand could potentially halt or reverse the
Big
Shift.
Time will tell.
For ongoing grain market commentary
and analysis, please follow us on Twitter
@TeucriumETFs
and visit our website at
www.teucrium.com
Portfolio
Diversification That Grows
Disclosure:
An investor should consider
investment objectives, risks, charges and expenses carefully before
investing. The prospectus contains this and other information. Read
the prospectus carefully before investing. The Teucrium Corn,
Sugar, Soybean, Wheat and Agricultural Funds (the
“Funds”) are not mutual funds or any other type of
Investment Company within the meaning of the
Investment Company Act of 1940, as amended, and are not subject to
regulation thereunder. Foreside Fund Services, LLC is the
distributor for the Teucrium Funds. Teucrium’s FINRA Office
of Supervisory Jurisdiction is located at Three Main Street, Suite
215, Burlington, Vermont 05401.
A
copy of the prospectus for each Fund may be obtained at:
https://teucrium.com/
Futures Risks: Commodities and futures
generally are volatile and are not suitable for all
investors.
Futures investing is highly
speculative and involves a high degree of risk. An investor may
lose all or substantially all of an investment. Investing in
commodity interests subject each Fund to the risks of its related
industry. These risks could result in large fluctuations in the
price of a particular Fund's respective shares. Funds that focus on
a single sector generally experience
greater volatility. Futures may be affected by Backwardation: a market condition in
which a futures price is lower in the distant delivery months than
in the near delivery months. As a result, the fund may benefit
because it would be selling more expensive contracts and buying
less expensive ones on an ongoing basis; and Contango: A condition in which distant
delivery prices for futures exceeds spot prices, often due to costs
of storing and inuring the underlying commodity. Opposite of
backwardation. As a result, the Fund’s total return may be
lower than might otherwise be the case because it would be selling
less expensive contracts and buying more expensive
one.
_________________________