
UNITED STATES
SECURITIES AND EXCHANGE COMMISSION
Washington, D.C. 20549
FORM N-CSR
CERTIFIED SHAREHOLDER REPORT OF REGISTERED
MANAGEMENT INVESTMENT COMPANIES
Investment Company Act file number 811-06740
Legg Mason Partners Institutional Trust
(Exact name of registrant as specified in charter)
620 Eighth Avenue, 47th Floor, New York, NY 10018
(Address of principal executive offices) (Zip code)
Marc A. De Oliveira
Franklin Templeton
100 First Stamford Place
Stamford, CT 06902
(Name and address of agent for service)
Registrant’s telephone number, including area code: 1-877-721-1926
Date of fiscal year end: February 28
Date of reporting period: August 31, 2021
| ITEM 1. | REPORT TO STOCKHOLDERS. |
The Semi-Annual Report to Stockholders is filed herewith.
| Semi-Annual Report | August 31, 2021 |
WESTERN ASSET
SMASh SERIES TF FUND

| INVESTMENT PRODUCTS: NOT FDIC INSURED • NO BANK GUARANTEE • MAY LOSE VALUE |
Fund objective
The Fund seeks to maximize current interest income that is excluded from gross income for regular federal income tax purposes.

Dear Shareholder,
We are pleased to provide the semi-annual report of Western Asset SMASh Series TF Fund for the six-month reporting period ended August 31, 2021.
As always, thank you for your confidence in our stewardship of your assets.
Sincerely,

Jane Trust, CFA
President and Chief Executive Officer
September 30, 2021
| II | Western Asset SMASh Series TF Fund |
Investment breakdown (%) as a percent of total investments
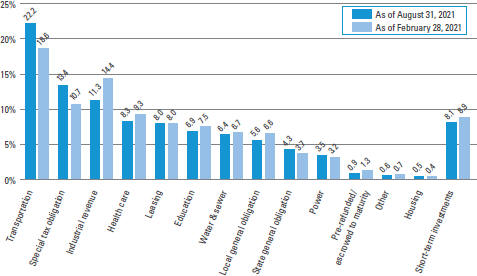
| † | The bar graph above represents the composition of the Fund’s investments as of August 31, 2021 and February 28, 2021. The Fund is actively managed. As a result, the composition of the Fund’s investments is subject to change at any time. |
| Western Asset SMASh Series TF Fund 2021 Semi-Annual Report | 1 |
Example
As a shareholder of the Fund, you may incur two types of costs: (1) transaction costs and (2) ongoing costs and other Fund expenses. This example is intended to help you understand your ongoing costs (in dollars) of investing in the Fund and to compare these costs with the ongoing costs of investing in other mutual funds.
This example is based on an investment of $1,000 invested on March 1, 2021 and held for the six months ended August 31, 2021.
Actual expenses
The table below titled “Based on Actual Total Return” provides information about actual account values and actual expenses. You may use the information provided in this table, together with the amount you invested, to estimate the expenses that you paid over the period. To estimate the expenses you paid on your account, divide your ending account value by $1,000 (for example, an $8,600 ending account value divided by $1,000 = 8.6), then multiply the result by the number under the heading entitled “Expenses Paid During the Period”.
Hypothetical example for comparison purposes
The table below titled “Based on Hypothetical Total Return” provides information about hypothetical account values and hypothetical expenses based on the actual expense ratio and an assumed rate of return of 5.00% per year before expenses, which is not the Fund’s actual return. The hypothetical account values and expenses may not be used to estimate the actual ending account balance or expenses you paid for the period. You may use the information provided in this table to compare the ongoing costs of investing in the Fund and other funds. To do so, compare the 5.00% hypothetical example relating to the Fund with the 5.00% hypothetical examples that appear in the shareholder reports of the other funds.
Please note that the expenses shown in the table below are meant to highlight your ongoing costs only and do not reflect any transactional costs. Therefore, the table is useful in comparing ongoing costs only, and will not help you determine the relative total costs of owning different funds. In addition, if these transaction costs were included, your costs would have been higher.
| Based on actual total return1 | Based on hypothetical total return1 | |||||||||||||||||||||||||||||||||||||||||||||||||
| Actual Total Return2,3 |
Beginning Account Value |
Ending Account Value |
Annualized Expense Ratio3 |
Expenses Paid During the Period3,4 |
Hypothetical Annualized Total Return |
Beginning Account Value |
Ending Account Value |
Annualized Expense Ratio3 |
Expenses Paid During the Period3,4 | |||||||||||||||||||||||||||||||||||||||||
| 3.88% | $ | 1,000.00 | $ | 1,038.80 | 0.00 | % | $ | 0.00 | 5.00 | % | $1,000.00 | $ | 1,025.21 | 0.00 | % | $ | 0.00 | |||||||||||||||||||||||||||||||||
| 1 | For the six months ended August 31, 2021. |
| 2 | Total return is not annualized, as it may not be representative of the total return for the year. Past performance is no guarantee of future results. Performance figures do not reflect any fees stated below in Note 3. If such fees were included, the return shown would have been lower. |
| 3 | All figures do not reflect the effect of fees and expenses associated with a separately managed account, nor a management fee or other operating expenses of the Fund. Such management fees are paid directly or indirectly by the separately managed account sponsor to the Fund’s manager or subadviser. All operating expenses of the Fund were reimbursed by the manager, pursuant to an expense reimbursement arrangement between the Fund and the manager. The expense reimbursement arrangement does not cover interest, brokerage, taxes and extraordinary expenses. |
| 4 | Expenses (net of compensating balance arrangements, fee waivers and/or expense reimbursements) are equal to the Fund’s annualized expense ratio multiplied by the average account value over the period, multiplied by the number of days in the most recent fiscal half-year (184), then divided by 365. |
| 2 | Western Asset SMASh Series TF Fund 2021 Semi-Annual Report |
Schedule of investments (unaudited)
August 31, 2021
Western Asset SMASh Series TF Fund
(Percentages shown based on Fund net assets)
| Security | Rate | Maturity Date |
Face Amount |
Value | ||||||||||||
| Municipal Bonds — 92.8% | ||||||||||||||||
| Alabama — 3.5% |
||||||||||||||||
| Hoover, AL, IDA Revenue, United States Steel Corp. Project, Series 2019 |
5.750 | % | 10/1/49 | $ | 100,000 | $ | 120,317 | (a) | ||||||||
| Jefferson County, AL, Sewer Revenue: |
||||||||||||||||
| Convertible CAB, Subordinated Lien, Warrants, Step bond, Series F, Refunding, (0.000% to 10/1/23 then 7.900%) |
0.000 | % | 10/1/50 | 470,000 | 484,643 | |||||||||||
| Senior Lien, Warrants, Series A, Refunding, AGM |
5.500 | % | 10/1/53 | 75,000 | 83,917 | |||||||||||
| Subordinated Lien, Warrants, Series D, Refunding |
6.000 | % | 10/1/42 | 105,000 | 121,291 | |||||||||||
| Lower Alabama Gas District, Natural Gas Revenue: |
||||||||||||||||
| Series 2020 |
4.000 | % | 12/1/21 | 200,000 | 201,851 | |||||||||||
| Series 2020 |
4.000 | % | 12/1/23 | 1,000,000 | 1,082,148 | |||||||||||
| Southeast Alabama Gas Supply District, Gas Supply Revenue, Series 2018A |
4.000 | % | 6/1/24 | 645,000 | 705,111 | (b)(c) | ||||||||||
| Total Alabama |
2,799,278 | |||||||||||||||
| Alaska — 1.1% |
||||||||||||||||
| Alaska State Housing Finance Corp. Revenue, State Capital Project II, Series B |
5.000 | % | 12/1/37 | 75,000 | 94,956 | |||||||||||
| Anchorage, AK, Port Revenue, Series A |
5.000 | % | 12/1/50 | 150,000 | 180,203 | (a) | ||||||||||
| Northern Tobacco Securitization Corp., AK, Revenue, Asset Backed Senior Bonds, Class 1, Series A, Refunding |
4.000 | % | 6/1/50 | 500,000 | 589,604 | |||||||||||
| Total Alaska |
864,763 | |||||||||||||||
| Arizona — 3.9% |
||||||||||||||||
| Arizona State IDA, Education Revenue: |
||||||||||||||||
| Academies Math & Science Project, Refunding, SD Credit Program |
5.000 | % | 7/1/37 | 45,000 | 52,696 | |||||||||||
| Academies Math & Science Project, Refunding, SD Credit Program |
5.000 | % | 7/1/38 | 500,000 | 591,990 | |||||||||||
| Academies Math & Science Project, Series S, Refunding, SD Credit Program |
5.000 | % | 7/1/47 | 50,000 | 57,598 | |||||||||||
| Chandler, AZ, IDA Revenue, Intel Corp. Project |
5.000 | % | 6/3/24 | 500,000 | 561,901 | (a)(b)(c) | ||||||||||
| Maricopa County, AZ, IDA, Legacy Traditional School Projects, Series A, SD Credit Program |
4.000 | % | 7/1/34 | 400,000 | 468,197 | |||||||||||
| Phoenix, AZ, IDA, Great Hearts Academies, Refunding |
5.000 | % | 7/1/36 | 75,000 | 84,175 | |||||||||||
See Notes to Financial Statements.
| Western Asset SMASh Series TF Fund 2021 Semi-Annual Report | 3 |
Schedule of investments (unaudited) (cont’d)
August 31, 2021
Western Asset SMASh Series TF Fund
(Percentages shown based on Fund net assets)
| Security | Rate | Maturity Date |
Face Amount |
Value | ||||||||||||
| Arizona — continued |
||||||||||||||||
| Queen Creek, AZ, Excise Tax & State Shared Revenue, Series A |
5.000 | % | 8/1/47 | $ | 585,000 | $ | 718,653 | |||||||||
| Salt Verde, AZ, Financial Corp., Natural Gas Revenue, Series 2007 |
5.000 | % | 12/1/32 | 495,000 | 663,653 | |||||||||||
| Total Arizona |
3,198,863 | |||||||||||||||
| California — 10.3% |
||||||||||||||||
| Alameda, CA, Corridor Transportation Authority Revenue: |
||||||||||||||||
| Second Subordinated Lien, Series B, Refunding |
5.000 | % | 10/1/34 | 50,000 | 59,452 | |||||||||||
| Second Subordinated Lien, Series B, Refunding |
5.000 | % | 10/1/36 | 50,000 | 59,316 | |||||||||||
| Second Subordinated Lien, Series B, Refunding |
5.000 | % | 10/1/37 | 200,000 | 236,718 | |||||||||||
| Bay Area Toll Authority, CA, Toll Bridge Revenue, San Francisco Bay Area, Series B-1, (SIFMA Municipal Swap Index Yield + 1.100%) |
1.120 | % | 4/1/24 | 160,000 | 162,743 | (b)(c) | ||||||||||
| California State Community Housing Agency, Essential Housing Revenue, Fountains at Emerald Park, Series A |
3.000 | % | 8/1/56 | 175,000 | 181,391 | |||||||||||
| California State Health Facilities Financing Authority Revenue, Memorial Health Services, Series A, Refunding |
5.000 | % | 10/1/33 | 115,000 | 120,850 | |||||||||||
| California State MFA Revenue: |
||||||||||||||||
| Senior Lien, LINXS APM Project, Series A |
5.000 | % | 12/31/34 | 100,000 | 123,116 | (a) | ||||||||||
| Senior Lien, LINXS APM Project, Series A |
5.000 | % | 12/31/43 | 100,000 | 121,650 | (a) | ||||||||||
| California State MFA Special Facility Revenue, United Airlines, Inc., Los Angeles International Airport Project |
4.000 | % | 7/15/29 | 75,000 | 87,594 | (a) | ||||||||||
| California State, GO: |
||||||||||||||||
| Various Purpose, Refunding |
4.000 | % | 11/1/36 | 15,000 | 17,735 | |||||||||||
| Various Purpose, Refunding |
5.000 | % | 9/1/41 | 500,000 | 666,250 | (d) | ||||||||||
| California Statewide CDA, Student Housing Revenue, University of CA, Irvine Campus Apartments, Phase IV |
5.000 | % | 5/15/33 | 50,000 | 60,997 | |||||||||||
| Eastern Municipal Water District Financing Authority, CA, Water & Wastewater Revenue, Series D |
5.000 | % | 7/1/47 | 50,000 | 61,594 | |||||||||||
| Golden State, CA, Tobacco Securitization Corp. Revenue, Tobacco Settlement Funded, Series A-1, Refunding |
5.250 | % | 6/1/47 | 275,000 | 284,788 | |||||||||||
| Long Beach, CA, Bond Finance Authority Revenue, Natural Gas Purchase, Series A |
5.500 | % | 11/15/37 | 50,000 | 75,106 | |||||||||||
See Notes to Financial Statements.
| 4 | Western Asset SMASh Series TF Fund 2021 Semi-Annual Report |
Western Asset SMASh Series TF Fund
(Percentages shown based on Fund net assets)
| Security | Rate | Maturity Date |
Face Amount |
Value | ||||||||||||
| California — continued |
||||||||||||||||
| Los Angeles County, CA, MTA, Sales Tax Revenue, Senior Proposition C, Series B |
5.000 | % | 7/1/32 | $ | 500,000 | $ | 641,364 | |||||||||
| Los Angeles, CA, Department of Airports Revenue: |
||||||||||||||||
| Los Angeles International Airport, Subordinated, Series C |
5.000 | % | 5/15/44 | 415,000 | 510,509 | (a) | ||||||||||
| Los Angeles International Airport, Subordinated, Series D |
5.000 | % | 5/15/49 | 400,000 | 495,498 | (a) | ||||||||||
| Subordinated, Los Angeles International Airport, Series C |
5.000 | % | 5/15/37 | 95,000 | 117,359 | (a) | ||||||||||
| Los Angeles, CA, Department of Water & Power Waterworks Revenue, Series A |
5.000 | % | 7/1/48 | 500,000 | 613,500 | |||||||||||
| Los Angeles, CA, Wastewater System Revenue, Green Bonds, Subordinated, Series A |
5.000 | % | 6/1/48 | 100,000 | 123,549 | |||||||||||
| M-S-R Energy Authority, CA, Natural Gas Revenue: |
||||||||||||||||
| Series A |
6.125 | % | 11/1/29 | 50,000 | 63,381 | |||||||||||
| Series B |
6.125 | % | 11/1/29 | 150,000 | 190,123 | |||||||||||
| Northern California Energy Authority, Commodity Supply Revenue, Series A |
4.000 | % | 7/1/24 | 250,000 | 274,219 | (b)(c) | ||||||||||
| Port of Oakland, CA, Intermediate Lien Revenue: |
||||||||||||||||
| Series H, Refunding |
5.000 | % | 5/1/29 | 150,000 | 192,712 | (a) | ||||||||||
| Series H, Refunding |
5.000 | % | 11/1/29 | 300,000 | 389,247 | (a) | ||||||||||
| Riverside County, CA, Transportation Commission Sales Tax Revenue, Series B, Refunding |
5.000 | % | 6/1/37 | 100,000 | 125,486 | |||||||||||
| Riverside, CA, Electric Revenue, Series A, Refunding |
5.000 | % | 10/1/48 | 100,000 | 125,250 | |||||||||||
| Riverside, CA, Sewer Revenue, Series A, Refunding |
5.000 | % | 8/1/34 | 100,000 | 126,717 | |||||||||||
| San Bernardino, CA, USD Revenue, COP, 2019 School Financing Project, AGM |
5.000 | % | 10/1/36 | 100,000 | 123,443 | |||||||||||
| San Diego County, CA, Regional Transportation Commission, Sales Tax Revenue, Series A |
5.000 | % | 4/1/48 | 300,000 | 355,200 | |||||||||||
| San Francisco, CA, City & County Airport Commission, International Airport Revenue, SFO Fuel Company LLC, Series A, Refunding |
5.000 | % | 1/1/33 | 100,000 | 125,557 | (a) | ||||||||||
| San Mateo County, CA, Joint Powers Financing Authority Lease Revenue, Capital Project, Series A |
5.000 | % | 7/15/43 | 50,000 | 62,621 | |||||||||||
| Southern California Water Replenishment District, Financing Authority, Replenishment Revenue, Series 2018 |
5.000 | % | 8/1/48 | 500,000 | 617,920 | |||||||||||
| Stockton, CA, PFA Parking Revenue, Refunding |
5.000 | % | 3/1/35 | 430,000 | 528,174 | |||||||||||
See Notes to Financial Statements.
| Western Asset SMASh Series TF Fund 2021 Semi-Annual Report | 5 |
Schedule of investments (unaudited) (cont’d)
August 31, 2021
Western Asset SMASh Series TF Fund
(Percentages shown based on Fund net assets)
| Security | Rate | Maturity Date |
Face Amount |
Value | ||||||||||||
| California — continued |
||||||||||||||||
| Stockton, CA, PFA Wastewater Revenue, BAN, Series 2019 |
1.400 | % | 6/1/22 | $ | 100,000 | $ | 100,191 | |||||||||
| Tobacco Securitization Authority of Southern California Revenue, Asset Backed Refunding, San Diego County Tobacco Asset Securitization Corporation, Class 1, Series A |
5.000 | % | 6/1/48 | 100,000 | 125,905 | |||||||||||
| Total California |
8,347,225 | |||||||||||||||
| Colorado — 1.3% |
||||||||||||||||
| Arvada, CO, Vauxmont Metropolitan District, GO, Refunding, AGM |
5.000 | % | 12/15/24 | 130,000 | 148,532 | |||||||||||
| Colorado State Educational & Cultural Facilities Authority Revenue, University of Denver Project, Series A |
5.000 | % | 3/1/43 | 50,000 | 60,566 | |||||||||||
| Colorado State Health Facilities Authority Revenue: |
||||||||||||||||
| Commonspirit Health Project, Series A-2 |
5.000 | % | 8/1/44 | 200,000 | 248,249 | |||||||||||
| Improvement and Refunding Revenue, Bethesda Project, Series A |
5.000 | % | 9/15/48 | 50,000 | 58,546 | |||||||||||
| Colorado State High Performance Transportation Enterprise Revenue: |
||||||||||||||||
| C-470 Express Lanes |
5.000 | % | 12/31/47 | 100,000 | 114,262 | |||||||||||
| C-470 Express Lanes |
5.000 | % | 12/31/51 | 230,000 | 262,394 | |||||||||||
| Denver, CO, City & County Special Facility Apartment Revenue, United Airlines Inc. Project, Refunding |
5.000 | % | 10/1/32 | 100,000 | 106,479 | (a) | ||||||||||
| University of Colorado Enterprise Revenue: |
||||||||||||||||
| Series B, Refunding |
5.000 | % | 6/1/37 | 15,000 | 15,549 | (e) | ||||||||||
| Series B, Refunding |
5.000 | % | 6/1/37 | 60,000 | 62,195 | (e) | ||||||||||
| Total Colorado |
1,076,772 | |||||||||||||||
| Connecticut — 1.6% |
||||||||||||||||
| Connecticut State HEFA Revenue, Sacred Heart University Issue, Series I-1, Refunding |
5.000 | % | 7/1/36 | 50,000 | 60,081 | |||||||||||
| Connecticut State Special Tax Revenue: |
||||||||||||||||
| Transportation Infrastructure, Series A |
5.000 | % | 1/1/37 | 500,000 | 619,332 | |||||||||||
| Transportation Infrastructure, Series A |
5.000 | % | 5/1/38 | 200,000 | 259,284 | |||||||||||
| Connecticut State, GO: |
||||||||||||||||
| Series A |
4.000 | % | 4/15/37 | 125,000 | 148,726 | |||||||||||
See Notes to Financial Statements.
| 6 | Western Asset SMASh Series TF Fund 2021 Semi-Annual Report |
Western Asset SMASh Series TF Fund
(Percentages shown based on Fund net assets)
| Security | Rate | Maturity Date |
Face Amount |
Value | ||||||||||||
| Connecticut — continued |
||||||||||||||||
| Series E |
5.000 | % | 10/15/34 | $ | 50,000 | $ | 60,293 | |||||||||
| University of Connecticut, Student Fee Revenue, Series A |
5.000 | % | 11/15/43 | 100,000 | 123,229 | |||||||||||
| Total Connecticut |
1,270,945 | |||||||||||||||
| Delaware — 0.1% |
||||||||||||||||
| Sustainable Energy Utility Inc., DE, Energy Efficiency Revenue |
5.000 | % | 9/15/34 | 75,000 | 75,133 | (e) | ||||||||||
| District of Columbia — 0.1% |
||||||||||||||||
| District of Columbia Revenue, KIPP DC Project, Series B, Refunding |
5.000 | % | 7/1/42 | 75,000 | 88,815 | |||||||||||
| Florida — 3.2% |
||||||||||||||||
| Broward County, FL, Airport System Revenue: |
||||||||||||||||
| Series 2017 |
5.000 | % | 10/1/47 | 50,000 | 60,367 | (a) | ||||||||||
| Series A |
5.000 | % | 10/1/45 | 250,000 | 291,053 | (a) | ||||||||||
| Broward County, FL, Port Facilities Revenue, Series B |
5.000 | % | 9/1/31 | 200,000 | 259,374 | (a) | ||||||||||
| Greater Orlando, FL, Aviation Authority, Airport Facilities Revenue, Priority Subordinated, Series A |
5.000 | % | 10/1/47 | 25,000 | 30,183 | (a) | ||||||||||
| Miami-Dade County, FL, Aviation Revenue: |
||||||||||||||||
| Series A, Refunding |
4.000 | % | 10/1/41 | 250,000 | 296,330 | |||||||||||
| Series A, Refunding |
5.000 | % | 10/1/49 | 300,000 | 371,598 | (a) | ||||||||||
| Series B, Refunding |
5.000 | % | 10/1/40 | 200,000 | 242,283 | (a) | ||||||||||
| Orange County, FL, Health Facilities Authority Revenue, Presbyterian Retirement Communities, Refunding |
5.000 | % | 8/1/36 | 5,000 | 5,523 | |||||||||||
| Palm Beach County, FL, Health Facilities Authority Revenue: |
||||||||||||||||
| ACTS Retirement-Life Communities, Series B |
5.000 | % | 11/15/42 | 500,000 | 612,240 | |||||||||||
| Toby & Leon Cooperman Sinai Residences of Boca Raton Expansion, Series B-1 |
3.000 | % | 6/1/27 | 250,000 | 262,394 | |||||||||||
| Tampa, FL, Hospital Revenue, H. Lee Moffitt Cancer Center Project, Series B |
5.000 | % | 7/1/50 | 100,000 | 124,791 | |||||||||||
| Volusia County, FL, EFA Revenue, Educational Facilities Embry-Riddle Aeronautical University Inc. Project, Refunding |
5.000 | % | 10/15/42 | 50,000 | 60,202 | |||||||||||
| Total Florida |
2,616,338 | |||||||||||||||
| Georgia — 1.4% |
||||||||||||||||
| Dahlonega, GA, Downtown Development Authority Revenue, North Georgia MAC LLC Project, Refunding |
5.000 | % | 7/1/39 | 100,000 | 120,487 | |||||||||||
See Notes to Financial Statements.
| Western Asset SMASh Series TF Fund 2021 Semi-Annual Report | 7 |
Schedule of investments (unaudited) (cont’d)
August 31, 2021
Western Asset SMASh Series TF Fund
(Percentages shown based on Fund net assets)
| Security | Rate | Maturity Date |
Face Amount |
Value | ||||||||||||
| Georgia — continued |
||||||||||||||||
| Fulton County, GA, Development Authority Revenue, Georgia Institute of Technology |
5.000 | % | 6/15/44 | $ | 100,000 | $ | 125,415 | |||||||||
| Georgia State Higher Education Facilities Authority Revenue, USG Real Estate, Refunding |
5.000 | % | 6/15/33 | 50,000 | 63,612 | |||||||||||
| Georgia State Municipal Electric Authority Power Revenue: |
||||||||||||||||
| Plant Vogtle Units 3&4, Project J, Series A |
5.000 | % | 1/1/56 | 200,000 | 245,818 | |||||||||||
| Plant Vogtle Units 3&4, Project P, Series A |
4.000 | % | 1/1/46 | 80,000 | 91,591 | |||||||||||
| Project One Subordinated, Series A |
5.000 | % | 1/1/45 | 100,000 | 126,889 | |||||||||||
| Main Street Natural Gas Inc., GA, Gas Project Revenue: |
||||||||||||||||
| Series A |
5.000 | % | 5/15/43 | 200,000 | 244,459 | |||||||||||
| Series C |
4.000 | % | 9/1/26 | 80,000 | 92,396 | (b)(c) | ||||||||||
| Total Georgia |
1,110,667 | |||||||||||||||
| Idaho — 0.1% |
||||||||||||||||
| Idaho State Health Facilities Authority Revenue, Trinity Health Credit Group, Series A |
5.000 | % | 12/1/47 | 100,000 | 122,549 | |||||||||||
| Illinois — 10.6% |
||||||||||||||||
| Chicago, IL, Board of Education, Dedicated Capital Improvement, Special Tax Revenue, Series 2018 |
5.000 | % | 4/1/42 | 100,000 | 121,414 | |||||||||||
| Chicago, IL, Board of Education, GO: |
||||||||||||||||
| Dedicated, Series H |
5.000 | % | 12/1/46 | 100,000 | 119,743 | |||||||||||
| Series A |
5.000 | % | 12/1/41 | 500,000 | 633,036 | |||||||||||
| Series C, Refunding |
5.000 | % | 12/1/25 | 100,000 | 117,850 | |||||||||||
| Chicago, IL, GO: |
||||||||||||||||
| Series A |
5.000 | % | 1/1/44 | 125,000 | 151,396 | |||||||||||
| Series A, Refunding |
5.000 | % | 1/1/26 | 250,000 | 294,652 | |||||||||||
| Series A, Refunding |
5.250 | % | 1/1/33 | 30,000 | 32,732 | |||||||||||
| Series A, Refunding |
5.000 | % | 1/1/35 | 185,000 | 200,453 | |||||||||||
| Series B |
5.500 | % | 1/1/32 | 150,000 | 171,290 | |||||||||||
| Series C, Refunding |
5.000 | % | 1/1/25 | 30,000 | 34,292 | |||||||||||
| Series D, Refunding |
5.500 | % | 1/1/34 | 10,000 | 11,410 | |||||||||||
| Chicago, IL, O’Hare International Airport Revenue: |
||||||||||||||||
| Series D, Refunding |
5.000 | % | 1/1/46 | 10,000 | 11,428 | |||||||||||
| TrIPS Obligated Group |
5.000 | % | 7/1/48 | 50,000 | 59,573 | (a) | ||||||||||
| Chicago, IL, Transit Authority Revenue, Series A, Refunding |
5.000 | % | 12/1/45 | 50,000 | 62,302 | |||||||||||
| Chicago, IL, Transit Authority, Sales Tax Receipts Revenue, Series 2011 |
5.250 | % | 12/1/40 | 100,000 | 101,275 | (e) | ||||||||||
See Notes to Financial Statements.
| 8 | Western Asset SMASh Series TF Fund 2021 Semi-Annual Report |
Western Asset SMASh Series TF Fund
(Percentages shown based on Fund net assets)
| Security | Rate | Maturity Date |
Face Amount |
Value | ||||||||||||
| Illinois — continued |
||||||||||||||||
| Chicago, IL, Wastewater Transmission Revenue, Second Lien, Series A |
5.000 | % | 1/1/47 | $ | 35,000 | $ | 41,198 | |||||||||
| Chicago, IL, Waterworks Revenue: |
||||||||||||||||
| Second Lien, Series 2017, Refunding |
5.000 | % | 11/1/29 | 30,000 | 37,586 | |||||||||||
| Second Lien, Series 2017-2, Refunding, AGM |
5.000 | % | 11/1/32 | 60,000 | 74,467 | |||||||||||
| Cook County, IL, Sales Tax Revenue, Series A, Refunding |
4.000 | % | 11/15/40 | 250,000 | 296,336 | |||||||||||
| Elk Grove Village, IL, GO, Cook and DuPage Counties, Refunding |
5.000 | % | 1/1/36 | 35,000 | 42,213 | |||||||||||
| Illinois State Finance Authority Revenue: |
||||||||||||||||
| Benedictine University, Refunding |
4.000 | % | 10/1/33 | 100,000 | 116,092 | |||||||||||
| Northshore University Health System, Refunding |
5.000 | % | 8/15/32 | 100,000 | 132,345 | |||||||||||
| University of Illinois at Urbana, Academic Facilities Lease Revenue Bonds |
5.000 | % | 10/1/49 | 50,000 | 61,385 | |||||||||||
| University of Illinois, Health Services Facility Lease Revenue Bonds |
5.000 | % | 10/1/30 | 250,000 | 326,906 | |||||||||||
| Illinois State Sales Tax Revenue, Subordinated, Series D, Refunding |
5.000 | % | 6/15/23 | 205,000 | 222,422 | |||||||||||
| Illinois State Sports Facilities Authority Revenue, Sport Facilities Project, Series 2019, Refunding, BAM |
5.000 | % | 6/15/29 | 50,000 | 63,456 | |||||||||||
| Illinois State, GO: |
||||||||||||||||
| Series 2016 |
5.000 | % | 1/1/33 | 25,000 | 28,574 | |||||||||||
| Series 2016, Refunding |
5.000 | % | 2/1/27 | 25,000 | 30,339 | |||||||||||
| Series 2016, Refunding |
5.000 | % | 2/1/29 | 20,000 | 23,890 | |||||||||||
| Series A |
5.000 | % | 5/1/36 | 250,000 | 301,670 | |||||||||||
| Series A |
5.000 | % | 3/1/46 | 400,000 | 499,133 | |||||||||||
| Series A, Refunding |
5.000 | % | 10/1/29 | 150,000 | 186,652 | |||||||||||
| Series A, Refunding |
5.000 | % | 10/1/30 | 350,000 | 434,220 | |||||||||||
| Series D |
5.000 | % | 11/1/27 | 225,000 | 277,191 | |||||||||||
| Kane County, IL, School District No 131 Aurora East Side, GO, Series A, AGM |
4.000 | % | 12/1/34 | 725,000 | 851,100 | |||||||||||
| Metropolitan Pier & Exposition Authority, IL, Revenue: |
||||||||||||||||
| McCormick Place Expansion Project, Series A, Refunding |
4.000 | % | 12/15/42 | 500,000 | 576,744 | (d) | ||||||||||
| McCormick Place Expansion Project, Series A, Refunding |
5.000 | % | 12/15/45 | 500,000 | 616,084 | |||||||||||
See Notes to Financial Statements.
| Western Asset SMASh Series TF Fund 2021 Semi-Annual Report | 9 |
Schedule of investments (unaudited) (cont’d)
August 31, 2021
Western Asset SMASh Series TF Fund
(Percentages shown based on Fund net assets)
| Security | Rate | Maturity Date |
Face Amount |
Value | ||||||||||||
| Illinois — continued |
||||||||||||||||
| McCormick Place Expansion Project, Series A, Refunding |
4.000 | % | 6/15/50 | $ | 500,000 | $ | 569,369 | |||||||||
| McCormick Place Expansion Project, Series B, Refunding |
5.000 | % | 6/15/42 | 60,000 | 75,806 | |||||||||||
| Regional Transportation Authority, IL, GO, Series A, Refunding, NATL |
6.000 | % | 7/1/29 | 415,000 | 533,412 | |||||||||||
| Total Illinois |
8,541,436 | |||||||||||||||
| Indiana — 1.3% |
||||||||||||||||
| Indiana State Finance Authority Revenue, Marion General Hospital, Series A |
4.000 | % | 7/1/45 | 100,000 | 115,772 | |||||||||||
| Indiana State Finance Authority Wastewater Utility Revenue, Green Bonds, CWA Authority Project, Series A |
5.000 | % | 10/1/41 | 100,000 | 119,927 | |||||||||||
| Indianapolis, IN, Local Public Improvement Bond Bank: |
||||||||||||||||
| Courthouse and Jail Project, Series A |
4.000 | % | 2/1/44 | 100,000 | 117,284 | |||||||||||
| Courthouse and Jail Project, Series A |
5.000 | % | 2/1/54 | 300,000 | 370,083 | |||||||||||
| Indianapolis Airport Authority Project, Revenue, Series D, Refunding |
5.000 | % | 1/1/26 | 300,000 | 357,305 | (a) | ||||||||||
| Total Indiana |
1,080,371 | |||||||||||||||
| Iowa — 0.3% |
||||||||||||||||
| Iowa State Finance Authority, Midwestern Disaster Area Revenue, Iowa Fertilizer Company Project, Refunding |
3.125 | % | 12/1/22 | 25,000 | 25,490 | |||||||||||
| Iowa State Tobacco Settlement Authority Revenue: |
||||||||||||||||
| Asset Backed Senior Bonds, Class 1, Series A-2, Refunding |
4.000 | % | 6/1/49 | 100,000 | 116,379 | |||||||||||
| Asset Backed Senior Bonds, Class 2, Series B-1, Refunding |
4.000 | % | 6/1/49 | 100,000 | 115,902 | |||||||||||
| Total Iowa |
257,771 | |||||||||||||||
| Kansas — 0.6% |
||||||||||||||||
| Wyandotte County, KS, USD #202 Turner, GO, Series A, AGM |
4.000 | % | 9/1/37 | 400,000 | 451,802 | |||||||||||
| Kentucky — 3.5% |
||||||||||||||||
| Ashland, KY, Medical Center Refunding Revenue Bonds: |
||||||||||||||||
| Ashland Hospital Corporation, King’s Daughters Medical Center, Refunding |
5.000 | % | 2/1/25 | 625,000 | 717,359 | |||||||||||
| Ashland Hospital Corporation, King’s Daughters Medical Center, Refunding |
5.000 | % | 2/1/26 | 550,000 | 651,774 | |||||||||||
See Notes to Financial Statements.
| 10 | Western Asset SMASh Series TF Fund 2021 Semi-Annual Report |
Western Asset SMASh Series TF Fund
(Percentages shown based on Fund net assets)
| Security | Rate | Maturity Date |
Face Amount |
Value | ||||||||||||
| Kentucky — continued |
||||||||||||||||
| Kentucky State Economic Development Finance Authority Revenue: |
||||||||||||||||
| Catholic Health Initiatives, Series B, Refunding |
2.700 | % | 11/10/21 | $ | 175,000 | $ | 175,782 | (b)(c) | ||||||||
| Louisville Arena, Louisville Arena Authority Inc., Refunding, AGM |
5.000 | % | 12/1/45 | 100,000 | 123,217 | |||||||||||
| Kentucky State PEA, Gas Supply Revenue: |
||||||||||||||||
| Series A |
4.000 | % | 6/1/26 | 300,000 | 344,699 | (b)(c) | ||||||||||
| Series C |
4.000 | % | 6/1/25 | 200,000 | 224,739 | (b)(c) | ||||||||||
| Louisville/Jefferson County, KY, Metropolitan Government Health System Revenue, Norton Healthcare Inc., Series A |
4.000 | % | 10/1/40 | 500,000 | 579,326 | |||||||||||
| Total Kentucky |
2,816,896 | |||||||||||||||
| Louisiana — 0.4% |
||||||||||||||||
| Louisiana State PFA, Lease Revenue, Provident Group, Flagship Properties |
5.000 | % | 7/1/42 | 50,000 | 59,121 | |||||||||||
| Shreveport, LA, Water & Sewer Revenue, Series A, AGM |
5.000 | % | 12/1/41 | 10,000 | 12,233 | |||||||||||
| St. John the Baptist Parish, LA, State Revenue: |
||||||||||||||||
| Marathon Oil Corp. Project, Refunding |
2.200 | % | 7/1/26 | 125,000 | 132,177 | (b)(c) | ||||||||||
| Marathon Oil Corp. Project, Series B-2, Refunding |
2.375 | % | 7/1/26 | 150,000 | 159,848 | (b)(c) | ||||||||||
| Total Louisiana |
363,379 | |||||||||||||||
| Massachusetts — 1.4% |
||||||||||||||||
| Massachusetts State Department of Transportation, Metropolitan Highway System Revenue, Series A, Refunding |
5.000 | % | 1/1/34 | 250,000 | 314,967 | |||||||||||
| Massachusetts State DFA Revenue: |
||||||||||||||||
| Broad Institute Inc., Refunding |
5.000 | % | 4/1/36 | 85,000 | 104,233 | |||||||||||
| UMass Boston Student Housing Project |
5.000 | % | 10/1/28 | 10,000 | 11,685 | |||||||||||
| Wellforce Issue, Series A, Refunding |
5.000 | % | 7/1/39 | 50,000 | 61,459 | |||||||||||
| Worcester Polytechnic Institute, Series B, Refunding |
5.000 | % | 9/1/42 | 75,000 | 91,698 | |||||||||||
| Massachusetts State Port Authority Revenue: |
||||||||||||||||
| Series A, Refunding |
5.000 | % | 7/1/36 | 160,000 | 200,985 | (a) | ||||||||||
| Series E |
5.000 | % | 7/1/46 | 250,000 | 319,311 | (a) | ||||||||||
| Massachusetts State Water Resources Authority Revenue, Series B, Refunding |
5.000 | % | 8/1/40 | 50,000 | 60,220 | |||||||||||
| Total Massachusetts |
1,164,558 | |||||||||||||||
See Notes to Financial Statements.
| Western Asset SMASh Series TF Fund 2021 Semi-Annual Report | 11 |
Schedule of investments (unaudited) (cont’d)
August 31, 2021
Western Asset SMASh Series TF Fund
(Percentages shown based on Fund net assets)
| Security | Rate | Maturity Date |
Face Amount |
Value | ||||||||||||
| Michigan — 2.8% |
||||||||||||||||
| Detroit, MI, Downtown Development Authority Revenue, Catalyst Development, Series A, Refunding, AGM |
5.000 | % | 7/1/43 | $ | 100,000 | $ | 111,723 | |||||||||
| Great Lakes Water Authority, MI, Water Supply System Revenue: |
||||||||||||||||
| Senior Lien, Series A |
5.000 | % | 7/1/45 | 750,000 | 952,909 | |||||||||||
| Senior Lien, Series A |
5.000 | % | 7/1/49 | 650,000 | 822,652 | |||||||||||
| Michigan State Finance Authority Revenue: |
||||||||||||||||
| Henry Ford Health System, Series A |
4.000 | % | 11/15/50 | 100,000 | 115,223 | |||||||||||
| Tobacco Settlement Asset Backed Senior Bonds, Series A, Refunding |
4.000 | % | 6/1/49 | 50,000 | 58,265 | |||||||||||
| Tobacco Settlement Asset Backed Senior Bonds, Series B-1, Refunding |
5.000 | % | 6/1/49 | 50,000 | 61,186 | |||||||||||
| Michigan State Strategic Fund Limited Obligation Revenue, I-75 Improvement Project |
5.000 | % | 12/31/43 | 100,000 | 121,228 | (a) | ||||||||||
| Total Michigan |
2,243,186 | |||||||||||||||
| Missouri — 0.1% |
||||||||||||||||
| Missouri State HEFA Revenue, Lutheran Senior Service Projects, Series A |
5.000 | % | 2/1/42 | 50,000 | 55,895 | |||||||||||
| Nebraska — 0.6% |
||||||||||||||||
| Douglas County, NE, Hospital Authority No. 2 Revenue, Children’s Hospital Obligated Group, Series A, Refunding |
4.000 | % | 11/15/36 | 425,000 | 511,639 | |||||||||||
| Nevada — 0.3% |
||||||||||||||||
| Sparks, NV, Tourism Improvement, Senior Sales Tax Anticipation Revenue, Series A, Refunding |
2.750 | % | 6/15/28 | 250,000 | 260,903 | (f) | ||||||||||
| New Jersey — 7.1% |
||||||||||||||||
| Essex County, NJ, Improvement Authority, GO: |
||||||||||||||||
| CHF-Newark LLC, New Jersey Institute of Technology Lease Revenue Bonds, Series A, BAM |
5.000 | % | 8/1/35 | 180,000 | 238,270 | |||||||||||
| CHF-Newark LLC, New Jersey Institute of Technology Lease Revenue Bonds, Series A, BAM |
5.000 | % | 8/1/36 | 215,000 | 283,664 | |||||||||||
| New Brunswick, NJ, Guaranteed Parking Revenue, Series 2017, AGM |
5.000 | % | 9/1/21 | 220,000 | 220,000 | |||||||||||
| New Jersey State EDA Revenue: |
||||||||||||||||
| Private Activity-The Goethals Bridge Replacement Project, AGM |
5.125 | % | 1/1/39 | 85,000 | 94,538 | (a) | ||||||||||
| Private Activity-The Goethals Bridge Replacement Project, AGM |
5.125 | % | 7/1/42 | 150,000 | 166,647 | (a) | ||||||||||
See Notes to Financial Statements.
| 12 | Western Asset SMASh Series TF Fund 2021 Semi-Annual Report |
Western Asset SMASh Series TF Fund
(Percentages shown based on Fund net assets)
| Security | Rate | Maturity Date |
Face Amount |
Value | ||||||||||||
| New Jersey — continued |
||||||||||||||||
| School Facilities Construction, Series BBB, Refunding |
5.500 | % | 6/15/31 | $ | 100,000 | $ | 123,455 | |||||||||
| School Facilities Construction, Series DDD |
5.000 | % | 6/15/33 | 50,000 | 60,590 | |||||||||||
| School Facilities Construction, Series I, Refunding, State Appropriations, (SIFMA Municipal Swap Index Yield + 1.600%) |
1.620 | % | 3/1/28 | 325,000 | 329,713 | (c) | ||||||||||
| School Facilities Construction, Series QQQ |
5.000 | % | 6/15/31 | 500,000 | 656,596 | |||||||||||
| Transit Transportation Project, Series A |
5.000 | % | 11/1/32 | 150,000 | 191,533 | |||||||||||
| New Jersey State EDA, Lease Revenue, Health Department and Taxation Division Office Project, Series A |
5.000 | % | 6/15/33 | 105,000 | 129,089 | |||||||||||
| New Jersey State EDA, Special Facility Revenue, Port Newark Container Terminal LLC Project, Refunding |
5.000 | % | 10/1/37 | 100,000 | 118,035 | (a) | ||||||||||
| New Jersey State Health Care Facilities Financing Authority Revenue, Hackensack Meridian Health, Series A, Refunding |
5.000 | % | 7/1/38 | 50,000 | 60,727 | |||||||||||
| New Jersey State Transportation Trust Fund Authority Revenue: |
||||||||||||||||
| Highway Reimbursement, Refunding |
5.000 | % | 6/15/31 | 60,000 | 71,134 | |||||||||||
| Transportation Program, Series AA |
5.250 | % | 6/15/43 | 100,000 | 125,130 | |||||||||||
| Transportation Program, Series AA |
4.000 | % | 6/15/45 | 500,000 | 581,227 | |||||||||||
| Transportation Program, Series AA |
5.000 | % | 6/15/45 | 100,000 | 114,595 | |||||||||||
| Transportation Program, Series AA, Refunding |
5.000 | % | 6/15/36 | 300,000 | 381,912 | (d) | ||||||||||
| Transportation Program, Series BB |
4.000 | % | 6/15/36 | 500,000 | 579,410 | |||||||||||
| Transportation System, Series A, Refunding |
5.000 | % | 12/15/25 | 100,000 | 118,961 | |||||||||||
| Transportation System, Series A, Refunding |
5.000 | % | 12/15/28 | 150,000 | 191,510 | |||||||||||
| New Jersey State Turnpike Authority Revenue: |
||||||||||||||||
| Series A, Refunding |
5.000 | % | 1/1/35 | 100,000 | 118,300 | |||||||||||
| Series G, Refunding |
5.000 | % | 1/1/35 | 60,000 | 74,921 | |||||||||||
| New Jersey State, GO, COVID-19 Emergency, Series A |
5.000 | % | 6/1/29 | 500,000 | 651,216 | |||||||||||
| Tobacco Settlement Financing Corp., NJ, Revenue, Series A, Refunding |
5.250 | % | 6/1/46 | 30,000 | 36,740 | |||||||||||
| Total New Jersey |
5,717,913 | |||||||||||||||
| New Mexico — 0.0%†† |
||||||||||||||||
| Farmington, NM, PCR, Public Service Co. Project, Refunding |
2.125 | % | 6/1/22 | 35,000 | 35,469 | (b)(c) | ||||||||||
See Notes to Financial Statements.
| Western Asset SMASh Series TF Fund 2021 Semi-Annual Report | 13 |
Schedule of investments (unaudited) (cont’d)
August 31, 2021
Western Asset SMASh Series TF Fund
(Percentages shown based on Fund net assets)
| Security | Rate | Maturity Date |
Face Amount |
Value | ||||||||||||
| New York — 13.4% |
||||||||||||||||
| Hempstead Town, NY, Local Development Corp. Revenue, Hofstra University Project, Refunding |
5.000 | % | 7/1/42 | $ | 100,000 | $ | 122,106 | |||||||||
| Hudson Yards Infrastructure Corp., NY, Second Indenture Revenue, Series A, Refunding |
5.000 | % | 2/15/35 | 140,000 | 169,259 | |||||||||||
| Long Island, NY, Power Authority Electric System Revenue, Series B, Refunding |
1.650 | % | 9/1/24 | 250,000 | 257,993 | (b)(c) | ||||||||||
| MTA, NY, Transportation Revenue: |
||||||||||||||||
| Green Bonds, Series A-2 |
5.000 | % | 11/15/24 | 50,000 | 57,222 | |||||||||||
| Green Bonds, Series D-1 |
5.000 | % | 11/15/43 | 100,000 | 125,205 | |||||||||||
| Green Bonds, Series D-3 |
4.000 | % | 11/15/49 | 100,000 | 114,816 | |||||||||||
| Green Bonds, Series E |
5.000 | % | 11/15/33 | 250,000 | 322,116 | |||||||||||
| Series A-2 |
5.000 | % | 5/15/30 | 335,000 | 437,584 | (b)(c) | ||||||||||
| Series F, Refunding |
5.000 | % | 11/15/27 | 500,000 | 589,998 | |||||||||||
| New York City, NY, GO: |
||||||||||||||||
| Subseries F-1 |
5.000 | % | 3/1/37 | 250,000 | 327,748 | |||||||||||
| Subseries F-1 |
5.000 | % | 3/1/50 | 250,000 | 317,244 | |||||||||||
| New York City, NY, Industrial Development Agency Revenue, Yankee Stadium Project, Refunding |
4.000 | % | 3/1/45 | 100,000 | 114,454 | |||||||||||
| New York City, NY, Municipal Water Finance Authority, Water & Sewer System Revenue: |
||||||||||||||||
| Second General Resolution Fiscal 2022, Series AA, Subseries AA-1 |
4.000 | % | 6/15/51 | 500,000 | 587,961 | |||||||||||
| Subordinated, Series BB-1 |
5.000 | % | 6/15/46 | 30,000 | 36,456 | |||||||||||
| New York City, NY, TFA Future Tax Secured Revenue, Subordinated, Series B-1 |
5.000 | % | 8/1/45 | 700,000 | 855,039 | |||||||||||
| New York City, NY, TFA Revenue, Future Tax Secured, Subordinate, Series C-1 |
4.000 | % | 5/1/40 | 700,000 | 835,760 | |||||||||||
| New York State Dormitory Authority Revenue: |
||||||||||||||||
| New York University, Series A, Refunding |
5.000 | % | 7/1/43 | 50,000 | 61,314 | |||||||||||
| Series B, Refunding |
5.000 | % | 2/15/43 | 100,000 | 122,506 | |||||||||||
| New York State Dormitory Authority, Sales Tax Revenue: |
||||||||||||||||
| Bidding Group 3, Series E, Refunding |
5.000 | % | 3/15/38 | 100,000 | 126,327 | |||||||||||
| Bidding Group 4, Series E, Refunding |
5.000 | % | 3/15/44 | 100,000 | 125,294 | |||||||||||
| New York State Liberty Development Corp., Liberty Revenue, 3 World Trade Center Project, Class 1, Refunding |
5.000 | % | 11/15/44 | 100,000 | 110,572 | (f) | ||||||||||
See Notes to Financial Statements.
| 14 | Western Asset SMASh Series TF Fund 2021 Semi-Annual Report |
Western Asset SMASh Series TF Fund
(Percentages shown based on Fund net assets)
| Security | Rate | Maturity Date |
Face Amount |
Value | ||||||||||||
| New York — continued |
||||||||||||||||
| New York State Thruway Authority General Revenue: |
||||||||||||||||
| Junior Indebtedness Obligations, Junior Lien, Series A |
5.000 | % | 1/1/46 | $ | 50,000 | $ | 58,373 | |||||||||
| Junior Indebtedness Obligations, Subordinated, Series B, Refunding |
4.000 | % | 1/1/50 | 200,000 | 232,845 | |||||||||||
| New York State Transportation Development Corp., Special Facilities Revenue: |
||||||||||||||||
| Delta Air Lines Inc., LaGuardia Airport Terminals C and D Redevelopment Project |
5.000 | % | 1/1/30 | 75,000 | 92,064 | (a) | ||||||||||
| Delta Air Lines Inc., LaGuardia Airport Terminals C and D Redevelopment Project |
5.000 | % | 1/1/32 | 45,000 | 54,862 | (a) | ||||||||||
| Delta Air Lines Inc., LaGuardia Airport Terminals C and D Redevelopment Project |
4.375 | % | 10/1/45 | 250,000 | 297,039 | (a) | ||||||||||
| LaGuardia Airport Terminal B Redevelopment Project |
5.000 | % | 7/1/30 | 50,000 | 56,315 | (a) | ||||||||||
| LaGuardia Airport Terminal B Redevelopment Project, Series A |
5.000 | % | 7/1/41 | 25,000 | 28,000 | (a) | ||||||||||
| LaGuardia Airport Terminal B Redevelopment Project, Series A |
5.250 | % | 1/1/50 | 750,000 | 843,612 | (a) | ||||||||||
| Terminal 4 John F. Kennedy International Airport Project, Series A |
4.000 | % | 12/1/40 | 300,000 | 347,815 | (a) | ||||||||||
| Port Authority of New York & New Jersey Revenue: |
||||||||||||||||
| Consolidated Series 185 |
5.000 | % | 9/1/25 | 10,000 | 11,410 | (a) | ||||||||||
| Consolidated Series 221 |
4.000 | % | 7/15/50 | 500,000 | 579,469 | (a) | ||||||||||
| Triborough Bridge & Tunnel Authority, NY, Revenue: |
||||||||||||||||
| General-MTA Bridges & Tunnels, Series A |
5.000 | % | 11/15/49 | 500,000 | 643,370 | |||||||||||
| General-MTA Bridges & Tunnels, Series A |
5.000 | % | 11/15/51 | 265,000 | 341,530 | |||||||||||
| General-MTA Bridges & Tunnels, Series A |
5.000 | % | 11/15/54 | 325,000 | 416,626 | |||||||||||
| General-MTA Bridges & Tunnels, Series A |
5.000 | % | 11/15/56 | 500,000 | 644,397 | |||||||||||
| Troy, NY, Capital Resource Corp., Rensselaer Polytechnic Institute Project, Series A, Refunding |
5.000 | % | 9/1/28 | 325,000 | 410,929 | |||||||||||
| Total New York |
10,875,630 | |||||||||||||||
| North Carolina — 0.6% |
||||||||||||||||
| Charlotte, NC, Lease Revenue, COP, Convention Facility Project, Series A, Refunding |
4.000 | % | 6/1/49 | 70,000 | 82,241 | |||||||||||
See Notes to Financial Statements.
| Western Asset SMASh Series TF Fund 2021 Semi-Annual Report | 15 |
Schedule of investments (unaudited) (cont’d)
August 31, 2021
Western Asset SMASh Series TF Fund
(Percentages shown based on Fund net assets)
| Security | Rate | Maturity Date |
Face Amount |
Value | ||||||||||||
| North Carolina — continued |
||||||||||||||||
| North Carolina State Medical Care Commission, Retirement Facilities Revenue, The Forest at Duke Project |
4.000 | % | 9/1/41 | $ | 330,000 | $ | 387,223 | |||||||||
| North Carolina State Turnpike Authority, Monroe Expressway Toll Revenue, Series A, Refunding |
5.000 | % | 7/1/42 | 5,000 | 5,730 | |||||||||||
| Total North Carolina |
475,194 | |||||||||||||||
| Ohio — 3.4% |
||||||||||||||||
| Buckeye, OH, Tobacco Settlement Financing Authority Revenue: |
||||||||||||||||
| Senior Bonds, Series A-2, Refunding |
4.000 | % | 6/1/48 | 100,000 | 114,935 | |||||||||||
| Senior Bonds, Series B-2, Refunding |
5.000 | % | 6/1/55 | 250,000 | 290,923 | |||||||||||
| Ohio State Air Quality Development Authority Revenue: |
||||||||||||||||
| American Electric Company Project, Series B, Refunding |
2.500 | % | 10/1/29 | 100,000 | 110,244 | (a)(b)(c) | ||||||||||
| American Electric Company Project, Series D, Refunding |
2.100 | % | 10/1/24 | 250,000 | 260,978 | (a)(b)(c) | ||||||||||
| Ohio State Higher Educational Facility Commission College & University Revenue: |
||||||||||||||||
| University of Dayton 2018 Project, Series B, Refunding |
5.000 | % | 12/1/34 | 500,000 | 621,622 | |||||||||||
| Xavier University 2020 Project |
5.000 | % | 5/1/33 | 495,000 | 642,506 | |||||||||||
| Warrensville Heights, OH, School District, GO: |
||||||||||||||||
| Refunding, BAM |
5.000 | % | 12/1/44 | 425,000 | 490,395 | (e) | ||||||||||
| Refunding, BAM |
5.000 | % | 12/1/44 | 175,000 | 198,027 | |||||||||||
| Total Ohio |
2,729,630 | |||||||||||||||
| Oklahoma — 0.6% |
||||||||||||||||
| Oklahoma State Development Finance Authority Revenue, Gilcrease Expressway West Project, Series A |
1.625 | % | 7/6/23 | 500,000 | 504,774 | (a) | ||||||||||
| Oregon — 0.4% |
||||||||||||||||
| Gilliam County, OR, Solid Waste Disposal Revenue, Waste Management Project, Series A |
2.400 | % | 5/2/22 | 125,000 | 125,232 | (a)(b)(c) | ||||||||||
| Port of Portland, OR, Airport Revenue, Portland International Airport, Series 26C, Refunding |
5.000 | % | 7/1/26 | 150,000 | 180,736 | (a) | ||||||||||
| Total Oregon |
305,968 | |||||||||||||||
| Pennsylvania — 2.7% |
||||||||||||||||
| Allegheny County, PA, HDA Revenue, University Pittsburgh Medical Center, Series A, Refunding |
4.000 | % | 7/15/38 | 150,000 | 176,868 | |||||||||||
See Notes to Financial Statements.
| 16 | Western Asset SMASh Series TF Fund 2021 Semi-Annual Report |
Western Asset SMASh Series TF Fund
(Percentages shown based on Fund net assets)
| Security | Rate | Maturity Date |
Face Amount |
Value | ||||||||||||
| Pennsylvania — continued |
||||||||||||||||
| Berks County, PA, IDA, Healthcare Facilities Revenue, Highlands at Wyomissing, Refunding |
5.000 | % | 5/15/32 | $ | 50,000 | $ | 59,259 | |||||||||
| Commonwealth Financing Authority, PA, Tobacco Master Settlement Payment Revenue |
5.000 | % | 6/1/30 | 50,000 | 62,420 | |||||||||||
| Pennsylvania State Economic Development Financing Authority, Solid Waste Disposal Revenue, Waste Management Inc. Project |
2.150 | % | 7/1/24 | 100,000 | 105,094 | (a)(b)(c) | ||||||||||
| Pennsylvania State Turnpike Commission Revenue: |
||||||||||||||||
| Series A |
5.000 | % | 12/1/44 | 175,000 | 221,330 | |||||||||||
| Series A-1 |
5.000 | % | 12/1/47 | 25,000 | 30,536 | |||||||||||
| Series B, Refunding |
5.000 | % | 12/1/46 | 250,000 | 322,635 | |||||||||||
| Subordinated, Series B |
5.000 | % | 12/1/48 | 100,000 | 123,037 | |||||||||||
| Subordinated, Series B |
5.000 | % | 12/1/50 | 250,000 | 320,995 | |||||||||||
| Philadelphia, PA, Authority for IDR, Charter School Revenue, Philadelphia Performing Arts: A String Theory Charter School Project, Series 2020, Refunding |
5.000 | % | 6/15/50 | 100,000 | 116,815 | |||||||||||
| Philadelphia, PA, Authority for IDR, City Service Agreement Revenue, Rebuild Project |
5.000 | % | 5/1/35 | 250,000 | 310,092 | |||||||||||
| Philadelphia, PA, Authority for IDR, Lease Revenue, Series 2019, Refunding |
5.000 | % | 10/1/30 | 100,000 | 130,862 | |||||||||||
| Philadelphia, PA, GO, Series B |
5.000 | % | 2/1/35 | 150,000 | 190,760 | |||||||||||
| State Public School Building Authority, PA, Lease Revenue, Philadelphia SD Project, Series A, Refunding, AGM, State Aid Withholding |
5.000 | % | 6/1/31 | 20,000 | 24,340 | |||||||||||
| Total Pennsylvania |
2,195,043 | |||||||||||||||
| Puerto Rico — 4.3% |
||||||||||||||||
| Puerto Rico Commonwealth Public Improvement, GO, Series A, Refunding |
5.000 | % | 7/1/41 | 240,000 | 206,100 | *(g) | ||||||||||
| Puerto Rico Electric Power Authority Revenue: |
||||||||||||||||
| Series A |
5.000 | % | 7/1/29 | 195,000 | 191,100 | *(g) | ||||||||||
| Series A |
5.000 | % | 7/1/42 | 270,000 | 264,600 | *(g) | ||||||||||
| Series A |
5.050 | % | 7/1/42 | 100,000 | 98,000 | *(g) | ||||||||||
| Series XX |
5.250 | % | 7/1/40 | 360,000 | 354,150 | *(g) | ||||||||||
| Puerto Rico Sales Tax Financing Corp., Sales Tax Revenue: |
||||||||||||||||
| CAB, Restructured, Series A-1 |
0.000 | % | 7/1/27 | 60,000 | 55,388 | |||||||||||
| CAB, Restructured, Series A-1 |
0.000 | % | 7/1/46 | 160,000 | 53,462 | |||||||||||
| CAB, Restructured, Series A-1 |
0.000 | % | 7/1/51 | 850,000 | 206,563 | |||||||||||
| Restructured, Series A-1 |
4.550 | % | 7/1/40 | 10,000 | 11,507 | |||||||||||
See Notes to Financial Statements.
| Western Asset SMASh Series TF Fund 2021 Semi-Annual Report | 17 |
Schedule of investments (unaudited) (cont’d)
August 31, 2021
Western Asset SMASh Series TF Fund
(Percentages shown based on Fund net assets)
| Security | Rate | Maturity Date |
Face Amount |
Value | ||||||||||||
| Puerto Rico — continued |
||||||||||||||||
| Restructured, Series A-1 |
4.750 | % | 7/1/53 | $ | 250,000 | $ | 286,101 | |||||||||
| Restructured, Series A-1 |
5.000 | % | 7/1/58 | 1,360,000 | 1,574,688 | |||||||||||
| Restructured, Series A-2 |
4.329 | % | 7/1/40 | 130,000 | 147,782 | |||||||||||
| Total Puerto Rico |
3,449,441 | |||||||||||||||
| South Dakota — 0.0%†† |
||||||||||||||||
| South Dakota State HEFA Revenue, Regional Health |
5.000 | % | 9/1/40 | 25,000 | 30,009 | |||||||||||
| Tennessee — 1.0% |
||||||||||||||||
| Knox County, TN, Health, Educational & Housing Facility Board Revenue, University Health System Inc., Series A |
5.000 | % | 9/1/30 | 100,000 | 124,341 | |||||||||||
| Metropolitan Government of Nashville & Davidson County, TN, Water & Sewer Revenue, Subordinated, Series B, Refunding |
5.000 | % | 7/1/46 | 50,000 | 61,442 | |||||||||||
| Tennessee State Energy Acquisition Corp., Natural Gas Revenue: |
||||||||||||||||
| Series 2018 |
4.000 | % | 11/1/25 | 100,000 | 113,386 | (b)(c) | ||||||||||
| Series A |
5.250 | % | 9/1/26 | 425,000 | 509,840 | |||||||||||
| Total Tennessee |
809,009 | |||||||||||||||
| Texas — 4.5% |
||||||||||||||||
| Arlington, TX, Higher Education Finance Corp., Education Revenue, Uplift Education, Series A, Refunding, PSF - GTD |
5.000 | % | 12/1/37 | 20,000 | 24,260 | |||||||||||
| Arlington, TX, Special Tax Revenue, Subordinated Lien, Series C, BAM |
5.000 | % | 2/15/41 | 100,000 | 111,972 | |||||||||||
| Austin, TX, Airport System Revenue, Series 2019B |
5.000 | % | 11/15/44 | 250,000 | 313,228 | (a) | ||||||||||
| Central Texas Regional Mobility Authority Revenue: |
||||||||||||||||
| Senior Lien, Series B |
4.000 | % | 1/1/51 | 250,000 | 292,583 | |||||||||||
| Senior Lien, Series E |
4.000 | % | 1/1/50 | 250,000 | 290,219 | |||||||||||
| Forney, TX, ISD, GO, School Building, Series 2019, PSF - GTD |
5.000 | % | 2/15/49 | 100,000 | 120,107 | |||||||||||
| Grand Parkway Transportation Corp., TX, System Toll Revenue, First Tier Toll Revenue, Series C, Refunding |
4.000 | % | 10/1/40 | 500,000 | 592,556 | |||||||||||
| Harris County, TX, Cultural Education Facilities Finance Corp., Thermal Utility Revenue, Teco Project, Refunding |
5.000 | % | 11/15/33 | 200,000 | 247,595 | |||||||||||
See Notes to Financial Statements.
| 18 | Western Asset SMASh Series TF Fund 2021 Semi-Annual Report |
Western Asset SMASh Series TF Fund
(Percentages shown based on Fund net assets)
| Security | Rate | Maturity Date |
Face Amount |
Value | ||||||||||||
| Texas — continued |
||||||||||||||||
| Houston, TX, Airport System Revenue: |
||||||||||||||||
| Special Facilities, United Airlines Inc., Technical Operations Center Project |
5.000 | % | 7/15/28 | $ | 100,000 | $ | 120,717 | (a) | ||||||||
| Special Facilities, United Airlines Inc., Terminal Improvement Project, Series B1 |
4.000 | % | 7/15/41 | 400,000 | 436,041 | (a) | ||||||||||
| Subordinated Lien, Series A, Refunding |
4.000 | % | 7/1/46 | 400,000 | 469,301 | (a) | ||||||||||
| New Hope Cultural Education Facilities Finance Corp., TX, Senior Living Revenue, Cardinal Bay Inc., Village on the Park/Carriage Inn Project, Series A1 |
5.000 | % | 7/1/31 | 15,000 | 16,005 | |||||||||||
| Southwest Texas, Higher Education Authority Inc. Revenue, Southern Methodist University Project, Refunding |
5.000 | % | 10/1/41 | 50,000 | 60,585 | |||||||||||
| Tarrant County, TX, Cultural Education Facilities Finance Corp., Retirement Facility Revenue: |
||||||||||||||||
| Buckner Retirement Services Inc. Project, Refunding |
5.000 | % | 11/15/37 | 50,000 | 60,202 | |||||||||||
| Buckner Retirement Services Inc. Project, Refunding |
5.000 | % | 11/15/46 | 50,000 | 59,268 | |||||||||||
| Texas State, Municipal Gas Acquisition & Supply Corp. I, Gas Supply Revenue, Senior Lien, Series D |
6.250 | % | 12/15/26 | 155,000 | 181,828 | |||||||||||
| Texas State Private Activity Bond Surface Transportation Corp. Revenue: |
||||||||||||||||
| LBJ Infrastructure Group LLC I-635 Managed Lanes Project, Series L |
4.000 | % | 12/31/38 | 75,000 | 89,104 | |||||||||||
| Senior Lien, Blueridge Transportation Group LLC |
5.000 | % | 12/31/40 | 5,000 | 5,669 | (a) | ||||||||||
| West Harris County, TX, Regional Water Authority Revenue, Series 2019 |
4.000 | % | 12/15/49 | 100,000 | 116,766 | |||||||||||
| Total Texas |
3,608,006 | |||||||||||||||
| U.S. Virgin Islands — 0.4% |
||||||||||||||||
| Virgin Islands Public Finance Authority Revenue: |
||||||||||||||||
| Matching Fund Loan, Senior Lien, Series A |
5.000 | % | 10/1/29 | 155,000 | 155,390 | |||||||||||
| Matching Fund Loan, Subordinated Lien, Series B |
5.250 | % | 10/1/29 | 175,000 | 172,367 | |||||||||||
| Total U.S. Virgin Islands |
327,757 | |||||||||||||||
| Utah — 3.1% |
||||||||||||||||
| Salt Lake City, UT, Airport Revenue, Salt Lake City International Airport, Series A |
5.000 | % | 7/1/43 | 250,000 | 305,230 | (a) | ||||||||||
| Utah State Charter School Finance Authority, Charter School Revenue: |
||||||||||||||||
| Syracuse Arts Academy Project, UT CSCE |
5.000 | % | 4/15/37 | 5,000 | 5,762 | |||||||||||
See Notes to Financial Statements.
| Western Asset SMASh Series TF Fund 2021 Semi-Annual Report | 19 |
Schedule of investments (unaudited) (cont’d)
August 31, 2021
Western Asset SMASh Series TF Fund
(Percentages shown based on Fund net assets)
| Security | Rate | Maturity Date |
Face Amount |
Value | ||||||||||||
| Utah — continued |
||||||||||||||||
| Utah Charter Academies Project, Series 2018, UT CSCE |
5.000 | % | 10/15/38 | $ | 220,000 | $ | 260,600 | |||||||||
| Utah State Infrastructure Agency, Telecommunications Revenue, Series A |
5.250 | % | 10/15/33 | 200,000 | 242,057 | |||||||||||
| Vineyard Redevelopment Agency, UT, Tax Increment Revenue: |
||||||||||||||||
| Series 2021, Refunding, AGM |
5.000 | % | 5/1/31 | 235,000 | 311,723 | |||||||||||
| Series 2021, Refunding, AGM |
4.000 | % | 5/1/37 | 275,000 | 329,838 | |||||||||||
| Series 2021, Refunding, AGM |
4.000 | % | 5/1/39 | 300,000 | 358,132 | |||||||||||
| Series 2021, Refunding, AGM |
4.000 | % | 5/1/41 | 290,000 | 344,076 | |||||||||||
| Series 2021, Refunding, AGM |
4.000 | % | 5/1/46 | 275,000 | 322,177 | |||||||||||
| Total Utah |
2,479,595 | |||||||||||||||
| Virginia — 0.9% |
||||||||||||||||
| Arlington County, VA, IDA Revenue: |
||||||||||||||||
| Refunding |
5.000 | % | 2/15/43 | 50,000 | 60,578 | |||||||||||
| Virginia Hospital Center, Refunding |
5.000 | % | 7/1/36 | 200,000 | 260,422 | |||||||||||
| Virginia State Small Business Financing Authority Revenue: |
||||||||||||||||
| Bon Secours Mercy Health, Series A, Refunding |
4.000 | % | 12/1/49 | 250,000 | 291,868 | |||||||||||
| National Senior Campuses, Inc., Series A, Refunding |
5.000 | % | 1/1/34 | 85,000 | 104,559 | |||||||||||
| Total Virginia |
717,427 | |||||||||||||||
| Washington — 0.5% |
||||||||||||||||
| Port of Seattle, WA, Intermediate Lien Revenue, Series 2019 |
5.000 | % | 4/1/34 | 250,000 | 313,559 | (a) | ||||||||||
| Washington State Health Care Facilities Authority Revenue, Seattle Cancer Care Alliance, Refunding |
5.000 | % | 9/1/55 | 100,000 | 126,847 | |||||||||||
| Total Washington |
440,406 | |||||||||||||||
| West Virginia — 1.2% |
||||||||||||||||
| West Virginia Parkways Authority, WV, Turnpike Toll Revenue, Senior Lien |
5.000 | % | 6/1/33 | 600,000 | 808,580 | |||||||||||
| West Virginia University Revenue, West Virginia Projects, Series B, Refunding |
5.000 | % | 10/1/29 | 100,000 | 128,474 | (b)(c) | ||||||||||
| Total West Virginia |
937,054 | |||||||||||||||
See Notes to Financial Statements.
| 20 | Western Asset SMASh Series TF Fund 2021 Semi-Annual Report |
Western Asset SMASh Series TF Fund
(Percentages shown based on Fund net assets)
| Security | Rate | Maturity Date |
Face Amount |
Value | ||||||||||||
| Wisconsin — 0.2% |
||||||||||||||||
| Public Finance Authority, WI, Revenue, Carmelite System Inc., Obligated Group, Series 2020 |
5.000 | % | 1/1/40 | $ | 50,000 | $ | 60,836 | |||||||||
| Public Finance Authority, WI, Student Housing Revenue, CHF Wilmington LLC, University of North Carolina at Wilmington Project, AGM |
5.000 | % | 7/1/53 | 100,000 | 119,553 | |||||||||||
| Total Wisconsin |
180,389 | |||||||||||||||
| Total Investments before Short-Term Investments (Cost — $70,203,710) |
|
75,137,898 | ||||||||||||||
| Short-Term Investments — 8.2% | ||||||||||||||||
| Municipal Bonds — 8.2% | ||||||||||||||||
| Arizona — 0.1% |
||||||||||||||||
| Phoenix, AZ, IDA, Health Care Facilities Revenue, Mayo Clinic, Series B, SPA - Northern Trust Co. |
0.010 | % | 11/15/52 | 100,000 | 100,000 | (h)(i) | ||||||||||
| California — 0.6% |
||||||||||||||||
| San Francisco, CA, City & County Airport Commission, International Airport Revenue, Second Series A, Refunding, LOC - Bank of America N.A. |
0.030 | % | 5/1/30 | 500,000 | 500,000 | (a)(h)(i) | ||||||||||
| Florida — 0.4% |
||||||||||||||||
| St. Lucie County, FL, Solid Waste Disposal Revenue, Florida Power & Light Co. Project, Refunding |
0.020 | % | 5/1/24 | 300,000 | 300,000 | (a)(h)(i) | ||||||||||
| Maryland — 0.9% |
||||||||||||||||
| Maryland State HEFA Revenue, University of Maryland Medical System, Series D, LOC - TD Bank N.A. |
0.010 | % | 7/1/41 | 700,000 | 700,000 | (h)(i) | ||||||||||
| Massachusetts — 0.6% |
||||||||||||||||
| Massachusetts State DFA Revenue: |
||||||||||||||||
| Boston University, Series U-6C, Refunding, LOC - TD Bank N.A. |
0.010 | % | 10/1/42 | 100,000 | 100,000 | (h)(i) | ||||||||||
| Boston University, Series U-6E, Refunding, LOC - TD Bank N.A. |
0.010 | % | 10/1/42 | 355,000 | 355,000 | (h)(i) | ||||||||||
| Total Massachusetts |
455,000 | |||||||||||||||
| Mississippi — 2.4% |
||||||||||||||||
| Mississippi State Business Finance Corp., Gulf Opportunity Zone, IDR: |
||||||||||||||||
| Chevron USA Inc. Project, Series A |
0.010 | % | 11/1/35 | 100,000 | 100,000 | (h)(i) | ||||||||||
| Chevron USA Inc. Project, Series E |
0.010 | % | 12/1/30 | 500,000 | 500,000 | (h)(i) | ||||||||||
| Chevron USA Inc. Project, Series G |
0.010 | % | 11/1/35 | 700,000 | 700,000 | (h)(i) | ||||||||||
See Notes to Financial Statements.
| Western Asset SMASh Series TF Fund 2021 Semi-Annual Report | 21 |
Schedule of investments (unaudited) (cont’d)
August 31, 2021
Western Asset SMASh Series TF Fund
(Percentages shown based on Fund net assets)
| Security | Rate | Maturity Date |
Face Amount |
Value | ||||||||||||
| Mississippi — continued |
||||||||||||||||
| Chevron USA Inc. Project, Series I |
0.010 | % | 11/1/35 | $ | 100,000 | $ | 100,000 | (h)(i) | ||||||||
| Chevron USA Inc. Project, Series K |
0.010 | % | 11/1/35 | 500,000 | 500,000 | (h)(i) | ||||||||||
| Total Mississippi |
1,900,000 | |||||||||||||||
| New Jersey — 0.1% |
||||||||||||||||
| New Jersey State Health Care Facilities Financing Authority Revenue, Series D, LOC - TD Bank N.A. |
0.010 | % | 7/1/43 | 100,000 | 100,000 | (h)(i) | ||||||||||
| New York — 2.5% |
||||||||||||||||
| New York City, NY, GO, Subseries G-6, LOC - Mizuho Bank Ltd. |
0.010 | % | 4/1/42 | 525,000 | 525,000 | (h)(i) | ||||||||||
| New York City, NY, Municipal Water Finance Authority, Water & Sewer System Revenue: |
||||||||||||||||
| Second General Resolution Fiscal 2008, Series BB-5, Refunding, SPA - Bank of America N.A. |
0.010 | % | 6/15/33 | 800,000 | 800,000 | (h)(i) | ||||||||||
| Second General Resolution Fiscal 2014, Series AA-5, Refunding, SPA - Mizuho Bank Ltd. |
0.010 | % | 6/15/48 | 600,000 | 600,000 | (h)(i) | ||||||||||
| New York City, NY, TFA Revenue Future Tax Secured, Subseries A, Refunding, SPA - TD Bank N.A. |
0.010 | % | 11/1/29 | 100,000 | 100,000 | (h)(i) | ||||||||||
| Total New York |
2,025,000 | |||||||||||||||
| Oregon — 0.1% |
||||||||||||||||
| Oregon State Facilities Authority Revenue, Peacehealth, Series A, Refunding, LOC - U.S. Bank N.A. |
0.010 | % | 8/1/34 | 100,000 | 100,000 | (h)(i) | ||||||||||
| Pennsylvania — 0.1% |
||||||||||||||||
| Lancaster County, PA, Hospital Authority Revenue, Series D, Refunding, LOC - JPMorgan Chase & Co. |
0.020 | % | 7/1/34 | 100,000 | 100,000 | (h)(i) | ||||||||||
| Texas — 0.4% |
||||||||||||||||
| Lower Neches Valley Authority, TX, Industrial Development Corp. Revenue, ExxonMobil Corp., Series B, Refunding |
0.020 | % | 11/1/29 | 300,000 | 300,000 | (a)(h)(i) | ||||||||||
| Total Municipal Bonds (Cost — $6,580,000) |
6,580,000 | |||||||||||||||
| Shares | ||||||||||||||||
| Overnight Deposits — 0.0%†† | ||||||||||||||||
| BNY Mellon Cash Reserve Fund (Cost — $6,483) |
0.010 | % | 6,483 | 6,483 | ||||||||||||
| Total Short-Term Investments (Cost — $6,586,483) |
|
6,586,483 | ||||||||||||||
| Total Investments — 101.0% (Cost — $76,790,193) |
|
81,724,381 | ||||||||||||||
| Liabilities in Excess of Other Assets — (1.0)% |
(781,342 | ) | ||||||||||||||
| Total Net Assets — 100.0% |
$ | 80,943,039 | ||||||||||||||
See Notes to Financial Statements.
| 22 | Western Asset SMASh Series TF Fund 2021 Semi-Annual Report |
Western Asset SMASh Series TF Fund
| †† | Represents less than 0.1%. |
| * | Non-income producing security. |
| (a) | Income from this issue is considered a preference item for purposes of calculating the alternative minimum tax (“AMT”). |
| (b) | Maturity date shown represents the mandatory tender date. |
| (c) | Variable rate security. Interest rate disclosed is as of the most recent information available. Certain variable rate securities are not based on a published reference rate and spread but are determined by the issuer or agent and are based on current market conditions. These securities do not indicate a reference rate and spread in their description above. |
| (d) | Securities traded on a when-issued or delayed delivery basis. |
| (e) | Pre-Refunded bonds are generally escrowed with U.S. government obligations and/or U.S. government agency securities. |
| (f) | Security is exempt from registration under Rule 144A of the Securities Act of 1933. This security may be resold in transactions that are exempt from registration, normally to qualified institutional buyers. This security has been deemed liquid pursuant to guidelines approved by the Board of Trustees. |
| (g) | The coupon payment on this security is currently in default as of August 31, 2021. |
| (h) | Variable rate demand obligations (“VRDOs”) have a demand feature under which the Fund can tender them back to the issuer or liquidity provider on no more than 7 days notice. The interest rate generally resets on a daily or weekly basis and is determined on the specific interest rate reset date by the remarketing agent, pursuant to a formula specified in official documents for the VRDO, or set at the highest rate allowable as specified in official documents for the VRDO. VRDOs are benchmarked to the Securities Industry and Financial Markets Association (“SIFMA”) Municipal Swap Index. The SIFMA Municipal Swap Index is compiled from weekly interest rate resets of tax-exempt VRDOs reported to the Municipal Securities Rulemaking Board’s Short-term Obligation Rate Transparency System. |
| (i) | Maturity date shown is the final maturity date. The security may be sold back to the issuer before final maturity. |
See Notes to Financial Statements.
| Western Asset SMASh Series TF Fund 2021 Semi-Annual Report | 23 |
Schedule of investments (unaudited) (cont’d)
August 31, 2021
Western Asset SMASh Series TF Fund
| Abbreviation(s) used in this schedule: | ||
| AGM | — Assured Guaranty Municipal Corporation — Insured Bonds | |
| BAM | — Build America Mutual — Insured Bonds | |
| BAN | — Bond Anticipation Notes | |
| CAB | — Capital Appreciation Bonds | |
| CDA | — Communities Development Authority | |
| COP | — Certificates of Participation | |
| CSCE | — Charter School Credit Enhancement | |
| CWA | — Clean Water Act | |
| DFA | — Development Finance Agency | |
| EDA | — Economic Development Authority | |
| EFA | — Educational Facilities Authority | |
| GO | — General Obligation | |
| GTD | — Guaranteed | |
| HDA | — Housing Development Authority | |
| HEFA | — Health & Educational Facilities Authority | |
| IDA | — Industrial Development Authority | |
| IDR | — Industrial Development Revenue | |
| ISD | — Independent School District | |
| LOC | — Letter of Credit | |
| MFA | — Municipal Finance Authority | |
| MTA | — Metropolitan Transportation Authority | |
| NATL | — National Public Finance Guarantee Corporation — Insured Bonds | |
| PCR | — Pollution Control Revenue | |
| PEA | — Public Energy Authority | |
| PFA | — Public Facilities Authority | |
| PSF | — Permanent School Fund | |
| SD | — School District | |
| SIFMA | — Securities Industry and Financial Markets Association | |
| SPA | — Standby Bond Purchase Agreement — Insured Bonds | |
| TFA | — Transitional Finance Authority | |
| USD | — Unified School District | |
See Notes to Financial Statements.
| 24 | Western Asset SMASh Series TF Fund 2021 Semi-Annual Report |
Statement of assets and liabilities (unaudited)
August 31, 2021
| Assets: | ||||
| Investments, at value (Cost — $76,790,193) |
$ | 81,724,381 | ||
| Interest receivable |
703,128 | |||
| Receivable for Fund shares sold |
111,183 | |||
| Receivable from investment manager |
15,866 | |||
| Prepaid expenses |
17,349 | |||
| Total Assets |
82,571,907 | |||
| Liabilities: | ||||
| Payable for securities purchased |
1,596,869 | |||
| Trustees’ fees payable |
257 | |||
| Accrued expenses |
31,742 | |||
| Total Liabilities |
1,628,868 | |||
| Total Net Assets | $ | 80,943,039 | ||
| Net Assets: | ||||
| Par value (Note 5) |
$ | 74 | ||
| Paid-in capital in excess of par value |
76,463,909 | |||
| Total distributable earnings (loss) |
4,479,056 | |||
| Total Net Assets | $ | 80,943,039 | ||
| Shares Outstanding | 7,372,041 | |||
| Net Asset Value | $10.98 | |||
See Notes to Financial Statements.
| Western Asset SMASh Series TF Fund 2021 Semi-Annual Report | 25 |
Statement of operations (unaudited)
For the Six Months Ended August 31, 2021
| Investment Income: |
| |||
| Interest |
$ | 899,710 | ||
| Expenses: | ||||
| Fund accounting fees |
34,733 | |||
| Registration fees |
17,514 | |||
| Audit and tax fees |
15,197 | |||
| Legal fees |
3,763 | |||
| Shareholder reports |
2,132 | |||
| Trustees’ fees |
1,086 | |||
| Insurance |
763 | |||
| Commitment fees (Note 6) |
250 | |||
| Interest expense |
234 | |||
| Custody fees |
225 | |||
| Transfer agent fees |
197 | |||
| Miscellaneous expenses |
2,973 | |||
| Total Expenses |
79,067 | |||
| Less: Fee waivers and/or expense reimbursements (Note 2) |
(79,067) | |||
| Net Expenses |
— | |||
| Net Investment Income | 899,710 | |||
| Realized and Unrealized Gain on Investments (Notes 1 and 3): | ||||
| Net Realized Gain From Investment Transactions |
186,802 | |||
| Change in Net Unrealized Appreciation (Depreciation) From Investments |
1,774,675 | |||
| Net Gain on Investments | 1,961,477 | |||
| Increase in Net Assets From Operations | $ | 2,861,187 | ||
See Notes to Financial Statements.
| 26 | Western Asset SMASh Series TF Fund 2021 Semi-Annual Report |
Statements of changes in net assets
| For the Six Months Ended August 31, 2021 (unaudited) and the Year Ended February 28, 2021 |
August 31 | February 28 | ||||||
| Operations: | ||||||||
| Net investment income |
$ | 899,710 | $ | 1,615,251 | ||||
| Net realized gain (loss) |
186,802 | (244,704) | ||||||
| Change in net unrealized appreciation (depreciation) |
1,774,675 | (521,360) | ||||||
| Increase in Net Assets From Operations |
2,861,187 | 849,187 | ||||||
| Distributions to Shareholders From (Note 1): | ||||||||
| Total distributable earnings |
(879,068) | (1,621,097) | ||||||
| Decrease in Net Assets From Distributions to Shareholders |
(879,068) | (1,621,097) | ||||||
| Fund Share Transactions (Note 5): | ||||||||
| Net proceeds from sale of shares |
18,031,519 | 31,900,100 | ||||||
| Cost of shares repurchased |
(7,072,440) | (21,792,737) | ||||||
| Increase in Net Assets From Fund Share Transactions |
10,959,079 | 10,107,363 | ||||||
| Increase in Net Assets |
12,941,198 | 9,335,453 | ||||||
| Net Assets: | ||||||||
| Beginning of period |
68,001,841 | 58,666,388 | ||||||
| End of period |
$ | 80,943,039 | $ | 68,001,841 | ||||
See Notes to Financial Statements.
| Western Asset SMASh Series TF Fund 2021 Semi-Annual Report | 27 |
| For a share of beneficial interest outstanding throughout each year ended February 28, unless otherwise noted: | ||||||||||||||||||||||||
| 20211,2 | 20211 | 20201,3 | 20191 | 20181 | 20171 | |||||||||||||||||||
| Net asset value, beginning of period | $10.69 | $10.86 | $10.09 | $10.00 | $9.84 | $10.05 | ||||||||||||||||||
| Income (loss) from operations: | ||||||||||||||||||||||||
| Net investment income |
0.13 | 0.28 | 0.28 | 0.28 | 0.24 | 0.28 | ||||||||||||||||||
| Net realized and unrealized gain (loss) |
0.28 | (0.17) | 0.77 | 0.07 | 0.15 | 4 | (0.20) | |||||||||||||||||
| Total income from operations |
0.41 | 0.11 | 1.05 | 0.35 | 0.39 | 0.08 | ||||||||||||||||||
| Less distributions from: | ||||||||||||||||||||||||
| Net investment income |
(0.12) | (0.28) | (0.28) | (0.26) | (0.23) | (0.28) | ||||||||||||||||||
| Net realized gains |
— | — | — | — | — | (0.01) | ||||||||||||||||||
| Total distributions |
(0.12) | (0.28) | (0.28) | (0.26) | (0.23) | (0.29) | ||||||||||||||||||
| Net asset value, end of period | $10.98 | $10.69 | $10.86 | $10.09 | $10.00 | $9.84 | ||||||||||||||||||
| Total return5 |
3.88 | % | 1.09 | % | 10.53 | % | 3.53 | % | 3.99 | % | 0.83 | % | ||||||||||||
| Net assets, end of period (000s) | $80,943 | $68,002 | $58,666 | $32,979 | $23,937 | $2,264 | ||||||||||||||||||
| Ratios to average net assets: | ||||||||||||||||||||||||
| Gross expenses6 |
0.20 | %7 | 0.25 | % | 0.34 | % | 0.56 | % | 0.91 | % | 7.57 | % | ||||||||||||
| Net expenses8,9 |
0.00 | 7 | 0.00 | 0.00 | 0.00 | 0.00 | 0.00 | |||||||||||||||||
| Net investment income |
2.31 | 7 | 2.66 | 2.72 | 2.76 | 2.44 | 2.79 | |||||||||||||||||
| Portfolio turnover rate | 5 | % | 35 | % | 9 | % | 22 | % | 16 | % | 14 | % | ||||||||||||
| 1 | Per share amounts have been calculated using the average shares method. |
| 2 | For the six months ended August 31, 2021 (unaudited). |
| 3 | For the year ended February 29. |
| 4 | Calculation of the net gain per share (both realized and unrealized) does not correlate to the aggregate realized and unrealized losses presented in the Statement of Operations due to the timing of the sales and repurchases of Fund shares in relation to fluctuating market values of the investments of the Fund. |
| 5 | Performance figures do not reflect the effect of fees and expenses associated with a separately managed account, nor a management fee or other operating expenses of the Fund. Such management fees are paid directly or indirectly by the separately managed account sponsor to the Fund’s manager or subadviser. All operating expenses of the Fund were reimbursed by the manager, pursuant to an expense reimbursement arrangement between the Fund and the manager. If such fees were included, the total return would have been lower. Past performance is no guarantee of future results. Total returns for periods of less than one year are not annualized. |
| 6 | Gross expenses do not include management fees paid to the manager and subadviser. Management fees are paid directly or indirectly by the separately managed account sponsor. |
| 7 | Annualized. |
| 8 | The Fund’s manager has entered into an expense reimbursement arrangement with the Fund, pursuant to which the Fund’s manager has agreed to reimburse 100% of the Fund’s ordinary operating expenses. The expense reimbursement arrangement does not cover interest, brokerage, taxes and extraordinary expenses. This arrangement cannot be terminated prior to December 31, 2022 without the Board of Trustees’ consent. |
| 9 | Reflects fee waivers and/or expense reimbursements. |
See Notes to Financial Statements.
| 28 | Western Asset SMASh Series TF Fund 2021 Semi-Annual Report |
Notes to financial statements (unaudited)
1. Organization and significant accounting policies
Western Asset SMASh Series TF Fund (the “Fund”) is a separate non-diversified investment series of Legg Mason Partners Institutional Trust (the “Trust”). The Trust, a Maryland statutory trust, is registered under the Investment Company Act of 1940, as amended (the “1940 Act”), as an open-end management investment company.
Shares of the Fund may be purchased only by or on behalf of separately managed account clients where an affiliate of Legg Mason Partners Fund Advisor, LLC (“LMPFA”) has an agreement to serve as investment adviser or subadviser (each affiliate, a “Managed Account Adviser”) to the account with the managed account program sponsor (the “Program Sponsor”) (typically, a registered investment adviser or broker/dealer) or directly with the client. Shareholders of the Fund pay fees to their separately managed account sponsor, some of which are paid to affiliates of LMPFA. LMPFA and the subadviser do not charge investment management fees to the Fund.
The following are significant accounting policies consistently followed by the Fund and are in conformity with U.S. generally accepted accounting principles (“GAAP”). Estimates and assumptions are required to be made regarding assets, liabilities and changes in net assets resulting from operations when financial statements are prepared. Changes in the economic environment, financial markets and any other parameters used in determining these estimates could cause actual results to differ. Subsequent events have been evaluated through the date the financial statements were issued.
(a) Investment valuation. The valuations for fixed income securities (which may include, but are not limited to, corporate, government, municipal, mortgage-backed, collateralized mortgage obligations and asset-backed securities) and certain derivative instruments are typically the prices supplied by independent third party pricing services, which may use market prices or broker/dealer quotations or a variety of valuation techniques and methodologies. The independent third party pricing services typically use inputs that are observable such as issuer details, interest rates, yield curves, prepayment speeds, credit risks/spreads, default rates and quoted prices for similar securities. Investments in open-end funds are valued at the closing net asset value per share of each fund on the day of valuation. Futures contracts are valued daily at the settlement price established by the board of trade or exchange on which they are traded. If independent third party pricing services are unable to supply prices for a portfolio investment, or if the prices supplied are deemed by the manager to be unreliable, the market price may be determined by the manager using quotations from one or more broker/dealers or at the transaction price if the security has recently been purchased and no value has yet been obtained from a pricing service or pricing broker. When reliable prices are not readily available, such as when the value of a security has been significantly affected by events after the close of the exchange or market on which the security is principally traded, but before the Fund calculates its net asset value, the Fund values these securities as determined in accordance with procedures approved by the Fund’s Board of Trustees.
| Western Asset SMASh Series TF Fund 2021 Semi-Annual Report | 29 |
Notes to financial statements (unaudited) (cont’d)
The Board of Trustees is responsible for the valuation process and has delegated the supervision of the daily valuation process to the Global Fund Valuation Committee (the “Valuation Committee”). The Valuation Committee, pursuant to the policies adopted by the Board of Trustees, is responsible for making fair value determinations, evaluating the effectiveness of the Fund’s pricing policies, and reporting to the Board of Trustees. When determining the reliability of third party pricing information for investments owned by the Fund, the Valuation Committee, among other things, conducts due diligence reviews of pricing vendors, monitors the daily change in prices and reviews transactions among market participants.
The Valuation Committee will consider pricing methodologies it deems relevant and appropriate when making fair value determinations. Examples of possible methodologies include, but are not limited to, multiple of earnings; discount from market of a similar freely traded security; discounted cash-flow analysis; book value or a multiple thereof; risk premium/yield analysis; yield to maturity; and/or fundamental investment analysis. The Valuation Committee will also consider factors it deems relevant and appropriate in light of the facts and circumstances. Examples of possible factors include, but are not limited to, the type of security; the issuer’s financial statements; the purchase price of the security; the discount from market value of unrestricted securities of the same class at the time of purchase; analysts’ research and observations from financial institutions; information regarding any transactions or offers with respect to the security; the existence of merger proposals or tender offers affecting the security; the price and extent of public trading in similar securities of the issuer or comparable companies; and the existence of a shelf registration for restricted securities.
For each portfolio security that has been fair valued pursuant to the policies adopted by the Board of Trustees, the fair value price is compared against the last available and next available market quotations. The Valuation Committee reviews the results of such back testing monthly and fair valuation occurrences are reported to the Board of Trustees quarterly.
The Fund uses valuation techniques to measure fair value that are consistent with the market approach and/or income approach, depending on the type of security and the particular circumstance. The market approach uses prices and other relevant information generated by market transactions involving identical or comparable securities. The income approach uses valuation techniques to discount estimated future cash flows to present value.
| 30 | Western Asset SMASh Series TF Fund 2021 Semi-Annual Report |
GAAP establishes a disclosure hierarchy that categorizes the inputs to valuation techniques used to value assets and liabilities at measurement date. These inputs are summarized in the three broad levels listed below:
| • | Level 1 — quoted prices in active markets for identical investments |
| • | Level 2 — other significant observable inputs (including quoted prices for similar investments, interest rates, prepayment speeds, credit risk, etc.) |
| • | Level 3 — significant unobservable inputs (including the Fund’s own assumptions in determining the fair value of investments) |
The inputs or methodologies used to value securities are not necessarily an indication of the risk associated with investing in those securities.
The following is a summary of the inputs used in valuing the Fund’s assets carried at fair value:
| ASSETS | ||||||||||||||||
| Description | Quoted Prices (Level 1) |
Other Significant Observable Inputs (Level 2) |
Significant (Level 3) |
Total | ||||||||||||
| Municipal Bonds† | — | $ | 75,137,898 | — | $ | 75,137,898 | ||||||||||
| Short-Term Investments†: | ||||||||||||||||
| Municipal Bonds |
— | 6,580,000 | — | 6,580,000 | ||||||||||||
| Overnight Deposits |
— | 6,483 | — | 6,483 | ||||||||||||
| Total Short-Term Investments | — | 6,586,483 | — | 6,586,483 | ||||||||||||
| Total Investments | — | $ | 81,724,381 | — | $ | 81,724,381 | ||||||||||
| † | See Schedule of Investments for additional detailed categorizations. |
(b) Securities traded on a when-issued and delayed delivery basis. The Fund may trade securities on a when-issued or delayed delivery basis. In when-issued and delayed delivery transactions, the securities are purchased or sold by the Fund with payment and delivery taking place in the future in order to secure what is considered to be an advantageous price and yield to the Fund at the time of entering into the transaction.
Purchasing such securities involves risk of loss if the value of the securities declines prior to settlement. These securities are subject to market fluctuations and their current value is determined in the same manner as for other securities.
(c) Security transactions and investment income. Security transactions are accounted for on a trade date basis. Interest income (including interest income from payment-in-kind securities), adjusted for amortization of premium and accretion of discount, is recorded on the accrual basis. The cost of investments sold is determined by use of the specific identification method. To the extent any issuer defaults or a credit event occurs that impacts
| Western Asset SMASh Series TF Fund 2021 Semi-Annual Report | 31 |
Notes to financial statements (unaudited) (cont’d)
the issuer, the Fund may halt any additional interest income accruals and consider the realizability of interest accrued up to the date of default or credit event.
(d) Distributions to shareholders. Distributions from net investment income of the Fund, if any, are declared and paid on a monthly basis. The Fund intends to satisfy conditions that will enable interest from municipal securities, which is exempt from federal and certain state income taxes, to retain such tax-exempt status when distributed to the shareholders of the Fund. Distributions of net realized gains, if any, are taxable and are declared at least annually. Distributions to shareholders of the Fund are recorded on the ex-dividend date and are determined in accordance with income tax regulations, which may differ from GAAP.
(e) Compensating balance arrangements. The Fund has an arrangement with its custodian bank whereby a portion of the custodian’s fees is paid indirectly by credits earned on the Fund’s cash on deposit with the bank.
(f) Federal and other taxes. It is the Fund’s policy to comply with the federal income and excise tax requirements of the Internal Revenue Code of 1986 (the “Code”), as amended, applicable to regulated investment companies. Accordingly, the Fund intends to distribute its taxable income and net realized gains, if any, to shareholders in accordance with timing requirements imposed by the Code. Therefore, no federal or state income tax provision is required in the Fund’s financial statements.
Management has analyzed the Fund’s tax positions taken on income tax returns for all open tax years and has concluded that as of February 28, 2021, no provision for income tax is required in the Fund’s financial statements. The Fund’s federal and state income and federal excise tax returns for tax years for which the applicable statutes of limitations have not expired are subject to examination by the Internal Revenue Service and state departments of revenue.
(g) Reclassification. GAAP requires that certain components of net assets be reclassified to reflect permanent differences between financial and tax reporting. These reclassifications have no effect on net assets or net asset value per share.
2. Investment management agreement and other transactions with affiliates
LMPFA is the Fund’s investment manager. Western Asset Management Company, LLC (“Western Asset”) is the Fund’s subadviser. LMPFA and Western Asset are indirect, wholly-owned subsidiaries of Franklin Resources, Inc. (“Franklin Resources”).
LMPFA and the subadviser do not charge investment management fees to the Fund. However, the Fund is an integral part of the separately managed account program, and LMPFA and the subadviser will be compensated directly or indirectly by separately managed account program sponsors. LMPFA provides administrative and certain oversight services to the Fund. LMPFA delegates to the subadviser the day-to-day portfolio management of the Fund.
| 32 | Western Asset SMASh Series TF Fund 2021 Semi-Annual Report |
LMPFA has entered into an expense reimbursement arrangement with the Fund, pursuant to which LMPFA has agreed to reimburse 100% of the Fund’s ordinary operating expenses. The expense reimbursement arrangement does not cover interest, brokerage, taxes and extraordinary expenses. This expense reimbursement arrangement cannot be terminated prior to December 31, 2022 without the Board of Trustees’ consent.
During the six months ended August 31, 2021, fees waived and/or expenses reimbursed amounted to $79,067.
Franklin Distributors, LLC (formerly known as Legg Mason Investor Services, LLC prior to July 7, 2021) (“Franklin Distributors”) serves as the Fund’s sole and exclusive distributor. Franklin Distributors is an indirect, wholly-owned broker-dealer subsidiary of Franklin Resources.
All officers and one Trustee of the Trust are employees of Franklin Resources or its affiliates and do not receive compensation from the Trust.
The Fund is permitted to purchase or sell securities, typically short-term variable rate demand obligations, from or to certain other affiliated funds or portfolios under specified conditions outlined in procedures adopted by the Board of Trustees. The procedures have been designed to provide assurance that any purchase or sale of securities by the Fund from or to another fund or portfolio that is, or could be considered, an affiliate by virtue of having a common investment manager or subadviser (or affiliated investment manager or subadviser), common Trustees and/or common officers complies with Rule 17a-7 under the 1940 Act. Further, as defined under the procedures, each transaction is effected at the current market price. For the six months ended August 31, 2021, such purchase and sale transactions (excluding accrued interest) were $12,258,500 and $13,900,000, respectively.
3. Investments
During the six months ended August 31, 2021, the aggregate cost of purchases and proceeds from sales of investments (excluding short-term investments) were as follows:
| Purchases | $ | 16,345,601 | ||
| Sales | 3,578,244 |
At August 31, 2021, the aggregate cost of investments and the aggregate gross unrealized appreciation and depreciation of investments for federal income tax purposes were substantially as follows:
| Cost | Gross Unrealized Appreciation |
Gross Unrealized Depreciation |
Net Unrealized Appreciation |
|||||||||||||
| Securities | $ | 76,790,193 | $ | 4,979,610 | $ | (45,422) | $ | 4,934,188 | ||||||||
| Western Asset SMASh Series TF Fund 2021 Semi-Annual Report | 33 |
Notes to financial statements (unaudited) (cont’d)
4. Derivative instruments and hedging activities
During the six months ended August 31, 2021, the Fund did not invest in derivative instruments.
5. Shares of beneficial interest
At August 31, 2021, the Trust had an unlimited number of shares of beneficial interest authorized with a par value of $0.00001 per share. Each share represents an identical interest and has the same rights.
Transactions in shares of the Fund were as follows:
| Six Months Ended August 31, 2021 |
Year Ended February 28, 2021 |
|||||||
| Shares sold | 1,655,911 | 3,055,100 | ||||||
| Shares repurchased | (645,313) | (2,095,843) | ||||||
| Net increase | 1,010,598 | 959,257 | ||||||
6. Redemption facility
The Fund and certain other participating funds within the Trust, together with other U.S. registered and foreign investment funds (collectively, the “Borrowers”) managed by LMPFA or Franklin Resources, are borrowers in a joint syndicated senior unsecured credit facility totaling $2.675 billion (the “Global Credit Facility”). The Global Credit Facility provides a source of funds to the Borrowers for temporary and emergency purposes, including the ability to meet future unanticipated or unusually large redemption requests. Unless renewed, the Global Credit Facility will terminate on February 4, 2022.
Under the terms of the Global Credit Facility, the Fund shall, in addition to interest charged on any borrowings made by the Fund and other costs incurred by the Fund, pay its share of fees and expenses incurred in connection with the implementation and maintenance of the Global Credit Facility, based upon its relative share of the aggregate net assets of all the Borrowers, including an annual commitment fee of 0.15% based upon the unused portion of the Global Credit Facility. These fees are reflected in the Statement of Operations. The Fund did not utilize the Global Credit Facility during the six months ended August 31, 2021.
7. Deferred capital losses
As of February 28, 2021, the Fund had deferred capital losses of $755,181, which have no expiration date, that will be available to offset future taxable capital gains.
8. Recent accounting pronouncement
In March 2020, the Financial Accounting Standards Board (FASB) issued Accounting Standards Update (ASU) No. 2020-04, Reference Rate Reform (Topic 848) – Facilitation of the Effects of Reference Rate Reform on Financial Reporting. In January 2021, the FASB issued ASU No. 2021-01, with further amendments to Topic 848. The amendments in the ASUs provide optional temporary accounting recognition and financial reporting relief from
| 34 | Western Asset SMASh Series TF Fund 2021 Semi-Annual Report |
the effect of certain types of contract modifications due to the planned discontinuation of the LIBOR and other interbank-offered based reference rates as of the end of 2021 and 2023. The ASUs are effective for certain reference rate-related contract modifications that occur during the period March 12, 2020 through December 31, 2022. Management has reviewed the requirements and believes the adoption of these ASUs will not have a material impact on the financial statements.
9. Other matters
The outbreak of the respiratory illness COVID-19 (commonly referred to as “coronavirus”) has continued to rapidly spread around the world, causing considerable uncertainty for the global economy and financial markets. The ultimate economic fallout from the pandemic, and the long-term impact on economies, markets, industries and individual issuers, are not known. The COVID-19 pandemic could adversely affect the value and liquidity of the Fund’s investments, impair the Fund’s ability to satisfy redemption requests, and negatively impact the Fund’s performance. In addition, the outbreak of COVID-19, and measures taken to mitigate its effects, could result in disruptions to the services provided to the Fund by its service providers.
* * *
The Fund’s investments, payment obligations, and financing terms may be based on floating rates, such as the London Interbank Offered Rate, or “LIBOR,” which is the offered rate for short-term Eurodollar deposits between major international banks. On March 5, 2021, the ICE Benchmark Administration, the administrator of LIBOR, stated that it will cease the publication of (i) the overnight and one-, three-, six- and twelve-month USD LIBOR settings immediately following the LIBOR publication on Friday, June 30, 2023 and (ii) all other LIBOR settings, including the one-week and two-month USD LIBOR settings, immediately following the LIBOR publication on Friday, December 31, 2021. There remains uncertainty regarding the nature of any replacement rate and the impact of the transition from LIBOR on the Fund’s transactions and the financial markets generally. As such, the potential effect of a transition away from LIBOR on the Fund or the Fund’s investments cannot yet be determined.
| Western Asset SMASh Series TF Fund 2021 Semi-Annual Report | 35 |
Western Asset
SMASh Series TF Fund
Trustees
Robert Abeles, Jr.
Jane F. Dasher
Anita L. DeFrantz
Susan B. Kerley
Michael Larson
Ronald L. Olson
Avedick B. Poladian
William E.B. Siart
Chairman
Jaynie M. Studenmund
Peter J. Taylor
Jane Trust
Investment manager
Legg Mason Partners Fund Advisor, LLC
Subadviser
Western Asset Management Company, LLC
Distributor
Franklin Distributors, LLC†
Custodian
The Bank of New York Mellon
| † | Effective July 7, 2021, Legg Mason Investor Services, LLC was renamed Franklin Distributors, LLC. |
Transfer agent
BNY Mellon Investment
Servicing (US) Inc.
4400 Computer Drive
Westborough, MA 01581
Independent registered public accounting firm
PricewaterhouseCoopers LLP
Baltimore, MD
Western Asset SMASh Series TF Fund
The Fund is a separate investment series of Legg Mason Partners Institutional Trust, a Maryland statutory trust.
Western Asset SMASh Series TF Fund
Legg Mason Funds
620 Eighth Avenue, 47th Floor
New York, NY 10018
The Fund files its complete schedule of portfolio holdings with the Securities and Exchange Commission (“SEC”) for the first and third quarters of each fiscal year as an exhibit to its reports on Form N-PORT. The Fund’s Forms N-PORT are available on the SEC’s website at www.sec.gov. To obtain information on Form N-PORT, shareholders can call the Fund at 1-877-721-1926.
Information on how the Fund voted proxies relating to portfolio securities during the prior 12-month period ended June 30th of each year and a description of the policies and procedures that the Fund uses to determine how to vote proxies related to portfolio transactions are available (1) without charge, upon request, by calling the Fund at 1-877-721-1926, (2) at www.franklintempleton.com and (3) on the SEC’s website at www.sec.gov.
This report is submitted for the general information of the shareholders of Western Asset SMASh Series TF Fund and is not intended for distribution to prospective investors.
This report must be preceded or accompanied by a free prospectus. Investors should consider the Fund’s investment objectives, risks, charges and expenses carefully before investing. The prospectus contains this and other important information about the Fund. Please read the prospectus carefully before investing. www.franklintempleton.com
© 2021 Franklin Distributors, LLC,
Member FINRA/SIPC. All rights reserved.
Legg Mason Funds Privacy and Security Notice
Your Privacy and the Security of Your Personal Information is Very Important to the Legg Mason Funds
This Privacy and Security Notice (the “Privacy Notice”) addresses the Legg Mason Funds’ privacy and data protection practices with respect to nonpublic personal information the Funds receive. The Legg Mason Funds include any funds sold by the Funds’ distributor, Franklin Distributors, LLC, as well as Legg Mason-sponsored closed-end funds. The provisions of this Privacy Notice apply to your information both while you are a shareholder and after you are no longer invested with the Funds.
The Type of Nonpublic Personal Information the Funds Collect About You
The Funds collect and maintain nonpublic personal information about you in connection with your shareholder account. Such information may include, but is not limited to:
| • | Personal information included on applications or other forms; |
| • | Account balances, transactions, and mutual fund holdings and positions; |
| • | Bank account information, legal documents, and identity verification documentation; |
| • | Online account access user IDs, passwords, security challenge question responses; and |
| • | Information received from consumer reporting agencies regarding credit history and creditworthiness (such as the amount of an individual’s total debt, payment history, etc.). |
How the Funds Use Nonpublic Personal Information About You
The Funds do not sell or share your nonpublic personal information with third parties or with affiliates for their marketing purposes, or with other financial institutions or affiliates for joint marketing purposes, unless you have authorized the Funds to do so. The Funds do not disclose any nonpublic personal information about you except as may be required to perform transactions or services you have authorized or as permitted or required by law.
The Funds may disclose information about you to:
| • | Employees, agents, and affiliates on a “need to know” basis to enable the Funds to conduct ordinary business, or to comply with obligations to government regulators; |
| • | Service providers, including the Funds’ affiliates, who assist the Funds as part of the ordinary course of business (such as printing, mailing services, or processing or servicing your account with us) or otherwise perform services on the Funds’ behalf, including companies that may perform statistical analysis, market research and marketing services solely for the Funds; |
| • | Permit access to transfer, whether in the United States or countries outside of the United States to such Funds’ employees, agents and affiliates and service providers as required to enable the Funds to conduct ordinary business, or to comply with obligations to government regulators; |
| • | The Funds’ representatives such as legal counsel, accountants and auditors to enable the Funds to conduct ordinary business, or to comply with obligations to government regulators; |
| • | Fiduciaries or representatives acting on your behalf, such as an IRA custodian or trustee of a grantor trust. |
| NOT PART OF THE SEMI-ANNUAL REPORT |
Legg Mason Funds Privacy and Security Notice (cont’d)
Except as otherwise permitted by applicable law, companies acting on the Funds’ behalf, including those outside the United States, are contractually obligated to keep nonpublic personal information the Funds provide to them confidential and to use the information the Funds share only to provide the services the Funds ask them to perform. The Funds may disclose nonpublic personal information about you when necessary to enforce their rights or protect against fraud, or as permitted or required by applicable law, such as in connection with a law enforcement or regulatory request, subpoena, or similar legal process. In the event of a corporate action or in the event a Fund service provider changes, the Funds may be required to disclose your nonpublic personal information to third parties. While it is the Funds’ practice to obtain protections for disclosed information in these types of transactions, the Funds cannot guarantee their privacy policy will remain unchanged.
Keeping You Informed of the Funds’ Privacy and Security Practices
The Funds will notify you annually of their privacy policy as required by federal law. While the Funds reserve the right to modify this policy at any time they will notify you promptly if this privacy policy changes.
The Funds’ Security Practices
The Funds maintain appropriate physical, electronic and procedural safeguards designed to guard your nonpublic personal information. The Funds’ internal data security policies restrict access to your nonpublic personal information to authorized employees, who may use your nonpublic personal information for Fund business purposes only.
Although the Funds strive to protect your nonpublic personal information, they cannot ensure or warrant the security of any information you provide or transmit to them, and you do so at your own risk. In the event of a breach of the confidentiality or security of your nonpublic personal information, the Funds will attempt to notify you as necessary, so you can take appropriate protective steps. If you have consented to the Funds using electronic communications or electronic delivery of statements, they may notify you under such circumstances using the most current email address you have on record with them.
In order for the Funds to provide effective service to you, keeping your account information accurate is very important. If you believe that your account information is incomplete, not accurate or not current, if you have questions about the Funds’ privacy practices, or our use of your nonpublic personal information, write the Funds using the contact information on your account statements, email the Funds by clicking on the Contact Us section of the Funds’ website at www.franklintempleton.com, or contact the Fund at 1-877-721-1926.
Revised April 2018
Legg Mason California Consumer Privacy Act Policy
Although much of the personal information we collect is “nonpublic personal information” subject to federal law, residents of California may, in certain circumstances, have additional rights under the California Consumer Privacy Act (“CCPA”). For example, if you are a broker,
| NOT PART OF THE SEMI-ANNUAL REPORT |
Legg Mason Funds Privacy and Security Notice (cont’d)
dealer, agent, fiduciary, or representative acting by or on behalf of, or for, the account of any other person(s) or household, or a financial advisor, or if you have otherwise provided personal information to us separate from the relationship we have with personal investors, the provisions of this Privacy Policy apply to your personal information (as defined by the CCPA).
| • | In addition to the provisions of the Legg Mason Funds Security and Privacy Notice, you may have the right to know the categories and specific pieces of personal information we have collected about you. |
| • | You also have the right to request the deletion of the personal information collected or maintained by the Funds. |
If you wish to exercise any of the rights you have in respect of your personal information, you should advise the Funds by contacting them as set forth below. The rights noted above are subject to our other legal and regulatory obligations and any exemptions under the CCPA. You may designate an authorized agent to make a rights request on your behalf, subject to the identification process described below. We do not discriminate based on requests for information related to our use of your personal information, and you have the right not to receive discriminatory treatment related to the exercise of your privacy rights.
We may request information from you in order to verify your identity or authority in making such a request. If you have appointed an authorized agent to make a request on your behalf, or you are an authorized agent making such a request (such as a power of attorney or other written permission), this process may include providing a password/passcode, a copy of government issued identification, affidavit or other applicable documentation, i.e. written permission. We may require you to verify your identity directly even when using an authorized agent, unless a power of attorney has been provided. We reserve the right to deny a request submitted by an agent if suitable and appropriate proof is not provided.
For the 12-month period prior to the date of this Privacy Policy, the Legg Mason Funds have not sold any of your personal information; nor do we have any plans to do so in the future.
Contact Information
Address: Data Privacy Officer, 100 International Dr., Baltimore, MD 21202
Email: DataProtectionOfficer@franklintempleton.com
Phone: 1-800-396-4748
Revised October 2020
| NOT PART OF THE SEMI-ANNUAL REPORT |
www.franklintempleton.com
© 2021 Franklin Distributors, LLC,
WASX307368 10/21 SR21-4258
| ITEM 2. | CODE OF ETHICS. |
Not applicable.
| ITEM 3. | AUDIT COMMITTEE FINANCIAL EXPERT. |
Not applicable.
| ITEM 4. | PRINCIPAL ACCOUNTANT FEES AND SERVICES. |
Not applicable.
| ITEM 5. | AUDIT COMMITTEE OF LISTED REGISTRANTS. |
Not applicable.
| ITEM 6. | SCHEDULE OF INVESTMENTS. |
Included herein under Item 1.
| ITEM 7. | DISCLOSURE OF PROXY VOTING POLICIES AND PROCEDURES FOR CLOSED-END MANAGEMENT INVESTMENT COMPANIES. |
Not applicable.
| ITEM 8. | PORTFOLIO MANAGERS OF CLOSED-END MANAGEMENT INVESTMENT COMPANIES. |
Not applicable.
| ITEM 9. | PURCHASES OF EQUITY SECURITIES BY CLOSED-END MANAGEMENT INVESTMENT COMPANY AND AFFILIATED PURCHASERS. |
Not applicable.
| ITEM 10. | SUBMISSION OF MATTERS TO A VOTE OF SECURITY HOLDERS. |
Not applicable.
| ITEM 11. | CONTROLS AND PROCEDURES. |
| (a) | The registrant’s principal executive officer and principal financial officer have concluded that the registrant’s disclosure controls and procedures (as defined in Rule 30a- 3(c) under the Investment Company Act of 1940, as amended (the “1940 Act”)) are effective as of a date within 90 days of the filing date of this report that includes the disclosure required by this paragraph, based on their evaluation of the disclosure controls and procedures required by Rule 30a-3(b) under the 1940 Act and 15d-15(b) under the Securities Exchange Act of 1934. |
| (b) | There were no changes in the registrant’s internal control over financial reporting (as defined in Rule 30a-3(d) under the 1940 Act) that occurred during the second fiscal quarter of the period covered by this report that have materially affected, or are likely to materially affect the registrant’s internal control over financial reporting. |
| ITEM 12. | DISCLOSURE OF SECURITIES LENDING ACTIVITIES FOR CLOSED-END MANAGEMENT INVESTMENT COMPANIES. |
Not applicable.
| ITEM 13. | EXHIBITS. |
(a) (1) Not applicable.
Exhibit 99.CODE ETH
(a) (2) Certifications pursuant to section 302 of the Sarbanes-Oxley Act of 2002 attached hereto.
Exhibit 99.CERT
(b) Certifications pursuant to Section 906 of the Sarbanes-Oxley Act of 2002 attached hereto.
Exhibit 99.906CERT
SIGNATURES
Pursuant to the requirements of the Securities Exchange Act of 1934 and the Investment Company Act of 1940, the registrant has duly caused this Report to be signed on its behalf by the undersigned, there unto duly authorized.
Legg Mason Partners Institutional Trust
| By: | /s/ Jane Trust |
|||||
| Jane Trust | ||||||
| Chief Executive Officer | ||||||
| Date: | October 26, 2021 | |||||
Pursuant to the requirements of the Securities Exchange Act of 1934 and the Investment Company Act of 1940, this report has been signed below by the following persons on behalf of the registrant and in the capacities and on the dates indicated.
| By: | /s/ Jane Trust |
|||||
| Jane Trust | ||||||
| Chief Executive Officer | ||||||
| Date: | October 26, 2021 | |||||
| By: | /s/ Christopher Berarducci |
|||||
| Christopher Berarducci | ||||||
| Principal Financial Officer | ||||||
| Date: | October 26, 2021 | |||||