Management’s Discussion and Analysis (MD&A) is provided to enable a reader to assess our results of operations and financial condition for the fiscal year ended October 31, 2021, compared to the preceding fiscal year. This MD&A should be read in conjunction with our 2021 Annual Consolidated Financial Statements and related notes and is dated November 30, 2021. All amounts are in Canadian dollars, unless otherwise specified, and are based on financial statements presented in accordance with International Financial Reporting Standards (IFRS) as issued by the International Accounting Standards Board (IASB), unless otherwise noted. Additional information about us, including our 2021 Annual Information Form, is available free of charge on our website at rbc.com/investorrelations, on the Canadian Securities Administrators’ website at sedar.com and on the EDGAR section of the United States (U.S.) Securities and Exchange Commission’s (SEC) website at sec.gov. Information contained in or otherwise accessible through the websites mentioned herein does not form part of this report. All references in this report to websites are inactive textual references and are for your information only. |
13 |
||||
14 |
||||
14 | ||||
15 | ||||
15 | ||||
15 | ||||
16 | ||||
17 |
||||
20 |
||||
20 | ||||
20 | ||||
21 | ||||
22 | ||||
22 | ||||
22 | ||||
23 | ||||
23 | ||||
24 |
||||
24 |
25 | ||||
26 | ||||
27 | ||||
32 | ||||
38 | ||||
41 | ||||
43 | ||||
47 | ||||
47 |
||||
47 | ||||
48 | ||||
49 |
||||
49 | ||||
50 | ||||
52 |
||||
52 | ||||
55 | ||||
56 | ||||
60 |
||||
60 | ||||
72 | ||||
78 |
91 | ||||
91 |
||||
91 | ||||
93 | ||||
93 |
||||
93 | ||||
93 | ||||
94 | ||||
95 | ||||
96 |
||||
96 | ||||
96 |
||||
100 |
||||
109 |
||||
109 | ||||
112 | ||||
113 |
||||
113 |
||||
121 |
||||
123 |
Caution regarding forward-looking statements |
Overview and outlook |
Selected financial and other highlights |
|
Table 1 |
|
(Millions of Canadian dollars, except per share, number of and percentage amounts) |
2021 |
2020 | 2021 vs. 2020 Increase (decrease) |
|||||||||||||
Total revenue |
$ |
49,693 |
$ | 47,181 | $ |
2,512 |
5.3% |
|||||||||
Provision for credit losses (PCL) |
(753 |
) |
4,351 | (5,104 |
) |
(117.3)% |
||||||||||
Insurance policyholder benefits, claims and acquisition expense (PBCAE) |
3,891 |
3,683 | 208 |
5.6% |
||||||||||||
Non-interest expense |
25,924 |
24,758 | 1,166 |
4.7% |
||||||||||||
Income before income taxes |
20,631 |
14,389 | 6,242 |
43.4% |
||||||||||||
Net income |
$ |
16,050 |
$ | 11,437 | $ |
4,613 |
40.3% |
|||||||||
Segments – net income |
||||||||||||||||
Personal & Commercial Banking |
$ |
7,847 |
$ | 5,087 | $ |
2,760 |
54.3% |
|||||||||
Wealth Management (1) |
2,626 |
2,154 | 472 |
21.9% |
||||||||||||
Insurance |
889 |
831 | 58 |
7.0% |
||||||||||||
Investor & Treasury Services |
440 |
536 | (96 |
) |
(17.9)% |
|||||||||||
Capital Markets |
4,187 |
2,776 | 1,411 |
50.8% |
||||||||||||
Corporate Support (1) |
61 |
53 | 8 |
n.m. |
||||||||||||
Net income |
$ |
16,050 |
$ | 11,437 | $ |
4,613 |
40.3% |
|||||||||
Selected information |
||||||||||||||||
Earnings per share (EPS) – basic |
$ |
11.08 |
$ | 7.84 | $ |
3.24 |
41.3% |
|||||||||
– diluted |
11.06 |
7.82 | 3.24 |
41.4% |
||||||||||||
Return on common equity (ROE) (2 ) |
18.6% |
14.2% | n.m. |
440 bps |
||||||||||||
Average common equity (2) |
$ |
84,850 |
$ | 78,800 | $ |
6,050 |
7.7% |
|||||||||
Net interest margin (NIM) – on average earning assets, net (3 ) |
1.48% |
1.55% | n.m. |
(7) bps |
||||||||||||
PCL on loans as a % of average net loans and acceptances |
(0.10)% |
0.63% | n.m. |
(73) bps |
||||||||||||
PCL on performing loans as a % of average net loans and acceptances |
(0.20)% |
0.39% | n.m. |
(59) bps |
||||||||||||
PCL on impaired loans as a % of average net loans and acceptances |
0.10% |
0.24% | n.m. |
(14) bps |
||||||||||||
Gross impaired loans (GIL) as a % of loans and acceptances |
0.31% |
0.47% | n.m. |
(16) bps |
||||||||||||
Liquidity coverage ratio (LCR) (4) |
123% |
145% | n.m. |
(2200) bps |
||||||||||||
Net stable funding ratio (NSFR) (5) |
116% |
n.a. | n.a. |
n.a. |
||||||||||||
Capital ratios and Leverage ratio (6) |
||||||||||||||||
Common Equity Tier 1 (CET1) ratio |
13.7% |
12.5% | n.m. |
120 bps |
||||||||||||
Tier 1 capital ratio |
14.9% |
13.5% | n.m. |
140 bps |
||||||||||||
Total capital ratio |
16.7% |
15.5% | n.m. |
120 bps |
||||||||||||
Leverage ratio |
4.9% |
4.8% | n.m. |
10 bps |
||||||||||||
Selected balance sheet and other information (7) |
||||||||||||||||
Total assets |
$ |
1,706,323 |
$ | 1,624,548 | $ |
81,775 |
5.0% |
|||||||||
Securities, net of applicable allowance |
284,724 |
275,814 | 8,910 |
3.2% |
||||||||||||
Loans, net of allowance for loan losses |
717,575 |
660,992 | 56,583 |
8.6% |
||||||||||||
Derivative related assets |
95,541 |
113,488 | (17,947 |
) |
(15.8)% |
|||||||||||
Deposits |
1,100,831 |
1,011,885 | 88,946 |
8.8% |
||||||||||||
Common equity |
91,983 |
80,719 | 11,264 |
14.0% |
||||||||||||
Total risk-weighted assets |
552,541 |
546,242 | 6,299 |
1.2% |
||||||||||||
Assets under management (AUM) (3) |
1,008,700 |
843,600 | 165,100 |
19.6% |
||||||||||||
Assets under administration (AUA) (3) , (8) |
6,347,300 |
5,891,200 | 456,100 |
7.7% |
||||||||||||
Common share information |
||||||||||||||||
Shares outstanding (000s) – average basic |
1,424,343 |
1,423,915 | 428 |
0.0% |
||||||||||||
– average diluted |
1,426,735 |
1,428,770 | (2,035 |
) |
(0.1)% |
|||||||||||
– end of period |
1,424,525 |
1,422,473 | 2,052 |
0.1% |
||||||||||||
Dividends declared per common share |
$ |
4.32 |
$ | 4.29 | $ |
0.03 |
0.7% |
|||||||||
Dividend yield (3) |
3.8% |
4.7% | n.m. |
(90) bps |
||||||||||||
Dividend payout ratio (3) |
39% |
55% | n.m. |
(1600) bps |
||||||||||||
Common share price (RY on TSX) (9) |
$ |
128.82 |
$ | 93.16 | $ |
35.66 |
38.3% |
|||||||||
Market capitalization (TSX) (9) |
183,507 |
132,518 | 50,989 |
38.5% |
||||||||||||
Business information |
||||||||||||||||
Employees (full-time equivalent) (FTE) |
85,301 |
83,842 | 1,459 |
1.7% |
||||||||||||
Bank branches |
1,295 |
1,329 | (34 |
) |
(2.6)% |
|||||||||||
Automated teller machines (ATMs) |
4,378 |
4,557 | (179 |
) |
(3.9)% |
|||||||||||
Period average US$ equivalent of C$1.00 (10) |
$ |
0.796 |
$ | 0.744 | $ |
0.052 |
7.0% |
|||||||||
Period-end US$ equivalent of C$1.00 |
$ |
0.808 |
$ | 0.751 | $ |
0.057 |
7.5% |
(1) | Effective Q4 2021, gains (losses) on economic hedges of our U.S. share-based compensation plans, which are reflected in revenue, and related variability in share-based compensation expense driven by changes in the fair value of liabilities relating to our U.S. share-based compensation plans have been reclassified from our Wealth Management segment to Corporate Support. Comparative amounts have been reclassified to conform with this presentation. |
(2) | Average amounts are calculated using methods intended to approximate the average of the daily balances for the period. This includes average common equity used in the calculation of ROE. For further details, refer to the Key performance and non-GAAP measures section. |
(3) | See Glossary for composition of this measure. |
(4) | LCR is the average for the three months ended for each respective period and is calculated in accordance with the Office of the Superintendent of Financial Institutions’ (OSFI) Liquidity Adequacy Requirements (LAR) guidance. For further details, refer to the Liquidity and funding risk section. |
(5) | Beginning in Q1 2021, OSFI requires Canadian Domestic Systemically Important Banks (D-SIBs) to disclose the NSFR on a prospective basis. The NSFR is calculated in accordance with OSFI’s Liquidity Adequacy Requirements (LAR) guideline. For further details, refer to the Liquidity and funding risk section. |
(6) | Capital ratios are calculated using OSFI’s Capital Adequacy Requirements (CAR) guideline and the Leverage ratio is calculated using OSFI’s Leverage Requirements (LR) guideline. |
(7) | Represents year-end spot balances. |
(8) | AUA includes $15 billion and $3 billion (2020 – $16 billion and $7 billion) of securitized residential mortgages and credit card loans, respectively. |
(9) | Based on TSX closing market price at period-end. |
(10) | Average amounts are calculated using month-end spot rates for the period. |
n.a. | not applicable |
n.m. | not meaningful |
About Royal Bank of Canada |
Personal & Commercial Banking |
Provides a broad suite of financial products and services in Canada, the Caribbean and the U.S. Our commitment to building and maintaining deep and meaningful relationships with our clients is underscored by the breadth of our product suite, our depth of expertise, and the features of our digital solutions. | |
Wealth Management |
Serves affluent, high net worth (HNW) and ultra-high net worth (UHNW) clients from our offices in key financial centres mainly in Canada, the U.S., the United Kingdom (U.K.), Europe, and Asia. We offer a comprehensive suite of investment, trust, banking, credit and other advice-based solutions. We also provide asset management products to institutional and individual clients through our distribution channels and third-party distributors. | |
Insurance |
Offers a wide range of life, health, home, auto, travel, wealth, annuities, reinsurance advice and solutions, as well as business insurance solutions, to individual, business and group clients. | |
Investor & Treasury Services |
Provides asset servicing, custody, payments and treasury services to financial and other investors worldwide. Trusted with over $4 trillion in assets under administration, and with offices in 16 countries in North America, Europe, the U.K., and Asia-Pacific, our focus is on safeguarding client assets and simplifying our clients’ operations in support of their growth. | |
Capital Markets |
Provides expertise in advisory & origination, sales & trading, and lending & financing to corporations, institutional investors, asset managers, private equity firms and governments globally. We serve clients from 58 offices in 14 countries across North America, the U.K. & Europe, and Australia, Asia & other regions. | |
Corporate Support |
Corporate Support consists of Technology & Operations, which provides the technological and operational foundation required to effectively deliver products and services to our clients, Functions, which includes our finance, human resources, risk management, internal audit and other functional groups, as well as our Corporate Treasury function. |
Vision and strategic goals |
• | In Canada, to be the undisputed leader in financial services; |
• | In the U.S., to be the preferred partner to corporate, institutional and high net worth clients and their businesses; and |
• | In select global financial centres, to be a leading financial services partner valued for our expertise. |
Economic, market and regulatory review and outlook – data as at November 30, 2021 |
Defining and measuring success through total shareholder returns |
Financial performance compared to our medium-term objectives |
Table 2 |
Medium-term objectives (1) |
3-year (2) |
5-year (2) |
||||||||
Diluted EPS growth of 7% + |
10% |
10% |
||||||||
ROE of 16% + |
|
16.5% |
16.8% |
|||||||
Strong capital ratio (CET1) (3) |
12.8% |
12.1% |
||||||||
Dividend payout ratio 40% – 50% |
47% |
46% |
(1) | A medium-term (3-5 year) objective is considered to be achieved when the performance goal is met in either a 3- or 5-year period. These objectives assume a normal business environment and our ability to achieve them in a period may be adversely affected by extraordinary developments such as the COVID-19 pandemic and the current low interest rate environment. |
(2) | Diluted EPS growth is calculated using a Compound Annual Growth Rate (CAGR). ROE, CET1 and dividend payout ratio are calculated using an average. |
(3) | For further details on the CET1 ratio, refer to the Capital management section. |
• | Canadian financial institutions: |
• | U.S. banks: |
• | International banks: |
Medium-term objectives – 3- and 5-year TSR vs. peer group average |
Table 3 |
3-year TSR (1) |
5-year TSR (1) |
|||||||
Royal Bank of Canada |
16% | 13% | ||||||
Top half | Top half | |||||||
Peer group average (excluding RBC) |
14% | 12% |
(1) | The 3- and 5-year annualized TSR are calculated based on our common share price appreciation as per the TSX closing market price plus reinvested dividends for the period October 31, 2018 to October 31, 2021 and October 31, 2016 to October 31, 2021. |
Common share and dividend information |
Table 4 |
For the year ended October 31 |
2021 |
2020 | 2019 | 2018 | 2017 | |||||||||||||||
Common share price (RY on TSX) – close, end of period |
$ |
128.82 |
$ | 93.16 | $ | 106.24 | $ | 95.92 | $ | 100.87 | ||||||||||
Dividends paid per share |
4.32 |
4.26 | 4.00 | 3.70 | 3.40 | |||||||||||||||
Increase (decrease) in share price |
38.3% |
(12.3)% | 10.8% | (4.9)% | 20.4% | |||||||||||||||
Total shareholder return |
43.8% |
(8.4)% | 15.2% | (1.0)% | 25.0% |
Impact of COVID-19 pandemic |
• | The Canada Emergency Business Account (CEBA) – Under this program, Canadian banks were able to facilitate interest-free loans of up to $60,000 to existing eligible small business clients as a source of liquidity for immediate operating costs. The loans were funded by the Government of Canada, with the Canadian banks retaining no credit risk. The application window for the CEBA program closed on June 30, 2021. |
• | Export Development Canada (EDC) Business Credit Availability Program Guarantee – Under this program, Canadian banks are able to provide existing eligible mid-sized and large business clients, focused on both export oriented and domestic sales-based businesses, with loans of up to $6.25 million to support short-term liquidity needs. These loans must be used for certain operating costs and are 80% guaranteed by the EDC. On June 2, 2021, the EDC announced that the application deadline for this program has been extended to December 31, 2021. |
• | Business Development Canada (BDC) Co-Lending Program – Under this program, the BDC and Canadian banks jointly provide loans, which are funded based on an 80%/20% split, respectively, to eligible business clients of up to $6.25 million to meet their operational and liquidity needs. The maximum loan varies by the size of the business and may be structured with an interest-only payment obligation for the first year. On June 2, 2021, the BDC announced that the application deadline for this program has been extended to December 31, 2021. |
• | BDC Mid-Market Financing Program – Under this program, the BDC and Canadian banks provide loans, which are funded based on a 90%/10% split, respectively, to eligible mid-sized business clients ranging between $12.5 million and $60 million to meet their operational and liquidity needs. On June 2, 2021, the BDC announced that the application deadline for this program has been extended to December 31, 2021. |
• | EDC Mid-Market Guarantee and Financing Program – Under this program, Canadian banks are able to provide existing eligible mid-sized and large business clients, focused on both export oriented and domestic sales-based businesses, with loans ranging from $12.5 million to a maximum of $80 million for terms up to 5 years, to support their liquidity needs. These loans must be used for certain operating costs and are 75% guaranteed by the EDC. On June 2, 2021, the EDC announced that the application deadline for this program has been extended to December 31, 2021. |
• | On January 26, 2021, the Canadian Federal government announced the BDC Highly Affected Sectors Credit Availability Program (HASCAP). Under this program, Canadian banks are able to provide low-interest loans ranging from $25,000 to $1 million to businesses that have been heavily impacted by the COVID-19 pandemic to cover operational cash flow needs. Loans funded under this program are fully guaranteed by the BDC. The application deadline for this program has been extended from June 30, 2021 to December 31, 2021. |
Financial performance |
Overview |
Impact of foreign currency translation |
|
Table 5 |
| ||
(Millions of Canadian dollars, except per share amounts) |
2021 vs. 2020 |
|||
Increase (decrease): |
||||
Total revenue |
$ |
(977 |
) | |
PCL |
28 |
|||
Non-interest expense |
(707 |
) | ||
Income taxes |
(50 |
) | ||
Net income |
(248 |
) | ||
Impact on EPS |
||||
Basic |
$ |
(0.17 |
) | |
Diluted |
(0.17 |
) |
Table 6 |
(Average foreign currency equivalent of C$1.00) (1) |
2021 |
2020 |
||||||
U.S. dollar |
0.796 |
0.744 | ||||||
British pound |
0.579 |
0.579 | ||||||
Euro |
0.668 |
0.658 |
(1) | Average amounts are calculated using month-end spot rates for the period. |
Total revenue |
Table 7 |
(Millions of Canadian dollars, except percentage amounts) |
2021 |
2020 |
||||||
Interest and dividend income |
$ |
28,145 |
$ | 34,883 | ||||
Interest expense |
8,143 |
14,048 | ||||||
Net interest income |
$ |
20,002 |
$ | 20,835 | ||||
NIM |
1.48% |
1.55% | ||||||
Insurance premiums, investment and fee income |
$ |
5,600 |
$ | 5,361 | ||||
Trading revenue |
1,183 |
1,239 | ||||||
Investment management and custodial fees |
7,132 |
6,101 | ||||||
Mutual fund revenue |
4,251 |
3,712 | ||||||
Securities brokerage commissions |
1,538 |
1,439 | ||||||
Service charges |
1,858 |
1,842 | ||||||
Underwriting and other advisory fees |
2,692 |
2,319 | ||||||
Foreign exchange revenue, other than trading |
1,066 |
1,012 | ||||||
Card service revenue |
1,078 |
969 | ||||||
Credit fees |
1,530 |
1,321 | ||||||
Net gains on investment securities |
145 |
90 | ||||||
Share of profit in joint ventures and associates |
130 |
77 | ||||||
Other |
1,488 |
864 | ||||||
Non-interest income |
$ |
29,691 |
$ | 26,346 | ||||
Total revenue |
$ |
49,693 |
$ | 47,181 |
Table 8 |
(Millions of Canadian dollars) |
2021 |
2020 | ||||||
Net interest income (1) |
$ |
2,623 |
$ | 3,459 | ||||
Non-interest income |
1,183 |
1,239 | ||||||
Total trading revenue |
$ |
3,806 |
$ | 4,698 | ||||
Total trading revenue by product |
||||||||
Interest rate and credit |
$ |
1,948 |
$ | 2,838 | ||||
Equities |
1,285 |
1,234 | ||||||
Foreign exchange and commodities |
573 |
626 | ||||||
Total trading revenue |
$ |
3,806 |
$ | 4,698 |
(1) | Reflects net interest income arising from trading-related positions, including assets and liabilities that are classified or designated at fair value through profit or loss (FVTPL). |
Provision for credit losses |
Insurance policyholder benefits, claims and acquisition expense (PBCAE) |
Non-interest expense |
Table 9 |
(Millions of Canadian dollars, except percentage amounts) |
2021 |
2020 | ||||||
Salaries |
$ |
6,724 |
$ | 6,758 | ||||
Variable compensation |
7,145 |
6,040 | ||||||
Benefits and retention compensation |
2,053 |
1,994 | ||||||
Share-based compensation |
617 |
460 | ||||||
Human resources |
16,539 |
15,252 | ||||||
Equipment |
1,986 |
1,907 | ||||||
Occupancy |
1,584 |
1,660 | ||||||
Communications |
931 |
989 | ||||||
Professional fees |
1,351 |
1,330 | ||||||
Amortization of other intangibles |
1,287 |
1,273 | ||||||
Other |
2,246 |
2,347 | ||||||
Non-interest expense |
$ |
25,924 |
$ | 24,758 | ||||
Efficiency ratio (1) |
52.2% |
52.5% | ||||||
Efficiency ratio adjusted (2) |
52.2% |
52.8% |
(1) | Efficiency ratio is calculated as Non-interest expense divided by Total revenue. |
(2) | This is a non-GAAP ratio. This measure has been adjusted by excluding the change in fair value of investments backing policyholder liabilities from total revenue. For further details, refer to the Key performance and non-GAAP measures section. |
Income and other taxes |
Table 10 |
(Millions of Canadian dollars, except percentage amounts) |
2021 |
2020 | ||||||
Income taxes |
$ |
4,581 |
$ | 2,952 | ||||
Other taxes |
||||||||
Value added and sales taxes |
443 |
496 | ||||||
Payroll taxes |
810 |
771 | ||||||
Capital taxes |
73 |
52 | ||||||
Property taxes |
140 |
140 | ||||||
Insurance premium taxes |
31 |
29 | ||||||
Business taxes |
39 |
43 | ||||||
1,536 |
1,531 | |||||||
Total income and other taxes |
$ |
6,117 |
$ | 4,483 | ||||
Income before income taxes |
$ |
20,631 |
$ | 14,389 | ||||
Effective income tax rate |
22.2% |
20.5% | ||||||
Effective total tax rate (1) |
27.6% |
28.2% |
(1) | Total income and other taxes as a percentage of income before income taxes and other taxes. |
Client assets |
AUA by geographic mix and asset class |
Table 11 |
(Millions of Canadian dollars) |
2021 |
2020 | ||||||
Canada (1) |
||||||||
Money market |
$ |
42,700 |
$ | 42,800 | ||||
Fixed income |
772,400 |
763,500 | ||||||
Equity |
781,400 |
591,200 | ||||||
Multi-asset and other |
1,150,400 |
954,800 | ||||||
Total Canada |
2,746,900 |
|
2,352,300 |
| ||||
U.S. (1) |
||||||||
Money market |
49,800 |
40,100 | ||||||
Fixed income |
90,400 |
107,300 | ||||||
Equity |
256,000 |
195,400 | ||||||
Multi-asset and other |
324,600 |
256,000 | ||||||
Total U.S. |
720,800 |
|
598,800 |
| ||||
Other International (1) |
||||||||
Money market |
32,800 |
40,700 | ||||||
Fixed income |
308,200 |
375,400 | ||||||
Equity |
865,000 |
837,200 | ||||||
Multi-asset and other |
1,673,600 |
|
1,686,800 |
| ||||
Total International |
2,879,600 |
|
2,940,100 |
| ||||
Total AUA |
$ |
6,347,300 |
$ |
5,891,200 |
|
(1) | Geographic information is based on the location from where our clients are serviced. |
Client assets – AUM |
Table 12 |
2021 |
2020 |
|||||||||||||||||||||||||||
(Millions of Canadian dollars) |
Money market |
Fixed income |
Equity |
Multi-asset and other |
Total |
Total |
||||||||||||||||||||||
AUM, beginning balance |
$ |
48,900 |
$ |
227,600 |
$ |
96,000 |
$ |
471,100 |
$ |
843,600 |
$ | 762,300 | ||||||||||||||||
Institutional inflows |
20,200 |
55,000 |
12,300 |
10,500 |
98,000 |
106,700 | ||||||||||||||||||||||
Institutional outflows |
(16,300 |
) |
(42,200 |
) |
(6,300 |
) |
(8,900 |
) |
(73,700 |
) |
(80,300 | ) | ||||||||||||||||
Personal flows, net |
(2,400 |
) |
3,300 |
3,500 |
47,100 |
51,500 |
31,600 | |||||||||||||||||||||
Total net flows |
1,500 |
16,100 |
9,500 |
48,700 |
75,800 |
58,000 | ||||||||||||||||||||||
Market impact |
– |
(300 |
) |
33,400 |
90,700 |
123,800 |
17,900 | |||||||||||||||||||||
Acquisition/dispositions |
(4,500 |
) |
– |
– |
– |
(4,500 |
) |
700 | ||||||||||||||||||||
Foreign exchange |
(2,400 |
) |
(8,000 |
) |
(1,300 |
) |
(18,300 |
) |
(30,000 |
) |
4,700 | |||||||||||||||||
Total market, acquisition/dispositions and foreign exchange impact |
(6,900 |
) |
(8,300 |
) |
32,100 |
72,400 |
89,300 |
23,300 | ||||||||||||||||||||
AUM, balance at end of year |
$ |
43,500 |
$ |
235,400 |
$ |
137,600 |
$ |
592,200 |
$ |
1,008,700 |
$ | 843,600 |
Business segment results |
Results by business segments |
Table 13 |
2021 |
2020 |
|||||||||||||||||||||||||||||||||||
(Millions of Canadian dollars, except percentage amounts) |
Personal & Commercial Banking |
Wealth Management |
Insurance |
Investor & Treasury Services |
Capital Markets (1) |
Corporate Support (1) |
Total |
Total | ||||||||||||||||||||||||||||
Net interest income |
$ |
12,621 |
$ |
2,689 |
$ |
– |
$ |
460 |
$ |
4,553 |
$ |
(321 |
) |
$ |
20,002 |
$ | 20,835 | |||||||||||||||||||
Non-interest income |
5,725 |
10,607 |
5,600 |
1,704 |
5,634 |
421 |
29,691 |
26,346 | ||||||||||||||||||||||||||||
Total revenue |
18,346 |
13,296 |
5,600 |
2,164 |
10,187 |
100 |
49,693 |
47,181 | ||||||||||||||||||||||||||||
PCL |
(187 |
) |
(47 |
) |
(1 |
) |
(8 |
) |
(509 |
) |
(1 |
) |
(753 |
) |
4,351 | |||||||||||||||||||||
PBCAE |
– |
– |
3,891 |
– |
– |
– |
3,891 |
3,683 | ||||||||||||||||||||||||||||
Non-interest expense |
7,978 |
9,929 |
596 |
1,589 |
5,427 |
405 |
25,924 |
24,758 | ||||||||||||||||||||||||||||
Income before income taxes |
10,555 |
3,414 |
1,114 |
583 |
5,269 |
(304 |
) |
20,631 |
14,389 | |||||||||||||||||||||||||||
Income taxes |
2,708 |
788 |
225 |
143 |
1,082 |
(365 |
) |
4,581 |
2,952 | |||||||||||||||||||||||||||
Net income |
$ |
7,847 |
$ |
2,626 |
$ |
889 |
$ |
440 |
$ |
4,187 |
$ |
61 |
$ |
16,050 |
$ | 11,437 | ||||||||||||||||||||
ROE (2) |
32.0% |
15.9% |
37.4% |
14.0% |
18.3% |
n.m. |
18.6% |
14.2% | ||||||||||||||||||||||||||||
Average assets |
$ |
527,100 |
$ |
136,000 |
$ |
21,600 |
$ |
235,400 |
$ |
710,200 |
$ |
47,900 |
$ |
1,678,200 |
$ | 1,636,700 |
(1) | Net interest income, Non-interest income, Total revenue, Income before income taxes, and Income taxes are presented in Capital Markets on a taxable equivalent basis (teb). The teb adjustment is eliminated in the Corporate Support segment. For a further discussion, refer to the How we measure and report our business segments section. |
(2) | For further details, refer to the Key performance and non-GAAP measures section. |
n.m. | not meaningful |
How we measure and report our business segments |
• | Wealth Management results include disclosure in U.S. dollars, primarily for U.S. Wealth Management (including City National) as we review and manage the results of this business largely in this currency. |
• | Capital Markets results are reported on a teb basis, which grosses up total revenue from certain tax-advantaged sources (Canadian taxable corporate dividends and the U.S. tax credit investment business) to their effective taxable equivalent value with a corresponding offset recorded in the provision for income taxes. We record the elimination of the teb adjustments in Corporate Support. We believe these adjustments are useful and reflect how Capital Markets manages its business, since it enhances the comparability of revenue and related ratios across taxable revenue and our principal tax-advantaged sources of revenue. The use of teb adjustments and measures may not be comparable to similar GAAP measures or similarly adjusted amounts disclosed by other financial institutions. |
• | Corporate Support results include all enterprise level activities that are undertaken for the benefit of the organization that are not allocated to our five business segments, such as certain treasury and liquidity management activities, including amounts associated with unattributed capital, and consolidation adjustments, including the elimination of the teb gross-up amounts. In addition, we record gains (losses) on economic hedges of our U.S. Wealth Management (including City National) share-based compensation plans, which are reflected in revenue, and related variability in share-based compensation expense driven by changes in the fair value of liabilities relating to these plans in Corporate Support as we believe this presentation more closely aligns with how we view business performance and manage the underlying risks. |
Key performance and non-GAAP measures |
Calculation of ROE |
Table 14 |
2021 |
2020 |
|||||||||||||||||||||||||||||||||||
(Millions of Canadian dollars, except percentage amounts) |
Personal & Commercial Banking |
Wealth Management |
Insurance |
Investor & Treasury Services |
Capital Markets |
Corporate Support |
Total |
Total | ||||||||||||||||||||||||||||
Net income available to common shareholders |
$ |
7,761 |
$ |
2,577 |
$ |
882 |
$ |
431 |
$ |
4,119 |
$ |
11 |
$ 15,781 |
$ 11,164 | ||||||||||||||||||||||
Total average common equity (1) , (2) |
24,200 |
16,200 |
2,350 |
3,100 |
22,550 |
16,450 |
84,850 |
78,800 | ||||||||||||||||||||||||||||
ROE (3) |
32.0% |
15.9% |
37.4% |
14.0% |
18.3% |
n.m. |
18.6% |
14.2% |
(1) | Total average common equity represents rounded figures. |
(2) | The amounts for the segments are referred to as attributed capital. |
(3) | ROE is based on actual balances of average common equity before rounding. |
n.m. | not meaningful |
Consolidated non-GAAP efficiency ratio |
Table 15 |
2021 |
2020 |
|||||||||||||||||||||||||
Item excluded |
Item excluded | |||||||||||||||||||||||||
(Millions of Canadian dollars, except percentage amounts) |
As reported |
Change in fair value of investments backing policyholder liabilities |
Adjusted |
As reported | Change in fair value of investments backing policyholder liabilities |
Adjusted | ||||||||||||||||||||
Total revenue |
$ |
49,693 |
$ |
13 |
$ |
49,706 |
$ | 47,181 | $ | (277 | ) | $ | 46,904 | |||||||||||||
Non-interest expense |
25,924 |
– |
25,924 |
24,758 | – | 24,758 | ||||||||||||||||||||
Efficiency ratio |
|
52.2% |
|
52.2% |
|
52.5% |
|
52.8% |
Personal & Commercial Banking |
> 14 million |
8 million |
36,675 | ||||||
Number of clients |
Active digital users in Canada 1 |
Employees | ||||||
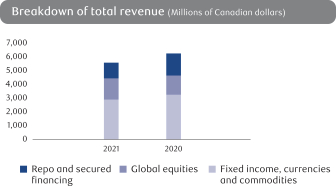
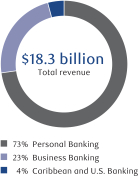
Revenue by business lines |
We operate through two businesses – Canadian Banking and Caribbean & U.S. Banking. Canadian Banking serves our home market in Canada, where we maintain top (#1 or #2) rankings in market share for all key retail and business products. We have the largest branch network, the most ATMs and one of the largest mobile sales forces across Canada. In Caribbean & U.S. Banking, we offer a broad range of financial products and services in targeted markets. In Canada, we compete with other Schedule 1 banks, independent trust companies, foreign banks, credit unions, caisses populaires, and auto financing companies. In the Caribbean, our competition includes banks, trust companies and investment management companies serving retail and corporate clients, as well as public institutions. In the U.S., we compete primarily with other Canadian banking institutions that have U.S. operations. | |||||||
![]() |
||||||||
› |
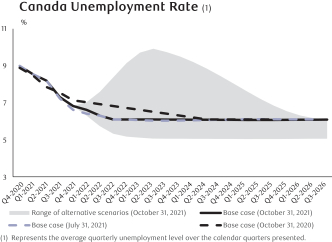
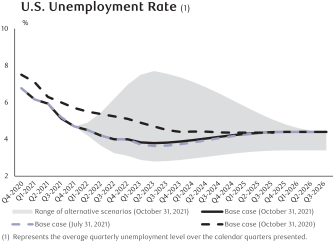
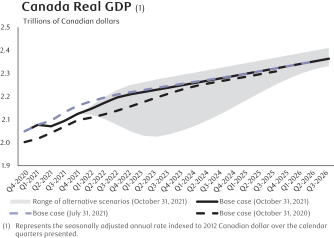
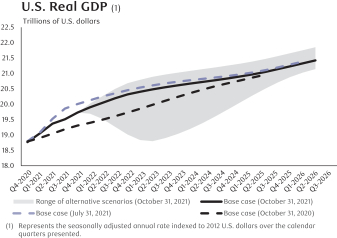
While impacts from the COVID-19 pandemic continued to persist, client activity improved driving strong volume and fee-based revenue growth throughout fiscal 2021 as economies re-opened due to progress on vaccination distribution, reduced containment measures and continued government support. Further, as businesses began re-opening, unemployment rates also improved. |
› |
Improvements in the credit environment, driven by the economic recovery from the COVID-19 pandemic, led to favourable changes in our macroeconomic and credit quality outlook, resulting in releases of provisions on performing assets. Lower provisions on impaired loans in our Canadian Banking retail portfolios also reflected the economic recovery underway and the continued impact of the COVID-19 related government support programs. |
› |
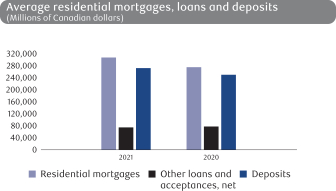
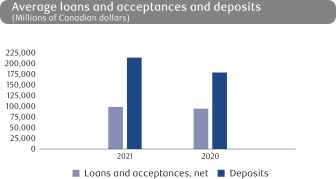
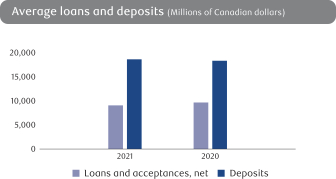
Personal and business deposits continued to see significant growth throughout fiscal 2021, reflecting clients’ preference for the safety of higher cash balances amidst the COVID-19 pandemic. |
› |
Housing activity was strong with record levels of mortgage originations in fiscal 2021. Despite the industry-wide tightening of mortgage lending criteria in the third quarter, low interest rates and demand for housing continued to support strong growth in residential mortgages. |
› |
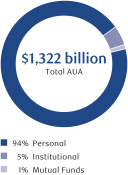
Throughout fiscal 2021, we saw favourable market conditions resulting in solid growth in mutual fund balances from a combination of market appreciation and strong net sales. We also saw significant market activity in the first half of the fiscal year which benefitted our Direct Investing business. While market activity moderated in the second half of the fiscal year, average trading volumes remained above pre-pandemic levels. |
› |
The ongoing low interest rate environment continued to be a headwind in fiscal 2021, resulting in a further decline in NIM. NIM was also negatively impacted by changes in product mix and competitive pricing pressures. |
› |
Client preferences for digital offerings continue to evolve and this shift has been accelerated due to the impact of the COVID-19 pandemic. We continued to invest in digital solutions to improve the client experience and deliver personalized advice. |
› |
Our Caribbean Banking business continued to be negatively impacted by the ongoing low interest rate environment; however, we also saw releases of provisions on performing assets. We also closed the sale of our Eastern Caribbean operations in the second quarter of 2021. |
› |
In the U.S., earnings were unfavourably impacted by the low interest rate environment and severe limitations on cross-border travel, as a result of the COVID-19 pandemic. |
1 |
Represents 90-day active clients |
OUR STRATEGY |
PROGRESS IN 2021 |
PRIORITIES IN 2022 | ||
Transform how we serve our clients |
Enabled the expedited digital processing of nearly 200,000 small business loans under the CEBA program since inception of the program Opened new format branches to address the needs of specific client segments including students and newcomers to Canada Introduced RBC Vantage TM that allows clients to unlock rewards, savings, insights and more with any eligible bank account |
Provide flexibility by continuing to deliver anytime, anywhere solutions to our clients across all channels, seamlessly integrating mobile and digital services into our clients’ lives Continue to reimagine our branch network to meet the evolving needs of our clients | ||
Accelerate our growth |
Continued to provide personalized advice and valued banking solutions to our clients Maintained our focus on key high-growth and high-value segments such as retirees, youth, newcomers, business owners, high net worth clients, and healthcare professionals Continued to further our partnerships, including helping our clients realize over $90 million in fuel savings with Petro Canada, a Suncor business Partnered with DoorDash to bring eligible RBC credit cardholders additional value through savings and special offers Established a new partnership with GrantMatch, leveraging its Funding Assessment & Strategy Tool to make it easy for business owners to pursue government funding that matches their business needs Launched the RBC ESG Market-Linked GIC which allows investors to support a global portfolio of companies that follow a set of rigorous ESG standards Offered Responsible Investing Portfolios through RBC InvestEase ® , which are built with a focus on companies that score highest on a wide range of ESG factors, including carbon emissions, product safety and quality, and business ethics |
Focus on engaging key high-growth client segments and enabling our advisors to build new and deeper relationships and achieve industry-leading volume growth Establish key partnerships to continue to add value for our clients Build a suite of best-in-class Continue to invest in RBC Ventures by working to scale Ventures and accelerate client acquisition | ||
Rapidly deliver digital solutions to our clients |
Continued to deliver leading digital capabilities and functionalities through our award-winning RBC mobile app Enhanced our Direct Investing client experience by launching a customizable, web-based Trading Dashboard, free for all clientsIntroduced NOMI ® Forecast, the latest capability in our award-winning NOMI® offering, which gives clients a view into their future cash flow by forecasting upcoming preauthorized payment withdrawals from their deposit accountContinued to expand the capabilities of MyAdvisor ® , an online advice platform that digitally connects our clients to an advisor, resulting in over 2.8 million clients activating their personalized investment plans since its launch in 2017Launched RBCx TM , a full-service platform designed to provide our business clients with access to capital solutions, innovative products and services, and operational expertise to help technology companies scaleExpanded RBC Insight Edge TM , our Beyond Banking solution, to provide direct access through a subscription to small and medium retail business and commercial clientsLaunched an integrated accounts payable solution for business clients through RBC PayEdge TM , which helped us earn the 2021 Celent Model Bank Award for Payments TransformationLaunched a new way for Canadians to pay for their purchases through PayPlan which offers clients a transparent and convenient pay-over-time solution for big-ticket purchases at participating retailers and merchants throughout Canada |
Deliver more personalized insights to improve the client experience while continuing to simplify and digitize everyday banking Enhance the digital experience for our small business and commercial clients and make it easier for them to transact with us Lead in mobile capabilities, enable fulfillment of servicing through digital channels, and move towards a higher degree of agile delivery to transform end-to-end | ||
Innovate to become a more agile and efficient bank |
Continued to invest in solutions that simplify, digitize and automate experiences for clients and employees, and enable employees to deliver relevant and expert advice Continued to help small businesses thrive by simplifying and automating business formation and everyday legal work with Ownr ® , Canada’s leading business and legal management platform |
Invest in new tools and capabilities and proactively seek ways to simplify and streamline both our internal processes and the end to end client experience at an accelerated speed | ||
In the Caribbean |
Continued transforming the business and overall client experience while driving profitability, simplifying operations, and strategically navigating the COVID-19 pandemic and its continued impact on our clients and employeesSuccessfully executed Eastern Caribbean divestiture which included the sale of 11 branches in 7 countries. This transaction aligns our investments and resources into markets where our vision can be executed more successfully |
Remain focused on becoming the premier digitally-enabled relationship bank by transforming the client experience through automation, digitization and process simplification, and enabling our employees for success | ||
In the U.S. |
Despite travel restrictions associated with the COVID-19 pandemic, continued to attract new clients and drive record real estate lendingMade focused investments in digital capabilities to improve productivity, offer a more digitally-enabled client experience, and enhance small business services to support Canadian businesses needing U.S. payment and collection services |
Drive accelerated cross-border client growth leading with real estate financing tailored specifically for Canadians, offering advice, tools and resources, value offers and discounts, and access to cross-border experts to guide clients through the full life cycle of owning U.S. property Ongoing digitization of end-to-end |
Personal & Commercial Banking |
Table 16 |
(Millions of Canadian dollars, except percentage amounts and as otherwise noted) |
2021 |
2020 | ||||||
Net interest income |
$ |
12,621 |
$ | 12,568 | ||||
Non-interest income |
5,725 |
5,163 | ||||||
Total revenue |
18,346 |
17,731 | ||||||
PCL on performing assets |
(909 |
) |
1,818 | |||||
PCL on impaired assets |
722 |
1,073 | ||||||
PCL |
(187 |
) |
2,891 | |||||
Non-interest expense |
7,978 |
7,946 | ||||||
Income before income taxes |
10,555 |
6,894 | ||||||
Net income |
$ |
7,847 |
$ | 5,087 | ||||
Revenue by business |
||||||||
Canadian Banking |
$ |
17,570 |
$ | 16,838 | ||||
Personal Banking |
13,337 |
12,703 | ||||||
Business Banking |
4,233 |
4,135 | ||||||
Caribbean & U.S. Banking |
776 |
893 | ||||||
Key ratios |
||||||||
ROE |
32.0% |
21.7% | ||||||
NIM |
2.51% |
2.67% | ||||||
Efficiency ratio |
43.5% |
44.8% | ||||||
Operating leverage (1) |
3.1% |
(3.1)% | ||||||
Selected balance sheet information |
||||||||
Average total assets |
$ |
527,100 |
$ | 494,600 | ||||
Average total earning assets, net |
502,000 |
470,200 | ||||||
Average loans and acceptances, net |
505,600 |
473,400 | ||||||
Average deposits |
504,300 |
447,300 | ||||||
Other information |
||||||||
AUA (2), (3) |
$ |
367,700 |
$ | 292,800 | ||||
Average AUA |
340,800 |
287,600 | ||||||
AUM (3) |
5,400 |
5,300 | ||||||
Number of employees (FTE) |
36,675 |
35,964 | ||||||
Credit information |
||||||||
PCL on impaired loans as a % of average net loans and acceptances |
0.14% |
0.23% | ||||||
Other selected information – Canadian Banking |
||||||||
Net income |
$ |
7,620 |
$ | 5,077 | ||||
NIM |
2.50% |
2.64% | ||||||
Efficiency ratio |
42.0% |
43.2% | ||||||
Operating leverage |
2.9% |
(3.3)% |
(1) | See Glossary for composition of this measure. |
(2) | AUA includes securitized residential mortgages and credit card loans as at October 31, 2021 of $15 billion and $3 billion, respectively (October 31, 2020 – $16 billion and $7 billion). |
(3) | Represents year-end spot balances. |
Business line review |
Personal Banking |
Selected highlights |
Table 17 |
(Millions of Canadian dollars, except number of) |
2021 |
2020 |
||||||
Total revenue |
$ |
13,337 |
$ | 12,703 | ||||
Other information |
||||||||
Average residential mortgages |
305,400 |
273,200 | ||||||
Average other loans and acceptances, net |
74,800 |
77,800 | ||||||
Average deposits |
270,500 |
248,100 | ||||||
Average credit card balances |
16,600 |
18,100 | ||||||
Credit card purchase volumes |
132,400 |
118,100 | ||||||
Branch mutual fund balances (1) |
205,500 |
166,000 | ||||||
Average branch mutual fund balances |
191,300 |
163,600 | ||||||
AUA – Self-directed brokerage (1) |
135,900 |
96,400 | ||||||
Number as at October 31: |
||||||||
Branches |
1,182 |
1,201 | ||||||
ATMs |
4,032 |
4,182 |
(1) | Represents year-end spot balances. |
Business Banking |
Selected highlights |
Table 18 |