American
Depositary Receipt (“ADR”)
Represents shares
of foreign companies traded in U.S. dollars on U.S. exchanges that are held by a U.S. bank or a trust. Foreign companies use ADRs in order to make it easier for Americans to buy their shares.
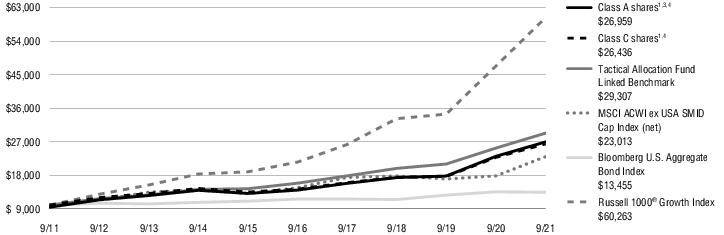
Bloomberg U.S. Aggregate Bond Index
The Bloomberg U.S. Aggregate Bond Index measures the U.S.
investment-grade fixed-rate bond market. The index is calculated on a total return basis. The index is unmanaged, its returns do not reflect any fees, expenses, or sales charges, and it is not available for direct investment.
Bloomberg U.S. Corporate High Yield Bond Index
The Bloomberg U.S. Corporate High Yield Bond Index measures the
U.S. dollar-denominated, high yield, fixed-rate corporate bond market. The index is calculated on a total return basis. The index is unmanaged, its returns do not reflect any fees, expenses, or sales charges, and it is not available for direct
investment.
Exchange-Traded Fund
(“ETF”)
An open-end fund that is traded on a
stock exchange. Most ETFs have a portfolio of stocks or bonds that track a specific market index.
Federal Reserve (the “Fed”)
The Central Bank of the U.S., the Fed is responsible for
controlling money supply, interest rates and credit with the goal of keeping the U.S. economy and currency stable. Governed by a seven-member board, the system includes 12 regional Federal Reserve Banks, 25 branches and all national and state banks
that are part of the system.
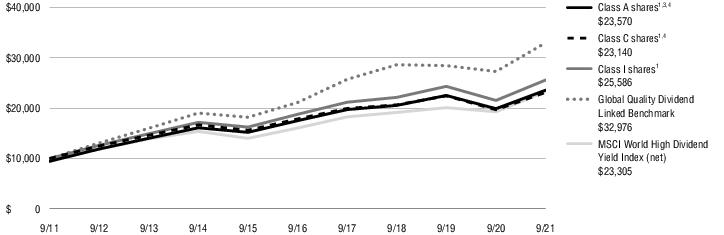
Global Quality Dividend
Linked Benchmark
Performance of the Global Quality
Dividend Linked benchmark is that of the MSCI World High Dividend Yield Index. Performance of the Global Quality Dividend Linked benchmark prior to February 1, 2017 is that of the Russell 1000® Value Index and from February 1, 2017 to December 31, 2018, it is that of the Russell Developed Large Cap Index (net). The indexes are unmanaged and not available for direct
investment.
London Interbank Offered Rate
(“LIBOR”)
A benchmark rate that some of the
world’s leading banks charge each other for short-term loans and that serves as the first step to calculating interest rates on various loans throughout the world.
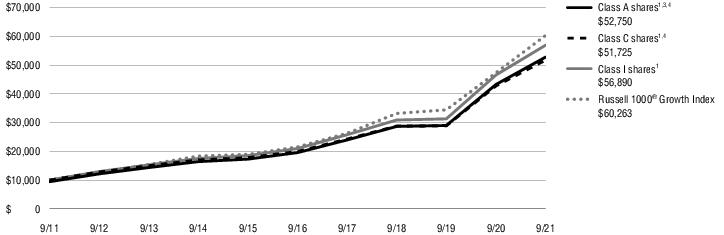
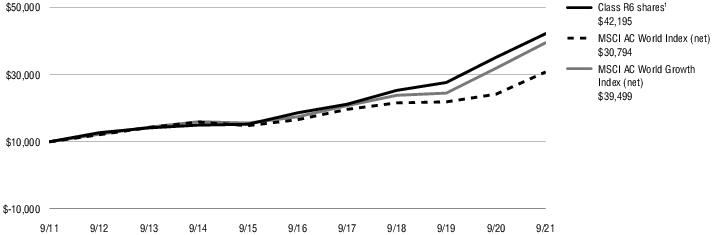
MSCI AC World Growth Index (net)
The MSCI AC World Growth Index (net) is a free float-adjusted
market capitalization-weighted index that measures equity performance of large and mid-cap securities exhibiting overall growth style characteristics across developed and emerging markets. The index is calculated on a total return basis with net
dividends reinvested. The index is unmanaged, its returns do not reflect any fees, expenses, or sales charges, and is not available for direct investment.
MSCI AC World Index (ACWI) (net)
The MSCI AC World Index (net) is a free float-adjusted market
capitalization-weighted index that measures equity performance of developed and emerging markets. The index is calculated on a total return basis with net dividends reinvested. The index is unmanaged, its returns do not reflect any fees, expenses,
or sales charges, and is not available for direct investment.
MSCI ACWI ex USA SMID Cap Index (net)
The MSCI ACWI ex USA SMID Cap Index (net) is a free
float-adjusted market capitalization-weighted index that measures mid- and small-cap performance across 22 of 23 Developed Market countries (excluding the U.S.) and 24 Emerging Markets countries. The index is calculated on a total return basis with
net dividends reinvested. The index is unmanaged, its returns do not reflect any fees, expenses, or sales charges, and is not available for direct investment.
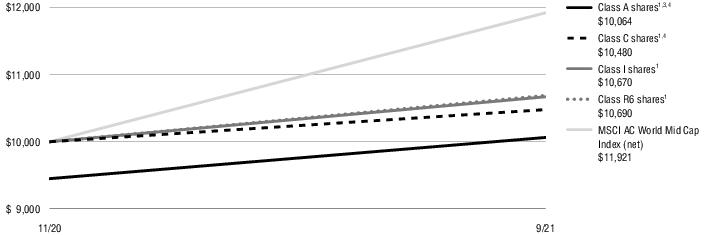
MSCI AC World Mid-Cap Index (net)
The MSCI AC World Mid Cap Index (net) is a free float-adjusted
market capitalization-weighted index that measures mid cap equity performance of developed and emerging markets. The index is calculated on a total return basis with net dividends reinvested.
MSCI EAFE® Index (net)
The MSCI EAFE® (Europe, Australasia, Far East) Index (net) is a free float-adjusted market capitalization-weighted index that measures developed foreign market equity performance, excluding
the U.S. and Canada. The index is calculated on a total return basis with net dividends reinvested. The index is unmanaged, its returns do not reflect any fees, expenses, or sales charges, and it is not available for direct investment.
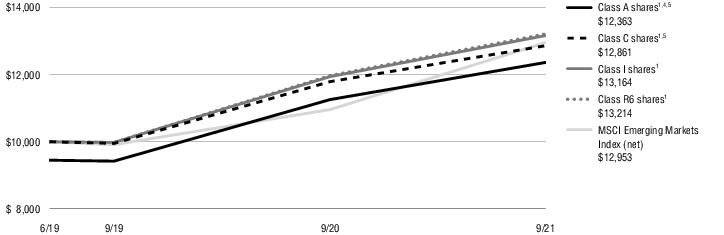
MSCI Emerging Markets Index (net)
The MSCI Emerging Markets Index (net) is a free float-adjusted
market capitalization-weighted index designed to measure equity market performance in the global emerging markets. The index is calculated on a total return basis with net dividends reinvested. The index is unmanaged, its returns do not reflect any
fees, expenses, or sales charges, and it is not available for direct investment.