UNITED STATES
SECURITIES AND EXCHANGE COMMISSION
Washington, D.C. 20549
FORM
N-CSR
CERTIFIED SHAREHOLDER REPORT OF REGISTERED MANAGEMENT INVESTMENT
COMPANIES
Investment
Company Act file number 811-05201
Thornburg Investment Trust
(Exact name of registrant as specified in charter)
c/o Thornburg Investment Management, Inc.
2300 North Ridgetop Road, Santa Fe, New Mexico 87506
(Address of principal executive offices) (Zip code)
Garrett Thornburg, 2300 North Ridgetop Road, Santa Fe, New Mexico 87506
(Name and address of agent for service)
Registrant’s telephone number, including area code: 505-984-0200
Date of fiscal year end: September 30
Date of reporting period: March 31, 2022
Item 1. Reports to Stockholders
The following
Semi-annual reports are attached hereto, in order:
Thornburg Global Opportunities
Thornburg International Equity Fund
Thornburg Better World International Fund
Thornburg International Growth Fund
Thornburg Developing World Fund
Thornburg Small/Mid Cap Core Fund
Thornburg Small/Mid Cap Growth Fund
Thornburg Investment Income Builder Fund
Thornburg Summit Fund
Thornburg
Limited Term U.S. Government Fund
Thornburg Limited Term Income Fund
Thornburg Ultra Short Income Fund
Thornburg Strategic Income Fund
Thornburg Short Duration Municipal Fund
Thornburg Limited Term Municipal Fund
Thornburg California Limited Term Municipal Fund
Thornburg New Mexico Intermediate Municipal Fund
Thornburg New York Intermediate Municipal Fund
Thornburg Intermediate Municipal Fund
Thornburg Strategic Municipal Income Fund
Thornburg Capital Management Fund

Semi-Annual Report | March 31,
2022
| EQUITY
FUNDS |
| Global
Equity |
| Thornburg
Global Opportunities Fund |
| International
Equity |
| Thornburg
International Equity Fund |
| Thornburg
Better World International Fund |
| Thornburg
International Growth Fund |
| Thornburg
Developing World Fund |
| U.S.
Equity |
| Thornburg
Small/Mid Cap Core Fund |
| Thornburg
Small/Mid Cap Growth Fund |
| Multi
Asset |
| Thornburg
Investment Income Builder Fund |
| Thornburg
Summit Fund |
Thornburg Equity Funds
Semi-Annual Report | March 31, 2022
Table of Contents
Investments carry risks, including possible loss of
principal. Additional risks may be associated with investments outside the United States, especially in emerging markets, including currency fluctuations, illiquidity, volatility, and political and economic risks. Investments in small- and
mid-capitalization companies may increase the risk of greater price fluctuations. Portfolios investing in bonds have the same interest rate, inflation, and credit risks that are associated with the underlying bonds. The value of bonds will fluctuate
relative to changes in interest rates, decreasing when interest rates rise. A short position will lose value as the security’s price increases. Theoretically, the loss on a short sale can be unlimited. Investments in derivatives are subject to
the risks associated with the securities or other assets underlying the pool of securities, including illiquidity and difficulty in valuation. Please see the Funds’ prospectus for a discussion of the risks associated with an investment in the
Funds. Investments in the Funds are not FDIC insured, nor are they deposits of or guaranteed by a bank or any other entity.
Thornburg Equity Funds Semi-Annual Report | 3
Letter to Shareholders
March 31, 2022 (Unaudited)
Dear Shareholder:
A one-time colleague of mine from decades ago, who was prone
to malapropisms, was also a Yogi Berra-esque source of wisdom at times. These days, I recall one of his pronouncements around the time of the dot.com bubble and crash: “Just when you think you’re out of the woods, you go right back into
the soup.” This seems to be appropriate relative to our emergence from a Covid-dominated recession into a new world that hinges on massively increasing price pressures and a geopolitical worst-case-scenario in Russia/Ukraine. I don’t
expect the volatility that we’ve seen in the last six months to abate and given somewhat elevated risk asset prices (though deflated from my last letter to you), markets remain vulnerable to shocks. High inflation has been one of those shocks,
and it will take some time to resolve factors contributing to that inflation, such as supply-chain challenges, home price appreciation effects on measured shelter costs, and labor cost and availability issues. Ultimately, we expect various central
banks across the globe, certainly including the Federal Reserve, to be forced to make a choice between containing inflation at the expense of employment and losing control of inflation expectations in the name of supporting a hotter economy.
It’s a tightrope walk without a net and just one of many elements of uncertainty in the aftermath of Covid.
In recent weeks, we’ve seen yields on most fixed income
securities rise dramatically. Combined with the very low starting point on income return, the past quarter has been one of the worst in history for those markets. Because many arguments around valuation in equities hinged on the TINA argument
(“There Is No Alternative”), and because the earnings yield (essentially the inverse of the Price/Earnings ratio) on equities far surpassed the yield on bonds, there has been a crossover effect into other risky assets. While we view this
as only part of the overall valuation conversation, any time investors experience outsized moves in major markets, it’s worth taking a deeper dive. In this case, we expect that the dramatic shift of policymakers’ approach from
stimulating growth to containing price pressures may drain liquidity and leave some market participants feeling like a fish out of water.
As in any environment, we will be focused on you, our clients,
as our most important constituency. Though there is never a guarantee that we will be able to navigate the evolving marketplace as well as we may have before, I have a confidence born of experience that our unsiloed, global approach to active
investment management gives us a distinct advantage. It is always the case that with challenge
comes opportunity, and I have watched our portfolios perform well over the
years when difficult situations arise. We continue to see that no market is an island, and the effects from actions somewhere in the world are felt everywhere. Our process, which focuses on this interconnection through the development of a
collaborative and deeply informed perspective, is designed to thrive in these investment conditions.
As we’ve discussed in the past, the story of Thornburg
is one of consistent and deliberate evolution to meet your needs in the context of a changing business and investment environment. As an example of this, we have completed the integration of Environmental, Social, and Governance (ESG) considerations
across our product set. While this does not mean that these considerations are part of our Principal Investment Strategy for all portfolios, it does mean that, when evaluating potential investment opportunities, we evaluate the significance of a
company’s ESG characteristics and their potential to impact the company’s investment performance. We believe that the integration of those ESG considerations into our investment process, alongside the other factors that we consider when
evaluating investments, is consistent with our long-term investment time horizon for both individual assets and whole portfolios, as well as an indelible part of the market landscape.
I have great respect for other investment firms and there are
many good products that are available to investors. “It’s tough to make predictions, especially, about the future” – an actual Yogi-ism – but we believe that in times like these, our firm’s broad perspective and
collaborative, unsiloed approach is our differentiator. These qualities are what underlie the excellent long-term outcomes we’ve been able to deliver: we’re built to deliver on the promise of active management.
Thank you so much for your time, and for your business.

|
|
Jason
Brady, cfa
Portfolio Manager
CEO, President, and
Managing Director |
|
The matters discussed in this report may
constitute forward-looking statements made pursuant to the safe harbor provisions of the Securities Litigation Reform Act of 1995. These include any advisor or portfolio manager prediction, assessment, analysis or outlook for individual securities,
industries, investment styles, market sectors and/or markets. These statements involve risks and uncertainties. In addition to the general risks described for each fund in its current prospectus, other factors bearing on these reports include the
accuracy of the advisor’s or portfolio manager’s forecasts and predictions, the appropriateness of the investment strategies designed by the advisor or portfolio manager and the ability of the advisor or portfolio manager to implement
their strategies efficiently and successfully. Any one or more of these factors, as well as other risks affecting the securities markets generally, could cause the actual results of any fund to differ materially as compared to its benchmarks.
The views expressed are subject to change and
do not necessarily reflect the views of Thornburg Investment Management, Inc. This information should not be relied upon as a recommendation or investment advice and is not intended to predict the performance of any investment or market.
Performance results of individual share
classes will vary based on the fees and expenses associated with each share class, and may be higher or lower than other share classes within the same Fund. Please see Performance Summary for performance results of each share class.
4 | Thornburg Equity Funds Semi-Annual Report
Letter to Shareholders, Continued
March 31, 2022 (Unaudited)
Thornburg Global Opportunities Fund |
March 31, 2022 (Unaudited)
Dear Fellow Shareholder:
This letter highlights the results of the Thornburg Global
Opportunities Fund for the six-month period ended March 31, 2022. Your Fund’s fiscal year ends on September 30.
The Fund paid $5.14 per share of dividends with respect to the
Class I shares during the six-month period. Due to a combination of those dividend payments and modest overall changes in the aggregate values of the Fund’s investments, the net asset value of the Class I shares decreased by $4.68 per share
($39.49 to $34.81), bringing the total return for the six-month period to +0.953%. This total return approximately matched the +0.958% return of the MSCI All Country World Index (the “Index”), the Fund’s benchmark, for the
six-month period. Dividend amounts and returns for other classes of Thornburg Global Opportunities Fund shares varied slightly based on class-specific expenses.
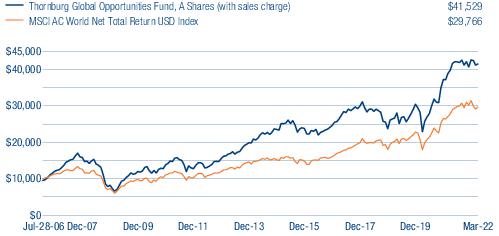
We are now in the 16th year of managing Thornburg Global
Opportunities Fund. From its inception on July 28, 2006 through March 31, 2022, Thornburg Global Opportunities Fund has outpaced the Index by an average margin of more than 3.0% per year, resulting in a total cumulative return since inception of
363% (Class I shares) versus 198% for the Index. Performance comparisons of Thornburg Global Opportunities Fund to the Index over various periods are shown below.
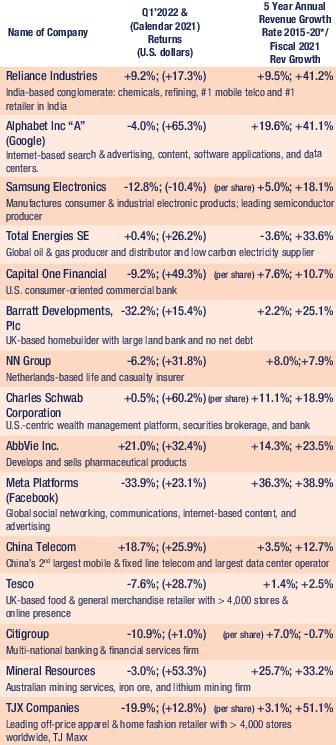
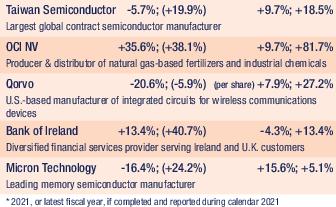
Most equities in the Fund’s portfolio recovered strongly
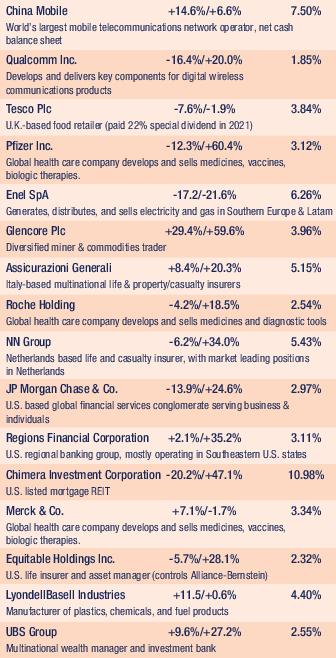
in the last 24 months from their March 2020 price troughs. Listed below in descending order are the 20 largest equity holdings of the Fund as of March 31, 2022, along with first quarter 2022 and calendar year 2021 returns (the latter in
parentheses). Returns are shown in U.S. dollars. We also show the trailing five-year average annual revenue growth rates for these businesses through year end 2020 along with the latest reported fiscal year ended September 30, 2021 revenue growth of
each company. Together, these firms comprised approximately 71% of the Fund’s total assets, 18 other equities comprised a total of approximately 25% of Fund assets, and near-cash debt comprised 4% of assets. Individual position sizes of the
Fund’s top 20 positions ranged from 5% or more (Reliance Industries, Alphabet) to approximately 2.5% for those shown near the bottom of this list.
Thornburg Equity Funds Semi-Annual Report | 5
Letter to Shareholders, Continued
March 31, 2022 (Unaudited)
These are not
trivial businesses. The reader will notice that revenue growth for a large majority of these firms last year exceeded the prior five-year annual average. These businesses tend to be doing well, most posting per share revenue growth exceeding global
GDP growth rates in recent years. Most of these have emerged from the 2020 economic valley with their competitive positions intact or improved.
The reader will also notice a high incidence of investments in
firms tied to the digital economy, and in providers of tools to facilitate digital communications. Despite strong revenue production from these “digital” businesses in early 2022, share price performances of these investments were mostly
negative in in the first quarter of 2022 due to concerns that strong demand conditions will not persist. We have more confidence in the fundamental backdrop for secular growth of digital communications, data collection and analysis, and the key
components of devices that make this possible.
As of
March 31, 2022 the weighted average price/earnings ratio for the equity investments of Thornburg Global Opportunities Fund was 11.9x. This compares to a multiple of 19.2x for the MSCI All Country World Index on the same date. For rough comparison,
the trailing five-year weighted average revenue growth rate of firms included in the MSCI All Country World Index Index was +4.0% through December 31, 2021, including +12.3% in calendar year 2021.
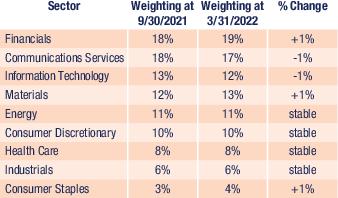
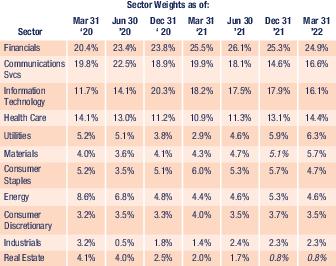
The following table summarizes major sector weightings within
the Fund’s portfolio as of March 31, 2022 and six months earlier. Your Fund’s sector weightings were broadly stable for the semiannual period.
Top contributors
to Fund performance during the six months ended March 31, 2022 included agricultural fertilizer manufacturers OCI NV and CF Industries, pharmaceuticals firms AbbVie and Pfizer, China Telecom, Charles Schwab, defense technology firm CACI
International, and metals miners Freeport-McMoran, Australia’s Mineral Resources and Canada’s Lundin Mining Corp. Fourteen equities holdings of the Fund contributed at least +0.25% to its performance for the quarter.
Eleven equities subtracted more than -0.25% from the
Fund’s performance in the six-month period. The most significant detractors were Meta Platforms (a.k.a. Facebook), U.K. homebuilder Barratt Developments, Vestas Wind Systems, semiconductor makers Samsung Electronics and Qorvo, Capital One,
Citigroup, Alibaba, and Teladoc Health. We made various position size adjustments in the Fund during this period for portfolio diversification purposes and to better balance the downside risk versus upside capital appreciation potential of
individual positions.
Aggregate demand across the global
economy is strong, though accelerating price inflation is in our view a significant concern. Economic news flow today is dominated by stories of shortages of labor, energy, semiconductors, other materials, and tight conditions in global shipping and
logistics. Many of these issues have been exacerbated by the tragic Russian invasion of Ukraine and resulting economic dislocations. We are paying close attention to the abilities of companies in the Fund’s portfolio to manage cost inflation
and maintain profit margins consistent with our expectations. Through it all, people around the world continue to trade with each other. We expect global trade and consumption to remain strong in the coming quarters.
Our Investment Framework
Thornburg Global Opportunities Fund seeks capital appreciation
from a focused portfolio of global equity investments. We believe the structure of the Fund—built on our core investment principles of flexibility, focus, and value—provides a durable framework for value-added investing.
We urge shareholders of the Fund to maintain a long-term
investment perspective rather than placing too much emphasis on return figures that are available daily, weekly, monthly and quarterly. Clear examples of the need to keep a
6 | Thornburg Equity Funds Semi-Annual Report
Letter to Shareholders, Continued
March 31, 2022 (Unaudited)
longer-term investment perspective are illustrated by comparing the trailing
12-month return of your Fund as of March 31, 2021 [+74.18%] with the returns from the single quarter ending March 31, 2020 [-24.8%]. In general, the businesses in your Fund’s portfolio have managed well through the COVID-impacted quarters
despite the initial impact of the pandemic on their share prices. We continue to follow our core investment principles of flexibility, focus, and value, as we have since the Fund’s inception back in 2006.
Thank you for being a shareholder of Thornburg Global
Opportunities Fund.
Sincerely,

|

|
Brian
McMahon
Portfolio Manager
Chief Investment Strategist
and Managing Director |
Miguel
Oleaga
Portfolio Manager
and Managing Director |
Thornburg Equity Funds Semi-Annual Report | 7
Letter to Shareholders, Continued
March 31, 2022 (Unaudited)
Thornburg Investment Income Builder Fund |
March 31, 2022 (Unaudited)
Dear Fellow Shareholder:
This letter highlights the results of Thornburg Investment
Income Builder Fund for the six-month period ended March 31, 2022. Your Fund’s fiscal year ended on September 30.
The Fund paid ordinary dividends of $0.66 per Class I share
during the six-month period. This was approximately 14.8% above the dividend of $0.54 for the prior year six-month period ended March 31, 2021. Your Fund paid $1.287 per Class I share for the trailing four quarters, +33.6% versus the prior year
comparable period. The dividend per share was lower for Class A and class C shares, to account for varying class specific expenses.
There were several drivers of your Fund’s higher dividend
income over the preceding year. We expect some, but not all, of these may repeat in calendar year 2022:
| •
|
Approximately 75% of the
Fund’s equity investments increased their dividends in calendar 2021. For now, we do expect a significant majority of your Fund’s equity investments to pay higher dividends in their home currencies in 2022. |
| •
|
Interest income was higher
due to strong receipts from asset backed securities and interest on tax rebate challenges against several foreign governments. These challenges succeeded in reclaiming prior year taxes that were improperly withheld, though it took court decisions to
resolve these claims. We do not expect a repeat of the interest earnings on tax rebates in 2022. It is too early in the year to know how much bond interest we will collect in 2022. Bond yields have NOT caught up to the unfolding inflation picture,
but macroeconomic fundamentals do appear to be setting up well for higher bond yields ahead. |
| •
|
Foreign currencies were
generally stronger versus the U.S. dollar when we received a significant portion of our dividends from the Fund’s non-U.S. equity investments in the first half of calendar 2021. For now, a stronger U.S. dollar is a high single digit percentage
headwind to dividends received in foreign currencies vis-à-vis this time in 2021. |
| •
|
Special
non-recurring dividends from several of our equity holdings relating to sales or spinoffs of subsidiaries, most notably Tesco and Daimler. Also, strong profits gave rise to enhanced distributions from other investments late in calendar 2021. So far,
we have no special 2022 dividends to report. We do have some candidates for such payments in the Fund’s portfolio. |
The net asset value of the Fund’s Class I shares
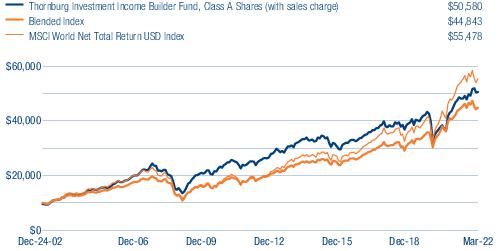
increased by $0.71 per share ($23.13 to $23.84) during the semiannual period and increased by $0.67 per share ($23.17 to $23.84) for the year ending March 31, 2022.
The Fund’s Class I share total return of 5.88% for the semiannual period
exceeded its blended benchmark (75% MSCI World Index and 25% Bloomberg Barclays U.S. Aggregate Bond Index), which returned 0.21% for the period. For the 12 months ended March 31, 2022 the Fund’s Class I share return of +8.53% exceeded the
blended benchmark return of +6.50%. Performance comparisons of the Fund to its blended benchmark over various periods are shown below.
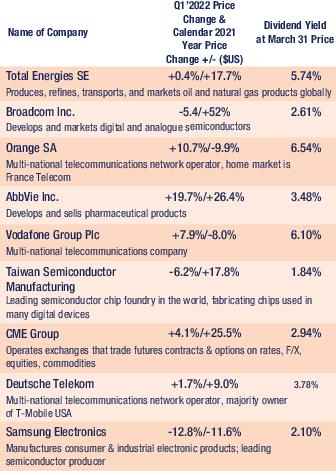
We believe the Fund is a bargain priced portfolio of income
producing assets that should be capable of generating additional price appreciation along with income in the coming years. Listed below in descending order are the 25 largest equity holdings in the Fund as of March 31, 2022, along with their Q1 2022
and 2021 calendar year share price changes in U.S. dollars. Also noted are dividend yields at closing March 31, 2022 stock prices. Together, these 25 firms comprised 65% of the Fund’s total assets. Thirty-three other equity investments
comprised a total of approximately 21% of Fund assets. Cash & approximately 200 interest-bearing debt and hybrid securities comprised around 14% of assets. Individual position sizes of the 25 equities range from 3.9% of Fund assets (Total
Energies) to approximately 1.4% for those shown near the bottom of the list.
8 | Thornburg Equity Funds Semi-Annual Report
Letter to Shareholders, Continued
March 31, 2022 (Unaudited)
These equity
holdings are not trivial businesses. These firms occupy important positions in their respective markets, and they tend to be well capitalized. The reader will notice that these investments have delivered mixed share price performances for the last
five quarters. Most have made reasonable progress in growing their bases of paying customers and distributable cash flows.
We have maintained your Fund’s exposure to dividend
paying firms that we believe have resilient businesses with strong capital structures. We have reduced exposures to less resilient businesses, paying increased attention to expected ability to generate cash in an inflationary environment. Compare
the sector allocations of the equities in the Fund from March 31, 2020 to March 31, 2022:
In the
Fund’s portfolio, 14 equity investments contributed positive returns of at least +0.25% to overall portfolio performance during the semiannual period. These most positive contributors included pharmaceutical firms AbbVie, Pfizer and Roche
Holding, commodities producer & trader Glencore, exchange operator CME Group, semiconductor manufacturers Broadcom and Qualcomm, Total Energies, and telecommunications network operators China Mobile, Orange, Vodafone Group, and China
Telecom.
Seven of the Fund’s equity investments
made negative contributions to portfolio performance of below -0.25% during semiannual period ended March 31, 2022. These detractors from Fund performance included Norilsk Nickel, JPMorgan Chase, Lukoil, Chimera Investment, Samsung Electronics,
Siemens AG, and multi-national electric utility ENEL.
The
Fund’s bond holdings delivered modest negative returns during the semiannual period. Six months of interest payments from bonds could not overcome relatively sharp price declines in bond values due to higher interest rates. Ten-year U.S.
Treasury bond yields rose from 1.49% on September 30, 2021 to 2.34% on March 31. Corporate and asset-backed bond prices declined in the March quarter as yield spreads to government bonds widened slightly. The Bloomberg U.S. Corporate High Yield
Index rose from 4.04% on September 30, 2021 to 6.01% on March 31 (yield to lower of call price or maturity).
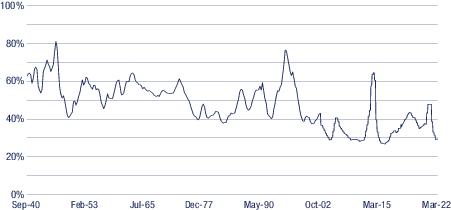
Readers of this commentary who are long time shareholders of
the Fund will recall that the interest-bearing debt portion of the Fund’s portfolio has varied over time, ranging from less than 9% in 2015 to 45% on June 30, 2009. We tend to allocate more Fund assets to interest bearing debt when yields are
more attractive. On March 31, 86% of Fund assets were invested in equities, the remaining 14% in interest bearing debt and near cash assets.
The outlook for bond returns is extremely cloudy. In our view,
the “real” yield on the 10-year U.S. Treasury note (market yield on 10-year UST of 2.9% minus core consumer price index of 6.5%) is near a multi-decade low at -3.6%
Thornburg Equity Funds Semi-Annual Report | 9
Letter to Shareholders, Continued
March 31, 2022 (Unaudited)
using the March 2022 core consumer price index. This negative real yield level
differs materially from levels typically experienced over the investment lifetimes of all readers of this commentary. The trailing 30-year average “real yield” on 10-year U.S. Treasury notes was +1.77%, so the current difference versus
historical average is extreme.
Aggregate demand across
the global economy is strong, though high price inflation is a significant concern. Economic news flow today is dominated by stories of shortages of labor, energy, semiconductors, other materials, and tight conditions in global shipping and
logistics. Many of these issues have been exacerbated by the tragic Russian invasion of Ukraine and resulting economic dislocations. We are paying close attention to the abilities of companies in the Fund’s portfolio to manage cost inflation
and maintain profit margins consistent with our expectations. Through it all, people around the world continue to trade with each other. We expect global trade and consumption to remain strong in the coming quarters.
We are optimistic about the future return potential of
Thornburg Investment Income Builder Fund’s assets. Why? Virtually all the businesses in the Fund’s portfolio retain their market positions providing important products and services that generate cash flows to pay attractive dividends. In
addition, we believe they are valued very attractively in relation to their own histories and relative to other assets. The weighted average price/operating cash flow ratio for the Fund’s equity portfolio tabulated using Bloomberg reported
results was approximately 6.6x as of March 31, 2022, significantly below the 12.9x price/cash flow ratio of the MSCI All Country World Index. Income Builder’s 4.0% weighted average equity portfolio dividend yield significantly exceeds the 2.2%
dividend yield of the MSCI All Country World Index. We believe investors will direct capital in the
coming quarters into dividend paying stocks, supporting prices of these.
The quarter ending March 31, 2022 was the 77th full calendar
quarter since the inception of Thornburg Investment Income Builder Fund in December 2002. In 57 of these quarters the Fund delivered a positive total return. The Fund has delivered positive total returns in 15 of its 19 calendar years of existence.
Importantly, Thornburg Investment Income Builder Fund has delivered a compound annualized total return of more than 9% since its inception, split between quarterly income distributions and share price appreciation.
Thank you for being a shareholder of Thornburg Investment
Income Builder Fund.
Sincerely,

|
|
Brian
McMahon
Portfolio Manager
Chief Investment Strategist
and Managing Director |
Jason
Brady, cfa
Portfolio Manager
CEO, President, and
Managing Director |

|

|
Ben
Kirby, cfa
Portfolio Manager
Head of Investments
and Managing Director |
Matt
Burdett
Portfolio Manager and
Managing Director |
10 | Thornburg Equity Funds Semi-Annual Report
Thornburg Global Opportunities
Fund
Investment Goal and
Fund
Overview
The Fund seeks long-term
capital appreciation by investing in equity and debt securities of all types from issuers around the world.
A flexible mandate allows the Fund to
pursue long-term performance using a broad approach to geography and market capitalization. The Fund invests primarily in a broad range of equity securities, including common stocks, preferred stocks and publicly traded real estate investment
trusts, including smaller companies with market capitalizations less than $500 million. Investment decisions are based on domestic and international economic developments, outlooks for securities markets, interest rates and inflation, the supply and
demand for debt and equity securities, and analysis of specific issuers.
See letter beginning on page 5 of this
report for a discussion of factors affecting the Fund’s performance for the reporting period ended March 31, 2022.
Performance Summary
March 31, 2022 (Unaudited)
GROWTH OF A HYPOTHETICAL $10,000 INVESTMENT
| THORNBURG
GLOBAL OPPORTUNITIES FUND |
FINAL
VALUE |
AVERAGE ANNUAL
TOTAL RETURNS
| THORNBURG
GLOBAL OPPORTUNITIES FUND |
1-YR
|
3-YR
|
5-YR
|
10-YR
|
SINCE
INCEPTION |
| Class
A Shares (Incep: 7/28/06) |
|
|
|
|
|
| Without
sales charge |
4.41%
|
15.92%
|
9.46%
|
11.16%
|
9.83%
|
| With
sales charge |
-0.29%
|
14.15%
|
8.46%
|
10.65%
|
9.51%
|
| Class
C Shares (Incep: 7/28/06) |
|
|
|
|
|
| Without
sales charge |
3.62%
|
15.06%
|
8.64%
|
10.32%
|
8.99%
|
| With
sales charge |
2.72%
|
15.06%
|
8.64%
|
10.32%
|
8.99%
|
| Class
I Shares (Incep: 7/28/06) |
4.75%
|
16.26%
|
9.79%
|
11.56%
|
10.28%
|
| Class
R3 Shares (Incep: 2/1/08) |
4.20%
|
15.67%
|
9.24%
|
10.99%
|
7.38%
|
| Class
R4 Shares (Incep: 2/1/08) |
4.30%
|
15.78%
|
9.34%
|
11.09%
|
7.48%
|
| Class
R5 Shares (Incep: 2/1/08) |
4.74%
|
16.25%
|
9.79%
|
11.55%
|
7.93%
|
| Class
R6 Shares (Incep: 4/10/17) |
4.87%
|
16.40%
|
-
|
-
|
9.87%
|
| MSCI
AC World Net Total Return USD Index (Since 7/28/06) |
7.28%
|
13.75%
|
11.64%
|
10.00%
|
7.21%
|
The matters discussed in
this report may constitute forward-looking statements made pursuant to the safe harbor provisions of the Securities Litigation Reform Act of 1995. These include any advisor or portfolio manager prediction, assessment, analysis or outlook for
individual securities, industries, investment styles, market sectors and/or markets. These statements involve risks and uncertainties. In addition to the general risks described for each fund in its current prospectus, other factors bearing on these
reports include the accuracy of the advisor’s or portfolio manager’s forecasts and predictions, the appropriateness of the investment strategies designed by the advisor or portfolio manager and the ability of the advisor or portfolio
manager to implement their strategies efficiently and successfully. Any one or more of these factors, as well as other risks affecting the securities markets generally, could cause the actual results of any fund to differ materially as compared to
its benchmarks.
The views expressed are subject to
change and do not necessarily reflect the views of Thornburg Investment Management, Inc. This information should not be relied upon as a recommendation or investment advice and is not intended to predict the performance of any investment or
market.
Performance results of individual share
classes will vary based on the fees and expenses associated with each share class, and may be higher or lower than other share classes within the same Fund. Please see Performance Summary for performance results of each share class.
Performance data shown represents past performance and
is no guarantee of future results. Investment return and principal value will fluctuate so shares, when redeemed, may be worth more or less than their original cost. Current performance may be lower or higher than quoted. For performance current to
the most recent month end, visit thornburg.com or call 800-847-0200. The performance information does not reflect the deduction of taxes that a shareholder would pay on distributions or the redemption of Fund shares. Returns reflect the reinvestment
of dividends and capital gains. Class A shares are sold with a maximum sales charge of 4.50%. Class C shares are subject to a 1% CDSC for the first year only. There is no sales charge for Class I, R3, R4, R5 and R6 shares. As disclosed in the
Fund’s most recent prospectus, the total annual fund operating expenses before fee waivers or expense reimbursements are as follows: A shares, 1.31%; C shares, 2.08%; I shares, 1.06%; R3 shares, 2.07%; R4 shares, 1.83%; R5 shares, 1.36%; R6
shares, 1.00%. Thornburg Investment Management has contractually agreed to waive fees and reimburse expenses until at least February 1, 2023, for some of the share classes, resulting in net expense ratios of the following: I shares, 0.99%;R3 shares,
1.50%; R4 shares, 1.40%; R5 shares, 0.99%; R6 shares, 0.85%. For more detailed information on fund expenses and waivers/reimbursements please see the Fund’s prospectus.
Thornburg Equity Funds Semi-Annual Report | 11
Thornburg International Equity Fund
Investment Goal and
Fund
Overview
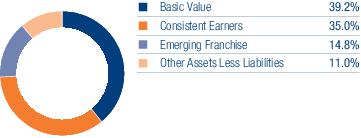
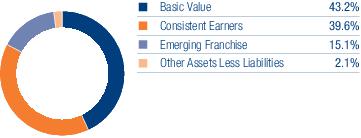
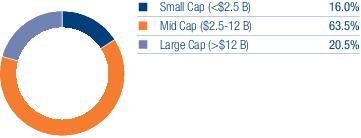
The International Equity
Fund seeks long-term capital appreciation by investing in equity and debt securities of all types. The secondary, nonfundamental goal of the Fund is to seek some current income. The Fund invests primarily in non-U.S. companies selected on a value
basis using fundamental research. Under normal conditions, the Fund invests at least 80% of its assets in common stocks or depositary receipts. As described in more detail in the Fund Prospectus, the portfolio is diversified to include basic value
stocks, but also includes stocks of companies with consistent earnings characteristics and those of emerging franchises, when these issues are value priced.
Performance drivers and detractors for
the reporting period ended March 31, 2022
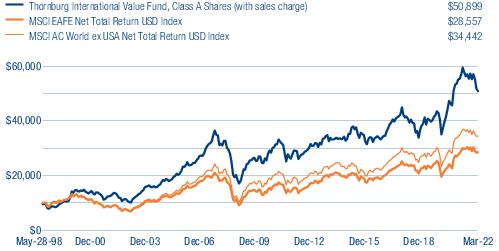
» For the six-month period ended
March 31, 2022 the Fund (Class I shares) lost 7.96% versus a loss of 3.72% for the MSCI AC World ex-USA Net Total Return USD Index and a loss of 3.38% for the MSCI EAFE Net Total Return USD Index.
» Numerous macro crosswinds impacted
market performance during the period, causing large dispersions in country and sector performance. Largest among them, the war in Ukraine, the rise in U.S. interest rates, and the beginning of Fed tightening.
» Within the MSCI AC World ex-USA Net
Total Return USD Index, value stocks outperformed growth stocks by 10%, with growth losing 8.6%. Energy, materials, and financials outperformed. Canada, Australia, the U.K., and oil producers (except for Russia) outperformed, while the eurozone and
China underperformed.
» In many
prior periods, Fund performance has been driven by bottom-up stock selection. Occasionally there are periods (like the pandemic in early 2020 and the last six months) where macro factors dominate stock selection and country and sector allocation are
the biggest drivers of performance.
» The Fund was underweight most of
the outperformers listed above and overweight the eurozone and China, which hurt performance. An overweight in communication services and information technology, which underperformed, were also negatives. An overweight in utilities, a zero weight in
Russia, and an average 6% allocation to cash in a down market were notable positives.
» Bottom-up stock selection also had
a negative impact. Our Basic Value basket underperformed in a strong market for value stocks as most of our holdings are higher quality value. We were underweight the growth companies in our Emerging Franchise basket, but many of them had
substantially negative returns. Our Consistent Earners had the best performance of our three baskets.
Performance Summary
March 31, 2022 (Unaudited)
GROWTH OF A HYPOTHETICAL $10,000 INVESTMENT
| THORNBURG
INTERNATIONAL EQUITY FUND |
FINAL
VALUE |
AVERAGE ANNUAL
TOTAL RETURNS
| THORNBURG
INTERNATIONAL EQUITY FUND |
1-YR
|
3-YR
|
5-YR
|
10-YR
|
SINCE
INCEPTION |
| Class
A Shares (Incep: 5/28/98) |
|
|
|
|
|
| Without
sales charge |
-8.23%
|
9.21%
|
7.07%
|
5.76%
|
7.27%
|
| With
sales charge |
-12.37%
|
7.55%
|
6.09%
|
5.28%
|
7.06%
|
| Class
C Shares (Incep: 5/28/98) |
|
|
|
|
|
| Without
sales charge |
-8.83%
|
8.45%
|
6.30%
|
5.00%
|
6.45%
|
| With
sales charge |
-9.62%
|
8.45%
|
6.30%
|
5.00%
|
6.45%
|
| Class
I Shares (Incep: 3/30/01) |
-7.87%
|
9.57%
|
7.43%
|
6.15%
|
7.12%
|
| Class
R3 Shares (Incep: 7/1/03) |
-8.34%
|
9.01%
|
6.88%
|
5.58%
|
7.79%
|
| Class
R4 Shares (Incep: 2/1/07) |
-8.14%
|
9.22%
|
7.10%
|
5.79%
|
4.17%
|
| Class
R5 Shares (Incep: 2/1/05) |
-7.92%
|
9.49%
|
7.37%
|
6.07%
|
6.55%
|
| Class
R6 Shares (Incep: 5/1/12) |
-7.74%
|
9.72%
|
7.58%
|
-
|
6.39%
|
| MSCI
AC World ex USA Net Total Return USD Index (Since 5/28/98) |
-1.48%
|
7.51%
|
6.76%
|
5.55%
|
4.92%
|
| MSCI
EAFE Net Total Return USD Index (Since 5/28/98) |
1.16%
|
7.78%
|
6.72%
|
6.27%
|
4.50%
|
The matters discussed in
this report may constitute forward-looking statements made pursuant to the safe harbor provisions of the Securities Litigation Reform Act of 1995. These include any advisor or portfolio manager prediction, assessment, analysis or outlook for
individual securities, industries, investment styles, market sectors and/or markets. These statements involve risks and uncertainties. In addition to the general risks described for each fund in its current prospectus, other factors bearing on these
reports include the accuracy of the advisor’s or portfolio manager’s forecasts and predictions, the appropriateness of the investment strategies designed by the advisor or portfolio manager and the ability of the advisor or portfolio
manager to implement their strategies efficiently and successfully. Any one or more of these factors, as well as other risks affecting the securities markets generally, could cause the actual results of any fund to differ materially as compared to
its benchmarks.
The views expressed are subject to
change and do not necessarily reflect the views of Thornburg Investment Management, Inc. This information should not be relied upon as a recommendation or investment advice and is not intended to predict the performance of any investment or
market.
Performance results of individual share
classes will vary based on the fees and expenses associated with each share class, and may be higher or lower than other share classes within the same Fund. Please see Performance Summary for performance results of each share class.
Performance data shown represents past performance and
is no guarantee of future results. Investment return and principal value will fluctuate so shares, when redeemed, may be worth more or less than their original cost. Current performance may be lower or higher than quoted. For performance current to
the most recent month end, visit thornburg.com or call 800-847-0200. The performance information does not reflect the deduction of taxes that a shareholder would pay on distributions or the redemption of Fund shares. Returns reflect the reinvestment
of dividends and capital gains. Class A shares are sold with a maximum sales charge of 4.50%. Class C shares are subject to a 1% CDSC for the first year only. There is no sales charge for Class I, R3, R4, R5 and R6 shares. As disclosed in the
Fund’s most recent prospectus, the total annual fund operating expenses before fee waivers or expense reimbursements are as follows: A shares, 1.25%; C shares, 1.96%; I shares, 0.94%; R3 shares, 1.61%; R4 shares, 1.40%; R5 shares, 1.16%; R6
shares, 0.88%. Thornburg Investment Management has contractually agreed to waive fees and reimburse expenses until at least February 1, 2023, for some of the share classes, resulting in net expense ratios of the following: I shares, 0.90%; R3
shares, 1.36%; R4 shares, 1.16%; R5 shares, 0.90%;R6 shares 0.70%. For more detailed information on fund expenses and waivers/reimbursements please see the Fund’s prospectus.
12 |
Thornburg Equity Funds Semi-Annual Report
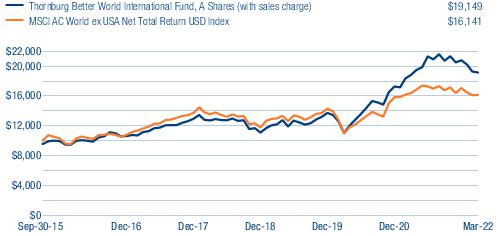
Thornburg Better World International
Fund
Investment Goal and
Fund
Overview
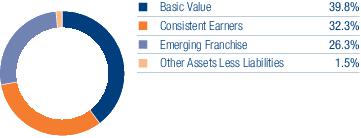
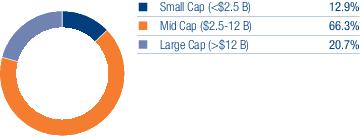
The Better World
International Fund seeks long-term capital appreciation. The Fund invests primarily in a broad range of foreign companies, based on fundamental research combined with analysis of those environmental, social and governance (ESG) characteristics that
the investment manager identifies as significant. The Fund targets companies of any size or country of origin, and which are high-quality, attractively valued and, in our view, also demonstrate one or more significant positive ESG characteristics.
The Fund portfolio is diversified to include basic value stocks, companies with consistent earnings, and emerging franchises as described in more detail in the Fund Prospectus.
Performance drivers and detractors for
the reporting period ended March 31, 2022
» For the six-month period ended March
31, 2022 the Fund (Class I shares) lost 7.41% versus a loss of 3.72% for the MSCI AC World ex-USA Net Total Return USD Index.
» Numerous macro crosswinds impacted
market performance during the period, causing large dispersions in country and sector performance. Largest among them, the war in Ukraine, the rise in U.S. interest rates, and the beginning of Fed tightening.
» Within the Fund’s benchmark
index, value stocks outperformed growth stocks by 10%, with growth losing 8.6%. Energy, materials, and financials outperformed. Canada, Australia, the U.K., and oil producers (except for Russia) outperformed, while the eurozone and China
underperformed.
» In many prior
periods, the Fund’s performance has been driven by bottom-up stock selection. Occasionally there are periods (like the pandemic in early 2020 and the last six months) where macro factors dominate stock selection and country and sector
allocation are the biggest drivers of performance.
» The Fund was underweight most of the
outperformers listed above and overweight the eurozone and China, which hurt performance. An overweight in utilities, an underweight in consumer discretionary, a zero weight in Russia, and an average 9% allocation to cash in a down market were
notable positives.
» Bottom-up
stock selection also had a negative impact. Our Basic Value basket underperformed in a strong market for value stocks as most of our holdings are higher quality value. Many of the growth stocks in our Emerging Franchise basket also had substantially
negative returns. Our Consistent Earners had the best performance of the three baskets during the period.
Performance Summary
March 31, 2022 (Unaudited)
GROWTH OF A HYPOTHETICAL $10,000 INVESTMENT
| THORNBURG
BETTER WORLD INTERNATIONAL FUND |
FINAL
VALUE |
AVERAGE ANNUAL
TOTAL RETURNS
THORNBURG
BETTER WORLD
INTERNATIONAL FUND |
1-YR
|
3-YR
|
5-YR
|
10-YR
|
SINCE
INCEPTION |
| Class
A Shares (Incep: 10/1/15) |
|
|
|
|
|
| Without
sales charge |
1.72%
|
16.23%
|
11.41%
|
-
|
11.29%
|
| With
sales charge |
-2.87%
|
14.46%
|
10.39%
|
-
|
10.51%
|
| Class
C Shares (Incep: 10/1/15) |
|
|
|
|
|
| Without
sales charge |
0.93%
|
15.47%
|
10.73%
|
-
|
10.62%
|
| With
sales charge |
0.06%
|
15.47%
|
10.73%
|
-
|
10.62%
|
| Class
I Shares (Incep: 10/1/15) |
2.24%
|
16.98%
|
12.17%
|
-
|
12.08%
|
| MSCI
AC World ex USA Net Total Return USD Index (Since 9/30/15) |
-1.48%
|
7.51%
|
6.76%
|
-
|
7.64%
|
The matters discussed in
this report may constitute forward-looking statements made pursuant to the safe harbor provisions of the Securities Litigation Reform Act of 1995. These include any advisor or portfolio manager prediction, assessment, analysis or outlook for
individual securities, industries, investment styles, market sectors and/or markets. These statements involve risks and uncertainties. In addition to the general risks described for each fund in its current prospectus, other factors bearing on these
reports include the accuracy of the advisor’s or portfolio manager’s forecasts and predictions, the appropriateness of the investment strategies designed by the advisor or portfolio manager and the ability of the advisor or portfolio
manager to implement their strategies efficiently and successfully. Any one or more of these factors, as well as other risks affecting the securities markets generally, could cause the actual results of any fund to differ materially as compared to
its benchmarks.
The views expressed are subject to
change and do not necessarily reflect the views of Thornburg Investment Management, Inc. This information should not be relied upon as a recommendation or investment advice and is not intended to predict the performance of any investment or
market.
Performance results of individual share
classes will vary based on the fees and expenses associated with each share class, and may be higher or lower than other share classes within the same Fund. Please see Performance Summary for performance results of each share class.
Performance data shown represents past performance and
is no guarantee of future results. Investment return and principal value will fluctuate so shares, when redeemed, may be worth more or less than their original cost. Current performance may be lower or higher than quoted. For performance current to
the most recent month end, visit thornburg.com or call 800-847-0200. The performance information does not reflect the deduction of taxes that a shareholder would pay on distributions or the redemption of Fund shares. Returns reflect the reinvestment
of dividends and capital gains. Class A shares are sold with a maximum sales charge of 4.50%. Class C shares are subject to a 1% CDSC for the first year only. There is no sales charge for Class I shares. As disclosed in the Fund’s most recent
prospectus, the total annual fund operating expenses before fee waivers or expense reimbursements are as follows: A shares, 1.57%; C shares, 2.85%; I shares, 1.21%. Thornburg Investment Management has contractually agreed to waive fees and reimburse
expenses until at least February 1, 2023, for some of the share classes, resulting in net expense ratios of the following: C shares, 2.19%; I shares, 0.90%. For more detailed information on fund expenses and
waivers/reimbursements please see the Fund’s prospectus.
Thornburg Equity Funds Semi-Annual Report | 13
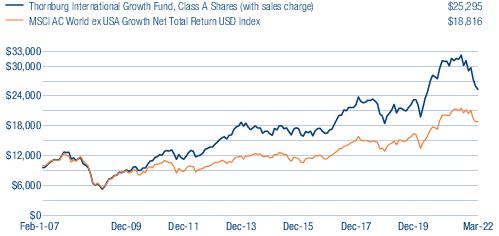
Thornburg International Growth Fund
Investment Goal and
Fund
Overview
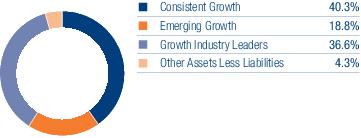
The International Growth
Fund seeks long-term growth of capital by investing in equity securities from around the world selected for their growth potential based on management’s belief that the companies will have growing revenues and earnings. The Fund can invest in
companies of any size, from large, well-established firms to small, emerging growth franchises. Management uses traditional fundamental research to evaluate securities and make buy/sell decisions.
Performance drivers and detractors for
the reporting period ended March 31, 2022
» For the six-month reporting period
ended March 31, 2022, stock selection was the primary driver of the Fund’s relative underperformance. For the period, the Fund (Class I shares) returned -15.94% versus a return of -8.66% for the MSCI AC World ex-USA Growth Net Total Return USD
Index.
» Currency had a
slightly positive impact on the Fund’s performance relative to the index due to a weakening dollar against the Japanese Yen.
» Positions in the U.K. and Emerging
Asia were the primary positive relative contributors to Fund performance for the period, while positions in Canada and Emerging Latin America detracted from relative performance versus the index.
» Stock selection within health care
and consumer staples was a positive relative contributor to Fund performance. Stock selections for the Fund within the information technology, communication services, and financials were the primary detractors to its relative underperformance versus
the index.
» Performance was
negative for all of the Fund’s three baskets during the period, with the consistent growers as the strongest relative basket and emerging growth franchises the weakest.
Performance Summary
March 31, 2022 (Unaudited)
GROWTH OF A HYPOTHETICAL $10,000 INVESTMENT
| THORNBURG
INTERNATIONAL GROWTH FUND |
FINAL
VALUE |
AVERAGE ANNUAL
TOTAL RETURNS
| THORNBURG
INTERNATIONAL GROWTH FUND |
1-YR
|
3-YR
|
5-YR
|
10-YR
|
SINCE
INCEPTION |
| Class
A Shares (Incep: 2/1/07) |
|
|
|
|
|
| Without
sales charge |
-15.82%
|
6.08%
|
6.68%
|
6.84%
|
6.64%
|
| With
sales charge |
-19.60%
|
4.46%
|
5.70%
|
6.35%
|
6.31%
|
| Class
C Shares (Incep: 2/1/07) |
|
|
|
|
|
| Without
sales charge |
-16.54%
|
5.24%
|
5.84%
|
6.02%
|
5.86%
|
| With
sales charge |
-17.31%
|
5.24%
|
5.84%
|
6.02%
|
5.86%
|
| Class
I Shares (Incep: 2/1/07) |
-15.59%
|
6.39%
|
7.02%
|
7.24%
|
7.11%
|
| Class
R3 Shares (Incep: 2/1/08) |
-15.99%
|
5.87%
|
6.48%
|
6.69%
|
5.70%
|
| Class
R4 Shares (Incep: 2/1/08) |
-15.94%
|
5.97%
|
6.59%
|
6.80%
|
5.81%
|
| Class
R5 Shares (Incep: 2/1/08) |
-15.58%
|
6.40%
|
7.02%
|
7.23%
|
6.24%
|
| Class
R6 Shares (Incep: 2/1/13) |
-15.49%
|
6.52%
|
7.13%
|
-
|
6.81%
|
| MSCI
AC World ex USA Growth Net Total Return USD Index (Since 2/1/07) |
-6.16%
|
9.12%
|
8.60%
|
6.70%
|
4.26%
|
The matters discussed in
this report may constitute forward-looking statements made pursuant to the safe harbor provisions of the Securities Litigation Reform Act of 1995. These include any advisor or portfolio manager prediction, assessment, analysis or outlook for
individual securities, industries, investment styles, market sectors and/or markets. These statements involve risks and uncertainties. In addition to the general risks described for each fund in its current prospectus, other factors bearing on these
reports include the accuracy of the advisor’s or portfolio manager’s forecasts and predictions, the appropriateness of the investment strategies designed by the advisor or portfolio manager and the ability of the advisor or portfolio
manager to implement their strategies efficiently and successfully. Any one or more of these factors, as well as other risks affecting the securities markets generally, could cause the actual results of any fund to differ materially as compared to
its benchmarks.
The views expressed are subject to
change and do not necessarily reflect the views of Thornburg Investment Management, Inc. This information should not be relied upon as a recommendation or investment advice and is not intended to predict the performance of any investment or
market.
Performance results of individual share
classes will vary based on the fees and expenses associated with each share class, and may be higher or lower than other share classes within the same Fund. Please see Performance Summary for performance results of each share class.
Performance data shown represents past performance and
is no guarantee of future results. Investment return and principal value will fluctuate so shares, when redeemed, may be worth more or less than their original cost. Current performance may be lower or higher than quoted. For performance current to
the most recent month end, visit thornburg.com or call 800-847-0200. The performance information does not reflect the deduction of taxes that a shareholder would pay on distributions or the redemption of Fund shares. Returns reflect the reinvestment
of dividends and capital gains. Class A shares are sold with a maximum sales charge of 4.50%. Class C shares are subject to a 1% CDSC for the first year only. There is no sales charge for Class I, R3, R4, R5 and R6 shares. As disclosed in the
Fund’s most recent prospectus, the total annual fund operating expenses before fee waivers or expense reimbursements are as follows: A shares, 1.26%; C shares, 2.07%; I shares, 0.99%; R3 shares, 1.88%; R4 shares, 1.62%; R5 shares, 1.26%; R6
shares, 0.95%. Thornburg Investment Management has contractually agreed to waive fees and reimburse expenses until at least February 1, 2023, for some of the share classes, resulting in net expense ratios of the following: R3 shares, 1.50%; R4
shares, 1.40%; R5 shares, 0.99%; R6 shares, 0.89%. For more detailed information on fund expenses and waivers/reimbursements please see the Fund’s prospectus.
14 |
Thornburg Equity Funds Semi-Annual Report
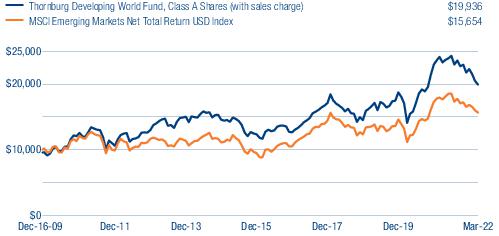
Thornburg Developing World Fund
Investment Goal and
Fund
Overview
The Developing World
Fund’s primary investment goal is long-term capital appreciation. The Fund invests at least 80% of its assets in equity securities of developing country issuers. A developing country issuer is a company or sovereign entity that is domiciled or
otherwise tied economically to one or more developing countries. The Fund portfolio is diversified to include basic value stocks, companies with consistent earnings, and emerging franchises as described in more detail in the Fund Prospectus.
Performance drivers and detractors for
the reporting period ended March 31, 2022
» For the period ended March 31, 2022,
the Fund’s underperformance on a sector basis relative to its benchmark index was attributable to stock selection, with sector allocation decisions essentially neutral and currency allocation decisions contributing positively to relative
performance. During the period, the Fund (Class I shares) returned -12.12% versus a return of -8.20% for the MSCI Emerging Markets Net Total Return USD Index.
» Stock selection within financials,
energy and consumer staples detracted from relative performance.
» Stock selection within materials,
consumer discretionary and communication services were additive to relative performance.
» On a geographic basis, the
Fund’s underperformance was driven by stock selection, with country allocation and currency allocation both contributing positively to relative performance.
» Stock selection in China and Brazil,
and an underweight allocation to Saudi Arabia, detracted from relative performance. Stock selection within the Philippines, as well as stock selection and an overweight allocation to Mexico, contributed positive to relative performance.
Performance Summary
March 31, 2022 (Unaudited)
GROWTH OF A HYPOTHETICAL $10,000 INVESTMENT
| THORNBURG
DEVELOPING WORLD FUND |
FINAL
VALUE |
AVERAGE ANNUAL
TOTAL RETURNS
| THORNBURG
DEVELOPING WORLD FUND |
1-YR
|
3-YR
|
5-YR
|
10-YR
|
SINCE
INCEPTION |
| Class
A Shares (Incep: 12/16/09) |
|
|
|
|
|
| Without
sales charge |
-14.46%
|
6.25%
|
7.80%
|
4.83%
|
6.17%
|
| With
sales charge |
-18.30%
|
4.63%
|
6.81%
|
4.35%
|
5.78%
|
| Class
C Shares (Incep: 12/16/09) |
|
|
|
|
|
| Without
sales charge |
-15.14%
|
5.44%
|
6.98%
|
4.03%
|
5.39%
|
| With
sales charge |
-15.99%
|
5.44%
|
6.98%
|
4.03%
|
5.39%
|
| Class
I Shares (Incep: 12/16/09) |
-14.16%
|
6.63%
|
8.20%
|
5.27%
|
6.65%
|
| Class
R5 Shares (Incep: 2/1/13) |
-14.17%
|
6.63%
|
8.21%
|
-
|
4.48%
|
| Class
R6 Shares (Incep: 2/1/13) |
-14.07%
|
6.73%
|
8.31%
|
-
|
4.58%
|
| MSCI
Emerging Markets Net Total Return USD Index (Since 12/16/09) |
-11.37%
|
4.94%
|
5.98%
|
3.36%
|
3.71%
|
The matters discussed in
this report may constitute forward-looking statements made pursuant to the safe harbor provisions of the Securities Litigation Reform Act of 1995. These include any advisor or portfolio manager prediction, assessment, analysis or outlook for
individual securities, industries, investment styles, market sectors and/or markets. These statements involve risks and uncertainties. In addition to the general risks described for each fund in its current prospectus, other factors bearing on these
reports include the accuracy of the advisor’s or portfolio manager’s forecasts and predictions, the appropriateness of the investment strategies designed by the advisor or portfolio manager and the ability of the advisor or portfolio
manager to implement their strategies efficiently and successfully. Any one or more of these factors, as well as other risks affecting the securities markets generally, could cause the actual results of any fund to differ materially as compared to
its benchmarks.
The views expressed are subject to
change and do not necessarily reflect the views of Thornburg Investment Management, Inc. This information should not be relied upon as a recommendation or investment advice and is not intended to predict the performance of any investment or
market.
Performance results of individual share
classes will vary based on the fees and expenses associated with each share class, and may be higher or lower than other share classes within the same Fund. Please see Performance Summary for performance results of each share class.
Performance data shown represents past performance and
is no guarantee of future results. Investment return and principal value will fluctuate so shares, when redeemed, may be worth more or less than their original cost. Current performance may be lower or higher than quoted. For performance current to
the most recent month end, visit thornburg.com or call 800-847-0200. The performance information does not reflect the deduction of taxes that a shareholder would pay on distributions or the redemption of Fund shares. Returns reflect the reinvestment
of dividends and capital gains. Class A shares are sold with a maximum sales charge of 4.50%. Class C shares are subject to a 1% CDSC for the first year only. There is no sales charge for Class I, R5 and R6 shares. As disclosed in the Fund’s
most recent prospectus, the total annual fund operating expenses before fee waivers or expense reimbursements are as follows: A shares, 1.43%; C shares, 2.19%; I shares, 1.15%; R5 shares, 1.70%; R6 shares, 1.11%. Thornburg Investment Management has
contractually agreed to waive fees and reimburse expenses until at least February 1, 2023, for some of the share classes, resulting in net expense ratios of the following: I shares, 1.04%; R5 shares, 1.04%; R6 shares, 0.94%. For more detailed
information on fund expenses and waivers/reimbursements please see the Fund’s prospectus.
Thornburg Equity Funds Semi-Annual Report | 15
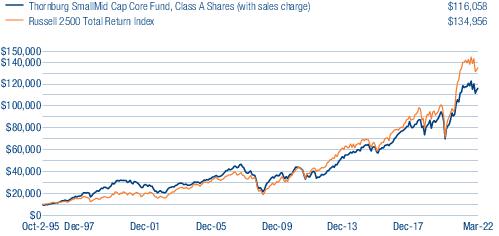
Thornburg Small/Mid Cap Core Fund
Investment Goal and
Fund
Overview
The Fund seeks long-term
capital appreciation by investing in equity and debt securities of all types. The secondary, non-fundamental goal of the Fund is to seek some current income. Under normal conditions, the Fund invests at least 80% of its net assets in small- and
mid-capitalization companies.
With
its core approach to stock selection, the Fund seeks to invest in a broadly diversified portfolio of companies the Fund categorizes as basic values, consistent earners, and emerging franchises, as described in more detail in the Fund Prospectus. The
relative proportions of securities invested in each of those categories will vary over time.
Performance drivers and detractors for
the reporting period ended March 31, 2022
» For the six-month period ended
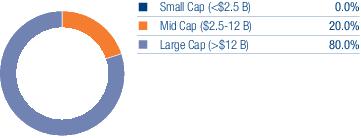
March 31, 2022, the Fund (Class I shares) returned -1.71% versus a return of -2.22% for the Russell 2500 Total Return Index, primarily due to sector and market cap allocations. The allocation towards slightly larger companies was beneficial as
mid-cap companies outperformed small-cap companies.
» Stock selection in health care and
industrials had a positive relative impact on performance, as did an overallocation to the outperforming energy sector.
» Stock selection in information
technology, consumer staples, and real estate had a negative relative impact on performance.
» Returns of mid-cap stocks outpaced
small-cap stocks within the benchmark. Stock selection was a slight negative contributor within the small-cap portion of the Fund’s portfolio. However, an overweight to larger stocks within the universe and a positive impact from selection of
stocks within the $2.5 billion to $12 billon market cap range were positive, contributing to outperformance for the period.
Performance Summary
March 31, 2022 (Unaudited)
GROWTH OF A HYPOTHETICAL $10,000 INVESTMENT
| THORNBURG
SMALL/MID CAP CORE FUND |
FINAL
VALUE |
AVERAGE ANNUAL
TOTAL RETURNS
| THORNBURG
SMALL/MID CAP CORE FUND |
1-YR
|
3-YR
|
5-YR
|
10-YR
|
SINCE
INCEPTION |
| Class
A Shares (Incep: 10/2/95) |
|
|
|
|
|
| Without
sales charge |
3.09%
|
11.53%
|
10.31%
|
11.14%
|
9.88%
|
| With
sales charge |
-1.56%
|
9.83%
|
9.30%
|
10.63%
|
9.69%
|
| Class
C Shares (Incep: 10/2/95) |
|
|
|
|
|
| Without
sales charge |
2.21%
|
10.63%
|
9.41%
|
10.27%
|
9.03%
|
| With
sales charge |
1.49%
|
10.63%
|
9.41%
|
10.27%
|
9.03%
|
| Class
I Shares (Incep: 11/2/98) |
3.44%
|
11.91%
|
10.69%
|
11.56%
|
8.23%
|
| Class
R3 Shares (Incep: 7/1/03) |
3.07%
|
11.52%
|
10.29%
|
11.16%
|
8.45%
|
| Class
R4 Shares (Incep: 2/1/07) |
3.17%
|
11.62%
|
10.40%
|
11.27%
|
6.92%
|
| Class
R5 Shares (Incep: 2/1/05) |
3.43%
|
11.91%
|
10.69%
|
11.55%
|
8.58%
|
Russell
2500 Total Return Index
(Since 10/2/95) |
0.34%
|
13.79%
|
11.57%
|
12.09%
|
10.32%
|
The matters discussed in
this report may constitute forward-looking statements made pursuant to the safe harbor provisions of the Securities Litigation Reform Act of 1995. These include any advisor or portfolio manager prediction, assessment, analysis or outlook for
individual securities, industries, investment styles, market sectors and/or markets. These statements involve risks and uncertainties. In addition to the general risks described for each fund in its current prospectus, other factors bearing on these
reports include the accuracy of the advisor’s or portfolio manager’s forecasts and predictions, the appropriateness of the investment strategies designed by the advisor or portfolio manager and the ability of the advisor or portfolio
manager to implement their strategies efficiently and successfully. Any one or more of these factors, as well as other risks affecting the securities markets generally, could cause the actual results of any fund to differ materially as compared to
its benchmarks.
The views expressed are subject to
change and do not necessarily reflect the views of Thornburg Investment Management, Inc. This information should not be relied upon as a recommendation or investment advice and is not intended to predict the performance of any investment or
market.
Performance results of individual share
classes will vary based on the fees and expenses associated with each share class, and may be higher or lower than other share classes within the same Fund. Please see Performance Summary for performance results of each share class.
Performance data shown represents past performance and
is no guarantee of future results. Investment return and principal value will fluctuate so shares, when redeemed, may be worth more or less than their original cost. Current performance may be lower or higher than quoted. For performance current to
the most recent month end, visit thornburg.com or call 800-847-0200. The performance information does not reflect the deduction of taxes that a shareholder would pay on distributions or the redemption of Fund shares. Returns reflect the reinvestment
of dividends and capital gains. Class A shares are sold with a maximum sales charge of 4.50%. Class C shares are subject to a 1% CDSC for the first year only. There is no sales charge for Class I, R3, R4 and R5 shares. As disclosed in the
Fund’s most recent prospectus, the total annual fund operating expenses before fee waivers or expense reimbursements are as follows: A shares, 1.31%; C shares, 2.13%; I shares, 1.06%; R3 shares, 1.79%; R4 shares, 1.76%; R5 shares, 1.46%.
Thornburg Investment Management has contractually agreed to waive fees and reimburse expenses until at least February 1, 2023, for some of the share classes, resulting in net expense ratios of the following: I shares, 0.95%; R3 shares, 1.31%; R4
shares, 1.21%; R5 shares, 0.95%. For more detailed information on fund expenses and waivers/reimbursements please see the Fund’s prospectus.
16 |
Thornburg Equity Funds Semi-Annual Report
Thornburg Small/Mid Cap Growth
Fund
Investment Goal and
Fund
Overview
The Fund seeks long-term
growth of capital by investing in equity securities selected for their growth potential. Under normal conditions, the Fund invests at least 80% of its net assets in small- and mid-capitalization companies.
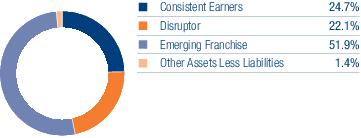
The Fund seeks to invest in a diversified
portfolio of companies the Fund categorizes as consistent earners, disruptors, and emerging franchises, as described in more detail in the Fund Prospectus. The relative proportions of securities invested in each of those categories will vary over
time.
Performance drivers and
detractors for the reporting period ended March 31, 2022
» For the six-month period ended March
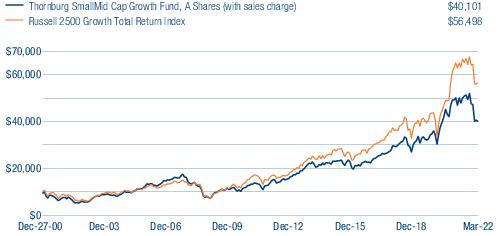
31, 2022, the Fund (Class I shares) returned -18.64% versus a return of -12.13% for the Russell 2500 Growth Total Return Index, primarily due to stock selection across sectors and market cap ranges.
» Stock selection in information
technology, consumer discretionary, and industrials had a negative relative impact on performance versus the index.
» The Fund’s allocation towards
slightly larger companies was beneficial as larger companies outperformed smaller companies within the small- and mid-cap universe.
» Stock selection in health care and
communication services had a positive relative impact on the Fund’s performance relative to the index.
» Returns of mid-caps outpaced
small-caps within the benchmark during the period. Stock selection was the primary negative contributor to the relative underperformance within both the small- and mid-cap portion of the Fund. However, an underweighting in the Fund to smaller stocks
within the index universe had a slight positive impact on relative performance.
Performance Summary
March 31, 2022 (Unaudited)
GROWTH OF A HYPOTHETICAL $10,000 INVESTMENT
| THORNBURG
SMALL/MID CAP GROWTH FUND |
FINAL
VALUE |
AVERAGE ANNUAL
TOTAL RETURNS
THORNBURG
SMALL/MID CAP
GROWTH FUND |
1-YR
|
3-YR
|
5-YR
|
10-YR
|
SINCE
INCEPTION |
| Class
A Shares (Incep: 12/27/00) |
|
|
|
|
|
| Without
sales charge |
-14.54%
|
8.03%
|
10.48%
|
10.17%
|
6.98%
|
| With
sales charge |
-18.39%
|
6.39%
|
9.46%
|
9.67%
|
6.75%
|
| Class
C Shares (Incep: 12/27/00) |
|
|
|
|
|
| Without
sales charge |
-15.29%
|
7.17%
|
9.59%
|
9.32%
|
6.14%
|
| With
sales charge |
-15.80%
|
7.17%
|
9.59%
|
9.32%
|
6.14%
|
| Class
I Shares (Incep: 11/3/03) |
-14.26%
|
8.40%
|
10.87%
|
10.60%
|
9.14%
|
| Class
R3 Shares (Incep: 7/1/03) |
-14.67%
|
7.86%
|
10.31%
|
10.04%
|
9.15%
|
| Class
R4 Shares (Incep: 2/1/07) |
-14.61%
|
7.97%
|
10.42%
|
10.15%
|
6.54%
|
| Class
R5 Shares (Incep: 10/3/05) |
-14.25%
|
8.40%
|
10.87%
|
10.61%
|
8.37%
|
| Russell
2500 Growth Total Return Index (Since 12/27/00) |
-10.12%
|
12.99%
|
13.22%
|
12.69%
|
8.49%
|
The matters discussed in
this report may constitute forward-looking statements made pursuant to the safe harbor provisions of the Securities Litigation Reform Act of 1995. These include any advisor or portfolio manager prediction, assessment, analysis or outlook for
individual securities, industries, investment styles, market sectors and/or markets. These statements involve risks and uncertainties. In addition to the general risks described for each fund in its current prospectus, other factors bearing on these
reports include the accuracy of the advisor’s or portfolio manager’s forecasts and predictions, the appropriateness of the investment strategies designed by the advisor or portfolio manager and the ability of the advisor or portfolio
manager to implement their strategies efficiently and successfully. Any one or more of these factors, as well as other risks affecting the securities markets generally, could cause the actual results of any fund to differ materially as compared to
its benchmarks.
The views expressed are subject to
change and do not necessarily reflect the views of Thornburg Investment Management, Inc. This information should not be relied upon as a recommendation or investment advice and is not intended to predict the performance of any investment or
market.
Performance results of individual share
classes will vary based on the fees and expenses associated with each share class, and may be higher or lower than other share classes within the same Fund. Please see Performance Summary for performance results of each share class.
Performance data shown represents past performance and
is no guarantee of future results. Investment return and principal value will fluctuate so shares, when redeemed, may be worth more or less than their original cost. Current performance may be lower or higher than quoted. For performance current to
the most recent month end, visit thornburg.com or call 800-847-0200. The performance information does not reflect the deduction of taxes that a shareholder would pay on distributions or the redemption of Fund shares. Returns reflect the reinvestment
of dividends and capital gains. Class A shares are sold with a maximum sales charge of 4.50%. Class C shares are subject to a 1% CDSC for the first year only. There is no sales charge for Class I, R3, R4 and R5 shares. As disclosed in the
Fund’s most recent prospectus, the total annual fund operating expenses before fee waivers or expense reimbursements are as follows: A shares, 1.31%; C shares, 2.09%; I shares, 1.04%; R3 shares, 1.79%; R4 shares, 2.17%; R5 shares, 1.31%.
Thornburg Investment Management has contractually agreed to waive fees and reimburse expenses until at least February 1, 2023, for some of the share classes, resulting in net expense ratios of the following: I shares, 0.95%; R3 shares, 1.46%; R4
shares, 1.36%; R5 shares, 0.95%. For more detailed information on fund expenses and waivers/reimbursements please see the Fund’s prospectus.
Thornburg Equity Funds Semi-Annual Report | 17
Thornburg Investment Income Builder
Fund
Investment Goal and
Fund
Overview
The Investment Income
Builder Fund’s primary investment goal is to provide a level of current income which exceeds the average yield on U.S. stocks generally, and which will generally grow, subject to periodic fluctuations, over the years on a per share basis. The
Fund’s secondary investment goal is long-term capital appreciation.
The Fund pursues its investment goals by
investing in a broad range of income producing securities, primarily stocks and bonds. Equity investments normally will be weighted in favor of companies which pay dividends. The Fund may invest in securities of issuers domiciled in or economically
tied to countries outside the United States, including developing countries. Investment decisions are based on domestic and international economic developments, outlooks for securities markets, interest rates and inflation, the supply and demand for
debt and equity securities, and analysis of specific issuers.
See letter beginning on page 8 of this
report for a discussion of factors affecting the Fund’s performance for the reporting period ended March 31, 2022.
Performance Summary
March 31, 2022 (Unaudited)
GROWTH OF A HYPOTHETICAL $10,000 INVESTMENT
| THORNBURG
INVESTMENT INCOME BUILDER FUND |
FINAL
VALUE |
AVERAGE ANNUAL
TOTAL RETURNS
| THORNBURG
INVESTMENT INCOME BUILDER FUND |
1-YR
|
3-YR
|
5-YR
|
10-YR
|
SINCE
INCEPTION |
| Class
A Shares (Incep: 12/24/02) |
|
|
|
|
|
| Without
sales charge |
8.25%
|
8.67%
|
7.72%
|
7.23%
|
9.04%
|
| With
sales charge |
3.39%
|
7.02%
|
6.73%
|
6.73%
|
8.78%
|
| Class
C Shares (Incep: 12/24/02) |
|
|
|
|
|
| Without
sales charge |
7.43%
|
7.86%
|
6.92%
|
6.45%
|
8.34%
|
| With
sales charge |
6.43%
|
7.86%
|
6.92%
|
6.45%
|
8.34%
|
| Class
I Shares (Incep: 11/3/03) |
8.53%
|
8.92%
|
8.01%
|
7.54%
|
8.55%
|
| Class
R3 Shares (Incep: 2/1/05) |
7.85%
|
8.27%
|
7.34%
|
6.87%
|
7.18%
|
| Class
R4 Shares (Incep: 2/1/08) |
8.00%
|
8.39%
|
7.45%
|
6.99%
|
5.81%
|
| Class
R5 Shares (Incep: 2/1/07) |
8.41%
|
8.83%
|
7.89%
|
7.41%
|
6.47%
|
| Class
R6 Shares (Incep: 4/10/17) |
8.62%
|
9.02%
|
-
|
-
|
8.21%
|
MSCI
World Net Total Return USD Index
(Since 12/24/02) |
10.12%
|
14.98%
|
12.42%
|
10.88%
|
9.30%
|
The matters discussed in
this report may constitute forward-looking statements made pursuant to the safe harbor provisions of the Securities Litigation Reform Act of 1995. These include any advisor or portfolio manager prediction, assessment, analysis or outlook for
individual securities, industries, investment styles, market sectors and/or markets. These statements involve risks and uncertainties. In addition to the general risks described for each fund in its current prospectus, other factors bearing on these
reports include the accuracy of the advisor’s or portfolio manager’s forecasts and predictions, the appropriateness of the investment strategies designed by the advisor or portfolio manager and the ability of the advisor or portfolio
manager to implement their strategies efficiently and successfully. Any one or more of these factors, as well as other risks affecting the securities markets generally, could cause the actual results of any fund to differ materially as compared to
its benchmarks.
The views expressed are subject to
change and do not necessarily reflect the views of Thornburg Investment Management, Inc. This information should not be relied upon as a recommendation or investment advice and is not intended to predict the performance of any investment or
market.
Performance results of individual share
classes will vary based on the fees and expenses associated with each share class, and may be higher or lower than other share classes within the same Fund. Please see Performance Summary for performance results of each share class.
Performance data shown represents past performance and
is no guarantee of future results. Investment return and principal value will fluctuate so shares, when redeemed, may be worth more or less than their original cost. Current performance may be lower or higher than quoted. For performance current to
the Fund’s most recent month end, visit thornburg.com or call 800-847-0200. The performance information does not reflect the deduction of taxes that a shareholder would pay on distributions or the redemption of Fund shares. Returns reflect the
reinvestment of dividends and capital gains. Class A shares are sold with a maximum sales charge of 4.50%. Class C shares are subject to a 1% CDSC for the first year only. There is no sales charge for Class I, R3, R4, R5 and R6 shares. As disclosed
in the Fund’s most recent prospectus, the total annual fund operating expenses before fee waivers or expense reimbursements are as follows: A shares, 1.18%; C shares, 1.95%; I shares, 0.94%; R3 shares, 1.63%; R4 shares, 1.51%; R5 shares,
1.14%; R6 shares, 0.89%. Thornburg Investment Management has contractually agreed to waive fees and reimburse expenses until at least February 1, 2023, for some of the share classes, resulting in net expense ratios of the following: R3 shares,1.50%;
R4 shares, 1.40%; R5 shares, 0.99%; R6 shares, 0.80%. For more detailed information on fund expenses and waivers/reimbursements please see the Fund’s prospectus.
30-day SEC Yield as of 3/31/22 (Class A Shares) :
2.72%
18 |
Thornburg Equity Funds Semi-Annual Report
Investment Goal and
Fund
Overview
The Summit Fund seeks to
grow real wealth over time. “Real wealth” for this purpose is a mix of capital appreciation and current income that is intended to exceed the rate of inflation. Under normal conditions the Fund’s investments are expected to
emphasize long positions in equity securities and fixed income obligations, though the Fund may also invest a significant amount of its assets in short positions in equity securities and fixed income obligations, in commodities-related investments,
in derivative instruments, in currencies, and in cash or cash equivalents.
There are no specific percentage
limitations on the amount of the Fund’s portfolio that may be invested in a particular asset class, and the proportions of the Fund’s assets that are invested in the respective asset classes are expected to vary over time and from time
to time depending upon Thornburg’s perceptions of which types of investments represent better values and opportunities to achieve the Fund’s investment goal.
Performance drivers and detractors for
the reporting period ended March 31, 2022
» Selection effect within both
equities and fixed income contributed strongly to the Fund’s relative outperformance versus its index during the trailing six-month period ended March 31, 2022. The Fund’s position to cash was modestly detractive to relative performance.
For the period, the Fund (Class I shares) returned 0.26% versus a return of -2.11% for the 60% MSCI All Country AC World Index and 40% Bloomberg Barclays Global Aggregate Bond Index (the benchmark blended index).
» Within equities, selection effect
from information technology and industrial stocks contributed positively to the Fund’s relative outperformance.
» The Fund’s modestly
underweight allocation to equities, versus its blended benchmark index, and its overweight allocation to communication services, as well as stock selection within financials, detracted from relative performance.
» Within fixed income, the
Fund’s relative outperformance was primarily driven by strong security selection across sectors. An overweight allocation to asset backed securities was also additive to relative performance versus the blended benchmark index.
» On a geographic basis, an
overweighting of Fund holdings in U.S. fixed income was additive to its relative performance.
Performance Summary
March 31, 2022 (Unaudited)
GROWTH OF A HYPOTHETICAL $10,000 INVESTMENT
| THORNBURG
SUMMIT FUND |
FINAL
VALUE |
AVERAGE ANNUAL
TOTAL RETURNS
| THORNBURG
SUMMIT FUND |
1-YR
|
3-YR
|
5-YR
|
10-YR
|
SINCE
INCEPTION |
| Class
A Shares (Incep: 1/26/22) |
|
|
|
|
|
| Without
sales charge |
-
|
-
|
-
|
-
|
0.76%
|
| With
sales charge |
-
|
-
|
-
|
-
|
-3.79%
|
| Class
I Shares (Incep: 3/1/19) |
5.60%
|
15.27%
|
-
|
-
|
15.54%
|
| 60%
MSCI All Country (AC) World Net Total Return USD Index/40% Bloomberg Global Aggregate Bond Index (Since 3/1/19) |
1.72%
|
8.67%
|
-
|
-
|
8.87%
|
The matters discussed in
this report may constitute forward-looking statements made pursuant to the safe harbor provisions of the Securities Litigation Reform Act of 1995. These include any advisor or portfolio manager prediction, assessment, analysis or outlook for
individual securities, industries, investment styles, market sectors and/or markets. These statements involve risks and uncertainties. In addition to the general risks described for each fund in its current prospectus, other factors bearing on these
reports include the accuracy of the advisor’s or portfolio manager’s forecasts and predictions, the appropriateness of the investment strategies designed by the advisor or portfolio manager and the ability of the advisor or portfolio
manager to implement their strategies efficiently and successfully. Any one or more of these factors, as well as other risks affecting the securities markets generally, could cause the actual results of any fund to differ materially as compared to
its benchmarks.
The views expressed are subject to
change and do not necessarily reflect the views of Thornburg Investment Management, Inc. This information should not be relied upon as a recommendation or investment advice and is not intended to predict the performance of any investment or
market.
Performance results of individual share
classes will vary based on the fees and expenses associated with each share class, and may be higher or lower than other share classes within the same Fund. Please see Performance Summary for performance results of each share class.
Performance data shown represents past performance and
is no guarantee of future results. Investment return and principal value will fluctuate so shares, when redeemed, may be worth more or less than their original cost. Current performance may be lower or higher than quoted. For performance current to
the Fund’s most recent month end, visit thornburg.com or call 800-847-0200. The performance information does not reflect the deduction of taxes that a shareholder would pay on distributions or the redemption of Fund shares. Returns reflect the
reinvestment of dividends and capital gains. Class A shares are sold with a maximum sales charge of 4.50%. There is no sales charge for Class I shares. As disclosed in the Fund’s most recent prospectus, the total annual fund operating expenses
before fee waivers or expense reimbursements are as follows: A shares, 1.47%; I shares, 1.22%. Thornburg Investment Management has contractually agreed to waive fees and reimburse expenses until at least February 1, 2023, for some of the share
classes, resulting in net expense ratios of the following: A shares, 1.24%; I shares, 0.99%. For more detailed information on fund expenses and waivers/reimbursements please see the Fund’s
prospectus.
Thornburg Equity Funds Semi-Annual Report | 19
Glossary
March 31, 2022 (Unaudited)
The
Bloomberg U.S. Aggregate Bond Total Return Index Value USD is composed of approximately 8,000 publicly traded bonds including U.S. government, mortgage-backed, corporate and Yankee bonds. The index is weighted by the market value of the bonds
included in the index.
The Bloomberg Global Aggregate Bond Index provides a broad-based measure of the global investment-grade fixed-rate debt markets. It is comprised of the U.S. Aggregate, Pan European Aggregate, and the
Asian-Pacific Aggregate indices. It also includes a wide range of standard and customized sub-indices by liquidity constraint, sector, quality, and maturity.
Thornburg Investment Income Builder Fund’s Blended Index is composed of 25% Bloomberg US Aggregate Bond Total Return Index Value USD and 75% MSCI World Net Total Return USD Index, rebalanced monthly.
Bond Credit Ratings (Credit Quality) – A bond credit rating assesses the financial ability of a debt issuer to make timely payments of principal and interest. Ratings of AAA (the highest), AA, A, and BBB are investment-grade
quality. Ratings of BB, B, CCC, CC, C and D (the lowest) are considered below investment grade, speculative grade, or junk bonds.
The
MSCI World Net Total Return USD Index is an unmanaged market-weighted index that consists of securities traded in 23 of the world’s most developed countries. Securities are listed on exchanges in the U.S., Europe, Canada, Australia, New
Zealand, and the Far East. The index is calculated with net dividends reinvested in U.S. dollars.
The
MSCI All Country (AC) World Net Total Return USD Index is a market capitalization weighted index that is representative of the market structure of 47 developed and emerging market countries in North and South America, Europe, Africa, the
Middle East, and the Pacific Rim. The index is calculated with net dividends reinvested in U.S. dollars.
The
MSCI All Country (AC) World ex-USA Total Return Index is a market capitalization weighted index representative of the market structure of 45 developed and emerging market countries in North and South America, Europe, Africa, and the Pacific
Rim, excluding securities of United States issuers. Beginning in January 2001, the index is calculated with net dividends reinvested in U.S. dollars. Prior data is calculated with gross dividends.
The
MSCI World ESG Leaders Index is a capitalization weighted index that provides exposure to companies with high Environmental, Social and Governance (ESG) performance relative to their sector
peers. MSCI World ESG Leaders Index is constructed by aggregating the following regional Index MSCI Pacific ESG Leaders Index, MSCI Europe & Middle East ESG Leaders Index, MSCI Canada ESG Leaders Index and MSCI USA ESG Leaders Index. The parent
index is MSCI World Index, which consists of large and mid-cap companies in 23 Developed Markets Countries.
The
MSCI EAFE (Europe, Australasia, Far East) Net Total Return USD Index is an unmanaged index. It is a generally accepted benchmark for major overseas markets. Index weightings represent the relative capitalizations of the major overseas
developed markets on a U.S. dollar adjusted basis. The index is calculated with net dividends reinvested in U.S. dollars.
The
MSCI All Country (AC) World ex USA Growth Net Total Return USD Index is a market capitalization weighted index that includes growth companies in developed and emerging markets throughout the world, excluding the United States.
The
MSCI Emerging Markets Index is a free float-adjusted market capitalization index that is designed to measure equity market performance of emerging markets. The MSCI Emerging Markets Index consists of the following 23 emerging market country
indexes: Brazil, Chile, China, Colombia, Czech Republic, Egypt, Greece, Hungary, India, Indonesia, Korea, Malaysia, Mexico, Peru, Philippines, Poland, Qatar, Russia, South Africa, Taiwan, Thailand, Turkey and United Arab Emirates.
The
Russell 2500 Total Return Index measures the performance of the 2,500 smallest companies in the Russell 3000 Index, with a weighted average market capitalization of approximately $4.3 billion, median capitalization of $1.2 billion and market
capitalization of the largest company of $18.7 billion.
The
Russell 2500 Growth Total Return Index measures the performance of the small to mid-cap growth segment of the U.S. equity universe. It includes those Russell 2500™ companies with higher
growth earning potential as defined by FTSE Russell’s leading style methodology. Source: Frank Russell Company.
Net Adjusted S&P 500 Index – For illustration purposes, the net adjusted S&P 500 Index adjusts the total return of the S&P 500 Index to reflect the same net exposure as the Fund.
P/E - Price/Earnings ratio (P/E ratio) is a valuation ratio of a company’s current share price compared to its per-share earnings. P/E equals a company’s market value per share divided by earnings per share. Forecasted
P/E is not intended to be a forecast of the Fund’s future performance.
Price/Book ratio (P/B ratio) – A ratio used to compare a stock’s market value to its book value. It is calculated by dividing the current closing price of the stock by the latest quarter’s book value per
share.
Yield to Worst (YTW) – The lowest potential yield that can be received on a bond without the issuer actually defaulting.
The performance of any index is not indicative of the
performance of any particular investment. Unless otherwise noted, index returns reflect the reinvestment of income dividends and capital gains, if any, but do not reflect fees, brokerage commissions or other expenses of investing. Investors may not
make direct investments into any index.
Any
securities, sectors, or countries mentioned are for illustration purposes only. Holdings are subject to change. Under no circumstances does the information contained within represent a recommendation to buy or sell any security.
The information given should not be considered tax
advice. Please consult your tax advisor for personal tax questions and concerns.
20
| Thornburg Equity Funds Semi-Annual Report
This page intentionally left
blank.
Thornburg Equity Funds Semi-Annual Report | 21
The Dividend Landscape
Thornburg Investment Income Builder Fund | March 31, 2022
(Unaudited)
To appreciate the investment environment in which Thornburg Investment Income
Builder Fund operates, you may wish to review these highlights of the “dividend landscape.”
The S&P 500 Index Payout Ratio — A Historical Perspective
The dividend payout ratio is a fraction that expresses
dividend payments as a percentage of per-share earnings. As the economy slowed in the wake of the financial crisis, earnings-per-share on average declined, causing the payout ratio to spike, even as dividends paid by the S&P 500 portfolio
declined. Earnings have since materially improved, bringing the payout ratio back in line with the overall trend in recent times.
Corporate Willingness to Pay Dividends is Key to the
Fund’s Investment Process
The Russell 1000 Index
includes approximately 1,000 public companies that are supposed to be generally representative of corporate America. Between 1980 and 1993, at least 75% of these firms paid some dividend. Between 1994 and 2001, the percentage of Russell 1000
companies paying dividends sank to just over 50%, indicating a preference towards reinvesting retained earnings in growth initiatives. Dividends returned to fashion between 2002 and 2008. A reduction in the number of Russell 1000 firms paying
dividends followed the 2008 recession. However, from early 2010, the number steadily climbed back to around 70%.
Rising Dividend Payments Despite Decreasing Dividend
Yields
Over time, the dollar dividend per unit of the
S&P 500 Index has generally increased. Because the price of the index itself has increased even more, the yield on the S&P 500 Index, as a percentage of the current index price, has generally decreased in recent decades. You should note,
however, that the dollar yield on an original investment made at a fixed point in time (say, 1970 or 1989) has increased, even without reinvestment of dividends.
S&P 500 Index Payout Ratio
Source:
Bloomberg, beginning in 1999 (uses operating earnings); “Irrational Exuberance”
by Robert J. Shiller, through 1998 (uses reported earnings).
Percentage of Companies Paying Dividends in Russell 1000
Index
Source:
CSFB Quantitative and Equity Derivatives Strategy, Baseline, and FactSet.
S&P 500 Index Average Yield vs. Annual Dividends from a
Hypothetical $100,000 Investment (Dividends not Reinvested)
Source:
Bloomberg and FactSet as of 3/31/22.
Past performance does not
guarantee future results.
22 | Thornburg Equity Funds Semi-Annual Report
The Dividend Landscape, Continued
Thornburg Investment Income Builder Fund | March 31, 2022 (Unaudited)
The Top 100 Dividend Yields
| |
RUSSELL
1000
INDEX |
RUSSELL
2000
INDEX |
| Financials
|
26%
|
40%
|
| Real
Estate |
22%
|
28%
|
| Energy
|
10%
|
7%
|
| Consumer
Discretionary |
9%
|
8%
|
| Utilities
|
8%
|
1%
|
| Consumer
Staples |
7%
|
4%
|
| Materials
|
5%
|
4%
|
| Health
Care |
4%
|
1%
|
| Information
Technology |
4%
|
1%
|
| Communication
Services |
3%
|
2%
|
| Industrials
|
2%
|
4%
|
Source: FactSet as of March
31, 2022.
Estimated Average Dividend Yields (MSCI Indices)
of Markets Around the Globe
Source:
Bloomberg as of March 31, 2022.
A Truly Diversified Dividend-Paying Portfolio Must Look Beyond the Obvious
High-Yield Stocks!
In the (large cap) Russell 1000
Index, 48% of the top 100 dividend payers are in the financials and real estate sectors. In the (small cap) Russell 2000 Index, 68% of the top 100 dividend-yielding stocks are real estate or financials companies. To construct a diversified portfolio
of attractive yielding stocks, one must look beyond these sectors. We certainly do.
Dividend yield is a ratio that shows how much a company
pays out in dividends each year relative to its share price.
Global Diversification Can Improve the Portfolio Yield
Since firms outside the U.S. tend to pay higher dividends
than U.S. firms, particularly outside the financial and utility sectors, we maintain the ability to diversify the Thornburg Investment Income Builder Fund into foreign dividend-paying stocks to try to take advantage of these opportunities.
Diversification does not assure or guarantee better
performance and cannot eliminate the risk of investment losses.
Dividends are not guaranteed.
Thornburg Equity Funds Semi-Annual Report | 23
Fund Summary
Thornburg Global Opportunities Fund | March 31, 2022 (Unaudited)
Fund Summary
ASSET STRUCTURE
MARKET
CAPITALIZATION EXPOSURE
| TOP
TEN EQUITY HOLDINGS |
| Reliance
Industries Ltd. |
5.7%
|
| Alphabet,
Inc. Class A |
5.0%
|
| TotalEnergies
SE |
4.6%
|
| OCI
NV |
4.3%
|
| Samsung
Electronics Co. Ltd. |
4.2%
|
| Capital
One Financial Corp. |
4.0%
|
| Bank
of Ireland Group plc |
3.7%
|
| NN
Group NV |
3.6%
|
| Charles
Schwab Corp. |
3.5%
|
| Tesco
plc |
3.4%
|
| SECTOR
EXPOSURE |
| Financials
|
18.1%
|
| Communication
Services |
16.0%
|
| Materials
|
12.7%
|
| Information
Technology |
11.6%
|
| Energy
|
10.3%
|
| Consumer
Discretionary |
9.8%
|
| Health
Care |
7.9%
|
| Industrials
|
6.1%
|
| Consumer
Staples |
3.4%
|
| Other
Assets Less Liabilities |
4.1%
|
| TOP
TEN INDUSTRY GROUPS |
| Materials
|
12.7%
|
| Energy
|
10.3%
|
| Media
& Entertainment |
9.7%
|
| Diversified
Financials |
7.5%
|
| Semiconductors
& Semiconductor Equipment |
7.4%
|
| Pharmaceuticals,
Biotechnology & Life Sciences |
7.4%
|
| Banks
|
7.0%
|
| Telecommunication
Services |
6.3%
|
| Retailing
|
4.9%
|
| Technology
Hardware & Equipment |
4.2%
|
THORNBURG
GLOBAL
OPPORTUNITIES FUND |
NASDAQ
SYMBOLS |
CUSIPS
|
| Class
A |
THOAX
|
885-215-343
|
| Class
C |
THOCX
|
885-215-335
|
| Class
I |
THOIX
|
885-215-327
|
| Class
R3 |
THORX
|
885-215-145
|
| Class
R4 |
THOVX
|
885-215-137
|
| Class
R5 |
THOFX
|
885-215-129
|
| Class
R6 |
THOGX
|
885-216-655
|
Class I, R3, R4, R5, and
R6 shares may not be available to all investors. Minimum investments for Class I shares may be higher than those for other classes.
There is no guarantee that the Fund will meet its
investment objectives.
All data is subject to
change. Charts may not add up to 100% due to rounding.
24 | Thornburg Equity Funds Semi-Annual Report
Fund Summary
Thornburg International Equity Fund | March 31, 2022 (Unaudited)
MARKET CAPITALIZATION EXPOSURE
BASKET
STRUCTURE
| TOP
TEN EQUITY HOLDINGS |
| TotalEnergies
SE |
3.9%
|
| CME
Group, Inc. |
3.1%
|
| LVMH
Moet Hennessy Louis Vuitton SE |
2.8%
|
| Kuehne
+ Nagel International AG |
2.8%
|
| Canadian
Pacific Railway Ltd. |
2.7%
|
| Linde
plc |
2.7%
|
| ABB
Ltd. |
2.7%
|
| Kweichow
Moutai Co. Ltd. Class A |
2.6%
|
| Roche
Holding AG |
2.5%
|
| Tencent
Holdings Ltd. |
2.5%
|
| SECTOR
EXPOSURE |
| Industrials
|
19.1%
|
| Information
Technology |
16.1%
|
| Financials
|
13.5%
|
| Utilities
|
8.4%
|
| Communication
Services |
8.2%
|
| Consumer
Discretionary |
8.2%
|
| Materials
|
7.0%
|
| Consumer
Staples |
5.0%
|
| Health
Care |
4.9%
|
| Energy
|
3.9%
|
| Other
Assets Less Liabilities |
5.7%
|
| TOP
TEN INDUSTRY GROUPS |
| Capital
Goods |
11.7%
|
| Utilities
|
8.4%
|
| Consumer
Durables & Apparel |
7.0%
|
| Materials
|
7.0%
|
| Semiconductors
& Semiconductor Equipment |
6.9%
|
| Banks
|
6.8%
|
| Technology
Hardware & Equipment |
6.3%
|
| Transportation
|
5.5%
|
| Media
& Entertainment |
5.2%
|
| Pharmaceuticals,
Biotechnology & Life Sciences |
4.9%
|
THORNBURG
INTERNATIONAL
EQUITY FUND |
NASDAQ
SYMBOLS |
CUSIPS
|
| Class
A |
TGVAX
|
885-215-657
|
| Class
C |
THGCX
|
885-215-640
|
| Class
I |
TGVIX
|
885-215-566
|
| Class
R3 |
TGVRX
|
885-215-525
|
| Class
R4 |
THVRX
|
885-215-269
|
| Class
R5 |
TIVRX
|
885-215-368
|
| Class
R6 |
TGIRX
|
885-216-804
|
Class I, R3, R4, R5, and
R6 shares may not be available to all investors. Minimum investments for Class I shares may be higher than those for other classes.
There is no guarantee that the Fund will meet its
investment objectives.
All data is subject to
change. Charts may not add up to 100% due to rounding.
Thornburg Equity Funds Semi-Annual Report | 25
Fund Summary
Thornburg Better World International Fund | March 31, 2022
(Unaudited)
MARKET CAPITALIZATION EXPOSURE
BASKET
STRUCTURE
| TOP
TEN EQUITY HOLDINGS |
| Roche
Holding AG |
2.8%
|
| L’Oreal
SA |
2.7%
|
| Taiwan
Semiconductor Manufacturing Co. Ltd. |
2.6%
|
| Seven
& i Holdings Co. Ltd. |
2.5%
|
| Tesco
plc |
2.5%
|
| Sony
Corp. |
2.4%
|
| Hitachi
Ltd. |
2.4%
|
| Recruit
Holdings Co. Ltd. |
2.4%
|
| Novartis
AG |
2.2%
|
| Visa,
Inc. Class A |
2.2%
|
| SECTOR
EXPOSURE |
| Information
Technology |
23.4%
|
| Industrials
|
16.7%
|
| Consumer
Staples |
11.8%
|
| Materials
|
9.6%
|
| Consumer
Discretionary |
9.3%
|
| Financials
|
7.6%
|
| Health
Care |
6.3%
|
| Communication
Services |
2.9%
|
| Real
Estate |
0.7%
|
| Utilities
|
0.7%
|
| Other
Assets Less Liabilities |
11.0%
|
| TOP
TEN INDUSTRY GROUPS |
| Software
& Services |
10.5%
|
| Materials
|
9.6%
|
| Semiconductors
& Semiconductor Equipment |
8.3%
|
| Capital
Goods |
8.0%
|
| Commercial
& Professional Services |
7.2%
|
| Food
& Staples Retailing |
6.3%
|
| Pharmaceuticals,
Biotechnology & Life Sciences |
6.3%
|
| Household
& Personal Products |
5.5%
|
| Technology
Hardware & Equipment |
4.6%
|
| Consumer
Durables & Apparel |
4.4%
|
THORNBURG
BETTER WORLD
INTERNATIONAL FUND |
NASDAQ
SYMBOLS |
CUSIPS
|
| Class
A |
TBWAX
|
885-216-721
|
| Class
C |
TBWCX
|
885-216-713
|
| Class
I |
TBWIX
|
885-216-697
|
Class I shares may not be
available to all investors. Minimum investments for Class I shares may be higher than those for other classes.
There is no guarantee that the Fund will meet its
investment objectives.
All data is subject to
change. Charts may not add up to 100% due to rounding.
26 | Thornburg Equity Funds Semi-Annual Report
Fund Summary
Thornburg International Growth Fund | March 31, 2022 (Unaudited)
MARKET CAPITALIZATION EXPOSURE
BASKET
STRUCTURE
| TOP
TEN EQUITY HOLDINGS |
| Taiwan
Semiconductor Manufacturing Co. Ltd. |
7.4%
|
| Nestle
SA |
6.6%
|
| AstraZeneca
plc |
4.9%
|
| ASML
Holding NV |
4.1%
|
| Tencent
Holdings Ltd. |
3.8%
|
| LVMH
Moet Hennessy Louis Vuitton SE |
3.0%
|
| Air
Liquide SA |
2.8%
|
| Visa,
Inc. Class A |
2.7%
|
| Mastercard,
Inc. Class A |
2.6%
|
| Adyen
NV |
2.6%
|
| SECTOR
EXPOSURE |
| Information
Technology |
26.1%
|
| Communication
Services |
13.3%
|
| Consumer
Discretionary |
13.1%
|
| Industrials
|
11.7%
|
| Health
Care |
9.5%
|
| Consumer
Staples |
8.0%
|
| Financials
|
6.7%
|
| Materials
|
6.3%
|
| Energy
|
1.0%
|
| Other
Assets Less Liabilities |
4.3%
|
| TOP
TEN INDUSTRY GROUPS |
| Semiconductors
& Semiconductor Equipment |
14.6%
|
| Software
& Services |
11.5%
|
| Media
& Entertainment |
11.1%
|
| Pharmaceuticals,
Biotechnology & Life Sciences |
9.5%
|
| Food,
Beverage & Tobacco |
8.0%
|
| Materials
|
6.3%
|
| Capital
Goods |
5.5%
|
| Commercial
& Professional Services |
5.1%
|
| Consumer
Durables & Apparel |
4.8%
|
| Diversified
Financials |
4.0%
|
THORNBURG
INTERNATIONAL
GROWTH FUND |
NASDAQ
SYMBOLS |
CUSIPS
|
| Class
A |
TIGAX
|
885-215-319
|
| Class
C |
TIGCX
|
885-215-293
|
| Class
I |
TINGX
|
885-215-244
|
| Class
R3 |
TIGVX
|
885-215-178
|
| Class
R4 |
TINVX
|
885-215-160
|
| Class
R5 |
TINFX
|
885-215-152
|
| Class
R6 |
THGIX
|
885-216-820
|
Class I, R3, R4, R5, and
R6 shares may not be available to all investors. Minimum investments for Class I shares may be higher than those for other classes.
There is no guarantee that the Fund will meet its
investment objectives.
All data is subject to
change. Charts may not add up to 100% due to rounding.
Thornburg Equity Funds Semi-Annual Report | 27
Fund Summary
Thornburg Developing World Fund | March 31, 2022 (Unaudited)
MARKET CAPITALIZATION EXPOSURE
BASKET
STRUCTURE
| TOP
TEN EQUITY HOLDINGS |
| Taiwan
Semiconductor Manufacturing Co. Ltd. |
9.0%
|
| Tencent
Holdings Ltd. |
4.7%
|
| Samsung
Electronics Co. Ltd. |
3.9%
|
| First
Quantum Minerals Ltd. |
3.0%
|
| Yum
China Holdings, Inc. |
3.0%
|
| B3
S.A. - Brasil Bolsa Balcao |
2.7%
|
| AIA
Group Ltd. |
2.7%
|
| Micron
Technology, Inc. |
2.6%
|
| Grupo
Aeroportuario del Pacifico SAB de CV Class B |
2.6%
|
| Infosys
Ltd. Sponsored ADR |
2.5%
|
| SECTOR
EXPOSURE |
| Financials
|
25.3%
|
| Information
Technology |
23.4%
|
| Consumer
Discretionary |
14.7%
|
| Communication
Services |
12.2%
|
| Materials
|
5.7%
|
| Industrials
|
4.7%
|
| Consumer
Staples |
4.0%
|
| Energy
|
3.0%
|
| Utilities
|
2.6%
|
| Health
Care |
2.3%
|
| Other
Assets Less Liabilities |
2.1%
|
| TOP
TEN INDUSTRY GROUPS |
| Semiconductors
& Semiconductor Equipment |
12.9%
|
| Banks
|
12.0%
|
| Diversified
Financials |
9.5%
|
| Media
& Entertainment |
8.4%
|
| Technology
Hardware & Equipment |
6.5%
|
| Retailing
|
6.4%
|
| Materials
|
5.7%
|
| Consumer
Services |
4.3%
|
| Software
& Services |
4.0%
|
| Insurance
|
3.8%
|
| THORNBURG
DEVELOPING WORLD FUND |
NASDAQ
SYMBOLS |
CUSIPS
|
| Class
A |
THDAX
|
885-216-408
|
| Class
C |
THDCX
|
885-216-507
|
| Class
I |
THDIX
|
885-216-606
|
| Class
R5 |
THDRX
|
885-216-846
|
| Class
R6 |
TDWRX
|
885-216-838
|
Class I, R5, and R6 shares
may not be available to all investors. Minimum investments for Class I shares may be higher than those for other classes.
There is no guarantee that the Fund will meet its
investment objectives.
All data is subject to
change. Charts may not add up to 100% due to rounding.
28 | Thornburg Equity Funds Semi-Annual Report
Fund Summary
Thornburg Small/Mid Cap Core Fund | March 31, 2022 (Unaudited)
MARKET CAPITALIZATION EXPOSURE
BASKET
STRUCTURE
| TOP
TEN EQUITY HOLDINGS |
| Chesapeake
Energy Corp. |
3.8%
|
| LPL
Financial Holdings, Inc. |
3.1%
|
| Diamondback
Energy, Inc. |
3.1%
|
| Signature
Bank |
3.0%
|
| Avantor,
Inc. |
3.0%
|
| AES
Corp. |
3.0%
|
| Casella
Waste Systems, Inc. Class A |
2.9%
|
| Pinnacle
Financial Partners, Inc. |
2.8%
|
| Aspen
Technology, Inc. |
2.8%
|
| Crown
Holdings, Inc. |
2.7%
|
| SECTOR
EXPOSURE |
| Industrials
|
19.5%
|
| Information
Technology |
14.3%
|
| Health
Care |
13.2%
|
| Financials
|
12.6%
|
| Materials
|
10.5%
|
| Energy
|
8.1%
|
| Consumer
Discretionary |
7.4%
|
| Real
Estate |
4.3%
|
| Communication
Services |
3.1%
|
| Utilities
|
2.9%
|
| Consumer
Staples |
2.6%
|
| Other
Assets Less Liabilities |
1.5%
|
| TOP
TEN INDUSTRY GROUPS |
| Materials
|
10.5%
|
| Capital
Goods |
10.1%
|
| Software
& Services |
9.1%
|
| Health
Care Equipment & Services |
8.3%
|
| Commercial
& Professional Services |
8.3%
|
| Energy
|
8.1%
|
| Banks
|
7.9%
|
| Pharmaceuticals,
Biotechnology & Life Sciences |
4.9%
|
| Diversified
Financials |
4.7%
|
| Real
Estate |
4.3%
|
THORNBURG
SMALL/MID CAP
CORE FUND |
NASDAQ
SYMBOLS |
CUSIPS
|
| Class
A |
TVAFX
|
885-215-731
|
| Class
C |
TVCFX
|
885-215-715
|
| Class
I |
TVIFX
|
885-215-632
|
| Class
R3 |
TVRFX
|
885-215-533
|
| Class
R4 |
TVIRX
|
885-215-277
|
| Class
R5 |
TVRRX
|
885-215-376
|
Class I, R3, R4, and R5
shares may not be available to all investors. Minimum investments for Class I shares may be higher than those for other classes.
There is no guarantee that the Fund will meet its
investment objectives.
All data is subject to
change. Charts may not add up to 100% due to rounding.
Thornburg Equity Funds Semi-Annual Report | 29
Fund Summary
Thornburg Small/Mid Cap Growth Fund | March 31, 2022 (Unaudited)
MARKET CAPITALIZATION EXPOSURE
BASKET
STRUCTURE
| TOP
TEN EQUITY HOLDINGS |
| Avantor,
Inc. |
3.7%
|
| Horizon
Therapeutics plc |
3.3%
|
| Casella
Waste Systems, Inc. Class A |
3.0%
|
| Signature
Bank |
2.9%
|
| Chart
Industries, Inc. |
2.8%
|
| Entegris,
Inc. |
2.8%
|
| CONMED
Corp. |
2.7%
|
| Monolithic
Power Systems, Inc. |
2.7%
|
| Eventbrite,
Inc. Class A |
2.6%
|
| Teledyne
Technologies, Inc. |
2.6%
|
| SECTOR
EXPOSURE |
| Information
Technology |
34.0%
|
| Health
Care |
22.4%
|
| Industrials
|
16.2%
|
| Consumer
Discretionary |
11.5%
|
| Financials
|
5.9%
|
| Consumer
Staples |
3.8%
|
| Communication
Services |
2.6%
|
| Materials
|
2.2%
|
| Other
Assets Less Liabilities |
1.4%
|
| TOP
TEN INDUSTRY GROUPS |
| Software
& Services |
19.6%
|
| Pharmaceuticals,
Biotechnology & Life Sciences |
11.4%
|
| Health
Care Equipment & Services |
11.0%
|
| Semiconductors
& Semiconductor Equipment |
9.4%
|
| Capital
Goods |
8.3%
|
| Commercial
& Professional Services |
5.6%
|
| Technology
Hardware & Equipment |
5.0%
|
| Retailing
|
4.8%
|
| Consumer
Durables & Apparel |
3.8%
|
| Food,
Beverage & Tobacco |
3.8%
|
THORNBURG
SMALL/MID CAP
GROWTH FUND |
NASDAQ
SYMBOLS |
CUSIPS
|
| Class
A |
THCGX
|
885-215-582
|
| Class
C |
TCGCX
|
885-215-574
|
| Class
I |
THIGX
|
885-215-475
|
| Class
R3 |
THCRX
|
885-215-517
|
| Class
R4 |
TCGRX
|
885-215-251
|
| Class
R5 |
THGRX
|
885-215-350
|
Class I, R3, R4, and R5
shares may not be available to all investors. Minimum investments for Class I shares may be higher than those for other classes.
There is no guarantee that the Fund will meet its
investment objectives.
All data is subject to
change. Charts may not add up to 100% due to rounding.
30 | Thornburg Equity Funds Semi-Annual Report
Fund Summary
Thornburg Investment Income Builder Fund | March 31, 2022
(Unaudited)
PORTFOLIO COMPOSITION
| TOP
TEN EQUITY HOLDINGS |
| TotalEnergies
SE |
3.9%
|
| Broadcom,
Inc. |
3.9%
|
| Orange
SA |
3.8%
|
| Vodafone
Group plc |
3.4%
|
| AbbVie,
Inc. |
3.4%
|
| Taiwan
Semiconductor Manufacturing Co. Ltd. |
3.3%
|
| CME
Group, Inc. |
3.3%
|
| Deutsche
Telekom AG |
3.0%
|
| Samsung
Electronics Co. Ltd. |
3.0%
|
| QUALCOMM,
Inc. |
2.5%
|
SECTOR
EXPOSURE
(percent of equity holdings) |
| Financials
|
25.0%
|
| Communication
Services |
16.7%
|
| Information
Technology |
16.0%
|
| Health
Care |
14.3%
|
| Utilities
|
6.3%
|
| Materials
|
5.7%
|
| Energy
|
4.8%
|
| Consumer
Staples |
4.6%
|
| Consumer
Discretionary |
3.5%
|
| Industrials
|
2.3%
|
| Real
Estate |
0.8%
|
Thornburg Equity Funds Semi-Annual Report | 31
Fund Summary, Continued
Thornburg Investment Income Builder Fund | March 31, 2022 (Unaudited)
| QUARTERLY
DIVIDEND HISTORY, CLASS A |
| YEAR
|
Q1
|
Q2
|
Q3
|
Q4
|
TOTAL
|
| 2003
|
9.2¢
|
11.2¢
|
12.4¢
|
17.5¢
|
50.3¢
|
| 2004
|
10.2¢
|
12.5¢
|
15.0¢
|
21.8¢
|
59.5¢
|
| 2005
|
11.0¢
|
13.6¢
|
17.4¢
|
29.0¢
|
71.0¢
|
| 2006
|
12.5¢
|
16.0¢
|
19.2¢
|
33.0¢
|
80.7¢
|
| 2007
|
14.2¢
|
18.5¢
|
21.5¢
|
36.8¢
|
91.0¢
|
| 2008
|
17.9¢
|
21.8¢
|
26.0¢
|
36.8¢
|
102.5¢
|
| 2009
|
18.0¢
|
24.2¢
|
28.0¢
|
34.5¢
|
104.7¢
|
| 2010
|
19.8¢
|
25.0¢
|
32.0¢
|
36.0¢
|
112.8¢
|
| 2011
|
21.0¢
|
26.0¢
|
32.0¢
|
37.5¢
|
116.5¢
|
| 2012
|
21.5¢
|
26.0¢
|
28.5¢
|
36.0¢
|
112.0¢
|
| 2013
|
21.5¢
|
25.3¢
|
25.0¢
|
24.5¢
|
96.3¢
|
| 2014
|
22.5¢
|
24.0¢
|
27.0¢
|
26.0¢
|
99.5¢
|
| 2015
|
16.5¢
|
20.0¢
|
20.0¢
|
25.3¢
|
81.8¢
|
| 2016
|
17.0¢
|
18.5¢
|
19.5¢
|
21.5¢
|
76.5¢
|
| 2017
|
17.0¢
|
20.0¢
|
26.0¢
|
29.5¢
|
92.5¢
|
| 2018
|
18.0¢
|
20.0¢
|
24.0¢
|
28.0¢
|
90.0¢
|
| 2019
|
19.0¢
|
21.5¢
|
25.0¢
|
30.0¢
|
95.5¢
|
| 2020
|
19.0¢
|
19.0¢
|
21.0¢
|
29.0¢
|
88.0¢
|
| 2021
|
22.5¢
|
27.5¢
|
31.0¢
|
43.5¢
|
124.5¢
|
| 2022
|
20.0¢
|
|
|
|
|
We do not expect each sequential quarter’s
dividend to increase over that of the prior quarter, since dividend payments outside the United States tend to be seasonal. Rather, the Fund aspires to increase the dividend paid on an annual basis.
32 | Thornburg Equity Funds Semi-Annual Report
Fund Summary, Continued
Thornburg Investment Income Builder Fund | March 31, 2022 (Unaudited)
EVOLUTION OF INDUSTRY GROUP EXPOSURE
Top 10 industry groups quarter by quarter (percent of equity holdings)
| As
of 3/31/2022 |
|
| Telecommunication
Services |
16.7%
|
| Pharmaceuticals,
Biotechnology & Life Sciences |
14.3%
|
| Semiconductors
& Semiconductor Equipment |
11.4%
|
| Diversified
Financials |
11.3%
|
| Insurance
|
6.9%
|
| Banks
|
6.8%
|
| Utilities
|
6.3%
|
| Materials
|
5.7%
|
| Energy
|
4.8%
|
| Technology
Hardware & Equipment |
4.6%
|
| As
of 12/31/2021 |
|
| Telecommunication
Services |
14.6%
|
| Pharmaceuticals,
Biotechnology & Life Sciences |
13.1%
|
| Semiconductors
& Semiconductor Equipment |
12.9%
|
| Diversified
Financials |
11.4%
|
| Banks
|
7.2%
|
| Insurance
|
6.8%
|
| Utilities
|
5.9%
|
| Energy
|
5.5%
|
| Food
& Staples Retailing |
5.3%
|
| Materials
|
5.1%
|
| As
of 9/30/2021 |
|
| Telecommunication
Services |
16.0%
|
| Pharmaceuticals,
Biotechnology & Life Sciences |
12.0%
|
| Semiconductors
& Semiconductor Equipment |
11.7%
|
| Diversified
Financials |
11.7%
|
| Banks
|
7.9%
|
| Insurance
|
7.4%
|
| Energy
|
5.4%
|
| Food
& Staples Retailing |
5.1%
|
| Technology
Hardware & Equipment |
4.9%
|
| Utilities
|
4.8%
|
| As
of 6/30/2021 |
|
| Telecommunication
Services |
18.0%
|
| Diversified
Financials |
12.5%
|
| Semiconductors
& Semiconductor Equipment |
12.1%
|
| Pharmaceuticals,
Biotechnology & Life Sciences |
11.2%
|
| Banks
|
7.2%
|
| Insurance
|
6.4%
|
| Technology
Hardware & Equipment |
5.4%
|
| Food
& Staples Retailing |
4.9%
|
| Energy
|
4.8%
|
| Utilities
|
4.7%
|
THORNBURG
INVESTMENT INCOME
BUILDER FUND |
NASDAQ
SYMBOLS |
CUSIPS
|
| Class
A |
TIBAX
|
885-215-558
|
| Class
C |
TIBCX
|
885-215-541
|
| Class
I |
TIBIX
|
885-215-467
|
| Class
R3 |
TIBRX
|
885-215-384
|
| Class
R4 |
TIBGX
|
885-215-186
|
| Class
R5 |
TIBMX
|
885-215-236
|
| Class
R6 |
TIBOX
|
885-216-663
|
Class I, R3, R4, R5, and
R6 shares may not be available to all investors. Minimum investments for Class I shares may be higher than those for other classes.
There is no guarantee that the Fund will meet its
investment objectives.
All data is subject to
change. Charts may not add up to 100% due to rounding.
Thornburg Equity Funds Semi-Annual Report | 33
Fund Summary
Thornburg Summit Fund | March 31, 2022 (Unaudited)
PORTFOLIO COMPOSITION
SECTOR
EXPOSURE
(percent of equity holdings) |
| Information
Technology |
29.3%
|
| Communication
Services |
15.4%
|
| Financials
|
12.8%
|
| Consumer
Discretionary |
12.1%
|
| Health
Care |
10.6%
|
| Materials
|
6.4%
|
| Industrials
|
4.6%
|
| Energy
|
4.3%
|
| Consumer
Staples |
3.3%
|
| Utilities
|
1.2%
|
| TOP
TEN LONG HOLDINGS |
| Alphabet,
Inc. Class A |
2.7%
|
| Microsoft
Corp. |
2.0%
|
| Amazon.com,
Inc. |
1.7%
|
| Merck
& Co., Inc. |
1.7%
|
| Apple,
Inc. |
1.7%
|
| JPMorgan
Chase & Co. |
1.6%
|
| Meta
Platforms, Inc. Class A |
1.5%
|
| Samsung
Electronics Co. Ltd. |
1.4%
|
| Taiwan
Semiconductor Manufacturing Co. Ltd. Sponsored ADR |
1.4%
|
| Chesapeake
Energy Corp. |
1.4%
|
| THORNBURG
SUMMIT FUND |
NASDAQ
SYMBOLS |
CUSIPS
|
| Class
A |
TSAMX
|
885-216-358
|
| Class
I |
TSUMX
|
885-216-580
|
Class I shares may not be
available to all investors. Minimum investments for Class I shares may be higher than those for other classes. Class A shares are not currently available for purchase.
There is no guarantee that the Fund will meet its
investment objectives.
All data is subject to
change. Charts may not add up to 100% due to rounding.
34 | Thornburg Equity Funds Semi-Annual Report
Schedule of Investments
Thornburg Global Opportunities Fund | March 31, 2022 (Unaudited)
| |
Issuer-Description
|
SHARES
|
VALUE
|
| |
Common
Stock — 95.9% |
|
|
| |
Banks
— 7.0% |
|
|
| |
Banks
— 7.0% |
|
|
|
a |
Bank
of Ireland Group plc |
6,154,498
|
$ 39,137,141
|
| |
Citigroup,
Inc. |
631,692
|
33,732,353
|
| |
|
|
72,869,494
|
| |
Capital
Goods — 3.1% |
|
|
| |
Aerospace
& Defense — 0.8% |
|
|
| |
L3Harris
Technologies, Inc. |
34,910
|
8,674,088
|
| |
Electrical
Equipment — 2.3% |
|
|
| |
Vestas
Wind Systems A/S |
809,286
|
23,740,243
|
| |
|
|
32,414,331
|
| |
Commercial
& Professional Services — 3.0% |
|
|
| |
Professional
Services — 3.0% |
|
|
|
a |
CACI
International, Inc. Class A |
103,000
|
31,029,780
|
| |
|
|
31,029,780
|
| |
Consumer
Durables & Apparel — 2.9% |
|
|
| |
Household
Durables — 2.9% |
|
|
| |
Barratt
Developments plc |
4,509,656
|
30,700,854
|
| |
|
|
30,700,854
|
| |
Consumer
Services — 2.0% |
|
|
| |
Hotels,
Restaurants & Leisure — 2.0% |
|
|
|
a |
Booking
Holdings, Inc. |
3,657
|
8,588,282 |
| |
Galaxy
Entertainment Group Ltd. |
2,036,462
|
12,050,522
|
| |
|
|
20,638,804
|
| |
Diversified
Financials — 7.5% |
|
|
| |
Capital
Markets — 3.5% |
|
|
| |
Charles
Schwab Corp. |
438,660
|
36,983,425
|
| |
Consumer
Finance — 4.0% |
|
|
| |
Capital
One Financial Corp. |
315,950
|
41,481,075
|
| |
|
|
78,464,500
|
| |
Energy
— 10.3% |
|
|
| |
Oil,
Gas & Consumable Fuels — 10.3% |
|
|
| |
Reliance
Industries Ltd. |
1,719,455
|
59,499,977 |
| |
TotalEnergies
SE |
953,499
|
48,246,591
|
| |
|
|
107,746,568
|
| |
Food
& Staples Retailing — 3.4% |
|
|
| |
Food
& Staples Retailing — 3.4% |
|
|
| |
Tesco
plc |
9,854,184
|
35,675,129
|
| |
|
|
35,675,129
|
| |
Health
Care Equipment & Services — 0.5% |
|
|
| |
Health
Care Technology — 0.5% |
|
|
|
a |
Teladoc
Health, Inc. |
76,025
|
5,483,683
|
| |
|
|
5,483,683
|
| |
Insurance
— 3.6% |
|
|
| |
Insurance
— 3.6% |
|
|
| |
NN
Group NV |
736,862
|
37,343,234
|
| |
|
|
37,343,234
|
| |
Materials
— 12.7% |
|
|
| |
Chemicals
— 5.9% |
|
|
| |
CF
Industries Holdings, Inc. |
155,954
|
16,072,619 |
|
a |
OCI
NV |
1,282,103
|
45,263,940
|
| |
Metals
& Mining — 6.8% |
|
|
See
notes to financial statements.
|
Thornburg Equity
Funds Semi-Annual Report | 35 |
Schedule of Investments, Continued
Thornburg Global Opportunities Fund | March 31, 2022 (Unaudited)
| |
Issuer-Description
|
SHARES
|
VALUE
|
| |
Antofagasta
plc |
621,589
|
$ 13,506,461
|
| |
Freeport-McMoRan,
Inc. |
344,564
|
17,138,613 |
| |
Lundin
Mining Corp. |
888,870
|
9,008,505 |
| |
Mineral
Resources Ltd. |
810,255
|
31,940,467
|
| |
|
|
132,930,605
|
| |
Media
& Entertainment — 9.7% |
|
|
| |
Interactive
Media & Services — 9.7% |
|
|
|
a |
Alphabet,
Inc. Class A |
18,872
|
52,489,637 |
|
a |
Meta
Platforms, Inc. Class A |
132,590
|
29,482,712 |
| |
Tencent
Holdings Ltd. |
429,779
|
19,810,381
|
| |
|
|
101,782,730
|
| |
Pharmaceuticals,
Biotechnology & Life Sciences — 7.4% |
|
|
| |
Biotechnology
— 2.5% |
|
|
| |
AbbVie,
Inc. |
164,587
|
26,681,198
|
| |
Pharmaceuticals
— 4.9% |
|
|
| |
Pfizer,
Inc. |
463,991
|
24,020,814 |
| |
Roche
Holding AG |
68,837
|
27,236,165
|
| |
|
|
77,938,177
|
| |
Retailing
— 4.9% |
|
|
| |
Internet
& Direct Marketing Retail — 2.1% |
|
|
|
a |
Alibaba
Group Holding Ltd. Sponsored ADR |
177,938
|
19,359,655 |
|
a |
JD.com,
Inc. Class A |
97,720
|
2,776,701
|
| |
Specialty
Retail — 2.8% |
|
|
| |
TJX
Companies, Inc. |
483,726
|
29,304,121
|
| |
|
|
51,440,477
|
| |
Semiconductors
& Semiconductor Equipment — 7.4% |
|
|
| |
Semiconductors
& Semiconductor Equipment — 7.4% |
|
|
| |
Micron
Technology, Inc. |
293,561
|
22,865,466 |
|
a |
Qorvo,
Inc. |
202,387
|
25,116,227 |
| |
Taiwan
Semiconductor Manufacturing Co. Ltd. |
1,462,114
|
29,993,094
|
| |
|
|
77,974,787
|
| |
Technology
Hardware & Equipment — 4.2% |
|
|
| |
Technology
Hardware, Storage & Peripherals — 4.2% |
|
|
| |
Samsung
Electronics Co. Ltd. |
765,727
|
43,817,170
|
| |
|
|
43,817,170
|
| |
Telecommunication
Services — 6.3% |
|
|
| |
Diversified
Telecommunication Services — 5.9% |
|
|
|
b |
China
Telecom Corp. Ltd. Class H |
89,612,045
|
35,371,218 |
|
a |
Converge
ICT Solutions, Inc. |
24,179,877
|
14,043,505 |
| |
Deutsche
Telekom AG |
648,377
|
12,075,453
|
| |
Wireless
Telecommunication Services — 0.4% |
|
|
|
a |
T-Mobile
US, Inc. |
32,679
|
4,194,350
|
| |
|
|
65,684,526
|
| |
Total
Common Stock (Cost $677,125,233) |
|
1,003,934,849
|
| |
Short-Term
Investments — 3.7% |
|
|
| c |
Thornburg
Capital Management Fund |
3,847,655
|
38,476,549
|
| |
Total
Short-Term Investments (Cost $38,476,549) |
|
38,476,549
|
| |
Total
Investments — 99.6% (Cost $715,601,782) |
|
$1,042,411,398
|
| |
Other
Assets Less Liabilities — 0.4% |
|
4,104,746
|
| |
Net
Assets — 100.0% |
|
$1,046,516,144
|
36 | Thornburg Equity Funds Semi-Annual Report
|
See notes to
financial statements. |
Schedule of Investments,
Continued
Thornburg Global Opportunities Fund | March 31, 2022 (Unaudited)
| Outstanding
Forward Currency Contracts To Buy Or Sell At March 31, 2022 |
Contract
Description |
Contract
Party* |
Buy/Sell
|
Contract
Amount |
Contract
Value Date |
Value
USD |
Unrealized
Appreciation |
Unrealized
Depreciation |
| Great
Britain Pound |
SSB
|
Sell
|
44,626,700
|
4/14/2022
|
58,619,120
|
$ 2,480,812
|
$ —
|
| Great
Britain Pound |
SSB
|
Buy
|
5,052,400
|
4/14/2022
|
6,636,548
|
13,787
|
— |
| Euro
|
SSB
|
Sell
|
26,548,500
|
5/18/2022
|
29,412,219
|
855,726 |
—
|
| Euro
|
BBH
|
Sell
|
20,187,100
|
5/18/2022
|
22,364,631
|
658,353 |
—
|
| |
|
| Total
|
|
|
|
|
|
$
4,008,678 |
—
|
| |
|
| Net
unrealized appreciation (depreciation) |
|
|
|
|
|
$
4,008,678 |
|
| *
|
Counterparties
include State Street Bank and Trust Company (“SSB”) and Brown Brothers Harriman & Co. (“BBH”). |
| Footnote Legend
|
| a
|
Non-income
producing. |
| b
|
On
November 12, 2020, the President of the United States issued an Executive Order (the "Order") to prohibit, beginning January 11, 2021, US persons (which includes the Fund) from transacting in certain securities and derivatives of publicly traded
securities of any company designated as a "Communist Chinese military company" (collectively with securities of certain subsidiaries of such companies and related depositary receipts that may be covered by the Order, "CCMC Securities") by the US
Department of Defense or the US Department of the Treasury’s Office of Foreign Assets Control ("OFAC") unless such transactions are for purposes of divestment and occur through November 11, 2021. In addition, US persons are also prohibited
from transacting in CCMS Securities designated as such 60 days after such designation. |
| c
|
Investment
in Affiliates. |
Portfolio
Abbreviations
To simplify the listings of securities, abbreviations are used per the table below:
| ADR
|
American Depositary
Receipt |
COUNTRY
EXPOSURE *
(percent of equity holdings) |
| United
States |
41.2%
|
| Netherlands
|
8.2%
|
| China
|
7.7%
|
| United
Kingdom |
6.6%
|
| India
|
5.9%
|
| France
|
4.8%
|
| South
Korea |
4.4%
|
| Ireland
|
3.9%
|
| Australia
|
3.2%
|
| Taiwan
|
3.0%
|
| Switzerland
|
2.7%
|
| Denmark
|
2.4%
|
| Chile
|
2.2%
|
| Philippines
|
1.4%
|
| Germany
|
1.2%
|
| Macao
|
1.2%
|
| *
|
Holdings
are classified by country of risk as determined by MSCI and Bloomberg. |
See
notes to financial statements.
|
Thornburg Equity
Funds Semi-Annual Report | 37 |
Schedule of Investments
Thornburg International Equity Fund | March 31, 2022 (Unaudited)
| |
Issuer-Description
|
SHARES
|
VALUE
|
| |
Common
Stock — 94.2% |
|
|
| |
Banks
— 6.8% |
|
|
| |
Banks
— 6.8% |
|
|
| |
China
Merchants Bank Co. Ltd. Class A |
3,085,084
|
$ 22,629,661
|
| |
ING
Groep NV |
5,806,357
|
60,623,736 |
| |
Intesa
Sanpaolo SpA |
25,987,646
|
59,479,598 |
| |
Mitsubishi
UFJ Financial Group, Inc. |
8,951,702
|
55,331,704
|
| |
|
|
198,064,699
|
| |
Capital
Goods — 11.7% |
|
|
| |
Aerospace
& Defense — 2.2% |
|
|
| |
Safran
SA |
542,046
|
63,818,034
|
| |
Construction
& Engineering — 2.0% |
|
|
| |
Ferrovial
SA |
2,146,055
|
57,074,016
|
| |
Electrical
Equipment — 5.7% |
|
|
| |
ABB
Ltd. |
2,357,979
|
76,494,469 |
| |
Schneider
Electric SE |
349,298
|
58,643,754 |
| |
Siemens
Energy AG |
1,290,935
|
29,369,714
|
| |
Industrial
Conglomerates — 1.3% |
|
|
| |
Hitachi
Ltd. |
773,679
|
38,718,117
|
| |
Machinery
— 0.5% |
|
|
| |
Kone
OYJ Class B |
274,755
|
14,377,949
|
| |
|
|
338,496,053
|
| |
Commercial
& Professional Services — 1.9% |
|
|
| |
Professional
Services — 1.9% |
|
|
| |
Recruit
Holdings Co. Ltd. |
1,279,412
|
55,586,634
|
| |
|
|
55,586,634
|
| |
Consumer
Durables & Apparel — 7.0% |
|
|
| |
Household
Durables — 2.4% |
|
|
| |
Sony
Group Corp. |
689,535
|
70,936,349
|
| |
Textiles,
Apparel & Luxury Goods — 4.6% |
|
|
| |
adidas
AG |
222,932
|
51,948,927 |
| |
LVMH
Moet Hennessy Louis Vuitton SE |
113,935
|
81,326,654
|
| |
|
|
204,211,930
|
| |
Diversified
Financials — 4.5% |
|
|
| |
Capital
Markets — 4.5% |
|
|
| |
CITIC
Securities Co. Ltd. Class A |
11,983,838
|
39,276,617 |
| |
CME
Group, Inc. |
377,771
|
89,856,610
|
| |
|
|
129,133,227
|
| |
Energy
— 3.9% |
|
|
| |
Oil,
Gas & Consumable Fuels — 3.9% |
|
|
| |
TotalEnergies
SE |
2,215,151
|
112,085,575
|
| |
|
|
112,085,575
|
| |
Food
& Staples Retailing — 1.6% |
|
|
| |
Food
& Staples Retailing — 1.6% |
|
|
| |
Seven
& i Holdings Co. Ltd. |
961,480
|
45,840,675
|
| |
|
|
45,840,675
|
| |
Food,
Beverage & Tobacco — 2.6% |
|
|
| |
Beverages
— 2.6% |
|
|
| |
Kweichow
Moutai Co. Ltd. Class A |
280,241
|
75,497,348
|
| |
|
|
75,497,348
|
| |
Household
& Personal Products — 0.8% |
|
|
| |
Personal
Products — 0.8% |
|
|
| |
L’Oreal
SA |
55,579
|
22,200,758
|
| |
|
|
22,200,758
|
38 | Thornburg Equity Funds Semi-Annual Report
|
See notes to
financial statements. |
Schedule of Investments,
Continued
Thornburg International Equity Fund | March 31, 2022 (Unaudited)
| |
Issuer-Description
|
SHARES
|
VALUE
|
| |
Insurance
— 2.2% |
|
|
| |
Insurance
— 2.2% |
|
|
| |
Assicurazioni
Generali SpA |
1,098,014
|
$ 25,113,938
|
| |
NN
Group NV |
748,905
|
37,953,558
|
| |
|
|
63,067,496
|
| |
Materials
— 7.0% |
|
|
| |
Chemicals
— 5.7% |
|
|
| |
Air
Liquide SA |
331,413
|
57,978,638 |
| |
Linde
plc |
243,280
|
77,628,754 |
| |
Sika
AG |
89,987
|
29,772,525
|
| |
Construction
Materials — 0.9% |
|
|
| |
CRH
plc |
661,675
|
26,428,380
|
| |
Metals
& Mining — 0.4% |
|
|
| |
Norsk
Hydro ASA |
1,126,807
|
10,947,912
|
| |
|
|
202,756,209
|
| |
Media
& Entertainment — 5.2% |
|
|
| |
Entertainment
— 1.7% |
|
|
| |
Nintendo
Co. Ltd. |
101,194
|
51,078,876
|
| |
Interactive
Media & Services — 3.5% |
|
|
|
a |
Kanzhun
Ltd. ADR |
1,156,695
|
28,813,272 |
| |
Tencent
Holdings Ltd. |
1,564,263
|
72,103,676
|
| |
|
|
151,995,824
|
| |
Pharmaceuticals,
Biotechnology & Life Sciences — 4.9% |
|
|
| |
Pharmaceuticals
— 4.9% |
|
|
| |
AstraZeneca
plc |
516,740
|
68,526,390 |
| |
Roche
Holding AG |
184,225
|
72,890,777
|
| |
|
|
141,417,167
|
| |
Retailing
— 1.2% |
|
|
| |
Internet
& Direct Marketing Retail — 1.2% |
|
|
|
a |
Alibaba
Group Holding Ltd. |
522,908
|
7,135,974 |
|
a |
JD.com,
Inc. Class A |
65,979
|
1,874,785 |
|
a,b |
Meituan
Class B |
1,386,035
|
26,256,960
|
| |
|
|
35,267,719
|
| |
Semiconductors
& Semiconductor Equipment — 6.9% |
|
|
| |
Semiconductors
& Semiconductor Equipment — 6.9% |
|
|
| |
Infineon
Technologies AG |
1,855,232
|
62,762,503 |
|
a |
Renesas
Electronics Corp. |
4,695,169
|
54,402,767 |
| |
Taiwan
Semiconductor Manufacturing Co. Ltd. Sponsored ADR |
576,898
|
60,147,385 |
| |
Tokyo
Electron Ltd. |
44,029
|
22,611,578
|
| |
|
|
199,924,233
|
| |
Software
& Services — 2.9% |
|
|
| |
Information
Technology Services — 2.9% |
|
|
| |
Mastercard,
Inc. Class A |
182,664
|
65,280,460 |
|
a |
Shopify,
Inc. Class A |
28,308
|
19,135,076
|
| |
|
|
84,415,536
|
| |
Technology
Hardware & Equipment — 6.3% |
|
|
| |
Communications
Equipment — 2.4% |
|
|
| |
Telefonaktiebolaget
LM Ericsson Class B |
7,685,804
|
70,060,277
|
| |
Electronic
Equipment, Instruments & Components — 1.8% |
|
|
| |
Keyence
Corp. |
112,898
|
52,351,077
|
| |
Technology
Hardware, Storage & Peripherals — 2.1% |
|
|
| |
Samsung
Electronics Co. Ltd. |
1,056,941
|
60,481,299
|
| |
|
|
182,892,653
|
| |
Telecommunication
Services — 3.0% |
|
|
| |
Diversified
Telecommunication Services — 3.0% |
|
|
| |
Orange
SA |
3,600,706
|
42,631,271 |
See
notes to financial statements.
|
Thornburg Equity
Funds Semi-Annual Report | 39 |
Schedule of Investments, Continued
Thornburg International Equity Fund | March 31, 2022 (Unaudited)
| |
Issuer-Description
|
SHARES
|
VALUE
|
| |
Vantage
Towers AG |
1,243,231
|
$ 43,911,313
|
| |
|
|
86,542,584
|
| |
Transportation
— 5.5% |
|
|
| |
Marine
— 2.8% |
|
|
| |
Kuehne
+ Nagel International AG |
281,638
|
79,965,209
|
| |
Road
& Rail — 2.7% |
|
|
| |
Canadian
Pacific Railway Ltd. |
957,580
|
79,038,653
|
| |
|
|
159,003,862
|
| |
Utilities
— 8.3% |
|
|
| |
Electric
Utilities — 6.1% |
|
|
| |
Electricite
de France SA |
3,020,447
|
28,350,478 |
| |
Endesa
SA |
2,030,396
|
44,269,969 |
| |
Enel
SpA |
7,974,555
|
53,244,105 |
| |
Iberdrola
SA |
4,750,930
|
51,927,517
|
| |
Multi-Utilities
— 2.2% |
|
|
| |
E.ON
SE |
5,377,710
|
62,478,995
|
| |
|
|
240,271,064
|
| |
Total
Common Stock (Cost $2,382,079,400) |
|
2,728,671,246
|
| |
Rights
— 0.1% |
|
|
| |
Utilities
— 0.1% |
|
|
| |
Electric
Utilities — 0.1% |
|
|
|
a,c |
Electricite
de France SA, 4/4/2022 |
3,020,446
|
1,122,699
|
| |
|
|
1,122,699
|
| |
Total
Rights (Cost $0) |
|
1,122,699
|
| |
Short-Term
Investments — 6.7% |
|
|
| d |
Thornburg
Capital Management Fund |
19,365,609
|
193,656,095
|
| |
Total
Short-Term Investments (Cost $193,656,095) |
|
193,656,095
|
| |
Total
Investments — 101.0% (Cost $2,575,735,495) |
|
$2,923,450,040
|
| |
Liabilities
Net of Other Assets — (1.0)% |
|
(27,874,512)
|
| |
Net
Assets — 100.0% |
|
$2,895,575,528
|
| Footnote Legend
|
| a
|
Non-income
producing. |
| b
|
Securities
exempt from registration under Rule 144A of the Securities Act of 1933, as amended. These securities are restricted but liquid and may only be resold in the ordinary course of business in transactions exempt from registration, normally to qualified
institutional buyers. As of March 31, 2022, the aggregate value of these securities in the Fund’s portfolio was $26,256,960, representing 0.91% of the Fund’s net assets. |
| c
|
Security
currently fair valued by the Valuation and Pricing Committee using procedures approved by the Trustees’ Audit Committee. |
| d
|
Investment
in Affiliates. |
Portfolio
Abbreviations
To simplify the listings of securities, abbreviations are used per the table below:
| ADR
|
American Depositary
Receipt |
40 | Thornburg Equity Funds Semi-Annual Report
|
See notes to
financial statements. |
Schedule of Investments,
Continued
Thornburg International Equity Fund | March 31, 2022 (Unaudited)
COUNTRY
EXPOSURE *
(percent of equity holdings) |
| Japan
|
16.4%
|
| France
|
15.0%
|
| China
|
10.0%
|
| Switzerland
|
9.5%
|
| Germany
|
9.2%
|
| United
States |
7.8%
|
| Spain
|
5.6%
|
| United
Kingdom |
5.4%
|
| Italy
|
5.0%
|
| Netherlands
|
3.6%
|
| Canada
|
3.6%
|
| Sweden
|
2.6%
|
| South
Korea |
2.2%
|
| Taiwan
|
2.2%
|
| Ireland
|
1.0%
|
| Finland
|
0.5%
|
| Norway
|
0.4%
|
| *
|
Holdings
are classified by country of risk as determined by MSCI and Bloomberg. |
See
notes to financial statements.
|
Thornburg Equity
Funds Semi-Annual Report | 41 |
Schedule of Investments
Thornburg Better World International Fund | March 31, 2022
(Unaudited)
| |
Issuer-Description
|
SHARES
|
VALUE
|
| |
Common
Stock — 89.0% |
|
|
| |
Banks
— 3.7% |
|
|
| |
Banks
— 3.7% |
|
|
| |
Bank
of Montreal |
77,078
|
$ 9,070,068
|
| |
ING
Groep NV |
222,322
|
2,321,247 |
| |
United
Overseas Bank Ltd. |
230,000
|
5,381,540
|
| |
|
|
16,772,855
|
| |
Capital
Goods — 8.0% |
|
|
| |
Construction
& Engineering — 1.4% |
|
|
| |
Skanska
AB Class B |
291,934
|
6,531,204
|
| |
Electrical
Equipment — 3.8% |
|
|
| |
ABB
Ltd. |
282,748
|
9,172,541 |
| |
Schneider
Electric SE |
47,987
|
8,056,553
|
| |
Industrial
Conglomerates — 2.4% |
|
|
| |
Hitachi
Ltd. |
217,000
|
10,859,583
|
| |
Trading
Companies & Distributors — 0.4% |
|
|
| |
Ashtead
Group plc |
32,876
|
2,070,017
|
| |
|
|
36,689,898
|
| |
Commercial
& Professional Services — 7.2% |
|
|
| |
Commercial
Services & Supplies — 2.0% |
|
|
|
a |
China
Conch Environment Protection Holdings Ltd. |
936,500
|
1,171,627 |
| |
Waste
Connections, Inc. |
56,866
|
7,944,180
|
| |
Professional
Services — 5.2% |
|
|
| |
Experian
plc |
218,108
|
8,402,743 |
| |
Recruit
Holdings Co. Ltd. |
248,900
|
10,813,962 |
|
a |
Visional,
Inc. |
76,000
|
4,677,336
|
| |
|
|
33,009,848
|
| |
Consumer
Durables & Apparel — 4.4% |
|
|
| |
Household
Durables — 2.4% |
|
|
| |
Sony
Group Corp. |
106,183
|
10,923,643
|
| |
Textiles,
Apparel & Luxury Goods — 2.0% |
|
|
| |
LVMH
Moet Hennessy Louis Vuitton SE |
12,614
|
9,003,857
|
| |
|
|
19,927,500
|
| |
Consumer
Services — 2.6% |
|
|
| |
Diversified
Consumer Services — 1.0% |
|
|
|
a |
Coursera,
Inc. |
198,537
|
4,574,293
|
| |
Hotels,
Restaurants & Leisure — 1.6% |
|
|
|
a |
Booking
Holdings, Inc. |
3,121
|
7,329,512
|
| |
|
|
11,903,805
|
| |
Diversified
Financials — 3.1% |
|
|
| |
Capital
Markets — 3.1% |
|
|
| |
CITIC
Securities Co. Ltd. Class A |
2,751,835
|
9,019,045 |
| |
East
Money Information Co. Ltd. Class A |
1,345,620
|
5,330,048
|
| |
|
|
14,349,093
|
| |
Food
& Staples Retailing — 6.3% |
|
|
| |
Food
& Staples Retailing — 6.3% |
|
|
| |
Alimentation
Couche-Tard, Inc. |
134,035
|
6,038,356 |
| |
Seven
& i Holdings Co. Ltd. |
245,700
|
11,714,288 |
| |
Tesco
plc |
3,125,486
|
11,315,206
|
| |
|
|
29,067,850
|
| |
Household
& Personal Products — 5.5% |
|
|
| |
Personal
Products — 5.5% |
|
|
| |
L’Oreal
SA |
31,099
|
12,422,342 |
|
a |
Natura
& Co. Holding SA |
831,298
|
4,548,432 |
| |
Shiseido
Co. Ltd. |
161,400
|
8,152,065
|
42 | Thornburg Equity Funds Semi-Annual Report
|
See notes to
financial statements. |
Schedule of Investments,
Continued
Thornburg Better World International Fund | March 31, 2022 (Unaudited)
| |
Issuer-Description
|
SHARES
|
VALUE
|
| |
|
|
25,122,839
|
| |
Insurance
— 0.8% |
|
|
| |
Insurance
— 0.8% |
|
|
| |
NN
Group NV |
70,961
|
$ 3,596,214
|
| |
|
|
3,596,214
|
| |
Materials
— 9.6% |
|
|
| |
Chemicals
— 5.9% |
|
|
| |
Air
Liquide SA |
42,661
|
7,463,276 |
| |
Albemarle
Corp. |
34,958
|
7,730,962 |
| |
JSR
Corp. |
148,500
|
4,373,014 |
| |
Linde
plc |
23,795
|
7,592,799
|
| |
Containers
& Packaging — 1.1% |
|
|
| |
Crown
Holdings, Inc. |
38,486
|
4,814,214
|
| |
Metals
& Mining — 2.6% |
|
|
| |
Norsk
Hydro ASA |
785,478
|
7,631,603 |
| |
Shandong
Nanshan Aluminum Co. Ltd. Class A |
7,061,825
|
4,496,378
|
| |
|
|
44,102,246
|
| |
Media
& Entertainment — 2.9% |
|
|
| |
Interactive
Media & Services — 2.9% |
|
|
|
a |
Kanzhun
Ltd. ADR |
258,927
|
6,449,872 |
| |
Tencent
Holdings Ltd. |
145,300
|
6,697,508
|
| |
|
|
13,147,380
|
| |
Pharmaceuticals,
Biotechnology & Life Sciences — 6.3% |
|
|
| |
Biotechnology
— 1.2% |
|
|
| |
CSL
Ltd. |
28,453
|
5,680,430
|
| |
Pharmaceuticals
— 5.1% |
|
|
| |
Novartis
AG |
116,927
|
10,265,197 |
| |
Roche
Holding AG |
33,045
|
13,074,641
|
| |
|
|
29,020,268
|
| |
Real
Estate — 0.7% |
|
|
| |
Real
Estate Management & Development — 0.7% |
|
|
| |
Vonovia
SE |
72,262
|
3,368,160
|
| |
|
|
3,368,160
|
| |
Retailing
— 2.3% |
|
|
| |
Internet
& Direct Marketing Retail — 2.3% |
|
|
|
a |
JD.com,
Inc. Class A |
9,952
|
282,785 |
|
a,b |
Meituan
Class B |
474,600
|
8,990,792 |
|
a |
MercadoLibre,
Inc. |
912
|
1,084,806
|
| |
|
|
10,358,383
|
| |
Semiconductors
& Semiconductor Equipment — 8.3% |
|
|
| |
Semiconductors
& Semiconductor Equipment — 8.3% |
|
|
| |
Infineon
Technologies AG |
216,300
|
7,317,430 |
| |
NVIDIA
Corp. |
16,154
|
4,407,780 |
|
a |
Renesas
Electronics Corp. |
627,600
|
7,271,980 |
| |
Taiwan
Semiconductor Manufacturing Co. Ltd. Sponsored ADR |
113,927
|
11,878,029 |
| |
Tokyo
Electron Ltd. |
13,900
|
7,138,498
|
| |
|
|
38,013,717
|
| |
Software
& Services — 10.5% |
|
|
| |
Information
Technology Services — 8.1% |
|
|
|
a,b |
Adyen
NV |
4,093
|
8,106,978 |
| |
Computershare
Ltd. |
368,500
|
6,772,693 |
| |
Nomura
Research Institute Ltd. |
174,900
|
5,706,512 |
|
a |
Shopify,
Inc. Class A |
10,142
|
6,855,586 |
| |
Visa,
Inc. Class A |
44,731
|
9,919,994
|
| |
Software
— 2.4% |
|
|
| |
Constellation
Software, Inc. |
2,636
|
4,505,965
|
See
notes to financial statements.
|
Thornburg Equity
Funds Semi-Annual Report | 43 |
Schedule of Investments, Continued
Thornburg Better World International Fund | March 31, 2022 (Unaudited)
| |
Issuer-Description
|
SHARES
|
VALUE
|
| |
SAP
SE |
58,090
|
$ 6,438,005
|
| |
|
|
48,305,733
|
| |
Technology
Hardware & Equipment — 4.6% |
|
|
| |
Communications
Equipment — 2.1% |
|
|
| |
Telefonaktiebolaget
LM Ericsson Class B |
1,065,006
|
9,708,108
|
| |
Electronic
Equipment, Instruments & Components — 2.5% |
|
|
| |
Halma
plc |
139,951
|
4,578,791 |
| |
Keyence
Corp. |
14,500
|
6,723,685
|
| |
|
|
21,010,584
|
| |
Transportation
— 1.5% |
|
|
| |
Road
& Rail — 1.5% |
|
|
| |
Canadian
Pacific Railway Ltd. |
81,778
|
6,749,956
|
| |
|
|
6,749,956
|
| |
Utilities
— 0.7% |
|
|
| |
Electric
Utilities — 0.7% |
|
|
| |
Electricite
de France SA |
360,493
|
3,383,654
|
| |
|
|
3,383,654
|
| |
Total
Common Stock (Cost $413,010,252) |
|
407,899,983
|
| |
Rights
— 0.0% |
|
|
| |
Utilities
— 0.0% |
|
|
| |
Electric
Utilities — 0.0% |
|
|
|
a,c |
Electricite
de France SA, 4/4/2022 |
360,490
|
133,994
|
| |
|
|
133,994
|
| |
Total
Rights (Cost $0) |
|
133,994
|
| |
Short-Term
Investments — 10.9% |
|
|
| d |
Thornburg
Capital Management Fund |
5,028,133
|
50,281,331
|
| |
Total
Short-Term Investments (Cost $50,281,331) |
|
50,281,331
|
| |
Total
Investments — 99.9% (Cost $463,291,583) |
|
$458,315,308
|
| |
Other
Assets Less Liabilities — 0.1% |
|
307,411
|
| |
Net
Assets — 100.0% |
|
$458,622,719
|
| Footnote Legend
|
| a
|
Non-income
producing. |
| b
|
Securities
exempt from registration under Rule 144A of the Securities Act of 1933, as amended. These securities are restricted but liquid and may only be resold in the ordinary course of business in transactions exempt from registration, normally to qualified
institutional buyers. As of March 31, 2022, the aggregate value of these securities in the Fund’s portfolio was $17,097,770, representing 3.73% of the Fund’s net assets. |
| c
|
Security
currently fair valued by the Valuation and Pricing Committee using procedures approved by the Trustees’ Audit Committee. |
| d
|
Investment
in Affiliates. |
Portfolio
Abbreviations
To simplify the listings of securities, abbreviations are used per the table below:
| ADR
|
American Depositary
Receipt |
44 | Thornburg Equity Funds Semi-Annual Report
|
See notes to
financial statements. |
Schedule of Investments,
Continued
Thornburg Better World International Fund | March 31, 2022 (Unaudited)
COUNTRY
EXPOSURE *
(percent of equity holdings) |
| Japan
|
21.7%
|
| United
States |
13.4%
|
| China
|
10.4%
|
| United
Kingdom |
8.3%
|
| Canada
|
8.1%
|
| Switzerland
|
8.0%
|
| France
|
7.9%
|
| Germany
|
4.2%
|
| Sweden
|
4.0%
|
| Netherlands
|
3.4%
|
| Australia
|
3.1%
|
| Taiwan
|
2.9%
|
| Norway
|
1.9%
|
| Brazil
|
1.4%
|
| Singapore
|
1.3%
|
| *
|
Holdings
are classified by country of risk as determined by MSCI and Bloomberg. |
See
notes to financial statements.
|
Thornburg Equity
Funds Semi-Annual Report | 45 |
Schedule of Investments
Thornburg International Growth Fund | March 31, 2022 (Unaudited)
| |
Issuer-Description
|
SHARES
|
VALUE
|
| |
Common
Stock — 95.7% |
|
|
| |
Automobiles
& Components — 1.8% |
|
|
| |
Automobiles
— 1.8% |
|
|
| |
Ferrari
NV |
118,938
|
$ 25,939,188
|
| |
|
|
25,939,188
|
| |
Banks
— 2.7% |
|
|
| |
Banks
— 2.7% |
|
|
|
a |
BAWAG
Group AG |
254,230
|
12,828,209 |
| |
HDFC
Bank Ltd. ADR |
397,344
|
24,369,107
|
| |
|
|
37,197,316
|
| |
Capital
Goods — 5.5% |
|
|
| |
Electrical
Equipment — 1.8% |
|
|
| |
Schneider
Electric SE |
145,434
|
24,416,961
|
| |
Machinery
— 2.5% |
|
|
| |
Otis
Worldwide Corp. |
453,168
|
34,871,278
|
| |
Trading
Companies & Distributors — 1.2% |
|
|
| |
Ashtead
Group plc |
276,450
|
17,406,507
|
| |
|
|
76,694,746
|
| |
Commercial
& Professional Services — 5.1% |
|
|
| |
Professional
Services — 5.1% |
|
|
| |
Experian
plc |
644,407
|
24,826,171 |
| |
Nihon
M&A Center Holdings, Inc. |
1,115,100
|
15,597,961 |
| |
Wolters
Kluwer NV |
291,920
|
31,120,521
|
| |
|
|
71,544,653
|
| |
Consumer
Durables & Apparel — 4.8% |
|
|
| |
Textiles,
Apparel & Luxury Goods — 4.8% |
|
|
| |
adidas
AG |
105,635
|
24,615,690 |
| |
LVMH
Moet Hennessy Louis Vuitton SE |
59,315
|
42,338,969
|
| |
|
|
66,954,659
|
| |
Consumer
Services — 2.6% |
|
|
| |
Hotels,
Restaurants & Leisure — 2.6% |
|
|
|
b |
Booking
Holdings, Inc. |
9,828
|
23,080,567 |
|
a |
Evolution
AB |
138,096
|
14,049,101
|
| |
|
|
37,129,668
|
| |
Diversified
Financials — 4.0% |
|
|
| |
Capital
Markets — 4.0% |
|
|
| |
Deutsche
Boerse AG |
177,708
|
31,989,346 |
| |
Japan
Exchange Group, Inc. |
1,279,800
|
23,763,199
|
| |
|
|
55,752,545
|
| |
Energy
— 1.0% |
|
|
| |
Oil,
Gas & Consumable Fuels — 1.0% |
|
|
| |
TotalEnergies
SE |
286,900
|
14,517,002
|
| |
|
|
14,517,002
|
| |
Food,
Beverage & Tobacco — 8.0% |
|
|
| |
Beverages
— 1.4% |
|
|
| |
Kweichow
Moutai Co. Ltd. Class A |
70,681
|
19,041,568
|
| |
Food
Products — 6.6% |
|
|
| |
Nestle
SA |
711,044
|
92,448,991
|
| |
|
|
111,490,559
|
| |
Materials
— 6.3% |
|
|
| |
Chemicals
— 5.2% |
|
|
| |
Air
Liquide SA |
224,199
|
39,222,217 |
| |
JSR
Corp. |
498,600
|
14,682,726 |
| |
Sika
AG |
59,834
|
19,796,295 |
46 | Thornburg Equity Funds Semi-Annual Report
|
See notes to
financial statements. |
Schedule of Investments,
Continued
Thornburg International Growth Fund | March 31, 2022 (Unaudited)
| |
Issuer-Description
|
SHARES
|
VALUE
|
| |
Containers
& Packaging — 1.1% |
|
|
| |
SIG
Combibloc Group AG |
603,763
|
$ 15,220,779
|
| |
|
|
88,922,017
|
| |
Media
& Entertainment — 11.1% |
|
|
| |
Entertainment
— 4.5% |
|
|
| |
Activision
Blizzard, Inc. |
436,798
|
34,991,888 |
|
b |
Sea
Ltd. ADR |
104,124
|
12,473,014 |
|
b |
Ubisoft
Entertainment SA |
366,108
|
16,087,815
|
| |
Interactive
Media & Services — 6.6% |
|
|
| |
carsales.com
Ltd. |
1,457,493
|
22,563,889 |
|
b |
Hemnet
Group AB |
1,045,510
|
15,724,091 |
| |
Tencent
Holdings Ltd. |
1,160,400
|
53,487,876
|
| |
|
|
155,328,573
|
| |
Pharmaceuticals,
Biotechnology & Life Sciences — 9.5% |
|
|
| |
Biotechnology
— 2.1% |
|
|
| |
CSL
Ltd. |
148,768
|
29,700,429
|
| |
Life
Sciences Tools & Services — 2.5% |
|
|
| |
Lonza
Group AG |
48,756
|
35,328,759
|
| |
Pharmaceuticals
— 4.9% |
|
|
| |
AstraZeneca
plc |
514,634
|
68,247,107
|
| |
|
|
133,276,295
|
| |
Retailing
— 3.9% |
|
|
| |
Internet
& Direct Marketing Retail — 2.3% |
|
|
|
a,b |
Boozt
AB |
518,149
|
6,617,006 |
|
b |
JD.com,
Inc. Class A |
72,666
|
2,064,795 |
|
b |
MercadoLibre,
Inc. |
19,010
|
22,612,015
|
| |
Multiline
Retail — 1.6% |
|
|
| |
B&M
European Value Retail SA |
3,245,456
|
22,706,165
|
| |
|
|
53,999,981
|
| |
Semiconductors
& Semiconductor Equipment — 14.6% |
|
|
| |
Semiconductors
& Semiconductor Equipment — 14.6% |
|
|
| |
ASML
Holding NV |
87,228
|
58,287,622 |
| |
BE
Semiconductor Industries NV |
196,990
|
16,792,075 |
| |
SK
Hynix, Inc. |
277,142
|
26,660,820 |
| |
Taiwan
Semiconductor Manufacturing Co. Ltd. |
5,029,000
|
103,162,457
|
| |
|
|
204,902,974
|
| |
Software
& Services — 11.5% |
|
|
| |
Information
Technology Services — 9.4% |
|
|
|
a,b |
Adyen
NV |
18,402
|
36,448,721 |
| |
Mastercard,
Inc. Class A |
102,639
|
36,681,126 |
| |
Nomura
Research Institute Ltd. |
626,300
|
20,434,467 |
| |
Visa,
Inc. Class A |
170,672
|
37,849,929
|
| |
Software
— 2.1% |
|
|
|
b |
Atlassian
Corp. plc Class A |
33,493
|
9,841,248 |
|
b |
Elastic
NV |
198,756
|
17,679,346 |
|
b |
Unifiedpost
Group SA |
289,623
|
2,045,142
|
| |
|
|
160,979,979
|
| |
Telecommunication
Services — 2.2% |
|
|
| |
Diversified
Telecommunication Services — 2.2% |
|
|
|
a |
Cellnex
Telecom SA |
630,488
|
30,341,855
|
| |
|
|
30,341,855
|
| |
Transportation
— 1.1% |
|
|
| |
Air
Freight & Logistics — 1.1% |
|
|
| |
DSV
AS |
82,831
|
15,875,019
|
| |
|
|
15,875,019
|
| |
Total
Common Stock (Cost $1,045,436,830) |
|
1,340,847,029
|
See
notes to financial statements.
|
Thornburg Equity
Funds Semi-Annual Report | 47 |
Schedule of Investments, Continued
Thornburg International Growth Fund | March 31, 2022 (Unaudited)
| |
Issuer-Description
|
SHARES
|
VALUE
|
| |
Short-Term
Investments — 4.1% |
|
|
| c |
Thornburg
Capital Management Fund |
5,740,349
|
$ 57,403,494
|
| |
Total
Short-Term Investments (Cost $57,403,494) |
|
57,403,494
|
| |
Total
Investments — 99.8% (Cost $1,102,840,324) |
|
$1,398,250,523
|
| |
Other
Assets Less Liabilities — 0.2% |
|
3,452,910
|
| |
Net
Assets — 100.0% |
|
$1,401,703,433
|
| Footnote Legend
|
| a
|
Securities
exempt from registration under Rule 144A of the Securities Act of 1933, as amended. These securities are restricted but liquid and may only be resold in the ordinary course of business in transactions exempt from registration, normally to qualified
institutional buyers. As of March 31, 2022, the aggregate value of these securities in the Fund’s portfolio was $100,284,892, representing 7.15% of the Fund’s net assets. |
| b
|
Non-income
producing. |
| c
|
Investment
in Affiliates. |
Portfolio
Abbreviations
To simplify the listings of securities, abbreviations are used per the table below:
| ADR
|
American Depositary
Receipt |
COUNTRY
EXPOSURE *
(percent of equity holdings) |
| United
States |
16.4%
|
| Switzerland
|
12.1%
|
| Netherlands
|
10.6%
|
| United
Kingdom |
9.9%
|
| Taiwan
|
8.6%
|
| France
|
8.4%
|
| China
|
5.6%
|
| Japan
|
5.6%
|
| Germany
|
4.2%
|
| Australia
|
3.9%
|
| Sweden
|
2.7%
|
| Spain
|
2.3%
|
| South
Korea |
2.0%
|
| Italy
|
1.9%
|
| India
|
1.8%
|
| Brazil
|
1.7%
|
| Denmark
|
1.2%
|
| Austria
|
1.0%
|
| Belgium
|
0.1%
|
| *
|
Holdings
are classified by country of risk as determined by MSCI and Bloomberg. |
48 | Thornburg Equity Funds Semi-Annual Report
|
See notes to
financial statements. |
Schedule of Investments
Thornburg Developing World Fund | March 31, 2022 (Unaudited)
| |
Issuer-Description
|
SHARES
|
VALUE
|
| |
Common
Stock — 97.9% |
|
|
| |
Automobiles
& Components — 2.9% |
|
|
| |
Automobiles
— 2.9% |
|
|
|
a |
Li
Auto, Inc. Class A |
801,244
|
$ 10,366,367
|
|
a |
Tata
Motors Ltd. Sponsored ADR |
771,916
|
21,575,052
|
| |
|
|
31,941,419
|
| |
Banks
— 12.0% |
|
|
| |
Banks
— 12.0% |
|
|
| |
Bank
Rakyat Indonesia Persero Tbk PT |
80,587,767
|
26,028,611 |
| |
China
Construction Bank Corp. |
19,002,743
|
14,234,280 |
| |
Grupo
Financiero Banorte SAB de CV |
2,706,032
|
20,382,992 |
| |
HDFC
Bank Ltd. |
1,425,301
|
27,444,491 |
| |
ICICI
Bank Ltd. |
482,047
|
4,600,270 |
|
a |
KakaoBank
Corp. |
272,485
|
11,508,482 |
|
b |
Postal
Savings Bank of China Co. Ltd. Class H |
19,860,250
|
15,992,403 |
| |
Siam
Commercial Bank PCL |
3,849,704
|
13,127,632
|
| |
|
|
133,319,161
|
| |
Capital
Goods — 2.1% |
|
|
| |
Electrical
Equipment — 1.0% |
|
|
| |
Sungrow
Power Supply Co. Ltd. Class A |
615,157
|
10,317,559
|
| |
Machinery
— 1.1% |
|
|
| |
Shenzhen
Inovance Technology Co. Ltd. Class A |
1,388,307
|
12,395,793
|
| |
|
|
22,713,352
|
| |
Consumer
Durables & Apparel — 1.1% |
|
|
| |
Textiles,
Apparel & Luxury Goods — 1.1% |
|
|
| |
Shenzhou
International Group Holdings Ltd. |
950,688
|
12,551,002
|
| |
|
|
12,551,002
|
| |
Consumer
Services — 4.3% |
|
|
| |
Hotels,
Restaurants & Leisure — 4.3% |
|
|
| |
Huazhu
Group Ltd. ADR |
451,075
|
14,880,964 |
| |
Yum
China Holdings, Inc. |
751,697
|
32,788,573
|
| |
|
|
47,669,537
|
| |
Diversified
Financials — 9.5% |
|
|
| |
Capital
Markets — 6.0% |
|
|
| |
B3
SA - Brasil Bolsa Balcao |
9,158,878
|
30,221,479 |
| |
East
Money Information Co. Ltd. Class A |
3,865,599
|
15,311,774 |
|
a |
XP,
Inc. Class A |
691,938
|
20,827,334
|
| |
Consumer
Finance — 1.5% |
|
|
| |
SBI
Cards & Payment Services Ltd. |
1,447,176
|
16,131,734
|
| |
Diversified
Financial Services — 2.0% |
|
|
| |
Chailease
Holding Co. Ltd. |
2,570,851
|
22,549,762
|
| |
|
|
105,042,083
|
| |
Energy
— 3.0% |
|
|
| |
Oil,
Gas & Consumable Fuels — 3.0% |
|
|
| |
Petroleo
Brasileiro SA |
1,532,142
|
22,675,702 |
| |
PTT
Exploration & Production PCL |
2,536,581
|
10,929,193
|
| |
|
|
33,604,895
|
| |
Food
& Staples Retailing — 2.9% |
|
|
| |
Food
& Staples Retailing — 2.9% |
|
|
|
a,b |
Dino
Polska SA |
133,923
|
10,808,495 |
| |
Wal-Mart
de Mexico SAB de CV |
5,097,380
|
20,889,263
|
| |
|
|
31,697,758
|
| |
Food,
Beverage & Tobacco — 1.1% |
|
|
| |
Beverages
— 1.1% |
|
|
| |
Wuliangye
Yibin Co. Ltd. Class A |
513,089
|
12,456,842
|
See
notes to financial statements.
|
Thornburg Equity
Funds Semi-Annual Report | 49 |
Schedule of Investments, Continued
Thornburg Developing World Fund | March 31, 2022 (Unaudited)
| |
Issuer-Description
|
SHARES
|
VALUE
|
| |
|
|
12,456,842
|
| |
Health
Care Equipment & Services — 1.2% |
|
|
| |
Health
Care Providers & Services — 1.2% |
|
|
|
a |
Oncoclinicas
do Brasil Servicos Medicos SA |
6,052,591
|
$ 13,424,635
|
| |
|
|
13,424,635
|
| |
Insurance
— 3.8% |
|
|
| |
Insurance
— 3.8% |
|
|
| |
AIA
Group Ltd. |
2,846,482
|
29,722,615 |
|
a |
Star
Health & Allied Insurance Co. Ltd. |
1,329,809
|
12,452,657
|
| |
|
|
42,175,272
|
| |
Materials
— 5.7% |
|
|
| |
Chemicals
— 2.7% |
|
|
| |
Fertiglobe
plc |
7,424,235
|
10,098,827 |
| |
Sociedad
Quimica y Minera de Chile SA Sponsored ADR |
225,922
|
19,338,923
|
| |
Metals
& Mining — 3.0% |
|
|
| |
First
Quantum Minerals Ltd. |
964,420
|
33,388,072
|
| |
|
|
62,825,822
|
| |
Media
& Entertainment — 8.4% |
|
|
| |
Entertainment
— 1.3% |
|
|
| |
NetEase,
Inc. |
832,571
|
15,021,884
|
| |
Interactive
Media & Services — 7.1% |
|
|
| |
NAVER
Corp. |
93,269
|
25,922,157 |
| |
Tencent
Holdings Ltd. |
1,138,201
|
52,464,627
|
| |
|
|
93,408,668
|
| |
Pharmaceuticals,
Biotechnology & Life Sciences — 1.1% |
|
|
| |
Pharmaceuticals
— 1.1% |
|
|
|
a,b |
Gland
Pharma Ltd. |
269,214
|
11,586,518
|
| |
|
|
11,586,518
|
| |
Retailing
— 6.4% |
|
|
| |
Internet
& Direct Marketing Retail — 3.9% |
|
|
|
a |
Alibaba
Group Holding Ltd. |
1,262,301
|
17,226,257 |
|
a |
JD.com,
Inc. Class A |
48,916
|
1,389,942 |
|
a,b |
Meituan
Class B |
620,075
|
11,746,662 |
|
a |
MercadoLibre,
Inc. |
11,377
|
13,532,714
|
| |
Specialty
Retail — 2.5% |
|
|
| |
China
Tourism Group Duty Free Corp. Ltd. Class A |
586,550
|
15,087,548 |
| |
K
Car Co. Ltd. |
457,341
|
12,204,536
|
| |
|
|
71,187,659
|
| |
Semiconductors
& Semiconductor Equipment — 12.9% |
|
|
| |
Semiconductors
& Semiconductor Equipment — 12.9% |
|
|
| |
MediaTek,
Inc. |
459,968
|
14,314,441 |
| |
Micron
Technology, Inc. |
375,398
|
29,239,750 |
| |
Taiwan
Semiconductor Manufacturing Co. Ltd. |
4,861,960
|
99,735,880
|
| |
|
|
143,290,071
|
| |
Software
& Services — 4.0% |
|
|
| |
Information
Technology Services — 3.0% |
|
|
| |
Infosys
Ltd. Sponsored ADR |
1,105,038
|
27,504,396 |
|
a,b |
Network
International Holdings plc |
1,694,885
|
6,193,858
|
| |
Software
— 1.0% |
|
|
| |
Yonyou
Network Technology Co. Ltd. Class A |
3,064,494
|
11,017,480
|
| |
|
|
44,715,734
|
| |
Technology
Hardware & Equipment — 6.5% |
|
|
| |
Electronic
Equipment, Instruments & Components — 2.6% |
|
|
| |
Hon
Hai Precision Industry Co. Ltd. |
6,225,761
|
22,859,930 |
| |
Sunny
Optical Technology Group Co. Ltd. |
411,959
|
6,542,456 |
50 | Thornburg Equity Funds Semi-Annual Report
|
See notes to
financial statements. |
Schedule of Investments,
Continued
Thornburg Developing World Fund | March 31, 2022 (Unaudited)
| |
Issuer-Description
|
SHARES
|
VALUE
|
| |
Technology
Hardware, Storage & Peripherals — 3.9% |
|
|
| |
Samsung
Electronics Co. Ltd. |
749,173
|
$ 42,869,901
|
| |
|
|
72,272,287
|
| |
Telecommunication
Services — 3.8% |
|
|
| |
Diversified
Telecommunication Services — 3.8% |
|
|
|
a |
Converge
ICT Solutions, Inc. |
45,723,046
|
26,555,628 |
| |
Telefonica
Brasil SA |
1,347,751
|
15,198,486
|
| |
|
|
41,754,114
|
| |
Transportation
— 2.6% |
|
|
| |
Transportation
Infrastructure — 2.6% |
|
|
| |
Grupo
Aeroportuario del Pacifico SAB de CV Class B |
1,773,037
|
28,581,642
|
| |
|
|
28,581,642
|
| |
Utilities
— 2.6% |
|
|
| |
Electric
Utilities — 0.8% |
|
|
| |
Enel
Chile SA |
292,224,492
|
8,728,108
|
| |
Independent
Power and Renewable Electricity Producers — 1.8% |
|
|
| |
China
Longyuan Power Group Corp. Ltd. Class H |
9,030,668
|
20,298,637
|
| |
|
|
29,026,745
|
| |
Total
Common Stock (Cost $882,877,527) |
|
1,085,245,216
|
| |
Short-Term
Investments — 0.9% |
|
|
| c |
Thornburg
Capital Management Fund |
953,784
|
9,537,844
|
| |
Total
Short-Term Investments (Cost $9,537,844) |
|
9,537,844
|
| |
Total
Investments — 98.8% (Cost $892,415,371) |
|
$1,094,783,060
|
| |
Other
Assets Less Liabilities — 1.2% |
|
13,215,353
|
| |
Net
Assets — 100.0% |
|
$1,107,998,413
|
| Footnote Legend
|
| a
|
Non-income
producing. |
| b
|
Securities
exempt from registration under Rule 144A of the Securities Act of 1933, as amended. These securities are restricted but liquid and may only be resold in the ordinary course of business in transactions exempt from registration, normally to qualified
institutional buyers. As of March 31, 2022, the aggregate value of these securities in the Fund’s portfolio was $56,327,936, representing 5.08% of the Fund’s net assets. |
| c
|
Investment
in Affiliates. |
Portfolio
Abbreviations
To simplify the listings of securities, abbreviations are used per the table below:
| ADR
|
American Depositary
Receipt |
See
notes to financial statements.
|
Thornburg Equity
Funds Semi-Annual Report | 51 |
Schedule of Investments, Continued
Thornburg Developing World Fund | March 31, 2022 (Unaudited)
COUNTRY
EXPOSURE *
(percent of equity holdings) |
| China
|
27.8%
|
| Taiwan
|
14.7%
|
| India
|
11.2%
|
| Brazil
|
10.7%
|
| South
Korea |
8.5%
|
| Mexico
|
6.4%
|
| Zambia
|
3.1%
|
| Hong
Kong |
2.7%
|
| United
States |
2.7%
|
| Chile
|
2.6%
|
| Philippines
|
2.5%
|
| Indonesia
|
2.4%
|
| Thailand
|
2.2%
|
| United
Arab Emirates |
1.5%
|
| Poland
|
1.0%
|
| *
|
Holdings
are classified by country of risk as determined by MSCI and Bloomberg. |
52 | Thornburg Equity Funds Semi-Annual Report
|
See notes to
financial statements. |
Schedule of Investments
Thornburg Small/Mid Cap Core Fund | March 31, 2022 (Unaudited)
| |
Issuer-Description
|
SHARES
|
VALUE
|
| |
Common
Stock — 98.5% |
|
|
| |
Automobiles
& Components — 0.8% |
|
|
| |
Auto
Components — 0.8% |
|
|
|
a |
Gentherm,
Inc. |
83,921
|
$ 6,129,590
|
| |
|
|
6,129,590
|
| |
Banks
— 7.9% |
|
|
| |
Banks
— 5.9% |
|
|
| |
Pinnacle
Financial Partners, Inc. |
223,775
|
20,605,202 |
| |
Signature
Bank |
75,690
|
22,214,258
|
| |
Thrifts
& Mortgage Finance — 2.0% |
|
|
| |
Walker
& Dunlop, Inc. |
116,271
|
15,047,793
|
| |
|
|
57,867,253
|
| |
Capital
Goods — 10.1% |
|
|
| |
Aerospace
& Defense — 1.8% |
|
|
| |
Spirit
AeroSystems Holdings, Inc. Class A |
258,559
|
12,640,949
|
| |
Building
Products — 2.4% |
|
|
|
a |
Builders
FirstSource, Inc. |
274,953
|
17,745,467
|
| |
Construction
& Engineering — 0.5% |
|
|
|
a |
API
Group Corp. |
171,771
|
3,612,344
|
| |
Machinery
— 5.4% |
|
|
|
a |
Chart
Industries, Inc. |
74,839
|
12,855,095 |
|
a |
Gates
Industrial Corp. plc |
1,065,241
|
16,042,529 |
| |
ITT,
Inc. |
140,594
|
10,574,075
|
| |
|
|
73,470,459
|
| |
Commercial
& Professional Services — 8.3% |
|
|
| |
Commercial
Services & Supplies — 4.9% |
|
|
|
a |
Casella
Waste Systems, Inc. Class A |
240,648
|
21,092,797 |
|
a |
Clean
Harbors, Inc. |
134,298
|
14,993,029
|
| |
Professional
Services — 3.4% |
|
|
| |
Booz
Allen Hamilton Holding Corp. Class A |
141,110
|
12,395,102 |
|
a |
Sterling
Check Corp. |
461,613
|
12,200,432
|
| |
|
|
60,681,360
|
| |
Consumer
Durables & Apparel — 1.6% |
|
|
| |
Household
Durables — 1.6% |
|
|
|
a |
Sonos,
Inc. |
415,366
|
11,721,628
|
| |
|
|
11,721,628
|
| |
Consumer
Services — 2.8% |
|
|
| |
Diversified
Consumer Services — 1.2% |
|
|
|
a |
Bright
Horizons Family Solutions, Inc. |
65,381
|
8,675,405
|
| |
Hotels,
Restaurants & Leisure — 1.6% |
|
|
|
a |
Norwegian
Cruise Line Holdings Ltd. |
552,548
|
12,089,750
|
| |
|
|
20,765,155
|
| |
Diversified
Financials — 4.7% |
|
|
| |
Capital
Markets — 3.1% |
|
|
| |
LPL
Financial Holdings, Inc. |
125,669
|
22,957,213
|
| |
Consumer
Finance — 1.6% |
|
|
| |
OneMain
Holdings, Inc. |
238,857
|
11,324,210
|
| |
|
|
34,281,423
|
| |
Energy
— 8.1% |
|
|
| |
Energy
Equipment & Services — 1.2% |
|
|
|
a |
Liberty
Oilfield Services, Inc. Class A |
583,801
|
8,651,931
|
| |
Oil,
Gas & Consumable Fuels — 6.9% |
|
|
| |
Chesapeake
Energy Corp. |
314,278
|
27,342,186 |
| |
Diamondback
Energy, Inc. |
166,997
|
22,891,949
|
| |
|
|
58,886,066
|
See
notes to financial statements.
|
Thornburg Equity
Funds Semi-Annual Report | 53 |
Schedule of Investments, Continued
Thornburg Small/Mid Cap Core Fund | March 31, 2022 (Unaudited)
| |
Issuer-Description
|
SHARES
|
VALUE
|
| |
Food,
Beverage & Tobacco — 2.6% |
|
|
| |
Food
Products — 2.6% |
|
|
| |
Lamb
Weston Holdings, Inc. |
184,931
|
$ 11,079,216
|
|
a |
SunOpta,
Inc. |
1,638,084
|
8,223,182
|
| |
|
|
19,302,398
|
| |
Health
Care Equipment & Services — 8.3% |
|
|
| |
Health
Care Equipment & Supplies — 5.2% |
|
|
|
a |
Envista
Holdings Corp. |
331,340
|
16,139,571 |
|
a |
Haemonetics
Corp. |
205,595
|
12,997,716 |
|
a |
Heska
Corp. |
66,667
|
9,218,713
|
| |
Health
Care Providers & Services — 3.1% |
|
|
|
a |
Amedisys,
Inc. |
42,094
|
7,252,375 |
|
a |
PetIQ,
Inc. Class A |
625,208
|
15,255,075
|
| |
|
|
60,863,450
|
| |
Materials
— 10.5% |
|
|
| |
Chemicals
— 5.5% |
|
|
| |
Element
Solutions, Inc. |
646,710
|
14,162,949 |
|
a |
Livent
Corp. |
330,707
|
8,621,532 |
| |
Sensient
Technologies Corp. |
201,972
|
16,955,549
|
| |
Containers
& Packaging — 2.7% |
|
|
| |
Crown
Holdings, Inc. |
156,936
|
19,631,124
|
| |
Metals
& Mining — 2.3% |
|
|
| |
Hudbay
Minerals, Inc. |
2,168,077
|
17,019,405
|
| |
|
|
76,390,559
|
| |
Media
& Entertainment — 1.3% |
|
|
| |
Media
— 1.3% |
|
|
|
a |
WideOpenWest,
Inc. |
532,572
|
9,288,056
|
| |
|
|
9,288,056
|
| |
Pharmaceuticals,
Biotechnology & Life Sciences — 4.9% |
|
|
| |
Life
Sciences Tools & Services — 4.9% |
|
|
|
a |
Avantor,
Inc. |
656,499
|
22,202,796 |
| |
Azenta,
Inc. |
163,385
|
13,541,349
|
| |
|
|
35,744,145
|
| |
Real
Estate — 4.3% |
|
|
| |
Equity
Real Estate Investment Trusts — 1.8% |
|
|
| |
Kite
Realty Group Trust |
563,643
|
12,834,151
|
| |
Real
Estate Management & Development — 2.5% |
|
|
|
a |
Jones
Lang LaSalle, Inc. |
77,355
|
18,523,428
|
| |
|
|
31,357,579
|
| |
Retailing
— 2.2% |
|
|
| |
Specialty
Retail — 2.2% |
|
|
|
a |
Floor
& Decor Holdings, Inc. Class A |
71,389
|
5,782,509 |
|
a |
Leslie’s,
Inc. |
542,328
|
10,499,470
|
| |
|
|
16,281,979
|
| |
Semiconductors
& Semiconductor Equipment — 3.0% |
|
|
| |
Semiconductors
& Semiconductor Equipment — 3.0% |
|
|
|
a |
FormFactor,
Inc. |
308,548
|
12,968,272 |
|
a |
MaxLinear,
Inc. |
153,542
|
8,959,176
|
| |
|
|
21,927,448
|
| |
Software
& Services — 9.1% |
|
|
| |
Information
Technology Services — 2.3% |
|
|
|
a |
Repay
Holdings Corp. Class A |
1,161,089
|
17,149,285
|
| |
Software
— 6.8% |
|
|
|
a |
Agilysys,
Inc. |
196,205
|
7,824,655 |
| a |
Aspen
Technology, Inc. |
122,934
|
20,329,596
|
54 | Thornburg Equity Funds Semi-Annual Report
|
See notes to
financial statements. |
Schedule of Investments,
Continued
Thornburg Small/Mid Cap Core Fund | March 31, 2022 (Unaudited)
| |
Issuer-Description
|
SHARES
|
VALUE
|
|
a |
Black
Knight, Inc. |
188,886
|
$ 10,953,499
|
|
a |
Varonis
Systems, Inc. Class B |
215,391
|
10,239,688
|
| |
|
|
66,496,723
|
| |
Technology
Hardware & Equipment — 2.2% |
|
|
| |
Electronic
Equipment, Instruments & Components — 2.2% |
|
|
|
a |
Teledyne
Technologies, Inc. |
33,546
|
15,854,846
|
| |
|
|
15,854,846
|
| |
Telecommunication
Services — 1.8% |
|
|
| |
Diversified
Telecommunication Services — 1.8% |
|
|
|
a |
Radius
Global Infrastructure, Inc. Class A |
895,664
|
12,790,082
|
| |
|
|
12,790,082
|
| |
Transportation
— 1.1% |
|
|
| |
Road
& Rail — 1.1% |
|
|
|
a |
XPO
Logistics, Inc. |
109,012
|
7,936,074
|
| |
|
|
7,936,074
|
| |
Utilities
— 2.9% |
|
|
| |
Independent
Power and Renewable Electricity Producers — 2.9% |
|
|
| |
AES
Corp. |
837,790
|
21,556,337
|
| |
|
|
21,556,337
|
| |
Total
Common Stock (Cost $640,428,399) |
|
719,592,610
|
| |
Short-Term
Investments — 1.8% |
|
|
| b |
Thornburg
Capital Management Fund |
1,322,677
|
13,226,766
|
| |
Total
Short-Term Investments (Cost $13,226,766) |
|
13,226,766
|
| |
Total
Investments — 100.3% (Cost $653,655,165) |
|
$732,819,376
|
| |
Liabilities
Net of Other Assets — (0.3)% |
|
(2,114,191)
|
| |
Net
Assets — 100.0% |
|
$730,705,185
|
| Footnote Legend
|
| a
|
Non-income
producing. |
| b
|
Investment
in Affiliates. |
See
notes to financial statements.
|
Thornburg Equity
Funds Semi-Annual Report | 55 |
Schedule of Investments
Thornburg Small/Mid Cap Growth Fund | March 31, 2022 (Unaudited)
| |
Issuer-Description
|
SHARES
|
VALUE
|
| |
Common
Stock — 98.6% |
|
|
| |
Automobiles
& Components — 2.9% |
|
|
| |
Auto
Components — 2.9% |
|
|
|
a |
Fox
Factory Holding Corp. |
93,311
|
$ 9,139,812
|
|
a |
Gentherm,
Inc. |
52,316
|
3,821,161
|
| |
|
|
12,960,973
|
| |
Banks
— 2.9% |
|
|
| |
Banks
— 2.9% |
|
|
| |
Signature
Bank |
44,762
|
13,137,199
|
| |
|
|
13,137,199
|
| |
Capital
Goods — 8.3% |
|
|
| |
Building
Products — 3.6% |
|
|
|
a |
Trex
Co., Inc. |
98,363
|
6,426,055 |
| |
Zurn
Water Solutions Corp. |
268,306
|
9,498,032
|
| |
Machinery
— 4.7% |
|
|
|
a |
Chart
Industries, Inc. |
72,809
|
12,506,402 |
|
a |
Kornit
Digital Ltd. |
106,069
|
8,770,846
|
| |
|
|
37,201,335
|
| |
Commercial
& Professional Services — 5.6% |
|
|
| |
Commercial
Services & Supplies — 3.1% |
|
|
|
a |
Casella
Waste Systems, Inc. Class A |
155,076
|
13,592,412
|
| |
Professional
Services — 2.5% |
|
|
| |
Booz
Allen Hamilton Holding Corp. Class A |
99,634
|
8,751,850 |
|
a |
Sterling
Check Corp. |
96,699
|
2,555,755
|
| |
|
|
24,900,017
|
| |
Consumer
Durables & Apparel — 3.8% |
|
|
| |
Household
Durables — 2.4% |
|
|
|
a |
Sonos,
Inc. |
389,123
|
10,981,051
|
| |
Leisure
Products — 1.4% |
|
|
|
a |
YETI
Holdings, Inc. |
103,165
|
6,187,837
|
| |
|
|
17,168,888
|
| |
Diversified
Financials — 1.1% |
|
|
| |
Capital
Markets — 1.1% |
|
|
|
a |
Open
Lending Corp. Class A |
250,582
|
4,738,506
|
| |
|
|
4,738,506
|
| |
Food,
Beverage & Tobacco — 3.8% |
|
|
| |
Beverages
— 1.9% |
|
|
|
a |
Celsius
Holdings, Inc. |
151,262
|
8,346,637
|
| |
Food
Products — 1.9% |
|
|
|
a |
Freshpet,
Inc. |
85,102
|
8,734,869
|
| |
|
|
17,081,506
|
| |
Health
Care Equipment & Services — 11.0% |
|
|
| |
Health
Care Equipment & Supplies — 9.2% |
|
|
|
a |
AtriCure,
Inc. |
110,741
|
7,272,361 |
| |
CONMED
Corp. |
80,225
|
11,917,424 |
|
a |
Heska
Corp. |
80,759
|
11,167,355 |
|
a |
Shockwave
Medical, Inc. |
50,948
|
10,564,577
|
| |
Health
Care Providers & Services — 1.8% |
|
|
|
a |
Amedisys,
Inc. |
46,497
|
8,010,968
|
| |
|
|
48,932,685
|
| |
Insurance
— 1.9% |
|
|
| |
Insurance
— 1.9% |
|
|
|
a |
Ryan
Specialty Group Holdings, Inc. Class A |
222,931
|
8,647,494
|
| |
|
|
8,647,494
|
56 | Thornburg Equity Funds Semi-Annual Report
|
See notes to
financial statements. |
Schedule of Investments,
Continued
Thornburg Small/Mid Cap Growth Fund | March 31, 2022 (Unaudited)
| |
Issuer-Description
|
SHARES
|
VALUE
|
| |
Materials
— 2.2% |
|
|
| |
Chemicals
— 2.2% |
|
|
|
a |
Livent
Corp. |
379,331
|
$ 9,889,159
|
| |
|
|
9,889,159
|
| |
Media
& Entertainment — 2.6% |
|
|
| |
Interactive
Media & Services — 2.6% |
|
|
|
a |
Eventbrite,
Inc. Class A |
792,462
|
11,704,664
|
| |
|
|
11,704,664
|
| |
Pharmaceuticals,
Biotechnology & Life Sciences — 11.4% |
|
|
| |
Biotechnology
— 5.8% |
|
|
|
a |
ChemoCentryx,
Inc. |
228,123
|
5,719,043 |
|
a |
Horizon
Therapeutics plc |
138,471
|
14,568,534 |
|
a |
IVERIC
bio, Inc. |
319,524
|
5,377,589
|
| |
Life
Sciences Tools & Services — 5.6% |
|
|
|
a |
Avantor,
Inc. |
494,342
|
16,718,646 |
|
a |
Repligen
Corp. |
44,361
|
8,343,861
|
| |
|
|
50,727,673
|
| |
Retailing
— 4.8% |
|
|
| |
Internet
& Direct Marketing Retail — 0.9% |
|
|
|
a |
Overstock.com,
Inc. |
90,717
|
3,992,001
|
| |
Specialty
Retail — 3.9% |
|
|
|
a |
Floor
& Decor Holdings, Inc. Class A |
102,389
|
8,293,509 |
|
a |
Leslie’s,
Inc. |
472,935
|
9,156,022
|
| |
|
|
21,441,532
|
| |
Semiconductors
& Semiconductor Equipment — 9.4% |
|
|
| |
Semiconductors
& Semiconductor Equipment — 9.4% |
|
|
|
a |
Ambarella,
Inc. |
82,923
|
8,700,281 |
| |
Entegris,
Inc. |
94,570
|
12,413,258 |
|
a |
MaxLinear,
Inc. |
152,925
|
8,923,174 |
| |
Monolithic
Power Systems, Inc. |
24,529
|
11,913,245
|
| |
|
|
41,949,958
|
| |
Software
& Services — 19.6% |
|
|
| |
Information
Technology Services — 7.6% |
|
|
|
a |
BigCommerce
Holdings, Inc. Series 1 |
205,872
|
4,510,655 |
|
a |
Endava
plc Sponsored ADR |
52,727
|
7,014,273 |
|
a,b |
Nuvei
Corp. |
149,676
|
11,254,285 |
|
a |
Shift4
Payments, Inc. Class A |
176,255
|
10,915,472
|
| |
Software
— 12.0% |
|
|
| |
Bentley
Systems, Inc. Class B |
252,659
|
11,162,475 |
|
a |
Black
Knight, Inc. |
165,099
|
9,574,091 |
|
a |
Domo,
Inc. Class B |
158,924
|
8,036,787 |
|
a |
Elastic
NV |
98,803
|
8,788,527 |
|
a |
Smartsheet,
Inc. Class A |
135,375
|
7,415,842 |
|
a |
Varonis
Systems, Inc. Class B |
181,671
|
8,636,639
|
| |
|
|
87,309,046
|
| |
Technology
Hardware & Equipment — 5.0% |
|
|
| |
Communications
Equipment — 2.5% |
|
|
|
a |
Calix,
Inc. |
256,670
|
11,013,710
|
| |
Electronic
Equipment, Instruments & Components — 2.5% |
|
|
|
a |
Teledyne
Technologies, Inc. |
24,118
|
11,398,890
|
| |
|
|
22,412,600
|
| |
Transportation
— 2.3% |
|
|
| |
Air
Freight & Logistics — 2.3% |
|
|
|
a |
GXO
Logistics, Inc. |
140,748
|
10,040,962
|
| |
|
|
10,040,962
|
| |
Total
Common Stock (Cost $450,047,082) |
|
440,244,197
|
See
notes to financial statements.
|
Thornburg Equity
Funds Semi-Annual Report | 57 |
Schedule of Investments, Continued
Thornburg Small/Mid Cap Growth Fund | March 31, 2022 (Unaudited)
| |
Issuer-Description
|
SHARES
|
VALUE
|
| |
Short-Term
Investments — 0.5% |
|
|
| c |
Thornburg
Capital Management Fund |
220,082
|
$ 2,200,818
|
| |
Total
Short-Term Investments (Cost $2,200,818) |
|
2,200,818
|
| |
Total
Investments — 99.1% (Cost $452,247,900) |
|
$442,445,015
|
| |
Other
Assets Less Liabilities — 0.9% |
|
3,851,775
|
| |
Net
Assets — 100.0% |
|
$446,296,790
|
| Footnote Legend
|
| a
|
Non-income
producing. |
| b
|
Securities
exempt from registration under Rule 144A of the Securities Act of 1933, as amended. These securities are restricted but liquid and may only be resold in the ordinary course of business in transactions exempt from registration, normally to qualified
institutional buyers. As of March 31, 2022, the aggregate value of these securities in the Fund’s portfolio was $11,254,285, representing 2.52% of the Fund’s net assets. |
| c
|
Investment
in Affiliates. |
Portfolio
Abbreviations
To simplify the listings of securities, abbreviations are used per the table below:
| ADR
|
American Depositary
Receipt |
COUNTRY
EXPOSURE *
(percent of equity holdings) |
| United
States |
93.9%
|
| Canada
|
2.5%
|
| Israel
|
2.0%
|
| United
Kingdom |
1.6%
|
| *
|
Holdings
are classified by country of risk as determined by MSCI and Bloomberg. |
58 | Thornburg Equity Funds Semi-Annual Report
|
See notes to
financial statements. |
Schedule of Investments
Thornburg Investment Income Builder Fund | March 31, 2022
(Unaudited)
| |
Issuer-Description
|
SHARES/
PRINCIPAL AMOUNT |
VALUE
|
| |
Common
Stock — 85.1% |
|
|
| |
Automobiles
& Components — 1.7% |
|
|
| |
Automobiles
— 1.7% |
|
|
| |
Mercedes-Benz
Group AG |
1,479,700
|
$ 103,859,376
|
| |
Stellantis
NV |
5,164,500
|
83,610,505
|
| |
|
|
187,469,881
|
| |
Banks
— 5.7% |
|
|
| |
Banks
— 5.7% |
|
|
| |
BNP
Paribas SA |
2,408,000
|
137,604,266 |
| |
Citigroup,
Inc. |
664,799
|
35,500,267 |
| |
JPMorgan
Chase & Co. |
1,747,148
|
238,171,215 |
| |
Regions
Financial Corp. |
10,525,108
|
234,288,904
|
| |
|
|
645,564,652
|
| |
Capital
Goods — 2.0% |
|
|
| |
Aerospace
& Defense — 0.8% |
|
|
| |
BAE
Systems plc |
9,463,900
|
88,879,723
|
| |
Industrial
Conglomerates — 1.2% |
|
|
| |
Siemens
AG |
971,100
|
134,465,550
|
| |
|
|
223,345,273
|
| |
Diversified
Financials — 9.6% |
|
|
| |
Capital
Markets — 5.7% |
|
|
| |
Apollo
Investment Corp. |
2,937,783
|
38,837,491 |
| |
CME
Group, Inc. |
1,562,801
|
371,727,846 |
|
a |
SLR
Investment Corp. |
4,407,900
|
79,915,227 |
| |
UBS
Group AG |
8,018,372
|
156,689,437
|
| |
Diversified
Financial Services — 1.9% |
|
|
| |
Equitable
Holdings, Inc. |
5,628,308
|
173,971,000 |
| |
M&G
plc |
15,374,000
|
44,297,590
|
| |
Mortgage
Real Estate Investment Trusts — 2.0% |
|
|
|
a |
Chimera
Investment Corp. |
17,217,311
|
207,296,424 |
| |
Granite
Point Mortgage Trust, Inc. |
1,417,500
|
15,762,600
|
| |
|
|
1,088,497,615
|
| |
Energy
— 3.9% |
|
|
| |
Oil,
Gas & Consumable Fuels — 3.9% |
|
|
|
b |
LUKOIL
PJSC Sponsored ADR |
314,000
|
226,080 |
|
a,b,c |
Malamute
Energy, Inc. |
12,439
|
12,439 |
| |
TotalEnergies
SE |
8,807,100
|
445,635,022
|
| |
|
|
445,873,541
|
| |
Food
& Staples Retailing — 3.6% |
|
|
| |
Food
& Staples Retailing — 3.6% |
|
|
| |
Tesco
plc |
78,102,630
|
282,755,164 |
| |
Walgreens
Boots Alliance, Inc. |
2,856,139
|
127,869,343
|
| |
|
|
410,624,507
|
| |
Food,
Beverage & Tobacco — 0.3% |
|
|
| |
Food
Products — 0.3% |
|
|
| |
Nestle
SA |
289,900
|
37,692,410
|
| |
|
|
37,692,410
|
| |
Insurance
— 5.9% |
|
|
| |
Insurance
— 5.9% |
|
|
| |
Assicurazioni
Generali SpA |
11,749,147
|
268,728,222 |
| |
Aviva
plc |
7,027,000
|
41,578,129 |
| |
AXA
SA |
2,620,500
|
76,713,365 |
| |
Legal
& General Group plc |
5,479,000
|
19,425,180 |
| |
NN
Group NV |
5,244,000
|
265,759,287
|
| |
|
|
672,204,183
|
See
notes to financial statements.
|
Thornburg Equity
Funds Semi-Annual Report | 59 |
Schedule of Investments, Continued
Thornburg Investment Income Builder Fund | March 31, 2022 (Unaudited)
| |
Issuer-Description
|
SHARES/
PRINCIPAL AMOUNT |
VALUE
|
| |
Materials
— 4.9% |
|
|
| |
Chemicals
— 1.5% |
|
|
| |
LyondellBasell
Industries NV Class A |
1,626,496
|
$ 167,236,319
|
| |
Metals
& Mining — 3.4% |
|
|
| |
BHP
Group Ltd. |
2,820,000
|
108,703,918 |
| |
Glencore
plc |
41,903,800
|
272,655,604 |
|
b |
MMC
Norilsk Nickel PJSC ADR |
3,514,000
|
2,073,260
|
| |
|
|
550,669,101
|
| |
Pharmaceuticals,
Biotechnology & Life Sciences — 12.2% |
|
|
| |
Biotechnology
— 3.4% |
|
|
| |
AbbVie,
Inc. |
2,399,490
|
388,981,324
|
| |
Pharmaceuticals
— 8.8% |
|
|
| |
AstraZeneca
plc |
1,175,800
|
155,926,248 |
| |
Merck
& Co., Inc. |
2,157,969
|
177,061,356 |
| |
Novartis
AG |
1,383,800
|
121,485,880 |
| |
Pfizer,
Inc. |
5,360,409
|
277,508,374 |
| |
Roche
Holding AG |
674,600
|
266,913,384
|
| |
|
|
1,387,876,566
|
| |
Real
Estate — 0.7% |
|
|
| |
Equity
Real Estate Investment Trusts — 0.7% |
|
|
| |
Washington
Real Estate Investment Trust |
2,963,074
|
75,558,387
|
| |
|
|
75,558,387
|
| |
Retailing
— 1.3% |
|
|
| |
Specialty
Retail — 1.3% |
|
|
| |
Home
Depot, Inc. |
505,482
|
151,305,927
|
| |
|
|
151,305,927
|
| |
Semiconductors
& Semiconductor Equipment — 9.7% |
|
|
| |
Semiconductors
& Semiconductor Equipment — 9.7% |
|
|
| |
Broadcom,
Inc. |
698,040
|
439,541,827 |
| |
QUALCOMM,
Inc. |
1,857,277
|
283,829,071 |
| |
Taiwan
Semiconductor Manufacturing Co. Ltd. |
18,600,000
|
381,551,342
|
| |
|
|
1,104,922,240
|
| |
Technology
Hardware & Equipment — 4.0% |
|
|
| |
Communications
Equipment — 1.0% |
|
|
| |
Cisco
Systems, Inc. |
2,053,251
|
114,489,276
|
| |
Technology
Hardware, Storage & Peripherals — 3.0% |
|
|
| |
Samsung
Electronics Co. Ltd. |
5,837,000
|
334,010,453
|
| |
|
|
448,499,729
|
| |
Telecommunication
Services — 14.2% |
|
|
| |
Diversified
Telecommunication Services — 8.3% |
|
|
|
d |
China
Telecom Corp. Ltd. Class H |
334,555,000
|
132,053,876 |
| |
Deutsche
Telekom AG |
18,574,500
|
345,933,771 |
| |
Koninklijke
KPN NV |
9,361,000
|
32,482,464 |
| |
Orange
SA |
36,645,780
|
433,874,960
|
| |
Wireless
Telecommunication Services — 5.9% |
|
|
|
d |
China
Mobile Ltd. |
40,920,774
|
281,616,999 |
| |
Vodafone
Group plc |
237,227,924
|
389,002,587
|
| |
|
|
1,614,964,657
|
| |
Utilities
— 5.4% |
|
|
| |
Electric
Utilities — 4.8% |
|
|
| |
Electricite
de France SA |
9,094,920
|
85,366,613 |
| |
Endesa
SA |
4,632,800
|
101,011,778 |
| |
Enel
SpA |
41,182,671
|
274,966,374 |
| |
Energias
de Portugal SA |
16,048,000
|
78,986,401
|
| |
Multi-Utilities
— 0.6% |
|
|
60 | Thornburg Equity Funds Semi-Annual Report
|
See notes to
financial statements. |
Schedule of Investments,
Continued
Thornburg Investment Income Builder Fund | March 31, 2022 (Unaudited)
| |
Issuer-Description
|
SHARES/
PRINCIPAL AMOUNT |
VALUE
|
| |
E.ON
SE |
5,714,000
|
$ 66,386,060
|
| |
|
|
606,717,226
|
| |
Total
Common Stock (Cost $7,063,850,092) |
|
9,651,785,895
|
| |
Preferred
Stock — 0.3% |
|
|
| |
Banks
— 0.1% |
|
|
| |
Banks
— 0.1% |
|
|
|
e,f,g |
First
Horizon Bank 3.75% (LIBOR 3 Month + 0.85%) |
12,000
|
10,444,500
|
| |
|
|
10,444,500
|
| |
Diversified
Financials — 0.0% |
|
|
| |
Capital
Markets — 0.0% |
|
|
|
f,g |
Morgan
Stanley Series A, 4.00% (LIBOR 3 Month + 0.70%) |
120,000
|
2,658,000
|
| |
|
|
2,658,000
|
| |
Energy
— 0.2% |
|
|
| |
Oil,
Gas & Consumable Fuels — 0.2% |
|
|
|
f |
Crestwood
Equity Partners LP 9.25% |
2,166,596
|
20,799,321
|
| |
|
|
20,799,321
|
| |
Total
Preferred Stock (Cost $34,858,652) |
|
33,901,821
|
| |
Asset
Backed Securities — 2.7% |
|
|
| |
Auto
Receivables — 1.6% |
|
|
| |
ACC
Trust, |
|
|
|
e |
Series
2019-1 Class C, 6.41% due 2/20/2024 |
$ 2,212,725
|
2,225,515 |
|
e |
Series
2020-A Class A, 6.00% due 3/20/2023 |
3,390,983 |
3,395,638 |
|
e |
Series
2020-A Class B, 12.50% due 6/20/2025 |
6,680,000 |
6,713,190 |
| |
American
Credit Acceptance Receivables Trust, |
|
|
|
e |
Series
2019-3 Class F, 5.42% due 5/12/2026 |
6,850,000 |
6,901,608 |
|
e |
Series
2019-4 Class F, 5.37% due 9/14/2026 |
5,000,000 |
5,034,682 |
|
e |
Series
2020-1 Class F, 4.75% due 11/13/2026 |
5,460,000 |
5,439,317 |
| |
Carvana
Auto Receivables Trust, |
|
|
|
e |
0.01%
due 1/10/2029 |
24,000 |
8,609,520 |
|
e |
Series
2019-4A Class R, 0.01% due 10/15/2026 |
32,000 |
11,980,359 |
|
e |
Series
2021-N1 Class R, due 1/10/2028 |
24,500 |
8,899,309 |
|
e |
Series
2021-N2 Class R, 0.01% due 3/10/2028 |
10,500 |
4,747,883 |
|
e |
Series
2021-P1 Class R, due 12/10/2027 |
24,000 |
6,381,121 |
|
e |
Series
2021-P2 Class R, due 5/10/2028 |
8,000 |
4,011,432 |
|
e |
Series
2021-P4 Class R, due 9/11/2028 |
17,500 |
9,970,551 |
| |
CPS
Auto Receivables Trust, |
|
|
|
e |
Series
2018-B Class E, 5.61% due 12/16/2024 |
5,158,000 |
5,219,736 |
|
e |
Series
2019-A Class E, 5.81% due 3/16/2026 |
1,000,000 |
1,021,462 |
|
e |
Series
2020-A Class E, 4.09% due 12/15/2025 |
2,000,000 |
2,014,303 |
|
e |
Series
2020-C Class F, 6.67% due 11/15/2027 |
3,000,000 |
3,003,304 |
|
b,e |
CPS
Auto Securitization Trust, Series 2021-1A Class A, 7.86% due 6/16/2026 |
14,000,000 |
13,538,000 |
|
b,e |
Credit
Suisse ABS Trust, Series 2020-AT1 Class CERT, 0.01% due 6/15/2026 |
40,000 |
2,117,284 |
|
e |
DT
Auto Owner Trust, Series 2020-1A Class E, 3.48% due 2/16/2027 |
4,500,000 |
4,384,026 |
| |
Flagship
Credit Auto Trust, |
|
|
|
e |
Series
2018-4 Class R, 0.01% due 3/16/2026 |
53,000 |
5,254,442 |
|
e |
Series
2019-1 Class R, 0.01% due 6/15/2026 |
6,000 |
637,448 |
|
e |
Series
2019-3 Class R, 0.01% due 12/15/2026 |
60,000 |
9,548,288 |
|
e |
Series
2019-4 Class R, 0.01% due 3/15/2027 |
42,000 |
7,774,151 |
|
e |
Foursight
Capital Automobile Receivables Trust, Series 2020-1 Class F, 4.62% due 6/15/2027 |
3,180,000 |
3,168,988 |
| |
JPMorgan
Chase Bank NA - CACLN, |
|
|
|
e |
Series
2020 -1 Class R, 33.784% due 1/25/2028 |
1,865,260 |
2,272,421 |
|
e |
Series
2020-2 Class R, 31.355% due 2/25/2028 |
1,189,179 |
1,452,213 |
|
e |
Series
2021-1 Class R, 28.348% due 9/25/2028 |
3,826,489 |
4,571,778 |
|
e |
Santander
Consumer Auto Receivables Trust, Series 2020-AA Class R, 0.01% due 1/16/2029 |
45,588 |
7,670,035 |
| e |
United
Auto Credit Securitization Trust, Series 2022-1 Class R, 0.01% due 11/10/2028 |
37,000 |
13,864,217 |
See
notes to financial statements.
|
Thornburg Equity
Funds Semi-Annual Report | 61 |
Schedule of Investments, Continued
Thornburg Investment Income Builder Fund | March 31, 2022 (Unaudited)
| |
Issuer-Description
|
SHARES/
PRINCIPAL AMOUNT |
VALUE
|
|
e |
Veros
Automobile Receivables Trust, Series 2020-1 Class D, 5.64% due 2/16/2027 |
$ 5,000,000
|
$ 4,999,242
|
|
e |
Westlake
Automobile Receivables Trust, Series 2019-3A Class F, 4.72% due 4/15/2026 |
8,000,000 |
8,023,008
|
| |
|
|
184,844,471
|
| |
Other
Asset Backed — 1.1% |
|
|
|
e |
Amur
Equipment Finance Receivables VIII LLC, Series 2020-1A Class E, 7.00% due 1/20/2027 |
5,536,362 |
5,508,817 |
|
e |
Aqua
Finance Trust, Series 2020-AA Class D, 7.15% due 7/17/2046 |
8,200,000 |
8,448,954 |
| |
CFG
Investments Ltd., |
|
|
|
e |
Series
2021-1 Class C, 7.48% due 5/20/2032 |
2,340,000 |
2,283,806 |
|
e |
Series
2021-1 Class D, 9.07% due 5/20/2032 |
800,000 |
779,685 |
| |
Consumer
Loan Underlying Bond Credit Trust, |
|
|
|
e |
Series
2018-P3 Class C, 5.54% due 1/15/2026 |
1,740,447 |
1,741,351 |
|
e |
Series
2019-HP1 Class C, 4.70% due 12/15/2026 |
6,700,000 |
6,711,153 |
|
e,g |
Series
2019-HP1 Class CERT, due 12/15/2026 |
400,000 |
4,174,292 |
|
e |
Series
2019-P1 Class C, 4.66% due 7/15/2026 |
6,334,828 |
6,346,978 |
|
e |
Series
2020-P1 Class C, 4.61% due 3/15/2028 |
5,000,000 |
4,991,787 |
|
e |
Fat
Brands Fazoli’s Native I LLC, Series 2021-1 Class A2, 6.00% due 7/25/2051 |
10,500,000 |
10,080,000 |
|
b,e |
Goldman
Home Improvement Trust Series 2021-GRN2 Class R, due 6/20/2051 |
42,000 |
3,967,740 |
|
e |
LendingPoint
Asset Securitization Trust, Series 2020-REV1 Class C, 7.699% due 10/15/2028 |
25,750,000 |
25,588,027 |
| |
Marlette
Funding Trust, |
|
|
|
e |
Series
2019-1A Class C, 4.42% due 4/16/2029 |
4,562,953 |
4,565,333 |
|
e |
Series
2021-1A Class R, 0.01% due 6/16/2031 |
9,550 |
2,336,182 |
|
e |
Series
2021-2A Class R, 0.01% due 9/15/2031 |
26,000 |
7,145,275 |
| |
Mosaic
Solar Loan Trust, |
|
|
|
b,e |
Series
2020-2A Class R, 0.01% due 8/20/2046 |
5,161,120 |
2,427,275 |
|
b,e |
Series
2021-1A Class R, 0.01% due 12/20/2046 |
8,406,707 |
3,890,624 |
|
b,e |
Series
2021-2A Class R, 0.01% due 4/22/2047 |
10,000,000 |
2,292,000 |
|
e,g |
Oportun
Funding LLC, 0.000% due 6/15/2029 |
11,604 |
6,808,415 |
| |
Prosper
Pass-Thru Trust, |
|
|
|
e |
Series
2019-ST1 Class CERT, 0.01% due 7/15/2025 |
38,500,000 |
1,219,241 |
|
e |
Series
2019-ST2 Class R1, 0.01% due 11/15/2025 |
17,477,134 |
3,356,903 |
|
e |
Series
2019-ST2 Class R2, 0.01% due 11/15/2025 |
8,738,067 |
1,678,356 |
|
e |
Upstart
Pass-Through Trust, Series 2021-ST4 Class CERT, 0.01% due 7/20/2027 |
1,375,000 |
1,023,165
|
| |
|
|
117,365,359
|
| |
Student
Loan — 0.0% |
|
|
|
e |
SoFi
Professional Loan Program Trust, Series 2021-B Class R1, due 2/15/2047 |
23,000 |
1,325,394
|
| |
|
|
1,325,394
|
| |
Total
Asset Backed Securities (Cost $291,710,535) |
|
303,535,224
|
| |
Corporate
Bonds — 6.9% |
|
|
| |
Commercial
& Professional Services — 0.4% |
|
|
| |
Commercial
Services & Supplies — 0.4% |
|
|
|
e,h |
Cimpress
plc, 7.00% due 6/15/2026 |
27,804,000 |
26,467,740 |
| |
CoreCivic,
Inc., 8.25% due 4/15/2026 |
20,726,000 |
21,436,280
|
| |
|
|
47,904,020
|
| |
Consumer
Services — 0.2% |
|
|
| |
Hotels,
Restaurants & Leisure — 0.2% |
|
|
|
e |
Nathan’s
Famous, Inc., 6.625% due 11/1/2025 |
4,538,000 |
4,559,102 |
|
e |
SeaWorld
Parks & Entertainment, Inc., 8.75% due 5/1/2025 |
21,000,000 |
21,960,120
|
| |
|
|
26,519,222
|
| |
Diversified
Financials — 0.5% |
|
|
| |
Capital
Markets — 0.2% |
|
|
|
b,c,e,i |
JPR
Royalty Sub LLC, 14.00% due 9/1/2020 |
5,000,000 |
0 |
|
e |
StoneX
Group, Inc., 8.625% due 6/15/2025 |
17,784,000 |
18,576,811
|
| |
Diversified
Financial Services — 0.3% |
|
|
| |
Antares
Holdings LP, |
|
|
|
e |
6.00%
due 8/15/2023 |
18,000,000 |
18,453,060 |
|
e |
8.50%
due 5/18/2025 |
11,500,000 |
12,654,370 |
|
f,g |
JPMorgan
Chase & Co., Series I, 3.769% (LIBOR 3 Month + 3.47%) due 7/30/2022 |
7,334,000 |
7,334,146
|
62 | Thornburg Equity Funds Semi-Annual Report
|
See notes to
financial statements. |
Schedule of Investments,
Continued
Thornburg Investment Income Builder Fund | March 31, 2022 (Unaudited)
| |
Issuer-Description
|
SHARES/
PRINCIPAL AMOUNT |
VALUE
|
| |
|
|
57,018,387
|
| |
Energy
— 2.5% |
|
|
| |
Energy
Equipment & Services — 0.0% |
|
|
| |
Odebrecht
Offshore Drilling Finance Ltd., |
|
|
|
e,h |
6.72%
due 12/1/2022 |
$ 726,088
|
$ 716,577
|
|
e,h,j |
7.72%
due 12/1/2026 PIK |
19,311,272 |
4,349,671 |
|
e,f,h |
Odebrecht
Oil & Gas Finance Ltd. (Guaranty: Odebrecht Oleo e Gas SA), Zero coupon due 5/2/2022 |
2,337,727 |
10,987 |
|
c,e,h,i |
Schahin
II Finance Co. SPV Ltd., 5.875% due 9/25/2023 |
11,396,735 |
770,419
|
| |
Oil,
Gas & Consumable Fuels — 2.5% |
|
|
|
e |
Citgo
Holding, Inc., 9.25% due 8/1/2024 |
14,196,000 |
14,342,077 |
|
e |
CITGO
Petroleum Corp., 7.00% due 6/15/2025 |
8,000,000 |
8,093,280 |
|
g |
Energy
Transfer LP, 3.334% (LIBOR 3 Month + 3.02%) due 11/1/2066 |
13,820,000 |
11,299,370 |
|
g |
Enterprise
TE Partners LP, Series 1, 3.301% (LIBOR 3 Month + 2.78%) due 6/1/2067 |
7,000,000 |
5,715,990 |
| |
Kinder
Morgan Energy Partners LP, |
|
|
| |
5.00%
due 3/1/2043 |
10,000,000 |
10,293,900 |
| |
5.80%
due 3/15/2035 |
10,000,000 |
11,348,000 |
| |
Kinder
Morgan, Inc., |
|
|
| |
5.30%
due 12/1/2034 |
23,630,000 |
25,877,686 |
| |
5.55%
due 6/1/2045 |
5,000,000 |
5,601,150 |
| |
ONEOK
Partners LP, 4.90% due 3/15/2025 |
9,544,000 |
9,855,134 |
|
e |
Par
Petroleum LLC/Par Petroleum Finance Corp., 7.75% due 12/15/2025 |
1,672,000 |
1,655,246 |
|
h |
Petroleos
Mexicanos, 5.95% due 1/28/2031 |
7,820,000 |
7,222,396 |
| |
Petroleos
Mexicanos (EUR), 3.75% due 2/21/2024 |
2,000,000 |
2,217,367 |
|
f,g |
Summit
Midstream Partners LP, Series A, 9.50% (LIBOR 3 Month + 7.43%) due 12/15/2022 |
16,097,000 |
12,475,819 |
| |
Transcontinental
Gas Pipe Line Co. LLC, 7.85% due 2/1/2026 |
32,700,000 |
37,487,607 |
| |
Williams
Cos., Inc., |
|
|
| |
3.70%
due 1/15/2023 |
29,129,000 |
29,330,573 |
| |
4.55%
due 6/24/2024 |
69,318,000 |
71,242,268 |
| |
5.75%
due 6/24/2044 |
14,198,000 |
16,389,745
|
| |
|
|
286,295,262
|
| |
Food
& Staples Retailing — 0.1% |
|
|
| |
Food
& Staples Retailing — 0.1% |
|
|
|
e |
KeHE
Distributors LLC/KeHE Finance Corp., 8.625% due 10/15/2026 |
4,675,000 |
4,955,781
|
| |
|
|
4,955,781
|
| |
Food,
Beverage & Tobacco — 0.4% |
|
|
| |
Tobacco
— 0.4% |
|
|
|
e |
Vector
Group Ltd., 10.50% due 11/1/2026 |
44,464,000 |
45,549,366
|
| |
|
|
45,549,366
|
| |
Insurance
— 0.5% |
|
|
| |
Insurance
— 0.5% |
|
|
|
e |
MetLife,
Inc., 9.25% due 4/8/2068 |
12,000,000 |
15,565,800 |
|
e,g,h |
QBE
Insurance Group Ltd., 7.50% (USSW10 + 6.03%) due 11/24/2043 |
40,000,000 |
41,956,800
|
| |
|
|
57,522,600
|
| |
Materials
— 0.2% |
|
|
| |
Containers
& Packaging — 0.1% |
|
|
|
e |
Matthews
International Corp., Class C, 5.25% due 12/1/2025 |
14,969,000 |
15,095,787
|
| |
Metals
& Mining — 0.1% |
|
|
|
e |
Cleveland-Cliffs,
Inc., 6.75% due 3/15/2026 |
5,000,000 |
5,266,500
|
| |
|
|
20,362,287
|
| |
Media
& Entertainment — 0.1% |
|
|
| |
Media
— 0.1% |
|
|
|
e,h |
Telenet
Finance Luxembourg Notes Sarl, 5.50% due 3/1/2028 |
10,000,000 |
9,781,100
|
| |
|
|
9,781,100
|
| |
Telecommunication
Services — 1.7% |
|
|
See
notes to financial statements.
|
Thornburg Equity
Funds Semi-Annual Report | 63 |
Schedule of Investments, Continued
Thornburg Investment Income Builder Fund | March 31, 2022 (Unaudited)
| |
Issuer-Description
|
SHARES/
PRINCIPAL AMOUNT |
VALUE
|
| |
Diversified
Telecommunication Services — 1.3% |
|
|
|
h |
Deutsche
Telekom International Finance BV (Guaranty: Deutsche Telekom AG), 8.75% due 6/15/2030 |
$ 26,150,000
|
$ 35,147,431
|
|
h |
Telefonica
Emisiones SA (Guaranty: Telefonica SA), 7.045% due 6/20/2036 |
85,390,000 |
107,221,661
|
| |
Wireless
Telecommunication Services — 0.4% |
|
|
| |
Digicel
International Finance Ltd./Digicel Holdings Bermuda Ltd., |
|
|
|
e,h |
8.00%
due 12/31/2026 |
10,003,281 |
9,303,051 |
|
e,h |
8.75%
due 5/25/2024 |
36,785,955 |
36,634,182
|
| |
|
|
188,306,325
|
| |
Transportation
— 0.2% |
|
|
| |
Airlines
— 0.2% |
|
|
| |
American
Airlines Pass Through Trust, |
|
|
| |
Series
2013-2, 4.95% due 7/15/2024 |
3,046,106 |
3,012,659 |
| |
Series
2016-3 Class B, 3.75% due 4/15/2027 |
11,924,064 |
10,964,297 |
| |
Series
2019-1B Class PPT, 3.85% due 8/15/2029 |
8,222,335 |
7,345,587 |
| |
US
Airways Pass Through Trust, Series 2010-1A Class PTT, 6.25% due 10/22/2024 |
966,385 |
967,632
|
| |
|
|
22,290,175
|
| |
Utilities
— 0.1% |
|
|
| |
Gas
Utilities — 0.1% |
|
|
|
e,h |
Rockpoint
Gas Storage Canada Ltd., 7.00% due 3/31/2023 |
13,880,000 |
13,870,839
|
| |
|
|
13,870,839
|
| |
Total
Corporate Bonds (Cost $698,917,031) |
|
780,375,364
|
| |
Mortgage
Backed — 1.3% |
|
|
|
g |
Bear
Stearns ARM Trust, Whole Loan Securities Trust CMO, Series 2003-6 Class 2B1, 2.396% due 8/25/2033 |
29,093 |
29,093
|
| |
Chase
Home Lending Mortgage Trust, Whole Loan Securities Trust CMO, |
|
|
|
e,g |
Series
2019-1 Class B4, 3.917% due 3/25/2050 |
1,058,874 |
1,047,601 |
|
e,g |
Series
2019-1 Class B5, 3.917% due 3/25/2050 |
489,808 |
458,289 |
|
e,g |
Series
2019-1 Class B6, 3.054% due 3/25/2050 |
748,607 |
646,944 |
|
e,g |
Chase
Mortgage Finance Corp., Whole Loan Securities Trust CMO, Series 2016-SH2 Class M4, 3.75% due 12/25/2045 |
865,770 |
839,216 |
| |
CIM
Trust, Whole Loan Securities Trust CMO, |
|
|
|
e,g,k |
Series
2020-J1 Class AIO1, 0.451% due 7/25/2050 |
73,470,201 |
749,896 |
|
e,g,k |
Series
2020-J1 Class AIO2, 0.50% due 7/25/2050 |
65,529,420 |
849,510 |
|
e,g,k |
Series
2020-J1 Class AIOS, 0.20% due 6/25/2050 |
86,631,831 |
474,067 |
|
e,g |
Series
2020-J1 Class B4, 3.451% due 7/25/2050 |
1,395,391 |
1,258,106 |
|
e,g |
Series
2020-J1 Class B5, 3.451% due 7/25/2050 |
698,178 |
609,721 |
|
e,g |
Series
2020-J1 Class B6, 3.451% due 7/25/2050 |
1,299,775 |
723,689 |
|
e,g,k |
Series
2020-J2 Class AX1, 0.267% due 1/25/2051 |
117,622,500
|
1,017,223 |
|
e,g,k |
Series
2020-J2 Class AXS, 0.21% due 1/25/2051 |
124,792,254
|
877,452 |
|
e,g |
Series
2020-J2 Class B4, 2.767% due 1/25/2051 |
491,000 |
319,698 |
|
e,g |
Series
2020-J2 Class B5, 2.767% due 1/25/2051 |
164,000 |
103,824 |
|
e,g |
Series
2020-J2 Class B6, 2.767% due 1/25/2051 |
655,000 |
225,249 |
| |
Citigroup
Mortgage Loan Trust, Whole Loan Securities Trust CMO, |
|
|
|
g |
Series
2004-HYB2 Class B1, 2.485% due 3/25/2034 |
220,434 |
220,434 |
|
e,g |
Series
2020-EXP1 Class B1, 4.467% due 5/25/2060 |
2,150,000 |
1,862,298 |
|
e,g |
Series
2020-EXP1 Class B2, 4.467% due 5/25/2060 |
1,450,000 |
1,159,013 |
|
e,g |
Series
2020-EXP1 Class B3, 4.467% due 5/25/2060 |
725,000 |
378,662 |
|
e,k |
Series
2020-EXP1 Class XS, 0.01% due 5/25/2060 |
46,358,490 |
34,769 |
|
e,g,k |
Series
2020-EXP2 Class A3IW, 0.862% due 8/25/2050 |
76,612,085 |
2,027,700 |
|
e,g,k |
Series
2020-EXP2 Class A4IW, 0.862% due 8/25/2050 |
8,235,799 |
217,978 |
|
e,g |
Series
2020-EXP2 Class B5, 3.362% due 8/25/2050 |
585,000 |
510,435 |
|
e,g |
Series
2020-EXP2 Class B6, 3.362% due 8/25/2050 |
1,400,000 |
756,870 |
|
e,g,k |
Series
2021-J1 Class A5IX, 0.112% due 4/25/2051 |
125,152,881
|
546,931 |
|
e,g,k |
Series
2021-J1 Class AIOS, 0.23% due 4/25/2051 |
127,432,464
|
1,402,840 |
|
e,g |
Series
2021-J1 Class B4, 2.612% due 4/25/2051 |
379,000 |
214,143 |
|
e,g |
Series
2021-J1 Class B5, 2.612% due 4/25/2051 |
615,000 |
296,918 |
|
e,g |
Series
2021-J1 Class B6, 2.612% due 4/25/2051 |
460,000 |
145,485 |
|
e,g,k |
Series
2021-J3 Class A3I1, 0.50% due 9/25/2051 |
16,145,552 |
375,949 |
|
e,g,k |
Series
2021-J3 Class A5I2, 0.25% due 9/25/2051 |
132,887,331
|
1,555,327 |
| e,g,k |
Series
2021-J3 Class AIOS, 0.08% due 9/25/2051 |
139,563,348
|
439,625 |
64 | Thornburg Equity Funds Semi-Annual Report
|
See notes to
financial statements. |
Schedule of Investments,
Continued
Thornburg Investment Income Builder Fund | March 31, 2022 (Unaudited)
| |
Issuer-Description
|
SHARES/
PRINCIPAL AMOUNT |
VALUE
|
|
e,g |
Series
2021-J3 Class B4, 2.859% due 9/25/2051 |
$ 1,033,000
|
$ 604,824
|
|
e,g |
Series
2021-J3 Class B6, 2.859% due 9/25/2051 |
590,000 |
201,092 |
| |
CSMC
Trust, Whole Loan Securities Trust CMO, |
|
|
|
e,g |
Series
2020-AFC1 Class M1, 2.841% due 2/25/2050 |
3,808,500 |
3,760,805 |
|
e,g,k |
Series
2021-AFC1 Class AIOS, 0.25% due 3/25/2056 |
103,545,948
|
648,560 |
|
e,g |
Series
2021-AFC1 Class B3, 4.398% due 3/25/2056 |
215,000 |
196,041 |
|
e,g,k |
Series
2021-AFC1 Class XS, 3.392% due 3/25/2056 |
103,545,948
|
4,966,364 |
| |
Flagstar
Mortgage Trust, Whole Loan Securities Trust CMO, |
|
|
|
e,g,k |
Series
2020-2 Class AX1, 0.69% due 8/25/2050 |
128,327,143
|
1,905,992 |
|
e,g,k |
Series
2020-2 Class AX2, 0.50% due 8/25/2050 |
21,994,605 |
257,036 |
|
e,g |
Series
2020-2 Class B4, 3.69% due 8/25/2050 |
862,670 |
799,006 |
|
e,g |
Series
2020-2 Class B5, 3.69% due 8/25/2050 |
2,588,009 |
2,369,763 |
|
e,g |
Series
2020-2 Class B6C, 3.617% due 8/25/2050 |
3,450,679 |
2,281,600 |
|
e,g,k |
Series
2021-13INV Class AX1, 0.194% due 12/30/2051 |
188,821,806
|
1,524,774 |
|
e,g,k |
Series
2021-13INV Class AX17, 0.18% due 12/30/2051 |
15,653,621 |
139,328 |
|
e,g,k |
Series
2021-13INV Class AX4, 0.50% due 12/30/2051 |
14,283,929 |
361,585 |
|
e,g |
Series
2021-13INV Class B4, 3.374% due 12/30/2051 |
2,483,914 |
1,995,650 |
|
e,g |
Series
2021-13INV Class B5, 3.374% due 12/30/2051 |
486,847 |
367,705 |
|
e,g |
Series
2021-13INV Class B6C, 3.31% due 12/30/2051 |
4,272,333 |
2,459,352 |
|
e,g |
Galton
Funding Mortgage Trust, Whole Loan Securities Trust CMO, Series 2020-H1 Class B1, 3.386% due 1/25/2060 |
4,379,900 |
4,182,881 |
| |
GS
Mortgage-Backed Securities Trust, Whole Loan Securities Trust CMO, |
|
|
|
e,g,k |
Series
2020-INV1 Class A11X, 3.452% due 10/25/2050 |
1,759,987 |
90,447 |
|
e,g,k |
Series
2020-INV1 Class A12X, 2.959% due 10/25/2050 |
21,072,781 |
930,129 |
|
e,g,k |
Series
2020-INV1 Class AIOS, 0.19% due 10/25/2050 |
106,822,925
|
620,225 |
|
e,g,k |
Series
2020-INV1 Class AX1, due 10/25/2050 |
77,136,663 |
771 |
|
e,g,k |
Series
2020-INV1 Class AX2, 0.459% due 10/25/2050 |
3,797,866 |
27,177 |
|
e,g,k |
Series
2020-INV1 Class AX4, 0.937% due 10/25/2050 |
4,088,726 |
63,404 |
|
e,g |
Series
2020-INV1 Class B4, 3.896% due 10/25/2050 |
1,948,753 |
1,881,744 |
|
e,g |
Series
2020-INV1 Class B5, 3.896% due 10/25/2050 |
1,948,753 |
1,734,653 |
|
e,g |
Series
2020-INV1 Class B6, 3.896% due 10/25/2050 |
4,491,544 |
3,290,232 |
|
e,g,k |
Series
2020-INV1 Class BX, 0.396% due 10/25/2050 |
22,241,096 |
358,008 |
| |
JPMorgan
Mortgage Trust, Whole Loan Securities Trust CMO, |
|
|
|
e,g |
Series
2016-5 Class B5, 2.318% due 12/25/2046 |
1,999,994 |
1,240,815 |
|
e,g,k |
Series
2020-3 Class AX1, 0.166% due 8/25/2050 |
18,266,305 |
26,950 |
|
e,g,k |
Series
2020-4 Class A11X, 5.063% (5.25% - LIBOR 1 Month) due 11/25/2050 |
3,519,926 |
122,352 |
|
e,g,k |
Series
2020-4 Class A3X, 0.50% due 11/25/2050 |
15,956,997 |
120,780 |
|
e,g,k |
Series
2020-4 Class AX1, 0.13% due 11/25/2050 |
58,939,396 |
80,494 |
|
e,g,k |
Series
2020-4 Class AX3, 3.50% due 11/25/2050 |
1,630,703 |
86,401 |
|
e,g,k |
Series
2020-4 Class AX4, 0.55% due 11/25/2050 |
3,763,387 |
31,334 |
|
e,g |
Series
2020-4 Class B4, 3.68% due 11/25/2050 |
2,008,847 |
1,991,581 |
|
e,g |
Series
2020-4 Class B5, 3.68% due 11/25/2050 |
927,308 |
846,243 |
|
e,g |
Series
2020-4 Class B6, 3.68% due 11/25/2050 |
1,603,555 |
1,400,718 |
|
e,g,k |
Series
2020-7 Class A3X, 0.50% due 1/25/2051 |
35,269,791 |
297,994 |
|
e,g,k |
Series
2020-7 Class AX1, 0.13% due 1/25/2051 |
167,618,810
|
266,598 |
|
e,g,k |
Series
2020-7 Class AX3, 3.50% due 1/25/2051 |
11,523,793 |
677,011 |
|
e,g,k |
Series
2020-7 Class AX4, 0.40% due 1/25/2051 |
10,685,699 |
71,168 |
|
e,g |
Series
2020-7 Class B4, 3.53% due 1/25/2051 |
2,456,831 |
2,236,795 |
|
e,g |
Series
2020-7 Class B5, 3.53% due 1/25/2051 |
1,721,716 |
1,507,076 |
|
e,g |
Series
2020-7 Class B6, 3.53% due 1/25/2051 |
2,277,936 |
1,343,899 |
|
e,g,k |
Series
2021-11 Class A3X, 0.50% due 1/25/2052 |
19,351,611 |
491,684 |
|
e,g,k |
Series
2021-11 Class AX1, 0.233% due 1/25/2052 |
368,602,104
|
3,550,044 |
|
e,g,k |
Series
2021-11 Class AX4, 0.30% due 1/25/2052 |
47,918,274 |
742,091 |
|
e,g |
Series
2021-11 Class B5, 3.033% due 1/25/2052 |
3,833,059 |
2,606,481 |
|
e,g |
Series
2021-11 Class B6, 2.935% due 1/25/2052 |
4,499,892 |
2,106,001 |
|
e,g,k |
Series
2022-2 Class AX1, 0.138% due 8/25/2052 |
234,066,676
|
1,146,927 |
|
e,g,k |
Series
2022-2 Class AX4, 0.50% due 8/25/2052 |
14,783,159 |
314,142 |
|
e,g |
Series
2022-2 Class B4, 3.138% due 8/25/2052 |
3,363,867 |
2,648,311 |
|
e,g |
Series
2022-2 Class B5, 3.138% due 8/25/2052 |
1,786,742 |
1,178,782 |
|
e,g |
Series
2022-2 Class B6, 3.138% due 8/25/2052 |
1,830,000 |
616,998 |
|
e,g,k |
Series
2022-3 Class AX1, 0.122% due 8/25/2052 |
429,949,000
|
1,934,770 |
|
e,g |
Series
2022-3 Class B4, 3.122% due 8/25/2052 |
2,759,000 |
2,086,079 |
|
e,g |
Series
2022-3 Class B5, 3.122% due 8/25/2052 |
1,756,000 |
922,509 |
| e,g |
Series
2022-3 Class B6, 3.122% due 8/25/2052 |
1,505,000
|
477,944 |
See
notes to financial statements.
|
Thornburg Equity
Funds Semi-Annual Report | 65 |
Schedule of Investments, Continued
Thornburg Investment Income Builder Fund | March 31, 2022 (Unaudited)
| |
Issuer-Description
|
SHARES/
PRINCIPAL AMOUNT |
VALUE
|
| |
Mello
Mortgage Capital Acceptance, Whole Loan Securities Trust CMO, |
|
|
|
e,g,k |
Series
2021-INV2 Class AX1, 0.134% due 8/25/2051 |
$112,229,934
|
$ 668,935
|
|
e,g,k |
Series
2021-INV2 Class AX4, 0.70% due 8/25/2051 |
7,689,794 |
272,826 |
|
e,g |
Series
2021-INV2 Class B5, 3.334% due 8/25/2051 |
325,247 |
246,929 |
|
e,g |
Series
2021-INV2 Class B6, 3.092% due 8/25/2051 |
1,565,669 |
780,580 |
|
e,g,k |
Series
2021-INV3 Class AX1, 0.177% due 10/25/2051 |
136,247,235
|
1,060,930 |
|
e,g,k |
Series
2021-INV3 Class AX4, 0.55% due 10/25/2051 |
11,034,107 |
311,044 |
|
e,g |
Series
2021-INV3 Class B5, 3.227% due 10/25/2051 |
455,403 |
342,145 |
|
e,g |
Series
2021-INV3 Class B6, 3.172% due 10/25/2051 |
1,971,334 |
995,835 |
|
g |
Merrill
Lynch Mortgage Investors Trust, Whole Loan Securities Trust CMO, Series 2004-A4 Class M1, 2.656% due 8/25/2034 |
1,246,318 |
1,271,393 |
| |
New
Residential Mortgage Loan Trust, Whole Loan Securities Trust CMO, |
|
|
|
e,g,k |
Series
2021-INV1 Class AX1, 0.759% due 6/25/2051 |
112,685,018
|
4,809,543 |
|
e,g |
Series
2021-INV1 Class B5, 3.259% due 6/25/2051 |
1,130,940 |
860,110 |
|
e,g |
Series
2021-INV1 Class B6, 2.932% due 6/25/2051 |
2,029,261 |
1,105,337 |
|
e,g |
Residential
Mortgage Loan Trust, Whole Loan Securities Trust CMO, Series 2019-3 Class B1, 3.81% due 9/25/2059 |
1,500,000 |
1,497,208 |
|
e |
Saluda
Grade Alternative Mortgage Trust, Whole Loan Securities Trust CMO, Series 2020-FIG1 Class C, 0.01% due 9/25/2050 |
28,263,346 |
4,572,670 |
|
e,g |
Sequoia
Mortgage Trust, Whole Loan Securities Trust CMO, Series 2017-7 Class B3, 3.719% due 10/25/2047 |
2,220,909 |
2,152,731 |
| |
SG
Residential Mortgage Trust, Whole Loan Securities Trust CMO, |
|
|
|
e,g,k |
Series
2019-3 Class AIOS, 0.375% due 9/25/2059 |
77,664,115 |
264,586 |
|
e,g |
Series
2019-3 Class B2, 5.663% due 9/25/2059 |
7,910,000 |
7,447,460 |
|
e,g |
Series
2019-3 Class B3, 5.963% due 9/25/2059 |
3,366,214 |
2,376,732 |
|
b,e,g |
Series
2019-3 Class C, due 9/25/2059 |
950 |
950 |
|
e |
Series
2019-3 Class XS1, 0.01% due 9/25/2059 |
77,035,268 |
3,051 |
|
e |
Series
2019-3 Class XS2, 0.01% due 9/25/2059 |
77,035,268 |
676,493 |
|
e,g |
Starwood
Mortgage Residential Trust, Whole Loan Securities Trust CMO, Series 2019-INV1 Class B1, 3.657% due 9/27/2049 |
10,000,000 |
9,967,244 |
|
e,g |
Verus
Securitization Trust, Whole Loan Securities Trust CMO, Series 2020-1 Class B1, 3.624% due 1/25/2060 |
2,000,000 |
1,992,281 |
|
e,g |
Vista
Point Securitization Trust, Whole Loan Securities Trust CMO, Series 2020-1 Class B2, 5.375% due 3/25/2065 |
4,500,000 |
4,460,896 |
| |
Wells
Fargo Mortgage Backed Securities Trust, Whole Loan Securities Trust CMO, |
|
|
|
e,g,k |
Series
2020-3 Class AIO1, 0.207% due 6/25/2050 |
197,096,392
|
921,209 |
|
e,g |
Series
2020-3 Class B5, 3.207% due 6/25/2050 |
1,046,000 |
813,362 |
|
e,g |
Series
2020-3 Class B6, 3.207% due 6/25/2050 |
1,968,473 |
1,148,879 |
|
e,g,k |
Series
2021-INV1 Class AIO2, 0.50% due 8/25/2051 |
207,849,217
|
4,125,807 |
|
e,g |
Series
2021-INV1 Class B4, 3.327% due 8/25/2051 |
3,471,655 |
2,793,688 |
|
e,g |
Series
2021-INV1 Class B5, 3.327% due 8/25/2051 |
2,678,134 |
2,030,024 |
| e,g |
Series
2021-INV1 Class B6, 3.327% due 8/25/2051 |
2,082,993
|
948,665
|
| |
Total
Mortgage Backed (Cost $169,960,137) |
|
154,484,618
|
| |
Loan
Participations — 0.4% |
|
|
| |
Commercial
& Professional Services — 0.1% |
|
|
| |
Professional
Services — 0.1% |
|
|
|
l |
Par
Pacific Holdings, Inc., 6.99% (LIBOR 3 Month + 6.75%) due 1/12/2026 |
12,573,376 |
12,504,223 |
|
l |
RGIS
Services LLC, 8.50% (LIBOR 1 Month + 7.50%) due 6/25/2025 |
2,871,460 |
2,814,030
|
| |
|
|
15,318,253
|
| |
Energy
— 0.1% |
|
|
| |
Oil,
Gas & Consumable Fuels — 0.1% |
|
|
|
l |
CITGO
Holding, Inc., 8.00% (LIBOR 1 Month + 7.00%) due 8/1/2023 |
7,893,278 |
7,774,879
|
| |
|
|
7,774,879
|
| |
Real
Estate — 0.1% |
|
|
| |
Equity
Real Estate Investment Trusts — 0.1% |
|
|
|
l |
CoreCivic,
Inc., 4.957% (LIBOR 1 Month + 4.50%) due 12/18/2024 |
7,261,500 |
7,170,731
|
| |
|
|
7,170,731
|
| |
Software
& Services — 0.1% |
|
|
| |
Information
Technology Services — 0.1% |
|
|
|
l |
Vericast
Corp., 8.756% (LIBOR 3 Month + 7.75%) due 6/16/2026 |
14,961,412 |
12,369,348
|
| |
|
|
12,369,348
|
| |
Total
Loan Participations (Cost $43,991,301) |
|
42,633,211
|
| |
Rights
— 0.0% |
|
|
66 | Thornburg Equity Funds Semi-Annual Report
|
See notes to
financial statements. |
Schedule of Investments,
Continued
Thornburg Investment Income Builder Fund | March 31, 2022 (Unaudited)
| |
Issuer-Description
|
SHARES/
PRINCIPAL AMOUNT |
VALUE
|
| |
Utilities
— 0.0% |
|
|
| |
Electric
Utilities — 0.0% |
|
|
|
b,c |
Electricite
de France SA, 4/4/2022 |
9,094,917
|
$ 3,380,580
|
| |
|
|
3,380,580
|
| |
Total
Rights (Cost $0) |
|
3,380,580
|
| |
Short-Term
Investments — 2.5% |
|
|
| a |
Thornburg
Capital Management Fund |
28,720,588
|
287,205,880
|
| |
Total
Short-Term Investments (Cost $287,205,880) |
|
287,205,880
|
| |
Total
Investments — 99.2% (Cost $8,590,493,628) |
|
$11,257,302,593
|
| |
Other
Assets Less Liabilities — 0.8% |
|
87,002,275
|
| |
Net
Assets — 100.0% |
|
$11,344,304,868
|
| Outstanding
Forward Currency Contracts To Buy Or Sell At March 31, 2022 |
Contract
Description |
Contract
Party* |
Buy/Sell
|
Contract
Amount |
Contract
Value Date |
Value
USD |
Unrealized
Appreciation |
Unrealized
Depreciation |
| Great
Britain Pound |
SSB
|
Sell
|
576,654,500
|
4/14/2022
|
757,460,881
|
$ 32,056,401
|
$ —
|
| Swiss
Franc |
SSB
|
Sell
|
53,466,500
|
4/26/2022
|
57,903,679
|
771,537
|
— |
| Euro
|
SSB
|
Sell
|
510,209,750
|
5/18/2022
|
565,244,769
|
16,445,368 |
—
|
| Euro
|
BBH
|
Sell
|
510,209,750
|
5/18/2022
|
565,244,768
|
16,639,247 |
—
|
| |
|
| Total
|
|
|
|
|
|
$
65,912,553 |
—
|
| |
|
| Net
unrealized appreciation (depreciation) |
|
|
|
|
|
$
65,912,553 |
|
| *
|
Counterparties
include State Street Bank and Trust Company (“SSB”) and Brown Brothers Harriman & Co. (“BBH”). |
| Footnote Legend
|
| a
|
Investment
in Affiliates. |
| b
|
Security
currently fair valued by the Valuation and Pricing Committee using procedures approved by the Trustees’ Audit Committee. |
| c
|
Non-income
producing. |
| d
|
On
November 12, 2020, the President of the United States issued an Executive Order (the "Order") to prohibit, beginning January 11, 2021, US persons (which includes the Fund) from transacting in certain securities and derivatives of publicly traded
securities of any company designated as a "Communist Chinese military company" (collectively with securities of certain subsidiaries of such companies and related depositary receipts that may be covered by the Order, "CCMC Securities") by the US
Department of Defense or the US Department of the Treasury’s Office of Foreign Assets Control ("OFAC") unless such transactions are for purposes of divestment and occur through November 11, 2021. In addition, US persons are also prohibited
from transacting in CCMS Securities designated as such 60 days after such designation. |
| e
|
Securities
exempt from registration under Rule 144A of the Securities Act of 1933, as amended. These securities are restricted but liquid and may only be resold in the ordinary course of business in transactions exempt from registration, normally to qualified
institutional buyers. As of March 31, 2022, the aggregate value of these securities in the Fund’s portfolio was $797,532,088, representing 7.03% of the Fund’s net assets. |
| f
|
Securities
are perpetual and, thus, do not have a predetermined maturity date. The date shown, if applicable, reflects the next call date. |
| g
|
Variable,
floating, step, or fixed to floating rate securities are securities for which interest rate changes are based on changes in a designated base rate or on a predetermined schedule. The rates shown are those in effect on March 31, 2022. |
| h
|
Yankee
bond denominated in U.S. dollars and is issued in the U.S. by foreign banks and corporations. |
| i
|
Bond
in default. |
| j
|
Pay-In-Kind
Payments (PIK). The issuer may pay cash interest and/or interest in additional debt securities. Rates shown are the rates in effect at March 31, 2022. |
| k
|
Interest
only. |
| l
|
The
stated coupon rate represents the greater of the LIBOR or the LIBOR floor rate plus a spread at March 31, 2022. |
See
notes to financial statements.
|
Thornburg Equity
Funds Semi-Annual Report | 67 |
Schedule of Investments, Continued
Thornburg Investment Income Builder Fund | March 31, 2022 (Unaudited)
Portfolio Abbreviations
To simplify the listings of securities, abbreviations are used per the table below:
| ADR
|
American Depositary
Receipt |
| ARM
|
Adjustable
Rate Mortgage |
| CMO
|
Collateralized
Mortgage Obligation |
| EUR
|
Denominated
in Euro |
| LIBOR
|
London Interbank
Offered Rates |
| PIK
|
Payment-in-kind
|
| SPV
|
Special Purpose
Vehicle |
| USSW10
|
USD 10
Year Swap Rate |
COUNTRY
EXPOSURE *
(percent of net assets) |
| United
States |
41.2%
|
| France
|
10.4%
|
| United
Kingdom |
9.0%
|
| Germany
|
6.1%
|
| Switzerland
|
5.1%
|
| Italy
|
4.8%
|
| Australia
|
3.7%
|
| China
|
3.7%
|
| Taiwan
|
3.4%
|
| South
Korea |
2.9%
|
| Netherlands
|
2.6%
|
| Spain
|
1.8%
|
| Portugal
|
0.7%
|
| Jamaica
|
0.4%
|
| Canada
|
0.4%
|
| Ireland
|
0.2%
|
| Belgium
|
0.1%
|
| Mexico
|
0.1%
|
| Brazil
|
0.1%
|
| Russian
Federation |
0.0%**
|
| Other
Assets Less Liabilities |
3.3%
|
| *
|
Holdings
are classified by country of risk as determined by MSCI and Bloomberg. |
| **
|
Country
percentage was less than 0.1%. |
68 | Thornburg Equity Funds Semi-Annual Report
|
See notes to
financial statements. |
Schedule of Investments
Thornburg Summit Fund | March 31, 2022 (Unaudited)
| |
Issuer-Description
|
SHARES/
PRINCIPAL AMOUNT |
VALUE
|
| |
Common
Stock — 54.4% |
|
|
| |
Automobiles
& Components — 0.3% |
|
|
| |
Automobiles
— 0.3% |
|
|
| |
Stellantis
NV |
14,739
|
$ 239,804
|
| |
|
|
239,804
|
| |
Banks
— 2.8% |
|
|
| |
Banks
— 2.8% |
|
|
| |
BNP
Paribas SA |
7,702
|
440,128 |
| |
JPMorgan
Chase & Co. |
8,633
|
1,176,851 |
| |
Mitsubishi
UFJ Financial Group, Inc. |
58,900
|
364,069
|
| |
|
|
1,981,048
|
| |
Capital
Goods — 1.7% |
|
|
| |
Aerospace
& Defense — 0.5% |
|
|
| |
L3Harris
Technologies, Inc. |
1,445
|
359,039 |
| |
Machinery
— 1.2% |
|
|
|
a |
Kornit
Digital Ltd. |
2,529
|
209,123 |
| |
Otis
Worldwide Corp. |
8,160
|
627,912
|
| |
|
|
1,196,074
|
| |
Consumer
Durables & Apparel — 1.1% |
|
|
| |
Household
Durables — 0.6% |
|
|
| |
Barratt
Developments plc |
57,281
|
389,958 |
| |
Textiles,
Apparel & Luxury Goods — 0.5% |
|
|
| |
LVMH
Moet Hennessy Louis Vuitton SE |
514
|
366,892
|
| |
|
|
756,850
|
| |
Consumer
Services — 1.2% |
|
|
| |
Hotels,
Restaurants & Leisure — 1.2% |
|
|
| |
Wyndham
Hotels & Resorts, Inc. |
10,204
|
864,177
|
| |
|
|
864,177
|
| |
Diversified
Financials — 3.1% |
|
|
| |
Capital
Markets — 1.4% |
|
|
| |
B3
SA - Brasil Bolsa Balcao |
71,949
|
237,410 |
| |
CME
Group, Inc. |
3,157
|
750,924 |
| |
Consumer
Finance — 1.7% |
|
|
| |
Capital
One Financial Corp. |
6,506
|
854,173 |
| |
SBI
Cards & Payment Services Ltd. |
32,326
|
360,339
|
| |
|
|
2,202,846
|
| |
Energy
— 2.4% |
|
|
| |
Oil,
Gas & Consumable Fuels — 2.4% |
|
|
| |
Chesapeake
Energy Corp. |
11,410
|
992,670 |
| |
TotalEnergies
SE |
13,661
|
691,240
|
| |
|
|
1,683,910
|
| |
Food,
Beverage & Tobacco — 1.0% |
|
|
| |
Food
Products — 1.0% |
|
|
| |
Nestle
SA |
5,694
|
740,326
|
| |
|
|
740,326
|
| |
Household
& Personal Products — 0.7% |
|
|
| |
Personal
Products — 0.7% |
|
|
| |
Estee
Lauder Cos., Inc. Class A |
1,938
|
527,756
|
| |
|
|
527,756
|
| |
Insurance
— 1.1% |
|
|
| |
Insurance
— 1.1% |
|
|
| |
NN
Group NV |
15,781
|
799,761
|
| |
|
|
799,761
|
See
notes to financial statements.
|
Thornburg Equity
Funds Semi-Annual Report | 69 |
Schedule of Investments, Continued
Thornburg Summit Fund | March 31, 2022 (Unaudited)
| |
Issuer-Description
|
SHARES/
PRINCIPAL AMOUNT |
VALUE
|
| |
Materials
— 3.5% |
|
|
| |
Chemicals
— 2.7% |
|
|
| |
Fertiglobe
plc |
324,966
|
$ 442,036
|
| |
Linde
plc |
2,142
|
684,219 |
| |
LyondellBasell
Industries NV Class A |
3,644
|
374,676 |
| |
PPG
Industries, Inc. |
3,442
|
451,143 |
| |
Metals
& Mining — 0.8% |
|
|
| |
Glencore
plc |
83,749
|
544,930
|
| |
|
|
2,497,004
|
| |
Media
& Entertainment — 5.9% |
|
|
| |
Entertainment
— 1.8% |
|
|
| |
Nintendo
Co. Ltd. |
900
|
454,286 |
|
a |
Sea
Ltd. ADR |
3,654
|
437,712 |
|
a |
Walt
Disney Co. |
2,743
|
376,230 |
| |
Interactive
Media & Services — 4.1% |
|
|
|
a |
Alphabet,
Inc. Class A |
691
|
1,921,913 |
|
a |
Meta
Platforms, Inc. Class A |
4,712
|
1,047,760
|
| |
|
|
4,237,901
|
| |
Pharmaceuticals,
Biotechnology & Life Sciences — 5.8% |
|
|
| |
Biotechnology
— 0.7% |
|
|
|
a |
ChemoCentryx,
Inc. |
18,154
|
455,121 |
| |
Life
Sciences Tools & Services — 1.2% |
|
|
| |
Thermo
Fisher Scientific, Inc. |
1,481
|
874,752 |
| |
Pharmaceuticals
— 3.9% |
|
|
| |
AstraZeneca
plc |
4,845
|
642,510 |
| |
Merck
& Co., Inc. |
14,580
|
1,196,289 |
| |
Roche
Holding AG |
2,373
|
938,905
|
| |
|
|
4,107,577
|
| |
Retailing
— 4.0% |
|
|
| |
Internet
& Direct Marketing Retail — 2.3% |
|
|
|
a |
Amazon.com,
Inc. |
375
|
1,222,481 |
|
a |
MercadoLibre,
Inc. |
362
|
430,592 |
| |
Multiline
Retail — 0.8% |
|
|
| |
Dollar
General Corp. |
2,542
|
565,925 |
| |
Specialty
Retail — 0.9% |
|
|
| |
Home
Depot, Inc. |
2,053
|
614,525
|
| |
|
|
2,833,523
|
| |
Semiconductors
& Semiconductor Equipment — 4.2% |
|
|
| |
Semiconductors
& Semiconductor Equipment — 4.2% |
|
|
| |
ASML
Holding NV |
1,014
|
677,577 |
| |
Broadcom,
Inc. |
1,005
|
632,828 |
| |
NVIDIA
Corp. |
2,396
|
653,773 |
| |
Taiwan
Semiconductor Manufacturing Co. Ltd. Sponsored ADR |
9,686
|
1,009,862
|
| |
|
|
2,974,040
|
| |
Software
& Services — 6.8% |
|
|
| |
Information
Technology Services — 2.8% |
|
|
| |
Mastercard,
Inc. Class A |
1,958
|
699,750 |
| |
Nomura
Research Institute Ltd. |
17,400
|
567,715 |
| |
Visa,
Inc. Class A |
3,322
|
736,720 |
| |
Software
— 4.0% |
|
|
|
a |
Fair
Isaac Corp. |
389
|
181,453 |
| |
Microsoft
Corp. |
4,632
|
1,428,092 |
| |
SAP
SE |
7,858
|
870,887 |
|
a |
ServiceNow,
Inc. |
619
|
344,715
|
| |
|
|
4,829,332
|
| |
Technology
Hardware & Equipment — 5.0% |
|
|
70 | Thornburg Equity Funds Semi-Annual Report
|
See notes to
financial statements. |
Schedule of Investments,
Continued
Thornburg Summit Fund | March 31, 2022 (Unaudited)
| |
Issuer-Description
|
SHARES/
PRINCIPAL AMOUNT |
VALUE
|
| |
Communications
Equipment — 1.2% |
|
|
| |
Cisco
Systems, Inc. |
15,061
|
$ 839,801
|
| |
Electronic
Equipment, Instruments & Components — 0.7% |
|
|
| |
Keyence
Corp. |
1,100
|
510,073 |
| |
Technology
Hardware, Storage & Peripherals — 3.1% |
|
|
| |
Apple,
Inc. |
6,789
|
1,185,427 |
| |
Samsung
Electronics Co. Ltd. |
17,903
|
1,024,463
|
| |
|
|
3,559,764
|
| |
Telecommunication
Services — 2.4% |
|
|
| |
Diversified
Telecommunication Services — 2.4% |
|
|
|
a |
Converge
ICT Solutions, Inc. |
561,400
|
326,057 |
| |
Deutsche
Telekom AG |
26,746
|
498,121 |
| |
Orange
SA |
75,531
|
894,264
|
| |
|
|
1,718,442
|
| |
Transportation
— 0.8% |
|
|
| |
Road
& Rail — 0.8% |
|
|
| |
Canadian
Pacific Railway Ltd. |
7,195
|
593,875
|
| |
|
|
593,875
|
| |
Utilities
— 0.6% |
|
|
| |
Electric
Utilities — 0.6% |
|
|
| |
Enel
SpA |
69,409
|
463,426
|
| |
|
|
463,426
|
| |
Total
Common Stock (Cost $34,658,658) |
|
38,807,436
|
| |
Asset
Backed Securities — 10.4% |
|
|
| |
Auto
Receivables — 3.0% |
|
|
| |
CPS
Auto Receivables Trust, |
|
|
|
b |
Series
2021-A 0.61% due 2/18/2025 |
$ 577,718
|
575,724 |
|
b |
Series
2022-A 0.98% due 4/16/2029 |
366,226 |
362,671 |
| |
GM
Financial Automobile Leasing Trust, Series 2021-3 0.24% due 12/20/2023 |
535,630 |
531,770 |
| |
Volkswagen
Auto Lease Trust, Series 2020-A Class A3, 0.39% due 1/22/2024 |
700,000 |
693,936
|
| |
|
|
2,164,101
|
| |
Credit
Card — 0.6% |
|
|
|
b |
Mission
Lane Credit Card Master Trust, Series 2021-A Class A, 1.59% due 9/15/2026 |
450,000 |
438,742
|
| |
|
|
438,742
|
| |
Other
Asset Backed — 6.2% |
|
|
|
b |
Amur
Equipment Finance Receivables X LLC, Series 2022-1A 0.335% due 1/20/2023 |
274,160 |
273,611 |
| |
Aqua
Finance Trust, |
|
|
|
b |
Series
2019-A Class A, 3.14% due 7/16/2040 |
28,840 |
28,536 |
|
b |
Series
2019-A Class B, 3.47% due 7/16/2040 |
200,000 |
194,262 |
|
b |
AXIS
Equipment Finance Receivables LLC, Series 2021-1A Class F, 6.09% due 2/20/2029 |
600,000 |
571,362 |
|
b |
Conn’s
Receivables Funding LLC, Series 2020-A Class A, 1.71% due 6/16/2025 |
6,121 |
6,119 |
|
b |
Diamond
Resorts Owner Trust, Series 2018-1 Class A, 3.70% due 1/21/2031 |
20,372 |
20,501 |
|
b,c |
ECAF
I Ltd., Series 2015-1A Class A2, 4.947% due 6/15/2040 |
184,144 |
151,011 |
|
b |
Foundation
Finance Trust, Series 2019-1A Class A, 3.86% due 11/15/2034 |
55,783 |
55,747 |
|
b,d |
Goldman
Home Improvement Trust Series 2021-GRN2 Class R, due 6/20/2051 |
2,000 |
188,940 |
|
b |
LendingPoint
Asset Securitization Trust, Series 2021-A Class A, 1.00% due 12/15/2028 |
172,820 |
170,886 |
|
b |
LendingPoint
Pass-Through Trust, Series 2022-ST1 2.50% due 3/15/2028 |
287,601 |
281,354 |
| |
Marlette
Funding Trust, |
|
|
|
b |
Series
2021-1A Class R, 0.01% due 6/16/2031 |
1,200 |
293,552 |
|
b |
Series
2021-2A Class R, 0.01% due 9/15/2031 |
1,150 |
316,041 |
|
b,d |
Mosaic
Solar Loan Trust, Series 2021-2A Class R, 0.01% due 4/22/2047 |
1,150,000 |
263,580 |
|
b |
New
Residential Advance Receivables Trust Advance Receivables Backed, Series 2020-T1 Class DT1, 3.011% due 8/15/2053 |
250,000 |
244,507 |
|
b |
New
Residential Advance Receivables Trust Advance Receivables Backed Notes, Series 2020-APT1 Class AT1, 1.035% due 12/16/2052 |
400,000 |
394,283 |
|
b,e |
SBA
Tower Trust, Series 2014-2A Class C, 3.869% due 10/15/2049 |
30,000 |
30,249 |
|
b |
Sierra
Timeshare Receivables Funding LLC, Series 2019-1A Class A, 3.20% due 1/20/2036 |
23,851 |
23,906 |
| b |
SoFi
Consumer Loan Program Trust, Series 2018-3 Class C, 4.67% due 8/25/2027 |
118,885 |
119,182 |
See
notes to financial statements.
|
Thornburg Equity
Funds Semi-Annual Report | 71 |
Schedule of Investments, Continued
Thornburg Summit Fund | March 31, 2022 (Unaudited)
| |
Issuer-Description
|
SHARES/
PRINCIPAL AMOUNT |
VALUE
|
| |
Upstart
Pass-Through Trust, |
|
|
|
b |
Series
2021-ST4 Class CERT, 0.01% due 7/20/2027 |
$ 500,000
|
$ 372,060
|
|
b |
Series
2021-ST7 Class A, 1.85% due 9/20/2029 |
409,755 |
395,568
|
| |
|
|
4,395,257
|
| |
Student
Loan — 0.6% |
|
|
|
b,e |
Navient
Private Education Loan Trust, Series 2015-AA Class A2B, 1.597% (LIBOR 1 Month + 1.20%) due 12/15/2028 |
230,898 |
230,719 |
|
b |
SMB
Private Education Loan Trust, Series 2020-B Class A1A, 1.29% due 7/15/2053 |
178,585 |
167,944
|
| |
|
|
398,663
|
| |
Total
Asset Backed Securities (Cost $7,799,245) |
|
7,396,763
|
| |
Corporate
Bonds — 3.6% |
|
|
| |
Automobiles
& Components — 0.4% |
|
|
| |
Automobiles
— 0.4% |
|
|
|
b |
Hyundai
Capital America, 0.875% due 6/14/2024 |
300,000 |
283,773
|
| |
|
|
283,773
|
| |
Diversified
Financials — 1.3% |
|
|
| |
Capital
Markets — 0.2% |
|
|
| |
Owl
Rock Technology Finance Corp., |
|
|
| |
2.50%
due 1/15/2027 |
168,000 |
151,637 |
|
b |
4.75%
due 12/15/2025 |
11,000 |
10,853 |
| |
Diversified
Financial Services — 1.1% |
|
|
|
e |
Goldman
Sachs Group, Inc., 0.836% (SOFR + 0.70%) due 1/24/2025 |
400,000 |
396,344 |
|
b,c,e |
Societe
Generale SA, 1.178% (SOFR + 1.05%) due 1/21/2026 |
400,000 |
393,788
|
| |
|
|
952,622
|
| |
Energy
— 0.7% |
|
|
| |
Oil,
Gas & Consumable Fuels — 0.7% |
|
|
| |
Petroleos
Mexicanos (EUR), 3.75% due 2/21/2024 |
170,000 |
188,476 |
|
b,c |
SA
Global Sukuk Ltd., 0.946% due 6/17/2024 |
300,000 |
287,073
|
| |
|
|
475,549
|
| |
Food,
Beverage & Tobacco — 0.4% |
|
|
| |
Tobacco
— 0.4% |
|
|
|
b |
Vector
Group Ltd., 10.50% due 11/1/2026 |
251,000 |
257,127
|
| |
|
|
257,127
|
| |
Real
Estate — 0.0% |
|
|
| |
Equity
Real Estate Investment Trusts — 0.0% |
|
|
| |
Service
Properties Trust, 4.95% due 2/15/2027 |
40,000 |
37,004
|
| |
|
|
37,004
|
| |
Technology
Hardware & Equipment — 0.4% |
|
|
| |
Technology
Hardware, Storage & Peripherals — 0.4% |
|
|
| |
Dell
International LLC/EMC Corp., 4.90% due 10/1/2026 |
250,000 |
262,430
|
| |
|
|
262,430
|
| |
Telecommunication
Services — 0.4% |
|
|
| |
Wireless
Telecommunication Services — 0.4% |
|
|
| |
Sprint
Communications, Inc., 9.25% due 4/15/2022 |
310,000 |
310,884
|
| |
|
|
310,884
|
| |
Total
Corporate Bonds (Cost $2,663,477) |
|
2,579,389
|
| |
Convertible
Bonds — 0.3% |
|
|
| |
Diversified
Financials — 0.3% |
|
|
| |
Diversified
Financial Services — 0.3% |
|
|
| |
EZCORP,
Inc., 2.375% due 5/1/2025 |
230,000 |
204,291
|
| |
|
|
204,291
|
| |
Total
Convertible Bonds (Cost $193,099) |
|
204,291
|
72 | Thornburg Equity Funds Semi-Annual Report
|
See notes to
financial statements. |
Schedule of Investments,
Continued
Thornburg Summit Fund | March 31, 2022 (Unaudited)
| |
Issuer-Description
|
SHARES/
PRINCIPAL AMOUNT |
VALUE
|
| |
U.S.
Treasury Securities — 13.8% |
|
|
| |
United
States Treasury Inflation Indexed Bonds, 0.125%, 7/15/2031 |
$ 209,740
|
$ 222,948
|
| |
United
States Treasury Notes, |
|
|
| |
0.125%,
5/31/2022 - 2/15/2024 |
2,000,000 |
1,967,688 |
| |
0.375%,
11/30/2025 |
610,000 |
563,916 |
| |
0.625%,
5/15/2030 - 8/15/2030 |
675,000 |
588,539 |
| |
1.25%,
8/15/2031 |
550,000 |
500,070 |
| |
1.375%,
11/15/2031 |
1,700,000 |
1,560,016 |
| |
1.625%,
5/15/2031 |
600,000 |
565,125 |
| |
2.25%,
12/31/2023 |
1,400,000 |
1,399,617 |
| |
United
States Treasury Notes Inflationary Index, |
|
|
| |
0.125%,
1/15/2030 - 7/15/2030 |
1,642,110 |
1,735,275 |
| |
0.25%,
2/15/2050 |
546,630 |
574,257 |
| |
3.625%,
4/15/2028 |
158,140 |
199,847
|
| |
Total
U.S. Treasury Securities (Cost $10,249,365) |
|
9,877,298
|
| |
Mortgage
Backed — 6.5% |
|
|
|
b,e |
Angel
Oak Mortgage Trust I LLC, Whole Loan Securities Trust CMO, Series 2019-2 Class A1, 3.628% due 3/25/2049 |
12,690 |
12,690 |
|
b,e |
Arroyo
Mortgage Trust, Whole Loan Securities Trust CMO, Series 2019-1 Class A1, 3.805% due 1/25/2049 |
60,311 |
60,311 |
| |
Citigroup
Mortgage Loan Trust, Whole Loan Securities Trust CMO, |
|
|
|
b,e,f |
Series
2021-J1 Class A5IX, 0.112% due 4/25/2051 |
12,696,669
|
55,486 |
|
b,e,f |
Series
2021-J1 Class AIOS, 0.23% due 4/25/2051 |
18,204,638
|
200,406 |
|
b,e |
Series
2021-J1 Class B4, 2.612% due 4/25/2051 |
100,000 |
56,502 |
|
b,e |
Series
2021-J1 Class B5, 2.612% due 4/25/2051 |
100,000 |
48,279 |
|
b,e |
Series
2021-J1 Class B6, 2.612% due 4/25/2051 |
100,000 |
31,627 |
| |
COMM
Mortgage Trust, CMBS, Series 2015-LC23 Class ASB, 3.598% due 10/10/2048 |
423,312 |
425,663 |
|
b,e |
Ellington
Financial Mortgage Trust, Whole Loan Securities Trust CMO, Series 2022-1 2.206% due 1/25/2067 |
292,564 |
272,179 |
| |
Federal
Home Loan Mtg Corp., Seasoned Credit Risk Transfer, Whole Loan Securities Trust CMO, Series 2019-1 Class MA, 3.50% due 7/25/2058 |
59,039 |
59,331 |
| |
Federal
Home Loan Mtg Corp., UMBS Collateral, |
|
|
| |
Pool
RC1535, 2.00% due 8/1/2035 |
473,539 |
460,764 |
| |
Pool
SB0308, 2.50% due 1/1/2035 |
258,271 |
256,483 |
| |
Federal
Home Loan Mtg Corp., Whole Loan Securities Trust CMO, Series 2017-SC02 Class 1A, 3.00% due 5/25/2047 |
83,008 |
80,384 |
| |
Federal
National Mtg Assoc., UMBS Collateral, |
|
|
| |
Pool
BP9550, 2.50% due 7/1/2035 |
173,833 |
172,351 |
| |
Pool
FM3758, 2.50% due 8/1/2031 |
131,084 |
130,746 |
| |
Pool
MA4045, 2.00% due 6/1/2040 |
123,187 |
116,036 |
|
b,e |
Flagstar
Mortgage Trust, Whole Loan Securities Trust CMO, Series 2019-2 Class B3, 4.056% due 12/25/2049 |
119,127 |
116,519 |
|
b,e |
GCAT
Trust, Whole Loan Securities Trust CMO, Series 2021-CM2 Class A1, 2.352% due 8/25/2066 |
350,659 |
341,117 |
|
b,e |
Imperial
Fund Mortgage Trust, Whole Loan Securities Trust CMO, Series 2021-NQM3 Class A1, 1.595% due 11/25/2056 |
382,046 |
370,463 |
| |
JPMorgan
Chase Commercial Mortgage Securities Trust, CMBS, |
|
|
|
b |
Series
2012-HSBC Class A, 3.093% due 7/5/2032 |
240,212 |
240,547 |
| |
Series
2013-LC11 Class A5, 2.96% due 4/15/2046 |
425,000 |
425,054 |
|
b,e |
Metlife
Securitization Trust, Whole Loan Securities Trust CMO, Series 2019-1A Class A1A, 3.75% due 4/25/2058 |
69,694 |
70,178 |
|
b,e |
MFRA
Trust Whole Loan Securities Trust CMO, Series 2022-CHM1, 3.875% due 9/25/2056 |
375,924 |
371,025 |
|
e |
Morgan
Stanley Bank of America Merrill Lynch Trust, CMBS, Series 2013-C10 Class ASB, 3.912% due 7/15/2046 |
98,876 |
99,603 |
| b,e |
TIAA
Bank Mortgage Loan Trust, Whole Loan Securities Trust CMO, Series 2018-2 Class B3, 3.755% due 7/25/2048 |
167,241 |
160,260
|
| |
Total
Mortgage Backed (Cost $4,759,040) |
|
4,634,004
|
| |
Loan
Participations — 0.1% |
|
|
| |
Real
Estate — 0.1% |
|
|
| |
Equity
Real Estate Investment Trusts — 0.1% |
|
|
|
g |
CoreCivic,
Inc., 4.957% (LIBOR 1 Month + 4.50%) due 12/18/2024 |
41,200 |
40,685
|
| |
|
|
40,685
|
| |
Total
Loan Participations (Cost $39,957) |
|
40,685
|
| |
Exchange-Traded
Funds — 5.3% |
|
|
|
a |
Invesco
DB Agriculture Fund |
25,677
|
561,813 |
| a |
Invesco
DB Base Metals Fund |
40,742
|
1,052,773
|
See
notes to financial statements.
|
Thornburg Equity
Funds Semi-Annual Report | 73 |
Schedule of Investments, Continued
Thornburg Summit Fund | March 31, 2022 (Unaudited)
| |
Issuer-Description
|
SHARES/
PRINCIPAL AMOUNT |
VALUE
|
|
a |
SPDR
Gold Shares Fund |
7,233
|
$ 1,306,642
|
| a |
United
States Oil Fund LP |
11,520
|
853,862
|
| |
Total
Exchange-Traded Funds (Cost $2,949,078) |
|
3,775,090
|
| |
Short-Term
Investments — 4.0% |
|
|
| h |
Thornburg
Capital Management Fund |
287,344
|
2,873,440
|
| |
Total
Short-Term Investments (Cost $2,873,440) |
|
2,873,440
|
| |
Total
Investments — 98.4% (Cost $66,185,359) |
|
$70,188,396
|
| |
Other
Assets Less Liabilities — 1.6% |
|
1,143,136
|
| |
Net
Assets — 100.0% |
|
$71,331,532
|
| Outstanding
Forward Currency Contracts To Buy Or Sell At March 31, 2022 |
Contract
Description |
Contract
Party* |
Buy/Sell
|
Contract
Amount |
Contract
Value Date |
Value
USD |
Unrealized
Appreciation |
Unrealized
Depreciation |
| Euro
|
MSC
|
Buy
|
433,820
|
4/28/2022
|
480,251
|
$ —
|
$ (10,288)
|
| Japanese
Yen |
MSC
|
Buy
|
73,300,000
|
4/28/2022
|
602,365
|
— |
(39,459) |
| |
|
| Total
|
|
|
|
|
|
—
|
$
(49,747) |
| |
|
| Net
unrealized appreciation (depreciation) |
|
|
|
|
|
|
$
(49,747) |
| *
|
Counterparty
includes Morgan Stanely & Co. Inc. ("MSC"). |
| Footnote Legend
|
| a
|
Non-income
producing. |
| b
|
Securities
exempt from registration under Rule 144A of the Securities Act of 1933, as amended. These securities are restricted but liquid and may only be resold in the ordinary course of business in transactions exempt from registration, normally to qualified
institutional buyers. As of March 31, 2022, the aggregate value of these securities in the Fund’s portfolio was $9,811,260, representing 13.75% of the Fund’s net assets. |
| c
|
Yankee
bond denominated in U.S. dollars and is issued in the U.S. by foreign banks and corporations. |
| d
|
Security
currently fair valued by the Valuation and Pricing Committee using procedures approved by the Trustees’ Audit Committee. |
| e
|
Variable,
floating, step, or fixed to floating rate securities are securities for which interest rate changes are based on changes in a designated base rate or on a predetermined schedule. The rates shown are those in effect on March 31, 2022. |
| f
|
Interest
only. |
| g
|
The
stated coupon rate represents the greater of the LIBOR or the LIBOR floor rate plus a spread at March 31, 2022. |
| h
|
Investment
in Affiliates. |
Portfolio
Abbreviations
To simplify the listings of securities, abbreviations are used per the table below:
| ADR
|
American Depositary
Receipt |
| CMBS
|
Commercial
Mortgage-Backed Securities |
| CMO
|
Collateralized
Mortgage Obligation |
| EUR
|
Denominated
in Euro |
| LIBOR
|
London Interbank
Offered Rates |
| Mtg
|
Mortgage
|
| SOFR
|
Secured Overnight
Financing Rate |
| UMBS
|
Uniform Mortgage
Backed Securities |
74 | Thornburg Equity Funds Semi-Annual Report
|
See notes to
financial statements. |
Schedule of Investments,
Continued
Thornburg Summit Fund | March 31, 2022 (Unaudited)
COUNTRY
EXPOSURE *
(percent of net assets) |
| United
States |
69.7%
|
| France
|
3.9%
|
| Japan
|
2.7%
|
| United
Kingdom |
2.4%
|
| Switzerland
|
2.4%
|
| Netherlands
|
2.1%
|
| Taiwan
|
2.0%
|
| Germany
|
1.9%
|
| South
Korea |
1.4%
|
| Brazil
|
0.9%
|
| Canada
|
0.8%
|
| Australia
|
0.8%
|
| Italy
|
0.6%
|
| United
Arab Emirates |
0.6%
|
| India
|
0.5%
|
| Philippines
|
0.5%
|
| Saudi
Arabia |
0.4%
|
| Israel
|
0.3%
|
| Mexico
|
0.3%
|
| Cayman
Islands |
0.2%
|
| Other
Assets Less Liabilities |
5.6%
|
| *
|
Holdings
are classified by country of risk as determined by MSCI and Bloomberg. |
See
notes to financial statements.
|
Thornburg Equity
Funds Semi-Annual Report | 75 |
Statements of Assets and Liabilities
March 31, 2022 (Unaudited)
| |
THORNBURG
GLOBAL
OPPORTUNITIES
FUND |
THORNBURG
INTERNATIONAL
EQUITY
FUND |
THORNBURG
BETTER WORLD
INTERNATIONAL
FUND |
THORNBURG
INTERNATIONAL
GROWTH
FUND |
THORNBURG
DEVELOPING
WORLD
FUND |
| ASSETS
|
|
|
|
|
|
| Investments
at cost |
|
|
|
|
|
| Non-affiliated
issuers |
$ 677,125,233
|
$ 2,382,079,400
|
$ 413,010,252
|
$ 1,045,436,830
|
$ 882,877,527
|
| Non-controlled
affiliated issuers |
38,476,549
|
193,656,095
|
50,281,331
|
57,403,494
|
9,537,844
|
| Investments
at value |
|
|
|
|
|
| Non-affiliated
issuers |
1,003,934,849
|
2,729,793,945
|
408,033,977
|
1,340,847,029
|
1,085,245,216 |
| Non-controlled
affiliated issuers |
38,476,549
|
193,656,095
|
50,281,331
|
57,403,494
|
9,537,844 |
| Foreign
currency at value (a) |
23
|
1,360,110
|
147,415
|
63
|
1,730,339 |
| Unrealized
appreciation on forward currency contracts |
4,008,678
|
-
|
-
|
-
|
- |
| Receivable
for investments sold |
3,903,174
|
25,811,249
|
7,395,437
|
-
|
9,127,234 |
| Receivable
for fund shares sold |
603,209
|
2,093,887
|
3,749,695
|
3,150,338
|
11,343,684 |
| Dividends
receivable |
1,227,530
|
7,345,006
|
871,962
|
2,299,844
|
3,724,896 |
| Tax
reclaims receivable |
847,944
|
4,100,042
|
419,953
|
855,756
|
331,907 |
| Prepaid
expenses and other assets |
125,620
|
142,761
|
101,814
|
110,628
|
101,137
|
| Total
Assets |
1,053,127,576
|
2,964,303,095
|
471,001,584
|
1,404,667,152
|
1,121,142,257
|
| Liabilities
|
|
|
|
|
|
| Payable
for investments purchased |
12,091
|
9,842,934
|
11,618,049
|
28,829
|
8,252,629 |
| Payable
for fund shares redeemed |
464,176
|
2,168,164
|
339,929
|
1,335,149
|
1,421,650 |
| Payable
to investment advisor and other affiliates |
936,753
|
2,070,445
|
243,387
|
986,584
|
863,527 |
| IRS
compliance fees for foreign withholding tax claims payable |
-
|
52,632,606
|
-
|
-
|
- |
| Deferred
taxes payable |
4,605,741
|
-
|
-
|
-
|
1,874,449 |
| Accounts
payable and accrued expenses |
592,671
|
2,013,418
|
177,500
|
613,157
|
731,589
|
| Total
Liabilities |
6,611,432
|
68,727,567
|
12,378,865
|
2,963,719
|
13,143,844
|
| Net
Assets |
$
1,046,516,144 |
$
2,895,575,528 |
$
458,622,719 |
$
1,401,703,433 |
$
1,107,998,413 |
| NET
ASSETS CONSIST OF |
|
|
|
|
|
| Net
capital paid in on shares of beneficial interest |
$ 662,119,511
|
$ 2,460,224,706
|
$ 476,644,267
|
$ 1,098,022,583
|
$ 997,235,662
|
| Distributable
earnings (accumulated loss) |
384,396,633
|
435,350,822
|
(18,021,548)
|
303,680,850
|
110,762,751
|
| Net
Assets |
$
1,046,516,144 |
$
2,895,575,528 |
$
458,622,719 |
$
1,401,703,433 |
$
1,107,998,413 |
76
| Thornburg Equity Funds Semi-Annual Report
Statements of Assets and Liabilities,
Continued
March 31, 2022 (Unaudited)
| |
THORNBURG
GLOBAL
OPPORTUNITIES
FUND |
THORNBURG
INTERNATIONAL
EQUITY
FUND |
THORNBURG
BETTER WORLD
INTERNATIONAL
FUND |
THORNBURG
INTERNATIONAL
GROWTH
FUND |
THORNBURG
DEVELOPING
WORLD
FUND |
| NET
ASSET VALUE |
|
|
|
|
|
| Class
A Shares: |
|
|
|
|
|
| Net
assets applicable to shares outstanding |
$ 272,062,259
|
$ 478,707,088
|
$ 44,197,748
|
$ 124,317,339
|
$ 119,893,658
|
| Shares
outstanding |
7,846,319
|
20,660,009
|
2,558,121
|
5,226,216
|
4,955,167 |
| Net
asset value and redemption price per share |
$ 34.67
|
$ 23.17
|
$ 17.28
|
$ 23.79
|
$ 24.20
|
| Maximum
offering price per share (net asset value, plus 4.50% of offering price) |
$ 36.30
|
$ 24.26
|
$ 18.09
|
$ 24.91
|
$ 25.34
|
| Class
C Shares: |
|
|
|
|
|
| Net
assets applicable to shares outstanding |
97,455,780
|
20,844,507
|
5,953,476
|
18,657,480
|
28,131,599 |
| Shares
outstanding |
2,964,826 |
1,044,685 |
353,066 |
871,350 |
1,242,064 |
| Net
asset value and redemption price per share* |
32.87
|
19.95
|
16.86
|
21.41
|
22.65
|
| Class
I Shares: |
|
|
|
|
|
| Net
assets applicable to shares outstanding |
589,400,164
|
1,740,105,959
|
408,471,495
|
1,126,277,766
|
884,829,311 |
| Shares
outstanding |
16,933,895 |
72,125,340 |
22,947,138 |
45,578,762 |
35,679,251 |
| Net
asset value and redemption price per share |
34.81
|
24.13
|
17.80
|
24.71
|
24.80
|
| Class
R3 Shares: |
|
|
|
|
|
| Net
assets applicable to shares outstanding |
3,505,894
|
133,823,484
|
-
|
6,050,884
|
- |
| Shares
outstanding |
102,430 |
5,778,878 |
- |
258,847 |
- |
| Net
asset value and redemption price per share |
34.23
|
23.16
|
-
|
23.38
|
-
|
| Class
R4 Shares: |
|
|
|
|
|
| Net
assets applicable to shares outstanding |
5,971,002
|
86,701,047
|
-
|
9,133,641
|
- |
| Shares
outstanding |
173,577 |
3,777,798 |
- |
387,496 |
- |
| Net
asset value and redemption price per share |
34.40
|
22.95
|
-
|
23.57
|
-
|
| Class
R5 Shares: |
|
|
|
|
|
| Net
assets applicable to shares outstanding |
18,993,858
|
130,630,825
|
-
|
28,239,357
|
3,229,510 |
| Shares
outstanding |
544,908 |
5,419,523 |
- |
1,139,280 |
130,655 |
| Net
asset value and redemption price per share |
34.86
|
24.10
|
-
|
24.79
|
24.72
|
| Class
R6 Shares: |
|
|
|
|
|
| Net
assets applicable to shares outstanding |
59,127,187
|
304,762,618
|
-
|
89,026,966
|
71,914,335 |
| Shares
outstanding |
1,692,494
|
12,701,118
|
-
|
3,574,602
|
2,894,063 |
| Net
asset value and redemption price per share |
34.93
|
23.99
|
-
|
24.91
|
24.85
|
| (a)
|
Cost
of foreign currency is $24; $1,350,248; $148,023; $63; $1,730,148 respectively. |
| *
|
Redemption
price per share is equal to net asset value less any applicable contingent deferred sales charge. |
See notes to financial statements.
Thornburg
Equity Funds Semi-Annual Report | 77
Statements of Assets and Liabilities,
Continued
March 31, 2022 (Unaudited)
| |
THORNBURG
SMALL/MID CAP
CORE
FUND |
THORNBURG
SMALL/MID CAP
GROWTH
FUND |
THORNBURG
INVESTMENT
INCOME BUILDER
FUND |
THORNBURG
SUMMIT
FUND |
| ASSETS
|
|
|
|
|
| Investments
at cost |
|
|
|
|
| Non-affiliated
issuers |
$ 640,428,399
|
$ 450,047,082
|
$ 8,059,139,655
|
$ 63,311,919
|
| Non-controlled
affiliated issuers |
13,226,766
|
2,200,818
|
531,353,973
|
2,873,440
|
| Investments
at value |
|
|
|
|
| Non-affiliated
issuers |
719,592,610
|
440,244,197
|
10,682,872,623
|
67,314,956 |
| Non-controlled
affiliated issuers |
13,226,766
|
2,200,818
|
574,429,970
|
2,873,440 |
| Cash
|
-
|
-
|
559,622
|
25,368 |
| Foreign
currency at value (a) |
5
|
5
|
94
|
52 |
| Unrealized
appreciation on forward currency contracts |
-
|
-
|
65,912,553
|
- |
| Receivable
for investments sold |
-
|
4,537,463
|
29,724,770
|
992,180 |
| Receivable
for fund shares sold |
102,177
|
74,094
|
10,131,513
|
17,559 |
| Dividends
receivable |
52,632
|
37,599
|
30,499,343
|
88,479 |
| Tax
reclaims receivable |
-
|
-
|
40,981,230
|
27,414 |
| Principal
and interest receivable |
-
|
-
|
18,745,996
|
91,410 |
| Prepaid
expenses and other assets |
89,118
|
93,291
|
231,557
|
36,417
|
| Total
Assets |
733,063,308
|
447,187,467
|
11,454,089,271
|
71,467,275
|
| Liabilities
|
|
|
|
|
| Unrealized
depreciation on forward currency contracts |
-
|
-
|
-
|
49,747 |
| Payable
for investments purchased |
860,904
|
1,693
|
26,581,072
|
- |
| Payable
for fund shares redeemed |
526,330
|
344,994
|
5,620,312
|
- |
| Payable
to investment advisor and other affiliates |
637,346
|
375,340
|
9,446,440
|
30,918 |
| IRS
compliance fees for foreign withholding tax claims payable |
-
|
-
|
48,887,163
|
- |
| Accounts
payable and accrued expenses |
333,543
|
168,650
|
4,299,017
|
55,078 |
| Dividends
payable |
-
|
-
|
14,950,399
|
-
|
| Total
Liabilities |
2,358,123
|
890,677
|
109,784,403
|
135,743
|
| Net
Assets |
$
730,705,185 |
$
446,296,790 |
$
11,344,304,868 |
$
71,331,532 |
| NET
ASSETS CONSIST OF |
|
|
|
|
| Net
capital paid in on shares of beneficial interest |
$ 654,771,025
|
$ 482,482,381
|
$ 9,422,940,957
|
$ 65,762,724
|
| Distributable
earnings (accumulated loss) |
75,934,160
|
(36,185,591)
|
1,921,363,911
|
5,568,808
|
| Net
Assets |
$
730,705,185 |
$
446,296,790 |
$
11,344,304,868 |
$
71,331,532 |
78
| Thornburg Equity Funds Semi-Annual Report
Statements of Assets and Liabilities,
Continued
March 31, 2022 (Unaudited)
| |
THORNBURG
SMALL/MID CAP
CORE
FUND |
THORNBURG
SMALL/MID CAP
GROWTH
FUND |
THORNBURG
INVESTMENT
INCOME BUILDER
FUND |
THORNBURG
SUMMIT
FUND |
| NET
ASSET VALUE |
|
|
|
|
| Class
A Shares: |
|
|
|
|
| Net
assets applicable to shares outstanding |
$ 398,484,297
|
$ 225,823,853
|
$ 4,080,525,611
|
$ 117,015
|
| Shares
outstanding |
5,639,098
|
8,034,483
|
172,440,989
|
9,682 |
| Net
asset value and redemption price per share |
$ 70.66
|
$ 28.11
|
$ 23.66
|
$ 12.09
|
| Maximum
offering price per share (net asset value, plus 4.50% of offering price) |
$ 73.99
|
$ 29.43
|
$ 24.77
|
$
- |
| Class
C Shares: |
|
|
|
|
| Net
assets applicable to shares outstanding |
12,139,578
|
10,566,894
|
811,519,578
|
- |
| Shares
outstanding |
200,130 |
512,893 |
34,343,113 |
- |
| Net
asset value and redemption price per share* |
60.66
|
20.60
|
23.63
|
-
|
| Class
I Shares: |
|
|
|
|
| Net
assets applicable to shares outstanding |
284,889,979
|
173,739,429
|
6,255,460,558
|
71,214,517 |
| Shares
outstanding |
3,855,740 |
5,391,662 |
262,411,189 |
5,890,785 |
| Net
asset value and redemption price per share |
73.89
|
32.22
|
23.84
|
12.09
|
| Class
R3 Shares: |
|
|
|
|
| Net
assets applicable to shares outstanding |
19,699,807
|
20,066,941
|
25,378,528
|
- |
| Shares
outstanding |
280,553 |
728,682 |
1,072,978 |
- |
| Net
asset value and redemption price per share |
70.22
|
27.54
|
23.65
|
-
|
| Class
R4 Shares: |
|
|
|
|
| Net
assets applicable to shares outstanding |
3,870,703
|
1,555,703
|
13,359,010
|
- |
| Shares
outstanding |
54,241 |
55,207 |
564,002 |
- |
| Net
asset value and redemption price per share |
71.36
|
28.18
|
23.69
|
-
|
| Class
R5 Shares: |
|
|
|
|
| Net
assets applicable to shares outstanding |
11,620,821
|
14,543,970
|
35,259,198
|
- |
| Shares
outstanding |
157,583 |
452,133 |
1,480,144 |
- |
| Net
asset value and redemption price per share |
73.74
|
32.17
|
23.82
|
-
|
| Class
R6 Shares: |
|
|
|
|
| Net
assets applicable to shares outstanding |
-
|
-
|
122,802,385
|
- |
| Shares
outstanding |
-
|
-
|
5,167,807
|
- |
| Net
asset value and redemption price per share |
-
|
-
|
23.76
|
-
|
| (a)
|
Cost
of foreign currency is $6; $6; $94; $52 respectively. |
| *
|
Redemption
price per share is equal to net asset value less any applicable contingent deferred sales charge. |
See notes to financial statements.
Thornburg
Equity Funds Semi-Annual Report | 79
Statements of Operations
Six Months Ended March 31, 2022 (Unaudited)
| |
THORNBURG
GLOBAL
OPPORTUNITIES
FUND |
THORNBURG
INTERNATIONAL
EQUITY
FUND |
THORNBURG
BETTER WORLD
INTERNATIONAL
FUND |
THORNBURG
INTERNATIONAL
GROWTH
FUND |
THORNBURG
DEVELOPING
WORLD
FUND |
| INVESTMENT
INCOME |
|
|
|
|
|
| Dividend
income |
|
|
|
|
|
| Non-affiliated
issuers |
$ 6,621,414
|
$ 32,639,787
|
$ 3,486,076
|
$ 6,552,114
|
$ 8,910,396
|
| Non-controlled
affiliated issuers |
33,029
|
189,646
|
45,878
|
84,504
|
30,303
|
| Non-cash
dividend |
598,530
|
4,082,496
|
363,051
|
2,650,869
|
1,784,464
|
| Dividend
taxes withheld |
(512,631)
|
(4,439,232)
|
(523,672)
|
(704,565)
|
(1,249,392)
|
| Interest
income |
24,909
|
109,544
|
2,579
|
24,558
|
1,910
|
| Foreign
withholding tax claims |
416,639
|
2,293,018
|
55,517
|
601,283
|
37,896
|
| Adjusted
for: IRS compliance fees for foreign withholding tax claims |
-
|
(2,307,638)
|
-
|
-
|
-
|
| Total
Income |
7,181,890
|
32,567,621
|
3,429,429
|
9,208,763
|
9,515,577
|
| EXPENSES
|
|
|
|
|
|
| Investment
management fees |
4,515,373
|
12,045,445
|
1,965,257
|
6,902,567
|
5,478,766
|
| Administration
fees |
448,083
|
1,340,901
|
169,185
|
711,646
|
489,113
|
| Distribution
and service fees |
|
|
|
|
|
| Class
A Shares |
345,848
|
668,519
|
55,700
|
179,283
|
161,842
|
| Class
C Shares |
527,864
|
121,685
|
29,124
|
119,268
|
172,736
|
| Class
R3 Shares |
9,210
|
374,228
|
-
|
17,262
|
-
|
| Class
R4 Shares |
7,649
|
122,656
|
-
|
11,867
|
-
|
| Transfer
agent fees |
|
|
|
|
|
| Class
A Shares |
122,623
|
586,750
|
27,069
|
67,750
|
67,875
|
| Class
C Shares |
58,027
|
5,826
|
6,764
|
16,236
|
23,081
|
| Class
I Shares |
210,580
|
744,500
|
159,894
|
527,430
|
323,560
|
| Class
R3 Shares |
6,796
|
202,135
|
-
|
14,403
|
-
|
| Class
R4 Shares |
15,098
|
148,390
|
-
|
22,460
|
-
|
| Class
R5 Shares |
35,486
|
235,335
|
-
|
62,152
|
5,546
|
| Class
R6 Shares |
2,730
|
10,805
|
-
|
5,096
|
7,644
|
| Registration
and filing fees |
|
|
|
|
|
| Class
A Shares |
7,728
|
12,930
|
4,276
|
10,503
|
10,090
|
| Class
C Shares |
7,339
|
8,006
|
3,351
|
8,957
|
9,480
|
| Class
I Shares |
8,349
|
15,712
|
5,355
|
9,820
|
13,576
|
| Class
R3 Shares |
8,739
|
7,014
|
-
|
9,099
|
-
|
| Class
R4 Shares |
8,739
|
8,666
|
-
|
9,106
|
-
|
| Class
R5 Shares |
8,925
|
8,743
|
-
|
9,505
|
9,550
|
| Class
R6 Shares |
8,784
|
10,326
|
-
|
9,605
|
9,549
|
| Custodian
fees |
121,580
|
619,600
|
78,945
|
261,400
|
570,800
|
| Professional
fees |
50,548
|
81,192
|
35,147
|
48,672
|
34,912
|
| Trustee
and officer fees |
29,299
|
90,673
|
9,965
|
50,365
|
31,391
|
| Other
expenses |
45,359
|
178,527
|
29,209
|
145,783
|
65,805
|
| Total
Expenses |
6,610,756
|
17,648,564
|
2,579,241
|
9,230,235
|
7,485,316
|
| Less:
|
|
|
|
|
|
| Expenses
reimbursed |
(180,106)
|
(727,467)
|
(311,863)
|
(420,857)
|
(389,330)
|
| Investment
management fees waived |
(184,687)
|
(545,602)
|
(68,652)
|
(41,481)
|
(422,213)
|
| Net
Expenses |
6,245,963
|
16,375,495
|
2,198,726
|
8,767,897
|
6,673,773
|
| Net
Investment Income (Loss) |
$ 935,927
|
$ 16,192,126
|
$ 1,230,703
|
$ 440,866
|
$ 2,841,804
|
80
| Thornburg Equity Funds Semi-Annual Report
Statements of Operations,
Continued
Six Months Ended March 31, 2022 (Unaudited)
| |
THORNBURG
GLOBAL
OPPORTUNITIES
FUND |
THORNBURG
INTERNATIONAL
EQUITY
FUND |
THORNBURG
BETTER WORLD
INTERNATIONAL
FUND |
THORNBURG
INTERNATIONAL
GROWTH
FUND |
THORNBURG
DEVELOPING
WORLD
FUND |
| REALIZED
AND UNREALIZED GAIN (LOSS) |
|
|
|
|
|
| Net
realized gain (loss) on: |
|
|
|
|
|
| Non-affiliated
issuer investments* |
$ 69,597,995
|
$ 75,177,953
|
$
(6,335,021) |
$ 22,451,597
|
$
(35,547,852) |
| Forward
currency contracts |
1,713,642
|
-
|
-
|
-
|
-
|
| Foreign
currency transactions |
7,263
|
(469,217)
|
(120,537)
|
180,046
|
(202,099)
|
| Net
realized gain (loss) |
71,318,900
|
74,708,736
|
(6,455,558)
|
22,631,643
|
(35,749,951)
|
| Net
change in unrealized appreciation (depreciation) on: |
|
|
|
|
|
| Non-affiliated
issuers investments** |
(65,203,910)
|
(342,688,629)
|
(29,680,182)
|
(303,820,202)
|
(119,366,088)
|
| Forward
currency contracts |
2,471,424
|
-
|
-
|
-
|
-
|
| Foreign
currency translations |
(8,569)
|
3,671
|
(14,611)
|
(25,213)
|
106,627
|
| Change
in net unrealized appreciation (depreciation) |
(62,741,055)
|
(342,684,958)
|
(29,694,793)
|
(303,845,415)
|
(119,259,461)
|
| Net
Realized and Unrealized Gain (Loss) |
8,577,845
|
(267,976,222)
|
(36,150,351)
|
(281,213,772)
|
(155,009,412)
|
| Change
in Net Assets Resulting from Operations |
$ 9,513,772
|
$
(251,784,096) |
$
(34,919,648) |
$
(280,772,906) |
$
(152,167,608) |
| *
Net of foreign capital gain taxes |
$ 615,910
|
$
- |
$
- |
$ 97,373
|
$ 4,109,830
|
| **
Net of change in deferred taxes |
$ 350,742
|
$
- |
$
- |
$ 537,183
|
$ 4,889,723
|
See notes to financial
statements.
Thornburg Equity Funds Semi-Annual Report | 81
Statements of Operations, Continued
Six Months Ended March 31, 2022 (Unaudited)
| |
THORNBURG
SMALL/MID CAP
CORE
FUND |
THORNBURG
SMALL/MID CAP
GROWTH
FUND |
THORNBURG
INVESTMENT
INCOME BUILDER
FUND |
THORNBURG
SUMMIT
FUND |
| INVESTMENT
INCOME |
|
|
|
|
| Dividend
income |
|
|
|
|
| Non-affiliated
issuers |
$ 2,958,458
|
$ 279,634
|
$ 186,464,181
|
$ 343,205
|
| Non-controlled
affiliated issuers |
6,796
|
3,853
|
17,449,212
|
4,913 |
| Dividend
taxes withheld |
(2,566)
|
-
|
(15,757,736)
|
(27,952) |
| Interest
income |
-
|
-
|
70,446,677
|
639,148 |
| Foreign
withholding tax claims |
-
|
-
|
24,120,083
|
- |
| Adjusted
for: IRS compliance fees for foreign withholding tax claims |
-
|
-
|
9,924,470
|
-
|
| Total
Income |
2,962,688
|
283,487
|
292,646,887
|
959,314
|
| EXPENSES
|
|
|
|
|
| Investment
management fees |
3,327,045
|
2,461,002
|
39,463,079
|
246,780 |
| Administration
fees |
325,345
|
237,594
|
4,748,178
|
27,608 |
| Distribution
and service fees |
|
|
|
|
| Class
A Shares† |
524,159
|
349,132
|
5,083,563
|
16 |
| Class
C Shares |
71,484
|
81,208
|
4,406,698
|
- |
| Class
R3 Shares |
53,358
|
58,144
|
63,901
|
- |
| Class
R4 Shares |
5,093
|
2,201
|
16,575
|
- |
| Transfer
agent fees |
|
|
|
|
| Class
A Shares† |
203,935
|
142,193
|
1,187,003
|
1,180 |
| Class
C Shares |
10,096
|
13,690
|
392,580
|
- |
| Class
I Shares |
128,425
|
74,473
|
2,095,710
|
11,936 |
| Class
R3 Shares |
29,048
|
35,342
|
30,070
|
- |
| Class
R4 Shares |
6,345
|
3,284
|
20,852
|
- |
| Class
R5 Shares |
27,474
|
33,038
|
53,682
|
- |
| Class
R6 Shares |
-
|
-
|
8,200
|
- |
| Registration
and filing fees |
|
|
|
|
| Class
A Shares† |
11,419
|
12,362
|
19,775
|
2,331 |
| Class
C Shares |
8,012
|
9,068
|
12,941
|
- |
| Class
I Shares |
8,541
|
11,754
|
19,631
|
14,811 |
| Class
R3 Shares |
6,563
|
7,148
|
8,936
|
- |
| Class
R4 Shares |
8,463
|
9,135
|
8,994
|
- |
| Class
R5 Shares |
8,366
|
7,263
|
9,104
|
- |
| Class
R6 Shares |
-
|
-
|
9,233
|
- |
| Custodian
fees |
37,800
|
35,060
|
888,000
|
49,620 |
| Professional
fees |
37,185
|
29,245
|
325,542
|
29,877 |
| Trustee
and officer fees |
22,338
|
18,446
|
295,841
|
1,547 |
| Other
expenses |
84,904
|
43,656
|
356,256
|
7,707
|
| Total
Expenses |
4,945,398
|
3,674,438
|
59,524,344
|
393,413 |
| Less:
|
|
|
|
|
| Expenses
reimbursed |
(254,402)
|
(199,471)
|
(97,984)
|
(67,631) |
| Investment
management fees waived |
(408,108)
|
(316,748)
|
-
|
-
|
| Net
Expenses |
4,282,888
|
3,158,219
|
59,426,360
|
325,782
|
| Net
Investment Income (Loss) |
$
(1,320,200) |
$
(2,874,732) |
$ 233,220,527
|
$ 633,532
|
82
| Thornburg Equity Funds Semi-Annual Report
Statements of Operations,
Continued
Six Months Ended March 31, 2022 (Unaudited)
| |
THORNBURG
SMALL/MID CAP
CORE
FUND |
THORNBURG
SMALL/MID CAP
GROWTH
FUND |
THORNBURG
INVESTMENT
INCOME BUILDER
FUND |
THORNBURG
SUMMIT
FUND |
| REALIZED
AND UNREALIZED GAIN (LOSS) |
|
|
|
|
| Net
realized gain (loss) on: |
|
|
|
|
| Non-affiliated
issuer investments* |
$ 5,197,561
|
$
(23,117,373) |
$ 142,917,004
|
$ 1,753,313
|
| Non-controlled
affiliated issuers |
-
|
-
|
(9,426,374)
|
- |
| Options
written |
-
|
-
|
-
|
32,635 |
| Forward
currency contracts |
-
|
-
|
28,883,969
|
(64,783) |
| Foreign
currency transactions |
4,658
|
(331)
|
345,406
|
1,190
|
| Net
realized gain (loss) |
5,202,219
|
(23,117,704)
|
162,720,005
|
1,722,355
|
| Net
change in unrealized appreciation (depreciation) on: |
|
|
|
|
| Non-affiliated
issuers investments** |
(16,397,243)
|
(90,127,483)
|
229,880,317
|
(2,256,917) |
| Non-controlled
affiliated issuers |
-
|
-
|
(41,373,165)
|
- |
| Forward
currency contracts |
-
|
-
|
41,665,563
|
(29,011) |
| Foreign
currency translations |
(1)
|
(65)
|
(10,321)
|
931
|
| Change
in net unrealized appreciation (depreciation) |
(16,397,244)
|
(90,127,548)
|
230,162,394
|
(2,284,997)
|
| Net
Realized and Unrealized Gain (Loss) |
(11,195,025)
|
(113,245,252)
|
392,882,399
|
(562,642)
|
| Change
in Net Assets Resulting from Operations |
$
(12,515,225) |
$
(116,119,984) |
$ 626,102,926
|
$ 70,890
|
| *
Net of foreign capital gain taxes |
$
- |
$
- |
$
- |
$ 41
|
| **
Net of change in deferred taxes |
$
- |
$
- |
$
- |
$ 2,144
|
| †
|
Effective
date of this class of shares of Summit Fund was January 26, 2022. |
See notes to financial statements.
Thornburg
Equity Funds Semi-Annual Report | 83
Statements of Changes in Net Assets
| |
THORNBURG
GLOBAL OPPORTUNITIES FUND |
THORNBURG
INTERNATIONAL EQUITY FUND |
| |
Six
Months Ended
March 31, 2022* |
Year
Ended
September 30, 2021 |
Six
Months Ended
March 31, 2022* |
Year
Ended
September 30, 2021 |
| INCREASE
(DECREASE) IN NET ASSETS FROM |
|
|
|
|
| OPERATIONS
|
|
|
|
|
| Net
investment income (loss) |
$ 935,927
|
$ 15,954,214
|
$ 16,192,126
|
$ 44,951,706
|
| Net
realized gain (loss) |
71,318,900
|
121,063,647
|
74,708,736
|
570,017,512 |
| Net
change in unrealized appreciation (depreciation) |
(62,741,055)
|
148,995,914
|
(342,684,958)
|
29,574,717
|
| Net
Increase (Decrease) in Net Assets Resulting from Operations |
9,513,772
|
286,013,775
|
(251,784,096)
|
644,543,935
|
| DIVIDENDS
TO SHAREHOLDERS |
|
|
|
|
| From
distributable earnings |
|
|
|
|
| Class
A Shares |
(35,940,962)
|
(15,556,947)
|
(71,630,114)
|
(27,537,806) |
| Class
C Shares |
(13,819,338)
|
(8,198,327)
|
(3,618,672)
|
(1,051,963) |
| Class
I Shares |
(79,676,826)
|
(35,542,986)
|
(255,342,551)
|
(59,075,703) |
| Class
R3 Shares |
(482,303)
|
(248,648)
|
(19,948,636)
|
(4,557,933) |
| Class
R4 Shares |
(784,298)
|
(365,924)
|
(13,551,778)
|
(3,204,878) |
| Class
R5 Shares |
(2,624,396) |
(2,182,325) |
(20,223,366) |
(4,382,041) |
| Class
R6 Shares |
(7,791,346)
|
(3,376,168)
|
(44,109,955)
|
(9,265,153) |
| FUND
SHARE TRANSACTIONS |
|
|
|
|
| Class
A Shares |
28,629,847
|
7,882,180
|
49,140,428
|
(427,661,468) |
| Class
C Shares |
(1,794,650)
|
(30,089,588)
|
(818,878)
|
(22,813,554) |
| Class
I Shares |
57,677,966
|
(38,078,183)
|
144,863,757
|
6,617,111 |
| Class
R3 Shares |
186,857
|
(700,070)
|
7,984,397
|
(19,695,062) |
| Class
R4 Shares |
528,054
|
(202,245)
|
3,136,484
|
(13,597,831) |
| Class
R5 Shares |
763,940
|
(19,124,205)
|
2,263,544
|
4,995,604 |
| Class
R6 Shares |
9,304,770
|
1,787,617
|
43,953,466
|
39,193,004
|
| Net
Increase (Decrease) in Net Assets |
(36,308,913)
|
142,017,956
|
(429,685,970)
|
102,506,262
|
| NET
ASSETS |
|
|
|
|
| Beginning
of Period |
1,082,825,057
|
940,807,101
|
3,325,261,498
|
3,222,755,236
|
| End
of Period |
$ 1,046,516,144
|
$ 1,082,825,057
|
$ 2,895,575,528
|
$ 3,325,261,498
|
See notes to financial
statements.
84
| Thornburg Equity Funds Semi-Annual Report
Statements of Changes in Net Assets,
Continued
| |
THORNBURG
BETTER WORLD INTERNATIONAL FUND |
THORNBURG
INTERNATIONAL GROWTH FUND |
| |
Six
Months Ended
March 31, 2022* |
Year
Ended
September 30, 2021 |
Six
Months Ended
March 31, 2022* |
Year
Ended
September 30, 2021 |
| INCREASE
(DECREASE) IN NET ASSETS FROM |
|
|
|
|
| OPERATIONS
|
|
|
|
|
| Net
investment income (loss) |
$ 1,230,703
|
$ 957,396
|
$ 440,866
|
$
(1,206,755) |
| Net
realized gain (loss) |
(6,455,558)
|
43,117,549
|
22,631,643
|
126,958,821 |
| Net
change in unrealized appreciation (depreciation) |
(29,694,793)
|
8,005,551
|
(303,845,415)
|
21,850,369
|
| Net
Increase (Decrease) in Net Assets Resulting from Operations |
(34,919,648)
|
52,080,496
|
(280,772,906)
|
147,602,435
|
| DIVIDENDS
TO SHAREHOLDERS |
|
|
|
|
| From
distributable earnings |
|
|
|
|
| Class
A Shares |
(5,765,352)
|
-
|
(10,325,458)
|
(1,957,081) |
| Class
C Shares |
(780,125)
|
-
|
(1,922,046)
|
(510,190) |
| Class
I Shares |
(42,774,823)
|
(467,138)
|
(99,259,527)
|
(19,125,765) |
| Class
R3 Shares |
-
|
-
|
(497,684)
|
(88,563) |
| Class
R4 Shares |
-
|
-
|
(657,230)
|
(114,616) |
| Class
R5 Shares |
- |
- |
(2,277,399) |
(406,256) |
| Class
R6 Shares |
-
|
-
|
(6,805,277)
|
(845,284) |
| FUND
SHARE TRANSACTIONS |
|
|
|
|
| Class
A Shares |
13,430,339
|
22,545,088
|
4,083,499
|
5,663,748 |
| Class
C Shares |
1,625,601
|
2,514,883
|
(3,206,632)
|
(17,085,519) |
| Class
I Shares |
179,897,033
|
174,010,009
|
(131,277,647)
|
23,821,895 |
| Class
R3 Shares |
-
|
-
|
83,995
|
813,193 |
| Class
R4 Shares |
-
|
-
|
1,518,188
|
1,028,673 |
| Class
R5 Shares |
-
|
-
|
(419,446)
|
(221,191) |
| Class
R6 Shares |
-
|
-
|
5,033,762
|
43,772,314
|
| Net
Increase (Decrease) in Net Assets |
110,713,025
|
250,683,338
|
(526,701,808)
|
182,347,793
|
| NET
ASSETS |
|
|
|
|
| Beginning
of Period |
347,909,694
|
97,226,356
|
1,928,405,241
|
1,746,057,448
|
| End
of Period |
$ 458,622,719
|
$ 347,909,694
|
$ 1,401,703,433
|
$ 1,928,405,241
|
See notes to financial
statements.
Thornburg Equity Funds Semi-Annual Report | 85
Statements of Changes in Net Assets,
Continued
| |
THORNBURG
DEVELOPING WORLD FUND |
THORNBURG
SMALL/MID CAP CORE FUND |
| |
Six
Months Ended
March 31, 2022* |
Year
Ended
September 30, 2021 |
Six
Months Ended
March 31, 2022* |
Year
Ended
September 30, 2021 |
| INCREASE
(DECREASE) IN NET ASSETS FROM |
|
|
|
|
| OPERATIONS
|
|
|
|
|
| Net
investment income (loss) |
$ 2,841,804
|
$ 2,995,896
|
$
(1,320,200) |
$ 465,695
|
| Net
realized gain (loss) |
(35,749,951)
|
92,825,380
|
5,202,219
|
226,101,666 |
| Net
change in unrealized appreciation (depreciation) |
(119,259,461)
|
81,047,307
|
(16,397,244)
|
(8,975,742)
|
| Net
Increase (Decrease) in Net Assets Resulting from Operations |
(152,167,608)
|
176,868,583
|
(12,515,225)
|
217,591,619
|
| DIVIDENDS
TO SHAREHOLDERS |
|
|
|
|
| From
distributable earnings |
|
|
|
|
| Class
A Shares |
-
|
-
|
(122,071,650)
|
- |
| Class
C Shares |
-
|
-
|
(4,832,240)
|
- |
| Class
I Shares |
-
|
(1,240,033)
|
(87,917,193)
|
- |
| Class
R3 Shares |
-
|
-
|
(6,082,568)
|
- |
| Class
R4 Shares |
-
|
-
|
(1,155,008)
|
- |
| Class
R5 Shares |
- |
(5,775) |
(3,628,978) |
- |
| Class
R6 Shares |
-
|
(173,993)
|
-
|
- |
| FUND
SHARE TRANSACTIONS |
|
|
|
|
| Class
A Shares |
5,131,947
|
9,170,861
|
73,044,815
|
(48,852,077) |
| Class
C Shares |
(8,403,546)
|
(17,794,278)
|
(95,622)
|
(11,067,483) |
| Class
I Shares |
80,486,648
|
125,144,133
|
45,160,686
|
(40,995,537) |
| Class
R3 Shares |
-
|
-
|
2,589,334
|
(8,215,545) |
| Class
R4 Shares |
-
|
-
|
710,846
|
(1,500,983) |
| Class
R5 Shares |
(451,225)
|
899,908
|
721,009
|
(3,417,832) |
| Class
R6 Shares |
3,555,597
|
2,122,539
|
-
|
-
|
| Net
Increase (Decrease) in Net Assets |
(71,848,187)
|
294,991,945
|
(116,071,794)
|
103,542,162
|
| NET
ASSETS |
|
|
|
|
| Beginning
of Period |
1,179,846,600
|
884,854,655
|
846,776,979
|
743,234,817
|
| End
of Period |
$ 1,107,998,413
|
$ 1,179,846,600
|
$ 730,705,185
|
$ 846,776,979
|
See notes to financial
statements.
86
| Thornburg Equity Funds Semi-Annual Report
Statements of Changes in Net Assets,
Continued
| |
THORNBURG
SMALL/MID CAP GROWTH FUND |
THORNBURG
INVESTMENT INCOME BUILDER FUND |
| |
Six
Months Ended
March 31, 2022* |
Year
Ended
September 30, 2021 |
Six
Months Ended
March 31, 2022* |
Year
Ended
September 30, 2021 |
| INCREASE
(DECREASE) IN NET ASSETS FROM |
|
|
|
|
| OPERATIONS
|
|
|
|
|
| Net
investment income (loss) |
$
(2,874,732) |
$
(6,572,232) |
$ 233,220,527
|
$ 574,602,639
|
| Net
realized gain (loss) |
(23,117,704)
|
246,517,937
|
162,720,005
|
362,903,576 |
| Net
change in unrealized appreciation (depreciation) |
(90,127,548)
|
(138,053,403)
|
230,162,394
|
1,694,666,970
|
| Net
Increase (Decrease) in Net Assets Resulting from Operations |
(116,119,984)
|
101,892,302
|
626,102,926
|
2,632,173,185
|
| DIVIDENDS
TO SHAREHOLDERS |
|
|
|
|
| From
distributable earnings |
|
|
|
|
| Class
A Shares |
(116,662,505)
|
(21,786,815)
|
(106,002,685)
|
(186,461,886) |
| Class
C Shares |
(9,000,446)
|
(2,420,920)
|
(19,677,347)
|
(46,091,421) |
| Class
I Shares |
(96,903,886)
|
(16,872,585)
|
(168,101,295)
|
(297,043,722) |
| Class
R3 Shares |
(9,133,414)
|
(2,196,040)
|
(619,524)
|
(1,196,087) |
| Class
R4 Shares |
(677,509)
|
(173,350)
|
(327,405)
|
(638,486) |
| Class
R5 Shares |
(6,929,696) |
(1,374,412) |
(1,018,793) |
(2,363,360) |
| Class
R6 Shares |
-
|
-
|
(3,319,641)
|
(5,592,075) |
| FUND
SHARE TRANSACTIONS |
|
|
|
|
| Class
A Shares |
58,473,168
|
(11,198,760)
|
87,743,127
|
263,624,361 |
| Class
C Shares |
(743,573)
|
(15,751,606)
|
(140,631,160)
|
(784,839,681) |
| Class
I Shares |
43,693,941
|
(28,121,333)
|
222,340,420
|
(335,800,673) |
| Class
R3 Shares |
7,145,262
|
(9,034,714)
|
(361,562)
|
(4,648,803) |
| Class
R4 Shares |
511,311
|
(878,637)
|
220,795
|
(3,061,055) |
| Class
R5 Shares |
2,406,915
|
(1,755,528)
|
(4,771,276)
|
(16,363,605) |
| Class
R6 Shares |
-
|
-
|
5,994,302
|
6,692,039
|
| Net
Increase (Decrease) in Net Assets |
(243,940,416)
|
(9,672,398)
|
497,570,882
|
1,218,388,731
|
| NET
ASSETS |
|
|
|
|
| Beginning
of Period |
690,237,206
|
699,909,604
|
10,846,733,986
|
9,628,345,255
|
| End
of Period |
$ 446,296,790
|
$ 690,237,206
|
$ 11,344,304,868
|
$ 10,846,733,986
|
See notes to financial
statements.
Thornburg Equity Funds Semi-Annual Report | 87
Statements of Changes in Net Assets,
Continued
| |
THORNBURG
SUMMIT FUND |
| |
Six
Months Ended
March 31, 2022* |
Year
Ended
September 30, 2021 |
| INCREASE
(DECREASE) IN NET ASSETS FROM |
|
|
| OPERATIONS
|
|
|
| Net
investment income (loss) |
$ 633,532
|
$ 679,700
|
| Net
realized gain (loss) |
1,722,355
|
10,340,154 |
| Net
change in unrealized appreciation (depreciation) |
(2,284,997)
|
562,641
|
| Net
Increase (Decrease) in Net Assets Resulting from Operations |
70,890
|
11,582,495
|
| DIVIDENDS
TO SHAREHOLDERS |
|
|
| From
distributable earnings |
|
|
| Class
A Shares† |
(548) |
- |
| Class
I Shares |
(10,072,626)
|
(3,131,551) |
| FUND
SHARE TRANSACTIONS |
|
|
| Class
A Shares† |
117,078
|
- |
| Class
I Shares |
18,750,890
|
8,128,955
|
| Net
Increase (Decrease) in Net Assets |
8,865,684
|
16,579,899
|
| NET
ASSETS |
|
|
| Beginning
of Period |
62,465,848
|
45,885,949
|
| End
of Period |
$ 71,331,532
|
$ 62,465,848
|
| *
|
Unaudited.
|
| †
|
Effective
date of this class of shares was January 26, 2022. |
See notes to financial statements.
88 | Thornburg Equity Funds Semi-Annual Report
Notes to Financial Statements
March 31, 2022 (Unaudited)
NOTE 1 – ORGANIZATION
Thornburg Global Opportunities Fund ("Global Opportunities
Fund"), Thornburg International Equity Fund ("International Equity Fund"), Thornburg Better World International Fund ("Better World International Fund"), Thornburg International Growth Fund ("International Growth Fund"), Thornburg Developing World
Fund ("Developing World Fund"), Thornburg Small/Mid Cap Core Fund ("Small/Mid Cap Core Fund"), Thornburg Small/Mid Cap Growth Fund ("Small/Mid Cap Growth Fund"), Thornburg Investment Income Builder Fund ("Income Builder Fund"), and Thornburg Summit
Fund ("Summit Fund"), collectively the "Funds", are diversified series of Thornburg Investment Trust (the “Trust”). The Trust is organized as a Massachusetts business trust under a Declaration of Trust dated June 3, 1987 and is
registered as a diversified, open-end management investment company under the Investment Company Act of 1940, as amended (the "1940 Act"). The Funds are currently nine of twenty-one separate series of the Trust. Each series is considered to be a
separate entity for financial reporting and tax purposes and bears expenses directly attributable to it.
Global Opportunities Fund: The
Fund’s investment goal is to seek long-term capital appreciation by investing in equity and debt securities of all types from issuers around the world. The Fund’s investments subject it to certain risks. As of the date of this report,
the principal risks of investing in the Fund include management risk, market and economic risk, equity risk, risks affecting specific issuers, foreign investment risk, developing country risk, foreign currency risk, risks affecting specific
countries or regions, small and mid-cap company risk, credit risk, liquidity risk, real estate risk, redemption risk, and cybersecurity and operational risk. Please see the Fund’s prospectus for a discussion of those principal risks and other
risks associated with an investment in the Fund.
International Equity Fund: The
Fund’s primary investment goal is to seek long-term capital appreciation by investing in equity and debt securities of all types. As a secondary objective, the Fund also seeks some current income. The Fund’s investments subject it to
certain risks. As of the date of this report, the principal risks of investing in the Fund include management risk, market and economic risk, equity risk, risks affecting specific issuers, foreign investment risk, developing country risk, foreign
currency risk, risks affecting specific countries or regions, risks affecting investments in China, small and mid-cap company risk, credit risk, liquidity risk, redemption risk, and cybersecurity and operational risk. Please see the Fund’s
prospectus for a discussion of those principal risks and other risks associated with an investment in the Fund.
Better World International Fund: The Fund’s investment goal is to seek long-term capital appreciation. The Fund’s investments subject it to certain risks. As of the date of this report, the principal risks of investing in the Fund include
management risk, market and economic risk, equity risk, risks affecting specific issuers, foreign investment risk, developing country risk, foreign currency risk, risks affecting specific countries or regions, risks affecting investments in China,
small and mid-cap company risk, credit risk, liquidity risk, ESG investing risk, real estate risk, redemption risk, and cybersecurity and operational risk. Please see the Fund’s prospectus for a discussion of those principal risks and other
risks associated with an investment in the Fund.
International Growth Fund: The
Fund’s investment goal is to seek long-term capital appreciation by investing in equity securities selected for their growth potential. The Fund’s investments subject it to certain risks. As of the date of this report, the principal
risks of investing in the Fund include management risk, market and economic risk, equity risk, risks affecting specific issuers, foreign investment risk, developing country risk, foreign currency risk, risks affecting specific countries or regions,
small and mid-cap company risk, credit risk, liquidity risk, redemption risk, and cybersecurity and operational risk. Please see the Fund’s prospectus for a discussion of those principal risks and other risks associated with an investment in
the Fund.
Developing World Fund: The Fund’s investment goal is to seek long-term capital appreciation. The Fund’s investments subject it to certain risks. As of the date of this report, the principal risks of investing in the Fund include
management risk, market and economic risk, equity risk, risks affecting specific issuers, foreign investment risk, developing country risk, foreign currency risk, risks affecting specific countries or regions, risks affecting investments in China,
small and mid-cap company risk, credit risk, liquidity risk, redemption risk, and cybersecurity and operational risk. Please see the Fund’s prospectus for a discussion of those principal risks and other risks associated with an investment in
the Fund.
Small/Mid Cap Core Fund: The Fund investment goal is to seek Long term capital appreciation by investing in equity and debt securities of all types. As a secondary objective, the Fund also seeks some current income. The Fund’s investments
subject it to certain risks. As of the date of this report, the principal risks of investing in the Fund include, management risk, market and economic risk, equity risk, risks affecting specific issuers, small and mid-cap company risk, foreign
investment risk, liquidity risk, redemption risk, and cybersecurity and operational risk. Please see the Fund’s prospectus for a discussion of those principal risks and other risks associated with an investment in the Fund.
Small/Mid Cap Growth Fund: The
Fund’s investment goal is to seek long-term capital appreciation by investing in equity securities selected for their growth potential. The Fund’s investments subject it to certain risks. As of the date of this report, the principal
risks of investing in the Fund include management risk, market and economic risk, equity risk, risks affecting specific issuers, small and mid-cap company risk, information technology securities risk, foreign investment risk, liquidity risk,
redemption risk, and cybersecurity and operational risk. Please see the Fund’s prospectus for a discussion of those principal risks and other risks associated with an investment in the Fund.
Thornburg Equity
Funds Semi-Annual Report | 89
Notes to Financial Statements,
Continued
March 31, 2022 (Unaudited)
Income Builder Fund: The
Fund’s primary investment goal is to provide a level of current income which exceeds the average yield on U.S. stocks generally, and which will generally grow, subject to periodic fluctuations, over the years on a per share basis. The
Fund’s secondary investment goal is long-term capital appreciation. The Fund’s investments subject it to certain risks. As of the date of this report, the principal risks of investing in the Fund include management risk, market and
economic risk, equity risk, risks affecting specific issuers, small and mid-cap company risk, credit risk, high-yield risk, interest rate risk, prepayment and extension risk, foreign investment risk, developing country risk, foreign currency risk,
risks affecting specific countries or regions, liquidity risk, real estate risk, redemption risk, and cybersecurity and operational risk. Please see the Fund’s prospectus for a discussion of those principal risks and other risks associated
with an investment in the Fund.
Summit Fund: The Fund’s investment goal is to seek to grow real wealth over time. The Fund’s investments subject it to certain risks. As of the date of this report, the principal risks of investing in the Fund include
management risk, market and economic risk, equity risk, risks affecting specific issuers, foreign investment risk, developing country risk, foreign currency risk, small and mid-cap company risk, short sale risk, credit risk, high yield risk,
interest rate risk, prepayment and extension risk, liquidity risk, inflation risk, structured products risk, commodities-related investment risk, real estate risk, derivatives risk, redemption risk, and cybersecurity and operational risk. Please see
the Fund’s prospectus for a discussion of those principal risks and other risks associated with an investment in the Fund.
Certain Funds have invested in securities that are
economically tied to Russia. Russia’s invasion of Ukraine in February 2022 resulted in market disruptions which have adversely affected, and which may continue to adversely affect, the value of those securities and certain other investments of
the Funds. The ongoing conflict has also caused investments in Russia to be subject to increased levels of political, economic, legal, market and currency risks, as well as the risk that further economic sanctions may be imposed by the United States
and other countries. Furthermore, transactions in certain Russian securities have been, or may in the future be, prohibited, and certain of the Funds’ existing investments have or may become illiquid.
As of March 31, 2022, the Funds currently offer up to seven
classes of shares of beneficial interest:
Each class of
shares of the Funds represents an interest in the same portfolio of investments, except that (i) Class A shares are sold subject to a front-end sales charge collected at the time the shares are purchased and bear a service fee, (ii) Class C shares
are sold at net asset value without a sales charge at the time of purchase, but are subject to a contingent deferred sales charge upon redemption within one year of purchase, and bear both a service fee and a distribution fee, (iii) Class I and
Class R5 shares are sold at net asset value without a sales charge at the time of purchase and may be subject to a service fee, (iv) Class R3 shares are sold at net asset value without a sales charge, but bear both a service fee and a distribution
fee, (v) Class R4 shares are sold at net asset value without a sales charge at the time of purchase but bear a service fee, (vi) Class R6 shares are sold at net asset value without a sales charge at the time of purchase, and (vii) the respective
classes may have different reinvestment privileges and conversion rights. Additionally, each Fund may allocate among its classes certain expenses, to the extent allocable to specific classes, including administration fees, transfer agent fees,
government registration fees, certain printing and postage costs and legal expenses. Currently, class specific expenses of the Funds are limited to distribution and service fees, transfer agent fees, and certain registration and filing fees.
At March 31, 2022, the following classes of shares are offered
in each respective Fund:
| |
Class
A |
Class
C |
Class
I |
Class
R3 |
Class
R4 |
Class
R5 |
Class
R6 |
| Global
Opportunities Fund |
X
|
X
|
X
|
X
|
X
|
X
|
X
|
| International
Equity Fund |
X
|
X
|
X
|
X
|
X
|
X
|
X
|
| Better
World International Fund |
X
|
X
|
X
|
|
|
|
|
| International
Growth Fund |
X
|
X
|
X
|
X
|
X
|
X
|
X
|
| Developing
World Fund |
X
|
X
|
X
|
|
|
X
|
X
|
| Small/Mid
Cap Core Fund |
X
|
X
|
X
|
X
|
X
|
X
|
|
| Small/Mid
Cap Growth Fund |
X
|
X
|
X
|
X
|
X
|
X
|
|
| Income
Builder Fund |
X
|
X
|
X
|
X
|
X
|
X
|
X
|
| Summit
Fund |
X
|
|
X
|
|
|
|
|
NOTE
2 – SIGNIFICANT ACCOUNTING POLICIES
The
following is a summary of significant accounting policies followed by each of the Funds in the preparation of its financial statements. Each Fund prepares its financial statements in conformity with United States generally accepted accounting
principles (“GAAP”), including investment company accounting and reporting guidance in the Financial Accounting Standards Board (the “FASB”) Accounting Standard Codification Topic 946.
Allocation of Income,
Gains, Losses and Expenses: Net investment income (other than class specific expenses) and realized and unrealized gains and losses are allocated daily to each class of shares based upon the relative net asset value of outstanding shares (or
the value of the dividend-eligible shares, as appropriate) of each class of shares at the beginning of the day (after adjusting for the current capital shares
90
| Thornburg Equity Funds Semi-Annual Report
Notes to Financial Statements,
Continued
March 31, 2022 (Unaudited)
activity of the respective class). Expenses common to all Funds are allocated
daily among the Funds comprising the Trust based upon their relative net asset values or other appropriate allocation methods. Operating expenses directly attributable to a specific class are charged against the operating income of that class.
Dividends and
Distributions to Shareholders: Dividends and distributions to shareholders, which are determined in accordance with federal income tax regulations and may differ from GAAP, are recorded on the ex-dividend date. Ordinary income dividends, if
any, are declared daily and paid quarterly or annually. Capital gain distributions, if any, are declared and paid annually and more often if deemed necessary by Thornburg Investment Management, Inc., the Trust’s investment advisor (the
“Advisor”). Dividends and distributions are paid and are reinvested in additional shares of the Funds at net asset value per share at the close of business on the ex-dividend date, or at the shareholder’s option, paid in
cash.
Foreign
Currency Translation: Portfolio investments and other assets and liabilities denominated in foreign currencies are translated into U.S. dollars based on the exchange rate of such currencies against the U.S. dollar on the date of valuation.
Purchases and sales of investments and income items denominated in foreign currencies are translated into U.S. dollars at the exchange rate in effect on the transaction date. When the Funds purchase or sell foreign investments, they will customarily
enter into a foreign exchange contract to minimize foreign exchange risk from the trade date to the settlement date of such transactions. The values of such spot contracts are included in receivable for investments sold and payable for investments
purchased on the Statement of Assets and Liabilities.
The Funds do not separately report the effect of changes in
foreign exchange rates from changes in market prices on investments held. Such changes are included in net unrealized appreciation (depreciation) from investments in the Statement of Operations.
Reported net realized gains and losses from foreign currency
transactions arise due to purchases and sales of foreign currencies, currency gains and losses realized between the trade and settlement dates on investment transactions and the difference between the amounts of dividends, interest, and foreign
withholding taxes recorded on the Funds’ books, and the U.S. dollar equivalent of the amounts actually received or paid. These amounts are included in foreign currency transactions in the Statement of Operations.
Net change in unrealized appreciation (depreciation) on
foreign currency translations arise from changes in the fair value of assets and liabilities, other than investments at period end, resulting from changes in exchange rates.
Guarantees and
Indemnifications: Under the Trust’s organizational documents (and under separate agreements with the independent Trustees), its officers and Trustees are provided with an indemnification against certain liabilities arising out of the
performance of their duties to the Funds. In the normal course of business the Trust may also enter into contracts with service providers that contain general indemnifications. The Trust’s maximum exposure under these arrangements is unknown.
However, based on experience, the Trust expects the risk of loss to be remote.
Investment
Income: Dividend income is recorded on the ex-dividend date. Certain income from foreign investments is recognized as soon as information is available to the Funds. Interest income is accrued as earned. Premiums and discounts are amortized
and accreted, respectively, to first call dates or maturity dates using the effective yield method of the respective investments. These amounts are included in Investment Income in the Statement of Operations.
Investment
Transactions: Investment transactions are accounted for on a trade date basis. Realized gains and losses from the sale of investments are recorded on an identified cost basis.
Repurchase
Agreements: The Funds may invest excess cash in repurchase agreements whereby the Funds purchase investments, which serve as collateral, with an agreement to resell such collateral to the seller at an agreed upon price at the maturity date of
the repurchase agreement. Investments pledged as collateral for repurchase agreements are held in custody until maturity of the repurchase agreement. Provisions in the agreements require that the market value of the collateral is at least equal to
the repurchase value in the event of default. In the event of default, the Funds have the right to liquidate the collateral and apply the proceeds in satisfaction of the obligation. Under certain circumstances, in the event of default or bankruptcy
by the other party to the agreement, realization and/or retention of the collateral may be subject to legal proceedings.
Security
Valuation: All investments in securities held by the Funds are valued as described in Note 3.
Short Sales: A
short sale involves the sale by the Funds of a security that the Funds do not own. The Funds borrow the security that they intend to sell from a broker or other institution, and at a later date the Funds complete the short sale by purchasing that
same security on the open market and delivering it to the lending institution. The Funds may be required to pay a premium, fee, or other amount to the lender in exchange for borrowing the security. These amounts are included in "Short sale financing
fees" on the Statement of Operations. When it enters into a short sale, the Funds seek to profit on a decline in the price of the security between the date the Funds borrow the security and the date the Funds purchase the security to deliver it to
the lender. If, however, the price of the security increases between those dates, or if the price of the security declines by an amount which is not sufficient to cover the expenses of borrowing the security, the Funds will experience a loss.
Although the potential for gain as a result of a short sale is limited to the price at which the Funds sold the
Thornburg Equity Funds Semi-Annual Report | 91
Notes to Financial Statements,
Continued
March 31, 2022 (Unaudited)
security short less the cost of borrowing the security, the potential for loss
is theoretically unlimited because there is no limit to the cost of replacing the borrowed security. Short sales held by the Funds during the six month period were fully collateralized by segregated cash or other securities, which are denoted on the
Schedule of Investments.
Use of Estimates: The preparation of financial statements in conformity with GAAP requires management to make estimates and assumptions that affect the reported amounts of assets and liabilities and
disclosure of contingent assets and liabilities at the date of the financial statements and the reported amounts of increases (decreases) in net assets from operations during the reporting period. Actual results could differ from those
estimates.
When-Issued and
Delayed Delivery Transactions: The Funds may engage in when-issued or delayed delivery transactions. To the extent the Funds engage in such transactions, they will do so for the purpose of acquiring portfolio investments consistent with the
Funds’ investment objectives and not for the purpose of investment leverage or to speculate on interest rate or market changes. At the time the Funds make a commitment to purchase an investment on a when-issued or delayed delivery basis, the
Funds will record the transaction and reflect the value in determining its net asset value. When effecting such transactions, assets of an amount sufficient to make payment for the portfolio investments to be purchased will be segregated on the
Funds’ records on the trade date. Investments purchased on a when-issued or delayed delivery basis do not earn interest until the settlement date. The values of these securities held at March 31, 2022 are detailed in the Schedule of
Investments.
NOTE 3 – SECURITY
VALUATION
Valuation of the Funds’ portfolio
investment securities is performed in accordance with policies and procedures adopted by and under the oversight of the Trustees.
The Trustees of the Trust have appointed the Advisor to assist
the Trustees with obtaining fair market values for portfolio investments, evaluating and monitoring professional pricing service providers appointed by the Trustees’ Audit Committee (the “Audit Committee”) to assist in determining
fair values for portfolio investments, assisting in calculating fair values for portfolio investments in certain circumstances, and performing other functions in connection with the valuation of investments. The Advisor acts through its Valuation
and Pricing Committee (the “Committee”) and other employees of the Advisor. The Committee regularly reviews its own valuation calculations, reviews the valuations, valuation techniques and services furnished by pricing service providers,
considers circumstances which may require valuation calculations by the Committee, and reviews previous valuation calculations. The Committee reports to the Audit Committee on the Committee’s activities, the performance of pricing service
providers, and other matters relating to valuation of portfolio investments.
In those instances when the Committee assists in calculating a
fair value for a portfolio investment, the Committee seeks to determine the price that the Funds would reasonably expect to receive upon a sale of the investment in an orderly transaction between market participants on the valuation date. The
Committee customarily utilizes quotations from securities broker dealers in calculating valuations, but also may utilize prices obtained from pricing service providers or other methods approved by the Audit Committee. Because fair values calculated
by the Committee are estimates, the calculation of a value for an investment may differ from the price that would be realized by the Funds upon a sale of the investment, and the difference could be material to the Funds’ financial statements.
The Committee’s calculation of a fair value for an investment may also differ from the prices obtained by other persons (including other mutual funds) for the investment.
Valuation of
Securities: Securities and other portfolio investments which are listed or traded on a United States securities exchange are valued at the last reported sale price on the valuation date. Investments listed or traded on an exchange for which
there has been no sale that day are valued at the mean between the last reported bid and asked prices on that valuation date. Portfolio investments reported by NASDAQ are valued at the official closing price on the valuation date. If an investment
is traded on more than one exchange, the investment is considered traded on the exchange that is normally the primary market for that investment. Securities and other portfolio investments which are listed or traded on exchanges outside the United
States are valued at the last price or the closing price of the investment on the exchange that is normally the primary market for the investment, as of the close of the exchange preceding the Funds’ valuation date. Foreign investments listed
or traded on an exchange for which there has been no sale that day are valued at the mean between the last reported bid and asked prices on that valuation date.
In any case when a market quotation is not readily available
for a portfolio investment ordinarily valued by market quotation, the Committee calculates a fair value for the investment using alternative methods approved by the Audit Committee. A market quotation is not readily available when the primary market
or exchange for the investment is not open for the entire scheduled day of trading. Market quotations for an investment also may not be readily available if developments after the most recent close of the investment’s primary exchange or
market, but prior to the close of business on any Funds’ business day, or an unusual event or significant period of time occurring since the availability of a market quotation, create a serious question concerning the reliability of the most
recent market quotation available for the investment. In particular, on days when market volatility thresholds established by the Audit Committee are exceeded, foreign equity investments held by the Funds may be valued using alternative methods. The
Committee customarily obtains valuations in these instances
92
| Thornburg Equity Funds Semi-Annual Report
Notes to Financial Statements,
Continued
March 31, 2022 (Unaudited)
from pricing service providers approved by the Audit Committee. Pricing
service providers ordinarily calculate valuations using multi-factor models to adjust market prices based upon various inputs, including exchange data, depository receipt prices, futures, index data and other data.
Debt obligations held by the Funds which are not listed or
traded on exchanges or for which no reported market exists are ordinarily valued at the valuation obtained from a pricing service provider approved by the Audit Committee.
Investments in open-end U.S. mutual funds are valued at net
asset value (“NAV”) each business day.
In
any case when a pricing service provider fails to provide a valuation for a debt obligation held by the Funds, the Committee calculates a fair value for the obligation using alternative methods under procedures approved by the Audit Committee.
Additionally, in cases when management believes that a valuation obtained from a pricing service provider is stale, does not reflect material factors affecting the valuation of the investment, is significantly different than the value the Funds are
likely to obtain if it sought a bid for the investment, or is otherwise unreliable, the Committee may calculate a fair value for the obligation using an alternative method approved by the Audit Committee.
Quotations for foreign investments expressed in foreign
currency amounts are converted to U.S. dollar equivalents using a foreign exchange quotation from a third party service provider at the time of valuation. Foreign investments held by the Funds may be traded on days and at times when the Funds are
not open for business. Consequently, the value of Funds’ investments may be significantly affected on days when shareholders cannot purchase or sell Funds’ shares.
Valuation
Hierarchy: The Funds categorize their investments based upon the inputs used in valuing those investments, according to a three-level hierarchy established in guidance from the FASB. Categorization of investments using this hierarchy is
intended by the FASB to maximize the use of observable inputs in valuing investments and minimize the use of unobservable inputs by requiring that the most observable inputs be used when available. Observable inputs are those that market
participants would use in valuing an investment based on available market information. Unobservable inputs are those that reflect assumptions about the information market participants would use in valuing an investment. An investment’s level
within the hierarchy is based on the lowest level input that is deemed significant to the valuation. The methodologies and inputs used to value investments are not necessarily indications of the risk or liquidity associated with those
investments.
Various inputs are used in calculating
valuations for the Funds’ investments. These inputs are generally summarized according to the three-level hierarchy below:
Level 1: Quoted prices in active markets for identical
investments.
Level 2: Other direct or indirect
significant observable inputs (including quoted prices for similar investments in active markets and other observable inputs, such as interest rates, prepayment rates, credit ratings, etc.).
Level 3: Significant unobservable inputs (including the
Committee’s own assumptions in calculating the fair values of investments).
Valuations for debt obligations held by the Funds are
typically calculated by pricing service providers approved by the Audit Committee and are generally characterized as Level 2 within the valuation hierarchy.
On days when market volatility thresholds established by the
Audit Committee are exceeded, foreign securities for which valuations are obtained from pricing service providers are fair valued. On these days, the foreign securities are characterized as Level 2 within the valuation hierarchy and revert to Level
1 after the threshold is no longer exceeded.
In any case
when a pricing service provider fails to provide a valuation for a debt obligation held by the Funds, the Committee calculates a fair value for the obligation using alternative methods under procedures approved by the Audit Committee. Additionally,
in cases when management believes that a valuation obtained from a pricing service provider is stale, does not reflect material factors affecting the valuation of the investment, is significantly different than the value the Funds are likely to
obtain if they sought a bid for the investment, or is otherwise unreliable, the Committee calculates a fair value for the obligation using an alternative method approved by the Audit Committee.
In a limited number of cases the Committee calculates a fair
value for investments using broker quotations or other methods approved by the Audit Committee. When the Committee uses a single broker quotation to calculate a fair value for an investment without other significant observable inputs, or if a fair
value is calculated using other significant inputs that are considered unobservable, the investment is characterized as Level 3 within the hierarchy. Other significant unobservable inputs used to calculate a fair value in these instances might
include an income-based valuation approach which considers discounted anticipated future cash flows from the investment and application of discounts due to the nature or duration of any restrictions on the disposition of the investment.
Thornburg
Equity Funds Semi-Annual Report | 93
Notes to Financial Statements,
Continued
March 31, 2022 (Unaudited)
Valuations based upon the use of inputs from Levels 1, 2 or 3
may not represent the actual price received upon the disposition of an investment, and a Fund may receive a price that is lower than the valuation based upon these inputs when it sells the investment.
| GLOBAL
OPPORTUNITIES FUND |
TOTAL
|
LEVEL
1 |
LEVEL
2 |
LEVEL
3 |
| Assets
|
|
|
|
|
| Investments
in Securities |
|
|
|
|
| Common
Stock |
$ 1,003,934,849
|
$
441,706,603 |
$
562,228,246 |
$ —
|
| Short-Term
Investments |
38,476,549
|
38,476,549
|
—
|
—
|
| Total
Investments in Securities |
$
1,042,411,398 |
$
480,183,152 |
$
562,228,246 |
$
— |
| Other
Financial Instruments |
|
|
|
|
| Forward
currency contracts |
$ 4,008,677
|
$ —
|
$
4,008,677 |
$ —
|
| Total
Assets |
$
1,046,420,075 |
$
480,183,152 |
$
566,236,923 |
$
— |
| INTERNATIONAL
EQUITY FUND |
TOTAL
|
LEVEL
1 |
LEVEL
2 |
LEVEL
3 |
| Assets
|
|
|
|
|
| Investments
in Securities |
|
|
|
|
| Common
Stock |
$ 2,728,671,246
|
$
342,271,456 |
$
2,386,399,790 |
$ —
|
| Rights
|
1,122,699
|
—
|
—
|
1,122,699 |
| Short-Term
Investments |
193,656,095
|
193,656,095
|
—
|
—
|
| Total
Investments in Securities |
$
2,923,450,040 |
$
535,927,551 |
$
2,386,399,790 |
$
1,122,699 |
| Total
Assets |
$
2,923,450,040 |
$
535,927,551 |
$
2,386,399,790 |
$
1,122,699 |
| BETTER
WORLD INTERNATIONAL FUND |
TOTAL
|
LEVEL
1 |
LEVEL
2 |
LEVEL
3 |
| Assets
|
|
|
|
|
| Investments
in Securities |
|
|
|
|
| Common
Stock |
$ 407,899,983
|
$
105,073,632 |
$
302,826,351 |
$ —
|
| Rights
|
133,994
|
—
|
—
|
133,994 |
| Short-Term
Investments |
50,281,331
|
50,281,331
|
—
|
—
|
| Total
Investments in Securities |
$
458,315,308 |
$
155,354,963 |
$
302,826,351 |
$
133,994 |
| Total
Assets |
$
458,315,308 |
$
155,354,963 |
$
302,826,351 |
$
133,994 |
| INTERNATIONAL
GROWTH FUND |
TOTAL
|
LEVEL
1 |
LEVEL
2 |
LEVEL
3 |
| Assets
|
|
|
|
|
| Investments
in Securities |
|
|
|
|
| Common
Stock |
$ 1,340,847,029
|
$
280,388,706 |
$
1,060,458,323 |
$ —
|
| Short-Term
Investments |
57,403,494
|
57,403,494
|
—
|
—
|
| Total
Investments in Securities |
$
1,398,250,523 |
$
337,792,200 |
$
1,060,458,323 |
$
— |
| Total
Assets |
$
1,398,250,523 |
$
337,792,200 |
$
1,060,458,323 |
$
— |
| DEVELOPING
WORLD FUND |
TOTAL
|
LEVEL
1 |
LEVEL
2 |
LEVEL
3 |
| Assets
|
|
|
|
|
| Investments
in Securities |
|
|
|
|
| Common
Stock |
$ 1,085,245,216
|
$
331,661,404 |
$
753,583,812 |
$ —
|
| Short-Term
Investments |
9,537,844
|
9,537,844
|
—
|
—
|
| Total
Investments in Securities |
$
1,094,783,060 |
$
341,199,248 |
$
753,583,812 |
$
— |
| Total
Assets |
$
1,094,783,060 |
$
341,199,248 |
$
753,583,812 |
$
— |
| SMALL/MID
CAP CORE FUND |
TOTAL
|
LEVEL
1 |
LEVEL
2 |
LEVEL
3 |
| Assets
|
|
|
|
|
| Investments
in Securities |
|
|
|
|
| Common
Stock |
$ 719,592,610
|
$
719,592,610 |
$ —
|
$ —
|
| Short-Term
Investments |
13,226,766
|
13,226,766
|
—
|
—
|
| Total
Investments in Securities |
$
732,819,376 |
$
732,819,376 |
$
— |
$
— |
| Total
Assets |
$
732,819,376 |
$
732,819,376 |
$
— |
$— |
94
| Thornburg Equity Funds Semi-Annual Report
Notes to Financial Statements,
Continued
March 31, 2022 (Unaudited)
| SMALL/MID
CAP GROWTH FUND |
TOTAL
|
LEVEL
1 |
LEVEL
2 |
LEVEL
3 |
| Assets
|
|
|
|
|
| Investments
in Securities |
|
|
|
|
| Common
Stock |
$
440,244,197 |
$
440,244,197 |
$
— |
$
— |
| Short-Term
Investments |
2,200,818
|
2,200,818
|
—
|
—
|
| Total
Investments in Securities |
$
442,445,015 |
$
442,445,015 |
$
— |
$
— |
| Total
Assets |
$
442,445,015 |
$
442,445,015 |
$
— |
$— |
The following tables display a summary of the fair value
hierarchy measurements of each Fund’s investments as of March 31, 2022:
| INCOME
BUILDER FUND |
TOTAL
|
LEVEL
1 |
LEVEL
2 |
LEVEL
3 |
| Assets
|
|
|
|
|
| Investments
in Securities |
|
|
|
|
| Common
Stock |
$ 9,651,785,895
|
$
3,598,852,178 |
$
6,050,621,938 |
$
2,311,779 |
| Preferred
Stock |
33,901,821
|
23,457,321
|
10,444,500
|
— |
| Asset
Backed Securities |
303,535,224
|
—
|
275,302,301
|
28,232,923 |
| Corporate
Bonds |
780,375,364
|
—
|
780,375,364
|
—(a) |
| Mortgage
Backed |
154,484,618
|
—
|
154,483,668
|
950 |
| Loan
Participations |
42,633,211
|
—
|
42,633,211
|
— |
| Rights
|
3,380,580
|
—
|
—
|
3,380,580 |
| Short-Term
Investments |
287,205,880
|
287,205,880
|
—
|
—
|
| Total
Investments in Securities |
$
11,257,302,593 |
$
3,909,515,379 |
$
7,313,860,982 |
$
33,926,232(b) |
| Other
Financial Instruments |
|
|
|
|
| Forward
currency contracts |
$ 65,912,553
|
$ —
|
$
65,912,553 |
$ —
|
| Total
Assets |
$
11,323,215,146 |
$
3,909,515,379 |
$
7,379,773,535 |
$33,926,232 |
|
(a) |
A
security categorized as Level 3 is currently valued at zero. |
|
(b) |
Level
3 investments at the beginning and end of the period in relation to net assets were not significant and accordingly, a reconciliation of Level 3 assets for the period ended March 31, 2022 is not presented. |
| SUMMIT
FUND |
TOTAL
|
LEVEL
1 |
LEVEL
2 |
LEVEL
3 |
| Assets
|
|
|
|
|
| Investments
in Securities |
|
|
|
|
| Common
Stock |
$ 38,807,436
|
$
25,799,473 |
$
13,007,963 |
$ —
|
| Asset
Backed Securities |
7,396,763
|
—
|
6,944,243
|
452,520 |
| Corporate
Bonds |
2,579,389
|
—
|
2,579,389
|
— |
| Convertible
Bonds |
204,291
|
—
|
204,291
|
— |
| U.S.
Treasury Securities |
9,877,298
|
9,877,298
|
—
|
— |
| Mortgage
Backed |
4,634,004
|
—
|
4,634,004
|
— |
| Loan
Participations |
40,685
|
—
|
40,685
|
— |
| Exchange-Traded
Funds |
3,775,090
|
3,775,090
|
—
|
— |
| Short-Term
Investments |
2,873,440
|
2,873,440
|
—
|
—
|
| Total
Investments in Securities |
$
70,188,396 |
$
42,325,301 |
$
27,410,575 |
$
452,520 |
| Total
Assets |
$
70,188,396 |
$
42,325,301 |
$
27,410,575 |
$
452,520 |
| Liabilities
|
|
|
|
|
| Other
Financial Instruments |
|
|
|
|
| Forward
currency contracts |
$
(49,747) |
$ —
|
$
(49,747) |
$ —
|
| Total
Other Financial Instruments |
$
(49,747) |
$
— |
$
(49,747) |
$
— |
| Total
Liabilities |
$
(49,747) |
$
— |
$
(49,747) |
$— |
NOTE 4 – INVESTMENT MANAGEMENT FEE AND
OTHER TRANSACTIONS WITH AFFILIATES
Pursuant to an
investment management agreement with the Trust, the Advisor serves as the investment advisor and performs advisory services for the Funds for which the Advisor’s management fees are payable at the end of each month. Under the investment
advisory
Thornburg Equity Funds Semi-Annual Report | 95
Notes to Financial Statements,
Continued
March 31, 2022 (Unaudited)
agreement, each Fund pays the Advisor a management fee based on the average
daily net assets of that fund at an annual rate as shown in the following table:
GLOBAL
OPPORTUNITIES FUND,
INTERNATIONAL EQUITY FUND,
INTERNATIONAL GROWTH FUND,
SMALL/MID CAP CORE FUND,
SMALL/MID CAP GROWTH FUND,
INCOME BUILDER FUND |
BETTER
WORLD
INTERNATIONAL FUND,
DEVELOPING WORLD FUND |
SUMMIT
FUND |
| DAILY
NET ASSETS |
FEE
RATE |
DAILY
NET ASSETS |
FEE
RATE |
DAILY
NET ASSETS |
FEE
RATE |
| Up
to $500 million |
0.875%
|
Up
to $500 million |
0.975%
|
Up
to $500 million |
0.750%
|
| Next
$500 million |
0.825
|
Next
$500 million |
0.925
|
Next
$500 million |
0.700
|
| Next
$500 million |
0.775
|
Next
$500 million |
0.875
|
Next
$500 million |
0.650
|
| Next
$500 million |
0.725
|
Next
$500 million |
0.825
|
Next
$500 million |
0.625
|
| Over
$2 billion |
0.675
|
Over
$2 billion |
0.775
|
Over
$2 billion |
0.600
|
The Funds’ effective
management fee, calculated on the basis of the Funds’ average daily net assets (before applicable management fee waivers) for the six months ended March 31, 2022 were as shown in the following table. Total management fees incurred by the Funds
for the six months ended March 31, 2022 are set forth in the Statement of Operations.
| |
Effective
Management
Fee |
| Global
Opportunities Fund |
0.845%
|
| International
Equity Fund |
0.753
|
| Better
World International Fund |
0.975
|
| International
Growth Fund |
0.812
|
| Developing
World Fund |
0.939
|
| Small/Mid
Cap Core Fund |
0.857
|
| Small/Mid
Cap Growth Fund |
0.867
|
| Income
Builder Fund |
0.697
|
| Summit
Fund |
0.750
|
The Trust has entered into an
administrative services agreement with the Advisor, whereby the Advisor will perform certain administrative services. The administrative services fees are computed as an annual percentage of the aggregate average daily net assets of all Funds in the
Trust as follows:
| Administrative
Services Fee Schedule |
| Daily
Net Assets |
Fee
Rate |
| Up
to $20 billion |
0.100%
|
| $20
billion to $40 billion |
0.075
|
| $40
billion to $60 billion |
0.040
|
| Over
$60 billion |
0.030
|
The aggregate administrative
services fee amount is allocated on a daily basis to each Fund based on net assets and subsequently allocated to each class of shares of the Funds. Total administrative services fees incurred by each class of shares of the Funds for the six months
ended March 31, 2022, are set forth in the Statement of Operations.
The Trust has an underwriting agreement with Thornburg
Securities Corporation (the “Distributor”), an affiliate of the Advisor, which acts as the distributor of the Funds’ shares. For the six months ended March 31, 2022, the Distributor has advised the Funds that they earned net
commissions from the sale of Class A shares and collected contingent deferred sales charges ("CDSC Fees") from redemptions of Class C shares as follows:
96 | Thornburg Equity Funds Semi-Annual Report
Notes to Financial Statements,
Continued
March 31, 2022 (Unaudited)
| |
Commissions
|
CDSC
fees |
| Global
Opportunities Fund |
$
3,101 |
$
1,203 |
| International
Equity Fund |
2,233 |
— |
| Better
World International Fund |
6,631 |
731 |
| International
Growth Fund |
2,725 |
822 |
| Developing
World Fund |
3,221 |
561 |
| Small/Mid
Cap Core Fund |
1,908 |
14 |
| Small/Mid
Cap Growth Fund |
2,604 |
— |
| Income
Builder Fund |
169,914 |
13,283 |
| Summit
Fund |
25 |
— |
Pursuant to a service plan under Rule 12b-1 of the 1940 Act,
the Funds may reimburse to the Distributor an amount not to exceed .25 of 1% per annum of the average daily net assets attributable to the applicable Class A, Class C, Class I, Class R3, Class R4, and Class R5 shares of the Global Opportunities
Fund, International Equity Fund, International Growth Fund, Small/Mid Cap Core Fund, Small/Mid Cap Growth Fund and Income Builder Fund, Class A, Class C, Class I, and Class R5 shares of the Developing World Fund, Class A, Class C, Class I shares of
the Better World International Fund and Class A and Class I shares of the Summit Fund. For the six months ended March 31, 2022, there were no 12b-1 service plan fees charged for Class I or Class R5 shares. Class R6 shares are not subject to a
service plan. The Advisor and Distributor each may pay out of its own resources additional expenses for distribution of each Fund’s shares and shareholder services.
The Trust has also adopted a distribution plan pursuant to
Rule 12b-1, applicable only to the Funds’ Class C and Class R3 shares, under which the Funds compensate the Distributor for services in promoting the sale of Class C and Class R3 shares of the Funds at an annual rate of up to .75 of 1% per
annum of the average daily net assets attributable to Class C shares and an annual rate of up to .25 of 1% per annum of the average daily net assets attributable to Class R3 shares. Total fees incurred by each class of shares of the Funds under
their respective service and distribution plans for the six months ended March 31, 2022 are set forth in the Statements of Operations.
The Advisor has contractually agreed to waive certain fees and
reimburse certain expenses incurred by the Funds. The agreement may be terminated by the Funds at any time, but may not be terminated by the Advisor before February 1, 2023 unless the Advisor ceases to be the investment advisor to the Funds prior to
that date. The Advisor may recoup amounts waived or reimbursed during the six months ended March 31, 2022 if, during the fiscal year, expenses fall below the contractual limit that was in place at the time these fees and expenses were waived or
reimbursed. The Advisor will not recoup fees or expenses as described in the preceding sentence if that recoupment would cause the Fund’s total annual operating expenses (after the recoupment is taken into account) to exceed the lesser of: (a)
the expense cap that was in place at the time the waiver or reimbursement occurred; or (b) the expense cap that is in place at the time of the recoupment.
Actual expenses of certain share classes do not exceed levels
as specified in each Fund’s most recent prospectus as shown in the following table:
| |
Class
A |
Class
C |
Class
I |
Class
R3 |
Class
R4 |
Class
R5 |
Class
R6 |
| Global
Opportunities Fund |
—% |
—% |
0.99% |
1.50% |
1.40% |
0.99% |
0.85% |
| International
Equity Fund |
— |
— |
0.90 |
1.36 |
1.16 |
0.90 |
0.70 |
| Better
World International Fund |
— |
2.19 |
0.90 |
— |
— |
— |
— |
| International
Growth Fund |
— |
— |
— |
1.50 |
1.40 |
0.99 |
0.89 |
| Developing
World Fund |
— |
— |
1.04 |
— |
— |
1.04 |
0.94 |
| Small/Mid
Cap Core Fund |
— |
— |
0.95 |
1.31 |
1.21 |
0.95 |
— |
| Small/Mid
Cap Growth Fund |
— |
— |
0.95 |
1.46 |
1.36 |
0.95 |
— |
| Income
Builder Fund |
— |
— |
— |
1.50 |
1.40 |
0.99 |
0.80 |
| Summit
Fund |
1.24 |
— |
0.99 |
— |
— |
— |
— |
Thornburg Equity Funds Semi-Annual Report | 97
Notes to Financial Statements,
Continued
March 31, 2022 (Unaudited)
For the six months ended March 31, 2022, the Advisor
contractually reimbursed certain class specific expenses and distribution fees and voluntarily waived Fund level investment advisory fees as follows:
| Contractual:
|
Class
A |
Class
C |
Class
I |
Class
R3 |
Class
R4 |
Class
R5 |
Class
R6 |
Total
|
| Global
Opportunities Fund |
$ —
|
$ —
|
$
28,479 |
$
14,464 |
$
17,437 |
$
39,531 |
$
38,235 |
$
138,146 |
| International
Equity Fund |
—
|
—
|
101,077
|
164,672
|
103,371
|
170,148
|
79,535
|
618,803
|
| Better
World International Fund |
—
|
4,879
|
306,984
|
—
|
—
|
—
|
—
|
311,863
|
| International
Growth Fund |
—
|
—
|
—
|
21,865
|
22,274
|
65,467
|
46,486
|
156,092
|
| Developing
World Fund |
—
|
—
|
320,079
|
—
|
—
|
15,139
|
54,112
|
389,330
|
| Small/Mid
Cap Core Fund |
219,558
|
7,766
|
311,875
|
62,885
|
16,945
|
43,481
|
—
|
662,510
|
| Small/Mid
Cap Growth Fund |
154,509
|
9,424
|
231,469
|
56,151
|
12,130
|
52,276
|
—
|
515,959
|
| Income
Builder Fund |
—
|
—
|
—
|
15,211
|
7,550
|
29,178
|
26,134
|
78,073
|
| Summit
Fund |
3,510
|
—
|
64,121
|
—
|
—
|
—
|
—
|
67,631
|
| Voluntary:
|
Class
A |
Class
C |
Class
I |
Class
R3 |
Class
R4 |
Class
R5 |
Class
R6 |
Total
|
| Global
Opportunities Fund |
$
48,017 |
$
17,344 |
$
145,885 |
$
605 |
$
1,048 |
$
3,363 |
$
10,385 |
$ 226,647
|
| International
Equity Fund |
90,094
|
3,941
|
328,368
|
25,199
|
16,281
|
24,643
|
165,740
|
654,266 |
| Better
World International Fund |
6,665
|
890
|
61,097
|
—
|
—
|
—
|
—
|
68,652 |
| International
Growth Fund |
3,663
|
555
|
298,145
|
179
|
259
|
829
|
2,616
|
306,246 |
| Developing
World Fund |
46,053
|
10,939
|
336,612
|
—
|
—
|
1,239
|
27,370
|
422,213 |
| Small/Mid
Cap Growth Fund |
—
|
260
|
—
|
—
|
—
|
—
|
—
|
260 |
| Income
Builder Fund |
— |
19,911 |
— |
— |
— |
— |
— |
19,911 |
Certain officers and
Trustees of the Trust are also officers or directors of the Advisor and Distributor. The compensation of the independent Trustees is borne by the Trust. The Trust also pays a portion of the Chief Compliance Officer’s compensation. These
amounts are reflected as Trustee and officer fees in the Statement of Operations.
As of March 31, 2022, the percentage of direct investments in
the Funds held by the Trustees, officers of the Trust, and the Advisor is approximately as follows.
| |
Percentage
of Direct Investments |
| Global
Opportunities Fund |
5.47%
|
| International
Equity Fund |
1.45
|
| Better
World International Fund |
9.65
|
| International
Growth Fund |
2.43
|
| Developing
World Fund |
3.68
|
| Small/Mid
Cap Core Fund |
5.68
|
| Small/Mid
Cap Growth Fund |
5.48
|
| Income
Builder Fund |
1.39
|
| Summit
Fund |
56.97
|
The Funds may purchase or sell
securities from or to an affiliated fund, provided the affiliation is due solely to having a common investment advisor, common officers, or common trustees, and provided that all such transactions will comply with Rule 17a-7 under the 1940 Act. For
the year ended at March 31, 2022, the Rule 17a-7 purchases, sales and gains/(losses) were as follows.
| |
Purchases
|
Sales
|
Realized
gains/(losses) |
| Small/Mid
Cap Core Fund |
$
15,017,169 |
$
6,910,492 |
$
2,339,166 |
| Small/Mid
Cap Growth Fund |
6,910,492 |
15,017,169 |
(3,903,148) |
Shown below are
holdings of voting securities of each portfolio company which is considered "affiliated" to the Funds under the 1940 Act, including companies for which the Funds’ holding represented 5% or more of the company’s voting securities, and a
series of the Thornburg Investment Trust in which the Funds invested for cash management purposes during the period:
| GLOBAL
OPPORTUNITIES FUND |
Market
Value
9/30/21 |
Purchases
at Cost |
Sales
Proceeds |
Realized
Gain
(Loss) |
Change
in
Unrealized
Appr./(Depr.) |
Market
Value
3/31/22 |
Dividend
Income |
| Thornburg
Capital Mgmt. Fund |
$
34,427,071 |
$109,513,010
|
$(105,463,532)
|
$
- |
$
- |
$
38,476,549 |
$
33,029 |
98
| Thornburg Equity Funds Semi-Annual Report
Notes to Financial Statements,
Continued
March 31, 2022 (Unaudited)
| INTERNATIONAL
EQUITY FUND |
Market
Value
9/30/21 |
Purchases
at Cost |
Sales
Proceeds |
Realized
Gain
(Loss) |
Change
in
Unrealized
Appr./(Depr.) |
Market
Value
3/31/22 |
Dividend
Income |
| Thornburg
Capital Mgmt. Fund |
$352,027,123
|
$511,936,180
|
$(670,307,208)
|
$
- |
$
- |
$193,656,095
|
$
189,646 |
| BETTER
WORLD INTERNATIONAL FUND |
|
|
|
|
|
|
|
| Thornburg
Capital Mgmt. Fund |
$
31,700,716 |
$220,735,588
|
$(202,154,973)
|
$
- |
$
- |
$
50,281,331 |
$
45,878 |
| INTERNATIONAL
GROWTH FUND |
|
|
|
|
|
|
|
| Thornburg
Capital Mgmt. Fund |
$
64,240,267 |
$414,381,472
|
$(421,218,245)
|
$
- |
$
- |
$
57,403,494 |
$
84,504 |
| DEVELOPING
WORLD FUND |
|
|
|
|
|
|
|
| Thornburg
Capital Mgmt. Fund |
$
29,224,822 |
$251,370,396
|
$(271,057,374)
|
$
- |
$
- |
$
9,537,844 |
$
30,303 |
| SMALL/MID
CAP CORE FUND |
|
|
|
|
|
|
|
| Thornburg
Capital Mgmt. Fund |
$
2,280,880 |
$
99,075,965 |
$
(88,130,079) |
$
- |
$
- |
$
13,226,766 |
$
6,796 |
| SMALL/MID
CAP GROWTH FUND |
|
|
|
|
|
|
|
| Thornburg
Capital Mgmt. Fund |
$
4,142,746 |
$116,906,924
|
$(118,848,852)
|
$
- |
$
- |
$
2,200,818 |
$
3,853 |
| INCOME
BUILDER FUND |
|
|
|
|
|
|
|
| Apollo
Investment Corp.* |
$
49,127,545 |
$
- |
$
(11,305,237) |
$(7,482,325)
|
$
8,497,508 |
$
- |
$
2,187,204 |
| Chimera
Investment Corp |
264,958,318
|
-
|
(10,205,936)
|
(819,325)
|
(46,636,633)
|
207,296,424
|
11,363,425
|
| Malamute
Energy, Inc. |
12,439
|
-
|
-
|
-
|
-
|
12,439
|
-
|
| SLR
Investment Corp |
88,149,127
|
-
|
(3,875,136)
|
(1,124,724)
|
(3,234,040)
|
79,915,227
|
3,614,478
|
| Thornburg
Capital Mgmt. Fund |
271,426,844
|
689,507,872
|
(673,728,836)
|
-
|
-
|
287,205,880
|
284,105
|
| Total
|
$673,674,273
|
$689,507,872
|
$(699,115,145)
|
$(9,426,374)
|
$(41,373,165)
|
$574,429,970
|
$17,449,212
|
| * Issuer
no longer affiliated at March 31, 2022. |
| SUMMIT
FUND |
|
|
|
|
|
|
|
| Thornburg
Capital Mgmt. Fund |
$
5,946,069 |
$
18,089,908 |
$
(21,162,537) |
$
- |
$
- |
$
2,873,440 |
$
4,913 |
NOTE 5 – TAXES
Federal Income
Taxes: It is the policy of the Trust to comply with the provisions of the Internal Revenue Code of 1986 applicable to regulated investment companies and to distribute to shareholders substantially all investment company taxable income
including net realized gains on investments (if any), and tax exempt income of the Funds. Therefore, no provision for federal income or excise tax is required.
The Funds file income tax returns in United States federal and
applicable state jurisdictions. The statute of limitations on the Funds’ tax return filings generally remains open for the three years following a return’s filing date. The Funds have analyzed each uncertain tax position believed to be
material in the preparation of the Funds’ financial statements for the six month period ended March 31, 2022, including open tax years, to assess whether it is more likely than not that the position would be sustained upon examination, based
on the technical merits of the position. The Funds have not identified any such position for which an asset or liability must be reflected in the Statements of Assets and Liabilities.
Thornburg
Equity Funds Semi-Annual Report | 99
Notes to Financial Statements,
Continued
March 31, 2022 (Unaudited)
At March 31, 2022, information on the tax components of
capital was as follows:
| |
Cost
|
Unrealized
Appreciation |
Unrealized
Depreciation |
Net
Unrealized
Appreciation
(Depreciation) |
| Global
Opportunities Fund |
$ 715,601,782
|
$ 351,990,888
|
$ (25,181,272)
|
$ 326,809,616
|
| International
Equity Fund |
2,575,735,495
|
500,434,036
|
(152,719,491)
|
347,714,545 |
| Better
World International Fund |
463,291,583
|
16,794,012
|
(21,770,287)
|
(4,976,275) |
| International
Growth Fund |
1,102,840,324
|
355,412,432
|
(60,002,233)
|
295,410,199 |
| Developing
World Fund |
892,415,371
|
271,485,598
|
(69,117,909)
|
202,367,689 |
| Small/Mid
Cap Core Fund |
653,655,165
|
125,584,214
|
(46,420,003)
|
79,164,211 |
| Small/Mid
Cap Growth Fund |
452,247,900
|
50,514,285
|
(60,317,170)
|
(9,802,885) |
| Income
Builder Fund |
8,590,493,628
|
3,178,630,688
|
(511,821,723)
|
2,666,808,965 |
| Summit
Fund |
66,185,359 |
5,920,550 |
(1,917,513) |
4,003,037 |
At
March 31, 2022, the Funds had deferred tax basis late-year ordinary investment losses and deferred tax basis capital losses occurring subsequent to October 31, 2020 through September 30, 2021 per the following table. For tax purposes, such losses
will be recognized in the year ending September 30, 2022.
| |
Deferred
Tax Basis |
| |
Late-Year
Ordinary Losses |
| Developing
World Fund |
$
1,948,545 |
At March 31, 2022, the
Funds had cumulative tax basis capital losses from prior fiscal years as shown on the following table, which may be carried forward to offset future capital gains. To the extent such carryforwards are used, capital gain distributions may be reduced
to the extent provided by regulations. Such capital loss carryforwards do not expire.
| |
Cumulative
Capital Losses |
| |
Short-Term
|
Long-Term
|
| Developing
World Fund |
$
54,039,967 |
$
— |
| Income
Builder Fund |
864,072,456 |
— |
Foreign Withholding Taxes: The Funds are subject to foreign tax withholding imposed by certain foreign countries in which the Funds may invest. Withholding taxes are incurred on certain foreign dividends
and are accrued at the time the dividend is recognized based on applicable foreign tax laws. The Funds may file withholding tax reclaims in certain jurisdictions to recover a portion of amounts previously withheld, in view of various considerations,
including recent decisions rendered by the courts in those and other jurisdictions. The Funds would expect to record a receivable for such a tax reclaim based on a variety of factors, including assessment of a jurisdiction’s legal obligation
to pay reclaims, the jurisdiction’s administrative practices and payment history, and industry convention.
As a result of several court rulings in France, the French tax
authorities recently paid several of the Funds’ tax reclaims for prior tax withholding. These tax reclaim payments are reflected as “Foreign withholding tax claims” in the Statements of Operations and any related interest is
included in “Interest Income”. Reducing the “Foreign withholding tax claim” amounts are fees paid by certain Funds to a third-party service provider that assisted in the recovery of the tax reclaims by pursuing administrative
and judicial proceedings on the Funds’ behalf. These third-party service provider fees are reflected in the Statement of Operations under “Tax reclaim collection fees.” For U.S. income tax purposes, tax reclaims paid by France and
received by the Funds will reduce the amount of foreign taxes paid in a fiscal year that Fund shareholders can use as tax credits in their individual income tax returns.
In the event that tax reclaims received by the Funds during
the fiscal year ending September 30, 2022 exceed the foreign withholding taxes paid by the Funds for other foreign investments, and the Funds have previously passed foreign tax credits on to their shareholders, the Funds will have a U.S. tax
liability. The Funds will enter into a closing agreement with the Internal Revenue Service (IRS) in order to pay the associated tax liability (fees) on behalf of the Funds’ shareholders. These IRS fees are estimated thru the six months period
ended March 31, 2022 and are reflected as “IRS Compliance Fees” in the Statements of Operations.
Deferred Foreign
Capital Gain Taxes: The Funds are subject to a tax imposed on net realized gains of securities of certain foreign countries. The Funds record an estimated deferred tax liability for net unrealized gains on these investments as reflected in
the accompanying financial statements. Such changes are included in net unrealized appreciation (depreciation) from investments in the Statement of Operations.
100 |
Thornburg Equity Funds Semi-Annual Report
Notes to Financial Statements,
Continued
March 31, 2022 (Unaudited)
NOTE 6 – SHARES OF BENEFICIAL
INTEREST
At March 31, 2022, there were an unlimited
number of shares of each Fund with no par value of beneficial interest authorized. Transactions in each Fund’s shares of beneficial interest were as follows:
| |
SIX
MONTHS ENDED
March 31, 2022 |
YEAR
ENDED
September 30, 2021 |
| GLOBAL
OPPORTUNITIES FUND |
SHARES
|
AMOUNT
|
SHARES
|
AMOUNT
|
| Class
A Shares |
|
|
|
|
| Shares
sold |
428,164
|
$ 15,572,679
|
874,275
|
$ 32,438,647
|
Shares
issued to shareholders in
reinvestment of dividends |
932,299
|
33,290,506
|
442,778
|
14,478,834 |
| Shares
repurchased |
(562,706)
|
(20,233,338)
|
(1,067,193)
|
(39,035,301)
|
| Net
increase (decrease) |
797,757
|
$ 28,629,847
|
249,860
|
$ 7,882,180
|
| Class
C Shares |
|
|
|
|
| Shares
sold |
55,369
|
$ 1,878,677
|
113,898
|
$ 4,047,616
|
Shares
issued to shareholders in
reinvestment of dividends |
402,531
|
13,579,745
|
255,394
|
7,988,719 |
| Shares
repurchased |
(501,862)
|
(17,253,072)
|
(1,194,390)
|
(42,125,923)
|
| Net
increase (decrease) |
(43,962)
|
$
(1,794,650) |
(825,098)
|
$
(30,089,588) |
| Class
I Shares |
|
|
|
|
| Shares
sold |
1,542,406
|
$ 55,604,813
|
1,864,870
|
$ 70,845,527
|
Shares
issued to shareholders in
reinvestment of dividends |
2,086,899
|
74,888,020
|
991,332
|
32,632,180 |
| Shares
repurchased |
(2,029,937)
|
(72,814,867)
|
(3,967,733)
|
(141,555,890)
|
| Net
increase (decrease) |
1,599,368
|
$ 57,677,966
|
(1,111,531)
|
$
(38,078,183) |
| Class
R3 Shares |
|
|
|
|
| Shares
sold |
7,836
|
$ 274,134
|
20,970
|
$ 794,404
|
Shares
issued to shareholders in
reinvestment of dividends |
13,696
|
482,287
|
7,186
|
232,451 |
| Shares
repurchased |
(16,391)
|
(569,564)
|
(46,653)
|
(1,726,925)
|
| Net
increase (decrease) |
5,141
|
$ 186,857
|
(18,497)
|
$
(700,070) |
| Class
R4 Shares |
|
|
|
|
| Shares
sold |
11,350
|
$ 403,284
|
30,008
|
$ 1,114,726
|
Shares
issued to shareholders in
reinvestment of dividends |
17,674
|
625,825
|
9,046
|
293,903 |
| Shares
repurchased |
(13,778)
|
(501,055)
|
(42,391)
|
(1,610,874)
|
| Net
increase (decrease) |
15,246
|
$ 528,054
|
(3,337)
|
$
(202,245) |
| Class
R5 Shares |
|
|
|
|
| Shares
sold |
58,493
|
$ 2,142,095
|
123,067
|
$ 4,568,125
|
Shares
issued to shareholders in
reinvestment of dividends |
63,528
|
2,282,290
|
58,718
|
1,934,612 |
| Shares
repurchased |
(100,055)
|
(3,660,445)
|
(689,498)
|
(25,626,942)
|
| Net
increase (decrease) |
21,966
|
$ 763,940
|
(507,713)
|
$
(19,124,205) |
| Class
R6 Shares |
|
|
|
|
| Shares
sold |
75,370
|
$ 2,948,165
|
131,284
|
$ 4,960,273
|
Shares
issued to shareholders in
reinvestment of dividends |
210,743
|
7,594,896
|
101,230
|
3,347,578 |
| Shares
repurchased |
(33,248)
|
(1,238,291)
|
(168,320)
|
(6,520,234)
|
| Net
increase (decrease) |
252,865
|
$ 9,304,770
|
64,194
|
$ 1,787,617
|
Thornburg Equity Funds Semi-Annual Report | 101
Notes to Financial Statements,
Continued
March 31, 2022 (Unaudited)
| |
SIX
MONTHS ENDED
March 31, 2022 |
YEAR
ENDED
September 30, 2021 |
| INTERNATIONAL
EQUITY FUND |
SHARES
|
AMOUNT
|
SHARES
|
AMOUNT
|
| Class
A Shares |
|
|
|
|
| Shares
sold |
1,497,651
|
$
40,821,311 |
2,896,091
|
$ 81,589,572
|
Shares
issued to shareholders in
reinvestment of dividends |
2,401,673
|
64,165,504
|
967,980
|
25,503,852 |
| In-kind
redemptions |
-
|
-
|
(13,269,318)
|
(391,975,649) |
| Shares
repurchased |
(2,132,657)
|
(55,846,387)
|
(5,021,375)
|
(142,779,243)
|
| Net
increase (decrease) |
1,766,667
|
$
49,140,428 |
(14,426,622)
|
$
(427,661,468) |
| Class
C Shares |
|
|
|
|
| Shares
sold |
57,307
|
$
1,326,379 |
152,073
|
$ 3,848,667
|
Shares
issued to shareholders in
reinvestment of dividends |
147,243
|
3,385,937
|
43,045
|
994,770 |
| Shares
repurchased |
(238,930)
|
(5,531,194)
|
(1,151,785)
|
(27,656,991)
|
| Net
increase (decrease) |
(34,380)
|
$
(818,878) |
(956,667)
|
$
(22,813,554) |
| Class
I Shares |
|
|
|
|
| Shares
sold |
7,804,946
|
$
207,096,133 |
11,175,901
|
$ 334,435,484
|
Shares
issued to shareholders in
reinvestment of dividends |
8,538,732
|
237,811,796
|
1,980,851
|
54,339,971 |
| Shares
repurchased |
(11,187,238)
|
(300,044,172)
|
(12,867,557)
|
(382,158,344)
|
| Net
increase (decrease) |
5,156,440
|
$
144,863,757 |
289,195
|
$ 6,617,111
|
| Class
R3 Shares |
|
|
|
|
| Shares
sold |
360,750
|
$
9,057,545 |
984,210
|
$ 28,294,741
|
Shares
issued to shareholders in
reinvestment of dividends |
740,732
|
19,783,311
|
170,983
|
4,488,294 |
| Shares
repurchased |
(808,845)
|
(20,856,459)
|
(1,836,277)
|
(52,478,097)
|
| Net
increase (decrease) |
292,637
|
$
7,984,397 |
(681,084)
|
$
(19,695,062) |
| Class
R4 Shares |
|
|
|
|
| Shares
sold |
573,171
|
$
14,352,431 |
645,614
|
$ 18,494,549
|
Shares
issued to shareholders in
reinvestment of dividends |
420,162
|
11,128,522
|
102,231
|
2,670,773 |
| Shares
repurchased |
(883,349)
|
(22,344,469)
|
(1,238,024)
|
(34,763,153)
|
| Net
increase (decrease) |
109,984
|
$
3,136,484 |
(490,179)
|
$
(13,597,831) |
| Class
R5 Shares |
|
|
|
|
| Shares
sold |
366,156
|
$
9,675,260 |
1,683,407
|
$ 50,629,374
|
Shares
issued to shareholders in
reinvestment of dividends |
717,832
|
19,976,446
|
158,583
|
4,338,871 |
| Shares
repurchased |
(1,025,935)
|
(27,388,162)
|
(1,691,896)
|
(49,972,641)
|
| Net
increase (decrease) |
58,053
|
$
2,263,544 |
150,094
|
$ 4,995,604
|
| Class
R6 Shares |
|
|
|
|
| Shares
sold |
1,316,181
|
$
34,578,204 |
3,588,727
|
$ 105,156,756
|
Shares
issued to shareholders in
reinvestment of dividends |
1,437,278
|
39,828,164
|
300,976
|
8,231,829 |
| Shares
repurchased |
(1,197,783)
|
(30,452,902)
|
(2,530,737)
|
(74,195,581)
|
| Net
increase (decrease) |
1,555,676
|
$
43,953,466 |
1,358,966
|
$ 39,193,004
|
102 |
Thornburg Equity Funds Semi-Annual Report
Notes to Financial Statements,
Continued
March 31, 2022 (Unaudited)
| |
SIX
MONTHS ENDED
March 31, 2022 |
YEAR
ENDED
September 30, 2021 |
| BETTER
WORLD INTERNATIONAL FUND |
SHARES
|
AMOUNT
|
SHARES
|
AMOUNT
|
| Class
A Shares |
|
|
|
|
| Shares
sold |
1,075,661
|
$
20,435,272 |
1,302,368
|
$ 26,146,896
|
Shares
issued to shareholders in
reinvestment of dividends |
294,897
|
5,729,841
|
-
|
- |
| Shares
repurchased |
(690,007)
|
(12,734,774)
|
(182,151)
|
(3,601,808)
|
| Net
increase (decrease) |
680,551
|
$
13,430,339 |
1,120,217
|
$ 22,545,088
|
| Class
C Shares |
|
|
|
|
| Shares
sold |
88,468
|
$
1,622,316 |
150,258
|
$ 2,960,554
|
Shares
issued to shareholders in
reinvestment of dividends |
41,038
|
780,125
|
-
|
- |
| Shares
repurchased |
(41,936)
|
(776,840)
|
(24,035)
|
(445,671)
|
| Net
increase (decrease) |
87,570
|
$
1,625,601 |
126,223
|
$ 2,514,883
|
| Class
I Shares |
|
|
|
|
| Shares
sold |
11,678,733
|
$
222,653,190 |
9,594,015
|
$ 196,134,568
|
Shares
issued to shareholders in
reinvestment of dividends |
2,124,211
|
42,507,949
|
23,974
|
433,681 |
| Shares
repurchased |
(4,567,991)
|
(85,264,106)
|
(1,087,648)
|
(22,558,240)
|
| Net
increase (decrease) |
9,234,953
|
$
179,897,033 |
8,530,341
|
$ 174,010,009
|
| |
SIX
MONTHS ENDED
March 31, 2022 |
YEAR
ENDED
September 30, 2021 |
| INTERNATIONAL
GROWTH FUND |
SHARES
|
AMOUNT
|
SHARES
|
AMOUNT
|
| Class
A Shares |
|
|
|
|
| Shares
sold |
681,808
|
$
18,834,743 |
1,593,500
|
$ 49,084,038
|
Shares
issued to shareholders in
reinvestment of dividends |
318,951
|
9,348,439
|
61,272
|
1,791,587 |
| Shares
repurchased |
(882,459)
|
(24,099,683)
|
(1,460,932)
|
(45,211,877)
|
| Net
increase (decrease) |
118,300
|
$
4,083,499 |
193,840
|
$ 5,663,748
|
| Class
C Shares |
|
|
|
|
| Shares
sold |
33,522
|
$
827,089 |
125,510
|
$ 3,534,608
|
Shares
issued to shareholders in
reinvestment of dividends |
68,485
|
1,812,795
|
18,333
|
491,332 |
| Shares
repurchased |
(242,056)
|
(5,846,516)
|
(750,148)
|
(21,111,459)
|
| Net
increase (decrease) |
(140,049)
|
$
(3,206,632) |
(606,305)
|
$
(17,085,519) |
| Class
I Shares |
|
|
|
|
| Shares
sold |
7,394,771
|
$
204,960,341 |
11,565,613
|
$ 368,764,672
|
Shares
issued to shareholders in
reinvestment of dividends |
2,988,849
|
90,890,906
|
582,668
|
17,584,909 |
| Shares
repurchased |
(15,380,952)
|
(427,128,894)
|
(11,260,799)
|
(362,527,686)
|
| Net
increase (decrease) |
(4,997,332)
|
$
(131,277,647) |
887,482
|
$ 23,821,895
|
| Class
R3 Shares |
|
|
|
|
| Shares
sold |
20,540
|
$
534,131 |
102,881
|
$ 3,150,965
|
Shares
issued to shareholders in
reinvestment of dividends |
17,128
|
493,619
|
2,994
|
86,381 |
| Shares
repurchased |
(35,259)
|
(943,755)
|
(78,786)
|
(2,424,153)
|
| Net
increase (decrease) |
2,409
|
$
83,995 |
27,089
|
$ 813,193
|
Thornburg Equity Funds Semi-Annual Report | 103
Notes to Financial Statements,
Continued
March 31, 2022 (Unaudited)
| |
SIX
MONTHS ENDED
March 31, 2022 |
YEAR
ENDED
September 30, 2021 |
| INTERNATIONAL
GROWTH FUND |
SHARES
|
AMOUNT
|
SHARES
|
AMOUNT
|
| Class
R4 Shares |
|
|
|
|
| Shares
sold |
79,278
|
$
2,130,441 |
178,688
|
$ 5,508,749
|
Shares
issued to shareholders in
reinvestment of dividends |
11,821
|
343,404
|
2,535
|
73,581 |
| Shares
repurchased |
(33,430)
|
(955,657)
|
(150,715)
|
(4,553,657)
|
| Net
increase (decrease) |
57,669
|
$
1,518,188 |
30,508
|
$ 1,028,673
|
| Class
R5 Shares |
|
|
|
|
| Shares
sold |
91,040
|
$
2,456,418 |
492,795
|
$ 15,657,087
|
Shares
issued to shareholders in
reinvestment of dividends |
74,090
|
2,260,498
|
13,159
|
398,322 |
| Shares
repurchased |
(184,523)
|
(5,136,362)
|
(510,772)
|
(16,276,600)
|
| Net
increase (decrease) |
(19,393)
|
$
(419,446) |
(4,818)
|
$
(221,191) |
| Class
R6 Shares |
|
|
|
|
| Shares
sold |
139,262
|
$
3,913,312 |
1,619,650
|
$ 52,755,172
|
Shares
issued to shareholders in
reinvestment of dividends |
210,948
|
6,463,441
|
26,476
|
803,816 |
| Shares
repurchased |
(196,421)
|
(5,342,991)
|
(301,858)
|
(9,786,674)
|
| Net
increase (decrease) |
153,789
|
$
5,033,762 |
1,344,268
|
$ 43,772,314
|
| |
SIX
MONTHS ENDED
March 31, 2022 |
YEAR
ENDED
September 30, 2021 |
| DEVELOPING
WORLD FUND |
SHARES
|
AMOUNT
|
SHARES
|
AMOUNT
|
| Class
A Shares |
|
|
|
|
| Shares
sold |
716,810
|
$
19,157,644 |
1,441,855
|
$ 40,291,192
|
Shares
issued to shareholders in
reinvestment of dividends |
-
|
-
|
-
|
- |
| Shares
repurchased |
(528,246)
|
(14,025,697)
|
(1,113,929)
|
(31,120,331)
|
| Net
increase (decrease) |
188,564
|
$
5,131,947 |
327,926
|
$ 9,170,861
|
| Class
C Shares |
|
|
|
|
| Shares
sold |
80,577
|
$
2,014,100 |
180,889
|
$ 4,875,796
|
Shares
issued to shareholders in
reinvestment of dividends |
-
|
-
|
-
|
- |
| Shares
repurchased |
(417,350)
|
(10,417,646)
|
(858,481)
|
(22,670,074)
|
| Net
increase (decrease) |
(336,773)
|
$
(8,403,546) |
(677,592)
|
$
(17,794,278) |
| Class
I Shares |
|
|
|
|
| Shares
sold |
7,723,739
|
$
207,088,521 |
10,225,864
|
$ 297,861,014
|
Shares
issued to shareholders in
reinvestment of dividends |
-
|
-
|
42,677
|
1,197,932 |
| Shares
repurchased |
(4,834,917)
|
(126,601,873)
|
(6,041,340)
|
(173,914,813)
|
| Net
increase (decrease) |
2,888,822
|
$
80,486,648 |
4,227,201
|
$ 125,144,133
|
| Class
R5 Shares |
|
|
|
|
| Shares
sold |
14,529
|
$
384,954 |
61,806
|
$ 1,799,071
|
Shares
issued to shareholders in
reinvestment of dividends |
-
|
-
|
206
|
5,772 |
| Shares
repurchased |
(31,662)
|
(836,179)
|
(31,472)
|
(904,935)
|
| Net
increase (decrease) |
(17,133)
|
$
(451,225) |
30,540
|
$ 899,908
|
104 |
Thornburg Equity Funds Semi-Annual Report
Notes to Financial Statements,
Continued
March 31, 2022 (Unaudited)
| |
SIX
MONTHS ENDED
March 31, 2022 |
YEAR
ENDED
September 30, 2021 |
| DEVELOPING
WORLD FUND |
SHARES
|
AMOUNT
|
SHARES
|
AMOUNT
|
| Class
R6 Shares |
|
|
|
|
| Shares
sold |
295,727
|
$
7,862,735 |
497,571
|
$ 14,615,052
|
Shares
issued to shareholders in
reinvestment of dividends |
-
|
-
|
5,578
|
156,695 |
| Shares
repurchased |
(161,964)
|
(4,307,138)
|
(431,178)
|
(12,649,208)
|
| Net
increase (decrease) |
133,763
|
$
3,555,597 |
71,971
|
$ 2,122,539
|
| |
SIX
MONTHS ENDED
March 31, 2022 |
YEAR
ENDED
September 30, 2021 |
| SMALL/MID
CAP CORE FUND |
SHARES
|
AMOUNT
|
SHARES
|
AMOUNT
|
| Class
A Shares |
|
|
|
|
| Shares
sold |
125,347
|
$
9,444,604 |
178,986
|
$ 15,661,024
|
Shares
issued to shareholders in
reinvestment of dividends |
1,546,880
|
116,587,733
|
-
|
- |
| Shares
repurchased |
(689,847)
|
(52,987,522)
|
(720,458)
|
(64,513,101)
|
| Net
increase (decrease) |
982,380
|
$
73,044,815 |
(541,472)
|
$
(48,852,077) |
| Class
C Shares |
|
|
|
|
| Shares
sold |
2,230
|
$
144,495 |
14,454
|
$ 1,131,222
|
Shares
issued to shareholders in
reinvestment of dividends |
74,225
|
4,803,824
|
-
|
- |
| Shares
repurchased |
(75,007)
|
(5,043,941)
|
(155,579)
|
(12,198,705)
|
| Net
increase (decrease) |
1,448
|
$
(95,622) |
(141,125)
|
$
(11,067,483) |
| Class
I Shares |
|
|
|
|
| Shares
sold |
118,099
|
$
9,582,318 |
176,656
|
$ 16,739,230
|
Shares
issued to shareholders in
reinvestment of dividends |
1,089,537
|
85,936,055
|
-
|
- |
| Shares
repurchased |
(641,758)
|
(50,357,687)
|
(615,795)
|
(57,734,767)
|
| Net
increase (decrease) |
565,878
|
$
45,160,686 |
(439,139)
|
$
(40,995,537) |
| Class
R3 Shares |
|
|
|
|
| Shares
sold |
12,131
|
$
924,331 |
25,950
|
$ 2,397,735
|
Shares
issued to shareholders in
reinvestment of dividends |
81,262
|
6,082,567
|
-
|
- |
| Shares
repurchased |
(55,836)
|
(4,417,564)
|
(117,894)
|
(10,613,280)
|
| Net
increase (decrease) |
37,557
|
$
2,589,334 |
(91,944)
|
$
(8,215,545) |
| Class
R4 Shares |
|
|
|
|
| Shares
sold |
8,749
|
$
634,659 |
3,422
|
$ 318,202
|
Shares
issued to shareholders in
reinvestment of dividends |
14,252
|
1,084,494
|
-
|
- |
| Shares
repurchased |
(13,376)
|
(1,008,307)
|
(19,198)
|
(1,819,185)
|
| Net
increase (decrease) |
9,625
|
$
710,846 |
(15,776)
|
$
(1,500,983) |
| Class
R5 Shares |
|
|
|
|
| Shares
sold |
5,795
|
$
448,827 |
17,992
|
$ 1,705,968
|
Shares
issued to shareholders in
reinvestment of dividends |
46,107
|
3,628,979
|
-
|
- |
| Shares
repurchased |
(40,192)
|
(3,356,797)
|
(55,840)
|
(5,123,800)
|
| Net
increase (decrease) |
11,710
|
$
721,009 |
(37,848)
|
$
(3,417,832) |
Thornburg Equity Funds Semi-Annual Report | 105
Notes to Financial Statements,
Continued
March 31, 2022 (Unaudited)
| |
SIX
MONTHS ENDED
March 31, 2022 |
YEAR
ENDED
September 30, 2021 |
| SMALL/MID
CAP GROWTH FUND |
SHARES
|
AMOUNT
|
SHARES
|
AMOUNT
|
| Class
A Shares |
|
|
|
|
| Shares
sold |
328,153
|
$
12,084,551 |
522,919
|
$ 26,958,739
|
Shares
issued to shareholders in
reinvestment of dividends |
3,054,719
|
110,183,728
|
427,260
|
20,478,571 |
| Shares
repurchased |
(1,926,591)
|
(63,795,111)
|
(1,140,046)
|
(58,636,070)
|
| Net
increase (decrease) |
1,456,281
|
$
58,473,168 |
(189,867)
|
$
(11,198,760) |
| Class
C Shares |
|
|
|
|
| Shares
sold |
21,311
|
$
511,254 |
65,596
|
$ 2,753,371
|
Shares
issued to shareholders in
reinvestment of dividends |
334,608
|
8,877,148
|
59,368
|
2,361,004 |
| Shares
repurchased |
(392,223)
|
(10,131,975)
|
(486,597)
|
(20,865,981)
|
| Net
increase (decrease) |
(36,304)
|
$
(743,573) |
(361,633)
|
$
(15,751,606) |
| Class
I Shares |
|
|
|
|
| Shares
sold |
799,744
|
$
46,029,512 |
296,435
|
$ 16,826,337
|
Shares
issued to shareholders in
reinvestment of dividends |
2,318,105
|
95,714,556
|
316,266
|
16,572,326 |
| Shares
repurchased |
(2,560,255)
|
(98,050,127)
|
(1,087,795)
|
(61,519,996)
|
| Net
increase (decrease) |
557,594
|
$
43,693,941 |
(475,094)
|
$
(28,121,333) |
| Class
R3 Shares |
|
|
|
|
| Shares
sold |
44,842
|
$
1,361,854 |
151,977
|
$ 7,844,430
|
Shares
issued to shareholders in
reinvestment of dividends |
257,207
|
9,092,273
|
45,769
|
2,168,563 |
| Shares
repurchased |
(99,495)
|
(3,308,865)
|
(374,516)
|
(19,047,707)
|
| Net
increase (decrease) |
202,554
|
$
7,145,262 |
(176,770)
|
$
(9,034,714) |
| Class
R4 Shares |
|
|
|
|
| Shares
sold |
5,568
|
$
208,792 |
8,612
|
$ 433,852
|
Shares
issued to shareholders in
reinvestment of dividends |
13,940
|
504,087
|
2,342
|
112,549 |
| Shares
repurchased |
(4,339)
|
(201,568)
|
(28,290)
|
(1,425,038)
|
| Net
increase (decrease) |
15,169
|
$
511,311 |
(17,336)
|
$
(878,637) |
| Class
R5 Shares |
|
|
|
|
| Shares
sold |
29,922
|
$
1,168,716 |
63,067
|
$ 3,516,214
|
Shares
issued to shareholders in
reinvestment of dividends |
159,882
|
6,590,335
|
24,886
|
1,302,303 |
| Shares
repurchased |
(142,465)
|
(5,352,136)
|
(117,021)
|
(6,574,045)
|
| Net
increase (decrease) |
47,339
|
$
2,406,915 |
(29,068)
|
$
(1,755,528) |
| |
SIX
MONTHS ENDED
March 31, 2022 |
YEAR
ENDED
September 30, 2021 |
| INCOME
BUILDER FUND |
SHARES
|
AMOUNT
|
SHARES
|
AMOUNT
|
| Class
A Shares |
|
|
|
|
| Shares
sold |
11,156,095
|
$
267,441,498 |
38,053,419
|
$ 805,315,392
|
Shares
issued to shareholders in
reinvestment of dividends |
4,099,447
|
98,851,746
|
7,326,764
|
166,752,349 |
| Shares
repurchased |
(11,626,990)
|
(278,550,117)
|
(32,268,779)
|
(708,443,380)
|
| Net
increase (decrease) |
3,628,552
|
$
87,743,127 |
13,111,404
|
$ 263,624,361
|
106 |
Thornburg Equity Funds Semi-Annual Report
Notes to Financial Statements,
Continued
March 31, 2022 (Unaudited)
| |
SIX
MONTHS ENDED
March 31, 2022 |
YEAR
ENDED
September 30, 2021 |
| INCOME
BUILDER FUND |
SHARES
|
AMOUNT
|
SHARES
|
AMOUNT
|
| Class
C Shares |
|
|
|
|
| Shares
sold |
1,787,357
|
$
42,854,147 |
2,768,674
|
$ 62,298,586
|
Shares
issued to shareholders in
reinvestment of dividends |
817,143
|
19,703,961
|
1,990,410
|
44,975,480 |
| Shares
repurchased |
(8,491,715)
|
(203,189,268)
|
(42,291,629)
|
(892,113,747)
|
| Net
increase (decrease) |
(5,887,215)
|
$
(140,631,160) |
(37,532,545)
|
$
(784,839,681) |
| Class
I Shares |
|
|
|
|
| Shares
sold |
21,730,102
|
$
524,918,391 |
31,505,910
|
$ 714,592,583
|
Shares
issued to shareholders in
reinvestment of dividends |
6,449,382
|
156,616,479
|
11,591,990
|
265,649,744 |
| Shares
repurchased |
(19,017,805)
|
(459,194,450)
|
(60,241,755)
|
(1,316,043,000)
|
| Net
increase (decrease) |
9,161,679
|
$
222,340,420 |
(17,143,855)
|
$
(335,800,673) |
| Class
R3 Shares |
|
|
|
|
| Shares
sold |
59,319
|
$
1,430,499 |
99,771
|
$ 2,233,156
|
Shares
issued to shareholders in
reinvestment of dividends |
25,634
|
618,166
|
50,662
|
1,150,008 |
| Shares
repurchased |
(99,924)
|
(2,410,227)
|
(364,539)
|
(8,031,967)
|
| Net
increase (decrease) |
(14,971)
|
$
(361,562) |
(214,106)
|
$
(4,648,803) |
| Class
R4 Shares |
|
|
|
|
| Shares
sold |
39,423
|
$
938,565 |
83,913
|
$ 1,871,243
|
Shares
issued to shareholders in
reinvestment of dividends |
12,099
|
292,158
|
24,287
|
552,047 |
| Shares
repurchased |
(42,276)
|
(1,009,928)
|
(250,185)
|
(5,484,345)
|
| Net
increase (decrease) |
9,246
|
$
220,795 |
(141,985)
|
$
(3,061,055) |
| Class
R5 Shares |
|
|
|
|
| Shares
sold |
167,566
|
$
4,008,740 |
408,481
|
$ 9,218,476
|
Shares
issued to shareholders in
reinvestment of dividends |
31,048
|
754,550
|
72,984
|
1,665,569 |
| Shares
repurchased |
(394,816)
|
(9,534,566)
|
(1,211,745)
|
(27,247,650)
|
| Net
increase (decrease) |
(196,202)
|
$
(4,771,276) |
(730,280)
|
$
(16,363,605) |
| Class
R6 Shares |
|
|
|
|
| Shares
sold |
273,352
|
$
6,557,199 |
590,224
|
$ 13,367,382
|
Shares
issued to shareholders in
reinvestment of dividends |
125,546
|
3,038,830
|
222,481
|
5,084,324 |
| Shares
repurchased |
(148,576)
|
(3,601,727)
|
(522,152)
|
(11,759,667)
|
| Net
increase (decrease) |
250,322
|
$
5,994,302 |
290,553
|
$ 6,692,039
|
| |
SIX
MONTHS ENDED
March 31, 2022 |
YEAR
ENDED
September 30, 2021 |
| SUMMIT
FUND |
SHARES
|
AMOUNT
|
SHARES
|
AMOUNT
|
| Class
A Shares† |
|
|
|
|
| Shares
sold |
9,636
|
$
116,529 |
-
|
$
- |
Shares
issued to shareholders in
reinvestment of dividends |
46
|
549
|
-
|
-
|
| Net
increase (decrease) |
9,682
|
$
117,078 |
-
|
$
- |
Thornburg Equity Funds Semi-Annual Report | 107
Notes to Financial Statements,
Continued
March 31, 2022 (Unaudited)
| |
SIX
MONTHS ENDED
March 31, 2022 |
YEAR
ENDED
September 30, 2021 |
| SUMMIT
FUND |
SHARES
|
AMOUNT
|
SHARES
|
AMOUNT
|
| Class
I Shares |
|
|
|
|
| Shares
sold |
738,801
|
$
9,085,155 |
501,726
|
$ 6,924,014
|
Shares
issued to shareholders in
reinvestment of dividends |
791,182
|
9,941,769
|
241,184
|
3,005,041 |
| Shares
repurchased |
(23,003)
|
(276,034)
|
(126,679)
|
(1,800,100)
|
| Net
increase (decrease) |
1,506,980
|
$
18,750,890 |
616,231
|
$ 8,128,955
|
| † Effective
date of this class of shares was January 26, 2022. |
NOTE 7 – INVESTMENT TRANSACTIONS
For the six months ended March 31, 2022, the Funds had
purchase and sale transactions of investments as listed in the table below (excluding short-term investments).
| |
LONG
|
|
| |
Purchases
|
Sales
|
| Global
Opportunities Fund |
$ 102,222,394
|
$ 157,809,973
|
| International
Equity Fund |
746,532,824
|
768,353,847 |
| Better
World International Fund |
440,195,612
|
313,730,183 |
| International
Growth Fund |
489,280,254
|
729,072,359 |
| Developing
World Fund |
503,431,163
|
418,366,553 |
| Small/Mid
Cap Core Fund |
164,836,883
|
279,463,908 |
| Small/Mid
Cap Growth Fund |
172,459,208
|
306,131,572 |
| Income
Builder Fund |
1,324,444,390
|
1,199,235,815 |
| Summit
Fund |
41,512,634 |
30,222,736 |
NOTE
8 – DERIVATIVE FINANCIAL INSTRUMENTS
The
Funds may use a variety of derivative financial instruments to hedge or adjust the risks affecting its investment portfolio or to enhance investment returns. Provisions of the FASB Accounting Standards Codification 815-10-50 (“ASC 815”)
require certain disclosures. The disclosures are intended to provide users of financial statements with an understanding of the use of derivative instruments by the Funds and how these derivatives affect the financial position, financial performance
and cash flows of the Funds. The Funds do not designate any derivative instruments as hedging instruments under ASC 815. During the six months ended March 31, 2022, the Funds’ principal exposure to derivative financial instruments of the type
addressed by ASC 815 was investment in foreign currency contracts, except that the Summit Fund also had exposure during the period to options.
Forward Currency
Contracts: During the six months ended March 31, 2022, some of the Funds entered into forward currency contracts in the normal course of pursuing their investment objectives, with the intent of reducing the risk to the value of the
Funds’ foreign investments from adverse changes in the relationship between the U.S. dollar and foreign currencies. Each of the forward currency contracts entered into by the Funds is an agreement between two parties to exchange different
currencies at a specified rate of exchange at an agreed upon future date. Foreign currency contracts involve risks to the Funds, including the risk that a contract’s counterparty will not meet its obligations to the Funds, the risk that a
change in a contract’s value may not correlate perfectly with the currency the contract was intended to track, and the risk that the Funds’ Advisor is unable to correctly implement its strategy in using a contract. In any such instance,
the Funds may not achieve the intended benefit of entering into a contract and may experience a loss.
The monthly average values of open forward currency sell
contracts for the six months ended March 31, 2022 for Global Opportunities Fund and Income Builder Fund were $ 99,641,644; and $1,496,053,538 respectively.
These contracts are accounted for by the Funds under ASC 815.
Unrealized appreciation and depreciation on outstanding contracts are reported in each Fund’s Statement of Assets and Liabilities, as measured by the difference between the forward exchange rates at the reporting date and the forward exchange
rates at each contract’s inception date. Net realized gain (loss) on contracts closed during the period, and changes in net unrealized appreciation (depreciation) on outstanding contracts are recognized in each Fund’s Statement of
Operations.
These outstanding forward currency contracts
in the table located in the Schedule of Investments which were entered into with State Street Bank and Trust Company (“SSB”), with Brown Brothers Harriman & Co. (“BBH”) and with Morgan Stanley & Co. Inc. ("MSC") were
entered
108 |
Thornburg Equity Funds Semi-Annual Report
Notes to Financial Statements,
Continued
March 31, 2022 (Unaudited)
into pursuant to International Swaps and Derivatives Association
(“ISDA”) Master Agreements. In the event of a default or termination under the ISDA Master Agreement with SSB or MSC, the non-defaulting party has the right to close out all outstanding forward currency contracts between the parties and
to net any payment amounts under those contracts, resulting in a single net amount payable by one party to the other.
Because the ISDA Master Agreement with SSB and the ISDA Master
Agreement with MSC do not result in an offset of reported amounts of financial assets and liabilities in the Funds’ Statement of Assets and Liabilities unless there has been an event of default or termination event under such agreements, the
Funds do not net its outstanding forward currency contracts for the purpose of disclosure in the Funds’ Statement of Assets and Liabilities. Instead the Funds recognize the unrealized appreciation (depreciation) on those forward currency
contracts on a gross basis in the Funds’ Statement of Assets and Liabilities.
Option
Contracts: Each Fund may engage in option transactions and in doing so achieves similar objectives to what it would achieve through the sale or purchase of individual securities. A call option, upon payment of a premium, gives the purchaser
of the option the right to buy, and the seller of the option the obligation to sell, the underlying security, index or other instrument at the exercise price.
A put option gives the purchaser of the option, upon payment
of a premium, the right to sell, and the seller the obligation to buy, the underlying security, index, or other instrument at the exercise price. To seek to offset some of the risk of a potential decline in value of certain long positions, each Fund
may also purchase put options on individual securities, broad-based securities indexes or certain exchange-traded funds (“ETFs”). Each Fund may also seek to generate income from option premiums by writing (selling) options on a portion
of the equity securities (including securities that are convertible into equity securities) in the Funds’ portfolio, on broad-based securities indexes, or certain ETFs.
When the Fund purchases an option, it pays a premium and an
amount equal to that premium is recorded as an asset. When the Fund writes an option, it receives a premium and an amount equal to that premium is recorded as a liability. The asset or liability is adjusted daily to reflect the current market value
of the option. If an option expires unexercised, the Fund realizes a gain or loss to the extent of the premium received or paid. If an option is exercised, the premium received or paid is recorded as an adjustment to the proceeds from the sale or
the cost basis of the purchase. The difference between the premium and the amount received or paid on a closing purchase or sale transaction is also treated as a realized gain or loss. The cost of securities acquired through the exercise of call
options is increased by premiums paid. The proceeds from securities sold through the exercise of put options are decreased by the premiums paid. Gain or loss on written options and purchased options is presented separately on the Statements of
Operations as net realized gain or loss on written options and net realized gain or loss on purchased options, respectively.
During the six month period ended March 31, 2022, Summit Fund
engaged in over-the-counter (OTC) option trades.
Options
written by each Fund do not typically give rise to counterparty credit risk since options written obligate each Fund and not the counterparty to perform. Exchange traded purchased options have minimal counterparty credit risk to each Fund since the
exchange’s clearinghouse, as counterparty to such instruments, guarantees against a possible default.
The monthly average notional value of open options written for
the six months ended March 31, 2022 for Summit Fund was $263,174. As of March 31, 2022, the Funds had no outstanding purchased options and/or written options.
The unrealized appreciation (depreciation) of the outstanding
forward currency contracts recognized in each Fund’s Statement of Assets and Liabilities at March 31, 2022 is disclosed in the following table:
| |
Type
of Derivative(a) |
Counter
Party |
Asset
Derivatives |
Liability
Derivatives |
Net
Amount |
| Global
Opportunities Fund |
Forward
currency contracts |
SSB
|
$
3,350,325 |
$ —
|
$ 3,350,325
|
| |
Forward
currency contracts |
BBH
|
658,353
|
—
|
658,353
|
| |
|
|
$
4,008,678 |
$
— |
$
4,008,678 |
| Income
Builder Fund |
Forward
currency contracts |
SSB
|
49,273,306
|
—
|
49,273,306
|
| |
Forward
currency contracts |
BBH
|
16,639,247
|
—
|
16,639,247
|
| |
|
|
$
65,912,553 |
$
— |
$
65,912,553 |
| Summit
Fund |
Forward
currency contracts |
MSC
|
— |
(49,747) |
(49,747) |
| (a)
|
Generally,
the Statement of Assets and Liabilities location for forward currency contracts is Assets - Unrealized appreciation on forward currency contracts for asset derivatives and Liabilities - Unrealized depreciation on forward currency contracts for
liabilities derivatives. |
Because the
Funds did not receive or post cash collateral in connection with its currency forward contracts during the period, the net amounts of each Fund’s assets and liabilities which are attributable to those contracts at March 31, 2022 can be
determined by offsetting the dollar amounts shown in the asset and liability columns in the preceding table, the results of which are reflected in the "Net Amount"
Thornburg Equity Funds Semi-Annual Report | 109
Notes to Financial Statements,
Continued
March 31, 2022 (Unaudited)
column. The Funds’ forward currency contracts and written options are
valued each day, and the net amounts of each Fund’s assets and liabilities which are attributable to those contracts and options are expected to vary over time.
The net realized gain (loss) from forward currency contracts
and written options and net change in unrealized appreciation (depreciation) on outstanding forward currency contracts and written options recognized in each Fund’s Statement of Operations for the six months ended March 31, 2022 are disclosed
in the following table:
| |
|
|
Net
Realized |
|
Net Change
in Unrealized |
| |
Type
of Derivative(a) |
|
Gain
(Loss) |
|
Appreciation
(Depreciation) |
| Global
Opportunities Fund |
Forward
currency contracts |
|
$ 1,713,642
|
|
$
2,471,424 |
| Income
Builder Fund |
Forward
currency contracts |
|
28,883,969
|
|
41,665,563 |
| Summit
Fund |
Forward
currency contracts |
|
(64,783)
|
|
(29,011) |
| Summit
Fund |
Written
Options |
|
32,635 |
|
— |
| (a)
|
Generally,
the Statement of Operations location for forward currency contracts is Net realized gain (loss) on: forward currency contracts and Net change in unrealized appreciation (depreciation) on: forward currency contracts. The Statement of Operations
location for written option contracts is Net realized gain (loss) on: options written and Net change in unrealized appreciation (depreciation) on: options written. |
110 | Thornburg Equity Funds Semi-Annual Report
This page intentionally left
blank.
Thornburg Equity Funds Semi-Annual Report | 111
Financial Highlights
Global Opportunities Fund
| |
PER
SHARE PERFORMANCE (FOR A SHARE OUTSTANDING THROUGHOUT THE PERIOD) |
UNLESS
OTHERWISE
NOTED, PERIODS ARE
FISCAL YEARS ENDED
SEPTEMBER 30, |
Net
Asset
Value,
Beginning
of PERIOD |
Net
Investment
Income
(Loss)+ |
Net
Realized &
Unrealized
Gain (Loss) on
Investments |
Total
from
Investment
Operations |
Dividends
from Net
Investment
Income |
Dividends
from Net
Realized
Gains |
Dividends
from
Return of
Capital |
Total
Dividends |
Net
Asset
Value,
End of
PERIOD |
| CLASS
A SHARES(c) |
| 2022
(d) |
$ 39.32
|
0.01
|
0.38
|
0.39
|
(0.49)
|
(4.55)
|
—
|
(5.04)
|
$ 34.67
|
| 2021
|
$ 31.69
|
0.53
|
9.40
|
9.93
|
—
(f) |
(2.30)
|
—
|
(2.30)
|
$ 39.32
|
| 2020
|
$ 27.56
|
0.08
|
4.47
|
4.55
|
(0.14)
|
(0.28)
|
—
|
(0.42)
|
$ 31.69
|
| 2019
|
$ 29.93
|
0.20
|
(2.02)
|
(1.82)
|
(0.55)
|
—
|
—
|
(0.55)
|
$ 27.56
|
| 2018
|
$ 30.98
|
0.44
|
(1.42)
|
(0.98)
|
(0.07)
|
—
|
—
|
(0.07)
|
$ 29.93
|
| 2017
|
$ 24.90
|
0.13
|
6.05
|
6.18
|
(0.10)
|
—
|
—
|
(0.10)
|
$ 30.98
|
| CLASS
C SHARES |
| 2022
(d) |
$ 37.36
|
(0.13)
|
0.38
|
0.25
|
(0.19)
|
(4.55)
|
—
|
(4.74)
|
$ 32.87
|
| 2021
|
$ 30.44
|
0.22
|
9.00
|
9.22
|
—
|
(2.30)
|
—
|
(2.30)
|
$ 37.36
|
| 2020
|
$ 26.55
|
(0.14)
|
4.31
|
4.17
|
—
|
(0.28)
|
—
|
(0.28)
|
$ 30.44
|
| 2019
|
$ 28.70
|
(0.01)
|
(1.89)
|
(1.90)
|
(0.25)
|
—
|
—
|
(0.25)
|
$ 26.55
|
| 2018
|
$ 29.88
|
0.23
|
(1.39)
|
(1.16)
|
(0.02)
|
—
|
—
|
(0.02)
|
$ 28.70
|
| 2017
|
$ 24.13
|
(0.08)
|
5.84
|
5.76
|
(0.01)
|
—
|
—
|
(0.01)
|
$ 29.88
|
| CLASS
I SHARES |
| 2022
(d) |
$ 39.49
|
0.06
|
0.40
|
0.46
|
(0.59)
|
(4.55)
|
—
|
(5.14)
|
$ 34.81
|
| 2021
|
$ 31.81
|
0.64
|
9.43
|
10.07
|
(0.09)
|
(2.30)
|
—
|
(2.39)
|
$ 39.49
|
| 2020
|
$ 27.67
|
0.15
|
4.50
|
4.65
|
(0.23)
|
(0.28)
|
—
|
(0.51)
|
$ 31.81
|
| 2019
|
$ 30.07
|
0.29
|
(2.04)
|
(1.75)
|
(0.65)
|
—
|
—
|
(0.65)
|
$ 27.67
|
| 2018
|
$ 31.06
|
0.56
|
(1.45)
|
(0.89)
|
(0.10)
|
—
|
—
|
(0.10)
|
$ 30.07
|
| 2017
|
$ 24.96
|
0.23
|
6.07
|
6.30
|
(0.20)
|
—
|
—
|
(0.20)
|
$ 31.06
|
| CLASS
R3 SHARES |
| 2022
(d) |
$ 38.81
|
(0.03)
|
0.40
|
0.37
|
(0.40)
|
(4.55)
|
—
|
(4.95)
|
$ 34.23
|
| 2021
|
$ 31.38
|
0.42
|
9.31
|
9.73
|
—
|
(2.30)
|
—
|
(2.30)
|
$ 38.81
|
| 2020
|
$ 27.28
|
0.01
|
4.42
|
4.43
|
(0.05)
|
(0.28)
|
—
|
(0.33)
|
$ 31.38
|
| 2019
|
$ 29.57
|
0.15
|
(1.98)
|
(1.83)
|
(0.46)
|
—
|
—
|
(0.46)
|
$ 27.28
|
| 2018
|
$ 30.66
|
0.38
|
(1.41)
|
(1.03)
|
(0.06)
|
—
|
—
|
(0.06)
|
$ 29.57
|
| 2017
|
$ 24.66
|
0.08
|
5.99
|
6.07
|
(0.07)
|
—
|
—
|
(0.07)
|
$ 30.66
|
| CLASS
R4 SHARES |
| 2022
(d) |
$ 39.01
|
(0.01)
|
0.39
|
0.38
|
(0.44)
|
(4.55)
|
—
|
(4.99)
|
$ 34.40
|
| 2021
|
$ 31.50
|
0.49
|
9.32
|
9.81
|
—
|
(2.30)
|
—
|
(2.30)
|
$ 39.01
|
| 2020
|
$ 27.32
|
0.03
|
4.43
|
4.46
|
—
|
(0.28)
|
—
|
(0.28)
|
$ 31.50
|
| 2019
|
$ 29.62
|
0.19
|
(2.00)
|
(1.81)
|
(0.49)
|
—
|
—
|
(0.49)
|
$ 27.32
|
| 2018
|
$ 30.69
|
0.46
|
(1.47)
|
(1.01)
|
(0.06)
|
—
|
—
|
(0.06)
|
$ 29.62
|
| 2017
|
$ 24.67
|
0.11
|
6.00
|
6.11
|
(0.09)
|
—
|
—
|
(0.09)
|
$ 30.69
|
| CLASS
R5 SHARES |
| 2022
(d) |
$ 39.53
|
0.06
|
0.40
|
0.46
|
(0.58)
|
(4.55)
|
—
|
(5.13)
|
$ 34.86
|
| 2021
|
$ 31.84
|
0.61
|
9.47
|
10.08
|
(0.09)
|
(2.30)
|
—
|
(2.39)
|
$ 39.53
|
| 2020
|
$ 27.70
|
0.15
|
4.50
|
4.65
|
(0.23)
|
(0.28)
|
—
|
(0.51)
|
$ 31.84
|
| 2019
|
$ 30.10
|
0.28
|
(2.02)
|
(1.74)
|
(0.66)
|
—
|
—
|
(0.66)
|
$ 27.70
|
| 2018
|
$ 31.10
|
0.57
|
(1.47)
|
(0.90)
|
(0.10)
|
—
|
—
|
(0.10)
|
$ 30.10
|
| 2017
|
$ 24.99
|
0.22
|
6.08
|
6.30
|
(0.19)
|
—
|
—
|
(0.19)
|
$ 31.10
|
| CLASS
R6 SHARES |
| 2022
(d) |
$ 39.64
|
0.09
|
0.39
|
0.48
|
(0.64)
|
(4.55)
|
—
|
(5.19)
|
$ 34.93
|
| 2021
|
$ 31.93
|
0.70
|
9.44
|
10.14
|
(0.13)
|
(2.30)
|
—
|
(2.43)
|
$ 39.64
|
| 2020
|
$ 27.77
|
0.21
|
4.50
|
4.71
|
(0.27)
|
(0.28)
|
—
|
(0.55)
|
$ 31.93
|
| 2019
|
$ 30.20
|
0.32
|
(2.05)
|
(1.73)
|
(0.70)
|
—
|
—
|
(0.70)
|
$ 27.77
|
| 2018
|
$ 31.16
|
0.90
|
(1.75)
|
(0.85)
|
(0.11)
|
—
|
—
|
(0.11)
|
$ 30.20
|
| 2017
(g) |
$ 28.35
|
0.11
|
2.73
|
2.84
|
(0.03)
|
—
|
—
|
(0.03)
|
$ 31.16
|
| (a)
|
Net
investment income (loss) includes income from foreign withholding tax claims adjusted for IRS compliance fees and/or tax reclaim collection fees. Without these proceeds, the Net Investment Income (Loss) ratios for 2022 would have been: Class A,
(0.02)%; Class C, (0.81)%; Class I, 0.28%; Class R3, (0.24)%; Class R4, (0.13)%; Class R5, 0.27%; Class R6, 0.42% and 2021 would have been: Class A, 1.36%; Class C, 0.57%; Class I, 1.64%; Class R3, 1.10%; Class R4, 1.27%; Class R5, 1.60%; Class R6,
1.80%. |
| (b)
|
Not
annualized for periods less than one year. |
| (c)
|
Sales
loads are not reflected in computing total return. |
| (d)
|
Unaudited
Six Month Period Ended March 31. |
| (e)
|
Annualized.
|
| (f)
|
Dividends
From Net Investment Income was less than 0.01. |
| (g)
|
Effective
date of this class of shares was April 10, 2017. |
| (h)
|
Due
to the size of net assets and fixed expenses, ratios may appear disproportionate. |
| +
|
Based
on weighted average shares outstanding. |
See notes to financial statements.
112 | Thornburg Equity Funds Semi-Annual Report
Financial Highlights, Continued
Global Opportunities Fund
| |
RATIOS
TO AVERAGE NET ASSETS |
|
Supplemental
Data |
UNLESS
OTHERWISE
NOTED, PERIODS ARE
FISCAL YEARS ENDED
SEPTEMBER 30, |
Net
Investment
Income (Loss) (%)(a) |
Expenses,
After
Expense
Reductions (%) |
Expenses,
Before Expense
Reductions (%) |
|
Total
Return (%)(b) |
Portfolio
Turnover
Rate (%)(b) |
Net
Assets
at End of PERIOD
(Thousands) |
| CLASS
A SHARES(c) |
| 2022
(d) |
0.06
(e) |
1.28
(e) |
1.32
(e) |
|
0.77
|
9.84
|
$ 272,062
|
| 2021
|
1.42
|
1.27
|
1.31
|
|
32.82
|
25.48
|
$ 277,126
|
| 2020
|
0.27
|
1.28
|
1.32
|
|
16.59
|
35.63
|
$ 215,473
|
| 2019
|
0.73
|
1.31
|
1.33
|
|
(5.78)
|
29.12
|
$ 236,560
|
| 2018
|
1.40
|
1.28
|
1.28
|
|
(3.16)
|
41.99
|
$ 367,449
|
| 2017
|
0.46
|
1.33
|
1.33
|
|
24.85
|
43.70
|
$ 442,522
|
| CLASS
C SHARES |
| 2022
(d) |
(0.73)
(e) |
2.06
(e) |
2.10
(e) |
|
0.41
|
9.84
|
$ 97,456
|
| 2021
|
0.63
|
2.04
|
2.08
|
|
31.77
|
25.48
|
$ 112,420
|
| 2020
|
(0.49)
|
2.02
|
2.06
|
|
15.78
|
35.63
|
$ 116,705
|
| 2019
|
(0.02)
|
2.07
|
2.09
|
|
(6.49)
|
29.12
|
$ 151,469
|
| 2018
|
0.78
|
2.03
|
2.03
|
|
(3.90)
|
41.99
|
$ 253,907
|
| 2017
|
(0.30)
|
2.08
|
2.08
|
|
23.88
|
43.70
|
$ 380,046
|
| CLASS
I SHARES |
| 2022
(d) |
0.35
(e) |
0.99
(e) |
1.05
(e) |
|
0.95
|
9.84
|
$ 589,400
|
| 2021
|
1.69
|
0.99
|
1.06
|
|
33.17
|
25.48
|
$ 605,581
|
| 2020
|
0.50
|
0.99
|
1.08
|
|
16.91
|
35.63
|
$ 523,175
|
| 2019
|
1.05
|
0.99
|
1.06
|
|
(5.46)
|
29.12
|
$ 762,697
|
| 2018
|
1.79
|
0.97
|
0.97
|
|
(2.88)
|
41.99
|
$ 1,200,267
|
| 2017
|
0.80
|
0.97
|
0.98
|
|
25.31
|
43.70
|
$ 1,514,039
|
| CLASS
R3 SHARES |
| 2022
(d) |
(0.16)
(e) |
1.50
(e) |
2.32
(e) |
|
0.71
|
9.84
|
$ 3,506
|
| 2021
|
1.15
|
1.50
|
2.07
|
|
32.48
|
25.48
|
$ 3,776
|
| 2020
|
0.03
|
1.50
|
2.00
|
|
16.32
|
35.63
|
$ 3,633
|
| 2019
|
0.55
|
1.50
|
2.20
|
|
(5.95)
|
29.12
|
$ 4,317
|
| 2018
|
1.22
|
1.50
|
1.92
|
|
(3.38)
|
41.99
|
$ 7,577
|
| 2017
|
0.28
|
1.50
|
1.97
|
|
24.66
|
43.70
|
$ 12,059
|
| CLASS
R4 SHARES |
| 2022
(d) |
(0.06)
(e) |
1.40
(e) |
2.00
(e) |
|
0.75
|
9.84
|
$ 5,971
|
| 2021
|
1.32
|
1.40
|
1.83
|
|
32.62
|
25.48
|
$ 6,177
|
| 2020
|
0.09
|
1.40
|
1.62
|
|
16.41
|
35.63
|
$ 5,093
|
| 2019
|
0.71
|
1.40
|
1.86
|
|
(5.84)
|
29.12
|
$ 9,254
|
| 2018
|
1.49
|
1.40
|
1.61
|
|
(3.29)
|
41.99
|
$ 20,786
|
| 2017
|
0.38
|
1.40
|
1.65
|
|
24.81
|
43.70
|
$ 28,061
|
| CLASS
R5 SHARES |
| 2022
(d) |
0.35
(e) |
0.99
(e) |
1.42
(e) |
|
0.95
|
9.84
|
$ 18,994
|
| 2021
|
1.64
|
0.99
|
1.36
|
|
33.18
|
25.48
|
$ 20,673
|
| 2020
|
0.53
|
0.99
|
1.28
|
|
16.89
|
35.63
|
$ 32,817
|
| 2019
|
1.04
|
0.99
|
1.27
|
|
(5.45)
|
29.12
|
$ 42,354
|
| 2018
|
1.82
|
0.99
|
1.16
|
|
(2.92)
|
41.99
|
$ 70,084
|
| 2017
|
0.79
|
0.99
|
1.16
|
|
25.29
|
43.70
|
$ 80,704
|
| CLASS
R6 SHARES |
| 2022
(d) |
0.50
(e) |
0.85
(e) |
1.01
(e) |
|
1.00
|
9.84
|
$ 59,127
|
| 2021
|
1.85
|
0.85
|
1.00
|
|
33.32
|
25.48
|
$ 57,072
|
| 2020
|
0.70
|
0.85
|
1.03
|
|
17.08
|
35.63
|
$ 43,911
|
| 2019
|
1.17
|
0.85
|
1.00
|
|
(5.34)
|
29.12
|
$ 45,699
|
| 2018
|
2.93
|
0.85
|
0.98
|
|
(2.75)
|
41.99
|
$ 51,836
|
| 2017
(g) |
0.77
(e) |
0.85
(e) |
13.31
(e)(h) |
|
10.02
|
43.70
|
$ 1,576
|
Thornburg Equity Funds Semi-Annual Report | 113
Financial Highlights
International Equity Fund
| |
PER
SHARE PERFORMANCE (FOR A SHARE OUTSTANDING THROUGHOUT THE PERIOD) |
UNLESS
OTHERWISE
NOTED, PERIODS ARE
FISCAL YEARS ENDED
SEPTEMBER 30, |
Net
Asset
Value,
Beginning
of PERIOD |
Net
Investment
Income
(Loss)+ |
Net
Realized &
Unrealized
Gain (Loss) on
Investments |
Total
from
Investment
Operations |
Dividends
from Net
Investment
Income |
Dividends
from Net
Realized
Gains |
Dividends
from
Return of
Capital |
Total
Dividends |
Net
Asset
Value,
End of
PERIOD |
| CLASS
A SHARES(d) |
| 2022
(e) |
$ 28.75
|
0.09
|
(1.97)
|
(1.88)
|
(0.27)
|
(3.43)
|
—
|
(3.70)
|
$ 23.17
|
| 2021
|
$ 24.78
|
0.31
|
4.49
|
4.80
|
(0.06)
|
(0.77)
|
—
|
(0.83)
|
$ 28.75
|
| 2020
|
$ 22.91
|
0.07
|
3.29
|
3.36
|
(0.21)
|
(1.28)
|
—
|
(1.49)
|
$ 24.78
|
| 2019
|
$ 22.69
|
0.19
|
0.31
|
0.50
|
(0.28)
|
—
|
—
|
(0.28)
|
$ 22.91
|
| 2018
|
$ 27.63
|
0.19
|
(1.10)
|
(0.91)
|
—
|
(4.03)
|
—
|
(4.03)
|
$ 22.69
|
| 2017
|
$ 23.43
|
0.16
|
4.24
|
4.40
|
(0.20)
|
—
|
—
|
(0.20)
|
$ 27.63
|
| CLASS
C SHARES |
| 2022
(e) |
$ 25.20
|
—
(g) |
(1.68)
|
(1.68)
|
(0.14)
|
(3.43)
|
—
|
(3.57)
|
$ 19.95
|
| 2021
|
$ 21.91
|
0.06
|
4.00
|
4.06
|
—
|
(0.77)
|
—
|
(0.77)
|
$ 25.20
|
| 2020
|
$ 20.33
|
(0.08)
|
2.94
|
2.86
|
—
|
(1.28)
|
—
|
(1.28)
|
$ 21.91
|
| 2019
|
$ 20.01
|
—
(g) |
0.32
|
0.32
|
—
|
—
|
—
|
—
|
$ 20.33
|
| 2018
|
$ 25.00
|
0.02
|
(0.98)
|
(0.96)
|
—
|
(4.03)
|
—
|
(4.03)
|
$ 20.01
|
| 2017
|
$ 21.29
|
(0.02)
|
3.84
|
3.82
|
(0.11)
|
—
|
—
|
(0.11)
|
$ 25.00
|
| CLASS
I SHARES |
| 2022
(e) |
$ 29.88
|
0.15
|
(2.06)
|
(1.91)
|
(0.41)
|
(3.43)
|
—
|
(3.84)
|
$ 24.13
|
| 2021
|
$ 25.70
|
0.39
|
4.68
|
5.07
|
(0.12)
|
(0.77)
|
—
|
(0.89)
|
$ 29.88
|
| 2020
|
$ 23.69
|
0.15
|
3.42
|
3.57
|
(0.28)
|
(1.28)
|
—
|
(1.56)
|
$ 25.70
|
| 2019
|
$ 23.47
|
0.25
|
0.32
|
0.57
|
(0.35)
|
—
|
—
|
(0.35)
|
$ 23.69
|
| 2018
|
$ 28.37
|
0.29
|
(1.15)
|
(0.86)
|
(0.01)
|
(4.03)
|
—
|
(4.04)
|
$ 23.47
|
| 2017
|
$ 24.02
|
0.25
|
4.37
|
4.62
|
(0.27)
|
—
|
—
|
(0.27)
|
$ 28.37
|
| CLASS
R3 SHARES |
| 2022
(e) |
$ 28.75
|
0.08
|
(1.98)
|
(1.90)
|
(0.26)
|
(3.43)
|
—
|
(3.69)
|
$ 23.16
|
| 2021
|
$ 24.77
|
0.23
|
4.52
|
4.75
|
—
|
(0.77)
|
—
|
(0.77)
|
$ 28.75
|
| 2020
|
$ 22.89
|
0.03
|
3.29
|
3.32
|
(0.16)
|
(1.28)
|
—
|
(1.44)
|
$ 24.77
|
| 2019
|
$ 22.65
|
0.15
|
0.31
|
0.46
|
(0.22)
|
—
|
—
|
(0.22)
|
$ 22.89
|
| 2018
|
$ 27.63
|
0.14
|
(1.09)
|
(0.95)
|
—
|
(4.03)
|
—
|
(4.03)
|
$ 22.65
|
| 2017
|
$ 23.44
|
0.14
|
4.22
|
4.36
|
(0.17)
|
—
|
—
|
(0.17)
|
$ 27.63
|
| CLASS
R4 SHARES |
| 2022
(e) |
$ 28.56
|
0.10
|
(1.96)
|
(1.86)
|
(0.32)
|
(3.43)
|
—
|
(3.75)
|
$ 22.95
|
| 2021
|
$ 24.60
|
0.28
|
4.49
|
4.77
|
(0.04)
|
(0.77)
|
—
|
(0.81)
|
$ 28.56
|
| 2020
|
$ 22.74
|
0.07
|
3.27
|
3.34
|
(0.20)
|
(1.28)
|
—
|
(1.48)
|
$ 24.60
|
| 2019
|
$ 22.52
|
0.19
|
0.30
|
0.49
|
(0.27)
|
—
|
—
|
(0.27)
|
$ 22.74
|
| 2018
|
$ 27.45
|
0.20
|
(1.10)
|
(0.90)
|
—
|
(4.03)
|
—
|
(4.03)
|
$ 22.52
|
| 2017
|
$ 23.26
|
0.18
|
4.21
|
4.39
|
(0.20)
|
—
|
—
|
(0.20)
|
$ 27.45
|
| CLASS
R5 SHARES |
| 2022
(e) |
$ 29.84
|
0.14
|
(2.05)
|
(1.91)
|
(0.40)
|
(3.43)
|
—
|
(3.83)
|
$ 24.10
|
| 2021
|
$ 25.66
|
0.38
|
4.67
|
5.05
|
(0.10)
|
(0.77)
|
—
|
(0.87)
|
$ 29.84
|
| 2020
|
$ 23.67
|
0.13
|
3.42
|
3.55
|
(0.28)
|
(1.28)
|
—
|
(1.56)
|
$ 25.66
|
| 2019
|
$ 23.44
|
0.25
|
0.32
|
0.57
|
(0.34)
|
—
|
—
|
(0.34)
|
$ 23.67
|
| 2018
|
$ 28.35
|
0.27
|
(1.15)
|
(0.88)
|
—
(h) |
(4.03)
|
—
|
(4.03)
|
$ 23.44
|
| 2017
|
$ 24.01
|
0.24
|
4.35
|
4.59
|
(0.25)
|
—
|
—
|
(0.25)
|
$ 28.35
|
| CLASS
R6 SHARES |
| 2022
(e) |
$ 29.75
|
0.17
|
(2.05)
|
(1.88)
|
(0.45)
|
(3.43)
|
—
|
(3.88)
|
$ 23.99
|
| 2021
|
$ 25.59
|
0.44
|
4.65
|
5.09
|
(0.16)
|
(0.77)
|
—
|
(0.93)
|
$ 29.75
|
| 2020
|
$ 23.61
|
0.18
|
3.41
|
3.59
|
(0.33)
|
(1.28)
|
—
|
(1.61)
|
$ 25.59
|
| 2019
|
$ 23.40
|
0.31
|
0.29
|
0.60
|
(0.39)
|
—
|
—
|
(0.39)
|
$ 23.61
|
| 2018
|
$ 28.27
|
0.33
|
(1.15)
|
(0.82)
|
(0.02)
|
(4.03)
|
—
|
(4.05)
|
$ 23.40
|
| 2017
|
$ 23.95
|
0.31
|
4.33
|
4.64
|
(0.32)
|
—
|
—
|
(0.32)
|
$ 28.27
|
| (a)
|
Net
investment income (loss) includes income from foreign withholding tax claims adjusted for IRS compliance fees and/or tax reclaim collection fees. Without these proceeds, the Net Investment Income (Loss) ratios for 2022 would have been: Class A,
0.69%; Class C, 0.04%; Class I, 1.11%; Class R3, 0.61%; Class R4, 0.81%; Class R5, 1.06%; Class R6, 1.28% and 2021 would have been: Class A, 0.99%; Class C, 0.16%; Class I, 1.23%; Class R3, 0.71%; Class R4, 0.90%; Class R5, 1.18%; Class R6, 1.40%.
|
| (b)
|
Net
expenses include tax reclaim collection fees that are excluded from the expense limitation agreement. If such expenses and fees had not occurred, the Expenses After Expense Reductions ratios for 2021 would have been: Class A, 1.25%; Class C, 1.96%;
Class I, 0.94%; Class R3, 1.45%; Class R4, 1.25%; Class R5, 0.99%; Class R6, 0.79%. |
| (c)
|
Not
annualized for periods less than one year. |
| (d)
|
Sales
loads are not reflected in computing total return. |
| (e)
|
Unaudited
Six Month Period Ended March 31. |
| (f)
|
Annualized.
|
| (g)
|
Net
investment income (loss) was less than $(0.01) per share. |
| (h)
|
Dividends
from net investment income per share were less than $(0.01). |
| +
|
Based
on weighted average shares outstanding. |
See notes to financial statements.
114 | Thornburg Equity Funds Semi-Annual Report
Financial Highlights, Continued
International Equity Fund
| |
RATIOS
TO AVERAGE NET ASSETS |
|
Supplemental
Data |
UNLESS
OTHERWISE
NOTED, PERIODS ARE
FISCAL YEARS ENDED
SEPTEMBER 30, |
Net
Investment
Income (Loss) (%)(a) |
Expenses,
After
Expense
Reductions (%)(b) |
Expenses,
Before Expense
Reductions (%) |
|
Total
Return (%)(c) |
Portfolio
Turnover
Rate (%)(c) |
Net
Assets
at End of PERIOD
(Thousands) |
| CLASS
A SHARES(d) |
| 2022
(e) |
0.69
(f) |
1.34
(f) |
1.37
(f) |
|
(8.14)
|
24.70
|
$ 478,707
|
| 2021
|
1.07
|
1.58
|
1.58
|
|
19.66
|
42.85
|
$ 543,262
|
| 2020
|
0.31
|
1.25
|
1.26
|
|
15.33
|
79.05
|
$ 825,677
|
| 2019
|
0.86
|
1.26
|
1.26
|
|
2.47
|
71.09
|
$ 655,807
|
| 2018
|
0.77
|
1.27
|
1.27
|
|
(4.13)
|
44.41
|
$ 782,371
|
| 2017
|
0.65
|
1.31
|
1.31
|
|
18.78
|
86.88
|
$ 840,244
|
| CLASS
C SHARES |
| 2022
(e) |
0.03
(f) |
1.98
(f) |
2.01
(f) |
|
(8.47)
|
24.70
|
$ 20,845
|
| 2021
|
0.24
|
2.26
|
2.26
|
|
18.83
|
42.85
|
$ 27,189
|
| 2020
|
(0.40)
|
1.93
|
1.94
|
|
14.69
|
79.05
|
$ 44,594
|
| 2019
|
(0.02)
|
2.09
|
2.09
|
|
1.60
|
71.09
|
$ 81,401
|
| 2018
|
0.07
|
2.02
|
2.02
|
|
(4.86)
|
44.41
|
$ 159,789
|
| 2017
|
(0.08)
|
2.04
|
2.04
|
|
17.94
|
86.88
|
$ 400,859
|
| CLASS
I SHARES |
| 2022
(e) |
1.11
(f) |
0.93
(f) |
0.98
(f) |
|
(7.96)
|
24.70
|
$ 1,740,106
|
| 2021
|
1.32
|
1.24
|
1.24
|
|
20.05
|
42.85
|
$ 2,000,723
|
| 2020
|
0.64
|
0.92
|
0.93
|
|
15.74
|
79.05
|
$ 1,713,358
|
| 2019
|
1.11
|
0.97
|
0.97
|
|
2.76
|
71.09
|
$ 1,694,780
|
| 2018
|
1.15
|
0.91
|
0.91
|
|
(3.81)
|
44.41
|
$ 2,462,564
|
| 2017
|
0.99
|
0.92
|
0.92
|
|
19.29
|
86.88
|
$ 3,370,930
|
| CLASS
R3 SHARES |
| 2022
(e) |
0.61
(f) |
1.42
(f) |
1.68
(f) |
|
(8.18)
|
24.70
|
$ 133,823
|
| 2021
|
0.80
|
1.75
|
1.91
|
|
19.46
|
42.85
|
$ 157,724
|
| 2020
|
0.12
|
1.45
|
1.58
|
|
15.11
|
79.05
|
$ 152,764
|
| 2019
|
0.67
|
1.45
|
1.65
|
|
2.25
|
71.09
|
$ 164,437
|
| 2018
|
0.59
|
1.45
|
1.64
|
|
(4.29)
|
44.41
|
$ 213,007
|
| 2017
|
0.55
|
1.45
|
1.64
|
|
18.63
|
86.88
|
$ 285,510
|
| CLASS
R4 SHARES |
| 2022
(e) |
0.80
(f) |
1.22
(f) |
1.47
(f) |
|
(8.11)
|
24.70
|
$ 86,701
|
| 2021
|
0.99
|
1.55
|
1.70
|
|
19.69
|
42.85
|
$ 104,735
|
| 2020
|
0.30
|
1.25
|
1.32
|
|
15.35
|
79.05
|
$ 102,266
|
| 2019
|
0.88
|
1.25
|
1.44
|
|
2.45
|
71.09
|
$ 125,363
|
| 2018
|
0.81
|
1.25
|
1.47
|
|
(4.11)
|
44.41
|
$ 164,663
|
| 2017
|
0.74
|
1.25
|
1.46
|
|
18.90
|
86.88
|
$ 209,066
|
| CLASS
R5 SHARES |
| 2022
(e) |
1.06
(f) |
0.96
(f) |
1.23
(f) |
|
(7.98)
|
24.70
|
$ 130,631
|
| 2021
|
1.26
|
1.29
|
1.46
|
|
19.97
|
42.85
|
$ 160,007
|
| 2020
|
0.55
|
0.99
|
1.02
|
|
15.64
|
79.05
|
$ 133,705
|
| 2019
|
1.10
|
0.99
|
1.12
|
|
2.74
|
71.09
|
$ 153,366
|
| 2018
|
1.06
|
0.99
|
1.17
|
|
(3.87)
|
44.41
|
$ 229,485
|
| 2017
|
0.96
|
0.99
|
1.15
|
|
19.17
|
86.88
|
$ 298,970
|
| CLASS
R6 SHARES |
| 2022
(e) |
1.28
(f) |
0.76
(f) |
0.91
(f) |
|
(7.89)
|
24.70
|
$ 304,763
|
| 2021
|
1.49
|
1.09
|
1.18
|
|
20.21
|
42.85
|
$ 331,621
|
| 2020
|
0.78
|
0.79
|
0.90
|
|
15.90
|
79.05
|
$ 250,391
|
| 2019
|
1.37
|
0.79
|
0.88
|
|
2.95
|
71.09
|
$ 219,441
|
| 2018
|
1.33
|
0.79
|
0.83
|
|
(3.68)
|
44.41
|
$ 457,006
|
| 2017
|
1.23
|
0.78
|
0.79
|
|
19.40
|
86.88
|
$ 536,296
|
Thornburg Equity Funds Semi-Annual Report | 115
Financial Highlights
Better World International Fund
| |
PER
SHARE PERFORMANCE (FOR A SHARE OUTSTANDING THROUGHOUT THE PERIOD) |
UNLESS
OTHERWISE
NOTED, PERIODS ARE
FISCAL YEARS ENDED
SEPTEMBER 30, |
Net
Asset
Value,
Beginning
of PERIOD |
Net
Investment
Income
(Loss)+ |
Net
Realized &
Unrealized
Gain (Loss) on
Investments |
Total
from
Investment
Operations |
Dividends
from Net
Investment
Income |
Dividends
from Net
Realized
Gains |
Dividends
from
Return of
Capital |
Total
Dividends |
Net
Asset
Value,
End of
PERIOD |
| CLASS
A SHARES(c) |
| 2022
(d) |
$ 21.46
|
0.02
|
(1.34)
|
(1.32)
|
—
|
(2.86)
|
—
|
(2.86)
|
$ 17.28
|
| 2021
|
$ 15.66
|
0.01
|
5.79
|
5.80
|
—
|
—
|
—
|
—
|
$ 21.46
|
| 2020
|
$ 12.85
|
—
(f) |
2.90
|
2.90
|
(0.09)
|
—
|
—
|
(0.09)
|
$ 15.66
|
| 2019
|
$ 14.51
|
0.12
|
(0.66)
|
(0.54)
|
(0.15)
|
(0.97)
|
—
|
(1.12)
|
$ 12.85
|
| 2018
|
$ 14.13
|
0.09
|
0.66
|
0.75
|
—
|
(0.37)
|
—
|
(0.37)
|
$ 14.51
|
| 2017
|
$ 13.86
|
0.09
|
0.99
|
1.08
|
(0.12)
|
(0.69)
|
—
|
(0.81)
|
$ 14.13
|
| CLASS
C SHARES |
| 2022
(d) |
$ 21.08
|
(0.05)
|
(1.31)
|
(1.36)
|
—
|
(2.86)
|
—
|
(2.86)
|
$ 16.86
|
| 2021
|
$ 15.51
|
(0.15)
|
5.72
|
5.57
|
—
|
—
|
—
|
—
|
$ 21.08
|
| 2020
|
$ 12.72
|
(0.08)
|
2.88
|
2.80
|
(0.01)
|
—
|
—
|
(0.01)
|
$ 15.51
|
| 2019
|
$ 14.32
|
0.03
|
(0.62)
|
(0.59)
|
(0.04)
|
(0.97)
|
—
|
(1.01)
|
$ 12.72
|
| 2018
|
$ 14.02
|
—
(f) |
0.67
|
0.67
|
—
|
(0.37)
|
—
|
(0.37)
|
$ 14.32
|
| 2017
|
$ 13.79
|
0.02
|
0.97
|
0.99
|
(0.07)
|
(0.69)
|
—
|
(0.76)
|
$ 14.02
|
| CLASS
I SHARES |
| 2022
(d) |
$ 22.03
|
0.07
|
(1.39)
|
(1.32)
|
(0.05)
|
(2.86)
|
—
|
(2.91)
|
$ 17.80
|
| 2021
|
$ 16.06
|
0.11
|
5.93
|
6.04
|
(0.07)
|
—
|
—
|
(0.07)
|
$ 22.03
|
| 2020
|
$ 13.16
|
0.10
|
2.99
|
3.09
|
(0.19)
|
—
|
—
|
(0.19)
|
$ 16.06
|
| 2019
|
$ 14.83
|
0.20
|
(0.67)
|
(0.47)
|
(0.23)
|
(0.97)
|
—
|
(1.20)
|
$ 13.16
|
| 2018
|
$ 14.33
|
0.18
|
0.69
|
0.87
|
—
|
(0.37)
|
—
|
(0.37)
|
$ 14.83
|
| 2017
|
$ 13.96
|
0.20
|
1.02
|
1.22
|
(0.16)
|
(0.69)
|
—
|
(0.85)
|
$ 14.33
|
| (a)
|
Net
investment income (loss) includes income from foreign withholding tax claims adjusted for IRS compliance fees and/or tax reclaim collection fees. Without these proceeds, the Net Investment Income (Loss) ratios for 2022 would have been: Class A,
0.16%; Class C, (0.61)%; Class I, 0.66% and 2021 would have been: Class A, 0.04%; Class C, (0.78)%; Class I, 0.51%. |
| (b)
|
Not
annualized for periods less than one year. |
| (c)
|
Sales
loads are not reflected in computing total return. |
| (d)
|
Unaudited
Six Month Period Ended March 31. |
| (e)
|
Annualized.
|
| (f)
|
Net
investment income (loss) was less than $0.01 per share. |
| +
|
Based
on weighted average shares outstanding. |
See notes to financial statements.
116 | Thornburg Equity Funds Semi-Annual Report
Financial Highlights, Continued
Better World International Fund
| |
RATIOS
TO AVERAGE NET ASSETS |
|
Supplemental
Data |
UNLESS
OTHERWISE
NOTED, PERIODS ARE
FISCAL YEARS ENDED
SEPTEMBER 30, |
Net
Investment
Income (Loss) (%)(a) |
Expenses,
After
Expense
Reductions (%) |
Expenses,
Before Expense
Reductions (%) |
|
Total
Return (%)(b) |
Portfolio
Turnover
Rate (%)(b) |
Net
Assets
at End of PERIOD
(Thousands) |
| CLASS
A SHARES(c) |
| 2022
(d) |
0.18
(e) |
1.49
(e) |
1.52
(e) |
|
(7.67)
|
85.89
|
$ 44,198
|
| 2021
|
0.05
|
1.57
|
1.57
|
|
37.04
|
119.96
|
$ 40,287
|
| 2020
|
(0.02)
|
1.83
|
1.94
|
|
22.65
|
42.87
|
$ 11,859
|
| 2019
|
0.91
|
1.82
|
2.10
|
|
(3.19)
|
62.33
|
$ 9,378
|
| 2018
|
0.64
|
1.82
|
2.12
|
|
5.37
|
111.99
|
$ 8,537
|
| 2017
|
0.64
|
1.79
|
3.21
|
|
8.61
|
105.55
|
$ 6,450
|
| CLASS
C SHARES |
| 2022
(d) |
(0.58)
(e) |
2.28
(e) |
2.48
(e) |
|
(7.97)
|
85.89
|
$ 5,953
|
| 2021
|
(0.77)
|
2.38
|
2.85
|
|
35.91
|
119.96
|
$ 5,597
|
| 2020
|
(0.56)
|
2.38
|
3.31
|
|
22.02
|
42.87
|
$ 2,159
|
| 2019
|
0.25
|
2.38
|
3.48
|
|
(3.75)
|
62.33
|
$ 1,687
|
| 2018
|
(0.03)
|
2.38
|
3.09
|
|
4.82
|
111.99
|
$ 2,292
|
| 2017
|
0.18
|
2.32
|
4.48
|
|
7.97
|
105.55
|
$ 2,205
|
| CLASS
I SHARES |
| 2022
(d) |
0.68
(e) |
1.02
(e) |
1.23
(e) |
|
(7.41)
|
85.89
|
$ 408,472
|
| 2021
|
0.53
|
1.09
|
1.21
|
|
37.72
|
119.96
|
$ 302,026
|
| 2020
|
0.74
|
1.09
|
1.33
|
|
23.62
|
42.87
|
$ 83,208
|
| 2019
|
1.57
|
1.09
|
1.44
|
|
(2.54)
|
62.33
|
$ 59,833
|
| 2018
|
1.20
|
1.09
|
1.35
|
|
6.15
|
111.99
|
$ 55,989
|
| 2017
|
1.48
|
0.94
|
1.62
|
|
9.58
|
105.55
|
$ 59,951
|
Thornburg Equity Funds Semi-Annual Report | 117
Financial Highlights
International Growth Fund
| |
PER
SHARE PERFORMANCE (FOR A SHARE OUTSTANDING THROUGHOUT THE PERIOD) |
UNLESS
OTHERWISE
NOTED, PERIODS ARE
FISCAL YEARS ENDED
SEPTEMBER 30, |
Net
Asset
Value,
Beginning
of PERIOD |
Net
Investment
Income
(Loss)+ |
Net
Realized &
Unrealized
Gain (Loss) on
Investments |
Total
from
Investment
Operations |
Dividends
from Net
Investment
Income |
Dividends
from Net
Realized
Gains |
Dividends
from
Return of
Capital |
Total
Dividends |
Net
Asset
Value,
End of
PERIOD |
| CLASS
A SHARES(d) |
| 2022
(e) |
$ 30.27
|
(0.03)
|
(4.46)
|
(4.49)
|
—
|
(1.99)
|
—
|
(1.99)
|
$ 23.79
|
| 2021
|
$ 28.37
|
(0.09)
|
2.37
|
2.28
|
—
|
(0.38)
|
—
|
(0.38)
|
$ 30.27
|
| 2020
|
$ 21.46
|
(0.08)
|
7.10
|
7.02
|
—
(g) |
(0.11)
|
—
|
(0.11)
|
$ 28.37
|
| 2019
|
$ 23.78
|
—
(h) |
(1.55)
|
(1.55)
|
(0.02)
|
(0.75)
|
—
|
(0.77)
|
$ 21.46
|
| 2018
|
$ 23.85
|
0.02
|
0.72
|
0.74
|
(0.05)
|
(0.76)
|
—
|
(0.81)
|
$ 23.78
|
| 2017
|
$ 19.22
|
(0.01)
|
4.65
|
4.64
|
(0.01)
|
—
|
—
|
(0.01)
|
$ 23.85
|
| CLASS
C SHARES |
| 2022
(e) |
$ 27.55
|
(0.13)
|
(4.02)
|
(4.15)
|
—
|
(1.99)
|
—
|
(1.99)
|
$ 21.41
|
| 2021
|
$ 26.06
|
(0.31)
|
2.18
|
1.87
|
—
|
(0.38)
|
—
|
(0.38)
|
$ 27.55
|
| 2020
|
$ 19.87
|
(0.25)
|
6.55
|
6.30
|
—
|
(0.11)
|
—
|
(0.11)
|
$ 26.06
|
| 2019
|
$ 22.21
|
(0.15)
|
(1.44)
|
(1.59)
|
—
|
(0.75)
|
—
|
(0.75)
|
$ 19.87
|
| 2018
|
$ 22.50
|
(0.15)
|
0.67
|
0.52
|
(0.05)
|
(0.76)
|
—
|
(0.81)
|
$ 22.21
|
| 2017
|
$ 18.26
|
(0.13)
|
4.37
|
4.24
|
—
|
—
|
—
|
—
|
$ 22.50
|
| CLASS
I SHARES |
| 2022
(e) |
$ 31.32
|
0.01
|
(4.63)
|
(4.62)
|
—
|
(1.99)
|
—
|
(1.99)
|
$ 24.71
|
| 2021
|
$ 29.27
|
(0.01)
|
2.44
|
2.43
|
—
|
(0.38)
|
—
|
(0.38)
|
$ 31.32
|
| 2020
|
$ 22.13
|
(0.01)
|
7.33
|
7.32
|
(0.07)
|
(0.11)
|
—
|
(0.18)
|
$ 29.27
|
| 2019
|
$ 24.51
|
0.07
|
(1.60)
|
(1.53)
|
(0.10)
|
(0.75)
|
—
|
(0.85)
|
$ 22.13
|
| 2018
|
$ 24.48
|
0.12
|
0.72
|
0.84
|
(0.05)
|
(0.76)
|
—
|
(0.81)
|
$ 24.51
|
| 2017
|
$ 19.69
|
0.10
|
4.75
|
4.85
|
(0.06)
|
—
|
—
|
(0.06)
|
$ 24.48
|
| CLASS
R3 SHARES |
| 2022
(e) |
$ 29.80
|
(0.05)
|
(4.38)
|
(4.43)
|
—
|
(1.99)
|
—
|
(1.99)
|
$ 23.38
|
| 2021
|
$ 28.01
|
(0.16)
|
2.33
|
2.17
|
—
|
(0.38)
|
—
|
(0.38)
|
$ 29.80
|
| 2020
|
$ 21.23
|
(0.13)
|
7.02
|
6.89
|
—
|
(0.11)
|
—
|
(0.11)
|
$ 28.01
|
| 2019
|
$ 23.54
|
(0.04)
|
(1.52)
|
(1.56)
|
—
|
(0.75)
|
—
|
(0.75)
|
$ 21.23
|
| 2018
|
$ 23.66
|
(0.02)
|
0.71
|
0.69
|
(0.05)
|
(0.76)
|
—
|
(0.81)
|
$ 23.54
|
| 2017
|
$ 19.07
|
(0.01)
|
4.60
|
4.59
|
—
|
—
|
—
|
—
|
$ 23.66
|
| CLASS
R4 SHARES |
| 2022
(e) |
$ 30.02
|
(0.04)
|
(4.42)
|
(4.46)
|
—
|
(1.99)
|
—
|
(1.99)
|
$ 23.57
|
| 2021
|
$ 28.18
|
(0.13)
|
2.35
|
2.22
|
—
|
(0.38)
|
—
|
(0.38)
|
$ 30.02
|
| 2020
|
$ 21.34
|
(0.03)
|
6.98
|
6.95
|
—
|
(0.11)
|
—
|
(0.11)
|
$ 28.18
|
| 2019
|
$ 23.63
|
(0.02)
|
(1.52)
|
(1.54)
|
—
|
(0.75)
|
—
|
(0.75)
|
$ 21.34
|
| 2018
|
$ 23.73
|
(0.01)
|
0.72
|
0.71
|
(0.05)
|
(0.76)
|
—
|
(0.81)
|
$ 23.63
|
| 2017
|
$ 19.11
|
0.01
|
4.61
|
4.62
|
—
(g) |
—
|
—
|
—
|
$ 23.73
|
| CLASS
R5 SHARES |
| 2022
(e) |
$ 31.41
|
0.01
|
(4.64)
|
(4.63)
|
—
|
(1.99)
|
—
|
(1.99)
|
$ 24.79
|
| 2021
|
$ 29.35
|
(0.01)
|
2.45
|
2.44
|
—
|
(0.38)
|
—
|
(0.38)
|
$ 31.41
|
| 2020
|
$ 22.19
|
(0.03)
|
7.37
|
7.34
|
(0.07)
|
(0.11)
|
—
|
(0.18)
|
$ 29.35
|
| 2019
|
$ 24.58
|
0.07
|
(1.61)
|
(1.54)
|
(0.10)
|
(0.75)
|
—
|
(0.85)
|
$ 22.19
|
| 2018
|
$ 24.54
|
0.10
|
0.75
|
0.85
|
(0.05)
|
(0.76)
|
—
|
(0.81)
|
$ 24.58
|
| 2017
|
$ 19.73
|
0.08
|
4.79
|
4.87
|
(0.06)
|
—
|
—
|
(0.06)
|
$ 24.54
|
| CLASS
R6 SHARES |
| 2022
(e) |
$ 31.54
|
0.03
|
(4.67)
|
(4.64)
|
—
|
(1.99)
|
—
|
(1.99)
|
$ 24.91
|
| 2021
|
$ 29.44
|
0.02
|
2.46
|
2.48
|
—
|
(0.38)
|
—
|
(0.38)
|
$ 31.54
|
| 2020
|
$ 22.26
|
0.02
|
7.37
|
7.39
|
(0.10)
|
(0.11)
|
—
|
(0.21)
|
$ 29.44
|
| 2019
|
$ 24.65
|
0.10
|
(1.61)
|
(1.51)
|
(0.13)
|
(0.75)
|
—
|
(0.88)
|
$ 22.26
|
| 2018
|
$ 24.59
|
0.21
|
0.66
|
0.87
|
(0.05)
|
(0.76)
|
—
|
(0.81)
|
$ 24.65
|
| 2017
|
$ 19.77
|
0.09
|
4.81
|
4.90
|
(0.08)
|
—
|
—
|
(0.08)
|
$ 24.59
|
| (a)
|
Net
investment income (loss) includes income from foreign withholding tax claims adjusted for IRS compliance fees and/or tax reclaim collection fees. Without these proceeds, the Net Investment Income (Loss) ratios for 2022 would have been: Class A,
(0.29)%; Class C, (1.16)%; Class I, 0.02%; Class R3, (0.47)%; Class R4, (0.34)%; Class R5, 0.03%; Class R6, 0.15% and 2021 would have been: Class A, (0.37)%; Class C, (1.18)%; Class I, (0.10)%; Class R3, (0.60)%; Class R4, (0.51)%; Class R5,
(0.11)%; Class R6, (0.02)%. |
| (b)
|
Net
expenses include tax reclaim collection fees that are excluded from the expense limitation agreement. If such expenses and fees had not occurred, the Expenses After Expense Reductions ratios for 2021 would have been: Class A, 1.26%; Class C, 2.07%;
Class I, 0.99%; Class R3, 1.50%; Class R4, 1.40%; Class R5, 0.99%; Class R6, 0.89%. |
| (c)
|
Not
annualized for periods less than one year. |
| (d)
|
Sales
loads are not reflected in computing total return. |
| (e)
|
Unaudited
Six Month Period Ended March 31. |
| (f)
|
Annualized.
|
| (g)
|
Dividends
from net investment income per share were less than $(0.01). |
| (h)
|
Net
investment income (loss) was less than $0.01 per share. |
| +
|
Based
on weighted average shares outstanding. |
See notes to financial statements.
118 | Thornburg Equity Funds Semi-Annual Report
Financial Highlights, Continued
International Growth Fund
| |
RATIOS
TO AVERAGE NET ASSETS |
|
Supplemental
Data |
UNLESS
OTHERWISE
NOTED, PERIODS ARE
FISCAL YEARS ENDED
SEPTEMBER 30, |
Net
Investment
Income (Loss) (%)(a) |
Expenses,
After
Expense
Reductions (%)(b) |
Expenses,
Before Expense
Reductions (%) |
|
Total
Return (%)(c) |
Portfolio
Turnover
Rate (%)(c) |
Net
Assets
at End of PERIOD
(Thousands) |
| CLASS
A SHARES(d) |
| 2022
(e) |
(0.21)
(f) |
1.31
(f) |
1.32
(f) |
|
(16.07)
|
30.27
|
$ 124,317
|
| 2021
|
(0.29)
|
1.27
|
1.27
|
|
8.07
|
34.41
|
$ 154,613
|
| 2020
|
(0.35)
|
1.31
|
1.31
|
|
32.88
|
35.88
|
$ 139,429
|
| 2019
|
0.02
|
1.32
|
1.32
|
|
(6.36)
|
25.83
|
$ 107,196
|
| 2018
|
0.09
|
1.32
|
1.32
|
|
3.28
|
33.28
|
$ 127,863
|
| 2017
|
(0.05)
|
1.42
|
1.43
|
|
24.12
|
60.88
|
$ 121,989
|
| CLASS
C SHARES |
| 2022
(e) |
(1.09)
(f) |
2.16
(f) |
2.17
(f) |
|
(16.45)
|
30.27
|
$ 18,657
|
| 2021
|
(1.10)
|
2.07
|
2.07
|
|
7.21
|
34.41
|
$ 27,864
|
| 2020
|
(1.13)
|
2.07
|
2.07
|
|
31.87
|
35.88
|
$ 42,164
|
| 2019
|
(0.78)
|
2.08
|
2.08
|
|
(7.04)
|
25.83
|
$ 47,980
|
| 2018
|
(0.65)
|
2.08
|
2.08
|
|
2.47
|
33.28
|
$ 77,262
|
| 2017
|
(0.69)
|
2.15
|
2.16
|
|
23.22
|
60.88
|
$ 90,689
|
| CLASS
I SHARES |
| 2022
(e) |
0.09
(f) |
0.99
(f) |
1.03
(f) |
|
(15.94)
|
30.27
|
$ 1,126,278
|
| 2021
|
(0.02)
|
1.00
|
1.00
|
|
8.34
|
34.41
|
$ 1,584,102
|
| 2020
|
(0.03)
|
0.99
|
1.02
|
|
33.31
|
35.88
|
$ 1,454,322
|
| 2019
|
0.34
|
0.99
|
1.03
|
|
(6.02)
|
25.83
|
$ 1,203,538
|
| 2018
|
0.47
|
0.99
|
0.99
|
|
3.61
|
33.28
|
$ 1,470,211
|
| 2017
|
0.50
|
0.99
|
1.03
|
|
24.66
|
60.88
|
$ 1,128,804
|
| CLASS
R3 SHARES |
| 2022
(e) |
(0.39)
(f) |
1.50
(f) |
2.14
(f) |
|
(16.13)
|
30.27
|
$ 6,051
|
| 2021
|
(0.52)
|
1.51
|
1.89
|
|
7.78
|
34.41
|
$ 7,643
|
| 2020
|
(0.56)
|
1.50
|
2.03
|
|
32.61
|
35.88
|
$ 6,424
|
| 2019
|
(0.17)
|
1.50
|
2.02
|
|
(6.50)
|
25.83
|
$ 6,274
|
| 2018
|
(0.10)
|
1.50
|
1.98
|
|
3.08
|
33.28
|
$ 8,426
|
| 2017
|
(0.03)
|
1.50
|
2.08
|
|
24.07
|
60.88
|
$ 10,525
|
| CLASS
R4 SHARES |
| 2022
(e) |
(0.27)
(f) |
1.40
(f) |
1.87
(f) |
|
(16.11)
|
30.27
|
$ 9,134
|
| 2021
|
(0.42)
|
1.41
|
1.63
|
|
7.91
|
34.41
|
$ 9,903
|
| 2020
|
(0.44)
|
1.40
|
1.45
|
|
32.73
|
35.88
|
$ 8,436
|
| 2019
|
(0.09)
|
1.40
|
1.91
|
|
(6.39)
|
25.83
|
$ 7,515
|
| 2018
|
(0.02)
|
1.40
|
1.88
|
|
3.16
|
33.28
|
$ 12,644
|
| 2017
|
0.07
|
1.40
|
1.84
|
|
24.19
|
60.88
|
$ 17,200
|
| CLASS
R5 SHARES |
| 2022
(e) |
0.11
(f) |
0.99
(f) |
1.39
(f) |
|
(15.93)
|
30.27
|
$ 28,239
|
| 2021
|
(0.02)
|
1.00
|
1.27
|
|
8.35
|
34.41
|
$ 36,396
|
| 2020
|
(0.03)
|
0.99
|
1.31
|
|
33.31
|
35.88
|
$ 34,152
|
| 2019
|
0.32
|
0.99
|
1.29
|
|
(6.05)
|
25.83
|
$ 28,729
|
| 2018
|
0.40
|
0.99
|
1.25
|
|
3.64
|
33.28
|
$ 38,052
|
| 2017
|
0.40
|
0.99
|
1.28
|
|
24.68
|
60.88
|
$ 45,591
|
| CLASS
R6 SHARES |
| 2022
(e) |
0.23
(f) |
0.89
(f) |
0.99
(f) |
|
(15.89)
|
30.27
|
$ 89,027
|
| 2021
|
0.06
|
0.90
|
0.96
|
|
8.46
|
34.41
|
$ 107,884
|
| 2020
|
0.07
|
0.89
|
0.99
|
|
33.42
|
35.88
|
$ 61,130
|
| 2019
|
0.47
|
0.89
|
0.99
|
|
(5.91)
|
25.83
|
$ 44,923
|
| 2018
|
0.82
|
0.89
|
0.99
|
|
3.72
|
33.28
|
$ 51,091
|
| 2017
|
0.44
|
0.89
|
1.03
|
|
24.82
|
60.88
|
$ 12,261
|
Thornburg Equity Funds Semi-Annual Report | 119
Financial Highlights
Developing World Fund
| |
PER
SHARE PERFORMANCE (FOR A SHARE OUTSTANDING THROUGHOUT THE PERIOD) |
UNLESS
OTHERWISE
NOTED, PERIODS ARE
FISCAL YEARS ENDED
SEPTEMBER 30, |
Net
Asset
Value,
Beginning
of PERIOD |
Net
Investment
Income
(Loss)+ |
Net
Realized &
Unrealized
Gain (Loss) on
Investments |
Total
from
Investment
Operations |
Dividends
from Net
Investment
Income |
Dividends
from Net
Realized
Gains |
Dividends
from
Return of
Capital |
Total
Dividends |
Net
Asset
Value,
End of
PERIOD |
| CLASS
A SHARES(d) |
| 2022
(e) |
$ 27.58
|
0.03
|
(3.41)
|
(3.38)
|
—
|
—
|
—
|
—
|
$ 24.20
|
| 2021
|
$ 22.92
|
—
(g) |
4.66
|
4.66
|
—
|
—
|
—
|
—
|
$ 27.58
|
| 2020
|
$ 20.43
|
0.03
|
2.69
|
2.72
|
(0.23)
|
—
|
—
|
(0.23)
|
$ 22.92
|
| 2019
|
$ 19.13
|
0.23
|
1.22
|
1.45
|
(0.15)
|
—
|
—
|
(0.15)
|
$ 20.43
|
| 2018
|
$ 19.86
|
0.11
|
(0.84)
|
(0.73)
|
—
|
—
|
—
|
—
|
$ 19.13
|
| 2017
|
$ 16.98
|
0.09
|
2.89
|
2.98
|
(0.10)
|
—
|
—
|
(0.10)
|
$ 19.86
|
| CLASS
C SHARES |
| 2022
(e) |
$ 25.93
|
(0.08)
|
(3.20)
|
(3.28)
|
—
|
—
|
—
|
—
|
$ 22.65
|
| 2021
|
$ 21.71
|
(0.21)
|
4.43
|
4.22
|
—
|
—
|
—
|
—
|
$ 25.93
|
| 2020
|
$ 19.35
|
(0.13)
|
2.54
|
2.41
|
(0.05)
|
—
|
—
|
(0.05)
|
$ 21.71
|
| 2019
|
$ 18.10
|
0.06
|
1.19
|
1.25
|
—
|
—
|
—
|
—
|
$ 19.35
|
| 2018
|
$ 18.93
|
(0.05)
|
(0.78)
|
(0.83)
|
—
|
—
|
—
|
—
|
$ 18.10
|
| 2017
|
$ 16.26
|
(0.03)
|
2.74
|
2.71
|
(0.04)
|
—
|
—
|
(0.04)
|
$ 18.93
|
| CLASS
I SHARES |
| 2022
(e) |
$ 28.22
|
0.08
|
(3.50)
|
(3.42)
|
—
|
—
|
—
|
—
|
$ 24.80
|
| 2021
|
$ 23.40
|
0.10
|
4.76
|
4.86
|
(0.04)
|
—
|
—
|
(0.04)
|
$ 28.22
|
| 2020
|
$ 20.86
|
0.11
|
2.74
|
2.85
|
(0.31)
|
—
|
—
|
(0.31)
|
$ 23.40
|
| 2019
|
$ 19.55
|
0.31
|
1.24
|
1.55
|
(0.24)
|
—
|
—
|
(0.24)
|
$ 20.86
|
| 2018
|
$ 20.21
|
0.19
|
(0.85)
|
(0.66)
|
—
|
—
|
—
|
—
|
$ 19.55
|
| 2017
|
$ 17.26
|
0.19
|
2.92
|
3.11
|
(0.16)
|
—
|
—
|
(0.16)
|
$ 20.21
|
| CLASS
R5 SHARES |
| 2022
(e) |
$ 28.12
|
0.07
|
(3.47)
|
(3.40)
|
—
|
—
|
—
|
—
|
$ 24.72
|
| 2021
|
$ 23.33
|
0.10
|
4.73
|
4.83
|
(0.04)
|
—
|
—
|
(0.04)
|
$ 28.12
|
| 2020
|
$ 20.79
|
0.10
|
2.75
|
2.85
|
(0.31)
|
—
|
—
|
(0.31)
|
$ 23.33
|
| 2019
|
$ 19.48
|
0.27
|
1.28
|
1.55
|
(0.24)
|
—
|
—
|
(0.24)
|
$ 20.79
|
| 2018
|
$ 20.14
|
0.19
|
(0.85)
|
(0.66)
|
—
|
—
|
—
|
—
|
$ 19.48
|
| 2017
|
$ 17.20
|
0.18
|
2.92
|
3.10
|
(0.16)
|
—
|
—
|
(0.16)
|
$ 20.14
|
| CLASS
R6 SHARES |
| 2022
(e) |
$ 28.26
|
0.09
|
(3.50)
|
(3.41)
|
—
|
—
|
—
|
—
|
$ 24.85
|
| 2021
|
$ 23.43
|
0.12
|
4.78
|
4.90
|
(0.07)
|
—
|
—
|
(0.07)
|
$ 28.26
|
| 2020
|
$ 20.88
|
0.13
|
2.75
|
2.88
|
(0.33)
|
—
|
—
|
(0.33)
|
$ 23.43
|
| 2019
|
$ 19.57
|
0.33
|
1.24
|
1.57
|
(0.26)
|
—
|
—
|
(0.26)
|
$ 20.88
|
| 2018
|
$ 20.21
|
0.24
|
(0.88)
|
(0.64)
|
—
|
—
|
—
|
—
|
$ 19.57
|
| 2017
|
$ 17.25
|
0.20
|
2.93
|
3.13
|
(0.17)
|
—
|
—
|
(0.17)
|
$ 20.21
|
| (a)
|
Net
investment income (loss) includes income from foreign withholding tax claims adjusted for IRS compliance fees and/or tax reclaim collection fees. Without these proceeds, the Net Investment Income (Loss) ratios for 2022 would have been: Class A,
0.19%; Class C, (0.69)%; Class I, 0.55%; Class R5, 0.55%; Class R6, 0.65% and 2021 would have been: Class A, (0.02)%; Class C, (0.82)%; Class I, 0.33%; Class R5, 0.34%; Class R6, 0.42%. |
| (b)
|
Net
expenses include tax reclaim collection fees that are excluded from the expense limitation agreement. If such expenses and fees had not occurred, the Expenses After Expense Reductions ratios for 2021 would have been: Class A, 1.43%; Class C, 2.19%;
Class I, 1.09%; Class R5, 1.09%; Class R6, 0.99%. |
| (c)
|
Not
annualized for periods less than one year. |
| (d)
|
Sales
loads are not reflected in computing total return. |
| (e)
|
Unaudited
Six Month Period Ended March 31. |
| (f)
|
Annualized.
|
| (g)
|
Net
investment income (loss) was less than $0.01 per share. |
| (h)
|
The
total return based on the NAV which reflects adjustments in accordance with U.S. GAAP is 12.47% for 2020 and 19.44% for 2021. |
| +
|
Based
on weighted average shares outstanding. |
See notes to financial statements.
120 | Thornburg Equity Funds Semi-Annual Report
Financial Highlights, Continued
Developing World Fund
| |
RATIOS
TO AVERAGE NET ASSETS |
|
Supplemental
Data |
UNLESS
OTHERWISE
NOTED, PERIODS ARE
FISCAL YEARS ENDED
SEPTEMBER 30, |
Net
Investment
Income (Loss) (%)(a) |
Expenses,
After
Expense
Reductions (%)(b) |
Expenses,
Before Expense
Reductions (%) |
|
Total
Return (%)(c) |
Portfolio
Turnover
Rate (%)(c) |
Net
Assets
at End of PERIOD
(Thousands) |
| CLASS
A SHARES(d) |
| 2022
(e) |
0.19
(f) |
1.44
(f) |
1.51
(f) |
|
(12.26)
|
37.06
|
$ 119,894
|
| 2021
|
(0.01)
|
1.43
|
1.43
|
|
20.33
|
61.50
|
$ 131,471
|
| 2020
|
0.13
|
1.45
|
1.48
|
|
13.31
|
56.55
|
$ 101,723
|
| 2019
|
1.18
|
1.47
|
1.50
|
|
7.74
|
43.52
|
$ 96,935
|
| 2018
|
0.55
|
1.46
|
1.48
|
|
(3.68)
|
58.28
|
$ 112,082
|
| 2017
|
0.54
|
1.52
|
1.60
|
|
17.58
|
77.61
|
$ 125,427
|
| CLASS
C SHARES |
| 2022
(e) |
(0.68)
(f) |
2.27
(f) |
2.33
(f) |
|
(12.65)
|
37.06
|
$ 28,132
|
| 2021
|
(0.81)
|
2.19
|
2.19
|
|
19.49
(h) |
61.50
|
$ 40,933
|
| 2020
|
(0.64)
|
2.20
|
2.23
|
|
12.42
(h) |
56.55
|
$ 48,977
|
| 2019
|
0.30
|
2.23
|
2.26
|
|
6.91
|
43.52
|
$ 63,203
|
| 2018
|
(0.23)
|
2.23
|
2.25
|
|
(4.38)
|
58.28
|
$ 80,728
|
| 2017
|
(0.16)
|
2.26
|
2.34
|
|
16.65
|
77.61
|
$ 109,227
|
| CLASS
I SHARES |
| 2022
(e) |
0.56
(f) |
1.07
(f) |
1.22
(f) |
|
(12.12)
|
37.06
|
$ 884,829
|
| 2021
|
0.34
|
1.09
|
1.15
|
|
20.78
|
61.50
|
$ 925,280
|
| 2020
|
0.50
|
1.09
|
1.18
|
|
13.68
|
56.55
|
$ 668,427
|
| 2019
|
1.53
|
1.09
|
1.19
|
|
8.14
|
43.52
|
$ 590,196
|
| 2018
|
0.93
|
1.08
|
1.16
|
|
(3.27)
|
58.28
|
$ 634,501
|
| 2017
|
1.05
|
1.07
|
1.20
|
|
18.06
|
77.61
|
$ 793,069
|
| CLASS
R5 SHARES |
| 2022
(e) |
0.55
(f) |
1.08
(f) |
1.95
(f) |
|
(12.09)
|
37.06
|
$ 3,229
|
| 2021
|
0.35
|
1.09
|
1.70
|
|
20.72
|
61.50
|
$ 4,157
|
| 2020
|
0.49
|
1.09
|
1.89
|
|
13.73
|
56.55
|
$ 2,735
|
| 2019
|
1.38
|
1.09
|
2.07
|
|
8.16
|
43.52
|
$ 2,430
|
| 2018
|
0.90
|
1.09
|
1.71
|
|
(3.28)
|
58.28
|
$ 3,340
|
| 2017
|
1.04
|
1.08
|
1.77
|
|
18.06
|
77.61
|
$ 5,506
|
| CLASS
R6 SHARES |
| 2022
(e) |
0.66
(f) |
0.97
(f) |
1.19
(f) |
|
(12.07)
|
37.06
|
$ 71,914
|
| 2021
|
0.43
|
0.99
|
1.11
|
|
20.90
|
61.50
|
$ 78,006
|
| 2020
|
0.60
|
0.99
|
1.15
|
|
13.82
|
56.55
|
$ 62,993
|
| 2019
|
1.65
|
0.99
|
1.14
|
|
8.25
|
43.52
|
$ 56,658
|
| 2018
|
1.16
|
0.99
|
1.14
|
|
(3.17)
|
58.28
|
$ 56,258
|
| 2017
|
1.14
|
0.97
|
1.13
|
|
18.16
|
77.61
|
$ 28,652
|
Thornburg Equity Funds Semi-Annual Report | 121
Financial Highlights
Small/Mid Cap Core Fund
| |
PER
SHARE PERFORMANCE (FOR A SHARE OUTSTANDING THROUGHOUT THE PERIOD) |
UNLESS
OTHERWISE
NOTED, PERIODS ARE
FISCAL YEARS ENDED
SEPTEMBER 30, |
Net
Asset
Value,
Beginning
of PERIOD |
Net
Investment
Income
(Loss)+ |
Net
Realized &
Unrealized
Gain (Loss) on
Investments |
Total
from
Investment
Operations |
Dividends
from Net
Investment
Income |
Dividends
from Net
Realized
Gains |
Dividends
from
Return of
Capital |
Total
Dividends |
Net
Asset
Value,
End of
PERIOD |
| CLASS
A SHARES(d) |
| 2022
(e) |
$ 97.60
|
(0.18)
|
(0.11)
|
(0.29)
|
(0.30)
|
(26.35)
|
—
|
(26.65)
|
$ 70.66
|
| 2021
|
$ 74.81
|
(0.05)
|
22.84
|
22.79
|
—
|
—
|
—
|
—
|
$ 97.60
|
| 2020
|
$ 71.81
|
0.07
|
3.11
|
3.18
|
(0.18)
|
—
|
—
|
(0.18)
|
$ 74.81
|
| 2019
|
$ 72.46
|
0.24
|
(0.60)
|
(0.36)
|
(0.29)
|
—
|
—
|
(0.29)
|
$ 71.81
|
| 2018
|
$ 65.26
|
0.39
|
7.17
|
7.56
|
(0.36)
|
—
|
—
|
(0.36)
|
$ 72.46
|
| 2017
|
$ 54.08
|
0.16
|
11.04
|
11.20
|
(0.02)
|
—
|
—
|
(0.02)
|
$ 65.26
|
| CLASS
C SHARES |
| 2022
(e) |
$ 87.40
|
(0.46)
|
0.07
|
(0.39)
|
—
|
(26.35)
|
—
|
(26.35)
|
$ 60.66
|
| 2021
|
$ 67.54
|
(0.71)
|
20.57
|
19.86
|
—
|
—
|
—
|
—
|
$ 87.40
|
| 2020
|
$ 65.19
|
(0.45)
|
2.80
|
2.35
|
—
|
—
|
—
|
—
|
$ 67.54
|
| 2019
|
$ 66.03
|
(0.31)
|
(0.53)
|
(0.84)
|
—
|
—
|
—
|
—
|
$ 65.19
|
| 2018
|
$ 59.87
|
(0.11)
|
6.52
|
6.41
|
(0.25)
|
—
|
—
|
(0.25)
|
$ 66.03
|
| 2017
|
$ 49.97
|
(0.27)
|
10.17
|
9.90
|
—
|
—
|
—
|
—
|
$ 59.87
|
| CLASS
I SHARES |
| 2022
(e) |
$ 100.99
|
(0.04)
|
(0.16)
|
(0.20)
|
(0.55)
|
(26.35)
|
—
|
(26.90)
|
$ 73.89
|
| 2021
|
$ 77.16
|
0.25
|
23.58
|
23.83
|
—
|
—
|
—
|
—
|
$ 100.99
|
| 2020
|
$ 74.04
|
0.33
|
3.22
|
3.55
|
(0.43)
|
—
|
—
|
(0.43)
|
$ 77.16
|
| 2019
|
$ 74.70
|
0.49
|
(0.65)
|
(0.16)
|
(0.50)
|
—
|
—
|
(0.50)
|
$ 74.04
|
| 2018
|
$ 67.10
|
0.64
|
7.38
|
8.02
|
(0.42)
|
—
|
—
|
(0.42)
|
$ 74.70
|
| 2017
|
$ 55.58
|
0.42
|
11.35
|
11.77
|
(0.25)
|
—
|
—
|
(0.25)
|
$ 67.10
|
| CLASS
R3 SHARES |
| 2022
(e) |
$ 97.10
|
(0.18)
|
(0.09)
|
(0.27)
|
(0.26)
|
(26.35)
|
—
|
(26.61)
|
$ 70.22
|
| 2021
|
$ 74.46
|
(0.08)
|
22.72
|
22.64
|
—
|
—
|
—
|
—
|
$ 97.10
|
| 2020
|
$ 71.44
|
0.06
|
3.10
|
3.16
|
(0.14)
|
—
|
—
|
(0.14)
|
$ 74.46
|
| 2019
|
$ 72.02
|
0.23
|
(0.59)
|
(0.36)
|
(0.22)
|
—
|
—
|
(0.22)
|
$ 71.44
|
| 2018
|
$ 64.88
|
0.39
|
7.11
|
7.50
|
(0.36)
|
—
|
—
|
(0.36)
|
$ 72.02
|
| 2017
|
$ 53.76
|
0.18
|
10.97
|
11.15
|
(0.03)
|
—
|
—
|
(0.03)
|
$ 64.88
|
| CLASS
R4 SHARES |
| 2022
(e) |
$ 98.30
|
(0.14)
|
(0.12)
|
(0.26)
|
(0.33)
|
(26.35)
|
—
|
(26.68)
|
$ 71.36
|
| 2021
|
$ 75.30
|
0.01
|
22.99
|
23.00
|
—
|
—
|
—
|
—
|
$ 98.30
|
| 2020
|
$ 72.25
|
0.12
|
3.14
|
3.26
|
(0.21)
|
—
|
—
|
(0.21)
|
$ 75.30
|
| 2019
|
$ 72.83
|
0.30
|
(0.60)
|
(0.30)
|
(0.28)
|
—
|
—
|
(0.28)
|
$ 72.25
|
| 2018
|
$ 65.55
|
0.47
|
7.19
|
7.66
|
(0.38)
|
—
|
—
|
(0.38)
|
$ 72.83
|
| 2017
|
$ 54.31
|
0.25
|
11.08
|
11.33
|
(0.09)
|
—
|
—
|
(0.09)
|
$ 65.55
|
| CLASS
R5 SHARES |
| 2022
(e) |
$ 100.84
|
(0.05)
|
(0.15)
|
(0.20)
|
(0.55)
|
(26.35)
|
—
|
(26.90)
|
$ 73.74
|
| 2021
|
$ 77.05
|
0.26
|
23.53
|
23.79
|
—
|
—
|
—
|
—
|
$ 100.84
|
| 2020
|
$ 73.93
|
0.33
|
3.22
|
3.55
|
(0.43)
|
—
|
—
|
(0.43)
|
$ 77.05
|
| 2019
|
$ 74.60
|
0.49
|
(0.66)
|
(0.17)
|
(0.50)
|
—
|
—
|
(0.50)
|
$ 73.93
|
| 2018
|
$ 67.01
|
0.63
|
7.38
|
8.01
|
(0.42)
|
—
|
—
|
(0.42)
|
$ 74.60
|
| 2017
|
$ 55.50
|
0.41
|
11.35
|
11.76
|
(0.25)
|
—
|
—
|
(0.25)
|
$ 67.01
|
| (a)
|
Net
investment income (loss) includes income from foreign withholding tax claims adjusted for IRS compliance fees and/or tax reclaim collection fees. Without these proceeds, the Net Investment Income (Loss) ratios for 2021 would have been: Class A,
(0.15)%; Class C, (0.95)%; Class I, 0.17%; Class R3, (0.17)%; Class R4, (0.09)%; Class R5, 0.18%. |
| (b)
|
Net
expenses include tax reclaim collection fees that are excluded from the expense limitation agreement. If such expenses and fees had not occurred, the Expenses After Expense Reductions ratios for 2021 would have been: Class A, 1.16%; Class C, 1.98%;
Class I, 0.84%; Class R3, 1.20%; Class R4, 1.10%; Class R5, 0.84%. |
| (c)
|
Not
annualized for periods less than one year. |
| (d)
|
Sales
loads are not reflected in computing total return. |
| (e)
|
Unaudited
Six Month Period Ended March 31. |
| (f)
|
Annualized.
|
| (g)
|
The
Fund modified its strategy in December 2020 and due to the change, the Fund experienced a higher portfolio turnover from higher purchases and sales. |
| +
|
Based
on weighted average shares outstanding. |
See notes to financial statements.
122 | Thornburg Equity Funds Semi-Annual Report
Financial Highlights, Continued
Small/Mid Cap Core Fund
| |
RATIOS
TO AVERAGE NET ASSETS |
|
Supplemental
Data |
UNLESS
OTHERWISE
NOTED, PERIODS ARE
FISCAL YEARS ENDED
SEPTEMBER 30, |
Net
Investment
Income (Loss) (%)(a) |
Expenses,
After
Expense
Reductions (%)(b) |
Expenses,
Before Expense
Reductions (%) |
|
Total
Return (%)(c) |
Portfolio
Turnover
Rate (%)(c) |
Net
Assets
at End of PERIOD
(Thousands) |
| CLASS
A SHARES(d) |
| 2022
(e) |
(0.47)
(f) |
1.24
(f) |
1.34
(f) |
|
(1.90)
|
21.28
|
$ 398,484
|
| 2021
|
(0.06)
|
1.18
|
1.33
|
|
30.46
|
135.80
(g) |
$ 454,488
|
| 2020
|
0.10
|
1.33
|
1.34
|
|
4.42
|
20.39
|
$ 388,895
|
| 2019
|
0.35
|
1.33
|
1.33
|
|
(0.42)
|
24.94
|
$ 425,218
|
| 2018
|
0.56
|
1.33
|
1.33
|
|
11.62
|
57.33
|
$ 473,740
|
| 2017
|
0.27
|
1.39
|
1.39
|
|
20.72
|
43.53
|
$ 383,118
|
| CLASS
C SHARES |
| 2022
(e) |
(1.37)
(f) |
2.13
(f) |
2.24
(f) |
|
(2.34)
|
21.28
|
$ 12,139
|
| 2021
|
(0.86)
|
2.00
|
2.15
|
|
29.40
|
135.80
(g) |
$ 17,364
|
| 2020
|
(0.69)
|
2.12
|
2.12
|
|
3.59
|
20.39
|
$ 22,951
|
| 2019
|
(0.50)
|
2.19
|
2.19
|
|
(1.26)
|
24.94
|
$ 35,934
|
| 2018
|
(0.17)
|
2.11
|
2.11
|
|
10.73
|
57.33
|
$ 52,023
|
| 2017
|
(0.49)
|
2.14
|
2.14
|
|
19.81
|
43.53
|
$ 160,663
|
| CLASS
I SHARES |
| 2022
(e) |
(0.11)
(f) |
0.87
(f) |
1.08
(f) |
|
(1.71)
|
21.28
|
$ 284,890
|
| 2021
|
0.26
|
0.86
|
1.08
|
|
30.88
|
135.80
(g) |
$ 332,235
|
| 2020
|
0.44
|
0.99
|
1.09
|
|
4.77
|
20.39
|
$ 287,746
|
| 2019
|
0.70
|
0.99
|
1.07
|
|
(0.07)
|
24.94
|
$ 360,070
|
| 2018
|
0.90
|
0.99
|
1.06
|
|
12.00
|
57.33
|
$ 422,302
|
| 2017
|
0.68
|
0.99
|
1.06
|
|
21.20
|
43.53
|
$ 368,790
|
| CLASS
R3 SHARES |
| 2022
(e) |
(0.47)
(f) |
1.23
(f) |
1.82
(f) |
|
(1.89)
|
21.28
|
$ 19,700
|
| 2021
|
(0.08)
|
1.22
|
1.81
|
|
30.41
|
135.80
(g) |
$ 23,594
|
| 2020
|
0.09
|
1.35
|
1.73
|
|
4.40
|
20.39
|
$ 24,939
|
| 2019
|
0.34
|
1.35
|
1.79
|
|
(0.43)
|
24.94
|
$ 29,601
|
| 2018
|
0.57
|
1.35
|
1.78
|
|
11.60
|
57.33
|
$ 39,211
|
| 2017
|
0.30
|
1.35
|
1.82
|
|
20.75
|
43.53
|
$ 45,668
|
| CLASS
R4 SHARES |
| 2022
(e) |
(0.37)
(f) |
1.13
(f) |
1.96
(f) |
|
(1.85)
|
21.28
|
$ 3,871
|
| 2021
|
0.01
|
1.12
|
1.78
|
|
30.54
|
135.80
(g) |
$ 4,386
|
| 2020
|
0.17
|
1.25
|
1.74
|
|
4.50
|
20.39
|
$ 4,548
|
| 2019
|
0.44
|
1.25
|
1.75
|
|
(0.33)
|
24.94
|
$ 6,434
|
| 2018
|
0.68
|
1.25
|
1.77
|
|
11.72
|
57.33
|
$ 7,868
|
| 2017
|
0.42
|
1.24
|
1.78
|
|
20.87
|
43.53
|
$ 10,159
|
| CLASS
R5 SHARES |
| 2022
(e) |
(0.11)
(f) |
0.87
(f) |
1.53
(f) |
|
(1.72)
|
21.28
|
$ 11,621
|
| 2021
|
0.27
|
0.86
|
1.48
|
|
30.88
|
135.80
(g) |
$ 14,710
|
| 2020
|
0.45
|
0.99
|
1.43
|
|
4.76
|
20.39
|
$ 14,156
|
| 2019
|
0.70
|
0.99
|
1.43
|
|
(0.07)
|
24.94
|
$ 18,119
|
| 2018
|
0.89
|
0.99
|
1.38
|
|
12.00
|
57.33
|
$ 19,085
|
| 2017
|
0.68
|
0.99
|
1.42
|
|
21.21
|
43.53
|
$ 17,060
|
Thornburg Equity Funds Semi-Annual Report | 123
Financial Highlights
Small/Mid Cap Growth Fund
| |
PER
SHARE PERFORMANCE (FOR A SHARE OUTSTANDING THROUGHOUT THE PERIOD) |
UNLESS
OTHERWISE
NOTED, PERIODS ARE
FISCAL YEARS ENDED
SEPTEMBER 30, |
Net
Asset
Value,
Beginning
of PERIOD |
Net
Investment
Income
(Loss)+ |
Net
Realized &
Unrealized
Gain (Loss) on
Investments |
Total
from
Investment
Operations |
Dividends
from Net
Investment
Income |
Dividends
from Net
Realized
Gains |
Dividends
from
Return of
Capital |
Total
Dividends |
Net
Asset
Value,
End of
PERIOD |
| CLASS
A SHARES(b) |
| 2022
(c) |
$ 51.77
|
(0.20)
|
(5.58)
|
(5.78)
|
—
|
(17.88)
|
—
|
(17.88)
|
$ 28.11
|
| 2021
|
$ 48.17
|
(0.51)
|
7.33
|
6.82
|
—
|
(3.22)
|
—
|
(3.22)
|
$ 51.77
|
| 2020
|
$ 39.37
|
(0.30)
|
12.72
|
12.42
|
—
|
(3.62)
|
—
|
(3.62)
|
$ 48.17
|
| 2019
|
$ 40.43
|
(0.17)
|
(0.89)
|
(1.06)
|
—
|
—
|
—
|
—
|
$ 39.37
|
| 2018
|
$ 32.46
|
(0.21)
|
8.18
|
7.97
|
—
|
—
|
—
|
—
|
$ 40.43
|
| 2017
|
$ 28.22
|
(0.24)
|
4.48
|
4.24
|
—
|
—
|
—
|
—
|
$ 32.46
|
| CLASS
C SHARES |
| 2022
(c) |
$ 42.67
|
(0.28)
|
(3.91)
|
(4.19)
|
—
|
(17.88)
|
—
|
(17.88)
|
$ 20.60
|
| 2021
|
$ 40.53
|
(0.75)
|
6.11
|
5.36
|
—
|
(3.22)
|
—
|
(3.22)
|
$ 42.67
|
| 2020
|
$ 33.91
|
(0.51)
|
10.75
|
10.24
|
—
|
(3.62)
|
—
|
(3.62)
|
$ 40.53
|
| 2019
|
$ 35.11
|
(0.42)
|
(0.78)
|
(1.20)
|
—
|
—
|
—
|
—
|
$ 33.91
|
| 2018
|
$ 28.43
|
(0.42)
|
7.10
|
6.68
|
—
|
—
|
—
|
—
|
$ 35.11
|
| 2017
|
$ 24.90
|
(0.41)
|
3.94
|
3.53
|
—
|
—
|
—
|
—
|
$ 28.43
|
| CLASS
I SHARES |
| 2022
(c) |
$ 56.75
|
(0.15)
|
(6.50)
|
(6.65)
|
—
|
(17.88)
|
—
|
(17.88)
|
$ 32.22
|
| 2021
|
$ 52.36
|
(0.38)
|
7.99
|
7.61
|
—
|
(3.22)
|
—
|
(3.22)
|
$ 56.75
|
| 2020
|
$ 42.35
|
(0.17)
|
13.80
|
13.63
|
—
|
(3.62)
|
—
|
(3.62)
|
$ 52.36
|
| 2019
|
$ 43.33
|
(0.03)
|
(0.95)
|
(0.98)
|
—
|
—
|
—
|
—
|
$ 42.35
|
| 2018
|
$ 34.67
|
(0.08)
|
8.74
|
8.66
|
—
|
—
|
—
|
—
|
$ 43.33
|
| 2017
|
$ 30.01
|
(0.12)
|
4.78
|
4.66
|
—
|
—
|
—
|
—
|
$ 34.67
|
| CLASS
R3 SHARES |
| 2022
(c) |
$ 51.09
|
(0.22)
|
(5.45)
|
(5.67)
|
—
|
(17.88)
|
—
|
(17.88)
|
$ 27.54
|
| 2021
|
$ 47.67
|
(0.60)
|
7.24
|
6.64
|
—
|
(3.22)
|
—
|
(3.22)
|
$ 51.09
|
| 2020
|
$ 39.05
|
(0.36)
|
12.60
|
12.24
|
—
|
(3.62)
|
—
|
(3.62)
|
$ 47.67
|
| 2019
|
$ 40.16
|
(0.23)
|
(0.88)
|
(1.11)
|
—
|
—
|
—
|
—
|
$ 39.05
|
| 2018
|
$ 32.30
|
(0.26)
|
8.12
|
7.86
|
—
|
—
|
—
|
—
|
$ 40.16
|
| 2017
|
$ 28.10
|
(0.27)
|
4.47
|
4.20
|
—
|
—
|
—
|
—
|
$ 32.30
|
| CLASS
R4 SHARES |
| 2022
(c) |
$ 51.86
|
(0.20)
|
(5.60)
|
(5.80)
|
—
|
(17.88)
|
—
|
(17.88)
|
$ 28.18
|
| 2021
|
$ 48.30
|
(0.55)
|
7.33
|
6.78
|
—
|
(3.22)
|
—
|
(3.22)
|
$ 51.86
|
| 2020
|
$ 39.49
|
(0.32)
|
12.75
|
12.43
|
—
|
(3.62)
|
—
|
(3.62)
|
$ 48.30
|
| 2019
|
$ 40.56
|
(0.19)
|
(0.88)
|
(1.07)
|
—
|
—
|
—
|
—
|
$ 39.49
|
| 2018
|
$ 32.59
|
(0.23)
|
8.20
|
7.97
|
—
|
—
|
—
|
—
|
$ 40.56
|
| 2017
|
$ 28.33
|
(0.24)
|
4.50
|
4.26
|
—
|
—
|
—
|
—
|
$ 32.59
|
| CLASS
R5 SHARES |
| 2022
(c) |
$ 56.68
|
(0.15)
|
(6.48)
|
(6.63)
|
—
|
(17.88)
|
—
|
(17.88)
|
$ 32.17
|
| 2021
|
$ 52.30
|
(0.38)
|
7.98
|
7.60
|
—
|
(3.22)
|
—
|
(3.22)
|
$ 56.68
|
| 2020
|
$ 42.31
|
(0.16)
|
13.77
|
13.61
|
—
|
(3.62)
|
—
|
(3.62)
|
$ 52.30
|
| 2019
|
$ 43.29
|
(0.04)
|
(0.94)
|
(0.98)
|
—
|
—
|
—
|
—
|
$ 42.31
|
| 2018
|
$ 34.64
|
(0.08)
|
8.73
|
8.65
|
—
|
—
|
—
|
—
|
$ 43.29
|
| 2017
|
$ 29.98
|
(0.12)
|
4.78
|
4.66
|
—
|
—
|
—
|
—
|
$ 34.64
|
| (a)
|
Not
annualized for periods less than one year. |
| (b)
|
Sales
loads are not reflected in computing total return. |
| (c)
|
Unaudited
Six Month Period Ended March 31. |
| (d)
|
Annualized.
|
| (e)
|
The
Fund modified its strategy in December 2020 and due to the change, the Fund experienced a higher portfolio turnover from higher purchases and sales. |
| +
|
Based
on weighted average shares outstanding. |
See notes to financial statements.
124 | Thornburg Equity Funds Semi-Annual Report
Financial Highlights, Continued
Small/Mid Cap Growth Fund
| |
RATIOS
TO AVERAGE NET ASSETS |
|
Supplemental
Data |
UNLESS
OTHERWISE
NOTED, PERIODS ARE
FISCAL YEARS ENDED
SEPTEMBER 30, |
Net
Investment
Income (Loss) (%) |
Expenses,
After
Expense
Reductions (%) |
Expenses,
Before Expense
Reductions (%) |
|
Total
Return (%)(a) |
Portfolio
Turnover
Rate (%)(a) |
Net
Assets
at End of PERIOD
(Thousands) |
| CLASS
A SHARES(b) |
| 2022
(c) |
(1.15)
(d) |
1.25
(d) |
1.36
(d) |
|
(18.79)
|
30.28
|
$ 225,824
|
| 2021
|
(0.99)
|
1.16
|
1.31
|
|
14.69
|
161.43
(e) |
$ 340,545
|
| 2020
|
(0.72)
|
1.33
|
1.33
|
|
34.37
|
43.82
|
$ 326,035
|
| 2019
|
(0.44)
|
1.35
|
1.35
|
|
(2.62)
|
40.69
|
$ 259,799
|
| 2018
|
(0.57)
|
1.34
|
1.34
|
|
24.55
|
54.98
|
$ 296,429
|
| 2017
|
(0.79)
|
1.40
|
1.40
|
|
15.02
|
72.03
|
$ 187,062
|
| CLASS
C SHARES |
| 2022
(c) |
(2.05)
(d) |
2.15
(d) |
2.27
(d) |
|
(19.18)
|
30.28
|
$ 10,567
|
| 2021
|
(1.76)
|
1.94
|
2.09
|
|
13.80
|
161.43
(e) |
$ 23,433
|
| 2020
|
(1.47)
|
2.09
|
2.09
|
|
33.38
|
43.82
|
$ 36,917
|
| 2019
|
(1.27)
|
2.18
|
2.18
|
|
(3.42)
|
40.69
|
$ 36,841
|
| 2018
|
(1.33)
|
2.14
|
2.14
|
|
23.50
|
54.98
|
$ 53,903
|
| 2017
|
(1.56)
|
2.16
|
2.16
|
|
14.18
|
72.03
|
$ 130,165
|
| CLASS
I SHARES |
| 2022
(c) |
(0.77)
(d) |
0.87
(d) |
1.07
(d) |
|
(18.64)
|
30.28
|
$ 173,739
|
| 2021
|
(0.67)
|
0.84
|
1.04
|
|
15.04
|
161.43
(e) |
$ 274,357
|
| 2020
|
(0.37)
|
0.99
|
1.06
|
|
34.84
|
43.82
|
$ 277,991
|
| 2019
|
(0.08)
|
0.99
|
1.05
|
|
(2.26)
|
40.69
|
$ 254,721
|
| 2018
|
(0.20)
|
0.99
|
1.05
|
|
24.98
|
54.98
|
$ 286,152
|
| 2017
|
(0.37)
|
0.99
|
1.05
|
|
15.53
|
72.03
|
$ 234,922
|
| CLASS
R3 SHARES |
| 2022
(c) |
(1.28)
(d) |
1.38
(d) |
1.86
(d) |
|
(18.83)
|
30.28
|
$ 20,067
|
| 2021
|
(1.17)
|
1.35
|
1.79
|
|
14.45
|
161.43
(e) |
$ 26,881
|
| 2020
|
(0.88)
|
1.50
|
1.71
|
|
34.17
|
43.82
|
$ 33,505
|
| 2019
|
(0.60)
|
1.50
|
1.80
|
|
(2.76)
|
40.69
|
$ 30,084
|
| 2018
|
(0.72)
|
1.50
|
1.80
|
|
24.33
|
54.98
|
$ 40,963
|
| 2017
|
(0.90)
|
1.50
|
1.84
|
|
14.95
|
72.03
|
$ 47,064
|
| CLASS
R4 SHARES |
| 2022
(c) |
(1.18)
(d) |
1.28
(d) |
2.66
(d) |
|
(18.79)
|
30.28
|
$ 1,556
|
| 2021
|
(1.07)
|
1.25
|
2.17
|
|
14.56
|
161.43
(e) |
$ 2,076
|
| 2020
|
(0.78)
|
1.40
|
2.00
|
|
34.28
|
43.82
|
$ 2,771
|
| 2019
|
(0.50)
|
1.40
|
1.91
|
|
(2.64)
|
40.69
|
$ 4,183
|
| 2018
|
(0.62)
|
1.40
|
1.97
|
|
24.46
|
54.98
|
$ 4,484
|
| 2017
|
(0.80)
|
1.40
|
2.00
|
|
15.04
|
72.03
|
$ 5,330
|
| CLASS
R5 SHARES |
| 2022
(c) |
(0.77)
(d) |
0.87
(d) |
1.42
(d) |
|
(18.62)
|
30.28
|
$ 14,544
|
| 2021
|
(0.67)
|
0.84
|
1.31
|
|
15.04
|
161.43
(e) |
$ 22,945
|
| 2020
|
(0.37)
|
0.99
|
1.26
|
|
34.83
|
43.82
|
$ 22,691
|
| 2019
|
(0.09)
|
0.99
|
1.39
|
|
(2.26)
|
40.69
|
$ 19,984
|
| 2018
|
(0.21)
|
0.99
|
1.33
|
|
24.97
|
54.98
|
$ 31,433
|
| 2017
|
(0.38)
|
0.99
|
1.34
|
|
15.54
|
72.03
|
$ 32,197
|
Thornburg Equity Funds Semi-Annual Report | 125
Financial Highlights
Income Builder Fund
| |
PER
SHARE PERFORMANCE (FOR A SHARE OUTSTANDING THROUGHOUT THE PERIOD) |
UNLESS
OTHERWISE
NOTED, PERIODS ARE
FISCAL YEARS ENDED
SEPTEMBER 30, |
Net
Asset
Value,
Beginning
of PERIOD |
Net
Investment
Income
(Loss)+ |
Net
Realized &
Unrealized
Gain (Loss) on
Investments |
Total
from
Investment
Operations |
Dividends
from Net
Investment
Income |
Dividends
from Net
Realized
Gains |
Dividends
from
Return of
Capital |
Total
Dividends |
Net
Asset
Value,
End of
PERIOD |
| CLASS
A SHARES(d) |
| 2022
(e) |
$ 22.96
|
0.48
|
0.84
|
1.32
|
(0.62)
|
—
|
—
|
(0.62)
|
$ 23.66
|
| 2021
|
$ 18.70
|
1.19
|
4.19
|
5.38
|
(1.12)
|
—
|
—
|
(1.12)
|
$ 22.96
|
| 2020
|
$ 21.72
|
0.86
|
(2.98)
|
(2.12)
|
(0.90)
|
—
|
—
|
(0.90)
|
$ 18.70
|
| 2019
|
$ 21.80
|
0.93
|
(0.07)
|
0.86
|
(0.94)
|
—
|
—
|
(0.94)
|
$ 21.72
|
| 2018
|
$ 21.50
|
0.92
|
0.30
|
1.22
|
(0.92)
|
—
|
—
|
(0.92)
|
$ 21.80
|
| 2017
|
$ 19.82
|
0.92
|
1.61
|
2.53
|
(0.85)
|
—
|
—
|
(0.85)
|
$ 21.50
|
| CLASS
C SHARES |
| 2022
(e) |
$ 22.93
|
0.38
|
0.85
|
1.23
|
(0.53)
|
—
|
—
|
(0.53)
|
$ 23.63
|
| 2021
|
$ 18.68
|
1.00
|
4.19
|
5.19
|
(0.94)
|
—
|
—
|
(0.94)
|
$ 22.93
|
| 2020
|
$ 21.69
|
0.69
|
(2.95)
|
(2.26)
|
(0.75)
|
—
|
—
|
(0.75)
|
$ 18.68
|
| 2019
|
$ 21.78
|
0.76
|
(0.06)
|
0.70
|
(0.79)
|
—
|
—
|
(0.79)
|
$ 21.69
|
| 2018
|
$ 21.48
|
0.76
|
0.30
|
1.06
|
(0.76)
|
—
|
—
|
(0.76)
|
$ 21.78
|
| 2017
|
$ 19.81
|
0.78
|
1.60
|
2.38
|
(0.71)
|
—
|
—
|
(0.71)
|
$ 21.48
|
| CLASS
I SHARES |
| 2022
(e) |
$ 23.13
|
0.52
|
0.85
|
1.37
|
(0.66)
|
—
|
—
|
(0.66)
|
$ 23.84
|
| 2021
|
$ 18.84
|
1.25
|
4.22
|
5.47
|
(1.18)
|
—
|
—
|
(1.18)
|
$ 23.13
|
| 2020
|
$ 21.88
|
0.89
|
(2.98)
|
(2.09)
|
(0.95)
|
—
|
—
|
(0.95)
|
$ 18.84
|
| 2019
|
$ 21.96
|
0.99
|
(0.07)
|
0.92
|
(1.00)
|
—
|
—
|
(1.00)
|
$ 21.88
|
| 2018
|
$ 21.65
|
1.00
|
0.29
|
1.29
|
(0.98)
|
—
|
—
|
(0.98)
|
$ 21.96
|
| 2017
|
$ 19.97
|
1.02
|
1.59
|
2.61
|
(0.93)
|
—
|
—
|
(0.93)
|
$ 21.65
|
| CLASS
R3 SHARES |
| 2022
(e) |
$ 22.95
|
0.44
|
0.84
|
1.28
|
(0.58)
|
—
|
—
|
(0.58)
|
$ 23.65
|
| 2021
|
$ 18.70
|
1.10
|
4.18
|
5.28
|
(1.03)
|
—
|
—
|
(1.03)
|
$ 22.95
|
| 2020
|
$ 21.71
|
0.78
|
(2.96)
|
(2.18)
|
(0.83)
|
—
|
—
|
(0.83)
|
$ 18.70
|
| 2019
|
$ 21.80
|
0.84
|
(0.07)
|
0.77
|
(0.86)
|
—
|
—
|
(0.86)
|
$ 21.71
|
| 2018
|
$ 21.49
|
0.83
|
0.32
|
1.15
|
(0.84)
|
—
|
—
|
(0.84)
|
$ 21.80
|
| 2017
|
$ 19.82
|
0.87
|
1.59
|
2.46
|
(0.79)
|
—
|
—
|
(0.79)
|
$ 21.49
|
| CLASS
R4 SHARES |
| 2022
(e) |
$ 22.98
|
0.45
|
0.85
|
1.30
|
(0.59)
|
—
|
—
|
(0.59)
|
$ 23.69
|
| 2021
|
$ 18.72
|
1.12
|
4.20
|
5.32
|
(1.06)
|
—
|
—
|
(1.06)
|
$ 22.98
|
| 2020
|
$ 21.74
|
0.77
|
(2.94)
|
(2.17)
|
(0.85)
|
—
|
—
|
(0.85)
|
$ 18.72
|
| 2019
|
$ 21.83
|
0.86
|
(0.07)
|
0.79
|
(0.88)
|
—
|
—
|
(0.88)
|
$ 21.74
|
| 2018
|
$ 21.52
|
0.85
|
0.33
|
1.18
|
(0.87)
|
—
|
—
|
(0.87)
|
$ 21.83
|
| 2017
|
$ 19.85
|
0.89
|
1.59
|
2.48
|
(0.81)
|
—
|
—
|
(0.81)
|
$ 21.52
|
| CLASS
R5 SHARES |
| 2022
(e) |
$ 23.11
|
0.50
|
0.85
|
1.35
|
(0.64)
|
—
|
—
|
(0.64)
|
$ 23.82
|
| 2021
|
$ 18.83
|
1.22
|
4.21
|
5.43
|
(1.15)
|
—
|
—
|
(1.15)
|
$ 23.11
|
| 2020
|
$ 21.86
|
0.90
|
(3.00)
|
(2.10)
|
(0.93)
|
—
|
—
|
(0.93)
|
$ 18.83
|
| 2019
|
$ 21.95
|
0.97
|
(0.09)
|
0.88
|
(0.97)
|
—
|
—
|
(0.97)
|
$ 21.86
|
| 2018
|
$ 21.64
|
0.94
|
0.33
|
1.27
|
(0.96)
|
—
|
—
|
(0.96)
|
$ 21.95
|
| 2017
|
$ 19.95
|
0.98
|
1.61
|
2.59
|
(0.90)
|
—
|
—
|
(0.90)
|
$ 21.64
|
| CLASS
R6 SHARES |
| 2022
(e) |
$ 23.06
|
0.53
|
0.83
|
1.36
|
(0.66)
|
—
|
—
|
(0.66)
|
$ 23.76
|
| 2021
|
$ 18.78
|
1.27
|
4.20
|
5.47
|
(1.19)
|
—
|
—
|
(1.19)
|
$ 23.06
|
| 2020
|
$ 21.81
|
0.92
|
(2.98)
|
(2.06)
|
(0.97)
|
—
|
—
|
(0.97)
|
$ 18.78
|
| 2019
|
$ 21.89
|
1.01
|
(0.08)
|
0.93
|
(1.01)
|
—
|
—
|
(1.01)
|
$ 21.81
|
| 2018
|
$ 21.58
|
1.16
|
0.14
|
1.30
|
(0.99)
|
—
|
—
|
(0.99)
|
$ 21.89
|
| 2017
(i) |
$ 20.55
|
0.44
|
1.12
|
1.56
|
(0.53)
|
—
|
—
|
(0.53)
|
$ 21.58
|
| (a)
|
Net
investment income (loss) includes income from foreign withholding tax claims adjusted for IRS compliance fees and/or tax reclaim collection fees. Without these proceeds, the Net Investment Income (Loss) ratios for 2022 would have been: Class A,
3.45%; Class C, 2.63%; Class I, 3.69%; Class R3, 3.07%; Class R4, 3.17%; Class R5, 3.56%; Class R6, 3.77% and 2021 would have been: Class A, 5.07%; Class C, 4.25%; Class I, 5.28%; Class R3, 4.68%; Class R4, 4.77%; Class R5, 5.18%; Class R6, 5.40%.
|
| (b)
|
Net
expenses include tax reclaim collection fees that are excluded from the expense limitation agreement. If such expenses and fees had not occurred, the Expenses After Expense Reductions ratios for 2021 would have been: Class A, 1.13%; Class C, 1.90%;
Class I, 0.89%; Class R3, 1.50%; Class R4, 1.40%; Class R5, 0.99%; Class R6, 0.80%. |
| (c)
|
Not
annualized for periods less than one year. |
| (d)
|
Sales
loads are not reflected in computing total return. |
| (e)
|
Unaudited
Six Month Period Ended March 31. |
| (f)
|
Annualized.
|
| (g)
|
The
total return based on the NAV which reflects the adjustments in accordance with U.S. GAAP is 28.55%. |
| (h)
|
The
total return based on the NAV which reflects the adjustments in accordance with U.S. GAAP is 29.02%. |
| (i)
|
Effective
date of this class of shares was April 10, 2017. |
| +
|
Based
on weighted average shares outstanding. |
See notes to financial statements.
126 | Thornburg Equity Funds Semi-Annual Report
Financial Highlights, Continued
Income Builder Fund
| |
RATIOS
TO AVERAGE NET ASSETS |
|
Supplemental
Data |
UNLESS
OTHERWISE
NOTED, PERIODS ARE
FISCAL YEARS ENDED
SEPTEMBER 30, |
Net
Investment
Income (Loss) (%)(a) |
Expenses,
After
Expense
Reductions (%)(b) |
Expenses,
Before Expense
Reductions (%) |
|
Total
Return (%)(c) |
Portfolio
Turnover
Rate (%)(c) |
Net
Assets
at End of PERIOD
(Thousands) |
| CLASS
A SHARES(d) |
| 2022
(e) |
4.05
(f) |
1.12
(f) |
1.12
(f) |
|
5.74
|
10.88
|
$ 4,080,526
|
| 2021
|
5.32
|
1.26
|
1.26
|
|
28.90
|
18.99
|
$ 3,876,333
|
| 2020
|
4.27
|
1.15
|
1.15
|
|
(9.78)
|
47.60
|
$ 2,912,063
|
| 2019
|
4.42
|
1.13
|
1.13
|
|
4.13
|
43.69
|
$ 3,458,385
|
| 2018
|
4.25
|
1.15
|
1.15
|
|
5.79
|
41.17
|
$ 3,378,149
|
| 2017
|
4.52
|
1.19
|
1.19
|
|
13.01
|
37.37
|
$ 3,374,895
|
| CLASS
C SHARES |
| 2022
(e) |
3.20
(f) |
1.90
(f) |
1.90
(f) |
|
5.34
|
10.88
|
$ 811,520
|
| 2021
|
4.49
|
2.03
|
2.03
|
|
27.93
|
18.99
|
$ 922,523
|
| 2020
|
3.40
|
1.88
|
1.88
|
|
(10.44)
|
47.60
|
$ 1,452,643
|
| 2019
|
3.60
|
1.87
|
1.87
|
|
3.35
|
43.69
|
$ 2,658,581
|
| 2018
|
3.51
|
1.90
|
1.90
|
|
5.01
|
41.17
|
$ 3,591,856
|
| 2017
|
3.80
|
1.90
|
1.93
|
|
12.19
|
37.37
|
$ 4,677,322
|
| CLASS
I SHARES |
| 2022
(e) |
4.29
(f) |
0.88
(f) |
0.88
(f) |
|
5.88
|
10.88
|
$ 6,255,461
|
| 2021
|
5.54
|
1.02
|
1.02
|
|
29.18
|
18.99
|
$ 5,858,020
|
| 2020
|
4.40
|
0.91
|
0.91
|
|
(9.55)
|
47.60
|
$ 5,094,055
|
| 2019
|
4.67
|
0.88
|
0.88
|
|
4.39
|
43.69
|
$ 7,810,067
|
| 2018
|
4.58
|
0.86
|
0.86
|
|
6.12
|
41.17
|
$ 7,806,245
|
| 2017
|
4.93
|
0.86
|
0.86
|
|
13.30
|
37.37
|
$ 7,804,930
|
| CLASS
R3 SHARES |
| 2022
(e) |
3.67
(f) |
1.50
(f) |
1.62
(f) |
|
5.54
|
10.88
|
$ 25,378
|
| 2021
|
4.93
|
1.63
|
1.71
|
|
28.39
|
18.99
|
$ 24,971
|
| 2020
|
3.86
|
1.49
|
1.49
|
|
(10.06)
|
47.60
|
$ 24,343
|
| 2019
|
3.97
|
1.50
|
1.58
|
|
3.72
|
43.69
|
$ 36,155
|
| 2018
|
3.84
|
1.50
|
1.61
|
|
5.47
|
41.17
|
$ 46,901
|
| 2017
|
4.24
|
1.47
|
1.56
|
|
12.63
|
37.37
|
$ 67,623
|
| CLASS
R4 SHARES |
| 2022
(e) |
3.77
(f) |
1.40
(f) |
1.51
(f) |
|
5.59
|
10.88
|
$ 13,359
|
| 2021
|
5.02
|
1.53
|
1.59
|
|
28.60
(g) |
18.99
|
$ 12,751
|
| 2020
|
3.79
|
1.40
|
1.51
|
|
(10.01)
|
47.60
|
$ 13,044
|
| 2019
|
4.09
|
1.40
|
1.50
|
|
3.79
|
43.69
|
$ 25,221
|
| 2018
|
3.91
|
1.40
|
1.56
|
|
5.58
|
41.17
|
$ 31,132
|
| 2017
|
4.35
|
1.40
|
1.51
|
|
12.72
|
37.37
|
$ 44,069
|
| CLASS
R5 SHARES |
| 2022
(e) |
4.14
(f) |
0.99
(f) |
1.14
(f) |
|
5.78
|
10.88
|
$ 35,259
|
| 2021
|
5.43
|
1.12
|
1.22
|
|
29.07
(h) |
18.99
|
$ 38,749
|
| 2020
|
4.44
|
0.99
|
1.05
|
|
(9.58)
|
47.60
|
$ 45,308
|
| 2019
|
4.55
|
0.99
|
1.08
|
|
4.20
|
43.69
|
$ 59,890
|
| 2018
|
4.30
|
0.99
|
1.12
|
|
5.99
|
41.17
|
$ 59,545
|
| 2017
|
4.76
|
0.99
|
1.09
|
|
13.22
|
37.37
|
$ 91,735
|
| CLASS
R6 SHARES |
| 2022
(e) |
4.38
(f) |
0.80
(f) |
0.84
(f) |
|
5.89
|
10.88
|
$ 122,802
|
| 2021
|
5.66
|
0.93
|
0.97
|
|
29.32
|
18.99
|
$ 113,387
|
| 2020
|
4.58
|
0.80
|
0.84
|
|
(9.44)
|
47.60
|
$ 86,889
|
| 2019
|
4.76
|
0.80
|
0.82
|
|
4.47
|
43.69
|
$ 157,924
|
| 2018
|
5.39
|
0.80
|
0.82
|
|
6.20
|
41.17
|
$ 156,750
|
| 2017
(i) |
4.37
(f) |
0.80
(f) |
1.09
(f) |
|
7.65
|
37.37
|
$ 36,909
|
Thornburg Equity Funds Semi-Annual Report | 127
Financial Highlights
Summit Fund
| |
PER
SHARE PERFORMANCE (FOR A SHARE OUTSTANDING THROUGHOUT THE PERIOD) |
UNLESS
OTHERWISE
NOTED, PERIODS ARE
FISCAL YEARS ENDED
SEPTEMBER 30, |
Net
Asset
Value,
Beginning
of PERIOD |
Net
Investment
Income
(Loss)+ |
Net
Realized &
Unrealized
Gain (Loss) on
Investments |
Total
from
Investment
Operations |
Dividends
from Net
Investment
Income |
Dividends
from Net
Realized
Gains |
Dividends
from
Return of
Capital |
Total
Dividends |
Net
Asset
Value,
End of
PERIOD |
| CLASS
A SHARES(d)(e) |
| 2022
(f) |
$ 12.06
|
0.04
|
0.05
|
0.09
|
(0.06)
|
—
|
—
|
(0.06)
|
$ 12.09
|
| CLASS
I SHARES |
| 2022
(f) |
$ 14.25
|
0.12
|
(0.01)
|
0.11
|
(0.10)
|
(2.17)
|
—
|
(2.27)
|
$ 12.09
|
| 2021
|
$ 12.18
|
0.16
|
2.71
|
2.87
|
(0.22)
|
(0.58)
|
—
|
(0.80)
|
$ 14.25
|
| 2020
|
$ 10.47
|
0.09
|
1.80
|
1.89
|
(0.13)
|
(0.05)
|
—
|
(0.18)
|
$ 12.18
|
| 2019
(h) |
$ 10.00
|
0.11
|
0.43
|
0.54
|
(0.07)
|
—
|
—
|
(0.07)
|
$ 10.47
|
| (a)
|
The
Fund incurs certain expenses and fees in connection with investments in short positions. If such expenses and fees had not occurred, the Expenses After Expense Reductions ratios for 2021, 2020 and 2019 would have been 0.99%, 0.99% and 0.99%
respectively. |
| (b)
|
The
Fund incurs certain expenses and fees in connection with investments in short positions. If such expenses and fees had not occurred, the Expenses Before Expense Reductions ratios for 2021, 2020 and 2019 would have been 1.19%, 1.31% and 1.71%
respectively. |
| (c)
|
Not
annualized for periods less than one year. |
| (d)
|
Effective
date of this class of shares was January 26, 2022. |
| (e)
|
Sales
loads are not reflected in computing total return. |
| (f)
|
Unaudited
Six Month Period Ended March 31. |
| (g)
|
Annualized.
|
| (h)
|
Fund commenced
operations on March 1, 2019. |
| +
|
Based
on weighted average shares outstanding. |
See notes to financial statements.
128 | Thornburg Equity Funds Semi-Annual Report
Financial Highlights, Continued
Summit Fund
| |
RATIOS
TO AVERAGE NET ASSETS |
|
Supplemental
Data |
UNLESS
OTHERWISE
NOTED, PERIODS ARE
FISCAL YEARS ENDED
SEPTEMBER 30, |
Net
Investment
Income (Loss) (%) |
Expenses,
After
Expense
Reductions (%)(a) |
Expenses,
Before Expense
Reductions (%)(b) |
|
Total
Return (%)(c) |
Portfolio
Turnover
Rate (%)(c) |
Net
Assets
at End of PERIOD
(Thousands) |
| CLASS
A SHARES(d)(e) |
| 2022
(f) |
2.04
(g) |
1.24
(g) |
28.32
(g) |
|
0.76
|
49.21
|
$ 117
|
| CLASS
I SHARES |
| 2022
(f) |
1.93
(g) |
0.99
(g) |
1.18
(g) |
|
0.26
|
49.21
|
$ 71,215
|
| 2021
|
1.20
|
1.01
|
1.21
|
|
24.63
|
155.26
|
$ 62,466
|
| 2020
|
0.81
|
1.09
|
1.41
|
|
18.45
|
139.88
|
$ 45,886
|
| 2019
(h) |
1.78
(g) |
1.72
(g) |
2.44
(g) |
|
5.45
|
53.38
|
$ 35,489
|
Thornburg Equity Funds Semi-Annual Report | 129
Expense Example
March 31, 2022 (Unaudited)
As a shareholder of the Fund, you incur two types of
costs:
| (1)
|
transaction costs, including
|
| (a)
|
sales charges (loads) on
purchase payments, for Class A shares; |
| (b)
|
a deferred sales charge on
redemptions of any part or all of a purchase of $1 million of Class A shares within 12 months of purchase; |
| (c)
|
a deferred
sales charge on redemptions of Class C shares within 12 months of purchase; |
| (2)
|
ongoing costs, including
management fees; distribution and/or service (12b-1) fees; and other Fund expenses. |
This example is intended to help you understand your ongoing
costs (in dollars) of investing in the Fund and to compare these costs with the ongoing costs of investing in other mutual funds.
The example is based on a $1,000 investment beginning on
October 1, 2021, and held until March 31, 2022.
ACTUAL EXPENSES
For each class of shares, the Actual section of the
accompanying table provides information about actual account values and actual expenses. You may use the information in this line, together with the amount you invested, to estimate the expenses that you paid over the period. Simply divide your
account value by $1,000 (for example, an $8,600 account value divided by $1,000 = 8.6), then multiply the result by the number in the Actual section for your class of shares under the heading entitled “Expenses Paid During Period” to
estimate the expenses you paid on your account during this period.
HYPOTHETICAL EXAMPLE FOR COMPARISON PURPOSES
For each class of shares, the Hypothetical section of the
accompanying table provides information about hypothetical account values and hypothetical expenses based on the Fund’s actual expense ratio and an assumed rate of return of 5% per year before expenses, which is not the Fund’s actual
return. The hypothetical account values and expenses may not be used to estimate the actual ending account balance or expenses you paid for the period. You may use this information to compare the ongoing costs of investing in the Fund and other
funds. To do so, compare this 5% hypothetical example with the 5% hypothetical examples that appear in the shareholder reports of the other funds.
Please note that the expenses shown in the table are meant to
highlight your ongoing costs only and do not reflect any transactional costs, such as sales charges (loads), redemption fees, or exchange fees. Therefore, the Hypothetical section of the table for each class of shares is useful in comparing ongoing
costs only, and will not help you determine the relative total costs of owning different mutual funds. In addition, if these transactional costs were included, your costs would have been higher.
The actual and hypothetical examples shown assume a $1,000
investment at the beginning of the period, October 1, 2021 and held through March 31, 2022.
| |
Actual
|
|
Hypothetical
* |
|
| |
Ending
Account Value
3/31/22 |
Expenses
Paid
During Period
10/1/21-3/31/22 |
|
Ending
Account Value
3/31/22 |
Expenses
Paid
During Period†
10/1/21-3/31/22 |
Annualized
Expense Ratio |
| GLOBAL
OPPORTUNITIES FUND |
| CLASS
A SHARES |
$1,007.70
|
$
6.41 |
|
$1,018.55
|
$
6.44 |
1.28%
|
| CLASS
C SHARES |
$1,004.06
|
$10.29
|
|
$1,014.66
|
$10.35
|
2.06%
|
| CLASS
I SHARES |
$1,009.53
|
$
4.96 |
|
$1,020.00
|
$
4.99 |
0.99%
|
| CLASS
R3 SHARES |
$1,007.09
|
$
7.51 |
|
$1,017.45
|
$
7.54 |
1.50%
|
| CLASS
R4 SHARES |
$1,007.46
|
$
7.01 |
|
$1,017.95
|
$
7.04 |
1.40%
|
| CLASS
R5 SHARES |
$1,009.51
|
$
4.96 |
|
$1,020.00
|
$
4.99 |
0.99%
|
| CLASS
R6 SHARES |
$1,010.04
|
$
4.26 |
|
$1,020.69
|
$
4.28 |
0.85%
|
| INTERNATIONAL
EQUITY FUND |
| CLASS
A SHARES |
$
918.62 |
$
6.41 |
|
$1,018.25
|
$
6.74 |
1.34%
|
| CLASS
C SHARES |
$
915.33 |
$
9.45 |
|
$1,015.06
|
$
9.95 |
1.98%
|
| CLASS
I SHARES |
$
920.39 |
$
4.45 |
|
$1,020.29
|
$
4.68 |
0.93%
|
| CLASS
R3 SHARES |
$
918.16 |
$
6.79 |
|
$1,017.85
|
$
7.14 |
1.42%
|
| CLASS
R4 SHARES |
$
918.89 |
$
5.84 |
|
$1,018.85
|
$
6.14 |
1.22%
|
| CLASS
R5 SHARES |
$
920.22 |
$
4.60 |
|
$1,020.14
|
$
4.84 |
0.96%
|
| CLASS
R6 SHARES |
$
921.10 |
$
3.64 |
|
$1,021.14
|
$
3.83 |
0.76%
|
| BETTER
WORLD INTERNATIONAL FUND |
| CLASS
A SHARES |
$
923.35 |
$
7.14 |
|
$1,017.50
|
$
7.49 |
1.49%
|
| CLASS
C SHARES |
$
920.29 |
$10.92
|
|
$1,013.56
|
$11.45
|
2.28%
|
| CLASS
I SHARES |
$
925.88 |
$
4.90 |
|
$1,019.85
|
$
5.14 |
1.02%
|
130 |
Thornburg Equity Funds Semi-Annual Report
Expense Example, Continued
March 31, 2022 (Unaudited)
| |
Actual
|
|
Hypothetical
* |
|
| |
Ending
Account Value
3/31/22 |
Expenses
Paid
During Period
10/1/21-3/31/22 |
|
Ending
Account Value
3/31/22 |
Expenses
Paid
During Period†
10/1/21-3/31/22 |
Annualized
Expense Ratio |
| INTERNATIONAL
GROWTH FUND |
| CLASS
A SHARES |
$
839.29 |
$
6.01 |
|
$1,018.40
|
$
6.59 |
1.31%
|
| CLASS
C SHARES |
$
835.55 |
$
9.88 |
|
$1,014.16
|
$10.85
|
2.16%
|
| CLASS
I SHARES |
$
840.58 |
$
4.54 |
|
$1,020.00
|
$
4.99 |
0.99%
|
| CLASS
R3 SHARES |
$
838.73 |
$
6.88 |
|
$1,017.45
|
$
7.54 |
1.50%
|
| CLASS
R4 SHARES |
$
838.93 |
$
6.42 |
|
$1,017.95
|
$
7.04 |
1.40%
|
| CLASS
R5 SHARES |
$
840.72 |
$
4.54 |
|
$1,020.00
|
$
4.99 |
0.99%
|
| CLASS
R6 SHARES |
$
841.09 |
$
4.09 |
|
$1,020.49
|
$
4.48 |
0.89%
|
| DEVELOPING
WORLD FUND |
| CLASS
A SHARES |
$
877.45 |
$
6.74 |
|
$1,017.75
|
$
7.24 |
1.44%
|
| CLASS
C SHARES |
$
873.51 |
$10.60
|
|
$1,013.61
|
$11.40
|
2.27%
|
| CLASS
I SHARES |
$
878.82 |
$
5.01 |
|
$1,019.60
|
$
5.39 |
1.07%
|
| CLASS
R5 SHARES |
$
879.10 |
$
5.06 |
|
$1,019.55
|
$
5.44 |
1.08%
|
| CLASS
R6 SHARES |
$
879.34 |
$
4.54 |
|
$1,020.09
|
$
4.89 |
0.97%
|
| SMALL/MID
CAP CORE FUND |
| CLASS
A SHARES |
$
981.01 |
$
6.12 |
|
$1,018.75
|
$
6.24 |
1.24%
|
| CLASS
C SHARES |
$
976.63 |
$10.50
|
|
$1,014.31
|
$10.70
|
2.13%
|
| CLASS
I SHARES |
$
982.89 |
$
4.30 |
|
$1,020.59
|
$
4.38 |
0.87%
|
| CLASS
R3 SHARES |
$
981.13 |
$
6.08 |
|
$1,018.80
|
$
6.19 |
1.23%
|
| CLASS
R4 SHARES |
$
981.54 |
$
5.58 |
|
$1,019.30
|
$
5.69 |
1.13%
|
| CLASS
R5 SHARES |
$
982.84 |
$
4.30 |
|
$1,020.59
|
$
4.38 |
0.87%
|
| SMALL/MID
CAP GROWTH FUND |
| CLASS
A SHARES |
$
812.15 |
$
5.65 |
|
$1,018.70
|
$
6.29 |
1.25%
|
| CLASS
C SHARES |
$
808.16 |
$
9.69 |
|
$1,014.21
|
$10.80
|
2.15%
|
| CLASS
I SHARES |
$
813.62 |
$
3.93 |
|
$1,020.59
|
$
4.38 |
0.87%
|
| CLASS
R3 SHARES |
$
811.71 |
$
6.23 |
|
$1,018.05
|
$
6.94 |
1.38%
|
| CLASS
R4 SHARES |
$
812.09 |
$
5.78 |
|
$1,018.55
|
$
6.44 |
1.28%
|
| CLASS
R5 SHARES |
$
813.78 |
$
3.93 |
|
$1,020.59
|
$
4.38 |
0.87%
|
| INCOME
BUILDER FUND |
| CLASS
A SHARES |
$1,057.37
|
$
5.74 |
|
$1,019.35
|
$
5.64 |
1.12%
|
| CLASS
C SHARES |
$1,053.41
|
$
9.73 |
|
$1,015.46
|
$
9.55 |
1.90%
|
| CLASS
I SHARES |
$1,058.81
|
$
4.52 |
|
$1,020.54
|
$
4.43 |
0.88%
|
| CLASS
R3 SHARES |
$1,055.44
|
$
7.69 |
|
$1,017.45
|
$
7.54 |
1.50%
|
| CLASS
R4 SHARES |
$1,055.89
|
$
7.18 |
|
$1,017.95
|
$
7.04 |
1.40%
|
| CLASS
R5 SHARES |
$1,057.81
|
$
5.08 |
|
$1,020.00
|
$
4.99 |
0.99%
|
| CLASS
R6 SHARES |
$1,058.87
|
$
4.11 |
|
$1,020.94
|
$
4.03 |
0.80%
|
| SUMMIT
FUND |
| CLASS
A SHARES‡ |
$1,007.60
|
$
2.01 |
|
$1,006.08
|
$
2.01 |
1.24%
|
| CLASS
I SHARES |
$1,002.63
|
$
4.94 |
|
$1,020.00
|
$
4.99 |
0.99%
|
| *
|
Hypothetical
assumes a rate of return of 5% per year before expenses. |
| †
|
Expenses
are equal to the annualized expense ratio for each class multiplied by the average account value over the period, multiplied by 182/365 to reflect the one-half year period. |
| ‡
|
Expenses
are equal to the annualized expense ratio for Class A multiplied by the average account value over the period, multiplied by 59/365 to reflect the accrual period from 2/1/22 to 3/31/2022. |
Thornburg
Equity Funds Semi-Annual Report | 131
Other Information
March 31, 2022 (Unaudited)
PORTFOLIO PROXY VOTING
Policies and Procedures:
The Trust has delegated to the Advisor voting decisions
respecting proxies for the Fund’s voting securities. The Advisor makes voting decisions in accordance with its Proxy Voting Policy and Procedures. A description of the Policy and Procedures is available (i) without charge, upon request, by
calling the Advisor toll-free at 1-800-847-0200, (ii) on the Thornburg website at www.thornburg.com, and (iii) on the U.S. Securities and Exchange Commission’s website at www.sec.gov.
Information regarding how proxies were voted is available on
or before August 31 of each year for the twelve months ending the preceding June 30. This information is available (i) without charge, upon request by calling the Advisor toll-free at 1-800-847-0200, (ii) on the Thornburg website at
www.thornburg.com, and (iii) on the U.S. Securities and Exchange Commission’s website at www.sec.gov.
AVAILABILITY OF QUARTERLY PORTFOLIO SCHEDULE
The Funds file with the Securities and Exchange Commission
schedules of their portfolio holdings on Form N-PORT EX for the first and third quarters of each fiscal year. The Funds’ Forms N-PORT EX are available on the Commission’s website at www.sec.gov, or may be reviewed and copied at the
Commission’s Public Reference Room in Washington, D.C. Information on the operation of the Public Reference Room may be obtained by calling 1-800-SEC-0330. The Funds also make this information available on their website at
www.thornburg.com/download or upon request by calling 1-800-847-0200.
STATEMENT REGARDING LIQUIDITY RISK MANAGEMENT
PROGRAM
The Trustees of the Trust have appointed the
Advisor (“Program Administrator”) to administer the Trust’s liquidity risk management program (the “LRMP”) adopted for each of the Funds under rule 22e-4 under the 1940 Act (the “Liquidity Rule”). The LRMP
is designed to reduce the risk that a Fund will be unable to meet its redemption obligations under the 1940 Act, and to mitigate the dilution of the interests of Fund shareholders occasioned by redemptions tendered by other shareholders
(“Liquidity Risk”). Pursuant to the LRMP, the Program Administrator has delegated certain functions, including daily oversight and management of the Funds’ Liquidity Risk, to its Liquidity Risk Management Committee (the
“Liquidity Committee”). Under the LRMP, the Liquidity Committee performs the annual review of the LRMP required by the Liquidity Rule.
On December 8, 2021, the Trustees reviewed the Liquidity
Committee’s written report (the “Report”) concerning the operation of the LRMP for the period from November 21, 2020 through November 20, 2021 (the “Reporting Period”). The Report addressed the operation, adequacy and
effectiveness of the LRMP, the operation of a Fund’s highly liquid investment minimum, and any material changes to the LRMP during the Reporting Period. The Report provided an assessment of the various factors relevant to each Fund’s
Liquidity Risk, an evaluation of data provided by a third-party liquidity assessment vendor and other relevant data, and reports on the Liquidity Committee’s consideration of intermediary firms with the largest beneficial ownership positions
in each Fund, the likelihood that any of those firms may redeem their clients’ investments from the Funds without prior notice, and the effect that such redemptions could have on Fund liquidity. The Report concluded that the LRMP remains
adequate and effective to address each Fund’s Liquidity Risk, that all of the Funds are able to meet redemption requests in current market conditions and in reasonably expected stressed conditions without significant dilution of remaining
shareholders, that each Fund remains primarily highly liquid, each Fund’s liquidity classifications during the reporting period were reasonable, and the third-party liquidity assessment vendor’s system continues to be a useful tool for
assessing the Funds’ Liquidity Risk. The Report stated that there have been no instances since the LRMP’s adoption in which a Fund exceeded its limitation on illiquid investments, nor have there been any material changes to the LRMP
since its adoption.
132 |
Thornburg Equity Funds Semi-Annual Report
Trustees’ Statement to
Shareholders (Unaudited)
Readopted September 14, 2021
The Trustees believe current and prospective shareholders
should know how we discharge our responsibilities in supervising the Funds’ investment advisor and in reviewing the advisor’s contract for renewal. Since 2005, we have issued a statement which sets out clearly the three principal
guidelines that we follow in supervising the Trust’s investment advisor on your behalf. In accordance with our customary practice, in September of this year we again reviewed our statement and concluded we should reissue this statement
outlining the principal features of our supervision of the advisor’s performance of investment management services for the Funds.
We begin with the premise that each shareholder selected his
or her Fund because its investments are managed by the investment advisor identified in the prospectus and in accordance with the objective and policies described in the prospectus. We realize, as each of you do, that if you believe that your
Fund’s stated objective and policies no longer serve your personal investment goals, you can sell your shares and leave the Fund.
Therefore, we believe that our primary supervisory task
– our principal obligation to you – is to assess the nature and quality of the advisor’s services, and to confirm that the advisor actively and competently pursues the Fund’s objective, in accordance with the policies set out
in the prospectus. To do this, we meet regularly with management to review your Fund’s portfolio and to discuss the advisor’s specific actions and judgments in pursuing the Fund’s objective. We do not substitute our own judgment
for the advisor’s decisions in selecting investments; the advisor is paid to exercise its informed judgment on investment decisions, and we seek to confirm, in reviewing the advisor’s performance, that the advisor is doing just
that.
Second, we are conscious of costs and the effect
that costs have on shareholders’ returns. We try to make sure that your Fund’s fees and costs are reasonable in relationship to the services rendered and that they are generally in line with those charged by other expert investment
advisors, consistent with our belief that the Fund’s investors searched for and expect that expertise and attention and have decided to pay a reasonable price for it. We do not put the management contract “out to bid” as a matter
of course, and we would not do so unless we had concluded that the advisor materially had failed to pursue the Fund’s objectives in accordance with its policies, or for other equally important reasons. We believe that any other approach would
be inconsistent with your interests and contrary to your expectations when you bought shares of the Fund in the first place.
Finally, because we believe that most Thornburg Fund
shareholders have invested with a long-term perspective, we try not to focus too much on the fashions of the moment and on short-term performance. The market will not favor any specific investment objective or set of policies at all times and under
all economic circumstances. A fund will experience periods of both high and low returns relative to other funds and other investments. Even if one of our Funds is not favored by the market at a particular time, we believe that the advisor is
nonetheless obliged to remain true to the Fund’s objective and policies, and we watch to see that it does so.
[This statement is submitted for the general information of the
shareholders of Thornburg Investment Trust. For prospective investors in any fund of Thornburg Investment Trust, this communication must be preceded or accompanied by a prospectus. You may obtain a current copy of the Funds’ prospectus, which
describes the Funds’ management fees, expenses and risks, by calling 1-800-847-0200 or by visiting www.thornburg.com/download. Please read the prospectus carefully before investing.]
Thornburg Investment Trust
2300 North Ridgetop Road
Santa Fe, NM 87506
505.984.0200 Tel
505.992.8681 Fax
www.thornburg.com
Thornburg
Equity Funds Semi-Annual Report | 133
Thornburg Investment Management is a privately-owned global
investment firm that offers a range of solutions for retail and institutional investors. Founded in 1982 and headquartered in Santa Fe, New Mexico, we manage approximately $44.3 billion (as of March 31, 2022) across U.S. mutual funds, separate
accounts for high-net-worth investors, institutional accounts, and UCITS funds for non-U.S. investors.
The funds outlined in this report are some of the many
equity and fixed-income products available from Thornburg Investment Management.
GLOBAL EQUITY
| ■
|
Thornburg Global
Opportunities Fund |
INTERNATIONAL EQUITY
| ■
|
Thornburg International
Equity Fund |
| ■
|
Thornburg Better World
International Fund |
| ■
|
Thornburg International
Growth Fund |
| ■
|
Thornburg
Developing World Fund |
U.S.
EQUITY
| ■
|
Thornburg Small/Mid Cap Core
Fund |
| ■
|
Thornburg
Small/Mid Cap Growth Fund |
MULTI ASSET
| ■
|
Thornburg Investment Income
Builder Fund |
| ■
|
Thornburg Income Builder
Opportunities Trust |
| ■
|
Thornburg
Summit Fund |
TAXABLE FIXED
INCOME
| ■
|
Thornburg Limited Term U.S.
Government Fund |
| ■
|
Thornburg Limited Term
Income Fund |
| ■
|
Thornburg Ultra Short Income
Fund |
| ■
|
Thornburg
Strategic Income Fund |
MUNICIPAL
| ■
|
Thornburg Short Duration
Municipal Fund |
| ■
|
Thornburg Limited Term
Municipal Fund |
| ■
|
Thornburg California Limited
Term Municipal Fund |
| ■
|
Thornburg New Mexico
Intermediate Municipal Fund |
| ■
|
Thornburg New York
Intermediate Municipal Fund |
| ■
|
Thornburg Intermediate
Municipal Fund |
| ■
|
Thornburg
Strategic Municipal Income Fund |
Before investing, carefully consider each
Fund’s investment goals, risks, charges, and expenses. For a prospectus or summary prospectus containing this and other information, contact your financial advisor or visit thornburg.com. Read it carefully before investing.
For additional information, please visit
thornburg.com
Thornburg Investment Management, Inc.
2300 North Ridgetop Road, Santa Fe, NM 87506
134 |
Thornburg Equity Funds Semi-Annual Report
This page intentionally left
blank.
Thornburg Equity Funds Semi-Annual Report | 135
To receive shareholder reports, prospectuses, and proxy statements
electronically, go to www.thornburg.com/edelivery.
This Semi-Annual Report is submitted for the general
information of shareholders of the Fund. It is not authorized for distribution to prospective investors in the Fund unless preceded or accompanied by an effective prospectus.
Investment Advisor:
Thornburg Investment Management®
800.847.0200
Distributor:
Thornburg Securities Corporation®

Semi-Annual Report | March 31,
2022
| Thornburg
Taxable Fixed Income Funds |
| Thornburg
Limited Term U.S. Government Fund |
| Thornburg
Limited Term Income Fund |
| Thornburg
Ultra Short Income Fund |
| Thornburg
Strategic Income Fund |
Thornburg Fixed Income Funds
Semi-Annual Report | March 31, 2022
Table of Contents
Investments carry risks, including possible loss of
principal. Portfolios investing in bonds have the same interest rate, inflation, and credit risks that are associated with the underlying bonds. The value of bonds will fluctuate relative to changes in interest rates, decreasing when interest rates
rise. This effect is more pronounced for longer-term bonds. Unlike bonds, bond funds have ongoing fees and expenses. Investments in lower rated and unrated bonds may be more sensitive to default, downgrades, and market volatility; these investments
may also be less liquid than higher rated bonds. Investments in derivatives are subject to the risks associated with the securities or other assets underlying the pool of securities, including illiquidity and difficulty in valuation. Investments in
equity securities are subject to additional risks, such as greater market fluctuations. Additional risks may be associated with investments outside the United States, especially in emerging markets, including currency fluctuations, illiquidity,
volatility, and political and economic risks. Please see the Funds’ prospectus for a discussion of the risks associated with an investment in the Funds. Investments in the Funds are not FDIC insured, nor are they bank deposits or guaranteed by
a bank or any other entity.
Thornburg Fixed Income Funds Semi-Annual Report | 3
Letter to Shareholders
March 31, 2022 (Unaudited)
Dear Shareholder:
A one-time colleague of mine from decades ago, who was prone
to malapropisms, was also a Yogi Berra-esque source of wisdom at times. These days, I recall one of his pronouncements around the time of the dot.com bubble and crash: “Just when you think you’re out of the woods, you go right back into
the soup.” This seems to be appropriate relative to our emergence from a Covid-dominated recession into a new world that hinges on massively increasing price pressures and a geopolitical worst-case-scenario in Russia/Ukraine. I don’t
expect the volatility that we’ve seen in the last six months to abate and given somewhat elevated risk asset prices (though deflated from my last letter to you), markets remain vulnerable to shocks. High inflation has been one of those shocks,
and it will take some time to resolve factors contributing to that inflation, such as supply-chain challenges, home price appreciation effects on measured shelter costs, and labor cost and availability issues. Ultimately, we expect various central
banks across the globe, certainly including the Federal Reserve, to be forced to make a choice between containing inflation at the expense of employment and losing control of inflation expectations in the name of supporting a hotter economy.
It’s a tightrope walk without a net and just one of many elements of uncertainty in the aftermath of Covid.
In recent weeks, we’ve seen yields on most fixed income
securities rise dramatically. Combined with the very low starting point on income return, the past quarter has been one of the worst in history for those markets. Because many arguments around valuation in equities hinged on the TINA argument
(“There Is No Alternative”), and because the earnings yield (essentially the inverse of the Price/Earnings ratio) on equities far surpassed the yield on bonds, there has been a crossover effect into other risky assets. While we view this
as only part of the overall valuation conversation, any time investors experience outsized moves in major markets, it’s worth taking a deeper dive. In this case, we expect that the dramatic shift of policymakers’ approach from
stimulating growth to containing price pressures may drain liquidity and leave some market participants feeling like a fish out of water.
As in any environment, we will be focused on you, our clients,
as our most important constituency. Though there is never a guarantee that we will be able to navigate the evolving marketplace as well as we may have before, I have a confidence born of experience that our unsiloed, global approach to active
investment management gives us a
distinct advantage. It is always the case that with challenge comes
opportunity, and I have watched our portfolios perform well over the years when difficult situations arise. We continue to see that no market is an island, and the effects from actions somewhere in the world are felt everywhere. Our process, which
focuses on this interconnection through the development of a collaborative and deeply informed perspective, is designed to thrive in these investment conditions.
As we’ve discussed in the past, the story of Thornburg
is one of consistent and deliberate evolution to meet your needs in the context of a changing business and investment environment. As an example of this, we have completed the integration of Environmental, Social, and Governance (ESG) considerations
across our product set. While this does not mean that these considerations are part of our Principal Investment Strategy for all portfolios, it does mean that, when evaluating potential investment opportunities, we evaluate the significance of a
company’s ESG characteristics and their potential to impact the company’s investment performance. We believe that the integration of those ESG considerations into our investment process, alongside the other factors that we consider when
evaluating investments, is consistent with our long-term investment time horizon for both individual assets and whole portfolios, as well as an indelible part of the market landscape.
I have great respect for other investment firms and there are
many good products that are available to investors. “It’s tough to make predictions, especially, about the future” – an actual Yogi-ism – but we believe that in times like these, our firm’s broad perspective and
collaborative, unsiloed approach is our differentiator. These qualities are what underlie the excellent long-term outcomes we’ve been able to deliver: we’re built to deliver on the promise of active management.
Thank you so much for your time, and for your business.

|
|
Jason
Brady, cfa
Portfolio Manager
CEO, President, and
Managing Director |
|
The matters discussed in this report may
constitute forward-looking statements made pursuant to the safe harbor provisions of the Securities Litigation Reform Act of 1995. These include any advisor or portfolio manager prediction, assessment, analysis or outlook for individual securities,
industries, investment styles, market sectors and/or markets. These statements involve risks and uncertainties. In addition to the general risks described for each fund in its current prospectus, other factors bearing on these reports include the
accuracy of the advisor’s or portfolio manager’s forecasts and predictions, the appropriateness of the investment strategies designed by the advisor or portfolio manager and the ability of the advisor or portfolio manager to implement
their strategies efficiently and successfully. Any one or more of these factors, as well as other risks affecting the securities markets generally, could cause the actual results of any fund to differ materially as compared to its benchmarks.
The views expressed are subject to change and
do not necessarily reflect the views of Thornburg Investment Management, Inc. This information should not be relied upon as a recommendation or investment advice and is not intended to predict the performance of any investment or market.
Performance results of individual share
classes will vary based on the fees and expenses associated with each share class, and may be higher or lower than other share classes within the same Fund. Please see Performance Summary for performance results of each share class.
4 | Thornburg Fixed Income Funds Semi-Annual Report
Thornburg Limited Term U.S. Government
Fund
Investment Goal and
Fund
Overview
The primary goal of Limited
Term U.S. Government Fund is to provide as high a level of current income as is consistent, in the view of the Fund’s investment advisor, with safety of capital. As a secondary goal, the Fund seeks to reduce changes in its share price compared
to longer term portfolios.
The Fund
is an actively managed portfolio of short/intermediate term debt obligations with a dollar-weighted average maturity of normally less than five years. The Fund generally invests at least 80% of its net assets in debt obligations issued or guaranteed
by the U.S. Government, its agencies, instrumentalities, or sponsored entities.
Performance drivers and detractors for
the reporting period ended March 31, 2022
» The Fund’s Class I shares
returned -4.04% for the six-month period ended 3/31/2022, outperforming the Bloomberg U.S. Government Intermediate Total Return Index Value Unhedged, which returned -4.75%.
» The Fund’s structural short
duration position versus its index proved to be a significant contributor in a rising rate environment. During the six-month period, five- and ten-year U.S. Treasury yields rose by 150 and 85 basis points (bps), respectively. The Fund’s focus
on the shorter end of the curve detracted from its relative performance as shorter-term U.S. Treasuries rose more than their longer-term counterparts.
» The Fund’s allocation to
mortgage-backed securities (MBS), and to a lesser extent exposure to collateralized mortgage obligations (CMO), proved to be a relative detractor versus the index.
Performance Summary
March 31, 2022 (Unaudited)
GROWTH OF A HYPOTHETICAL $10,000 INVESTMENT
| THORNBURG
LIMITED TERM U.S. GOVERNMENT FUND |
FINAL
VALUE |
AVERAGE ANNUAL
TOTAL RETURNS
| THORNBURG
LIMITED TERM U.S. GOVERNMENT FUND |
1-YR
|
3-YR
|
5-YR
|
10-YR
|
SINCE
INCEPTION |
| Class
A Shares (Incep: 11/16/87) |
|
|
|
|
|
| Without
sales charge |
-3.78%
|
0.14%
|
0.59%
|
0.64%
|
4.24%
|
| With
sales charge |
-5.93%
|
-0.37%
|
0.28%
|
0.49%
|
4.19%
|
| Class
C Shares (Incep: 9/1/94) |
|
|
|
|
|
| Without
sales charge |
-4.11%
|
-0.19%
|
0.26%
|
0.34%
|
3.12%
|
| With
sales charge |
-4.58%
|
-0.19%
|
0.26%
|
0.34%
|
3.12%
|
| Class
C2 Shares (Incep: 10/1/20) |
|
|
|
|
|
| Without
sales charge |
-4.09%
|
-
|
-
|
-
|
-3.92%
|
| With
sales charge |
-4.71%
|
-
|
-
|
-
|
-3.92%
|
| Class
I Shares (Incep: 7/5/96) |
-3.52%
|
0.41%
|
0.87%
|
0.95%
|
3.58%
|
| Class
R3 Shares (Incep: 7/1/03) |
-3.88%
|
0.03%
|
0.49%
|
0.56%
|
1.91%
|
| Class
R4 Shares (Incep: 2/1/14) |
-3.88%
|
0.03%
|
0.49%
|
-
|
0.62%
|
| Class
R5 Shares (Incep: 5/1/12) |
-3.57%
|
0.35%
|
0.82%
|
-
|
0.86%
|
| Bloomberg
Barclays U.S. Government Intermediate Total Return Index Value Unhedged ( Since 11/16/87) |
-4.16%
|
1.03%
|
1.34%
|
1.28%
|
4.94%
|
The matters discussed in
this report may constitute forward-looking statements made pursuant to the safe harbor provisions of the Securities Litigation Reform Act of 1995. These include any advisor or portfolio manager prediction, assessment, analysis or outlook for
individual securities, industries, investment styles, market sectors and/or markets. These statements involve risks and uncertainties. In addition to the general risks described for each fund in its current prospectus, other factors bearing on these
reports include the accuracy of the advisor’s or portfolio manager’s forecasts and predictions, the appropriateness of the investment strategies designed by the advisor or portfolio manager and the ability of the advisor or portfolio
manager to implement their strategies efficiently and successfully. Any one or more of these factors, as well as other risks affecting the securities markets generally, could cause the actual results of any fund to differ materially as compared to
its benchmarks.
The views expressed are subject to
change and do not necessarily reflect the views of Thornburg Investment Management, Inc. This information should not be relied upon as a recommendation or investment advice and is not intended to predict the performance of any investment or
market.
Performance results of individual share
classes will vary based on the fees and expenses associated with each share class, and may be higher or lower than other share classes within the same Fund. Please see Performance Summary for performance results of each share class.
Performance data shown represents past performance and
is no guarantee of future results. Investment return and principal value will fluctuate so shares, when redeemed, may be worth more or less than their original cost. Current performance may be lower or higher than quoted. For performance current to
the most recent month end, visit thornburg.com or call 800-847-0200. The performance information does not reflect the deduction of taxes that a shareholder would pay on distributions or the redemption of Fund shares. Returns reflect the reinvestment
of dividends and capital gains. Class A shares are sold with a maximum sales charge of 2.25%. Class C and Class C2 shares include 0.50% and 0.65% CDSC respectively, for the first year only. There is no sales charge for Class I, Class R3, Class R4
and Class R5 shares. As disclosed in the Fund’s most recent prospectus, the total annual fund operating expenses before waivers and expense reimbursements are as follows: A shares, 0.87%; C shares, 1.24%; C2 shares, 3.37%; I shares, 0.61%; R3
shares, 1.31%; R4 shares, 1.63%; R5 shares, 1.56%; Thornburg Investment Management has contractually agreed to waive fees and reimburse expenses until at least February 01, 2023, for some of the share classes, resulting in net expense ratios of the
following: C2 shares, 1.24%; R3 shares, 0.99%; R4 shares, 0.99%; R5 shares, 0.67%. For more detailed information on fund expenses and waivers/reimbursements please see the Fund’s prospectus.
Thornburg Fixed Income Funds Semi-Annual Report | 5
Thornburg Limited Term Income Fund
Investment Goal and
Fund
Overview
The primary goal of
Limited Term Income Fund is to provide as high a level of current income as is consistent, in the view of the Fund’s investment advisor, with safety of capital. As a secondary goal, the Fund seeks to reduce changes in its share prices compared
to longer term portfolios.
The Fund
is an actively managed portfolio of short/intermediate term debt obligations with a dollar-weighted average maturity of normally less than five years. The Fund invests in debt obligations which are investment grade at the time of purchase, and will
invest at least 65% of its net assets in (i) obligations of the U.S. government, its agencies and instrumentalities, and (ii) debt obligations rated at the time of purchase in one of the three highest principal long term rating categories of S&P
Global Ratings or Moody’s Investors Services, Inc., or the equivalent three highest short term ratings of those ratings agencies, or, if no credit rating is available, judged to be of comparable quality as determined by Thornburg.
Performance drivers and detractors for
the reporting period ended March 31, 2022
» The Fund’s Class I shares
returned -4.16% for the six-month period ended 3/31/2022, outperforming the Bloomberg Intermediate U.S Government/Credit Total Return Index Value Unhedged, which returned -5.05% over the period.
» The Fund’s structural short
duration position versus its index proved to be a significant contributor in a rising rate environment. During the six-month period, five- and ten-year Treasury yields rose by 150 and 85 basis points (bps), respectively. Our focus on the shorter end
of the curve detracted from the Fund’s relative performance as the yields on shorter-term Treasuries rose more than their longer-term counterparts.
» Security selection among corporate
securities, and to a lesser extent, collateralized mortgage obligations, detracted from the Fund’s relative performance. Within emerging markets, a small exposure to Russian-domiciled securities detracted from Fund performance in the wake of
Russia’s invasion of Ukraine in late February.
Performance Summary
March 31, 2022 (Unaudited)
GROWTH OF A HYPOTHETICAL $10,000 INVESTMENT
| THORNBURG
LIMITED TERM INCOME FUND |
FINAL
VALUE |
AVERAGE ANNUAL
TOTAL RETURNS
| THORNBURG
LIMITED TERM INCOME FUND |
1-YR
|
3-YR
|
5-YR
|
10-YR
|
SINCE
INCEPTION |
| Class
A Shares (Incep: 10/1/92) |
|
|
|
|
|
| Without
sales charge |
-3.46%
|
1.79%
|
1.97%
|
2.25%
|
4.50%
|
| With
sales charge |
-5.65%
|
1.28%
|
1.67%
|
2.10%
|
4.44%
|
| Class
C Shares (Incep: 9/1/94) |
|
|
|
|
|
| Without
sales charge |
-3.67%
|
1.56%
|
1.75%
|
2.02%
|
4.17%
|
| With
sales charge |
-4.15%
|
1.56%
|
1.75%
|
2.02%
|
4.17%
|
| Class
C2 Shares (Incep: 10/1/20) |
|
|
|
|
|
| Without
sales charge |
-3.93%
|
-
|
-
|
-
|
-3.20%
|
| With
sales charge |
-4.54%
|
-
|
-
|
-
|
-3.20%
|
| Class
I Shares (Incep: 7/5/96) |
-3.19%
|
2.09%
|
2.29%
|
2.59%
|
4.65%
|
| Class
R3 Shares (Incep: 7/1/03) |
-3.67%
|
1.56%
|
1.78%
|
2.10%
|
3.22%
|
| Class
R4 Shares (Incep: 2/1/14) |
-3.67%
|
1.59%
|
1.79%
|
-
|
1.84%
|
| Class
R5 Shares (Incep: 5/1/12) |
-3.19%
|
2.07%
|
2.22%
|
-
|
2.44%
|
| Class
R6 Shares (Incep: 4/10/17) |
-3.11%
|
2.14%
|
-
|
-
|
2.44%
|
| Bloomberg
Barclays U.S. Aggregate Bond Total Return Index Value USD (Since 10/1/92) |
-4.15%
|
1.69%
|
2.14%
|
2.24%
|
4.90%
|
| Bloomberg
Barclays Intermediate U.S. Government/Credit Total Return Index Value Unhedged (Since 10/1/92) |
-4.10%
|
1.50%
|
1.81%
|
1.85%
|
4.44%
|
The matters discussed in
this report may constitute forward-looking statements made pursuant to the safe harbor provisions of the Securities Litigation Reform Act of 1995. These include any advisor or portfolio manager prediction, assessment, analysis or outlook for
individual securities, industries, investment styles, market sectors and/or markets. These statements involve risks and uncertainties. In addition to the general risks described for each fund in its current prospectus, other factors bearing on these
reports include the accuracy of the advisor’s or portfolio manager’s forecasts and predictions, the appropriateness of the investment strategies designed by the advisor or portfolio manager and the ability of the advisor or portfolio
manager to implement their strategies efficiently and successfully. Any one or more of these factors, as well as other risks affecting the securities markets generally, could cause the actual results of any fund to differ materially as compared to
its benchmarks.
The views expressed are subject to
change and do not necessarily reflect the views of Thornburg Investment Management, Inc. This information should not be relied upon as a recommendation or investment advice and is not intended to predict the performance of any investment or
market.
Performance results of individual share
classes will vary based on the fees and expenses associated with each share class, and may be higher or lower than other share classes within the same Fund. Please see Performance Summary for performance results of each share class.
Performance data shown represents past performance and
is no guarantee of future results. Investment return and principal value will fluctuate so shares, when redeemed, may be worth more or less than their original cost. Current performance may be lower or higher than quoted. For performance current to
the most recent month end, visit thornburg.com or call 800-847-0200. The performance information does not reflect the deduction of taxes that a shareholder would pay on distributions or the redemption of Fund shares. Returns reflect the reinvestment
of dividends and capital gains. Class A shares are sold with a maximum sales charge of 2.25%. Class C and Class C2 shares include 0.50% and 0.65% CDSC respectively, for the first year only. There is no sales charge for Class I, Class R3, Class R4,
Class R5 and Class R6 shares. As disclosed in the Fund’s most recent prospectus, the total annual fund operating expenses before waivers and expense reimbursements are as follows: A shares, 0.77%; C shares, 0.99%; C2 shares, 1.32%; I shares,
0.50%; R3 shares, 1.02%; R4 shares, 1.19%; R5 shares, 0.69%; R6 shares, 0.43%. Thornburg Investment Management has contractually agreed to waive fees and reimburse expenses until at least February 1, 2023, for some of the share classes, resulting in
net expense ratios of the following: C2 shares, 1.24%; I shares, 0.49%; R3 shares, 0.99%; R4 shares, 0.99%; R5 shares, 0.49%; R6 shares 0.42%. For more detailed information on fund expenses and waivers/reimbursements please see the Fund’s
prospectus.
6 |
Thornburg Fixed Income Funds Semi-Annual Report
Thornburg Ultra Short Income Fund
Investment Goal and
Fund
Overview
The Ultra Short Income Fund
seeks current income, consistent with preservation of capital.
The Fund is an actively managed portfolio
of debt obligations, and under normal conditions at least 80% of the Fund’s net assets are invested in (i) debt obligations of the U.S. government, its agencies and instrumentalities, and (ii) debt obligations rated at the time of purchase in
one of the four highest ratings of S&P Global Ratings (AAA, AA, A, or BBB) or Moody’s Investors Services, Inc. (Aaa, Aa, A, or Baa) or, if no credit rating is available, judged to be of comparable quality by Thornburg. The Fund seeks to
reduce changes in its share value compared to longer duration fixed income portfolios by maintaining a portfolio of investments with a dollar-weighted average duration of normally no more than one half (0.5) of a year. The Fund’s investments
are determined by individual security analysis.
Performance drivers and detractors for
the reporting period ended March 31, 2022
» The Fund’s Class I shares
returned -1.01% for the six-month period ended 3/31/2022, underperforming the ICE BofAML U.S. Treasury Bill Index, which returned -0.02%.
» Although the Fund has a short
duration on an absolute basis, its relative long position versus the index was a detractor, as two- and five-year U.S. Treasuries rose by 206 basis points (bps) and 150 bps, respectively.
» The Fund’s small exposure to
Russian-domiciled securities detracted in the wake of Russia’s invasion of Ukraine in late February.
Performance Summary
March 31, 2022 (Unaudited)
GROWTH OF A HYPOTHETICAL $10,000 INVESTMENT
| THORNBURG
ULTRA SHORT INCOME FUND |
FINAL
VALUE |
AVERAGE ANNUAL
TOTAL RETURNS
| THORNBURG
ULTRA SHORT INCOME FUND |
1-YR
|
3-YR
|
5-YR
|
10-YR
|
SINCE
INCEPTION |
| Class
A Shares (Incep: 12/30/13) |
|
|
|
|
|
| Without
sales charge |
-0.92%
|
1.48%
|
1.59%
|
-
|
1.44%
|
| With
sales charge |
-3.16%
|
0.97%
|
1.28%
|
-
|
1.25%
|
| Class
I Shares (Incep: 12/30/13) |
-0.72%
|
1.68%
|
1.79%
|
-
|
1.63%
|
| ICE
BofAML U.S. Treasury Bill Index (Since 12/30/13) |
-
|
0.82%
|
1.14%
|
-
|
0.76%
|
The matters discussed in
this report may constitute forward-looking statements made pursuant to the safe harbor provisions of the Securities Litigation Reform Act of 1995. These include any advisor or portfolio manager prediction, assessment, analysis or outlook for
individual securities, industries, investment styles, market sectors and/or markets. These statements involve risks and uncertainties. In addition to the general risks described for each fund in its current prospectus, other factors bearing on these
reports include the accuracy of the advisor’s or portfolio manager’s forecasts and predictions, the appropriateness of the investment strategies designed by the advisor or portfolio manager and the ability of the advisor or portfolio
manager to implement their strategies efficiently and successfully. Any one or more of these factors, as well as other risks affecting the securities markets generally, could cause the actual results of any fund to differ materially as compared to
its benchmarks.
The views expressed are subject to
change and do not necessarily reflect the views of Thornburg Investment Management, Inc. This information should not be relied upon as a recommendation or investment advice and is not intended to predict the performance of any investment or
market.
Performance results of individual share
classes will vary based on the fees and expenses associated with each share class, and may be higher or lower than other share classes within the same Fund. Please see Performance Summary for performance results of each share class.
Performance data shown represents past performance and
is no guarantee of future results. Investment return and principal value will fluctuate so shares, when redeemed, may be worth more or less than their original cost. Current performance may be lower or higher than quoted. For performance current to
the most recent month end, visit thornburg.com or call 800-847-0200. The performance information does not reflect the deduction of taxes that a shareholder would pay on distributions or the redemption of Fund shares. Returns reflect the reinvestment
of dividends and capital gains. Class A shares are sold with a maximum sales charge of 2.25%. There is no sales charge for Class I shares. As disclosed in the Fund’s most recent prospectus, the total annual fund operating expenses before fee
waivers and expense reimbursements are as follows: A shares, 1.38%; I shares, 0.76%. Thornburg Investment Management has contractually agreed to waive fees and reimburse expenses until at least February 1, 2023, resulting in net expense ratios of
the following: A shares, 0.50%; I shares, 0.30%. For more detailed information on fund expenses and waivers/reimbursements please see the Fund’s prospectus.
Thornburg Fixed Income Funds Semi-Annual Report | 7
Thornburg Strategic Income Fund
Investment Goal and
Fund
Overview
Strategic Income
Fund’s primary investment goal is to seek a high level of current income. The Fund’s secondary investment goal is some long-term capital appreciation.
The Fund is a global, income-oriented
portfolio with a flexible mandate focused on paying an attractive, sustainable yield. The portfolio invests in a broad range of income-producing securities, primarily debt obligations
Performance drivers and detractors for
the reporting period ended March 31, 2022
» The Fund’s Class I shares
returned -3.31% for the six-month period ended 3/31/2022, significantly outperforming the Bloomberg U.S. Universal Total Return Index Value Unhedged, which returned -6.14%.
» The Fund’s structural short
duration position versus its index proved to be a significant contributor in a rising rate environment. During the six-month period, five- and ten-year Treasury yields rose by 150 and 85 basis points (bps), respectively. Our focus on the shorter end
of the curve detracted from the Fund’s relative performance as the yields on shorter-term Treasuries rose more than their longer-term counterparts.
» Security selection was broadly
beneficial across asset-backed securities, collateralized mortgage obligations, and corporate credit securities. Within emerging markets, a small exposure to Russian-domiciled securities detracted from Fund performance in the wake of Russia’s
invasion of Ukraine in late February.
Performance Summary
March 31, 2022 (Unaudited)
GROWTH OF A HYPOTHETICAL $10,000 INVESTMENT
| THORNBURG
STRATEGIC INCOME FUND |
FINAL
VALUE |
AVERAGE ANNUAL
TOTAL RETURNS
THORNBURG
STRATEGIC
INCOME FUND |
1-YR
|
3-YR
|
5-YR
|
10-YR
|
SINCE
INCEPTION |
| Class
A Shares (Incep: 12/19/07) |
|
|
|
|
|
| Without
sales charge |
-1.33%
|
3.64%
|
3.62%
|
4.17%
|
5.40%
|
| With
sales charge |
-5.76%
|
2.07%
|
2.67%
|
3.69%
|
5.06%
|
| Class
C Shares (Incep: 12/19/07) |
|
|
|
|
|
| Without
sales charge |
-2.09%
|
2.85%
|
2.86%
|
3.50%
|
4.74%
|
| With
sales charge |
-3.05%
|
2.85%
|
2.86%
|
3.50%
|
4.74%
|
| Class
I Shares (Incep: 12/19/07) |
-0.92%
|
4.01%
|
4.01%
|
4.54%
|
5.75%
|
| Class
R3 Shares (Incep: 5/1/12) |
-1.56%
|
3.31%
|
3.41%
|
-
|
4.00%
|
| Class
R4 Shares (Incep: 2/1/14) |
-1.55%
|
3.35%
|
3.39%
|
-
|
3.29%
|
| Class
R5 Shares (Incep: 5/1/12) |
-0.92%
|
4.01%
|
4.04%
|
-
|
4.48%
|
| Class
R6 Shares (Incep: 4/10/17) |
-0.84%
|
4.08%
|
-
|
-
|
4.20%
|
| Bloomberg
Barclays U.S. Universal Total Return Index Value Unhedged (Since 12/19/07) |
-4.23%
|
1.85%
|
2.31%
|
2.57%
|
3.65%
|
The matters discussed in
this report may constitute forward-looking statements made pursuant to the safe harbor provisions of the Securities Litigation Reform Act of 1995. These include any advisor or portfolio manager prediction, assessment, analysis or outlook for
individual securities, industries, investment styles, market sectors and/or markets. These statements involve risks and uncertainties. In addition to the general risks described for each fund in its current prospectus, other factors bearing on these
reports include the accuracy of the advisor’s or portfolio manager’s forecasts and predictions, the appropriateness of the investment strategies designed by the advisor or portfolio manager and the ability of the advisor or portfolio
manager to implement their strategies efficiently and successfully. Any one or more of these factors, as well as other risks affecting the securities markets generally, could cause the actual results of any fund to differ materially as compared to
its benchmarks.
The views expressed are subject to
change and do not necessarily reflect the views of Thornburg Investment Management, Inc. This information should not be relied upon as a recommendation or investment advice and is not intended to predict the performance of any investment or
market.
Performance results of individual share
classes will vary based on the fees and expenses associated with each share class, and may be higher or lower than other share classes within the same Fund. Please see Performance Summary for performance results of each share class.
Performance data shown represents past performance and
is no guarantee of future results. Investment return and principal value will fluctuate so shares, when redeemed, may be worth more or less than their original cost. Current performance may be lower or higher than quoted. For performance current to
the most recent month end, visit thornburg.com or call 800-847-0200. The performance information does not reflect the deduction of taxes that a shareholder would pay on distributions or the redemption of Fund shares. Returns reflect the reinvestment
of dividends and capital gains. Class A shares are sold with a maximum sales charge of 4.50%. Class C shares include a 1% CDSC for the first year only. There is no sales charge for Class I, Class R3, Class R4, Class R5 and Class R6 shares. As
disclosed in the Fund’s most recent prospectus, the total annual fund operating expenses before fee waivers and expense reimbursements are as follows: A shares, 1.05%; C shares, 1.83%; I shares, 0.81%; R3 shares, 3.16%; R4 shares, 2.28%; R5
shares, 0.92% and R6 shares, 0.75%. Thornburg Investment Management has contractually agreed to waive fees and reimburse expenses until at least February 1, 2023, resulting in net expense ratios of the following: C shares, 1.80%; I shares, 0.60%; R3
shares, 1.25%; R4 shares, 1.25%; R5 shares, 0.60% and R6 shares, 0.53%. For more detailed information on fund expenses and waivers/reimbursements please see the Fund’s prospectus.
8 |
Thornburg Fixed Income Funds Semi-Annual Report
Glossary
March 31, 2022 (Unaudited)
The
Bloomberg Barclays Intermediate U.S. Government/Credit Total Return Index Value Unhedged is an unmanaged, market-weighted index generally representative of intermediate government and investment-grade corporate debt securities having
maturities from one up to ten years.
The Bloomberg Barclays U.S. Government Intermediate Total Return Index Value Unhedged is an unmanaged, market-weighted index generally representative of all public obligations of the U.S. Government,
its agencies and instrumentalities having maturities from one up to ten years.
The
Bloomberg Barclays U.S. Aggregate Bond Total Return Index Value USD is composed of approximately 8,000 publicly traded bonds including U.S. government, mortgage-backed, corporate and Yankee bonds. The index is weighted by the market value of
the bonds included in the index.
The Bloomberg Barclays U.S. Universal Total Return Index Value Unhedged represents the union of the U.S. Aggregate Index, U.S. Corporate High-Yield, investment Grade 144A Index, Eurodollar Index, U.S.
Emerging Markets Index, and the non-ERISA eligible portion of the CMBS Index. The index covers USD denominated, taxable bonds that are rated either investment-grade or below investment-grade.
The
ICE BofAML U.S. Treasury Bill Index is an unmanaged index that measures returns of U.S. Treasury Bills.
Thornburg Strategic Income Fund’s Blended Index is composed of 80% Bloomberg U.S Aggregate Bond Index and 20% MSCI World Index.
The performance of any index is not indicative of the
performance of any particular investment. Unless otherwise noted, index returns reflect the reinvestment of income dividends and capital gains, if any, but do not reflect fees, brokerage commissions or other expenses of investing. Investors may not
make direct investments into any index.
Asset backed
Security (ABS) – A security whose value and income payments are derived from and collateralized (or “backed”) by a specified pool of underlying assets. The pool of assets
is typically a group of small and illiquid assets that are unable to be sold individually. Pooling the assets into financial instruments allows them to be sold to general investors, a process called securitization, and allows the risk of investing
in the underlying assets to be diversified because each security will represent a fraction of the total value of the diverse pool of underlying assets.
Credit Spread/Quality Spread – The difference between the yields of securities with different credit qualities.
Duration – A bond’s sensitivity to interest rates. Bonds with longer durations experience greater price volatility than bonds with shorter durations. Effective duration incorporates a
bond’s embedded option features, such as call provisions.
High yield bonds may offer higher yields in return for
risk exposure.
U.S. Treasury securities, such as
bills, notes and bonds, are negotiable debt obligations of the U.S. government. These debt obligations are backed by the “full faith and credit” of the government and issued at various schedules and maturities. Income from Treasury
securities is exempt from state and local, but not federal, taxes.
A bond credit rating assesses the financial ability of a
debt issuer to make timely payments of principal and interest. Ratings of AAA (the highest), AA, A, and BBB are investment-grade quality. Ratings of BB, B, CCC, CC, C and D (the lowest) are considered below investment grade, speculative grade, or
junk bonds. Investments in mortgage-backed securities (MBS) may bear additional risk.
Thornburg Fixed Income Funds Semi-Annual Report | 9
Fund Summary
Thornburg Limited Term U.S. Government Fund | March 31, 2022
(Unaudited)
LONG-TERM STABILITY OF PRINCIPAL
Net Asset Value History of Class A Shares
| KEY
PORTFOLIO ATTRIBUTES |
|
| Number
of Bonds |
190
|
| Effective
Duration |
3.3
Yrs |
| Average
Maturity |
4.1
Yrs |
30-DAY YIELDS, CLASS A
SHARES (with sales charge)
| Annualized
Distribution Yield |
1.43%
|
| SEC
Yield |
1.46%
|
TYPES OF HOLDINGS
PORTFOLIO
LADDER
| 7%
|
4%
|
11%
|
20%
|
14%
|
14%
|
5%
|
3%
|
10%
|
6%
|
6%
|
Percent of portfolio
maturing in each year. Cash includes cash equivalents and other.
THORNBURG
LIMITED TERM U.S.
GOVERNMENT FUND |
NASDAQ
SYMBOLS |
CUSIPS
|
| Class
A |
LTUSX
|
885-215-103
|
| Class
C |
LTUCX
|
885-215-830
|
| Class
C2 |
LTUQX
|
885-216-465
|
| Class
I |
LTUIX
|
885-215-699
|
| Class
R3 |
LTURX
|
885-215-491
|
| Class
R4 |
LTUGX
|
885-216-747
|
| Class
R5 |
LTGRX
|
885-216-861
|
Class I, R3, R4, and R5
shares may not be available to all investors. Minimum investments for Class I shares may be higher than those for other classes.
There is no guarantee that the Fund will meet its
investment objectives.
All data is subject to
change. Charts may not add up to 100% due to rounding.
10 | Thornburg Fixed Income Funds Semi-Annual Report
Fund Summary
Thornburg Limited Term Income Fund | March 31, 2022 (Unaudited)
LONG-TERM STABILITY OF PRINCIPAL
Net Asset Value History of Class A Shares
| KEY
PORTFOLIO ATTRIBUTES |
|
| Number
of Bonds |
820
|
| Effective
Duration |
2.9
Yrs |
| Average
Maturity |
3.6
Yrs |
30-DAY YIELDS, CLASS A
SHARES (with sales charge)
| Annualized
Distribution Yield |
1.51%
|
| SEC
Yield |
1.74%
|
SECURITY CREDIT RATINGS
A bond
credit rating assesses the financial ability of a debt issuer to make timely payments of principal and interest. Ratings of AAA (the highest), AA, A, and BBB are investment-grade quality. Ratings of BB, B, CCC, CC, C and D (the lowest) are
considered below investment grade, speculative grade, or junk bonds.
Unrated bonds are included in the not rated (NR)
category.
PORTFOLIO LADDER
| 5%
|
13%
|
14%
|
14%
|
13%
|
16%
|
8%
|
6%
|
5%
|
3%
|
4%
|
Percent of portfolio maturing
in each year. Cash includes cash equivalents and other.
THORNBURG
LIMITED TERM
INCOME FUND |
NASDAQ
SYMBOLS |
CUSIPS
|
| Class
A |
THIFX
|
885-215-509
|
| Class
C |
THICX
|
885-215-764
|
| Class
C2 |
THIQX
|
885-216-424
|
| Class
I |
THIIX
|
885-215-681
|
| Class
R3 |
THIRX
|
885-215-483
|
| Class
R4 |
THRIX
|
885-216-762
|
| Class
R5 |
THRRX
|
885-216-853
|
| Class
R6 |
THRLX
|
885-216-671
|
Class I, R3, R4, R5, and
R6 shares may not be available to all investors. Minimum investments for Class I shares may be higher than those for other classes.
There is no guarantee that the Fund will meet its
investment objectives.
All data is subject to
change. Charts may not add up to 100% due to rounding.
Thornburg Fixed Income Funds Semi-Annual Report | 11
Fund Summary
Thornburg Ultra Short Income Fund | March 31, 2022 (Unaudited)
LONG-TERM STABILITY OF PRINCIPAL
Net Asset Value History of Class A Shares
| KEY
PORTFOLIO ATTRIBUTES |
|
| Number
of Bonds |
327
|
| Effective
Duration |
0.6
Yrs |
| Average
Maturity |
0.9
Yrs |
30-DAY YIELDS, CLASS A
SHARES (with sales charge)
| Annualized
Distribution Yield |
1.10%
|
| SEC
Yield |
1.13%
|
Without the fee waivers
and expense reimbursements, the Annualized Distribution yield and the SEC yield would have been 0.55% and 0.58%, respectively.
SECURITY CREDIT RATINGS
A bond
credit rating assesses the financial ability of a debt issuer to make timely payments of principal and interest. Ratings of AAA (the highest), AA, A, and BBB are investment-grade quality. Ratings of BB, B, CCC, CC, C and D (the lowest) are
considered below investment grade, speculative grade, or junk bonds.
Unrated bonds are included in the not rated (NR)
category.
PORTFOLIO LADDER
Percent of portfolio maturing
in each year. Cash includes cash equivalents and other.
THORNBURG
ULTRA SHORT
INCOME FUND |
NASDAQ
SYMBOLS |
CUSIPS
|
| Class
A |
TLDAX
|
885-216-812
|
| Class
I |
TLDIX
|
885-216-796
|
Class I shares may not be
available to all investors. Minimum investments for Class I shares may be higher than those for other classes.
There is no guarantee that the Fund will meet its
investment objectives.
All data is subject to
change. Charts may not add up to 100% due to rounding.
12 | Thornburg Fixed Income Funds Semi-Annual Report
Fund Summary
Thornburg Strategic Income Fund | March 31, 2022 (Unaudited)
| PORTFOLIO
COMPOSITION |
| Corporate/Convertible
Bonds |
48.0%
|
| Asset
Backed Securities |
22.7%
|
| Bank
Loans |
2.7%
|
| Common
& Preferred Stock |
0.7%
|
| U.S.
Government Agencies |
0.3%
|
| U.S.
Treasury Securities |
0.7%
|
| Other
Fixed Income |
15.7%
|
| Other
Assets Less Liabilities |
9.2%
|
30-DAY YIELDS, CLASS A SHARES (with sales charge)
| Annualized
Distribution Yield |
2.78%
|
| SEC
Yield |
2.34%
|
FIXED INCOME CREDIT QUALITY *
*
Excludes equity securities.
A bond credit rating
assesses the financial ability of a debt issuer to make timely payments of principal and interest. Ratings of AAA (the highest), AA, A, and BBB are investment-grade quality. Ratings of BB, B, CCC, CC, C and D (the lowest) are considered below
investment grade, speculative grade, or junk bonds.
For purposes of presenting the credit quality
information in the above graph, we have used ratings from Moody’s Investors Service. Where Moody’s ratings are not available, we have used Standard & Poor’s ratings. Where neither rating is available, we have used ratings from
other nationally recognized statistical rating organizations (NRSROs). Unrated bonds are included in the not rated (NR) category.
| TOP
TEN INDUSTRY GROUPS |
| Diversified
Financials |
7.6%
|
| Software
& Services |
5.5%
|
| Utilities
|
4.6%
|
| Materials
|
3.8%
|
| Energy
|
3.5%
|
| Insurance
|
3.1%
|
| Capital
Goods |
2.3%
|
| Health
Care Equipment & Services |
2.3%
|
| Real
Estate |
1.9%
|
| Food,
Beverage & Tobacco |
1.9%
|
THORNBURG
STRATEGIC
INCOME FUND |
NASDAQ
SYMBOLS |
CUSIPS
|
| Class
A |
TSIAX
|
885-215-228
|
| Class
C |
TSICX
|
885-215-210
|
| Class
I |
TSIIX
|
885-215-194
|
| Class
R3 |
TSIRX
|
885-216-887
|
| Class
R4 |
TSRIX
|
885-216-754
|
| Class
R5 |
TSRRX
|
885-216-879
|
| Class
R6 |
TSRSX
|
885-216-648
|
Class I, R3, R4, R5, and
R6 shares may not be available to all investors. Minimum investments for Class I shares may be higher than those for other classes.
There is no guarantee that the Fund will meet its
investment objectives.
All data is subject to
change. Charts may not add up to 100% due to rounding.
Thornburg Fixed Income Funds Semi-Annual Report | 13
Schedule of Investments
Thornburg Limited Term U.S. Government Fund | March 31, 2022
(Unaudited)
| |
Issuer-Description
|
SHARES/PRINCIPAL
AMOUNT |
VALUE
|
| |
U.S.
Treasury Securities — 20.1% |
|
|
| |
United
States Treasury Notes, |
|
|
| |
0.125%
due 12/15/2023 |
$ 5,800,000
|
$ 5,594,734
|
| |
0.375%
due 11/30/2025 |
1,100,000 |
1,016,898 |
| |
0.625%
due 5/15/2030 |
14,000,000
|
12,208,438 |
| |
1.50%
due 10/31/2024 - 2/15/2030 |
6,635,000 |
6,394,969 |
| |
2.25%
due 12/31/2023 |
10,600,000
|
10,597,102 |
| |
United
States Treasury Notes Inflationary Index, |
|
|
| |
0.125%
due 1/15/2030 - 7/15/2030 |
12,793,942
|
13,491,071 |
| |
0.25%
due 7/15/2029 |
5,450,147
|
5,802,485
|
| |
Total
U.S. Treasury Securities (Cost $57,953,670) |
|
55,105,697
|
| |
U.S.
Government Agencies — 7.5% |
|
|
|
a |
Durrah
MSN 35603 (Guaranty: Export-Import Bank of the United States), 1.684% due 1/22/2025 |
387,276 |
382,680
|
| |
HNA
Group LLC (Guaranty: Export-Import Bank of the United States), Series 2015, 2.291% due 6/30/2027 |
1,438,953 |
1,413,645 |
|
a |
MSN
41079 and 41084 Ltd. (Guaranty: Export-Import Bank of the United States), 1.717% due 7/13/2024 |
356,357 |
352,907 |
| |
Petroleos
Mexicanos (Guaranty: Export-Import Bank of the United States), |
|
|
|
a,b |
0.591%
(LIBOR 3 Month + 0.35%) due 4/15/2025 |
1,137,500 |
1,125,602 |
|
a |
1.70%
due 12/20/2022 |
522,500 |
496,375 |
|
a |
2.29%
due 2/15/2024 |
105,000 |
103,550 |
|
a |
2.46%
due 12/15/2025 |
1,000,000 |
982,510 |
| |
Reliance
Industries Ltd. (Guaranty: Export-Import Bank of the United States), |
|
|
|
a |
2.06%
due 1/15/2026 |
1,400,000 |
1,350,762 |
|
a |
2.512%
due 1/15/2026 |
2,110,000 |
2,065,226 |
| |
Small
Business Administration Participation Certificates, |
|
|
| |
Series
2002-20K Class 1, 5.08% due 11/1/2022 |
20,896 |
20,976 |
| |
Series
2005-20H Class 1, 5.11% due 8/1/2025 |
37,910 |
38,770 |
| |
Series
2007-20D Class 1, 5.32% due 4/1/2027 |
121,850 |
126,028 |
| |
Series
2007-20F Class 1, 5.71% due 6/1/2027 |
76,524 |
79,690 |
| |
Series
2007-20I Class 1, 5.56% due 9/1/2027 |
218,667 |
227,376 |
| |
Series
2007-20K Class 1, 5.51% due 11/1/2027 |
186,930 |
194,269 |
| |
Series
2008-20G Class 1, 5.87% due 7/1/2028 |
383,922 |
403,698 |
| |
Series
2011-20G Class 1, 3.74% due 7/1/2031 |
603,800 |
609,755 |
| |
Series
2011-20K Class 1, 2.87% due 11/1/2031 |
982,607 |
968,900 |
| |
Series
2014-20H Class 1, 2.88% due 8/1/2034 |
556,759 |
551,120 |
| |
Series
2015-20B Class 1, 2.46% due 2/1/2035 |
518,330 |
505,585 |
| |
Series
2015-20G Class 1, 2.88% due 7/1/2035 |
1,078,556 |
1,069,048 |
| |
Series
2015-20I Class 1, 2.82% due 9/1/2035 |
1,004,390 |
994,132 |
| |
Series
2017-20I Class 1, 2.59% due 9/1/2037 |
2,178,822 |
2,138,828 |
| |
Series
2017-20K Class 1, 2.79% due 11/1/2037 |
1,102,195 |
1,092,336 |
| |
Thirax
1 LLC (Guaranty: Export-Import Bank of the United States), 0.968% due 1/14/2033 |
1,383,012 |
1,218,434 |
| |
Ulani
MSN 35940 LLC (Guaranty: Export-Import Bank of the United States), 2.227% due 5/16/2025 |
1,354,167 |
1,311,985 |
| a,b |
Washington
Aircraft 2 Co DAC (Guaranty: Export-Import Bank of the United States), 1.396% (LIBOR 3 Month + 0.43%) due 6/26/2024 |
869,007 |
864,983
|
| |
Total
U.S. Government Agencies (Cost $21,201,906) |
|
20,689,170
|
| |
Mortgage
Backed — 62.3% |
|
|
|
b,c |
Federal
Agricultural Mortgage Corp. Mtg Trust, Whole Loan Securities Trust CMO, Seies 2021-1 Class A, 2.18% due 1/25/2051 |
4,687,993 |
4,347,372
|
| |
Federal
Home Loan Mtg Corp., |
|
|
| |
Pool
D98887, 3.50% due 1/1/2032 |
251,941 |
257,698 |
| |
Pool
E09025, 2.50% due 3/1/2028 |
58,937 |
58,778 |
| |
Pool
G13804, 5.00% due 3/1/2025 |
54,363 |
56,169 |
| |
Pool
G15227, 3.50% due 12/1/2029 |
958,066 |
982,460 |
| |
Pool
G16710, 3.00% due 11/1/2030 |
1,458,514 |
1,477,258 |
| |
Pool
J11371, 4.50% due 12/1/2024 |
56,351 |
57,834 |
| |
Pool
J21208, 2.50% due 11/1/2027 |
1,117,704 |
1,113,698 |
| |
Pool
J37586, 3.50% due 9/1/2032 |
210,593 |
217,238 |
| |
Pool
T61943, 3.50% due 8/1/2045 |
126,025 |
126,909 |
| |
Pool
T65457, 3.00% due 1/1/2048 |
583,129 |
573,399 |
| |
Federal
Home Loan Mtg Corp., CMO REMIC, |
|
|
| |
Series
1351 Class TE, 7.00% due 8/15/2022 |
1,934 |
1,946 |
| |
Series
3704 Class DC, 4.00% due 11/15/2036 |
86,035 |
86,988 |
| |
Series
3867 Class VA, 4.50% due 3/15/2024 |
543,352 |
548,226 |
14 | Thornburg Fixed Income Funds Semi-Annual Report
|
See notes to
financial statements. |
Schedule of Investments,
Continued
Thornburg Limited Term U.S. Government Fund | March 31, 2022 (Unaudited)
| |
Issuer-Description
|
SHARES/PRINCIPAL
AMOUNT |
VALUE
|
| |
Series
3922 Class PQ, 2.00% due 4/15/2041 |
$ 139,907
|
$ 137,276
|
| |
Series
4050 Class MV, 3.50% due 8/15/2023 |
518,984 |
522,415 |
|
b |
Series
4105 Class FG, 0.797% (LIBOR 1 Month + 0.40%) due 9/15/2042 |
600,476 |
598,852 |
| |
Series
4120 Class TC, 1.50% due 10/15/2027 |
620,092 |
605,866 |
| |
Series
4120 Class UE, 2.00% due 10/15/2027 |
701,795 |
691,718 |
| |
Federal
Home Loan Mtg Corp., Multi-Family Structured Pass Through CMBS, |
|
|
| |
Series
K035 Class A1, 2.615% due 3/25/2023 |
109,651 |
109,662 |
|
b |
Series
K035 Class A2, 3.458% due 8/25/2023 |
3,000,000 |
3,034,114 |
| |
Series
K037 Class A1, 2.592% due 4/25/2023 |
305,624 |
306,209 |
| |
Series
K038 Class A1, 2.604% due 10/25/2023 |
654,597 |
655,763 |
| |
Series
K042 Class A1, 2.267% due 6/25/2024 |
1,335,373 |
1,331,805 |
|
b |
Series
K047 Class A2, 3.329% due 5/25/2025 |
1,250,000 |
1,267,150 |
| |
Series
K055 Class A1, 2.263% due 4/25/2025 |
76,909 |
76,506 |
|
b |
Series
K061 Class A2, 3.347% due 11/25/2026 |
290,000 |
296,214 |
|
b |
Series
K069 Class A2, 3.187% due 9/25/2027 |
180,000 |
183,227 |
| |
Series
K071 Class A2, 3.286% due 11/25/2027 |
2,000,000 |
2,049,051 |
| |
Series
K072 Class A2, 3.444% due 12/25/2027 |
120,000 |
123,903 |
| |
Series
K073 Class A2, 3.35% due 1/25/2028 |
3,000,000 |
3,084,558 |
| |
Series
K095 Class A2, 2.785% due 6/25/2029 |
577,000 |
575,974 |
| |
Series
K729 Class A2, 3.136% due 10/25/2024 |
3,500,000 |
3,522,813 |
| |
Series
K730 Class A1, 3.452% due 9/25/2024 |
9,849 |
9,879 |
|
b |
Series
K730 Class A2, 3.59% due 1/25/2025 |
190,000 |
193,208 |
|
b |
Series
KF15 Class A, 0.911% (LIBOR 1 Month + 0.67%) due 2/25/2023 |
58,645 |
58,659 |
| |
Series
KHG1 Class A3, 3.341% due 12/25/2027 |
300,000 |
304,269 |
| |
Series
KS03 Class A2, 2.79% due 6/25/2022 |
2,444,208 |
2,445,418 |
| |
Federal
Home Loan Mtg Corp., Seasoned Credit Risk Transfer, Whole Loan Securities Trust CMO, |
|
|
|
b |
Series
2017-3 Class HA, 3.25% due 7/25/2056 |
1,096,303 |
1,083,276 |
|
b |
Series
2017-4 Class HT, 3.25% due 6/25/2057 |
3,130,131 |
3,119,375 |
| |
Series
2017-4 Class MT, 3.50% due 6/25/2057 |
705,020 |
707,523 |
|
b |
Series
2018-1 Class HA, 3.00% due 5/25/2057 |
1,463,508 |
1,442,821 |
|
b |
Series
2018-2 Class HA, 3.00% due 11/25/2057 |
838,240 |
827,604 |
| |
Series
2018-3 Class HA, 3.00% due 8/25/2057 |
1,072,572 |
1,060,602 |
|
b |
Series
2018-3 Class MA, 3.50% due 8/25/2057 |
1,265,008 |
1,271,488 |
| |
Series
2018-4 Class HA, 3.00% due 3/25/2058 |
1,315,896 |
1,298,104 |
| |
Series
2018-4 Class MA, 3.50% due 3/25/2058 |
962,831 |
967,300 |
| |
Series
2019-1 Class MA, 3.50% due 7/25/2058 |
2,705,965 |
2,719,346 |
| |
Series
2019-2 Class MA, 3.50% due 8/25/2058 |
2,339,915 |
2,349,233 |
| |
Series
2019-3 Class MA, 3.50% due 10/25/2058 |
972,551 |
977,264 |
| |
Series
2019-4 Class MA, 3.00% due 2/25/2059 |
1,369,114 |
1,359,756 |
| |
Series
2020-1 Class MA, 2.50% due 8/25/2059 |
2,114,278 |
2,068,231 |
| |
Series
2020-2 Class A1D, 1.75% due 9/25/2030 |
2,515,210 |
2,386,556 |
| |
Series
2020-2 Class MA, 2.00% due 11/25/2059 |
2,065,799 |
1,989,091 |
| |
Series
2020-3 Class MA, 2.00% due 5/25/2060 |
661,023 |
635,627 |
| |
Series
2020-3 Class MT, 2.00% due 5/25/2060 |
745,767 |
698,500 |
| |
Federal
Home Loan Mtg Corp., UMBS Collateral, |
|
|
|
d |
Pool
RA6808 3.00% due 2/1/2052 |
2,495,391 |
2,443,299 |
| |
Pool
RC1280, 3.00% due 3/1/2035 |
642,715 |
650,951 |
| |
Pool
RC1535, 2.00% due 8/1/2035 |
2,283,132 |
2,221,540 |
| |
Pool
RC1826, 2.00% due 2/1/2036 |
1,656,507 |
1,611,819 |
| |
Pool
RD5043, 2.00% due 12/1/2030 |
2,628,942 |
2,581,349 |
| |
Pool
SB0464, 2.50% due 1/1/2036 |
5,612,970 |
5,574,172 |
| |
Pool
SB8010, 2.50% due 10/1/2034 |
754,213 |
748,990 |
| |
Pool
SB8030, 2.00% due 12/1/2034 |
1,082,777 |
1,052,473 |
| |
Pool
ZS4730, 3.50% due 8/1/2047 |
996,872 |
1,005,809 |
| |
Pool
ZS7299, 3.00% due 10/1/2030 |
745,078 |
754,124 |
| |
Pool
ZS7942, 3.00% due 2/1/2033 |
2,467,514 |
2,501,679 |
| |
Pool
ZS8034, 3.00% due 6/1/2033 |
1,834,433 |
1,862,078 |
| |
Federal
Home Loan Mtg Corp., Whole Loan Securities Trust CMO, |
|
|
| |
Series
2015-SC02 Class 2A, 3.50% due 9/25/2045 |
234,891 |
231,175 |
| |
Series
2016-SC01 Class 2A, 3.50% due 7/25/2046 |
294,021 |
289,429 |
| |
Series
2016-SC02 Class 2A, 3.50% due 10/25/2046 |
231,136 |
227,087 |
| |
Series
2017-SC01 Class 1A, 3.00% due 12/25/2046 |
457,158 |
441,505 |
| |
Series
2017-SC02 Class 1A, 3.00% due 5/25/2047 |
374,088 |
362,263 |
See
notes to financial statements.
|
Thornburg Fixed
Income Funds Semi-Annual Report | 15 |
Schedule of Investments, Continued
Thornburg Limited Term U.S. Government Fund | March 31, 2022 (Unaudited)
| |
Issuer-Description
|
SHARES/PRINCIPAL
AMOUNT |
VALUE
|
| |
Series
2017-SC02 Class 2A, 3.50% due 5/25/2047 |
$ 184,367
|
$ 181,279
|
| |
Federal
National Mtg Assoc., |
|
|
|
b |
Pool
895572, 2.195% (LIBOR 12 Month + 1.82%) due 6/1/2036 |
80,407 |
84,422 |
| |
Pool
BF0130, 3.50% due 8/1/2056 |
392,491 |
400,069 |
| |
Pool
BF0144, 3.50% due 10/1/2056 |
565,414 |
576,331 |
| |
Pool
FS0898, 3.00% due 2/1/2052 |
5,482,130 |
5,369,416 |
| |
Pool
FS0916, 3.00% due 3/1/2052 |
5,476,727 |
5,365,316 |
| |
Pool
MA1582, 3.50% due 9/1/2043 |
1,641,549 |
1,687,154 |
| |
Federal
National Mtg Assoc., CMBS, |
|
|
|
b |
Series
2015-SB5 Class A10, 3.15% due 9/25/2035 |
307,427 |
307,223 |
|
b |
Series
2018-SB47 Class A5H, 2.92% due 1/25/2038 |
960,159 |
966,071 |
| |
Federal
National Mtg Assoc., CMO REMIC, |
|
|
| |
Series
1993-32 Class H, 6.00% due 3/25/2023 |
974 |
986 |
|
b |
Series
2009-17 Class AH, 0.593% due 3/25/2039 |
229,419 |
203,774 |
| |
Series
2009-52 Class AJ, 4.00% due 7/25/2024 |
439 |
441 |
| |
Series
2011-70 Class CA, 3.00% due 8/25/2026 |
947,164 |
946,051 |
|
b |
Series
2013-81 Class FW, 0.757% (LIBOR 1 Month + 0.30%) due 1/25/2043 |
1,049,946 |
1,043,196 |
|
b |
Series
2013-92 Class FA, 1.007% (LIBOR 1 Month + 0.55%) due 9/25/2043 |
738,422 |
740,342 |
| |
Federal
National Mtg Assoc., Grantor Trust, Series 2017-T1 Class A, 2.898% due 6/25/2027 |
994,859 |
997,916 |
| |
Federal
National Mtg Assoc., UMBS Collateral, |
|
|
| |
Pool
AE0704, 4.00% due 1/1/2026 |
517,068 |
532,196 |
| |
Pool
AJ1752, 3.50% due 9/1/2026 |
515,877 |
526,806 |
| |
Pool
AK6768, 3.00% due 3/1/2027 |
620,198 |
626,776 |
| |
Pool
AL6582, 3.50% due 4/1/2030 |
612,543 |
627,704 |
| |
Pool
AL7801, 2.50% due 11/1/2030 |
2,132,818 |
2,128,294 |
| |
Pool
AL9445, 3.00% due 7/1/2031 |
16,773 |
16,977 |
| |
Pool
AL9821, 2.50% due 1/1/2032 |
2,436,860 |
2,430,591 |
| |
Pool
AS4916, 3.00% due 5/1/2030 |
1,051,161 |
1,063,925 |
| |
Pool
AS9733, 4.00% due 6/1/2047 |
1,187,233 |
1,234,013 |
| |
Pool
AS9749, 4.00% due 6/1/2047 |
414,876 |
426,743 |
| |
Pool
AU2669, 2.50% due 10/1/2028 |
681,134 |
678,845 |
| |
Pool
AZ3778, 3.00% due 4/1/2030 |
1,574,517 |
1,592,453 |
| |
Pool
BM4153, 3.00% due 6/1/2033 |
1,608,933 |
1,628,663 |
| |
Pool
BM4864, 3.50% due 5/1/2033 |
1,043,771 |
1,071,233 |
| |
Pool
BP9589, 2.50% due 8/1/2035 |
2,385,429 |
2,365,091 |
| |
Pool
CA0200, 3.00% due 8/1/2032 |
1,131,519 |
1,147,187 |
| |
Pool
CA0942, 2.50% due 12/1/2032 |
970,792 |
967,389 |
| |
Pool
CA4102, 3.50% due 8/1/2029 |
864,965 |
895,287 |
| |
Pool
CA5271, 2.50% due 3/1/2035 |
1,333,991 |
1,324,753 |
| |
Pool
CA5282, 3.00% due 3/1/2035 |
2,913,041 |
2,960,764 |
| |
Pool
CA6862, 2.00% due 9/1/2035 |
1,605,824 |
1,563,232 |
| |
Pool
CA7470, 2.00% due 10/1/2035 |
2,835,735 |
2,760,522 |
| |
Pool
CA7535, 1.50% due 10/1/2030 |
3,198,265 |
3,075,906 |
| |
Pool
CA7891, 1.50% due 11/1/2035 |
1,660,132 |
1,575,641 |
| |
Pool
FM1126, 3.00% due 3/1/2033 |
1,679,852 |
1,698,988 |
| |
Pool
FM1523, 2.50% due 8/1/2029 |
911,605 |
907,236 |
| |
Pool
FM2831, 2.50% due 5/1/2032 |
1,820,911 |
1,816,226 |
| |
Pool
FM3494, 2.50% due 4/1/2048 |
1,339,681 |
1,295,323 |
| |
Pool
FM5458, 1.50% due 12/1/2035 |
1,475,708 |
1,399,998 |
| |
Pool
FM8523, 2.00% due 8/1/2036 |
1,619,169 |
1,574,062 |
| |
Pool
FM8858, 2.00% due 9/1/2036 |
1,438,029 |
1,397,615 |
| |
Pool
MA2353, 3.00% due 8/1/2035 |
779,316 |
780,163 |
| |
Pool
MA2480, 4.00% due 12/1/2035 |
813,060 |
844,849 |
| |
Pool
MA3465, 4.00% due 9/1/2038 |
451,592 |
465,053 |
| |
Pool
MA3557, 4.00% due 1/1/2029 |
717,278 |
738,880 |
| |
Pool
MA3681, 3.00% due 6/1/2034 |
429,848 |
434,157 |
| |
Pool
MA3826, 3.00% due 11/1/2029 |
1,054,556 |
1,071,241 |
| |
Pool
MA3896, 2.50% due 1/1/2035 |
119,557 |
118,729 |
| |
Pool
MA3953, 2.50% due 3/1/2030 |
553,462 |
553,128 |
| |
Pool
MA4016, 2.50% due 5/1/2040 |
1,207,200 |
1,169,169 |
| |
Pool
MA4042, 2.00% due 6/1/2035 |
2,629,283 |
2,558,355 |
| |
Pool
MA4045, 2.00% due 6/1/2040 |
2,340,561 |
2,204,689 |
| |
Pool
MA4148, 2.00% due 10/1/2030 |
639,878 |
628,290 |
16 | Thornburg Fixed Income Funds Semi-Annual Report
|
See notes to
financial statements. |
Schedule of Investments,
Continued
Thornburg Limited Term U.S. Government Fund | March 31, 2022 (Unaudited)
| |
Issuer-Description
|
SHARES/PRINCIPAL
AMOUNT |
VALUE
|
| |
Pool
MA4173, 2.00% due 11/1/2030 |
$ 680,333
|
$ 668,016
|
| |
Pool
MA4309, 2.00% due 4/1/2031 |
1,704,723 |
1,673,683 |
| |
Pool
MA4390, 2.00% due 7/1/2031 |
4,362,848 |
4,283,408 |
| |
Government
National Mtg Assoc., |
|
|
|
b |
Pool
751392, 5.00% due 2/20/2061 |
618,683 |
628,227 |
|
b |
Pool
894205, 1.625% (H15T1Y + 1.50%) due 8/20/2039 |
298,848 |
304,218 |
|
b |
Pool
MA0100, 1.875% (H15T1Y + 1.50%) due 5/20/2042 |
216,254 |
224,530 |
| |
Pool
MA0907, 2.00% due 4/20/2028 |
720,438 |
700,842 |
| |
Government
National Mtg Assoc., CMO, |
|
|
| |
Series
2016-32 Class LJ, 2.50% due 12/20/2040 |
599,960 |
601,439 |
| |
Series
2017-186 Class VA, 3.00% due 2/20/2031 |
2,174,296 |
2,184,647 |
| |
Seasoned
Loans Structured Transaction Trust, Whole Loan Securities Trust CMO, Series 2020-2 Class A1C, 2.00% due 9/25/2030 |
2,515,210
|
2,393,805
|
| |
Total
Mortgage Backed (Cost $177,299,923) |
|
171,021,865
|
| |
Corporate
Bonds — 2.2% |
|
|
| |
Telecommunication
Services — 1.3% |
|
|
| |
Wireless
Telecommunication Services — 1.3% |
|
|
|
e |
Sprint
Communications, Inc., 9.25% due 4/15/2022 |
3,500,000 |
3,509,975
|
| |
|
|
3,509,975
|
| |
Utilities
— 0.9% |
|
|
| |
Electric
Utilities — 0.9% |
|
|
|
c |
Caledonia
Generating LLC, 1.95% due 2/28/2034 |
2,819,541 |
2,657,310
|
| |
|
|
2,657,310
|
| |
Total
Corporate Bonds (Cost $6,327,674) |
|
6,167,285
|
| |
Short-Term
Investments — 8.6% |
|
|
|
f |
State
Street Institutional Treasury Money Market Fund Premier Class, 0.17% |
1,134,439
|
1,134,439
|
| |
United
States Treasury Bill |
|
|
| |
0.218%
due 5/5/2022 |
$ 2,500,000
|
2,499,491 |
| |
0.224%
due 4/28/2022 |
2,500,000 |
2,499,587 |
| |
0.232%
due 4/26/2022 |
2,500,000 |
2,499,603 |
| |
0.233%
due 5/3/2022 |
2,500,000 |
2,499,489 |
| |
0.251%
due 4/21/2022 |
2,500,000 |
2,499,656 |
| |
0.256%
due 5/10/2022 |
2,500,000 |
2,499,316 |
| |
0.264%
due 5/12/2022 |
2,500,000 |
2,499,260 |
| |
0.28%
due 5/24/2022 |
2,500,000 |
2,498,960 |
| |
United
States Treasury Note, 2.125% due 5/15/2022 |
2,500,000
|
2,505,535
|
| |
Total
Short-Term Investments (Cost $23,635,336) |
|
23,635,336
|
| |
Total
Investments — 100.7% (Cost $286,418,509) |
|
$276,619,353
|
| |
Liabilities
Net of Other Assets — (0.7)% |
|
(1,891,698)
|
| |
Net
Assets — 100.0% |
|
$274,727,655
|
| Footnote Legend
|
| a
|
Yankee
bond denominated in U.S. dollars and is issued in the U.S. by foreign banks and corporations. |
| b
|
Variable,
floating, step, or fixed to floating rate securities are securities for which interest rate changes are based on changes in a designated base rate or on a predetermined schedule. The rates shown are those in effect on March 31, 2022. |
| c
|
Securities
exempt from registration under Rule 144A of the Securities Act of 1933, as amended. These securities are restricted but liquid and may only be resold in the ordinary course of business in transactions exempt from registration, normally to qualified
institutional buyers. As of March 31, 2022, the aggregate value of these securities in the Fund’s portfolio was $7,004,682, representing 2.55% of the Fund’s net assets. |
| d
|
When-issued
security. |
| e
|
Segregated
as collateral for a when-issued security. |
| f
|
Rate
represents the money market fund annualized seven-day yield at March 31, 2022. |
See
notes to financial statements.
|
Thornburg Fixed
Income Funds Semi-Annual Report | 17 |
Schedule of Investments, Continued
Thornburg Limited Term U.S. Government Fund | March 31, 2022 (Unaudited)
Portfolio Abbreviations
To simplify the listings of securities, abbreviations are used per the table below:
| CMBS
|
Commercial
Mortgage-Backed Securities |
| CMO
|
Collateralized
Mortgage Obligation |
| H15T1Y
|
US
Treasury Yield Curve Rate T-Note Constant Maturity 1 Year |
| LIBOR
|
London
Interbank Offered Rates |
| Mtg
|
Mortgage
|
| REMIC
|
Real
Estate Mortgage Investment Conduit |
| UMBS
|
Uniform Mortgage
Backed Securities |
18 | Thornburg Fixed Income Funds Semi-Annual Report
|
See notes to
financial statements. |
Schedule of Investments
Thornburg Limited Term Income Fund | March 31, 2022 (Unaudited)
| |
Issuer-Description
|
SHARES/PRINCIPAL
AMOUNT |
VALUE
|
| |
U.S.
Treasury Securities — 8.5% |
|
|
| |
United
States Treasury Notes, |
|
|
| |
0.375%
due 11/30/2025 |
$148,015,000
|
$ 136,832,930
|
| |
0.625%
due 5/15/2030 |
5,350,000 |
4,665,367 |
| |
1.375%
due 11/15/2031 |
90,000,000 |
82,589,062 |
| |
1.50%
due 10/31/2024 |
88,520,000 |
86,348,494 |
| |
1.625%
due 2/15/2026 |
52,700,000 |
50,933,727 |
| |
1.75%
due 11/15/2029 |
62,136,000 |
59,446,676 |
| |
2.00%
due 8/15/2025 |
30,000,000 |
29,470,313 |
| |
2.25%
due 11/15/2025 - 8/15/2027 |
31,662,000 |
31,326,656 |
| |
2.625%
due 2/15/2029 |
17,058,000 |
17,263,229 |
| |
United
States Treasury Notes Inflationary Index, |
|
|
| |
0.125%
due 1/15/2030 |
38,236,100 |
40,247,453 |
| |
0.25%
due 1/15/2025 - 7/15/2029 |
126,083,905
|
134,119,784 |
| |
0.375%
due 7/15/2027 |
72,250,378 |
76,679,396 |
| |
0.875%
due 1/15/2029 |
59,510,112
|
65,504,852
|
| |
Total
U.S. Treasury Securities (Cost $821,166,298) |
|
815,427,939
|
| |
U.S.
Government Agencies — 0.6% |
|
|
| |
ALEX
Alpha LLC (Guaranty: Export-Import Bank of the United States), 1.617% due 8/15/2024 |
1,086,956 |
1,076,029
|
| |
Petroleos
Mexicanos (Guaranty: Export-Import Bank of the United States), |
|
|
|
a,b |
0.591%
(LIBOR 3 Month + 0.35%) due 4/15/2025 |
3,367,000 |
3,331,781 |
|
b |
1.70%
due 12/20/2022 |
1,040,000 |
988,000 |
|
b |
6.50%
due 1/23/2029 |
10,007,000 |
9,927,444 |
| |
Private
Export Funding Corp. (Guaranty: Export-Import Bank of the United States), Series KK, 3.55% due 1/15/2024 |
10,000,000 |
10,155,800 |
| |
Reliance
Industries Ltd. (Guaranty: Export-Import Bank of the United States), |
|
|
|
b |
2.06%
due 1/15/2026 |
600,000 |
578,898 |
|
b |
2.512%
due 1/15/2026 |
2,600,000 |
2,544,828 |
| |
Santa
Rosa Leasing LLC (Guaranty: Export-Import Bank of the United States), 1.693% due 8/15/2024 |
1,285,112 |
1,256,171 |
| |
Small
Business Administration Participation Certificates, |
|
|
| |
Series
2008-20D Class 1, 5.37% due 4/1/2028 |
460,820 |
479,475 |
| |
Series
2009-20E Class 1, 4.43% due 5/1/2029 |
268,355 |
274,356 |
| |
Series
2009-20K Class 1, 4.09% due 11/1/2029 |
1,917,418 |
1,948,008 |
| |
Series
2011-20E Class 1, 3.79% due 5/1/2031 |
2,265,044 |
2,285,998 |
| |
Series
2011-20F Class 1, 3.67% due 6/1/2031 |
423,628 |
426,644 |
| |
Series
2011-20G Class 1, 3.74% due 7/1/2031 |
2,415,199 |
2,439,019 |
| |
Series
2011-20I Class 1, 2.85% due 9/1/2031 |
3,895,711 |
3,840,430 |
| |
Series
2011-20K Class 1, 2.87% due 11/1/2031 |
3,824,796 |
3,771,443 |
| |
Series
2012-20D Class 1, 2.67% due 4/1/2032 |
3,560,210 |
3,492,003 |
| |
Series
2012-20J Class 1, 2.18% due 10/1/2032 |
2,858,972 |
2,760,357 |
| |
Series
2012-20K Class 1, 2.09% due 11/1/2032 |
1,934,122
|
1,862,845
|
| |
Total
U.S. Government Agencies (Cost $54,329,656) |
|
53,439,529
|
| |
Other
Government — 0.2% |
|
|
|
b,c |
Bermuda
Government International Bond, 2.375% due 8/20/2030 |
6,800,000 |
6,238,252
|
| |
Carpintero
Finance Ltd. (Guaranty: Export Credits Guarantee Department), |
|
|
|
b,c |
2.004%
due 9/18/2024 |
3,238,323 |
3,198,362 |
|
b,c |
2.581%
due 11/11/2024 |
3,349,971 |
3,353,137 |
|
b,c |
Khadrawy
Ltd. (Guaranty: Export Credits Guarantee Department), 2.471% due 3/31/2025 |
1,978,654 |
1,967,019 |
| b |
Sharjah
Sukuk Program Ltd., 4.226% due 3/14/2028 |
2,000,000
|
2,031,380
|
| |
Total
Other Government (Cost $17,525,308) |
|
16,788,150
|
| |
Mortgage
Backed — 24.5% |
|
|
|
a,c |
Angel
Oak Mortgage Trust LLC, Whole Loan Securities Trust CMO, Series 2020-2 Class A3, 5.00% due 1/26/2065 |
7,141,034 |
7,194,855
|
| |
Arroyo
Mortgage Trust, Whole Loan Securities Trust CMO, |
|
|
|
a,c |
Series
2019-1 Class A1, 3.805% due 1/25/2049 |
7,418,216 |
7,418,216 |
|
a,c |
Series
2019-1 Class A3, 3.996% due 1/25/2049 |
3,881,258 |
3,881,258 |
|
a,c |
Series
2019-2 Class A1, 3.347% due 4/25/2049 |
2,991,535 |
2,986,864 |
|
a,c |
Series
2019-3 Class A1, 2.962% due 10/25/2048 |
6,841,284 |
6,845,735 |
|
c |
Series
2020-1 Class A2, 2.927% due 3/25/2055 |
6,518,000 |
6,503,218 |
| c |
Series
2020-1 Class A3, 3.328% due 3/25/2055 |
4,500,000
|
4,507,187 |
See
notes to financial statements.
|
Thornburg Fixed
Income Funds Semi-Annual Report | 19 |
Schedule of Investments, Continued
Thornburg Limited Term Income Fund | March 31, 2022 (Unaudited)
| |
Issuer-Description
|
SHARES/PRINCIPAL
AMOUNT |
VALUE
|
|
c |
Series
2020-1 Class M1, 4.277% due 3/25/2055 |
$ 3,189,000
|
$ 3,153,011
|
|
a,c |
Series
2021-1R Class A1, 1.175% due 10/25/2048 |
12,802,320 |
12,124,436 |
|
c |
Series
2022-1 Class M1, 3.65% due 12/25/2056 |
7,338,000 |
6,846,315 |
| |
Bank,
CMBS, Series 2017-BNK5 Class A2, 2.987% due 6/15/2060 |
138,071 |
138,277 |
|
a,c |
Bayview
Commercial Asset Trust, CMBS, Series 2004-3 Class A2, 1.087% (LIBOR 1 Month + 0.63%) due 1/25/2035 |
872,489 |
868,305 |
|
c |
Bravo
Residential Funding Trust, Whole Loan Securities Trust CMO, Series 2019-1 Class A1C, 3.50% due 3/25/2058 |
1,715,191 |
1,719,482 |
|
a,c |
Bunker
Hill Loan Depositary Trust, Whole Loan Securities Trust CMO, Series 2020-1 Class A3, 3.253% due 2/25/2055 |
3,285,000 |
3,264,688 |
|
c |
CFMT
Issuer Trust, Whole Loan Securities Trust CMO, Series 2021-GRN1 Class A, 1.10% due 3/20/2041 |
8,381,134 |
8,075,771 |
| |
Chase
Mortgage Finance Corp., Whole Loan Securities Trust CMO, |
|
|
|
a,c |
Series
2016-SH1 Class M3, 3.75% due 4/25/2045 |
2,528,012 |
2,468,851 |
|
a,c |
Series
2016-SH2 Class M3, 3.75% due 12/25/2045 |
3,029,102 |
2,943,931 |
| |
CHNGE
Mortgage Trust, Whole Loan Securities Trust CMO, |
|
|
|
a,c |
Series
2022-1 3.007% due 1/25/2067 |
18,739,404 |
18,259,546 |
|
a,c |
Series
2022-2 Class M1, 4.609% due 3/25/2067 |
14,163,000 |
13,664,447 |
|
a,c |
CIM
Trust, Whole Loan Securities Trust CMO, Series 18-INV1 Class A4, 4.00% due 8/25/2048 |
1,079,170 |
1,090,424 |
| |
Citigroup
Mortgage Loan Trust, Whole Loan Securities Trust CMO, |
|
|
|
a |
Series
2004-HYB2 Class B1, 2.485% due 3/25/2034 |
61,171 |
61,171 |
|
a,c |
Series
2014-A Class A, 4.00% due 1/25/2035 |
646,376 |
637,702 |
|
a,c |
Series
2014-J1 Class B4, 3.653% due 6/25/2044 |
1,489,969 |
1,439,933 |
|
a,c |
Series
2021-J2 Class A7A, 2.50% due 7/25/2051 |
26,513,366 |
25,391,506 |
| |
COMM
Mortgage Trust, CMBS, Series 2015-DC1 Class A4, 3.078% due 2/10/2048 |
19,800,000 |
19,589,592 |
| |
CSMC
Trust, Whole Loan Securities Trust CMO, |
|
|
|
a,c |
Series
2013-HYB1 Class B3, 2.923% due 4/25/2043 |
2,490,014 |
2,490,014 |
|
a,c |
Series
2021-AFC1 Class-A1, 0.83% due 3/25/2056 |
11,167,202 |
10,800,323 |
|
a,c |
Series
2021-NQM3 Class A1, 1.015% due 4/25/2066 |
15,122,285 |
14,650,347 |
|
a,c |
Series
2021-NQM8 Class-A1, 1.841% due 10/25/2066 |
18,522,365 |
17,681,174 |
|
a,c |
Deephaven
Residential Mortgage Trust, Whole Loan Securities Trust CMO, Series 2021-1 Class A1, 0.715% due 5/25/2065 |
5,427,031 |
5,285,740 |
| |
Ellington
Financial Mortgage Trust, Whole Loan Securities Trust CMO, |
|
|
|
a,c |
Series
2019-2 Class A1, 2.739% due 11/25/2059 |
5,448,793 |
5,439,598 |
|
a,c |
Series
2021-2 Class A1, 0.931% due 6/25/2066 |
13,171,152 |
12,458,163 |
|
a,c |
Series
2022-1 2.206% due 1/25/2067 |
21,162,122 |
19,687,604 |
| |
Federal
Home Loan Mtg Corp., |
|
|
| |
Pool
D98887, 3.50% due 1/1/2032 |
843,370 |
862,643 |
| |
Pool
G16710, 3.00% due 11/1/2030 |
395,607 |
400,691 |
| |
Pool
J17504, 3.00% due 12/1/2026 |
391,775 |
396,090 |
| |
Pool
T65457, 3.00% due 1/1/2048 |
5,235,669 |
5,148,308 |
| |
Federal
Home Loan Mtg Corp., CMO REMIC, |
|
|
| |
Series
3195 Class PD, 6.50% due 7/15/2036 |
290,144 |
317,970 |
| |
Series
3838 Class GV, 4.00% due 3/15/2024 |
2,283,359 |
2,293,910 |
| |
Series
3919 Class VB, 4.00% due 8/15/2024 |
106,422 |
108,021 |
| |
Series
3922 Class PQ, 2.00% due 4/15/2041 |
209,860 |
205,914 |
| |
Series
4050 Class MV, 3.50% due 8/15/2023 |
592,956 |
596,875 |
| |
Series
4120 Class TC, 1.50% due 10/15/2027 |
805,195 |
786,723 |
| |
Federal
Home Loan Mtg Corp., Multifamily Structured Pass Through Certificates CMBS, |
|
|
| |
Series
K722 Class A2, 2.406% due 3/25/2023 |
4,451,268 |
4,457,881 |
| |
Series
K725 Class A1, 2.666% due 5/25/2023 |
2,055,917 |
2,060,001 |
| |
Federal
Home Loan Mtg Corp., Multi-Family Structured Pass Through CMBS, Series K071 Class A2, 3.286% due 11/25/2027 |
4,420,000 |
4,528,403 |
| |
Federal
Home Loan Mtg Corp., Seasoned Credit Risk Transfer, Whole Loan Securities Trust CMO, |
|
|
|
a |
Series
2017-1 Class HA, 3.00% due 1/25/2056 |
5,239,607 |
5,171,779 |
|
a |
Series
2017-3 Class HA, 3.25% due 7/25/2056 |
9,148,870 |
9,040,154 |
|
a |
Series
2017-4 Class HT, 3.25% due 6/25/2057 |
8,390,621 |
8,361,788 |
|
a |
Series
2018-1 Class HA, 3.00% due 5/25/2057 |
5,817,443 |
5,735,212 |
|
a |
Series
2018-2 Class HA, 3.00% due 11/25/2057 |
13,411,847 |
13,241,665 |
| |
Series
2018-3 Class HA, 3.00% due 8/25/2057 |
15,445,039 |
15,272,674 |
|
a |
Series
2018-3 Class MA, 3.50% due 8/25/2057 |
10,706,545 |
10,761,389 |
| |
Series
2018-4 Class HA, 3.00% due 3/25/2058 |
12,941,548 |
12,766,572 |
| |
Series
2019-1 Class MA, 3.50% due 7/25/2058 |
27,261,370 |
27,396,175 |
| |
Series
2019-2 Class MA, 3.50% due 8/25/2058 |
28,029,363 |
28,140,987 |
| |
Series
2019-3 Class MA, 3.50% due 10/25/2058 |
13,728,536 |
13,795,061 |
| |
Series
2019-4 Class MA, 3.00% due 2/25/2059 |
21,123,041 |
20,978,678 |
| |
Series
2020-1 Class MA, 2.50% due 8/25/2059 |
3,633,554 |
3,554,419 |
| |
Series
2020-2 Class A1D, 1.75% due 9/25/2030 |
39,409,749 |
37,393,924 |
| |
Series
2020-2 Class MA, 2.00% due 11/25/2059 |
27,293,587
|
26,280,116 |
20 | Thornburg Fixed Income Funds Semi-Annual Report
|
See notes to
financial statements. |
Schedule of Investments,
Continued
Thornburg Limited Term Income Fund | March 31, 2022 (Unaudited)
| |
Issuer-Description
|
SHARES/PRINCIPAL
AMOUNT |
VALUE
|
| |
Series
2020-3 Class MA, 2.00% due 5/25/2060 |
$ 15,210,130
|
$ 14,625,783
|
| |
Series
2020-3 Class MT, 2.00% due 5/25/2060 |
4,317,991 |
4,044,313 |
| |
Federal
Home Loan Mtg Corp., UMBS Collateral, |
|
|
| |
Pool
RA1833, 4.00% due 10/1/2049 |
655,553 |
670,061 |
|
d |
Pool
RA6808 3.00% due 2/1/2052 |
13,789,528 |
13,501,668 |
| |
Pool
RC1280, 3.00% due 3/1/2035 |
4,319,042 |
4,374,390 |
| |
Pool
RC1535, 2.00% due 8/1/2035 |
50,087,927 |
48,736,699 |
| |
Pool
RD5039, 2.00% due 10/1/2030 |
47,305,620 |
46,449,229 |
| |
Pool
RD5045, 2.00% due 11/1/2030 |
17,644,379 |
17,324,957 |
| |
Pool
RD5060, 2.00% due 6/1/2031 |
11,096,658 |
10,894,586 |
| |
Pool
SB0308, 2.50% due 1/1/2035 |
45,945,834 |
45,627,648 |
| |
Pool
SB0464, 2.50% due 1/1/2036 |
13,144,389 |
13,053,531 |
| |
Pool
SD0257, 3.00% due 1/1/2050 |
2,126,630 |
2,091,851 |
| |
Pool
ZS7942, 3.00% due 2/1/2033 |
33,164,251 |
33,623,439 |
| |
Pool
ZS8034, 3.00% due 6/1/2033 |
27,975,108 |
28,396,696 |
| |
Federal
Home Loan Mtg Corp., Whole Loan Securities Trust CMO, |
|
|
| |
Series
2016-SC01 Class 2A, 3.50% due 7/25/2046 |
1,127,082 |
1,109,477 |
| |
Series
2017-SC01 Class 1A, 3.00% due 12/25/2046 |
9,612,776 |
9,283,647 |
| |
Series
2017-SC02 Class 2A, 3.50% due 5/25/2047 |
702,898 |
691,126 |
| |
Federal
National Mtg Assoc., |
|
|
| |
Pool
FS0898, 3.00% due 2/1/2052 |
35,698,635 |
34,964,664 |
| |
Pool
FS0916, 3.00% due 3/1/2052 |
35,663,450 |
34,937,960 |
| |
Federal
National Mtg Assoc., CMO REMIC, |
|
|
| |
Series
2007-42 Class PA, 5.50% due 4/25/2037 |
20,728 |
21,002 |
|
a |
Series
2009-17 Class AH, 0.593% due 3/25/2039 |
382,365 |
339,623 |
| |
Series
2009-52 Class AJ, 4.00% due 7/25/2024 |
732 |
735 |
| |
Series
2012-129 Class LA, 3.50% due 12/25/2042 |
1,504,630 |
1,519,832 |
|
a |
Series
2013-81 Class FW, 0.757% (LIBOR 1 Month + 0.30%) due 1/25/2043 |
3,814,945 |
3,790,419 |
| |
Federal
National Mtg Assoc., Grantor Trust, Series 2017-T1 Class A, 2.898% due 6/25/2027 |
17,907,470 |
17,962,491 |
| |
Federal
National Mtg Assoc., UMBS Collateral, |
|
|
| |
Pool
AE0704, 4.00% due 1/1/2026 |
1,344,882 |
1,384,229 |
| |
Pool
AS3111, 3.00% due 8/1/2029 |
3,612,915 |
3,654,072 |
| |
Pool
AS4916, 3.00% due 5/1/2030 |
327,251 |
331,225 |
| |
Pool
AS8242, 2.50% due 11/1/2031 |
4,284,135 |
4,273,113 |
| |
Pool
AS9749, 4.00% due 6/1/2047 |
3,522,160 |
3,622,907 |
| |
Pool
AV5059, 3.00% due 2/1/2029 |
2,290,099 |
2,316,187 |
| |
Pool
BM4324, 3.50% due 7/1/2033 |
3,390,450 |
3,495,016 |
| |
Pool
BP9550, 2.50% due 7/1/2035 |
5,132,521 |
5,088,761 |
| |
Pool
BP9589, 2.50% due 8/1/2035 |
963,246 |
955,033 |
| |
Pool
CA0200, 3.00% due 8/1/2032 |
8,421,692 |
8,538,309 |
| |
Pool
CA4102, 3.50% due 8/1/2029 |
4,951,556 |
5,125,133 |
| |
Pool
CA5282, 3.00% due 3/1/2035 |
3,873,205 |
3,936,659 |
| |
Pool
CA6862, 2.00% due 9/1/2035 |
12,564,310 |
12,231,063 |
| |
Pool
CA7532, 1.50% due 10/1/2030 |
3,842,483 |
3,695,210 |
| |
Pool
CA7536, 2.00% due 11/1/2030 |
10,358,558 |
10,173,582 |
| |
Pool
CA7540, 2.00% due 10/1/2030 |
9,635,005 |
9,463,983 |
| |
Pool
CA7891, 1.50% due 11/1/2035 |
15,533,982 |
14,743,394 |
| |
Pool
CB1476, 2.50% due 8/1/2036 |
55,911,248 |
55,378,751 |
| |
Pool
FM1542, 3.50% due 9/1/2034 |
2,309,742 |
2,385,240 |
| |
Pool
FM5458, 1.50% due 12/1/2035 |
30,857,253 |
29,274,136 |
| |
Pool
FM7615, 2.00% due 6/1/2036 |
67,351,172 |
65,557,699 |
| |
Pool
FM7616, 2.00% due 6/1/2036 |
64,136,178 |
62,349,445 |
| |
Pool
FM8117, 2.00% due 7/1/2036 |
41,228,481 |
40,116,284 |
| |
Pool
FM8119, 2.00% due 4/1/2036 |
9,828,006 |
9,562,882 |
| |
Pool
FM8608, 2.00% due 8/1/2031 |
9,150,789 |
8,985,566 |
| |
Pool
FM8868, 2.00% due 10/1/2036 |
38,178,892 |
37,125,724 |
| |
Pool
FM8869, 2.00% due 9/1/2036 |
13,238,278 |
12,874,700 |
| |
Pool
FM8924, 2.00% due 9/1/2036 |
36,764,392 |
35,740,193 |
| |
Pool
FP0000, 3.00% due 11/1/2027 |
4,827,978 |
4,879,186 |
| |
Pool
MA3465, 4.00% due 9/1/2038 |
4,049,873 |
4,170,599 |
| |
Pool
MA3953, 2.50% due 3/1/2030 |
3,719,267 |
3,717,022 |
| |
Pool
MA4016, 2.50% due 5/1/2040 |
14,466,283 |
14,010,542 |
| |
Pool
MA4148, 2.00% due 10/1/2030 |
21,115,971
|
20,733,554 |
See
notes to financial statements.
|
Thornburg Fixed
Income Funds Semi-Annual Report | 21 |
Schedule of Investments, Continued
Thornburg Limited Term Income Fund | March 31, 2022 (Unaudited)
| |
Issuer-Description
|
SHARES/PRINCIPAL
AMOUNT |
VALUE
|
| |
Pool
MA4173, 2.00% due 11/1/2030 |
$ 58,214,667
|
$ 57,160,730
|
| |
Pool
MA4309, 2.00% due 4/1/2031 |
12,297,647 |
12,073,727 |
| |
Pool
MA4368, 2.00% due 6/1/2031 |
29,894,384 |
29,350,056 |
| |
Pool
MA4390, 2.00% due 7/1/2031 |
1,614,254 |
1,584,861 |
|
a,c |
Flagstar
Mortgage Trust, Whole Loan Securities Trust CMO, Series 2017-1 Class 2A2, 3.00% due 3/25/2047 |
2,576,699 |
2,499,788 |
|
a,c |
FWD
Securitization Trust, Whole Loan Securities Trust CMO, Series 2019-INV1 Class A1, 2.81% due 6/25/2049 |
2,155,222 |
2,144,313 |
| |
GCAT
Trust, Whole Loan Securities Trust CMO, |
|
|
|
a,c |
Series
2019-NQM3 Class A1, 2.686% due 11/25/2059 |
6,104,550 |
6,101,242 |
|
a,c |
Series
2021-CM1 Class A, 1.469% due 4/25/2065 |
15,296,994 |
14,961,199 |
|
a,c |
Series
2021-CM2 Class A1, 2.352% due 8/25/2066 |
32,493,917 |
31,609,689 |
|
a,c |
Series
2021-NQM4 Class A1, 1.093% due 8/25/2066 |
15,860,033 |
14,526,211 |
| |
Government
National Mtg Assoc., |
|
|
|
a |
Pool
731491, 5.31% due 12/20/2060 |
60,727 |
62,693 |
|
a |
Pool
MA0100, 1.875% (H15T1Y + 1.50%) due 5/20/2042 |
218,438 |
226,798 |
| |
Government
National Mtg Assoc., CMO, Series 2016-32 Class LJ, 2.50% due 12/20/2040 |
2,362,750 |
2,368,577 |
|
a,c |
GS
Mortgage-Backed Securities Corp. Trust, Whole Loan Securities Trust CMO, Series 2020-PJ2 Class B3, 3.606% due 7/25/2050 |
5,245,956 |
5,044,026 |
| |
Imperial
Fund Mortgage Trust, Whole Loan Securities Trust CMO, |
|
|
|
a,c |
3.638%
due 3/25/2067 |
25,000,000 |
24,712,092 |
|
a,c |
Series
2021-NQM3 Class A1, 1.595% due 11/25/2056 |
18,720,263 |
18,152,693 |
|
a,c |
Series
2021-NQM4 Class A1, 2.091% due 1/25/2057 |
24,506,658 |
23,577,219 |
|
a,c |
Series
2022- NQM1 Class A1, 2.493% due 2/25/2067 |
43,177,486 |
42,119,494 |
| |
JPMorgan
Mortgage Trust, Whole Loan Securities Trust CMO, |
|
|
|
a,c |
Series
2014-IVR3 Class B4, 2.383% due 9/25/2044 |
1,940,616 |
1,939,606 |
|
a,c |
Series
2018-3 Class B2, 3.725% due 9/25/2048 |
2,531,274 |
2,519,347 |
|
a,c |
Series
2018-6 Class B2, 3.91% due 12/25/2048 |
1,040,916 |
1,042,751 |
|
a,c |
Series
2019-5 Class B3, 4.482% due 11/25/2049 |
8,190,076 |
8,236,897 |
|
a,c |
Series
2019-HYB1 Class B3, 3.591% due 10/25/2049 |
5,673,116 |
5,386,256 |
|
a,c |
Series
2019-INV2 Class B3A, 3.755% due 2/25/2050 |
9,451,841 |
8,900,390 |
|
a,c |
Series
2021-LTV2 ClassA1, 2.52% due 5/25/2052 |
41,184,991 |
37,939,542 |
|
a,c |
Series
2022- LTV1 Class A1, 3.25% due 7/25/2052 |
14,705,722 |
14,099,804 |
|
a,c |
Series
2022-2 Class A6A, 2.50% due 8/25/2052 |
36,875,097 |
35,592,806 |
|
a,c |
Mello
Warehouse Securitization Trust, Whole Loan Securities Trust CMO, Series 2020-2 Class A, 1.257% (LIBOR 1 Month + 0.80%) due 11/25/2053 |
20,000,000 |
19,945,982 |
|
a |
Merrill
Lynch Mortgage Investors Trust, Whole Loan Securities Trust CMO, Series 2004-A4 Class M1, 2.656% due 8/25/2034 |
169,337 |
172,744 |
|
a,c |
Metlife
Securitization Trust, Whole Loan Securities Trust CMO, Series 2019-1A Class A1A, 3.75% due 4/25/2058 |
1,829,478 |
1,842,168 |
| |
MFA
Trust, Whole Loan Securities Trust CMO, |
|
|
|
a,c |
4.20%
due 12/25/2066 |
13,129,000 |
12,820,912 |
|
a,c |
Series
2020-NQM3 Class A1, 1.014% due 1/26/2065 |
5,517,015 |
5,442,749 |
|
a,c |
Series
2021-AEI1 Class A4, 2.50% due 8/25/2051 |
18,209,599 |
17,385,514 |
|
a,c |
Series
2021-INV1 Class A1, 0.852% due 1/25/2056 |
7,176,028 |
7,019,492 |
|
a,c |
Series
2021-INV2 Class A1, 1.906% due 11/25/2056 |
27,564,555 |
25,983,185 |
|
a,c |
MFRA
Trust Whole Loan Securities Trust CMO, Series 2022-CHM1, 3.875% due 9/25/2056 |
25,210,375 |
24,881,879 |
| |
Morgan
Stanley Bank of America Merrill Lynch Trust CMBS, Series 2015-C22 Class A4, 3.306% due 4/15/2048 |
1,100,000 |
1,090,662 |
| |
New
Residential Mortgage Loan Trust, Whole Loan Securities Trust CMO, |
|
|
|
a,c |
Series
2017-2A Class A3, 4.00% due 3/25/2057 |
3,959,006 |
3,968,271 |
|
a,c |
Series
2017-3A Class A1, 4.00% due 4/25/2057 |
4,814,243 |
4,827,932 |
|
a,c |
Series
2017-4A Class A1, 4.00% due 5/25/2057 |
5,184,670 |
5,192,025 |
|
a,c |
Series
2017-5A Class A1, 1.957% (LIBOR 1 Month + 1.50%) due 6/25/2057 |
395,674 |
398,916 |
|
a,c |
Series
2017-6A Class A1, 4.00% due 8/27/2057 |
2,320,428 |
2,333,550 |
|
a,c |
Series
2018-1A Class A1A, 4.00% due 12/25/2057 |
2,829,161 |
2,852,324 |
|
a,c |
Series
2018-2A Class A1, 4.50% due 2/25/2058 |
5,033,773 |
5,094,170 |
|
a,c |
Series
2018-RPL1 Class A1, 3.50% due 12/25/2057 |
2,943,605 |
2,949,339 |
|
a,c |
OBX
Trust, Whole Loan Securities Trust CMO, Series 2021-NQM2 Class A1, 1.101% due 5/25/2061 |
23,202,126 |
22,202,885 |
|
a,c |
Onslow
Bay Mortgage Loan Trust, Whole Loan Securities Trust CMO, Series 2021-NQM4 Class A1, 1.957% due 10/25/2061 |
53,361,152 |
51,408,132 |
| |
PRKCM
Trust, Whole Loan Securities Trust CMO, |
|
|
|
a,c |
Series
2021-AFC1 Class A1, 1.51% due 8/25/2056 |
35,572,280 |
32,990,850 |
|
a,c |
Series
2021-AFC2 Class A1, 2.071% due 11/25/2056 |
19,340,788 |
18,269,518 |
| |
RAMP
Trust, Whole Loan Securities Trust CMO, Series 2003-SL1 Class A31, 7.125% due 4/25/2031 |
475,451 |
474,875 |
|
a,c |
Rate
Mortgage Trust, Whole Loan Securities Trust CMO, Series 2022-J1 2.50% due 1/25/2052 |
55,711,051 |
53,251,258 |
|
a,c |
RCKT
Mortgage Trust, Whole Loan Securities Trust CMO, Series 2020-1 Class B3, 3.488% due 2/25/2050 |
3,192,877 |
3,029,153 |
| |
Seasoned
Loans Structured Transaction Trust, Whole Loan Securities Trust CMO, |
|
|
| |
Series
2019-2 Class A1C, 2.75% due 9/25/2029 |
19,241,097 |
19,141,498 |
| |
Series
2019-3 Class A1C, 2.75% due 11/25/2029 |
3,325,926
|
3,297,106 |
22 | Thornburg Fixed Income Funds Semi-Annual Report
|
See notes to
financial statements. |
Schedule of Investments,
Continued
Thornburg Limited Term Income Fund | March 31, 2022 (Unaudited)
| |
Issuer-Description
|
SHARES/PRINCIPAL
AMOUNT |
VALUE
|
| |
Series
2020-2 Class A1C, 2.00% due 9/25/2030 |
$ 29,312,327
|
$ 27,897,465
|
| |
Sequoia
Mortgage Trust, Whole Loan Securities Trust CMO, |
|
|
|
a |
Series
2013-6 Class B4, 3.511% due 5/25/2043 |
716,584 |
668,861 |
|
a |
Series
2013-7 Class B4, 3.506% due 6/25/2043 |
647,772 |
642,346 |
| |
SG
Residential Mortgage Trust, Whole Loan Securities Trust CMO, |
|
|
|
a,c |
Series
2019-3 Class A1, 2.703% due 9/25/2059 |
1,010,128 |
1,010,128 |
|
a,c |
Series
2019-3 Class A3, 3.082% due 9/25/2059 |
1,755,356 |
1,755,356 |
|
a,c |
Series
2020-2 Class A1, 1.381% due 5/25/2065 |
13,668,209 |
13,487,794 |
|
a,c |
Series
2020-2 Class A2, 1.587% due 5/25/2065 |
2,655,726 |
2,624,626 |
|
a,c |
Series
2020-2 Class A3, 1.895% due 5/25/2065 |
906,694 |
896,859 |
|
a,c |
Series
2021-2 Class A1, 1.737% due 12/25/2061 |
17,800,887 |
17,424,297 |
|
a,c |
Shellpoint
Asset Funding Trust, Whole Loan Securities Trust CMO, Series 2013-1 Class A1, 3.75% due 7/25/2043 |
1,042,700 |
1,015,362 |
|
a,c |
Spruce
Hill Mortgage Loan Trust, Whole Loan Securities Trust CMO, Series 2020-SH1 Class A1, 2.521% due 1/28/2050 |
3,843,859 |
3,826,329 |
|
a,c |
Starwood
Mortgage Residential Trust, Whole Loan Securities Trust CMO, Series 2021-5 Class A1, 1.92% due 9/25/2066 |
51,353,125 |
49,317,480 |
|
a |
Structured
Asset Securities Corp., Mortgage Pass-Through Certificates, Whole Loan Securities Trust CMO, Series 2003-9A Class 2A2, 2.328% due 3/25/2033 |
513,586 |
510,357 |
| |
Towd
Point Mortgage Trust, Whole Loan Securities Trust CMO, |
|
|
|
a,c |
Series
2016-5 Class A1, 2.50% due 10/25/2056 |
2,002,091 |
2,002,138 |
|
a,c |
Series
2018-2 Class A1, 3.25% due 3/25/2058 |
20,186,594 |
20,193,657 |
|
a,c |
Series
2018-6 Class A1A, 3.75% due 3/25/2058 |
4,515,085 |
4,542,956 |
|
a,c |
Series
2019-HY2 Class A1, 1.457% (LIBOR 1 Month + 1.00%) due 5/25/2058 |
16,181,512 |
16,181,509 |
| |
Verus
Securitization Trust, Whole Loan Securities Trust CMO, |
|
|
|
a,c |
Series
2019-3 Class A1, 2.784% due 7/25/2059 |
3,289,473 |
3,289,473 |
|
a,c |
Series
2020-1 Class M1, 3.021% due 1/25/2060 |
5,000,000 |
4,971,810 |
|
a,c |
Series
2020-2 Class M1, 5.36% due 5/25/2060 |
3,275,000 |
3,285,959 |
|
a,c |
Series
2020-INV1 Class M1, 5.50% due 3/25/2060 |
900,000 |
901,350 |
|
a,c |
Series
2021-R1 Class A1, 0.82% due 10/25/2063 |
11,621,759 |
11,397,953 |
|
a,c |
Vista
Point Securitization Trust, Whole Loan Securities Trust CMO, Series 2020-2 Class A1, 1.475% due 4/25/2065 |
7,638,665 |
7,534,761 |
| a,c |
WinWater
Mortgage Loan Trust, Whole Loan Securities Trust CMO, Series 2015-3 Class B4, 3.876% due 3/20/2045 |
1,251,658
|
1,256,299
|
| |
Total
Mortgage Backed (Cost $2,441,018,850) |
|
2,346,381,954
|
| |
Asset
Backed Securities — 19.7% |
|
|
| |
Auto
Receivables — 2.2% |
|
|
|
c |
ACC
Auto Trust, Series 2021-A Class A, 1.08% due 4/15/2027 |
12,564,858 |
12,409,509 |
| |
ACC
Trust, |
|
|
|
c |
Series
2020-A Class A, 6.00% due 3/20/2023 |
3,607,158 |
3,612,110 |
|
c |
Series
2021-1 Class A, 0.74% due 11/20/2023 |
3,237,948 |
3,232,081 |
|
c |
Series
2022-1 Class A, 1.19% due 9/20/2024 |
12,511,569 |
12,374,970 |
| |
American
Credit Acceptance Receivables Trust, |
|
|
|
c |
Series
2020-2 Class C, 3.88% due 4/13/2026 |
11,500,000 |
11,587,051 |
|
c |
Series
2020-2 Class D, 5.65% due 5/13/2026 |
4,250,000 |
4,362,865 |
| |
Arivo
Acceptance Auto Loan Receivables Trust, |
|
|
|
c |
Series
2019-1 Class A, 2.99% due 7/15/2024 |
678,389 |
680,249 |
|
c |
Series
2019-1 Class B, 3.37% due 6/15/2025 |
3,547,000 |
3,553,596 |
|
c |
Series
2021-1A Class A, 1.19% due 1/15/2027 |
5,906,268 |
5,845,693 |
|
c |
CarNow
Auto Receivables Trust, Series 2021-2A Class A, 0.73% due 9/15/2023 |
6,281,688 |
6,269,115 |
|
c |
Carvana
Auto Receivables Trust, Series 2019-1A Class D, 3.88% due 10/15/2024 |
11,540,737 |
11,607,945 |
|
c |
CIG
Auto Receivables Trust, Series 2020-1A Class A, 0.68% due 10/12/2023 |
1,288,866 |
1,287,853 |
|
c |
CPS
Auto Receivables Trust, Series 2017-D Class D, 3.73% due 9/15/2023 |
238,152 |
238,288 |
|
c |
Credito
Real USA Auto Receivables Trust, Series 2021-1A Class A, 1.35% due 2/16/2027 |
6,288,944 |
6,175,081 |
| |
Drive
Auto Receivables Trust, Series 2019-1 Class D, 4.09% due 6/15/2026 |
11,066,974 |
11,160,349 |
|
c |
DT
Auto Owner Trust, Series 2019-4A Class D, 2.85% due 7/15/2025 |
7,500,000 |
7,467,945 |
|
c |
Exeter
Automobile Receivables Trust, Series 2019-3A Class D, 3.11% due 8/15/2025 |
2,000,000 |
2,003,568 |
| |
FHF
Trust, |
|
|
|
c |
Series
2020-1A Class A, 2.59% due 12/15/2023 |
4,350,741 |
4,355,007 |
|
c |
Series
2021-1A Class A, 1.27% due 3/15/2027 |
15,537,992 |
15,128,260 |
|
c |
Series
2021-2A Class A, 0.83% due 12/15/2026 |
12,148,362 |
11,711,934 |
|
c |
Flagship
Credit Auto Trust, Series 2019-2 Class D, 3.53% due 5/15/2025 |
3,500,000 |
3,513,595 |
|
c |
GLS
Auto Receivables Issuer Trust, Series 2020-3A Class B, 1.38% due 8/15/2024 |
3,197,345 |
3,195,867 |
|
c |
Lendbuzz
Securitization Trust, Series 2021-1A Class A, 1.46% due 6/15/2026 |
26,508,464 |
25,921,929 |
|
c |
Octane
Receivables Trust, Series 2020-1A Class A, 1.71% due 2/20/2025 |
5,853,368 |
5,818,866 |
| b,c |
Oscar
US Funding Trust IX LLC, Series 2018-2A Class A4, 3.63% due 9/10/2025 |
1,033,872
|
1,037,399 |
See
notes to financial statements.
|
Thornburg Fixed
Income Funds Semi-Annual Report | 23 |
Schedule of Investments, Continued
Thornburg Limited Term Income Fund | March 31, 2022 (Unaudited)
| |
Issuer-Description
|
SHARES/PRINCIPAL
AMOUNT |
VALUE
|
|
b,c |
Oscar
US Funding XI LLC, Series 2019-2A Class A3, 2.59% due 9/11/2023 |
$ 4,425,984
|
$ 4,432,450
|
|
b,c |
Oscar
US Funding XII LLC, Series 2021-1A Class A3, 0.70% due 4/10/2025 |
18,000,000 |
17,471,529 |
|
c |
Tesla
Auto Lease Trust, Series 2020-A Class A2, 0.55% due 5/22/2023 |
603,982 |
603,544 |
|
c |
US
Auto Funding, Series 2021-1A Class A, 0.79% due 7/15/2024 |
10,596,024 |
10,474,618 |
|
c |
USASF
Receivables LLC, Series 2020-1A Class A, 2.47% due 8/15/2023 |
1,167,510 |
1,167,609 |
|
c |
Veros
Auto Receivables Trust, Series 2021-1 Class A, 0.92% due 10/15/2026 |
7,567,209 |
7,467,464
|
| |
|
|
216,168,339
|
| |
Credit
Card — 1.5% |
|
|
|
c |
Avant
Credit Card Master Trust, Series 2021-1A Class A, 1.37% due 4/15/2027 |
11,900,000 |
11,309,449 |
|
c |
Brex
Commercial Charge Card Master Trust, Series 2021-1 Class A, 2.09% due 7/15/2024 |
3,400,000 |
3,361,326 |
|
c |
Continental
Credit Card LLC, Series 2019-1A Class A, 3.83% due 8/15/2026 |
16,533,467 |
16,586,531 |
|
c |
Continental
Finance Credit Card ABS Master Trust, Series 2020-1A Class A, 2.24% due 12/15/2028 |
17,500,000 |
16,871,033 |
|
c |
Genesis
Sales Finance Master Trust, Series 2020-AA Class A, 1.65% due 9/22/2025 |
15,000,000 |
14,836,689 |
| |
Mercury
Financial Credit Card Master Trust, |
|
|
|
c |
Series
2021-1A Class A, 1.54% due 3/20/2026 |
31,450,000 |
30,518,344 |
|
c |
Series
2022-1A Class A, 2.50% due 9/21/2026 |
32,350,000 |
31,213,503 |
|
c |
Mission
Lane Credit Card Master Trust, Series 2021-A Class A, 1.59% due 9/15/2026 |
21,455,000 |
20,918,241
|
| |
|
|
145,615,116
|
| |
Other
Asset Backed — 13.0% |
|
|
| |
Affirm
Asset Securitization Trust, |
|
|
|
c |
Series
2020-A Class A, 2.10% due 2/18/2025 |
17,719,799 |
17,688,226 |
|
c |
Series
2021-A, 0.88% due 8/15/2025 |
14,500,000 |
14,313,267 |
|
c |
Amur
Equipment Finance Receivables VI LLC, Series 2018-2A Class A2, 3.89% due 7/20/2022 |
116,424 |
116,535 |
|
c |
Amur
Equipment Finance Receivables VII LLC, Series 2019-1A Class A2, 2.63% due 6/20/2024 |
2,092,242 |
2,096,461 |
|
c |
Amur
Equipment Finance Receivables VIII LLC, Series 2020-1A Class A2, 1.68% due 8/20/2025 |
6,997,884 |
6,989,954 |
|
c |
Amur
Equipment Finance Receivables X LLC, Series 2022-1A 1.64% due 10/20/2027 |
37,500,000 |
36,528,684 |
| |
Appalachian
Consumer Rate Relief Funding LLC, Series 2013-1 Class A1, 2.008% due 2/1/2024 |
1,611,114 |
1,610,516 |
| |
Aqua
Finance Trust, |
|
|
|
c |
Series
2017-A Class A, 3.72% due 11/15/2035 |
1,015,582 |
1,015,789 |
|
c |
Series
2019-A Class A, 3.14% due 7/16/2040 |
6,575,522 |
6,506,328 |
|
c |
Series
2020-AA Class A, 1.90% due 7/17/2046 |
29,188,820 |
28,461,192 |
|
c |
Series
2020-AA Class C, 3.97% due 7/17/2046 |
6,300,000 |
6,047,244 |
|
c |
Series
2021-A Class A, 1.54% due 7/17/2046 |
18,203,159 |
17,348,867 |
|
a,b,c |
Arbor
Realty Commercial Real Estate Notes Ltd., Series 2022-FL1 1.50% (SOFR30A + 1.45%) due 1/15/2037 |
37,350,000 |
37,154,521 |
|
c |
Arm
Master Trust, Series 2021-T2 Class A, 1.42% due 1/15/2024 |
228,000 |
227,909 |
|
c |
Bankers
Healthcare Group Securitization Trust, Series 2020-A Class A, 2.56% due 9/17/2031 |
3,311,396 |
3,301,368 |
|
a,c |
Bayview
Opportunity Master Fund Trust, Series 2017-RT1 Class A1, 3.00% due 3/28/2057 |
1,052,078 |
1,039,475 |
| |
BHG
Securitization Trust, |
|
|
|
c |
Series
2021-A Class A, 1.42% due 11/17/2033 |
23,201,851 |
22,327,188 |
|
c |
Series
2021-B Class A, 0.90% due 10/17/2034 |
12,513,433 |
12,143,098 |
|
c |
Series
2022-A 1.71% due 2/20/2035 |
38,288,289 |
37,488,593 |
|
c |
BRE
Grand Islander Timeshare Issuer LLC, Series 2017-1A Class A, 2.94% due 5/25/2029 |
1,418,421 |
1,406,227 |
|
c |
CFG
Investments Ltd., Series 2021-1 Class A, 4.70% due 5/20/2032 |
6,000,000 |
5,916,749 |
| |
Conn’s
Receivables Funding LLC, |
|
|
|
c |
Series
2020-A Class A, 1.71% due 6/16/2025 |
621,865 |
621,647 |
|
c |
Series
2021-A Class A, 1.05% due 5/15/2026 |
11,194,152 |
11,090,513 |
|
c |
Crossroads
Asset Trust, Series 2021-A Class A2, 0.82% due 3/20/2024 |
4,049,726 |
4,020,351 |
|
c |
Dell
Equipment Finance Trust, Series 2020-1 Class D, 5.92% due 3/23/2026 |
6,000,000 |
6,108,107 |
| |
Dext
ABS LLC, |
|
|
|
c |
Series
2020-1 Class A, 1.46% due 2/16/2027 |
12,508,026 |
12,413,384 |
|
c |
Series
2021-1 Class A, 1.12% due 2/15/2028 |
13,807,427 |
13,465,927 |
|
c |
Diamond
Infrastructure Funding LLC, Series 2021-1A Class A, 1.76% due 4/15/2049 |
36,000,000 |
32,595,836 |
|
c |
Diamond
Issuer, Series 2021-1A Class A, 2.305% due 11/20/2051 |
27,894,000 |
25,796,737 |
| |
Diamond
Resorts Owner Trust, |
|
|
|
c |
Series
2018-1 Class A, 3.70% due 1/21/2031 |
2,974,385 |
2,993,101 |
|
c |
Series
2019-1A Class A, 2.89% due 2/20/2032 |
7,165,193 |
7,152,988 |
|
b,c |
ECAF
I Ltd., Series 2015-1A Class A2, 4.947% due 6/15/2040 |
3,682,874 |
3,020,222 |
| |
Entergy
New Orleans Storm Recovery Funding I LLC, Series 2015-1 Class A, 2.67% due 6/1/2027 |
4,706,300 |
4,659,732 |
|
c |
ExteNet
LLC, Series 2019-1A Class A2, 3.204% due 7/26/2049 |
9,855,000 |
9,773,585 |
| |
Foundation
Finance Trust, |
|
|
|
c |
Series
2017-1A Class A, 3.30% due 7/15/2033 |
419,271 |
420,099 |
| c |
Series
2019-1A Class A, 3.86% due 11/15/2034 |
8,493,036
|
8,487,479 |
24 | Thornburg Fixed Income Funds Semi-Annual Report
|
See notes to
financial statements. |
Schedule of Investments,
Continued
Thornburg Limited Term Income Fund | March 31, 2022 (Unaudited)
| |
Issuer-Description
|
SHARES/PRINCIPAL
AMOUNT |
VALUE
|
|
c |
Series
2020-1A Class A, 3.54% due 7/16/2040 |
$ 8,248,035
|
$ 8,242,818
|
|
c |
Series
2020-1A Class B, 4.62% due 7/16/2040 |
3,000,000 |
3,016,766 |
|
c |
Series
2021-1A Class A, 1.27% due 5/15/2041 |
24,795,784 |
23,446,949 |
|
c |
Series
2021-2A Class A, 2.19% due 1/15/2042 |
17,068,229 |
16,461,169 |
| |
Freed
ABS Trust, |
|
|
|
c |
Series
2021-1CP Class A, 0.66% due 3/20/2028 |
1,552,346 |
1,548,614 |
|
c |
Series
2021-2 Class A, 0.68% due 6/19/2028 |
2,460,167 |
2,455,166 |
|
c |
Goldman
Home Improvement Trust, Series 2021-GRN2 Class A, 1.15% due 6/25/2051 |
24,824,444 |
23,713,970 |
|
c |
Goodgreen
Trust, Series 2021-1A Class A, 2.66% due 10/15/2056 |
22,455,158 |
21,058,434 |
| |
GoodLeap
Sustainable Home Solutions Trust, |
|
|
|
c |
Series
2021-3CS Class A, 2.10% due 5/20/2048 |
17,917,800 |
16,155,529 |
|
c |
Series
2021-4GS Class A, 1.93% due 7/20/2048 |
11,924,161 |
10,665,316 |
|
a,c |
Gracie
Point International Funding, Series 2020-B Class A, 1.631% (LIBOR 1 Month + 1.40%) due 5/2/2023 |
14,174,446 |
14,202,073 |
|
a,b,c |
Greystone
Commercial Real Estate Notes Ltd., Series 2021-FL3 Class A, 1.417% (LIBOR 1 Month + 1.02%) due 7/15/2039 |
28,050,000 |
27,608,830 |
| |
HERO
Funding Trust, |
|
|
|
c |
Series
2015-1A Class A, 3.84% due 9/21/2040 |
3,096,972 |
3,113,559 |
|
c |
Series
2017-2A Class A1, 3.28% due 9/20/2048 |
624,757 |
616,034 |
| |
Hilton
Grand Vacations Trust, |
|
|
|
c |
Series
2019-AA Class A, 2.34% due 7/25/2033 |
5,913,275 |
5,812,433 |
|
c |
Series
2020-AA Class A, 2.74% due 2/25/2039 |
1,200,970 |
1,171,665 |
|
c |
HIN
Timeshare Trust, Series 2020-A Class A, 1.39% due 10/9/2039 |
5,544,002 |
5,205,157 |
|
c |
InStar
Leasing III LLC, Series 2021-1A, 2.30% due 2/15/2054 |
9,448,252 |
8,353,985 |
| |
LendingPoint
Asset Securitization Trust, |
|
|
|
c |
Series
2020-REV1 Class A, 2.731% due 10/15/2028 |
50,250,000 |
50,104,415 |
|
c |
Series
2021-A Class A, 1.00% due 12/15/2028 |
8,338,550 |
8,245,232 |
|
c |
Series
2021-B Class A, 1.11% due 2/15/2029 |
11,121,114 |
10,962,596 |
| |
LendingPoint
Pass-Through Trust, |
|
|
|
c |
4.00%
due 5/15/2028 |
10,579,000 |
10,580,555 |
|
c |
Series
2022-ST1 2.50% due 3/15/2028 |
10,144,646 |
9,924,308 |
| |
LL
ABS Trust, |
|
|
|
c |
Series
2020-1A Class A, 2.33% due 1/17/2028 |
1,063,056 |
1,062,598 |
|
c |
Series
2021-1A Class A, 1.07% due 5/15/2029 |
14,978,854 |
14,361,552 |
|
c |
Loanpal
Solar Loan Ltd., Series 2021-1GS Class A, 2.29% due 1/20/2048 |
19,110,003 |
17,473,419 |
| |
Marlette
Funding Trust, |
|
|
|
c |
Series
2019-4A Class B, 2.95% due 12/17/2029 |
895,034 |
895,266 |
|
c |
Series
2021-1A Class A, 0.60% due 6/16/2031 |
4,097,461 |
4,081,708 |
|
a,b,c |
MF1
Ltd., Series 2022-FL8 1.40% (SOFR30A + 1.35%) due 2/19/2037 |
34,070,000 |
33,941,100 |
| |
Mosaic
Solar Loan Trust, |
|
|
|
c |
Series
2019-1A Class A, 4.37% due 12/21/2043 |
1,412,844 |
1,404,426 |
|
c |
Series
2021 Class A, 2.10% due 4/20/2046 |
4,620,305 |
4,361,074 |
|
c |
New
Residential Advance Receivables Trust Advance Receivables Backed, Series 2020-T1 Class AT1, 1.426% due 8/15/2053 |
65,590,000 |
64,211,554 |
| |
NRZ
Advance Receivables Trust, |
|
|
|
c |
Series
2020-T2 Class AT2, 1.475% due 9/15/2053 |
40,000,000 |
38,884,712 |
|
c |
Series
2020-T2 Class BT2, 1.724% due 9/15/2053 |
3,000,000 |
2,915,754 |
|
c |
Series
2020-T3 Class AT3, 1.317% due 10/15/2052 |
17,400,000 |
17,326,266 |
|
c |
Ocwen
Master Advance Receivables Trust, Series 2020-T1 Class AT1, 1.278% due 8/15/2052 |
52,486,579 |
52,488,101 |
| |
Oportun
Funding LLC, |
|
|
|
c |
3.25%
due 6/15/2029 |
27,175,000 |
27,108,201 |
|
c |
Series
2019-A Class B, 3.87% due 8/8/2025 |
7,500,000 |
7,501,718 |
|
c |
Series
2020-1 Class A, 2.20% due 5/15/2024 |
149,054 |
149,028 |
| |
Pagaya
AI Debt Selection Trust, |
|
|
|
c |
Series
2020-3 Class A, 2.10% due 5/17/2027 |
1,308,167 |
1,306,384 |
|
c |
Series
2021-1 Class A, 1.18% due 11/15/2027 |
23,829,892 |
23,481,578 |
|
c |
Series
2021-3 Class A, 1.15% due 5/15/2029 |
24,757,059 |
24,258,588 |
|
c |
Series
2021-HG1 Class A, 1.22% due 1/16/2029 |
12,492,094 |
12,100,339 |
|
c |
Pagaya
AI Debt Trust, Series 2022-1 2.03% due 10/15/2029 |
29,010,000 |
28,478,715 |
| |
Pawnee
Equipment Receivables LLC, |
|
|
|
c |
Series
2019-1 Class A2, 2.29% due 10/15/2024 |
5,199,956 |
5,205,271 |
|
c |
Series
2020-1 Class A, 1.37% due 11/17/2025 |
4,913,782 |
4,882,652 |
|
c |
Series
2021-1, 1.10% due 7/15/2027 |
8,500,000 |
8,226,541 |
| c |
PFS
Financing Corp., Series 2020-B Class A, 1.21% due 6/15/2024 |
15,600,000
|
15,590,957 |
See
notes to financial statements.
|
Thornburg Fixed
Income Funds Semi-Annual Report | 25 |
Schedule of Investments, Continued
Thornburg Limited Term Income Fund | March 31, 2022 (Unaudited)
| |
Issuer-Description
|
SHARES/PRINCIPAL
AMOUNT |
VALUE
|
| |
SCF
Equipment Leasing LLC, |
|
|
|
c |
Series
2019-2A Class A1, 2.22% due 6/20/2024 |
$ 506,633
|
$ 506,747
|
|
c |
Series
2019-2A Class C, 3.11% due 6/21/2027 |
3,000,000 |
2,949,045 |
|
c |
Service
Experts Issuer LLC, Series 2021-1A Class A, 2.67% due 2/2/2032 |
22,148,298 |
21,208,797 |
|
c |
Sierra
Timeshare Receivables Funding LLC, Series 2019-1A Class A, 3.20% due 1/20/2036 |
1,168,721 |
1,171,388 |
| |
SoFi
Consumer Loan Program Trust, |
|
|
|
c |
Series
2018-3 Class C, 4.67% due 8/25/2027 |
7,689,497 |
7,708,691 |
|
c |
Series
2019-1 Class D, 4.42% due 2/25/2028 |
2,955,000 |
2,964,766 |
|
c |
SpringCastle
America Funding LLC, Series 2020-AA Class A, 1.97% due 9/25/2037 |
37,419,179 |
37,370,411 |
|
c |
SPS
Servicer Advance Receivables Trust, Series 2020-T2 Class A, 1.83% due 11/15/2055 |
6,000,000 |
5,610,206 |
| |
Theorem
Funding Trust, |
|
|
|
c |
Series
2020-1A Class A, 2.48% due 10/15/2026 |
554,369 |
554,384 |
|
c |
Series
2021-1A Class A, 1.21% due 12/15/2027 |
15,207,018 |
14,969,989 |
| |
Towd
Point Mortgage Trust, Whole Loan Securities Trust CMO, |
|
|
|
a,c |
Series
2017-1 Class A1, 2.75% due 10/25/2056 |
1,011,390 |
1,011,376 |
|
a,c |
Series
2018-1 Class A1, 3.00% due 1/25/2058 |
497,825 |
496,010 |
|
a,c |
Series
2018-3 Class A1, 3.75% due 5/25/2058 |
3,460,209 |
3,455,893 |
| |
Upstart
Pass-Through Trust, |
|
|
|
c |
Series
2020-ST2 Class A, 3.50% due 3/20/2028 |
859,196 |
855,160 |
|
c |
Series
2020-ST3 Class A, 3.35% due 4/20/2028 |
4,172,560 |
4,146,839 |
|
c |
Series
2021-ST4 Class A, 2.00% due 7/20/2027 |
3,402,718 |
3,285,252 |
|
c |
Series
2021-ST6 Class A, 1.85% due 8/20/2027 |
6,194,689 |
5,952,968 |
|
c |
Series
2021-ST8, 1.75% due 10/20/2029 |
7,966,394 |
7,587,214 |
| |
Upstart
Securitization Trust, |
|
|
|
c |
Series
2019-2 Class B, 3.734% due 9/20/2029 |
1,296,668 |
1,297,232 |
|
c |
Series
2019-3 Class B, 3.829% due 1/21/2030 |
1,091,323 |
1,092,969 |
|
c |
Series
2020-1 Class B, 3.093% due 4/22/2030 |
3,250,000 |
3,251,007 |
|
c |
Series
2020-3 Class A, 1.702% due 11/20/2030 |
4,783,690 |
4,767,844 |
|
c |
Series
2021-1 Class A, 0.87% due 3/20/2031 |
4,356,647 |
4,289,014 |
|
c |
Series
2021-2 Class A, 0.91% due 6/20/2031 |
5,358,007 |
5,264,821 |
|
c |
Series
2021-4 Class A, 0.84% due 9/20/2031 |
7,307,746 |
7,105,481
|
| |
|
|
1,245,584,478
|
| |
Student
Loan — 3.0% |
|
|
| |
College
Ave Student Loans LLC, |
|
|
|
a,c |
Series
2021-A Class A1, 1.557% (LIBOR 1 Month + 1.10%) due 7/25/2051 |
10,972,208 |
10,919,880 |
|
c |
Series
2021-A Class A2, 1.60% due 7/25/2051 |
2,537,346 |
2,368,133 |
|
a,c |
Series
2021-C Class A1, 1.357% (LIBOR 1 Month + 0.90%) due 7/26/2055 |
16,613,966 |
16,328,721 |
| |
Commonbond
Student Loan Trust, |
|
|
|
c |
Series
18-CGS Class A1, 3.87% due 2/25/2046 |
2,350,920 |
2,364,451 |
|
c |
Series
2020-1 Class A, 1.69% due 10/25/2051 |
16,802,214 |
16,272,790 |
|
c |
Series
2021-AGS Class A, 1.20% due 3/25/2052 |
11,729,139 |
11,162,957 |
|
c |
Series
2021-BGS Class A, 1.17% due 9/25/2051 |
13,643,484 |
12,709,135 |
|
a,c |
Navient
Private Education Loan Trust, Series 2015-AA Class A2B, 1.597% (LIBOR 1 Month + 1.20%) due 12/15/2028 |
1,243,295 |
1,242,331 |
| |
Navient
Private Education Refi Loan Trust, |
|
|
|
a,c |
Series
2019-D Class A2B, 1.447% (LIBOR 1 Month + 1.05%) due 12/15/2059 |
11,222,197 |
11,129,056 |
|
c |
Series
2021-A Class A, 0.84% due 5/15/2069 |
4,211,361 |
4,021,973 |
| |
Navient
Student Loan Trust, |
|
|
|
a |
Series
2014-1 Class A3, 0.967% (LIBOR 1 Month + 0.51%) due 6/25/2031 |
6,073,285 |
5,954,213 |
|
a,c |
Series
2016-6A Class A2, 1.207% (LIBOR 1 Month + 0.75%) due 3/25/2066 |
4,021,231 |
4,014,883 |
|
a,c |
Series
2019-BA Class A2B, 1.377% (LIBOR 1 Month + 0.98%) due 12/15/2059 |
1,787,745 |
1,791,693 |
|
a,c |
Nelnet
Private Education Loan Trust, Series 2016-A Class A1A, 2.207% (LIBOR 1 Month + 1.75%) due 12/26/2040 |
934,832 |
936,571 |
| |
Nelnet
Student Loan Trust, |
|
|
|
a,c |
Series
2013-1A Class A, 1.057% (LIBOR 1 Month + 0.60%) due 6/25/2041 |
3,961,155 |
3,883,436 |
|
a,c |
Series
2015-2A Class A2, 1.057% (LIBOR 1 Month + 0.60%) due 9/25/2047 |
28,798,476 |
28,253,389 |
|
a,c |
Series
2015-3A Class A2, 1.057% (LIBOR 1 Month + 0.60%) due 2/27/2051 |
1,929,490 |
1,902,888 |
|
a,c |
Series
2021-CA Class AFL, 1.189% (LIBOR 1 Month + 0.74%) due 4/20/2062 |
16,559,716 |
16,329,543 |
|
a,c |
Series
2021-DA Class AFL, 1.139% (LIBOR 1 Month + 0.69%) due 4/20/2062 |
23,108,627 |
22,758,989 |
|
a,c |
Pennsylvania
Higher Education Assistance Agency, Student Loan Trust, Series 2012-1A Class A1, 1.007% (LIBOR 1 Month + 0.55%) due 5/25/2057 |
920,850 |
906,806 |
| a,b,c |
Prodigy
Finance DAC, Series 2021-1A Class A, 1.707% (LIBOR 1 Month + 1.25%) due 7/25/2051 |
4,858,051
|
4,781,921 |
26 | Thornburg Fixed Income Funds Semi-Annual Report
|
See notes to
financial statements. |
Schedule of Investments,
Continued
Thornburg Limited Term Income Fund | March 31, 2022 (Unaudited)
| |
Issuer-Description
|
SHARES/PRINCIPAL
AMOUNT |
VALUE
|
| |
SLM
Student Loan Trust, |
|
|
|
a |
Series
2011-2 Class A2, 1.657% (LIBOR 1 Month + 1.20%) due 10/25/2034 |
$ 12,584,624
|
$ 12,699,687
|
|
a |
Series
2013-6 Class A3, 1.107% (LIBOR 1 Month + 0.65%) due 6/26/2028 |
29,727,536 |
29,331,297 |
| |
SMB
Private Education Loan Trust, |
|
|
|
a,c |
Series
2015-A Class A3, 1.897% (LIBOR 1 Month + 1.50%) due 2/17/2032 |
8,377,359 |
8,379,097 |
|
a,c |
Series
2017-B 1.147% (LIBOR 1 Month + 0.75%) due 10/15/2035 |
1,285,102 |
1,273,723 |
|
a,c |
Series
2021-A Class A1, 0.897% (LIBOR 1 Month + 0.50%) due 1/15/2053 |
1,834,333 |
1,832,854 |
|
a,c |
Series
2021-D Class A1B, 0.997% (LIBOR 1 Month + 0.60%) due 3/17/2053 |
10,312,799 |
10,144,183 |
|
a,c |
Series
2021-E Class A1B, 1.027% (LIBOR 1 Month + 0.63%) due 2/15/2051 |
30,794,420 |
30,169,547 |
|
c |
SoFi
Professional Loan Program LLC, Series 2017-E Class A2B, 2.72% due 11/26/2040 |
1,250,014 |
1,250,495 |
|
a,c |
Towd
Point Asset Trust, Series 2021-SL1 Class A2, 1.149% (LIBOR 1 Month + 0.70%) due 11/20/2061 |
8,618,340 |
8,532,048
|
| |
|
|
283,646,690
|
| |
Total
Asset Backed Securities (Cost $1,930,816,847) |
|
1,891,014,623
|
| |
Corporate
Bonds — 39.9% |
|
|
| |
Automobiles
& Components — 1.4% |
|
|
| |
Auto
Components — 0.0% |
|
|
|
b |
Aptiv
plc/Aptiv Corp., 2.396% due 2/18/2025 |
5,434,000 |
5,295,977
|
| |
Automobiles
— 1.4% |
|
|
|
a,b,c |
BMW
Finance NV, 1.185% (LIBOR 3 Month + 0.79%) due 8/12/2022 |
25,800,000 |
25,849,020 |
| |
BMW
US Capital LLC, |
|
|
|
a,c |
0.566%
(SOFRINDX + 0.38%) due 8/12/2024 |
18,065,000 |
17,958,055 |
|
c |
2.95%
due 4/14/2022 |
1,894,000 |
1,895,364 |
| |
Daimler
Finance North America LLC, |
|
|
|
c |
2.125%
due 3/10/2025 |
16,900,000 |
16,325,738 |
|
c |
3.70%
due 5/4/2023 |
4,725,000 |
4,788,079 |
|
a,c |
Daimler
Trucks Finance North America LLC, 1.015% (SOFR + 0.75%) due 12/13/2024 |
10,414,000 |
10,326,835 |
| |
Hyundai
Capital America, |
|
|
|
c |
0.875%
due 6/14/2024 |
8,710,000 |
8,238,876 |
|
c |
1.00%
due 9/17/2024 |
4,639,000 |
4,365,856 |
|
c |
1.65%
due 9/17/2026 |
2,105,000 |
1,919,634 |
|
c |
1.80%
due 10/15/2025 - 1/10/2028 |
9,765,000 |
8,906,350 |
|
c |
2.375%
due 2/10/2023 |
11,460,000 |
11,416,452 |
|
c |
2.75%
due 9/27/2026 |
3,477,000 |
3,314,763 |
| |
Hyundai
Capital Services, Inc., |
|
|
|
b,c |
1.25%
due 2/8/2026 |
2,970,000 |
2,737,300 |
|
b,c |
3.75%
due 3/5/2023 |
2,029,000 |
2,049,980 |
|
b,c |
Kia
Corp., 2.375% due 2/14/2025 |
9,800,000 |
9,550,884 |
|
a,c |
Nissan
Motor Acceptance Co. LLC, 0.894% (LIBOR 3 Month + 0.65%) due 7/13/2022 |
1,560,000 |
1,560,078
|
| |
|
|
136,499,241
|
| |
Banks
— 1.0% |
|
|
| |
Banks
— 1.0% |
|
|
|
a |
Capital
One NA, 1.159% (LIBOR 3 Month + 0.82%) due 8/8/2022 |
28,150,000 |
28,183,498 |
|
a |
Citizens
Bank NA/Providence RI, 1.933% (LIBOR 3 Month + 0.95%) due 3/29/2023 |
20,500,000 |
20,594,710 |
|
a,b,c |
NBK
SPC Ltd., 1.625% (SOFR + 1.05%) due 9/15/2027 |
12,348,000 |
11,289,036 |
| |
Santander
Holdings USA, Inc., |
|
|
| |
3.244%
due 10/5/2026 |
6,823,000 |
6,650,787 |
| |
3.45%
due 6/2/2025 |
4,453,000 |
4,438,706 |
| |
4.40%
due 7/13/2027 |
4,940,000 |
5,025,116 |
| |
Sumitomo
Mitsui Trust Bank Ltd., |
|
|
|
b,c |
0.80%
due 9/12/2023 |
14,760,000 |
14,357,938 |
|
b,c |
0.85%
due 3/25/2024 |
6,550,000 |
6,275,752
|
| |
|
|
96,815,543
|
| |
Capital
Goods — 0.8% |
|
|
| |
Aerospace
& Defense — 0.3% |
|
|
| |
Boeing
Co., 2.196% due 2/4/2026 |
6,256,000 |
5,919,114 |
| |
Teledyne
Technologies, Inc., |
|
|
| |
2.25%
due 4/1/2028 |
14,013,000 |
12,999,860 |
| |
2.75%
due 4/1/2031 |
7,501,000
|
6,949,902 |
See
notes to financial statements.
|
Thornburg Fixed
Income Funds Semi-Annual Report | 27 |
Schedule of Investments, Continued
Thornburg Limited Term Income Fund | March 31, 2022 (Unaudited)
| |
Issuer-Description
|
SHARES/PRINCIPAL
AMOUNT |
VALUE
|
| |
Industrial
Conglomerates — 0.0% |
|
|
| |
Trane
Technologies Co. LLC, 6.391% due 11/15/2027 |
$ 3,000,000
|
$ 3,313,560
|
| |
Machinery
— 0.5% |
|
|
| |
Flowserve
Corp., 3.50% due 10/1/2030 |
8,414,000 |
7,972,013 |
|
c |
Huntington
Ingalls Industries, Inc., 2.043% due 8/16/2028 |
17,717,000 |
16,014,042 |
| |
nVent
Finance Sarl, |
|
|
|
b |
2.75%
due 11/15/2031 |
10,462,000 |
9,400,839 |
|
b |
4.55%
due 4/15/2028 |
7,023,000 |
7,240,643 |
| |
Westinghouse
Air Brake Technologies Corp., 4.40% due 3/15/2024 |
3,853,000 |
3,925,398
|
| |
|
|
73,735,371
|
| |
Commercial
& Professional Services — 0.2% |
|
|
| |
Commercial
Services & Supplies — 0.1% |
|
|
| |
Quanta
Services, Inc., 0.95% due 10/1/2024 |
9,321,000 |
8,843,299
|
| |
Hotels,
Restaurants & Leisure — 0.0% |
|
|
|
c |
Magallanes,
Inc., 3.428% due 3/15/2024 |
4,090,000 |
4,112,454
|
| |
Information
Technology Services — 0.1% |
|
|
|
c |
S&P
Global, Inc., 2.70% due 3/1/2029 |
7,000,000 |
6,784,050
|
| |
|
|
19,739,803
|
| |
Consumer
Durables & Apparel — 0.2% |
|
|
| |
Household
Durables — 0.2% |
|
|
| |
Panasonic
Corp., |
|
|
|
b,c,e |
2.536%
due 7/19/2022 |
16,810,000 |
16,849,672 |
|
b,c |
2.679%
due 7/19/2024 |
2,000,000 |
1,976,740
|
| |
|
|
18,826,412
|
| |
Consumer
Services — 0.0% |
|
|
| |
Hotels,
Restaurants & Leisure — 0.0% |
|
|
|
a |
Starbucks
Corp., 0.608% (SOFRINDX + 0.42%) due 2/14/2024 |
1,538,000 |
1,539,723
|
| |
|
|
1,539,723
|
| |
Diversified
Financials — 8.2% |
|
|
| |
Capital
Markets — 2.1% |
|
|
| |
Blackstone
Private Credit Fund, |
|
|
|
c |
2.625%
due 12/15/2026 |
8,137,000 |
7,302,469 |
|
c |
3.25%
due 3/15/2027 |
3,543,000 |
3,252,899 |
|
a |
Charles
Schwab Corp., 0.77% (SOFRINDX + 0.50%) due 3/18/2024 |
18,814,000 |
18,743,071 |
| |
Hercules
Capital, Inc., |
|
|
| |
2.625%
due 9/16/2026 |
14,120,000 |
12,930,814 |
| |
3.375%
due 1/20/2027 |
7,458,000 |
7,010,073 |
| |
Legg
Mason, Inc., 4.75% due 3/15/2026 |
5,000,000 |
5,273,850 |
|
b,c |
LSEGA
Financing plc, 1.375% due 4/6/2026 |
9,720,000 |
8,949,593 |
| |
Main
Street Capital Corp., 3.00% due 7/14/2026 |
8,163,000 |
7,599,671 |
| |
Owl
Rock Capital Corp., |
|
|
| |
2.625%
due 1/15/2027 |
2,081,000 |
1,873,836 |
| |
2.875%
due 6/11/2028 |
20,499,000 |
17,937,035 |
|
c |
Owl
Rock Capital Corp. III, 3.125% due 4/13/2027 |
16,243,000 |
14,369,208 |
| |
Owl
Rock Core Income Corp., |
|
|
|
c |
3.125%
due 9/23/2026 |
19,056,000 |
17,256,732 |
|
c |
4.70%
due 2/8/2027 |
4,870,000 |
4,685,914 |
|
c |
5.50%
due 3/21/2025 |
6,810,000 |
6,792,362 |
| |
Owl
Rock Technology Finance Corp., |
|
|
| |
2.50%
due 1/15/2027 |
10,556,000 |
9,527,846 |
|
c |
3.75%
due 6/17/2026 |
12,276,000 |
11,710,936 |
|
c |
4.75%
due 12/15/2025 |
17,883,000 |
17,644,441 |
| |
Sixth
Street Specialty Lending, Inc., |
|
|
| |
2.50%
due 8/1/2026 |
2,591,000 |
2,390,819 |
| |
3.875%
due 11/1/2024 |
14,960,000 |
14,930,828 |
| |
SLR
Investment Corp., 4.50% due 1/20/2023 |
13,191,000 |
13,292,307
|
| |
Consumer
Finance — 0.2% |
|
|
| a,c |
Wells
Fargo Bank NA, 1.00% (LIBOR 3 Month + 0.20%) due 5/18/2022 |
14,750,000
|
14,740,412 |
28 | Thornburg Fixed Income Funds Semi-Annual Report
|
See notes to
financial statements. |
Schedule of Investments,
Continued
Thornburg Limited Term Income Fund | March 31, 2022 (Unaudited)
| |
Issuer-Description
|
SHARES/PRINCIPAL
AMOUNT |
VALUE
|
| |
Diversified
Financial Services — 5.6% |
|
|
| |
Antares
Holdings LP, |
|
|
|
c |
2.75%
due 1/15/2027 |
$ 7,360,000
|
$ 6,498,659
|
|
c |
3.75%
due 7/15/2027 |
8,520,000 |
7,860,893 |
|
c |
3.95%
due 7/15/2026 |
14,391,000 |
13,405,073 |
|
c |
6.00%
due 8/15/2023 |
10,075,000 |
10,328,588 |
| |
Bank
of America Corp., |
|
|
|
a |
0.909%
(BSBY3M + 0.43%) due 5/28/2024 |
5,093,000 |
5,083,374 |
|
a |
0.976%
(SOFR + 0.69%) due 4/22/2025 |
9,525,000 |
9,126,379 |
|
a |
1.197%
(SOFR + 1.01%) due 10/24/2026 |
3,035,000 |
2,808,468 |
|
a |
1.734%
(SOFR + 0.96%) due 7/22/2027 |
3,632,000 |
3,376,162 |
|
a |
2.572%
(SOFR + 1.21%) due 10/20/2032 |
6,371,000 |
5,802,516 |
|
a,b |
Barclays
plc, 1.839% (LIBOR 3 Month + 1.38%) due 5/16/2024 |
17,500,000 |
17,624,250 |
| |
BNP
Paribas SA, |
|
|
|
a,b,c |
1.323%
(SOFR + 1.00%) due 1/13/2027 |
7,000,000 |
6,376,300 |
|
a,b,c |
2.159%
(SOFR + 1.22%) due 9/15/2029 |
3,650,000 |
3,254,741 |
|
a,b,c |
2.219%
(SOFR + 2.07%) due 6/9/2026 |
4,800,000 |
4,561,104 |
|
a |
Charles
Schwab Corp., 1.209% (SOFRINDX + 1.05%) due 3/3/2027 |
33,148,000 |
33,225,566 |
| |
Citigroup
Mortgage Loan Trust, |
|
|
|
a |
0.834%
(SOFR + 0.67%) due 5/1/2025 |
5,753,000 |
5,687,013 |
|
a |
1.023%
(SOFR + 0.77%) due 6/9/2027 |
17,355,000 |
16,987,421 |
|
a |
1.462%
(SOFR + 0.77%) due 6/9/2027 |
11,526,000 |
10,612,334 |
|
a |
3.106%
(SOFR + 2.84%) due 4/8/2026 |
4,265,000 |
4,229,131 |
| |
3.40%
due 5/1/2026 |
2,425,000 |
2,445,685 |
|
a |
4.412%
(SOFR + 3.91%) due 3/31/2031 |
10,815,000 |
11,261,443 |
| |
Deutsche
Bank AG, |
|
|
|
b |
0.898%
due 5/28/2024 |
10,952,000 |
10,439,884 |
|
b |
0.962%
due 11/8/2023 |
4,850,000 |
4,712,357 |
|
a,b |
1.738%
(LIBOR 3 Month + 1.23%) due 2/27/2023 |
17,100,000 |
17,195,076 |
|
a,b |
2.311%
(SOFR + 1.22%) due 11/16/2027 |
4,850,000 |
4,462,194 |
| |
Goldman
Sachs Group, Inc., |
|
|
|
a |
0.65%
(SOFR + 0.50%) due 7/16/2024 |
14,450,000 |
13,691,953 |
|
a |
0.751%
(SOFR + 0.50%) due 9/10/2024 |
10,786,000 |
10,667,678 |
|
a |
0.836%
(SOFR + 0.70%) due 1/24/2025 |
6,322,000 |
6,264,217 |
|
a |
0.856%
(SOFR + 0.62%) due 12/6/2023 |
5,123,000 |
5,099,998 |
|
a |
1.052%
(SOFR + 0.92%) due 10/21/2027 |
6,991,000 |
6,858,800 |
|
a |
1.071%
(SOFR + 0.82%) due 9/10/2027 |
10,881,000 |
10,630,302 |
| |
3.00%
due 3/15/2024 |
6,942,000 |
6,934,641 |
| |
HSBC
Holdings plc, |
|
|
|
a,b |
0.782%
(SOFR + 0.58%) due 11/22/2024 |
1,585,000 |
1,570,561 |
|
a,b |
1.589%
(SOFR + 1.29%) due 5/24/2027 |
6,100,000 |
5,579,914 |
|
a,b |
1.645%
(SOFR + 1.54%) due 4/18/2026 |
3,025,000 |
2,851,577 |
|
a,b |
2.013%
(SOFR + 1.73%) due 9/22/2028 |
9,550,000 |
8,667,962 |
|
a,b |
2.099%
(SOFR + 1.93%) due 6/4/2026 |
6,800,000 |
6,464,964 |
|
a,b |
2.206%
(SOFR + 1.29%) due 8/17/2029 |
3,500,000 |
3,152,800 |
|
a,b |
2.251%
(SOFR + 1.10%) due 11/22/2027 |
3,430,000 |
3,195,457 |
| |
JPMorgan
Chase & Co., |
|
|
|
a |
0.851%
(SOFR + 0.60%) due 12/10/2025 |
6,825,000 |
6,751,495 |
|
a |
1.02%
(SOFR + 0.89%) due 4/22/2027 |
10,389,000 |
10,228,594 |
|
a |
1.045%
(SOFR + 0.80%) due 11/19/2026 |
5,982,000 |
5,530,359 |
|
a |
2.069%
(SOFR + 1.02%) due 6/1/2029 |
4,897,000 |
4,501,665 |
|
a |
2.545%
(SOFR + 1.18%) due 11/8/2032 |
4,917,000 |
4,487,992 |
|
a |
0.851%
(SOFR + 0.58%) due 6/23/2025 |
29,209,000 |
28,912,529 |
|
a,b |
Lloyds
Banking Group plc, 3.87% (H15T1Y + 3.50%) due 7/9/2025 |
3,500,000 |
3,532,620 |
| |
Mitsubishi
UFJ Financial Group, Inc., |
|
|
|
a,b |
0.953%
(H15T1Y + 0.55%) due 7/19/2025 |
14,075,000 |
13,357,738 |
|
a,b |
1.538%
(H15T1Y + 0.75%) due 7/20/2027 |
4,800,000 |
4,411,584 |
|
a,b |
1.64%
(H15T1Y + 0.67%) due 10/13/2027 |
6,750,000 |
6,205,680 |
|
b |
2.623%
due 7/18/2022 |
10,800,000 |
10,842,768 |
| |
Mizuho
Financial Group, Inc., |
|
|
|
a,b |
1.128%
(LIBOR 3 Month + 0.63%) due 5/25/2024 |
4,854,000 |
4,854,485 |
|
a,b |
2.226%
(LIBOR 3 Month + 0.83%) due 5/25/2026 |
4,800,000 |
4,605,072 |
| a,b |
3.922%
(LIBOR 3 Month + 1.00%) due 9/11/2024 |
10,850,000
|
10,974,449 |
See
notes to financial statements.
|
Thornburg Fixed
Income Funds Semi-Annual Report | 29 |
Schedule of Investments, Continued
Thornburg Limited Term Income Fund | March 31, 2022 (Unaudited)
| |
Issuer-Description
|
SHARES/PRINCIPAL
AMOUNT |
VALUE
|
| |
Morgan
Stanley, |
|
|
|
a |
0.791%
(SOFR + 0.51%) due 1/22/2025 |
$ 11,785,000
|
$ 11,314,307
|
|
a |
1.164%
(SOFR + 0.56%) due 10/21/2025 |
9,635,000 |
9,156,719 |
|
c |
National
Securities Clearing Corp., 1.50% due 4/23/2025 |
7,000,000 |
6,699,070 |
| |
Natwest
Group plc, |
|
|
|
a,b |
1.642%
( H15T1Y + 0.90%) due 6/14/2027 |
3,000,000 |
2,742,510 |
|
a,b |
1.976%
(LIBOR 3 Month + 1.47%) due 5/15/2023 |
1,952,000 |
1,954,089 |
| |
Societe
Generale SA, |
|
|
|
a,b,c |
1.178%
(SOFR + 1.05%) due 1/21/2026 |
6,400,000 |
6,300,608 |
|
a,b,c |
1.792%
(H15T1Y + 1.00%) due 6/9/2027 |
4,933,000 |
4,468,361 |
|
b,c |
2.625%
due 1/22/2025 |
4,000,000 |
3,860,680 |
|
b,c |
3.875%
due 3/28/2024 |
8,000,000 |
8,026,240 |
|
b,c |
4.25%
due 9/14/2023 |
9,000,000 |
9,126,630 |
| |
Sumitomo
Mitsui Financial Group, Inc., |
|
|
|
b |
0.948%
due 1/12/2026 |
11,650,000 |
10,650,080 |
|
a,b |
0.984%
(SOFR + 0.88%) due 1/14/2027 |
19,486,000 |
19,421,696 |
|
a,b,c |
UBS
AG, 0.626% (SOFR + 0.45%) due 8/9/2024 |
2,800,000 |
2,777,320 |
|
a,b,c |
UBS
Group AG, 1.494% (H15T1Y + 0.85%) due 8/10/2027 |
7,121,000 |
6,488,014 |
| |
Western
Union Co., 2.85% due 1/10/2025 |
7,256,000 |
7,169,726
|
| |
Insurance
— 0.3% |
|
|
|
c |
Global
Atlantic Fin Co., 4.40% due 10/15/2029 |
27,285,000 |
27,208,875
|
| |
|
|
783,772,506
|
| |
Energy
— 2.1% |
|
|
| |
Energy
Equipment & Services — 0.0% |
|
|
|
c |
Hanwha
Energy USA Holdings Corp., 2.375% due 7/30/2022 |
5,100,000 |
5,096,277 |
|
b,c,f,g |
Schahin
II Finance Co. SPV Ltd., 5.875% due 9/25/2023 |
3,997,362 |
270,222
|
| |
Oil,
Gas & Consumable Fuels — 2.1% |
|
|
|
a |
BP
Capital Markets America, Inc., 1.578% (LIBOR 3 Month + 0.65%) due 9/19/2022 |
6,771,000 |
6,770,255 |
| |
Buckeye
Partners LP, 4.15% due 7/1/2023 |
7,000,000 |
7,025,690 |
|
c |
Colorado
Interstate Gas Co. LLC/Colorado Interstate Issuing Corp., 4.15% due 8/15/2026 |
9,168,000 |
9,392,066 |
| |
EQM
Midstream Partners LP, Series 5Y, 4.75% due 7/15/2023 |
3,853,000 |
3,881,319 |
| |
Florida
Gas Transmission Co. LLC, |
|
|
|
c |
2.30%
due 10/1/2031 |
10,778,000 |
9,544,889 |
|
c |
3.875%
due 7/15/2022 |
10,435,000 |
10,444,704 |
| |
Galaxy
Pipeline Assets Bidco Ltd., |
|
|
|
b,c |
1.75%
due 9/30/2027 |
37,050,033 |
35,579,888 |
|
b,c |
2.16%
due 3/31/2034 |
10,040,000 |
9,256,278 |
|
b,c |
Gazprom
PJSC via Gaz Finance plc, 3.50% due 7/14/2031 |
32,475,000 |
13,477,125 |
| |
Gray
Oak Pipeline LLC, |
|
|
|
c |
2.00%
due 9/15/2023 |
7,678,000 |
7,564,596 |
|
c |
3.45%
due 10/15/2027 |
12,955,000 |
12,497,300 |
|
b,c |
Lukoil
International Finance BV, 4.563% due 4/24/2023 |
3,000,000 |
1,740,000 |
|
c |
Midwest
Connector Capital Co. LLC, 4.625% due 4/1/2029 |
16,535,000 |
16,736,065 |
| |
SA
Global Sukuk Ltd., |
|
|
|
b,c |
0.946%
due 6/17/2024 |
14,331,000 |
13,713,477 |
|
b,c |
1.602%
due 6/17/2026 |
16,124,000 |
15,161,881 |
|
b,c |
Saudi
Arabian Oil Co., 2.75% due 4/16/2022 |
3,674,000 |
3,674,735 |
|
b,c |
Sinopec
Group Overseas Development 2018 Ltd., 3.75% due 9/12/2023 |
11,800,000 |
11,965,318 |
|
c |
Tennessee
Gas Pipeline Co. LLC, 2.90% due 3/1/2030 |
11,946,000 |
11,200,092
|
| |
|
|
204,992,177
|
| |
Food
& Staples Retailing — 0.3% |
|
|
| |
Food
& Staples Retailing — 0.3% |
|
|
| |
7-Eleven,
Inc., |
|
|
|
c |
0.625%
due 2/10/2023 |
5,947,000 |
5,855,179 |
|
c |
0.80%
due 2/10/2024 |
18,780,000 |
18,041,758 |
| |
Walgreens
Boots Alliance, Inc., 3.20% due 4/15/2030 |
5,024,000 |
4,901,816
|
| |
|
|
28,798,753
|
| |
Food,
Beverage & Tobacco — 0.6% |
|
|
| |
Beverages
— 0.3% |
|
|
| b,c |
Becle
SAB de CV, 2.50% due 10/14/2031 |
28,038,000
|
24,974,007 |
30 | Thornburg Fixed Income Funds Semi-Annual Report
|
See notes to
financial statements. |
Schedule of Investments,
Continued
Thornburg Limited Term Income Fund | March 31, 2022 (Unaudited)
| |
Issuer-Description
|
SHARES/PRINCIPAL
AMOUNT |
VALUE
|
| |
Food
Products — 0.1% |
|
|
|
a |
General
Mills, Inc., 1.249% (LIBOR 3 Month + 1.01%) due 10/17/2023 |
$ 2,475,000
|
$ 2,503,067
|
| |
Ingredion,
Inc., 2.90% due 6/1/2030 |
9,725,000 |
9,164,159
|
| |
Tobacco
— 0.2% |
|
|
| |
BAT
Capital Corp., |
|
|
| |
2.726%
due 3/25/2031 |
2,950,000 |
2,602,667 |
| |
3.557%
due 8/15/2027 |
5,838,000 |
5,681,133 |
| |
BAT
International Finance plc, |
|
|
|
b |
1.668%
due 3/25/2026 |
4,764,000 |
4,379,259 |
|
b,c |
3.95%
due 6/15/2025 |
3,000,000 |
2,991,870
|
| |
|
|
52,296,162
|
| |
Health
Care Equipment & Services — 1.0% |
|
|
| |
Health
Care Equipment & Supplies — 0.1% |
|
|
|
b,c |
Olympus
Corp., 2.143% due 12/8/2026 |
14,061,000 |
13,267,538
|
| |
Health
Care Providers & Services — 0.9% |
|
|
| |
AmerisourceBergen
Corp., |
|
|
| |
0.737%
due 3/15/2023 |
14,719,000 |
14,507,046 |
| |
2.80%
due 5/15/2030 |
5,311,000 |
4,994,836 |
| |
Catholic
Health Initiatives, 2.95% due 11/1/2022 |
7,000,000 |
7,042,000 |
|
c |
Highmark,
Inc., 1.45% due 5/10/2026 |
25,450,000 |
23,550,921 |
| |
Humana,
Inc., 0.65% due 8/3/2023 |
15,869,000 |
15,481,003 |
| |
Laboratory
Corp. of America Holdings, 1.55% due 6/1/2026 |
19,555,000 |
18,231,909
|
| |
|
|
97,075,253
|
| |
Household
& Personal Products — 0.0% |
|
|
| |
Household
Products — 0.0% |
|
|
|
b,c |
Kimberly-Clark
de Mexico SAB de CV, 3.80% due 4/8/2024 |
3,900,000 |
3,932,487
|
| |
|
|
3,932,487
|
| |
Insurance
— 6.1% |
|
|
| |
Insurance
— 6.1% |
|
|
|
b,c |
AIA
Group Ltd., 3.375% due 4/7/2030 |
4,800,000 |
4,777,776 |
|
b,c |
Ascot
Group Ltd., 4.25% due 12/15/2030 |
7,747,000 |
7,654,346 |
|
c |
Belrose
Funding Trust, 2.33% due 8/15/2030 |
9,685,000 |
8,485,028 |
| |
Brighthouse
Financial Global Funding, |
|
|
|
a,c |
0.867%
(SOFR + 0.76%) due 4/12/2024 |
7,247,000 |
7,262,508 |
|
c |
1.55%
due 5/24/2026 |
7,538,000 |
6,981,394 |
|
c |
2.00%
due 6/28/2028 |
10,733,000 |
9,593,585 |
| |
Brighthouse
Financial, Inc., 5.625% due 5/15/2030 |
10,707,000 |
11,796,972 |
|
c |
CNO
Global Funding, 1.65% due 1/6/2025 |
14,773,000 |
14,082,805 |
|
b,c |
DaVinciRe
Holdings Ltd., 4.75% due 5/1/2025 |
10,260,000 |
10,246,765 |
| |
Enstar
Group Ltd., |
|
|
|
b |
3.10%
due 9/1/2031 |
8,016,000 |
7,177,767 |
|
b |
4.95%
due 6/1/2029 |
16,116,000 |
16,725,346 |
| |
Equitable
Financial Life Global Funding, |
|
|
|
c |
1.00%
due 1/9/2026 |
8,665,000 |
7,957,156 |
|
c |
1.30%
due 7/12/2026 |
9,820,000 |
9,024,285 |
|
c |
1.40%
due 7/7/2025 - 8/27/2027 |
19,048,000 |
17,595,767 |
|
c |
1.80%
due 3/8/2028 |
10,616,000 |
9,551,534 |
| |
F&G
Global Funding, |
|
|
|
c |
1.75%
due 6/30/2026 |
32,026,000 |
29,731,978 |
|
c |
2.00%
due 9/20/2028 |
17,963,000 |
16,074,011 |
|
c |
2.30%
due 4/11/2027 |
10,870,000 |
10,164,320 |
| |
Fairfax
Financial Holdings Ltd., |
|
|
|
b |
3.375%
due 3/3/2031 |
5,261,000 |
4,926,506 |
|
b |
4.625%
due 4/29/2030 |
11,984,000 |
12,347,115 |
|
b,c |
Fidelis
Insurance Holdings Ltd., 4.875% due 6/30/2030 |
17,531,000 |
19,264,640 |
| |
Fidelity
National Financial, Inc., 3.40% due 6/15/2030 |
11,286,000 |
10,859,728 |
| |
First
American Financial Corp., 4.00% due 5/15/2030 |
4,845,000
|
4,864,235 |
See
notes to financial statements.
|
Thornburg Fixed
Income Funds Semi-Annual Report | 31 |
Schedule of Investments, Continued
Thornburg Limited Term Income Fund | March 31, 2022 (Unaudited)
| |
Issuer-Description
|
SHARES/PRINCIPAL
AMOUNT |
VALUE
|
| |
GA
Global Funding Trust, |
|
|
|
a,c |
0.755%
(SOFR + 0.50%) due 9/13/2024 |
$ 14,424,000
|
$ 14,210,813
|
|
c |
1.00%
due 4/8/2024 |
1,390,000 |
1,330,703 |
|
c |
2.25%
due 1/6/2027 |
11,420,000 |
10,665,024 |
| |
Horace
Mann Educators Corp., 4.50% due 12/1/2025 |
4,800,000 |
4,936,080 |
|
c |
Jackson
National Life Global Funding, 3.25% due 1/30/2024 |
10,000,000 |
10,062,000 |
| |
Mercury
General Corp., 4.40% due 3/15/2027 |
2,901,000 |
2,980,864 |
| |
Metropolitan
Life Global Funding I, |
|
|
|
a,c |
0.418%
(SOFR + 0.32%) due 1/7/2024 |
14,683,000 |
14,600,041 |
|
c |
3.30%
due 3/21/2029 |
4,000,000 |
3,970,920 |
|
a,c |
Nationwide
Mutual Insurance Co., 3.116% (LIBOR 3 Month + 2.29%) due 12/15/2024 |
16,096,000 |
16,101,473 |
| |
New
York Life Global Funding, |
|
|
|
a,c |
0.378%
(SOFR + 0.22%) due 2/2/2023 |
14,125,000 |
14,102,259 |
|
a,c |
0.728%
(SOFR + 0.48%) due 6/9/2026 |
49,075,000 |
48,496,406 |
| |
Pacific
Life Global Funding II, |
|
|
|
a,c |
0.856%
(SOFR + 0.62%) due 6/4/2026 |
13,475,000 |
13,299,286 |
|
a,c |
1.00%
(SOFRINDX + 0.80%) due 3/30/2025 |
10,506,000 |
10,484,988 |
|
a,c |
Principal
Life Global Funding II, 0.557% (SOFR + 0.45%) due 4/12/2024 |
6,725,000 |
6,710,676 |
|
c |
Protective
Life Corp., 3.40% due 1/15/2030 |
19,740,000 |
19,513,187 |
| |
Protective
Life Global Funding, |
|
|
|
c |
1.618%
due 4/15/2026 |
14,716,000 |
13,816,264 |
|
c |
3.218%
due 3/28/2025 |
4,000,000 |
3,992,800 |
| |
Reliance
Standard Life Global Funding II, |
|
|
|
c |
1.512%
due 9/28/2026 |
10,762,000 |
9,903,946 |
|
c |
2.75%
due 5/7/2025 |
13,490,000 |
13,254,060 |
|
c |
3.85%
due 9/19/2023 |
9,950,000 |
10,085,021 |
| |
RGA
Global Funding, |
|
|
|
c |
2.00%
due 11/30/2026 |
2,734,000 |
2,592,406 |
|
c |
2.70%
due 1/18/2029 |
11,803,000 |
11,158,438 |
|
c |
Sammons
Financial Group, Inc., 4.45% due 5/12/2027 |
7,950,000 |
8,173,713 |
|
c |
Security
Benefit Global Funding, 1.25% due 5/17/2024 |
37,488,000 |
35,823,533 |
|
b |
Sompo
International Holdings Ltd., 4.70% due 10/15/2022 |
5,000,000 |
5,070,650 |
| |
Stewart
Information Services Corp., 3.60% due 11/15/2031 |
21,476,000 |
19,632,715
|
| |
Semiconductors
& Semiconductor Equipment — 0.0% |
|
|
| |
TSMC
Global Ltd., |
|
|
|
b,c |
1.00%
due 9/28/2027 |
2,750,000 |
2,430,780 |
|
b,c |
1.75%
due 4/23/2028 |
1,450,000 |
1,321,197
|
| |
|
|
585,865,810
|
| |
Materials
— 1.0% |
|
|
| |
Chemicals
— 0.3% |
|
|
|
c |
Chevron
Phillips Chemical Co. LLC/Chevron Phillips Chemical Co. LP, 5.125% due 4/1/2025 |
9,870,000 |
10,411,172 |
|
b,c |
OCP
SA, 5.625% due 4/25/2024 |
8,555,000 |
8,793,000 |
| |
Phosagro
OAO Via Phosagro Bond Funding DAC, |
|
|
|
b,c |
3.05%
due 1/23/2025 |
2,525,000 |
707,000 |
|
b,c |
3.949%
due 4/24/2023 |
29,098,000 |
8,147,440
|
| |
Construction
Materials — 0.1% |
|
|
| |
Martin
Marietta Materials, Inc., 0.65% due 7/15/2023 |
14,635,000 |
14,288,297
|
| |
Containers
& Packaging — 0.3% |
|
|
|
b,c |
CCL
Industries, Inc., 3.05% due 6/1/2030 |
9,810,000 |
9,215,220 |
|
c |
Graphic
Packaging International LLC, 1.512% due 4/15/2026 |
6,873,000 |
6,317,661 |
|
c |
Silgan
Holdings, Inc., 1.40% due 4/1/2026 |
10,204,000 |
9,317,885
|
| |
Metals
& Mining — 0.3% |
|
|
|
b |
AngloGold
Ashanti Holdings plc, 3.375% due 11/1/2028 |
23,500,000 |
21,919,155 |
|
b,c |
Metalloinvest
Finance DAC, Series 2022-1A Class A, 3.375% due 10/22/2028 |
12,700,000 |
2,540,000 |
|
b,c |
Newcrest
Finance Pty Ltd., 3.25% due 5/13/2030 |
2,961,000 |
2,835,513
|
| |
|
|
94,492,343
|
| |
Media
& Entertainment — 0.1% |
|
|
| |
Media
— 0.1% |
|
|
|
c |
Magallanes,
Inc., 3.528% due 3/15/2024 |
10,415,000 |
10,411,459
|
| |
|
|
10,411,459
|
32 | Thornburg Fixed Income Funds Semi-Annual Report
|
See notes to
financial statements. |
Schedule of Investments,
Continued
Thornburg Limited Term Income Fund | March 31, 2022 (Unaudited)
| |
Issuer-Description
|
SHARES/PRINCIPAL
AMOUNT |
VALUE
|
| |
Pharmaceuticals,
Biotechnology & Life Sciences — 0.4% |
|
|
| |
Biotechnology
— 0.2% |
|
|
| |
Bio-Rad
Laboratories, Inc., 3.30% due 3/15/2027 |
$ 5,820,000
|
$ 5,747,134
|
| |
Gilead
Sciences, Inc., 0.75% due 9/29/2023 |
5,113,000 |
4,990,390 |
| |
Regeneron
Pharmaceuticals, Inc., 1.75% due 9/15/2030 |
8,132,000 |
7,044,101 |
|
b |
Royalty
Pharma plc, 1.20% due 9/2/2025 |
7,532,000 |
6,968,832
|
| |
Pharmaceuticals
— 0.2% |
|
|
|
a,b |
AstraZeneca
plc, 1.134% (LIBOR 3 Month + 0.67%) due 8/17/2023 |
10,524,000 |
10,548,310 |
|
c |
Bayer
US Finance II LLC, 4.25% due 12/15/2025 |
2,500,000 |
2,545,600 |
| |
Viatris,
Inc., 2.30% due 6/22/2027 |
4,935,000 |
4,492,479
|
| |
|
|
42,336,846
|
| |
Real
Estate — 1.7% |
|
|
| |
Equity
Real Estate Investment Trusts — 1.6% |
|
|
| |
American
Tower Corp., |
|
|
| |
1.45%
due 9/15/2026 |
4,969,000 |
4,545,542 |
| |
1.50%
due 1/31/2028 |
15,000,000 |
13,259,850 |
| |
2.40%
due 3/15/2025 |
7,375,000 |
7,185,241 |
| |
3.375%
due 5/15/2024 |
5,475,000 |
5,495,422 |
|
d |
3.65%
due 3/15/2027 |
6,380,000 |
6,369,792 |
|
d |
4.05%
due 3/15/2032 |
3,414,000 |
3,424,276 |
| |
Crown
Castle International Corp., |
|
|
| |
1.05%
due 7/15/2026 |
14,604,000 |
13,218,811 |
| |
2.10%
due 4/1/2031 |
22,231,000 |
19,257,159 |
| |
Extra
Space Storage LP, 3.90% due 4/1/2029 |
4,920,000 |
4,937,515 |
| |
SBA
Tower Trust, |
|
|
|
c |
1.631%
due 5/15/2051 |
26,000,000 |
24,433,359 |
|
c |
1.84%
due 4/15/2027 |
8,140,000 |
7,434,078 |
|
c |
2.836%
due 1/15/2050 |
12,525,000 |
12,320,991 |
|
c |
3.448%
due 3/15/2048 |
2,085,000 |
2,085,293 |
| |
Service
Properties Trust, |
|
|
| |
4.35%
due 10/1/2024 |
10,161,000 |
9,821,521 |
| |
4.65%
due 3/15/2024 |
4,233,000 |
4,070,749 |
| |
5.25%
due 2/15/2026 |
4,020,000 |
3,801,634 |
| |
Vornado
Realty LP, |
|
|
| |
2.15%
due 6/1/2026 |
3,500,000 |
3,277,750 |
| |
3.40%
due 6/1/2031 |
2,916,000 |
2,731,330
|
| |
Mortgage
Real Estate Investment Trusts — 0.1% |
|
|
| |
Sun
Communities Operating LP, 2.30% due 11/1/2028 |
13,878,000 |
12,603,722
|
| |
Real
Estate Management & Development — 0.0% |
|
|
|
a,c |
Pershing
Road Development Co., LLC, 0.923% (LIBOR 3 Month + 0.40%) due 9/15/2026 |
3,420,000 |
3,127,077
|
| |
|
|
163,401,112
|
| |
Retailing
— 0.1% |
|
|
| |
Specialty
Retail — 0.1% |
|
|
| |
Advance
Auto Parts, Inc., |
|
|
| |
1.75%
due 10/1/2027 |
4,763,000 |
4,295,464 |
| |
3.90%
due 4/15/2030 |
6,584,000 |
6,578,074
|
| |
|
|
10,873,538
|
| |
Semiconductors
& Semiconductor Equipment — 1.6% |
|
|
| |
Semiconductors
& Semiconductor Equipment — 1.6% |
|
|
|
b |
Broadcom
Corp./Broadcom Cayman Finance Ltd., 3.875% due 1/15/2027 |
4,565,000 |
4,595,768 |
| |
Broadcom,
Inc., |
|
|
|
c |
3.187%
due 11/15/2036 |
6,583,000 |
5,784,680 |
| |
3.459%
due 9/15/2026 |
3,127,000 |
3,117,431 |
|
c,d |
4.00%
due 4/15/2029 |
2,060,000 |
2,058,991 |
| |
4.11%
due 9/15/2028 |
15,820,000 |
16,050,339 |
| |
4.15%
due 11/15/2030 |
2,980,000 |
3,018,829 |
| |
Microchip
Technology, Inc., |
|
|
| |
0.972%
due 2/15/2024 |
18,694,000 |
17,935,397 |
| |
4.25%
due 9/1/2025 |
10,634,000 |
10,771,498 |
| |
Micron
Technology, Inc., |
|
|
See
notes to financial statements.
|
Thornburg Fixed
Income Funds Semi-Annual Report | 33 |
Schedule of Investments, Continued
Thornburg Limited Term Income Fund | March 31, 2022 (Unaudited)
| |
Issuer-Description
|
SHARES/PRINCIPAL
AMOUNT |
VALUE
|
| |
4.663%
due 2/15/2030 |
$ 4,150,000
|
$ 4,365,924
|
| |
5.327%
due 2/6/2029 |
7,690,000 |
8,359,184 |
| |
Qorvo,
Inc., |
|
|
|
c |
1.75%
due 12/15/2024 |
6,858,000 |
6,539,652 |
|
c |
3.375%
due 4/1/2031 |
10,000,000 |
9,093,400 |
|
b,c |
Renesas
Electronics Corp., 1.543% due 11/26/2024 |
17,721,000 |
16,862,063 |
| |
SK
Hynix, Inc., |
|
|
|
b,c |
1.00%
due 1/19/2024 |
6,800,000 |
6,533,576 |
|
b,c |
1.50%
due 1/19/2026 |
10,200,000 |
9,452,340 |
|
b,c |
2.375%
due 1/19/2031 |
6,588,000 |
5,766,872 |
| |
Skyworks
Solutions, Inc., 1.80% due 6/1/2026 |
3,574,000 |
3,329,217 |
| |
TSMC
Arizona Corp., 1.75% due 10/25/2026 |
19,472,000 |
18,252,663
|
| |
|
|
151,887,824
|
| |
Software
& Services — 2.3% |
|
|
| |
Information
Technology Services — 1.2% |
|
|
| |
Block
Financial LLC, 2.50% due 7/15/2028 |
10,392,000 |
9,519,176 |
| |
DXC
Technology Co., 2.375% due 9/15/2028 |
31,549,000 |
28,527,237 |
|
b |
Genpact
Luxembourg Sarl, 3.375% due 12/1/2024 |
4,350,000 |
4,339,865 |
|
b |
Genpact
Luxembourg Sarl/Genpact USA, Inc., 1.75% due 4/10/2026 |
9,063,000 |
8,411,823 |
| |
Global
Payments, Inc., |
|
|
| |
1.50%
due 11/15/2024 |
5,624,000 |
5,377,556 |
| |
2.15%
due 1/15/2027 |
3,516,000 |
3,304,302 |
| |
Kyndryl
Holdings, Inc., |
|
|
|
c |
2.05%
due 10/15/2026 |
10,562,000 |
9,490,274 |
|
c |
2.70%
due 10/15/2028 |
22,750,000 |
19,778,850 |
| |
Leidos,
Inc., 2.30% due 2/15/2031 |
8,489,000 |
7,360,897 |
| |
Moody’s
Corp., 3.75% due 3/24/2025 |
8,127,000 |
8,269,548 |
| |
Total
System Services, Inc., 4.00% due 6/1/2023 |
3,835,000 |
3,889,610 |
|
c |
Wipro
IT Services LLC, 1.50% due 6/23/2026 |
10,647,000 |
9,802,586
|
| |
Interactive
Media & Services — 0.2% |
|
|
| |
Baidu,
Inc., |
|
|
|
b |
1.72%
due 4/9/2026 |
7,251,000 |
6,684,987 |
|
b |
3.875%
due 9/29/2023 |
6,000,000 |
6,060,240 |
|
b |
4.375%
due 5/14/2024 |
6,376,000 |
6,488,600
|
| |
Internet
Software & Services — 0.3% |
|
|
| |
Prosus
NV, |
|
|
|
b,c |
3.061%
due 7/13/2031 |
20,870,000 |
17,342,135 |
|
b,c |
3.257%
due 1/19/2027 |
6,400,000 |
5,847,424 |
|
b,c |
Tencent
Holdings Ltd., 2.39% due 6/3/2030 |
5,000,000 |
4,446,900
|
| |
Software
— 0.6% |
|
|
|
c |
Infor,
Inc., 1.75% due 7/15/2025 |
12,382,000 |
11,610,230 |
| |
Oracle
Corp., |
|
|
| |
1.65%
due 3/25/2026 |
15,136,000 |
14,090,102 |
| |
2.30%
due 3/25/2028 |
7,482,000 |
6,851,043 |
| |
VMware,
Inc., |
|
|
| |
1.00%
due 8/15/2024 |
3,304,000 |
3,149,505 |
| |
4.50%
due 5/15/2025 |
15,043,000 |
15,502,413
|
| |
|
|
216,145,303
|
| |
Technology
Hardware & Equipment — 2.0% |
|
|
| |
Communications
Equipment — 0.5% |
|
|
| |
Motorola
Solutions, Inc., 2.30% due 11/15/2030 |
1,582,000 |
1,387,082 |
|
b |
Telefonaktiebolaget
LM Ericsson, 4.125% due 5/15/2022 |
41,407,000 |
41,407,000
|
| |
Electronic
Equipment, Instruments & Components — 0.7% |
|
|
|
b |
Flex
Ltd., 4.875% due 5/12/2030 |
15,741,000 |
16,346,084 |
|
c |
TD
SYNNEX Corp., 1.75% due 8/9/2026 |
28,691,000 |
26,268,045 |
| |
Trimble,
Inc., 4.75% due 12/1/2024 |
17,000,000 |
17,490,110 |
| |
Vontier
Corp., |
|
|
| |
1.80%
due 4/1/2026 |
5,272,000 |
4,768,471 |
| |
2.40%
due 4/1/2028 |
3,766,000 |
3,317,997
|
| |
Technology
Hardware, Storage & Peripherals — 0.8% |
|
|
34 | Thornburg Fixed Income Funds Semi-Annual Report
|
See notes to
financial statements. |
Schedule of Investments,
Continued
Thornburg Limited Term Income Fund | March 31, 2022 (Unaudited)
| |
Issuer-Description
|
SHARES/PRINCIPAL
AMOUNT |
VALUE
|
| |
Dell
International LLC/EMC Corp., 4.90% due 10/1/2026 |
$ 18,299,000
|
$ 19,208,826
|
| |
HP,
Inc., |
|
|
| |
1.45%
due 6/17/2026 |
8,834,000 |
8,144,418 |
| |
3.00%
due 6/17/2027 |
10,493,000 |
10,224,589 |
| |
Lenovo
Group Ltd., |
|
|
|
b |
4.75%
due 3/29/2023 |
23,428,000 |
23,606,990 |
|
b |
5.875%
due 4/24/2025 |
10,600,000 |
11,087,176 |
| |
NetApp,
Inc., 2.375% due 6/22/2027 |
3,453,000 |
3,288,395
|
| |
|
|
186,545,183
|
| |
Telecommunication
Services — 1.2% |
|
|
| |
Diversified
Telecommunication Services — 0.5% |
|
|
| |
AT&T,
Inc., |
|
|
|
e |
1.65%
due 2/1/2028 |
2,905,000 |
2,645,990 |
| |
1.70%
due 3/25/2026 |
9,905,000 |
9,396,675 |
| |
2.55%
due 12/1/2033 |
1,016,000 |
903,793 |
| |
NBN
Co. Ltd., |
|
|
|
b,c |
1.45%
due 5/5/2026 |
29,450,000 |
27,242,723 |
|
b,c |
1.625%
due 1/8/2027 |
9,800,000 |
9,005,220
|
| |
Wireless
Telecommunication Services — 0.7% |
|
|
| |
Sprint
Communications, Inc., 9.25% due 4/15/2022 |
67,194,000 |
67,385,503
|
| |
|
|
116,579,904
|
| |
Transportation
— 0.1% |
|
|
| |
Air
Freight & Logistics — 0.1% |
|
|
|
c |
TTX
Co., 4.15% due 1/15/2024 |
6,000,000 |
6,107,820
|
| |
Airlines
— 0.0% |
|
|
| |
American
Airlines Pass Through Trust, Series 2013-2, 4.95% due 7/15/2024 |
1,285,664 |
1,271,547 |
| |
US
Airways Pass Through Trust, Series 2010-1A Class PTT, 6.25% due 10/22/2024 |
2,420,150 |
2,423,273
|
| |
Diversified
Consumer Services — 0.0% |
|
|
| |
University
of Chicago, Series 12-B, 3.065% due 10/1/2024 |
532,000 |
526,563
|
| |
|
|
10,329,203
|
| |
Utilities
— 7.5% |
|
|
| |
Electric
Utilities — 6.7% |
|
|
| |
AEP
Texas, Inc., Series I, 2.10% due 7/1/2030 |
14,455,000 |
12,892,270 |
|
c |
Alexander
Funding Trust, 1.841% due 11/15/2023 |
38,072,000 |
36,905,855 |
| |
Alliant
Energy Finance LLC, |
|
|
|
c |
1.40%
due 3/15/2026 |
5,240,000 |
4,797,954 |
|
c |
3.75%
due 6/15/2023 |
9,673,000 |
9,779,016 |
| |
Ameren
Corp., |
|
|
| |
1.75%
due 3/15/2028 |
9,990,000 |
9,019,072 |
| |
3.50%
due 1/15/2031 |
6,670,000 |
6,592,161 |
| |
American
Electric Power Co., Inc., |
|
|
| |
0.75%
due 11/1/2023 |
9,667,000 |
9,360,846 |
| |
2.031%
due 3/15/2024 |
7,700,000 |
7,566,482 |
| |
2.30%
due 3/1/2030 |
14,211,000 |
12,915,099 |
|
c |
American
Transmission Systems, Inc., 2.65% due 1/15/2032 |
4,885,000 |
4,512,958 |
| |
Appalachian
Power Co., 3.40% due 6/1/2025 |
7,000,000 |
7,069,090 |
| |
Avangrid,
Inc., |
|
|
| |
3.15%
due 12/1/2024 |
8,870,000 |
8,853,679 |
| |
3.20%
due 4/15/2025 |
9,395,000 |
9,373,767 |
| |
Black
Hills Corp., |
|
|
| |
1.037%
due 8/23/2024 |
22,410,000 |
21,396,396 |
| |
2.50%
due 6/15/2030 |
5,490,000 |
4,992,386 |
|
c |
Caledonia
Generating LLC, 1.95% due 2/28/2034 |
20,247,126 |
19,082,147 |
|
a |
CenterPoint
Energy, Inc., 0.837% (SOFRINDX + 0.65%) due 5/13/2024 |
2,289,000 |
2,270,367 |
| |
Comision
Federal de Electricidad, |
|
|
|
b,c |
3.348%
due 2/9/2031 |
31,040,000 |
27,312,096 |
|
b,c |
4.688%
due 5/15/2029 |
6,125,000 |
6,045,987 |
|
b |
5.00%
due 9/29/2036 |
2,291,000 |
2,236,932 |
| |
Consolidated
Edison Co. of New York, Inc., 3.35% due 4/1/2030 |
6,835,000 |
6,809,710 |
| |
Consolidated
Edison, Inc., 0.65% due 12/1/2023 |
34,039,000
|
33,160,794 |
See
notes to financial statements.
|
Thornburg Fixed
Income Funds Semi-Annual Report | 35 |
Schedule of Investments, Continued
Thornburg Limited Term Income Fund | March 31, 2022 (Unaudited)
| |
Issuer-Description
|
SHARES/PRINCIPAL
AMOUNT |
VALUE
|
| |
Dominion
Energy, Inc., 3.60% due 3/15/2027 |
$ 29,576,000
|
$ 29,883,590
|
| |
Edison
International, 2.40% due 9/15/2022 |
4,900,000 |
4,908,379 |
| |
Enel
Finance International NV, |
|
|
|
b,c |
1.375%
due 7/12/2026 |
12,250,000 |
11,260,812 |
|
b,c |
1.875%
due 7/12/2028 |
5,750,000 |
5,172,700 |
| |
Entergy
Louisiana LLC, 0.62% due 11/17/2023 |
6,555,000 |
6,363,070 |
| |
Entergy
Mississippi LLC, 3.25% due 12/1/2027 |
4,727,000 |
4,670,229 |
| |
Entergy
Texas, Inc., |
|
|
| |
1.50%
due 9/1/2026 |
8,640,000 |
7,942,579 |
| |
3.45%
due 12/1/2027 |
12,000,000 |
11,871,720 |
| |
Eversource
Energy, 3.80% due 12/1/2023 |
12,395,000 |
12,572,620 |
| |
Exelon
Corp., 4.05% due 4/15/2030 |
9,640,000 |
9,951,854 |
|
c |
ITC
Holdings Corp., 2.95% due 5/14/2030 |
14,800,000 |
14,066,068 |
|
c |
Jersey
Central Power & Light Co., 4.30% due 1/15/2026 |
9,414,000 |
9,610,094 |
|
c |
Liberty
Utilities Finance GP 1, 2.05% due 9/15/2030 |
11,980,000 |
10,519,997 |
|
c |
Midland
Cogeneration Venture LP, 6.00% due 3/15/2025 |
1,672,581 |
1,698,088 |
|
a |
Mississippi
Power Co., Series A, 0.571% (SOFR + 0.30%) due 6/28/2024 |
6,780,000 |
6,713,285 |
|
c |
Monongahela
Power Co., 3.55% due 5/15/2027 |
3,300,000 |
3,293,268 |
|
c |
Narragansett
Electric Co., 3.395% due 4/9/2030 |
6,905,000 |
6,790,377 |
| |
NextEra
Energy Capital Holdings, Inc., |
|
|
| |
0.65%
due 3/1/2023 |
5,000,000 |
4,930,100 |
|
a |
0.75%
(LIBOR 3 Month + 0.27%) due 2/22/2023 |
33,970,000 |
33,787,581 |
| |
Northern
States Power Co., 3.30% due 6/15/2024 |
10,000,000 |
10,029,200 |
| |
OGE
Energy Corp., 0.703% due 5/26/2023 |
6,063,000 |
5,935,798 |
| |
Oklahoma
Gas & Electric Co., 3.25% due 4/1/2030 |
13,653,000 |
13,471,005 |
| |
Pacific
Gas & Electric Co., 3.25% due 2/16/2024 |
20,160,000 |
20,094,077 |
| |
Pacific
Gas and Electric Co., |
|
|
|
a |
1.338%
(SOFRINDX + 1.15%) due 11/14/2022 |
982,000 |
980,223 |
| |
1.367%
due 3/10/2023 |
11,228,000 |
11,028,591 |
| |
1.75%
due 6/16/2022 |
17,691,000 |
17,669,063 |
|
a |
PPL
Electric Utilities Corp., 0.601% (SOFR + 0.33%) due 6/24/2024 |
10,496,000 |
10,431,869 |
| |
Public
Service Co. of Oklahoma, Series J, 2.20% due 8/15/2031 |
9,905,000 |
8,852,297 |
| |
Public
Service Enterprise Group, Inc., 2.65% due 11/15/2022 |
2,852,000 |
2,858,417 |
| |
Puget
Energy, Inc., |
|
|
| |
2.379%
due 6/15/2028 |
8,825,000 |
8,089,966 |
| |
4.10%
due 6/15/2030 |
4,742,000 |
4,746,031 |
| |
San
Diego Gas & Electric Co., 3.60% due 9/1/2023 |
4,212,000 |
4,265,914 |
| |
Southern
California Edison Co., |
|
|
|
a |
0.91%
(SOFRINDX + 0.64%) due 4/3/2023 |
19,476,000 |
19,478,727 |
|
a |
Series
F, 0.605% (SOFRINDX + 0.35%) due 6/13/2022 |
14,453,000 |
14,456,469 |
| |
Southern
Co., |
|
|
| |
3.25%
due 7/1/2026 |
2,769,000 |
2,770,274 |
| |
Series
21-B, 1.75% due 3/15/2028 |
5,000,000 |
4,504,750 |
| |
Southern
Power Co., 0.90% due 1/15/2026 |
4,703,000 |
4,313,686 |
| |
Transelec
SA, |
|
|
|
b,c |
4.25%
due 1/14/2025 |
6,000,000 |
6,115,800 |
|
b,c |
4.625%
due 7/26/2023 |
2,880,000 |
2,949,754 |
| |
WEC
Energy Group, Inc., 2.20% due 12/15/2028 |
11,412,000 |
10,464,005
|
| |
Gas
Utilities — 0.8% |
|
|
|
a |
CenterPoint
Energy Resources Corp., 1.004% (LIBOR 3 Month + 0.50%) due 3/2/2023 |
4,398,000 |
4,394,965 |
| |
NiSource,
Inc., 0.95% due 8/15/2025 |
14,735,000 |
13,552,811 |
|
a |
ONE
Gas, Inc., 1.355% (LIBOR 3 Month + 0.61%) due 3/11/2023 |
18,914,000 |
18,924,214 |
| |
Southwest
Gas Corp., 4.05% due 3/15/2032 |
13,150,000 |
13,108,709 |
|
a |
Spire
Missouri, Inc., 0.732% (SOFR + 0.50%) due 12/2/2024 |
31,347,000 |
31,331,953
|
| |
|
|
723,770,043
|
| |
Total
Corporate Bonds (Cost $4,034,601,341) |
|
3,830,661,999
|
| |
Loan
Participations — 0.7% |
|
|
| |
Media
& Entertainment — 0.6% |
|
|
36 | Thornburg Fixed Income Funds Semi-Annual Report
|
See notes to
financial statements. |
Schedule of Investments,
Continued
Thornburg Limited Term Income Fund | March 31, 2022 (Unaudited)
| |
Issuer-Description
|
SHARES/PRINCIPAL
AMOUNT |
VALUE
|
| |
Media
— 0.6% |
|
|
|
h |
Charter
Communications Operating LLC, ( LIBOR 1 Month + 1.75%) due 2/1/2027 |
$ 38,815,998
|
$ 38,449,575
|
|
h |
Lamar
Media Corp., ( LIBOR 1 Month + 1.50%) due 2/5/2027 |
4,750,000 |
4,714,375 |
|
h |
Nielsen
Finance LLC, (LIBOR 1 Month + 2.00%) due 10/4/2023 |
14,511,083 |
14,488,446
|
| |
|
|
57,652,396
|
| |
Software
& Services — 0.1% |
|
|
| |
Information
Technology Services — 0.1% |
|
|
|
h |
Genpact
International, Inc., (LIBOR 3 Month + 2.00%) due 8/9/2023 |
12,805,970 |
12,709,926
|
| |
|
|
12,709,926
|
| |
Total
Loan Participations (Cost $69,972,107) |
|
70,362,322
|
| |
Long-Term
Municipal Bonds — 0.1% |
|
|
| |
Colorado
Educational & Cultural Facilities Authority, Series B, 2.691% due 3/1/2023 |
580,000 |
583,305
|
| |
Los
Angeles Community College District GO, 1.806% due 8/1/2030 |
5,460,000 |
4,911,046 |
| |
New
Jersey Transportation Trust Fund Authority, |
|
|
| |
2.551%
due 6/15/2023 |
1,170,000 |
1,173,052 |
| |
2.631%
due 6/15/2024 |
860,000 |
855,980 |
| |
Redlands
Redevelopment Agency Successor Agency (Insured: AMBAC) ETM, Series A, 5.818% due 8/1/2022 |
285,000 |
289,263 |
| |
State
of Connecticut GO, Series A, 3.471% due 9/15/2022 |
4,695,000
|
4,739,870
|
| |
Total
Long-Term Municipal Bonds (Cost $12,472,395) |
|
12,552,516
|
| |
Preferred
Stock — 0.3% |
|
|
| |
Diversified
Financials — 0.3% |
|
|
| |
Capital
Markets — 0.3% |
|
|
|
a,i |
Gabelli
Dividend & Income Trust, 1.70% due 3/26/2028 |
1,162 |
29,012,816
|
| |
|
|
29,012,816
|
| |
Total
Preferred Stock (Cost $29,019,196) |
|
29,012,816
|
| |
Short-Term
Investments — 5.0% |
|
|
| j |
Thornburg
Capital Management Fund |
48,360,146
|
483,601,459
|
| |
Total
Short-Term Investments (Cost $483,601,459) |
|
483,601,459
|
| |
Total
Investments — 99.5% (Cost $9,894,523,457) |
|
$9,549,243,307
|
| |
Other
Assets Less Liabilities — 0.5% |
|
48,559,581
|
| |
Net
Assets — 100.0% |
|
$9,597,802,888
|
See
notes to financial statements.
|
Thornburg Fixed
Income Funds Semi-Annual Report | 37 |
Schedule of Investments, Continued
Thornburg Limited Term Income Fund | March 31, 2022 (Unaudited)
| Footnote Legend
|
| a
|
Variable,
floating, step, or fixed to floating rate securities are securities for which interest rate changes are based on changes in a designated base rate or on a predetermined schedule. The rates shown are those in effect on March 31, 2022. |
| b
|
Yankee
bond denominated in U.S. dollars and is issued in the U.S. by foreign banks and corporations. |
| c
|
Securities
exempt from registration under Rule 144A of the Securities Act of 1933, as amended. These securities are restricted but liquid and may only be resold in the ordinary course of business in transactions exempt from registration, normally to qualified
institutional buyers. As of March 31, 2022, the aggregate value of these securities in the Fund’s portfolio was $4,579,120,983, representing 47.71% of the Fund’s net assets. |
| d
|
When-issued
security. |
| e
|
Segregated
as collateral for a when-issued security. |
| f
|
Bond
in default. |
| g
|
Non-income
producing. |
| h
|
The
stated coupon rate represents the greater of the LIBOR or the LIBOR floor rate plus a spread at March 31, 2022. |
| i
|
Security
currently fair valued by the Valuation and Pricing Committee using procedures approved by the Trustees’ Audit Committee. |
| j
|
Investment
in Affiliates. |
Portfolio
Abbreviations
To simplify the listings of securities, abbreviations are used per the table below:
| AMBAC
|
Insured by American
Municipal Bond Assurance Corp. |
| BSBY3M
|
Bloomberg
Short Term Bank Yield 3 Month |
| CMBS
|
Commercial
Mortgage-Backed Securities |
| CMO
|
Collateralized
Mortgage Obligation |
| ETM
|
Escrowed
to Maturity |
| GO
|
General Obligation
|
| H15T1Y
|
US
Treasury Yield Curve Rate T-Note Constant Maturity 1 Year |
| LIBOR
|
London
Interbank Offered Rates |
| Mtg
|
Mortgage
|
| REMIC
|
Real
Estate Mortgage Investment Conduit |
| SOFR
|
Secured Overnight
Financing Rate |
| SOFR30A
|
Secured Overnight
Financing Rate 30-Day Average |
| SOFRINDX
|
Secured Overnight
Financing Rate Index |
| SPV
|
Special Purpose
Vehicle |
| UMBS
|
Uniform Mortgage
Backed Securities |
38 | Thornburg Fixed Income Funds Semi-Annual Report
|
See notes to
financial statements. |
Schedule of Investments
Thornburg Ultra Short Income Fund | March 31, 2022 (Unaudited)
| |
Issuer-Description
|
SHARES/PRINCIPAL
AMOUNT |
VALUE
|
| |
U.S.
Treasury Securities — 2.3% |
|
|
| |
United
States Treasury Note, |
|
|
| |
0.125%
due 4/30/2023 |
$1,000,000
|
$ 982,188
|
| |
1.25%
due 7/31/2023 |
1,000,000
|
989,453 |
| |
United
States Treasury Notes Inflationary Index, 0.125% due 4/15/2022 |
346,725
|
347,950
|
| |
Total
U.S. Treasury Securities (Cost $2,334,070) |
|
2,319,591
|
| |
U.S.
Government Agencies — 0.1% |
|
|
| |
Petroleos
Mexicanos (Guaranty: Export-Import Bank of the United States), |
|
|
|
a,b |
0.591%
(LIBOR 3 Month + 0.35%) due 4/15/2025 |
32,500 |
32,160 |
|
b |
1.70%
due 12/20/2022 |
10,000 |
9,500 |
| |
Small
Business Administration Participation Certificates, |
|
|
| |
Series
2005-20K Class 1, 5.36% due 11/1/2025 |
7,962 |
8,170 |
| |
Series
2009-20E Class 1, 4.43% due 5/1/2029 |
26,836 |
27,436
|
| |
Total
U.S. Government Agencies (Cost $77,506) |
|
77,266
|
| |
Mortgage
Backed — 5.5% |
|
|
| |
Arroyo
Mortgage Trust, Whole Loan Securities Trust CMO, |
|
|
|
a,c |
Series
2019-1 Class A1, 3.805% due 1/25/2049 |
34,463 |
34,463 |
|
a,c |
Series
2019-3 Class A1, 2.962% due 10/25/2048 |
30,006 |
30,025 |
| |
Bank,
CMBS, Series 2017-BNK5 Class A2, 2.987% due 6/15/2060 |
433,937 |
434,584 |
|
c |
Bravo
Residential Funding Trust, Whole Loan Securities Trust CMO, Series 2019-1 Class A1C, 3.50% due 3/25/2058 |
19,381 |
19,429 |
|
a,c |
COLT
Mortgage Pass-Through Certificates, Whole Loan Securities Trust CMO, Series 2021-1R Class A1, 0.857% due 5/25/2065 |
328,852 |
326,820 |
| |
COMM
Mortgage Trust, CMBS, |
|
|
| |
Series
2012-CR2 Class A4, 3.147% due 8/15/2045 |
423,610 |
423,328 |
| |
Series
2012-CR3 Class A3, 2.822% due 10/15/2045 |
70,810 |
70,769 |
| |
Series
2012-CR5 Class ASB, 2.388% due 12/10/2045 |
9,803 |
9,815 |
|
a,c |
CSMC
Trust, CMBS, Series 2021-BPNY 4.111% (LIBOR 1 Month + 3.71%) due 8/15/2023 |
300,000 |
295,302 |
|
a,c |
CSMC
Trust, Whole Loan Securities Trust CMO, Series 2020-NQM1 Class A1, 1.208% due 5/25/2065 |
142,158 |
140,180 |
| |
Federal
Home Loan Mtg Corp., Multi-Family Structured Pass Through Certificates, CMBS, Series K036 Class A1, 2.777% due 4/25/2023 |
51,468 |
51,630 |
|
a |
Federal
Home Loan Mtg Corp., REMIC, Series 3877 Class FA, 0.747% (LIBOR 1 Month + 0.35%) due 11/15/2040 |
15,250 |
15,245 |
| |
Federal
Home Loan Mtg Corp., Seasoned Credit Risk Transfer, Whole Loan Securities Trust CMO, |
|
|
|
a |
Series
2017-3 Class HA, 3.25% due 7/25/2056 |
32,889 |
32,498 |
|
a |
Series
2018-1 Class HA, 3.00% due 5/25/2057 |
24,392 |
24,047 |
|
a |
Series
2018-2 Class HA, 3.00% due 11/25/2057 |
95,799 |
94,583 |
| |
Federal
National Mtg Assoc., UMBS Collateral, |
|
|
| |
Pool
FM1126, 3.00% due 3/1/2033 |
31,197 |
31,553 |
| |
Pool
MA3557, 4.00% due 1/1/2029 |
47,967 |
49,412 |
|
a,c |
Flagstar
Mortgage Trust, Whole Loan Securities Trust CMO, Series 2017-1 Class 2A2, 3.00% due 3/25/2047 |
19,974 |
19,378 |
|
a,c |
FWD
Securitization Trust, Whole Loan Securities Trust CMO, Series 2019-INV1 Class A1, 2.81% due 6/25/2049 |
28,736 |
28,591 |
| |
GCAT
Trust, Whole Loan Securities Trust CMO, |
|
|
|
a,c |
Series
2021-CM1 Class A, 1.469% due 4/25/2065 |
361,647 |
353,708 |
|
a,c |
Series
2021-CM2 Class A1, 2.352% due 8/25/2066 |
221,469 |
215,442 |
| |
JPMorgan
Chase Commercial Mortgage Securities Trust, CMBS, |
|
|
| |
Series
2012-C6 Class A3, 3.507% due 5/15/2045 |
52,189 |
52,175 |
|
c |
Series
2012-HSBC Class A, 3.093% due 7/5/2032 |
441,566 |
442,183 |
|
a,c |
Metlife
Securitization Trust, Whole Loan Securities Trust CMO, Series 2019-1A Class A1A, 3.75% due 4/25/2058 |
104,542 |
105,267 |
|
a,c |
MFRA
Trust Whole Loan Securities Trust CMO, Series 2022-CHM1, 3.875% due 9/25/2056 |
704,857 |
695,672 |
| |
Morgan
Stanley Bank of America Merrill Lynch Trust, CMBS, |
|
|
|
a |
Series
2013-C10 Class ASB, 3.912% due 7/15/2046 |
215,550 |
217,135 |
| |
Series
2013-C7 Class AAB, 2.469% due 2/15/2046 |
20,457 |
20,484 |
| |
Series
2016-C31 Class A3, 2.731% due 11/15/2049 |
67,415 |
67,228 |
|
a,c |
New
Residential Mortgage Loan Trust, Whole Loan Securities Trust CMO, Series 2017-5A Class A1, 1.957% (LIBOR 1 Month + 1.50%) due 6/25/2057 |
20,825 |
20,996 |
|
a,c |
SG
Residential Mortgage Trust, Whole Loan Securities Trust CMO, Series 2019-3 Class A1, 2.703% due 9/25/2059 |
8,038 |
8,038 |
| |
Towd
Point Mortgage Trust, Whole Loan Securities Trust CMO, |
|
|
|
a,c |
Series
2016-5 Class A1, 2.50% due 10/25/2056 |
13,437 |
13,437 |
|
a,c |
Series
2018-2 Class A1, 3.25% due 3/25/2058 |
36,586 |
36,599 |
|
a,c |
Series
2018-6 Class A1A, 3.75% due 3/25/2058 |
92,144 |
92,714 |
| a,c |
Series
2019-HY2 Class A1, 1.457% (LIBOR 1 Month + 1.00%) due 5/25/2058 |
67,634 |
67,634 |
See
notes to financial statements.
|
Thornburg Fixed
Income Funds Semi-Annual Report | 39 |
Schedule of Investments, Continued
Thornburg Ultra Short Income Fund | March 31, 2022 (Unaudited)
| |
Issuer-Description
|
SHARES/PRINCIPAL
AMOUNT |
VALUE
|
| |
Verus
Securitization Trust, Whole Loan Securities Trust CMO, |
|
|
|
a,c |
Series
2019-3 Class A1, 2.784% due 7/25/2059 |
$ 18,726
|
$ 18,726
|
|
a,c |
Series
2019-INV3 Class A1B, 3.192% due 11/25/2059 |
503,484 |
504,832 |
| |
WFRBS
Commercial Mortgage Trust, CMBS, |
|
|
| |
Series
2012-C7 Class A2, 3.431% due 6/15/2045 |
202,562 |
202,353 |
| |
Series
2013-C14 Class ASB, 2.977% due 6/15/2046 |
38,146 |
38,270 |
| |
Series
2013-C17 Class ASB, 3.558% due 12/15/2046 |
247,260
|
249,066
|
| |
Total
Mortgage Backed (Cost $5,634,364) |
|
5,553,611
|
| |
Asset
Backed Securities — 63.8% |
|
|
| |
Auto
Receivables — 22.4% |
|
|
|
c |
ACC
Auto Trust, Series 2021-A Class A, 1.08% due 4/15/2027 |
116,568 |
115,127 |
| |
ACC
Trust, |
|
|
|
c |
Series
2020-A Class A, 6.00% due 3/20/2023 |
122,923 |
123,092 |
|
c |
Series
2021-1 Class A, 0.74% due 11/20/2023 |
47,111 |
47,026 |
|
c |
Series
2022-1 Class A, 1.19% due 9/20/2024 |
837,087 |
827,948 |
| |
American
Credit Acceptance Receivables Trust, |
|
|
|
c |
Series
2020-4 Class B, 0.85% due 12/13/2024 |
438,537 |
437,952 |
|
c |
Series
2021-1 Class A, 0.35% due 5/13/2024 |
5,739 |
5,737 |
|
c |
Series
2021-4 Class A, 0.45% due 9/15/2025 |
194,221 |
191,806 |
|
c |
ARI
Fleet Lease Trust, Series 2019-A Class A2A, 2.41% due 11/15/2027 |
72,906 |
72,956 |
|
c |
Arivo
Acceptance Auto Loan Receivables Trust, Series 2019-1 Class A, 2.99% due 7/15/2024 |
261,271 |
261,988 |
|
c |
Avid
Automobile Receivables Trust, Series 2020-1 Class A, 0.61% due 1/15/2025 |
207,901 |
205,588 |
| |
Capital
One Prime Auto Receivables Trust, Series 2020-1 Class A3, 1.60% due 11/15/2024 |
735,666 |
734,279 |
| |
CarNow
Auto Receivables Trust, |
|
|
|
c |
Series
2019-1A Class C, 3.36% due 6/17/2024 |
664,304 |
665,795 |
|
c |
Series
2021-1A Class A, 0.97% due 10/15/2024 |
391,870 |
390,831 |
|
c |
Series
2021-2A Class A, 0.73% due 9/15/2023 |
478,743 |
477,785 |
| |
Carvana
Auto Receivables Trust, |
|
|
|
c |
2.31%
due 12/11/2028 |
750,000 |
746,072 |
| |
Series
2021-N2 Class A1, 0.32% due 3/10/2028 |
99,158 |
97,805 |
| |
Series
2021-N3 Class A1, 0.35% due 6/12/2028 |
1,221,654
|
1,204,661 |
|
c |
Series
2021-N3 Class N, 2.53% due 6/12/2028 |
439,383 |
439,076 |
|
c |
Series
2021-P1 Class N, 2.16% due 12/10/2027 |
4,108 |
4,107 |
| |
CIG
Auto Receivables Trust, |
|
|
|
c |
Series
2019-1A Class B, 3.59% due 8/15/2024 |
123,165 |
123,384 |
|
c |
Series
2020-1A Class A, 0.68% due 10/12/2023 |
15,214 |
15,202 |
| |
CPS
Auto Receivables Trust, |
|
|
|
c |
2.54%
due 12/15/2025 |
766,725 |
767,599 |
|
c |
Series
2021-B Class A, 0.37% due 3/17/2025 |
77,649 |
77,255 |
|
c |
Series
2022-A 0.98% due 4/16/2029 |
961,343 |
952,011 |
|
c |
Credito
Real USA Auto Receivables Trust, Series 2021-1A Class A, 1.35% due 2/16/2027 |
242,400 |
238,012 |
| |
Drive
Auto Receivables Trust, Series 2021-1 0.65% due 7/15/2025 |
500,000 |
495,904 |
| |
DT
Auto Owner Trust, |
|
|
|
c |
Series
2020-3A Class B, 0.91% due 12/16/2024 |
615,000 |
610,314 |
|
c |
Series
2021-1A Class A, 0.35% due 1/15/2025 |
122,698 |
122,149 |
|
c |
Series
2021-2A Class A, 0.41% due 3/17/2025 |
527,536 |
524,175 |
|
c |
Series
2021-4A Class A, 0.56% due 9/15/2025 |
525,323 |
518,620 |
|
c |
Series
2022-1A Class A, 1.58% due 4/15/2026 |
650,000 |
645,710 |
|
c |
Exeter
Automobile Receivables Trust, Series 2017-3A Class C, 3.68% due 7/17/2023 |
80,446 |
80,636 |
| |
FHF
Trust, |
|
|
|
c |
Series
2020-1A Class A, 2.59% due 12/15/2023 |
33,397 |
33,430 |
|
c |
Series
2021-1A Class A, 1.27% due 3/15/2027 |
78,238 |
76,175 |
|
c |
Series
2021-2A Class A, 0.83% due 12/15/2026 |
156,453 |
150,832 |
|
c |
First
Investors Auto Owner Trust, Series 2021-1A Class A, 0.45% due 3/16/2026 |
155,222 |
154,023 |
|
c |
Flagship
Credit Auto Trust, Series 2020-4 Class A, 0.53% due 4/15/2025 |
455,701 |
453,593 |
| |
Ford
Credit Auto Owner Trust, Series 2021-A Class A2, 0.17% due 10/15/2023 |
101,808 |
101,577 |
|
c |
Foursight
Capital Automobile Receivables Trust, Series 2021-1 Class A2, 0.40% due 8/15/2024 |
63,089 |
62,984 |
| |
GLS
Auto Receivables Issuer Trust, |
|
|
|
c |
Series
2019-4A 2.78% due 9/16/2024 |
437,901 |
438,710 |
| c |
Series
2020-1A Class B, 2.43% due 11/15/2024 |
213,007
|
213,123 |
40 | Thornburg Fixed Income Funds Semi-Annual Report
|
See notes to
financial statements. |
Schedule of Investments,
Continued
Thornburg Ultra Short Income Fund | March 31, 2022 (Unaudited)
| |
Issuer-Description
|
SHARES/PRINCIPAL
AMOUNT |
VALUE
|
|
c |
Series
2021-1A Class A, 0.34% due 5/15/2024 |
$ 25,937
|
$ 25,904
|
|
c |
Series
2021-4A Class A, 0.84% due 7/15/2025 |
338,299 |
334,382 |
|
c |
Hyundai
Auto Lease Securitization Trust, Series 2020-B Class A3, 0.51% due 9/15/2023 |
231,936 |
230,983 |
|
c |
Hyundai
Floorplan Master Owner Trust, Series 2019-1 Class A, 2.68% due 4/15/2024 |
625,000 |
625,252 |
|
c |
Lendbuzz
Securitization Trust, Series 2021-1A Class A, 1.46% due 6/15/2026 |
439,578 |
429,852 |
| |
Mercedes-Benz
Auto Lease Trust, Series 2021-B Class A2, 0.22% due 1/16/2024 |
77,291 |
76,910 |
|
c |
Mercedes-Benz
Master Owner Trust, Series 2019-BA Class A, 2.61% due 5/15/2024 |
450,000 |
450,781 |
|
a,c |
Navistar
Financial Dealer Note Master Trust, Series 2020-1 Class A, 1.407% (LIBOR 1 Month + 0.95%) due 7/25/2025 |
123,000 |
123,049 |
| |
Octane
Receivables Trust, |
|
|
|
c |
Series
2019-1A Class A, 3.16% due 9/20/2023 |
11,384 |
11,397 |
|
c |
Series
2020-1A Class A, 1.71% due 2/20/2025 |
978,448 |
972,680 |
|
b,c |
Oscar
US Funding XI LLC, Series 2019-2A Class A3, 2.59% due 9/11/2023 |
30,736 |
30,781 |
|
c |
Prestige
Auto Receivables Trust, Series 2019-1A Class B, 2.53% due 1/16/2024 |
54,409 |
54,421 |
| |
Santander
Consumer Auto Receivables Trust, |
|
|
|
c |
Series
2020-AA 2.26% due 12/15/2025 |
1,000,000
|
1,000,381 |
|
c |
Series
2021-CA Class B, 1.44% due 4/17/2028 |
155,334 |
154,867 |
|
c |
Santander
Retail Auto Lease Trust, Series 2019-B Class A4, 2.38% due 8/21/2023 |
222,588 |
222,691 |
| |
Tesla
Auto Lease Trust, |
|
|
|
c |
Series
2020-A Class A2, 0.55% due 5/22/2023 |
21,571 |
21,555 |
|
c |
Series
2021-A Class A2, 0.36% due 3/20/2025 |
362,415 |
358,329 |
| |
United
Auto Credit Securitization Trust, |
|
|
|
c |
Series
2021-1 0.68% due 3/11/2024 |
500,000 |
497,756 |
|
c |
Series
2021-1 Class A, 0.34% due 7/10/2023 |
18,731 |
18,717 |
|
c |
Series
2022-1 Class A, 1.11% due 7/10/2024 |
450,752 |
448,493 |
|
c |
US
Auto Funding, Series 2021-1A Class A, 0.79% due 7/15/2024 |
263,928 |
260,904 |
|
c |
USASF
Receivables LLC, Series 2020-1A Class A, 2.47% due 8/15/2023 |
4,926 |
4,927 |
| |
Veros
Auto Receivables Trust, |
|
|
|
c,d |
3.47%
due 12/15/2025 |
750,000 |
750,788 |
|
c |
Series
2021-1 Class A, 0.92% due 10/15/2026 |
610,259 |
602,215 |
|
c |
Westlake
Automobile Receivables Trust, Series 2019-2A 3.20% due 11/15/2024 |
600,000 |
602,490 |
| |
World
Omni Auto Receivables Trust, Series 2019-C Class A3, 1.96% due 12/16/2024 |
530,657 |
530,879
|
| |
|
|
22,746,433
|
| |
Credit
Card — 3.1% |
|
|
|
c |
Brex
Commercial Charge Card Master Trust, Series 2021-1 Class A, 2.09% due 7/15/2024 |
200,000 |
197,725 |
|
c |
Genesis
Private Label Amortizing Trust, Series 2020-1 Class C, 4.19% due 7/20/2030 |
93,014 |
92,936 |
|
c |
Genesis
Sales Finance Master Trust, Series 2020-AA Class A, 1.65% due 9/22/2025 |
175,000 |
173,095 |
|
c |
Mercury
Financial Credit Card Master Trust, Series 2021-1A Class A, 1.54% due 3/20/2026 |
975,000 |
946,117 |
|
c |
Mission
Lane Credit Card Master Trust, Series 2021-A Class A, 1.59% due 9/15/2026 |
859,000 |
837,510 |
|
c |
Perimeter
Master Note Business Trust, Series 2019-2A Class C, 7.06% due 5/15/2024 |
500,000 |
496,863 |
| |
World
Financial Network Credit Card Master Trust, Series 2019-B Class A, 2.49% due 4/15/2026 |
400,000 |
400,959
|
| |
|
|
3,145,205
|
| |
Other
Asset Backed — 29.8% |
|
|
| |
Affirm
Asset Securitization Trust, |
|
|
|
c |
Series
2020-A Class A, 2.10% due 2/18/2025 |
953,624 |
951,925 |
|
c |
Series
2020-Z1 Class A, 3.46% due 10/15/2024 |
716,312 |
718,662 |
|
c |
Series
2020-Z2 Class A, 1.90% due 1/15/2025 |
99,239 |
98,235 |
| |
Amur
Equipment Finance Receivables VI LLC, |
|
|
|
c |
Series
2018-2A Class A2, 3.89% due 7/20/2022 |
3,326 |
3,330 |
|
c |
Series
2018-2A Class C, 4.27% due 1/20/2023 |
125,000 |
125,421 |
|
c |
Amur
Equipment Finance Receivables VII LLC, Series 2019-1A Class A2, 2.63% due 6/20/2024 |
331,272 |
331,940 |
|
c |
Amur
Equipment Finance Receivables VIII LLC, Series 2020-1A Class A2, 1.68% due 8/20/2025 |
39,094 |
39,050 |
|
c |
Amur
Equipment Finance Receivables X LLC, Series 2022-1A 0.335% due 1/20/2023 |
239,890 |
239,410 |
|
c |
Aqua
Finance Trust, Series 2019-A Class A, 3.14% due 7/16/2040 |
317,240 |
313,902 |
|
c |
Arm
Master Trust, Series 2021-T2 Class A, 1.42% due 1/15/2024 |
24,000 |
23,990 |
|
c |
Bankers
Healthcare Group Securitization Trust, Series 2020-A Class A, 2.56% due 9/17/2031 |
60,207 |
60,025 |
| |
Bayview
Opportunity Master Fund Trust, |
|
|
|
a,c |
Series
2017-RT1 Class A1, 3.00% due 3/28/2057 |
37,301 |
36,854 |
|
a,c |
Series
2017-RT3 Class A, 3.50% due 1/28/2058 |
27,994 |
27,577 |
|
c |
BHG
Securitization Trust, Series 2021-B Class A, 0.90% due 10/17/2034 |
158,398 |
153,710 |
|
c |
BRE
Grand Islander Timeshare Issuer LLC, Series 2017-1A Class A, 2.94% due 5/25/2029 |
68,705 |
68,114 |
| c |
CCG
Receivables Trust, Series 2019-2 Class A2, 2.11% due 3/15/2027 |
335,231
|
335,544 |
See
notes to financial statements.
|
Thornburg Fixed
Income Funds Semi-Annual Report | 41 |
Schedule of Investments, Continued
Thornburg Ultra Short Income Fund | March 31, 2022 (Unaudited)
| |
Issuer-Description
|
SHARES/PRINCIPAL
AMOUNT |
VALUE
|
| |
Conn’s
Receivables Funding LLC, |
|
|
|
c |
Series
2020-A Class A, 1.71% due 6/16/2025 |
$ 11,629
|
$ 11,625
|
|
c |
Series
2021-A Class A, 1.05% due 5/15/2026 |
170,469 |
168,891 |
| |
Dell
Equipment Finance Trust, |
|
|
|
c |
Series
2020-2 Class A2, 0.47% due 10/24/2022 |
217,182 |
216,995 |
|
c |
Series
2021-1 Class A2, 0.33% due 5/22/2026 |
294,395 |
292,665 |
| |
Dext
ABS LLC, |
|
|
|
c |
Series
2020-1 Class A, 1.46% due 2/16/2027 |
77,091 |
76,508 |
|
c |
Series
2021-1 Class A, 1.12% due 2/15/2028 |
87,945 |
85,770 |
|
c |
Diamond
Resorts Owner Trust, Series 2019-1A Class A, 2.89% due 2/20/2032 |
61,504 |
61,399 |
|
c |
DLL
LLC, Series 2019-DA1 Class A4, 2.92% due 4/20/2027 |
492,409 |
494,224 |
|
c |
Encina
Equipment Finance LLC, Series 2021-1A Class A1, 0.50% due 9/15/2025 |
419,112 |
418,464 |
| |
Foundation
Finance Trust, |
|
|
|
c |
Series
2017-1A Class A, 3.30% due 7/15/2033 |
5,241 |
5,251 |
|
c |
Series
2019-1A Class A, 3.86% due 11/15/2034 |
41,838 |
41,810 |
| |
Freed
ABS Trust, |
|
|
|
c |
Series
2020-3FP Class B, 4.18% due 9/20/2027 |
42,163 |
42,184 |
|
c |
Series
2021-1CP Class A, 0.66% due 3/20/2028 |
154,162 |
153,792 |
|
c |
Series
2021-2 Class A, 0.68% due 6/19/2028 |
33,472 |
33,404 |
|
c |
Series
2021-3FP Class A, 0.62% due 11/20/2028 |
132,466 |
131,527 |
|
a,c |
Gracie
Point International Funding, Series 2020-B Class A, 1.631% (LIBOR 1 Month + 1.40%) due 5/2/2023 |
749,971 |
751,432 |
|
a,b,c |
Greystone
Commercial Real Estate Notes Ltd., Series 2021-FL3 Class A, 1.417% (LIBOR 1 Month + 1.02%) due 7/15/2039 |
100,000 |
98,427 |
|
c |
Hilton
Grand Vacations Trust, Series 2019-AA Class A, 2.34% due 7/25/2033 |
68,230 |
67,067 |
|
a,c |
Invitation
Homes Trust, Series 2018-SFRI Class A, 1.141% (LIBOR 1 Month + 0.70%) due 3/17/2037 |
592,483 |
586,469 |
|
c |
LendingClub
Receivables Trust, Series 2020-6A Class A, 2.75% due 11/15/2047 |
37,495 |
37,452 |
| |
LendingPoint
Asset Securitization Trust, |
|
|
|
c |
Series
2019-2 Class C, 4.66% due 11/10/2025 |
8,203 |
8,204 |
|
c |
Series
2020-REV1 Class A, 2.731% due 10/15/2028 |
150,000 |
149,565 |
|
c |
Series
2021-A Class A, 1.00% due 12/15/2028 |
86,410 |
85,443 |
|
c |
Series
2021-B Class A, 1.11% due 2/15/2029 |
120,718 |
118,997 |
|
c |
Series
2022-A 1.68% due 6/15/2029 |
619,523 |
612,900 |
| |
LendingPoint
Pass-Through Trust, |
|
|
|
c |
4.00%
due 5/15/2028 |
475,000 |
475,070 |
|
c |
Series
2022-ST1 2.50% due 3/15/2028 |
479,335 |
468,924 |
|
c |
Series
2022-ST2 Class A, 3.25% due 4/15/2028 |
400,000 |
394,909 |
|
c |
Lendmark
Funding Trust, Series 2019-1A 3.00% due 12/20/2027 |
950,000 |
952,682 |
| |
LL
ABS Trust, |
|
|
|
c |
Series
2020-1A Class A, 2.33% due 1/17/2028 |
15,519 |
15,512 |
|
c |
Series
2021-1A Class A, 1.07% due 5/15/2029 |
777,205 |
745,175 |
|
c |
LP
LMS Asset Securitization Trust, Series 2021-2A Class A, 1.75% due 1/15/2029 |
206,933 |
204,364 |
| |
Mariner
Finance Issuance Trust, |
|
|
| |
Series
2019-AA |
|
|
|
c |
2.96%
due 7/20/2032 |
700,000 |
696,462 |
|
c |
3.51%
due 7/20/2032 |
490,000 |
484,864 |
| |
Marlette
Funding Trust, |
|
|
|
c |
Series
2019-4A Class B, 2.95% due 12/17/2029 |
387,848 |
387,949 |
|
c |
Series
2020-1A Class B, 2.38% due 3/15/2030 |
25,820 |
25,820 |
|
c |
Series
2021-1A Class A, 0.60% due 6/16/2031 |
74,310 |
74,024 |
|
c |
Series
2021-1A Class B, 1.00% due 6/16/2031 |
725,000 |
710,130 |
|
c |
Series
2021-3, Class A, 0.65% due 12/15/2031 |
311,062 |
306,329 |
| |
MMAF
Equipment Finance LLC, |
|
|
|
c |
Series
2014-AA Class A5, 2.33% due 12/8/2025 |
269,212 |
269,509 |
|
c |
Series
2017-AA Class A5, 2.68% due 7/16/2027 |
579,641 |
580,849 |
|
c |
Series
2020-B, Class A2, 0.38% due 8/14/2023 |
443,385 |
441,131 |
|
c |
Mosaic
Solar Loan Trust, Series 2018-1A Class C, Zero coupon due 6/22/2043 |
291,734 |
274,955 |
|
c |
New
Residential Advance Receivables Trust Advance Receivables Backed, Series 2020-T1 Class AT1, 1.426% due 8/15/2053 |
535,000 |
523,756 |
|
c |
New
Residential Advance Receivables Trust Advance Receivables Backed Notes, Series 2020-APT1 Class AT1, 1.035% due 12/16/2052 |
485,000 |
478,069 |
| |
NRZ
Advance Receivables Trust, |
|
|
|
c |
Series
2020-T2 Class AT2, 1.475% due 9/15/2053 |
450,000 |
437,453 |
|
c |
Series
2020-T3 Class AT3, 1.317% due 10/15/2052 |
963,000 |
958,919 |
| |
Oportun
Funding LLC, |
|
|
|
c |
3.25%
due 6/15/2029 |
725,000 |
723,218 |
| c |
Series
2020-1 Class A, 2.20% due 5/15/2024 |
5,230 |
5,229 |
42 | Thornburg Fixed Income Funds Semi-Annual Report
|
See notes to
financial statements. |
Schedule of Investments,
Continued
Thornburg Ultra Short Income Fund | March 31, 2022 (Unaudited)
| |
Issuer-Description
|
SHARES/PRINCIPAL
AMOUNT |
VALUE
|
| |
Pagaya
AI Debt Selection Trust, |
|
|
|
c |
Series
2020-3 Class A, 2.10% due 5/17/2027 |
$ 37,745
|
$ 37,694
|
|
c |
Series
2021-1 Class A, 1.18% due 11/15/2027 |
1,010,779
|
996,005 |
|
c |
Series
2021-3 Class A, 1.15% due 5/15/2029 |
459,237 |
449,991 |
|
c |
Pagaya
AI Debt Trust, Series 2022-1 2.03% due 10/15/2029 |
215,000 |
211,063 |
| |
Pawnee
Equipment Receivables LLC, |
|
|
|
c |
Series
2019-1 Class A2, 2.29% due 10/15/2024 |
32,206 |
32,239 |
|
c |
Series
2020-1 Class A, 1.37% due 11/17/2025 |
199,622 |
198,358 |
|
c |
Pawneee
Equipment Receivables LLC, Series 2021-1 Class A1, 0.302% due 10/17/2022 |
166,246 |
165,874 |
| |
PFS
Financing Corp., |
|
|
|
c |
Series
2019-A Class A2, 2.86% due 4/15/2024 |
400,000 |
399,893 |
|
c |
Series
2019-C 2.23% due 10/15/2024 |
947,000 |
948,275 |
|
c |
Series
2020-B Class A, 1.21% due 6/15/2024 |
250,000 |
249,855 |
| |
PSNH
Funding LLC 3, Series 2018-1 Class A1, 3.094% due 2/1/2026 |
32,024 |
32,179 |
|
c |
SCF
Equipment Leasing LLC, Series 2019-2A Class A1, 2.22% due 6/20/2024 |
3,828 |
3,829 |
|
c |
SoFi
Consumer Loan Program Trust, Series 2020-1 Class A, 2.02% due 1/25/2029 |
18,484 |
18,493 |
|
c |
SpringCastle
America Funding LLC, Series 2020-AA Class A, 1.97% due 9/25/2037 |
480,293 |
479,667 |
|
c |
SPS
Servicer Advance Receivables Trust, Series 2020-T2 Class A, 1.83% due 11/15/2055 |
450,000 |
420,765 |
|
c |
SPS
Servicer Advance Receivables Trust II, Series 2020-T1 Class AT1, 1.28% due 11/15/2052 |
513,333 |
509,380 |
|
c |
STORE
Master Funding LLC, Series 2014-1A Class A2, 5.00% due 4/20/2044 |
197,932 |
198,192 |
| |
Theorem
Funding Trust, |
|
|
|
c |
Series
2020-1A Class A, 2.48% due 10/15/2026 |
4,918 |
4,919 |
|
c |
Series
2020-1A Class B, 3.95% due 10/15/2026 |
1,000,000
|
1,004,192 |
|
c |
Series
2021-1A Class A, 1.21% due 12/15/2027 |
912,943 |
898,713 |
|
c |
Transportation
Finance Equipment Trust, Series 2019-1 1.88% due 3/25/2024 |
700,000 |
698,070 |
| |
Upstart
Pass-Through Trust, |
|
|
|
c |
Series
2020-ST1 3.75% due 2/20/2028 |
110,193 |
109,895 |
|
c |
Series
2020-ST2 Class A, 3.50% due 3/20/2028 |
186,961 |
186,083 |
|
c |
Series
2020-ST3 Class A, 3.35% due 4/20/2028 |
35,816 |
35,595 |
| |
Upstart
Securitization Trust, |
|
|
|
c |
Series
2019-2 Class B, 3.734% due 9/20/2029 |
17,844 |
17,852 |
|
c |
Series
2019-3 Class B, 3.829% due 1/21/2030 |
69,659 |
69,764 |
|
c |
Series
2020-2 Class A, 2.309% due 11/20/2030 |
829,386 |
819,925 |
|
c |
Series
2020-3 Class A, 1.702% due 11/20/2030 |
783,224 |
780,629 |
|
c |
Series
2021-1 Class A, 0.87% due 3/20/2031 |
55,854 |
54,987 |
|
c |
Series
2021-2 Class A, 0.91% due 6/20/2031 |
81,594 |
80,175 |
|
c |
Series
2021-4 Class A, 0.84% due 9/20/2031 |
1,127,259
|
1,096,058 |
|
c |
VSE
VOI Mortgage LLC, Series 2016-A Class A, 2.54% due 7/20/2033 |
91,117 |
91,117
|
| |
|
|
30,213,182
|
| |
Student
Loan — 8.5% |
|
|
|
c |
Laurel
Road Prime Student Loan Trust, Series 2019-A Class A2FX, 2.73% due 10/25/2048 |
618,788 |
618,682 |
|
a |
National
Collegiate Student Loan Trust, Series 2006-4 Class A4, 0.767% (LIBOR 1 Month + 0.31%) due 5/25/2032 |
436,264 |
422,699 |
| |
Navient
Private Education Loan Trust, |
|
|
|
c |
Series
2014-AA Class A2A, 2.74% due 2/15/2029 |
170,063 |
169,882 |
|
a,c |
Series
2014-AA Class A2B, 1.647% (LIBOR 1 Month + 1.25%) due 2/15/2029 |
149,530 |
149,439 |
|
a,c |
Series
2017-A Class A2B, 1.297% (LIBOR 1 Month + 0.90%) due 12/16/2058 |
51,897 |
51,760 |
|
a,c |
Series
2018-BA Class A2B, 1.117% (LIBOR 1 Month + 0.72%) due 12/15/2059 |
78,597 |
77,967 |
|
c |
Navient
Private Education Refi Loan Trust, Series 2018-CA Class A2, 3.52% due 6/16/2042 |
933,889 |
939,560 |
| |
Navient
Student Loan Trust, |
|
|
|
a,c |
Series
2016-6A Class A2, 1.207% (LIBOR 1 Month + 0.75%) due 3/25/2066 |
28,930 |
28,884 |
|
a,c |
Series
2019-BA Class A2B, 1.377% (LIBOR 1 Month + 0.98%) due 12/15/2059 |
446,936 |
447,923 |
|
a,c |
Nelnet
Private Education Loan Trust, Series 2016-A Class A1A, 2.207% (LIBOR 1 Month + 1.75%) due 12/26/2040 |
7,820 |
7,834 |
| |
Nelnet
Student Loan Trust, |
|
|
|
a,c |
Series
2012-2A Class A, 1.257% (LIBOR 1 Month + 0.80%) due 12/26/2033 |
93,391 |
93,387 |
|
a,c |
Series
2015-3A Class A2, 1.057% (LIBOR 1 Month + 0.60%) due 2/27/2051 |
38,398 |
37,869 |
|
a,c |
Series
2021-DA Class AFL, 1.139% (LIBOR 1 Month + 0.69%) due 4/20/2062 |
202,510 |
199,446 |
|
a,c |
Pennsylvania
Higher Education Assistance Agency, Student Loan Trust, Series 2012-1A Class A1, 1.007% (LIBOR 1 Month + 0.55%) due 5/25/2057 |
16,743 |
16,487 |
|
a,b,c |
Prodigy
Finance DAC, Series 2021-1A Class A, 1.707% (LIBOR 1 Month + 1.25%) due 7/25/2051 |
173,502 |
170,783 |
| |
SLM
Student Loan Trust, |
|
|
|
a |
Series
2013-4 Class A, 1.007% (LIBOR 1 Month + 0.55%) due 6/25/2043 |
28,084 |
27,605 |
| a |
Series
2013-6 Class A3, 1.107% (LIBOR 1 Month + 0.65%) due 6/26/2028 |
175,424
|
173,085 |
See
notes to financial statements.
|
Thornburg Fixed
Income Funds Semi-Annual Report | 43 |
Schedule of Investments, Continued
Thornburg Ultra Short Income Fund | March 31, 2022 (Unaudited)
| |
Issuer-Description
|
SHARES/PRINCIPAL
AMOUNT |
VALUE
|
| |
SMB
Private Education Loan Trust, |
|
|
|
a,c |
Series
2015-C Class A3, 2.347% (LIBOR 1 Month + 1.95%) due 8/16/2032 |
$ 576,074
|
$ 578,934
|
|
a,c |
Series
2016-A 1.897% (LIBOR 1 Month + 1.50%) due 5/15/2031 |
524,561 |
525,643 |
|
a,c |
Series
2016-B Class A2B, 1.847% (LIBOR 1 Month + 1.45%) due 2/17/2032 |
555,362 |
556,233 |
|
a,c |
Series
2017-A 1.297% (LIBOR 1 Month + 0.90%) due 9/15/2034 |
427,599 |
425,230 |
|
a,c |
Series
2017-B 1.147% (LIBOR 1 Month + 0.75%) due 10/15/2035 |
713,946 |
707,624 |
|
a,c |
Series
2018-B 1.117% (LIBOR 1 Month + 0.72%) due 1/15/2037 |
847,641 |
843,065 |
|
a,c |
Series
2018-C Class A2B, 1.147% (LIBOR 1 Month + 0.75%) due 11/15/2035 |
200,009 |
199,429 |
|
a,c |
Series
2021-A Class A1, 0.897% (LIBOR 1 Month + 0.50%) due 1/15/2053 |
212,396 |
212,225 |
|
a,c |
Series
2021-C 0.797% (LIBOR 1 Month + 0.40%) due 1/15/2053 |
306,513 |
305,555 |
| |
SoFi
Professional Loan Program LLC, |
|
|
|
c |
Series
2016-B Class A2B, 2.74% due 10/25/2032 |
6,720 |
6,646 |
|
a,c |
Series
2016-C Class A1, 1.557% (LIBOR 1 Month + 1.10%) due 10/27/2036 |
230,166 |
229,708 |
|
c |
Series
2016-E Class A2B, 2.49% due 1/25/2036 |
10,268 |
10,271 |
|
a,c |
Series
2017-A Class A1, 1.157% (LIBOR 1 Month + 0.70%) due 3/26/2040 |
15,656 |
15,585 |
| |
Towd
Point Asset Trust, |
|
|
|
a,c |
Series
2018-SL1 Class A, 1.057% (LIBOR 1 Month + 0.60%) due 1/25/2046 |
169,451 |
169,017 |
|
a,c |
Series
2021-SL1 Class A2, 1.149% (LIBOR 1 Month + 0.70%) due 11/20/2061 |
206,893 |
204,822
|
| |
|
|
8,623,279
|
| |
Total
Asset Backed Securities (Cost $65,225,953) |
|
64,728,099
|
| |
Corporate
Bonds — 19.4% |
|
|
| |
Automobiles
& Components — 1.7% |
|
|
| |
Automobiles
— 1.7% |
|
|
|
a,c |
BMW
U.S. Capital LLC, 0.768% (LIBOR 3 Month + 0.53%) due 4/14/2022 |
750,000 |
750,007 |
|
c |
BMW
US Capital LLC, 2.95% due 4/14/2022 |
130,000 |
130,094 |
|
a,c |
Nissan
Motor Acceptance Co. LLC, 1.656% (LIBOR 3 Month + 0.69%) due 9/28/2022 |
33,000 |
33,010 |
|
b |
Toyota
Motor Corp., 2.157% due 7/2/2022 |
18,000 |
18,042 |
| |
Toyota
Motor Credit Corp., |
|
|
|
a |
0.455%
(SOFR + 0.34%) due 10/14/2022 |
250,000 |
249,960 |
|
a |
0.55%
(SOFR + 0.28%) due 12/14/2022 |
500,000 |
499,520
|
| |
|
|
1,680,633
|
| |
Banks
— 0.3% |
|
|
| |
Banks
— 0.3% |
|
|
|
a,b |
Credit
Suisse AG, Series FRN 0.556% (SOFRINDX + 0.38%) due 8/9/2023 |
300,000 |
298,797
|
| |
|
|
298,797
|
| |
Capital
Goods — 0.9% |
|
|
| |
Machinery
— 0.9% |
|
|
|
a |
Caterpillar
Financial Services Corp., 0.442% (SOFR + 0.25%) due 5/17/2024 |
950,000 |
945,735
|
| |
|
|
945,735
|
| |
Consumer
Durables & Apparel — 0.2% |
|
|
| |
Household
Durables — 0.2% |
|
|
|
b,c |
Panasonic
Corp., 2.536% due 7/19/2022 |
200,000 |
200,472
|
| |
|
|
200,472
|
| |
Consumer
Services — 0.9% |
|
|
| |
Hotels,
Restaurants & Leisure — 0.9% |
|
|
| |
Hyatt
Hotels Corp., 1.30% due 10/1/2023 |
125,000 |
121,846 |
|
a |
Starbucks
Corp., 0.608% (SOFRINDX + 0.42%) due 2/14/2024 |
765,000 |
765,857
|
| |
|
|
887,703
|
| |
Diversified
Financials — 1.1% |
|
|
| |
Consumer
Finance — 0.3% |
|
|
|
a,c |
Wells
Fargo Bank NA, 1.00% (LIBOR 3 Month + 0.20%) due 5/18/2022 |
250,000 |
249,838
|
| |
Diversified
Financial Services — 0.8% |
|
|
|
c |
Antares
Holdings LP, 6.00% due 8/15/2023 |
250,000 |
256,292 |
| a |
Citigroup,
Inc., 1.218% (LIBOR 3 Month + 0.96%) due 4/25/2022 |
312,000
|
312,022 |
44 | Thornburg Fixed Income Funds Semi-Annual Report
|
See notes to
financial statements. |
Schedule of Investments,
Continued
Thornburg Ultra Short Income Fund | March 31, 2022 (Unaudited)
| |
Issuer-Description
|
SHARES/PRINCIPAL
AMOUNT |
VALUE
|
| |
Deutsche
Bank AG, |
|
|
|
a,b |
1.738%
(LIBOR 3 Month + 1.23%) due 2/27/2023 |
$ 100,000
|
$ 100,556
|
|
a,b |
Series
E, 0.672% (SOFR + 0.50%) due 11/8/2023 |
150,000 |
148,845
|
| |
|
|
1,067,553
|
| |
Energy
— 0.6% |
|
|
| |
Oil,
Gas & Consumable Fuels — 0.6% |
|
|
| |
EQM
Midstream Partners LP, Series 5Y, 4.75% due 7/15/2023 |
21,000 |
21,154 |
|
b,c |
Gazprom
PJSC Via Gaz Capital SA, 4.95% due 7/19/2022 |
275,000 |
178,750 |
|
b,c |
Saudi
Arabian Oil Co., 2.75% due 4/16/2022 |
450,000 |
450,090
|
| |
|
|
649,994
|
| |
Food,
Beverage & Tobacco — 1.3% |
|
|
| |
Food
Products — 0.6% |
|
|
|
b,c |
Barry
Callebaut Services NV, 5.50% due 6/15/2023 |
200,000 |
205,488 |
| |
General
Mills, Inc., 2.60% due 10/12/2022 |
300,000 |
301,386 |
| |
McCormick
& Co., Inc., 2.70% due 8/15/2022 |
100,000 |
100,366
|
| |
Tobacco
— 0.7% |
|
|
|
a |
BAT
Capital Corp., 1.386% (LIBOR 3 Month + 0.88%) due 8/15/2022 |
750,000 |
750,772
|
| |
|
|
1,358,012
|
| |
Health
Care Equipment & Services — 1.0% |
|
|
| |
Health
Care Providers & Services — 1.0% |
|
|
|
a,e |
Cardinal
Health, Inc., 1.596% (LIBOR 3 Month + 0.77%) due 6/15/2022 |
923,000 |
924,163 |
| |
CVS
Health Corp., 3.50% due 7/20/2022 |
125,000 |
125,432
|
| |
|
|
1,049,595
|
| |
Insurance
— 0.7% |
|
|
| |
Insurance
— 0.7% |
|
|
|
a,c |
New
York Life Global Funding, 0.378% (SOFR + 0.22%) due 2/2/2023 |
250,000 |
249,597 |
|
a,c |
Pacific
Life Global Funding II, 1.00% (SOFRINDX + 0.80%) due 3/30/2025 |
235,000 |
234,530 |
| |
Reliance
Standard Life Global Funding II, |
|
|
|
c |
2.625%
due 7/22/2022 |
175,000 |
175,637 |
|
c |
3.85%
due 9/19/2023 |
50,000 |
50,679
|
| |
|
|
710,443
|
| |
Materials
— 0.6% |
|
|
| |
Chemicals
— 0.1% |
|
|
|
b,c |
Phosagro
OAO Via Phosagro Bond Funding DAC, 3.949% due 4/24/2023 |
260,000 |
72,800
|
| |
Containers
& Packaging — 0.5% |
|
|
| |
Graphic
Packaging International LLC, 4.875% due 11/15/2022 |
475,000 |
477,912
|
| |
|
|
550,712
|
| |
Pharmaceuticals,
Biotechnology & Life Sciences — 2.7% |
|
|
| |
Life
Sciences Tools & Services — 0.3% |
|
|
|
a |
Thermo
Fisher Scientific, Inc., 0.468% (SOFRINDX + 0.35%) due 4/18/2023 |
300,000 |
299,646
|
| |
Pharmaceuticals
— 2.4% |
|
|
|
a |
AbbVie,
Inc., 1.13% (LIBOR 3 Month + 0.65%) due 11/21/2022 |
983,000 |
984,583 |
|
a,b |
AstraZeneca
plc, 1.134% (LIBOR 3 Month + 0.67%) due 8/17/2023 |
240,000 |
240,554 |
|
a,c |
Roche
Holdings, Inc., 0.515% (SOFR + 0.33%) due 9/11/2023 |
850,000 |
849,720 |
| |
Viatris,
Inc., 1.125% due 6/22/2022 |
400,000 |
399,896
|
| |
|
|
2,774,399
|
| |
Real
Estate — 0.1% |
|
|
| |
Equity
Real Estate Investment Trusts — 0.1% |
|
|
|
c |
SBA
Tower Trust, 2.836% due 1/15/2050 |
100,000 |
98,371
|
| |
|
|
98,371
|
| |
Software
& Services — 0.5% |
|
|
| |
Software
— 0.5% |
|
|
| |
Oracle
Corp., |
|
|
| |
2.50%
due 5/15/2022 |
275,000 |
275,127 |
| |
2.625%
due 2/15/2023 |
192,000 |
192,326
|
See
notes to financial statements.
|
Thornburg Fixed
Income Funds Semi-Annual Report | 45 |
Schedule of Investments, Continued
Thornburg Ultra Short Income Fund | March 31, 2022 (Unaudited)
| |
Issuer-Description
|
SHARES/PRINCIPAL
AMOUNT |
VALUE
|
| |
|
|
467,453
|
| |
Technology
Hardware & Equipment — 0.9% |
|
|
| |
Communications
Equipment — 0.6% |
|
|
| |
Cisco
Systems, Inc., 3.00% due 6/15/2022 |
$ 35,000
|
$ 35,159
|
|
b |
Telefonaktiebolaget
LM Ericsson, 4.125% due 5/15/2022 |
575,000 |
575,000
|
| |
Technology
Hardware, Storage & Peripherals — 0.3% |
|
|
|
a |
Apple,
Inc., 0.727% (LIBOR 3 Month + 0.35%) due 5/11/2022 |
50,000 |
49,995 |
|
b |
Lenovo
Group Ltd., 4.75% due 3/29/2023 |
250,000 |
251,910
|
| |
|
|
912,064
|
| |
Telecommunication
Services — 1.3% |
|
|
| |
Diversified
Telecommunication Services — 0.7% |
|
|
|
a |
AT&T,
Inc., 0.911% (SOFRINDX + 0.64%) due 3/25/2024 |
750,000 |
750,225
|
| |
Wireless
Telecommunication Services — 0.6% |
|
|
| |
Sprint
Communications, Inc., 9.25% due 4/15/2022 |
550,000 |
551,568
|
| |
|
|
1,301,793
|
| |
Utilities
— 4.6% |
|
|
| |
Electric
Utilities — 4.3% |
|
|
|
c |
Alliant
Energy Finance LLC, 3.75% due 6/15/2023 |
42,000 |
42,460 |
|
a |
Dominion
Energy, Inc., Series D, 1.356% (LIBOR 3 Month + 0.53%) due 9/15/2023 |
225,000 |
224,464 |
|
a |
Duke
Energy Corp., 0.501% (SOFR + 0.25%) due 6/10/2023 |
135,000 |
134,521 |
|
a |
Mississippi
Power Co., Series A, 0.571% (SOFR + 0.30%) due 6/28/2024 |
750,000 |
742,620 |
|
a |
National
Rural Utilities Cooperative Finance Corp., 0.571% (SOFR + 0.40%) due 8/7/2023 |
250,000 |
249,800 |
| |
NextEra
Energy Capital Holdings, Inc., |
|
|
|
a |
0.75%
(LIBOR 3 Month + 0.27%) due 2/22/2023 |
200,000 |
198,926 |
|
a |
1.306%
(SOFRINDX + 1.02%) due 3/21/2024 |
375,000 |
375,184 |
| |
OGE
Energy Corp., 0.703% due 5/26/2023 |
225,000 |
220,280 |
| |
Pacific
Gas and Electric Co., 1.75% due 6/16/2022 |
695,000 |
694,138 |
|
a |
PPL
Electric Utilities Corp., 1.216% (LIBOR 3 Month + 0.25%) due 9/28/2023 |
200,000 |
198,592 |
| |
Public
Service Enterprise Group, Inc., 2.65% due 11/15/2022 |
345,000 |
345,776 |
| |
Southern
California Edison Co., |
|
|
|
a |
0.702%
(SOFR + 0.47%) due 12/2/2022 |
190,000 |
189,555 |
|
a |
Series
F, 0.605% (SOFRINDX + 0.35%) due 6/13/2022 |
230,000 |
230,055 |
|
a |
Southern
Co., 0.549% (SOFR + 0.37%) due 5/10/2023 |
300,000 |
299,121 |
| |
Tampa
Electric Co., 2.60% due 9/15/2022 |
185,000 |
185,498
|
| |
Gas
Utilities — 0.3% |
|
|
|
a |
Atmos
Energy Corp., 1.023% (LIBOR 3 Month + 0.38%) due 3/9/2023 |
170,000 |
169,777 |
|
a |
CenterPoint
Energy Resources Corp., 1.004% (LIBOR 3 Month + 0.50%) due 3/2/2023 |
89,000 |
88,939 |
|
a |
ONE
Gas, Inc., 1.355% (LIBOR 3 Month + 0.61%) due 3/11/2023 |
107,000 |
107,058
|
| |
|
|
4,696,764
|
| |
Total
Corporate Bonds (Cost $19,991,555) |
|
19,650,493
|
| |
Convertible
Bonds — 0.2% |
|
|
| |
Diversified
Financials — 0.2% |
|
|
| |
Capital
Markets — 0.2% |
|
|
| |
Goldman
Sachs BDC, Inc., 4.50% due 4/1/2022 |
260,000 |
259,558
|
| |
|
|
259,558
|
| |
Total
Convertible Bonds (Cost $260,000) |
|
259,558
|
| |
Long-Term
Municipal Bonds — 0.1% |
|
|
| |
New
Jersey Transportation Trust Fund Authority, |
|
|
| |
2.551%
due 6/15/2023 |
30,000 |
30,079 |
| |
2.631%
due 6/15/2024 |
25,000 |
24,883 |
| |
State
of Connecticut GO, Series A, 3.471% due 9/15/2022 |
20,000 |
20,191
|
| |
Total
Long-Term Municipal Bonds (Cost $75,000) |
|
75,153
|
| |
Short-Term
Investments — 10.9% |
|
|
| f |
Thornburg
Capital Management Fund |
360,816
|
3,608,163
|
46 | Thornburg Fixed Income Funds Semi-Annual Report
|
See notes to
financial statements. |
Schedule of Investments,
Continued
Thornburg Ultra Short Income Fund | March 31, 2022 (Unaudited)
| |
Issuer-Description
|
SHARES/PRINCIPAL
AMOUNT |
VALUE
|
| |
United
States Treasury Bill |
|
|
| |
0.381%
due 6/2/2022 |
$ 500,000
|
$ 499,677
|
| |
0.541%
due 7/5/2022 |
1,000,000
|
998,595 |
| |
0.567%
due 7/21/2022 |
500,000 |
499,140 |
| |
0.713%
due 10/6/2022 |
1,000,000
|
996,344 |
| |
0.717%
due 8/25/2022 |
1,000,000
|
997,141 |
| |
0.734%
due 11/3/2022 |
1,000,000
|
995,680 |
| |
0.94%
due 12/29/2022 |
1,000,000
|
993,053 |
| |
1.023%
due 1/26/2023 |
500,000 |
495,833 |
| |
1.12%
due 2/23/2023 |
1,000,000
|
990,046
|
| |
Total
Short-Term Investments (Cost $11,073,672) |
|
11,073,672
|
| |
Total
Investments — 102.3% (Cost $104,672,120) |
|
$103,737,443
|
| |
Liabilities
Net of Other Assets — (2.3)% |
|
(2,293,360)
|
| |
Net
Assets — 100.0% |
|
$101,444,083
|
| Footnote Legend
|
| a
|
Variable,
floating, step, or fixed to floating rate securities are securities for which interest rate changes are based on changes in a designated base rate or on a predetermined schedule. The rates shown are those in effect on March 31, 2022. |
| b
|
Yankee
bond denominated in U.S. dollars and is issued in the U.S. by foreign banks and corporations. |
| c
|
Securities
exempt from registration under Rule 144A of the Securities Act of 1933, as amended. These securities are restricted but liquid and may only be resold in the ordinary course of business in transactions exempt from registration, normally to qualified
institutional buyers. As of March 31, 2022, the aggregate value of these securities in the Fund’s portfolio was $68,126,828, representing 67.16% of the Fund’s net assets. |
| d
|
When-issued
security. |
| e
|
Segregated
as collateral for a when-issued security. |
| f
|
Investment
in Affiliates. |
Portfolio
Abbreviations
To simplify the listings of securities, abbreviations are used per the table below:
| CMBS
|
Commercial
Mortgage-Backed Securities |
| CMO
|
Collateralized
Mortgage Obligation |
| GO
|
General Obligation
|
| LIBOR
|
London
Interbank Offered Rates |
| Mtg
|
Mortgage
|
| REMIC
|
Real Estate Mortgage
Investment Conduit |
| SOFR
|
Secured Overnight
Financing Rate |
| SOFRINDX
|
Secured Overnight
Financing Rate Index |
| UMBS
|
Uniform Mortgage
Backed Securities |
See
notes to financial statements.
|
Thornburg Fixed
Income Funds Semi-Annual Report | 47 |
Schedule of Investments
Thornburg Strategic Income Fund | March 31, 2022 (Unaudited)
| |
Issuer-Description
|
SHARES/
PRINCIPAL AMOUNT |
VALUE
|
| |
Common
Stock — 0.0% |
|
|
| |
Energy
— 0.0% |
|
|
| |
Oil,
Gas & Consumable Fuels — 0.0% |
|
|
|
a,b |
Malamute
Energy, Inc. |
847
|
$ 847
|
| |
|
|
847
|
| |
Total
Common Stock (Cost $0) |
|
847
|
| |
Preferred
Stock — 0.7% |
|
|
| |
Banks
— 0.2% |
|
|
| |
Banks
— 0.2% |
|
|
|
c,d |
AgriBank
FCB 6.875% (LIBOR 3 Month + 4.23%) |
40,000
|
4,220,000 |
|
c,d |
CoBank
ACB Series F, 6.25% (LIBOR 3 Month + 4.56%) |
50,000
|
5,056,500
|
| |
|
|
9,276,500
|
| |
Diversified
Financials — 0.3% |
|
|
| |
Capital
Markets — 0.2% |
|
|
|
a,d |
Gabelli
Dividend & Income Trust 1.70%, 3/26/2028 |
412
|
10,286,816
|
| |
Diversified
Financial Services — 0.1% |
|
|
|
c |
Compass
Diversified Holdings Series C, 7.875% |
108,150
|
2,802,167
|
| |
|
|
13,088,983
|
| |
Energy
— 0.2% |
|
|
| |
Oil,
Gas & Consumable Fuels — 0.2% |
|
|
|
c |
Crestwood
Equity Partners LP 9.25% |
653,920
|
6,277,632
|
| |
|
|
6,277,632
|
| |
Total
Preferred Stock (Cost $26,788,009) |
|
28,643,115
|
| |
Asset
Backed Securities — 22.7% |
|
|
| |
Auto
Receivables — 5.6% |
|
|
|
e |
ACC
Auto Trust, Series 2021-A Class A, 1.08% due 4/15/2027 |
$ 4,550,229
|
4,493,972 |
| |
ACC
Trust, |
|
|
|
e |
Series
2019-1 Class C, 6.41% due 2/20/2024 |
3,097,816 |
3,115,721 |
|
e |
Series
2019-2 Class B, 3.63% due 8/21/2023 |
1,940,162 |
1,942,811 |
|
e |
Series
2019-2 Class C, 5.24% due 10/21/2024 |
1,900,000 |
1,902,608 |
|
e |
Series
2020-A Class A, 6.00% due 3/20/2023 |
1,186,844 |
1,188,473 |
|
e |
Series
2021-1 Class A, 0.74% due 11/20/2023 |
1,782,591 |
1,779,360 |
|
e |
Series
2022-1 Class A, 1.19% due 9/20/2024 |
4,794,400 |
4,742,056 |
|
e |
American
Credit Acceptance Receivables Trust, Series 2019-2 Class F, 5.81% due 6/12/2026 |
2,550,000 |
2,588,039 |
| |
Arivo
Acceptance Auto Loan Receivables Trust, |
|
|
|
e |
Series
2019-1 Class A, 2.99% due 7/15/2024 |
297,941 |
298,758 |
|
e |
Series
2019-1 Class B, 3.37% due 6/15/2025 |
2,000,000 |
2,003,719 |
|
e |
Series
2021-1A Class A, 1.19% due 1/15/2027 |
590,627 |
584,569 |
|
e |
Series
2021-1A Class C, 3.77% due 3/15/2027 |
900,000 |
871,706 |
|
e |
Series
2021-1A Class D, 5.83% due 1/18/2028 |
850,000 |
814,072 |
| |
CarNow
Auto Receivables Trust, |
|
|
|
e |
Series
2021-1A Class A, 0.97% due 10/15/2024 |
3,400,309 |
3,391,300 |
|
e |
Series
2021-2A Class A, 0.73% due 9/15/2023 |
2,379,208 |
2,374,446 |
| |
Carvana
Auto Receivables Trust, |
|
|
|
e |
0.01%
due 1/10/2029 |
764,539,050 |
13,573,830 |
|
e |
6.01%
due 12/11/2028 |
6,000,000 |
5,845,284 |
|
e |
Series
2019-4A Class R, 0.01% due 10/15/2026 |
8,000 |
2,995,090 |
|
e |
Series
2020-P1 Class R, 0.01% due 9/8/2027 |
20,000 |
4,919,037 |
|
e |
Series
2021-N1 Class R, due 1/10/2028 |
16,371 |
5,946,555 |
|
e |
Series
2021-N2 Class R, 0.01% due 3/10/2028 |
7,000 |
3,165,255 |
| |
Series
2021-N3 Class A1, 0.35% due 6/12/2028 |
782,348 |
771,465 |
|
e |
Series
2021-N4 Class R, due 9/12/2028 |
11,650 |
3,569,136 |
|
e |
Series
2021-P1 Class R, due 12/10/2027 |
23,500 |
6,248,181 |
| e |
Series
2021-P2 Class R, due 5/10/2028 |
7,500 |
3,760,717 |
48 | Thornburg Fixed Income Funds Semi-Annual Report
|
See notes to
financial statements. |
Schedule of Investments,
Continued
Thornburg Strategic Income Fund | March 31, 2022 (Unaudited)
| |
Issuer-Description
|
SHARES/
PRINCIPAL AMOUNT |
VALUE
|
|
e |
Series
2021-P3 Class R, due 9/11/2028 |
$ 9,000
|
$ 4,841,716
|
|
e |
Series
2021-P4 Class R, due 9/11/2028 |
8,250 |
4,700,403 |
|
e |
CIG
Auto Receivables Trust, Series 2019-1A Class D, 4.85% due 5/15/2026 |
2,000,000 |
2,007,935 |
| |
CPS
Auto Receivables Trust, |
|
|
|
e |
Series
2018-B Class E, 5.61% due 12/16/2024 |
3,500,000 |
3,541,891 |
|
e |
Series
2020-A Class F, 6.93% due 3/15/2027 |
3,500,000 |
3,476,527 |
|
e |
Series
2020-B Class D, 4.75% due 4/15/2026 |
1,400,000 |
1,421,627 |
|
e |
Series
2020-C Class F, 6.67% due 11/15/2027 |
1,000,000 |
1,001,101 |
|
a,e |
CPS
Auto Securitization Trust, Series 2021-1A Class A, 7.86% due 6/16/2026 |
10,000,000 |
9,670,000 |
|
e |
CPS
Auto Trust, Series 2018-C Class E, 6.07% due 9/15/2025 |
2,000,000 |
2,037,754 |
|
a,e |
Credit
Suisse ABS Trust, Series 2020-AT1 Class CERT, 0.01% due 6/15/2026 |
10,000 |
529,321 |
|
e |
Credito
Real USA Auto Receivables Trust, Series 2021-1A Class A, 1.35% due 2/16/2027 |
6,329,344 |
6,214,750 |
| |
FHF
Trust, |
|
|
|
e |
Series
2020-1A Class A, 2.59% due 12/15/2023 |
910,832 |
911,725 |
|
e |
Series
2021-2A Class A, 0.83% due 12/15/2026 |
4,355,312 |
4,198,848 |
| |
First
Investors Auto Owner Trust, |
|
|
|
e |
Series
2019-1A Class E, 4.53% due 6/16/2025 |
3,640,000 |
3,679,226 |
|
e |
Series
2022-1A Class E, 5.41% due 6/15/2029 |
5,000,000 |
4,865,406 |
| |
Flagship
Credit Auto Trust, |
|
|
|
e |
Series
2018-4 Class R, 0.01% due 3/16/2026 |
13,000 |
1,288,825 |
|
e |
Series
2019-1 Class R, 0.01% due 6/15/2026 |
24,000 |
2,549,793 |
|
e |
Series
2019-3 Class R, 0.01% due 12/15/2026 |
15,000 |
2,387,072 |
|
e |
Series
2019-4 Class R, 0.01% due 3/15/2027 |
8,000 |
1,480,791 |
|
e |
Series
2022-1 Class E, 5.37% due 6/15/2029 |
6,120,000 |
5,917,464 |
| |
Foursight
Capital Automobile Receivables Trust, |
|
|
|
e |
Series
2018-2 Class E, 5.50% due 10/15/2024 |
1,370,000 |
1,379,558 |
|
e |
Series
2018-2 Class F, 6.48% due 6/15/2026 |
335,000 |
337,747 |
|
e |
Series
2019-1 Class F, 5.57% due 11/16/2026 |
500,000 |
501,306 |
|
e |
Series
2020-1 Class E, 3.49% due 4/15/2026 |
1,100,000 |
1,090,014 |
|
e |
Series
2021-1 Class F, 4.06% due 8/15/2028 |
2,830,000 |
2,694,493 |
| |
GLS
Auto Receivables Issuer Trust, |
|
|
|
e |
Series
2020-2A Class C, 4.57% due 4/15/2026 |
2,025,000 |
2,053,383 |
|
e |
Series
2020-3A Class B, 1.38% due 8/15/2024 |
1,844,622 |
1,843,770 |
| |
JPMorgan
Chase Bank NA - CACLN, |
|
|
|
e |
Series
2020 -1 Class R, 33.784% due 1/25/2028 |
1,865,260 |
2,272,421 |
|
e |
Series
2020-2 Class R, 31.355% due 2/25/2028 |
8,740,466 |
10,673,769 |
|
e |
Series
2021-1 Class R, 28.348% due 9/25/2028 |
3,390,560 |
4,050,943 |
|
e |
Series
2021-2 Class G, 8.482% due 12/26/2028 |
3,950,000 |
3,739,945 |
|
e |
Lendbuzz
Securitization Trust, Series 2021-1A Class A, 1.46% due 6/15/2026 |
7,071,472 |
6,915,006 |
|
e |
Octane
Receivables Trust, Series 2020-1A Class A, 1.71% due 2/20/2025 |
1,039,059 |
1,032,935 |
|
e |
Prestige
Auto Receivables Trust, Series 2018-1A Class E, 5.03% due 1/15/2026 |
2,625,000 |
2,653,307 |
| |
Santander
Consumer Auto Receivables Trust, |
|
|
|
e |
Series
2020-AA Class R, 0.01% due 1/16/2029 |
25,000 |
4,206,170 |
|
e |
Series
2021-AA Class F, 5.79% due 8/15/2028 |
3,000,000 |
2,990,367 |
|
e |
Series
2021-AA Class R, 0.01% due 8/15/2028 |
28,500 |
3,547,614 |
| |
Skopos
Auto Receivables Trust, |
|
|
|
e |
Series
2019-1A Class C, 3.63% due 9/16/2024 |
1,383,304 |
1,389,165 |
|
e |
Series
2019-1A Class D, 5.24% due 4/15/2025 |
2,650,000 |
2,650,268 |
|
e |
U.S.
Auto Funding LLC, Series 2019-1A Class C, 5.34% due 3/15/2023 |
1,400,758 |
1,403,117 |
| |
United
Auto Credit Securitization Trust, |
|
|
|
e |
Series
2020-1 Class F, 9.08% due 1/12/2026 |
3,205,000 |
3,260,859 |
|
e |
Series
2021-1 Class F, 4.30% due 9/10/2027 |
6,125,000 |
5,827,089 |
|
e |
Series
2022-1 Class R, 0.01% due 11/10/2028 |
37,000 |
13,864,217 |
|
e |
US
Auto Funding, Series 2021-1A Class A, 0.79% due 7/15/2024 |
3,889,469 |
3,844,904 |
|
e |
USASF
Receivables LLC, Series 2020-1A Class A, 2.47% due 8/15/2023 |
232,235 |
232,255 |
|
e |
Veros
Auto Receivables Trust, Series 2021-1 Class A, 0.92% due 10/15/2026 |
2,441,035 |
2,408,859 |
|
e |
Veros
Automobile Receivables Trust, Series 2020-1 Class D, 5.64% due 2/16/2027 |
7,000,000 |
6,998,939
|
| |
|
|
243,470,755
|
| |
Credit
Card — 1.6% |
|
|
|
e |
Avant
Credit Card Master Trust, Series 2021-1A Class A, 1.37% due 4/15/2027 |
3,000,000 |
2,851,122 |
| e |
Brex
Commercial Charge Card Master Trust, Series 2021-1 Class A, 2.09% due 7/15/2024 |
3,150,000 |
3,114,170 |
See
notes to financial statements.
|
Thornburg Fixed
Income Funds Semi-Annual Report | 49 |
Schedule of Investments, Continued
Thornburg Strategic Income Fund | March 31, 2022 (Unaudited)
| |
Issuer-Description
|
SHARES/
PRINCIPAL AMOUNT |
VALUE
|
| |
Continental
Credit Card LLC, |
|
|
|
e |
Series
2019-1A Class A, 3.83% due 8/15/2026 |
$ 5,031,925
|
$ 5,048,075
|
|
e |
Series
2019-1A Class C, 6.16% due 8/15/2026 |
6,440,000 |
6,437,642 |
| |
Continental
Finance Credit Card ABS Master Trust, |
|
|
|
e |
Series
2020-1A Class A, 2.24% due 12/15/2028 |
3,000,000 |
2,892,177 |
|
e |
Series
2020-1A Class B, 3.66% due 12/15/2028 |
3,700,000 |
3,559,999 |
| |
Genesis
Private Label Amortizing Trust, |
|
|
|
e |
Series
2020-1 Class C, 4.19% due 7/20/2030 |
2,023,057 |
2,021,365 |
|
e |
Series
2020-1 Class D, 6.63% due 7/20/2030 |
1,550,000 |
1,567,136 |
| |
Genesis
Sales Finance Master Trust, |
|
|
|
e |
Series
2020-AA Class C, 2.99% due 9/22/2025 |
1,780,000 |
1,760,060 |
|
e |
Series
2020-AA Class D, 4.71% due 9/22/2025 |
2,300,000 |
2,287,524 |
| |
Mercury
Financial Credit Card Master Trust, |
|
|
|
e |
Series
2021-1A Class D, 6.26% due 3/20/2026 |
5,000,000 |
4,888,689 |
|
e |
Series
2022-1A Class A, 2.50% due 9/21/2026 |
12,500,000 |
12,060,859 |
|
e |
Mission
Lane Credit Card Master Trust, Series 2021-A Class A, 1.59% due 9/15/2026 |
13,599,000 |
13,258,781 |
| |
Perimeter
Master Note Business Trust, |
|
|
|
e |
Series
2019-2A Class A, 4.23% due 5/15/2024 |
2,966,000 |
2,962,734 |
|
e |
Series
2019-2A Class B, 5.21% due 5/15/2024 |
6,500,000 |
6,458,492 |
|
e |
Series
2019-2A Class C, 7.06% due 5/15/2024 |
1,463,000 |
1,453,820
|
| |
|
|
72,622,645
|
| |
Other
Asset Backed — 12.7% |
|
|
|
d,e |
321
Henderson Receivables I LLC, Series 2006-3A Class A1, 0.597% (LIBOR 1 Month + 0.20%) due 9/15/2041 |
919,062 |
901,115 |
|
e |
Amur
Equipment Finance Receivables VII LLC, Series 2019-1A Class A2, 2.63% due 6/20/2024 |
498,153 |
499,157 |
| |
Amur
Equipment Finance Receivables VIII LLC, |
|
|
|
e |
Series
2020-1A Class E, 7.00% due 1/20/2027 |
2,237,613 |
2,226,480 |
|
e |
Series
2020-1A Class F, 7.00% due 12/20/2027 |
6,301,302 |
6,273,068 |
| |
Aqua
Finance Trust, |
|
|
|
e |
Series
2019-A Class A, 3.14% due 7/16/2040 |
1,961,120 |
1,940,484 |
|
e |
Series
2019-A Class D, 6.07% due 7/16/2040 |
18,900,000 |
18,915,928 |
|
e |
Series
2020-AA Class A, 1.90% due 7/17/2046 |
2,013,022 |
1,962,841 |
|
e |
Series
2020-AA Class D, 7.15% due 7/17/2046 |
2,550,000 |
2,627,419 |
|
e |
Series
2021-A Class A, 1.54% due 7/17/2046 |
5,103,690 |
4,864,168 |
|
d,e,f |
Arbor
Realty Commercial Real Estate Notes Ltd., Series 2022-FL1 1.50% (SOFR30A + 1.45%) due 1/15/2037 |
20,000,000 |
19,895,326 |
|
e |
Arm
Master Trust LLC, Series 2021-T1 Class A, 2.43% due 11/15/2027 |
2,000,000 |
1,913,388 |
|
e |
AXIS
Equipment Finance Receivables LLC, Series 2021-1A Class F, 6.09% due 2/20/2029 |
8,152,000 |
7,762,900 |
| |
BHG
Securitization Trust, |
|
|
|
e |
Series
2021-A Class A, 1.42% due 11/17/2033 |
9,034,989 |
8,694,388 |
|
e |
Series
2021-A Class C, 3.69% due 11/17/2033 |
2,200,000 |
2,151,395 |
|
e |
Series
2021-B Class A, 0.90% due 10/17/2034 |
4,751,937 |
4,611,303 |
|
e |
Series
2022-A 1.71% due 2/20/2035 |
19,584,803 |
19,175,751 |
|
d,e,f |
Blackbird
Capital Aircraft Lease Securitization Ltd., Series 2016-1A Class A, 4.213% due 12/16/2041 |
4,724,745 |
4,408,818 |
| |
CFG
Investments Ltd., |
|
|
|
e |
Series
2021-1 Class A, 4.70% due 5/20/2032 |
7,275,000 |
7,174,059 |
|
e |
Series
2021-1 Class C, 7.48% due 5/20/2032 |
1,560,000 |
1,522,537 |
|
e |
Series
2021-1 Class D, 9.07% due 5/20/2032 |
515,000 |
501,922 |
| |
Conn’s
Receivables Funding LLC, |
|
|
|
e |
Series
2020-A Class A, 1.71% due 6/16/2025 |
175,971 |
175,909 |
|
e |
Series
2021-A Class A, 1.05% due 5/15/2026 |
4,486,035 |
4,444,502 |
| |
Consumer
Loan Underlying Bond Credit Trust, |
|
|
|
e |
Series
2018-P3 Class C, 5.54% due 1/15/2026 |
2,393,115 |
2,394,357 |
|
e |
Series
2019-HP1 Class C, 4.70% due 12/15/2026 |
5,000,000 |
5,008,323 |
|
d,e |
Series
2019-HP1 Class CERT, due 12/15/2026 |
100,000 |
1,043,573 |
|
e |
Series
2019-P1 Class C, 4.66% due 7/15/2026 |
3,800,897 |
3,808,187 |
|
e |
Series
2019-P2 Class C, 4.41% due 10/15/2026 |
1,333,855 |
1,329,727 |
|
e |
Series
2020-P1 Class B, 2.92% due 3/15/2028 |
378,934 |
378,955 |
|
e |
Credit
Suisse ABS Trust, Series 2018-LD1 Class D, 6.30% due 7/25/2024 |
438,637 |
438,760 |
| |
Dext
ABS LLC, |
|
|
|
e |
Series
2020-1 Class A, 1.46% due 2/16/2027 |
1,927,277 |
1,912,694 |
|
e |
Series
2021-1 Class A, 1.12% due 2/15/2028 |
5,452,615 |
5,317,755 |
|
e |
Diamond
Infrastructure Funding LLC, Series 2021-1A Class A, 1.76% due 4/15/2049 |
15,300,000 |
13,853,231 |
| e |
Diamond
Issuer, Series 2021-1A Class A, 2.305% due 11/20/2051 |
10,983,000 |
10,157,222 |
50 | Thornburg Fixed Income Funds Semi-Annual Report
|
See notes to
financial statements. |
Schedule of Investments,
Continued
Thornburg Strategic Income Fund | March 31, 2022 (Unaudited)
| |
Issuer-Description
|
SHARES/
PRINCIPAL AMOUNT |
VALUE
|
| |
Diamond
Resorts Owner Trust, |
|
|
|
e |
Series
2018-1 Class A, 3.70% due 1/21/2031 |
$ 814,900
|
$ 820,028
|
|
e |
Series
2019-1A Class A, 2.89% due 2/20/2032 |
1,998,874 |
1,995,469 |
|
e,f |
ECAF
I Ltd., Series 2015-1A Class B1, 5.802% due 6/15/2040 |
4,759,620 |
1,918,527 |
|
e |
ExteNet
LLC, Series 2019-1A Class A2, 3.204% due 7/26/2049 |
5,000,000 |
4,958,694 |
|
e |
Fat
Brands Fazoli’s Native I LLC, Series 2021-1 Class A2, 6.00% due 7/25/2051 |
8,000,000 |
7,680,000 |
| |
Foundation
Finance Trust, |
|
|
|
e |
Series
2017-1A Class A, 3.30% due 7/15/2033 |
204,394 |
204,798 |
|
e |
Series
2019-1A Class A, 3.86% due 11/15/2034 |
2,593,932 |
2,592,235 |
|
e |
Series
2019-1A Class C, 5.66% due 11/15/2034 |
575,000 |
592,076 |
|
e |
Series
2020-1A Class A, 3.54% due 7/16/2040 |
1,947,473 |
1,946,241 |
|
e |
Series
2020-1A Class C, 5.75% due 7/16/2040 |
4,025,000 |
4,112,597 |
|
e |
Series
2021-1A Class A, 1.27% due 5/15/2041 |
2,744,262 |
2,594,981 |
|
e |
Series
2021-1A Class D, 4.96% due 5/15/2041 |
2,345,000 |
2,200,339 |
|
e |
Series
2021-2A Class A, 2.19% due 1/15/2042 |
2,728,007 |
2,630,981 |
|
e |
Series
2021-2A Class D, 5.73% due 1/15/2042 |
3,750,000 |
3,546,253 |
| |
Freed
ABS Trust, |
|
|
|
e |
Series
2019-2 Class C, 4.86% due 11/18/2026 |
4,827,896 |
4,832,139 |
|
e |
Series
2021-1CP Class A, 0.66% due 3/20/2028 |
402,162 |
401,195 |
| |
Goldman
Home Improvement Trust, |
|
|
|
e |
Series
2021-GRN2 Class A, 1.15% due 6/25/2051 |
13,211,889 |
12,620,880 |
|
a,e |
Series
2021-GRN2 Class R, due 6/20/2051 |
41,500 |
3,920,505 |
|
e |
Goodgreen
Trust, Series 2021-1A Class A, 2.66% due 10/15/2056 |
12,818,890 |
12,021,547 |
| |
GoodLeap
Sustainable Home Solutions Trust, |
|
|
|
e |
Series
2021-3CS Class C, 3.50% due 5/20/2048 |
4,500,000 |
3,762,390 |
|
e |
Series
2021-4GS Class A, 1.93% due 7/20/2048 |
4,568,644 |
4,086,328 |
|
d,e,f |
Greystone
Commercial Real Estate Notes Ltd., Series 2021-FL3 Class A, 1.417% (LIBOR 1 Month + 1.02%) due 7/15/2039 |
14,000,000 |
13,779,808 |
|
e |
HERO
Funding Trust, Series 2017-2A Class A1, 3.28% due 9/20/2048 |
1,249,513 |
1,232,068 |
|
e |
Hilton
Grand Vacations Trust, Series 2019-AA Class A, 2.34% due 7/25/2033 |
1,751,239 |
1,721,374 |
|
e |
InStar
Leasing III LLC, Series 2021-1A Class C, 5.29% due 2/15/2054 |
7,246,428 |
6,720,826 |
|
e |
LendingClub
Receivables Trust, Series 2020-6A Class A, 2.75% due 11/15/2047 |
1,912,236 |
1,910,072 |
| |
LendingPoint
Asset Securitization Trust, |
|
|
|
e |
Series
2019-2 Class C, 4.66% due 11/10/2025 |
105,030 |
105,041 |
|
e |
Series
2020-REV1 Class A, 2.731% due 10/15/2028 |
6,500,000 |
6,481,168 |
|
e |
Series
2020-REV1 Class C, 7.699% due 10/15/2028 |
4,000,000 |
3,974,839 |
|
e |
Series
2021-1 Class A, 1.75% due 4/15/2027 |
1,182,881 |
1,182,968 |
|
e |
Series
2021-A Class D, 5.73% due 12/15/2028 |
9,000,000 |
8,573,587 |
|
e |
Series
2021-B Class D, 6.12% due 2/15/2029 |
5,000,000 |
4,640,246 |
|
e |
Series
2022-A 7.02% due 6/15/2029 |
6,000,000 |
5,766,487 |
| |
LL
ABS Trust, |
|
|
|
e |
Series
2020-1A Class C, 6.54% due 1/17/2028 |
2,200,000 |
2,224,740 |
|
e |
Series
2021-1A Class A, 1.07% due 5/15/2029 |
4,239,298 |
4,064,590 |
| |
Loanpal
Solar Loan Ltd., |
|
|
|
a,e,g |
Series
2021-1GS Class R, 0.01% due 1/20/2048 |
13,252,480 |
11,389,181 |
|
e |
Series
2021-2GS Class C, 3.50% due 3/20/2048 |
3,378,000 |
2,850,354 |
|
e |
LP
LMS Asset Securitization Trust, Series 2021-2A Class D, 6.61% due 1/15/2029 |
2,947,000 |
2,687,200 |
| |
Marlette
Funding Trust, |
|
|
|
e |
Series
2019-1A Class C, 4.42% due 4/16/2029 |
2,561,538 |
2,562,874 |
|
e |
Series
2020-1A Class B, 2.38% due 3/15/2030 |
318,444 |
318,443 |
|
e |
Series
2021-1A Class R, 0.01% due 6/16/2031 |
9,520 |
2,328,844 |
|
e |
Series
2021-2A Class R, 0.01% due 9/15/2031 |
16,347 |
4,492,454 |
|
e |
Series
2021-3A Class R, due 12/15/2031 |
15,892 |
7,176,274 |
|
d,e,f |
MF1
Ltd., Series 2022-FL8 1.40% (SOFR30A + 1.35%) due 2/19/2037 |
13,750,000 |
13,697,978 |
| |
Mosaic
Solar Loan Trust, |
|
|
|
e |
Series
2020-1A Class C, 4.47% due 4/20/2046 |
458,694 |
457,589 |
|
e |
Series
2020-2A Class D, 5.42% due 8/20/2046 |
1,216,607 |
1,190,206 |
|
a,e |
Series
2020-2A Class R, 0.01% due 8/20/2046 |
1,144,603 |
538,307 |
|
a,e |
Series
2021-1A Class R, 0.01% due 12/20/2046 |
8,505,609 |
3,936,396 |
|
a,e |
Series
2021-2A Class R, 0.01% due 4/22/2047 |
9,930,000 |
2,275,956 |
|
a,e |
Series
2021-3A Class R, 0.01% due 6/20/2052 |
12,320,000 |
3,537,072 |
| |
New
Residential Advance Receivables Trust Advance Receivables Backed, |
|
|
|
e |
Series
2020-T1 Class AT1, 1.426% due 8/15/2053 |
8,500,000 |
8,321,363 |
| e |
Series
2020-T1 Class BT1, 1.823% due 8/15/2053 |
3,000,000 |
2,930,597 |
See
notes to financial statements.
|
Thornburg Fixed
Income Funds Semi-Annual Report | 51 |
Schedule of Investments, Continued
Thornburg Strategic Income Fund | March 31, 2022 (Unaudited)
| |
Issuer-Description
|
SHARES/
PRINCIPAL AMOUNT |
VALUE
|
|
e |
Series
2020-T1 Class CT1, 2.269% due 8/15/2053 |
$ 3,400,000
|
$ 3,322,129
|
|
e |
Series
2020-T1 Class DT1, 3.011% due 8/15/2053 |
6,575,000 |
6,430,547 |
|
e |
New
Residential Advance Receivables Trust Advance Receivables Backed Notes, Series 2020-APT1 Class AT1, 1.035% due 12/16/2052 |
2,600,000 |
2,562,841 |
| |
NRZ
Advance Receivables Trust, |
|
|
|
e |
Series
2020-T2 Class CT2, 2.17% due 9/15/2053 |
3,000,000 |
2,916,557 |
|
e |
Series
2020-T2 Class DT2, 2.863% due 9/15/2053 |
5,550,000 |
5,399,736 |
|
e |
Series
2020-T3 Class DT3, 2.458% due 10/15/2052 |
2,640,000 |
2,628,686 |
| |
Ocwen
Master Advance Receivables Trust, |
|
|
|
e |
Series
2020-T1 Class AT1, 1.278% due 8/15/2052 |
7,494,737 |
7,494,954 |
|
e |
Series
2020-T1 Class BT1, 1.774% due 8/15/2052 |
2,670,000 |
2,670,405 |
|
e |
Series
2020-T1 Class CT1, 2.32% due 8/15/2052 |
1,386,526 |
1,386,783 |
|
e |
Series
2020-T1 Class DT1, 3.061% due 8/15/2052 |
7,827,316 |
7,830,761 |
| |
Oportun
Funding LLC, |
|
|
|
d,e |
0.000%
due 6/15/2029 |
11,000 |
6,454,030 |
|
e |
3.25%
due 6/15/2029 |
12,000,000 |
11,970,503 |
|
e |
Series
2020-1 Class B, 3.45% due 5/15/2024 |
9,900,000 |
9,895,586 |
| |
Pagaya
AI Debt Selection Trust, |
|
|
|
e |
Series
2020-3 Class A, 2.10% due 5/17/2027 |
844,299 |
843,148 |
|
e |
Series
2021-1 Class A, 1.18% due 11/15/2027 |
6,738,530 |
6,640,035 |
|
e |
Series
2021-3 Class A, 1.15% due 5/15/2029 |
8,349,767 |
8,181,649 |
|
e |
Series
2021-HG1 Class A, 1.22% due 1/16/2029 |
4,913,557 |
4,759,467 |
|
e |
Pagaya
AI Debt Trust, Series 2022-1 2.03% due 10/15/2029 |
15,000,000 |
14,725,292 |
|
e |
Pawnee
Equipment Receivables LLC, Series 2020-1 Class A, 1.37% due 11/17/2025 |
1,228,445 |
1,220,663 |
|
e |
PFS
Financing Corp., Series 2020-B Class A, 1.21% due 6/15/2024 |
2,500,000 |
2,498,551 |
| |
Prosper
Pass-Thru Trust, |
|
|
|
e |
Series
2019-ST1 Class CERT, 0.01% due 7/15/2025 |
13,363,728 |
423,210 |
|
e |
Series
2019-ST2 Class R1, 0.01% due 11/15/2025 |
6,385,267 |
1,226,444 |
|
e |
Series
2019-ST2 Class R2, 0.01% due 11/15/2025 |
3,193,133 |
613,318 |
|
e |
SCF
Equipment Leasing LLC, Series 2019-2A Class C, 3.11% due 6/21/2027 |
7,300,000 |
7,176,009 |
|
e |
Service
Experts Issuer LLC, Series 2021-1A Class A, 2.67% due 2/2/2032 |
9,093,943 |
8,708,190 |
|
e |
SolarCity
LMC Series I LLC, Series 2013-1 Class A, 4.80% due 11/20/2038 |
1,416,064 |
1,391,796 |
|
e |
SpringCastle
America Funding LLC, Series 2020-AA Class A, 1.97% due 9/25/2037 |
5,821,731 |
5,814,144 |
|
e |
SPS
Servicer Advance Receivables Trust, Series 2020-T2 Class A, 1.83% due 11/15/2055 |
3,300,000 |
3,085,613 |
|
e |
Theorem
Funding Trust, Series 2021-1A Class A, 1.21% due 12/15/2027 |
6,825,160 |
6,718,778 |
| |
Upstart
Pass-Through Trust, |
|
|
|
e |
Series
2020-ST2 Class A, 3.50% due 3/20/2028 |
1,632,472 |
1,624,805 |
|
e |
Series
2020-ST3 Class A, 3.35% due 4/20/2028 |
2,148,958 |
2,135,711 |
|
e |
Series
2021-ST4 Class A, 2.00% due 7/20/2027 |
1,463,534 |
1,413,012 |
|
e |
Series
2021-ST6 Class A, 1.85% due 8/20/2027 |
3,920,690 |
3,767,701 |
|
e |
Series
2021-ST8 Class CERT, 0.01% due 10/20/2029 |
1,270,000 |
1,060,708 |
| |
Upstart
Securitization Trust, |
|
|
|
e,g |
Series
2018-2 Class CERT, 0.01% due 12/22/2025 |
84,500 |
3,952,270 |
|
e |
Series
2021-2 Class A, 0.91% due 6/20/2031 |
2,175,840 |
2,137,998 |
|
e |
Series
2021-3 Class CERT, due 7/20/2031 |
7,165 |
4,275,646 |
|
e |
Series
2021-4 Class A, 0.84% due 9/20/2031 |
4,509,035 |
4,384,233 |
|
e |
Series
2021-4 Class CERT, 0.01% due 9/20/2031 |
4,706 |
3,808,509
|
| |
|
|
554,343,165
|
| |
Student
Loan — 2.8% |
|
|
| |
College
Ave Student Loans LLC, |
|
|
|
d,e |
Series
2021-A Class A1, 1.557% (LIBOR 1 Month + 1.10%) due 7/25/2051 |
3,806,019 |
3,787,867 |
|
e |
Series
2021-A Class A2, 1.60% due 7/25/2051 |
362,478 |
338,305 |
|
d,e |
Series
2021-C Class A1, 1.357% (LIBOR 1 Month + 0.90%) due 7/26/2055 |
6,751,685 |
6,635,765 |
| |
Commonbond
Student Loan Trust, |
|
|
|
e |
Series
18-CGS Class A1, 3.87% due 2/25/2046 |
641,160 |
644,850 |
|
e |
Series
2020-1 Class A, 1.69% due 10/25/2051 |
2,400,316 |
2,324,684 |
|
e |
Series
2021-BGS Class A, 1.17% due 9/25/2051 |
3,465,012 |
3,227,717 |
| |
National
Collegiate Student Loan Trust, |
|
|
|
d |
Series
2004-2 Class B, 0.997% (LIBOR 1 Month + 0.54%) due 12/26/2033 |
20,652,424 |
20,058,582 |
|
d |
Series
2006-1 Class A5, 0.807% (LIBOR 1 Month + 0.35%) due 3/25/2033 |
18,075,310 |
17,467,851 |
|
d |
Series
2006-4 Class A4, 0.767% (LIBOR 1 Month + 0.31%) due 5/25/2032 |
6,752,912 |
6,542,938 |
|
d |
Series
2007-2 Class A4, 0.747% (LIBOR 1 Month + 0.29%) due 1/25/2033 |
3,176,855 |
3,009,652 |
| d,e |
Navient
Private Education Refi Loan Trust, Series 2019-D Class A2B, 1.447% (LIBOR 1 Month + 1.05%) due 12/15/2059 |
4,675,915 |
4,637,106 |
52 | Thornburg Fixed Income Funds Semi-Annual Report
|
See notes to
financial statements. |
Schedule of Investments,
Continued
Thornburg Strategic Income Fund | March 31, 2022 (Unaudited)
| |
Issuer-Description
|
SHARES/
PRINCIPAL AMOUNT |
VALUE
|
|
d,e |
Nelnet
Private Education Loan Trust, Series 2016-A Class A1A, 2.207% (LIBOR 1 Month + 1.75%) due 12/26/2040 |
$ 234,594
|
$ 235,031
|
| |
Nelnet
Student Loan Trust, |
|
|
|
d,e |
Series
2015-2A Class A2, 1.057% (LIBOR 1 Month + 0.60%) due 9/25/2047 |
2,613,800 |
2,564,327 |
|
d,e |
Series
2021-CA Class AFL, 1.189% (LIBOR 1 Month + 0.74%) due 4/20/2062 |
4,694,765 |
4,629,510 |
|
d,e |
Series
2021-DA Class AFL, 1.139% (LIBOR 1 Month + 0.69%) due 4/20/2062 |
5,400,263 |
5,318,556 |
|
d,e,f |
Prodigy
Finance DAC, Series 2021-1A Class A, 1.707% (LIBOR 1 Month + 1.25%) due 7/25/2051 |
1,735,018 |
1,707,829 |
| |
SLM
Student Loan Trust, |
|
|
|
d |
Series
2008-2 Class A3, 1.008% (LIBOR 3 Month + 0.75%) due 4/25/2023 |
729,691 |
717,890 |
|
d |
Series
2008-5 Class A4, 1.958% (LIBOR 3 Month + 1.70%) due 7/25/2023 |
961,533 |
964,514 |
|
d |
Series
2011-2 Class A2, 1.657% (LIBOR 1 Month + 1.20%) due 10/25/2034 |
4,712,636 |
4,755,725 |
|
d |
Series
2012-1 Class A3, 1.407% (LIBOR 1 Month + 0.95%) due 9/25/2028 |
1,992,351 |
1,956,682 |
|
d |
Series
2013-6 Class A3, 1.107% (LIBOR 1 Month + 0.65%) due 6/26/2028 |
2,159,058 |
2,130,280 |
| |
SMB
Private Education Loan Trust, |
|
|
|
e |
4.75%
due 11/16/2054 |
6,000,000 |
5,841,347 |
|
d,e |
Series
2021-A Class A1, 0.897% (LIBOR 1 Month + 0.50%) due 1/15/2053 |
48,272 |
48,233 |
|
e |
Series
2021-A Class R, 0.01% due 1/15/2053 |
2,742 |
8,767,827 |
|
d,e |
Series
2021-D Class A1B, 0.997% (LIBOR 1 Month + 0.60%) due 3/17/2053 |
3,772,975 |
3,711,286 |
|
e |
SoFi
Professional Loan Program Trust, Series 2021-B Class R1, due 2/15/2047 |
90,000 |
5,186,322 |
|
d,e |
Towd
Point Asset Trust, Series 2021-SL1 Class A2, 1.149% (LIBOR 1 Month + 0.70%) due 11/20/2061 |
3,724,076 |
3,686,789
|
| |
|
|
120,897,465
|
| |
Total
Asset Backed Securities (Cost $993,993,512) |
|
991,334,030
|
| |
Corporate
Bonds — 47.3% |
|
|
| |
Automobiles
& Components — 1.4% |
|
|
| |
Auto
Components — 0.1% |
|
|
|
e |
Real
Hero Merger Sub 2, Inc., 6.25% due 2/1/2029 |
4,616,000 |
4,210,669
|
| |
Automobiles
— 1.0% |
|
|
|
d,e,f |
BMW
Finance NV, 1.185% (LIBOR 3 Month + 0.79%) due 8/12/2022 |
4,000,000 |
4,007,600 |
|
d,e |
BMW
US Capital LLC, 0.566% (SOFRINDX + 0.38%) due 8/12/2024 |
6,539,000 |
6,500,289 |
|
e |
Daimler
Finance North America LLC, 2.125% due 3/10/2025 |
7,500,000 |
7,245,150 |
|
d,e |
Daimler
Trucks Finance North America LLC, 1.015% (SOFR + 0.75%) due 12/13/2024 |
4,099,000 |
4,064,691 |
| |
Hyundai
Capital America, |
|
|
|
e |
0.875%
due 6/14/2024 |
2,950,000 |
2,790,434 |
|
e |
1.00%
due 9/17/2024 |
5,000,000 |
4,705,600 |
|
e |
1.65%
due 9/17/2026 |
2,750,000 |
2,507,835 |
|
e |
1.80%
due 10/15/2025 - 1/10/2028 |
1,933,000 |
1,777,703 |
|
e |
2.375%
due 2/10/2023 |
6,747,000 |
6,721,361 |
|
e |
2.75%
due 9/27/2026 |
1,250,000 |
1,191,675 |
| |
Hyundai
Capital Services, Inc., |
|
|
|
e,f |
1.25%
due 2/8/2026 |
830,000 |
764,970 |
|
e,f |
3.75%
due 3/5/2023 |
971,000 |
981,040 |
| |
Nissan
Motor Acceptance Co. LLC, |
|
|
|
d,e |
0.894%
(LIBOR 3 Month + 0.65%) due 7/13/2022 |
440,000 |
440,022 |
|
d,e |
1.656%
(LIBOR 3 Month + 0.69%) due 9/28/2022 |
460,000 |
460,143
|
| |
Construction
& Engineering — 0.3% |
|
|
|
e,f |
IHS
Netherlands Holdco BV, 8.00% due 9/18/2027 |
13,800,000 |
13,869,552
|
| |
|
|
62,238,734
|
| |
Banks
— 0.4% |
|
|
| |
Banks
— 0.4% |
|
|
|
d |
Capital
One NA, 1.159% (LIBOR 3 Month + 0.82%) due 8/8/2022 |
3,000,000 |
3,003,570 |
|
d |
Citizens
Bank NA/Providence RI, 1.933% (LIBOR 3 Month + 0.95%) due 3/29/2023 |
4,000,000 |
4,018,480 |
|
e,f |
Macquarie
Bank Ltd., 3.624% due 6/3/2030 |
2,800,000 |
2,639,924 |
|
d,e,f |
NBK
SPC Ltd., 1.625% (SOFR + 1.05%) due 9/15/2027 |
4,862,000 |
4,445,035 |
| |
Santander
Holdings USA, Inc., |
|
|
| |
3.244%
due 10/5/2026 |
1,815,000 |
1,769,189 |
| |
3.45%
due 6/2/2025 |
1,185,000 |
1,181,196
|
| |
|
|
17,057,394
|
| |
Capital
Goods — 2.3% |
|
|
| |
Aerospace
& Defense — 1.1% |
|
|
See
notes to financial statements.
|
Thornburg Fixed
Income Funds Semi-Annual Report | 53 |
Schedule of Investments, Continued
Thornburg Strategic Income Fund | March 31, 2022 (Unaudited)
| |
Issuer-Description
|
SHARES/
PRINCIPAL AMOUNT |
VALUE
|
| |
Boeing
Co., 2.196% due 2/4/2026 |
$ 2,832,000
|
$ 2,679,497
|
|
e |
BWX
Technologies, Inc.,4.125% due 6/30/2028 - 4/15/2029 |
12,961,000 |
12,480,168 |
|
e |
Spirit
AeroSystems, Inc., 7.50% due 4/15/2025 |
7,817,000 |
8,101,539 |
| |
Teledyne
Technologies, Inc., |
|
|
| |
2.25%
due 4/1/2028 |
4,423,000 |
4,103,217 |
| |
2.75%
due 4/1/2031 |
2,217,000 |
2,054,117 |
| |
TransDigm,
Inc., |
|
|
|
e |
6.25%
due 3/15/2026 |
12,244,000 |
12,607,157 |
|
e |
8.00%
due 12/15/2025 |
5,600,000 |
5,840,576
|
| |
Machinery
— 0.7% |
|
|
|
e,f |
ATS
Automation Tooling Systems, Inc., 4.125% due 12/15/2028 |
9,620,000 |
9,053,863 |
| |
Flowserve
Corp., 3.50% due 10/1/2030 |
4,053,000 |
3,840,096 |
|
e |
Huntington
Ingalls Industries, Inc., 2.043% due 8/16/2028 |
6,445,000 |
5,825,507 |
| |
nVent
Finance Sarl, |
|
|
|
f |
2.75%
due 11/15/2031 |
4,097,000 |
3,681,441 |
|
f |
4.55%
due 4/15/2028 |
3,000,000 |
3,092,970 |
| |
Westinghouse
Air Brake Technologies Corp., 4.40% due 3/15/2024 |
3,854,000 |
3,926,417
|
| |
Trading
Companies & Distributors — 0.5% |
|
|
|
e |
IAA,
Inc., 5.50% due 6/15/2027 |
19,559,000 |
19,654,448 |
|
e |
Ritchie
Bros Holdings, Inc., 4.75% due 12/15/2031 |
2,045,000 |
1,994,100
|
| |
|
|
98,935,113
|
| |
Commercial
& Professional Services — 1.4% |
|
|
| |
Commercial
Services & Supplies — 1.1% |
|
|
|
e |
ACCO
Brands Corp., 4.25% due 3/15/2029 |
12,736,000 |
11,775,960 |
|
e,f |
Cimpress
plc, 7.00% due 6/15/2026 |
9,141,000 |
8,701,684 |
| |
CoreCivic,
Inc., 8.25% due 4/15/2026 |
4,827,000 |
4,992,421 |
|
e |
Nielsen
Finance LLC/Nielsen Finance Co., 5.875% due 10/1/2030 |
9,182,000 |
9,203,211 |
| |
Quanta
Services, Inc., 0.95% due 10/1/2024 |
9,094,000 |
8,627,933 |
|
e,f |
Ritchie
Bros Auctioneers, Inc., 5.375% due 1/15/2025 |
3,026,000 |
3,069,574
|
| |
Hotels,
Restaurants & Leisure — 0.0% |
|
|
|
e |
Magallanes,
Inc., 3.428% due 3/15/2024 |
1,800,000 |
1,809,882
|
| |
Machinery
— 0.1% |
|
|
| |
Scotts
Miracle-Gro Co., 5.25% due 12/15/2026 |
2,000,000 |
2,030,600
|
| |
Media
— 0.0% |
|
|
|
e |
CCO
Holdings LLC/CCO Holdings Capital Corp., 4.75% due 2/1/2032 |
900,000 |
838,728
|
| |
Professional
Services — 0.2% |
|
|
| |
Gartner,
Inc., |
|
|
|
e |
3.625%
due 6/15/2029 |
7,155,000 |
6,771,993 |
|
e |
4.50%
due 7/1/2028 |
3,749,000 |
3,736,928
|
| |
|
|
61,558,914
|
| |
Consumer
Durables & Apparel — 0.5% |
|
|
| |
Household
Durables — 0.2% |
|
|
|
e |
CD&R
Smokey Buyer, Inc., 6.75% due 7/15/2025 |
5,658,000 |
5,840,301 |
|
e,f |
Panasonic
Corp., 2.536% due 7/19/2022 |
2,790,000 |
2,796,584
|
| |
Leisure
Products — 0.3% |
|
|
|
e |
Vista
Outdoor, Inc., 4.50% due 3/15/2029 |
16,065,000 |
14,776,748
|
| |
|
|
23,413,633
|
| |
Consumer
Services — 1.2% |
|
|
| |
Hotels,
Restaurants & Leisure — 1.2% |
|
|
| |
Hyatt
Hotels Corp., |
|
|
| |
1.80%
due 10/1/2024 |
6,520,000 |
6,270,154 |
| |
5.75%
due 4/23/2030 |
4,475,000 |
4,937,849 |
|
e |
Nathan’s
Famous, Inc., 6.625% due 11/1/2025 |
10,127,000 |
10,174,090 |
|
e |
Papa
John’s International, Inc., 3.875% due 9/15/2029 |
12,568,000 |
11,500,474 |
|
e |
SeaWorld
Parks & Entertainment, Inc., 8.75% due 5/1/2025 |
11,405,000 |
11,926,437 |
|
e |
TKC
Holdings, Inc., 6.875% due 5/15/2028 |
8,650,000 |
8,405,032
|
| |
|
|
53,214,036
|
| |
Diversified
Financials — 7.0% |
|
|
54 | Thornburg Fixed Income Funds Semi-Annual Report
|
See notes to
financial statements. |
Schedule of Investments,
Continued
Thornburg Strategic Income Fund | March 31, 2022 (Unaudited)
| |
Issuer-Description
|
SHARES/
PRINCIPAL AMOUNT |
VALUE
|
| |
Capital
Markets — 2.3% |
|
|
|
e,f |
B3
SA - Brasil Bolsa Balcao, 4.125% due 9/20/2031 |
$ 8,827,000
|
$ 7,929,912
|
| |
Blackstone
Private Credit Fund, |
|
|
|
e |
2.625%
due 12/15/2026 |
2,995,000 |
2,687,833 |
|
e |
3.25%
due 3/15/2027 |
1,397,000 |
1,282,614 |
|
d |
Citigroup
Global Markets Holdings, Inc., 6.40% due 1/29/2035 |
4,108,000 |
3,128,427 |
| |
Compass
Group Diversified Holdings LLC, |
|
|
|
e |
5.00%
due 1/15/2032 |
800,000 |
724,096 |
|
e |
5.25%
due 4/15/2029 |
5,610,000 |
5,273,568 |
| |
Hercules
Capital, Inc., |
|
|
| |
2.625%
due 9/16/2026 |
5,218,000 |
4,778,540 |
| |
3.375%
due 1/20/2027 |
4,157,000 |
3,907,330 |
|
a,b,e,h |
JPR
Royalty Sub LLC, 14.00% due 9/1/2020 |
2,000,000 |
0 |
| |
LPL
Holdings, Inc., |
|
|
|
e |
4.00%
due 3/15/2029 |
2,820,000 |
2,675,757 |
|
e |
4.375%
due 5/15/2031 |
5,085,000 |
4,921,721 |
|
e |
4.625%
due 11/15/2027 |
3,515,000 |
3,456,651 |
| |
Main
Street Capital Corp., 3.00% due 7/14/2026 |
2,258,000 |
2,102,175 |
| |
Owl
Rock Capital Corp., |
|
|
| |
2.625%
due 1/15/2027 |
833,000 |
750,075 |
| |
2.875%
due 6/11/2028 |
7,319,000 |
6,404,271 |
|
e |
Owl
Rock Capital Corp. III, 3.125% due 4/13/2027 |
6,070,000 |
5,369,765 |
| |
Owl
Rock Core Income Corp., |
|
|
|
e |
3.125%
due 9/23/2026 |
7,087,000 |
6,417,845 |
|
e |
4.70%
due 2/8/2027 |
1,910,000 |
1,837,802 |
|
e |
5.50%
due 3/21/2025 |
2,690,000 |
2,683,033 |
| |
Owl
Rock Technology Finance Corp., |
|
|
| |
2.50%
due 1/15/2027 |
3,547,000 |
3,201,522 |
|
e |
3.75%
due 6/17/2026 |
3,540,000 |
3,377,054 |
|
e |
4.75%
due 12/15/2025 |
6,409,000 |
6,323,504 |
| |
Sixth
Street Specialty Lending, Inc., |
|
|
| |
2.50%
due 8/1/2026 |
609,000 |
561,949 |
| |
3.875%
due 11/1/2024 |
4,054,000 |
4,046,095 |
| |
SLR
Investment Corp., 4.50% due 1/20/2023 |
3,875,000 |
3,904,760 |
|
e |
StoneX
Group, Inc., 8.625% due 6/15/2025 |
11,286,000 |
11,789,130
|
| |
Consumer
Finance — 0.4% |
|
|
|
e |
FirstCash,
Inc., 5.625% due 1/1/2030 |
17,215,000 |
16,555,321
|
| |
Diversified
Financial Services — 4.2% |
|
|
| |
Antares
Holdings LP, |
|
|
|
e |
2.75%
due 1/15/2027 |
1,630,000 |
1,439,241 |
|
e |
3.75%
due 7/15/2027 |
3,480,000 |
3,210,787 |
|
e |
3.95%
due 7/15/2026 |
9,451,000 |
8,803,512 |
|
e |
6.00%
due 8/15/2023 |
4,400,000 |
4,510,748 |
|
e |
8.50%
due 5/18/2025 |
2,750,000 |
3,026,045 |
| |
Bank
of America Corp., |
|
|
|
d |
0.909%
(BSBY3M + 0.43%) due 5/28/2024 |
1,707,000 |
1,703,774 |
|
d,i |
0.976%
(SOFR + 0.69%) due 4/22/2025 |
9,500,000 |
9,102,425 |
|
d |
1.734%
(SOFR + 0.96%) due 7/22/2027 |
1,290,000 |
1,199,132 |
|
d,f |
Barclays
plc, 1.839% (LIBOR 3 Month + 1.38%) due 5/16/2024 |
2,500,000 |
2,517,750 |
| |
BNP
Paribas SA, |
|
|
|
d,e,f |
2.159%
(SOFR + 1.22%) due 9/15/2029 |
1,350,000 |
1,203,808 |
|
e,f |
3.375%
due 1/9/2025 |
5,000,000 |
4,984,700 |
|
d |
Charles
Schwab Corp., 1.209% (SOFRINDX + 1.05%) due 3/3/2027 |
20,000,000 |
20,046,800 |
| |
Citigroup
Mortgage Loan Trust, |
|
|
|
d |
0.834%
(SOFR + 0.67%) due 5/1/2025 |
3,971,000 |
3,925,453 |
|
d |
1.023%
(SOFR + 0.77%) due 6/9/2027 |
6,750,000 |
6,607,035 |
|
d |
1.462%
(SOFR + 0.77%) due 6/9/2027 |
9,250,000 |
8,516,752 |
| |
Deutsche
Bank AG, |
|
|
|
f |
0.898%
due 5/28/2024 |
3,667,000 |
3,495,531 |
|
d,f |
1.738%
(LIBOR 3 Month + 1.23%) due 2/27/2023 |
2,800,000 |
2,815,568 |
|
d,f |
2.311%
(SOFR + 1.22%) due 11/16/2027 |
4,670,000 |
4,296,587 |
| |
Goldman
Sachs Group, Inc., |
|
|
| d |
0.65%
(SOFR + 0.50%) due 7/16/2024 |
5,092,000 |
4,824,874 |
See
notes to financial statements.
|
Thornburg Fixed
Income Funds Semi-Annual Report | 55 |
Schedule of Investments, Continued
Thornburg Strategic Income Fund | March 31, 2022 (Unaudited)
| |
Issuer-Description
|
SHARES/
PRINCIPAL AMOUNT |
VALUE
|
|
d |
0.751%
(SOFR + 0.50%) due 9/10/2024 |
$ 3,687,000
|
$ 3,646,554
|
|
d |
0.836%
(SOFR + 0.70%) due 1/24/2025 |
2,610,000 |
2,586,145 |
|
d |
0.856%
(SOFR + 0.62%) due 12/6/2023 |
2,027,000 |
2,017,899 |
|
d |
1.052%
(SOFR + 0.92%) due 10/21/2027 |
2,692,000 |
2,641,094 |
|
d |
1.071%
(SOFR + 0.82%) due 9/10/2027 |
3,687,000 |
3,602,051 |
| |
3.00%
due 3/15/2024 |
3,052,000 |
3,048,765 |
| |
HSBC
Holdings plc, |
|
|
|
d,f |
0.782%
(SOFR + 0.58%) due 11/22/2024 |
715,000 |
708,486 |
|
d,f |
1.589%
(SOFR + 1.29%) due 5/24/2027 |
3,500,000 |
3,201,590 |
|
d,f |
1.645%
(SOFR + 1.54%) due 4/18/2026 |
3,750,000 |
3,535,012 |
|
d,f |
2.206%
(SOFR + 1.29%) due 8/17/2029 |
3,500,000 |
3,152,800 |
|
d,f |
2.251%
(SOFR + 1.10%) due 11/22/2027 |
1,350,000 |
1,257,687 |
| |
JPMorgan
Chase & Co., |
|
|
|
d |
0.851%
(SOFR + 0.60%) due 12/10/2025 |
2,000,000 |
1,978,460 |
|
d |
1.02%
(SOFR + 0.89%) due 4/22/2027 |
4,200,000 |
4,135,152 |
|
d |
2.069%
(SOFR + 1.02%) due 6/1/2029 |
1,640,000 |
1,507,603 |
|
d |
0.851%
(SOFR + 0.58%) due 6/23/2025 |
10,125,000 |
10,022,231 |
|
d,f |
Mizuho
Financial Group, Inc., 1.128% (LIBOR 3 Month + 0.63%) due 5/25/2024 |
2,946,000 |
2,946,295 |
| |
Natwest
Group plc, |
|
|
|
d,f |
1.642%
( H15T1Y + 0.90%) due 6/14/2027 |
2,000,000 |
1,828,340 |
|
d,f |
1.976%
(LIBOR 3 Month + 1.47%) due 5/15/2023 |
1,398,000 |
1,399,496 |
| |
Societe
Generale SA, |
|
|
|
d,e,f |
1.178%
(SOFR + 1.05%) due 1/21/2026 |
2,600,000 |
2,559,622 |
|
d,e,f |
1.792%
(H15T1Y + 1.00%) due 6/9/2027 |
1,667,000 |
1,509,985 |
|
e,f |
2.625%
due 1/22/2025 |
3,000,000 |
2,895,510 |
|
e,f |
3.875%
due 3/28/2024 |
2,000,000 |
2,006,560 |
|
e,f |
4.25%
due 9/14/2023 |
3,000,000 |
3,042,210 |
|
d,f |
Sumitomo
Mitsui Financial Group, Inc., 0.984% (SOFR + 0.88%) due 1/14/2027 |
4,760,000 |
4,744,292 |
|
d,e,f |
UBS
Group AG, 1.494% (H15T1Y + 0.85%) due 8/10/2027 |
2,679,000 |
2,440,864 |
|
e |
United
Wholesale Mortgage LLC, 5.50% due 11/15/2025 |
12,301,000 |
11,926,189 |
| |
Western
Union Co., 2.85% due 1/10/2025 |
2,338,000 |
2,310,201
|
| |
Insurance
— 0.1% |
|
|
|
e |
Global
Atlantic Fin Co., 4.40% due 10/15/2029 |
7,275,000 |
7,254,703
|
| |
|
|
306,227,068
|
| |
Energy
— 3.3% |
|
|
| |
Energy
Equipment & Services — 0.3% |
|
|
|
e |
Enviva
Partners LP/Enviva Partners Finance Corp., 6.50% due 1/15/2026 |
8,464,000 |
8,710,979 |
|
e |
Hanwha
Energy USA Holdings Corp., 2.375% due 7/30/2022 |
1,915,000 |
1,913,602 |
| |
Odebrecht
Offshore Drilling Finance Ltd., |
|
|
|
e,f |
6.72%
due 12/1/2022 |
94,700 |
93,460 |
|
e,f,j |
7.72%
due 12/1/2026 PIK |
2,518,668 |
567,305 |
|
c,e,f |
Odebrecht
Oil & Gas Finance Ltd. (Guaranty: Odebrecht Oleo e Gas SA), Zero coupon due 5/2/2022 |
304,899 |
1,433 |
|
b,e,f,h |
Schahin
II Finance Co. SPV Ltd., 5.875% due 9/25/2023 |
10,461,182 |
707,176
|
| |
Oil,
Gas & Consumable Fuels — 3.0% |
|
|
|
e |
Chesapeake
Energy Corp., 5.50% due 2/1/2026 |
1,055,000 |
1,081,575 |
|
e |
Citgo
Holding, Inc., 9.25% due 8/1/2024 |
12,777,000 |
12,908,475 |
|
e |
Colorado
Interstate Gas Co. LLC/Colorado Interstate Issuing Corp., 4.15% due 8/15/2026 |
725,000 |
742,719 |
| |
Delek
Logistics Partners LP/Delek Logistics Finance Corp., 6.75% due 5/15/2025 |
9,188,000 |
9,188,000 |
|
d |
Energy
Transfer LP, 3.334% (LIBOR 3 Month + 3.02%) due 11/1/2066 |
1,200,000 |
981,132 |
| |
EQM
Midstream Partners LP, Series 5Y, 4.75% due 7/15/2023 |
2,651,000 |
2,670,485 |
| |
Florida
Gas Transmission Co. LLC, |
|
|
|
e |
2.30%
due 10/1/2031 |
3,985,000 |
3,529,076 |
|
e |
3.875%
due 7/15/2022 |
4,765,000 |
4,769,431 |
| |
Galaxy
Pipeline Assets Bidco Ltd., |
|
|
|
e,f,i |
1.75%
due 9/30/2027 |
9,187,802 |
8,823,230 |
|
e,f |
2.16%
due 3/31/2034 |
4,360,000 |
4,019,658 |
|
e,f |
2.625%
due 3/31/2036 |
6,630,000 |
5,952,878 |
|
e,f |
Gazprom
PJSC via Gaz Finance plc, 3.50% due 7/14/2031 |
16,000,000 |
6,640,000 |
| |
Gray
Oak Pipeline LLC, |
|
|
|
e |
2.00%
due 9/15/2023 |
3,809,000 |
3,752,741 |
|
e |
3.45%
due 10/15/2027 |
5,130,000 |
4,948,757 |
| e |
Gulfstream
Natural Gas System LLC, 4.60% due 9/15/2025 |
5,000,000 |
5,151,450 |
56 | Thornburg Fixed Income Funds Semi-Annual Report
|
See notes to
financial statements. |
Schedule of Investments,
Continued
Thornburg Strategic Income Fund | March 31, 2022 (Unaudited)
| |
Issuer-Description
|
SHARES/
PRINCIPAL AMOUNT |
VALUE
|
|
e,f |
Lukoil
International Finance BV, 4.563% due 4/24/2023 |
$ 1,050,000
|
$ 609,000
|
|
e |
Midwest
Connector Capital Co. LLC, 4.625% due 4/1/2029 |
5,487,000 |
5,553,722 |
|
e |
Par
Petroleum LLC/Par Petroleum Finance Corp., 7.75% due 12/15/2025 |
451,000 |
446,481 |
| |
Parkland
Corp., |
|
|
|
e,f |
4.50%
due 10/1/2029 |
1,825,000 |
1,692,213 |
|
e,f |
5.875%
due 7/15/2027 |
3,726,000 |
3,722,982 |
| |
Petroleos
Mexicanos, |
|
|
|
f |
3.50%
due 1/30/2023 |
2,674,000 |
2,674,669 |
|
f |
5.95%
due 1/28/2031 |
2,802,000 |
2,587,871 |
| |
Petroleos
Mexicanos (EUR), 3.75% due 2/21/2024 |
4,466,000 |
4,951,381 |
|
e,f |
Petrorio
Luxembourg Sarl, 6.125% due 6/9/2026 |
800,000 |
801,472 |
| |
SA
Global Sukuk Ltd., |
|
|
|
e,f |
0.946%
due 6/17/2024 |
4,969,000 |
4,754,886 |
|
e,f |
1.602%
due 6/17/2026 |
6,076,000 |
5,713,445 |
|
e,f |
Saudi
Arabian Oil Co., 2.75% due 4/16/2022 |
1,846,000 |
1,846,369 |
|
e |
Summit
Midstream Holdings LLC/Summit Midstream Finance Corp., 8.50% due 10/15/2026 |
848,000 |
810,383 |
|
c,d |
Summit
Midstream Partners LP, Series A, 9.50% (LIBOR 3 Month + 7.43%) due 12/15/2022 |
2,114,000 |
1,638,435 |
| |
Sunoco
LP/Sunoco Finance Corp., |
|
|
| |
5.875%
due 3/15/2028 |
12,500,000 |
12,695,250 |
| |
6.00%
due 4/15/2027 |
3,000,000 |
3,062,550 |
| |
Tennessee
Gas Pipeline Co. LLC, 7.00% due 3/15/2027 |
2,251,000 |
2,593,084
|
| |
|
|
143,307,755
|
| |
Food
& Staples Retailing — 0.5% |
|
|
| |
Food
& Staples Retailing — 0.5% |
|
|
| |
7-Eleven,
Inc., |
|
|
|
e |
0.625%
due 2/10/2023 |
1,600,000 |
1,575,296 |
|
e |
0.80%
due 2/10/2024 |
5,236,000 |
5,030,173 |
| |
Albertsons
Cos., Inc./Safeway, Inc./New Albertsons LP/Albertsons LLC, |
|
|
|
e |
4.625%
due 1/15/2027 |
9,788,000 |
9,473,316 |
|
e |
5.875%
due 2/15/2028 |
4,365,000 |
4,358,147 |
|
e |
KeHE
Distributors LLC/KeHE Finance Corp., 8.625% due 10/15/2026 |
3,074,000 |
3,258,624
|
| |
|
|
23,695,556
|
| |
Food,
Beverage & Tobacco — 1.9% |
|
|
| |
Beverages
— 0.5% |
|
|
|
e,f |
Becle
SAB de CV, 2.50% due 10/14/2031 |
10,661,000 |
9,495,966 |
|
e,f |
Central
American Bottling Corp./CBC Bottling Holdco SL/Beliv Holdco SL, 5.25% due 4/27/2029 |
10,825,000 |
10,796,639
|
| |
Food
Products — 0.8% |
|
|
|
e,f |
Barry
Callebaut Services NV, 5.50% due 6/15/2023 |
13,052,000 |
13,410,147 |
|
d |
General
Mills, Inc., 1.249% (LIBOR 3 Month + 1.01%) due 10/17/2023 |
2,530,000 |
2,558,690 |
| |
Kraft
Heinz Foods Co., 3.875% due 5/15/2027 |
4,582,000 |
4,653,113 |
| |
Post
Holdings, Inc., |
|
|
|
e |
4.625%
due 4/15/2030 |
8,247,000 |
7,437,062 |
|
e |
5.625%
due 1/15/2028 |
8,445,000 |
8,294,003
|
| |
Tobacco
— 0.6% |
|
|
| |
Altria
Group, Inc., 2.45% due 2/4/2032 |
9,890,000 |
8,599,256 |
| |
BAT
Capital Corp., 2.726% due 3/25/2031 |
7,615,000 |
6,718,410 |
|
e |
Vector
Group Ltd., 10.50% due 11/1/2026 |
11,512,000 |
11,793,008
|
| |
|
|
83,756,294
|
| |
Health
Care Equipment & Services — 2.0% |
|
|
| |
Health
Care Equipment & Supplies — 0.3% |
|
|
|
e |
Hologic,
Inc., 3.25% due 2/15/2029 |
10,357,000 |
9,668,570 |
|
e,f |
Olympus
Corp., 2.143% due 12/8/2026 |
5,510,000 |
5,199,071
|
| |
Health
Care Providers & Services — 1.3% |
|
|
| |
Centene
Corp., 3.375% due 2/15/2030 |
10,647,000 |
10,028,622 |
| |
Charles
River Laboratories International, Inc., |
|
|
|
e |
3.75%
due 3/15/2029 |
4,567,000 |
4,312,344 |
|
e |
4.25%
due 5/1/2028 |
4,480,000 |
4,379,335 |
|
e |
Highmark,
Inc., 1.45% due 5/10/2026 |
8,000,000 |
7,403,040 |
| |
Humana,
Inc., 0.65% due 8/3/2023 |
6,500,000 |
6,341,075 |
| |
Tenet
Healthcare Corp., |
|
|
See
notes to financial statements.
|
Thornburg Fixed
Income Funds Semi-Annual Report | 57 |
Schedule of Investments, Continued
Thornburg Strategic Income Fund | March 31, 2022 (Unaudited)
| |
Issuer-Description
|
SHARES/
PRINCIPAL AMOUNT |
VALUE
|
| |
4.625%
due 7/15/2024 |
$ 3,656,000
|
$ 3,672,781
|
|
e |
4.875%
due 1/1/2026 |
2,826,000 |
2,859,629 |
|
e |
5.125%
due 11/1/2027 |
12,798,000 |
12,864,038 |
|
e |
Universal
Health Services, Inc., 2.65% due 10/15/2030 |
4,646,000 |
4,224,561
|
| |
Health
Care Technology — 0.4% |
|
|
|
e |
Change
Healthcare Holdings LLC/Change Healthcare Finance, Inc., 5.75% due 3/1/2025 |
16,315,000 |
16,312,390
|
| |
|
|
87,265,456
|
| |
Household
& Personal Products — 1.6% |
|
|
| |
Household
Products — 1.4% |
|
|
|
e |
Energizer
Holdings, Inc., 4.75% due 6/15/2028 |
8,110,000 |
7,376,045 |
|
e |
Kronos
Acquisition Holdings, Inc./KIK Custom Products, Inc., 5.00% due 12/31/2026 |
4,585,000 |
4,228,195 |
| |
Prestige
Brands, Inc., |
|
|
|
e |
3.75%
due 4/1/2031 |
6,386,000 |
5,699,760 |
|
e |
5.125%
due 1/15/2028 |
12,321,000 |
12,225,389 |
| |
Scotts
Miracle-Gro Co., 4.375% due 2/1/2032 |
13,166,000 |
11,662,180 |
| |
Spectrum
Brands, Inc., |
|
|
|
e |
3.875%
due 3/15/2031 |
9,098,000 |
8,016,248 |
|
e |
5.50%
due 7/15/2030 |
5,705,000 |
5,471,494 |
| |
Spectrum
Brands, Inc. (EUR), 4.00% due 10/1/2026 |
2,900,000 |
3,189,325 |
|
e |
Spectrum
Brands, Inc.(EUR), 4.00% due 10/1/2026 |
2,000,000 |
2,199,534
|
| |
Personal
Products — 0.2% |
|
|
|
e |
Edgewell
Personal Care Co., 5.50% due 6/1/2028 |
10,292,000 |
10,244,657
|
| |
|
|
70,312,827
|
| |
Insurance
— 3.1% |
|
|
| |
Insurance
— 3.1% |
|
|
|
e,f |
Ascot
Group Ltd., 4.25% due 12/15/2030 |
2,507,000 |
2,477,016 |
| |
Brighthouse
Financial Global Funding, |
|
|
|
d,e |
0.867%
(SOFR + 0.76%) due 4/12/2024 |
2,307,000 |
2,311,937 |
|
e |
1.55%
due 5/24/2026 |
2,089,000 |
1,934,748 |
|
e |
2.00%
due 6/28/2028 |
4,823,000 |
4,310,990 |
| |
Brighthouse
Financial, Inc., 5.625% due 5/15/2030 |
3,750,000 |
4,131,750 |
|
e,f |
DaVinciRe
Holdings Ltd., 4.75% due 5/1/2025 |
4,790,000 |
4,783,821 |
|
d |
Enstar
Finance LLC, 5.75% (5-Yr. CMT + 5.47%) due 9/1/2040 |
1,672,000 |
1,671,281 |
| |
Enstar
Group Ltd., |
|
|
|
f |
3.10%
due 9/1/2031 |
2,645,000 |
2,368,412 |
|
f |
4.95%
due 6/1/2029 |
4,726,000 |
4,904,690 |
| |
Equitable
Financial Life Global Funding, |
|
|
|
e |
1.00%
due 1/9/2026 |
3,000,000 |
2,754,930 |
|
e |
1.40%
due 8/27/2027 |
4,620,000 |
4,152,687 |
|
e |
1.80%
due 3/8/2028 |
4,074,000 |
3,665,500 |
| |
F&G
Global Funding, |
|
|
|
e |
1.75%
due 6/30/2026 |
11,945,000 |
11,089,380 |
|
e |
2.00%
due 9/20/2028 |
6,641,000 |
5,942,632 |
|
e |
2.30%
due 4/11/2027 |
3,210,000 |
3,001,607 |
| |
Fairfax
Financial Holdings Ltd., |
|
|
|
f |
3.375%
due 3/3/2031 |
1,520,000 |
1,423,358 |
|
f |
4.625%
due 4/29/2030 |
4,673,000 |
4,814,592 |
|
f |
4.85%
due 4/17/2028 |
1,105,000 |
1,143,288 |
|
e,f |
Fidelis
Insurance Holdings Ltd., 4.875% due 6/30/2030 |
4,409,000 |
4,845,006 |
| |
Fidelity
National Financial, Inc., 3.40% due 6/15/2030 |
3,137,000 |
3,018,516 |
| |
First
American Financial Corp., 4.00% due 5/15/2030 |
1,843,000 |
1,850,317 |
| |
GA
Global Funding Trust, |
|
|
|
d,e |
0.755%
(SOFR + 0.50%) due 9/13/2024 |
5,322,000 |
5,243,341 |
|
e |
1.00%
due 4/8/2024 |
435,000 |
416,443 |
|
e |
2.25%
due 1/6/2027 |
3,580,000 |
3,343,326 |
| |
Mercury
General Corp., 4.40% due 3/15/2027 |
2,438,000 |
2,505,118 |
|
d,e |
Nationwide
Mutual Insurance Co., 3.116% (LIBOR 3 Month + 2.29%) due 12/15/2024 |
6,178,000 |
6,180,101 |
|
d,e |
Pacific
Life Global Funding II, 0.856% (SOFR + 0.62%) due 6/4/2026 |
4,533,000 |
4,473,890 |
| e |
Protective
Life Corp., 3.40% due 1/15/2030 |
4,902,000 |
4,845,676 |
58 | Thornburg Fixed Income Funds Semi-Annual Report
|
See notes to
financial statements. |
Schedule of Investments,
Continued
Thornburg Strategic Income Fund | March 31, 2022 (Unaudited)
| |
Issuer-Description
|
SHARES/
PRINCIPAL AMOUNT |
VALUE
|
| |
Reliance
Standard Life Global Funding II, |
|
|
|
e |
1.512%
due 9/28/2026 |
$ 4,000,000
|
$ 3,681,080
|
|
e |
2.75%
due 5/7/2025 - 1/21/2027 |
6,420,000 |
6,241,257 |
|
e |
3.85%
due 9/19/2023 |
3,000,000 |
3,040,710 |
|
e |
RGA
Global Funding, 2.00% due 11/30/2026 |
4,124,000 |
3,910,418 |
|
e |
Sammons
Financial Group, Inc., 4.45% due 5/12/2027 |
2,000,000 |
2,056,280 |
|
e |
Security
Benefit Global Funding, 1.25% due 5/17/2024 |
2,404,000 |
2,297,262 |
| |
Stewart
Information Services Corp., 3.60% due 11/15/2031 |
12,275,000 |
11,221,437
|
| |
Semiconductors
& Semiconductor Equipment — 0.0% |
|
|
| |
TSMC
Global Ltd., |
|
|
|
e,f |
1.00%
due 9/28/2027 |
250,000 |
220,980 |
|
e,f |
1.75%
due 4/23/2028 |
240,000 |
218,681
|
| |
|
|
136,492,458
|
| |
Materials
— 3.8% |
|
|
| |
Chemicals
— 1.0% |
|
|
|
e,f |
NOVA
Chemicals Corp., 5.25% due 6/1/2027 |
9,300,000 |
9,269,589 |
|
e,f |
Nufarm
Australia Ltd./Nufarm Americas, Inc., 5.00% due 1/27/2030 |
10,325,000 |
10,186,129 |
| |
OCP
SA, |
|
|
|
e,f |
3.75%
due 6/23/2031 |
7,800,000 |
7,082,634 |
|
e,f |
5.625%
due 4/25/2024 |
4,710,000 |
4,841,032 |
| |
Phosagro
OAO Via Phosagro Bond Funding DAC, |
|
|
|
e,f |
3.05%
due 1/23/2025 |
933,000 |
261,240 |
|
e,f |
3.949%
due 4/24/2023 |
11,250,000 |
3,150,000 |
|
e,f |
SPCM
SA, 3.125% due 3/15/2027 |
8,405,000 |
7,735,290
|
| |
Containers
& Packaging — 1.7% |
|
|
|
e,f |
Ardagh
Metal Packaging Finance USA LLC/Ardagh Metal Packaging Finance plc, 3.25% due 9/1/2028 |
16,310,000 |
14,804,587 |
| |
Ball
Corp., |
|
|
| |
2.875%
due 8/15/2030 |
7,300,000 |
6,547,589 |
| |
3.125%
due 9/15/2031 |
5,414,000 |
4,833,673 |
|
e |
Crown
Americas LLC, 5.25% due 4/1/2030 |
7,000,000 |
7,173,530 |
| |
Graphic
Packaging International LLC, |
|
|
|
e |
3.50%
due 3/15/2028 - 3/1/2029 |
8,150,000 |
7,645,077 |
| |
4.875%
due 11/15/2022 |
8,160,000 |
8,210,021 |
|
e |
Matthews
International Corp., Class C, 5.25% due 12/1/2025 |
15,091,000 |
15,218,821 |
|
e |
Sealed
Air Corp., 5.125% due 12/1/2024 |
4,500,000 |
4,671,945 |
|
e |
Silgan
Holdings, Inc., 1.40% due 4/1/2026 |
6,169,000 |
5,633,284
|
| |
Metals
& Mining — 1.1% |
|
|
|
f |
AngloGold
Ashanti Holdings plc, 3.375% due 11/1/2028 |
15,715,000 |
14,657,852 |
|
e |
Cleveland-Cliffs,
Inc., 6.75% due 3/15/2026 |
16,150,000 |
17,010,795 |
|
e |
Compass
Minerals International, Inc., 6.75% due 12/1/2027 |
2,144,000 |
2,169,835 |
|
e,f |
Metalloinvest
Finance DAC, Series 2022-1A Class A, 3.375% due 10/22/2028 |
7,500,000 |
1,500,000 |
| |
Stillwater
Mining Co., |
|
|
|
e |
4.00%
due 11/16/2026 |
9,328,000 |
8,966,913 |
|
e |
4.50%
due 11/16/2029 |
3,050,000 |
2,835,219
|
| |
|
|
164,405,055
|
| |
Media
& Entertainment — 0.9% |
|
|
| |
Media
— 0.9% |
|
|
| |
CCO
Holdings LLC/CCO Holdings Capital Corp., |
|
|
|
e |
4.25%
due 2/1/2031 |
6,548,000 |
5,968,371 |
|
e |
4.75%
due 3/1/2030 |
8,394,000 |
8,068,313 |
|
e |
Directv
Financing LLC/Directv Financing Co.-Obligor, Inc., 5.875% due 8/15/2027 |
3,880,000 |
3,824,981 |
|
e |
Magallanes,
Inc., 3.528% due 3/15/2024 |
4,585,000 |
4,583,441 |
|
e |
News
Corp., 5.125% due 2/15/2032 |
1,980,000 |
1,990,910 |
|
e,f |
Telenet
Finance Luxembourg Notes Sarl, 5.50% due 3/1/2028 |
14,200,000 |
13,889,162
|
| |
|
|
38,325,178
|
| |
Pharmaceuticals,
Biotechnology & Life Sciences — 0.2% |
|
|
| |
Biotechnology
— 0.1% |
|
|
| |
Bio-Rad
Laboratories, Inc., 3.30% due 3/15/2027 |
2,505,000 |
2,473,637 |
| f |
Royalty
Pharma plc, 1.20% due 9/2/2025 |
4,086,000 |
3,780,490 |
See
notes to financial statements.
|
Thornburg Fixed
Income Funds Semi-Annual Report | 59 |
Schedule of Investments, Continued
Thornburg Strategic Income Fund | March 31, 2022 (Unaudited)
| |
Issuer-Description
|
SHARES/
PRINCIPAL AMOUNT |
VALUE
|
| |
Life
Sciences Tools & Services — 0.0% |
|
|
|
e |
Avantor
Funding, Inc. (EUR), 2.625% due 11/1/2025 |
$ 2,000,000
|
$ 2,242,147
|
| |
Pharmaceuticals
— 0.1% |
|
|
|
a,b,h |
Atlas
U.S. Royalty LLC Participation Rights, Zero coupon due 3/15/2027 |
5,450,000 |
0 |
|
e |
Bayer
US Finance II LLC, 4.25% due 12/15/2025 |
2,500,000 |
2,545,600
|
| |
|
|
11,041,874
|
| |
Real
Estate — 1.4% |
|
|
| |
Equity
Real Estate Investment Trusts — 1.2% |
|
|
| |
American
Tower Corp., |
|
|
| |
1.45%
due 9/15/2026 |
1,842,000 |
1,685,025 |
|
k |
3.65%
due 3/15/2027 |
2,830,000 |
2,825,472 |
|
k |
4.05%
due 3/15/2032 |
1,546,000 |
1,550,654 |
| |
Crown
Castle International Corp., |
|
|
| |
1.05%
due 7/15/2026 |
2,636,000 |
2,385,975 |
| |
2.10%
due 4/1/2031 |
5,453,000 |
4,723,552 |
| |
Iron
Mountain, Inc., |
|
|
|
e |
5.00%
due 7/15/2028 |
2,880,000 |
2,811,571 |
|
e |
5.25%
due 7/15/2030 |
8,085,000 |
7,921,117 |
| |
Retail
Opportunity Investments Partnership LP (Guaranty: Retail Opportunity Investments Corp.), 5.00% due 12/15/2023 |
1,500,000 |
1,530,480 |
| |
SBA
Tower Trust, |
|
|
|
e |
1.631%
due 5/15/2051 |
13,500,000 |
12,686,552 |
|
e |
1.84%
due 4/15/2027 |
3,400,000 |
3,105,143 |
|
e |
3.448%
due 3/15/2048 |
763,000 |
763,107 |
| |
Service
Properties Trust, |
|
|
| |
4.35%
due 10/1/2024 |
2,295,000 |
2,218,324 |
| |
4.65%
due 3/15/2024 |
900,000 |
865,503 |
| |
4.95%
due 2/15/2027 |
2,850,000 |
2,636,564 |
| |
5.25%
due 2/15/2026 |
700,000 |
661,976 |
| |
Vornado
Realty LP, |
|
|
| |
2.15%
due 6/1/2026 |
1,151,000 |
1,077,912 |
| |
3.40%
due 6/1/2031 |
957,000 |
896,393
|
| |
Mortgage
Real Estate Investment Trusts — 0.1% |
|
|
| |
Sun
Communities Operating LP, 2.30% due 11/1/2028 |
5,153,000 |
4,679,852
|
| |
Real
Estate Management & Development — 0.1% |
|
|
|
e |
Cushman
& Wakefield US Borrower LLC, 6.75% due 5/15/2028 |
6,259,000 |
6,540,467
|
| |
|
|
61,565,639
|
| |
Retailing
— 0.5% |
|
|
| |
Internet
& Direct Marketing Retail — 0.4% |
|
|
|
e,f |
B2W
Digital Lux Sarl, 4.375% due 12/20/2030 |
2,000,000 |
1,722,220 |
| |
MercadoLibre,
Inc., 2.375% due 1/14/2026 |
15,315,000 |
14,280,165
|
| |
Specialty
Retail — 0.1% |
|
|
| |
Advance
Auto Parts, Inc., |
|
|
| |
1.75%
due 10/1/2027 |
1,792,000 |
1,616,097 |
| |
3.90%
due 4/15/2030 |
2,996,000 |
2,993,304
|
| |
|
|
20,611,786
|
| |
Semiconductors
& Semiconductor Equipment — 1.5% |
|
|
| |
Semiconductors
& Semiconductor Equipment — 1.5% |
|
|
|
f |
Broadcom
Corp./Broadcom Cayman Finance Ltd., 3.875% due 1/15/2027 |
4,975,000 |
5,008,531 |
| |
Broadcom,
Inc., |
|
|
|
e |
3.187%
due 11/15/2036 |
4,861,000 |
4,271,506 |
|
e,k |
4.00%
due 4/15/2029 |
940,000 |
939,539 |
| |
4.11%
due 9/15/2028 |
2,104,000 |
2,134,634 |
| |
4.25%
due 4/15/2026 |
1,046,000 |
1,074,033 |
| |
Microchip
Technology, Inc., |
|
|
| |
0.972%
due 2/15/2024 |
5,137,000 |
4,928,541 |
| |
4.25%
due 9/1/2025 |
11,300,000 |
11,446,109 |
| |
Micron
Technology, Inc., |
|
|
| |
4.663%
due 2/15/2030 |
1,186,000 |
1,247,708 |
| |
5.327%
due 2/6/2029 |
2,031,000 |
2,207,738 |
60 | Thornburg Fixed Income Funds Semi-Annual Report
|
See notes to
financial statements. |
Schedule of Investments,
Continued
Thornburg Strategic Income Fund | March 31, 2022 (Unaudited)
| |
Issuer-Description
|
SHARES/
PRINCIPAL AMOUNT |
VALUE
|
| |
Qorvo,
Inc., |
|
|
|
e |
3.375%
due 4/1/2031 |
$ 6,367,000
|
$ 5,789,768
|
| |
4.375%
due 10/15/2029 |
5,936,000 |
5,945,616 |
|
e,f |
Renesas
Electronics Corp., 1.543% due 11/26/2024 |
6,990,000 |
6,651,195 |
| |
SK
Hynix, Inc., |
|
|
|
e,f |
1.00%
due 1/19/2024 |
2,800,000 |
2,690,296 |
|
e,f |
1.50%
due 1/19/2026 |
4,400,000 |
4,077,480 |
|
e,f |
2.375%
due 1/19/2031 |
2,812,000 |
2,461,512 |
| |
Skyworks
Solutions, Inc., 1.80% due 6/1/2026 |
1,160,000 |
1,080,552 |
| |
TSMC
Arizona Corp., 1.75% due 10/25/2026 |
4,950,000 |
4,640,031
|
| |
|
|
66,594,789
|
| |
Software
& Services — 4.6% |
|
|
| |
Information
Technology Services — 1.4% |
|
|
| |
Block
Financial LLC, 2.50% due 7/15/2028 |
3,605,000 |
3,302,216 |
| |
DXC
Technology Co., 2.375% due 9/15/2028 |
11,657,000 |
10,540,493 |
|
f |
Genpact
Luxembourg Sarl, 3.375% due 12/1/2024 |
4,939,000 |
4,927,492 |
|
f |
Genpact
Luxembourg Sarl/Genpact USA, Inc., 1.75% due 4/10/2026 |
2,762,000 |
2,563,550 |
| |
Global
Payments, Inc., |
|
|
| |
1.50%
due 11/15/2024 |
2,230,000 |
2,132,281 |
|
i |
2.15%
due 1/15/2027 |
1,394,000 |
1,310,067 |
| |
Kyndryl
Holdings, Inc., |
|
|
|
e |
2.05%
due 10/15/2026 |
3,968,000 |
3,565,367 |
|
e |
2.70%
due 10/15/2028 |
8,296,000 |
7,212,542 |
| |
Leidos,
Inc., 2.30% due 2/15/2031 |
2,220,000 |
1,924,984 |
| |
Sabre
GLBL, Inc., |
|
|
|
e |
7.375%
due 9/1/2025 |
3,586,000 |
3,745,398 |
|
e |
9.25%
due 4/15/2025 |
2,267,000 |
2,514,330 |
|
e |
Science
Applications International Corp., 4.875% due 4/1/2028 |
15,749,000 |
15,602,062 |
|
e |
Wipro
IT Services LLC, 1.50% due 6/23/2026 |
3,953,000 |
3,639,488
|
| |
Interactive
Media & Services — 0.1% |
|
|
| |
Baidu,
Inc., |
|
|
|
f |
1.72%
due 4/9/2026 |
2,149,000 |
1,981,249 |
|
f |
4.375%
due 5/14/2024 |
1,424,000 |
1,449,148
|
| |
Internet
Software & Services — 0.7% |
|
|
|
e |
Arches
Buyer, Inc., 4.25% due 6/1/2028 |
11,799,000 |
10,984,515 |
|
e,f |
Prosus
NV, 3.061% due 7/13/2031 |
17,750,000 |
14,749,540 |
|
e |
Twitter,
Inc., 3.875% due 12/15/2027 |
3,815,000 |
3,704,708
|
| |
Professional
Services — 0.3% |
|
|
|
e |
Korn
Ferry, 4.625% due 12/15/2027 |
15,003,000 |
14,625,975
|
| |
Software
— 2.1% |
|
|
| |
CDK
Global, Inc., |
|
|
| |
4.875%
due 6/1/2027 |
13,685,000 |
13,831,019 |
|
e |
5.25%
due 5/15/2029 |
460,000 |
463,997 |
|
e |
Fair
Isaac Corp., 4.00% due 6/15/2028 |
11,087,000 |
10,726,672 |
|
e |
Infor,
Inc., 1.75% due 7/15/2025 |
2,250,000 |
2,109,758 |
|
e |
LogMeIn,
Inc, 5.50% due 9/1/2027 |
2,467,000 |
2,308,643 |
| |
MSCI,
Inc., |
|
|
|
e |
3.875%
due 2/15/2031 |
9,973,000 |
9,466,671 |
|
e |
4.00%
due 11/15/2029 |
6,289,000 |
6,110,644 |
|
e,f |
Open
Text Corp., 3.875% due 2/15/2028 |
7,761,000 |
7,434,029 |
|
e |
Open
Text Holdings, Inc., 4.125% due 12/1/2031 |
7,667,000 |
7,178,612 |
| |
Oracle
Corp., |
|
|
| |
1.65%
due 3/25/2026 |
4,565,000 |
4,249,559 |
| |
2.30%
due 3/25/2028 |
2,257,000 |
2,066,667 |
|
e |
PTC,
Inc., 3.625% due 2/15/2025 |
14,847,000 |
14,689,919 |
|
e |
S&P
Global, Inc., 2.45% due 3/1/2027 |
3,728,000 |
3,627,642 |
| |
VMware,
Inc., |
|
|
| |
1.00%
due 8/15/2024 |
1,180,000 |
1,124,823 |
| |
4.50%
due 5/15/2025 |
4,040,000 |
4,163,382
|
| |
|
|
200,027,442
|
| |
Technology
Hardware & Equipment — 1.4% |
|
|
See
notes to financial statements.
|
Thornburg Fixed
Income Funds Semi-Annual Report | 61 |
Schedule of Investments, Continued
Thornburg Strategic Income Fund | March 31, 2022 (Unaudited)
| |
Issuer-Description
|
SHARES/
PRINCIPAL AMOUNT |
VALUE
|
| |
Communications
Equipment — 0.3% |
|
|
| |
Motorola
Solutions, Inc., 2.30% due 11/15/2030 |
$ 337,000
|
$ 295,478
|
|
f |
Telefonaktiebolaget
LM Ericsson, 4.125% due 5/15/2022 |
13,803,000 |
13,803,000
|
| |
Electronic
Equipment, Instruments & Components — 0.6% |
|
|
|
f |
Flex
Ltd., 4.875% due 5/12/2030 |
4,671,000 |
4,850,553 |
|
e,f |
Sensata
Technologies BV, 4.875% due 10/15/2023 |
4,838,000 |
5,000,702 |
|
e |
TD
SYNNEX Corp., 1.75% due 8/9/2026 |
10,183,000 |
9,323,045 |
| |
Trimble,
Inc., 4.75% due 12/1/2024 |
6,525,000 |
6,713,116 |
| |
Vontier
Corp., |
|
|
| |
1.80%
due 4/1/2026 |
1,533,000 |
1,386,583 |
| |
2.40%
due 4/1/2028 |
1,095,000 |
964,739
|
| |
Technology
Hardware, Storage & Peripherals — 0.5% |
|
|
| |
Dell
International LLC/EMC Corp., 4.90% due 10/1/2026 |
5,123,000 |
5,377,716 |
| |
HP,
Inc., 3.00% due 6/17/2027 |
3,237,000 |
3,154,198 |
|
f |
Lenovo
Group Ltd., 5.875% due 4/24/2025 |
10,993,000 |
11,498,238 |
| |
NetApp,
Inc., 2.375% due 6/22/2027 |
1,331,000 |
1,267,551
|
| |
|
|
63,634,919
|
| |
Telecommunication
Services — 1.6% |
|
|
| |
Diversified
Telecommunication Services — 0.4% |
|
|
| |
Videotron
Ltd., |
|
|
|
e,f |
5.125%
due 4/15/2027 |
7,150,000 |
7,229,151 |
|
e,f |
5.375%
due 6/15/2024 |
6,000,000 |
6,169,140 |
|
e,f |
Virgin
Media Secured Finance plc, 5.50% due 5/15/2029 |
1,800,000 |
1,782,486
|
| |
Wireless
Telecommunication Services — 1.2% |
|
|
| |
America
Movil SAB de CV (MXN), 6.45% due 12/5/2022 |
45,000,000 |
2,233,846 |
| |
Digicel
International Finance Ltd./Digicel Holdings Bermuda Ltd., |
|
|
|
e,f |
8.00%
due 12/31/2026 |
1,111,755 |
1,033,932 |
|
e,f |
8.75%
due 5/25/2024 |
4,866,916 |
4,846,839 |
|
e,f |
SK
Telecom Co. Ltd., 3.75% due 4/16/2023 |
3,000,000 |
3,032,970 |
| |
Sprint
Communications, Inc., 9.25% due 4/15/2022 |
20,251,000 |
20,308,716 |
| |
T-Mobile
USA, Inc., |
|
|
| |
3.375%
due 4/15/2029 |
5,540,000 |
5,280,063 |
|
e |
3.375%
due 4/15/2029 |
4,550,000 |
4,330,508 |
| |
5.375%
due 4/15/2027 |
3,690,000 |
3,791,881 |
| |
Vmed
O2 UK Financing I plc, |
|
|
|
e,f |
4.25%
due 1/31/2031 |
7,818,000 |
7,128,765 |
|
e,f |
4.75%
due 7/15/2031 |
1,500,000 |
1,411,800
|
| |
|
|
68,580,097
|
| |
Transportation
— 0.2% |
|
|
| |
Airlines
— 0.2% |
|
|
| |
American
Airlines Pass Through Trust, |
|
|
| |
Series
2013-2, 4.95% due 7/15/2024 |
4,118,867 |
4,073,641 |
| |
Series
2016-3 Class B, 3.75% due 4/15/2027 |
840,406 |
772,761 |
|
e |
British
Airways Pass Through Trust, Series 2020-1 Class A, 4.25% due 5/15/2034 |
1,058,136 |
1,050,666 |
| |
US
Airways Pass Through Trust, |
|
|
| |
Series
2010-1A Class PTT, 6.25% due 10/22/2024 |
644,256 |
645,088 |
| |
Series
2012-1A Class PTT, 5.90% due 4/1/2026 |
910,942 |
932,003
|
| |
|
|
7,474,159
|
| |
Utilities
— 4.6% |
|
|
| |
Electric
Utilities — 3.5% |
|
|
| |
AEP
Texas, Inc., Series I, 2.10% due 7/1/2030 |
4,500,000 |
4,013,505 |
|
e,f |
AES
Andres BV, 5.70% due 5/4/2028 |
8,167,000 |
7,727,697 |
|
e |
Alexander
Funding Trust, 1.841% due 11/15/2023 |
14,718,000 |
14,267,188 |
|
e |
Alliant
Energy Finance LLC, 1.40% due 3/15/2026 |
1,500,000 |
1,373,460 |
| |
American
Electric Power Co., Inc., 2.031% due 3/15/2024 |
3,302,000 |
3,244,743 |
| |
Appalachian
Power Co., Series AA, 2.70% due 4/1/2031 |
4,705,000 |
4,380,637 |
| |
Black
Hills Corp., |
|
|
| |
1.037%
due 8/23/2024 |
8,226,000 |
7,853,938 |
| |
2.50%
due 6/15/2030 |
1,000,000 |
909,360 |
| e |
Boston
Gas Co., 3.757% due 3/16/2032 |
6,140,000 |
6,133,369 |
62 | Thornburg Fixed Income Funds Semi-Annual Report
|
See notes to
financial statements. |
Schedule of Investments,
Continued
Thornburg Strategic Income Fund | March 31, 2022 (Unaudited)
| |
Issuer-Description
|
SHARES/
PRINCIPAL AMOUNT |
VALUE
|
|
d |
CenterPoint
Energy, Inc., 0.837% (SOFRINDX + 0.65%) due 5/13/2024 |
$ 2,500,000
|
$ 2,479,650
|
| |
Comision
Federal de Electricidad, |
|
|
|
e,f |
3.348%
due 2/9/2031 |
10,720,000 |
9,432,528 |
|
e,f |
4.688%
due 5/15/2029 |
5,000,000 |
4,935,500 |
|
f |
5.00%
due 9/29/2036 |
869,000 |
848,492 |
| |
Enel
Finance International NV, |
|
|
|
e,f |
1.375%
due 7/12/2026 |
2,750,000 |
2,527,938 |
|
e,f |
1.875%
due 7/12/2028 |
1,250,000 |
1,124,500 |
| |
Entergy
Texas, Inc., |
|
|
| |
1.50%
due 9/1/2026 |
5,866,000 |
5,392,496 |
| |
3.45%
due 12/1/2027 |
3,000,000 |
2,967,930 |
|
e |
Evergy
Missouri West, Inc., 3.75% due 3/15/2032 |
4,100,000 |
4,122,673 |
|
e |
Mid-Atlantic
Interstate Transmission LLC, 4.10% due 5/15/2028 |
945,000 |
956,302 |
|
e |
Midland
Cogeneration Venture LP, 6.00% due 3/15/2025 |
418,145 |
424,522 |
|
e |
Monongahela
Power Co., 3.55% due 5/15/2027 |
3,305,000 |
3,298,258 |
| |
NextEra
Energy Capital Holdings, Inc., 0.65% due 3/1/2023 |
10,000,000 |
9,860,200 |
| |
Pacific
Gas & Electric Co., 3.25% due 2/16/2024 |
8,680,000 |
8,651,616 |
| |
Pacific
Gas and Electric Co., |
|
|
| |
1.367%
due 3/10/2023 |
3,318,000 |
3,259,072 |
| |
1.75%
due 6/16/2022 |
7,888,000 |
7,878,219 |
|
d |
PPL
Electric Utilities Corp., 0.601% (SOFR + 0.33%) due 6/24/2024 |
3,560,000 |
3,538,248 |
| |
Puget
Energy, Inc., |
|
|
| |
2.379%
due 6/15/2028 |
2,980,000 |
2,731,796 |
| |
4.10%
due 6/15/2030 |
1,950,000 |
1,951,658 |
| |
4.224%
due 3/15/2032 |
3,655,000 |
3,663,809 |
| |
Southern
California Edison Co., Series J 0.70% due 8/1/2023 |
8,857,000 |
8,631,855 |
| |
Southern
Co., 3.25% due 7/1/2026 |
6,725,000 |
6,728,094 |
|
e |
Toledo
Edison Co., 2.65% due 5/1/2028 |
3,933,000 |
3,778,826 |
| |
Transelec
SA, |
|
|
|
e,f |
4.25%
due 1/14/2025 |
400,000 |
407,720 |
|
e,f |
4.625%
due 7/26/2023 |
2,409,000 |
2,467,346
|
| |
Gas
Utilities — 1.1% |
|
|
|
d |
CenterPoint
Energy Resources Corp., 1.004% (LIBOR 3 Month + 0.50%) due 3/2/2023 |
1,263,000 |
1,262,129 |
|
e,f |
ENN
Clean Energy International Investment Ltd., 3.375% due 5/12/2026 |
9,524,000 |
8,873,701 |
|
d |
ONE
Gas, Inc., 1.355% (LIBOR 3 Month + 0.61%) due 3/11/2023 |
5,588,000 |
5,591,018 |
|
e,f |
Rockpoint
Gas Storage Canada Ltd., 7.00% due 3/31/2023 |
16,816,000 |
16,804,901 |
| |
Southwest
Gas Corp., 4.05% due 3/15/2032 |
5,870,000 |
5,851,568 |
|
d |
Spire
Missouri, Inc., 0.732% (SOFR + 0.50%) due 12/2/2024 |
12,345,000 |
12,339,074
|
| |
|
|
202,685,536
|
| |
Total
Corporate Bonds (Cost $2,191,173,567) |
|
2,072,421,712
|
| |
Convertible
Bonds — 0.7% |
|
|
| |
Diversified
Financials — 0.3% |
|
|
| |
Diversified
Financial Services — 0.3% |
|
|
| |
EZCORP,
Inc., |
|
|
| |
2.375%
due 5/1/2025 |
13,431,000 |
11,929,683 |
| |
2.875%
due 7/1/2024 |
215,000 |
209,850
|
| |
|
|
12,139,533
|
| |
Media
& Entertainment — 0.2% |
|
|
| |
Media
— 0.2% |
|
|
| |
Comcast
Holdings Corp. (Guaranty: Comcast Corp.), 2.00% due 10/15/2029 |
15,486,000 |
8,904,760
|
| |
|
|
8,904,760
|
| |
Real
Estate — 0.2% |
|
|
| |
Equity
Real Estate Investment Trusts — 0.2% |
|
|
|
e |
Radius
Global Infrastructure, Inc., 2.50% due 9/15/2026 |
11,200,000 |
10,599,344
|
| |
|
|
10,599,344
|
| |
Total
Convertible Bonds (Cost $32,266,961) |
|
31,643,637
|
| |
Long-Term
Municipal Bonds — 0.3% |
|
|
See
notes to financial statements.
|
Thornburg Fixed
Income Funds Semi-Annual Report | 63 |
Schedule of Investments, Continued
Thornburg Strategic Income Fund | March 31, 2022 (Unaudited)
| |
Issuer-Description
|
SHARES/
PRINCIPAL AMOUNT |
VALUE
|
| |
California
Health Facilities Financing Authority, 7.875% due 2/1/2026 |
$ 1,610,000
|
$ 1,618,607
|
| |
City
of Chicago IL GO, Series B, 7.045% due 1/1/2029 |
2,225,000 |
2,444,327 |
| |
City
of Detroit GO, |
|
|
| |
Series
B |
|
|
| |
1.817%
due 4/1/2022 |
655,000 |
655,000 |
| |
2.017%
due 4/1/2023 |
275,000 |
272,002 |
| |
2.189%
due 4/1/2024 |
275,000 |
269,403 |
| |
2.511%
due 4/1/2025 |
465,000 |
453,186 |
| |
New
Jersey Transportation Trust Fund Authority, |
|
|
| |
2.551%
due 6/15/2023 |
2,115,000 |
2,120,516 |
| |
2.631%
due 6/15/2024 |
1,565,000 |
1,557,685 |
| |
New
York Transportation Development Corp., 4.248% due 9/1/2035 |
3,195,000 |
3,281,125 |
| |
West
Contra Costa USD GO, 2.612% due 8/1/2032 |
980,000 |
914,045
|
| |
Total
Long-Term Municipal Bonds (Cost $13,390,597) |
|
13,585,896
|
| |
Other
Government — 0.7% |
|
|
|
e,f |
Dominican
Republic International Bond, Series 144A 5.50% due 2/22/2029 |
6,450,000 |
6,391,950
|
|
e,f |
Finance
Department Government of Sharjah, 3.625% due 3/10/2033 |
14,382,000 |
13,219,215 |
| |
Indonesia
Treasury Bond (IDR), |
|
|
| |
7.50%
due 5/15/2038 - 4/15/2040 |
80,985,000,000
|
5,770,018 |
| |
8.375%
due 4/15/2039 |
44,919,000,000
|
3,452,281 |
| e,f |
Oman
Government International Bond, 5.625% due 1/17/2028 |
3,150,000 |
3,247,083
|
| |
Total
Other Government (Cost $33,256,053) |
|
32,080,547
|
| |
U.S.
Treasury Securities — 0.7% |
|
|
| |
United
States Treasury Notes, |
|
|
| |
0.375%,
11/30/2025 |
8,200,000 |
7,580,516 |
| |
0.625%,
5/15/2030 - 8/15/2030 |
19,127,000 |
16,661,547 |
| |
United
States Treasury Notes Inflationary Index, 0.125%, 1/15/2030 |
7,100,990 |
7,474,527
|
| |
Total
U.S. Treasury Securities (Cost $34,049,892) |
|
31,716,590
|
| |
U.S.
Government Agencies — 0.3% |
|
|
|
c,d,e |
Farm
Credit Bank of Texas, Series 4, 5.70% (5-Yr. CMT + 5.42%), 9/15/2025 |
9,580,000 |
9,963,200
|
| f |
Petroleos
Mexicanos (Guaranty: Export-Import Bank of the United States), 6.50%, 1/23/2029 |
4,118,000 |
4,085,262
|
| |
Total
U.S. Government Agencies (Cost $14,041,595) |
|
14,048,462
|
| |
Mortgage
Backed — 14.7% |
|
|
|
d,e |
Angel
Oak Mortgage Trust, Whole Loan Securities Trust CMO, Series 2022 Class B1, 4.083% due 12/25/2066 |
4,575,000 |
4,302,718
|
| |
Arroyo
Mortgage Trust, Whole Loan Securities Trust CMO, |
|
|
|
d,e |
Series
2019-1 Class A1, 3.805% due 1/25/2049 |
1,378,530 |
1,378,530 |
|
d,e |
Series
2019-3 Class A1, 2.962% due 10/25/2048 |
2,419,954 |
2,421,529 |
|
d,e |
Series
2021-1R Class A1, 1.175% due 10/25/2048 |
4,498,112 |
4,259,937 |
|
d |
Bear
Stearns ARM Trust, Whole Loan Securities Trust CMO, Series 2003-6 Class 2B1, 2.396% due 8/25/2033 |
29,093 |
29,093 |
|
e |
Bravo
Residential Funding Trust, Whole Loan Securities Trust CMO, Series 2019-1 Class A1C, 3.50% due 3/25/2058 |
1,695,811 |
1,700,052 |
|
d,e |
Bunker
Hill Loan Depositary Trust, Whole Loan Securities Trust CMO, Series 2020-1 Class B1, 5.082% due 2/25/2055 |
3,500,000 |
3,505,976 |
|
d,e |
Cascade
MH Asset Trust, Whole Loan Securities Trust CMO, Series 2021-MH1 Class B3, 7.595% due 2/25/2046 |
1,936,119 |
1,717,634 |
|
e |
CFMT
Issuer Trust, Whole Loan Securities Trust CMO, Series 2021-GRN1 Class A, 1.10% due 3/20/2041 |
1,734,028 |
1,670,849 |
| |
Chase
Home Lending Mortgage Trust, Whole Loan Securities Trust CMO, |
|
|
|
d,e |
Series
2019-1 Class B4, 3.917% due 3/25/2050 |
739,286 |
731,416 |
|
d,e |
Series
2019-1 Class B5, 3.917% due 3/25/2050 |
377,152 |
352,883 |
|
d,e |
Series
2019-1 Class B6, 3.054% due 3/25/2050 |
523,263 |
452,202 |
|
d,e |
Chase
Mortgage Finance Corp., Whole Loan Securities Trust CMO, Series 2016-SH2 Class M4, 3.75% due 12/25/2045 |
2,943,618 |
2,853,335 |
| |
CHNGE
Mortgage Trust, Whole Loan Securities Trust CMO, |
|
|
|
d,e |
4.663%
due 3/25/2067 |
7,015,000 |
6,197,429 |
| |
Series
2022-1 |
|
|
|
d,e |
3.007%
due 1/25/2067 |
4,756,194 |
4,634,403 |
|
d,e |
4.57%
due 1/25/2067 |
4,700,000 |
4,147,072 |
| |
CIM
Trust, Whole Loan Securities Trust CMO, |
|
|
|
d,e |
Series
18-INV1 Class A4, 4.00% due 8/25/2048 |
242,510 |
245,039 |
|
d,e,g |
Series
2020-J1 Class AIO1, 0.451% due 7/25/2050 |
18,367,683 |
187,475 |
| d,e,g |
Series
2020-J1 Class AIO2, 0.50% due 7/25/2050 |
16,382,355 |
212,378 |
64 | Thornburg Fixed Income Funds Semi-Annual Report
|
See notes to
financial statements. |
Schedule of Investments,
Continued
Thornburg Strategic Income Fund | March 31, 2022 (Unaudited)
| |
Issuer-Description
|
SHARES/
PRINCIPAL AMOUNT |
VALUE
|
|
d,e,g |
Series
2020-J1 Class AIOS, 0.20% due 6/25/2050 |
$ 21,657,893
|
$ 118,516
|
|
d,e |
Series
2020-J1 Class B4, 3.451% due 7/25/2050 |
349,089 |
314,744 |
|
d,e |
Series
2020-J1 Class B5, 3.451% due 7/25/2050 |
174,544 |
152,430 |
|
d,e |
Series
2020-J1 Class B6, 3.451% due 7/25/2050 |
325,435 |
181,196 |
|
d,e,g |
Series
2020-J2 Class AX1, 0.267% due 1/25/2051 |
117,622,500 |
1,017,223 |
|
d,e,g |
Series
2020-J2 Class AXS, 0.21% due 1/25/2051 |
124,791,890 |
877,449 |
|
d,e |
Series
2020-J2 Class B4, 2.767% due 1/25/2051 |
491,000 |
319,698 |
|
d,e |
Series
2020-J2 Class B5, 2.767% due 1/25/2051 |
164,000 |
103,824 |
|
d,e |
Series
2020-J2 Class B6, 2.767% due 1/25/2051 |
654,523 |
225,085 |
| |
Citigroup
Mortgage Loan Trust, Whole Loan Securities Trust CMO, |
|
|
|
d |
Series
2004-HYB2 Class B1, 2.485% due 3/25/2034 |
27,554 |
27,554 |
|
d,e |
Series
2014-A Class A, 4.00% due 1/25/2035 |
497,709 |
491,030 |
|
d,e |
Series
2019-IMC1 Class B1, 3.97% due 7/25/2049 |
1,500,000 |
1,500,000 |
|
d,e |
Series
2020-EXP1 Class B1, 4.467% due 5/25/2060 |
1,180,900 |
1,022,878 |
|
d,e |
Series
2020-EXP1 Class B2, 4.467% due 5/25/2060 |
770,600 |
615,955 |
|
d,e |
Series
2020-EXP1 Class B3, 4.467% due 5/25/2060 |
386,242 |
201,731 |
|
e,g |
Series
2020-EXP1 Class XS, 0.01% due 5/25/2060 |
25,398,628 |
19,049 |
|
d,e,g |
Series
2020-EXP2 Class A3IW, 0.862% due 8/25/2050 |
19,549,489 |
517,418 |
|
d,e,g |
Series
2020-EXP2 Class A4IW, 0.862% due 8/25/2050 |
2,115,260 |
55,985 |
|
d,e |
Series
2020-EXP2 Class B5, 3.362% due 8/25/2050 |
153,000 |
133,498 |
|
d,e |
Series
2020-EXP2 Class B6, 3.362% due 8/25/2050 |
372,000 |
201,111 |
|
d,e,g |
Series
2021-J1 Class A5IX, 0.112% due 4/25/2051 |
124,810,978 |
545,436 |
|
d,e,g |
Series
2021-J1 Class AIOS, 0.23% due 4/25/2051 |
125,700,519 |
1,383,774 |
|
d,e |
Series
2021-J1 Class B4, 2.612% due 4/25/2051 |
375,000 |
211,883 |
|
d,e |
Series
2021-J1 Class B5, 2.612% due 4/25/2051 |
616,000 |
297,401 |
|
d,e |
Series
2021-J1 Class B6, 2.612% due 4/25/2051 |
454,249 |
143,666 |
|
d,e,g |
Series
2021-J2 Class A4I2, 0.18% due 7/25/2051 |
39,648,042 |
332,802 |
|
d,e,g |
Series
2021-J2 Class A5IX, 0.095% due 7/25/2051 |
362,129,552 |
1,410,929 |
|
d,e,g |
Series
2021-J2 Class AIOS, 0.08% due 7/25/2051 |
380,736,985 |
1,471,548 |
|
d,e |
Series
2021-J2 Class B4, 2.775% due 7/25/2051 |
2,281,541 |
1,487,204 |
|
d,e |
Series
2021-J2 Class B5, 2.775% due 7/25/2051 |
623,000 |
374,112 |
|
d,e |
Series
2021-J2 Class B6, 2.775% due 7/25/2051 |
1,247,350 |
413,817 |
|
d,e,g |
Series
2021-J3 Class A3I1, 0.50% due 9/25/2051 |
16,145,552 |
375,949 |
|
d,e,g |
Series
2021-J3 Class A5I2, 0.25% due 9/25/2051 |
132,886,387 |
1,555,316 |
|
d,e,g |
Series
2021-J3 Class AIOS, 0.08% due 9/25/2051 |
139,561,658 |
439,619 |
|
d,e |
Series
2021-J3 Class B4, 2.859% due 9/25/2051 |
1,032,000 |
604,239 |
|
d,e |
Series
2021-J3 Class B5, 2.859% due 9/25/2051 |
173,000 |
86,635 |
|
d,e |
Series
2021-J3 Class B6, 2.859% due 9/25/2051 |
590,214 |
201,165 |
|
d,e,g |
Series
2022-INV1 Class A5IX, 0.304% due 11/27/2051 |
231,359,007 |
3,014,238 |
|
d,e |
Series
2022-INV1 Class B4, 3.304% due 11/27/2051 |
1,375,353 |
1,111,053 |
|
d,e |
Series
2022-INV1 Class B6, 3.304% due 11/27/2051 |
3,467,284 |
1,593,866 |
|
d,e,g |
Series
2022-J1 Class A4IO, 0.25% due 2/25/2052 |
36,062,253 |
387,669 |
|
d,e,g |
Series
2022-J1 Class A5IX, 0.162% due 2/25/2052 |
329,388,894 |
2,253,349 |
|
d,e,g |
Series
2022-J1 Class AIOS, 0.08% due 2/25/2052 |
345,306,444 |
1,146,417 |
|
d,e |
Series
2022-J1 Class B4, 2.912% due 2/25/2052 |
700,598 |
417,543 |
|
d,e |
Series
2022-J1 Class B5, 2.912% due 2/25/2052 |
527,000 |
266,861 |
|
d,e |
Series
2022-J1 Class B6, 2.912% due 2/25/2052 |
1,404,735 |
457,098 |
| |
COMM
Mortgage Trust, CMBS, Series 2015-DC1 Class A4, 3.078% due 2/10/2048 |
4,810,000 |
4,758,886 |
|
d,e |
CSMC
Trust, CMBS, Series 2021-BPNY 4.111% (LIBOR 1 Month + 3.71%) due 8/15/2023 |
13,600,000 |
13,387,029 |
| |
CSMC
Trust, Whole Loan Securities Trust CMO, |
|
|
|
d,e |
Series
2013-HYB1 Class B3, 2.923% due 4/25/2043 |
2,177,673 |
2,177,673 |
|
d,e,g |
Series
2021-AFC1 Class AIOS, 0.25% due 3/25/2056 |
64,870,842 |
406,319 |
|
d,e |
Series
2021-AFC1 Class B3, 4.398% due 3/25/2056 |
146,228 |
133,333 |
|
d,e,g |
Series
2021-AFC1 Class XS, 3.392% due 3/25/2056 |
64,870,842 |
3,111,394 |
|
d,e |
Series
2021-NQM3 Class A1, 1.015% due 4/25/2066 |
3,436,883 |
3,329,624 |
|
d,e |
Series
2021-NQM3 Class B2, 4.128% due 4/25/2066 |
2,650,000 |
2,467,102 |
|
d,e |
Series
2021-NQM8 Class B2, 4.253% due 10/25/2066 |
3,478,650 |
3,034,447 |
|
d,e |
Deephaven
Residential Mortgage Trust, Whole Loan Securities Trust CMO, Series 2021-1 Class A1, 0.715% due 5/25/2065 |
1,252,392 |
1,219,786 |
| |
Ellington
Financial Mortgage Trust, Whole Loan Securities Trust CMO, |
|
|
|
d,e |
Series
2019-2 Class A1, 2.739% due 11/25/2059 |
1,594,062 |
1,591,372 |
|
d,e |
Series
2021-2 Class A1, 0.931% due 6/25/2066 |
3,658,653 |
3,460,601 |
|
d,e |
Series
2022-1 3.896% due 1/25/2067 |
6,901,000 |
5,905,712 |
| d,g |
Federal
Home Loan Mtg Corp., Multifamily Structured Pass Through Certificates, CMBS, Series KIR1 Class X, 1.048% due 3/25/2026 |
34,175,255 |
1,231,677 |
See
notes to financial statements.
|
Thornburg Fixed
Income Funds Semi-Annual Report | 65 |
Schedule of Investments, Continued
Thornburg Strategic Income Fund | March 31, 2022 (Unaudited)
| |
Issuer-Description
|
SHARES/
PRINCIPAL AMOUNT |
VALUE
|
| |
Federal
Home Loan Mtg Corp., Seasoned Credit Risk Transfer, Whole Loan Securities Trust CMO, Series 2020-2 Class MA, 2.00% due 11/25/2059 |
$ 3,755,998
|
$ 3,616,530
|
| |
Federal
Home Loan Mtg Corp., UMBS Collateral, |
|
|
| |
Pool
QN2877, 2.00% due 7/1/2035 |
6,685,404 |
6,505,051 |
|
k |
Pool
RA6808 3.00% due 2/1/2052 |
7,486,172 |
7,329,896 |
| |
Pool
RC1535, 2.00% due 8/1/2035 |
13,191,431 |
12,835,565 |
| |
Pool
RD5063, 2.00% due 7/1/2031 |
10,459,303 |
10,268,837 |
| |
Pool
SB0308, 2.50% due 1/1/2035 |
12,582,457 |
12,495,320 |
| |
Pool
SB0464, 2.50% due 1/1/2036 |
49,714,880 |
49,371,238 |
| |
Pool
ZS7942, 3.00% due 2/1/2033 |
11,255,326 |
11,411,166 |
| |
Pool
ZS8034, 3.00% due 6/1/2033 |
7,337,733 |
7,448,314 |
| |
Federal
Home Loan Mtg Corp., Whole Loan Securities Trust CMO, |
|
|
|
d,e |
Series
2017-SC01 Class M1, 3.651% due 12/25/2046 |
517,594 |
513,456 |
|
d,e |
Series
2017-SC02 Class M1, 3.844% due 5/25/2047 |
212,372 |
211,757 |
| |
Federal
National Mtg Assoc., |
|
|
|
k |
3.00%
due 12/1/2051 |
7,795,879 |
7,655,709 |
| |
Pool
FS0898, 3.00% due 2/1/2052 |
7,475,632 |
7,321,932 |
| |
Pool
FS0916, 3.00% due 3/1/2052 |
7,468,264 |
7,316,340 |
| |
Federal
National Mtg Assoc., CMO REMIC, Series 1994-37 Class L, 6.50% due 3/25/2024 |
261 |
269 |
| |
Federal
National Mtg Assoc., UMBS Collateral, |
|
|
| |
Pool
FM7615, 2.00% due 6/1/2036 |
9,659,884 |
9,402,654 |
| |
Pool
FM7616, 2.00% due 6/1/2036 |
8,367,408 |
8,134,305 |
| |
Pool
FM8869, 2.00% due 9/1/2036 |
15,324,362 |
14,903,492 |
| |
Pool
MA4368, 2.00% due 6/1/2031 |
7,713,080 |
7,572,637 |
| |
First
Republic Mortgage Trust, Whole Loan Securities Trust CMO, |
|
|
|
d,e,g |
Series
2020-1 Class A2IO, 1.232% due 4/25/2050 |
148,004,431 |
3,062,922 |
|
d,e |
Series
2020-1 Class B3, 2.872% due 4/25/2050 |
1,418,005 |
1,223,221 |
|
d,e |
Series
2020-1 Class B4, 2.872% due 4/25/2050 |
1,325,000 |
1,043,422 |
|
d,e |
Series
2020-1 Class B5, 2.872% due 4/25/2050 |
470,000 |
311,916 |
|
d,e |
Series
2020-1 Class B6, 2.872% due 4/25/2050 |
755,000 |
400,513 |
| |
Flagstar
Mortgage Trust, Whole Loan Securities Trust CMO, |
|
|
|
d,e |
Series
2017-1 Class 2A2, 3.00% due 3/25/2047 |
399,488 |
387,564 |
|
d,e |
Series
2018-3 Class B4, 4.483% due 5/25/2048 |
5,472,929 |
5,385,631 |
|
d,e |
Series
2019-2 Class B3, 4.056% due 12/25/2049 |
3,710,092 |
3,628,868 |
|
d,e,g |
Series
2020-2 Class AX1, 0.69% due 8/25/2050 |
31,466,240 |
467,356 |
|
d,e,g |
Series
2020-2 Class AX2, 0.50% due 8/25/2050 |
5,392,470 |
63,018 |
|
d,e |
Series
2020-2 Class B4, 3.69% due 8/25/2050 |
212,275 |
196,609 |
|
d,e |
Series
2020-2 Class B5, 3.69% due 8/25/2050 |
633,917 |
580,459 |
|
d,e |
Series
2020-2 Class B6C, 3.617% due 8/25/2050 |
847,306 |
560,241 |
|
d,e,g |
Series
2021-13INV Class AX1, 0.194% due 12/30/2051 |
188,476,986 |
1,521,989 |
|
d,e,g |
Series
2021-13INV Class AX17, 0.18% due 12/30/2051 |
15,581,859 |
138,689 |
|
d,e,g |
Series
2021-13INV Class AX4, 0.50% due 12/30/2051 |
14,251,319 |
360,759 |
|
d,e |
Series
2021-13INV Class B4, 3.374% due 12/30/2051 |
2,654,857 |
2,132,991 |
|
d,e |
Series
2021-13INV Class B5, 3.374% due 12/30/2051 |
483,981 |
365,540 |
|
d,e |
Series
2021-13INV Class B6C, 3.31% due 12/30/2051 |
4,218,500 |
2,428,364 |
|
d,e |
FREMF
Mortgage Trust, CMBS, Series 2016-KF24 Class B, 5.241% (LIBOR 1 Month + 5.00%) due 10/25/2026 |
363,162 |
366,257 |
| |
GCAT
Trust, Whole Loan Securities Trust CMO, |
|
|
|
d,e |
Series
2019-NQM3 Class A1, 2.686% due 11/25/2059 |
1,106,649 |
1,106,049 |
|
d,e |
Series
2021-CM1 Class A, 1.469% due 4/25/2065 |
5,479,494 |
5,359,210 |
|
d,e |
Series
2021-CM2 Class A1, 2.352% due 8/25/2066 |
12,549,904 |
12,208,395 |
|
d,e |
Series
2021-NQM4 Class A1, 1.093% due 8/25/2066 |
2,876,172 |
2,634,287 |
| |
GS
Mortgage-Backed Securities Trust, Whole Loan Securities Trust CMO, |
|
|
|
d,e,g |
Series
2020-INV1 Class A11X, 3.452% due 10/25/2050 |
1,173,324 |
60,298 |
|
d,e,g |
Series
2020-INV1 Class A12X, 2.959% due 10/25/2050 |
14,048,804 |
620,099 |
|
d,e,g |
Series
2020-INV1 Class AIOS, 0.19% due 10/25/2050 |
71,215,552 |
413,485 |
|
d,e,g |
Series
2020-INV1 Class AX1, due 10/25/2050 |
51,424,442 |
514 |
|
d,e,g |
Series
2020-INV1 Class AX2, 0.459% due 10/25/2050 |
2,531,910 |
18,118 |
|
d,e,g |
Series
2020-INV1 Class AX4, 0.937% due 10/25/2050 |
2,725,571 |
42,265 |
|
d,e |
Series
2020-INV1 Class B4, 3.896% due 10/25/2050 |
1,299,491 |
1,254,807 |
|
d,e |
Series
2020-INV1 Class B5, 3.896% due 10/25/2050 |
1,299,491 |
1,156,722 |
|
d,e |
Series
2020-INV1 Class B6, 3.896% due 10/25/2050 |
2,994,941 |
2,193,912 |
|
d,e,g |
Series
2020-INV1 Class BX, 0.396% due 10/25/2050 |
14,826,753 |
238,662 |
| d,e,g |
Series
2020-PJ3 Class A11X, 3.50% due 10/25/2050 |
2,998,759 |
202,353 |
66 | Thornburg Fixed Income Funds Semi-Annual Report
|
See notes to
financial statements. |
Schedule of Investments,
Continued
Thornburg Strategic Income Fund | March 31, 2022 (Unaudited)
| |
Issuer-Description
|
SHARES/
PRINCIPAL AMOUNT |
VALUE
|
|
d,e,g |
Series
2020-PJ3 Class AIOS, 0.20% due 10/25/2050 |
$ 108,761,570
|
$ 658,954
|
|
d,e,g |
Series
2020-PJ3 Class AX1, 0.084% due 10/25/2050 |
88,958,083 |
88,487 |
|
d,e,g |
Series
2020-PJ3 Class AX2, 0.50% due 10/25/2050 |
8,297,419 |
105,544 |
|
d,e,g |
Series
2020-PJ3 Class AX4, 0.35% due 10/25/2050 |
8,184,277 |
73,202 |
|
d,e |
Homeward
Opportunities Fund I Trust, , Whole Loan Securities Trust CMO, Series 2020-2 5.514% due 5/25/2065 |
14,305,000 |
14,254,313 |
| |
Imperial
Fund Mortgage Trust, Whole Loan Securities Trust CMO, |
|
|
|
d,e |
4.20%
due 3/25/2067 |
12,000,000 |
10,536,781 |
|
d,e |
Series
2021-NQM3 Class B2, 4.182% due 11/25/2056 |
5,408,000 |
4,649,076 |
|
d,e |
Series
2021-NQM4 Class A1, 2.091% due 1/25/2057 |
4,921,016 |
4,734,381 |
|
d,e |
Series
2021-NQM4 Class B2, 4.10% due 1/25/2057 |
2,500,000 |
2,147,917 |
|
d,e |
Series
2022- NQM1 Class A1, 2.493% due 2/25/2067 |
19,581,626 |
19,101,811 |
| |
JPMorgan
Mortgage Trust, Whole Loan Securities Trust CMO, |
|
|
|
d,e |
Series
2015-4 Class B4, 3.57% due 6/25/2045 |
912,621 |
839,144 |
|
d,e |
Series
2016-5 Class B4, 2.318% due 12/25/2046 |
1,630,300 |
1,341,539 |
|
d,e |
Series
2016-5 Class B5, 2.318% due 12/25/2046 |
1,235,596 |
766,576 |
|
d,e |
Series
2017-5 Class B6, 3.05% due 10/26/2048 |
2,746,442 |
2,089,350 |
|
d,e |
Series
2019-8 Class B4, 4.188% due 3/25/2050 |
3,466,152 |
3,322,016 |
|
d,e,g |
Series
2020-3 Class AX1, 0.166% due 8/25/2050 |
11,974,578 |
17,667 |
|
d,e,g |
Series
2020-4 Class A11X, 5.063% (5.25% - LIBOR 1 Month) due 11/25/2050 |
2,346,617 |
81,568 |
|
d,e,g |
Series
2020-4 Class A3X, 0.50% due 11/25/2050 |
10,637,998 |
80,520 |
|
d,e,g |
Series
2020-4 Class AX1, 0.13% due 11/25/2050 |
39,292,931 |
53,662 |
|
d,e,g |
Series
2020-4 Class AX3, 3.50% due 11/25/2050 |
1,087,070 |
57,597 |
|
d,e,g |
Series
2020-4 Class AX4, 0.55% due 11/25/2050 |
2,508,925 |
20,889 |
|
d,e |
Series
2020-4 Class B4, 3.68% due 11/25/2050 |
1,339,874 |
1,328,358 |
|
d,e |
Series
2020-4 Class B5, 3.68% due 11/25/2050 |
617,884 |
563,869 |
|
d,e |
Series
2020-4 Class B6, 3.68% due 11/25/2050 |
1,069,000 |
933,780 |
|
d,e,g |
Series
2020-7 Class A3X, 0.50% due 1/25/2051 |
8,904,761 |
75,236 |
|
d,e,g |
Series
2020-7 Class AX1, 0.13% due 1/25/2051 |
42,345,400 |
67,350 |
|
d,e,g |
Series
2020-7 Class AX3, 3.50% due 1/25/2051 |
2,908,186 |
170,853 |
|
d,e,g |
Series
2020-7 Class AX4, 0.40% due 1/25/2051 |
2,721,012 |
18,122 |
|
d,e |
Series
2020-7 Class B4, 3.53% due 1/25/2051 |
636,455 |
579,453 |
|
d,e |
Series
2020-7 Class B5, 3.53% due 1/25/2051 |
443,971 |
388,622 |
|
d,e |
Series
2020-7 Class B6, 3.53% due 1/25/2051 |
585,530 |
345,441 |
|
d,e |
Series
2020-LTV1 Class B3A, 3.802% due 6/25/2050 |
2,800,113 |
2,798,807 |
|
d,e,g |
Series
2021-11 Class A3X, 0.50% due 1/25/2052 |
12,080,934 |
306,951 |
|
d,e,g |
Series
2021-11 Class AX1, 0.233% due 1/25/2052 |
237,355,335 |
2,285,993 |
|
d,e,g |
Series
2021-11 Class AX4, 0.30% due 1/25/2052 |
29,743,425 |
460,625 |
|
d,e |
Series
2021-11 Class B5, 3.033% due 1/25/2052 |
2,408,504 |
1,637,784 |
|
d,e |
Series
2021-11 Class B6, 2.935% due 1/25/2052 |
2,831,927 |
1,325,374 |
|
d,e |
Series
2021-LTV2 ClassA1, 2.52% due 5/25/2052 |
15,933,232 |
14,677,666 |
|
d,e,g |
Series
2022-2 Class AX1, 0.138% due 8/25/2052 |
234,137,142 |
1,147,272 |
|
d,e,g |
Series
2022-2 Class AX4, 0.50% due 8/25/2052 |
14,783,168 |
314,142 |
|
d,e |
Series
2022-2 Class B4, 3.138% due 8/25/2052 |
3,364,865 |
2,649,096 |
|
d,e |
Series
2022-2 Class B5, 3.138% due 8/25/2052 |
1,789,737 |
1,180,758 |
|
d,e |
Series
2022-2 Class B6, 3.138% due 8/25/2052 |
1,841,056 |
620,726 |
|
d,e,g |
Series
2022-3 Class AX1, 0.122% due 8/25/2052 |
429,948,494 |
1,934,768 |
|
d,e |
Series
2022-3 Class B4, 3.122% due 8/25/2052 |
2,760,000 |
2,086,835 |
|
d,e |
Series
2022-3 Class B5, 3.122% due 8/25/2052 |
1,756,000 |
922,509 |
|
d,e |
Series
2022-3 Class B6, 3.122% due 8/25/2052 |
1,505,760 |
478,185 |
|
d,e |
JPMorgan
Wealth Management, Whole Loan Securities Trust CMO, Series 2021-CL1 Class M1, 1.399% (SOFR30A + 1.30%) due 3/25/2051 |
5,016,643 |
4,888,325 |
| |
Mello
Mortgage Capital Acceptance, Whole Loan Securities Trust CMO, |
|
|
|
d,e,g |
Series
2021-INV2 Class AX1, 0.134% due 8/25/2051 |
112,229,934 |
668,935 |
|
d,e,g |
Series
2021-INV2 Class AX4, 0.70% due 8/25/2051 |
7,689,794 |
272,826 |
|
d,e |
Series
2021-INV2 Class B5, 3.334% due 8/25/2051 |
326,235 |
247,679 |
|
d,e |
Series
2021-INV2 Class B6, 3.092% due 8/25/2051 |
1,564,679 |
780,087 |
|
d,e,g |
Series
2021-INV3 Class AX1, 0.177% due 10/25/2051 |
135,180,285 |
1,052,622 |
|
d,e,g |
Series
2021-INV3 Class AX4, 0.55% due 10/25/2051 |
10,995,728 |
309,962 |
|
d,e |
Series
2021-INV3 Class B5, 3.227% due 10/25/2051 |
452,433 |
339,914 |
|
d,e |
Series
2021-INV3 Class B6, 3.172% due 10/25/2051 |
1,970,343 |
995,335 |
|
d |
Merrill
Lynch Mortgage Investors Trust, Whole Loan Securities Trust CMO, Series 2004-A4 Class M1, 2.656% due 8/25/2034 |
67,735 |
69,097 |
| d,e |
Metlife
Securitization Trust, Whole Loan Securities Trust CMO, Series 2019-1A Class A1A, 3.75% due 4/25/2058 |
696,944 |
701,778 |
See
notes to financial statements.
|
Thornburg Fixed
Income Funds Semi-Annual Report | 67 |
Schedule of Investments, Continued
Thornburg Strategic Income Fund | March 31, 2022 (Unaudited)
| |
Issuer-Description
|
SHARES/
PRINCIPAL AMOUNT |
VALUE
|
| |
MFA
Trust, Whole Loan Securities Trust CMO, |
|
|
|
d,e |
Series
2020-NQM3 Class M1, 2.654% due 1/26/2065 |
$ 800,000
|
$ 787,469
|
|
d,e |
Series
2021-INV2 Class A1, 1.906% due 11/25/2056 |
10,796,279 |
10,176,900 |
|
d,e |
MFRA
Trust Whole Loan Securities Trust CMO, Series 2022-CHM1, 3.875% due 9/25/2056 |
10,807,803 |
10,666,975 |
| |
New
Residential Mortgage Loan Trust, Whole Loan Securities Trust CMO, |
|
|
|
d,e |
Series
2017-3A Class A1, 4.00% due 4/25/2057 |
1,211,130 |
1,214,574 |
|
d,e |
Series
2017-4A Class A1, 4.00% due 5/25/2057 |
987,556 |
988,957 |
|
d,e |
Series
2017-5A Class A1, 1.957% (LIBOR 1 Month + 1.50%) due 6/25/2057 |
624,748 |
629,867 |
|
d,e |
Series
2017-6A Class A1, 4.00% due 8/27/2057 |
535,483 |
538,511 |
|
d,e |
Series
2018-1A Class A1A, 4.00% due 12/25/2057 |
1,010,415 |
1,018,687 |
|
d,e |
Series
2020-NQM1 Class B2, 4.525% due 1/26/2060 |
1,214,000 |
1,197,058 |
|
d,e,g |
Series
2021-INV1 Class AX1, 0.759% due 6/25/2051 |
115,974,997 |
4,949,964 |
|
d,e |
Series
2021-INV1 Class B5, 3.259% due 6/25/2051 |
1,233,574 |
938,166 |
|
d,e |
Series
2021-INV1 Class B6, 2.932% due 6/25/2051 |
2,170,333 |
1,182,179 |
|
d,e |
OBX
Trust, Whole Loan Securities Trust CMO, Series 2021-NQM2 Class A1, 1.101% due 5/25/2061 |
7,734,042 |
7,400,962 |
|
d,e |
Onslow
Bay Mortgage Loan Trust, Whole Loan Securities Trust CMO, Series 2021-NQM4 Class A1, 1.957% due 10/25/2061 |
18,697,609 |
18,013,276 |
| |
PRKCM
Trust, Whole Loan Securities Trust CMO, |
|
|
|
d,e |
Series
2021-AFC1 Class A1, 1.51% due 8/25/2056 |
5,486,727 |
5,088,563 |
|
d,e |
Series
2021-AFC1 Class B2, 3.95% due 8/25/2056 |
2,729,000 |
2,325,385 |
|
d,e |
Rate
Mortgage Trust, Whole Loan Securities Trust CMO, Series 2022-J1 2.50% due 1/25/2052 |
14,531,176 |
13,889,585 |
|
e |
Saluda
Grade Alternative Mortgage Trust, Whole Loan Securities Trust CMO, Series 2020-FIG1 Class C, 0.01% due 9/25/2050 |
7,538,179 |
1,219,587 |
| |
Seasoned
Loans Structured Transaction Trust, Whole Loan Securities Trust CMO, Series 2020-2 Class A1C, 2.00% due 9/25/2030 |
7,904,946 |
7,523,386 |
| |
Sequoia
Mortgage Trust, Whole Loan Securities Trust CMO, |
|
|
|
d,e |
Series
2015-4 Class B4, 3.152% due 11/25/2030 |
1,686,000 |
1,661,493 |
|
d,e |
Series
2016-3 Class B3, 3.64% due 11/25/2046 |
3,047,177 |
2,999,541 |
|
d,e |
Series
2017-7 Class B3, 3.719% due 10/25/2047 |
1,425,824 |
1,382,053 |
|
d,e |
Series
2018-7 Class B4, 4.26% due 9/25/2048 |
1,802,000 |
1,802,000 |
| |
SG
Residential Mortgage Trust, Whole Loan Securities Trust CMO, |
|
|
|
d,e |
3.998%
due 3/27/2062 |
4,204,000 |
3,636,447 |
|
d,e |
Series
2019-3 Class A1, 2.703% due 9/25/2059 |
321,526 |
321,526 |
|
d,e,g |
Series
2019-3 Class AIOS, 0.375% due 9/25/2059 |
19,416,074 |
66,147 |
|
d,e |
Series
2019-3 Class B2, 5.663% due 9/25/2059 |
1,978,000 |
1,862,336 |
|
d,e |
Series
2019-3 Class B3, 5.963% due 9/25/2059 |
842,000 |
594,498 |
|
e |
Series
2019-3 Class XS1, 0.01% due 9/25/2059 |
19,258,862 |
763 |
|
e |
Series
2019-3 Class XS2, 0.01% due 9/25/2059 |
19,258,862 |
169,124 |
|
d,e |
Series
2020-2 Class A3, 1.895% due 5/25/2065 |
1,680,386 |
1,662,159 |
|
d,e |
Series
2021-2 Class A1, 1.737% due 12/25/2061 |
7,697,681 |
7,534,831 |
|
d,e |
Shellpoint
Co-Originator Trust, Whole Loan Securities Trust CMO, Series 2016-1 Class B4, 3.578% due 11/25/2046 |
3,011,714 |
2,736,407 |
|
d,e |
Spruce
Hill Mortgage Loan Trust, Whole Loan Securities Trust CMO, Series 2020-SH1 Class A1, 2.521% due 1/28/2050 |
552,188 |
549,670 |
|
d,e |
Starwood
Mortgage Residential Trust, Whole Loan Securities Trust CMO, Series 2021-5 Class A1, 1.92% due 9/25/2066 |
19,820,504 |
19,034,817 |
| |
TIAA
Bank Mortgage Loan Trust, Whole Loan Securities Trust CMO, |
|
|
|
d,e |
Series
2018-2 Class B3, 3.755% due 7/25/2048 |
2,637,895 |
2,527,772 |
|
d,e |
Series
2018-2 Class B4, 3.755% due 7/25/2048 |
2,040,000 |
1,782,920 |
|
d,e |
Towd
Point Mortgage Trust, Whole Loan Securities Trust CMO, Series 2018-2 Class A1, 3.25% due 3/25/2058 |
2,561,054 |
2,561,950 |
| |
Verus
Securitization Trust, Whole Loan Securities Trust CMO, |
|
|
|
d,e |
Series
2019-3 Class A1, 2.784% due 7/25/2059 |
811,445 |
811,445 |
|
d,e |
Series
2019-3 Class B1, 4.043% due 7/25/2059 |
300,000 |
300,000 |
|
d,e |
Series
2019-4 Class B1, 3.86% due 11/25/2059 |
3,250,000 |
3,245,106 |
|
d,e |
Series
2019-INV3 Class B2, 4.791% due 11/25/2059 |
1,385,000 |
1,372,762 |
|
d,e |
Series
2020-1 Class B1, 3.624% due 1/25/2060 |
1,500,000 |
1,494,211 |
|
d,e |
Series
2020-2 Class B1, 5.36% due 5/25/2060 |
2,225,000 |
2,234,404 |
|
d,e |
Series
2020-INV1 Class B1, 5.75% due 3/25/2060 |
875,000 |
881,902 |
|
d,e |
Series
2020-INV1 Class B2, 6.00% due 3/25/2060 |
1,416,000 |
1,402,530 |
|
d,e |
Series
2021-R1 Class B2, 4.199% due 10/25/2063 |
1,125,000 |
1,034,340 |
| |
Vista
Point Securitization Trust, Whole Loan Securities Trust CMO, |
|
|
|
d,e |
Series
2020-1 Class B1, 5.375% due 3/25/2065 |
2,625,000 |
2,606,002 |
|
d,e |
Series
2020-1 Class B2, 5.375% due 3/25/2065 |
4,473,000 |
4,434,131 |
|
d,e |
Series
2020-2 Class A2, 1.986% due 4/25/2065 |
1,922,097 |
1,903,625 |
| |
Wells
Fargo Commercial Mortgage Trust CMBS, Series 2016-C34 Class A2, 2.603% due 6/15/2049 |
4,215,970 |
4,188,023 |
| |
Wells
Fargo Mortgage Backed Securities Trust, Whole Loan Securities Trust CMO, |
|
|
|
d,e,g |
Series
2021-INV1 Class AIO2, 0.50% due 8/25/2051 |
104,151,353 |
2,067,404 |
| d,e |
Series
2021-INV1 Class B4, 3.327% due 8/25/2051 |
1,702,103 |
1,369,705 |
68 | Thornburg Fixed Income Funds Semi-Annual Report
|
See notes to
financial statements. |
Schedule of Investments,
Continued
Thornburg Strategic Income Fund | March 31, 2022 (Unaudited)
| |
Issuer-Description
|
SHARES/
PRINCIPAL AMOUNT |
VALUE
|
|
d,e |
Series
2021-INV1 Class B5, 3.327% due 8/25/2051 |
$ 1,365,848
|
$ 1,035,312
|
|
d,e |
Series
2021-INV1 Class B6, 3.327% due 8/25/2051 |
1,061,873 |
483,613 |
| |
WFRBS
Commercial Mortgage Trust, CMBS, Series 2012-C7 Class A2, 3.431% due 6/15/2045 |
405,125 |
404,707
|
| |
Total
Mortgage Backed (Cost $669,680,245) |
|
642,296,697
|
| |
Loan
Participations — 2.7% |
|
|
| |
Commercial
& Professional Services — 0.1% |
|
|
| |
Professional
Services — 0.1% |
|
|
|
l |
Par
Pacific Holdings, Inc., 6.99% (LIBOR 3 Month + 6.75%) due 1/12/2026 |
4,179,351 |
4,156,364 |
|
l |
RGIS
Services LLC, 8.50% (LIBOR 1 Month + 7.50%) due 6/25/2025 |
775,739 |
760,225
|
| |
|
|
4,916,589
|
| |
Consumer
Services — 0.1% |
|
|
| |
Hotels,
Restaurants & Leisure — 0.1% |
|
|
|
l |
TKC
Holdings, Inc., 6.506% (LIBOR 3 Month + 5.50%) due 5/15/2028 |
4,674,454 |
4,597,326
|
| |
|
|
4,597,326
|
| |
Health
Care Equipment & Services — 0.3% |
|
|
| |
Health
Care Providers & Services — 0.3% |
|
|
|
l |
Change
Healthcare Holdings LLC, 3.50% (LIBOR 1 Month + 2.50%) due 3/1/2024 |
10,536,904 |
10,465,780
|
| |
|
|
10,465,780
|
| |
Household
& Personal Products — 0.1% |
|
|
| |
Household
Products — 0.1% |
|
|
|
l |
Energizer
Holdings, Inc., 2.75% (LIBOR 1 Month + 2.25%) due 12/22/2027 |
5,573,700 |
5,476,160
|
| |
|
|
5,476,160
|
| |
Media
& Entertainment — 0.5% |
|
|
| |
Media
— 0.5% |
|
|
|
m |
ABG
Intermediate Holdings 2 LLC, due 12/8/2028 - 12/21/2028 |
9,310,000 |
9,147,075 |
|
l |
DirecTV
Financing LLC, 5.75% (LIBOR 1 Month + 5.00%) due 8/2/2027 |
9,932,000 |
9,910,050 |
|
l |
Nielsen
Finance LLC, 2.306% (LIBOR 1 Month + 2.00%) due 10/4/2023 |
1,688,022 |
1,685,389
|
| |
|
|
20,742,514
|
| |
Pharmaceuticals,
Biotechnology & Life Sciences — 0.1% |
|
|
| |
Life
Sciences Tools & Services — 0.1% |
|
|
|
l |
Avantor
Funding, Inc., 2.50% (LIBOR 1 Month + 2.00%) due 11/21/2024 |
4,347,087 |
4,301,790
|
| |
|
|
4,301,790
|
| |
Real
Estate — 0.3% |
|
|
| |
Equity
Real Estate Investment Trusts — 0.3% |
|
|
|
l,m |
CoreCivic,
Inc., 4.957% (LIBOR 1 Month + 4.50%) due 12/18/2024 |
13,699,181 |
13,527,941
|
| |
|
|
13,527,941
|
| |
Semiconductors
& Semiconductor Equipment — 0.3% |
|
|
| |
Information
Technology Services — 0.3% |
|
|
|
l |
Xperi
Corporation, 3.957% (LIBOR 1 Month + 3.50%) due 6/8/2028 |
11,569,726 |
11,416,427
|
| |
|
|
11,416,427
|
| |
Software
& Services — 0.9% |
|
|
| |
Information
Technology Services — 0.2% |
|
|
|
l |
Genpact
International, Inc., 2.498% (LIBOR 3 Month + 2.00%) due 8/9/2023 |
4,925,373 |
4,888,433 |
|
l |
Vericast
Corp., 8.756% (LIBOR 3 Month + 7.75%) due 6/16/2026 |
3,963,405 |
3,276,745
|
| |
Internet
Software & Services — 0.6% |
|
|
|
l |
Titan
Acquisition Co. Ltd., 5.006% (LIBOR 3 Month + 4.00%) due 10/18/2028 |
7,460,000 |
7,385,400 |
|
l |
Dun
& Bradstreet Corporation, 3.697% (LIBOR 1 Month + 3.25%) due 2/6/2026 |
18,558,692 |
18,363,083
|
| |
Software
— 0.1% |
|
|
|
l |
GoTo
Group, Inc., 5.218% (LIBOR 1 Month + 4.75%) due 8/31/2027 |
7,335,150 |
7,190,721
|
| |
|
|
41,104,382
|
| |
Total
Loan Participations (Cost $116,962,713) |
|
116,548,909
|
See
notes to financial statements.
|
Thornburg Fixed
Income Funds Semi-Annual Report | 69 |
Schedule of Investments, Continued
Thornburg Strategic Income Fund | March 31, 2022 (Unaudited)
| |
Issuer-Description
|
SHARES/
PRINCIPAL AMOUNT |
VALUE
|
| |
Short-Term
Investments — 8.8% |
|
|
| n |
Thornburg
Capital Management Fund |
38,297,161
|
$ 382,971,615
|
| |
Total
Short-Term Investments (Cost $382,971,615) |
|
382,971,615
|
| |
Total
Investments — 99.6% (Cost $4,508,574,759) |
|
$4,357,292,057
|
| |
Other
Assets Less Liabilities — 0.4% |
|
19,666,250
|
| |
Net
Assets — 100.0% |
|
$4,376,958,307
|
| Outstanding
Forward Currency Contracts To Buy Or Sell At March 31, 2022 |
Contract
Description |
Contract
Party* |
Buy/Sell
|
Contract
Amount |
Contract
Value Date |
Value
USD |
Unrealized
Appreciation |
Unrealized
Depreciation |
| Euro
|
SSB
|
Sell
|
10,886,700
|
9/23/2022
|
12,144,747
|
$ —
|
$ (20,284)
|
| |
|
| Net
unrealized appreciation (depreciation) |
|
|
|
|
|
|
$
(20,284) |
| *
|
Counterparty
includes State Street Bank and Trust Company ("SSB"). |
| Footnote Legend
|
| a
|
Security
currently fair valued by the Valuation and Pricing Committee using procedures approved by the Trustees’ Audit Committee. |
| b
|
Non-income
producing. |
| c
|
Securities
are perpetual and, thus, do not have a predetermined maturity date. The date shown, if applicable, reflects the next call date. |
| d
|
Variable,
floating, step, or fixed to floating rate securities are securities for which interest rate changes are based on changes in a designated base rate or on a predetermined schedule. The rates shown are those in effect on March 31, 2022. |
| e
|
Securities
exempt from registration under Rule 144A of the Securities Act of 1933, as amended. These securities are restricted but liquid and may only be resold in the ordinary course of business in transactions exempt from registration, normally to qualified
institutional buyers. As of March 31, 2022, the aggregate value of these securities in the Fund’s portfolio was $2,743,651,570, representing 62.68% of the Fund’s net assets. |
| f
|
Yankee
bond denominated in U.S. dollars and is issued in the U.S. by foreign banks and corporations. |
| g
|
Interest
only. |
| h
|
Bond
in default. |
| i
|
Segregated
as collateral for a when-issued security. |
| j
|
Pay-In-Kind
Payments (PIK). The issuer may pay cash interest and/or interest in additional debt securities. Rates shown are the rates in effect at March 31, 2022. |
| k
|
When-issued
security. |
| l
|
The
stated coupon rate represents the greater of the LIBOR or the LIBOR floor rate plus a spread at March 31, 2022. |
| m
|
This
position or a portion of this position represents an unsettled loan purchase. The coupon rate will be effective at the time of settlement and will be based upon the London-Interbank Offered Rate ("LIBOR") plus a premium which was determined at the
time of purchase. |
| n
|
Investment
in Affiliates. |
70 | Thornburg Fixed Income Funds Semi-Annual Report
|
See notes to
financial statements. |
Schedule of Investments,
Continued
Thornburg Strategic Income Fund | March 31, 2022 (Unaudited)
Portfolio Abbreviations
To simplify the listings of securities, abbreviations are used per the table below:
| ARM
|
Adjustable Rate
Mortgage |
| BSBY3M
|
Bloomberg
Short Term Bank Yield 3 Month |
| CMBS
|
Commercial
Mortgage-Backed Securities |
| CMO
|
Collateralized
Mortgage Obligation |
| CMT
|
Constant
Maturity Rate |
| EUR
|
Denominated
in Euro |
| FCB
|
Farm
Credit Bank |
| GO
|
General Obligation
|
| H15T1Y
|
US
Treasury Yield Curve Rate T-Note Constant Maturity 1 Year |
| IDR
|
Denominated
in Indonesian Rupiah |
| LIBOR
|
London
Interbank Offered Rates |
| Mtg
|
Mortgage
|
| MXN
|
Denominated
in Mexican Peso |
| PIK
|
Payment-in-kind
|
| REMIC
|
Real
Estate Mortgage Investment Conduit |
| SOFR
|
Secured Overnight
Financing Rate |
| SOFR30A
|
Secured Overnight
Financing Rate 30-Day Average |
| SOFRINDX
|
Secured Overnight
Financing Rate Index |
| SPV
|
Special Purpose
Vehicle |
| UMBS
|
Uniform Mortgage
Backed Securities |
| USD
|
Unified School
District |
COUNTRY
EXPOSURE *
(percent of net assets) |
| United
States |
75.6%
|
| Canada
|
2.4%
|
| Cayman
Islands |
1.2%
|
| United
Kingdom |
1.0%
|
| Mexico
|
0.9%
|
| China
|
0.9%
|
| Germany
|
0.8%
|
| United
Arab Emirates |
0.7%
|
| Belgium
|
0.6%
|
| Brazil
|
0.6%
|
| France
|
0.6%
|
| Japan
|
0.5%
|
| South
Korea |
0.4%
|
| United
Republic of Tanzania |
0.3%
|
| Dominican
Republic |
0.3%
|
| Nigeria
|
0.3%
|
| Sweden
|
0.3%
|
| Australia
|
0.3%
|
| Saudi
Arabia |
0.3%
|
| Russian
Federation |
0.3%
|
| Bermuda
|
0.3%
|
| Morocco
|
0.3%
|
| South
Africa |
0.3%
|
| Guatemala
|
0.2%
|
| Indonesia
|
0.2%
|
| Ireland
|
0.2%
|
| New
Zealand |
0.2%
|
| Jamaica
|
0.1%
|
| Taiwan
|
0.1%
|
| Kuwait
|
0.1%
|
| Italy
|
0.1%
|
| India
|
0.1%
|
| Oman
|
0.1%
|
| Chile
|
0.1%
|
| Switzerland
|
0.1%
|
| Other
Assets Less Liabilities |
9.2%
|
| *
|
Holdings
are classified by country of risk as determined by MSCI and Bloomberg. |
See
notes to financial statements.
|
Thornburg Fixed
Income Funds Semi-Annual Report | 71 |
Statements of Assets and Liabilities
March 31, 2022 (Unaudited)
| |
THORNBURG
LIMITED TERM U.S.
GOVERNMENT FUND |
THORNBURG
LIMITED TERM
INCOME FUND |
THORNBURG
ULTRA SHORT
INCOME FUND |
THORNBURG
STRATEGIC
INCOME FUND |
| ASSETS
|
|
|
|
|
| Investments
at cost |
|
|
|
|
| Non-affiliated
issuers |
$ 286,418,509
|
$ 9,410,921,998
|
$ 101,063,957
|
$ 4,125,603,144
|
| Non-controlled
affiliated issuers |
-
|
483,601,459
|
3,608,163
|
382,971,615
|
| Investments
at value |
|
|
|
|
| Non-affiliated
issuers |
276,619,353
|
9,065,641,848
|
100,129,280
|
3,974,320,442 |
| Non-controlled
affiliated issuers |
-
|
483,601,459
|
3,608,163
|
382,971,615 |
| Cash
|
-
|
19,239,695
|
1,339,984
|
8,885,920 |
| Receivable
for investments sold |
-
|
26,401,250
|
-
|
12,114,447 |
| Receivable
for fund shares sold |
378,249
|
32,877,446
|
2,825,329
|
22,117,078 |
| Receivable
from investment advisor |
-
|
-
|
6,921
|
- |
| Dividends
receivable |
119
|
262,923
|
1,188
|
6,121,202 |
| Principal
and interest receivable |
788,850
|
39,721,726
|
174,483
|
27,761,159 |
| Prepaid
expenses and other assets |
72,085
|
228,222
|
46,292
|
183,817
|
| Total
Assets |
277,858,656
|
9,667,974,569
|
108,131,640
|
4,434,475,680
|
| Liabilities
|
|
|
|
|
| Unrealized
depreciation on forward currency contracts |
-
|
-
|
-
|
20,284 |
| Payable
for investments purchased |
2,491,258
|
32,939,644
|
6,248,916
|
39,390,125 |
| Payable
for fund shares redeemed |
344,061
|
31,704,877
|
380,064
|
15,314,282 |
| Payable
to investment advisor and other affiliates |
136,207
|
3,598,902
|
-
|
1,649,760 |
| Deferred
taxes payable |
-
|
-
|
-
|
18,462 |
| Accounts
payable and accrued expenses |
81,356
|
410,757
|
57,800
|
196,320 |
| Dividends
payable |
78,119
|
1,517,501
|
777
|
928,140
|
| Total
Liabilities |
3,131,001
|
70,171,681
|
6,687,557
|
57,517,373
|
| Net
Assets |
$
274,727,655 |
$
9,597,802,888 |
$
101,444,083 |
$
4,376,958,307 |
| NET
ASSETS CONSIST OF |
|
|
|
|
| Net
capital paid in on shares of beneficial interest |
$ 301,917,325
|
$ 9,961,887,118
|
$ 102,702,678
|
$ 4,530,865,548
|
| Accumulated
loss |
(27,189,670)
|
(364,084,230)
|
(1,258,595)
|
(153,907,241)
|
| Net
Assets |
$
274,727,655 |
$
9,597,802,888 |
$
101,444,083 |
$
4,376,958,307 |
72
| Thornburg Fixed Income Funds Semi-Annual Report
Statements of Assets and Liabilities,
Continued
March 31, 2022 (Unaudited)
| |
THORNBURG
LIMITED TERM U.S.
GOVERNMENT FUND |
THORNBURG
LIMITED TERM
INCOME FUND |
THORNBURG
ULTRA SHORT
INCOME FUND |
THORNBURG
STRATEGIC
INCOME FUND |
| NET
ASSET VALUE |
|
|
|
|
| Class
A Shares: |
|
|
|
|
| Net
assets applicable to shares outstanding |
$ 69,132,917
|
$ 708,524,044
|
$ 13,636,673
|
$ 354,344,241
|
| Shares
outstanding |
5,556,187
|
53,907,290
|
1,115,027
|
30,097,026 |
| Net
asset value and redemption price per share |
$ 12.44
|
$ 13.14
|
$ 12.23
|
$ 11.77
|
| Maximum
offering price per share (net asset value, plus 2.25% of offering price) |
$ 12.73
|
$ 13.44
|
$ 12.51
|
$ 12.32
* |
| Class
C Shares: |
|
|
|
|
| Net
assets applicable to shares outstanding |
7,559,046
|
290,061,176
|
-
|
92,121,606 |
| Shares
outstanding |
603,963 |
22,104,733 |
- |
7,836,964 |
| Net
asset value and redemption price per share** |
12.52
|
13.12
|
-
|
11.75
|
| Class
C2 Shares: |
|
|
|
|
| Net
assets applicable to shares outstanding |
550,413
|
11,041,103
|
-
|
- |
| Shares
outstanding |
43,967 |
841,323 |
- |
- |
| Net
asset value and redemption price per share** |
12.52
|
13.12
|
-
|
-
|
| Class
I Shares: |
|
|
|
|
| Net
assets applicable to shares outstanding |
188,427,886
|
8,173,314,714
|
87,807,410
|
3,757,638,195 |
| Shares
outstanding |
15,145,041 |
621,697,634 |
7,184,302 |
319,999,074 |
| Net
asset value and redemption price per share |
12.44
|
13.15
|
12.22
|
11.74
|
| Class
R3 Shares: |
|
|
|
|
| Net
assets applicable to shares outstanding |
5,132,761
|
59,772,430
|
-
|
731,341 |
| Shares
outstanding |
412,298 |
4,544,578 |
- |
62,193 |
| Net
asset value and redemption price per share |
12.45
|
13.15
|
-
|
11.76
|
| Class
R4 Shares: |
|
|
|
|
| Net
assets applicable to shares outstanding |
1,778,962
|
9,776,164
|
-
|
2,179,036 |
| Shares
outstanding |
143,027 |
744,103 |
- |
185,355 |
| Net
asset value and redemption price per share |
12.44
|
13.14
|
-
|
11.76
|
| Class
R5 Shares: |
|
|
|
|
| Net
assets applicable to shares outstanding |
2,145,670
|
136,411,935
|
-
|
61,819,809 |
| Shares
outstanding |
172,328 |
10,379,401 |
- |
5,261,291 |
| Net
asset value and redemption price per share |
12.45
|
13.14
|
-
|
11.75
|
| Class
R6 Shares: |
|
|
|
|
| Net
assets applicable to shares outstanding |
-
|
208,901,322
|
-
|
108,124,079 |
| Shares
outstanding |
-
|
15,861,000
|
-
|
9,179,872 |
| Net
asset value and redemption price per share |
-
|
13.17
|
-
|
11.78
|
| *
|
Net
asset value, plus 4.50% of offering price. |
| **
|
Redemption
price per share is equal to net asset value less any applicable contingent deferred sales charge. |
See notes to financial statements.
Thornburg Fixed
Income Funds Semi-Annual Report | 73
Statements of Operations
Six Months Ended March 31, 2022 (Unaudited)
| |
THORNBURG
LIMITED TERM U.S.
GOVERNMENT FUND |
THORNBURG
LIMITED TERM
INCOME FUND |
THORNBURG
ULTRA SHORT
INCOME FUND |
THORNBURG
STRATEGIC
INCOME FUND |
| INVESTMENT
INCOME |
|
|
|
|
| Dividend
income |
|
|
|
|
| Non-affiliated
issuers |
$ 198
|
$ 246,925
|
$
- |
$ 6,566,840
|
| Non-controlled
affiliated issuers |
-
|
803,142
|
4,605
|
418,055
|
| Interest
income |
2,339,793
|
95,792,314
|
540,527
|
76,466,267
|
| Total
Income |
2,339,991
|
96,842,381
|
545,132
|
83,451,162
|
| EXPENSES
|
|
|
|
|
| Investment
management fees |
575,268
|
15,498,709
|
86,849
|
11,924,671
|
| Administration
fees |
128,584
|
4,269,581
|
29,198
|
1,739,403
|
| Distribution
and service fees |
|
|
|
|
| Class
A Shares |
102,923
|
954,612
|
12,511
|
474,010
|
| Class
C Shares |
22,344
|
820,750
|
-
|
486,645
|
| Class
C2 Shares |
2,245
|
40,303
|
-
|
-
|
| Class
R3 Shares |
16,412
|
140,816
|
-
|
1,956
|
| Class
R4 Shares |
2,427
|
12,600
|
-
|
2,834
|
| Transfer
agent fees |
|
|
|
|
| Class
A Shares |
35,815
|
309,400
|
14,388
|
209,048
|
| Class
C Shares |
6,760
|
102,381
|
-
|
37,674
|
| Class
C2 Shares |
697
|
3,225
|
-
|
-
|
| Class
I Shares |
80,710
|
3,659,410
|
24,167
|
1,493,285
|
| Class
R3 Shares |
5,943
|
26,119
|
-
|
1,181
|
| Class
R4 Shares |
3,770
|
23,626
|
-
|
4,997
|
| Class
R5 Shares |
2,468
|
180,390
|
-
|
61,075
|
| Class
R6 Shares |
-
|
14,245
|
-
|
7,514
|
| Registration
and filing fees |
|
|
|
|
| Class
A Shares |
11,203
|
9,615
|
11,653
|
13,073
|
| Class
C Shares |
7,826
|
11,210
|
-
|
9,434
|
| Class
C2 Shares |
2,043
|
8,776
|
-
|
-
|
| Class
I Shares |
2,683
|
18,553
|
13,122
|
28,783
|
| Class
R3 Shares |
7,370
|
7,366
|
-
|
8,688
|
| Class
R4 Shares |
9,080
|
8,761
|
-
|
9,291
|
| Class
R5 Shares |
8,478
|
8,090
|
-
|
8,720
|
| Class
R6 Shares |
-
|
8,727
|
-
|
9,746
|
| Custodian
fees |
42,370
|
276,400
|
40,080
|
202,200
|
| Professional
fees |
25,773
|
73,095
|
24,558
|
65,890
|
| Trustee
and officer fees |
8,175
|
254,890
|
1,660
|
105,485
|
| Other
expenses |
20,350
|
384,156
|
6,191
|
167,735
|
| Total
Expenses |
1,131,717
|
27,125,806
|
264,377
|
17,073,338
|
| Less:
|
|
|
|
|
| Expenses
reimbursed |
(41,749)
|
(266,060)
|
(102,499)
|
(1,923,308)
|
| Investment
management fees waived |
-
|
-
|
(45,149)
|
(1,468,128)
|
| Net
Expenses |
1,089,968
|
26,859,746
|
116,729
|
13,681,902
|
| Net
Investment Income (Loss) |
$ 1,250,023
|
$ 69,982,635
|
$ 428,403
|
$ 69,769,260
|
74
| Thornburg Fixed Income Funds Semi-Annual Report
Statements of Operations,
Continued
Six Months Ended March 31, 2022 (Unaudited)
| |
THORNBURG
LIMITED TERM U.S.
GOVERNMENT FUND |
THORNBURG
LIMITED TERM
INCOME FUND |
THORNBURG
ULTRA SHORT
INCOME FUND |
THORNBURG
STRATEGIC
INCOME FUND |
| REALIZED
AND UNREALIZED GAIN (LOSS) |
|
|
|
|
| Net
realized gain (loss) on: |
|
|
|
|
| Non-affiliated
issuer investments |
$
(1,188,086) |
$
(6,400,406) |
$
(218,490) |
$
(4,437,370) |
| Forward
currency contracts |
-
|
-
|
-
|
615,702
|
| Foreign
currency transactions |
-
|
-
|
-
|
(311,016)
|
| Net
realized gain (loss) |
(1,188,086)
|
(6,400,406)
|
(218,490)
|
(4,132,684)
|
| Net
change in unrealized appreciation (depreciation) on: |
|
|
|
|
| Non-affiliated
issuers investments* |
(12,236,765)
|
(500,002,489)
|
(1,070,899)
|
(209,654,007)
|
| Forward
currency contracts |
-
|
-
|
-
|
(114,561)
|
| Foreign
currency translations |
-
|
-
|
-
|
1,361
|
| Change
in net unrealized appreciation (depreciation) |
(12,236,765)
|
(500,002,489)
|
(1,070,899)
|
(209,767,207)
|
| Net
Realized and Unrealized Gain (Loss) |
(13,424,851)
|
(506,402,895)
|
(1,289,389)
|
(213,899,891)
|
| Change
in Net Assets Resulting from Operations |
$
(12,174,828) |
$
(436,420,260) |
$
(860,986) |
$
(144,130,631) |
| *
Net of change in deferred taxes |
$
- |
$
- |
$
- |
$ 6,377
|
See notes to financial
statements.
Thornburg Fixed Income Funds Semi-Annual Report | 75
Statements of Changes in Net Assets
| |
THORNBURG
LIMITED TERM U.S. GOVERNMENT FUND |
THORNBURG
LIMITED TERM INCOME FUND |
| |
Six
Months Ended
March 31, 2022* |
Year
Ended
September 30, 2021 |
Six
Months Ended
March 31, 2022* |
Year
Ended
September 30, 2021 |
| INCREASE
(DECREASE) IN NET ASSETS FROM |
|
|
|
|
| OPERATIONS
|
|
|
|
|
| Net
investment income (loss) |
$ 1,250,023
|
$ 2,650,322
|
$ 69,982,635
|
$ 135,614,167
|
| Net
realized gain (loss) |
(1,188,086)
|
(481,170)
|
(6,400,406)
|
31,389,587 |
| Net
change in unrealized appreciation (depreciation) |
(12,236,765)
|
(6,115,378)
|
(500,002,489)
|
(119,058,798)
|
| Net
Increase (Decrease) in Net Assets Resulting from Operations |
(12,174,828)
|
(3,946,226)
|
(436,420,260)
|
47,944,956
|
| DIVIDENDS
TO SHAREHOLDERS |
|
|
|
|
| From
distributable earnings |
|
|
|
|
| Class
A Shares |
(490,932)
|
(1,094,797)
|
(5,087,123)
|
(21,072,252) |
| Class
C Shares |
(37,581)
|
(105,422)
|
(1,797,527)
|
(8,841,603) |
| Class
C2 Shares† |
(2,911)
|
(2,960)
|
(51,667)
|
(126,453) |
| Class
I Shares |
(1,512,086)
|
(3,422,038)
|
(68,976,714)
|
(221,942,585) |
| Class
R3 Shares |
(35,352)
|
(90,264)
|
(309,943)
|
(1,410,582) |
| Class
R4 Shares |
(10,657)
|
(26,679)
|
(54,749)
|
(171,614) |
| Class
R5 Shares |
(15,278) |
(30,686) |
(1,075,708) |
(4,172,915) |
| Class
R6 Shares |
-
|
-
|
(1,497,099)
|
(3,047,965) |
| FUND
SHARE TRANSACTIONS |
|
|
|
|
| Class
A Shares |
(19,907,017)
|
8,081,692
|
(72,214,101)
|
68,738,938 |
| Class
C Shares |
(2,112,495)
|
(7,583,446)
|
(54,577,226)
|
(43,304,295) |
| Class
C2 Shares† |
(95,755)
|
687,492
|
(1,242,437)
|
13,071,097 |
| Class
I Shares |
(21,799,196)
|
(18,148,982)
|
(227,172,604)
|
2,018,755,489 |
| Class
R3 Shares |
(2,181,899)
|
(1,415,499)
|
10,918,078
|
(7,865,318) |
| Class
R4 Shares |
(140,833)
|
(704,842)
|
(492,949)
|
4,508,488 |
| Class
R5 Shares |
51,398
|
(53,994)
|
8,480,544
|
(11,086,652) |
| Class
R6 Shares |
-
|
-
|
91,116,521
|
31,498,592
|
| Net
Increase (Decrease) in Net Assets |
(60,465,422)
|
(27,856,651)
|
(760,454,964)
|
1,861,475,326
|
| NET
ASSETS |
|
|
|
|
| Beginning
of Period |
335,193,077
|
363,049,728
|
10,358,257,852
|
8,496,782,526
|
| End
of Period |
$ 274,727,655
|
$ 335,193,077
|
$ 9,597,802,888
|
$ 10,358,257,852
|
| *
|
Unaudited.
|
| †
|
Class
C2 Shares commenced operations on October 1, 2020. |
See notes to financial statements.
76 | Thornburg Fixed Income Funds Semi-Annual Report
Statements of Changes in Net Assets,
Continued
| |
THORNBURG
ULTRA SHORT INCOME FUND |
THORNBURG
STRATEGIC INCOME FUND |
| |
Six
Months Ended
March 31, 2022* |
Year
Ended
September 30, 2021 |
Six
Months Ended
March 31, 2022* |
Year
Ended
September 30, 2021 |
| INCREASE
(DECREASE) IN NET ASSETS FROM |
|
|
|
|
| OPERATIONS
|
|
|
|
|
| Net
investment income (loss) |
$ 428,403
|
$ 595,029
|
$ 69,769,260
|
$ 114,804,418
|
| Net
realized gain (loss) |
(218,490)
|
21,878
|
(4,132,684)
|
22,596,463 |
| Net
change in unrealized appreciation (depreciation) |
(1,070,899)
|
(339,975)
|
(209,767,207)
|
18,702,917
|
| Net
Increase (Decrease) in Net Assets Resulting from Operations |
(860,986)
|
276,932
|
(144,130,631)
|
156,103,798
|
| DIVIDENDS
TO SHAREHOLDERS |
|
|
|
|
| From
distributable earnings |
|
|
|
|
| Class
A Shares |
(73,447)
|
(165,718)
|
(6,716,370)
|
(11,838,501) |
| Class
C Shares |
-
|
-
|
(1,355,382)
|
(2,909,127) |
| Class
I Shares |
(389,079)
|
(635,577)
|
(67,838,247)
|
(102,593,163) |
| Class
R3 Shares |
-
|
-
|
(12,678)
|
(33,969) |
| Class
R4 Shares |
-
|
-
|
(37,035)
|
(65,369) |
| Class
R5 Shares |
- |
- |
(1,235,960) |
(2,346,007) |
| Class
R6 Shares |
-
|
-
|
(2,008,305)
|
(2,506,048) |
| FUND
SHARE TRANSACTIONS |
|
|
|
|
| Class
A Shares |
2,932,443
|
2,921,508
|
(1,686,518)
|
122,803,510 |
| Class
C Shares |
-
|
-
|
(3,156,496)
|
(4,262,879) |
| Class
I Shares |
46,317,895
|
14,744,120
|
691,572,584
|
1,468,998,195 |
| Class
R3 Shares |
-
|
-
|
(64,072)
|
(283,900) |
| Class
R4 Shares |
-
|
-
|
160,594
|
482,876 |
| Class
R5 Shares |
-
|
-
|
735,026
|
20,087,534 |
| Class
R6 Shares |
-
|
-
|
36,252,338
|
37,609,848
|
| Net
Increase (Decrease) in Net Assets |
47,926,826
|
17,141,265
|
500,478,848
|
1,679,246,798
|
| NET
ASSETS |
|
|
|
|
| Beginning
of Period |
53,517,257
|
36,375,992
|
3,876,479,459
|
2,197,232,661
|
| End
of Period |
$ 101,444,083
|
$ 53,517,257
|
$ 4,376,958,307
|
$ 3,876,479,459
|
See notes to financial
statements.
Thornburg Fixed Income Funds Semi-Annual Report | 77
Notes to Financial Statements
March 31, 2022 (Unaudited)
NOTE 1 – ORGANIZATION
Thornburg Limited Term U.S. Government Fund (the
“Limited Term U.S. Government Fund”), Thornburg Limited Term Income Fund (the “Limited Term Income Fund”), Thornburg Ultra Short Income Fund (the “Ultra Short Income Fund”) and Thornburg Strategic Income Fund (the
“Strategic Income Fund”), collectively the “Funds”, are diversified series of Thornburg Investment Trust (the “Trust”). The Trust is organized as a Massachusetts business trust under a Declaration of Trust dated
June 3, 1987 and is registered as a diversified, open-end management investment company under the Investment Company Act of 1940, as amended (the "1940 Act"). The Funds are currently four of twenty-one separate series of the Trust. Each series is
considered to be a separate entity for financial reporting and tax purposes and bears expenses directly attributable to it.
Limited Term U.S. Government Fund: The Fund’s primary objective is to provide a high level of current income as is consistent, in the view of the Trust’s investment advisor, Thornburg Investment Management, Inc. (the “Advisor”),
with safety of capital. As a secondary objective, the Fund seeks to reduce changes in its share price compared to longer term portfolios. The Fund’s investments subject it to certain risks. As of the date of this report, the principal risks of
investing in the Fund include management risk, interest rate risk, prepayment and extension risk, credit risk, market and economic risk, liquidity risk, structured products risk, redemption risk, and cybersecurity and operational risk. Please see
the Fund’s prospectus for a discussion of those principal risks and other risks associated with an investment in the Fund.
Limited Term Income Fund: The
Fund’s primary objective is to provide a high level of current income as is consistent, in the view of the Advisor, with safety of capital. As a secondary objective, the Fund seeks to reduce changes in its share price compared to longer term
portfolios. The Fund’s investments subject it to certain risks. As of the date of this report, the principal risks of investing in the Fund include management risk, interest rate risk, prepayment and extension risk, credit risk, market and
economic risk, risks affecting specific issuers, foreign investment risk, liquidity risk, structured products risk, redemption risk, and cybersecurity and operational risk. Please see the Fund’s prospectus for a discussion of those principal
risks and other risks associated with an investment in the Fund.
Ultra Short Income Fund: The
Fund’s primary objective is to seek current income, consistent with preservation of capital. The Fund’s investments subject it to certain risks. As of the date of this report, the principal risks of investing in the Fund include
management risk, interest rate risk, prepayment and extension risk, credit risk, high yield risk, market and economic risk, risks affecting specific issuers, foreign investment risk, liquidity risk, structured products risk, derivatives risk,
redemption risk, and cybersecurity and operational risk. Please see the Fund’s prospectus for a discussion of those principal risks and other risks associated with an investment in the Fund.
Strategic Income Fund: The
Fund’s primary objective is to seek a high level of current income. As a secondary objective, the Fund seeks some long-term capital appreciation. The Fund’s investments subject it to certain risks. As of the date of this report, the
principal risks of investing in the Fund include management risk, interest rate risk, prepayment and extension risk, credit risk, high yield risk, market and economic risk, risks affecting specific issuers, liquidity risk, small and mid-cap company
risk, foreign investment risk, developing country risk, foreign currency risk, structured products risk, redemption risk, and cybersecurity and operational risk. Please see the Fund’s prospectus for a discussion of those principal risks and
other risks associated with an investment in the Fund.
Certain Funds have invested in securities that are
economically tied to Russia. Russia’s invasion of Ukraine in February 2022 resulted in market disruptions which have adversely affected, and which may continue to adversely affect, the value of those securities and certain other investments of
the Funds. The ongoing conflict has also caused investments in Russia to be subject to increased levels of political, economic, legal, market and currency risks, as well as the risk that further economic sanctions may be imposed by the United States
and other countries. Furthermore, transactions in certain Russian securities have been, or may in the future be, prohibited, and certain of the Funds’ existing investments have or may become illiquid.
As of March 31, 2022, the Funds currently offer up to eight
classes of shares of beneficial interest.
Each class of
shares of the Funds represents an interest in the same portfolio of investments, except that (i) Class A shares are sold subject to a front-end sales charge collected at the time the shares are purchased and bear a service fee, (ii) Class C shares
are sold at net asset value without a sales charge at the time of purchase, but are subject to a contingent deferred sales charge upon redemption within one year of purchase, and bear both a service fee and a distribution fee, (iii) Class C2 shares
are sold at net asset value without a sales charge at the time of purchase, but are subject to a contingent deferred sales charge upon redemption within one year of purchase, and bear both a service fee and a distribution fee, (iv) Class I and Class
R5 shares are sold at net asset value without a sales charge at the time of purchase and may be subject to a service fee, (v) Class R3 shares are sold at net asset value without a sales charge, but bear both a service fee and a distribution fee,
(vi) Class R4 shares are sold at net asset value without a sales charge at the time of purchase but bear a service fee, (vii) Class R6 shares are sold at net asset value without a sales charge at the time of purchase, and (viii) the respective
classes may have different reinvestment privileges and conversion rights. Additionally, each Fund may allocate among its classes certain expenses, to the extent allocable to specific classes, including administration fees, transfer agent fees,
government registration fees, certain printing and postage costs, and legal expenses. Currently, class specific expenses of the Funds are limited to distribution and service fees, transfer agent fees, and certain registration and filing fees.
78 | Thornburg Fixed Income Funds Semi-Annual Report
Notes to Financial Statements,
Continued
March 31, 2022 (Unaudited)
At March 31, 2022, the following class of shares are offered
in each respective Fund:
| |
Class
A |
Class
C |
Class
C2 |
Class
I |
Class
R3 |
Class
R4 |
Class
R5 |
Class
R6 |
| Limited
Term U.S. Government Fund |
X
|
X
|
X
|
X
|
X
|
X
|
X
|
|
| Limited
Term Income Fund |
X
|
X
|
X
|
X
|
X
|
X
|
X
|
X
|
| Ultra
Short Income Fund |
X
|
|
|
X
|
|
|
|
|
| Strategic
Income Fund |
X
|
X
|
|
X
|
X
|
X
|
X
|
X
|
NOTE
2 – SIGNIFICANT ACCOUNTING POLICIES
The
following is a summary of significant accounting policies followed by each of the Funds in the preparation of its financial statements. Each Fund prepares its financial statements in conformity with United States generally accepted accounting
principles (“GAAP”), including investment company accounting and reporting guidance in the Financial Accounting Standards Board (the “FASB”) Accounting Standard Codification Topic 946.
Allocation of Income,
Gains, Losses and Expenses: Net investment income (other than class specific expenses) and realized and unrealized gains and losses are allocated daily to each class of shares based upon the relative net asset value of outstanding shares (or
the value of the dividend-eligible shares, as appropriate) of each class of shares at the beginning of the day (after adjusting for the current capital shares activity of the respective class). Expenses common to all Funds are allocated daily among
the Funds comprising the Trust based upon their relative net asset values or other appropriate allocation methods. Operating expenses directly attributable to a specific class are charged against the operating income of that class.
Dividends and
Distributions to Shareholders: Dividends and distributions to shareholders, which are determined in accordance with federal income tax regulations and may differ from GAAP, are recorded on the ex-dividend date. Ordinary income dividends, if
any, are declared daily and paid monthly. Capital gain distributions, if any, are declared and paid annually and more often if deemed necessary by the Advisor. Dividends and distributions are paid and are reinvested in additional shares of the Funds
at net asset value per share at the close of business on the ex-dividend date, or at the shareholder’s option, paid in cash.
Foreign Currency
Translation: Portfolio investments and other assets and liabilities denominated in foreign currencies are translated into U.S. dollars based on the exchange rate of such currencies against the U.S. dollar on the date of valuation. Purchases
and sales of investments and income items denominated in foreign currencies are translated into U.S. dollars at the exchange rate in effect on the transaction date. When the Funds purchase or sell foreign investments, they will customarily enter
into a foreign exchange contract to minimize foreign exchange risk from the trade date to the settlement date of such transactions. The values of such spot contracts are included in receivable for investments sold and payable for investments
purchased on the Statement of Assets and Liabilities.
The Funds do not separately report the effect of changes in
foreign exchange rates from changes in market prices on investments held. Such changes are included in net unrealized appreciation (depreciation) from investments in the Statement of Operations.
Reported net realized gains and losses from foreign currency
transactions arise due to purchases and sales of foreign currencies, currency gains and losses realized between the trade and settlement dates on investment transactions and the difference between the amounts of dividends, interest, and foreign
withholding taxes recorded on the Funds’ books, and the U.S. dollar equivalent of the amounts actually received or paid. These amounts are included in foreign currency transactions in the Statement of Operations.
Net change in unrealized appreciation (depreciation) on
foreign currency translations arise from changes in the fair value of assets and liabilities, other than investments at period end, resulting from changes in exchange rates.
Guarantees and
Indemnifications: Under the Trust’s organizational documents (and under separate agreements with the independent Trustees), its officers and Trustees are provided with an indemnification against certain liabilities arising out of the
performance of their duties to the Funds. In the normal course of business the Trust may also enter into contracts with service providers that contain general indemnifications. The Trust’s maximum exposure under these arrangements is unknown.
However, based on experience, the Trust expects the risk of loss to be remote.
Investment
Income: Dividend income is recorded on the ex-dividend date. Certain income from foreign investments is recognized as soon as information is available to the Funds. Interest income is accrued as earned. Premiums and discounts are amortized
and accreted, respectively, to first call dates or maturity dates using the effective yield method of the respective investments. These amounts are included in Investment Income in the Statement of Operations.
Investment
Transactions: Investment transactions are accounted for on a trade date basis. Realized gains and losses from the sale of investments are recorded on an identified cost basis.
Thornburg Fixed
Income Funds Semi-Annual Report | 79
Notes to Financial Statements,
Continued
March 31, 2022 (Unaudited)
Repurchase
Agreements: The Funds may invest excess cash in repurchase agreements whereby the Funds purchase investments, which serve as collateral, with an agreement to resell such collateral to the seller at an agreed upon price at the maturity date of
the repurchase agreement. Investments pledged as collateral for repurchase agreements are held in custody until maturity of the repurchase agreement. Provisions in the agreements require that the market value of the collateral is at least equal to
the repurchase value in the event of default. In the event of default, the Funds have the right to liquidate the collateral and apply the proceeds in satisfaction of the obligation. Under certain circumstances, in the event of default or bankruptcy
by the other party to the agreement, realization and/or retention of the collateral may be subject to legal proceedings.
Security
Valuation: All investments in securities held by the Funds are valued as described in Note 3.
Use of
Estimates: The preparation of financial statements in conformity with GAAP requires management to make estimates and assumptions that affect the reported amounts of assets and liabilities and disclosure of contingent assets and liabilities at
the date of the financial statements and the reported amounts of increases (decreases) in net assets from operations during the reporting period. Actual results could differ from those estimates.
When-Issued and
Delayed Delivery Transactions: The Funds may engage in when-issued or delayed delivery transactions. To the extent the Funds engage in such transactions, they will do so for the purpose of acquiring portfolio investments consistent with the
Funds’ investment objectives and not for the purpose of investment leverage or to speculate on interest rate or market changes. At the time the Funds make a commitment to purchase an investment on a when-issued or delayed delivery basis, the
Funds will record the transaction and reflect the value in determining its net asset value. When effecting such transactions, assets of an amount sufficient to make payment for the portfolio investments to be purchased will be segregated on the
Funds’ records on the trade date. Investments purchased on a when-issued or delayed delivery basis do not earn interest until the settlement date. The values of these securities held at March 31, 2022 are detailed in the Schedule of
Investments.
NOTE 3 – SECURITY
VALUATION
Valuation of the Funds’ portfolio
investment securities is performed in accordance with policies and procedures adopted by and under the oversight of the Trustees.
The Trustees of the Trust have appointed the Advisor to assist
the Trustees with obtaining fair market values for portfolio investments, evaluating and monitoring professional pricing service providers appointed by the Trustees’ Audit Committee (the “Audit Committee”) to assist in determining
fair values for portfolio investments, assisting in calculating fair values for portfolio investments in certain circumstances, and performing other functions in connection with the valuation of investments. The Advisor acts through its Valuation
and Pricing Committee (the “Committee”) and other employees of the Advisor. The Committee regularly reviews its own valuation calculations, reviews the valuations, valuation techniques and services furnished by pricing service providers,
considers circumstances which may require valuation calculations by the Committee, and reviews previous valuation calculations. The Committee reports to the Audit Committee on the Committee’s activities, the performance of pricing service
providers, and other matters relating to valuation of portfolio investments.
In those instances when the Committee assists in calculating a
fair value for a portfolio investment, the Committee seeks to determine the price that the Funds would reasonably expect to receive upon a sale of the investment in an orderly transaction between market participants on the valuation date. The
Committee customarily utilizes quotations from securities broker dealers in calculating valuations, but also may utilize prices obtained from pricing service providers or other methods approved by the Audit Committee. Because fair values calculated
by the Committee are estimates, the calculation of a value for an investment may differ from the price that would be realized by the Funds upon a sale of the investment, and the difference could be material to the Funds’ financial statements.
The Committee’s calculation of a fair value for an investment may also differ from the prices obtained by other persons (including other mutual funds) for the investment.
Valuation of
Securities: Securities and other portfolio investments which are listed or traded on a United States securities exchange are valued at the last reported sale price on the valuation date. Investments listed or traded on an exchange for which
there has been no sale that day are valued at the mean between the last reported bid and asked prices on that valuation date. Portfolio investments reported by NASDAQ are valued at the official closing price on the valuation date. If an investment
is traded on more than one exchange, the investment is considered traded on the exchange that is normally the primary market for that investment. Securities and other portfolio investments which are listed or traded on exchanges outside the United
States are valued at the last price or the closing price of the investment on the exchange that is normally the primary market for the investment, as of the close of the exchange preceding the Fund’s valuation date. Foreign investments listed
or traded on an exchange for which there has been no sale that day are valued at the mean between the last reported bid and asked prices on that valuation date.
In any case when a market quotation is not readily available
for a portfolio investment ordinarily valued by market quotation, the Committee calculates a fair value for the investment using alternative methods approved by the Audit Committee. A market quotation is not readily
80 | Thornburg Fixed Income Funds Semi-Annual Report
Notes to Financial Statements,
Continued
March 31, 2022 (Unaudited)
available when the primary market or exchange for the investment is not open
for the entire scheduled day of trading. Market quotations for an investment also may not be readily available if developments after the most recent close of the investment’s primary exchange or market, but prior to the close of business on
any Fund business day, or an unusual event or significant period of time occurring since the availability of a market quotation, create a serious question concerning the reliability of the most recent market quotation available for the investment.
In particular, on days when market volatility thresholds established by the Audit Committee are exceeded, foreign equity investments held by the Fund may be valued using alternative methods. The Committee customarily obtains valuations in these
instances from pricing service providers approved by the Audit Committee. Pricing service providers ordinarily calculate valuations using multi-factor models to adjust market prices based upon various inputs, including exchange data, depository
receipt prices, futures, index data and other data.
Investments in open-end U.S. mutual funds are valued at net
asset value (“NAV”) each business day.
Debt
obligations held by the Funds which are not listed or traded on exchanges or for which no reported market exists are ordinarily valued at the valuation obtained from a pricing service provider approved by the Audit Committee.
In any case when a pricing service provider fails to provide a
valuation for a debt obligation held by the Funds, the Committee may calculate a fair value for the obligation using alternative methods under procedures approved by the Audit Committee. Additionally, in cases when management believes that a
valuation obtained from a pricing service provider is stale, does not reflect material factors affecting the valuation of the investment, is significantly different than the value the Funds are likely to obtain if it sought a bid for the investment,
or is otherwise unreliable, the Committee may calculate a fair value for the obligation using an alternative method approved by the Audit Committee.
Quotations for foreign investments expressed in foreign
currency amounts are converted to U.S. dollar equivalents using a foreign exchange quotation from a third party service provider at the time of valuation. Foreign investments held by the Funds may be traded on days and at times when the Funds are
not open for business. Consequently, the value of Funds’ investments may be significantly affected on days when shareholders cannot purchase or sell Funds’ shares.
Valuation
Hierarchy: The Funds categorize their investments based upon the inputs used in valuing those investments, according to a three-level hierarchy established in guidance from the FASB. Categorization of investments using this hierarchy is
intended by the FASB to maximize the use of observable inputs in valuing investments and minimize the use of unobservable inputs by requiring that the most observable inputs be used when available. Observable inputs are those that market
participants would use in valuing an investment based on available market information. Unobservable inputs are those that reflect assumptions about the information market participants would use in valuing an investment. An investment’s level
within the hierarchy is based on the lowest level input that is deemed significant to the valuation. The methodologies and inputs used to value investments are not necessarily indications of the risk or liquidity associated with those
investments.
Various inputs are used in calculating
valuations for the Funds’ investments. These inputs are generally summarized according to the three-level hierarchy below:
Level 1: Quoted prices in active markets for identical
investments.
Level 2: Other direct or indirect
significant observable inputs (including quoted prices for similar investments in active markets and other observable inputs, such as interest rates, prepayment rates, credit ratings, etc.).
Level 3: Significant unobservable inputs (including the
Committee’s own assumptions in calculating the fair values of investments).
Valuations for debt obligations held by the Funds are
typically calculated by pricing service providers approved by the Audit Committee and are generally characterized as Level 2 within the valuation hierarchy.
On days when market volatility thresholds established by the
Audit Committee are exceeded, foreign securities for which valuations are obtained from pricing service providers are fair valued. On these days, the foreign securities are characterized as Level 2 within the valuation hierarchy and revert to Level
1 after the threshold is no longer exceeded.
In a
limited number of cases the Committee calculates a fair value for investments using broker quotations or other methods approved by the Audit Committee. When the Committee uses a single broker quotation to calculate a fair value for an investment
without other significant observable inputs, or if a fair value is calculated using other significant inputs that are considered unobservable, the investment is characterized as Level 3 within the hierarchy. Other significant unobservable inputs
used to calculate a fair value in these instances might include an income-based valuation approach which considers discounted anticipated future cash flows from the investment and application of discounts due to the nature or duration of any
restrictions on the disposition of the investment.
Thornburg Fixed Income Funds Semi-Annual Report | 81
Notes to Financial Statements,
Continued
March 31, 2022 (Unaudited)
Valuations based upon the use of inputs from Levels 1, 2 or 3
may not represent the actual price received upon the disposition of an investment, and a Fund may receive a price that is lower than the valuation based upon these inputs when it sells the investment.
The following tables display a summary of the fair value
hierarchy measurements of each Fund’s investments as of March 31, 2022:
| LIMITED
TERM U.S. GOVERNMENT FUND |
TOTAL
|
LEVEL
1 |
LEVEL
2 |
LEVEL
3 |
| Assets
|
|
|
|
|
| Investments
in Securities |
|
|
|
|
| Corporate
Bonds |
$ 6,167,285
|
$ —
|
$
6,167,285 |
$ —
|
| U.S.
Treasury Securities |
55,105,697
|
55,105,697
|
—
|
— |
| U.S.
Government Agencies |
20,689,170
|
—
|
20,689,170
|
— |
| Mortgage
Backed |
171,021,865
|
—
|
171,021,865
|
— |
| Short-Term
Investments |
23,635,336
|
1,134,439
|
22,500,897
|
—
|
| Total
Investments in Securities |
$
276,619,353 |
$
56,240,136 |
$
220,379,217 |
$
— |
| Total
Assets |
$
276,619,353 |
$
56,240,136 |
$
220,379,217 |
$
— |
| LIMITED
TERM INCOME FUND |
TOTAL
|
LEVEL
1 |
LEVEL
2 |
LEVEL
3 |
| Assets
|
|
|
|
|
| Investments
in Securities |
|
|
|
|
| Preferred
Stock |
$ 29,012,816
|
$ —
|
$ —
|
$
29,012,816 |
| Asset
Backed Securities |
1,891,014,623
|
—
|
1,891,014,623
|
— |
| Corporate
Bonds |
3,830,661,999
|
—
|
3,830,661,999
|
— |
| Long-Term
Municipal Bonds |
12,552,516
|
—
|
12,552,516
|
— |
| Other
Government |
16,788,150
|
—
|
16,788,150
|
— |
| U.S.
Treasury Securities |
815,427,939
|
815,427,939
|
—
|
— |
| U.S.
Government Agencies |
53,439,529
|
—
|
53,439,529
|
— |
| Mortgage
Backed |
2,346,381,954
|
—
|
2,346,381,954
|
— |
| Loan
Participations |
70,362,322
|
—
|
70,362,322
|
— |
| Short-Term
Investments |
483,601,459
|
483,601,459
|
—
|
—
|
| Total
Investments in Securities |
$
9,549,243,307 |
$
1,299,029,398 |
$
8,221,201,093 |
$
29,012,816 |
| Total
Assets |
$
9,549,243,307 |
$
1,299,029,398 |
$
8,221,201,093 |
$
29,012,816 |
| ULTRA
SHORT INCOME FUND |
TOTAL
|
LEVEL
1 |
LEVEL
2 |
LEVEL
3 |
| Assets
|
|
|
|
|
| Investments
in Securities |
|
|
|
|
| Asset
Backed Securities |
$ 64,728,099
|
$ —
|
$
64,728,099 |
$ —
|
| Corporate
Bonds |
19,650,493
|
—
|
19,650,493
|
— |
| Convertible
Bonds |
259,558
|
—
|
259,558
|
— |
| Long-Term
Municipal Bonds |
75,153
|
—
|
75,153
|
— |
| U.S.
Treasury Securities |
2,319,591
|
2,319,591
|
—
|
— |
| U.S.
Government Agencies |
77,266
|
—
|
77,266
|
— |
| Mortgage
Backed |
5,553,611
|
—
|
5,553,611
|
— |
| Short-Term
Investments |
11,073,672
|
3,608,163
|
7,465,509
|
—
|
| Total
Investments in Securities |
$
103,737,443 |
$
5,927,754 |
$
97,809,689 |
$
— |
| Total
Assets |
$
103,737,443 |
$
5,927,754 |
$
97,809,689 |
$— |
82
| Thornburg Fixed Income Funds Semi-Annual Report
Notes to Financial Statements,
Continued
March 31, 2022 (Unaudited)
| STRATEGIC
INCOME FUND |
TOTAL
|
LEVEL
1 |
LEVEL
2 |
LEVEL
3 |
| Assets
|
|
|
|
|
| Investments
in Securities |
|
|
|
|
| Common
Stock |
$
847 |
$
— |
$
— |
$
847 |
| Preferred
Stock |
28,643,115
|
14,136,299
|
4,220,000
|
10,286,816 |
| Asset
Backed Securities |
991,334,030
|
—
|
955,537,292
|
35,796,738 |
| Corporate
Bonds |
2,072,421,712
|
—
|
2,072,421,712
|
—(a) |
| Convertible
Bonds |
31,643,637
|
—
|
31,643,637
|
— |
| Long-Term
Municipal Bonds |
13,585,896
|
—
|
13,585,896
|
— |
| Other
Government |
32,080,547
|
6,391,950
|
25,688,597
|
— |
| U.S.
Treasury Securities |
31,716,590
|
31,716,590
|
—
|
— |
| U.S.
Government Agencies |
14,048,462
|
—
|
14,048,462
|
— |
| Mortgage
Backed |
642,296,697
|
—
|
642,296,697
|
— |
| Loan
Participations |
116,548,909
|
—
|
116,548,909
|
— |
| Short-Term
Investments |
382,971,615
|
382,971,615
|
—
|
—
|
| Total
Investments in Securities |
$
4,357,292,057 |
$
435,216,454 |
$
3,875,991,202 |
$
46,084,401(b) |
| Total
Assets |
$
4,357,292,057 |
$
435,216,454 |
$
3,875,991,202 |
$
46,084,401 |
| Liabilities
|
|
|
|
|
| Other
Financial Instruments |
|
|
|
|
| Forward
currency contracts |
$
(20,284) |
$
— |
$
(20,284) |
$
— |
| Total
Other Financial Instruments |
$
(20,284) |
$
— |
$
(20,284) |
$
— |
| Total
Liabilities |
$
(20,284) |
$
— |
$
(20,284) |
$— |
|
(a) |
A
security categorized as Level 3 is currently valued at zero. |
|
(b) |
In
accordance with the guidance prescribed in Accounting Standards Update ("ASU") No. 2011-04, the following table displays a summary of the valuation techniques and unobservable inputs used to value portfolio securities characterized as Level 3
investments for the period ended at March 31, 2022. |
| |
FAIR
VALUE AT
March 31, 2022 |
VALUATION
TECHNIQUE(S) |
UNOBSERVABLE
INPUT |
RANGE
(WEIGHTED AVERAGE) |
| Common
Stock |
$ 847
|
Reference
instrument |
Discount
for lack of marketability |
$95.24%/(N/A)
(a) |
| Preferred
Stock |
10,286,816
|
Purchase
price |
Purchase
price |
$24,968.00/(N/A)
|
| Asset-Backed
Securities |
9,670,000
|
Discounted
cash flows |
Credit
spread |
$9.40%/(N/A)
|
| |
1,067,628
|
Amortized
cost |
Expected
recovery |
$47.03-$5,293.21/($2,648.04)
|
| |
25,059,110
|
Discounted
cash flows |
Yield
(Discount rate of cash flows) |
$13.63%-23.50%/(16.97%)
|
| Total
|
$
46,084,401 |
|
|
|
|
(a) Represents price used after factoring in market impact including discounts, as applicable. |
|
A rollforward of fair value measurements using significant
unobservable inputs (Level 3) for the six months ended March 31, 2022 is as follows:
| STRATEGIC
INCOME FUND |
COMMON
STOCK |
PREFERRED
STOCK |
ASSET
BACKED
SECURITIES |
Total
(e) |
| Beginning
Balance 9/30/2021 |
$
847 |
$
10,286,816 |
$
55,912,422 |
$
66,200,085 |
| Accrued
Discounts (Premiums) |
–
|
–
|
(3,251,796)
|
(3,251,796)
|
| Net
Realized Gain (Loss)(a) |
–
|
–
|
359,299
|
359,299
|
| Gross
Purchases |
–
|
–
|
–
|
–
|
| Gross
Sales |
–
|
–
|
(2,190,000)
|
(2,190,000)
|
| Net
Change in Unrealized Appreciation (Depreciation)(b)(c) |
–
|
–
|
(1,057,783)
|
(1,057,783)
|
| Transfers
into Level 3(d) |
–
|
–
|
–
|
–
|
| Transfers
out of Level 3(d) |
–
|
–
|
(13,975,404)
|
(13,975,404)
|
| Ending
Balance 3/31/2022 |
$
847 |
$
10,286,816 |
$
35,796,738 |
$
46,084,401 |
Thornburg Fixed
Income Funds Semi-Annual Report | 83
Notes to Financial Statements,
Continued
March 31, 2022 (Unaudited)
| (a)
|
Amount
of net realized gain (loss) from investments recognized in income is included in the Fund’s Statement of Operations for the six months ended March 31, 2022. |
| (b)
|
Amount
of net change in unrealized appreciation (depreciation) on investments recognized in income is included in the Fund’s Statement of Operations for the six months ended March 31, 2022. |
| (c)
|
The
net change in unrealized appreciation (depreciation) attributable to securities owned at March 31, 2022, which were valued using significant unobservable inputs, was $(1,041,712). This is included within net change in unrealized appreciation
(depreciation) on investments in the Fund’s the Statement of Operations for the six months ended March 31, 2022. |
| (d)
|
Transfers
into or out of Level 3 were out of or into Level 2, and were due to changes in other significant observable inputs available during the six months ended March 31, 2022. Transfers into or out of Level 3 are based on the beginning market value of the
period in which they occurred. |
| (e)
|
Level
3 investments represent 1.05% of total net assets at the six months ended March 31, 2022. Significant fluctuations of the unobservable inputs applied to portfolio securities characterized as Level 3 investments could be expected to increase or
decrease the fair value of these portfolio securities. |
NOTE 4 – INVESTMENT MANAGEMENT FEE AND
OTHER TRANSACTIONS WITH AFFILIATES
Pursuant to an
investment management agreement with the Trust, the Advisor serves as the investment advisor and performs advisory services for the Funds for which the Advisor’s management fees are payable at the end of each month. Under the investment
advisory agreement, each Fund pays the Advisor a management fee based on the average daily net assets of that fund at an annual rate as shown in the following table:
| LIMITED
TERM U.S. GOVERNMENT FUND |
LIMITED
TERM INCOME FUND |
ULTRA
SHORT INCOME FUND |
STRATEGIC
INCOME FUND |
| DAILY
NET ASSETS |
FEE
RATE |
DAILY
NET ASSETS |
FEE
RATE |
DAILY
NET ASSETS |
FEE
RATE |
DAILY
NET ASSETS |
FEE
RATE |
| Up
to $1 billion |
0.375%
|
Up
to $500 million |
0.500%
|
Up
to $5 billion |
0.250%
|
Up
to $500 million |
0.750%
|
| Next
$1 billion |
0.325
|
Next
$500 million |
0.450
|
Next
$5 billion |
0.225
|
Next
$500 million |
0.675
|
| Over
$2 billion |
0.275
|
Next
$500 million |
0.400
|
Over
$10 billion |
0.200
|
Next
$500 million |
0.625
|
| |
|
Next
$500 million |
0.350
|
|
|
Next
$500 million |
0.575
|
| |
|
Over
$2 billion |
0.275
|
|
|
Over
$2 billion |
0.500
|
The Funds’ effective
management fees, calculated on the basis of the Funds’ average daily net assets (before applicable management fee waivers) for the six months ended March 31, 2022 were as shown in the following table. Total management fees incurred by the
Funds for the six months ended March 31, 2022 are set forth in the Statement of Operations.
| |
Effective
Management
Fee |
| Limited
Term U.S. Government Fund |
0.375%
|
| Limited
Term Income Fund |
0.304
|
| Ultra
Short Income Fund |
0.250
|
| Strategic
Income Fund |
0.575
|
The Trust has entered into an
administrative services agreement with the Advisor, whereby the Advisor will perform certain administrative services. The administrative services fees are computed as an annual percentage of the aggregate average daily net assets of all Funds in the
Trust as follows:
| Administrative
Services Fee Schedule |
| Daily
Net Assets |
Fee
Rate |
| Up
to $20 billion |
0.100%
|
| $20
billion to $40 billion |
0.075
|
| $40
billion to $60 billion |
0.040
|
| Over
$60 billion |
0.030
|
The aggregate administrative
services fee amount is allocated on a daily basis to each Fund based on net assets and subsequently allocated to each class of shares of the Funds. Total administrative services fees incurred by each class of shares of the Funds for the six months
ended March 31, 2022, are set forth in the Statement of Operations.
The Trust has an underwriting agreement with Thornburg
Securities Corporation (the “Distributor”), an affiliate of the Advisor, which acts as the distributor of the Funds’ shares. For the six months ended March 31, 2022, the Distributor has advised the Funds that they earned net
84 | Thornburg Fixed Income Funds Semi-Annual Report
Notes to Financial Statements,
Continued
March 31, 2022 (Unaudited)
commissions from the sale of Class A shares and collected contingent deferred
sales charges ("CDSC Fees") from redemptions of Class C and Class C2 shares as follows:
| |
Commissions
|
CDSC
fees |
| Limited
Term U.S. Government Fund |
$
437 |
$
297 |
| Limited
Term Income Fund |
6,749 |
11,835 |
| Ultra
Short Income Fund |
276 |
— |
| Strategic
Income Fund |
16,810 |
10,884 |
Pursuant to a service plan
under Rule 12b-1 of the 1940 Act, the Funds may reimburse to the Distributor an amount not to exceed .25 of 1% per annum of the average daily net assets attributable to the applicable Class A, Class C, Class C2, Class I, Class R3, Class R4, and
Class R5 shares of the Limited Term U.S. Government Fund and Limited Term Income Fund, Class A, Class C, Class I, Class R3, Class R4, and Class R5 shares of the Strategic Income Fund and .20 of 1% per annum of the average daily net assets
attributable to the applicable Class A and Class I of the Ultra Short Income Fund for payments made by the Distributor to securities dealers and other financial institutions to obtain various shareholder and distribution related services. For the
six months ended March 31, 2022, there were no 12b-1 service plan fees charged for Class I or Class R5 shares. Class R6 shares are not subject to a service plan. The Advisor and Distributor each may pay out of its own resources additional expenses
for distribution of each Funds’ shares and shareholder services.
The Trust has also adopted a distribution plan pursuant to
Rule 12b-1, applicable only to the Funds’ Class C, Class C2, and Class R3 shares, under which the Funds compensate the Distributor for services in promoting the sale of Class C, Class C2 and Class R3 shares of the Funds at an annual rate of up
to .25 of 1% per annum of the average daily net assets attributable to Class C shares of Limited Term U.S. Government Fund and Limited Term Income Fund, .40 of 1% per annum of the average daily net assets attributable to Class C2 shares of the
Limited Term U.S. Government Fund and Limited Term Income Fund, .75 of 1% per annum of the average daily net assets attributable to Class C shares of Strategic Income Fund, and .25 of 1% per annum of the average daily net assets attributable to
Class R3 shares. Total fees incurred by each class of shares of the Funds under their respective service and distribution plans for the six months ended March 31, 2022 are set forth in the Statements of Operations.
The Advisor has contractually agreed to waive certain fees and
reimburse certain expenses incurred by the Funds. The agreement may be terminated by the Funds at any time, but may not be terminated by the Advisor before February 1, 2023 unless the Advisor ceases to be the investment advisor to the Funds prior to
that date. The Advisor may recoup amounts waived or reimbursed during the six months ended March 31, 2022 if, during the fiscal year, expenses fall below the contractual limit that was in place at the time these fees and expenses were waived or
reimbursed. The Advisor will not recoup fees or expenses as described in the preceding sentence if that recoupment would cause the Fund’s total annual operating expenses (after the recoupment is taken into account) to exceed the lesser of: (a)
the expense cap that was in place at the time the waiver or reimbursement occurred; or (b) the expense cap that is in place at the time of the recoupment.
Actual expenses of certain share classes do not exceed levels
as specified in each Fund’s most recent prospectus as shown on the following table:
| |
Class
A |
Class
C |
Class
C2 |
Class
I |
Class
R3 |
Class
R4 |
Class
R5 |
Class
R6 |
| Limited
Term U.S. Government Fund |
—% |
—% |
1.24% |
—% |
0.99% |
0.99% |
0.67% |
—% |
| Limited
Term Income Fund |
— |
— |
1.24 |
0.49 |
0.99 |
0.99 |
0.49 |
0.42 |
| Ultra
Short Income Fund |
0.50 |
— |
— |
0.30 |
— |
— |
— |
— |
| Strategic
Income Fund |
— |
1.80 |
— |
0.60 |
1.25 |
1.25 |
0.60 |
0.53 |
For the six months ended March
31, 2022, the Advisor contractually reimbursed certain class specific expenses and distribution fees and voluntarily waived Fund level investment advisory fees as follows:
| Contractual:
|
Class
A |
Class
C |
Class
C2 |
Class
I |
Class
R3 |
Class
R4 |
Class
R5 |
Class
R6 |
Total
|
| Limited
Term U.S. Government Fund |
$ —
|
$ —
|
$
869 |
$ —
|
$
14,302 |
$
10,736 |
$
9,363 |
$ —
|
$
35,270 |
| Limited
Term Income Fund |
—
|
—
|
689 |
91,560
|
10,666
|
15,649
|
133,012
|
14,484
|
266,060
|
| Ultra
Short Income Fund |
34,984
|
—
|
— |
67,515
|
—
|
—
|
—
|
—
|
102,499
|
| Strategic
Income Fund |
97,092
|
24,919
|
— |
2,661,812
|
9,546
|
10,528
|
91,258
|
87,742
|
2,982,897
|
| Voluntary:
|
Class
A |
Class
C |
Class
C2 |
Class
I |
Class
R3 |
Class
R4 |
Class
R5 |
Class
R6 |
Total
|
| Limited
Term U.S. Government Fund |
$ —
|
$
4,843 |
$
1,636 |
$ —
|
$ —
|
$ —
|
$ —
|
$ —
|
$ 6,479
|
| Ultra
Short Income Fund |
6,631
|
—
|
— |
38,518
|
—
|
—
|
—
|
—
|
45,149 |
| Strategic
Income Fund |
34,742 |
8,712 |
— |
348,758 |
71 |
200 |
5,878 |
10,178 |
408,539 |
Thornburg Fixed Income Funds Semi-Annual Report | 85
Notes to Financial Statements,
Continued
March 31, 2022 (Unaudited)
Certain officers and Trustees of the Trust are also officers
or directors of the Advisor and Distributor. The compensation of the independent Trustees is borne by the Trust. The Trust also pays a portion of the Chief Compliance Officer’s compensation. These amounts are reflected as Trustee and officer
fees in the Statement of Operations.
As of March 31,
2022, the percentage of direct investments in the Funds held by the Trustees, officers of the Trust, and the Advisor is approximately as follows.
| |
Percentage
of Direct Investments |
| Limited
Term U.S. Government Fund |
11.46%
|
| Limited
Term Income Fund |
0.10
|
| Ultra
Short Income Fund |
4.85
|
| Strategic
Income Fund |
0.27
|
The Funds may purchase or sell
securities from or to an affiliated fund, provided the affiliation is due solely to having a common investment advisor, common officers, or common trustees, and provided that all such transactions will comply with Rule 17a-7 under the 1940 Act. For
the six months ended at March 31, 2022, the Funds had no such transactions with affiliated funds.
Shown below are holdings of voting securities of each
portfolio company which is considered "affiliated" to the Funds under the 1940 Act, including companies for which the Funds’ holding represented 5% or more of the company’s voting securities, and a series of the Thornburg Investment
Trust in which the Funds invested for cash management purposes during the period:
| LIMITED
TERM INCOME FUND |
Market
Value
9/30/21 |
Purchases
at Cost |
Sales
Proceeds |
Realized
Gain
(Loss) |
Change
in
Unrealized
Appr./(Depr.) |
Market
Value
3/31/22 |
Dividend
Income |
| Thornburg
Capital Mgmt. Fund |
$874,046,644
|
$1,687,408,649
|
$(2,077,853,834)
|
$-
|
$-
|
$483,601,459
|
$803,142
|
| ULTRA
SHORT INCOME FUND |
|
|
|
|
|
|
|
| Thornburg
Capital Mgmt. Fund |
$
4,848,903 |
$
56,028,506 |
$
(57,269,246) |
$-
|
$-
|
$
3,608,163 |
$
4,605 |
| STRATEGIC
INCOME FUND |
|
|
|
|
|
|
|
| Thornburg
Capital Mgmt. Fund |
$346,532,754
|
$
787,906,573 |
$
(751,467,712) |
$-
|
$-
|
$382,971,615
|
$418,055
|
NOTE
5 – TAXES
Federal Income Taxes: It is the policy of the Trust to comply with the provisions of the Internal Revenue Code of 1986 applicable to regulated investment companies and to distribute to shareholders
substantially all investment company taxable income including net realized gains on investments (if any), and tax exempt income of the Funds. Therefore, no provision for federal income or excise tax is required.
The Funds file income tax returns in United States federal and
applicable state jurisdictions. The statute of limitations on the Funds’ tax return filings generally remains open for the three years following a return’s filing date. The Funds have analyzed each uncertain tax position believed to be
material in the preparation of the Funds’ financial statements for the six month period ended March 31, 2022, including open tax years, to assess whether it is more likely than not that the position would be sustained upon examination, based
on the technical merits of the position. The Funds have not identified any such position for which an asset or liability must be reflected in the Statements of Assets and Liabilities.
At March 31, 2022, information on the tax components of
capital was as follows:
| |
Cost
|
Unrealized
Appreciation |
Unrealized
Depreciation |
Net
Unrealized
Appreciation
(Depreciation) |
| Limited
Term U.S. Government Fund |
$ 286,418,509
|
$ 333,566
|
$ (10,132,722)
|
$ (9,799,156)
|
| Limited
Term Income Fund |
9,894,523,457
|
35,905,508
|
(381,185,658)
|
(345,280,150) |
| Ultra
Short Income Fund |
104,672,120
|
39,710
|
(974,387)
|
(934,677) |
| Strategic
Income Fund |
4,508,574,759 |
57,250,784 |
(208,533,486) |
(151,282,702) |
Temporary
differences between book and tax basis appreciation (depreciation) on cost of investments is primarily attributed to tax deferral of losses on wash sales and partnership basis adjustments.
86 | Thornburg Fixed Income Funds Semi-Annual Report
Notes to Financial Statements,
Continued
March 31, 2022 (Unaudited)
At March 31, 2022, the Fund had deferred tax basis ordinary
and capital losses occurring subsequent to October 31, 2020 through September 30, 2021 per the following table. For tax purposes, such losses will be recognized in the year ending September 30, 2022.
| |
Deferred
Tax Basis |
| |
Capital
Losses |
| Limited
Term U.S. Government Fund |
$
2,443,321 |
| Limited
Term Income Fund |
2,831,888 |
| Ultra
Short Income Fund |
62,788 |
At March 31, 2022, the Funds had cumulative tax basis
capital losses from prior fiscal years as shown on the following table, which may be carried forward to offset future capital gains. To the extent such carryforwards are used, capital gain distributions may be reduced to the extent provided by
regulations. Such capital loss carryforwards do not expire.
| |
Cumulative
Capital Losses |
| |
Short-Term
|
Long-Term
|
| Limited
Term U.S. Government Fund |
$
2,145,425 |
$
10,714,016 |
| Ultra
Short Income Fund |
8,418 |
262 |
Foreign Withholding
Taxes: The Funds are subject to foreign tax withholding imposed by certain foreign countries in which the Funds may invest. Withholding taxes are incurred on certain foreign dividends and are accrued at the time the dividend is recognized
based on applicable foreign tax laws. The Funds may file withholding tax reclaims in certain jurisdictions to recover a portion of amounts previously withheld, in view of various considerations, including recent decisions rendered by the courts in
those and other jurisdictions. The Funds would expect to record a receivable for such a tax reclaim based on a variety of factors, including assessment of a jurisdiction’s legal obligation to pay reclaims, the jurisdiction’s
administrative practices and payment history, and industry convention.
Deferred Foreign
Capital Gain Taxes: The Funds are subject to a tax imposed on net realized gains of securities of certain foreign countries. The Funds record an estimated deferred tax liability for net unrealized gains on these investments as reflected in
the accompanying financial statements. Such changes are included in net unrealized appreciation (depreciation) from investments in the Statement of Operations.
NOTE 6 – SHARES OF BENEFICIAL
INTEREST
At March 31, 2022, there were an unlimited
number of shares of the Trust with no par value of beneficial interest authorized. Transactions in the Trust’s shares of beneficial interest were as follows:
| |
SIX
MONTHS ENDED
March 31, 2022 |
YEAR
ENDED
September 30, 2021 |
| LIMITED
TERM U.S. GOVERNMENT FUND |
SHARES
|
AMOUNT
|
SHARES
|
AMOUNT
|
| Class
A Shares |
|
|
|
|
| Shares
sold |
258,239
|
$ 3,323,087
|
1,775,725
|
$ 23,523,870
|
Shares
issued to shareholders in
reinvestment of dividends |
35,157
|
450,563
|
77,740
|
1,025,356 |
| Shares
repurchased |
(1,843,142)
|
(23,680,667)
|
(1,247,329)
|
(16,467,534)
|
| Net
increase (decrease) |
(1,549,746)
|
$
(19,907,017) |
606,136
|
$ 8,081,692
|
| Class
C Shares |
|
|
|
|
| Shares
sold |
48,779
|
$ 628,081
|
146,397
|
$ 1,959,523
|
Shares
issued to shareholders in
reinvestment of dividends |
2,768
|
35,625
|
7,565
|
100,445 |
| Shares
repurchased |
(215,364)
|
(2,776,201)
|
(723,232)
|
(9,643,414)
|
| Net
increase (decrease) |
(163,817)
|
$
(2,112,495) |
(569,270)
|
$
(7,583,446) |
| Class
C2 Shares* |
|
|
|
|
| Shares
sold |
11,802
|
$ 153,581
|
62,725
|
$ 832,727
|
Shares
issued to shareholders in
reinvestment of dividends |
226
|
2,906
|
224
|
2,959 |
| Shares
repurchased |
(19,792)
|
(252,242)
|
(11,218)
|
(148,194)
|
| Net
increase (decrease) |
(7,764)
|
$
(95,755) |
51,731
|
$ 687,492
|
Thornburg Fixed Income Funds Semi-Annual Report | 87
Notes to Financial Statements,
Continued
March 31, 2022 (Unaudited)
| |
SIX
MONTHS ENDED
March 31, 2022 |
YEAR
ENDED
September 30, 2021 |
| LIMITED
TERM U.S. GOVERNMENT FUND |
SHARES
|
AMOUNT
|
SHARES
|
AMOUNT
|
| Class
I Shares |
|
|
|
|
| Shares
sold |
1,294,459
|
$
16,662,752 |
6,333,832
|
$ 83,894,429
|
Shares
issued to shareholders in
reinvestment of dividends |
92,781
|
1,187,927
|
201,104
|
2,652,960 |
| Shares
repurchased |
(3,078,824)
|
(39,649,875)
|
(7,922,351)
|
(104,696,371)
|
| Net
increase (decrease) |
(1,691,584)
|
$
(21,799,196) |
(1,387,415)
|
$
(18,148,982) |
| Class
R3 Shares |
|
|
|
|
| Shares
sold |
34,656
|
$
442,606 |
262,387
|
$ 3,482,548
|
Shares
issued to shareholders in
reinvestment of dividends |
2,646
|
33,938
|
6,630
|
87,532 |
| Shares
repurchased |
(206,804)
|
(2,658,443)
|
(376,167)
|
(4,985,579)
|
| Net
increase (decrease) |
(169,502)
|
$
(2,181,899) |
(107,150)
|
$
(1,415,499) |
| Class
R4 Shares |
|
|
|
|
| Shares
sold |
8,498
|
$
109,400 |
61,496
|
$ 817,081
|
Shares
issued to shareholders in
reinvestment of dividends |
833
|
10,657
|
2,020
|
26,648 |
| Shares
repurchased |
(20,393)
|
(260,890)
|
(117,230)
|
(1,548,571)
|
| Net
increase (decrease) |
(11,062)
|
$
(140,833) |
(53,714)
|
$
(704,842) |
| Class
R5 Shares |
|
|
|
|
| Shares
sold |
11,770
|
$
150,466 |
72,656
|
$ 960,892
|
Shares
issued to shareholders in
reinvestment of dividends |
927
|
11,868
|
1,820
|
24,015 |
| Shares
repurchased |
(8,601)
|
(110,936)
|
(78,569)
|
(1,038,901)
|
| Net
increase (decrease) |
4,096
|
$
51,398 |
(4,093)
|
$
(53,994) |
| * Effective
date of this class of shares was October 1, 2020. |
| |
SIX
MONTHS ENDED
March 31, 2022 |
YEAR
ENDED
September 30, 2021 |
| LIMITED
TERM INCOME FUND |
SHARES
|
AMOUNT
|
SHARES
|
AMOUNT
|
| Class
A Shares |
|
|
|
|
| Shares
sold |
6,879,467
|
$
93,241,445 |
24,401,159
|
$ 341,462,892
|
Shares
issued to shareholders in
reinvestment of dividends |
337,503
|
4,571,941
|
1,373,184
|
19,166,534 |
| Shares
repurchased |
(12,507,687)
|
(170,027,487)
|
(20,936,473)
|
(291,890,488)
|
| Net
increase (decrease) |
(5,290,717)
|
$
(72,214,101) |
4,837,870
|
$ 68,738,938
|
| Class
C Shares |
|
|
|
|
| Shares
sold |
597,388
|
$
8,142,461 |
7,530,197
|
$ 105,256,557
|
Shares
issued to shareholders in
reinvestment of dividends |
117,626
|
1,590,304
|
567,631
|
7,913,777 |
| Shares
repurchased |
(4,739,186)
|
(64,309,991)
|
(11,193,232)
|
(156,474,629)
|
| Net
increase (decrease) |
(4,024,172)
|
$
(54,577,226) |
(3,095,404)
|
$
(43,304,295) |
| Class
C2 Shares* |
|
|
|
|
| Shares
sold |
39,872
|
$
546,369 |
969,768
|
$ 13,571,305
|
Shares
issued to shareholders in
reinvestment of dividends |
3,821
|
51,662
|
9,090
|
126,453 |
| Shares
repurchased |
(136,550)
|
(1,840,468)
|
(44,678)
|
(626,661)
|
| Net
increase (decrease) |
(92,857)
|
$
(1,242,437) |
934,180
|
$ 13,071,097
|
88
| Thornburg Fixed Income Funds Semi-Annual Report
Notes to Financial Statements,
Continued
March 31, 2022 (Unaudited)
| |
SIX
MONTHS ENDED
March 31, 2022 |
YEAR
ENDED
September 30, 2021 |
| LIMITED
TERM INCOME FUND |
SHARES
|
AMOUNT
|
SHARES
|
AMOUNT
|
| Class
I Shares |
|
|
|
|
| Shares
sold |
125,633,709
|
$
1,710,137,920 |
312,941,287
|
$ 4,370,456,366
|
Shares
issued to shareholders in
reinvestment of dividends |
4,547,550
|
61,626,509
|
14,032,956
|
195,865,734 |
| Shares
repurchased |
(147,426,504)
|
(1,998,937,033)
|
(182,860,536)
|
(2,547,566,611)
|
| Net
increase (decrease) |
(17,245,245)
|
$
(227,172,604) |
144,113,707
|
$ 2,018,755,489
|
| Class
R3 Shares |
|
|
|
|
| Shares
sold |
1,482,876
|
$
20,191,863 |
1,444,308
|
$ 20,214,175
|
Shares
issued to shareholders in
reinvestment of dividends |
22,695
|
306,937
|
100,048
|
1,397,999 |
| Shares
repurchased |
(705,041)
|
(9,580,722)
|
(2,113,408)
|
(29,477,492)
|
| Net
increase (decrease) |
800,530
|
$
10,918,078 |
(569,052)
|
$
(7,865,318) |
| Class
R4 Shares |
|
|
|
|
| Shares
sold |
82,168
|
$
1,110,949 |
484,688
|
$ 6,724,843
|
Shares
issued to shareholders in
reinvestment of dividends |
2,141
|
28,966
|
8,242
|
114,980 |
| Shares
repurchased |
(119,588)
|
(1,632,864)
|
(167,236)
|
(2,331,335)
|
| Net
increase (decrease) |
(35,279)
|
$
(492,949) |
325,694
|
$ 4,508,488
|
| Class
R5 Shares |
|
|
|
|
| Shares
sold |
4,116,774
|
$
56,182,354 |
4,014,217
|
$ 56,052,414
|
Shares
issued to shareholders in
reinvestment of dividends |
74,729
|
1,010,710
|
282,760
|
3,946,257 |
| Shares
repurchased |
(3,570,286)
|
(48,712,520)
|
(5,097,432)
|
(71,085,323)
|
| Net
increase (decrease) |
621,217
|
$
8,480,544 |
(800,455)
|
$
(11,086,652) |
| Class
R6 Shares |
|
|
|
|
| Shares
sold |
8,337,089
|
$
114,155,678 |
5,874,589
|
$ 82,027,784
|
Shares
issued to shareholders in
reinvestment of dividends |
104,834
|
1,418,300
|
210,234
|
2,939,663 |
| Shares
repurchased |
(1,797,704)
|
(24,457,457)
|
(3,827,841)
|
(53,468,855)
|
| Net
increase (decrease) |
6,644,219
|
$
91,116,521 |
2,256,982
|
$ 31,498,592
|
| * Effective
date of this class of shares was October 1, 2020. |
| |
SIX
MONTHS ENDED
March 31, 2022 |
YEAR
ENDED
September 30, 2021 |
| ULTRA
SHORT INCOME FUND |
SHARES
|
AMOUNT
|
SHARES
|
AMOUNT
|
| Class
A Shares |
|
|
|
|
| Shares
sold |
478,700
|
$
5,921,207 |
488,930
|
$ 6,117,808
|
Shares
issued to shareholders in
reinvestment of dividends |
5,909
|
72,932
|
13,191
|
164,973 |
| Shares
repurchased |
(248,417)
|
(3,061,696)
|
(268,880)
|
(3,361,273)
|
| Net
increase (decrease) |
236,192
|
$
2,932,443 |
233,241
|
$ 2,921,508
|
| Class
I Shares |
|
|
|
|
| Shares
sold |
4,759,950
|
$
58,698,662 |
2,666,106
|
$ 33,304,475
|
Shares
issued to shareholders in
reinvestment of dividends |
31,149
|
383,914
|
49,957
|
624,128 |
| Shares
repurchased |
(1,033,055)
|
(12,764,681)
|
(1,535,141)
|
(19,184,483)
|
| Net
increase (decrease) |
3,758,044
|
$
46,317,895 |
1,180,922
|
$ 14,744,120
|
Thornburg Fixed Income Funds Semi-Annual Report | 89
Notes to Financial Statements,
Continued
March 31, 2022 (Unaudited)
| |
SIX
MONTHS ENDED
March 31, 2022 |
YEAR
ENDED
September 30, 2021 |
| STRATEGIC
INCOME FUND |
SHARES
|
AMOUNT
|
SHARES
|
AMOUNT
|
| Class
A Shares |
|
|
|
|
| Shares
sold |
5,501,913
|
$
67,026,576 |
14,700,609
|
$ 182,043,527
|
Shares
issued to shareholders in
reinvestment of dividends |
504,200
|
6,126,854
|
846,563
|
10,497,897 |
| Shares
repurchased |
(6,218,914)
|
(74,839,948)
|
(5,622,435)
|
(69,737,914)
|
| Net
increase (decrease) |
(212,801)
|
$
(1,686,518) |
9,924,737
|
$ 122,803,510
|
| Class
C Shares |
|
|
|
|
| Shares
sold |
974,705
|
$
11,871,941 |
2,677,316
|
$ 33,142,091
|
Shares
issued to shareholders in
reinvestment of dividends |
105,601
|
1,282,021
|
221,212
|
2,737,340 |
| Shares
repurchased |
(1,344,325)
|
(16,310,458)
|
(3,252,222)
|
(40,142,310)
|
| Net
increase (decrease) |
(264,019)
|
$
(3,156,496) |
(353,694)
|
$
(4,262,879) |
| Class
I Shares |
|
|
|
|
| Shares
sold |
104,303,520
|
$
1,262,906,651 |
168,387,967
|
$ 2,082,035,823
|
Shares
issued to shareholders in
reinvestment of dividends |
5,151,202
|
62,351,417
|
7,443,755
|
92,061,854 |
| Shares
repurchased |
(52,409,461)
|
(633,685,484)
|
(56,999,784)
|
(705,099,482)
|
| Net
increase (decrease) |
57,045,261
|
$
691,572,584 |
118,831,938
|
$ 1,468,998,195
|
| Class
R3 Shares |
|
|
|
|
| Shares
sold |
1,686
|
$
20,430 |
23,817
|
$ 294,588
|
Shares
issued to shareholders in
reinvestment of dividends |
1,022
|
12,402
|
2,359
|
29,218 |
| Shares
repurchased |
(8,027)
|
(96,904)
|
(49,094)
|
(607,706)
|
| Net
increase (decrease) |
(5,319)
|
$
(64,072) |
(22,918)
|
$
(283,900) |
| Class
R4 Shares |
|
|
|
|
| Shares
sold |
57,720
|
$
703,758 |
141,793
|
$ 1,758,520
|
Shares
issued to shareholders in
reinvestment of dividends |
2,769
|
33,614
|
4,525
|
56,004 |
| Shares
repurchased |
(47,776)
|
(576,778)
|
(107,374)
|
(1,331,648)
|
| Net
increase (decrease) |
12,713
|
$
160,594 |
38,944
|
$ 482,876
|
| Class
R5 Shares |
|
|
|
|
| Shares
sold |
421,227
|
$
5,102,658 |
1,846,234
|
$ 22,842,753
|
Shares
issued to shareholders in
reinvestment of dividends |
100,945
|
1,223,822
|
186,289
|
2,305,472 |
| Shares
repurchased |
(464,179)
|
(5,591,454)
|
(409,029)
|
(5,060,691)
|
| Net
increase (decrease) |
57,993
|
$
735,026 |
1,623,494
|
$ 20,087,534
|
| Class
R6 Shares |
|
|
|
|
| Shares
sold |
3,800,205
|
$
46,494,983 |
4,298,421
|
$ 53,232,633
|
Shares
issued to shareholders in
reinvestment of dividends |
126,493
|
1,535,585
|
119,756
|
1,486,511 |
| Shares
repurchased |
(981,627)
|
(11,778,230)
|
(1,378,635)
|
(17,109,296)
|
| Net
increase (decrease) |
2,945,071
|
$
36,252,338 |
3,039,542
|
$ 37,609,848
|
NOTE
7 – INVESTMENT TRANSACTIONS
For the
six months ended March 31, 2022, the Funds had purchase and sale transactions of investments (excluding short-term investments and U.S. Government obligations) as listed in the table below.
90 | Thornburg Fixed Income Funds Semi-Annual Report
Notes to Financial Statements,
Continued
March 31, 2022 (Unaudited)
| |
Purchases
|
Sales
|
| Limited
Term U.S. Government Fund |
$ 95,650,231
|
$ 111,211,490
|
| Limited
Term Income Fund |
2,465,715,942
|
1,486,190,804 |
| Ultra
Short Income Fund |
76,988,400
|
12,803,103 |
| Strategic
Income Fund |
1,408,508,183 |
456,302,818 |
NOTE
8 – DERIVATIVE FINANCIAL INSTRUMENTS
The
Funds may use a variety of derivative financial instruments to hedge or adjust the risks affecting its investment portfolio or to enhance investment returns. Provisions of the FASB Accounting Standards Codification 815-10-50 (“ASC 815”)
require certain disclosures. The disclosures are intended to provide users of financial statements with an understanding of the use of derivative instruments by the Funds and how these derivatives affect the financial position, financial performance
and cash flows of the Funds. The Funds do not designate any derivative instruments as hedging instruments under ASC 815. During the six months ended March 31, 2022, the Funds’ principal exposure to derivative financial instruments of the type
addressed by ASC 815 was investment in foreign currency contracts.
During the six months ended March 31, 2022, some of the Funds
entered into forward currency contracts in the normal course of pursuing their investment objectives, with the intent of reducing the risk to the value of the Funds’ foreign investments from adverse changes in the relationship between the U.S.
dollar and foreign currencies. Each of the forward currency contracts entered into by the Funds is an agreement between two parties to exchange different currencies at a specified rate of exchange at an agreed upon future date. Foreign currency
contracts involve risks to the Funds, including the risk that a contract’s counterparty will not meet its obligations to the Funds, the risk that a change in a contract’s value may not correlate perfectly with the currency the contract
was intended to track, and the risk that the Funds’ Advisor is unable to correctly implement its strategy in using a contract. In any such instance, the Funds may not achieve the intended benefit of entering into a contract and may experience
a loss. The monthly average value of open forward currency sell contracts for the six months ended March 31, 2022 for Strategic Income Fund was $9,019,297.
These contracts are accounted for by the Funds under ASC 815.
Unrealized appreciation and depreciation on outstanding contracts are reported in each Fund’s Statement of Assets and Liabilities, as measured by the difference between the forward exchange rates at the reporting date and the forward exchange
rates at each contract’s inception date. Net realized gain (loss) on contracts closed during the period, and changes in net unrealized appreciation (depreciation) on outstanding contracts are recognized in each Fund’s Statement of
Operations.
The outstanding forward currency contracts
in the table located in the Strategic Income Fund’s Schedule of Investments, which were entered into with State Street Bank and Trust Company (“SSB”), were entered into pursuant to an International Swaps and Derivatives Association
(“ISDA”) Master Agreement. In the event of a default or termination under the ISDA Master Agreement with SSB, the non-defaulting party has the right to close out all outstanding forward currency contracts between the parties and to net
any payment amounts under those contracts, resulting in a single net amount payable by one party to the other.
Because the ISDA Master Agreement with SSB does not result in
an offset of reported amounts of financial assets and liabilities in the Strategic Income Fund’s Statement of Assets and Liabilities unless there has been an event of default or termination event under that agreement, the Fund does not net its
outstanding forward currency contracts for purposes of the disclosure in the Strategic Income Fund’s Statement of Assets and Liabilities. Instead the Fund recognizes the unrealized appreciation (depreciation) on those forward currency
contracts on a gross basis in the Strategic Income Fund’s Statement of Assets and Liabilities.
The unrealized appreciation (depreciation) of the outstanding
forward currency contracts recognized in each Fund’s Statement of Assets and Liabilities at March 31, 2022 is disclosed in the following table:
| |
Type
of Derivative(a) |
Counter
Party |
Asset
Derivatives |
Liability
Derivatives |
Net
Amount |
| Strategic
Income Fund |
Forward
currency contracts |
SSB
|
$ —
|
$ (20,284)
|
$ (20,284)
|
| (a)
|
Generally,
the Statement of Assets and Liabilities location for forward currency contracts is Assets - Unrealized appreciation on forward currency contracts for asset derivatives and Liabilities - Unrealized depreciation on forward currency contracts for
liabilities derivatives. |
Because the
Funds did not receive or post cash collateral in connection with its currency forward contracts during the period, the net amounts of each Fund’s assets and liabilities which are attributable to those contracts at March 31, 2022 can be
determined by offsetting the dollar amounts shown in the asset and liability columns in the preceding table, the results of which are reflected in the "Net Amount" column. The Funds’ forward currency contracts are valued each day, and the net
amounts of each Fund’s assets and liabilities which are attributable to those contracts are expected to vary over time.
Thornburg Fixed Income Funds Semi-Annual Report | 91
Notes to Financial Statements,
Continued
March 31, 2022 (Unaudited)
The net realized gain (loss) from forward currency contracts
and the net change in unrealized appreciation (depreciation) on outstanding forward currency contracts recognized in each Fund’s Statement of Operations for the six months ended March 31, 2022 are disclosed in the following table:
| |
|
|
Net
Realized |
|
Net Change
in Unrealized |
| |
Type
of Derivative(a) |
|
Gain
(Loss) |
|
Appreciation
(Depreciation) |
| Strategic
Income Fund |
Forward
currency contracts |
|
$ 615,702
|
|
$ (114,561)
|
| (a)
|
Generally,
the Statement of Operations location for forward currency contracts is Net realized gain (loss) on: forward currency contracts and Net change in unrealized appreciation (depreciation) on: forward currency contracts. |
92 | Thornburg Fixed Income Funds Semi-Annual Report
This page intentionally left
blank.
Thornburg Fixed Income Funds Semi-Annual Report | 93
Financial Highlights
Limited Term U.S. Government Fund
| |
PER
SHARE PERFORMANCE (FOR A SHARE OUTSTANDING THROUGHOUT THE PERIOD) |
UNLESS
OTHERWISE
NOTED, PERIODS ARE
FISCAL YEARS ENDED
SEPTEMBER 30, |
Net
Asset
Value,
Beginning
of PERIOD |
Net
Investment
Income
(Loss)+ |
Net
Realized &
Unrealized
Gain (Loss) on
Investments |
Total
from
Investment
Operations |
Dividends
from Net
Investment
Income |
Dividends
from Net
Realized
Gains |
Dividends
from
Return of
Capital |
Total
Dividends |
Net
Asset
Value,
End of
PERIOD |
| CLASS
A SHARES(b) |
| 2022
(c) |
$ 13.06
|
0.04
|
(0.58)
|
(0.54)
|
(0.08)
|
—
|
—
|
(0.08)
|
$ 12.44
|
| 2021
|
$ 13.38
|
0.08
|
(0.24)
|
(0.16)
|
(0.16)
|
—
|
—
|
(0.16)
|
$ 13.06
|
| 2020
|
$ 13.10
|
0.15
|
0.33
|
0.48
|
(0.20)
|
—
|
—
|
(0.20)
|
$ 13.38
|
| 2019
|
$ 12.69
|
0.19
|
0.45
|
0.64
|
(0.23)
|
—
|
—
|
(0.23)
|
$ 13.10
|
| 2018
|
$ 13.01
|
0.18
|
(0.28)
|
(0.10)
|
(0.22)
|
—
|
—
|
(0.22)
|
$ 12.69
|
| 2017
|
$ 13.25
|
0.14
|
(0.20)
|
(0.06)
|
(0.18)
|
—
|
—
|
(0.18)
|
$ 13.01
|
| CLASS
C SHARES |
| 2022
(c) |
$ 13.13
|
0.02
|
(0.58)
|
(0.56)
|
(0.05)
|
—
|
—
|
(0.05)
|
$ 12.52
|
| 2021
|
$ 13.46
|
0.03
|
(0.25)
|
(0.22)
|
(0.11)
|
—
|
—
|
(0.11)
|
$ 13.13
|
| 2020
|
$ 13.17
|
0.11
|
0.35
|
0.46
|
(0.17)
|
—
|
—
|
(0.17)
|
$ 13.46
|
| 2019
|
$ 12.77
|
0.15
|
0.43
|
0.58
|
(0.18)
|
—
|
—
|
(0.18)
|
$ 13.17
|
| 2018
|
$ 13.09
|
0.14
|
(0.28)
|
(0.14)
|
(0.18)
|
—
|
—
|
(0.18)
|
$ 12.77
|
| 2017
|
$ 13.33
|
0.10
|
(0.20)
|
(0.10)
|
(0.14)
|
—
|
—
|
(0.14)
|
$ 13.09
|
| CLASS
C2 SHARES |
| 2022
(c) |
$ 13.14
|
0.02
|
(0.59)
|
(0.57)
|
(0.05)
|
—
|
—
|
(0.05)
|
$ 12.52
|
| 2021
(e) |
$ 13.46
|
0.04
|
(0.25)
|
(0.21)
|
(0.11)
|
—
|
—
|
(0.11)
|
$ 13.14
|
| CLASS
I SHARES |
| 2022
(c) |
$ 13.06
|
0.06
|
(0.58)
|
(0.52)
|
(0.10)
|
—
|
—
|
(0.10)
|
$ 12.44
|
| 2021
|
$ 13.38
|
0.11
|
(0.24)
|
(0.13)
|
(0.19)
|
—
|
—
|
(0.19)
|
$ 13.06
|
| 2020
|
$ 13.10
|
0.18
|
0.34
|
0.52
|
(0.24)
|
—
|
—
|
(0.24)
|
$ 13.38
|
| 2019
|
$ 12.69
|
0.23
|
0.44
|
0.67
|
(0.26)
|
—
|
—
|
(0.26)
|
$ 13.10
|
| 2018
|
$ 13.01
|
0.22
|
(0.28)
|
(0.06)
|
(0.26)
|
—
|
—
|
(0.26)
|
$ 12.69
|
| 2017
|
$ 13.26
|
0.18
|
(0.20)
|
(0.02)
|
(0.23)
|
—
|
—
|
(0.23)
|
$ 13.01
|
| CLASS
R3 SHARES |
| 2022
(c) |
$ 13.06
|
0.03
|
(0.57)
|
(0.54)
|
(0.07)
|
—
|
—
|
(0.07)
|
$ 12.45
|
| 2021
|
$ 13.39
|
0.06
|
(0.25)
|
(0.19)
|
(0.14)
|
—
|
—
|
(0.14)
|
$ 13.06
|
| 2020
|
$ 13.10
|
0.13
|
0.35
|
0.48
|
(0.19)
|
—
|
—
|
(0.19)
|
$ 13.39
|
| 2019
|
$ 12.70
|
0.18
|
0.44
|
0.62
|
(0.22)
|
—
|
—
|
(0.22)
|
$ 13.10
|
| 2018
|
$ 13.02
|
0.17
|
(0.28)
|
(0.11)
|
(0.21)
|
—
|
—
|
(0.21)
|
$ 12.70
|
| 2017
|
$ 13.26
|
0.13
|
(0.19)
|
(0.06)
|
(0.18)
|
—
|
—
|
(0.18)
|
$ 13.02
|
| CLASS
R4 SHARES |
| 2022
(c) |
$ 13.05
|
0.03
|
(0.57)
|
(0.54)
|
(0.07)
|
—
|
—
|
(0.07)
|
$ 12.44
|
| 2021
|
$ 13.37
|
0.06
|
(0.24)
|
(0.18)
|
(0.14)
|
—
|
—
|
(0.14)
|
$ 13.05
|
| 2020
|
$ 13.09
|
0.13
|
0.34
|
0.47
|
(0.19)
|
—
|
—
|
(0.19)
|
$ 13.37
|
| 2019
|
$ 12.69
|
0.18
|
0.43
|
0.61
|
(0.21)
|
—
|
—
|
(0.21)
|
$ 13.09
|
| 2018
|
$ 13.01
|
0.17
|
(0.28)
|
(0.11)
|
(0.21)
|
—
|
—
|
(0.21)
|
$ 12.69
|
| 2017
|
$ 13.25
|
0.12
|
(0.19)
|
(0.07)
|
(0.17)
|
—
|
—
|
(0.17)
|
$ 13.01
|
| CLASS
R5 SHARES |
| 2022
(c) |
$ 13.07
|
0.06
|
(0.59)
|
(0.53)
|
(0.09)
|
—
|
—
|
(0.09)
|
$ 12.45
|
| 2021
|
$ 13.39
|
0.11
|
(0.25)
|
(0.14)
|
(0.18)
|
—
|
—
|
(0.18)
|
$ 13.07
|
| 2020
|
$ 13.11
|
0.17
|
0.34
|
0.51
|
(0.23)
|
—
|
—
|
(0.23)
|
$ 13.39
|
| 2019
|
$ 12.70
|
0.23
|
0.44
|
0.67
|
(0.26)
|
—
|
—
|
(0.26)
|
$ 13.11
|
| 2018
|
$ 13.02
|
0.21
|
(0.28)
|
(0.07)
|
(0.25)
|
—
|
—
|
(0.25)
|
$ 12.70
|
| 2017
|
$ 13.28
|
0.18
|
(0.21)
|
(0.03)
|
(0.23)
|
—
|
—
|
(0.23)
|
$ 13.02
|
| (a)
|
Not
annualized for periods less than one year. |
| (b)
|
Sales
loads are not reflected in computing total return. |
| (c)
|
Unaudited
Six Month Period Ended March 31. |
| (d)
|
Annualized.
|
| (e)
|
Effective
date of this class of shares was October 1, 2020. |
| +
|
Based
on weighted average shares outstanding. |
See notes to financial statements.
94 | Thornburg Fixed Income Funds Semi-Annual Report
Financial Highlights, Continued
Limited Term U.S. Government Fund
| |
RATIOS
TO AVERAGE NET ASSETS |
|
Supplemental
Data |
UNLESS
OTHERWISE
NOTED, PERIODS ARE
FISCAL YEARS ENDED
SEPTEMBER 30, |
Net
Investment
Income (Loss) (%) |
Expenses,
After
Expense
Reductions (%) |
Expenses,
Before Expense
Reductions (%) |
|
Total
Return (%)(a) |
Portfolio
Turnover
Rate (%)(a) |
Net
Assets
at End of PERIOD
(Thousands) |
| CLASS
A SHARES(b) |
| 2022
(c) |
0.64
(d) |
0.89
(d) |
0.89
(d) |
|
(4.17)
|
12.91
|
$ 69,133
|
| 2021
|
0.60
|
0.87
|
0.87
|
|
(1.22)
|
9.50
|
$ 92,786
|
| 2020
|
1.10
|
0.89
|
0.89
|
|
3.70
|
11.66
|
$ 86,955
|
| 2019
|
1.48
|
0.90
|
0.90
|
|
5.06
|
29.37
|
$ 66,140
|
| 2018
|
1.42
|
0.91
|
0.91
|
|
(0.77)
|
5.93
|
$ 69,634
|
| 2017
|
1.03
|
0.93
|
0.93
|
|
(0.43)
|
11.05
|
$ 84,674
|
| CLASS
C SHARES |
| 2022
(c) |
0.28
(d) |
1.24
(d) |
1.35
(d) |
|
(4.24)
|
12.91
|
$ 7,559
|
| 2021
|
0.21
|
1.24
|
1.24
|
|
(1.65)
|
9.50
|
$ 10,084
|
| 2020
|
0.82
|
1.16
|
1.16
|
|
3.48
|
11.66
|
$ 17,994
|
| 2019
|
1.13
|
1.24
|
1.24
|
|
4.60
|
29.37
|
$ 15,618
|
| 2018
|
1.10
|
1.23
|
1.23
|
|
(1.08)
|
5.93
|
$ 19,686
|
| 2017
|
0.73
|
1.23
|
1.24
|
|
(0.72)
|
11.05
|
$ 34,821
|
| CLASS
C2 SHARES |
| 2022
(c) |
0.29
(d) |
1.24
(d) |
1.96
(d) |
|
(4.31)
|
12.91
|
$ 550
|
| 2021
(e) |
0.28
|
1.24
|
3.37
|
|
(1.58)
|
9.50
|
$ 680
|
| CLASS
I SHARES |
| 2022
(c) |
0.92
(d) |
0.60
(d) |
0.60
(d) |
|
(4.04)
|
12.91
|
$ 188,428
|
| 2021
|
0.85
|
0.61
|
0.61
|
|
(0.96)
|
9.50
|
$ 219,833
|
| 2020
|
1.36
|
0.60
|
0.60
|
|
4.00
|
11.66
|
$ 243,793
|
| 2019
|
1.76
|
0.62
|
0.62
|
|
5.35
|
29.37
|
$ 145,273
|
| 2018
|
1.73
|
0.60
|
0.60
|
|
(0.47)
|
5.93
|
$ 131,898
|
| 2017
|
1.36
|
0.60
|
0.60
|
|
(0.18)
|
11.05
|
$ 147,464
|
| CLASS
R3 SHARES |
| 2022
(c) |
0.52
(d) |
0.99
(d) |
1.43
(d) |
|
(4.15)
|
12.91
|
$ 5,133
|
| 2021
|
0.46
|
0.99
|
1.31
|
|
(1.41)
|
9.50
|
$ 7,601
|
| 2020
|
1.02
|
0.99
|
1.29
|
|
3.67
|
11.66
|
$ 9,222
|
| 2019
|
1.39
|
0.99
|
1.43
|
|
4.88
|
29.37
|
$ 9,181
|
| 2018
|
1.34
|
0.99
|
1.45
|
|
(0.85)
|
5.93
|
$ 9,036
|
| 2017
|
1.00
|
0.97
|
1.40
|
|
(0.47)
|
11.05
|
$ 10,871
|
| CLASS
R4 SHARES |
| 2022
(c) |
0.54
(d) |
0.99
(d) |
2.10
(d) |
|
(4.15)
|
12.91
|
$ 1,779
|
| 2021
|
0.47
|
0.99
|
1.63
|
|
(1.34)
|
9.50
|
$ 2,011
|
| 2020
|
1.01
|
0.99
|
1.60
|
|
3.60
|
11.66
|
$ 2,779
|
| 2019
|
1.38
|
0.99
|
1.78
|
|
4.88
|
29.37
|
$ 2,293
|
| 2018
|
1.35
|
0.99
|
1.75
|
|
(0.85)
|
5.93
|
$ 2,509
|
| 2017
|
0.96
|
0.99
|
1.95
|
|
(0.49)
|
11.05
|
$ 3,365
|
| CLASS
R5 SHARES |
| 2022
(c) |
0.87
(d) |
0.67
(d) |
1.54
(d) |
|
(4.06)
|
12.91
|
$ 2,146
|
| 2021
|
0.80
|
0.67
|
1.56
|
|
(1.02)
|
9.50
|
$ 2,198
|
| 2020
|
1.27
|
0.67
|
2.12
|
|
3.93
|
11.66
|
$ 2,307
|
| 2019
|
1.80
|
0.67
|
2.04
|
|
5.29
|
29.37
|
$ 897
|
| 2018
|
1.60
|
0.65
|
1.94
|
|
(0.52)
|
5.93
|
$ 661
|
| 2017
|
1.40
|
0.58
|
1.21
|
|
(0.23)
|
11.05
|
$ 4,131
|
Thornburg Fixed Income Funds Semi-Annual Report | 95
Financial Highlights
Limited Term Income Fund
| |
PER
SHARE PERFORMANCE (FOR A SHARE OUTSTANDING THROUGHOUT THE PERIOD) |
UNLESS
OTHERWISE
NOTED, PERIODS ARE
FISCAL YEARS ENDED
SEPTEMBER 30, |
Net
Asset
Value,
Beginning
of PERIOD |
Net
Investment
Income
(Loss)+ |
Net
Realized &
Unrealized
Gain (Loss) on
Investments |
Total
from
Investment
Operations |
Dividends
from Net
Investment
Income |
Dividends
from Net
Realized
Gains |
Dividends
from
Return of
Capital |
Total
Dividends |
Net
Asset
Value,
End of
PERIOD |
| CLASS
A SHARES(b) |
| 2022
(c) |
$ 13.83
|
0.08
|
(0.68)
|
(0.60)
|
(0.09)
|
—
|
—
|
(0.09)
|
$ 13.14
|
| 2021
|
$ 14.14
|
0.16
|
(0.11)
|
0.05
|
(0.19)
|
(0.17)
|
—
|
(0.36)
|
$ 13.83
|
| 2020
|
$ 13.61
|
0.27
|
0.64
|
0.91
|
(0.28)
|
(0.10)
|
—
|
(0.38)
|
$ 14.14
|
| 2019
|
$ 13.16
|
0.33
|
0.45
|
0.78
|
(0.33)
|
—
|
—
|
(0.33)
|
$ 13.61
|
| 2018
|
$ 13.44
|
0.28
|
(0.27)
|
0.01
|
(0.29)
|
—
|
—
|
(0.29)
|
$ 13.16
|
| 2017
|
$ 13.51
|
0.24
|
(0.07)
|
0.17
|
(0.24)
|
—
|
—
|
(0.24)
|
$ 13.44
|
| CLASS
C SHARES |
| 2022
(c) |
$ 13.81
|
0.06
|
(0.68)
|
(0.62)
|
(0.07)
|
—
|
—
|
(0.07)
|
$ 13.12
|
| 2021
|
$ 14.12
|
0.13
|
(0.11)
|
0.02
|
(0.16)
|
(0.17)
|
—
|
(0.33)
|
$ 13.81
|
| 2020
|
$ 13.59
|
0.24
|
0.64
|
0.88
|
(0.25)
|
(0.10)
|
—
|
(0.35)
|
$ 14.12
|
| 2019
|
$ 13.14
|
0.30
|
0.46
|
0.76
|
(0.31)
|
—
|
—
|
(0.31)
|
$ 13.59
|
| 2018
|
$ 13.42
|
0.25
|
(0.27)
|
(0.02)
|
(0.26)
|
—
|
—
|
(0.26)
|
$ 13.14
|
| 2017
|
$ 13.49
|
0.21
|
(0.06)
|
0.15
|
(0.22)
|
—
|
—
|
(0.22)
|
$ 13.42
|
| CLASS
C2 SHARES |
| 2022
(c) |
$ 13.81
|
0.04
|
(0.67)
|
(0.63)
|
(0.06)
|
—
|
—
|
(0.06)
|
$ 13.12
|
| 2021
(e) |
$ 14.12
|
0.09
|
(0.11)
|
(0.02)
|
(0.12)
|
(0.17)
|
—
|
(0.29)
|
$ 13.81
|
| CLASS
I SHARES |
| 2022
(c) |
$ 13.84
|
0.10
|
(0.68)
|
(0.58)
|
(0.11)
|
—
|
—
|
(0.11)
|
$ 13.15
|
| 2021
|
$ 14.15
|
0.20
|
(0.11)
|
0.09
|
(0.23)
|
(0.17)
|
—
|
(0.40)
|
$ 13.84
|
| 2020
|
$ 13.62
|
0.30
|
0.65
|
0.95
|
(0.32)
|
(0.10)
|
—
|
(0.42)
|
$ 14.15
|
| 2019
|
$ 13.16
|
0.37
|
0.47
|
0.84
|
(0.38)
|
—
|
—
|
(0.38)
|
$ 13.62
|
| 2018
|
$ 13.44
|
0.33
|
(0.28)
|
0.05
|
(0.33)
|
—
|
—
|
(0.33)
|
$ 13.16
|
| 2017
|
$ 13.52
|
0.29
|
(0.08)
|
0.21
|
(0.29)
|
—
|
—
|
(0.29)
|
$ 13.44
|
| CLASS
R3 SHARES |
| 2022
(c) |
$ 13.84
|
0.06
|
(0.68)
|
(0.62)
|
(0.07)
|
—
|
—
|
(0.07)
|
$ 13.15
|
| 2021
|
$ 14.15
|
0.13
|
(0.11)
|
0.02
|
(0.16)
|
(0.17)
|
—
|
(0.33)
|
$ 13.84
|
| 2020
|
$ 13.63
|
0.24
|
0.63
|
0.87
|
(0.25)
|
(0.10)
|
—
|
(0.35)
|
$ 14.15
|
| 2019
|
$ 13.17
|
0.30
|
0.47
|
0.77
|
(0.31)
|
—
|
—
|
(0.31)
|
$ 13.63
|
| 2018
|
$ 13.45
|
0.26
|
(0.27)
|
(0.01)
|
(0.27)
|
—
|
—
|
(0.27)
|
$ 13.17
|
| 2017
|
$ 13.52
|
0.22
|
(0.06)
|
0.16
|
(0.23)
|
—
|
—
|
(0.23)
|
$ 13.45
|
| CLASS
R4 SHARES |
| 2022
(c) |
$ 13.83
|
0.06
|
(0.68)
|
(0.62)
|
(0.07)
|
—
|
—
|
(0.07)
|
$ 13.14
|
| 2021
|
$ 14.14
|
0.13
|
(0.11)
|
0.02
|
(0.16)
|
(0.17)
|
—
|
(0.33)
|
$ 13.83
|
| 2020
|
$ 13.61
|
0.24
|
0.64
|
0.88
|
(0.25)
|
(0.10)
|
—
|
(0.35)
|
$ 14.14
|
| 2019
|
$ 13.16
|
0.30
|
0.46
|
0.76
|
(0.31)
|
—
|
—
|
(0.31)
|
$ 13.61
|
| 2018
|
$ 13.43
|
0.26
|
(0.26)
|
—
(h) |
(0.27)
|
—
|
—
|
(0.27)
|
$ 13.16
|
| 2017
|
$ 13.51
|
0.22
|
(0.07)
|
0.15
|
(0.23)
|
—
|
—
|
(0.23)
|
$ 13.43
|
| CLASS
R5 SHARES |
| 2022
(c) |
$ 13.83
|
0.10
|
(0.68)
|
(0.58)
|
(0.11)
|
—
|
—
|
(0.11)
|
$ 13.14
|
| 2021
|
$ 14.14
|
0.20
|
(0.11)
|
0.09
|
(0.23)
|
(0.17)
|
—
|
(0.40)
|
$ 13.83
|
| 2020
|
$ 13.61
|
0.31
|
0.64
|
0.95
|
(0.32)
|
(0.10)
|
—
|
(0.42)
|
$ 14.14
|
| 2019
|
$ 13.16
|
0.36
|
0.46
|
0.82
|
(0.37)
|
—
|
—
|
(0.37)
|
$ 13.61
|
| 2018
|
$ 13.44
|
0.31
|
(0.28)
|
0.03
|
(0.31)
|
—
|
—
|
(0.31)
|
$ 13.16
|
| 2017
|
$ 13.51
|
0.27
|
(0.07)
|
0.20
|
(0.27)
|
—
|
—
|
(0.27)
|
$ 13.44
|
| CLASS
R6 SHARES |
| 2022
(c) |
$ 13.86
|
0.10
|
(0.68)
|
(0.58)
|
(0.11)
|
—
|
—
|
(0.11)
|
$ 13.17
|
| 2021
|
$ 14.17
|
0.21
|
(0.11)
|
0.10
|
(0.24)
|
(0.17)
|
—
|
(0.41)
|
$ 13.86
|
| 2020
|
$ 13.64
|
0.32
|
0.64
|
0.96
|
(0.33)
|
(0.10)
|
—
|
(0.43)
|
$ 14.17
|
| 2019
|
$ 13.19
|
0.38
|
0.46
|
0.84
|
(0.39)
|
—
|
—
|
(0.39)
|
$ 13.64
|
| 2018
|
$ 13.46
|
0.35
|
(0.28)
|
0.07
|
(0.34)
|
—
|
—
|
(0.34)
|
$ 13.19
|
| 2017
(i) |
$ 13.40
|
0.15
|
0.11
|
0.26
|
(0.20)
|
—
|
—
|
(0.20)
|
$ 13.46
|
| (a)
|
Not
annualized for periods less than one year. |
| (b)
|
Sales
loads are not reflected in computing total return. |
| (c)
|
Unaudited
Six Month Period Ended March 31. |
| (d)
|
Annualized.
|
| (e)
|
Effective
date of this class of shares was October 1, 2020. |
| (f)
|
The
total return based on the NAV which reflects the adjustments in accordance with U.S. GAAP is 0.61%. |
See notes to financial statements.
96 | Thornburg Fixed Income Funds Semi-Annual Report
Financial Highlights, Continued
Limited Term Income Fund
| |
RATIOS
TO AVERAGE NET ASSETS |
|
Supplemental
Data |
UNLESS
OTHERWISE
NOTED, PERIODS ARE
FISCAL YEARS ENDED
SEPTEMBER 30, |
Net
Investment
Income (Loss) (%) |
Expenses,
After
Expense
Reductions (%) |
Expenses,
Before Expense
Reductions (%) |
|
Total
Return (%)(a) |
Portfolio
Turnover
Rate (%)(a) |
Net
Assets
at End of PERIOD
(Thousands) |
| CLASS
A SHARES(b) |
| 2022
(c) |
1.16
(d) |
0.74
(d) |
0.74
(d) |
|
(4.35)
|
15.95
|
$ 708,524
|
| 2021
|
1.17
|
0.77
|
0.77
|
|
0.33
|
33.37
|
$ 818,846
|
| 2020
|
1.94
|
0.77
|
0.77
|
|
6.78
|
53.84
|
$ 768,798
|
| 2019
|
2.44
|
0.81
|
0.81
|
|
6.03
|
43.22
|
$ 645,383
|
| 2018
|
2.12
|
0.84
|
0.84
|
|
0.09
|
33.62
|
$ 680,473
|
| 2017
|
1.76
|
0.87
|
0.87
|
|
1.31
|
26.90
|
$ 890,990
|
| CLASS
C SHARES |
| 2022
(c) |
0.92
(d) |
0.98
(d) |
0.98
(d) |
|
(4.47)
|
15.95
|
$ 290,061
|
| 2021
|
0.94
|
0.99
|
0.99
|
|
0.11
|
33.37
|
$ 360,840
|
| 2020
|
1.72
|
1.00
|
1.00
|
|
6.55
|
53.84
|
$ 412,659
|
| 2019
|
2.24
|
1.02
|
1.02
|
|
5.82
|
43.22
|
$ 356,205
|
| 2018
|
1.91
|
1.05
|
1.05
|
|
(0.13)
|
33.62
|
$ 439,305
|
| 2017
|
1.56
|
1.08
|
1.08
|
|
1.10
|
26.90
|
$ 567,771
|
| CLASS
C2 SHARES |
| 2022
(c) |
0.66
(d) |
1.24
(d) |
1.25
(d) |
|
(4.60)
|
15.95
|
$ 11,041
|
| 2021
(e) |
0.65
|
1.24
|
1.32
|
|
(0.17)
|
33.37
|
$ 12,902
|
| CLASS
I SHARES |
| 2022
(c) |
1.41
(d) |
0.49
(d) |
0.49
(d) |
|
(4.16)
|
15.95
|
$ 8,173,315
|
| 2021
|
1.44
|
0.49
|
0.50
|
|
0.53
(f) |
33.37
|
$ 8,840,331
|
| 2020
|
2.21
|
0.49
|
0.51
|
|
7.08
|
53.84
|
$ 6,999,911
|
| 2019
|
2.75
|
0.50
|
0.53
|
|
6.44
|
43.22
|
$ 4,455,457
|
| 2018
|
2.46
|
0.51
|
0.51
|
|
0.41
|
33.62
|
$ 3,685,859
|
| 2017
|
2.14
|
0.50
|
0.50
|
|
1.61
|
26.90
|
$ 3,232,277
|
| CLASS
R3 SHARES |
| 2022
(c) |
0.93
(d) |
0.99
(d) |
1.03
(d) |
|
(4.46)
|
15.95
|
$ 59,773
|
| 2021
|
0.94
|
0.99
|
1.02
|
|
0.11
|
33.37
|
$ 51,825
|
| 2020
|
1.75
|
0.99
|
1.02
|
|
6.54
(g) |
53.84
|
$ 61,041
|
| 2019
|
2.27
|
0.99
|
1.06
|
|
5.84
|
43.22
|
$ 64,335
|
| 2018
|
1.98
|
0.99
|
1.09
|
|
(0.06)
|
33.62
|
$ 88,298
|
| 2017
|
1.65
|
0.99
|
1.12
|
|
1.19
|
26.90
|
$ 96,715
|
| CLASS
R4 SHARES |
| 2022
(c) |
0.91
(d) |
0.99
(d) |
1.30
(d) |
|
(4.47)
|
15.95
|
$ 9,776
|
| 2021
|
0.94
|
0.99
|
1.19
|
|
0.11
|
33.37
|
$ 10,777
|
| 2020
|
1.74
|
0.99
|
1.32
|
|
6.55
|
53.84
|
$ 6,413
|
| 2019
|
2.27
|
0.99
|
1.23
|
|
5.84
|
43.22
|
$ 8,073
|
| 2018
|
1.98
|
0.99
|
1.45
|
|
0.01
|
33.62
|
$ 7,962
|
| 2017
|
1.65
|
0.99
|
1.56
|
|
1.11
|
26.90
|
$ 8,101
|
| CLASS
R5 SHARES |
| 2022
(c) |
1.42
(d) |
0.49
(d) |
0.69
(d) |
|
(4.23)
|
15.95
|
$ 136,412
|
| 2021
|
1.44
|
0.49
|
0.69
|
|
0.61
|
33.37
|
$ 134,974
|
| 2020
|
2.24
|
0.49
|
0.64
|
|
7.08
|
53.84
|
$ 149,322
|
| 2019
|
2.70
|
0.56
|
0.74
|
|
6.31
|
43.22
|
$ 106,753
|
| 2018
|
2.31
|
0.67
|
0.69
|
|
0.26
|
33.62
|
$ 113,333
|
| 2017
|
1.99
|
0.65
|
0.67
|
|
1.53
|
26.90
|
$ 101,189
|
| CLASS
R6 SHARES |
| 2022
(c) |
1.52
(d) |
0.42
(d) |
0.44
(d) |
|
(4.18)
|
15.95
|
$ 208,901
|
| 2021
|
1.51
|
0.42
|
0.43
|
|
0.68
|
33.37
|
$ 127,763
|
| 2020
|
2.31
|
0.42
|
0.46
|
|
7.15
|
53.84
|
$ 98,639
|
| 2019
|
2.82
|
0.43
|
0.49
|
|
6.43
|
43.22
|
$ 60,440
|
| 2018
|
2.62
|
0.45
|
0.57
|
|
0.56
|
33.62
|
$ 29,568
|
| 2017
(i) |
2.28
(d) |
0.45
(d) |
24.38
(d)(j) |
|
1.92
|
26.90
|
$ 770
|
| (g)
|
The
total return based on the NAV which reflects the adjustments in accordance with U.S. GAAP is 6.47%. |
| (h)
|
Total
from investment operations was less than $0.01 per share. |
| (i)
|
Effective
date of this class of shares was April 10, 2017. |
| (j)
|
Due
to the size of net assets and fixed expenses, ratios may appear disproportionate. |
| +
|
Based
on weighted average shares outstanding. |
Thornburg Fixed Income Funds Semi-Annual Report | 97
Financial Highlights
Ultra Short Income Fund
| |
PER
SHARE PERFORMANCE (FOR A SHARE OUTSTANDING THROUGHOUT THE PERIOD) |
UNLESS
OTHERWISE
NOTED, PERIODS ARE
FISCAL YEARS ENDED
SEPTEMBER 30, |
Net
Asset
Value,
Beginning
of PERIOD |
Net
Investment
Income
(Loss)+ |
Net
Realized &
Unrealized
Gain (Loss) on
Investments |
Total
from
Investment
Operations |
Dividends
from Net
Investment
Income |
Dividends
from Net
Realized
Gains |
Dividends
from
Return of
Capital |
Total
Dividends |
Net
Asset
Value,
End of
PERIOD |
| CLASS
A SHARES(b) |
| 2022
(c) |
$ 12.44
|
0.07
|
(0.21)
|
(0.14)
|
(0.07)
|
—
|
—
|
(0.07)
|
$ 12.23
|
| 2021
|
$ 12.59
|
0.15
|
(0.08)
|
0.07
|
(0.18)
|
(0.04)
|
—
|
(0.22)
|
$ 12.44
|
| 2020
|
$ 12.49
|
0.23
|
0.15
|
0.38
|
(0.24)
|
(0.04)
|
—
|
(0.28)
|
$ 12.59
|
| 2019
|
$ 12.29
|
0.28
|
0.21
|
0.49
|
(0.29)
|
—
|
—
|
(0.29)
|
$ 12.49
|
| 2018
|
$ 12.42
|
0.22
|
(0.13)
|
0.09
|
(0.22)
|
—
|
—
|
(0.22)
|
$ 12.29
|
| 2017
|
$ 12.46
|
0.16
|
(0.03)
|
0.13
|
(0.17)
|
—
|
—
|
(0.17)
|
$ 12.42
|
| CLASS
I SHARES |
| 2022
(c) |
$ 12.43
|
0.08
|
(0.21)
|
(0.13)
|
(0.08)
|
—
|
—
|
(0.08)
|
$ 12.22
|
| 2021
|
$ 12.58
|
0.18
|
(0.08)
|
0.10
|
(0.21)
|
(0.04)
|
—
|
(0.25)
|
$ 12.43
|
| 2020
|
$ 12.48
|
0.25
|
0.16
|
0.41
|
(0.27)
|
(0.04)
|
—
|
(0.31)
|
$ 12.58
|
| 2019
|
$ 12.28
|
0.31
|
0.20
|
0.51
|
(0.31)
|
—
|
—
|
(0.31)
|
$ 12.48
|
| 2018
|
$ 12.41
|
0.24
|
(0.12)
|
0.12
|
(0.25)
|
—
|
—
|
(0.25)
|
$ 12.28
|
| 2017
|
$ 12.45
|
0.18
|
(0.03)
|
0.15
|
(0.19)
|
—
|
—
|
(0.19)
|
$ 12.41
|
| (a)
|
Not
annualized for periods less than one year. |
| (b)
|
Sales
loads are not reflected in computing total return. |
| (c)
|
Unaudited
Six Month Period Ended March 31. |
| (d)
|
Annualized.
|
| +
|
Based
on weighted average shares outstanding. |
See notes to financial statements.
98 | Thornburg Fixed Income Funds Semi-Annual Report
Financial Highlights, Continued
Ultra Short Income Fund
| |
RATIOS
TO AVERAGE NET ASSETS |
|
Supplemental
Data |
UNLESS
OTHERWISE
NOTED, PERIODS ARE
FISCAL YEARS ENDED
SEPTEMBER 30, |
Net
Investment
Income (Loss) (%) |
Expenses,
After
Expense
Reductions (%) |
Expenses,
Before Expense
Reductions (%) |
|
Total
Return (%)(a) |
Portfolio
Turnover
Rate (%)(a) |
Net
Assets
at End of PERIOD
(Thousands) |
| CLASS
A SHARES(b) |
| 2022
(c) |
1.08
(d) |
0.50
(d) |
1.17
(d) |
|
(1.11)
|
22.05
|
$ 13,637
|
| 2021
|
1.22
|
0.50
|
1.38
|
|
0.54
|
37.51
|
$ 10,930
|
| 2020
|
1.83
|
0.70
|
1.84
|
|
3.13
|
46.29
|
$ 8,127
|
| 2019
|
2.28
|
0.70
|
1.65
|
|
4.00
|
79.59
|
$ 8,012
|
| 2018
|
1.75
|
0.70
|
1.82
|
|
0.75
|
20.93
|
$ 7,140
|
| 2017
|
1.30
|
0.65
|
1.77
|
|
1.03
|
34.79
|
$ 6,532
|
| CLASS
I SHARES |
| 2022
(c) |
1.27
(d) |
0.30
(d) |
0.67
(d) |
|
(1.01)
|
22.05
|
$ 87,807
|
| 2021
|
1.40
|
0.30
|
0.76
|
|
0.74
|
37.51
|
$ 42,587
|
| 2020
|
2.02
|
0.50
|
1.06
|
|
3.33
|
46.29
|
$ 28,249
|
| 2019
|
2.47
|
0.50
|
0.94
|
|
4.21
|
79.59
|
$ 24,858
|
| 2018
|
1.96
|
0.50
|
1.09
|
|
0.95
|
20.93
|
$ 22,748
|
| 2017
|
1.46
|
0.50
|
1.03
|
|
1.19
|
34.79
|
$ 12,854
|
Thornburg Fixed Income Funds Semi-Annual Report | 99
Financial Highlights
Strategic Income Fund
| |
PER
SHARE PERFORMANCE (FOR A SHARE OUTSTANDING THROUGHOUT THE PERIOD) |
UNLESS
OTHERWISE
NOTED, PERIODS ARE
FISCAL YEARS ENDED
SEPTEMBER 30, |
Net
Asset
Value,
Beginning
of PERIOD |
Net
Investment
Income
(Loss)+ |
Net
Realized &
Unrealized
Gain (Loss) on
Investments |
Total
from
Investment
Operations |
Dividends
from Net
Investment
Income |
Dividends
from Net
Realized
Gains |
Dividends
from
Return of
Capital |
Total
Dividends |
Net
Asset
Value,
End of
PERIOD |
| CLASS
A SHARES(c) |
| 2022
(d) |
$ 12.41
|
0.18
|
(0.60)
|
(0.42)
|
(0.19)
|
(0.03)
|
—
|
(0.22)
|
$ 11.77
|
| 2021
|
$ 12.24
|
0.43
|
0.21
|
0.64
|
(0.47)
|
—
|
—
|
(0.47)
|
$ 12.41
|
| 2020
|
$ 11.92
|
0.40
|
0.31
|
0.71
|
(0.39)
|
—
|
—
|
(0.39)
|
$ 12.24
|
| 2019
|
$ 11.65
|
0.42
|
0.26
|
0.68
|
(0.41)
|
—
|
—
|
(0.41)
|
$ 11.92
|
| 2018
|
$ 11.82
|
0.40
|
(0.24)
|
0.16
|
(0.33)
|
—
|
—
|
(0.33)
|
$ 11.65
|
| 2017
|
$ 11.56
|
0.42
|
0.20
|
0.62
|
(0.36)
|
—
|
—
|
(0.36)
|
$ 11.82
|
| CLASS
C SHARES |
| 2022
(d) |
$ 12.39
|
0.14
|
(0.61)
|
(0.47)
|
(0.14)
|
(0.03)
|
—
|
(0.17)
|
$ 11.75
|
| 2021
|
$ 12.22
|
0.33
|
0.21
|
0.54
|
(0.37)
|
—
|
—
|
(0.37)
|
$ 12.39
|
| 2020
|
$ 11.90
|
0.31
|
0.31
|
0.62
|
(0.30)
|
—
|
—
|
(0.30)
|
$ 12.22
|
| 2019
|
$ 11.63
|
0.33
|
0.26
|
0.59
|
(0.32)
|
—
|
—
|
(0.32)
|
$ 11.90
|
| 2018
|
$ 11.81
|
0.32
|
(0.25)
|
0.07
|
(0.25)
|
—
|
—
|
(0.25)
|
$ 11.63
|
| 2017
|
$ 11.55
|
0.35
|
0.19
|
0.54
|
(0.28)
|
—
|
—
|
(0.28)
|
$ 11.81
|
| CLASS
I SHARES |
| 2022
(d) |
$ 12.38
|
0.21
|
(0.61)
|
(0.40)
|
(0.21)
|
(0.03)
|
—
|
(0.24)
|
$ 11.74
|
| 2021
|
$ 12.20
|
0.47
|
0.22
|
0.69
|
(0.51)
|
—
|
—
|
(0.51)
|
$ 12.38
|
| 2020
|
$ 11.89
|
0.44
|
0.30
|
0.74
|
(0.43)
|
—
|
—
|
(0.43)
|
$ 12.20
|
| 2019
|
$ 11.62
|
0.45
|
0.27
|
0.72
|
(0.45)
|
—
|
—
|
(0.45)
|
$ 11.89
|
| 2018
|
$ 11.80
|
0.45
|
(0.25)
|
0.20
|
(0.38)
|
—
|
—
|
(0.38)
|
$ 11.62
|
| 2017
|
$ 11.54
|
0.47
|
0.19
|
0.66
|
(0.40)
|
—
|
—
|
(0.40)
|
$ 11.80
|
| CLASS
R3 SHARES |
| 2022
(d) |
$ 12.40
|
0.17
|
(0.61)
|
(0.44)
|
(0.17)
|
(0.03)
|
—
|
(0.20)
|
$ 11.76
|
| 2021
|
$ 12.22
|
0.40
|
0.21
|
0.61
|
(0.43)
|
—
|
—
|
(0.43)
|
$ 12.40
|
| 2020
|
$ 11.91
|
0.35
|
0.31
|
0.66
|
(0.35)
|
—
|
—
|
(0.35)
|
$ 12.22
|
| 2019
|
$ 11.64
|
0.39
|
0.26
|
0.65
|
(0.38)
|
—
|
—
|
(0.38)
|
$ 11.91
|
| 2018
|
$ 11.82
|
0.38
|
(0.25)
|
0.13
|
(0.31)
|
—
|
—
|
(0.31)
|
$ 11.64
|
| 2017
|
$ 11.55
|
0.42
|
0.20
|
0.62
|
(0.35)
|
—
|
—
|
(0.35)
|
$ 11.82
|
| CLASS
R4 SHARES |
| 2022
(d) |
$ 12.39
|
0.17
|
(0.60)
|
(0.43)
|
(0.17)
|
(0.03)
|
—
|
(0.20)
|
$ 11.76
|
| 2021
|
$ 12.22
|
0.40
|
0.20
|
0.60
|
(0.43)
|
—
|
—
|
(0.43)
|
$ 12.39
|
| 2020
|
$ 11.90
|
0.36
|
0.31
|
0.67
|
(0.35)
|
—
|
—
|
(0.35)
|
$ 12.22
|
| 2019
|
$ 11.63
|
0.39
|
0.26
|
0.65
|
(0.38)
|
—
|
—
|
(0.38)
|
$ 11.90
|
| 2018
|
$ 11.82
|
0.38
|
(0.25)
|
0.13
|
(0.32)
|
—
|
—
|
(0.32)
|
$ 11.63
|
| 2017
|
$ 11.56
|
0.41
|
0.20
|
0.61
|
(0.35)
|
—
|
—
|
(0.35)
|
$ 11.82
|
| CLASS
R5 SHARES |
| 2022
(d) |
$ 12.39
|
0.21
|
(0.61)
|
(0.40)
|
(0.21)
|
(0.03)
|
—
|
(0.24)
|
$ 11.75
|
| 2021
|
$ 12.21
|
0.47
|
0.22
|
0.69
|
(0.51)
|
—
|
—
|
(0.51)
|
$ 12.39
|
| 2020
|
$ 11.89
|
0.45
|
0.30
|
0.75
|
(0.43)
|
—
|
—
|
(0.43)
|
$ 12.21
|
| 2019
|
$ 11.62
|
0.46
|
0.26
|
0.72
|
(0.45)
|
—
|
—
|
(0.45)
|
$ 11.89
|
| 2018
|
$ 11.80
|
0.45
|
(0.25)
|
0.20
|
(0.38)
|
—
|
—
|
(0.38)
|
$ 11.62
|
| 2017
|
$ 11.54
|
0.47
|
0.19
|
0.66
|
(0.40)
|
—
|
—
|
(0.40)
|
$ 11.80
|
| CLASS
R6 SHARES |
| 2022
(d) |
$ 12.42
|
0.21
|
(0.61)
|
(0.40)
|
(0.21)
|
(0.03)
|
—
|
(0.24)
|
$ 11.78
|
| 2021
|
$ 12.24
|
0.48
|
0.22
|
0.70
|
(0.52)
|
—
|
—
|
(0.52)
|
$ 12.42
|
| 2020
|
$ 11.93
|
0.45
|
0.30
|
0.75
|
(0.44)
|
—
|
—
|
(0.44)
|
$ 12.24
|
| 2019
|
$ 11.65
|
0.47
|
0.27
|
0.74
|
(0.46)
|
—
|
—
|
(0.46)
|
$ 11.93
|
| 2018
|
$ 11.85
|
0.45
|
(0.26)
|
0.19
|
(0.39)
|
—
|
—
|
(0.39)
|
$ 11.65
|
| 2017
(g) |
$ 11.63
|
0.33
|
0.13
|
0.46
|
(0.24)
|
—
|
—
|
(0.24)
|
$ 11.85
|
| (a)
|
Net
investment income (loss) includes income from foreign withholding tax claims adjusted for IRS compliance fees and/or tax reclaim collection fees. Without these proceeds, the Net Investment Income (Loss) ratios for 2021 would have been: Class A,
3.48%; Class C, 2.71%; Class I, 3.81%; Class R3, 3.19%; Class R4, 3.21%; Class R5, 3.84%; Class R6, 3.89%. |
| (b)
|
Not
annualized for periods less than one year. |
| (c)
|
Sales
loads are not reflected in computing total return. |
| (d)
|
Unaudited
Six Month Period Ended March 31. |
| (e)
|
Annualized.
|
| (f)
|
The
total return based on the NAV which reflects adjustments in accordance with U.S. GAAP is 6.49% for 2019 and 6.46% for 2020. |
| (g)
|
Effective
date of this class of shares was April 10, 2017. |
| (h)
|
Due
to the size of net assets and fixed expenses, ratios may appear disproportionate. |
| (i)
|
Net
Assets at End of Period was less than $1,000. |
| +
|
Based
on weighted average shares outstanding. |
See notes to financial statements.
100 | Thornburg Fixed Income Funds Semi-Annual Report
Financial Highlights, Continued
Strategic Income Fund
| |
RATIOS
TO AVERAGE NET ASSETS |
|
Supplemental
Data |
UNLESS
OTHERWISE
NOTED, PERIODS ARE
FISCAL YEARS ENDED
SEPTEMBER 30, |
Net
Investment
Income (Loss) (%)(a) |
Expenses,
After
Expense
Reductions (%) |
Expenses,
Before Expense
Reductions (%) |
|
Total
Return (%)(b) |
Portfolio
Turnover
Rate (%)(b) |
Net
Assets
at End of PERIOD
(Thousands) |
| CLASS
A SHARES(c) |
| 2022
(d) |
3.01
(e) |
0.98
(e) |
1.05
(e) |
|
(3.46)
|
12.15
|
$
354,344 |
| 2021
|
3.48
|
0.95
|
1.05
|
|
5.30
|
28.55
|
$
376,252 |
| 2020
|
3.35
|
0.96
|
1.13
|
|
6.07
|
58.91
|
$
249,520 |
| 2019
|
3.55
|
0.99
|
1.16
|
|
5.92
|
31.55
|
$
215,441 |
| 2018
|
3.41
|
1.09
|
1.21
|
|
1.39
|
29.90
|
$
198,320 |
| 2017
|
3.61
|
1.17
|
1.25
|
|
5.41
|
44.74
|
$
232,938 |
| CLASS
C SHARES |
| 2022
(d) |
2.27
(e) |
1.71
(e) |
1.78
(e) |
|
(3.84)
|
12.15
|
$
92,122 |
| 2021
|
2.71
|
1.73
|
1.83
|
|
4.49
|
28.55
|
$
100,385 |
| 2020
|
2.57
|
1.70
|
1.88
|
|
5.30
|
58.91
|
$
103,302 |
| 2019
|
2.80
|
1.75
|
1.92
|
|
5.15
|
31.55
|
$
118,982 |
| 2018
|
2.70
|
1.80
|
1.96
|
|
0.59
|
29.90
|
$
150,364 |
| 2017
|
2.98
|
1.80
|
1.99
|
|
4.76
|
44.74
|
$
205,253 |
| CLASS
I SHARES |
| 2022
(d) |
3.43
(e) |
0.60
(e) |
0.77
(e) |
|
(3.31)
|
12.15
|
$
3,757,638 |
| 2021
|
3.81
|
0.60
|
0.81
|
|
5.74
|
28.55
|
$
3,255,002 |
| 2020
|
3.73
|
0.60
|
0.88
|
|
6.39
|
58.91
|
$
1,758,843 |
| 2019
|
3.89
|
0.63
|
0.91
|
|
6.35
|
31.55
|
$
1,141,046 |
| 2018
|
3.81
|
0.69
|
0.91
|
|
1.71
|
29.90
|
$
762,239 |
| 2017
|
4.02
|
0.75
|
0.92
|
|
5.85
|
44.74
|
$
620,780 |
| CLASS
R3 SHARES |
| 2022
(d) |
2.74
(e) |
1.25
(e) |
3.71
(e) |
|
(3.61)
|
12.15
|
$
731 |
| 2021
|
3.20
|
1.25
|
3.16
|
|
5.06
|
28.55
|
$
837 |
| 2020
|
2.96
|
1.25
|
2.53
|
|
5.70
|
58.91
|
$
1,105 |
| 2019
|
3.30
|
1.25
|
2.59
|
|
5.71
|
31.55
|
$
1,661 |
| 2018
|
3.24
|
1.25
|
2.46
|
|
1.16
|
29.90
|
$
1,968 |
| 2017
|
3.65
|
1.12
|
2.58
|
|
5.49
|
44.74
|
$
2,667 |
| CLASS
R4 SHARES |
| 2022
(d) |
2.73
(e) |
1.25
(e) |
2.20
(e) |
|
(3.53)
|
12.15
|
$
2,179 |
| 2021
|
3.21
|
1.25
|
2.28
|
|
4.98
|
28.55
|
$
2,139 |
| 2020
|
3.06
|
1.25
|
2.70
|
|
5.79
|
58.91
|
$
1,633 |
| 2019
|
3.28
|
1.25
|
2.51
|
|
5.71
|
31.55
|
$
1,279 |
| 2018
|
3.25
|
1.25
|
2.14
|
|
1.08
|
29.90
|
$
2,182 |
| 2017
|
3.52
|
1.25
|
2.30
|
|
5.35
|
44.74
|
$
2,772 |
| CLASS
R5 SHARES |
| 2022
(d) |
3.40
(e) |
0.60
(e) |
0.91
(e) |
|
(3.31)
|
12.15
|
$
61,820 |
| 2021
|
3.84
|
0.60
|
0.92
|
|
5.74
|
28.55
|
$
64,449 |
| 2020
|
3.78
|
0.60
|
1.00
|
|
6.48
|
58.91
|
$
43,715 |
| 2019
|
3.94
|
0.59
|
1.18
|
|
6.35
|
31.55
|
$
11,180 |
| 2018
|
3.82
|
0.69
|
1.20
|
|
1.71
|
29.90
|
$
7,406 |
| 2017
|
4.03
|
0.74
|
1.36
|
|
5.84
|
44.74
|
$
6,286 |
| CLASS
R6 SHARES |
| 2022
(d) |
3.52
(e) |
0.53
(e) |
0.72
(e) |
|
(3.26)
|
12.15
|
$
108,124 |
| 2021
|
3.89
|
0.53
|
0.75
|
|
5.81
|
28.55
|
$
77,415 |
| 2020
|
3.77
|
0.53
|
0.88
|
|
6.55
(f) |
58.91
|
$
39,115 |
| 2019
|
3.98
|
0.53
|
0.98
|
|
6.40
(f) |
31.55
|
$
21,630 |
| 2018
|
3.91
|
0.65
|
1.13
|
|
1.66
|
29.90
|
$
9,679 |
| 2017
(g) |
5.83
(e) |
0.00
(e) |
200.66
(e)(h) |
|
3.99
|
44.74
|
$ —
(i) |
Thornburg Fixed Income Funds Semi-Annual Report | 101
Expense Example
March 31, 2022 (Unaudited)
As a shareholder of the Fund, you incur two types of
costs:
| (1)
|
transaction costs, including
|
| (a)
|
sales charges (loads) on
purchase payments, for Class A shares; |
| (b)
|
a deferred sales charge on
redemptions of any part or all of a purchase of $1 million of Class A shares within 12 months of purchase; |
| (c)
|
a deferred
sales charge on redemptions of Class C and Class C2 shares within 12 months of purchase; |
| (2)
|
ongoing costs, including
management fees; distribution and/or service (12b-1) fees; and other Fund expenses. |
This example is intended to help you understand your ongoing
costs (in dollars) of investing in the Fund and to compare these costs with the ongoing costs of investing in other mutual funds.
The example is based on a $1,000 investment beginning on
October 1, 2021, and held until March 31, 2022.
ACTUAL EXPENSES
For each class of shares, the Actual section of the
accompanying table provides information about actual account values and actual expenses. You may use the information in this line, together with the amount you invested, to estimate the expenses that you paid over the period. Simply divide your
account value by $1,000 (for example, an $8,600 account value divided by $1,000 = 8.6), then multiply the result by the number in the Actual section for your class of shares under the heading entitled “Expenses Paid During Period” to
estimate the expenses you paid on your account during this period.
HYPOTHETICAL EXAMPLE FOR COMPARISON PURPOSES
For each class of shares, the Hypothetical section of the
accompanying table provides information about hypothetical account values and hypothetical expenses based on the Fund’s actual expense ratio and an assumed rate of return of 5% per year before expenses, which is not the Fund’s actual
return. The hypothetical account values and expenses may not be used to estimate the actual ending account balance or expenses you paid for the period. You may use this information to compare the ongoing costs of investing in the Fund and other
funds. To do so, compare this 5% hypothetical example with the 5% hypothetical examples that appear in the shareholder reports of the other funds.
Please note that the expenses shown in the table are meant to
highlight your ongoing costs only and do not reflect any transactional costs, such as sales charges (loads), redemption fees, or exchange fees. Therefore, the Hypothetical section of the table for each class of shares is useful in comparing ongoing
costs only, and will not help you determine the relative total costs of owning different mutual funds. In addition, if these transactional costs were included, your costs would have been higher.
The actual and hypothetical examples shown assume a $1,000
investment at the beginning of the period, October 1, 2021 and held through March 31, 2022.
| |
Actual
|
|
Hypothetical
* |
|
| |
Ending
Account Value
3/31/22 |
Expenses
Paid
During Period
10/1/21-3/31/22 |
|
Ending
Account Value
3/31/22 |
Expenses
Paid
During Period†
10/1/21-3/31/22 |
Annualized
Expense Ratio |
| LIMITED
TERM U.S. GOVERNMENT FUND |
| CLASS
A SHARES |
$958.28
|
$4.35
|
|
$1,020.49
|
$4.48
|
0.89%
|
| CLASS
C SHARES |
$957.62
|
$6.05
|
|
$1,018.75
|
$6.24
|
1.24%
|
| CLASS
C2 SHARES |
$956.89
|
$6.05
|
|
$1,018.75
|
$6.24
|
1.24%
|
| CLASS
I SHARES |
$959.65
|
$2.93
|
|
$1,021.94
|
$3.02
|
0.60%
|
| CLASS
R3 SHARES |
$958.55
|
$4.83
|
|
$1,020.00
|
$4.99
|
0.99%
|
| CLASS
R4 SHARES |
$958.53
|
$4.83
|
|
$1,020.00
|
$4.99
|
0.99%
|
| CLASS
R5 SHARES |
$959.37
|
$3.27
|
|
$1,021.59
|
$3.38
|
0.67%
|
| LIMITED
TERM INCOME FUND |
| CLASS
A SHARES |
$956.50
|
$3.61
|
|
$1,021.24
|
$3.73
|
0.74%
|
| CLASS
C SHARES |
$955.30
|
$4.78
|
|
$1,020.04
|
$4.94
|
0.98%
|
| CLASS
C2 SHARES |
$954.03
|
$6.04
|
|
$1,018.75
|
$6.24
|
1.24%
|
| CLASS
I SHARES |
$958.43
|
$2.39
|
|
$1,022.49
|
$2.47
|
0.49%
|
| CLASS
R3 SHARES |
$955.36
|
$4.83
|
|
$1,020.00
|
$4.99
|
0.99%
|
| CLASS
R4 SHARES |
$955.31
|
$4.83
|
|
$1,020.00
|
$4.99
|
0.99%
|
| CLASS
R5 SHARES |
$957.70
|
$2.39
|
|
$1,022.49
|
$2.47
|
0.49%
|
| CLASS
R6 SHARES |
$958.16
|
$2.05
|
|
$1,022.84
|
$2.12
|
0.42%
|
| ULTRA
SHORT INCOME FUND |
| CLASS
A SHARES |
$988.91
|
$2.48
|
|
$1,022.44
|
$2.52
|
0.50%
|
| CLASS
I SHARES |
$989.87
|
$1.49
|
|
$1,023.44
|
$1.51
|
0.30%
|
102 |
Thornburg Fixed Income Funds Semi-Annual Report
Expense Example, Continued
March 31, 2022 (Unaudited)
| |
Actual
|
|
Hypothetical
* |
|
| |
Ending
Account Value
3/31/22 |
Expenses
Paid
During Period
10/1/21-3/31/22 |
|
Ending
Account Value
3/31/22 |
Expenses
Paid
During Period†
10/1/21-3/31/22 |
Annualized
Expense Ratio |
| STRATEGIC
INCOME FUND |
| CLASS
A SHARES |
$965.38
|
$4.80
|
|
$1,020.04
|
$4.94
|
0.98%
|
| CLASS
C SHARES |
$961.62
|
$8.36
|
|
$1,016.40
|
$8.60
|
1.71%
|
| CLASS
I SHARES |
$966.92
|
$2.94
|
|
$1,021.94
|
$3.02
|
0.60%
|
| CLASS
R3 SHARES |
$963.88
|
$6.12
|
|
$1,018.70
|
$6.29
|
1.25%
|
| CLASS
R4 SHARES |
$964.67
|
$6.12
|
|
$1,018.70
|
$6.29
|
1.25%
|
| CLASS
R5 SHARES |
$966.94
|
$2.94
|
|
$1,021.94
|
$3.02
|
0.60%
|
| CLASS
R6 SHARES |
$967.42
|
$2.60
|
|
$1,022.29
|
$2.67
|
0.53%
|
| *
|
Hypothetical
assumes a rate of return of 5% per year before expenses. |
| †
|
Expenses
are equal to the annualized expense ratio for each class multiplied by the average account value over the period, multiplied by 182/365 to reflect the one-half year period. |
Thornburg
Fixed Income Funds Semi-Annual Report | 103
Other Information
March 31, 2022 (Unaudited)
PORTFOLIO PROXY VOTING
Policies and Procedures:
The Trust has delegated to the Advisor voting decisions
respecting proxies for the Fund’s voting securities. The Advisor makes voting decisions in accordance with its Proxy Voting Policy and Procedures. A description of the Policy and Procedures is available (i) without charge, upon request, by
calling the Advisor toll-free at 1-800-847-0200, (ii) on the Thornburg website at www.thornburg.com, and (iii) on the U.S. Securities and Exchange Commission’s website at www.sec.gov.
Information regarding how proxies were voted is available on
or before August 31 of each year for the twelve months ending the preceding June 30. This information is available (i) without charge, upon request by calling the Advisor toll-free at 1-800-847-0200, (ii) on the Thornburg website at
www.thornburg.com, and (iii) on the U.S. Securities and Exchange Commission’s website at www.sec.gov.
AVAILABILITY OF QUARTERLY PORTFOLIO SCHEDULE
The Funds file with the Securities and Exchange Commission
schedules of their portfolio holdings on Form N-PORT EX for the first and third quarters of each fiscal year. The Funds’ Forms N-PORT EX are available on the Commission’s website at www.sec.gov, or may be reviewed and copied at the
Commission’s Public Reference Room in Washington, D.C. Information on the operation of the Public Reference Room may be obtained by calling 1-800-SEC-0330. The Funds also make this information available on their website at
www.thornburg.com/download or upon request by calling 1-800-847-0200.
STATEMENT REGARDING LIQUIDITY RISK MANAGEMENT
PROGRAM
The Trustees of the Trust have appointed the
Advisor (“Program Administrator”) to administer the Trust’s liquidity risk management program (the “LRMP”) adopted for each of the Funds under rule 22e-4 under the 1940 Act (the “Liquidity Rule”). The LRMP
is designed to reduce the risk that a Fund will be unable to meet its redemption obligations under the 1940 Act, and to mitigate the dilution of the interests of Fund shareholders occasioned by redemptions tendered by other shareholders
(“Liquidity Risk”). Pursuant to the LRMP, the Program Administrator has delegated certain functions, including daily oversight and management of the Funds’ Liquidity Risk, to its Liquidity Risk Management Committee (the
“Liquidity Committee”). Under the LRMP, the Liquidity Committee performs the annual review of the LRMP required by the Liquidity Rule.
On December 8, 2021, the Trustees reviewed the Liquidity
Committee’s written report (the “Report”) concerning the operation of the LRMP for the period from November 21, 2020 through November 20, 2021 (the “Reporting Period”). The Report addressed the operation, adequacy and
effectiveness of the LRMP, the operation of a Fund’s highly liquid investment minimum, and any material changes to the LRMP during the Reporting Period. The Report provided an assessment of the various factors relevant to each Fund’s
Liquidity Risk, an evaluation of data provided by a third-party liquidity assessment vendor and other relevant data, and reports on the Liquidity Committee’s consideration of intermediary firms with the largest beneficial ownership positions
in each Fund, the likelihood that any of those firms may redeem their clients’ investments from the Funds without prior notice, and the effect that such redemptions could have on Fund liquidity. The Report concluded that the LRMP remains
adequate and effective to address each Fund’s Liquidity Risk, that all of the Funds are able to meet redemption requests in current market conditions and in reasonably expected stressed conditions without significant dilution of remaining
shareholders, that each Fund remains primarily highly liquid, each Fund’s liquidity classifications during the reporting period were reasonable, and the third-party liquidity assessment vendor’s system continues to be a useful tool for
assessing the Funds’ Liquidity Risk. The Report stated that there have been no instances since the LRMP’s adoption in which a Fund exceeded its limitation on illiquid investments, nor have there been any material changes to the LRMP
since its adoption.
104 |
Thornburg Fixed Income Funds Semi-Annual Report
Trustees’ Statement to
Shareholders (Unaudited)
Readopted September 14, 2021
The Trustees believe current and prospective shareholders
should know how we discharge our responsibilities in supervising the Funds’ investment advisor and in reviewing the advisor’s contract for renewal. Since 2005, we have issued a statement which sets out clearly the three principal
guidelines that we follow in supervising the Trust’s investment advisor on your behalf. In accordance with our customary practice, in September of this year we again reviewed our statement and concluded we should reissue this statement
outlining the principal features of our supervision of the advisor’s performance of investment management services for the Funds.
We begin with the premise that each shareholder selected his
or her Fund because its investments are managed by the investment advisor identified in the prospectus and in accordance with the objective and policies described in the prospectus. We realize, as each of you do, that if you believe that your
Fund’s stated objective and policies no longer serve your personal investment goals, you can sell your shares and leave the Fund.
Therefore, we believe that our primary supervisory task
– our principal obligation to you – is to assess the nature and quality of the advisor’s services, and to confirm that the advisor actively and competently pursues the Fund’s objective, in accordance with the policies set out
in the prospectus. To do this, we meet regularly with management to review your Fund’s portfolio and to discuss the advisor’s specific actions and judgments in pursuing the Fund’s objective. We do not substitute our own judgment
for the advisor’s decisions in selecting investments; the advisor is paid to exercise its informed judgment on investment decisions, and we seek to confirm, in reviewing the advisor’s performance, that the advisor is doing just
that.
Second, we are conscious of costs and the effect
that costs have on shareholders’ returns. We try to make sure that your Fund’s fees and costs are reasonable in relationship to the services rendered and that they are generally in line with those charged by other expert investment
advisors, consistent with our belief that the Fund’s investors searched for and expect that expertise and attention and have decided to pay a reasonable price for it. We do not put the management contract “out to bid” as a matter
of course, and we would not do so unless we had concluded that the advisor materially had failed to pursue the Fund’s objectives in accordance with its policies, or for other equally important reasons. We believe that any other approach would
be inconsistent with your interests and contrary to your expectations when you bought shares of the Fund in the first place.
Finally, because we believe that most Thornburg Fund
shareholders have invested with a long-term perspective, we try not to focus too much on the fashions of the moment and on short-term performance. The market will not favor any specific investment objective or set of policies at all times and under
all economic circumstances. A fund will experience periods of both high and low returns relative to other funds and other investments. Even if one of our Funds is not favored by the market at a particular time, we believe that the advisor is
nonetheless obliged to remain true to the Fund’s objective and policies, and we watch to see that it does so.
[This statement is submitted for the general information of the
shareholders of Thornburg Investment Trust. For prospective investors in any fund of Thornburg Investment Trust, this communication must be preceded or accompanied by a prospectus. You may obtain a current copy of the Funds’ prospectus, which
describes the Funds’ management fees, expenses and risks, by calling 1-800-847-0200 or by visiting www.thornburg.com/download. Please read the prospectus carefully before investing.]
Thornburg Investment Trust
2300 North Ridgetop Road
Santa Fe, NM 87506
505.984.0200 Tel
505.992.8681 Fax
www.thornburg.com
Thornburg
Fixed Income Funds Semi-Annual Report | 105
Thornburg Investment Management is a privately-owned global
investment firm that offers a range of solutions for retail and institutional investors. Founded in 1982 and headquartered in Santa Fe, New Mexico, we manage approximately $44.3 billion (as of March 31, 2022) across U.S. mutual funds, separate
accounts for high-net-worth investors, institutional accounts, and UCITS funds for non-U.S. investors.
The funds outlined in this report are some of the many
equity and fixed-income products available from Thornburg Investment Management.
GLOBAL EQUITY
| ■
|
Thornburg Global
Opportunities Fund |
INTERNATIONAL EQUITY
| ■
|
Thornburg International
Equity Fund |
| ■
|
Thornburg Better World
International Fund |
| ■
|
Thornburg International
Growth Fund |
| ■
|
Thornburg
Developing World Fund |
U.S.
EQUITY
| ■
|
Thornburg Small/Mid Cap Core
Fund |
| ■
|
Thornburg
Small/Mid Cap Growth Fund |
MULTI ASSET
| ■
|
Thornburg Investment Income
Builder Fund |
| ■
|
Thornburg Income Builder
Opportunities Trust |
| ■
|
Thornburg
Summit Fund |
TAXABLE FIXED
INCOME
| ■
|
Thornburg Limited Term U.S.
Government Fund |
| ■
|
Thornburg Limited Term
Income Fund |
| ■
|
Thornburg Ultra Short Income
Fund |
| ■
|
Thornburg
Strategic Income Fund |
MUNICIPAL
| ■
|
Thornburg Short Duration
Municipal Fund |
| ■
|
Thornburg Limited Term
Municipal Fund |
| ■
|
Thornburg California Limited
Term Municipal Fund |
| ■
|
Thornburg New Mexico
Intermediate Municipal Fund |
| ■
|
Thornburg New York
Intermediate Municipal Fund |
| ■
|
Thornburg Intermediate
Municipal Fund |
| ■
|
Thornburg
Strategic Municipal Income Fund |
Before investing, carefully consider each
Fund’s investment goals, risks, charges, and expenses. For a prospectus or summary prospectus containing this and other information, contact your financial advisor or visit thornburg.com. Read it carefully before investing.
For additional information, please visit
thornburg.com
Thornburg Investment Management, Inc.
2300 North Ridgetop Road, Santa Fe, NM 87506
106 |
Thornburg Fixed Income Funds Semi-Annual Report
This page intentionally left
blank.
Thornburg Fixed Income Funds Semi-Annual Report | 107
To receive shareholder reports, prospectuses, and proxy statements
electronically, go to www.thornburg.com/edelivery.
This Semi-Annual Report is submitted for the general
information of shareholders of the Fund. It is not authorized for distribution to prospective investors in the Fund unless preceded or accompanied by an effective prospectus.
Investment Advisor:
Thornburg Investment Management®
800.847.0200
Distributor:
Thornburg Securities Corporation®

Semi-Annual Report | March 31,
2022
| Thornburg
Municipal Funds |
| Thornburg
Short Duration Municipal Fund |
| Thornburg
Limited Term Municipal Fund |
| Thornburg
California Limited Term Municipal Fund |
| Thornburg
New Mexico Intermediate Municipal Fund |
| Thornburg
New York Intermediate Municipal Fund |
| Thornburg
Intermediate Municipal Fund |
| Thornburg
Strategic Municipal Income Fund |
Thornburg Municipal Funds
Semi-Annual Report | March 31, 2022
Table of Contents
Investments carry risks, including possible loss of
principal. Portfolios investing in bonds have the same interest rate, inflation, and credit risks that are associated with the underlying bonds. The value of bonds will fluctuate relative to changes in interest rates, decreasing when interest rates
rise. Unlike bonds, bond funds have ongoing fees and expenses. Please see the Funds’ prospectus for a discussion of the risks associated with an investment in the Funds. Investments in the Funds are not FDIC insured, nor are they bank deposits
or guaranteed by a bank or any other entity.
Thornburg Municipal Funds Semi-Annual Report | 3
Letter to Shareholders
March 31, 2022 (Unaudited)
Dear Shareholder:
A one-time colleague of mine from decades ago, who was prone
to malapropisms, was also a Yogi Berra-esque source of wisdom at times. These days, I recall one of his pronouncements around the time of the dot.com bubble and crash: “Just when you think you’re out of the woods, you go right back into
the soup.” This seems to be appropriate relative to our emergence from a Covid-dominated recession into a new world that hinges on massively increasing price pressures and a geopolitical worst-case-scenario in Russia/Ukraine. I don’t
expect the volatility that we’ve seen in the last six months to abate and given somewhat elevated risk asset prices (though deflated from my last letter to you), markets remain vulnerable to shocks. High inflation has been one of those shocks,
and it will take some time to resolve factors contributing to that inflation, such as supply-chain challenges, home price appreciation effects on measured shelter costs, and labor cost and availability issues. Ultimately, we expect various central
banks across the globe, certainly including the Federal Reserve, to be forced to make a choice between containing inflation at the expense of employment and losing control of inflation expectations in the name of supporting a hotter economy.
It’s a tightrope walk without a net and just one of many elements of uncertainty in the aftermath of Covid.
In recent weeks, we’ve seen yields on most fixed income
securities rise dramatically. Combined with the very low starting point on income return, the past quarter has been one of the worst in history for those markets. Because many arguments around valuation in equities hinged on the TINA argument
(“There Is No Alternative”), and because the earnings yield (essentially the inverse of the Price/Earnings ratio) on equities far surpassed the yield on bonds, there has been a crossover effect into other risky assets. While we view this
as only part of the overall valuation conversation, any time investors experience outsized moves in major markets, it’s worth taking a deeper dive. In this case, we expect that the dramatic shift of policymakers’ approach from
stimulating growth to containing price pressures may drain liquidity and leave some market participants feeling like a fish out of water.
As in any environment, we will be focused on you, our clients,
as our most important constituency. Though there is never a guarantee that we will be able to navigate the evolving marketplace as well as we may have before, I have a confidence born of experience that our unsiloed, global approach to active
investment management gives us a
distinct advantage. It is always the case that with challenge comes
opportunity, and I have watched our portfolios perform well over the years when difficult situations arise. We continue to see that no market is an island, and the effects from actions somewhere in the world are felt everywhere. Our process, which
focuses on this interconnection through the development of a collaborative and deeply informed perspective, is designed to thrive in these investment conditions.
As we’ve discussed in the past, the story of Thornburg
is one of consistent and deliberate evolution to meet your needs in the context of a changing business and investment environment. As an example of this, we have completed the integration of Environmental, Social, and Governance (ESG) considerations
across our product set. While this does not mean that these considerations are part of our Principal Investment Strategy for all portfolios, it does mean that, when evaluating potential investment opportunities, we evaluate the significance of a
company’s ESG characteristics and their potential to impact the company’s investment performance. We believe that the integration of those ESG considerations into our investment process, alongside the other factors that we consider when
evaluating investments, is consistent with our long-term investment time horizon for both individual assets and whole portfolios, as well as an indelible part of the market landscape.
I have great respect for other investment firms and there are
many good products that are available to investors. “It’s tough to make predictions, especially, about the future” – an actual Yogi-ism – but we believe that in times like these, our firm’s broad perspective and
collaborative, unsiloed approach is our differentiator. These qualities are what underlie the excellent long-term outcomes we’ve been able to deliver: we’re built to deliver on the promise of active management.
Thank you so much for your time, and for your business.

|
|
Jason
Brady, cfa
Portfolio Manager
CEO, President, and
Managing Director |
|
The matters discussed in this report may
constitute forward-looking statements made pursuant to the safe harbor provisions of the Securities Litigation Reform Act of 1995. These include any advisor or portfolio manager prediction, assessment, analysis or outlook for individual securities,
industries, investment styles, market sectors and/or markets. These statements involve risks and uncertainties. In addition to the general risks described for each fund in its current prospectus, other factors bearing on these reports include the
accuracy of the advisor’s or portfolio manager’s forecasts and predictions, the appropriateness of the investment strategies designed by the advisor or portfolio manager and the ability of the advisor or portfolio manager to implement
their strategies efficiently and successfully. Any one or more of these factors, as well as other risks affecting the securities markets generally, could cause the actual results of any fund to differ materially as compared to its benchmarks.
The views expressed are subject to change and
do not necessarily reflect the views of Thornburg Investment Management, Inc. This information should not be relied upon as a recommendation or investment advice and is not intended to predict the performance of any investment or market.
Performance results of individual share
classes will vary based on the fees and expenses associated with each share class, and may be higher or lower than other share classes within the same Fund. Please see Performance Summary for performance results of each share class.
4 | Thornburg Municipal Funds Semi-Annual Report
Thornburg Short Duration Municipal
Fund
Investment Goal and
Fund
Overview
The primary goal of Short
Duration Municipal Fund is to provide current income exempt from federal income tax, consistent with preservation of capital.
The Fund is an actively managed, laddered
portfolio of municipal bonds with a dollar-weighted average duration of normally no more than three years. Actively laddering portfolios involves building a portfolio of bonds with different maturities, based on our assessment of market risks and
individual credit opportunities, so that a portion of the portfolio matures each year and cash from maturing bonds may be invested in bonds with longer maturities.
Performance drivers and detractors for
the reporting period ended March 31, 2022
» The Fund’s Class I shares
returned -2.50% versus the ICE BofAML 1-3 Year U.S. Municipal Securities Index’s return of -2.34%, for the six-month period ended March 31, 2022. The Fund’s underperformance relative to the index comes during a challenging period for
fixed income as inflation in the U.S. touched the highest level in 40 years, causing yields to spike.
» The Fund’s negative
performance relative to the index during the quarter was a result of large interest rate movements across all maturities. The Fund’s yield curve positioning, specifically holdings of four and five-year maturity bonds, was a detractor to
relative performance.
» The
Fund’s security selection had a negative impact on performance relative to the index during the period. The Fund’s allocation to power and utilities revenue bonds was the primary driver of the relative underperformance versus the
index.
Performance Summary
March 31, 2022 (Unaudited)
GROWTH OF A HYPOTHETICAL $10,000 INVESTMENT
| THORNBURG
SHORT DURATION MUNICIPAL FUND |
FINAL
VALUE |
AVERAGE ANNUAL
TOTAL RETURNS
THORNBURG
SHORT DURATION
MUNICIPAL FUND |
1-YR
|
3-YR
|
5-YR
|
10-YR
|
SINCE
INCEPTION |
| Class
A Shares (Incep: 12/30/13) |
|
|
|
|
|
| Without
sales charge |
-2.74%
|
-0.25%
|
0.26%
|
-
|
0.27%
|
| With
sales charge |
-4.89%
|
-0.76%
|
-0.05%
|
-
|
0.08%
|
| Class
I Shares (Incep: 12/30/13) |
-2.46%
|
-0.02%
|
0.46%
|
-
|
0.47%
|
| ICE
BofAML 1-3 Year U.S. Municipal Securities Index (Since 12/30/13) |
-2.19%
|
0.64%
|
0.98%
|
-
|
0.91%
|
The matters discussed in
this report may constitute forward-looking statements made pursuant to the safe harbor provisions of the Securities Litigation Reform Act of 1995. These include any advisor or portfolio manager prediction, assessment, analysis or outlook for
individual securities, industries, investment styles, market sectors and/or markets. These statements involve risks and uncertainties. In addition to the general risks described for each fund in its current prospectus, other factors bearing on these
reports include the accuracy of the advisor’s or portfolio manager’s forecasts and predictions, the appropriateness of the investment strategies designed by the advisor or portfolio manager and the ability of the advisor or portfolio
manager to implement their strategies efficiently and successfully. Any one or more of these factors, as well as other risks affecting the securities markets generally, could cause the actual results of any fund to differ materially as compared to
its benchmarks.
The views expressed are subject to
change and do not necessarily reflect the views of Thornburg Investment Management, Inc. This information should not be relied upon as a recommendation or investment advice and is not intended to predict the performance of any investment or
market.
Performance results of individual share
classes will vary based on the fees and expenses associated with each share class, and may be higher or lower than other share classes within the same Fund. Please see Performance Summary for performance results of each share class.
Performance data shown represents past performance and
is no guarantee of future results. Investment return and principal value will fluctuate so shares, when redeemed, may be worth more or less than their original cost. Current performance may be lower or higher than quoted. For performance current to
the most recent month end, visit thornburg.com or call 800-847-0200. The performance information does not reflect the deduction of taxes that a shareholder would pay on distributions or the redemption of Fund shares. Returns reflect the reinvestment
of dividends and capital gains. Class A shares are sold with a maximum sales charge of 2.25%. There is no sales charge for Class I shares. As disclosed in the Fund’s most recent prospectus, the total annual fund operating expenses before fee
waivers and expense reimbursements are as follows: A shares, 0.98%; I shares, 0.65%; Thornburg Investment Management has contractually agreed to waive fees and reimburse expenses until at least February 1, 2023, for some of the share classes,
resulting in net expense ratios of the following: A shares, 0.70%; I shares, 0.50%. For more detailed information on fund expenses and waivers/reimbursements please see the Fund’s prospectus.
The ICE index data referenced herein is the property of
ICE Data Indices, LLC, its affiliates (“ICE Data”) and/or its Third Party Suppliers and has been licensed for use by Thornburg Investment Management, Inc. ICE Data and its Third Party Suppliers accept no liability in connection with its
use. See www.thornburg.com/indices for a full copy of the Disclaimer.
Thornburg Municipal Funds Semi-Annual Report | 5
Thornburg Limited Term Municipal
Fund
Investment Goal and
Fund
Overview
The primary investment
goal of Limited Term Municipal Fund is to obtain as high a level of current income exempt from federal individual income tax as is consistent, in the view of the Fund’s investment advisor, with preservation of capital. The secondary goal of
the Fund is to reduce expected changes in its share price compared to longer intermediate and long-term bond portfolios.
The Fund is an actively managed, laddered
portfolio of municipal bonds with a dollar-weighted average maturity normally of less than five years. Actively laddering portfolios involves building a portfolio of bonds with different maturities, based on our assessment of market risks and
individual credit opportunities, so that portion of the portfolio matures each year and cash from maturing bonds may be invested in bonds with longer maturities.
Performance drivers and detractors for
the reporting period ended March 31, 2022
» The Fund’s Class I shares
returned -4.24% versus the ICE BofAML 1-10 Year U.S. Municipal Securities Index’s return of -4.27%, for the six-month period ended March 31, 2022. The Fund’s outperformance relative to the index comes during a challenging period for
fixed income as inflation in the U.S. touched the highest level in 40 years, causing yields to spike.
» The Fund’s duration and yield
curve positioning were large detractors from absolute performance during the period as yields spiked significantly. However, the Fund’s relatively shorter duration and underweight to longer maturities allowed it to outperform its index during
the period.
» The Fund’s
security selection had a negative impact on performance relative to the index during the period, specifically within the revenue bond sector. Selection within hospitals, utilities, leasing, and appropriation debt were all detractors from performance
relative to the index.
Performance Summary
March 31, 2022 (Unaudited)
GROWTH OF A HYPOTHETICAL $10,000 INVESTMENT
| THORNBURG
LIMITED TERM MUNICIPAL FUND |
FINAL
VALUE |
AVERAGE ANNUAL
TOTAL RETURNS
| THORNBURG
LIMITED TERM MUNICIPAL FUND |
1-YR
|
3-YR
|
5-YR
|
10-YR
|
SINCE
INCEPTION |
| Class
A Shares (Incep: 9/28/84) |
|
|
|
|
|
| Without
sales charge |
-4.22%
|
0.18%
|
0.83%
|
1.11%
|
4.32%
|
| With
sales charge |
-6.41%
|
-0.33%
|
0.52%
|
0.96%
|
4.28%
|
| Class
C Shares (Incep: 9/1/94) |
|
|
|
|
|
| Without
sales charge |
-4.40%
|
-0.08%
|
0.58%
|
0.86%
|
2.80%
|
| With
sales charge |
-4.88%
|
-0.08%
|
0.58%
|
0.86%
|
2.80%
|
| Class
C2 Shares (Incep: 10/1/20) |
|
|
|
|
|
| Without
sales charge |
-4.74%
|
-
|
-
|
-
|
-3.16%
|
| With
sales charge |
-5.35%
|
-
|
-
|
-
|
-3.16%
|
| Class
I Shares (Incep: 7/5/96) |
-4.01%
|
0.41%
|
1.08%
|
1.40%
|
3.33%
|
| ICE
BofAML 1-10 Year U.S. Municipal Securities Index (Since 9/28/84) |
-3.74%
|
0.92%
|
1.60%
|
1.76%
|
-
|
The matters discussed in
this report may constitute forward-looking statements made pursuant to the safe harbor provisions of the Securities Litigation Reform Act of 1995. These include any advisor or portfolio manager prediction, assessment, analysis or outlook for
individual securities, industries, investment styles, market sectors and/or markets. These statements involve risks and uncertainties. In addition to the general risks described for each fund in its current prospectus, other factors bearing on these
reports include the accuracy of the advisor’s or portfolio manager’s forecasts and predictions, the appropriateness of the investment strategies designed by the advisor or portfolio manager and the ability of the advisor or portfolio
manager to implement their strategies efficiently and successfully. Any one or more of these factors, as well as other risks affecting the securities markets generally, could cause the actual results of any fund to differ materially as compared to
its benchmarks.
The views expressed are subject to
change and do not necessarily reflect the views of Thornburg Investment Management, Inc. This information should not be relied upon as a recommendation or investment advice and is not intended to predict the performance of any investment or
market.
Performance results of individual share
classes will vary based on the fees and expenses associated with each share class, and may be higher or lower than other share classes within the same Fund. Please see Performance Summary for performance results of each share class.
Performance data shown represents past performance and
is no guarantee of future results. Investment return and principal value will fluctuate so shares, when redeemed, may be worth more or less than their original cost. Current performance may be lower or higher than quoted. For performance current to
the most recent month end, visit thornburg.com or call 800-847-0200. The performance information does not reflect the deduction of taxes that a shareholder would pay on distributions or the redemption of Fund shares. Returns reflect the reinvestment
of dividends and capital gains. Class A shares are sold with a maximum sales charge of 2.25%. Class C and Class C2 shares include 0.50% and 0.65% CDSC respectively, for the first year only. There is no sales charge for Class I shares. As disclosed
in the Fund’s most recent prospectus, the total annual fund operating expenses before fee waivers and expense reimbursements are as follows: A shares, 0.69%; C shares, 0.97%; C2 Shares, 1.72%; I shares, 0.46%. Thornburg Investment Management
has contractually agreed to waive fees and reimburse expenses until at least February 1, 2023, for some of the share classes, resulting in net expense ratios of the following: C2 Shares, 1.24%. For more detailed information on fund expenses and
waivers/reimbursements please see the Fund’s prospectus.
The ICE index data referenced herein is the property of
ICE Data Indices, LLC, its affiliates (“ICE Data”) and/or its Third Party Suppliers and has been licensed for use by Thornburg Investment Management, Inc. ICE Data and its Third Party Suppliers accept no liability in connection with its
use. See www.thornburg.com/indices for a full copy of the Disclaimer.
6 |
Thornburg Municipal Funds Semi-Annual Report
Thornburg California Limited Term
Municipal Fund
Investment Goal and
Fund
Overview
The primary investment goal
of Limited Term California Fund is to obtain as high a level of current income exempt from federal and California state individual income taxes as is consistent, in the view of the Fund’s investment advisor, with preservation of capital. The
secondary goal of the Fund is to reduce expected changes in its share price compared to longer intermediate and long-term bond portfolios.
The Fund is an actively managed, laddered
portfolio of California and U.S. territory municipal bonds with a dollar-weighted average maturity normally less than five years. Actively laddering portfolios involves building a portfolio of bonds with different maturities, based on our assessment
of market risks and individual credit opportunities, so that a portion of the portfolio matures each year and cash from maturing bonds may be invested in bonds with longer maturities.
Performance drivers and detractors for
the reporting period ended March 31, 2022
» The Fund’s Class I shares
returned -3.96% versus the ICE BofAML 1-10 Year U.S. Municipal Securities Index’s return of -4.27% for the six-month period ended March 31, 2022. The Fund’s outperformance relative to the index comes during a challenging period for fixed
income as inflation in the U.S. touched the highest level in 40 years, causing yields to spike.
»The Fund’s duration and yield
curve positioning were large detractors from absolute performance during the period as yields spiked significantly. However, the Fund’s relatively shorter duration and underweight to longer maturities allowed it to outperform its index during
the period.
» The Fund’s
performance relative to the index was muted with respect to its sector and quality allocations due to the outsized impact that duration and yield curve positioning had during the period. Security selection was a detractor to performance relative to
the index which was a result of California municipal bonds selling off more than the national index.
Performance Summary
March 31, 2022 (Unaudited)
GROWTH OF A HYPOTHETICAL $10,000 INVESTMENT
| THORNBURG
CALIFORNIA LIMITED TERM MUNICIPAL FUND |
FINAL
VALUE |
AVERAGE ANNUAL
TOTAL RETURNS
| THORNBURG
CALIFORNIA LIMITED TERM MUNICIPAL FUND |
1-YR
|
3-YR
|
5-YR
|
10-YR
|
SINCE
INCEPTION |
| Class
A Shares (Incep: 2/19/87) |
|
|
|
|
|
| Without
sales charge |
-4.02%
|
-0.24%
|
0.42%
|
1.03%
|
3.70%
|
| With
sales charge |
-6.21%
|
-0.75%
|
0.12%
|
0.88%
|
3.66%
|
| Class
C Shares (Incep: 9/1/94) |
|
|
|
|
|
| Without
sales charge |
-4.29%
|
-0.52%
|
0.15%
|
0.76%
|
2.66%
|
| With
sales charge |
-4.76%
|
-0.52%
|
0.15%
|
0.76%
|
2.66%
|
| Class
C2 Shares (Incep: 10/1/20) |
|
|
|
|
|
| Without
sales charge |
-4.30%
|
-
|
-
|
-
|
-2.95%
|
| With
sales charge |
-4.92%
|
-
|
-
|
-
|
-2.95%
|
| Class
I Shares (Incep: 4/1/97) |
-3.85%
|
0.01%
|
0.68%
|
1.32%
|
3.10%
|
| ICE
BofAML 1-10 Year U.S. Municipal Securities Index (Since 2/19/87) |
-3.74%
|
0.92%
|
1.60%
|
1.76%
|
-
|
The matters discussed in
this report may constitute forward-looking statements made pursuant to the safe harbor provisions of the Securities Litigation Reform Act of 1995. These include any advisor or portfolio manager prediction, assessment, analysis or outlook for
individual securities, industries, investment styles, market sectors and/or markets. These statements involve risks and uncertainties. In addition to the general risks described for each fund in its current prospectus, other factors bearing on these
reports include the accuracy of the advisor’s or portfolio manager’s forecasts and predictions, the appropriateness of the investment strategies designed by the advisor or portfolio manager and the ability of the advisor or portfolio
manager to implement their strategies efficiently and successfully. Any one or more of these factors, as well as other risks affecting the securities markets generally, could cause the actual results of any fund to differ materially as compared to
its benchmarks.
The views expressed are subject to
change and do not necessarily reflect the views of Thornburg Investment Management, Inc. This information should not be relied upon as a recommendation or investment advice and is not intended to predict the performance of any investment or
market.
Performance results of individual share
classes will vary based on the fees and expenses associated with each share class, and may be higher or lower than other share classes within the same Fund. Please see Performance Summary for performance results of each share class.
Performance data shown represents past performance and
is no guarantee of future results. Investment return and principal value will fluctuate so shares, when redeemed, may be worth more or less than their original cost. Current performance may be lower or higher than quoted. For performance current to
the most recent month end, visit thornburg.com or call 800-847-0200. The performance information does not reflect the deduction of taxes that a shareholder would pay on distributions or the redemption of Fund shares. Returns reflect the reinvestment
of dividends and capital gains. Class A shares are sold with a maximum sales charge of 2.25%. Class C and Class C2 shares include 0.50% and 0.65% CDSC respectively, for the first year only. There is no sales charge for Class I shares. As disclosed
in the Fund’s most recent prospectus, the total annual fund operating expenses before fee waivers and expense reimbursements are as follows: A shares, 0.92%; C shares, 1.27%; C2 shares, 6.50%; I shares, 0.70%; Thornburg Investment Management
has contractually agreed to waive fees and reimburse expenses until at least February 1, 2023, for some of the share classes, resulting in net expense ratios of the following: A shares, 0.74%; C shares, 1.02%; C2 shares, 1.02%; I shares, 0.49%. For
more detailed information on fund expenses and waivers/reimbursements please see the Fund’s prospectus.
The ICE index data referenced herein is the property of
ICE Data Indices, LLC, its affiliates (“ICE Data”) and/or its Third Party Suppliers and has been licensed for use by Thornburg Investment Management, Inc. ICE Data and its Third Party Suppliers accept no liability in connection with its
use. See www.thornburg.com/indices for a full copy of the Disclaimer.
Thornburg Municipal Funds Semi-Annual Report | 7
Thornburg New Mexico Intermediate
Municipal Fund
Investment Goal and
Fund
Overview
The primary investment
goal of Intermediate New Mexico Fund is to obtain as high a level of current income exempt from federal and New Mexico state individual income taxes as is consistent, in the view of the Fund’s investment advisor, with preservation of capital.
The secondary goal of the Fund is to reduce expected changes in its share price compared to long term bond portfolios.
The Fund is an actively managed, laddered
portfolio of New Mexico and U.S. territory municipal bonds with a dollar weighted average maturity of normally three to ten years. Actively laddering portfolios involves building a portfolio of bonds with different maturities, based on our
assessment of market risks and individual credit opportunities, so that a portion of the portfolio matures each year and cash from maturing bonds may be invested in bonds with longer maturities.
Performance drivers and detractors for
the reporting period ended March 31, 2022
» The Fund’s Class I shares
returned -4.61% versus the ICE BofAML 3-15 Year U.S. Municipal Securities Index’s return of -5.45% during the six-month period ended March 31, 2022. The Fund’s outperformance relative to the index comes during a challenging period for
fixed income as inflation in the U.S. touched the highest level in 40 years, causing yields to spike.
» The Fund’s duration and yield
curve positioning were large detractors from absolute performance during the period as yields spiked significantly. However, the Fund’s relatively shorter duration and underweight to longer maturities allowed it to outperform its index during
the period.
» The Fund’s
sector/quality allocations had a positive impact on performance relative to the index during the period. The Fund’s holdings of education bonds lead to the relative outperformance as the sector held up well during the increase in yields.
Performance Summary
March 31, 2022 (Unaudited)
GROWTH OF A HYPOTHETICAL $10,000 INVESTMENT
| THORNBURG
NEW MEXICO INTERMEDIATE MUNICIPAL FUND |
FINAL
VALUE |
AVERAGE ANNUAL
TOTAL RETURNS
| THORNBURG
NEW MEXICO INTERMEDIATE MUNICIPAL FUND |
1-YR
|
3-YR
|
5-YR
|
10-YR
|
SINCE
INCEPTION |
| Class
A Shares (Incep: 6/18/91) |
|
|
|
|
|
| Without
sales charge |
-4.22%
|
0.38%
|
1.11%
|
1.48%
|
3.79%
|
| With
sales charge |
-6.11%
|
-0.30%
|
0.70%
|
1.28%
|
3.73%
|
| Class
D Shares (Incep: 6/1/99) |
-4.39%
|
0.14%
|
0.85%
|
1.22%
|
2.68%
|
| Class
I Shares (Incep: 2/1/07) |
-3.85%
|
0.71%
|
1.42%
|
1.81%
|
2.83%
|
| ICE
BofAML 3-15 Year U.S. Municipal Securities Index (Since 6/18/91) |
-4.54%
|
1.26%
|
2.20%
|
2.50%
|
-
|
The matters discussed in
this report may constitute forward-looking statements made pursuant to the safe harbor provisions of the Securities Litigation Reform Act of 1995. These include any advisor or portfolio manager prediction, assessment, analysis or outlook for
individual securities, industries, investment styles, market sectors and/or markets. These statements involve risks and uncertainties. In addition to the general risks described for each fund in its current prospectus, other factors bearing on these
reports include the accuracy of the advisor’s or portfolio manager’s forecasts and predictions, the appropriateness of the investment strategies designed by the advisor or portfolio manager and the ability of the advisor or portfolio
manager to implement their strategies efficiently and successfully. Any one or more of these factors, as well as other risks affecting the securities markets generally, could cause the actual results of any fund to differ materially as compared to
its benchmarks.
The views expressed are subject to
change and do not necessarily reflect the views of Thornburg Investment Management, Inc. This information should not be relied upon as a recommendation or investment advice and is not intended to predict the performance of any investment or
market.
Performance results of individual share
classes will vary based on the fees and expenses associated with each share class, and may be higher or lower than other share classes within the same Fund. Please see Performance Summary for performance results of each share class.
Performance data shown represents past performance and
is no guarantee of future results. Investment return and principal value will fluctuate so shares, when redeemed, may be worth more or less than their original cost. Current performance may be lower or higher than quoted. For performance current to
the most recent month end, visit thornburg.com or call 800-847-0200. The performance information does not reflect the deduction of taxes that a shareholder would pay on distributions or the redemption of Fund shares. Returns reflect the reinvestment
of dividends and capital gains. Class A shares are sold with a maximum sales charge of 2.00%. There is no sales charge for Class D and Class I shares. As disclosed in the Fund’s most recent prospectus, the total annual fund operating expenses
before fee waivers and expense reimbursements are as follows: A shares, 0.98%; D shares, 1.29%; I shares, 0.71%. Thornburg Investment Management has contractually agreed to waive fees and reimburse expenses until at least February 1, 2023, for some
of the share classes, resulting in net expense ratios of the following: D shares, 1.24%; I shares, 0.67%. For more detailed information on fund expenses and waivers/reimbursements please see the Fund’s prospectus.
The ICE index data referenced herein is the property of
ICE Data Indices, LLC, its affiliates (“ICE Data”) and/or its Third Party Suppliers and has been licensed for use by Thornburg Investment Management, Inc. ICE Data and its Third Party Suppliers accept no liability in connection with its
use. See www.thornburg.com/indices for a full copy of the Disclaimer.
8 |
Thornburg Municipal Funds Semi-Annual Report
Thornburg New York Intermediate
Municipal Fund
Investment Goal and
Fund
Overview
The primary investment goal
of Intermediate New York Fund is to obtain as high a level of current income exempt from federal, New York State and New York City individual income taxes as is consistent, in the view of the Fund’s investment advisor, with preservation of
capital. The secondary goal of the Fund is to reduce expected changes in its share price compared to long term bond portfolios.
The Fund is an actively managed, laddered
portfolio of New York and US territory municipal bonds with a dollar weighted average maturity of normally three to ten years. Actively laddering portfolios involves building a portfolio of bonds with different maturities, based on our assessment of
market risks and individual credit opportunities, so that a portion of the portfolio matures each year and cash from maturing bonds may be invested in bonds with longer maturities.
Performance drivers and detractors for
the reporting period ended March 31, 2022
» The Fund’s Class I shares
returned -4.32% versus the ICE BofAML 3-15 Year U.S. Municipal Securities Index’s return of -5.45% during the six-month period ended March 31, 2022. The Fund’s outperformance relative to the index comes during a challenging period for
fixed income as inflation in the U.S. touched the highest level in 40 years, causing yields to spike.
» The Fund’s duration and yield
curve positioning were large detractors from absolute performance during the period as yields spiked significantly. However, the Fund’s relatively shorter duration and underweight to longer maturities allowed it to outperform its index during
the period.
» The Fund’s
sector/quality allocations had a positive impact on performance relative to the index during the period. The Fund’s holdings of tax-backed revenue bonds lead to the relative outperformance as the sector held up well during the increase in
yields.
Performance Summary
March 31, 2022 (Unaudited)
GROWTH OF A HYPOTHETICAL $10,000 INVESTMENT
| THORNBURG
NEW YORK INTERMEDIATE MUNICIPAL FUND |
FINAL
VALUE |
AVERAGE ANNUAL
TOTAL RETURNS
| THORNBURG
NEW YORK INTERMEDIATE MUNICIPAL FUND |
1-YR
|
3-YR
|
5-YR
|
10-YR
|
SINCE
INCEPTION |
| Class
A Shares (Incep: 9/5/97) |
|
|
|
|
|
| Without
sales charge |
-4.02%
|
0.30%
|
0.94%
|
1.52%
|
3.23%
|
| With
sales charge |
-5.92%
|
-0.37%
|
0.54%
|
1.31%
|
3.15%
|
| Class
I Shares (Incep: 2/1/10) |
-3.64%
|
0.65%
|
1.28%
|
1.85%
|
2.58%
|
| ICE
BofAML 3-15 Year U.S. Municipal Securities Index (Since 9/5/97) |
-4.54%
|
1.26%
|
2.20%
|
2.50%
|
4.38%
|
The matters discussed in
this report may constitute forward-looking statements made pursuant to the safe harbor provisions of the Securities Litigation Reform Act of 1995. These include any advisor or portfolio manager prediction, assessment, analysis or outlook for
individual securities, industries, investment styles, market sectors and/or markets. These statements involve risks and uncertainties. In addition to the general risks described for each fund in its current prospectus, other factors bearing on these
reports include the accuracy of the advisor’s or portfolio manager’s forecasts and predictions, the appropriateness of the investment strategies designed by the advisor or portfolio manager and the ability of the advisor or portfolio
manager to implement their strategies efficiently and successfully. Any one or more of these factors, as well as other risks affecting the securities markets generally, could cause the actual results of any fund to differ materially as compared to
its benchmarks.
The views expressed are subject to
change and do not necessarily reflect the views of Thornburg Investment Management, Inc. This information should not be relied upon as a recommendation or investment advice and is not intended to predict the performance of any investment or
market.
Performance results of individual share
classes will vary based on the fees and expenses associated with each share class, and may be higher or lower than other share classes within the same Fund. Please see Performance Summary for performance results of each share class.
Performance data shown represents past performance and
is no guarantee of future results. Investment return and principal value will fluctuate so shares, when redeemed, may be worth more or less than their original cost. Current performance may be lower or higher than quoted. For performance current to
the most recent month end, visit thornburg.com or call 800-847-0200. The performance information does not reflect the deduction of taxes that a shareholder would pay on distributions or the redemption of Fund shares. Returns reflect the reinvestment
of dividends and capital gains. Class A shares are sold with a maximum sales charge of 2.00%. There is no sales charge for Class I shares. As disclosed in the Fund’s most recent prospectus, the total annual fund operating expenses before fee
waivers and expense reimbursements are as follows: A shares, 1.14%; I shares, 0.93%; Thornburg Investment Management has contractually agreed to waive fees and reimburse expenses until at least February 1, 2023, for some of the share classes,
resulting in net expense ratios of the following: A shares, 0.99%; I shares, 0.67%. For more detailed information on fund expenses and waivers/reimbursements please see the Fund’s prospectus.
The ICE index data referenced herein is the property of
ICE Data Indices, LLC, its affiliates (“ICE Data”) and/or its Third Party Suppliers and has been licensed for use by Thornburg Investment Management, Inc. ICE Data and its Third Party Suppliers accept no liability in connection with its
use. See www.thornburg.com/indices for a full copy of the Disclaimer.
Thornburg Municipal Funds Semi-Annual Report | 9
Thornburg Intermediate Municipal
Fund
Investment Goal and
Fund
Overview
The primary investment
goal of Intermediate Municipal Fund is to obtain as high a level of current income exempt from federal individual income tax as is consistent, in the view of the Fund’s investment advisor, with preservation of capital. The secondary goal of
the Fund is to reduce expected changes in its share price compared to long-term bond portfolios.
The Fund is an actively managed, laddered
portfolio of municipal bonds with a dollar weighted average maturity of normally three to ten years. Actively laddering portfolios involves building a portfolio of bonds with different maturities, based on our assessment of market risks and
individual credit opportunities, so that a portion of the portfolio matures each year and cash from maturing bonds may be invested in bonds with longer maturities.
Performance drivers and detractors for
the reporting period ended March 31, 2022
» The Fund Class I shares returned
-4.92% versus the ICE BofAML 3-15 Year U.S. Municipal Securities Index’s return of -5.45% during the six-month period ended March 31, 2022. The Fund’s outperformance relative to the index comes during a challenging period for fixed
income as inflation in the U.S. touched the highest level in 40 years, causing yields to spike.
» The Fund’s duration and yield
curve positioning were large detractors from absolute performance during the period as yields spiked significantly. However, the Fund’s relatively shorter duration and underweight to longer maturities allowed it to outperform its index during
the period.
» The Fund’s
security selection had a positive impact on performance relative to the index during the period. The Fund’s holdings of 5% coupon bonds led to the relative outperformance as higher coupon bonds held up better than lower coupon bonds during the
increase in yields.
Performance Summary
March 31, 2022 (Unaudited)
GROWTH OF A HYPOTHETICAL $10,000 INVESTMENT
| THORNBURG
INTERMEDIATE MUNICIPAL FUND |
FINAL
VALUE |
AVERAGE ANNUAL
TOTAL RETURNS
| THORNBURG
INTERMEDIATE MUNICIPAL FUND |
1-YR
|
3-YR
|
5-YR
|
10-YR
|
SINCE
INCEPTION |
| Class
A Shares (Incep: 7/22/91) |
|
|
|
|
|
| Without
sales charge |
-4.23%
|
0.90%
|
1.62%
|
2.00%
|
4.22%
|
| With
sales charge |
-6.12%
|
0.21%
|
1.21%
|
1.79%
|
4.15%
|
| Class
C Shares (Incep: 9/1/94) |
|
|
|
|
|
| Without
sales charge |
-4.58%
|
0.53%
|
1.27%
|
1.65%
|
3.42%
|
| With
sales charge |
-5.14%
|
0.53%
|
1.27%
|
1.65%
|
3.42%
|
| Class
C2 Shares (Incep: 10/1/20) |
|
|
|
|
|
| Without
sales charge |
-4.58%
|
-
|
-
|
-
|
-2.37%
|
| With
sales charge |
-5.19%
|
-
|
-
|
-
|
-2.37%
|
| Class
I Shares (Incep: 7/5/96) |
-3.94%
|
1.14%
|
1.89%
|
2.29%
|
3.93%
|
| ICE
BofAML 3-15 Year U.S. Municipal Securities Index (Since 7/22/91) |
-4.54%
|
1.26%
|
2.20%
|
2.50%
|
-
|
The matters discussed in
this report may constitute forward-looking statements made pursuant to the safe harbor provisions of the Securities Litigation Reform Act of 1995. These include any advisor or portfolio manager prediction, assessment, analysis or outlook for
individual securities, industries, investment styles, market sectors and/or markets. These statements involve risks and uncertainties. In addition to the general risks described for each fund in its current prospectus, other factors bearing on these
reports include the accuracy of the advisor’s or portfolio manager’s forecasts and predictions, the appropriateness of the investment strategies designed by the advisor or portfolio manager and the ability of the advisor or portfolio
manager to implement their strategies efficiently and successfully. Any one or more of these factors, as well as other risks affecting the securities markets generally, could cause the actual results of any fund to differ materially as compared to
its benchmarks.
The views expressed are subject to
change and do not necessarily reflect the views of Thornburg Investment Management, Inc. This information should not be relied upon as a recommendation or investment advice and is not intended to predict the performance of any investment or
market.
Performance results of individual share
classes will vary based on the fees and expenses associated with each share class, and may be higher or lower than other share classes within the same Fund. Please see Performance Summary for performance results of each share class.
Performance data shown represents past performance and
is no guarantee of future results. Investment return and principal value will fluctuate so shares, when redeemed, may be worth more or less than their original cost. Current performance may be lower or higher than quoted. For performance current to
the most recent month end, visit thornburg.com or call 800-847-0200. The performance information does not reflect the deduction of taxes that a shareholder would pay on distributions or the redemption of Fund shares. Returns reflect the reinvestment
of dividends and capital gains. Class A shares are sold with a maximum sales charge of 2.00%. Class C and Class C2 shares include 0.60% and 0.65% CDSC respectively, for the first year only. There is no sales charge for Class I shares. As disclosed
in the Fund’s most recent prospectus, the total annual fund operating expenses before fee waivers and expense reimbursements are as follows: A shares, 0.91%; C shares, 1.30%; C2 shares, 2.62%; I shares, 0.67%. Thornburg Investment Management
has contractually agreed to waive fees and reimburse expenses until at least February 1, 2023, for some of the share classes, resulting in net expense ratios of the following: A shares, 0.77%; C shares, 1.14%; C2 shares, 1.14%; I shares, 0.53%. For
more detailed information on fund expenses and waivers/reimbursements please see the Fund’s prospectus.
The ICE index data referenced herein is the property of
ICE Data Indices, LLC, its affiliates (“ICE Data”) and/or its Third Party Suppliers and has been licensed for use by Thornburg Investment Management, Inc. ICE Data and its Third Party Suppliers accept no liability in connection with its
use. See www.thornburg.com/indices for a full copy of the Disclaimer.
10 |
Thornburg Municipal Funds Semi-Annual Report
Thornburg Strategic Municipal Income
Fund
Investment Goal and
Fund
Overview
The primary goal of
Strategic Municipal Income Fund is to seek a high level of current income exempt from federal individual income tax.
The Fund has a flexible mandate to invest
across a wide range of maturities and credit qualities. The Fund will not invest more than 50% of its portfolio in bonds rated below investment grade and/or unrated bonds at the time of purchase. Also, the portfolio will generally be diversified
among sectors, issuers, credit qualities, geographic regions, and segments of the yield curve.
Performance drivers and detractors for
the reporting period ended March 31, 2022
» The Fund’s Class I shares
returned -5.24% versus the ICE BofAML U.S. Municipal Master Index’s return of -5.39% during the six-month period ended March 31, 2022. The Fund’s outperformance relative to the index comes during a challenging period for fixed income as
inflation in the U.S. touched the highest level in 40 years, causing yields to spike.
» The Fund’s relatively shorter
duration versus the index was the largest contributor to the positive relative performance during the period. The Fund’s duration finished the period at 1.5 years shorter than the index which was very beneficial as yields spiked significantly
across the municipal market.
»
The Fund’s security selection proved a hinderance to relative performance versus the index during the period. The Fund’s larger allocation to A-rated municipal bonds in comparison to its index was a detractor as lower quality bonds held
by the Fund underperformed higher quality bonds.
Performance Summary
March 31, 2022 (Unaudited)
GROWTH OF A HYPOTHETICAL $10,000 INVESTMENT
| THORNBURG
STRATEGIC MUNICIPAL INCOME FUND |
FINAL
VALUE |
AVERAGE ANNUAL
TOTAL RETURNS
| THORNBURG
STRATEGIC MUNICIPAL INCOME FUND |
1-YR
|
3-YR
|
5-YR
|
10-YR
|
SINCE
INCEPTION |
| Class
A Shares (Incep: 4/1/09) |
|
|
|
|
|
| Without
sales charge |
-4.36%
|
0.88%
|
1.73%
|
2.40%
|
4.58%
|
| With
sales charge |
-6.24%
|
0.20%
|
1.33%
|
2.19%
|
4.42%
|
| Class
C Shares (Incep: 4/1/09) |
|
|
|
|
|
| Without
sales charge |
-4.80%
|
0.43%
|
1.27%
|
2.00%
|
4.21%
|
| With
sales charge |
-5.36%
|
0.43%
|
1.27%
|
2.00%
|
4.21%
|
| Class
I Shares (Incep: 4/1/09) |
-4.21%
|
1.10%
|
1.96%
|
2.67%
|
4.86%
|
| ICE
BofAML U.S. Municipal Master Index (Since 4/1/09) |
-4.13%
|
1.71%
|
2.62%
|
3.00%
|
4.20%
|
The matters discussed in
this report may constitute forward-looking statements made pursuant to the safe harbor provisions of the Securities Litigation Reform Act of 1995. These include any advisor or portfolio manager prediction, assessment, analysis or outlook for
individual securities, industries, investment styles, market sectors and/or markets. These statements involve risks and uncertainties. In addition to the general risks described for each fund in its current prospectus, other factors bearing on these
reports include the accuracy of the advisor’s or portfolio manager’s forecasts and predictions, the appropriateness of the investment strategies designed by the advisor or portfolio manager and the ability of the advisor or portfolio
manager to implement their strategies efficiently and successfully. Any one or more of these factors, as well as other risks affecting the securities markets generally, could cause the actual results of any fund to differ materially as compared to
its benchmarks.
The views expressed are subject to
change and do not necessarily reflect the views of Thornburg Investment Management, Inc. This information should not be relied upon as a recommendation or investment advice and is not intended to predict the performance of any investment or
market.
Performance results of individual share
classes will vary based on the fees and expenses associated with each share class, and may be higher or lower than other share classes within the same Fund. Please see Performance Summary for performance results of each share class.
Performance data shown represents past performance and
is no guarantee of future results. Investment return and principal value will fluctuate so shares, when redeemed, may be worth more or less than their original cost. Current performance may be lower or higher than quoted. For performance current to
the most recent month end, visit thornburg.com or call 800-847-0200. The performance information does not reflect the deduction of taxes that a shareholder would pay on distributions or the redemption of Fund shares. Returns reflect the reinvestment
of dividends and capital gains. Class A shares are sold with a maximum sales charge of 2.00%. Class C shares include a 0.60% CDSC for the first year only. There is no sales charge for Class I shares. As disclosed in the Fund’s most recent
prospectus, the total annual fund operating expenses before fee waivers and expense reimbursements are as follows: A shares, 1.26%; C shares, 1.71%; I shares, 0.97%. Thornburg Investment Management has contractually agreed to waive fees and
reimburse expenses until at least February 1, 2023, for some of the share classes, resulting in net expense ratios of the following: A shares, 0.81%; C shares, 1.28%; I shares, 0.59%. For more detailed information on fund expenses and
waivers/reimbursements please see the Fund’s prospectus.
The ICE index data referenced herein is the property of
ICE Data Indices, LLC, its affiliates (“ICE Data”) and/or its Third Party Suppliers and has been licensed for use by Thornburg Investment Management, Inc. ICE Data and its Third Party Suppliers accept no liability in connection with its
use. See www.thornburg.com/indices for a full copy of the Disclaimer.
Thornburg Municipal Funds Semi-Annual Report | 11
Glossary
March 31, 2022 (Unaudited)
The
ICE BofAML 1-3 Year U.S. Municipal Securities Index is a subset of the ICE BofAML U.S. Municipal Securities Index including all securities with a remaining term to final maturity greater than
or equal to 1 year and less than 3 years.
The ICE BofAML 1-10 Year U.S. Municipal Securities Index is a subset of the ICE BofAML U.S. Municipal Securities Index including all securities with a remaining term to final maturity less than 10
years.
The ICE BofAML 3-15 Year U.S. Municipal Securities Index is a subset of the ICE BofAML U.S. Municipal Securities Index including all securities with a remaining term to final maturity greater than or
equal to 3 years and less than 15 years.
The ICE BofAML U.S. Municipal Master Index tracks the performance of the investment-grade U.S. tax-exempt bond market. Qualifying bonds must have at least one year remaining term to maturity, a fixed
coupon schedule, and an investment grade rating (based on average of Moody’s, S&P, and Fitch).
The performance of any index is not indicative of the
performance of any particular investment. Unless otherwise noted, index returns reflect the reinvestment of income dividends and capital gains, if any, but do not reflect fees, brokerage commissions or other expenses of investing. Investors may not
make direct investments into any index.
Duration – A bond’s sensitivity to interest rates. Bonds with longer durations experience greater price volatility than bonds with shorter durations. Effective duration incorporates a
bond’s embedded option features, such as call provisions.
Yield Curve – A line that plots the interest rates, at a set point in time, of bonds having equal credit quality, but differing maturity dates.
Parallel and non-parallel shifts – Relates to the movement of the yield curve. A parallel shift means the yield curve moves up or down the same amount across the entire curve (short and long ends move). A non-parallel
shift means the short end and long end move at different amounts. For example, the short end may move up 10 basis points while the long-end may move up 20 basis points.
12
| Thornburg Municipal Funds Semi-Annual Report
Fund Summary
Thornburg Short Duration Municipal Fund | March 31, 2022 (Unaudited)
LONG-TERM STABILITY OF PRINCIPAL
Net Asset Value History of Class A Shares
| KEY
PORTFOLIO ATTRIBUTES |
|
| Number
of Bonds |
195
|
| Effective
Duration |
1.4
Yrs |
| Average
Maturity |
1.7
Yrs |
30-DAY YIELDS, CLASS A
SHARES (with sales charge)
| Annualized
Distribution Yield |
0.39%
|
| SEC
Yield |
0.52%
|
Without the fee waivers
and expense reimbursements, the Annualized Distribution yield and the SEC yield would have been -0.01% and 0.11%, respectively.
SECURITY CREDIT RATINGS
A bond
credit rating assesses the financial ability of a debt issuer to make timely payments of principal and interest. Ratings of AAA (the highest), AA, A, and BBB are investment-grade quality. Ratings of BB, B, CCC, CC, C and D (the lowest) are
considered below investment grade, speculative grade, or junk bonds.
Unrated pre-refunded and escrowed-to-maturity bonds are
included in the not rated (NR) category.
PORTFOLIO
LADDER
Percent of portfolio maturing
in each year. Cash includes cash equivalents and other.
There is no guarantee that the Fund will meet its
investment objectives.
All data is subject to
change. Charts may not add up to 100% due to rounding.
THORNBURG
SHORT DURATION
MUNICIPAL FUND |
NASDAQ
SYMBOLS |
CUSIPS
|
| Class
A |
TLMAX
|
885-216-788
|
| Class
I |
TLMIX
|
885-216-770
|
Minimum investments for
Class I shares may be higher than those for Class A shares. Class I shares may not be available to all investors.
The laddering strategy does not assure or guarantee
better performance and cannot eliminate the risk of investment losses.
Thornburg Municipal Funds Semi-Annual Report | 13
Fund Summary
Thornburg Limited Term Municipal Fund | March 31, 2022 (Unaudited)
LONG-TERM STABILITY OF PRINCIPAL
Net Asset Value History of Class A Shares
| KEY
PORTFOLIO ATTRIBUTES |
|
| Number
of Bonds |
1,745
|
| Effective
Duration |
3.4
Yrs |
| Average
Maturity |
4.0
Yrs |
30-DAY YIELDS, CLASS A
SHARES (with sales charge)
| Annualized
Distribution Yield |
1.21%
|
| SEC
Yield |
0.96%
|
SECURITY CREDIT RATINGS
A bond
credit rating assesses the financial ability of a debt issuer to make timely payments of principal and interest. Ratings of AAA (the highest), AA, A, and BBB are investment-grade quality. Ratings of BB, B, CCC, CC, C and D (the lowest) are
considered below investment grade, speculative grade, or junk bonds.
Unrated pre-refunded and escrowed-to-maturity bonds are
included in the not rated (NR) category.
PORTFOLIO
LADDER
| 6%
|
14%
|
14%
|
14%
|
9%
|
8%
|
7%
|
6%
|
7%
|
5%
|
9%
|
Percent of portfolio maturing
in each year. Cash includes cash equivalents and other.
There is no guarantee that the Fund will meet its
investment objectives.
All data is subject to
change. Charts may not add up to 100% due to rounding.
THORNBURG
LIMITED TERM
MUNICIPAL FUND |
NASDAQ
SYMBOLS |
CUSIPS
|
| Class
A |
LTMFX
|
885-215-459
|
| Class
C |
LTMCX
|
885-215-442
|
| Class
C2 |
LTMQX
|
885-216-556
|
| Class
I |
LTMIX
|
885-215-434
|
Minimum investments for
Class I shares may be higher than those for other classes. Class I shares may not be available to all investors.
The laddering strategy does not assure or guarantee
better performance and cannot eliminate the risk of investment losses.
14 | Thornburg Municipal Funds Semi-Annual Report
Fund Summary
Thornburg California Limited Term Municipal Fund | March 31, 2022
(Unaudited)
LONG-TERM STABILITY OF PRINCIPAL
Net Asset Value History of Class A Shares
| KEY
PORTFOLIO ATTRIBUTES |
|
| Number
of Bonds |
329
|
| Effective
Duration |
3.1
Yrs |
| Average
Maturity |
3.7
Yrs |
30-DAY YIELDS, CLASS A
SHARES (with sales charge)
| Annualized
Distribution Yield |
1.01%
|
| SEC
Yield |
0.91%
|
Without the fee waivers
and expense reimbursements, the Annualized Distribution yield and the SEC yield would have been 0.81% and 0.71%, respectively.
SECURITY CREDIT RATINGS
A bond
credit rating assesses the financial ability of a debt issuer to make timely payments of principal and interest. Ratings of AAA (the highest), AA, A, and BBB are investment-grade quality. Ratings of BB, B, CCC, CC, C and D (the lowest) are
considered below investment grade, speculative grade, or junk bonds.
Unrated pre-refunded and escrowed-to-maturity bonds are
included in the not rated (NR) category.
PORTFOLIO
LADDER
| 3%
|
17%
|
14%
|
16%
|
10%
|
10%
|
7%
|
6%
|
6%
|
5%
|
7%
|
Percent of portfolio maturing
in each year. Cash includes cash equivalents and other.
There is no guarantee that the Fund will meet its
investment objectives.
All data is subject to
change. Charts may not add up to 100% due to rounding.
THORNBURG
CALIFORNIA LIMITED TERM
MUNICIPAL FUND |
NASDAQ
SYMBOLS |
CUSIPS
|
| Class
A |
LTCAX
|
885-215-426
|
| Class
C |
LTCCX
|
885-215-418
|
| Class
C2 |
LTCQX
|
885-216-515
|
| Class
I |
LTCIX
|
885-215-392
|
Minimum investments for
Class I shares may be higher than those for other classes. Class I shares may not be available to all investors.
The laddering strategy does not assure or guarantee
better performance and cannot eliminate the risk of investment losses.
Thornburg Municipal Funds Semi-Annual Report | 15
Fund Summary
Thornburg New Mexico Intermediate Municipal Fund | March 31, 2022
(Unaudited)
LONG-TERM STABILITY OF PRINCIPAL
Net Asset Value History of Class A Shares
| KEY
PORTFOLIO ATTRIBUTES |
|
| Number
of Bonds |
142
|
| Effective
Duration |
4.6
Yrs |
| Average
Maturity |
7.6
Yrs |
30-DAY YIELDS, CLASS A
SHARES (with sales charge)
| Annualized
Distribution Yield |
1.34%
|
| SEC
Yield |
0.97%
|
Without the fee waivers
and expense reimbursements, the Annualized Distribution yield and the SEC yield would have been 1.33% and 0.95%, respectively.
SECURITY CREDIT RATINGS
A bond
credit rating assesses the financial ability of a debt issuer to make timely payments of principal and interest. Ratings of AAA (the highest), AA, A, and BBB are investment-grade quality. Ratings of BB, B, CCC, CC, C and D (the lowest) are
considered below investment grade, speculative grade, or junk bonds.
Unrated pre-refunded and escrowed-to-maturity bonds are
included in the not rated (NR) category.
PORTFOLIO
LADDER
| 3%
|
4%
|
6%
|
3%
|
8%
|
9%
|
10%
|
7%
|
4%
|
5%
|
39%
|
Percent of portfolio maturing
in each year. Cash includes cash equivalents and other.
There is no guarantee that the Fund will meet its
investment objectives.
All data is subject to
change. Charts may not add up to 100% due to rounding.
THORNBURG
NEW MEXICO INTERMEDIATE
MUNICIPAL FUND |
NASDAQ
SYMBOLS |
CUSIPS
|
| Class
A |
THNMX
|
885-215-301
|
| Class
D |
THNDX
|
885-215-624
|
| Class
I |
THNIX
|
885-215-285
|
Minimum investments for
Class I shares may be higher than those for other classes. Class I shares may not be available to all investors.
The laddering strategy does not assure or guarantee
better performance and cannot eliminate the risk of investment losses.
16 | Thornburg Municipal Funds Semi-Annual Report
Fund Summary
Thornburg New York Intermediate Municipal Fund | March 31, 2022
(Unaudited)
LONG-TERM STABILITY OF PRINCIPAL
Net Asset Value History of Class A Shares
| KEY
PORTFOLIO ATTRIBUTES |
|
| Number
of Bonds |
53
|
| Effective
Duration |
4.6
Yrs |
| Average
Maturity |
8.7
Yrs |
30-DAY YIELDS, CLASS A
SHARES (with sales charge)
| Annualized
Distribution Yield |
1.85%
|
| SEC
Yield |
0.92%
|
Without the fee waivers
and expense reimbursements, the Annualized Distribution yield and the SEC yield would have been 1.66% and 0.73%, respectively.
SECURITY CREDIT RATINGS
A bond
credit rating assesses the financial ability of a debt issuer to make timely payments of principal and interest. Ratings of AAA (the highest), AA, A, and BBB are investment-grade quality. Ratings of BB, B, CCC, CC, C and D (the lowest) are
considered below investment grade, speculative grade, or junk bonds.
Unrated pre-refunded and escrowed-to-maturity bonds are
included in the not rated (NR) category.
PORTFOLIO
LADDER
| 2%
|
4%
|
8%
|
11%
|
1%
|
0%
|
7%
|
4%
|
9%
|
6%
|
47%
|
Percent of portfolio maturing
in each year. Cash includes cash equivalents and other.
There is no guarantee that the Fund will meet its
investment objectives.
All data is subject to
change. Charts may not add up to 100% due to rounding.
THORNBURG
NEW YORK INTERMEDIATE
MUNICIPAL FUND |
NASDAQ
SYMBOLS |
CUSIPS
|
| Class
A |
THNYX
|
885-215-665
|
| Class
I |
TNYIX
|
885-216-705
|
Minimum investments for
Class I shares may be higher than those for Class A shares. Class I shares may not be available to all investors.
The laddering strategy does not assure or guarantee
better performance and cannot eliminate the risk of investment losses.
Thornburg Municipal Funds Semi-Annual Report | 17
Fund Summary
Thornburg Intermediate Municipal Fund | March 31, 2022 (Unaudited)
LONG-TERM STABILITY OF PRINCIPAL
Net Asset Value History of Class A Shares
| KEY
PORTFOLIO ATTRIBUTES |
|
| Number
of Bonds |
460
|
| Effective
Duration |
4.8
Yrs |
| Average
Maturity |
8.3
Yrs |
30-DAY YIELDS, CLASS A
SHARES (with sales charge)
| Annualized
Distribution Yield |
2.14%
|
| SEC
Yield |
1.27%
|
Without the fee waivers
and expense reimbursements, the Annualized Distribution yield and the SEC yield would have been 1.99% and 1.12%, respectively.
SECURITY CREDIT RATINGS
A bond
credit rating assesses the financial ability of a debt issuer to make timely payments of principal and interest. Ratings of AAA (the highest), AA, A, and BBB are investment-grade quality. Ratings of BB, B, CCC, CC, C and D (the lowest) are
considered below investment grade, speculative grade, or junk bonds.
Unrated pre-refunded and escrowed-to-maturity bonds are
included in the not rated (NR) category.
PORTFOLIO
LADDER
| 3%
|
7%
|
7%
|
8%
|
4%
|
2%
|
7%
|
5%
|
4%
|
6%
|
47%
|
Percent of portfolio maturing
in each year. Cash includes cash equivalents and other.
There is no guarantee that the Fund will meet its
investment objectives.
All data is subject to
change. Charts may not add up to 100% due to rounding.
THORNBURG
INTERMEDIATE
MUNICIPAL FUND |
NASDAQ
SYMBOLS |
CUSIPS
|
| Class
A |
THIMX
|
885-215-202
|
| Class
C |
THMCX
|
885-215-780
|
| Class
C2 |
THMQX
|
885-216-374
|
| Class
I |
THMIX
|
885-215-673
|
Minimum investments for
Class I shares may be higher than those for other classes. Class I shares may not be available to all investors.
The laddering strategy does not assure or guarantee
better performance and cannot eliminate the risk of investment losses.
18 | Thornburg Municipal Funds Semi-Annual Report
Fund Summary
Thornburg Strategic Municipal Income Fund | March 31, 2022
(Unaudited)
| KEY
PORTFOLIO ATTRIBUTES |
|
| Number
of Bonds |
293
|
| Effective
Duration |
5.2
Yrs |
| Average
Maturity |
9.1
Yrs |
30-DAY YIELDS, CLASS A
SHARES (with sales charge)
| Annualized
Distribution Yield |
1.88%
|
| SEC
Yield |
1.38%
|
Without the fee waivers
and expense reimbursements, the Annualized Distribution yield and the SEC yield would have been 1.58% and 1.09%, respectively.
SECURITY CREDIT RATINGS
A bond
credit rating assesses the financial ability of a debt issuer to make timely payments of principal and interest. Ratings of AAA (the highest), AA, A, and BBB are investment-grade quality. Ratings of BB, B, CCC, CC, C and D (the lowest) are
considered below investment grade, speculative grade, or junk bonds.
Unrated pre-refunded and escrowed-to-maturity bonds are
included in the not rated (NR) category.
There is
no guarantee that the Fund will meet its investment objectives.
All data is subject to change. Charts may not add up to
100% due to rounding.
THORNBURG
STRATEGIC MUNICIPAL
INCOME FUND |
NASDAQ
SYMBOLS |
CUSIPS
|
| Class
A |
TSSAX
|
885-216-101
|
| Class
C |
TSSCX
|
885-216-200
|
| Class
I |
TSSIX
|
885-216-309
|
Minimum investments for
Class I shares may be higher than those for other classes. Class I shares may not be available to all investors.
Thornburg Municipal Funds Semi-Annual Report | 19
Schedule of Investments
Thornburg Short Duration Municipal Fund | March 31, 2022 (Unaudited)
| |
ISSUER-DESCRIPTION
|
Principal
Amount |
VALUE
|
| |
LONG-TERM
MUNICIPAL BONDS — 90.0% |
|
|
| |
Alabama
— 1.7% |
|
|
| |
Alabama
Community College System ACCS Enhancements Fee Revenue (Insured: AGM), 4.00% due 9/1/2024 - 9/1/2025 |
$ 285,000
|
$ 299,410
|
| |
Alabama
Public School and College Authority, Series A, 5.00% due 11/1/2025 |
1,000,000
|
1,101,211 |
|
a |
Selma
(International Paper Co.) IDB, Series A, 2.00% due 11/1/2033 (put 10/1/2024) |
1,500,000
|
1,473,894
|
| |
Arizona
— 1.1% |
|
|
|
a |
Arizona
HFA, Series B, 0.76% (MUNIPSA + 0.25%) due 1/1/2046 (put 11/4/2026) |
1,000,000
|
997,453 |
|
a |
Maricopa
County (Banner Health Obligated Group) IDA, Series B, 0.89% (MUNIPSA + 0.38%) due 1/1/2035 (put 10/18/2022) |
890,000 |
890,124
|
| |
California
— 1.6% |
|
|
|
a |
California
Infrastructure & Economic Development Bank, Series B-2, 3.00% due 10/1/2047 (put 10/1/2026) |
1,000,000
|
1,036,948 |
| |
California
Municipal Finance Authority (Insured: BAM), 5.00% due 5/15/2024 |
400,000 |
421,446 |
| |
California
Municipal Finance Authority (Insured: BAM) (Green Bond), 5.00% due 5/15/2025 - 5/15/2026 |
650,000 |
703,293 |
| |
Pittsburg
Successor Agency Redevelopment Agency (Insured: AGM), Series A 5.00% due 9/1/2022 |
500,000 |
507,514
|
| |
Colorado
— 3.3% |
|
|
|
a |
Colorado
(AdventHealth Obligated Group) HFA, Series C, 5.00% due 11/15/2036 (put 11/15/2023) |
1,000,000
|
1,047,158 |
| |
Crystal
Valley Metropolitan District No 2 (Insured: AGM) GO, Series A, 5.00% due 12/1/2022 - 12/1/2024 |
365,000 |
385,869 |
|
a |
E-470
Public Highway Authority, Series B, 0.531% (SOFR + 0.35%) due 9/1/2039 (put 9/1/2024) |
2,000,000
|
1,918,248 |
| |
Interlocken
Metropolitan District (Insured: AGM) GO, Series A-1, 5.00% due 12/1/2022 - 12/1/2023 |
1,425,000
|
1,473,782 |
| |
Sierra
Ridge Metropolitan District No 2 (Insured: AGM) GO, 4.00% due 12/1/2025 - 12/1/2026 |
575,000 |
610,649
|
| |
Connecticut
— 0.9% |
|
|
| |
State
of Connecticut GO, Series C, 5.00% due 6/15/2022 |
715,000 |
720,888 |
| |
State
of Connecticut Special Tax Revenue, Series C, 5.00% due 10/1/2022 |
680,000 |
692,966
|
| |
District
of Columbia — 0.5% |
|
|
| |
District
of Columbia (Federal Highway Grant Anticipation), 5.00% due 12/1/2025 |
685,000 |
757,307
|
| |
Florida
— 0.6% |
|
|
|
a |
Escambia
County (International Paper Co.), 2.00% due 11/1/2033 (put 10/1/2024) |
775,000 |
769,370 |
| |
State
of Florida (Department of Transportation Right-of-Way Acquisition & Bridge Construction) GO, Series B, 5.00% due 7/1/2023 |
255,000 |
265,301
|
| |
Georgia
— 3.7% |
|
|
| |
Main
Street Natural Gas Inc. (Guaranty: Macquarie Group Ltd.), Series A, 5.00% due 5/15/2022 |
1,000,000
|
1,004,156 |
| |
Main
Street Natural Gas Inc. (Guaranty: Royal Bank of Canada), Series A, 4.00% due 9/1/2026 |
400,000 |
421,790 |
|
a |
Main
Street Natural Gas, Inc. (Guaranty: Citigroup Global Markets), Series C, 4.00% due 3/1/2050 (put 9/1/2026) |
1,250,000
|
1,299,584 |
| |
Municipal
Electric Authority of Georgia, |
|
|
| |
Series
A 5.00% due 1/1/2026 |
790,000 |
862,613 |
| |
Series
A, 5.00% due 1/1/2024 |
1,430,000
|
1,499,262 |
|
a |
Private
Colleges & Universities Authority (Emory University), Series B, 0.93% (MUNIPSA + 0.42%) due 10/1/2039 (put 8/16/2022) |
1,000,000
|
998,612
|
| |
Illinois
— 4.4% |
|
|
| |
City
of Chicago (Water System), Series 2017-2, 5.00% due 11/1/2022 |
600,000 |
613,874 |
| |
Cook
County Community College District No. 508 (City Colleges of Chicago) GO, 5.00% due 12/1/2023 |
500,000 |
521,368 |
| |
Cook
County Community High School District No 233 Homewood-Flossmoor GO, 4.00% due 12/1/2025 |
1,000,000
|
1,061,106 |
| |
Cook
County School District No. 170 Chicago Heights (Insured: AGM) GO, Series D, 5.00% due 12/1/2022 |
1,500,000
|
1,534,731 |
| |
Illinois
Finance Authority, 4.00% due 10/15/2022 - 10/15/2024 |
585,000 |
593,990 |
| |
State
of Illinois (State Facilities Improvements) GO, |
|
|
| |
Series
A, 5.00% due 10/1/2022 |
1,000,000
|
1,017,034 |
| |
Series
D, 5.00% due 11/1/2024 |
1,000,000
|
1,064,975 |
| |
Village
of Tinley Park GO, 5.00% due 12/1/2024 |
870,000 |
911,924
|
| |
Indiana
— 1.7% |
|
|
| |
Carmel
Local Public Improvement Bond Bank, Series A, 4.00% due 7/15/2024 - 7/15/2025 |
940,000 |
985,980 |
| |
Columbus
Multi School Building Corp., 4.00% due 1/15/2024 - 1/15/2025 |
1,730,000
|
1,800,896
|
| |
Kentucky
— 2.8% |
|
|
| |
County
of Trimble (Louisville Gas and Electric Co.), Series A, 0.625% due 9/1/2026 |
1,000,000
|
929,835 |
| |
Kentucky
Public Energy Authority (Guaranty: Morgan Stanley Group), |
|
|
|
a |
Series
A, 4.00% due 4/1/2048 (put 4/1/2024) |
1,000,000
|
1,032,319 |
| |
Series
A1, 4.00% due 2/1/2023 - 8/1/2024 |
2,675,000
|
2,753,352
|
| |
Louisiana
— 4.3% |
|
|
| |
City
of Shreveport Water & Sewer Revenue (Insured: BAM), Series C, 5.00% due 12/1/2023 |
860,000 |
900,854 |
| |
Louisiana
Office Facilities Corp. (Louisiana Division of Administration), 5.00% due 11/1/2022 |
1,455,000
|
1,486,611 |
|
a |
Louisiana
Offshore Terminal Authority (Loop LLC), 1.65% due 9/1/2027 (put 12/1/2023) |
1,500,000
|
1,491,644 |
|
a |
Louisiana
Public Facilities Authority (Ochsner Clinic Foundation Obligated Group), Series B, 5.00% due 5/15/2050 (put 5/15/2025) |
875,000 |
943,782 |
|
a |
Parish
of St. Charles (Valero Energy Corp. Refinery; Guaranty: Valero Energy Corp.), 4.00% due 12/1/2040 (put 6/1/2022) |
1,300,000
|
1,304,444 |
| a |
State
of Louisiana Gasoline & Fuels Tax Revenue, Series A 0.689% (SOFR + 0.50%) due 5/1/2043 (put 5/1/2026) |
1,000,000
|
999,684 |
20 | Thornburg Municipal Funds Semi-Annual Report
|
See notes to
financial statements. |
Schedule of Investments,
Continued
Thornburg Short Duration Municipal Fund | March 31, 2022 (Unaudited)
| |
ISSUER-DESCRIPTION
|
Principal
Amount |
VALUE
|
| |
Maryland
— 1.3% |
|
|
| |
County
of Washington (Diakon Lutheran Social Ministries Obligated Group), Series B, 5.00% due 1/1/2023 |
$ 300,000
|
$ 306,925
|
| |
Maryland
Health & Higher Educational Facilities Authority (UPMC Obligated Group), Series B, 5.00% due 4/15/2022 - 4/15/2024 |
1,200,000
|
1,231,279 |
| |
Maryland
Stadium Authority Built to Learn Revenue, 5.00% due 6/1/2023 |
600,000 |
621,655
|
| |
Massachusetts
— 4.9% |
|
|
| |
City
of Haverhill (State Aid Withholding) GO, 1.00% due 9/1/2022 |
1,857,000
|
1,856,226 |
| |
City
of Methuen (Bans) (State Aid Withholding) GO, 1.00% due 9/1/2022 |
866,000 |
865,851 |
|
a |
Commonwealth
of Massachusetts GO, Series A, 5.00% due 6/1/2044 (put 6/1/2023) |
1,000,000
|
1,037,337 |
|
a,b |
Massachusetts
(Mass General Brigham, Inc.) DFA, 1.11% (MUNIPSA + 0.60%) due 7/1/2049 (put 1/29/2026) |
2,500,000
|
2,470,320 |
|
a |
Massachusetts
(President & Trustees of Williams College) DFA, Series N, 0.45% due 7/1/2041 (put 7/1/2025) |
1,500,000
|
1,426,216 |
| |
University
of Massachusetts Building Authority (University of Massachusetts), Series 2021-1, 5.00% due 11/1/2024 |
500,000 |
538,530
|
| |
Michigan
— 0.5% |
|
|
| |
Detroit
Downtown Development Authority (Catalyst Development Project; Insured: AGM), Series A, 5.00% due 7/1/2022 |
300,000 |
302,715 |
|
a |
Michigan
State Hospital Finance Authority (Ascension Health Credit Group), Series F-5-REM 2.40% due 11/15/2047 (put 3/15/2023) |
500,000 |
502,411
|
| |
Minnesota
— 1.1% |
|
|
|
a |
Minnesota
Housing Finance Agency (Residential Single Family Development; Collateralized: GNMA, FNMA, FHLMC), Series H, 1.06% (MUNIPSA + 0.55%) due 7/1/2041 (put 12/12/2023) |
1,000,000
|
1,006,796 |
| |
Minnesota
Municipal Gas Agency, Series A, 4.00% due 6/1/2025 |
700,000 |
732,481
|
| |
Mississippi
— 1.1% |
|
|
| |
Biloxi
Public School District (Insured: BAM), 5.00% due 4/1/2025 |
1,350,000
|
1,457,950 |
| |
Mississippi
Development Bank (Jackson Public School District; Insured: BAM), 5.00% due 10/1/2022 |
375,000 |
382,422
|
| |
Nebraska
— 1.6% |
|
|
|
a |
Central
Plains Energy Project (Guaranty: Goldman Sachs Group, Inc.), 5.00% due 3/1/2050 (put 1/1/2024) |
1,000,000
|
1,040,041 |
|
a |
Nebraska
Public Power District, 0.60% due 1/1/2051 (put 7/1/2023) |
1,720,000
|
1,694,109
|
| |
Nevada
— 1.8% |
|
|
|
a,c |
County
of Clark (Nevada Power Co.), 1.65% due 1/1/2036 (put 3/31/2023) |
500,000 |
498,721 |
| |
County
of Washoe GO, 5.00% due 7/1/2024 |
1,470,000
|
1,570,522 |
| |
Las
Vegas Valley Water District GO, Series B, 5.00% due 6/1/2023 |
900,000 |
933,976
|
| |
New
Jersey — 3.5% |
|
|
| |
City
of Newark GO, Series E, 1.25% due 10/3/2022 |
2,000,000
|
1,999,662 |
| |
New
Jersey (Middlesex Water Co) EDA, Series A, 5.00% due 10/1/2023 |
1,500,000
|
1,567,015 |
| |
New
Jersey (State of New Jersey Department of the Treasury) EDA, Series XX 5.00% due 6/15/2024 |
400,000 |
423,027 |
| |
New
Jersey EDA, Series QQQ, 5.00% due 6/15/2022 - 6/15/2024 |
205,000 |
211,523 |
| |
State
of New Jersey (COVID-19 GO Emergency Bonds) GO, |
|
|
| |
Series
A, |
|
|
| |
4.00%
due 6/1/2023 |
1,000,000
|
1,022,830 |
| |
5.00%
due 6/1/2024 |
500,000 |
529,673
|
| |
New
Mexico — 7.1% |
|
|
| |
City
of Albuquerque GO, Series A, 5.00% due 7/1/2022 |
300,000 |
302,924 |
| |
City
of Farmington (Public Service Co. of New Mexico), |
|
|
|
a |
Series
A, 0.875% due 6/1/2040 (put 10/1/2026) |
1,000,000
|
920,001 |
|
a |
Series
B, 2.125% due 6/1/2040 (put 6/1/2022) |
1,225,000
|
1,226,041 |
|
a |
Series
C, 1.15% due 6/1/2040 (put 6/1/2024) |
1,500,000
|
1,456,995 |
| |
Lea
County Public School District No 8 Eunice (State Aid Withholding) GO, 5.00% due 9/15/2022 |
2,500,000
|
2,542,450 |
|
a |
New
Mexico Mortgage Finance Authority (JLG Central 217 LLLP), 0.53% due 11/1/2024 (put 5/1/2024) |
2,000,000
|
1,938,902 |
| |
New
Mexico Municipal Energy Acquisition Authority, Series A, 4.00% due 5/1/2022 - 11/1/2022 |
1,375,000
|
1,385,865 |
| |
Santa
Fe Public School District GO, 4.00% due 8/1/2024 |
1,250,000
|
1,304,245 |
| |
State
of New Mexico Severance Tax Permanent Fund, |
|
|
| |
Series
A, 5.00% due 7/1/2023 |
240,000 |
249,608 |
| |
Series
B, 4.00% due 7/1/2023 |
240,000 |
246,673 |
| |
University
of New Mexico, Series A, 5.00% due 6/1/2023 |
280,000 |
290,381
|
| |
New
York — 7.6% |
|
|
| |
City
of New York GO, Series C, 5.00% due 8/1/2024 |
775,000 |
826,922 |
| |
County
of Suffolk (Insured: AGM) GO, |
|
|
| |
Series
A, |
|
|
| |
2.125%
due 5/1/2024 |
250,000 |
248,124 |
| |
5.00%
due 2/1/2025 |
750,000 |
806,465 |
| |
County
of Suffolk (Insured: BAM) GO, Series D, 5.00% due 10/15/2025 |
750,000 |
817,898 |
| |
Metropolitan
Transportation Authority (Transit and Commuter System), Series B-1, 5.00% due 5/15/2022 |
1,500,000
|
1,505,352 |
|
a |
Nassau
County Local Economic Assistance Corp. (Park Lake Hempstead L.P.), 0.30% due 11/1/2024 (put 11/1/2023) |
2,000,000
|
1,948,438 |
| |
New
York City Transitional Finance Authority Future Tax Secured Revenue, Series D, 5.00% due 11/1/2025 |
1,000,000
|
1,097,021
|
See
notes to financial statements.
|
Thornburg Municipal
Funds Semi-Annual Report | 21 |
Schedule of Investments, Continued
Thornburg Short Duration Municipal Fund | March 31, 2022 (Unaudited)
| |
ISSUER-DESCRIPTION
|
Principal
Amount |
VALUE
|
| |
New
York State Dormitory Authority (Barnard College), Series A, 4.00% due 7/1/2024 - 7/1/2025 |
$ 350,000
|
$ 366,604
|
| |
New
York State Dormitory Authority (School District Bond Financing Program) (State Aid Withholding), Series F, 5.00% due 10/1/2022 |
800,000 |
815,473 |
|
a |
New
York State Energy Research & Development Authority (New York State Electric & Gas Corp.), Series C, 2.625% due 4/1/2034 (put 7/3/2023) |
1,000,000
|
1,005,654 |
| |
New
York State Housing Finance Agency (Green Bond), Series I, 2.70% due 11/1/2023 |
1,000,000
|
1,010,086 |
| |
Oneida
County Local Development Corp. (Utica College), 5.00% due 7/1/2022 - 7/1/2024 |
825,000 |
848,384 |
| |
Town
of Oyster Bay GO, 4.00% due 3/1/2023 |
850,000 |
867,362 |
| |
Westchester
County Local Development Corp. (Miriam Osborn Memorial Home Assoc.), 5.00% due 7/1/2023 |
425,000 |
439,656
|
| |
North
Dakota — 1.8% |
|
|
| |
County
of McKenzie, 5.00% due 8/1/2022 |
1,000,000
|
1,012,716 |
|
a |
North
Dakota Housing Finance Agency, Series B, 0.71% (MUNIPSA + 0.20%) due 1/1/2043 (put 7/1/2024) |
2,000,000
|
1,998,118
|
| |
Ohio
— 2.9% |
|
|
| |
County
of Scioto (Southern Ohio Medical Center), 5.00% due 2/15/2023 |
2,020,000
|
2,076,683 |
|
a |
Lancaster
Port Authority, 5.00% due 8/1/2049 (put 2/1/2025) |
1,500,000
|
1,591,139 |
| |
State
of Ohio (Cleveland Clinic Health System Obligated Group), Series A, 5.00% due 1/1/2026 |
1,000,000
|
1,102,742
|
| |
Oklahoma
— 0.1% |
|
|
| |
Muskogee
Industrial Trust (Muskogee County ISD No. 20), 5.00% due 9/1/2023 |
200,000 |
208,117
|
| |
Pennsylvania
— 3.9% |
|
|
|
a |
Bethlehem
Area School District Authority (State Aid Withholding), Series B, 0.538% (SOFR + 0.35%) due 7/1/2031 (put 11/1/2025) |
2,000,000
|
1,929,250 |
| |
City
of Lancaster PA (Insured: AGM) GO, Series A, 4.00% due 11/1/2022 |
385,000 |
390,982 |
|
a |
Pennsylvania
(Waste Management Obligated Group; Guaranty: Waste Management, Inc.) EDFA, 0.95% due 12/1/2033 (put 12/1/2026) |
1,000,000
|
938,649 |
| |
Philadelphia
Authority for Industrial Development, 5.00% due 5/1/2022 |
400,000 |
401,136 |
| |
Philadelphia
Gas Works Co. (Insured: AGM), |
|
|
| |
Series
A, 5.00% due 8/1/2024 |
400,000 |
426,056 |
| |
Series
B, 5.00% due 8/1/2024 |
500,000 |
532,570 |
| |
Sports
& Exhibition Authority of Pittsburgh and Allegheny County (Allegheny County Hotel Room Excise Tax Revenue; Insured AGM), Series A 4.00% due 2/1/2024 |
1,800,000
|
1,859,915
|
| |
Rhode
Island — 0.6% |
|
|
| |
City
of Cranston RI GO, Series 1, 1.00% due 8/23/2022 |
1,000,000
|
999,798
|
| |
South
Carolina — 0.4% |
|
|
| |
City
of North Charleston (North Charleston Noisette Community Redevelopment Project Area), 5.00% due 10/1/2022 |
700,000 |
712,699
|
| |
South
Dakota — 0.4% |
|
|
| |
South
Dakota Health & Educational Facilities Authority (Monument Health Obligated Group), Series A, 5.00% due 9/1/2023 - 9/1/2024 |
685,000 |
723,182
|
| |
Tennessee
— 0.8% |
|
|
| |
Tennessee
Energy Acquisition Corp. (The Gas Project; Guaranty: Goldman Sachs Group, Inc.), Series C, 5.00% due 2/1/2023 |
1,310,000
|
1,347,335
|
| |
Texas
— 15.4% |
|
|
|
d |
Arlington
Higher Education Finance Corp (Riverwalk Education Foundation, Inc.) (Insured: PSF-GTD), 5.00% due 8/15/2026 |
365,000 |
404,808 |
| |
City
of Conroe GO, 5.00% due 3/1/2023 - 3/1/2024 |
355,000 |
372,351 |
| |
City
of Houston Airport System Revenue, Series B, 5.00% due 7/1/2022 - 7/1/2023 |
780,000 |
791,388 |
| |
City
of Lubbock Electric Light & Power System Revenue, 5.00% due 4/15/2025 |
725,000 |
783,911 |
| |
Clifton
Higher Education Finance Corp. (Idea Public Schools) (Insured: PSF-GTD), |
|
|
| |
5.00%
due 8/15/2025 |
460,000 |
502,069 |
| |
Series
T 5.00% due 8/15/2026 |
400,000 |
445,368 |
|
a |
Cypress-Fairbanks
(Insured: PSF-GTD) ISD GO, Series B-1, 1.25% due 2/15/2036 (put 8/15/2022) |
925,000 |
925,678 |
| |
Dallas
County Utility & Reclamation District GO, 5.00% due 2/15/2026 |
1,000,000
|
1,095,939 |
| |
Dallas
Fort Worth International Airport, 5.00% due 11/1/2023 |
1,000,000
|
1,045,675 |
|
a |
Deer
Park ISD (Insured: PSF-GTD) GO, 0.16% due 10/1/2042 (put 10/3/2022) |
1,500,000
|
1,493,506 |
|
a |
Denton
(Insured: PSF-GTD) ISD GO, Series B-REM 2.00% due 8/1/2044 (pre-refunded 8/1/2024) |
135,000 |
134,193 |
|
a |
Goose
Creek (Insured: PSF-GTD) ISD GO, Series B, 0.15% due 10/1/2049 (put 10/3/2022) |
1,500,000
|
1,492,771 |
| |
Highland
Park (Insured: PSF-GTD) ISD GO, 5.00% due 2/15/2024 |
1,015,000
|
1,074,931 |
| |
Houston
(Insured: PSF-GTD) ISD GO, |
|
|
|
a |
Series
A-2, 2.25% due 6/1/2039 (put 6/1/2022) |
260,000 |
260,358 |
|
a |
Series
B, 3.00% due 6/1/2036 (put 6/1/2024) |
1,500,000
|
1,531,864 |
|
c |
Little
Elm (Insured: PSF-GTD) ISD GO, 5.00% due 8/15/2022 |
1,300,000
|
1,320,576 |
| |
Lower
Colorado River Authority, 5.00% due 5/15/2024 |
725,000 |
772,319 |
|
a |
New
Caney (Insured: PSF-GTD) ISD GO, 1.25% due 2/15/2050 (put 8/15/2024) |
1,000,000
|
984,451 |
|
a |
North
East (Insured: PSF-GTD) ISD GO, 2.375% due 8/1/2047 (put 8/1/2022) |
285,000 |
286,292 |
| |
Odessa
Junior College District (Insured: AGM), 4.00% due 7/1/2025 |
400,000 |
423,812 |
| |
Olmos
Park Higher Education Facilities Corp. (University of the Incarnate Word) ETM, 5.00% due 12/1/2022 |
1,000,000
|
1,024,437 |
|
a |
Pflugerville
(Insured: PSF-GTD) ISD GO, Series A, 2.25% due 8/15/2037 (put 8/15/2022) |
1,200,000
|
1,205,074 |
| |
Port
Arthur ISD (Insured: AGM) GO, 5.00% due 2/15/2023 - 2/15/2024 |
925,000 |
969,590 |
| a |
Prosper
(Insured: PSF-GTD) ISD GO, Series B, 2.00% due 2/15/2050 (put 8/15/2023) |
750,000
|
752,982 |
22 | Thornburg Municipal Funds Semi-Annual Report
|
See notes to
financial statements. |
Schedule of Investments,
Continued
Thornburg Short Duration Municipal Fund | March 31, 2022 (Unaudited)
| |
ISSUER-DESCRIPTION
|
Principal
Amount |
VALUE
|
|
a |
San
Antonio Housing Trust Finance Corp. (Arbors at West Avenue L.P.), 1.45% due 3/1/2026 (put 3/1/2025) |
$2,000,000
|
$ 1,954,254
|
|
a |
San
Antonio Water System, Series B, 2.00% due 5/1/2044 (put 11/1/2022) |
405,000 |
406,864 |
| |
Stephen
F Austin State University, 5.00% due 10/15/2024 |
1,445,000
|
1,546,763 |
| |
Texas
Municipal Gas Acquisition & Supply Corp. III (Guaranty: Macquarie Group Ltd.), 5.00% due 12/15/2022 - 12/15/2024 |
1,610,000
|
1,670,459
|
| |
Utah
— 0.3% |
|
|
|
a |
County
of Utah (IHC Health Services, Inc. Obligated Group), Series B-1, 5.00% due 5/15/2056 (put 8/1/2022) |
500,000 |
501,475
|
| |
Virginia
— 1.9% |
|
|
|
a,d |
Halifax
County IDA, 1.65% due 12/1/2041 (put 5/31/2024) |
1,000,000
|
986,803 |
| |
Virginia
Small Business Financing Authority (National Senior Campuses, Inc. Obligated Group), Series A, 5.00% due 1/1/2023 - 1/1/2024 |
700,000 |
723,224 |
|
a |
Wise
County IDA, Series A, 1.20% due 11/1/2040 (put 5/31/2024) |
1,500,000
|
1,463,412
|
| |
Washington
— 1.4% |
|
|
| |
King
County Housing Authority, 2.00% due 6/1/2022 - 6/1/2023 |
1,430,000
|
1,434,152 |
| |
State
of Washington GO, Series 2021A, 5.00% due 6/1/2024 |
500,000 |
532,698 |
| |
University
of Washington, 5.00% due 4/1/2023 |
300,000 |
310,229
|
| |
West
Virginia — 1.5% |
|
|
| |
County
of Mason (Appalachian Power Co.), Series L, 2.75% due 10/1/2022 |
1,000,000
|
1,005,819 |
|
a |
West
Virginia (Appalachian Power Co.) EDA, Series A, 2.625% due 12/1/2042 (put 6/1/2022) |
1,425,000
|
1,427,645
|
| |
Wisconsin
— 1.5% |
|
|
| |
Public
Finance Authority, 4.00% due 10/1/2025 - 1/1/2027 |
1,460,000
|
1,525,999 |
| a |
Wisconsin
Housing & EDA, Series B, 0.40% due 5/1/2045 (put 11/1/2023) |
1,000,000
|
976,419
|
| |
Total
Long-Term Municipal Bonds — 90.0% (Cost $151,968,697) |
|
149,616,633
|
| |
Short-Term
Municipal Bonds — 9.8% |
|
|
| |
Alabama
— 2.3% |
|
|
|
a |
City
of Mobile Alabama (Alabama Power Co.) IDB, 0.38% due 6/1/2034 (put 4/1/2022) |
3,800,000
|
3,800,000
|
| |
Colorado
— 0.6% |
|
|
|
a |
City
& County of Denver (SPA JPMorgan Chase Bank, N.A.) COP, Series A1 0.35% due 12/1/2029 (put 4/1/2022) |
1,100,000
|
1,100,000
|
| |
Florida
— 2.3% |
|
|
| |
City
of Gainesville FL Utilities System Revenue (SPA Barclays Bank PLC), |
|
|
|
a |
Series
A-REMK 5/20/2020 0.36% due 10/1/2026 (put 4/1/2022) |
1,700,000
|
1,700,000 |
|
a |
Series
B-REMK 05/20/ 0.35% due 10/1/2042 (put 4/1/2022) |
2,100,000
|
2,100,000
|
| |
Nevada
— 0.8% |
|
|
|
a,b |
Tender
Option Bond Trust Receipts/Certificates (Guaranty: Deutsche Bank A.G.), Series 2021-XF1120, 0.76% due 11/1/2061 (put 4/7/2022) |
1,330,000
|
1,330,000
|
| |
New
York — 0.7% |
|
|
|
a |
New
York City Municipal Water Finance Authority (New York City Water & Sewer System; SPA Mizuho Bank Ltd.), Series A2, 0.36% due 6/15/2044 (put 4/1/2022) |
625,000 |
625,000 |
|
a |
New
York State Dormitory Authority (Cornell University; SPA U.S. Bank N.A.), Series B, 0.37% due 7/1/2039 (put 4/1/2022) |
500,000 |
500,000
|
| |
Ohio
— 0.9% |
|
|
|
a |
Ohio
Higher Educational Facility Commission (Cleveland Clinic Health System Obligated Group; SPA U.S. Bank N.A.), Series B3, 0.38% due 1/1/2039 (put 4/1/2022) |
1,500,000
|
1,500,000
|
| |
Oregon
— 1.0% |
|
|
|
a,b |
Tender
Option Bond Trust Receipts (Guaranty: Deutsche Bank A.G.), Series 2021-XF1123 0.76% due 10/1/2061 (put 4/7/2022) |
1,670,000
|
1,670,000
|
| |
Texas
— 1.2% |
|
|
| a,b |
Tender
Option Bond Trust Receipts/Certificates (LOC Deutsche Bank A.G.), Series 2021-XF1102, 0.76% due 7/1/2061 (put 4/7/2022) |
2,000,000
|
2,000,000
|
| |
Total
Short-Term Municipal Bonds — 9.8% (Cost $16,325,000) |
|
16,325,000
|
| |
Total
Investments — 99.8% (Cost $168,293,697) |
|
$165,941,633
|
| |
Other
Assets Less Liabilities — 0.2% |
|
365,044
|
| |
Net
Assets — 100.0% |
|
$166,306,677
|
See
notes to financial statements.
|
Thornburg Municipal
Funds Semi-Annual Report | 23 |
Schedule of Investments, Continued
Thornburg Short Duration Municipal Fund | March 31, 2022 (Unaudited)
| Footnote Legend
|
| a
|
Variable,
floating, step, or fixed to floating rate securities are securities for which interest rate changes are based on changes in a designated base rate or on a predetermined schedule. The rates shown are those in effect on March 31, 2022. |
| b
|
Securities
exempt from registration under Rule 144A of the Securities Act of 1933, as amended. These securities are restricted but liquid and may only be resold in the ordinary course of business in transactions exempt from registration, normally to qualified
institutional buyers. As of March 31, 2022, the aggregate value of these securities in the Fund’s portfolio was $7,470,320, representing 4.49% of the Fund’s net assets. |
| c
|
Segregated
as collateral for a when-issued security. |
| d
|
When-issued
security. |
Portfolio Abbreviations
To simplify the listings of securities, abbreviations are used per the table below:
| AGM
|
Insured by Assured
Guaranty Municipal Corp. |
| BAM
|
Insured by
Build America Mutual Insurance Co. |
| COP
|
Certificates
of Participation |
| DFA
|
Development
Finance Authority/Agency |
| EDA
|
Economic
Development Authority |
| EDFA
|
Economic
Development Financing Authority |
| ETM
|
Escrowed
to Maturity |
| FHLMC
|
Collateralized
by Federal Home Loan Mortgage Corp. |
| FNMA
|
Collateralized
by Federal National Mortgage Association |
| GNMA
|
Collateralized
by Government National Mortgage Association |
| GO
|
General Obligation
|
| HFA
|
Health Facilities
Authority |
| IDA
|
Industrial
Development Authority/Agency |
| IDB
|
Industrial
Development Board |
| ISD
|
Independent
School District |
| LOC
|
Letter
of Credit |
| MUNIPSA
|
Securities
Industry and Financial Markets Association (SIFMA) Municipal Swap Index |
| PSF-GTD
|
Guaranteed
by Permanent School Fund |
| REMK
|
Remarketing
Agreement |
| SOFR
|
Secured Overnight
Financing Rate |
| SPA
|
Stand-by
Purchase Agreement |
24 | Thornburg Municipal Funds Semi-Annual Report
|
See notes to
financial statements. |
Schedule of Investments
Thornburg Limited Term Municipal Fund | March 31, 2022 (Unaudited)
| |
ISSUER-DESCRIPTION
|
Principal
Amount |
VALUE
|
| |
LONG-TERM
MUNICIPAL BONDS — 93.3% |
|
|
| |
Alabama
— 1.8% |
|
|
| |
Alabama
Community College System ACCS Enhancements Fee Revenue (Insured: AGM), 4.00% due 9/1/2027 - 9/1/2030 |
$ 1,345,000
|
$ 1,469,980
|
| |
Alabama
Public School & College Authority, Series A, 5.00% due 11/1/2028 - 11/1/2031 |
9,000,000 |
10,691,631 |
| |
Alabama
Public School & College Authority (Education System Capital Improvements), |
|
|
| |
Series
A, 5.00% due 6/1/2022 |
5,605,000 |
5,640,922 |
| |
Series
B, 5.00% due 6/1/2023 |
735,000 |
762,796 |
| |
Alabama
State Board of Education (Calhoun Community College), 4.00% due 5/1/2022 |
1,230,000 |
1,232,568 |
|
a |
Black
Belt Energy Gas District (Guaranty: Goldman Sachs Group, Inc.), Series B, 4.00% due 10/1/2052 (put 12/1/2026) |
16,865,000
|
17,595,288 |
|
a |
Black
Belt Energy Gas District (Guaranty: Royal Bank Of Canada), 4.00% due 6/1/2051 (put 12/1/2031) |
23,000,000
|
24,812,745 |
| |
Chatom
(Powersouth Energy Co-operative Projects; Insured: AGM) IDB, 5.00% due 8/1/2025 - 8/1/2030 |
3,830,000 |
4,366,345 |
| |
Lower
Alabama Gas District (Guaranty: Goldman Sachs Group, Inc.), |
|
|
| |
4.00%
due 12/1/2023 - 12/1/2025 |
1,220,000 |
1,259,254 |
| |
Series
A, 5.00% due 9/1/2029 |
3,625,000 |
4,037,790 |
|
a,b |
Selma
(International Paper Co.) IDB, Series A, 2.00% due 11/1/2033 (put 10/1/2024) |
2,500,000 |
2,456,490 |
| |
Southeast
Energy Authority A Cooperative District (Guaranty: Goldman Sachs Group, Inc.), Series A, 4.00% due 10/1/2025 |
1,100,000 |
1,144,592 |
|
a |
Southeast
Energy Authority A Cooperative District (Guaranty: Morgan Stanley Group), 4.00% due 12/1/2051 (put 12/1/2031) |
1,800,000 |
1,936,206 |
| |
UAB
Medicine Finance Authority (University Hospital), Series B, 5.00% due 9/1/2025 - 9/1/2027 |
8,915,000 |
10,077,218 |
| |
Water
Works Board of the City of Birmingham, 5.00% due 1/1/2029 |
2,230,000 |
2,574,961
|
| |
Arizona
— 2.2% |
|
|
| |
Arizona
(Scottsdale Lincoln Hospitals) HFA, 5.00% due 12/1/2022 - 12/1/2024 |
3,360,000 |
3,512,775 |
| |
Arizona
Board of Regents (Arizona State University), Series C, 5.00% due 7/1/2028 - 7/1/2031 |
3,125,000 |
3,745,031 |
| |
Arizona
Board of Regents (Arizona State University) COP, Series A, 5.00% due 9/1/2022 - 9/1/2023 |
9,960,000 |
10,271,649 |
| |
Arizona
Board of Regents (Northern Arizona University Projects) COP, 5.00% due 9/1/2022 - 9/1/2023 |
5,825,000 |
5,910,897 |
| |
Arizona
Board of Regents (University of Arizona), 5.00% due 8/1/2023 - 8/1/2024 |
1,350,000 |
1,419,623 |
| |
Arizona
Board of Regents (University of Arizona) COP, Series C, 5.00% due 6/1/2022 - 6/1/2028 |
7,770,000 |
7,930,764 |
|
a |
Arizona
HFA, Series B, 0.76% (MUNIPSA + 0.25%) due 1/1/2046 (put 11/4/2026) |
4,000,000 |
3,989,812 |
| |
City
of Phoenix Civic Improvement Corp., Series A, 5.00% due 7/1/2022 - 7/1/2025 |
8,580,000 |
9,109,773 |
| |
City
of Tucson (Street and Highway Projects), Series A, 5.00% due 7/1/2022 |
2,135,000 |
2,155,996 |
| |
County
of Pima (TMC HealthCare Obligated Group) IDA, 5.00% due 4/1/2031 |
1,000,000 |
1,194,563 |
|
a |
Maricopa
County (Banner Health Obligated Group) IDA, Series B, 0.89% (MUNIPSA + 0.38%) due 1/1/2035 (put 10/18/2022) |
8,250,000 |
8,251,147 |
|
a |
Maricopa
County Pollution Control Corp. (Public Service Co. of New Mexico), 0.875% due 6/1/2043 (put 10/1/2026) |
4,700,000 |
4,347,368 |
| |
Maricopa
County Special Health Care District GO, Series D, 5.00% due 7/1/2030 - 7/1/2031 |
6,800,000 |
8,153,878 |
| |
Northern
Arizona University (Insured: BAM), Series B, 5.00% due 6/1/2025 - 6/1/2030 |
1,580,000 |
1,830,820 |
| |
Pima
County (Ina & Roger Road Wastewater Reclamation Facilities) ETM, |
|
|
| |
Series
A, |
|
|
| |
3.00%
due 7/1/2022 |
1,325,000 |
1,331,224 |
| |
5.00%
due 7/1/2022 |
500,000 |
504,753 |
| |
Pima
County (Sewer System & Fleet Services Facilities Expansion) COP, Series A, 5.00% due 12/1/2022 |
1,275,000 |
1,305,322 |
| |
Pima
County Sewer System Revenue COP, Series B, 5.00% due 7/1/2027 - 7/1/2030 |
2,150,000 |
2,499,995 |
| |
Pinal
County (Detention and Training Facilities), Series A, 5.00% due 8/1/2023 - 8/1/2025 |
3,300,000 |
3,527,031 |
| |
Pinal
County (Hunt Highway (Phases III-V), Ironwood Drive, Public Safety Radio & Court Buildings), 5.00% due 8/1/2025 |
3,000,000 |
3,197,034 |
| |
Pinal
County (Tucson Electric Power Co.) IDA, 4.00% due 9/1/2029 |
3,320,000 |
3,377,934 |
| |
Pinal
County Community College District GO, |
|
|
| |
4.00%
due 7/1/2022 |
400,000 |
402,957 |
| |
5.00%
due 7/1/2023 - 7/1/2030 |
5,000,000 |
5,743,323 |
| |
Salt
River Project Agricultural Improvement and Power District (Salt River Electric System), 5.00% due 1/1/2026 - 1/1/2029 |
8,405,000 |
9,562,195 |
| |
State
of Arizona COP ETM, Series A, 5.00% due 10/1/2025 |
3,375,000 |
3,706,577
|
| |
Arkansas
— 0.0% |
|
|
| |
Board
of Trustees of the University of Arkansas (Fayetteville Campus Athletic Facilities) ETM, Series A, 3.00% due 11/1/2023 |
615,000 |
627,267
|
| |
California
— 4.1% |
|
|
| |
Alameda
County Joint Powers Authority (Alameda County Medical Center Highland Hospital), Series A, 5.00% due 12/1/2022 - 12/1/2023 |
5,200,000 |
5,415,897 |
| |
Anaheim
Public Financing Authority (Public Improvements; Insured: AGM), Series C, Zero Coupon due 9/1/2022 |
3,250,000 |
3,234,972 |
|
a |
Bay
Area Toll Authority (San Francisco Bay Area Toll Bridge), Series E, 0.92% (MUNIPSA + 0.41%) due 4/1/2056 (put 4/1/2028) |
1,500,000 |
1,478,428 |
| |
California
(Kaiser Foundation Hospitals) HFFA, |
|
|
|
a |
Series
B, 5.00% due 11/1/2029 (put 11/1/2022) |
1,075,000 |
1,098,755 |
|
a |
Series
C, 5.00% due 6/1/2041 (put 11/1/2029) |
5,250,000 |
6,220,940 |
| |
California
Municipal Finance Authority (CHF-Davis II LLC; Insured: BAM) (Green Bond), 5.00% due 5/15/2029 - 5/15/2031 |
1,195,000 |
1,376,129 |
| |
California
Municipal Finance Authority (Insured: BAM) (Green Bond), 5.00% due 5/15/2027 - 5/15/2028 |
750,000 |
837,033 |
| |
California
State Public Works Board (Coalinga State Hospital), Series E, 5.00% due 6/1/2022 |
11,555,000
|
11,629,333 |
| |
California
State Public Works Board (Laboratory Facility and San Diego Courthouse), Series I, 5.00% due 11/1/2022 |
10,075,000
|
10,299,088 |
| |
California
Statewide Communities Development Authority (Southern California Edison Co.) (Green Bond), 1.75% due 9/1/2029 |
2,250,000
|
1,959,642 |
See
notes to financial statements.
|
Thornburg Municipal
Funds Semi-Annual Report | 25 |
Schedule of Investments, Continued
Thornburg Limited Term Municipal Fund | March 31, 2022 (Unaudited)
| |
ISSUER-DESCRIPTION
|
Principal
Amount |
VALUE
|
| |
Castaic
Lake Water Agency (Water System Improvement; Insured: AMBAC) COP, Zero Coupon due 8/1/2023 |
$10,125,000
|
$ 9,899,739
|
| |
City
of Modesto Wastewater Revenue, Series B, 5.00% due 11/1/2027 - 11/1/2029 |
3,500,000 |
4,046,752 |
| |
County
of Los Angeles Redevelopment Refunding Authority (Bunker Hill Project), Series C, 5.00% due 6/1/2022 - 12/1/2024 |
23,895,000
|
25,057,744 |
| |
Los
Angeles (Educational Facilities and Information Technology Infrastructure) USD GO, |
|
|
| |
Series
A, 5.00% due 7/1/2023 |
8,950,000 |
9,315,017 |
| |
Series
B, 5.00% due 7/1/2023 |
11,950,000
|
12,437,130 |
| |
Series
D, 5.00% due 7/1/2022 - 7/1/2024 |
22,900,000
|
23,744,836 |
| |
Los
Angeles USD GO, Series A, 5.00% due 7/1/2024 |
1,500,000 |
1,601,908 |
| |
Needles
(Insured: Natl-Re) USD GO, Series B, Zero Coupon due 8/1/2023 |
1,005,000 |
978,114 |
| |
North
City West School Facilities Financing Authority (Carmel Valley Educational Facilities; Insured: AGM), Series A, 5.00% due 9/1/2023 |
4,545,000 |
4,613,007 |
|
a |
Northern
California Energy Authority (Commodity Supply Revenue; Guaranty: Goldman Sachs Group, Inc.), Series A, 4.00% due 7/1/2049 (put 7/1/2024) |
35,000,000
|
35,976,815 |
| |
Rocklin
(Insured: Natl-Re) USD GO, Zero Coupon due 8/1/2022 |
3,910,000 |
3,898,536 |
| |
San
Diego Convention Center Expansion Financing Authority, Series A, 5.00% due 4/15/2022 |
8,000,000 |
8,009,808 |
| |
Santa
Fe Springs Community Development Commission (Consolidated Redevelopment Project; Insured: Natl-Re), Series A, Zero Coupon due 9/1/2024 |
7,000,000 |
6,625,220 |
| |
State
of California GO, 5.00% due 12/1/2024 - 11/1/2032 |
4,105,000 |
4,789,707 |
| |
West
Contra Costa (Educational Facilities; Insured: AGC) USD GO, Series C-1, Zero Coupon due 8/1/2022 |
4,000,000 |
3,986,620 |
| |
West
Covina Redevelopment Agency (Fashion Plaza), 6.00% due 9/1/2022 |
1,570,000 |
1,589,702
|
| |
Colorado
— 2.1% |
|
|
| |
City
& County of Denver (Buell Theatre Property) COP, Series A, 5.00% due 12/1/2023 |
1,720,000 |
1,807,773 |
| |
City
& County of Denver School District No. 1 (Eastbridge Elementary and Conservatory Green K-8 Schools) COP, Series C, 5.00% due 12/15/2022 - 12/15/2023 |
2,210,000 |
2,294,334 |
| |
City
of Aurora COP, 5.00% due 12/1/2027 - 12/1/2029 |
7,155,000 |
8,337,971 |
|
a |
Colorado
(AdventHealth Obligated Group) HFA, Series C, 5.00% due 11/15/2036 (put 11/15/2023) |
1,000,000 |
1,047,158 |
|
a |
Colorado
(Adventist Health System/Sunbelt Obligated Group) HFA, 5.00% due 11/15/2049 (put 11/19/2026) |
11,150,000
|
12,457,928 |
| |
Colorado
(Northern Colorado Medical Center) HFA ETM, 5.00% due 5/15/2025 - 5/15/2026 |
1,305,000 |
1,442,461 |
| |
Colorado
(Sanford Obligated Group) HFA, Series A, 5.00% due 11/1/2026 |
2,315,000 |
2,595,166 |
| |
Colorado
Higher Education COP, 4.00% due 9/1/2032 |
1,000,000 |
1,105,424 |
| |
County
of Larimer (Jail Facilities Project) COP, 5.00% due 12/1/2028 - 12/1/2029 |
3,025,000 |
3,555,611 |
| |
Crystal
Valley Metropolitan District No 2 (Insured: AGM) GO, Series A, 5.00% due 12/1/2025 - 12/1/2030 |
1,810,000 |
2,089,767 |
| |
Durango
School District No. 9-R (State Aid Witholding) GO, Series R, 5.00% due 11/1/2030 - 11/1/2031 |
4,195,000 |
5,052,592 |
|
a |
E-470
Public Highway Authority, Series B, 0.531% (SOFR + 0.35%) due 9/1/2039 (put 9/1/2024) |
2,000,000 |
1,918,248 |
| |
El
Paso County (Judicial Complex; Insured: AGM) COP, 5.00% due 12/1/2022 - 12/1/2028 |
2,500,000 |
2,768,286 |
| |
El
Paso County (Pikes Peak Regional Development Center) COP, 5.00% due 12/1/2023 |
1,330,000 |
1,397,871 |
| |
El
Paso County Falcon School District No. 49 COP, 5.00% due 12/15/2023 - 12/15/2024 |
1,600,000 |
1,699,948 |
| |
Interlocken
Metropolitan District (Insured: AGM) GO, |
|
|
| |
Series
A-1, 5.00% due 12/1/2024 - 12/1/2026 |
2,375,000 |
2,577,547 |
| |
Series
A-2, 5.00% due 12/1/2027 |
365,000 |
411,976 |
| |
Regional
Transportation District (Denver Transit Partners LLC), Series A, 5.00% due 7/15/2024 - 1/15/2031 |
3,245,000 |
3,618,015 |
| |
Regional
Transportation District (North Metro Rail Line) COP, Series A, 5.00% due 6/1/2023 - 6/1/2024 |
8,000,000 |
8,288,560 |
| |
Regional
Transportation District COP, 5.00% due 6/1/2030 |
3,000,000 |
3,494,634 |
| |
Regional
Transportation District Sales Tax Revenue (Green Bond), 5.00% due 11/1/2030 |
1,500,000 |
1,811,464 |
| |
Sierra
Ridge Metropolitan District No 2 (Insured: AGM) GO, 4.00% due 12/1/2027 - 12/1/2032 |
1,505,000 |
1,642,371 |
| |
State
of Colorado COP, |
|
|
| |
5.00%
due 3/15/2030 |
1,000,000 |
1,170,618 |
| |
Series
A, 5.00% due 9/1/2024 - 12/15/2031 |
25,055,000
|
29,484,582 |
| |
Series
M 5.00% due 3/15/2028 |
300,000 |
346,042
|
| |
Connecticut
— 2.3% |
|
|
| |
City
of Hartford (Various Public Improvements; Insured: AGM) GO, |
|
|
| |
Series
A, 5.00% due 7/1/2024 - 7/1/2025 |
1,820,000 |
1,959,465 |
| |
Series
B, 5.00% due 10/1/2022 |
1,765,000 |
1,799,220 |
| |
Connecticut
State Health & Educational Facilities Authority (Hartford HealthCare Obligated Group), Series A, 5.00% due 7/1/2032 |
600,000 |
719,285 |
| |
State
of Connecticut (Educational Facilities) GO, |
|
|
| |
Series
B, 5.00% due 6/15/2024 - 6/15/2025 |
30,400,000
|
32,606,295 |
| |
Series
E, 5.00% due 9/1/2023 |
5,550,000 |
5,802,259 |
| |
State
of Connecticut (Various Capital Projects) GO, |
|
|
| |
Series
B, 5.00% due 5/15/2027 |
16,615,000
|
18,389,781 |
| |
Series
E, 5.00% due 8/15/2024 |
1,845,000 |
1,924,776 |
| |
State
of Connecticut GO, |
|
|
| |
Series
A, 5.00% due 4/15/2031 |
1,000,000 |
1,165,355 |
| |
Series
B, 5.00% due 2/15/2024 |
7,000,000 |
7,391,104 |
| |
Series
C, 5.00% due 6/15/2022 - 6/15/2028 |
12,540,000
|
13,990,313 |
26 | Thornburg Municipal Funds Semi-Annual Report
|
See notes to
financial statements. |
Schedule of Investments,
Continued
Thornburg Limited Term Municipal Fund | March 31, 2022 (Unaudited)
| |
ISSUER-DESCRIPTION
|
Principal
Amount |
VALUE
|
| |
Series
E, 5.00% due 9/15/2028 |
$ 2,560,000
|
$ 2,966,981
|
| |
State
of Connecticut Special Tax Revenue, |
|
|
| |
Series
A, 5.00% due 5/1/2028 - 5/1/2031 |
15,925,000
|
18,864,062 |
| |
Series
B, 5.00% due 9/1/2028 |
1,175,000 |
1,311,247 |
| |
Series
D, 5.00% due 11/1/2032 |
500,000 |
602,933 |
| |
State
of Connecticut Special Tax Revenue (Transportation Infrastructure Purposes), Series A, 5.00% due 8/1/2026 |
1,200,000 |
1,309,716 |
|
c |
University
of Connecticut, 5.00% due 5/1/2032 |
1,000,000 |
1,202,220
|
| |
Delaware
— 0.1% |
|
|
| |
Delaware
Transportation Authority, 5.00% due 9/1/2027 - 9/1/2031 |
2,900,000 |
3,415,468 |
| |
Delaware
Transportation Authority (Transportation System), 5.00% due 7/1/2022 |
1,440,000 |
1,454,208
|
| |
District
of Columbia — 0.4% |
|
|
| |
District
of Columbia (Federal Highway Grant Anticipation), 5.00% due 12/1/2025 - 12/1/2031 |
2,500,000 |
2,881,785 |
| |
Washington
Metropolitan Area Transit Authority, 5.00% due 7/1/2022 - 7/1/2028 |
6,405,000 |
6,844,832 |
| |
Washington
Metropolitan Area Transit Authority (Green Bond), Series A, 5.00% due 7/15/2031 |
6,655,000 |
8,081,546
|
| |
Florida
— 5.8% |
|
|
| |
Alachua
County School Board (Educational Facilities) COP, 5.00% due 7/1/2022 - 7/1/2023 |
3,850,000 |
3,952,487 |
| |
Broward
County School Board (Educational Facilities) COP, |
|
|
| |
Series
A, 5.00% due 7/1/2022 - 7/1/2027 |
18,880,000
|
19,996,964 |
| |
Series
B, 5.00% due 7/1/2023 - 7/1/2025 |
9,275,000 |
9,973,207 |
| |
Series
C, 5.00% due 7/1/2025 - 7/1/2026 |
12,830,000
|
14,206,730 |
| |
Broward
County School Board COP, |
|
|
| |
Series
A, 5.00% due 7/1/2028 |
8,590,000 |
9,976,546 |
| |
Series
B, 5.00% due 7/1/2029 |
8,920,000 |
10,530,042 |
| |
Central
Florida Expressway Authority, 5.00% due 7/1/2022 - 7/1/2026 |
4,100,000 |
4,313,597 |
| |
Central
Florida Expressway Authority (Insured: AGM), 5.00% due 7/1/2028 - 7/1/2031 |
5,000,000 |
5,930,667 |
| |
City
of Cape Coral (Water and Sewer System Improvements), 5.00% due 10/1/2022 - 10/1/2026 |
5,435,000 |
5,988,722 |
| |
City
of Jacksonville, |
|
|
| |
5.00%
due 10/1/2027 |
400,000 |
457,700 |
| |
Series
C, 5.00% due 10/1/2023 |
1,105,000 |
1,157,577 |
| |
City
of Lakeland (Lakeland Regional Health Systems), 5.00% due 11/15/2026 - 11/15/2028 |
2,105,000 |
2,355,880 |
| |
City
of Miami (Stormwater Management Utility System), 5.00% due 9/1/2026 - 9/1/2028 |
2,675,000 |
3,015,324 |
| |
City
of Miami GO, 5.00% due 9/1/2022 |
1,000,000 |
1,003,145 |
| |
City
of Orlando (Senior Tourist Development; Insured: AGM), Series A, 5.00% due 11/1/2023 - 11/1/2027 |
3,545,000 |
3,873,845 |
| |
County
of Manatee FL Public Utilities Revenue, 5.00% due 10/1/2032 |
300,000 |
340,792 |
| |
Florida
Higher Educational Facilities Financing Authority (University of Tampa) ETM, Series A, 5.00% due 4/1/2022 |
620,000 |
620,000 |
| |
Florida
State Board of Governors, Series A, 5.00% due 7/1/2028 - 7/1/2029 |
1,755,000 |
2,050,640 |
| |
Florida
State Board of Governors (Florida State University Student Health Fee Revenue), 5.00% due 7/1/2030 |
1,010,000 |
1,197,368 |
| |
Florida
State Board of Governors (University System Capital Improvements), Series A, 4.00% due 7/1/2022 |
4,385,000 |
4,417,006 |
| |
Hillsborough
County (Jail and Storm Water Projects), Series A, 5.00% due 11/1/2022 |
3,005,000 |
3,068,246 |
| |
Hillsborough
County School Board (Master Lease Program) COP, |
|
|
| |
5.00%
due 7/1/2027 - 7/1/2029 |
10,575,000
|
11,961,024 |
| |
Series
B, 5.00% due 7/1/2028 |
4,835,000 |
5,425,919 |
| |
JEA
Electric System, Series A, 5.00% due 10/1/2024 (pre-refunded 10/1/2023) |
1,200,000 |
1,255,751 |
| |
JEA
Electric System ETM, Series A, 5.00% due 10/1/2023 |
1,395,000 |
1,461,649 |
| |
Lee
County School Board (School Facilities Improvements) COP, 5.00% due 8/1/2023 - 8/1/2024 |
3,000,000 |
3,175,131 |
| |
Manatee
County (Public Utilities Improvements), 5.00% due 10/1/2024 - 10/1/2025 |
970,000 |
1,045,763 |
| |
Manatee
County School District (School Facilities Improvements; Insured: AGM), 5.00% due 10/1/2025 - 10/1/2027 |
2,900,000 |
3,208,635 |
| |
Marion
County School Board (Insured: BAM) COP, Series B, 5.00% due 6/1/2024 |
3,065,000 |
3,252,026 |
| |
Miami-Dade
County (Miami International Airport), Series B, 5.00% due 10/1/2025 |
2,500,000 |
2,664,042 |
| |
Miami-Dade
County (Transit System), 5.00% due 7/1/2023 - 7/1/2025 |
10,265,000
|
11,039,236 |
| |
Miami-Dade
County Aviation Revenue, Series A, 5.00% due 10/1/2025 - 10/1/2031 |
3,000,000 |
3,440,949 |
| |
Miami-Dade
County Expressway Authority (Toll System), Series B, 5.00% due 7/1/2024 - 7/1/2025 |
4,000,000 |
4,240,350 |
| |
Miami-Dade
County School Board (Educational Facilities Improvements) COP, |
|
|
| |
Series
A, |
|
|
| |
5.00%
due 5/1/2022 - 5/1/2024 |
15,535,000
|
16,170,064 |
|
a |
5.00%
due 5/1/2031 (put 5/1/2024) |
2,550,000 |
2,703,331 |
| |
Series
C, 5.00% due 5/1/2025 |
15,000,000
|
16,245,150 |
| |
Okaloosa
County School Board COP, Series A 5.00% due 10/1/2028 - 10/1/2030 |
2,500,000 |
2,916,235 |
| |
Orange
County School Board (Educational Facilities) COP, Series D, 5.00% due 8/1/2022 - 8/1/2025 |
6,000,000 |
6,269,847 |
| |
Orange
County School Board COP, |
|
|
| |
5.00%
due 8/1/2027 |
610,000 |
687,646 |
| |
Series
A, 5.00% due 8/1/2029 - 8/1/2031 |
4,600,000 |
5,457,067 |
| |
Palm
Beach County (Baptist Health South Florida Obligated Group) HFA, 5.00% due 8/15/2024 - 8/15/2027 |
1,360,000
|
1,486,750 |
See
notes to financial statements.
|
Thornburg Municipal
Funds Semi-Annual Report | 27 |
Schedule of Investments, Continued
Thornburg Limited Term Municipal Fund | March 31, 2022 (Unaudited)
| |
ISSUER-DESCRIPTION
|
Principal
Amount |
VALUE
|
| |
Palm
Beach County School Board (Educational Facilities) COP, |
|
|
| |
Series
B, |
|
|
|
b |
5.00%
due 8/1/2022 |
$ 1,000,000
|
$ 1,012,833
|
| |
5.00%
due 8/1/2023 - 8/1/2024 |
9,095,000 |
9,593,534 |
| |
Series
C, 5.00% due 8/1/2022 |
1,810,000 |
1,833,228 |
| |
Palm
Beach County School District COP, Series C, 5.00% due 8/1/2022 - 8/1/2026 |
9,130,000 |
9,673,944 |
| |
Pasco
County School Board COP, Series A, 5.00% due 8/1/2028 - 8/1/2031 |
9,785,000 |
11,487,311 |
| |
Polk
County (Water and Wastewater Utility Systems), 5.00% due 10/1/2023 |
1,420,000 |
1,445,282 |
| |
Reedy
Creek Improvement District (Buena Vista Drive Corridor Improvements) GO, Series A, 5.00% due 6/1/2023 |
1,940,000 |
2,013,889 |
| |
Reedy
Creek Improvement District (Walt Disney World Resort Complex Utility Systems), Series 1, 5.00% due 10/1/2022 - 10/1/2023 |
1,375,000 |
1,420,620 |
| |
Reedy
Creek Improvement District (Walt Disney World Resort Complex Utility Systems) GO, Series A, 5.00% due 6/1/2023 - 6/1/2025 |
3,710,000 |
3,981,429 |
| |
South
Florida Water Management District (Everglades Restoration Plan) COP, 5.00% due 10/1/2022 |
2,000,000 |
2,037,476 |
| |
St.
Johns County School Board COP, Series A, 5.00% due 7/1/2023 - 7/1/2029 |
8,015,000 |
9,051,633 |
| |
Sunshine
State Governmental Financing Commission (Miami-Dade County Program), Series B-1, 5.00% due 9/1/2024 (pre-refunded 9/1/2023) |
1,725,000 |
1,801,212 |
| |
Sunshine
State Governmental Financing Commission (Miami-Dade County Program) ETM, Series B-1, 5.00% due 9/1/2022 - 9/1/2023 |
4,100,000 |
4,223,378 |
| |
Volusia
County Educational Facilities Authority (Embry-Riddle Aeronautical University, Inc.), Series B, 5.00% due 10/15/2023 - 10/15/2025 |
1,750,000 |
1,854,890 |
| |
Volusia
County School Board (University High School, River Springs Middle School) COP, Series B, 5.00% due 8/1/2024 |
1,000,000 |
1,066,658 |
| |
Volusia
County School Board COP, |
|
|
| |
5.00%
due 10/1/2029 |
510,000 |
569,538 |
| |
Series
A, 5.00% due 8/1/2028 - 8/1/2031 |
8,100,000 |
9,480,852
|
| |
Georgia
— 3.4% |
|
|
| |
Athens-Clarke
County Unified Government Development Authority (UGAREF Central Precinct LLC), 5.00% due 6/15/2022 - 6/15/2023 |
1,270,000 |
1,293,843 |
| |
City
of Atlanta, Series A, 5.00% due 7/1/2028 - 7/1/2030 |
3,600,000 |
4,202,565 |
| |
City
of Atlanta (Airport Passenger Facility), |
|
|
| |
Series
A, 5.00% due 1/1/2024 - 1/1/2025 |
3,850,000 |
4,049,818 |
| |
Series
B, 5.00% due 1/1/2023 - 1/1/2025 |
2,645,000 |
2,753,363 |
| |
City
of Atlanta (Atlantic Station Project), 5.00% due 12/1/2022 - 12/1/2024 |
3,290,000 |
3,456,452 |
| |
City
of Atlanta (Water & Wastewater System), 5.00% due 11/1/2022 - 11/1/2025 |
4,130,000 |
4,367,867 |
| |
Development
Authority of Fulton County (Georgia Tech Athletic Assoc.) ETM, 5.00% due 10/1/2022 |
4,420,000 |
4,503,861 |
| |
Georgia
Ports Authority, |
|
|
|
b |
5.00%
due 7/1/2028 |
500,000 |
580,143 |
| |
5.00%
due 7/1/2029 - 7/1/2032 |
5,500,000 |
6,601,343 |
| |
Georgia
State Road & Tollway Authority, 5.00% due 6/1/2025 - 6/1/2031 |
6,550,000 |
7,618,371 |
| |
Georgia
State Road & Tollway Authority (GARVEE), 5.00% due 6/1/2032 |
1,000,000 |
1,180,547 |
|
a |
Main
Street Natural Gas, Inc. (Guaranty: Citigroup Global Markets), Series C, 4.00% due 3/1/2050 (put 9/1/2026) |
25,625,000
|
26,641,467 |
|
a |
Main
Street Natural Gas, Inc. (Guaranty: Citigroup, Inc.), Series A, 4.00% due 9/1/2052 (put 12/1/2029) |
23,500,000
|
24,842,672 |
| |
Main
Street Natural Gas, Inc. (Guaranty: Macquarie Group Ltd.), Series A, 5.00% due 5/15/2023 - 5/15/2029 |
14,265,000
|
15,510,076 |
| |
Main
Street Natural Gas, Inc. (Guaranty: Royal Bank of Canada), Series A, 4.00% due 9/1/2025 - 3/1/2026 |
770,000 |
808,620 |
| |
Municipal
Electric Authority of Georgia, |
|
|
| |
4.00%
due 11/1/2023 - 11/1/2025 |
2,100,000 |
2,181,916 |
| |
5.00%
due 11/1/2026 - 11/1/2029 |
3,550,000 |
4,065,734 |
| |
Series
A 5.00% due 1/1/2026 |
5,000,000 |
5,459,580 |
| |
Series
A, 5.00% due 1/1/2026 - 1/1/2032 |
18,485,000
|
21,135,711 |
| |
Private
Colleges & Universities Authority, 5.00% due 4/1/2032 |
755,000 |
904,205 |
| |
Private
Colleges & Universities Authority (Corp. of Mercer University), 5.00% due 10/1/2022 - 10/1/2029 |
2,810,000 |
3,074,504 |
|
a |
Private
Colleges & Universities Authority (Emory University), Series B, 0.93% (MUNIPSA + 0.42%) due 10/1/2039 (put 8/16/2022) |
18,400,000
|
18,374,461 |
| |
Private
Colleges & Universities Authority (Savannah College of Art & Design, Inc.), 5.00% due 4/1/2029 - 4/1/2031 |
1,525,000 |
1,801,350 |
|
b |
Savannah
(International Paper Co.) EDA, 1.90% due 8/1/2024 |
4,000,000 |
3,966,052
|
| |
Guam
— 0.4% |
|
|
| |
Government
of Guam (Various Capital Projects), Series D, 5.00% due 11/15/2024 |
4,500,000 |
4,833,067 |
| |
Guam
Government Waterworks Authority (Water & Wastewater System Improvements), 5.25% due 7/1/2022 - 7/1/2023 |
1,695,000 |
1,727,211 |
| |
Guam
Power Authority (Electric Power System), Series A, 5.00% due 10/1/2023 - 10/1/2026 |
4,330,000 |
4,591,022 |
| |
Guam
Power Authority (Electric Power System; Insured: AGM), Series A, 5.00% due 10/1/2022 |
6,340,000 |
6,459,826 |
| |
Territory
of Guam, Series D, 5.00% due 11/15/2022 |
310,000 |
316,211 |
| |
Territory
of Guam ETM, Series D, 5.00% due 11/15/2022 |
2,650,000 |
2,710,741
|
| |
Hawaii
— 0.4% |
|
|
| |
City
and County of Honolulu (Capital Improvements) GO, Series B, 5.00% due 11/1/2022 |
6,695,000 |
6,841,567 |
| |
City
and County of Honolulu (Capital Improvements) GO ETM, Series A, 5.00% due 11/1/2022 |
1,750,000 |
1,788,969 |
| |
County
of Hawaii (Capital Improvements) GO, |
|
|
| |
Series
A, 5.00% due 9/1/2023 |
800,000 |
834,766 |
| |
Series
B, 5.00% due 9/1/2023 |
1,500,000 |
1,565,185 |
| |
Series
C, 5.00% due 9/1/2022 - 9/1/2026 |
3,750,000 |
3,975,488 |
| |
Series
D, 5.00% due 9/1/2023 - 9/1/2026 |
3,085,000
|
3,354,338 |
28 | Thornburg Municipal Funds Semi-Annual Report
|
See notes to
financial statements. |
Schedule of Investments,
Continued
Thornburg Limited Term Municipal Fund | March 31, 2022 (Unaudited)
| |
ISSUER-DESCRIPTION
|
Principal
Amount |
VALUE
|
| |
Series
E, 5.00% due 9/1/2022 - 9/1/2026 |
$ 2,500,000
|
$ 2,613,247
|
| |
Honolulu
City & County Board of Water Supply, Series A, 5.00% due 7/1/2024 (pre-refunded 7/1/2022) |
1,000,000 |
1,010,070
|
| |
Idaho
— 0.1% |
|
|
| |
Idaho
(Trinity Health Credit Group) HFA, Series D, 5.00% due 12/1/2022 - 12/1/2024 |
4,350,000 |
4,627,714
|
| |
Illinois
— 6.0% |
|
|
| |
Chicago
Midway International Airport, Series B, 5.00% due 1/1/2023 - 1/1/2024 |
2,900,000 |
2,995,601 |
| |
Chicago
O’Hare International Airport (2016 Airport Projects), Series C, 5.00% due 1/1/2027 |
1,750,000 |
1,899,595 |
| |
Chicago
Park District (Capital Improvement Plan) GO, |
|
|
| |
Series
A, 5.00% due 1/1/2025 |
610,000 |
652,388 |
| |
Series
B, 5.00% due 1/1/2023 - 1/1/2024 |
2,945,000 |
3,046,467 |
| |
Series
C, 5.00% due 1/1/2023 |
3,215,000 |
3,291,636 |
| |
Series
D, 5.00% due 1/1/2023 - 1/1/2024 |
3,435,000 |
3,557,948 |
| |
Chicago
Park District GO, Series A, 5.00% due 1/1/2024 |
155,000 |
162,312 |
| |
Chicago
Park District GO ETM, |
|
|
| |
Series
A, 5.00% due 1/1/2024 |
1,150,000 |
1,211,093 |
| |
Series
D, 5.00% due 1/1/2024 |
1,060,000 |
1,116,311 |
| |
City
of Chicago (Chicago Midway Airport), Series B, 5.00% due 1/1/2023 - 1/1/2024 |
22,275,000
|
22,799,640 |
| |
City
of Chicago (Riverwalk Expansion Project; Insured: AGM) ETM, 5.00% due 1/1/2023 |
1,000,000 |
1,026,117 |
| |
City
of Chicago (Wastewater Transmission System), Series C, 5.00% due 1/1/2023 - 1/1/2025 |
13,750,000
|
14,445,166 |
| |
City
of Chicago (Water System), |
|
|
| |
Series
2017-2, 5.00% due 11/1/2023 - 11/1/2024 |
1,650,000 |
1,765,611 |
| |
Series
A, 5.00% due 11/1/2027 |
6,250,000 |
7,087,875 |
| |
Series
A-1, 5.00% due 11/1/2024 |
4,000,000 |
4,325,168 |
| |
City
of Chicago (Water System; Insured: AGM), Series 2017-2, 5.00% due 11/1/2028 |
2,000,000 |
2,284,252 |
| |
City
of Waukegan (Lakehurst Redevelopment Project; Insured: AGM) GO, Series A, 5.00% due 12/30/2022 |
1,000,000 |
1,023,326 |
| |
Clinton
Bond Fayette Etc Counties Community College District No 501 Kaskaskia (Insured: AGM) GO, |
|
|
| |
5.00%
due 12/1/2027 - 12/1/2032 |
1,670,000 |
1,975,765 |
|
b |
5.00%
due 12/1/2030 |
275,000 |
325,547 |
| |
Community
College District No. 503 (Black Hawk College; Insured: AGM) GO, 5.00% due 12/1/2023 - 12/1/2024 |
7,570,000 |
8,039,520 |
| |
Community
Unit School District No. 5 (Insured: BAM) GO, 5.00% due 4/15/2024 - 4/15/2026 |
1,650,000 |
1,786,205 |
| |
Cook
County Community College District No. 508 (City Colleges of Chicago) GO, |
|
|
| |
5.00%
due 12/1/2022 - 12/1/2024 |
5,675,000 |
5,889,292 |
| |
5.25%
due 12/1/2025 - 12/1/2026 |
3,365,000 |
3,516,924 |
| |
Cook
County Community High School District No 233 Homewood-Flossmoor Go, 4.00% due 12/1/2027 |
1,805,000 |
1,960,975 |
| |
Cook
County Community High School District No 233 Homewood-Flossmoor GO, 4.00% due 12/1/2025 - 12/1/2029 |
6,215,000 |
6,770,289 |
| |
Cook
County School District No 87 Berkeley (Insured: AGM) GO, 5.00% due 12/1/2029 |
500,000 |
583,197 |
| |
Cook
County School District No.170 (Insured: AGM) GO, Series D, 5.00% due 12/1/2024 |
1,190,000 |
1,275,803 |
| |
County
of Cook (Capital Improvement Plan) GO, |
|
|
| |
Series
C, |
|
|
| |
4.00%
due 11/15/2022 |
1,000,000 |
1,015,900 |
| |
5.00%
due 11/15/2022 |
1,500,000 |
1,532,982 |
| |
County
of Cook IL Sales Tax Revenue, Series A, 5.00% due 11/15/2029 |
500,000 |
585,420 |
| |
County
of Cook Sales Tax Revenue, 5.00% due 11/15/2028 |
2,250,000 |
2,562,788 |
| |
County
of Sangamon (Insured: BAM) GO, |
|
|
| |
4.00%
due 12/15/2030 |
300,000 |
329,323 |
| |
5.00%
due 12/15/2027 - 12/15/2029 |
525,000 |
607,497 |
| |
DuPage
County School District No 53 Butler, |
|
|
| |
5.00%
due 1/1/2028 - 1/1/2029 |
810,000 |
938,496 |
|
b |
5.00%
due 1/1/2030 |
615,000 |
730,153 |
| |
Forest
Preserve District of DuPage County GO, 5.00% due 11/1/2022 - 11/1/2024 |
7,530,000 |
8,015,884 |
| |
Illinois
Finance Authority (Advocate Health Care), 5.00% due 8/1/2023 - 8/1/2024 |
1,365,000 |
1,443,487 |
|
a |
Illinois
Finance Authority (Carle Foundation Obligated Group), Series B 5.00% due 8/15/2053 (put 8/15/2031) |
4,800,000 |
5,717,136 |
| |
Illinois
Finance Authority (NorthShore University HealthSystem Obligated Group), 5.00% due 8/15/2023 - 8/15/2031 |
7,990,000 |
9,272,418 |
|
a |
Illinois
Finance Authority (Northwestern Memorial Healthcare Obligated Group), Series B, 5.00% due 7/15/2057 (put 12/15/2022) |
2,270,000 |
2,326,366 |
| |
Illinois
Finance Authority (Rush University Medical Center), Series A, 5.00% due 11/15/2022 - 11/15/2025 |
2,520,000 |
2,703,793 |
| |
Illinois
State Toll Highway Authority, |
|
|
| |
5.00%
due 1/1/2025 |
2,000,000 |
2,157,454 |
| |
Series
D, 5.00% due 1/1/2023 - 1/1/2024 |
10,500,000
|
10,952,551 |
| |
Kane
McHenry Cook & DeKalb Counties Unit School District No. 300 GO, 5.00% due 1/1/2024 |
7,150,000 |
7,516,366 |
| |
Knox
& Warren Counties Community Unit School District No 205 Galesburg GO, |
|
|
| |
Series
B, |
|
|
| |
4.00%
due 12/1/2022 - 12/1/2024 |
3,550,000 |
3,661,242 |
| |
5.00%
due 12/1/2025 - 12/1/2029 |
7,400,000
|
8,312,140 |
See
notes to financial statements.
|
Thornburg Municipal
Funds Semi-Annual Report | 29 |
Schedule of Investments, Continued
Thornburg Limited Term Municipal Fund | March 31, 2022 (Unaudited)
| |
ISSUER-DESCRIPTION
|
Principal
Amount |
VALUE
|
| |
McHenry
County Conservation District GO, 5.00% due 2/1/2025 |
$ 2,000,000
|
$ 2,166,378
|
| |
Metropolitan
Water Reclamation District of Greater Chicago (Green Bond) GO, |
|
|
| |
Series
A, 5.00% due 12/1/2029 - 12/1/2032 |
9,510,000 |
11,365,658 |
| |
Series
E, 5.00% due 12/1/2025 |
1,000,000 |
1,095,697 |
| |
Peoria
Metropolitan Airport Authority GO, Series D, 5.00% due 12/1/2027 |
1,000,000 |
1,117,210 |
| |
Sales
Tax Securitization Corp., Series A, 5.00% due 1/1/2028 - 1/1/2029 |
6,445,000 |
7,240,334 |
| |
Sangamon
County School District No 186 Springfield (Insured: AGM) GO, 4.00% due 2/1/2030 - 2/1/2032 |
3,500,000 |
3,844,884 |
| |
State
of Illinois (State Facilities Improvements) GO, Series D, 5.00% due 11/1/2024 |
3,650,000 |
3,887,159 |
| |
State
of Illinois GO, |
|
|
| |
5.50%
due 5/1/2024 - 5/1/2030 |
2,350,000 |
2,573,475 |
| |
Series
D, 5.00% due 11/1/2023 - 11/1/2028 |
36,240,000
|
39,579,726 |
| |
State
of Illinois Sales Tax Revenue, Series B, 5.00% due 6/15/2026 - 6/15/2029 |
20,000,000
|
22,261,370 |
| |
State
of Illinois Sales Tax Revenue (Insured: BAM-Natl-Re), Series 1, 6.00% due 6/15/2026 |
235,000 |
268,776 |
| |
Village
of Tinley Park GO, 4.00% due 12/1/2022 |
625,000 |
635,334 |
| |
Will
& Kendall Counties Plainfield Community Consolidated School District 202 (Capital Improvements; Insured: BAM) GO, Series A, 5.00% due 1/1/2023 - 1/1/2025 |
21,125,000
|
22,249,726 |
| |
Will
County Community Unit School District No 201-U Crete-Monee (Insured: BAM) GO, Series U-A 5.00% due 1/1/2028 - 1/1/2030 |
615,000 |
705,794
|
| |
Indiana
— 1.5% |
|
|
| |
Avon
Community School Building Corp (Educational Facilities; Insured: State Intercept), 5.00% due 7/15/2022 - 7/15/2027 |
4,530,000 |
4,889,816 |
| |
Avon
Community School Building Corp. (Insured: State Intercept), 5.00% due 7/15/2029 - 7/15/2031 |
1,000,000 |
1,196,413 |
| |
Carmel
Local Public Improvement Bond Bank, Series A, 4.00% due 1/15/2029 - 7/15/2030 |
2,215,000 |
2,426,224 |
| |
City
of Carmel Redevelopment Authority (Road and Intersection Improvements), 5.00% due 8/1/2022 |
1,270,000 |
1,285,485 |
| |
City
of Indianapolis Department of Public Utilities Gas Utility Revenue, Series A, 5.00% due 8/15/2022 |
1,000,000 |
1,014,459 |
| |
Crown
Point Multi School Building Corp. (Insured: State Intercept), 5.00% due 7/15/2027 - 7/15/2032 |
33,000,000
|
39,048,496 |
| |
Hamilton
Southeastern Consolidated School Building Corp. (Educational Facilities; Insured: State Intercept), Series D, 5.00% due 7/15/2022 - 1/15/2024 |
1,980,000 |
2,038,365 |
| |
Indiana
Finance Authority (Community Health Network), Series A, 5.00% due 5/1/2022 |
1,230,000 |
1,233,518 |
| |
Indiana
Finance Authority (CWA Authority, Inc. Wastewater System Project), Series A, 5.00% due 10/1/2023 - 10/1/2024 |
1,500,000 |
1,579,261 |
| |
Indiana
Finance Authority (CWA Authority, Inc.), |
|
|
| |
5.00%
due 10/1/2032 |
1,275,000 |
1,535,953 |
| |
Series
1, 5.00% due 10/1/2031 |
2,250,000 |
2,715,806 |
| |
Series
2, 5.00% due 10/1/2029 - 10/1/2031 |
3,990,000 |
4,789,613 |
| |
Indiana
Finance Authority (Parkview Health System), 5.00% due 5/1/2022 |
1,135,000 |
1,138,375 |
| |
Indiana
Municipal Power Agency (Power Supply System), Series A, 5.00% due 1/1/2026 - 1/1/2028 |
4,235,000 |
4,729,087 |
| |
Lake
Central Multi-District School Building Corp. (Educational Facilities) (State Aid Withholding), Series B, 5.00% due 7/15/2022 |
1,000,000 |
1,010,585 |
| |
Southwest
Allen Multi School Building Corp. (Metropolitan School District of Southwest Allen County; Insured: State Intercept), 5.00% due 1/15/2029 - 7/15/2029 |
4,070,000 |
4,690,040
|
| |
Iowa
— 0.2% |
|
|
| |
Iowa
Finance Authority (Genesis Health System), 5.00% due 7/1/2024 (pre-refunded 7/1/2023) |
2,350,000 |
2,444,214 |
| |
Iowa
Finance Authority (Genesis Health System) ETM, 5.00% due 7/1/2022 - 7/1/2023 |
3,735,000 |
3,826,629 |
| |
Woodbury
County Law Enforcement Center Authority, 4.00% due 6/1/2026 - 6/1/2032 |
2,935,000 |
3,215,449
|
| |
Kansas
— 1.2% |
|
|
|
a |
Kansas
(AdventHealth Obligated Group) DFA, Series B, 5.00% due 11/15/2054 (put 11/15/2031) |
9,415,000 |
11,286,890 |
| |
Kansas
(National Bio and Agro-Defense Facility) DFA, Series G, 5.00% due 4/1/2022 - 4/1/2025 |
27,395,000
|
28,172,706 |
| |
Kansas
DFA, Series SRF, 5.00% due 5/1/2026 |
765,000 |
853,126 |
| |
Seward
County No. 480 USD GO, |
|
|
| |
Series
B, |
|
|
| |
5.00%
due 9/1/2024 - 9/1/2026 |
4,020,000 |
4,383,402 |
| |
5.00%
due 9/1/2027 (pre-refunded 9/1/2025) |
2,100,000 |
2,304,437 |
| |
Unified
Government of Wyandotte County/Kansas City (Utility Systems Improvement), Series A, 5.00% due 9/1/2022 - 9/1/2024 |
3,600,000 |
3,715,640 |
| |
Wyandotte
County No. 500 (General Improvement) USD GO, Series A, 5.00% due 9/1/2025 - 9/1/2026 |
5,675,000 |
6,280,809
|
| |
Kentucky
— 2.5% |
|
|
| |
County
of Trimble (Louisville Gas and Electric Co.), Series A, 0.625% due 9/1/2026 |
2,000,000 |
1,859,670 |
| |
Kentucky
Economic (Norton Healthcare, Inc.; Insured: Natl-Re) DFA, Series B, Zero Coupon due 10/1/2023 |
4,195,000 |
4,073,236 |
| |
Kentucky
Public Energy Authority (Guaranty: Morgan Stanley Group), |
|
|
|
a |
Series
A, 4.00% due 4/1/2048 (put 4/1/2024) |
77,915,000
|
80,433,135 |
| |
Series
A1, 4.00% due 2/1/2025 - 8/1/2027 |
9,525,000 |
10,028,955 |
| |
Kentucky
State Property & Building Commission, Series B, 5.00% due 11/1/2028 |
785,000 |
875,471 |
| |
Kentucky
State Property & Building Commission (Insured: AGM), Series A 5.00% due 11/1/2029 |
750,000 |
872,427 |
| |
Kentucky
State Property & Building Commission (Kentucky Finance and Administration Cabinet; Insured: BAM), 5.00% due 4/1/2031 |
11,760,000
|
13,137,155 |
| |
Kentucky
Turnpike Authority (Kentucky Transportation Cabinet), Series A, 5.00% due 7/1/2029 - 7/1/2031 |
3,665,000 |
4,346,491 |
| |
Louisville/Jefferson
County Metropolitan Government (Norton Healthcare, Inc.), 5.00% due 10/1/2026 |
3,000,000
|
3,367,524 |
30 | Thornburg Municipal Funds Semi-Annual Report
|
See notes to
financial statements. |
Schedule of Investments,
Continued
Thornburg Limited Term Municipal Fund | March 31, 2022 (Unaudited)
| |
ISSUER-DESCRIPTION
|
Principal
Amount |
VALUE
|
| |
Turnpike
Authority of Kentucky (Revitalization Projects), Series B, 5.00% due 7/1/2025 - 7/1/2026 |
$ 5,615,000
|
$ 6,191,576
|
| |
Louisiana
— 2.5% |
|
|
| |
City
of Shreveport (Water and Sewer System; Insured: BAM), Series A, 5.00% due 12/1/2022 - 12/1/2024 |
15,195,000
|
15,903,284 |
| |
Consolidated
Government of the City of Baton Rouge & Parish of East Baton Rouge (Insured: AGM), 5.00% due 8/1/2027 - 8/1/2030 |
4,750,000 |
5,493,893 |
| |
East
Baton Rouge Sewerage Commission (Wastewater System Improvements), |
|
|
| |
Series
A, 5.00% due 2/1/2028 - 2/1/2030 |
2,400,000 |
2,807,996 |
| |
Series
B, 5.00% due 2/1/2023 - 2/1/2025 |
2,150,000 |
2,274,406 |
| |
Ernest
N. Morial - New Orleans Exhibition Hall Authority (Convention Center), 5.00% due 7/15/2022 - 7/15/2023 |
2,000,000 |
2,020,715 |
| |
Jefferson
Sales Tax District (Insured: AGM), |
|
|
| |
Series
A, 5.00% due 12/1/2023 - 12/1/2027 |
4,700,000 |
5,177,595 |
| |
Series
B, 5.00% due 12/1/2027 - 12/1/2028 |
4,690,000 |
5,374,718 |
| |
Louisiana
Energy & Power Authority (LEPA Unit No. 1 Power; Insured: AGM), |
|
|
| |
Series
A, |
|
|
| |
5.00%
due 6/1/2022 |
1,000,000 |
1,006,273 |
|
b |
5.00%
due 6/1/2023 |
750,000 |
777,633 |
| |
Louisiana
Energy & Power Authority (Rodemacher Unit No. 2 Power), 5.00% due 1/1/2023 |
1,740,000 |
1,777,751 |
| |
Louisiana
Local Govt Environmental Facilities & Community Development Authority (LCTCS Act 391 Project; Insured: BAM), 5.00% due 10/1/2022 - 10/1/2027 |
15,565,000
|
16,843,373 |
| |
Louisiana
Local Govt Environmental Facilities & Community Development Authority (Louisiana Community & Technical College System), 5.00% due 10/1/2025 - 10/1/2027 |
2,960,000 |
3,267,408 |
| |
Louisiana
Offshore Terminal Authority (Loop LLC), |
|
|
|
a |
1.65%
due 9/1/2027 (put 12/1/2023) |
6,150,000 |
6,115,738 |
|
a |
Series
A, 1.65% due 9/1/2033 (put 12/1/2023) |
5,000,000 |
4,972,145 |
|
a |
Series
C, 1.65% due 9/1/2034 (put 12/1/2023) |
5,000,000 |
4,972,145 |
| |
Louisiana
Public Facilities Authority (Hurricane Recovery Program), 5.00% due 6/1/2022 - 6/1/2023 |
7,945,000 |
8,149,841 |
|
a |
Louisiana
Public Facilities Authority (Ochsner Clinic Foundation Obligated Group), Series B, 5.00% due 5/15/2050 (put 5/15/2025) |
3,500,000 |
3,775,128 |
| |
Parish
of LaFourche (Roads, Highways & Bridges), 5.00% due 1/1/2023 |
515,000 |
528,804 |
|
a |
Parish
of St. Charles (Valero Energy Corp. Refinery; Guaranty: Valero Energy Corp.), 4.00% due 12/1/2040 (put 6/1/2022) |
19,125,000
|
19,190,369 |
| |
Shreveport
Water & Sewer Revenue (Insured: BAM), Series C, 5.00% due 12/1/2024 - 12/1/2026 |
2,420,000 |
2,635,733 |
| |
State
of Louisiana, 5.00% due 9/1/2028 - 9/1/2032 |
6,410,000 |
7,630,576 |
|
a |
State
of Louisiana Gasoline & Fuels Tax Revenue, Series A 0.689% (SOFR + 0.50%) due 5/1/2043 (put 5/1/2026) |
3,000,000 |
2,999,052
|
| |
Maine
— 0.1% |
|
|
| |
Maine
Governmental Facilities Authority (Augusta & Machias Courthouses), Series A, 5.00% due 10/1/2022 - 10/1/2023 |
2,620,000 |
2,713,767
|
| |
Maryland
— 0.9% |
|
|
| |
Maryland
Health & Higher Educational Facilities Authority (UPMC Obligated Group), Series B, 5.00% due 4/15/2025 - 4/15/2030 |
7,005,000 |
7,972,374 |
| |
Maryland
Stadium Authority Built to Learn Revenue, 5.00% due 6/1/2027 - 6/1/2032 |
14,690,000
|
17,216,085 |
| |
Montgomery
County GO, Series C, 5.00% due 10/1/2025 |
1,250,000 |
1,377,283 |
| |
Prince
County George’s GO, Series A, 5.00% due 9/15/2026 |
6,110,000 |
6,885,579 |
| |
State
of Maryland GO, Series B, 5.00% due 8/1/2024 |
6,955,000 |
7,454,647 |
| |
Washington
Suburban Sanitary Commission, 5.00% due 6/1/2030 |
3,000,000 |
3,562,740
|
| |
Massachusetts
— 1.4% |
|
|
| |
City
of Methuen (Bans) (State Aid Withholding) GO, 1.00% due 9/1/2022 |
2,000,000 |
1,999,656 |
| |
Commonwealth
of Massachusetts GO, Series G, 5.00% due 9/1/2029 |
5,000,000 |
5,955,600 |
| |
Massachusetts
(Berkshire Health Systems, Inc. Obligated Group) DFA, Series I, 5.00% due 10/1/2027 - 10/1/2031 |
3,520,000 |
4,076,694 |
| |
Massachusetts
(Beth Israel Lahey Health Obligated Group) DFA, 5.00% due 7/1/2027 - 7/1/2028 |
2,000,000 |
2,290,176 |
| |
Massachusetts
(CareGroup Healthcare System) DFA, Series I, 5.00% due 7/1/2023 - 7/1/2027 |
11,470,000
|
12,383,936 |
| |
Massachusetts
(Insured: BHAC-CR FGIC), 5.50% due 1/1/2029 |
8,300,000 |
9,833,574 |
|
a,d |
Massachusetts
(Mass General Brigham, Inc.) DFA, 1.11% (MUNIPSA + 0.60%) due 7/1/2049 (put 1/29/2026) |
3,750,000 |
3,705,480 |
| |
Massachusetts
(Mount Auburn Hospital Health Records System) DFA, Series H-1, 5.00% due 7/1/2022 - 7/1/2025 |
15,415,000
|
16,230,992 |
|
a |
Massachusetts
(President & Trustees of Williams College) DFA, Series N, 0.45% due 7/1/2041 (put 7/1/2025) |
2,000,000 |
1,901,622 |
|
a |
Massachusetts
Transportation Trust Fund Metropolitan Highway System Revenue, Series A, 5.00% due 1/1/2039 (put 1/1/2023) |
3,630,000 |
3,722,482 |
| |
Pennsylvania
(UPMC Obligated Group) EDFA, Series J, 5.25% due 10/1/2023 |
595,000 |
620,769 |
| |
University
of Massachusetts Building Authority (University of Massachusetts), Series 2021-1, 5.00% due 11/1/2028 - 11/1/2031 |
3,500,000 |
4,173,789
|
| |
Michigan
— 1.6% |
|
|
| |
Board
of Governors of Wayne State University (Educational Facilities and Equipment), Series A, 5.00% due 11/15/2022 - 11/15/2025 |
2,000,000 |
2,117,025 |
| |
County
of Genesee (Water Supply System; Insured: BAM) GO, 5.00% due 11/1/2022 |
600,000 |
612,746 |
| |
Livonia
Public Schools (Insured: BAM) GO, Series I, 5.00% due 5/1/2029 - 5/1/2030 |
2,035,000 |
2,393,869 |
| |
Michigan
Finance Authority ((McLaren Health Care Corp. Obligated Group), 5.00% due 2/15/2029 |
1,000,000 |
1,187,297 |
| |
Michigan
Finance Authority (Beaumont Health Credit Group), 5.00% due 8/1/2023 - 8/1/2025 |
18,800,000
|
20,092,648 |
| |
Michigan
Finance Authority (Henry Ford Health System), 5.00% due 11/15/2027 |
1,500,000 |
1,683,557 |
| |
Michigan
Finance Authority (McLaren Health Care Corp. Obligated Group), 5.00% due 2/15/2028 |
1,000,000 |
1,165,261 |
| |
Michigan
Finance Authority (Trinity Health Credit Group), |
|
|
See
notes to financial statements.
|
Thornburg Municipal
Funds Semi-Annual Report | 31 |
Schedule of Investments, Continued
Thornburg Limited Term Municipal Fund | March 31, 2022 (Unaudited)
| |
ISSUER-DESCRIPTION
|
Principal
Amount |
VALUE
|
| |
5.00%
due 12/1/2022 - 12/1/2024 |
$ 4,500,000
|
$ 4,712,698
|
| |
Series
A, 5.00% due 12/1/2024 - 12/1/2028 |
6,000,000 |
6,616,638 |
| |
Michigan
State Building Authority, Series I, 5.00% due 10/15/2030 |
2,500,000 |
3,022,747 |
| |
Michigan
State Building Authority (Facilities Program), Series I, 5.00% due 4/15/2023 - 4/15/2026 |
1,865,000 |
1,986,566 |
| |
Muskegon
Public Schools (Insured: Q-SBLF) GO, Series- II, 5.00% due 5/1/2027 |
200,000 |
225,325 |
| |
Northern
Michigan University, 5.00% due 6/1/2031 - 6/1/2032 |
1,300,000 |
1,529,084 |
| |
Royal
Oak Hospital Finance Authority (William Beaumont Hospital), Series D, 5.00% due 9/1/2023 - 9/1/2024 |
3,240,000 |
3,424,987 |
| |
School
District of the City of Dearborn (Insured: Q-SBLF) GO, 4.00% due 5/1/2022 - 5/1/2023 |
1,160,000 |
1,175,713 |
| |
School
District of the City of Detroit (Wayne County School Building & Site; Insured: Q-SBLF) GO, Series A, 5.00% due 5/1/2022 |
3,000,000 |
3,008,841 |
| |
State
Building Authority of the State of Michigan (Higher Education Facilities Program), Series I-A, 5.00% due 10/15/2022 - 10/15/2023 |
10,715,000
|
11,144,387 |
| |
Wayne
State University, Series A, 5.00% due 11/15/2023 - 11/15/2026 |
12,640,000
|
13,744,630 |
| |
West
Ottawa Public Schools (Insured: AGM) GO, |
|
|
| |
4.00%
due 11/1/2031 |
395,000 |
444,520 |
| |
5.00%
due 11/1/2028 - 11/1/2029 |
625,000 |
733,588
|
| |
Minnesota
— 0.7% |
|
|
| |
Minnesota
Higher Education Facilities Authority, 5.00% due 10/1/2029 |
300,000 |
350,076 |
| |
Minnesota
Housing Finance Agency (Collateralized: GNMA, FNMA, FHLMC), |
|
|
| |
Series
F, |
|
|
| |
1.90%
due 1/1/2029 |
180,000 |
172,487 |
| |
1.95%
due 7/1/2029 |
420,000 |
402,052 |
|
a |
Minnesota
Housing Finance Agency (Residential Single Family Development; Collateralized: GNMA, FNMA, FHLMC), Series H, 1.06% (MUNIPSA + 0.55%) due 7/1/2041 (put 12/12/2023) |
7,525,000 |
7,576,140 |
| |
Minnesota
Municipal Gas Agency, |
|
|
| |
Series
A, |
|
|
| |
4.00%
due 12/1/2025 |
4,100,000 |
4,311,482 |
|
a |
4.00%
due 12/1/2052 (put 12/1/2027) |
14,500,000
|
15,457,551 |
| |
Port
Authority of the City of St. Paul (Minnesota Andersen Office Building), Series 3, 5.00% due 12/1/2022 |
1,250,000 |
1,280,244 |
| |
St.
Paul Housing and Redevelopment Authority (HealthPartners), Series A, 5.00% due 7/1/2023 - 7/1/2025 |
1,850,000 |
1,948,969 |
|
a,d |
Tender
Option Bond Trust Receipts/Certificates (Guaranty: Deutsche Bank A.G.), Series 2021-XF1130, 0.76% due 12/1/2061 (put 4/7/2022) |
4,775,000 |
4,775,000
|
| |
Mississippi
— 0.2% |
|
|
|
a |
County
of Warren MS, 1.375% due 5/1/2034 (put 6/16/2025) |
1,625,000 |
1,560,569 |
| |
Mississippi
Development Bank (City of Gulfport) GO, |
|
|
| |
4.00%
due 9/1/2031 |
395,000 |
428,096 |
| |
5.00%
due 9/1/2028 |
310,000 |
356,084 |
| |
Mississippi
Development Bank (Jackson Public School District; Insured: BAM), 5.00% due 10/1/2024 - 10/1/2028 |
2,400,000 |
2,685,249 |
| |
Mississippi
Development Bank (MDOT-Harrison County Highway), Series A, 5.00% due 1/1/2023 |
1,500,000 |
1,539,063 |
| |
Mississippi
Development Bank (MDOT-Madison County Highway), Series C, 5.00% due 1/1/2023 |
1,250,000 |
1,282,552
|
| |
Missouri
— 0.5% |
|
|
| |
City
of Excelsior Springs (Insured: BAM) COP, |
|
|
| |
Series
A, 4.00% due 9/1/2024 - 9/1/2028 |
1,860,000 |
1,986,262 |
| |
Series
B, 4.00% due 3/1/2025 - 3/1/2030 |
1,230,000 |
1,313,551 |
| |
City
of Kansas City GO, Series A 5.00% due 2/1/2028 - 2/1/2031 |
3,350,000 |
3,938,707 |
| |
City
of Kansas City Water Revenue, Series A, 5.00% due 12/1/2029 - 12/1/2032 |
2,020,000 |
2,445,971 |
|
a |
Health
& Educational Facilities Authority of the State of Missouri (BJC Healthcare Obligated Group), Series C 5.00% due 5/1/2052 (put 5/1/2028) |
1,500,000 |
1,726,213 |
| |
Kansas
City Municipal Assistance Corp. (H. Roe Bartle Convention Center & Infrastructure Project; Insured: AMBAC), Series B-1, Zero Coupon due 4/15/2022 |
5,040,000 |
5,038,226 |
| |
Missouri
(City of Independence Electric System) DFB ISD, Series F, 4.00% due 6/1/2022 |
3,155,000 |
3,168,059 |
| |
Special
Administrative Board of the Transitional School District of the City of St. Louis (State Aid Withholding) GO, 4.00% due 4/1/2022 |
3,300,000 |
3,300,000
|
| |
Nebraska
— 1.2% |
|
|
|
a |
Central
Plains Energy Project (Guaranty: Goldman Sachs Group, Inc.), 5.00% due 3/1/2050 (put 1/1/2024) |
50,000,000
|
52,002,050 |
| |
Douglas
County Hospital Authority No. 3 (Nebraska Methodist Health System), 5.00% due 11/1/2022 - 11/1/2025 |
6,980,000 |
7,383,400 |
|
a |
Nebraska
Public Power District, 0.60% due 1/1/2051 (put 7/1/2023) |
1,000,000 |
984,947
|
| |
Nevada
— 3.1% |
|
|
| |
Carson
City (Carson Tahoe Regional Healthcare), 5.00% due 9/1/2023 - 9/1/2027 |
1,705,000 |
1,847,377 |
| |
Carson
City (Carson Tahoe Regional Healthcare) ETM, 5.00% due 9/1/2022 |
2,450,000 |
2,489,298 |
| |
Clark
County School District (Acquisition of Transportation & Technology Equipment) GO, |
|
|
| |
Series
C, 5.00% due 6/15/2022 |
2,560,000 |
2,579,960 |
| |
Series
D, 5.00% due 6/15/2022 |
27,150,000
|
27,361,689 |
| |
Clark
County School District GO, |
|
|
| |
5.00%
due 6/15/2030 |
6,085,000 |
7,211,194 |
| |
Series
A, 5.00% due 6/15/2023 |
4,000,000 |
4,151,420 |
| |
Series
C, 5.00% due 6/15/2023 |
700,000 |
726,493 |
32 | Thornburg Municipal Funds Semi-Annual Report
|
See notes to
financial statements. |
Schedule of Investments,
Continued
Thornburg Limited Term Municipal Fund | March 31, 2022 (Unaudited)
| |
ISSUER-DESCRIPTION
|
Principal
Amount |
VALUE
|
| |
County
of Washoe GO, 5.00% due 7/1/2027 - 7/1/2031 |
$15,220,000
|
$ 18,252,267
|
| |
Las
Vegas Convention and Visitors Authority, Series C, 5.00% due 7/1/2023 - 7/1/2026 |
3,050,000 |
3,291,598 |
| |
Las
Vegas Valley Water District GO, |
|
|
| |
Series
A, 5.00% due 6/1/2023 - 6/1/2026 |
55,955,000
|
59,802,570 |
| |
Series
B, 5.00% due 12/1/2025 |
20,000,000
|
21,794,600 |
| |
State
of Nevada (Water Pollution Control Revolving Fund) GO, 5.00% due 8/1/2030 |
1,530,000 |
1,813,729
|
| |
New
Hampshire — 0.1% |
|
|
| |
New
Hampshire Municipal Bond Bank (Educational Facilities; Insured: State Intercept), Series C, 5.25% due 8/15/2022 |
2,770,000 |
2,811,702
|
| |
New
Jersey — 3.3% |
|
|
| |
City
of Jersey City (Qualified General Improvement; Insured: BAM) (State Aid Withholding) GO, Series A, 5.00% due 8/1/2022 - 8/1/2023 |
4,985,000 |
5,116,082 |
| |
City
of Newark GO, Series E, 1.25% due 10/3/2022 |
4,000,000 |
3,999,324 |
| |
Essex
County Improvement Authority (County Correctional Facilities & Gibraltar Facilities; Insured: Natl-Re) GO, 5.50% due 10/1/2024 |
5,000,000 |
5,419,950 |
| |
Hudson
County Improvement Authority, Series C-1, 1.00% due 8/16/2022 |
3,400,000 |
3,398,892 |
| |
Jersey
City Redevelopment Agency, 4.00% due 12/15/2031 |
4,480,000 |
5,001,060 |
| |
New
Jersey (New Jersey Transit Corporation) (State Aid Withholding) EDA, Series B, 5.00% due 11/1/2024 |
8,000,000 |
8,526,440 |
| |
New
Jersey (New Jersey Transit Corporation) EDA, |
|
|
| |
5.00%
due 11/1/2029 |
40,000 |
45,548 |
| |
Series
B, 5.00% due 11/1/2023 |
2,500,000 |
2,609,062 |
| |
New
Jersey (School Facilities Construction) EDA, |
|
|
| |
5.00%
due 6/15/2028 - 6/15/2029 |
4,190,000 |
4,725,738 |
|
b |
Series
NN, 5.00% due 3/1/2026 |
1,410,000 |
1,446,361 |
| |
Series
UU, 5.00% due 6/15/2028 (pre-refunded 6/15/2024) |
7,930,000 |
8,449,447 |
| |
New
Jersey (School Facilities Construction; Insured: Natl-Re) EDA, Series N-1, 5.50% due 9/1/2027 |
2,750,000 |
3,127,996 |
| |
New
Jersey (Self Designated Social Bonds) EDA, Series QQQ, 5.00% due 6/15/2030 - 6/15/2031 |
830,000 |
951,475 |
| |
New
Jersey (State of New Jersey Department of the Treasury) EDA, |
|
|
| |
5.00%
due 6/15/2028 - 6/15/2031 |
5,240,000 |
5,938,038 |
| |
Series
BBB, 5.50% due 6/15/2029 (pre-refunded 12/15/2026) |
1,000,000 |
1,151,871 |
| |
New
Jersey (Virtua Health Issue) HFFA, 5.00% due 7/1/2023 - 7/1/2024 |
1,535,000 |
1,606,511 |
| |
New
Jersey EDA, |
|
|
| |
Series-
II, 5.00% due 3/1/2025 |
775,000 |
776,656 |
| |
Series
XX, 5.00% due 6/15/2026 |
1,140,000 |
1,228,285 |
|
c |
New
Jersey Educational Facilities Authority (Ramapo College of New Jersey; Insured: AGM), Series A 5.00% due 7/1/2030 - 7/1/2032 |
1,475,000 |
1,767,683 |
| |
New
Jersey Transportation Trust Fund Authority, |
|
|
| |
Series
A, 5.00% due 12/15/2029 |
1,550,000 |
1,747,921 |
| |
Series-A,
5.00% due 6/15/2028 |
4,240,000 |
4,693,226 |
| |
New
Jersey Transportation Trust Fund Authority (State Transportation System Improvements), |
|
|
|
b |
5.00%
due 6/15/2023 |
3,000,000 |
3,113,640 |
| |
5.00%
due 6/15/2024 |
3,275,000 |
3,479,694 |
| |
Series
A, 5.25% due 12/15/2022 |
2,000,000 |
2,049,488 |
| |
Series
A-1, 5.00% due 6/15/2025 - 6/15/2027 |
30,535,000
|
33,820,469 |
| |
New
Jersey Transportation Trust Fund Authority (State Transportation System Improvements; Insured: AMBAC), Series B, 5.25% due 12/15/2023 |
3,545,000 |
3,724,285 |
| |
New
Jersey Transportation Trust Fund Authority (Transportation Program Bonds), Series BB, 5.00% due 6/15/2031 - 6/15/2032 |
3,270,000 |
3,775,193 |
| |
New
Jersey Transportation Trust Fund Authority (Transportation System), |
|
|
| |
5.00%
due 12/15/2025 - 12/15/2027 |
21,850,000
|
24,195,353 |
| |
Series
A, 5.00% due 6/15/2024 |
950,000 |
1,009,234 |
| |
State
of New Jersey (COVID-19 GO Emergency Bonds) GO, Series A, 5.00% due 6/1/2024 - 6/1/2029 |
16,000,000
|
17,835,634
|
| |
New
Mexico — 1.4% |
|
|
| |
Albuquerque
Bernalillo County Water Utility Authority, |
|
|
| |
4.00%
due 7/1/2030 |
700,000 |
780,105 |
| |
5.00%
due 7/1/2028 - 7/1/2029 |
2,785,000 |
3,261,183 |
| |
Albuquerque
Municipal School District No 12 (State Aid Withholding) GO, 5.00% due 8/1/2028 |
1,000,000 |
1,155,441 |
| |
Albuquerque
Municipal School District No 12 (State Aid Witholding) GO, Series A, 5.00% due 8/1/2022 - 8/1/2026 |
1,675,000 |
1,779,108 |
| |
Carlsbad
Municipal School District (Educational Facilities) (State Aid Withholding) ETM GO, 5.00% due 8/1/2023 |
1,650,000 |
1,719,303 |
| |
City
of Albuquerque (City Infrastructure Improvements) GO, Series A, 5.00% due 7/1/2023 |
1,360,000 |
1,414,804 |
| |
City
of Albuquerque NM Transportation Infrastructure GRT, 4.00% due 7/1/2031 |
800,000 |
879,707 |
| |
City
of Farmington (Public Service Co. of New Mexico), |
|
|
|
a |
Series
A, 0.875% due 6/1/2040 (put 10/1/2026) |
2,000,000 |
1,840,002 |
|
a |
Series
B, 2.125% due 6/1/2040 (put 6/1/2022) |
3,500,000 |
3,502,975 |
|
a |
Series
C, 1.15% due 6/1/2040 (put 6/1/2024) |
4,500,000 |
4,370,985 |
|
a |
Series
D, 1.10% due 6/1/2040 (put 6/1/2023) |
11,500,000
|
11,342,335 |
| |
City
of Santa Fe (El Castillo Retirement Residences), 4.50% due 5/15/2022 |
565,000 |
566,380 |
| |
New
Mexico Hospital Equipment Loan Council (Presbyterian Healthcare Services Obligated Group), 5.00% due 8/1/2024 - 8/1/2031 |
2,280,000 |
2,462,382 |
| |
New
Mexico Mortgage Finance Authority (Collateralized: GNMA, FNMA, FHLMC), Series F, 3.50% due 7/1/2050 |
9,015,000
|
9,193,632 |
See
notes to financial statements.
|
Thornburg Municipal
Funds Semi-Annual Report | 33 |
Schedule of Investments, Continued
Thornburg Limited Term Municipal Fund | March 31, 2022 (Unaudited)
| |
ISSUER-DESCRIPTION
|
Principal
Amount |
VALUE
|
|
a |
New
Mexico Mortgage Finance Authority (JLG Central 217 LLLP), 0.53% due 11/1/2024 (put 5/1/2024) |
$ 8,500,000
|
$ 8,240,333
|
| |
New
Mexico Municipal Energy Acquisition Authority, Series A, 4.00% due 11/1/2023 - 11/1/2024 |
2,650,000 |
2,739,201 |
| |
New
Mexico State University, Series B, 5.00% due 4/1/2022 |
575,000 |
575,000 |
| |
New
Mexico State University (Insured: BAM), Series A, 5.00% due 4/1/2029 |
1,645,000 |
1,894,553 |
| |
New
Mexico State University ETM, Series B, 5.00% due 4/1/2022 |
675,000 |
675,000 |
| |
Rio
Rancho Public School District No. 94 (State Aid Withholding) GO, Series A, 5.00% due 8/1/2026 |
1,085,000 |
1,205,134 |
| |
Santa
Fe County (County Buildings & Facilities) GRT, Series A, 5.00% due 6/1/2025 |
1,250,000 |
1,360,686 |
|
c |
Santa
Fe Public School District (State Aid Withholding) GO, 5.00% due 8/1/2029 - 8/1/2032 |
5,175,000 |
6,057,198 |
| |
State
of New Mexico Severance Tax Permanent Fund, Series A, 5.00% due 7/1/2026 |
600,000 |
670,820
|
| |
New
York — 6.0% |
|
|
| |
City
of New York (City Budget Financial Management) GO, |
|
|
| |
Series
D, 5.00% due 8/1/2022 |
3,000,000 |
3,038,166 |
| |
Series
G, 5.00% due 8/1/2022 - 8/1/2023 |
16,145,000
|
16,631,607 |
| |
Series
J, 5.00% due 8/1/2023 - 8/1/2024 |
33,130,000
|
35,068,425 |
| |
Series
K, 5.00% due 8/1/2022 |
13,075,000
|
13,244,648 |
| |
City
of New York GO, |
|
|
|
c |
5.00%
due 8/1/2032 |
2,000,000 |
2,427,352 |
| |
Series
J, 5.00% due 8/1/2026 |
750,000 |
836,714 |
| |
County
of Nassau (Insured: AGM) GO, Series A, 5.00% due 4/1/2028 - 4/1/2031 |
4,500,000 |
5,273,389 |
| |
County
of Suffolk (Insured: AGM) GO, |
|
|
| |
Series
A, 5.00% due 2/1/2025 |
800,000 |
860,230 |
| |
Series
B, 5.00% due 10/15/2026 |
1,000,000 |
1,110,126 |
| |
County
of Suffolk (Insured: BAM) GO, Series D, 5.00% due 10/15/2025 |
750,000 |
817,898 |
| |
Erie
County (State Aid Witholding) IDA, Series A, 5.00% due 5/1/2029 - 5/1/2030 |
3,300,000 |
3,929,177 |
| |
Long
Island Power Authority, Series A, 5.00% due 9/1/2026 - 9/1/2030 |
2,675,000 |
3,133,941 |
| |
Metropolitan
Transportation Authority, |
|
|
| |
Series
A-1, 5.00% due 11/15/2025 |
1,265,000 |
1,360,318 |
| |
Series
B, |
|
|
| |
4.00%
due 11/15/2026 |
1,660,000 |
1,753,609 |
| |
5.00%
due 11/15/2028 |
1,230,000 |
1,349,534 |
| |
Series
C-1, |
|
|
| |
5.00%
due 11/15/2027 |
1,070,000 |
1,158,241 |
| |
5.25%
due 11/15/2028 - 11/15/2029 |
16,100,000
|
17,542,062 |
| |
Series
D-1, 5.00% due 11/15/2028 - 11/15/2029 |
4,990,000 |
5,394,169 |
| |
Series
F, 5.00% due 11/15/2025 |
1,055,000 |
1,144,421 |
| |
Metropolitan
Transportation Authority (Green Bond), |
|
|
| |
Series
A2, 5.00% due 11/15/2027 |
3,450,000 |
3,789,214 |
| |
Series
B, 5.00% due 11/15/2025 - 11/15/2027 |
6,650,000 |
7,266,498 |
| |
Series
C-1, 5.00% due 11/15/2024 - 11/15/2026 |
6,840,000 |
7,425,445 |
| |
Metropolitan
Transportation Authority (Transit and Commuter System), Series B-1, 5.00% due 5/15/2022 |
15,430,000
|
15,485,054 |
| |
Monroe
County (St. John Fisher College) IDC, Series A, 5.00% due 6/1/2022 |
2,000,000 |
2,012,198 |
| |
Nassau
County Interim Finance Authority, Series A, 5.00% due 11/15/2025 |
700,000 |
774,821 |
|
a |
Nassau
County Local Economic Assistance Corp. (Park Lake Hempstead L.P.), 0.30% due 11/1/2024 (put 11/1/2023) |
4,000,000 |
3,896,876 |
| |
New
York City Municipal Water Finance Authority (New York City Water & Sewer System), Series DD, 5.00% due 6/15/2030 |
10,500,000
|
12,544,507 |
| |
New
York City Transitional Finance Authority Future Tax Secured Revenue, |
|
|
| |
5.00%
due 11/1/2024 - 11/1/2032 |
25,730,000
|
30,668,434 |
| |
Series
1, 5.00% due 11/1/2027 - 11/1/2029 |
6,500,000 |
7,516,523 |
| |
Series
D, 5.00% due 11/1/2025 |
750,000 |
822,766 |
| |
Series
G5, 5.00% due 5/1/2028 |
1,500,000 |
1,726,717 |
| |
New
York City Trust for Cultural Resources (Lincoln Center for the Performing Arts, Inc.), Series A, 5.00% due 12/1/2026 |
2,500,000 |
2,810,057 |
| |
New
York State Dormitory Authority, Series A, 5.00% due 3/15/2030 |
8,040,000 |
9,252,135 |
| |
New
York State Dormitory Authority (School Districts Financing Program) (State Aid Withholding), Series G, 5.00% due 10/1/2022 |
300,000 |
305,855 |
| |
New
York State Dormitory Authority (School Districts Financing Program; Insured: AGC) (State Aid Withholding), Series B, 5.25% due 10/1/2023 |
140,000 |
140,474 |
| |
New
York State Dormitory Authority (School Districts Financing Program; Insured: AGM) (State Aid Withholding), Series A, 5.00% due 10/1/2022 - 10/1/2024 |
6,300,000 |
6,606,759 |
| |
New
York State Dormitory Authority (State of New York Personal Income Tax Revenue), |
|
|
| |
Series
A, 5.00% due 3/15/2031 |
11,700,000
|
14,005,668 |
| |
Series
D 5.00% due 2/15/2032 |
8,320,000 |
9,752,588 |
| |
Series
D, 5.00% due 2/15/2030 |
1,230,000 |
1,454,319 |
| |
New
York State Dormitory Authority (State of New York Sales Tax Revenue), Series E, 5.00% due 3/15/2029 |
4,135,000 |
4,809,485 |
|
a |
New
York State Energy Research & Development Authority (New York State Electric & Gas Corp.), Series C, 2.625% due 4/1/2034 (put 7/3/2023) |
5,640,000 |
5,671,889 |
| |
New
York State Housing Finance Agency (Green Bond), Series I, 2.70% due 11/1/2023 |
2,125,000 |
2,146,433 |
| |
New
York State Thruway Authority, Series J, 5.00% due 1/1/2033 |
325,000 |
340,286 |
34 | Thornburg Municipal Funds Semi-Annual Report
|
See notes to
financial statements. |
Schedule of Investments,
Continued
Thornburg Limited Term Municipal Fund | March 31, 2022 (Unaudited)
| |
ISSUER-DESCRIPTION
|
Principal
Amount |
VALUE
|
| |
New
York State Thruway Authority (Governor Thomas E. Dewey Thruway), Series K, 5.00% due 1/1/2024 - 1/1/2025 |
$ 3,000,000
|
$ 3,201,165
|
| |
New
York State Urban Development Corp., |
|
|
| |
Series
D, 5.00% due 3/15/2024 |
1,000,000 |
1,030,824 |
| |
Series
E, 5.00% due 3/15/2031 |
5,000,000 |
5,911,150 |
| |
New
York State Urban Development Corp. (State of New York Personal Income Tax Revenue), Series A 4.00% due 3/15/2026 |
200,000 |
213,815 |
| |
State
of New York Mortgage Agency, |
|
|
| |
Series
223, |
|
|
| |
1.85%
due 4/1/2026 |
400,000 |
389,942 |
| |
1.90%
due 10/1/2026 |
815,000 |
791,433 |
| |
1.95%
due 4/1/2027 |
1,000,000 |
967,327 |
| |
2.00%
due 10/1/2027 |
775,000 |
746,865 |
| |
2.05%
due 4/1/2028 |
450,000 |
431,993 |
| |
2.25%
due 4/1/2030 |
1,320,000 |
1,244,039 |
| |
2.30%
due 10/1/2030 |
1,110,000 |
1,042,098 |
| |
Town
of Oyster Bay (Insured: AGM) GO, 4.00% due 3/1/2027 |
800,000 |
862,310 |
| |
Town
of Oyster Bay (Insured: BAM) GO, 4.00% due 11/1/2023 - 11/1/2026 |
2,670,000 |
2,803,522 |
| |
Town
of Oyster Bay GO, 4.00% due 3/1/2024 |
825,000 |
854,485 |
| |
Triborough
Bridge and Tunnel Authority (MTA Bridges and Tunnels), Series C-1, 5.00% due 11/15/2026 |
4,000,000 |
4,506,688 |
| |
West
Seneca Central School District (Insured: BAM) (State Aid Withholding) GO, 5.00% due 11/15/2022 |
1,000,000 |
1,023,725 |
| |
Westchester
County Local Development Corp. (Miriam Osborn Memorial Home Association Obligated Group), 5.00% due 7/1/2024 - 7/1/2028 |
1,395,000 |
1,511,596
|
| |
North
Carolina — 1.3% |
|
|
|
a |
Charlotte-Mecklenburg
Hospital Authority (Atrium Health Obligated Group), Series D, 5.00% due 1/15/2049 (put 12/1/2031) |
21,180,000
|
25,545,664 |
| |
Charlotte-Mecklenburg
Hospital Authority (Carolinas HealthCare System), Series A, 5.00% due 1/15/2023 - 1/15/2024 |
4,255,000 |
4,362,432 |
|
a |
Charlotte-Mecklenburg
Hospital Authority/The, Series B, 1.95% due 1/15/2048 (put 11/1/2029) |
1,000,000 |
962,971 |
| |
City
of Charlotte (Equipment Acquisition & Public Facilities) ETM COP, Series C, 5.00% due 12/1/2022 - 12/1/2025 |
6,840,000 |
7,248,967 |
|
a |
Columbus
County Industrial Facilities & Pollution Control Financing Authority (International Paper Co.), 2.00% due 11/1/2033 (put 10/1/2024) |
1,100,000 |
1,091,202 |
| |
County
of Buncombe (Primary, Middle School & Community College Facilities), Series A, 5.00% due 6/1/2022 - 6/1/2024 |
2,350,000 |
2,426,020 |
| |
County
of Dare (Educational Facility Capital Projects), |
|
|
| |
Series
A, |
|
|
| |
4.00%
due 6/1/2022 |
490,000 |
492,329 |
| |
5.00%
due 6/1/2024 |
700,000 |
725,803 |
| |
County
of Randolph, |
|
|
| |
Series
B, 5.00% due 10/1/2022 - 10/1/2023 |
2,495,000 |
2,565,524 |
| |
Series
C, 5.00% due 10/1/2023 |
400,000 |
421,251 |
| |
North
Carolina Turnpike Authority, 5.00% due 1/1/2023 - 1/1/2029 |
18,130,000
|
19,723,416 |
| |
Winston-Salem
State University (Student Housing and Student Services Facilities), 5.00% due 4/1/2022 |
945,000 |
945,000
|
| |
North
Dakota — 0.0% |
|
|
| |
County
of McKenzie, 5.00% due 8/1/2022 |
1,000,000 |
1,012,716
|
| |
Ohio
— 3.2% |
|
|
| |
American
Municipal Power, Inc. (AMP Fremont Energy Center), 5.00% due 2/15/2028 - 2/15/2032 |
6,200,000 |
7,342,488 |
| |
Cincinnati
City School District Board of Education (Educational Facilities; Insured: Natl-Re) GO, 5.25% due 12/1/2023 |
2,690,000 |
2,836,748 |
| |
City
of Cleveland (Municipal Street System Improvements) GO, |
|
|
| |
Series
A, |
|
|
| |
4.00%
due 12/1/2022 - 12/1/2023 |
6,725,000 |
6,908,198 |
| |
5.00%
due 12/1/2025 - 12/1/2026 |
7,165,000 |
7,912,919 |
| |
City
of Cleveland (Parks & Recreation Facilities), |
|
|
| |
Series
A2, 5.00% due 11/15/2022 |
1,030,000 |
1,053,123 |
| |
Series
A3, 5.00% due 10/1/2022 - 10/1/2023 |
1,230,000 |
1,269,983 |
| |
City
of Cleveland (Public Facilities Improvements), Series B1, 5.00% due 10/1/2025 - 10/1/2028 |
2,855,000 |
3,237,631 |
| |
City
of Cleveland (Public Facilities), Series A1, 5.00% due 10/1/2022 - 10/1/2023 |
2,060,000 |
2,129,646 |
| |
City
of Cleveland Income Tax Revenue, Series A1, 4.00% due 10/1/2031 |
500,000 |
564,302 |
| |
City
of Columbus GO, Series A, 5.00% due 4/1/2022 |
1,800,000 |
1,800,000 |
| |
City
of Toledo (Water System Improvements), 5.00% due 11/15/2022 - 11/15/2023 |
5,005,000 |
5,143,729 |
| |
City
of Toledo OH Water System Revenue, 5.00% due 11/15/2031 |
1,000,000 |
1,194,238 |
| |
County
of Cuyahoga (Convention Hotel Project) COP, 5.00% due 12/1/2023 - 12/1/2024 |
17,160,000
|
18,126,204 |
| |
County
of Hamilton Sales Tax Revenue, Series A, 5.00% due 12/1/2029 - 12/1/2032 |
2,620,000 |
3,223,320 |
| |
County
of Scioto (Southern Ohio Medical Center), 5.00% due 2/15/2025 |
1,695,000 |
1,824,886 |
| |
Franklin
County Convention Facilities Authority (Greater Columbus Convention Center) ETM, 5.00% due 12/1/2022 - 12/1/2024 |
1,500,000 |
1,588,953 |
|
a |
Lancaster
Port Authority, 5.00% due 8/1/2049 (put 2/1/2025) |
15,000,000
|
15,911,385 |
|
a |
Ohio
Higher Educational Facility Commission (Case Western Reserve University), Series C, 1.625% due 12/1/2034 (put 12/1/2026) |
2,200,000 |
2,131,580 |
| |
Ohio
Turnpike & Infrastructure Commission, Series A, 5.00% due 2/15/2027 - 2/15/2028 |
14,555,000
|
16,602,197 |
| |
Ohio
Water Development Authority, Series A, 5.00% due 12/1/2030 |
1,000,000 |
1,115,089 |
| |
State
of Ohio (Cleveland Clinic Health System Obligated Group), Series A, 5.00% due 1/1/2026 |
1,875,000
|
2,067,641 |
See
notes to financial statements.
|
Thornburg Municipal
Funds Semi-Annual Report | 35 |
Schedule of Investments, Continued
Thornburg Limited Term Municipal Fund | March 31, 2022 (Unaudited)
| |
ISSUER-DESCRIPTION
|
Principal
Amount |
VALUE
|
| |
State
of Ohio (Major New Street Infrastructure Project), Series 2016-1, 5.00% due 12/15/2026 |
$ 1,000,000
|
$ 1,115,994
|
| |
State
of Ohio GO, |
|
|
| |
Series
A, 5.00% due 6/15/2028 - 6/15/2031 |
4,775,000 |
5,712,188 |
| |
Series
C, 5.00% due 3/1/2030 - 3/1/2031 |
2,250,000 |
2,720,962 |
| |
Series
V, 5.00% due 5/1/2022 - 5/1/2028 |
35,610,000
|
38,291,878 |
| |
Youngstown
City School District (Educational Facilities) (State Aid Withholding) GO, 4.00% due 12/1/2022 - 12/1/2023 |
3,505,000 |
3,512,945
|
| |
Oklahoma
— 1.1% |
|
|
| |
Canadian
County Educational Facilities Authority (Mustang Public Schools Project) ISD, 5.00% due 9/1/2027 |
1,000,000 |
1,114,456 |
| |
Cleveland
County Educational Facilities Authority (Moore Public Schools) ISD, |
|
|
| |
4.00%
due 6/1/2030 - 6/1/2031 |
8,100,000 |
9,012,207 |
| |
5.00%
due 6/1/2023 - 6/1/2030 |
10,155,000
|
11,216,568 |
| |
Muskogee
Industrial Trust (Muskogee County No. 20) ISD, 5.00% due 9/1/2024 - 9/1/2027 |
3,550,000 |
3,881,864 |
| |
Oklahoma
(INTEGRIS Health) DFA, Series A, 5.00% due 8/15/2022 - 8/15/2025 |
4,725,000 |
4,958,016 |
| |
Oklahoma
Capitol Improvement Authority (State Highway Capital Improvement), 5.00% due 7/1/2023 |
325,000 |
338,218 |
| |
Oklahoma
County Finance Authority (Midwest City Public Service) ISD, 5.00% due 10/1/2022 - 10/1/2026 |
4,450,000 |
4,697,692 |
| |
Oklahoma
Municipal Power Authority (Power Supply System; Insured: AGM), Series A, 5.00% due 1/1/2028 - 1/1/2030 |
2,550,000 |
2,961,484 |
| |
Pontotoc
County Educational Facilities Authority (ADA Public Schools Project), 4.00% due 9/1/2026 - 9/1/2032 |
2,125,000 |
2,272,520 |
| |
Texas
Water Development Board (Texas Water Development Board State Revolving Fund), Series A, 4.00% due 9/1/2030 - 9/1/2031 |
9,250,000 |
10,200,498 |
| |
Tulsa
County Industrial Authority ISD, 5.00% due 9/1/2022 |
1,500,000 |
1,522,451
|
| |
Oregon
— 0.4% |
|
|
| |
Hillsboro
School District No. 1J (School Capital Improvements) (State Aid Withholding) GO, 5.00% due 6/15/2025 - 6/15/2027 |
9,130,000 |
10,197,569 |
|
a |
Oregon
Health & Science University (Oregon Health & Science University Obligated Group), Series B-2, 5.00% due 7/1/2046 (put 2/1/2032) |
6,780,000 |
8,119,003 |
| |
Tri-County
Metropolitan Transportation District of Oregon, Series A, 5.00% due 10/1/2028 |
2,845,000 |
3,288,100
|
| |
Pennsylvania
— 7.1% |
|
|
| |
Allegheny
County Higher Education Building Authority (Duquesne University of the Holy Spirit), Series A, 5.00% due 3/1/2023 - 3/1/2025 |
1,945,000 |
2,047,905 |
| |
Allegheny
County Hospital Development Authority, Series A, 5.00% due 7/15/2028 - 7/15/2029 |
7,425,000 |
8,552,332 |
| |
Allegheny
County Sanitary Authority (2015 Capital Project), 5.00% due 12/1/2023 - 12/1/2024 |
19,150,000
|
20,241,734 |
| |
Allegheny
County Sanitary Authority (2015 Capital Project; Insured: BAM), 5.00% due 12/1/2025 |
1,000,000 |
1,100,482 |
| |
Allegheny
County Sanitary Authority (Insured: BAM), 5.00% due 12/1/2029 |
2,830,000 |
3,108,390 |
| |
Altoona
Area School District (State Aid Withholding) (Insured: AGM) GO ETM, 3.00% due 12/1/2022 |
1,335,000 |
1,349,442 |
| |
Bethlehem
Area School District Authority (State Aid Withholding), |
|
|
|
a |
Series
A, 0.538% (SOFR + 0.35%) due 1/1/2030 (put 11/1/2025) |
2,995,000 |
2,893,868 |
|
a |
Series
C, 0.538% (SOFR + 0.35%) due 1/1/2032 (put 11/1/2025) |
2,995,000 |
2,893,862 |
| |
City
of Philadelphia (Insured: AGM) GO, 5.00% due 8/1/2025 - 8/1/2027 |
28,685,000
|
31,794,424 |
| |
City
of Philadelphia (Pennsylvania Gas Works), 5.00% due 8/1/2023 - 8/1/2025 |
11,150,000
|
11,806,823 |
| |
City
of Philadelphia (Water and Wastewater System), 5.00% due 10/1/2024 - 10/1/2026 |
5,455,000 |
5,953,670 |
| |
City
of Philadelphia Airport Revenue, Series A, 5.00% due 7/1/2029 |
1,000,000 |
1,154,440 |
| |
City
of Philadelphia GO, Series A, 5.00% due 8/1/2025 |
10,710,000
|
11,693,778 |
| |
City
of Philadelphia Water & Wastewater Revenue, |
|
|
| |
5.00%
due 10/1/2027 - 10/1/2031 |
9,205,000 |
10,908,829 |
| |
Series
C, 5.00% due 10/1/2032 |
1,355,000 |
1,645,130 |
| |
City
of Pittsburgh (Insured: BAM) GO, 5.00% due 9/1/2022 |
1,100,000 |
1,117,469 |
| |
Commonwealth
Financing Authority (Tobacco Master Settlement), 5.00% due 6/1/2023 |
930,000 |
961,218 |
| |
Commonwealth
of Pennsylvania (Capital Facilities) GO, Series D, 5.00% due 8/15/2023 - 8/15/2025 |
39,450,000
|
42,099,039 |
| |
Commonwealth
of Pennsylvania GO, 5.00% due 7/15/2030 |
12,930,000
|
15,223,860 |
| |
Cumberland
County Municipal Authority (Penn State Health Obligated Group), 5.00% due 11/1/2027 - 11/1/2029 |
3,150,000 |
3,639,086 |
| |
East
Hempfield Township (Student Services, Inc.) IDA, 5.00% due 7/1/2035 (pre-refunded 7/1/2025) |
1,060,000 |
1,162,185 |
| |
Economy
Borough Municipal Authority (Beaver County Sewer System; Insured: BAM) ETM, 4.00% due 12/15/2022 |
1,180,000 |
1,201,292 |
| |
Lancaster
County Solid Waste Management Authority (Harrisburg Resource Recovery Facility), |
|
|
| |
Series
A, |
|
|
| |
5.00%
due 12/15/2023 |
2,680,000 |
2,823,736 |
| |
5.25%
due 12/15/2024 |
4,770,000 |
5,041,251 |
| |
Luzerne
County (Insured: AGM) GO, Series A, 5.00% due 11/15/2022 - 11/15/2024 |
9,160,000 |
9,633,870 |
| |
Luzerne
County (Insured: AGM) IDA GO, 5.00% due 12/15/2022 - 12/15/2027 |
5,045,000 |
5,396,196 |
| |
Montgomery
County Higher Education & Health Authority (Abington Memorial Hospital), 5.00% due 6/1/2022 |
2,800,000 |
2,816,663 |
| |
Montgomery
County Higher Education & Health Authority (Thomas Jefferson University Obligated Group), 5.00% due 9/1/2026 - 9/1/2029 |
3,575,000 |
4,046,155 |
| |
Northampton
Borough Municipal Authority (Water System; Insured: AGM), |
|
|
| |
3.00%
due 5/15/2023 |
1,255,000 |
1,257,998 |
| |
4.00%
due 5/15/2022 |
1,185,000 |
1,189,217 |
| |
Pennsylvania
(Presbyterian Homes Obligated Group) EDFA, 4.00% due 7/1/2030 |
1,600,000 |
1,717,003 |
| |
Pennsylvania
(UPMC Obligated Group) EDFA, |
|
|
| |
5.00%
due 3/15/2026 |
220,000 |
241,410 |
| |
Series
A, 5.00% due 11/15/2026 |
2,310,000
|
2,565,343 |
36 | Thornburg Municipal Funds Semi-Annual Report
|
See notes to
financial statements. |
Schedule of Investments,
Continued
Thornburg Limited Term Municipal Fund | March 31, 2022 (Unaudited)
| |
ISSUER-DESCRIPTION
|
Principal
Amount |
VALUE
|
| |
Series
A-1, 5.00% due 4/15/2024 - 4/15/2030 |
$10,095,000
|
$ 11,399,980
|
|
a |
Pennsylvania
(Waste Management Obligated Group; Guaranty: Waste Management, Inc.) EDFA, 0.95% due 12/1/2033 (put 12/1/2026) |
19,000,000
|
17,834,331 |
| |
Pennsylvania
Higher Educational Facilities Authority (Shippensburg University Student Services, Inc. Student Housing) ETM, 4.00% due 10/1/2022 |
540,000 |
547,543 |
| |
Pennsylvania
Higher Educational Facilities Authority (University of Pennsylvania Health System), 5.00% due 8/15/2027 |
1,000,000 |
1,141,375 |
| |
Pennsylvania
Housing Finance Agency, Series 137, 5.00% due 4/1/2029 - 10/1/2029 |
675,000 |
771,853 |
| |
Pennsylvania
Turnpike Commission, |
|
|
| |
Series
A-1, 5.00% due 12/1/2022 - 12/1/2027 |
5,050,000 |
5,584,770 |
| |
Series
B, 5.00% due 12/1/2028 - 12/1/2031 |
5,025,000 |
5,986,167 |
| |
Philadelphia
(Philadelphia) IDA, 5.00% due 5/1/2024 - 5/1/2028 |
2,975,000 |
3,286,390 |
| |
Philadelphia
Gas Works Co. (Insured: AGM), Series A, 5.00% due 8/1/2025 - 8/1/2031 |
4,235,000 |
4,893,897 |
| |
Philadelphia
Municipal Authority (Juvenile Justice Services Center), 5.00% due 4/1/2022 - 4/1/2027 |
7,020,000 |
7,477,272 |
| |
Pittsburgh
Water & Sewer Authority (Insured: AGM), Series B, 5.00% due 9/1/2028 - 9/1/2031 |
1,745,000 |
2,019,743 |
| |
Pittsburgh
Water and Sewer Authority, |
|
|
| |
Series
A, 5.00% due 9/1/2024 |
7,365,000 |
7,665,823 |
| |
Series
B, 5.00% due 9/1/2024 (pre-refunded 9/1/2023) |
2,395,000 |
2,503,541 |
| |
Pittsburgh
Water and Sewer Authority ETM, Series B, 5.00% due 9/1/2023 |
2,520,000 |
2,631,455 |
| |
Plum
Borough School District (Insured: BAM) (State Aid Withholding) GO, |
|
|
| |
Series
A, 5.00% due 9/15/2022 - 9/15/2024 |
4,790,000 |
4,957,507 |
| |
Series
B, 5.00% due 9/15/2023 |
470,000 |
490,216 |
| |
School
District of Philadelphia (State Aid Withholding) (Green Bond) GO, Series B, 5.00% due 9/1/2027 - 9/1/2031 |
6,480,000 |
7,525,046 |
| |
School
District of Philadelphia (State Aid Withholding) GO, Series A, 5.00% due 9/1/2023 - 9/1/2031 |
8,100,000 |
9,210,608 |
| |
Southeastern
Pennsylvania Transportation Authority, 5.00% due 6/1/2022 - 6/1/2028 |
7,705,000 |
8,415,530 |
| |
Sports
& Exhibition Authority of Pittsburgh and Allegheny County (Allegheny County Hotel Room Excise Tax Revenue; Insured: AGM), Series A 5.00% due 2/1/2030 - 2/1/2032 |
14,095,000
|
16,475,151 |
| |
Sports
& Exhibition Authority of Pittsburgh and Allegheny County (Allegheny Regional Asset District; Insured: AGM), 5.00% due 2/1/2029 - 2/1/2030 |
7,075,000 |
8,189,778 |
| |
York
County GO, Series A, 5.00% due 6/1/2028 - 6/1/2030 |
3,000,000 |
3,533,120
|
| |
Rhode
Island — 0.9% |
|
|
| |
Rhode
Island Clean Water Finance Agency (Public Drinking Water Supply or Treatment Facilities), Series B, 5.00% due 10/1/2022 - 10/1/2023 |
4,660,000 |
4,816,523 |
| |
Rhode
Island Commerce Corp., |
|
|
| |
Series
A, 5.00% due 5/15/2031 |
6,875,000 |
8,126,133 |
| |
Series
B, 5.00% due 6/15/2028 |
2,060,000 |
2,282,595 |
| |
Rhode
Island Health and Educational Building Corp. (Providence College), Series B, 5.00% due 11/1/2028 - 11/1/2029 |
655,000 |
765,040 |
| |
Rhode
Island Health and Educational Building Corp. (University of Rhode Island Auxiliary Enterprise), Series C, 5.00% due 9/15/2023 |
1,400,000 |
1,464,026 |
| |
Rhode
Island Health and Educational Building Corp. (University of Rhode Island), Series B, 5.00% due 9/15/2022 - 9/15/2025 |
965,000 |
1,021,196 |
| |
Rhode
Island Housing and Mortgage Finance Corp, Series 76-A 5.00% due 10/1/2027 - 10/1/2029 |
635,000 |
728,478 |
| |
State
of Rhode Island and Providence Plantations (Consolidated Capital Development Loan) GO, |
|
|
| |
Series
A, 5.00% due 8/1/2022 |
9,825,000 |
9,950,839 |
| |
Series
B, 4.00% due 10/15/2022 |
1,000,000 |
1,014,965 |
| |
State
of Rhode Island and Providence Plantations (Energy Conservation) COP, Series C, 5.00% due 4/1/2022 |
2,020,000 |
2,020,000 |
| |
State
of Rhode Island and Providence Plantations (Information Technology) COP, Series C, 5.00% due 11/1/2024 |
3,010,000 |
3,230,335 |
| |
State
of Rhode Island and Providence Plantations (Kent County Courthouse) COP, Series A, 5.00% due 10/1/2022 - 10/1/2023 |
3,600,000 |
3,708,395 |
| |
State
of Rhode Island and Providence Plantations (Training School) COP, Series B, 5.00% due 10/1/2022 - 10/1/2023 |
5,325,000 |
5,471,449
|
| |
South
Carolina — 0.3% |
|
|
| |
Beaufort-Jasper
Water & Sewer Authority (Waterworks & Sewer System), Series B, 5.00% due 3/1/2023 - 3/1/2025 |
3,000,000 |
3,177,170 |
| |
Berkeley
County School District (School Facility Equipment Acquisition), 5.00% due 12/1/2024 |
2,000,000 |
2,152,898 |
| |
Charleston
County (South Aviation Avenue Construction), 5.00% due 12/1/2022 - 12/1/2023 |
4,270,000 |
4,444,944 |
| |
City
of Charleston Public Facilities Corp. (City of Charleston Project), Series A, 5.00% due 9/1/2022 - 9/1/2025 |
1,700,000 |
1,815,019 |
| |
SCAGO
Educational Facilities Corp. (School District of Pickens County), 5.00% due 12/1/2022 - 12/1/2025 |
3,510,000 |
3,729,066
|
| |
South
Dakota — 0.2% |
|
|
| |
County
of Lawrence (Insured: AGM) COP, |
|
|
| |
4.00%
due 12/1/2032 |
460,000 |
506,410 |
| |
5.00%
due 12/1/2025 - 12/1/2029 |
310,000 |
353,477 |
| |
South
Dakota Building Authority, |
|
|
| |
Series
B, |
|
|
| |
5.00%
due 6/1/2022 |
500,000 |
503,194 |
| |
5.00%
due 6/1/2024 (pre-refunded 6/1/2023) |
1,000,000 |
1,037,433 |
| |
South
Dakota Health & Educational Facilities Authority (Monument Health Obligated Group), Series A, 5.00% due 9/1/2025 - 9/1/2027 |
3,350,000 |
3,738,934 |
| |
South
Dakota Health & Educational Facilities Authority (Sanford Health), 5.00% due 11/1/2022 - 11/1/2025 |
2,475,000 |
2,621,714
|
| |
Tennessee
— 0.8% |
|
|
| a |
Tennergy
Corp. (Guaranty: Morgan Stanley Group), Series A, 4.00% due 12/1/2051 (put 9/1/2028) |
14,730,000
|
15,629,502 |
See
notes to financial statements.
|
Thornburg Municipal
Funds Semi-Annual Report | 37 |
Schedule of Investments, Continued
Thornburg Limited Term Municipal Fund | March 31, 2022 (Unaudited)
| |
ISSUER-DESCRIPTION
|
Principal
Amount |
VALUE
|
| |
Tennessee
Energy Acquisition Corp. (The Gas Project; Guaranty: Goldman Sachs Group, Inc.), Series A, 5.25% due 9/1/2023 |
$ 1,115,000
|
$ 1,166,202
|
|
a |
Tennessee
Energy Acquisition Corp. (The Tennessee Energy Acquisition Corp.; Guaranty: Goldman Sachs Group, Inc.), Series A, 5.00% due 5/1/2052 (put 11/1/2031) |
18,000,000
|
20,641,518
|
| |
Texas
— 13.5% |
|
|
|
c |
Arlington
Higher Education Finance Corp (Riverwalk Education Foundation, Inc.) (Insured: PSF-GTD), 5.00% due 8/15/2029 - 8/15/2032 |
1,130,000 |
1,326,383 |
| |
Austin
(Insured: PSF-GTD) ISD GO, Series B 5.00% due 8/1/2032 |
3,530,000 |
4,306,247 |
| |
Austin
Community College District GO, 5.00% due 8/1/2028 - 8/1/2031 |
4,980,000 |
5,893,909 |
| |
Bexar
County Hospital District (University Health System) GO, 5.00% due 2/15/2023 - 2/15/2027 |
6,105,000 |
6,627,198 |
| |
City
of Austin (Electric Utility), Series A, 5.00% due 11/15/2029 - 11/15/2031 |
7,400,000 |
8,852,288 |
| |
City
of Beaumont (Waterworks & Sewer System Improvements; Insured: AGM), Series A, 5.00% due 9/1/2023 - 9/1/2024 |
7,500,000 |
7,867,042 |
| |
City
of Beaumont GO, 5.00% due 3/1/2023 - 3/1/2026 |
2,930,000 |
3,187,021 |
| |
City
of Brownsville (Water, Wastewater & Electric Utilities Systems), |
|
|
| |
5.00%
due 9/1/2022 |
1,300,000 |
1,320,481 |
| |
Series
A, 5.00% due 9/1/2022 - 9/1/2023 |
3,900,000 |
4,027,147 |
| |
City
of Bryan (Electric System Improvements), Series B, 5.00% due 7/1/2026 |
535,000 |
592,403 |
| |
City
of Bryan Electric System Revenue (Insured: AGM), Series A, 5.00% due 7/1/2027 - 7/1/2030 |
1,600,000 |
1,893,889 |
| |
City
of Conroe GO, 5.00% due 3/1/2026 - 3/1/2029 |
810,000 |
921,069 |
| |
City
of Dallas (Public Improvements) GO, 5.00% due 2/15/2025 |
3,000,000 |
3,251,337 |
| |
City
of Dallas (Trinity River Corridor Infrastructure) GO, |
|
|
| |
5.00%
due 2/15/2024 - 2/15/2026 |
20,640,000
|
21,810,575 |
| |
Series
A, 5.00% due 2/15/2024 |
10,235,000
|
10,528,908 |
| |
City
of Dallas TX GO, Series A, 5.00% due 2/15/2028 |
1,325,000 |
1,523,276 |
| |
City
of El Paso GO, |
|
|
| |
Series
B, 5.00% due 8/15/2028 - 8/15/2031 |
1,380,000 |
1,627,278 |
| |
Series
C, 5.00% due 8/15/2028 - 8/15/2031 |
1,615,000 |
1,907,757 |
| |
City
of Houston (Airport System), |
|
|
| |
Series
B, 5.00% due 7/1/2025 - 7/1/2028 |
9,105,000 |
10,129,633 |
| |
Series
D, 5.00% due 7/1/2027 |
3,355,000 |
3,782,122 |
| |
City
of Houston (Combined Utility System), |
|
|
| |
Series
A, 5.00% due 11/15/2028 - 11/15/2031 |
3,475,000 |
4,158,497 |
| |
Series
C, 5.00% due 5/15/2022 - 5/15/2024 |
14,695,000
|
15,338,173 |
| |
Series
D, 5.00% due 11/15/2022 - 11/15/2024 |
17,535,000
|
18,353,388 |
| |
City
of Houston (Public Improvements) GO, Series A, 5.00% due 3/1/2023 - 3/1/2028 |
48,505,000
|
52,747,841 |
| |
City
of Laredo (Acquire & Purchase Personal Property) GO, 5.00% due 2/15/2023 - 2/15/2026 |
3,695,000 |
3,954,847 |
| |
City
of Laredo (City Infrastructure Improvements) GO, Series A, 5.00% due 2/15/2023 - 2/15/2027 |
2,600,000 |
2,823,654 |
| |
City
of Laredo (Sports Venues; Insured: AGM) ETM, 5.00% due 3/15/2023 - 3/15/2024 |
1,800,000 |
1,865,540 |
| |
City
of Lubbock (Waterworks System) GO, 5.00% due 2/15/2023 - 2/15/2025 |
27,040,000
|
28,778,452 |
| |
City
of Lubbock Electric Light & Power System Revenue, 5.00% due 4/15/2026 - 4/15/2031 |
4,950,000 |
5,701,645 |
| |
City
of McAllen (International Toll Bridge System; Insured: AGM), Series A, 5.00% due 3/1/2024 - 3/1/2027 |
3,015,000 |
3,259,435 |
| |
City
of Pflugerville GO, 5.00% due 8/1/2026 |
900,000 |
1,007,378 |
|
a |
City
of San Antonio, 1.75% due 2/1/2049 (put 12/1/2025) |
10,750,000
|
10,606,358 |
| |
City
of San Antonio (CPS Energy), 5.25% due 2/1/2024 |
7,100,000 |
7,502,776 |
| |
City
of San Antonio (San Antonio Water System), Series A, 5.00% due 5/15/2023 - 5/15/2026 |
3,700,000 |
3,980,439 |
| |
City
of San Antonio Public Facilities Corp. (Convention Center Refinancing & Expansion), 5.00% due 9/15/2022 |
1,450,000 |
1,474,464 |
| |
City
of San Antonio TX Electric & Gas Systems Revenue, 5.25% due 2/1/2025 |
1,000,000 |
1,084,079 |
| |
Clifton
Higher Education Finance Corp. (Idea Public Schools), 5.00% due 8/15/2023 |
575,000 |
590,258 |
| |
Clifton
Higher Education Finance Corp. (Idea Public Schools) (Insured: PSF-GTD), |
|
|
| |
5.00%
due 8/15/2027 |
535,000 |
606,989 |
| |
Series
T 5.00% due 8/15/2028 - 8/15/2032 |
1,315,000 |
1,565,398 |
| |
Comal
(Insured: PSF-GTD) ISD GO, 5.00% due 2/1/2025 - 2/1/2029 |
3,055,000 |
3,514,036 |
| |
Conroe
(Insured: PSF-GTD) ISD GO, |
|
|
| |
5.00%
due 2/15/2031 |
500,000 |
575,571 |
| |
Series
A, 5.00% due 2/15/2030 |
2,000,000 |
2,391,312 |
| |
County
of Harris TX GO, Series A, 5.00% due 10/1/2026 |
250,000 |
280,530 |
| |
Cypress-Fairbanks
(Insured: PSF-GTD) ISD GO, |
|
|
| |
Series
A, 5.00% due 2/15/2029 - 2/15/2031 |
3,500,000 |
4,196,474 |
|
a |
Series
A-2, 1.25% due 2/15/2036 (put 8/15/2022) |
5,500,000 |
5,504,031 |
|
a |
Series
B-1, 1.25% due 2/15/2036 (put 8/15/2022) |
3,500,000 |
3,502,565 |
|
a |
Series
B-3, 1.25% due 2/15/2040 (put 8/15/2022) |
6,750,000 |
6,754,948 |
| |
Dallas
County Utility & Reclamation District GO, 5.00% due 2/15/2023 - 2/15/2027 |
10,005,000
|
10,922,773 |
| |
Dallas
Fort Worth International Airport, Series A 5.00% due 11/1/2027 |
1,000,000 |
1,134,092 |
| |
Del
Valle TX (Insured: PSF-GTD) ISD GO, 4.00% due 6/15/2027 |
575,000 |
624,240 |
38 | Thornburg Municipal Funds Semi-Annual Report
|
See notes to
financial statements. |
Schedule of Investments,
Continued
Thornburg Limited Term Municipal Fund | March 31, 2022 (Unaudited)
| |
ISSUER-DESCRIPTION
|
Principal
Amount |
VALUE
|
| |
Denton
(Insured: PSF-GTD) ISD GO, |
|
|
|
a |
2.00%
due 8/1/2043 (put 8/1/2023) |
$ 700,000
|
$ 701,831
|
|
a |
Series
B-REM 2.00% due 8/1/2044 (pre-refunded 8/1/2024) |
340,000 |
337,968 |
| |
Elgin
(Insured: PSF-GTD) ISD GO, 5.00% due 8/1/2029 - 8/1/2032 |
4,940,000 |
5,991,916 |
|
a |
Goose
Creek (Insured: PSF-GTD) ISD GO, Series B, 0.15% due 10/1/2049 (put 10/3/2022) |
1,000,000 |
995,181 |
| |
Greater
Texas Cultural Education Facilities Finance Corp., 5.00% due 3/1/2027 |
400,000 |
449,210 |
| |
Greater
Texas Cultural Education Facilities Finance Corp. (County of Fort Bend), Series A, 5.00% due 3/1/2030 |
475,000 |
559,337 |
| |
Gulf
Coast Waste Disposal Authority (Bayport Area Wastewater Treatment System; Insured: AGM), 5.00% due 10/1/2022 - 10/1/2025 |
3,485,000 |
3,662,207 |
| |
Harris
County (Flood Control) GO, Series A, 5.00% due 10/1/2025 - 10/1/2027 |
14,305,000
|
16,342,090 |
| |
Harris
County (Tax Road) GO, Series A, 5.00% due 10/1/2025 - 10/1/2028 |
8,985,000 |
10,192,122 |
| |
Harris
County (Texas Permanent Improvement) GO, Series A, 5.00% due 10/1/2025 - 10/1/2027 |
11,565,000
|
13,100,264 |
|
a |
Harris
County Cultural Education Facilities Finance Corp. (Memorial Hermann Health System Obligated Group), 5.00% due 6/1/2032 (put 12/1/2026) |
1,300,000 |
1,446,182 |
| |
Harris
County Cultural Education Facilities Finance Corp. (Memorial Hermann Health), Series A, 5.00% due 12/1/2022 - 12/1/2025 |
6,445,000 |
6,882,095 |
| |
Harris
County Cultural Education Facilities Finance Corp. (TECO Project), 5.00% due 11/15/2023 - 11/15/2027 |
5,300,000 |
5,941,197 |
|
a |
Harris
County Cultural Education Facilities Finance Corp. (Texas Children’s Hospital Obligated Group), 5.00% due 10/1/2051 (put 10/1/2031) |
20,265,000
|
24,309,529 |
| |
Harris
County Cultural Education Facilities Finance Corp. (Texas Medical Center), |
|
|
| |
Series
A, |
|
|
| |
5.00%
due 5/15/2026 - 5/15/2029 |
8,250,000 |
9,272,056 |
|
b |
5.00%
due 5/15/2028 |
2,450,000 |
2,804,072 |
| |
Harris
County-Houston Sports Authority (Insured: AGM), Series A, 5.00% due 11/15/2022 - 11/15/2024 |
18,995,000
|
20,037,408 |
| |
Harris
County-Houston Sports Authority (Insured: AGM) ETM, Series A, 5.00% due 11/15/2022 |
4,320,000 |
4,419,896 |
| |
Hays
County GO, 5.00% due 2/15/2023 - 2/15/2025 |
5,250,000 |
5,467,051 |
|
a |
Houston
(Insured: PSF-GTD) ISD GO, Series B, 3.00% due 6/1/2036 (put 6/1/2024) |
3,000,000 |
3,063,729 |
| |
Houston
Community College System GO, Series A, 5.00% due 2/15/2030 - 2/15/2031 |
4,430,000 |
5,292,563 |
| |
Houston
Higher Education Finance Corp. (KIPP, Inc.; Insured: PSF-GTD), 5.00% due 8/15/2022 |
1,185,000 |
1,201,782 |
| |
Katy
(Educational Facilities Improvements; Insured: PSF-GTD) ISD GO, Series A, 5.00% due 2/15/2023 - 2/15/2026 |
9,670,000 |
10,399,230 |
| |
Keller
(Insured: PSF-GTD) ISD GO, Series A, 5.00% due 8/15/2023 |
1,715,000 |
1,789,349 |
| |
La
Salle County (Insured: AGM) GO, 5.00% due 3/1/2023 - 3/1/2028 |
18,075,000
|
19,783,126 |
| |
Laredo
Community College District (School Facilities Improvements) GO, 5.00% due 8/1/2022 - 8/1/2024 |
1,980,000 |
2,064,590 |
| |
Lower
Colorado River Authority, |
|
|
| |
Series
A, |
|
|
| |
5.00%
due 5/15/2025 |
8,020,000 |
8,057,734 |
| |
5.00%
due 5/15/2025 (pre-refunded 5/15/2022) |
55,000 |
55,253 |
| |
Lower
Colorado River Authority (Insured: AGM), 5.00% due 5/15/2031 - 5/15/2032 |
8,000,000 |
9,613,146 |
| |
Lower
Colorado River Authority (LCRA Transmission Services Corp.), 5.00% due 5/15/2030 - 5/15/2032 |
3,890,000 |
4,601,435 |
| |
Lubbock
Electric Light & Power System Revenue, 5.00% due 4/15/2032 |
1,000,000 |
1,169,953 |
| |
Metropolitan
Transit Authority of Harris County, |
|
|
| |
5.00%
due 11/1/2022 - 11/1/2028 |
18,750,000
|
20,798,369 |
| |
Series
D, 5.00% due 11/1/2022 - 11/1/2027 |
7,355,000 |
7,937,798 |
| |
New
Caney (Insured: PSF-GTD) ISD GO, |
|
|
|
a |
1.25%
due 2/15/2050 (put 8/15/2024) |
2,500,000 |
2,461,127 |
| |
5.00%
due 2/15/2024 (pre-refunded 8/15/2022) |
865,000 |
877,530 |
| |
North
Fort Bend Water Authority, Series B 5.00% due 12/15/2029 |
1,130,000 |
1,331,395 |
| |
North
Fort Bend Water Authority (Insured: BAM), 5.00% due 12/15/2028 - 12/15/2029 |
950,000 |
1,115,063 |
| |
North
Harris County Regional Water Authority (Regional Water Production Design, Acquisition and Construction), 5.00% due 12/15/2023 - 12/15/2026 |
4,490,000 |
4,911,331 |
| |
North
Texas Tollway Authority (North Texas Tollway System), |
|
|
| |
Series
A, 5.00% due 1/1/2026 - 1/1/2029 |
7,550,000 |
8,589,851 |
| |
Series
B, 5.00% due 1/1/2029 - 1/1/2031 |
4,350,000 |
5,107,384 |
| |
Pecos
Barstow Toyah (Insured: PSF-GTD) ISD GO, |
|
|
| |
4.00%
due 2/15/2031 |
1,445,000 |
1,618,539 |
| |
5.00%
due 2/15/2030 |
3,600,000 |
4,297,057 |
|
a |
Pflugerville
(Insured: PSF-GTD) ISD GO, Series A, 2.25% due 8/15/2037 (put 8/15/2022) |
2,750,000 |
2,761,627 |
| |
Port
Authority of Houston of Harris County Texas GO, Series A-2, 5.00% due 10/1/2030 |
400,000 |
481,793 |
| |
Rio
Grande City (Insured: PSF-GTD) ISD GO, 5.00% due 8/15/2025 - 8/15/2031 |
5,305,000 |
6,185,988 |
| |
Round
Rock (Educational Facilities Improvements) ISD GO, 5.00% due 8/1/2026 - 8/1/2027 |
2,100,000 |
2,365,313 |
| |
Round
Rock (Educational Facilities Improvements; Insured: PSF-GTD) ISD GO, |
|
|
| |
5.00%
due 8/1/2022 - 8/1/2026 |
2,245,000 |
2,405,893 |
| |
5.00%
due 8/1/2028 - 8/1/2029 (pre-refunded 8/1/2025) |
5,820,000 |
6,369,373 |
| |
San
Antonio (Insured: PSF-GTD) ISD GO, Series B, 5.00% due 8/15/2027 - 8/15/2029 |
4,150,000 |
4,845,567 |
|
a |
San
Antonio Housing Trust Finance Corp. (Arbors at West Avenue L.P.), 1.45% due 3/1/2026 (put 3/1/2025) |
1,500,000 |
1,465,690 |
| |
San
Antonio Water System, |
|
|
| |
Series
A, 5.00% due 5/15/2023 |
425,000 |
440,364 |
See
notes to financial statements.
|
Thornburg Municipal
Funds Semi-Annual Report | 39 |
Schedule of Investments, Continued
Thornburg Limited Term Municipal Fund | March 31, 2022 (Unaudited)
| |
ISSUER-DESCRIPTION
|
Principal
Amount |
VALUE
|
| |
Series
C, 5.00% due 5/15/2029 - 5/15/2030 |
$ 2,000,000
|
$ 2,364,601
|
| |
Stephen
F Austin State University, 5.00% due 10/15/2022 - 10/15/2029 |
6,480,000 |
7,218,077 |
| |
Sugar
Land Waterworks And Sewer Revenue, 5.00% due 8/15/2029 |
2,010,000 |
2,380,783 |
| |
Tarrant
County Cultural Education Facilities Finance Corp. (Methodist Hospitals of Dallas Obligated Group), 5.00% due 10/1/2030 - 10/1/2031 |
1,770,000 |
2,131,835 |
| |
Tarrant
Regional Water District, Series A, 5.00% due 3/1/2023 - 3/1/2027 |
7,200,000 |
7,826,182 |
| |
Texas
Municipal Gas Acquisition & Supply Corp. III (Guaranty: Macquarie Group Ltd.), |
|
|
| |
5.00%
due 12/15/2025 - 12/15/2030 |
3,125,000 |
3,395,495 |
|
b |
5.00%
due 12/15/2029 |
625,000 |
692,705 |
| |
Texas
State University System, |
|
|
| |
Series
A, |
|
|
| |
4.00%
due 3/15/2032 |
1,050,000 |
1,171,522 |
| |
5.00%
due 3/15/2028 - 3/15/2030 |
13,090,000
|
15,171,443 |
| |
Texas
Transportation Commission (Central Texas Turnpike System), Series C, 5.00% due 8/15/2022 - 8/15/2024 |
2,130,000 |
2,224,934 |
| |
Texas
Transportation Commission (Highway Improvements) GO, Series A, 5.00% due 4/1/2022 - 4/1/2024 |
10,380,000
|
10,732,283 |
| |
Texas
Transportation Commission State Highway Fund, Series A, 5.00% due 4/1/2024 |
1,650,000 |
1,751,782 |
| |
Texas
Water Development Board, 5.00% due 8/1/2031 |
2,920,000 |
3,508,292 |
| |
Texas
Water Development Board (Texas Water Development Board State Revolving Fund), 5.00% due 8/1/2029 - 8/1/2031 |
6,180,000 |
7,417,516 |
| |
Waco
Educational Finance Corp. (Baylor University), 5.00% due 3/1/2029 - 3/1/2031 |
3,220,000 |
3,800,875 |
| |
Walnut
Creek Special Utility District (Water System Improvements; Insured: BAM), 5.00% due 1/10/2024 |
750,000 |
795,398
|
| |
Utah
— 1.1% |
|
|
|
a |
County
of Utah (IHC Health Services, Inc. Obligated Group), Series B-1, 5.00% due 5/15/2056 (put 8/1/2022) |
9,500,000 |
9,528,035 |
| |
Granite
School District Board of Education (Insured: SCH BD GTY) GO, 5.00% due 6/1/2030 |
4,135,000 |
5,007,175 |
| |
University
of Utah, Series A-1, 5.00% due 8/1/2029 - 8/1/2031 |
1,350,000 |
1,611,663 |
| |
Utah
State Board of Regents (Insured: Natl-Re), Series A, 5.50% due 4/1/2029 |
30,365,000
|
35,587,355 |
| |
Utah
Transit Authority (Integrated Mass Transit System), Series A, 5.00% due 6/15/2022 - 6/15/2025 |
3,545,000 |
3,742,050
|
| |
Virginia
— 0.9% |
|
|
| |
County
of Fairfax (State Aid Withholding) GO, |
|
|
| |
Series
A, |
|
|
| |
4.50%
due 10/1/2027 |
4,975,000 |
5,614,646 |
| |
5.00%
due 10/1/2030 |
2,000,000 |
2,414,998 |
| |
County
of Henrico (State Aid Witholding) GO, Series A, 5.00% due 8/1/2030 |
1,000,000 |
1,209,898 |
| |
Fairfax
County (Inova Health System) IDA, |
|
|
| |
4.00%
due 5/15/2022 |
5,550,000 |
5,568,287 |
| |
5.00%
due 5/15/2022 |
5,000,000 |
5,022,135 |
|
a,c |
Halifax
County IDA, 1.65% due 12/1/2041 (put 5/31/2024) |
2,000,000 |
1,973,606 |
| |
Hampton
Roads Transportation Accountability Commission, Series A, 5.00% due 7/1/2026 |
5,000,000 |
5,581,565 |
| |
Virginia
College Building Authority, Series A, 5.00% due 2/1/2029 |
3,165,000 |
3,716,488 |
| |
Virginia
Commonwealth Transportation Board, 5.00% due 9/15/2028 |
3,945,000 |
4,521,333 |
| |
Virginia
Small Business Financing Authority (National Senior Campuses, Inc. Obligated Group), Series A, 5.00% due 1/1/2025 - 1/1/2030 |
4,685,000 |
5,177,328 |
|
a |
Wise
County IDA, Series A, 1.20% due 11/1/2040 (put 5/31/2024) |
5,155,000 |
5,029,259
|
| |
Washington
— 3.1% |
|
|
| |
Central
Puget Sound Regional Transit Authority (Central Puget Sound Regional Transit Auth Sales Motor Vehicle & Rental Car Taxe) (Green Bond), Series S-1 5.00% due 11/1/2032 |
9,800,000 |
11,991,731 |
| |
Central
Puget Sound Regional Transit Authority (Green Bond), Series S-1, 5.00% due 11/1/2029 |
2,650,000 |
3,157,613 |
| |
Clark
County School District No 37 Vancouver (State Aid Withholding) GO, 5.00% due 12/1/2026 - 12/1/2028 |
1,700,000 |
1,956,538 |
| |
Energy
Northwest (Nine Canyon Wind Project Phase I-III), 5.00% due 7/1/2022 - 7/1/2025 |
2,850,000 |
2,969,744 |
| |
King
County Housing Authority, |
|
|
| |
2.00%
due 12/1/2023 |
800,000 |
800,844 |
| |
3.00%
due 6/1/2024 - 12/1/2025 |
3,285,000 |
3,345,500 |
| |
4.00%
due 6/1/2026 - 12/1/2031 |
3,825,000 |
4,063,453 |
| |
Marysville
School District No. 25 (Snohomish County Educational Facilities) (State Aid Withholding) GO, 5.00% due 12/1/2022 - 12/1/2023 |
4,320,000 |
4,449,546 |
| |
Skagit
County Public Hospital District No. 1 (Skagit Regional Health) ETM, Series A, 5.00% due 12/1/2022 - 12/1/2023 |
1,250,000 |
1,302,110 |
| |
Skagit
County Public Hospital District No. 1 (Skagit Regional Health) GO, 5.00% due 12/1/2022 |
3,635,000 |
3,718,816 |
| |
Skagit
County Public Hospital District No. 2 (Island Hospital) GO, 5.00% due 12/1/2022 |
1,700,000 |
1,739,199 |
| |
State
of Washington, Series E, 5.00% due 6/1/2028 |
4,905,000 |
5,716,738 |
| |
State
of Washington (Capital Projects) GO, Series R-G, 5.00% due 7/1/2025 |
10,475,000
|
11,316,750 |
| |
State
of Washington (State and Local Agency Real and Personal Property Projects) (Insured: State Intercept) COP, Series B, 5.00% due 7/1/2022 |
3,000,000 |
3,028,485 |
| |
State
of Washington (State and Local Agency Real and Personal Property Projects) COP, Series A, 5.00% due 7/1/2024 - 7/1/2027 |
17,775,000
|
19,618,620 |
| |
State
of Washington (Various Purposes) GO, Series C, 5.00% due 2/1/2025 - 2/1/2029 |
45,385,000
|
51,719,352 |
| |
State
of Washington COP, Series D, 5.00% due 7/1/2031 |
3,200,000 |
3,827,965 |
| |
State
of Washington GO, 5.00% due 6/1/2025 - 6/1/2030 |
4,900,000 |
5,619,176 |
| a |
Washington
Health Care Facilities Authority (Providence St. Joseph Health Obligated Group), 4.00% due 10/1/2042 (put 10/1/2030) |
13,100,000
|
14,480,622 |
40 | Thornburg Municipal Funds Semi-Annual Report
|
See notes to
financial statements. |
Schedule of Investments,
Continued
Thornburg Limited Term Municipal Fund | March 31, 2022 (Unaudited)
| |
ISSUER-DESCRIPTION
|
Principal
Amount |
VALUE
|
| |
West
Virginia — 0.5% |
|
|
| |
County
of Mason (Appalachian Power Co.), Series L, 2.75% due 10/1/2022 |
$15,000,000
|
$ 15,087,285
|
| |
West
Virginia (Appalachian Power Co.) EDA, |
|
|
|
a |
Series
A, 2.625% due 12/1/2042 (put 6/1/2022) |
4,500,000 |
4,508,352 |
|
a |
Series
B, 2.625% due 12/1/2042 (put 6/1/2022) |
6,000,000 |
6,011,136 |
| |
West
Virginia Higher Education Policy Commission (Higher Education Facilities), Series A, 5.00% due 4/1/2022 |
1,500,000 |
1,500,000
|
| |
Wisconsin
— 1.4% |
|
|
| |
Public
Finance Authority, 4.00% due 1/1/2023 - 1/1/2032 |
7,145,000 |
7,493,375 |
|
a |
Public
Finance Authority (Providence St. Joseph Health Obligated Group), Series C, 4.00% due 10/1/2041 (put 10/1/2030) |
2,650,000 |
2,984,584 |
| |
Public
Finance Authority (Renown Regional Medical Center), |
|
|
| |
5.00%
due 6/1/2028 - 6/1/2030 |
2,745,000 |
3,252,088 |
| |
Series
A, 5.00% due 6/1/2027 |
350,000 |
398,265 |
| |
State
of Wisconsin GO, Series 2021-2, 5.00% due 5/1/2029 |
4,100,000 |
4,857,524 |
| |
Wisconsin
Health & Educational Facilities Authority (Advocate Aurora Health Obligated Group), |
|
|
|
a |
5.00%
due 8/15/2054 (put 7/1/2027) |
3,500,000 |
3,890,050 |
|
a |
Series
B-2, 5.00% due 8/15/2054 (put 1/25/2023) |
10,485,000
|
10,775,277 |
|
a |
Series
B-4, 5.00% due 8/15/2054 (put 1/29/2025) |
16,065,000
|
17,347,501 |
| |
Wisconsin
Health & Educational Facilities Authority (Ascension Health Alliance System), Series A, 5.00% due 11/15/2025 - 11/15/2026 |
3,235,000 |
3,588,910 |
| |
Wisconsin
Health & Educational Facilities Authority (Marquette University), |
|
|
| |
5.00%
due 10/1/2023 - 10/1/2025 |
1,135,000 |
1,223,667 |
|
b |
5.00%
due 10/1/2026 |
440,000 |
493,583 |
| |
Wisconsin
Health & Educational Facilities Authority (UnityPoint Health), Series A, 5.00% due 12/1/2022 |
1,000,000 |
1,024,940 |
|
a |
Wisconsin
Housing & Economic Development Authority, Series B, 0.50% due 11/1/2050 (put 11/1/2024) |
1,500,000 |
1,436,922 |
| |
Wisconsin
Housing & Economic Development Authority (Collateralized: FNMA), |
|
|
| |
Series
C, |
|
|
| |
1.65%
due 9/1/2026 |
1,615,000 |
1,550,108 |
| |
1.75%
due 9/1/2027 |
1,645,000 |
1,564,915 |
| |
1.80%
due 3/1/2028 |
1,660,000 |
1,572,822 |
| |
1.95%
due 3/1/2029 |
1,695,000 |
1,595,780 |
| |
WPPI
Energy, Series A, 5.00% due 7/1/2022 - 7/1/2028 |
1,835,000
|
1,966,282
|
| |
Total
Long-Term Municipal Bonds — 93.3% (Cost $4,641,830,048) |
|
4,595,321,546
|
| |
Short-Term
Municipal Bonds — 4.3% |
|
|
| |
California
— 0.4% |
|
|
|
a,d |
Deutsche
Bank Spears/Lifers Trust (LOC Deutsche Bank A.G.), Series DBE-8082 0.91% due 10/1/2058 (put 4/7/2022) |
18,000,000
|
18,000,000
|
| |
Colorado
— 0.5% |
|
|
|
a |
City
& County of Denver (SPA JPMorgan Chase Bank, N.A.) COP, Series A3 0.35% due 12/1/2031 (put 4/1/2022) |
22,455,000
|
22,455,000
|
| |
Florida
— 0.4% |
|
|
|
a |
City
of Gainesville FL Utilities System Revenue (SPA Barclays Bank PLC), Series A-REMK 5/20/2020 0.36% due 10/1/2026 (put 4/1/2022) |
610,000 |
610,000 |
|
a |
County
of Manatee FL (Florida Power & Light Co.), 0.39% due 9/1/2024 (put 4/1/2022) |
13,300,000
|
13,300,000 |
|
a,d |
Deutsche
Bank Spears/Lifers Trust (LOC Deutsche Bank A.G.), Series DBE-8083 0.91% due 7/1/2061 (put 4/7/2022) |
6,500,000 |
6,500,000
|
| |
Minnesota
— 0.1% |
|
|
|
a,d |
Tender
Option Bond Trust Receipts (Guaranty: Deutsche Bank A.G.), Series 2021-XF1129 0.76% due 6/1/2064 (put 4/7/2022) |
4,825,000 |
4,825,000
|
| |
Nevada
— 0.0% |
|
|
|
a,d |
Tender
Option Bond Trust Receipts (Guaranty: Deutsche Bank A.G.), Series 2021-XF1120 0.76% due 11/1/2061 (put 4/7/2022) |
2,000,000 |
2,000,000
|
| |
New
York — 2.0% |
|
|
|
a |
City
of New York (LOC Mizuho Bank Ltd.) GO, Series G6, 0.36% due 4/1/2042 (put 4/1/2022) |
5,200,000 |
5,200,000 |
|
a |
New
York City Municipal Water Finance Authority (New York City Water & Sewer System; SPA JP Morgan Chase Bank N.A.), Series FF2, 0.33% due 6/15/2044 (put 4/1/2022) |
42,150,000
|
42,150,000 |
| |
New
York City Transitional Finance Authority Future Tax Secured Revenue (SPA JP Morgan Chase Bank N.A.), |
|
|
|
a |
Series
B4, 0.33% due 8/1/2042 (put 4/1/2022) |
20,000,000
|
20,000,000 |
|
a |
Series
E4, 0.33% due 2/1/2045 (put 4/1/2022) |
32,070,000
|
32,070,000
|
| |
North
Carolina — 0.2% |
|
|
|
a |
North
Carolina Medical Care Commission (Novant Health Obligated Group; SPA JP Morgan Chase Bank N.A.), Series A 0.53% due 11/1/2034 (put 4/7/2022) |
10,000,000
|
10,000,000
|
| |
Ohio
— 0.1% |
|
|
|
a,d |
Tender
Option Bond Trust Receipts (LOC Deutsche Bank A.G.), Series 2021-XF1132 0.76% due 12/1/2061 (put 4/7/2022) |
7,200,000 |
7,200,000
|
| |
Oregon
— 0.0% |
|
|
| a,d |
Tender
Option Bond Trust Receipts (Guaranty: Deutsche Bank A.G.), Series 2021-XF1123 0.76% due 10/1/2061 (put 4/7/2022) |
2,000,000
|
2,000,000 |
See
notes to financial statements.
|
Thornburg Municipal
Funds Semi-Annual Report | 41 |
Schedule of Investments, Continued
Thornburg Limited Term Municipal Fund | March 31, 2022 (Unaudited)
| |
ISSUER-DESCRIPTION
|
Principal
Amount |
VALUE
|
| |
Texas
— 0.6% |
|
|
|
a |
San
Antonio Education Facilities Corp (Trinity University), 0.50% due 6/1/2033 (put 4/7/2022) |
$12,000,000
|
$ 12,000,000
|
|
a,d |
Tender
Option Bond Trust Receipts (Guaranty: Deutsche Bank A.G.), Series 2021-XF1109 0.76% due 7/1/2061 (put 4/7/2022) |
8,000,000 |
8,000,000 |
| a,d |
Tender
Option Bond Trust Receipts/Certificates (LOC Deutsche Bank A.G.), Series 2021-XF1102, 0.76% due 7/1/2061 (put 4/7/2022) |
7,750,000
|
7,750,000
|
| |
Total
Short-Term Municipal Bonds — 4.3% (Cost $214,060,000) |
|
214,060,000
|
| |
Total
Investments — 97.6% (Cost $4,855,890,048) |
|
$4,809,381,546
|
| |
Other
Assets Less Liabilities — 2.4% |
|
117,088,195
|
| |
Net
Assets — 100.0% |
|
$4,926,469,741
|
| Footnote Legend
|
| a
|
Variable,
floating, step, or fixed to floating rate securities are securities for which interest rate changes are based on changes in a designated base rate or on a predetermined schedule. The rates shown are those in effect on March 31, 2022. |
| b
|
Segregated
as collateral for a when-issued security. |
| c
|
When-issued
security. |
| d
|
Securities
exempt from registration under Rule 144A of the Securities Act of 1933, as amended. These securities are restricted but liquid and may only be resold in the ordinary course of business in transactions exempt from registration, normally to qualified
institutional buyers. As of March 31, 2022, the aggregate value of these securities in the Fund’s portfolio was $64,755,480, representing 1.31% of the Fund’s net assets. |
Portfolio Abbreviations
To simplify the listings of securities, abbreviations are used per the table below:
| AGC
|
Insured by Assured
Guaranty Corp. |
| AGM
|
Insured by
Assured Guaranty Municipal Corp. |
| AMBAC
|
Insured by
American Municipal Bond Assurance Corp. |
| BAM
|
Insured by
Build America Mutual Insurance Co. |
| BHAC-CR
|
Berkshire
Hathaway Assurance Corp. Custodial Receipts |
| COP
|
Certificates
of Participation |
| DFA
|
Development
Finance Authority/Agency |
| DFB
|
Development
Finance Board |
| EDA
|
Economic
Development Authority |
| EDFA
|
Economic
Development Financing Authority |
| ETM
|
Escrowed
to Maturity |
| FGIC
|
Insured by
Financial Guaranty Insurance Co. |
| FHLMC
|
Collateralized
by Federal Home Loan Mortgage Corp. |
| FNMA
|
Collateralized
by Federal National Mortgage Association |
| GNMA
|
Collateralized
by Government National Mortgage Association |
| GO
|
General Obligation
|
| GRT
|
Gross
Receipts Tax |
| HFA
|
Health
Facilities Authority |
| HFFA
|
Health Facilities
Financing Authority |
| IDA
|
Industrial
Development Authority/Agency |
| IDB
|
Industrial
Development Board |
| IDC
|
Industrial
Development Corp. |
| ISD
|
Independent
School District |
| JEA
|
Jacksonville
Electric Authority |
| LOC
|
Letter
of Credit |
| MUNIPSA
|
Securities
Industry and Financial Markets Association (SIFMA) Municipal Swap Index |
| Natl-Re
|
Insured by
National Public Finance Guarantee Corp. |
| PSF-GTD
|
Guaranteed
by Permanent School Fund |
| Q-SBLF
|
Insured by
Qualified School Bond Loan Fund |
| REMK
|
Remarketing
Agreement |
| SCH
BD GTY |
School
Bond Guaranty |
| SOFR
|
Secured Overnight
Financing Rate |
| SPA
|
Stand-by
Purchase Agreement |
| USD
|
Unified School
District |
42 | Thornburg Municipal Funds Semi-Annual Report
|
See notes to
financial statements. |
Schedule of Investments
Thornburg California Limited Term Municipal Fund | March 31, 2022
(Unaudited)
| ISSUER-DESCRIPTION
|
PRINCIPAL
AMOUNT |
VALUE
|
| |
LONG-TERM
MUNICIPAL BONDS — 95.1% |
|
|
| |
Alameda
County Joint Powers Authority (Alameda County Medical Center Highland Hospital), Series A, 5.00% due 12/1/2024 |
$ 2,500,000
|
$ 2,627,850
|
| |
Anaheim
Public Financing Authority (Public Improvements; Insured: AGM), Series C, Zero Coupon due 9/1/2022 |
3,000,000 |
2,986,128 |
| |
Apple
Valley Public Financing Authority (Insured: BAM), Series A, 4.00% due 6/1/2026 - 6/1/2028 |
990,000 |
1,079,704 |
| |
Bay
Area Toll Authority (San Francisco Bay Area Toll Bridge), |
|
|
|
a |
Series
A, 2.95% due 4/1/2047 (put 4/1/2026) |
4,705,000 |
4,807,668 |
|
a |
Series
E, 0.92% (MUNIPSA + 0.41%) due 4/1/2056 (put 4/1/2028) |
3,500,000 |
3,449,666 |
|
a |
Series
G, 2.00% due 4/1/2053 (put 4/1/2024) |
1,500,000 |
1,497,725 |
| |
Bonita
(Educational Facilities) USD GO, 5.00% due 8/1/2024 (pre-refunded 8/1/2022) |
1,000,000 |
1,013,208 |
| |
Brentwood
Infrastructure Financing Authority (Residential Single Family Development; Insured: AGM), Series A, 5.00% due 9/2/2022 - 9/2/2023 |
3,535,000 |
3,668,147 |
| |
California
(Adventist Health System/West Obligated Group) HFFA, Series A, 4.00% due 3/1/2026 |
820,000 |
874,569 |
| |
California
(Cedars-Sinai Medical Center Obligated Group) HFFA, 5.00% due 11/15/2022 |
300,000 |
306,897 |
| |
California
(Children’s Hospital Los Angeles Obligated Group) HFFA, Series A, 5.00% due 8/15/2030 |
2,640,000 |
3,026,610 |
| |
California
(Children’s Hospital Los Angeles) HFFA, Series A, 5.00% due 11/15/2023 |
1,835,000 |
1,877,060 |
| |
California
(Children’s Hospital of Orange County Obligated Group) HFFA, 5.00% due 11/1/2022 - 11/1/2028 |
4,195,000 |
4,630,470 |
|
a |
California
(Kaiser Foundation Hospitals) HFFA, Series C, 5.00% due 6/1/2041 (put 11/1/2029) |
2,000,000 |
2,369,882 |
| |
California
(Kaiser Permanente) HFFA, Series A-1, 5.00% due 11/1/2027 |
3,025,000 |
3,472,791 |
| |
California
(PIH Health, Inc. Obligated Group) HFFA, Series A, 5.00% due 6/1/2027 - 6/1/2030 |
3,315,000 |
3,880,125 |
|
a |
California
(Providence St. Joseph Health Obligated Group) HFFA, 5.00% due 10/1/2039 (put 10/1/2027) |
3,000,000 |
3,405,318 |
| |
California
(St. Joseph Health System) HFFA, Series A, 5.00% due 7/1/2024 |
1,000,000 |
1,037,487 |
|
a |
California
Community Choice Financing Authority (Guaranty: Goldman Sachs Group, Inc.) (Green Bond), Series A, 4.00% due 10/1/2052 (put 12/1/2027) |
1,000,000 |
1,056,120 |
|
a |
California
Community Choice Financing Authority (Guaranty: Morgan Stanley Group) (Green Bond), 4.00% due 2/1/2052 (put 8/1/2031) |
6,000,000 |
6,500,262 |
| |
California
Health Facilities Financing Authority (Stanford Health Care Obligated Group), Series A 5.00% due 11/15/2030 |
1,500,000 |
1,707,586 |
|
a |
California
Infrastructure & Economic Development Bank, Series B-2, 3.00% due 10/1/2047 (put 10/1/2026) |
5,250,000 |
5,443,977 |
| |
California
Infrastructure and Economic Development Bank (The Scripps Research Institute), 5.00% due 7/1/2024 - 7/1/2027 |
1,000,000 |
1,090,244 |
| |
California
Municipal Finance Authority (Biola University Residential Hall and Parking Structure), 5.00% due 10/1/2022 - 10/1/2023 |
405,000 |
415,794 |
| |
California
Municipal Finance Authority (Biola University), 5.00% due 10/1/2023 - 10/1/2027 |
2,240,000 |
2,437,509 |
| |
California
Municipal Finance Authority (Biola University, Inc.), 5.00% due 10/1/2030 |
1,000,000 |
1,122,811 |
| |
California
Municipal Finance Authority (CHF-Davis II, LLC; Insured: BAM) (Green Bond), 4.00% due 5/15/2032 |
600,000 |
645,744 |
| |
California
Municipal Finance Authority (Collegiate Housing Foundation Davis-I LLC-West Village; Insured: BAM), 5.00% due 5/15/2028 |
2,905,000 |
3,301,015 |
| |
California
Municipal Finance Authority (Congregational Homes, Inc. Obligated Group), |
|
|
| |
2.75%
due 11/15/2027 |
520,000 |
500,097 |
| |
Series
B-2, 2.125% due 11/15/2026 |
615,000 |
577,250 |
|
a |
California
Municipal Finance Authority (Waste Management, Inc.; Guaranty: Waste Management Holdings) AMT, 1.00% due 10/1/2045 (put 6/1/2022) |
3,500,000 |
3,500,000 |
|
a |
California
Municipal Finance Authority AMT, Series A, 0.30% due 7/1/2041 (put 10/3/2022) |
1,500,000 |
1,500,000 |
|
a,b |
California
Pollution Control Financing Authority (Republic Services, Inc.) AMT, 0.25% due 11/1/2042 (put 4/18/2022) |
2,500,000 |
2,500,000 |
|
a |
California
Pollution Control Financing Authority (Waste Management, Inc.) AMT, Series A, 2.50% due 11/1/2038 (put 5/1/2024) |
2,000,000 |
2,002,842 |
|
a |
California
Pollution Control Financing Authority AMT, Series A, 2.50% due 7/1/2031 (put 5/1/2024) |
1,125,000 |
1,124,900 |
| |
California
State Public Works Board (California School for the Deaf Riverside Campus), Series H, 5.00% due 4/1/2022 |
565,000 |
565,000 |
| |
California
State Public Works Board (Correctional and Rehabilitation Facilities), |
|
|
| |
Series
A, 5.00% due 9/1/2022 - 9/1/2024 |
10,310,000
|
10,777,769 |
| |
Series
G, 5.00% due 11/1/2022 |
1,500,000 |
1,533,406 |
| |
California
State Public Works Board (Judicial Council Projects), Series A, 5.00% due 3/1/2023 - 3/1/2024 |
2,400,000 |
2,473,584 |
| |
California
State Public Works Board (Laboratory Facility and San Diego Courthouse), Series I, 5.00% due 11/1/2023 - 11/1/2024 |
7,000,000 |
7,347,988 |
| |
California
State Public Works Board (Yuba City Courthouse), Series D, 5.00% due 6/1/2022 |
1,950,000 |
1,962,544 |
|
a |
California
Statewide Communities Development Authority (Adventist Health System/West Obligated Group), Series A, 5.00% due 3/1/2037 (put 3/1/2027) |
3,775,000 |
4,200,273 |
| |
California
Statewide Communities Development Authority (CHF-Irvine LLC), Series A, 5.00% due 5/15/2027 |
500,000 |
560,533 |
| |
California
Statewide Communities Development Authority (CHF-Irvine LLC; Insured: BAM), 5.00% due 5/15/2030 - 5/15/2031 |
4,000,000 |
4,738,082 |
| |
California
Statewide Communities Development Authority (Collis P and Howard Huntington Memorial Hospital Obligated Group), Series B 5.00% due 7/1/2044 (pre-refunded 7/1/2024) |
5,075,000 |
5,418,111 |
| |
California
Statewide Communities Development Authority (Cottage Health System), 5.00% due 11/1/2025 (pre-refunded 11/1/2024) |
135,000 |
145,344 |
| |
California
Statewide Communities Development Authority (Cottage Health System) ETM, 5.00% due 11/1/2022 - 11/1/2024 |
475,000 |
500,990 |
| |
California
Statewide Communities Development Authority (Irvine East Campus Apartments), 5.00% due 5/15/2024 - 5/15/2027 |
2,000,000 |
2,135,724 |
|
a |
California
Statewide Communities Development Authority (Kaiser Foundation Hospitals), Series 2003-D, 5.00% due 5/1/2033 (put 11/1/2029) |
3,500,000 |
4,156,568 |
| |
California
Statewide Communities Development Authority (Methodist Hospital of Southern California Obligated Group), 5.00% due 1/1/2024 - 1/1/2030 |
635,000 |
678,379 |
| |
California
Statewide Communities Development Authority (Montage Health Obligated Group), Series A, 4.00% due 6/1/2030 - 6/1/2032 |
2,000,000 |
2,260,533 |
|
a |
California
Statewide Communities Development Authority (Southern California Edison Co.), 2.625% due 11/1/2033 (put 12/1/2023) |
4,895,000 |
4,883,746 |
| |
California
Statewide Communities Development Authority (Southern California Edison Co.) (Green Bond), 1.75% due 9/1/2029 |
2,000,000 |
1,741,904 |
| |
California
Statewide Communities Development Authority (Sutter Health Obligated Group), Series A, 5.00% due 8/15/2024 (pre-refunded 8/15/2022) |
535,000 |
542,859 |
| |
Calipatria
(Educational Facilities; Insured: ACA) USD GO, Series B, Zero Coupon due 8/1/2025 |
2,970,000 |
2,574,515 |
| |
Carson
Redevelopment Successor Agency (Redevelopment Project Area No 1; Insured: AGM), Series A, 5.00% due 10/1/2026 |
500,000 |
534,609 |
See
notes to financial statements.
|
Thornburg Municipal
Funds Semi-Annual Report | 43 |
Schedule of Investments, Continued
Thornburg California Limited Term Municipal Fund | March 31, 2022 (Unaudited)
| ISSUER-DESCRIPTION
|
PRINCIPAL
AMOUNT |
VALUE
|
| |
CDC
Successor Agency of the City of Santee (Redevelopment and Low and Moderate Income Housing; Insured: BAM), Series A, 5.00% due 8/1/2025 |
$ 550,000
|
$ 599,128
|
| |
Chino
Basin Regional Financing Authority, |
|
|
| |
4.00%
due 11/1/2025 |
370,000 |
392,553 |
| |
Series
A, 5.00% due 6/1/2026 |
725,000 |
805,049 |
| |
Chino
Basin Regional Financing Authority (Subordinate-Inland Empire), Series A, 5.00% due 6/1/2028 |
425,000 |
490,481 |
| |
City
and County of San Francisco (525 Golden Gate Avenue-Public Utilities Commission Office Project) COP, Series C, 5.00% due 11/1/2022 |
700,000 |
702,206 |
| |
City
of Antioch Public Financing Authority (Municipal Facilities Project), 5.00% due 5/1/2022 - 5/1/2024 |
1,400,000 |
1,458,016 |
| |
City
of Chula Vista (Police Facility Project) COP, 5.00% due 10/1/2024 |
1,700,000 |
1,825,293 |
| |
City
of Chula Vista Financing Authority (Infrastructure, Facilities and Equipment), 5.00% due 5/1/2026 - 5/1/2027 |
3,500,000 |
3,912,473 |
| |
City
of Clovis (Water System Facilities; Insured: BAM), 5.00% due 3/1/2023 |
1,000,000 |
1,031,761 |
| |
City
of Delano (Central California Foundation for Health) COP, 5.00% due 1/1/2024 (pre-refunded 1/1/2023) |
270,000 |
277,208 |
| |
City
of Irvine (Irvine Assessment District No 21-1; Insured: BAM), 4.00% due 9/2/2031 |
1,000,000 |
1,146,137 |
| |
City
of Los Angeles Department of Airports AMT, Series A 5.00% due 5/15/2023 |
1,000,000 |
1,032,319 |
| |
City
of Manteca (Water Supply System), 5.00% due 7/1/2023 |
650,000 |
656,447 |
| |
City
of Modesto Wastewater Revenue, Series B, 5.00% due 11/1/2030 |
500,000 |
599,131 |
| |
City
of Norco CA, 5.00% due 9/1/2025 |
1,000,000 |
1,094,876 |
| |
City
of Redding Wastewater System Revenue, 5.00% due 6/1/2029 - 6/1/2031 |
2,760,000 |
3,292,371 |
| |
City
of San Jose Financing Authority (Civic Center Project), Series A, 5.00% due 6/1/2024 (pre-refunded 6/1/2023) |
750,000 |
778,283 |
| |
City
of San Jose Financing Authority (Civic Center Project) ETM, Series A, 5.00% due 6/1/2022 - 6/1/2023 |
1,745,000 |
1,788,585 |
| |
Compton
(Insured: BAM) USD GO, Series B, 5.00% due 6/1/2028 - 6/1/2029 |
1,625,000 |
1,839,271 |
| |
Coronado
Community Development Agency Successor Agency, Series A, 5.00% due 9/1/2022 |
585,000 |
594,342 |
| |
County
of Los Angeles Redevelopment Refunding Authority (Bunker Hill Project), Series C, 5.00% due 6/1/2022 - 6/1/2024 |
2,975,000 |
3,051,421 |
| |
County
of Riverside, Series A, 0.50% due 10/20/2022 |
2,000,000 |
1,992,918 |
| |
County
of San Joaquin CA (Insured: AGM) COP, 5.00% due 11/15/2027 - 11/15/2028 |
900,000 |
1,025,100 |
| |
Cucamonga
Valley Water District Financing Authority, Series B, 5.00% due 9/1/2025 - 9/1/2031 |
850,000 |
990,475 |
| |
Desert
Hot Springs Public Financing Authority (Desert Hot Springs), 4.00% due 3/1/2027 - 3/1/2032 |
355,000 |
388,578 |
| |
Dinuba
(CAP APPREC; Insured: AGM) USD GO, Zero Coupon due 8/1/2030 |
460,000 |
362,564 |
| |
Downey
Public Financing Authority (Public Capital Improvements), 5.00% due 12/1/2025 - 12/1/2027 |
1,445,000 |
1,621,812 |
| |
Elk
Grove Finance Authority (Poppy Ridge CFD No. 2003-1 and East Franklin CFD No. 2002-1), 5.00% due 9/1/2025 |
750,000 |
799,215 |
| |
Emeryville
Redevelopment Agency (Emeryville and Shellmound Park Projects; Insured: AGM), Series A, 5.00% due 9/1/2022 - 9/1/2024 |
9,095,000 |
9,515,033 |
| |
Fullerton
Redevelopment Agency Successor Agency (Insured: BAM), Series A, 4.00% due 9/1/2022 |
1,150,000 |
1,164,114 |
| |
Grossmont
Healthcare District GO, |
|
|
| |
Series
D, 5.00% due 7/15/2022 |
960,000 |
971,273 |
| |
Series
E, 5.00% due 7/15/2028 - 7/15/2031 |
1,655,000 |
1,995,363 |
| |
Guam
Power Authority (Electric Power System), Series A, 5.00% due 10/1/2027 |
1,230,000 |
1,358,552 |
| |
Guam
Waterworks Authority (Water and Wastewater System), 5.00% due 7/1/2022 - 7/1/2027 |
2,460,000 |
2,610,899 |
| |
Hacienda
La Puente (Educational Facilities; Insured: AGM) USD COP, 5.00% due 6/1/2022 - 6/1/2025 |
2,755,000 |
2,903,475 |
| |
Jurupa
Public Financing Authority (Insured: BAM), Series A, 5.00% due 9/1/2022 - 9/1/2025 |
2,720,000 |
2,843,138 |
| |
La
Canada USD GO, Series B, 4.00% due 8/1/2022 - 8/1/2024 |
680,000 |
699,926 |
| |
La
Quinta Redevelopment Agency (Redevelopment Project Areas No. 1 and 2) ETM, Series A, 5.00% due 9/1/2022 - 9/1/2023 |
3,500,000 |
3,602,201 |
| |
La
Quinta Redevelopment Agency Successor Agency, Series A, 4.00% due 9/1/2027 (pre-refunded 9/1/2023) |
410,000 |
422,743 |
| |
Lodi
Public Financing Authority (City Police Building and Jail), 5.00% due 10/1/2022 - 10/1/2023 |
2,160,000 |
2,162,553 |
| |
Los
Angeles (Educational Facilities and Information Technology Infrastructure) USD GO, |
|
|
| |
Series
B, 5.00% due 7/1/2023 |
3,000,000 |
3,122,292 |
| |
Series
D, 5.00% due 7/1/2022 - 7/1/2024 |
5,750,000 |
5,981,220 |
| |
Los
Angeles County Public Works Financing Authority (Green Bond), Series F, 5.00% due 12/1/2028 - 12/1/2032 |
1,000,000 |
1,215,467 |
|
c |
Los
Angeles County Sanitation Districts Financing Authority (Green Bond), Series A 5.00% due 10/1/2032 |
625,000 |
779,232 |
| |
Los
Angeles Department of Airports AMT, Series B, 5.00% due 5/15/2025 - 5/15/2026 |
7,220,000 |
7,883,943 |
| |
Los
Angeles Department of Water & Power System, 5.00% due 7/1/2026 |
665,000 |
741,016 |
| |
Los
Angeles Department of Water & Power Water System Revenue, Series A, 5.00% due 7/1/2027 |
1,600,000 |
1,827,718 |
| |
Los
Angeles Department of Water and Power (Power System Capital Improvements), Series A, 5.00% due 7/1/2025 - 7/1/2026 |
800,000 |
878,561 |
| |
Los
Angeles USD GO, Series A, 5.00% due 7/1/2024 |
4,600,000 |
4,912,519 |
| |
Lynwood
(Insured: AGM) USD GO, 5.00% due 8/1/2023 |
1,000,000 |
1,043,003 |
| |
Manteca
Community Facilities District No. 1989-2 (Educational Facilities; Insured: AGM) USD, Series F, 5.00% due 9/1/2023 |
500,000 |
522,363 |
| |
Milpitas
Redevelopment Agency (Redevelopment Project Area No. 1), 5.00% due 9/1/2025 |
2,300,000 |
2,509,877 |
| |
Modesto
Irrigation District, 5.00% due 10/1/2022 |
600,000 |
612,197 |
| |
Modesto
Irrigation District (San Joaquin Valley Electric System), Series A, 5.00% due 7/1/2022 |
1,295,000 |
1,306,809 |
| |
Moreno
Valley Public Financing Authority (Public Improvements), 5.00% due 11/1/2024 |
1,455,000 |
1,565,289 |
| |
Murrieta
Valley Public Financing Authority (Educational Facilities; Insured: BAM) USD GO, 5.00% due 9/1/2023 |
1,080,000 |
1,129,218 |
| |
Norman
Y Mineta San Jose International Airport SJC AMT, Series A, 5.00% due 3/1/2029 - 3/1/2031 |
1,545,000 |
1,768,244 |
| |
North
City West School Facilities Financing Authority (Carmel Valley; Insured: AGM), Series A, 5.00% due 9/1/2022 |
2,260,000 |
2,295,353 |
| a |
Northern
California Energy Authority (Commodity Supply Revenue; Guaranty: Goldman Sachs Group, Inc.), Series A, 4.00% due 7/1/2049 (put 7/1/2024) |
5,000,000
|
5,139,545
|
44 | Thornburg Municipal Funds Semi-Annual Report
|
See notes to
financial statements. |
Schedule of Investments,
Continued
Thornburg California Limited Term Municipal Fund | March 31, 2022 (Unaudited)
| ISSUER-DESCRIPTION
|
PRINCIPAL
AMOUNT |
VALUE
|
| |
Oakland
(County of Alameda Educational Facilities) USD GO, Series A, 5.00% due 8/1/2022 - 8/1/2025 |
$ 2,745,000
|
$ 2,901,259
|
| |
Oakland
(County of Alameda Educational Facilities; Insured: BAM) USD GO, Series A, 5.00% due 8/1/2030 - 8/1/2032 |
2,290,000 |
2,763,366 |
| |
Oceanside
(Insured: AGM) USD GO, Series F, 4.00% due 8/1/2022 - 8/1/2023 |
1,125,000 |
1,146,792 |
| |
Pittsburg
Successor Agency Redevelopment Agency (Insured: AGM), Series A 5.00% due 9/1/2022 |
1,500,000 |
1,522,540 |
| |
Pomona
Public Financing Authority (Facilities Improvements; Insured: AGM), Series BC, 4.00% due 6/1/2024 - 6/1/2026 |
725,000 |
762,215 |
| |
Rancho
Santa Fe Community Services District Financing Authority, Series A, 5.00% due 9/1/2025 |
1,745,000 |
1,863,477 |
| |
Redevelopment
Agency of the City of Rialto (Merged Project Area; Insured: BAM), Series A, 5.00% due 9/1/2023 - 9/1/2024 |
1,050,000 |
1,108,704 |
| |
Rialto
Redevelopment Agency (Insured: BAM), Series A 4.00% due 9/1/2025 |
250,000 |
261,225 |
| |
Ripon
Redevelopment Agency Successor Agency (Insured: BAM), 4.00% due 11/1/2030 - 11/1/2031 |
1,025,000 |
1,139,005 |
| |
Riverside
County Infrastructure Financing Authority, Series A, 5.00% due 11/1/2031 |
1,000,000 |
1,213,983 |
| |
Riverside
County Public Financing Authority (Capital Facilities Project) ETM, 5.00% due 11/1/2025 |
1,000,000 |
1,099,507 |
| |
Riverside
Financing Authority (Educational Facilities; Insured: BAM) USD, 5.00% due 9/1/2022 - 9/1/2025 |
1,245,000 |
1,322,241 |
| |
Riverside
Redevelopment Agency Successor Agency, Series A, 5.00% due 9/1/2022 |
600,000 |
609,363 |
| |
Sacramento
City (Educational Facilities Improvements; Insured: AGM) USD GO, 5.00% due 7/1/2022 |
700,000 |
706,500 |
| |
Sacramento
City Schools Joint Power Financing Authority (Sacramento City USD Educational Facility Sublease; Insured: BAM), Series A, 5.00% due 3/1/2023 - 3/1/2025 |
3,755,000 |
4,004,867 |
| |
Sacramento
County (Insured: AGM) COP, 5.00% due 10/1/2026 - 10/1/2029 |
3,625,000 |
4,123,851 |
| |
Sacramento
County Sanitation Districts Financing Authority (Sacramento Regional County Sanitation District), |
|
|
| |
5.00%
due 12/1/2032 |
575,000 |
718,679 |
| |
Series
A, |
|
|
| |
5.00%
due 12/1/2028 - 12/1/2031 |
3,250,000 |
3,958,150 |
|
d |
5.00%
due 12/1/2029 |
800,000 |
959,822 |
|
a |
Sacramento
Municipal Utility District, Series A, 5.00% due 8/15/2049 (put 10/17/2023) |
600,000 |
617,788 |
| |
Salinas
Valley Solid Waste Authority (Insured: AGM) AMT ETM, Series A, 5.00% due 8/1/2023 |
1,530,000 |
1,593,028 |
| |
San
Bernardino Redevelopment Agency Successor Agency (Insured: AGM), Series A, 5.00% due 12/1/2023 |
150,000 |
157,553 |
| |
San
Diego (Educational System Capital Projects) USD GO, Series R-3, 5.00% due 7/1/2023 - 7/1/2024 |
8,000,000 |
8,373,384 |
| |
San
Diego County Regional Airport Authority, |
|
|
| |
5.00%
due 7/1/2029 - 7/1/2030 |
2,000,000 |
2,355,694 |
| |
Series
A, 5.00% due 7/1/2030 |
330,000 |
385,715 |
| |
San
Diego County Regional Airport Authority AMT, Series B 5.00% due 7/1/2032 |
1,020,000 |
1,163,600 |
| |
San
Diego Redevelopment Agency Successor Agency, Series A, 5.00% due 9/1/2028 |
250,000 |
273,306 |
| |
San
Francisco City and County Airports Commission (San Francisco International Airport), Series A, 5.00% due 5/1/2026 |
5,000,000 |
5,510,700 |
| |
San
Francisco City and County Airports Commission (San Francisco International Airport) AMT, Series H, 5.00% due 5/1/2028 |
6,500,000 |
7,315,919 |
| |
San
Joaquin Hills Transportation Corridor Agency, Series A, 5.00% due 1/15/2030 |
750,000 |
875,015 |
| |
San
Jose Financing Authority, Series A, 4.00% due 10/1/2029 - 10/1/2032 |
970,000 |
1,093,507 |
| |
San
Mateo County Joint Powers Financing Authority (Maple Street Correctional Center), 5.00% due 6/15/2022 - 6/15/2023 |
1,585,000 |
1,615,325 |
| |
Santa
Clara County Financing Authority (Multiple Facilities Projects), Series P, 5.00% due 5/15/2025 |
6,755,000 |
7,360,741 |
| |
Santa
Margarita Water District (Talega Community Facilities), Series A, 5.00% due 9/1/2026 - 9/1/2027 |
1,050,000 |
1,181,278 |
| |
Semitropic
Water Storage Improvement District (Irrigation Water System; Insured: AGM), Series A, 5.00% due 12/1/2022 - 12/1/2027 |
3,535,000 |
3,814,321 |
| |
South
Bay/San Diego County USD GO, Zero Coupon due 8/1/2022 |
2,250,000 |
2,238,462 |
| |
South
Placer Wastewater Authority (Roseville), 5.00% due 11/1/2029 - 11/1/2030 |
700,000 |
842,762 |
| |
Southern
California Public Power Authority (Guaranty: Goldman Sachs Group, Inc.), Series A, 5.00% due 11/1/2029 |
350,000 |
404,854 |
| |
Southern
California Public Power Authority (Magnolia Power Project), Series A-1, 5.00% due 7/1/2022 |
2,795,000 |
2,822,223 |
| |
Southwestern
Community College District GO, Series B, 4.00% due 8/1/2024 - 8/1/2026 |
1,125,000 |
1,196,629 |
| |
State
of California GO, 5.00% due 11/1/2029 |
5,000,000 |
5,943,170 |
| |
Stockton
(Insured: BAM) USD GO, 5.00% due 8/1/2027 |
1,200,000 |
1,328,351 |
| |
Stockton
Public Financing Authority (Stockton Water Revenue; Green Bond; Insured: BAM), Series A, 5.00% due 10/1/2022 - 10/1/2031 |
4,945,000 |
5,493,451 |
| |
Successor
Agency to the City of Colton Redevelopment Agency (Multiple Redevelopment Project Areas; Insured: BAM), 5.00% due 8/1/2023 - 8/1/2025 |
1,875,000 |
1,998,208 |
| |
Successor
Agency to the City of Riverside Redevelopment Agency (Multiple Redevelopment Project Areas), Series A, 5.00% due 9/1/2023 - 9/1/2024 |
2,985,000 |
3,143,589 |
| |
Successor
Agency to the City of San Diego Redevelopment Agency (Multiple Redevelopment Project Areas), Series A, 5.00% due 9/1/2025 - 9/1/2026 |
1,990,000 |
2,177,882 |
| |
Successor
Agency to the Commerce Community Development Commission (Multiple Redevelopment Project Areas; Insured: AGM), Series A, 5.00% due 8/1/2027 - 8/1/2030 |
3,315,000 |
3,694,515 |
| |
Successor
Agency to the Community Development Agency of the City of Menlo Park (Las Pulgas Community Development Project; Insured: AGM), 5.00% due 10/1/2022 - 10/1/2025 |
1,915,000 |
2,025,928 |
| |
Successor
Agency to the Community Redevelopment Agency of the City of Palmdale (Merged Redevelopment Project Areas), Series A, 5.00% due 9/1/2025 - 9/1/2026 |
1,000,000 |
1,099,280 |
| |
Successor
Agency to the Poway Redevelopment Agency (Paguay Redevelopment Project), Series A, 5.00% due 6/15/2025 |
4,665,000 |
5,077,013 |
| |
Successor
Agency to the Rancho Cucamonga Redevelopment Project (Rancho Redevelopment Project Area; Insured: AGM), 5.00% due 9/1/2023 - 9/1/2024 |
3,350,000 |
3,545,427 |
| |
Successor
Agency to the Redevelopment Agency of the City of San Mateo (Multiple Redevelopment Project Areas), Series A, 5.00% due 8/1/2025 |
425,000 |
463,799 |
See
notes to financial statements.
|
Thornburg Municipal
Funds Semi-Annual Report | 45 |
Schedule of Investments, Continued
Thornburg California Limited Term Municipal Fund | March 31, 2022 (Unaudited)
| ISSUER-DESCRIPTION
|
PRINCIPAL
AMOUNT |
VALUE
|
| |
Successor
Agency to the Redevelopment Agency of the City of Stockton (Redevelopment of Midtown, North and South Stockton and Waterfront Areas; Insured: AGM), Series A, 5.00% due 9/1/2026 - 9/1/2027 |
$ 2,000,000
|
$ 2,209,348
|
| |
Successor
Agency to the Richmond County Redevelopment Agency (Joint Powers Financing Authority & Harbour Redevelopment Project; Insured: BAM), Series A, 5.00% due 9/1/2022 - 9/1/2024 |
1,250,000 |
1,300,700 |
| |
Successor
Agency to the Rosemead Community Development Commission (Rosemead Merged Project Area; Insured: BAM), 5.00% due 10/1/2022 - 10/1/2026 |
3,410,000 |
3,627,514 |
| |
Temecula
Valley Financing Authority (Educational Facilities; Insured: BAM) USD, 5.00% due 9/1/2022 - 9/1/2025 |
1,375,000 |
1,461,335 |
| |
Temecula
Valley Financing Authority (Insured: BAM) USD, 5.00% due 9/1/2027 |
2,220,000 |
2,421,769 |
| |
Trustees
of the California State University (Educational Facilities Improvements), Series A, 5.00% due 11/1/2026 |
1,000,000 |
1,113,100 |
| |
Tulare
County Transportation Authority, 5.00% due 2/1/2024 - 2/1/2030 |
3,435,000 |
4,012,177 |
| |
Tulare
Public Financing Authority (Insured: BAM), |
|
|
| |
4.00%
due 4/1/2022 |
250,000 |
250,000 |
| |
5.00%
due 4/1/2023 - 4/1/2028 |
1,410,000 |
1,535,662 |
| |
Val
Verde (Insured: BAM) USD GO, Series A, 4.00% due 8/1/2022 - 8/1/2023 |
950,000 |
968,012 |
| |
Vallejo
City (Insured: BAM) USD GO, 5.00% due 8/1/2031 |
840,000 |
1,012,187 |
| |
Ventura
County Public Financing Authority (Office Building Purchase and Improvements), Series B, 5.00% due 11/1/2023 - 11/1/2024 |
1,560,000 |
1,636,839 |
| |
Vista
Redevelopment Agency (Vista Redevelopment Project; Insured: AGM), Series B1, 5.00% due 9/1/2022 - 9/1/2023 |
735,000 |
758,324 |
| |
West
Contra Costa (Insured: AGM) USD GO, |
|
|
| |
Series
E, 4.00% due 8/1/2022 - 8/1/2025 |
1,270,000 |
1,307,580 |
| |
Series
F, 4.00% due 8/1/2022 - 8/1/2024 |
2,690,000 |
2,740,231 |
| |
West
Contra Costa (Insured: Natl-Re) USD GO, Zero Coupon due 8/1/2028 |
160,000 |
137,534
|
| |
TOTAL
LONG-TERM MUNICIPAL BONDS — 95.1% (Cost $402,284,747) |
|
$397,061,341
|
| |
SHORT-TERM
MUNICIPAL BONDS — 4.5% |
|
|
|
a |
City
of Irvine CA (Irvine Reassessment District No 05-21; LOC U.S. Bank N.A.), 0.37% due 9/2/2050 (put 4/1/2022) |
3,784,000 |
3,784,000
|
|
a,b |
Deutsche
Bank Spears/Lifers Trust (LOC Deutsche Bank A.G.), Series DBE-8082 0.91% due 10/1/2058 (put 4/7/2022) |
6,000,000 |
6,000,000 |
| a |
State
of California (LOC State Street B&T Co.) GO, Series A-2, 0.33% due 5/1/2034 (put 4/1/2022) |
9,000,000
|
9,000,000
|
| |
TOTAL
SHORT-TERM MUNICIPAL BONDS — 4.5% (Cost $18,784,000) |
|
$
18,784,000 |
| |
Total
Investments — 99.6% (Cost $421,068,747) |
|
$415,845,341
|
| |
Other
Assets Less Liabilities — 0.4% |
|
1,629,280
|
| |
Net
Assets — 100.0% |
|
$417,474,621
|
| Footnote Legend
|
| a
|
Variable,
floating, step, or fixed to floating rate securities are securities for which interest rate changes are based on changes in a designated base rate or on a predetermined schedule. The rates shown are those in effect on March 31, 2022. |
| b
|
Securities
exempt from registration under Rule 144A of the Securities Act of 1933, as amended. These securities are restricted but liquid and may only be resold in the ordinary course of business in transactions exempt from registration, normally to qualified
institutional buyers. As of March 31, 2022, the aggregate value of these securities in the Fund’s portfolio was $8,500,000, representing 2.04% of the Fund’s net assets. |
| c
|
When-issued
security. |
| d
|
Segregated
as collateral for a when-issued security. |
Portfolio Abbreviations
To simplify the listings of securities, abbreviations are used per the table below:
| ACA
|
Insured by American
Capital Access |
| AGM
|
Insured by
Assured Guaranty Municipal Corp. |
| AMT
|
Alternative
Minimum Tax |
| BAM
|
Insured by
Build America Mutual Insurance Co. |
| COP
|
Certificates
of Participation |
| ETM
|
Escrowed
to Maturity |
| GO
|
General Obligation
|
| HFFA
|
Health Facilities
Financing Authority |
| LOC
|
Letter
of Credit |
| MUNIPSA
|
Securities
Industry and Financial Markets Association (SIFMA) Municipal Swap Index |
| Natl-Re
|
Insured by
National Public Finance Guarantee Corp. |
| USD
|
Unified School
District |
46 | Thornburg Municipal Funds Semi-Annual Report
|
See notes to
financial statements. |
Schedule of Investments
Thornburg New Mexico Intermediate Municipal Fund | March 31, 2022
(Unaudited)
| ISSUER-DESCRIPTION
|
PRINCIPAL
AMOUNT |
VALUE
|
| |
LONG-TERM
MUNICIPAL BONDS — 96.2% |
|
|
| |
Albuquerque
Bernalillo County Water Utility Authority, |
|
|
| |
4.00%
due 7/1/2030 |
$ 500,000
|
$ 557,218
|
| |
5.00%
due 7/1/2023 - 7/1/2024 |
65,000 |
68,187 |
| |
Albuquerque
Bernalillo County Water Utility Authority (2005 NMFA Loan and Joint Water and Sewer System Improvements), Series A, 5.00% due 7/1/2026 |
2,000,000
|
2,129,298 |
| |
Albuquerque
Bernalillo County Water Utility Authority (2007 NMFA Loan and Joint Water and Sewer System Improvements), 5.00% due 7/1/2031 - 7/1/2032 |
1,500,000
|
1,634,580 |
| |
Albuquerque
Municipal School District No. 12 (Bernalillo and Sandoval Counties School Facilities) (State Aid Withholding) GO, |
|
|
| |
5.00%
due 8/1/2034 |
1,260,000
|
1,431,200 |
| |
Series
2017, 5.00% due 8/1/2031 |
1,000,000
|
1,112,835 |
| |
Series
A, 4.00% due 8/1/2029 |
1,300,000
|
1,334,074 |
| |
Albuquerque
Municipal School District No. 12 (State Aid Withholding) GO, |
|
|
| |
Series
A, |
|
|
| |
4.00%
due 8/1/2030 - 8/1/2031 |
650,000 |
714,727 |
| |
5.00%
due 8/1/2027 - 8/1/2029 |
1,100,000
|
1,269,642 |
| |
Bernalillo
County (Government Services) GRT, |
|
|
| |
5.25%
due 4/1/2027 |
300,000 |
329,011 |
| |
Series
B, 5.70% due 4/1/2027 |
3,000,000
|
3,348,405 |
| |
Bernalillo
County (Government Services; Insured: AMBAC) GRT, 5.25% due 10/1/2022 - 10/1/2025 |
8,295,000
|
8,841,317 |
| |
Bernalillo
County (Government Services; Insured: Natl-Re) GRT, Series B, 5.70% due 4/1/2027 |
815,000 |
908,915 |
| |
Bernalillo
County GO, Series A, 4.00% due 8/15/2022 |
100,000 |
101,107 |
| |
Bernalillo
Municipal School District No. 1 (State Aid Withholding) GO, |
|
|
| |
3.00%
due 8/1/2022 |
200,000 |
201,217 |
| |
4.00%
due 8/1/2023 - 8/1/2026 |
340,000 |
354,807 |
| |
Carlsbad
Municipal School District (State Aid Withholding) GO, 5.00% due 8/1/2027 |
1,000,000
|
1,130,163 |
| |
Central
New Mexico Community College (Campus Buildings Acquisition & Improvements) GO, Series A, 5.00% due 8/15/2022 |
1,100,000
|
1,115,969 |
| |
City
of Albuquerque (City Infrastructure Improvements) GO, Series A, 5.00% due 7/1/2026 |
870,000 |
973,943 |
| |
City
of Albuquerque (City Infrastructure Improvements) GRT, |
|
|
| |
Series
A, |
|
|
| |
4.00%
due 7/1/2035 |
2,070,000
|
2,256,557 |
| |
5.00%
due 7/1/2025 - 7/1/2034 |
2,500,000
|
2,726,680 |
| |
City
of Albuquerque (I-25/Paseo del Norte Interchange) GRT, 5.00% due 7/1/2025 - 7/1/2027 (pre-refunded 7/1/2023) |
1,095,000
|
1,138,900 |
| |
City
of Albuquerque GRT, Series A, 4.00% due 7/1/2037 (pre-refunded 7/1/2023) |
120,000 |
123,344 |
| |
City
of Albuquerque Refuse Removal & Disposal Revenue, 5.00% due 7/1/2030 - 7/1/2038 |
1,510,000
|
1,767,841 |
|
a |
City
of Farmington (Public Service Co. of New Mexico), Series D, 1.10% due 6/1/2040 (put 6/1/2023) |
3,500,000
|
3,452,015 |
| |
City
of Las Cruces (Joint Utility System), Series A, 4.00% due 6/1/2022 - 6/1/2025 |
2,115,000
|
2,179,732 |
| |
City
of Roswell (Joint Water and Sewer Improvement; Insured: BAM), 5.00% due 6/1/2026 - 6/1/2036 |
2,050,000
|
2,244,868 |
| |
City
of Roswell GRT, 4.00% due 8/1/2029 |
260,000 |
283,879 |
| |
City
of Santa Fe (El Castillo Retirement Residences), 4.50% due 5/15/2027 |
3,275,000
|
3,280,545 |
| |
City
of Santa Fe (Public Facilities) GRT, |
|
|
| |
5.00%
due 6/1/2028 - 6/1/2029 |
1,880,000
|
1,999,392 |
| |
Series
A, |
|
|
| |
5.00%
due 6/1/2034 - 6/1/2038 |
1,420,000
|
1,607,386 |
|
b |
5.00%
due 6/1/2035 |
450,000 |
511,213 |
| |
County
of Sandoval GO, 5.00% due 8/1/2025 - 8/1/2029 |
2,015,000
|
2,272,726 |
| |
County
of Santa Fe GO, 5.00% due 7/1/2024 |
825,000 |
881,894 |
| |
Guam
Power Authority (Electric Power System; Insured: AGM), Series A, 5.00% due 10/1/2026 |
2,000,000
|
2,031,574 |
| |
Guam
Waterworks Authority (Water and Wastewater System), 5.00% due 7/1/2035 - 7/1/2037 |
2,200,000
|
2,418,414 |
| |
Las
Cruces School District No. 2 (State Aid Withholding) GO, |
|
|
| |
5.00%
due 8/1/2025 - 8/1/2028 |
3,800,000
|
4,287,112 |
| |
Series
C, 5.00% due 8/1/2024 |
425,000 |
454,127 |
| |
Lea
County Public School District No 8 Eunice (State Aid Withholding) GO, |
|
|
| |
4.00%
due 9/15/2027 - 9/15/2028 |
2,150,000
|
2,298,380 |
| |
5.00%
due 9/15/2026 |
650,000 |
723,495 |
| |
New
Mexico Educational Assistance Foundation AMT, Series 1A, 5.00% due 9/1/2029 |
1,750,000
|
2,043,499 |
| |
New
Mexico Finance Authority, |
|
|
| |
5.00%
due 6/1/2038 |
1,150,000
|
1,332,136 |
| |
Series
A, 5.00% due 6/1/2024 - 6/15/2026 |
795,000 |
859,642 |
| |
Series
B, 5.00% due 6/1/2032 - 6/1/2033 |
4,125,000
|
4,831,085 |
| |
Series
D, 5.00% due 6/15/2029 - 6/1/2033 |
995,000 |
1,136,917 |
| |
New
Mexico Finance Authority (New Mexico Finance Authority Public Project Revolving Fund), |
|
|
| |
5.00%
due 6/1/2025 |
200,000
|
218,170 |
See
notes to financial statements.
|
Thornburg Municipal
Funds Semi-Annual Report | 47 |
Schedule of Investments, Continued
Thornburg New Mexico Intermediate Municipal Fund | March 31, 2022 (Unaudited)
| ISSUER-DESCRIPTION
|
PRINCIPAL
AMOUNT |
VALUE
|
| |
Series
D, 5.00% due 6/15/2022 |
$ 150,000
|
$ 151,203
|
| |
New
Mexico Finance Authority (State Highway Infrastructure), Series A, 5.00% due 6/15/2026 - 6/15/2027 |
2,415,000
|
2,574,221 |
| |
New
Mexico Finance Authority (The Public Project Revolving Fund Program), Series A, 5.00% due 6/15/2031 |
1,000,000
|
1,088,973 |
| |
New
Mexico Hospital Equipment Loan Council (Haverland Carter Lifestyle Obligated Group), |
|
|
| |
5.00%
due 7/1/2032 |
1,000,000
|
1,007,689 |
| |
Series
A, 5.00% due 7/1/2032 - 7/1/2034 |
1,310,000
|
1,419,012 |
| |
New
Mexico Hospital Equipment Loan Council (Presbyterian Healthcare Services Obligated Group), |
|
|
| |
5.00%
due 8/1/2031 |
1,750,000
|
1,957,513 |
| |
Series
A, 5.00% due 8/1/2036 - 8/1/2038 |
2,955,000
|
3,352,541 |
| |
New
Mexico Hospital Equipment Loan Council (San Juan Regional Medical Center, Inc.), 5.00% due 6/1/2030 - 6/1/2031 |
1,215,000
|
1,410,742 |
| |
New
Mexico Housing Authority (El Paseo Apartments; Insured: AMBAC) AMT, Series A, 5.30% due 12/1/2022 |
5,000 |
5,011 |
| |
New
Mexico Institute of Mining and Technology (Campus Buildings Acquisition & Improvements; Insured: AGM), 4.00% due 12/1/2035 - 12/1/2040 |
2,595,000
|
2,756,496 |
| |
New
Mexico Mortgage Finance Authority (Collateralized: GNMA, FNMA, FHLMC), |
|
|
| |
Series
C, 2.85% due 7/1/2031 |
450,000 |
452,243 |
| |
Series
F, |
|
|
| |
2.60%
due 7/1/2034 |
535,000 |
532,622 |
| |
2.85%
due 7/1/2039 |
1,395,000
|
1,386,496 |
| |
3.50%
due 7/1/2050 |
800,000 |
815,852 |
|
a |
New
Mexico Mortgage Finance Authority (JLG Central 217 LLLP), 0.53% due 11/1/2024 (put 5/1/2024) |
500,000 |
484,725 |
| |
New
Mexico Municipal Energy Acquisition Authority, |
|
|
| |
Series
A, |
|
|
| |
4.00%
due 5/1/2024 |
250,000 |
258,262 |
|
a |
5.00%
due 11/1/2039 (put 5/1/2025) |
1,000,000
|
1,072,426 |
| |
Regents
of New Mexico State University (Campus Buildings Acquisition & Improvements), Series A, 5.00% due 4/1/2032 - 4/1/2036 |
5,935,000
|
6,524,368 |
| |
Regents
of New Mexico State University (Campus Buildings Acquisition & Improvements; Insured: BAM), Series A, 5.00% due 4/1/2030 |
1,440,000
|
1,654,988 |
| |
Regents
of the University of New Mexico (Campus Buildings Acquisition & Improvements), Series A, 4.50% due 6/1/2034 - 6/1/2036 |
4,500,000
|
4,858,189 |
| |
San
Juan County (County Capital Improvements) GRT, Series B, 5.00% due 6/15/2028 - 6/15/2030 |
2,645,000
|
2,795,220 |
| |
Santa
Fe County (County Buildings & Facilities) GRT, Series A, 5.00% due 6/1/2026 - 6/1/2027 |
940,000 |
1,022,550 |
| |
Santa
Fe County (County Correctional System; Insured: AGM), 6.00% due 2/1/2027 |
940,000 |
1,037,611 |
| |
Santa
Fe Gasoline Tax GRT, 5.00% due 6/1/2024 - 6/1/2028 |
1,540,000
|
1,709,346 |
|
c |
Santa
Fe Public School District (State Aid Withholding) GO, 5.00% due 8/1/2034 |
350,000 |
405,138 |
| |
Santa
Fe Public School District GO, |
|
|
| |
4.00%
due 8/1/2024 |
250,000 |
260,849 |
| |
5.00%
due 8/1/2030 |
725,000 |
828,604 |
| |
State
of New Mexico GO, 5.00% due 3/1/2029 |
2,000,000
|
2,362,012 |
| |
State
of New Mexico Severance Tax Permanent Fund, |
|
|
| |
5.00%
due 7/1/2022 - 7/1/2028 |
665,000 |
744,146 |
| |
Series
A, 5.00% due 7/1/2030 |
750,000 |
903,370 |
| |
State
of New Mexico Severance Tax Permanent Fund (Educational Facilities), Series A, 5.00% due 7/1/2025 |
2,040,000
|
2,229,767 |
| |
Village
of Los Ranchos de Albuquerque (Albuquerque Academy), |
|
|
| |
4.00%
due 9/1/2040 |
825,000 |
877,614 |
| |
5.00%
due 9/1/2029 - 9/1/2032 |
1,330,000
|
1,557,855 |
| |
Zuni
Public School District (Teacher Housing Projects), 5.00% due 8/1/2028 |
1,600,000
|
1,615,946
|
| |
TOTAL
LONG-TERM MUNICIPAL BONDS — 96.2% (Cost $129,312,520) |
|
$129,031,738
|
| |
SHORT-TERM
MUNICIPAL BONDS — 1.5% |
|
|
|
a |
New
Mexico Hospital Equipment Loan Council (Presbyterian Healthcare Services Obligated Group: SPA Wells Fargo Bank N.A.), 0.34% due 8/1/2034 (put 4/1/2022) |
1,560,000
|
1,560,000
|
| a |
University
of New Mexico (SPA U.S. Bank N.A.), Series B 0.53% due 6/1/2026 (put 4/7/2022) |
500,000
|
500,000
|
| |
TOTAL
SHORT-TERM MUNICIPAL BONDS — 1.5% (Cost $2,060,000) |
|
$
2,060,000 |
| |
Total
Investments — 97.7% (Cost $131,372,520) |
|
$131,091,738
|
| |
Other
Assets Less Liabilities — 2.3% |
|
3,051,780
|
| |
Net
Assets — 100.0% |
|
$134,143,518
|
48 | Thornburg Municipal Funds Semi-Annual Report
|
See notes to
financial statements. |
Schedule of Investments,
Continued
Thornburg New Mexico Intermediate Municipal Fund | March 31, 2022 (Unaudited)
| Footnote Legend
|
| a
|
Variable,
floating, step, or fixed to floating rate securities are securities for which interest rate changes are based on changes in a designated base rate or on a predetermined schedule. The rates shown are those in effect on March 31, 2022. |
| b
|
Segregated
as collateral for a when-issued security. |
| c
|
When-issued
security. |
Portfolio Abbreviations
To simplify the listings of securities, abbreviations are used per the table below:
| AGM
|
Insured by Assured
Guaranty Municipal Corp. |
| AMBAC
|
Insured by
American Municipal Bond Assurance Corp. |
| AMT
|
Alternative
Minimum Tax |
| BAM
|
Insured by
Build America Mutual Insurance Co. |
| FHLMC
|
Collateralized
by Federal Home Loan Mortgage Corp. |
| FNMA
|
Collateralized
by Federal National Mortgage Association |
| GNMA
|
Collateralized by
Government National Mortgage Association |
| GO
|
General Obligation
|
| GRT
|
Gross
Receipts Tax |
| Natl-Re
|
Insured by
National Public Finance Guarantee Corp. |
| SPA
|
Stand-by
Purchase Agreement |
See
notes to financial statements.
|
Thornburg Municipal
Funds Semi-Annual Report | 49 |
Schedule of Investments
Thornburg New York Intermediate Municipal Fund | March 31, 2022
(Unaudited)
| ISSUER-DESCRIPTION
|
PRINCIPAL
AMOUNT |
VALUE
|
| |
LONG-TERM
MUNICIPAL BONDS — 96.5% |
|
|
| |
City
of New York (City Budget Financial Management) GO, Series G, 5.00% due 8/1/2030 |
$1,000,000
|
$ 1,052,341
|
| |
City
of New York GO, |
|
|
| |
Series
A, 5.00% due 8/1/2039 |
1,000,000
|
1,143,665 |
| |
Series
F1, 5.00% due 4/1/2037 |
940,000 |
1,058,583 |
| |
County
of Nassau (Insured: BAM) GO, Series B, 5.00% due 4/1/2026 |
1,000,000
|
1,033,576 |
| |
Erie
County Fiscal Stability Authority, Series D, 5.00% due 9/1/2034 |
850,000 |
974,071 |
| |
Guam
Waterworks Authority (Water and Wastewater System), 5.00% due 7/1/2028 - 7/1/2036 |
1,500,000
|
1,613,456 |
| |
Hudson
Yards Infrastructure Corp. (Hudson Yards Subway Station), Series A, 5.00% due 2/15/2035 |
1,000,000
|
1,112,442 |
| |
Long
Island Power Authority (Electric System Capital Improvements; Insured: AGC), Series C, 5.25% due 9/1/2029 |
645,000 |
764,454 |
| |
Metropolitan
Transportation Authority, Series D-1, 5.00% due 11/15/2031 |
1,000,000
|
1,075,152 |
| |
Metropolitan
Transportation Authority (Transit and Commuter System), Series B-1, 5.00% due 5/15/2022 |
600,000 |
602,141 |
| |
Monroe
County (Monroe Community College Association, Inc.; Insured: AGM) IDC, 5.00% due 1/15/2028 - 1/15/2029 |
550,000 |
582,653 |
| |
Nassau
County Sewer & Storm Water Finance Authority (Sewerage and Storm Water Resource Facilities), Series A, 5.00% due 10/1/2028 - 10/1/2031 |
1,400,000
|
1,504,846 |
| |
New
York City Transitional Finance Authority Future Tax Secured Revenue, |
|
|
| |
Series
A1, 5.00% due 8/1/2038 |
1,000,000
|
1,114,616 |
| |
Series
A2, 5.00% due 5/1/2039 |
1,000,000
|
1,122,552 |
| |
New
York State Dormitory Authority, Series A, 5.00% due 2/15/2032 |
1,000,000
|
1,119,169 |
| |
New
York State Dormitory Authority (Columbia University Teachers College), Series A, 5.00% due 7/1/2027 |
750,000 |
757,001 |
| |
New
York State Dormitory Authority (Green Bond-Cornell University), Series D, 5.00% due 7/1/2036 |
500,000 |
635,943 |
| |
New
York State Dormitory Authority (Metropolitan Transportation Authority & State Urban Development Corp.), Series A, 5.00% due 12/15/2027 |
1,500,000
|
1,533,019 |
| |
New
York State Dormitory Authority (Northwell Health Obligated Group), Series A, 5.00% due 5/1/2033 |
100,000 |
116,222 |
| |
New
York State Dormitory Authority (School District Financing Program) (State Aid Withholding), Series C, 5.00% due 10/1/2023 |
575,000 |
602,534 |
| |
New
York State Dormitory Authority (School District Financing Program; Insured: AGM) (State Aid Withholding), |
|
|
| |
Series
A, 5.00% due 10/1/2028 |
200,000 |
214,529 |
| |
Series
H, 5.00% due 10/1/2024 |
480,000 |
481,505 |
| |
New
York State Dormitory Authority (St. John’s University; Insured: Natl-Re), Series C, 5.25% due 7/1/2022 |
1,000,000
|
1,010,230 |
| |
New
York State Dormitory Authority (State Aid Withholding), Series A, 5.00% due 10/1/2033 |
100,000 |
112,409 |
| |
New
York State Dormitory Authority (State of New York Personal Income Tax Revenue), Series D, 4.00% due 2/15/2040 |
500,000 |
529,795 |
| |
New
York State Dormitory Authority (State of New York Sales Tax Revenue), Series A, 5.00% due 3/15/2033 |
500,000 |
556,957 |
| |
New
York State Thruway Authority, Series N, 5.00% due 1/1/2035 |
250,000 |
287,269 |
| |
Oneida
County Local Development Corp. (Utica College), 5.00% due 7/1/2025 - 7/1/2032 |
855,000 |
935,761 |
| |
Port
Authority of New York & New Jersey AMT, 5.00% due 11/1/2039 |
200,000 |
224,505 |
| |
Sales
Tax Asset Receivable Corp. (New York Local Government Assistance Corp.), Series A, 5.00% due 10/15/2029 - 10/15/2031 (pre-refunded 10/15/2024) |
2,250,000
|
2,421,405 |
| |
State
of New York Mortgage Agency, Series 223, 2.65% due 10/1/2034 |
450,000 |
414,317 |
| |
Tompkins
County Development Corp. (Ithaca College Project), 5.00% due 7/1/2034 - 7/1/2037 |
820,000 |
925,037 |
| |
Triborough
Bridge & Tunnel Authority, Series D, 5.00% due 11/15/2033 |
250,000 |
298,120 |
| |
Triborough
Bridge & Tunnel Authority (MTA Bridges and Tunnels), |
|
|
| |
Series
A, |
|
|
| |
5.00%
due 11/15/2028 (pre-refunded 5/15/2024) |
1,000,000
|
1,064,920 |
| |
5.00%
due 11/15/2029 |
1,000,000
|
1,062,163 |
| |
Troy
Capital Resource Corp. (Rensselaer Polytechnic Institute), Series A, 5.00% due 9/1/2038 |
250,000 |
284,399 |
| |
Utility
Debt Securitization Authority (Long Island Power Authority-Electric Service), Series TE, 5.00% due 12/15/2029 - 12/15/2030 |
2,000,000
|
2,101,621 |
| |
West
Seneca Central School District (Facilities Improvements; Insured: BAM) (State Aid Withholding) GO, 5.00% due 11/15/2023 |
1,300,000
|
1,366,817 |
| |
Westchester
County Local Development Corp. (Miriam Osborn Memorial Home Association Obligated Group), 5.00% due 7/1/2029 - 7/1/2034 |
450,000 |
490,811 |
| |
Western
Nassau County Water Authority (Green Bonds), Series A, 4.00% due 4/1/2040 - 4/1/2041 |
475,000 |
513,316 |
| |
Yonkers
Industrial Development Agency (New Community School Project) (State Aid Withholding), 4.00% due 5/1/2041 |
250,000
|
264,425
|
| |
TOTAL
LONG-TERM MUNICIPAL BONDS — 96.5% (Cost $34,859,106) |
|
$35,078,747
|
| |
SHORT-TERM
MUNICIPAL BONDS — 1.4% |
|
|
| a |
New
York City Municipal Water Finance Authority (New York City Water & Sewer System; SPA Mizuho Bank Ltd.), Series AA6, 0.33% due 6/15/2048 (put 4/1/2022) |
500,000
|
500,000
|
| |
TOTAL
SHORT-TERM MUNICIPAL BONDS — 1.4% (Cost $500,000) |
|
$
500,000 |
| |
Total
Investments — 97.9% (Cost $35,359,106) |
|
$35,578,747
|
| |
Other
Assets Less Liabilities — 2.1% |
|
772,072
|
| |
Net
Assets — 100.0% |
|
$36,350,819
|
50 | Thornburg Municipal Funds Semi-Annual Report
|
See notes to
financial statements. |
Schedule of Investments,
Continued
Thornburg New York Intermediate Municipal Fund | March 31, 2022 (Unaudited)
| Footnote Legend
|
| a
|
Variable,
floating, step, or fixed to floating rate securities are securities for which interest rate changes are based on changes in a designated base rate or on a predetermined schedule. The rates shown are those in effect on March 31, 2022.
|
Portfolio Abbreviations
To simplify the listings of securities, abbreviations are used per the table below:
| AGC
|
Insured by Assured
Guaranty Corp. |
| AGM
|
Insured by
Assured Guaranty Municipal Corp. |
| AMT
|
Alternative
Minimum Tax |
| BAM
|
Insured by
Build America Mutual Insurance Co. |
| GO
|
General Obligation
|
| IDC
|
Industrial
Development Corp. |
| Natl-Re
|
Insured by
National Public Finance Guarantee Corp. |
| SPA
|
Stand-by
Purchase Agreement |
See
notes to financial statements.
|
Thornburg Municipal
Funds Semi-Annual Report | 51 |
Schedule of Investments
Thornburg Intermediate Municipal Fund | March 31, 2022 (Unaudited)
| |
ISSUER-DESCRIPTION
|
Principal
Amount |
VALUE
|
| |
LONG-TERM
MUNICIPAL BONDS — 97.7% |
|
|
| |
Alabama
— 1.5% |
|
|
| |
Alabama
Community College System ACCS Enhancements Fee Revenue (Insured: AGM), 4.00% due 9/1/2040 - 9/1/2041 |
$ 1,600,000
|
$ 1,720,924
|
| |
Alabama
Public School & College Authority (Educational Facilities), Series B, 5.00% due 6/1/2026 (pre-refunded 6/1/2023) |
4,380,000 |
4,542,393 |
| |
UAB
Medicine Finance Authority (University Hospital), Series B, 5.00% due 9/1/2032 |
6,000,000 |
6,795,420
|
| |
Arizona
— 2.1% |
|
|
| |
Arizona
(Scottsdale Lincoln Hospitals) HFA, 5.00% due 12/1/2031 |
2,500,000 |
2,659,567 |
| |
Arizona
Board of Regents (University of Arizona SPEED), 5.00% due 8/1/2029 |
1,000,000 |
1,064,873 |
| |
County
of Pima (TMC HealthCare Obligated Group) IDA, 4.00% due 4/1/2041 |
1,000,000 |
1,051,547 |
| |
County
of Yavapai (Waste Management, Inc.) AMT IDA, 1.30% due 6/1/2027 |
1,000,000 |
934,175 |
| |
Northern
Arizona University (Insured: BAM), Series B, 5.00% due 6/1/2039 |
1,300,000 |
1,517,589 |
| |
Salt
River Project Agricultural Improvement and Power District (Salt River Electric System), 5.00% due 1/1/2033 - 1/1/2037 |
7,000,000 |
7,989,530 |
| |
Salt
Verde Financial Corp. (Gas Supply Acquisition; Guaranty: Citigroup Global Markets), 5.25% due 12/1/2022 - 12/1/2028 |
2,770,000 |
2,921,330
|
| |
Arkansas
— 0.4% |
|
|
| |
Board
of Trustees of the University of Arkansas (Fayetteville Campus), Series A, 5.00% due 11/1/2031 - 11/1/2034 (pre-refunded 11/1/2024) |
3,655,000 |
3,935,455
|
| |
California
— 4.3% |
|
|
| |
Alameda
County Joint Powers Authority (Alameda County Medical Center Highland Hospital), Series A, 5.25% due 12/1/2027 - 12/1/2029 |
3,650,000 |
3,843,971 |
| |
California
(Adventist Health System/West) HFFA, Series A, 5.00% due 3/1/2026 |
2,815,000 |
2,895,171 |
| |
California
(Children’s Hospital Los Angeles) HFFA, Series A, 5.00% due 11/15/2022 - 8/15/2033 |
1,950,000 |
2,108,379 |
| |
California
Infrastructure and Economic Development Bank (King City Joint Union High School District), 5.75% due 8/15/2029 |
1,500,000 |
1,502,340 |
| |
California
Municipal Finance Authority (CHF-Davis II LLC; Insured: BAM) (Green Bond), 4.00% due 5/15/2041 |
500,000 |
523,457 |
| |
Delano
Financing Authority (City of Delano Police Station and Woollomes Avenue Bridge), Series A, 5.00% due 12/1/2025 |
2,555,000 |
2,561,510 |
| |
Franklin-McKinley
School District (Insured: Natl-Re) GO, 5.25% due 8/1/2027 |
1,000,000 |
1,145,741 |
| |
Fresno
(Educational Facilities and Improvements; Insured: Natl-Re) USD GO, Series A, 6.00% due 8/1/2026 |
1,105,000 |
1,199,592 |
| |
Jurupa
Public Financing Authority (Eastvale Community Services; Insured: AGM), Series A, 5.50% due 9/1/2025 - 9/1/2027 |
2,530,000 |
2,654,036 |
| |
Los
Angeles Department of Airports AMT, Series A, 5.00% due 5/15/2036 |
3,635,000 |
4,072,316 |
| |
M-S-R
Energy Authority (Guaranty: Citigroup Global Markets), Series B, 6.125% due 11/1/2029 |
2,365,000 |
2,707,561 |
| |
North
City West School Facilities Financing Authority (Carmel Valley Schools; Insured: AGM), Series A, 5.00% due 9/1/2024 |
1,080,000 |
1,095,316 |
|
a |
Northern
California Energy Authority (Commodity Supply Revenue; Guaranty: Goldman Sachs Group, Inc.), Series A, 4.00% due 7/1/2049 (put 7/1/2024) |
5,000,000 |
5,139,545 |
| |
Oakland
(County of Alameda Educational Facilities) USD GO, Series A, 5.00% due 8/1/2032 - 8/1/2034 (pre-refunded 8/1/2025) |
3,000,000 |
3,287,895 |
| |
Redwood
City Redevelopment Agency (Redevelopment Area A-2; Insured: AMBAC), Series A-2, Zero Coupon due 7/15/2023 |
2,065,000 |
2,016,704 |
| |
Saratoga
Union School District (Insured: Natl-Re) USD GO, Series B, Zero Coupon due 9/1/2023 |
900,000 |
879,674
|
| |
Colorado
— 1.3% |
|
|
| |
Colorado
(Sanford Obligated Group) HFA, Series A, 5.00% due 11/1/2039 |
2,015,000 |
2,299,699 |
| |
Housing
Authority of the City and County of Denver (Three Towers Rehabilitation; Insured: AGM) AMT, 5.20% due 11/1/2027 |
1,335,000 |
1,337,536 |
| |
Regional
Transportation District (North Metro Rail Line) COP, Series A, 5.00% due 6/1/2028 |
1,650,000 |
1,706,214 |
| |
State
of Colorado COP, |
|
|
| |
Series
A, |
|
|
| |
4.00%
due 12/15/2040 |
400,000 |
429,584 |
| |
5.00%
due 9/1/2029 - 9/1/2032 |
5,205,000 |
5,968,270
|
| |
Connecticut
— 2.8% |
|
|
| |
City
of Hartford (Various Public Improvements; Insured: AGM) GO, Series A, 5.00% due 7/1/2031 |
1,700,000 |
1,843,908 |
| |
State
of Connecticut (Various Capital Projects) GO, Series B, 5.00% due 5/15/2027 |
1,000,000 |
1,106,818 |
| |
State
of Connecticut GO, |
|
|
| |
Series
A, |
|
|
| |
5.00%
due 4/15/2033 - 4/15/2035 |
7,000,000 |
7,961,816 |
|
b |
5.00%
due 4/15/2034 |
5,415,000 |
6,147,482 |
| |
Series
C, 5.00% due 6/15/2028 - 6/15/2029 |
1,890,000 |
2,180,474 |
| |
Series
E, 5.00% due 9/15/2033 |
2,650,000 |
3,031,873 |
| |
State
of Connecticut, Special Tax Revenue, Series A, 5.00% due 5/1/2038 |
1,750,000 |
2,022,468
|
| |
District
of Columbia — 2.4% |
|
|
| |
Metropolitan
Washington Airports Authority (Dulles Toll Road Revenue), Series A, 5.00% due 10/1/2038 - 10/1/2039 |
3,000,000 |
3,379,971 |
| |
Metropolitan
Washington Airports Authority (Dulles Toll Road Revenue; Insured: AGC), Series B, Zero Coupon due 10/1/2023 - 10/1/2024 |
9,890,000 |
9,445,359 |
| |
Metropolitan
Washington Airports Authority Aviation Revenue AMT, Series A, 4.00% due 10/1/2040 - 10/1/2041 |
2,750,000 |
2,867,016 |
| |
Washington
Convention & Sports Authority, Series A, 5.00% due 10/1/2028 |
1,105,000 |
1,264,391 |
| |
Washington
Metropolitan Area Transit Authority, 5.00% due 7/1/2032 - 7/1/2037 |
3,325,000 |
3,767,705
|
| |
Florida
— 6.6% |
|
|
| |
Broward
County (Airport System Improvements) AMT, 5.00% due 10/1/2034 - 10/1/2035 |
3,500,000 |
3,839,226 |
| |
City
of Jacksonville (Better Jacksonville Plan), Series A, 5.00% due 10/1/2026 |
2,075,000 |
2,109,283 |
| |
City
of Lakeland (Electric Power System Smart Grid Project; Insured: AGM), 5.25% due 10/1/2027 - 10/1/2036 |
6,450,000
|
7,815,852
|
52 | Thornburg Municipal Funds Semi-Annual Report
|
See notes to
financial statements. |
Schedule of Investments,
Continued
Thornburg Intermediate Municipal Fund | March 31, 2022 (Unaudited)
| |
ISSUER-DESCRIPTION
|
Principal
Amount |
VALUE
|
| |
City
of Orlando (Senior Tourist Development; Insured: AGM), Series A, 5.00% due 11/1/2032 - 11/1/2037 |
$ 3,430,000
|
$ 3,863,287
|
| |
JEA
Water & Sewer System Revenue, Series A, 5.00% due 10/1/2035 |
600,000 |
710,237 |
| |
Lake
County School Board (School District Facility Projects) COP, Series B, 5.00% due 6/1/2026 (pre-refunded 6/1/2022) |
1,210,000 |
1,217,698 |
| |
Manatee
County (Public Utilities System Improvements), 5.00% due 10/1/2026 - 10/1/2033 |
6,080,000 |
6,580,710 |
| |
Miami-Dade
County (Miami International Airport), Series B, 5.00% due 10/1/2028 - 10/1/2031 |
5,335,000 |
5,676,075 |
| |
Miami-Dade
County (Nicklaus Children’s Hospital) HFA, 5.00% due 8/1/2035 - 8/1/2037 |
2,905,000 |
3,241,709 |
| |
Miami-Dade
County Educational Facilities Authority (University of Miami; Insured: AMBAC), Series B, 5.25% due 4/1/2024 |
1,000,000 |
1,055,501 |
| |
Miami-Dade
County School Board COP, Series A, 5.00% due 5/1/2030 |
3,250,000 |
3,510,858 |
| |
Orange
County (Tourist Development), Series A, 5.00% due 10/1/2031 |
2,000,000 |
2,220,272 |
| |
Palm
Beach County (Boca Raton Regional Hospital) HFA, 5.00% due 12/1/2025 (pre-refunded 12/1/2024) |
500,000 |
538,278 |
| |
Palm
Beach County School District COP, Series C, 5.00% due 8/1/2028 |
595,000 |
686,672 |
| |
School
District of Broward County (Educational Facilities and Equipment) COP, |
|
|
| |
Series
A, 5.00% due 7/1/2027 |
2,000,000 |
2,016,014 |
| |
Series
B, 5.00% due 7/1/2032 |
2,000,000 |
2,178,938 |
| |
School
District of Broward County COP, |
|
|
| |
Series
A, |
|
|
| |
5.00%
due 7/1/2026 |
545,000 |
549,543 |
| |
5.00%
due 7/1/2026 (pre-refunded 7/1/2022) |
2,455,000 |
2,479,287 |
| |
School
District of Manatee County (School Facilities Improvement; Insured: AGM), 5.00% due 10/1/2032 |
2,250,000 |
2,487,978 |
| |
Sunshine
State Governmental Finance Commission (Miami-Dade County Program), Series B-1, 5.00% due 9/1/2028 (pre-refunded 9/1/2023) |
3,500,000 |
3,654,633 |
| |
Wildwood
Utility Dependent District (Insured: BAM), 5.00% due 10/1/2032 - 10/1/2041 |
1,000,000 |
1,166,405
|
| |
Georgia
— 2.9% |
|
|
| |
Athens-Clarke
County Unified Government Development Authority (UGAREF Bolton Commons LLC), 5.00% due 6/15/2024 - 6/15/2028 |
2,320,000 |
2,403,822 |
| |
City
of Atlanta (Water & Wastewater System; Insured: Natl-Re), Series A, 5.50% due 11/1/2022 |
185,000 |
188,857 |
| |
Main
Street Natural Gas, Inc. (Guaranty: Macquarie Group Ltd.), Series A, 5.00% due 5/15/2035 - 5/15/2037 |
11,170,000
|
13,203,561 |
| |
Municipal
Electric Authority of Georgia, Series A, 5.00% due 1/1/2035 - 1/1/2038 |
8,515,000 |
9,707,827
|
| |
Guam
— 0.9% |
|
|
| |
Guam
Power Authority (Electric Power System; Insured: AGM), Series A, 5.00% due 10/1/2023 - 10/1/2025 |
6,500,000 |
6,609,785 |
| |
Guam
Waterworks Authority (Water and Wastewater System), 5.25% due 7/1/2024 |
1,000,000 |
1,034,987
|
| |
Hawaii
— 0.8% |
|
|
| |
County
of Hawaii GO, Series A, 5.00% due 9/1/2033 |
1,250,000 |
1,383,292 |
| |
State
of Hawaii Airports System Revenue AMT, Series A, 5.00% due 7/1/2032 - 7/1/2033 |
5,000,000 |
5,744,118
|
| |
Illinois
— 12.7% |
|
|
| |
Chicago
O’Hare International Airport (2016 Airport Projects), Series C, 5.00% due 1/1/2029 - 1/1/2030 |
1,765,000 |
1,914,005 |
| |
Chicago
O’Hare International Airport (2017 Airport Projects), Series B, 5.00% due 1/1/2034 - 1/1/2037 |
8,160,000 |
8,902,635 |
| |
Chicago
Park District (Capital Improvement Plan) GO, |
|
|
| |
Series
B, 5.00% due 1/1/2025 |
1,000,000 |
1,046,204 |
| |
Series
D, 5.00% due 1/1/2028 |
3,450,000 |
3,606,478 |
| |
Chicago
Park District GO, |
|
|
| |
Series
A, |
|
|
| |
5.00%
due 1/1/2027 - 1/1/2029 |
1,355,000 |
1,416,439 |
| |
5.00%
due 1/1/2027 - 1/1/2029 (pre-refunded 1/1/2024) |
2,585,000 |
2,721,211 |
| |
Series
B, |
|
|
| |
5.00%
due 1/1/2030 |
1,215,000 |
1,269,339 |
| |
5.00%
due 1/1/2030 (pre-refunded 1/1/2024) |
2,285,000 |
2,405,404 |
| |
City
of Chicago (Midway Airport), |
|
|
| |
Series
B, |
|
|
| |
5.00%
due 1/1/2032 - 1/1/2033 |
9,805,000 |
10,247,644 |
| |
5.25%
due 1/1/2034 |
4,700,000 |
4,802,629 |
| |
City
of Chicago (Wastewater Transmission System), Series C-2, 5.00% due 1/1/2028 - 1/1/2029 |
7,865,000 |
8,407,096 |
| |
City
of Chicago (Wastewater Transmission System; Insured: AGM-CR), Series B, 5.00% due 1/1/2034 |
1,375,000 |
1,509,577 |
| |
City
of Chicago (Water System), Series A-1, 5.00% due 11/1/2024 |
1,000,000 |
1,081,292 |
| |
City
of Chicago (Water System; Insured: AGM), Series 2017-2, 5.00% due 11/1/2037 |
4,250,000 |
4,792,326 |
| |
City
of Chicago (Water System; Insured: BHAC-CR AMBAC), 5.75% due 11/1/2030 |
1,270,000 |
1,504,406 |
| |
City
of Chicago GO, |
|
|
| |
Series
A, |
|
|
| |
5.625%
due 1/1/2031 |
1,585,000 |
1,748,414 |
| |
6.00%
due 1/1/2038 |
7,500,000 |
8,267,520 |
| |
Clinton
Bond Fayette Etc Counties Community College District No 501 Kaskaskia (Insured: AGM) GO, 4.00% due 12/1/2033 |
1,500,000 |
1,652,876 |
| |
Cook
County School District No. 104 (Argo Summit Elementary School Facilities; Insured: AGM) GO ETM, Series D, Zero Coupon due 12/1/2022 |
2,000,000 |
1,980,256 |
| |
Illinois
Finance Authority (Northwestern Memorial Healthcare Obligated Group), Series A, 5.00% due 7/15/2031 |
175,000 |
199,663 |
| |
Illinois
Finance Authority (Rush University Medical Center), Series A, 5.00% due 11/15/2033 |
1,000,000
|
1,074,527
|
See
notes to financial statements.
|
Thornburg Municipal
Funds Semi-Annual Report | 53 |
Schedule of Investments, Continued
Thornburg Intermediate Municipal Fund | March 31, 2022 (Unaudited)
| |
ISSUER-DESCRIPTION
|
Principal
Amount |
VALUE
|
| |
Illinois
Finance Authority (Silver Cross Hospital and Medical Centers), 5.00% due 8/15/2024 |
$ 1,000,000
|
$ 1,064,585
|
| |
Illinois
Toll Highway Authority (Move Illinois Program), Series A, 5.00% due 1/1/2037 |
5,550,000 |
5,974,869 |
| |
Knox
& Warren Counties Community Unit School District No. 205 Galesburg GO, Series B, 5.00% due 12/1/2030 - 12/1/2031 |
2,655,000 |
2,996,612 |
| |
Metropolitan
Pier & Exposition Authority (McCormick Place Expansion Project), Series B, 5.00% due 12/15/2022 |
1,000,000 |
1,017,946 |
| |
Monroe
and St. Clair Counties (Community Unit School District No. 5; Insured: BAM) GO, 5.00% due 4/15/2027 - 4/15/2031 |
6,285,000 |
6,917,839 |
| |
Regional
Transportation Authority (Insured: Natl-Re), Series A, 6.00% due 7/1/2031 |
1,070,000 |
1,316,626 |
| |
Sales
Tax Securitization Corp., Series A, 5.00% due 1/1/2029 |
2,000,000 |
2,247,344 |
| |
Sangamon
County (Insured: BAM) GO, 4.00% due 12/15/2040 |
150,000 |
159,643 |
| |
State
of Illinois GO, Series D, 5.00% due 11/1/2027 - 11/1/2028 |
4,250,000 |
4,662,318 |
| |
State
of Illinois Sales Tax Revenue, Series B, 5.00% due 6/15/2030 - 6/15/2031 |
9,280,000 |
10,246,030 |
| |
State
of Illinois Sales Tax Revenue (Insured: BAM-Natl-Re), Series B, 5.00% due 6/15/2032 |
2,885,000 |
3,155,867 |
| |
Tazewell
County School District (Insured: Natl-Re) GO ETM, 9.00% due 12/1/2024 |
1,205,000 |
1,414,612
|
| |
Indiana
— 1.4% |
|
|
|
a |
City
of Whiting Environmental Facilities (BP Products North America Inc. Project) AMT, Series A, 5.00% due 3/1/2046 (put 3/1/2023) |
1,000,000 |
1,028,216 |
|
a |
City
of Whiting IN (BP Products North America, Inc.; Guaranty : BP plc) AMT, 5.00% due 11/1/2047 (put 11/1/2024) |
250,000 |
266,480 |
| |
Indiana
(Ascension Health Credit Group) HFFA, 5.00% due 11/15/2034 - 11/15/2036 |
8,325,000 |
9,114,781 |
| |
Indiana
Bond Bank (Hendricks Regional Health Financing Program; Insured: AMBAC), Series A, 5.25% due 4/1/2023 |
2,000,000 |
2,066,906
|
| |
Iowa
— 0.5% |
|
|
| |
Iowa
Finance Authority (UnityPoint Health), Series C, 5.00% due 2/15/2030 - 2/15/2032 |
4,100,000 |
4,310,625
|
| |
Kansas
— 0.1% |
|
|
| |
Unified
Government of Wyandotte County/Kansas City (School Improvement Project; Insured: AGM) USD GO, Series A, 5.00% due 9/1/2030 - 9/1/2031 |
990,000 |
1,122,039
|
| |
Kentucky
— 1.6% |
|
|
|
a,b |
Kentucky
Public Energy Authority (Guaranty: Morgan Stanley Group), Series A, 4.00% due 4/1/2048 (put 4/1/2024) |
6,500,000 |
6,710,073 |
| |
Kentucky
State Property & Building Commission (Insured: AGM), Series A, 5.00% due 11/1/2035 |
4,000,000 |
4,697,092 |
| |
Louisville/Jefferson
County Metropolitan Government (Norton Suburban Hospital and Kosair Children’s Hospital), Series A, 5.25% due 10/1/2026 |
2,320,000 |
2,435,005
|
| |
Louisiana
— 2.3% |
|
|
| |
East
Baton Rouge Sewerage Commission, Series B, 5.00% due 2/1/2030 - 2/1/2032 (pre-refunded 2/1/2025) |
6,825,000 |
7,380,964 |
| |
Jefferson
Sales Tax District (Insured: AGM), Series B, 5.00% due 12/1/2034 - 12/1/2035 |
1,500,000 |
1,681,817 |
| |
Louisiana
Energy and Power Authority (LEPA Unit No. 1; Insured: AGM), Series A, 5.25% due 6/1/2029 - 6/1/2031 (pre-refunded 6/1/2023) |
6,100,000 |
6,345,598 |
| |
Parish
of Lafourche (Roads, Highways and Bridges), 5.00% due 1/1/2024 - 1/1/2025 |
3,685,000 |
3,953,351 |
|
a |
Parish
of St. Charles (Valero Energy Corp. Refinery; Guaranty: Valero Energy Corp.), 4.00% due 12/1/2040 (put 6/1/2022) |
1,000,000 |
1,003,418
|
| |
Maryland
— 0.0% |
|
|
| |
Montgomery
County GO, Series C, 5.00% due 10/1/2025 |
365,000 |
402,166
|
| |
Massachusetts
— 1.7% |
|
|
| |
Massachusetts
(CareGroup Healthcare System) DFA, Series I, 5.00% due 7/1/2036 |
1,750,000 |
1,926,484 |
| |
Massachusetts
(Insured: BHAC-CR FGIC), 5.50% due 1/1/2029 |
8,370,000 |
9,916,508 |
| |
Massachusetts
(Simmons College) DFA, Series J, 5.50% due 10/1/2025 - 10/1/2028 |
1,790,000 |
1,870,298 |
| |
Massachusetts
Bay Transportation Authority Assessment Revenue (Transportation Capital Program), Series A, 5.25% due 7/1/2030 |
1,000,000 |
1,220,664
|
| |
Michigan
— 2.8% |
|
|
| |
Board
of Governors of Wayne State University (Educational Facilities and Equipment), Series A, 5.00% due 11/15/2031 |
1,010,000 |
1,083,597 |
| |
County
of Genesee (Water Supply System; Insured: BAM) GO, |
|
|
| |
5.00%
due 11/1/2024 - 11/1/2030 |
3,360,000 |
3,467,753 |
| |
5.125%
due 11/1/2032 |
750,000 |
774,286 |
| |
5.25%
due 11/1/2026 - 11/1/2028 |
2,920,000 |
3,022,272 |
| |
Detroit
City School District (School Building & Site Improvement; Insured: AGM Q-SBLF) GO, Series A, 5.25% due 5/1/2026 |
3,150,000 |
3,538,606 |
| |
Detroit
City School District (School Building & Site; Insured: AGM Q-SBLF) GO, Series A, 5.25% due 5/1/2027 |
1,100,000 |
1,264,379 |
| |
Gerald
R Ford International Airport Authority AMT, 5.00% due 1/1/2039 - 1/1/2041 |
2,205,000 |
2,548,288 |
| |
Kalamazoo
Hospital Finance Authority (Bronson Healthcare), 5.25% due 5/15/2026 |
175,000 |
175,499 |
| |
Michigan
Finance Authority (Government Loan Program), Series F, 5.00% due 4/1/2026 |
1,295,000 |
1,298,595 |
| |
Michigan
Finance Authority (McLaren Health System), Series A, 5.00% due 2/15/2039 |
3,200,000 |
3,723,469 |
| |
Michigan
State Housing Development Authority, Series B, 2.95% due 12/1/2039 |
3,000,000 |
2,799,021 |
| |
West
Ottawa Public Schools (Insured: AGM) GO, 4.00% due 11/1/2032 |
800,000 |
899,914
|
| |
Minnesota
— 0.4% |
|
|
| |
Minneapolis-St
Paul Metropolitan Airports Commission AMT, Series B 5.00% due 1/1/2026 |
1,245,000 |
1,347,349 |
| |
Minnesota
Higher Education Facilities Authority, (University of St. Thomas), 5.00% due 10/1/2034 - 10/1/2035 |
600,000 |
692,462 |
| |
Minnesota
Housing Finance Agency (Collateralized: GNMA, FNMA, FHLMC), Series F, 2.45% due 7/1/2034 |
1,310,000 |
1,285,230
|
| |
Mississippi
— 0.8% |
|
|
| |
Mississippi
Development Bank (Jackson Public School District; Insured BAM), 5.25% due 10/1/2037 - 10/1/2038 |
5,250,000 |
6,112,322 |
| |
Mississippi
Development Bank (Vicksburg Warren School District; Insured: BAM), 5.50% due 3/1/2038 |
700,000 |
825,903
|
| |
Missouri
— 0.0% |
|
|
54 | Thornburg Municipal Funds Semi-Annual Report
|
See notes to
financial statements. |
Schedule of Investments,
Continued
Thornburg Intermediate Municipal Fund | March 31, 2022 (Unaudited)
| |
ISSUER-DESCRIPTION
|
Principal
Amount |
VALUE
|
| |
City
of Excelsior Springs (Insured: BAM) COP, Series B, 4.00% due 3/1/2031 |
$ 150,000
|
$ 164,999
|
| |
Nebraska
— 0.6% |
|
|
|
a |
Central
Plains Energy Project (Guaranty: Goldman Sachs Group, Inc.), 5.00% due 3/1/2050 (put 1/1/2024) |
5,350,000 |
5,564,219
|
| |
Nevada
— 0.4% |
|
|
| |
Carson
City (Carson Tahoe Regional Healthcare), |
|
|
| |
5.00%
due 9/1/2027 (pre-refunded 9/1/2022) |
2,450,000 |
2,490,053 |
| |
5.00%
due 9/1/2032 |
730,000 |
810,884
|
| |
New
Hampshire — 0.4% |
|
|
| |
New
Hampshire Municipal Bond Bank, Series C, 5.00% due 8/15/2026 (pre-refunded 8/15/2023) |
1,860,000 |
1,940,125 |
| |
State
of New Hampshire (Turnpike System), Series B, 5.00% due 2/1/2024 |
1,755,000 |
1,760,407
|
| |
New
Jersey — 5.0% |
|
|
| |
Essex
County Improvement Authority (County Correctional Facilities & Gibraltar Facilities; Insured: Natl-Re) GO, 5.50% due 10/1/2024 |
2,500,000 |
2,709,975 |
| |
New
Jersey (School Facilities Construction) EDA, |
|
|
| |
5.00%
due 6/15/2035 - 6/15/2038 |
4,515,000 |
5,037,341 |
| |
Series
NN, 5.00% due 3/1/2026 |
2,000,000 |
2,051,576 |
| |
New
Jersey (School Facilities Construction; Insured: AMBAC) EDA, Series N-1, 5.50% due 9/1/2026 |
3,000,000 |
3,359,031 |
| |
New
Jersey (School Facilities Construction; Insured: Natl-Re) EDA, Series N-1, 5.50% due 9/1/2027 |
1,700,000 |
1,933,670 |
| |
New
Jersey (State of New Jersey Department of the Treasury) EDA, Series DDD, 5.00% due 6/15/2033 |
1,000,000 |
1,090,379 |
| |
New
Jersey (Transit Corp.) EDA, 5.00% due 11/1/2036 |
2,950,000 |
3,289,448 |
| |
New
Jersey State Health Care Facilities Financing Authority (Virtua Health), 5.00% due 7/1/2027 - 7/1/2028 |
3,000,000 |
3,148,418 |
| |
New
Jersey Transportation Trust Fund Authority, |
|
|
| |
Series
A, 5.00% due 12/15/2032 |
485,000 |
538,766 |
| |
Series
AA, 5.00% due 6/15/2036 - 6/15/2040 |
1,500,000 |
1,684,320 |
| |
Series
BB, 5.00% due 6/15/2034 |
2,000,000 |
2,212,500 |
| |
New
Jersey Transportation Trust Fund Authority (State Transportation System Improvements), |
|
|
| |
5.00%
due 6/15/2023 - 6/15/2024 |
2,500,000 |
2,619,322 |
| |
Series
A, 5.00% due 6/15/2031 |
1,000,000 |
1,099,797 |
| |
New
Jersey Transportation Trust Fund Authority (Transportation Program Bonds), Series AA, 5.00% due 6/15/2038 |
3,500,000 |
3,850,868 |
| |
New
Jersey Transportation Trust Fund Authority (Transportation System), Series A, 5.00% due 12/15/2034 - 12/15/2036 |
5,500,000 |
6,070,253 |
| |
Passaic
Valley Sewage Commissioners, Series G, 5.75% due 12/1/2022 |
3,000,000 |
3,084,420
|
| |
New
Mexico — 0.3% |
|
|
| |
New
Mexico Hospital Equipment Loan Council (Haverland Carter Lifestyle Obligated Group), 5.00% due 7/1/2032 |
2,130,000 |
2,146,377 |
| |
New
Mexico Hospital Equipment Loan Council (Presbyterian Healthcare Services Obligated Group), Series A, 5.00% due 8/1/2039 |
440,000 |
496,119
|
| |
New
York — 5.6% |
|
|
|
c |
City
of New York, 5.00% due 2/1/2037 |
200,000 |
232,676 |
| |
City
of New York (City Budget Financial Management) GO, |
|
|
| |
Series
G, 5.00% due 8/1/2027 |
4,530,000 |
4,774,896 |
| |
Series
J, 5.00% due 8/1/2030 - 8/1/2031 |
9,000,000 |
9,591,420 |
| |
City
of New York GO, Series C, 5.00% due 8/1/2035 |
500,000 |
584,761 |
| |
County
of Nassau (Insured: BAM) GO, Series B, 5.00% due 4/1/2026 |
1,300,000 |
1,343,649 |
| |
Erie
County (City of Buffalo School District) (State Aid Withholding) IDA, Series A, 5.00% due 5/1/2027 |
5,000,000 |
5,170,050 |
| |
Metropolitan
Transportation Authority, |
|
|
| |
Series
D, 5.00% due 11/15/2030 - 11/15/2035 |
8,295,000 |
9,049,504 |
| |
Series
D-1, 5.00% due 11/15/2031 |
2,285,000 |
2,456,722 |
| |
Metropolitan
Transportation Authority (Green Bond), |
|
|
| |
Series
A1, 5.00% due 11/15/2035 - 11/15/2036 |
1,820,000 |
1,960,095 |
| |
Series
A2, 5.00% due 11/15/2025 |
600,000 |
650,561 |
| |
Monroe
County (Rochester City School District) (State Aid Withholding) IDC, 5.00% due 5/1/2033 |
620,000 |
711,895 |
| |
New
York City Transitional Finance Authority Future Tax Secured Revenue, 5.00% due 11/1/2036 |
2,230,000 |
2,574,281 |
| |
New
York State Dormitory Authority, Series A, 5.00% due 3/15/2037 |
735,000 |
835,473 |
| |
New
York State Dormitory Authority (Metropolitan Transportation Authority & State Urban Development Corp.), Series A, 5.00% due 12/15/2027 |
2,500,000 |
2,555,032 |
| |
New
York State Dormitory Authority (State of New York Personal Income Tax Revenue), |
|
|
| |
Series
A, 5.00% due 3/15/2035 - 3/15/2036 |
2,650,000 |
3,122,730 |
| |
Series
D, 4.00% due 2/15/2040 |
1,000,000 |
1,059,591 |
| |
New
York State Dormitory Authority (State of New York Sales Tax Revenue), Series A, 5.00% due 3/15/2033 |
500,000 |
556,957 |
| |
New
York State Urban Development Corp. (State of New York Personal Income Tax Revenue), Series A, 5.00% due 3/15/2041 |
1,500,000 |
1,719,059 |
| |
New
York State Urban Development Corp. (State of New York Sales Tax Revenue), Series A, 5.00% due 3/15/2037 |
500,000 |
577,817
|
| |
North
Carolina — 1.3% |
|
|
| |
Charlotte-Mecklenburg
Hospital Authority (Carolinas HealthCare System), Series A, 5.00% due 1/15/2028 |
2,190,000 |
2,240,858 |
| |
North
Carolina Medical Care Commission (Vidant Health), 5.00% due 6/1/2030 (pre-refunded 6/1/2025) |
3,000,000 |
3,268,965 |
| |
State
of North Carolina, 5.00% due 3/1/2033 |
5,000,000 |
5,755,055
|
| |
Ohio
— 5.7% |
|
|
See
notes to financial statements.
|
Thornburg Municipal
Funds Semi-Annual Report | 55 |
Schedule of Investments, Continued
Thornburg Intermediate Municipal Fund | March 31, 2022 (Unaudited)
| |
ISSUER-DESCRIPTION
|
Principal
Amount |
VALUE
|
| |
Akron,
Bath and Copley Joint Township Hospital District (Children’s Hospital Medical Center of Akron), 5.00% due 11/15/2024 |
$ 1,000,000
|
$ 1,004,064
|
| |
Akron,
Bath and Copley Joint Township Hospital District (Summa Health System Obligated Group), 5.00% due 11/15/2027 - 11/15/2029 |
1,985,000 |
2,269,355 |
| |
American
Municipal Power Inc. (AMP Fremont Energy Center), 4.00% due 2/15/2038 |
500,000 |
537,383 |
| |
Cincinnati
City School District (School Improvement Project) COP, 5.00% due 12/15/2031 (pre-refunded 12/15/2024) |
3,075,000 |
3,320,480 |
| |
City
of Cleveland (Bridges and Roadways), Series A-2, 5.00% due 10/1/2028 - 10/1/2029 (pre-refunded 10/1/2023) |
2,520,000 |
2,641,940 |
| |
City
of Cleveland (Public Facilities Improvements), Series A-1, 5.00% due 11/15/2027 - 11/15/2030 (pre-refunded 11/15/2023) |
5,185,000 |
5,453,007 |
| |
City
of Cleveland (Various Municipal Capital Improvements) GO, 5.00% due 12/1/2024 |
1,000,000 |
1,022,079 |
| |
City
of Cleveland GO, |
|
|
| |
5.00%
due 12/1/2026 |
15,000 |
15,324 |
| |
5.00%
due 12/1/2026 (pre-refunded 12/1/2022) |
1,215,000 |
1,245,641 |
| |
City
of Cleveland Income Tax Revenue, |
|
|
| |
5.00%
due 10/1/2033 - 10/1/2035 |
1,450,000 |
1,661,550 |
| |
Series
A-1, 4.00% due 10/1/2032 - 10/1/2033 |
960,000 |
1,070,609 |
| |
Cleveland-Cuyahoga
County Port Authority (County Administration Offices), 5.00% due 7/1/2025 |
1,780,000 |
1,938,457 |
| |
County
of Allen (Catholic Health Partners-Mercy Health West Facility), Series A, 5.00% due 5/1/2025 - 5/1/2026 (pre-refunded 5/1/2022) |
8,325,000 |
8,351,049 |
| |
County
of Cuyahoga (Musical Arts Association), 5.00% due 1/1/2030 - 1/1/2039 |
3,170,000 |
3,588,233 |
| |
County
of Hamilton (Cincinnati Children’s Hospital Medical Center), 5.00% due 5/15/2028 - 5/15/2031 |
8,085,000 |
8,584,930 |
| |
Greene
County Vocational School District (School Facilities Construction and Improvement) GO, 5.00% due 12/1/2030 - 12/1/2033 |
2,580,000 |
2,979,365 |
| |
Northeast
Ohio Medical University (Insured: BAM), Series B, 4.00% due 12/1/2035 - 12/1/2041 |
3,875,000 |
4,092,140
|
| |
Oklahoma
— 0.2% |
|
|
| |
Pontotoc
County Educational Facilities Authority, 4.00% due 9/1/2040 |
1,500,000 |
1,573,046
|
| |
Pennsylvania
— 9.4% |
|
|
| |
Allegheny
County Higher Education Building Authority, Series A, 4.00% due 3/1/2041 |
1,500,000 |
1,573,606 |
| |
Allegheny
County Hospital Development Authority (University of Pittsburgh Medical Center), Series A, 5.00% due 7/15/2034 |
1,150,000 |
1,310,504 |
| |
Bucks
County (Waste Management, Inc.) AMT IDA, Series A-2, 2.75% due 12/1/2022 |
7,000,000 |
7,054,362 |
| |
City
of Philadelphia (Pennsylvania Gas Works), 5.00% due 8/1/2032 - 8/1/2034 |
2,300,000 |
2,490,500 |
| |
City
of Philadelphia (Philadelphia Gas Works), 5.00% due 8/1/2036 - 8/1/2037 |
5,485,000 |
6,085,095 |
| |
City
of Philadelphia (Water and Wastewater System), Series A, 5.00% due 10/1/2029 |
1,100,000 |
1,230,526 |
| |
City
of Pittsburgh (Capital Projects) GO, 5.00% due 9/1/2035 - 9/1/2036 |
1,215,000 |
1,356,200 |
| |
County
of Luzerne (Insured: AGM) GO, Series A, 5.00% due 11/15/2029 |
3,000,000 |
3,281,259 |
|
c |
Hospitals
& Higher Education Facilities Authority of Philadelphia (Temple University Health System Obligated Group; Insured AGM), 4.00% due 7/1/2038 |
9,000,000 |
9,506,232 |
| |
Lancaster
County Solid Waste Management Authority (Acquisition of Susquehanna Resource Management Facility), Series A, 5.25% due 12/15/2030 |
3,000,000 |
3,164,841 |
| |
Monroeville
Financing Authority (University of Pittsburgh Medical Center), 5.00% due 2/15/2026 |
3,490,000 |
3,823,703 |
| |
Pennsylvania
State Public School Building Authority (Philadelphia School District; Insured: AGM) (State Aid Withholding), Series B, 5.00% due 6/1/2027 |
5,000,000 |
5,639,945 |
| |
Pennsylvania
Turnpike Commission, |
|
|
| |
Series
B, |
|
|
| |
4.00%
due 12/1/2040 |
1,000,000 |
1,071,374 |
| |
5.00%
due 12/1/2032 - 12/1/2038 |
1,450,000 |
1,708,057 |
| |
Pennsylvania
Turnpike Commission (Highway Improvements), Series A-1, 5.00% due 12/1/2035 - 12/1/2036 |
1,750,000 |
1,969,835 |
| |
Philadelphia
Authority for Industrial Development (Thomas Jefferson University), Series A, 5.00% due 9/1/2032 - 9/1/2034 |
5,000,000 |
5,529,171 |
| |
Philadelphia
Municipal Authority (Juvenile Justice Services Center), 5.00% due 4/1/2032 - 4/1/2036 |
11,125,000
|
12,401,184 |
| |
Pittsburgh
Water & Sewer Authority (Water and Sewer System; Insured: AGM), |
|
|
| |
Series
A, 5.00% due 9/1/2030 - 9/1/2031 |
8,740,000 |
9,078,227 |
| |
Series
B, 5.00% due 9/1/2031 (pre-refunded 9/1/2023) |
3,665,000 |
3,831,098
|
| |
Rhode
Island — 0.5% |
|
|
| |
State
of Rhode Island and Providence Plantations (Consolidated Capital Development Loan) GO, Series B, 4.00% due 10/15/2023 |
800,000 |
810,549 |
| |
State
of Rhode Island and Providence Plantations (Training School Project) COP, Series B, 5.00% due 10/1/2024 |
3,595,000 |
3,757,142
|
| |
South
Carolina — 0.5% |
|
|
| |
City
of Myrtle Beach (Municipal Sports Complex), Series B, 5.00% due 6/1/2028 - 6/1/2030 |
2,000,000 |
2,110,670 |
| |
City
of North Charleston (North Charleston Noisette Community Redevelopment Project Area), 4.00% due 10/1/2040 - 10/1/2041 |
2,000,000 |
2,160,265
|
| |
South
Dakota — 0.2% |
|
|
| |
South
Dakota Health and Educational Facilities Authority (Sanford Health), 5.00% due 11/1/2028 - 11/1/2029 |
1,800,000 |
1,966,866
|
| |
Tennessee
— 2.4% |
|
|
| |
County
of Shelby Health, Educational and Housing Facility Board (Methodist Le Bonheur Healthcare), 5.00% due 5/1/2027 - 5/1/2035 |
3,560,000 |
4,002,343 |
| |
Metropolitan
Government of Nashville and Davidson County (Green Projects), Series B, 5.00% due 7/1/2033 - 7/1/2036 |
3,000,000 |
3,384,845 |
|
a |
Tennergy
Corp. (Guaranty: Morgan Stanley Group), Series A, 4.00% due 12/1/2051 (put 9/1/2028) |
2,000,000 |
2,122,132 |
| |
Tennessee
Energy Acquisition Corp. (The Gas Project; Guaranty: Goldman Sachs Group, Inc.), |
|
|
| |
Series
A, 5.25% due 9/1/2023 |
7,000,000 |
7,321,447 |
| |
Series
C, 5.00% due 2/1/2023 |
2,650,000 |
2,725,525 |
|
a |
Tennessee
Energy Acquisition Corp. (The Tennessee Energy Acquisition Corp.; Guaranty: Goldman Sachs Group, Inc.), Series A, 5.00% due 5/1/2052 (put 11/1/2031) |
1,000,000 |
1,146,751
|
| |
Texas
— 9.1% |
|
|
56 | Thornburg Municipal Funds Semi-Annual Report
|
See notes to
financial statements. |
Schedule of Investments,
Continued
Thornburg Intermediate Municipal Fund | March 31, 2022 (Unaudited)
| |
ISSUER-DESCRIPTION
|
Principal
Amount |
VALUE
|
| |
City
of Brownsville AMT GO, 5.00% due 2/15/2030 - 2/15/2032 |
$ 1,090,000
|
$ 1,255,438
|
| |
City
of Bryan Electric System Revenue (Insured: AGM), Series A, 4.00% due 7/1/2032 - 7/1/2035 |
2,335,000 |
2,612,104 |
| |
City
of Bryan Rural Electric System Revenue (Insured: AGM), 5.00% due 7/1/2032 |
555,000 |
676,700 |
| |
City
of Dallas (Public Improvements) GO, 5.00% due 2/15/2025 - 2/15/2034 |
9,720,000 |
10,510,822 |
| |
City
of Dallas (Trinity River Corridor Infrastructure) GO, 5.00% due 2/15/2028 |
1,000,000 |
1,055,536 |
| |
City
of Galveston (Galveston Island Convention Center; Insured: AGM), Series B, 5.00% due 9/1/2024 |
1,115,000 |
1,130,239 |
| |
City
of Houston (Public Improvements) GO, Series A, 5.00% due 3/1/2027 |
1,295,000 |
1,431,247 |
| |
City
of Houston Airport System Revenue, Series D, 5.00% due 7/1/2030 - 7/1/2035 |
3,750,000 |
4,260,192 |
| |
City
of McAllen (International Toll Bridge Revenue; Insured: AGM), Series A, 5.00% due 3/1/2028 - 3/1/2032 |
6,120,000 |
6,739,599 |
| |
City
of San Antonio (Airport System Capital Improvements) AMT, 5.00% due 7/1/2024 - 7/1/2025 |
3,225,000 |
3,249,839 |
| |
City
of San Antonio (Water System), Series A, 5.00% due 5/15/2033 - 5/15/2034 |
3,075,000 |
3,408,661 |
| |
Dallas
Area Rapid Transit, Series A, 5.00% due 12/1/2035 - 12/1/2036 (pre-refunded 12/1/2025) |
7,200,000 |
7,930,739 |
| |
Dallas
County Utility & Reclamation District GO, 5.00% due 2/15/2027 |
1,905,000 |
2,124,822 |
| |
Greater
Texas Cultural Education Facilities Finance Corp. (Fort County Bend), 4.00% due 3/1/2040 - 3/1/2041 |
2,000,000 |
2,140,784 |
| |
Harris
County Cultural Education Facilities Finance Corp. (Memorial Hermann Health System), Series A, 5.00% due 12/1/2028 |
3,000,000 |
3,207,438 |
| |
Harris
County Cultural Education Facilities Finance Corp. (TECO Project), 5.00% due 11/15/2028 - 11/15/2033 |
2,225,000 |
2,563,220 |
| |
Lower
Colorado River Authority, |
|
|
| |
Series
A, |
|
|
| |
5.00%
due 5/15/2026 |
9,415,000 |
9,459,298 |
| |
5.00%
due 5/15/2026 (pre-refunded 5/15/2022) |
55,000 |
55,253 |
| |
Lower
Colorado River Authority (LCRA Transmission Services Corp.), 5.00% due 5/15/2033 - 5/15/2038 |
600,000 |
695,908 |
| |
Lubbock
Electric Light & Power System Revenue, 4.00% due 4/15/2041 |
1,000,000 |
1,073,370 |
| |
Metropolitan
Transit Authority of Harris County, 5.00% due 11/1/2029 - 11/1/2030 |
4,130,000 |
4,844,497 |
| |
North
Texas Tollway Authority (NTTA System), Series A, 5.00% due 1/1/2037 |
1,750,000 |
1,938,164 |
| |
San
Antonio Water System, Series A, 5.00% due 5/15/2037 |
500,000 |
568,052 |
| |
Stephen
F Austin State University (Financing System), Series A, 5.00% due 10/15/2030 - 10/15/2033 |
1,265,000 |
1,443,958 |
| |
Tarrant
County Cultural Education Facilities Finance Corp. (Methodist Hospitals of Dallas Obligated Group), 4.00% due 10/1/2041 |
1,880,000 |
2,007,966 |
| |
Texas
Transportation Commission (Central Texas Turnpike System), Series C, 5.00% due 8/15/2024 - 8/15/2025 |
2,490,000 |
2,641,883 |
| |
Waco
Educational Finance Corp. (Baylor University Issue), 4.00% due 3/1/2041 |
850,000 |
908,257
|
| |
Utah
— 0.3% |
|
|
|
a |
County
of Utah (IHC Health Services, Inc. Obligated Group), Series B-1, 5.00% due 5/15/2056 (put 8/1/2022) |
2,500,000 |
2,507,378
|
| |
Virginia
— 0.3% |
|
|
| |
Virginia
Small Business Financing Authority (National Senior Campuses, Inc. Obligated Group), Series A, 5.00% due 1/1/2032 - 1/1/2033 |
2,000,000 |
2,232,718
|
| |
Washington
— 4.3% |
|
|
| |
King
County Public Hospital District No. 2 (EvergreenHealth Medical Center) GO, 5.00% due 12/1/2028 - 12/1/2030 (pre-refunded 12/1/2024) |
4,545,000 |
4,888,739 |
| |
Skagit
County Public Hospital District No. 1 (Skagit Regional Health) GO, 5.00% due 12/1/2025 - 12/1/2028 (pre-refunded 12/1/2022) |
7,860,000 |
8,047,445 |
| |
Skagit
County Public Hospital District No. 2 (Island Hospital) GO, 5.00% due 12/1/2027 - 12/1/2028 (pre-refunded 12/1/2022) |
4,640,000 |
4,750,654 |
| |
State
of Washington (Acquisition and Improvements of Real and Personal Property) COP, Series A, 5.00% due 7/1/2030 |
4,415,000 |
5,015,630 |
| |
State
of Washington (Various Purposes) GO, |
|
|
| |
Series
2021A, 5.00% due 6/1/2038 |
1,965,000 |
2,319,679 |
| |
Series
C, 5.00% due 2/1/2036 - 2/1/2037 |
7,425,000 |
8,619,567 |
| |
Washington
Higher Education Facilities Authority (Seattle Pacific University), 5.00% due 10/1/2038 - 10/1/2040 |
3,340,000 |
3,837,781
|
| |
Wisconsin
— 0.9% |
|
|
| |
Public
Finance Authority, 4.00% due 10/1/2035 - 10/1/2041 |
1,225,000 |
1,269,106 |
| |
Wisconsin
Health & Educational Facilities Authority, |
|
|
| |
4.00%
due 8/15/2040 |
1,000,000 |
1,087,961 |
| |
5.00%
due 8/15/2039 |
2,000,000 |
2,377,944 |
| |
WPPI
Energy, |
|
|
| |
Series
A, |
|
|
| |
5.00%
due 7/1/2029 - 7/1/2036 |
2,680,000 |
3,059,194 |
| b |
5.00%
due 7/1/2030 |
300,000 |
344,922
|
| |
Total
Long-Term Municipal Bonds — 97.7% (Cost $843,069,002) |
|
856,637,886
|
| |
Short-Term
Municipal Bonds — 1.4% |
|
|
| |
Alabama
— 1.2% |
|
|
|
a |
City
of Mobile Alabama (Alabama Power Co.) IDB, 0.38% due 6/1/2034 (put 4/1/2022) |
10,000,000
|
10,000,000
|
| |
Florida
— 0.2% |
|
|
| a |
County
of Manatee FL (Florida Power & Light Co.), 0.39% due 9/1/2024 (put 4/1/2022) |
2,100,000
|
2,100,000
|
| |
Total
Short-Term Municipal Bonds — 1.4% (Cost $12,100,000) |
|
12,100,000
|
| |
Total
Investments — 99.1% (Cost $855,169,002) |
|
$868,737,886
|
See
notes to financial statements.
|
Thornburg Municipal
Funds Semi-Annual Report | 57 |
Schedule of Investments, Continued
Thornburg Intermediate Municipal Fund | March 31, 2022 (Unaudited)
| |
ISSUER-DESCRIPTION
|
Principal
Amount |
VALUE
|
| |
Other
Assets Less Liabilities — 0.9% |
|
8,043,118
|
| |
Net
Assets — 100.0% |
|
$876,781,004
|
| Footnote Legend
|
| a
|
Variable,
floating, step, or fixed to floating rate securities are securities for which interest rate changes are based on changes in a designated base rate or on a predetermined schedule. The rates shown are those in effect on March 31, 2022. |
| b
|
Segregated
as collateral for a when-issued security. |
| c
|
When-issued
security. |
Portfolio Abbreviations
To simplify the listings of securities, abbreviations are used per the table below:
| AGC
|
Insured by Assured
Guaranty Corp. |
| AGM
|
Insured by
Assured Guaranty Municipal Corp. |
| AMBAC
|
Insured by
American Municipal Bond Assurance Corp. |
| AMT
|
Alternative
Minimum Tax |
| BAM
|
Insured by
Build America Mutual Insurance Co. |
| BHAC-CR
|
Berkshire
Hathaway Assurance Corp. Custodial Receipts |
| COP
|
Certificates
of Participation |
| DFA
|
Development
Finance Authority/Agency |
| EDA
|
Economic
Development Authority |
| ETM
|
Escrowed
to Maturity |
| FGIC
|
Insured by
Financial Guaranty Insurance Co. |
| FHLMC
|
Collateralized
by Federal Home Loan Mortgage Corp. |
| FNMA
|
Collateralized by
Federal National Mortgage Association |
| GNMA
|
Collateralized
by Government National Mortgage Association |
| GO
|
General Obligation
|
| HFA
|
Health
Facilities Authority |
| HFFA
|
Health
Facilities Financing Authority |
| IDA
|
Industrial
Development Authority/Agency |
| IDB
|
Industrial
Development Board |
| IDC
|
Industrial
Development Corp. |
| JEA
|
Jacksonville
Electric Authority |
| Natl-Re
|
Insured by
National Public Finance Guarantee Corp. |
| Q-SBLF
|
Insured by
Qualified School Bond Loan Fund |
| USD
|
Unified School
District |
58 | Thornburg Municipal Funds Semi-Annual Report
|
See notes to
financial statements. |
Schedule of Investments
Thornburg Strategic Municipal Income Fund | March 31, 2022
(Unaudited)
| |
ISSUER-DESCRIPTION
|
Principal
Amount |
VALUE
|
| |
LONG-TERM
MUNICIPAL BONDS — 87.9% |
|
|
| |
Alabama
— 1.0% |
|
|
| |
Alabama
Community College System ACCS Enhancements Fee Revenue (Insured: AGM), 4.00% due 9/1/2046 |
$1,500,000
|
$ 1,605,628
|
|
a |
Selma
(International Paper Co.) IDB, Series A, 2.00% due 11/1/2033 (put 10/1/2024) |
2,025,000
|
1,989,757
|
| |
Alaska
— 0.2% |
|
|
| |
State
of Alaska International Airports System AMT, Series C 5.00% due 10/1/2029 |
750,000 |
862,975
|
| |
Arizona
— 1.9% |
|
|
| |
Arizona
(GreatHearts Arizona Obligated Group; Insured: SD CRED PROG) IDA, Series A, 5.00% due 7/1/2026 - 7/1/2031 |
615,000 |
720,556 |
| |
Arizona
(Scottsdale Lincoln Hospitals) HFA, 5.00% due 12/1/2031 |
2,500,000
|
2,659,568 |
| |
County
of Pima (TMC HealthCare Obligated Group ) IDA, 4.00% due 4/1/2046 |
250,000 |
263,779 |
| |
County
of Yavapai (Waste Management, Inc.) AMT IDA, 1.30% due 6/1/2027 |
750,000 |
700,631 |
| |
Maricopa
County (Highland Prep Obligated Group; Insured: State Intercept) IDA, Series A, 4.00% due 7/1/2046 |
740,000 |
786,108 |
| |
Pinal
County (Tucson Electric Power Co.) IDA, 4.00% due 9/1/2029 |
1,520,000
|
1,546,524
|
| |
Arkansas
— 0.3% |
|
|
| |
University
of Arkansas Board of Trustees (Fayetteville Campus), Series A, 5.00% due 11/1/2036 (pre-refunded 11/1/2024) |
1,000,000
|
1,076,730
|
| |
California
— 5.1% |
|
|
| |
ABAG
Finance Authority for Nonprofit Corporations (Episcopal Senior Communities), Series A, 5.00% due 7/1/2047 (pre-refunded 7/1/2022) |
1,635,000
|
1,650,461 |
| |
Benicia
(Benicia High School; Insured: AGM) USD GO, Series C, Zero Coupon due 8/1/2026 |
830,000 |
746,482 |
| |
California
(Children’s Hospital Los Angeles) HFFA, Series A, 5.00% due 11/15/2034 - 8/15/2036 |
920,000 |
994,956 |
| |
California
(Community Program Developmental Disabilities; Insured: California Mtg Insurance) HFFA, 6.25% due 2/1/2026 |
1,170,000
|
1,174,492 |
| |
California
Municipal Finance Authority (California Institute of the Arts), 4.00% due 10/1/2046 |
960,000 |
1,010,843 |
|
b |
California
Pollution Control Financing Authority (Poseidon Resources (Channelside) LP Desalination Project) AMT, 5.00% due 11/21/2045 |
1,000,000
|
1,017,218 |
| |
Calipatria
(Educational Facilities; Insured: ACA) USD GO, Series B, Zero Coupon due 8/1/2025 |
1,440,000
|
1,248,250 |
| |
City
of Palm Springs Financing Authority (Downtown Revitalization Project), Series B, 5.25% due 6/1/2027 (pre-refunded 6/1/2022) |
1,620,000
|
1,631,167 |
| |
County
of El Dorado (El Dorado Hills Development-Community Facilities), 5.00% due 9/1/2026 |
625,000 |
633,392 |
|
c |
Daly
County Housing (Franciscan Country Club Mobile Home Park Acquisition) DFA, Series A, 5.25% due 12/15/2023 |
650,000 |
651,869 |
| |
M-S-R
Energy Authority (Guaranty: Citigroup Global Markets), Series A, 6.50% due 11/1/2039 |
1,245,000
|
1,727,543 |
|
a |
Northern
California Energy Authority (Commodity Supply Revenue; Guaranty: Goldman Sachs Group, Inc.), Series A, 4.00% due 7/1/2049 (put 7/1/2024) |
2,000,000
|
2,055,818 |
| |
Oakland
(County of Alameda Educational Facilities) USD GO, Series A, 5.00% due 8/1/2035 (pre-refunded 8/1/2025) |
1,000,000
|
1,096,175 |
| |
Ontario
International Airport Authority (Insured: AGM) AMT, Series B, 5.00% due 5/15/2034 |
500,000 |
565,746 |
| |
San
Francisco City & County Redevelopment Financing Authority (Redevelopment Project; Insured: Natl-Re), Series D, Zero Coupon due 8/1/2023 |
1,025,000
|
1,000,239 |
| |
Union
Elementary School District (Santa Clara County District Schools; Insured: Natl-Re) GO, Series D, Zero Coupon due 9/1/2027 |
905,000 |
798,933
|
| |
Colorado
— 1.7% |
|
|
| |
Denver
Convention Center Hotel Authority, 5.00% due 12/1/2028 |
1,000,000
|
1,095,394 |
| |
Public
Authority for Colorado Energy (Natural Gas Purchase; Guaranty: Merrill Lynch & Co), 6.50% due 11/15/2038 |
260,000 |
351,028 |
| |
Regional
Transportation District, Series A, 5.00% due 7/15/2032 |
600,000 |
684,847 |
| |
Regional
Transportation District (FasTracks Transportation System) COP, Series A, 5.00% due 6/1/2044 |
565,000 |
582,409 |
| |
State
of Colorado COP, Series A, 4.00% due 12/15/2040 |
1,500,000
|
1,610,938 |
| |
Village
Metropolitan District GO, 5.00% due 12/1/2040 |
1,000,000
|
1,063,709 |
| |
Wild
Plum Metropolitan District GO, Series A, 5.00% due 12/1/2049 |
595,000 |
584,944
|
| |
Connecticut
— 2.6% |
|
|
| |
City
of New Haven (Insured: AGM) GO, Series B, 5.00% due 2/1/2026 - 2/1/2030 |
2,620,000
|
2,967,166 |
| |
State
of Connecticut GO, |
|
|
| |
Series
A, 5.00% due 4/15/2035 |
2,000,000
|
2,264,306 |
| |
Series
E, 5.00% due 9/15/2033 |
1,350,000
|
1,544,539 |
| |
University
of Connecticut (Insured: AGM), Series A, 5.00% due 4/15/2028 |
1,975,000
|
2,261,606
|
| |
District
of Columbia — 0.4% |
|
|
|
c |
Metropolitan
Washington Airports Authority (Dulles Toll Road; Insured: AGC), Series B, Zero Coupon due 10/1/2027 |
1,500,000
|
1,288,697
|
| |
Florida
— 3.1% |
|
|
| |
Broward
County (Airport System Improvements) AMT, 5.00% due 10/1/2037 |
1,000,000
|
1,089,728 |
|
b |
Charlotte
County (Town & Country Utilities Projects) IDA AMT, 5.00% due 10/1/2029 |
500,000 |
533,071 |
| |
County
of Miami-Dade Aviation Revenue, Series A, 5.00% due 10/1/2032 |
500,000 |
583,043 |
| |
Miami-Dade
County Expressway Authority (Toll System Five-Year Work Program), Series A, 5.00% due 7/1/2022 - 7/1/2024 |
1,250,000
|
1,293,465 |
| |
Miami-Dade
County School Board (District School Facilities and Infrastructure) COP, Series A, 5.00% due 8/1/2027 |
1,100,000
|
1,111,551 |
| |
Orange
County (Tourist Development), Series A, 5.00% due 10/1/2031 |
1,000,000
|
1,110,136 |
| |
Pasco
County School Board COP, Series A, 5.00% due 8/1/2032 |
750,000 |
900,049 |
| |
Pompano
Beach, Series A 4.00% due 9/1/2041 |
1,500,000
|
1,503,528 |
| |
Town
of Davie (Nova Southeastern University, Inc.), 5.00% due 4/1/2032 |
400,000 |
451,551 |
| |
Volusia
County Educational Facilities Authority (Embry-Riddle Aeronautical University, Inc.), Series B, 5.00% due 10/15/2030 |
1,500,000
|
1,610,044 |
| |
Wildwood
Utility Dependent District (Insured: BAM), 5.00% due 10/1/2046 |
500,000
|
573,912 |
See
notes to financial statements.
|
Thornburg Municipal
Funds Semi-Annual Report | 59 |
Schedule of Investments, Continued
Thornburg Strategic Municipal Income Fund | March 31, 2022 (Unaudited)
| |
ISSUER-DESCRIPTION
|
Principal
Amount |
VALUE
|
| |
Georgia
— 2.8% |
|
|
| |
Development
Authority of Burke County, 2.20% due 10/1/2032 |
$1,225,000
|
$ 1,092,831
|
|
a |
Main
Street Natural Gas, Inc. (Guaranty: Citigroup, Inc.), Series A, 4.00% due 9/1/2052 (put 12/1/2029) |
1,500,000
|
1,585,703 |
| |
Main
Street Natural Gas, Inc. (Guaranty: Macquarie Group Ltd.), Series A, 5.00% due 5/15/2037 |
2,640,000
|
3,144,918 |
| |
Main
Street Natural Gas, Inc. (Guaranty: Merrill Lynch & Co), Series A, 5.50% due 9/15/2023 |
350,000 |
366,416 |
| |
Municipal
Electric Authority of Georgia, Series A, 5.00% due 1/1/2038 - 1/1/2039 |
2,725,000
|
3,107,405 |
| |
Private
Colleges & Universities Authority (Corp. of Mercer University), 5.00% due 10/1/2030 - 10/1/2032 |
350,000 |
407,792
|
| |
Guam
— 0.9% |
|
|
| |
Guam
Power Authority (Electric Power System; Insured: AGM), Series A, 5.00% due 10/1/2027 |
1,000,000
|
1,015,605 |
| |
Guam
Waterworks Authority (Water and Wastewater System), |
|
|
| |
5.00%
due 7/1/2028 |
500,000 |
515,108 |
| |
5.25%
due 7/1/2024 |
500,000 |
517,494 |
| |
Territory
of Guam, Series F, 5.00% due 1/1/2030 - 1/1/2031 |
1,000,000
|
1,107,735
|
| |
Hawaii
— 0.7% |
|
|
| |
State
of Hawaii Airports System Revenue AMT, Series A, 5.00% due 7/1/2034 |
2,000,000
|
2,290,206 |
| |
State
of Hawaii Harbor System Revenue AMT, Series A, 5.00% due 7/1/2029 |
250,000 |
288,578
|
| |
Illinois
— 10.9% |
|
|
| |
Chicago
Midway International Airport AMT, Series A, 5.00% due 1/1/2030 |
1,500,000
|
1,563,742 |
| |
Chicago
Park District GO, |
|
|
| |
Series
A, |
|
|
| |
5.00%
due 1/1/2027 - 1/1/2040 |
1,510,000
|
1,612,687 |
| |
5.00%
due 1/1/2040 (pre-refunded 1/1/2024) |
1,315,000
|
1,384,291 |
| |
City
of Chicago (Chicago O’Hare International Airport), Series C, 5.00% due 1/1/2031 |
500,000 |
541,861 |
| |
City
of Chicago (Wastewater Transmission System), Series C, 5.00% due 1/1/2030 |
1,500,000
|
1,602,009 |
| |
City
of Chicago (Water System Improvements), 5.00% due 11/1/2029 |
200,000 |
203,851 |
| |
City
of Chicago (Water System; Insured: AGM), Series 2017-2, 5.00% due 11/1/2037 |
1,500,000
|
1,691,409 |
| |
City
of Chicago GO, |
|
|
| |
Series
A, |
|
|
| |
5.00%
due 1/1/2039 |
1,000,000
|
1,069,955 |
| |
5.625%
due 1/1/2031 |
500,000 |
551,550 |
| |
6.00%
due 1/1/2038 |
2,330,000
|
2,568,443 |
| |
Illinois
Finance Authority (Advocate Health Care Network), 5.00% due 8/1/2029 (pre-refunded 8/1/2024) |
2,195,000
|
2,338,566 |
| |
Illinois
Finance Authority (Silver Cross Hospital & Medical Centers), Series C, 5.00% due 8/15/2035 |
2,355,000
|
2,536,337 |
| |
Illinois
Finance Authority (Southern Illinois Healthcare), 5.00% due 3/1/2032 - 3/1/2034 |
700,000 |
777,453 |
| |
Illinois
State University (Insured: AGM), Series A, 5.00% due 4/1/2022 - 4/1/2036 |
1,815,000
|
1,999,896 |
| |
Illinois
Toll Highway Authority (Move Illinois Program), Series A, 5.00% due 1/1/2037 |
1,000,000
|
1,076,553 |
| |
Kane,
Cook, & DuPage Counties School District No. 46 GO, |
|
|
| |
Series
A, 5.00% due 1/1/2031 |
2,255,000
|
2,360,399 |
| |
Series
D, 5.00% due 1/1/2028 |
1,000,000
|
1,047,600 |
| |
Metropolitan
Water Reclamation District of Greater Chicago (Various Capital Improvement Projects) GO, Series C, 5.25% due 12/1/2032 |
40,000 |
49,725 |
| |
Metropolitan
Water Reclamation District of Greater Chicago GO, Series A, 5.00% due 12/1/2025 |
585,000 |
640,983 |
| |
Northern
Illinois University (Insured: BAM), 4.00% due 10/1/2033 - 10/1/2034 |
950,000 |
1,051,331 |
| |
Regional
Transportation Authority (Insured: AGM), Series A, 5.75% due 6/1/2034 |
1,100,000
|
1,356,682 |
| |
Sales
Tax Securitization Corp., Series A, 5.00% due 1/1/2029 |
1,000,000
|
1,123,672 |
| |
State
of Illinois GO, |
|
|
| |
5.50%
due 5/1/2039 |
375,000 |
426,428 |
| |
Series
D, 5.00% due 11/1/2028 |
3,000,000
|
3,286,686 |
| |
State
of Illinois Sales Tax Revenue (Insured: BAM-Natl-Re), Series B, 5.00% due 6/15/2032 - 6/15/2035 |
4,500,000
|
4,905,156 |
| |
Will
County School District No. 114 Manhattan (Insured: Natl-Re) ETM GO, Series C, Zero Coupon due 12/1/2023 |
115,000 |
111,278 |
| |
Will
County School District No. 114 Manhattan (Insured: Natl-Re) GO, Series C, Zero Coupon due 12/1/2023 |
455,000 |
439,732
|
| |
Indiana
— 0.8% |
|
|
|
a |
City
of Whiting (Guaranty: BP plc) AMT, 5.00% due 12/1/2044 (put 6/5/2026) |
2,610,000
|
2,872,404
|
| |
Kansas
— 1.0% |
|
|
| |
Kansas
Independent College Finance Authority (Ottawa University), Series C, 4.125% due 5/1/2022 |
1,250,000
|
1,248,526 |
| |
Unified
Government of Wyandotte County/Kansas City (Utility System Improvement), Series A, 5.00% due 9/1/2031 - 9/1/2032 |
2,000,000
|
2,129,517
|
| |
Kentucky
— 2.4% |
|
|
|
b,d |
City
of Henderson KY (Pratt Paper, LLC) AMT, Series B, 4.45% due 1/1/2042 |
1,000,000
|
1,007,800 |
| |
Kentucky
Economic (Norton Healthcare, Inc.; Insured: Natl-Re) DFA, Series B, Zero Coupon due 10/1/2022 |
2,650,000
|
2,634,124 |
| |
Kentucky
Higher Education Student Loan Corp. AMT, Series A-1, 5.00% due 6/1/2029 |
500,000 |
572,066 |
|
a |
Kentucky
Public Energy Authority (Guaranty: Morgan Stanley Group), Series A, 4.00% due 4/1/2048 (put 4/1/2024) |
4,000,000
|
4,129,276
|
| |
Louisiana
— 2.4% |
|
|
| |
City
of New Orleans (Water System Facilities Improvement), 5.00% due 12/1/2034 (pre-refunded 12/1/2024) |
400,000
|
430,901 |
60 | Thornburg Municipal Funds Semi-Annual Report
|
See notes to
financial statements. |
Schedule of Investments,
Continued
Thornburg Strategic Municipal Income Fund | March 31, 2022 (Unaudited)
| |
ISSUER-DESCRIPTION
|
Principal
Amount |
VALUE
|
| |
Louisiana
Energy and Power Authority (Louisiana Energy & Power Authority Unit No. 1; Insured: AGM), Series A, 5.25% due 6/1/2038 (pre-refunded 6/1/2023) |
$2,250,000
|
$ 2,340,589
|
| |
Louisiana
Public Facilities Authority (Ochsner Clinic Foundation Obligated Group), Series A, 5.00% due 5/15/2035 - 5/15/2037 |
1,925,000
|
2,189,747 |
| |
New
Orleans Aviation Board (Louis Armstrong New Orleans International Airport CFC Revenue; Insured: AGM), 5.00% due 1/1/2029 |
700,000 |
799,862 |
|
a |
Parish
of St. Charles (Valero Energy Corp. Refinery; Guaranty: Valero Energy Corp.), 4.00% due 12/1/2040 (put 6/1/2022) |
2,750,000
|
2,759,399
|
| |
Maine
— 0.3% |
|
|
| |
Maine
State Housing Authority AMT, Series C-1, 3.00% due 11/15/2023 |
1,000,000
|
1,011,458
|
| |
Massachusetts
— 0.2% |
|
|
| |
Massachusetts
(Jordan Hospital and Milton Hospital) DFA, Series H-1, 5.00% due 7/1/2032 - 7/1/2033 |
555,000 |
603,207
|
| |
Michigan
— 4.2% |
|
|
| |
Board
of Governors of Wayne State University (Educational Facilities and Equipment), Series A, 5.00% due 11/15/2033 |
1,250,000
|
1,340,254 |
| |
City
of Detroit GO, |
|
|
| |
5.00%
due 4/1/2023 - 4/1/2024 |
900,000 |
936,658 |
| |
Series
A, 5.00% due 4/1/2032 |
300,000 |
350,010 |
| |
County
of Genesee (Water Supply System; Insured: BAM) GO, 5.375% due 11/1/2038 |
1,000,000
|
1,033,927 |
| |
Detroit
City School District (School Building & Site; Insured: AGM Q-SBLF) GO, Series A, 5.25% due 5/1/2027 |
1,000,000
|
1,149,435 |
| |
Detroit
City School District (School Building & Site; Insured: Q-SBLF) GO, Series A, 5.00% due 5/1/2025 |
1,000,000
|
1,002,947 |
| |
Detroit
Downtown Development Authority (Catalyst Development Project; Insured: AGM), Series A, 5.00% due 7/1/2024 |
850,000 |
901,526 |
| |
Gerald
R Ford International Airport Authority AMT, 5.00% due 1/1/2046 |
500,000 |
569,684 |
| |
Kalamazoo
Hospital Finance Authority (Bronson Methodist Hospital), 5.25% due 5/15/2041 |
140,000 |
140,321 |
| |
Livonia
Public School District (School Building & Site; Insured: AGM) GO, Series I, 5.00% due 5/1/2036 (pre-refunded 5/1/2023) |
225,000 |
233,107 |
| |
Michigan
Finance Authority (State Department of Human Services Office Buildings), Series F, 5.00% due 4/1/2031 |
1,000,000
|
1,002,403 |
| |
Michigan
Finance Authority (Trinity Health Corp. Obligated Group), 5.00% due 12/1/2027 |
165,000 |
185,271 |
| |
Michigan
State Housing Development Authority, Series B, 2.95% due 12/1/2039 |
2,000,000
|
1,866,014 |
|
a |
Michigan
Strategic Fund (Graphic Packaging International LLC) (Green Bond) AMT, 4.00% due 10/1/2061 (put 10/1/2026) |
1,000,000
|
1,054,451 |
| |
Wayne
County Airport Authority (Detroit Metropolitan Wayne County Airport), |
|
|
| |
Series
B, |
|
|
| |
5.00%
due 12/1/2031 - 12/1/2033 |
1,475,000
|
1,576,237 |
|
c |
5.00%
due 12/1/2034 |
1,140,000
|
1,217,551
|
| |
Minnesota
— 0.6% |
|
|
| |
Minneapolis-St
Paul Metropolitan Airports Commission AMT, Series B 5.00% due 1/1/2026 |
1,000,000
|
1,082,208 |
| |
Minnesota
Housing Finance Agency (Collateralized: GNMA, FNMA, FHLMC), Series F, 2.55% due 7/1/2039 |
1,180,000
|
1,110,524
|
| |
Nebraska
— 1.0% |
|
|
|
a |
Central
Plains Energy Project (Guaranty: Goldman Sachs Group, Inc.), 5.00% due 3/1/2050 (put 1/1/2024) |
1,650,000
|
1,716,068 |
| |
Douglas
County Health Facilities (Nebraska Methodist Health System), 5.00% due 11/1/2029 - 11/1/2030 |
1,750,000
|
1,906,628
|
| |
Nevada
— 1.3% |
|
|
| |
Carson
City (Carson Tahoe Regional Healthcare), 5.00% due 9/1/2037 |
1,000,000
|
1,099,664 |
| |
City
of Las Vegas Special Improvement District No. 814 (Summerlin Vlg 21 & 24A), 4.00% due 6/1/2039 - 6/1/2044 |
1,090,000
|
1,098,443 |
| |
Clark
County School District (Insured: AGM) GO, Series B, 5.00% due 6/15/2031 |
1,650,000
|
1,919,278 |
| |
Las
Vegas Valley Water District GO, Series A, 5.00% due 6/1/2030 |
400,000 |
444,927
|
| |
New
Hampshire — 0.4% |
|
|
|
a |
New
Hampshire Business Finance Authority (Waste Management, Inc.; Guaranty: Waste Management Holdings) AMT, Series A4, 2.15% due 8/1/2038 (put 7/1/2024) |
1,250,000
|
1,233,363
|
| |
New
Jersey — 4.3% |
|
|
| |
New
Jersey (New Jersey Transit Corp.) EDA, 5.00% due 11/1/2033 |
500,000 |
559,319 |
| |
New
Jersey (School Facilities Construction) EDA, |
|
|
| |
5.00%
due 6/15/2035 - 6/15/2038 |
1,250,000
|
1,393,408 |
| |
Series
NN, 5.00% due 3/1/2026 |
1,000,000
|
1,025,788 |
| |
New
Jersey (School Facilities Construction; Insured: Natl-Re) EDA, Series N-1, 5.50% due 9/1/2027 |
1,000,000
|
1,137,453 |
| |
New
Jersey (State of New Jersey Department of the Treasury) EDA, Series DDD, 5.00% due 6/15/2033 |
500,000 |
545,190 |
| |
New
Jersey Transportation Trust Fund Authority (State Transportation System Improvements), Series A-1, 5.00% due 6/15/2027 |
3,000,000
|
3,323,856 |
| |
New
Jersey Transportation Trust Fund Authority (Transportation Program Bonds), Series AA, 5.00% due 6/15/2038 |
1,500,000
|
1,650,372 |
| |
New
Jersey Transportation Trust Fund Authority (Transportation System), Series A, 5.00% due 6/15/2024 - 12/15/2039 |
5,050,000
|
5,547,438
|
| |
New
Mexico — 2.5% |
|
|
| |
City
of Santa Fe (El Castillo Retirement Project), Series A, 5.00% due 5/15/2044 |
950,000 |
1,018,119 |
| |
City
of Santa Fe (El Castillo Retirement Residences), 5.00% due 5/15/2034 |
1,465,000
|
1,467,663 |
| |
New
Mexico Hospital Equipment Loan Council (Haverland Carter Lifestyle Obligated Group), 5.00% due 7/1/2032 |
2,525,000
|
2,544,415 |
| |
New
Mexico Hospital Equipment Loan Council (Presbyterian Healthcare Services Obligated Group), Series A, 5.00% due 8/1/2039 |
1,000,000
|
1,127,543 |
| |
New
Mexico Mortgage Finance Authority (Collateralized: GNMA, FNMA, FHLMC), |
|
|
| |
Series
F, |
|
|
| |
2.85%
due 7/1/2039 |
870,000
|
864,696 |
See
notes to financial statements.
|
Thornburg Municipal
Funds Semi-Annual Report | 61 |
Schedule of Investments, Continued
Thornburg Strategic Municipal Income Fund | March 31, 2022 (Unaudited)
| |
ISSUER-DESCRIPTION
|
Principal
Amount |
VALUE
|
| |
3.50%
due 7/1/2050 |
$1,605,000
|
$ 1,636,803
|
| |
New
York — 3.6% |
|
|
| |
City
of New York (City Budget Financial Management) GO, |
|
|
| |
Series
G, 5.00% due 8/1/2023 |
3,000,000
|
3,127,263 |
| |
Series
J, 5.00% due 8/1/2031 |
1,500,000
|
1,598,220 |
| |
County
of Nassau (Insured: BAM) GO, Series B, 5.00% due 4/1/2034 (pre-refunded 4/1/2024) |
500,000 |
529,066 |
| |
Metropolitan
Transportation Authority (Green Bond), Series A1, 5.00% due 11/15/2030 |
1,045,000
|
1,134,089 |
| |
Metropolitan
Transportation Authority (Transit and Commuter System), Series B-1, 5.00% due 5/15/2022 |
2,000,000
|
2,007,136 |
| |
New
York City Transitional Finance Authority Future Tax Secured Revenue, Series C-1, 5.00% due 5/1/2033 |
1,000,000
|
1,177,067 |
| |
New
York State Dormitory Authority (State of New York Personal Income Tax Revenue), |
|
|
| |
Series
A, 5.00% due 3/15/2036 |
1,000,000
|
1,171,105 |
| |
Series
D, 4.00% due 2/15/2040 |
1,000,000
|
1,059,591 |
| |
Port
Authority of New York & New Jersey AMT, Series 223, 5.00% due 7/15/2033 |
750,000 |
873,019
|
| |
North
Carolina — 2.4% |
|
|
|
a |
Charlotte-Mecklenburg
Hospital Authority (Atrium Health Obligated Group), Series D, 5.00% due 1/15/2049 (put 12/1/2031) |
2,500,000
|
3,015,305 |
|
a |
Charlotte-Mecklenburg
Hospital Authority/The, Series B, 1.95% due 1/15/2048 (put 11/1/2029) |
1,000,000
|
962,971 |
| |
North
Carolina Medical Care Commission, 4.00% due 1/1/2041 |
1,020,000
|
1,069,264 |
| |
North
Carolina Medical Care Commission (Vidant Health), 5.00% due 6/1/2029 (pre-refunded 6/1/2025) |
1,705,000
|
1,857,862 |
| |
North
Carolina Turnpike Authority, 5.00% due 2/1/2024 - 1/1/2030 |
1,500,000
|
1,656,719
|
| |
North
Dakota — 0.5% |
|
|
| |
University
of North Dakota (Insured: AGM) COP, Series A, 4.00% due 6/1/2046 |
1,500,000
|
1,597,524
|
| |
Ohio
— 1.6% |
|
|
| |
Akron,
Bath and Copley Joint Township Hospital District (Summa Health System Obligated Group), |
|
|
| |
5.00%
due 11/15/2030 - 11/15/2032 |
1,025,000
|
1,193,483 |
| |
5.25%
due 11/15/2030 |
1,420,000
|
1,582,112 |
| |
City
of Akron (Community Learning Centers), Series A, 5.00% due 12/1/2031 |
625,000 |
628,861 |
|
a |
Lancaster
Port Authority, 5.00% due 8/1/2049 (put 2/1/2025) |
1,000,000
|
1,060,759 |
|
a |
Ohio
Air Quality Development Authority (Ohio Valley Electric Corp.), Series B, 1.375% due 2/1/2026 (put 11/1/2024) |
1,000,000
|
956,575
|
| |
Oklahoma
— 0.3% |
|
|
| |
Pontotoc
County Educational Facilities Authority, 4.00% due 9/1/2040 |
1,000,000
|
1,048,697
|
| |
Oregon
— 0.3% |
|
|
| |
Salem
Hospital Facility Authority, 4.00% due 5/15/2040 |
500,000 |
507,005 |
| |
Yamhill
County Hospital Authority (Friendsview Manor Obligated Group), Series B-3, 1.75% due 11/15/2026 |
500,000 |
455,104
|
| |
Pennsylvania
— 7.3% |
|
|
| |
Bucks
County (Waste Management, Inc.) AMT IDA, Series A-2, 2.75% due 12/1/2022 |
4,000,000
|
4,031,064 |
| |
City
of Philadelphia (Philadelphia Airport Revenue; Insured: AGM) AMT, 4.00% due 7/1/2046 |
250,000 |
257,211 |
| |
Coatesville
Area School District (Insured: AGM) (State Aid Withholding) GO, 5.00% due 8/1/2024 - 8/1/2025 |
1,475,000
|
1,582,883 |
| |
Commonwealth
Financing Authority, 5.00% due 6/1/2029 |
1,000,000
|
1,128,055 |
| |
County
of Luzerne (Insured: AGM) GO, Series A, 5.00% due 11/15/2029 |
1,000,000
|
1,093,753 |
|
d |
Hospitals
& Higher Education Facilities Authority of Philadelphia (Temple University Health System Obligated Group; Insured AGM), 4.00% due 7/1/2038 |
1,000,000
|
1,056,248 |
| |
Montgomery
County Higher Education & Health Authority (Thomas Jefferson University Obligated Group), 5.00% due 9/1/2033 |
700,000 |
800,430 |
| |
Pennsylvania
(Presbyterian Homes Obligated Group) EDFA, Series A, 4.00% due 7/1/2041 |
1,050,000
|
1,102,628 |
| |
Pennsylvania
EDFA, Series A, 4.00% due 10/15/2037 |
1,000,000
|
1,057,024 |
| |
Pennsylvania
Turnpike Commission, |
|
|
| |
Series
B, |
|
|
| |
4.00%
due 12/1/2040 |
785,000 |
841,029 |
| |
5.00%
due 12/1/2036 |
350,000 |
410,017 |
| |
Pennsylvania
Turnpike Commission (Highway Improvements), Series A-1, 5.00% due 12/1/2037 |
750,000 |
841,766 |
| |
Philadelphia
(Philadelphia) IDA, 5.00% due 5/1/2024 |
1,000,000
|
1,057,179 |
| |
Philadelphia
(Thomas Jefferson University) IDA, Series A, 5.00% due 9/1/2035 |
1,500,000
|
1,650,138 |
| |
Philadelphia
Airport Revenue, Series A, 5.00% due 7/1/2030 |
750,000 |
876,850 |
| |
Philadelphia
Airport Revenue AMT, Series B, 5.00% due 7/1/2030 |
925,000 |
1,020,470 |
| |
Philadelphia
Municipal Authority (Juvenile Justice Services Center), 5.00% due 4/1/2038 |
1,360,000
|
1,509,154 |
| |
Philadelphia
Pennsylvania Airport Revenue (Insured: AGM) AMT, 4.00% due 7/1/2040 - 7/1/2041 |
2,700,000
|
2,808,215 |
| |
Pittsburgh
Water & Sewer Authority (Insured: AGM), Series B, 5.00% due 9/1/2033 |
1,000,000
|
1,209,528 |
| |
School
District of Philadelphia (State Aid Witholding) GO, |
|
|
| |
Series
A, |
|
|
| |
4.00%
due 9/1/2041 |
1,000,000
|
1,065,844 |
| |
5.00%
due 9/1/2038 |
100,000 |
112,218
|
| |
Rhode
Island — 0.6% |
|
|
| |
Pawtucket
Housing Authority, 5.50% due 9/1/2022 - 9/1/2024 |
475,000 |
484,508 |
| |
Rhode
Island Health and Educational Building Corp. (St. George’s School), 4.00% due 10/1/2046 |
1,600,000
|
1,716,789
|
62 | Thornburg Municipal Funds Semi-Annual Report
|
See notes to
financial statements. |
Schedule of Investments,
Continued
Thornburg Strategic Municipal Income Fund | March 31, 2022 (Unaudited)
| |
ISSUER-DESCRIPTION
|
Principal
Amount |
VALUE
|
| |
South
Carolina — 0.7% |
|
|
| |
Patriots
Energy Group, Series A, 4.00% due 6/1/2046 - 6/1/2051 |
$2,500,000
|
$ 2,615,188
|
| |
Tennessee
— 3.9% |
|
|
| |
Memphis-Shelby
County Airport Authority AMT, |
|
|
| |
Series
A 5.00% due 7/1/2026 |
550,000 |
601,433 |
| |
Series
A, 5.00% due 7/1/2033 |
1,770,000
|
2,033,185 |
| |
Metropolitan
Government Nashville & Davidson County Health & Educational Facs Bd, 5.00% due 7/1/2031 |
1,500,000
|
1,760,622 |
| |
Shelby
County Health, Educational and Housing Facility (Methodist Le Bonheur Healthcare), Series A, 5.00% due 5/1/2036 |
1,000,000
|
1,115,359 |
|
a |
Tennergy
Corp. (Guaranty: Morgan Stanley Group), Series A, 4.00% due 12/1/2051 (put 9/1/2028) |
5,500,000
|
5,835,863 |
| |
Tennessee
Energy Acquisition Corp. (The Gas Project; Guaranty: Goldman Sachs Group, Inc.), Series A, 5.25% due 9/1/2024 |
500,000 |
534,873 |
|
a |
Tennessee
Energy Acquisition Corp. (The Tennessee Energy Acquisition Corp.; Guaranty: Goldman Sachs Group, Inc.), Series A, 5.00% due 5/1/2052 (put 11/1/2031) |
1,500,000
|
1,720,126
|
| |
Texas
— 7.5% |
|
|
| |
Arlington
Higher Education Finance Corp. (Pineywoods Community Academy; Insured: PSF-GTD), Series A, 4.00% due 8/15/2044 |
1,970,000
|
2,045,207 |
| |
City
of Brownsville AMT GO, 4.00% due 2/15/2034 - 2/15/2042 |
1,460,000
|
1,541,391 |
| |
City
of Dallas (Public Improvements) GO, 5.00% due 2/15/2031 |
1,930,000
|
2,085,143 |
| |
City
of Houston (Combined Utility System), Series D, 5.00% due 11/15/2028 |
2,500,000
|
2,689,897 |
| |
City
of Houston (Public Improvements) GO, Series A, 5.00% due 3/1/2032 |
2,500,000
|
2,756,705 |
| |
City
of Houston Airport System Revenue AMT, Series A, 4.00% due 7/1/2040 |
1,500,000
|
1,555,735 |
| |
City
of Houston TX Airport System Revenue AMT, Series A, 4.00% due 7/1/2041 |
1,310,000
|
1,354,198 |
|
a |
Denton
(Insured: PSF-GTD) ISD GO, Series B-REM 2.00% due 8/1/2044 (pre-refunded 8/1/2024) |
65,000 |
64,612 |
| |
Greater
Texas Cultural Education Facilities Finance Corp. (County of Fort Bend), 4.00% due 3/1/2046 |
1,500,000
|
1,598,799 |
|
a |
Harris
County Cultural Education Facilities Finance Corp. (Texas Children’s Hospital Obligated Group), 5.00% due 10/1/2051 (put 10/1/2031) |
1,500,000
|
1,799,373 |
| |
Lower
Colorado River Authority, |
|
|
| |
Series
A, |
|
|
| |
5.00%
due 5/15/2026 |
2,980,000
|
2,994,021 |
| |
5.00%
due 5/15/2026 (pre-refunded 5/15/2022) |
20,000 |
20,092 |
| |
Newark
Higher Education Finance Corp. (Abilene Christian University), Series A, 4.00% due 4/1/2057 |
1,000,000
|
1,036,732 |
| |
North
Texas Tollway Authority (NTTA System), Series A, 5.00% due 1/1/2034 |
750,000 |
927,583 |
| |
Texas
Municipal Gas Acquisition & Supply Corp. III (Guaranty: Macquarie Group Ltd.), 5.00% due 12/15/2032 |
1,300,000
|
1,464,102 |
| |
Texas
Transportation Commission (Central Texas Turnpike System), Series C, 5.00% due 8/15/2034 |
1,250,000
|
1,314,901 |
| |
Waco
Educational Finance Corp. (Baylor University), 4.00% due 3/1/2046 |
1,000,000
|
1,054,409
|
| |
Utah
— 0.7% |
|
|
| |
Utah
Charter School Finance Authority (Summit Academy, Inc.), Series A, 5.00% due 4/15/2039 |
700,000 |
794,785 |
| |
Utah
Transit Authority (Integrated Mass Transit System), Series A, 5.00% due 6/15/2033 (pre-refunded 6/15/2025) |
1,000,000
|
1,089,557 |
| |
Vineyard
Redevelopment Agency (Vineyard Redevelopment Agency Geneva Urban Renewal Project Area; Insured: AGM), 4.00% due 5/1/2040 - 5/1/2046 |
610,000 |
656,805
|
| |
Virginia
— 0.6% |
|
|
|
a,d |
Halifax
County IDA, 1.65% due 12/1/2041 (put 5/31/2024) |
500,000 |
493,401 |
| |
James
City County (Williamsburg Landing, Inc. Obligated Group) EDA, Series A, 4.00% due 12/1/2029 - 12/1/2030 |
455,000 |
473,140 |
| |
Virginia
Small Business Financing Authority (National Senior Campuses, Inc. Obligated Group), Series A, 5.00% due 1/1/2034 |
1,000,000
|
1,111,431
|
| |
Washington
— 1.5% |
|
|
| |
Port
of Seattle AMT, 5.00% due 4/1/2039 |
1,705,000
|
1,890,615 |
| |
State
of Washington (Various Purposes) GO, Series 2021A, 5.00% due 6/1/2038 |
1,000,000
|
1,180,498 |
| |
Washington
Health Care Facilities Authority (Catholic Health Initiatives), Series A, 5.75% due 1/1/2045 (pre-refunded 1/1/2023) |
2,000,000
|
2,063,136
|
| |
West
Virginia — 0.4% |
|
|
|
a |
West
Virginia (Appalachian Power Co.) EDA, Series B, 2.625% due 12/1/2042 (put 6/1/2022) |
1,500,000
|
1,502,784
|
| |
Wisconsin
— 3.0% |
|
|
| |
Public
Finance Authority, 4.00% due 1/1/2042 - 10/1/2051 |
4,060,000
|
4,187,020 |
| |
Public
Finance Authority (Renown Regional Medical Center), 5.00% due 6/1/2036 |
650,000 |
760,549 |
|
a |
Public
Finance Authority (St. John’s College), 3.00% due 10/1/2045 (put 10/1/2026) |
1,500,000
|
1,448,951 |
| |
Public
Finance Authority (Texas Biomedical Research Institute), 4.00% due 6/1/2039 - 6/1/2041 |
770,000 |
816,978 |
| |
Wisconsin
Health & Educational Facilities Authority, 4.00% due 8/15/2046 - 12/1/2051 |
1,645,000
|
1,644,655 |
|
a |
Wisconsin
Health & Educational Facilities Authority (Advocate Aurora Health Obligated Group), Series B-4, 5.00% due 8/15/2054 (put 1/29/2025) |
1,250,000
|
1,349,790 |
| |
Wisconsin
Housing (Collateralized: FNMA) EDA, Series C, 2.75% due 9/1/2039 |
305,000
|
281,416
|
| |
Total
Long-Term Municipal Bonds — 87.9% (Cost $309,200,324) |
|
308,022,263
|
| |
Short-Term
Municipal Bonds — 8.9% |
|
|
See
notes to financial statements.
|
Thornburg Municipal
Funds Semi-Annual Report | 63 |
Schedule of Investments, Continued
Thornburg Strategic Municipal Income Fund | March 31, 2022 (Unaudited)
| |
ISSUER-DESCRIPTION
|
Principal
Amount |
VALUE
|
| |
Florida
— 1.7% |
|
|
|
a |
County
of Manatee FL (Florida Power & Light Co.), 0.39% due 9/1/2024 (put 4/1/2022) |
$1,000,000
|
$ 1,000,000
|
|
a,b |
Deutsche
Bank Spears/Lifers Trust (LOC Deutsche Bank A.G.), Series DBE-8083 0.91% due 7/1/2061 (put 4/7/2022) |
5,000,000
|
5,000,000
|
| |
Maryland
— 0.5% |
|
|
|
a |
County
of Montgomery MD (SPA U.S. Bank N.A.) GO, Series E 0.35% due 11/1/2037 (put 4/1/2022) |
1,800,000
|
1,800,000
|
| |
New
York — 5.6% |
|
|
|
a |
City
of New York (LOC Mizuho Bank Ltd.) GO, Series G6, 0.36% due 4/1/2042 (put 4/1/2022) |
2,400,000
|
2,400,000 |
|
a |
City
of New York (SPA JP Morgan Chase Bank N.A.) GO, 0.33% due 6/1/2044 (put 4/1/2022) |
500,000 |
500,000 |
|
a |
New
York City Municipal Water Finance Authority (New York City Water & Sewer System; SPA JP Morgan Chase Bank N.A.), Series FF2, 0.33% due 6/15/2044 (put 4/1/2022) |
7,400,000
|
7,400,000 |
| |
New
York City Transitional Finance Authority Future Tax Secured Revenue (SPA JP Morgan Chase Bank N.A.), |
|
|
|
a |
Series
B4, 0.33% due 8/1/2042 (put 4/1/2022) |
2,500,000
|
2,500,000 |
|
a |
Series
E4, 0.33% due 2/1/2045 (put 4/1/2022) |
1,950,000
|
1,950,000 |
|
a |
New
York State Housing Finance Agency (160 Madison Ave, LLC; LOC Landesbank Hessen-Thuringen), 0.36% due 11/1/2046 (put 4/1/2022) |
5,000,000
|
5,000,000
|
| |
Oregon
— 0.7% |
|
|
|
a,b |
Tender
Option Bond Trust Receipts (Guaranty: Deutsche Bank A.G.), Series 2021-XF1123 0.76% due 10/1/2061 (put 4/7/2022) |
2,470,000
|
2,470,000
|
| |
Virginia
— 0.4% |
|
|
| a |
Virginia
College Building Authority (University of Richmond; SPA Wells Fargo Bank N.A.), 0.37% due 11/1/2036 (put 4/1/2022) |
1,180,000
|
1,180,000
|
| |
Total
Short-Term Municipal Bonds — 8.9% (Cost $31,200,000) |
|
31,200,000
|
| |
Total
Investments — 96.8% (Cost $340,400,324) |
|
$339,222,263
|
| |
Other
Assets Less Liabilities — 3.2% |
|
11,223,430
|
| |
Net
Assets — 100.0% |
|
$350,445,693
|
| Footnote Legend
|
| a
|
Variable,
floating, step, or fixed to floating rate securities are securities for which interest rate changes are based on changes in a designated base rate or on a predetermined schedule. The rates shown are those in effect on March 31, 2022. |
| b
|
Securities
exempt from registration under Rule 144A of the Securities Act of 1933, as amended. These securities are restricted but liquid and may only be resold in the ordinary course of business in transactions exempt from registration, normally to qualified
institutional buyers. As of March 31, 2022, the aggregate value of these securities in the Fund’s portfolio was $10,028,089, representing 2.86% of the Fund’s net assets. |
| c
|
Segregated
as collateral for a when-issued security. |
| d
|
When-issued
security. |
Portfolio Abbreviations
To simplify the listings of securities, abbreviations are used per the table below:
| ABAG
|
Association of Bay
Area Governments |
| ACA
|
Insured by
American Capital Access |
| AGC
|
Insured by
Assured Guaranty Corp. |
| AGM
|
Insured by
Assured Guaranty Municipal Corp. |
| AMT
|
Alternative
Minimum Tax |
| BAM
|
Insured by
Build America Mutual Insurance Co. |
| COP
|
Certificates
of Participation |
| DFA
|
Development
Finance Authority/Agency |
| EDA
|
Economic
Development Authority |
| EDFA
|
Economic
Development Financing Authority |
| ETM
|
Escrowed
to Maturity |
| FHLMC
|
Collateralized
by Federal Home Loan Mortgage Corp. |
| FNMA
|
Collateralized
by Federal National Mortgage Association |
| GNMA
|
Collateralized
by Government National Mortgage Association |
| GO
|
General Obligation
|
| HFA
|
Health
Facilities Authority |
| HFFA
|
Health
Facilities Financing Authority |
| IDA
|
Industrial
Development Authority/Agency |
| IDB
|
Industrial
Development Board |
| ISD
|
Independent
School District |
| LOC
|
Letter
of Credit |
| Mtg
|
Mortgage
|
| Natl-Re
|
Insured by
National Public Finance Guarantee Corp. |
| PSF-GTD
|
Guaranteed
by Permanent School Fund |
| Q-SBLF
|
Insured by
Qualified School Bond Loan Fund |
| SD
CRED PROG |
State
School District Credit Enhancement Program |
| SPA
|
Stand-by
Purchase Agreement |
| USD
|
Unified School
District |
64 | Thornburg Municipal Funds Semi-Annual Report
|
See notes to
financial statements. |
This page intentionally left
blank.
Thornburg Municipal Funds Semi-Annual Report | 65
Statements of Assets and Liabilities
March 31, 2022 (Unaudited)
| |
THORNBURG
SHORT DURATION
MUNICIPAL FUND |
THORNBURG
LIMITED TERM
MUNICIPAL FUND |
THORNBURG
CALIFORNIA LIMITED TERM
MUNICIPAL FUND |
THORNBURG
NEW MEXICO INTERMEDIATE
MUNICIPAL FUND |
| ASSETS
|
|
|
|
|
| Investment
in securities, at cost |
$ 168,293,697
|
$ 4,855,890,048
|
$ 421,068,747
|
$ 131,372,520
|
| Investments
at value |
165,941,633
|
4,809,381,546
|
415,845,341
|
131,091,738 |
| Cash
|
618,343
|
1,843,323
|
150,721
|
2,010,479 |
| Receivable
for investments sold |
6,432,533
|
96,868,250
|
3,420,000
|
146,066 |
| Receivable
for fund shares sold |
56,468
|
11,055,687
|
2,628,847
|
15,219 |
| Principal
and interest receivable |
1,367,688
|
55,977,799
|
4,599,225
|
1,656,356 |
| Prepaid
expenses and other assets |
34,714
|
84,980
|
19,232
|
13,193
|
| Total
Assets |
174,451,379
|
4,975,211,585
|
426,663,366
|
134,933,051
|
| Liabilities
|
|
|
|
|
| Payable
for investments purchased |
7,954,259
|
26,438,373
|
8,106,916
|
415,622 |
| Payable
for fund shares redeemed |
43,538
|
19,256,265
|
719,222
|
223,694 |
| Payable
to investment advisor and other affiliates |
55,582
|
1,904,348
|
162,865
|
89,813 |
| Accounts
payable and accrued expenses |
91,171
|
774,142
|
127,536
|
55,035 |
| Dividends
payable |
152
|
368,716
|
72,206
|
5,369
|
| Total
Liabilities |
8,144,702
|
48,741,844
|
9,188,745
|
789,533
|
| Net
Assets |
$
166,306,677 |
$
4,926,469,741 |
$
417,474,621 |
$
134,143,518 |
| NET
ASSETS CONSIST OF |
|
|
|
|
| Net
capital paid in on shares of beneficial interest |
$ 172,350,886
|
$ 5,044,698,420
|
$ 427,756,979
|
$ 135,755,563
|
| Accumulated
loss |
(6,044,209)
|
(118,228,679)
|
(10,282,358)
|
(1,612,045)
|
| Net
Assets |
$
166,306,677 |
$
4,926,469,741 |
$
417,474,621 |
$
134,143,518 |
| NET
ASSET VALUE |
|
|
|
|
| Class
A Shares: |
|
|
|
|
| Net
assets applicable to shares outstanding |
$ 15,496,346
|
$ 869,551,128
|
$ 89,996,690
|
$ 59,935,363
|
| Shares
outstanding |
1,292,071
|
63,046,128
|
6,906,713
|
4,729,623 |
| Net
asset value and redemption price per share |
$ 11.99
|
$ 13.79
|
$ 13.03
|
$ 12.67
|
| Maximum
offering price per share (net asset value, plus 2.25% of offering price) |
$ 12.27
|
$ 14.11
|
$ 13.33
|
$ 12.93
* |
| Class
C Shares: |
|
|
|
|
| Net
assets applicable to shares outstanding |
-
|
119,213,801
|
7,552,436
|
- |
| Shares
outstanding |
- |
8,627,883 |
579,123 |
- |
| Net
asset value and redemption price per share** |
-
|
13.82
|
13.04
|
-
|
| Class
C2 Shares: |
|
|
|
|
| Net
assets applicable to shares outstanding |
-
|
5,600,236
|
132,781
|
- |
| Shares
outstanding |
- |
405,250 |
10,182 |
- |
| Net
asset value and redemption price per share** |
-
|
13.82
|
13.04
|
-
|
| Class
D Shares: |
|
|
|
|
| Net
assets applicable to shares outstanding |
-
|
-
|
-
|
11,714,558 |
| Shares
outstanding |
- |
- |
- |
923,987 |
| Net
asset value and redemption price per share |
-
|
-
|
-
|
12.68
|
66
| Thornburg Municipal Funds Semi-Annual Report
Statements of Assets and Liabilities,
Continued
March 31, 2022 (Unaudited)
| |
THORNBURG
SHORT DURATION
MUNICIPAL FUND |
THORNBURG
LIMITED TERM
MUNICIPAL FUND |
THORNBURG
CALIFORNIA LIMITED TERM
MUNICIPAL FUND |
THORNBURG
NEW MEXICO INTERMEDIATE
MUNICIPAL FUND |
| Class
I Shares: |
|
|
|
|
| Net
assets applicable to shares outstanding |
$ 150,810,331
|
$ 3,932,104,576
|
$ 319,792,714
|
$ 62,493,597
|
| Shares
outstanding |
12,582,587
|
285,060,753
|
24,517,046
|
4,933,644 |
| Net
asset value and redemption price per share |
11.99
|
13.79
|
13.04
|
12.67
|
| *
|
Net
asset value, plus 2.00% of offering price. |
| **
|
Redemption
price per share is equal to net asset value less any applicable contingent deferred sales charge. |
See notes to financial statements.
Thornburg
Municipal Funds Semi-Annual Report | 67
Statements of Assets and Liabilities,
Continued
March 31, 2022 (Unaudited)
| |
THORNBURG
NEW YORK INTERMEDIATE
MUNICIPAL FUND |
THORNBURG
INTERMEDIATE
MUNICIPAL FUND |
THORNBURG
STRATEGIC MUNICIPAL
INCOME FUND |
| ASSETS
|
|
|
|
| Investment
in securities, at cost |
$ 35,359,106
|
$ 855,169,002
|
$ 340,400,324
|
| Investments
at value |
35,578,747
|
868,737,886
|
339,222,263 |
| Cash
|
347,950
|
20,945,303
|
8,709,399 |
| Receivable
for investments sold |
-
|
880,769
|
1,686,528 |
| Receivable
for fund shares sold |
3,116
|
1,865,804
|
2,969,201 |
| Principal
and interest receivable |
503,536
|
11,280,446
|
3,704,848 |
| Prepaid
expenses and other assets |
9,354
|
51,373
|
56,878
|
| Total
Assets |
36,442,703
|
903,761,581
|
356,349,117
|
| Liabilities
|
|
|
|
| Payable
for investments purchased |
-
|
10,012,436
|
4,056,640 |
| Payable
for fund shares redeemed |
20,483
|
16,129,847
|
1,639,802 |
| Payable
to investment advisor and other affiliates |
16,738
|
445,073
|
137,178 |
| Accounts
payable and accrued expenses |
44,657
|
188,892
|
59,063 |
| Dividends
payable |
10,006
|
204,329
|
10,741
|
| Total
Liabilities |
91,884
|
26,980,577
|
5,903,424
|
| Net
Assets |
$
36,350,819 |
$
876,781,004 |
$
350,445,693 |
| NET
ASSETS CONSIST OF |
|
|
|
| Net
capital paid in on shares of beneficial interest |
$ 36,709,293
|
$ 878,999,260
|
$ 355,997,900
|
| Accumulated
loss |
(358,474)
|
(2,218,256)
|
(5,552,207)
|
| Net
Assets |
$
36,350,819 |
$
876,781,004 |
$
350,445,693 |
| NET
ASSET VALUE |
|
|
|
| Class
A Shares: |
|
|
|
| Net
assets applicable to shares outstanding |
$ 19,963,363
|
$ 293,034,249
|
$ 64,156,426
|
| Shares
outstanding |
1,638,445
|
21,732,983
|
4,430,289 |
| Net
asset value and redemption price per share |
$ 12.18
|
$ 13.48
|
$ 14.48
|
| Maximum
offering price per share (net asset value, plus 2.00% of offering price) |
$ 12.43
|
$ 13.76
|
$ 14.78
|
| Class
C Shares: |
|
|
|
| Net
assets applicable to shares outstanding |
-
|
28,741,430
|
11,152,710 |
| Shares
outstanding |
- |
2,129,104 |
769,315 |
| Net
asset value and redemption price per share* |
-
|
13.50
|
14.50
|
| Class
C2 Shares: |
|
|
|
| Net
assets applicable to shares outstanding |
-
|
1,576,926
|
- |
| Shares
outstanding |
- |
116,788 |
- |
| Net
asset value and redemption price per share* |
-
|
13.50
|
-
|
68
| Thornburg Municipal Funds Semi-Annual Report
Statements of Assets and Liabilities,
Continued
March 31, 2022 (Unaudited)
| |
THORNBURG
NEW YORK INTERMEDIATE
MUNICIPAL FUND |
THORNBURG
INTERMEDIATE
MUNICIPAL FUND |
THORNBURG
STRATEGIC MUNICIPAL
INCOME FUND |
| Class
I Shares: |
|
|
|
| Net
assets applicable to shares outstanding |
$ 16,387,456
|
$ 553,428,399
|
$ 275,136,557
|
| Shares
outstanding |
1,344,820
|
41,097,320
|
18,981,908 |
| Net
asset value and redemption price per share |
12.19
|
13.47
|
14.49
|
| *
|
Redemption
price per share is equal to net asset value less any applicable contingent deferred sales charge. |
See notes to financial statements.
Thornburg
Municipal Funds Semi-Annual Report | 69
Statements of Operations
Six Months Ended March 31, 2022 (Unaudited)
| |
THORNBURG
SHORT DURATION
MUNICIPAL FUND |
THORNBURG
LIMITED TERM
MUNICIPAL FUND |
THORNBURG
CALIFORNIA LIMITED TERM
MUNICIPAL FUND |
THORNBURG
NEW MEXICO INTERMEDIATE
MUNICIPAL FUND |
| INVESTMENT
INCOME |
|
|
|
|
| Interest
income |
$ 903,786
|
$ 53,329,152
|
$ 4,226,006
|
$ 1,739,023
|
| EXPENSES
|
|
|
|
|
| Investment
management fees |
353,740
|
7,449,419
|
1,145,436
|
357,590 |
| Administration
fees |
74,138
|
2,252,771
|
192,062
|
59,968 |
| Distribution
and service fees |
|
|
|
|
| Class
A Shares |
15,607
|
1,183,469
|
120,760
|
81,459 |
| Class
C Shares |
-
|
336,524
|
22,294
|
- |
| Class
C2 Shares |
-
|
18,250
|
466
|
- |
| Class
D Shares |
-
|
-
|
-
|
30,820 |
| Transfer
agent fees |
|
|
|
|
| Class
A Shares |
16,450
|
270,011
|
22,658
|
21,685 |
| Class
C Shares |
-
|
47,490
|
4,204
|
- |
| Class
C2 Shares |
-
|
2,236
|
887
|
- |
| Class
D Shares |
-
|
-
|
-
|
3,918 |
| Class
I Shares |
13,132
|
1,765,380
|
135,745
|
11,590 |
| Registration
and filing fees |
|
|
|
|
| Class
A Shares |
11,579
|
15,000
|
4,509
|
3,193 |
| Class
C Shares |
-
|
7,209
|
3,202
|
- |
| Class
C2 Shares |
-
|
8,823
|
1,701
|
- |
| Class
D Shares |
-
|
-
|
-
|
3,026 |
| Class
I Shares |
11,694
|
7,383
|
3,067
|
3,378 |
| Custodian
fees |
29,140
|
196,893
|
42,380
|
26,420 |
| Professional
fees |
23,606
|
49,879
|
25,033
|
21,297 |
| Trustee
and officer fees |
4,890
|
149,673
|
12,421
|
3,943 |
| Other
expenses |
5,927
|
155,200
|
17,899
|
8,128
|
| Total
Expenses |
559,903
|
13,915,610
|
1,754,724
|
636,415 |
| Less:
|
|
|
|
|
| Expenses
reimbursed |
(102,121)
|
(5,159)
|
(384,925)
|
(17,842) |
| Investment
management fees waived |
-
|
-
|
(102,500)
|
-
|
| Net
Expenses |
457,782
|
13,910,451
|
1,267,299
|
618,573
|
| Net
Investment Income (Loss) |
$ 446,004
|
$ 39,418,701
|
$ 2,958,707
|
$ 1,120,450
|
| REALIZED
AND UNREALIZED GAIN (LOSS) |
|
|
|
|
| Net
realized gain (loss) |
(1,467,687)
|
(30,188,318)
|
(493,564)
|
(35,968) |
| Net
change in unrealized appreciation (depreciation) |
(3,310,131)
|
(236,803,550)
|
(20,386,768)
|
(7,839,162)
|
| Net
Realized and Unrealized Gain (Loss) |
(4,777,818)
|
(266,991,868)
|
(20,880,332)
|
(7,875,130)
|
| Change
in Net Assets Resulting from Operations |
$
(4,331,814) |
$
(227,573,167) |
$
(17,921,625) |
$
(6,754,680) |
See notes to financial statements.
70 | Thornburg Municipal Funds Semi-Annual Report
Statements of Operations,
Continued
Six Months Ended March 31, 2022 (Unaudited)
| |
THORNBURG
NEW YORK INTERMEDIATE
MUNICIPAL FUND |
THORNBURG
INTERMEDIATE
MUNICIPAL FUND |
THORNBURG
STRATEGIC MUNICIPAL
INCOME FUND |
| INVESTMENT
INCOME |
|
|
|
| Interest
income |
$ 575,271
|
$ 14,761,497
|
$ 4,898,524
|
| EXPENSES
|
|
|
|
| Investment
management fees |
101,486
|
2,378,768
|
1,400,039 |
| Administration
fees |
17,015
|
420,846
|
156,507 |
| Distribution
and service fees |
|
|
|
| Class
A Shares |
27,455
|
396,609
|
83,010 |
| Class
C Shares |
-
|
97,670
|
35,177 |
| Class
C2 Shares |
-
|
5,952
|
- |
| Transfer
agent fees |
|
|
|
| Class
A Shares |
8,560
|
90,163
|
28,017 |
| Class
C Shares |
-
|
12,680
|
4,697 |
| Class
C2 Shares |
-
|
1,359
|
- |
| Class
I Shares |
7,819
|
224,813
|
121,300 |
| Registration
and filing fees |
|
|
|
| Class
A Shares |
3,879
|
9,254
|
9,917 |
| Class
C Shares |
-
|
8,521
|
10,043 |
| Class
C2 Shares |
-
|
5,405
|
- |
| Class
I Shares |
3,071
|
5,852
|
13,497 |
| Custodian
fees |
19,590
|
57,400
|
35,070 |
| Professional
fees |
20,864
|
27,639
|
23,803 |
| Trustee
and officer fees |
1,242
|
26,894
|
9,805 |
| Other
expenses |
3,486
|
31,867
|
13,299
|
| Total
Expenses |
214,467
|
3,801,692
|
1,944,181 |
| Less:
|
|
|
|
| Expenses
reimbursed |
(33,940)
|
(655,686)
|
(362,962) |
| Investment
management fees waived |
(9,393)
|
-
|
(366,352)
|
| Net
Expenses |
171,134
|
3,146,006
|
1,214,867
|
| Net
Investment Income (Loss) |
$ 404,137
|
$ 11,615,491
|
$ 3,683,657
|
| REALIZED
AND UNREALIZED GAIN (LOSS) |
|
|
|
| Net
realized gain (loss) |
(79,564)
|
(5,533,023)
|
(2,713,604) |
| Net
change in unrealized appreciation (depreciation) |
(2,073,703)
|
(55,928,151)
|
(20,548,119)
|
| Net
Realized and Unrealized Gain (Loss) |
(2,153,267)
|
(61,461,174)
|
(23,261,723)
|
| Change
in Net Assets Resulting from Operations |
$
(1,749,130) |
$
(49,845,683) |
$
(19,578,066) |
See notes to financial statements.
Thornburg
Municipal Funds Semi-Annual Report | 71
Statements of Changes in Net Assets
| |
THORNBURG
SHORT DURATION MUNICIPAL FUND |
THORNBURG
LIMITED TERM MUNICIPAL FUND |
| |
Six
Months Ended
March 31, 2022* |
Year
Ended
September 30, 2021 |
Six
Months Ended
March 31, 2022* |
Year
Ended
September 30, 2021 |
| INCREASE
(DECREASE) IN NET ASSETS FROM |
|
|
|
|
| OPERATIONS
|
|
|
|
|
| Net
investment income (loss) |
$ 446,004
|
$ 827,637
|
$ 39,418,701
|
$ 85,366,085
|
| Net
realized gain (loss) |
(1,467,687)
|
(16,487)
|
(30,188,318)
|
(2,855,864) |
| Net
change in unrealized appreciation (depreciation) |
(3,310,131)
|
(505,677)
|
(236,803,550)
|
(48,294,868)
|
| Net
Increase (Decrease) in Net Assets Resulting from Operations |
(4,331,814)
|
305,473
|
(227,573,167)
|
34,215,353
|
| DIVIDENDS
TO SHAREHOLDERS |
|
|
|
|
| From
distributable earnings |
|
|
|
|
| Class
A Shares |
(25,490)
|
(64,774)
|
(6,115,563)
|
(12,597,747) |
| Class
C Shares |
-
|
-
|
(685,265)
|
(1,664,168) |
| Class
C2 Shares† |
- |
- |
(20,888) |
(20,800) |
| Class
I Shares |
(420,578)
|
(762,863)
|
(32,765,284)
|
(70,836,627) |
| FUND
SHARE TRANSACTIONS |
|
|
|
|
| Class
A Shares |
(402,870)
|
(8,197,490)
|
(61,784,608)
|
44,026,090 |
| Class
C Shares |
-
|
-
|
(21,060,729)
|
(83,003,282) |
| Class
C2 Shares† |
-
|
-
|
411,753
|
5,521,913 |
| Class
I Shares |
(24,089,420)
|
47,176,676
|
(357,015,566)
|
(23,033,764)
|
| Net
Increase (Decrease) in Net Assets |
(29,270,172)
|
38,457,022
|
(706,609,317)
|
(107,393,032)
|
| NET
ASSETS |
|
|
|
|
| Beginning
of Period |
195,576,849
|
157,119,827
|
5,633,079,058
|
5,740,472,090
|
| End
of Period |
$ 166,306,677
|
$ 195,576,849
|
$ 4,926,469,741
|
$ 5,633,079,058
|
| *
|
Unaudited.
|
| †
|
Class
C2 Shares commenced operations on October 1, 2020. |
See notes to financial statements.
72 | Thornburg Municipal Funds Semi-Annual Report
Statements of Changes in Net Assets,
Continued
| |
THORNBURG
CALIFORNIA LIMITED TERM MUNICIPAL FUND |
THORNBURG
NEW MEXICO INTERMEDIATE MUNICIPAL FUND |
| |
Six
Months Ended
March 31, 2022* |
Year
Ended
September 30, 2021 |
Six
Months Ended
March 31, 2022* |
Year
Ended
September 30, 2021 |
| INCREASE
(DECREASE) IN NET ASSETS FROM |
|
|
|
|
| OPERATIONS
|
|
|
|
|
| Net
investment income (loss) |
$ 2,958,707
|
$ 6,751,080
|
$ 1,120,450
|
$ 2,460,746
|
| Net
realized gain (loss) |
(493,564)
|
292,644
|
(35,968)
|
(13,677) |
| Net
change in unrealized appreciation (depreciation) |
(20,386,768)
|
(5,416,521)
|
(7,839,162)
|
(863,382)
|
| Net
Increase (Decrease) in Net Assets Resulting from Operations |
(17,921,625)
|
1,627,203
|
(6,754,680)
|
1,583,687
|
| DIVIDENDS
TO SHAREHOLDERS |
|
|
|
|
| From
distributable earnings |
|
|
|
|
| Class
A Shares |
(535,466)
|
(1,189,036)
|
(466,272)
|
(1,098,803) |
| Class
C Shares |
(36,715)
|
(103,182)
|
-
|
- |
| Class
C2 Shares† |
(593)
|
(1,164)
|
-
|
- |
| Class
D Shares |
- |
- |
(72,913) |
(162,397) |
| Class
I Shares |
(2,387,948)
|
(5,468,843)
|
(574,152)
|
(1,169,485) |
| FUND
SHARE TRANSACTIONS |
|
|
|
|
| Class
A Shares |
(7,553,839)
|
(6,044,354)
|
(6,565,737)
|
(10,031,781) |
| Class
C Shares |
(1,674,909)
|
(7,828,256)
|
-
|
- |
| Class
C2 Shares† |
(9,343)
|
149,981
|
-
|
- |
| Class
D Shares |
-
|
-
|
(520,144)
|
(1,486,390) |
| Class
I Shares |
(30,986,838)
|
(79,199,873)
|
(182,614)
|
992,050
|
| Net
Increase (Decrease) in Net Assets |
(61,107,276)
|
(98,057,524)
|
(15,136,512)
|
(11,373,119)
|
| NET
ASSETS |
|
|
|
|
| Beginning
of Period |
478,581,897
|
576,639,421
|
149,280,030
|
160,653,149
|
| End
of Period |
$ 417,474,621
|
$ 478,581,897
|
$ 134,143,518
|
$ 149,280,030
|
| *
|
Unaudited.
|
| †
|
Class
C2 Shares commenced operations on October 1, 2020. |
See notes to financial statements.
Thornburg
Municipal Funds Semi-Annual Report | 73
Statements of Changes in Net Assets,
Continued
| |
THORNBURG
NEW YORK INTERMEDIATE MUNICIPAL FUND |
THORNBURG
INTERMEDIATE MUNICIPAL FUND |
| |
Six
Months Ended
March 31, 2022* |
Year
Ended
September 30, 2021 |
Six
Months Ended
March 31, 2022* |
Year
Ended
September 30, 2021 |
| INCREASE
(DECREASE) IN NET ASSETS FROM |
|
|
|
|
| OPERATIONS
|
|
|
|
|
| Net
investment income (loss) |
$ 404,137
|
$ 896,114
|
$ 11,615,491
|
$ 24,899,369
|
| Net
realized gain (loss) |
(79,564)
|
(71,251)
|
(5,533,023)
|
57,240 |
| Net
change in unrealized appreciation (depreciation) |
(2,073,703)
|
(172,704)
|
(55,928,151)
|
(886,015)
|
| Net
Increase (Decrease) in Net Assets Resulting from Operations |
(1,749,130)
|
652,159
|
(49,845,683)
|
24,070,594
|
| DIVIDENDS
TO SHAREHOLDERS |
|
|
|
|
| From
distributable earnings |
|
|
|
|
| Class
A Shares |
(202,743)
|
(466,060)
|
(3,454,564)
|
(7,607,115) |
| Class
C Shares |
-
|
-
|
(293,697)
|
(741,939) |
| Class
C2 Shares |
- |
- |
(16,517) |
(19,602) |
| Class
I Shares |
(201,394)
|
(448,411)
|
(7,868,482)
|
(16,658,749) |
| FUND
SHARE TRANSACTIONS |
|
|
|
|
| Class
A Shares |
(2,746,020)
|
(3,098,489)
|
(15,735,983)
|
1,684,016 |
| Class
C Shares |
-
|
-
|
(3,650,776)
|
(18,625,674) |
| Class
C2 Shares |
-
|
-
|
(173,241)
|
1,872,135 |
| Class
I Shares |
(3,088,521)
|
(617,840)
|
(72,909,645)
|
(1,195,209)
|
| Net
Increase (Decrease) in Net Assets |
(7,987,808)
|
(3,978,641)
|
(153,948,588)
|
(17,221,543)
|
| NET
ASSETS |
|
|
|
|
| Beginning
of Period |
44,338,627
|
48,317,268
|
1,030,729,592
|
1,047,951,135
|
| End
of Period |
$ 36,350,819
|
$ 44,338,627
|
$ 876,781,004
|
$ 1,030,729,592
|
See notes to financial
statements.
74
| Thornburg Municipal Funds Semi-Annual Report
Statements of Changes in Net Assets,
Continued
| |
THORNBURG
STRATEGIC MUNICIPAL INCOME FUND |
| |
Six
Months Ended
March 31, 2022* |
Year
Ended
September 30, 2021 |
| INCREASE
(DECREASE) IN NET ASSETS FROM |
|
|
| OPERATIONS
|
|
|
| Net
investment income (loss) |
$ 3,683,657
|
$ 7,198,648
|
| Net
realized gain (loss) |
(2,713,604)
|
325,278 |
| Net
change in unrealized appreciation (depreciation) |
(20,548,119)
|
1,426,361
|
| Net
Increase (Decrease) in Net Assets Resulting from Operations |
(19,578,066)
|
8,950,287
|
| DIVIDENDS
TO SHAREHOLDERS |
|
|
| From
distributable earnings |
|
|
| Class
A Shares |
(608,979)
|
(1,288,474) |
| Class
C Shares |
(79,840) |
(196,045) |
| Class
I Shares |
(3,019,073)
|
(5,715,407) |
| FUND
SHARE TRANSACTIONS |
|
|
| Class
A Shares |
3,132,163
|
3,239,395 |
| Class
C Shares |
142,000
|
(3,935,329) |
| Class
I Shares |
(5,386,500)
|
72,175,504
|
| Net
Increase (Decrease) in Net Assets |
(25,398,295)
|
73,229,931
|
| NET
ASSETS |
|
|
| Beginning
of Period |
375,843,988
|
302,614,057
|
| End
of Period |
$ 350,445,693
|
$ 375,843,988
|
See notes to financial
statements.
Thornburg Municipal Funds Semi-Annual Report | 75
Notes to Financial Statements
March 31, 2022 (Unaudited)
NOTE 1 – ORGANIZATION
Thornburg Short Duration Municipal Fund (“Short Duration
Municipal Fund”), Thornburg Limited Term Municipal Fund (“Limited Term Municipal Fund”), Thornburg California Limited Term Municipal Fund (“Limited Term California Fund”), Thornburg New Mexico Intermediate Municipal
Fund (“Intermediate New Mexico Fund”), Thornburg New York Intermediate Municipal Fund (“Intermediate New York Fund”), Thornburg Intermediate Municipal Fund (“Intermediate Municipal Fund”) and Thornburg Strategic
Municipal Income Fund (“Strategic Municipal Income Fund”), collectively the "Funds", are series of Thornburg Investment Trust (the “Trust”). The Short Duration Municipal Fund, Limited Term Municipal Fund, Limited Term
California Fund, Intermediate Municipal Fund, and Strategic Municipal Income Fund are diversified. The Intermediate New Mexico Fund and Intermediate New York Fund are non-diversified. The Trust is organized as a Massachusetts business trust under a
Declaration of Trust dated June 3, 1987 and is registered as a diversified, open-end management investment company under the Investment Company Act of 1940, as amended (the "1940 Act"). The Funds are currently seven of twenty-one separate series of
the Trust. Each series is considered to be a separate entity for financial reporting and tax purposes and bears expenses directly attributable to it.
Short Duration Municipal Fund:
The Fund’s investment goal is to seek current income exempt from federal income tax, consistent with preservation of capital. The Fund’s investments subject it to certain risks. As of the date of this
report, the principal risks of investing in the Fund include management risk, interest rate risk, credit risk, market and economic risk, liquidity risk, redemption risk, and cybersecurity and operational risk. Please see the Fund’s prospectus
for a discussion of those principal risks and other risks associated with an investment in the Fund.
Limited Term Municipal Fund:
The Fund’s primary investment goal is to obtain as high a level of current income exempt from federal individual income taxes as is consistent, in the view of Thornburg Investment Management, Inc., the Trust’s investment advisor (the
“Advisor”), with the preservation of capital. The Fund’s secondary objective is to reduce expected changes in its share price compared to longer intermediate and long-term bond portfolios. The Fund’s investments subject it to
certain risks. As of the date of this report, the principal risks of investing in the Fund include management risk, interest rate risk, credit risk, market and economic risk, liquidity risk, redemption risk, and cybersecurity and operational risk.
Please see the Fund’s prospectus for a discussion of those principal risks and other risks associated with an investment in the Fund.
Limited Term California Fund:
The Fund’s primary investment goal is to obtain as high a level of current income exempt from federal and California state individual income tax as is consistent, in the view of the Advisor, with the preservation of capital. The Fund’s
secondary goal is to reduce expected changes in its share price compared to longer intermediate and long-term bond portfolios. The Fund’s investments subject it to certain risks. As of the date of this report, the principal risks of investing
in the Fund include management risk, interest rate risk, credit risk, market and economic risk, liquidity risk, single state risk, redemption risk, and cybersecurity and operational risk. Please see the Fund’s prospectus for a discussion of
those principal risks and other risks associated with an investment in the Fund.
Intermediate New Mexico Fund:
The Fund’s primary investment goal is to obtain as high a level of current income exempt from federal and New Mexico state individual income tax as is consistent, in the view of the Advisor, with the preservation of capital. The Fund’s
secondary goal is to reduce expected changes in its share price compared to long-term bond portfolios. The Fund’s investments subject it to certain risks. As of the date of this report, the principal risks of investing in the Fund include
management risk, interest rate risk, credit risk, market and economic risk, liquidity risk, single state risk, non-diversification risk, redemption risk, and cybersecurity and operational risk. Please see the Fund’s prospectus for a discussion
of those principal risks and other risks associated with an investment in the Fund.
Intermediate New York Fund:
The Fund’s primary investment goal is to obtain as high a level of current income exempt from federal, New York State, and New York City individual income taxes as is consistent, in the view of the Advisor, with the preservation of capital.
The Fund’s secondary goal is to reduce expected changes in its share price compared to long-term bond portfolios. The Fund’s investments subject it to certain risks. As of the date of this report, the principal risks of investing in the
Fund include management risk, interest rate risk, credit risk, market and economic risk, liquidity risk, single state risk, and non-diversification risk, redemption risk, and cybersecurity and operational risk. Please see the Fund’s prospectus
for a discussion of those principal risks and other risks associated with an investment in the Fund.
Intermediate Municipal Fund:
The Fund’s primary investment goal is to obtain as high a level of current income exempt from federal individual income taxes as is consistent, in the view of the Advisor, with the preservation of capital. The Fund’s secondary goal is to
reduce expected changes in its share price compared to long-term bond portfolios. The Fund’s investments subject it to certain risks. As of the date of this report, the principal risks of investing in the Fund include management risk, interest
rate risk, credit risk, market and economic risk, liquidity risk, redemption risk, and cybersecurity and operational risk. Please see the Fund’s prospectus for a discussion of those principal risks and other risks associated with an investment
in the Fund.
Strategic Municipal Income Fund: The investment goal is to seek a high level of current income exempt from federal individual income tax. The Fund’s investments subject it to certain risks. As of the date of this report, the principal risks of
investing in the Fund include management risk, interest rate risk, credit risk, high yield risk, market and economic risk, liquidity risk, redemption risk, and cybersecurity
76
| Thornburg Municipal Funds Semi-Annual Report
Notes to Financial Statements,
Continued
March 31, 2022 (Unaudited)
and operational risk. Please see the Fund’s prospectus for a discussion
of those principal risks and other risks associated with an investment in the Fund.
As of March 31, 2022, the Funds currently offer up to four
classes of shares of beneficial interest.
Each class of
shares of the Funds represents an interest in the same portfolio of investments, except that (i) Class A shares are sold subject to a front-end sales charge collected at the time the shares are purchased and bear a service fee, (ii) Class C shares
are sold at net asset value without a sales charge at the time of purchase, but are subject to a contingent deferred sales charge upon redemption within one year of purchase, and bear both a service fee and a distribution fee, (iii) Class C2 shares
are sold at net asset value without a sales charge at the time of purchase, but are subject to a contingent deferred sales charge upon redemption within one year of purchase, and bear both a service fee and a distribution fee, (iv) Class D shares
are sold at net asset value without a sales charge at the time of purchase or redemption, and bear both a service fee and a distribution fee, (v) Class I shares are sold at net asset value without a sales charge at the time of purchase and may be
subject to a service fee, and (vi) the respective classes may have different reinvestment privileges and conversion rights. Additionally, each Fund may allocate among its classes certain expenses, to the extent allocable to specific classes,
including administration fees, transfer agent fees, government registration fees, certain printing and postage costs, and legal expenses. Currently, class specific expenses of the Funds are limited to distribution and service fees and certain
registration and filing fees.
At March 31, 2022, the
following classes of shares are offered in each respective Fund:
| |
Class
A |
Class
C |
Class
C2 |
Class
D |
Class
I |
| Short
Duration Municipal Fund |
X
|
|
|
|
X
|
| Limited
Term Municipal Fund |
X
|
X
|
X
|
|
X
|
| Limited
Term California Fund |
X
|
X
|
X
|
|
X
|
| Intermediate
New Mexico Fund |
X
|
|
|
X
|
X
|
| Intermediate
New York Fund |
X
|
|
|
|
X
|
| Intermediate
Municipal Fund |
X
|
X
|
X
|
|
X
|
| Strategic
Municipal Income Fund |
X
|
X
|
|
|
X
|
NOTE
2 – SIGNIFICANT ACCOUNTING POLICIES
The
following is a summary of significant accounting policies followed by each of the Funds in the preparation of its financial statements. Each Fund prepares its financial statements in conformity with United States generally accepted accounting
principles (“GAAP”), including investment company accounting and reporting guidance in the Financial Accounting Standards Board (the “FASB”) Accounting Standard Codification Topic 946.
Allocation of Income,
Gains, Losses and Expenses: Net investment income (other than class specific expenses) and realized and unrealized gains and losses are allocated daily to each class of shares based upon the relative net asset value of outstanding shares (or
the value of the dividend-eligible shares, as appropriate) of each class of shares at the beginning of the day (after adjusting for the current capital shares activity of the respective class). Expenses common to all Funds are allocated daily among
the Funds comprising the Trust based upon their relative net asset values or other appropriate allocation methods. Operating expenses directly attributable to a specific class are charged against the operating income of that class.
Dividends and
Distributions to Shareholders: Dividends and distributions to shareholders, which are determined in accordance with federal income tax regulations and may differ from GAAP, are recorded on the ex-dividend date. Ordinary income dividends, if
any, are declared daily and paid monthly. Capital gain distributions, if any, are declared and paid annually and more often if deemed necessary by the Advisor. Dividends and distributions are paid and are reinvested in additional shares of the Funds
at net asset value per share at the close of business on the ex-dividend date, or at the shareholder’s option, paid in cash.
Guarantees and
Indemnifications: Under the Trust’s organizational documents (and under separate agreements with the independent Trustees), its officers and Trustees are provided with an indemnification against certain liabilities arising out of the
performance of their duties to the Funds. In the normal course of business the Trust may also enter into contracts with service providers that contain general indemnifications. The Trust’s maximum exposure under these arrangements is unknown.
However, based on experience, the Trust expects the risk of loss to be remote.
Investment
Income: Interest income is accrued as earned. Premiums and discounts are amortized and accreted, respectively, to first call dates or maturity dates using the effective yield method of the respective investments. These amounts are included in
Investment Income in the Statement of Operations.
Investment Transactions: Investment transactions are accounted for on a trade date basis. Realized gains and losses from the sale of investments are recorded on an identified cost basis.
Thornburg
Municipal Funds Semi-Annual Report | 77
Notes to Financial Statements,
Continued
March 31, 2022 (Unaudited)
Security
Valuation: All investments in securities held by the Funds are valued as described in Note 3.
Use of
Estimates: The preparation of financial statements in conformity with GAAP requires management to make estimates and assumptions that affect the reported amounts of assets and liabilities and disclosure of contingent assets and liabilities at
the date of the financial statements and the reported amounts of increases (decreases) in net assets from operations during the reporting period. Actual results could differ from those estimates.
When-Issued and
Delayed Delivery Transactions: The Funds may engage in when-issued or delayed delivery transactions. To the extent the Funds engage in such transactions, they will do so for the purpose of acquiring portfolio investments consistent with the
Funds’ investment objectives and not for the purpose of investment leverage or to speculate on interest rate or market changes. At the time the Funds make a commitment to purchase an investment on a when-issued or delayed delivery basis, the
Funds will record the transaction and reflect the value in determining its net asset value. When effecting such transactions, assets of an amount sufficient to make payment for the portfolio investments to be purchased will be segregated on the
Funds’ records on the trade date. Investments purchased on a when-issued or delayed delivery basis do not earn interest until the settlement date. The values of these securities held at March 31, 2022 are detailed in the Schedule of
Investments.
NOTE 3 – SECURITY
VALUATION
Valuation of the Funds’ portfolio
investment securities is performed in accordance with policies and procedures adopted by and under the oversight of the Trustees.
The Trustees of the Trust have appointed the Advisor to assist
the Trustees with obtaining fair market values for portfolio investments, evaluating and monitoring professional pricing service providers appointed by the Trustees’ Audit Committee (the “Audit Committee”) to assist in determining
fair values for portfolio investments, assisting in calculating fair values for portfolio investments in certain circumstances, and performing other functions in connection with the valuation of investments. The Advisor acts through its Valuation
and Pricing Committee (the “Committee”) and other employees of the Advisor. The Committee regularly reviews its own valuation calculations, reviews the valuations, valuation techniques and services furnished by pricing service providers,
considers circumstances which may require valuation calculations by the Committee, and reviews previous valuation calculations. The Committee reports to the Audit Committee on the Committee’s activities, the performance of pricing service
providers, and other matters relating to valuation of portfolio investments.
In those instances when the Committee assists in calculating a
fair value for a portfolio investment, the Committee seeks to determine the price that the Funds would reasonably expect to receive upon a sale of the investment in an orderly transaction between market participants on the valuation date. The
Committee customarily utilizes quotations from securities broker dealers in calculating valuations, but also may utilize prices obtained from pricing service providers or other methods approved by the Audit Committee. Because fair values calculated
by the Committee are estimates, the calculation of a value for an investment may differ from the price that would be realized by the Funds upon a sale of the investment, and the difference could be material to the Funds’ financial statements.
The Committee’s calculation of a fair value for an investment may also differ from the prices obtained by other persons (including other mutual funds) for the investment.
Valuation of
Securities: Debt obligations held by the Funds which are not listed or traded on exchanges or for which no reported market exists are ordinarily valued at the valuation obtained from a pricing service provider approved by the Audit
Committee.
In any case when a pricing service provider
fails to provide a valuation for a debt obligation held by the Funds, the Committee calculates a fair value for the obligation using alternative methods under procedures approved by the Audit Committee. Additionally, in cases when management
believes that a valuation obtained from a pricing service provider is stale, does not reflect material factors affecting the valuation of the investment, is significantly different than the value the Funds are likely to obtain if it sought a bid for
the investment, or is otherwise unreliable, the Committee may calculate a fair value for the obligation using an alternative method approved by the Audit Committee.
Valuation
Hierarchy: The Funds categorize their investments based upon the inputs used in valuing those investments, according to a three-level hierarchy established in guidance from the FASB. Categorization of investments using this hierarchy is
intended by the FASB to maximize the use of observable inputs in valuing investments and minimize the use of unobservable inputs by requiring that the most observable inputs be used when available. Observable inputs are those that market
participants would use in valuing an investment based on available market information. Unobservable inputs are those that reflect assumptions about the information market participants would use in valuing an investment. An investment’s level
within the hierarchy is based on the lowest level input that is deemed significant to the valuation. The methodologies and inputs used to value investments are not necessarily indications of the risk or liquidity associated with those
investments.
78
| Thornburg Municipal Funds Semi-Annual Report
Notes to Financial Statements,
Continued
March 31, 2022 (Unaudited)
Various inputs are used in calculating valuations for the
Funds’ investments. These inputs are generally summarized according to the three-level hierarchy below:
Level 1: Quoted prices in active markets for identical
investments.
Level 2: Other direct or indirect
significant observable inputs (including quoted prices for similar investments in active markets and other observable inputs, such as interest rates, prepayment rates, credit ratings, etc.).
Level 3: Significant unobservable inputs (including the
Committee’s own assumptions in calculating the fair values of investments).
Valuations for debt obligations held by the Funds are
typically calculated by pricing service providers approved by the Audit Committee and are generally characterized as Level 2 within the valuation hierarchy.
In a limited number of cases the Committee calculates a fair
value for investments using broker quotations or other methods approved by the Audit Committee. When the Committee uses a single broker quotation to calculate a fair value for an investment without other significant observable inputs, or if a fair
value is calculated using other significant inputs that are considered unobservable, the investment is characterized as Level 3 within the hierarchy. Other significant unobservable inputs used to calculate a fair value in these instances might
include an income-based valuation approach which considers discounted anticipated future cash flows from the investment and application of discounts due to the nature or duration of any restrictions on the disposition of the investment.
Valuations based upon the use of inputs from Levels 1, 2 or 3
may not represent the actual price received upon the disposition of an investment, and a Fund may receive a price that is lower than the valuation based upon these inputs when it sells the investment.
The following tables display a summary of the fair value
hierarchy measurements of each Fund’s investments as of March 31, 2022:
| SHORT
DURATION MUNICIPAL FUND |
TOTAL
|
LEVEL
1 |
LEVEL
2 |
LEVEL
3 |
| Assets
|
|
|
|
|
| Investments
in Securities |
|
|
|
|
| Long-Term
Municipal Bonds |
$ 149,616,633
|
$ —
|
$ 149,616,633
|
$ —
|
| Short-Term
Municipal Bonds |
16,325,000
|
—
|
16,325,000
|
—
|
| Total
Investments in Securities |
$
165,941,633 |
$
— |
$
165,941,633 |
$
— |
| Total
Assets |
$
165,941,633 |
$
— |
$
165,941,633 |
$
— |
| LIMITED
TERM MUNICIPAL FUND |
TOTAL
|
LEVEL
1 |
LEVEL
2 |
LEVEL
3 |
| Assets
|
|
|
|
|
| Investments
in Securities |
|
|
|
|
| Long-Term
Municipal Bonds |
$ 4,595,321,546
|
$ —
|
$ 4,595,321,546
|
$ —
|
| Short-Term
Municipal Bonds |
214,060,000
|
—
|
214,060,000
|
—
|
| Total
Investments in Securities |
$
4,809,381,546 |
$
— |
$
4,809,381,546 |
$
— |
| Total
Assets |
$
4,809,381,546 |
$
— |
$
4,809,381,546 |
$
— |
| LIMITED
TERM CALIFORNIA FUND |
TOTAL
|
LEVEL
1 |
LEVEL
2 |
LEVEL
3 |
| Assets
|
|
|
|
|
| Investments
in Securities |
|
|
|
|
| Long-Term
Municipal Bonds |
$ 397,061,341
|
$ —
|
$ 397,061,341
|
$ —
|
| Short-Term
Municipal Bonds |
18,784,000
|
—
|
18,784,000
|
—
|
| Total
Investments in Securities |
$
415,845,341 |
$
— |
$
415,845,341 |
$
— |
| Total
Assets |
$
415,845,341 |
$
— |
$
415,845,341 |
$
— |
| INTERMEDIATE
NEW MEXICO FUND |
TOTAL
|
LEVEL
1 |
LEVEL
2 |
LEVEL
3 |
| Assets
|
|
|
|
|
| Investments
in Securities |
|
|
|
|
| Long-Term
Municipal Bonds |
$ 129,031,738
|
$ —
|
$ 129,031,738
|
$ —
|
| Short-Term
Municipal Bonds |
2,060,000
|
—
|
2,060,000
|
—
|
| Total
Investments in Securities |
$
131,091,738 |
$
— |
$
131,091,738 |
$
— |
| Total
Assets |
$
131,091,738 |
$
— |
$
131,091,738 |
$— |
Thornburg Municipal Funds Semi-Annual Report | 79
Notes to Financial Statements,
Continued
March 31, 2022 (Unaudited)
| INTERMEDIATE
NEW YORK FUND |
TOTAL
|
LEVEL
1 |
LEVEL
2 |
LEVEL
3 |
| Assets
|
|
|
|
|
| Investments
in Securities |
|
|
|
|
| Long-Term
Municipal Bonds |
$ 35,078,747
|
$ —
|
$ 35,078,747
|
$ —
|
| Short-Term
Municipal Bonds |
500,000
|
—
|
500,000
|
—
|
| Total
Investments in Securities |
$
35,578,747 |
$
— |
$
35,578,747 |
$
— |
| Total
Assets |
$
35,578,747 |
$
— |
$
35,578,747 |
$
— |
| INTERMEDIATE
MUNICIPAL FUND |
TOTAL
|
LEVEL
1 |
LEVEL
2 |
LEVEL
3 |
| Assets
|
|
|
|
|
| Investments
in Securities |
|
|
|
|
| Long-Term
Municipal Bonds |
$ 856,637,886
|
$ —
|
$ 856,637,886
|
$ —
|
| Short-Term
Municipal Bonds |
12,100,000
|
—
|
12,100,000
|
—
|
| Total
Investments in Securities |
$
868,737,886 |
$
— |
$
868,737,886 |
$
— |
| Total
Assets |
$
868,737,886 |
$
— |
$
868,737,886 |
$
— |
| STRATEGIC
MUNICIPAL INCOME FUND |
TOTAL
|
LEVEL
1 |
LEVEL
2 |
LEVEL
3 |
| Assets
|
|
|
|
|
| Investments
in Securities |
|
|
|
|
| Long-Term
Municipal Bonds |
$ 308,022,263
|
$ —
|
$ 308,022,263
|
$ —
|
| Short-Term
Municipal Bonds |
31,200,000
|
—
|
31,200,000
|
—
|
| Total
Investments in Securities |
$
339,222,263 |
$
— |
$
339,222,263 |
$
— |
| Total
Assets |
$
339,222,263 |
$
— |
$
339,222,263 |
$— |
NOTE 4 – INVESTMENT MANAGEMENT FEE AND
OTHER TRANSACTIONS WITH AFFILIATES
Pursuant to an
investment management agreement with the Trust, the Advisor serves as the investment advisor and performs advisory services for the Funds for which the Advisor’s management fees are payable at the end of each month. Under the investment
advisory agreement, each Fund pays the Advisor a management fee based on the average daily net assets of that fund at an annual rate as shown in the following table:
| SHORT
DURATION MUNICIPAL FUND |
LIMITED
TERM MUNICIPAL FUND,
LIMITED TERM CALIFORNIA FUND |
INTERMEDIATE
NEW MEXICO FUND,
INTERMEDIATE NEW YORK FUND,
INTERMEDIATE MUNICIPAL FUND |
STRATEGIC
MUNICIPAL INCOME FUND |
| DAILY
NET ASSETS |
FEE
RATE |
DAILY
NET ASSETS |
FEE
RATE |
DAILY
NET ASSETS |
FEE
RATE |
DAILY
NET ASSETS |
FEE
RATE |
| Up
to $1 billion |
0.400%
|
Up
to $500 million |
0.500%
|
Up
to $500 million |
0.500%
|
Up
to $500 million |
0.750%
|
| Next
$500 million |
0.300
|
Next
$500 million |
0.400
|
Next
$500 million |
0.450
|
Next
$500 million |
0.675
|
| Next
$500 million |
0.250
|
Next
$500 million |
0.300
|
Next
$500 million |
0.400
|
Next
$500 million |
0.625
|
| Over
$2 billion |
0.225
|
Next
$500 million |
0.250
|
Next
$500 million |
0.350
|
Next
$500 million |
0.575
|
| |
|
Over
$2 billion |
0.225
|
Over
$2 billion |
0.275
|
Over
$2 billion |
0.500
|
The Funds’ effective
management fees, calculated on the basis of the Funds’ average daily net assets (before applicable management fee waivers) for the six months ended March 31, 2022 were as shown in the following table. Total management fees incurred by the
Funds for the six months ended March 31, 2022 are set forth in the Statement of Operations.
80 | Thornburg Municipal Funds Semi-Annual Report
Notes to Financial Statements,
Continued
March 31, 2022 (Unaudited)
| |
Effective
Management
Fee |
| Short
Duration Municipal Fund |
0.400%
|
| Limited
Term Municipal Fund |
0.276
|
| Limited
Term California Fund |
0.500
|
| Intermediate
New Mexico Fund |
0.500
|
| Intermediate
New York Fund |
0.500
|
| Intermediate
Municipal Fund |
0.474
|
| Strategic
Municipal Income Fund |
0.750
|
The Trust has entered into an
administrative services agreement with the Advisor, whereby the Advisor will perform certain administrative services. The administrative services fees are computed as an annual percentage of the aggregate average daily net assets of all Funds in the
Trust as follows:
| Administrative
Services Fee Schedule |
| Daily
Net Assets |
Fee
Rate |
| Up
to $20 billion |
0.100%
|
| $20
billion to $40 billion |
0.075
|
| $40
billion to $60 billion |
0.040
|
| Over
$60 billion |
0.030
|
The aggregate administrative
services fee amount is allocated on a daily basis to each Fund based on net assets and subsequently allocated to each class of shares of the Funds. Total administrative services fees incurred by each class of shares of the Funds for the six months
ended March 31, 2022, are set forth in the Statement of Operations.
The Trust has an underwriting agreement with Thornburg
Securities Corporation (the “Distributor”), an affiliate of the Advisor, which acts as the distributor of the Funds’ shares. For the six months ended March 31, 2022, the Distributor has advised the Funds that they earned net
commissions from the sale of Class A shares and collected contingent deferred sales charges ("CDSC Fees") from redemptions of Class C and Class C2 shares as follows:
| |
Commissions
|
CDSC
fees |
| Limited
Term Municipal Fund |
$
4,871 |
$
4,138 |
| Limited
Term California Fund |
674 |
152 |
| Intermediate
New Mexico Fund |
273 |
— |
| Intermediate
New York Fund |
(10) |
— |
| Intermediate
Municipal Fund |
2,703 |
— |
| Strategic
Municipal Income Fund |
844 |
1,260 |
Pursuant to a service plan
under Rule 12b-1 of the 1940 Act, the Funds may reimburse to the Distributor an amount not to exceed .25 of 1% per annum of the average daily net assets attributable to the applicable Class A, Class C, Class C2 and Class I shares of the Limited Term
Municipal Fund, Limited Term California Fund and Intermediate Municipal Fund, Class A, Class C, and Class I shares of the Strategic Municipal Income Fund, Class A and Class I shares of the Intermediate New York Fund and Class A, Class D and Class I
shares of the Intermediate New Mexico Fund and .20 of 1% per annum of the average daily net assets attributable to the applicable Class A and Class I shares of Short Duration Municipal Fund for payments made by the Distributor to securities dealers
and other financial institutions to obtain various shareholder and distribution related services. For the six months ended March 31, 2022, there were no 12b-1 service plan fees charged for Class I. The Advisor and Distributor each may pay out of its
own resources additional expenses for distribution of each Fund’s shares and shareholder services.
The Trust has also adopted a distribution plan pursuant to
Rule 12b-1, applicable only to the Fund’s Class C, Class C2, and Class D shares, under which the Funds compensate the Distributor for services in promoting the sale of Class C and Class D shares of the Funds at an annual rate of up to .25 of
1% per annum of the average daily net assets attributable to Class C of the Limited Term Municipal Fund and Limited Term California Fund and Class D shares of the Intermediate New Mexico Fund, .35 of 1% per annum of the average daily net assets
attributable to Class C of the Intermediate Municipal Fund and Strategic Municipal Income Fund and .40 of 1% per annum of the average daily net assets attributed to Class C2 shares of the Limited Term Municipal Fund, Limited Term California Fund,
and Intermediate
Thornburg Municipal Funds Semi-Annual Report | 81
Notes to Financial Statements,
Continued
March 31, 2022 (Unaudited)
Municipal Fund. Total fees incurred by each class of shares of the Funds under
their respective service and distribution plans for the six months ended March 31, 2022, are set forth in the Statements of Operations.
The Advisor has contractually agreed to waive certain fees and
reimburse certain expenses incurred by the Funds. The agreement may be terminated by the Funds at any time, but may not be terminated by the Advisor before February 1, 2023 unless the Advisor ceases to be the investment advisor to the Funds prior to
that date. The Advisor may recoup amounts waived or reimbursed during the six months ended March 31, 2022 if, during the fiscal year, expenses fall below the contractual limit that was in place at the time these fees and expenses were waived or
reimbursed. The Advisor will not recoup fees or expenses as described in the preceding sentence if that recoupment would cause the Fund’s total annual operating expenses (after the recoupment is taken into account) to exceed the lesser of: (a)
the expense cap that was in place at the time the waiver or reimbursement occurred; or (b) the expense cap that is in place at the time of the recoupment.
Actual expenses of certain share classes do not exceed levels
as specified in each Fund’s most recent prospectus as shown on the following table:
| |
Class
A |
Class
C |
Class
C2 |
Class
D |
Class
I |
| Short
Duration Municipal Fund |
0.70% |
—% |
—% |
—% |
0.50% |
| Limited
Term Municipal Fund |
— |
— |
1.24 |
— |
— |
| Limited
Term California Fund |
0.74 |
1.02 |
1.02 |
— |
0.49 |
| Intermediate
New Mexico Fund |
— |
— |
— |
1.24 |
0.67 |
| Intermediate
New York Fund |
0.99 |
— |
— |
— |
0.67 |
| Intermediate
Municipal Fund |
0.77 |
1.14 |
1.14 |
— |
0.53 |
| Strategic
Municipal Income Fund |
0.81 |
1.28 |
— |
— |
0.59 |
For the six months ended March
31, 2022, the Advisor contractually reimbursed certain class specific expenses and distribution fees and voluntarily waived Fund level investment advisory fees as follows:
| Contractual:
|
Class
A |
Class
C |
Class
C2 |
Class
D |
Class
I |
Total
|
| Short
Duration Municipal Fund |
$
32,476 |
$ —
|
$
— |
$ —
|
$
69,645 |
$
102,121 |
| Limited
Term Municipal Fund |
—
|
—
|
2,514 |
—
|
—
|
2,514
|
| Limited
Term California Fund |
71,648
|
10,203
|
2,739 |
—
|
300,335
|
384,925
|
| Intermediate
New Mexico Fund |
—
|
—
|
— |
722
|
14,164
|
14,886
|
| Intermediate
New York Fund |
14,611
|
—
|
— |
—
|
19,329
|
33,940
|
| Intermediate
Municipal Fund |
205,590
|
28,762
|
7,648 |
—
|
413,686
|
655,686
|
| Strategic
Municipal Income Fund |
127,738
|
23,572
|
— |
—
|
491,660
|
642,970
|
| Voluntary:
|
Class
A |
Class
C |
Class
C2 |
Class
D |
Class
I |
Total
|
| Limited
Term Municipal Fund |
$ —
|
$ —
|
$
2,645 |
$ —
|
$ —
|
$ 2,645
|
| Limited
Term California Fund |
21,885
|
1,935
|
32 |
—
|
78,648
|
102,500 |
| Intermediate
New Mexico Fund |
1,180
|
—
|
— |
1,776
|
—
|
2,956 |
| Intermediate
New York Fund |
5,177
|
—
|
— |
—
|
4,216
|
9,393 |
| Strategic
Municipal Income Fund |
16,095 |
2,809 |
— |
— |
67,440 |
86,344 |
Certain officers and
Trustees of the Trust are also officers or directors of the Advisor and Distributor. The compensation of the independent Trustees is borne by the Trust. The Trust also pays a portion of the Chief Compliance Officer’s compensation. These
amounts are reflected as Trustee and officer fees in the Statement of Operations.
As of March 31, 2022, the percentage of direct investments in
the Funds held by the Trustees, officers of the Trust, and the Advisor is approximately as follows.
| |
Percentage
of Direct Investments |
| Short
Duration Municipal Fund |
69.10%
|
| Limited
Term Municipal Fund |
2.66
|
| Limited
Term California Fund |
—
|
| Intermediate
New Mexico Fund |
14.68
|
| Intermediate
New York Fund |
—
|
| Intermediate
Municipal Fund |
0.20
|
| Strategic
Municipal Income Fund |
7.77
|
82
| Thornburg Municipal Funds Semi-Annual Report
Notes to Financial Statements,
Continued
March 31, 2022 (Unaudited)
The Funds may purchase or sell securities from or to an
affiliated fund, provided the affiliation is due solely to having a common investment advisor, common officers, or common trustees, and provided that all such transactions will comply with Rule 17a-7 under the 1940 Act. For the year ended at March
31, 2022, the Rule 17a-7 purchases, sales and gains/(losses) were as follows.
| |
Purchases
|
Sales
|
Realized
gains/(losses) |
| Short
Duration Municipal Fund |
$
8,560,710 |
$
4,915,555 |
$
(152,810) |
| Limited
Term Municipal Fund |
32,199,825 |
12,894,637 |
(471,907) |
| Limited
Term California Fund |
7,628,651 |
5,738,584 |
(412,827) |
| Intermediate
New York Fund |
— |
1,809,759 |
(45,356) |
| Intermediate
Municipal Fund |
3,250,953 |
17,687,418 |
(1,086,118) |
| Strategic
Municipal Income Fund |
5,253,753 |
13,847,938 |
(850,135) |
NOTE 5 – TAXES
Federal Income
Taxes: It is the policy of the Trust to comply with the provisions of the Internal Revenue Code of 1986 applicable to regulated investment companies and to distribute to shareholders substantially all investment company taxable income
including net realized gains on investments (if any), and tax exempt income of the Funds. Therefore, no provision for federal income or excise tax is required.
The Funds file income tax returns in United States federal and
applicable state jurisdictions. The statute of limitations on the Funds’ tax return filings generally remains open for the three years following a return’s filing date. The Funds have analyzed each uncertain tax position believed to be
material in the preparation of the Funds’ financial statements for the six month period ended March 31, 2022, including open tax years, to assess whether it is more likely than not that the position would be sustained upon examination, based
on the technical merits of the position. The Funds have not identified any such position for which an asset or liability must be reflected in the Statements of Assets and Liabilities.
At March 31, 2022, information on the tax components of
capital was as follows:
| |
Cost
|
Unrealized
Appreciation |
Unrealized
Depreciation |
Net
Unrealized
Appreciation
(Depreciation) |
| Short
Duration Municipal Fund |
$ 168,293,697
|
$ 231,177
|
$ (2,583,241)
|
$
(2,352,064) |
| Limited
Term Municipal Fund |
4,855,890,048
|
48,321,448
|
(94,829,950)
|
(46,508,502) |
| Limited
Term California Fund |
421,068,747
|
2,959,980
|
(8,183,386)
|
(5,223,406) |
| Intermediate
New Mexico Fund |
131,372,520
|
1,684,892
|
(1,965,674)
|
(280,782) |
| Intermediate
New York Fund |
35,359,106
|
663,313
|
(443,672)
|
219,641 |
| Intermediate
Municipal Fund |
855,169,002
|
22,524,578
|
(8,955,694)
|
13,568,884 |
| Strategic
Municipal Income Fund |
340,400,324 |
7,008,062 |
(8,186,123) |
(1,178,061) |
At March 31, 2022,
the Funds had deferred tax basis capital losses occurring subsequent to October 31, 2020 through September 30, 2021 per the following table. For tax purposes, such losses will be recognized in the year ending September 30, 2022.
| |
Deferred
Tax Basis |
| |
Capital
Losses |
| Short
Duration Municipal Fund |
$
16,487 |
| Limited
Term Municipal Fund |
827,787 |
| Limited
Term California Fund |
198,318 |
| Intermediate
New Mexico Fund |
13,676 |
| Intermediate
New York Fund |
294 |
| Intermediate
Municipal Fund |
61,092 |
| Strategic
Municipal Income Fund |
77,999 |
At March 31, 2022, the Funds had cumulative tax basis
capital losses from prior fiscal years as shown on the following table, which may be carried forward to offset future capital gains. To the extent such carryforwards are used, capital gain distributions may be reduced to the extent provided by
regulations. Such capital loss carryforwards do not expire.
| |
Cumulative
Capital Losses |
| |
Short-Term
|
Long-Term
|
| Short
Duration Municipal Fund |
$
1,573,484 |
$
634,422 |
| Limited
Term Municipal Fund |
21,445,971 |
18,890,095 |
Thornburg Municipal Funds Semi-Annual Report | 83
Notes to Financial Statements,
Continued
March 31, 2022 (Unaudited)
| |
Cumulative
Capital Losses |
| |
Short-Term
|
Long-Term
|
| Limited
Term California Fund |
$
2,990,414 |
$
1,372,448 |
| Intermediate
New Mexico Fund |
437,966 |
794,659 |
| Intermediate
New York Fund |
414,730 |
70,957 |
| Intermediate
Municipal Fund |
7,142,768 |
2,796,952 |
| Strategic
Municipal Income Fund |
1,576,863 |
— |
NOTE 6 – SHARES OF BENEFICIAL
INTEREST
At March 31, 2022, there were an unlimited
number of shares of each Fund with no par value of beneficial interest authorized. Transactions in each Fund’s shares of beneficial interest were as follows:
| |
SIX
MONTHS ENDED
March 31, 2022 |
YEAR
ENDED
September 30, 2021 |
| SHORT
DURATION MUNICIPAL FUND |
SHARES
|
AMOUNT
|
SHARES
|
AMOUNT
|
| Class
A Shares |
|
|
|
|
| Shares
sold |
172,874
|
$ 2,102,400
|
114,099
|
$ 1,410,251
|
Shares
issued to shareholders in
reinvestment of dividends |
2,076
|
25,277
|
5,233
|
64,680 |
| Shares
repurchased |
(207,056)
|
(2,530,547)
|
(782,797)
|
(9,672,421)
|
| Net
increase (decrease) |
(32,106)
|
$
(402,870) |
(663,465)
|
$
(8,197,490) |
| Class
I Shares |
|
|
|
|
| Shares
sold |
1,058,709
|
$ 12,923,849
|
6,210,964
|
$ 76,754,762
|
Shares
issued to shareholders in
reinvestment of dividends |
34,519
|
420,558
|
61,088
|
754,508 |
| Shares
repurchased |
(3,053,378)
|
(37,433,827)
|
(2,454,472)
|
(30,332,594)
|
| Net
increase (decrease) |
(1,960,150)
|
$
(24,089,420) |
3,817,580
|
$ 47,176,676
|
| |
SIX
MONTHS ENDED
March 31, 2022 |
YEAR
ENDED
September 30, 2021 |
| LIMITED
TERM MUNICIPAL FUND |
SHARES
|
AMOUNT
|
SHARES
|
AMOUNT
|
| Class
A Shares |
|
|
|
|
| Shares
sold |
3,204,831
|
$ 46,010,481
|
13,380,045
|
$ 195,645,598
|
Shares
issued to shareholders in
reinvestment of dividends |
389,292
|
5,543,902
|
779,385
|
11,382,935 |
| Shares
repurchased |
(7,971,248)
|
(113,338,991)
|
(11,148,993)
|
(163,002,443)
|
| Net
increase (decrease) |
(4,377,125)
|
$
(61,784,608) |
3,010,437
|
$ 44,026,090
|
| Class
C Shares |
|
|
|
|
| Shares
sold |
354,655
|
$ 5,104,846
|
1,943,246
|
$ 28,468,205
|
Shares
issued to shareholders in
reinvestment of dividends |
45,895
|
654,782
|
107,651
|
1,575,043 |
| Shares
repurchased |
(1,873,075)
|
(26,820,357)
|
(7,718,607)
|
(113,046,530)
|
| Net
increase (decrease) |
(1,472,525)
|
$
(21,060,729) |
(5,667,710)
|
$
(83,003,282) |
| Class
C2 Shares* |
|
|
|
|
| Shares
sold |
47,100
|
$ 680,757
|
405,294
|
$ 5,940,353
|
Shares
issued to shareholders in
reinvestment of dividends |
1,465
|
20,884
|
1,423
|
20,800 |
| Shares
repurchased |
(20,056)
|
(289,888)
|
(29,976)
|
(439,240)
|
| Net
increase (decrease) |
28,509
|
$ 411,753
|
376,741
|
$ 5,521,913
|
84
| Thornburg Municipal Funds Semi-Annual Report
Notes to Financial Statements,
Continued
March 31, 2022 (Unaudited)
| |
SIX
MONTHS ENDED
March 31, 2022 |
YEAR
ENDED
September 30, 2021 |
| LIMITED
TERM MUNICIPAL FUND |
SHARES
|
AMOUNT
|
SHARES
|
AMOUNT
|
| Class
I Shares |
|
|
|
|
| Shares
sold |
39,122,707
|
$
559,100,536 |
93,651,095
|
$ 1,369,424,146
|
Shares
issued to shareholders in
reinvestment of dividends |
2,146,226
|
30,567,923
|
4,500,941
|
65,743,881 |
| Shares
repurchased |
(66,509,492)
|
(946,684,025)
|
(99,773,411)
|
(1,458,201,791)
|
| Net
increase (decrease) |
(25,240,559)
|
$
(357,015,566) |
(1,621,375)
|
$
(23,033,764) |
| * Effective
date of this class of shares was October 1, 2020. |
| |
SIX
MONTHS ENDED
March 31, 2022 |
YEAR
ENDED
September 30, 2021 |
| LIMITED
TERM CALIFORNIA FUND |
SHARES
|
AMOUNT
|
SHARES
|
AMOUNT
|
| Class
A Shares |
|
|
|
|
| Shares
sold |
239,435
|
$
3,233,940 |
1,078,354
|
$ 14,853,611
|
Shares
issued to shareholders in
reinvestment of dividends |
34,232
|
459,548
|
74,554
|
1,024,942 |
| Shares
repurchased |
(831,314)
|
(11,247,327)
|
(1,593,182)
|
(21,922,907)
|
| Net
increase (decrease) |
(557,647)
|
$
(7,553,839) |
(440,274)
|
$
(6,044,354) |
| Class
C Shares |
|
|
|
|
| Shares
sold |
49,224
|
$
667,574 |
74,107
|
$ 1,021,391
|
Shares
issued to shareholders in
reinvestment of dividends |
2,299
|
30,892
|
6,525
|
89,800 |
| Shares
repurchased |
(176,423)
|
(2,373,375)
|
(648,687)
|
(8,939,447)
|
| Net
increase (decrease) |
(124,900)
|
$
(1,674,909) |
(568,055)
|
$
(7,828,256) |
| Class
C2 Shares* |
|
|
|
|
| Shares
sold |
-
|
$
- |
10,805
|
$ 148,988
|
Shares
issued to shareholders in
reinvestment of dividends |
44
|
587
|
85
|
1,164 |
| Shares
repurchased |
(740)
|
(9,930)
|
(12)
|
(171)
|
| Net
increase (decrease) |
(696)
|
$
(9,343) |
10,878
|
$ 149,981
|
| Class
I Shares |
|
|
|
|
| Shares
sold |
4,285,158
|
$
57,612,205 |
11,607,452
|
$ 160,039,842
|
Shares
issued to shareholders in
reinvestment of dividends |
148,142
|
1,990,174
|
326,860
|
4,498,890 |
| Shares
repurchased |
(6,749,643)
|
(90,589,217)
|
(17,669,069)
|
(243,738,605)
|
| Net
increase (decrease) |
(2,316,343)
|
$
(30,986,838) |
(5,734,757)
|
$
(79,199,873) |
| * Effective
date of this class of shares was October 1, 2020. |
| |
SIX
MONTHS ENDED
March 31, 2022 |
YEAR
ENDED
September 30, 2021 |
| INTERMEDIATE
NEW MEXICO FUND |
SHARES
|
AMOUNT
|
SHARES
|
AMOUNT
|
| Class
A Shares |
|
|
|
|
| Shares
sold |
45,595
|
$
604,419 |
101,939
|
$ 1,374,335
|
Shares
issued to shareholders in
reinvestment of dividends |
32,228
|
423,700
|
71,806
|
968,051 |
| Shares
repurchased |
(574,311)
|
(7,593,856)
|
(916,564)
|
(12,374,167)
|
| Net
increase (decrease) |
(496,488)
|
$
(6,565,737) |
(742,819)
|
$
(10,031,781) |
Thornburg Municipal Funds Semi-Annual Report | 85
Notes to Financial Statements,
Continued
March 31, 2022 (Unaudited)
| |
SIX
MONTHS ENDED
March 31, 2022 |
YEAR
ENDED
September 30, 2021 |
| INTERMEDIATE
NEW MEXICO FUND |
SHARES
|
AMOUNT
|
SHARES
|
AMOUNT
|
| Class
D Shares |
|
|
|
|
| Shares
sold |
23,961
|
$
317,987 |
38,479
|
$ 521,785
|
Shares
issued to shareholders in
reinvestment of dividends |
4,926
|
64,793
|
11,682
|
157,583 |
| Shares
repurchased |
(68,092)
|
(902,924)
|
(160,244)
|
(2,165,758)
|
| Net
increase (decrease) |
(39,205)
|
$
(520,144) |
(110,083)
|
$
(1,486,390) |
| Class
I Shares |
|
|
|
|
| Shares
sold |
288,928
|
$
3,823,978 |
459,651
|
$ 6,213,029
|
Shares
issued to shareholders in
reinvestment of dividends |
40,788
|
535,929
|
79,786
|
1,075,113 |
| Shares
repurchased |
(345,402)
|
(4,542,521)
|
(467,064)
|
(6,296,092)
|
| Net
increase (decrease) |
(15,686)
|
$
(182,614) |
72,373
|
$ 992,050
|
| |
SIX
MONTHS ENDED
March 31, 2022 |
YEAR
ENDED
September 30, 2021 |
| INTERMEDIATE
NEW YORK FUND |
SHARES
|
AMOUNT
|
SHARES
|
AMOUNT
|
| Class
A Shares |
|
|
|
|
| Shares
sold |
33,837
|
$
434,575 |
14,587
|
$ 189,521
|
Shares
issued to shareholders in
reinvestment of dividends |
13,860
|
175,080
|
29,578
|
383,826 |
| Shares
repurchased |
(264,105)
|
(3,355,675)
|
(282,520)
|
(3,671,836)
|
| Net
increase (decrease) |
(216,408)
|
$
(2,746,020) |
(238,355)
|
$
(3,098,489) |
| Class
I Shares |
|
|
|
|
| Shares
sold |
147,524
|
$
1,853,822 |
248,368
|
$ 3,227,207
|
Shares
issued to shareholders in
reinvestment of dividends |
13,343
|
168,634
|
28,767
|
373,311 |
| Shares
repurchased |
(404,360)
|
(5,110,977)
|
(324,796)
|
(4,218,358)
|
| Net
increase (decrease) |
(243,493)
|
$
(3,088,521) |
(47,661)
|
$
(617,840) |
| |
SIX
MONTHS ENDED
March 31, 2022 |
YEAR
ENDED
September 30, 2021 |
| INTERMEDIATE
MUNICIPAL FUND |
SHARES
|
AMOUNT
|
SHARES
|
AMOUNT
|
| Class
A Shares |
|
|
|
|
| Shares
sold |
976,969
|
$
13,796,790 |
3,652,741
|
$ 52,691,051
|
Shares
issued to shareholders in
reinvestment of dividends |
225,376
|
3,163,339
|
484,727
|
6,996,636 |
| Shares
repurchased |
(2,331,601)
|
(32,696,112)
|
(4,014,691)
|
(58,003,671)
|
| Net
increase (decrease) |
(1,129,256)
|
$
(15,735,983) |
122,777
|
$ 1,684,016
|
| Class
C Shares |
|
|
|
|
| Shares
sold |
112,428
|
$
1,605,235 |
305,609
|
$ 4,418,312
|
Shares
issued to shareholders in
reinvestment of dividends |
18,146
|
255,093
|
44,064
|
636,696 |
| Shares
repurchased |
(391,205)
|
(5,511,104)
|
(1,643,503)
|
(23,680,682)
|
| Net
increase (decrease) |
(260,631)
|
$
(3,650,776) |
(1,293,830)
|
$
(18,625,674) |
| Class
C2 Shares* |
|
|
|
|
| Shares
sold |
4,531
|
$
64,981 |
128,207
|
$ 1,854,580
|
Shares
issued to shareholders in
reinvestment of dividends |
1,174
|
16,505
|
1,355
|
19,602 |
| Shares
repurchased |
(18,337)
|
(254,727)
|
(142)
|
(2,047)
|
| Net
increase (decrease) |
(12,632)
|
$
(173,241) |
129,420
|
$ 1,872,135
|
86
| Thornburg Municipal Funds Semi-Annual Report
Notes to Financial Statements,
Continued
March 31, 2022 (Unaudited)
| |
SIX
MONTHS ENDED
March 31, 2022 |
YEAR
ENDED
September 30, 2021 |
| INTERMEDIATE
MUNICIPAL FUND |
SHARES
|
AMOUNT
|
SHARES
|
AMOUNT
|
| Class
I Shares |
|
|
|
|
| Shares
sold |
5,134,326
|
$
72,723,282 |
9,472,649
|
$ 136,694,970
|
Shares
issued to shareholders in
reinvestment of dividends |
474,465
|
6,651,162
|
974,350
|
14,045,182 |
| Shares
repurchased |
(10,992,084)
|
(152,284,089)
|
(10,522,226)
|
(151,935,361)
|
| Net
increase (decrease) |
(5,383,293)
|
$
(72,909,645) |
(75,227)
|
$
(1,195,209) |
| * Effective
date of this class of shares was October 1, 2020. |
| |
SIX
MONTHS ENDED
March 31, 2022 |
YEAR
ENDED
September 30, 2021 |
| STRATEGIC
MUNICIPAL INCOME FUND |
SHARES
|
AMOUNT
|
SHARES
|
AMOUNT
|
| Class
A Shares |
|
|
|
|
| Shares
sold |
406,349
|
$
6,197,471 |
982,855
|
$ 15,190,802
|
Shares
issued to shareholders in
reinvestment of dividends |
39,640
|
597,800
|
81,453
|
1,260,156 |
| Shares
repurchased |
(242,266)
|
(3,663,108)
|
(852,980)
|
(13,211,563)
|
| Net
increase (decrease) |
203,723
|
$
3,132,163 |
211,328
|
$ 3,239,395
|
| Class
C Shares |
|
|
|
|
| Shares
sold |
138,681
|
$
2,108,855 |
169,860
|
$ 2,627,196
|
Shares
issued to shareholders in
reinvestment of dividends |
5,194
|
78,410
|
12,233
|
189,390 |
| Shares
repurchased |
(135,363)
|
(2,045,265)
|
(437,607)
|
(6,751,915)
|
| Net
increase (decrease) |
8,512
|
$
142,000 |
(255,514)
|
$
(3,935,329) |
| Class
I Shares |
|
|
|
|
| Shares
sold |
4,545,062
|
$
68,202,097 |
6,699,528
|
$ 103,913,515
|
Shares
issued to shareholders in
reinvestment of dividends |
199,387
|
3,012,412
|
367,370
|
5,690,379 |
| Shares
repurchased |
(5,113,185)
|
(76,601,009)
|
(2,416,145)
|
(37,428,390)
|
| Net
increase (decrease) |
(368,736)
|
$
(5,386,500) |
4,650,753
|
$ 72,175,504
|
NOTE
7 – INVESTMENT TRANSACTIONS
For the
six months ended March 31, 2022, the Funds had purchase and sale transactions of investments as listed in the table below (excluding short-term investments).
| |
Purchases
|
Sales
|
| Short
Duration Municipal Fund |
$
63,357,638 |
$ 59,489,004
|
| Limited
Term Municipal Fund |
876,887,767
|
891,361,210 |
| Limited
Term California Fund |
61,588,234
|
60,153,189 |
| Intermediate
New Mexico Fund |
4,547,394
|
12,155,960 |
| Intermediate
New York Fund |
—
|
5,278,011 |
| Intermediate
Municipal Fund |
49,440,020
|
110,894,912 |
| Strategic
Municipal Income Fund |
55,891,998 |
66,208,241 |
Thornburg Municipal Funds Semi-Annual Report | 87
Financial Highlights
Short Duration Municipal Fund
| |
PER
SHARE PERFORMANCE (FOR A SHARE OUTSTANDING THROUGHOUT THE PERIOD) |
UNLESS
OTHERWISE
NOTED, PERIODS ARE
FISCAL YEARS ENDED
SEPTEMBER 30, |
Net
Asset
Value,
Beginning
of PERIOD |
Net
Investment
Income
(Loss)+ |
Net
Realized &
Unrealized
Gain (Loss) on
Investments |
Total
from
Investment
Operations |
Dividends
from Net
Investment
Income |
Dividends
from Net
Realized
Gains |
Dividends
from
Return of
Capital |
Total
Dividends |
Net
Asset
Value,
End of
PERIOD |
| CLASS
A SHARES(b) |
| 2022
(c) |
$ 12.33
|
0.02
|
(0.34)
|
(0.32)
|
(0.02)
|
—
|
—
|
(0.02)
|
$ 11.99
|
| 2021
|
$ 12.37
|
0.03
|
(0.04)
|
(0.01)
|
(0.03)
|
—
|
—
|
(0.03)
|
$ 12.33
|
| 2020
|
$ 12.36
|
0.13
|
0.01
|
0.14
|
(0.13)
|
—
|
—
|
(0.13)
|
$ 12.37
|
| 2019
|
$ 12.27
|
0.16
|
0.09
|
0.25
|
(0.16)
|
—
|
—
|
(0.16)
|
$ 12.36
|
| 2018
|
$ 12.38
|
0.11
|
(0.11)
|
—
(e) |
(0.11)
|
—
|
—
|
(0.11)
|
$ 12.27
|
| 2017
|
$ 12.34
|
0.08
|
0.04
|
0.12
|
(0.08)
|
—
|
—
|
(0.08)
|
$ 12.38
|
| CLASS
I SHARES |
| 2022
(c) |
$ 12.33
|
0.03
|
(0.34)
|
(0.31)
|
(0.03)
|
—
|
—
|
(0.03)
|
$ 11.99
|
| 2021
|
$ 12.36
|
0.06
|
(0.03)
|
0.03
|
(0.06)
|
—
|
—
|
(0.06)
|
$ 12.33
|
| 2020
|
$ 12.36
|
0.16
|
(0.01)
|
0.15
|
(0.15)
|
—
|
—
|
(0.15)
|
$ 12.36
|
| 2019
|
$ 12.27
|
0.18
|
0.09
|
0.27
|
(0.18)
|
—
|
—
|
(0.18)
|
$ 12.36
|
| 2018
|
$ 12.37
|
0.14
|
(0.10)
|
0.04
|
(0.14)
|
—
|
—
|
(0.14)
|
$ 12.27
|
| 2017
|
$ 12.34
|
0.10
|
0.03
|
0.13
|
(0.10)
|
—
|
—
|
(0.10)
|
$ 12.37
|
| (a)
|
Not
annualized for periods less than one year. |
| (b)
|
Sales
loads are not reflected in computing total return. |
| (c)
|
Unaudited
Six Month Period Ended March 31. |
| (d)
|
Annualized.
|
| (e)
|
Total
from investment operations was less than $0.01 per share. |
| +
|
Based
on weighted average shares outstanding. |
See notes to financial statements.
88 | Thornburg Municipal Funds Semi-Annual Report
Financial Highlights, Continued
Short Duration Municipal Fund
| |
RATIOS
TO AVERAGE NET ASSETS |
|
Supplemental
Data |
UNLESS
OTHERWISE
NOTED, PERIODS ARE
FISCAL YEARS ENDED
SEPTEMBER 30, |
Net
Investment
Income (Loss) (%) |
Expenses,
After
Expense
Reductions (%) |
Expenses,
Before Expense
Reductions (%) |
|
Total
Return (%)(a) |
Portfolio
Turnover
Rate (%)(a) |
Net
Assets
at End of PERIOD
(Thousands) |
| CLASS
A SHARES(b) |
| 2022
(c) |
0.33
(d) |
0.70
(d) |
1.12
(d) |
|
(2.60)
|
38.84
|
$ 15,497
|
| 2021
|
0.27
|
0.70
|
0.98
|
|
(0.05)
|
34.71
|
$ 16,332
|
| 2020
|
1.04
|
0.70
|
1.03
|
|
1.14
|
38.44
|
$ 24,581
|
| 2019
|
1.26
|
0.70
|
0.99
|
|
2.02
|
33.60
|
$ 16,899
|
| 2018
|
0.92
|
0.70
|
1.06
|
|
0.02
|
35.36
|
$ 19,497
|
| 2017
|
0.72
|
0.67
|
1.16
|
|
0.98
|
42.94
|
$ 16,412
|
| CLASS
I SHARES |
| 2022
(c) |
0.52
(d) |
0.50
(d) |
0.59
(d) |
|
(2.50)
|
38.84
|
$ 150,810
|
| 2021
|
0.46
|
0.50
|
0.65
|
|
0.23
|
34.71
|
$ 179,245
|
| 2020
|
1.28
|
0.50
|
0.65
|
|
1.26
|
38.44
|
$ 132,539
|
| 2019
|
1.47
|
0.50
|
0.64
|
|
2.22
|
33.60
|
$ 224,343
|
| 2018
|
1.12
|
0.50
|
0.64
|
|
0.30
|
35.36
|
$ 162,259
|
| 2017
|
0.85
|
0.49
|
0.67
|
|
1.09
|
42.94
|
$ 53,765
|
Thornburg Municipal Funds Semi-Annual Report | 89
Financial Highlights
Limited Term Municipal Fund
| |
PER
SHARE PERFORMANCE (FOR A SHARE OUTSTANDING THROUGHOUT THE PERIOD) |
UNLESS
OTHERWISE
NOTED, PERIODS ARE
FISCAL YEARS ENDED
SEPTEMBER 30, |
Net
Asset
Value,
Beginning
of PERIOD |
Net
Investment
Income
(Loss)+ |
Net
Realized &
Unrealized
Gain (Loss) on
Investments |
Total
from
Investment
Operations |
Dividends
from Net
Investment
Income |
Dividends
from Net
Realized
Gains |
Dividends
from
Return of
Capital |
Total
Dividends |
Net
Asset
Value,
End of
PERIOD |
| CLASS
A SHARES(b) |
| 2022
(c) |
$ 14.51
|
0.09
|
(0.72)
|
(0.63)
|
(0.09)
|
—
|
—
|
(0.09)
|
$ 13.79
|
| 2021
|
$ 14.64
|
0.19
|
(0.13)
|
0.06
|
(0.19)
|
—
|
—
|
(0.19)
|
$ 14.51
|
| 2020
|
$ 14.46
|
0.24
|
0.18
|
0.42
|
(0.24)
|
—
|
—
|
(0.24)
|
$ 14.64
|
| 2019
|
$ 14.10
|
0.26
|
0.36
|
0.62
|
(0.26)
|
—
|
—
|
(0.26)
|
$ 14.46
|
| 2018
|
$ 14.43
|
0.24
|
(0.33)
|
(0.09)
|
(0.24)
|
—
|
—
|
(0.24)
|
$ 14.10
|
| 2017
|
$ 14.63
|
0.23
|
(0.20)
|
0.03
|
(0.23)
|
—
|
—
|
(0.23)
|
$ 14.43
|
| CLASS
C SHARES |
| 2022
(c) |
$ 14.53
|
0.07
|
(0.71)
|
(0.64)
|
(0.07)
|
—
|
—
|
(0.07)
|
$ 13.82
|
| 2021
|
$ 14.66
|
0.15
|
(0.13)
|
0.02
|
(0.15)
|
—
|
—
|
(0.15)
|
$ 14.53
|
| 2020
|
$ 14.48
|
0.20
|
0.18
|
0.38
|
(0.20)
|
—
|
—
|
(0.20)
|
$ 14.66
|
| 2019
|
$ 14.12
|
0.22
|
0.36
|
0.58
|
(0.22)
|
—
|
—
|
(0.22)
|
$ 14.48
|
| 2018
|
$ 14.46
|
0.20
|
(0.34)
|
(0.14)
|
(0.20)
|
—
|
—
|
(0.20)
|
$ 14.12
|
| 2017
|
$ 14.66
|
0.20
|
(0.20)
|
—
|
(0.20)
|
—
|
—
|
(0.20)
|
$ 14.46
|
| CLASS
C2 SHARES |
| 2022
(c) |
$ 14.54
|
0.05
|
(0.72)
|
(0.67)
|
(0.05)
|
—
|
—
|
(0.05)
|
$ 13.82
|
| 2021
(e) |
$ 14.66
|
0.10
|
(0.12)
|
(0.02)
|
(0.10)
|
—
|
—
|
(0.10)
|
$ 14.54
|
| CLASS
I SHARES |
| 2022
(c) |
$ 14.51
|
0.11
|
(0.72)
|
(0.61)
|
(0.11)
|
—
|
—
|
(0.11)
|
$ 13.79
|
| 2021
|
$ 14.64
|
0.22
|
(0.13)
|
0.09
|
(0.22)
|
—
|
—
|
(0.22)
|
$ 14.51
|
| 2020
|
$ 14.46
|
0.27
|
0.18
|
0.45
|
(0.27)
|
—
|
—
|
(0.27)
|
$ 14.64
|
| 2019
|
$ 14.10
|
0.29
|
0.36
|
0.65
|
(0.29)
|
—
|
—
|
(0.29)
|
$ 14.46
|
| 2018
|
$ 14.43
|
0.28
|
(0.33)
|
(0.05)
|
(0.28)
|
—
|
—
|
(0.28)
|
$ 14.10
|
| 2017
|
$ 14.64
|
0.28
|
(0.21)
|
0.07
|
(0.28)
|
—
|
—
|
(0.28)
|
$ 14.43
|
| (a)
|
Not
annualized for periods less than one year. |
| (b)
|
Sales
loads are not reflected in computing total return. |
| (c)
|
Unaudited
Six Month Period Ended March 31. |
| (d)
|
Annualized.
|
| (e)
|
Effective
date of this class of shares was October 1, 2020. |
| +
|
Based
on weighted average shares outstanding. |
See notes to financial statements.
90 | Thornburg Municipal Funds Semi-Annual Report
Financial Highlights, Continued
Limited Term Municipal Fund
| |
RATIOS
TO AVERAGE NET ASSETS |
|
Supplemental
Data |
UNLESS
OTHERWISE
NOTED, PERIODS ARE
FISCAL YEARS ENDED
SEPTEMBER 30, |
Net
Investment
Income (Loss) (%) |
Expenses,
After
Expense
Reductions (%) |
Expenses,
Before Expense
Reductions (%) |
|
Total
Return (%)(a) |
Portfolio
Turnover
Rate (%)(a) |
Net
Assets
at End of PERIOD
(Thousands) |
| CLASS
A SHARES(b) |
| 2022
(c) |
1.29
(d) |
0.69
(d) |
0.69
(d) |
|
(4.34)
|
17.97
|
$ 869,551
|
| 2021
|
1.28
|
0.69
|
0.69
|
|
0.39
|
22.29
|
$ 978,221
|
| 2020
|
1.63
|
0.69
|
0.69
|
|
2.91
|
20.62
|
$ 942,857
|
| 2019
|
1.80
|
0.69
|
0.69
|
|
4.41
|
21.22
|
$ 915,684
|
| 2018
|
1.67
|
0.71
|
0.71
|
|
(0.64)
|
16.29
|
$ 1,037,769
|
| 2017
|
1.62
|
0.73
|
0.73
|
|
0.24
|
17.56
|
$ 1,314,094
|
| CLASS
C SHARES |
| 2022
(c) |
1.01
(d) |
0.96
(d) |
0.96
(d) |
|
(4.40)
|
17.97
|
$ 119,214
|
| 2021
|
1.00
|
0.97
|
0.97
|
|
0.11
|
22.29
|
$ 146,806
|
| 2020
|
1.39
|
0.94
|
0.94
|
|
2.65
|
20.62
|
$ 231,226
|
| 2019
|
1.56
|
0.94
|
0.94
|
|
4.16
|
21.22
|
$ 325,144
|
| 2018
|
1.43
|
0.95
|
0.95
|
|
(0.94)
|
16.29
|
$ 450,402
|
| 2017
|
1.38
|
0.97
|
0.97
|
|
0.01
|
17.56
|
$ 605,898
|
| CLASS
C2 SHARES |
| 2022
(c) |
0.74
(d) |
1.24
(d) |
1.42
(d) |
|
(4.60)
|
17.97
|
$ 5,600
|
| 2021
(e) |
0.69
|
1.24
|
1.72
|
|
(0.11)
|
22.29
|
$ 5,477
|
| CLASS
I SHARES |
| 2022
(c) |
1.51
(d) |
0.46
(d) |
0.46
(d) |
|
(4.24)
|
17.97
|
$ 3,932,105
|
| 2021
|
1.50
|
0.46
|
0.46
|
|
0.61
|
22.29
|
$ 4,502,575
|
| 2020
|
1.87
|
0.46
|
0.46
|
|
3.15
|
20.62
|
$ 4,566,389
|
| 2019
|
2.04
|
0.45
|
0.45
|
|
4.67
|
21.22
|
$ 4,893,865
|
| 2018
|
1.95
|
0.43
|
0.43
|
|
(0.36)
|
16.29
|
$ 5,089,760
|
| 2017
|
1.93
|
0.42
|
0.42
|
|
0.49
|
17.56
|
$ 5,265,576
|
Thornburg Municipal Funds Semi-Annual Report | 91
Financial Highlights
Limited Term California Fund
| |
PER
SHARE PERFORMANCE (FOR A SHARE OUTSTANDING THROUGHOUT THE PERIOD) |
UNLESS
OTHERWISE
NOTED, PERIODS ARE
FISCAL YEARS ENDED
SEPTEMBER 30, |
Net
Asset
Value,
Beginning
of PERIOD |
Net
Investment
Income
(Loss)+ |
Net
Realized &
Unrealized
Gain (Loss) on
Investments |
Total
from
Investment
Operations |
Dividends
from Net
Investment
Income |
Dividends
from Net
Realized
Gains |
Dividends
from
Return of
Capital |
Total
Dividends |
Net
Asset
Value,
End of
PERIOD |
| CLASS
A SHARES(b) |
| 2022
(c) |
$ 13.66
|
0.07
|
(0.63)
|
(0.56)
|
(0.07)
|
—
|
—
|
(0.07)
|
$ 13.03
|
| 2021
|
$ 13.80
|
0.15
|
(0.14)
|
0.01
|
(0.15)
|
—
|
—
|
(0.15)
|
$ 13.66
|
| 2020
|
$ 13.72
|
0.18
|
0.08
|
0.26
|
(0.18)
|
—
|
—
|
(0.18)
|
$ 13.80
|
| 2019
|
$ 13.45
|
0.22
|
0.27
|
0.49
|
(0.22)
|
—
|
—
|
(0.22)
|
$ 13.72
|
| 2018
|
$ 13.78
|
0.20
|
(0.33)
|
(0.13)
|
(0.20)
|
—
|
—
|
(0.20)
|
$ 13.45
|
| 2017
|
$ 13.98
|
0.18
|
(0.20)
|
(0.02)
|
(0.18)
|
—
|
—
|
(0.18)
|
$ 13.78
|
| CLASS
C SHARES |
| 2022
(c) |
$ 13.67
|
0.06
|
(0.63)
|
(0.57)
|
(0.06)
|
—
|
—
|
(0.06)
|
$ 13.04
|
| 2021
|
$ 13.81
|
0.11
|
(0.14)
|
(0.03)
|
(0.11)
|
—
|
—
|
(0.11)
|
$ 13.67
|
| 2020
|
$ 13.73
|
0.15
|
0.07
|
0.22
|
(0.14)
|
—
|
—
|
(0.14)
|
$ 13.81
|
| 2019
|
$ 13.46
|
0.18
|
0.27
|
0.45
|
(0.18)
|
—
|
—
|
(0.18)
|
$ 13.73
|
| 2018
|
$ 13.79
|
0.17
|
(0.33)
|
(0.16)
|
(0.17)
|
—
|
—
|
(0.17)
|
$ 13.46
|
| 2017
|
$ 13.99
|
0.15
|
(0.20)
|
(0.05)
|
(0.15)
|
—
|
—
|
(0.15)
|
$ 13.79
|
| CLASS
C2 SHARES |
| 2022
(c) |
$ 13.67
|
0.06
|
(0.63)
|
(0.57)
|
(0.06)
|
—
|
—
|
(0.06)
|
$ 13.04
|
| 2021
(e) |
$ 13.81
|
0.11
|
(0.13)
|
(0.02)
|
(0.12)
|
—
|
—
|
(0.12)
|
$ 13.67
|
| CLASS
I SHARES |
| 2022
(c) |
$ 13.67
|
0.09
|
(0.63)
|
(0.54)
|
(0.09)
|
—
|
—
|
(0.09)
|
$ 13.04
|
| 2021
|
$ 13.82
|
0.19
|
(0.15)
|
0.04
|
(0.19)
|
—
|
—
|
(0.19)
|
$ 13.67
|
| 2020
|
$ 13.73
|
0.21
|
0.10
|
0.31
|
(0.22)
|
—
|
—
|
(0.22)
|
$ 13.82
|
| 2019
|
$ 13.46
|
0.25
|
0.27
|
0.52
|
(0.25)
|
—
|
—
|
(0.25)
|
$ 13.73
|
| 2018
|
$ 13.79
|
0.24
|
(0.33)
|
(0.09)
|
(0.24)
|
—
|
—
|
(0.24)
|
$ 13.46
|
| 2017
|
$ 13.99
|
0.22
|
(0.20)
|
0.02
|
(0.22)
|
—
|
—
|
(0.22)
|
$ 13.79
|
| (a)
|
Not
annualized for periods less than one year. |
| (b)
|
Sales
loads are not reflected in computing total return. |
| (c)
|
Unaudited
Six Month Period Ended March 31. |
| (d)
|
Annualized.
|
| (e)
|
Effective
date of this class of shares was October 1, 2020. |
| (f)
|
Due
to the size of net assets and fixed expenses, ratios may appear disproportionate. |
| +
|
Based
on weighted average shares outstanding. |
See notes to financial statements.
92 | Thornburg Municipal Funds Semi-Annual Report
Financial Highlights, Continued
Limited Term California Fund
| |
RATIOS
TO AVERAGE NET ASSETS |
|
Supplemental
Data |
UNLESS
OTHERWISE
NOTED, PERIODS ARE
FISCAL YEARS ENDED
SEPTEMBER 30, |
Net
Investment
Income (Loss) (%) |
Expenses,
After
Expense
Reductions (%) |
Expenses,
Before Expense
Reductions (%) |
|
Total
Return (%)(a) |
Portfolio
Turnover
Rate (%)(a) |
Net
Assets
at End of PERIOD
(Thousands) |
| CLASS
A SHARES(b) |
| 2022
(c) |
1.11
(d) |
0.74
(d) |
0.93
(d) |
|
(4.08)
|
14.65
|
$ 89,997
|
| 2021
|
1.11
|
0.74
|
0.92
|
|
0.10
|
16.22
|
$ 101,949
|
| 2020
|
1.33
|
0.80
|
0.92
|
|
1.93
|
25.88
|
$ 109,102
|
| 2019
|
1.58
|
0.93
|
0.93
|
|
3.63
|
17.86
|
$ 113,635
|
| 2018
|
1.50
|
0.92
|
0.92
|
|
(0.92)
|
25.20
|
$ 127,346
|
| 2017
|
1.33
|
0.93
|
0.93
|
|
(0.11)
|
18.25
|
$ 158,142
|
| CLASS
C SHARES |
| 2022
(c) |
0.82
(d) |
1.02
(d) |
1.29
(d) |
|
(4.21)
|
14.65
|
$ 7,552
|
| 2021
|
0.82
|
1.02
|
1.27
|
|
(0.19)
|
16.22
|
$ 9,623
|
| 2020
|
1.06
|
1.09
|
1.20
|
|
1.64
|
25.88
|
$ 17,573
|
| 2019
|
1.31
|
1.21
|
1.21
|
|
3.34
|
17.86
|
$ 28,083
|
| 2018
|
1.23
|
1.19
|
1.19
|
|
(1.18)
|
25.20
|
$ 40,608
|
| 2017
|
1.08
|
1.19
|
1.19
|
|
(0.36)
|
18.25
|
$ 56,737
|
| CLASS
C2 SHARES |
| 2022
(c) |
0.83
(d) |
1.02
(d) |
4.89
(d) |
|
(4.21)
|
14.65
|
$ 133
|
| 2021
(e) |
0.84
|
1.02
|
6.50
(f) |
|
(0.18)
|
16.22
|
$ 149
|
| CLASS
I SHARES |
| 2022
(c) |
1.35
(d) |
0.49
(d) |
0.71
(d) |
|
(3.96)
|
14.65
|
$ 319,793
|
| 2021
|
1.35
|
0.49
|
0.70
|
|
0.27
|
16.22
|
$ 366,861
|
| 2020
|
1.56
|
0.54
|
0.69
|
|
2.25
|
25.88
|
$ 449,964
|
| 2019
|
1.84
|
0.67
|
0.68
|
|
3.90
|
17.86
|
$ 350,962
|
| 2018
|
1.76
|
0.66
|
0.67
|
|
(0.65)
|
25.20
|
$ 368,824
|
| 2017
|
1.62
|
0.64
|
0.64
|
|
0.19
|
18.25
|
$ 434,859
|
Thornburg Municipal Funds Semi-Annual Report | 93
Financial Highlights
Intermediate New Mexico Fund
| |
PER
SHARE PERFORMANCE (FOR A SHARE OUTSTANDING THROUGHOUT THE PERIOD) |
UNLESS
OTHERWISE
NOTED, PERIODS ARE
FISCAL YEARS ENDED
SEPTEMBER 30, |
Net
Asset
Value,
Beginning
of PERIOD |
Net
Investment
Income
(Loss)+ |
Net
Realized &
Unrealized
Gain (Loss) on
Investments |
Total
from
Investment
Operations |
Dividends
from Net
Investment
Income |
Dividends
from Net
Realized
Gains |
Dividends
from
Return of
Capital |
Total
Dividends |
Net
Asset
Value,
End of
PERIOD |
| CLASS
A SHARES(b) |
| 2022
(c) |
$ 13.40
|
0.10
|
(0.74)
|
(0.64)
|
(0.09)
|
—
|
—
|
(0.09)
|
$ 12.67
|
| 2021
|
$ 13.48
|
0.20
|
(0.09)
|
0.11
|
(0.19)
|
—
|
—
|
(0.19)
|
$ 13.40
|
| 2020
|
$ 13.35
|
0.24
|
0.14
|
0.38
|
(0.25)
|
—
|
—
|
(0.25)
|
$ 13.48
|
| 2019
|
$ 13.00
|
0.31
|
0.35
|
0.66
|
(0.31)
|
—
|
—
|
(0.31)
|
$ 13.35
|
| 2018
|
$ 13.30
|
0.33
|
(0.30)
|
0.03
|
(0.33)
|
—
|
—
|
(0.33)
|
$ 13.00
|
| 2017
|
$ 13.67
|
0.31
|
(0.37)
|
(0.06)
|
(0.31)
|
—
|
—
|
(0.31)
|
$ 13.30
|
| CLASS
D SHARES |
| 2022
(c) |
$ 13.41
|
0.08
|
(0.73)
|
(0.65)
|
(0.08)
|
—
|
—
|
(0.08)
|
$ 12.68
|
| 2021
|
$ 13.49
|
0.16
|
(0.08)
|
0.08
|
(0.16)
|
—
|
—
|
(0.16)
|
$ 13.41
|
| 2020
|
$ 13.36
|
0.21
|
0.13
|
0.34
|
(0.21)
|
—
|
—
|
(0.21)
|
$ 13.49
|
| 2019
|
$ 13.01
|
0.28
|
0.35
|
0.63
|
(0.28)
|
—
|
—
|
(0.28)
|
$ 13.36
|
| 2018
|
$ 13.31
|
0.30
|
(0.30)
|
—
|
(0.30)
|
—
|
—
|
(0.30)
|
$ 13.01
|
| 2017
|
$ 13.68
|
0.28
|
(0.37)
|
(0.09)
|
(0.28)
|
—
|
—
|
(0.28)
|
$ 13.31
|
| CLASS
I SHARES |
| 2022
(c) |
$ 13.40
|
0.12
|
(0.73)
|
(0.61)
|
(0.12)
|
—
|
—
|
(0.12)
|
$ 12.67
|
| 2021
|
$ 13.47
|
0.24
|
(0.07)
|
0.17
|
(0.24)
|
—
|
—
|
(0.24)
|
$ 13.40
|
| 2020
|
$ 13.34
|
0.29
|
0.13
|
0.42
|
(0.29)
|
—
|
—
|
(0.29)
|
$ 13.47
|
| 2019
|
$ 13.00
|
0.35
|
0.34
|
0.69
|
(0.35)
|
—
|
—
|
(0.35)
|
$ 13.34
|
| 2018
|
$ 13.29
|
0.37
|
(0.29)
|
0.08
|
(0.37)
|
—
|
—
|
(0.37)
|
$ 13.00
|
| 2017
|
$ 13.67
|
0.36
|
(0.38)
|
(0.02)
|
(0.36)
|
—
|
—
|
(0.36)
|
$ 13.29
|
| (a)
|
Not
annualized for periods less than one year. |
| (b)
|
Sales
loads are not reflected in computing total return. |
| (c)
|
Unaudited
Six Month Period Ended March 31. |
| (d)
|
Annualized.
|
| +
|
Based
on weighted average shares outstanding. |
See notes to financial statements.
94 | Thornburg Municipal Funds Semi-Annual Report
Financial Highlights, Continued
Intermediate New Mexico Fund
| |
RATIOS
TO AVERAGE NET ASSETS |
|
Supplemental
Data |
UNLESS
OTHERWISE
NOTED, PERIODS ARE
FISCAL YEARS ENDED
SEPTEMBER 30, |
Net
Investment
Income (Loss) (%) |
Expenses,
After
Expense
Reductions (%) |
Expenses,
Before Expense
Reductions (%) |
|
Total
Return (%)(a) |
Portfolio
Turnover
Rate (%)(a) |
Net
Assets
at End of PERIOD
(Thousands) |
| CLASS
A SHARES(b) |
| 2022
(c) |
1.44
(d) |
0.99
(d) |
0.99
(d) |
|
(4.77)
|
3.30
|
$ 59,935
|
| 2021
|
1.46
|
0.98
|
0.98
|
|
0.85
|
7.43
|
$ 70,051
|
| 2020
|
1.83
|
0.98
|
0.98
|
|
2.84
|
22.92
|
$ 80,463
|
| 2019
|
2.37
|
0.97
|
0.97
|
|
5.15
|
17.26
|
$ 84,782
|
| 2018
|
2.51
|
0.97
|
0.97
|
|
0.24
|
7.77
|
$ 94,686
|
| 2017
|
2.36
|
0.98
|
0.98
|
|
(0.38)
|
8.61
|
$ 116,915
|
| CLASS
D SHARES |
| 2022
(c) |
1.19
(d) |
1.24
(d) |
1.28
(d) |
|
(4.88)
|
3.30
|
$ 11,715
|
| 2021
|
1.20
|
1.24
|
1.29
|
|
0.59
|
7.43
|
$ 12,917
|
| 2020
|
1.57
|
1.24
|
1.26
|
|
2.58
|
22.92
|
$ 14,475
|
| 2019
|
2.10
|
1.24
|
1.25
|
|
4.87
|
17.26
|
$ 15,888
|
| 2018
|
2.26
|
1.23
|
1.23
|
|
(0.02)
|
7.77
|
$ 18,436
|
| 2017
|
2.13
|
1.21
|
1.21
|
|
(0.61)
|
8.61
|
$ 22,666
|
| CLASS
I SHARES |
| 2022
(c) |
1.76
(d) |
0.67
(d) |
0.71
(d) |
|
(4.61)
|
3.30
|
$ 62,494
|
| 2021
|
1.77
|
0.67
|
0.71
|
|
1.24
|
7.43
|
$ 66,312
|
| 2020
|
2.13
|
0.67
|
0.71
|
|
3.16
|
22.92
|
$ 65,715
|
| 2019
|
2.66
|
0.67
|
0.69
|
|
5.39
|
17.26
|
$ 62,162
|
| 2018
|
2.82
|
0.67
|
0.68
|
|
0.62
|
7.77
|
$ 53,675
|
| 2017
|
2.68
|
0.66
|
0.66
|
|
(0.13)
|
8.61
|
$ 62,243
|
Thornburg Municipal Funds Semi-Annual Report | 95
Financial Highlights
Intermediate New York Fund
| |
PER
SHARE PERFORMANCE (FOR A SHARE OUTSTANDING THROUGHOUT THE PERIOD) |
UNLESS
OTHERWISE
NOTED, PERIODS ARE
FISCAL YEARS ENDED
SEPTEMBER 30, |
Net
Asset
Value,
Beginning
of PERIOD |
Net
Investment
Income
(Loss)+ |
Net
Realized &
Unrealized
Gain (Loss) on
Investments |
Total
from
Investment
Operations |
Dividends
from Net
Investment
Income |
Dividends
from Net
Realized
Gains |
Dividends
from
Return of
Capital |
Total
Dividends |
Net
Asset
Value,
End of
PERIOD |
| CLASS
A SHARES(b) |
| 2022
(c) |
$ 12.88
|
0.12
|
(0.70)
|
(0.58)
|
(0.12)
|
—
|
—
|
(0.12)
|
$ 12.18
|
| 2021
|
$ 12.96
|
0.23
|
(0.07)
|
0.16
|
(0.24)
|
—
|
—
|
(0.24)
|
$ 12.88
|
| 2020
|
$ 12.95
|
0.26
|
0.01
|
0.27
|
(0.26)
|
—
|
—
|
(0.26)
|
$ 12.96
|
| 2019
|
$ 12.61
|
0.30
|
0.34
|
0.64
|
(0.30)
|
—
|
—
|
(0.30)
|
$ 12.95
|
| 2018
|
$ 13.00
|
0.30
|
(0.39)
|
(0.09)
|
(0.30)
|
—
|
—
|
(0.30)
|
$ 12.61
|
| 2017
|
$ 13.40
|
0.33
|
(0.40)
|
(0.07)
|
(0.33)
|
—
|
—
|
(0.33)
|
$ 13.00
|
| CLASS
I SHARES |
| 2022
(c) |
$ 12.88
|
0.14
|
(0.69)
|
(0.55)
|
(0.14)
|
—
|
—
|
(0.14)
|
$ 12.19
|
| 2021
|
$ 12.96
|
0.27
|
(0.07)
|
0.20
|
(0.28)
|
—
|
—
|
(0.28)
|
$ 12.88
|
| 2020
|
$ 12.95
|
0.30
|
0.01
|
0.31
|
(0.30)
|
—
|
—
|
(0.30)
|
$ 12.96
|
| 2019
|
$ 12.61
|
0.34
|
0.34
|
0.68
|
(0.34)
|
—
|
—
|
(0.34)
|
$ 12.95
|
| 2018
|
$ 13.00
|
0.34
|
(0.39)
|
(0.05)
|
(0.34)
|
—
|
—
|
(0.34)
|
$ 12.61
|
| 2017
|
$ 13.40
|
0.37
|
(0.40)
|
(0.03)
|
(0.37)
|
—
|
—
|
(0.37)
|
$ 13.00
|
| (a)
|
Not
annualized for periods less than one year. |
| (b)
|
Sales
loads are not reflected in computing total return. |
| (c)
|
Unaudited
Six Month Period Ended March 31. |
| (d)
|
Annualized.
|
| +
|
Based
on weighted average shares outstanding. |
See notes to financial statements.
96 | Thornburg Municipal Funds Semi-Annual Report
Financial Highlights, Continued
Intermediate New York Fund
| |
RATIOS
TO AVERAGE NET ASSETS |
|
Supplemental
Data |
UNLESS
OTHERWISE
NOTED, PERIODS ARE
FISCAL YEARS ENDED
SEPTEMBER 30, |
Net
Investment
Income (Loss) (%) |
Expenses,
After
Expense
Reductions (%) |
Expenses,
Before Expense
Reductions (%) |
|
Total
Return (%)(a) |
Portfolio
Turnover
Rate (%)(a) |
Net
Assets
at End of PERIOD
(Thousands) |
| CLASS
A SHARES(b) |
| 2022
(c) |
1.85
(d) |
0.99
(d) |
1.17
(d) |
|
(4.55)
|
0.00
|
$ 19,963
|
| 2021
|
1.77
|
0.99
|
1.14
|
|
1.20
|
11.29
|
$ 23,885
|
| 2020
|
2.01
|
0.99
|
1.14
|
|
2.10
|
18.61
|
$ 27,120
|
| 2019
|
2.38
|
0.99
|
1.12
|
|
5.16
|
17.75
|
$ 26,416
|
| 2018
|
2.36
|
0.99
|
1.08
|
|
(0.68)
|
15.88
|
$ 33,778
|
| 2017
|
2.50
|
0.99
|
1.09
|
|
(0.52)
|
11.11
|
$ 36,576
|
| CLASS
I SHARES |
| 2022
(c) |
2.16
(d) |
0.67
(d) |
0.92
(d) |
|
(4.32)
|
0.00
|
$ 16,388
|
| 2021
|
2.09
|
0.67
|
0.93
|
|
1.52
|
11.29
|
$ 20,454
|
| 2020
|
2.33
|
0.67
|
0.91
|
|
2.43
|
18.61
|
$ 21,197
|
| 2019
|
2.69
|
0.67
|
0.88
|
|
5.50
|
17.75
|
$ 24,550
|
| 2018
|
2.68
|
0.67
|
0.82
|
|
(0.36)
|
15.88
|
$ 24,010
|
| 2017
|
2.81
|
0.67
|
0.77
|
|
(0.20)
|
11.11
|
$ 27,217
|
Thornburg Municipal Funds Semi-Annual Report | 97
Financial Highlights
Intermediate Municipal Fund
| |
PER
SHARE PERFORMANCE (FOR A SHARE OUTSTANDING THROUGHOUT THE PERIOD) |
UNLESS
OTHERWISE
NOTED, PERIODS ARE
FISCAL YEARS ENDED
SEPTEMBER 30, |
Net
Asset
Value,
Beginning
of PERIOD |
Net
Investment
Income
(Loss)+ |
Net
Realized &
Unrealized
Gain (Loss) on
Investments |
Total
from
Investment
Operations |
Dividends
from Net
Investment
Income |
Dividends
from Net
Realized
Gains |
Dividends
from
Return of
Capital |
Total
Dividends |
Net
Asset
Value,
End of
PERIOD |
| CLASS
A SHARES(b) |
| 2022
(c) |
$ 14.35
|
0.15
|
(0.87)
|
(0.72)
|
(0.15)
|
—
|
—
|
(0.15)
|
$ 13.48
|
| 2021
|
$ 14.37
|
0.33
|
(0.02)
|
0.31
|
(0.33)
|
—
|
—
|
(0.33)
|
$ 14.35
|
| 2020
|
$ 14.33
|
0.35
|
0.04
|
0.39
|
(0.35)
|
—
|
—
|
(0.35)
|
$ 14.37
|
| 2019
|
$ 13.80
|
0.34
|
0.53
|
0.87
|
(0.34)
|
—
|
—
|
(0.34)
|
$ 14.33
|
| 2018
|
$ 14.15
|
0.32
|
(0.35)
|
(0.03)
|
(0.32)
|
—
|
—
|
(0.32)
|
$ 13.80
|
| 2017
|
$ 14.47
|
0.30
|
(0.32)
|
(0.02)
|
(0.30)
|
—
|
—
|
(0.30)
|
$ 14.15
|
| CLASS
C SHARES |
| 2022
(c) |
$ 14.37
|
0.13
|
(0.87)
|
(0.74)
|
(0.13)
|
—
|
—
|
(0.13)
|
$ 13.50
|
| 2021
|
$ 14.39
|
0.27
|
(0.01)
|
0.26
|
(0.28)
|
—
|
—
|
(0.28)
|
$ 14.37
|
| 2020
|
$ 14.35
|
0.30
|
0.04
|
0.34
|
(0.30)
|
—
|
—
|
(0.30)
|
$ 14.39
|
| 2019
|
$ 13.82
|
0.29
|
0.53
|
0.82
|
(0.29)
|
—
|
—
|
(0.29)
|
$ 14.35
|
| 2018
|
$ 14.17
|
0.27
|
(0.35)
|
(0.08)
|
(0.27)
|
—
|
—
|
(0.27)
|
$ 13.82
|
| 2017
|
$ 14.49
|
0.26
|
(0.32)
|
(0.06)
|
(0.26)
|
—
|
—
|
(0.26)
|
$ 14.17
|
| CLASS
C2 SHARES |
| 2022
(c) |
$ 14.37
|
0.13
|
(0.87)
|
(0.74)
|
(0.13)
|
—
|
—
|
(0.13)
|
$ 13.50
|
| 2021
(e) |
$ 14.39
|
0.27
|
(0.02)
|
0.25
|
(0.27)
|
—
|
—
|
(0.27)
|
$ 14.37
|
| CLASS
I SHARES |
| 2022
(c) |
$ 14.34
|
0.17
|
(0.87)
|
(0.70)
|
(0.17)
|
—
|
—
|
(0.17)
|
$ 13.47
|
| 2021
|
$ 14.35
|
0.36
|
(0.01)
|
0.35
|
(0.36)
|
—
|
—
|
(0.36)
|
$ 14.34
|
| 2020
|
$ 14.31
|
0.38
|
0.04
|
0.42
|
(0.38)
|
—
|
—
|
(0.38)
|
$ 14.35
|
| 2019
|
$ 13.78
|
0.38
|
0.53
|
0.91
|
(0.38)
|
—
|
—
|
(0.38)
|
$ 14.31
|
| 2018
|
$ 14.13
|
0.36
|
(0.35)
|
0.01
|
(0.36)
|
—
|
—
|
(0.36)
|
$ 13.78
|
| 2017
|
$ 14.46
|
0.35
|
(0.33)
|
0.02
|
(0.35)
|
—
|
—
|
(0.35)
|
$ 14.13
|
| (a)
|
Not
annualized for periods less than one year. |
| (b)
|
Sales
loads are not reflected in computing total return. |
| (c)
|
Unaudited
Six Month Period Ended March 31. |
| (d)
|
Annualized.
|
| (e)
|
Effective
date of this class of shares was October 1, 2020. |
| +
|
Based
on weighted average shares outstanding. |
See notes to financial statements.
98 | Thornburg Municipal Funds Semi-Annual Report
Financial Highlights, Continued
Intermediate Municipal Fund
| |
RATIOS
TO AVERAGE NET ASSETS |
|
Supplemental
Data |
UNLESS
OTHERWISE
NOTED, PERIODS ARE
FISCAL YEARS ENDED
SEPTEMBER 30, |
Net
Investment
Income (Loss) (%) |
Expenses,
After
Expense
Reductions (%) |
Expenses,
Before Expense
Reductions (%) |
|
Total
Return (%)(a) |
Portfolio
Turnover
Rate (%)(a) |
Net
Assets
at End of PERIOD
(Thousands) |
| CLASS
A SHARES(b) |
| 2022
(c) |
2.17
(d) |
0.77
(d) |
0.90
(d) |
|
(5.03)
|
5.19
|
$ 293,034
|
| 2021
|
2.26
|
0.77
|
0.91
|
|
2.16
|
10.20
|
$ 328,170
|
| 2020
|
2.45
|
0.81
|
0.90
|
|
2.76
|
17.84
|
$ 326,770
|
| 2019
|
2.44
|
0.89
|
0.89
|
|
6.39
|
15.88
|
$ 313,967
|
| 2018
|
2.29
|
0.89
|
0.89
|
|
(0.21)
|
20.68
|
$ 324,199
|
| 2017
|
2.15
|
0.92
|
0.92
|
|
(0.08)
|
24.04
|
$ 387,790
|
| CLASS
C SHARES |
| 2022
(c) |
1.80
(d) |
1.14
(d) |
1.32
(d) |
|
(5.20)
|
5.19
|
$ 28,742
|
| 2021
|
1.89
|
1.14
|
1.30
|
|
1.78
|
10.20
|
$ 34,344
|
| 2020
|
2.08
|
1.18
|
1.28
|
|
2.38
|
17.84
|
$ 52,996
|
| 2019
|
2.08
|
1.24
|
1.26
|
|
6.02
|
15.88
|
$ 76,994
|
| 2018
|
1.94
|
1.24
|
1.26
|
|
(0.55)
|
20.68
|
$ 104,093
|
| 2017
|
1.83
|
1.24
|
1.27
|
|
(0.40)
|
24.04
|
$ 140,176
|
| CLASS
C2 SHARES |
| 2022
(c) |
1.80
(d) |
1.14
(d) |
1.98
(d) |
|
(5.20)
|
5.19
|
$ 1,577
|
| 2021
(e) |
1.85
|
1.14
|
2.62
|
|
1.76
|
10.20
|
$ 1,860
|
| CLASS
I SHARES |
| 2022
(c) |
2.41
(d) |
0.53
(d) |
0.66
(d) |
|
(4.92)
|
5.19
|
$ 553,428
|
| 2021
|
2.50
|
0.53
|
0.67
|
|
2.47
|
10.20
|
$ 666,356
|
| 2020
|
2.69
|
0.56
|
0.65
|
|
3.01
|
17.84
|
$ 668,185
|
| 2019
|
2.67
|
0.65
|
0.65
|
|
6.66
|
15.88
|
$ 730,144
|
| 2018
|
2.55
|
0.63
|
0.63
|
|
0.05
|
20.68
|
$ 905,641
|
| 2017
|
2.45
|
0.62
|
0.62
|
|
0.15
|
24.04
|
$ 951,888
|
Thornburg Municipal Funds Semi-Annual Report | 99
Financial Highlights
Strategic Municipal Income Fund
| |
PER
SHARE PERFORMANCE (FOR A SHARE OUTSTANDING THROUGHOUT THE PERIOD) |
UNLESS
OTHERWISE
NOTED, PERIODS ARE
FISCAL YEARS ENDED
SEPTEMBER 30, |
Net
Asset
Value,
Beginning
of PERIOD |
Net
Investment
Income
(Loss)+ |
Net
Realized &
Unrealized
Gain (Loss) on
Investments |
Total
from
Investment
Operations |
Dividends
from Net
Investment
Income |
Dividends
from Net
Realized
Gains |
Dividends
from
Return of
Capital |
Total
Dividends |
Net
Asset
Value,
End of
PERIOD |
| CLASS
A SHARES(b) |
| 2022
(c) |
$ 15.43
|
0.14
|
(0.95)
|
(0.81)
|
(0.14)
|
—
|
—
|
(0.14)
|
$ 14.48
|
| 2021
|
$ 15.33
|
0.30
|
0.10
|
0.40
|
(0.30)
|
—
|
—
|
(0.30)
|
$ 15.43
|
| 2020
|
$ 15.32
|
0.38
|
0.01
|
0.39
|
(0.38)
|
—
|
—
|
(0.38)
|
$ 15.33
|
| 2019
|
$ 14.82
|
0.39
|
0.50
|
0.89
|
(0.39)
|
—
|
—
|
(0.39)
|
$ 15.32
|
| 2018
|
$ 15.14
|
0.37
|
(0.32)
|
0.05
|
(0.37)
|
—
|
—
|
(0.37)
|
$ 14.82
|
| 2017
|
$ 15.53
|
0.35
|
(0.39)
|
(0.04)
|
(0.35)
|
—
|
—
|
(0.35)
|
$ 15.14
|
| CLASS
C SHARES |
| 2022
(c) |
$ 15.45
|
0.10
|
(0.95)
|
(0.85)
|
(0.10)
|
—
|
—
|
(0.10)
|
$ 14.50
|
| 2021
|
$ 15.34
|
0.23
|
0.11
|
0.34
|
(0.23)
|
—
|
—
|
(0.23)
|
$ 15.45
|
| 2020
|
$ 15.34
|
0.30
|
—
(e) |
0.30
|
(0.30)
|
—
|
—
|
(0.30)
|
$ 15.34
|
| 2019
|
$ 14.84
|
0.32
|
0.50
|
0.82
|
(0.32)
|
—
|
—
|
(0.32)
|
$ 15.34
|
| 2018
|
$ 15.16
|
0.30
|
(0.32)
|
(0.02)
|
(0.30)
|
—
|
—
|
(0.30)
|
$ 14.84
|
| 2017
|
$ 15.54
|
0.28
|
(0.38)
|
(0.10)
|
(0.28)
|
—
|
—
|
(0.28)
|
$ 15.16
|
| CLASS
I SHARES |
| 2022
(c) |
$ 15.45
|
0.15
|
(0.95)
|
(0.80)
|
(0.16)
|
—
|
—
|
(0.16)
|
$ 14.49
|
| 2021
|
$ 15.34
|
0.34
|
0.11
|
0.45
|
(0.34)
|
—
|
—
|
(0.34)
|
$ 15.45
|
| 2020
|
$ 15.33
|
0.41
|
0.01
|
0.42
|
(0.41)
|
—
|
—
|
(0.41)
|
$ 15.34
|
| 2019
|
$ 14.84
|
0.42
|
0.49
|
0.91
|
(0.42)
|
—
|
—
|
(0.42)
|
$ 15.33
|
| 2018
|
$ 15.16
|
0.41
|
(0.32)
|
0.09
|
(0.41)
|
—
|
—
|
(0.41)
|
$ 14.84
|
| 2017
|
$ 15.54
|
0.39
|
(0.38)
|
0.01
|
(0.39)
|
—
|
—
|
(0.39)
|
$ 15.16
|
| (a)
|
Not
annualized for periods less than one year. |
| (b)
|
Sales
loads are not reflected in computing total return. |
| (c)
|
Unaudited
Six Month Period Ended March 31. |
| (d)
|
Annualized.
|
| (e)
|
Net
realized and unrealized gain (loss) on investments was less than $0.01 per share. |
| +
|
Based
on weighted average shares outstanding. |
See notes to financial statements.
100 | Thornburg Municipal Funds Semi-Annual Report
Financial Highlights, Continued
Strategic Municipal Income Fund
| |
RATIOS
TO AVERAGE NET ASSETS |
|
Supplemental
Data |
UNLESS
OTHERWISE
NOTED, PERIODS ARE
FISCAL YEARS ENDED
SEPTEMBER 30, |
Net
Investment
Income (Loss) (%) |
Expenses,
After
Expense
Reductions (%) |
Expenses,
Before Expense
Reductions (%) |
|
Total
Return (%)(a) |
Portfolio
Turnover
Rate (%)(a) |
Net
Assets
at End of PERIOD
(Thousands) |
| CLASS
A SHARES(b) |
| 2022
(c) |
1.82
(d) |
0.81
(d) |
1.24
(d) |
|
(5.29)
|
16.74
|
$ 64,156
|
| 2021
|
1.96
|
0.81
|
1.26
|
|
2.65
|
10.43
|
$ 65,220
|
| 2020
|
2.47
|
0.87
|
1.26
|
|
2.56
|
32.45
|
$ 61,537
|
| 2019
|
2.59
|
1.00
|
1.26
|
|
6.08
|
20.04
|
$ 56,124
|
| 2018
|
2.49
|
1.00
|
1.28
|
|
0.36
|
21.06
|
$ 53,693
|
| 2017
|
2.30
|
1.09
|
1.30
|
|
(0.23)
|
27.35
|
$ 61,525
|
| CLASS
C SHARES |
| 2022
(c) |
1.35
(d) |
1.28
(d) |
1.73
(d) |
|
(5.51)
|
16.74
|
$ 11,153
|
| 2021
|
1.50
|
1.28
|
1.71
|
|
2.24
|
10.43
|
$ 11,753
|
| 2020
|
2.00
|
1.35
|
1.65
|
|
2.02
|
32.45
|
$ 15,591
|
| 2019
|
2.13
|
1.47
|
1.65
|
|
5.58
|
20.04
|
$ 20,085
|
| 2018
|
2.01
|
1.48
|
1.64
|
|
(0.12)
|
21.06
|
$ 24,951
|
| 2017
|
1.88
|
1.52
|
1.66
|
|
(0.59)
|
27.35
|
$ 32,926
|
| CLASS
I SHARES |
| 2022
(c) |
2.03
(d) |
0.59
(d) |
0.97
(d) |
|
(5.24)
|
16.74
|
$ 275,137
|
| 2021
|
2.17
|
0.59
|
0.97
|
|
2.94
|
10.43
|
$ 298,871
|
| 2020
|
2.68
|
0.65
|
0.99
|
|
2.79
|
32.45
|
$ 225,486
|
| 2019
|
2.81
|
0.78
|
0.98
|
|
6.24
|
20.04
|
$ 219,535
|
| 2018
|
2.72
|
0.78
|
0.96
|
|
0.59
|
21.06
|
$ 185,555
|
| 2017
|
2.56
|
0.83
|
0.94
|
|
0.09
|
27.35
|
$ 174,892
|
Thornburg Municipal Funds Semi-Annual Report | 101
Expense Example
March 31, 2022 (Unaudited)
As a shareholder of the Fund, you incur two types of
costs:
| (1)
|
transaction costs, including
|
| (a)
|
sales charges (loads) on
purchase payments, for Class A shares; |
| (b)
|
a deferred sales charge on
redemptions of any part or all of a purchase of $1 million of Class A shares within 12 months of purchase; |
| (c)
|
a deferred
sales charge on redemptions of Class C and Class C2 shares within 12 months of purchase; |
| (2)
|
ongoing costs, including
management fees; distribution and/or service (12b-1) fees; and other Fund expenses. |
This example is intended to help you understand your ongoing
costs (in dollars) of investing in the Fund and to compare these costs with the ongoing costs of investing in other mutual funds.
The example is based on a $1,000 investment beginning on
October 1, 2021, and held until March 31, 2022.
ACTUAL EXPENSES
For each class of shares, the Actual section of the
accompanying table provides information about actual account values and actual expenses. You may use the information in this line, together with the amount you invested, to estimate the expenses that you paid over the period. Simply divide your
account value by $1,000 (for example, an $8,600 account value divided by $1,000 = 8.6), then multiply the result by the number in the Actual section for your class of shares under the heading entitled “Expenses Paid During Period” to
estimate the expenses you paid on your account during this period.
HYPOTHETICAL EXAMPLE FOR COMPARISON PURPOSES
For each class of shares, the Hypothetical section of the
accompanying table provides information about hypothetical account values and hypothetical expenses based on the Fund’s actual expense ratio and an assumed rate of return of 5% per year before expenses, which is not the Fund’s actual
return. The hypothetical account values and expenses may not be used to estimate the actual ending account balance or expenses you paid for the period. You may use this information to compare the ongoing costs of investing in the Fund and other
funds. To do so, compare this 5% hypothetical example with the 5% hypothetical examples that appear in the shareholder reports of the other funds.
Please note that the expenses shown in the table are meant to
highlight your ongoing costs only and do not reflect any transactional costs, such as sales charges (loads), redemption fees, or exchange fees. Therefore, the Hypothetical section of the table for each class of shares is useful in comparing ongoing
costs only, and will not help you determine the relative total costs of owning different mutual funds. In addition, if these transactional costs were included, your costs would have been higher.
The actual and hypothetical examples shown assume a $1,000
investment at the beginning of the period, October 1, 2021 and held through March 31, 2022.
| |
Actual
|
|
Hypothetical
* |
|
| |
Ending
Account Value
3/31/22 |
Expenses
Paid
During Period
10/1/21-3/31/22 |
|
Ending
Account Value
3/31/22 |
Expenses
Paid
During Period†
10/1/21-3/31/22 |
Annualized
Expense Ratio |
| SHORT
DURATION MUNICIPAL FUND |
| CLASS
A SHARES |
$974.03
|
$3.45
|
|
$1,021.44
|
$3.53
|
0.70%
|
| CLASS
I SHARES |
$975.00
|
$2.46
|
|
$1,022.44
|
$2.52
|
0.50%
|
| LIMITED
TERM MUNICIPAL FUND |
| CLASS
A SHARES |
$956.56
|
$3.37
|
|
$1,021.49
|
$3.48
|
0.69%
|
| CLASS
C SHARES |
$956.03
|
$4.68
|
|
$1,020.14
|
$4.84
|
0.96%
|
| CLASS
C2 SHARES |
$954.03
|
$6.04
|
|
$1,018.75
|
$6.24
|
1.24%
|
| CLASS
I SHARES |
$957.65
|
$2.25
|
|
$1,022.64
|
$2.32
|
0.46%
|
| LIMITED
TERM CALIFORNIA FUND |
| CLASS
A SHARES |
$959.20
|
$3.61
|
|
$1,021.24
|
$3.73
|
0.74%
|
| CLASS
C SHARES |
$957.88
|
$4.98
|
|
$1,019.85
|
$5.14
|
1.02%
|
| CLASS
C2 SHARES |
$957.89
|
$4.98
|
|
$1,019.85
|
$5.14
|
1.02%
|
| CLASS
I SHARES |
$960.43
|
$2.39
|
|
$1,022.49
|
$2.47
|
0.49%
|
| INTERMEDIATE
NEW MEXICO FUND |
| CLASS
A SHARES |
$952.34
|
$4.82
|
|
$1,020.00
|
$4.99
|
0.99%
|
| CLASS
D SHARES |
$951.19
|
$6.03
|
|
$1,018.75
|
$6.24
|
1.24%
|
| CLASS
I SHARES |
$953.86
|
$3.26
|
|
$1,021.59
|
$3.38
|
0.67%
|
| INTERMEDIATE
NEW YORK FUND |
| CLASS
A SHARES |
$954.46
|
$4.82
|
|
$1,020.00
|
$4.99
|
0.99%
|
| CLASS
I SHARES |
$956.77
|
$3.27
|
|
$1,021.59
|
$3.38
|
0.67%
|
102 |
Thornburg Municipal Funds Semi-Annual Report
Expense Example, Continued
March 31, 2022 (Unaudited)
| |
Actual
|
|
Hypothetical
* |
|
| |
Ending
Account Value
3/31/22 |
Expenses
Paid
During Period
10/1/21-3/31/22 |
|
Ending
Account Value
3/31/22 |
Expenses
Paid
During Period†
10/1/21-3/31/22 |
Annualized
Expense Ratio |
| INTERMEDIATE
MUNICIPAL FUND |
| CLASS
A SHARES |
$949.70
|
$3.74
|
|
$1,021.09
|
$3.88
|
0.77%
|
| CLASS
C SHARES |
$948.02
|
$5.54
|
|
$1,019.25
|
$5.74
|
1.14%
|
| CLASS
C2 SHARES |
$948.01
|
$5.54
|
|
$1,019.25
|
$5.74
|
1.14%
|
| CLASS
I SHARES |
$950.79
|
$2.58
|
|
$1,022.29
|
$2.67
|
0.53%
|
| STRATEGIC
MUNICIPAL INCOME FUND |
| CLASS
A SHARES |
$947.11
|
$3.93
|
|
$1,020.89
|
$4.08
|
0.81%
|
| CLASS
C SHARES |
$944.95
|
$6.21
|
|
$1,018.55
|
$6.44
|
1.28%
|
| CLASS
I SHARES |
$947.57
|
$2.86
|
|
$1,021.99
|
$2.97
|
0.59%
|
| *
|
Hypothetical
assumes a rate of return of 5% per year before expenses. |
| †
|
Expenses
are equal to the annualized expense ratio for each class multiplied by the average account value over the period, multiplied by 182/365 to reflect the one-half year period. |
Thornburg
Municipal Funds Semi-Annual Report | 103
Other Information
March 31, 2022 (Unaudited)
PORTFOLIO PROXY VOTING
Policies and Procedures:
The Trust has delegated to the Advisor voting decisions
respecting proxies for the Fund’s voting securities. The Advisor makes voting decisions in accordance with its Proxy Voting Policy and Procedures. A description of the Policy and Procedures is available (i) without charge, upon request, by
calling the Advisor toll-free at 1-800-847-0200, (ii) on the Thornburg website at www.thornburg.com, and (iii) on the U.S. Securities and Exchange Commission’s website at www.sec.gov.
Information regarding how proxies were voted is available on
or before August 31 of each year for the twelve months ending the preceding June 30. This information is available (i) without charge, upon request by calling the Advisor toll-free at 1-800-847-0200, (ii) on the Thornburg website at
www.thornburg.com, and (iii) on the U.S. Securities and Exchange Commission’s website at www.sec.gov.
AVAILABILITY OF QUARTERLY PORTFOLIO SCHEDULE
The Funds file with the Securities and Exchange Commission
schedules of their portfolio holdings on Form N-PORT EX for the first and third quarters of each fiscal year. The Funds’ Forms N-PORT EX are available on the Commission’s website at www.sec.gov, or may be reviewed and copied at the
Commission’s Public Reference Room in Washington, D.C. Information on the operation of the Public Reference Room may be obtained by calling 1-800-SEC-0330. The Funds also make this information available on their website at
www.thornburg.com/download or upon request by calling 1-800-847-0200.
STATEMENT REGARDING LIQUIDITY RISK MANAGEMENT
PROGRAM
The Trustees of the Trust have appointed the
Advisor (“Program Administrator”) to administer the Trust’s liquidity risk management program (the “LRMP”) adopted for each of the Funds under rule 22e-4 under the 1940 Act (the “Liquidity Rule”). The LRMP
is designed to reduce the risk that a Fund will be unable to meet its redemption obligations under the 1940 Act, and to mitigate the dilution of the interests of Fund shareholders occasioned by redemptions tendered by other shareholders
(“Liquidity Risk”). Pursuant to the LRMP, the Program Administrator has delegated certain functions, including daily oversight and management of the Funds’ Liquidity Risk, to its Liquidity Risk Management Committee (the
“Liquidity Committee”). Under the LRMP, the Liquidity Committee performs the annual review of the LRMP required by the Liquidity Rule.
On December 8, 2021, the Trustees reviewed the Liquidity
Committee’s written report (the “Report”) concerning the operation of the LRMP for the period from November 21, 2020 through November 20, 2021 (the “Reporting Period”). The Report addressed the operation, adequacy and
effectiveness of the LRMP, the operation of a Fund’s highly liquid investment minimum, and any material changes to the LRMP during the Reporting Period. The Report provided an assessment of the various factors relevant to each Fund’s
Liquidity Risk, an evaluation of data provided by a third-party liquidity assessment vendor and other relevant data, and reports on the Liquidity Committee’s consideration of intermediary firms with the largest beneficial ownership positions
in each Fund, the likelihood that any of those firms may redeem their clients’ investments from the Funds without prior notice, and the effect that such redemptions could have on Fund liquidity. The Report concluded that the LRMP remains
adequate and effective to address each Fund’s Liquidity Risk, that all of the Funds are able to meet redemption requests in current market conditions and in reasonably expected stressed conditions without significant dilution of remaining
shareholders, that each Fund remains primarily highly liquid, each Fund’s liquidity classifications during the reporting period were reasonable, and the third-party liquidity assessment vendor’s system continues to be a useful tool for
assessing the Funds’ Liquidity Risk. The Report stated that there have been no instances since the LRMP’s adoption in which a Fund exceeded its limitation on illiquid investments, nor have there been any material changes to the LRMP
since its adoption.
104 |
Thornburg Municipal Funds Semi-Annual Report
Trustees’ Statement to
Shareholders (Unaudited)
Readopted September 14, 2021
The Trustees believe current and prospective shareholders
should know how we discharge our responsibilities in supervising the Funds’ investment advisor and in reviewing the advisor’s contract for renewal. Since 2005, we have issued a statement which sets out clearly the three principal
guidelines that we follow in supervising the Trust’s investment advisor on your behalf. In accordance with our customary practice, in September of this year we again reviewed our statement and concluded we should reissue this statement
outlining the principal features of our supervision of the advisor’s performance of investment management services for the Funds.
We begin with the premise that each shareholder selected his
or her Fund because its investments are managed by the investment advisor identified in the prospectus and in accordance with the objective and policies described in the prospectus. We realize, as each of you do, that if you believe that your
Fund’s stated objective and policies no longer serve your personal investment goals, you can sell your shares and leave the Fund.
Therefore, we believe that our primary supervisory task
– our principal obligation to you – is to assess the nature and quality of the advisor’s services, and to confirm that the advisor actively and competently pursues the Fund’s objective, in accordance with the policies set out
in the prospectus. To do this, we meet regularly with management to review your Fund’s portfolio and to discuss the advisor’s specific actions and judgments in pursuing the Fund’s objective. We do not substitute our own judgment
for the advisor’s decisions in selecting investments; the advisor is paid to exercise its informed judgment on investment decisions, and we seek to confirm, in reviewing the advisor’s performance, that the advisor is doing just
that.
Second, we are conscious of costs and the effect
that costs have on shareholders’ returns. We try to make sure that your Fund’s fees and costs are reasonable in relationship to the services rendered and that they are generally in line with those charged by other expert investment
advisors, consistent with our belief that the Fund’s investors searched for and expect that expertise and attention and have decided to pay a reasonable price for it. We do not put the management contract “out to bid” as a matter
of course, and we would not do so unless we had concluded that the advisor materially had failed to pursue the Fund’s objectives in accordance with its policies, or for other equally important reasons. We believe that any other approach would
be inconsistent with your interests and contrary to your expectations when you bought shares of the Fund in the first place.
Finally, because we believe that most Thornburg Fund
shareholders have invested with a long-term perspective, we try not to focus too much on the fashions of the moment and on short-term performance. The market will not favor any specific investment objective or set of policies at all times and under
all economic circumstances. A fund will experience periods of both high and low returns relative to other funds and other investments. Even if one of our Funds is not favored by the market at a particular time, we believe that the advisor is
nonetheless obliged to remain true to the Fund’s objective and policies, and we watch to see that it does so.
[This statement is submitted for the general information of the
shareholders of Thornburg Investment Trust. For prospective investors in any fund of Thornburg Investment Trust, this communication must be preceded or accompanied by a prospectus. You may obtain a current copy of the Funds’ prospectus, which
describes the Funds’ management fees, expenses and risks, by calling 1-800-847-0200 or by visiting www.thornburg.com/download. Please read the prospectus carefully before investing.]
Thornburg Investment Trust
2300 North Ridgetop Road
Santa Fe, NM 87506
505.984.0200 Tel
505.992.8681 Fax
www.thornburg.com
Thornburg
Municipal Funds Semi-Annual Report | 105
Thornburg Investment Management is a privately-owned global
investment firm that offers a range of solutions for retail and institutional investors. Founded in 1982 and headquartered in Santa Fe, New Mexico, we manage approximately $44.3 billion (as of March 31, 2022) across U.S. mutual funds, separate
accounts for high-net-worth investors, institutional accounts, and UCITS funds for non-U.S. investors.
The funds outlined in this report are some of the many
equity and fixed-income products available from Thornburg Investment Management.
GLOBAL EQUITY
| ■
|
Thornburg Global
Opportunities Fund |
INTERNATIONAL EQUITY
| ■
|
Thornburg International
Equity Fund |
| ■
|
Thornburg Better World
International Fund |
| ■
|
Thornburg International
Growth Fund |
| ■
|
Thornburg
Developing World Fund |
U.S.
EQUITY
| ■
|
Thornburg Small/Mid Cap Core
Fund |
| ■
|
Thornburg
Small/Mid Cap Growth Fund |
MULTI ASSET
| ■
|
Thornburg Investment Income
Builder Fund |
| ■
|
Thornburg Income Builder
Opportunities Trust |
| ■
|
Thornburg
Summit Fund |
TAXABLE FIXED
INCOME
| ■
|
Thornburg Limited Term U.S.
Government Fund |
| ■
|
Thornburg Limited Term
Income Fund |
| ■
|
Thornburg Ultra Short Income
Fund |
| ■
|
Thornburg
Strategic Income Fund |
MUNICIPAL
| ■
|
Thornburg Short Duration
Municipal Fund |
| ■
|
Thornburg Limited Term
Municipal Fund |
| ■
|
Thornburg California Limited
Term Municipal Fund |
| ■
|
Thornburg New Mexico
Intermediate Municipal Fund |
| ■
|
Thornburg New York
Intermediate Municipal Fund |
| ■
|
Thornburg Intermediate
Municipal Fund |
| ■
|
Thornburg
Strategic Municipal Income Fund |
Before investing, carefully consider each
Fund’s investment goals, risks, charges, and expenses. For a prospectus or summary prospectus containing this and other information, contact your financial advisor or visit thornburg.com. Read it carefully before investing.
For additional information, please visit
thornburg.com
Thornburg Investment Management, Inc.
2300 North Ridgetop Road, Santa Fe, NM 87506
106 |
Thornburg Municipal Funds Semi-Annual Report
This page intentionally left
blank.
Thornburg Municipal Funds Semi-Annual Report | 107
To receive shareholder reports, prospectuses, and proxy statements
electronically, go to www.thornburg.com/edelivery.
This Semi-Annual Report is submitted for the general
information of shareholders of the Fund. It is not authorized for distribution to prospective investors in the Fund unless preceded or accompanied by an effective prospectus.
Investment Advisor:
Thornburg Investment Management®
800.847.0200
Distributor:
Thornburg Securities Corporation®

Semi-Annual Report | March 31,
2022
THORNBURG CAPITAL
MANAGEMENT FUND |
Thornburg Capital Management Fund
Semi-Annual Report | March 31, 2022
Table of Contents
|
4
|
|
5
|
|
5
|
|
6
|
|
9
|
|
10
|
|
11
|
|
12
|
|
16
|
|
18
|
|
19
|
|
20
|
| SHARE
CLASS |
NASDAQ
SYMBOL |
CUSIP
|
| Class
I |
N/A
|
885-216-739
|
Letter to Shareholders
Thornburg Capital Management Fund | March 31, 2022 (Unaudited)
Dear Shareholder:
A one-time colleague of mine from decades ago, who was prone
to malapropisms, was also a Yogi Berra-esque source of wisdom at times. These days, I recall one of his pronouncements around the time of the dot.com bubble and crash: “Just when you think you’re out of the woods, you go right back into
the soup.” This seems to be appropriate relative to our emergence from a Covid-dominated recession into a new world that hinges on massively increasing price pressures and a geopolitical worst-case-scenario in Russia/Ukraine. I don’t
expect the volatility that we’ve seen in the last six months to abate and given somewhat elevated risk asset prices (though deflated from my last letter to you), markets remain vulnerable to shocks. High inflation has been one of those shocks,
and it will take some time to resolve factors contributing to that inflation, such as supply-chain challenges, home price appreciation effects on measured shelter costs, and labor cost and availability issues. Ultimately, we expect various central
banks across the globe, certainly including the Federal Reserve, to be forced to make a choice between containing inflation at the expense of employment and losing control of inflation expectations in the name of supporting a hotter economy.
It’s a tightrope walk without a net and just one of many elements of uncertainty in the aftermath of Covid.
In recent weeks, we’ve seen yields on most fixed income
securities rise dramatically. Combined with the very low starting point on income return, the past quarter has been one of the worst in history for those markets. Because many arguments around valuation in equities hinged on the TINA argument
(“There Is No Alternative”), and because the earnings yield (essentially the inverse of the Price/Earnings ratio) on equities far surpassed the yield on bonds, there has been a crossover effect into other risky assets. While we view this
as only part of the overall valuation conversation, any time investors experience outsized moves in major markets, it’s worth taking a deeper dive. In this case, we expect that the dramatic shift of policymakers’ approach from
stimulating growth to containing price pressures may drain liquidity and leave some market participants feeling like a fish out of water.
As in any environment, we will be focused on you, our clients,
as our most important constituency. Though there is never a guarantee that we will be able to navigate the evolving marketplace as well as we may have before, I have a confidence born of experience that our unsiloed, global approach to active
investment management gives us a
distinct advantage. It is always the case that with challenge comes
opportunity, and I have watched our portfolios perform well over the years when difficult situations arise. We continue to see that no market is an island, and the effects from actions somewhere in the world are felt everywhere. Our process, which
focuses on this interconnection through the development of a collaborative and deeply informed perspective, is designed to thrive in these investment conditions.
As we’ve discussed in the past, the story of Thornburg
is one of consistent and deliberate evolution to meet your needs in the context of a changing business and investment environment. As an example of this, we have completed the integration of Environmental, Social, and Governance (ESG) considerations
across our product set. While this does not mean that these considerations are part of our Principal Investment Strategy for all portfolios, it does mean that, when evaluating potential investment opportunities, we evaluate the significance of a
company’s ESG characteristics and their potential to impact the company’s investment performance. We believe that the integration of those ESG considerations into our investment process, alongside the other factors that we consider when
evaluating investments, is consistent with our long-term investment time horizon for both individual assets and whole portfolios, as well as an indelible part of the market landscape.
I have great respect for other investment firms and there are
many good products that are available to investors. “It’s tough to make predictions, especially, about the future” – an actual Yogi-ism – but we believe that in times like these, our firm’s broad perspective and
collaborative, unsiloed approach is our differentiator. These qualities are what underlie the excellent long-term outcomes we’ve been able to deliver: we’re built to deliver on the promise of active management.
Thank you so much for your time, and for your business.

|
|
Jason
Brady, cfa
Portfolio Manager
CEO, President, and
Managing Director |
|
The matters discussed in this report may
constitute forward-looking statements made pursuant to the safe harbor provisions of the Securities Litigation Reform Act of 1995. These include any advisor or portfolio manager prediction, assessment, analysis or outlook for individual securities,
industries, investment styles, market sectors and/or markets. These statements involve risks and uncertainties. In addition to the general risks described for each fund in its current prospectus, other factors bearing on these reports include the
accuracy of the advisor’s or portfolio manager’s forecasts and predictions, the appropriateness of the investment strategies designed by the advisor or portfolio manager and the ability of the advisor or portfolio manager to implement
their strategies efficiently and successfully. Any one or more of these factors, as well as other risks affecting the securities markets generally, could cause the actual results of any fund to differ materially as compared to its benchmarks.
The views expressed are subject to change and
do not necessarily reflect the views of Thornburg Investment Management, Inc. This information should not be relied upon as a recommendation or investment advice and is not intended to predict the performance of any investment or market.
Performance results of individual share
classes will vary based on the fees and expenses associated with each share class, and may be higher or lower than other share classes within the same Fund. Please see Performance Summary for performance results of each share class.
Thornburg Capital Management Fund
Investment Goal and
Fund
Overview
Thornburg Capital
Management Fund seeks current income consistent with liquidity management and safety of capital.
Under normal circumstances, the Fund
invests 100% of its net assets in a portfolio of debt obligations rated by a nationally recognized statistical rating organization at the time of purchase as investment grade or, if unrated, judged to be of comparable quality by the Fund’s
investment advisor, and in cash, cash equivalents and cash sweep programs, consistent with the Fund’s investment goal.
The Fund seeks to provide superior risk
exposures - higher returns and lower costs - for cash management across the Thornburg family of funds. By combining the cash balances of eligible Thornburg Investment Trust portfolios and other eligible clients of Thornburg into a single pool of
high quality, short-term instruments, the Fund seeks to reduce the costs of investing and significantly diversify and reduce risk exposures in any given portfolio.
The Fund’s investment strategy helps
illustrate Thornburg’s long-standing culture of efficient capital stewardship, and Thornburg’s efforts to benefit all eligible portfolios through reduced transaction costs and more efficient management.
Performance drivers and detractors for
the reporting period ended March 31, 2022
| •
|
The Fund
generated positive total returns and outpaced its benchmark index, the FTSE 1-Month Treasury Bill Index during the six-month period ended March 31, 2022. |
| •
|
Over the
period, the Fund maintained a per share price of $10.00, which has not fluctuated since the Fund’s inception, and is consistent with its goal of "safety of capital". |
| •
|
A rising
interest rate environment provided Fund’s investments with the ability to generate better yields. |
| •
|
As
of March 31, 2022, the Fund has matched or outperformed its benchmark index for all standard time periods since inception. |
Performance Summary
March 31, 2022 (Unaudited)
AVERAGE ANNUAL TOTAL RETURNS
| |
1-YR
|
3-YR
|
5-YR
|
10-YR
|
SINCE
INCEPTION |
| Class
I Shares (Incep: 7/31/15) |
0.16%
|
0.84%
|
1.22%
|
-
|
1.04%
|
| FTSE
1-Month T-Bill Index (Since 7/31/15) |
0.04%
|
0.70%
|
1.04%
|
-
|
0.83%
|
30-DAY YIELDS, CLASS I
SHARES
| Annualized
Distribution Yield |
0.51%
|
| SEC
Yield |
0.49%
|
GROWTH OF A HYPOTHETICAL $10,000
INVESTMENT
Performance
data shown represents past performance and is no guarantee of future results. Investment return and principal value will fluctuate so shares, when redeemed, may be worth more or less than their original cost. Current performance may be lower or
higher than quoted. For performance current to the most recent month end, call 800-847-0200. There is no sales charge for class I shares.
Fund Summary
PORTFOLIO COMPOSITION
There is no
guarantee that the Fund will meet its investment objectives.
All data is subject to change. Charts may not add up to
100% due to rounding.
Glossary
The FTSE 1-Month Treasury Bill Local Currency measures
monthly return equivalents of yield averages that are not marked to market. The One-Month Treasury Bill Index consists of the last one-month Treasury bill issue.
The performance of any index is not indicative of the
performance of any particular investment. Unless otherwise noted, index returns reflect the reinvestment of income dividends and capital gains, if any, but do not reflect fees, brokerage commissions or other expenses of investing. Investors may not
make direct investments into any index.
Schedule of Investments
Thornburg Capital Management Fund | March 31, 2022 (Unaudited)
| |
ISSUER-DESCRIPTION
|
Shares/Principal
Amount |
VALUE
|
| |
U.S.
Treasury Securities — 0.5% |
|
|
| |
United
States Treasury Bill, 0.28% due 5/24/2022 |
$ 6,900,000
|
$ 6,897,196
|
| |
Total
U.S. Treasury Securities (Cost $6,897,196) |
|
6,897,196
|
| |
Commercial
Paper — 102.9% |
|
|
| |
Ameren
Corp., 0.659% due 4/4/2022 |
6,000,000 |
5,999,675
|
| |
Ameren
Illinois Co., 0.558% due 4/4/2022 |
25,000,000
|
24,998,854 |
| |
Amphenol
Corp., |
|
|
|
a |
0.964%
due 4/11/2022 |
21,000,000
|
20,994,458 |
|
a |
0.812%
due 4/13/2022 |
1,000,000 |
999,733 |
|
a |
Anthem,
Inc., 0.608% due 4/1/2022 |
32,000,000
|
32,000,000 |
|
a |
Aon
Corp., 0.507% due 4/1/2022 |
22,000,000
|
22,000,000 |
| |
Arizona
Public Service Co., |
|
|
| |
0.588%
due 4/1/2022 |
23,000,000
|
23,000,000 |
| |
0.629%
due 4/6/2022 |
8,000,000 |
7,999,311 |
|
a |
AT&T,
Inc., 0.761% due 4/12/2022 |
1,000,000 |
999,771 |
| |
AutoZone,
Inc., |
|
|
|
a |
0.608%
due 4/1/2022 |
25,000,000
|
25,000,000 |
|
a |
0.608%
due 4/5/2022 |
5,000,000 |
4,999,667 |
|
a |
0.659%
due 4/12/2022 |
2,000,000 |
1,999,603 |
|
a |
0.659%
due 4/13/2022 |
1,000,000 |
999,783 |
|
a |
0.609%
due 4/20/2022 |
23,000,000
|
22,992,717 |
|
a |
Avery
Dennison Corp., 0.507% due 4/1/2022 |
31,000,000
|
31,000,000 |
| |
Baltimore
Gas & Electric Co., |
|
|
| |
0.507%
due 4/4/2022 |
12,000,000
|
11,999,500 |
| |
0.761%
due 4/12/2022 |
18,000,000
|
17,995,875 |
| |
BAT
International Finance PLC, |
|
|
|
a,b |
0.811%
due 4/1/2022 |
1,000,000 |
1,000,000 |
|
a,b |
0.71%
due 4/7/2022 |
5,300,000 |
5,299,382 |
|
a,b |
0.862%
due 4/11/2022 |
7,000,000 |
6,998,347 |
|
a,b |
Canadian
National Railway Co., 0.456% due 4/21/2022 |
18,989,000
|
18,984,253 |
| |
Canadian
Pacific Railway Co., |
|
|
|
a,b |
0.608%
due 4/4/2022 |
693,000 |
692,965 |
|
a,b |
0.71%
due 4/4/2022 |
7,400,000 |
7,399,568 |
|
a,b |
0.71%
due 4/5/2022 |
20,000,000
|
19,998,445 |
| |
Caterpillar
Financial Services Corp., 0.284% due 4/1/2022 |
31,000,000
|
31,000,000 |
|
a |
CenterPoint
Energy Resources Corp., 0.497% due 4/4/2022 |
31,000,000
|
30,998,734 |
| |
Cintas
Corp. No. 2, |
|
|
|
a |
0.659%
due 4/1/2022 |
5,000,000 |
5,000,000 |
|
a |
0.558%
due 4/4/2022 |
31,000,000
|
30,998,579 |
|
a |
Colgate-Palmolive
Co., 0.304% due 4/8/2022 |
2,280,000 |
2,279,867 |
| |
Consolidated
Edison Co. of New York, Inc., |
|
|
|
a |
0.862%
due 4/5/2022 |
3,850,000 |
3,849,636 |
|
a |
0.73%
due 4/8/2022 |
2,000,000 |
1,999,720 |
|
a |
0.832%
due 4/11/2022 |
20,000,000
|
19,995,444 |
|
a |
0.761%
due 4/12/2022 |
1,000,000 |
999,771 |
|
a |
0.811%
due 4/12/2022 |
7,000,000 |
6,998,289 |
|
a |
Dollar
General Corp., 0.558% due 4/6/2022 |
33,000,000
|
32,997,479 |
| |
Ecolab,
Inc., |
|
|
|
a |
0.71%
due 4/8/2022 |
22,000,000
|
21,997,006 |
|
a |
0.812%
due 4/11/2022 |
4,100,000 |
4,099,089 |
|
a |
0.761%
due 4/18/2022 |
5,000,000 |
4,998,229 |
|
a,b |
Electricite
de France SA, 0.527% due 4/1/2022 |
34,000,000
|
34,000,000 |
|
a |
Eni
Finance USA, Inc., 1.065% due 4/13/2022 |
4,000,000 |
3,998,600 |
| |
Entergy
Corp., |
|
|
|
a |
0.507%
due 4/1/2022 |
6,000,000 |
6,000,000 |
|
a |
0.558%
due 4/5/2022 |
16,000,000
|
15,999,022 |
|
a |
Evergy
Kansas Central, Inc., 0.608% due 4/5/2022 |
500,000 |
499,967 |
| |
Evergy
Missouri West, Inc., |
|
|
| |
0.71%
due 4/4/2022 |
500,000 |
499,971 |
|
a |
0.608%
due 4/6/2022 |
10,000,000
|
9,999,167 |
| a |
Hitachi
America Capital Ltd., 0.862% due 4/6/2022 |
32,000,000
|
31,996,222 |
6 | Semi-Annual Report
|
See notes to
financial statements. |
Schedule of Investments,
Continued
Thornburg Capital Management Fund | March 31, 2022 (Unaudited)
| |
ISSUER-DESCRIPTION
|
Shares/Principal
Amount |
VALUE
|
| |
HP,
Inc., |
|
|
|
a |
0.862%
due 4/18/2022 |
$ 1,000,000
|
$ 999,599
|
|
a |
0.913%
due 4/18/2022 |
3,000,000 |
2,998,725 |
|
a |
0.862%
due 4/22/2022 |
30,000,000
|
29,985,125 |
|
a |
Intercontinental
Exchange., 1.015% due 4/29/2022 |
6,000,000 |
5,995,333 |
|
a |
Jm
Smucker Co., 0.558% due 4/1/2022 |
25,000,000
|
25,000,000 |
| |
Kellogg
Company., |
|
|
|
a |
0.71%
due 4/4/2022 |
1,000,000 |
999,942 |
|
a |
0.73%
due 4/4/2022 |
1,000,000 |
999,940 |
| |
Kentucky
Utilities Co., |
|
|
|
a |
0.649%
due 4/4/2022 |
15,000,000
|
14,999,200 |
|
a |
0.71%
due 4/6/2022 |
3,000,000 |
2,999,708 |
|
a |
0.913%
due 4/6/2022 |
14,000,000
|
13,998,250 |
|
a |
0.751%
due 4/11/2022 |
1,950,000 |
1,949,599 |
| |
Louisville
Gas & Electric Co., |
|
|
|
a |
0.649%
due 4/4/2022 |
15,000,000
|
14,999,200 |
|
a |
0.761%
due 4/4/2022 |
6,000,000 |
5,999,625 |
|
a |
0.761%
due 4/5/2022 |
7,580,000 |
7,579,368 |
|
a |
0.964%
due 4/27/2022 |
4,000,000 |
3,997,256 |
|
a |
Lowe’s
Cos., Inc., 0.71% due 4/4/2022 |
12,400,000
|
12,399,277 |
| |
Marsh
& McLennan Cos., Inc., |
|
|
|
a |
0.761%
due 4/8/2022 |
14,000,000
|
13,997,958 |
|
a |
0.812%
due 4/22/2022 |
3,000,000 |
2,998,600 |
| |
McCormick
& Co., Inc., |
|
|
|
a |
0.558%
due 4/1/2022 |
14,195,000
|
14,195,000 |
|
a |
0.608%
due 4/8/2022 |
31,000,000
|
30,996,383 |
| |
Mitsubishi
HC Capital America, Inc., |
|
|
| |
0.811%
due 4/4/2022 |
7,000,000 |
6,999,533 |
| |
0.558%
due 4/1/2022 |
27,000,000
|
27,000,000 |
|
a |
Mondelez
International, Inc., 0.659% due 4/4/2022 |
33,000,000
|
32,998,213 |
| |
Oglethorpe
Power Corp., |
|
|
|
a |
1.014%
due 4/4/2022 |
2,000,000 |
1,999,833 |
|
a |
0.761%
due 4/7/2022 |
1,000,000 |
999,875 |
|
a |
0.893%
due 4/12/2022 |
772,000 |
771,792 |
|
a |
0.964%
due 4/12/2022 |
946,000 |
945,725 |
|
a |
1.015%
due 4/12/2022 |
5,000,000 |
4,998,472 |
|
a |
1.015%
due 4/14/2022 |
24,000,000
|
23,991,333 |
| |
One
Gas, Inc., |
|
|
|
a |
0.964%
due 4/7/2022 |
1,765,000 |
1,764,721 |
|
a |
0.994%
due 4/14/2022 |
18,000,000
|
17,993,630 |
|
a |
1.065%
due 4/18/2022 |
1,000,000 |
999,504 |
| |
Ppg
Industries., |
|
|
| |
0.74%
due 4/5/2022 |
6,000,000 |
5,999,513 |
| |
0.761%
due 4/5/2022 |
1,000,000 |
999,917 |
| |
Puget
Sound Energy, Inc., |
|
|
| |
0.862%
due 4/11/2022 |
10,000,000
|
9,997,639 |
| |
0.70%
due 4/12/2022 |
2,149,000 |
2,148,547 |
| |
Rockwell
Automation, Inc., |
|
|
|
a |
0.487%
due 4/11/2022 |
25,000,000
|
24,996,667 |
|
a |
0.507%
due 4/11/2022 |
4,000,000 |
3,999,445 |
|
a |
0.507%
due 4/14/2022 |
5,000,000 |
4,999,097 |
| |
Ryder
System, Inc., |
|
|
| |
0.862%
due 4/5/2022 |
6,000,000 |
5,999,433 |
| |
0.822%
due 4/8/2022 |
16,505,000
|
16,502,401 |
| |
0.822%
due 4/11/2022 |
10,300,000
|
10,297,683 |
| |
0.811%
due 4/12/2022 |
1,000,000 |
999,756 |
| |
Sempra
Energy., |
|
|
|
a |
0.50%
due 4/6/2022 |
25,000,000
|
24,997,153 |
|
a |
0.832%
due 4/7/2022 |
7,000,000 |
6,999,043 |
|
a |
0.44%
due 4/8/2022 |
2,000,000 |
1,999,681 |
| |
Sonoco
Products Co., |
|
|
| |
0.537%
due 4/1/2022 |
31,000,000
|
31,000,000 |
| |
0.507%
due 4/4/2022 |
31,000,000
|
30,998,708 |
See
notes to financial statements.
|
Semi-Annual Report | 7 |
Schedule of Investments, Continued
Thornburg Capital Management Fund | March 31, 2022 (Unaudited)
| |
ISSUER-DESCRIPTION
|
Shares/Principal
Amount |
VALUE
|
|
a |
Southern
California Edison Co., 0.811% due 4/6/2022 |
$34,000,000
|
$ 33,996,222
|
| |
Southwestern
Public Service Co., |
|
|
|
a |
0.761%
due 4/1/2022 |
1,000,000 |
1,000,000 |
|
a |
0.781%
due 4/1/2022 |
31,000,000
|
31,000,000 |
|
a |
0.771%
due 4/6/2022 |
1,000,000 |
999,895 |
|
a |
0.811%
due 4/6/2022 |
1,000,000 |
999,889 |
| |
Spire,
Inc., |
|
|
|
a |
0.771%
due 4/4/2022 |
5,000,000 |
4,999,683 |
|
a |
0.609%
due 4/11/2022 |
15,000,000
|
14,997,500 |
|
a |
Stanley
Black & Decker, Inc., 0.507% due 4/18/2022 |
3,000,000 |
2,999,292 |
|
a |
Stryker
Corp., 0.862% due 4/4/2022 |
32,000,000
|
31,997,733 |
|
a,b |
Telus
Corp., 0.761% due 4/5/2022 |
1,121,000 |
1,120,907 |
| |
TotalEnergies
Capital Canada Ltd., |
|
|
|
a,b |
0.406%
due 4/8/2022 |
22,000,000
|
21,998,289 |
|
a,b |
0.355%
due 4/19/2022 |
9,000,000 |
8,998,425 |
| |
Union
Electric Co., |
|
|
| |
0.588%
due 4/1/2022 |
32,000,000
|
32,000,000 |
| |
0.913%
due 4/1/2022 |
2,831,000 |
2,831,000 |
| |
Verizon
Communications, Inc., |
|
|
|
a |
0.659%
due 4/6/2022 |
500,000 |
499,955 |
|
a |
0.781%
due 4/6/2022 |
32,596,000
|
32,592,514 |
| |
Virginia
Electric & Power Co., 0.71% due 4/21/2022 |
34,000,000
|
33,986,778 |
|
a |
Volvo
Treasury North America LP, 0.913% due 4/20/2022 |
33,000,000
|
32,984,325 |
|
a |
Walmart,
Inc., 0.335% due 4/13/2022 |
34,000,000
|
33,996,260 |
| |
WEC
Energy Group, Inc., |
|
|
|
a |
1.014%
due 4/11/2022 |
5,000,000 |
4,998,611 |
|
a |
0.994%
due 4/19/2022 |
25,000,000
|
24,987,750 |
|
a |
0.994%
due 4/20/2022 |
3,000,000 |
2,998,448 |
| |
Wisconsin
Power & Light Co., 0.507% due 4/4/2022 |
34,000,000
|
33,998,583 |
| |
Wisconsin
Public Service Corp., |
|
|
| |
0.527%
due 4/5/2022 |
25,000,000
|
24,998,556 |
| |
0.507%
due 4/6/2022 |
6,000,000 |
5,999,583 |
| |
Xcel
Energy, Inc., |
|
|
|
a |
0.608%
due 4/7/2022 |
28,000,000
|
27,997,200 |
| a |
0.913%
due 4/11/2022 |
3,000,000
|
2,999,250
|
| |
Total
Commercial Paper (Cost $1,583,018,749) |
|
1,583,018,749
|
| |
Mutual
Fund — 0.0% |
|
|
| c |
State
Street Institutional Treasury Money Market Fund Premier Class, 0.17% |
532,589 |
532,589
|
| |
Total
Mutual Fund (Cost $532,589) |
|
532,589
|
| |
Total
Investments — 103.4% (Cost $1,590,448,534) |
|
$1,590,448,534
|
| |
Liabilities
Net of Other Assets — (3.4)% |
|
(52,601,896)
|
| |
Net
Assets — 100.0% |
|
$1,537,846,638
|
| Footnote Legend
|
| a
|
Securities
exempt from registration under Rule 144A of the Securities Act of 1933, as amended. These securities are restricted but liquid and may only be resold in the ordinary course of business in transactions exempt from registration, normally to qualified
institutional buyers. As of March 31, 2022, the aggregate value of these securities in the Fund’s portfolio was $1,176,767,933, representing 76.52% of the Fund’s net assets. |
| b
|
Yankee
bond denominated in U.S. dollars and is issued in the U.S. by foreign banks and corporations. |
| c
|
Rate
represents the money market fund annualized seven-day yield at March 31, 2022. |
8 | Semi-Annual Report
|
See notes to
financial statements. |
Statement of Assets and Liabilities
Thornburg Capital Management Fund | March 31, 2022 (Unaudited)
| ASSETS
|
|
| Investment
in securities, at cost |
$ 1,590,448,534
|
| Investments
at value |
1,590,448,534 |
| Cash
|
150,393,315 |
| Principal
and interest receivable |
51,767 |
| Prepaid
expenses and other assets |
8,267
|
| Total
Assets |
1,740,901,883
|
| Liabilities
|
|
| Payable
for investments purchased |
202,979,916 |
| Accounts
payable and accrued expenses |
75,329
|
| Total
Liabilities |
203,055,245
|
| Net
Assets |
$
1,537,846,638 |
| NET
ASSETS CONSIST OF |
|
| Net
capital paid in on shares of beneficial interest |
$ 1,537,826,033
|
| Distributable
earnings |
20,605
|
| Net
Assets |
$
1,537,846,638 |
| NET
ASSET VALUE |
|
| Class
I Shares: |
|
| Net
assets applicable to shares outstanding |
$ 1,537,846,638
|
| Shares
outstanding |
153,784,973 |
| Net
asset value and redemption price per share |
$ 10.00
|
See notes to financial
statements.
Statement of Operations
Thornburg Capital Management Fund | Six Months Ended March 31, 2022
(Unaudited)
| INVESTMENT
INCOME |
|
| Interest
income |
$
2,010,445 |
| Dividend
income |
72
|
| Total
Income |
2,010,517
|
| EXPENSES
|
|
| Transfer
agent fees |
2,272 |
| Custodian
fees |
62,901 |
| Professional
fees |
17,012 |
| Officer
fees |
6,541 |
| Other
expenses |
10,544
|
| Total
Expenses |
99,270
|
| Net
Investment Income (Loss) |
$ 1,911,247
|
| REALIZED
AND UNREALIZED GAIN (LOSS) |
|
| Net
realized gain (loss) |
23,601
|
| Net
Realized and Unrealized Gain (Loss) |
23,601
|
| Change
in Net Assets Resulting from Operations |
$ 1,934,848
|
See notes to financial
statements.
Statements of Changes in Net Assets
Thornburg Capital Management Fund
| |
Six
Months Ended
March 31, 2022* |
Year
Ended
September 30, 2021 |
| INCREASE
(DECREASE) IN NET ASSETS FROM |
|
|
| OPERATIONS
|
|
|
| Net
investment income |
$ 1,911,247
|
$ 2,449,055
|
| Net
realized gain (loss) on investments |
23,601
|
5,567
|
| Net
Increase (Decrease) in Net Assets Resulting from Operations |
1,934,848
|
2,454,622
|
| DIVIDENDS
TO SHAREHOLDERS |
|
|
| From distributable
earnings |
|
|
| Class
I Shares |
(1,919,804)
|
(2,449,509) |
| FUND
SHARE TRANSACTIONS |
|
|
| Class
I Shares |
(522,281,062)
|
398,819,337
|
| Net
Increase (Decrease) in Net Assets |
(522,266,018)
|
398,824,450
|
| NET
ASSETS |
|
|
| Beginning
of Period |
2,060,112,656
|
1,661,288,206
|
| End
of Period |
$ 1,537,846,638
|
$ 2,060,112,656
|
See notes to financial
statements.
Notes to Financial Statements
Thornburg Capital Management Fund | March 31, 2022 (Unaudited)
NOTE 1 – ORGANIZATION
Thornburg Capital Management Fund (the “Fund”) is
a diversified series of Thornburg Investment Trust (the “Trust”). The Trust is organized as a Massachusetts business trust under a Declaration of Trust dated June 3, 1987 and is registered as a diversified, open-end management investment
company under the Investment Company Act of 1940, as amended (the "1940 Act"). The Fund is currently one of twenty-one separate series of the Trust. Each series is considered to be a separate entity for financial reporting and tax purposes and bears
expenses directly attributable to it. The Fund’s investment goal is to seek current income consistent with liquidity management and safety of capital. The Fund’s investments subject it to certain risks. As of the date of this report, the
principal risks of investing in the Fund include management risk, interest rate risk, prepayment and extension risk, credit risk, market and economic risk, foreign investment risk, liquidity risk, diversification risk, and cybersecurity and
operational risk. Please see the Fund’s prospectus for a discussion of those principal risks and other risks associated with an investment in the Fund.
As of March 31, 2022, the Fund currently offers one class of
shares of beneficial interest: Institutional Class (“Class I”). This class of shares of the Fund represents all interest in the portfolio of investments. Class I shares are sold at net asset value without a sales charge at the time of
purchase and may be subject to a service fee. All expenses are allocated to the class including transfer agent fees, government registration fees, printing and postage costs, and legal expenses.
Shares of the Fund are issued solely in private placement
transactions that do not involve any “public offering” within the meaning of Section 4(2) of the Securities Act of 1933 (the "1933 Act"). Investments in the Fund may only be made by investment companies, or other persons that are
“accredited investors” within the meaning of Regulation D under the 1933 Act. Thornburg Investment Management, Inc. (the "Advisor"), acting as the agent for the other series of the Trust, will effect all purchases and sells of shares of
the Fund on behalf of any series of the Trust.
NOTE
2 – SIGNIFICANT ACCOUNTING POLICIES
The
following is a summary of significant accounting policies followed by the Fund in the preparation of its financial statements. The Fund prepares its financial statements in conformity with United States generally accepted accounting principles
(“GAAP”), including investment company accounting and reporting guidance in the Financial Accounting Standards Board (the “FASB”) Accounting Standard Codification Topic 946.
Allocation of
Expenses: Expenses common to all Funds are allocated among the Funds comprising the Trust based upon their relative net asset values or other appropriate allocation methods.
Dividends and
Distributions to Shareholders: Dividends and distributions to shareholders, which are determined in accordance with federal income tax regulations and may differ from GAAP, are recorded on the ex-dividend date. Ordinary income dividends, if
any, are declared daily and paid monthly. Capital gain distributions, if any, are declared and paid annually and more often if deemed necessary by the Advisor. Dividends and distributions are paid and are reinvested in additional shares of the Fund
at net asset value per share at the close of business on the ex-dividend date, or at the shareholder’s option, paid in cash.
Guarantees and
Indemnifications: Under the Trust’s organizational documents (and under separate agreements with the independent Trustees), its officers and Trustees are provided with an indemnification against certain liabilities arising out of the
performance of their duties to the Fund. In the normal course of business the Trust may also enter into contracts with service providers that contain general indemnifications. The Trust’s maximum exposure under these arrangements is unknown.
However, based on experience, the Trust expects the risk of loss to be remote.
Investment
Income: Interest income is accrued as earned. Premiums and discounts are amortized and accreted, respectively, to first call dates or maturity dates using the effective yield method of the respective investments. These amounts are included in
Investment Income in the Statement of Operations.
Investment Transactions: Investment transactions are accounted for on a trade date basis. Realized gains and losses from the sale of investments are recorded on an identified cost basis.
Repurchase
Agreements: The Fund may invest excess cash in repurchase agreements whereby the Fund purchases investments, which serve as collateral, with an agreement to resell such collateral to the seller at an agreed upon price at the maturity date of
the repurchase agreement. Investments pledged as collateral for repurchase agreements are held in custody until maturity of the repurchase agreement. Provisions in the agreements require that the market value of the collateral is at least equal to
the repurchase value in the event of default. In the event of default, the Fund has the right to liquidate the collateral and apply the proceeds in satisfaction of the obligation. Under certain circumstances, in the event of default or bankruptcy by
the other party to the agreement, realization and/or retention of the collateral may be subject to legal proceedings.
Notes to Financial Statements,
Continued
Thornburg Capital Management Fund | March 31, 2022 (Unaudited)
Security
Valuation: All investments in securities held by the Fund are valued as described in Note 3.
Use of
Estimates: The preparation of financial statements in conformity with GAAP requires management to make estimates and assumptions that affect the reported amounts of assets and liabilities and disclosure of contingent assets and liabilities at
the date of the financial statements and the reported amounts of increases (decreases) in net assets from operations during the reporting period. Actual results could differ from those estimates.
When-Issued and
Delayed Delivery Transactions: The Fund may engage in when-issued or delayed delivery transactions. To the extent the Fund engages in such transactions, it will do so for the purpose of acquiring portfolio investments consistent with the
Fund’s investment objectives and not for the purpose of investment leverage or to speculate on interest rate or market changes. At the time the Fund makes a commitment to purchase an investment on a when-issued or delayed delivery basis, the
Fund will record the transaction and reflect the value in determining its net asset value. When effecting such transactions, assets of an amount sufficient to make payment for the portfolio investments to be purchased will be segregated on the
Fund’s records on the trade date. Investments purchased on a when-issued or delayed delivery basis do not earn interest until the settlement date. The values of these securities held at March 31, 2022 are detailed in the Schedule of
Investments.
NOTE 3 – SECURITY
VALUATION
Valuation of the Fund’s portfolio
investment securities is performed in accordance with policies and procedures adopted by and under the oversight of the Trustees.
The Trustees of the Trust have appointed the Advisor to assist
the Trustees with obtaining fair market values for portfolio investments, evaluating and monitoring professional pricing service providers appointed by the Trustees’ Audit Committee (the “Audit Committee”) to assist in determining
fair values for portfolio investments, assisting in calculating fair values for portfolio investments in certain circumstances, and performing other functions in connection with the valuation of investments. The Advisor acts through its Valuation
and Pricing Committee (the “Committee”) and other employees of the Advisor. The Committee regularly reviews its own valuation calculations, reviews the valuations, valuation techniques and services furnished by pricing service providers,
considers circumstances which may require valuation calculations by the Committee, and reviews previous valuation calculations. The Committee reports to the Audit Committee on the Committee’s activities, the performance of pricing service
providers, and other matters relating to valuation of portfolio investments.
In those instances when the Committee assists in calculating a
fair value for a portfolio investment, the Committee seeks to determine the price that the Fund would reasonably expect to receive upon a sale of the investment in an orderly transaction between market participants on the valuation date. The
Committee customarily utilizes quotations from securities broker dealers in calculating valuations, but also may utilize prices obtained from pricing service providers or other methods approved by the Audit Committee. Because fair values calculated
by the Committee are estimates, the calculation of a value for an investment may differ from the price that would be realized by the Fund upon a sale of the investment, and the difference could be material to the Fund’s financial statements.
The Committee’s calculation of a fair value for an investment may also differ from the prices obtained by other persons (including other mutual funds) for the investment.
Valuation of
Securities: Securities held with a maturity of less than 60 days are valued using the amortized cost method. The amortized cost method of valuation involves valuing a security at its cost initially and thereafter assuming a constant
amortization to maturity of any discount or premium, regardless of the impact of fluctuating interest rates on the market value of the security. This method may result in periods during which value, as determined by amortized cost, is higher or
lower than the price each Fund would receive if it sold the security. The market value of securities in the Fund can be expected to vary inversely with changes in prevailing interest rates.
Debt obligations held by the Fund which are not listed or
traded on exchanges or for which no reported market exists are ordinarily valued at the valuation obtained from a pricing service provider approved by the Audit Committee.
The amortized cost method of valuation may be used with
respect to debt obligations with sixty days or less remaining to maturity unless the Committee determines such method does not represent fair value. Investments in open-end U.S. mutual funds are valued at net asset value (“NAV”) each
business day.
In any case when a pricing service
provider fails to provide a valuation for a debt obligation held by the Fund, the Committee calculates a fair value for the obligation using alternative methods under procedures approved by the Audit Committee. Additionally, in cases when management
believes that a valuation obtained from a pricing service provider is stale, does not reflect material factors affecting the valuation of the investment, is significantly different than the value the Fund is likely to obtain if it sought a bid for
the investment, or is otherwise unreliable, the Committee may calculate a fair value for the obligation using an alternative method approved by the Audit Committee.
Notes to Financial Statements,
Continued
Thornburg Capital Management Fund | March 31, 2022 (Unaudited)
Valuation
Hierarchy: The Fund categorizes its investments based upon the inputs used in valuing those investments, according to a three-level hierarchy established in guidance from the FASB. Categorization of investments using this hierarchy is
intended by the FASB to maximize the use of observable inputs in valuing investments and minimize the use of unobservable inputs by requiring that the most observable inputs be used when available. Observable inputs are those that market
participants would use in valuing an investment based on available market information. Unobservable inputs are those that reflect assumptions about the information market participants would use in valuing an investment. An investment’s level
within the hierarchy is based on the lowest level input that is deemed significant to the valuation. The methodologies and inputs used to value investments are not necessarily indications of the risk or liquidity associated with those
investments.
Various inputs are used in calculating
valuations for the Fund’s investments. These inputs are generally summarized according to the three-level hierarchy below:
Level 1: Quoted prices in active markets for identical
investments.
Level 2: Other direct or indirect
significant observable inputs (including quoted prices for similar investments in active markets and other observable inputs, such as interest rates, prepayment rates, credit ratings, etc.).
Level 3: Significant unobservable inputs (including the
Committee’s own assumptions in calculating the fair values of investments).
Valuations for debt obligations held by the Fund is typically
calculated by pricing service providers approved by the Audit Committee and are generally characterized as Level 2 within the valuation hierarchy.
In a limited number of cases the Committee calculates a fair
value for investments using broker quotations or other methods approved by the Audit Committee. When the Committee uses a single broker quotation to calculate a fair value for an investment without other significant observable inputs, or if a fair
value is calculated using other significant inputs that are considered unobservable, the investment is characterized as Level 3 within the hierarchy. Other significant unobservable inputs used to calculate a fair value in these instances might
include an income-based valuation approach which considers discounted anticipated future cash flows from the investment and application of discounts due to the nature or duration of any restrictions on the disposition of the investment.
Valuations based upon the use of inputs from Levels 1, 2 or 3
may not represent the actual price received upon the disposition of an investment, and a Fund may receive a price that is lower than the valuation based upon these inputs when it sells the investment.
The following table displays a summary of the fair value
hierarchy measurements of the Fund’s investments as of March 31, 2022:
| |
TOTAL
|
LEVEL
1 |
LEVEL
2 |
LEVEL
3 |
| Assets
|
|
|
|
|
| Investments
in Securities |
|
|
|
|
| U.S.
Treasury Securities |
$ 6,897,196
|
$ —
|
$
6,897,196 |
$ —
|
| Commercial
Paper |
1,583,018,749
|
—
|
1,583,018,749
|
— |
| Mutual
Fund |
532,589
|
532,589
|
—
|
—
|
| Total
Investments in Securities |
$
1,590,448,534 |
$
532,589 |
$
1,589,915,945 |
$
— |
| Total
Assets |
$
1,590,448,534 |
$
532,589 |
$
1,589,915,945 |
$— |
NOTE 4 – INVESTMENT MANAGEMENT FEE AND
OTHER TRANSACTIONS WITH AFFILIATES
Pursuant to an
investment advisory agreement with the Trust, the Advisor serves as the investment advisor and performs services for the Fund. The Fund does not pay an advisory fee to the Advisor under this agreement.
The Advisor provides certain administrative services to the
Fund. No fees are charged for these services.
The Fund
may purchase or sell securities from or to an affiliated fund, provided the affiliation is due solely to having a common investment advisor, common officers, or common trustees, and provided that all such transactions will comply with Rule 17a-7
under the 1940 Act. For the six months ended March 31, 2022, the Fund had no such transactions with affiliated funds.
Notes to Financial Statements,
Continued
Thornburg Capital Management Fund | March 31, 2022 (Unaudited)
NOTE 5 – TAXES
Federal Income
Taxes: It is the policy of the Trust to comply with the provisions of the Internal Revenue Code of 1986 applicable to regulated investment companies and to distribute to shareholders substantially all investment company taxable income
including net realized gains on investments (if any), and tax exempt income of the Fund. Therefore, no provision for federal income or excise tax is required.
The Fund files income tax returns in United States federal and
applicable state jurisdictions. The statute of limitations on the Fund’s tax return filings generally remains open for the three years following a return’s filing date. The Fund has analyzed each uncertain tax position believed to be
material in the preparation of the Fund’s financial statements for the six month period ended March 31, 2022, including open tax years, to assess whether it is more likely than not that the position would be sustained upon examination, based
on the technical merits of the position. The Fund has not identified any such position for which an asset or liability must be reflected in the Statement of Assets and Liabilities.
At March 31, 2022, information on the tax components of
capital was as follows:
| Cost
of investments for tax purposes |
$ 1,590,448,534
|
| Net
unrealized appreciation (depreciation) on investments (tax basis) |
$
- |
There is no unrealized gain (loss) in the Fund at March 31,
2022 due to all securities with less than 60 days to maturity being valued by the amortized cost method.
NOTE 6 – SHARES OF BENEFICIAL
INTEREST
At March 31, 2022, there were an unlimited
number of shares with no par value of beneficial interest authorized. Transactions in shares of beneficial interest were as follows:
| |
SIX
MONTHS ENDED
March 31, 2022 |
YEAR
ENDED
September 30, 2021 |
| |
SHARES
|
AMOUNT
|
SHARES
|
AMOUNT
|
| Class
I Shares |
|
|
|
|
| Shares
sold |
510,304,330
|
$ 5,103,043,302
|
999,368,358
|
$ 9,993,683,575
|
| Shares
issued to shareholders in reinvestment of dividends |
191,981
|
1,919,805
|
244,951
|
2,449,509 |
| Shares
repurchased |
(562,724,417)
|
(5,627,244,169)
|
(959,731,375)
|
(9,597,313,747)
|
| Net
increase (decrease) |
(52,228,106)
|
$
(522,281,062) |
39,881,934
|
$ 398,819,337
|
NOTE
7 – INVESTMENT TRANSACTIONS
For the
six months ended March 31, 2022, the Fund had no purchase and sale transactions of investments other than short-term investments.
| |
Per
Share Performance (For a Share Outstanding throughout the Period) |
UNLESS
OTHERWISE
NOTED, PERIODS ARE
FISCAL YEARS ENDED
SEPTEMBER 30, |
Net
Asset
Value,
Beginning of
Period |
Net
Investment
Income
(Loss)+ |
Net
Realized &
Unrealized Gain
(Loss) on
Investments |
Total
from
Investment
Operations |
Dividends
from Net
Investment
Income |
Dividends
from Net
Realized
Gains |
Total
Dividends |
Net
Asset
Value,
End
of Period |
| Class
I(b) |
| 2022
(c) |
$ 10.00
|
0.01
|
—
(d) |
0.01
|
(0.01)
|
—
|
(0.01)
|
$ 10.00
|
| 2021
|
$ 10.00
|
0.01
|
—
(d) |
0.01
|
(0.01)
|
—
|
(0.01)
|
$ 10.00
|
| 2020
|
$ 10.00
|
0.10
|
0.01
|
0.11
|
(0.11)
|
—
|
(0.11)
|
$ 10.00
|
| 2019
|
$ 10.00
|
0.24
|
—
|
0.24
|
(0.24)
|
—
|
(0.24)
|
$ 10.00
|
| 2018
|
$ 10.00
|
0.18
|
—
|
0.18
|
(0.18)
|
—
|
(0.18)
|
$ 10.00
|
| 2017
|
$ 10.00
|
0.09
|
—
|
0.09
|
(0.09)
|
—
|
(0.09)
|
$ 10.00
|
| (a)
|
Not
annualized for periods less than one year. |
| (b)
|
Sales
loads are not reflected in computing total return. |
| (c)
|
Unaudited
Six Month Period Ended March 31. |
| (d)
|
Net
realized and unrealized gain (loss) on investments was less than $0.01 per share. |
| (e)
|
Annualized.
|
| (f)
|
Portfolio
turnover rate equals zero due to no long term investment transactions in the period. |
| +
|
Based
on weighted average shares outstanding. |
See notes to financial statements.
Financial Highlights, Continued
| |
Ratios
to Average Net Assets |
|
Supplemental
Data |
|
UNLESS
OTHERWISE
NOTED, PERIODS ARE
FISCAL YEARS ENDED
SEPTEMBER 30, |
Net
Investment
Income (Loss) (%) |
Expenses,
After
Expense
Reductions (%) |
Expenses,
Before Expense
Reductions (%) |
|
Total
Return (%)(a) |
Portfolio
Turnover
Rate (%)(a) |
Net
Assets
at End of Period
(Thousands) |
| Class
I(b) |
| 2022
(c) |
0.21
(e) |
0.01
(e) |
0.01
(e) |
|
0.11
|
—
(f) |
$ 1,537,847
|
| 2021
|
0.12
|
0.01
|
0.01
|
|
0.12
|
—
(f) |
$ 2,060,113
|
| 2020
|
1.00
|
0.01
|
0.01
|
|
1.08
|
—
(f) |
$ 1,661,288
|
| 2019
|
2.44
|
0.02
|
0.02
|
|
2.48
|
—
(f) |
$ 1,552,677
|
| 2018
|
1.76
|
0.02
|
0.02
|
|
1.76
|
—
(f) |
$ 1,325,525
|
| 2017
|
0.89
|
0.03
|
0.03
|
|
0.87
|
—
(f) |
$ 1,130,021
|
Expense Example
Thornburg Capital Management Fund | March 31, 2022 (Unaudited)
As a shareholder of the Fund, you incur ongoing costs of investing in the
Fund. Because the Fund does not pay any management fee or distribution and/or service (12b-1) fee, the Fund’s ongoing costs are comprised of other Fund expenses. Shareholders of the Fund do not incur any transaction costs.
This example is intended to help you understand your ongoing
costs (in dollars) of investing in the Fund and to compare these costs with the ongoing costs of investing in other mutual funds.
The example is based on a $1,000 investment beginning on
October 1, 2021, and held until March 31, 2022.
| |
BEGINNING
ACCOUNT VALUE
10/1/21 |
ENDING
ACCOUNT VALUE
3/31/22 |
EXPENSES
PAID
DURING PERIOD†
10/1/21—3/31/22 |
| CLASS
I SHARES |
| Actual
|
$1,000.00
|
$1,001.08
|
$0.05
|
| Hypothetical*
|
$1,000.00
|
$1,024.88
|
$0.05
|
| †
|
Expenses
are equal to the annualized expense ratio for each class (I: 0.01%) multiplied by the average account value over the period, multiplied by 182/365 to reflect the one-half year period. |
| *
|
Hypothetical
assumes a rate of return of 5% per year before expenses. |
ACTUAL EXPENSES
For each class of shares, the Actual section of the
accompanying table provides information about actual account values and actual expenses. You may use the information in this line, together with the amount you invested, to estimate the expenses that you paid over the period. Simply divide your
account value by $1,000 (for example, an $8,600 account value divided by $1,000 = 8.6), then multiply the result by the number in the Actual section for your class of shares under the heading entitled “Expenses Paid During Period” to
estimate the expenses you paid on your account during this period.
HYPOTHETICAL EXAMPLE FOR COMPARISON
PURPOSES
For each class of shares, the
Hypothetical section of the accompanying table provides information about hypothetical account values and hypothetical expenses based on the Fund’s actual expense ratio and an assumed rate of return of 5% per year before expenses, which is not
the Fund’s actual return. The hypothetical account values and expenses may not be used to estimate the actual ending account balance or expenses you paid for the period. You may use this information to compare the ongoing costs of investing in
the Fund and other funds. To do so, compare this 5% hypothetical example with the 5% hypothetical examples that appear in the shareholder reports of the other funds.
Please note that the expenses shown in the table are
meant to highlight your ongoing costs only and do not reflect any transactional costs, such as sales charges (loads), redemption fees, or exchange fees. Therefore, the Hypothetical section of the table for each class of shares is useful in comparing
ongoing costs only, and will not help you determine the relative total costs of owning different mutual funds. In addition, if these transactional costs were included, your costs would have been higher.
Other Information
March 31, 2022 (Unaudited)
PORTFOLIO PROXY VOTING
Policies and Procedures:
The Trust has delegated to the Advisor voting decisions
respecting proxies for the Fund’s voting securities. The Advisor makes voting decisions in accordance with its Proxy Voting Policy and Procedures. A description of the Policy and Procedures is available (i) without charge, upon request, by
calling the Advisor toll-free at 1-800-847-0200, (ii) on the Thornburg website at www.thornburg.com, and (iii) on the U.S. Securities and Exchange Commission’s website at www.sec.gov.
Information regarding how proxies were voted is available on
or before August 31 of each year for the twelve months ending the preceding June 30. This information is available (i) without charge, upon request by calling the Advisor toll-free at 1-800-847-0200, (ii) on the Thornburg website at
www.thornburg.com, and (iii) on the U.S. Securities and Exchange Commission’s website at www.sec.gov.
AVAILABILITY OF QUARTERLY PORTFOLIO SCHEDULE
The Fund files with the Securities and Exchange Commission
schedules of its portfolio holdings on Form N-PORT EX for the first and third quarters of each fiscal year. The Fund’s Form N-PORT EX are available on the Commission’s website at www.sec.gov, or may be reviewed and copied at the
Commission’s Public Reference Room in Washington, D.C. Information on the operation of the Public Reference Room may be obtained by calling 1-800-SEC-0330. The Fund also makes this information available on its website at
www.thornburg.com/download or upon request by calling 1-800-847-0200.
STATEMENT REGARDING LIQUIDITY RISK MANAGEMENT
PROGRAM
The Trustees of the Trust have appointed the
Advisor (“Program Administrator”) to administer the Trust’s liquidity risk management program (the “LRMP”) adopted for each of the Funds under rule 22e-4 under the 1940 Act (the “Liquidity Rule”). The LRMP
is designed to reduce the risk that a Fund will be unable to meet its redemption obligations under the 1940 Act, and to mitigate the dilution of the interests of Fund shareholders occasioned by redemptions tendered by other shareholders
(“Liquidity Risk”). Pursuant to the LRMP, the Program Administrator has delegated certain functions, including daily oversight and management of the Funds’ Liquidity Risk, to its Liquidity Risk Management Committee (the
“Liquidity Committee”). Under the LRMP, the Liquidity Committee performs the annual review of the LRMP required by the Liquidity Rule.
On December 8, 2021, the Trustees reviewed the Liquidity
Committee’s written report (the “Report”) concerning the operation of the LRMP for the period from November 21, 2020 through November 20, 2021 (the “Reporting Period”). The Report addressed the operation, adequacy and
effectiveness of the LRMP, the operation of a Fund’s highly liquid investment minimum, and any material changes to the LRMP during the Reporting Period. The Report provided an assessment of the various factors relevant to each Fund’s
Liquidity Risk, an evaluation of data provided by a third-party liquidity assessment vendor and other relevant data, and reports on the Liquidity Committee’s consideration of intermediary firms with the largest beneficial ownership positions
in each Fund, the likelihood that any of those firms may redeem their clients’ investments from the Funds without prior notice, and the effect that such redemptions could have on Fund liquidity. The Report concluded that the LRMP remains
adequate and effective to address each Fund’s Liquidity Risk, that all of the Funds are able to meet redemption requests in current market conditions and in reasonably expected stressed conditions without significant dilution of remaining
shareholders, that each Fund remains primarily highly liquid, each Fund’s liquidity classifications during the reporting period were reasonable, and the third-party liquidity assessment vendor’s system continues to be a useful tool for
assessing the Funds’ Liquidity Risk. The Report stated that there have been no instances since the LRMP’s adoption in which a Fund exceeded its limitation on illiquid investments, nor have there been any material changes to the LRMP
since its adoption.
Trustees’ Statement to
Shareholders (Unaudited)
Readopted September 14, 2021
The Trustees believe current and prospective shareholders
should know how we discharge our responsibilities in supervising the Funds’ investment advisor and in reviewing the advisor’s contract for renewal. Since 2005, we have issued a statement which sets out clearly the three principal
guidelines that we follow in supervising the Trust’s investment advisor on your behalf. In accordance with our customary practice, in September of this year we again reviewed our statement and concluded we should reissue this statement
outlining the principal features of our supervision of the advisor’s performance of investment management services for the Funds.
We begin with the premise that each shareholder selected his
or her Fund because its investments are managed by the investment advisor identified in the prospectus and in accordance with the objective and policies described in the prospectus. We realize, as each of you do, that if you believe that your
Fund’s stated objective and policies no longer serve your personal investment goals, you can sell your shares and leave the Fund.
Therefore, we believe that our primary supervisory task
– our principal obligation to you – is to assess the nature and quality of the advisor’s services, and to confirm that the advisor actively and competently pursues the Fund’s objective, in accordance with the policies set out
in the prospectus. To do this, we meet regularly with management to review your Fund’s portfolio and to discuss the advisor’s specific actions and judgments in pursuing the Fund’s objective. We do not substitute our own judgment
for the advisor’s decisions in selecting investments; the advisor is paid to exercise its informed judgment on investment decisions, and we seek to confirm, in reviewing the advisor’s performance, that the advisor is doing just
that.
Second, we are conscious of costs and the effect
that costs have on shareholders’ returns. We try to make sure that your Fund’s fees and costs are reasonable in relationship to the services rendered and that they are generally in line with those charged by other expert investment
advisors, consistent with our belief that the Fund’s investors searched for and expect that expertise and attention and have decided to pay a reasonable price for it. We do not put the management contract “out to bid” as a matter
of course, and we would not do so unless we had concluded that the advisor materially had failed to pursue the Fund’s objectives in accordance with its policies, or for other equally important reasons. We believe that any other approach would
be inconsistent with your interests and contrary to your expectations when you bought shares of the Fund in the first place.
Finally, because we believe that most Thornburg Fund
shareholders have invested with a long-term perspective, we try not to focus too much on the fashions of the moment and on short-term performance. The market will not favor any specific investment objective or set of policies at all times and under
all economic circumstances. A fund will experience periods of both high and low returns relative to other funds and other investments. Even if one of our Funds is not favored by the market at a particular time, we believe that the advisor is
nonetheless obliged to remain true to the Fund’s objective and policies, and we watch to see that it does so.
[This statement is submitted for the general information of the
shareholders of Thornburg Investment Trust. For prospective investors in any fund of Thornburg Investment Trust, this communication must be preceded or accompanied by a prospectus. You may obtain a current copy of the Funds’ prospectus, which
describes the Funds’ management fees, expenses and risks, by calling 1-800-847-0200. Please read the prospectus carefully before investing.]
Thornburg Investment Trust
2300 North Ridgetop Road
Santa Fe, NM 87506
505.984.0200 Tel
505.992.8681 Fax
www.thornburg.com
Thornburg Investment Management is a privately-owned global
investment firm that offers a range of solutions for retail and institutional investors. Founded in 1982 and headquartered in Santa Fe, New Mexico, we manage approximately $44.3 billion (as of March 31, 2022) across U.S. mutual funds, separate
accounts for high-net-worth investors, institutional accounts, and UCITS funds for non-U.S. investors.
The fund outlined in this report is one of many equity and
fixed-income products available from Thornburg Investment Management.
GLOBAL EQUITY
| ■
|
Thornburg Global
Opportunities Fund |
INTERNATIONAL EQUITY
| ■
|
Thornburg International
Equity Fund |
| ■
|
Thornburg Better World
International Fund |
| ■
|
Thornburg International
Growth Fund |
| ■
|
Thornburg
Developing World Fund |
U.S.
EQUITY
| ■
|
Thornburg Small/Mid Cap Core
Fund |
| ■
|
Thornburg
Small/Mid Cap Growth Fund |
MULTI ASSET
| ■
|
Thornburg Investment Income
Builder Fund |
| ■
|
Thornburg Income Builder
Opportunities Trust |
| ■
|
Thornburg
Summit Fund |
TAXABLE FIXED
INCOME
| ■
|
Thornburg Limited Term U.S.
Government Fund |
| ■
|
Thornburg Limited Term
Income Fund |
| ■
|
Thornburg Ultra Short Income
Fund |
| ■
|
Thornburg
Strategic Income Fund |
MUNICIPAL
| ■
|
Thornburg Short Duration
Municipal Fund |
| ■
|
Thornburg Limited Term
Municipal Fund |
| ■
|
Thornburg California Limited
Term Municipal Fund |
| ■
|
Thornburg New Mexico
Intermediate Municipal Fund |
| ■
|
Thornburg New York
Intermediate Municipal Fund |
| ■
|
Thornburg Intermediate
Municipal Fund |
| ■
|
Thornburg
Strategic Municipal Income Fund |
Before investing, carefully consider the Fund’s
investment goals, risks, charges, and expenses. For a prospectus or summary prospectus containing this and other information, contact your financial advisor or visit thornburg.com. Read it carefully before investing.
For additional information, please visit
thornburg.com
Thornburg Investment Management, Inc.
2300 North Ridgetop Road, Santa Fe, NM 87506
This page intentionally left
blank.
This page intentionally left
blank.
To receive shareholder reports, prospectuses, and proxy statements
electronically, go to www.thornburg.com/edelivery.
This Semi-Annual Report is submitted for the general
information of shareholders of the Fund. It is not authorized for distribution to prospective investors in the Fund unless preceded or accompanied by an effective prospectus.
Investment Advisor:
Thornburg Investment Management®
800.847.0200
Distributor:
Thornburg Securities Corporation®
Item 2. Code of Ethics
Not applicable.
Item 3. Audit Committee Financial
Expert
Not applicable.
Item 4. Principal
Accountant Fees and Services
Not applicable.
Item 5. Audit Committee of Listed Registrants
Not
applicable.
Item 6. Schedule of Investments
Filed as part of the reports to shareholders filed under item 1 of this Form.
Item 7. Disclosure of Proxy Voting Policies and Procedures for Closed-End Management Investment Companies
Not applicable.
Item 8. Portfolio Managers of
Closed-End Management Investment Companies
Not applicable.
Item 9. Purchases of Equity Securities by Closed-End Management Investment Companies and Affiliated Purchasers.
Not applicable.
Item 10. Submission of Matters to a
Vote of Security Holders
The authority to consider candidates recommended by the shareholders in accordance with the Trust’s Procedures for
Shareholder Communications is committed to the Governance and Nominating Committee.
Item 11. Controls and Procedures
(a) The principal executive officer and the principal financial officer have concluded that Thornburg Investment Trust’s disclosure controls and
procedures provide reasonable assurance that material information relating to Thornburg Investment Trust is made known to them by the appropriate persons, based on their evaluation of these controls and procedures as of a date within 90 days prior
to the filing date of this report.
(b) There was no change in Thornburg Investment Trust’s internal control over financial reporting that occurred
during the registrant’s second fiscal quarter of the period covered by this report (that is, the registrant’s second fiscal quarter) that has materially affected, or is reasonably likely to materially affect, the registrant’s internal
control over financial reporting.
Item 12. Disclosure of Securities Lending Activities for Closed-End Management Investment Companies
Not applicable.
Item 13. Exhibits
SIGNATURES
Pursuant to the requirements of the Securities Exchange Act of 1934 and the Investment Company Act of 1940, the registrant has duly caused this report to be
signed on its behalf by the undersigned, thereunto duly authorized.
Thornburg Investment Trust, in respect of the following Thornburg Funds: Global
Opportunities Fund, International Equity Fund, Better World International Fund, International Growth Fund, Developing World Fund, Small/Mid Cap Core Fund, Small/Mid Cap Growth Fund, Investment Income Builder Fund, Summit Fund, Limited Term U.S.
Government Fund, Limited Term Income Fund, Ultra Short Income Fund, Strategic Income Fund, Short Duration Municipal Fund, Limited Term Municipal Fund, California Limited Term Municipal Fund, New Mexico Intermediate Municipal Fund, New York
Intermediate Municipal Fund, Intermediate Municipal Fund, Strategic Municipal Income Fund, and Capital Management Fund.
|
|
|
|
|
| By: |
|
/s/ Jason H. Brady |
|
|
|
|
Jason H. Brady |
|
|
|
|
President and principal executive officer |
|
|
| Date: |
|
May 18, 2022 |
Pursuant to the requirements of the Securities Exchange Act of 1934 and the Investment Company Act of 1940, this report has
been signed below by the following persons on behalf of the registrant and in the capacities and on the dates indicated.
|
|
|
|
|
| By: |
|
/s/ Jason H. Brady |
|
|
|
|
Jason H. Brady |
|
|
|
|
President and principal executive officer |
|
|
| Date: |
|
May 18, 2022 |
|
|
| By: |
|
/s/ Nimish Bhatt |
|
|
|
|
Nimish Bhatt |
|
|
|
|
Principal financial officer |
|
|
| Date: |
|
May 18, 2022 |