
UNITED STATES
SECURITIES AND EXCHANGE COMMISSION
Washington, D.C. 20549
FORM N-CSR
CERTIFIED SHAREHOLDER REPORT OF REGISTERED
MANAGEMENT INVESTMENT COMPANIES
Investment Company Act file number 811-22338
Legg Mason Global Asset Management Trust
(Exact name of registrant as specified in charter)
620 Eighth Avenue, 47th Floor, New York, NY 10018
(Address of principal executive offices) (Zip code)
Marc A. De Oliveira
Franklin Templeton
100 First Stamford Place
Stamford, CT 06902
(Name and address of agent for service)
Registrant’s telephone number, including area code: 877-6LM-FUND/656-3863
Date of fiscal year end: September 30
Date of reporting period: March 31, 2022
ITEM 1. REPORT TO STOCKHOLDERS.
The Semi-Annual Report to Stockholders is filed herewith.
|
Semi-Annual Report
|
March 31, 2022
|
FRANKLIN
STRATEGIC REAL
RETURN FUND
| INVESTMENT PRODUCTS: NOT FDIC INSURED • NO BANK GUARANTEE • MAY LOSE VALUE |
Fund objective
The Fund seeks to provide an attractive long-term real return.

Dear Shareholder,
We are pleased to provide the semi-annual report of Franklin Strategic Real Return Fund for the six-month reporting period ended March 31, 2022. Please read on for Fund performance information during the Fund’s reporting period.
Special shareholder notice
It is anticipated that Thomas Picciochi will step down as a member of the Fund’s portfolio management team effective on or about June 30, 2022. For more information, please see the Fund’s prospectus supplement dated March 11, 2022.
As always, we remain committed to providing you with excellent service and a full spectrum of investment choices. We also remain committed to supplementing the support you receive from your financial advisor. One way we accomplish this is through our website, www.franklintempleton.com. Here you can gain immediate access to market and investment information, including:
| • | Fund prices and performance, |
| • | Market insights and commentaries from our portfolio managers, and |
| • | A host of educational resources. |
We look forward to helping you meet your financial goals.
Sincerely,

Jane Trust, CFA
President and Chief Executive Officer
April 29, 2022
|
II |
Franklin Strategic Real Return Fund |
For the six months ended March 31, 2022, Class A shares of Franklin Strategic Real Return Fund, excluding sales charges, returned 7.53%. The Fund’s unmanaged benchmark, the Bloomberg U.S. Treasury Inflation-Linked Bond Indexi, returned -0.73% for the same period. The Composite Indexii, representing the Fund’s underlying investments, returned 5.84% over the same time frame. The Lipper Real Return Funds Category Averageiii returned 10.49% over the same time frame.
| Performance Snapshot as of March 31, 2022 (unaudited) | ||||
| (excluding sales charges) | 6 months | |||
| Franklin Strategic Real Return Fund: | ||||
| Class A |
7.53 | % | ||
| Class C |
8.55 | % | ||
| Class I |
7.68 | % | ||
| Class IS |
7.69 | % | ||
| Bloomberg U.S. Treasury Inflation-Linked Bond Index | -0.73 | % | ||
| Composite Index | 5.84 | % | ||
| Lipper Real Return Funds Category Average | 10.49 | % | ||
The performance shown represents past performance. Past performance is no guarantee of future results and current performance may be higher or lower than the performance shown above. Principal value and investment returns will fluctuate and investors’ shares, when redeemed, may be worth more or less than their original cost. To obtain performance data current to the most recent month-end, please visit our website at www.franklintempleton.com.
All share class returns assume the reinvestment of all distributions, including returns of capital, if any, at net asset value and the deduction of all Fund expenses. Returns have not been adjusted to include sales charges that may apply or the deduction of taxes that a shareholder would pay on Fund distributions. If sales charges were reflected, the performance quoted would be lower. Performance figures for periods shorter than one year represent cumulative figures and are not annualized.
Fund performance figures reflect fee waivers and/or expense reimbursements, without which the performance would have been lower.
| Total Annual Operating Expenses (unaudited) |
As of the Fund’s current prospectus dated January 28, 2022, the gross total annual fund operating expense ratios for Class A, Class C, Class I and Class IS shares were 1.66%, 2.45%, 1.53% and 1.11%, respectively.
Actual expenses may be higher. For example, expenses may be higher than those shown if average net assets decrease. Net assets are more likely to decrease and Fund expense ratios are more likely to increase when markets are volatile.
As a result of expense limitation arrangements, the ratio of total annual fund operating expenses, other than interest, brokerage commissions (except for brokerage commissions paid on purchases and sales of shares of exchange-traded funds (“ETFs”)), dividend expense on short sales, taxes and extraordinary expenses, to average net assets will not exceed 1.35% for Class A shares, 2.10% for Class C shares, 1.10% for Class I shares and 1.00% for Class IS shares. In addition, the ratio of total
| Franklin Strategic Real Return Fund |
III |
Performance review (cont’d)
annual fund operating expenses for Class IS shares will not exceed the ratio of total annual fund operating expenses for Class I shares. Acquired fund fees and expenses are subject to these arrangements. These expense limitation arrangements cannot be terminated prior to December 31, 2023 without the Board of Trustees’ consent.
The manager is permitted to recapture amounts waived and/or reimbursed to a class within three years after the fiscal year in which the manager earned the fee or incurred the expense if the class’ total annual fund operating expenses have fallen to a level below the expense limitation (“expense cap”) in effect at the time the fees were earned or the expenses incurred. In no case will the manager recapture any amount that would result, on any particular business day of the Fund, in the class’ total annual fund operating expenses exceeding the expense cap or any other lower limit then in effect.
As always, thank you for your confidence in our stewardship of your assets.
Sincerely,
Jane Trust, CFA
President and Chief Executive Officer
April 29, 2022
RISKS: The Fund is subject to interest rate, credit, income, prepayment and inflation risks. As interest rates rise, bond prices fall, reducing the value of a fixed income investment. Changes in inflation will cause the Fund’s income to fluctuate, sometimes substantially. Periods of deflation may adversely affect the Fund’s net asset value. Equity securities are subject to market and price fluctuations. The Fund is non-diversified, and therefore it is permitted to invest a larger percentage of its assets in a smaller number of issuers than a diversified fund, which may magnify the Fund’s losses from events affecting a particular issuer. The Fund is subject to the risks of the underlying funds in which it invests. In addition to the Fund’s operating expenses, you will indirectly bear the operating expenses of any underlying funds, including ETFs. Each underlying fund may engage in active and frequent trading, resulting in higher portfolio turnover and transaction costs. Derivatives, such as options and futures, can be illiquid, may disproportionately increase losses and have a potentially large impact on Fund performance. International investments are subject to special risks including currency fluctuations and social, economic and political uncertainties, which could increase volatility. These risks are magnified in emerging markets. Emerging market countries tend to have economic, political, and legal systems that are less developed and are less stable than those of more developed countries. The Fund may use leverage, which may increase volatility and possibility of loss. The Fund may invest in REITs, which are closely linked to the performance of the real estate markets. The Fund is subject to the illiquidity, credit and interest rate risks of REITs, as well as risks associated with small- and mid-cap investments. The model used to manage the Fund’s assets provides no
|
IV |
Franklin Strategic Real Return Fund |
assurance that the recommended allocation will either maximize returns or minimize risks. There is no assurance that a recommended allocation will prove the ideal allocation in all circumstances. The Fund may engage in short selling, which is a speculative strategy that involves special risks. Unlike the possible loss on a security that is purchased, there is no limit on the amount of loss on an appreciating security that is sold short. Additional risks may include those risks associated with investing in commodities, ETFs, exchange-traded notes (ETNs) and master limited partnerships (MLPs). Please see the Fund’s prospectus for a more complete discussion of these and other risks and the Fund’s investment strategies.
All investments are subject to risk including the possible loss of principal. Past performance is no guarantee of future results. All index performance reflects no deduction for fees, expenses or taxes. Please note that an investor cannot invest directly in an index.
| i | The Bloomberg U.S. Treasury Inflation-Linked Bond Index represents an unmanaged market index made up of U.S. Treasury Inflation Protected securities (TIPS). |
| ii | The Composite Index reflects the blended rate of return of the following underlying indices: 40% Bloomberg U.S. Treasury Inflation-Linked Bond Index, 20% MSCI All Country World Index, 20% S&P GSCI®, 10% FTSE NAREIT All REITs Index and 10% FTSE 1-Month U.S. Treasury Bill Index. The Composite Index is hedged to 50% exposure to the U.S. dollar, as defined by the U.S. Dollar Index (USDX). The Composite Index’s unhedged currency exposure is predominantly U.S. dollar-based. The Fund’s target hedged currency exposure is 50% U.S. dollar, 50% non-U.S. dollar. The Fund may deviate, either up or down, from its target currency allocation due to market conditions. |
| iii | Lipper, Inc., a wholly-owned subsidiary of Refinitiv, provides independent insight on global collective investments. Returns are based on the six-month period ended March 31, 2022, including the reinvestment of all distributions, including returns of capital, if any, calculated among the 94 funds in the Fund’s Lipper category, and excluding sales charges, if any. |
| Franklin Strategic Real Return Fund |
V |
Investment breakdown (%) as a percent of total investments
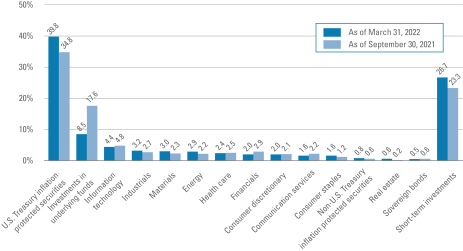
| † | The bar graph above represents the composition of the Fund’s investments as of March 31, 2022 and September 30, 2021 and does not include derivatives, such as futures contracts and forward foreign currency contracts. The Fund is actively managed. As a result, the composition of the Fund’s investments is subject to change at any time. |
| Franklin Strategic Real Return Fund 2022 Semi-Annual Report |
|
1 |
|
Example
As a shareholder of the Fund, you may incur two types of costs: (1) transaction costs, including front-end and back-end sales charges (loads) on purchase payments; and (2) ongoing costs, including management fees; service and/or distribution (12b-1) fees; and other Fund expenses. This example is intended to help you understand your ongoing costs (in dollars) of investing in the Fund and to compare these costs with the ongoing costs of investing in other mutual funds.
This example is based on an investment of $1,000 invested on October 1, 2021 and held for the six months ended March 31, 2022.
Actual expenses
The table below titled “Based on Actual Total Return” provides information about actual account values and actual expenses. You may use the information provided in this table, together with the amount you invested, to estimate the expenses that you paid over the period. To estimate the expenses you paid on your account, divide your ending account value by $1,000 (for example, an $8,600 ending account value divided by $1,000 = 8.6), then multiply the result by the number under the heading entitled “Expenses Paid During the Period”.
Hypothetical example for comparison purposes
The table below titled “Based on Hypothetical Total Return” provides information about hypothetical account values and hypothetical expenses based on the actual expense ratio and an assumed rate of return of 5.00% per year before expenses, which is not the Fund’s actual return. The hypothetical account values and expenses may not be used to estimate the actual ending account balance or expenses you paid for the period. You may use the information provided in this table to compare the ongoing costs of investing in the Fund and other funds. To do so, compare the 5.00% hypothetical example relating to the Fund with the 5.00% hypothetical examples that appear in the shareholder reports of the other funds.
Please note that the expenses shown in the table below are meant to highlight your ongoing costs only and do not reflect any transactional costs, such as front-end or back-end sales charges (loads). Therefore, the table is useful in comparing ongoing costs only, and will not help you determine the relative total costs of owning different funds. In addition, if these transaction costs were included, your costs would have been higher.
| Based on actual total return1 | Based on hypothetical total return1 | |||||||||||||||||||||||||||||||||||||||||||||
| Actual Total Return Without Sales Charge2 |
Beginning Account Value |
Ending Account Value |
Annualized Expense Ratio3 |
Expenses Paid During the Period4 |
Hypothetical Annualized Total Return |
Beginning Account Value |
Ending Account Value |
Annualized Expense Ratio3 |
Expenses Paid During the Period4 |
|||||||||||||||||||||||||||||||||||||
| Class A | 7.53 | % | $ | 1,000.00 | $ | 1,075.30 | 1.30 | % | $ | 6.73 | Class A | 5.00 | % | $ | 1,000.00 | $ | 1,018.45 | 1.30 | % | $ | 6.54 | |||||||||||||||||||||||||
| Class C | 8.55 | 1,000.00 | 1,085.50 | 2.06 | 10.71 | Class C | 5.00 | 1,000.00 | 1,014.66 | 2.06 | 10.35 | |||||||||||||||||||||||||||||||||||
| Class I | 7.68 | 1,000.00 | 1,076.80 | 1.05 | 5.44 | Class I | 5.00 | 1,000.00 | 1,019.70 | 1.05 | 5.29 | |||||||||||||||||||||||||||||||||||
| Class IS | 7.69 | 1,000.00 | 1,076.90 | 0.95 | 4.92 | Class IS | 5.00 | 1,000.00 | 1,020.19 | 0.95 | 4.78 | |||||||||||||||||||||||||||||||||||
|
2 |
Franklin Strategic Real Return Fund 2022 Semi-Annual Report |
| 1 | For the six months ended March 31, 2022. |
| 2 | Assumes the reinvestment of all distributions, including returns of capital, if any, at net asset value and does not reflect the deduction of the applicable sales charge with respect to Class A shares or the applicable contingent deferred sales charge (“CDSC”) with respect to Class C shares. Total return is not annualized, as it may not be representative of the total return for the year. Performance figures may reflect compensating balance arrangements, fee waivers and/or expense reimbursements. In the absence of compensating balance arrangements, fee waivers and/or expense reimbursements, the total return would have been lower. Past performance is no guarantee of future results. |
| 3 | Does not include fees and expenses of the Underlying Funds in which the Fund invests. |
| 4 | Expenses (net of compensating balance arrangements, fee waivers and/or expense reimbursements) are equal to each class’ respective annualized expense ratio multiplied by the average account value over the period, multiplied by the number of days in the most recent fiscal half-year (182), then divided by 365. |
| Franklin Strategic Real Return Fund 2022 Semi-Annual Report |
3 |
Consolidated schedule of investments (unaudited)
March 31, 2022
Franklin Strategic Real Return Fund
(Percentages shown based on Fund net assets)
| Security | Rate | Maturity Date |
Face Amount† |
Value | ||||||||||||
| U.S. Treasury Inflation Protected Securities — 38.9% | ||||||||||||||||
| U.S. Treasury Bonds, Inflation Indexed |
2.500 | % | 1/15/29 | 1,309,490 | $ | 1,596,062 | ||||||||||
| U.S. Treasury Bonds, Inflation Indexed |
3.875 | % | 4/15/29 | 2,223,286 | 2,941,128 | |||||||||||
| U.S. Treasury Bonds, Inflation Indexed |
2.125 | % | 2/15/40 | 494,293 | 699,603 | |||||||||||
| U.S. Treasury Bonds, Inflation Indexed |
0.750 | % | 2/15/42 | 2,612,883 | 2,988,996 | |||||||||||
| U.S. Treasury Bonds, Inflation Indexed |
1.375 | % | 2/15/44 | 3,341,562 | 4,288,119 | |||||||||||
| U.S. Treasury Bonds, Inflation Indexed |
0.250 | % | 2/15/50 | 601,458 | 632,543 | |||||||||||
| U.S. Treasury Notes, Inflation Indexed |
0.625 | % | 4/15/23 | 2,716,488 | 2,832,556 | |||||||||||
| U.S. Treasury Notes, Inflation Indexed |
0.375 | % | 7/15/23 | 2,416,220 | 2,536,514 | |||||||||||
| U.S. Treasury Notes, Inflation Indexed |
0.625 | % | 1/15/24 | 2,650,846 | 2,788,499 | |||||||||||
| U.S. Treasury Notes, Inflation Indexed |
0.500 | % | 4/15/24 | 1,660,963 | 1,746,056 | |||||||||||
| U.S. Treasury Notes, Inflation Indexed |
0.125 | % | 4/15/25 | 424,495 | 443,833 | |||||||||||
| U.S. Treasury Notes, Inflation Indexed |
0.625 | % | 1/15/26 | 6,129,131 | 6,536,576 | |||||||||||
| U.S. Treasury Notes, Inflation Indexed |
0.125 | % | 4/15/26 | 3,537,798 | 3,699,326 | |||||||||||
| U.S. Treasury Notes, Inflation Indexed |
0.125 | % | 10/15/26 | 1,440,418 | 1,514,760 | |||||||||||
| U.S. Treasury Notes, Inflation Indexed |
0.750 | % | 7/15/28 | 560,020 | 612,813 | |||||||||||
| U.S. Treasury Notes, Inflation Indexed |
0.875 | % | 1/15/29 | 5,344,560 | 5,904,544 | |||||||||||
| U.S. Treasury Notes, Inflation Indexed |
0.250 | % | 7/15/29 | 769,384 | 821,884 | |||||||||||
| U.S. Treasury Notes, Inflation Indexed |
0.125 | % | 1/15/30 | 1,857,675 | 1,962,317 | |||||||||||
| U.S. Treasury Notes, Inflation Indexed |
0.125 | % | 1/15/32 | 1,115,653 | 1,187,608 | |||||||||||
| Total U.S. Treasury Inflation Protected Securities (Cost — $44,755,410) |
|
45,733,737 | ||||||||||||||
| Shares | ||||||||||||||||
| Common Stocks — 21.1% | ||||||||||||||||
| Communication Services — 1.6% | ||||||||||||||||
| Diversified Telecommunication Services — 0.1% |
||||||||||||||||
| LG Uplus Corp. |
12,100 | 139,421 | (a) | |||||||||||||
| Entertainment — 0.5% |
||||||||||||||||
| Activision Blizzard Inc. |
1,738 | 139,231 | ||||||||||||||
| Electronic Arts Inc. |
970 | 122,715 | ||||||||||||||
| NetEase Inc., ADR |
1,430 | 128,256 | ||||||||||||||
| Nintendo Co. Ltd. |
300 | 151,369 | (a) | |||||||||||||
| Total Entertainment |
541,571 | |||||||||||||||
| Interactive Media & Services — 0.8% |
||||||||||||||||
| Alphabet Inc., Class A Shares |
153 | 425,546 | * | |||||||||||||
| Alphabet Inc., Class C Shares |
140 | 391,019 | * | |||||||||||||
| Auto Trader Group PLC |
14,233 | 117,823 | (a) | |||||||||||||
| Meta Platforms Inc., Class A Shares |
286 | 63,595 | * | |||||||||||||
| Total Interactive Media & Services |
997,983 | |||||||||||||||
See Notes to Consolidated Financial Statements.
|
4 |
Franklin Strategic Real Return Fund 2022 Semi-Annual Report |
Franklin Strategic Real Return Fund
(Percentages shown based on Fund net assets)
| Security | Shares | Value | ||||||||||||||
| Wireless Telecommunication Services — 0.2% |
||||||||||||||||
| MTN Group Ltd. |
15,200 | $ | 196,951 | (a) | ||||||||||||
| Total Communication Services |
1,875,926 | |||||||||||||||
| Consumer Discretionary — 1.9% | ||||||||||||||||
| Automobiles — 0.1% |
||||||||||||||||
| Kia Corp. |
2,600 | 157,903 | (a) | |||||||||||||
| Hotels, Restaurants & Leisure — 0.2% |
||||||||||||||||
| Jack in the Box Inc. |
1,195 | 111,625 | ||||||||||||||
| Yum! Brands Inc. |
1,142 | 135,361 | ||||||||||||||
| Total Hotels, Restaurants & Leisure |
246,986 | |||||||||||||||
| Household Durables — 0.1% |
||||||||||||||||
| PulteGroup Inc. |
3,600 | 150,840 | ||||||||||||||
| Internet & Direct Marketing Retail — 0.4% |
||||||||||||||||
| Amazon.com Inc. |
85 | 277,096 | * | |||||||||||||
| eBay Inc. |
2,100 | 120,246 | ||||||||||||||
| Total Internet & Direct Marketing Retail |
397,342 | |||||||||||||||
| Multiline Retail — 0.2% |
||||||||||||||||
| Canadian Tire Corp. Ltd., Class A Shares |
800 | 120,792 | ||||||||||||||
| Target Corp. |
720 | 152,798 | ||||||||||||||
| Total Multiline Retail |
273,590 | |||||||||||||||
| Specialty Retail — 0.6% |
||||||||||||||||
| AutoZone Inc. |
75 | 153,344 | * | |||||||||||||
| Home Depot Inc. |
600 | 179,598 | ||||||||||||||
| Lowe’s Cos. Inc. |
960 | 194,102 | ||||||||||||||
| TJX Cos. Inc. |
2,500 | 151,450 | ||||||||||||||
| Total Specialty Retail |
678,494 | |||||||||||||||
| Textiles, Apparel & Luxury Goods — 0.3% |
||||||||||||||||
| Deckers Outdoor Corp. |
300 | 82,131 | * | |||||||||||||
| Pandora A/S |
1,738 | 164,432 | (a) | |||||||||||||
| Under Armour Inc., Class A Shares |
5,200 | 88,504 | * | |||||||||||||
| Total Textiles, Apparel & Luxury Goods |
335,067 | |||||||||||||||
| Total Consumer Discretionary |
2,240,222 | |||||||||||||||
| Consumer Staples — 1.6% | ||||||||||||||||
| Beverages — 0.3% |
||||||||||||||||
| Remy Cointreau SA |
750 | 154,526 | (a) | |||||||||||||
| Treasury Wine Estates Ltd. |
15,600 | 133,626 | (a) | |||||||||||||
| Total Beverages |
288,152 | |||||||||||||||
| Food & Staples Retailing — 0.6% |
||||||||||||||||
| George Weston Ltd. |
1,300 | 160,089 | ||||||||||||||
| Kroger Co. |
2,900 | 166,373 | ||||||||||||||
See Notes to Consolidated Financial Statements.
| Franklin Strategic Real Return Fund 2022 Semi-Annual Report |
5 |
Consolidated schedule of investments (unaudited) (cont’d)
March 31, 2022
Franklin Strategic Real Return Fund
(Percentages shown based on Fund net assets)
| Security | Shares | Value | ||||||||||||||
| Food & Staples Retailing — continued |
||||||||||||||||
| Walgreens Boots Alliance Inc. |
3,800 | $170,126 | ||||||||||||||
| Walmart Inc. |
1,600 | 238,272 | ||||||||||||||
| Total Food & Staples Retailing |
734,860 | |||||||||||||||
| Food Products — 0.3% |
||||||||||||||||
| Hershey Co. |
650 | 140,809 | ||||||||||||||
| Ingredion Inc. |
1,017 | 88,632 | ||||||||||||||
| JBS SA |
17,000 | 133,863 | ||||||||||||||
| Total Food Products |
363,304 | |||||||||||||||
| Household Products — 0.2% |
||||||||||||||||
| Procter & Gamble Co. |
1,229 | 187,791 | ||||||||||||||
| Tobacco — 0.2% |
||||||||||||||||
| Japan Tobacco Inc. |
6,300 | 107,844 | (a) | |||||||||||||
| Swedish Match AB |
19,000 | 142,919 | (a) | |||||||||||||
| Total Tobacco |
250,763 | |||||||||||||||
| Total Consumer Staples |
1,824,870 | |||||||||||||||
| Energy — 1.8% | ||||||||||||||||
| Oil, Gas & Consumable Fuels — 1.8% |
||||||||||||||||
| BP PLC |
42,000 | 205,255 | (a) | |||||||||||||
| China Shenhua Energy Co. Ltd., Class H Shares |
54,500 | 173,839 | (a) | |||||||||||||
| ENEOS Holdings Inc. |
29,000 | 108,997 | (a) | |||||||||||||
| EOG Resources Inc. |
1,740 | 207,460 | ||||||||||||||
| Exxon Mobil Corp. |
3,700 | 305,583 | ||||||||||||||
| Lundin Energy AB |
4,200 | 178,057 | (a) | |||||||||||||
| Marathon Petroleum Corp. |
2,300 | 196,650 | ||||||||||||||
| PetroChina Co. Ltd., Class H Shares |
280,000 | 143,388 | (a) | |||||||||||||
| Phillips 66 |
2,100 | 181,419 | ||||||||||||||
| Shell PLC |
8,900 | 244,250 | (a) | |||||||||||||
| Valero Energy Corp. |
1,700 | 172,618 | ||||||||||||||
| Total Energy |
2,117,516 | |||||||||||||||
| Financials — 1.9% | ||||||||||||||||
| Banks — 0.8% |
||||||||||||||||
| Bank of America Corp. |
1,930 | 79,555 | ||||||||||||||
| Citigroup Inc. |
2,433 | 129,922 | ||||||||||||||
| Comerica Inc. |
1,800 | 162,774 | ||||||||||||||
| JPMorgan Chase & Co. |
600 | 81,792 | ||||||||||||||
| Lloyds Banking Group PLC |
189,203 | 115,830 | (a) | |||||||||||||
| Postal Savings Bank of China Co. Ltd., Class H Shares |
129,000 | 104,148 | (a) | |||||||||||||
| Wells Fargo & Co. |
4,400 | 213,224 | ||||||||||||||
| Total Banks |
887,245 | |||||||||||||||
See Notes to Consolidated Financial Statements.
|
6 |
Franklin Strategic Real Return Fund 2022 Semi-Annual Report |
Franklin Strategic Real Return Fund
(Percentages shown based on Fund net assets)
| Security | Shares | Value | ||||||||||||||
| Capital Markets — 0.2% |
||||||||||||||||
| Ameriprise Financial Inc. |
438 | $ | 131,557 | |||||||||||||
| CI Financial Corp. |
8,000 | 127,089 | ||||||||||||||
| Total Capital Markets |
258,646 | |||||||||||||||
| Consumer Finance — 0.4% |
||||||||||||||||
| Capital One Financial Corp. |
1,083 | 142,187 | ||||||||||||||
| Discover Financial Services |
1,606 | 176,965 | ||||||||||||||
| Synchrony Financial |
4,300 | 149,683 | ||||||||||||||
| Total Consumer Finance |
468,835 | |||||||||||||||
| Insurance — 0.5% |
||||||||||||||||
| Allianz SE, Registered Shares |
829 | 197,961 | (a) | |||||||||||||
| Allstate Corp. |
1,520 | 210,535 | ||||||||||||||
| Legal & General Group PLC |
29,298 | 103,887 | (a) | |||||||||||||
| Prudential Financial Inc. |
1,139 | 134,596 | ||||||||||||||
| Total Insurance |
646,979 | |||||||||||||||
| Total Financials |
2,261,705 | |||||||||||||||
| Health Care — 2.4% | ||||||||||||||||
| Biotechnology — 0.5% |
||||||||||||||||
| Biogen Inc. |
488 | 102,773 | * | |||||||||||||
| Regeneron Pharmaceuticals Inc. |
329 | 229,780 | * | |||||||||||||
| Vertex Pharmaceuticals Inc. |
810 | 211,385 | * | |||||||||||||
| Total Biotechnology |
543,938 | |||||||||||||||
| Health Care Equipment & Supplies — 0.1% |
||||||||||||||||
| Masimo Corp. |
711 | 103,479 | * | |||||||||||||
| Health Care Providers & Services — 1.1% |
||||||||||||||||
| Anthem Inc. |
480 | 235,786 | ||||||||||||||
| Cardinal Health Inc. |
2,000 | 113,400 | ||||||||||||||
| HCA Healthcare Inc. |
860 | 215,533 | ||||||||||||||
| McKesson Corp. |
700 | 214,291 | ||||||||||||||
| Molina Healthcare Inc. |
600 | 200,154 | * | |||||||||||||
| UnitedHealth Group Inc. |
700 | 356,979 | ||||||||||||||
| Total Health Care Providers & Services |
1,336,143 | |||||||||||||||
| Life Sciences Tools & Services — 0.1% |
||||||||||||||||
| Bio-Rad Laboratories Inc., Class A Shares |
260 | 146,440 | * | |||||||||||||
| Pharmaceuticals — 0.6% |
||||||||||||||||
| Novo Nordisk A/S, Class B Shares |
1,987 | 220,054 | (a) | |||||||||||||
| Ono Pharmaceutical Co. Ltd. |
6,400 | 160,733 | (a) | |||||||||||||
| Pfizer Inc. |
4,300 | 222,611 | ||||||||||||||
| Shionogi & Co. Ltd. |
1,900 | 116,686 | (a) | |||||||||||||
| Total Pharmaceuticals |
720,084 | |||||||||||||||
| Total Health Care |
2,850,084 | |||||||||||||||
See Notes to Consolidated Financial Statements.
| Franklin Strategic Real Return Fund 2022 Semi-Annual Report |
7 |
Consolidated schedule of investments (unaudited) (cont’d)
March 31, 2022
Franklin Strategic Real Return Fund
(Percentages shown based on Fund net assets)
| Security | Shares | Value | ||||||
| Industrials — 3.1% | ||||||||
| Air Freight & Logistics — 0.3% |
||||||||
| Deutsche Post AG, Registered Shares |
2,600 | $124,848 | (a) | |||||
| United Parcel Service Inc., Class B Shares |
880 | 188,725 | ||||||
| Total Air Freight & Logistics |
313,573 | |||||||
| Airlines — 0.1% |
||||||||
| Southwest Airlines Co. |
3,400 | 155,720 * | ||||||
| Building Products — 0.2% |
||||||||
| Lennox International Inc. |
600 | 154,716 | ||||||
| Masco Corp. |
2,900 | 147,900 | ||||||
| Total Building Products |
302,616 | |||||||
| Electrical Equipment — 0.1% |
||||||||
| ABB Ltd., Registered Shares |
4,100 | 132,649 (a) | ||||||
| Industrial Conglomerates — 0.3% |
||||||||
| 3M Co. |
1,200 | 178,656 | ||||||
| CITIC Ltd. |
65,000 | 72,035 | (a) | |||||
| LG Corp. |
1,167 | 73,265 | (a) | |||||
| Total Industrial Conglomerates |
323,956 | |||||||
| Machinery — 0.8% |
||||||||
| Caterpillar Inc. |
940 | 209,451 | ||||||
| CNH Industrial NV |
9,000 | 142,507 | (a) | |||||
| Cummins Inc. |
843 | 172,908 | ||||||
| Deere & Co. |
500 | 207,730 | ||||||
| GEA Group AG |
3,100 | 128,081 | (a) | |||||
| Zoomlion Heavy Industry Science and Technology Co. Ltd., Class H Shares |
125,200 | 79,275 | (a) | |||||
| Total Machinery |
939,952 | |||||||
| Marine — 0.3% |
||||||||
| A.P. Moller - Maersk A/S, Class B Shares |
53 | 159,750 | (a) | |||||
| Evergreen Marine Corp. Ltd. |
33,000 | 154,326 | (a) | |||||
| Total Marine |
314,076 | |||||||
| Professional Services — 0.2% |
||||||||
| ManpowerGroup Inc. |
1,200 | 112,704 | ||||||
| Wolters Kluwer NV |
1,617 | 172,129 | (a) | |||||
| Total Professional Services |
284,833 | |||||||
| Trading Companies & Distributors — 0.8% |
||||||||
| Marubeni Corp. |
17,700 | 206,498 | (a) | |||||
| Mitsubishi Corp. |
4,600 | 173,319 | (a) | |||||
| Mitsui & Co. Ltd. |
5,600 | 152,542 | (a) | |||||
See Notes to Consolidated Financial Statements.
|
8 |
Franklin Strategic Real Return Fund 2022 Semi-Annual Report |
Franklin Strategic Real Return Fund
(Percentages shown based on Fund net assets)
| Security | Shares | Value | ||||||||||||||
| Trading Companies & Distributors — continued |
||||||||||||||||
| Sumitomo Corp. |
10,800 | $ | 187,277 | (a) | ||||||||||||
| W.W. Grainger Inc. |
332 | 171,242 | ||||||||||||||
| Total Trading Companies & Distributors |
890,878 | |||||||||||||||
| Total Industrials |
3,658,253 | |||||||||||||||
| Information Technology — 4.3% | ||||||||||||||||
| Communications Equipment — 0.2% |
||||||||||||||||
| Cisco Systems Inc. |
4,008 | 223,486 | ||||||||||||||
| IT Services — 0.3% |
||||||||||||||||
| Adyen NV |
47 | 92,852 | *(a) | |||||||||||||
| CGI Inc. |
1,600 | 127,460 | * | |||||||||||||
| Gartner Inc. |
600 | 178,476 | * | |||||||||||||
| Total IT Services |
398,788 | |||||||||||||||
| Semiconductors & Semiconductor Equipment — 1.4% |
||||||||||||||||
| Advanced Micro Devices Inc. |
1,800 | 196,812 | * | |||||||||||||
| Applied Materials Inc. |
1,600 | 210,880 | ||||||||||||||
| ASM International NV |
482 | 174,725 | (a) | |||||||||||||
| ASML Holding NV |
415 | 276,805 | (a) | |||||||||||||
| KLA Corp. |
522 | 191,083 | ||||||||||||||
| MediaTek Inc. |
4,000 | 124,716 | (a) | |||||||||||||
| Powertech Technology Inc. |
38,000 | 125,419 | (a) | |||||||||||||
| QUALCOMM Inc. |
1,235 | 188,733 | ||||||||||||||
| United Microelectronics Corp. |
94,000 | 173,594 | (a) | |||||||||||||
| Total Semiconductors & Semiconductor Equipment |
1,662,767 | |||||||||||||||
| Software — 1.1% |
||||||||||||||||
| Check Point Software Technologies Ltd. |
1,224 | 169,230 | * | |||||||||||||
| Fortinet Inc. |
600 | 205,044 | * | |||||||||||||
| Microsoft Corp. |
2,982 | 919,381 | ||||||||||||||
| Total Software |
1,293,655 | |||||||||||||||
| Technology Hardware, Storage & Peripherals — 1.3% |
||||||||||||||||
| Apple Inc. |
6,538 | 1,141,600 | ||||||||||||||
| Logitech International SA, Registered Shares |
1,300 | 96,345 | (a) | |||||||||||||
| Samsung Electronics Co. Ltd. |
3,826 | 218,570 | (a) | |||||||||||||
| Total Technology Hardware, Storage & Peripherals |
1,456,515 | |||||||||||||||
| Total Information Technology |
5,035,211 | |||||||||||||||
| Materials — 1.9% | ||||||||||||||||
| Chemicals — 0.3% |
||||||||||||||||
| Huntsman Corp. |
4,912 | 184,249 | ||||||||||||||
| LyondellBasell Industries NV, Class A Shares |
1,700 | 174,794 | ||||||||||||||
| Total Chemicals |
359,043 | |||||||||||||||
See Notes to Consolidated Financial Statements.
| Franklin Strategic Real Return Fund 2022 Semi-Annual Report |
9 |
Consolidated schedule of investments (unaudited) (cont’d)
March 31, 2022
Franklin Strategic Real Return Fund
(Percentages shown based on Fund net assets)
| Security | Shares | Value | ||||||||||||||
| Metals & Mining — 1.5% |
||||||||||||||||
| Anglo American Platinum Ltd. |
1,016 | $ | 139,518 | (a) | ||||||||||||
| BHP Group Ltd. |
4,650 | 178,281 | (a) | |||||||||||||
| First Quantum Minerals Ltd. |
4,700 | 162,713 | ||||||||||||||
| Fortescue Metals Group Ltd. |
11,700 | 179,546 | (a) | |||||||||||||
| Glencore PLC |
27,300 | 177,416 | (a) | |||||||||||||
| Nucor Corp. |
1,425 | 211,826 | ||||||||||||||
| POSCO Holdings Inc. |
500 | 120,086 | (a) | |||||||||||||
| Rio Tinto PLC |
2,750 | 218,146 | (a) | |||||||||||||
| Teck Resources Ltd., Class B Shares |
4,100 | 165,555 | ||||||||||||||
| Vale SA |
9,800 | 196,616 | ||||||||||||||
| Total Metals & Mining |
1,749,703 | |||||||||||||||
| Paper & Forest Products — 0.1% |
||||||||||||||||
| Louisiana-Pacific Corp. |
2,600 | 161,512 | ||||||||||||||
| Total Materials |
2,270,258 | |||||||||||||||
| Real Estate — 0.6% | ||||||||||||||||
| Equity Real Estate Investment Trusts (REITs) — 0.4% |
||||||||||||||||
| Host Hotels & Resorts Inc. |
7,400 | 143,782 | ||||||||||||||
| Klepierre SA |
5,300 | 140,917 | (a) | |||||||||||||
| Stockland |
40,000 | 126,266 | (a) | |||||||||||||
| Total Equity Real Estate Investment Trusts (REITs) |
410,965 | |||||||||||||||
| Real Estate Management & Development — 0.2% |
||||||||||||||||
| Daito Trust Construction Co. Ltd. |
1,300 | 137,930 | (a) | |||||||||||||
| Sun Hung Kai Properties Ltd. |
8,500 | 101,253 | (a) | |||||||||||||
| Total Real Estate Management & Development |
239,183 | |||||||||||||||
| Total Real Estate |
650,148 | |||||||||||||||
| Total Common Stocks (Cost — $17,532,478) |
24,784,193 | |||||||||||||||
| Investments in Underlying Funds — 8.3% | ||||||||||||||||
| Vanguard Real Estate ETF (Cost — $3,718,134) |
90,565 | 9,814,529 | ||||||||||||||
| Rate | Maturity Date |
Face Amount† |
||||||||||||||
| Corporate Bonds & Notes — 2.0% | ||||||||||||||||
| Energy — 1.0% | ||||||||||||||||
| Energy Equipment & Services — 0.0%†† |
||||||||||||||||
| Halliburton Co., Senior Notes |
3.800 | % | 11/15/25 | 2,000 | 2,045 | |||||||||||
| Oil, Gas & Consumable Fuels — 1.0% |
||||||||||||||||
| Apache Corp., Senior Notes |
2.625 | % | 1/15/23 | 29,000 | 28,950 | |||||||||||
| Apache Corp., Senior Notes |
4.750 | % | 4/15/43 | 60,000 | 56,829 | |||||||||||
| BP Capital Markets America Inc., Senior Notes |
3.588 | % | 4/14/27 | 240,000 | 243,818 | |||||||||||
| Devon Energy Corp., Senior Notes |
5.850 | % | 12/15/25 | 230,000 | 249,130 | |||||||||||
See Notes to Consolidated Financial Statements.
|
10 |
Franklin Strategic Real Return Fund 2022 Semi-Annual Report |
Franklin Strategic Real Return Fund
(Percentages shown based on Fund net assets)
| Security | Rate | Maturity Date |
Face Amount† |
Value | ||||||||||||
| Oil, Gas & Consumable Fuels — continued |
||||||||||||||||
| Energy Transfer LP, Senior Notes |
2.900 | % | 5/15/25 | 20,000 | $ | 19,584 | ||||||||||
| Enterprise Products Operating LLC, Senior Notes |
3.125 | % | 7/31/29 | 120,000 | 117,973 | |||||||||||
| Enterprise Products Operating LLC, Senior Notes |
2.800 | % | 1/31/30 | 60,000 | 57,750 | |||||||||||
| Exxon Mobil Corp., Senior Notes |
3.043 | % | 3/1/26 | 50,000 | 50,505 | |||||||||||
| Kinder Morgan Inc., Senior Notes |
4.300 | % | 6/1/25 | 80,000 | 82,253 | |||||||||||
| Occidental Petroleum Corp., Senior Notes |
5.550 | % | 3/15/26 | 40,000 | 42,447 | |||||||||||
| Occidental Petroleum Corp., Senior Notes |
3.000 | % | 2/15/27 | 60,000 | 58,775 | |||||||||||
| Occidental Petroleum Corp., Senior Notes |
3.500 | % | 8/15/29 | 50,000 | 49,335 | |||||||||||
| Transcontinental Gas Pipe Line Co. LLC, Senior Notes |
7.850 | % | 2/1/26 | 80,000 | 91,787 | |||||||||||
| Western Midstream Operating LP, Senior Notes |
3.600 | % | 2/1/25 | 30,000 | 29,844 | |||||||||||
| Total Oil, Gas & Consumable Fuels |
1,178,980 | |||||||||||||||
| Total Energy |
1,181,025 | |||||||||||||||
| Materials — 1.0% | ||||||||||||||||
| Metals & Mining — 0.8% |
||||||||||||||||
| Anglo American Capital PLC, Senior Notes |
4.000 | % | 9/11/27 | 200,000 | 200,744 | (b) | ||||||||||
| Antofagasta PLC, Senior Notes |
2.375 | % | 10/14/30 | 200,000 | 177,399 | (b) | ||||||||||
| ArcelorMittal SA, Senior Notes |
7.000 | % | 10/15/39 | 50,000 | 58,812 | |||||||||||
| Glencore Funding LLC, Senior Notes |
4.125 | % | 3/12/24 | 40,000 | 40,568 | (b) | ||||||||||
| Glencore Funding LLC, Senior Notes |
4.000 | % | 3/27/27 | 50,000 | 50,229 | (b) | ||||||||||
| Glencore Funding LLC, Senior Notes |
3.875 | % | 10/27/27 | 90,000 | 89,856 | (b) | ||||||||||
| Southern Copper Corp., Senior Notes |
5.250 | % | 11/8/42 | 220,000 | 249,346 | |||||||||||
| Teck Resources Ltd., Senior Notes |
3.750 | % | 2/1/23 | 40,000 | 40,102 | |||||||||||
| Vale Overseas Ltd., Senior Notes |
6.250 | % | 8/10/26 | 50,000 | 54,946 | |||||||||||
| Total Metals & Mining |
962,002 | |||||||||||||||
| Paper & Forest Products — 0.2% |
||||||||||||||||
| Inversiones CMPC SA, Senior Notes |
4.375 | % | 4/4/27 | 200,000 | 209,595 | (c) | ||||||||||
| Total Materials |
1,171,597 | |||||||||||||||
| Total Corporate Bonds & Notes (Cost — $2,313,497) |
|
2,352,622 | ||||||||||||||
| Non-U.S. Treasury Inflation Protected Securities — 0.8% |
|
|||||||||||||||
| Canada — 0.8% |
||||||||||||||||
| Canadian Government Real Return Bond |
4.250 | % | 12/1/26 | 661,764 | CAD | 647,297 | ||||||||||
| Canadian Government Real Return Bond |
1.500 | % | 12/1/44 | 175,969 | CAD | 167,974 | ||||||||||
| Canadian Government Real Return Bond |
0.500 | % | 12/1/50 | 134,158 | CAD | 106,177 | ||||||||||
| Total Non-U.S. Treasury Inflation Protected Securities (Cost — $953,012) |
|
921,448 | ||||||||||||||
| Sovereign Bonds — 0.5% | ||||||||||||||||
| Indonesia — 0.2% |
||||||||||||||||
| Indonesia Government International Bond, Senior Notes |
4.750 | % | 2/11/29 | 200,000 | 221,560 | |||||||||||
See Notes to Consolidated Financial Statements.
| Franklin Strategic Real Return Fund 2022 Semi-Annual Report |
11 |
Consolidated schedule of investments (unaudited) (cont’d)
March 31, 2022
Franklin Strategic Real Return Fund
(Percentages shown based on Fund net assets)
| Security |
Rate | Maturity Date |
Face Amount† |
Value | ||||||||||||
| Peru — 0.1% |
||||||||||||||||
| Peruvian Government International Bond, Senior Notes |
2.783 | % | 1/23/31 | 160,000 | $ | 151,040 | ||||||||||
| United Arab Emirates — 0.2% |
||||||||||||||||
| Abu Dhabi Government International Bond, Senior Notes |
2.500 | % | 9/30/29 | 200,000 | 196,408 | (b) | ||||||||||
| Total Sovereign Bonds (Cost — $580,952) |
|
569,008 | ||||||||||||||
| Total Investments before Short-Term Investments (Cost — $69,853,483) |
|
84,175,537 | ||||||||||||||
| Shares | ||||||||||||||||
| Short-Term Investments — 26.1% | ||||||||||||||||
| Dreyfus Government Cash Management, Institutional Shares |
0.201 | % | 1,523,795 | 1,523,795 | ||||||||||||
| Invesco Government & Agency Portfolio, Institutional Class |
0.262 | % | 28,630,751 | 28,630,751 | ||||||||||||
| Invesco Treasury Portfolio, Institutional Class |
0.172 | % | 466,682 | 466,682 | ||||||||||||
| Total Short-Term Investments (Cost — $30,621,228) |
|
30,621,228 | ||||||||||||||
| Total Investments — 97.7% (Cost — $100,474,711) |
|
114,796,765 | ||||||||||||||
| Other Assets in Excess of Liabilities — 2.3% |
2,649,019 | |||||||||||||||
| Total Net Assets — 100.0% |
$ | 117,445,784 | ||||||||||||||
| † | Face amount denominated in U.S. dollars, unless otherwise noted. |
| †† | Represents less than 0.1%. |
| * | Non-income producing security. |
| (a) | Security is valued in good faith in accordance with procedures approved by the Board of Trustees (Note 1). |
| (b) | Security is exempt from registration under Rule 144A of the Securities Act of 1933. This security may be resold in transactions that are exempt from registration, normally to qualified institutional buyers. This security has been deemed liquid pursuant to guidelines approved by the Board of Trustees. |
| (c) | Security is exempt from registration under Regulation S of the Securities Act of 1933. Regulation S applies to securities offerings that are made outside of the United States and do not involve direct selling efforts in the United States. This security has been deemed liquid pursuant to guidelines approved by the Board of Trustees. |
| Abbreviation(s) used in this schedule: | ||
| ADR | — American Depositary Receipts | |
| CAD | — Canadian Dollar | |
| ETF | — Exchange-Traded Fund | |
See Notes to Consolidated Financial Statements.
|
12 |
Franklin Strategic Real Return Fund 2022 Semi-Annual Report |
Franklin Strategic Real Return Fund
At March 31, 2022, the Fund had the following open futures contracts:
| Number of Contracts |
Expiration Date |
Notional Amount |
Market Value |
Unrealized Appreciation (Depreciation) |
||||||||||||||||
| Contracts to Buy: | ||||||||||||||||||||
| E-mini S&P 500 Index | 26 | 6/22 | $ | 5,768,592 | $ | 5,889,975 | $ | 121,383 | ||||||||||||
| S&P GSCI | 129 | 4/22 | 26,406,693 | 23,390,925 | (3,015,768) | |||||||||||||||
| U.S. Treasury 5-Year Notes | 14 | 6/22 | 1,647,357 | 1,605,625 | (41,732) | |||||||||||||||
| U.S. Treasury 10-Year Notes | 14 | 6/22 | 1,729,297 | 1,720,250 | (9,047) | |||||||||||||||
| U.S. Treasury Ultra Long- Term Bonds | 2 | 6/22 | 346,066 | 354,250 | 8,184 | |||||||||||||||
| Net unrealized depreciation on open futures contracts |
|
$ | (2,936,980) | |||||||||||||||||
At March 31, 2022, the Fund had the following open forward foreign currency contracts:
| Currency Purchased |
Currency Sold |
Counterparty | Settlement Date |
Unrealized Appreciation |
||||||||||||||||
| AUD | 3,939,000 | USD | 2,883,517 | Bank of New York | 4/8/22 | $ | 64,286 | |||||||||||||
| JPY | 27,200,000 | USD | 229,185 | Bank of New York | 4/8/22 | (5,728) | ||||||||||||||
| USD | 870,200 | EUR | 784,000 | Bank of New York | 4/8/22 | 2,709 | ||||||||||||||
| AUD | 5,184,000 | USD | 3,867,245 | Citibank N.A. | 4/8/22 | 12,270 | ||||||||||||||
| CAD | 2,313,000 | USD | 1,815,888 | Citibank N.A. | 4/8/22 | 34,255 | ||||||||||||||
| CAD | 6,776,000 | USD | 5,319,697 | Citibank N.A. | 4/8/22 | 100,350 | ||||||||||||||
| CHF | 8,221,000 | USD | 8,800,685 | Citibank N.A. | 4/8/22 | 98,263 | ||||||||||||||
| JPY | 379,000,000 | USD | 3,140,451 | Citibank N.A. | 4/8/22 | (26,847) | ||||||||||||||
| SEK | 13,450,000 | USD | 1,357,842 | Citibank N.A. | 4/8/22 | 72,838 | ||||||||||||||
| SEK | 17,000,000 | USD | 1,792,815 | Citibank N.A. | 4/8/22 | 15,480 | ||||||||||||||
| USD | 939,547 | CAD | 1,205,000 | Citibank N.A. | 4/8/22 | (24,319) | ||||||||||||||
| USD | 4,540,947 | SEK | 44,980,000 | Citibank N.A. | 4/8/22 | (243,588) | ||||||||||||||
| AUD | 3,114,000 | USD | 2,295,044 | HSBC Securities Inc. | 4/8/22 | 35,359 | ||||||||||||||
| CAD | 1,552,000 | USD | 1,226,150 | HSBC Securities Inc. | 4/8/22 | 15,277 | ||||||||||||||
| CHF | 566,000 | USD | 612,034 | HSBC Securities Inc. | 4/8/22 | 642 | ||||||||||||||
| CHF | 664,000 | USD | 708,665 | HSBC Securities Inc. | 4/8/22 | 10,092 | ||||||||||||||
| CHF | 1,123,000 | USD | 1,216,203 | HSBC Securities Inc. | 4/8/22 | (595) | ||||||||||||||
| EUR | 2,141,000 | USD | 2,375,242 | HSBC Securities Inc. | 4/8/22 | (6,240) | ||||||||||||||
| EUR | 3,614,000 | USD | 3,964,883 | HSBC Securities Inc. | 4/8/22 | 33,984 | ||||||||||||||
| EUR | 17,391,000 | USD | 19,007,421 | HSBC Securities Inc. | 4/8/22 | 235,606 | ||||||||||||||
| GBP | 2,153,000 | USD | 2,839,234 | HSBC Securities Inc. | 4/8/22 | (11,142) | ||||||||||||||
| GBP | 3,011,000 | USD | 3,970,708 | HSBC Securities Inc. | 4/8/22 | (15,583) | ||||||||||||||
| JPY | 221,300,000 | USD | 1,921,799 | HSBC Securities Inc. | 4/8/22 | (103,750) | ||||||||||||||
| JPY | 530,700,000 | USD | 4,608,670 | HSBC Securities Inc. | 4/8/22 | (248,803) | ||||||||||||||
| MXN | 46,170,000 | USD | 2,178,247 | HSBC Securities Inc. | 4/8/22 | 139,824 | ||||||||||||||
| NZD | 3,339,000 | USD | 2,288,167 | HSBC Securities Inc. | 4/8/22 | 25,746 | ||||||||||||||
See Notes to Consolidated Financial Statements.
| Franklin Strategic Real Return Fund 2022 Semi-Annual Report |
|
13 |
|
Consolidated schedule of investments (unaudited) (cont’d)
March 31, 2022
Franklin Strategic Real Return Fund
| Currency Purchased |
Currency Sold |
Counterparty | Settlement Date |
Unrealized Appreciation |
||||||||||||||||
| NZD | 4,229,000 | USD | 2,893,214 | HSBC Securities Inc. | 4/8/22 | $ | 37,466 | |||||||||||||
| NZD | 9,051,000 | USD | 6,277,810 | HSBC Securities Inc. | 4/8/22 | (5,504) | ||||||||||||||
| SEK | 26,820,000 | USD | 2,851,611 | HSBC Securities Inc. | 4/8/22 | 1,240 | ||||||||||||||
| USD | 2,304,451 | AUD | 3,134,000 | HSBC Securities Inc. | 4/8/22 | (40,919) | ||||||||||||||
| USD | 4,413,943 | AUD | 5,989,000 | HSBC Securities Inc. | 4/8/22 | (68,004) | ||||||||||||||
| USD | 2,113,985 | CAD | 2,660,000 | HSBC Securities Inc. | 4/8/22 | (13,720) | ||||||||||||||
| USD | 10,235,385 | CHF | 9,451,000 | HSBC Securities Inc. | 4/8/22 | 5,004 | ||||||||||||||
| USD | 5,433,034 | EUR | 4,971,000 | HSBC Securities Inc. | 4/8/22 | (67,345) | ||||||||||||||
| USD | 417,723 | GBP | 317,000 | HSBC Securities Inc. | 4/8/22 | 1,325 | ||||||||||||||
| USD | 771,393 | GBP | 588,000 | HSBC Securities Inc. | 4/8/22 | (979) | ||||||||||||||
| USD | 1,644,590 | GBP | 1,248,000 | HSBC Securities Inc. | 4/8/22 | 5,269 | ||||||||||||||
| USD | 5,421,977 | JPY | 627,500,000 | HSBC Securities Inc. | 4/8/22 | 266,867 | ||||||||||||||
| USD | 952,802 | NOK | 8,380,000 | HSBC Securities Inc. | 4/8/22 | 1,032 | ||||||||||||||
| USD | 4,319,241 | NOK | 37,960,000 | HSBC Securities Inc. | 4/8/22 | 7,880 | ||||||||||||||
| USD | 951,378 | NZD | 1,387,000 | HSBC Securities Inc. | 4/8/22 | (9,807) | ||||||||||||||
| USD | 8,150,096 | NZD | 11,893,000 | HSBC Securities Inc. | 4/8/22 | (91,705) | ||||||||||||||
| NOK | 19,870,000 | USD | 2,203,794 | UBS Securities LLC | 4/8/22 | 52,970 | ||||||||||||||
| NOK | 46,730,000 | USD | 5,182,853 | UBS Securities LLC | 4/8/22 | 124,573 | ||||||||||||||
| SEK | 1,160,000 | USD | 120,116 | UBS Securities LLC | 4/8/22 | 3,274 | ||||||||||||||
| USD | 43,740 | NOK | 390,000 | UBS Securities LLC | 4/8/22 | (555) | ||||||||||||||
| USD | 659,882 | CAD | 840,000 | Goldman Sachs Group Inc. | 4/19/22 | (11,979) | ||||||||||||||
| Total |
|
$ | 406,769 | |||||||||||||||||
| Abbreviation(s) used in this table: | ||
| AUD | — Australian Dollar | |
| CAD | — Canadian Dollar | |
| CHF | — Swiss Franc | |
| EUR | — Euro | |
| GBP | — British Pound | |
| JPY | — Japanese Yen | |
| MXN | — Mexican Peso | |
| NOK | — Norwegian Krone | |
| NZD | — New Zealand Dollar | |
| SEK | — Swedish Krona | |
| USD | — United States Dollar | |
See Notes to Consolidated Financial Statements.
|
14 |
Franklin Strategic Real Return Fund 2022 Semi-Annual Report |
Consolidated statement of assets and liabilities (unaudited)
March 31, 2022
| Assets: | ||||
| Investments, at value (Cost — $100,474,711) |
$ | 114,796,765 | ||
| Foreign currency, at value (Cost — $1,723,390) |
1,731,974 | |||
| Deposits with brokers for open futures contracts |
4,342,657 | |||
| Unrealized appreciation on forward foreign currency contracts |
1,403,881 | |||
| Interest and dividends receivable |
217,006 | |||
| Receivable for Fund shares sold |
202,308 | |||
| Prepaid expenses |
32,982 | |||
| Total Assets |
122,727,573 | |||
| Liabilities: | ||||
| Foreign currency collateral due to brokers for open futures contracts, at value (Cost — $2,050,506) |
2,077,227 | |||
| Payable for securities purchased |
1,070,842 | |||
| Unrealized depreciation on forward foreign currency contracts |
997,112 | |||
| Payable to brokers — net variation margin on open futures contracts |
915,963 | |||
| Payable for Fund shares repurchased |
100,545 | |||
| Investment management fee payable |
21,297 | |||
| Service and/or distribution fees payable |
1,198 | |||
| Trustees’ fees payable |
853 | |||
| Accrued expenses |
96,752 | |||
| Total Liabilities |
5,281,789 | |||
| Total Net Assets | $ | 117,445,784 | ||
| Net Assets: | ||||
| Par value (Note 7) |
$ | 100 | ||
| Paid-in capital in excess of par value |
96,527,782 | |||
| Total distributable earnings (loss) |
20,917,902 | |||
| Total Net Assets | $ | 117,445,784 | ||
See Notes to Consolidated Financial Statements.
| Franklin Strategic Real Return Fund 2022 Semi-Annual Report |
15 |
Consolidated statement of assets and liabilities (unaudited) (cont’d)
March 31, 2022
| Net Assets: | ||||
| Class A |
$7,180,009 | |||
| Class C |
$459,356 | |||
| Class I |
$218,316 | |||
| Class IS |
$109,588,103 | |||
| Shares Outstanding: | ||||
| Class A |
620,960 | |||
| Class C |
40,947 | |||
| Class I |
18,242 | |||
| Class IS |
9,315,845 | |||
| Net Asset Value: | ||||
| Class A (and redemption price) |
$11.56 | |||
| Class C* |
$11.22 | |||
| Class I (and redemption price) |
$11.97 | |||
| Class IS (and redemption price) |
$11.76 | |||
| Maximum Public Offering Price Per Share: | ||||
| Class A (based on maximum initial sales charge of 5.75%) |
$12.27 | |||
| * | Redemption price per share is NAV of Class C shares reduced by a 1.00% CDSC if shares are redeemed within one year from purchase payment (Note 2). |
See Notes to Consolidated Financial Statements.
|
16 |
Franklin Strategic Real Return Fund 2022 Semi-Annual Report |
Consolidated statement of operations (unaudited)
For the Six Months Ended March 31, 2022
| Investment Income: | ||||
| Dividends |
$ | 406,262 | ||
| Interest |
920,652 | |||
| Less: Foreign taxes withheld |
(15,377) | |||
| Total Investment Income |
1,311,537 | |||
| Expenses: | ||||
| Investment management fee (Note 2) |
422,082 | |||
| Fund accounting fees |
58,941 | |||
| Audit and tax fees |
36,134 | |||
| Registration fees |
33,791 | |||
| Legal fees |
17,880 | |||
| Commodity pool reports |
5,994 | |||
| Shareholder reports |
4,718 | |||
| Trustees’ fees |
3,887 | |||
| Service and/or distribution fees (Notes 2 and 5) |
3,391 | |||
| Transfer agent fees (Note 5) |
2,317 | |||
| Custody fees |
1,150 | |||
| Interest expense |
900 | |||
| Insurance |
416 | |||
| Fees recaptured by investment manager (Note 2) |
151 | |||
| Miscellaneous expenses |
5,609 | |||
| Total Expenses |
597,361 | |||
| Less: Fee waivers and/or expense reimbursements (Notes 2 and 5) |
(59,155) | |||
| Net Expenses |
538,206 | |||
| Net Investment Income | 773,331 | |||
| Realized and Unrealized Gain (Loss) on Investments, Futures Contracts, Forward Foreign Currency Contracts and Foreign Currency Transactions (Notes 1, 3 and 4): |
| |||
| Net Realized Gain (Loss) From: |
||||
| Investment transactions |
5,080,276 | |||
| Futures contracts |
11,773,113 | |||
| Forward foreign currency contracts |
(2,198,198) | |||
| Foreign currency transactions |
(72,644) | |||
| Net Realized Gain |
14,582,547 | |||
| Change in Net Unrealized Appreciation (Depreciation) From: |
||||
| Investments |
(3,499,905) | |||
| Futures contracts |
(4,422,003) | |||
| Forward foreign currency contracts |
980,622 | |||
| Foreign currencies |
(17,859) | |||
| Change in Net Unrealized Appreciation (Depreciation) |
(6,959,145) | |||
| Net Gain on Investments, Futures Contracts, Forward Foreign Currency Contracts and Foreign Currency Transactions | 7,623,402 | |||
| Increase in Net Assets From Operations | $ | 8,396,733 | ||
See Notes to Consolidated Financial Statements.
| Franklin Strategic Real Return Fund 2022 Semi-Annual Report |
|
17 |
|
Consolidated statements of changes in net assets
| For the Six Months Ended March 31, 2022 (unaudited) and the Year Ended September 30, 2021 |
2022 | 2021 | ||||||
| Operations: | ||||||||
| Net investment income |
$ | 773,331 | $ | 1,583,191 | ||||
| Net realized gain |
14,582,547 | 13,866,382 | ||||||
| Change in net unrealized appreciation (depreciation) |
(6,959,145) | 7,087,589 | ||||||
| Increase in Net Assets From Operations |
8,396,733 | 22,537,162 | ||||||
| Distributions to Shareholders From (Notes 1 and 6): | ||||||||
| Total distributable earnings |
(17,876,153) | (2,398,862) | ||||||
| Decrease in Net Assets From Distributions to Shareholders |
(17,876,153) | (2,398,862) | ||||||
| Fund Share Transactions (Note 7): | ||||||||
| Net proceeds from sale of shares |
6,307,622 | 4,081,591 | ||||||
| Reinvestment of distributions |
17,864,036 | 2,397,295 | ||||||
| Cost of shares repurchased |
(8,269,244) | (10,536,194) | ||||||
| Increase (Decrease) in Net Assets From Fund Share Transactions |
15,902,414 | (4,057,308) | ||||||
| Increase in Net Assets |
6,422,994 | 16,080,992 | ||||||
| Net Assets: | ||||||||
| Beginning of period |
111,022,790 | 94,941,798 | ||||||
| End of period |
$ | 117,445,784 | $ | 111,022,790 | ||||
See Notes to Consolidated Financial Statements.
|
18 |
Franklin Strategic Real Return Fund 2022 Semi-Annual Report |
Consolidated financial highlights
| For a share of each class of beneficial interest outstanding throughout each year ended September 30, unless otherwise noted: |
||||||||||||||||||||||||
| Class A Shares1 | 20222 | 2021 | 2020 | 2019 | 2018 | 2017 | ||||||||||||||||||
| Net asset value, beginning of period | $12.72 | $10.54 | $11.15 | $12.24 | $11.93 | $11.63 | ||||||||||||||||||
| Income (loss) from operations: | ||||||||||||||||||||||||
| Net investment income |
0.07 | 0.21 | 0.05 | 0.14 | 0.13 | 0.05 | ||||||||||||||||||
| Net realized and unrealized gain (loss) |
0.78 | 2.23 | (0.24) | (0.30) | 0.60 | 0.49 | ||||||||||||||||||
| Total income (loss) from operations |
0.85 | 2.44 | (0.19) | (0.16) | 0.73 | 0.54 | ||||||||||||||||||
| Less distributions from: | ||||||||||||||||||||||||
| Net investment income |
(1.30) | (0.16) | (0.05) | (0.49) | (0.10) | — | ||||||||||||||||||
| Net realized gains |
(0.71) | (0.10) | (0.37) | (0.44) | (0.32) | (0.24) | ||||||||||||||||||
| Total distributions |
(2.01) | (0.26) | (0.42) | (0.93) | (0.42) | (0.24) | ||||||||||||||||||
| Net asset value, end of period | $11.56 | $12.72 | $10.54 | $11.15 | $12.24 | $11.93 | ||||||||||||||||||
| Total return3 |
7.53 | % | 23.37 | % | (1.74) | % | (0.73) | % | 6.32 | % | 4.75 | % | ||||||||||||
| Net assets, end of period (000s) | $7,180 | $1,704 | $259 | $272 | $324 | $551 | ||||||||||||||||||
| Ratios to average net assets: | ||||||||||||||||||||||||
| Gross expenses4 |
1.50 | %5 | 1.63 | % | 1.81 | % | 1.68 | % | 1.54 | % | 1.49 | %6 | ||||||||||||
| Net expenses4,7,8 |
1.30 | 5 | 1.30 | 1.31 | 1.32 | 1.33 | 1.33 | 6 | ||||||||||||||||
| Net investment income |
1.18 | 5 | 1.75 | 0.43 | 1.27 | 1.11 | 0.46 | |||||||||||||||||
| Portfolio turnover rate | 29 | % | 41 | % | 43 | % | 44 | % | 61 | % | 42 | % | ||||||||||||
| 1 | Per share amounts have been calculated using the average shares method. |
| 2 | For the six months ended March 31, 2022 (unaudited). |
| 3 | Performance figures, exclusive of sales charges, may reflect compensating balance arrangements, fee waivers and/or expense reimbursements. In the absence of compensating balance arrangements, fee waivers and/or expense reimbursements, the total return would have been lower. Past performance is no guarantee of future results. Total returns for periods of less than one year are not annualized. |
| 4 | Does not include fees and expenses of the Underlying Funds in which the Fund invests. |
| 5 | Annualized. |
| 6 | Reflects recapture of expenses waived/reimbursed from prior fiscal years. |
| 7 | Reflects fee waivers and/or expense reimbursements. |
| 8 | As a result of an expense limitation arrangement, the ratio of total annual fund operating expenses, other than interest, brokerage commissions (except for brokerage commissions paid on purchases and sales of shares of ETFs), dividend expense on short sales, taxes and extraordinary expenses, to average net assets of Class A shares did not exceed 1.35%. This expense limitation arrangement cannot be terminated prior to December 31, 2023 without the Board of Trustees’ consent. Acquired fund fees and expenses are subject to the expense limitation arrangement. |
See Notes to Consolidated Financial Statements.
| Franklin Strategic Real Return Fund 2022 Semi-Annual Report |
19 |
Consolidated financial highlights (cont’d)
| For a share of each class of beneficial interest outstanding throughout each year ended September 30, unless otherwise noted: |
||||||||||||||||||||||||
| Class C Shares1 | 20222 | 2021 | 2020 | 2019 | 2018 | 2017 | ||||||||||||||||||
| Net asset value, beginning of period | $12.14 | $10.13 | $10.79 | $11.82 | $11.52 | $11.31 | ||||||||||||||||||
| Income (loss) from operations: | ||||||||||||||||||||||||
| Net investment income (loss) |
0.06 | 0.02 | (0.04) | 0.04 | 0.05 | (0.02) | ||||||||||||||||||
| Net realized and unrealized gain (loss) |
0.85 | 2.23 | (0.21) | (0.27) | 0.57 | 0.47 | ||||||||||||||||||
| Total income (loss) from operations |
0.91 | 2.25 | (0.25) | (0.23) | 0.62 | 0.45 | ||||||||||||||||||
| Less distributions from: | ||||||||||||||||||||||||
| Net investment income |
(1.12) | (0.14) | (0.04) | (0.36) | — | — | ||||||||||||||||||
| Net realized gains |
(0.71) | (0.10) | (0.37) | (0.44) | (0.32) | (0.24) | ||||||||||||||||||
| Total distributions |
(1.83) | (0.24) | (0.41) | (0.80) | (0.32) | (0.24) | ||||||||||||||||||
| Net asset value, end of period | $11.22 | $12.14 | $10.13 | $10.79 | $11.82 | $11.52 | ||||||||||||||||||
| Total return3 |
8.55 | % | 22.53 | % | (2.54) | % | (1.51) | % | 5.51 | % | 3.98 | % | ||||||||||||
| Net assets, end of period (000s) | $459 | $13 | $54 | $81 | $183 | $196 | ||||||||||||||||||
| Ratios to average net assets: | ||||||||||||||||||||||||
| Gross expenses4 |
2.28 | %5 | 2.42 | % | 2.45 | % | 2.42 | %6 | 2.34 | % | 2.28 | %6 | ||||||||||||
| Net expenses4,7,8 |
2.06 | 5 | 2.05 | 2.06 | 2.07 | 6 | 2.08 | 2.08 | 6 | |||||||||||||||
| Net investment income (loss) |
1.17 | 5 | 0.20 | (0.37) | 0.40 | 0.44 | (0.18) | |||||||||||||||||
| Portfolio turnover rate | 29 | % | 41 | % | 43 | % | 44 | % | 61 | % | 42 | % | ||||||||||||
| 1 | Per share amounts have been calculated using the average shares method. |
| 2 | For the six months ended March 31, 2022 (unaudited). |
| 3 | Performance figures, exclusive of CDSC, may reflect compensating balance arrangements, fee waivers and/or expense reimbursements. In the absence of compensating balance arrangements, fee waivers and/or expense reimbursements, the total return would have been lower. Past performance is no guarantee of future results. Total returns for periods of less than one year are not annualized. |
| 4 | Does not include fees and expenses of the Underlying Funds in which the Fund invests. |
| 5 | Annualized. |
| 6 | Reflects recapture of expenses waived/reimbursed from prior fiscal years. |
| 7 | Reflects fee waivers and/or expense reimbursements. |
| 8 | As a result of an expense limitation arrangement, the ratio of total annual fund operating expenses, other than interest, brokerage commissions (except for brokerage commissions paid on purchases and sales of shares of ETFs), dividend expense on short sales, taxes and extraordinary expenses, to average net assets of Class C shares did not exceed 2.10%. This expense limitation arrangement cannot be terminated prior to December 31, 2023 without the Board of Trustees’ consent. Acquired fund fees and expenses are subject to the expense limitation arrangement. |
See Notes to Consolidated Financial Statements.
|
20 |
Franklin Strategic Real Return Fund 2022 Semi-Annual Report |
| For a share of each class of beneficial interest outstanding throughout each year ended September 30, unless otherwise noted: |
||||||||||||||||||||||||
| Class I Shares1 | 20222 | 2021 | 2020 | 2019 | 2018 | 2017 | ||||||||||||||||||
| Net asset value, beginning of period | $13.07 | $10.81 | $11.40 | $12.52 | $12.22 | $11.87 | ||||||||||||||||||
| Income (loss) from operations: | ||||||||||||||||||||||||
| Net investment income |
0.09 | 0.05 | 0.06 | 0.16 | 0.18 | 0.11 | ||||||||||||||||||
| Net realized and unrealized gain (loss) |
0.80 | 2.48 | (0.22) | (0.31) | 0.60 | 0.48 | ||||||||||||||||||
| Total income (loss) from operations |
0.89 | 2.53 | (0.16) | (0.15) | 0.78 | 0.59 | ||||||||||||||||||
| Less distributions from: | ||||||||||||||||||||||||
| Net investment income |
(1.28) | (0.17) | (0.06) | (0.53) | (0.16) | — | ||||||||||||||||||
| Net realized gains |
(0.71) | (0.10) | (0.37) | (0.44) | (0.32) | (0.24) | ||||||||||||||||||
| Total distributions |
(1.99) | (0.27) | (0.43) | (0.97) | (0.48) | (0.24) | ||||||||||||||||||
| Net asset value, end of period | $11.97 | $13.07 | $10.81 | $11.40 | $12.52 | $12.22 | ||||||||||||||||||
| Total return3 |
7.68 | % | 23.72 | % | (1.55) | % | (0.52) | % | 6.62 | % | 5.08 | % | ||||||||||||
| Net assets, end of period (000s) | $218 | $51 | $515 | $1,684 | $1,854 | $1,674 | ||||||||||||||||||
| Ratios to average net assets: | ||||||||||||||||||||||||
| Gross expenses4 |
1.15 | %5,6 | 1.50 | % | 1.31 | %6 | 1.30 | %6 | 1.18 | % | 1.20 | %6 | ||||||||||||
| Net expenses4,7,8 |
1.05 | 5,6 | 1.05 | 1.06 | 6 | 1.07 | 6 | 1.08 | 1.08 | 6 | ||||||||||||||
| Net investment income |
1.55 | 5 | 0.44 | 0.51 | 1.41 | 1.47 | 0.97 | |||||||||||||||||
| Portfolio turnover rate | 29 | % | 41 | % | 43 | % | 44 | % | 61 | % | 42 | % | ||||||||||||
| 1 | Per share amounts have been calculated using the average shares method. |
| 2 | For the six months ended March 31, 2022 (unaudited). |
| 3 | Performance figures may reflect compensating balance arrangements, fee waivers and/or expense reimbursements. In the absence of compensating balance arrangements, fee waivers and/or expense reimbursements, the total return would have been lower. Past performance is no guarantee of future results. Total returns for periods of less than one year are not annualized. |
| 4 | Does not include fees and expenses of the Underlying Funds in which the Fund invests. |
| 5 | Annualized. |
| 6 | Reflects recapture of expenses waived/reimbursed from prior fiscal years. |
| 7 | Reflects fee waivers and/or expense reimbursements. |
| 8 | As a result of an expense limitation arrangement, the ratio of total annual fund operating expenses, other than interest, brokerage commissions (except for brokerage commissions paid on purchases and sales of shares of ETFs), dividend expense on short sales, taxes and extraordinary expenses, to average net assets of Class I shares did not exceed 1.10%. This expense limitation arrangement cannot be terminated prior to December 31, 2023 without the Board of Trustees’ consent. Acquired fund fees and expenses are subject to the expense limitation arrangement. |
See Notes to Consolidated Financial Statements.
| Franklin Strategic Real Return Fund 2022 Semi-Annual Report |
21 |
Consolidated financial highlights (cont’d)
| For a share of each class of beneficial interest outstanding throughout each year ended September 30, unless otherwise noted: |
||||||||||||||||||||||||
| Class IS Shares1 | 20222 | 2021 | 2020 | 2019 | 2018 | 2017 | ||||||||||||||||||
| Net asset value, beginning of period | $12.91 | $10.67 | $11.25 | $12.36 | $12.08 | $11.73 | ||||||||||||||||||
| Income (loss) from operations: | ||||||||||||||||||||||||
| Net investment income |
0.08 | 0.18 | 0.08 | 0.18 | 0.19 | 0.11 | ||||||||||||||||||
| Net realized and unrealized gain (loss) |
0.80 | 2.33 | (0.23) | (0.31) | 0.58 | 0.48 | ||||||||||||||||||
| Total income (loss) from operations |
0.88 | 2.51 | (0.15) | (0.13) | 0.77 | 0.59 | ||||||||||||||||||
| Less distributions from: | ||||||||||||||||||||||||
| Net investment income |
(1.32) | (0.17) | (0.06) | (0.54) | (0.17) | — | ||||||||||||||||||
| Net realized gains |
(0.71) | (0.10) | (0.37) | (0.44) | (0.32) | (0.24) | ||||||||||||||||||
| Total distributions |
(2.03) | (0.27) | (0.43) | (0.98) | (0.49) | (0.24) | ||||||||||||||||||
| Net asset value, end of period | $11.76 | $12.91 | $10.67 | $11.25 | $12.36 | $12.08 | ||||||||||||||||||
| Total return3 |
7.69 | % | 23.88 | % | (1.45) | % | (0.35) | % | 6.62 | % | 5.14 | % | ||||||||||||
| Net assets, end of period (000s) | $109,588 | $109,255 | $93,150 | $94,463 | $102,792 | $101,496 | ||||||||||||||||||
| Ratios to average net assets: | ||||||||||||||||||||||||
| Gross expenses4 |
1.05 | %5 | 1.08 | % | 1.17 | %6 | 1.17 | %6 | 1.11 | %6 | 1.08 | % | ||||||||||||
| Net expenses4,7,8 |
0.95 | 5 | 0.95 | 0.96 | 6 | 0.97 | 6 | 0.98 | 6 | 0.98 | ||||||||||||||
| Net investment income |
1.38 | 5 | 1.48 | 0.78 | 1.65 | 1.55 | 0.91 | |||||||||||||||||
| Portfolio turnover rate | 29 | % | 41 | % | 43 | % | 44 | % | 61 | % | 42 | % | ||||||||||||
| 1 | Per share amounts have been calculated using the average shares method. |
| 2 | For the six months ended March 31, 2022 (unaudited). |
| 3 | Performance figures may reflect compensating balance arrangements, fee waivers and/or expense reimbursements. In the absence of compensating balance arrangements, fee waivers and/or expense reimbursements, the total return would have been lower. Past performance is no guarantee of future results. Total returns for periods of less than one year are not annualized. |
| 4 | Does not include fees and expenses of the Underlying Funds in which the Fund invests. |
| 5 | Annualized. |
| 6 | Reflects recapture of expenses waived/reimbursed from prior fiscal years. |
| 7 | Reflects fee waivers and/or expense reimbursements. |
| 8 | As a result of an expense limitation arrangement, the ratio of total annual fund operating expenses, other than interest, brokerage commissions (except for brokerage commissions paid on purchases and sales of ETFs), dividend expense on short sales, taxes and extraordinary expenses, to average net assets of Class IS shares did not exceed 1.00%. In addition, the ratio of total annual fund operating expenses for Class IS shares did not exceed the ratio of total annual fund operating expenses for Class I shares. These expense limitation arrangements cannot be terminated prior to December 31, 2023 without the Board of Trustees’ consent. Acquired fund fees and expenses are subject to the expense limitation arrangement. |
See Notes to Consolidated Financial Statements.
|
22 |
Franklin Strategic Real Return Fund 2022 Semi-Annual Report |
Notes to consolidated financial statements (unaudited)
1. Organization and significant accounting policies
Franklin Strategic Real Return Fund (the “Fund”) is a separate non-diversified investment series of Legg Mason Global Asset Management Trust (the “Trust”). The Trust, a Maryland statutory trust, is registered under the Investment Company Act of 1940, as amended (the “1940 Act”), as an open-end management investment company.
The Fund gains exposure to the commodities markets by investing a portion of its assets in a wholly-owned subsidiary, Real Return Fund Ltd. (the “Subsidiary”), organized under the laws of the Cayman Islands. Among other investments, the Subsidiary may invest in commodity-linked instruments. The Fund may invest up to 25% of its total assets in the Subsidiary. These financial statements are the consolidated financial statements of the Fund and the Subsidiary. All interfund transactions have been eliminated in consolidation.
The following are significant accounting policies consistently followed by the Fund and are in conformity with U.S. generally accepted accounting principles (“GAAP”). Estimates and assumptions are required to be made regarding assets, liabilities and changes in net assets resulting from operations when financial statements are prepared. Changes in the economic environment, financial markets and any other parameters used in determining these estimates could cause actual results to differ. Subsequent events have been evaluated through the date the financial statements were issued.
(a) Investment valuation. Equity securities for which market quotations are available are valued at the last reported sales price or official closing price on the primary market or exchange on which they trade. The valuations for fixed income securities (which may include, but are not limited to, corporate, government, municipal, mortgage-backed, collateralized mortgage obligations and asset-backed securities) and certain derivative instruments are typically the prices supplied by independent third party pricing services, which may use market prices or broker/dealer quotations or a variety of valuation techniques and methodologies. The independent third party pricing services typically use inputs that are observable such as issuer details, interest rates, yield curves, prepayment speeds, credit risks/spreads, default rates and quoted prices for similar securities. Investments in open-end funds are valued at the closing net asset value per share of each fund on the day of valuation. Futures contracts are valued daily at the settlement price established by the board of trade or exchange on which they are traded. When the Fund holds securities or other assets that are denominated in a foreign currency, the Fund will normally use the currency exchange rates as of 4:00 p.m. (Eastern Time). If independent third party pricing services are unable to supply prices for a portfolio investment, or if the prices supplied are deemed by the manager to be unreliable, the market price may be determined by the manager using quotations from one or more broker/dealers or at the transaction price if the security has recently been purchased and no value has yet been obtained from a pricing service or pricing broker. When reliable prices are not readily available, such as when the value of a security has been significantly affected by events after the close of the exchange or market on which the security is principally traded, but before the Fund calculates its net asset value, the Fund values these securities as determined in accordance with procedures approved by the Fund’s Board of Trustees.
| Franklin Strategic Real Return Fund 2022 Semi-Annual Report |
23 |
Notes to consolidated financial statements (unaudited) (cont’d)
The Board of Trustees is responsible for the valuation process and has delegated the supervision of the daily valuation process to the Global Fund Valuation Committee (the “Valuation Committee”). The Valuation Committee, pursuant to the policies adopted by the Board of Trustees, is responsible for making fair value determinations, evaluating the effectiveness of the Fund’s pricing policies, and reporting to the Board of Trustees. When determining the reliability of third party pricing information for investments owned by the Fund, the Valuation Committee, among other things, conducts due diligence reviews of pricing vendors, monitors the daily change in prices and reviews transactions among market participants.
The Valuation Committee will consider pricing methodologies it deems relevant and appropriate when making fair value determinations. Examples of possible methodologies include, but are not limited to, multiple of earnings; discount from market of a similar freely traded security; discounted cash-flow analysis; book value or a multiple thereof; risk premium/yield analysis; yield to maturity; and/or fundamental investment analysis. The Valuation Committee will also consider factors it deems relevant and appropriate in light of the facts and circumstances. Examples of possible factors include, but are not limited to, the type of security; the issuer’s financial statements; the purchase price of the security; the discount from market value of unrestricted securities of the same class at the time of purchase; analysts’ research and observations from financial institutions; information regarding any transactions or offers with respect to the security; the existence of merger proposals or tender offers affecting the security; the price and extent of public trading in similar securities of the issuer or comparable companies; and the existence of a shelf registration for restricted securities.
For each portfolio security that has been fair valued pursuant to the policies adopted by the Board of Trustees, the fair value price is compared against the last available and next available market quotations. The Valuation Committee reviews the results of such back testing monthly and fair valuation occurrences are reported to the Board of Trustees quarterly.
The Fund uses valuation techniques to measure fair value that are consistent with the market approach and/or income approach, depending on the type of security and the particular circumstance. The market approach uses prices and other relevant information generated by market transactions involving identical or comparable securities. The income approach uses valuation techniques to discount estimated future cash flows to present value.
|
24 |
Franklin Strategic Real Return Fund 2022 Semi-Annual Report |
GAAP establishes a disclosure hierarchy that categorizes the inputs to valuation techniques used to value assets and liabilities at measurement date. These inputs are summarized in the three broad levels listed below:
| • | Level 1 — quoted prices in active markets for identical investments |
| • | Level 2 — other significant observable inputs (including quoted prices for similar investments, interest rates, prepayment speeds, credit risk, etc.) |
| • | Level 3 — significant unobservable inputs (including the Fund’s own assumptions in determining the fair value of investments) |
The inputs or methodologies used to value securities are not necessarily an indication of the risk associated with investing in those securities.
The following is a summary of the inputs used in valuing the Fund’s assets and liabilities carried at fair value:
| ASSETS | ||||||||||||||
| Description | Quoted Prices (Level 1) |
Other Significant Observable Inputs (Level 2)* |
Significant Unobservable Inputs (Level 3) |
Total | ||||||||||
| Long-Term Investments†: | ||||||||||||||
| U.S. Treasury Inflation Protected Securities |
— | $ | 45,733,737 | — | $ | 45,733,737 | ||||||||
| Common Stocks: |
||||||||||||||
| Communication Services |
$ | 1,270,362 | 605,564 | — | 1,875,926 | |||||||||
| Consumer Discretionary |
1,917,887 | 322,335 | — | 2,240,222 | ||||||||||
| Consumer Staples |
1,285,955 | 538,915 | — | 1,824,870 | ||||||||||
| Energy |
1,063,730 | 1,053,786 | — | 2,117,516 | ||||||||||
| Financials |
1,739,879 | 521,826 | — | 2,261,705 | ||||||||||
| Health Care |
2,352,611 | 497,473 | — | 2,850,084 | ||||||||||
| Industrials |
1,699,752 | 1,958,501 | — | 3,658,253 | ||||||||||
| Information Technology |
3,752,185 | 1,283,026 | — | 5,035,211 | ||||||||||
| Materials |
1,257,265 | 1,012,993 | — | 2,270,258 | ||||||||||
| Real Estate |
143,782 | 506,366 | — | 650,148 | ||||||||||
| Investments in Underlying Funds |
9,814,529 | — | — | 9,814,529 | ||||||||||
| Corporate Bonds & Notes |
— | 2,352,622 | — | 2,352,622 | ||||||||||
| Non-U.S. Treasury Inflation Protected Securities |
— | 921,448 | — | 921,448 | ||||||||||
| Sovereign Bonds |
— | 569,008 | — | 569,008 | ||||||||||
| Total Long-Term Investments | 26,297,937 | 57,877,600 | — | 84,175,537 | ||||||||||
| Short-Term Investments† | 30,621,228 | — | — | 30,621,228 | ||||||||||
| Total Investments | $ | 56,919,165 | $ | 57,877,600 | — | $ | 114,796,765 | |||||||
| Franklin Strategic Real Return Fund 2022 Semi-Annual Report |
25 |
Notes to consolidated financial statements (unaudited) (cont’d)
| ASSETS (cont’d) | ||||||||||||||
| Description | Quoted Prices (Level 1) |
Other Significant Observable Inputs (Level 2)* |
Significant Unobservable Inputs (Level 3) |
Total | ||||||||||
| Other Financial Instruments: | ||||||||||||||
| Futures Contracts†† |
$ | 129,567 | — | — | $ | 129,567 | ||||||||
| Forward Foreign Currency Contracts†† |
— | $ | 1,403,881 | — | 1,403,881 | |||||||||
| Total Other Financial Instruments | $ | 129,567 | $ | 1,403,881 | — | $ | 1,533,448 | |||||||
| Total | $ | 57,048,732 | $ | 59,281,481 | — | $ | 116,330,213 | |||||||
| LIABILITIES | ||||||||||||||
| Description | Quoted Prices (Level 1) |
Other Significant Observable Inputs (Level 2) |
Significant Unobservable Inputs (Level 3) |
Total | ||||||||||
| Other Financial Instruments: | ||||||||||||||
| Futures Contracts†† |
$ | 3,066,547 | — | — | $ | 3,066,547 | ||||||||
| Forward Foreign Currency Contracts†† |
— | $ | 997,112 | — | 997,112 | |||||||||
| Total | $ | 3,066,547 | $ | 997,112 | — | $ | 4,063,659 | |||||||
| * | As a result of the fair value pricing procedures for international equities utilized by the Fund, which account for events occurring after the close of the principal market of the security but prior to the calculation of the Fund’s net asset value, certain securities were classified as Level 2 within the fair value hierarchy. |
| † | See Consolidated Schedule of Investments for additional detailed categorizations. |
| †† | Reflects the unrealized appreciation (depreciation) of the instruments. |
(b) Futures contracts. The Fund uses futures contracts generally to gain exposure to, or hedge against, changes in interest rates or gain exposure to, or hedge against, changes in certain asset classes. A futures contract represents a commitment for the future purchase or sale of an asset at a specified price on a specified date.
Upon entering into a futures contract, the Fund is required to deposit cash or securities with a broker in an amount equal to a certain percentage of the contract amount. This is known as the ‘‘initial margin’’ and subsequent payments (‘‘variation margin’’) are made or received by the Fund each day, depending on the daily fluctuation in the value of the contract. For certain futures, including foreign denominated futures, variation margin is not settled daily, but is recorded as a net variation margin payable or receivable. The daily changes in contract value are recorded as unrealized appreciation or depreciation in the Consolidated Statement of Operations and the Fund recognizes a realized gain or loss when the contract is closed.
Futures contracts involve, to varying degrees, risk of loss in excess of the amounts reflected in the financial statements. In addition, there is the risk that the Fund may not be able to enter into a closing transaction because of an illiquid secondary market.
|
26 |
Franklin Strategic Real Return Fund 2022 Semi-Annual Report |
(c) Forward foreign currency contracts. The Fund enters into a forward foreign currency contract to maintain its target exposure to foreign currencies, to hedge against foreign currency exchange rate risk on its non-U.S. dollar denominated securities, to facilitate settlement of a foreign currency denominated portfolio transaction or to attempt to increase the Fund’s return. A forward foreign currency contract is an agreement between two parties to buy and sell a currency at a set price with delivery and settlement at a future date. The contract is marked-to-market daily and the change in value is recorded by the Fund as an unrealized gain or loss. When a forward foreign currency contract is closed, through either delivery or offset by entering into another forward foreign currency contract, the Fund recognizes a realized gain or loss equal to the difference between the value of the contract at the time it was opened and the value of the contract at the time it is closed.
Forward foreign currency contracts involve elements of market risk in excess of the amounts reflected on the Consolidated Statement of Assets and Liabilities. The Fund bears the risk of an unfavorable change in the foreign exchange rate underlying the forward foreign currency contract. Risks may also arise upon entering into these contracts from the potential inability of the counterparties to meet the terms of their contracts.
(d) Inflation-indexed bonds. Inflation-indexed bonds are fixed income securities whose principal value or interest rate is periodically adjusted according to the rate of inflation. As the index measuring inflation changes, the principal value or interest rate of inflation-indexed bonds will be adjusted accordingly. Inflation adjustments to the principal amount of inflation-indexed bonds are reflected as an increase or decrease to investment income on the Consolidated Statement of Operations. Repayment of the original bond principal upon maturity (as adjusted for inflation) is guaranteed in the case of U.S. Treasury inflation-indexed bonds. For bonds that do not provide a similar guarantee, the adjusted principal value of the bond repaid at maturity may be less than the original principal.
(e) Foreign currency translation. Investment securities and other assets and liabilities denominated in foreign currencies are translated into U.S. dollar amounts based upon prevailing exchange rates on the date of valuation. Purchases and sales of investment securities and income and expense items denominated in foreign currencies are translated into U.S. dollar amounts based upon prevailing exchange rates on the respective dates of such transactions.
The Fund does not isolate that portion of the results of operations resulting from fluctuations in foreign exchange rates on investments from the fluctuations arising from changes in market prices of securities held. Such fluctuations are included with the net realized and unrealized gain or loss on investments.
Net realized foreign exchange gains or losses arise from sales of foreign currencies, including gains and losses on forward foreign currency contracts, currency gains or losses realized between the trade and settlement dates on securities transactions, and the difference between the amounts of dividends, interest, and foreign withholding taxes recorded on the Fund’s books and the U.S. dollar equivalent of the amounts actually
| Franklin Strategic Real Return Fund 2022 Semi-Annual Report |
27 |
Notes to consolidated financial statements (unaudited) (cont’d)
received or paid. Net unrealized foreign exchange gains and losses arise from changes in the values of assets and liabilities, other than investments in securities, on the date of valuation, resulting from changes in exchange rates.
Foreign security and currency transactions may involve certain considerations and risks not typically associated with those of U.S. dollar denominated transactions as a result of, among other factors, the possibility of lower levels of governmental supervision and regulation of foreign securities markets and the possibility of political or economic instability.
(f) Foreign investment risks. The Fund’s investments in foreign securities may involve risks not present in domestic investments. Since securities may be denominated in foreign currencies, may require settlement in foreign currencies or may pay interest or dividends in foreign currencies, changes in the relationship of these foreign currencies to the U.S. dollar can significantly affect the value of the investments and earnings of the Fund. Foreign investments may also subject the Fund to foreign government exchange restrictions, expropriation, taxation or other political, social or economic developments, all of which affect the market and/or credit risk of the investments.
(g) Counterparty risk and credit-risk-related contingent features of derivative instruments. The Fund may invest in certain securities or engage in other transactions where the Fund is exposed to counterparty credit risk in addition to broader market risks. The Fund may invest in securities of issuers, which may also be considered counterparties as trading partners in other transactions. This may increase the risk of loss in the event of default or bankruptcy by the counterparty or if the counterparty otherwise fails to meet its contractual obligations. The Fund’s subadviser attempts to mitigate counterparty risk by (i) periodically assessing the creditworthiness of its trading partners, (ii) monitoring and/or limiting the amount of its net exposure to each individual counterparty based on its assessment and (iii) requiring collateral from the counterparty for certain transactions. Market events and changes in overall economic conditions may impact the assessment of such counterparty risk by the subadviser. In addition, declines in the values of underlying collateral received may expose the Fund to increased risk of loss.
With exchange traded and centrally cleared derivatives, there is less counterparty risk to the Fund since the exchange or clearinghouse, as counterparty to such instruments, guarantees against a possible default. The clearinghouse stands between the buyer and the seller of the contract; therefore, the credit risk is limited to failure of the clearinghouse. While offset rights may exist under applicable law, the Fund does not have a contractual right of offset against a clearing broker or clearinghouse in the event of a default of the clearing broker or clearinghouse.
The Fund has entered into master agreements, such as an International Swaps and Derivatives Association, Inc. Master Agreement (“ISDA Master Agreement”) or similar agreement, with certain of its derivative counterparties that govern over-the-counter (“OTC”) derivatives and provide for general obligations, representations, agreements,
|
28 |
Franklin Strategic Real Return Fund 2022 Semi-Annual Report |
collateral posting terms, netting provisions in the event of default or termination and credit related contingent features. The credit related contingent features include, but are not limited to, a percentage decrease in the Fund’s net assets or net asset value per share over a specified period of time. If these credit related contingent features were triggered, the derivatives counterparty could terminate the positions and demand payment or require additional collateral.
Under an ISDA Master Agreement, the Fund may, under certain circumstances, offset with the counterparty certain derivative financial instruments’ payables and/or receivables with collateral held and/or posted and create one single net payment. However, absent an event of default by the counterparty or a termination of the agreement, the terms of the ISDA Master Agreements do not result in an offset of reported amounts of financial assets and financial liabilities in the Consolidated Statement of Assets and Liabilities across transactions between the Fund and the applicable counterparty. The enforceability of the right to offset may vary by jurisdiction.
Collateral requirements differ by type of derivative. Collateral or margin requirements are set by the broker or exchange clearinghouse for exchange traded derivatives while collateral terms are contract specific for OTC traded derivatives. Cash collateral that has been pledged to cover obligations of the Fund under derivative contracts, if any, will be reported separately in the Consolidated Statement of Assets and Liabilities. Securities pledged as collateral, if any, for the same purpose are noted in the Consolidated Schedule of Investments.
As of March 31, 2022, the Fund held forward foreign currency contracts with credit related contingent features which had a liability position of $997,112. If a contingent feature in the master agreements would have been triggered, the Fund would have been required to pay this amount to its derivatives counterparties.
(h) Security transactions and investment income. Security transactions are accounted for on a trade date basis. Interest income (including interest income from payment-in-kind securities), adjusted for amortization of premium and accretion of discount, is recorded on the accrual basis. Dividend income is recorded on the ex-dividend date for dividends received in cash and/or securities. Foreign dividend income is recorded on the ex-dividend date or as soon as practicable after the Fund determines the existence of a dividend declaration after exercising reasonable due diligence. The cost of investments sold is determined by use of the specific identification method. To the extent any issuer defaults or a credit event occurs that impacts the issuer, the Fund may halt any additional interest income accruals and consider the realizability of interest accrued up to the date of default or credit event.
(i) REIT distributions. The character of distributions received from Real Estate Investment Trusts (‘‘REITs’’) held by the Fund is generally comprised of net investment income, capital gains, and return of capital. It is the policy of the Fund to estimate the character of distributions received from underlying REITs based on historical data provided by the REITs.
| Franklin Strategic Real Return Fund 2022 Semi-Annual Report |
29 |
Notes to consolidated financial statements (unaudited) (cont’d)
After each calendar year end, REITs report the actual tax character of these distributions. Differences between the estimated and actual amounts reported by the REITs are reflected in the Fund’s records in the year in which they are reported by the REITs by adjusting related investment cost basis, capital gains and income, as necessary.
(j) Distributions to shareholders. Distributions from net investment income and distributions of net realized gains, if any, are declared at least annually. Distributions to shareholders of the Fund are recorded on the ex-dividend date and are determined in accordance with income tax regulations, which may differ from GAAP.
(k) Share class accounting. Investment income, common expenses and realized/ unrealized gains (losses) on investments are allocated to the various classes of the Fund on the basis of daily net assets of each class. Fees relating to a specific class are charged directly to that share class.
(l) Compensating balance arrangements. The Fund has an arrangement with its custodian bank whereby a portion of the custodian’s fees is paid indirectly by credits earned on the Fund’s cash on deposit with the bank.
(m) Federal and other taxes. It is the Fund’s policy to comply with the federal income and excise tax requirements of the Internal Revenue Code of 1986 (the “Code”), as amended, applicable to regulated investment companies. Accordingly, the Fund intends to distribute its taxable income and net realized gains, if any, to shareholders in accordance with timing requirements imposed by the Code. Therefore, no federal or state income tax provision is required in the Fund’s financial statements.
Management has analyzed the Fund’s tax positions taken on income tax returns for all open tax years and has concluded that as of September 30, 2021, no provision for income tax is required in the Fund’s financial statements. The Fund’s federal and state income and federal excise tax returns for tax years for which the applicable statutes of limitations have not expired are subject to examination by the Internal Revenue Service and state departments of revenue.
Under the applicable foreign tax laws, a withholding tax may be imposed on interest, dividends and capital gains at various rates.
(n) Reclassification. GAAP requires that certain components of net assets be reclassified to reflect permanent differences between financial and tax reporting. These reclassifications have no effect on net assets or net asset value per share.
2. Investment management agreement and other transactions with affiliates
Legg Mason Partners Fund Advisor, LLC (“LMPFA”) is the Fund’s investment manager. Franklin Advisers, Inc. (“Franklin Advisers”) is the Fund’s adviser and a subadviser. ClearBridge Investments, LLC (“ClearBridge”), Western Asset Management Company, LLC (“Western Asset”), Western Asset Management Company Limited in London (“Western Asset London”) and Western Asset Management Company Ltd in Japan (“Western Japan”)
|
30 |
Franklin Strategic Real Return Fund 2022 Semi-Annual Report |
are also the Fund’s subadvisers. Western Asset also manages the portion of the Fund’s cash and short-term instruments allocated to it pursuant to a separate subadvisory agreement between LMPFA and Western Asset (“Western Asset Agreement”). LMPFA, Franklin Advisers, ClearBridge, Western Asset, Western Asset London and Western Japan are wholly-owned subsidiaries of Franklin Resources, Inc. (“Franklin Resources”).
Under the investment management agreement, the Fund pays LMPFA an investment management fee, calculated daily and paid monthly, at an annual rate of 0.75% of the Fund’s average daily net assets.
LMPFA provides administrative and certain oversight services to the Fund. LMPFA delegates to Franklin Advisers the day-to-day portfolio management of the Fund, except for the management of the portion of the cash and short term instruments allocated to Western Asset. Franklin Advisers is responsible for monitoring and coordinating the overall management of the Fund, including rebalancing the Fund’s target asset allocations among itself and the subadvisers. Franklin Advisers also provides management for a portion of the Fund’s assets.
LMPFA pays Franklin Advisers for its services to the Fund an advisory fee, calculated daily and paid monthly, at an annual rate of 0.20% of the Fund’s average daily net assets. The Subsidiary has agreed to reimburse the Fund for the fees paid thereby for the services provided by Franklin Advisers to the Subsidiary. LMPFA pays Franklin Advisers, ClearBridge and Western Asset each a subadvisory fee for their services to the Fund, calculated daily and paid monthly, at annual rates of 0.45%, 0.35% and 0.25% of the average daily net assets managed by each, respectively. For Western Asset’s cash management services to the Fund pursuant to the Western Asset Agreement, LMPFA, not the Fund, pays Western Asset monthly 0.02% of the portion of the Fund’s average daily net assets that are allocated to them by LMPFA. Western Asset pays each of Western Asset London and Western Japan a subadvisory fee for their services to the Fund, calculated daily and paid monthly, at an annual rate of 0.25% of the average daily net assets managed by each.
LMPFA has agreed to waive fees and/or reimburse operating expenses (other than interest, brokerage commissions (except for brokerage commissions paid on purchases and sales of shares of ETFs), dividend expense on short sales, taxes and extraordinary expenses), subject to recapture as described below. As a result, total annual fund operating expenses did not exceed 1.35%, 2.10%, 1.10% and 1.00% for Class A, Class C, Class I and Class IS shares, respectively. In addition, the ratio of total annual fund operating expenses for Class IS shares did not exceed the ratio of total annual fund operating expenses for Class I shares. Acquired fund fees and expenses are subject to the expense limitation arrangements, and are calculated based on an average of the net expense ratio (as shown in the most recent prospectus or shareholder report for each acquired fund as of the date of the Fund’s most recent prospectus) of each acquired fund held by the Fund, weighted in proportion to the Fund’s investment allocation among the acquired funds. These arrangements are expected to continue until December 31, 2023, may be terminated prior to that date by agreement of LMPFA and the Board of Trustees, and may be terminated at any time after that date by
| Franklin Strategic Real Return Fund 2022 Semi-Annual Report |
31 |
Notes to consolidated financial statements (unaudited) (cont’d)
LMPFA. The arrangements, however, may be modified by LMPFA to decrease total annual fund operating expenses at any time.
During the six months ended March 31, 2022, fees waived and/or expenses reimbursed amounted to $59,155.
LMPFA is permitted to recapture amounts waived and/or reimbursed to a class within three years after the fiscal year in which LMPFA earned the fee or incurred the expense if the class’ total annual fund operating expenses have fallen to a level below the expense limitation (“expense cap”) in effect at the time the fees were earned or the expenses incurred. In no case will LMPFA recapture any amount that would result, on any particular business day of the Fund, in the class’ total annual fund operating expenses exceeding the expense cap or any other lower limit then in effect.
Pursuant to these arrangements, at March 31, 2022, the Fund had remaining fee waivers and/or expense reimbursements subject to recapture by LMPFA and respective dates of expiration as follows:
| Class A | Class C | Class I | Class IS | |||||||||||||
| Expires September 30, 2022 | $ | 1,023 | $ | 405 | $ | 3,989 | $ | 194,718 | ||||||||
| Expires September 30, 2023 | 1,263 | 264 | 2,626 | 188,674 | ||||||||||||
| Expires September 30, 2024 | 2,164 | 176 | 1,174 | 129,364 | ||||||||||||
| Expires September 30, 2025 | 2,399 | 75 | 39 | 56,389 | ||||||||||||
| Total fee waivers/expense reimbursements subject to recapture | $ | 6,849 | $ | 920 | $ | 7,828 | $ | 569,145 | ||||||||
For the six months ended March 31, 2022, fee waivers and/or expense reimbursements recaptured by LMPFA, if any, were as follows:
| Class I | ||||
| LMPFA recaptured | $ | 151 | ||
Franklin Distributors, LLC (“Franklin Distributors”) serves as the Fund’s sole and exclusive distributor. Franklin Distributors is an indirect, wholly-owned broker-dealer subsidiary of Franklin Resources.
There is a maximum initial sales charge of 5.75% for Class A shares. There is a contingent deferred sales charge (“CDSC”) of 1.00% on Class C shares, which applies if redemption occurs within 12 months from purchase payment. In certain cases, Class A shares have a 1.00% CDSC, which applies if redemption occurs within 18 months from purchase payment. This CDSC only applies to those purchases of Class A shares, which, when combined with current holdings of other shares of funds sold by Franklin Distributors, equal or exceed $1,000,000 in the aggregate. These purchases do not incur an initial sales charge.
|
32 |
Franklin Strategic Real Return Fund 2022 Semi-Annual Report |
For the six months ended March 31, 2022, sales charges retained by and CDSCs paid to Franklin Distributors and its affiliates, if any, were as follows:
| Class A | ||||
| Sales charges | $ | 5,538 | ||
| CDSCs | — | |||
Under a Deferred Compensation Plan (the “Plan”), Trustees may have elected to defer receipt of all or a specified portion of their compensation. A participating Trustee selected one or more funds managed by LMPFA or an affiliate of LMPFA in which his or her deferred trustee’s fees were deemed to be invested. Deferred amounts remain in the Fund until distributed in accordance with the Plan. In May 2015, the Board of Trustees approved an amendment to the Plan so that effective January 1, 2016, no compensation earned after that date may be deferred under the Plan.
All officers and one Trustee of the Trust are employees of Franklin Resources or its affiliates and do not receive compensation from the Trust.
As of March 31, 2022, Franklin Resources and its affiliates owned 93% of the Fund.
3. Investments
During the six months ended March 31, 2022, the aggregate cost of purchases and proceeds from sales of investments (excluding short-term investments) and U.S. Government & Agency Obligations were as follows:
| Investments | U.S. Government & Agency Obligations |
|||||||
| Purchases | $ | 5,215,008 | $ | 18,331,006 | ||||
| Sales | 15,309,485 | 10,406,984 | ||||||
At March 31, 2022, the aggregate cost of investments and the aggregate gross unrealized appreciation and depreciation of investments for federal income tax purposes were substantially as follows:
| Cost | Gross Unrealized Appreciation |
Gross Unrealized Depreciation |
Net Unrealized Appreciation (Depreciation) |
|||||||||||||
| Securities | $ | 100,474,711 | $ | 15,339,234 | $ | (1,017,180) | $ | 14,322,054 | ||||||||
| Futures contracts | — | 129,567 | (3,066,547) | (2,936,980) | ||||||||||||
| Forward foreign currency contracts | — | 1,403,881 | (997,112) | 406,769 | ||||||||||||
| Franklin Strategic Real Return Fund 2022 Semi-Annual Report |
33 |
Notes to consolidated financial statements (unaudited) (cont’d)
4. Derivative instruments and hedging activities
Below is a table, grouped by derivative type, that provides information about the fair value and the location of derivatives within the Consolidated Statement of Assets and Liabilities at March 31, 2022.
| ASSET DERIVATIVES1 | ||||||||||||||||
| Interest Rate Risk |
Foreign Exchange Risk |
Equity Risk |
Total | |||||||||||||
| Futures contracts2 | $ | 8,184 | — | $ | 121,383 | $ | 129,567 | |||||||||
| Forward foreign currency contracts | — | $ | 1,403,881 | — | 1,403,881 | |||||||||||
| Total | $ | 8,184 | $ | 1,403,881 | $ | 121,383 | $ | 1,533,448 | ||||||||
| LIABILITY DERIVATIVES1 | ||||||||||||||||
| Interest Rate Risk |
Foreign Exchange Risk |
Commodity Risk |
Total | |||||||||||||
| Futures contracts2 | $ | 50,779 | — | $ | 3,015,768 | $ | 3,066,547 | |||||||||
| Forward foreign currency contracts | — | $ | 997,112 | — | 997,112 | |||||||||||
| Total | $ | 50,779 | $ | 997,112 | $ | 3,015,768 | $ | 4,063,659 | ||||||||
| 1 | Generally, the balance sheet location for asset derivatives is receivables/net unrealized appreciation and for liability derivatives is payables/net unrealized depreciation. |
| 2 | Includes cumulative unrealized appreciation (depreciation) of futures contracts as reported in the Consolidated Schedule of Investments. Only net variation margin is reported within the receivables and/or payables on the Consolidated Statement of Assets and Liabilities. |
The following tables provide information about the effect of derivatives and hedging activities on the Fund’s Consolidated Statement of Operations for the six months ended March 31, 2022. The first table provides additional detail about the amounts and sources of gains (losses) realized on derivatives during the period. The second table provides additional information about the change in unrealized appreciation (depreciation) resulting from the Fund’s derivatives and hedging activities during the period.
| AMOUNT OF REALIZED GAIN (LOSS) ON DERIVATIVES RECOGNIZED | ||||||||||||||||||||
| Interest Rate Risk |
Foreign Exchange Risk |
Equity Risk |
Commodity Risk |
Total | ||||||||||||||||
| Futures contracts | $ | (378,020) | — | $ | (213,142) | $ | 12,364,275 | $ | 11,773,113 | |||||||||||
| Forward foreign currency contracts | — | $ | (2,198,198) | — | — | (2,198,198) | ||||||||||||||
| Total | $ | (378,020) | $ | (2,198,198) | $ | (213,142) | $ | 12,364,275 | $ | 9,574,915 | ||||||||||
| CHANGE IN UNREALIZED APPRECIATION (DEPRECIATION) ON DERIVATIVES RECOGNIZED | ||||||||||||||||||||
| Interest Rate Risk |
Foreign Exchange Risk |
Equity Risk |
Commodity Risk |
Total | ||||||||||||||||
| Futures contracts | $ | (73,434) | — | $ | 166,488 | $ | (4,515,057) | $ | (4,422,003) | |||||||||||
| Forward foreign currency contracts | — | $ | 980,622 | — | — | 980,622 | ||||||||||||||
| Total | $ | (73,434) | $ | 980,622 | $ | 166,488 | $ | (4,515,057) | $ | (3,441,381) | ||||||||||
|
34 |
Franklin Strategic Real Return Fund 2022 Semi-Annual Report |
During the six months ended March 31, 2022, the volume of derivative activity for the Fund was as follows:
| Average Market Value |
||||
| Futures contracts (to buy) | $ | 52,453,693 | ||
| Futures contracts (to sell)† | 22,507,903 | |||
| Forward foreign currency contracts (to buy) | 77,014,324 | |||
| Forward foreign currency contracts (to sell) | 46,202,132 | |||
| † | At March 31, 2022, there were no open positions held in this derivative. |
The following table presents the Fund’s OTC derivative assets and liabilities by counterparty net of amounts available for offset under an ISDA Master Agreement and net of the related collateral pledged (received) by the Fund as of March 31, 2022.
| Counterparty | Gross Assets Subject to Master Agreements1 |
Gross Agreements1 |
Net Assets Agreements |
Collateral (Received) |
Net Amount2 |
|||||||||||||||
| Bank of New York | $ | 66,995 | $ | (5,728) | $ | 61,267 | — | $ | 61,267 | |||||||||||
| Citibank N.A. | 333,456 | (294,754) | 38,702 | — | 38,702 | |||||||||||||||
| Goldman Sachs Group Inc. | — | (11,979) | (11,979) | — | (11,979) | |||||||||||||||
| HSBC Securities Inc. | 822,613 | (684,096) | 138,517 | — | 138,517 | |||||||||||||||
| UBS Securities LLC | 180,817 | (555) | 180,262 | — | 180,262 | |||||||||||||||
| Total | $ | 1,403,881 | $ | (997,112) | $ | 406,769 | — | $ | 406,769 | |||||||||||
| 1 | Absent an event of default or early termination, derivative assets and liabilities are presented gross and not offset in the Consolidated Statement of Assets and Liabilities. |
| 2 | Represents the net amount receivable (payable) from (to) the counterparty in the event of default. |
5. Class specific expenses, waivers and/or expense reimbursements
The Fund has adopted a Rule 12b-1 shareholder services and distribution plan and under that plan the Fund pays service and/or distribution fees with respect to its Class A and Class C shares calculated at the annual rate of 0.25% and 1.00% of the average daily net assets of each class, respectively. Service and/or distribution fees are accrued daily and paid monthly.
For the six months ended March 31, 2022, class specific expenses were as follows:
| Service and/or Distribution Fees |
Transfer Agent Fees |
|||||||
| Class A | $ | 3,057 | $ | 2,162 | ||||
| Class C | 334 | 48 | ||||||
| Class I | — | (116) | ||||||
| Class IS | — | 223 | ||||||
| Total | $ | 3,391 | $ | 2,317 | ||||
| Franklin Strategic Real Return Fund 2022 Semi-Annual Report |
35 |
Notes to consolidated financial statements (unaudited) (cont’d)
For the six months ended March 31, 2022, waivers and/or expense reimbursements by class were as follows:
| Waivers/Expense Reimbursements |
||||
| Class A | $ | 2,413 | ||
| Class C | 76 | |||
| Class I | 40 | |||
| Class IS | 56,626 | |||
| Total | $ | 59,155 | ||
6. Distributions to shareholders by class
| Six Months Ended March 31, 2022 |
Year Ended September 30, 2021 |
|||||||
| Net Investment Income: | ||||||||
| Class A | $ | 204,101 | $ | 3,970 | ||||
| Class A2† | — | 14,355 | ||||||
| Class C | 2,647 | 704 | ||||||
| Class I | 5,435 | 8,545 | ||||||
| Class IS | 11,637,820 | 1,497,432 | ||||||
| Total | $ | 11,850,003 | $ | 1,525,006 | ||||
| Net Realized Gains: | ||||||||
| Class A | $ | 100,865 | $ | 2,418 | ||||
| Class A2† | — | 9,093 | ||||||
| Class C | 1,578 | 486 | ||||||
| Class I | 2,851 | 4,744 | ||||||
| Class IS | 5,920,856 | 857,115 | ||||||
| Total | $ | 6,026,150 | $ | 873,856 | ||||
| † | On June 24, 2021, the Fund converted its Class A2 shares into Class A shares. |
7. Shares of beneficial interest
At March 31, 2022, the Trust had an unlimited number of shares of beneficial interest authorized with a par value of $0.00001 per share. The Fund has the ability to issue multiple classes of shares. Each class of shares represents an identical interest and has the same rights, except that each class bears certain direct expenses, including those specifically related to the distribution of its shares.
|
36 |
Franklin Strategic Real Return Fund 2022 Semi-Annual Report |
Transactions in shares of each class were as follows:
| Six Months Ended March 31, 2022 |
Year Ended September 30, 2021 |
|||||||||||||||
| Shares | Amount | Shares | Amount | |||||||||||||
| Class A | ||||||||||||||||
| Shares sold | 492,540 | $ | 5,695,759 | 129,977 | $ | 1,645,685 | ||||||||||
| Shares issued on reinvestment | 25,790 | 292,849 | 430 | 4,821 | ||||||||||||
| Shares repurchased | (31,342) | (364,694) | (20,987) | (266,829) | ||||||||||||
| Net increase | 486,988 | $ | 5,623,914 | 109,420 | $ | 1,383,677 | ||||||||||
| Class A2† | ||||||||||||||||
| Shares sold | — | — | 35,453 | $ | 430,063 | |||||||||||
| Shares issued on reinvestment | — | — | 2,135 | 23,448 | ||||||||||||
| Shares repurchased | — | — | (131,052) | (1,608,079) | ||||||||||||
| Net decrease | — | — | (93,464) | $ | (1,154,568) | |||||||||||
| Class C | ||||||||||||||||
| Shares sold | 39,522 | $ | 446,783 | — | — | |||||||||||
| Shares issued on reinvestment | 388 | 4,225 | 111 | $ | 1,190 | |||||||||||
| Shares repurchased | — | — | (4,358) | (52,418) | ||||||||||||
| Net increase (decrease) | 39,910 | $ | 451,008 | (4,247) | $ | (51,228) | ||||||||||
| Class I | ||||||||||||||||
| Shares sold | 14,034 | $ | 165,080 | 4,359 | $ | 50,844 | ||||||||||
| Shares issued on reinvestment | 705 | 8,286 | 1,154 | 13,289 | ||||||||||||
| Shares repurchased | (378) | (4,550) | (49,240) | (593,769) | ||||||||||||
| Net increase (decrease) | 14,361 | $ | 168,816 | (43,727) | $ | (529,636) | ||||||||||
| Class IS | ||||||||||||||||
| Shares sold | — | — | 164,048 | $ | 1,954,999 | |||||||||||
| Shares issued on reinvestment | 1,519,519 | $ | 17,558,676 | 207,219 | 2,354,547 | |||||||||||
| Shares repurchased | (666,466) | (7,900,000) | (637,720) | (8,015,099) | ||||||||||||
| Net increase (decrease) | 853,053 | $ | 9,658,676 | (266,453) | $ | (3,705,553) | ||||||||||
| † | On June 24, 2021, the Fund converted 109,490 Class A2 shares into 106,984 Class A shares, valued at $1,355,485. These amounts are reflected in the Class A shares sold and Class A2 shares repurchased, respectively. |
8. Redemption facility
On February 4, 2022, the Fund, together with other U.S. registered and foreign investment funds (collectively, the “Borrowers”) managed by Franklin Resources or its affiliates, became a borrower in a joint syndicated senior unsecured credit facility totaling $2.675 billion (the “Global Credit Facility”). The Global Credit Facility provides a source of funds to the Borrowers for temporary and emergency purposes, including the ability to meet future unanticipated or unusually large redemption requests. Unless renewed, the Global Credit Facility will terminate on February 3, 2023.
| Franklin Strategic Real Return Fund 2022 Semi-Annual Report |
37 |
Notes to consolidated financial statements (unaudited) (cont’d)
Under the terms of the Global Credit Facility, the Fund shall, in addition to interest charged on any borrowings made by the Fund and other costs incurred by the Fund, pay its share of fees and expenses incurred in connection with the implementation and maintenance of the Global Credit Facility, based upon its relative share of the aggregate net assets of all the Borrowers, including an annual commitment fee of 0.15% based upon the unused portion of the Global Credit Facility. These fees are reflected in the Statement of Operations. The Fund did not utilize the Global Credit Facility during the six months ended March 31, 2022.
9. Recent accounting pronouncement
In March 2020, the Financial Accounting Standards Board (FASB) issued Accounting Standards Update (ASU) No. 2020-04, Reference Rate Reform (Topic 848) – Facilitation of the Effects of Reference Rate Reform on Financial Reporting. In January 2021, the FASB issued ASU No. 2021-01, with further amendments to Topic 848. The amendments in the ASUs provide optional temporary accounting recognition and financial reporting relief from the effect of certain types of contract modifications due to the planned discontinuation of the LIBOR and other interbank-offered based reference rates as of the end of 2021 and 2023. The ASUs are effective for certain reference rate-related contract modifications that occur during the period March 12, 2020 through December 31, 2022. Management has reviewed the requirements and believes the adoption of these ASUs will not have a material impact on the financial statements.
10. Other matters
The outbreak of the respiratory illness COVID-19 (commonly referred to as “coronavirus”) has continued to rapidly spread around the world, causing considerable uncertainty for the global economy and financial markets. The ultimate economic fallout from the pandemic, and the long-term impact on economies, markets, industries and individual issuers, are not known. The COVID-19 pandemic could adversely affect the value and liquidity of the Fund’s investments, impair the Fund’s ability to satisfy redemption requests, and negatively impact the Fund’s performance. In addition, the outbreak of COVID-19, and measures taken to mitigate its effects, could result in disruptions to the services provided to the Fund by its service providers.
* * *
The Fund’s investments, payment obligations, and financing terms may be based on floating rates, such as the London Interbank Offered Rate, or “LIBOR,” which is the offered rate for short-term Eurodollar deposits between major international banks. On March 5, 2021, the ICE Benchmark Administration, the administrator of LIBOR, stated that it will cease the publication of the overnight and one-, three-, six- and twelve-month USD LIBOR settings immediately following the LIBOR publication on Friday, June 30, 2023. All other LIBOR settings, including the one-week and two-month USD LIBOR settings, have ceased publication as of January 1, 2022. There remains uncertainty regarding the nature of any replacement rate and the impact of the transition from LIBOR on the Fund’s transactions and
|
38 |
Franklin Strategic Real Return Fund 2022 Semi-Annual Report |
the financial markets generally. As such, the potential effect of a transition away from LIBOR on the Fund or the Fund’s investments cannot yet be determined.
* * *
On February 24, 2022, Russia engaged in military actions in the sovereign territory of Ukraine. The current political and financial uncertainty surrounding Russia and Ukraine may increase market volatility and the economic risk of investing in securities in these countries and may also cause uncertainty for the global economy and broader financial markets. The ultimate fallout and long-term impact from these events are not known. The Fund will continue to assess the impact on valuations and liquidity and will take any potential actions needed in accordance with procedures approved by the Board of Trustees.
| Franklin Strategic Real Return Fund 2022 Semi-Annual Report |
39 |
Statement regarding liquidity risk management program (unaudited)
Each Fund has adopted and implemented a written Liquidity Risk Management Program (the “LRMP”) as required by Rule 22e-4 under the Investment Company Act of 1940 (the “Liquidity Rule”). The LRMP is designed to assess and manage each Fund’s liquidity risk, which is defined as the risk that the Fund could not meet requests to redeem shares issued by the Fund without significant dilution of remaining investors’ interests in the Fund. In accordance with the Liquidity Rule, the LRMP includes policies and procedures that provide for: (1) assessment, management, and review (no less frequently than annually) of each Fund’s liquidity risk; (2) classification of each Fund’s portfolio holdings into one of four liquidity categories (Highly Liquid, Moderately Liquid, Less Liquid, and Illiquid); (3) for Funds that do not primarily hold assets that are Highly Liquid, establishing and maintaining a minimum percentage of the Fund’s net assets in Highly Liquid investments (called a “Highly Liquid Investment Minimum” or “HLIM”); and (4) prohibiting the Fund’s acquisition of Illiquid investments that would result in the Fund holding more than 15% of its net assets in Illiquid assets. The LRMP also requires reporting to the Securities and Exchange Commission (“SEC”) (on a non-public basis) and to the Board if the Fund’s holdings of Illiquid assets exceed 15% of the Fund’s net assets. Funds with HLIMs must have procedures for addressing HLIM shortfalls, including reporting to the Board and, with respect to HLIM shortfalls lasting more than seven consecutive calendar days, reporting to the SEC (on a non-public basis).
The Director of Liquidity Risk within the Investment Risk Management Group (the “IRMG”) is the appointed Administrator of the LRMP. The IRMG maintains the Investment Liquidity Committee (the “ILC”) to provide oversight and administration of policies and procedures governing liquidity risk management for Franklin Templeton and Legg Mason products and portfolios. The ILC includes representatives from Franklin Templeton’s Risk, Trading, Global Compliance, Legal, Investment Compliance, Investment Operations, Valuation Committee, Product Management and Global Product Strategy.
In assessing and managing each Fund’s liquidity risk, the ILC considers, as relevant, a variety of factors, including the Fund’s investment strategy and the liquidity of its portfolio investments during both normal and reasonably foreseeable stressed conditions; its short and long-term cash flow projections; and its cash holdings and access to other funding sources including the Funds’ interfund lending facility and line of credit. Classification of the Fund’s portfolio holdings in the four liquidity categories is based on the number of days it is reasonably expected to take to convert the investment to cash (for Highly Liquid and Moderately Liquid holdings) or sell or dispose of the investment (for Less Liquid and Illiquid investments), in current market conditions without significantly changing the investment’s market value.
Each Fund primarily holds liquid assets that are defined under the Liquidity Rule as “Highly Liquid Investments,” and therefore is not required to establish an HLIM. Highly Liquid
|
40 |
Franklin Strategic Real Return Fund |
Investments are defined as cash and any investment reasonably expected to be convertible to cash in current market conditions in three business days or less without the conversion to cash significantly changing the market value of the investment.
At meetings of the Funds’ Board of Trustees/Directors held in November 2021, the Program Administrator provided a written report to the Board addressing the adequacy and effectiveness of the program for the year ended December 31, 2020. The Program Administrator report concluded that (i.) the LRMP, as adopted and implemented, remains reasonably designed to assess and manage each Fund’s liquidity risk; (ii.) the LRMP, including the Highly Liquid Investment Minimum (“HLIM”) where applicable, was implemented and operated effectively to achieve the goal of assessing and managing each Fund’s liquidity risk; and (iii.) each Fund was able to meet requests for redemption without significant dilution of remaining investors’ interests in the Fund.
| Franklin Strategic Real Return Fund |
41 |
Franklin
Strategic Real Return Fund
Trustees
Paul R. Ades
Andrew L. Breech
Althea L. Duersten
Chair
Stephen R. Gross
Susan M. Heilbron
Howard J. Johnson
Arnold L. Lehman
Robin J. W. Masters
Jerome H. Miller
Ken Miller
G. Peter O’Brien
Thomas F. Schlafly
Jane Trust
Investment manager
Legg Mason Partners Fund Advisor, LLC
Investment adviser
Franklin Advisers, Inc.
Subadvisers
Franklin Advisers, Inc. ClearBridge Investments, LLC
Western Asset Management Company, LLC
Western Asset Management Company Limited
Western Asset Management Company Ltd
Distributor
Franklin Distributors, LLC
Custodian
The Bank of New York Mellon
Transfer agent#
Franklin Templeton Investor Services, LLC
3344 Quality Drive
Rancho Cordova, CA 95670-7313
Independent registered public accounting firm
PricewaterhouseCoopers LLP
Baltimore, MD
| # | Effective February 22, 2022, Franklin Templeton Investor Services, LLC replaced BNY Mellon Investment Servicing (US) Inc. as Transfer Agent. |
Franklin Strategic Real Return Fund
The Fund is a separate investment series of Legg Mason Global Asset Management Trust, a Maryland statutory trust.
Franklin Strategic Real Return Fund
Legg Mason Funds
620 Eighth Avenue, 47th Floor
New York, NY 10018
The Fund files its complete schedule of portfolio holdings with the Securities and Exchange Commission (“SEC”) for the first and third quarters of each fiscal year as an exhibit to its reports on Form N-PORT. The Fund’s Forms N-PORT are available on the SEC’s website at www.sec.gov. To obtain information on Form N-PORT, shareholders can call the Fund at 877-6LM-FUND/656-3863.
Information on how the Fund voted proxies relating to portfolio securities during the prior 12-month period ended June 30th of each year and a description of the policies and procedures that the Fund uses to determine how to vote proxies related to portfolio transactions are available (1) without charge, upon request, by calling the Fund at 877-6LM-FUND/656-3863, (2) at www.franklintempleton.com and (3) on the SEC’s website at www.sec.gov.
This report is submitted for the general information of the shareholders of Franklin Strategic Real Return Fund. This report is not authorized for distribution to prospective investors in the Fund unless preceded or accompanied by a current prospectus.
Investors should consider the Fund’s investment objectives, risks, charges and expenses carefully before investing. The prospectus contains this and other important information about the Fund. Please read the prospectus carefully before investing.
www.franklintempleton.com
© 2022 Franklin Distributors, LLC, Member FINRA/SIPC. All rights reserved.
Legg Mason Funds Privacy and Security Notice
Your Privacy and the Security of Your Personal Information is Very Important to the Legg Mason Funds
This Privacy and Security Notice (the “Privacy Notice”) addresses the Legg Mason Funds’ privacy and data protection practices with respect to nonpublic personal information the Funds receive. The Legg Mason Funds include any funds sold by the Funds’ distributor, Franklin Distributors, LLC, as well as Legg Mason-sponsored closed-end funds. The provisions of this Privacy Notice apply to your information both while you are a shareholder and after you are no longer invested with the Funds.
The Type of Nonpublic Personal Information the Funds Collect About You
The Funds collect and maintain nonpublic personal information about you in connection with your shareholder account. Such information may include, but is not limited to:
| • | Personal information included on applications or other forms; |
| • | Account balances, transactions, and mutual fund holdings and positions; |
| • | Bank account information, legal documents, and identity verification documentation; |
| • | Online account access user IDs, passwords, security challenge question responses; and |
| • | Information received from consumer reporting agencies regarding credit history and creditworthiness (such as the amount of an individual’s total debt, payment history, etc.). |
How the Funds Use Nonpublic Personal Information About You
The Funds do not sell or share your nonpublic personal information with third parties or with affiliates for their marketing purposes, or with other financial institutions or affiliates for joint marketing purposes, unless you have authorized the Funds to do so. The Funds do not disclose any nonpublic personal information about you except as may be required to perform transactions or services you have authorized or as permitted or required by law.
The Funds may disclose information about you to:
| • | Employees, agents, and affiliates on a “need to know” basis to enable the Funds to conduct ordinary business, or to comply with obligations to government regulators; |
| • | Service providers, including the Funds’ affiliates, who assist the Funds as part of the ordinary course of business (such as printing, mailing services, or processing or servicing your account with us) or otherwise perform services on the Funds’ behalf, including companies that may perform statistical analysis, market research and marketing services solely for the Funds; |
| • | Permit access to transfer, whether in the United States or countries outside of the United States to such Funds’ employees, agents and affiliates and service providers as required to enable the Funds to conduct ordinary business, or to comply with obligations to government regulators; |
| • | The Funds’ representatives such as legal counsel, accountants and auditors to enable the Funds to conduct ordinary business, or to comply with obligations to government regulators; |
| • | Fiduciaries or representatives acting on your behalf, such as an IRA custodian or trustee of a grantor trust. |
| NOT PART OF THE SEMI-ANNUAL REPORT |
Legg Mason Funds Privacy and Security Notice (cont’d)
Except as otherwise permitted by applicable law, companies acting on the Funds’ behalf, including those outside the United States, are contractually obligated to keep nonpublic personal information the Funds provide to them confidential and to use the information the Funds share only to provide the services the Funds ask them to perform. The Funds may disclose nonpublic personal information about you when necessary to enforce their rights or protect against fraud, or as permitted or required by applicable law, such as in connection with a law enforcement or regulatory request, subpoena, or similar legal process. In the event of a corporate action or in the event a Fund service provider changes, the Funds may be required to disclose your nonpublic personal information to third parties. While it is the Funds’ practice to obtain protections for disclosed information in these types of transactions, the Funds cannot guarantee their privacy policy will remain unchanged.
Keeping You Informed of the Funds’ Privacy and Security Practices
The Funds will notify you annually of their privacy policy as required by federal law. While the Funds reserve the right to modify this policy at any time they will notify you promptly if this privacy policy changes.
The Funds’ Security Practices
The Funds maintain appropriate physical, electronic and procedural safeguards designed to guard your nonpublic personal information. The Funds’ internal data security policies restrict access to your nonpublic personal information to authorized employees, who may use your nonpublic personal information for Fund business purposes only.
Although the Funds strive to protect your nonpublic personal information, they cannot ensure or warrant the security of any information you provide or transmit to them, and you do so at your own risk. In the event of a breach of the confidentiality or security of your nonpublic personal information, the Funds will attempt to notify you as necessary, so you can take appropriate protective steps. If you have consented to the Funds using electronic communications or electronic delivery of statements, they may notify you under such circumstances using the most current email address you have on record with them.
In order for the Funds to provide effective service to you, keeping your account information accurate is very important. If you believe that your account information is incomplete, not accurate or not current, if you have questions about the Funds’ privacy practices, or our use of your nonpublic personal information, write the Funds using the contact information on your account statements, email the Funds by clicking on the Contact Us section of the Funds’ website at www.franklintempleton.com, or contact the Fund at 877-6LM-FUND/656-3863.
Revised April 2018
Legg Mason California Consumer Privacy Act Policy
Although much of the personal information we collect is “nonpublic personal information” subject to federal law, residents of California may, in certain circumstances, have additional rights under the California Consumer Privacy Act (“CCPA”). For example, if you are a broker,
| NOT PART OF THE SEMI-ANNUAL REPORT |
Legg Mason Funds Privacy and Security Notice (cont’d)
dealer, agent, fiduciary, or representative acting by or on behalf of, or for, the account of any other person(s) or household, or a financial advisor, or if you have otherwise provided personal information to us separate from the relationship we have with personal investors, the provisions of this Privacy Policy apply to your personal information (as defined by the CCPA).
| • | In addition to the provisions of the Legg Mason Funds Security and Privacy Notice, you may have the right to know the categories and specific pieces of personal information we have collected about you. |
| • | You also have the right to request the deletion of the personal information collected or maintained by the Funds. |
If you wish to exercise any of the rights you have in respect of your personal information, you should advise the Funds by contacting them as set forth below. The rights noted above are subject to our other legal and regulatory obligations and any exemptions under the CCPA. You may designate an authorized agent to make a rights request on your behalf, subject to the identification process described below. We do not discriminate based on requests for information related to our use of your personal information, and you have the right not to receive discriminatory treatment related to the exercise of your privacy rights.
We may request information from you in order to verify your identity or authority in making such a request. If you have appointed an authorized agent to make a request on your behalf, or you are an authorized agent making such a request (such as a power of attorney or other written permission), this process may include providing a password/passcode, a copy of government issued identification, affidavit or other applicable documentation, i.e. written permission. We may require you to verify your identity directly even when using an authorized agent, unless a power of attorney has been provided. We reserve the right to deny a request submitted by an agent if suitable and appropriate proof is not provided.
For the 12-month period prior to the date of this Privacy Policy, the Legg Mason Funds have not sold any of your personal information; nor do we have any plans to do so in the future.
Contact Information
Address: Data Privacy Officer, 100 International Dr., Baltimore, MD 21202
Email: DataProtectionOfficer@franklintempleton.com
Phone: 1-800-396-4748
Revised October 2020
| NOT PART OF THE SEMI-ANNUAL REPORT |
www.franklintempleton.com
© 2022 Franklin Distributors, LLC, Member FINRA/SIPC. All rights reserved.
LMFX012787 5/22 SR22-4395
| ITEM 2. | CODE OF ETHICS. |
Not applicable.
| ITEM 3. | AUDIT COMMITTEE FINANCIAL EXPERT. |
Not applicable.
| ITEM 4. | PRINCIPAL ACCOUNTANT FEES AND SERVICES. |
Not applicable.
| ITEM 5. | AUDIT COMMITTEE OF LISTED REGISTRANTS. |
Not applicable.
| ITEM 6. | SCHEDULE OF INVESTMENTS. |
Included herein under Item 1.
| ITEM 7. | DISCLOSURE OF PROXY VOTING POLICIES AND PROCEDURES FOR CLOSED-END MANAGEMENT INVESTMENT COMPANIES. |
Not applicable.
| ITEM 8. | PORTFOLIO MANAGERS OF CLOSED-END MANAGEMENT INVESTMENT COMPANIES. |
Not applicable.
| ITEM 9. | PURCHASES OF EQUITY SECURITIES BY CLOSED-END MANAGEMENT INVESTMENT COMPANY AND AFFILIATED PURCHASERS. |
Not applicable.
| ITEM 10. | SUBMISSION OF MATTERS TO A VOTE OF SECURITY HOLDERS. |
Not applicable.
| ITEM 11. | CONTROLS AND PROCEDURES. |
| (a) | The registrant’s principal executive officer and principal financial officer have concluded that the registrant’s disclosure controls and procedures (as defined in Rule 30a- 3(c) under the Investment Company Act of 1940, as amended (the “1940 Act”)) are effective as of a date within 90 days of the filing date of this report that includes the disclosure required by this paragraph, based on their evaluation of the disclosure controls and procedures required by Rule 30a-3(b) under the 1940 Act and 15d-15(b) under the Securities Exchange Act of 1934. |
| (b) | There were no changes in the registrant’s internal control over financial reporting (as defined in Rule 30a-3(d) under the 1940 Act) that occurred during the second fiscal quarter of the period covered by this report that have materially affected, or are likely to materially affect the registrant’s internal control over financial reporting. |
| ITEM 12. | DISCLOSURE OF SECURITIES LENDING ACTIVITIES FOR CLOSED-END MANAGEMENT INVESTMENT COMPANIES. |
Not applicable.
| ITEM 13. | EXHIBITS. |
(a) (1) Not applicable.
Exhibit 99.CODE ETH
(a) (2) Certifications pursuant to section 302 of the Sarbanes-Oxley Act of 2002 attached hereto.
Exhibit 99.CERT
(b) Certifications pursuant to Section 906 of the Sarbanes-Oxley Act of 2002 attached hereto.
Exhibit 99.906CERT
SIGNATURES
Pursuant to the requirements of the Securities Exchange Act of 1934 and the Investment Company Act of 1940, the registrant has duly caused this Report to be signed on its behalf by the undersigned, there unto duly authorized.
| Legg Mason Global Asset Management Trust | ||
| By: | /s/ Jane Trust | |
| Jane Trust | ||
| Chief Executive Officer | ||
| Date: | May 24, 2022 | |
Pursuant to the requirements of the Securities Exchange Act of 1934 and the Investment Company Act of 1940, this report has been signed below by the following persons on behalf of the registrant and in the capacities and on the dates indicated.
| By: | /s/ Jane Trust | |
| Jane Trust | ||
| Chief Executive Officer | ||
| Date: | May 24, 2022 | |
| By: | /s/ Christopher Berarducci | |
| Christopher Berarducci | ||
| Principal Financial Officer | ||
| Date: | May 24, 2022 | |