First Trust
Intermediate
Duration Preferred & Income Fund (FPF)
Semi-Annual
Report
For the Six
Months Ended
April 30,
2022


UNITED STATES
SECURITIES AND EXCHANGE COMMISSION
Washington, D.C. 20549
FORM N-CSR
CERTIFIED SHAREHOLDER REPORT OF REGISTERED MANAGEMENT INVESTMENT COMPANIES
Investment Company Act file number 811-22795
First Trust Intermediate Duration
Preferred & Income Fund
(Exact name of registrant as specified in charter)
120 East Liberty Drive, Suite 400
Wheaton, IL 60187
(Address of principal executive offices) (Zip code)
W. Scott Jardine, Esq.
First Trust Portfolios L.P.
120 East Liberty Drive, Suite 400
Wheaton, IL 60187
(Name and address of agent for service)
Registrant’s telephone number, including area code: 630-765-8000
Date of fiscal year end: October 31
Date of reporting period: April 30, 2022
Form N-CSR is to be used by management investment companies to file reports with the Commission not later than 10 days after the transmission to stockholders of any report that is required to be transmitted to stockholders under Rule 30e-1 under the Investment Company Act of 1940 (17 CFR 270.30e-1). The Commission may use the information provided on Form N-CSR in its regulatory, disclosure review, inspection, and policymaking roles.
A registrant is required to disclose the information specified by Form N-CSR, and the Commission will make this information public. A registrant is not required to respond to the collection of information contained in Form N-CSR unless the Form displays a currently valid Office of Management and Budget ("OMB") control number. Please direct comments concerning the accuracy of the information collection burden estimate and any suggestions for reducing the burden to Secretary, Securities and Exchange Commission, 100 F Street, NE, Washington, DC 20549. The OMB has reviewed this collection of information under the clearance requirements of 44 U.S.C. § 3507.
Item 1. Reports to Stockholders.
| (a) | The Report to Shareholders is attached herewith. |
| 1 | |
| 2 | |
| 4 | |
| 7 | |
| 16 | |
| 17 | |
| 18 | |
| 19 | |
| 20 | |
| 21 | |
| 28 |

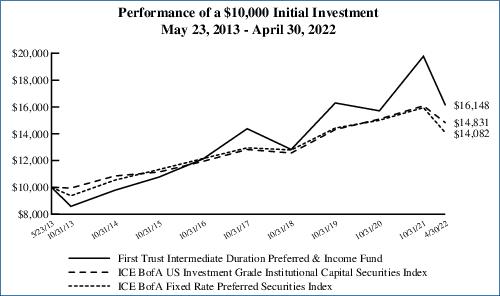
| Performance | ||||
| Average Annual Total Returns | ||||
| 6 Months Ended 4/30/22 | 1 Year Ended 4/30/22 | 5 Years Ended 4/30/22 | Inception (5/23/13) to 4/30/22 | |
| Fund Performance(3) | ||||
| NAV | -11.30% | -7.32% | 4.69% | 6.78% |
| Market Value | -18.37% | -13.29% | 4.13% | 5.51% |
| Index Performance | ||||
| ICE BofA US Investment Grade Institutional Capital Securities Index | -7.82% | -6.20% | 3.84% | 4.51% |
| Blended Index(4) | -10.15% | -8.15% | 3.56% | N/A |
| ICE BofA Fixed Rate Preferred Securities Index | -11.70% | -10.10% | 2.39% | 3.90% |
| Prior Blended Index | -9.89% | -8.16% | 3.19% | 4.19% |
| (1) | Most recent distribution paid or declared through April 30, 2022. Subject to change in the future. |
| (2) | Distribution rates are calculated by annualizing the most recent distribution paid or declared through the report date and then dividing by Common Share Price or NAV, as applicable, as of April 30, 2022. Subject to change in the future. |
| (3) | Total return is based on the combination of reinvested dividend, capital gain, and return of capital distributions, if any, at prices obtained by the Dividend Reinvestment Plan and changes in NAV per share for NAV returns and changes in Common Share Price for market value returns. Total returns do not reflect sales load and are not annualized for periods of less than one year. Past performance is not indicative of future results. |
| (4) | The Blended Index consists of a 30/30/30/10 blend of the ICE BofA Core Plus Fixed Rate Preferred Securities Index, the ICE BofA US Investment Grade Institutional Capital Securities Index, the ICE USD Contingent Capital Index and the ICE BofA US High Yield Institutional Capital Securities Index. The Blended Index is intended to reflect the proportional market cap of each segment of the preferred and hybrid securities market. The Prior Blended Index consists of a 50/50 blend of the ICE BofA Fixed Rate Preferred Securities Index and the ICE BofA U.S. Capital Securities Index. The Blended Index was added to reflect the diverse allocation of institutional preferred and hybrid securities in the Fund’s portfolio. The Blended Index and Prior Blended Index returns are calculated by using the monthly returns of the indices listed above during each period shown. At the beginning of each month the indices are rebalanced to a 30/30/30/10 and 50-50 ratio respectively to account for divergence from that ratio that occurred during the course of each month. The monthly returns are then compounded for each period shown above, giving the performance for the Blended Index for each period shown above. Since the ICE USD Contingent Capital Index had an inception date of December 31, 2013, the performance of the Blended Index is not available for all of the periods disclosed. |
| (5) | The credit quality and ratings information presented above reflect the ratings assigned by one or more nationally recognized statistical rating organizations (NRSROs), including S&P Global Ratings, Moody’s Investors Service, Inc., Fitch Ratings or a comparably rated NRSRO. For situations in which a security is rated by more than one NRSRO and the ratings are not equivalent, the highest rating is used. Sub-investment grade ratings are those rated BB+/Ba1 or lower. Investment grade ratings are those rated BBB-/Baa3 or higher. The credit ratings shown relate to the creditworthiness of the issuers of the underlying securities in the Fund, and not to the Fund or its shares. Credit ratings are subject to change. |
| Performance | ||||
| Average Annual Total Returns | ||||
| 6 Months Ended 4/30/22 | 1 Year Ended 4/30/22 | 5 Years Ended 4/30/22 | Inception (5/23/13) to 4/30/22 | |
| Fund Performance* | ||||
| NAV | -11.30% | -7.32% | 4.69% | 6.78% |
| Market Value | -18.37% | -13.29% | 4.13% | 5.51% |
| Index Performance | ||||
| ICE BofA US Investment Grade Institutional Capital Securities Index | -7.82% | -6.20% | 3.84% | 4.51% |
| Blended Index** | -10.15% | -8.15% | 3.56% | N/A |
| ICE BofA Fixed Rate Preferred Securities Index | -11.70% | -10.10% | 2.39% | 3.90% |
| Prior Blended Index | -9.89% | -8.16% | 3.19% | 4.19% |
| * | Total return is based on the combination of reinvested dividend, capital gain, and return of capital distributions, if any, at prices obtained by the Dividend Reinvestment Plan and changes in NAV per share for NAV returns and changes in Common Share Price for market value returns. Total returns do not reflect sales load and are not annualized for periods of less than one year. |
| ** | The Blended Index consists of a 30/30/30/10 blend of the ICE BofA Core Plus Fixed Rate Preferred Securities Index, the ICE BofA US Investment Grade Institutional Capital Securities Index, the ICE USD Contingent Capital Index and the ICE BofA US High Yield Institutional Capital Securities Index. The Blended Index is intended to reflect the proportional market cap of each segment of the preferred and hybrid securities market. The Prior Blended Index consists of a 50/50 blend of the ICE BofA Fixed Rate Preferred Securities Index and the ICE BofA U.S. Capital Securities Index. The Blended Index was added to reflect the diverse allocation of institutional preferred and hybrid securities in the Fund’s portfolio. The Blended Index and Prior Blended Index returns are calculated by using the monthly returns of the indices listed above during each period shown. At the beginning of each month the indices are rebalanced to a 30/30/30/10 and 50-50 ratio respectively to account for divergence from that ratio that occurred during the course of each month. The monthly returns are then compounded for each period shown above, giving the performance for the Blended Index for each period shown above. Since the ICE USD Contingent Capital Index had an inception date of December 31, 2013, the performance of the Blended Index is not available for all of the periods disclosed. |
| Shares | Description | Stated Rate | Stated Maturity | Value | ||||
| $25 PAR PREFERRED SECURITIES – 21.1% | ||||||||
| Banks – 3.3% | ||||||||
| 3,007 | Atlantic Union Bankshares Corp., Series A | 6.88% | (a) | $77,340 | ||||
| 45,331 | Citizens Financial Group, Inc., Series D (b) | 6.35% | (a) | 1,172,713 | ||||
| 12,374 | Fifth Third Bancorp, Series I (b) | 6.63% | (a) | 320,363 | ||||
| 70,463 | First Republic Bank, Series M | 4.00% | (a) | 1,233,102 | ||||
| 143,945 | JPMorgan Chase & Co., Series LL (c) | 4.63% | (a) | 2,789,654 | ||||
| 56,961 | Old National Bancorp, Series A (c) | 7.00% | (a) | 1,490,669 | ||||
| 272,168 | Pinnacle Financial Partners, Inc., Series B (c) | 6.75% | (a) | 6,964,779 | ||||
| 602,536 | Signature Bank, Series A (c) | 5.00% | (a) | 11,526,514 | ||||
| 102,268 | Wells Fargo & Co., Series Q (b) | 5.85% | (a) | 2,494,317 | ||||
| 49,802 | Wells Fargo & Co., Series Y | 5.63% | (a) | 1,175,327 | ||||
| 205,000 | WesBanco, Inc., Series A (b) (c) | 6.75% | (a) | 5,537,050 | ||||
| 66,146 | Western Alliance Bancorp, Series A (b) | 4.25% | (a) | 1,453,228 | ||||
| 255,439 | Wintrust Financial Corp., Series E (b) (c) | 6.88% | (a) | 6,792,123 | ||||
| 43,027,179 | ||||||||
| Capital Markets – 1.2% | ||||||||
| 29,434 | Affiliated Managers Group, Inc. | 4.75% | 09/30/60 | 579,850 | ||||
| 173,946 | Affiliated Managers Group, Inc. (d) | 4.20% | 09/30/61 | 3,110,155 | ||||
| 369,562 | Carlyle Finance LLC (d) | 4.63% | 05/15/61 | 6,932,983 | ||||
| 269,834 | KKR Group Finance Co., IX LLC (c) | 4.63% | 04/01/61 | 5,199,701 | ||||
| 12,696 | Oaktree Capital Group LLC, Series A | 6.63% | (a) | 324,637 | ||||
| 5,847 | State Street Corp., Series D (b) | 5.90% | (a) | 147,344 | ||||
| 16,294,670 | ||||||||
| Diversified Financial Services – 1.2% | ||||||||
| 187,368 | Apollo Asset Management, Inc., Series B (c) | 6.38% | (a) | 4,774,136 | ||||
| 518,884 | Equitable Holdings, Inc., Series A (c) | 5.25% | (a) | 11,290,916 | ||||
| 16,065,052 | ||||||||
| Diversified Telecommunication Services – 0.3% | ||||||||
| 132,294 | Qwest Corp. (d) | 6.50% | 09/01/56 | 2,956,771 | ||||
| 29,752 | Qwest Corp. (d) | 6.75% | 06/15/57 | 667,635 | ||||
| 3,624,406 | ||||||||
| Electric Utilities – 1.1% | ||||||||
| 245,850 | Brookfield BRP Holdings Canada, Inc. (c) | 4.63% | (a) | 4,296,229 | ||||
| 195,763 | Brookfield Infrastructure Finance ULC (d) | 5.00% | 05/24/81 | 3,807,590 | ||||
| 120,245 | SCE Trust IV, Series J (b) (c) | 5.38% | (a) | 2,621,341 | ||||
| 81,831 | SCE Trust V, Series K (b) | 5.45% | (a) | 1,953,306 | ||||
| 63,514 | Southern (The) Co., Series 2020A (d) | 4.95% | 01/30/80 | 1,341,416 | ||||
| 14,019,882 | ||||||||
| Equity Real Estate Investment Trusts – 0.5% | ||||||||
| 69,919 | Agree Realty Corp., Series A | 4.25% | (a) | 1,313,778 | ||||
| 11,821 | DigitalBridge Group, Inc., Series I | 7.15% | (a) | 271,056 | ||||
| 1,939 | DigitalBridge Group, Inc., Series J | 7.13% | (a) | 43,724 | ||||
| 173,947 | Global Net Lease, Inc., Series A (d) | 7.25% | (a) | 4,407,817 | ||||
| 17,466 | National Storage Affiliates Trust, Series A | 6.00% | (a) | 439,270 | ||||
| 6,475,645 | ||||||||
| Food Products – 0.7% | ||||||||
| 352,723 | CHS, Inc., Series 3 (b) (c) | 6.75% | (a) | 9,340,105 | ||||
| Gas Utilities – 0.3% | ||||||||
| 197,017 | South Jersey Industries, Inc. (c) (d) | 5.63% | 09/16/79 | 3,447,798 | ||||
| Shares | Description | Stated Rate | Stated Maturity | Value | ||||
| $25 PAR PREFERRED SECURITIES (Continued) | ||||||||
| Independent Power & Renewable Electricity Producers – 0.3% | ||||||||
| 161,321 | Brookfield Renewable Partners L.P., Series 17 | 5.25% | (a) | $3,365,156 | ||||
| Insurance – 5.5% | ||||||||
| 471,737 | Aegon Funding Co., LLC (c) | 5.10% | 12/15/49 | 9,977,238 | ||||
| 611 | Allstate (The) Corp. (b) | 5.10% | 01/15/53 | 15,397 | ||||
| 503,143 | American Equity Investment Life Holding Co., Series A (b) (c) | 5.95% | (a) | 12,422,601 | ||||
| 247,889 | American Equity Investment Life Holding Co., Series B (b) (c) | 6.63% | (a) | 6,417,846 | ||||
| 193,648 | AmTrust Financial Services, Inc. (d) | 7.25% | 06/15/55 | 3,679,312 | ||||
| 210,480 | AmTrust Financial Services, Inc. (d) | 7.50% | 09/15/55 | 3,946,500 | ||||
| 192,000 | Arch Capital Group Ltd., Series G (d) | 4.55% | (a) | 3,703,680 | ||||
| 52,243 | Aspen Insurance Holdings Ltd. (d) | 5.63% | (a) | 1,216,739 | ||||
| 349,200 | Aspen Insurance Holdings Ltd. (c) | 5.63% | (a) | 8,083,980 | ||||
| 8,296 | Aspen Insurance Holdings Ltd. (b) | 5.95% | (a) | 203,169 | ||||
| 133,393 | CNO Financial Group, Inc. (d) | 5.13% | 11/25/60 | 2,734,557 | ||||
| 584,250 | Delphi Financial Group, Inc., 3 Mo. LIBOR + 3.19% (d) (e) | 3.70% | 05/15/37 | 12,123,187 | ||||
| 11,540 | Globe Life, Inc. (d) | 4.25% | 06/15/61 | 228,030 | ||||
| 193,528 | Phoenix Cos. (The), Inc. | 7.45% | 01/15/32 | 3,538,176 | ||||
| 160,945 | RenaissanceRe Holdings Ltd., Series G | 4.20% | (a) | 3,022,547 | ||||
| 71,312,959 | ||||||||
| Mortgage Real Estate Investment Trusts – 0.4% | ||||||||
| 6,592 | AGNC Investment Corp., Series C (b) | 7.00% | (a) | 162,295 | ||||
| 117,083 | AGNC Investment Corp., Series F (b) (d) | 6.13% | (a) | 2,706,959 | ||||
| 73,779 | Annaly Capital Management, Inc., Series F (b) | 6.95% | (a) | 1,831,933 | ||||
| 4,701,187 | ||||||||
| Multi-Utilities – 1.8% | ||||||||
| 84,780 | Brookfield Infrastructure Partners L.P., Series 13 | 5.13% | (a) | 1,648,115 | ||||
| 169 | Brookfield Infrastructure Partners L.P., Series 14 | 5.00% | (a) | 3,199 | ||||
| 141,212 | DTE Energy Co. | 4.38% | 12/01/81 | 2,800,234 | ||||
| 15,000 | DTE Energy Co., Series E | 5.25% | 12/01/77 | 348,450 | ||||
| 670,375 | Integrys Holding, Inc. (b) (d) | 6.00% | 08/01/73 | 16,926,969 | ||||
| 74,647 | Sempra Energy | 5.75% | 07/01/79 | 1,787,795 | ||||
| 23,514,762 | ||||||||
| Oil, Gas & Consumable Fuels – 1.7% | ||||||||
| 35,235 | Energy Transfer L.P., Series C (b) | 7.38% | (a) | 837,536 | ||||
| 1,879 | Energy Transfer L.P., Series D (b) | 7.63% | (a) | 45,171 | ||||
| 573,841 | Energy Transfer L.P., Series E (b) (c) | 7.60% | (a) | 13,886,952 | ||||
| 172,376 | NuStar Energy L.P., Series A, 3 Mo. LIBOR + 6.77% (e) | 7.59% | (a) | 4,137,024 | ||||
| 8,648 | NuStar Energy L.P., Series C (b) | 9.00% | (a) | 211,876 | ||||
| 135,233 | NuStar Logistics L.P., 3 Mo. LIBOR + 6.73% (d) (e) | 7.78% | 01/15/43 | 3,420,043 | ||||
| 22,538,602 | ||||||||
| Real Estate Management & Development – 1.7% | ||||||||
| 273,319 | Brookfield Property Partners L.P., Series A | 5.75% | (a) | 5,398,050 | ||||
| 374,243 | Brookfield Property Partners L.P., Series A2 (c) | 6.38% | (a) | 7,892,785 | ||||
| 398,983 | Brookfield Property Preferred L.P. | 6.25% | 07/26/81 | 8,326,775 | ||||
| 21,617,610 | ||||||||
| Trading Companies & Distributors – 0.6% | ||||||||
| 284,980 | WESCO International, Inc., Series A (b) (d) | 10.63% | (a) | 8,136,179 | ||||
| Wireless Telecommunication Services – 0.5% | ||||||||
| 75,137 | United States Cellular Corp. (d) | 6.25% | 09/01/69 | 1,628,219 | ||||
| Shares | Description | Stated Rate | Stated Maturity | Value | ||||
| $25 PAR PREFERRED SECURITIES (Continued) | ||||||||
| Wireless Telecommunication Services (Continued) | ||||||||
| 253,239 | United States Cellular Corp. (d) | 5.50% | 06/01/70 | $5,106,564 | ||||
| 6,734,783 | ||||||||
Total $25 Par Preferred Securities | 274,215,975 | |||||||
| (Cost $302,719,982) | ||||||||
| $100 PAR PREFERRED SECURITIES – 3.3% | ||||||||
| Banks – 3.3% | ||||||||
| 80,000 | AgriBank FCB (b) | 6.88% | (a) | 8,420,000 | ||||
| 179,000 | CoBank ACB, Series F (b) (c) | 6.25% | (a) | 18,079,000 | ||||
| 54,250 | CoBank ACB, Series H (b) (c) | 6.20% | (a) | 5,682,687 | ||||
| 102,000 | Farm Credit Bank of Texas (b) (c) (f) | 6.75% | (a) | 10,582,500 | ||||
Total $100 Par Preferred Securities | 42,764,187 | |||||||
| (Cost $42,908,750) | ||||||||
| $1,000 PAR PREFERRED SECURITIES – 3.8% | ||||||||
| Banks – 2.9% | ||||||||
| 7,719 | Bank of America Corp., Series L | 7.25% | (a) | 9,392,634 | ||||
| 23,451 | Wells Fargo & Co., Series L | 7.50% | (a) | 28,410,652 | ||||
| 37,803,286 | ||||||||
| Diversified Financial Services – 0.9% | ||||||||
| 12,000 | Compeer Financial ACA (b) (c) (f) | 6.75% | (a) | 12,240,000 | ||||
Total $1,000 Par Preferred Securities | 50,043,286 | |||||||
| (Cost $54,528,152) | ||||||||
| $1,000,000 PAR PREFERRED SECURITIES – 1.2% | ||||||||
| Mortgage Real Estate Investment Trusts – 1.2% | ||||||||
| 12 | FT Real Estate Securities Co., Inc. (g) (h) (i) | 9.50% | (a) | 15,311,808 | ||||
| (Cost $15,990,000) | ||||||||
| Par Amount | Description | Stated Rate | Stated Maturity | Value | ||||
| CAPITAL PREFERRED SECURITIES – 113.7% | ||||||||
| Banks – 50.0% | ||||||||
| $12,935,000 | Australia & New Zealand Banking Group Ltd. (b) (c) (f) (j) | 6.75% | (a) | 13,560,213 | ||||
| 8,800,000 | Banco Bilbao Vizcaya Argentaria S.A., Series 9 (b) (c) (j) | 6.50% | (a) | 8,547,000 | ||||
| 2,000,000 | Banco Mercantil del Norte S.A. (b) (f) (j) | 6.88% | (a) | 1,981,290 | ||||
| 5,000,000 | Banco Mercantil del Norte S.A. (b) (f) (j) | 7.50% | (a) | 4,793,875 | ||||
| 8,000,000 | Banco Mercantil del Norte S.A. (b) (f) (j) | 7.63% | (a) | 7,934,680 | ||||
| 7,400,000 | Banco Mercantil del Norte S.A. (b) (f) (j) | 8.38% | (a) | 7,649,935 | ||||
| 10,800,000 | Banco Santander S.A. (b) (c) (j) | 4.75% | (a) | 9,566,843 | ||||
| 12,600,000 | Banco Santander S.A. (b) (j) (k) | 7.50% | (a) | 12,737,819 | ||||
| 6,114,000 | Bank of America Corp., Series RR (b) (c) | 4.38% | (a) | 5,426,175 | ||||
| 6,000,000 | Bank of America Corp., Series TT (b) | 6.13% | (a) | 6,012,000 | ||||
| 5,900,000 | Bank of America Corp., Series X (b) (c) | 6.25% | (a) | 5,987,320 | ||||
| 10,300,000 | Bank of Nova Scotia (The) (b) (c) | 4.90% | (a) | 10,131,698 | ||||
| 7,300,000 | Barclays PLC (b) (c) (j) | 4.38% | (a) | 6,104,625 | ||||
| 11,200,000 | Barclays PLC (b) (c) (j) | 6.13% | (a) | 10,996,944 | ||||
| 49,560,000 | Barclays PLC (b) (c) (d) (j) | 8.00% | (a) | 51,201,675 | ||||
| 8,550,000 | BBVA Bancomer S.A. (b) (d) (f) (j) | 5.88% | 09/13/34 | 8,161,231 | ||||
| 15,000,000 | BNP Paribas S.A. (b) (c) (f) (j) | 4.63% | (a) | 13,605,600 | ||||
| 3,300,000 | BNP Paribas S.A. (b) (f) (j) | 7.38% | (a) | 3,437,296 | ||||
| 13,370,000 | Citigroup, Inc. (b) (c) | 3.88% | (a) | 12,110,813 | ||||
| 5,041,000 | Citigroup, Inc. (b) (c) | 5.90% | (a) | 5,137,636 | ||||
| Par Amount | Description | Stated Rate | Stated Maturity | Value | ||||
| CAPITAL PREFERRED SECURITIES (Continued) | ||||||||
| Banks (Continued) | ||||||||
| $3,022,000 | Citigroup, Inc. (b) | 5.95% | (a) | $3,022,000 | ||||
| 9,937,000 | Citigroup, Inc., Series D (b) (c) | 5.35% | (a) | 9,812,787 | ||||
| 8,600,000 | Citigroup, Inc., Series P (b) (c) | 5.95% | (a) | 8,418,970 | ||||
| 14,486,000 | Citigroup, Inc., Series W (b) (c) | 4.00% | (a) | 13,182,260 | ||||
| 7,381,000 | Citigroup, Inc., Series Y (b) (c) | 4.15% | (a) | 6,547,685 | ||||
| 1,720,000 | Citizens Financial Group, Inc., Series B (b) | 6.00% | (a) | 1,644,836 | ||||
| 6,800,000 | Citizens Financial Group, Inc., Series G (b) (c) | 4.00% | (a) | 6,052,000 | ||||
| 25,000,000 | CoBank ACB, Series I (b) (c) | 6.25% | (a) | 25,187,500 | ||||
| 2,800,000 | Commerzbank AG (b) (j) (k) | 7.00% | (a) | 2,769,200 | ||||
| 20,000,000 | Credit Agricole S.A. (b) (c) (f) (j) | 6.88% | (a) | 20,135,000 | ||||
| 28,240,000 | Credit Agricole S.A. (b) (c) (f) (j) | 8.13% | (a) | 30,437,693 | ||||
| 3,000,000 | Danske Bank A.S. (b) (j) (k) | 4.38% | (a) | 2,718,750 | ||||
| 9,080,000 | Danske Bank A.S. (b) (j) (k) | 6.13% | (a) | 8,995,847 | ||||
| 6,740,000 | Danske Bank A.S. (b) (c) (j) (k) | 7.00% | (a) | 6,716,397 | ||||
| 3,450,000 | Farm Credit Bank of Texas, Series 3 (b) (c) (f) | 6.20% | (a) | 3,657,000 | ||||
| 7,500,000 | Farm Credit Bank of Texas, Series 4 (b) (c) (d) (f) | 5.70% | (a) | 7,875,000 | ||||
| 2,464,000 | Fifth Third Bancorp, Series H (b) | 5.10% | (a) | 2,399,320 | ||||
| 18,000,000 | HSBC Holdings PLC (b) (c) (j) | 6.38% | (a) | 18,101,790 | ||||
| 1,600,000 | Huntington Bancshares, Inc., Series G (b) (c) | 4.45% | (a) | 1,536,133 | ||||
| 14,092,000 | ING Groep N.V. (b) (j) | 5.75% | (a) | 13,540,087 | ||||
| 12,920,000 | ING Groep N.V. (b) (c) (j) | 6.50% | (a) | 12,917,416 | ||||
| 16,200,000 | Intesa Sanpaolo S.p.A. (b) (c) (f) (j) | 7.70% | (a) | 16,362,000 | ||||
| 6,646,000 | JPMorgan Chase & Co., Series Q (b) (c) | 5.15% | (a) | 6,554,617 | ||||
| 5,045,000 | JPMorgan Chase & Co., Series V, 3 Mo. LIBOR + 3.32% (c) (e) | 4.29% | (a) | 4,994,550 | ||||
| 13,045,000 | Lloyds Banking Group PLC (b) (c) (j) | 6.75% | (a) | 13,149,817 | ||||
| 21,213,000 | Lloyds Banking Group PLC (b) (c) (j) | 7.50% | (a) | 21,676,928 | ||||
| 5,400,000 | M&T Bank Corp. (b) (c) | 3.50% | (a) | 4,549,569 | ||||
| 2,000,000 | Macquarie Bank Ltd. (b) (f) (j) | 6.13% | (a) | 1,927,670 | ||||
| 2,900,000 | NatWest Group PLC (b) (j) | 6.00% | (a) | 2,865,345 | ||||
| 1,200,000 | NatWest Group PLC (b) (c) (j) | 8.00% | (a) | 1,265,208 | ||||
| 24,400,000 | Nordea Bank Abp (b) (c) (f) (j) | 6.63% | (a) | 24,827,000 | ||||
| 6,300,000 | PNC Financial Services Group (The), Inc., Series T (b) (c) | 3.40% | (a) | 5,433,750 | ||||
| 3,000,000 | PNC Financial Services Group (The), Inc., Series U (b) | 6.00% | (a) | 2,988,600 | ||||
| 5,150,000 | Regions Financial Corp., Series D (b) (c) | 5.75% | (a) | 5,265,875 | ||||
| 9,200,000 | Skandinaviska Enskilda Banken AB (b) (c) (j) (k) | 5.13% | (a) | 8,837,750 | ||||
| 26,100,000 | Societe Generale S.A. (b) (c) (f) (j) | 5.38% | (a) | 22,981,050 | ||||
| 6,710,000 | Societe Generale S.A. (b) (c) (f) (j) | 7.88% | (a) | 6,883,826 | ||||
| 1,300,000 | Societe Generale S.A. (b) (f) (j) | 8.00% | (a) | 1,355,803 | ||||
| 19,940,000 | Standard Chartered PLC (b) (f) (j) | 4.30% | (a) | 16,550,200 | ||||
| 9,400,000 | Standard Chartered PLC (b) (f) (j) | 6.00% | (a) | 9,364,750 | ||||
| 65,000 | Standard Chartered PLC (b) (k) | 7.01% | (a) | 75,697 | ||||
| 14,346,000 | SVB Financial Group, Series D (b) (c) | 4.25% | (a) | 12,445,155 | ||||
| 5,800,000 | Swedbank AB, Series NC5 (b) (j) (k) | 5.63% | (a) | 5,752,875 | ||||
| 2,779,000 | Texas Capital Bancshares, Inc. (b) | 4.00% | 05/06/31 | 2,666,679 | ||||
| 580,000 | Truist Financial Corp., Series L (b) | 5.05% | (a) | 553,900 | ||||
| 21,201,000 | UniCredit S.p.A. (b) (c) (j) (k) | 8.00% | (a) | 21,426,579 | ||||
| 5,000,000 | UniCredit S.p.A. (b) (d) (f) | 5.46% | 06/30/35 | 4,521,435 | ||||
| 16,181,000 | Wells Fargo & Co., Series BB (b) (c) | 3.90% | (a) | 14,774,467 | ||||
| 650,803,434 | ||||||||
| Capital Markets – 12.7% | ||||||||
| 12,296,000 | Apollo Management Holdings L.P. (b) (c) (d) (f) | 4.95% | 01/14/50 | 11,432,769 | ||||
| 8,340,000 | Bank of New York Mellon (The) Corp., Series I (b) (c) | 3.75% | (a) | 7,443,450 | ||||
| 2,200,000 | Charles Schwab (The) Corp. (b) | 5.00% | (a) | 2,125,134 | ||||
| 12,294,000 | Charles Schwab (The) Corp., Series G (b) (c) | 5.38% | (a) | 12,432,307 | ||||
| Par Amount | Description | Stated Rate | Stated Maturity | Value | ||||
| CAPITAL PREFERRED SECURITIES (Continued) | ||||||||
| Capital Markets (Continued) | ||||||||
| $19,380,000 | Charles Schwab (The) Corp., Series I (b) (c) | 4.00% | (a) | $17,597,040 | ||||
| 19,220,000 | Credit Suisse Group AG (b) (c) (f) (j) | 5.25% | (a) | 16,937,625 | ||||
| 2,000,000 | Credit Suisse Group AG (b) (f) (j) | 6.25% | (a) | 1,945,998 | ||||
| 12,080,000 | Credit Suisse Group AG (b) (c) (f) (j) | 6.38% | (a) | 11,402,191 | ||||
| 1,629,000 | Credit Suisse Group AG (b) (c) (f) (j) | 7.50% | (a) | 1,635,671 | ||||
| 28,250,000 | Credit Suisse Group AG (b) (c) (f) (j) | 7.50% | (a) | 28,046,600 | ||||
| 13,900,000 | Deutsche Bank AG (b) (j) | 6.00% | (a) | 12,996,500 | ||||
| 3,400,000 | Deutsche Bank AG (b) (j) | 7.50% | (a) | 3,344,750 | ||||
| 7,850,000 | EFG International AG (b) (j) (k) | 5.50% | (a) | 7,531,361 | ||||
| 300,000 | Goldman Sachs Group (The), Inc., Series R (b) (c) | 4.95% | (a) | 289,500 | ||||
| 4,680,000 | Goldman Sachs Group (The), Inc., Series T (b) (c) | 3.80% | (a) | 4,130,026 | ||||
| 11,486,000 | Goldman Sachs Group (The), Inc., Series U (b) (c) | 3.65% | (a) | 9,992,820 | ||||
| 10,000,000 | UBS Group AG (b) (f) (j) | 4.88% | (a) | 9,212,500 | ||||
| 4,800,000 | UBS Group AG (b) (j) (k) | 6.88% | (a) | 4,875,648 | ||||
| 2,165,000 | UBS Group AG (b) (f) (j) | 7.00% | (a) | 2,205,594 | ||||
| 165,577,484 | ||||||||
| Consumer Finance – 1.9% | ||||||||
| 4,500,000 | Ally Financial, Inc., Series B (b) | 4.70% | (a) | 3,899,812 | ||||
| 12,861,000 | American Express Co. (b) (c) | 3.55% | (a) | 11,109,975 | ||||
| 11,339,000 | Capital One Financial Corp., Series M (b) (c) | 3.95% | (a) | 9,864,930 | ||||
| 24,874,717 | ||||||||
| Diversified Financial Services – 4.0% | ||||||||
| 15,000,000 | American AgCredit Corp. (b) (c) (f) | 5.25% | (a) | 13,706,250 | ||||
| 9,300,000 | Ares Finance Co. III LLC (b) (c) (f) | 4.13% | 06/30/51 | 8,665,440 | ||||
| 9,350,000 | Capital Farm Credit ACA, Series 1 (b) (c) (f) | 5.00% | (a) | 8,555,250 | ||||
| 3,800,000 | Compeer Financial ACA (b) (c) (f) | 4.88% | (a) | 3,377,250 | ||||
| 1,850,000 | Depository Trust & Clearing (The) Corp., Series D (b) (f) | 3.38% | (a) | 1,646,500 | ||||
| 11,949,000 | Voya Financial, Inc. (b) (c) | 5.65% | 05/15/53 | 11,904,251 | ||||
| 4,781,000 | Voya Financial, Inc., Series A (b) (c) | 6.13% | (a) | 4,769,048 | ||||
| 52,623,989 | ||||||||
| Diversified Telecommunication Services – 0.9% | ||||||||
| 11,222,000 | Koninklijke KPN N.V. (b) (d) (f) | 7.00% | 03/28/73 | 11,362,275 | ||||
| Electric Utilities – 3.4% | ||||||||
| 5,116,000 | Edison International, Series B (b) (c) | 5.00% | (a) | 4,643,402 | ||||
| 26,976,000 | Emera, Inc., Series 16-A (b) (c) (d) | 6.75% | 06/15/76 | 27,448,080 | ||||
| 8,586,000 | Southern (The) Co., Series 21-A (b) (c) | 3.75% | 09/15/51 | 7,748,865 | ||||
| 5,110,000 | Southern California Edison Co., Series E, 3 Mo. LIBOR + 4.20% (c) (e) | 4.52% | (a) | 5,033,350 | ||||
| 44,873,697 | ||||||||
| Energy Equipment & Services – 1.6% | ||||||||
| 21,650,000 | Transcanada Trust (b) (c) (d) | 5.50% | 09/15/79 | 20,919,312 | ||||
| Food Products – 5.5% | ||||||||
| 6,000,000 | Dairy Farmers of America, Inc. (c) (g) | 7.13% | (a) | 5,887,501 | ||||
| 17,788,000 | Land O’Lakes Capital Trust I (c) (d) (g) | 7.45% | 03/15/28 | 20,014,080 | ||||
| 10,000,000 | Land O’Lakes, Inc. (c) (f) | 7.25% | (a) | 10,488,000 | ||||
| 33,000,000 | Land O’Lakes, Inc. (c) (f) | 8.00% | (a) | 34,774,575 | ||||
| 71,164,156 | ||||||||
| Insurance – 14.3% | ||||||||
| 3,900,000 | Allianz SE (b) (f) | 3.50% | (a) | 3,539,250 | ||||
| Par Amount | Description | Stated Rate | Stated Maturity | Value | ||||
| CAPITAL PREFERRED SECURITIES (Continued) | ||||||||
| Insurance (Continued) | ||||||||
| $7,368,000 | Asahi Mutual Life Insurance Co. (b) (c) (k) | 6.50% | (a) | $7,524,570 | ||||
| 17,585,000 | Assurant, Inc. (b) (c) (d) | 7.00% | 03/27/48 | 18,189,133 | ||||
| 5,150,000 | Assured Guaranty Municipal Holdings, Inc. (b) (d) (f) | 6.40% | 12/15/66 | 5,209,225 | ||||
| 9,932,000 | AXIS Specialty Finance LLC (b) (d) | 4.90% | 01/15/40 | 9,250,367 | ||||
| 8,704,000 | Enstar Finance LLC (b) (c) (d) | 5.75% | 09/01/40 | 8,577,134 | ||||
| 17,149,000 | Enstar Finance LLC (b) (d) | 5.50% | 01/15/42 | 15,978,667 | ||||
| 15,300,000 | Fortegra Financial Corp. (b) (c) (d) (g) | 8.50% | 10/15/57 | 18,305,521 | ||||
| 22,078,000 | Global Atlantic Fin Co. (b) (d) (f) | 4.70% | 10/15/51 | 20,076,850 | ||||
| 6,200,000 | Hartford Financial Services Group (The), Inc., 3 Mo. LIBOR + 2.13% (c) (e) (f) | 2.63% | 02/12/47 | 5,462,632 | ||||
| 8,183,000 | Kuvare US Holdings, Inc. (b) (c) (f) | 7.00% | 02/17/51 | 8,496,059 | ||||
| 2,000,000 | La Mondiale SAM (b) (c) (k) | 5.88% | 01/26/47 | 2,025,488 | ||||
| 9,500,000 | Lancashire Holdings Ltd. (b) (c) (k) | 5.63% | 09/18/41 | 8,497,750 | ||||
| 6,700,000 | Liberty Mutual Group, Inc. (b) (c) (f) | 4.13% | 12/15/51 | 6,090,601 | ||||
| 11,300,000 | Markel Corp. (b) (c) | 6.00% | (a) | 11,568,375 | ||||
| 2,442,000 | Nationwide Financial Services Capital Trust (d) (l) | 7.90% | 03/01/37 | 2,905,980 | ||||
| 2,910,000 | Nationwide Financial Services, Inc. (c) (d) | 6.75% | 05/15/37 | 3,131,887 | ||||
| 2,000,000 | Principal Financial Group, Inc., 3 Mo. LIBOR + 3.04% (e) | 3.55% | 05/15/55 | 1,925,000 | ||||
| 12,900,000 | QBE Insurance Group Ltd. (b) (c) (f) | 5.88% | (a) | 12,996,750 | ||||
| 9,765,000 | QBE Insurance Group Ltd. (b) (c) (k) | 6.75% | 12/02/44 | 10,109,363 | ||||
| 2,000,000 | QBE Insurance Group Ltd. (b) (k) | 5.88% | 06/17/46 | 2,035,229 | ||||
| 5,070,000 | Reinsurance Group of America, Inc., 3 Mo. LIBOR + 2.67% (d) (e) | 3.49% | 12/15/65 | 4,537,650 | ||||
| 186,433,481 | ||||||||
| Multi-Utilities – 3.2% | ||||||||
| 16,581,000 | Algonquin Power & Utilities Corp. (b) (c) | 4.75% | 01/18/82 | 15,187,698 | ||||
| 4,491,000 | CenterPoint Energy, Inc., Series A (b) (c) | 6.13% | (a) | 4,324,137 | ||||
| 6,400,000 | NiSource, Inc. (b) (c) | 5.65% | (a) | 6,208,000 | ||||
| 3,906,000 | Sempra Energy (b) (c) | 4.88% | (a) | 3,857,175 | ||||
| 13,642,000 | Sempra Energy (b) (c) | 4.13% | 04/01/52 | 12,053,848 | ||||
| 41,630,858 | ||||||||
| Oil, Gas & Consumable Fuels – 10.7% | ||||||||
| 4,500,000 | Buckeye Partners L.P. (b) | 6.38% | 01/22/78 | 3,722,310 | ||||
| 13,756,000 | DCP Midstream L.P., Series A (b) (c) | 7.38% | (a) | 13,102,590 | ||||
| 7,907,000 | DCP Midstream Operating L.P. (b) (c) (f) | 5.85% | 05/21/43 | 7,201,656 | ||||
| 27,810,000 | Enbridge, Inc. (b) (c) | 6.25% | 03/01/78 | 28,107,426 | ||||
| 21,262,000 | Enbridge, Inc., Series 16-A (b) (c) | 6.00% | 01/15/77 | 21,403,377 | ||||
| 15,150,000 | Enbridge, Inc., Series 20-A (b) (c) | 5.75% | 07/15/80 | 15,074,250 | ||||
| 20,365,000 | Energy Transfer L.P., 3 Mo. LIBOR + 3.02% (e) | 3.33% | 11/01/66 | 16,801,125 | ||||
| 805,000 | Energy Transfer L.P., Series A (b) | 6.25% | (a) | 685,256 | ||||
| 5,428,000 | Energy Transfer L.P., Series F (b) | 6.75% | (a) | 5,238,020 | ||||
| 2,236,000 | Energy Transfer L.P., Series H (b) | 6.50% | (a) | 2,130,036 | ||||
| 13,399,000 | Enterprise Products Operating LLC, 3 Mo. LIBOR + 2.78% (c) (e) | 3.30% | 06/01/67 | 11,709,453 | ||||
| 8,287,000 | Enterprise Products Operating LLC, Series D (b) (c) | 4.88% | 08/16/77 | 7,417,754 | ||||
| 6,450,000 | Transcanada Trust (b) (d) | 5.60% | 03/07/82 | 6,248,438 | ||||
| 138,841,691 | ||||||||
| Trading Companies & Distributors – 3.8% | ||||||||
| 41,445,000 | AerCap Holdings N.V. (b) (c) | 5.88% | 10/10/79 | 38,915,197 | ||||
| 4,863,000 | Air Lease Corp., Series B (b) (d) | 4.65% | (a) | 4,388,858 | ||||
| 7,200,000 | Aircastle Ltd. (b) (d) (f) | 5.25% | (a) | 6,418,016 | ||||
| 49,722,071 | ||||||||
| Par Amount | Description | Stated Rate | Stated Maturity | Value | ||||
| CAPITAL PREFERRED SECURITIES (Continued) | ||||||||
| Transportation Infrastructure – 1.7% | ||||||||
| $18,772,000 | AerCap Global Aviation Trust (b) (c) (f) | 6.50% | 06/15/45 | $18,276,044 | ||||
| 3,844,000 | BNSF Funding Trust I (b) (d) | 6.61% | 12/15/55 | 3,959,320 | ||||
| 22,235,364 | ||||||||
Total Capital Preferred Securities | 1,481,062,529 | |||||||
| (Cost $1,533,496,302) | ||||||||
| Principal Value | Description | Stated Coupon | Stated Maturity | Value | ||||
| FOREIGN CORPORATE BONDS AND NOTES – 1.9% | ||||||||
| Insurance – 1.9% | ||||||||
| 23,795,925 | Highlands Holdings Bond Issuer Ltd./Highlands Holdings Bond Co-Issuer, Inc. (f) (m) | 7.63% | 10/15/25 | 24,198,790 | ||||
| (Cost $24,743,602) | ||||||||
| CORPORATE BONDS AND NOTES – 0.5% | ||||||||
| Insurance – 0.5% | ||||||||
| 6,600,000 | AmTrust Financial Services, Inc. (d) | 6.13% | 08/15/23 | 6,583,403 | ||||
| (Cost $6,593,966) | ||||||||
| Shares | Description | Value | ||
| EXCHANGE-TRADED FUNDS – 0.1% | ||||
| Capital Markets – 0.1% | ||||
| 120,493 | Invesco Preferred ETF | 1,502,547 | ||
| (Cost $1,657,715) | ||||
Total Investments – 145.6% | 1,895,682,525 | |||
| (Cost $1,982,638,469) | ||||
| REVERSE REPURCHASE AGREEMENT – (7.7)% | ||||
| (100,000,000) | Scotia Bank, due 7/29/22, 1 month LIBOR plus 65 bps | (100,000,000) | ||
Outstanding Loan – (39.4)% | (512,600,000) | |||
Net Other Assets and Liabilities – 1.5% | 19,300,344 | |||
Net Assets – 100.0% | $1,302,382,869 | |||
| (a) | Perpetual maturity. |
| (b) | Fixed-to-floating or fixed-to-variable rate security. The interest rate shown reflects the fixed rate in effect at April 30, 2022. At a predetermined date, the fixed rate will change to a floating rate or a variable rate. |
| (c) | All or a portion of this security serves as collateral on the outstanding loan. |
| (d) | This security or a portion of this security is segregated as collateral for reverse repurchase agreements. All of these securities are corporate bonds with a remaining contractual maturity of 30-90 days. At April 30, 2022, securities noted as such are valued at $108,181,705. |
| (e) | Floating or variable rate security. |
| (f) | This security, sold within the terms of a private placement memorandum, is exempt from registration upon resale under Rule 144A of the Securities Act of 1933, as amended (the “1933 Act”), and may be resold in transactions exempt from registration, normally to qualified institutional buyers. Pursuant to procedures adopted by the Fund’s Board of Trustees, this security has been determined to be liquid by Stonebridge Advisors LLC (the “Sub-Advisor”). Although market instability can result in periods of increased overall market illiquidity, liquidity for each security is determined based on security specific factors and assumptions, which require subjective judgment. At April 30, 2022, securities noted as such amounted to $544,185,408 or 41.8% of net assets. |
| (g) | This security, sold within the terms of a private placement memorandum, is exempt from registration upon resale under Rule 144A of the 1933 Act, and may be resold in transactions exempt from registration, normally to qualified institutional buyers (see Note 2D - Restricted Securities in the Notes to Financial Statements). |
| (h) | This security is fair valued by the Advisor’s Pricing Committee in accordance with procedures adopted by the Fund’s Board of Trustees, and in accordance with the provisions of the Investment Company Act of 1940, as amended. At April 30, 2022, securities noted as such are valued at $15,311,808 or 1.2% of net assets. |
| (i) | This security’s value was determined using significant unobservable inputs. (see Note 2A- Portfolio Valuation in the Notes to Financial Statements). |
| (j) | This security is a contingent convertible capital security which may be subject to conversion into common stock of the issuer under certain circumstances. At April 30, 2022, securities noted as such amounted to $551,972,445 or 28.8% of managed assets. Of these securities, 5.5% originated in emerging markets, and 94.5% originated in foreign markets. |
| (k) | This security may be resold to qualified foreign investors and foreign institutional buyers under Regulation S of the 1933 Act. |
| (l) | Pursuant to procedures adopted by the Fund’s Board of Trustees, this security has been determined to be illiquid by the Sub-Advisor. |
| (m) | These notes are Senior Payment-in-kind (“PIK”) Toggle Notes whereby the issuer may, at its option, elect to pay interest on the notes (1) entirely in cash or (2) entirely in PIK interest. Interest paid in cash will accrue on the notes at a rate of 7.63% per annum (“Cash Interest Rate”) and PIK interest will accrue on the notes at a rate per annum equal to the Cash Interest Rate plus 75 basis points. For the six months ended April 30, 2022, this security paid all of its interest in cash. |
| LIBOR | London Interbank Offered Rate |
| ASSETS TABLE | ||||
| Total Value at 4/30/2022 | Level 1 Quoted Prices | Level 2 Significant Observable Inputs | Level 3 Significant Unobservable Inputs | |
| $25 Par Preferred Securities: | ||||
Insurance | $ 71,312,959 | $ 48,025,784 | $ 23,287,175 | $ — |
Multi-Utilities | 23,514,762 | 6,587,793 | 16,926,969 | — |
Other industry categories* | 179,388,254 | 179,388,254 | — | — |
$100 Par Preferred Securities* | 42,764,187 | — | 42,764,187 | — |
| $1,000 Par Preferred Securities: | ||||
Banks | 37,803,286 | 37,803,286 | — | — |
Diversified Financial Services | 12,240,000 | — | 12,240,000 | — |
$1,000,000 Par Preferred Securities* | 15,311,808 | — | — | 15,311,808 |
Capital Preferred Securities* | 1,481,062,529 | — | 1,481,062,529 | — |
Foreign Corporate Bonds and Notes* | 24,198,790 | — | 24,198,790 | — |
Corporate Bonds and Notes* | 6,583,403 | — | 6,583,403 | — |
Exchange-Traded Funds* | 1,502,547 | 1,502,547 | — | — |
Total Investments | $ 1,895,682,525 | $ 273,307,664 | $ 1,607,063,053 | $ 15,311,808 |
| LIABILITIES TABLE | ||||
| Total Value at 4/30/2022 | Level 1 Quoted Prices | Level 2 Significant Observable Inputs | Level 3 Significant Unobservable Inputs | |
Reverse Repurchase Agreements | $ (100,000,000) | $ — | $ (100,000,000) | $ — |
| * | See Portfolio of Investments for industry breakout. |
| Beginning Balance at October 31, 2021 | |
| $1,000,000 Par Preferred Securities | $16,938,396 |
| Net Realized Gain (Loss) | — |
| Net Change in Unrealized Appreciation/Depreciation | (1,626,588) |
| Purchases | — |
| Sales | — |
| Transfers In | — |
| Transfers Out | — |
| Ending Balance at April 30, 2022 | |
| $1,000,000 Par Preferred Securities | 15,311,808 |
| Total Level 3 holdings | $15,311,808 |
| ASSETS: | |
Investments, at value (Cost $1,982,638,469) | $ 1,895,682,525 |
Cash | 140,769 |
Foreign currency (Cost $100) | 98 |
| Receivables: | |
Interest | 19,874,552 |
Dividends | 1,373,720 |
Investment securities sold | 788,861 |
Interest reclaims | 239,837 |
Dividend reclaims | 81,760 |
Prepaid expenses | 31,601 |
Total Assets | 1,918,213,723 |
| LIABILITIES: | |
Outstanding loan | 512,600,000 |
Reverse repurchase agreement | 100,000,000 |
| Payables: | |
Investment advisory fees | 1,366,299 |
Interest and fees on loan and repurchase agreement | 718,084 |
Investment securities purchased | 697,611 |
Administrative fees | 305,443 |
Legal fees | 64,744 |
Custodian fees | 34,323 |
Audit and tax fees | 27,370 |
Shareholder reporting fees | 10,898 |
Transfer agent fees | 4,885 |
Financial reporting fees | 771 |
Other liabilities | 426 |
Total Liabilities | 615,830,854 |
NET ASSETS | $1,302,382,869 |
| NET ASSETS consist of: | |
Paid-in capital | $ 1,430,655,674 |
Par value | 608,478 |
Accumulated distributable earnings (loss) | (128,881,283) |
NET ASSETS | $1,302,382,869 |
NET ASSET VALUE, per Common Share (par value $0.01 per Common Share) | $21.40 |
Number of Common Shares outstanding (unlimited number of Common Shares has been authorized) | 60,847,827 |
| INVESTMENT INCOME: | ||
Interest (net of foreign withholding tax of $6,932) | $ 46,414,381 | |
Dividends (net of foreign withholding tax of $34,763) | 12,783,608 | |
Other | 100 | |
Total investment income | 59,198,089 | |
| EXPENSES: | ||
Investment advisory fees | 8,767,229 | |
Interest and fees on loan and repurchase agreement | 3,156,787 | |
Administrative fees | 344,160 | |
Custodian fees | 102,811 | |
Shareholder reporting fees | 99,436 | |
Legal fees | 55,364 | |
Listing expense | 29,763 | |
Audit and tax fees | 20,643 | |
Transfer agent fees | 11,338 | |
Trustees’ fees and expenses | 7,719 | |
Financial reporting fees | 4,625 | |
Other | 25,846 | |
Total expenses | 12,625,721 | |
NET INVESTMENT INCOME (LOSS) | 46,572,368 | |
| NET REALIZED AND UNREALIZED GAIN (LOSS): | ||
| Net realized gain (loss) on: | ||
Investments | 2,985,634 | |
Foreign currency transactions | (35) | |
Net realized gain (loss) | 2,985,599 | |
| Net change in unrealized appreciation (depreciation) on: | ||
Investments | (217,664,794) | |
Foreign currency translation | (2) | |
Net change in unrealized appreciation (depreciation) | (217,664,796) | |
NET REALIZED AND UNREALIZED GAIN (LOSS) | (214,679,197) | |
NET INCREASE (DECREASE) IN NET ASSETS RESULTING FROM OPERATIONS | $(168,106,829) | |
| Six Months Ended 4/30/2022 (Unaudited) | Year Ended 10/31/2021 | ||
| OPERATIONS: | |||
Net investment income (loss) | $ 46,572,368 | $ 95,982,008 | |
Net realized gain (loss) | 2,985,599 | 33,755,999 | |
Net change in unrealized appreciation (depreciation) | (217,664,796) | 101,543,158 | |
Net increase (decrease) in net assets resulting from operations | (168,106,829) | 231,281,165 | |
| DISTRIBUTIONS TO SHAREHOLDERS FROM: | |||
Investment operations | (46,543,367) | (89,986,073) | |
Return of capital | — | (2,998,208) | |
Total distributions to shareholders | (46,543,367) | (92,984,281) | |
| CAPITAL TRANSACTIONS: | |||
Proceeds from Common Shares reinvested | 669,323 | 1,365,713 | |
Net increase (decrease) in net assets resulting from capital transactions | 669,323 | 1,365,713 | |
Total increase (decrease) in net assets | (213,980,873) | 139,662,597 | |
| NET ASSETS: | |||
Beginning of period | 1,516,363,742 | 1,376,701,145 | |
End of period | $ 1,302,382,869 | $ 1,516,363,742 | |
| CAPITAL TRANSACTIONS were as follows: | |||
Common Shares at beginning of period | 60,820,579 | 60,765,997 | |
Common Shares issued as reinvestment under the Dividend Reinvestment Plan | 27,248 | 54,582 | |
Common Shares at end of period | 60,847,827 | 60,820,579 |
| Cash flows from operating activities: | ||
Net increase (decrease) in net assets resulting from operations | $(168,106,829) | |
| Adjustments to reconcile net increase (decrease) in net assets resulting from operations to net cash provided by operating activities: | ||
Purchases of investments | (232,765,893) | |
Sales, maturities and paydown of investments | 286,419,192 | |
Net amortization/accretion of premiums/discounts on investments | 139,019 | |
Net realized gain/loss on investments | (2,985,634) | |
Net change in unrealized appreciation/depreciation on investments | 217,664,794 | |
| Changes in assets and liabilities: | ||
Increase in interest receivable | (295,287) | |
Increase in interest reclaims receivable | (17,471) | |
Decrease in dividend reclaims receivable | 1 | |
Increase in dividends receivable | (320,600) | |
Increase in prepaid expenses | (19,225) | |
Increase in interest and fees payable on loan and repurchase agreement | 215,993 | |
Decrease in investment advisory fees payable | (215,160) | |
Decrease in audit and tax fees payable | (14,630) | |
Increase in legal fees payable | 9,804 | |
Decrease in shareholder reporting fees payable | (42,333) | |
Increase in administrative fees payable | 43,403 | |
Decrease in custodian fees payable | (5,044) | |
Increase in transfer agent fees payable | 1,468 | |
Decrease in other liabilities payable | (5,975) | |
Cash provided by operating activities | $99,699,593 | |
| Cash flows from financing activities: | ||
Proceeds from Common Shares reinvested | 669,323 | |
Distributions to Common Shareholders from investment operations | (46,543,367) | |
Repayment of borrowings | (75,500,000) | |
Proceeds from borrowings | 12,100,000 | |
Cash used in financing activities | (109,274,044) | |
Decrease in cash and foreign currency | (9,574,451) | |
Cash and foreign currency at beginning of period | 9,715,318 | |
Cash and foreign currency at end of period | $140,867 | |
| Supplemental disclosure of cash flow information: | ||
Cash paid during the period for interest and fees | $2,940,794 |
| Six Months Ended 4/30/2022 (Unaudited) | Year Ended October 31, | |||||||||||
| 2021 | 2020 | 2019 | 2018 | 2017 | ||||||||
Net asset value, beginning of period | $ 24.93 | $ 22.66 | $ 24.40 | $ 22.84 | $ 25.26 | $ 24.03 | ||||||
| Income from investment operations: | ||||||||||||
Net investment income (loss) | 0.77 | 1.58 | 1.56 | 1.65 | 1.73 | 1.86 | ||||||
Net realized and unrealized gain (loss) | (3.53) | 2.22 | (1.71) | 1.61 | (2.38) | 1.26 | ||||||
Total from investment operations | (2.76) | 3.80 | (0.15) | 3.26 | (0.65) | 3.12 | ||||||
| Distributions paid to shareholders from: | ||||||||||||
Net investment income | (0.77) | (1.48) | (1.45) | (1.64) | (1.70) | (1.89) | ||||||
Return of capital | — | (0.05) | (0.14) | (0.06) | (0.07) | — | ||||||
Total distributions paid to Common Shareholders | (0.77) | (1.53) | (1.59) | (1.70) | (1.77) | (1.89) | ||||||
Net asset value, end of period | $21.40 | $24.93 | $22.66 | $24.40 | $22.84 | $25.26 | ||||||
Market value, end of period | $20.11 | $25.48 | $21.56 | $24.07 | $20.47 | $24.80 | ||||||
Total return based on net asset value (a) | (11.30)% | 17.25% | (0.05)% | 15.44% | (2.23)% | 13.85% | ||||||
Total return based on market value (a) | (18.37)% | 25.89% | (3.60)% | 27.06% | (10.78)% | 18.53% | ||||||
| Ratios to average net assets/supplemental data: | ||||||||||||
Net assets, end of period (in 000’s) | $ 1,302,383 | $ 1,516,364 | $ 1,376,701 | $ 1,482,428 | $ 1,387,961 | $ 1,535,234 | ||||||
Ratio of total expenses to average net assets | 1.78% (b) | 1.72% | 1.98% | 2.70% | 2.49% | 2.09% | ||||||
Ratio of total expenses to average net assets excluding interest expense | 1.33% (b) | 1.33% | 1.31% | 1.33% | 1.33% | 1.31% | ||||||
Ratio of net investment income (loss) to average net assets | 6.56% (b) | 6.44% | 6.93% | 7.14% | 7.21% | 7.67% | ||||||
Portfolio turnover rate | 11% | 39% | 45% | 40% | 29% | 31% | ||||||
| Indebtedness: | ||||||||||||
Total loan and repurchase agreement outstanding (in 000’s) | $ 612,600 | $ 676,000 | $ 616,000 | $ 646,000 | $ 620,000 | $ 680,000 | ||||||
Asset coverage per $1,000 of indebtedness (c) | $ 3,126 | $ 3,243 | $ 3,235 | $ 3,295 | $ 3,239 | $ 3,258 | ||||||
| (a) | Total return is based on the combination of reinvested dividend, capital gain and return of capital distributions, if any, at prices obtained by the Dividend Reinvestment Plan, and changes in net asset value per share for net asset value returns and changes in Common Share Price for market value returns. Total returns do not reflect sales load and are not annualized for periods of less than one year. Past performance is not indicative of future results. |
| (b) | Annualized. |
| (c) | Calculated by subtracting the Fund’s total liabilities (not including the loan and repurchase agreement outstanding) from the Fund’s total assets, and dividing by the outstanding loan and repurchase agreement balances in 000’s. |
| 1) | benchmark yields; |
| 2) | reported trades; |
| 3) | broker/dealer quotes; |
| 4) | issuer spreads; |
| 5) | benchmark securities; |
| 6) | bids and offers; and |
| 7) | reference data including market research publications. |
| 1) | the type of security; |
| 2) | the size of the holding; |
| 3) | the initial cost of the security; |
| 4) | transactions in comparable securities; |
| 5) | price quotes from dealers and/or third-party pricing services; |
| 6) | relationships among various securities; |
| 7) | information obtained by contacting the issuer, analysts, or the appropriate stock exchange; |
| 8) | an analysis of the issuer’s financial statements; and |
| 9) | the existence of merger proposals or tender offers that might affect the value of the security. |
| 1) | the value of similar foreign securities traded on other foreign markets; |
| 2) | ADR trading of similar securities; |
| 3) | closed-end fund or exchange-traded fund trading of similar securities; |
| 4) | foreign currency exchange activity; |
| 5) | the trading prices of financial products that are tied to baskets of foreign securities; |
| 6) | factors relating to the event that precipitated the pricing problem; |
| 7) | whether the event is likely to recur; and |
| 8) | whether the effects of the event are isolated or whether they affect entire markets, countries or regions. |
| • | Level 1 – Level 1 inputs are quoted prices in active markets for identical investments. An active market is a market in which transactions for the investment occur with sufficient frequency and volume to provide pricing information on an ongoing basis. |
| • | Level 2 – Level 2 inputs are observable inputs, either directly or indirectly, and include the following: |
| o | Quoted prices for similar investments in active markets. |
| o | Quoted prices for identical or similar investments in markets that are non-active. A non-active market is a market where there are few transactions for the investment, the prices are not current, or price quotations vary substantially either over time or among market makers, or in which little information is released publicly. |
| o | Inputs other than quoted prices that are observable for the investment (for example, interest rates and yield curves observable at commonly quoted intervals, volatilities, prepayment speeds, loss severities, credit risks, and default rates). |
| o | Inputs that are derived principally from or corroborated by observable market data by correlation or other means. |
| • | Level 3 – Level 3 inputs are unobservable inputs. Unobservable inputs may reflect the reporting entity’s own assumptions about the assumptions that market participants would use in pricing the investment. |
| Security | Acquisition Date | Principal Value/Shares | Current Price | Carrying Cost | Value | % of Net Assets | ||
| Dairy Farmers of America, Inc., 7.13% | 9/15/16 | $6,000,000 | $98.13 | $6,000,000 | $5,887,501 | 0.45% | ||
| Fortegra Financial Corp., 8.50%, 10/15/57 | 10/12/17 - 3/12/18 | $15,300,000 | 119.64 | 15,343,904 | 18,305,521 | 1.41 | ||
| FT Real Estate Securities Co., Inc., 9.50% | 6/15/16 | 12 | 1,275,984 | 15,990,000 | 15,311,808 | 1.18 | ||
| Land O’Lakes Capital Trust I, 7.45%, 03/15/28 | 6/6/14 - 2/25/19 | $17,788,000 | 112.51 | 18,348,979 | 20,014,080 | 1.54 | ||
| $55,682,883 | $59,518,910 | 4.58% |
| Gross Amounts not Offset in the Statement of Assets and Liabilities | |||||||||||
| Gross Amounts of Recognized Liabilities | Gross Amounts Offset in the Statement of Assets and Liabilities | Net Amounts of Liabilities Presented in the Statement of Assets and Liabilities | Financial Instruments | Cash Segregated as Collateral | Net Amount | ||||||
| Reverse Repurchase Agreements | $ (100,000,000) | $ — | $ (100,000,000) | $ 100,000,000 | $ — | $ — | |||||
| Distributions paid from: | |
Ordinary income | $89,986,073 |
Capital gains | — |
Return of capital | 2,998,208 |
Undistributed ordinary income | $— |
Undistributed capital gains | — |
Total undistributed earnings | — |
Accumulated capital and other losses | (52,266,895) |
Net unrealized appreciation (depreciation) | 138,035,808 |
Total accumulated earnings (losses) | 85,768,913 |
Other | — |
Paid-in capital | 1,430,594,829 |
Total net assets | $1,516,363,742 |
| Tax Cost | Gross Unrealized Appreciation | Gross Unrealized (Depreciation) | Net Unrealized Appreciation (Depreciation) | |||
| $1,982,638,469 | $28,039,507 | $(114,995,451) | $(86,955,944) |
| (1) | If Common Shares are trading at or above net asset value (“NAV”) at the time of valuation, the Fund will issue new shares at a price equal to the greater of (i) NAV per Common Share on that date or (ii) 95% of the market price on that date. |
| (2) | If Common Shares are trading below NAV at the time of valuation, the Plan Agent will receive the dividend or distribution in cash and will purchase Common Shares in the open market, on the NYSE or elsewhere, for the participants’ accounts. It is possible that the market price for the Common Shares may increase before the Plan Agent has completed its purchases. Therefore, the average purchase price per share paid by the Plan Agent may exceed the market price at the time of valuation, resulting in the purchase of fewer shares than if the dividend or distribution had been paid in Common Shares issued by the Fund. The Plan Agent will use all dividends and distributions received in cash to purchase Common Shares in the open market within 30 days of the valuation date except where temporary curtailment or suspension of purchases is necessary to comply with federal securities laws. Interest will not be paid on any uninvested cash payments. |
| • | Issuer Risk. The value of these securities may decline for a number of reasons which directly relate to the issuer, such as management performance, leverage and reduced demand for the issuer’s goods and services. |
| • | Interest Rate Risk. Interest rate risk is the risk that fixed rate securities will decline in value because of changes in market interest rates. When market interest rates rise, the market value of fixed rate securities generally will fall. Market value generally falls further for fixed rate securities with longer duration. During periods of rising interest rates, the average life of certain types of securities may be extended because of slower than expected prepayments. This may lock in a below-market yield, increase the security’s duration and further reduce the value of the security. Investments in fixed rate securities with long-term maturities may experience significant price declines if long-term interest rates increase. |
| • | Floating Rate and Fixed-to-Floating Rate Risk. The market value of floating rate and fixed-to-floating rate securities may fall in a declining interest rate environment and may also fall in a rising interest rate environment if there is a lag between the rise in interest rates and the interest rate reset. Securities with a floating or variable interest rate component can be less sensitive to interest rate changes than securities with fixed interest rates. A secondary risk associated with declining interest rates is the risk that income earned by the Fund on floating rate and fixed-to-floating rate securities may decline due to lower coupon payments on floating rate securities. |
| • | Prepayment Risk. Prepayment risk is the risk that the issuer of a debt security will repay principal prior to the scheduled maturity date. During periods of declining interest rates, the issuer of a security may exercise its option to prepay principal earlier than scheduled, forcing the Fund to reinvest the proceeds from such prepayment in lower yielding securities, which may result in a decline in the Fund’s income and distributions to common shareholders. |
| • | Reinvestment Risk. Reinvestment risk is the risk that income from the Fund’s portfolio will decline if the Fund invests the proceeds from matured, traded or called securities at market interest rates that are below the Fund portfolio’s current earnings rate. |
| • | Subordination Risk. Preferred securities are typically subordinated to bonds and other debt instruments in a company’s capital structure, in terms of priority to corporate income and liquidation payments, and therefore will be subject to greater credit risk than those debt instruments. |
| (b) | Not applicable. |
Item 2. Code of Ethics.
Not applicable.
Item 3. Audit Committee Financial Expert.
Not applicable.
Item 4. Principal Accountant Fees and Services.
Not applicable.
Item 5. Audit Committee of Listed registrants.
Not applicable.
Item 6. Investments.
| (a) | Schedule of Investments in securities of unaffiliated issuers as of the close of the reporting period is included as part of the report to shareholders filed under Item 1 of this form. |
| (b) | Not applicable. |
Item 7. Disclosure of Proxy Voting Policies and Procedures for Closed-End Management Investment Companies.
Not applicable.
Item 8. Portfolio Managers of Closed-End Management Investment Companies.
| (a) | Not applicable. |
| (b) | Not applicable. |
Item 9. Purchases of Equity Securities by Closed-End Management Investment Company and Affiliated Purchasers.
Not applicable.
Item 10. Submission of Matters to a Vote of Security Holders.
There have been no material changes to the procedures by which the shareholders may recommend nominees to the registrant’s board of directors, where those changes were implemented after the registrant last provided disclosure in response to the requirements of Item 407(c)(2)(iv) of Regulation S-K (17 CFR 229.407) (as required by Item 22(b)(15) of Schedule 14A (17 CFR 240.14a-101)), or this Item.
Item 11. Controls and Procedures.
| (a) | The registrant’s principal executive and principal financial officers, or persons performing similar functions, have concluded that the registrant’s disclosure controls and procedures (as defined in Rule 30a-3(c) under the Investment Company Act of 1940, as amended (the “1940 Act”) (17 CFR 270.30a-3(c))) are effective, as of a date within 90 days of the filing date of the report that includes the disclosure required by this paragraph, based on their evaluation of these controls and procedures required by Rule 30a-3(b) under the 1940 Act (17 CFR 270.30a-3(b)) and Rules 13a-15(b) or 15d-15(b) under the Securities Exchange Act of 1934, as amended (17 CFR 240.13a-15(b) or 240.15d-15(b)). |
| (b) | There were no changes in the registrant’s internal control over financial reporting (as defined in Rule 30a-3(d) under the 1940 Act (17 CFR 270.30a-3(d)) that occurred during the period covered by this report that has materially affected, or is reasonably likely to materially affect, the registrant’s internal control over financial reporting. |
Item 12. Disclosure of Securities Lending Activities for Closed-End Management Investment Companies.
| (a) | Not applicable. |
| (b) | Not applicable. |
Item 13. Exhibits.
| (a)(1) | Not Applicable. |
| (a)(2) | Certifications pursuant to Rule 30a-2(a) under the 1940 Act and Section 302 of the Sarbanes-Oxley Act of 2002 are attached hereto. |
| (a)(3) | Not applicable. |
| (a)(4) | Not applicable. |
| (b) | Certifications pursuant to Rule 30a-2(b) under the 1940 Act and Section 906 of the Sarbanes-Oxley Act of 2002 are attached hereto. |
SIGNATURES
Pursuant to the requirements of the Securities Exchange Act of 1934 and the Investment Company Act of 1940, the registrant has duly caused this report to be signed on its behalf by the undersigned, thereunto duly authorized.
| (registrant) | First Trust Intermediate Duration Preferred & Income Fund |
| By (Signature and Title)* | /s/ James M. Dykas | |
| James M. Dykas, President and Chief Executive Officer (principal executive officer) |
| Date: | July 1, 2022 |
Pursuant to the requirements of the Securities Exchange Act of 1934 and the Investment Company Act of 1940, this report has been signed below by the following persons on behalf of the registrant and in the capacities and on the dates indicated.
| By (Signature and Title)* | /s/ James M. Dykas | |
| James M. Dykas, President and Chief Executive Officer (principal executive officer) |
| Date: | July 1, 2022 |
| By (Signature and Title)* | /s/ Donald P. Swade | |
| Donald P. Swade, Treasurer, Chief Financial Officer and Chief Accounting Officer (principal financial officer) |
| Date: | July 1, 2022 |
* Print the name and title of each signing officer under his or her signature.