united
states
securities and exchange commission
washington, d.c. 20549
form n-csr
certified shareholder report of registered management
investment companies
Investment Company Act file number 811-21720
Northern Lights Fund Trust
(Exact name of registrant as specified in charter)
225 Pictoria Drive, Ste 450, Cincinnati, Ohio 45246
(Address of principal executive offices) (Zip code)
Richard Malinowski
4221 North 203rd Street, Suite 100, Elkhorn, NE 68022
(Name and address of agent for service)
Registrant's telephone number, including area code: 631-470-2619
Date of fiscal year end: 4/30
Date of reporting period:4/30/22
Item 1. Reports to Stockholders.

| 11624 SE 5th Street, Suite 100 |
| Bellevue, WA 98005 |
| 800.735.7199 | Toll Free |
| 866.583.8734 | Sales |
| 425.451.7722 | Direct |
| 425.451.7731 | Fax |
Dear Fellow Shareholders:
In sitting down to write this letter, I am struck by how far we have come over the past year, yet in certain ways it feels much the same. While Covid-19 still remains a part of our daily lives, we have come far in the sense that pandemic related restrictions are no longer widespread and there is a general sense of life returning to normal. At the same time, we are still dealing with supply chain issues and higher prices as a result of the pandemic and other consequential events.
Market performance over the past year ending April 30, 2022 was unremarkable, with most major indices posting solid returns as we closed the books on 2021. However, as we entered 2022, investors began reassessing the economic outlook with inflation remaining stubbornly high and the Federal Reserve aggressively raising rates. In addition, the Russian invasion of Ukraine meant more supply chain disruptions and higher energy prices, notably at the gas pump, which negatively impacts consumer spending.
The confluence of these factors resulted in the S&P falling 12.92% between January and April of 2022, the worst four-month start to a year since 1939. Bonds fared even worse as a result of sharply rising interest rates. In fact, the first quarter of 2022 was the worst quarter U.S. bonds have had in more than 40 years. Growth oriented stocks, due to their sensitivity to interest rates, were one of the worst performing areas of the market, with the NASDAQ posting a loss of 21.06% from January through April.
While negative returns are never welcome, they are a healthy part of investing. As we began 2022, the annualized three-year rolling rate of return on the S&P 500 was just over 26%. While that number is very impressive, it is simply not sustainable. To add perspective, the long-term average three-year rolling return of the S&P 500 is closer to 12%. It is an important reminder for shareholders to focus on their long-term investing goals and not be distracted by the inevitable market fluctuations that occur over the short term.
The PFG funds performed within our expectations over the one-year period ending April 30, 2022. Most were in-line with their benchmark prior to the market sell-off this year. PFG funds with a growth overweight underperformed from January to April, primarily due to interest rates rising sharply over a short-time period. Growth stocks tend to be more sensitive to interest rates because future cash flows are expected to be larger than present cash flows. As interest rates rise, those expected cash flows are discounted more, resulting in lower present valuations. Tactical strategies generally performed well as a result of moving to a more defensive position or by shifting allocations toward areas of the market that typically perform well late cycle. By offering distinct investing styles, we are able to provide our clients a full suite of model portfolios with different risk objectives and diversification across various PFG funds.
We remain optimistic for the outlook going forward. We believe higher interest rates have largely been priced in and, in a worst-case scenario, should we enter into a recession, we believe it will likely be shallow as consumer balance sheets are strong and corporate earnings remain robust.
Thank you for your continued trust in the Pacific Financial Group.
Sincerely,

Jennifer
Enstad, Chief Investment Officer
Pacific Financial Group, LLC
April 30, 2022
6524-NLD-06092022

1
| 11624 SE 5th Street, Suite 100 |
| Bellevue, WA 98005 |
| 800.735.7199 | Toll Free |
| 866.583.8734 | Sales |
| 425.451.7722 | Direct |
| 425.451.7731 | Fax |
Mutual Funds Involve Risk Including Possible Loss of Principal. Past performance is no guarantee of future results. Investment return and principal value will vary. Investors’ shares when redeemed may be worth more or less than the original cost. Returns do not reflect the deduction of taxes a shareholder would pay on distributions or redemption of Fund shares. Before investing you should carefully consider the investment objectives, risks, shares, and expenses of the Pacific Financial Group family of funds (referred to as PFG Strategies). This and other important information about the Funds/PFG Strategies are contained in the prospectus; to obtain a prospectus please call 1-888-451-TPFG. The prospectus should be read carefully before investing. The Pacific Financial Group family of funds (PFG Strategies) is distributed by Northern Lights Distributors, LLC member FINRA/SIPC.
The Bloomberg U.S. Aggregate Bond Index is a broad-based flagship benchmark that measures the investment grade, U.S. dollar-denominated, fixed-rate taxable bond market. The index includes Treasuries, government-related and corporate securities, MBS (agency fixed-rate and hybrid ARM pass-throughs), ABS, and CMBS (agency and non-agency).
The Morningstar Target Risk Index Family provides global market risk levels that are scaled to fit five equity market risk profiles: aggressive, moderately aggressive, moderate, moderately conservative, and conservative. The Morningstar Conservative Target Risk Total Return Index consists of 13% U.S. Equity Exposure, 9% Non-U.S. Equity Exposure, 58% U.S. Bond Exposure, 18% Non-U.S. Bond Exposure, and 2% Inflation Hedge. The Morningstar Moderate Conservative Target Risk Total Return Index consists of 26% U.S. Equity Exposure, 16% Non-U.S. Equity Exposure, 44% U.S. Bond Exposure, 13% Non-U.S. Bond Exposure, and 1% Inflation Hedge. The Morningstar Moderate Target Risk Total Return Index consists of 36% U.S. Equity Exposure, 26% Non-U.S. Equity Exposure, 29% U.S. Bond Exposure, 8% Non-U.S. Bond Exposure, and 1% Inflation Hedge. The Morningstar Moderate Aggressive Target Risk Total Return Index consists of 48% U.S. Equity Exposure, 34% Non-U.S. Equity Exposure, 14% U.S. Bond Exposure, and 4% Non-U.S. Bond Exposure. The Morningstar Aggressive Target Risk Total Return Index consists of 57% U.S. Equity Exposure, 39% Non-U.S. Equity Exposure, 3% U.S. Bond Exposure, and 1% Non-U.S. Bond Exposure.
The benchmark returns reflect the reinvestment of dividends and interest, but do not reflect the deduction of fees, expenses, transaction costs, nor taxes that actual shareholder accounts are subject to. The indexes are presented as broad-based measures of the equity and fixed income markets. Index returns have been taken from published sources. Investors cannot invest directly in an index. Investing in any security involves a risk of loss.
2
| PFG Active Core Bond Strategy Fund |
| Portfolio Review (Unaudited) |
| April 30, 2022 |
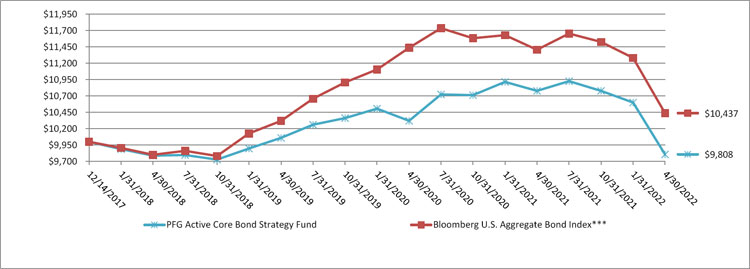
The PFG Active Core Bond Strategy provides investors with a globally diversified fixed income allocation. This PFG Strategy returned (9.00)% for the year ending 4/30/2022, while the Bloomberg U.S. Aggregate Bond Index returned (8.51)% for the same period. The past twelve-month period ending 4/30/2022 was exceptionally difficult for bond investors, with the 10-Year U.S. Treasury yield increasing to 2.93% from 1.61% over this time. To put this into perspective, the first quarter 2022 was the worst quarter for U.S. government bonds since at least 1973. This PFG Strategy is cautious on duration, focusing on a diversified mix of credit, with some exposure to high yield and emerging markets bonds. The top contributors to performance on a weighted basis were mortgage-related securities and a PIMCO Income holding. The largest detractor was the PIMCO Total Return Fund.
The Fund’s performance figures* for the periods ended April 30, 2022 as compared to its benchmark:
| Annualized | |||
| One | Three | Performance | |
| Year | Year | Since Inception** | |
| PFG Active Core Bond Strategy Fund | |||
| Class R | (9.00)% | (0.84)% | (0.44)% |
| Bloomberg U.S. Aggregate Bond Index*** | (8.51)% | 0.38% | 0.98% |
| * | The performance data quoted is historical. Past performance is no guarantee of future results. Current performance may be higher or lower than the performance data quoted. The principal value and investment return of an investment will fluctuate so that your shares, when redeemed, may be worth more or less than their original cost. The returns shown do not reflect the deduction of taxes that a shareholder may pay on Fund distributions or on the redemption of Fund shares. The Fund’s total annual operating expenses, including acquired fund fees and expenses, were 2.61% for Class R shares per the August 28, 2021 prospectus. For performance information current to the most recent month-end, please call 1-888-451-TPFG. |
| ** | Commencement of trading was on December 14, 2017. |
| *** | The Bloomberg Barclays U.S. Aggregate Bond Index is an unmanaged index which represents the U.S. investment-grade fixed-rate bond market (including government and corporate securities, mortgage pass-through securities, and asset-backed securities). Investors cannot invest directly in an index or benchmark. |
Comparison of the Change in Value of a $10,000 Investment
| Holdings by Asset Class | % of Net Assets | |||
| Open End Funds - Fixed Income | 99.3 | % | ||
| Money Market Fund | 0.3 | % | ||
| Other Assets Less Liabilities - Net | 0.4 | % | ||
| 100.0 | % | |||
Please refer to the Portfolio of Investments in this annual report for more information regarding the Fund’s holdings as of April 30, 2022.
3
| PFG American Funds® Conservative Income Strategy Fund |
| Portfolio Review (Unaudited) |
| April 30, 2022 |
The PFG American Funds® Conservative Income Strategy provides investors with a broadly diversified strategic allocation that seeks current income and limited price volatility, including exposure to high-quality bonds and dividend-paying equities. This PFG Strategy returned (4.55)% for the year ending 4/30/2022, while the Morningstar Conservative Target Risk Index (Total Return) returned (7.37)% for the same period. A tilt towards value stocks was a contributor on the equity side, as value stocks typically outperform growth stocks during periods of rising interest rates. Fixed income exposure is focused on capital preservation via a tilt towards Treasuries and short-duration bonds. High quality, short-duration fixed income instruments outperformed the broad fixed income market, as they tend to fall less when interest rates rise. The top contributors to performance on a weighted basis were the American Funds American Mutual Fund and the American Funds Income Fund of America. The largest detractors to performance on a weighted basis were American Funds Bond Fund of America and the American Funds Intermediate Bond Fund of America.
The Fund’s performance figures* for the periods ended April 30, 2022 as compared to its benchmark:
| Annualized | ||
| One | Performance | |
| Year | Since Inception** | |
| PFG American Funds® Conservative Income Strategy Fund | ||
| Class R | (4.55)% | 0.54% |
| Morningstar Conservative Target Risk Index (Total Return)*** | (7.37)% | 1.07% |
| * | The performance data quoted is historical. Past performance is no guarantee of future results. Current performance may be higher or lower than the performance data quoted. The principal value and investment return of an investment will fluctuate so that your shares, when redeemed, may be worth more or less than their original cost. The returns shown do not reflect the deduction of taxes that a shareholder may pay on Fund distributions or on the redemption of Fund shares. The Fund’s total annual operating expenses, including acquired fund fees and expenses, were 2.32% for Class R shares per the August 28, 2021 prospectus. For performance information current to the most recent month-end, please call 1-888-451-TPFG. |
| ** | Commencement of trading was on May 2, 2020. |
| *** | The Morningstar Conservative Target Risk Index (Total Return) is an index designed to meet the benchmarking needs of target risk investors by offering an objective yardstick for performance comparison. The index invests in 20% global equity exposure and 80% global bond exposure. Investors cannot invest directly in an index. |
The PFG American Funds® Conservative Income Strategy Fund is not sponsored, endorsed, sold or promoted by Morningstar, Inc. or any of its affiliates (all such entities, collectively, “Morningstar Entities”). The Morningstar Entities make no representation or warranty, express or implied, to the owners of the PFG American Funds® Conservative Income Strategy Fund or any member of the public regarding the advisability of investing in equities and bonds generally or in the the PFG American Funds® Conservative Income Strategy Fund in particular or the ability of The Morningstar Conservative Target Risk Index (Total Return) to track general equities and bonds market performance.
THE MORNINGSTAR ENTITIES DO NOT GUARANTEE THE ACCURACY AND/OR THE COMPLETENESS OF THE MORNINGSTAR CONSERVATIVE TARGET RISK INDEX (TOTAL RETURN) OR ANY DATA INCLUDED THERIN AND MORNINGSTAR ENTITIES SHALL HAVE NO LIABILITY FOR ANY ERRORS, OMISSIONS, OR INTERRUPTIONS THERIN.
Comparison of the Change in Value of a $10,000 Investment
| Holdings by Asset Class | % of Net Assets | |||
| Open End Funds - Fixed Income | 70.9 | % | ||
| Open End Funds - Mixed Allocation | 18.9 | % | ||
| Open End Funds - Equity | 9.9 | % | ||
| Money Market Fund | 0.5 | % | ||
| Other Assets Less Liabilities - Net | (0.2 | )% | ||
| 100.0 | % | |||
Please refer to the Portfolio of Investments in this annual report for more information regarding the Fund’s holdings as of April 30, 2022.
4
| PFG American Funds® Growth Strategy Fund |
| Portfolio Review (Unaudited) |
| April 30, 2022 |
The PFG American Funds® Growth Strategy provides investors with a broadly diversified, strategic global equity allocation that is designed to take advantage of opportunities across various market segments with active stock picking taking place in the underlying fund holdings. This PFG Strategy returned (15.06)% for the year ending 4/30/2022, while the Morningstar Aggressive Target Risk Index (Total Return) returned (5.62)% for the same period. A growth overweight in this Strategy was the primary driver of underperformance. The Strategy performed well and was in-line with its benchmark coming into 2022. However, the Federal Reserve began increasing interest rates at the beginning of 2022 as they announced their plans to combat inflation. Growth stocks tend to be more sensitive to interest rates because future cash flows are expected to be larger than present cash flows and, as interest rates rise, those expected cash flows are discounted more, resulting in lower present valuations. The top contributor to performance on a weighted basis was the American Funds Fundamental Investors Fund. The largest detractor was the American Funds Smallcap World Fund.
The Fund’s performance figures* for the periods ended April 30, 2022 as compared to its benchmark:
| Annualized | ||
| One | Performance | |
| Year | Since Inception** | |
| PFG American Funds® Growth Strategy Fund | ||
| Class R | (15.06)% | 11.33% |
| Morningstar Aggressive Target Risk Index (Total Return)*** | (5.62)% | 18.70% |
| * | The performance data quoted is historical. Past performance is no guarantee of future results. Current performance may be higher or lower than the performance data quoted. The principal value and investment return of an investment will fluctuate so that your shares, when redeemed, may be worth more or less than their original cost. The returns shown do not reflect the deduction of taxes that a shareholder may pay on Fund distributions or on the redemption of Fund shares. The Fund’s total annual operating expenses, including acquired fund fees and expenses, were 2.43% for Class R shares per the August 28, 2021 prospectus. For performance information current to the most recent month-end, please call 1-888-451-TPFG. |
| ** | Commencement of trading was on May 2, 2020. |
| *** | The Morningstar Aggressive Target Risk Index (Total Return) is an index designed to meet the benchmarking needs of target risk investors by offering an objective yardstick for performance comparison. The index invests in 95% global equity exposure and 5% global bond exposure. Investors cannot invest directly in an index. |
The PFG American Funds® Growth Strategy Fund is not sponsored, endorsed, sold or promoted by Morningstar, Inc. or any of its affiliates (all such entities, collectively, “Morningstar Entities”). The Morningstar Entities make no representation or warranty, express or implied, to the owners of the PFG American Funds® Growth Strategy Fund or any member of the public regarding the advisability of investing in equities and bonds generally or in the PFG American Funds® Growth Strategy Fund in particular or the ability of The Morningstar Aggressive Target Risk Index (Total Return) to track general equities and bonds market performance.
THE MORNINGSTAR ENTITIES DO NOT GUARANTEE THE ACCURACY AND/OR THE COMPLETENESS OF THE MORNINGSTAR AGGRESSIVE TARGET RISK INDEX (TOTAL RETURN) OR ANY DATA INCLUDED THERIN AND MORNINGSTAR ENTITIES SHALL HAVE NO LIABILITY FOR ANY ERRORS, OMISSIONS, OR INTERRUPTIONS THERIN.
Comparison of the Change in Value of a $10,000 Investment
| Holdings by Asset Class | % of Net Assets | |||
| Open End Funds - Equity | 99.7 | % | ||
| Money Market Fund | 0.4 | % | ||
| Other Assets Less Liabilities - Net | (0.1 | )% | ||
| 100.0 | % | |||
Please refer to the Portfolio of Investments in this annual report for more information regarding the Fund’s holdings as of April 30, 2022.
5
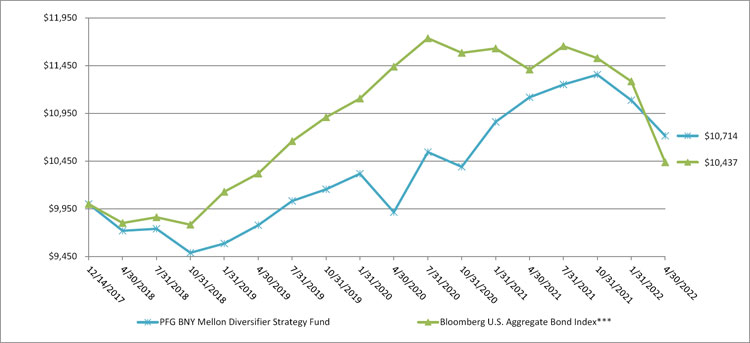
| PFG BNY Mellon Diversifier Strategy Fund |
| Portfolio Review (Unaudited) |
| April 30, 2022 |
The PFG BNY Mellon Diversifier Strategy utilizes a blend of alternative asset classes alongside traditional fixed income in an effort to outperform bonds during periods of both rising and falling interest rates. This PFG Strategy returned (3.64)% for the year ending 4/30/2022, while the Bloomberg U.S. Aggregate Bond Index returned (8.51)% for the same period. An allocation to natural resources within this Strategy was the largest contributor to performance. Holdings in floating rate bonds were another large contributor, benefiting from rising rates relative to fixed income. All positions within the Strategy allocation outperformed the benchmark over the period measured.
The Fund’s performance figures* for the periods ended April 30, 2022 as compared to its benchmark:
| Annualized | |||
| One | Three | Performance | |
| Year | Year | Since Inception** | |
| PFG BNY Mellon Diversifier Strategy Fund | |||
| Class R | (3.64)% | 3.09% | 1.59% |
| Bloomberg U.S. Aggregate Bond Index*** | (8.51)% | 0.38% | 0.98% |
| * | The performance data quoted is historical. Past performance is no guarantee of future results. Current performance may be higher or lower than the performance data quoted. The principal value and investment return of an investment will fluctuate so that your shares, when redeemed, may be worth more or less than their original cost. The returns shown do not reflect the deduction of taxes that a shareholder may pay on Fund distributions or on the redemption of Fund shares. The Fund’s total annual operating expenses, including acquired fund fees and expenses, were 2.71% for Class R shares per the August 28, 2021 prospectus. For performance information current to the most recent month-end, please call 1-888-451-TPFG. |
| ** | Commencement of trading was on December 14, 2017. |
| *** | The Bloomberg Barclays U.S. Aggregate Bond Index is an unmanaged index which represents the U.S. investment-grade fixed-rate bond market (including government and corporate securities, mortgage pass-through securities, and asset-backed securities). Investors cannot invest directly in an index. |
Comparison of the Change in Value of a $10,000 Investment
| Holdings by Asset Class | % of Net Assets | |||
| Open End Funds - Fixed Income | 51.8 | % | ||
| Open End Funds - Alternative | 38.3 | % | ||
| Open End Funds - Equity | 9.8 | % | ||
| Money Market Fund | 0.2 | % | ||
| Other Assets Less Liabilities - Net | (0.1 | )% | ||
| 100.0 | % | |||
Please refer to the Portfolio of Investments in this annual report for more information regarding the Fund’s holdings as of April 30, 2022.
6
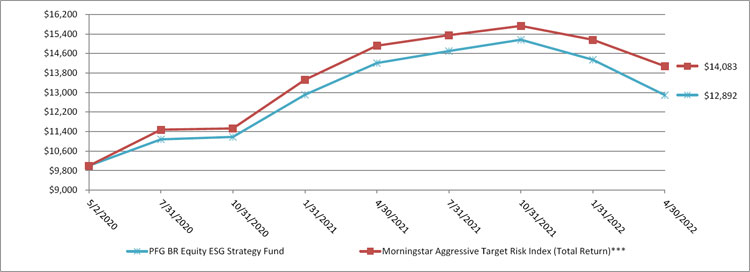
| PFG BR Equity ESG Strategy Fund |
| Portfolio Review (Unaudited) |
| April 30, 2022 |
The PFG BR Equity ESG Strategy’s tactical allocation provides investors with global exposure, emphasizing companies that exhibit positive environmental, social, and governance characteristics. This PFG Strategy returned (9.29)% for the year ending 4/30/2022, while the Morningstar Aggressive Target Risk Index (Total Return) returned (5.62)% for the same period. A growth overweight in this Strategy was the primary driver of underperformance. The Strategy performed well and was in-line with its benchmark coming into 2022. However, the Federal Reserve began increasing interest rates at the beginning of 2022 as they announced their plans to combat inflation. Growth stocks tend to be more sensitive to interest rates because future cash flows are expected to be larger than present cash flows and, as interest rates rise, those expected cash flows are discounted more, resulting in lower present valuations. The top contributors to performance on a weighted basis were the iShares ESG Aware MSCI USA ETF and the iShares MSCI KLD 400 Social ETF. The largest detractors were iShares ESG Aware MSCI EM ETF and the iShares ESG Advanced MSCI EAFE ETF.
The Fund’s performance figures* for the periods ended April 30, 2022 as compared to its benchmark:
| Annualized | ||
| One | Performance | |
| Year | Since Inception** | |
| PFG BR Equity ESG Strategy Fund | ||
| Class R | (9.29)% | 13.56% |
| Morningstar Aggressive Target Risk Index (Total Return)*** | (5.62)% | 18.70% |
| * | The performance data quoted is historical. Past performance is no guarantee of future results. Current performance may be higher or lower than the performance data quoted. The principal value and investment return of an investment will fluctuate so that your shares, when redeemed, may be worth more or less than their original cost. The returns shown do not reflect the deduction of taxes that a shareholder may pay on Fund distributions or on the redemption of Fund shares. The Fund’s total annual operating expenses, including acquired fund fees and expenses, were 2.26% for Class R shares per the August 28, 2021 prospectus. For performance information current to the most recent month-end, please call 1-888-451-TPFG. |
| ** | Commencement of trading was on May 2, 2020. |
| *** | The Morningstar Aggressive Target Risk Index (Total Return) is an index designed to meet the benchmarking needs of target risk investors by offering an objective yardstick for performance comparison. The index invests in 95% global equity exposure and 5% global bond exposure. Investors cannot invest directly in an index. |
The PFG BR Equity ESG Strategy Fund is not sponsored, endorsed, sold or promoted by Morningstar, Inc. or any of its affiliates (all such entities, collectively, “Morningstar Entities”). The Morningstar Entities make no representation or warranty, express or implied, to the owners of the PFG BR Equity ESG Strategy Fund or any member of the public regarding the advisability of investing in equities and bonds generally or in the PFG BR Equity ESG Strategy Fund in particular or the ability of The Morningstar Aggressive Target Risk Index (Total Return) to track general equities and bonds market performance.
THE MORNINGSTAR ENTITIES DO NOT GUARANTEE THE ACCURACY AND/OR THE COMPLETENESS OF THE MORNINGSTAR AGGRESSIVE TARGET RISK INDEX (TOTAL RETURN) OR ANY DATA INCLUDED THERIN AND MORNINGSTAR ENTITIES SHALL HAVE NO LIABILITY FOR ANY ERRORS, OMISSIONS, OR INTERRUPTIONS THERIN.
Comparison of the Change in Value of a $10,000 Investment
| Holdings by Asset Class | % of Net Assets | |||
| Exchange Traded Funds - Equity | 99.6 | % | ||
| Money Market Fund | 0.4 | % | ||
| Other Assets Less Liabilities - Net | 0.0 | % | ||
| 100.0 | % | |||
Please refer to the Portfolio of Investments in this annual report for more information regarding the Fund’s holdings as of April 30, 2022.
7
| PFG Fidelity Institutional AM® Bond ESG Strategy Fund |
| Portfolio Review (Unaudited) |
| April 30, 2022 |
The inception for this Strategy was 10/29/2021. The PFG Fidelity Institutional AM® Bond ESG Strategy provides investors with a strategic, broadly diversified fixed income allocation with a focus on securities that emphasize environmental, social, and governance factors. This PFG Strategy returned (10.00)% since its inception through 4/30/2022, while the Bloomberg U.S. Aggregate Bond Index returned (9.47)% for the same time period. The Strategy experienced some underperformance in the first couple weeks after its launch due to the timing of fund flows. Since that time, the Strategy has performed in line with its benchmark. The top contributors to performance on a weighted basis were the Calvert Bond Fund and the Fidelity Sustainability Bond Fund. The largest detractor was the Fidelity Total Bond ETF.
The Fund’s performance figures* for the period ended April 30, 2022 as compared to its benchmark:
| Performance | |
| Since Inception** | |
| PFG Fidelity Institutional AM® Bond ESG Strategy Fund | |
| Class R | (10.00)% |
| Bloomberg U.S. Aggregate Bond Index*** | (9.47)% |
| * | The performance data quoted is historical. Past performance is no guarantee of future results. Current performance may be higher or lower than the performance data quoted. The principal value and investment return of an investment will fluctuate so that your shares, when redeemed, may be worth more or less than their original cost. The returns shown do not reflect the deduction of taxes that a shareholder may pay on Fund distributions or on the redemption of Fund shares. The Fund’s total annual operating expenses, including acquired fund fees and expenses, were 2.24% for Class R shares per the October 6, 2021 prospectus. For performance information current to the most recent month-end, please call 1-888-451-TPFG. |
| ** | Commencement of trading was on October 29, 2021. |
| *** | The Bloomberg Barclays U.S. Aggregate Bond Index is an unmanaged index which represents the U.S. investment-grade fixed-rate bond market (including government and corporate securities, mortgage pass-through securities, and asset-backed securities). Investors cannot invest directly in an index. |
Comparison of the Change in Value of a $10,000 Investment
| Holdings by Asset Class | % of Net Assets | |||
| Open End Funds - Fixed Income | 81.7 | % | ||
| Exchange-Traded Funds - Fixed Income | 18.0 | % | ||
| Money Market Fund | 0.3 | % | ||
| Other Assets Less Liabilities - Net | 0.0 | % | ||
| 100.0 | % | |||
Please refer to the Portfolio of Investments in this annual report for more information regarding the Fund’s holdings as of April 30, 2022.
8
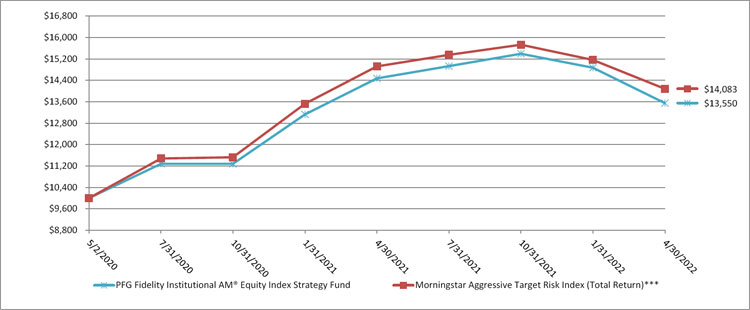
| PFG Fidelity Institutional AM® Equity Index Strategy Fund |
| Portfolio Review (Unaudited) |
| April 30, 2022 |
The PFG Fidelity Institutional AM® Equity Index Strategy provides investors with a passive, globally diversified, strategic equity allocation. This PFG Strategy returned (6.37)% for the year ending 4/30/2022, while the Morningstar Aggressive Target Risk Index (Total Return) returned (5.62)% for the same period. The Strategy performed well and was in-line with its benchmark through the the middle of April 2022. The Strategy lagged its benchmark in the final two weeks of April due to small and midcap exposure. The top contributor to performance on a weighted basis was the Fidelity 500 Index Fund. The largest detractors were the Fidelity Global ex-U.S. Index Fund and the Fidelity Small Cap Index Fund.
The Fund’s performance figures* for the periods ended April 30, 2022 as compared to its benchmark:
| Annualized | ||
| One | Performance | |
| Year | Since Inception** | |
| PFG Fidelity Institutional AM® Equity Index Strategy Fund | ||
| Class R | (6.37)% | 16.43% |
| Morningstar Aggressive Target Risk Index (Total Return)*** | (5.62)% | 18.70% |
| * | The performance data quoted is historical. Past performance is no guarantee of future results. Current performance may be higher or lower than the performance data quoted. The principal value and investment return of an investment will fluctuate so that your shares, when redeemed, may be worth more or less than their original cost. The returns shown do not reflect the deduction of taxes that a shareholder may pay on Fund distributions or on the redemption of Fund shares. The Fund’s total annual operating expenses, including acquired fund fees and expenses, were 2.08% for Class R shares per the August 28, 2021 prospectus. For performance information current to the most recent month-end, please call 1-888-451-TPFG. |
| ** | Commencement of trading was on May 2, 2020. |
| *** | The Morningstar Aggressive Target Risk Index (Total Return) is an index designed to meet the benchmarking needs of target risk investors by offering an objective yardstick for performance comparison. The index invests in 95% global equity exposure and 5% global bond exposure. Investors cannot invest directly in an index. |
The PFG Fidelity Institutional AM® Equity Index Strategy Fund is not sponsored, endorsed, sold or promoted by Morningstar, Inc. or any of its affiliates (all such entities, collectively, “Morningstar Entities”). The Morningstar Entities make no representation or warranty, express or implied, to the owners of the PFG Fidelity Institutional AM® Equity Index Strategy Fund or any member of the public regarding the advisability of investing in equities and bonds generally or in the PFG Fidelity Institutional AM® Equity Index Strategy Fund in particular or the ability of The Morningstar Aggressive Target Risk Index (Total Return) to track general equities and bonds market performance.
THE MORNINGSTAR ENTITIES DO NOT GUARANTEE THE ACCURACY AND/OR THE COMPLETENESS OF THE MORNINGSTAR AGGRESSIVE TARGET RISK INDEX (TOTAL RETURN) OR ANY DATA INCLUDED THERIN AND MORNINGSTAR ENTITIES SHALL HAVE NO LIABILITY FOR ANY ERRORS, OMISSIONS, OR INTERRUPTIONS THERIN.
Comparison of the Change in Value of a $10,000 Investment
| Holdings by Asset Class | % of Net Assets | |||
| Open End Funds - Equity | 98.8 | % | ||
| Money Market Fund | 0.4 | % | ||
| Other Assets Less Liabilities - Net | 0.8 | % | ||
| 100.0 | % | |||
Please refer to the Portfolio of Investments in this annual report for more information regarding the Fund’s holdings as of April 30, 2022.
9
| PFG Fidelity Institutional AM® Equity Sector Strategy Fund |
| Portfolio Review (Unaudited) |
| April 30, 2022 |
The PFG Fidelity Institutional AM® Equity Sector Strategy provides investors with a tactically managed, diversified allocation that tilts exposure to sectors based on shifts in the business cycle. This PFG Strategy returned 2.58% for the year ending 4/30/2022, while the Morningstar Aggressive Target Risk Index (Total Return) returned (5.62)% for the same period. The primary driver of outperformance was a defensive position taken at the beginning of 2022 as a result of economic data suggesting the economy was approaching a late-cycle phase. The Strategy was repositioned to be overweighted to areas of the market that typically perform well late cycle, such as energy, utilities, and materials, all of which outperformed the benchmark during the market sell-off that started at the beginning of 2022. The top contributors to performance on a weighted basis came from the Fidelity Select Semiconductors ETF and the Fidelity MSCI Energy ETFs. The largest detractor was the Fidelity Advisor Health Care Fund.
The Fund’s performance figures* for the periods ended April 30, 2022 as compared to its benchmark:
| Annualized | ||
| One | Performance | |
| Year | Since Inception** | |
| PFG Fidelity Institutional AM® Equity Sector Strategy Fund | ||
| Class R | 2.58% | 18.10% |
| Morningstar Aggressive Target Risk Index (Total Return)*** | (5.62)% | 18.70% |
| * | The performance data quoted is historical. Past performance is no guarantee of future results. Current performance may be higher or lower than the performance data quoted. The principal value and investment return of an investment will fluctuate so that your shares, when redeemed, may be worth more or less than their original cost. The returns shown do not reflect the deduction of taxes that a shareholder may pay on Fund distributions or on the redemption of Fund shares. The Fund’s total annual operating expenses, including acquired fund fees and expenses, were 2.46% for Class R shares per the August 28, 2021 prospectus. For performance information current to the most recent month-end, please call 1-888-451-TPFG. |
| ** | Commencement of trading was on May 2, 2020. |
| *** | The Morningstar Aggressive Target Risk Index (Total Return) is an index designed to meet the benchmarking needs of target risk investors by offering an objective yardstick for performance comparison. The index invests in 95% global equity exposure and 5% global bond exposure. Investors cannot invest directly in an index. |
The PFG Fidelity Institutional AM® Equity Sector Strategy Fund is not sponsored, endorsed, sold or promoted by Morningstar, Inc. or any of its affiliates (all such entities, collectively, “Morningstar Entities”). The Morningstar Entities make no representation or warranty, express or implied, to the owners of the PFG Fidelity Institutional AM® Equity Sector Strategy Fund or any member of the public regarding the advisability of investing in equities and bonds generally or in the PFG Fidelity Institutional AM® Equity Sector Strategy Fund in particular or the ability of The Morningstar Aggressive Target Risk Index (Total Return) to track general equities and bonds market performance.
THE MORNINGSTAR ENTITIES DO NOT GUARANTEE THE ACCURACY AND/OR THE COMPLETENESS OF THE MORNINGSTAR AGGRESSIVE TARGET RISK INDEX (TOTAL RETURN) OR ANY DATA INCLUDED THERIN AND MORNINGSTAR ENTITIES SHALL HAVE NO LIABILITY FOR ANY ERRORS, OMISSIONS, OR INTERRUPTIONS THERIN.
Comparison of the Change in Value of a $10,000 Investment
| Holdings by Asset Class | % of Net Assets | |||
| Exchange Traded Funds - Equity | 61.7 | % | ||
| Open End Funds - Equity | 37.6 | % | ||
| Money Market Fund | 0.4 | % | ||
| Other Assets Less Liabilities - Net | 0.3 | % | ||
| 100.0 | % | |||
Please refer to the Portfolio of Investments in this annual report for more information regarding the Fund’s holdings as of April 30, 2022.
10
| PFG Invesco® Thematic ESG Strategy Fund |
| Portfolio Review (Unaudited) |
| April 30, 2022 |
The inception for this Strategy was 10/29/2021. The PFG Invesco® Thematic ESG Strategy provides investors with a tactically managed all-equity model that focuses on ESG investing by providing exposure to environmental themes aimed at addressing a more sustainable future. This PFG Strategy returned (23.77)% since its inception through 4/30/2022, while the Morningstar Aggressive Target Risk Index (Total Return) returned (10.48)% for the same period. This is a concentrated Strategy and focuses on three specific environmental themes: clean technology, clean energy, and clean water. Due to its concentration, the Strategy is expected to have higher volatility relative to its benchmark. The primary detractor to underperformance was a higher allocation to small cap growth stocks which underperformed the broader market over this time period. The top contributor to performance on a weighted basis was the Invesco S&P Global Water ETF. The largest detractors were the Invesco MSCI Sustainable Future ETF and the Invesco WilderHill Clean Energy ETF.
The Fund’s performance figures* for the period ended April 30, 2022 as compared to its benchmark:
| Performance | |
| Since Inception** | |
| PFG Invesco® Thematic ESG Strategy Fund | |
| Class R | (23.77)% |
| Morningstar Aggressive Target Risk Index (Total Return)*** | (10.48)% |
| * | The performance data quoted is historical. Past performance is no guarantee of future results. Current performance may be higher or lower than the performance data quoted. The principal value and investment return of an investment will fluctuate so that your shares, when redeemed, may be worth more or less than their original cost. The returns shown do not reflect the deduction of taxes that a shareholder may pay on Fund distributions or on the redemption of Fund shares. The Fund’s total annual operating expenses, including acquired fund fees and expenses, were 2.68% for Class R shares per the October 6, 2021 prospectus. For performance information current to the most recent month-end, please call 1-888-451-TPFG. |
| ** | Commencement of trading was on October 29, 2021. |
| *** | The Morningstar Aggressive Target Risk Index (Total Return) is an index designed to meet the benchmarking needs of target risk investors by offering an objective yardstick for performance comparison. The index invests in 95% global equity exposure and 5% global bond exposure. Investors cannot invest directly in an index. |
The PFG Invesco® Thematic ESG Strategy Fund is not sponsored, endorsed, sold or promoted by Morningstar, Inc. or any of its affiliates (all such entities, collectively, “Morningstar Entities”). The Morningstar Entities make no representation or warranty, express or implied, to the owners of the PFG Invesco® Thematic ESG Strategy Fund or any member of the public regarding the advisability of investing in equities and bonds generally or in the PFG Invesco® Thematic ESG Strategy Fund in particular or the ability of The Morningstar Aggressive Target Risk Index (Total Return) to track general equities and bonds market performance.
THE MORNINGSTAR ENTITIES DO NOT GUARANTEE THE ACCURACY AND/OR THE COMPLETENESS OF THE MORNINGSTAR AGGRESSIVE TARGET RISK INDEX (TOTAL RETURN) OR ANY DATA INCLUDED THERIN AND MORNINGSTAR ENTITIES SHALL HAVE NO LIABILITY FOR ANY ERRORS, OMISSIONS, OR INTERRUPTIONS THERIN.
Comparison of the Change in Value of a $10,000 Investment
| Holdings by Asset Class | % of Net Assets | |||
| Exchange Traded Funds - Equity | 99.8 | % | ||
| Money Market Fund | 0.3 | % | ||
| Other Assets Less Liabilities - Net | (0.1 | )% | ||
| 100.0 | % | |||
Please refer to the Portfolio of Investments in this annual report for more information regarding the Fund’s holdings as of April 30, 2022.
11
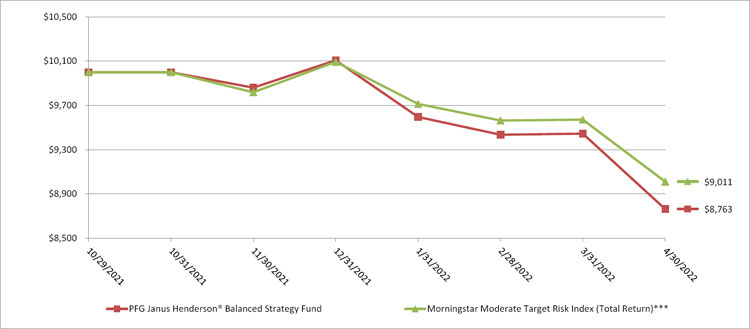
| PFG Janus Henderson® Balanced Strategy Fund |
| Portfolio Review (Unaudited) |
| April 30, 2022 |
The inception for this Strategy was 10/29/2021. The PFG Janus Henderson® Balanced Strategy provides investors with a tactically managed model that proactively adjusts equity and fixed income exposure between 30% to 70% of the Strategy, depending on market conditions. This PFG Strategy returned (12.37)% since its inception through 4/30/2022, while the Morningstar Moderate Target Risk Index (Total Return) returned (9.89)% for the same period. The primary detractor to performance was an overweight to growth stocks which underperformed the broader market due to rising interest rates. Growth stocks tend to be more sensitive to interest rates because future cash flows are expected to be larger than present cash flows and, as interest rates rise, those expected cash flows are discounted more, resulting in lower present valuations. The top contributor to performance on a weighted basis was the Janus Henderson High Yield Fund. The largest detractor was the Janus Henderson Small Cap Growth Alpha ETF.
The Fund’s performance figures* for the period ended April 30, 2022 as compared to its benchmark:
| Performance | |
| Since Inception** | |
| PFG Janus Henderson® Balanced Strategy Fund | |
| Class R | (12.37)% |
| Morningstar Moderate Target Risk Index (Total Return)*** | (9.89)% |
| * | The performance data quoted is historical. Past performance is no guarantee of future results. Current performance may be higher or lower than the performance data quoted. The principal value and investment return of an investment will fluctuate so that your shares, when redeemed, may be worth more or less than their original cost. The returns shown do not reflect the deduction of taxes that a shareholder may pay on Fund distributions or on the redemption of Fund shares. The Fund’s total annual operating expenses, including acquired fund fees and expenses, were 2.62% for Class R shares per the October 6, 2021 prospectus. For performance information current to the most recent month-end, please call 1-888-451-TPFG. |
| ** | Commencement of trading was on October 29, 2021. |
| *** | The Morningstar Moderate Target Risk Index (Total Return) is an index designed to meet the benchmarking needs of target risk investors by offering an objective yardstick for performance comparison. The index invests in 60% global equity exposure and 40% global bond exposure. Investors cannot invest directly in an index. |
The PFG Janus Henderson® Balanced Strategy Fund is not sponsored, endorsed, sold or promoted by Morningstar, Inc. or any of its affiliates (all such entities, collectively, “Morningstar Entities”). The Morningstar Entities make no representation or warranty, express or implied, to the owners of the PFG Janus Henderson® Balanced Strategy Fund or any member of the public regarding the advisability of investing in equities and bonds generally or in the PFG Janus Henderson® Balanced Strategy Fund in particular or the ability of The Morningstar Moderate Target Risk Index (Total Return) to track general equities and bonds market performance.
THE MORNINGSTAR ENTITIES DO NOT GUARANTEE THE ACCURACY AND/OR THE COMPLETENESS OF THE MORNINGSTAR MODERATE TARGET RISK INDEX (TOTAL RETURN) OR ANY DATA INCLUDED THERIN AND MORNINGSTAR ENTITIES SHALL HAVE NO LIABILITY FOR ANY ERRORS, OMISSIONS, OR INTERRUPTIONS THERIN.
Comparison of the Change in Value of a $10,000 Investment
| Holdings by Asset Class | % of Net Assets | |||
| Open End Funds - Mixed Allocation | 79.8 | % | ||
| Open End Funds - Fixed Income | 7.8 | % | ||
| Exchange Traded Funds - Equity | 5.8 | % | ||
| Open End Funds - Equity | 4.9 | % | ||
| Exchange Traded Funds - Fixed Income | 1.3 | % | ||
| Money Market Fund | 0.3 | % | ||
| Other Assets Less Liabilities - Net | 0.1 | % | ||
| 100.0 | % | |||
Please refer to the Portfolio of Investments in this annual report for more information regarding the Fund’s holdings as of April 30, 2022.
12
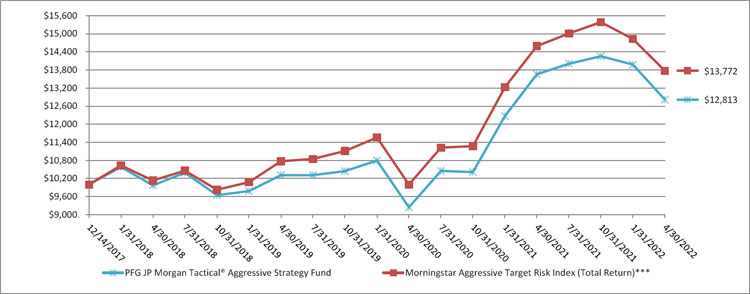
| PFG JP Morgan Tactical® Aggressive Strategy Fund |
| Portfolio Review (Unaudited) |
| April 30, 2022 |
The PFG JP Morgan® Tactical Aggressive Strategy provides a globally diversified allocation with the ability to dynamically adjust the equity and fixed income exposure based upon current market conditions. The PFG Strategy returned (6.17)% for the year ending 4/30/2022, while the Morningstar Aggressive Target Risk Index (Total Return) returned (5.62)% for the same period. The Strategy performed well and was in-line with its benchmark through the end of February 2022. The Strategy fluctuated between underperforming and outperforming its benchmark throughout March and April, and ultimately ended with slight underperformance for the 12-month time period. The top contributors to performance on a weighted basis were the JPMorgan Diversified Return U.S. Equity ETF and the JPMorgan Large Cap Value Fund. The largest detractors were the JPMorgan Large Cap Growth Fund and the JPMorgan International Researched Enhanced Fund.
The Fund’s performance figures* for the periods ended April 30, 2022 as compared to its benchmark:
| Annualized | |||
| One | Three | Performance | |
| Year | Year | Since Inception** | |
| PFG JP Morgan Tactical® Aggressive Strategy Fund | |||
| Class R | (6.17)% | 7.52% | 5.82% |
| Morningstar Aggressive Target Risk Index (Total Return)*** | (5.62)% | 8.54% | 7.57% |
| * | The performance data quoted is historical. Past performance is no guarantee of future results. Current performance may be higher or lower than the performance data quoted. The principal value and investment return of an investment will fluctuate so that your shares, when redeemed, may be worth more or less than their original cost. The returns shown do not reflect the deduction of taxes that a shareholder may pay on Fund distributions or on the redemption of Fund shares. The Fund’s total annual operating expenses, including acquired fund fees and expenses, were 2.48% for Class R shares per the August 28, 2021 prospectus. For performance information current to the most recent month-end, please call 1-888-451-TPFG. |
| ** | Commencement of trading was on December 14, 2017. |
| *** | The Morningstar Aggressive Target Risk Index (Total Return) is an index designed to meet the benchmarking needs of target risk investors by offering an objective yardstick for performance comparison. The index invests in 95% global equity exposure and 5% global bond exposure. Investors cannot invest directly in an index. |
The PFG JP Morgan Tactical® Aggressive Strategy Fund is not sponsored, endorsed, sold or promoted by Morningstar, Inc. or any of its affiliates (all such entities, collectively, “Morningstar Entities”). The Morningstar Entities make no representation or warranty, express or implied, to the owners of the PFG JP Morgan Tactical® Aggressive Strategy Fund or any member of the public regarding the advisability of investing in equities and bonds generally or in the PFG JP Morgan Tactical® Aggressive Strategy Fund in particular or the ability of The Morningstar Aggressive Target Risk Index (Total Return) to track general equities and bonds market performance.
THE MORNINGSTAR ENTITIES DO NOT GUARANTEE THE ACCURACY AND/OR THE COMPLETENESS OF THE MORNINGSTAR AGGRESSIVE TARGET RISK INDEX (TOTAL RETURN) OR ANY DATA INCLUDED THERIN AND MORNINGSTAR ENTITIES SHALL HAVE NO LIABILITY FOR ANY ERRORS, OMISSIONS, OR INTERRUPTIONS THERIN.
Comparison of the Change in Value of a $10,000 Investment
| Holdings by Asset Class | % of Net Assets | |||
| Open End Funds - Equity | 60.7 | % | ||
| Exchange Traded Funds - Equity | 33.3 | % | ||
| Open End Funds - Alternative | 5.7 | % | ||
| Money Market Fund | 0.4 | % | ||
| Other Assets Less Liabilities - Net | (0.1 | )% | ||
| 100.0 | % | |||
Please refer to the Portfolio of Investments in this annual report for more information regarding the Fund’s holdings as of April 30, 2022.
13
| PFG JP Morgan® Tactical Moderate Strategy Fund |
| Portfolio Review (Unaudited) |
| April 30, 2022 |
The PFG JP Morgan® Tactical Moderate Strategy provides a globally diversified allocation with the ability to dynamically adjust the equity and fixed income exposure based upon market conditions. The PFG Strategy returned (7.49)% for the year ending 4/30/2022, while the Morningstar Moderate Target Risk Index (Total Return) returned (6.42)% for the same period. The Strategy performed well and was in-line with its benchmark through the end of February 2022. The Strategy lagged the benchmark in March and April with the primary driver of underperformance being exposure to international and emerging markets. The top contributors to performance on a weighted basis were the JPMorgan Diversified Return U.S. Equity ETF and the JPMorgan Large Cap Value Fund. The largest detractors were the JPMorgan International Focus Fund and the JPMorgan Europe Dynamic Fund.
The Fund’s performance figures* for the periods ended April 30, 2022 as compared to its benchmark:
| Annualized | |||
| One | Three | Performance | |
| Year | Year | Since Inception** | |
| PFG JP Morgan® Tactical Moderate Strategy Fund | |||
| Class R | (7.49)% | 4.25% | 2.98% |
| Morningstar Moderately Aggressive Target Risk Index (Total Return)*** | (6.14)% | 7.53% | 6.53% |
| Morningstar Moderate Target Risk Index (Total Return)**** | (6.42)% | 6.04% | 5.55% |
| * | The performance data quoted is historical. Past performance is no guarantee of future results. Current performance may be higher or lower than the performance data quoted. The principal value and investment return of an investment will fluctuate so that your shares, when redeemed, may be worth more or less than their original cost. The returns shown do not reflect the deduction of taxes that a shareholder may pay on Fund distributions or on the redemption of Fund shares. The Fund’s total annual operating expenses, including acquired fund fees and expenses, were 2.51% for Class R shares per the August 28, 2021 prospectus. For performance information current to the most recent month-end, please call 1-888-451-TPFG. |
| ** | Commencement of operations and trading was March 15, 2018. |
| *** | The Morningstar Moderately Aggressive Target Risk Index (Total Return) is an index designed to meet the benchmarking needs of target risk investors by offering an objective yardstick for performance comparison. The index invests in 80% global equity exposure and 20% global bond exposure. Investors cannot invest directly in an index. |
| **** | The Morningstar Moderate Target Risk Index (Total Return) is an index designed to meet the benchmarking needs of target risk investors by offering an objective yardstick for performance comparison. The index invests in 60% global equity exposure and 40% global bond exposure. Investors cannot invest directly in an index. |
The PFG JP Morgan® Tactical Moderate Strategy Fund is not sponsored, endorsed, sold or promoted by Morningstar, Inc. or any of its affiliates (all such entities, collectively, “Morningstar Entities”). The Morningstar Entities make no representation or warranty, express or implied, to the owners of the PFG JP Morgan® Tactical Moderate Strategy Fund or any member of the public regarding the advisability of investing in equities and bonds generally or in the PFG JP Morgan® Tactical Moderate Strategy Fund in particular or the ability of The Morningstar Moderately Aggressive Target Risk Index (Total Return) and Morningstar Moderate Target Risk Index (Total Return) to track general equities and bonds market performance.
THE MORNINGSTAR ENTITIES DO NOT GUARANTEE THE ACCURACY AND/OR THE COMPLETENESS OF THE MORNINGSTAR MODERATELY AGGRESSIVE TARGET RISK INDEX (TOTAL RETURN) AND MORNINGSTAR MODERATE TARGET RISK INDEX (TOTAL RETURN) OR ANY DATA INCLUDED THERIN AND MORNINGSTAR ENTITIES SHALL HAVE NO LIABILITY FOR ANY ERRORS, OMISSIONS, OR INTERRUPTIONS THERIN.
Comparison of the Change in Value of a $10,000 Investment
| Holdings by Asset Class | % of Net Assets | |||
| Open End Funds - Fixed Income | 39.6 | % | ||
| Open End Funds - Equity | 31.1 | % | ||
| Exchange Traded Funds - Equity | 24.6 | % | ||
| Open End Funds - Alternative | 4.0 | % | ||
| Money Market Fund | 0.8 | % | ||
| Other Assets Less Liabilities - Net | (0.1 | )% | ||
| 100.0 | % | |||
Please refer to the Portfolio of Investments in this annual report for more information regarding the Fund’s holdings as of April 30, 2022.
14
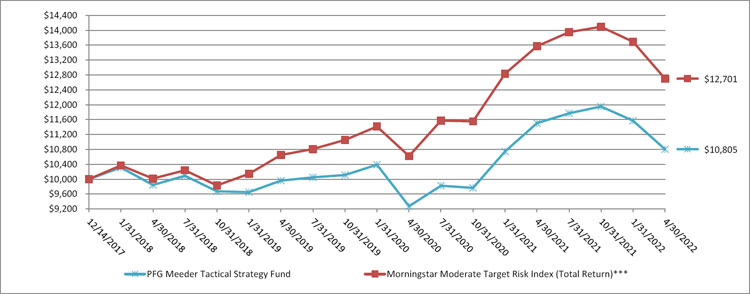
| PFG Meeder Tactical Strategy Fund |
| Portfolio Review (Unaudited) |
| April 30, 2022 |
The PFG Meeder Tactical Strategy provides a highly tactical allocation by shifting equity and fixed income exposure during various market conditions. This PFG Strategy returned (6.09)% for the year ending 4/30/2022, while the Morningstar Moderate Target Risk Index (Total Return) returned (6.42)% for the same period. The primary driver of outperformance was a defensive position taken at the beginning of 2022 due to above-average valuations, rising interest rates, and weak market breadth. The top contributors to performance on a weighted basis were the Meeder Balanced and Muirfield funds. The largest detractor was the Meeder Dynamic Allocation Fund.
The Fund’s performance figures* for the periods ended April 30, 2022 as compared to its benchmark:
| Annualized | |||
| One | Three | Performance | |
| Year | Year | Since Inception** | |
| PFG Meeder Tactical Strategy Fund | |||
| Class R | (6.09)% | 2.75% | 1.78% |
| Morningstar Moderate Target Risk Index (Total Return)*** | (6.42)% | 6.04% | 5.61% |
| * | The performance data quoted is historical. Past performance is no guarantee of future results. Current performance may be higher or lower than the performance data quoted. The principal value and investment return of an investment will fluctuate so that your shares, when redeemed, may be worth more or less than their original cost. The returns shown do not reflect the deduction of taxes that a shareholder may pay on Fund distributions or on the redemption of Fund shares. The Fund’s total annual operating expenses, including acquired fund fees and expenses, were 3.06% for Class R shares per the August 28, 2021 prospectus. For performance information current to the most recent month-end, please call 1-888-451-TPFG. |
| ** | Commencement of trading was on December 14, 2017. |
| *** | The Morningstar Moderate Target Risk Index (Total Return) is an index designed to meet the benchmarking needs of target risk investors by offering an objective yardstick for performance comparison. The index invests in 60% global equity exposure and 40% global bond exposure. Investors cannot invest directly in an index. |
The PFG Meeder Tactical Strategy Fund is not sponsored, endorsed, sold or promoted by Morningstar, Inc. or any of its affiliates (all such entities, collectively, “Morningstar Entities”). The Morningstar Entities make no representation or warranty, express or implied, to the owners of the PFG Meeder Tactical Strategy Fund or any member of the public regarding the advisability of investing in equities and bonds generally or in the PFG Meeder Tactical Strategy Fund in particular or the ability of The Morningstar Moderate Target Risk Index (Total Return) to track general equities and bonds market performance.
THE MORNINGSTAR ENTITIES DO NOT GUARANTEE THE ACCURACY AND/OR THE COMPLETENESS OF THE MORNINGSTAR MODERATE TARGET RISK INDEX (TOTAL RETURN) OR ANY DATA INCLUDED THERIN AND MORNINGSTAR ENTITIES SHALL HAVE NO LIABILITY FOR ANY ERRORS, OMISSIONS, OR INTERRUPTIONS THERIN.
Comparison of the Change in Value of a $10,000 Investment
| Holdings by Asset Class | % of Net Assets | |||
| Open End Funds - Equity | 76.3 | % | ||
| Open End Funds - Mixed Allocation | 10.9 | % | ||
| Open End Funds - Alternative | 10.0 | % | ||
| Open End Funds - Fixed Income | 2.8 | % | ||
| Money Market Fund | 0.3 | % | ||
| Other Assets Less Liabilities - Net | (0.3 | )% | ||
| 100.0 | % | |||
Please refer to the Portfolio of Investments in this annual report for more information regarding the Fund’s holdings as of April 30, 2022.
15
| PFG MFS® Aggressive Growth Strategy Fund |
| Portfolio Review (Unaudited) |
| April 30, 2022 |
The PFG MFS Aggressive Growth Strategy provides a globally diversified equity allocation with a growth bias and holds diversifying allocations to real estate and commodities. The PFG Strategy returned (5.81)% for the year ending 4/30/2022, while the Morningstar Aggressive Target Risk Index (Total Return) returned (5.62)% for the same period. The Strategy performed well and was ahead of its benchmark coming into 2022. The Strategy experienced some underperformance in January due to an overweight to growth stocks. Thereafter, it performed in-line with its benchmark despite having a growth overweight, largely due to holdings in commodities which performed exceptionally well during the first four months of 2022. The top contributors to performance on a weighted basis came from the iShares GSCI Commodity ETF and the MFS Value Fund. The largest detractors were MFS Mid Cap Growth Fund and the MFS Growth Fund.
The Fund’s performance figures* for the periods ended April 30, 2022 as compared to its benchmark:
| Annualized | |||
| One | Three | Performance | |
| Year | Year | Since Inception** | |
| PFG MFS® Aggressive Growth Strategy Fund | |||
| Class R | (5.81)% | 7.36% | 6.81% |
| Morningstar Aggressive Target Risk Index (Total Return)*** | (5.62)% | 8.54% | 7.57% |
| * | The performance data quoted is historical. Past performance is no guarantee of future results. Current performance may be higher or lower than the performance data quoted. The principal value and investment return of an investment will fluctuate so that your shares, when redeemed, may be worth more or less than their original cost. The returns shown do not reflect the deduction of taxes that a shareholder may pay on Fund distributions or on the redemption of Fund shares. The Fund’s total annual operating expenses, including acquired fund fees and expenses, were 2.62% for Class R shares per the August 28, 2021 prospectus. For performance information current to the most recent month-end, please call 1-888-451-TPFG. |
| ** | Commencement of trading was on December 14, 2017. |
| *** | The Morningstar Aggressive Target Risk Index (Total Return) is an index designed to meet the benchmarking needs of target risk investors by offering an objective yardstick for performance comparison. The index invests in 95% global equity exposure and 5% global bond exposure. Investors cannot invest directly in an index. |
The PFG MFS® Aggressive Growth Strategy Fund is not sponsored, endorsed, sold or promoted by Morningstar, Inc. or any of its affiliates (all such entities, collectively, “Morningstar Entities”). The Morningstar Entities make no representation or warranty, express or implied, to the owners of the PFG MFS® Aggressive Growth Strategy Fund or any member of the public regarding the advisability of investing in equities and bonds generally or in the PFG MFS® Aggressive Growth Strategy Fund in particular or the ability of The Morningstar Aggressive Target Risk Index (Total Return) to track general equities and bonds market performance.
THE MORNINGSTAR ENTITIES DO NOT GUARANTEE THE ACCURACY AND/OR THE COMPLETENESS OF THE MORNINGSTAR AGGRESSIVE TARGET RISK INDEX (TOTAL RETURN) OR ANY DATA INCLUDED THERIN AND MORNINGSTAR ENTITIES SHALL HAVE NO LIABILITY FOR ANY ERRORS, OMISSIONS, OR INTERRUPTIONS THERIN.
Comparison of the Change in Value of a $10,000 Investment
| Holdings by Asset Class | % of Net Assets | |||
| Open End Funds - Equity | 84.4 | % | ||
| Exchange Traded Funds - Equity | 9.6 | % | ||
| Exchange Traded Funds - Commodity | 5.2 | % | ||
| Money Market Fund | 0.3 | % | ||
| Other Assets Less Liabilities - Net | 0.5 | % | ||
| 100.0 | % | |||
Please refer to the Portfolio of Investments in this annual report for more information regarding the Fund’s holdings as of April 30, 2022.
16
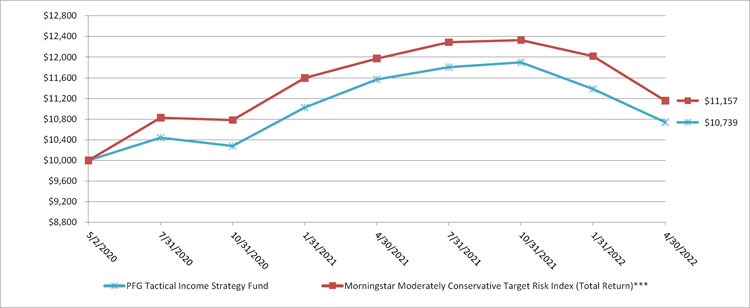
| PFG Tactical Income Strategy Fund |
| Portfolio Review (Unaudited) |
| April 30, 2022 |
The PFG Tactical Income Strategy seeks a high level of income with a focus on tactical high yield strategies, investment grade credit, and dividend paying equities. This PFG Strategy returned (7.18)% for the year ending 4/30/2022, while the Morningstar Moderate Conservative Target Risk Index (Total Return) returned (6.81)% for the same period. The primary driver of underperformance came from holdings in small cap and technology stocks. The underperformance was partially offset by positions in high yield bond timing strategies, which became defensive at the beginning of 2022 and experienced less drawdown than the broad market. The top contributors to performance on a weighted basis came from Counterpoint Tactical Income Fund and Sierra Tactical Bond Fund. The largest detractors were Janus Henderson Global Technology and Innovation Fund and the Janus Henderson Small Cap Growth Alpha ETF.
The Fund’s performance figures* for the periods ended April 30, 2022 as compared to its benchmark:
| Annualized | ||
| Six | One | Performance |
| Year | Since Inception** | |
| PFG Tactical Income Strategy Fund | ||
| Class R | (7.18)% | 3.63% |
| Morningstar Moderately Conservative Target Risk Index (Total Return)*** | (6.81)% | 5.64% |
| * | The performance data quoted is historical. Past performance is no guarantee of future results. Current performance may be higher or lower than the performance data quoted. The principal value and investment return of an investment will fluctuate so that your shares, when redeemed, may be worth more or less than their original cost. The returns shown do not reflect the deduction of taxes that a shareholder may pay on Fund distributions or on the redemption of Fund shares. The Fund’s total annual operating expenses, including acquired fund fees and expenses, were 2.68% for Class R shares per the August 28, 2021 prospectus. For performance information current to the most recent month-end, please call 1-888-451-TPFG. |
| ** | Commencement of trading was on May 2, 2020. |
| *** | The Morningstar Moderately Conservative Target Risk Index (Total Return) is an index designed to meet the benchmarking needs of target risk investors by offering an objective yardstick for performance comparison. The index invests in 40% global equity exposure and 60% global bond exposure. Investors cannot invest directly in an index. |
The PFG Tactical Income Strategy Fund is not sponsored, endorsed, sold or promoted by Morningstar, Inc. or any of its affiliates (all such entities, collectively, “Morningstar Entities”). The Morningstar Entities make no representation or warranty, express or implied, to the owners of the PFG Tactical Income Strategy Fund or any member of the public regarding the advisability of investing in equities and bonds generally or in the PFG Tactical Income Strategy Fund in particular or the ability of The Morningstar Moderately Conservative Target Risk Index (Total Return) to track general equities and bonds market performance.
THE MORNINGSTAR ENTITIES DO NOT GUARANTEE THE ACCURACY AND/OR THE COMPLETENESS OF THE MORNINGSTAR MODERATELY CONSERVATIVE TARGET RISK INDEX (TOTAL RETURN) OR ANY DATA INCLUDED THERIN AND MORNINGSTAR ENTITIES SHALL HAVE NO LIABILITY FOR ANY ERRORS, OMISSIONS, OR INTERRUPTIONS THERIN.
Comparison of the Change in Value of a $10,000 Investment
| Holdings by Asset Class | % of Net Assets | |||
| Open End Funds - Fixed Income | 52.7 | % | ||
| Open End Funds - Equity | 27.8 | % | ||
| Exchange Traded Funds - Equity | 8.1 | % | ||
| Exchange Traded Funds - Fixed Income | 6.5 | % | ||
| Open End Funds - Mixed Allocation | 4.7 | % | ||
| Money Market Fund | 0.0 | % | ||
| Other Assets Less Liabilities - Net | 0.2 | % | ||
| 100.0 | % | |||
Please refer to the Portfolio of Investments in this annual report for more information regarding the Fund’s holdings as of April 30, 2022.
17
| PFG ACTIVE CORE BOND STRATEGY FUND |
| SCHEDULE OF INVESTMENTS |
| April 30, 2022 |
| Shares | Fair Value | |||||||
| OPEN END FUNDS — 99.3% | ||||||||
| FIXED INCOME - 99.3% | ||||||||
| 797,069 | PIMCO Emerging Markets Bond Fund, Institutional Class | $ | 6,974,351 | |||||
| 857,614 | PIMCO High Yield Fund, Institutional Class | 6,989,558 | ||||||
| 3,841,391 | PIMCO Income Fund, Institutional Class | 42,178,468 | ||||||
| 1,519,942 | PIMCO Investment Grade Credit Bond Fund, Institutional Class | 14,059,461 | ||||||
| 1,376,201 | PIMCO Mortgage Opportunities and Bond Fund, Institutional Class | 14,119,824 | ||||||
| 6,105,327 | PIMCO Total Return Fund, Institutional Class | 56,046,907 | ||||||
| TOTAL OPEN END FUNDS (Cost $152,715,681) | 140,368,569 | |||||||
| SHORT-TERM INVESTMENTS — 0.3% | ||||||||
| MONEY MARKET FUNDS - 0.3% | ||||||||
| 383,765 | BlackRock Liquidity FedFund, Institutional Class, 0.31% (Cost $383,765)(a) | 383,765 | ||||||
| TOTAL INVESTMENTS - 99.6% (Cost $153,099,446) | $ | 140,752,334 | ||||||
| OTHER ASSETS IN EXCESS OF LIABILITIES - 0.4% | 506,565 | |||||||
| NET ASSETS - 100.0% | $ | 141,258,899 | ||||||
| (a) | Rate disclosed is the seven day effective yield as of April 30, 2022. |
See accompanying notes to financial statements.
18
| PFG AMERICAN FUNDS® CONSERVATIVE INCOME STRATEGY FUND |
| SCHEDULE OF INVESTMENTS |
| April 30, 2022 |
| Shares | Fair Value | |||||||
| OPEN END FUNDS — 99.7% | ||||||||
| EQUITY - 9.9% | ||||||||
| 400,427 | American Mutual Fund, Class R-6 | $ | 20,245,568 | |||||
| FIXED INCOME - 70.9% | ||||||||
| 3,364,339 | American Funds - Bond Fund of America, Class R-6 | 40,775,784 | ||||||
| 2,138,543 | American Funds Strategic Bond Fund, Class R-6 | 22,476,087 | ||||||
| 3,147,057 | American Intermediate Bond Fund of America, Class R-6 | 40,848,796 | ||||||
| 4,245,733 | American Short Term Bond Fund of America, Class R-6 | 41,013,780 | ||||||
| 145,114,447 | ||||||||
| MIXED ALLOCATION - 18.9% | ||||||||
| 602,775 | American Balanced Fund, Class R-6 | 18,245,987 | ||||||
| 830,676 | The Income Fund of America, Class R-6 | 20,326,635 | ||||||
| 38,572,622 | ||||||||
| TOTAL OPEN END FUNDS (Cost $215,093,698) | 203,932,637 | |||||||
| SHORT-TERM INVESTMENTS — 0.5% | ||||||||
| MONEY MARKET FUNDS - 0.5% | ||||||||
| 1,010,682 | BlackRock Liquidity FedFund, Institutional Class, 0.31% (Cost $1,010,682)(a) | 1,010,682 | ||||||
| TOTAL INVESTMENTS - 100.2% (Cost $216,104,380) | $ | 204,943,319 | ||||||
| LIABILITIES IN EXCESS OF OTHER ASSETS - (0.2)% | (417,938 | ) | ||||||
| NET ASSETS - 100.0% | $ | 204,525,381 | ||||||
| (a) | Rate disclosed is the seven day effective yield as of April 30, 2022. |
See accompanying notes to financial statements.
19
| PFG AMERICAN FUNDS GROWTH STRATEGY FUND |
| SCHEDULE OF INVESTMENTS |
| April 30, 2022 |
| Shares | Fair Value | |||||||
| OPEN END FUNDS — 99.7% | ||||||||
| EQUITY - 99.7% | ||||||||
| 3,088,475 | AMCAP Fund, Class R-6 | $ | 111,277,757 | |||||
| 2,355,428 | American - The Growth Fund of America, Class R-6 | 137,745,449 | ||||||
| 1,180,677 | American Funds - New Economy Fund, Class R-6 | 55,822,425 | ||||||
| 1,734,961 | American Funds Fundamental Investors, Class R-6 | 113,796,113 | ||||||
| 1,054,538 | American New Perspective Fund, Class R-6 | 56,586,497 | ||||||
| 1,345,662 | Smallcap World Fund, Inc., Class R-6 | 85,314,997 | ||||||
| TOTAL OPEN END FUNDS (Cost $628,472,409) | 560,543,238 | |||||||
| SHORT-TERM INVESTMENTS — 0.4% | ||||||||
| MONEY MARKET FUNDS - 0.4% | ||||||||
| 2,287,915 | BlackRock Liquidity FedFund, Institutional Class, 0.31% (Cost $2,287,915)(a) | 2,287,915 | ||||||
| TOTAL INVESTMENTS - 100.1% (Cost $630,760,324) | $ | 562,831,153 | ||||||
| LIABILITIES IN EXCESS OF OTHER ASSETS - (0.1)% | (406,283 | ) | ||||||
| NET ASSETS - 100.0% | $ | 562,424,870 | ||||||
| (a) | Rate disclosed is the seven day effective yield as of April 30, 2022. |
See accompanying notes to financial statements.
20
| PFG BNY MELLON DIVERSIFIED STRATEGY FUND |
| SCHEDULE OF INVESTMENTS |
| April 30, 2022 |
| Shares | Fair Value | |||||||
| OPEN END FUNDS — 99.9% | ||||||||
| ALTERNATIVE - 38.3% | ||||||||
| 3,793,030 | BNY Mellon Global Real Return, Class I | $ | 62,016,047 | |||||
| EQUITY - 9.8% | ||||||||
| 665,601 | BNY Mellon Global Real Estate Securities Fund, Class I | 6,283,270 | ||||||
| 174,679 | BNY Mellon Natural Resources Fund, Class I | 9,472,840 | ||||||
| 15,756,110 | ||||||||
| FIXED INCOME - 51.8% | ||||||||
| 6,171,928 | BNY Mellon Core Plus Fund, Class I | 59,312,226 | ||||||
| 2,181,590 | BNY Mellon Floating Rate Income Fund, Class I | 24,521,071 | ||||||
| 83,833,297 | ||||||||
| TOTAL OPEN END FUNDS (Cost $168,791,123) | 161,605,454 | |||||||
| SHORT-TERM INVESTMENTS — 0.2% | ||||||||
| MONEY MARKET FUNDS - 0.2% | ||||||||
| 357,506 | BlackRock Liquidity FedFund, Institutional Class, 0.31% (Cost $357,506)(a) | 357,506 | ||||||
| TOTAL INVESTMENTS - 100.1% (Cost $169,148,629) | $ | 161,962,960 | ||||||
| LIABILITIES IN EXCESS OF OTHER ASSETS - (0.1)% | (169,583 | ) | ||||||
| NET ASSETS - 100.0% | $ | 161,793,377 | ||||||
| (a) | Rate disclosed is the seven day effective yield as of April 30, 2022. |
See accompanying notes to financial statements.
21
| PFG BR EQUITY ESG STRATEGY FUND |
| SCHEDULE OF INVESTMENTS |
| April 30, 2022 |
| Shares | Fair Value | |||||||
| EXCHANGE-TRADED FUNDS — 99.6% | ||||||||
| EQUITY - 99.6% | ||||||||
| 391,771 | iShares ESG Advanced MSCI EAFE ETF(a) | $ | 22,048,871 | |||||
| 1,419,471 | iShares ESG Advanced MSCI USA ETF(a) | 46,416,702 | ||||||
| 596,012 | iShares ESG Aware MSCI USA ETF | 54,839,063 | ||||||
| 788,601 | iShares ESG Aware MSCI USA Small-Cap ETF | 27,380,227 | ||||||
| 333,910 | iShares, Inc. iShares ESG Aware MSCI EM ETF | 11,463,130 | ||||||
| 474,646 | iShares Trust - iShares MSCI KLD 400 Social ETF | 37,316,669 | ||||||
| 243,281 | iShares Trust iShares ESG Aware MSCI EAFE ETF | 16,803,419 | ||||||
| TOTAL EXCHANGE-TRADED FUNDS (Cost $231,258,989) | 216,268,081 | |||||||
| SHORT-TERM INVESTMENTS — 0.4% | ||||||||
| MONEY MARKET FUNDS - 0.4% | ||||||||
| 916,874 | BlackRock Liquidity FedFund, Institutional Class, 0.31% (Cost $916,874)(b) | 916,874 | ||||||
| TOTAL INVESTMENTS - 100.0% (Cost $232,175,863) | $ | 217,184,955 | ||||||
| OTHER ASSETS IN EXCESS OF LIABILITIES- 0.0%(c) | 47,516 | |||||||
| NET ASSETS - 100.0% | $ | 217,232,471 | ||||||
| EAFE | - Europe, Australasia and Far East |
| ETF | - Exchange-Traded Fund |
| MSCI | - Morgan Stanley Capital International |
| (a) | Affiliated Company – PFG BR Equity ESG Strategy Fund holds in excess of 5% of outstanding voting securities of this security. |
| (b) | Rate disclosed is the seven day effective yield as of April 30, 2022. |
| (c) | Percentage rounds to less than 0.1%. |
See accompanying notes to financial statements.
22
| PFG FIDELITY INSTITUTIONAL AM® BOND ESG STRATEGY FUND |
| SCHEDULE OF INVESTMENTS |
| April 30, 2022 |
| Shares | Fair Value | |||||||
| EXCHANGE-TRADED FUNDS — 18.0% | ||||||||
| FIXED INCOME - 18.0% | ||||||||
| 17,267 | Fidelity Total Bond ETF | $ | 827,090 | |||||
| 1,265 | iShares Short Treasury Bond ETF | 139,403 | ||||||
| 2,820 | SPDR Bloomberg High Yield Bond ETF | 275,260 | ||||||
| TOTAL EXCHANGE-TRADED FUNDS (Cost $1,337,187) | 1,241,753 | |||||||
| OPEN END FUNDS — 81.7% | ||||||||
| FIXED INCOME - 81.7% | ||||||||
| 50,323 | Calvert Bond Fund, Class I | 759,874 | ||||||
| 503,903 | Fidelity Sustainability Bond Index Fund, Institutional Class | 4,857,625 | ||||||
| TOTAL OPEN END FUNDS (Cost $6,112,765) | 5,617,499 | |||||||
| SHORT-TERM INVESTMENTS — 0.3% | ||||||||
| MONEY MARKET FUNDS - 0.3% | ||||||||
| 17,889 | BlackRock Liquidity FedFund, Institutional Class, 0.31% (Cost $17,889)(a) | 17,889 | ||||||
| TOTAL INVESTMENTS - 100.0% (Cost $7,467,841) | $ | 6,877,141 | ||||||
| LIABILITIES IN EXCESS OF OTHER ASSETS - 0.0%(b) | (221 | ) | ||||||
| NET ASSETS - 100.0% | $ | 6,876,920 | ||||||
| ETF | - Exchange-Traded Fund |
| SPDR | - Standard & Poor’s Depositary Receipt |
| (a) | Rate disclosed is the seven day effective yield as of April 30, 2022. |
| (b) | Percentage rounds to less than 0.1%. |
23
| PFG FIDELITY INSTITUTIONAL AM® EQUITY INDEX STRATEGY FUND |
| SCHEDULE OF INVESTMENTS |
| April 30, 2022 |
| Shares | Fair Value | |||||||
| OPEN END FUNDS — 98.8% | ||||||||
| EQUITY - 98.8% | ||||||||
| 534,525 | Fidelity 500 Index Fund, Institutional Premium Class | $ | 76,720,389 | |||||
| 2,986,438 | Fidelity Global ex US Index Fund, Institutional Premium Class | 40,137,730 | ||||||
| 281,211 | Fidelity Mid Cap Index Fund, Institutional Premium Class | 7,831,728 | ||||||
| 284,668 | Fidelity Small Cap Index Fund, Institutional Premium Class | 6,541,678 | ||||||
| TOTAL OPEN END FUNDS (Cost $106,911,765) | 131,231,525 | |||||||
| SHORT-TERM INVESTMENTS — 0.4% | ||||||||
| MONEY MARKET FUNDS - 0.4% | ||||||||
| 575,063 | BlackRock Liquidity FedFund, Institutional Class, 0.31% (Cost $575,063)(a) | 575,063 | ||||||
| TOTAL INVESTMENTS - 99.2% (Cost $107,486,828) | $ | 131,806,588 | ||||||
| OTHER ASSETS IN EXCESS OF LIABILITIES- 0.8% | 1,012,458 | |||||||
| NET ASSETS - 100.0% | $ | 132,819,046 | ||||||
| (a) | Rate disclosed is the seven day effective yield as of April 30, 2022. |
See accompanying notes to financial statements.
24
| PFG FIDELITY INSTITUTIONAL AM® EQUITY SECTOR STRATEGY FUND |
| SCHEDULE OF INVESTMENTS |
| April 30, 2022 |
| Shares | Fair Value | |||||||
| EXCHANGE-TRADED FUNDS — 61.7% | ||||||||
| EQUITY - 61.7% | ||||||||
| 107,323 | Fidelity MSCI Consumer Staples Index ETF | $ | 5,011,984 | |||||
| 1,101,129 | Fidelity MSCI Energy Index ETF | 22,639,212 | ||||||
| 704,205 | Fidelity MSCI Industrials Index ETF | 34,766,601 | ||||||
| 579,918 | Fidelity MSCI Materials Index ETF | 27,621,494 | ||||||
| 615,107 | Fidelity MSCI Utilities Index ETF | 28,184,203 | ||||||
| 56,156 | iShares US Pharmaceuticals ETF | 10,547,220 | ||||||
| 53,724 | Vanguard Industrials ETF | 9,624,655 | ||||||
| TOTAL EXCHANGE-TRADED FUNDS (Cost $135,910,512) | 138,395,369 | |||||||
| OPEN END FUNDS — 37.6% | ||||||||
| EQUITY - 37.6% | ||||||||
| 643,730 | Fidelity Advisor Health Care Fund, Class Z | 39,080,846 | ||||||
| 158,767 | Fidelity Advisor Technology Fund, Class Z | 13,636,519 | ||||||
| 1,919,790 | Fidelity Select Semiconductors Portfolio | 31,734,136 | ||||||
| TOTAL OPEN END FUNDS (Cost $98,478,560) | 84,451,501 | |||||||
| SHORT-TERM INVESTMENTS — 0.4% | ||||||||
| MONEY MARKET FUNDS - 0.4% | ||||||||
| 854,030 | BlackRock Liquidity FedFund, Institutional Class, 0.31% (Cost $854,030)(a) | 854,030 | ||||||
| TOTAL INVESTMENTS - 99.7% (Cost $235,243,102) | $ | 223,700,900 | ||||||
| OTHER ASSETS IN EXCESS OF LIABILITIES- 0.3% | 694,122 | |||||||
| NET ASSETS - 100.0% | $ | 224,395,022 | ||||||
| ETF | - Exchange-Traded Fund |
| MSCI | - Morgan Stanley Capital International |
| (a) | Rate disclosed is the seven day effective yield as of April 30, 2022. |
See accompanying notes to financial statements.
25
| PFG INVESCO® THEMATIC ESG STRATEGY FUND |
| SCHEDULE OF INVESTMENTS |
| April 30, 2022 |
| Shares | Fair Value | |||||||
| EXCHANGE-TRADED FUNDS — 99.8% | ||||||||
| EQUITY - 99.8% | ||||||||
| 138,053 | Invesco Global Clean Energy ETF | $ | 2,941,909 | |||||
| 382,101 | Invesco Global Water ETF | 13,048,749 | ||||||
| 271,638 | Invesco MSCI Sustainable Future ETF | 14,850,450 | ||||||
| 243,648 | Invesco S&P Global Water Index ETF | 11,736,524 | ||||||
| 45,158 | Invesco Solar ETF | 2,900,498 | ||||||
| 223,408 | Invesco Water Resources ETF | 10,891,140 | ||||||
| 54,485 | Invesco WilderHill Clean Energy ETF | 2,776,011 | ||||||
| TOTAL EXCHANGE-TRADED FUNDS (Cost $75,268,268) | 59,145,281 | |||||||
| SHORT-TERM INVESTMENTS — 0.3% | ||||||||
| MONEY MARKET FUNDS - 0.3% | ||||||||
| 199,883 | BlackRock Liquidity FedFund, Institutional Class, 0.31% (Cost $199,883)(a) | 199,883 | ||||||
| TOTAL INVESTMENTS - 100.1% (Cost $75,468,151) | $ | 59,345,164 | ||||||
| LIABILITIES IN EXCESS OF OTHER ASSETS - (0.1)% | (93,990 | ) | ||||||
| NET ASSETS - 100.0% | $ | 59,251,174 | ||||||
| ETF | - Exchange-Traded Fund |
| MSCI | - Morgan Stanley Capital International |
| (a) | Rate disclosed is the seven day effective yield as of April 30, 2022. |
See accompanying notes to financial statements.
26
| PFG JANUS HENDERSON® BALANCED STRATEGY FUND |
| SCHEDULE OF INVESTMENTS |
| April 30, 2022 |
| Shares | Fair Value | |||||||
| EXCHANGE-TRADED FUNDS — 7.1% | ||||||||
| EQUITY - 5.8% | ||||||||
| 156,759 | Janus Henderson Small Cap Growth Alpha ETF(a) | $ | 7,971,195 | |||||
| 147,003 | Janus Henderson Small/Mid Cap Growth Alpha ETF(a) | 8,088,105 | ||||||
| 16,059,300 | ||||||||
| FIXED INCOME - 1.3% | ||||||||
| 72,217 | Janus Henderson Short Duration Income ETF | 3,528,523 | ||||||
| TOTAL EXCHANGE-TRADED FUNDS (Cost $24,358,506) | 19,587,823 | |||||||
| OPEN END FUNDS — 92.5% | ||||||||
| EQUITY - 4.9% | ||||||||
| 524,731 | Janus Henderson Contrarian Fund, Class N | 13,616,764 | ||||||
| FIXED INCOME - 7.8% | ||||||||
| 2,823,211 | Janus Henderson High-Yield Fund, Class N | 21,484,636 | ||||||
| MIXED ALLOCATION - 79.8% | ||||||||
| 5,490,231 | Janus Henderson Balanced Fund, Class N | 219,334,718 | ||||||
| TOTAL OPEN END FUNDS (Cost $298,384,923) | 254,436,118 | |||||||
| SHORT-TERM INVESTMENTS — 0.3% | ||||||||
| MONEY MARKET FUNDS - 0.3% | ||||||||
| 712,878 | BlackRock Liquidity FedFund, Institutional Class, 0.31% (Cost $712,878)(b) | 712,878 | ||||||
| TOTAL INVESTMENTS - 99.9% (Cost $323,456,307) | $ | 274,736,819 | ||||||
| OTHER ASSETS IN EXCESS OF LIABILITIES- 0.1% | 159,761 | |||||||
| NET ASSETS - 100.0% | $ | 274,896,580 | ||||||
| ETF | - Exchange-Traded Fund |
| (a) | Affiliated Company – PFG Janus Henderson® Balanced Strategy Fund holds in excess of 5% of outstanding voting securities of this security. |
| (b) | Rate disclosed is the seven day effective yield as of April 30, 2022. |
See accompanying notes to financial statements.
27
| PFG JP MORGAN® TACTICAL AGGRESSIVE STRATEGY FUND |
| SCHEDULE OF INVESTMENTS |
| April 30, 2022 |
| Shares | Fair Value | |||||||
| EXCHANGE-TRADED FUNDS — 33.3% | ||||||||
| EQUITY - 33.3% | ||||||||
| 311,660 | JPMorgan Diversified Return Emerging Markets Equity ETF(a) | $ | 16,517,076 | |||||
| 344,102 | JPMorgan Diversified Return International Equity ETF | 18,402,575 | ||||||
| 205,692 | JPMorgan Diversified Return US Equity ETF | 20,398,476 | ||||||
| 371,506 | JPMorgan US Momentum Factor ETF(a) | 14,778,694 | ||||||
| 378,172 | JPMorgan US Value Factor ETF | 13,171,731 | ||||||
| TOTAL EXCHANGE-TRADED FUNDS (Cost $85,730,644) | 83,268,552 | |||||||
| OPEN END FUNDS — 66.4% | ||||||||
| ALTERNATIVE - 5.7% | ||||||||
| 856,540 | JPMorgan Emerging Market Research Enhanced Equity, Class R6 | 14,158,607 | ||||||
| EQUITY - 60.7% | ||||||||
| 732,997 | JPMorgan Equity Index Fund, Class R6 | 45,511,810 | ||||||
| 441,074 | JPMorgan International Focus Fund, Class R6 | 10,100,601 | ||||||
| 1,390,443 | JPMorgan International Research Enhanced Equity, Class R6 | 24,986,257 | ||||||
| 604,806 | JPMorgan Large Cap Growth Fund, Class R6 | 31,407,551 | ||||||
| 1,493,471 | JPMorgan Large Cap Value Fund, Class R6 | 28,450,618 | ||||||
| 466,361 | JPMorgan Realty Income Fund, Class R6 | 7,517,741 | ||||||
| 45,120 | Undiscovered Managers Behavioral Value Fund, Class R6 | 3,712,057 | ||||||
| 151,686,635 | ||||||||
| TOTAL OPEN END FUNDS (Cost $179,932,432) | 165,845,242 | |||||||
| SHORT-TERM INVESTMENTS — 0.4% | ||||||||
| MONEY MARKET FUNDS - 0.4% | ||||||||
| 874,262 | BlackRock Liquidity FedFund, Institutional Class, 0.31% (Cost $874,262)(b) | 874,262 | ||||||
| TOTAL INVESTMENTS - 100.1% (Cost $266,537,338) | $ | 249,988,056 | ||||||
| LIABILITIES IN EXCESS OF OTHER ASSETS - (0.1)% | (228,983 | ) | ||||||
| NET ASSETS - 100.0% | $ | 249,759,073 | ||||||
| ETF | - Exchange-Traded Fund |
| (a) | Affiliated Company – PFG JP Morgan® Tactical Aggressive Strategy Fund holds in excess of 5% of outstanding voting securities of this security. |
| (b) | Rate disclosed is the seven day effective yield as of April 30, 2022. |
See accompanying notes to financial statements.
28
| PFG JP MORGAN® TACTICAL MODERATE STRATEGY FUND |
| SCHEDULE OF INVESTMENTS |
| April 30, 2022 |
| Shares | Fair Value | |||||||
| EXCHANGE-TRADED FUNDS — 24.6% | ||||||||
| EQUITY - 24.6% | ||||||||
| 135,040 | JPMorgan Diversified Return Emerging Markets Equity ETF | $ | 7,156,728 | |||||
| 269,449 | JPMorgan Diversified Return International Equity ETF | 14,410,133 | ||||||
| 39,252 | JPMorgan Diversified Return US Equity ETF | 3,892,621 | ||||||
| 300,943 | JPMorgan US Momentum Factor ETF | 11,971,663 | ||||||
| 273,841 | JPMorgan US Value Factor ETF | 9,537,882 | ||||||
| TOTAL EXCHANGE-TRADED FUNDS (Cost $46,218,744) | 46,969,027 | |||||||
| OPEN END FUNDS — 74.7% | ||||||||
| ALTERNATIVE - 4.0% | ||||||||
| 462,416 | JPMorgan Emerging Market Research Enhanced Equity, Class R6 | 7,643,732 | ||||||
| EQUITY - 31.1% | ||||||||
| 457,396 | JPMorgan Equity Index Fund, Class R6 | 28,399,694 | ||||||
| 249,305 | JPMorgan International Focus Fund, Class R6 | 5,709,095 | ||||||
| 175,708 | JPMorgan Large Cap Growth Fund, Class R6 | 9,124,522 | ||||||
| 448,967 | JPMorgan Large Cap Value Fund, Class R6 | 8,552,830 | ||||||
| 288,194 | JPMorgan Realty Income Fund, Class R6 | 4,645,694 | ||||||
| 34,549 | Undiscovered Managers Behavioral Value Fund, Class R6 | 2,842,371 | ||||||
| 59,274,206 | ||||||||
| FIXED INCOME - 39.6% | ||||||||
| 4,416,978 | JPMorgan Core Bond Fund, Class R6 | 47,526,682 | ||||||
| 2,387,626 | JPMorgan Core Plus Bond Fund, Class R6 | 18,193,710 | ||||||
| 578,871 | JPMorgan High Yield Fund, Class R6 | 3,855,282 | ||||||
| 659,910 | JPMorgan Income Fund, Class R6 | 5,853,399 | ||||||
| 75,429,073 | ||||||||
| TOTAL OPEN END FUNDS (Cost $154,475,146) | 142,347,011 | |||||||
See accompanying notes to financial statements.
29
| PFG JP MORGAN® TACTICAL MODERATE STRATEGY FUND |
| SCHEDULE OF INVESTMENTS (Continued) |
| April 30, 2022 |
| Shares | Fair Value | |||||||
| SHORT-TERM INVESTMENTS — 0.8% | ||||||||
| MONEY MARKET FUNDS - 0.8% | ||||||||
| 1,437,980 | BlackRock Liquidity FedFund, Institutional Class, 0.31%(a) | $ | 1,437,980 | |||||
| 172,820 | Fidelity Treasury Money Market Fund, 0.39%(a) | 172,820 | ||||||
| TOTAL SHORT-TERM INVESTMENTS (Cost $1,610,800) | 1,610,800 | |||||||
| TOTAL INVESTMENTS - 100.1% (Cost $202,304,690) | $ | 190,926,838 | ||||||
| LIABILITIES IN EXCESS OF OTHER ASSETS - (0.1)% | (295,357 | ) | ||||||
| NET ASSETS - 100.0% | $ | 190,631,481 | ||||||
| ETF | - Exchange-Traded Fund |
| (a) | Rate disclosed is the seven day effective yield as of April 30, 2022. |
See accompanying notes to financial statements.
30
| PFG MEEDER TACTICAL STRATEGY FUND |
| SCHEDULE OF INVESTMENTS |
| April 30, 2022 |
| Shares | Fair Value | |||||||
| OPEN END FUNDS — 100.0% | ||||||||
| ALTERNATIVE - 10.0% | ||||||||
| 940,676 | Meeder Spectrum Fund, Institutional Class(a) | $ | 11,946,581 | |||||
| EQUITY - 76.3% | ||||||||
| 1,599,110 | Meeder Dynamic Allocation Fund, Institutional Class(a) | 19,669,052 | ||||||
| 364,894 | Meeder Moderate Allocation Fund, Institutional Class | 4,291,149 | ||||||
| 7,677,645 | Meeder Muirfield Fund, Institutional Class(a) | 66,795,512 | ||||||
| 90,755,713 | ||||||||
| FIXED INCOME - 2.8% | ||||||||
| 195,847 | Meeder Total Return Bond Fund | 1,821,381 | ||||||
| 75,423 | Performance Trust Strategic Bond Fund | 1,555,980 | ||||||
| 3,377,361 | ||||||||
| MIXED ALLOCATION - 10.9% | ||||||||
| 767,590 | Meeder Balanced Fund, Institutional Class | 9,518,120 | ||||||
| 152,485 | Meeder Conservative Allocation Fund, Institutional Class | 3,420,243 | ||||||
| 12,938,363 | ||||||||
| TOTAL OPEN END FUNDS (Cost $130,116,330) | 119,018,018 | |||||||
| SHORT-TERM INVESTMENTS — 0.3% | ||||||||
| MONEY MARKET FUNDS - 0.3% | ||||||||
| 365,542 | BlackRock Liquidity FedFund, Institutional Class, 0.31% (Cost $365,542)(b) | 365,542 | ||||||
| TOTAL INVESTMENTS - 100.3% (Cost $130,481,872) | $ | 119,383,560 | ||||||
| LIABILITIES IN EXCESS OF OTHER ASSETS - (0.3)% | (374,664 | ) | ||||||
| NET ASSETS - 100.0% | $ | 119,008,896 | ||||||
| (a) | Affiliated Company – PFG Meeder Tactical Strategy Fund holds in excess of 5% of outstanding voting securities of this security. |
| (b) | Rate disclosed is the seven day effective yield as of April 30, 2022. |
See accompanying notes to financial statements.
31
| PFG MFS® AGGRESSIVE GROWTH STRATEGY FUND |
| SCHEDULE OF INVESTMENTS |
| April 30, 2022 |
| Shares | Fair Value | |||||||
| EXCHANGE-TRADED FUNDS — 14.8% | ||||||||
| COMMODITY - 5.2% | ||||||||
| 109,161 | iShares GSCI Commodity Dynamic | $ | 4,535,640 | |||||
| EQUITY - 9.6% | ||||||||
| 48,254 | Schwab International Small-Cap Equity ETF | 1,697,093 | ||||||
| 70,770 | SPDR Portfolio Emerging Markets ETF | 2,568,950 | ||||||
| 8,993 | Vanguard Small-Cap Growth ETF | 1,985,295 | ||||||
| 13,519 | Vanguard Small-Cap Value ETF | 2,227,796 | ||||||
| 8,479,134 | ||||||||
| TOTAL EXCHANGE-TRADED FUNDS (Cost $11,955,117) | 13,014,774 | |||||||
| OPEN END FUNDS — 84.4% | ||||||||
| EQUITY - 84.4% | ||||||||
| 226,929 | MFS Global Real Estate Fund, Class R5 | 4,549,918 | ||||||
| 68,591 | MFS Growth Fund, Class R6 | 10,369,653 | ||||||
| 150,716 | MFS Institutional International Equity Fund, Class I | 4,358,703 | ||||||
| 116,101 | MFS International Growth Fund, Class R5 | 4,378,167 | ||||||
| 367,666 | MFS International Large Cap Value Fund, Class R6 | 4,441,409 | ||||||
| 51,407 | MFS International New Discovery Fund, Class R6 | 1,641,429 | ||||||
| 335,941 | MFS Mid Cap Growth Fund, Class R6 | 8,539,629 | ||||||
| 298,277 | MFS Mid Cap Value Fund, Class R5 | 8,918,469 | ||||||
| 182,768 | MFS Research Fund, Class R6 | 9,481,987 | ||||||
| 339,068 | MFS Research International Fund, Class R6 | 6,984,794 | ||||||
| 216,178 | MFS Value Fund, Class R6 | 10,666,224 | ||||||
| TOTAL OPEN END FUNDS (Cost $71,092,730) | 74,330,382 | |||||||
See accompanying notes to financial statements.
32
| PFG MFS® AGGRESSIVE GROWTH STRATEGY FUND |
| SCHEDULE OF INVESTMENTS (Continued) |
| April 30, 2022 |
| Shares | Fair Value | |||||||
| SHORT-TERM INVESTMENTS — 0.3% | ||||||||
| MONEY MARKET FUNDS - 0.3% | ||||||||
| 302,848 | BlackRock Liquidity FedFund, Institutional Class, 0.31% (Cost $302,848)(a) | $ | 302,848 | |||||
| TOTAL INVESTMENTS - 99.5% (Cost $83,350,695) | $ | 87,648,004 | ||||||
| OTHER ASSETS IN EXCESS OF LIABILITIES- 0.5% | 428,378 | |||||||
| NET ASSETS - 100.0% | $ | 88,076,382 | ||||||
| ETF | - Exchange-Traded Fund |
| SPDR | - Standard & Poor’s Depositary Receipt |
| (a) | Rate disclosed is the seven day effective yield as of April 30, 2022. |
See accompanying notes to financial statements.
33
| PFG TACTICAL INCOME STRATEGY FUND |
| SCHEDULE OF INVESTMENTS |
| April 30, 2022 |
| Shares | Fair Value | |||||||
| EXCHANGE-TRADED FUNDS — 14.6% | ||||||||
| EQUITY - 8.1% | ||||||||
| 96,890 | Janus Henderson Small Cap Growth Alpha ETF | $ | 4,926,857 | |||||
| 85,319 | Janus Henderson Small/Mid Cap Growth Alpha ETF | 4,694,251 | ||||||
| 9,621,108 | ||||||||
| FIXED INCOME - 6.5% | ||||||||
| 10,987 | CP High Yield Trend ETF | 242,648 | ||||||
| 59,173 | Janus Henderson Mortgage-Backed Securities ETF | 2,858,056 | ||||||
| 92,745 | Janus Henderson Short Duration Income ETF | 4,531,521 | ||||||
| 7,632,225 | ||||||||
| TOTAL EXCHANGE-TRADED FUNDS (Cost $19,967,481) | 17,253,333 | |||||||
| OPEN END FUNDS — 85.2% | ||||||||
| EQUITY - 27.8% | ||||||||
| 652,661 | Janus Henderson Asia Equity Fund, Class N(a) | 6,637,564 | ||||||
| 221,477 | Janus Henderson Contrarian Fund, Class N | 5,747,315 | ||||||
| 1,721,692 | Janus Henderson Global Equity Income Fund, Class N | 11,328,732 | ||||||
| 100,961 | Janus Henderson Global Life Sciences Fund, Class N | 6,169,722 | ||||||
| 72,963 | Janus Henderson Global Technology and Innovation, Class N | 2,895,904 | ||||||
| 32,779,237 | ||||||||
| FIXED INCOME - 52.7% | ||||||||
| 1,729,081 | Counterpoint Tactical Income Fund, Class I | 19,296,541 | ||||||
| 145,456 | Counterpoint Tactical Municipal Fund, Class I | 1,531,655 | ||||||
| 1,029,789 | Janus Henderson Developed World Bond Fund, Class R6 | 9,113,633 | ||||||
| 591,082 | Janus Henderson Flexible Bond Fund, Class N | 5,881,269 | ||||||
| 685,334 | Janus Henderson High-Yield Fund, Class N | 5,215,388 | ||||||
| 48,566 | Kensington Managed Income Fund, Institutional Class | 506,055 | ||||||
| 782,218 | Sierra Tactical Bond Fund, Institutional Class | 20,619,274 | ||||||
| 62,163,815 | ||||||||
| MIXED ALLOCATION - 4.7% | ||||||||
| 404,997 | Janus Henderson Dividend & Income Builder Fund, Class R6 | 5,487,704 | ||||||
See accompanying notes to financial statements.
34
| PFG TACTICAL INCOME STRATEGY FUND |
| SCHEDULE OF INVESTMENTS (Continued) |
| April 30, 2022 |
| Shares | Fair Value | |||||||
| OPEN END FUNDS — 85.2% (Continued) | ||||||||
| MIXED ALLOCATION - 4.7% (Continued) | ||||||||
| TOTAL OPEN END FUNDS (Cost $109,660,087) | $ | 100,430,756 | ||||||
| SHORT-TERM INVESTMENTS — 0.0%(b) | ||||||||
| MONEY MARKET FUNDS - 0.0% (b) | ||||||||
| 18,694 | BlackRock Liquidity FedFund, Institutional Class, 0.31%(c) | 18,694 | ||||||
| 33,717 | Fidelity Treasury Money Market Fund, 0.39%(c) | 33,717 | ||||||
| SHORT-TERM INVESTMENTS (Cost $52,411) | 52,411 | |||||||
| TOTAL INVESTMENTS - 99.8% (Cost $129,679,979) | $ | 117,736,500 | ||||||
| OTHER ASSETS IN EXCESS OF LIABILITIES- 0.2% | 191,175 | |||||||
| NET ASSETS - 100.0% | $ | 117,927,675 | ||||||
| ETF | - Exchange-Traded Fund |
| (a) | Affiliated Company – PFG Tactical Income Strategy Fund holds in excess of 5% of outstanding voting securities of this security. |
| (b) | Percentage rounds to less than 0.1%. |
| (c) | Rate disclosed is the seven day effective yield as of April 30, 2022. |
See accompanying notes to financial statements.
35
| The Pacific Financial Funds |
| Statements of Assets and Liabilities |
| April 30, 2022 |
| PFG American Funds® | ||||||||||||||||
| PFG Active Core Bond | Conservative Income | PFG American Funds® | PFG BNY Mellon Diversifier | |||||||||||||
| Assets: | Strategy Fund | Strategy Fund | Growth Strategy Fund | Strategy Fund | ||||||||||||
| Total Securities, at cost | $ | 153,099,446 | $ | 216,104,380 | $ | 630,760,324 | $ | 169,148,629 | ||||||||
| Total Securities, at fair value | $ | 140,752,334 | $ | 204,943,319 | $ | 562,831,153 | $ | 161,962,960 | ||||||||
| Receivable for Fund shares sold | 576,087 | 793,879 | 1,186,857 | 125,456 | ||||||||||||
| Interest and dividends receivable | 432,395 | 223,802 | 480 | 132,469 | ||||||||||||
| Total Assets | 141,760,816 | 205,961,000 | 564,018,490 | 162,220,885 | ||||||||||||
| Liabilities: | ||||||||||||||||
| Payable for Fund shares redeemed | 238,549 | 639,743 | 570,310 | 125,367 | ||||||||||||
| Payable for securities purchased | — | 435,050 | — | — | ||||||||||||
| Accrued 12b-1 fees | 11,924 | 16,751 | 49,661 | 13,635 | ||||||||||||
| Accrued investment advisory fees | 149,054 | 209,381 | 620,747 | 170,441 | ||||||||||||
| Payable to related parties | 102,390 | 134,694 | 352,902 | 118,065 | ||||||||||||
| Total Liabilities | 501,917 | 1,435,619 | 1,593,620 | 427,508 | ||||||||||||
| Net Assets | $ | 141,258,899 | $ | 204,525,381 | $ | 562,424,870 | $ | 161,793,377 | ||||||||
| Net Assets: | ||||||||||||||||
| Paid in capital | $ | 154,528,853 | $ | 212,503,570 | $ | 546,401,330 | $ | 167,214,588 | ||||||||
| Accumulated earnings/(deficit) | (13,269,954 | ) | (7,978,189 | ) | 16,023,540 | (5,421,211 | ) | |||||||||
| Net Assets | $ | 141,258,899 | $ | 204,525,381 | $ | 562,424,870 | $ | 161,793,377 | ||||||||
| Class R Shares: | ||||||||||||||||
| Net assets | $ | 141,258,899 | $ | 204,525,381 | $ | 562,424,870 | $ | 161,793,377 | ||||||||
| Total shares outstanding at end of year ($0 par value, unlimited shares authorized) | 15,853,810 | 20,846,036 | 48,773,322 | 16,092,141 | ||||||||||||
| Net asset value, offering and redemption price per share (Net assets ÷ Total shares of beneficial interest outstanding) | $ | 8.91 | $ | 9.81 | $ | 11.53 | $ | 10.05 | ||||||||
See accompanying notes to financial statements.
36
| The Pacific Financial Funds |
| Statements of Assets and Liabilities (Continued) |
| April 30, 2022 |
| PFG Fidelity Institutional | PFG Fidelity Institutional | PFG Fidelity Institutional | ||||||||||||||
| PFG BR Equity ESG | AM® Bond ESG | AM® Equity Index | AM® Equity Sector | |||||||||||||
| Assets: | Strategy Fund | Strategy Fund | Strategy Fund | Strategy Fund | ||||||||||||
| Investments in unaffiliated securities, at cost | $ | 153,038,937 | $ | 7,467,841 | $ | 107,486,828 | $ | 235,243,102 | ||||||||
| Investments in affiliated securities, at cost | 79,136,926 | — | — | — | ||||||||||||
| Total Securities, at cost | $ | 232,175,863 | $ | 7,467,841 | $ | 107,486,828 | $ | 235,243,102 | ||||||||
| Investments in unaffiliated securities, at fair value | $ | 148,719,382 | $ | 6,877,141 | $ | 131,806,588 | $ | 223,700,900 | ||||||||
| Investments in affiliated securities, at fair value | 68,465,573 | — | — | — | ||||||||||||
| Total Securities, at fair value | $ | 217,184,955 | $ | 6,877,141 | $ | 131,806,588 | $ | 223,700,900 | ||||||||
| Receivable for Fund shares sold | 847,532 | 29,021 | 1,347,269 | 1,294,166 | ||||||||||||
| Interest and dividends receivable | 227 | 9,885 | 190 | 222 | ||||||||||||
| Total Assets | 218,032,714 | 6,916,047 | 133,154,047 | 224,995,288 | ||||||||||||
| Liabilities: | ||||||||||||||||
| Payable for Fund shares redeemed | 197,301 | 4,387 | 82,180 | 176,693 | ||||||||||||
| Payable for securities purchased | 190,551 | — | — | — | ||||||||||||
| Accrued 12b-1 Fees | 18,792 | 563 | 11,329 | 19,319 | ||||||||||||
| Accrued investment advisory fees | 234,900 | 7,035 | 141,605 | 241,489 | ||||||||||||
| Payable to related parties | 158,699 | 27,142 | 99,887 | 162,765 | ||||||||||||
| Total Liabilities | 800,243 | 39,127 | 335,001 | 600,266 | ||||||||||||
| Net Assets | $ | 217,232,471 | $ | 6,876,920 | $ | 132,819,046 | $ | 224,395,022 | ||||||||
| Net Assets: | ||||||||||||||||
| Paid in capital | $ | 232,636,877 | $ | 7,479,736 | $ | 102,725,602 | $ | 210,080,078 | ||||||||
| Accumulated earnings/(deficit) | (15,404,406 | ) | (602,816 | ) | 30,093,444 | 14,314,944 | ||||||||||
| Net Assets | $ | 217,232,471 | $ | 6,876,920 | $ | 132,819,046 | $ | 224,395,022 | ||||||||
| Class R Shares: | ||||||||||||||||
| Net assets | $ | 217,232,471 | $ | 6,876,920 | $ | 132,819,046 | $ | 224,395,022 | ||||||||
| Total shares outstanding at end of year ($0 par value, unlimited shares authorized) | 19,083,889 | 763,847 | 10,546,913 | 18,127,158 | ||||||||||||
| Net asset value, offering and redemption price per share (Net assets ÷ Total shares of beneficial interest outstanding) | $ | 11.38 | $ | 9.00 | $ | 12.59 | $ | 12.38 | ||||||||
See accompanying notes to financial statements.
37
The Pacific Financial Funds |
| Statements of Assets and Liabilities (Continued) |
| April 30, 2022 |
| PFG Invesco® Thematic ESG | PFG Janus Henderson® | PFG JP Morgan® Tactical | PFG JP Morgan® Tactical | |||||||||||||
| Assets: | Strategy Fund | Balanced Strategy Fund | Aggressive Strategy Fund | Moderate Strategy Fund | ||||||||||||
| Investments in unaffiliated securities, at cost | $ | 75,468,151 | $ | 302,705,157 | $ | 233,372,926 | $ | 202,304,690 | ||||||||
| Investments in affiliated securities, at cost | — | 20,751,150 | 33,164,412 | — | ||||||||||||
| Total Securities, at cost | $ | 75,468,151 | $ | 323,456,307 | $ | 266,537,338 | $ | 202,304,690 | ||||||||
| Investments in unaffiliated securities, at fair value | $ | 59,345,164 | $ | 258,677,519 | $ | 218,692,286 | $ | 190,926,838 | ||||||||
| Investments in affiliated securities, at fair value | — | 16,059,300 | 31,295,770 | — | ||||||||||||
| Total Securities, at fair value | $ | 59,345,164 | $ | 274,736,819 | $ | 249,988,056 | $ | 190,926,838 | ||||||||
| Receivable for Fund shares sold | 39,649 | 732,111 | 244,597 | 169,448 | ||||||||||||
| Interest and dividends receivable | 66 | 93,533 | 213 | 20,445 | ||||||||||||
| Prepaid expenses and other assets | — | — | — | — | ||||||||||||
| Total Assets | 59,384,879 | 275,562,463 | 250,232,866 | 191,116,731 | ||||||||||||
| Liabilities: | ||||||||||||||||
| Payable for Fund shares redeemed | 2,882 | 151,857 | 3,488 | 129,292 | ||||||||||||
| Accrued 12b-1 Fees | 5,183 | 23,606 | 21,594 | 16,320 | ||||||||||||
| Accrued investment advisory fees | 64,784 | 295,070 | 269,918 | 203,998 | ||||||||||||
| Payable to related parties | 60,856 | 195,350 | 178,793 | 135,640 | ||||||||||||
| Total Liabilities | 133,705 | 665,883 | 473,793 | 485,250 | ||||||||||||
| Net Assets | $ | 59,251,174 | $ | 274,896,580 | $ | 249,759,073 | $ | 190,631,481 | ||||||||
| Net Assets: | ||||||||||||||||
| Paid in capital | $ | 76,633,023 | $ | 316,668,984 | $ | 253,978,285 | $ | 193,013,779 | ||||||||
| Accumulated deficit | (17,381,849 | ) | (41,772,404 | ) | (4,219,212 | ) | (2,382,298 | ) | ||||||||
| Net Assets | $ | 59,251,174 | $ | 274,896,580 | $ | 249,759,073 | $ | 190,631,481 | ||||||||
| Class R Shares: | ||||||||||||||||
| Net assets | $ | 59,251,174 | $ | 274,896,580 | $ | 249,759,073 | $ | 190,631,481 | ||||||||
| Total shares outstanding at end of year ($0 par value, unlimited shares authorized) | 7,788,926 | 31,479,295 | 21,171,736 | 18,115,934 | ||||||||||||
| Net asset value, offering and redemption price per share (Net assets ÷ Total shares of beneficial interest outstanding) | $ | 7.61 | $ | 8.73 | $ | 11.80 | $ | 10.52 | ||||||||
See accompanying notes to financial statements.
38
| The Pacific Financial Funds |
| Statements of Assets and Liabilities (Continued) |
| April 30, 2022 |
| PFG Meeder Tactical | PFG MFS® Aggressive | PFG Tactical Income | ||||||||||
| Assets: | Strategy Fund | Growth Strategy Fund | Strategy Fund | |||||||||
| Investments in unaffiliated securities, at cost | $ | 21,740,374 | $ | 83,350,695 | $ | 121,610,314 | ||||||
| Investments in affiliated securities, at cost | 108,741,498 | — | 8,069,665 | |||||||||
| Total Securities, at cost | $ | 130,481,872 | $ | 83,350,695 | $ | 129,679,979 | ||||||
| Investments in unaffiliated securities, at fair value | $ | 20,972,415 | $ | 87,648,004 | $ | 111,098,936 | ||||||
| Investments in affiliated securities, at fair value | 98,411,145 | — | 6,637,564 | |||||||||
| Total Securities, at fair value | $ | 119,383,560 | $ | 87,648,004 | $ | 117,736,500 | ||||||
| Receivable for Fund shares sold | 42,007 | 604,751 | 198,524 | |||||||||
| Receivable for securities sold | — | — | 249,975 | |||||||||
| Interest and dividends receivable | 1,045 | 78 | 49,658 | |||||||||
| Prepaid expenses and other assets | — | — | — | |||||||||
| Total Assets | 119,426,612 | 88,252,833 | 118,234,657 | |||||||||
| Liabilities: | ||||||||||||
| Payable for Fund shares redeemed | 189,914 | 2,585 | 78,378 | |||||||||
| Accrued 12b-1 Fees | 10,188 | 7,524 | 10,032 | |||||||||
| Accrued investment advisory fees | 127,346 | 94,045 | 125,401 | |||||||||
| Payable to related parties | 90,268 | 72,297 | 93,171 | |||||||||
| Total Liabilities | 417,716 | 176,451 | 306,982 | |||||||||
| Net Assets | $ | 119,008,896 | $ | 88,076,382 | $ | 117,927,675 | ||||||
| Net Assets: | ||||||||||||
| Paid in capital | $ | 114,194,229 | $ | 73,187,911 | $ | 129,961,763 | ||||||
| Accumulated earnings/(deficit) | 4,814,667 | 14,888,471 | (12,034,088 | ) | ||||||||
| Net Assets | $ | 119,008,896 | $ | 88,076,382 | $ | 117,927,675 | ||||||
| Class R Shares: | ||||||||||||
| Net assets | $ | 119,008,896 | $ | 88,076,382 | $ | 117,927,675 | ||||||
| Total shares outstanding at end of year ($0 par value, unlimited shares authorized) | 11,401,201 | 8,537,871 | 12,833,865 | |||||||||
| Net asset value, offering and redemption price per share (Net assets ÷ Total shares of beneficial interest outstanding) | $ | 10.44 | $ | 10.32 | $ | 9.19 | ||||||
See accompanying notes to financial statements.
39
| The Pacific Financial Funds |
| Statements of Operations |
| For the Year Ended April 30, 2022 |
| PFG American Funds® | ||||||||||||||||
| PFG Active Core Bond | Conservative Income | PFG American Funds® Growth | PFG BNY Mellon Diversifier | |||||||||||||
| Strategy Fund | Strategy Fund | Strategy Fund | Strategy Fund | |||||||||||||
| Investment Income: | ||||||||||||||||
| Dividend income | $ | 4,013,230 | $ | 3,767,339 | $ | 3,176,041 | $ | 4,388,531 | ||||||||
| Interest income | 456 | 659 | 1,920 | 387 | ||||||||||||
| Total Investment Income | 4,013,686 | 3,767,998 | 3,177,961 | 4,388,918 | ||||||||||||
| Expenses: | ||||||||||||||||
| Investment advisory fees | 1,816,315 | 2,659,362 | 9,039,149 | 2,031,431 | ||||||||||||
| Distribution fees (12b-1) - Class R Shares | 145,326 | 212,783 | 723,247 | 162,541 | ||||||||||||
| Administrative service fees | 1,017,832 | 1,490,041 | 5,063,150 | 1,138,351 | ||||||||||||
| Total Expenses | 2,979,473 | 4,362,186 | 14,825,546 | 3,332,323 | ||||||||||||
| Net Investment Income/(Loss) | 1,034,213 | (594,188 | ) | (11,647,585 | ) | 1,056,595 | ||||||||||
| Net Realized and Unrealized Gain/(Loss) on Investments | ||||||||||||||||
| Net realized gain from: | ||||||||||||||||
| Unaffiliated investments | 82,479 | 1,408,460 | 83,697,626 | 4,124,509 | ||||||||||||
| Distributions received from underlying investment companies | 65,879 | 2,206,065 | 51,851,670 | 714,618 | ||||||||||||
| Total realized gain | 148,358 | 3,614,525 | 135,549,296 | 4,839,127 | ||||||||||||
| Net change in unrealized depreciation of: | ||||||||||||||||
| Unaffiliated investments | (14,196,905 | ) | (13,580,345 | ) | (209,652,137 | ) | (12,238,151 | ) | ||||||||
| Total unrealized depreciation | (14,196,905 | ) | (13,580,345 | ) | (209,652,137 | ) | (12,238,151 | ) | ||||||||
| Net Realized and Unrealized Loss on Investments | (14,048,547 | ) | (9,965,820 | ) | (74,102,841 | ) | (7,399,024 | ) | ||||||||
| Net Decrease in Net Assets Resulting from Operations | $ | (13,014,334 | ) | $ | (10,560,008 | ) | $ | (85,750,426 | ) | $ | (6,342,429 | ) | ||||
See accompanying notes to financial statements.
40
| The Pacific Financial Funds |
| Statements of Operations (Continued) |
| For the Year/Period Ended April 30, 2022 |
| PFG Fidelity Institutional | PFG Fidelity Institutional | PFG Fidelity Institutional | ||||||||||||||
| PFG BR Equity ESG | AM® Bond ESG | AM® Equity Index | AM® Equity Sector | |||||||||||||
| Strategy Fund | Strategy Fund* | Strategy Fund | Strategy Fund | |||||||||||||
| Investment Income: | ||||||||||||||||
| Dividend income | $ | 2,015,285 | $ | 45,668 | $ | 2,378,851 | $ | 3,605,039 | ||||||||
| Income from affiliates | 748,311 | — | — | — | ||||||||||||
| Interest income | 802 | — | 466 | 742 | ||||||||||||
| Total Investment Income | 2,764,398 | 45,668 | 2,379,317 | 3,605,781 | ||||||||||||
| Expenses: | ||||||||||||||||
| Investment advisory fees | 2,279,283 | 31,528 | 1,760,543 | 2,499,108 | ||||||||||||
| Distribution fees (12b-1) - Class R Shares | 182,377 | 2,703 | 140,479 | 199,965 | ||||||||||||
| Administrative service fees | 1,276,634 | 17,660 | 986,818 | 1,400,100 | ||||||||||||
| Total Expenses | 3,738,294 | 51,891 | 2,887,840 | 4,099,173 | ||||||||||||
| Net Investment Loss | (973,896 | ) | (6,223 | ) | (508,523 | ) | (493,392 | ) | ||||||||
| Net Realized and Unrealized Gain/(Loss) on Investments | ||||||||||||||||
| Net realized gain/(loss) from: | ||||||||||||||||
| Unaffiliated investments | 17,985,625 | (12,321 | ) | 9,103,921 | 19,767,374 | |||||||||||
| Affiliated investments (Note 5) | (36,885 | ) | — | — | — | |||||||||||
| Distributions received from underlying investment companies | — | 5,106 | 314,483 | 10,077,615 | ||||||||||||
| Total realized gain/(loss) | 17,948,740 | (7,215 | ) | 9,418,404 | 29,844,989 | |||||||||||
| Net change in unrealized depreciation of: | ||||||||||||||||
| Unaffiliated investments | (35,277,242 | ) | (590,700 | ) | (17,131,311 | ) | (29,510,024 | ) | ||||||||
| Affiliated Investments (Note 5) | (10,671,353 | ) | — | — | — | |||||||||||
| Total change in unrealized depreciation of investments | (45,948,595 | ) | (590,700 | ) | (17,131,311 | ) | (29,510,024 | ) | ||||||||
| Net Realized and Unrealized Gain/(Loss) on Investments | (27,999,855 | ) | (597,915 | ) | (7,712,907 | ) | 334,965 | |||||||||
| Net Decrease in Net Assets Resulting from Operations | $ | (28,973,751 | ) | $ | (604,138 | ) | $ | (8,221,430 | ) | $ | (158,427 | ) | ||||
| * | Commencement of operations and trading was October 29, 2021. |
See accompanying notes to financial statements.
41
| The Pacific Financial Funds |
| Statements of Operations (Continued) |
| For the Year/Period Ended April 30, 2022 |
| PFG Invesco® Thematic | PFG Janus Henderson® | PFG JP Morgan® Tactical | PFG JP Morgan® Tactical | |||||||||||||
| ESG Strategy Fund* | Balanced Strategy Fund* | Aggressive Strategy Fund | Moderate Strategy Fund | |||||||||||||
| Investment Income: | ||||||||||||||||
| Dividend income | $ | 391,276 | $ | 2,872,676 | $ | 5,797,157 | $ | 5,356,723 | ||||||||
| Income from affiliates | — | 27,809 | 797,677 | — | ||||||||||||
| Interest income | 320 | 644 | 1,264 | 1,329 | ||||||||||||
| Total Investment Income | 391,596 | 2,901,129 | 6,596,098 | 5,358,052 | ||||||||||||
| Expenses: | ||||||||||||||||
| Investment advisory fees | 396,353 | 1,774,734 | 2,680,450 | 2,401,289 | ||||||||||||
| Distribution fees (12b-1) - Class R Shares | 31,718 | 142,019 | 214,477 | 192,136 | ||||||||||||
| Administrative service fees | 222,022 | 994,286 | 1,501,670 | 1,345,576 | ||||||||||||
| Total Expenses | 650,093 | 2,911,039 | 4,396,597 | 3,939,001 | ||||||||||||
| Net Investment Income/(Loss) | (258,497 | ) | (9,910 | ) | 2,199,501 | 1,419,051 | ||||||||||
| Net Realized and Unrealized Gain/(Loss) on Investments | ||||||||||||||||
| Net realized gain/(loss) from: | ||||||||||||||||
| Unaffiliated investments | (885,068 | ) | (577,047 | ) | 13,668,099 | 14,200,915 | ||||||||||
| Affiliated investments (Note 5) | — | (172,520 | ) | 1,356,176 | — | |||||||||||
| Distributions received from underlying investment companies | — | 8,877,561 | 5,741,489 | 1,935,577 | ||||||||||||
| Total realized gain/(loss) | (885,068 | ) | 8,127,994 | 20,765,764 | 16,136,492 | |||||||||||
| Net change in unrealized depreciation of: | ||||||||||||||||
| Unaffiliated Investments | (16,122,987 | ) | (44,027,638 | ) | (42,603,314 | ) | (34,830,389 | ) | ||||||||
| Affiliated Investments (Note 5) | — | (4,691,850 | ) | (4,677,339 | ) | — | ||||||||||
| Total change in unrealized depreciation of investments | (16,122,987 | ) | (48,719,488 | ) | (47,280,653 | ) | (34,830,389 | ) | ||||||||
| Net Realized and Unrealized Loss on Investments | (17,008,055 | ) | (40,591,494 | ) | (26,514,889 | ) | (18,693,897 | ) | ||||||||
| Net Decrease in Net Assets Resulting from Operations | $ | (17,266,552 | ) | $ | (40,601,404 | ) | $ | (24,315,388 | ) | $ | (17,274,846 | ) | ||||
| * | Commencement of operations and trading was October 29, 2021. |
See accompanying notes to financial statements.
42
| The Pacific Financial Funds |
| Statements of Operations (Continued) |
| For the Year Ended April 30, 2022 |
| PFG Meeder Tactical | PFG MFS® Aggressive | PFG Tactical Income | ||||||||||
| Strategy Fund | Growth Strategy Fund | Strategy Fund | ||||||||||
| Investment Income: | ||||||||||||
| Dividend income | $ | 849,121 | $ | 2,015,908 | $ | 3,044,284 | ||||||
| Income from affiliates | 2,207,754 | — | 114,756 | |||||||||
| Interest income | 257 | 435 | 328 | |||||||||
| Total Investment Income | 3,057,132 | 2,016,343 | 3,159,368 | |||||||||
| Expenses: | ||||||||||||
| Investment advisory fees | 1,478,706 | 1,623,166 | 1,456,539 | |||||||||
| Distribution fees (12b-1) - Class R Shares | 118,317 | 129,870 | 116,542 | |||||||||
| Administrative service fees | 828,815 | 909,683 | 816,402 | |||||||||
| Total Expenses | 2,425,838 | 2,662,719 | 2,389,483 | |||||||||
| Net Investment Income/(Loss) | 631,294 | (646,376 | ) | 769,885 | ||||||||
| Net Realized and Unrealized Gain/(Loss) on Investments | ||||||||||||
| Net realized gain(loss) from: | ||||||||||||
| Unaffiliated investments | 12,287,477 | 35,596,702 | 10,808,201 | |||||||||
| Affiliated investments (Note 5) | 868,718 | — | (297,970 | ) | ||||||||
| Distributions received from underlying investment companies | 4,642,862 | 2,003,701 | 1,347,316 | |||||||||
| Total realized gain | 17,799,057 | 37,600,403 | 11,857,547 | |||||||||
| Net change in unrealized depreciation of: | ||||||||||||
| Unaffiliated Investments | (12,169,062 | ) | (35,871,201 | ) | (20,083,935 | ) | ||||||
| Affiliated Investments (Note 5) | (15,222,519 | ) | — | (1,432,101 | ) | |||||||
| Total change in unrealized depreciation of investments | (27,391,581 | ) | (35,871,201 | ) | (21,516,036 | ) | ||||||
| Net Realized and Unrealized Gain/(Loss) on Investments | (9,592,524 | ) | 1,729,202 | (9,658,489 | ) | |||||||
| Net Increase/(Decrease) in Net Assets Resulting from Operations | $ | (8,961,230 | ) | $ | 1,082,826 | $ | (8,888,604 | ) | ||||
See accompanying notes to financial statements.
43
| The Pacific Financial Funds |
| Statements of Changes in Net Assets |
| PFG American Funds® | ||||||||||||||||
| PFG Active Core Bond Strategy Fund | Conservative Income Strategy Fund | |||||||||||||||
| Year Ended | Year Ended | Year Ended | Period* Ended | |||||||||||||
| April 30, | April 30, | April 30, | April 30, | |||||||||||||
| 2022 | 2021 | 2022 | 2021 | |||||||||||||
| Increase/(Decrease) in Net Assets From Operations: | ||||||||||||||||
| Net investment income/(loss) | $ | 1,034,213 | $ | 3,563,800 | $ | (594,188 | ) | $ | 1,171,562 | |||||||
| Distributions received from underlying investment companies | 65,879 | 755,877 | 2,206,065 | 1,102,761 | ||||||||||||
| Net realized gain on investments | 82,479 | 4,388,613 | 1,408,460 | 3,515,396 | ||||||||||||
| Net change in unrealized appreciation/(depreciation) on investments | (14,196,905 | ) | 218,027 | (13,580,345 | ) | 2,419,284 | ||||||||||
| Net increase/(decrease) in net assets resulting from operations | (13,014,334 | ) | 8,926,317 | (10,560,008 | ) | 8,209,003 | ||||||||||
| From Distributions to Shareholders: | ||||||||||||||||
| Total Distributions Paid | (4,424,014 | ) | (5,442,469 | ) | (3,324,767 | ) | (2,621,779 | ) | ||||||||
| From Shares of Beneficial Interest: | ||||||||||||||||
| Proceeds from shares sold | 85,014,197 | 219,554,854 | 140,763,076 | 261,318,426 | ||||||||||||
| Reinvestment of distributions | 4,422,777 | 5,437,546 | 3,319,778 | 2,620,788 | ||||||||||||
| Cost of shares redeemed | (99,893,166 | ) | (180,527,732 | ) | (120,615,262 | ) | (74,583,874 | ) | ||||||||
| Net increase/(decrease) in net assets from share transactions of beneficial interest | (10,456,192 | ) | 44,464,668 | 23,467,592 | 189,355,340 | |||||||||||
| Total increase/(decrease) in net assets | (27,894,540 | ) | 47,948,516 | 9,582,817 | 194,942,564 | |||||||||||
| Net Assets: | ||||||||||||||||
| Beginning of year | 169,153,439 | 121,204,923 | 194,942,564 | — | ||||||||||||
| End of year | $ | 141,258,899 | $ | 169,153,439 | $ | 204,525,381 | $ | 194,942,564 | ||||||||
| Share Activity: | ||||||||||||||||
| Shares Sold | 8,684,105 | 21,673,885 | 13,482,023 | 25,741,331 | ||||||||||||
| Shares Reinvested | 451,765 | 527,405 | 316,773 | 254,941 | ||||||||||||
| Shares Redeemed | (9,941,525 | ) | (17,690,259 | ) | (11,657,442 | ) | (7,291,590 | ) | ||||||||
| Net increase/(decrease) in shares of beneficial interest outstanding | (805,655 | ) | 4,511,031 | 2,141,354 | 18,704,682 | |||||||||||
| * | Commencement of operations and trading was May 2, 2020. |
See accompanying notes to financial statements.
44
| The Pacific Financial Funds |
| Statements of Changes in Net Assets (Continued) |
| PFG American Funds® Growth Strategy Fund | PFG BNY Mellon Diversifier Strategy Fund | |||||||||||||||
| Year Ended | Period* Ended | Year Ended | Year Ended | |||||||||||||
| April 30, | April 30, | April 30, | April 30, | |||||||||||||
| 2022 | 2021 | 2022 | 2021 | |||||||||||||
| Increase/(Decrease) in Net Assets From Operations: | ||||||||||||||||
| Net investment income/(loss) | $ | (11,647,585 | ) | $ | (6,646,155 | ) | $ | 1,056,595 | $ | 73,410 | ||||||
| Distributions received from underlying investment companies | 51,851,670 | 15,376,114 | 714,618 | — | ||||||||||||
| Net realized gain on investments | 83,697,626 | 27,630,286 | 4,124,509 | 4,999,583 | ||||||||||||
| Net change in unrealized appreciation/(depreciation) on investments | (209,652,137 | ) | 141,722,966 | (12,238,151 | ) | 3,074,152 | ||||||||||
| Net increase/(decrease) in net assets resulting from operations | (85,750,426 | ) | 178,083,211 | (6,342,429 | ) | 8,147,145 | ||||||||||
| From Distributions to Shareholders: | ||||||||||||||||
| Total Distributions Paid | (32,643,916 | ) | (13,974,091 | ) | (5,590,981 | ) | (55,532 | ) | ||||||||
| From Shares of Beneficial Interest: | ||||||||||||||||
| Proceeds from shares sold | 275,516,450 | 787,835,192 | 87,606,209 | 106,036,067 | ||||||||||||
| Reinvestment of distributions | 32,638,578 | 13,967,077 | 5,589,344 | 55,491 | ||||||||||||
| Cost of shares redeemed | (397,082,839 | ) | (196,164,366 | ) | (44,405,355 | ) | (60,075,118 | ) | ||||||||
| Net increase/(decrease) in net assets from share | ||||||||||||||||
| transactions of beneficial interest | (88,927,811 | ) | 605,637,903 | 48,790,198 | 46,016,440 | |||||||||||
| Total increase/(decrease) in net assets | (207,322,153 | ) | 769,747,023 | 36,856,788 | 54,108,053 | |||||||||||
| Net Assets: | ||||||||||||||||
| Beginning of year | 769,747,023 | — | 124,936,589 | 70,828,536 | ||||||||||||
| End of year | $ | 562,424,870 | $ | 769,747,023 | $ | 161,793,377 | $ | 124,936,589 | ||||||||
| Share Activity: | ||||||||||||||||
| Shares Sold | 19,441,753 | 69,100,388 | 8,100,906 | 10,144,444 | ||||||||||||
| Shares Reinvested | 2,233,989 | 1,064,564 | 524,329 | 5,225 | ||||||||||||
| Shares Redeemed | (26,920,936 | ) | (16,146,436 | ) | (4,117,168 | ) | (5,918,368 | ) | ||||||||
| Net increase/(decrease) in shares of beneficial interest outstanding | (5,245,194 | ) | 54,018,516 | 4,508,067 | 4,231,301 | |||||||||||
| * | Commencement of operations and trading was May 2, 2020. |
See accompanying notes to financial statements.
45
| The Pacific Financial Funds |
| Statements of Changes in Net Assets (Continued) |
| PFG Fidelity Institutional | ||||||||||||
| AM® Bond ESG | ||||||||||||
| PFG BR Equity ESG Strategy Fund | Strategy Fund | |||||||||||
| Year Ended | Period* Ended | Period** Ended | ||||||||||
| April 30, | April 30, | April 30, | ||||||||||
| 2022 | 2021 | 2022 | ||||||||||
| Increase/(Decrease) in Net Assets From Operations: | ||||||||||||
| Net investment loss | $ | (973,896 | ) | $ | (717,658 | ) | $ | (6,223 | ) | |||
| Distributions received from underlying investment companies | — | — | 5,106 | |||||||||
| Net realized gain/(loss) on investments | 17,948,740 | 10,429,545 | (12,321 | ) | ||||||||
| Net change in unrealized appreciation/(depreciation) on investments | (45,948,595 | ) | 30,957,687 | (590,700 | ) | |||||||
| Net increase/(decrease) in net assets resulting from operations | (28,973,751 | ) | 40,669,574 | (604,138 | ) | |||||||
| From Distributions to Shareholders: | ||||||||||||
| Total Distributions Paid | (22,723,983 | ) | (3,193,939 | ) | — | |||||||
| From Shares of Beneficial Interest: | ||||||||||||
| Proceeds from shares sold | 144,652,401 | 140,363,521 | 8,321,988 | |||||||||
| Reinvestment of distributions | 22,695,460 | 3,189,959 | — | |||||||||
| Cost of shares redeemed | (35,342,243 | ) | (44,104,528 | ) | (840,930 | ) | ||||||
| Net increase in net assets from share transactions of beneficial interest | 132,005,618 | 99,448,952 | 7,481,058 | |||||||||
| Total increase in net assets | 80,307,884 | 136,924,587 | 6,876,920 | |||||||||
| Net Assets: | ||||||||||||
| Beginning of year | 136,924,587 | — | — | |||||||||
| End of year | $ | 217,232,471 | $ | 136,924,587 | $ | 6,876,920 | ||||||
| Share Activity: | ||||||||||||
| Shares Sold | 10,131,921 | 13,279,320 | 851,618 | |||||||||
| Shares Reinvested | 1,681,146 | 252,971 | — | |||||||||
| Shares Redeemed | (2,607,922 | ) | (3,653,547 | ) | (87,771 | ) | ||||||
| Net increase in shares of beneficial interest outstanding | 9,205,145 | 9,878,744 | 763,847 | |||||||||
| * | Commencement of operations and trading was May 2, 2020. |
| ** | Commencement of operations and trading was October 29, 2021. |
See accompanying notes to financial statements.
46
| The Pacific Financial Funds |
| Statements of Changes in Net Assets (Continued) |
| PFG Fidelity Institutional AM® | PFG Fidelity Institutional AM® | |||||||||||||||
| Equity Index Strategy Fund | Equity Sector Strategy Fund | |||||||||||||||
| Year Ended | Period* Ended | Year Ended | Period* Ended | |||||||||||||
| April 30, | April 30, | April 30, | April 30, | |||||||||||||
| 2022 | 2021 | 2022 | 2021 | |||||||||||||
| Increase/(Decrease) in Net Assets From Operations: | ||||||||||||||||
| Net investment loss | $ | (508,523 | ) | $ | (491,969 | ) | $ | (493,392 | ) | $ | (86,065 | ) | ||||
| Distributions received from underlying investment companies | 314,483 | 76,087 | 10,077,615 | 2,903,151 | ||||||||||||
| Net realized gain on investments | 9,103,921 | 8,514,695 | 19,767,374 | 18,412,750 | ||||||||||||
| Net change in unrealized appreciation/(depreciation) on investments | (17,131,311 | ) | 41,451,071 | (29,510,024 | ) | 17,967,822 | ||||||||||
| Net increase/(decrease) in net assets resulting from operations | (8,221,430 | ) | 49,549,884 | (158,427 | ) | 39,197,658 | ||||||||||
| From Distributions to Shareholders: | ||||||||||||||||
| Total Distributions Paid | (6,813,622 | ) | (3,374,218 | ) | (15,102,006 | ) | (6,835,862 | ) | ||||||||
| From Shares of Beneficial Interest: | ||||||||||||||||
| Proceeds from shares sold | 39,818,239 | 154,169,293 | 126,557,543 | 147,614,532 | ||||||||||||
| Reinvestment of distributions | 6,811,916 | 3,372,896 | 15,095,085 | 6,833,997 | ||||||||||||
| Cost of shares redeemed | (41,439,483 | ) | (61,054,429 | ) | (40,649,407 | ) | (48,158,091 | ) | ||||||||
| Net increase in net assets from share transactions of beneficial interest | 5,190,672 | 96,487,760 | 101,003,221 | 106,290,438 | ||||||||||||
| Total increase/(decrease) in net assets | (9,844,380 | ) | 142,663,426 | 85,742,788 | 138,652,234 | |||||||||||
| Net Assets: | ||||||||||||||||
| Beginning of year | 142,663,426 | — | 138,652,234 | — | ||||||||||||
| End of year | $ | 132,819,046 | $ | 142,663,426 | $ | 224,395,022 | $ | 138,652,234 | ||||||||
| Share Activity: | ||||||||||||||||
| Shares Sold | 2,826,089 | 14,834,908 | 9,307,892 | 14,398,077 | ||||||||||||
| Shares Reinvested | 468,173 | 262,891 | 1,082,861 | 582,112 | ||||||||||||
| Shares Redeemed | (2,850,234 | ) | (4,994,914 | ) | (3,027,478 | ) | (4,216,306 | ) | ||||||||
| Net increase in shares of beneficial interest outstanding | 444,028 | 10,102,885 | 7,363,275 | 10,763,883 | ||||||||||||
| * | Commencement of operations and trading was May 2, 2020. |
See accompanying notes to financial statements.
47
| The Pacific Financial Funds |
| Statements of Changes in Net Assets (Continued) |
| PFG Invesco® Thematic ESG Strategy | PFG Janus Henderson® Balanced | |||||||
| Fund | Strategy Fund | |||||||
| Period* Ended | Period* Ended | |||||||
| April 30, | April 30, | |||||||
| 2022 | 2022 | |||||||
| Decrease in Net Assets From Operations: | ||||||||
| Net investment loss | $ | (258,497 | ) | $ | (9,910 | ) | ||
| Distributions received from underlying investment companies | — | 8,877,561 | ||||||
| Net realized loss on investments | (885,068 | ) | (749,567 | ) | ||||
| Net change in unrealized depreciation on investments | (16,122,987 | ) | (48,719,488 | ) | ||||
| Net decrease in net assets resulting from operations | (17,266,552 | ) | (40,601,404 | ) | ||||
| From Distributions to Shareholders: | ||||||||
| Total Distributions Paid | (123,094 | ) | (1,171,000 | ) | ||||
| From Shares of Beneficial Interest: | ||||||||
| Proceeds from shares sold | 81,105,473 | 345,340,712 | ||||||
| Reinvestment of distributions | 123,078 | 1,170,251 | ||||||
| Cost of shares redeemed | (4,587,731 | ) | (29,841,979 | ) | ||||
| Net increase in net assets from share transactions of beneficial interest | 76,640,820 | 316,668,984 | ||||||
| Total increase in net assets | 59,251,174 | 274,896,580 | ||||||
| Net Assets: | ||||||||
| Beginning of period | — | — | ||||||
| End of period | $ | 59,251,174 | $ | 274,896,580 | ||||
| Share Activity: | ||||||||
| Shares Sold | 8,306,644 | 34,494,824 | ||||||
| Shares Reinvested | 12,901 | 115,981 | ||||||
| Shares Redeemed | (530,619 | ) | (3,131,510 | ) | ||||
| Net increase in shares of beneficial interest outstanding | 7,788,926 | 31,479,295 | ||||||
| * | Commencement of operations and trading was October 29, 2021. |
See accompanying notes to financial statements.
48
| The Pacific Financial Funds |
| Statements of Changes in Net Assets (Continued) |
| PFG JP Morgan® Tactical Aggressive Strategy Fund | PFG JP Morgan® Tactical Moderate Strategy Fund | |||||||||||||||
| Year Ended | Year Ended | Year Ended | Year Ended | |||||||||||||
| April 30, | April 30, | April 30, | April 30, | |||||||||||||
| 2022 | 2021 | 2022 | 2021 | |||||||||||||
| Increase/(Decrease) in Net Assets From Operations: | ||||||||||||||||
| Net investment income/(loss) | $ | 2,199,501 | $ | (421,456 | ) | $ | 1,419,051 | $ | 330,461 | |||||||
| Distributions received from underlying | ||||||||||||||||
| investment companies | 5,741,489 | 767,422 | 1,935,577 | 899,257 | ||||||||||||
| Net realized gain on investments | 15,024,275 | 6,230,438 | 14,200,915 | 10,199,815 | ||||||||||||
| Net change in unrealized appreciation/(depreciation) on investments | (47,280,653 | ) | 35,768,714 | (34,830,389 | ) | 28,817,279 | ||||||||||
| Net increase/(decrease) in net assets resulting from operations | (24,315,388 | ) | 42,345,118 | (17,274,846 | ) | 40,246,812 | ||||||||||
| From Distributions to Shareholders: | ||||||||||||||||
| Total Distributions Paid | (14,135,073 | ) | — | (13,499,368 | ) | (582,817 | ) | |||||||||
| From Shares of Beneficial Interest: | ||||||||||||||||
| Proceeds from shares sold | 183,173,026 | 113,143,425 | 140,261,262 | 88,991,087 | ||||||||||||
| Reinvestment of distributions | 14,128,887 | — | 13,494,083 | 582,176 | ||||||||||||
| Cost of shares redeemed | (46,935,556 | ) | (89,058,564 | ) | (100,445,645 | ) | (99,881,497 | ) | ||||||||
| Net increase/(decrease) in net assets from share transactions of beneficial interest | 150,366,357 | 24,084,861 | 53,309,700 | (10,308,234 | ) | |||||||||||
| Total increase in net assets | 111,915,896 | 66,429,979 | 22,535,486 | 29,355,761 | ||||||||||||
| Net Assets: | ||||||||||||||||
| Beginning of year | 137,843,177 | 71,413,198 | 168,095,995 | 138,740,234 | ||||||||||||
| End of year | $ | 249,759,073 | $ | 137,843,177 | $ | 190,631,481 | $ | 168,095,995 | ||||||||
| Share Activity: | ||||||||||||||||
| Shares Sold | 13,285,477 | 11,469,192 | 11,317,882 | 8,656,256 | ||||||||||||
| Shares Reinvested | 1,055,971 | — | 1,141,632 | 51,475 | ||||||||||||
| Shares Redeemed | (3,597,356 | ) | (9,016,827 | ) | (8,237,780 | ) | (9,707,655 | ) | ||||||||
| Net increase/(decrease) in shares of beneficial interest outstanding | 10,744,092 | 2,452,365 | 4,221,734 | (999,924 | ) | |||||||||||
See accompanying notes to financial statements.
49
| The Pacific Financial Funds |
| Statements of Changes in Net Assets (Continued) |
| PFG Meeder Tactical Strategy Fund | PFG MFS® Aggressive Growth Strategy Fund | |||||||||||||||
| Year Ended | Year Ended | Year Ended | Year Ended | |||||||||||||
| April 30, | April 30, | April 30, | April 30, | |||||||||||||
| 2022 | 2021 | 2022 | 2021 | |||||||||||||
| Increase/(Decrease) in Net Assets From Operations: | ||||||||||||||||
| Net investment income/(loss) | $ | 631,294 | $ | (1,016,171 | ) | $ | (646,376 | ) | $ | (1,975,376 | ) | |||||
| Distributions received from underlying investment companies | 4,642,862 | — | 2,003,701 | 2,034,711 | ||||||||||||
| Net realized gain on investments | 13,156,195 | 1,505,631 | 35,596,702 | 11,049,064 | ||||||||||||
| Net change in unrealized appreciation/(depreciation) on investments | (27,391,581 | ) | 22,611,571 | (35,871,201 | ) | 46,547,573 | ||||||||||
| Net increase/(decrease) in net assets resulting from operations | (8,961,230 | ) | 23,101,031 | 1,082,826 | 57,655,972 | |||||||||||
| From Distributions to Shareholders: | ||||||||||||||||
| Total Distributions Paid | (2,652,537 | ) | (1,089,533 | ) | (15,781,776 | ) | (5,246,887 | ) | ||||||||
| From Shares of Beneficial Interest: | ||||||||||||||||
| Proceeds from shares sold | 73,864,402 | 72,152,407 | 48,838,826 | 116,724,646 | ||||||||||||
| Reinvestment of distributions | 2,651,619 | 1,089,128 | 15,777,173 | 5,241,945 | ||||||||||||
| Cost of shares redeemed | (51,942,971 | ) | (85,807,054 | ) | (130,811,297 | ) | (124,338,337 | ) | ||||||||
| Net increase/(decrease) in net assets from share transactions of beneficial interest | 24,573,050 | (12,565,519 | ) | (66,195,298 | ) | (2,371,746 | ) | |||||||||
| Total increase/(decrease) in net assets | 12,959,283 | 9,445,979 | (80,894,248 | ) | 50,037,339 | |||||||||||
| Net Assets: | ||||||||||||||||
| Beginning of year | 106,049,613 | 96,603,634 | 168,970,630 | 118,933,291 | ||||||||||||
| End of year | $ | 119,008,896 | $ | 106,049,613 | $ | 88,076,382 | $ | 168,970,630 | ||||||||
| Share Activity: | ||||||||||||||||
| Shares Sold | 6,297,225 | 7,488,595 | 3,800,231 | 11,019,472 | ||||||||||||
| Shares Reinvested | 227,412 | 102,458 | 1,333,658 | 432,147 | ||||||||||||
| Shares Redeemed | (4,477,418 | ) | (8,699,312 | ) | (9,370,069 | ) | (11,015,144 | ) | ||||||||
| Net increase/(decrease) in shares of beneficial interest outstanding | 2,047,219 | (1,108,259 | ) | (4,236,180 | ) | 436,475 | ||||||||||
See accompanying notes to financial statements.
50
| The Pacific Financial Funds |
| Statements of Changes in Net Assets (Continued) |
| PFG Tactical Income Strategy Fund | ||||||||
| Year Ended | Period* Ended | |||||||
| April 30, | April 30, | |||||||
| 2022 | 2021 | |||||||
| Increase/(Decrease) in Net Assets From Operations: | ||||||||
| Net investment income | $ | 769,885 | $ | 1,301,186 | ||||
| Distributions received from underlying investment companies | 1,347,316 | 166,319 | ||||||
| Net realized gain on investments | 10,510,231 | 3,228,980 | ||||||
| Net change in unrealized appreciation/(depreciation) on investments | (21,516,036 | ) | 9,572,557 | |||||
| Net increase/(decrease) in net assets resulting from operations | (8,888,604 | ) | 14,269,042 | |||||
| From Distributions to Shareholders: | ||||||||
| Total Distributions Paid | (13,973,607 | ) | (2,739,989 | ) | ||||
| From Shares of Beneficial Interest: | ||||||||
| Proceeds from shares sold | 56,228,567 | 160,229,440 | ||||||
| Reinvestment of distributions | 13,968,243 | 2,738,774 | ||||||
| Cost of shares redeemed | (45,945,319 | ) | (57,958,872 | ) | ||||
| Net increase in net assets from share transactions of beneficial interest | 24,251,491 | 105,009,342 | ||||||
| Total increase in net assets | 1,389,280 | 116,538,395 | ||||||
| Net Assets: | ||||||||
| Beginning of year/period | 116,538,395 | — | ||||||
| End of year/period | $ | 117,927,675 | $ | 116,538,395 | ||||
| Share Activity: | ||||||||
| Shares Sold | 5,252,813 | 15,577,112 | ||||||
| Shares Reinvested | 1,380,261 | 254,297 | ||||||
| Shares Redeemed | (4,165,031 | ) | (5,465,587 | ) | ||||
| Net increase in shares of beneficial interest outstanding | 2,468,043 | 10,365,822 | ||||||
| * | Commencement of operations and trading was May 2, 2020. |
See accompanying notes to financial statements.
51
| The Pacific Financial Funds |
| Financial Highlights |
| PFG Active Core Bond Strategy Fund |
| Selected data based on a share outstanding throughout the year/period indicated. |
| Class R Shares | ||||||||||||||||||||
| Year Ended | Year Ended | Year Ended | Year Ended | Period Ended | ||||||||||||||||
| April 30, | April 30, | April 30, | April 30, | April 30, | ||||||||||||||||
| 2022 | 2021 | 2020 | 2019 | 2018* | ||||||||||||||||
| Net asset value, beginning of year/period | $ | 10.15 | $ | 9.98 | $ | 9.95 | $ | 9.77 | $ | 10.00 | ||||||||||
| Income/(loss) from investment operations: | ||||||||||||||||||||
| Net investment income(1,2) | 0.07 | 0.18 | 0.19 | 0.15 | 0.02 | |||||||||||||||
| Net realized and unrealized gain/(loss) on investments | (0.95 | ) | 0.27 | 0.07 | 0.12 | (0.23 | ) | |||||||||||||
| Total income/(loss) from investment operations | (0.88 | ) | 0.45 | 0.26 | 0.27 | (0.21 | ) | |||||||||||||
| Less distributions from: | ||||||||||||||||||||
| Net investment income | (0.08 | ) | (0.19 | ) | (0.20 | ) | (0.09 | ) | (0.02 | ) | ||||||||||
| Net realized gain | (0.28 | ) | (0.09 | ) | (0.03 | ) | (0.00 | ) (7) | — | |||||||||||
| Return of capital | — | — | (0.00 | ) (7) | — | — | ||||||||||||||
| Total distributions from net investment income, net realized gains and return of capital | (0.36 | ) | (0.28 | ) | (0.23 | ) | (0.09 | ) | (0.02 | ) | ||||||||||
| Net asset value, end of year/period | $ | 8.91 | $ | 10.15 | $ | 9.98 | $ | 9.95 | $ | 9.77 | ||||||||||
| Total return (3) | (9.00 | )% | 4.43 | % | 2.59 | % | 2.78 | % | (2.12 | )% | ||||||||||
| Ratios and Supplemental Data: | ||||||||||||||||||||
| Net assets, end of year/period (in 000’s) | $ | 141,259 | $ | 169,153 | $ | 121,205 | $ | 68,594 | $ | 54,225 | ||||||||||
| Ratio of expenses to average net assets (4) | 2.05 | % | 2.05 | % | 2.12 | % | 1.98 | % | 2.67 | % (5) | ||||||||||
| Ratio of net investment income to average net assets (2,4) | 0.71 | % | 1.78 | % | 1.92 | % | 1.50 | % | 0.41 | % (5) | ||||||||||
| Portfolio turnover rate | 53 | % | 64 | % | 89 | % | 38 | % | 43 | % (6) | ||||||||||
| * | PFG Active Core Bond Strategy Fund commenced operations on December 11, 2017 and commenced trading on December 14, 2017. |
| (1) | Net investment income has been calculated using the average shares method, which more appropriately presents the per share data for the period. |
| (2) | Recognition of net investment income by the Fund is affected by the timing of the declaration of dividends by the underlying investment companies in which the Fund invests. |
| (3) | Total returns are historical and assume changes in share price and reinvestment of dividends and capital gains distributions. Total return does not reflect the deduction of taxes that a shareholder may pay on Fund distributions or on the redemption of Fund shares. Total returns for periods of less than one year are not annualized. |
| (4) | Does not include the expenses of the investment companies in which the Fund invests. |
| (5) | Annualized. |
| (6) | Not annualized. |
| (7) | Amount represents less than $0.005. |
See accompanying notes to financial statements.
52
| The Pacific Financial Funds |
| Financial Highlights |
| PFG American Funds® Conservative Income Strategy Fund |
| Selected data based on a share outstanding throughout the year/period indicated. |
| Class R Shares | ||||||||
| Year Ended | Period Ended | |||||||
| April 30, | April 30, | |||||||
| 2022 | 2021* | |||||||
| Net asset value, beginning of year/period | $ | 10.42 | $ | 10.00 | ||||
| Income/(loss) from investment operations: | ||||||||
| Net investment income/(loss) (1,2) | (0.03 | ) | 0.09 | |||||
| Net realized and unrealized gain/(loss) on investments | (0.43 | ) | 0.50 | |||||
| Total income/(loss) from investment operations | (0.46 | ) | 0.59 | |||||
| Less distributions from: | ||||||||
| Net investment income | — | (0.11 | ) | |||||
| Net realized gain | (0.15 | ) | (0.06 | ) | ||||
| Total distributions from net investment income and net realized gains | (0.15 | ) | (0.17 | ) | ||||
| Net asset value, end of year/period | $ | 9.81 | $ | 10.42 | ||||
| Total return (3) | (4.55 | )% | 5.89 | % | ||||
| Ratios and Supplemental Data: | ||||||||
| Net assets, end of year/period (in 000’s) | $ | 204,525 | $ | 194,943 | ||||
| Ratio of expenses to average net assets (4) | 2.05 | % | 2.05 | % (5) | ||||
| Ratio of net investment income/(loss) to average net assets (2,4) | (0.28 | )% | 0.86 | % (5) | ||||
| Portfolio turnover rate | 34 | % | 52 | % (6) | ||||
| * | PFG American Funds® Conservative Income Strategy Fund commenced operations and trading on May 2, 2020. |
| (1) | Net investment income has been calculated using the average shares method, which more appropriately presents the per share data for the period. |
| (2) | Recognition of net investment income by the Fund is affected by the timing of the declaration of dividends by the underlying investment companies in which the Fund invests. |
| (3) | Total returns are historical and assume changes in share price and reinvestment of dividends and capital gains distributions. Total return does not reflect the deduction of taxes that a shareholder may pay on Fund distributions or on the redemption of Fund shares. Total returns for periods of less than one year are not annualized. |
| (4) | Does not include the expenses of the investment companies in which the Fund invests. |
| (5) | Annualized. |
| (6) | Not annualized. |
See accompanying notes to financial statements.
53
| The Pacific Financial Funds |
| Financial Highlights |
| PFG American Funds® Growth Strategy Fund |
| Selected data based on a share outstanding throughout the year/period indicated. |
| Class R Shares | ||||||||
| Year Ended | Period Ended | |||||||
| April 30, | April 30, | |||||||
| 2022 | 2021* | |||||||
| Net asset value, beginning of year/period | $ | 14.25 | $ | 10.00 | ||||
| Income/(loss) from investment operations: | ||||||||
| Net investment income/(loss) (1,2) | (0.23 | ) | (0.16 | ) | ||||
| Net realized and unrealized gain/(loss) on investments | (1.76 | ) | 4.72 | |||||
| Total income/(loss) from investment operations | (1.99 | ) | 4.56 | |||||
| Less distributions from: | ||||||||
| Net realized gain | (0.73 | ) | (0.31 | ) | ||||
| Net asset value, end of year/period | $ | 11.53 | $ | 14.25 | ||||
| Total return (3) | (15.06 | )% | 45.89 | % | ||||
| Ratios and Supplemental Data: | ||||||||
| Net assets, end of year/period (in 000’s) | $ | 562,425 | $ | 769,747 | ||||
| Ratio of expenses to average net assets (4) | 2.05 | % | 2.05 | % (5) | ||||
| Ratio of net investment loss to average net assets (2,4) | (1.61 | )% | (1.31 | )% (5) | ||||
| Portfolio turnover rate | 25 | % | 33 | % (6) | ||||
| * | PFG American Funds® Growth Strategy Fund commenced operations and trading on May 2, 2020. |
| (1) | Net investment income has been calculated using the average shares method, which more appropriately presents the per share data for the period. |
| (2) | Recognition of net investment income by the Fund is affected by the timing of the declaration of dividends by the underlying investment companies in which the Fund invests. |
| (3) | Total returns are historical and assume changes in share price and reinvestment of dividends and capital gains distributions. Total return does not reflect the deduction of taxes that a shareholder may pay on Fund distributions or on the redemption of Fund shares. Total returns for periods of less than one year are not annualized. |
| (4) | Does not include the expenses of the investment companies in which the Fund invests. |
| (5) | Annualized. |
| (6) | Not annualized. |
See accompanying notes to financial statements.
54
| The Pacific Financial Funds |
| Financial Highlights |
| PFG BNY Mellon Diversifier Strategy Fund |
| Selected data based on a share outstanding throughout the year/period indicated. |
| Class R Shares | ||||||||||||||||||||
| Year Ended | Year Ended | Year Ended | Year Ended | Period Ended | ||||||||||||||||
| April 30, | April 30, | April 30, | April 30, | April 30, | ||||||||||||||||
| 2022 | 2021 | 2020 | 2019 | 2018* | ||||||||||||||||
| Net asset value, beginning of year/period | $ | 10.79 | $ | 9.63 | $ | 9.64 | $ | 9.67 | $ | 10.00 | ||||||||||
| Income/(loss) from investment operations: | ||||||||||||||||||||
| Net investment income (1,2) | 0.07 | 0.01 | 0.07 | 0.14 | 0.02 | |||||||||||||||
| Net realized and unrealized gain/(loss) on investments | (0.44 | ) | 1.16 | 0.07 | (0.09 | ) | (0.30 | ) | ||||||||||||
| Total income/(loss) from investment operations | (0.37 | ) | 1.17 | 0.14 | 0.05 | (0.28 | ) | |||||||||||||
| Less distributions from: | ||||||||||||||||||||
| Net investment income | — | (0.01 | ) | (0.13 | ) | (0.08 | ) | (0.05 | ) | |||||||||||
| Net realized gain | (0.37 | ) | — | — | — | — | ||||||||||||||
| Return of capital | — | — | (0.02 | ) | — | — | ||||||||||||||
| Total distributions from net investment income, net realized gains and return of capital | (0.37 | ) | (0.01 | ) | (0.15 | ) | (0.08 | ) | (0.05 | ) | ||||||||||
| Net asset value, end of year/period | $ | 10.05 | $ | 10.79 | $ | 9.63 | $ | 9.64 | $ | 9.67 | ||||||||||
| Total return (3) | (3.64 | )% | 12.14 | % | 1.40 | % | 0.60 | % | (2.80 | )% | ||||||||||
| Ratios and Supplemental Data: | ||||||||||||||||||||
| Net assets, end of year/period (in 000’s) | $ | 161,793 | $ | 124,937 | $ | 70,829 | $ | 61,653 | $ | 58,744 | ||||||||||
| Ratio of expenses to average net assets (4) | 2.05 | % (5) | 2.05 | % | 2.19 | % | 2.09 | % | 2.44 | % (5) | ||||||||||
| Ratio of net investment income/(loss) to average net assets (2,4) | 0.65 | % (5) | 0.10 | % | 0.67 | % | 1.49 | % | 0.50 | % (5) | ||||||||||
| Portfolio turnover rate | 19 | % (6) | 67 | % | 22 | % | 203 | % | 1 | % (6) | ||||||||||
| * | PFG BNY Mellon Diversifier Strategy Fund commenced operations on December 11, 2017 and commenced trading on December 14, 2017. |
| (1) | Net investment income/(loss) has been calculated using the average shares method, which more appropriately presents the per share data for the period. |
| (2) | Recognition of net investment income/(loss) by the Fund is affected by the timing of the declaration of dividends by the underlying investment companies in which the Fund invests. |
| (3) | Total returns are historical and assume changes in share price and reinvestment of dividends and capital gains distributions. Total return does not reflect the deduction of taxes that a shareholder may pay on Fund distributions or on the redemption of Fund shares. Total returns for periods of less than one year are not annualized. |
| (4) | Does not include the expenses of the investment companies in which the Fund invests. |
| (5) | Annualized. |
| (6) | Not annualized. |
See accompanying notes to financial statements.
55
| The Pacific Financial Funds |
| Financial Highlights |
| PFG BR Equity ESG Strategy Fund |
| Selected data based on a share outstanding throughout the year/period indicated. |
| Class R Shares | ||||||||
| Year Ended | Period Ended | |||||||
| April 30, | April 30, | |||||||
| 2022 | 2021* | |||||||
| Net asset value, beginning of year/period | $ | 13.86 | $ | 10.00 | ||||
| Income/(Loss) from investment operations: | ||||||||
| Net investment loss (1,2) | (0.07 | ) | (0.08 | ) | ||||
| Net realized and unrealized gain/(loss) on investments | (0.99 | ) | 4.26 | |||||
| Total income/(loss) from investment operations | (1.06 | ) | 4.18 | |||||
| Less distributions from: | ||||||||
| Net investment income | — | — | ||||||
| Net realized gain | (1.42 | ) | (0.32 | ) | ||||
| Return of capital | — | — | ||||||
| Total distributions from net investment income and return of capital | (1.42 | ) | (0.32 | ) | ||||
| Net asset value, end of year/period | $ | 11.38 | $ | 13.86 | ||||
| Total return (3) | (9.29 | )% | 42.12 | % | ||||
| Ratios and Supplemental Data: | ||||||||
| Net assets, end of year/period (in 000’s) | $ | 217,232 | $ | 136,925 | ||||
| Ratio of expenses to average net assets (4) | 2.05 | % | 2.05 | % (5) | ||||
| Ratio of net investment loss to average net assets (2,4) | (0.53 | )% | (0.66 | )% (5) | ||||
| Portfolio turnover rate | 48 | % | 52 | % (6) | ||||
| * | PFG BR Equity ESG Strategy Fund commenced operations and trading on May 2, 2020. |
| (1) | Net investment income/(loss) has been calculated using the average shares method, which more appropriately presents the per share data for the period. |
| (2) | Recognition of net investment income/(loss) by the Fund is affected by the timing of the declaration of dividends by the underlying investment companies in which the Fund invests. |
| (3) | Total returns are historical and assume changes in share price and reinvestment of dividends and capital gains distributions. Total return does not reflect the deduction of taxes that a shareholder may pay on Fund distributions or on the redemption of Fund shares. Total returns for periods of less than one year are not annualized. |
| (4) | Does not include the expenses of the investment companies in which the Fund invests. |
| (5) | Annualized. |
| (6) | Not annualized. |
See accompanying notes to financial statements.
56
| The Pacific Financial Funds |
| Financial Highlights |
| PFG Fidelity Institutional AM® Bond ESG Strategy Fund |
| Selected data based on a share outstanding throughout the period indicated. |
| Class R Shares | ||||
| Period Ended | ||||
| April 30, | ||||
| 2022* | ||||
| Net asset value, beginning of period | $ | 10.00 | ||
| Loss from investment operations: | ||||
| Net investment loss (1,2) | (0.01 | ) | ||
| Net realized and unrealized loss on investments | (0.99 | ) | ||
| Total loss from investment operations | (1.00 | ) | ||
| Net asset value, end of period | $ | 9.00 | ||
| Total return (3) | (10.00 | )% | ||
| Ratios and Supplemental Data: | ||||
| Net assets, end of period (in 000’s) | $ | 6,877 | ||
| Ratio of expenses to average net assets (4,5) | 2.06 | % | ||
| Ratio of net investment loss to average net assets (2,4,5) | (0.25 | )% | ||
| Portfolio turnover rate (6) | 6 | % | ||
| * | PFG Fidelity Institutional AM® Bond ESG Strategy Fund commenced operations and trading on October 29, 2021. |
| (1) | Net investment income/(loss) has been calculated using the average shares method, which more appropriately presents the per share data for the period. |
| (2) | Recognition of net investment income/(loss) by the Fund is affected by the timing of the declaration of dividends by the underlying investment companies in which the Fund invests. |
| (3) | Total returns are historical and assume changes in share price and reinvestment of dividends and capital gains distributions. Total return does not reflect the deduction of taxes that a shareholder may pay on Fund distributions or on the redemption of Fund shares. Total returns for periods of less than one year are not annualized. |
| (4) | Does not include the expenses of the investment companies in which the Fund invests. |
| (5) | Annualized. |
| (6) | Not annualized. |
See accompanying notes to financial statements.
57
| The Pacific Financial Funds |
| Financial Highlights |
| PFG Fidelity Institutional AM® Equity Index Strategy Fund |
| Selected data based on a share outstanding throughout the year/period indicated. |
| Class R Shares | ||||||||
| Year Ended | Period Ended | |||||||
| April 30, | April 30, | |||||||
| 2022 | 2021* | |||||||
| Net asset value, beginning of year/period | $ | 14.12 | $ | 10.00 | ||||
| Income/(loss) from investment operations: | ||||||||
| Net investment loss (1,2) | (0.05 | ) | (0.05 | ) | ||||
| Net realized and unrealized gain/(loss) on investments | (0.75 | ) | 4.49 | |||||
| Total income/(loss) from investment operations | (0.80 | ) | 4.44 | |||||
| Less distributions from: | ||||||||
| Net investment income | (0.02 | ) | (0.02 | ) | ||||
| Net realized gain | (0.71 | ) | (0.30 | ) | ||||
| Return of capital | — | — | ||||||
| Total distributions from net investment income, net realized gains and return of capital | (0.73 | ) | (0.32 | ) | ||||
| Net asset value, end of year/period | $ | 12.59 | $ | 14.12 | ||||
| Total return (3) | (6.37 | )% | 44.72 | % | ||||
| Ratios and Supplemental Data: | ||||||||
| Net assets, end of year/period (in 000’s) | $ | 132,819 | $ | 142,663 | ||||
| Ratio of expenses to average net assets (4) | 2.05 | % | 2.05 | % (5) | ||||
| Ratio of net investment loss to average net assets (2,4) | (0.36 | )% | (0.38 | )% (5) | ||||
| Portfolio turnover rate | 16 | % | 30 | % (6) | ||||
| * | PFG Fidelity Institutional AM® Equity Index Strategy Fund commenced operations and trading on May 2, 2020. |
| (1) | Net investment income/(loss) has been calculated using the average shares method, which more appropriately presents the per share data for the period. |
| (2) | Recognition of net investment income by the Fund is affected by the timing of the declaration of dividends by the underlying investment companies in which the Fund invests. |
| (3) | Total returns are historical and assume changes in share price and reinvestment of dividends and capital gains distributions. Total return does not reflect the deduction of taxes that a shareholder may pay on Fund distributions or on the redemption of Fund shares. Total returns for periods of less than one year are not annualized. |
| (4) | Does not include the expenses of the investment companies in which the Fund invests. |
| (5) | Annualized. |
| (6) | Not annualized. |
See accompanying notes to financial statements.
58
| The Pacific Financial Funds |
| Financial Highlights |
| PFG Fidelity Institutional AM® Equity Sector Strategy Fund |
| Selected data based on a share outstanding throughout the year/period indicated. |
| Class R Shares | ||||||||
| Year Ended | Period Ended | |||||||
| April 30, | April 30, | |||||||
| 2022 | 2021* | |||||||
| Net asset value, beginning of year/period | $ | 12.88 | $ | 10.00 | ||||
| Income/(loss) from investment operations: | ||||||||
| Net investment loss (1,2) | (0.03 | ) | (0.01 | ) | ||||
| Net realized and unrealized gain on investments | 0.47 | 3.54 | ||||||
| Total income from investment operations | 0.44 | 3.53 | ||||||
| Less distributions from: | ||||||||
| Net investment income | (0.02 | ) | (0.04 | ) | ||||
| Net realized gain | (0.92 | ) | (0.61 | ) | ||||
| Total distributions from net investment income and net realized gains | (0.94 | ) | (0.65 | ) | ||||
| Net asset value, end of year/period | $ | 12.38 | $ | 12.88 | ||||
| Total return (3) | 2.58 | % | 35.91 | % | ||||
| Ratios and Supplemental Data: | ||||||||
| Net assets, end of year/period (in 000’s) | $ | 224,395 | $ | 138,652 | ||||
| Ratio of expenses to average net assets (4) | 2.05 | % | 2.05 | % (5) | ||||
| Ratio of net investment loss to average net assets (2,4) | (0.25 | )% | (0.08 | )% (5) | ||||
| Portfolio turnover rate | 70 | % | 189 | % (6) | ||||
| * | PFG Fidelity Institutional AM® Equity Sector Strategy Fund commenced operations and trading on May 2, 2020. |
| (1) | Net investment loss has been calculated using the average shares method, which more appropriately presents the per share data for the period. |
| (2) | Recognition of net investment loss by the Fund is affected by the timing of the declaration of dividends by the underlying investment companies in which the Fund invests. |
| (3) | Total returns are historical and assume changes in share price and reinvestment of dividends and capital gains distributions. Total return does not reflect the deduction of taxes that a shareholder may pay on Fund distributions or on the redemption of Fund shares. Total returns for periods of less than one year are not annualized. |
| (4) | Does not include the expenses of the investment companies in which the Fund invests. |
| (5) | Annualized. |
| (6) | Not annualized. |
See accompanying notes to financial statements.
59
| The Pacific Financial Funds |
| Financial Highlights |
| PFG Invesco® Thematic ESG Strategy Fund |
| Selected data based on a share outstanding throughout the period indicated. |
| Class R Shares | ||||
| Period Ended | ||||
| April 30, | ||||
| 2022 | ||||
| Net asset value, beginning of period | $ | 10.00 | ||
| Loss from investment operations: | ||||
| Net investment loss (1,2) | (0.04 | ) | ||
| Net realized and unrealized loss on investments | (2.33 | ) | ||
| Total loss from investment operations | (2.37 | ) | ||
| Less distributions from: | ||||
| Net investment income | (0.02 | ) | ||
| Net realized gain | — | |||
| Total distributions from net investment income and net realized gains | (0.02 | ) | ||
| Net asset value, end of period | $ | 7.61 | ||
| Total return (3) | (23.77 | )% | ||
| Ratios and Supplemental Data: | ||||
| Net assets, end of period (in 000’s) | $ | 59,251 | ||
| Ratio of expenses to average net assets (4) | 2.05 | % (5) | ||
| Ratio of net investment loss to average net assets (2,4) | (0.82 | )% (5) | ||
| Portfolio turnover rate | 7 | % (6) | ||
| * | PFG Invesco® Thematic ESG Strategy Fund commenced operations and trading on October 29, 2021. |
| (1) | Net investment income/(loss) has been calculated using the average shares method, which more appropriately presents the per share data for the period. |
| (2) | Recognition of net investment income/(loss) by the Fund is affected by the timing of the declaration of dividends by the underlying investment companies in which the Fund invests. |
| (3) | Total returns are historical and assume changes in share price and reinvestment of dividends and capital gains distributions. Total return does not reflect the deduction of taxes that a shareholder may pay on Fund distributions or on the redemption of Fund shares. Total returns for periods of less than one year are not annualized. |
| (4) | Does not include the expenses of the investment companies in which the Fund invests. |
| (5) | Annualized. |
| (6) | Not annualized. |
See accompanying notes to financial statements.
60
| The Pacific Financial Funds |
| Financial Highlights |
| PFG Janus Henderson® Balanced Strategy Fund |
| Selected data based on a share outstanding throughout the period indicated. |
| Class R Shares | ||||
| Period Ended | ||||
| April 30, | ||||
| 2022 | ||||
| Net asset value, beginning of period | $ | 10.00 | ||
| Loss from investment operations: | ||||
| Net investment loss (1,2) | (0.00 | ) (7) | ||
| Net realized and unrealized loss on investments | (1.23 | ) | ||
| Total loss from investment operations | (1.23 | ) | ||
| Less distributions from: | ||||
| Net investment loss | (0.04 | ) | ||
| Total distributions from net investment income and net realized gains | (0.04 | ) | ||
| Net asset value, end of period | $ | 8.73 | ||
| Total return (3) | (12.37 | )% | ||
| Ratios and Supplemental Data: | ||||
| Net assets, end of period (in 000’s) | $ | 274,897 | ||
| Ratio of expenses to average net assets (4) | 2.05 | % (5) | ||
| Ratio of net investment income/(loss) to average net assets (2,4) | (0.01 | )% (5) | ||
| Portfolio turnover rate | 4 | % (6) | ||
| * | PFG Janus Henderson® Balanced Strategy Fund commenced operations and trading on October 29, 2021. |
| (1) | Net investment income/(loss) has been calculated using the average shares method, which more appropriately presents the per share data for the period. |
| (2) | Recognition of net investment income/(loss) by the Fund is affected by the timing of the declaration of dividends by the underlying investment companies in which the Fund invests. |
| (3) | Total returns are historical and assume changes in share price and reinvestment of dividends and capital gains distributions. Total return does not reflect the deduction of taxes that a shareholder may pay on Fund distributions or on the redemption of Fund shares. Total returns for periods of less than one year are not annualized. |
| (4) | Does not include the expenses of the investment companies in which the Fund invests. |
| (5) | Annualized. |
| (6) | Not annualized. |
| (7) | Amount represents less than $0.005. |
See accompanying notes to financial statements.
61
| The Pacific Financial Funds |
| Financial Highlights |
| PFG JP Morgan® Tactical Aggressive Strategy Fund |
| Selected data based on a share outstanding throughout the year/period indicated. |
| Class R Shares | ||||||||||||||||||||
| Year Ended | Year Ended | Year Ended | Year Ended | Period Ended | ||||||||||||||||
| April 30, | April 30, | April 30, | April 30, | April 30, | ||||||||||||||||
| 2022 | 2021 | 2020 | 2019 | 2018* | ||||||||||||||||
| Net asset value, beginning of year/period | $ | 13.22 | $ | 8.95 | $ | 9.98 | $ | 9.97 | $ | 10.00 | ||||||||||
| Income/(loss) from investment operations: | ||||||||||||||||||||
| Net investment income/(loss) (1,2) | 0.14 | (0.04 | ) | 0.01 | (0.04 | ) | (0.09 | ) | ||||||||||||
| Net realized and unrealized gain/(loss) on investments | (0.87 | ) | 4.31 | (1.04 | ) | 0.34 | 0.06 | (3) | ||||||||||||
| Total income/(loss) from investment operations | (0.73 | ) | 4.27 | (1.03 | ) | 0.30 | (0.03 | ) | ||||||||||||
| Less distributions from: | ||||||||||||||||||||
| Net investment income | (0.16 | ) | — | — | — | — | ||||||||||||||
| Net realized gain | (0.53 | ) | — | — | (0.25 | ) | — | |||||||||||||
| Return of capital | — | — | — | (0.04 | ) | — | ||||||||||||||
| Total distributions from net realized gains and return of capital | (0.69 | ) | — | — | (0.29 | ) | — | |||||||||||||
| Net asset value, end of year/period | $ | 11.80 | $ | 13.22 | $ | 8.95 | $ | 9.98 | $ | 9.97 | ||||||||||
| Total return (4) | (6.17 | )% | 47.71 | % | (10.32 | )% | 3.40 | % (8) | (0.30 | )% | ||||||||||
| Ratios and Supplemental Data: | ||||||||||||||||||||
| Net assets, end of year/period (in 000’s) | $ | 249,759 | $ | 137,843 | $ | 71,413 | $ | 89,498 | $ | 86,033 | ||||||||||
| Ratio of expenses to average net assets (5) | 2.05 | % | 2.05 | % | 2.14 | % | 2.03 | % | 2.34 | % (6) | ||||||||||
| Ratio of net investment income/(loss) to average net assets (2,5) | 1.03 | % | (0.39 | )% | 0.07 | % | (0.40 | )% | (2.22 | )% (6) | ||||||||||
| Portfolio turnover rate | 57 | % | 42 | % | 39 | % | 116 | % | 38 | % (7) | ||||||||||
| * | PFG JP Morgan® Tactical Aggressive Strategy Fund commenced operations on December 11, 2017 and commenced trading on December 14, 2017. |
| (1) | Net investment income has been calculated using the average shares method, which more appropriately presents the per share data for the period. |
| (2) | Recognition of net investment income/(loss) by the Fund is affected by the timing of the declaration of dividends by the underlying investment companies in which the Fund invests. |
| (3) | Realized and unrealized gains and losses per share in this caption are balancing amounts necessary to reconcile the change in net asset value per share for the period, and may not reconcile with the aggregate gains and losses in the Statement of Operations due to share transactions for the period. |
| (4) | Total returns are historical and assume changes in share price and reinvestment of dividends and capital gains distributions. Total return does not reflect the deduction of taxes that a shareholder may pay on Fund distributions or on the redemption of Fund shares. Total returns for periods of less than one year are not annualized. |
| (5) | Does not include the expenses of the investment companies in which the Fund invests. |
| (6) | Annualized. |
| (7) | Not annualized. |
| (8) | For the year ended April 30, 2019, the Fund received a reimbursement from affiliates. This reimbursement had no impact on the Fund’s total return. |
See accompanying notes to financial statements.
62
| The Pacific Financial Funds |
| Financial Highlights |
| PFG JP Morgan® Tactical Moderate Strategy Fund |
| Selected data based on a share outstanding throughout the year/period indicated. |
| Class R Shares | ||||||||||||||||||||
| Year Ended | Year Ended | Year Ended | Year Ended | Period Ended | ||||||||||||||||
| April 30, | April 30, | April 30, | April 30, | April 30, | ||||||||||||||||
| 2022 | 2021 | 2020 | 2019 | 2018* | ||||||||||||||||
| Net asset value, beginning of year/period | $ | 12.10 | $ | 9.32 | $ | 9.96 | $ | 9.80 | $ | 10.00 | ||||||||||
| Income/(loss) from investment operations: | ||||||||||||||||||||
| Net investment income/(loss) (1,2) | 0.09 | 0.02 | 0.06 | (0.02 | ) | (0.01 | ) | |||||||||||||
| Net realized and unrealized gain/(loss) on investments | (0.91 | ) | 2.80 | (0.65 | ) | 0.18 | (0.19 | ) | ||||||||||||
| Total income/(loss) from investment operations | (0.82 | ) | 2.82 | (0.59 | ) | 0.16 | (0.20 | ) | ||||||||||||
| Less distributions from: | ||||||||||||||||||||
| Net investment income | (0.10 | ) | (0.04 | ) | (0.05 | ) | (0.00 | ) (7) | — | |||||||||||
| Net realized gain | (0.66 | ) | — | — | — | — | ||||||||||||||
| Total distributions from net investment income and return of capital | (0.76 | ) | (0.04 | ) | (0.05 | ) | — | — | ||||||||||||
| Net asset value, end of year/period | $ | 10.52 | $ | 12.10 | $ | 9.32 | $ | 9.96 | $ | 9.80 | ||||||||||
| Total return (3) | (7.49 | )% | 30.29 | % | (6.00 | )% | 1.68 | % | 2.00 | % | ||||||||||
| Ratios and Supplemental Data: | ||||||||||||||||||||
| Net assets, end of year/period (in 000’s) | $ | 190,631 | $ | 168,096 | $ | 138,740 | $ | 148,742 | $ | 153,858 | ||||||||||
| Ratio of expenses to average net assets (4) | 2.05 | % | 2.05 | % | 2.09 | % | 2.06 | % | 2.26 | % (5) | ||||||||||
| Ratio of net investment income/(loss) to average net assets (2,4) | 0.74 | % | 0.22 | % | 0.56 | % | (0.16 | )% | 0.80 | % (5) | ||||||||||
| Portfolio turnover rate | 76 | % | 58 | % | 60 | % | 112 | % | 0 | % (6) | ||||||||||
| * | PFG JP Morgan® Tactical Moderate Strategy Fund commenced operations and trading on March 15, 2018. |
| (1) | Net investment income has been calculated using the average shares method, which more appropriately presents the per share data for the period. |
| (2) | Recognition of net investment income/(loss) by the Fund is affected by the timing of the declaration of dividends by the underlying investment companies in which the Fund invests. |
| (3) | Total returns are historical and assume changes in share price and reinvestment of dividends and capital gains distributions. Total return does not reflect the deduction of taxes that a shareholder may pay on Fund distributions or on the redemption of Fund shares. Total returns for periods of less than one year are not annualized. |
| (4) | Does not include the expenses of the investment companies in which the Fund invests. |
| (5) | Annualized. |
| (6) | Not annualized. |
| (7) | Amount represents less than $0.005. |
See accompanying notes to financial statements.
63
| The Pacific Financial Funds |
| Financial Highlights |
| PFG Meeder Tactical Strategy Fund |
| Selected data based on a share outstanding throughout the year/period indicated. |
| Class R Shares | ||||||||||||||||||||
| Year Ended | Year Ended | Year Ended | Year Ended | Period Ended | ||||||||||||||||
| April 30, | April 30, | April 30, | April 30, | April 30, | ||||||||||||||||
| 2022 | 2021 | 2020 | 2019 | 2018* | ||||||||||||||||
| Net asset value, beginning of year/period | $ | 11.34 | $ | 9.23 | $ | 9.93 | $ | 9.83 | $ | 10.00 | ||||||||||
| Income/(loss) from investment operations: | ||||||||||||||||||||
| Net investment income/(loss) (1,2) | 0.06 | (0.10 | ) | (0.11 | ) | (0.03 | ) | (0.05 | ) | |||||||||||
| Net realized and unrealized gain/(loss) on investments | (0.73 | ) | 2.32 | (0.57 | ) | 0.15 | (0.11 | ) | ||||||||||||
| Total income/(loss) from investment operations | (0.67 | ) | 2.22 | (0.68 | ) | 0.12 | (0.16 | ) | ||||||||||||
| Less distributions from: | ||||||||||||||||||||
| Net investment income | — | — | — | (0.02 | ) | (0.01 | ) | |||||||||||||
| Net realized gain | (0.23 | ) | (0.11 | ) | (0.02 | ) | — | — | ||||||||||||
| Total distributions from net investment income and net realized gains | (0.23 | ) | (0.11 | ) | (0.02 | ) | (0.02 | ) | (0.01 | ) | ||||||||||
| Net asset value, end of year/period | $ | 10.44 | $ | 11.34 | $ | 9.23 | $ | 9.93 | $ | 9.83 | ||||||||||
| Total return (3) | (6.09 | )% | 24.09 | % | (6.91 | )% | 1.20 | % | 1.57 | % | ||||||||||
| Ratios and Supplemental Data: | ||||||||||||||||||||
| Net assets, end of year/period (in 000’s) | $ | 119,009 | $ | 106,050 | $ | 96,604 | $ | 103,481 | $ | 100,881 | ||||||||||
| Ratio of expenses to average net assets (4) | 2.05 | % | 2.05 | % | 2.09 | % | 2.04 | % | 2.28 | % (5) | ||||||||||
| Ratio of net investment income/(loss) to average net assets (2,4) | 0.53 | % | (0.98 | )% | (1.07 | )% | (0.27 | )% | (1.25 | )% (5) | ||||||||||
| Portfolio turnover rate | 67 | % | 19 | % | 18 | % | 23 | % | 8 | % (6) | ||||||||||
| * | PFG Meeder Tactical Strategy Fund commenced operations on December 11, 2017 and commenced trading on December 14, 2017. |
| (1) | Net investment income/(loss) has been calculated using the average shares method, which more appropriately presents the per share data for the period. |
| (2) | Recognition of net investment income/(loss) by the Fund is affected by the timing of the declaration of dividends by the underlying investment companies in which the Fund invests. |
| (3) | Total returns are historical and assume changes in share price and reinvestment of dividends and capital gains distributions. Total return does not reflect the deduction of taxes that a shareholder may pay on Fund distributions or on the redemption of Fund shares. Total returns for periods of less than one year are not annualized. |
| (4) | Does not include the expenses of the investment companies in which the Fund invests. |
| (5) | Annualized. |
| (6) | Not annualized. |
See accompanying notes to financial statements.
64
| The Pacific Financial Funds |
| Financial Highlights |
| PFG MFS® Aggressive Growth Strategy Fund |
| Selected data based on a share outstanding throughout the year/period indicated. |
| Class R Shares | ||||||||||||||||||||
| Year Ended | Year Ended | Year Ended | Year Ended | Period Ended | ||||||||||||||||
| April 30, | April 30, | April 30, | April 30, | April 30, | ||||||||||||||||
| 2022 | 2021 | 2020 | 2019 | 2018* | ||||||||||||||||
| Net asset value, beginning of year/period | $ | 13.23 | $ | 9.64 | $ | 10.52 | $ | 9.97 | $ | 10.00 | ||||||||||
| Income/(loss) from investment operations: | ||||||||||||||||||||
| Net investment loss (1,2) | (0.06 | ) | (0.14 | ) | (0.04 | ) | — | (0.01 | ) | |||||||||||
| Net realized and unrealized gain/(loss) on investments | (0.39 | ) (7) | 4.10 | (0.68 | ) | 0.70 | 0.06 | |||||||||||||
| Total income/(loss) from investment operations | (0.45 | ) | 3.96 | (0.72 | ) | 0.70 | 0.05 | |||||||||||||
| Less distributions from: | ||||||||||||||||||||
| Net investment income | — | — | — | — | (0.08 | ) | ||||||||||||||
| Net realized gain | (2.46 | ) | (0.37 | ) | (0.16 | ) | (0.15 | ) | — | |||||||||||
| Total distributions from net investment income and net realized gains | (2.46 | ) | (0.37 | ) | (0.16 | ) | (0.15 | ) | (0.08 | ) | ||||||||||
| Net asset value, end of year/period | $ | 10.32 | $ | 13.23 | $ | 9.64 | $ | 10.52 | $ | 9.97 | ||||||||||
| Total return (3) | (5.81 | )% | 41.39 | % | (7.10 | )% | 7.34 | % | 0.50 | % | ||||||||||
| Ratios and Supplemental Data: | ||||||||||||||||||||
| Net assets, end of year/period (in 000’s) | $ | 88,076 | $ | 168,971 | $ | 118,933 | $ | 118,749 | $ | 113,953 | ||||||||||
| Ratio of expenses to average net assets (4) | 2.05 | % | 2.05 | % | 2.09 | % | 2.05 | % | 2.23 | % (5) | ||||||||||
| Ratio of net investment loss to average net assets (2,4) | (0.50 | )% | (1.18 | )% | (0.34 | )% | 0.00 | % | (0.37 | )% (5) | ||||||||||
| Portfolio turnover rate | 30 | % | 39 | % | 7 | % | 26 | % | 0 | % (6) | ||||||||||
| * | PFG MFS® Aggressive Growth Strategy Fund commenced operations on December 11, 2017 and commenced trading on December 14, 2017. |
| (1) | Net investment income has been calculated using the average shares method, which more appropriately presents the per share data for the period. |
| (2) | Recognition of net investment income/(loss) by the Fund is affected by the timing of the declaration of dividends by the underlying investment companies in which the Fund invests. |
| (3) | Total returns are historical and assume changes in share price and reinvestment of dividends and capital gains distributions. Total return does not reflect the deduction of taxes that a shareholder may pay on Fund distributions or on the redemption of Fund shares. Total returns for periods of less than one year are not annualized. |
| (4) | Does not include the expenses of the investment companies in which the Fund invests. |
| (5) | Annualized. |
| (6) | Not annualized. |
| (7) | Realized and unrealized gains and losses per share in this caption are balancing amounts necessary to reconcile the change in net asset value per share for the period, and may not reconcile with the aggregate gains and losses in the Statement of Operations due to share transactions for the period. |
See accompanying notes to financial statements.
65
| The Pacific Financial Funds |
| Financial Highlights |
| PFG Tactical Income Strategy Fund |
| Selected data based on a share outstanding throughout the year/period indicated. |
| Class R Shares | ||||||||
| Year Ended | Period Ended | |||||||
| April 30, | April 30, | |||||||
| 2022 | 2021* | |||||||
| Net asset value, beginning of year/period | $ | 11.24 | $ | 10.00 | ||||
| Income/(loss) from investment operations: | ||||||||
| Net investment income (1,2) | 0.07 | 0.17 | ||||||
| Net realized and unrealized gain/(loss) on investments | (0.75 | ) | 1.39 | |||||
| Total income/(loss) from investment operations | (0.68 | ) | 1.56 | |||||
| Less distributions from: | ||||||||
| Net investment income | (0.13 | ) | (0.14 | ) | ||||
| Net realized gain | (1.24 | ) | (0.18 | ) | ||||
| Total distributions from net investment income and net realized gains | (1.37 | ) | (0.32 | ) | ||||
| Net asset value, end of year/period | $ | 9.19 | $ | 11.24 | ||||
| Total return (3) | (7.18 | )% | 15.69 | % | ||||
| Ratios and Supplemental Data: | ||||||||
| Net assets, end of year/period (in 000’s) | $ | 117,928 | $ | 116,538 | ||||
| Ratio of expenses to average net assets (4) | 2.05 | % | 2.05 | % (5) | ||||
| Ratio of net investment income to average net assets (2,4) | 0.66 | % | 1.59 | % (5) | ||||
| Portfolio turnover rate | 104 | % | 70 | % (6) | ||||
| * | PFG Tactical Income Strategy Fund commenced operations and trading on May 1, 2020. |
| (1) | Net investment income/(loss) has been calculated using the average shares method, which more appropriately presents the per share data for the period. |
| (2) | Recognition of net investment income/(loss) by the Fund is affected by the timing of the declaration of dividends by the underlying investment companies in which the Fund invests. |
| (3) | Total returns are historical and assume changes in share price and reinvestment of dividends and capital gains distributions. Total return does not reflect the deduction of taxes that a shareholder may pay on Fund distributions or on the redemption of Fund shares. Total returns for periods of less than one year are not annualized. |
| (4) | Does not include the expenses of the investment companies in which the Fund invests. |
| (5) | Annualized. |
| (6) | Not annualized. |
See accompanying notes to financial statements.
66
| THE PACIFIC FINANCIAL FUNDS |
| NOTES TO FINANCIAL STATEMENTS |
| April 30, 2022 |
| 1. | ORGANIZATION |
The Pacific Financial Family of Mutual Funds is comprised of fifteen different actively managed funds. Each Fund is a diversified series of shares of beneficial interest of Northern Lights Fund Trust (the “Trust”), a trust organized under the laws of the State of Delaware on January 19, 2005, and registered under the Investment Company Act of 1940, as amended (the “1940 Act”), as an open-end management investment company. The Funds and their primary investment objectives are listed below. Each Fund currently offers Class R shares. The investment objective of each Fund, as of April 30, 2022 is as follows:
| Fund | Primary Objective |
| PFG Active Core Bond Strategy Fund | Income |
| PFG American Funds® Conservative Income Strategy Fund | Current Income |
| PFG American Funds® Growth Strategy Fund | Growth of capital |
| PFG BNY Mellon Diversifier Strategy Fund | Income with a secondary objective of capital appreciation |
| PFG BR Equity ESG Strategy Fund | Growth of capital |
| PFG Fidelity Institutional AM® Bond ESG Strategy Fund | Current income |
| PFG Fidelity Institutional AM® Equity Index Strategy Fund | Total return |
| PFG Fidelity Institutional AM® Equity Sector Strategy Fund | Growth of capital |
| PFG Invesco® Thematic ESG Strategy Fund | Aggressive growth |
| PFG Janus Henderson® Balanced Strategy Fund | Capital appreciation with a secondary objective of income |
| PFG JP Morgan® Tactical Aggressive Strategy Fund | Aggressive growth |
| PFG JP Morgan® Tactical Moderate Strategy Fund | Capital appreciation with a secondary objective of income |
| PFG Meeder Tactical Strategy Fund | Capital appreciation |
| PFG MFS® Aggressive Growth Strategy Fund | Aggressive growth |
| PFG Tactical Income Strategy Fund | Current income |
| 2. | SIGNIFICANT ACCOUNTING POLICIES |
The following is a summary of significant accounting policies followed by the Funds in preparation of their financial statements. The policies are in conformity with accounting principles generally accepted in the United States of America (“GAAP”). The preparation of the financial statements requires management to make estimates and assumptions that affect the reported amounts of assets and liabilities and disclosure of contingent assets and liabilities at the date of the financial statements and the reported amounts of income and expenses for the period. Actual results could differ from those estimates. The Funds are investment companies and accordingly follow the investment company accounting and reporting guidance of the Financial Accounting Standards Board (“FASB”) Accounting Standards Codification Topic 946 “Financial Services – Investment Companies” including FASB Accounting Standards Update (“ASU”) 2013-08.
Securities Valuation – Securities listed on an exchange are valued at the last reported sale price at the close of the regular trading session of the primary exchange on the business day the value is being determined, or in the case of securities listed on NASDAQ at the NASDAQ Official Closing Price (“NOCP”). In the absence of a sale, such securities shall be valued at the mean between the current bid and ask prices on the primary exchange on the day of valuation. Short-term debt obligations having 60 days or less remaining until maturity, at time of purchase, may be valued at amortized cost. Investments in open-end investment companies are valued at net asset value.
Valuation of Fund of Funds – The Funds may invest in portfolios of open-end or closed-end investment companies. Open-end investment companies are valued at their respective net asset values as reported by such investment companies. Open-end funds value securities in their portfolios for which market quotations are readily available at their market values (generally the last reported sale price) and all other securities and assets at their fair value based upon methods established by the board of directors of the open-end funds.
67
| THE PACIFIC FINANCIAL FUNDS |
| NOTES TO FINANCIAL STATEMENTS (Continued) |
| April 30, 2022 |
The shares of many closed-end investment companies, after their initial public offering, frequently trade at a price per share, which is different than the net asset value per share. The difference represents a market premium or market discount of such shares. There can be no assurances that the market discount or market premium on shares of any closed-end investment company purchased by the Funds will not change.
Exchange Traded Funds – The Funds may invest in exchange traded funds (“ETFs”). ETFs are a type of fund bought and sold on a securities exchange. An ETF trades like common stock and represents a fixed portfolio of securities. The Funds may purchase an ETF to gain exposure to a portion of the U.S. or a foreign market. The risks of owning an ETF generally reflect the risks of owning the underlying securities they are designed to track, although the lack of liquidity on an ETF could result in it being more volatile. Additionally, ETFs have fees and expenses that reduce their value.
The Funds may hold securities, such as private investments, interests in commodity pools, other non-traded securities or temporarily illiquid securities, for which market quotations are not readily available or are determined to be unreliable. These securities will be valued using the “fair value” procedures approved by the Trust’s Board of Trustees (the “Board”). The Board has delegated execution of these procedures to a fair value committee composed of one or more representatives from each of the (i) Trust, (ii) administrator, and (iii) advisor. The committee may also enlist third party consultants such as a valuation specialist at a public accounting firm, valuation consultant or financial officer of a security issuer on an as-needed basis to assist in determining a security-specific fair value. The Board has also engaged a third party valuation firm to attend valuation meetings held by the Trust, review minutes of such meetings and report to the Board on a quarterly basis. The Board reviews and ratifies the execution of this process and the resultant fair value prices at least quarterly to assure the process produces reliable results.
Fair Valuation Process – As noted above, the fair value committee is composed of one or more representatives from each of the (i) Trust, (ii) administrator, and (iii) advisor. The applicable investments are valued collectively via inputs from each of these groups. For example, fair value determinations are required for the following securities: (i) securities for which market quotations are insufficient or not readily available on a particular business day (including securities for which there is a short and temporary lapse in the provision of a price by the regular pricing source); (ii) securities for which, in the judgment of the advisor, the prices or values available do not represent the fair value of the instrument. Factors which may cause the advisor to make such a judgment include, but are not limited to, the following: only a bid price or an ask price is available; the spread between bid and ask prices is substantial; the frequency of sales; the thinness of the market; the size of reported trades; and actions of the securities markets, such as the suspension or limitation of trading; (iii) securities determined to be illiquid; (iv) securities with respect to which an event that will affect the value thereof has occurred (a “significant event”) since the closing prices were established on the principal exchange on which they are traded, but prior to a Fund’s calculation of its net asset value. Specifically, interests in commodity pools or managed futures pools are valued on a daily basis by reference to the closing market prices of each futures contract or other asset held by a pool, as adjusted for pool expenses. Restricted or illiquid securities, such as private investments or non-traded securities are valued via inputs from the advisor based upon the current bid for the security from two or more independent dealers or other parties reasonably familiar with the facts and circumstances of the security (who take into consideration all relevant factors as may be appropriate under the circumstances). If the advisor is unable to obtain a current bid from such independent dealers or other independent parties, the fair value committee shall determine the fair value of such security using the following factors: (i) the type of security; (ii) the cost at date of purchase; (iii) the size and nature of the Fund’s holdings; (iv) the discount from market value of unrestricted securities of the same class at the time of purchase and subsequent thereto; (v) information as to any transactions or offers with respect to the security; (vi) the nature and duration of restrictions on disposition of the security and the existence of any registration rights; (vii) how the yield of the security compares to similar securities of companies of similar or equal creditworthiness; (viii) the level of recent trades of similar or comparable securities; (ix) the liquidity characteristics of the security; (x) current market conditions; and (xi) the market value of any securities into which the security is convertible or exchangeable.
Funds utilize various methods to measure the fair value of all of their investments on a recurring basis. GAAP establishes a hierarchy that prioritizes inputs to valuation methods. The three levels of input are:
Level 1 – Unadjusted quoted prices in active markets for identical assets and liabilities that a Fund has the ability to access.
Level 2 – Observable inputs other than quoted prices included in Level 1 that are observable for the asset or liability, either directly or indirectly. These inputs may include quoted prices for the identical instrument on an inactive market, prices for similar instruments, interest rates, prepayment speeds, credit risk, yield curves, default rates and similar data.
68
| THE PACIFIC FINANCIAL FUNDS |
| NOTES TO FINANCIAL STATEMENTS (Continued) |
| April 30, 2022 |
Level 3 – Unobservable inputs for the asset or liability, to the extent relevant observable inputs are not available, representing a Fund’s own assumptions about the assumptions a market participant would use in valuing the asset or liability, and would be based on the best information available.
The availability of observable inputs can vary from security to security and is affected by a wide variety of factors, including, for example, the type of security, whether the security is new and not yet established in the marketplace, the liquidity of markets, and other characteristics particular to the security. To the extent that valuation is based on models or inputs that are less observable or unobservable in the market, the determination of fair value requires more judgment. Accordingly, the degree of judgment exercised in determining fair value is greatest for instruments categorized in Level 3.
The inputs used to measure fair value may fall into different levels of the fair value hierarchy. In such cases, for disclosure purposes, the level in the fair value hierarchy within which the fair value measurement falls in its entirety, is determined based on the lowest level input that is significant to the fair value measurement in its entirety.
The inputs or methodology used for valuing securities are not necessarily an indication of the risk associated with investing in those securities. The following tables summarize the inputs used as of April 30, 2022 for each Fund’s investments measured at fair value:
| PFG Active Core Bond Strategy Fund | ||||||||||||||||
| Assets * | Level 1 | Level 2 | Level 3 | Total | ||||||||||||
| Open End Funds | $ | 140,368,569 | $ | — | $ | — | $ | 140,368,569 | ||||||||
| Short-Term Investment | 383,765 | — | — | 383,765 | ||||||||||||
| Total | $ | 140,752,334 | $ | — | $ | — | $ | 140,752,334 | ||||||||
| PFG American Funds® Conservative Income Strategy Fund | ||||||||||||||||
| Assets * | Level 1 | Level 2 | Level 3 | Total | ||||||||||||
| Open End Funds | $ | 203,932,637 | $ | — | $ | — | $ | 203,932,637 | ||||||||
| Short-Term Investment | 1,010,682 | — | — | 1,010,682 | ||||||||||||
| Total | $ | 204,943,319 | $ | — | $ | — | $ | 204,943,319 | ||||||||
| PFG American Funds® Growth Strategy Fund | ||||||||||||||||
| Assets * | Level 1 | Level 2 | Level 3 | Total | ||||||||||||
| Open End Funds | $ | 560,543,238 | $ | — | $ | — | $ | 560,543,238 | ||||||||
| Short-Term Investment | 2,287,915 | — | — | 2,287,915 | ||||||||||||
| Total | $ | 562,831,153 | $ | — | $ | — | $ | 562,831,153 | ||||||||
69
| THE PACIFIC FINANCIAL FUNDS |
| NOTES TO FINANCIAL STATEMENTS (Continued) |
| April 30, 2022 |
| PFG BNY Mellon Diversifier Strategy Fund | ||||||||||||||||
| Assets * | Level 1 | Level 2 | Level 3 | Total | ||||||||||||
| Open End Funds | $ | 161,605,454 | $ | — | $ | — | $ | 161,605,454 | ||||||||
| Short-Term Investment | 357,506 | — | — | 357,506 | ||||||||||||
| Total | $ | 161,962,960 | $ | — | $ | — | $ | 161,962,960 | ||||||||
| PFG BR Equity ESG Strategy Fund | ||||||||||||||||
| Assets * | Level 1 | Level 2 | Level 3 | Total | ||||||||||||
| Exchange Traded Funds | $ | 216,268,081 | $ | — | $ | — | $ | 216,268,081 | ||||||||
| Short-Term Investment | 916,874 | — | — | 916,874 | ||||||||||||
| Total | $ | 217,184,955 | $ | — | $ | — | $ | 217,184,955 | ||||||||
| PFG Fidelity Institutional AM® Bond ESG Strategy Fund | ||||||||||||||||
| Assets * | Level 1 | Level 2 | Level 3 | Total | ||||||||||||
| Exchange Traded Funds | $ | 1,241,753 | $ | — | $ | — | $ | 1,241,753 | ||||||||
| Open End Funds | 5,617,499 | — | — | 5,617,499 | ||||||||||||
| Short-Term Investment | 17,889 | — | — | 17,889 | ||||||||||||
| Total | $ | 6,877,141 | $ | — | $ | — | $ | 6,877,141 | ||||||||
| PFG Fidelity Institutional AM® Equity Index Strategy Fund | ||||||||||||||||
| Assets * | Level 1 | Level 2 | Level 3 | Total | ||||||||||||
| Open End Funds | $ | 131,231,525 | $ | — | $ | — | $ | 131,231,525 | ||||||||
| Short-Term Investment | 575,063 | — | — | 575,063 | ||||||||||||
| Total | $ | 131,806,588 | $ | — | $ | — | $ | 131,806,588 | ||||||||
| PFG Fidelity Institutional AM® Equity Sector Strategy Fund | ||||||||||||||||
| Assets * | Level 1 | Level 2 | Level 3 | Total | ||||||||||||
| Exchange Traded Funds | $ | 138,395,369 | $ | — | $ | — | $ | 138,395,369 | ||||||||
| Open End Funds | 84,451,501 | — | — | 84,451,501 | ||||||||||||
| Short-Term Investment | 854,030 | — | — | 854,030 | ||||||||||||
| Total | $ | 223,700,900 | $ | — | $ | — | $ | 223,700,900 | ||||||||
| PFG Invesco® Thematic ESG Strategy Fund | ||||||||||||||||
| Assets * | Level 1 | Level 2 | Level 3 | Total | ||||||||||||
| Exchange Traded Funds | $ | 59,145,281 | $ | — | $ | — | $ | 59,145,281 | ||||||||
| Short-Term Investment | 199,883 | — | — | 199,883 | ||||||||||||
| Total | $ | 59,345,164 | $ | — | $ | — | $ | 59,345,164 | ||||||||
70
| THE PACIFIC FINANCIAL FUNDS |
| NOTES TO FINANCIAL STATEMENTS (Continued) |
| April 30, 2022 |
| PFG Janus Henderson® Balanced Strategy Fund | ||||||||||||||||
| Assets * | Level 1 | Level 2 | Level 3 | Total | ||||||||||||
| Exchange Traded Funds | $ | 19,587,823 | $ | — | $ | — | $ | 19,587,823 | ||||||||
| Open End Funds | 254,436,118 | — | — | 254,436,118 | ||||||||||||
| Short-Term Investment | 712,878 | — | — | 712,878 | ||||||||||||
| Total | $ | 274,736,819 | $ | — | $ | — | $ | 274,736,819 | ||||||||
| PFG JP Morgan® Tactical Aggressive Strategy Fund | ||||||||||||||||
| Assets * | Level 1 | Level 2 | Level 3 | Total | ||||||||||||
| Exchange Traded Funds | $ | 83,268,552 | $ | — | $ | — | $ | 83,268,552 | ||||||||
| Open End Funds | 165,845,242 | — | — | 165,845,242 | ||||||||||||
| Short-Term Investment | 874,262 | — | — | 874,262 | ||||||||||||
| Total | $ | 249,988,056 | $ | — | $ | — | $ | 249,988,056 | ||||||||
| PFG JP Morgan® Tactical Moderate Strategy Fund | ||||||||||||||||
| Assets * | Level 1 | Level 2 | Level 3 | Total | ||||||||||||
| Exchange Traded Funds | $ | 46,969,027 | $ | — | $ | — | $ | 46,969,027 | ||||||||
| Open End Funds | 142,347,011 | — | — | 142,347,011 | ||||||||||||
| Short-Term Investment | 1,610,800 | — | — | 1,610,800 | ||||||||||||
| Total | $ | 190,926,838 | $ | — | $ | — | $ | 190,926,838 | ||||||||
| PFG Meeder Tactical Strategy Fund | ||||||||||||||||
| Assets * | Level 1 | Level 2 | Level 3 | Total | ||||||||||||
| Open End Funds | $ | 119,018,018 | $ | — | $ | — | $ | 119,018,018 | ||||||||
| Short-Term Investment | 365,542 | — | — | 365,542 | ||||||||||||
| Total | $ | 119,383,560 | $ | — | $ | — | $ | 119,383,560 | ||||||||
| PFG MFS® Aggressive Growth Strategy Fund | ||||||||||||||||
| Assets * | Level 1 | Level 2 | Level 3 | Total | ||||||||||||
| Exchange Traded Fund | $ | 13,014,774 | $ | — | $ | — | $ | 13,014,774 | ||||||||
| Open End Funds | 74,330,382 | — | — | 74,330,382 | ||||||||||||
| Short-Term Investment | 302,848 | — | — | 302,848 | ||||||||||||
| Total | $ | 87,648,004 | $ | — | $ | — | $ | 87,648,004 | ||||||||
| PFG Tactical Income Strategy Fund | ||||||||||||||||
| Assets * | Level 1 | Level 2 | Level 3 | Total | ||||||||||||
| Exchange Traded Funds | $ | 17,253,333 | $ | — | $ | — | $ | 17,253,333 | ||||||||
| Open End Funds | 100,430,756 | — | — | 100,430,756 | ||||||||||||
| Short-Term Investment | 52,411 | — | — | 52,411 | ||||||||||||
| Total | $ | 117,736,500 | $ | — | $ | — | $ | 117,736,500 | ||||||||
| * | Refer to the Portfolios of Investments for industry classification. |
The Funds did not hold any Level 3 securities during the period.
71
| THE PACIFIC FINANCIAL FUNDS |
| NOTES TO FINANCIAL STATEMENTS (Continued) |
| April 30, 2022 |
Security Transactions and Related Income – Security transactions are accounted for on the trade date. Interest income is recognized on an accrual basis. Discounts are accreted and premiums are amortized on securities purchased over the lives of the respective securities under the effective interest method. Dividend income is recorded on the ex- dividend date. Realized gains or losses from sales of securities are determined by comparing the identified cost of the security lot sold with the net sales proceeds. Withholding taxes on foreign dividends have been provided for in accordance with the Funds’ understanding of the applicable country’s tax rules and rates.
Dividends and Distributions to Shareholders – Dividends from net investment income and distributable net realized capital gains, if any, are declared and distributed annually by the Funds. Dividends from net investment income and distributions from net realized gains are recorded on the ex-dividend date and are determined in accordance with federal income tax regulations, which may differ from GAAP. These “book/tax” differences are considered either temporary (e.g., deferred losses, capital loss carryforwards) or permanent in nature. To the extent these differences are permanent in nature, such amounts are reclassified within the composition of net assets based on their federal tax-basis treatment; and temporary differences do not require reclassification. Any such reclassifications will have no effect on net assets, results of operations or net asset values per share of each Fund.
Federal Income Tax – It is the policy of each Fund to qualify as a regulated investment company by complying with the provisions of Subchapter M of the Internal Revenue Code that are applicable to regulated investment companies and to distribute substantially all of its taxable income and net realized gains to shareholders. Therefore, no federal income tax provision is required. Each Fund recognizes the tax benefits of uncertain tax positions only where the position is “more likely than not” to be sustained assuming examination by tax authorities. Management has analyzed each Fund’s tax positions and has concluded that no liability for unrecognized tax benefits should be recorded related to uncertain tax positions, taken on returns filed for open tax years ended April 30, 2019 through April 30, 2021, or expected to be taken in the Funds’ April 30, 2022 year-end tax returns. Each Fund identifies its major tax jurisdictions as U.S. federal, Ohio, and foreign jurisdictions where a Fund makes significant investments; however, the Funds are not aware of any tax positions for which it is reasonably possible that the total amounts of unrecognized tax benefits will change materially in the next twelve months. The Funds recognized interest and penalties related to unrecognized tax benefits in interest and other expenses, respectively. For the year ended April 30, 2022, the Funds did not have any interest or penalties.
Indemnification – The Trust indemnifies its officers and Trustees for certain liabilities that may arise from the performance of their duties to the Trust. Additionally, in the normal course of business, the Funds enter into contracts that contain a variety of representations and warranties and which provide general indemnities. The Funds’ maximum exposure under these arrangements is unknown, as this would involve future claims that may be made against the Funds that have not yet occurred. However, based on experience, the Funds expect the risk of loss due to these warranties and indemnities to be remote.
| 3. | INVESTMENT TRANSACTIONS |
For the year/period ended April 30, 2022, cost of purchases and proceeds from sales of Fund securities, other than short-term investments, amounted to the following:
| Fund | Purchases | Sales | ||||||
| PFG Active Core Bond Strategy Fund | $ | 77,550,616 | $ | 90,727,586 | ||||
| PFG American Funds® Conservative Income Strategy Fund | 93,619,477 | 71,430,805 | ||||||
| PFG American Funds® Growth Strategy Fund | 179,684,758 | 258,719,630 | ||||||
| PFG BNY Mellon Diversifier Strategy Fund | 75,659,255 | 30,275,779 | ||||||
| PFG BR Equity ESG Strategy Fund | 194,123,840 | 86,393,497 | ||||||
| PFG Fidelity Institutional AM® Bond ESG Strategy Fund | 7,786,919 | 324,647 | ||||||
| PFG Fidelity Institutional AM® Equity Index Strategy Fund | 22,735,549 | 25,867,638 | ||||||
| PFG Fidelity Institutional AM® Equity Sector Strategy Fund | 231,765,266 | 137,523,809 | ||||||
| PFG Invesco® Thematic ESG Strategy Fund | 80,551,946 | 4,398,610 | ||||||
| PFG Janus Henderson® Balanced Strategy Fund | 335,523,445 | 12,030,480 | ||||||
| PFG JP Morgan® Tactical Aggressive Strategy Fund | 263,857,314 | 119,919,924 | ||||||
| PFG JP Morgan® Tactical Moderate Strategy Fund | 190,006,443 | 140,733,530 | ||||||
| PFG Meeder Tactical Strategy Fund | 105,145,460 | 77,596,616 | ||||||
| PFG MFS® Aggressive Growth Strategy Fund | 39,225,583 | 119,928,333 | ||||||
| PFG Tactical Income Strategy Fund | 133,410,167 | 120,571,697 | ||||||
72
| THE PACIFIC FINANCIAL FUNDS |
| NOTES TO FINANCIAL STATEMENTS (Continued) |
| April 30, 2022 |
| 4. | INVESTMENT ADVISORY AGREEMENT AND TRANSACTIONS WITH RELATED PARTIES |
The Pacific Financial Group, LLC serves as the Funds’ investment advisor (the “Advisor”). Pursuant to an investment advisory agreement with the Trust, on behalf of the Funds, the Advisor, under the oversight of the Board, directs the daily operations of the Funds and supervises the performance of administrative and professional services provided by others. As compensation for its services and the related expenses borne by the Advisor, each Fund pays the Advisor an investment advisory fee, computed and accrued daily and paid monthly, at an annual rate of 1.25% of each Fund’s average daily net assets.
For the year/period ended April 30, 2022, pursuant to the investment advisory agreement, the Advisor earned the following advisory fees:
| Fund | ||||
| PFG Active Core Bond Strategy Fund | $ | 1,816,315 | ||
| PFG American Funds® Conservative Income Strategy Fund | 2,659,362 | |||
| PFG American Funds® Growth Strategy Fund | 9,039,149 | |||
| PFG BNY Mellon Diversifier Strategy Fund | 2,031,431 | |||
| PFG BR Equity ESG Strategy Fund | 2,279,283 | |||
| PFG Fidelity Institutional AM® Bond ESG Strategy Fund | 31,528 | |||
| PFG Fidelity Institutional AM® Equity Index Strategy Fund | 1,760,543 | |||
| PFG Fidelity Institutional AM® Equity Sector Strategy Fund | 2,499,108 | |||
| PFG Invesco® Thematic ESG Strategy Fund | 396,353 | |||
| PFG Janus Henderson® Balanced Strategy Fund | 1,774,734 | |||
| PFG JP Morgan® Tactical Aggressive Strategy Fund | 2,680,450 | |||
| PFG JP Morgan® Tactical Moderate Strategy Fund | 2,401,289 | |||
| PFG Meeder Tactical Strategy Fund | 1,478,706 | |||
| PFG MFS® Aggressive Growth Strategy Fund | 1,623,166 | |||
| PFG Tactical Income Strategy Fund | 1,456,539 |
Effective May 1, 2020, The Pacific Financial Group, Inc. (“TPFG), an affiliate of the Advisor, entered into an Administrative Services Agreement with the Trust (the “Administrative Services Agreement”). Under the terms of the Administrative Services Agreement, TPFG receives a fee from each Fund in an amount equal to 0.70% of the Fund’s average daily net assets. In exchange, TPFG is responsible to provide the following services and to pay for the following Fund expenses.
The Funds are used to construct Model Portfolios, consisting solely of the Funds, which are purchased by the Funds’ shareholders. The shareholders are investment management clients of TPFG and are typically introduced to TPFG by a Financial Intermediary. In most, but not all, instances, the shareholders are participants in a retirement plan, regulated by ERISA or by Internal Revenue Code, and the shareholders invest in the Model Portfolios through a self-directed brokerage account (“SDBA”) or a similar type of account made available by the retirement plan.
Among the services provided to shareholders, by TPFG, under the Administrative Services Agreement, are: (i) assistance in opening an account in which the shareholder will invest in a Model Portfolio; (ii) providing resources that enable the Financial Intermediary to assist the shareholder, in identifying the shareholder’s investment objective and risk profile; (iii) educating, and responding to questions from, shareholders, or from Financial Intermediaries acting on behalf of a shareholder, about the Funds and the Model Portfolios; (iv) trading Model Portfolios on behalf of shareholders, and reconciling those trades, typically with the custodian of a retirement plan; (v) maintaining records of investments in Model Portfolios, the performance of Model Portfolios, and contributions to, and withdrawals from, Model Portfolios, for shareholders and for their Financial Intermediaries; and (vi) assisting in account maintenance, account closings, and account transfers, for shareholders. All of these services are in addition to the services provided by other Fund Service Providers.
73
| THE PACIFIC FINANCIAL FUNDS |
| NOTES TO FINANCIAL STATEMENTS (Continued) |
| April 30, 2022 |
In addition to providing services, TPFG is responsible to make the following payments, on behalf of the Funds: (a) the fees and certain expenses incurred in connection with the provision of Fund Administration, Fund Accounting and Fund Transfer Agent Services; (b) the fees and certain expenses of the Funds’ Custodian; (c) the fees charged by retirement plan or other custodians that maintain SDBAs or other brokerage accounts for Fund shareholders; (d) the charges and expenses of legal counsel and independent accountants for the Funds; (e) the fees and expenses of Trustees who are not affiliated persons of the Advisor or Distributor; (f) the fees of the Funds’ participation in any trade association of which the Trust may be a member; (g) the cost of fidelity and liability insurance; (h) the fees and expenses involved in maintaining registration of the Fund and of the Funds’ shares with the SEC, maintaining qualification of the Funds’ shares under state securities laws, and the preparation and printing of the Fund’s registration statements and prospectuses for such purposes; (i) expenses of shareholders and Trustees’ meetings; and (j) expenses of preparing, printing and mailing reports, proxy statements and prospectuses to shareholders in the amount necessary for distribution to shareholders (collectively, “Fund Operating Expenses”).
Under the Administrative Services Agreement, Fund Operating Expenses do not include (i) advertising, promotion and other expenses incurred in connection with the sale or distribution of the Funds’ shares (including expenses that the Funds are authorized to pay pursuant to Rule 12b -1); (ii) brokerage fees and commissions; (iii) taxes; (iv) borrowing costs; (iv) fees and expenses of investment companies acquired by a Fund; (v) advisory fees payable to the Funds’ Advisor; and (vi) extraordinary or non-recurring expenses, such as litigation and indemnification expenses. TPFG’s role with respect to paying Fund Operating Expenses shall be as the paying agent, without responsibility (under the Administrative Services Agreement) for the manner of performance by the Funds’ service providers.
The Administrative Services Agreement will continue in effect for one (1) year and thereafter shall continue from year to year provided such continuance is approved at least annually by a vote of the majority of the Trustees. The Servicing Administration Agreement may be terminated without penalty on 60 days’ written notice by a vote of a majority of the Trustees or by the TPFG, or by holders of a majority of that Trust’s outstanding shares.
The Trust, with respect to the Funds, has adopted the Trust’s Master Distribution and Shareholder Servicing Plan pursuant to Rule 12b-1 under the 1940 Act (the “Plan”). The Plan provides that a monthly service and/or distribution fee is calculated by each Fund at an annual rate up to 0.25% of its average daily net assets.
Northern Lights Fund Distributors, LLC, the Fund’s distributor (“Distributor”), and other entities are paid under the Plan for services provided and the expenses borne by the Distributor and others, such as custodial platform providers and retirement plan administrators (“Platforms”), in the distribution of Fund shares and in the servicing of Fund shareholders. For the Distributor, such services and expenses include overhead and telephone expenses; printing and distribution of prospectuses and reports used in connection with the offering of the Funds’ shares to other than current shareholders; and preparation, printing and distribution of sales literature and advertising materials. For Platforms, the Plan permits the payment of fees charged by Platforms for distribution services provided in connection with Fund shares and custodial, recordkeeping and other services provided to Fund shareholders.
For financial intermediaries, such as brokers, investment advisers, financial planners, banks, insurance companies and others, including their respective representatives (collectively, “Financial Intermediaries”), Plan fees may be used for payment of shareholder services, such as shareholder account administrative services, and marketing support, which may include access to, or financial support for, sales meetings; access to sales representatives and Financial Intermediary management representatives; inclusion of the Funds on a sales list, including a preferred or select sales list; printing and distribution of sales literature and advertising materials; or participation in other sales programs . If you work with a Financial Intermediary in investing in the Funds, the Financial Intermediary may receive 12b-1 fees from the Distributor, for the marketing support and shareholder services provided by the Financial Intermediary.
74
| THE PACIFIC FINANCIAL FUNDS |
| NOTES TO FINANCIAL STATEMENTS (Continued) |
| April 30, 2022 |
Each Fund is currently accruing 0.10% of its average daily net assets under the plan. For the year/period ended April 30, 2022, pursuant to the Plan, the Funds accrued the following fees:
| Fund | 12b-1 Fee | |||
| PFG Active Core Bond Strategy Fund | $ | 145,326 | ||
| PFG American Funds® Conservative Income Strategy Fund | 212,783 | |||
| PFG American Funds® Growth Strategy Fund | 723,247 | |||
| PFG BNY Mellon Diversifier Strategy Fund | 162,541 | |||
| PFG BR Equity ESG Strategy Fund | 182,377 | |||
| PFG Fidelity Institutional AM® Bond ESG Strategy Fund | 2,703 | |||
| PFG Fidelity Institutional AM® Equity Index Strategy Fund | 140,479 | |||
| PFG Fidelity Institutional AM® Equity Sector Strategy Fund | 199,965 | |||
| PFG Invesco® Thematic ESG Strategy Fund | 31,718 | |||
| PFG Janus Henderson® Balanced Strategy Fund | 142,019 | |||
| PFG JP Morgan® Tactical Aggressive Strategy Fund | 214,477 | |||
| PFG JP Morgan® Tactical Moderate Strategy Fund | 192,136 | |||
| PFG Meeder Tactical Strategy Fund | 118,317 | |||
| PFG MFS® Aggressive Growth Strategy Fund | 129,870 | |||
| PFG Tactical Income Strategy Fund | 116,542 | |||
The Distributor acts as the Funds’ principal underwriter in a continuous public offering of the Funds’ shares. The Distributor did not receive any commissions from the sale of the Funds’ shares.
In addition, certain affiliates of the Distributor provide services to the Funds as follows:
Ultimus Fund Services, LLC (“UFS”), an affiliate of the Distributor, provides administration, fund accounting, and transfer agent services to the Funds. Pursuant to separate servicing agreements with UFS, TPFG pay UFS customary fees for providing administration, fund accounting and transfer agency services to the Funds. Certain officers of the Trust are also officers of UFS and are not paid any fees directly by the Funds for serving in such capacities.
Northern Lights Compliance Services, LLC (“NLCS”), an affiliate of UFS and the Distributor, provides a chief compliance officer to the Trust, as well as related compliance services, pursuant to a consulting agreement between NLCS and the Trust. Under the terms of such agreement, NLCS receives customary fees from TPFG.
BluGiant, LLC (“BluGiant”), an affiliate of UFS and the Distributor, provides EDGAR conversion and filing services as well as print For the provision of these services, BluGiant receives customary fees from management services for the Funds on an ad-hoc basis. TPFG.
| 5. | INVESTMENT IN AFFILIATED COMPANIES |
An affiliated company is a company in which a Fund has ownership of at least 5% of the voting securities. Transactions during the year/period ended April 30, 2022 with affiliated companies are as follows:
PFG BR Equity ESG Strategy Fund
| Change in | ||||||||||||||||||||||||||
| Value-Beginning of | Net Realized Gain | Unrealized | Value-End of | |||||||||||||||||||||||
| CUSIP | Description | Period | Purchases | Sales Proceeds | (Loss) | Appreciation | Period | |||||||||||||||||||
| 46436E759 | iShares ESG Advanced MSCI EAFE ETF | $ | — | $ | 27,546,818 | $ | 482,588 | $ | (38,836 | ) | $ | (4,976,521 | ) | $ | 22,048,871 | |||||||||||
| 46436E767 | iShares ESG Advanced MSCI USA ETF | — | 53,543,275 | 1,433,692 | 1,951 | (5,694,832 | ) | 46,416,702 | ||||||||||||||||||
75
| THE PACIFIC FINANCIAL FUNDS |
| NOTES TO FINANCIAL STATEMENTS (Continued) |
| April 30, 2022 |
PFG Janus Henderson® Balanced Strategy Fund
| Change in | ||||||||||||||||||||||||||
| Value-Beginning of | Net Realized | Unrealized | Value-End of | |||||||||||||||||||||||
| CUSIP | Description | Period | Purchases | Sales Proceeds | Loss | Depreciation | Period | |||||||||||||||||||
| 47103U100 | Janus Henderson Small Cap Growth Alpha ETF | $ | — | $ | 11,283,911 | $ | 560,536 | $ | (124,167 | ) | $ | (2,628,013 | ) | $ | 7,971,195 | |||||||||||
| 47103U209 | Janus Henderson Small/Mid Cap Growth Alpha ETF | — | 10,486,031 | 285,736 | (48,353 | ) | (2,063,837 | ) | 8,088,105 | |||||||||||||||||
PFG JP Morgan® Tactical Aggressive Strategy Fund
| Change in | ||||||||||||||||||||||||||
| Value-Beginning of | Unrealized | Value-End of | ||||||||||||||||||||||||
| CUSIP | Description | Period | Purchases | Sales Proceeds | Net Realized Gain | Depreciation | Period | |||||||||||||||||||
| 46641Q308 | JPMorgan Diversified Return Emerging Markets Equity ETF | $ | 12,351,706 | $ | 27,142,966 | $ | 20,936,810 | $ | 1,067,329 | $ | (3,108,115 | ) | $ | 16,517,076 | ||||||||||||
| 46641Q779 | JPMorgan US Momentum Factor ETF | 4,072,973 | 12,695,559 | 709,461 | 288,847 | (1,569,224 | ) | 14,778,694 | ||||||||||||||||||
PFG Meeder Tactical Strategy Fund
| Change in | ||||||||||||||||||||||||||
| Value-Beginning of | Unrealized | Value-End of | ||||||||||||||||||||||||
| CUSIP | Description | Period | Purchases | Sales Proceeds | Net Realized Gain | Depreciation | Period | |||||||||||||||||||
| 58510R762 | Meeder Dynamic Allocation Fund | $ | — | $ | 26,618,559 | $ | 1,482,000 | $ | (220,265 | ) | $ | (5,247,242 | ) | $ | 19,669,052 | |||||||||||
| 58510R788 | Meeder Muirfield Fund | 15,885,544 | 63,967,516 | 5,212,000 | 871,738 | (8,717,286 | ) | 66,795,512 | ||||||||||||||||||
| 58510R655 | Meeder Spectrum Fund | 10,552,327 | 3,859,000 | 1,424,000 | 217,245 | (1,257,991 | ) | 11,946,581 | ||||||||||||||||||
PFG Tactical Income Strategy Fund
| Change in | ||||||||||||||||||||||||||
| Value-Beginning of | Unrealized | Value-End of | ||||||||||||||||||||||||
| CUSIP | Description | Period | Purchases | Sales Proceeds | Net Realized Loss | Depreciation | Period | |||||||||||||||||||
| 47103E346 | Janus Henderson Asia Equity Fund | $ | — | $ | 9,417,560 | $ | 1,049,925 | $ | (297,970 | ) | $ | (1,432,101 | ) | $ | 6,637,564 | |||||||||||
| 6. | AGGREGATE UNREALIZED APPRECIATION AND DEPRECIATION – TAX BASIS |
The identified cost of investments in securities owned by each Fund for federal income tax purposes and its respective gross unrealized appreciation and depreciation at April 30, 2022, were as follows:
| Net | ||||||||||||||||
| Gross | Gross | Unrealized | ||||||||||||||
| Tax | Unrealized | Unrealized | Appreciation/ | |||||||||||||
| Cost | Appreciation | Depreciation | (Depreciation) | |||||||||||||
| PFG Active Core Bond Strategy Fund | $ | 153,901,429 | $ | 708,974 | $ | (13,858,069 | ) | $ | (13,149,095 | ) | ||||||
| PFG American Funds® Conservative Income Strategy Fund | 217,199,110 | 1,490,299 | (13,746,090 | ) | (12,255,791 | ) | ||||||||||
| PFG American Funds® Growth Strategy Fund | 630,760,324 | — | (67,929,171 | ) | (67,929,171 | ) | ||||||||||
| PFG BNY Mellon Diversifier Strategy Fund | 169,281,172 | 2,192,231 | (9,510,443 | ) | (7,318,212 | ) | ||||||||||
| PFG BR Equity ESG Strategy Fund | 232,480,328 | 4,255,546 | (19,550,919 | ) | (15,295,373 | ) | ||||||||||
| PFG Fidelity Institutional AM® Bond ESG Strategy Fund | 7,480,161 | — | (603,020 | ) | (603,020 | ) | ||||||||||
| PFG Fidelity Institutional AM® Equity Index Strategy Fund | 107,486,828 | 24,319,760 | — | 24,319,760 | ||||||||||||
| PFG Fidelity Institutional AM® Equity Sector Strategy Fund | 235,381,849 | 6,379,332 | (18,060,281 | ) | (11,680,949 | ) | ||||||||||
| PFG Invesco® Thematic ESG Strategy Fund | 76,174,651 | — | (16,829,487 | ) | (16,829,487 | ) | ||||||||||
| PFG Janus Henderson® Balanced Strategy Fund | 324,036,712 | — | (49,299,893 | ) | (49,299,893 | ) | ||||||||||
| PFG JP Morgan® Tactical Aggressive Strategy Fund | 266,737,855 | 673,346 | (17,423,145 | ) | (16,749,799 | ) | ||||||||||
| PFG JP Morgan® Tactical Moderate Strategy Fund | 203,323,181 | 1,663,309 | (14,059,652 | ) | (12,396,343 | ) | ||||||||||
76
| THE PACIFIC FINANCIAL FUNDS |
| NOTES TO FINANCIAL STATEMENTS (Continued) |
| April 30, 2022 |
| Net | ||||||||||||||||
| Gross | Gross | Unrealized | ||||||||||||||
| Tax | Unrealized | Unrealized | Appreciation/ | |||||||||||||
| Cost | Appreciation | Depreciation | (Depreciation) | |||||||||||||
| PFG Meeder Tactical Strategy Fund | 131,081,983 | 541,614 | (12,240,037 | ) | (11,698,423 | ) | ||||||||||
| PFG MFS® Aggressive Growth Strategy Fund | 83,560,624 | 6,108,343 | (2,020,963 | ) | 4,087,380 | |||||||||||
| PFG Tactical Income Strategy Fund | 130,312,644 | — | (12,576,144 | ) | (12,576,144 | ) | ||||||||||
| 7. | DISTRIBUTIONS TO SHAREHOLDERS AND TAX COMPONENTS OF CAPITAL |
The tax character of distributions paid during the fiscal year ended April 30, 2022 and the fiscal year ended April 30, 2021 were as follows:
| For fiscal year ended | Ordinary | Long-Term | Return of | |||||||||||||
| 4/30/2022 | Income | Capital Gains | Capital | Total | ||||||||||||
| PFG Active Core Bond Strategy Fund | $ | 2,389,559 | $ | 2,034,455 | $ | — | $ | 4,424,014 | ||||||||
| PFG American Funds® Conservative Income Strategy Fund | 2,208,736 | 1,116,031 | — | 3,324,767 | ||||||||||||
| PFG American Funds® Growth Strategy Fund | 9,121,964 | 23,521,952 | — | 32,643,916 | ||||||||||||
| PFG BNY Mellon Diversifier Strategy Fund | 1,002,777 | 4,588,204 | — | 5,590,981 | ||||||||||||
| PFG BR Equity ESG Strategy Fund | 9,763,622 | 12,960,361 | — | 22,723,983 | ||||||||||||
| PFG Fidelity Institutional AM® Bond ESG Strategy Fund | — | — | — | — | ||||||||||||
| PFG Fidelity Institutional AM® Equity Index Strategy Fund | 4,001,195 | 2,812,427 | — | 6,813,622 | ||||||||||||
| PFG Fidelity Institutional AM® Equity Sector Strategy Fund | 12,757,675 | 2,344,331 | — | 15,102,006 | ||||||||||||
| PFG Invesco® Thematic ESG Strategy Fund | 123,094 | — | — | 123,094 | ||||||||||||
| PFG Janus Henderson® Balanced Strategy Fund | 1,124,954 | 46,046 | — | 1,171,000 | ||||||||||||
| PFG JP Morgan® Tactical Aggressive Strategy Fund | 3,496,799 | 10,638,274 | — | 14,135,073 | ||||||||||||
| PFG JP Morgan® Tactical Moderate Strategy Fund | 4,927,831 | 8,571,537 | — | 13,499,368 | ||||||||||||
| PFG Meeder Tactical Strategy Fund | — | 2,652,537 | — | 2,652,537 | ||||||||||||
| PFG MFS® Aggressive Growth Strategy Fund | — | 15,781,776 | — | 15,781,776 | ||||||||||||
| PFG Tactical Income Strategy Fund | 8,132,655 | 5,840,952 | — | 13,973,607 | ||||||||||||
| For fiscal year ended | Ordinary | Long-Term | Return of | |||||||||||||
| 4/30/2021 | Income | Capital Gains | Capital | Total | ||||||||||||
| PFG Active Core Bond Strategy Fund | $ | 4,072,997 | $ | 1,369,472 | — | $ | 5,442,469 | |||||||||
| PFG American Funds® Conservative Income Strategy Fund | 2,585,671 | 36,108 | — | 2,621,779 | ||||||||||||
| PFG American Funds® Growth Strategy Fund | 11,930,414 | 2,043,677 | — | 13,974,091 | ||||||||||||
| PFG BNY Mellon Diversifier Strategy Fund | — | 55,532 | — | 55,532 | ||||||||||||
| PFG BR Equity ESG Strategy Fund | 3,193,939 | — | — | 3,193,939 | ||||||||||||
| PFG Fidelity Institutional AM® Bond ESGStrategy Fund | — | — | — | — | ||||||||||||
| PFG Fidelity Institutional AM® Equity Index Strategy Fund | 3,367,881 | 6,337 | — | 3,374,218 | ||||||||||||
| PFG Fidelity Institutional AM® Equity Sector Strategy Fund | 6,835,862 | — | — | 6,835,862 | ||||||||||||
| PFG Invesco® Thematic ESG Strategy Fund | — | — | — | — | ||||||||||||
| PFG Janus Henderson® Balanced Strategy Fund | — | — | — | — | ||||||||||||
| PFG JP Morgan® Tactical Aggressive Strategy Fund | — | — | — | — | ||||||||||||
| PFG JP Morgan® Tactical Moderate Strategy Fund | 379,840 | 202,977 | — | 582,817 | ||||||||||||
| PFG Meeder Tactical Strategy Fund | — | 1,089,533 | — | 1,089,533 | ||||||||||||
| PFG MFS® Aggressive Growth Strategy Fund | — | 5,246,887 | — | 5,246,887 | ||||||||||||
| PFG Tactical Income Strategy Fund | 2,739,989 | — | — | 2,739,989 | ||||||||||||
77
| THE PACIFIC FINANCIAL FUNDS |
| NOTES TO FINANCIAL STATEMENTS (Continued) |
| April 30, 2022 |
As of April 30, 2022, the components of accumulated earnings/(deficit) on a tax basis were as follows:
| Undistributed | Undistributed | Post October Loss | Capital Loss | Other | Unrealized | Total | ||||||||||||||||||||||
| Ordinary | Long-Term | and | Carry | Book/Tax | Appreciation/ | Accumulated | ||||||||||||||||||||||
| Income | Capital Gains | Late Year Loss | Forwards | Differences | (Depreciation) | Earnings/(Deficits | ||||||||||||||||||||||
| PFG Active Core Bond Strategy Fund | $ | 54,789 | $ | — | $ | (175,648 | ) | $ | — | $ | — | $ | (13,149,095 | ) | $ | (13,269,954 | ) | |||||||||||
| PFG American Funds® Conservative Income Strategy | — | 4,558,212 | (280,610 | ) | — | — | (12,255,791 | ) | (7,978,189 | ) | ||||||||||||||||||
| PFG American Funds® Growth Strategy Fund | — | 87,714,334 | (3,761,623 | ) | — | — | (67,929,171 | ) | 16,023,540 | |||||||||||||||||||
| PFG BNY Mellon Diversifier Strategy Fund | 1,897,001 | — | — | — | — | (7,318,212 | ) | (5,421,211 | ) | |||||||||||||||||||
| PFG BR Equity ESG Strategy Fund | 35,875 | 1,382,574 | (1,527,482 | ) | — | — | (15,295,373 | ) | (15,404,406 | ) | ||||||||||||||||||
| PFG Fidelity Institutional AM® Bond ESGStrategy Fund | — | 5,105 | (4,901 | ) | — | — | (603,020 | ) | (602,816 | ) | ||||||||||||||||||
| PFG Fidelity Institutional AM® Equity Index Strategy Fund | — | 6,446,805 | (673,121 | ) | — | — | 24,319,760 | 30,093,444 | ||||||||||||||||||||
| PFG Fidelity Institutional AM® Equity Sector Strategy Fund | 7,136,380 | 18,859,513 | — | — | — | (11,680,949 | ) | 14,314,944 | ||||||||||||||||||||
| PFG Invesco® Thematic ESG Strategy Fund | — | — | (552,362 | ) | — | — | (16,829,487 | ) | (17,381,849 | ) | ||||||||||||||||||
| PFG Janus Henderson® Balanced Strategy Fund | — | 8,641,045 | (1,113,556 | ) | — | — | (49,299,893 | ) | (41,772,404 | ) | ||||||||||||||||||
| PFG JP Morgan® Tactical Aggressive Strategy Fund | — | 13,827,885 | (1,297,298 | ) | — | — | (16,749,799 | ) | (4,219,212 | ) | ||||||||||||||||||
| PFG JP Morgan® Tactical Moderate Strategy Fund | — | 12,732,806 | (2,718,761 | ) | — | — | (12,396,343 | ) | (2,382,298 | ) | ||||||||||||||||||
| PFG Meeder Tactical Strategy Fund | — | 16,513,090 | — | — | — | (11,698,423 | ) | 4,814,667 | ||||||||||||||||||||
| PFG MFS® Aggressive Growth Strategy Fund | — | 11,342,192 | (541,101 | ) | — | — | 4,087,380 | 14,888,471 | ||||||||||||||||||||
| PFG Tactical Income Strategy Fund | — | 871,398 | (329,342 | ) | — | — | (12,576,144 | ) | (12,034,088 | ) | ||||||||||||||||||
The difference between book basis and tax basis unrealized appreciation (depreciation) and accumulated net realized gain/(loss) from investments is primarily attributable to the tax deferral of losses on wash sales.
Late year losses incurred after December 31 within the fiscal year are deemed to arise on the first business day of the following fiscal year for tax purposes. The following Funds incurred and elected to defer such late year losses as follows:
| Late Year | ||||
| Losses | ||||
| PFG Active Core Bond Strategy Fund | $ | — | ||
| PFG American Funds® Conservative Income Strategy Fund | 280,610 | |||
| PFG American Funds® Growth Strategy Fund | 3,761,623 | |||
| PFG BNY Mellon Diversifier Strategy Fund | — | |||
| PFG BR Equity ESG Strategy Fund | 1,055,460 | |||
| PFG Fidelity Institutional AM® Bond ESG Strategy Fund | 4,901 | |||
| PFG Fidelity Institutional AM® Equity Index Strategy Fund | 673,121 | |||
| PFG Fidelity Institutional AM® Equity Sector Strategy Fund | — | |||
| PFG Invesco® Thematic ESG Strategy Fund | 373,794 | |||
| PFG Janus Henderson® Balanced Strategy Fund | 1,113,556 | |||
| PFG JP Morgan® Tactical Aggressive Strategy Fund | 1,297,298 | |||
| PFG JP Morgan® Tactical Moderate Strategy Fund | 442,488 | |||
| PFG Meeder Tactical Strategy Fund | — | |||
| PFG MFS® Aggressive Growth Strategy Fund | 541,101 | |||
| PFG Tactical Income Strategy Fund | 329,342 | |||
78
| THE PACIFIC FINANCIAL FUNDS |
| NOTES TO FINANCIAL STATEMENTS (Continued) |
| April 30, 2022 |
Capital losses incurred after October 31 within the fiscal year are deemed to arise on the first business day of the following fiscal year for tax purposes. The following Funds incurred and elected to defer such capital losses as follows:
| Post October | ||||
| Losses | ||||
| PFG Active Core Bond Strategy Fund | $ | 175,648 | ||
| PFG American Funds® Conservative Income Strategy Fund | — | |||
| PFG American Funds® Growth Strategy Fund | — | |||
| PFG BNY Mellon Diversifier Strategy Fund | — | |||
| PFG BR Equity ESG Strategy Fund | 472,022 | |||
| PFG Fidelity Institutional AM® Bond ESGStrategy Fund | — | |||
| PFG Fidelity Institutional AM® Equity Index Strategy Fund | — | |||
| PFG Fidelity Institutional AM® Equity Sector Strategy Fund | — | |||
| PFG Invesco® Thematic ESG Strategy Fund | 178,568 | |||
| PFG Janus Henderson® Balanced Strategy Fund | — | |||
| PFG JP Morgan® Tactical Aggressive Strategy Fund | — | |||
| PFG JP Morgan® Tactical Moderate Strategy Fund | 2,276,273 | |||
| PFG Meeder Tactical Strategy Fund | — | |||
| PFG MFS® Aggressive Growth Strategy Fund | — | |||
| PFG Tactical Income Strategy Fund | — | |||
During the fiscal year ended April 30, 2022, certain of the Funds utilized tax equalization which is the use of earnings and profits distributions to shareholders on redemption of shares as part of the dividends paid deduction for income tax purposes. Permanent book and tax differences, primarily attributable to the book/tax basis treatment of net operating losses, distributions in excess, and use of tax equalization credits, resulted in reclassifications for the Funds for the fiscal year ended April 30, 2022 as follows:
| Paid In | Accumulated | |||||||
| Capital | Earnings (Losses) | |||||||
| PFG Active Core Bond Strategy Fund | $ | — | $ | — | ||||
| PFG American Funds® Conservative Income Strategy Fund | (302,804 | ) | 302,804 | |||||
| PFG American Funds® Growth Strategy Fund | 25,019,413 | (25,019,413 | ) | |||||
| PFG BNY Mellon Diversifier Strategy Fund | — | — | ||||||
| PFG BR Equity ESG Strategy Fund | — | — | ||||||
| PFG Fidelity Institutional AM® Bond ESG Strategy Fund | (1,322 | ) | 1,322 | |||||
| PFG Fidelity Institutional AM® Equity Index Strategy Fund | — | — | ||||||
| PFG Fidelity Institutional AM® Equity Sector Strategy Fund | — | — | ||||||
| PFG Invesco® Thematic ESG Strategy Fund | (7,797 | ) | 7,797 | |||||
| PFG Janus Henderson® Balanced Strategy Fund | — | — | ||||||
| PFG JP Morgan® Tactical Aggressive Strategy Fund | — | — | ||||||
| PFG JP Morgan® Tactical Moderate Strategy Fund | 27 | (27 | ) | |||||
| PFG Meeder Tactical Strategy Fund | (57,767 | ) | 57,767 | |||||
| PFG MFS® Aggressive Growth Strategy Fund | 15,812,798 | (15,812,798 | ) | |||||
| PFG Tactical Income Strategy Fund | — | — | ||||||
79
| THE PACIFIC FINANCIAL FUNDS |
| NOTES TO FINANCIAL STATEMENTS (Continued) |
| April 30, 2022 |
| 8. | Foreign Tax Credit (Unaudited) |
The PFG BNY Mellon Diversifier Strategy Fund intends to elect to pass through to shareholders the income tax credit for taxes paid to foreign countries. Foreign source income and foreign tax expense per outstanding share as of fiscal year ended April 30, 2022, were as follows:
| For fiscal year ended | ||||||||
| 4/30/2022 | Foreign Taxes Paid | Foreign Source Income | ||||||
| PFG BNY Mellon Diversifier Strategy Fund | $ | 0.0019 | $ | 0.0474 | ||||
| 9. | CONTROL OWNERSHIP |
The beneficial ownership, either directly or indirectly, of more than 25% of the voting securities of a Fund creates presumption of control of the Fund, under Section 2(a)(9) of the 1940 Act. As of April 30, 2022, beneficial ownership in excess of 25% for the Funds is as follows:
| Portfolio | Beneficial Owner | % of Outstanding Shares |
| PFG Active Core Bond Strategy Fund | NFS | 40% |
| Pershing | 32% | |
| PFG American Funds® Conservative Income Strategy Fund | NFS | 45% |
| PFG American Funds® Growth Strategy Fund | NFS | 49% |
| PFG BNY Mellon Diversifier Strategy Fund | NFS | 41% |
| PFG BR Equity ESG Strategy Fund | NFS | 47% |
| PFG Fidelity Institutional AM® Bond ESG Strategy Fund | NFS | 53% |
| PFG Fidelity Institutional AM® Equity Index Strategy Fund | NFS | 49% |
| PFG Fidelity Institutional AM® Equity Sector Strategy Fund | NFS | 47% |
| PFG Invesco® Thematic ESG Strategy Fund | NFS | 49% |
| PFG Janus Henderson® Balanced Strategy Fund | NFS | 40% |
| Pershing | 26% | |
| PFG JP Morgan® Tactical Aggressive Strategy Fund | NFS | 51% |
| PFG JP Morgan® Tactical Moderate Strategy Fund | NFS | 42% |
| Pershing | 26% | |
| PFG Meeder Tactical Strategy Fund | NFS | 41% |
| PFG MFS® Aggressive Growth Strategy Fund | NFS | 46% |
| PFG Tactical Income Strategy Fund | NFS | 37% |
| Pershing | 30% |
80
| THE PACIFIC FINANCIAL FUNDS |
| NOTES TO FINANCIAL STATEMENTS (Continued) |
| April 30, 2022 |
| 10. | UNDERLYING INVESTMENTS IN OTHER INVESTMENT COMPANIES |
The following Funds currently invest a portion of their assets in the corresponding investment companies. The Funds may redeem their investment from these investment companies at any time if the Adviser determines that it is in the best interest of the Funds and their shareholders to do so. The performance of the Funds will be directly affected by the performance of these investment companies. The financial statements of these investment companies, including their portfolios of investments, can be found at the Securities and Exchange Commission’s website www.sec.gov and should be read in conjunction with the Funds’ financial statements.
| Percentage | ||
| Fund | Investment | of Net Assets |
| PFG Active Core Bond Strategy Fund | PIMCO Income Fund | 29.9% |
| PIMCO Total Return Fund | 39.7% | |
| PFG BNY Mellon Diversifier Strategy Fund | BNY Mellon Global Real Return Fund | 38.3% |
| BNY Mellon Core Plus Fund | 36.7% | |
| PFG BR Equity Strategy Fund | iShare ESG Aware MSCI USA ETF | 25.2% |
PFG Fidelity Institutional AM® Bond ESG Strategy Fund |
Fidelity Sustainability Bond Index Fund | 70.6% |
| PFG Fidelity Institutional AM® Equity Index Strategy Fund | Fidelity 500 Index Fund | 57.8% |
| Fidelity Global ex US Index Fund | 30.2% | |
| PFG Invesco® Thematic ESG Strategy Fund | Invesco MSCI Sustainable Future ETF | 25.1% |
| PFG Janus Henderson® Balanced Strategy Fund | Janus Henderson Balanced Fund | 79.8% |
| PFG Meeder Tactical Strategy Fund | Meeder Muirfield Fund | 56.1% |
| 11. | SUBSEQUENT EVENTS |
Subsequent events after the date of the Statements of Assets and Liabilities have been evaluated through the date the financial statements were issued. Management has determined that no events or transactions occurred requiring adjustment or disclosure in the financial statements.
| 12. | MARKET AND GEOPOLITICAL RISK |
The increasing interconnectivity between global economies and financial markets increases the likelihood that events or conditions in one region or financial market may adversely impact issuers in a different country, region or financial market. Securities in a Fund may underperform due to inflation (or expectations for inflation), interest rates, global demand for particular products or resources, natural disasters, pandemics, epidemics, terrorism, regulatory events and governmental or quasi-governmental actions. The occurrence of global events similar to those in recent years, such as terrorist attacks around the world, natural disasters, social and political discord or debt crises and downgrades, among others, may result in market volatility and may have long term effects on both the U.S. and global financial markets. It is difficult to predict when similar events affecting the U.S. or global financial markets may occur, the effects that such events may have and the duration of those effects. Any such event(s) could have a significant adverse impact on the value and risk profile of a Fund. The current novel coronavirus (COVID-19) global pandemic and the aggressive responses taken by many governments, including closing borders, restricting international and domestic travel, and the imposition of prolonged quarantines or similar restrictions, as well as the forced or voluntary closure of, or operational changes to, many retail and other businesses, has had negative impacts, and in many cases severe negative impacts, on markets worldwide. It is not known how long such impacts, or any future impacts of other significant events described above, will or would last, but there could be a prolonged period of global economic slowdown, which may impact your investment. Therefore, a Fund could lose money over short periods due to short-term market movements and over longer periods during
81
| THE PACIFIC FINANCIAL FUNDS |
| NOTES TO FINANCIAL STATEMENTS (Continued) |
| April 30, 2022 |
more prolonged market downturns. During a general market downturn, multiple asset classes may be negatively affected. Changes in market conditions and interest rates can have the same impact on all types of securities and instruments. In times of severe market disruptions, you could lose your entire investment.
82

REPORT OF INDEPENDENT REGISTERED PUBLIC ACCOUNTING FIRM
To the Shareholders of The Pacific Financial Funds and
Board of Trustees of Northern Lights Fund Trust
Opinion on the Financial Statements
We have audited the accompanying statements of assets and liabilities, including the schedules of investments, of PFG Funds, comprising the funds listed below (the “Funds”), each a series of Northern Lights Fund Trust, as of April 30, 2022, the related statements of operations, the statements of changes in net assets, the related notes, and the financial highlights for each of the periods indicated below (collectively referred to as the “financial statements”). In our opinion, the financial statements present fairly, in all material respects, the financial position of each of the Funds as of April 30, 2022, the results of their operations, the changes in net assets, and the financial highlights for each of the periods indicated below in conformity with accounting principles generally accepted in the United States of America.
| Fund Name | Statements
of Operations |
Statement(s)
of Changes in Net Assets |
Financial
Highlights |
| PFG Active Core Bond Strategy Fund, PFG BNY Mellon Diversifier Strategy Fund, PFG JP Morgan Tactical Aggressive Strategy Fund, PFG Meeder Tactical Strategy Fund and PFG MFS Aggressive Growth Strategy Fund | For the year ended April 30, 2022 | For the years ended April 30, 2022 and 2021 | For the years ended April 30, 2022, 2021, 2020, 2019 and for the period from December 11, 2017 (commencement of operations) through April 30, 2018. |
| PFG JP Morgan Tactical Moderate Strategy Fund | For the year ended April 30, 2022 | For the years ended April 30, 2022 and 2021 | For the years ended April 30, 2022, 2021, 2020, 2019 and for the period from March 15, 2018 (commencement of operations) through April 30, 2018. |
| PFG American Funds Conservative Income Strategy Fund, PFG American Funds Growth Strategy Fund, PFG BR Equity ESG Strategy Fund, PFG Fidelity Institutional AM Equity Index Strategy Fund and PFG Fidelity Institutional AM Equity Sector Strategy Fund | For the year ended April 30, 2022 | For the year ended April 30, 2022 and period from May 2, 2020 (commencement of operations) through April 30, 2021. | For the year ended April 30, 2022 and period from May 2, 2020 (commencement of operations) through April 30, 2021. |
| PFG Tactical Income Strategy Fund | For the year ended April 30, 2022 | For the year ended April 30, 2022 and period from May 1, 2020 (commencement of operations) through April 30, 2021. | For the year ended April 30, 2022 and period from May 1, 2020 (commencement of operations) through April 30, 2021. |
| PFG Fidelity Institutional AM Bond ESG Strategy Fund, PFG Invesco Thematic ESG Strategy Fund and PFG Janus Henderson Balanced Strategy Fund | For the period from October 29, 2021 (commencement of operations) through April 30, 2022. | ||
COHEN & COMPANY, LTD.
800.229.1099 | 866.818.4535 fax | cohencpa.com
Registered with the Public Company Accounting Oversight Board
83
Basis for Opinion
These financial statements are the responsibility of the Funds’ management. Our responsibility is to express an opinion on the Funds’ financial statements based on our audits. We are a public accounting firm registered with the Public Company Accounting Oversight Board (United States) (“PCAOB”) and are required to be independent with respect to the Funds in accordance with the U.S. federal securities laws and the applicable rules and regulations of the Securities and Exchange Commission and the PCAOB.
We conducted our audits in accordance with the standards of the PCAOB. Those standards require that we plan and perform the audit to obtain reasonable assurance about whether the financial statements are free of material misstatement whether due to error or fraud.
Our audits included performing procedures to assess the risks of material misstatement of the financial statements, whether due to error or fraud, and performing procedures that respond to those risks. Such procedures included examining, on a test basis, evidence regarding the amounts and disclosures in the financial statements. Our procedures included confirmation of securities owned as of April 30, 2022, by correspondence with the custodians and brokers; when replies were not received from brokers, we performed other auditing procedures. Our audits also included evaluating the accounting principles used and significant estimates made by management, as well as evaluating the overall presentation of the financial statements. We believe that our audits provide a reasonable basis for our opinion.
We have served as the auditor of certain previously related investment companies within the Fund family since 2008.

COHEN & COMPANY, LTD.
Cleveland, Ohio
June 24, 2022
84
| THE PACIFIC FINANCIAL FUNDS |
| EXPENSE EXAMPLES |
| April 30, 2022 (Unaudited) |
Example
As a shareholder of a Fund you will pay ongoing expenses, such as advisory fees, distribution and service fees (12b-1), and other fund expenses. The following examples are intended to help you understand the ongoing cost (in dollars) of investing in a Fund and to compare these costs with the ongoing costs of investing in other mutual funds. Please note, the expenses shown in the tables are meant to highlight ongoing costs only and do not reflect any transactional costs, such as sales charges (loads), or contingent deferred sales charges on redemptions which may be assessed by mutual funds. This Example is based on an investment of $1,000 invested at the beginning of the period and held for the entire period as indicated below.
Actual Expenses
The columns under the heading entitled “Actual” help you estimate the actual expenses you paid over the period. The “Actual Ending Account Value” shown is derived from each Fund’s actual return, and the “Actual Expenses Paid During Period” shows the dollar amount that would have been paid by an investor who started with $1,000 in the Fund. To estimate the expenses you paid on your account during this period, simply divide your account value by $1,000 (for example, an $8,600 account value divided by $1,000 = 8.6), then multiply the result by the number in the column under the heading entitled “Actual Expenses Paid During Period”.
Hypothetical Examples for Comparison Purposes
The columns under the heading entitled “Hypothetical” provide information about hypothetical account values and hypothetical expenses based on each Fund’s actual expense ratio and an assumed rate of return of 5% per year before expenses, which is not the Fund’s actual return. The hypothetical account values and expenses may not be used to estimate the actual ending account balance or expenses you paid for the period. You may use this information to compare the ongoing costs of investing in a Fund and other funds. To do so, compare this 5% hypothetical example with the 5% hypothetical examples that appear in the shareholder reports of other funds.
Please note that the expenses shown in the table are meant to highlight your ongoing costs only and do not reflect any transactional costs which may be applicable to your account. Therefore, the last column of the table (Hypothetical Expenses Paid During Period) is useful in comparing ongoing costs only and will not help you determine the relative total costs of owning different funds. In addition, if these transactional costs were included, your costs would have been higher.
| Hypothetical | ||||||||||||
| Actual | (5% return before expenses) | |||||||||||
| Fund’s Annualized | Beginning Account | Ending Account | Expenses Paid | Ending Account | Expenses Paid | |||||||
| Expense Ratio | Value | Value | During Period | Value | During Period | |||||||
| PFG Active Core Bond Strategy Fund * | 2.05% | $1,000.00 | $910.00 | $9.71 | $1,014.63 | $10.24 | ||||||
| PFG American Funds® Conservative Income Strategy Fund * | 2.05% | $1,000.00 | $943.60 | $9.88 | $1,014.63 | $10.24 | ||||||
| PFG American Funds® Growth Strategy Fund * | 2.05% | $1,000.00 | $781.40 | $9.05 | $1,014.63 | $10.24 | ||||||
| PFG BNY Mellon Diversifier Strategy Fund * | 2.05% | $1,000.00 | $943.50 | $9.88 | $1,014.63 | $10.24 | ||||||
| PFG BR Equity ESG Strategy Fund * | 2.05% | $1,000.00 | $850.10 | $9.40 | $1,014.63 | $10.24 | ||||||
| PFG Fidelity Institutional AM® Bond ESG Strategy Fund * | 2.05% | $1,000.00 | $900.00 | $9.66 | $1,014.63 | $10.24 | ||||||
| PFG Fidelity Institutional AM® Equity Index Strategy Fund * | 2.05% | $1,000.00 | $880.20 | $9.56 | $1,014.63 | $10.24 | ||||||
| PFG Fidelity Institutional AM® Equity Sector Strategy Fund * | 2.05% | $1,000.00 | $935.10 | $9.84 | $1,014.63 | $10.24 | ||||||
| PFG Invesco Thematic® ESG Strategy Fund * | 2.05% | $1,000.00 | $762.30 | $8.96 | $1,014.63 | $10.24 | ||||||
| PFG Janus Henderson® Balanced Strategy Fund * | 2.05% | $1,000.00 | $876.30 | $9.54 | $1,014.63 | $10.24 | ||||||
| PFG JP Morgan® Tactical Aggressive Strategy Fund * | 2.05% | $1,000.00 | $898.90 | $9.65 | $1,014.63 | $10.24 | ||||||
| PFG JP Morgan® Tactical Moderate Strategy Fund * | 2.05% | $1,000.00 | $902.00 | $9.67 | $1,014.63 | $10.24 | ||||||
| PFG Meeder Tactical Strategy Fund * | 2.05% | $1,000.00 | $904.00 | $9.68 | $1,014.63 | $10.24 | ||||||
| PFG MFS® Aggressive Growth Strategy Fund * | 2.05% | $1,000.00 | $878.80 | $9.55 | $1,014.63 | $10.24 | ||||||
| PFG Tactical Income Strategy Fund * | 2.05% | $1,000.00 | $902.50 | $9.67 | $1,014.63 | $10.24 | ||||||
| * | Expenses Paid during the period are equal to the Fund’s annualized expense ratio, multiplied by the average account value over the period, multiplied by 181/365 (to reflect the full six-month period). |
85
| THE PACIFIC FINANCIAL FUNDS |
| Supplemental Information (Unaudited) |
| April 30, 2022 |
Pacific Financial Group, LLC Adviser to PFG Fidelity Institutional AM® Bond ESG Strategy Fund (“PFG Fidelity”), PFG Janus Henderson® Balanced Strategy Fund (“PFG Janus”), and PFG Invesco® Thematic Equity ESG Strategy Fund (“PFG Invesco”), (each a “New Fund” and collectively the “New Funds”)*
In connection with the regular meeting held on September 21-23, 2021 of the Board of Trustees (the “Trustees” or the “Board”) of the Northern Lights Fund Trust (the “Trust”), including a majority of the Trustees who are not “interested persons,” as that term is defined in the Investment Company Act of 1940, as amended, discussed the approval of an investment advisory agreement (the “Advisory Agreement”) between The Pacific Financial Group, LLC (“PFG” or “Adviser”) and the Trust, with respect to the New Funds. In considering the approval of the Advisory Agreement, the Board received materials specifically relating to the Advisory Agreement.
The Trustees were assisted by independent legal counsel throughout the Advisory Agreement review process. The Trustees relied upon the advice of independent legal counsel and their own business judgment in determining the material factors to be considered in evaluating the Advisory Agreement and the weight to be given to each such factor. The conclusions reached by the Trustees were based on a comprehensive evaluation of all of the information provided and were not the result of any one factor. Moreover, each Trustee may have afforded different weight to the various factors in reaching his conclusions with respect to the Advisory Agreement.
Nature, Extent, and Quality of Services. The Board noted that PFG was founded in 1984 and, together with its affiliate, managed a combined $3.6 billion in assets with approximately $2.8 billion in mutual funds as of June 30, 2021. The Board acknowledged that PFG’s investment process used information derived from research services to make investment decisions and allocations to mutual funds and ETFs. The Board reviewed the background information of the key investment professionals who would be responsible for servicing the New Funds and noted their educational backgrounds and diverse financial industry experience. The Board noted its familiarity with PFG’s personnel and expressed satisfaction with their experience with PFG and its investment process. The Board commented on their appreciation of PFGs focus on risk management and performance and recognized that PFG maintained adequate resources to support the New Funds. The Board concluded that it could expect PFG to provide quality service to the New Funds and its shareholders.
Performance. The Board reviewed the investment objective of each New Fund and its anticipated Morningstar category. The Board acknowledged that the existing Funds managed by PFG had demonstrated consistency in asset management.
PFG Fidelity. The Board examined the performance of PFG Active Core (a PFG Fund that pursues a bond strategy) compared to its Benchmark index, the Bloomberg Barclays U.S. Aggregate Bond Index, recognizing that PFG Active Core had produced positive returns since inception, outperforming the index over the past 12 months.
PFG Janus. The Board examined the performance of JP Morgan Tactical (a PFG Fund that pursues a tactical moderate strategy) compared to its Benchmark index, the Morningstar Moderate Target Index, recognizing that JP Morgan Tactical had produced positive returns since inception, outperforming the index over the past 12 months.
PFG Invesco. The Board examined the performance of PFG BR Equity (a PFG Fund that pursues an equity strategy) compared to its Benchmark index, the Morningstar Aggressive Target Index, recognizing that PFG BR Equity had produced positive returns since inception, slightly underperforming the index over the past 12 months.
After discussion, the Board concluded that performance of these funds compared reasonably to the benchmark indices in each instance and that PFG was qualified, and should be allowed the opportunity, to manage each New Fund for
86
| THE PACIFIC FINANCIAL FUNDS |
| Supplemental Information (Unaudited)(Continued) |
| April 30, 2022 |
Fees and Expenses. The Board reviewed PFG’s proposed advisory fee of 1.25% for each New Fund, acknowledging that it was higher than each New Fund’s Morningstar category median and average, and in some cases significantly higher. The Board also considered the advisory fee peer group data for each New Fund. The Board remarked that each New Fund had an estimated net expense ratio of 2.05%, which was higher than its Morningstar category and peer group medians and averages. The Board discussed that the peer groups and custom Morningstar categories provided by Broadridge were informative but did not appear to be wholly reflective of each Fund’s respective strategy or use within asset allocation models. The Board considered that the risk-based strategies provide shareholders the opportunity to determine their investment plan based on an individual risk profile. After considering the nature of each New Fund’s strategy, the Board concluded that the advisory fee for each New Fund was not unreasonable. The Board considered that there were no expense limitation agreements proposed for any of the New Funds but acknowledged PFG’s assertion that the fee structure fixed the total expenses of each New Fund at 2.05%, subject to the 0.05% breakpoint in place for the entire family of PFG Funds.
Given these considerations, and that the advisory fee would decrease to 1.20% when the Funds had combined total assets of $3 billion, the Board concluded that PFG’s proposed advisory fee was not unreasonable.
Economies of Scale. The Board reviewed the Adviser’s asset projections and noted the adviser’s assertion that the asset levels at which economies of scale would be achieved were unlikely to be realized in the near term, and that the Adviser expected to utilize capital from growth to implement a variety of enhancements that could indirectly benefit shareholders. They considered, however, the Adviser’s willingness to discuss the matter of economies as each New Fund’s size materially increased. The Board acknowledged that the Adviser had agreed to implement a breakpoint at which each New PFG Fund’s advisory fee would be reduced by 5 basis points when the aggregate of all Funds it advised in the Trust exceed $3 billion in total assets. They considered the Adviser’s use of the New Funds in asset allocation models as an important consideration in applying breakpoints at the fund family level, rather than at the fund level, enabling the Adviser to allocate investor assets without concern over any differences in expense. The Board agreed that the proposed breakpoint adequately addressed the issue of economies of scale and was an appropriate level at which to share economies with shareholders.
Profitability. The Board considered the estimated profitability to be realized by PFG in connection with the operation of the New Funds and whether the amount of profit was a fair entrepreneurial profit with respect to the services to be provided to the New Funds. The Board reviewed the profitability analysis provided by PFG, which assumed average net assets of each New Fund for the first and second year. The Board agreed that the estimated profits, both in terms of actual dollars and as a percent of total revenue, would not be excessive.
Conclusion. Having requested and received such information from PFG as the Board believed to be reasonably necessary to evaluate the terms of the Advisory Agreement, and as assisted by the advice of counsel, the Board concluded that each New Fund’s advisory fee was not unreasonable, and that approval of the Advisory Agreement was in the best interest of future shareholders of each New Fund.
| * | Due to the timing of the contract renewal schedule, these deliberations may or may not relate to the current performance results of the New Funds. |
87
| THE PACIFIC FINANCIAL FUNDS |
| Supplemental Information (Unaudited) |
| April 30, 2022 |
The Pacific Financial Group, LLC – Adviser to PFG JP Morgan Tactical Moderate Strategy Fund (“JP Morgan Moderate”), PFG JP Morgan Tactical Aggressive Strategy Fund (“JP Morgan Aggressive”), PFG Meeder Tactical Strategy Fund (“PFG Meeder”), PFG BNY Mellon Diversifier Strategy Fund (“PFG BNY Mellon”), PFG Active Core Bond Strategy Fund (“PFG Active Core”), PFG MFS® Aggressive Growth Strategy Fund (“PFG MFS”), PFG American Funds® Growth Strategy Fund (“PFG American Growth”), PFG American Funds® Conservative Income Strategy Fund (“PFG American Conservative”), PFG BR Equity ESG Strategy Fund (“PFG BR Equity”), PFG Fidelity Institutional AM® Equity Sector Strategy Fund (“PFG Fidelity Sector”), PFG Fidelity Institutional AM® Equity Index Strategy Fund (“PFG Fidelity Index”), and PFG Tactical Income Strategy Fund (“PFG Tactical”) (each a “Fund” and collectively the “PFG Funds”) *
In connection with the regular meeting held on November 9-10 & 12, 2021 of the Board of Trustees (the “Trustees” or the “Board”) of the Northern Lights Fund Trust (the “Trust”), including a majority of the Trustees who are not “interested persons,” as that term is defined in the Investment Company Act of 1940, as amended, discussed the renewal of an investment advisory agreement (the “Advisory Agreement”) between The Pacific Financial Group, LLC (“PFG” or “Adviser”) and the Trust, with respect to the PFG Funds. In considering the approval of the Advisory Agreement, the Board received materials specifically relating to the Advisory Agreement.
The Trustees were assisted by independent legal counsel throughout the Advisory Agreement review process. The Trustees relied upon the advice of independent legal counsel and their own business judgment in determining the material factors to be considered in evaluating the Advisory Agreement and the weight to be given to each such factor. The conclusions reached by the Trustees were based on a comprehensive evaluation of all of the information provided and were not the result of any one factor. Moreover, each Trustee may have afforded different weight to the various factors in reaching his conclusions with respect to the Advisory Agreement.
Nature, Extent and Quality of Service. The Trustees noted that the Adviser was founded in 1984 and advised approximately $2.9 billion in assets under management as of July 31, 2021. They reviewed the Adviser’s services and noted that the Adviser specialized in providing money management services and investment solutions to professional financial advisers and retirement plan investors. They reviewed the background information of the key investment personnel responsible for servicing the PFG Funds and took into consideration their diverse education and financial industry experience. The Trustees noted that Adviser performed on-going due diligence of each PFG Fund’s strategist and models, their research services, and their proprietary mutual funds and exchange traded funds. They further noted that the Adviser was responsible for trading each Fund’s portfolio, portfolio allocation, and performance evaluation. They considered the Adviser’s investment process, acknowledging that the Adviser used third party research tools to compare investment performance to peer groups and benchmarks. They further noted that this software enabled investors to access portfolios customized to an investor’s risk tolerances and investment goals. The Trustees commented that the Adviser’s chief compliance officer monitored each Fund’s investment limitations by reviewing each Fund’s day-to-day trading activities and holdings. They acknowledged that the Adviser’s CCO also monitored the volatility of each Fund and ensured that each Fund complied with its respective volatility targets. They reviewed the Adviser’s broker-dealer criteria selection and noted that the Adviser selected and evaluated broker-dealers based on a variety of qualities including execution, research, trade reporting, and cost. The Trustees, based upon their review, concluded that the Adviser provided a high level of service to the PFG Funds and shareholders.
Performance.
JP Morgan Moderate. The Trustees discussed the Fund’s objective and its strategy of investing primarily in J.P. Morgan funds. They noted that the Fund returned 23.82% for the one-year period ended July 31, 2021 and received a 2-star Morningstar rating. They considered the performance of the Fund and commented that it outperformed its peer group and Morningstar category medians and benchmark for the one-year period. They acknowledged that the Fund underperformed its Morningstar category and peer group medians and benchmark for the three-year and since inception periods. The Trustees reviewed the Fund’s Sharpe and Sortino ratios and acknowledged that the Fund’s risk metrics had improved to the 1st quartile of the Fund’s Morningstar category for the one-year period. The Trustees acknowledged the Fund’s improved performance and risk metrics and concluded that performance was acceptable.
88
| THE PACIFIC FINANCIAL FUNDS |
| Supplemental Information (Unaudited)(Continued) |
| April 30, 2022 |
JP Morgan Aggressive. The Trustees discussed the Fund’s objective and strategy and noted that it was designed to achieve its objective by investing more than 80% of the Fund’s assets in funds advised by J.P. Morgan. The Trustees further noted that the Fund had returned 36.74% for the one-year period ended July 31, 2021 and received a 1-star Morningstar rating. The Trustees considered the Fund’s performance and acknowledged that it outperformed its benchmark for the one-year and since inception periods. They noted that the Fund underperformed its Morningstar category and peer group median for all comparison periods. They reviewed the Fund’s risk metrics and commented that the Fund’s Sharpe and Sortino ratios ranked in the 1st or 2nd quartile of the Fund’s Morningstar category for the one-year period. The Trustees considered the Adviser’s explanation for the improved performance and acknowledged that the Adviser attributed the Fund’s improved performance to a higher allocation to international securities. The Trustees acknowledged the Fund’s improved performance and agreed that performance was acceptable.
PFG Meeder. The Trustees discussed the Fund’s objective and strategy, noting that it was designed to invest more than 80% of the Fund’s assets in funds advised by Meeder Asset Management, Inc. (“Meeder”). They commented that the Fund returned 22.26% for the one-year period ended July 31, 2021 and was a 2-star Morningstar fund. The Trustees considered the Fund’s performance and noted that it outperformed the peer group median, Morningstar category median, and benchmark for the one-year period. They further noted that the Fund underperformed all of its comparison groups for the three-year and since inception periods. They acknowledged that the Fund’s Sharpe ratio improved to the 2nd quartile of the Fund’s Morningstar category for the one-year period. The Trustees acknowledged the Fund’s improved performance and agreed that performance was acceptable.
PFG BNY Mellon. The Trustees reviewed the Fund’s investment objective and strategy and noted that the Fund returned 8.92% for the one-year period ended July 31, 2021. They further noted that the Fund outperformed its benchmark for the one-year, three-year, and since inception periods. They acknowledged that the Fund underperformed its peer group and Morningstar category medians for all comparison periods. The Trustees concluded that the Fund’s top quartile Standard Deviation for all comparison periods indicated that the Adviser diligently managed the Fund’s exposure to risk.
PFG Active Core. The Trustees reviewed the Fund’s investment objective and strategy, noting that the Fund invested 80% of its assets in underlying funds managed by PIMCO. They further noted that the Adviser incorporated a proprietary risk overlay that estimated the forward-looking annual returns or losses to 15% of the Fund’s assets. They acknowledged that the Fund outperformed the Fund’s benchmark for the one-year, three-year, and since inception periods. The Trustees noted that the Fund underperformed its peer group and Morningstar category medians for all comparison periods. They considered the reasons for the Fund’s underperformance and acknowledged that the Fund’s peer group and Morningstar category funds had higher allocations to high yield bonds and equities. The Trustees reviewed the Fund’s Standard Deviation and noted the Fund’s 1st quartile peer group ranking and concluded that the Adviser was managing the Fund’s exposure to risk.
PFG MFS. The Trustees reviewed the Fund’s investment objective and strategy, noting that the Adviser sought to achieve the Fund’s investment objective by investing at least 80% of the Fund’s assets in Massachusetts Financial Services Company. They acknowledged that the Fund returned 33.22% for the one-year period ended July 31, 2021 and was a 1-star Morningstar fund. The Trustees noted that the Fund outperformed its benchmark for the three-year and since inception periods but underperformed its peer group and Morningstar category medians for all comparison periods. They acknowledged that the Fund’s Standard Deviation indicated that Adviser was doing a good job balancing risk and returns and concluded that the Fund was performing in accordance with its prospectus mandate.
89
| THE PACIFIC FINANCIAL FUNDS |
| Supplemental Information (Unaudited)(Continued) |
| April 30, 2022 |
PFG American Growth. The Trustees reviewed the Fund’s investment objective and strategy, noting that the Adviser sought to achieve the Fund’s objective by investing at least 80% of the Fund’s assets in mutual funds managed by Capital Research and Management. They considered the Fund’s performance and acknowledged that it returned 35.32% for the one year period ended July 31, 2021. The Trustees noted that the Fund’s outperformed its benchmark for the one-year and since inception periods but underperformed its peer group and Morningstar category medians for the same periods. They considered the Fund’s risk metrics and noted that the Fund’s Standard Deviation ranked in the top quartile for the Fund’s peer group and Morningstar category. They concluded that the Fund’s highly rated Standard Deviation demonstrated that the Fund’s Adviser was actively managing the Fund’s exposure to downside risk.
PFG American Conservative. The Trustees reviewed the Fund’s investment strategy and objective and noted that the Fund returned 7.06% for the one-year period ended July 31, 2021. They further noted that the Fund outperformed its benchmark for the one-year period but underperformed its Morningstar category and peer group medians for the one-year and since inception periods. The Trustees considered the Adviser’s explanation for the Fund’s underperformance, attributing it to a lower allocation to equities and high yield bonds. They reviewed the Fund’s risk metrics, acknowledging the Fund’s top quartile Standard Deviation for the one-year and since inception periods. The Trustees concluded that performance was acceptable.
PFG BR Equity. The Trustees considered the Fund’s strategy and recent performance and noted that as of July 31, 2021, the Fund returned 35.43%. They further noted that the Fund outperformed its benchmark for the one-year and since inception periods. The Trustees acknowledged that the Fund underperformed its peer group and Morningstar medians for the one-year and since inception periods. The Trustees considered the Adviser’s explanation for the Fund’s underperformance and commented that the Adviser attributed it to the Fund’s allocations to growth rather than value stocks. The Trustees concluded that the performance was acceptable.
PFG Fidelity Sector. The Trustees considered the Fund’s objective and strategy and noted that the Adviser invested 80% of the Fund’s assets in mutual funds and ETFs managed by Fidelity. They acknowledged that the Fund’s recent performance and noted that the Fund returned 38.06% for the one-year period ended July 31, 2021. They commented that the Fund outperformed its benchmark and Morningstar category median for the one-year period however underperformed its benchmark, peer group and Morningstar categories medians for the since inception period. The Trustees acknowledged the Fund’s risk metrics and concluded that the Fund was performing as designed and in accordance with its prospectus mandates.
PFG Fidelity Index. The Trustees reviewed the Fund’s objective and strategy and noted that the Adviser invested the Fund’s assets in mutual funds and ETFs managed by Fidelity. They considered the Fund’s performance and acknowledged that the Fund outperformed its benchmark for the one-year and since inception periods. They noted that the Fund underperformed its peer group and Morningstar category medians for the one-year and since inception periods. They reviewed the Fund’s risk metrics and commented that all of the Fund’s risk metrics were in the 2nd or 3rd quartile of the Fund’s Morningstar category. The Trustees acknowledged that the Fund was relatively new but had provided strong risk adjusted returns.
PFG Tactical. The Trustees reviewed the Fund’s investment objective and strategy and noted that the Adviser utilized research services provided by Counterpoint Mutual Funds, LLC and Janus Capital Management, LLC. They further noted that the Fund outperformed its benchmark for the one-year and since inception periods however trailed its peer group and Morningstar category medians for all comparison periods. The Trustees considered the Adviser’s explanation for the Fund’s underperformance and acknowledged that the Adviser initially defensively positioned the Fund’s portfolio. They noted that the Adviser had repositioned the Fund’s portfolio and the Fund’s recent performance reflected this change.
90
| THE PACIFIC FINANCIAL FUNDS |
| Supplemental Information (Unaudited)(Continued) |
| April 30, 2022 |
Fees and Expenses. The Trustees noted that the advisory fee for each Fund was 1.25%, which decreased to 1.20% on incremental assets when the aggregate of all PFG Fund assets exceeded $3 billion. They further noted that each Fund’s advisory fee exceeded its respective peer group median and averages. The Trustees reviewed each Fund’s net expense ratio and acknowledged that the net expense ratio was capped at 2.05% and the Adviser agreed to pay all expenses in excess of 2.05%. They commented that each Fund’s net expense ratio exceeded its respective peer group median and average. The Trustees discussed each Fund’s advisory fees and net expense ratio and noted that the peer groups provided by an independent third-party service were informative but did not appear to be reflective of each Fund’s respective strategy or use within asset allocation models. The trustees also acknowledged that a portion of the Adviser’s aggregate compensation was paid out to third-party investment advisers who invested their clients’ funds in the individual Funds. The Trustees considered that the risk-based strategies provided shareholders the opportunity to determine their investment plan based on an individual risk profile. The Trustees concluded that the advisory fee for each Fund was not unreasonable.
Profitability. The Trustees reviewed the profitability analysis provided by the Adviser. The Trustees noted that with respect to each Fund, the Adviser realized a robust profit in connection with its relationship with each Fund. They considered additional benefits received by the Adviser, including soft dollar arrangements, and profits realized by an adviser affiliate under the administrative services agreement with the PFG Funds. They reasoned that such profits were reasonable in terms of both actual dollars and as percentage of revenue given the level of services provided to the PFG Funds and their respective shareholders, and that each Fund was specifically designed for needs of retirement plan participants. The Trustee’s concluded that the Adviser’s profits were not excessive.
Economies of Scale. The Trustees noted that the advisory fee for each Fund was reduced in accordance with the breakpoint schedule when the PFG Funds’ aggregate assets recently exceeded $3 billion. They observed that the Adviser would consider additional future breakpoints as the PFG Funds’ assets continued to increase. The Trustees concluded that the current breakpoints were reasonable.
Conclusion. Having requested and received such information from the Adviser as the Trustees believed to be reasonably necessary to evaluate the terms of the Advisory Agreement, and as assisted by the advice of independent counsel, the Trustees concluded that renewal of the Advisory Agreement was in the best interests of the shareholders of each of the PFG Funds.
| * | Due to the timing of the contract renewal schedule, these deliberations may or may not relate to the current performance results of the PFG Fund. |
91
| THE PACIFIC FINANCIAL FUNDS |
| Supplemental Information (Unaudited) |
| April 30, 2021 |
The Trustees and the executive officers of the Trust are listed below with their present positions with the Trust and principal occupations over at least the last five years. The business address of each Trustee and Officer is 225 Pictoria Drive, Suite 450, Cincinnati, OH 45246. All correspondence to the Trustees and Officers should be directed to c/o Ultimus Fund Solutions, LLC, P.O. Box 541150, Omaha, Nebraska 68154.
Independent Trustees
| Name, Address and Year of Birth |
Position/Term of Office* |
Principal
Occupation During the Past Five Years |
Number
of Portfolios in Fund Complex** Overseen by Trustee |
Other
Directorships held by Trustee During the Past Five Years |
| Mark
Garbin Born in 1951 |
Trustee Since 2013 | Managing Principal, Coherent Capital Management LLC (since 2007). | 15 | Northern Lights Fund Trust (for series not affiliated with the Funds since 2013); Two Roads Shared Trust (since 2012); Forethought Variable Insurance Trust (since 2013); Northern Lights Variable Trust (since 2013); OHA Mortgage Strategies Fund (offshore), Ltd. (2014 - 2017); and Altegris KKR Commitments Master Fund (since 2014); Carlyle Tactical Private Credit Fund (since March 2018) and Independent Director OHA CLO Enhanced Equity II Genpar LLP (since June 2021). |
| Mark
D. Gersten Born in 1950 |
Trustee Since 2013 | Independent Consultant (since 2012). | 15 | Northern Lights Fund Trust (for series not affiliated with the Funds since 2013); Northern Lights Variable Trust (since 2013); Two Roads Shared Trust (since 2012); Altegris KKR Commitments Master Fund (since 2014); previously, Ramius Archview Credit and Distressed Fund (2015-2017); and Schroder Global Series Trust (2012 to 2017). |
| Anthony
J. Hertl Born in 1950 |
Trustee Since 2005; Chairman of the Board since 2013 | Retired, previously held several positions in a major Wall Street firm including Capital Markets Controller, Director of Global Taxation, and CFO of the Specialty Finance Group. | 15 | Northern Lights Fund Trust (for series not affiliated with the Funds since 2005); Northern Lights Variable Trust (since 2006); Alternative Strategies Fund (since 2010); Satuit Capital Management Trust (2007-2019). |
| Gary
W. Lanzen Born in 1954 |
Trustee Since 2005 | Retired (since 2012). Formerly, Founder, President, and Chief Investment Officer, Orizon Investment Counsel, Inc. (2000- 2012). | 15 | Northern Lights Fund Trust (for series not affiliated with the Funds since 2005) Northern Lights Variable Trust (since 2006); AdvisorOne Funds (since 2003); Alternative Strategies Fund (since 2010); and previously, CLA Strategic Allocation Fund (2014-2015). |
| John
V. Palancia Born in 1954 |
Trustee Since 2011 | Retired (since 2011). Formerly, Director of Futures Operations, Merrill Lynch, Pierce, Fenner & Smith Inc. (1975-2011) . | 15 | Northern Lights Fund Trust (for series not affiliated with the Funds since 2011); Northern Lights Fund Trust III (since February 2012); Alternative Strategies Fund (since 2012) and Northern Lights Variable Trust (since 2011). |
| Mark
H. Taylor Born in 1964 |
Trustee Since 2007; Chairman of the Audit Committee since 2013 | Director, Lynn Pippenger School of Accountancy Muma College of Business, University of South Florida, Tampa FL (since 2019); Chair, Department of Accountancy and Andrew D. Braden Professor of Accounting and Auditing, Weatherhead School of Management, Case Western Reserve University (2009-2019); Vice President-Finance, American Accounting Association (2017- 2020); President, Auditing Section of the American Accounting Association (2012-15). AICPA Auditing Standards Board Member (2009-2012). | 15 | Northern Lights Fund Trust (for series not affiliated with the Funds since 2007); Alternative Strategies Fund (since 2010); Northern Lights Fund Trust III (since 2012); and Northern Lights Variable Trust (since 2007). |
4/30/22 – NLFT_v1
92
| THE PACIFIC FINANCIAL FUNDS |
| Supplemental Information (Unaudited)(Continued) |
| April 30, 2021 |
Officers
| Name, Address and Year of Birth |
Position/Term
of Office* |
Principal
Occupation During the Past Five Years |
Number
of Portfolios in Fund Complex** Overseen by Trustee |
Other
Directorships held by Trustee During the Past Five Years |
| Kevin
E. Wolf Born in 1969 |
President Since June 2017 | Executive Vice President, Head of Fund Administration, and Product; Ultimus Fund Solutions, LLC (since 2020); Vice President of The Ultimus Group, LLC (since 2019); Executive Vice President, Gemini Fund Services, LLC (2019-2020); President, Gemini Fund Services, LLC (2012-2019); Treasurer of the Trust (2006-June 2017). | N/A | N/A |
| Richard
Malinowski Born in 1983 |
Vice President Since March 2018 | Senior Vice President and Senior Managing Counsel, Ultimus Fund Solutions, LLC (since 2020); Senior Vice President Legal Administration, Gemini Fund Services, LLC (2017-2020); Vice President and Counsel (2016- 2017) and Assistant Vice President and Staff Attorney (2012-2016). | N/A | N/A |
| James
Colantino Born in 1969 |
Treasurer Since June 2017 | Senior Vice President Fund Administration, Ultimus Fund Solutions (since 2020); Senior Vice President Fund Administration, Gemini Fund Services, LLC (2012-2020); Assistant Treasurer of the Trust (2006-June 2017). | N/A | N/A |
| Stephanie
Shearer Born in 1979 |
Secretary Since February 2017 | Assistant Secretary of the Trust (2012-February 2017); Manager of Legal Administration, Ultimus Fund Solutions (since 2020); Manager of Legal Administration, Gemini Fund Services, LLC (2018-2020); Senior Paralegal, Gemini Fund Services, LLC (2013 - 2018). | N/A | N/A |
| Michael
J. Nanosky Born in 1966 |
Chief Compliance Officer Since January 2021 | Chief Compliance Officer, of the Trust (since January 2021); Vice President-Senior Compliance Officer, Ultimus Fund Solutions (since 2020); Vice President, Chief Compliance Officer for Williamsburg Investment Trust (2020-current); Senior Vice President- Chief Compliance Officer, PNC Funds (2014-2019). | N/A | N/A |
| * | The term of office for each Trustee and officer listed above will continue indefinitely until the individual resigns or is removed. |
| ** | As of April 30, 2022, the Trust was comprised of 68 active portfolios managed by unaffiliated investment advisers. The term “Fund Complex” applies only to the Funds in the Trust advised by the Funds’ Adviser. The Funds do not hold themselves out as related to any other series within the Trust that is not advised by the Funds’ Adviser. |
The Funds’ SAI includes additional information about the Trustees and is available free of charge, upon request, by calling toll-free at 1-888-451-TPFG.
4/30/22 – NLFT_v1
93
PRIVACY NOTICE
Northern Lights Fund Trust
Rev. February 2014
| FACTS | WHAT DOES NORTHERN LIGHTS FUND TRUST DO WITH YOUR PERSONAL INFORMATION? |
| Why? | Financial companies choose how they share your personal information. Federal law gives consumers the right to limit some, but not all sharing. Federal law also requires us to tell you how we collect, share, and protect your personal information. Please read this notice carefully to understand what we do. |
| What? | The types of personal information we collect and share depends on the product or service that you have with us. This information can include:
● Social Security number and wire transfer instructions
● account transactions and transaction history
● investment experience and purchase history
When you are no longer our customer, we continue to share your information as described in this notice. |
| How? | All financial companies need to share customers’ personal information to run their everyday business. In the section below, we list the reasons financial companies can share their customers’ personal information; the reasons Northern Lights Fund Trust chooses to share; and whether you can limit this sharing. |
| Reasons
we can share your personal information: |
Does
Northern Lights Fund Trust share information? |
Can you limit this sharing? |
| For our everyday business purposes - such as to process your transactions, maintain your account(s), respond to court orders and legal investigations, or report to credit bureaus. | YES | NO |
| For our marketing purposes - to offer our products and services to you. | NO | We don’t share |
| For joint marketing with other financial companies. | NO | We don’t share |
| For our affiliates’ everyday business purposes - information about your transactions and records. | NO | We don’t share |
| For our affiliates’ everyday business purposes - information about your credit worthiness. | NO | We don’t share |
| For nonaffiliates to market to you | NO | We don’t share |
| QUESTIONS? | Call 1-402-493-4603 |
94
PRIVACY NOTICE
Northern Lights Fund Trust
| Page 2 |
| What we do: | |
How does Northern Lights Fund Trust protect my personal information? |
To protect your personal information from unauthorized access and use, we use security measures that comply with federal law. These measures include computer safeguards and secured files and buildings.
Our service providers are held accountable for adhering to strict policies and procedures to prevent any misuse of your nonpublic personal information. |
How does Northern Lights Fund Trust collect my personal information? |
We collect your personal information, for example, when you ● open an account or deposit money
● direct us to buy securities or direct us to sell your securities
● seek advice about your investments
We also collect your personal information from others, such as credit bureaus, affiliates, or other companies. |
Why can’t I limit all sharing? |
Federal law gives you the right to limit only: ● sharing for affiliates’ everyday business purposes – information about your creditworthiness.
● affiliates from using your information to market to you.
● sharing for nonaffiliates to market to you.
State laws and individual companies may give you additional rights to limit sharing. |
| Definitions | |
| Affiliates | Companies related by common ownership or control. They can be financial and nonfinancial companies.
● Northern Lights Fund Trust does not share with our affiliates. |
| Nonaffiliates | Companies not related by common ownership or control. They can be financial and nonfinancial companies.
● Northern Lights Fund Trust does not share with nonaffiliates so they can market to you. |
| Joint marketing | A formal agreement between nonaffiliated financial companies that together market financial products or services to you.
● Northern Lights Fund Trust doesn’t jointly market. |
95
PROXY VOTING POLICY
Information regarding how a Fund voted proxies relating to portfolio securities for the most recent twelve month period ended June 30 as well as a description of the policies and procedures that a Fund uses to determine how to vote proxies is available without charge, upon request, by calling 1-888-451-TPFG or by referring to the Securities and Exchange Commission’s (“SEC”) website at http://www.sec.gov.
PORTFOLIO HOLDINGS
Each Fund files its complete schedule of portfolio holdings with the SEC for the first and third quarters of each fiscal year on Form N-PORT. Form N-PORT is available on the SEC’s website at http://www.sec.gov. The information on Form N-PORT is available without charge, upon request, by calling 1-888-451-TPFG.
| INVESTMENT ADVISOR |
| The Pacific Financial Group, LLC |
| 11811 NE First Street, Suite 201 |
| Bellevue, WA 98005 |
| ADMINISTRATOR |
| Ultimus Fund Solutions, LLC |
| 225 Pictoria Drive, Suite 450 |
| Cincinnati, OH 45246 |
| Pacific Financial-AR-22 |
(a) Include a copy of the report transmitted to stockholders pursuant to Rule 30e-1 under the Act (17 CFR 270.30e-1).
(b) Include a copy of each notice transmitted to stockholders in reliance on Rule 30e-3 under the Act (17 CFR 270.30e-3) that contains disclosures specified by paragraph (c)(3) of that rule.
Item 2. Code of Ethics.
(a) As of the end of the period covered by this report, the registrant has adopted a code of ethics that applies to the registrant's principal executive officer, principal financial officer, principal accounting officer or controller, or persons performing similar functions, regardless of whether these individuals are employed by the registrant or a third party.
(b) For purposes of this item, “code of ethics” means written standards that are reasonably designed to deter wrongdoing and to promote:
| (1) | Honest and ethical conduct, including the ethical handling of actual or apparent conflicts of interest between personal and professional relationships; |
| (2) | Full, fair, accurate, timely, and understandable disclosure in reports and documents that a registrant files with, or submits to, the Commission and in other public communications made by the registrant; |
(3) Compliance with applicable governmental laws, rules, and regulations;
| (4) | The prompt internal reporting of violations of the code to an appropriate person or persons identified in the code; and |
(5) Accountability for adherence to the code.
(c) Amendments: During the period covered by the report, there have not been any amendments to the provisions of the code of ethics.
(d) Waivers: During the period covered by the report, the registrant has not granted any express or implicit waivers from the provisions of the code of ethics.
(e) The Code of Ethics is not posted on Registrant’ website.
(f) A copy of the Code of Ethics is attached as an exhibit.
Item 3. Audit Committee Financial Expert.
(a) The Registrant’s board of trustees has determined that Anthony J. Hertl is an audit committee financial expert, as defined in Item 3 of Form N-CSR. Mr. Hertl is independent for purposes of this Item 3.
Item 4. Principal Accountant Fees and Services.
| (a) | Audit Fees |
2022 - $180,000
2021 - $165,000
2020 - $143,000
| (b) | Audit-Related Fees |
2022 - $0
2021 - $0
2020 - $0
| (c) | Tax Fees |
2022 - $45,000
2021 - $45,000
2020 - $39,000
Preparation of Federal & State income tax returns, assistance with calculation of required income, capital gain and excise distributions and preparation of Federal excise tax returns.
| (d) | All Other Fees |
2022 - None
2021 - None
2020 - None
| (e) | (1) Audit Committee’s Pre-Approval Policies |
The registrant’s Audit Committee is required to pre-approve all audit services and, when appropriate, any non-audit services (including audit-related, tax and all other services) to the registrant. The registrant’s Audit Committee also is required to pre-approve, when appropriate, any non-audit services (including audit-related, tax and all other services) to its adviser, or any entity controlling, controlled by or under common control with the adviser that provides ongoing services to the registrant, to the extent that the services may be determined to have an impact on the operations or financial reporting of the registrant. Services are reviewed on an engagement by engagement basis by the Audit Committee.
| (2) | Percentages of Services Approved by the Audit Committee |
2020 2021 2022
Audit-Related Fees: 0.00% 0.00% 0.00%
Tax Fees: 0.00% 0.00% 0.00%
All Other Fees: 0.00% 0.00% 0.00%
| (f) | During the audit of registrant's financial statements for the most recent fiscal year, less than 50 percent of the hours expended on the principal accountant's engagement were attributed to work performed by persons other than the principal accountant's full-time, permanent employees. |
| (g) | The aggregate non-audit fees billed by the registrant's accountant for services rendered to the registrant, and rendered to the registrant's investment adviser (not including any sub-adviser whose role is primarily portfolio management and is subcontracted with or overseen by another investment adviser), and any entity controlling, controlled by, or under common control with the adviser that provides ongoing services to the registrant: |
2022 - $45,000
2021 - $45,000
2020 - $39,000
| (h) | The registrant's audit committee has considered whether the provision of non-audit services to the registrant's investment adviser (not including any sub-adviser whose role is primarily portfolio management and is subcontracted with or overseen by another investment adviser), and any entity controlling, controlled by, or under common control with the investment adviser that provides ongoing services to the registrant, that were not pre-approved pursuant to paragraph (c)(7)(ii) of Rule 2-01 of Regulation S-X, is compatible with maintaining the principal accountant's independence. |
Item 5. Audit Committee of Listed Companies. Not applicable to open-end investment companies.
Item 6. Investments. Schedule of investments in securities of unaffiliated issuers is included under Item 1.
Item 7. Disclosure of Proxy Voting Policies and Procedures for Closed-End Management Investment Companies. Not applicable to open-end investment companies.
Item 8. Portfolio Managers of Closed-End Management Investment Companies. Not applicable to open-end investment companies.
Item 9. Purchases of Equity Securities by Closed-End Management Investment Companies and Affiliated Purchasers. Not applicable to open-end investment companies.
Item 10. Submission of Matters to a Vote of Security Holders. None
Item 11. Controls and Procedures.
(a) Based on an evaluation of the Registrant’s disclosure controls and procedures as of a date within 90 days of filing date of this Form N-CSR, the principal executive officer and principal financial officer of the Registrant have concluded that the disclosure controls and procedures of the Registrant are reasonably designed to ensure that the information required in filings on Form N-CSR is recorded, processed, summarized, and reported by the filing date, including that information required to be disclosed is accumulated and communicated to the Registrant’s management, including the Registrant’s principal executive officer and principal financial officer, as appropriate to allow timely decisions regarding required disclosure.
(b) There were no significant changes in the Registrant’s internal control over financial reporting that occurred during the Registrant’s last fiscal half-year that have materially affected, or are reasonably likely to materially affect, the Registrant’s internal control over financial reporting.
Item 12. Disclosure of Securities Lending Activities for Closed-End Management Investment Companies. Not applicable to open-end investment companies.
Item 13. Exhibits.
(a)(1) Code of Ethics filed herewith.
(a)(3) Not applicable for open-end investment companies.
SIGNATURES
Pursuant to the requirements of the Securities Exchange Act of 1934 and the Investment Company Act of 1940, the registrant has duly caused this report to be signed on its behalf by the undersigned, thereunto duly authorized.
(Registrant) Northern Lights Fund Trust
By (Signature and Title)
/s/ Kevin E. Wolf
Kevin E. Wolf, Principal Executive Officer
Date 7/1/22
Pursuant to the requirements of the Securities Exchange Act of 1934 and the Investment Company Act of 1940, this report has been signed below by the following persons on behalf of the registrant and in the capacities and on the dates indicated.
By (Signature and Title)
/s/ Kevin E. Wolf
Kevin E. Wolf, Principal Executive Officer
Date 7/1/22
By (Signature and Title)
/s/ Jim Colantino
Jim Colantino, Principal Financial Officer
Date 7/1/22