
UNITED STATES
SECURITIES AND EXCHANGE COMMISSION
Washington, D.C. 20549
FORM N-CSR
CERTIFIED SHAREHOLDER REPORT OF REGISTERED
MANAGEMENT INVESTMENT COMPANIES
Investment Company Act file number 811-03329
Variable Insurance Products Fund
(Exact name of registrant as specified in charter)
245 Summer St., Boston, MA 02210
(Address of principal executive offices) (Zip code)
Cynthia Lo Bessette, Secretary
245 Summer St.
Boston, Massachusetts 02210
(Name and address of agent for service)
Registrant's telephone number, including area code:
617-563-7000
|
Date of fiscal year end: |
December 31 |
|
|
|
|
Date of reporting period: |
June 30, 2022 |
Item 1.
Reports to Stockholders

Contents
| Board Approval of Investment Advisory Contracts and Management Fees |
|
Top Holdings (% of Fund's net assets)
|
||
|
Exxon Mobil Corp.
|
3.0
|
|
|
The Travelers Companies, Inc.
|
2.5
|
|
|
Cigna Corp.
|
2.4
|
|
|
AstraZeneca PLC sponsored ADR
|
2.1
|
|
|
M&T Bank Corp.
|
1.9
|
|
|
Roche Holding AG (participation certificate)
|
1.9
|
|
|
T-Mobile U.S., Inc.
|
1.8
|
|
|
Centene Corp.
|
1.7
|
|
|
Canadian Natural Resources Ltd.
|
1.7
|
|
|
Jazz Pharmaceuticals PLC
|
1.6
|
|
|
20.6
|
||
|
Market Sectors (% of Fund's net assets)
|
||
|
Financials
|
18.0
|
|
|
Health Care
|
14.0
|
|
|
Industrials
|
12.8
|
|
|
Energy
|
10.5
|
|
|
Consumer Discretionary
|
9.0
|
|
|
Communication Services
|
7.4
|
|
|
Materials
|
6.2
|
|
|
Utilities
|
6.2
|
|
|
Information Technology
|
5.7
|
|
|
Real Estate
|
5.3
|
|
|
Consumer Staples
|
3.0
|
|
|
Asset Allocation (% of Fund's net assets)
|

|
|
Foreign investments - 18.8%
|
|
Geographic Diversification (% of Fund's net assets)
|
|
|
* Includes Short-Term investments and Net Other Assets (Liabilities).
Percentages are based on country or territory of incorporation and are adjusted for the effect of futures contracts, if applicable.
|
|
Common Stocks - 98.1%
|
|||
|
Shares
|
Value ($)
|
||
|
COMMUNICATION SERVICES - 7.4%
|
|||
|
Interactive Media & Services - 2.6%
|
|||
|
Alphabet, Inc. Class A (a)
|
3,452
|
7,522,806
|
|
|
Meta Platforms, Inc. Class A (a)
|
29,800
|
4,805,250
|
|
|
12,328,056
|
|||
|
Media - 3.0%
|
|||
|
Comcast Corp. Class A
|
85,514
|
3,355,569
|
|
|
Interpublic Group of Companies, Inc.
|
131,777
|
3,627,821
|
|
|
Liberty Broadband Corp. Class C (a)
|
31,500
|
3,642,660
|
|
|
Nexstar Broadcasting Group, Inc. Class A
|
22,300
|
3,632,224
|
|
|
14,258,274
|
|||
|
Wireless Telecommunication Services - 1.8%
|
|||
|
T-Mobile U.S., Inc. (a)
|
66,505
|
8,947,583
|
|
|
TOTAL COMMUNICATION SERVICES
|
35,533,913
|
||
|
CONSUMER DISCRETIONARY - 9.0%
|
|||
|
Auto Components - 1.4%
|
|||
|
Adient PLC (a)
|
113,800
|
3,371,894
|
|
|
Autoliv, Inc.
|
48,100
|
3,442,517
|
|
|
6,814,411
|
|||
|
Diversified Consumer Services - 0.8%
|
|||
|
Adtalem Global Education, Inc. (a)
|
113,939
|
4,098,386
|
|
|
Hotels, Restaurants & Leisure - 1.1%
|
|||
|
Caesars Entertainment, Inc. (a)
|
133,370
|
5,108,071
|
|
|
Household Durables - 1.5%
|
|||
|
Mohawk Industries, Inc. (a)
|
30,219
|
3,749,876
|
|
|
PulteGroup, Inc.
|
89,400
|
3,542,922
|
|
|
7,292,798
|
|||
|
Internet & Direct Marketing Retail - 1.0%
|
|||
|
eBay, Inc.
|
109,962
|
4,582,117
|
|
|
Multiline Retail - 1.0%
|
|||
|
Dollar Tree, Inc. (a)
|
30,433
|
4,742,983
|
|
|
Specialty Retail - 2.2%
|
|||
|
American Eagle Outfitters, Inc.
|
398,600
|
4,456,348
|
|
|
Rent-A-Center, Inc.
|
121,929
|
2,371,519
|
|
|
Victoria's Secret & Co. (a)
|
140,800
|
3,938,176
|
|
|
10,766,043
|
|||
|
TOTAL CONSUMER DISCRETIONARY
|
43,404,809
|
||
|
CONSUMER STAPLES - 3.0%
|
|||
|
Beverages - 0.6%
|
|||
|
Primo Water Corp.
|
227,787
|
3,047,790
|
|
|
Food & Staples Retailing - 1.3%
|
|||
|
U.S. Foods Holding Corp. (a)
|
199,500
|
6,120,660
|
|
|
Food Products - 1.1%
|
|||
|
Darling Ingredients, Inc. (a)
|
91,087
|
5,447,003
|
|
|
TOTAL CONSUMER STAPLES
|
14,615,453
|
||
|
ENERGY - 10.5%
|
|||
|
Energy Equipment & Services - 1.0%
|
|||
|
Halliburton Co.
|
157,400
|
4,936,064
|
|
|
Oil, Gas & Consumable Fuels - 9.5%
|
|||
|
Canadian Natural Resources Ltd.
|
151,045
|
8,116,674
|
|
|
Cenovus Energy, Inc. (Canada)
|
290,218
|
5,521,627
|
|
|
Exxon Mobil Corp.
|
166,102
|
14,224,974
|
|
|
Hess Corp.
|
59,040
|
6,254,698
|
|
|
Imperial Oil Ltd.
|
94,500
|
4,454,832
|
|
|
Tourmaline Oil Corp.
|
138,300
|
7,191,127
|
|
|
Woodside Energy Group Ltd. ADR
|
1
|
22
|
|
|
45,763,954
|
|||
|
TOTAL ENERGY
|
50,700,018
|
||
|
FINANCIALS - 18.0%
|
|||
|
Banks - 4.0%
|
|||
|
First Citizens Bancshares, Inc.
|
7,258
|
4,745,135
|
|
|
M&T Bank Corp.
|
58,411
|
9,310,129
|
|
|
Signature Bank
|
28,600
|
5,125,406
|
|
|
19,180,670
|
|||
|
Capital Markets - 3.6%
|
|||
|
Ameriprise Financial, Inc.
|
24,433
|
5,807,235
|
|
|
Lazard Ltd. Class A
|
127,787
|
4,141,577
|
|
|
LPL Financial
|
39,088
|
7,210,954
|
|
|
17,159,766
|
|||
|
Consumer Finance - 1.9%
|
|||
|
OneMain Holdings, Inc.
|
126,700
|
4,736,046
|
|
|
SLM Corp.
|
268,912
|
4,286,457
|
|
|
9,022,503
|
|||
|
Diversified Financial Services - 2.0%
|
|||
|
Apollo Global Management, Inc.
|
121,296
|
5,880,430
|
|
|
Berkshire Hathaway, Inc. Class B (a)
|
14,200
|
3,876,884
|
|
|
9,757,314
|
|||
|
Insurance - 5.5%
|
|||
|
American Financial Group, Inc.
|
25,090
|
3,482,743
|
|
|
Assurant, Inc.
|
38,488
|
6,652,651
|
|
|
Reinsurance Group of America, Inc.
|
40,000
|
4,691,600
|
|
|
The Travelers Companies, Inc.
|
70,609
|
11,942,100
|
|
|
26,769,094
|
|||
|
Thrifts & Mortgage Finance - 1.0%
|
|||
|
Walker & Dunlop, Inc.
|
49,500
|
4,768,830
|
|
|
TOTAL FINANCIALS
|
86,658,177
|
||
|
HEALTH CARE - 14.0%
|
|||
|
Biotechnology - 0.7%
|
|||
|
United Therapeutics Corp. (a)
|
13,700
|
3,228,268
|
|
|
Health Care Providers & Services - 6.5%
|
|||
|
AdaptHealth Corp. (a)
|
177,200
|
3,196,688
|
|
|
Centene Corp. (a)
|
98,410
|
8,326,470
|
|
|
Cigna Corp.
|
44,638
|
11,763,006
|
|
|
Laboratory Corp. of America Holdings
|
19,738
|
4,625,798
|
|
|
Tenet Healthcare Corp. (a)
|
63,800
|
3,353,328
|
|
|
31,265,290
|
|||
|
Pharmaceuticals - 6.8%
|
|||
|
AstraZeneca PLC sponsored ADR
|
152,280
|
10,061,140
|
|
|
Jazz Pharmaceuticals PLC (a)
|
49,740
|
7,759,937
|
|
|
Roche Holding AG (participation certificate)
|
27,124
|
9,067,549
|
|
|
Sanofi SA sponsored ADR
|
119,463
|
5,976,734
|
|
|
32,865,360
|
|||
|
TOTAL HEALTH CARE
|
67,358,918
|
||
|
INDUSTRIALS - 12.8%
|
|||
|
Aerospace & Defense - 0.9%
|
|||
|
The Boeing Co. (a)
|
31,800
|
4,347,696
|
|
|
Air Freight & Logistics - 1.3%
|
|||
|
FedEx Corp.
|
27,951
|
6,336,771
|
|
|
Building Products - 1.6%
|
|||
|
Builders FirstSource, Inc. (a)
|
82,106
|
4,409,092
|
|
|
Jeld-Wen Holding, Inc. (a)
|
215,800
|
3,148,522
|
|
|
7,557,614
|
|||
|
Commercial Services & Supplies - 0.8%
|
|||
|
The Brink's Co.
|
65,904
|
4,001,032
|
|
|
Construction & Engineering - 0.9%
|
|||
|
Willscot Mobile Mini Holdings (a)
|
138,223
|
4,481,190
|
|
|
Electrical Equipment - 0.8%
|
|||
|
Regal Rexnord Corp.
|
34,400
|
3,905,088
|
|
|
Industrial Conglomerates - 1.1%
|
|||
|
General Electric Co.
|
81,200
|
5,170,004
|
|
|
Machinery - 2.9%
|
|||
|
Allison Transmission Holdings, Inc.
|
62,100
|
2,387,745
|
|
|
Crane Holdings Co.
|
41,813
|
3,661,146
|
|
|
Flowserve Corp.
|
65,806
|
1,884,026
|
|
|
Kennametal, Inc.
|
127,400
|
2,959,502
|
|
|
Timken Co.
|
59,000
|
3,129,950
|
|
|
14,022,369
|
|||
|
Professional Services - 0.8%
|
|||
|
Manpower, Inc.
|
50,000
|
3,820,500
|
|
|
Road & Rail - 0.8%
|
|||
|
XPO Logistics, Inc. (a)
|
80,700
|
3,886,512
|
|
|
Trading Companies & Distributors - 0.9%
|
|||
|
Beacon Roofing Supply, Inc. (a)
|
79,670
|
4,091,851
|
|
|
TOTAL INDUSTRIALS
|
61,620,627
|
||
|
INFORMATION TECHNOLOGY - 5.7%
|
|||
|
Electronic Equipment & Components - 1.1%
|
|||
|
Flex Ltd. (a)
|
367,985
|
5,324,743
|
|
|
IT Services - 3.2%
|
|||
|
Concentrix Corp.
|
29,659
|
4,022,947
|
|
|
Fidelity National Information Services, Inc.
|
61,300
|
5,619,371
|
|
|
SS&C Technologies Holdings, Inc.
|
97,756
|
5,676,691
|
|
|
15,319,009
|
|||
|
Software - 1.4%
|
|||
|
NCR Corp. (a)
|
150,600
|
4,685,166
|
|
|
NortonLifeLock, Inc.
|
106,600
|
2,340,936
|
|
|
7,026,102
|
|||
|
TOTAL INFORMATION TECHNOLOGY
|
27,669,854
|
||
|
MATERIALS - 6.2%
|
|||
|
Chemicals - 2.5%
|
|||
|
Axalta Coating Systems Ltd. (a)
|
202,600
|
4,479,486
|
|
|
Olin Corp.
|
88,227
|
4,083,146
|
|
|
Tronox Holdings PLC
|
218,000
|
3,662,400
|
|
|
12,225,032
|
|||
|
Containers & Packaging - 1.4%
|
|||
|
Berry Global Group, Inc. (a)
|
53,800
|
2,939,632
|
|
|
Crown Holdings, Inc.
|
40,509
|
3,733,715
|
|
|
6,673,347
|
|||
|
Metals & Mining - 2.3%
|
|||
|
Arconic Corp. (a)
|
224,900
|
6,308,445
|
|
|
Glencore Xstrata PLC
|
866,200
|
4,691,717
|
|
|
11,000,162
|
|||
|
TOTAL MATERIALS
|
29,898,541
|
||
|
REAL ESTATE - 5.3%
|
|||
|
Equity Real Estate Investment Trusts (REITs) - 3.1%
|
|||
|
Crown Castle International Corp.
|
16,500
|
2,778,270
|
|
|
CubeSmart
|
113,106
|
4,831,888
|
|
|
Equity Lifestyle Properties, Inc.
|
39,101
|
2,755,447
|
|
|
Ventas, Inc.
|
85,100
|
4,376,693
|
|
|
14,742,298
|
|||
|
Real Estate Management & Development - 2.2%
|
|||
|
Anywhere Real Estate, Inc. (a)
|
82,435
|
810,336
|
|
|
Cushman & Wakefield PLC (a)
|
240,500
|
3,665,220
|
|
|
Jones Lang LaSalle, Inc. (a)
|
20,600
|
3,602,116
|
|
|
WeWork, Inc. (a)(b)
|
519,300
|
2,606,886
|
|
|
10,684,558
|
|||
|
TOTAL REAL ESTATE
|
25,426,856
|
||
|
UTILITIES - 6.2%
|
|||
|
Electric Utilities - 3.6%
|
|||
|
Constellation Energy Corp.
|
60,633
|
3,471,846
|
|
|
Edison International
|
77,181
|
4,880,926
|
|
|
Entergy Corp.
|
40,800
|
4,595,712
|
|
|
PG&E Corp. (a)
|
440,016
|
4,391,360
|
|
|
17,339,844
|
|||
|
Independent Power and Renewable Electricity Producers - 1.9%
|
|||
|
The AES Corp.
|
286,300
|
6,015,163
|
|
|
Vistra Corp.
|
127,000
|
2,901,950
|
|
|
8,917,113
|
|||
|
Multi-Utilities - 0.7%
|
|||
|
Sempra Energy
|
22,700
|
3,411,129
|
|
|
TOTAL UTILITIES
|
29,668,086
|
||
|
TOTAL COMMON STOCKS
(Cost $430,544,930)
|
472,555,252
|
||
|
Money Market Funds - 2.8%
|
|||
|
Shares
|
Value ($)
|
||
|
Fidelity Cash Central Fund 1.58% (c)
|
10,921,548
|
10,923,732
|
|
|
Fidelity Securities Lending Cash Central Fund 1.58% (c)(d)
|
2,725,683
|
2,725,956
|
|
|
TOTAL MONEY MARKET FUNDS
(Cost $13,649,688)
|
13,649,688
|
||
|
TOTAL INVESTMENT IN SECURITIES - 100.9%
(Cost $444,194,618)
|
486,204,940
|
|
NET OTHER ASSETS (LIABILITIES) - (0.9)%
|
(4,356,065)
|
|
NET ASSETS - 100.0%
|
481,848,875
|
|
(a)
|
Non-income producing
|
|
(b)
|
Security or a portion of the security is on loan at period end.
|
|
(c)
|
Affiliated fund that is generally available only to investment companies and other accounts managed by Fidelity Investments. The rate quoted is the annualized seven-day yield of the fund at period end. A complete unaudited listing of the fund's holdings as of its most recent quarter end is available upon request. In addition, each Fidelity Central Fund's financial statements are available on the SEC's website or upon request.
|
|
(d)
|
Investment made with cash collateral received from securities on loan.
|
|
Affiliate
|
Value,
beginning
of period ($)
|
Purchases ($)
|
Sales
Proceeds ($)
|
Dividend
Income ($)
|
Realized
Gain (loss) ($)
|
Change in
Unrealized
appreciation
(depreciation) ($)
|
Value,
end
of period ($)
|
%ownership,
end
of period
|
|
Fidelity Cash Central Fund 1.58%
|
3,889,486
|
114,316,912
|
107,282,666
|
29,113
|
-
|
-
|
10,923,732
|
0.0%
|
|
Fidelity Securities Lending Cash Central Fund 1.58%
|
14,027,163
|
79,737,265
|
91,038,472
|
48,101
|
-
|
-
|
2,725,956
|
0.0%
|
|
Total
|
17,916,649
|
194,054,177
|
198,321,138
|
77,214
|
-
|
-
|
13,649,688
|
|
Valuation Inputs at Reporting Date:
|
||||
|
Description
|
Total ($)
|
Level 1 ($)
|
Level 2 ($)
|
Level 3 ($)
|
|
Investments in Securities:
|
||||
|
Equities:
|
||||
|
Communication Services
|
35,533,913
|
35,533,913
|
-
|
-
|
|
Consumer Discretionary
|
43,404,809
|
43,404,809
|
-
|
-
|
|
Consumer Staples
|
14,615,453
|
14,615,453
|
-
|
-
|
|
Energy
|
50,700,018
|
50,700,018
|
-
|
-
|
|
Financials
|
86,658,177
|
86,658,177
|
-
|
-
|
|
Health Care
|
67,358,918
|
58,291,369
|
9,067,549
|
-
|
|
Industrials
|
61,620,627
|
61,620,627
|
-
|
-
|
|
Information Technology
|
27,669,854
|
27,669,854
|
-
|
-
|
|
Materials
|
29,898,541
|
25,206,824
|
4,691,717
|
-
|
|
Real Estate
|
25,426,856
|
25,426,856
|
-
|
-
|
|
Utilities
|
29,668,086
|
29,668,086
|
-
|
-
|
|
Money Market Funds
|
13,649,688
|
13,649,688
|
-
|
-
|
|
Total Investments in Securities:
|
486,204,940
|
472,445,674
|
13,759,266
|
-
|
|
Statement of Assets and Liabilities
|
||||
|
June 30, 2022
(Unaudited)
|
||||
|
Assets
|
||||
|
Investment in securities, at value (including securities loaned of $2,606,384) - See accompanying schedule:
|
$472,555,252
|
|||
|
Unaffiliated issuers (cost $430,544,930)
|
||||
|
Fidelity Central Funds (cost $13,649,688)
|
13,649,688
|
|||
|
Total Investment in Securities (cost $444,194,618)
|
$
|
486,204,940
|
||
|
Cash
|
21,108
|
|||
|
Foreign currency held at value (cost $39,396)
|
39,396
|
|||
|
Receivable for investments sold
|
2,558,092
|
|||
|
Receivable for fund shares sold
|
1,092,186
|
|||
|
Dividends receivable
|
543,339
|
|||
|
Distributions receivable from Fidelity Central Funds
|
44,181
|
|||
|
Total assets
|
490,503,242
|
|||
|
Liabilities
|
||||
|
Payable for investments purchased
|
$5,033,016
|
|||
|
Payable for fund shares redeemed
|
573,087
|
|||
|
Accrued management fee
|
221,320
|
|||
|
Distribution and service plan fees payable
|
7,296
|
|||
|
Other affiliated payables
|
62,111
|
|||
|
Other payables and accrued expenses
|
31,737
|
|||
|
Collateral on securities loaned
|
2,725,800
|
|||
|
Total Liabilities
|
8,654,367
|
|||
|
Net Assets
|
$
|
481,848,875
|
||
|
Net Assets consist of:
|
||||
|
Paid in capital
|
$
|
424,034,583
|
||
|
Total accumulated earnings (loss)
|
57,814,292
|
|||
|
Net Assets
|
$
|
481,848,875
|
||
|
Net Asset Value and Maximum Offering Price
|
||||
|
Initial Class :
|
||||
|
Net Asset Value
, offering price and redemption price per share ($132,420,117 ÷ 8,052,474 shares)
|
$
|
16.44
|
||
|
Service Class :
|
||||
|
Net Asset Value
, offering price and redemption price per share ($305,087 ÷ 18,558 shares)
|
$
|
16.44
|
||
|
Service Class 2 :
|
||||
|
Net Asset Value
, offering price and redemption price per share ($34,775,911 ÷ 2,158,792 shares)
|
$
|
16.11
|
||
|
Investor Class :
|
||||
|
Net Asset Value
, offering price and redemption price per share ($314,347,760 ÷ 19,170,491 shares)
|
$
|
16.40
|
||
|
Statement of Operations
|
||||
|
Six months ended
June 30, 2022
(Unaudited)
|
||||
|
Investment Income
|
||||
|
Dividends
|
$
|
3,554,585
|
||
|
Non-Cash dividends
|
396,497
|
|||
|
Income from Fidelity Central Funds (including $48,101 from security lending)
|
77,214
|
|||
|
Total Income
|
4,028,296
|
|||
|
Expenses
|
||||
|
Management fee
|
$
|
1,319,616
|
||
|
Transfer agent fees
|
275,575
|
|||
|
Distribution and service plan fees
|
36,865
|
|||
|
Accounting fees
|
95,825
|
|||
|
Custodian fees and expenses
|
8,925
|
|||
|
Independent trustees' fees and expenses
|
829
|
|||
|
Audit
|
27,028
|
|||
|
Legal
|
1,737
|
|||
|
Miscellaneous
|
851
|
|||
|
Total expenses before reductions
|
1,767,251
|
|||
|
Expense reductions
|
(7,122)
|
|||
|
Total expenses after reductions
|
1,760,129
|
|||
|
Net Investment income (loss)
|
2,268,167
|
|||
|
Realized and Unrealized Gain (Loss)
|
||||
|
Net realized gain (loss) on:
|
||||
|
Investment Securities:
|
||||
|
Unaffiliated issuers
|
14,764,747
|
|||
|
Foreign currency transactions
|
25,278
|
|||
|
Total net realized gain (loss)
|
14,790,025
|
|||
|
Change in net unrealized appreciation (depreciation) on:
|
||||
|
Investment Securities:
|
||||
|
Unaffiliated issuers
|
(65,044,575)
|
|||
|
Assets and liabilities in foreign currencies
|
(11,856)
|
|||
|
Total change in net unrealized appreciation (depreciation)
|
(65,056,431)
|
|||
|
Net gain (loss)
|
(50,266,406)
|
|||
|
Net increase (decrease) in net assets resulting from operations
|
$
|
(47,998,239)
|
||
|
Statement of Changes in Net Assets
|
||||
|
Six months ended
June 30, 2022
(Unaudited)
|
Year ended
December 31, 2021
|
|||
|
Increase (Decrease) in Net Assets
|
||||
|
Operations
|
||||
|
Net investment income (loss)
|
$
|
2,268,167
|
$
|
6,779,873
|
|
Net realized gain (loss)
|
14,790,025
|
62,491,051
|
||
|
Change in net unrealized appreciation (depreciation)
|
(65,056,431)
|
34,951,052
|
||
|
Net increase (decrease) in net assets resulting from operations
|
(47,998,239)
|
104,221,976
|
||
|
Distributions to shareholders
|
(6,404,580)
|
(57,416,733)
|
||
|
Share transactions - net increase (decrease)
|
59,085,667
|
98,615,092
|
||
|
Total increase (decrease) in net assets
|
4,682,848
|
145,420,335
|
||
|
Net Assets
|
||||
|
Beginning of period
|
477,166,027
|
331,745,692
|
||
|
End of period
|
$
|
481,848,875
|
$
|
477,166,027
|
|
Value Portfolio Initial Class
|
|
Six months ended
(Unaudited) June 30, 2022
|
Years ended December 31, 2021
|
2020
|
2019
|
2018
|
2017
|
|||||||
|
Selected Per-Share Data
|
||||||||||||
|
Net asset value, beginning of period
|
$
|
18.28
|
$
|
15.96
|
$
|
15.78
|
$
|
13.08
|
$
|
16.36
|
$
|
14.74
|
|
Income from Investment Operations
|
||||||||||||
|
Net investment income (loss)
A,B
|
.09
|
.31
|
.19
|
.26
|
.21
|
.21
C
|
||||||
|
Net realized and unrealized gain (loss)
|
(1.69)
|
4.41
|
.75
|
3.74
|
(2.41)
|
2.07
|
||||||
|
Total from investment operations
|
(1.60)
|
4.72
|
.94
|
4.00
|
(2.20)
|
2.28
|
||||||
|
Distributions from net investment income
|
-
|
(.32)
|
(.20)
|
(.27)
|
(.18)
|
(.21)
|
||||||
|
Distributions from net realized gain
|
(.24)
|
(2.07)
|
(.56)
|
(1.03)
|
(.90)
|
(.45)
|
||||||
|
Total distributions
|
(.24)
|
(2.40)
D
|
(.76)
|
(1.30)
|
(1.08)
|
(.66)
|
||||||
|
Net asset value, end of period
|
$
|
16.44
|
$
|
18.28
|
$
|
15.96
|
$
|
15.78
|
$
|
13.08
|
$
|
16.36
|
|
Total Return
E,F,G
|
(8.88)%
|
30.07%
|
6.33%
|
32.13%
|
(13.84)%
|
15.58%
|
||||||
|
Ratios to Average Net Assets
B,H,I
|
||||||||||||
|
Expenses before reductions
|
.64%
J
|
.64%
|
.67%
|
.67%
|
.67%
|
.68%
|
||||||
|
Expenses net of fee waivers, if any
|
.64%
J
|
.64%
|
.67%
|
.67%
|
.67%
|
.68%
|
||||||
|
Expenses net of all reductions
|
.64%
J
|
.64%
|
.65%
|
.66%
|
.66%
|
.67%
|
||||||
|
Net investment income (loss)
|
.97%
J
|
1.62%
|
1.48%
|
1.78%
|
1.36%
|
1.34%
C
|
||||||
|
Supplemental Data
|
||||||||||||
|
Net assets, end of period (000 omitted)
|
$
|
132,420
|
$
|
159,917
|
$
|
131,037
|
$
|
116,401
|
$
|
110,203
|
$
|
130,365
|
|
Portfolio turnover rate
K
|
63%
J
|
68%
|
81%
|
67%
|
64%
|
55%
|
|
Value Portfolio Service Class
|
|
Six months ended
(Unaudited) June 30, 2022
|
Years ended December 31, 2021
|
2020
|
2019
|
2018
|
2017
|
|||||||
|
Selected Per-Share Data
|
||||||||||||
|
Net asset value, beginning of period
|
$
|
18.28
|
$
|
15.96
|
$
|
15.78
|
$
|
13.08
|
$
|
16.36
|
$
|
14.73
|
|
Income from Investment Operations
|
||||||||||||
|
Net investment income (loss)
A,B
|
.08
|
.29
|
.18
|
.24
|
.20
|
.19
C
|
||||||
|
Net realized and unrealized gain (loss)
|
(1.68)
|
4.40
|
.75
|
3.75
|
(2.42)
|
2.08
|
||||||
|
Total from investment operations
|
(1.60)
|
4.69
|
.93
|
3.99
|
(2.22)
|
2.27
|
||||||
|
Distributions from net investment income
|
-
|
(.30)
|
(.19)
|
(.25)
|
(.15)
|
(.20)
|
||||||
|
Distributions from net realized gain
|
(.24)
|
(2.07)
|
(.56)
|
(1.03)
|
(.90)
|
(.45)
|
||||||
|
Total distributions
|
(.24)
|
(2.37)
|
(.75)
|
(1.29)
D
|
(1.06)
D
|
(.64)
D
|
||||||
|
Net asset value, end of period
|
$
|
16.44
|
$
|
18.28
|
$
|
15.96
|
$
|
15.78
|
$
|
13.08
|
$
|
16.36
|
|
Total Return
E,F,G
|
(8.88)%
|
29.92%
|
6.23%
|
32.01%
|
(13.97)%
|
15.53%
|
||||||
|
Ratios to Average Net Assets
B,H,I
|
||||||||||||
|
Expenses before reductions
|
.74%
J
|
.74%
|
.77%
|
.77%
|
.77%
|
.78%
|
||||||
|
Expenses net of fee waivers, if any
|
.74%
J
|
.74%
|
.77%
|
.77%
|
.77%
|
.78%
|
||||||
|
Expenses net of all reductions
|
.74%
J
|
.74%
|
.75%
|
.76%
|
.76%
|
.77%
|
||||||
|
Net investment income (loss)
|
.87%
J
|
1.52%
|
1.38%
|
1.68%
|
1.26%
|
1.24%
C
|
||||||
|
Supplemental Data
|
||||||||||||
|
Net assets, end of period (000 omitted)
|
$
|
305
|
$
|
337
|
$
|
275
|
$
|
270
|
$
|
233
|
$
|
368
|
|
Portfolio turnover rate
K
|
63%
J
|
68%
|
81%
|
67%
|
64%
|
55%
|
|
Value Portfolio Service Class 2
|
|
Six months ended
(Unaudited) June 30, 2022
|
Years ended December 31, 2021
|
2020
|
2019
|
2018
|
2017
|
|||||||
|
Selected Per-Share Data
|
||||||||||||
|
Net asset value, beginning of period
|
$
|
17.93
|
$
|
15.70
|
$
|
15.55
|
$
|
12.91
|
$
|
16.15
|
$
|
14.55
|
|
Income from Investment Operations
|
||||||||||||
|
Net investment income (loss)
A,B
|
.06
|
.26
|
.16
|
.22
|
.17
|
.17
C
|
||||||
|
Net realized and unrealized gain (loss)
|
(1.64)
|
4.33
|
.72
|
3.68
|
(2.37)
|
2.05
|
||||||
|
Total from investment operations
|
(1.58)
|
4.59
|
.88
|
3.90
|
(2.20)
|
2.22
|
||||||
|
Distributions from net investment income
|
-
|
(.28)
|
(.17)
|
(.23)
|
(.14)
|
(.17)
|
||||||
|
Distributions from net realized gain
|
(.24)
|
(2.07)
|
(.56)
|
(1.03)
|
(.90)
|
(.45)
|
||||||
|
Total distributions
|
(.24)
|
(2.36)
D
|
(.73)
|
(1.26)
|
(1.04)
|
(.62)
|
||||||
|
Net asset value, end of period
|
$
|
16.11
|
$
|
17.93
|
$
|
15.70
|
$
|
15.55
|
$
|
12.91
|
$
|
16.15
|
|
Total Return
E,F,G
|
(8.94)%
|
29.72%
|
6.02%
|
31.77%
|
(14.02)%
|
15.36%
|
||||||
|
Ratios to Average Net Assets
B,H,I
|
||||||||||||
|
Expenses before reductions
|
.89%
J
|
.89%
|
.92%
|
.92%
|
.92%
|
.93%
|
||||||
|
Expenses net of fee waivers, if any
|
.89%
J
|
.89%
|
.92%
|
.92%
|
.92%
|
.93%
|
||||||
|
Expenses net of all reductions
|
.89%
J
|
.89%
|
.91%
|
.91%
|
.91%
|
.92%
|
||||||
|
Net investment income (loss)
|
.72%
J
|
1.37%
|
1.22%
|
1.53%
|
1.11%
|
1.09%
C
|
||||||
|
Supplemental Data
|
||||||||||||
|
Net assets, end of period (000 omitted)
|
$
|
34,776
|
$
|
26,890
|
$
|
10,204
|
$
|
9,262
|
$
|
7,764
|
$
|
9,474
|
|
Portfolio turnover rate
K
|
63%
J
|
68%
|
81%
|
67%
|
64%
|
55%
|
|
Value Portfolio Investor Class
|
|
Six months ended
(Unaudited) June 30, 2022
|
Years ended December 31, 2021
|
2020
|
2019
|
2018
|
2017
|
|||||||
|
Selected Per-Share Data
|
||||||||||||
|
Net asset value, beginning of period
|
$
|
18.23
|
$
|
15.92
|
$
|
15.75
|
$
|
13.06
|
$
|
16.33
|
$
|
14.71
|
|
Income from Investment Operations
|
||||||||||||
|
Net investment income (loss)
A,B
|
.08
|
.29
|
.18
|
.25
|
.20
|
.20
C
|
||||||
|
Net realized and unrealized gain (loss)
|
(1.67)
|
4.40
|
.74
|
3.73
|
(2.40)
|
2.07
|
||||||
|
Total from investment operations
|
(1.59)
|
4.69
|
.92
|
3.98
|
(2.20)
|
2.27
|
||||||
|
Distributions from net investment income
|
-
|
(.31)
|
(.19)
|
(.26)
|
(.16)
|
(.20)
|
||||||
|
Distributions from net realized gain
|
(.24)
|
(2.07)
|
(.56)
|
(1.03)
|
(.90)
|
(.45)
|
||||||
|
Total distributions
|
(.24)
|
(2.38)
|
(.75)
|
(1.29)
|
(1.07)
D
|
(.65)
|
||||||
|
Net asset value, end of period
|
$
|
16.40
|
$
|
18.23
|
$
|
15.92
|
$
|
15.75
|
$
|
13.06
|
$
|
16.33
|
|
Total Return
E,F,G
|
(8.85)%
|
29.98%
|
6.20%
|
32.01%
|
(13.88)%
|
15.52%
|
||||||
|
Ratios to Average Net Assets
B,H,I
|
||||||||||||
|
Expenses before reductions
|
.72%
J
|
.72%
|
.74%
|
.75%
|
.75%
|
.76%
|
||||||
|
Expenses net of fee waivers, if any
|
.71%
J
|
.72%
|
.74%
|
.75%
|
.75%
|
.76%
|
||||||
|
Expenses net of all reductions
|
.71%
J
|
.72%
|
.73%
|
.74%
|
.74%
|
.75%
|
||||||
|
Net investment income (loss)
|
.89%
J
|
1.55%
|
1.40%
|
1.70%
|
1.28%
|
1.26%
C
|
||||||
|
Supplemental Data
|
||||||||||||
|
Net assets, end of period (000 omitted)
|
$
|
314,348
|
$
|
290,021
|
$
|
190,229
|
$
|
197,903
|
$
|
170,228
|
$
|
204,443
|
|
Portfolio turnover rate
K
|
63%
J
|
68%
|
81%
|
67%
|
64%
|
55%
|
|
Fidelity Central Fund
|
Investment Manager
|
Investment Objective
|
Investment Practices
|
Expense Ratio
A
|
|
Fidelity Money Market Central Funds
|
Fidelity Management & Research Company LLC (FMR)
|
Each fund seeks to obtain a high level of current income consistent with the preservation of capital and liquidity.
|
Short-term Investments
|
Less than .005%
|
|
Dividend Income
|
Net Unrealized Appreciation (Depreciation)
|
|
|
VIP Value Portfolio
|
$(1,209,983)
|
$1,209,983
|
|
Gross unrealized appreciation
|
$79,080,101
|
|
Gross unrealized depreciation
|
(37,731,104)
|
|
Net unrealized appreciation (depreciation)
|
$41,348,997
|
|
Tax cost
|
$444,855,943
|
|
Purchases ($)
|
Sales ($)
|
|
|
VIP Value Portfolio
|
197,600,916
|
154,316,990
|
|
Service Class
|
$160
|
|
Service Class 2
|
36,705
|
|
$36,865
|
|
Amount
|
% of Class-Level Average Net Assets
A
|
|
|
Initial Class
|
$47,027
|
.06
|
|
Service Class
|
99
|
.06
|
|
Service Class 2
|
9,116
|
.06
|
|
Investor Class
|
219,333
|
.14
|
|
$275,575
|
|
% of Average Net Assets
|
|
|
VIP Value Portfolio
|
.04
|
|
Amount
|
|
|
VIP Value Portfolio
|
$4,160
|
|
Purchases ($)
|
Sales ($)
|
Realized Gain (Loss) ($)
|
|
|
VIP Value Portfolio
|
30,771,624
|
23,054,155
|
2,008,947
|
|
Amount
|
|
|
VIP Value Portfolio
|
$394
|
|
Total Security Lending Fees Paid to NFS
|
Security Lending Income From Securities Loaned to NFS
|
Value of Securities Loaned to NFS at Period End
|
|
|
VIP Value Portfolio
|
$5,253
|
$-
|
$-
|
|
Six months ended
June 30, 2022
|
Year ended
December 31, 2021
|
|
|
VIP Value Portfolio
|
||
|
Distributions to shareholders
|
||
|
Initial Class
|
$2,057,790
|
$19,591,894
|
|
Service Class
|
4,350
|
40,837
|
|
Service Class 2
|
346,323
|
3,281,098
|
|
Investor Class
|
3,996,117
|
34,502,904
|
|
Total
|
$6,404,580
|
$57,416,733
|
|
Shares
|
Shares
|
Dollars
|
Dollars
|
|
|
Six months ended June 30, 2022
|
Year ended December 31, 2021
|
Six months ended June 30, 2022
|
Year ended December 31, 2021
|
|
|
VIP Value Portfolio
|
||||
|
Initial Class
|
||||
|
Shares sold
|
2,943,478
|
2,560,940
|
$52,678,472
|
$47,739,910
|
|
Reinvestment of distributions
|
115,223
|
1,074,650
|
2,057,790
|
19,591,894
|
|
Shares redeemed
|
(3,755,033)
|
(3,099,696)
|
(66,710,606)
|
(57,424,040)
|
|
Net increase (decrease).
|
(696,332)
|
535,894
|
$(11,974,344)
|
$9,907,764
|
|
Service Class
|
||||
|
Shares sold
|
13,984
|
-
|
$239,677
|
$-
|
|
Reinvestment of distributions
|
183
|
1,642
|
3,266
|
29,932
|
|
Shares redeemed
|
(14,053)
|
(449)
|
(247,344)
|
(8,891)
|
|
Net increase (decrease).
|
114
|
1,193
|
$(4,401)
|
$21,041
|
|
Service Class 2
|
||||
|
Shares sold
|
1,288,423
|
1,266,412
|
$22,045,693
|
$23,516,757
|
|
Reinvestment of distributions
|
19,767
|
183,243
|
346,323
|
3,281,098
|
|
Shares redeemed
|
(648,808)
|
(600,350)
|
(10,951,770)
|
(11,324,848)
|
|
Net increase (decrease).
|
659,382
|
849,305
|
$11,440,246
|
$15,473,007
|
|
Investor Class
|
||||
|
Shares sold
|
4,595,798
|
5,101,753
|
$82,975,889
|
$96,130,989
|
|
Reinvestment of distributions
|
224,254
|
1,896,770
|
3,996,117
|
34,502,904
|
|
Shares redeemed
|
(1,555,420)
|
(3,041,764)
|
(27,347,840)
|
(57,420,613)
|
|
Net increase (decrease).
|
3,264,632
|
3,956,759
|
$59,624,166
|
$73,213,280
|
|
Fund
|
Affiliated %
|
|
VIP Value Portfolio
|
64%
|
|
Fund
|
% of shares held
|
|
VIP Value Portfolio
|
27%
|
|
The Example is based on an investment of $1,000 invested at the beginning of the period and held for the entire period (January 1, 2022 to June 30, 2022).
|
|
Annualized Expense Ratio-
A
|
Beginning Account Value January 1, 2022
|
Ending Account Value June 30, 2022
|
Expenses Paid During Period-
C
January 1, 2022 to June 30, 2022
|
|||||||
|
Value Portfolio
|
||||||||||
|
Initial Class
|
.64%
|
|||||||||
|
Actual
|
$ 1,000
|
$ 911.20
|
$ 3.03
|
|||||||
|
Hypothetical-
B
|
$ 1,000
|
$ 1,021.62
|
$ 3.21
|
|||||||
|
Service Class
|
.74%
|
|||||||||
|
Actual
|
$ 1,000
|
$ 911.20
|
$ 3.51
|
|||||||
|
Hypothetical-
B
|
$ 1,000
|
$ 1,021.12
|
$ 3.71
|
|||||||
|
Service Class 2
|
.89%
|
|||||||||
|
Actual
|
$ 1,000
|
$ 910.60
|
$ 4.22
|
|||||||
|
Hypothetical-
B
|
$ 1,000
|
$ 1,020.38
|
$ 4.46
|
|||||||
|
Investor Class
|
.71%
|
|||||||||
|
Actual
|
$ 1,000
|
$ 911.50
|
$ 3.37
|
|||||||
|
Hypothetical-
B
|
$ 1,000
|
$ 1,021.27
|
$ 3.56
|
|||||||
|
|


Contents
| Board Approval of Investment Advisory Contracts and Management Fees |
|
Top Holdings (% of Fund's net assets)
|
||
|
Nestle SA (Reg. S) (Switzerland, Food Products)
|
3.5
|
|
|
Roche Holding AG (participation certificate) (Switzerland, Pharmaceuticals)
|
2.7
|
|
|
LVMH Moet Hennessy Louis Vuitton SE (France, Textiles, Apparel & Luxury Goods)
|
2.6
|
|
|
ASML Holding NV (Netherlands) (Netherlands, Semiconductors & Semiconductor Equipment)
|
2.4
|
|
|
TotalEnergies SE (France, Oil, Gas & Consumable Fuels)
|
2.2
|
|
|
AIA Group Ltd. (Hong Kong, Insurance)
|
2.2
|
|
|
Diageo PLC (United Kingdom, Beverages)
|
2.1
|
|
|
Sony Group Corp. (Japan, Household Durables)
|
1.6
|
|
|
Wolters Kluwer NV (Netherlands, Professional Services)
|
1.6
|
|
|
Compass Group PLC (United Kingdom, Hotels, Restaurants & Leisure)
|
1.5
|
|
|
22.4
|
||
|
Market Sectors (% of Fund's net assets)
|
||
|
Industrials
|
21.2
|
|
|
Financials
|
20.8
|
|
|
Information Technology
|
14.8
|
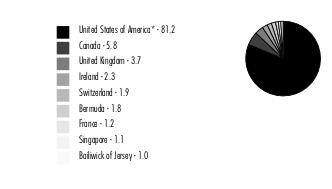
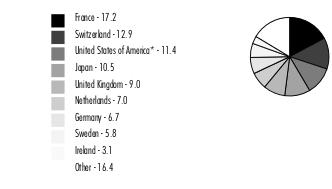
|
|
Health Care
|
13.1
|
|
|
Consumer Discretionary
|
9.7
|
|
|
Consumer Staples
|
7.0
|
|
|
Materials
|
4.4
|
|
|
Energy
|
2.2
|
|
|
Real Estate
|
1.2
|
|
|
Communication Services
|
0.9
|
|
|
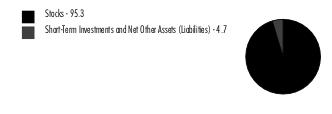
Asset Allocation (% of Fund's net assets)
|
|
|
Foreign investments - 88.6%
|
|
Geographic Diversification (% of Fund's net assets)
|
|
|
* Includes Short-Term investments and Net Other Assets (Liabilities).
Percentages are based on country or territory of incorporation and are adjusted for the effect of futures contracts, if applicable.
|
|
Common Stocks - 95.2%
|
|||
|
Shares
|
Value ($)
|
||
|
Bailiwick of Jersey - 1.3%
|
|||
|
Ferguson PLC
|
154,100
|
17,235,395
|
|
|
JTC PLC (a)
|
514,500
|
3,695,175
|
|
|
TOTAL BAILIWICK OF JERSEY
|
20,930,570
|
||
|
Belgium - 1.0%
|
|||
|
Azelis Group NV
|
105,900
|
2,317,219
|
|
|
KBC Group NV
|
230,099
|
12,945,597
|
|
|
TOTAL BELGIUM
|
15,262,816
|
||
|
Bermuda - 0.4%
|
|||
|
Hiscox Ltd.
|
595,251
|
6,828,621
|
|
|
Canada - 1.5%
|
|||
|
Constellation Software, Inc.
|
14,795
|
21,963,426
|
|
|
Topicus.Com, Inc. (b)
|
23,814
|
1,343,700
|
|
|
TOTAL CANADA
|
23,307,126
|
||
|
Cayman Islands - 0.4%
|
|||
|
Parade Technologies Ltd.
|
159,000
|
6,150,974
|
|
|
Denmark - 1.7%
|
|||
|
DSV A/S
|
160,872
|
22,621,390
|
|
|
GN Store Nord A/S
|
138,243
|
4,844,071
|
|
|
TOTAL DENMARK
|
27,465,461
|
||
|
Finland - 0.9%
|
|||
|
Nordea Bank ABP
|
1,567,303
|
13,788,926
|
|
|
France - 17.2%
|
|||
|
Air Liquide SA (c)
|
144,320
|
19,425,882
|
|
|
ALTEN
|
111,181
|
12,093,959
|
|
|
Antin Infrastructure Partners SA
|
40,800
|
962,873
|
|
|
BNP Paribas SA
|
392,100
|
18,754,917
|
|
|
Capgemini SA
|
129,265
|
22,141,469
|
|
|
Dassault Systemes SA
|
79,880
|
2,958,825
|
|
|
Edenred SA
|
429,442
|
20,238,017
|
|
|
EssilorLuxottica SA (c)
|
133,194
|
19,946,075
|
|
|
Legrand SA
|
255,500
|
18,970,494
|
|
|
LVMH Moet Hennessy Louis Vuitton SE
|
66,130
|
40,529,625
|
|
|
Pernod Ricard SA
|
117,842
|
21,648,239
|
|
|
Safran SA
|
167,600
|
16,687,179
|
|
|
Teleperformance
|
74,924
|
23,028,920
|
|
|
TotalEnergies SE (c)
|
669,512
|
35,241,082
|
|
|
TOTAL FRANCE
|
272,627,556
|
||
|
Germany - 6.7%
|
|||
|
Allianz SE
|
109,586
|
21,008,766
|
|
|
Brenntag SE
|
193,700
|
12,683,133
|
|
|
Deutsche Borse AG
|
110,572
|
18,567,998
|
|
|
Hannover Reuck SE
|
104,125
|
15,112,814
|
|
|
Merck KGaA
|
132,000
|
22,390,014
|
|
|
Siemens Healthineers AG (a)
|
330,400
|
16,845,893
|
|
|
TOTAL GERMANY
|
106,608,618
|
||
|
Hong Kong - 2.2%
|
|||
|
AIA Group Ltd.
|
3,140,400
|
34,313,800
|
|
|
Chervon Holdings Ltd.
|
137,100
|
770,519
|
|
|
TOTAL HONG KONG
|
35,084,319
|
||
|
India - 1.0%
|
|||
|
HDFC Bank Ltd.
|
927,691
|
15,892,032
|
|
|
Ireland - 3.1%
|
|||
|
Flutter Entertainment PLC (b)
|
51,790
|
5,197,345
|
|
|
ICON PLC (b)
|
69,800
|
15,125,660
|
|
|
Kingspan Group PLC (Ireland)
|
201,600
|
12,126,710
|
|
|
Linde PLC
|
58,768
|
16,897,563
|
|
|
TOTAL IRELAND
|
49,347,278
|
||
|
Italy - 2.4%
|
|||
|
FinecoBank SpA
|
1,017,699
|
12,179,403
|
|
|
GVS SpA (a)
|
109,736
|
894,683
|
|
|
Moncler SpA
|
229,000
|
9,822,404
|
|
|
Recordati SpA
|
360,119
|
15,665,322
|
|
|
TOTAL ITALY
|
38,561,812
|
||
|
Japan - 10.5%
|
|||
|
Capcom Co. Ltd.
|
204,900
|
4,976,013
|
|
|
FUJIFILM Holdings Corp.
|
239,200
|
12,852,561
|
|
|
Hoya Corp.
|
223,811
|
19,110,042
|
|
|
Iriso Electronics Co. Ltd.
|
97,729
|
2,315,734
|
|
|
Misumi Group, Inc.
|
339,360
|
7,153,373
|
|
|
NOF Corp.
|
183,411
|
6,799,509
|
|
|
Olympus Corp.
|
695,888
|
14,102,305
|
|
|
Persol Holdings Co. Ltd.
|
468,603
|
8,516,915
|
|
|
Recruit Holdings Co. Ltd.
|
417,171
|
12,285,871
|
|
|
Relo Group, Inc.
|
367,574
|
5,924,855
|
|
|
SMC Corp.
|
31,085
|
13,837,163
|
|
|
Sony Group Corp.
|
314,333
|
25,635,987
|
|
|
Suzuki Motor Corp.
|
220,276
|
6,925,021
|
|
|
TIS, Inc.
|
330,374
|
8,656,247
|
|
|
Tokyo Electron Ltd.
|
49,832
|
16,264,833
|
|
|
TOTAL JAPAN
|
165,356,429
|
||
|
Kenya - 0.3%
|
|||
|
Safaricom Ltd.
|
19,349,700
|
4,094,784
|
|
|
Luxembourg - 0.9%
|
|||
|
Eurofins Scientific SA
|
177,100
|
13,934,243
|
|
|
Netherlands - 7.0%
|
|||
|
Akzo Nobel NV
|
89,800
|
5,872,732
|
|
|
ASM International NV (Netherlands)
|
49,100
|
12,277,007
|
|
|
ASML Holding NV (Netherlands)
|
79,039
|
37,341,022
|
|
|
Euronext NV (a)
|
137,289
|
11,207,629
|
|
|
IMCD NV
|
133,726
|
18,351,092
|
|
|
Wolters Kluwer NV
|
260,417
|
25,259,994
|
|
|
TOTAL NETHERLANDS
|
110,309,476
|
||
|
Spain - 1.4%
|
|||
|
Amadeus IT Holding SA Class A (b)
|
320,007
|
17,918,524
|
|
|
Cellnex Telecom SA (a)
|
102,455
|
3,975,827
|
|
|
TOTAL SPAIN
|
21,894,351
|
||
|
Sweden - 5.7%
|
|||
|
Addlife AB
|
541,224
|
8,126,494
|
|
|
AddTech AB (B Shares)
|
748,409
|
9,759,550
|
|
|
ASSA ABLOY AB (B Shares)
|
840,056
|
17,926,834
|
|
|
Atlas Copco AB (A Shares)
|
1,570,476
|
14,699,727
|
|
|
Hexagon AB (B Shares)
|
1,755,294
|
18,341,163
|
|
|
Indutrade AB
|
877,841
|
16,008,332
|
|
|
Kry International AB (b)(d)(e)
|
587
|
136,243
|
|
|
Nordnet AB
|
347,100
|
4,536,501
|
|
|
TOTAL SWEDEN
|
89,534,844
|
||
|
Switzerland - 12.9%
|
|||
|
Compagnie Financiere Richemont SA Series A
|
167,810
|
18,050,178
|
|
|
Julius Baer Group Ltd.
|
270,275
|
12,538,080
|
|
|
Lonza Group AG
|
3,674
|
1,962,421
|
|
|
Nestle SA (Reg. S)
|
476,135
|
55,647,213
|
|
|
Partners Group Holding AG
|
13,100
|
11,803,928
|
|
|
Roche Holding AG (participation certificate)
|
126,091
|
42,152,202
|
|
|
Sika AG
|
90,344
|
20,854,763
|
|
|
Sonova Holding AG
|
58,074
|
18,493,161
|
|
|
Zurich Insurance Group Ltd.
|
51,630
|
22,514,471
|
|
|
TOTAL SWITZERLAND
|
204,016,417
|
||
|
Taiwan - 1.0%
|
|||
|
Taiwan Semiconductor Manufacturing Co. Ltd.
|
986,600
|
15,815,057
|
|
|
United Kingdom - 9.0%
|
|||
|
Beazley PLC
|
903,392
|
5,487,498
|
|
|
Bridgepoint Group Holdings Ltd. (a)
|
782,300
|
2,300,742
|
|
|
Compass Group PLC
|
1,184,039
|
24,309,968
|
|
|
Dechra Pharmaceuticals PLC
|
212,135
|
8,929,660
|
|
|
Diageo PLC
|
762,422
|
32,931,078
|
|
|
Diploma PLC
|
305,335
|
8,281,126
|
|
|
Dr. Martens Ltd.
|
166,800
|
482,030
|
|
|
RELX PLC (London Stock Exchange)
|
889,948
|
24,163,299
|
|
|
Rentokil Initial PLC
|
2,699,789
|
15,597,507
|
|
|
Smith & Nephew PLC
|
306,336
|
4,284,043
|
|
|
St. James's Place PLC
|
724,000
|
9,716,610
|
|
|
Volution Group PLC
|
1,405,597
|
5,757,627
|
|
|
TOTAL UNITED KINGDOM
|
142,241,188
|
||
|
United States of America - 6.7%
|
|||
|
Ares Management Corp.
|
173,165
|
9,846,162
|
|
|
CBRE Group, Inc. (b)
|
173,100
|
12,741,891
|
|
|
Equifax, Inc.
|
69,600
|
12,721,488
|
|
|
Intercontinental Exchange, Inc.
|
132,251
|
12,436,884
|
|
|
Marsh & McLennan Companies, Inc.
|
143,376
|
22,259,124
|
|
|
Moody's Corp.
|
46,000
|
12,510,620
|
|
|
Pool Corp.
|
15,500
|
5,444,065
|
|
|
S&P Global, Inc.
|
54,921
|
18,511,672
|
|
|
TOTAL UNITED STATES OF AMERICA
|
106,471,906
|
||
|
TOTAL COMMON STOCKS
(Cost $1,313,200,138)
|
1,505,524,804
|
||
|
Nonconvertible Preferred Stocks - 0.1%
|
|||
|
Shares
|
Value ($)
|
||
|
Sweden - 0.1%
|
|||
|
Kry International AB Series E (b)(d)(e)
(Cost $1,550,731)
|
3,392
|
787,283
|
|
|
Money Market Funds - 5.5%
|
|||
|
Shares
|
Value ($)
|
||
|
Fidelity Cash Central Fund 1.58% (f)
|
56,052,874
|
56,064,085
|
|
|
Fidelity Securities Lending Cash Central Fund 1.58% (f)(g)
|
30,950,278
|
30,953,373
|
|
|
TOTAL MONEY MARKET FUNDS
(Cost $87,017,458)
|
87,017,458
|
||
|
TOTAL INVESTMENT IN SECURITIES - 100.8%
(Cost $1,401,768,327)
|
1,593,329,545
|
|
NET OTHER ASSETS (LIABILITIES) - (0.8)%
|
(12,420,267)
|
|
NET ASSETS - 100.0%
|
1,580,909,278
|
|
(a)
|
Security exempt from registration under Rule 144A of the Securities Act of 1933. These securities may be resold in transactions exempt from registration, normally to qualified institutional buyers. At the end of the period, the value of these securities amounted to $38,919,949 or 2.5% of net assets.
|
|
(b)
|
Non-income producing
|
|
(c)
|
Security or a portion of the security is on loan at period end.
|
|
(d)
|
Restricted securities (including private placements) - Investment in securities not registered under the Securities Act of 1933 (excluding 144A issues). At the end of the period, the value of restricted securities (excluding 144A issues) amounted to $923,526 or 0.1% of net assets.
|
|
(e)
|
Level 3 security
|
|
(f)
|
Affiliated fund that is generally available only to investment companies and other accounts managed by Fidelity Investments. The rate quoted is the annualized seven-day yield of the fund at period end. A complete unaudited listing of the fund's holdings as of its most recent quarter end is available upon request. In addition, each Fidelity Central Fund's financial statements are available on the SEC's website or upon request.
|
|
(g)
|
Investment made with cash collateral received from securities on loan.
|
|
Additional information on each restricted holding is as follows:
|
||
|
Security
|
Acquisition Date
|
Acquisition Cost ($)
|
|
Kry International AB
|
5/14/21
|
254,938
|
|
Kry International AB Series E
|
5/14/21
|
1,550,731
|
|
Affiliate
|
Value,
beginning
of period ($)
|
Purchases ($)
|
Sales
Proceeds ($)
|
Dividend
Income ($)
|
Realized
Gain (loss) ($)
|
Change in
Unrealized
appreciation
(depreciation) ($)
|
Value,
end
of period ($)
|
%ownership,
end
of period
|
|
Fidelity Cash Central Fund 1.58%
|
36,218,372
|
276,470,695
|
256,624,982
|
107,596
|
-
|
-
|
56,064,085
|
0.1%
|
|
Fidelity Securities Lending Cash Central Fund 1.58%
|
-
|
122,512,220
|
91,558,847
|
119,547
|
-
|
-
|
30,953,373
|
0.1%
|
|
Total
|
36,218,372
|
398,982,915
|
348,183,829
|
227,143
|
-
|
-
|
87,017,458
|
|
Valuation Inputs at Reporting Date:
|
||||
|
Description
|
Total ($)
|
Level 1 ($)
|
Level 2 ($)
|
Level 3 ($)
|
|
Investments in Securities:
|
||||
|
Equities:
|
||||
|
Communication Services
|
13,046,624
|
13,046,624
|
-
|
-
|
|
Consumer Discretionary
|
157,113,217
|
41,662,438
|
115,450,779
|
-
|
|
Consumer Staples
|
110,226,530
|
21,648,239
|
88,578,291
|
-
|
|
Energy
|
35,241,082
|
-
|
35,241,082
|
-
|
|
Financials
|
329,720,843
|
173,185,182
|
156,535,661
|
-
|
|
Health Care
|
205,965,531
|
104,228,653
|
101,736,878
|
-
|
|
Industrials
|
336,885,021
|
183,009,931
|
153,875,090
|
-
|
|
Information Technology
|
229,596,044
|
107,180,533
|
121,491,985
|
923,526
|
|
Materials
|
69,850,449
|
23,697,072
|
46,153,377
|
-
|
|
Real Estate
|
18,666,746
|
18,666,746
|
-
|
-
|
|
Money Market Funds
|
87,017,458
|
87,017,458
|
-
|
-
|
|
Total Investments in Securities:
|
1,593,329,545
|
773,342,876
|
819,063,143
|
923,526
|
|
Statement of Assets and Liabilities
|
||||
|
June 30, 2022
(Unaudited)
|
||||
|
Assets
|
||||
|
Investment in securities, at value (including securities loaned of $23,646,839) - See accompanying schedule:
|
$1,506,312,087
|
|||
|
Unaffiliated issuers (cost $1,314,750,869)
|
||||
|
Fidelity Central Funds (cost $87,017,458)
|
87,017,458
|
|||
|
Total Investment in Securities (cost $1,401,768,327)
|
$
|
1,593,329,545
|
||
|
Foreign currency held at value (cost $2,178,220)
|
2,176,992
|
|||
|
Receivable for investments sold
|
4,227,608
|
|||
|
Receivable for fund shares sold
|
9,333,621
|
|||
|
Dividends receivable
|
748,519
|
|||
|
Reclaims receivable
|
4,638,297
|
|||
|
Distributions receivable from Fidelity Central Funds
|
67,886
|
|||
|
Other receivables
|
158,753
|
|||
|
Total assets
|
1,614,681,221
|
|||
|
Liabilities
|
||||
|
Payable for investments purchased
|
$712,285
|
|||
|
Payable for fund shares redeemed
|
740,330
|
|||
|
Accrued management fee
|
881,961
|
|||
|
Distribution and service plan fees payable
|
70,532
|
|||
|
Other affiliated payables
|
168,066
|
|||
|
Other payables and accrued expenses
|
245,396
|
|||
|
Collateral on securities loaned
|
30,953,373
|
|||
|
Total Liabilities
|
33,771,943
|
|||
|
Net Assets
|
$
|
1,580,909,278
|
||
|
Net Assets consist of:
|
||||
|
Paid in capital
|
$
|
1,389,093,937
|
||
|
Total accumulated earnings (loss)
|
191,815,341
|
|||
|
Net Assets
|
$
|
1,580,909,278
|
||
|
Net Asset Value and Maximum Offering Price
|
||||
|
Initial Class :
|
||||
|
Net Asset Value
, offering price and redemption price per share ($799,309,414 ÷ 38,358,030 shares)
|
$
|
20.84
|
||
|
Service Class :
|
||||
|
Net Asset Value
, offering price and redemption price per share ($119,861,627 ÷ 5,785,757 shares)
|
$
|
20.72
|
||
|
Service Class 2 :
|
||||
|
Net Asset Value
, offering price and redemption price per share ($278,650,010 ÷ 13,549,632 shares)
|
$
|
20.57
|
||
|
Investor Class :
|
||||
|
Net Asset Value
, offering price and redemption price per share ($383,088,227 ÷ 18,469,139 shares)
|
$
|
20.74
|
||
|
Statement of Operations
|
||||
|
Six months ended
June 30, 2022
(Unaudited)
|
||||
|
Investment Income
|
||||
|
Dividends
|
$
|
26,641,790
|
||
|
Foreign Tax Reclaims
|
2,505,333
|
|||
|
Income from Fidelity Central Funds (including $119,547 from security lending)
|
227,143
|
|||
|
Income before foreign taxes withheld
|
29,374,266
|
|||
|
Less foreign taxes withheld
|
(5,324,210)
|
|||
|
Total Income
|
24,050,056
|
|||
|
Expenses
|
||||
|
Management fee
|
$
|
5,896,567
|
||
|
Transfer agent fees
|
725,648
|
|||
|
Distribution and service plan fees
|
481,644
|
|||
|
Accounting fees
|
399,822
|
|||
|
Custodian fees and expenses
|
49,127
|
|||
|
Independent trustees' fees and expenses
|
3,201
|
|||
|
Audit
|
37,346
|
|||
|
Legal
|
541
|
|||
|
Miscellaneous
|
3,562
|
|||
|
Total expenses before reductions
|
7,597,458
|
|||
|
Expense reductions
|
(29,053)
|
|||
|
Total expenses after reductions
|
7,568,405
|
|||
|
Net Investment income (loss)
|
16,481,651
|
|||
|
Realized and Unrealized Gain (Loss)
|
||||
|
Net realized gain (loss) on:
|
||||
|
Investment Securities:
|
||||
|
Unaffiliated issuers(net of foreign taxes of $567,846)
|
(12,199,700)
|
|||
|
Foreign currency transactions
|
(167,308)
|
|||
|
Total net realized gain (loss)
|
(12,367,008)
|
|||
|
Change in net unrealized appreciation (depreciation) on:
|
||||
|
Investment Securities:
|
||||
|
Unaffiliated issuers
(net of decrease in deferred foreign taxes of $713,209)
|
(614,517,679)
|
|||
|
Assets and liabilities in foreign currencies
|
(360,213)
|
|||
|
Total change in net unrealized appreciation (depreciation)
|
(614,877,892)
|
|||
|
Net gain (loss)
|
(627,244,900)
|
|||
|
Net increase (decrease) in net assets resulting from operations
|
$
|
(610,763,249)
|
||
|
Statement of Changes in Net Assets
|
||||
|
Six months ended
June 30, 2022
(Unaudited)
|
Year ended
December 31, 2021
|
|||
|
Increase (Decrease) in Net Assets
|
||||
|
Operations
|
||||
|
Net investment income (loss)
|
$
|
16,481,651
|
$
|
8,601,327
|
|
Net realized gain (loss)
|
(12,367,008)
|
111,414,540
|
||
|
Change in net unrealized appreciation (depreciation)
|
(614,877,892)
|
230,036,881
|
||
|
Net increase (decrease) in net assets resulting from operations
|
(610,763,249)
|
350,052,748
|
||
|
Distributions to shareholders
|
(15,374,748)
|
(158,054,169)
|
||
|
Share transactions - net increase (decrease)
|
94,633,094
|
124,163,902
|
||
|
Total increase (decrease) in net assets
|
(531,504,903)
|
316,162,481
|
||
|
Net Assets
|
||||
|
Beginning of period
|
2,112,414,181
|
1,796,251,700
|
||
|
End of period
|
$
|
1,580,909,278
|
$
|
2,112,414,181
|
|
Overseas Portfolio Initial Class
|
|
Six months ended
(Unaudited) June 30, 2022
|
Years ended December 31, 2021
|
2020
|
2019
|
2018
|
2017
|
|||||||
|
Selected Per-Share Data
|
||||||||||||
|
Net asset value, beginning of period
|
$
|
29.28
|
$
|
26.52
|
$
|
23.13
|
$
|
19.13
|
$
|
22.87
|
$
|
17.81
|
|
Income from Investment Operations
|
||||||||||||
|
Net investment income (loss)
A,B
|
.23
|
.15
|
.13
|
.40
|
.36
|
.31
|
||||||
|
Net realized and unrealized gain (loss)
|
(8.46)
|
4.91
|
3.46
|
4.74
|
(3.75)
|
5.08
|
||||||
|
Total from investment operations
|
(8.23)
|
5.06
|
3.59
|
5.14
|
(3.39)
|
5.39
|
||||||
|
Distributions from net investment income
|
-
|
(.14)
C
|
(.10)
|
(.38)
|
(.35)
|
(.31)
|
||||||
|
Distributions from net realized gain
|
(.21)
|
(2.16)
C
|
(.10)
|
(.77)
|
-
|
(.02)
|
||||||
|
Total distributions
|
(.21)
|
(2.30)
|
(.20)
|
(1.14)
D
|
(.35)
|
(.33)
|
||||||
|
Net asset value, end of period
|
$
|
20.84
|
$
|
29.28
|
$
|
26.52
|
$
|
23.13
|
$
|
19.13
|
$
|
22.87
|
|
Total Return
E,F,G
|
(28.26)%
|
19.70%
|
15.61%
|
27.77%
|
(14.81)%
|
30.28%
|
||||||
|
Ratios to Average Net Assets
B,H,I
|
||||||||||||
|
Expenses before reductions
|
.77%
J
|
.77%
|
.79%
|
.79%
|
.79%
|
.80%
|
||||||
|
Expenses net of fee waivers, if any
|
.76%
J
|
.77%
|
.79%
|
.79%
|
.79%
|
.80%
|
||||||
|
Expenses net of all reductions
|
.76%
J
|
.77%
|
.77%
|
.78%
|
.78%
|
.78%
|
||||||
|
Net investment income (loss)
|
1.89%
J
|
.51%
|
.59%
|
1.87%
|
1.59%
|
1.46%
|
||||||
|
Supplemental Data
|
||||||||||||
|
Net assets, end of period (000 omitted)
|
$
|
799,309
|
$
|
1,034,416
|
$
|
872,019
|
$
|
826,554
|
$
|
662,011
|
$
|
822,994
|
|
Portfolio turnover rate
K
|
35%
J
|
26%
|
47%
|
38%
|
40%
|
35%
|
|
Overseas Portfolio Service Class
|
|
Six months ended
(Unaudited) June 30, 2022
|
Years ended December 31, 2021
|
2020
|
2019
|
2018
|
2017
|
|||||||
|
Selected Per-Share Data
|
||||||||||||
|
Net asset value, beginning of period
|
$
|
29.13
|
$
|
26.40
|
$
|
23.03
|
$
|
19.05
|
$
|
22.77
|
$
|
17.74
|
|
Income from Investment Operations
|
||||||||||||
|
Net investment income (loss)
A,B
|
.22
|
.12
|
.11
|
.37
|
.33
|
.28
|
||||||
|
Net realized and unrealized gain (loss)
|
(8.42)
|
4.88
|
3.44
|
4.73
|
(3.72)
|
5.05
|
||||||
|
Total from investment operations
|
(8.20)
|
5.00
|
3.55
|
5.10
|
(3.39)
|
5.33
|
||||||
|
Distributions from net investment income
|
-
|
(.11)
C
|
(.08)
|
(.36)
|
(.33)
|
(.28)
|
||||||
|
Distributions from net realized gain
|
(.21)
|
(2.16)
C
|
(.10)
|
(.77)
|
-
|
(.02)
|
||||||
|
Total distributions
|
(.21)
|
(2.27)
|
(.18)
|
(1.12)
D
|
(.33)
|
(.30)
|
||||||
|
Net asset value, end of period
|
$
|
20.72
|
$
|
29.13
|
$
|
26.40
|
$
|
23.03
|
$
|
19.05
|
$
|
22.77
|
|
Total Return
E,F,G
|
(28.30)%
|
19.57%
|
15.49%
|
27.67%
|
(14.88)%
|
30.10%
|
||||||
|
Ratios to Average Net Assets
B,H,I
|
||||||||||||
|
Expenses before reductions
|
.87%
J
|
.87%
|
.89%
|
.89%
|
.89%
|
.90%
|
||||||
|
Expenses net of fee waivers, if any
|
.86%
J
|
.87%
|
.89%
|
.89%
|
.89%
|
.90%
|
||||||
|
Expenses net of all reductions
|
.86%
J
|
.87%
|
.87%
|
.88%
|
.88%
|
.88%
|
||||||
|
Net investment income (loss)
|
1.79%
J
|
.41%
|
.49%
|
1.77%
|
1.49%
|
1.36%
|
||||||
|
Supplemental Data
|
||||||||||||
|
Net assets, end of period (000 omitted)
|
$
|
119,862
|
$
|
168,369
|
$
|
151,886
|
$
|
134,648
|
$
|
114,094
|
$
|
141,047
|
|
Portfolio turnover rate
K
|
35%
J
|
26%
|
47%
|
38%
|
40%
|
35%
|
|
Overseas Portfolio Service Class 2
|
|
Six months ended
(Unaudited) June 30, 2022
|
Years ended December 31, 2021
|
2020
|
2019
|
2018
|
2017
|
|||||||
|
Selected Per-Share Data
|
||||||||||||
|
Net asset value, beginning of period
|
$
|
28.94
|
$
|
26.25
|
$
|
22.90
|
$
|
18.95
|
$
|
22.66
|
$
|
17.65
|
|
Income from Investment Operations
|
||||||||||||
|
Net investment income (loss)
A,B
|
.20
|
.07
|
.08
|
.34
|
.30
|
.25
|
||||||
|
Net realized and unrealized gain (loss)
|
(8.36)
|
4.86
|
3.42
|
4.71
|
(3.71)
|
5.04
|
||||||
|
Total from investment operations
|
(8.16)
|
4.93
|
3.50
|
5.05
|
(3.41)
|
5.29
|
||||||
|
Distributions from net investment income
|
-
|
(.08)
C
|
(.05)
|
(.33)
|
(.30)
|
(.26)
|
||||||
|
Distributions from net realized gain
|
(.21)
|
(2.16)
C
|
(.10)
|
(.77)
|
-
|
(.02)
|
||||||
|
Total distributions
|
(.21)
|
(2.24)
|
(.15)
|
(1.10)
|
(.30)
|
(.28)
|
||||||
|
Net asset value, end of period
|
$
|
20.57
|
$
|
28.94
|
$
|
26.25
|
$
|
22.90
|
$
|
18.95
|
$
|
22.66
|
|
Total Return
D,E,F
|
(28.35)%
|
19.39%
|
15.33%
|
27.50%
|
(15.06)%
|
29.99%
|
||||||
|
Ratios to Average Net Assets
B,G,H
|
||||||||||||
|
Expenses before reductions
|
1.02%
I
|
1.02%
|
1.04%
|
1.04%
|
1.04%
|
1.05%
|
||||||
|
Expenses net of fee waivers, if any
|
1.01%
I
|
1.02%
|
1.04%
|
1.04%
|
1.04%
|
1.05%
|
||||||
|
Expenses net of all reductions
|
1.01%
I
|
1.02%
|
1.02%
|
1.03%
|
1.03%
|
1.03%
|
||||||
|
Net investment income (loss)
|
1.64%
I
|
.26%
|
.34%
|
1.62%
|
1.34%
|
1.21%
|
||||||
|
Supplemental Data
|
||||||||||||
|
Net assets, end of period (000 omitted)
|
$
|
278,650
|
$
|
398,271
|
$
|
352,459
|
$
|
331,113
|
$
|
291,392
|
$
|
361,446
|
|
Portfolio turnover rate
J
|
35%
I
|
26%
|
47%
|
38%
|
40%
|
35%
|
|
Overseas Portfolio Investor Class
|
|
Six months ended
(Unaudited) June 30, 2022
|
Years ended December 31, 2021
|
2020
|
2019
|
2018
|
2017
|
|||||||
|
Selected Per-Share Data
|
||||||||||||
|
Net asset value, beginning of period
|
$
|
29.16
|
$
|
26.42
|
$
|
23.05
|
$
|
19.06
|
$
|
22.79
|
$
|
17.75
|
|
Income from Investment Operations
|
||||||||||||
|
Net investment income (loss)
A,B
|
.22
|
.12
|
.11
|
.38
|
.34
|
.29
|
||||||
|
Net realized and unrealized gain (loss)
|
(8.43)
|
4.90
|
3.44
|
4.74
|
(3.74)
|
5.06
|
||||||
|
Total from investment operations
|
(8.21)
|
5.02
|
3.55
|
5.12
|
(3.40)
|
5.35
|
||||||
|
Distributions from net investment income
|
-
|
(.12)
C
|
(.08)
|
(.36)
|
(.33)
|
(.29)
|
||||||
|
Distributions from net realized gain
|
(.21)
|
(2.16)
C
|
(.10)
|
(.77)
|
-
|
(.02)
|
||||||
|
Total distributions
|
(.21)
|
(2.28)
|
(.18)
|
(1.13)
|
(.33)
|
(.31)
|
||||||
|
Net asset value, end of period
|
$
|
20.74
|
$
|
29.16
|
$
|
26.42
|
$
|
23.05
|
$
|
19.06
|
$
|
22.79
|
|
Total Return
D,E,F
|
(28.31)%
|
19.63%
|
15.49%
|
27.74%
|
(14.90)%
|
30.18%
|
||||||
|
Ratios to Average Net Assets
B,G,H
|
||||||||||||
|
Expenses before reductions
|
.84%
I
|
.85%
|
.87%
|
.87%
|
.87%
|
.88%
|
||||||
|
Expenses net of fee waivers, if any
|
.84%
I
|
.84%
|
.86%
|
.87%
|
.87%
|
.88%
|
||||||
|
Expenses net of all reductions
|
.84%
I
|
.84%
|
.85%
|
.86%
|
.86%
|
.86%
|
||||||
|
Net investment income (loss)
|
1.82%
I
|
.43%
|
.51%
|
1.79%
|
1.51%
|
1.38%
|
||||||
|
Supplemental Data
|
||||||||||||
|
Net assets, end of period (000 omitted)
|
$
|
383,088
|
$
|
511,358
|
$
|
419,888
|
$
|
421,140
|
$
|
340,705
|
$
|
445,429
|
|
Portfolio turnover rate
J
|
35%
I
|
26%
|
47%
|
38%
|
40%
|
35%
|
|
Fidelity Central Fund
|
Investment Manager
|
Investment Objective
|
Investment Practices
|
Expense Ratio
A
|
|
Fidelity Money Market Central Funds
|
Fidelity Management & Research Company LLC (FMR)
|
Each fund seeks to obtain a high level of current income consistent with the preservation of capital and liquidity.
|
Short-term Investments
|
Less than .005%
|
|
VIP Overseas Portfolio
|
$11,211
|
|
Gross unrealized appreciation
|
$316,672,366
|
|
Gross unrealized depreciation
|
(129,189,085)
|
|
Net unrealized appreciation (depreciation)
|
$187,483,281
|
|
Tax cost
|
$1,405,846,264
|
|
Purchases ($)
|
Sales ($)
|
|
|
VIP Overseas Portfolio
|
354,059,504
|
309,019,918
|
|
Service Class
|
$70,400
|
|
Service Class 2
|
411,244
|
|
$481,644
|
|
Amount
|
% of Class-Level Average Net Assets
A
|
|
|
Initial Class
|
$280,100
|
.06
|
|
Service Class
|
43,533
|
.06
|
|
Service Class 2
|
101,700
|
.06
|
|
Investor Class
|
300,315
|
.14
|
|
$725,648
|
|
% of Average Net Assets
|
|
|
VIP Overseas Portfolio
|
.04
|
|
Amount
|
|
|
VIP Overseas Portfolio
|
$317
|
|
Purchases ($)
|
Sales ($)
|
Realized Gain (Loss) ($)
|
|
|
VIP Overseas Portfolio
|
26,235,637
|
14,122,293
|
655,615
|
|
Amount
|
|
|
VIP Overseas Portfolio
|
$1,639
|
|
Total Security Lending Fees Paid to NFS
|
Security Lending Income From Securities Loaned to NFS
|
Value of Securities Loaned to NFS at Period End
|
|
|
VIP Overseas Portfolio
|
$12,570
|
$-
|
$-
|
|
Six months ended
June 30, 2022
|
Year ended
December 31, 2021
|
|
|
VIP Overseas Portfolio
|
||
|
Distributions to shareholders
|
||
|
Initial Class
|
$7,525,384
|
$77,624,654
|
|
Service Class
|
1,212,093
|
12,782,530
|
|
Service Class 2
|
2,874,149
|
29,640,102
|
|
Investor Class
|
3,763,122
|
38,006,883
|
|
Total
|
$15,374,748
|
$158,054,169
|
|
Shares
|
Shares
|
Dollars
|
Dollars
|
|
|
Six months ended June 30, 2022
|
Year ended December 31, 2021
|
Six months ended June 30, 2022
|
Year ended December 31, 2021
|
|
|
VIP Overseas Portfolio
|
||||
|
Initial Class
|
||||
|
Shares sold
|
12,125,656
|
7,306,732
|
$289,031,364
|
$206,775,528
|
|
Reinvestment of distributions
|
285,945
|
2,766,494
|
7,525,384
|
77,624,654
|
|
Shares redeemed
|
(9,379,598)
|
(7,626,572)
|
(221,014,340)
|
(216,138,658)
|
|
Net increase (decrease)
|
3,032,003
|
2,446,654
|
$75,542,408
|
$68,261,524
|
|
Service Class
|
||||
|
Shares sold
|
361,276
|
376,377
|
$8,642,317
|
$10,474,364
|
|
Reinvestment of distributions
|
46,298
|
459,099
|
1,212,093
|
12,782,530
|
|
Shares redeemed
|
(402,229)
|
(809,211)
|
(9,635,722)
|
(22,845,537)
|
|
Net increase (decrease)
|
5,345
|
26,265
|
$218,688
|
$411,357
|
|
Service Class 2
|
||||
|
Shares sold
|
929,166
|
882,761
|
$22,547,769
|
$24,684,454
|
|
Reinvestment of distributions
|
110,544
|
1,070,686
|
2,874,149
|
29,640,102
|
|
Shares redeemed
|
(1,253,140)
|
(1,619,652)
|
(30,219,642)
|
(45,173,824)
|
|
Net increase (decrease)
|
(213,430)
|
333,795
|
$(4,797,724)
|
$9,150,732
|
|
Investor Class
|
||||
|
Shares sold
|
2,051,894
|
3,219,623
|
$50,224,740
|
$91,456,154
|
|
Reinvestment of distributions
|
143,607
|
1,359,649
|
3,763,122
|
38,006,883
|
|
Shares redeemed
|
(1,263,441)
|
(2,932,892)
|
(30,318,140)
|
(83,122,748)
|
|
Net increase (decrease)
|
932,060
|
1,646,380
|
$23,669,722
|
$46,340,289
|
|
The Example is based on an investment of $1,000 invested at the beginning of the period and held for the entire period (January 1, 2022 to June 30, 2022).
|
|
Annualized Expense Ratio-
A
|
Beginning Account Value January 1, 2022
|
Ending Account Value June 30, 2022
|
Expenses Paid During Period-
C
January 1, 2022 to June 30, 2022
|
|||||||
|
Overseas Portfolio
|
||||||||||
|
Initial Class
|
.76%
|
|||||||||
|
Actual
|
$ 1,000
|
$ 717.40
|
$ 3.24
|
|||||||
|
Hypothetical-
B
|
$ 1,000
|
$ 1,021.03
|
$ 3.81
|
|||||||
|
Service Class
|
.86%
|
|||||||||
|
Actual
|
$ 1,000
|
$ 717.00
|
$ 3.66
|
|||||||
|
Hypothetical-
B
|
$ 1,000
|
$ 1,020.53
|
$ 4.31
|
|||||||
|
Service Class 2
|
1.01%
|
|||||||||
|
Actual
|
$ 1,000
|
$ 716.50
|
$ 4.30
|
|||||||
|
Hypothetical-
B
|
$ 1,000
|
$ 1,019.79
|
$ 5.06
|
|||||||
|
Investor Class
|
.84%
|
|||||||||
|
Actual
|
$ 1,000
|
$ 716.90
|
$ 3.58
|
|||||||
|
Hypothetical-
B
|
$ 1,000
|
$ 1,020.63
|
$ 4.21
|
|||||||
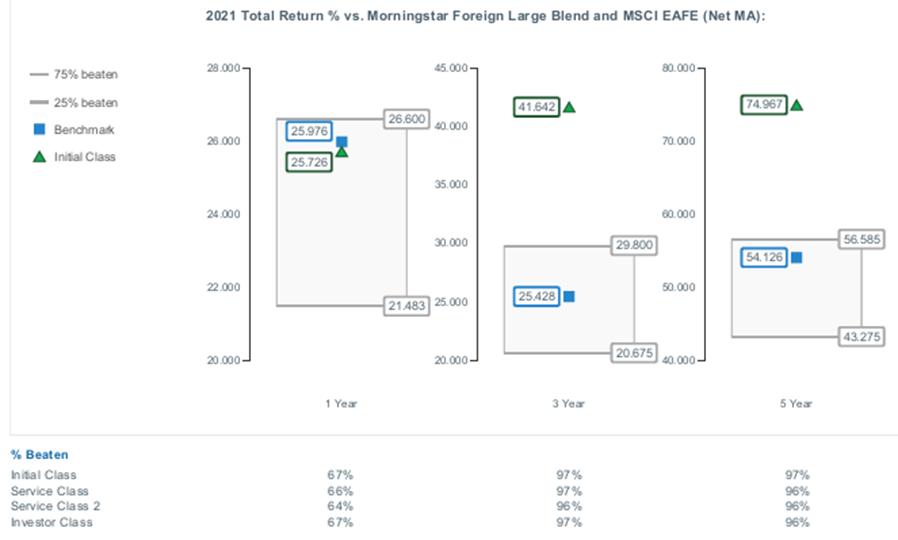
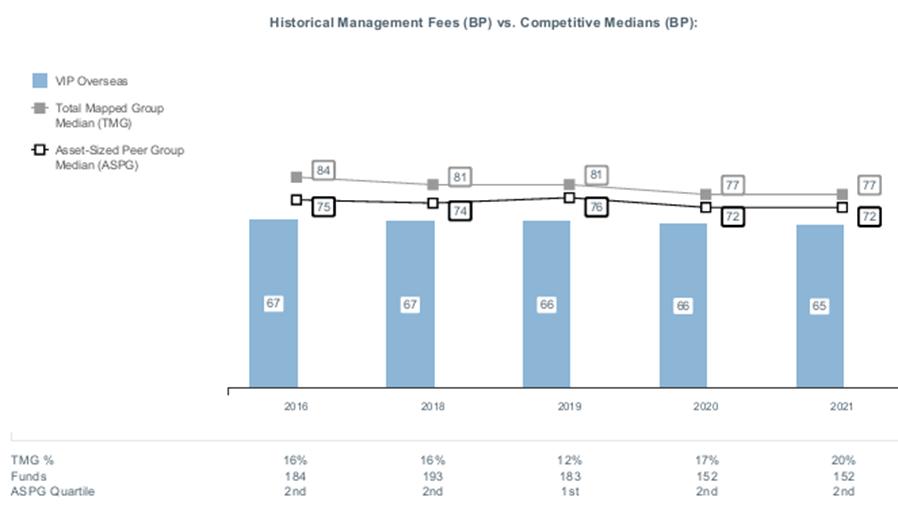
|
|


Contents
| Board Approval of Investment Advisory Contracts and Management Fees |
|
Top Holdings (% of Fund's net assets)
|
||
|
Tenet Healthcare Corp.
|
2.1
|
|
|
New Fortress Energy, Inc.
|
2.1
|
|
|
Uniti Group LP / Uniti Group Finance, Inc.
|
2.1
|
|
|
Icahn Enterprises LP/Icahn Enterprises Finance Corp.
|
2.0
|
|
|
Community Health Systems, Inc.
|
1.9
|
|
|
Mesquite Energy, Inc.
|
1.7
|
|
|
Altice France SA
|
1.5
|
|
|
Crestwood Midstream Partners LP/Crestwood Midstream Finance Corp.
|
1.4
|
|
|
Alliant Holdings Intermediate LLC
|
1.3
|
|
|
Tallgrass Energy Partners LP / Tallgrass Energy Finance Corp.
|
1.3
|
|
|
17.4
|
||
|
Market Sectors (% of Fund's net assets)
|
||
|
Energy
|
13.8
|
|
|
Healthcare
|
10.5
|
|
|
Telecommunications
|
9.6
|
|
|
Technology
|
6.8
|
|
|
Services
|
6.2
|
|
|
Quality Diversification (% of Fund's net assets)
|
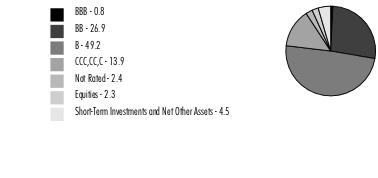
|
|
We have used ratings from Moody's Investors Service, Inc. Where Moody's® ratings are not available, we have used S&P® ratings. All ratings are as of the date indicated and do not reflect subsequent changes.
|
|
Asset Allocation (% of Fund's net assets)
|
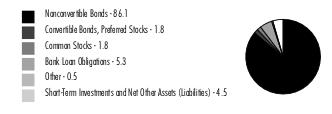
|
|
Foreign investments - 19.4%
|
|
Geographic Diversification (% of Fund's net assets)
|
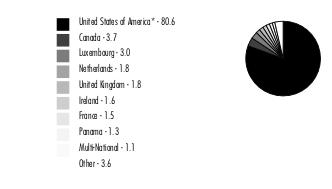
|
|
* Includes Short-Term investments and Net Other Assets (Liabilities).
Percentages are based on country or territory of incorporation and are adjusted for the effect of futures contracts, if applicable.
|
|
Corporate Bonds - 87.9%
|
|||
|
Principal
Amount (a)
|
Value ($)
|
||
|
Convertible Bonds - 1.8%
|
|||
|
Broadcasting - 0.7%
|
|||
|
DISH Network Corp.:
|
|||
|
2.375% 3/15/24
|
2,594,000
|
2,282,720
|
|
|
3.375% 8/15/26
|
4,068,000
|
2,747,934
|
|
|
5,030,654
|
|||
|
Energy - 1.1%
|
|||
|
Mesquite Energy, Inc. 15% 7/15/23 (b)(c)
|
649,253
|
3,246,265
|
|
|
Mesquite Energy, Inc. 15% 7/15/23 (b)(c)
|
1,120,884
|
5,100,022
|
|
|
8,346,287
|
|||
|
TOTAL CONVERTIBLE BONDS
|
13,376,941
|
||
|
Nonconvertible Bonds - 86.1%
|
|||
|
Aerospace - 3.9%
|
|||
|
Allegheny Technologies, Inc.:
|
|||
|
4.875% 10/1/29
|
250,000
|
199,373
|
|
|
5.875% 12/1/27
|
5,715,000
|
5,060,587
|
|
|
Bombardier, Inc.:
|
|||
|
6% 2/15/28 (d)
|
2,030,000
|
1,521,282
|
|
|
7.125% 6/15/26 (d)
|
1,720,000
|
1,401,800
|
|
|
7.875% 4/15/27 (d)
|
6,425,000
|
5,293,925
|
|
|
BWX Technologies, Inc. 4.125% 6/30/28 (d)
|
2,565,000
|
2,282,850
|
|
|
Kaiser Aluminum Corp.:
|
|||
|
4.5% 6/1/31 (d)
|
485,000
|
367,087
|
|
|
4.625% 3/1/28 (d)
|
1,980,000
|
1,648,390
|
|
|
Moog, Inc. 4.25% 12/15/27 (d)
|
2,140,000
|
1,854,289
|
|
|
TransDigm, Inc.:
|
|||
|
4.625% 1/15/29
|
855,000
|
688,292
|
|
|
5.5% 11/15/27
|
9,310,000
|
7,913,500
|
|
|
7.5% 3/15/27
|
425,000
|
400,949
|
|
|
28,632,324
|
|||
|
Air Transportation - 0.1%
|
|||
|
American Airlines, Inc. / AAdvantage Loyalty IP Ltd. 5.5% 4/20/26 (d)
|
740,000
|
679,901
|
|
|
Automotive & Auto Parts - 0.3%
|
|||
|
Ford Motor Credit Co. LLC:
|
|||
|
2.9% 2/10/29
|
1,555,000
|
1,216,788
|
|
|
3.815% 11/2/27
|
925,000
|
786,250
|
|
|
2,003,038
|
|||
|
Banks & Thrifts - 0.1%
|
|||
|
Jane Street Group LLC/JSG Finance, Inc. 4.5% 11/15/29 (d)
|
560,000
|
498,400
|
|
|
Broadcasting - 1.1%
|
|||
|
Diamond Sports Group LLC/Diamond Sports Finance Co. 5.375% 8/15/26 (d)
|
5,215,000
|
1,303,750
|
|
|
Sinclair Television Group, Inc. 5.5% 3/1/30 (d)
|
990,000
|
728,956
|
|
|
Sirius XM Radio, Inc. 4% 7/15/28 (d)
|
2,920,000
|
2,525,800
|
|
|
TEGNA, Inc.:
|
|||
|
4.625% 3/15/28
|
1,100,000
|
1,028,500
|
|
|
5% 9/15/29
|
425,000
|
401,986
|
|
|
Univision Communications, Inc.:
|
|||
|
4.5% 5/1/29 (d)
|
1,265,000
|
1,058,834
|
|
|
6.625% 6/1/27 (d)
|
890,000
|
847,378
|
|
|
7,895,204
|
|||
|
Building Materials - 0.6%
|
|||
|
Advanced Drain Systems, Inc. 5% 9/30/27 (d)
|
2,180,000
|
2,010,004
|
|
|
Builders FirstSource, Inc. 4.25% 2/1/32 (d)
|
1,270,000
|
966,686
|
|
|
SRS Distribution, Inc.:
|
|||
|
4.625% 7/1/28 (d)
|
780,000
|
682,500
|
|
|
6% 12/1/29 (d)
|
715,000
|
561,439
|
|
|
4,220,629
|
|||
|
Cable/Satellite TV - 3.5%
|
|||
|
CCO Holdings LLC/CCO Holdings Capital Corp.:
|
|||
|
4.25% 2/1/31 (d)
|
2,925,000
|
2,383,875
|
|
|
4.5% 8/15/30 (d)
|
1,750,000
|
1,452,987
|
|
|
4.5% 5/1/32
|
2,190,000
|
1,773,243
|
|
|
4.5% 6/1/33 (d)
|
1,870,000
|
1,473,597
|
|
|
CSC Holdings LLC:
|
|||
|
4.125% 12/1/30 (d)
|
795,000
|
620,100
|
|
|
4.625% 12/1/30 (d)
|
4,050,000
|
2,708,397
|
|
|
5.375% 2/1/28 (d)
|
2,720,000
|
2,352,800
|
|
|
5.75% 1/15/30 (d)
|
1,940,000
|
1,411,408
|
|
|
7.5% 4/1/28 (d)
|
1,270,000
|
1,060,450
|
|
|
Dolya Holdco 18 DAC 5% 7/15/28 (d)
|
950,000
|
786,095
|
|
|
Radiate Holdco LLC/Radiate Financial Service Ltd.:
|
|||
|
4.5% 9/15/26 (d)
|
2,685,000
|
2,315,222
|
|
|
6.5% 9/15/28 (d)
|
4,550,000
|
3,516,581
|
|
|
Telenet Finance Luxembourg Notes SARL 5.5% 3/1/28 (d)
|
3,000,000
|
2,647,200
|
|
|
Ziggo Bond Co. BV 5.125% 2/28/30 (d)
|
185,000
|
145,116
|
|
|
Ziggo BV 4.875% 1/15/30 (d)
|
990,000
|
839,711
|
|
|
25,486,782
|
|||
|
Capital Goods - 0.9%
|
|||
|
Mueller Water Products, Inc. 4% 6/15/29 (d)
|
1,110,000
|
968,297
|
|
|
Vertical Holdco GmbH 7.625% 7/15/28 (d)
|
1,315,000
|
1,180,213
|
|
|
Vertical U.S. Newco, Inc. 5.25% 7/15/27 (d)
|
4,830,000
|
4,306,259
|
|
|
6,454,769
|
|||
|
Chemicals - 3.5%
|
|||
|
CVR Partners LP 6.125% 6/15/28 (d)
|
1,179,000
|
1,054,052
|
|
|
Element Solutions, Inc. 3.875% 9/1/28 (d)
|
1,465,000
|
1,208,815
|
|
|
Kronos Acquisition Holdings, Inc. / KIK Custom Products, Inc.:
|
|||
|
5% 12/31/26 (d)
|
2,590,000
|
2,214,476
|
|
|
7% 12/31/27 (d)
|
260,000
|
195,000
|
|
|
LSB Industries, Inc. 6.25% 10/15/28 (d)
|
2,345,000
|
2,069,463
|
|
|
Methanex Corp.:
|
|||
|
5.125% 10/15/27
|
2,855,000
|
2,519,538
|
|
|
5.65% 12/1/44
|
1,257,000
|
883,354
|
|
|
NOVA Chemicals Corp.:
|
|||
|
4.25% 5/15/29 (d)
|
1,135,000
|
895,061
|
|
|
5% 5/1/25 (d)
|
530,000
|
484,457
|
|
|
5.25% 6/1/27 (d)
|
3,100,000
|
2,658,870
|
|
|
Nufarm Australia Ltd. 5% 1/27/30 (d)
|
1,480,000
|
1,250,600
|
|
|
Olympus Water U.S. Holding Corp.:
|
|||
|
4.25% 10/1/28 (d)
|
1,180,000
|
924,235
|
|
|
6.25% 10/1/29 (d)
|
1,250,000
|
868,544
|
|
|
SCIL IV LLC / SCIL U.S.A. Holdings LLC 5.375% 11/1/26 (d)
|
905,000
|
724,000
|
|
|
The Chemours Co. LLC:
|
|||
|
4.625% 11/15/29 (d)
|
1,075,000
|
845,466
|
|
|
5.375% 5/15/27
|
2,147,000
|
1,889,047
|
|
|
5.75% 11/15/28 (d)
|
4,510,000
|
3,843,557
|
|
|
W.R. Grace Holding LLC 5.625% 8/15/29 (d)
|
1,800,000
|
1,325,250
|
|
|
25,853,785
|
|||
|
Consumer Products - 0.3%
|
|||
|
Michaels Companies, Inc.:
|
|||
|
5.25% 5/1/28 (d)
|
810,000
|
636,636
|
|
|
7.875% 5/1/29 (d)
|
620,000
|
408,592
|
|
|
Nordstrom, Inc.:
|
|||
|
4.25% 8/1/31
|
950,000
|
719,939
|
|
|
4.375% 4/1/30
|
635,000
|
493,713
|
|
|
2,258,880
|
|||
|
Containers - 0.9%
|
|||
|
Graphic Packaging International, Inc. 3.75% 2/1/30 (d)
|
500,000
|
423,776
|
|
|
Sealed Air Corp. 5% 4/15/29 (d)
|
1,265,000
|
1,182,775
|
|
|
Trivium Packaging Finance BV:
|
|||
|
5.5% 8/15/26 (d)
|
2,845,000
|
2,676,206
|
|
|
8.5% 8/15/27 (d)
|
2,470,000
|
2,315,973
|
|
|
6,598,730
|
|||
|
Diversified Financial Services - 3.7%
|
|||
|
Altus Midstream LP 5.875% 6/15/30 (d)
|
890,000
|
847,827
|
|
|
Coinbase Global, Inc.:
|
|||
|
3.375% 10/1/28 (d)
|
2,595,000
|
1,633,436
|
|
|
3.625% 10/1/31 (d)
|
2,875,000
|
1,614,616
|
|
|
Hightower Holding LLC 6.75% 4/15/29 (d)
|
1,250,000
|
939,863
|
|
|
Icahn Enterprises LP/Icahn Enterprises Finance Corp.:
|
|||
|
4.375% 2/1/29
|
1,860,000
|
1,503,178
|
|
|
5.25% 5/15/27
|
10,205,000
|
9,031,425
|
|
|
6.25% 5/15/26
|
4,405,000
|
4,096,650
|
|
|
Ladder Capital Finance Holdings LLLP/Ladder Capital Finance Corp.:
|
|||
|
4.25% 2/1/27 (d)
|
105,000
|
84,769
|
|
|
4.75% 6/15/29 (d)
|
820,000
|
630,931
|
|
|
OneMain Finance Corp.:
|
|||
|
3.5% 1/15/27
|
1,905,000
|
1,524,000
|
|
|
3.875% 9/15/28
|
3,375,000
|
2,581,875
|
|
|
7.125% 3/15/26
|
2,750,000
|
2,551,490
|
|
|
27,040,060
|
|||
|
Diversified Media - 1.2%
|
|||
|
Advantage Sales & Marketing, Inc. 6.5% 11/15/28 (d)
|
4,725,000
|
4,051,546
|
|
|
Nielsen Finance LLC/Nielsen Finance Co.:
|
|||
|
4.5% 7/15/29 (d)
|
1,110,000
|
1,002,758
|
|
|
5.625% 10/1/28 (d)
|
1,850,000
|
1,718,095
|
|
|
5.875% 10/1/30 (d)
|
910,000
|
835,526
|
|
|
Terrier Media Buyer, Inc. 8.875% 12/15/27 (d)
|
1,430,000
|
1,129,714
|
|
|
8,737,639
|
|||
|
Energy - 11.0%
|
|||
|
Apache Corp. 4.25% 1/15/30
|
445,000
|
394,381
|
|
|
Atlantica Sustainable Infrastructure PLC 4.125% 6/15/28 (d)
|
1,480,000
|
1,288,756
|
|
|
Citgo Petroleum Corp. 6.375% 6/15/26 (d)
|
3,930,000
|
3,628,058
|
|
|
Colgate Energy Partners III LLC 5.875% 7/1/29 (d)
|
1,800,000
|
1,577,250
|
|
|
Comstock Resources, Inc.:
|
|||
|
5.875% 1/15/30 (d)
|
2,015,000
|
1,732,900
|
|
|
6.75% 3/1/29 (d)
|
2,390,000
|
2,140,078
|
|
|
Crestwood Midstream Partners LP/Crestwood Midstream Finance Corp.:
|
|||
|
5.625% 5/1/27 (d)
|
5,198,000
|
4,626,220
|
|
|
5.75% 4/1/25
|
3,627,000
|
3,391,245
|
|
|
6% 2/1/29 (d)
|
2,560,000
|
2,233,805
|
|
|
CrownRock LP/CrownRock Finance, Inc.:
|
|||
|
5% 5/1/29 (d)
|
575,000
|
515,679
|
|
|
5.625% 10/15/25 (d)
|
130,000
|
122,200
|
|
|
CVR Energy, Inc.:
|
|||
|
5.25% 2/15/25 (d)
|
2,461,000
|
2,262,668
|
|
|
5.75% 2/15/28 (d)
|
3,209,000
|
2,861,471
|
|
|
Delek Logistics Partners LP 7.125% 6/1/28 (d)
|
2,780,000
|
2,502,000
|
|
|
DT Midstream, Inc. 4.125% 6/15/29 (d)
|
935,000
|
792,413
|
|
|
Endeavor Energy Resources LP/EER Finance, Inc. 5.75% 1/30/28 (d)
|
285,000
|
271,505
|
|
|
EnLink Midstream LLC 5.625% 1/15/28 (d)
|
395,000
|
362,321
|
|
|
EQM Midstream Partners LP:
|
|||
|
6.5% 7/1/27 (d)
|
800,000
|
743,840
|
|
|
7.5% 6/1/27 (d)
|
410,000
|
395,466
|
|
|
7.5% 6/1/30 (d)
|
410,000
|
393,864
|
|
|
Global Partners LP/GLP Finance Corp. 6.875% 1/15/29
|
1,285,000
|
1,087,404
|
|
|
Harvest Midstream I LP 7.5% 9/1/28 (d)
|
645,000
|
605,804
|
|
|
Hess Midstream Partners LP:
|
|||
|
4.25% 2/15/30 (d)
|
635,000
|
531,790
|
|
|
5.125% 6/15/28 (d)
|
2,465,000
|
2,212,338
|
|
|
Hilcorp Energy I LP/Hilcorp Finance Co.:
|
|||
|
5.75% 2/1/29 (d)
|
445,000
|
390,772
|
|
|
6.25% 11/1/28 (d)
|
445,000
|
419,417
|
|
|
Holly Energy Partners LP/Holly Energy Finance Corp. 5% 2/1/28 (d)
|
870,000
|
745,103
|
|
|
Mesquite Energy, Inc. 7.25% 2/15/23 (c)(d)(e)
|
5,722,000
|
1
|
|
|
New Fortress Energy, Inc.:
|
|||
|
6.5% 9/30/26 (d)
|
6,955,000
|
6,299,571
|
|
|
6.75% 9/15/25 (d)
|
8,015,000
|
7,574,175
|
|
|
NGL Energy Operating LLC/NGL Energy Finance Corp. 7.5% 2/1/26 (d)
|
5,480,000
|
4,932,000
|
|
|
NGL Energy Partners LP/NGL Energy Finance Corp. 7.5% 11/1/23
|
1,260,000
|
1,140,300
|
|
|
Occidental Petroleum Corp.:
|
|||
|
7.5% 5/1/31
|
1,440,000
|
1,548,000
|
|
|
7.875% 9/15/31
|
375,000
|
411,563
|
|
|
8.875% 7/15/30
|
1,270,000
|
1,458,058
|
|
|
Rockies Express Pipeline LLC:
|
|||
|
4.8% 5/15/30 (d)
|
250,000
|
208,125
|
|
|
4.95% 7/15/29 (d)
|
1,010,000
|
863,550
|
|
|
6.875% 4/15/40 (d)
|
385,000
|
318,588
|
|
|
SM Energy Co. 5.625% 6/1/25
|
1,165,000
|
1,100,925
|
|
|
Southwestern Energy Co. 4.75% 2/1/32
|
925,000
|
790,436
|
|
|
Sunoco LP/Sunoco Finance Corp.:
|
|||
|
4.5% 5/15/29
|
620,000
|
511,056
|
|
|
5.875% 3/15/28
|
500,000
|
455,879
|
|
|
Superior Plus LP / Superior General Partner, Inc. 4.5% 3/15/29 (d)
|
670,000
|
569,500
|
|
|
Tallgrass Energy Partners LP / Tallgrass Energy Finance Corp.:
|
|||
|
5.5% 1/15/28 (d)
|
2,252,000
|
1,914,583
|
|
|
6% 3/1/27 (d)
|
4,005,000
|
3,574,463
|
|
|
6% 12/31/30 (d)
|
2,070,000
|
1,718,100
|
|
|
6% 9/1/31 (d)
|
2,100,000
|
1,732,500
|
|
|
7.5% 10/1/25 (d)
|
625,000
|
604,859
|
|
|
Transocean Guardian Ltd. 5.875% 1/15/24 (d)
|
721,613
|
666,914
|
|
|
Transocean Phoenix 2 Ltd. 7.75% 10/15/24 (d)
|
135,000
|
129,600
|
|
|
Transocean Pontus Ltd. 6.125% 8/1/25 (d)
|
365,925
|
334,821
|
|
|
Transocean Poseidon Ltd. 6.875% 2/1/27 (d)
|
557,813
|
496,453
|
|
|
Transocean Proteus Ltd. 6.25% 12/1/24 (d)
|
148,500
|
138,476
|
|
|
Transocean Sentry Ltd. 5.375% 5/15/23 (d)
|
818,343
|
769,243
|
|
|
Venture Global Calcasieu Pass LLC:
|
|||
|
3.875% 8/15/29 (d)
|
1,220,000
|
1,067,165
|
|
|
4.125% 8/15/31 (d)
|
1,205,000
|
1,029,697
|
|
|
80,587,349
|
|||
|
Environmental - 1.3%
|
|||
|
Covanta Holding Corp. 4.875% 12/1/29 (d)
|
985,000
|
801,514
|
|
|
Darling Ingredients, Inc. 6% 6/15/30 (d)
|
510,000
|
508,292
|
|
|
Madison IAQ LLC:
|
|||
|
4.125% 6/30/28 (d)
|
2,380,000
|
1,965,745
|
|
|
5.875% 6/30/29 (d)
|
5,735,000
|
4,394,845
|
|
|
Stericycle, Inc.:
|
|||
|
3.875% 1/15/29 (d)
|
1,625,000
|
1,328,438
|
|
|
5.375% 7/15/24 (d)
|
325,000
|
313,765
|
|
|
9,312,599
|
|||
|
Food & Drug Retail - 1.0%
|
|||
|
Albertsons Companies LLC/Safeway, Inc./New Albertson's, Inc./Albertson's LLC:
|
|||
|
3.5% 3/15/29 (d)
|
4,942,000
|
3,999,630
|
|
|
4.875% 2/15/30 (d)
|
1,430,000
|
1,226,711
|
|
|
Emergent BioSolutions, Inc. 3.875% 8/15/28 (d)
|
2,115,000
|
1,499,391
|
|
|
Murphy Oil U.S.A., Inc. 3.75% 2/15/31 (d)
|
395,000
|
335,651
|
|
|
7,061,383
|
|||
|
Food/Beverage/Tobacco - 2.0%
|
|||
|
C&S Group Enterprises LLC 5% 12/15/28 (d)
|
3,700,000
|
2,748,636
|
|
|
JBS U.S.A. Lux SA / JBS Food Co. 5.5% 1/15/30 (d)
|
630,000
|
596,169
|
|
|
Lamb Weston Holdings, Inc. 4.125% 1/31/30 (d)
|
2,730,000
|
2,362,979
|
|
|
Performance Food Group, Inc. 5.5% 10/15/27 (d)
|
125,000
|
115,718
|
|
|
Post Holdings, Inc. 4.625% 4/15/30 (d)
|
1,125,000
|
949,241
|
|
|
Primo Water Holdings, Inc. 4.375% 4/30/29 (d)
|
2,945,000
|
2,405,270
|
|
|
TreeHouse Foods, Inc. 4% 9/1/28
|
480,000
|
391,075
|
|
|
Triton Water Holdings, Inc. 6.25% 4/1/29 (d)
|
4,605,000
|
3,269,550
|
|
|
U.S. Foods, Inc.:
|
|||
|
4.625% 6/1/30 (d)
|
475,000
|
400,445
|
|
|
4.75% 2/15/29 (d)
|
1,285,000
|
1,123,334
|
|
|
14,362,417
|
|||
|
Gaming - 3.0%
|
|||
|
Affinity Gaming LLC 6.875% 12/15/27 (d)
|
2,425,000
|
2,037,097
|
|
|
Caesars Entertainment, Inc.:
|
|||
|
4.625% 10/15/29 (d)
|
1,170,000
|
909,675
|
|
|
8.125% 7/1/27 (d)
|
6,925,000
|
6,691,281
|
|
|
Fertitta Entertainment LLC / Fertitta Entertainment Finance Co., Inc. 6.75% 1/15/30 (d)
|
2,555,000
|
1,960,963
|
|
|
Golden Entertainment, Inc. 7.625% 4/15/26 (d)
|
3,070,000
|
3,039,300
|
|
|
Jacobs Entertainment, Inc. 6.75% 2/15/29 (d)
|
555,000
|
469,326
|
|
|
Melco Resorts Finance Ltd.:
|
|||
|
5.375% 12/4/29 (d)
|
940,000
|
564,503
|
|
|
5.75% 7/21/28 (d)
|
1,420,000
|
908,800
|
|
|
Premier Entertainment Sub LLC:
|
|||
|
5.625% 9/1/29 (d)
|
1,590,000
|
1,132,016
|
|
|
5.875% 9/1/31 (d)
|
750,000
|
520,510
|
|
|
Station Casinos LLC 4.5% 2/15/28 (d)
|
750,000
|
633,458
|
|
|
Wynn Las Vegas LLC/Wynn Las Vegas Capital Corp. 5.25% 5/15/27 (d)
|
1,935,000
|
1,657,308
|
|
|
Wynn Macau Ltd. 5.5% 10/1/27 (d)
|
1,950,000
|
1,248,000
|
|
|
21,772,237
|
|||
|
Healthcare - 10.0%
|
|||
|
180 Medical, Inc. 3.875% 10/15/29 (d)
|
1,305,000
|
1,128,825
|
|
|
AMN Healthcare 4% 4/15/29 (d)
|
1,880,000
|
1,588,600
|
|
|
Avantor Funding, Inc.:
|
|||
|
3.875% 11/1/29 (d)
|
1,930,000
|
1,688,075
|
|
|
4.625% 7/15/28 (d)
|
998,000
|
914,867
|
|
|
Bausch Health Companies, Inc.:
|
|||
|
5% 1/30/28 (d)
|
1,420,000
|
756,150
|
|
|
7% 1/15/28 (d)
|
2,335,000
|
1,336,788
|
|
|
Cano Health, Inc. 6.25% 10/1/28 (d)
|
1,885,000
|
1,541,546
|
|
|
Catalent Pharma Solutions 3.5% 4/1/30 (d)
|
2,470,000
|
2,015,345
|
|
|
Charles River Laboratories International, Inc.:
|
|||
|
3.75% 3/15/29 (d)
|
660,000
|
572,781
|
|
|
4.25% 5/1/28 (d)
|
290,000
|
260,510
|
|
|
Community Health Systems, Inc.:
|
|||
|
4.75% 2/15/31 (d)
|
2,065,000
|
1,511,886
|
|
|
5.25% 5/15/30 (d)
|
2,210,000
|
1,679,379
|
|
|
5.625% 3/15/27 (d)
|
5,805,000
|
4,913,178
|
|
|
6% 1/15/29 (d)
|
2,135,000
|
1,768,677
|
|
|
6.125% 4/1/30 (d)
|
1,680,000
|
1,024,800
|
|
|
6.875% 4/15/29 (d)
|
2,095,000
|
1,351,275
|
|
|
8% 3/15/26 (d)
|
2,060,000
|
1,876,021
|
|
|
CTR Partnership LP/CareTrust Capital Corp. 3.875% 6/30/28 (d)
|
1,200,000
|
1,024,800
|
|
|
DaVita HealthCare Partners, Inc.:
|
|||
|
3.75% 2/15/31 (d)
|
510,000
|
365,665
|
|
|
4.625% 6/1/30 (d)
|
4,695,000
|
3,661,452
|
|
|
Embecta Corp. 5% 2/15/30 (d)
|
620,000
|
520,450
|
|
|
Grifols Escrow Issuer SA 4.75% 10/15/28 (d)
|
1,780,000
|
1,544,150
|
|
|
HealthEquity, Inc. 4.5% 10/1/29 (d)
|
3,090,000
|
2,703,750
|
|
|
Hologic, Inc.:
|
|||
|
3.25% 2/15/29 (d)
|
2,030,000
|
1,735,041
|
|
|
4.625% 2/1/28 (d)
|
395,000
|
369,621
|
|
|
Jazz Securities DAC 4.375% 1/15/29 (d)
|
2,625,000
|
2,334,981
|
|
|
MEDNAX, Inc. 5.375% 2/15/30 (d)
|
1,290,000
|
1,105,220
|
|
|
Minerva Merger Sub, Inc. 6.5% 2/15/30 (d)
|
4,145,000
|
3,446,941
|
|
|
ModivCare Escrow Issuer, Inc. 5% 10/1/29 (d)
|
450,000
|
363,484
|
|
|
Molina Healthcare, Inc. 3.875% 11/15/30 (d)
|
855,000
|
730,837
|
|
|
Option Care Health, Inc. 4.375% 10/31/29 (d)
|
1,910,000
|
1,637,825
|
|
|
Organon & Co. / Organon Foreign Debt Co-Issuer BV:
|
|||
|
4.125% 4/30/28 (d)
|
4,265,000
|
3,774,525
|
|
|
5.125% 4/30/31 (d)
|
730,000
|
629,866
|
|
|
Owens & Minor, Inc. 4.5% 3/31/29 (d)
|
585,000
|
477,653
|
|
|
Radiology Partners, Inc. 9.25% 2/1/28 (d)
|
2,216,000
|
1,664,260
|
|
|
RP Escrow Issuer LLC 5.25% 12/15/25 (d)
|
3,120,000
|
2,696,705
|
|
|
Teleflex, Inc. 4.25% 6/1/28 (d)
|
535,000
|
483,391
|
|
|
Tenet Healthcare Corp.:
|
|||
|
4.25% 6/1/29 (d)
|
2,345,000
|
1,974,982
|
|
|
4.375% 1/15/30 (d)
|
2,160,000
|
1,827,425
|
|
|
4.625% 6/15/28 (d)
|
4,245,000
|
3,696,461
|
|
|
6.125% 10/1/28 (d)
|
6,535,000
|
5,592,522
|
|
|
6.125% 6/15/30 (d)
|
1,640,000
|
1,513,031
|
|
|
6.25% 2/1/27 (d)
|
1,195,000
|
1,099,896
|
|
|
Valeant Pharmaceuticals International, Inc. 8.5% 1/31/27 (d)
|
670,000
|
469,838
|
|
|
73,373,475
|
|||
|
Homebuilders/Real Estate - 3.9%
|
|||
|
Ashton Woods U.S.A. LLC/Ashton Woods Finance Co. 4.625% 8/1/29 (d)
|
565,000
|
423,750
|
|
|
Howard Hughes Corp.:
|
|||
|
4.125% 2/1/29 (d)
|
775,000
|
597,748
|
|
|
4.375% 2/1/31 (d)
|
775,000
|
573,564
|
|
|
Kennedy-Wilson, Inc. 4.75% 2/1/30
|
2,880,000
|
2,253,600
|
|
|
MPT Operating Partnership LP/MPT Finance Corp.:
|
|||
|
4.625% 8/1/29
|
255,000
|
223,763
|
|
|
5% 10/15/27
|
5,430,000
|
4,966,658
|
|
|
Railworks Holdings LP 8.25% 11/15/28 (d)
|
1,660,000
|
1,498,150
|
|
|
Realogy Group LLC/Realogy Co-Issuer Corp. 5.75% 1/15/29 (d)
|
1,980,000
|
1,512,225
|
|
|
TopBuild Corp. 4.125% 2/15/32 (d)
|
2,135,000
|
1,643,610
|
|
|
Uniti Group LP / Uniti Group Finance, Inc.:
|
|||
|
4.75% 4/15/28 (d)
|
5,020,000
|
4,128,398
|
|
|
6.5% 2/15/29 (d)
|
14,955,000
|
10,954,518
|
|
|
28,775,984
|
|||
|
Hotels - 0.5%
|
|||
|
Hilton Domestic Operating Co., Inc.:
|
|||
|
3.625% 2/15/32 (d)
|
2,175,000
|
1,727,766
|
|
|
3.75% 5/1/29 (d)
|
295,000
|
250,204
|
|
|
4% 5/1/31 (d)
|
1,055,000
|
876,705
|
|
|
Wyndham Hotels & Resorts, Inc. 4.375% 8/15/28 (d)
|
1,060,000
|
927,140
|
|
|
3,781,815
|
|||
|
Insurance - 1.7%
|
|||
|
Alliant Holdings Intermediate LLC:
|
|||
|
4.25% 10/15/27 (d)
|
2,775,000
|
2,401,958
|
|
|
6.75% 10/15/27 (d)
|
8,317,000
|
7,380,339
|
|
|
AmWINS Group, Inc. 4.875% 6/30/29 (d)
|
2,535,000
|
2,075,969
|
|
|
AssuredPartners, Inc. 5.625% 1/15/29 (d)
|
795,000
|
636,423
|
|
|
12,494,689
|
|||
|
Leisure - 2.8%
|
|||
|
Carnival Corp.:
|
|||
|
4% 8/1/28 (d)
|
1,085,000
|
889,700
|
|
|
5.75% 3/1/27 (d)
|
3,850,000
|
2,795,986
|
|
|
6% 5/1/29 (d)
|
3,190,000
|
2,229,013
|
|
|
6.65% 1/15/28
|
175,000
|
130,004
|
|
|
7.625% 3/1/26 (d)
|
4,445,000
|
3,433,763
|
|
|
MajorDrive Holdings IV LLC 6.375% 6/1/29 (d)
|
825,000
|
565,125
|
|
|
NCL Corp. Ltd.:
|
|||
|
3.625% 12/15/24 (d)
|
2,225,000
|
1,862,681
|
|
|
5.875% 3/15/26 (d)
|
525,000
|
412,067
|
|
|
7.75% 2/15/29 (d)
|
1,120,000
|
856,800
|
|
|
NCL Finance Ltd. 6.125% 3/15/28 (d)
|
370,000
|
269,175
|
|
|
Royal Caribbean Cruises Ltd.:
|
|||
|
4.25% 7/1/26 (d)
|
2,390,000
|
1,697,760
|
|
|
5.375% 7/15/27 (d)
|
875,000
|
636,011
|
|
|
5.5% 8/31/26 (d)
|
2,375,000
|
1,763,438
|
|
|
5.5% 4/1/28 (d)
|
2,785,000
|
1,935,575
|
|
|
Viking Ocean Cruises Ship VII Ltd. 5.625% 2/15/29 (d)
|
370,000
|
291,747
|
|
|
Voc Escrow Ltd. 5% 2/15/28 (d)
|
850,000
|
682,984
|
|
|
20,451,829
|
|||
|
Metals/Mining - 0.9%
|
|||
|
Eldorado Gold Corp. 6.25% 9/1/29 (d)
|
350,000
|
282,078
|
|
|
ERO Copper Corp. 6.5% 2/15/30 (d)
|
2,545,000
|
2,042,363
|
|
|
First Quantum Minerals Ltd. 6.875% 10/15/27 (d)
|
2,238,000
|
1,991,820
|
|
|
HudBay Minerals, Inc. 4.5% 4/1/26 (d)
|
500,000
|
418,390
|
|
|
Mineral Resources Ltd. 8.5% 5/1/30 (d)
|
790,000
|
778,150
|
|
|
PMHC II, Inc. 9% 2/15/30 (d)
|
1,185,000
|
835,336
|
|
|
6,348,137
|
|||
|
Paper - 0.7%
|
|||
|
Ardagh Metal Packaging Finance U.S.A. LLC/Ardagh Metal Packaging Finance PLC:
|
|||
|
4% 9/1/29 (d)
|
680,000
|
543,279
|
|
|
6% 6/15/27 (d)
|
1,155,000
|
1,140,563
|
|
|
Clydesdale Acquisition Holdings, Inc. 6.625% 4/15/29 (d)
|
455,000
|
427,532
|
|
|
Glatfelter Corp. 4.75% 11/15/29 (d)
|
810,000
|
567,000
|
|
|
SPA Holdings 3 OY 4.875% 2/4/28 (d)
|
2,600,000
|
2,170,414
|
|
|
4,848,788
|
|||
|
Publishing/Printing - 0.1%
|
|||
|
News Corp. 5.125% 2/15/32 (d)
|
940,000
|
832,370
|
|
|
Railroad - 0.3%
|
|||
|
First Student Bidco, Inc./First Transit Parent, Inc. 4% 7/31/29 (d)
|
3,050,000
|
2,439,357
|
|
|
Restaurants - 0.4%
|
|||
|
1011778 BC Unlimited Liability Co./New Red Finance, Inc. 4% 10/15/30 (d)
|
1,425,000
|
1,143,563
|
|
|
Yum! Brands, Inc. 4.625% 1/31/32
|
1,985,000
|
1,745,629
|
|
|
2,889,192
|
|||
|
Services - 5.6%
|
|||
|
ADT Corp. 4.125% 8/1/29 (d)
|
895,000
|
726,351
|
|
|
Adtalem Global Education, Inc. 5.5% 3/1/28 (d)
|
2,241,000
|
2,000,093
|
|
|
APX Group, Inc. 6.75% 2/15/27 (d)
|
837,000
|
776,235
|
|
|
Aramark Services, Inc. 5% 2/1/28 (d)
|
870,000
|
788,403
|
|
|
ASGN, Inc. 4.625% 5/15/28 (d)
|
1,310,000
|
1,134,853
|
|
|
Booz Allen Hamilton, Inc. 3.875% 9/1/28 (d)
|
2,713,000
|
2,401,005
|
|
|
Brand Energy & Infrastructure Services, Inc. 8.5% 7/15/25 (d)
|
5,130,000
|
3,830,725
|
|
|
CoreCivic, Inc.:
|
|||
|
4.75% 10/15/27
|
2,485,000
|
2,037,700
|
|
|
8.25% 4/15/26
|
5,160,000
|
5,031,877
|
|
|
Fair Isaac Corp. 4% 6/15/28 (d)
|
1,155,000
|
1,023,145
|
|
|
Gartner, Inc.:
|
|||
|
3.625% 6/15/29 (d)
|
575,000
|
498,163
|
|
|
3.75% 10/1/30 (d)
|
205,000
|
174,506
|
|
|
GEMS MENASA Cayman Ltd. 7.125% 7/31/26 (d)
|
5,635,000
|
5,287,391
|
|
|
Legends Hospitality Holding Co. LLC/Legends Hospitality Co-Issuer, Inc. 5% 2/1/26 (d)
|
3,680,000
|
3,083,840
|
|
|
PowerTeam Services LLC 9.033% 12/4/25 (d)
|
490,000
|
394,842
|
|
|
Service Corp. International:
|
|||
|
4% 5/15/31
|
960,000
|
819,600
|
|
|
5.125% 6/1/29
|
1,420,000
|
1,337,910
|
|
|
Sotheby's 7.375% 10/15/27 (d)
|
4,315,000
|
3,999,027
|
|
|
The GEO Group, Inc. 6% 4/15/26
|
1,315,000
|
1,071,396
|
|
|
TriNet Group, Inc. 3.5% 3/1/29 (d)
|
1,930,000
|
1,589,683
|
|
|
WASH Multifamily Acquisition, Inc. 5.75% 4/15/26 (d)
|
3,468,000
|
3,268,590
|
|
|
41,275,335
|
|||
|
Steel - 0.3%
|
|||
|
Commercial Metals Co. 4.125% 1/15/30
|
940,000
|
791,483
|
|
|
Roller Bearing Co. of America, Inc. 4.375% 10/15/29 (d)
|
1,715,000
|
1,459,321
|
|
|
2,250,804
|
|||
|
Super Retail - 1.6%
|
|||
|
Bath & Body Works, Inc.:
|
|||
|
5.25% 2/1/28
|
235,000
|
198,270
|
|
|
6.625% 10/1/30 (d)
|
360,000
|
310,946
|
|
|
6.694% 1/15/27
|
850,000
|
794,595
|
|
|
Carvana Co.:
|
|||
|
4.875% 9/1/29 (d)
|
745,000
|
423,611
|
|
|
5.5% 4/15/27 (d)
|
1,245,000
|
803,445
|
|
|
5.875% 10/1/28 (d)
|
310,000
|
196,824
|
|
|
10.25% 5/1/30 (d)
|
170,000
|
139,400
|
|
|
EG Global Finance PLC:
|
|||
|
6.75% 2/7/25 (d)
|
2,170,000
|
2,046,060
|
|
|
8.5% 10/30/25 (d)
|
3,690,000
|
3,574,688
|
|
|
LBM Acquisition LLC 6.25% 1/15/29 (d)
|
1,295,000
|
833,740
|
|
|
Levi Strauss & Co. 3.5% 3/1/31 (d)
|
1,310,000
|
1,070,925
|
|
|
Wolverine World Wide, Inc. 4% 8/15/29 (d)
|
1,855,000
|
1,488,341
|
|
|
11,880,845
|
|||
|
Technology - 6.1%
|
|||
|
Acuris Finance U.S. 5% 5/1/28 (d)
|
3,360,000
|
2,788,195
|
|
|
Arches Buyer, Inc.:
|
|||
|
4.25% 6/1/28 (d)
|
1,240,000
|
1,009,614
|
|
|
6.125% 12/1/28 (d)
|
1,720,000
|
1,402,858
|
|
|
Black Knight InfoServ LLC 3.625% 9/1/28 (d)
|
2,525,000
|
2,184,125
|
|
|
Clarivate Science Holdings Corp.:
|
|||
|
3.875% 7/1/28 (d)
|
455,000
|
380,156
|
|
|
4.875% 7/1/29 (d)
|
460,000
|
377,660
|
|
|
CommScope, Inc.:
|
|||
|
4.75% 9/1/29 (d)
|
825,000
|
665,523
|
|
|
6% 3/1/26 (d)
|
1,015,000
|
934,845
|
|
|
7.125% 7/1/28 (d)
|
1,455,000
|
1,105,916
|
|
|
8.25% 3/1/27 (d)
|
435,000
|
343,868
|
|
|
Elastic NV 4.125% 7/15/29 (d)
|
2,310,000
|
1,928,342
|
|
|
Entegris Escrow Corp.:
|
|||
|
4.75% 4/15/29 (d)
|
1,290,000
|
1,201,284
|
|
|
5.95% 6/15/30 (d)
|
1,370,000
|
1,303,384
|
|
|
Gartner, Inc. 4.5% 7/1/28 (d)
|
1,470,000
|
1,349,761
|
|
|
II-VI, Inc. 5% 12/15/29 (d)
|
1,990,000
|
1,736,275
|
|
|
ION Trading Technologies Ltd. 5.75% 5/15/28 (d)
|
3,323,000
|
2,657,702
|
|
|
MicroStrategy, Inc. 6.125% 6/15/28 (d)
|
2,735,000
|
2,177,963
|
|
|
Northwest Fiber LLC/Northwest Fiber Finance Sub, Inc. 10.75% 6/1/28 (d)
|
705,000
|
627,302
|
|
|
onsemi 3.875% 9/1/28 (d)
|
1,115,000
|
981,798
|
|
|
Open Text Corp. 3.875% 12/1/29 (d)
|
2,540,000
|
2,137,791
|
|
|
Rackspace Hosting, Inc.:
|
|||
|
3.5% 2/15/28 (d)
|
1,695,000
|
1,328,007
|
|
|
5.375% 12/1/28 (d)
|
11,522,000
|
7,529,281
|
|
|
Roblox Corp. 3.875% 5/1/30 (d)
|
1,955,000
|
1,584,567
|
|
|
Sensata Technologies BV 4% 4/15/29 (d)
|
995,000
|
843,840
|
|
|
TTM Technologies, Inc. 4% 3/1/29 (d)
|
4,145,000
|
3,485,742
|
|
|
Twilio, Inc. 3.875% 3/15/31
|
730,000
|
600,622
|
|
|
Uber Technologies, Inc. 8% 11/1/26 (d)
|
2,220,000
|
2,210,010
|
|
|
44,876,431
|
|||
|
Telecommunications - 9.0%
|
|||
|
Altice Financing SA:
|
|||
|
5% 1/15/28 (d)
|
3,230,000
|
2,602,863
|
|
|
5.75% 8/15/29 (d)
|
6,895,000
|
5,533,238
|
|
|
Altice France Holding SA 6% 2/15/28 (d)
|
4,250,000
|
3,006,875
|
|
|
Altice France SA:
|
|||
|
5.125% 1/15/29 (d)
|
5,090,000
|
3,856,235
|
|
|
5.125% 7/15/29 (d)
|
3,525,000
|
2,661,375
|
|
|
5.5% 1/15/28 (d)
|
1,850,000
|
1,466,125
|
|
|
5.5% 10/15/29 (d)
|
3,705,000
|
2,829,879
|
|
|
C&W Senior Financing Designated Activity Co. 6.875% 9/15/27 (d)
|
9,905,000
|
8,889,738
|
|
|
Cablevision Lightpath LLC:
|
|||
|
3.875% 9/15/27 (d)
|
455,000
|
376,513
|
|
|
5.625% 9/15/28 (d)
|
360,000
|
281,614
|
|
|
Consolidated Communications, Inc. 5% 10/1/28 (d)
|
535,000
|
427,663
|
|
|
Frontier Communications Holdings LLC:
|
|||
|
5% 5/1/28 (d)
|
2,360,000
|
2,006,000
|
|
|
5.875% 10/15/27 (d)
|
940,000
|
845,156
|
|
|
5.875% 11/1/29
|
1,430,000
|
1,100,585
|
|
|
6% 1/15/30 (d)
|
1,240,000
|
954,118
|
|
|
6.75% 5/1/29 (d)
|
1,600,000
|
1,316,000
|
|
|
8.75% 5/15/30 (d)
|
955,000
|
965,495
|
|
|
Intelsat Jackson Holdings SA 6.5% 3/15/30 (d)
|
1,895,000
|
1,563,375
|
|
|
Level 3 Financing, Inc.:
|
|||
|
3.625% 1/15/29 (d)
|
340,000
|
262,158
|
|
|
4.25% 7/1/28 (d)
|
3,590,000
|
2,876,488
|
|
|
Lumen Technologies, Inc.:
|
|||
|
4.5% 1/15/29 (d)
|
4,700,000
|
3,498,657
|
|
|
5.125% 12/15/26 (d)
|
1,310,000
|
1,102,784
|
|
|
Millicom International Cellular SA 4.5% 4/27/31 (d)
|
200,000
|
148,000
|
|
|
Sable International Finance Ltd. 5.75% 9/7/27 (d)
|
464,000
|
423,307
|
|
|
SBA Communications Corp. 3.125% 2/1/29
|
935,000
|
765,298
|
|
|
Sprint Capital Corp.:
|
|||
|
6.875% 11/15/28
|
1,123,000
|
1,180,857
|
|
|
8.75% 3/15/32
|
1,575,000
|
1,895,481
|
|
|
Telecom Italia Capital SA:
|
|||
|
6% 9/30/34
|
1,185,000
|
893,810
|
|
|
7.2% 7/18/36
|
845,000
|
641,562
|
|
|
7.721% 6/4/38
|
235,000
|
181,303
|
|
|
Uniti Group, Inc. 6% 1/15/30 (d)
|
4,060,000
|
2,808,708
|
|
|
Virgin Media Secured Finance PLC 4.5% 8/15/30 (d)
|
690,000
|
566,980
|
|
|
VMED O2 UK Financing I PLC 4.25% 1/31/31 (d)
|
1,735,000
|
1,394,506
|
|
|
Windstream Escrow LLC 7.75% 8/15/28 (d)
|
5,460,000
|
4,395,300
|
|
|
Zayo Group Holdings, Inc.:
|
|||
|
4% 3/1/27 (d)
|
1,600,000
|
1,327,344
|
|
|
6.125% 3/1/28 (d)
|
1,020,000
|
736,552
|
|
|
65,781,942
|
|||
|
Textiles/Apparel - 0.2%
|
|||
|
Foot Locker, Inc. 4% 10/1/29 (d)
|
2,065,000
|
1,561,749
|
|
|
Kontoor Brands, Inc. 4.125% 11/15/29 (d)
|
335,000
|
266,030
|
|
|
1,827,779
|
|||
|
Transportation Ex Air/Rail - 0.5%
|
|||
|
Golar LNG Ltd. 7% 10/20/25 (d)
|
1,025,000
|
954,403
|
|
|
Great Lakes Dredge & Dock Corp. 5.25% 6/1/29 (d)
|
595,000
|
514,778
|
|
|
Seaspan Corp. 5.5% 8/1/29 (d)
|
3,290,000
|
2,625,826
|
|
|
4,095,007
|
|||
|
Utilities - 3.1%
|
|||
|
Clearway Energy Operating LLC:
|
|||
|
3.75% 2/15/31 (d)
|
1,005,000
|
810,251
|
|
|
4.75% 3/15/28 (d)
|
585,000
|
526,314
|
|
|
Global Partners LP/GLP Finance Corp. 7% 8/1/27
|
1,282,000
|
1,153,800
|
|
|
InterGen NV 7% 6/30/23 (d)
|
4,960,000
|
4,770,280
|
|
|
NRG Energy, Inc.:
|
|||
|
3.375% 2/15/29 (d)
|
1,535,000
|
1,237,839
|
|
|
5.25% 6/15/29 (d)
|
1,405,000
|
1,253,963
|
|
|
NSG Holdings II LLC/NSG Holdings, Inc. 7.75% 12/15/25 (d)
|
1,870,422
|
1,833,014
|
|
|
PG&E Corp.:
|
|||
|
5% 7/1/28
|
2,715,000
|
2,291,134
|
|
|
5.25% 7/1/30
|
4,455,000
|
3,665,039
|
|
|
Pike Corp. 5.5% 9/1/28 (d)
|
4,985,000
|
4,046,873
|
|
|
Vistra Operations Co. LLC 5.625% 2/15/27 (d)
|
1,455,000
|
1,368,078
|
|
|
22,956,585
|
|||
|
TOTAL NONCONVERTIBLE BONDS
|
630,636,490
|
||
|
TOTAL CORPORATE BONDS
(Cost $770,891,275)
|
644,013,431
|
||
|
Common Stocks - 1.8%
|
|||
|
Shares
|
Value ($)
|
||
|
Cable/Satellite TV - 0.1%
|
|||
|
Altice U.S.A., Inc. Class A (f)
|
59,900
|
554,075
|
|
|
Energy - 1.4%
|
|||
|
California Resources Corp. warrants 10/27/24 (f)
|
1,768
|
18,157
|
|
|
Jonah Energy Parent LLC (c)(f)
|
58,499
|
2,661,705
|
|
|
Mesquite Energy, Inc. (c)(f)
|
82,533
|
4,838,897
|
|
|
New Fortress Energy, Inc.
|
32,000
|
1,266,240
|
|
|
Pioneer Natural Resources Co.
|
6,000
|
1,338,480
|
|
|
TOTAL ENERGY
|
10,123,479
|
||
|
Gaming - 0.1%
|
|||
|
Caesars Entertainment, Inc. (f)
|
32,100
|
1,229,430
|
|
|
Telecommunications - 0.0%
|
|||
|
CUI Acquisition Corp. Class E (c)(f)
|
1
|
35,011
|
|
|
GTT Communications, Inc. rights (c)(f)
|
92,208
|
92,208
|
|
|
TOTAL TELECOMMUNICATIONS
|
127,219
|
||
|
Utilities - 0.2%
|
|||
|
EQT Corp.
|
39,000
|
1,341,600
|
|
|
TOTAL COMMON STOCKS
(Cost $10,616,767)
|
13,375,803
|
||
|
Bank Loan Obligations - 5.3%
|
|||
|
Principal
Amount (a)
|
Value ($)
|
||
|
Broadcasting - 0.2%
|
|||
|
Diamond Sports Group LLC:
|
|||
|
1LN, term loan U.S. Secured Overnight Fin. Rate (SOFR) Indx + 8.000% 9.1808% 5/25/26 (g)(h)(i)
|
1,137,109
|
1,129,525
|
|
|
2LN, term loan 3 month U.S. LIBOR + 3.250% 4.4308% 8/24/26 (g)(h)(i)
|
2,563,935
|
598,243
|
|
|
TOTAL BROADCASTING
|
1,727,768
|
||
|
Building Materials - 0.1%
|
|||
|
Acproducts Holdings, Inc. Tranche B 1LN, term loan 1 month U.S. LIBOR + 4.250% 6.0622% 5/17/28 (g)(h)(i)
|
1,260,451
|
970,547
|
|
|
Chemicals - 0.4%
|
|||
|
Consolidated Energy Finance SA Tranche B 1LN, term loan 3 month U.S. LIBOR + 3.500% 4.0287% 5/7/25 (c)(g)(h)(i)
|
1,594,970
|
1,515,221
|
|
|
Olympus Water U.S. Holding Corp. Tranche B 1LN, term loan 1 month U.S. LIBOR + 3.750% 6.0625% 11/9/28 (g)(h)(i)
|
1,467,625
|
1,363,512
|
|
|
TOTAL CHEMICALS
|
2,878,733
|
||
|
Consumer Products - 0.1%
|
|||
|
Michaels Companies, Inc. 1LN, term loan 3 month U.S. LIBOR + 4.250% 6.5004% 4/15/28 (g)(h)(i)
|
798,322
|
655,510
|
|
|
Energy - 0.3%
|
|||
|
EG America LLC Tranche B 1LN, term loan 3 month U.S. LIBOR + 4.000% 6.2504% 2/6/25 (g)(h)(i)
|
1,391,841
|
1,304,851
|
|
|
EG Finco Ltd. Tranche B, term loan 3 month U.S. LIBOR + 4.000% 6.2504% 2/6/25 (g)(h)(i)
|
937,758
|
879,148
|
|
|
Mesquite Energy, Inc.:
|
|||
|
1LN, term loan 3 month U.S. LIBOR + 8.000% 0% (c)(e)(g)(h)(i)
|
1,525,908
|
0
|
|
|
term loan 3 month U.S. LIBOR + 0.000% 0% (c)(e)(g)(h)(i)
|
658,000
|
0
|
|
|
TOTAL ENERGY
|
2,183,999
|
||
|
Gaming - 0.4%
|
|||
|
Fertitta Entertainment LLC NV Tranche B 1LN, term loan U.S. Secured Overnight Fin. Rate (SOFR) Indx + 4.000% 5.5253% 1/27/29 (g)(h)(i)
|
2,826,147
|
2,599,009
|
|
|
Healthcare - 0.5%
|
|||
|
Da Vinci Purchaser Corp. Tranche B 1LN, term loan 3 month U.S. LIBOR + 4.000% 6.0306% 12/13/26 (g)(h)(i)
|
74,620
|
70,516
|
|
|
Gainwell Acquisition Corp. Tranche B 1LN, term loan 3 month U.S. LIBOR + 4.000% 6.2504% 10/1/27 (g)(h)(i)
|
4,014,060
|
3,788,269
|
|
|
TOTAL HEALTHCARE
|
3,858,785
|
||
|
Insurance - 0.2%
|
|||
|
HUB International Ltd. Tranche B, term loan 3 month U.S. LIBOR + 3.000% 4.2137% 4/25/25 (g)(h)(i)
|
1,381,100
|
1,305,001
|
|
|
Leisure - 0.4%
|
|||
|
City Football Group Ltd. Tranche B 1LN, term loan 1 month U.S. LIBOR + 3.500% 4.5983% 7/21/28 (g)(h)(i)
|
3,417,438
|
3,126,955
|
|
|
Paper - 0.1%
|
|||
|
Clydesdale Acquisition Holdings, Inc. 1LN, term loan CME TERM SOFR 1 MONTH INDEX + 4.250% 5.8753% 3/30/29 (g)(h)(i)
|
570,000
|
531,793
|
|
|
Services - 0.6%
|
|||
|
ABG Intermediate Holdings 2 LLC:
|
|||
|
Tranche B 2LN, term loan 3 month U.S. LIBOR + 6.000% 7.6253% 12/20/29 (c)(g)(h)(i)
|
75,000
|
69,000
|
|
|
Tranche B1 LN, term loan U.S. Secured Overnight Fin. Rate (SOFR) Indx + 3.500% 5.1253% 12/21/28 (g)(h)(i)
|
345,000
|
321,713
|
|
|
Ascend Learning LLC:
|
|||
|
2LN, term loan 1 month U.S. LIBOR + 5.750% 7.4161% 12/10/29 (g)(h)(i)
|
130,000
|
118,950
|
|
|
Tranche B 1LN, term loan 1 month U.S. LIBOR + 3.500% 5.1661% 12/10/28 (g)(h)(i)
|
1,298,475
|
1,196,220
|
|
|
Brand Energy & Infrastructure Services, Inc. Tranche B, term loan 3 month U.S. LIBOR + 4.250% 5.4% 6/21/24 (g)(h)(i)
|
3,390,729
|
2,921,690
|
|
|
TOTAL SERVICES
|
4,627,573
|
||
|
Super Retail - 0.4%
|
|||
|
Bass Pro Group LLC Tranche B 1LN, term loan 3 month U.S. LIBOR + 3.750% 5.4161% 3/5/28 (g)(h)(i)
|
1,561,068
|
1,419,011
|
|
|
LBM Acquisition LLC Tranche B 1LN, term loan 3 month U.S. LIBOR + 3.750% 5.4161% 12/18/27 (g)(h)(i)
|
1,778,907
|
1,453,705
|
|
|
TOTAL SUPER RETAIL
|
2,872,716
|
||
|
Technology - 0.7%
|
|||
|
Acuris Finance U.S., Inc. 1LN, term loan 3 month U.S. LIBOR + 4.000% 6.2044% 2/16/28 (g)(h)(i)
|
589,062
|
553,719
|
|
|
Athenahealth Group, Inc.:
|
|||
|
Tranche B 1LN, term loan U.S. Secured Overnight Fin. Rate (SOFR) Indx + 3.500% 5.0091% 2/15/29 (g)(h)(i)
|
1,902,536
|
1,746,776
|
|
|
Tranche DD 1LN, term loan U.S. Secured Overnight Fin. Rate (SOFR) Indx + 3.500% 2/15/29 (g)(h)(i)(j)
|
322,464
|
296,064
|
|
|
Central Parent, Inc. 1LN, term loan CME TERM SOFR 1 MONTH INDEX + 4.500% 6/9/29 (g)(h)(i)(k)
|
345,000
|
325,207
|
|
|
CommScope, Inc. Tranche B 1LN, term loan 3 month U.S. LIBOR + 3.250% 4.9161% 4/4/26 (g)(h)(i)
|
942,730
|
844,337
|
|
|
Rackspace Technology Global, Inc. Tranche B 1LN, term loan 3 month U.S. LIBOR + 2.750% 4.16% 2/15/28 (g)(h)(i)
|
767,231
|
697,221
|
|
|
Verscend Holding Corp. Tranche B 1LN, term loan 3 month U.S. LIBOR + 4.000% 5.6661% 8/27/25 (g)(h)(i)
|
464,754
|
443,840
|
|
|
TOTAL TECHNOLOGY
|
4,907,164
|
||
|
Telecommunications - 0.6%
|
|||
|
GTT Communications, Inc. Tranche B, term loan 3 month U.S. LIBOR + 4.750% 8.5% 5/31/25 (g)(h)(i)
|
3,558,601
|
2,779,160
|
|
|
Northwest Fiber LLC Tranche B 1LN, term loan 3 month U.S. LIBOR + 3.750% 5.2593% 4/30/27 (g)(h)(i)
|
1,344,373
|
1,193,131
|
|
|
TOTAL TELECOMMUNICATIONS
|
3,972,291
|
||
|
Utilities - 0.3%
|
|||
|
Brookfield WEC Holdings, Inc. 1LN, term loan CME TERM SOFR 1 MONTH INDEX + 3.750% 5.7474% 8/1/25 (g)(h)(i)
|
770,000
|
738,653
|
|
|
PG&E Corp. Tranche B 1LN, term loan 3 month U.S. LIBOR + 3.000% 4.6875% 6/23/25 (g)(h)(i)
|
1,695,864
|
1,594,960
|
|
|
TOTAL UTILITIES
|
2,333,613
|
||
|
TOTAL BANK LOAN OBLIGATIONS
(Cost $44,202,890)
|
38,551,457
|
||
|
Other - 0.5%
|
|||
|
Shares
|
Value ($)
|
||
|
Other - 0.5%
|
|||
|
Fidelity Direct Lending Fund, LP (b)(l)
(Cost $3,722,430)
|
3,704,087
|
||
|
Money Market Funds - 2.2%
|
|||
|
Shares
|
Value ($)
|
||
|
Fidelity Cash Central Fund 1.58% (m)
(Cost $16,385,234)
|
16,381,958
|
16,385,234
|
|
|
TOTAL INVESTMENT IN SECURITIES - 97.7%
(Cost $845,818,596)
|
716,030,012
|
|
NET OTHER ASSETS (LIABILITIES) - 2.3%
|
16,877,477
|
|
NET ASSETS - 100.0%
|
732,907,489
|
|
(a)
|
Amount is stated in United States dollars unless otherwise noted.
|
|
(b)
|
Restricted securities (including private placements) - Investment in securities not registered under the Securities Act of 1933 (excluding 144A issues). At the end of the period, the value of restricted securities (excluding 144A issues) amounted to $12,050,374 or 1.6% of net assets.
|
|
(c)
|
Level 3 security
|
|
(d)
|
Security exempt from registration under Rule 144A of the Securities Act of 1933. These securities may be resold in transactions exempt from registration, normally to qualified institutional buyers. At the end of the period, the value of these securities amounted to $534,920,515 or 73.0% of net assets.
|
|
(e)
|
Non-income producing - Security is in default.
|
|
(f)
|
Non-income producing
|
|
(g)
|
Coupon rates for floating and adjustable rate securities reflect the rates in effect at period end.
|
|
(h)
|
Coupon is indexed to a floating interest rate which may be multiplied by a specified factor and/or subject to caps or floors.
|
|
(i)
|
Remaining maturities of bank loan obligations may be less than the stated maturities shown as a result of contractual or optional prepayments by the borrower. Such prepayments cannot be predicted with certainty.
|
|
(j)
|
Position or a portion of the position represents an unfunded loan commitment. At period end, the total principal amount and market value of unfunded commitments totaled $322,464 and $299,085, respectively.
|
|
(k)
|
The coupon rate will be determined upon settlement of the loan after period end.
|
|
(l)
|
Affiliated Fund
|
|
(m)
|
Affiliated fund that is generally available only to investment companies and other accounts managed by Fidelity Investments. The rate quoted is the annualized seven-day yield of the fund at period end. A complete unaudited listing of the fund's holdings as of its most recent quarter end is available upon request. In addition, each Fidelity Central Fund's financial statements are available on the SEC's website or upon request.
|
|
Additional information on each restricted holding is as follows:
|
||
|
Security
|
Acquisition Date
|
Acquisition Cost ($)
|
|
Fidelity Direct Lending Fund, LP
|
12/09/21 - 6/30/22
|
3,722,431
|
|
Mesquite Energy, Inc. 15% 7/15/23
|
7/10/20 - 1/18/22
|
649,253
|
|
Mesquite Energy, Inc. 15% 7/15/23
|
11/05/20 - 1/18/22
|
1,120,884
|
|
Affiliate
|
Value,
beginning
of period ($)
|
Purchases ($)
|
Sales
Proceeds ($)
|
Dividend
Income ($)
|
Realized
Gain (loss) ($)
|
Change in
Unrealized
appreciation
(depreciation) ($)
|
Value,
end
of period ($)
|
%ownership,
end
of period
|
|
Fidelity Cash Central Fund 1.58%
|
19,357,047
|
186,675,454
|
189,647,267
|
39,480
|
-
|
-
|
16,385,234
|
0.0%
|
|
Fidelity Securities Lending Cash Central Fund 1.58%
|
-
|
39,441,647
|
39,441,647
|
30,211
|
-
|
-
|
-
|
0.0%
|
|
Total
|
19,357,047
|
226,117,101
|
229,088,914
|
69,691
|
-
|
-
|
16,385,234
|
|
Affiliate
|
Value,
beginning
of period ($)
|
Purchases ($)
|
Sales
Proceeds ($)
|
Dividend
Income ($)
|
Realized
Gain (loss) ($)
|
Change in
Unrealized
appreciation
(depreciation) ($)
|
Value,
end
of period ($)
|
|
Fidelity Direct Lending Fund, LP
|
1,504,067
|
2,218,363
|
-
|
90,834
|
-
|
(18,343)
|
3,704,087
|
|
1,504,067
|
2,218,363
|
-
|
90,834
|
-
|
(18,343)
|
3,704,087
|
|
Valuation Inputs at Reporting Date:
|
||||
|
Description
|
Total ($)
|
Level 1 ($)
|
Level 2 ($)
|
Level 3 ($)
|
|
Investments in Securities:
|
||||
|
Equities:
|
||||
|
Communication Services
|
589,086
|
554,075
|
-
|
35,011
|
|
Consumer Discretionary
|
1,229,430
|
1,229,430
|
-
|
-
|
|
Energy
|
11,465,079
|
3,964,477
|
-
|
7,500,602
|
|
Information Technology
|
92,208
|
-
|
-
|
92,208
|
|
Corporate Bonds
|
644,013,431
|
-
|
635,667,143
|
8,346,288
|
|
Bank Loan Obligations
|
38,551,457
|
-
|
36,967,236
|
1,584,221
|
|
Money Market Funds
|
16,385,234
|
16,385,234
|
-
|
-
|
|
Total Investments in Securities:
|
712,325,925
|
22,133,216
|
672,634,379
|
17,558,330
|
|
Investments in Securities:
|
|||
|
Energy
|
|||
|
Beginning Balance
|
$
|
6,728,090
|
|
|
Net Realized Gain (Loss) on Investment Securities
|
-
|
||
|
Net Unrealized Gain (Loss) on Investment Securities
|
772,512
|
||
|
Cost of Purchases
|
-
|
||
|
Proceeds of Sales
|
-
|
||
|
Amortization/Accretion
|
-
|
||
|
Transfers into Level 3
|
-
|
||
|
Transfers out of Level 3
|
-
|
||
|
Ending Balance
|
$
|
7,500,602
|
|
|
The change in unrealized gain (loss) for the period attributable to Level 3 securities held at June 30, 2022
|
$
|
772,512
|
|
|
Corporate Bonds
|
|||
|
Beginning Balance
|
$
|
5,561,322
|
|
|
Net Realized Gain (Loss) on Investment Securities
|
-
|
||
|
Net Unrealized Gain (Loss) on Investment Securities
|
2,720,213
|
||
|
Cost of Purchases
|
64,753
|
||
|
Proceeds of Sales
|
-
|
||
|
Amortization/Accretion
|
-
|
||
|
Transfers into Level 3
|
-
|
||
|
Transfers out of Level 3
|
-
|
||
|
Ending Balance
|
$
|
8,346,288
|
|
|
The change in unrealized gain (loss) for the period attributable to Level 3 securities held at June 30, 2022
|
$
|
2,720,213
|
|
|
Other Investments in Securities
|
|||
|
Beginning Balance
|
$
|
3,954,735
|
|
|
Net Realized Gain (Loss) on Investment Securities
|
1,310
|
||
|
Net Unrealized Gain (Loss) on Investment Securities
|
(48,538)
|
||
|
Cost of Purchases
|
-
|
||
|
Proceeds of Sales
|
(772,455)
|
||
|
Amortization/Accretion
|
5,455
|
||
|
Transfers into Level 3
|
75,000
|
||
|
Transfers out of Level 3
|
(1,504,067)
|
||
|
Ending Balance
|
$
|
1,711,440
|
|
|
The change in unrealized gain (loss) for the period attributable to Level 3 securities held at June 30, 2022
|
$
|
(48,538)
|
|
|
Statement of Assets and Liabilities
|
||||
|
June 30, 2022
(Unaudited)
|
||||
|
Assets
|
||||
|
Investment in securities, at value - See accompanying schedule:
|
$695,940,691
|
|||
|
Unaffiliated issuers (cost $825,710,932)
|
||||
|
Fidelity Central Funds (cost $16,385,234)
|
16,385,234
|
|||
|
Other affiliated issuers (cost $3,722,430)
|
3,704,087
|
|||
|
Total Investment in Securities (cost $845,818,596)
|
$
|
716,030,012
|
||
|
Receivable for investments sold
|
5,871,764
|
|||
|
Receivable for fund shares sold
|
943,956
|
|||
|
Dividends receivable
|
20,526
|
|||
|
Interest receivable
|
12,032,423
|
|||
|
Distributions receivable from Fidelity Central Funds
|
35,802
|
|||
|
Total assets
|
734,934,483
|
|||
|
Liabilities
|
||||
|
Payable to custodian bank
|
$37,959
|
|||
|
Payable for investments purchased
|
1,162,060
|
|||
|
Payable for fund shares redeemed
|
315,940
|
|||
|
Accrued management fee
|
360,166
|
|||
|
Distribution and service plan fees payable
|
31,957
|
|||
|
Other affiliated payables
|
79,138
|
|||
|
Other payables and accrued expenses
|
39,774
|
|||
|
Total Liabilities
|
2,026,994
|
|||
|
Net Assets
|
$
|
732,907,489
|
||
|
Net Assets consist of:
|
||||
|
Paid in capital
|
$
|
935,516,756
|
||
|
Total accumulated earnings (loss)
|
(202,609,267)
|
|||
|
Net Assets
|
$
|
732,907,489
|
||
|
Net Asset Value and Maximum Offering Price
|
||||
|
Initial Class :
|
||||
|
Net Asset Value
, offering price and redemption price per share ($239,192,367 ÷ 53,098,317 shares)
|
$
|
4.50
|
||
|
Service Class :
|
||||
|
Net Asset Value
, offering price and redemption price per share ($43,941,088 ÷ 9,840,833 shares)
|
$
|
4.47
|
||
|
Service Class 2 :
|
||||
|
Net Asset Value
, offering price and redemption price per share ($120,556,187 ÷ 27,989,216 shares)
|
$
|
4.31
|
||
|
Investor Class :
|
||||
|
Net Asset Value
, offering price and redemption price per share ($329,217,847 ÷ 73,578,543 shares)
|
$
|
4.47
|
||
|
Statement of Operations
|
||||
|
Six months ended
June 30, 2022
(Unaudited)
|
||||
|
Investment Income
|
||||
|
Dividends (including $90,834 earned from affiliated issuers)
|
$
|
391,848
|
||
|
Interest
|
23,269,552
|
|||
|
Income from Fidelity Central Funds (including $30,211 from security lending)
|
69,691
|
|||
|
Total Income
|
23,731,091
|
|||
|
Expenses
|
||||
|
Management fee
|
$
|
2,370,591
|
||
|
Transfer agent fees
|
361,144
|
|||
|
Distribution and service plan fees
|
203,387
|
|||
|
Accounting fees
|
158,868
|
|||
|
Custodian fees and expenses
|
5,473
|
|||
|
Independent trustees' fees and expenses
|
1,517
|
|||
|
Audit
|
40,936
|
|||
|
Legal
|
166,136
|
|||
|
Interest
|
344
|
|||
|
Miscellaneous
|
1,761
|
|||
|
Total expenses before reductions
|
3,310,157
|
|||
|
Expense reductions
|
(7,589)
|
|||
|
Total expenses after reductions
|
3,302,568
|
|||
|
Net Investment income (loss)
|
20,428,523
|
|||
|
Realized and Unrealized Gain (Loss)
|
||||
|
Net realized gain (loss) on:
|
||||
|
Investment Securities:
|
||||
|
Unaffiliated issuers
|
(10,591,197)
|
|||
|
Total net realized gain (loss)
|
(10,591,197)
|
|||
|
Change in net unrealized appreciation (depreciation) on:
|
||||
|
Investment Securities:
|
||||
|
Unaffiliated issuers
|
(140,593,067)
|
|||
|
Affiliated issuers
|
(18,343)
|
|||
|
Total change in net unrealized appreciation (depreciation)
|
(140,611,410)
|
|||
|
Net gain (loss)
|
(151,202,607)
|
|||
|
Net increase (decrease) in net assets resulting from operations
|
$
|
(130,774,084)
|
||
|
Statement of Changes in Net Assets
|
||||
|
Six months ended
June 30, 2022
(Unaudited)
|
Year ended
December 31, 2021
|
|||
|
Increase (Decrease) in Net Assets
|
||||
|
Operations
|
||||
|
Net investment income (loss)
|
$
|
20,428,523
|
$
|
44,147,271
|
|
Net realized gain (loss)
|
(10,591,197)
|
21,951,238
|
||
|
Change in net unrealized appreciation (depreciation)
|
(140,611,410)
|
(23,268,129)
|
||
|
Net increase (decrease) in net assets resulting from operations
|
(130,774,084)
|
42,830,380
|
||
|
Distributions to shareholders
|
(358,625)
|
(51,264,851)
|
||
|
Share transactions - net increase (decrease)
|
(111,325,847)
|
14,687,529
|
||
|
Total increase (decrease) in net assets
|
(242,458,556)
|
6,253,058
|
||
|
Net Assets
|
||||
|
Beginning of period
|
975,366,045
|
969,112,987
|
||
|
End of period
|
$
|
732,907,489
|
$
|
975,366,045
|
|
High Income Portfolio Initial Class
|
|
Six months ended
(Unaudited) June 30, 2022
|
Years ended December 31, 2021
|
2020
|
2019
|
2018
|
2017
|
|||||||
|
Selected Per-Share Data
|
||||||||||||
|
Net asset value, beginning of period
|
$
|
5.25
|
$
|
5.31
|
$
|
5.43
|
$
|
4.97
|
$
|
5.46
|
$
|
5.38
|
|
Income from Investment Operations
|
||||||||||||
|
Net investment income (loss)
A,B
|
.118
|
.245
|
.266
|
.286
|
.288
|
.290
|
||||||
|
Net realized and unrealized gain (loss)
|
(.866)
|
(.016)
|
(.121)
|
.457
|
(.473)
|
.091
|
||||||
|
Total from investment operations
|
(.748)
|
.229
|
.145
|
.743
|
(.185)
|
.381
|
||||||
|
Distributions from net investment income
|
(.002)
|
(.289)
|
(.265)
|
(.283)
|
(.305)
|
(.301)
|
||||||
|
Total distributions
|
(.002)
|
(.289)
|
(.265)
|
(.283)
|
(.305)
|
(.301)
|
||||||
|
Net asset value, end of period
|
$
|
4.50
|
$
|
5.25
|
$
|
5.31
|
$
|
5.43
|
$
|
4.97
|
$
|
5.46
|
|
Total Return
C,D,E
|
(14.25)%
|
4.41%
|
2.75%
|
15.11%
|
(3.46)%
|
7.13%
|
||||||
|
Ratios to Average Net Assets
B,F,G
|
||||||||||||
|
Expenses before reductions
|
.71%
H
|
.67%
|
.67%
|
.67%
|
.67%
|
.67%
|
||||||
|
Expenses net of fee waivers, if any
|
.71%
H
|
.66%
|
.67%
|
.67%
|
.67%
|
.67%
|
||||||
|
Expenses net of all reductions
|
.71%
H
|
.66%
|
.67%
|
.67%
|
.67%
|
.67%
|
||||||
|
Net investment income (loss)
|
4.82%
H
|
4.57%
|
5.14%
|
5.31%
|
5.33%
|
5.22%
|
||||||
|
Supplemental Data
|
||||||||||||
|
Net assets, end of period (000 omitted)
|
$
|
239,192
|
$
|
312,771
|
$
|
313,973
|
$
|
327,442
|
$
|
299,239
|
$
|
355,469
|
|
Portfolio turnover rate
I
|
32%
H
|
66%
|
72%
|
30%
|
69%
|
70%
|
|
High Income Portfolio Service Class
|
|
Six months ended
(Unaudited) June 30, 2022
|
Years ended December 31, 2021
|
2020
|
2019
|
2018
|
2017
|
|||||||
|
Selected Per-Share Data
|
||||||||||||
|
Net asset value, beginning of period
|
$
|
5.21
|
$
|
5.26
|
$
|
5.38
|
$
|
4.93
|
$
|
5.42
|
$
|
5.34
|
|
Income from Investment Operations
|
||||||||||||
|
Net investment income (loss)
A,B
|
.115
|
.238
|
.259
|
.279
|
.280
|
.283
|
||||||
|
Net realized and unrealized gain (loss)
|
(.853)
|
(.007)
|
(.120)
|
.449
|
(.471)
|
.092
|
||||||
|
Total from investment operations
|
(.738)
|
.231
|
.139
|
.728
|
(.191)
|
.375
|
||||||
|
Distributions from net investment income
|
(.002)
|
(.281)
|
(.259)
|
(.278)
|
(.299)
|
(.295)
|
||||||
|
Total distributions
|
(.002)
|
(.281)
|
(.259)
|
(.278)
|
(.299)
|
(.295)
|
||||||
|
Net asset value, end of period
|
$
|
4.47
|
$
|
5.21
|
$
|
5.26
|
$
|
5.38
|
$
|
4.93
|
$
|
5.42
|
|
Total Return
C,D,E
|
(14.17)%
|
4.50%
|
2.65%
|
14.92%
|
(3.60)%
|
7.07%
|
||||||
|
Ratios to Average Net Assets
B,F,G
|
||||||||||||
|
Expenses before reductions
|
.81%
H
|
.77%
|
.77%
|
.77%
|
.77%
|
.77%
|
||||||
|
Expenses net of fee waivers, if any
|
.81%
H
|
.76%
|
.77%
|
.77%
|
.77%
|
.77%
|
||||||
|
Expenses net of all reductions
|
.81%
H
|
.76%
|
.77%
|
.77%
|
.77%
|
.77%
|
||||||
|
Net investment income (loss)
|
4.72%
H
|
4.47%
|
5.04%
|
5.21%
|
5.23%
|
5.12%
|
||||||
|
Supplemental Data
|
||||||||||||
|
Net assets, end of period (000 omitted)
|
$
|
43,941
|
$
|
53,927
|
$
|
53,326
|
$
|
66,123
|
$
|
58,231
|
$
|
68,104
|
|
Portfolio turnover rate
I
|
32%
H
|
66%
|
72%
|
30%
|
69%
|
70%
|
|
High Income Portfolio Service Class 2
|
|
Six months ended
(Unaudited) June 30, 2022
|
Years ended December 31, 2021
|
2020
|
2019
|
2018
|
2017
|
|||||||
|
Selected Per-Share Data
|
||||||||||||
|
Net asset value, beginning of period
|
$
|
5.03
|
$
|
5.09
|
$
|
5.22
|
$
|
4.79
|
$
|
5.27
|
$
|
5.20
|
|
Income from Investment Operations
|
||||||||||||
|
Net investment income (loss)
A,B
|
.108
|
.222
|
.244
|
.262
|
.264
|
.267
|
||||||
|
Net realized and unrealized gain (loss)
|
(.826)
|
(.009)
|
(.121)
|
.438
|
(.451)
|
.090
|
||||||
|
Total from investment operations
|
(.718)
|
.213
|
.123
|
.700
|
(.187)
|
.357
|
||||||
|
Distributions from net investment income
|
(.002)
|
(.273)
|
(.253)
|
(.270)
|
(.293)
|
(.287)
|
||||||
|
Total distributions
|
(.002)
|
(.273)
|
(.253)
|
(.270)
|
(.293)
|
(.287)
|
||||||
|
Net asset value, end of period
|
$
|
4.31
|
$
|
5.03
|
$
|
5.09
|
$
|
5.22
|
$
|
4.79
|
$
|
5.27
|
|
Total Return
C,D,E
|
(14.28)%
|
4.29%
|
2.42%
|
14.77%
|
(3.63)%
|
6.91%
|
||||||
|
Ratios to Average Net Assets
B,F,G
|
||||||||||||
|
Expenses before reductions
|
.96%
H
|
.92%
|
.92%
|
.92%
|
.92%
|
.92%
|
||||||
|
Expenses net of fee waivers, if any
|
.96%
H
|
.91%
|
.92%
|
.92%
|
.92%
|
.92%
|
||||||
|
Expenses net of all reductions
|
.96%
H
|
.91%
|
.92%
|
.92%
|
.92%
|
.92%
|
||||||
|
Net investment income (loss)
|
4.57%
H
|
4.32%
|
4.89%
|
5.06%
|
5.08%
|
4.97%
|
||||||
|
Supplemental Data
|
||||||||||||
|
Net assets, end of period (000 omitted)
|
$
|
120,556
|
$
|
166,773
|
$
|
170,257
|
$
|
187,747
|
$
|
139,564
|
$
|
166,993
|
|
Portfolio turnover rate
I
|
32%
H
|
66%
|
72%
|
30%
|
69%
|
70%
|
|
High Income Portfolio Investor Class
|
|
Six months ended
(Unaudited) June 30, 2022
|
Years ended December 31, 2021
|
2020
|
2019
|
2018
|
2017
|
|||||||
|
Selected Per-Share Data
|
||||||||||||
|
Net asset value, beginning of period
|
$
|
5.22
|
$
|
5.27
|
$
|
5.39
|
$
|
4.94
|
$
|
5.43
|
$
|
5.36
|
|
Income from Investment Operations
|
||||||||||||
|
Net investment income (loss)
A,B
|
.117
|
.242
|
.263
|
.283
|
.284
|
.287
|
||||||
|
Net realized and unrealized gain (loss)
|
(.865)
|
(.004)
|
(.119)
|
.448
|
(.470)
|
.083
|
||||||
|
Total from investment operations
|
(.748)
|
.238
|
.144
|
.731
|
(.186)
|
.370
|
||||||
|
Distributions from net investment income
|
(.002)
|
(.288)
|
(.264)
|
(.281)
|
(.304)
|
(.300)
|
||||||
|
Total distributions
|
(.002)
|
(.288)
|
(.264)
|
(.281)
|
(.304)
|
(.300)
|
||||||
|
Net asset value, end of period
|
$
|
4.47
|
$
|
5.22
|
$
|
5.27
|
$
|
5.39
|
$
|
4.94
|
$
|
5.43
|
|
Total Return
C,D,E
|
(14.33)%
|
4.63%
|
2.74%
|
14.94%
|
(3.50)%
|
6.95%
|
||||||
|
Ratios to Average Net Assets
B,F,G
|
||||||||||||
|
Expenses before reductions
|
.74%
H
|
.70%
|
.71%
|
.70%
|
.71%
|
.71%
|
||||||
|
Expenses net of fee waivers, if any
|
.74%
H
|
.70%
|
.71%
|
.70%
|
.71%
|
.71%
|
||||||
|
Expenses net of all reductions
|
.74%
H
|
.70%
|
.71%
|
.70%
|
.71%
|
.71%
|
||||||
|
Net investment income (loss)
|
4.79%
H
|
4.53%
|
5.11%
|
5.28%
|
5.30%
|
5.18%
|
||||||
|
Supplemental Data
|
||||||||||||
|
Net assets, end of period (000 omitted)
|
$
|
329,218
|
$
|
441,896
|
$
|
431,557
|
$
|
462,593
|
$
|
391,173
|
$
|
456,983
|
|
Portfolio turnover rate
I
|
32%
H
|
66%
|
72%
|
30%
|
69%
|
70%
|
|
Fidelity Central Fund
|
Investment Manager
|
Investment Objective
|
Investment Practices
|
Expense Ratio
A
|
|
Fidelity Money Market Central Funds
|
Fidelity Management & Research Company LLC (FMR)
|
Each fund seeks to obtain a high level of current income consistent with the preservation of capital and liquidity.
|
Short-term Investments
|
Less than .005%
|
|
Asset Type
|
Fair Value
|
Valuation Technique(s)
|
Unobservable Input
|
Amount or Range/Weighted Average
|
Impact to Valuation from an Increase in Input
A
|
|
Equities
|
$7,627,821
|
Recovery value
|
Recovery value
|
$1.00-$45,228.15/$12,447.66
|
Increase
|
|
Market comparable
|
Book value multiple
|
1.0
|
Increase
|
||
|
Discount rate
|
10.0%
|
Decrease
|
|||
|
Discount for lack of marketability
|
10.0%
|
Decrease
|
|||
|
Enterprise value/EBITDA multiple (EV/EBITDA)
|
2.3-2.9/2.5
|
Increase
|
|||
|
Comparable sales - land ($/Acre)
|
$5,000.00 - $5,300.00 / $5,193.54
|
Increase
|
|||
|
Daily production multiple ($/Million cubic feet per day)
|
$1,900.00
|
Increase
|
|||
|
Daily production multiple ($/Barrels of oil equivalent per day)
|
$17,500.00
|
Increase
|
|||
|
Corporate Bonds
|
$8,346,288
|
Recovery value
|
Recovery value
|
$0.00
|
Increase
|
|
Market comparable
|
Book value multiple
|
1.0
|
Increase
|
||
|
Discount rate
|
10.0%
|
Decrease
|
|||
|
Discount for lack of marketability
|
10.0%
|
Decrease
|
|||
|
Enterprise value/EBITDA multiple (EV/EBITDA)
|
2.3
|
Increase
|
|||
|
Comparable sales - land ($/Acre)
|
$5,300
|
Increase
|
|||
|
Daily production multiple ($/Barrels of oil equivalent per day)
|
$17,500.00
|
Increase
|
|||
|
Bank Loan Obligations
|
$1,584,221
|
Recovery value
|
Recovery value
|
$0.00
|
Increase
|
|
Indicative market price
|
Evaluated bid
|
$92.00 - $95.00 / $94.87
|
Increase
|
|
No expiration
|
|
|
Gross unrealized appreciation
|
$15,798,704
|
|
Gross unrealized depreciation
|
(143,300,434)
|
|
Net unrealized appreciation (depreciation)
|
$(127,501,730)
|
|
Tax cost
|
$843,531,742
|
|
Short-term
|
$(38,111,063)
|
|
Long-term
|
(46,767,544)
|
|
Total capital loss carryforward
|
$(84,878,607)
|
|
Investment to be Acquired
|
Commitment Amount
|
|
|
VIP High Income Portfolio
|
Fidelity Direct Lending Fund, LP
|
$7,277,570
|
|
Purchases ($)
|
Sales ($)
|
|
|
VIP High Income Portfolio
|
134,612,483
|
226,081,268
|
|
Service Class
|
$25,914
|
|
Service Class 2
|
177,473
|
|
$203,387
|
|
Amount
|
% of Class-Level Average Net Assets
A
|
|
|
Initial Class
|
$95,373
|
.07
|
|
Service Class
|
17,621
|
.07
|
|
Service Class 2
|
48,273
|
.07
|
|
Investor Class
|
199,877
|
.10
|
|
$361,144
|
|
% of Average Net Assets
|
|
|
VIP High Income Portfolio
|
.04
|
|
Amount
|
|
|
VIP High Income Portfolio
|
$40
|
|
Borrower or Lender
|
Average Loan Balance
|
Weighted Average Interest Rate
|
Interest Expense
|
|
|
VIP High Income Portfolio
|
Borrower
|
$7,865,000
|
.32%
|
$344
|
|
Purchases ($)
|
Sales ($)
|
Realized Gain (Loss) ($)
|
|
|
VIP High Income Portfolio
|
7,495
|
-
|
-
|
|
Amount
|
|
|
VIP High Income Portfolio
|
$782
|
|
Total Security Lending Fees Paid to NFS
|
Security Lending Income From Securities Loaned to NFS
|
Value of Securities Loaned to NFS at Period End
|
|
|
VIP High Income Portfolio
|
$3,219
|
$3
|
$-
|
|
Six months ended
June 30, 2022
|
Year ended
December 31, 2021
|
|
|
VIP High Income Portfolio
|
||
|
Distributions to shareholders
|
||
|
Initial Class
|
$117,034
|
$16,578,946
|
|
Service Class
|
20,634
|
2,827,038
|
|
Service Class 2
|
59,834
|
8,286,498
|
|
Investor Class
|
161,123
|
23,572,369
|
|
Total
|
$358,625
|
$51,264,851
|
|
Shares
|
Shares
|
Dollars
|
Dollars
|
|
|
Six months ended June 30, 2022
|
Year ended December 31, 2021
|
Six months ended June 30, 2022
|
Year ended December 31, 2021
|
|
|
VIP High Income Portfolio
|
||||
|
Initial Class
|
||||
|
Shares sold
|
7,049,560
|
6,582,111
|
$34,417,658
|
$35,316,676
|
|
Reinvestment of distributions
|
22,981
|
3,175,763
|
116,971
|
16,578,946
|
|
Shares redeemed
|
(13,493,033)
|
(9,420,357)
|
(66,271,077)
|
(50,485,840)
|
|
Net increase (decrease)
|
(6,420,492)
|
337,517
|
$(31,736,448)
|
$1,409,782
|
|
Service Class
|
||||
|
Shares sold
|
5,089,872
|
5,935,782
|
$24,592,884
|
$31,370,807
|
|
Reinvestment of distributions
|
4,086
|
546,572
|
20,634
|
2,827,038
|
|
Shares redeemed
|
(5,599,283)
|
(6,270,913)
|
(26,217,104)
|
(33,538,593)
|
|
Net increase (decrease)
|
(505,325)
|
211,441
|
$(1,603,586)
|
$659,252
|
|
Service Class 2
|
||||
|
Shares sold
|
5,888,588
|
12,586,111
|
$27,956,551
|
$64,381,008
|
|
Reinvestment of distributions
|
12,261
|
1,658,903
|
59,834
|
8,286,498
|
|
Shares redeemed
|
(11,059,988)
|
(14,557,956)
|
(52,466,019)
|
(74,483,522)
|
|
Net increase (decrease)
|
(5,159,139)
|
(312,942)
|
$(24,449,634)
|
$(1,816,016)
|
|
Investor Class
|
||||
|
Shares sold
|
5,782,441
|
11,138,508
|
$28,637,653
|
$59,901,440
|
|
Reinvestment of distributions
|
31,807
|
4,549,245
|
160,936
|
23,572,369
|
|
Shares redeemed
|
(16,879,994)
|
(12,883,556)
|
(82,334,768)
|
(69,039,298)
|
|
Net increase (decrease)
|
(11,065,746)
|
2,804,197
|
$(53,536,179)
|
$14,434,511
|
|
Fund
|
Affiliated %
|
Number ofUnaffiliated Shareholders
|
Unaffiliated Shareholders %
|
|
VIP: High Income Portfolio
|
50%
|
1
|
12%
|
|
The Example is based on an investment of $1,000 invested at the beginning of the period and held for the entire period (January 1, 2022 to June 30, 2022).
|
|
Annualized Expense Ratio-
A
|
Beginning Account Value January 1, 2022
|
Ending Account Value June 30, 2022
|
Expenses Paid During Period-
C
January 1, 2022 to June 30, 2022
|
|||||||
|
High Income Portfolio
|
||||||||||
|
Initial Class
|
.71%
|
|||||||||
|
Actual
|
$ 1,000
|
$ 857.50
|
$ 3.27
|
|||||||
|
Hypothetical-
B
|
$ 1,000
|
$ 1,021.27
|
$ 3.56
|
|||||||
|
Service Class
|
.81%
|
|||||||||
|
Actual
|
$ 1,000
|
$ 858.30
|
$ 3.73
|
|||||||
|
Hypothetical-
B
|
$ 1,000
|
$ 1,020.78
|
$ 4.06
|
|||||||
|
Service Class 2
|
.96%
|
|||||||||
|
Actual
|
$ 1,000
|
$ 857.20
|
$ 4.42
|
|||||||
|
Hypothetical-
B
|
$ 1,000
|
$ 1,020.03
|
$ 4.81
|
|||||||
|
Investor Class
|
.74%
|
|||||||||
|
Actual
|
$ 1,000
|
$ 856.70
|
$ 3.41
|
|||||||
|
Hypothetical-
B
|
$ 1,000
|
$ 1,021.12
|
$ 3.71
|
|||||||
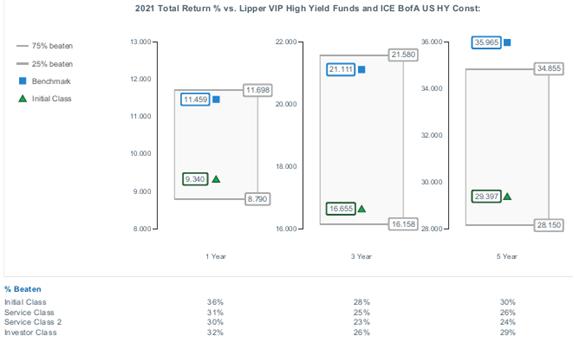
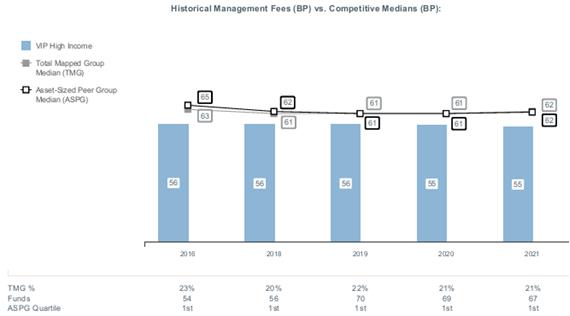
|
|


Contents
| Board Approval of Investment Advisory Contracts and Management Fees |
|
Top Holdings (% of Fund's net assets)
|
||
|
Microsoft Corp.
|
11.4
|
|
|
Alphabet, Inc. Class A
|
8.3
|
|
|
UnitedHealth Group, Inc.
|
5.7
|
|
|
Apple, Inc.
|
4.7
|
|
|
Amazon.com, Inc.
|
4.5
|
|
|
Vertex Pharmaceuticals, Inc.
|
2.9
|
|
|
Adobe, Inc.
|
2.0
|
|
|
Reliance Industries Ltd.
|
1.9
|
|
|
The Coca-Cola Co.
|
1.8
|
|
|
Qualcomm, Inc.
|
1.7
|
|
|
44.9
|
||
|
Market Sectors (% of Fund's net assets)
|
||
|
Information Technology
|
29.8
|
|
|
Health Care
|
19.2
|
|
|
Communication Services
|
15.4
|
|
|
Consumer Discretionary
|
9.2
|
|
|
Industrials
|
6.4
|
|
|
Financials
|
5.5
|
|
|
Energy
|
5.0
|
|
|
Consumer Staples
|
4.4
|
|
|
Materials
|
4.1
|
|
|
Real Estate
|
0.8
|
|
|
Utilities
|
0.3
|
|
|
Asset Allocation (% of Fund's net assets)
|

|
|
Short-Term Investments and Net Other Assets (Liabilities) - (0.1)%*
|
|
Foreign investments - 10.6%
|
|
*Short-term investments and Net Other Assets (Liabilities) are not available in the pie chart.
|
|
Geographic Diversification (% of Fund's net assets)
|
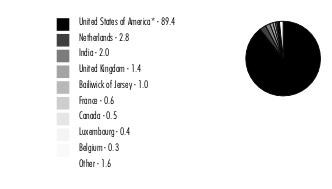
|
|
* Includes Short-Term investments and Net Other Assets (Liabilities).
Percentages are based on country or territory of incorporation and are adjusted for the effect of futures contracts, if applicable.
|
|
Common Stocks - 99.7%
|
|||
|
Shares
|
Value ($)
|
||
|
COMMUNICATION SERVICES - 15.4%
|
|||
|
Entertainment - 3.1%
|
|||
|
Universal Music Group NV
|
5,754,153
|
115,290,380
|
|
|
Warner Music Group Corp. Class A
|
3,829,775
|
93,293,319
|
|
|
208,583,699
|
|||
|
Interactive Media & Services - 10.4%
|
|||
|
Alphabet, Inc. Class A (a)
|
256,889
|
559,827,922
|
|
|
Bumble, Inc. (a)
|
590,300
|
16,616,945
|
|
|
Meta Platforms, Inc. Class A (a)
|
718,118
|
115,796,528
|
|
|
Zoominfo Technologies, Inc. (a)
|
381,235
|
12,672,251
|
|
|
704,913,646
|
|||
|
Media - 1.9%
|
|||
|
Charter Communications, Inc. Class A (a)
|
146,900
|
68,827,057
|
|
|
Innovid Corp. (b)
|
432,557
|
718,045
|
|
|
Liberty Media Corp. Liberty Formula One Group Series C (a)
|
1,012,668
|
64,274,038
|
|
|
133,819,140
|
|||
|
TOTAL COMMUNICATION SERVICES
|
1,047,316,485
|
||
|
CONSUMER DISCRETIONARY - 9.2%
|
|||
|
Automobiles - 0.5%
|
|||
|
Ferrari NV
|
197,589
|
36,253,630
|
|
|
XPeng, Inc. ADR (a)
|
34,600
|
1,098,204
|
|
|
37,351,834
|
|||
|
Diversified Consumer Services - 0.7%
|
|||
|
Laureate Education, Inc. Class A
|
2,780,602
|
32,171,565
|
|
|
Mister Car Wash, Inc. (c)
|
1,167,800
|
12,705,664
|
|
|
44,877,229
|
|||
|
Hotels, Restaurants & Leisure - 0.8%
|
|||
|
Airbnb, Inc. Class A (a)
|
408,900
|
36,424,812
|
|
|
Flutter Entertainment PLC (a)
|
145,600
|
14,611,573
|
|
|
Wingstop, Inc. (c)
|
74,600
|
5,577,842
|
|
|
56,614,227
|
|||
|
Household Durables - 0.0%
|
|||
|
Blu Investments LLC (a)(b)(d)
|
14,533,890
|
4,506
|
|
|
Internet & Direct Marketing Retail - 5.1%
|
|||
|
Amazon.com, Inc. (a)
|
2,897,280
|
307,720,109
|
|
|
Uber Technologies, Inc. (a)
|
1,868,605
|
38,231,658
|
|
|
345,951,767
|
|||
|
Multiline Retail - 0.0%
|
|||
|
Dollarama, Inc.
|
59,000
|
3,397,359
|
|
|
Specialty Retail - 1.2%
|
|||
|
Aritzia, Inc. (a)
|
157,900
|
4,275,027
|
|
|
Five Below, Inc. (a)
|
274,900
|
31,181,907
|
|
|
Floor & Decor Holdings, Inc. Class A (a)
|
76,105
|
4,791,571
|
|
|
TJX Companies, Inc.
|
244,500
|
13,655,325
|
|
|
Victoria's Secret & Co. (a)
|
886,800
|
24,803,796
|
|
|
78,707,626
|
|||
|
Textiles, Apparel & Luxury Goods - 0.9%
|
|||
|
LVMH Moet Hennessy Louis Vuitton SE
|
50,858
|
31,169,751
|
|
|
On Holding AG
|
20,300
|
359,107
|
|
|
Samsonite International SA (a)(e)
|
13,358,700
|
26,592,100
|
|
|
58,120,958
|
|||
|
TOTAL CONSUMER DISCRETIONARY
|
625,025,506
|
||
|
CONSUMER STAPLES - 4.4%
|
|||
|
Beverages - 3.8%
|
|||
|
Boston Beer Co., Inc. Class A (a)
|
67,300
|
20,389,881
|
|
|
Constellation Brands, Inc. Class A (sub. vtg.)
|
106,200
|
24,750,972
|
|
|
Keurig Dr. Pepper, Inc.
|
1,061,000
|
37,548,790
|
|
|
Monster Beverage Corp. (a)
|
593,747
|
55,040,347
|
|
|
The Coca-Cola Co.
|
1,948,624
|
122,587,936
|
|
|
260,317,926
|
|||
|
Household Products - 0.6%
|
|||
|
Reckitt Benckiser Group PLC
|
499,164
|
37,543,253
|
|
|
TOTAL CONSUMER STAPLES
|
297,861,179
|
||
|
ENERGY - 5.0%
|
|||
|
Energy Equipment & Services - 0.9%
|
|||
|
Baker Hughes Co. Class A
|
1,180,300
|
34,075,261
|
|
|
Cactus, Inc.
|
174,500
|
7,027,115
|
|
|
Championx Corp.
|
367,200
|
7,288,920
|
|
|
Helmerich & Payne, Inc.
|
176,300
|
7,591,478
|
|
|
ProPetro Holding Corp. (a)
|
531,200
|
5,312,000
|
|
|
TechnipFMC PLC (a)
|
114,122
|
768,041
|
|
|
62,062,815
|
|||
|
Oil, Gas & Consumable Fuels - 4.1%
|
|||
|
Canadian Natural Resources Ltd. (c)
|
460,800
|
24,735,744
|
|
|
Cheniere Energy, Inc.
|
587,126
|
78,105,372
|
|
|
Denbury, Inc. (a)
|
158,900
|
9,532,411
|
|
|
New Fortress Energy, Inc.
|
415,400
|
16,437,378
|
|
|
Range Resources Corp. (a)
|
885,100
|
21,906,225
|
|
|
Reliance Industries Ltd.
|
3,841,352
|
126,268,667
|
|
|
276,985,797
|
|||
|
TOTAL ENERGY
|
339,048,612
|
||
|
FINANCIALS - 5.5%
|
|||
|
Banks - 0.1%
|
|||
|
HDFC Bank Ltd.
|
234,578
|
4,018,494
|
|
|
M&T Bank Corp.
|
19,800
|
3,155,922
|
|
|
7,174,416
|
|||
|
Capital Markets - 3.1%
|
|||
|
CME Group, Inc.
|
563,622
|
115,373,423
|
|
|
MarketAxess Holdings, Inc.
|
82,100
|
21,018,421
|
|
|
Moody's Corp.
|
39,400
|
10,715,618
|
|
|
Morningstar, Inc.
|
48,700
|
11,777,121
|
|
|
MSCI, Inc.
|
66,900
|
27,572,835
|
|
|
S&P Global, Inc.
|
69,900
|
23,560,494
|
|
|
210,017,912
|
|||
|
Insurance - 2.3%
|
|||
|
American Financial Group, Inc.
|
270,968
|
37,613,068
|
|
|
Arthur J. Gallagher & Co.
|
401,230
|
65,416,539
|
|
|
BRP Group, Inc. (a)
|
485,700
|
11,729,655
|
|
|
Marsh & McLennan Companies, Inc.
|
285,600
|
44,339,400
|
|
|
159,098,662
|
|||
|
TOTAL FINANCIALS
|
376,290,990
|
||
|
HEALTH CARE - 19.2%
|
|||
|
Biotechnology - 6.0%
|
|||
|
Adamas Pharmaceuticals, Inc.:
|
|||
|
rights (a)(d)
|
1,781,700
|
106,902
|
|
|
rights (a)(d)
|
1,781,700
|
106,902
|
|
|
Affimed NV (a)
|
594,887
|
1,647,837
|
|
|
Alnylam Pharmaceuticals, Inc. (a)
|
140,900
|
20,550,265
|
|
|
Applied Therapeutics, Inc. (a)
|
92,711
|
87,909
|
|
|
Atara Biotherapeutics, Inc. (a)
|
455,700
|
3,549,903
|
|
|
Cytokinetics, Inc. (a)
|
206,200
|
8,101,598
|
|
|
EQRx, Inc. (a)
|
433,699
|
2,034,048
|
|
|
Erasca, Inc.
|
165,900
|
924,063
|
|
|
Evelo Biosciences, Inc. (a)
|
466,900
|
985,159
|
|
|
Galapagos NV sponsored ADR (a)
|
370,100
|
20,651,580
|
|
|
Gamida Cell Ltd. (a)(c)
|
1,674,200
|
2,963,334
|
|
|
Hookipa Pharma, Inc. (a)
|
1,185,700
|
1,932,691
|
|
|
Innovent Biologics, Inc. (a)(e)
|
1,085,000
|
4,825,725
|
|
|
Insmed, Inc. (a)(c)
|
783,184
|
15,444,388
|
|
|
Prelude Therapeutics, Inc. (a)
|
30,200
|
157,644
|
|
|
Regeneron Pharmaceuticals, Inc. (a)
|
111,731
|
66,047,546
|
|
|
Rubius Therapeutics, Inc. (a)
|
134,856
|
114,722
|
|
|
Seagen, Inc. (a)
|
263,100
|
46,552,914
|
|
|
Seres Therapeutics, Inc. (a)
|
405,600
|
1,391,208
|
|
|
Synlogic, Inc. (a)
|
1,192,900
|
1,371,835
|
|
|
Vertex Pharmaceuticals, Inc. (a)
|
688,550
|
194,026,505
|
|
|
Vor Biopharma, Inc. (a)
|
454,995
|
2,261,325
|
|
|
XOMA Corp. (a)(c)
|
374,819
|
8,350,967
|
|
|
404,186,970
|
|||
|
Health Care Equipment & Supplies - 0.9%
|
|||
|
Edwards Lifesciences Corp. (a)
|
490,198
|
46,612,928
|
|
|
Insulet Corp. (a)
|
8,300
|
1,808,902
|
|
|
Nevro Corp. (a)
|
68,100
|
2,984,823
|
|
|
Penumbra, Inc. (a)
|
65,000
|
8,093,800
|
|
|
59,500,453
|
|||
|
Health Care Providers & Services - 7.1%
|
|||
|
Guardant Health, Inc. (a)
|
452,000
|
18,233,680
|
|
|
HealthEquity, Inc. (a)
|
1,140,096
|
69,990,493
|
|
|
Option Care Health, Inc. (a)
|
60,800
|
1,689,632
|
|
|
Tenet Healthcare Corp. (a)
|
89,000
|
4,677,840
|
|
|
UnitedHealth Group, Inc.
|
752,962
|
386,743,872
|
|
|
481,335,517
|
|||
|
Health Care Technology - 0.3%
|
|||
|
Certara, Inc. (a)
|
645,600
|
13,854,576
|
|
|
Doximity, Inc.
|
125,600
|
4,373,392
|
|
|
Simulations Plus, Inc. (c)
|
117,500
|
5,796,275
|
|
|
24,024,243
|
|||
|
Life Sciences Tools & Services - 2.4%
|
|||
|
10X Genomics, Inc. (a)
|
71,814
|
3,249,584
|
|
|
Bio-Techne Corp.
|
54,100
|
18,753,224
|
|
|
Bruker Corp.
|
507,020
|
31,820,575
|
|
|
Codexis, Inc. (a)
|
640,300
|
6,697,538
|
|
|
Danaher Corp.
|
279,935
|
70,969,121
|
|
|
Nanostring Technologies, Inc. (a)
|
111,500
|
1,416,050
|
|
|
Thermo Fisher Scientific, Inc.
|
55,700
|
30,260,696
|
|
|
163,166,788
|
|||
|
Pharmaceuticals - 2.5%
|
|||
|
Aclaris Therapeutics, Inc. (a)
|
278,900
|
3,893,444
|
|
|
AstraZeneca PLC sponsored ADR
|
629,100
|
41,564,637
|
|
|
Eli Lilly & Co.
|
340,846
|
110,512,499
|
|
|
Euroapi SASU (a)
|
3,156
|
49,789
|
|
|
Nuvation Bio, Inc. (a)
|
326,843
|
1,058,971
|
|
|
Revance Therapeutics, Inc. (a)
|
442,900
|
6,120,878
|
|
|
Sanofi SA
|
72,600
|
7,321,424
|
|
|
170,521,642
|
|||
|
TOTAL HEALTH CARE
|
1,302,735,613
|
||
|
INDUSTRIALS - 6.4%
|
|||
|
Aerospace & Defense - 1.6%
|
|||
|
Axon Enterprise, Inc. (a)
|
96,700
|
9,009,539
|
|
|
Northrop Grumman Corp.
|
113,500
|
54,317,695
|
|
|
The Boeing Co. (a)
|
323,300
|
44,201,576
|
|
|
107,528,810
|
|||
|
Electrical Equipment - 0.8%
|
|||
|
Ballard Power Systems, Inc. (a)(c)
|
30,600
|
192,780
|
|
|
Bloom Energy Corp. Class A (a)(c)
|
153,100
|
2,526,150
|
|
|
Ceres Power Holdings PLC (a)
|
1,786,200
|
11,915,390
|
|
|
Eaton Corp. PLC
|
57,500
|
7,244,425
|
|
|
Generac Holdings, Inc. (a)
|
113,799
|
23,963,793
|
|
|
Vestas Wind Systems A/S
|
350,400
|
7,450,206
|
|
|
53,292,744
|
|||
|
Machinery - 1.4%
|
|||
|
Caterpillar, Inc.
|
153,700
|
27,475,412
|
|
|
Chart Industries, Inc. (a)(c)
|
74,600
|
12,486,548
|
|
|
Ingersoll Rand, Inc.
|
1,145,675
|
48,210,004
|
|
|
Parker Hannifin Corp.
|
18,600
|
4,576,530
|
|
|
92,748,494
|
|||
|
Professional Services - 1.9%
|
|||
|
ASGN, Inc. (a)
|
158,500
|
14,304,625
|
|
|
Clarivate Analytics PLC (a)
|
1,571,800
|
21,785,148
|
|
|
CoStar Group, Inc. (a)
|
45,200
|
2,730,532
|
|
|
KBR, Inc.
|
1,449,355
|
70,134,288
|
|
|
Kforce, Inc.
|
74,100
|
4,545,294
|
|
|
Upwork, Inc. (a)
|
808,431
|
16,718,353
|
|
|
130,218,240
|
|||
|
Trading Companies & Distributors - 0.7%
|
|||
|
Azelis Group NV
|
141,000
|
3,085,249
|
|
|
Ferguson PLC
|
435,649
|
48,725,391
|
|
|
51,810,640
|
|||
|
TOTAL INDUSTRIALS
|
435,598,928
|
||
|
INFORMATION TECHNOLOGY - 29.8%
|
|||
|
Electronic Equipment & Components - 0.2%
|
|||
|
Teledyne Technologies, Inc. (a)
|
43,200
|
16,204,752
|
|
|
IT Services - 1.2%
|
|||
|
Cloudflare, Inc. (a)
|
344,500
|
15,071,875
|
|
|
MasterCard, Inc. Class A
|
71,232
|
22,472,271
|
|
|
MongoDB, Inc. Class A (a)(c)
|
169,918
|
44,093,721
|
|
|
Snowflake, Inc. (a)
|
13,100
|
1,821,686
|
|
|
83,459,553
|
|||
|
Semiconductors & Semiconductor Equipment - 6.0%
|
|||
|
Aixtron AG
|
732,900
|
18,571,269
|
|
|
Allegro MicroSystems LLC (a)
|
210,400
|
4,353,176
|
|
|
ASML Holding NV
|
58,838
|
27,999,827
|
|
|
eMemory Technology, Inc.
|
64,000
|
2,228,277
|
|
|
Enphase Energy, Inc. (a)
|
262,541
|
51,258,505
|
|
|
NVIDIA Corp.
|
553,086
|
83,842,307
|
|
|
NXP Semiconductors NV
|
83,900
|
12,419,717
|
|
|
Qualcomm, Inc.
|
914,249
|
116,786,167
|
|
|
Silicon Laboratories, Inc. (a)
|
14,300
|
2,005,146
|
|
|
SiTime Corp. (a)
|
82,300
|
13,417,369
|
|
|
SolarEdge Technologies, Inc. (a)
|
170,700
|
46,717,176
|
|
|
Taiwan Semiconductor Manufacturing Co. Ltd. sponsored ADR
|
8,100
|
662,175
|
|
|
Universal Display Corp.
|
259,900
|
26,286,286
|
|
|
406,547,397
|
|||
|
Software - 17.7%
|
|||
|
Adobe, Inc. (a)
|
369,704
|
135,333,846
|
|
|
Confluent, Inc. (c)
|
378,500
|
8,796,340
|
|
|
Elastic NV (a)
|
5,300
|
358,651
|
|
|
Epic Games, Inc. (a)(b)(d)
|
5,869
|
5,458,170
|
|
|
GitLab, Inc.
|
20,100
|
1,068,114
|
|
|
HashiCorp, Inc. (c)
|
287,100
|
8,452,224
|
|
|
HubSpot, Inc. (a)
|
31,600
|
9,500,540
|
|
|
Intuit, Inc.
|
143,920
|
55,472,525
|
|
|
Manhattan Associates, Inc. (a)
|
265,800
|
30,460,680
|
|
|
Microsoft Corp.
|
3,002,491
|
771,129,767
|
|
|
Oracle Corp.
|
803,791
|
56,160,877
|
|
|
Palo Alto Networks, Inc. (a)
|
232,400
|
114,791,656
|
|
|
Volue A/S (a)
|
1,818,700
|
4,394,556
|
|
|
1,201,377,946
|
|||
|
Technology Hardware, Storage & Peripherals - 4.7%
|
|||
|
Apple, Inc.
|
2,316,886
|
316,764,654
|
|
|
TOTAL INFORMATION TECHNOLOGY
|
2,024,354,302
|
||
|
MATERIALS - 3.7%
|
|||
|
Chemicals - 3.3%
|
|||
|
Albemarle Corp.
|
337,843
|
70,602,430
|
|
|
CF Industries Holdings, Inc.
|
712,314
|
61,066,679
|
|
|
Sherwin-Williams Co.
|
314,558
|
70,432,682
|
|
|
The Chemours Co. LLC
|
644,900
|
20,649,698
|
|
|
222,751,489
|
|||
|
Metals & Mining - 0.4%
|
|||
|
Lynas Rare Earths Ltd. (a)
|
3,037,341
|
18,358,822
|
|
|
MP Materials Corp. (a)(c)
|
310,600
|
9,964,048
|
|
|
28,322,870
|
|||
|
TOTAL MATERIALS
|
251,074,359
|
||
|
REAL ESTATE - 0.8%
|
|||
|
Equity Real Estate Investment Trusts (REITs) - 0.5%
|
|||
|
Prologis (REIT), Inc.
|
261,800
|
30,800,770
|
|
|
Welltower, Inc.
|
50,200
|
4,133,970
|
|
|
34,934,740
|
|||
|
Real Estate Management & Development - 0.3%
|
|||
|
Doma Holdings, Inc. (a)(b)
|
869,482
|
895,566
|
|
|
WeWork, Inc. (a)
|
3,204,300
|
16,085,586
|
|
|
16,981,152
|
|||
|
TOTAL REAL ESTATE
|
51,915,892
|
||
|
UTILITIES - 0.3%
|
|||
|
Electric Utilities - 0.2%
|
|||
|
ORSTED A/S (e)
|
118,500
|
12,480,884
|
|
|
Independent Power and Renewable Electricity Producers - 0.1%
|
|||
|
Brookfield Renewable Partners LP
|
146,600
|
5,101,680
|
|
|
TOTAL UTILITIES
|
17,582,564
|
||
|
TOTAL COMMON STOCKS
(Cost $4,760,433,298)
|
6,768,804,430
|
||
|
Convertible Preferred Stocks - 0.4%
|
|||
|
Shares
|
Value ($)
|
||
|
HEALTH CARE - 0.0%
|
|||
|
Biotechnology - 0.0%
|
|||
|
ElevateBio LLC Series C (a)(b)(d)
|
198,400
|
907,283
|
|
|
INFORMATION TECHNOLOGY - 0.0%
|
|||
|
IT Services - 0.0%
|
|||
|
AppNexus, Inc. Series E (Escrow) (a)(b)(d)
|
181,657
|
5,690
|
|
|
Software - 0.0%
|
|||
|
ASAPP, Inc. Series C (a)(b)(d)
|
654,971
|
2,279,299
|
|
|
TOTAL INFORMATION TECHNOLOGY
|
2,284,989
|
||
|
MATERIALS - 0.4%
|
|||
|
Metals & Mining - 0.4%
|
|||
|
Illuminated Holdings, Inc.:
|
|||
|
Series C2 (a)(b)(d)
|
137,249
|
6,865,195
|
|
|
Series C3 (a)(b)(d)
|
171,560
|
8,581,431
|
|
|
Series C4 (a)(b)(d)
|
48,240
|
2,412,965
|
|
|
Series C5 (b)(d)
|
96,064
|
4,805,121
|
|
|
22,664,712
|
|||
|
TOTAL CONVERTIBLE PREFERRED STOCKS
(Cost $19,617,827)
|
25,856,984
|
||
|
Money Market Funds - 0.8%
|
|||
|
Shares
|
Value ($)
|
||
|
Fidelity Cash Central Fund 1.58% (f)
|
2,610,245
|
2,610,767
|
|
|
Fidelity Securities Lending Cash Central Fund 1.58% (f)(g)
|
49,071,546
|
49,076,453
|
|
|
TOTAL MONEY MARKET FUNDS
(Cost $51,687,220)
|
51,687,220
|
||
|
TOTAL INVESTMENT IN SECURITIES - 100.9%
(Cost $4,831,738,345)
|
6,846,348,634
|
|
NET OTHER ASSETS (LIABILITIES) - (0.9)%
|
(58,389,533)
|
|
NET ASSETS - 100.0%
|
6,787,959,101
|
|
(a)
|
Non-income producing
|
|
(b)
|
Restricted securities (including private placements) - Investment in securities not registered under the Securities Act of 1933 (excluding 144A issues). At the end of the period, the value of restricted securities (excluding 144A issues) amounted to $32,933,271 or 0.5% of net assets.
|
|
(c)
|
Security or a portion of the security is on loan at period end.
|
|
(d)
|
Level 3 security
|
|
(e)
|
Security exempt from registration under Rule 144A of the Securities Act of 1933. These securities may be resold in transactions exempt from registration, normally to qualified institutional buyers. At the end of the period, the value of these securities amounted to $43,898,709 or 0.6% of net assets.
|
|
(f)
|
Affiliated fund that is generally available only to investment companies and other accounts managed by Fidelity Investments. The rate quoted is the annualized seven-day yield of the fund at period end. A complete unaudited listing of the fund's holdings as of its most recent quarter end is available upon request. In addition, each Fidelity Central Fund's financial statements are available on the SEC's website or upon request.
|
|
(g)
|
Investment made with cash collateral received from securities on loan.
|
|
Additional information on each restricted holding is as follows:
|
||
|
Security
|
Acquisition Date
|
Acquisition Cost ($)
|
|
AppNexus, Inc. Series E (Escrow)
|
8/01/14
|
0
|
|
ASAPP, Inc. Series C
|
4/30/21
|
4,320,909
|
|
Blu Investments LLC
|
5/21/20
|
25,138
|
|
Doma Holdings, Inc.
|
3/02/21
|
8,694,820
|
|
ElevateBio LLC Series C
|
3/09/21
|
832,288
|
|
Epic Games, Inc.
|
3/29/21
|
5,194,065
|
|
Illuminated Holdings, Inc. Series C2
|
7/07/20
|
3,431,225
|
|
Illuminated Holdings, Inc. Series C3
|
7/07/20
|
5,146,800
|
|
Illuminated Holdings, Inc. Series C4
|
1/08/21
|
1,736,640
|
|
Illuminated Holdings, Inc. Series C5
|
6/16/21
|
4,149,965
|
|
Innovid Corp.
|
6/24/21
|
4,325,570
|
|
Affiliate
|
Value,
beginning
of period ($)
|
Purchases ($)
|
Sales
Proceeds ($)
|
Dividend
Income ($)
|
Realized
Gain (loss) ($)
|
Change in
Unrealized
appreciation
(depreciation) ($)
|
Value,
end
of period ($)
|
%ownership,
end
of period
|
|
Fidelity Cash Central Fund 1.58%
|
8,407,342
|
728,956,474
|
734,753,049
|
48,902
|
-
|
-
|
2,610,767
|
0.0%
|
|
Fidelity Securities Lending Cash Central Fund 1.58%
|
18,613,591
|
211,946,660
|
181,483,798
|
252,696
|
-
|
-
|
49,076,453
|
0.1%
|
|
Total
|
27,020,933
|
940,903,134
|
916,236,847
|
301,598
|
-
|
-
|
51,687,220
|
|
Valuation Inputs at Reporting Date:
|
||||
|
Description
|
Total ($)
|
Level 1 ($)
|
Level 2 ($)
|
Level 3 ($)
|
|
Investments in Securities:
|
||||
|
Equities:
|
||||
|
Communication Services
|
1,047,316,485
|
932,026,105
|
115,290,380
|
-
|
|
Consumer Discretionary
|
625,025,506
|
593,851,249
|
31,169,751
|
4,506
|
|
Consumer Staples
|
297,861,179
|
260,317,926
|
37,543,253
|
-
|
|
Energy
|
339,048,612
|
339,048,612
|
-
|
-
|
|
Financials
|
376,290,990
|
372,272,496
|
4,018,494
|
-
|
|
Health Care
|
1,303,642,896
|
1,295,200,385
|
7,321,424
|
1,121,087
|
|
Industrials
|
435,598,928
|
428,148,722
|
7,450,206
|
-
|
|
Information Technology
|
2,026,639,291
|
2,018,896,132
|
-
|
7,743,159
|
|
Materials
|
273,739,071
|
232,715,537
|
18,358,822
|
22,664,712
|
|
Real Estate
|
51,915,892
|
51,915,892
|
-
|
-
|
|
Utilities
|
17,582,564
|
5,101,680
|
12,480,884
|
-
|
|
Money Market Funds
|
51,687,220
|
51,687,220
|
-
|
-
|
|
Total Investments in Securities:
|
6,846,348,634
|
6,581,181,956
|
233,633,214
|
31,533,464
|
|
Statement of Assets and Liabilities
|
||||
|
June 30, 2022
(Unaudited)
|
||||
|
Assets
|
||||
|
Investment in securities, at value (including securities loaned of $46,940,891) - See accompanying schedule:
|
$6,794,661,414
|
|||
|
Unaffiliated issuers (cost $4,780,051,125)
|
||||
|
Fidelity Central Funds (cost $51,687,220)
|
51,687,220
|
|||
|
Total Investment in Securities (cost $4,831,738,345)
|
$
|
6,846,348,634
|
||
|
Cash
|
51,991
|
|||
|
Foreign currency held at value (cost $1,069)
|
1,069
|
|||
|
Receivable for investments sold
|
98,941
|
|||
|
Receivable for fund shares sold
|
11,144,258
|
|||
|
Dividends receivable
|
2,252,733
|
|||
|
Distributions receivable from Fidelity Central Funds
|
157,525
|
|||
|
Other receivables
|
95,226
|
|||
|
Total assets
|
6,860,150,377
|
|||
|
Liabilities
|
||||
|
Payable for investments purchased
|
$10,063,311
|
|||
|
Payable for fund shares redeemed
|
1,603,662
|
|||
|
Accrued management fee
|
3,058,511
|
|||
|
Distribution and service plan fees payable
|
379,128
|
|||
|
Other affiliated payables
|
501,131
|
|||
|
Deferred taxes
|
7,399,359
|
|||
|
Other payables and accrued expenses
|
130,463
|
|||
|
Collateral on securities loaned
|
49,055,711
|
|||
|
Total Liabilities
|
72,191,276
|
|||
|
Net Assets
|
$
|
6,787,959,101
|
||
|
Net Assets consist of:
|
||||
|
Paid in capital
|
$
|
4,632,763,089
|
||
|
Total accumulated earnings (loss)
|
2,155,196,012
|
|||
|
Net Assets
|
$
|
6,787,959,101
|
||
|
Net Asset Value and Maximum Offering Price
|
||||
|
Initial Class :
|
||||
|
Net Asset Value
, offering price and redemption price per share ($3,737,398,931 ÷ 50,147,914 shares)
|
$
|
74.53
|
||
|
Service Class :
|
||||
|
Net Asset Value
, offering price and redemption price per share ($872,553,207 ÷ 11,799,137 shares)
|
$
|
73.95
|
||
|
Service Class 2 :
|
||||
|
Net Asset Value
, offering price and redemption price per share ($1,422,940,095 ÷ 19,716,567 shares)
|
$
|
72.17
|
||
|
Investor Class :
|
||||
|
Net Asset Value
, offering price and redemption price per share ($755,066,868 ÷ 10,215,191 shares)
|
$
|
73.92
|
||
|
Statement of Operations
|
||||
|
Six months ended
June 30, 2022
(Unaudited)
|
||||
|
Investment Income
|
||||
|
Dividends
|
$
|
(1,639,115)
|
||
|
Special dividends
|
2,720,880
|
|||
|
Foreign Tax Reclaims
|
176,233
|
|||
|
Income from Fidelity Central Funds (including $252,696 from security lending)
|
301,598
|
|||
|
Income before foreign taxes withheld
|
1,559,596
|
|||
|
Less foreign taxes withheld
|
(460,896)
|
|||
|
Total Income
|
1,098,700
|
|||
|
Expenses
|
||||
|
Management fee
|
$
|
20,499,207
|
||
|
Transfer agent fees
|
2,731,521
|
|||
|
Distribution and service plan fees
|
2,544,697
|
|||
|
Accounting fees
|
587,739
|
|||
|
Custodian fees and expenses
|
25,598
|
|||
|
Independent trustees' fees and expenses
|
13,823
|
|||
|
Audit
|
34,994
|
|||
|
Legal
|
3,693
|
|||
|
Interest
|
5,935
|
|||
|
Miscellaneous
|
15,565
|
|||
|
Total expenses before reductions
|
26,462,772
|
|||
|
Expense reductions
|
(127,811)
|
|||
|
Total expenses after reductions
|
26,334,961
|
|||
|
Net Investment income (loss)
|
(25,236,261)
|
|||
|
Realized and Unrealized Gain (Loss)
|
||||
|
Net realized gain (loss) on:
|
||||
|
Investment Securities:
|
||||
|
Unaffiliated issuers(net of foreign taxes of $62,479)
|
239,627,317
|
|||
|
Foreign currency transactions
|
(85,370)
|
|||
|
Total net realized gain (loss)
|
239,541,947
|
|||
|
Change in net unrealized appreciation (depreciation) on:
|
||||
|
Investment Securities:
|
||||
|
Unaffiliated issuers(net of increase in deferred foreign taxes of $754,022)
|
(2,353,040,602)
|
|||
|
Assets and liabilities in foreign currencies
|
13,888
|
|||
|
Total change in net unrealized appreciation (depreciation)
|
(2,353,026,714)
|
|||
|
Net gain (loss)
|
(2,113,484,767)
|
|||
|
Net increase (decrease) in net assets resulting from operations
|
$
|
(2,138,721,028)
|
||
|
Statement of Changes in Net Assets
|
||||
|
Six months ended
June 30, 2022
(Unaudited)
|
Year ended
December 31, 2021
|
|||
|
Increase (Decrease) in Net Assets
|
||||
|
Operations
|
||||
|
Net investment income (loss)
|
$
|
(25,236,261)
|
$
|
24,765,172
|
|
Net realized gain (loss)
|
239,541,947
|
1,145,778,049
|
||
|
Change in net unrealized appreciation (depreciation)
|
(2,353,026,714)
|
612,872,621
|
||
|
Net increase (decrease) in net assets resulting from operations
|
(2,138,721,028)
|
1,783,415,842
|
||
|
Distributions to shareholders
|
(394,453,959)
|
(1,793,757,552)
|
||
|
Share transactions - net increase (decrease)
|
89,402,074
|
1,310,351,053
|
||
|
Total increase (decrease) in net assets
|
(2,443,772,913)
|
1,300,009,343
|
||
|
Net Assets
|
||||
|
Beginning of period
|
9,231,732,014
|
7,931,722,671
|
||
|
End of period
|
$
|
6,787,959,101
|
$
|
9,231,732,014
|
|
Growth Portfolio Initial Class
|
|
Six months ended
(Unaudited) June 30, 2022
|
Years ended December 31, 2021
|
2020
|
2019
|
2018
|
2017
|
|||||||
|
Selected Per-Share Data
|
||||||||||||
|
Net asset value, beginning of period
|
$
|
102.43
|
$
|
103.00
|
$
|
79.09
|
$
|
63.12
|
$
|
74.05
|
$
|
59.31
|
|
Income from Investment Operations
|
||||||||||||
|
Net investment income (loss)
A,B
|
(.24)
C
|
.37
D
|
.01
|
.18
|
.21
|
.15
|
||||||
|
Net realized and unrealized gain (loss)
|
(23.25)
|
21.52
|
32.21
|
20.42
|
(.25)
E
|
19.66
|
||||||
|
Total from investment operations
|
(23.49)
|
21.89
|
32.22
|
20.60
|
(.04)
|
19.81
|
||||||
|
Distributions from net investment income
|
(.32)
|
-
|
(.07)
|
(.19)
|
(.18)
|
(.15)
|
||||||
|
Distributions from net realized gain
|
(4.09)
|
(22.46)
|
(8.25)
|
(4.44)
|
(10.72)
|
(4.92)
|
||||||
|
Total distributions
|
(4.41)
|
(22.46)
|
(8.31)
F
|
(4.63)
|
(10.89)
F
|
(5.07)
|
||||||
|
Net asset value, end of period
|
$
|
74.53
|
$
|
102.43
|
$
|
103.00
|
$
|
79.09
|
$
|
63.12
|
$
|
74.05
|
|
Total Return
G,H,I
|
(23.55)%
|
23.21%
|
43.89%
|
34.31%
|
(.17)%
E
|
35.13%
|
||||||
|
Ratios to Average Net Assets
B,J,K
|
||||||||||||
|
Expenses before reductions
|
.61%
L
|
.61%
|
.62%
|
.63%
|
.63%
|
.64%
|
||||||
|
Expenses net of fee waivers, if any
|
.60%
L
|
.60%
|
.62%
|
.62%
|
.63%
|
.64%
|
||||||
|
Expenses net of all reductions
|
.60%
L
|
.60%
|
.61%
|
.62%
|
.62%
|
.63%
|
||||||
|
Net investment income (loss)
|
(.61)%
C,L
|
.36%
D
|
.02%
|
.25%
|
.30%
|
.22%
|
||||||
|
Supplemental Data
|
||||||||||||
|
Net assets, end of period (000 omitted)
|
$
|
3,737,399
|
$
|
5,103,811
|
$
|
4,533,075
|
$
|
3,441,605
|
$
|
2,869,484
|
$
|
3,165,086
|
|
Portfolio turnover rate
M
|
42%
L
|
45%
|
53%
|
47%
|
34%
|
50%
|
|
Growth Portfolio Service Class
|
|
Six months ended
(Unaudited) June 30, 2022
|
Years ended December 31, 2021
|
2020
|
2019
|
2018
|
2017
|
|||||||
|
Selected Per-Share Data
|
||||||||||||
|
Net asset value, beginning of period
|
$
|
101.70
|
$
|
102.42
|
$
|
78.69
|
$
|
62.83
|
$
|
73.76
|
$
|
59.10
|
|
Income from Investment Operations
|
||||||||||||
|
Net investment income (loss)
A,B
|
(.29)
C
|
.27
D
|
(.07)
|
.11
|
.14
|
.08
|
||||||
|
Net realized and unrealized gain (loss)
|
(23.07)
|
21.37
|
32.03
|
20.31
|
(.25)
E
|
19.59
|
||||||
|
Total from investment operations
|
(23.36)
|
21.64
|
31.96
|
20.42
|
(.11)
|
19.67
|
||||||
|
Distributions from net investment income
|
(.31)
|
-
|
(.05)
|
(.12)
|
(.11)
|
(.09)
|
||||||
|
Distributions from net realized gain
|
(4.09)
|
(22.36)
|
(8.18)
|
(4.44)
|
(10.72)
|
(4.92)
|
||||||
|
Total distributions
|
(4.39)
F
|
(22.36)
|
(8.23)
|
(4.56)
|
(10.82)
F
|
(5.01)
|
||||||
|
Net asset value, end of period
|
$
|
73.95
|
$
|
101.70
|
$
|
102.42
|
$
|
78.69
|
$
|
62.83
|
$
|
73.76
|
|
Total Return
G,H,I
|
(23.59)%
|
23.08%
|
43.77%
|
34.17%
|
(.27)%
E
|
35.00%
|
||||||
|
Ratios to Average Net Assets
B,J,K
|
||||||||||||
|
Expenses before reductions
|
.71%
L
|
.71%
|
.72%
|
.73%
|
.73%
|
.74%
|
||||||
|
Expenses net of fee waivers, if any
|
.70%
L
|
.70%
|
.72%
|
.72%
|
.73%
|
.74%
|
||||||
|
Expenses net of all reductions
|
.70%
L
|
.70%
|
.71%
|
.72%
|
.72%
|
.73%
|
||||||
|
Net investment income (loss)
|
(.71)%
C,L
|
.26%
D
|
(.08)%
|
.15%
|
.20%
|
.12%
|
||||||
|
Supplemental Data
|
||||||||||||
|
Net assets, end of period (000 omitted)
|
$
|
872,553
|
$
|
1,176,735
|
$
|
1,018,192
|
$
|
745,767
|
$
|
600,590
|
$
|
624,381
|
|
Portfolio turnover rate
M
|
42%
L
|
45%
|
53%
|
47%
|
34%
|
50%
|
|
Growth Portfolio Service Class 2
|
|
Six months ended
(Unaudited) June 30, 2022
|
Years ended December 31, 2021
|
2020
|
2019
|
2018
|
2017
|
|||||||
|
Selected Per-Share Data
|
||||||||||||
|
Net asset value, beginning of period
|
$
|
99.42
|
$
|
100.58
|
$
|
77.43
|
$
|
61.91
|
$
|
72.86
|
$
|
58.44
|
|
Income from Investment Operations
|
||||||||||||
|
Net investment income (loss)
A,B
|
(.34)
C
|
.11
D
|
(.19)
|
-
E
|
.03
|
(.02)
|
||||||
|
Net realized and unrealized gain (loss)
|
(22.54)
|
20.95
|
31.46
|
20.00
|
(.23)
F
|
19.36
|
||||||
|
Total from investment operations
|
(22.88)
|
21.06
|
31.27
|
20.00
|
(.20)
|
19.34
|
||||||
|
Distributions from net investment income
|
(.28)
|
-
|
(.04)
|
(.04)
|
(.03)
|
(.06)
|
||||||
|
Distributions from net realized gain
|
(4.09)
|
(22.22)
|
(8.08)
|
(4.44)
|
(10.72)
|
(4.86)
|
||||||
|
Total distributions
|
(4.37)
|
(22.22)
|
(8.12)
|
(4.48)
|
(10.75)
|
(4.92)
|
||||||
|
Net asset value, end of period
|
$
|
72.17
|
$
|
99.42
|
$
|
100.58
|
$
|
77.43
|
$
|
61.91
|
$
|
72.86
|
|
Total Return
G,H,I
|
(23.65)%
|
22.90%
|
43.55%
|
33.98%
|
(.43)%
F
|
34.81%
|
||||||
|
Ratios to Average Net Assets
B,J,K
|
||||||||||||
|
Expenses before reductions
|
.86%
L
|
.85%
|
.87%
|
.88%
|
.88%
|
.89%
|
||||||
|
Expenses net of fee waivers, if any
|
.85%
L
|
.85%
|
.87%
|
.87%
|
.88%
|
.89%
|
||||||
|
Expenses net of all reductions
|
.85%
L
|
.85%
|
.86%
|
.87%
|
.87%
|
.88%
|
||||||
|
Net investment income (loss)
|
(.86)%
C,L
|
.11%
D
|
(.23)%
|
-%
M
|
.05%
|
(.03)%
|
||||||
|
Supplemental Data
|
||||||||||||
|
Net assets, end of period (000 omitted)
|
$
|
1,422,940
|
$
|
1,941,161
|
$
|
1,587,581
|
$
|
1,182,162
|
$
|
971,010
|
$
|
1,069,117
|
|
Portfolio turnover rate
N
|
42%
L
|
45%
|
53%
|
47%
|
34%
|
50%
|
|
Growth Portfolio Investor Class
|
|
Six months ended
(Unaudited) June 30, 2022
|
Years ended December 31, 2021
|
2020
|
2019
|
2018
|
2017
|
|||||||
|
Selected Per-Share Data
|
||||||||||||
|
Net asset value, beginning of period
|
$
|
101.65
|
$
|
102.38
|
$
|
78.66
|
$
|
62.81
|
$
|
73.73
|
$
|
59.08
|
|
Income from Investment Operations
|
||||||||||||
|
Net investment income (loss)
A,B
|
(.27)
C
|
.29
D
|
(.05)
|
.12
|
.15
|
.10
|
||||||
|
Net realized and unrealized gain (loss)
|
(23.06)
|
21.37
|
32.02
|
20.30
|
(.23)
E
|
19.58
|
||||||
|
Total from investment operations
|
(23.33)
|
21.66
|
31.97
|
20.42
|
(.08)
|
19.68
|
||||||
|
Distributions from net investment income
|
(.31)
|
-
|
(.06)
|
(.13)
|
(.12)
|
(.10)
|
||||||
|
Distributions from net realized gain
|
(4.09)
|
(22.39)
|
(8.20)
|
(4.44)
|
(10.72)
|
(4.92)
|
||||||
|
Total distributions
|
(4.40)
|
(22.39)
|
(8.25)
F
|
(4.57)
|
(10.84)
|
(5.03)
F
|
||||||
|
Net asset value, end of period
|
$
|
73.92
|
$
|
101.65
|
$
|
102.38
|
$
|
78.66
|
$
|
62.81
|
$
|
73.73
|
|
Total Return
G,H,I
|
(23.58)%
|
23.12%
|
43.80%
|
34.18%
|
(.24)%
E
|
35.03%
|
||||||
|
Ratios to Average Net Assets
B,J,K
|
||||||||||||
|
Expenses before reductions
|
.68%
L
|
.68%
|
.70%
|
.70%
|
.71%
|
.72%
|
||||||
|
Expenses net of fee waivers, if any
|
.68%
L
|
.68%
|
.70%
|
.70%
|
.71%
|
.72%
|
||||||
|
Expenses net of all reductions
|
.68%
L
|
.68%
|
.69%
|
.70%
|
.70%
|
.71%
|
||||||
|
Net investment income (loss)
|
(.68)%
C,L
|
.28%
D
|
(.06)%
|
.17%
|
.22%
|
.14%
|
||||||
|
Supplemental Data
|
||||||||||||
|
Net assets, end of period (000 omitted)
|
$
|
755,067
|
$
|
1,010,025
|
$
|
792,875
|
$
|
547,920
|
$
|
457,395
|
$
|
448,392
|
|
Portfolio turnover rate
M
|
42%
L
|
45%
|
53%
|
47%
|
34%
|
50%
|
|
Fidelity Central Fund
|
Investment Manager
|
Investment Objective
|
Investment Practices
|
Expense Ratio
A
|
|
Fidelity Money Market Central Funds
|
Fidelity Management & Research Company LLC (FMR)
|
Each fund seeks to obtain a high level of current income consistent with the preservation of capital and liquidity.
|
Short-term Investments
|
Less than .005%
|
|
Dividend Income
|
Net Unrealized Appreciation (Depreciation)
|
|
|
VIP Growth Portfolio
|
$(27,163,865)
|
$27,163,865
|
|
VIP Growth Portfolio
|
$29,715
|
|
Gross unrealized appreciation
|
$2,560,018,018
|
|
Gross unrealized depreciation
|
(554,238,976)
|
|
Net unrealized appreciation (depreciation)
|
$2,005,779,042
|
|
Tax cost
|
$4,840,569,592
|
|
Purchases ($)
|
Sales ($)
|
|
|
VIP Growth Portfolio
|
1,663,169,662
|
1,958,835,785
|
|
Service Class
|
$498,417
|
|
Service Class 2
|
2,046,280
|
|
$2,544,697
|
|
Amount
|
% of Class-Level Average Net Assets
A
|
|
|
Initial Class
|
$1,333,114
|
.06
|
|
Service Class
|
308,243
|
.06
|
|
Service Class 2
|
506,189
|
.06
|
|
Investor Class
|
583,975
|
.14
|
|
$2,731,521
|
|
% of Average Net Assets
|
|
|
VIP Growth Portfolio
|
.02
|
|
Amount
|
|
|
VIP Growth Portfolio
|
$26,682
|
|
Borrower or Lender
|
Average Loan Balance
|
Weighted Average Interest Rate
|
Interest Expense
|
|
|
VIP Growth Portfolio
|
Borrower
|
$10,066,667
|
.55%
|
$4,608
|
|
Purchases ($)
|
Sales ($)
|
Realized Gain (Loss) ($)
|
|
|
VIP Growth Portfolio
|
99,332,246
|
82,561,031
|
9,795,742
|
|
Amount
|
|
|
VIP Growth Portfolio
|
$7,127
|
|
Total Security Lending Fees Paid to NFS
|
Security Lending Income From Securities Loaned to NFS
|
Value of Securities Loaned to NFS at Period End
|
|
|
VIP Growth Portfolio
|
$26,469
|
$61
|
$53,472
|
|
Average Loan Balance
|
Weighted Average Interest Rate
|
Interest Expense
|
|
|
VIP Growth Portfolio
|
$35,939,000
|
1.33%
|
$1,327
|
|
Six months ended
June 30, 2022
|
Year ended
December 31, 2021
|
|
|
VIP Growth Portfolio
|
||
|
Distributions to shareholders
|
||
|
Initial Class
|
$217,136,077
|
$1,004,167,547
|
|
Service Class
|
50,329,984
|
229,154,517
|
|
Service Class 2
|
83,916,524
|
372,447,117
|
|
Investor Class
|
43,071,374
|
187,988,371
|
|
Total
|
$394,453,959
|
$1,793,757,552
|
|
Shares
|
Shares
|
Dollars
|
Dollars
|
|
|
Six months ended June 30, 2022
|
Year ended December 31, 2021
|
Six months ended June 30, 2022
|
Year ended December 31, 2021
|
|
|
VIP Growth Portfolio
|
||||
|
Initial Class
|
||||
|
Shares sold
|
1,752,954
|
1,500,845
|
$145,753,631
|
$154,353,263
|
|
Reinvestment of distributions
|
2,493,532
|
10,041,255
|
217,136,077
|
1,004,167,547
|
|
Shares redeemed
|
(3,926,787)
|
(5,724,689)
|
(332,687,554)
|
(592,742,913)
|
|
Net increase (decrease)
|
319,699
|
5,817,411
|
$30,202,154
|
$565,777,897
|
|
Service Class
|
||||
|
Shares sold
|
663,075
|
663,784
|
$55,338,873
|
$68,529,797
|
|
Reinvestment of distributions
|
582,321
|
2,306,433
|
50,329,984
|
229,154,517
|
|
Shares redeemed
|
(1,016,414)
|
(1,341,622)
|
(85,918,867)
|
(137,215,055)
|
|
Net increase (decrease)
|
228,982
|
1,628,595
|
$19,749,990
|
$160,469,259
|
|
Service Class 2
|
||||
|
Shares sold
|
963,933
|
2,396,982
|
$79,495,653
|
$239,091,093
|
|
Reinvestment of distributions
|
994,272
|
3,827,850
|
83,916,524
|
372,447,117
|
|
Shares redeemed
|
(1,766,967)
|
(2,484,467)
|
(147,994,301)
|
(248,399,937)
|
|
Net increase (decrease)
|
191,238
|
3,740,365
|
$15,417,876
|
$363,138,273
|
|
Investor Class
|
||||
|
Shares sold
|
545,333
|
1,085,907
|
$45,787,513
|
$113,031,177
|
|
Reinvestment of distributions
|
498,577
|
1,890,418
|
43,071,374
|
187,988,371
|
|
Shares redeemed
|
(764,883)
|
(784,776)
|
(64,826,833)
|
(80,053,924)
|
|
Net increase (decrease)
|
279,027
|
2,191,549
|
$24,032,054
|
$220,965,624
|
|
Fund
|
Affiliated %
|
Number of Unaffiliated Shareholders
|
Unaffiliated Shareholders %
|
|
VIP Growth Portfolio
|
19%
|
2
|
38%
|
|
The Example is based on an investment of $1,000 invested at the beginning of the period and held for the entire period (January 1, 2022 to June 30, 2022).
|
|
Annualized Expense Ratio-
A
|
Beginning Account Value January 1, 2022
|
Ending Account Value June 30, 2022
|
Expenses Paid During Period-
C
January 1, 2022 to June 30, 2022
|
|||||||
|
Growth Portfolio
|
||||||||||
|
Initial Class
|
.60%
|
|||||||||
|
Actual
|
$ 1,000
|
$ 764.50
|
$ 2.62
|
|||||||
|
Hypothetical-
B
|
$ 1,000
|
$ 1,021.82
|
$ 3.01
|
|||||||
|
Service Class
|
.70%
|
|||||||||
|
Actual
|
$ 1,000
|
$ 764.10
|
$ 3.06
|
|||||||
|
Hypothetical-
B
|
$ 1,000
|
$ 1,021.32
|
$ 3.51
|
|||||||
|
Service Class 2
|
.85%
|
|||||||||
|
Actual
|
$ 1,000
|
$ 763.50
|
$ 3.72
|
|||||||
|
Hypothetical-
B
|
$ 1,000
|
$ 1,020.58
|
$ 4.26
|
|||||||
|
Investor Class
|
.68%
|
|||||||||
|
Actual
|
$ 1,000
|
$ 764.20
|
$ 2.97
|
|||||||
|
Hypothetical-
B
|
$ 1,000
|
$ 1,021.42
|
$ 3.41
|
|||||||
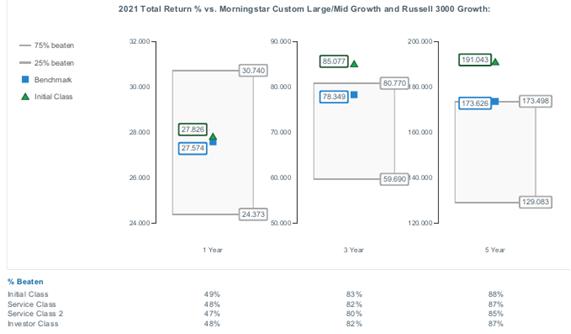
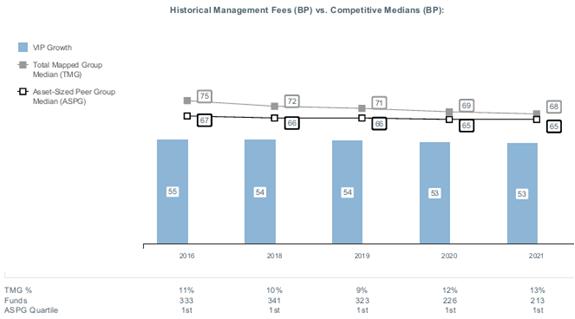
|
|


Contents
| Board Approval of Investment Advisory Contracts and Management Fees |
|
Top Holdings (% of Fund's net assets)
|
||
|
Bass Pro Group LLC
|
2.5
|
|
|
Asurion LLC
|
1.7
|
|
|
Caesars Resort Collection LLC
|
1.5
|
|
|
Intelsat Jackson Holdings SA
|
1.3
|
|
|
Athenahealth Group, Inc.
|
1.2
|
|
|
Fertitta Entertainment LLC NV
|
1.2
|
|
|
HUB International Ltd.
|
1.0
|
|
|
Seattle Spinco, Inc.
|
1.0
|
|
|
Peraton Corp.
|
0.9
|
|
|
TransDigm, Inc.
|
0.8
|
|
|
13.1
|
||
|
Market Sectors (% of Fund's net assets)
|
||
|
Technology
|
17.2
|
|
|
Services
|
8.2
|
|
|
Healthcare
|
6.1
|
|
|
Gaming
|
5.4
|
|
|
Telecommunications
|
4.8
|
|
|
Quality Diversification (% of Fund's net assets)
|

|
|
We have used ratings from Moody's Investors Service, Inc. Where Moody's® ratings are not available, we have used S&P® ratings. All ratings are as of the date indicated and do not reflect subsequent changes.
|
|
Asset Allocation (% of Fund's net assets)
|
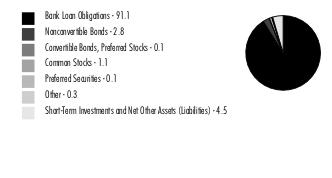
|
|
Foreign investments - 9.5%
|
|
Bank Loan Obligations - 91.1%
|
|||
|
Principal
Amount (a)
|
Value ($)
|
||
|
Aerospace - 1.0%
|
|||
|
ADS Tactical, Inc. Tranche B 1LN, term loan 3 month U.S. LIBOR + 5.750% 7.3451% 3/19/26 (b)(c)(d)
|
328,125
|
299,824
|
|
|
Gemini HDPE LLC Tranche B 1LN, term loan 3 month U.S. LIBOR + 3.000% 4.2389% 12/31/27 (b)(c)(d)
|
151,507
|
144,216
|
|
|
Jazz Acquisition, Inc. 1LN, term loan 3 month U.S. LIBOR + 4.250% 5.92% 6/19/26 (b)(c)(d)
|
128,713
|
121,023
|
|
|
TransDigm, Inc.:
|
|||
|
Tranche E 1LN, term loan 3 month U.S. LIBOR + 2.250% 3.9161% 5/30/25 (b)(c)(d)
|
581,780
|
551,626
|
|
|
Tranche F 1LN, term loan 3 month U.S. LIBOR + 2.250% 3.9161% 12/9/25 (b)(c)(d)
|
1,140,540
|
1,079,076
|
|
|
WP CPP Holdings LLC:
|
|||
|
Tranche B 1LN, term loan 3 month U.S. LIBOR + 3.750% 4.9896% 4/30/25 (b)(c)(d)
|
404,464
|
333,395
|
|
|
Tranche B 2LN, term loan 3 month U.S. LIBOR + 7.750% 8.99% 4/30/26 (b)(c)(d)
|
120,000
|
97,200
|
|
|
TOTAL AEROSPACE
|
2,626,360
|
||
|
Air Transportation - 1.5%
|
|||
|
AAdvantage Loyalty IP Ltd. Tranche B 1LN, term loan 3 month U.S. LIBOR + 4.750% 5.8127% 4/20/28 (b)(c)(d)
|
605,000
|
576,045
|
|
|
Air Canada Tranche B 1LN, term loan 1 month U.S. LIBOR + 3.500% 4.25% 8/11/28 (b)(c)(d)
|
280,000
|
256,900
|
|
|
Dynasty Acquisition Co., Inc.:
|
|||
|
Tranche B 1LN, term loan 3 month U.S. LIBOR + 3.500% 5.1661% 4/8/26 (b)(c)(d)
|
322,557
|
296,591
|
|
|
Tranche B2 1LN, term loan 3 month U.S. LIBOR + 3.500% 5.1661% 4/4/26 (b)(c)(d)
|
173,418
|
159,458
|
|
|
Mileage Plus Holdings LLC Tranche B 1LN, term loan 3 month U.S. LIBOR + 5.250% 7.3134% 7/2/27 (b)(c)(d)
|
570,000
|
562,020
|
|
|
SkyMiles IP Ltd. Tranche B 1LN, term loan 3 month U.S. LIBOR + 3.750% 4.75% 10/20/27 (b)(c)(d)
|
495,000
|
491,441
|
|
|
STG Logistics, Inc. 1LN, term loan CME TERM SOFR 1 MONTH INDEX + 6.000% 8.2044% 3/24/28 (b)(c)(d)
|
255,000
|
244,800
|
|
|
United Airlines, Inc. Tranche B 1LN, term loan 3 month U.S. LIBOR + 3.750% 5.3916% 4/21/28 (b)(c)(d)
|
955,350
|
885,495
|
|
|
WestJet Airlines Ltd. 1LN, term loan 3 month U.S. LIBOR + 3.000% 5.0296% 12/11/26 (b)(c)(d)
|
433,020
|
386,687
|
|
|
TOTAL AIR TRANSPORTATION
|
3,859,437
|
||
|
Automotive & Auto Parts - 1.8%
|
|||
|
Adient U.S. LLC Tranche B 1LN, term loan 3 month U.S. LIBOR + 3.250% 4.9161% 4/8/28 (b)(c)(d)
|
133,650
|
124,071
|
|
|
American Trailer World Corp. Tranche B 1LN, term loan 3 month U.S. LIBOR + 3.750% 5.3753% 3/5/28 (b)(c)(d)
|
456,121
|
389,605
|
|
|
Avis Budget Car Rental LLC 1LN, term loan U.S. Secured Overnight Fin. Rate (SOFR) Indx + 3.500% 5.1253% 3/16/29 (b)(c)(d)
|
204,488
|
195,286
|
|
|
Clarios Global LP Tranche B 1LN, term loan 3 month U.S. LIBOR + 3.250% 4.9161% 4/30/26 (b)(c)(d)
|
386,501
|
359,929
|
|
|
CWGS Group LLC Tranche B 1LN, term loan 1 month U.S. LIBOR + 2.500% 3.8512% 6/3/28 (b)(c)(d)
|
757,564
|
671,709
|
|
|
Driven Holdings LLC Tranche B 1LN, term loan 1 month U.S. LIBOR + 3.000% 3.5169% 11/17/28 (b)(c)(d)(e)
|
104,738
|
97,668
|
|
|
Les Schwab Tire Centers Tranche B 1LN, term loan 3 month U.S. LIBOR + 3.250% 4% 11/2/27 (b)(c)(d)
|
465,322
|
433,331
|
|
|
Midas Intermediate Holdco II LLC Tranche B 1LN, term loan 3 month U.S. LIBOR + 7.750% 11.5% 12/16/25 (b)(c)(d)
|
310,848
|
284,168
|
|
|
PECF USS Intermediate Holding III Corp. Tranche B 1LN, term loan 1 month U.S. LIBOR + 4.250% 5.9161% 12/17/28 (b)(c)(d)
|
343,275
|
308,948
|
|
|
Power Stop LLC 1LN, term loan 3 month U.S. LIBOR + 4.750% 5.9889% 1/26/29 (b)(c)(d)
|
418,666
|
337,026
|
|
|
Rough Country LLC:
|
|||
|
2LN, term loan 1 month U.S. LIBOR + 6.500% 8.7504% 7/28/29 (b)(c)(d)
|
100,000
|
95,250
|
|
|
Tranche B 1LN, term loan 1 month U.S. LIBOR + 3.500% 5.7504% 7/28/28 (b)(c)(d)
|
513,500
|
486,541
|
|
|
Thor Industries, Inc. Tranche B 1LN, term loan 3 month U.S. LIBOR + 3.000% 4.6875% 2/1/26 (b)(c)(d)
|
265,746
|
258,659
|
|
|
Truck Hero, Inc. Tranche B 1LN, term loan 3 month U.S. LIBOR + 3.250% 5.1661% 1/29/28 (b)(c)(d)
|
523,734
|
467,171
|
|
|
TOTAL AUTOMOTIVE & AUTO PARTS
|
4,509,362
|
||
|
Banks & Thrifts - 0.9%
|
|||
|
Citadel Securities LP Tranche B 1LN, term loan 3 month U.S. LIBOR + 2.500% 4.1398% 2/27/28 (b)(c)(d)
|
772,761
|
741,611
|
|
|
Deerfield Dakota Holding LLC Tranche B 1LN, term loan 3 month U.S. LIBOR + 3.750% 5.2753% 4/9/27 (b)(c)(d)
|
420,169
|
392,333
|
|
|
LHS Borrower LLC Tranche B 1LN, term loan U.S. Secured Overnight Fin. Rate (SOFR) Indx + 4.750% 6.3753% 2/18/29 (b)(c)(d)
|
528,675
|
454,661
|
|
|
Novae LLC:
|
|||
|
1LN, term loan U.S. Secured Overnight Fin. Rate (SOFR) Indx + 5.000% 6.6253% 12/22/28 (b)(c)(d)
|
306,454
|
287,046
|
|
|
Tranche DD 1LN, term loan U.S. Secured Overnight Fin. Rate (SOFR) Indx + 5.000% 6.6253% 12/22/28 (b)(c)(d)
|
87,778
|
82,219
|
|
|
Russell Investments U.S. Institutional Holdco, Inc. Tranche B 1LN, term loan 3 month U.S. LIBOR + 3.500% 4.9997% 5/30/25 (b)(c)(d)
|
108,019
|
100,593
|
|
|
Superannuation & Investments U.S. LLC 1LN, term loan 1 month U.S. LIBOR + 3.750% 5.4161% 12/1/28 (b)(c)(d)
|
144,275
|
137,918
|
|
|
Walker & Dunlop, Inc. Tranche B 1LN, term loan CME TERM SOFR 1 MONTH INDEX + 2.250% 3.8753% 12/16/28 (b)(c)(d)
|
149,250
|
142,534
|
|
|
TOTAL BANKS & THRIFTS
|
2,338,915
|
||
|
Broadcasting - 1.8%
|
|||
|
AppLovin Corp.:
|
|||
|
Tranche B 1LN, term loan 1 month U.S. LIBOR + 3.000% 5.2504% 10/25/28 (b)(c)(d)
|
264,338
|
250,240
|
|
|
Tranche B, term loan 3 month U.S. LIBOR + 3.250% 5.5004% 8/15/25 (b)(c)(d)
|
807,376
|
770,374
|
|
|
Diamond Sports Group LLC:
|
|||
|
1LN, term loan U.S. Secured Overnight Fin. Rate (SOFR) Indx + 8.000% 9.1808% 5/25/26 (b)(c)(d)
|
199,681
|
198,349
|
|
|
2LN, term loan 3 month U.S. LIBOR + 3.250% 4.4308% 8/24/26 (b)(c)(d)
|
1,625,110
|
379,187
|
|
|
Dotdash Meredith, Inc. Tranche B 1LN, term loan U.S. Secured Overnight Fin. Rate (SOFR) Indx + 4.000% 5.1451% 12/1/28 (b)(c)(d)
|
776,773
|
724,341
|
|
|
Gray Television, Inc. Tranche D 1LN, term loan 1 month U.S. LIBOR + 3.000% 4.0617% 12/1/28 (b)(c)(d)
|
288,550
|
275,565
|
|
|
Nexstar Broadcasting, Inc. Tranche B, term loan 3 month U.S. LIBOR + 2.500% 4.1661% 9/19/26 (b)(c)(d)
|
386,875
|
380,534
|
|
|
Sinclair Television Group, Inc. Tranche B4 1LN, term loan CME TERM SOFR 1 MONTH INDEX + 2.750% 5.3753% 4/21/29 (b)(c)(d)
|
405,000
|
372,600
|
|
|
Univision Communications, Inc.:
|
|||
|
Tranche B 1LN, term loan 1 month U.S. LIBOR + 3.250% 4.9161% 1/31/29 (b)(c)(d)
|
962,588
|
897,613
|
|
|
Tranche C 5LN, term loan 3 month U.S. LIBOR + 2.750% 4.4161% 3/15/24 (b)(c)(d)
|
151,661
|
148,724
|
|
|
TOTAL BROADCASTING
|
4,397,527
|
||
|
Building Materials - 2.9%
|
|||
|
Acproducts Holdings, Inc. Tranche B 1LN, term loan 1 month U.S. LIBOR + 4.250% 6.0622% 5/17/28 (b)(c)(d)
|
603,900
|
465,003
|
|
|
APi Group DE, Inc. Tranche B 1LN, term loan:
|
|||
|
1 month U.S. LIBOR + 2.750% 4.4161% 1/3/29 (b)(c)(d)
|
665,779
|
638,149
|
|
|
3 month U.S. LIBOR + 2.500% 4.1661% 10/1/26 (b)(c)(d)
|
436,218
|
418,953
|
|
|
Beacon Roofing Supply, Inc. Tranche B 1LN, term loan 1 month U.S. LIBOR + 2.250% 3.9161% 5/19/28 (b)(c)(d)
|
247,500
|
235,692
|
|
|
DiversiTech Holdings, Inc.:
|
|||
|
Tranche B 1LN, term loan 1 month U.S. LIBOR + 3.750% 6.0004% 12/22/28 (b)(c)(d)
|
165,300
|
154,969
|
|
|
Tranche B-DD 1LN, term loan 1 month U.S. LIBOR + 3.750% 12/22/28 (c)(d)(f)
|
34,286
|
32,143
|
|
|
Foley Products Co. LLC 1LN, term loan U.S. Secured Overnight Fin. Rate (SOFR) Indx + 4.750% 6.9544% 12/29/28 (b)(c)(d)
|
244,388
|
230,641
|
|
|
Hunter Douglas, Inc. Tranche B 1LN, term loan U.S. Secured Overnight Fin. Rate (SOFR) Indx + 3.500% 4.8417% 2/25/29 (b)(c)(d)
|
1,900,000
|
1,630,447
|
|
|
Ingersoll-Rand Services Co. Tranche B 1LN, term loan 3 month U.S. LIBOR + 1.750% 3.3753% 2/28/27 (b)(c)(d)
|
347,013
|
331,397
|
|
|
Installed Building Products, Inc. Tranche B 1LN, term loan 1 month U.S. LIBOR + 2.250% 3.9161% 12/14/28 (b)(c)(d)
|
169,150
|
167,107
|
|
|
Oscar AcquisitionCo LLC 1LN, term loan CME TERM SOFR 1 MONTH INDEX + 4.500% 6.1085% 4/29/29 (b)(c)(d)
|
710,000
|
630,125
|
|
|
Smyrna Ready Mix LLC Tranche B 1lN, term loan CME TERM SOFR 1 MONTH INDEX + 4.250% 5.8753% 4/1/29 (b)(c)(d)
|
145,000
|
133,763
|
|
|
Specialty Building Products Holdings LLC Tranche B 1LN, term loan 1 month U.S. LIBOR + 3.750% 5.3451% 10/15/28 (b)(c)(d)
|
199,500
|
175,061
|
|
|
SRS Distribution, Inc. Tranche B 1LN, term loan:
|
|||
|
1 month U.S. LIBOR + 3.500% 4.0187% 6/4/28 (b)(c)(d)
|
838,663
|
771,989
|
|
|
U.S. Secured Overnight Fin. Rate (SOFR) Indx + 3.500% 4% 6/2/28 (b)(c)(d)
|
239,400
|
219,949
|
|
|
Standard Industries, Inc./New Jersey Tranche B 1LN, term loan 1 month U.S. LIBOR + 2.500% 3.7876% 9/22/28 (b)(c)(d)
|
225,514
|
217,461
|
|
|
Traverse Midstream Partners Ll Tranche B, term loan U.S. Secured Overnight Fin. Rate (SOFR) Indx + 4.250% 5.94% 9/27/24 (b)(c)(d)
|
296,348
|
282,026
|
|
|
USIC Holdings, Inc. Tranche B 1LN, term loan 1 month U.S. LIBOR + 3.500% 5.1661% 5/7/28 (b)(c)(d)
|
258,050
|
239,470
|
|
|
White Capital Buyer LLC Tranche B 1LN, term loan 3 month U.S. LIBOR + 4.000% 5.2753% 10/19/27 (b)(c)(d)
|
246,258
|
226,249
|
|
|
TOTAL BUILDING MATERIALS
|
7,200,594
|
||
|
Cable/Satellite TV - 2.8%
|
|||
|
Charter Communication Operating LLC Tranche B2 1LN, term loan 3 month U.S. LIBOR + 1.750% 3.42% 2/1/27 (b)(c)(d)
|
1,497,589
|
1,424,582
|
|
|
Coral-U.S. Co.-Borrower LLC Tranche B, term loan 3 month U.S. LIBOR + 2.250% 3.574% 1/31/28 (b)(c)(d)
|
985,000
|
914,996
|
|
|
CSC Holdings LLC Tranche B3 1LN, term loan 3 month U.S. LIBOR + 2.250% 3.574% 1/15/26 (b)(c)(d)
|
967,500
|
897,966
|
|
|
DIRECTV Financing LLC 1LN, term loan 1 month U.S. LIBOR + 5.000% 6.6661% 8/2/27 (b)(c)(d)
|
797,288
|
731,846
|
|
|
LCPR Loan Financing LLC 1LN, term loan 3 month U.S. LIBOR + 3.750% 5.074% 9/25/28 (b)(c)(d)
|
195,000
|
187,931
|
|
|
Neptune Finco Corp. Tranche B, term loan 3 month U.S. LIBOR + 2.250% 3.574% 7/17/25 (b)(c)(d)
|
904,308
|
839,198
|
|
|
Numericable LLC:
|
|||
|
Tranche B 11LN, term loan 3 month U.S. LIBOR + 2.750% 3.9889% 7/31/25 (b)(c)(d)
|
560,333
|
507,802
|
|
|
Tranche B 12LN, term loan 3 month U.S. LIBOR + 3.680% 4.7318% 1/31/26 (b)(c)(d)
|
479,900
|
435,509
|
|
|
Tranche B 13LN, term loan 3 month U.S. LIBOR + 4.000% 5.4113% 8/14/26 (b)(c)(d)
|
675,625
|
615,873
|
|
|
Virgin Media Bristol LLC Tranche N, term loan 3 month U.S. LIBOR + 2.500% 3.824% 1/31/28 (b)(c)(d)
|
480,000
|
448,531
|
|
|
TOTAL CABLE/SATELLITE TV
|
7,004,234
|
||
|
Capital Goods - 0.7%
|
|||
|
Ali Group North America Corp. Tranche B 1LN, term loan 3 month U.S. LIBOR + 2.000% 10/12/28 (c)(d)(g)
|
450,000
|
429,075
|
|
|
CPM Holdings, Inc.:
|
|||
|
2LN, term loan 3 month U.S. LIBOR + 8.250% 9.3117% 11/15/26 (b)(c)(d)
|
67,828
|
64,776
|
|
|
Tranche B 1LN, term loan 3 month U.S. LIBOR + 3.500% 4.5617% 11/15/25 (b)(c)(d)
|
279,849
|
266,066
|
|
|
Griffon Corp. Tranche B 1LN, term loan U.S. Secured Overnight Fin. Rate (SOFR) Indx + 2.750% 4.355% 1/24/29 (b)(c)(d)
|
535,350
|
510,146
|
|
|
MHI Holdings LLC Tranche B 1LN, term loan 3 month U.S. LIBOR + 5.000% 6.6661% 9/20/26 (b)(c)(d)
|
252,529
|
240,534
|
|
|
TNT Crane & Rigging LLC 2LN, term loan 3 month U.S. LIBOR + 8.750% 9.75% 4/16/25 (b)(c)(d)(e)
|
36,396
|
34,532
|
|
|
Vertical U.S. Newco, Inc. Tranche B 1LN, term loan 1 month U.S. LIBOR + 3.500% 4.0187% 7/31/27 (b)(c)(d)
|
221,351
|
206,826
|
|
|
TOTAL CAPITAL GOODS
|
1,751,955
|
||
|
Chemicals - 2.8%
|
|||
|
ARC Falcon I, Inc.:
|
|||
|
Tranche B 1LN, term loan 1 month U.S. LIBOR + 3.750% 5.4161% 9/30/28 (b)(c)(d)
|
460,172
|
423,588
|
|
|
Tranche DD 1LN, term loan 1 month U.S. LIBOR + 3.750% 9/30/28 (c)(d)(f)
|
67,516
|
62,148
|
|
|
Aruba Investment Holdings LLC:
|
|||
|
2LN, term loan 3 month U.S. LIBOR + 7.750% 9.3827% 11/24/28 (b)(c)(d)
|
410,000
|
387,450
|
|
|
Tranche B 1LN, term loan 3 month U.S. LIBOR + 4.000% 5.6327% 11/24/27 (b)(c)(d)
|
336,482
|
309,564
|
|
|
Bakelite U.S. Holding Ltd. 1LN, term loan U.S. Secured Overnight Fin. Rate (SOFR) Indx + 4.000% 6.1632% 5/27/29 (b)(c)(d)(e)
|
340,000
|
317,050
|
|
|
Cimpress U.S.A., Inc. Tranche B 1LN, term loan 1 month U.S. LIBOR + 3.500% 5.1661% 5/17/28 (b)(c)(d)
|
107,853
|
99,629
|
|
|
Consolidated Energy Finance SA:
|
|||
|
Tranche B 1LN, term loan 3 month U.S. LIBOR + 3.500% 4.0287% 5/7/25 (b)(c)(d)(e)
|
262,350
|
249,233
|
|
|
Tranche B, term loan 3 month U.S. LIBOR + 2.500% 2.964% 5/7/25 (b)(c)(d)
|
342,526
|
318,549
|
|
|
Element Solutions, Inc. Tranche B 1LN, term loan 3 month U.S. LIBOR + 2.000% 3.6661% 1/31/26 (b)(c)(d)
|
343,658
|
338,589
|
|
|
Groupe Solmax, Inc. Tranche B 1LN, term loan 3 month U.S. LIBOR + 4.750% 7.0004% 5/27/28 (b)(c)(d)
|
337,124
|
300,603
|
|
|
Herens U.S. Holdco Corp. Tranche B 1LN, term loan 3 month U.S. LIBOR + 4.000% 6.2504% 7/3/28 (b)(c)(d)
|
217,807
|
193,848
|
|
|
Hexion Holdings Corp. 1LN, term loan U.S. Secured Overnight Fin. Rate (SOFR) Indx + 4.500% 5.9241% 3/15/29 (b)(c)(d)
|
655,000
|
584,588
|
|
|
Hexion, Inc. 2LN, term loan U.S. Secured Overnight Fin. Rate (SOFR) Indx + 7.000% 8.8713% 2/9/30 (b)(c)(d)(e)
|
170,000
|
147,900
|
|
|
ICP Group Tranche B 1LN, term loan 3 month U.S. LIBOR + 3.750% 6.0004% 12/29/27 (b)(c)(d)
|
167,875
|
146,191
|
|
|
INEOS U.S. Petrochem LLC Tranche B 1LN, term loan 3 month U.S. LIBOR + 2.750% 4.4161% 1/20/26 (b)(c)(d)
|
658,350
|
619,876
|
|
|
LSF11 Skyscraper HoldCo SARL Tranche B 1LN, term loan 3 month U.S. LIBOR + 3.500% 5.7504% 9/30/27 (b)(c)(d)(e)
|
281,455
|
268,790
|
|
|
Manchester Acquisition Sub LLC Tranche B 1LN, term loan U.S. Secured Overnight Fin. Rate (SOFR) Indx + 5.750% 7.2995% 12/1/26 (b)(c)(d)
|
328,475
|
293,985
|
|
|
Messer Industries U.S.A., Inc. Tranche B 1LN, term loan 3 month U.S. LIBOR + 2.500% 4.7504% 3/1/26 (b)(c)(d)
|
226,093
|
215,354
|
|
|
Olympus Water U.S. Holding Corp. Tranche B 1LN, term loan 1 month U.S. LIBOR + 3.750% 6.0625% 11/9/28 (b)(c)(d)
|
517,400
|
480,696
|
|
|
Oxea Corp. Tranche B2, term loan 3 month U.S. LIBOR + 3.250% 4.375% 10/11/24 (b)(c)(d)
|
320,274
|
295,655
|
|
|
Starfruit U.S. Holdco LLC Tranche B, term loan 3 month U.S. LIBOR + 3.000% 5.2504% 10/1/25 (b)(c)(d)
|
742,611
|
701,069
|
|
|
The Chemours Co. LLC Tranche B 1LN, term loan 3 month U.S. LIBOR + 1.750% 3.42% 4/3/25 (b)(c)(d)
|
340,869
|
322,405
|
|
|
Valcour Packaging LLC Tranche B 1LN, term loan 1 month U.S. LIBOR + 3.750% 5.2199% 10/4/28 (b)(c)(d)(e)
|
75,000
|
69,938
|
|
|
TOTAL CHEMICALS
|
7,146,698
|
||
|
Consumer Products - 2.4%
|
|||
|
19Th Holdings Golf LLC Tranche B 1LN, term loan U.S. Secured Overnight Fin. Rate (SOFR) Indx + 3.250% 4.4926% 2/7/29 (b)(c)(d)(e)
|
655,000
|
618,975
|
|
|
BCPE Empire Holdings, Inc.:
|
|||
|
1LN, term loan 3 month U.S. LIBOR + 4.000% 5.6661% 6/11/26 (b)(c)(d)
|
243,278
|
229,290
|
|
|
Tranche B 1LN, term loan 1 month U.S. LIBOR + 4.000% 5.6661% 6/11/26 (b)(c)(d)
|
238,800
|
224,472
|
|
|
Bombardier Recreational Products, Inc. Tranche B 1LN, term loan 3 month U.S. LIBOR + 2.000% 3.6661% 5/23/27 (b)(c)(d)
|
123,422
|
113,650
|
|
|
CNT Holdings I Corp. Tranche B 1LN, term loan 3 month U.S. LIBOR + 3.500% 4.6903% 11/8/27 (b)(c)(d)
|
513,500
|
486,433
|
|
|
Diamond BC BV Tranche B 1LN, term loan 1 month U.S. LIBOR + 2.750% 3.9889% 9/29/28 (b)(c)(d)
|
323,375
|
297,909
|
|
|
Energizer Holdings, Inc. Tranche B 1LN, term loan 3 month U.S. LIBOR + 2.250% 3.875% 12/16/27 (b)(c)(d)
|
227,125
|
215,060
|
|
|
Gloves Buyer, Inc. Tranche B 1LN, term loan 3 month U.S. LIBOR + 4.000% 5.6661% 1/6/28 (b)(c)(d)
|
118,800
|
113,454
|
|
|
Knowlton Development Corp., Inc. Tranche B 1LN, term loan 3 month U.S. LIBOR + 3.750% 5.4161% 12/21/25 (b)(c)(d)
|
316,577
|
297,054
|
|
|
Kronos Acquisition Holdings, Inc. Tranche B 1LN, term loan 3 month U.S. LIBOR + 3.750% 5.4161% 12/22/26 (b)(c)(d)
|
682,590
|
618,085
|
|
|
Mattress Firm, Inc. Tranche B 1LN, term loan 1 month U.S. LIBOR + 4.250% 5.64% 9/24/28 (b)(c)(d)
|
537,300
|
462,078
|
|
|
Michaels Companies, Inc. 1LN, term loan 3 month U.S. LIBOR + 4.250% 6.5004% 4/15/28 (b)(c)(d)
|
836,550
|
686,900
|
|
|
Petco Health & Wellness Co., Inc. Tranche B 1LN, term loan 3 month U.S. LIBOR + 3.250% 5.5004% 3/4/28 (b)(c)(d)
|
202,438
|
190,386
|
|
|
Rodan & Fields LLC Tranche B, term loan 3 month U.S. LIBOR + 4.000% 5.324% 6/16/25 (b)(c)(d)
|
277,679
|
151,596
|
|
|
Runner Buyer, Inc. Tranche B 1LN, term loan 1 month U.S. LIBOR + 5.500% 7.0749% 10/20/28 (b)(c)(d)
|
339,150
|
257,754
|
|
|
Sweetwater Borrower LLC Tranche B 1LN, term loan 3 month U.S. LIBOR + 4.250% 5.9375% 8/5/28 (b)(c)(d)(e)
|
307,004
|
263,256
|
|
|
TGP Holdings III LLC:
|
|||
|
Tranche B 1LN, term loan 1 month U.S. LIBOR + 3.250% 4.9161% 6/29/28 (b)(c)(d)
|
290,042
|
244,650
|
|
|
Tranche DD 1LN, term loan 1 month U.S. LIBOR + 3.250% 3.6665% 6/29/28 (b)(c)(d)(f)
|
38,244
|
32,259
|
|
|
TKC Holdings, Inc. 1LN, term loan 1 month U.S. LIBOR + 5.500% 7% 5/3/28 (b)(c)(d)
|
260,979
|
245,484
|
|
|
Woof Holdings LLC Tranche B 1LN, term loan 3 month U.S. LIBOR + 3.750% 5.8134% 12/21/27 (b)(c)(d)(e)
|
296,250
|
276,253
|
|
|
TOTAL CONSUMER PRODUCTS
|
6,024,998
|
||
|
Containers - 2.0%
|
|||
|
AOT Packaging Products AcquisitionCo LLC 1LN, term loan 3 month U.S. LIBOR + 3.250% 4.9161% 3/3/28 (b)(c)(d)
|
470,770
|
436,724
|
|
|
Berlin Packaging, LLC Tranche B 1LN, term loan:
|
|||
|
1 month U.S. LIBOR + 3.750% 4.89% 3/11/28 (b)(c)(d)
|
669,938
|
621,923
|
|
|
3 month U.S. LIBOR + 3.250% 4.43% 3/11/28 (b)(c)(d)
|
197,505
|
182,198
|
|
|
Berry Global, Inc. Tranche Z 1LN, term loan 3 month U.S. LIBOR + 1.750% 3.0047% 7/1/26 (b)(c)(d)
|
601,197
|
579,572
|
|
|
BWAY Holding Co. Tranche B, term loan 3 month U.S. LIBOR + 3.250% 4.3117% 4/3/24 (b)(c)(d)
|
475,000
|
445,807
|
|
|
Canister International Group, Inc. 1LN, term loan 3 month U.S. LIBOR + 4.750% 6.4161% 12/21/26 (b)(c)(d)
|
122,188
|
116,689
|
|
|
Charter NEX U.S., Inc. 1LN, term loan 1 month U.S. LIBOR + 3.750% 5.4161% 12/1/27 (b)(c)(d)
|
335,861
|
315,431
|
|
|
Graham Packaging Co., Inc. Tranche B 1LN, term loan 3 month U.S. LIBOR + 3.000% 4.6661% 8/4/27 (b)(c)(d)
|
435,337
|
407,401
|
|
|
Kloeckner Pentaplast of America, Inc. Tranche B 1LN, term loan 3 month U.S. LIBOR + 4.750% 5.5544% 2/9/26 (b)(c)(d)
|
192,563
|
162,234
|
|
|
Pregis TopCo Corp. 1LN, term loan:
|
|||
|
1 month U.S. LIBOR + 4.000% 5.6661% 8/1/26 (b)(c)(d)
|
99,250
|
93,419
|
|
|
3 month U.S. LIBOR + 4.000% 5.6661% 7/31/26 (b)(c)(d)
|
243,750
|
229,937
|
|
|
Printpack Holdings, Inc. Tranche B, term loan 3 month U.S. LIBOR + 3.000% 4.6875% 7/26/23 (b)(c)(d)
|
123,042
|
120,581
|
|
|
Reynolds Consumer Products LLC Tranche B 1LN, term loan 3 month U.S. LIBOR + 1.750% 3.4161% 1/30/27 (b)(c)(d)
|
595,120
|
570,708
|
|
|
Reynolds Group Holdings, Inc. Tranche B 1LN, term loan:
|
|||
|
1 month U.S. LIBOR + 3.500% 5.1661% 9/24/28 (b)(c)(d)
|
322,563
|
301,422
|
|
|
3 month U.S. LIBOR + 3.250% 4.9161% 2/5/26 (b)(c)(d)
|
206,850
|
192,501
|
|
|
Ring Container Technologies Group LLC Tranche B 1LN, term loan 1 month U.S. LIBOR + 3.750% 4.2687% 8/12/28 (b)(c)(d)
|
268,650
|
254,546
|
|
|
TOTAL CONTAINERS
|
5,031,093
|
||
|
Diversified Financial Services - 1.9%
|
|||
|
ACNR Holdings, Inc. term loan 17.6416% 9/16/25 (b)(d)(e)
|
93,435
|
94,135
|
|
|
AlixPartners LLP Tranche B 1LN, term loan 3 month U.S. LIBOR + 2.750% 4.4161% 2/4/28 (b)(c)(d)
|
246,875
|
234,183
|
|
|
Armor Holdco, Inc. Tranche B 1LN, term loan 1 month U.S. LIBOR + 4.500% 6.7504% 12/10/28 (b)(c)(d)
|
228,850
|
216,263
|
|
|
AVSC Holding Corp. Tranche B2 1LN, term loan 3 month U.S. LIBOR + 5.500% 7.1107% 10/15/26 (b)(c)(d)
|
372,271
|
321,348
|
|
|
BCP Renaissance Parent LLC Tranche B3 1LN, term loan U.S. Secured Overnight Fin. Rate (SOFR) Indx + 3.500% 5.0253% 10/31/26 (b)(c)(d)
|
89,946
|
85,561
|
|
|
Broadstreet Partners, Inc. Tranche B 1LN, term loan 1 month U.S. LIBOR + 3.250% 4.9161% 1/27/27 (b)(c)(d)
|
223,313
|
208,797
|
|
|
Eagle 4 Ltd. Tranche B 1LN, term loan 3 month U.S. LIBOR + 3.500% 5.1661% 7/12/28 (b)(c)(d)
|
144,259
|
137,527
|
|
|
Finco I LLC Tranche B 1LN, term loan 3 month U.S. LIBOR + 2.500% 4.1661% 6/27/25 (b)(c)(d)
|
122,813
|
116,749
|
|
|
Focus Financial Partners LLC:
|
|||
|
Tranche B 1LN, term loan 1 month U.S. LIBOR + 2.500% 4.1661% 6/24/28 (b)(c)(d)
|
396,186
|
378,770
|
|
|
Tranche B3 1LN, term loan 3 month U.S. LIBOR + 2.000% 3.6661% 7/3/24 (b)(c)(d)
|
177,792
|
170,378
|
|
|
GT Polaris, Inc. Tranche B 1LN, term loan 3 month U.S. LIBOR + 3.750% 4.9889% 9/24/27 (b)(c)(d)
|
123,129
|
115,536
|
|
|
HarbourVest Partners LLC Tranche B 1LN, term loan 3 month U.S. LIBOR + 2.250% 3.2884% 3/1/25 (b)(c)(d)
|
623,118
|
597,028
|
|
|
Hightower Holding LLC Tranche B 1LN, term loan 3 month U.S. LIBOR + 4.000% 5.0983% 4/21/28 (b)(c)(d)
|
203,463
|
188,543
|
|
|
KREF Holdings X LLC Tranche B 1LN, term loan 1 month U.S. LIBOR + 3.500% 4.75% 9/1/27 (b)(c)(d)(e)
|
242,842
|
229,486
|
|
|
Nexus Buyer LLC:
|
|||
|
2LN, term loan 1 month U.S. LIBOR + 6.250% 7.4403% 11/5/29 (b)(c)(d)
|
335,000
|
312,666
|
|
|
Tranche B 1LN, term loan 1 month U.S. LIBOR + 3.750% 5.4161% 11/8/26 (b)(c)(d)
|
263,648
|
248,093
|
|
|
TransUnion LLC Tranche B5 1LN, term loan 3 month U.S. LIBOR + 1.750% 3.4161% 11/16/26 (b)(c)(d)
|
167,992
|
158,193
|
|
|
UFC Holdings LLC Tranche B 1LN, term loan 3 month U.S. LIBOR + 2.750% 3.5% 4/29/26 (b)(c)(d)
|
449,635
|
417,711
|
|
|
WH Borrower LLC Tranche B 1LN, term loan U.S. Secured Overnight Fin. Rate (SOFR) Indx + 5.500% 6.7523% 2/9/27 (b)(c)(d)
|
480,000
|
457,800
|
|
|
TOTAL DIVERSIFIED FINANCIAL SERVICES
|
4,688,767
|
||
|
Diversified Media - 1.2%
|
|||
|
Advantage Sales & Marketing, Inc. Tranche B 1LN, term loan 1 month U.S. LIBOR + 4.500% 6.1661% 10/28/27 (b)(c)(d)
|
512,200
|
469,944
|
|
|
Allen Media LLC Tranche B 1LN, term loan 3 month U.S. LIBOR + 5.500% 7.7044% 2/10/27 (b)(c)(d)
|
977,342
|
863,971
|
|
|
Terrier Media Buyer, Inc. Tranche B 1LN, term loan 3 month U.S. LIBOR + 3.500% 5.1661% 12/17/26 (b)(c)(d)
|
1,774,579
|
1,631,140
|
|
|
TOTAL DIVERSIFIED MEDIA
|
2,965,055
|
||
|
Energy - 3.3%
|
|||
|
Aip Rd Buyer Corp. 1LN, term loan U.S. Secured Overnight Fin. Rate (SOFR) Indx + 4.250% 5.7753% 12/22/28 (b)(c)(d)
|
389,025
|
366,656
|
|
|
Apro LLC Tranche B 1LN, term loan 1 month U.S. LIBOR + 3.750% 5.38% 11/14/26 (b)(c)(d)
|
293,451
|
273,643
|
|
|
Array Technologies, Inc. Tranche B 1LN, term loan 3 month U.S. LIBOR + 3.250% 4.7549% 10/14/27 (b)(c)(d)
|
623,388
|
572,738
|
|
|
Brazos Delaware II LLC Tranche B, term loan 3 month U.S. LIBOR + 4.000% 5.5951% 5/21/25 (b)(c)(d)
|
115,820
|
111,361
|
|
|
BW Gas & Convenience Holdings LLC Tranche B 1LN, term loan 3 month U.S. LIBOR + 3.500% 5.1661% 3/17/28 (b)(c)(d)(e)
|
178,200
|
168,399
|
|
|
Citgo Holding, Inc. Tranche B 1LN, term loan 3 month U.S. LIBOR + 7.000% 8.6661% 8/1/23 (b)(c)(d)
|
304,077
|
299,579
|
|
|
Citgo Petroleum Corp. Tranche B 1LN, term loan 3 month U.S. LIBOR + 6.250% 7.9161% 3/28/24 (b)(c)(d)
|
413,352
|
409,392
|
|
|
CQP Holdco LP / BIP-V Chinook Holdco LLC Tranche B 1LN, term loan 1 month U.S. LIBOR + 3.750% 6.0004% 6/4/28 (b)(c)(d)
|
1,687,950
|
1,582,453
|
|
|
EG America LLC Tranche B 1LN, term loan 3 month U.S. LIBOR + 4.000% 6.2504% 2/6/25 (b)(c)(d)
|
407,089
|
381,646
|
|
|
EG Finco Ltd. Tranche B, term loan 3 month U.S. LIBOR + 4.000% 6.2504% 2/6/25 (b)(c)(d)
|
374,476
|
351,071
|
|
|
Epic Crude Services LP Tranche B 1LN, term loan 3 month U.S. LIBOR + 5.000% 7.08% 3/1/26 (b)(c)(d)
|
397,738
|
339,513
|
|
|
Esdec Solar Group BV Tranche B 1LN, term loan 1 month U.S. LIBOR + 5.000% 6.4997% 8/27/28 (b)(c)(d)(e)
|
399,438
|
361,491
|
|
|
GIP II Blue Holding LP Tranche B 1LN, term loan 1 month U.S. LIBOR + 4.500% 6.7504% 9/29/28 (b)(c)(d)
|
1,152,025
|
1,114,100
|
|
|
GIP III Stetson I LP Tranche B, term loan 3 month U.S. LIBOR + 4.250% 5.9161% 7/18/25 (b)(c)(d)
|
527,584
|
497,085
|
|
|
Granite Acquisition, Inc. Tranche B 1LN, term loan 3 month U.S. LIBOR + 2.750% 5.0004% 3/25/28 (b)(c)(d)
|
267,300
|
253,334
|
|
|
ITT Holdings LLC Tranche B 1LN, term loan 1 month U.S. LIBOR + 2.750% 4.4161% 7/30/28 (b)(c)(d)
|
447,819
|
427,667
|
|
|
Natgasoline LLC Tranche B, term loan 3 month U.S. LIBOR + 3.500% 5.1875% 11/14/25 (b)(c)(d)(e)
|
309,878
|
295,158
|
|
|
Rockwood Service Corp. Tranche B 1LN, term loan 3 month U.S. LIBOR + 4.250% 5.9161% 1/23/27 (b)(c)(d)
|
297,669
|
287,994
|
|
|
WaterBridge Operating LLC Tranche B 1LN, term loan 3 month U.S. LIBOR + 5.750% 7.3916% 6/21/26 (b)(c)(d)
|
232,726
|
219,577
|
|
|
TOTAL ENERGY
|
8,312,857
|
||
|
Entertainment/Film - 0.2%
|
|||
|
AP Core Holdings II LLC:
|
|||
|
Tranche B1 1LN, term loan 1 month U.S. LIBOR + 5.500% 7.1661% 9/1/27 (b)(c)(d)
|
352,775
|
333,665
|
|
|
Tranche B2 1LN, term loan 1 month U.S. LIBOR + 5.500% 7.1661% 9/1/27 (b)(c)(d)
|
195,000
|
183,300
|
|
|
TOTAL ENTERTAINMENT/FILM
|
516,965
|
||
|
Environmental - 0.7%
|
|||
|
Clean Harbors, Inc. Tranche B 1LN, term loan 1 month U.S. LIBOR + 2.000% 3.6661% 10/8/28 (b)(c)(d)
|
348,250
|
344,768
|
|
|
Covanta Holding Corp.:
|
|||
|
Tranche B 1LN, term loan 1 month U.S. LIBOR + 2.500% 4.1661% 11/30/28 (b)(c)(d)
|
329,436
|
310,658
|
|
|
Tranche C 1LN, term loan 1 month U.S. LIBOR + 2.500% 4.1661% 11/30/28 (b)(c)(d)
|
24,739
|
23,329
|
|
|
Madison IAQ LLC Tranche B 1LN, term loan 1 month U.S. LIBOR + 3.250% 4.5244% 6/21/28 (b)(c)(d)
|
638,550
|
580,014
|
|
|
The Brickman Group, Ltd. Tranche B 1LN, term loan 3 month U.S. LIBOR + 3.250% 4.7753% 4/14/29 (b)(c)(d)
|
425,000
|
403,750
|
|
|
WTG Holdings III Corp. Tranche B 1LN, term loan 3 month U.S. LIBOR + 2.500% 4.1875% 4/1/28 (b)(c)(d)
|
113,850
|
110,198
|
|
|
TOTAL ENVIRONMENTAL
|
1,772,717
|
||
|
Food & Drug Retail - 0.8%
|
|||
|
Froneri U.S., Inc. Tranche B 1LN, term loan 3 month U.S. LIBOR + 2.250% 3.9161% 1/29/27 (b)(c)(d)
|
480,200
|
440,785
|
|
|
JBS U.S.A. Lux SA Tranche B 1LN, term loan 3 month U.S. LIBOR + 2.000% 2.8044% 5/1/26 (b)(c)(d)
|
634,895
|
611,086
|
|
|
JP Intermediate B LLC Tranche B, term loan 3 month U.S. LIBOR + 5.500% 6.7389% 11/20/25 (b)(c)(d)
|
338,399
|
272,411
|
|
|
PetIQ, Inc. Tranche B 1LN, term loan 3 month U.S. LIBOR + 4.250% 5.5047% 4/13/28 (b)(c)(d)(e)
|
287,825
|
267,677
|
|
|
Primary Products Finance LLC 1LN, term loan 1 month U.S. LIBOR + 4.000% 4.6509% 4/1/29 (b)(c)(d)
|
460,000
|
446,343
|
|
|
TOTAL FOOD & DRUG RETAIL
|
2,038,302
|
||
|
Food/Beverage/Tobacco - 1.3%
|
|||
|
8th Avenue Food & Provisions, Inc. Tranche B 1LN, term loan 3 month U.S. LIBOR + 3.750% 5.4161% 10/1/25 (b)(c)(d)
|
119,752
|
100,420
|
|
|
Bengal Debt Merger Sub LLC:
|
|||
|
1LN, term loan U.S. Secured Overnight Fin. Rate (SOFR) Indx + 3.250% 5.4031% 1/24/29 (b)(c)(d)
|
675,000
|
626,906
|
|
|
2LN, term loan U.S. Secured Overnight Fin. Rate (SOFR) Indx + 6.000% 8.1544% 1/24/30 (b)(c)(d)
|
170,000
|
153,000
|
|
|
Chobani LLC Tranche B 1LN, term loan 3 month U.S. LIBOR + 3.500% 5.1661% 10/23/27 (b)(c)(d)
|
407,738
|
368,799
|
|
|
Del Monte Foods, Inc. Tranche B 1LN, term loan U.S. Secured Overnight Fin. Rate (SOFR) Indx + 4.250% 5.6838% 5/16/29 (b)(c)(d)
|
665,000
|
625,100
|
|
|
Shearer's Foods, Inc. Tranche B 1LN, term loan 3 month U.S. LIBOR + 3.500% 5.1661% 9/23/27 (b)(c)(d)
|
451,032
|
407,863
|
|
|
Triton Water Holdings, Inc. Tranche B 1LN, term loan 3 month U.S. LIBOR + 3.500% 5.7504% 3/31/28 (b)(c)(d)
|
895,951
|
790,040
|
|
|
U.S. Foods, Inc. 1LN, term loan 3 month U.S. LIBOR + 2.000% 3.5749% 9/13/26 (b)(c)(d)
|
120,344
|
113,199
|
|
|
TOTAL FOOD/BEVERAGE/TOBACCO
|
3,185,327
|
||
|
Gaming - 5.0%
|
|||
|
Aristocrat Technologies, Inc. Tranche B 1LN, term loan CME TERM SOFR 1 MONTH INDEX + 2.250% 4.4044% 5/13/29 (b)(c)(d)
|
195,000
|
185,556
|
|
|
Bally's Corp. Tranche B 1LN, term loan 1 month U.S. LIBOR + 3.250% 4.3699% 10/1/28 (b)(c)(d)
|
1,009,925
|
934,968
|
|
|
Caesars Resort Collection LLC:
|
|||
|
Tranche B 1LN, term loan 3 month U.S. LIBOR + 2.750% 4.4161% 12/22/24 (b)(c)(d)
|
1,616,970
|
1,553,973
|
|
|
Tranche B 1LN, term loan 3 month U.S. LIBOR + 3.500% 5.1661% 7/20/25 (b)(c)(d)
|
2,511,591
|
2,415,523
|
|
|
Churchill Downs, Inc. Tranche B 1LN, term loan 3 month U.S. LIBOR + 2.000% 3.67% 3/17/28 (b)(c)(d)
|
296,250
|
278,721
|
|
|
Fertitta Entertainment LLC NV Tranche B 1LN, term loan U.S. Secured Overnight Fin. Rate (SOFR) Indx + 4.000% 5.5253% 1/27/29 (b)(c)(d)
|
3,259,189
|
2,997,248
|
|
|
Golden Entertainment, Inc. Tranche B, term loan 3 month U.S. LIBOR + 3.000% 4.63% 10/20/24 (b)(c)(d)
|
718,013
|
698,045
|
|
|
GVC Holdings Gibraltar Ltd. Tranche B4 1LN, term loan 1 month U.S. LIBOR + 2.250% 3.7427% 3/16/27 (b)(c)(d)
|
198,000
|
189,140
|
|
|
J&J Ventures Gaming LLC 1LN, term loan 3 month U.S. LIBOR + 4.000% 6.2504% 4/26/28 (b)(c)(d)
|
327,525
|
311,558
|
|
|
Light & Wonder, Inc. 1LN, term loan CME TERM SOFR 1 MONTH INDEX + 3.250% 4.3577% 4/7/29 (b)(c)(d)
|
650,000
|
615,875
|
|
|
PCI Gaming Authority 1LN, term loan 3 month U.S. LIBOR + 2.500% 4.1661% 5/29/26 (b)(c)(d)
|
303,389
|
289,779
|
|
|
Playtika Holding Corp. Tranche B 1LN, term loan 3 month U.S. LIBOR + 2.750% 4.4161% 3/11/28 (b)(c)(d)
|
245,030
|
230,482
|
|
|
Scientific Games Holdings LP term loan U.S. Secured Overnight Fin. Rate (SOFR) Indx + 3.500% 4.1751% 4/4/29 (b)(c)(d)
|
565,000
|
521,919
|
|
|
Stars Group Holdings BV Tranche B 1LN, term loan 1 month U.S. LIBOR + 2.250% 4.5004% 7/16/26 (b)(c)(d)
|
471,058
|
447,086
|
|
|
Station Casinos LLC Tranche B 1LN, term loan 3 month U.S. LIBOR + 2.250% 3.92% 2/7/27 (b)(c)(d)
|
977,337
|
917,338
|
|
|
TOTAL GAMING
|
12,587,211
|
||
|
Healthcare - 6.0%
|
|||
|
Accelerated Health Systems LLC Tranche B1 LN, term loan U.S. Secured Overnight Fin. Rate (SOFR) Indx + 4.250% 5.1596% 2/2/29 (b)(c)(d)
|
340,000
|
321,939
|
|
|
AHP Health Partners, Inc. Tranche B 1LN, term loan 1 month U.S. LIBOR + 3.500% 5.1661% 8/23/28 (b)(c)(d)
|
153,838
|
144,800
|
|
|
Avantor Funding, Inc. Tranche B5 1LN, term loan 1 month U.S. LIBOR + 2.250% 3.9161% 11/6/27 (b)(c)(d)
|
523,092
|
501,760
|
|
|
Confluent Health LLC:
|
|||
|
Tranche B 1LN, term loan 1 month U.S. LIBOR + 4.000% 5.6661% 11/30/28 (b)(c)(d)
|
238,076
|
220,618
|
|
|
Tranche DD 1LN, term loan 1 month U.S. LIBOR + 4.000% 4.3249% 11/30/28 (b)(c)(d)(f)
|
51,327
|
47,564
|
|
|
Da Vinci Purchaser Corp. Tranche B 1LN, term loan 3 month U.S. LIBOR + 4.000% 6.0306% 12/13/26 (b)(c)(d)
|
615,204
|
581,368
|
|
|
Elanco Animal Health, Inc. Tranche B 1LN, term loan 3 month U.S. LIBOR + 1.750% 2.8117% 8/1/27 (b)(c)(d)
|
1,177,531
|
1,109,823
|
|
|
Electron BidCo, Inc. Tranche B 1LN, term loan 1 month U.S. LIBOR + 3.000% 4.6661% 11/1/28 (b)(c)(d)
|
264,338
|
246,968
|
|
|
Embecta Corp. Tranche B 1LN, term loan U.S. Secured Overnight Fin. Rate (SOFR) Indx + 3.000% 5.0544% 3/31/29 (b)(c)(d)
|
222,486
|
209,749
|
|
|
Gainwell Acquisition Corp. Tranche B 1LN, term loan 3 month U.S. LIBOR + 4.000% 6.2504% 10/1/27 (b)(c)(d)
|
1,436,007
|
1,355,231
|
|
|
Horizon Pharma U.S.A., Inc. Tranche B 1LN, term loan 3 month U.S. LIBOR + 1.750% 3.375% 3/15/28 (b)(c)(d)
|
425,222
|
409,676
|
|
|
ICU Medical, Inc. Tranche B 1LN, term loan U.S. Secured Overnight Fin. Rate (SOFR) Indx + 2.500% 4.4544% 1/6/29 (b)(c)(d)
|
284,288
|
272,916
|
|
|
Insulet Corp. Tranche B 1LN, term loan 1 month U.S. LIBOR + 3.250% 4.9161% 5/4/28 (b)(c)(d)
|
346,500
|
328,309
|
|
|
Jazz Financing Lux SARL Tranche B 1LN, term loan 1 month U.S. LIBOR + 3.500% 5.1661% 5/5/28 (b)(c)(d)
|
1,634,161
|
1,555,770
|
|
|
Mamba Purchaser, Inc. Tranche B 1LN, term loan 1 month U.S. LIBOR + 3.750% 5.3451% 10/14/28 (b)(c)(d)
|
199,500
|
188,861
|
|
|
Maravai Intermediate Holdings LLC Tranche B 1LN, term loan U.S. Secured Overnight Fin. Rate (SOFR) Indx + 3.000% 3.8512% 10/19/27 (b)(c)(d)(e)
|
364,227
|
345,105
|
|
|
MED ParentCo LP:
|
|||
|
1LN, term loan 3 month U.S. LIBOR + 4.250% 5.9161% 8/31/26 (b)(c)(d)
|
277,399
|
249,745
|
|
|
2LN, term loan 3 month U.S. LIBOR + 8.250% 9.9161% 8/30/27 (b)(c)(d)
|
180,000
|
165,150
|
|
|
Mozart Borrower LP Tranche B 1LN, term loan 1 month U.S. LIBOR + 3.250% 4.9161% 10/21/28 (b)(c)(d)
|
793,013
|
734,155
|
|
|
Organon & Co. Tranche B 1LN, term loan 3 month U.S. LIBOR + 3.000% 4.625% 6/2/28 (b)(c)(d)
|
1,070,458
|
1,028,090
|
|
|
Packaging Coordinators Midco, Inc. Tranche B 1LN, term loan 3 month U.S. LIBOR + 3.750% 6.0004% 11/30/27 (b)(c)(d)
|
227,125
|
214,161
|
|
|
Pathway Vet Alliance LLC Tranche B 1LN, term loan 3 month U.S. LIBOR + 3.750% 6.0004% 3/31/27 (b)(c)(d)
|
719,150
|
666,113
|
|
|
Perrigo Investments LLC Tranche B 1LN, term loan CME TERM SOFR 1 MONTH INDEX + 2.500% 3.6451% 4/20/29 (b)(c)(d)
|
400,000
|
384,000
|
|
|
Phoenix Newco, Inc. Tranche B 1LN, term loan 1 month U.S. LIBOR + 3.250% 4.9161% 11/15/28 (b)(c)(d)
|
967,575
|
906,618
|
|
|
Pluto Acquisition I, Inc. term loan 1 month U.S. LIBOR + 4.000% 6.0757% 6/20/26 (b)(c)(d)
|
346,649
|
300,718
|
|
|
PRA Health Sciences, Inc. Tranche B 1LN, term loan 1 month U.S. LIBOR + 2.250% 4.5625% 7/3/28 (b)(c)(d)
|
373,645
|
360,462
|
|
|
RadNet Management, Inc. Tranche B 1LN, term loan 3 month U.S. LIBOR + 3.000% 4.6236% 4/23/28 (b)(c)(d)
|
99,001
|
93,824
|
|
|
Sharp Midco LLC Tranche B 1LN, term loan 1 month U.S. LIBOR + 4.000% 6.2504% 12/31/28 (b)(c)(d)(e)
|
194,513
|
181,869
|
|
|
Surgery Center Holdings, Inc. term loan 1 month U.S. LIBOR + 3.750% 4.95% 8/31/26 (c)(d)
|
287,234
|
267,039
|
|
|
U.S. Anesthesia Partners, Inc. Tranche B 1LN, term loan 1 month U.S. LIBOR + 4.250% 5.3117% 10/1/28 (b)(c)(d)
|
492,525
|
458,541
|
|
|
U.S. Radiology Specialists, Inc. Tranche B 1LN, term loan 3 month U.S. LIBOR + 5.250% 7.5625% 12/15/27 (b)(c)(d)
|
341,969
|
300,933
|
|
|
U.S. Renal Care, Inc. Tranche B 1LN, term loan 3 month U.S. LIBOR + 5.000% 6.6875% 6/13/26 (b)(c)(d)
|
1,085,459
|
739,273
|
|
|
Upstream Newco, Inc. 1LN, term loan 1 month U.S. LIBOR + 4.250% 5.8898% 11/20/26 (b)(c)(d)
|
202,950
|
184,812
|
|
|
TOTAL HEALTHCARE
|
15,075,960
|
||
|
Homebuilders/Real Estate - 0.8%
|
|||
|
DTZ U.S. Borrower LLC Tranche B 1LN, term loan 3 month U.S. LIBOR + 2.750% 4.4161% 8/21/25 (b)(c)(d)
|
816,032
|
766,458
|
|
|
Fluidra Finco SL Tranche B 1LN, term loan U.S. Secured Overnight Fin. Rate (SOFR) Indx + 2.000% 3.6253% 1/27/29 (b)(c)(d)
|
407,950
|
394,863
|
|
|
Lightstone Holdco LLC:
|
|||
|
Tranche B 1LN, term loan CME TERM SOFR 1 MONTH INDEX + 5.750% 7.0241% 1/30/27 (b)(c)(d)
|
412,168
|
368,891
|
|
|
Tranche C 1LN, term loan CME TERM SOFR 1 MONTH INDEX + 5.750% 7.0241% 1/30/27 (b)(c)(d)
|
23,247
|
20,806
|
|
|
Ryan Specialty Group LLC Tranche B 1LN, term loan 3 month U.S. LIBOR + 3.000% 4.6253% 9/1/27 (b)(c)(d)
|
447,185
|
429,298
|
|
|
TOTAL HOMEBUILDERS/REAL ESTATE
|
1,980,316
|
||
|
Hotels - 2.1%
|
|||
|
Aimbridge Acquisition Co., Inc.:
|
|||
|
Tranche B 1LN, term loan 3 month U.S. LIBOR + 4.750% 6.2593% 2/1/26 (b)(c)(d)
|
78,229
|
70,406
|
|
|
Tranche B, term loan 3 month U.S. LIBOR + 3.750% 5.4161% 2/1/26 (b)(c)(d)
|
148,365
|
131,797
|
|
|
ASP LS Acquisition Corp. Tranche B 1LN, term loan 3 month U.S. LIBOR + 4.500% 7.3769% 4/30/28 (b)(c)(d)
|
397,000
|
352,338
|
|
|
Carnival Finance LLC Tranche B 1LN, term loan 1 month U.S. LIBOR + 3.250% 6.1269% 10/18/28 (b)(c)(d)
|
1,124,350
|
1,006,293
|
|
|
Four Seasons Holdings, Inc. Tranche B, term loan 3 month U.S. LIBOR + 2.000% 3.6661% 11/30/23 (b)(c)(d)
|
537,476
|
530,758
|
|
|
Hilton Grand Vacations Borrower LLC Tranche B 1LN, term loan 1 month U.S. LIBOR + 3.000% 4.6661% 8/2/28 (b)(c)(d)
|
1,475,932
|
1,379,082
|
|
|
Marriott Ownership Resorts, Inc. Tranche B 1LN, term loan 3 month U.S. LIBOR + 1.750% 3.4161% 8/31/25 (b)(c)(d)
|
635,145
|
604,182
|
|
|
Oravel Stays Singapore Pte Ltd. Tranche B 1LN, term loan 1 month U.S. LIBOR + 8.250% 10.44% 6/23/26 (b)(c)(d)
|
178,200
|
152,659
|
|
|
Travelport Finance Luxembourg SARL 1LN, term loan:
|
|||
|
3 month U.S. LIBOR + 2.500% 2.506% 2/28/25 (b)(c)(d)
|
419,496
|
413,938
|
|
|
3 month U.S. LIBOR + 6.750% 9.0004% 5/30/26 (b)(c)(d)
|
526,354
|
404,966
|
|
|
Wyndham Hotels & Resorts, Inc. Tranche B, term loan 3 month U.S. LIBOR + 1.750% 3.4161% 5/30/25 (b)(c)(d)
|
317,668
|
306,324
|
|
|
TOTAL HOTELS
|
5,352,743
|
||
|
Insurance - 4.7%
|
|||
|
Acrisure LLC Tranche B 1LN, term loan:
|
|||
|
1 month U.S. LIBOR + 4.250% 5.9161% 2/15/27 (b)(c)(d)
|
213,925
|
201,447
|
|
|
3 month U.S. LIBOR + 3.500% 5.1661% 2/13/27 (b)(c)(d)
|
1,618,184
|
1,480,638
|
|
|
Alliant Holdings Intermediate LLC:
|
|||
|
Tranche B, term loan 3 month U.S. LIBOR + 3.250% 4.9161% 5/10/25 (b)(c)(d)
|
201,458
|
189,227
|
|
|
Tranche B-2 1LN, term loan 3 month U.S. LIBOR + 3.250% 4.9161% 5/9/25 (b)(c)(d)
|
485,000
|
457,631
|
|
|
Tranche B3 1LN, term loan 1 month U.S. LIBOR + 3.500% 5.0093% 11/12/27 (b)(c)(d)
|
496,250
|
460,396
|
|
|
AmWINS Group, Inc. Tranche B 1LN, term loan 3 month U.S. LIBOR + 2.250% 3.9161% 2/19/28 (b)(c)(d)
|
542,966
|
511,973
|
|
|
AssuredPartners, Inc.:
|
|||
|
1 LN, term loan 3 month U.S. LIBOR + 3.500% 5.0253% 2/13/27 (b)(c)(d)
|
259,350
|
241,196
|
|
|
Tranche B 1LN, term loan:
|
|||
|
1 month U.S. LIBOR + 3.500% 5.1661% 2/13/27 (b)(c)(d)
|
14,850
|
13,888
|
|
|
3 month U.S. LIBOR + 3.500% 5.1661% 2/13/27 (b)(c)(d)
|
365,625
|
341,859
|
|
|
Asurion LLC:
|
|||
|
Tranche B 6LN, term loan 3 month U.S. LIBOR + 3.120% 4.7911% 11/3/23 (b)(c)(d)
|
851,225
|
816,112
|
|
|
Tranche B3 2LN, term loan 3 month U.S. LIBOR + 5.250% 6.9161% 1/31/28 (b)(c)(d)
|
835,000
|
709,750
|
|
|
Tranche B4 2LN, term loan 1 month U.S. LIBOR + 5.250% 6.9161% 1/20/29 (b)(c)(d)
|
1,390,000
|
1,174,550
|
|
|
Tranche B8 1LN, term loan 3 month U.S. LIBOR + 3.250% 4.9161% 12/23/26 (b)(c)(d)
|
1,208,204
|
1,092,675
|
|
|
Tranche B9 1LN, term loan 3 month U.S. LIBOR + 3.250% 4.9161% 7/31/27 (b)(c)(d)
|
568,308
|
512,898
|
|
|
HUB International Ltd.:
|
|||
|
Tranche B 1LN, term loan 3 month U.S. LIBOR + 3.250% 4.3483% 4/25/25 (b)(c)(d)
|
385,000
|
364,395
|
|
|
Tranche B, term loan 3 month U.S. LIBOR + 3.000% 4.2137% 4/25/25 (b)(c)(d)
|
2,133,703
|
2,016,136
|
|
|
USI, Inc.:
|
|||
|
1LN, term loan 3 month U.S. LIBOR + 3.250% 5.5004% 12/2/26 (b)(c)(d)
|
464,249
|
428,269
|
|
|
Tranche B, term loan 3 month U.S. LIBOR + 3.000% 5.2504% 5/16/24 (b)(c)(d)
|
810,402
|
775,457
|
|
|
TOTAL INSURANCE
|
11,788,497
|
||
|
Leisure - 2.4%
|
|||
|
Alterra Mountain Co. Tranche B 1LN, term loan 1 month U.S. LIBOR + 3.500% 5.1661% 8/17/28 (b)(c)(d)
|
127,412
|
120,882
|
|
|
Callaway Golf Co. Tranche B, term loan 3 month U.S. LIBOR + 4.500% 6.1661% 1/4/26 (b)(c)(d)
|
172,381
|
170,335
|
|
|
City Football Group Ltd. Tranche B 1LN, term loan 1 month U.S. LIBOR + 3.500% 4.5983% 7/21/28 (b)(c)(d)
|
803,700
|
735,386
|
|
|
Crown Finance U.S., Inc. Tranche B 1LN, term loan:
|
|||
|
1 month U.S. LIBOR + 8.250% 10.0763% 5/23/24 (b)(c)(d)
|
47,287
|
49,178
|
|
|
3 month U.S. LIBOR + 2.500% 3.9997% 2/28/25 (b)(c)(d)
|
514,179
|
322,791
|
|
|
15.25% 5/23/24 (d)
|
78,548
|
87,627
|
|
|
Delta 2 SARL Tranche B, term loan 3 month U.S. LIBOR + 2.500% 4.1661% 2/1/24 (b)(c)(d)
|
1,570,522
|
1,528,118
|
|
|
Equinox Holdings, Inc.:
|
|||
|
Tranche 2LN, term loan 3 month U.S. LIBOR + 7.000% 9.2504% 9/8/24 (b)(c)(d)
|
115,000
|
85,228
|
|
|
Tranche B-1, term loan 3 month U.S. LIBOR + 3.000% 5.2504% 3/8/24 (b)(c)(d)
|
600,910
|
444,673
|
|
|
Hayward Industries, Inc. Tranche B 1LN, term loan 1 month U.S. LIBOR + 2.500% 4.1661% 5/28/28 (b)(c)(d)
|
279,295
|
265,243
|
|
|
Herschend Entertainment Co. LLC Tranche B 1LN, term loan 1 month U.S. LIBOR + 3.750% 5.44% 8/27/28 (b)(c)(d)
|
143,913
|
136,897
|
|
|
Lids Holdings, Inc. 1LN, term loan U.S. Secured Overnight Fin. Rate (SOFR) Indx + 5.500% 7.326% 12/14/26 (b)(c)(d)(e)
|
342,188
|
335,344
|
|
|
MajorDrive Holdings IV LLC 1LN, term loan 3 month U.S. LIBOR + 4.000% 5.625% 5/12/28 (b)(c)(d)
|
228,275
|
204,377
|
|
|
PlayPower, Inc. Tranche B 1LN, term loan 3 month U.S. LIBOR + 5.500% 7.7504% 5/10/26 (b)(c)(d)
|
224,639
|
211,723
|
|
|
SeaWorld Parks & Entertainment, Inc. Tranche B 1LN, term loan 1 month U.S. LIBOR + 3.000% 4.6875% 8/25/28 (b)(c)(d)
|
223,313
|
209,300
|
|
|
Seminole Tribe of Florida Tranche B, term loan 3 month U.S. LIBOR + 1.750% 3.4161% 7/6/24 (b)(c)(d)
|
85,764
|
85,464
|
|
|
SP PF Buyer LLC Tranche B 1LN, term loan 3 month U.S. LIBOR + 4.500% 6.1661% 12/21/25 (b)(c)(d)
|
223,036
|
188,465
|
|
|
United PF Holdings LLC:
|
|||
|
1LN, term loan 3 month U.S. LIBOR + 4.000% 6.2504% 12/30/26 (b)(c)(d)
|
828,542
|
755,009
|
|
|
2LN, term loan 3 month U.S. LIBOR + 8.500% 10.7504% 12/30/27 (b)(c)(d)
|
100,000
|
93,083
|
|
|
Tranche B 1LN, term loan 3 month U.S. LIBOR + 8.500% 10.7504% 12/30/26 (b)(c)(d)(e)
|
83,513
|
81,425
|
|
|
TOTAL LEISURE
|
6,110,548
|
||
|
Paper - 0.8%
|
|||
|
Ahlstrom-Munksjo OYJ 1LN, term loan 3 month U.S. LIBOR + 3.750% 6.0004% 2/4/28 (b)(c)(d)
|
266,642
|
247,310
|
|
|
Clydesdale Acquisition Holdings, Inc. 1LN, term loan CME TERM SOFR 1 MONTH INDEX + 4.250% 5.8753% 3/30/29 (b)(c)(d)
|
1,640,000
|
1,530,071
|
|
|
Journey Personal Care Corp. Tranche B 1LN, term loan 3 month U.S. LIBOR + 4.250% 6.5004% 3/1/28 (b)(c)(d)
|
138,947
|
105,600
|
|
|
Neenah, Inc. Tranche B 1LN, term loan 3 month U.S. LIBOR + 3.000% 6.75% 4/6/28 (b)(c)(d)
|
167,557
|
165,882
|
|
|
TOTAL PAPER
|
2,048,863
|
||
|
Publishing/Printing - 0.9%
|
|||
|
Cengage Learning, Inc. Tranche B 1LN, term loan 1 month U.S. LIBOR + 4.750% 5.75% 7/14/26 (b)(c)(d)
|
128,551
|
115,636
|
|
|
Harland Clarke Holdings Corp.:
|
|||
|
1LN, term loan 1 month U.S. LIBOR + 7.750% 10.0004% 6/16/26 (b)(c)(d)
|
352,191
|
272,360
|
|
|
Tranche B 7LN, term loan 3 month U.S. LIBOR + 4.750% 7.0004% 11/3/23 (b)(c)(d)
|
42,570
|
33,311
|
|
|
Learning Care Group (U.S.) No 2, Inc. Tranche B 1LN, term loan:
|
|||
|
3 month U.S. LIBOR + 3.250% 4.4998% 3/13/25 (b)(c)(d)
|
260,140
|
240,304
|
|
|
3 month U.S. LIBOR + 8.500% 9.8215% 3/13/25 (b)(c)(d)
|
205,800
|
201,684
|
|
|
MJH Healthcare Holdings LLC Tranche B 1LN, term loan U.S. Secured Overnight Fin. Rate (SOFR) Indx + 3.500% 5.1091% 1/28/29 (b)(c)(d)
|
390,000
|
366,600
|
|
|
Recorded Books, Inc. Tranche B 1LN, term loan 3 month U.S. LIBOR + 4.000% 6.0033% 8/29/25 (b)(c)(d)
|
325,000
|
307,531
|
|
|
RLG Holdings LLC Tranche B 1LN, term loan 1 month U.S. LIBOR + 4.250% 5.9161% 7/8/28 (b)(c)(d)
|
203,975
|
189,866
|
|
|
Scripps (E.W.) Co.:
|
|||
|
Tranche B 1LN, term loan 3 month U.S. LIBOR + 2.750% 4.4161% 1/7/28 (b)(c)(d)
|
223,763
|
211,317
|
|
|
Tranche B, term loan 3 month U.S. LIBOR + 2.000% 3.6661% 10/2/24 (b)(c)(d)
|
238,125
|
233,215
|
|
|
TOTAL PUBLISHING/PRINTING
|
2,171,824
|
||
|
Railroad - 0.7%
|
|||
|
AIT Worldwide Logistics Holdings, Inc. 1LN, term loan 3 month U.S. LIBOR + 4.750% 5.719% 4/6/28 (b)(c)(d)
|
352,338
|
318,277
|
|
|
Echo Global Logistics, Inc. 1LN, term loan 1 month U.S. LIBOR + 3.500% 5.1661% 11/23/28 (b)(c)(d)
|
209,475
|
194,812
|
|
|
Einstein Merger Sub, Inc. 2LN, term loan 3 month U.S. LIBOR + 7.250% 8.4889% 11/23/29 (b)(c)(d)(e)
|
175,000
|
174,125
|
|
|
First Student Bidco, Inc.:
|
|||
|
Tranche B 1LN, term loan 1 month U.S. LIBOR + 3.000% 5.2316% 7/21/28 (b)(c)(d)
|
308,865
|
275,276
|
|
|
Tranche C 1LN, term loan 1 month U.S. LIBOR + 3.000% 5.2316% 7/21/28 (b)(c)(d)
|
114,583
|
102,122
|
|
|
Genesee & Wyoming, Inc. 1LN, term loan 3 month U.S. LIBOR + 2.000% 4.2504% 12/30/26 (b)(c)(d)
|
466,837
|
447,407
|
|
|
Worldwide Express, Inc. 1LN, term loan 1 month U.S. LIBOR + 4.250% 6.2504% 7/22/28 (b)(c)(d)
|
403,187
|
365,138
|
|
|
TOTAL RAILROAD
|
1,877,157
|
||
|
Restaurants - 1.0%
|
|||
|
Burger King Worldwide, Inc. Tranche B 1LN, term loan 3 month U.S. LIBOR + 1.750% 3.4161% 11/19/26 (b)(c)(d)
|
487,500
|
464,466
|
|
|
Dave & Buster's, Inc. 1LN, term loan CME TERM SOFR 1 MONTH INDEX + 5.000% 6/23/29 (c)(d)(g)
|
250,000
|
237,658
|
|
|
Flynn Restaurant Group LP Tranche B 1LN, term loan 1 month U.S. LIBOR + 4.250% 5.9161% 11/22/28 (b)(c)(d)
|
129,350
|
120,231
|
|
|
Pacific Bells LLC Tranche B 1LN, term loan 1 month U.S. LIBOR + 4.500% 6.8161% 10/20/28 (b)(c)(d)
|
453,440
|
418,298
|
|
|
PFC Acquisition Corp. Tranche B 1LN, term loan 3 month U.S. LIBOR + 6.250% 7.8249% 3/1/26 (b)(c)(d)
|
362,813
|
326,531
|
|
|
Whatabrands LLC Tranche B 1LN, term loan 1 month U.S. LIBOR + 3.250% 4.9161% 7/21/28 (b)(c)(d)
|
1,109,425
|
1,037,312
|
|
|
TOTAL RESTAURANTS
|
2,604,496
|
||
|
Services - 8.0%
|
|||
|
ABG Intermediate Holdings 2 LLC:
|
|||
|
Tranche B 1LN, term loan 3 month U.S. LIBOR + 3.250% 4.9161% 9/27/24 (b)(c)(d)
|
246,618
|
235,952
|
|
|
Tranche B 2LN, term loan 3 month U.S. LIBOR + 6.000% 7.6253% 12/20/29 (b)(c)(d)(e)
|
180,000
|
165,600
|
|
|
Tranche B1 LN, term loan U.S. Secured Overnight Fin. Rate (SOFR) Indx + 3.500% 5.1253% 12/21/28 (b)(c)(d)
|
1,140,000
|
1,063,050
|
|
|
Adtalem Global Education, Inc. Tranche B 1LN, term loan 3 month U.S. LIBOR + 4.000% 5.5951% 8/12/28 (b)(c)(d)
|
235,228
|
223,819
|
|
|
AEA International Holdings Luxembourg SARL Tranche B 1LN, term loan 3 month U.S. LIBOR + 3.750% 6.0625% 9/7/28 (b)(c)(d)(e)
|
159,200
|
151,638
|
|
|
All-Star Bidco AB:
|
|||
|
Tranche B 1LN, term loan 1 month U.S. LIBOR + 4.000% 5.5979% 11/16/28 (b)(c)(d)(e)
|
134,663
|
127,593
|
|
|
Tranche B1 1LN, term loan 1 month U.S. LIBOR + 3.500% 5.0979% 11/16/28 (b)(c)(d)
|
228,850
|
215,881
|
|
|
Allied Universal Holdco LLC Tranche B 1LN, term loan 1 month U.S. LIBOR + 3.750% 5.4161% 5/14/28 (b)(c)(d)
|
575,650
|
526,478
|
|
|
APX Group, Inc. Tranche B 1LN, term loan 1 month U.S. LIBOR + 3.500% 5.0108% 7/9/28 (b)(c)(d)
|
481,437
|
453,605
|
|
|
Aramark Services, Inc.:
|
|||
|
Tranche B 1LN, term loan 3 month U.S. LIBOR + 2.500% 4.1661% 4/6/28 (b)(c)(d)
|
90,000
|
85,875
|
|
|
Tranche B 3LN, term loan 3 month U.S. LIBOR + 1.750% 3.4161% 3/11/25 (b)(c)(d)
|
699,497
|
669,943
|
|
|
Tranche B-4 1LN, term loan 3 month U.S. LIBOR + 1.750% 3.4161% 1/15/27 (b)(c)(d)
|
116,563
|
110,371
|
|
|
Ascend Learning LLC Tranche B 1LN, term loan 1 month U.S. LIBOR + 3.500% 5.1661% 12/10/28 (b)(c)(d)
|
741,275
|
682,900
|
|
|
Brand Energy & Infrastructure Services, Inc. Tranche B, term loan 3 month U.S. LIBOR + 4.250% 5.4% 6/21/24 (b)(c)(d)
|
1,270,052
|
1,094,366
|
|
|
Cast & Crew Payroll LLC Tranche B 1LN, term loan:
|
|||
|
1 month U.S. LIBOR + 3.750% 5.2753% 12/30/28 (b)(c)(d)
|
333,325
|
315,619
|
|
|
3 month U.S. LIBOR + 3.500% 5.1661% 2/7/26 (b)(c)(d)
|
687,190
|
650,542
|
|
|
CHG Healthcare Services, Inc. 1LN, term loan 1 month U.S. LIBOR + 3.250% 4.7497% 9/30/28 (b)(c)(d)
|
158,526
|
149,569
|
|
|
Congruex Group LLC Tranche B 1LN, term loan CME TERM SOFR 1 MONTH INDEX + 5.750% 7.0116% 4/26/29 (b)(c)(d)
|
375,000
|
359,063
|
|
|
CoreLogic, Inc. Tranche B 1LN, term loan 3 month U.S. LIBOR + 3.500% 5.1875% 6/2/28 (b)(c)(d)
|
759,263
|
629,429
|
|
|
EAB Global, Inc. Tranche B 1LN, term loan 1 month U.S. LIBOR + 3.500% 4.7389% 8/16/28 (b)(c)(d)
|
208,950
|
196,152
|
|
|
Element Materials Technology Group:
|
|||
|
Tranche B 1LN, term loan CME TERM SOFR 1 MONTH INDEX + 4.250% 4/12/29 (c)(d)(g)
|
153,947
|
147,405
|
|
|
Tranche DD 1LN, term loan CME TERM SOFR 1 MONTH INDEX + 4.250% 4/12/29 (c)(d)(g)
|
71,053
|
68,033
|
|
|
EmployBridge LLC Tranche B 1LN, term loan 1 month U.S. LIBOR + 4.750% 7.0004% 7/19/28 (b)(c)(d)
|
545,875
|
495,382
|
|
|
Ensemble RCM LLC 1LN, term loan 3 month U.S. LIBOR + 3.750% 4.9889% 8/1/26 (b)(c)(d)
|
364,688
|
351,847
|
|
|
Filtration Group Corp.:
|
|||
|
Tranche B 1LN, term loan 1 month U.S. LIBOR + 3.500% 5.1661% 10/21/28 (b)(c)(d)
|
263,013
|
245,259
|
|
|
Tranche B, term loan 3 month U.S. LIBOR + 3.000% 4.6661% 3/29/25 (b)(c)(d)
|
325,615
|
307,765
|
|
|
Finastra U.S.A., Inc.:
|
|||
|
Tranche 2LN, term loan 3 month U.S. LIBOR + 7.250% 8.4889% 6/13/25 (b)(c)(d)
|
235,000
|
200,758
|
|
|
Tranche B 1LN, term loan 3 month U.S. LIBOR + 3.500% 4.7389% 6/13/24 (b)(c)(d)
|
521,458
|
468,822
|
|
|
Flexera Software LLC Tranche B 1LN, term loan 3 month U.S. LIBOR + 3.750% 5.37% 3/3/28 (b)(c)(d)
|
170,515
|
161,222
|
|
|
Franchise Group, Inc. Tranche B 1LN, term loan 3 month U.S. LIBOR + 4.750% 6.5% 3/10/26 (b)(c)(d)
|
537,101
|
488,316
|
|
|
Galaxy U.S. Opco, Inc. 1LN, term loan 3 month U.S. LIBOR + 4.750% 6.2753% 4/19/29 (b)(c)(d)
|
410,000
|
383,863
|
|
|
Gateway Merger Sub 2021, Inc. Tranche B 1LN, term loan 1 month U.S. LIBOR + 5.250% 6.4884% 6/30/28 (b)(c)(d)
|
158,800
|
146,096
|
|
|
GEMS MENASA Cayman Ltd. Tranche B 1LN, term loan 3 month U.S. LIBOR + 5.000% 6.5749% 7/30/26 (b)(c)(d)
|
265,523
|
250,255
|
|
|
Greeneden U.S. Holdings II LLC Tranche B 1LN, term loan 3 month U.S. LIBOR + 4.000% 5.6661% 12/1/27 (b)(c)(d)
|
406,471
|
387,570
|
|
|
Indy U.S. Bidco LLC Tranche B 1LN, term loan 1 month U.S. LIBOR + 3.750% 5.4161% 3/5/28 (b)(c)(d)
|
202,445
|
187,600
|
|
|
Ion Trading Finance Ltd. Tranche B 1LN, term loan 3 month U.S. LIBOR + 4.750% 7.0004% 3/26/28 (b)(c)(d)
|
792,000
|
728,149
|
|
|
KNS Acquisitions, Inc. Tranche B 1LN, term loan 3 month U.S. LIBOR + 6.250% 8.5004% 4/21/27 (b)(c)(d)
|
171,719
|
155,835
|
|
|
KUEHG Corp. Tranche B, term loan 3 month U.S. LIBOR + 3.750% 6.0004% 2/21/25 (b)(c)(d)
|
712,010
|
660,895
|
|
|
Lakeshore Intermediate LLC 1LN, term loan 1 month U.S. LIBOR + 3.500% 4% 9/29/28 (b)(c)(d)
|
144,275
|
136,881
|
|
|
Maverick Purchaser Sub LLC:
|
|||
|
Tranche B 1LN, term loan:
|
|||
|
3 month U.S. LIBOR + 3.750% 5.4161% 1/23/27 (b)(c)(d)
|
460,600
|
437,284
|
|
|
U.S. Secured Overnight Fin. Rate (SOFR) Indx + 4.000% 5.16% 2/16/29 (b)(c)(d)
|
645,000
|
612,350
|
|
|
Tranche B 2LN, term loan 1 month U.S. LIBOR + 8.750% 11.0004% 1/31/28 (b)(c)(d)(e)
|
290,000
|
274,050
|
|
|
Mckissock Investment Holdings Tranche B 1LN, term loan U.S. Secured Overnight Fin. Rate (SOFR) Indx + 5.000% 5.9498% 3/10/29 (b)(c)(d)
|
159,600
|
154,014
|
|
|
Pilot Travel Centers LLC Tranche B 1LN, term loan 1 month U.S. LIBOR + 2.000% 3.6253% 8/4/28 (b)(c)(d)
|
645,125
|
616,901
|
|
|
PowerTeam Services LLC Tranche B 1LN, term loan 1 month U.S. LIBOR + 3.500% 5.7504% 3/6/25 (b)(c)(d)
|
351,735
|
277,182
|
|
|
Sabert Corp. Tranche B 1LN, term loan 3 month U.S. LIBOR + 4.500% 6.1875% 12/10/26 (b)(c)(d)(e)
|
455,710
|
431,785
|
|
|
Sabre GLBL, Inc.:
|
|||
|
Tranche B-1 1LN, term loan 1 month U.S. LIBOR + 3.500% 5.1661% 12/17/27 (b)(c)(d)
|
47,705
|
44,515
|
|
|
Tranche B-2 1LN, term loan 1 month U.S. LIBOR + 3.500% 5.1661% 12/17/27 (b)(c)(d)
|
76,045
|
70,960
|
|
|
Signal Parent, Inc. Tranche B 1LN, term loan 3 month U.S. LIBOR + 3.500% 5.1661% 4/3/28 (b)(c)(d)
|
495,000
|
377,848
|
|
|
Sotheby's Tranche B 1LN, term loan 1 month U.S. LIBOR + 4.500% 5.5443% 1/15/27 (b)(c)(d)
|
123,980
|
118,401
|
|
|
Spin Holdco, Inc. Tranche B 1LN, term loan 3 month U.S. LIBOR + 4.000% 5.6107% 3/4/28 (b)(c)(d)
|
1,496,718
|
1,374,736
|
|
|
SuperMoose Borrower LLC Tranche B 1LN, term loan 3 month U.S. LIBOR + 3.750% 6.0004% 8/29/25 (b)(c)(d)
|
281,743
|
253,482
|
|
|
Uber Technologies, Inc. Tranche B 1LN, term loan 3 month U.S. LIBOR + 3.500% 5.0749% 4/4/25 (b)(c)(d)
|
720,641
|
688,983
|
|
|
Vaco Holdings LLC 1LN, term loan U.S. Secured Overnight Fin. Rate (SOFR) Indx + 5.000% 7.2044% 1/21/29 (b)(c)(d)
|
263,675
|
252,909
|
|
|
TOTAL SERVICES
|
20,064,798
|
||
|
Steel - 0.1%
|
|||
|
JMC Steel Group, Inc. 1LN, term loan 3 month U.S. LIBOR + 2.000% 4.1846% 1/24/27 (b)(c)(d)
|
386,077
|
359,534
|
|
|
Super Retail - 3.8%
|
|||
|
Academy Ltd. Tranche B 1LN, term loan 1 month U.S. LIBOR + 3.750% 4.8117% 11/6/27 (b)(c)(d)
|
281,438
|
267,014
|
|
|
Ambience Merger Sub, Inc. Tranche B 1LN, term loan 1 month U.S. LIBOR + 4.000% 4.9669% 7/24/28 (b)(c)(d)
|
433,550
|
334,050
|
|
|
Bass Pro Group LLC Tranche B 1LN, term loan 3 month U.S. LIBOR + 3.750% 5.4161% 3/5/28 (b)(c)(d)
|
7,032,867
|
6,392,855
|
|
|
Empire Today LLC Tranche B 1LN, term loan 3 month U.S. LIBOR + 5.000% 5.75% 4/1/28 (b)(c)(d)
|
540,902
|
412,438
|
|
|
Harbor Freight Tools U.S.A., Inc. Tranche B 1LN, term loan 1 month U.S. LIBOR + 2.750% 4.4161% 10/19/27 (b)(c)(d)
|
749,605
|
660,252
|
|
|
LBM Acquisition LLC Tranche B 1LN, term loan 3 month U.S. LIBOR + 3.750% 5.4161% 12/18/27 (b)(c)(d)
|
306,270
|
250,281
|
|
|
Red Ventures LLC Tranche B 1LN, term loan 3 month U.S. LIBOR + 2.500% 4.1661% 11/8/24 (b)(c)(d)
|
313,448
|
303,261
|
|
|
RH:
|
|||
|
Tranche B 1LN, term loan 1 month U.S. LIBOR + 2.500% 4.1661% 10/20/28 (b)(c)(d)
|
674,900
|
589,275
|
|
|
Tranche B2 1LN, term loan CME TERM SOFR 1 MONTH INDEX + 3.250% 4.8753% 10/20/28 (b)(d)
|
500,000
|
445,000
|
|
|
TOTAL SUPER RETAIL
|
9,654,426
|
||
|
Technology - 17.1%
|
|||
|
A&V Holdings Midco LLC Tranche B 1LN, term loan 3 month U.S. LIBOR + 5.370% 6.8747% 3/10/27 (b)(c)(d)(e)
|
226,719
|
222,185
|
|
|
Acuris Finance U.S., Inc. 1LN, term loan 3 month U.S. LIBOR + 4.000% 6.2044% 2/16/28 (b)(c)(d)
|
270,573
|
254,339
|
|
|
Alliance Laundry Systems LLC Tranche B 1LN, term loan 3 month U.S. LIBOR + 3.500% 4.52% 10/8/27 (b)(c)(d)
|
202,044
|
191,564
|
|
|
Anastasia Parent LLC Tranche B, term loan 3 month U.S. LIBOR + 3.750% 6.0004% 8/10/25 (b)(c)(d)
|
962,500
|
763,022
|
|
|
Aptean, Inc. 1LN, term loan 3 month U.S. LIBOR + 4.250% 5.9161% 4/23/26 (b)(c)(d)
|
276,605
|
261,163
|
|
|
Arches Buyer, Inc. Tranche B 1LN, term loan 3 month U.S. LIBOR + 3.250% 4.9161% 12/4/27 (b)(c)(d)
|
663,175
|
603,489
|
|
|
Athenahealth Group, Inc.:
|
|||
|
Tranche B 1LN, term loan U.S. Secured Overnight Fin. Rate (SOFR) Indx + 3.500% 5.0091% 2/15/29 (b)(c)(d)
|
2,826,014
|
2,594,649
|
|
|
Tranche DD 1LN, term loan U.S. Secured Overnight Fin. Rate (SOFR) Indx + 3.500% 2/15/29 (c)(d)(f)
|
478,986
|
439,771
|
|
|
AZZ, Inc. Tranche B 1LN, term loan CME TERM SOFR 1 MONTH INDEX + 4.250% 5.8753% 5/6/29 (b)(c)(d)
|
470,000
|
447,675
|
|
|
Camelot Finance SA:
|
|||
|
Tranche B 1LN, term loan 3 month U.S. LIBOR + 3.000% 4.6661% 10/31/26 (b)(c)(d)
|
738,750
|
695,038
|
|
|
Tranche B, term loan 3 month U.S. LIBOR + 3.000% 4.6661% 10/31/26 (b)(c)(d)
|
876,402
|
827,473
|
|
|
Central Parent, Inc. 1LN, term loan CME TERM SOFR 1 MONTH INDEX + 4.500% 6/9/29 (c)(d)(g)
|
1,100,000
|
1,036,893
|
|
|
Ceridian HCM Holding, Inc. Tranche B, term loan 3 month U.S. LIBOR + 2.500% 4.1661% 4/30/25 (b)(c)(d)
|
417,193
|
394,118
|
|
|
CMC Materials, Inc. Tranche B 1LN, term loan 3 month U.S. LIBOR + 2.000% 3.6875% 11/15/25 (b)(c)(d)
|
182,982
|
182,067
|
|
|
CMI Marketing, Inc. Tranche B 1LN, term loan 1 month U.S. LIBOR + 4.250% 5.8736% 3/23/28 (b)(c)(d)
|
173,250
|
163,505
|
|
|
CommScope, Inc. Tranche B 1LN, term loan 3 month U.S. LIBOR + 3.250% 4.9161% 4/4/26 (b)(c)(d)
|
981,381
|
878,954
|
|
|
ConnectWise LLC Tranche B 1LN, term loan 3 month U.S. LIBOR + 3.500% 5.7504% 9/30/28 (b)(c)(d)
|
686,550
|
627,047
|
|
|
Constant Contact, Inc. Tranche B 1LN, term loan 3 month U.S. LIBOR + 4.000% 5.0107% 2/10/28 (b)(c)(d)
|
307,556
|
271,803
|
|
|
DCert Buyer, Inc.:
|
|||
|
1LN, term loan 3 month U.S. LIBOR + 4.000% 5.6661% 10/16/26 (b)(c)(d)
|
948,335
|
903,962
|
|
|
Tranche B 2LN, term loan 3 month U.S. LIBOR + 7.000% 8.6661% 2/19/29 (b)(c)(d)
|
595,000
|
550,375
|
|
|
DG Investment Intermediate Holdings, Inc.:
|
|||
|
2LN, term loan 3 month U.S. LIBOR + 6.750% 8.4161% 3/31/29 (b)(c)(d)
|
60,000
|
57,600
|
|
|
Tranche B 1LN, term loan 3 month U.S. LIBOR + 3.750% 5.4161% 3/31/28 (b)(c)(d)
|
262,359
|
244,568
|
|
|
ECL Entertainment LLC 1LN, term loan 3 month U.S. LIBOR + 7.500% 9.7504% 4/30/28 (b)(c)(d)
|
198,000
|
192,927
|
|
|
Emerald TopCo, Inc. 1LN, term loan 3 month U.S. LIBOR + 3.500% 4.7384% 7/25/26 (b)(c)(d)
|
509,979
|
476,320
|
|
|
Entegris, Inc. Tranche B 1LN, term loan U.S. Secured Overnight Fin. Rate (SOFR) Indx + 3.000% 3/2/29 (c)(d)(g)
|
645,000
|
622,425
|
|
|
EP Purchaser LLC Tranche B 1LN, term loan 1 month U.S. LIBOR + 3.500% 5.7504% 10/28/28 (b)(c)(d)
|
174,563
|
165,689
|
|
|
Epicor Software Corp. Tranche B 1LN, term loan 3 month U.S. LIBOR + 3.250% 4.9161% 7/31/27 (b)(c)(d)
|
586,658
|
552,456
|
|
|
EXC Holdings III Corp. Tranche B, term loan 3 month U.S. LIBOR + 3.500% 5.7504% 12/2/24 (b)(c)(d)
|
152,800
|
145,924
|
|
|
Global IID Parent LLC Tranche B 1LN, term loan 1 month U.S. LIBOR + 4.500% 6.7504% 12/16/28 (b)(c)(d)
|
159,200
|
153,628
|
|
|
Go Daddy Operating Co. LLC:
|
|||
|
Tranche B 1LN, term loan 3 month U.S. LIBOR + 2.000% 3.6661% 8/10/27 (b)(c)(d)
|
122,500
|
117,478
|
|
|
Tranche B, term loan 3 month U.S. LIBOR + 1.750% 3.4161% 2/15/24 (b)(c)(d)
|
468,605
|
452,119
|
|
|
Grab Holdings, Inc. Tranche B 1LN, term loan 3 month U.S. LIBOR + 4.500% 5.5% 1/29/26 (b)(c)(d)
|
58,053
|
52,828
|
|
|
Hunter U.S. Bidco, Inc. Tranche B 1LN, term loan 1 month U.S. LIBOR + 4.250% 6.5004% 8/19/28 (b)(c)(d)
|
486,156
|
460,633
|
|
|
Hyland Software, Inc. Tranche B 1LN, term loan 3 month U.S. LIBOR + 3.500% 5.1661% 7/1/24 (b)(c)(d)
|
393,464
|
378,820
|
|
|
Icon Luxembourg Sarl Tranche B 1LN, term loan 1 month U.S. LIBOR + 2.250% 4.5625% 7/3/28 (b)(c)(d)
|
1,499,673
|
1,446,765
|
|
|
II-VI, Inc. Tranche B 1LN, term loan 1 month U.S. LIBOR + 2.750% 12/8/28 (c)(d)(g)
|
1,090,000
|
1,042,313
|
|
|
Imprivata, Inc. Tranche B 1LN, term loan 3 month U.S. LIBOR + 3.750% 5.4161% 12/1/27 (b)(c)(d)
|
286,375
|
274,384
|
|
|
MA FinanceCo. LLC Tranche B 1LN, term loan 3 month U.S. LIBOR + 4.250% 5.915% 6/5/25 (b)(c)(d)(e)
|
143,410
|
130,861
|
|
|
Maxar Technologies, Inc. Tranche B 1LN, term loan CME TERM SOFR 1 MONTH INDEX + 4.250% 6/9/29 (c)(d)(g)
|
105,000
|
99,532
|
|
|
McAfee Corp. Tranche B 1LN, term loan U.S. Secured Overnight Fin. Rate (SOFR) Indx + 4.000% 5.1451% 2/2/29 (b)(c)(d)
|
185,000
|
167,888
|
|
|
MH Sub I LLC:
|
|||
|
1LN, term loan 3 month U.S. LIBOR + 3.750% 5.4161% 9/15/24 (b)(c)(d)
|
1,052,802
|
989,371
|
|
|
Tranche B 2LN, term loan 3 month U.S. LIBOR + 6.250% 7.9161% 2/23/29 (b)(c)(d)
|
225,000
|
211,124
|
|
|
Tranche B, term loan 3 month U.S. LIBOR + 3.500% 5.4161% 9/15/24 (b)(c)(d)
|
561,524
|
527,485
|
|
|
MKS Instruments, Inc. Tranche B 1LN, term loan CME TERM SOFR 1 MONTH INDEX + 2.750% 4/11/29 (c)(d)(g)
|
705,000
|
672,923
|
|
|
Motus Group LLC Tranche B 1LN, term loan 3 month U.S. LIBOR + 4.000% 5.6661% 12/10/28 (b)(c)(d)
|
134,663
|
125,741
|
|
|
NAVEX TopCo, Inc. Tranche B 1LN, term loan 3 month U.S. LIBOR + 3.250% 4.92% 9/5/25 (b)(c)(d)
|
157,028
|
149,864
|
|
|
NortonLifeLock, Inc. Tranche B 1LN, term loan U.S. Secured Overnight Fin. Rate (SOFR) Indx + 2.000% 1/28/29 (c)(d)(g)
|
1,955,000
|
1,849,430
|
|
|
Osmosis Debt Merger Sub, Inc. Tranche B 1LN, term loan 1 month U.S. LIBOR + 4.000% 4.8308% 7/30/28 (b)(c)(d)
|
215,000
|
195,381
|
|
|
Park Place Technologies LLC 1LN, term loan 3 month U.S. LIBOR + 5.000% 6.6253% 11/10/27 (b)(c)(d)
|
663,447
|
635,801
|
|
|
Peraton Corp. Tranche B 1LN, term loan 3 month U.S. LIBOR + 3.750% 5.4161% 2/1/28 (b)(c)(d)
|
2,329,050
|
2,182,227
|
|
|
PointClickCare Technologies, Inc. Tranche B 1LN, term loan 3 month U.S. LIBOR + 3.000% 5.9375% 12/29/27 (b)(c)(d)
|
143,188
|
135,073
|
|
|
Polaris Newco LLC Tranche B 1LN, term loan 1 month U.S. LIBOR + 4.000% 5.6661% 6/2/28 (b)(c)(d)
|
1,236,546
|
1,139,390
|
|
|
Project Boost Purchaser LLC:
|
|||
|
1LN, term loan 3 month U.S. LIBOR + 3.500% 5.1661% 5/30/26 (b)(c)(d)
|
421,661
|
391,090
|
|
|
Tranche B 1LN, term loan 1 month U.S. LIBOR + 3.500% 5.1661% 5/30/26 (b)(c)(d)
|
173,250
|
160,582
|
|
|
Proofpoint, Inc. Tranche B 1LN, term loan 1 month U.S. LIBOR + 3.250% 4.8249% 8/31/28 (b)(c)(d)
|
999,975
|
927,117
|
|
|
Rackspace Technology Global, Inc. Tranche B 1LN, term loan 3 month U.S. LIBOR + 2.750% 4.16% 2/15/28 (b)(c)(d)
|
773,221
|
702,664
|
|
|
RealPage, Inc. Tranche B 1LN, term loan 3 month U.S. LIBOR + 3.250% 4.6661% 4/22/28 (b)(c)(d)
|
731,325
|
674,340
|
|
|
Red Planet Borrower LLC Tranche B 1LN, term loan 1 month U.S. LIBOR + 3.750% 5.4161% 9/30/28 (b)(c)(d)
|
287,551
|
251,247
|
|
|
Renaissance Holdings Corp.:
|
|||
|
Tranche B 1LN, term loan 3 month U.S. LIBOR + 3.250% 4.9161% 5/31/25 (b)(c)(d)
|
490,132
|
462,969
|
|
|
Tranche B 2LN, term loan 3 month U.S. LIBOR + 7.000% 8.6661% 5/31/26 (b)(c)(d)
|
115,000
|
106,375
|
|
|
Seattle Spinco, Inc.:
|
|||
|
Tranche B 1LN, term loan U.S. Secured Overnight Fin. Rate (SOFR) Indx + 4.000% 5.6091% 3/1/27 (b)(c)(d)(e)
|
1,561,088
|
1,416,687
|
|
|
Tranche B 3LN, term loan 3 month U.S. LIBOR + 2.750% 4.4161% 6/21/24 (b)(c)(d)(e)
|
965,757
|
915,055
|
|
|
Sophia LP Tranche B 1LN, term loan 1 month U.S. LIBOR + 3.250% 5.5004% 10/7/27 (b)(c)(d)
|
571,333
|
531,699
|
|
|
SS&C Technologies, Inc.:
|
|||
|
Tranche B 3LN, term loan 3 month U.S. LIBOR + 1.750% 3.4161% 4/16/25 (b)(c)(d)
|
241,650
|
229,116
|
|
|
Tranche B 4LN, term loan 3 month U.S. LIBOR + 1.750% 3.4161% 4/16/25 (b)(c)(d)
|
196,169
|
185,993
|
|
|
Tranche B 5LN, term loan 3 month U.S. LIBOR + 1.750% 3.4161% 4/16/25 (b)(c)(d)
|
848,435
|
804,427
|
|
|
STG-Fairway Holdings LLC Tranche B 1LN, term loan 3 month U.S. LIBOR + 2.750% 4.4161% 1/31/27 (b)(c)(d)
|
180,416
|
172,683
|
|
|
Sybil Software LLC. Tranche B 1LN, term loan 3 month U.S. LIBOR + 1.750% 4.0004% 3/22/28 (b)(c)(d)
|
138,405
|
135,088
|
|
|
Tempo Acquisition LLC:
|
|||
|
1LN, term loan 1 month U.S. LIBOR + 3.000% 4.5253% 8/31/28 (b)(c)(d)
|
897,295
|
849,066
|
|
|
Tranche B, term loan 3 month U.S. LIBOR + 2.750% 4.4161% 5/1/24 (b)(c)(d)
|
38,336
|
37,713
|
|
|
TTM Technologies, Inc. Tranche B, term loan 3 month U.S. LIBOR + 2.500% 3.5617% 9/28/24 (b)(c)(d)
|
318,685
|
313,408
|
|
|
UKG, Inc. 1LN, term loan 3 month U.S. LIBOR + 3.750% 5.4161% 5/4/26 (b)(c)(d)
|
797,450
|
751,700
|
|
|
Ultimate Software Group, Inc.:
|
|||
|
1LN, term loan 1 month U.S. LIBOR + 3.250% 4.2116% 5/3/26 (b)(c)(d)
|
1,413,316
|
1,320,574
|
|
|
2LN, term loan 1 month U.S. LIBOR + 5.250% 6.2116% 5/3/27 (b)(c)(d)
|
600,000
|
552,000
|
|
|
Ust Global, Inc. Tranche B 1LN, term loan 1 month U.S. LIBOR + 3.750% 5.3916% 11/19/28 (b)(c)(d)
|
228,850
|
216,549
|
|
|
Verscend Holding Corp. Tranche B 1LN, term loan 3 month U.S. LIBOR + 4.000% 5.6661% 8/27/25 (b)(c)(d)
|
123,739
|
118,171
|
|
|
VFH Parent LLC Tranche B 1LN, term loan 3 month U.S. LIBOR + 3.000% 4.4338% 1/13/29 (b)(c)(d)
|
365,000
|
345,078
|
|
|
Virgin Pulse, Inc.:
|
|||
|
2LN, term loan 3 month U.S. LIBOR + 7.250% 8.9161% 4/6/29 (b)(c)(d)
|
115,000
|
97,750
|
|
|
Tranche B 1LN, term loan 3 month U.S. LIBOR + 4.000% 5.6661% 4/6/28 (b)(c)(d)
|
276,221
|
234,442
|
|
|
VM Consolidated, Inc. Tranche B 1LN, term loan 3 month U.S. LIBOR + 3.250% 6.1253% 3/27/28 (b)(c)(d)
|
489,004
|
463,028
|
|
|
VS Buyer LLC Tranche B 1LN, term loan 3 month U.S. LIBOR + 3.000% 4.6661% 2/28/27 (b)(c)(d)
|
254,150
|
238,583
|
|
|
Weber-Stephen Products LLC Tranche B 1LN, term loan:
|
|||
|
3 month U.S. LIBOR + 3.250% 4.9161% 10/30/27 (b)(c)(d)
|
206,275
|
186,679
|
|
|
3 month U.S. LIBOR + 4.250% 5.8753% 10/30/27 (b)(c)(d)(e)
|
119,700
|
112,518
|
|
|
WEX, Inc. Tranche B 1LN, term loan 3 month U.S. LIBOR + 2.250% 3.9161% 4/1/28 (b)(c)(d)
|
167,875
|
161,056
|
|
|
Zelis Payments Buyer, Inc. Tranche B 1LN, term loan 3 month U.S. LIBOR + 3.500% 4.5617% 9/30/26 (b)(c)(d)
|
541,775
|
508,932
|
|
|
TOTAL TECHNOLOGY
|
42,932,439
|
||
|
Telecommunications - 4.4%
|
|||
|
Altice Financing SA Tranche B, term loan 3 month U.S. LIBOR + 2.750% 3.7943% 7/15/25 (b)(c)(d)
|
475,298
|
428,362
|
|
|
Cablevision Lightpath LLC Tranche B 1LN, term loan 3 month U.S. LIBOR + 3.250% 4.574% 11/30/27 (b)(c)(d)
|
127,468
|
119,900
|
|
|
Connect U.S. Finco LLC Tranche B 1LN, term loan 3 month U.S. LIBOR + 3.500% 5.17% 12/12/26 (b)(c)(d)
|
244,375
|
224,214
|
|
|
Consolidated Communications, Inc. Tranche B 1LN, term loan 3 month U.S. LIBOR + 3.500% 5.1875% 10/2/27 (b)(c)(d)
|
318,651
|
280,945
|
|
|
Crown Subsea Communications Holding, Inc. Tranche B 1LN, term loan 1 month U.S. LIBOR + 4.750% 5.8117% 4/27/27 (b)(c)(d)
|
140,240
|
133,228
|
|
|
Frontier Communications Holdings LLC Tranche B 1LN, term loan 3 month U.S. LIBOR + 3.750% 6.0625% 5/1/28 (b)(c)(d)
|
893,885
|
834,442
|
|
|
GTT Communications, Inc. Tranche B, term loan 3 month U.S. LIBOR + 4.750% 8.5% 5/31/25 (b)(c)(d)
|
365,944
|
285,791
|
|
|
Intelsat Jackson Holdings SA 1LN, term loan U.S. Secured Overnight Fin. Rate (SOFR) Indx + 4.250% 4.9195% 2/1/29 (b)(c)(d)
|
2,955,441
|
2,703,697
|
|
|
Level 3 Financing, Inc. Tranche B 1LN, term loan 3 month U.S. LIBOR + 1.750% 3.4161% 3/1/27 (b)(c)(d)
|
317,652
|
293,564
|
|
|
Lumen Technologies, Inc. Tranche B 1LN, term loan 3 month U.S. LIBOR + 2.250% 3.9161% 3/15/27 (b)(c)(d)
|
699,483
|
641,993
|
|
|
Northwest Fiber LLC Tranche B 1LN, term loan 3 month U.S. LIBOR + 3.750% 5.2593% 4/30/27 (b)(c)(d)
|
637,872
|
566,111
|
|
|
Radiate Holdco LLC Tranche B 1LN, term loan 1 month U.S. LIBOR + 3.250% 4.9161% 9/25/26 (b)(c)(d)
|
1,108,851
|
1,028,460
|
|
|
SBA Senior Finance II, LLC Tranche B, term loan 3 month U.S. LIBOR + 1.750% 3.42% 4/11/25 (b)(c)(d)
|
454,870
|
437,499
|
|
|
Securus Technologies Holdings Tranche B, term loan:
|
|||
|
3 month U.S. LIBOR + 4.500% 6.7504% 11/1/24 (b)(c)(d)
|
480,740
|
435,974
|
|
|
3 month U.S. LIBOR + 8.250% 9.4889% 11/1/25 (b)(c)(d)
|
685,000
|
627,207
|
|
|
Windstream Services LLC Tranche B 1LN, term loan 3 month U.S. LIBOR + 6.250% 7.9161% 9/21/27 (b)(c)(d)
|
492,696
|
458,946
|
|
|
Zayo Group Holdings, Inc. 1LN, term loan:
|
|||
|
3 month U.S. LIBOR + 3.000% 4.6661% 3/9/27 (b)(c)(d)
|
1,183,133
|
1,087,429
|
|
|
CME TERM SOFR 1 MONTH INDEX + 4.250% 5.7753% 3/9/27 (b)(c)(d)
|
588,525
|
547,817
|
|
|
TOTAL TELECOMMUNICATIONS
|
11,135,579
|
||
|
Textiles/Apparel - 1.3%
|
|||
|
Birkenstock GmbH & Co. KG Tranche B 1LN, term loan 3 month U.S. LIBOR + 3.250% 5.0981% 4/28/28 (b)(c)(d)
|
400,950
|
366,035
|
|
|
Byju's Alpha, Inc. Tranche B 1LN, term loan 1 month U.S. LIBOR + 5.500% 7.0064% 11/24/26 (b)(c)(d)
|
547,250
|
461,058
|
|
|
Crocs, Inc. Tranche B1 LN, term loan U.S. Secured Overnight Fin. Rate (SOFR) Indx + 3.500% 4.4495% 2/17/29 (b)(c)(d)
|
1,695,750
|
1,539,961
|
|
|
Jo-Ann Stores LLC Tranche B 1LN, term loan 1 month U.S. LIBOR + 4.750% 5.9637% 7/7/28 (b)(c)(d)
|
233,387
|
162,204
|
|
|
Samsonite IP Holdings SARL Tranche B2 1LN, term loan 3 month U.S. LIBOR + 3.000% 4.6661% 4/25/25 (b)(c)(d)
|
140,225
|
136,048
|
|
|
Tory Burch LLC Tranche B 1LN, term loan 3 month U.S. LIBOR + 3.000% 4.6661% 4/14/28 (b)(c)(d)
|
406,835
|
363,483
|
|
|
Victoria's Secret & Co. Tranche B 1LN, term loan 1 month U.S. LIBOR + 3.250% 4.536% 8/2/28 (b)(c)(d)
|
288,299
|
274,605
|
|
|
TOTAL TEXTILES/APPAREL
|
3,303,394
|
||
|
Transportation Ex Air/Rail - 0.1%
|
|||
|
ASP LS Acquisition Corp. 2LN, term loan 1 month U.S. LIBOR + 7.500% 10.3769% 5/7/29 (b)(c)(d)(e)
|
230,000
|
223,100
|
|
|
Utilities - 1.9%
|
|||
|
Brookfield WEC Holdings, Inc.:
|
|||
|
1LN, term loan CME TERM SOFR 1 MONTH INDEX + 3.750% 5.7474% 8/1/25 (b)(c)(d)
|
165,000
|
158,283
|
|
|
Tranche B 1LN, term loan 3 month U.S. LIBOR + 2.750% 4.4161% 8/1/25 (b)(c)(d)
|
1,226,327
|
1,156,930
|
|
|
ExGen Renewables IV, LLC Tranche B 1LN, term loan 3 month U.S. LIBOR + 2.500% 4.08% 12/15/27 (b)(c)(d)
|
170,658
|
164,173
|
|
|
Granite Generation LLC 1LN, term loan 3 month U.S. LIBOR + 3.750% 5.51% 11/1/26 (b)(c)(d)
|
337,286
|
309,038
|
|
|
Limetree Bay Terminals LLC Tranche B 1LN, term loan 3 month U.S. LIBOR + 4.000% 7.0544% 2/15/24 (b)(c)(d)
|
216,177
|
143,650
|
|
|
Luxembourg Investment Co. 428 SARL Tranche B 1LN, term loan 1 month U.S. LIBOR + 5.000% 7.0544% 1/3/29 (b)(c)(d)
|
345,000
|
322,575
|
|
|
Osmose Utilities Services, Inc. Tranche B 1LN, term loan 1 month U.S. LIBOR + 3.250% 4.9161% 6/17/28 (b)(c)(d)
|
327,525
|
290,885
|
|
|
PG&E Corp. Tranche B 1LN, term loan 3 month U.S. LIBOR + 3.000% 4.6875% 6/23/25 (b)(c)(d)
|
612,500
|
576,056
|
|
|
Pike Corp. Tranche B 1LN, term loan 3 month U.S. LIBOR + 3.000% 4.67% 1/21/28 (b)(c)(d)
|
239,726
|
227,390
|
|
|
Vertiv Group Corp. Tranche B 1LN, term loan 3 month U.S. LIBOR + 2.750% 3.8699% 3/2/27 (b)(c)(d)
|
847,013
|
785,604
|
|
|
Vistra Operations Co. LLC Tranche B 3LN, term loan 3 month U.S. LIBOR + 1.750% 3.3879% 12/31/25 (b)(c)(d)
|
644,964
|
616,412
|
|
|
TOTAL UTILITIES
|
4,750,996
|
||
|
TOTAL BANK LOAN OBLIGATIONS
(Cost $247,737,110)
|
229,393,044
|
||
|
Nonconvertible Bonds - 2.8%
|
|||
|
Principal
Amount (a)
|
Value ($)
|
||
|
Aerospace - 0.2%
|
|||
|
TransDigm, Inc.:
|
|||
|
6.25% 3/15/26 (h)
|
500,000
|
481,875
|
|
|
8% 12/15/25 (h)
|
40,000
|
40,450
|
|
|
TOTAL AEROSPACE
|
522,325
|
||
|
Air Transportation - 0.1%
|
|||
|
American Airlines, Inc. / AAdvantage Loyalty IP Ltd. 5.5% 4/20/26 (h)
|
105,000
|
96,472
|
|
|
Delta Air Lines, Inc. / SkyMiles IP Ltd. 4.5% 10/20/25 (h)
|
70,000
|
68,016
|
|
|
TOTAL AIR TRANSPORTATION
|
164,488
|
||
|
Automotive & Auto Parts - 0.6%
|
|||
|
Rivian Holdco & Rivian LLC & Rivian Automotive LLC 6 month U.S. LIBOR + 5.620% 7.1766% 10/15/26 (b)(c)(h)
|
1,715,000
|
1,533,210
|
|
|
Broadcasting - 0.0%
|
|||
|
Univision Communications, Inc. 6.625% 6/1/27 (h)
|
105,000
|
99,972
|
|
|
Cable/Satellite TV - 0.1%
|
|||
|
Charter Communications Operating LLC/Charter Communications Operating Capital Corp. 3 month U.S. LIBOR + 1.650% 2.936% 2/1/24 (b)(c)
|
250,000
|
251,929
|
|
|
Chemicals - 0.0%
|
|||
|
Kronos Acquisition Holdings, Inc. / KIK Custom Products, Inc. 5% 12/31/26 (h)
|
5,000
|
4,275
|
|
|
Containers - 0.2%
|
|||
|
Ardagh Packaging Finance PLC/Ardagh MP Holdings U.S.A., Inc. 4.125% 8/15/26 (h)
|
260,000
|
220,314
|
|
|
Trivium Packaging Finance BV 5.5% 8/15/26 (h)
|
150,000
|
141,101
|
|
|
TOTAL CONTAINERS
|
361,415
|
||
|
Diversified Financial Services - 0.0%
|
|||
|
Park Aerospace Holdings Ltd. 5.25% 8/15/22 (h)
|
7,000
|
7,000
|
|
|
Energy - 0.1%
|
|||
|
Citgo Petroleum Corp. 7% 6/15/25 (h)
|
95,000
|
91,913
|
|
|
New Fortress Energy, Inc. 6.75% 9/15/25 (h)
|
45,000
|
42,525
|
|
|
PBF Holding Co. LLC/PBF Finance Corp. 9.25% 5/15/25 (h)
|
105,000
|
109,988
|
|
|
TOTAL ENERGY
|
244,426
|
||
|
Gaming - 0.4%
|
|||
|
Affinity Gaming LLC 6.875% 12/15/27 (h)
|
150,000
|
126,006
|
|
|
Fertitta Entertainment LLC / Fertitta Entertainment Finance Co., Inc. 4.625% 1/15/29 (h)
|
795,000
|
677,738
|
|
|
Golden Entertainment, Inc. 7.625% 4/15/26 (h)
|
145,000
|
143,550
|
|
|
VICI Properties LP / VICI Note Co.:
|
|||
|
3.5% 2/15/25 (h)
|
30,000
|
28,063
|
|
|
4.25% 12/1/26 (h)
|
45,000
|
41,099
|
|
|
4.625% 12/1/29 (h)
|
25,000
|
22,349
|
|
|
TOTAL GAMING
|
1,038,805
|
||
|
Healthcare - 0.1%
|
|||
|
Tenet Healthcare Corp. 4.625% 7/15/24
|
155,000
|
148,758
|
|
|
Hotels - 0.0%
|
|||
|
Marriott Ownership Resorts, Inc. 6.125% 9/15/25 (h)
|
86,000
|
85,106
|
|
|
Leisure - 0.1%
|
|||
|
Royal Caribbean Cruises Ltd.:
|
|||
|
9.125% 6/15/23 (h)
|
25,000
|
24,690
|
|
|
10.875% 6/1/23 (h)
|
120,000
|
120,024
|
|
|
TOTAL LEISURE
|
144,714
|
||
|
Paper - 0.0%
|
|||
|
Ardagh Metal Packaging Finance U.S.A. LLC/Ardagh Metal Packaging Finance PLC 3.25% 9/1/28 (h)
|
80,000
|
68,285
|
|
|
Restaurants - 0.0%
|
|||
|
CEC Entertainment LLC 6.75% 5/1/26 (h)
|
95,000
|
83,655
|
|
|
Services - 0.2%
|
|||
|
Adtalem Global Education, Inc. 5.5% 3/1/28 (h)
|
97,000
|
86,573
|
|
|
Aramark Services, Inc. 6.375% 5/1/25 (h)
|
60,000
|
58,701
|
|
|
GEMS MENASA Cayman Ltd. 7.125% 7/31/26 (h)
|
115,000
|
107,906
|
|
|
PowerTeam Services LLC 9.033% 12/4/25 (h)
|
390,000
|
314,262
|
|
|
TOTAL SERVICES
|
567,442
|
||
|
Super Retail - 0.2%
|
|||
|
EG Global Finance PLC:
|
|||
|
6.75% 2/7/25 (h)
|
125,000
|
117,861
|
|
|
8.5% 10/30/25 (h)
|
250,000
|
242,188
|
|
|
TOTAL SUPER RETAIL
|
360,049
|
||
|
Technology - 0.1%
|
|||
|
CommScope, Inc. 6% 3/1/26 (h)
|
125,000
|
115,129
|
|
|
Maxar Technologies, Inc. 7.75% 6/15/27 (h)
|
155,000
|
153,531
|
|
|
TOTAL TECHNOLOGY
|
268,660
|
||
|
Telecommunications - 0.4%
|
|||
|
Altice Financing SA 5.75% 8/15/29 (h)
|
225,000
|
180,563
|
|
|
Altice France SA:
|
|||
|
5.125% 1/15/29 (h)
|
110,000
|
83,337
|
|
|
5.5% 1/15/28 (h)
|
95,000
|
75,288
|
|
|
Frontier Communications Holdings LLC 5% 5/1/28 (h)
|
100,000
|
85,000
|
|
|
Intelsat Jackson Holdings SA 6.5% 3/15/30 (h)
|
465,000
|
383,625
|
|
|
Northwest Fiber LLC/Northwest Fiber Finance Sub, Inc. 4.75% 4/30/27 (h)
|
15,000
|
12,353
|
|
|
Windstream Escrow LLC 7.75% 8/15/28 (h)
|
250,000
|
201,250
|
|
|
TOTAL TELECOMMUNICATIONS
|
1,021,416
|
||
|
TOTAL NONCONVERTIBLE BONDS
(Cost $7,737,895)
|
6,975,930
|
||
|
Common Stocks - 1.1%
|
|||
|
Shares
|
Value ($)
|
||
|
Capital Goods - 0.0%
|
|||
|
TNT Crane & Rigging LLC (e)(i)
|
5,338
|
42,384
|
|
|
TNT Crane & Rigging LLC warrants 10/31/25 (e)(i)
|
1,797
|
1,024
|
|
|
TOTAL CAPITAL GOODS
|
43,408
|
||
|
Diversified Financial Services - 0.1%
|
|||
|
ACNR Holdings, Inc. (e)(i)
|
1,374
|
100,302
|
|
|
Lime Tree Bay Ltd. (e)
|
38
|
1,282
|
|
|
TOTAL DIVERSIFIED FINANCIAL SERVICES
|
101,584
|
||
|
Energy - 0.9%
|
|||
|
California Resources Corp.
|
19,196
|
739,046
|
|
|
California Resources Corp. warrants 10/27/24 (i)
|
885
|
9,089
|
|
|
Chesapeake Energy Corp. (j)
|
14,325
|
1,161,758
|
|
|
Chesapeake Energy Corp. (i)(k)
|
103
|
8,353
|
|
|
Denbury, Inc. (i)
|
5,885
|
353,041
|
|
|
TOTAL ENERGY
|
2,271,287
|
||
|
Entertainment/Film - 0.0%
|
|||
|
Cineworld Group PLC warrants 11/23/25 (i)
|
22,063
|
385
|
|
|
Restaurants - 0.1%
|
|||
|
CEC Entertainment, Inc. (e)(i)
|
15,069
|
278,777
|
|
|
Super Retail - 0.0%
|
|||
|
David's Bridal, Inc. rights (e)(i)
|
347
|
0
|
|
|
Telecommunications - 0.0%
|
|||
|
GTT Communications, Inc. rights (e)(i)
|
8,983
|
8,983
|
|
|
TOTAL COMMON STOCKS
(Cost $1,178,660)
|
2,704,424
|
||
|
Nonconvertible Preferred Stocks - 0.1%
|
|||
|
Shares
|
Value ($)
|
||
|
Diversified Financial Services - 0.1%
|
|||
|
ACNR Holdings, Inc. (e)(i)
(Cost $98,250)
|
786
|
344,268
|
|
|
Preferred Securities - 0.1%
|
|||
|
Principal
Amount (a)
|
Value ($)
|
||
|
Banks & Thrifts - 0.1%
|
|||
|
JPMorgan Chase & Co.:
|
|||
|
3 month U.S. LIBOR + 3.320% 4.2869% (b)(c)(l)
|
80,000
|
75,667
|
|
|
3 month U.S. LIBOR + 3.470% 4.7089% (b)(c)(l)
|
80,000
|
76,499
|
|
|
TOTAL PREFERRED SECURITIES
(Cost $146,934)
|
152,166
|
||
|
Other - 0.3%
|
|||
|
Shares
|
Value ($)
|
||
|
Other - 0.3%
|
|||
|
Fidelity Direct Lending Fund, LP (k)(m)
(Cost $710,442)
|
706,941
|
||
|
Money Market Funds - 7.2%
|
|||
|
Shares
|
Value ($)
|
||
|
Fidelity Cash Central Fund 1.58% (n)
|
16,997,165
|
17,000,565
|
|
|
Fidelity Securities Lending Cash Central Fund 1.58% (n)(o)
|
1,270,081
|
1,270,208
|
|
|
TOTAL MONEY MARKET FUNDS
(Cost $18,270,773)
|
18,270,773
|
||
|
TOTAL INVESTMENT IN SECURITIES - 102.7%
(Cost $275,880,064)
|
258,547,546
|
|
NET OTHER ASSETS (LIABILITIES) - (2.7)%
|
(6,830,622)
|
|
NET ASSETS - 100.0%
|
251,716,924
|
|
(a)
|
Amount is stated in United States dollars unless otherwise noted.
|
|
(b)
|
Coupon rates for floating and adjustable rate securities reflect the rates in effect at period end.
|
|
(c)
|
Coupon is indexed to a floating interest rate which may be multiplied by a specified factor and/or subject to caps or floors.
|
|
(d)
|
Remaining maturities of bank loan obligations may be less than the stated maturities shown as a result of contractual or optional prepayments by the borrower. Such prepayments cannot be predicted with certainty.
|
|
(e)
|
Level 3 security
|
|
(f)
|
Position or a portion of the position represents an unfunded loan commitment. At period end, the total principal amount and market value of unfunded commitments totaled $652,328 and $603,344, respectively.
|
|
(g)
|
The coupon rate will be determined upon settlement of the loan after period end.
|
|
(h)
|
Security exempt from registration under Rule 144A of the Securities Act of 1933. These securities may be resold in transactions exempt from registration, normally to qualified institutional buyers. At the end of the period, the value of these securities amounted to $6,575,243 or 2.6% of net assets.
|
|
(i)
|
Non-income producing
|
|
(j)
|
Security or a portion of the security is on loan at period end.
|
|
(k)
|
Restricted securities (including private placements) - Investment in securities not registered under the Securities Act of 1933 (excluding 144A issues). At the end of the period, the value of restricted securities (excluding 144A issues) amounted to $715,294 or 0.3% of net assets.
|
|
(l)
|
Security is perpetual in nature with no stated maturity date.
|
|
(m)
|
Affiliated Fund
|
|
(n)
|
Affiliated fund that is generally available only to investment companies and other accounts managed by Fidelity Investments. The rate quoted is the annualized seven-day yield of the fund at period end. A complete unaudited listing of the fund's holdings as of its most recent quarter end is available upon request. In addition, each Fidelity Central Fund's financial statements are available on the SEC's website or upon request.
|
|
(o)
|
Investment made with cash collateral received from securities on loan.
|
|
Additional information on each restricted holding is as follows:
|
||
|
Security
|
Acquisition Date
|
Acquisition Cost ($)
|
|
Chesapeake Energy Corp.
|
2/10/21
|
975
|
|
Fidelity Direct Lending Fund, LP
|
12/09/21 - 6/30/22
|
710,444
|
|
Affiliate
|
Value,
beginning
of period ($)
|
Purchases ($)
|
Sales
Proceeds ($)
|
Dividend
Income ($)
|
Realized
Gain (loss) ($)
|
Change in
Unrealized
appreciation
(depreciation) ($)
|
Value,
end
of period ($)
|
%ownership,
end
of period
|
|
Fidelity Cash Central Fund 1.58%
|
25,933,391
|
50,566,139
|
59,498,965
|
50,078
|
-
|
-
|
17,000,565
|
0.0%
|
|
Fidelity Securities Lending Cash Central Fund 1.58%
|
-
|
4,866,755
|
3,596,547
|
307
|
-
|
-
|
1,270,208
|
0.0%
|
|
Total
|
25,933,391
|
55,432,894
|
63,095,512
|
50,385
|
-
|
-
|
18,270,773
|
|
Affiliate
|
Value,
beginning
of period ($)
|
Purchases ($)
|
Sales
Proceeds ($)
|
Dividend
Income ($)
|
Realized
Gain (loss) ($)
|
Change in
Unrealized
appreciation
(depreciation) ($)
|
Value,
end
of period ($)
|
|
Fidelity Direct Lending Fund, LP
|
286,775
|
423,667
|
-
|
17,329
|
-
|
(3,501)
|
706,941
|
|
286,775
|
423,667
|
-
|
17,329
|
-
|
(3,501)
|
706,941
|
|
Valuation Inputs at Reporting Date:
|
||||
|
Description
|
Total ($)
|
Level 1 ($)
|
Level 2 ($)
|
Level 3 ($)
|
|
Investments in Securities:
|
||||
|
Equities:
|
||||
|
Communication Services
|
385
|
-
|
385
|
-
|
|
Consumer Discretionary
|
278,777
|
-
|
-
|
278,777
|
|
Energy
|
2,271,287
|
2,271,287
|
-
|
-
|
|
Financials
|
445,852
|
-
|
-
|
445,852
|
|
Industrials
|
43,408
|
-
|
-
|
43,408
|
|
Information Technology
|
8,983
|
-
|
-
|
8,983
|
|
Bank Loan Obligations
|
229,393,044
|
-
|
220,344,163
|
9,048,881
|
|
Corporate Bonds
|
6,975,930
|
-
|
6,975,930
|
-
|
|
Preferred Securities
|
152,166
|
-
|
152,166
|
-
|
|
Money Market Funds
|
18,270,773
|
18,270,773
|
-
|
-
|
|
Total Investments in Securities:
|
257,840,605
|
20,542,060
|
227,472,644
|
9,825,901
|
|
Investments in Securities:
|
|||
|
Bank Loan Obligations
|
|||
|
Beginning Balance
|
$
|
2,658,642
|
|
|
Net Realized Gain (Loss) on Investment Securities
|
6,725
|
||
|
Net Unrealized Gain (Loss) on Investment Securities
|
(561,809)
|
||
|
Cost of Purchases
|
2,957,046
|
||
|
Proceeds of Sales
|
(1,381,342)
|
||
|
Amortization/Accretion
|
4,647
|
||
|
Transfers into Level 3
|
5,922,661
|
||
|
Transfers out of Level 3
|
(557,689)
|
||
|
Ending Balance
|
$
|
9,048,881
|
|
|
The change in unrealized gain (loss) for the period attributable to Level 3 securities held at June 30, 2022
|
$
|
(559,145)
|
|
|
Other Investments in Securities
|
|||
|
Beginning Balance
|
$
|
2,378,786
|
|
|
Net Realized Gain (Loss) on Investment Securities
|
-
|
||
|
Net Unrealized Gain (Loss) on Investment Securities
|
148,482
|
||
|
Cost of Purchases
|
1,240
|
||
|
Proceeds of Sales
|
-
|
||
|
Amortization/Accretion
|
-
|
||
|
Transfers into Level 3
|
-
|
||
|
Transfers out of Level 3
|
(1,751,488)
|
||
|
Ending Balance
|
$
|
777,020
|
|
|
The change in unrealized gain (loss) for the period attributable to Level 3 securities held at June 30, 2022
|
$
|
148,482
|
|
|
Statement of Assets and Liabilities
|
||||
|
June 30, 2022
(Unaudited)
|
||||
|
Assets
|
||||
|
Investment in securities, at value (including securities loaned of $1,157,459) - See accompanying schedule:
|
$239,569,832
|
|||
|
Unaffiliated issuers (cost $256,898,849)
|
||||
|
Fidelity Central Funds (cost $18,270,773)
|
18,270,773
|
|||
|
Other affiliated issuers (cost $710,442)
|
706,941
|
|||
|
Total Investment in Securities (cost $275,880,064)
|
$
|
258,547,546
|
||
|
Cash
|
509,916
|
|||
|
Receivable for investments sold
|
2,131,615
|
|||
|
Dividends receivable
|
4,159
|
|||
|
Interest receivable
|
1,116,635
|
|||
|
Distributions receivable from Fidelity Central Funds
|
16,770
|
|||
|
Total assets
|
262,326,641
|
|||
|
Liabilities
|
||||
|
Payable for investments purchased
|
$8,876,242
|
|||
|
Payable for fund shares redeemed
|
261,237
|
|||
|
Accrued management fee
|
118,885
|
|||
|
Other affiliated payables
|
31,985
|
|||
|
Other payables and accrued expenses
|
51,160
|
|||
|
Collateral on securities loaned
|
1,270,208
|
|||
|
Total Liabilities
|
10,609,717
|
|||
|
Net Assets
|
$
|
251,716,924
|
||
|
Net Assets consist of:
|
||||
|
Paid in capital
|
$
|
281,124,805
|
||
|
Total accumulated earnings (loss)
|
(29,407,881)
|
|||
|
Net Assets
|
$
|
251,716,924
|
||
|
Net Asset Value and Maximum Offering Price
|
||||
|
Initial Class :
|
||||
|
Net Asset Value
, offering price and redemption price per share ($12,894,046 ÷ 1,375,702 shares)
|
$
|
9.37
|
||
|
Investor Class :
|
||||
|
Net Asset Value
, offering price and redemption price per share ($238,822,878 ÷ 25,501,369 shares)
|
$
|
9.37
|
||
|
Statement of Operations
|
||||
|
Six months ended
June 30, 2022
(Unaudited)
|
||||
|
Investment Income
|
||||
|
Dividends (including $17,329 earned from affiliated issuers)
|
$
|
82,998
|
||
|
Interest
|
5,453,306
|
|||
|
Income from Fidelity Central Funds (including $307 from security lending)
|
50,385
|
|||
|
Total Income
|
5,586,689
|
|||
|
Expenses
|
||||
|
Management fee
|
$
|
720,860
|
||
|
Transfer agent fees
|
132,219
|
|||
|
Accounting fees
|
64,360
|
|||
|
Custodian fees and expenses
|
33,289
|
|||
|
Independent trustees' fees and expenses
|
430
|
|||
|
Audit
|
35,733
|
|||
|
Legal
|
1,864
|
|||
|
Miscellaneous
|
397
|
|||
|
Total expenses before reductions
|
989,152
|
|||
|
Expense reductions
|
(2,095)
|
|||
|
Total expenses after reductions
|
987,057
|
|||
|
Net Investment income (loss)
|
4,599,632
|
|||
|
Realized and Unrealized Gain (Loss)
|
||||
|
Net realized gain (loss) on:
|
||||
|
Investment Securities:
|
||||
|
Unaffiliated issuers
|
(161,577)
|
|||
|
Total net realized gain (loss)
|
(161,577)
|
|||
|
Change in net unrealized appreciation (depreciation) on:
|
||||
|
Investment Securities:
|
||||
|
Unaffiliated issuers
|
(17,997,142)
|
|||
|
Affiliated issuers
|
(3,501)
|
|||
|
Total change in net unrealized appreciation (depreciation)
|
(18,000,643)
|
|||
|
Net gain (loss)
|
(18,162,220)
|
|||
|
Net increase (decrease) in net assets resulting from operations
|
$
|
(13,562,588)
|
||
|
Statement of Changes in Net Assets
|
||||
|
Six months ended
June 30, 2022
(Unaudited)
|
Year ended
December 31, 2021
|
|||
|
Increase (Decrease) in Net Assets
|
||||
|
Operations
|
||||
|
Net investment income (loss)
|
$
|
4,599,632
|
$
|
6,536,833
|
|
Net realized gain (loss)
|
(161,577)
|
(2,585,167)
|
||
|
Change in net unrealized appreciation (depreciation)
|
(18,000,643)
|
5,759,221
|
||
|
Net increase (decrease) in net assets resulting from operations
|
(13,562,588)
|
9,710,887
|
||
|
Distributions to shareholders
|
(1,149,072)
|
(5,835,875)
|
||
|
Share transactions - net increase (decrease)
|
22,623,428
|
71,311,989
|
||
|
Total increase (decrease) in net assets
|
7,911,768
|
75,187,001
|
||
|
Net Assets
|
||||
|
Beginning of period
|
243,805,156
|
168,618,155
|
||
|
End of period
|
$
|
251,716,924
|
$
|
243,805,156
|
|
Floating Rate High Income Portfolio Initial Class
|
|
Six months ended
(Unaudited) June 30, 2022
|
Years ended December 31, 2021
|
2020
|
2019
|
2018
|
2017
|
|||||||
|
Selected Per-Share Data
|
||||||||||||
|
Net asset value, beginning of period
|
$
|
9.90
|
$
|
9.66
|
$
|
9.85
|
$
|
9.55
|
$
|
9.93
|
$
|
9.86
|
|
Income from Investment Operations
|
||||||||||||
|
Net investment income (loss)
A,B
|
.172
|
.323
|
.376
|
.505
|
.438
|
.402
|
||||||
|
Net realized and unrealized gain (loss)
|
(.658)
|
.177
|
(.104)
|
.325
|
(.452)
|
(.027)
|
||||||
|
Total from investment operations
|
(.486)
|
.500
|
.272
|
.830
|
(.014)
|
.375
|
||||||
|
Distributions from net investment income
|
(.044)
|
(.260)
|
(.462)
|
(.530)
|
(.366)
|
(.305)
|
||||||
|
Total distributions
|
(.044)
|
(.260)
|
(.462)
|
(.530)
|
(.366)
|
(.305)
|
||||||
|
Net asset value, end of period
|
$
|
9.37
|
$
|
9.90
|
$
|
9.66
|
$
|
9.85
|
$
|
9.55
|
$
|
9.93
|
|
Total Return
C,D,E
|
(4.93)%
|
5.21%
|
2.82%
|
8.79%
|
(.16)%
|
3.81%
|
||||||
|
Ratios to Average Net Assets
B,F,G
|
||||||||||||
|
Expenses before reductions
|
.73%
H
|
.72%
|
.73%
|
.71%
|
.71%
|
.73%
|
||||||
|
Expenses net of fee waivers, if any
|
.72%
H
|
.72%
|
.73%
|
.71%
|
.71%
|
.73%
|
||||||
|
Expenses net of all reductions
|
.72%
H
|
.72%
|
.73%
|
.70%
|
.71%
|
.72%
|
||||||
|
Net investment income (loss)
|
3.56%
H
|
3.26%
|
3.95%
|
5.06%
|
4.37%
|
4.01%
|
||||||
|
Supplemental Data
|
||||||||||||
|
Net assets, end of period (000 omitted)
|
$
|
12,894
|
$
|
9,840
|
$
|
7,689
|
$
|
12,292
|
$
|
12,905
|
$
|
6,602
|
|
Portfolio turnover rate
I
|
25%
H
|
37%
|
40%
|
29%
|
45%
|
68%
|
|
Floating Rate High Income Portfolio Investor Class
|
|
Six months ended
(Unaudited) June 30, 2022
|
Years ended December 31, 2021
|
2020
|
2019
|
2018
|
2017
|
|||||||
|
Selected Per-Share Data
|
||||||||||||
|
Net asset value, beginning of period
|
$
|
9.89
|
$
|
9.66
|
$
|
9.85
|
$
|
9.54
|
$
|
9.93
|
$
|
9.86
|
|
Income from Investment Operations
|
||||||||||||
|
Net investment income (loss)
A,B
|
.170
|
.319
|
.373
|
.502
|
.434
|
.398
|
||||||
|
Net realized and unrealized gain (loss)
|
(.647)
|
.169
|
(.105)
|
.335
|
(.461)
|
(.025)
|
||||||
|
Total from investment operations
|
(.477)
|
.488
|
.268
|
.837
|
(.027)
|
.373
|
||||||
|
Distributions from net investment income
|
(.043)
|
(.258)
|
(.458)
|
(.527)
|
(.363)
|
(.303)
|
||||||
|
Total distributions
|
(.043)
|
(.258)
|
(.458)
|
(.527)
|
(.363)
|
(.303)
|
||||||
|
Net asset value, end of period
|
$
|
9.37
|
$
|
9.89
|
$
|
9.66
|
$
|
9.85
|
$
|
9.54
|
$
|
9.93
|
|
Total Return
C,D,E
|
(4.84)%
|
5.08%
|
2.78%
|
8.88%
|
(.30)%
|
3.79%
|
||||||
|
Ratios to Average Net Assets
B,F,G
|
||||||||||||
|
Expenses before reductions
|
.76%
H
|
.76%
|
.76%
|
.74%
|
.74%
|
.76%
|
||||||
|
Expenses net of fee waivers, if any
|
.76%
H
|
.76%
|
.76%
|
.74%
|
.74%
|
.76%
|
||||||
|
Expenses net of all reductions
|
.76%
H
|
.76%
|
.76%
|
.74%
|
.74%
|
.76%
|
||||||
|
Net investment income (loss)
|
3.52%
H
|
3.23%
|
3.91%
|
5.03%
|
4.33%
|
3.97%
|
||||||
|
Supplemental Data
|
||||||||||||
|
Net assets, end of period (000 omitted)
|
$
|
238,823
|
$
|
233,965
|
$
|
160,929
|
$
|
253,710
|
$
|
253,242
|
$
|
180,482
|
|
Portfolio turnover rate
I
|
25%
H
|
37%
|
40%
|
29%
|
45%
|
68%
|
|
Fidelity Central Fund
|
Investment Manager
|
Investment Objective
|
Investment Practices
|
Expense Ratio
A
|
|
Fidelity Money Market Central Funds
|
Fidelity Management & Research Company LLC (FMR)
|
Each fund seeks to obtain a high level of current income consistent with the preservation of capital and liquidity.
|
Short-term Investments
|
Less than .005%
|
|
Asset Type
|
Fair Value
|
Valuation Technique(s)
|
Unobservable Input
|
Amount or Range/Weighted Average
|
Impact to Valuation from an Increase in Input
A
|
|
Equities
|
$777,020
|
Recovery value
|
Recovery value
|
$0.00 - $1.00 / $1.00
|
Increase
|
|
Market comparable
|
Enterprise value/EBITDA multiple (EV/EBITDA)
|
6.8
|
Increase
|
||
|
Book value
|
Book value multiple
|
1.0
|
Increase
|
||
|
Indicative market price
|
Evaluated bid
|
$73.00 - $438.00 / $355.65
|
Increase
|
||
|
Mid price
|
$18.50
|
Increase
|
|||
|
Black scholes
|
Term
|
3.3
|
Increase
|
||
|
Volatility
|
52.5%
|
Increase
|
|||
|
Bank Loan Obligations
|
$9,048,881
|
Market approach
|
Transaction price
|
$99.50
|
Increase
|
|
Parity price
|
$96.00
|
Increase
|
|||
|
Indicative market price
|
Evaluated bid
|
$85.75 - $100.75 / $93.59
|
Increase
|
||
|
Gross unrealized appreciation
|
$2,701,187
|
|
Gross unrealized depreciation
|
(19,590,492)
|
|
Net unrealized appreciation (depreciation)
|
$(16,889,305)
|
|
Tax cost
|
$275,436,851
|
|
Short-term
|
$(3,171,387)
|
|
Long-term
|
(13,678,973)
|
|
Total capital loss carryforward
|
$(16,850,360)
|
|
Investment to be Acquired
|
Commitment Amount
|
|
|
VIP Floating Rate High Income Portfolio
|
Fidelity Direct Lending Fund, LP
|
$ 1,389,558
|
|
Purchases ($)
|
Sales ($)
|
|
|
VIP Floating Rate High Income Portfolio
|
66,080,508
|
30,850,812
|
|
Amount
|
% of Class-Level Average Net Assets
A
|
|
|
Initial Class
|
$4,221
|
.07
|
|
Investor Class
|
127,998
|
.10
|
|
$132,219
|
|
% of Average Net Assets
|
|
|
VIP Floating Rate High Income Portfolio
|
.05
|
|
Amount
|
|
|
VIP Floating Rate High Income Portfolio
|
$202
|
|
Total Security Lending Fees Paid to NFS
|
Security Lending Income From Securities Loaned to NFS
|
Value of Securities Loaned to NFS at Period End
|
|
|
VIP Floating Rate High Income Portfolio
|
$29
|
$-
|
$-
|
|
Six months ended
June 30, 2022
|
Year ended
December 31, 2021
|
|
|
VIP Floating Rate High Income Portfolio
|
||
|
Distributions to shareholders
|
||
|
Initial Class
|
$52,158
|
$234,771
|
|
Investor Class
|
1,096,914
|
5,601,104
|
|
Total
|
$1,149,072
|
$5,835,875
|
|
Shares
|
Shares
|
Dollars
|
Dollars
|
|
|
Six months ended June 30, 2022
|
Year ended December 31, 2021
|
Six months ended June 30, 2022
|
Year ended December 31, 2021
|
|
|
VIP Floating Rate High Income Portfolio
|
||||
|
Initial Class
|
||||
|
Shares sold
|
659,968
|
580,666
|
$6,472,948
|
$5,724,796
|
|
Reinvestment of distributions
|
5,285
|
23,903
|
52,158
|
234,771
|
|
Shares redeemed
|
(283,724)
|
(406,209)
|
(2,753,607)
|
(3,998,861)
|
|
Net increase (decrease)
|
381,529
|
198,360
|
$3,771,499
|
$1,960,706
|
|
Investor Class
|
||||
|
Shares sold
|
4,997,579
|
8,388,256
|
$49,327,055
|
$83,272,934
|
|
Reinvestment of distributions
|
111,215
|
570,003
|
1,096,576
|
5,599,077
|
|
Shares redeemed
|
(3,262,981)
|
(1,968,012)
|
(31,571,702)
|
(19,520,728)
|
|
Net increase (decrease)
|
1,845,813
|
6,990,247
|
$18,851,929
|
$69,351,283
|
|
Fund
|
Affiliated %
|
|
VIP Floating Rate High Income Portfolio
|
99%
|
|
The Example is based on an investment of $1,000 invested at the beginning of the period and held for the entire period (January 1, 2022 to June 30, 2022).
|
|
Annualized Expense Ratio-
A
|
Beginning Account Value January 1, 2022
|
Ending Account Value June 30, 2022
|
Expenses Paid During Period-
C
January 1, 2022 to June 30, 2022
|
|||||||
|
Floating Rate High Income Portfolio
|
||||||||||
|
Initial Class
|
.72%
|
|||||||||
|
Actual
|
$ 1,000
|
$ 950.70
|
$ 3.48
|
|||||||
|
Hypothetical-
B
|
$ 1,000
|
$ 1,021.22
|
$ 3.61
|
|||||||
|
Investor Class
|
.76%
|
|||||||||
|
Actual
|
$ 1,000
|
$ 951.60
|
$ 3.68
|
|||||||
|
Hypothetical-
B
|
$ 1,000
|
$ 1,021.03
|
$ 3.81
|
|||||||
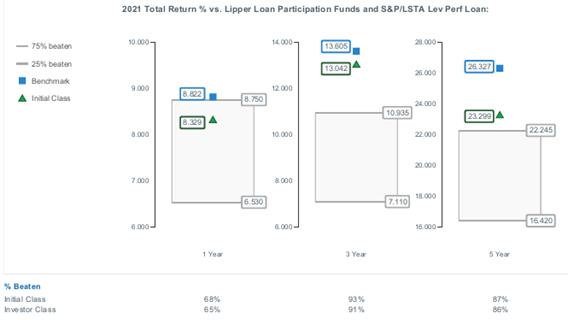
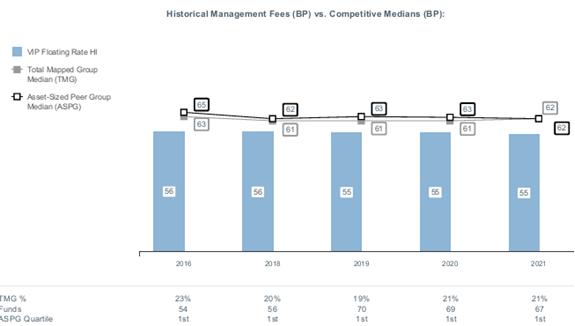
|
|


Contents
| Board Approval of Investment Advisory Contracts and Management Fees |
|
Top Holdings (% of Fund's net assets)
|
||
|
Exxon Mobil Corp.
|
3.1
|
|
|
JPMorgan Chase & Co.
|
2.8
|
|
|
Johnson & Johnson
|
2.3
|
|
|
Danaher Corp.
|
2.1
|
|
|
Bank of America Corp.
|
2.0
|
|
|
Bristol-Myers Squibb Co.
|
2.0
|
|
|
Walmart, Inc.
|
1.9
|
|
|
Linde PLC
|
1.7
|
|
|
Wells Fargo & Co.
|
1.6
|
|
|
Procter & Gamble Co.
|
1.6
|
|
|
21.1
|
||
|
Market Sectors (% of Fund's net assets)
|
||
|
Health Care
|
17.9
|
|
|
Financials
|
14.0
|
|
|
Consumer Staples
|
10.4
|
|
|
Communication Services
|
9.6
|
|
|
Energy
|
9.6
|
|
|
Information Technology
|
9.1
|
|
|
Industrials
|
7.1
|
|
|
Utilities
|
6.6
|
|
|
Materials
|
4.7
|
|
|
Consumer Discretionary
|
3.2
|
|
|
Real Estate
|
2.1
|
|
|
Asset Allocation (% of Fund's net assets)
|

|
|
Foreign investments - 18.1%
|
|
Geographic Diversification (% of Fund's net assets)
|

|
|
* Includes Short-Term investments and Net Other Assets (Liabilities).
Percentages are based on country or territory of incorporation and are adjusted for the effect of futures contracts, if applicable.
|
|
Common Stocks - 94.3%
|
|||
|
Shares
|
Value ($)
|
||
|
COMMUNICATION SERVICES - 9.6%
|
|||
|
Diversified Telecommunication Services - 2.2%
|
|||
|
AT&T, Inc.
|
2,463,570
|
51,636,427
|
|
|
Verizon Communications, Inc.
|
1,357,860
|
68,911,395
|
|
|
120,547,822
|
|||
|
Entertainment - 1.9%
|
|||
|
Activision Blizzard, Inc.
|
579,300
|
45,104,298
|
|
|
The Walt Disney Co. (a)
|
612,997
|
57,866,917
|
|
|
102,971,215
|
|||
|
Interactive Media & Services - 1.1%
|
|||
|
Alphabet, Inc. Class A (a)
|
27,288
|
59,467,647
|
|
|
Media - 2.5%
|
|||
|
Comcast Corp. Class A
|
2,176,833
|
85,418,927
|
|
|
Interpublic Group of Companies, Inc.
|
623,773
|
17,172,471
|
|
|
Shaw Communications, Inc. Class B
|
1,155,700
|
34,055,082
|
|
|
136,646,480
|
|||
|
Wireless Telecommunication Services - 1.9%
|
|||
|
Rogers Communications, Inc. Class B (non-vtg.)
|
395,300
|
18,941,970
|
|
|
T-Mobile U.S., Inc. (a)
|
641,318
|
86,282,924
|
|
|
105,224,894
|
|||
|
TOTAL COMMUNICATION SERVICES
|
524,858,058
|
||
|
CONSUMER DISCRETIONARY - 3.2%
|
|||
|
Hotels, Restaurants & Leisure - 1.3%
|
|||
|
McDonald's Corp.
|
284,780
|
70,306,486
|
|
|
Internet & Direct Marketing Retail - 0.2%
|
|||
|
eBay, Inc.
|
271,798
|
11,325,823
|
|
|
Multiline Retail - 0.9%
|
|||
|
Dollar Tree, Inc. (a)
|
104,100
|
16,223,985
|
|
|
Kohl's Corp.
|
427,200
|
15,246,768
|
|
|
Target Corp.
|
127,908
|
18,064,447
|
|
|
49,535,200
|
|||
|
Specialty Retail - 0.8%
|
|||
|
Best Buy Co., Inc. (b)
|
139,600
|
9,100,524
|
|
|
Burlington Stores, Inc. (a)
|
69,478
|
9,464,988
|
|
|
TJX Companies, Inc.
|
464,574
|
25,946,458
|
|
|
44,511,970
|
|||
|
TOTAL CONSUMER DISCRETIONARY
|
175,679,479
|
||
|
CONSUMER STAPLES - 10.4%
|
|||
|
Beverages - 3.1%
|
|||
|
Diageo PLC
|
615,400
|
26,580,799
|
|
|
Keurig Dr. Pepper, Inc.
|
1,702,700
|
60,258,553
|
|
|
The Coca-Cola Co.
|
1,339,946
|
84,296,003
|
|
|
171,135,355
|
|||
|
Food & Staples Retailing - 3.2%
|
|||
|
Albertsons Companies, Inc. (b)
|
631,700
|
16,879,024
|
|
|
BJ's Wholesale Club Holdings, Inc. (a)
|
453,005
|
28,231,272
|
|
|
Costco Wholesale Corp.
|
56,600
|
27,127,248
|
|
|
Walmart, Inc.
|
834,445
|
101,451,823
|
|
|
173,689,367
|
|||
|
Food Products - 1.4%
|
|||
|
Bunge Ltd.
|
168,500
|
15,281,265
|
|
|
Mondelez International, Inc.
|
719,971
|
44,702,999
|
|
|
Nestle SA (Reg. S)
|
121,377
|
14,185,665
|
|
|
74,169,929
|
|||
|
Household Products - 1.6%
|
|||
|
Procter & Gamble Co.
|
612,344
|
88,048,944
|
|
|
Personal Products - 0.2%
|
|||
|
Unilever PLC
|
247,400
|
11,276,443
|
|
|
Tobacco - 0.9%
|
|||
|
Philip Morris International, Inc.
|
525,100
|
51,848,374
|
|
|
TOTAL CONSUMER STAPLES
|
570,168,412
|
||
|
ENERGY - 9.6%
|
|||
|
Oil, Gas & Consumable Fuels - 9.6%
|
|||
|
Canadian Natural Resources Ltd.
|
771,500
|
41,457,936
|
|
|
ConocoPhillips Co.
|
629,104
|
56,499,830
|
|
|
Enterprise Products Partners LP
|
1,344,244
|
32,759,226
|
|
|
Exxon Mobil Corp.
|
1,971,566
|
168,844,909
|
|
|
Hess Corp.
|
285,900
|
30,288,246
|
|
|
Imperial Oil Ltd.
|
1,079,435
|
50,885,733
|
|
|
Phillips 66 Co.
|
465,600
|
38,174,544
|
|
|
Suncor Energy, Inc.
|
1,429,700
|
50,159,456
|
|
|
Thungela Resources Ltd.
|
50,370
|
713,711
|
|
|
Valero Energy Corp.
|
493,134
|
52,410,282
|
|
|
522,193,873
|
|||
|
FINANCIALS - 14.0%
|
|||
|
Banks - 9.1%
|
|||
|
Bank of America Corp.
|
3,553,309
|
110,614,509
|
|
|
Huntington Bancshares, Inc.
|
2,646,170
|
31,833,425
|
|
|
JPMorgan Chase & Co.
|
1,345,475
|
151,513,940
|
|
|
M&T Bank Corp.
|
356,967
|
56,896,970
|
|
|
PNC Financial Services Group, Inc.
|
353,900
|
55,834,803
|
|
|
Wells Fargo & Co.
|
2,249,901
|
88,128,622
|
|
|
494,822,269
|
|||
|
Capital Markets - 0.7%
|
|||
|
BlackRock, Inc. Class A
|
61,054
|
37,184,328
|
|
|
Consumer Finance - 1.0%
|
|||
|
Capital One Financial Corp.
|
540,416
|
56,305,943
|
|
|
Insurance - 3.2%
|
|||
|
American Financial Group, Inc.
|
256,100
|
35,549,241
|
|
|
Chubb Ltd.
|
317,482
|
62,410,612
|
|
|
Hartford Financial Services Group, Inc.
|
468,300
|
30,640,869
|
|
|
The Travelers Companies, Inc.
|
276,240
|
46,720,471
|
|
|
175,321,193
|
|||
|
TOTAL FINANCIALS
|
763,633,733
|
||
|
HEALTH CARE - 17.9%
|
|||
|
Biotechnology - 2.3%
|
|||
|
AbbVie, Inc.
|
368,339
|
56,414,801
|
|
|
Amgen, Inc.
|
295,975
|
72,010,718
|
|
|
128,425,519
|
|||
|
Health Care Providers & Services - 2.7%
|
|||
|
Cigna Corp.
|
234,809
|
61,876,868
|
|
|
UnitedHealth Group, Inc.
|
165,912
|
85,217,381
|
|
|
147,094,249
|
|||
|
Life Sciences Tools & Services - 2.1%
|
|||
|
Danaher Corp.
|
445,568
|
112,960,399
|
|
|
Pharmaceuticals - 10.8%
|
|||
|
AstraZeneca PLC (United Kingdom)
|
482,136
|
63,604,253
|
|
|
Bristol-Myers Squibb Co.
|
1,415,237
|
108,973,249
|
|
|
Eli Lilly & Co.
|
250,358
|
81,173,574
|
|
|
Johnson & Johnson
|
725,296
|
128,747,293
|
|
|
Merck & Co., Inc.
|
468,200
|
42,685,794
|
|
|
Roche Holding AG (participation certificate)
|
231,551
|
77,407,464
|
|
|
Royalty Pharma PLC
|
554,800
|
23,323,792
|
|
|
Sanofi SA
|
654,455
|
65,999,211
|
|
|
591,914,630
|
|||
|
TOTAL HEALTH CARE
|
980,394,797
|
||
|
INDUSTRIALS - 7.1%
|
|||
|
Aerospace & Defense - 2.6%
|
|||
|
Huntington Ingalls Industries, Inc.
|
102,800
|
22,391,896
|
|
|
Lockheed Martin Corp.
|
64,400
|
27,689,424
|
|
|
Northrop Grumman Corp.
|
98,901
|
47,331,052
|
|
|
The Boeing Co. (a)
|
318,900
|
43,600,008
|
|
|
141,012,380
|
|||
|
Air Freight & Logistics - 0.4%
|
|||
|
United Parcel Service, Inc. Class B
|
131,514
|
24,006,566
|
|
|
Building Products - 0.4%
|
|||
|
Johnson Controls International PLC
|
472,200
|
22,608,936
|
|
|
Electrical Equipment - 0.6%
|
|||
|
AMETEK, Inc.
|
305,552
|
33,577,109
|
|
|
Industrial Conglomerates - 1.2%
|
|||
|
General Electric Co.
|
653,720
|
41,622,352
|
|
|
Hitachi Ltd.
|
269,900
|
12,839,161
|
|
|
Siemens AG
|
122,329
|
12,574,993
|
|
|
67,036,506
|
|||
|
Machinery - 1.2%
|
|||
|
Crane Holdings Co.
|
186,400
|
16,321,184
|
|
|
Fortive Corp.
|
359,116
|
19,528,728
|
|
|
ITT, Inc.
|
372,852
|
25,070,568
|
|
|
Nordson Corp.
|
14,324
|
2,899,751
|
|
|
63,820,231
|
|||
|
Professional Services - 0.2%
|
|||
|
Clarivate Analytics PLC (a)(b)
|
653,900
|
9,063,054
|
|
|
Trading Companies & Distributors - 0.3%
|
|||
|
Watsco, Inc.
|
66,758
|
15,943,146
|
|
|
Transportation Infrastructure - 0.2%
|
|||
|
Aena SME SA (a)(c)
|
83,700
|
10,680,204
|
|
|
TOTAL INDUSTRIALS
|
387,748,132
|
||
|
INFORMATION TECHNOLOGY - 9.1%
|
|||
|
Communications Equipment - 1.3%
|
|||
|
Cisco Systems, Inc.
|
1,662,054
|
70,869,983
|
|
|
IT Services - 1.6%
|
|||
|
Accenture PLC Class A
|
94,800
|
26,321,220
|
|
|
Amdocs Ltd.
|
355,933
|
29,652,778
|
|
|
Genpact Ltd.
|
441,500
|
18,701,940
|
|
|
Visa, Inc. Class A
|
64,242
|
12,648,607
|
|
|
87,324,545
|
|||
|
Semiconductors & Semiconductor Equipment - 1.8%
|
|||
|
NXP Semiconductors NV
|
329,500
|
48,775,885
|
|
|
Taiwan Semiconductor Manufacturing Co. Ltd. sponsored ADR
|
633,291
|
51,771,539
|
|
|
100,547,424
|
|||
|
Software - 3.2%
|
|||
|
Microsoft Corp.
|
273,250
|
70,178,798
|
|
|
NortonLifeLock, Inc.
|
661,800
|
14,533,128
|
|
|
Open Text Corp.
|
900,300
|
34,055,009
|
|
|
Roper Technologies, Inc.
|
134,894
|
53,235,917
|
|
|
172,002,852
|
|||
|
Technology Hardware, Storage & Peripherals - 1.2%
|
|||
|
Apple, Inc.
|
87,429
|
11,953,293
|
|
|
Samsung Electronics Co. Ltd.
|
1,082,546
|
47,872,394
|
|
|
Seagate Technology Holdings PLC
|
96,000
|
6,858,240
|
|
|
66,683,927
|
|||
|
TOTAL INFORMATION TECHNOLOGY
|
497,428,731
|
||
|
MATERIALS - 4.7%
|
|||
|
Chemicals - 2.0%
|
|||
|
Linde PLC
|
321,489
|
92,437,732
|
|
|
Nutrien Ltd. (b)
|
233,300
|
18,579,539
|
|
|
111,017,271
|
|||
|
Containers & Packaging - 1.7%
|
|||
|
Ball Corp.
|
476,900
|
32,796,413
|
|
|
Crown Holdings, Inc.
|
576,259
|
53,113,792
|
|
|
Packaging Corp. of America
|
63,775
|
8,769,063
|
|
|
94,679,268
|
|||
|
Metals & Mining - 1.0%
|
|||
|
Anglo American PLC (United Kingdom)
|
486,300
|
17,384,529
|
|
|
Freeport-McMoRan, Inc.
|
991,100
|
28,999,586
|
|
|
Lundin Mining Corp.
|
814,200
|
5,161,492
|
|
|
51,545,607
|
|||
|
TOTAL MATERIALS
|
257,242,146
|
||
|
REAL ESTATE - 2.1%
|
|||
|
Equity Real Estate Investment Trusts (REITs) - 2.1%
|
|||
|
American Tower Corp.
|
175,973
|
44,976,939
|
|
|
Lamar Advertising Co. Class A
|
383,008
|
33,693,214
|
|
|
Public Storage
|
111,096
|
34,736,386
|
|
|
113,406,539
|
|||
|
UTILITIES - 6.6%
|
|||
|
Electric Utilities - 3.7%
|
|||
|
Constellation Energy Corp.
|
351,049
|
20,101,066
|
|
|
Exelon Corp.
|
758,549
|
34,377,441
|
|
|
FirstEnergy Corp.
|
487,100
|
18,699,769
|
|
|
NextEra Energy, Inc.
|
1,012,616
|
78,437,235
|
|
|
NRG Energy, Inc.
|
235,829
|
9,001,593
|
|
|
PG&E Corp. (a)
|
1,081,900
|
10,797,362
|
|
|
Southern Co.
|
443,200
|
31,604,592
|
|
|
203,019,058
|
|||
|
Independent Power and Renewable Electricity Producers - 0.3%
|
|||
|
Vistra Corp.
|
765,701
|
17,496,268
|
|
|
Multi-Utilities - 2.6%
|
|||
|
Ameren Corp.
|
325,858
|
29,444,529
|
|
|
CenterPoint Energy, Inc.
|
1,024,168
|
30,294,889
|
|
|
Dominion Energy, Inc.
|
617,900
|
49,314,599
|
|
|
WEC Energy Group, Inc.
|
316,025
|
31,804,756
|
|
|
140,858,773
|
|||
|
TOTAL UTILITIES
|
361,374,099
|
||
|
TOTAL COMMON STOCKS
(Cost $3,754,585,291)
|
5,154,127,999
|
||
|
Money Market Funds - 5.7%
|
|||
|
Shares
|
Value ($)
|
||
|
Fidelity Cash Central Fund 1.58% (d)
|
281,831,312
|
281,887,678
|
|
|
Fidelity Securities Lending Cash Central Fund 1.58% (d)(e)
|
31,076,942
|
31,080,050
|
|
|
TOTAL MONEY MARKET FUNDS
(Cost $312,967,728)
|
312,967,728
|
||
|
TOTAL INVESTMENT IN SECURITIES - 100.0%
(Cost $4,067,553,019)
|
5,467,095,727
|
|
NET OTHER ASSETS (LIABILITIES) - 0.0%
|
(408,292)
|
|
NET ASSETS - 100.0%
|
5,466,687,435
|
|
(a)
|
Non-income producing
|
|
(b)
|
Security or a portion of the security is on loan at period end.
|
|
(c)
|
Security exempt from registration under Rule 144A of the Securities Act of 1933. These securities may be resold in transactions exempt from registration, normally to qualified institutional buyers. At the end of the period, the value of these securities amounted to $10,680,204 or 0.2% of net assets.
|
|
(d)
|
Affiliated fund that is generally available only to investment companies and other accounts managed by Fidelity Investments. The rate quoted is the annualized seven-day yield of the fund at period end. A complete unaudited listing of the fund's holdings as of its most recent quarter end is available upon request. In addition, each Fidelity Central Fund's financial statements are available on the SEC's website or upon request.
|
|
(e)
|
Investment made with cash collateral received from securities on loan.
|
|
Affiliate
|
Value,
beginning
of period ($)
|
Purchases ($)
|
Sales
Proceeds ($)
|
Dividend
Income ($)
|
Realized
Gain (loss) ($)
|
Change in
Unrealized
appreciation
(depreciation) ($)
|
Value,
end
of period ($)
|
%ownership,
end
of period
|
|
Fidelity Cash Central Fund 1.58%
|
37,073,593
|
680,344,108
|
435,530,023
|
447,808
|
1,002
|
(1,002)
|
281,887,678
|
0.5%
|
|
Fidelity Securities Lending Cash Central Fund 1.58%
|
28,726,908
|
461,509,977
|
459,156,835
|
87,830
|
-
|
-
|
31,080,050
|
0.1%
|
|
Total
|
65,800,501
|
1,141,854,085
|
894,686,858
|
535,638
|
1,002
|
(1,002)
|
312,967,728
|
|
Valuation Inputs at Reporting Date:
|
||||
|
Description
|
Total ($)
|
Level 1 ($)
|
Level 2 ($)
|
Level 3 ($)
|
|
Investments in Securities:
|
||||
|
Equities:
|
||||
|
Communication Services
|
524,858,058
|
524,858,058
|
-
|
-
|
|
Consumer Discretionary
|
175,679,479
|
175,679,479
|
-
|
-
|
|
Consumer Staples
|
570,168,412
|
518,125,505
|
52,042,907
|
-
|
|
Energy
|
522,193,873
|
522,193,873
|
-
|
-
|
|
Financials
|
763,633,733
|
763,633,733
|
-
|
-
|
|
Health Care
|
980,394,797
|
773,383,869
|
207,010,928
|
-
|
|
Industrials
|
387,748,132
|
351,653,774
|
36,094,358
|
-
|
|
Information Technology
|
497,428,731
|
497,428,731
|
-
|
-
|
|
Materials
|
257,242,146
|
239,857,617
|
17,384,529
|
-
|
|
Real Estate
|
113,406,539
|
113,406,539
|
-
|
-
|
|
Utilities
|
361,374,099
|
361,374,099
|
-
|
-
|
|
Money Market Funds
|
312,967,728
|
312,967,728
|
-
|
-
|
|
Total Investments in Securities:
|
5,467,095,727
|
5,154,563,005
|
312,532,722
|
-
|
|
Statement of Assets and Liabilities
|
||||
|
June 30, 2022
(Unaudited)
|
||||
|
Assets
|
||||
|
Investment in securities, at value (including securities loaned of $28,282,196) - See accompanying schedule:
|
$5,154,127,999
|
|||
|
Unaffiliated issuers (cost $3,754,585,291)
|
||||
|
Fidelity Central Funds (cost $312,967,728)
|
312,967,728
|
|||
|
Total Investment in Securities (cost $4,067,553,019)
|
$
|
5,467,095,727
|
||
|
Foreign currency held at value (cost $3,531,172)
|
3,531,172
|
|||
|
Receivable for investments sold
|
29,430,959
|
|||
|
Receivable for fund shares sold
|
2,831,891
|
|||
|
Dividends receivable
|
9,468,774
|
|||
|
Distributions receivable from Fidelity Central Funds
|
170,693
|
|||
|
Other receivables
|
22,231
|
|||
|
Total assets
|
5,512,551,447
|
|||
|
Liabilities
|
||||
|
Payable for investments purchased
|
$7,519,818
|
|||
|
Payable for fund shares redeemed
|
4,447,634
|
|||
|
Accrued management fee
|
1,997,892
|
|||
|
Distribution and service plan fees payable
|
331,662
|
|||
|
Other affiliated payables
|
414,429
|
|||
|
Other payables and accrued expenses
|
72,527
|
|||
|
Collateral on securities loaned
|
31,080,050
|
|||
|
Total Liabilities
|
45,864,012
|
|||
|
Net Assets
|
$
|
5,466,687,435
|
||
|
Net Assets consist of:
|
||||
|
Paid in capital
|
$
|
3,857,120,549
|
||
|
Total accumulated earnings (loss)
|
1,609,566,886
|
|||
|
Net Assets
|
$
|
5,466,687,435
|
||
|
Net Asset Value and Maximum Offering Price
|
||||
|
Initial Class :
|
||||
|
Net Asset Value
, offering price and redemption price per share ($3,169,211,588 ÷ 135,848,159 shares)
|
$
|
23.33
|
||
|
Service Class :
|
||||
|
Net Asset Value
, offering price and redemption price per share ($281,476,320 ÷ 12,157,850 shares)
|
$
|
23.15
|
||
|
Service Class 2 :
|
||||
|
Net Asset Value
, offering price and redemption price per share ($1,435,472,954 ÷ 63,770,843 shares)
|
$
|
22.51
|
||
|
Investor Class :
|
||||
|
Net Asset Value
, offering price and redemption price per share ($580,526,573 ÷ 25,076,414 shares)
|
$
|
23.15
|
||
|
Statement of Operations
|
||||
|
Six months ended
June 30, 2022
(Unaudited)
|
||||
|
Investment Income
|
||||
|
Dividends
|
$
|
72,338,294
|
||
|
Income from Fidelity Central Funds (including $87,830 from security lending)
|
535,638
|
|||
|
Total Income
|
72,873,932
|
|||
|
Expenses
|
||||
|
Management fee
|
$
|
12,857,536
|
||
|
Transfer agent fees
|
2,102,535
|
|||
|
Distribution and service plan fees
|
2,122,138
|
|||
|
Accounting fees
|
551,685
|
|||
|
Custodian fees and expenses
|
41,215
|
|||
|
Independent trustees' fees and expenses
|
10,338
|
|||
|
Audit
|
35,926
|
|||
|
Legal
|
3,036
|
|||
|
Interest
|
692
|
|||
|
Miscellaneous
|
11,292
|
|||
|
Total expenses before reductions
|
17,736,393
|
|||
|
Expense reductions
|
(91,298)
|
|||
|
Total expenses after reductions
|
17,645,095
|
|||
|
Net Investment income (loss)
|
55,228,837
|
|||
|
Realized and Unrealized Gain (Loss)
|
||||
|
Net realized gain (loss) on:
|
||||
|
Investment Securities:
|
||||
|
Unaffiliated issuers
|
178,390,276
|
|||
|
Fidelity Central Funds
|
1,002
|
|||
|
Foreign currency transactions
|
(218,958)
|
|||
|
Total net realized gain (loss)
|
178,172,320
|
|||
|
Change in net unrealized appreciation (depreciation) on:
|
||||
|
Investment Securities:
|
||||
|
Unaffiliated issuers
|
(901,327,708)
|
|||
|
Fidelity Central Funds
|
(1,002)
|
|||
|
Assets and liabilities in foreign currencies
|
(97,272)
|
|||
|
Total change in net unrealized appreciation (depreciation)
|
(901,425,982)
|
|||
|
Net gain (loss)
|
(723,253,662)
|
|||
|
Net increase (decrease) in net assets resulting from operations
|
$
|
(668,024,825)
|
||
|
Statement of Changes in Net Assets
|
||||
|
Six months ended
June 30, 2022
(Unaudited)
|
Year ended
December 31, 2021
|
|||
|
Increase (Decrease) in Net Assets
|
||||
|
Operations
|
||||
|
Net investment income (loss)
|
$
|
55,228,837
|
$
|
94,277,467
|
|
Net realized gain (loss)
|
178,172,320
|
547,074,338
|
||
|
Change in net unrealized appreciation (depreciation)
|
(901,425,982)
|
685,924,155
|
||
|
Net increase (decrease) in net assets resulting from operations
|
(668,024,825)
|
1,327,275,960
|
||
|
Distributions to shareholders
|
(8,076,980)
|
(789,899,370)
|
||
|
Share transactions - net increase (decrease)
|
(237,907,625)
|
345,216,711
|
||
|
Total increase (decrease) in net assets
|
(914,009,430)
|
882,593,301
|
||
|
Net Assets
|
||||
|
Beginning of period
|
6,380,696,865
|
5,498,103,564
|
||
|
End of period
|
$
|
5,466,687,435
|
$
|
6,380,696,865
|
|
Equity-Income Portfolio Initial Class
|
|
Six months ended
(Unaudited) June 30, 2022
|
Years ended December 31, 2021
|
2020
|
2019
|
2018
|
2017
|
|||||||
|
Selected Per-Share Data
|
||||||||||||
|
Net asset value, beginning of period
|
$
|
26.15
|
$
|
23.90
|
$
|
23.77
|
$
|
20.37
|
$
|
23.89
|
$
|
21.97
|
|
Income from Investment Operations
|
||||||||||||
|
Net investment income (loss)
A,B
|
.24
|
.43
|
.39
|
.46
|
.58
|
.50
|
||||||
|
Net realized and unrealized gain (loss)
|
(3.03)
|
5.29
|
1.12
|
4.84
|
(2.50)
|
2.29
|
||||||
|
Total from investment operations
|
(2.79)
|
5.72
|
1.51
|
5.30
|
(1.92)
|
2.79
|
||||||
|
Distributions from net investment income
|
-
|
(.51)
|
(.39)
|
(.45)
|
(.52)
|
(.40)
|
||||||
|
Distributions from net realized gain
|
(.03)
|
(2.95)
|
(.99)
|
(1.45)
|
(1.07)
|
(.47)
|
||||||
|
Total distributions
|
(.03)
|
(3.47)
C
|
(1.38)
|
(1.90)
|
(1.60)
C
|
(.87)
|
||||||
|
Net asset value, end of period
|
$
|
23.33
|
$
|
26.15
|
$
|
23.90
|
$
|
23.77
|
$
|
20.37
|
$
|
23.89
|
|
Total Return
D,E,F
|
(10.67)%
|
24.89%
|
6.69%
|
27.44%
|
(8.29)%
|
12.89%
|
||||||
|
Ratios to Average Net Assets
B,G,H
|
||||||||||||
|
Expenses before reductions
|
.51%
I
|
.51%
|
.53%
|
.53%
|
.53%
|
.53%
|
||||||
|
Expenses net of fee waivers, if any
|
.51%
I
|
.51%
|
.53%
|
.53%
|
.53%
|
.53%
|
||||||
|
Expenses net of all reductions
|
.51%
I
|
.51%
|
.52%
|
.52%
|
.52%
|
.53%
|
||||||
|
Net investment income (loss)
|
1.91%
I
|
1.63%
|
1.87%
|
2.11%
|
2.53%
|
2.19%
|
||||||
|
Supplemental Data
|
||||||||||||
|
Net assets, end of period (000 omitted)
|
$
|
3,169,212
|
$
|
3,766,480
|
$
|
3,185,391
|
$
|
3,202,982
|
$
|
2,804,988
|
$
|
3,440,095
|
|
Portfolio turnover rate
J
|
33%
I
|
27%
|
57%
|
32%
|
39%
|
36%
|
|
Equity-Income Portfolio Service Class
|
|
Six months ended
(Unaudited) June 30, 2022
|
Years ended December 31, 2021
|
2020
|
2019
|
2018
|
2017
|
|||||||
|
Selected Per-Share Data
|
||||||||||||
|
Net asset value, beginning of period
|
$
|
25.97
|
$
|
23.74
|
$
|
23.63
|
$
|
20.26
|
$
|
23.77
|
$
|
21.86
|
|
Income from Investment Operations
|
||||||||||||
|
Net investment income (loss)
A,B
|
.23
|
.40
|
.37
|
.44
|
.55
|
.47
|
||||||
|
Net realized and unrealized gain (loss)
|
(3.02)
|
5.26
|
1.10
|
4.81
|
(2.49)
|
2.29
|
||||||
|
Total from investment operations
|
(2.79)
|
5.66
|
1.47
|
5.25
|
(1.94)
|
2.76
|
||||||
|
Distributions from net investment income
|
-
|
(.48)
|
(.37)
|
(.43)
|
(.50)
|
(.38)
|
||||||
|
Distributions from net realized gain
|
(.03)
|
(2.95)
|
(.99)
|
(1.45)
|
(1.07)
|
(.47)
|
||||||
|
Total distributions
|
(.03)
|
(3.43)
|
(1.36)
|
(1.88)
|
(1.57)
|
(.85)
|
||||||
|
Net asset value, end of period
|
$
|
23.15
|
$
|
25.97
|
$
|
23.74
|
$
|
23.63
|
$
|
20.26
|
$
|
23.77
|
|
Total Return
C,D,E
|
(10.74)%
|
24.83%
|
6.55%
|
27.32%
|
(8.40)%
|
12.80%
|
||||||
|
Ratios to Average Net Assets
B,F,G
|
||||||||||||
|
Expenses before reductions
|
.61%
H
|
.61%
|
.63%
|
.63%
|
.63%
|
.63%
|
||||||
|
Expenses net of fee waivers, if any
|
.61%
H
|
.61%
|
.63%
|
.63%
|
.63%
|
.63%
|
||||||
|
Expenses net of all reductions
|
.61%
H
|
.61%
|
.62%
|
.62%
|
.62%
|
.63%
|
||||||
|
Net investment income (loss)
|
1.81%
H
|
1.53%
|
1.77%
|
2.01%
|
2.43%
|
2.09%
|
||||||
|
Supplemental Data
|
||||||||||||
|
Net assets, end of period (000 omitted)
|
$
|
281,476
|
$
|
326,787
|
$
|
284,767
|
$
|
299,079
|
$
|
264,055
|
$
|
326,565
|
|
Portfolio turnover rate
I
|
33%
H
|
27%
|
57%
|
32%
|
39%
|
36%
|
|
Equity-Income Portfolio Service Class 2
|
|
Six months ended
(Unaudited) June 30, 2022
|
Years ended December 31, 2021
|
2020
|
2019
|
2018
|
2017
|
|||||||
|
Selected Per-Share Data
|
||||||||||||
|
Net asset value, beginning of period
|
$
|
25.27
|
$
|
23.18
|
$
|
23.10
|
$
|
19.85
|
$
|
23.32
|
$
|
21.46
|
|
Income from Investment Operations
|
||||||||||||
|
Net investment income (loss)
A,B
|
.20
|
.35
|
.33
|
.40
|
.51
|
.43
|
||||||
|
Net realized and unrealized gain (loss)
|
(2.93)
|
5.13
|
1.09
|
4.70
|
(2.44)
|
2.24
|
||||||
|
Total from investment operations
|
(2.73)
|
5.48
|
1.42
|
5.10
|
(1.93)
|
2.67
|
||||||
|
Distributions from net investment income
|
-
|
(.44)
|
(.34)
|
(.40)
|
(.47)
|
(.34)
|
||||||
|
Distributions from net realized gain
|
(.03)
|
(2.95)
|
(.99)
|
(1.45)
|
(1.07)
|
(.47)
|
||||||
|
Total distributions
|
(.03)
|
(3.39)
|
(1.34)
C
|
(1.85)
|
(1.54)
|
(.81)
|
||||||
|
Net asset value, end of period
|
$
|
22.51
|
$
|
25.27
|
$
|
23.18
|
$
|
23.10
|
$
|
19.85
|
$
|
23.32
|
|
Total Return
D,E,F
|
(10.80)%
|
24.60%
|
6.44%
|
27.11%
|
(8.54)%
|
12.65%
|
||||||
|
Ratios to Average Net Assets
B,G,H
|
||||||||||||
|
Expenses before reductions
|
.76%
I
|
.76%
|
.78%
|
.78%
|
.78%
|
.78%
|
||||||
|
Expenses net of fee waivers, if any
|
.76%
I
|
.76%
|
.78%
|
.78%
|
.78%
|
.78%
|
||||||
|
Expenses net of all reductions
|
.76%
I
|
.76%
|
.77%
|
.77%
|
.77%
|
.78%
|
||||||
|
Net investment income (loss)
|
1.66%
I
|
1.38%
|
1.62%
|
1.86%
|
2.28%
|
1.94%
|
||||||
|
Supplemental Data
|
||||||||||||
|
Net assets, end of period (000 omitted)
|
$
|
1,435,473
|
$
|
1,659,719
|
$
|
1,563,662
|
$
|
1,431,212
|
$
|
1,200,026
|
$
|
1,452,633
|
|
Portfolio turnover rate
J
|
33%
I
|
27%
|
57%
|
32%
|
39%
|
36%
|
|
Equity-Income Portfolio Investor Class
|
|
Six months ended
(Unaudited) June 30, 2022
|
Years ended December 31, 2021
|
2020
|
2019
|
2018
|
2017
|
|||||||
|
Selected Per-Share Data
|
||||||||||||
|
Net asset value, beginning of period
|
$
|
25.96
|
$
|
23.74
|
$
|
23.63
|
$
|
20.26
|
$
|
23.77
|
$
|
21.86
|
|
Income from Investment Operations
|
||||||||||||
|
Net investment income (loss)
A,B
|
.23
|
.41
|
.38
|
.44
|
.55
|
.48
|
||||||
|
Net realized and unrealized gain (loss)
|
(3.01)
|
5.26
|
1.10
|
4.81
|
(2.48)
|
2.28
|
||||||
|
Total from investment operations
|
(2.78)
|
5.67
|
1.48
|
5.25
|
(1.93)
|
2.76
|
||||||
|
Distributions from net investment income
|
-
|
(.49)
|
(.38)
|
(.44)
|
(.51)
|
(.38)
|
||||||
|
Distributions from net realized gain
|
(.03)
|
(2.95)
|
(.99)
|
(1.45)
|
(1.07)
|
(.47)
|
||||||
|
Total distributions
|
(.03)
|
(3.45)
C
|
(1.37)
|
(1.88)
C
|
(1.58)
|
(.85)
|
||||||
|
Net asset value, end of period
|
$
|
23.15
|
$
|
25.96
|
$
|
23.74
|
$
|
23.63
|
$
|
20.26
|
$
|
23.77
|
|
Total Return
D,E,F
|
(10.71)%
|
24.83%
|
6.57%
|
27.35%
|
(8.37)%
|
12.83%
|
||||||
|
Ratios to Average Net Assets
B,G,H
|
||||||||||||
|
Expenses before reductions
|
.58%
I
|
.59%
|
.60%
|
.61%
|
.61%
|
.62%
|
||||||
|
Expenses net of fee waivers, if any
|
.58%
I
|
.58%
|
.60%
|
.61%
|
.61%
|
.61%
|
||||||
|
Expenses net of all reductions
|
.58%
I
|
.58%
|
.60%
|
.60%
|
.60%
|
.61%
|
||||||
|
Net investment income (loss)
|
1.83%
I
|
1.55%
|
1.80%
|
2.03%
|
2.45%
|
2.11%
|
||||||
|
Supplemental Data
|
||||||||||||
|
Net assets, end of period (000 omitted)
|
$
|
580,527
|
$
|
627,711
|
$
|
464,283
|
$
|
449,909
|
$
|
382,041
|
$
|
457,011
|
|
Portfolio turnover rate
J
|
33%
I
|
27%
|
57%
|
32%
|
39%
|
36%
|
|
Fidelity Central Fund
|
Investment Manager
|
Investment Objective
|
Investment Practices
|
Expense Ratio
A
|
|
Fidelity Money Market Central Funds
|
Fidelity Management & Research Company LLC (FMR)
|
Each fund seeks to obtain a high level of current income consistent with the preservation of capital and liquidity.
|
Short-term Investments
|
Less than .005%
|
|
VIP Equity-Income Portfolio
|
$20,424
|
|
Gross unrealized appreciation
|
$1,546,245,234
|
|
Gross unrealized depreciation
|
(162,141,217)
|
|
Net unrealized appreciation (depreciation)
|
$1,384,104,017
|
|
Tax cost
|
$ 4,082,991,710
|
|
Purchases ($)
|
Sales ($)
|
|
|
VIP Equity-Income Portfolio
|
957,927,743
|
1,429,947,783
|
|
Service Class
|
$154,870
|
|
Service Class 2
|
1,967,268
|
|
$2,122,138
|
|
Amount
|
% of Class-Level Average Net Assets
A
|
|
|
Initial Class
|
$1,096,703
|
.06
|
|
Service Class
|
95,936
|
.06
|
|
Service Class 2
|
487,470
|
.06
|
|
Investor Class
|
422,426
|
.14
|
|
$2,102,535
|
|
% of Average Net Assets
|
|
|
VIP Equity-Income Portfolio
|
.02
|
|
Amount
|
|
|
VIP Equity-Income Portfolio
|
$20,596
|
|
Borrower or Lender
|
Average Loan Balance
|
Weighted Average Interest Rate
|
Interest Expense
|
|
|
VIP Equity-Income Portfolio
|
Borrower
|
$7,908,800
|
.32%
|
$692
|
|
Purchases ($)
|
Sales ($)
|
Realized Gain (Loss) ($)
|
|
|
VIP Equity-Income Portfolio
|
40,291,094
|
240,472,509
|
19,178,363
|
|
Amount
|
|
|
VIP Equity-Income Portfolio
|
$5,139
|
|
Total Security Lending Fees Paid to NFS
|
Security Lending Income From Securities Loaned to NFS
|
Value of Securities Loaned to NFS at Period End
|
|
|
VIP Equity-Income Portfolio
|
$9,387
|
$-
|
$-
|
|
Six months ended
June 30, 2022
|
Year ended
December 31, 2021
|
|
|
VIP Equity-Income Portfolio
|
||
|
Distributions to shareholders
|
||
|
Initial Class
|
$4,712,509
|
$463,404,060
|
|
Service Class
|
411,647
|
40,340,660
|
|
Service Class 2
|
2,148,854
|
210,857,612
|
|
Investor Class
|
803,970
|
75,297,038
|
|
Total
|
$8,076,980
|
$789,899,370
|
|
Shares
|
Shares
|
Dollars
|
Dollars
|
|
|
Six months ended June 30, 2022
|
Year ended December 31, 2021
|
Six months ended June 30, 2022
|
Year ended December 31, 2021
|
|
|
VIP Equity-Income Portfolio
|
||||
|
Initial Class
|
||||
|
Shares sold
|
5,965,684
|
8,955,693
|
$150,157,069
|
$237,708,161
|
|
Reinvestment of distributions
|
181,952
|
18,115,164
|
4,712,509
|
463,404,059
|
|
Shares redeemed
|
(14,322,154)
|
(16,345,548)
|
(358,716,876)
|
(432,790,636)
|
|
Net increase (decrease)
|
(8,174,518)
|
10,725,309
|
$(203,847,298)
|
$268,321,584
|
|
Service Class
|
||||
|
Shares sold
|
717,736
|
461,352
|
$18,094,877
|
$12,148,893
|
|
Reinvestment of distributions
|
16,011
|
1,588,165
|
411,647
|
40,340,660
|
|
Shares redeemed
|
(1,160,641)
|
(1,458,054)
|
(28,919,699)
|
(38,445,404)
|
|
Net increase (decrease)
|
(426,894)
|
591,463
|
$(10,413,175)
|
$14,044,149
|
|
Service Class 2
|
||||
|
Shares sold
|
4,456,896
|
5,231,653
|
$107,921,222
|
$134,560,733
|
|
Reinvestment of distributions
|
85,885
|
8,533,721
|
2,148,854
|
210,857,612
|
|
Shares redeemed
|
(6,459,830)
|
(15,544,137)
|
(156,678,799)
|
(400,531,327)
|
|
Net increase (decrease)
|
(1,917,049)
|
(1,778,763)
|
$(46,608,723)
|
$(55,112,982)
|
|
Investor Class
|
||||
|
Shares sold
|
2,330,506
|
3,641,902
|
$58,503,265
|
$94,416,901
|
|
Reinvestment of distributions
|
31,272
|
2,958,477
|
803,970
|
75,297,038
|
|
Shares redeemed
|
(1,464,044)
|
(1,975,712)
|
(36,345,664)
|
(51,749,979)
|
|
Net increase (decrease)
|
897,734
|
4,624,667
|
$22,961,571
|
$117,963,960
|
|
Fund
|
Affiliated %
|
Number ofUnaffiliated Shareholders
|
Unaffiliated Shareholders %
|
|
VIP Equity-Income Portfolio
|
17%
|
2
|
29%
|
|
The Example is based on an investment of $1,000 invested at the beginning of the period and held for the entire period (January 1, 2022 to June 30, 2022).
|
|
Annualized Expense Ratio-
A
|
Beginning Account Value January 1, 2022
|
Ending Account Value June 30, 2022
|
Expenses Paid During Period-
C
January 1, 2022 to June 30, 2022
|
|||||||
|
Equity-Income Portfolio
|
||||||||||
|
Initial Class
|
.51%
|
|||||||||
|
Actual
|
$ 1,000
|
$ 893.30
|
$ 2.39
|
|||||||
|
Hypothetical-
B
|
$ 1,000
|
$ 1,022.27
|
$ 2.56
|
|||||||
|
Service Class
|
.61%
|
|||||||||
|
Actual
|
$ 1,000
|
$ 892.60
|
$ 2.86
|
|||||||
|
Hypothetical-
B
|
$ 1,000
|
$ 1,021.77
|
$ 3.06
|
|||||||
|
Service Class 2
|
.76%
|
|||||||||
|
Actual
|
$ 1,000
|
$ 892.00
|
$ 3.57
|
|||||||
|
Hypothetical-
B
|
$ 1,000
|
$ 1,021.03
|
$ 3.81
|
|||||||
|
Investor Class
|
.58%
|
|||||||||
|
Actual
|
$ 1,000
|
$ 892.90
|
$ 2.72
|
|||||||
|
Hypothetical-
B
|
$ 1,000
|
$ 1,021.92
|
$ 2.91
|
|||||||
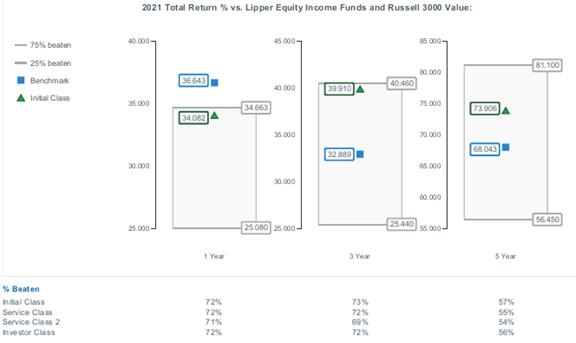
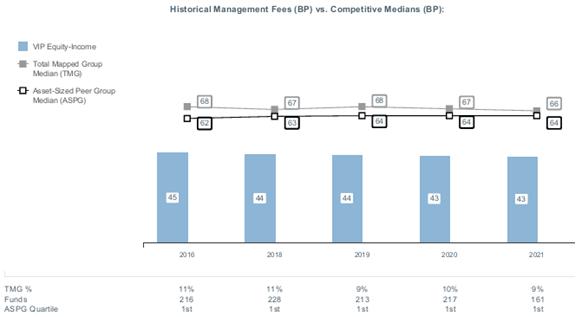
|
|


Contents
|
Top Holdings (% of Fund's net assets)
|
||
|
Microsoft Corp.
|
6.7
|
|
|
Apple, Inc.
|
6.5
|
|
|
Alphabet, Inc. Class A
|
3.9
|
|
|
Amazon.com, Inc.
|
2.9
|
|
|
UnitedHealth Group, Inc.
|
1.8
|
|
|
Exxon Mobil Corp.
|
1.4
|
|
|
Meta Platforms, Inc. Class A
|
1.4
|
|
|
Bank of America Corp.
|
1.4
|
|
|
The Travelers Companies, Inc.
|
1.2
|
|
|
Wells Fargo & Co.
|
1.1
|
|
|
28.3
|
||
|
Market Sectors (% of Fund's net assets)
|
||
|
Information Technology
|
25.7
|
|
|
Health Care
|
14.5
|
|
|
Consumer Discretionary
|
11.0
|
|
|
Financials
|
10.8
|
|
|
Communication Services
|
8.7
|
|
|
Industrials
|
8.5
|
|
|
Consumer Staples
|
6.5
|
|
|
Energy
|
4.3
|
|
|
Real Estate
|
3.5
|
|
|
Utilities
|
3.0
|
|
|
Materials
|
2.8
|
|
|
Asset Allocation (% of Fund's net assets)
|
|
|
Foreign investments - 7.9%
|
|
Common Stocks - 99.3%
|
|||
|
Shares
|
Value ($)
|
||
|
COMMUNICATION SERVICES - 8.7%
|
|||
|
Diversified Telecommunication Services - 0.2%
|
|||
|
Liberty Global PLC Class C (a)
|
436,200
|
9,635,658
|
|
|
Entertainment - 1.6%
|
|||
|
Activision Blizzard, Inc.
|
143,800
|
11,196,268
|
|
|
Cinemark Holdings, Inc. (a)
|
150,800
|
2,265,016
|
|
|
Electronic Arts, Inc.
|
99,300
|
12,079,845
|
|
|
Endeavor Group Holdings, Inc. (a)
|
83,700
|
1,720,872
|
|
|
Lions Gate Entertainment Corp.:
|
|||
|
Class A (a)
|
23,700
|
220,647
|
|
|
Class B (a)
|
162,200
|
1,432,226
|
|
|
Marcus Corp. (a)(b)
|
111,000
|
1,639,470
|
|
|
Netflix, Inc. (a)
|
81,700
|
14,286,879
|
|
|
Take-Two Interactive Software, Inc. (a)
|
41,700
|
5,109,501
|
|
|
The Walt Disney Co. (a)
|
176,200
|
16,633,280
|
|
|
Warner Bros Discovery, Inc. (a)
|
31,305
|
420,113
|
|
|
Warner Music Group Corp. Class A
|
61,200
|
1,490,832
|
|
|
World Wrestling Entertainment, Inc. Class A (b)
|
36,400
|
2,274,636
|
|
|
70,769,585
|
|||
|
Interactive Media & Services - 5.6%
|
|||
|
Alphabet, Inc. Class A (a)
|
78,500
|
171,071,910
|
|
|
Angi, Inc. (a)(b)
|
255,000
|
1,167,900
|
|
|
IAC (a)
|
4,000
|
303,880
|
|
|
Meta Platforms, Inc. Class A (a)
|
370,400
|
59,727,000
|
|
|
Snap, Inc. Class A (a)
|
270,900
|
3,556,917
|
|
|
Twitter, Inc. (a)
|
142,400
|
5,324,336
|
|
|
Zoominfo Technologies, Inc. (a)
|
39,400
|
1,309,656
|
|
|
242,461,599
|
|||
|
Media - 0.6%
|
|||
|
Advantage Solutions, Inc. Class A (a)
|
601,200
|
2,284,560
|
|
|
Altice U.S.A., Inc. Class A (a)
|
223,800
|
2,070,150
|
|
|
Comcast Corp. Class A
|
262,500
|
10,300,500
|
|
|
DISH Network Corp. Class A (a)
|
20,500
|
367,565
|
|
|
Liberty Broadband Corp.:
|
|||
|
Class A (a)
|
16,600
|
1,884,930
|
|
|
Class C (a)
|
82,300
|
9,517,172
|
|
|
S4 Capital PLC (a)
|
183,200
|
511,137
|
|
|
TechTarget, Inc. (a)
|
6,800
|
446,896
|
|
|
27,382,910
|
|||
|
Wireless Telecommunication Services - 0.7%
|
|||
|
T-Mobile U.S., Inc. (a)
|
227,000
|
30,540,580
|
|
|
TOTAL COMMUNICATION SERVICES
|
380,790,332
|
||
|
CONSUMER DISCRETIONARY - 11.0%
|
|||
|
Auto Components - 0.0%
|
|||
|
Adient PLC (a)
|
46,200
|
1,368,906
|
|
|
Automobiles - 1.2%
|
|||
|
Ferrari NV
|
12,500
|
2,293,500
|
|
|
Tesla, Inc. (a)
|
71,900
|
48,418,898
|
|
|
50,712,398
|
|||
|
Hotels, Restaurants & Leisure - 2.1%
|
|||
|
Airbnb, Inc. Class A (a)
|
41,800
|
3,723,544
|
|
|
ARAMARK Holdings Corp.
|
190,000
|
5,819,700
|
|
|
Booking Holdings, Inc. (a)
|
8,650
|
15,128,764
|
|
|
Brinker International, Inc. (a)
|
43,900
|
967,117
|
|
|
Caesars Entertainment, Inc. (a)
|
151,000
|
5,783,300
|
|
|
Chipotle Mexican Grill, Inc. (a)
|
5,700
|
7,451,382
|
|
|
Churchill Downs, Inc.
|
36,300
|
6,952,539
|
|
|
Compass Group PLC
|
157
|
3,223
|
|
|
Domino's Pizza, Inc.
|
12,900
|
5,027,259
|
|
|
Dutch Bros, Inc. (b)
|
50,293
|
1,591,773
|
|
|
Flutter Entertainment PLC (a)
|
25,700
|
2,579,103
|
|
|
Hilton Worldwide Holdings, Inc.
|
106,800
|
11,901,792
|
|
|
Lindblad Expeditions Holdings (a)
|
121,000
|
980,100
|
|
|
Marriott International, Inc. Class A
|
80,800
|
10,989,608
|
|
|
McDonald's Corp.
|
9,300
|
2,295,984
|
|
|
Noodles & Co. (a)
|
226,700
|
1,065,490
|
|
|
Penn National Gaming, Inc. (a)
|
78,000
|
2,372,760
|
|
|
Planet Fitness, Inc. (a)
|
53,500
|
3,638,535
|
|
|
Ruth's Hospitality Group, Inc.
|
52,775
|
858,122
|
|
|
Vail Resorts, Inc.
|
10,800
|
2,354,940
|
|
|
Wingstop, Inc. (b)
|
25,700
|
1,921,589
|
|
|
93,406,624
|
|||
|
Household Durables - 0.2%
|
|||
|
D.R. Horton, Inc.
|
40,500
|
2,680,695
|
|
|
Lennar Corp. Class A
|
45,600
|
3,217,992
|
|
|
Tempur Sealy International, Inc.
|
76,500
|
1,634,805
|
|
|
Tupperware Brands Corp. (a)
|
31,600
|
200,344
|
|
|
7,733,836
|
|||
|
Internet & Direct Marketing Retail - 3.2%
|
|||
|
Amazon.com, Inc. (a)
|
1,169,800
|
124,244,458
|
|
|
eBay, Inc.
|
116,300
|
4,846,221
|
|
|
Uber Technologies, Inc. (a)
|
436,400
|
8,928,744
|
|
|
138,019,423
|
|||
|
Multiline Retail - 0.6%
|
|||
|
Dollar General Corp.
|
40,700
|
9,989,408
|
|
|
Dollar Tree, Inc. (a)
|
44,600
|
6,950,910
|
|
|
Ollie's Bargain Outlet Holdings, Inc. (a)
|
59,700
|
3,507,375
|
|
|
Target Corp.
|
34,400
|
4,858,312
|
|
|
25,306,005
|
|||
|
Specialty Retail - 2.0%
|
|||
|
Aritzia, Inc. (a)
|
47,200
|
1,277,906
|
|
|
Bath & Body Works, Inc.
|
54,200
|
1,459,064
|
|
|
Burlington Stores, Inc. (a)
|
65,682
|
8,947,859
|
|
|
Dick's Sporting Goods, Inc.
|
23,900
|
1,801,343
|
|
|
Five Below, Inc. (a)
|
42,100
|
4,775,403
|
|
|
Floor & Decor Holdings, Inc. Class A (a)
|
75,700
|
4,766,072
|
|
|
Lowe's Companies, Inc.
|
122,000
|
21,309,740
|
|
|
Ross Stores, Inc.
|
66,900
|
4,698,387
|
|
|
The Home Depot, Inc.
|
82,700
|
22,682,129
|
|
|
TJX Companies, Inc.
|
237,400
|
13,258,790
|
|
|
Victoria's Secret & Co. (a)
|
58,500
|
1,636,245
|
|
|
Warby Parker, Inc. (a)
|
110,000
|
1,238,600
|
|
|
87,851,538
|
|||
|
Textiles, Apparel & Luxury Goods - 1.7%
|
|||
|
adidas AG
|
10,700
|
1,900,652
|
|
|
Capri Holdings Ltd. (a)
|
394,400
|
16,174,344
|
|
|
Crocs, Inc. (a)
|
20,300
|
988,001
|
|
|
Deckers Outdoor Corp. (a)
|
23,800
|
6,077,330
|
|
|
Levi Strauss & Co. Class A
|
70,440
|
1,149,581
|
|
|
lululemon athletica, Inc. (a)
|
32,000
|
8,723,520
|
|
|
LVMH Moet Hennessy Louis Vuitton SE
|
3,900
|
2,390,224
|
|
|
NIKE, Inc. Class B
|
172,500
|
17,629,500
|
|
|
On Holding AG
|
77,900
|
1,378,051
|
|
|
PVH Corp.
|
101,820
|
5,793,558
|
|
|
Ralph Lauren Corp.
|
17,400
|
1,559,910
|
|
|
Skechers U.S.A., Inc. Class A (sub. vtg.) (a)
|
21,400
|
761,412
|
|
|
Tapestry, Inc.
|
329,600
|
10,059,392
|
|
|
74,585,475
|
|||
|
TOTAL CONSUMER DISCRETIONARY
|
478,984,205
|
||
|
CONSUMER STAPLES - 6.5%
|
|||
|
Beverages - 2.2%
|
|||
|
Boston Beer Co., Inc. Class A (a)
|
28,300
|
8,574,051
|
|
|
Celsius Holdings, Inc. (a)
|
1,500
|
97,890
|
|
|
Constellation Brands, Inc. Class A (sub. vtg.)
|
35,285
|
8,223,522
|
|
|
Diageo PLC
|
27,402
|
1,183,567
|
|
|
Keurig Dr. Pepper, Inc.
|
221,700
|
7,845,963
|
|
|
Molson Coors Beverage Co. Class B
|
12,900
|
703,179
|
|
|
Monster Beverage Corp. (a)
|
149,300
|
13,840,110
|
|
|
PepsiCo, Inc.
|
53,800
|
8,966,308
|
|
|
Primo Water Corp.
|
34,700
|
464,286
|
|
|
The Coca-Cola Co.
|
745,000
|
46,867,950
|
|
|
96,766,826
|
|||
|
Food & Staples Retailing - 0.8%
|
|||
|
Albertsons Companies, Inc.
|
13,800
|
368,736
|
|
|
BJ's Wholesale Club Holdings, Inc. (a)
|
10,200
|
635,664
|
|
|
Grocery Outlet Holding Corp. (a)
|
10,300
|
439,089
|
|
|
Performance Food Group Co. (a)
|
150,100
|
6,901,598
|
|
|
Sprouts Farmers Market LLC (a)
|
1,300
|
32,916
|
|
|
Sysco Corp.
|
8,900
|
753,919
|
|
|
U.S. Foods Holding Corp. (a)
|
174,300
|
5,347,524
|
|
|
Walgreens Boots Alliance, Inc.
|
800
|
30,320
|
|
|
Walmart, Inc.
|
181,300
|
22,042,454
|
|
|
36,552,220
|
|||
|
Food Products - 1.0%
|
|||
|
Archer Daniels Midland Co.
|
6,400
|
496,640
|
|
|
Bunge Ltd.
|
42,700
|
3,872,463
|
|
|
Conagra Brands, Inc.
|
62,300
|
2,133,152
|
|
|
Darling Ingredients, Inc. (a)
|
28,600
|
1,710,280
|
|
|
Freshpet, Inc. (a)
|
29,900
|
1,551,511
|
|
|
Ingredion, Inc.
|
400
|
35,264
|
|
|
Laird Superfood, Inc. (a)
|
35,100
|
67,041
|
|
|
Lamb Weston Holdings, Inc.
|
110,700
|
7,910,622
|
|
|
Mondelez International, Inc.
|
252,600
|
15,683,934
|
|
|
Nomad Foods Ltd. (a)
|
90,600
|
1,811,094
|
|
|
Sanderson Farms, Inc.
|
2,400
|
517,272
|
|
|
Sovos Brands, Inc.
|
3,500
|
55,545
|
|
|
The Hain Celestial Group, Inc. (a)
|
8,700
|
206,538
|
|
|
The Simply Good Foods Co. (a)
|
1,500
|
56,655
|
|
|
TreeHouse Foods, Inc. (a)
|
124,300
|
5,198,226
|
|
|
Tyson Foods, Inc. Class A
|
30,400
|
2,616,224
|
|
|
43,922,461
|
|||
|
Household Products - 1.4%
|
|||
|
Energizer Holdings, Inc.
|
120,600
|
3,419,010
|
|
|
Kimberly-Clark Corp.
|
55,100
|
7,446,765
|
|
|
Procter & Gamble Co.
|
290,100
|
41,713,479
|
|
|
Reckitt Benckiser Group PLC
|
91
|
6,844
|
|
|
Reynolds Consumer Products, Inc.
|
144,400
|
3,937,788
|
|
|
Spectrum Brands Holdings, Inc.
|
10,900
|
894,018
|
|
|
The Clorox Co.
|
31,300
|
4,412,674
|
|
|
61,830,578
|
|||
|
Personal Products - 0.4%
|
|||
|
Edgewell Personal Care Co.
|
66,000
|
2,278,320
|
|
|
Estee Lauder Companies, Inc. Class A
|
12,500
|
3,183,375
|
|
|
Herbalife Nutrition Ltd. (a)
|
297,800
|
6,090,010
|
|
|
Olaplex Holdings, Inc.
|
31,100
|
438,199
|
|
|
Shiseido Co. Ltd.
|
12,400
|
499,809
|
|
|
The Beauty Health Co. (a)(b)
|
170,404
|
2,191,395
|
|
|
Unilever PLC
|
26,223
|
1,195,239
|
|
|
15,876,347
|
|||
|
Tobacco - 0.7%
|
|||
|
Altria Group, Inc.
|
232,400
|
9,707,348
|
|
|
Philip Morris International, Inc.
|
190,800
|
18,839,592
|
|
|
RLX Technology, Inc. ADR (a)
|
260,200
|
554,226
|
|
|
29,101,166
|
|||
|
TOTAL CONSUMER STAPLES
|
284,049,598
|
||
|
ENERGY - 4.3%
|
|||
|
Energy Equipment & Services - 0.5%
|
|||
|
Baker Hughes Co. Class A
|
28,000
|
808,360
|
|
|
Halliburton Co.
|
233,900
|
7,335,104
|
|
|
Helmerich & Payne, Inc.
|
26,400
|
1,136,784
|
|
|
Liberty Oilfield Services, Inc. Class A (a)
|
180,300
|
2,300,628
|
|
|
Nextier Oilfield Solutions, Inc. (a)
|
127,900
|
1,216,329
|
|
|
Schlumberger Ltd.
|
248,300
|
8,879,208
|
|
|
Valaris Ltd. (a)
|
7,800
|
329,472
|
|
|
Weatherford International PLC (a)
|
51,700
|
1,094,489
|
|
|
23,100,374
|
|||
|
Oil, Gas & Consumable Fuels - 3.8%
|
|||
|
Antero Resources Corp. (a)
|
151,800
|
4,652,670
|
|
|
Canadian Natural Resources Ltd.
|
312,500
|
16,792,748
|
|
|
CVR Energy, Inc.
|
31,700
|
1,061,950
|
|
|
Delek U.S. Holdings, Inc.
|
76,600
|
1,979,344
|
|
|
Exxon Mobil Corp.
|
729,200
|
62,448,688
|
|
|
Genesis Energy LP
|
434,300
|
3,483,086
|
|
|
Hess Corp.
|
185,300
|
19,630,682
|
|
|
Imperial Oil Ltd.
|
198,600
|
9,362,219
|
|
|
Kosmos Energy Ltd. (a)
|
931,377
|
5,765,224
|
|
|
MEG Energy Corp. (a)
|
1,168,200
|
16,172,564
|
|
|
Peabody Energy Corp. (a)
|
53,200
|
1,134,756
|
|
|
Phillips 66 Co.
|
67,000
|
5,493,330
|
|
|
Range Resources Corp. (a)
|
84,100
|
2,081,475
|
|
|
Tourmaline Oil Corp.
|
103,800
|
5,397,245
|
|
|
Valero Energy Corp.
|
103,400
|
10,989,352
|
|
|
166,445,333
|
|||
|
TOTAL ENERGY
|
189,545,707
|
||
|
FINANCIALS - 10.8%
|
|||
|
Banks - 5.1%
|
|||
|
Bank of America Corp.
|
1,905,331
|
59,312,954
|
|
|
Bank of Ireland Group PLC
|
928,800
|
5,871,163
|
|
|
BankUnited, Inc.
|
47,290
|
1,682,105
|
|
|
BNP Paribas SA
|
91,796
|
4,390,784
|
|
|
Citizens Financial Group, Inc.
|
140,976
|
5,031,433
|
|
|
Comerica, Inc.
|
59,843
|
4,391,279
|
|
|
First Horizon National Corp.
|
182,422
|
3,987,745
|
|
|
JPMorgan Chase & Co.
|
145,714
|
16,408,854
|
|
|
M&T Bank Corp.
|
63,331
|
10,094,328
|
|
|
Piraeus Financial Holdings SA (a)
|
887,300
|
871,452
|
|
|
PNC Financial Services Group, Inc.
|
74,903
|
11,817,446
|
|
|
Signature Bank
|
22,056
|
3,952,656
|
|
|
Silvergate Capital Corp. (a)
|
12,531
|
670,784
|
|
|
Societe Generale Series A
|
258,291
|
5,710,740
|
|
|
Standard Chartered PLC (United Kingdom)
|
157,667
|
1,190,291
|
|
|
Sumitomo Mitsui Financial Group, Inc.
|
57,300
|
1,703,248
|
|
|
SVB Financial Group (a)
|
8,872
|
3,504,351
|
|
|
U.S. Bancorp
|
544,869
|
25,074,871
|
|
|
UniCredit SpA
|
488,201
|
4,665,417
|
|
|
Wells Fargo & Co.
|
1,268,472
|
49,686,048
|
|
|
Wintrust Financial Corp.
|
41,121
|
3,295,848
|
|
|
223,313,797
|
|||
|
Capital Markets - 1.9%
|
|||
|
Bank of New York Mellon Corp.
|
538,377
|
22,455,705
|
|
|
BlackRock, Inc. Class A
|
22,505
|
13,706,445
|
|
|
Brookfield Asset Management, Inc. Class A
|
103,088
|
4,584,323
|
|
|
Cboe Global Markets, Inc.
|
40,480
|
4,581,931
|
|
|
Goldman Sachs Group, Inc.
|
5,299
|
1,573,909
|
|
|
Intercontinental Exchange, Inc.
|
133,916
|
12,593,461
|
|
|
Lazard Ltd. Class A
|
92,200
|
2,988,202
|
|
|
Patria Investments Ltd.
|
238,500
|
3,152,970
|
|
|
State Street Corp.
|
115,922
|
7,146,591
|
|
|
StepStone Group, Inc. Class A
|
161,789
|
4,211,368
|
|
|
TMX Group Ltd.
|
23,500
|
2,391,625
|
|
|
Virtu Financial, Inc. Class A
|
152,537
|
3,570,891
|
|
|
82,957,421
|
|||
|
Consumer Finance - 0.5%
|
|||
|
American Express Co.
|
83,794
|
11,615,524
|
|
|
Capital One Financial Corp.
|
47,469
|
4,945,795
|
|
|
OneMain Holdings, Inc.
|
159,456
|
5,960,465
|
|
|
22,521,784
|
|||
|
Insurance - 3.0%
|
|||
|
AIA Group Ltd.
|
132,800
|
1,451,048
|
|
|
Arch Capital Group Ltd. (a)
|
150,932
|
6,865,897
|
|
|
Arthur J. Gallagher & Co.
|
65,784
|
10,725,423
|
|
|
Chubb Ltd.
|
28,400
|
5,582,872
|
|
|
Globe Life, Inc.
|
94,647
|
9,225,243
|
|
|
Hartford Financial Services Group, Inc.
|
216,486
|
14,164,679
|
|
|
Marsh & McLennan Companies, Inc.
|
126,671
|
19,665,673
|
|
|
Prudential PLC
|
114,060
|
1,418,819
|
|
|
Reinsurance Group of America, Inc.
|
42,500
|
4,984,825
|
|
|
The Travelers Companies, Inc.
|
316,877
|
53,593,407
|
|
|
Unum Group
|
114,400
|
3,891,888
|
|
|
131,569,774
|
|||
|
Thrifts & Mortgage Finance - 0.3%
|
|||
|
Essent Group Ltd.
|
177,100
|
6,889,190
|
|
|
MGIC Investment Corp.
|
322,048
|
4,057,805
|
|
|
10,946,995
|
|||
|
TOTAL FINANCIALS
|
471,309,771
|
||
|
HEALTH CARE - 14.5%
|
|||
|
Biotechnology - 2.6%
|
|||
|
ADC Therapeutics SA (a)
|
75,000
|
596,250
|
|
|
Agios Pharmaceuticals, Inc. (a)
|
54,000
|
1,197,180
|
|
|
Alnylam Pharmaceuticals, Inc. (a)
|
48,000
|
7,000,800
|
|
|
Ambrx Biopharma, Inc. ADR
|
50,000
|
132,500
|
|
|
Arcutis Biotherapeutics, Inc. (a)
|
63,000
|
1,342,530
|
|
|
Argenx SE ADR (a)
|
40,000
|
15,155,200
|
|
|
Ascendis Pharma A/S sponsored ADR (a)
|
72,300
|
6,721,008
|
|
|
Atara Biotherapeutics, Inc. (a)
|
134,000
|
1,043,860
|
|
|
Avid Bioservices, Inc. (a)
|
70,000
|
1,068,200
|
|
|
Beam Therapeutics, Inc. (a)
|
30,000
|
1,161,300
|
|
|
BeiGene Ltd. ADR (a)
|
8,500
|
1,375,725
|
|
|
Blueprint Medicines Corp. (a)
|
60,000
|
3,030,600
|
|
|
Celldex Therapeutics, Inc. (a)
|
50,000
|
1,348,000
|
|
|
Century Therapeutics, Inc.
|
65,000
|
546,000
|
|
|
Cerevel Therapeutics Holdings (a)
|
100,000
|
2,644,000
|
|
|
Cytokinetics, Inc. (a)
|
145,000
|
5,697,050
|
|
|
Denali Therapeutics, Inc. (a)
|
50,000
|
1,471,500
|
|
|
Erasca, Inc.
|
185,000
|
1,030,450
|
|
|
Exelixis, Inc. (a)
|
120,000
|
2,498,400
|
|
|
Fate Therapeutics, Inc. (a)(b)
|
25,000
|
619,500
|
|
|
Generation Bio Co. (a)
|
70,000
|
459,200
|
|
|
Graphite Bio, Inc.
|
63,800
|
175,450
|
|
|
Imago BioSciences, Inc.
|
28,000
|
374,920
|
|
|
Innovent Biologics, Inc. (a)(c)
|
600,000
|
2,668,604
|
|
|
Instil Bio, Inc. (a)
|
100,000
|
462,000
|
|
|
Intellia Therapeutics, Inc. (a)
|
40,000
|
2,070,400
|
|
|
Janux Therapeutics, Inc.
|
45,000
|
549,450
|
|
|
Keros Therapeutics, Inc. (a)
|
34,000
|
939,420
|
|
|
Legend Biotech Corp. ADR (a)
|
84,000
|
4,620,000
|
|
|
Mirati Therapeutics, Inc. (a)
|
15,000
|
1,006,950
|
|
|
Nuvalent, Inc. Class A (a)
|
42,600
|
577,656
|
|
|
Poseida Therapeutics, Inc. (a)
|
142,200
|
366,876
|
|
|
PTC Therapeutics, Inc. (a)
|
86,000
|
3,445,160
|
|
|
Regeneron Pharmaceuticals, Inc. (a)
|
25,000
|
14,778,250
|
|
|
Relay Therapeutics, Inc. (a)
|
118,000
|
1,976,500
|
|
|
Sarepta Therapeutics, Inc. (a)
|
37,000
|
2,773,520
|
|
|
Scholar Rock Holding Corp. (a)
|
15,000
|
82,350
|
|
|
Shattuck Labs, Inc. (a)
|
68,600
|
278,516
|
|
|
Stoke Therapeutics, Inc. (a)
|
42,500
|
561,425
|
|
|
uniQure B.V. (a)
|
50,000
|
932,000
|
|
|
Vaxcyte, Inc. (a)
|
65,000
|
1,414,400
|
|
|
Vertex Pharmaceuticals, Inc. (a)
|
28,000
|
7,890,120
|
|
|
Verve Therapeutics, Inc.
|
18,000
|
275,040
|
|
|
Xencor, Inc. (a)
|
115,000
|
3,147,550
|
|
|
Xenon Pharmaceuticals, Inc. (a)
|
37,968
|
1,154,987
|
|
|
Zai Lab Ltd. (a)
|
500,000
|
1,704,516
|
|
|
Zentalis Pharmaceuticals, Inc. (a)
|
85,000
|
2,388,500
|
|
|
112,753,813
|
|||
|
Health Care Equipment & Supplies - 2.2%
|
|||
|
Boston Scientific Corp. (a)
|
920,000
|
34,288,400
|
|
|
Envista Holdings Corp. (a)
|
135,000
|
5,202,900
|
|
|
Hologic, Inc. (a)
|
38,000
|
2,633,400
|
|
|
Insulet Corp. (a)
|
84,000
|
18,306,960
|
|
|
Masimo Corp. (a)
|
32,000
|
4,181,440
|
|
|
Novocure Ltd. (a)
|
24,000
|
1,668,000
|
|
|
Outset Medical, Inc. (a)
|
67,000
|
995,620
|
|
|
Penumbra, Inc. (a)
|
118,000
|
14,693,360
|
|
|
PROCEPT BioRobotics Corp.
|
50,000
|
1,634,500
|
|
|
ResMed, Inc.
|
48,500
|
10,167,055
|
|
|
Tandem Diabetes Care, Inc. (a)
|
84,000
|
4,971,960
|
|
|
98,743,595
|
|||
|
Health Care Providers & Services - 4.3%
|
|||
|
1Life Healthcare, Inc. (a)
|
130,000
|
1,019,200
|
|
|
agilon health, Inc. (a)
|
460,000
|
10,041,800
|
|
|
Alignment Healthcare, Inc. (a)
|
231,300
|
2,639,133
|
|
|
Cano Health, Inc. (a)
|
630,000
|
2,759,400
|
|
|
Centene Corp. (a)
|
186,000
|
15,737,460
|
|
|
Cigna Corp.
|
89,000
|
23,453,280
|
|
|
Guardant Health, Inc. (a)
|
50,000
|
2,017,000
|
|
|
HCA Holdings, Inc.
|
45,000
|
7,562,700
|
|
|
Humana, Inc.
|
67,000
|
31,360,690
|
|
|
LifeStance Health Group, Inc.
|
350,000
|
1,946,000
|
|
|
Oak Street Health, Inc. (a)
|
500,000
|
8,220,000
|
|
|
Surgery Partners, Inc. (a)
|
170,000
|
4,916,400
|
|
|
UnitedHealth Group, Inc.
|
150,000
|
77,044,500
|
|
|
188,717,563
|
|||
|
Health Care Technology - 0.4%
|
|||
|
Change Healthcare, Inc. (a)
|
218,000
|
5,027,080
|
|
|
Definitive Healthcare Corp. (b)
|
45,000
|
1,031,850
|
|
|
Doximity, Inc. (b)
|
92,000
|
3,203,440
|
|
|
Inspire Medical Systems, Inc. (a)
|
34,000
|
6,210,780
|
|
|
Medlive Technology Co. Ltd. (c)
|
220,000
|
323,546
|
|
|
Phreesia, Inc. (a)
|
65,000
|
1,625,650
|
|
|
17,422,346
|
|||
|
Life Sciences Tools & Services - 2.7%
|
|||
|
10X Genomics, Inc. (a)
|
61,900
|
2,800,975
|
|
|
Agilent Technologies, Inc.
|
45,000
|
5,344,650
|
|
|
Avantor, Inc. (a)
|
170,000
|
5,287,000
|
|
|
Bio-Rad Laboratories, Inc. Class A (a)
|
11,500
|
5,692,500
|
|
|
Bruker Corp.
|
115,000
|
7,217,400
|
|
|
Charles River Laboratories International, Inc. (a)
|
15,000
|
3,209,550
|
|
|
Danaher Corp.
|
143,000
|
36,253,360
|
|
|
Lonza Group AG
|
11,200
|
5,982,339
|
|
|
Nanostring Technologies, Inc. (a)
|
70,000
|
889,000
|
|
|
Olink Holding AB ADR (a)
|
70,000
|
1,064,000
|
|
|
Quanterix Corp. (a)
|
40,000
|
647,600
|
|
|
Sartorius Stedim Biotech
|
6,187
|
1,940,561
|
|
|
Seer, Inc. (a)
|
8,901
|
79,664
|
|
|
Stevanato Group SpA
|
84,000
|
1,328,040
|
|
|
Thermo Fisher Scientific, Inc.
|
57,000
|
30,966,960
|
|
|
West Pharmaceutical Services, Inc.
|
26,000
|
7,861,620
|
|
|
116,565,219
|
|||
|
Pharmaceuticals - 2.3%
|
|||
|
Arvinas Holding Co. LLC (a)
|
57,900
|
2,437,011
|
|
|
AstraZeneca PLC (United Kingdom)
|
105,000
|
13,851,790
|
|
|
Bristol-Myers Squibb Co.
|
154,000
|
11,858,000
|
|
|
Eli Lilly & Co.
|
121,000
|
39,231,830
|
|
|
Merck & Co., Inc.
|
50,000
|
4,558,500
|
|
|
Pharvaris BV (a)
|
60,000
|
1,326,000
|
|
|
Roche Holding AG (participation certificate)
|
26,000
|
8,691,796
|
|
|
Royalty Pharma PLC
|
360,000
|
15,134,400
|
|
|
Theseus Pharmaceuticals, Inc.
|
40,000
|
221,200
|
|
|
UCB SA
|
17,000
|
1,436,614
|
|
|
98,747,141
|
|||
|
TOTAL HEALTH CARE
|
632,949,677
|
||
|
INDUSTRIALS - 8.5%
|
|||
|
Aerospace & Defense - 1.8%
|
|||
|
Axon Enterprise, Inc. (a)
|
16,900
|
1,574,573
|
|
|
HEICO Corp. Class A
|
29,400
|
3,098,172
|
|
|
Howmet Aerospace, Inc.
|
116,100
|
3,651,345
|
|
|
L3Harris Technologies, Inc.
|
50,700
|
12,254,190
|
|
|
Lockheed Martin Corp.
|
41,700
|
17,929,332
|
|
|
Northrop Grumman Corp.
|
12,200
|
5,838,554
|
|
|
Raytheon Technologies Corp.
|
180,800
|
17,376,688
|
|
|
The Boeing Co. (a)
|
119,600
|
16,351,712
|
|
|
78,074,566
|
|||
|
Air Freight & Logistics - 0.1%
|
|||
|
Air Transport Services Group, Inc. (a)
|
99,500
|
2,858,635
|
|
|
Airlines - 0.2%
|
|||
|
Delta Air Lines, Inc. (a)
|
197,600
|
5,724,472
|
|
|
JetBlue Airways Corp. (a)
|
422,200
|
3,533,814
|
|
|
9,258,286
|
|||
|
Building Products - 0.9%
|
|||
|
Carlisle Companies, Inc.
|
68,200
|
16,273,202
|
|
|
Fortune Brands Home & Security, Inc.
|
140,300
|
8,401,164
|
|
|
The AZEK Co., Inc. (a)
|
96,600
|
1,617,084
|
|
|
Trane Technologies PLC
|
113,900
|
14,792,193
|
|
|
41,083,643
|
|||
|
Commercial Services & Supplies - 0.9%
|
|||
|
Cintas Corp.
|
46,900
|
17,518,557
|
|
|
Copart, Inc. (a)
|
16,400
|
1,782,024
|
|
|
CoreCivic, Inc. (a)
|
76,300
|
847,693
|
|
|
Waste Connections, Inc. (United States)
|
146,200
|
18,122,952
|
|
|
38,271,226
|
|||
|
Construction & Engineering - 0.3%
|
|||
|
Willscot Mobile Mini Holdings (a)
|
452,200
|
14,660,324
|
|
|
Electrical Equipment - 0.5%
|
|||
|
AMETEK, Inc.
|
207,000
|
22,747,230
|
|
|
Industrial Conglomerates - 0.2%
|
|||
|
Honeywell International, Inc.
|
54,400
|
9,455,264
|
|
|
Machinery - 2.0%
|
|||
|
AGCO Corp.
|
80,300
|
7,925,610
|
|
|
Caterpillar, Inc.
|
105,200
|
18,805,552
|
|
|
Chart Industries, Inc. (a)(b)
|
47,800
|
8,000,764
|
|
|
Deere & Co.
|
49,600
|
14,853,712
|
|
|
Fortive Corp.
|
394,200
|
21,436,596
|
|
|
IDEX Corp.
|
57,500
|
10,443,725
|
|
|
ITT, Inc.
|
78,400
|
5,271,616
|
|
|
86,737,575
|
|||
|
Marine - 0.1%
|
|||
|
Eagle Bulk Shipping, Inc.
|
32,200
|
1,670,536
|
|
|
Genco Shipping & Trading Ltd.
|
65,100
|
1,257,732
|
|
|
2,928,268
|
|||
|
Professional Services - 0.3%
|
|||
|
Equifax, Inc.
|
20,944
|
3,828,144
|
|
|
TransUnion Holding Co., Inc.
|
96,200
|
7,695,038
|
|
|
11,523,182
|
|||
|
Road & Rail - 1.2%
|
|||
|
CSX Corp.
|
767,900
|
22,315,174
|
|
|
Landstar System, Inc.
|
77,000
|
11,197,340
|
|
|
Old Dominion Freight Lines, Inc.
|
22,900
|
5,868,812
|
|
|
Union Pacific Corp.
|
69,800
|
14,886,944
|
|
|
54,268,270
|
|||
|
Trading Companies & Distributors - 0.0%
|
|||
|
Air Lease Corp. Class A
|
33,000
|
1,103,190
|
|
|
TOTAL INDUSTRIALS
|
372,969,659
|
||
|
INFORMATION TECHNOLOGY - 25.7%
|
|||
|
Communications Equipment - 0.2%
|
|||
|
Cisco Systems, Inc.
|
195,900
|
8,353,176
|
|
|
Electronic Equipment & Components - 0.5%
|
|||
|
Cognex Corp.
|
51,700
|
2,198,284
|
|
|
Corning, Inc.
|
256,500
|
8,082,315
|
|
|
TE Connectivity Ltd.
|
67,100
|
7,592,365
|
|
|
Teledyne Technologies, Inc. (a)
|
5,800
|
2,175,638
|
|
|
Trimble, Inc. (a)
|
25,100
|
1,461,573
|
|
|
21,510,175
|
|||
|
IT Services - 4.1%
|
|||
|
Affirm Holdings, Inc. (a)(b)
|
58,164
|
1,050,442
|
|
|
Akamai Technologies, Inc. (a)
|
101,300
|
9,251,729
|
|
|
AvidXchange Holdings, Inc. (b)
|
14,900
|
91,486
|
|
|
Block, Inc. Class A (a)
|
16,100
|
989,506
|
|
|
Capgemini SA
|
102,400
|
17,539,833
|
|
|
Cognizant Technology Solutions Corp. Class A
|
334,500
|
22,575,405
|
|
|
Cyxtera Technologies, Inc. Class A (a)
|
211,400
|
2,397,276
|
|
|
DXC Technology Co. (a)
|
43,700
|
1,324,547
|
|
|
ExlService Holdings, Inc. (a)
|
28,500
|
4,198,905
|
|
|
Gartner, Inc. (a)
|
24,900
|
6,021,567
|
|
|
Global Payments, Inc.
|
83,500
|
9,238,440
|
|
|
GoDaddy, Inc. (a)
|
138,800
|
9,654,928
|
|
|
MasterCard, Inc. Class A
|
87,300
|
27,541,404
|
|
|
MongoDB, Inc. Class A (a)
|
30,600
|
7,940,700
|
|
|
PayPal Holdings, Inc. (a)
|
146,100
|
10,203,624
|
|
|
Repay Holdings Corp. (a)
|
241,736
|
3,106,308
|
|
|
Snowflake, Inc. (a)
|
14,500
|
2,016,370
|
|
|
StoneCo Ltd. Class A (a)
|
38,400
|
295,680
|
|
|
Thoughtworks Holding, Inc.
|
19,900
|
280,789
|
|
|
Twilio, Inc. Class A (a)
|
70,500
|
5,908,605
|
|
|
Visa, Inc. Class A
|
174,000
|
34,258,860
|
|
|
Wix.com Ltd. (a)
|
37,200
|
2,438,460
|
|
|
Worldline SA (a)(c)
|
37,759
|
1,399,970
|
|
|
179,724,834
|
|||
|
Semiconductors & Semiconductor Equipment - 2.6%
|
|||
|
Advanced Micro Devices, Inc. (a)
|
123,410
|
9,437,163
|
|
|
Analog Devices, Inc.
|
251,500
|
36,741,635
|
|
|
Intel Corp.
|
275,400
|
10,302,714
|
|
|
Lam Research Corp.
|
3,900
|
1,661,985
|
|
|
Marvell Technology, Inc.
|
87,200
|
3,795,816
|
|
|
Microchip Technology, Inc.
|
240,600
|
13,974,048
|
|
|
Micron Technology, Inc.
|
412,800
|
22,819,584
|
|
|
NVIDIA Corp.
|
41,300
|
6,260,667
|
|
|
onsemi (a)
|
45,500
|
2,289,105
|
|
|
Skyworks Solutions, Inc.
|
44,600
|
4,131,744
|
|
|
111,414,461
|
|||
|
Software - 11.7%
|
|||
|
Adobe, Inc. (a)
|
107,400
|
39,314,844
|
|
|
Alteryx, Inc. Class A (a)
|
36,900
|
1,786,698
|
|
|
Aspen Technology, Inc. (a)
|
18,226
|
3,347,752
|
|
|
Autodesk, Inc. (a)
|
90,600
|
15,579,576
|
|
|
Black Knight, Inc. (a)
|
50,100
|
3,276,039
|
|
|
Blackbaud, Inc. (a)
|
59,700
|
3,466,779
|
|
|
Blend Labs, Inc. (b)
|
76,900
|
181,484
|
|
|
Braze, Inc. (b)
|
6,800
|
246,364
|
|
|
Ceridian HCM Holding, Inc. (a)
|
97,300
|
4,580,884
|
|
|
Citrix Systems, Inc.
|
13,600
|
1,321,512
|
|
|
Constellation Software, Inc.
|
3,000
|
4,453,550
|
|
|
Coupa Software, Inc. (a)
|
29,100
|
1,661,610
|
|
|
Elastic NV (a)
|
76,200
|
5,156,454
|
|
|
Five9, Inc. (a)
|
6,400
|
583,296
|
|
|
GitLab, Inc.
|
4,900
|
260,386
|
|
|
HashiCorp, Inc.
|
5,600
|
164,864
|
|
|
HubSpot, Inc. (a)
|
18,600
|
5,592,090
|
|
|
Micro Focus International PLC
|
200,000
|
680,562
|
|
|
Microsoft Corp.
|
1,132,400
|
290,834,291
|
|
|
Momentive Global, Inc. (a)
|
86,800
|
763,840
|
|
|
New Relic, Inc. (a)
|
35,800
|
1,791,790
|
|
|
NortonLifeLock, Inc.
|
394,200
|
8,656,632
|
|
|
Palo Alto Networks, Inc. (a)
|
43,600
|
21,535,784
|
|
|
PTC, Inc. (a)
|
90,200
|
9,591,868
|
|
|
Roper Technologies, Inc.
|
35,500
|
14,010,075
|
|
|
Salesforce.com, Inc. (a)
|
257,200
|
42,448,288
|
|
|
Samsara, Inc. (b)
|
18,500
|
206,645
|
|
|
Smartsheet, Inc. (a)
|
17,900
|
562,597
|
|
|
Tenable Holdings, Inc. (a)
|
176,900
|
8,033,029
|
|
|
Workday, Inc. Class A (a)
|
79,700
|
11,124,526
|
|
|
Workiva, Inc. (a)
|
14,300
|
943,657
|
|
|
Zendesk, Inc. (a)
|
113,700
|
8,421,759
|
|
|
Zoom Video Communications, Inc. Class A (a)
|
21,200
|
2,288,964
|
|
|
512,868,489
|
|||
|
Technology Hardware, Storage & Peripherals - 6.6%
|
|||
|
Apple, Inc.
|
2,066,000
|
282,463,520
|
|
|
Western Digital Corp. (a)
|
84,600
|
3,792,618
|
|
|
286,256,138
|
|||
|
TOTAL INFORMATION TECHNOLOGY
|
1,120,127,273
|
||
|
MATERIALS - 2.8%
|
|||
|
Chemicals - 1.9%
|
|||
|
Air Products & Chemicals, Inc.
|
22,400
|
5,386,752
|
|
|
Albemarle Corp.
|
26,800
|
5,600,664
|
|
|
Ashland Global Holdings, Inc.
|
7,900
|
814,095
|
|
|
CF Industries Holdings, Inc.
|
76,600
|
6,566,918
|
|
|
Corteva, Inc.
|
99,200
|
5,370,688
|
|
|
DuPont de Nemours, Inc.
|
62,000
|
3,445,960
|
|
|
Eastman Chemical Co.
|
8,900
|
798,953
|
|
|
Ecolab, Inc.
|
33,000
|
5,074,080
|
|
|
Element Solutions, Inc.
|
49,700
|
884,660
|
|
|
FMC Corp.
|
7,400
|
791,874
|
|
|
Huntsman Corp.
|
29,500
|
836,325
|
|
|
International Flavors & Fragrances, Inc.
|
29,400
|
3,502,128
|
|
|
Linde PLC
|
57,700
|
16,590,481
|
|
|
Livent Corp. (a)(b)
|
42,500
|
964,325
|
|
|
LyondellBasell Industries NV Class A
|
31,700
|
2,772,482
|
|
|
Nutrien Ltd.
|
48,100
|
3,830,587
|
|
|
Olin Corp.
|
59,000
|
2,730,520
|
|
|
PPG Industries, Inc.
|
23,400
|
2,675,556
|
|
|
RPM International, Inc.
|
15,100
|
1,188,672
|
|
|
Sherwin-Williams Co.
|
28,600
|
6,403,826
|
|
|
The Mosaic Co.
|
68,300
|
3,225,809
|
|
|
The Scotts Miracle-Gro Co. Class A
|
5,200
|
410,748
|
|
|
Tronox Holdings PLC
|
240,900
|
4,047,120
|
|
|
Wacker Chemie AG
|
4,900
|
706,570
|
|
|
84,619,793
|
|||
|
Construction Materials - 0.1%
|
|||
|
Martin Marietta Materials, Inc.
|
8,100
|
2,423,844
|
|
|
Summit Materials, Inc. (a)
|
33,200
|
773,228
|
|
|
Vulcan Materials Co.
|
16,900
|
2,401,490
|
|
|
5,598,562
|
|||
|
Containers & Packaging - 0.2%
|
|||
|
Aptargroup, Inc.
|
11,600
|
1,197,236
|
|
|
Avery Dennison Corp.
|
12,800
|
2,071,936
|
|
|
Ball Corp.
|
37,200
|
2,558,244
|
|
|
Crown Holdings, Inc.
|
25,300
|
2,331,901
|
|
|
Packaging Corp. of America
|
8,900
|
1,223,750
|
|
|
9,383,067
|
|||
|
Metals & Mining - 0.5%
|
|||
|
Alcoa Corp.
|
73,300
|
3,341,014
|
|
|
Commercial Metals Co.
|
41,500
|
1,373,650
|
|
|
Compass Minerals International, Inc.
|
5,600
|
198,184
|
|
|
First Quantum Minerals Ltd.
|
91,900
|
1,743,473
|
|
|
Freeport-McMoRan, Inc.
|
191,200
|
5,594,512
|
|
|
Lundin Mining Corp.
|
94,300
|
597,800
|
|
|
Newmont Corp.
|
90,200
|
5,382,234
|
|
|
Reliance Steel & Aluminum Co.
|
13,500
|
2,293,110
|
|
|
Royal Gold, Inc.
|
7,700
|
822,206
|
|
|
Steel Dynamics, Inc.
|
12,600
|
833,490
|
|
|
22,179,673
|
|||
|
Paper & Forest Products - 0.1%
|
|||
|
Louisiana-Pacific Corp.
|
21,500
|
1,126,815
|
|
|
West Fraser Timber Co. Ltd.
|
6,800
|
521,781
|
|
|
1,648,596
|
|||
|
TOTAL MATERIALS
|
123,429,691
|
||
|
REAL ESTATE - 3.5%
|
|||
|
Equity Real Estate Investment Trusts (REITs) - 3.2%
|
|||
|
Alexandria Real Estate Equities, Inc.
|
23,700
|
3,437,211
|
|
|
American Tower Corp.
|
59,700
|
15,258,723
|
|
|
Crown Castle International Corp.
|
78,300
|
13,184,154
|
|
|
CubeSmart
|
258,400
|
11,038,848
|
|
|
Douglas Emmett, Inc.
|
78,600
|
1,759,068
|
|
|
Duke Realty Corp.
|
80,700
|
4,434,465
|
|
|
EastGroup Properties, Inc.
|
23,200
|
3,580,456
|
|
|
Equinix, Inc.
|
14,800
|
9,723,896
|
|
|
Equity Lifestyle Properties, Inc.
|
80,300
|
5,658,741
|
|
|
Essex Property Trust, Inc.
|
25,200
|
6,590,052
|
|
|
Four Corners Property Trust, Inc.
|
169,600
|
4,509,664
|
|
|
Invitation Homes, Inc.
|
148,800
|
5,294,304
|
|
|
Mid-America Apartment Communities, Inc.
|
44,100
|
7,702,947
|
|
|
Phillips Edison & Co., Inc.
|
50,000
|
1,670,500
|
|
|
Prologis (REIT), Inc.
|
94,300
|
11,094,395
|
|
|
Public Storage
|
5,700
|
1,782,219
|
|
|
RLJ Lodging Trust
|
205,800
|
2,269,974
|
|
|
Ryman Hospitality Properties, Inc. (a)
|
45,100
|
3,428,953
|
|
|
SITE Centers Corp.
|
221,400
|
2,982,258
|
|
|
Spirit Realty Capital, Inc.
|
54,600
|
2,062,788
|
|
|
Terreno Realty Corp.
|
26,200
|
1,460,126
|
|
|
UDR, Inc.
|
23,800
|
1,095,752
|
|
|
Urban Edge Properties
|
132,500
|
2,015,325
|
|
|
Ventas, Inc.
|
162,100
|
8,336,803
|
|
|
VICI Properties, Inc.
|
156,700
|
4,668,093
|
|
|
Washington REIT (SBI)
|
41,400
|
882,234
|
|
|
Welltower, Inc.
|
56,800
|
4,677,480
|
|
|
140,599,429
|
|||
|
Real Estate Management & Development - 0.3%
|
|||
|
CBRE Group, Inc. (a)
|
84,000
|
6,183,240
|
|
|
Digitalbridge Group, Inc. (a)
|
323,000
|
1,576,240
|
|
|
Doma Holdings, Inc. Class A (a)
|
712,700
|
734,081
|
|
|
Jones Lang LaSalle, Inc. (a)
|
11,000
|
1,923,460
|
|
|
WeWork, Inc. (a)
|
394,600
|
1,980,892
|
|
|
12,397,913
|
|||
|
TOTAL REAL ESTATE
|
152,997,342
|
||
|
UTILITIES - 3.0%
|
|||
|
Electric Utilities - 2.0%
|
|||
|
American Electric Power Co., Inc.
|
69,800
|
6,696,612
|
|
|
Avangrid, Inc. (b)
|
24,100
|
1,111,492
|
|
|
Constellation Energy Corp.
|
111,600
|
6,390,216
|
|
|
Duke Energy Corp.
|
24,700
|
2,648,087
|
|
|
Edison International
|
56,600
|
3,579,384
|
|
|
Entergy Corp.
|
58,100
|
6,544,384
|
|
|
Eversource Energy
|
15,900
|
1,343,073
|
|
|
Exelon Corp.
|
163,800
|
7,423,416
|
|
|
FirstEnergy Corp.
|
116,300
|
4,464,757
|
|
|
NextEra Energy, Inc.
|
285,065
|
22,081,135
|
|
|
OGE Energy Corp.
|
46,300
|
1,785,328
|
|
|
PG&E Corp. (a)
|
556,357
|
5,552,443
|
|
|
PPL Corp.
|
183,800
|
4,986,494
|
|
|
Southern Co.
|
189,100
|
13,484,721
|
|
|
88,091,542
|
|||
|
Gas Utilities - 0.0%
|
|||
|
Southwest Gas Corp.
|
16,800
|
1,462,944
|
|
|
Independent Power and Renewable Electricity Producers - 0.3%
|
|||
|
Clearway Energy, Inc. Class A
|
11,800
|
377,246
|
|
|
NextEra Energy Partners LP
|
33,100
|
2,454,696
|
|
|
Sunnova Energy International, Inc. (a)(b)
|
41,291
|
760,993
|
|
|
The AES Corp.
|
210,700
|
4,426,807
|
|
|
Vistra Corp.
|
168,000
|
3,838,800
|
|
|
11,858,542
|
|||
|
Multi-Utilities - 0.7%
|
|||
|
CenterPoint Energy, Inc.
|
122,400
|
3,620,592
|
|
|
Consolidated Edison, Inc.
|
4,300
|
408,930
|
|
|
Dominion Energy, Inc.
|
106,400
|
8,491,784
|
|
|
NiSource, Inc.
|
151,000
|
4,452,990
|
|
|
Public Service Enterprise Group, Inc.
|
83,600
|
5,290,208
|
|
|
Sempra Energy
|
45,700
|
6,867,339
|
|
|
29,131,843
|
|||
|
TOTAL UTILITIES
|
130,544,871
|
||
|
TOTAL COMMON STOCKS
(Cost $5,385,513,313)
|
4,337,698,126
|
||
|
Convertible Bonds - 0.0%
|
|||
|
Principal
Amount (d)
|
Value ($)
|
||
|
INFORMATION TECHNOLOGY - 0.0%
|
|||
|
IT Services - 0.0%
|
|||
|
Affirm Holdings, Inc. 0% 11/15/26 (c)
(Cost $1,880,919)
|
3,152,000
|
1,764,393
|
|
|
U.S. Treasury Obligations - 0.2%
|
|||
|
Principal
Amount (d)
|
Value ($)
|
||
|
U.S. Treasury Bills, yield at date of purchase 1.11% to 1.7% 9/1/22 to 9/29/22 (e)
(Cost $7,331,639)
|
7,360,000
|
7,331,583
|
|
|
Money Market Funds - 1.7%
|
|||
|
Shares
|
Value ($)
|
||
|
Fidelity Cash Central Fund 1.58% (f)
|
57,372,631
|
57,384,106
|
|
|
Fidelity Securities Lending Cash Central Fund 1.58% (f)(g)
|
16,813,879
|
16,815,560
|
|
|
TOTAL MONEY MARKET FUNDS
(Cost $74,199,666)
|
74,199,666
|
||
|
TOTAL INVESTMENT IN SECURITIES - 101.2%
(Cost $5,468,925,537)
|
4,420,993,768
|
|
NET OTHER ASSETS (LIABILITIES) - (1.2)%
|
(52,616,475)
|
|
NET ASSETS - 100.0%
|
4,368,377,293
|
|
Futures Contracts
|
|||||
|
Number
of contracts
|
Expiration
Date
|
Notional
Amount ($)
|
Value ($)
|
Unrealized
Appreciation/
(Depreciation) ($)
|
|
|
Purchased
|
|||||
|
Equity Index Contracts
|
|||||
|
CME E-mini S&P 500 Index Contracts (United States)
|
50
|
Sep 2022
|
9,473,750
|
(2,005)
|
(2,005)
|
|
The notional amount of futures purchased as a percentage of Net Assets is 0.2%
|
|||||
|
(a)
|
Non-income producing
|
|
(b)
|
Security or a portion of the security is on loan at period end.
|
|
(c)
|
Security exempt from registration under Rule 144A of the Securities Act of 1933. These securities may be resold in transactions exempt from registration, normally to qualified institutional buyers. At the end of the period, the value of these securities amounted to $6,156,513 or 0.1% of net assets.
|
|
(d)
|
Amount is stated in United States dollars unless otherwise noted.
|
|
(e)
|
Security or a portion of the security was pledged to cover margin requirements for futures contracts. At period end, the value of securities pledged amounted to $7,331,583.
|
|
(f)
|
Affiliated fund that is generally available only to investment companies and other accounts managed by Fidelity Investments. The rate quoted is the annualized seven-day yield of the fund at period end. A complete unaudited listing of the fund's holdings as of its most recent quarter end is available upon request. In addition, each Fidelity Central Fund's financial statements are available on the SEC's website or upon request.
|
|
(g)
|
Investment made with cash collateral received from securities on loan.
|
|
Affiliate
|
Value,
beginning
of period ($)
|
Purchases ($)
|
Sales
Proceeds ($)
|
Dividend
Income ($)
|
Realized
Gain (loss) ($)
|
Change in
Unrealized
appreciation
(depreciation) ($)
|
Value,
end
of period ($)
|
%ownership,
end
of period
|
|
Fidelity Cash Central Fund 1.58%
|
97,237,484
|
498,717,851
|
538,571,229
|
112,176
|
-
|
-
|
57,384,106
|
0.1%
|
|
Fidelity Securities Lending Cash Central Fund 1.58%
|
-
|
55,948,939
|
39,133,379
|
183,808
|
-
|
-
|
16,815,560
|
0.0%
|
|
Total
|
97,237,484
|
554,666,790
|
577,704,608
|
295,984
|
-
|
-
|
74,199,666
|
|
Valuation Inputs at Reporting Date:
|
||||
|
Description
|
Total ($)
|
Level 1 ($)
|
Level 2 ($)
|
Level 3 ($)
|
|
Investments in Securities:
|
||||
|
Equities:
|
||||
|
Communication Services
|
380,790,332
|
380,790,332
|
-
|
-
|
|
Consumer Discretionary
|
478,984,205
|
474,690,106
|
4,294,099
|
-
|
|
Consumer Staples
|
284,049,598
|
281,164,139
|
2,885,459
|
-
|
|
Energy
|
189,545,707
|
189,545,707
|
-
|
-
|
|
Financials
|
471,309,771
|
450,779,424
|
20,530,347
|
-
|
|
Health Care
|
632,949,677
|
604,423,752
|
28,525,925
|
-
|
|
Industrials
|
372,969,659
|
372,969,659
|
-
|
-
|
|
Information Technology
|
1,120,127,273
|
1,119,446,711
|
680,562
|
-
|
|
Materials
|
123,429,691
|
123,429,691
|
-
|
-
|
|
Real Estate
|
152,997,342
|
152,997,342
|
-
|
-
|
|
Utilities
|
130,544,871
|
130,544,871
|
-
|
-
|
|
Corporate Bonds
|
1,764,393
|
-
|
1,764,393
|
-
|
|
U.S. Government and Government Agency Obligations
|
7,331,583
|
-
|
7,331,583
|
-
|
|
Money Market Funds
|
74,199,666
|
74,199,666
|
-
|
-
|
|
Total Investments in Securities:
|
4,420,993,768
|
4,354,981,400
|
66,012,368
|
-
|
|
Derivative Instruments:
|
||||
|
Liabilities
|
||||
|
Futures Contracts
|
(2,005)
|
(2,005)
|
-
|
-
|
|
Total Liabilities
|
(2,005)
|
(2,005)
|
-
|
-
|
|
Total Derivative Instruments:
|
(2,005)
|
(2,005)
|
-
|
-
|
|
Primary Risk Exposure / Derivative Type
|
Value
|
|
|
Asset ($)
|
Liability ($)
|
|
|
Equity Risk
|
||
|
Futures Contracts
(a)
|
0
|
(2,005)
|
|
Total Equity Risk
|
0
|
(2,005)
|
|
Total Value of Derivatives
|
0
|
(2,005)
|
|
Statement of Assets and Liabilities
|
||||
|
June 30, 2022
(Unaudited)
|
||||
|
Assets
|
||||
|
Investment in securities, at value (including securities loaned of $16,192,952) - See accompanying schedule:
|
$4,346,794,102
|
|||
|
Unaffiliated issuers (cost $5,394,725,871)
|
||||
|
Fidelity Central Funds (cost $74,199,666)
|
74,199,666
|
|||
|
Total Investment in Securities (cost $5,468,925,537)
|
$
|
4,420,993,768
|
||
|
Foreign currency held at value (cost $15,478)
|
15,478
|
|||
|
Receivable for investments sold
|
90,087,287
|
|||
|
Receivable for fund shares sold
|
8,755
|
|||
|
Dividends receivable
|
3,138,613
|
|||
|
Distributions receivable from Fidelity Central Funds
|
136,541
|
|||
|
Total assets
|
4,514,380,442
|
|||
|
Liabilities
|
||||
|
Payable to custodian bank
|
$4,439,717
|
|||
|
Payable for investments purchased
|
7,076,714
|
|||
|
Payable for fund shares redeemed
|
113,833,334
|
|||
|
Accrued management fee
|
2,042,115
|
|||
|
Distribution and service plan fees payable
|
24
|
|||
|
Payable for daily variation margin on futures contracts
|
1,121,138
|
|||
|
Other affiliated payables
|
617,391
|
|||
|
Other payables and accrued expenses
|
57,156
|
|||
|
Collateral on securities loaned
|
16,815,560
|
|||
|
Total Liabilities
|
146,003,149
|
|||
|
Net Assets
|
$
|
4,368,377,293
|
||
|
Net Assets consist of:
|
||||
|
Paid in capital
|
$
|
5,588,338,554
|
||
|
Total accumulated earnings (loss)
|
(1,219,961,261)
|
|||
|
Net Assets
|
$
|
4,368,377,293
|
||
|
Net Asset Value and Maximum Offering Price
|
||||
|
Initial Class :
|
||||
|
Net Asset Value
, offering price and redemption price per share ($79,240 ÷ 10,000 shares)
|
$
|
7.92
|
||
|
Service Class :
|
||||
|
Net Asset Value
, offering price and redemption price per share ($79,200 ÷ 10,000 shares)
|
$
|
7.92
|
||
|
Service Class 2 :
|
||||
|
Net Asset Value
, offering price and redemption price per share ($79,141 ÷ 10,000 shares)
|
$
|
7.91
|
||
|
Investor Class :
|
||||
|
Net Asset Value
, offering price and redemption price per share ($4,368,139,712 ÷ 551,483,129 shares)
|
$
|
7.92
|
||
|
Statement of Operations
|
||||
|
Six months ended
June 30, 2022
(Unaudited)
|
||||
|
Investment Income
|
||||
|
Dividends
|
$
|
31,963,888
|
||
|
Interest
|
4,640
|
|||
|
Income from Fidelity Central Funds (including $183,808 from security lending)
|
295,984
|
|||
|
Total Income
|
32,264,512
|
|||
|
Expenses
|
||||
|
Management fee
|
$
|
14,089,816
|
||
|
Transfer agent fees
|
3,656,022
|
|||
|
Distribution and service plan fees
|
158
|
|||
|
Accounting fees
|
537,730
|
|||
|
Custodian fees and expenses
|
77,850
|
|||
|
Independent trustees' fees and expenses
|
8,426
|
|||
|
Audit
|
38,308
|
|||
|
Legal
|
1,527
|
|||
|
Interest
|
3,801
|
|||
|
Miscellaneous
|
483
|
|||
|
Total expenses before reductions
|
18,414,121
|
|||
|
Expense reductions
|
(54,494)
|
|||
|
Total expenses after reductions
|
18,359,627
|
|||
|
Net Investment income (loss)
|
13,904,885
|
|||
|
Realized and Unrealized Gain (Loss)
|
||||
|
Net realized gain (loss) on:
|
||||
|
Investment Securities:
|
||||
|
Unaffiliated issuers
|
(167,562,535)
|
|||
|
Foreign currency transactions
|
(47,742)
|
|||
|
Futures contracts
|
(1,269,935)
|
|||
|
Total net realized gain (loss)
|
(168,880,212)
|
|||
|
Change in net unrealized appreciation (depreciation) on:
|
||||
|
Investment Securities:
|
||||
|
Unaffiliated issuers
|
(1,160,034,779)
|
|||
|
Assets and liabilities in foreign currencies
|
(1,617)
|
|||
|
Futures contracts
|
(240,134)
|
|||
|
Total change in net unrealized appreciation (depreciation)
|
(1,160,276,530)
|
|||
|
Net gain (loss)
|
(1,329,156,742)
|
|||
|
Net increase (decrease) in net assets resulting from operations
|
$
|
(1,315,251,857)
|
||
|
Statement of Changes in Net Assets
|
||||
|
Six months ended
June 30, 2022
(Unaudited)
|
For the period October 21, 2021 (commencement of operations) through December 31, 2021
|
|||
|
Increase (Decrease) in Net Assets
|
||||
|
Operations
|
||||
|
Net investment income (loss)
|
$
|
13,904,885
|
$
|
5,058,246
|
|
Net realized gain (loss)
|
(168,880,212)
|
(16,561,585)
|
||
|
Change in net unrealized appreciation (depreciation)
|
(1,160,276,530)
|
112,342,567
|
||
|
Net increase (decrease) in net assets resulting from operations
|
(1,315,251,857)
|
100,839,228
|
||
|
Distributions to shareholders
|
-
|
(7,191,188)
|
||
|
Share transactions - net increase (decrease)
|
(409,615,069)
|
5,999,596,179
|
||
|
Total increase (decrease) in net assets
|
(1,724,866,926)
|
6,093,244,219
|
||
|
Net Assets
|
||||
|
Beginning of period
|
6,093,244,219
|
-
|
||
|
End of period
|
$
|
4,368,377,293
|
$
|
6,093,244,219
|
|
Stock Selector All Cap Portfolio Initial Class
|
|
Six months ended
(Unaudited) June 30, 2022
|
Years ended December 31, 2021
A
|
|||
|
Selected Per-Share Data
|
||||
|
Net asset value, beginning of period
|
$
|
10.16
|
$
|
10.00
|
|
Income from Investment Operations
|
||||
|
Net investment income (loss)
B,C
|
.03
|
.01
|
||
|
Net realized and unrealized gain (loss)
|
(2.27)
|
.16
|
||
|
Total from investment operations
|
(2.24)
|
.17
|
||
|
Distributions from net investment income
|
-
|
(.01)
|
||
|
Total distributions
|
-
|
(.01)
|
||
|
Net asset value, end of period
|
$
|
7.92
|
$
|
10.16
|
|
Total Return
D,E,F
|
(22.05)%
|
1.73%
|
||
|
Ratios to Average Net Assets
C,G,H
|
||||
|
Expenses before reductions
|
.61%
I
|
.61%
I,J
|
||
|
Expenses net of fee waivers, if any
|
.61%
I
|
.61%
I,J
|
||
|
Expenses net of all reductions
|
.61%
I
|
.61%
I,J
|
||
|
Net investment income (loss)
|
.59%
I
|
.52%
I,J
|
||
|
Supplemental Data
|
||||
|
Net assets, end of period (000 omitted)
|
$
|
79
|
$
|
102
|
|
Portfolio turnover rate
K
|
34%
I
|
159%
L,M
|
|
Stock Selector All Cap Portfolio Investor Class
|
|
Six months ended
(Unaudited) June 30, 2022
|
Years ended December 31, 2021
A
|
|||
|
Selected Per-Share Data
|
||||
|
Net asset value, beginning of period
|
$
|
10.16
|
$
|
10.00
|
|
Income from Investment Operations
|
||||
|
Net investment income (loss)
B,C
|
.02
|
.01
|
||
|
Net realized and unrealized gain (loss)
|
(2.26)
|
.16
|
||
|
Total from investment operations
|
(2.24)
|
.17
|
||
|
Distributions from net investment income
|
-
|
(.01)
|
||
|
Total distributions
|
-
|
(.01)
|
||
|
Net asset value, end of period
|
$
|
7.92
|
$
|
10.16
|
|
Total Return
D,E,F
|
(22.05)%
|
1.72%
|
||
|
Ratios to Average Net Assets
C,G,H
|
||||
|
Expenses before reductions
|
.69%
I
|
.68%
I,J
|
||
|
Expenses net of fee waivers, if any
|
.69%
I
|
.68%
I,J
|
||
|
Expenses net of all reductions
|
.69%
I
|
.68%
I,J
|
||
|
Net investment income (loss)
|
.52%
I
|
.44%
I,J
|
||
|
Supplemental Data
|
||||
|
Net assets, end of period (000 omitted)
|
$
|
4,368,140
|
$
|
6,092,940
|
|
Portfolio turnover rate
K
|
34%
I
|
159%
L,M
|
|
Stock Selector All Cap Portfolio Service Class
|
|
Six months ended
(Unaudited) June 30, 2022
|
Years ended December 31, 2021
A
|
|||
|
Selected Per-Share Data
|
||||
|
Net asset value, beginning of period
|
$
|
10.16
|
$
|
10.00
|
|
Income from Investment Operations
|
||||
|
Net investment income (loss)
B,C
|
.02
|
.01
|
||
|
Net realized and unrealized gain (loss)
|
(2.26)
|
.16
|
||
|
Total from investment operations
|
(2.24)
|
.17
|
||
|
Distributions from net investment income
|
-
|
(.01)
|
||
|
Total distributions
|
-
|
(.01)
|
||
|
Net asset value, end of period
|
$
|
7.92
|
$
|
10.16
|
|
Total Return
D,E,F
|
(22.05)%
|
1.71%
|
||
|
Ratios to Average Net Assets
C,G,H
|
||||
|
Expenses before reductions
|
.71%
I
|
.71%
I,J
|
||
|
Expenses net of fee waivers, if any
|
.71%
I
|
.71%
I,J
|
||
|
Expenses net of all reductions
|
.71%
I
|
.71%
I,J
|
||
|
Net investment income (loss)
|
.49%
I
|
.41%
I,J
|
||
|
Supplemental Data
|
||||
|
Net assets, end of period (000 omitted)
|
$
|
79
|
$
|
102
|
|
Portfolio turnover rate
K
|
34%
I
|
159%
L,M
|
|
Stock Selector All Cap Portfolio Service Class 2
|
|
Six months ended
(Unaudited) June 30, 2022
|
Years ended December 31, 2021
A
|
|||
|
Selected Per-Share Data
|
||||
|
Net asset value, beginning of period
|
$
|
10.16
|
$
|
10.00
|
|
Income from Investment Operations
|
||||
|
Net investment income (loss)
B,C
|
.02
|
.01
|
||
|
Net realized and unrealized gain (loss)
|
(2.27)
|
.16
|
||
|
Total from investment operations
|
(2.25)
|
.17
|
||
|
Distributions from net investment income
|
-
|
(.01)
|
||
|
Total distributions
|
-
|
(.01)
|
||
|
Net asset value, end of period
|
$
|
7.91
|
$
|
10.16
|
|
Total Return
D,E,F
|
(22.15)%
|
1.68%
|
||
|
Ratios to Average Net Assets
C,G,H
|
||||
|
Expenses before reductions
|
.86%
I
|
.86%
I,J
|
||
|
Expenses net of fee waivers, if any
|
.86%
I
|
.86%
I,J
|
||
|
Expenses net of all reductions
|
.86%
I
|
.86%
I,J
|
||
|
Net investment income (loss)
|
.34%
I
|
.26%
I,J
|
||
|
Supplemental Data
|
||||
|
Net assets, end of period (000 omitted)
|
$
|
79
|
$
|
102
|
|
Portfolio turnover rate
K
|
34%
I
|
159%
L,M
|
|
Fidelity Central Fund
|
Investment Manager
|
Investment Objective
|
Investment Practices
|
Expense Ratio
A
|
|
Fidelity Money Market Central Funds
|
Fidelity Management & Research Company LLC (FMR)
|
Each fund seeks to obtain a high level of current income consistent with the preservation of capital and liquidity.
|
Short-term Investments
|
Less than .005%
|
|
Gross unrealized appreciation
|
$124,279,038
|
|
Gross unrealized depreciation
|
(1,187,066,413)
|
|
Net unrealized appreciation (depreciation)
|
$(1,062,787,375)
|
|
Tax cost
|
$5,483,779,138
|
|
Short-term
|
$(14,019,690)
|
|
Long-term
|
-
|
|
Total capital loss carryforward
|
$(14,019,690)
|
|
Equity Risk
|
Equity risk relates to the fluctuations in the value of financial instruments as a result of changes in market prices (other than those arising from interest rate risk or foreign exchange risk), whether caused by factors specific to an individual investment, its issuer, or all factors affecting all instruments traded in a market or market segment.
|
|
Purchases ($)
|
Sales ($)
|
|
|
VIP Stock Selector All Cap Portfolio
|
898,048,585
|
1,207,320,616
|
|
Service Class
|
$45
|
|
Service Class 2
|
113
|
|
$158
|
|
Amount
|
% of Class-Level Average Net Assets
A
|
|
|
Initial Class
|
$28
|
.06
|
|
Service Class
|
28
|
.06
|
|
Service Class 2
|
28
|
.06
|
|
Investor Class
|
3,655,938
|
.14
|
|
$3,656,022
|
|
% of Average Net Assets
|
|
|
VIP Stock Selector All Cap Portfolio
|
.02
|
|
Amount
|
|
|
VIP Stock Selector All Cap Portfolio
|
$20,739
|
|
Borrower or Lender
|
Average Loan Balance
|
Weighted Average Interest Rate
|
Interest Expense
|
|
|
VIP Stock Selector All Cap Portfolio
|
Borrower
|
$128,491,000
|
1.06%
|
$3,801
|
|
Purchases ($)
|
Sales ($)
|
Realized Gain (Loss) ($)
|
|
|
VIP Stock Selector All Cap Portfolio
|
69,196,242
|
82,852,141
|
(6,655,919)
|
|
Shares
|
Total Proceeds ($)
|
Participating Classes
|
|
|
VIP Stock Selector All Cap Portfolio
|
602,403,398
|
6,024,033,979
|
Investor Class
|
|
Amount
|
|
|
VIP Stock Selector All Cap Portfolio
|
$362
|
|
Total Security Lending Fees Paid to NFS
|
Security Lending Income From Securities Loaned to NFS
|
Value of Securities Loaned to NFS at Period End
|
|
|
VIP Stock Selector All Cap Portfolio
|
$18,390
|
$103,432
|
$1,127,721
|
|
Six months ended
June 30, 2022
|
Year ended
December 31, 2021
A
|
|
|
VIP Stock Selector All Cap Portfolio
|
||
|
Distributions to shareholders
|
||
|
Initial Class
|
$-
|
$130
|
|
Service Class
|
-
|
110
|
|
Service Class 2
|
-
|
80
|
|
Investor Class
|
-
|
7,190,868
|
|
Total
|
$-
|
$7,191,188
|
|
Shares
|
Shares
|
Dollars
|
Dollars
|
|
|
Six months ended June 30, 2022
|
Year ended December 31, 2021
A
|
Six months ended June 30, 2022
|
Year ended December 31, 2021
A
|
|
|
VIP Stock Selector All Cap Portfolio
|
||||
|
Initial Class
|
||||
|
Shares sold
|
-
|
10,000
|
$-
|
$100,000
|
|
Net increase (decrease).
|
-
|
10,000
|
$-
|
$100,000
|
|
Service Class
|
||||
|
Shares sold
|
-
|
10,000
|
$-
|
$100,000
|
|
Net increase (decrease).
|
-
|
10,000
|
$-
|
$100,000
|
|
Service Class 2
|
||||
|
Shares sold
|
-
|
10,000
|
$-
|
$100,000
|
|
Net increase (decrease).
|
-
|
10,000
|
$-
|
$100,000
|
|
Investor Class
|
||||
|
Shares sold
|
7,615,269
|
605,228,309
|
$70,550,797
|
$6,052,366,991
|
|
Reinvestment of distributions
|
-
|
706,372
|
-
|
7,190,868
|
|
Shares redeemed
|
(56,031,598)
|
(6,035,223)
|
(480,165,866)
|
(60,261,680)
|
|
Net increase (decrease).
|
(48,416,329)
|
599,899,458
|
$(409,615,069)
|
$5,999,296,179
|
|
VIP FundsManager 50% Portfolio
|
VIP FundsManager 60% Portfolio
|
VIP FundsManager 70% Portfolio
|
|
|
VIP Stock Selector All Cap Portfolio
|
34%
|
41%
|
15%
|
|
Fund
|
% of shares held
|
|
VIP Stock Selector All Cap Portfolio
|
100%
|
|
The Example is based on an investment of $1,000 invested at the beginning of the period and held for the entire period (January 1, 2022 to June 30, 2022).
|
|
Annualized Expense Ratio-
A
|
Beginning Account Value January 1, 2022
|
Ending Account Value June 30, 2022
|
Expenses Paid During Period-
C
January 1, 2022 to June 30, 2022
|
|||||||
|
Stock Selector All Cap Portfolio
|
||||||||||
|
Initial Class
|
.61%
|
|||||||||
|
Actual
|
$ 1,000
|
$ 779.50
|
$ 2.69
|
|||||||
|
Hypothetical-
B
|
$ 1,000
|
$ 1,021.77
|
$ 3.06
|
|||||||
|
Investor Class
|
.69%
|
|||||||||
|
Actual
|
$ 1,000
|
$ 779.50
|
$ 3.04
|
|||||||
|
Hypothetical-
B
|
$ 1,000
|
$ 1,021.37
|
$ 3.46
|
|||||||
|
Service Class
|
.71%
|
|||||||||
|
Actual
|
$ 1,000
|
$ 779.50
|
$ 3.13
|
|||||||
|
Hypothetical-
B
|
$ 1,000
|
$ 1,021.27
|
$ 3.56
|
|||||||
|
Service Class 2
|
.86%
|
|||||||||
|
Actual
|
$ 1,000
|
$ 778.50
|
$ 3.79
|
|||||||
|
Hypothetical-
B
|
$ 1,000
|
$ 1,020.53
|
$ 4.31
|
|||||||
|
|
Item 2.
Code of Ethics
Not applicable.
Item 3.
Audit Committee Financial Expert
Not applicable.
Item 4.
Principal Accountant Fees and Services
Not applicable.
Item 5.
Audit Committee of Listed Registrants
Not applicable.
Item 6.
Investments
(a)
Not applicable.
(b)
Not applicable
Item 7.
Disclosure of Proxy Voting Policies and Procedures for Closed-End Management Investment Companies
Not applicable.
Item 8.
Portfolio Managers of Closed-End Management Investment Companies
Not applicable.
Item 9.
Purchase of Equity Securities by Closed-End Management Investment Company and Affiliated Purchasers
Not applicable.
Item 10.
Submission of Matters to a Vote of Security Holders
There were no material changes to the procedures by which shareholders may recommend nominees to the Variable Insurance Products Fund’s Board of Trustees.
Item 11.
Controls and Procedures
(a)(i) The President and Treasurer and the Chief Financial Officer have concluded that the Variable Insurance Products Fund’s (the “Trust”) disclosure controls and procedures (as defined in Rule 30a-3(c) under the Investment Company Act) provide reasonable
assurances that material information relating to the Trust is made known to them by the appropriate persons, based on their evaluation of these controls and procedures as of a date within 90 days of the filing date of this report.
(a)(ii) There was no change in the Trust’s internal control over financial reporting (as defined in Rule 30a-3(d) under the Investment Company Act) that occurred during the period covered by this report that has materially affected, or is reasonably likely to materially affect, the Trust’s internal control over financial reporting.
Item 12.
Disclosure of Securities Lending Activities for Closed-End Management
Investment Companies
Not applicable.
Item 13.
Exhibits
| (a) |
(1) |
Not applicable. |
| (a) |
(2) |
|
| (a) |
(3) |
Not applicable. |
| (b) |
|
SIGNATURES
Pursuant to the requirements of the Securities Exchange Act of 1934 and the Investment Company Act of 1940, the registrant has duly caused this report to be signed on its behalf by the undersigned, thereunto duly authorized.
Variable Insurance Products Fund
| By: |
/s/Stacie M. Smith |
| |
Stacie M. Smith |
| |
President and Treasurer |
| |
|
| Date: |
August 19, 2022 |
Pursuant to the requirements of the Securities Exchange Act of 1934 and the Investment Company Act of 1940, this report has been signed below by the following persons on behalf of the registrant and in the capacities and on the dates indicated.
| By: |
/s/Stacie M. Smith |
| |
Stacie M. Smith |
| |
President and Treasurer |
| |
|
| Date: |
August 19, 2022 |
| By: |
/s/John J. Burke III |
| |
John J. Burke III |
| |
Chief Financial Officer |
| |
|
| Date: |
August 19, 2022 |