
As filed with the Securities and Exchange Commission on March 3, 2014.
Registration No. 333-
UNITED STATES
SECURITIES AND EXCHANGE COMMISSION
WASHINGTON, D.C. 20549
FORM S-1
REGISTRATION STATEMENT
UNDER
THE SECURITIES ACT OF 1933
Opower, Inc.
(Exact Name of Registrant as Specified in Its Charter)
| Delaware | 7372 | 26-0542549 | ||
| (State or Other Jurisdiction of Incorporation or Organization) |
(Primary Standard Industrial Classification Code Number) |
(I.R.S. Employer Identification Number) |
1515 North Courthouse Road, 8th Floor
Arlington, Virginia 22201
703.778.4544
(Address, Including Zip Code, and Telephone Number, Including Area Code, of Registrant’s Principal Executive Offices)
Daniel Yates
Chief Executive Officer
Opower, Inc.
1515 North Courthouse Road, 8th Floor
Arlington, Virginia 22201
703.778.4544
(Name, address, including zip code, and telephone number, including area code, of agent for service)
Copies to:
| Richard A. Kline, Esq. Anthony J. McCusker, Esq. Joseph C. Theis, Esq. Goodwin Procter LLP 135 Commonwealth Drive Menlo Park, California 94025 650.752.3100 |
Michael Sachse, Esq. Senior Vice President and General Counsel Opower, Inc. 1515 North Courthouse Road, 8th Floor Arlington, Virginia 22201 703.778.4544 |
Mark R. Fitzgerald, Esq. Michael C. Labriola, Esq. Wilson Sonsini Goodrich & Rosati, Professional Corporation 1700 K Street NW, Fifth Floor Washington, District of Columbia 20006 202.973.8800 |
Approximate date of commencement of proposed sale to the public: As soon as practicable after this registration statement becomes effective.
If any of the securities being registered on this Form are to be offered on a delayed or continuous basis pursuant to Rule 415 under the Securities Act, check the following box: ¨
If this Form is filed to register additional securities for an offering pursuant to Rule 462(b) under the Securities Act, please check the following box and list the Securities Act registration statement number of the earlier effective registration statement for the same offering. ¨
If this Form is a post-effective amendment filed pursuant to Rule 462(c) under the Securities Act, check the following box and list the Securities Act registration statement number of the earlier effective registration statement for the same offering. ¨
If this Form is a post-effective amendment filed pursuant to Rule 462(d) under the Securities Act, check the following box and list the Securities Act registration statement number of the earlier effective registration statement for the same offering. ¨
Indicate by check mark whether the registrant is a large accelerated filer, an accelerated filer, a non-accelerated filer, or a smaller reporting company. See the definitions of “large accelerated filer,” “accelerated filer” and “smaller reporting company” in Rule 12b-2 of the Exchange Act. (Check one):
| Large accelerated filer | ¨ | Accelerated filer | ¨ | |||
| Non-accelerated filer | x (Do not check if a smaller reporting company) | Smaller reporting company | ¨ | |||
CALCULATION OF REGISTRATION FEE
|
| ||||
| Title of each class of securities to be registered |
Proposed maximum aggregate offering price(1)(2) |
Amount of registration fee | ||
| Common Stock, $0.000005 par value per share |
$100,000,000 | $12,880 | ||
|
| ||||
|
| ||||
| (1) | Estimated solely for the purpose of computing the amount of the registration fee pursuant to Rule 457(o) under the Securities Act of 1933, as amended. |
| (2) | Includes the aggregate offering price of additional shares that the underwriters have the option to purchase to cover overallotments, if any. |
The registrant hereby amends this registration statement on such date or dates as may be necessary to delay its effective date until the registrant shall file a further amendment which specifically states that this registration statement shall thereafter become effective in accordance with Section 8(a) of the Securities Act of 1933 or until the registration statement shall become effective on such date as the Commission, acting pursuant to said Section 8(a), may determine.
The information in this prospectus is not complete and may be changed. We may not sell these securities until the registration statement filed with the Securities and Exchange Commission is effective. This prospectus is not an offer to sell these securities and we are not soliciting offers to buy these securities in any jurisdiction where the offer or sale is not permitted.
PROSPECTUS (Subject to completion)
Issued , 2014
Shares
COMMON STOCK
Opower, Inc. is offering shares of its common stock. This is our initial public offering, and no public market currently exists for our shares. We anticipate that the initial public offering price of our common stock will be between $ and $ per share.
We have applied to list our common stock on the New York Stock Exchange under the symbol “OPWR.”
We are an “emerging growth company” under the U.S. federal securities laws and are subject to reduced public company reporting requirements. Investing in our common stock involves risks. See “Risk Factors” beginning on page 12.
PRICE $ A SHARE
| Price
to |
Underwriting |
Proceeds to Opower | ||||
| Per Share |
$ | $ | $ | |||
| Total |
$ |
$ | $ | |||
| (1) | See “Underwriters” for additional information regarding underwriting compensation. |
We have granted the underwriters the right to purchase up to an additional shares of common stock to cover over-allotments.
The Securities and Exchange Commission and any state securities regulators have not approved or disapproved of these securities, or determined if this prospectus is truthful or complete. Any representation to the contrary is a criminal offense.
The underwriters expect to deliver the shares of common stock to purchasers on , 2014.
| MORGAN STANLEY | GOLDMAN, SACHS & CO. | |
| Allen & Company LLC | Pacific Crest Securities | |
| Canaccord Genuity | Cowen and Company | |
, 2014

INFORMATION IS POWER

POWERFUL SOFTWARE, POWERED BY DATA 1.4 MILLION households served in 2010 32.1 MILLION households and businesses served in 2013 1,900 GWh saved in 2013 100+ BILLION meter reads analyzed annually $234.1 MILLIONsaved by consumers in 2013* 40+ behavioral science techniques used in our products *at average U.S. electricity prices 52 MILLION households and businesses in the Opower data set 93 utility customers across 8 COUNTRIES 27 of the 50 LARGEST U.S. ELECTRIC UTILITIES 52 MILLION households and businesses in the Opower data set

This is OPOWER
You should rely only on the information contained in this prospectus or contained in any free writing prospectus filed with the Securities and Exchange Commission. Neither we nor any of the underwriters have authorized anyone to provide any information or make any representations other than those contained in this prospectus or in any free writing prospectus filed with the Securities and Exchange Commission. We take no responsibility for, and can provide no assurance as to the reliability of, any other information that others may give you. We are offering to sell, and seeking offers to buy, shares of common stock only in jurisdictions where offers and sales are permitted. The information contained in this prospectus is accurate only as of the date of this prospectus, regardless of the time of delivery of this prospectus or of any sale of the common stock. Our business, financial condition, results of operations and prospects may have changed since such date.
Through and including , 2014 (the 25th day after the date of this prospectus), all dealers effecting transactions in these securities, whether or not participating in this offering, may be required to deliver a prospectus. This is in addition to a dealer’s obligation to deliver a prospectus when acting as an underwriter and with respect to an unsold allotment or subscription.
For investors outside of the United States: Neither we nor any of the underwriters have done anything that would permit this offering or possession or distribution of this prospectus in any jurisdiction where action for that purpose is required, other than in the United States. You are required to inform yourselves about, and to observe any restrictions relating to, this offering and the distribution of this prospectus outside of the United States.
i
This summary highlights selected information that is presented in greater detail elsewhere in this prospectus. This summary does not contain all of the information you should consider before investing in our common stock. You should read this entire prospectus carefully, including the sections titled “Risk Factors” and “Management’s Discussion and Analysis of Financial Condition and Results of Operations” and our financial statements and the related notes included elsewhere in this prospectus, before making an investment decision. Unless the context otherwise requires, the terms “Opower,” “the company,” “we,” “us,” and “our” in this prospectus refer to Opower, Inc.
OPOWER, INC.
Overview
Opower is a leading provider of cloud-based software to the $2.2 trillion utility industry. Utilities use our software platform to deliver key customer-facing applications that reduce energy demand and improve customer perception of the utility. Our software analyzes energy data and presents personalized insights to consumers in order to motivate reductions in energy consumption. These reductions are valued as a source of energy much like a conventional power plant. We believe that we are poised to transform the way the utility industry meets energy demand.
Utilities face two critical challenges that our software is built to address. First, utilities are under political, regulatory and environmental pressure to build fewer power plants, find cleaner sources of fuel and keep rates low. In order to accomplish these goals, utilities implement energy efficiency and demand response programs, which reduce overall and peak usage. Regulatory mechanisms support these programs by compensating utilities for reducing usage. Second, utilities need to strengthen their customer relationships. In many parts of the world, utilities compete for customers, and therefore customer engagement is critical. In regulated markets, which include much of the United States, regulators reward utilities for improving customer satisfaction. Utilities committed an estimated $11 billion to energy efficiency, demand response and customer engagement programs in 2013 in an effort to address these two challenges.
Our software is replacing low-tech and hardware-intensive products. Alternative efficiency programs today primarily consist of subsidies for energy efficient products, such as air conditioners and light bulbs. A common residential demand response program is a decades-old hardware switch connected to a pager network that shuts off the consumer’s air conditioner. Utility marketing efforts are often limited to traditional mass market approaches, such as bus stop advertisements and television commercials. We are able to replace these programs because our software offers measurable results and a better return on investment to utilities when scaled. Our approach has improved customer sentiment metrics by a median of 6% and up to 10% in some cases and we helped utilities and their customers save over 1,900 gigawatt hours of energy in 2013.
We can embed our solutions within utilities’ websites, mobile applications and customer service interfaces, and deliver individualized emails, text messages, automated phone calls and mail. In the design of these consumer touch points, we apply behavioral science insights to actionable patterns identified by our proprietary data analytics engine, which analyzes hundreds of billions of energy usage data points. Our cloud-based platform is extensible and configurable, a necessity to accommodate our customers’ diverse needs on a single code base.
We have developed four interconnected solutions on our platform:
| • | 2007: Opower Energy Efficiency – Reports and alerts, via mail and email, that compare consumers’ energy use to their neighbors’ and provide targeted energy saving recommendations. |
1
| • | 2010: Opower Customer Engagement – Web, mobile, digital alerts and customer service applications that improve customer experience and streamline operations. |
| • | 2012: Opower Thermostat Management – Mobile and web applications that connect to third-party thermostats in order to control and optimize peak and overall HVAC utilization. |
| • | 2013: Opower Demand Response – A zero-hardware solution consisting of near real-time text messages, email and automated phone alerts that motivates peak reductions in energy consumption. |
We generate revenue from utilities by selling primarily multi-year subscriptions to our software. As of December 31, 2013, we served 93 utility customers in eight countries, including 27 of the 50 largest electric utilities in the United States. We have the opportunity to expand within these existing customers; for example, the average penetration of our Energy Efficiency solution is approximately 10% of our utility clients’ customer base. We believe our addressable market includes 1,300 electric and gas utilities worldwide, serving 650 million households and 60 million businesses.
Because our clients often provide us all of their energy data even when launching smaller programs, we currently manage data representing 37% of all U.S. households. The scale and scope of this data enable us to better optimize the energy-saving performance of our programs and continually improve our pattern-matching algorithms. We share our proprietary cross-utility insights with our utility customers, and they see it as a valued benefit. We believe that as we grow, these network effects will continue to strengthen, and that these advantages give us a defensible leadership position.
We have experienced significant growth since our inception. Through our utility customers, we have increased the households we serve from 1.4 million in 2010 to 32.1 million in 2013. For the years ended December 31, 2011, 2012 and 2013, our revenue was $28.7 million, $51.8 million and $88.7 million, respectively, representing year-over-year revenue growth of 80% and 71%, respectively. We generated more than 90% of our revenue from annual recurring subscription fees in 2013. Because we believe our opportunity is large, we continue to invest significantly in our growth. As a result, we have generated net losses of $21.3 million, $12.3 million and $14.2 million in 2011, 2012 and 2013, respectively.
Utility Industry Background and Our Market Opportunity
Utilities operate in a highly regulated environment. Regulators review and approve capital expenditures and, in most markets, set the rates utilities charge their customers. In particular, regulators increasingly incentivize utilities to pursue energy efficiency and demand response, and place higher priority on better customer experience.
Key Industry Trends Affecting Utilities
Key trends affecting utilities include:
Regulators Prioritizing Energy Efficiency Over New Capacity. More than 25 U.S. states have enacted long-term energy efficiency resource standards, and these states account for over 61% of total U.S. electricity consumption. Similarly, the European Union adopted an Energy Efficiency Directive in October 2012 in order to ensure the achievement of its commitment to reduce emissions by 20% by 2020. In Asia and Latin America, rapid development, limited supply and government regulation and initiatives are also creating an imperative for energy saving measures.
Increasing Focus on Reducing Peak Demand. As it is for most large network providers, reducing peak demand is valuable for utilities. In fact, it has become even more valuable as peak supply prices have gone up and as changing regulations have made it easier to sell energy reductions on par with supply.
2
Changing Consumer Expectations. The widespread adoption of smartphones, mobile apps and social networking tools has changed the way consumers interact with their service providers. The change in consumer expectations has led utilities to seek new communication tools. As a result, utilities are looking for services that can improve their relationship with their customers.
Increasing Data Available to Utilities. Smart meter rollouts continue to accelerate globally. According to a January 2013 IMS Research report, smart meter penetration is expected to increase from 18% of all electricity meters in 2011 to 35% of all meters in 2016. Smart meters generate over 700 times more data than traditional meters, and this large increase creates an opportunity for utilities to offer new services and analytics-driven insights for their customers. In addition, the emergence of WiFi-enabled thermostats is likely to increase available energy data even further.
Increasing Competition. Over the past two decades, many countries and some U.S. states have separated the retail sale of energy from the generation, distribution and transmission of power. In these markets, competition among retail providers can be high, and customer retention is a challenge with some utilities experiencing customer churn of more than 25% per year. In noncompetitive, or regulated, energy markets, other providers, such as rooftop solar contractors, are entering the market with products and services that threaten to disintermediate the utility. All of these challenges mean that utilities must build deeper relationships with their customers.
The Opportunity for the Opower Solution
We believe our solutions give utilities greater returns than their historical options and, as a result, we expect to continue to grow our share of these large markets over time.
| • | Energy Efficiency. In the U.S. alone, utilities spent $6.9 billion on electric efficiency in 2012. Since 2007, this spending has grown at a 21% CAGR, according to a July 2013 report from the Institute for Electric Innovation. |
| • | Demand Response. The global demand response market is projected to grow from $3.0 billion in 2013 to $5.8 billion in 2020, representing a CAGR of 10%, according to a second quarter 2013 report published by Navigant Research. |
| • | Customer Engagement. We believe that customer engagement is at the intersection of a number of markets for utilities, including customer billing and information systems, home energy management solutions and smart grid analytics. These markets are expected to grow from $4.1 billion in 2013 to $12.1 billion in 2020, representing a 17% CAGR, according to Navigant Research and Greentech Media. |
Our solutions address a portion of each of these markets. Based on our internal analysis and industry experience, we estimate our addressable market opportunity to be at least $11 billion annually. Our newest solutions, Thermostat Management and Demand Response, offer significant growth potential, but both are still in a nascent stage with an immaterial impact on our revenue to date.
Key Benefits to Utilities
The key benefits utilities derive from our solutions include:
Low Cost, Large Scale Energy Efficiency. We are able to cost-effectively drive energy efficiency results across millions of homes. As a result, for some utilities, our efficiency solution has become their single biggest source of residential energy savings.
Low Cost, Large Scale Residential Demand Response. Our software enables utilities to scale residential peak demand reductions by rapidly communicating with energy consumers.
3
Improved Customer Satisfaction. Utilities have implemented our user-friendly solutions to increase customer satisfaction. We have surveyed over 30,000 energy consumers who receive our solutions. These consumers consistently report greater trust in their utility as a source of information, and they believe that the utility wants to help them save energy and money.
Reduced Cost to Serve. Utilities spend $6 billion annually on customer service. With our digital solutions, utilities can communicate with their customers through web and mobile applications, making interactions more cost effective and efficient. We believe this reduces customer service costs. Customer service software has been reducing the cost of service for a wide set of industries, but the utility industry has lagged behind.
Better Customer Engagement Technology. Our platform gives utilities the ability to deploy state-of-the-art technology for their customer communications, allowing them to reach and engage their customers across multiple channels with minimal effort. Much as next generation customer relationship management (“CRM”) software and digital marketing software have delivered significant value to enterprises globally, our solutions help utilities strengthen their relationships with their customers.
Network Effects. We have six years of experience working with industry leading utilities. Our large and growing energy dataset combined with our significant industry experience has caused many utilities to view us as a source of third-party benchmarking and industry knowledge.
Our Differentiated Approach
The key components of our differentiated approach are:
Highly Scalable Data Analytics Engine. We have built what we believe to be the most sophisticated data engine serving utilities. As of December 31, 2013, we have collected energy data from 52 million households and businesses aggregated from our utility customers. Our data analytics engine can process and analyze our vast data set and provide personalized insights to the households and businesses that our utility customers serve.
Cloud-Based Architecture. Our solutions are built on a cloud-based architecture and delivered through web and mobile applications, text message, email, phone and mail. We maintain a single version of our code base, which means that all of our customers receive new features and updates simultaneously. In an industry that is accustomed to long-term investments, the fact that our software is regularly updated at no added cost is a significant benefit.
Intuitive User Experience Informed by Behavioral Science. An intuitive user experience and behavioral science are at the core of all of our solutions. We seek to change the habits of consumers by presenting realistic goals, encouragement and rewards. We use more than 40 behavioral science techniques such as loss language, normative comparisons and reciprocity to encourage utility customers to optimize their energy consumption.
Track Record of Measurable Results. We design our products to deliver measurable outcomes, which are necessary for utilities to meet their energy efficiency and demand response targets. We have 189 client years of results, and we believe this track record gives us a significant advantage over our competitors. Our approach to savings has been approved by regulators in 30 states, and that track record has strengthened our brand.
4
Our Growth Strategy
The key elements of our growth strategy include:
Expand With Existing Customers. We see a significant opportunity to grow our revenue simply by expanding our presence within our existing customer base. Currently, our energy efficiency reports are deployed to approximately 10% of households that our utility customers serve. Most of our utility customers initially purchase only one of our four solutions, and deploy that initial solution to only a portion of their customers. Because all of our easily integrated products help utilities improve their engagement with energy consumers, we believe that utilities will derive even greater benefits as they deploy additional solutions. Moreover, once a utility begins to send us its data, we can more easily roll out programs to additional households and businesses.
Win New Customers Globally. As of December 31, 2013, we had 93 utility customers in eight countries, yet we believe that there are approximately 1,300 utilities that could benefit from our solutions. To reach more of these potential customers, we are expanding our sales, marketing and regulatory efforts, in particular internationally.
Develop New Offerings on Our Industry Data Platform. Since we are a trusted partner, our customers often ask us to develop new offerings to meet their growing needs. These requests are increasingly central to our plans for growth. We have made, and will continue to make, significant investments to augment our platform to capture adjacent opportunities.
Focus on Gas and Electric Consumer Outcomes. From the outset, we have designed products that can deliver measurable changes in consumer behavior, which has been core to our success. We believe we can achieve more both with our existing solutions and through new products. We have focused and will continue to focus our research and development efforts to continue to improve outcomes for gas and electric consumers.
Risks Affecting Us
Our business, financial condition, results of operations and prospects are subject to numerous risks. These risks include:
| • | We have a history of losses and we may not achieve or sustain profitability on a quarterly or annual basis. |
| • | Sales and implementation cycles to our customers can be lengthy and unpredictable. |
| • | We operate in a highly regulated business environment. |
| • | We are dependent on the utility industry, which has experienced increased and changing regulations. |
| • | A limited number of our utility customers are responsible for a significant portion of our bookings, revenue and cash flow. |
| • | We have experienced rapid growth and organizational change in recent periods. |
| • | The market for our products and solutions is still developing. |
| • | Utilities in critical markets may fail to collect data or may be unable to collect current data that we require to provide our products and solutions. |
| • | Our quarterly results are inherently unpredictable and subject to substantial fluctuations. |
| • | We operate in a competitive industry. |
5
Corporate Information
We were incorporated in Delaware in 2007. Our principal executive offices are located at 1515 North Courthouse Road, 8th Floor, Arlington, Virginia 22201, and our telephone number is (703) 778-4544. Our website address is www.opower.com. Information contained on or that can be accessed through our website does not constitute part of this prospectus and inclusions of our website address in this prospectus are inactive textual references only.
“Opower” is our registered trademark in the United States, Australia, Canada, the European Community, Japan and New Zealand. Other trademarks and trade names referred to in this prospectus are the property of their respective owners.
6
| Common stock offered by us |
shares | |
| Common stock to be outstanding after this offering |
shares | |
| Option to purchase additional shares from us |
We have granted the underwriters an option, exercisable for 30 days after the date of this prospectus, to purchase up to an additional shares from us. | |
| Use of proceeds |
We estimate that the net proceeds from the sale of shares of our common stock that we are selling in this offering will be approximately $ million (or approximately $ million if the underwriters’ option to purchase additional shares in this offering is exercised in full), based upon an assumed initial public offering price of $ per share, which is the midpoint of the estimated offering price range set forth on the cover page of this prospectus, and after deducting estimated underwriting discounts and commissions and estimated offering expenses payable by us. | |
| We currently intend to use the net proceeds of this offering for working capital and other general corporate purposes, including investing further in our sales and marketing and research and development efforts. We intend to use proceeds from this offering to further grow our business and to fund our growth strategies discussed in this prospectus. We may also use a portion of the net proceeds to acquire or invest in complementary businesses, products, services, technologies or other assets. See “Use of Proceeds” for additional information. | ||
| Concentration of ownership |
Upon completion of this offering, our executive officers and directors, and their affiliates, will beneficially own, in the aggregate, approximately % of our outstanding shares of common stock. | |
| Risk factors |
See “Risk Factors” for a discussion of factors you should carefully consider before deciding to invest in our common stock. | |
| New York Stock Exchange trading symbol |
“OPWR” | |
The number of shares of common stock that will be outstanding after this offering is based on 41,359,839 shares outstanding as of December 31, 2013, and excludes:
| • | 7,789,720 shares of common stock issuable upon the exercise of options to purchase common stock that were outstanding as of December 31, 2013, with a weighted-average exercise price of $3.83 per share; |
7
| • | 1,093,326 shares of common stock issuable upon the vesting of restricted stock units that were outstanding as of December 31, 2013; |
| • | 283,950 shares of common stock issuable upon the vesting of restricted stock units that were granted after December 31, 2013; |
| • | shares of common stock issuable upon the conversion of the subordinated convertible promissory note with a utility partner dated March 8, 2013, based on an assumed initial public offering price of $ per share, which is the midpoint of the estimated offering price range set forth on the cover page of this prospectus; and |
| • | 6,529,852 shares of common stock reserved for future issuance under our stock-based compensation plans, consisting of 1,529,852 shares of common stock reserved for future issuance under our 2007 Stock Plan as of December 31, 2013, which shares will be added to the shares to be reserved under our 2014 Stock Incentive Plan, and 5,000,000 shares of common stock reserved for future issuance under our 2014 Stock Incentive Plan, which will become effective in connection with this offering, and shares that become available pursuant to provisions thereof that automatically increase the share reserves under the 2014 Stock Incentive Plan each year. |
Except as otherwise indicated, all information in this prospectus assumes:
| • | the automatic conversion of all outstanding shares of our convertible preferred stock into an aggregate of 19,246,714 shares of common stock, the conversion of which will occur immediately prior to the completion of this offering; |
| • | the filing and effectiveness of our amended and restated certificate of incorporation in Delaware and the adoption of our amended and restated bylaws, each of which will occur immediately prior to the completion of this offering; and |
| • | no exercise by the underwriters of their option to purchase up to an additional shares of common stock from us in this offering. |
8
The following tables summarize our historical financial data. We have derived the summary statement of operations data for the years ended December 31, 2011, 2012 and 2013 and the balance sheet data as of December 31, 2013 from our audited financial statements included elsewhere in this prospectus. Our historical results are not necessarily indicative of the results that may be expected in the future. The following summary financial and other data should be read in conjunction with “Management’s Discussion and Analysis of Financial Condition and Results of Operations” and our financial statements and related notes included elsewhere in this prospectus.
| Year Ended December 31, | ||||||||||||
| 2011 | 2012 | 2013 | ||||||||||
| (In thousands, except per share amounts) |
||||||||||||
| Consolidated Statements of Operations Data: |
||||||||||||
| Revenue |
$ | 28,746 | $ | 51,756 | $ | 88,703 | ||||||
| Cost of revenue(1) |
13,306 | 18,913 | 31,304 | |||||||||
|
|
|
|
|
|
|
|||||||
| Gross profit |
15,440 | 32,843 | 57,399 | |||||||||
| Operating expenses(1): |
||||||||||||
| Sales and marketing |
13,648 | 21,338 | 30,551 | |||||||||
| Research and development |
14,372 | 16,134 | 27,087 | |||||||||
| General and administrative |
8,716 | 7,730 | 13,578 | |||||||||
|
|
|
|
|
|
|
|||||||
| Total operating expenses |
36,736 | 45,202 | 71,216 | |||||||||
|
|
|
|
|
|
|
|||||||
| Operating loss |
(21,296 | ) | (12,359 | ) | (13,817 | ) | ||||||
| Other income (expense), net |
(1 | ) | 54 | (321 | ) | |||||||
|
|
|
|
|
|
|
|||||||
| Loss before income taxes |
(21,297 | ) | (12,305 | ) | (14,138 | ) | ||||||
| Provision for income taxes |
— | 27 | 23 | |||||||||
|
|
|
|
|
|
|
|||||||
| Net loss |
$ | (21,297 | ) | $ | (12,332 | ) | $ | (14,161 | ) | |||
|
|
|
|
|
|
|
|||||||
| Weighted-average common stock outstanding(2): |
||||||||||||
| Basic and diluted |
17,836 | 19,442 | 21,121 | |||||||||
| Net income (loss) per share(2): |
||||||||||||
| Basic and diluted |
$ | (1.19 | ) | $ | (0.63 | ) | $ | (0.67 | ) | |||
| Pro forma weighted-average common stock outstanding(2): |
||||||||||||
| Basic and diluted |
||||||||||||
| Pro forma net loss per share (unaudited)(2): |
||||||||||||
| Basic and diluted |
$ | |||||||||||
| (1) | Stock-based compensation was allocated as follows: |
| Year Ended December 31, | ||||||||||||
| 2011 | 2012 | 2013 | ||||||||||
| (In thousands) | ||||||||||||
| Cost of revenue |
$ | 87 | $ | 137 | $ | 197 | ||||||
| Sales and marketing |
340 | 484 | 1,348 | |||||||||
| Research and development |
382 | 447 | 939 | |||||||||
| General and administrative |
151 | 119 | 1,141 | |||||||||
|
|
|
|
|
|
|
|||||||
| Total stock-based compensation |
$ | 960 | $ | 1,187 | $ | 3,625 | ||||||
|
|
|
|
|
|
|
|||||||
| (2) | See Note 10 to our audited financial statements for an explanation of the method used to calculate basic and diluted net loss per share attributable to common stockholders, pro forma basic and diluted net loss per share attributable to common stockholders and the weighted-average number of shares used in the computation of the per share amounts. |
9
| December 31, 2013 | ||||||||||||
| Actual | Pro Forma(1) | Pro Forma
As Adjusted(2)(3) |
||||||||||
| (In thousands) | ||||||||||||
| Balance Sheet Data: |
||||||||||||
| Cash and cash equivalents |
$ | 28,819 | $ | $ | ||||||||
| Working capital (deficit) |
(11,851 | ) | ||||||||||
| Property and equipment, net |
10,813 | |||||||||||
| Total assets |
63,135 | |||||||||||
| Deferred revenue |
52,390 | |||||||||||
| Total indebtedness |
3,673 | |||||||||||
| Total stockholders’ equity (deficit) |
(6,263 | ) | ||||||||||
| (1) | The pro forma column in the balance sheet data table above gives effect to (i) the filing of our amended and restated certificate of incorporation, (ii) the automatic conversion of all outstanding shares of our convertible preferred stock into an aggregate of 19,246,714 shares of common stock and (iii) the automatic conversion of all outstanding debt under a subordinated convertible promissory note with a utility partner dated March 8, 2013 into shares of common stock, based on an assumed initial public offering price of $ per share, which is the midpoint of the estimated offering price range set forth on the cover page of this prospectus, which conversion will occur prior to the completion of this offering, as if such conversion had occurred on December 31, 2013. |
| (2) | The pro forma as adjusted column in the balance sheet data table above gives effect to the pro forma adjustments set forth in footnote 1 above and the sale and issuance by us of shares of common stock in this offering at an assumed initial public offering price of $ per share, which is the midpoint of the estimated offering price range set forth on the cover page of this prospectus, after deducting the estimated underwriting discounts and commissions and estimated offering expenses payable by us. |
| (3) | Each $1.00 increase or decrease in the assumed initial public offering price of $ per share, which is the midpoint of the estimated offering price range set forth on the cover page of this prospectus, would increase or decrease, as applicable, the cash and cash equivalents, working capital (deficit), total assets and total stockholders’ equity (deficit) by $ million, assuming that the number of shares offered by us, as set forth on the cover page of this prospectus, remains the same, and after deducting estimated underwriting discounts and commissions payable by us. An increase or decrease of 1.0 million shares in the number of shares offered by us would increase or decrease, as applicable, the cash and cash equivalents, working capital (deficit), total assets and total stockholders’ equity (deficit) by $ million assuming an initial public offering price of $ per share, which is the midpoint of the estimated offering price range set forth on the cover page of this prospectus, and after deducting estimated underwriting discounts and commissions payable by us. |
| Year Ended December 31, | ||||||||||||
| 2011 | 2012 | 2013 | ||||||||||
| (In thousands) | ||||||||||||
| Other Financial Metrics: | ||||||||||||
| Adjusted EBITDA |
$ | (19,710 | ) | $ | (9,573 | ) | $ | (6,426 | ) | |||
To provide investors with additional information regarding our financial results, we have disclosed in the table above and within this prospectus adjusted EBITDA, a non-GAAP financial measure. We have provided a reconciliation below between adjusted EBITDA and net loss, the most directly comparable financial measure as measured in accordance with U.S. generally accepted accounting principles (“GAAP”).
We have included adjusted EBITDA in this prospectus because it is a key measure used by our management to evaluate our operating performance, generate future operating plans and make strategic decisions. Accordingly, we believe that adjusted EBITDA provides useful information to investors and others in understanding and evaluating our results of operations in the same manner as our management and board of directors.
10
While we believe that this non-GAAP financial measure is useful in evaluating our business, this information should be considered as supplemental in nature and is not meant as a substitute for the related financial information prepared in accordance with GAAP. Some of these limitations are:
| • | although depreciation and amortization are non-cash charges, the assets being depreciated and amortized may have to be replaced in the future and adjusted EBITDA does not reflect cash capital expenditure requirements for such replacements or for new capital expenditure requirements; |
| • | adjusted EBITDA does not reflect changes in, or cash requirements for, our working capital needs; |
| • | adjusted EBITDA does not include the impact of stock-based compensation; |
| • | adjusted EBITDA does not reflect income tax payments that may represent a reduction in cash available to us; and |
| • | other companies, including companies in our industry, may calculate adjusted EBITDA differently or not at all, which reduces its usefulness as a comparative measure. |
We believe it is useful to exclude non-cash charges, such as depreciation and amortization and stock-based compensation, from our adjusted EBITDA because the amount of such expenses in any specific period may not directly correlate to the underlying performance of our business operations.
Because of the aforementioned limitations, you should consider adjusted EBITDA alongside other financial performance measures, including net loss, cash flow metrics and our financial results presented in accordance with GAAP. The following table presents a reconciliation of net loss to adjusted EBITDA for each of the periods indicated:
| Year Ended December 31, | ||||||||||||
| 2011 | 2012 | 2013 | ||||||||||
| (In thousands) | ||||||||||||
| Reconciliation of Net Loss to Adjusted EBITDA: |
||||||||||||
| Net loss |
$ | (21,297 | ) | $ | (12,332 | ) | $ | (14,161 | ) | |||
| Provision for income taxes |
— | 27 | 23 | |||||||||
| Other (income) expense, including interest |
1 | (54 | ) | 321 | ||||||||
| Depreciation and amortization |
626 | 1,599 | 3,766 | |||||||||
| Stock-based compensation |
960 | 1,187 | 3,625 | |||||||||
|
|
|
|
|
|
|
|||||||
| Adjusted EBITDA |
$ | (19,710 | ) | $ | (9,573 | ) | $ | (6,426 | ) | |||
|
|
|
|
|
|
|
|||||||
11
Investing in our common stock involves a high degree of risk. You should carefully consider the risks and uncertainties described below, together with all of the other information in this prospectus, before making a decision to invest in our common stock. If any of the risks actually occur, our business, financial condition, results of operations and prospects could be harmed. In that event, the trading price of our common stock could decline, and you could lose part or all of your investment.
Risks Related to Our Business
We have a history of losses and anticipate continued losses and negative operating cash flow for the foreseeable future, and we may not achieve or sustain profitability on a quarterly or annual basis.
We have incurred significant losses to date, with an accumulated deficit of $83.2 million as of December 31, 2013. For the years ended December 31, 2011, 2012 and 2013, we incurred net losses of $21.3 million, $12.3 million and $14.2 million, respectively. We expect these losses to continue. We also anticipate negative operating cash flow for the foreseeable future, as we expect to incur significant operating expenses in connection with the continued development and expansion of our business. Many of these expenses relate to prospective customers that may never contract with us, as well as products that may not be introduced, that we may choose to discontinue, that may fail to achieve desired results or that may not generate revenue until later periods, if at all. We may not achieve or sustain profitability on a quarterly or annual basis.
Sales cycles and implementation times can be lengthy and unpredictable and require significant employee time and financial resources.
Sales cycles for our products tend to be long and unpredictable. Even after we have convinced prospective customers of the need for, and value of, our products and solutions, our customers are large organizations that frequently have extensive budgeting, procurement, competitive bidding, technical and performance reviews and regulatory approval processes that can slow down the sales process by months or even years. Utilities may choose, and many historically have chosen, to follow industry trends rather than be early adopters of new products or solutions, which can extend the lead time for or prevent acceptance of more recently introduced products or solutions such as ours. In many instances, a utility may require one or more pilot programs to test our products and solutions before committing to a larger deployment. These pilot programs may be quite lengthy and provide no assurance that they will lead to a larger deployment or future sales. The implementation and deployment of our solutions can be unpredictable due to contract negotiations and challenges with implementation, or critical dependencies, such as the installation of other products, including smart meters. Furthermore, the implementation and deployment of new products and solutions may require troubleshooting, which requires additional time and resources from us and our customers. These delays may lengthen our sales cycles.
Our sales cycle is typically 6 months to 24 months. This extended sales, implementation and deployment process requires our senior management and our sales and marketing and customer services personnel to dedicate significant time to sales, and to use significant financial resources without any assurance of success or recovery of our related expenses.
The lengthy sales cycle also makes it difficult to forecast new customer implementations and deployments, as well as the volume and timing of future agreements, which, in turn, makes forecasting our future results of operations challenging. In the event that we publicly disclose any forecasts of our future results of operations or other forward-looking metrics, and those forecasts ultimately turn out to be inaccurate, the value of our common stock could significantly decline.
12
We provide services to utilities that operate in a highly regulated business environment, and regulatory requirements or need for regulatory approval could delay or reduce demand for our products, impose costs on us or make our products less attractive to our customers.
Our customers, products and solutions are subject to many federal, state, local and foreign laws and regulations. In many cases, our customers are subject to direct oversight from Public Utility Commissions, Public Service Commissions, Independent System Operators, the Federal Energy Regulatory Commission or other regulatory entities primarily focused on the energy utility sector. Applicable laws and regulations govern, among other things, utility demand for energy efficiency and demand response solutions, the data that we are able to handle and collect, utility structuring and incentives, the utility’s ability to spend money on our products and solutions and the methods and manners that we can use to contact utility customers. Depending on the solutions sought, prospective customers may be required to gain approval from any of these organizations prior to implementing our solutions, which could delay our ability to collect cash and recognize revenue.
We are dependent in part on regulations on the utility industry, and the changing regulatory landscape could alter our customers’ buying patterns.
The utility industry has been subject to increasing and changing regulations in recent years. We derive substantially all of our revenue from sales of products and solutions directly and indirectly to utilities, and this complex and difficult landscape poses a risk to us. We have experienced, and may in the future experience, variability in our results of operations on an annual and a quarterly basis as a result of these factors. Going forward, these factors could harm our financial condition and cash flows.
Changes in the regulatory conditions could reduce a customer’s interest in or ability to implement our products and solutions. Examples of market dynamics driven by regulation include:
| • | energy efficiency goals; |
| • | interpretations of the energy savings credit attributed to our products; |
| • | regulated compensation associated with energy efficiency; |
| • | demand response goals; |
| • | rules concerning the peak reductions attributed to our products; |
| • | regulated compensation associated with demand response; |
| • | smart metering or advanced meter infrastructure deployments; and |
| • | data privacy. |
Many regulatory jurisdictions have implemented rules that provide financial incentives for the implementation of energy efficiency and demand response technologies, either by providing rebates or through the restructuring of utility rates. In the past, we have seen demand for our solutions altered by changes in regulation. We have also had to limit or alter our offerings to comply with regulatory requirements, and these changes have affected our revenue. In addition, deregulation may change the incentives for our customers or prospective customers to use our solutions. If changes in regulation reduce or negatively alter the demand for our solutions, our business and results of operations could be harmed. In order to counteract this risk, we have invested significant time and effort in understanding and attempting to impact government decisions that we believe will affect our market. These efforts, however, have not always been successful and may not succeed in the future.
13
If we fail to respond to evolving technological changes, our products and solutions could become obsolete or less competitive.
Our industry is highly competitive and characterized by new and rapidly evolving technologies, techniques, standards, regulations, customer requirements and frequent product introductions. Accordingly, our results of operations depend upon, among other things, our ability to develop and introduce new products and solutions, as well as our ability to improve existing products. The process of developing new technologies and products is complex. If we are unable to develop enhancements to, and new features for, our existing products or if we are unable to develop new products that keep pace with technological developments or industry standards, our business could be harmed.
We continue to invest in new product offerings and the success of those offerings is uncertain. A few examples of such product development challenges are:
| • | Over the last three years, we have invested significant resources in developing a thermostat offering. We have yet to see a significant return from that investment, as our development and sales growth has been slowed by market challenges. These challenges may continue, and our investment in this area may not yield returns. |
| • | We are developing an offering tailored specially for small and medium-sized businesses. The market for this offering is unproven, and our ability to successfully deliver the results our customers seek is uncertain. |
| • | We have invested considerable resources in developing a demand response offering. While the early results have been promising, it is possible that the market could be smaller than we have expected or that our product will not function as intended. |
| • | We also have other products in development; it is possible that none of those products will prove to be successful. |
All of our research and development efforts are dependent upon our ability to deliver products and functionality in a timely and efficient manner. In the past, we have experienced delays delivering products, and while we have taken steps to improve the predictability of our research and development efforts, those efforts may not be successful. If we continue to experience delays in our ability to deliver new products and functionality, our business and growth rates would suffer.
Our success depends in part on our ability to deliver measurable outcomes, and our business may be harmed if our products became less effective or our results are questioned.
Our products deliver valuable measurable outcomes for our customers and receive favorable treatment from their regulators, both of which are important to our customers. Our ability to deliver expected results is dependent on numerous factors, including but not limited to the effectiveness of our approach and products, the cost of alternate sources of energy savings, the availability of data and our ability to effectively reach energy consumers. We may not be able to continue to deliver valuable measurable outcomes or we may find that our programs yield diminishing returns over time. In addition, it is possible that regulators will change their view of our results in a way that might harm our business overall. For example, if regulators were to treat our energy savings as less significant or less reliable than other efficiency programs, or if regulators were to alter how utilities are compensated for working with us, our business and results of operations may be harmed. If our ability to deliver results were to change, or if regulators were to view our results less favorably, our brand, business and results of operations may be harmed.
Because we recognize subscription revenue over the term of the contract, downturns or upturns in new sales will not be immediately reflected in our results of operations and may be difficult to discern.
We generally recognize subscription revenue from customers ratably over the terms of their contracts, which typically range from one to five years. As a result, most of the subscription revenue we report in each
14
quarter is derived from the recognition of deferred revenue relating to subscriptions entered into during previous periods. Consequently, a decline in new or renewed subscriptions in any single quarter will likely have only a small impact on our revenue results for that quarter, but will negatively affect our revenue in future quarters. Accordingly, the effect of significant downturns in sales and market acceptance of our solutions, and potential changes in our pricing policies or rates of renewals, may not be fully reflected in our results of operations until future periods. We may be unable to adjust our cost structure to reflect the changes in revenue. In addition, a significant majority of our costs are expensed as incurred. As a result, increased growth in the number of our customers could result in our recognition of more costs than revenue in the earlier periods of the terms of our agreements. Our subscription model also makes it difficult for us to rapidly increase our revenue through additional sales in any period, as revenue from new customers must be recognized over the applicable subscription term.
A limited number of our utility customers are responsible for a significant portion of our revenue and cash flow. A decrease in sales to these utility customers or delays in customer implementation and deployments could harm our results of operations and financial condition.
We operate in a large and concentrated market. A substantial portion of our revenue, profitability and cash flow depends on a limited number of utility customers, and we cannot easily replace a lost customer. As a result, there may be significant variability in our quarterly results if we were to lose one or more of our large customers.
For the year ended December 31, 2012, our ten largest customers by revenue represented 61% of our total revenue, with two clients, National Grid and Pacific Gas and Electric Company (“PG&E”), representing more than 10% of our total revenue at 15% and 14%, respectively. For the year ended December 31, 2013 our ten largest customers by revenue represented 62% of our total revenue, with three clients, National Grid, PG&E, and Exelon each representing more than 10% of our total revenue at 14%, 13% and 11%, respectively. Many of our fees are not due until we have actually begun to deliver our solutions and, as a result, are subject to delay. We have contracted to provide multiple services to National Grid, PG&E and Exelon, including processing and analyzing data and displaying results to their customers. We entered into an implementation and licensing agreement with National Grid in June 2009, which was renewed and now expires in December 2015, and a renewed application services agreement with PG&E in December 2012 with a term of 3 years. We have also entered into multiple agreements with Exelon subsidiaries, including Baltimore Gas & Electric (“BGE”), PECO and Commonwealth Edison. We entered into an agreement with BGE in March 2011 with an initial term expiring in February 2015 and a renewed agreement with Commonwealth Edison in February 2011 with a term expiring in May 2014, subject to certain additional limitations on the initial term. National Grid, PG&E, BGE and Commonwealth Edison may generally terminate their respective agreements in each case for cause upon written notice of certain uncured material breaches of contract by us, upon the bankruptcy or insolvency of the other party or under certain other circumstances. In addition, National Grid, PG&E, BGE and Commonwealth Edison may generally terminate their respective agreements for convenience upon prior written notice.
We expect that a limited number of utility customers will continue to account for a substantial portion of our revenue in future periods. Changes in the business requirements, vendor selection or purchasing behavior of our utility customers could significantly decrease our sales.
Many of our customer agreements provide our customers with the ability to terminate the agreement for convenience, which may limit our ability to forecast our revenue accurately or could harm our results of operations and financial condition.
Many of our customer agreements, including National Grid and PG&E, are subject to customer termination for any reason, including for the customer’s convenience following a specified notice period. In limited circumstances, we may be required to provide refunds or sales credits in addition to the loss of future revenue from these customers. If customers terminate their agreements with us for convenience, our results of operations may be harmed and our revenue forecasts may be incorrect.
15
We have experienced rapid growth and organizational change in recent periods. If we fail to manage our growth effectively, our financial performance may suffer.
We have substantially expanded our overall business, customer base, employee headcount and operations in recent periods both domestically and internationally. We increased our total number of full-time employees from 162 employees as of December 31, 2010 to 465 employees as of December 31, 2013. Our expansion has placed, and our expected future growth will continue to place, a significant strain on our managerial, customer operations, research and development, sales and marketing, manufacturing, administrative, financial and other resources. We anticipate further growth in headcount will be required to address increases in our solution offerings and continued expansion. Our success will depend in part upon the ability of our management team to manage this growth effectively. To do so, we must continue to recruit, hire, train, manage and integrate a significant number of qualified managers and employees in specialized roles within our company, including in technology, sales and marketing. If our new employees perform poorly, or if we are unsuccessful in recruiting, hiring, training, managing and integrating these new employees, or retaining these or our existing employees, our business and results of operations may suffer.
In addition, to manage the expected growth of our headcount and operations, we will need to continue to improve our operational, financial, management and information technology infrastructure. Our anticipated additional headcount and capital investments will increase our costs, which will make it more difficult for us to address any future revenue shortfalls by reducing expenses in the short term. If we are unable to manage our growth successfully, our business and results of operations will be harmed.
The market for our products and solutions is still developing. If the market does not develop as quickly or as much as we expect, our business and growth rates could be harmed.
The market for our products and solutions is still developing, and it is uncertain whether our products and solutions will achieve and sustain high levels of demand and market acceptance, both domestically and internationally. Our near-term and long-term success will depend to a substantial extent on the willingness and ability of utilities, both domestically and internationally, to pursue energy efficiency, demand response and customer engagement programs. Utilities’ activities are governed by regulatory agencies, including public utility commissions, which may not create a regulatory environment that is conducive to the implementation of energy efficiency or demand response in a particular jurisdiction. Indeed, currently many utilities lack the economic motivation, regulatory requirements or financial incentives to deploy our technology. If utilities do not pursue energy efficiency, demand response or customer engagement or do so in fewer numbers or more slowly than we expect, our business and results of operations would be harmed.
Utilities in critical markets may fail to collect data or may be unable to collect current data that we require to provide our products and solutions.
Our cloud-based platform is dependent upon receiving specific data inputs from our customers such as current energy usage data. Without those inputs, our platform may be less reliable or effective or may not work and we may not be able to provide effective solutions. In markets where energy usage data is infrequently collected or where access to that data is restricted, including in international markets, we may prove unable to provide our products and solutions, or we may be forced to alter our products and solutions in a manner that reduces our ability to derive revenue from them. For example, the processes for data collection in Europe are still developing, and as a result, data may be more difficult to obtain or more expensive to access. If we are unable to access current data from our customers, our business and results of operations may be harmed.
Our quarterly results are inherently unpredictable and subject to substantial fluctuations and, as a result, we may fail to meet the expectations of securities analysts and investors, which could harm the trading price of our common stock.
Our results of operations, including our revenue, profitability and cash flows, may vary significantly from quarter to quarter due to a number of factors, many of which are outside of our control. While our revenue has increased in recent periods, our revenue may not continue to increase or may decrease on a quarterly or annual basis.
16
Factors that may affect the unpredictability of our quarterly results and cause our stock price to fluctuate include, but are not limited to:
| • | long, and sometimes unpredictable, sales and customer implementation and deployment cycles; |
| • | changes in the mix of products and solutions sold; |
| • | our dependence on a limited number of customers; |
| • | the timing of deployment of our products and solutions by our customers, which can have a material effect on when we recognize related revenue under our revenue recognition policies; |
| • | changing market and competitive conditions; |
| • | failures of our solutions that may harm our reputation or result in contractual penalties or terminations; |
| • | product or project failures by our customers that result in the cancellation, slowing down or deferring of projects; |
| • | changes to our cost structure, including changes to our cost of postage, data acquisition, data storage and management, data security and labor; |
| • | delays in adopting our solutions associated with data privacy concerns; |
| • | changes in laws or regulations, directly affecting either our operations, those of our customers or utility consumers; |
| • | delays in regulatory approvals for our utility customers and utility customer implementations and deployments; |
| • | political and consumer sentiment and the related impact on the scope and timing of deployment of our products and solutions; |
| • | economic, regulatory and political conditions in the markets where we operate or anticipate operating; |
| • | the addition of new employees; and |
| • | extraordinary expenses such as litigation or other dispute-related settlement payments. |
As a result, we believe that quarter-to-quarter comparisons of our results of operations are not necessarily a good indication of what our future performance will be. It is likely that in some future quarters our results of operations may be below the expectations of securities analysts or investors, in which case the price of our common stock would likely decline.
We operate in a competitive industry and our market share and results of operations may be harmed if we are unable to respond to our competitors effectively.
Competition in our market involves rapidly changing technologies, evolving regulatory requirements and industry expectations, frequent new product introductions and changes in customer requirements. To maintain and improve our competitive position, we must keep pace with the evolving needs of our utility customers and continue to develop and introduce new products, features and solutions in a timely and efficient manner. We compete with software suppliers to utilities. Our key competitors currently include Aclara, C3 Energy, Nest Labs (which was acquired by Google), Oracle, SAP and Tendril, as well as many other smaller providers. Certain of these companies have, and future competitors may have, substantially greater financial, marketing, technological and other resources than we do.
Additionally, we compete with energy efficiency providers that provide utilities with other efficiency programs and demand response companies that offer programs specifically focused on reduction in peak capacity. If these programs become more cost effective, it would harm our business. For example, if the cost of alternative efficiency approaches, such as light bulb replacement subsidies or home retrofits, decreased or if utilities could more easily deploy those measures on a large scale, our business could be harmed.
17
We have also seen many companies imitate our products, solutions and tactics, and we expect that trend to continue. As we look to expand into new markets, we expect to face additional competitors that may be more established in specific geographies. We anticipate that in the future, additional competitors will emerge that offer a broad range of competing products and solutions.
Our business and financial performance could be harmed by changes in tax laws or regulations.
New income, sales, use or other tax laws, statutes, rules, regulations or ordinances could be enacted at any time. Those enactments could harm our domestic and international business operations, and our business and financial performance. Further, existing tax laws, statutes, rules, regulations or ordinances could be interpreted, changed, modified or applied adversely to us. These events could require us or our utility customers to pay additional tax amounts on a prospective or retroactive basis, as well as require us or our utility customers to pay fines and/or penalties and interest for past amounts deemed to be due. If we raise our prices to offset the costs of these changes, existing and potential future utility customers may elect not to purchase our products and solutions in the future. Additionally, new, changed, modified or newly interpreted or applied tax laws could increase our utility customers’ and our compliance, operating and other costs, as well as the costs of our products. Further, these events could decrease the capital we have available to operate our business. The occurrence of any or all of these events could harm our business and results of operations.
In addition, we may be subject to sales, use and income tax audits by many tax jurisdictions throughout the world, many of which have not established clear guidance on the tax treatment of software-as-a-service based companies. Although we believe our income tax liabilities are reasonably estimated and accounted for in accordance with applicable laws and principles, an adverse resolution of one or more uncertain tax positions in any period could have a material impact on the results of operations for that period.
Our results of operations may be harmed if we are required to collect sales taxes for our products and solutions in jurisdictions where we have not historically done so.
Historically, we have not collected sales tax from our customers nor have we remitted such taxes in many states where we sell our products and solutions. Although we believe we are not obligated to collect sales taxes from our customers in those jurisdictions, states or one or more countries may seek to impose sales or other tax collection obligations on us, including for past sales by us or our utilities. A successful assertion that we should be collecting additional sales or other taxes on our products or solutions could discourage customers from purchasing our solutions or otherwise harm our business and results of operations.
We rely on our management team and need additional key personnel to grow our business, and the loss of key employees or inability to hire key personnel could harm our business.
Our success and future growth depend on the skills, working relationships and continued services of our management team and other key personnel. The loss of any member of our senior management team, and in particular our Chief Executive Officer, President or other key executives, could harm our business. All of our officers are at-will employees, which means they may terminate their employment relationship with us at any time, and their knowledge of our business and industry would be extremely difficult to replace.
Volatility or lack of performance in our stock price may affect our ability to retain our senior management and key personnel. Many of our longest-tenured employees, including members of our senior management and other key personnel with deep institutional knowledge, hold significant vested stock options and shares of our common stock. Employees may be more likely to leave us if the shares they own or the shares underlying their vested stock options have significantly appreciated in value relative to the original purchase prices of the shares or the exercise prices of the options, or if the exercise prices of the options that they hold are significantly above the market price of our common stock. As a result of these factors, we may be unable to attract or retain qualified personnel. Our inability to retain the necessary personnel to run and grow our business could harm our business and results of operations.
18
In addition, our future success will depend on our ability to attract, retain and motivate highly skilled management, product development, operations, sales, engineering and other personnel in the United States and abroad. Competition for these types of personnel is intense and we have experienced periods where we had difficulty hiring for critical roles. In particular, we have struggled at times to attract and hire sales executives and software developers who meet our standards. Even if we are able to hire qualified individuals, we may be unable to retain such individuals. Furthermore, if we hire from competitors or other companies, their former employers may attempt to assert that these employees or we have breached legal obligations, resulting in a diversion of our time and resources.
Postal charges are one of our most significant costs. If postal rates or mailing costs increase, our cost of delivering our solutions could increase.
In each country where we deliver mailed paper reports, we are dependent upon the government mail carrier to deliver our products. We have very little ability to control postal expenses and a change in postal expenses could have a significant impact on our business. For example, the United States Postal Service (“USPS”) delivers all of our U.S. mail correspondence, and we are bound to accept any postage rate increases enacted by the USPS. In the past, we have seen the specific postage rate applied to our products change due to a change in how the USPS interpreted its classification rules. In January 2013, the USPS determined that these reports should be charged first class postage rates rather than standard mail rates, thereby increasing our postage cost significantly. These increased charges continued through June 2013 when we were able to modify our product to comply with classification rules for postage at the standard rate. During the six months ended June 30, 2013, our payments to the USPS increased by $2.9 million as a result of these first class postage rates. We have encountered similar concerns from other carriers to a lesser extent as well. Such increased charges harmed our business and our results of operations during this period. If the USPS or other mail carriers change their position as to our mailed reports or we change our product offerings again, our future results of operations could be harmed.
If we cannot maintain our environmental focus as we grow, we could lose the innovation, teamwork, passion and focus on execution that we believe contributes to our success.
We believe that a critical contributor to our success has been our focus on the environmental impact of our products and solutions. We believe that focus has driven innovation, increased attention to results and has allowed us to attract and retain highly talented individuals who are motivated by our mission driven culture. As we grow and change, we may find it difficult to maintain this critical aspect of our corporate culture. Any failure to preserve our culture could harm our ability to retain and recruit quality personnel, thereby harming our future success.
We have a limited operating history in an evolving industry, which makes it difficult to predict our future prospects and may increase the risk that we will not be successful.
We have a limited operating history in an evolving market that may not develop as expected. This limited operating history makes it difficult to effectively assess or forecast our future prospects. We have encountered and will continue to encounter risks and uncertainties frequently experienced by growing companies in the technology industry, such as the risks and uncertainties described in this prospectus. If our assumptions regarding these risks and uncertainties are incorrect or change due to changes in our markets, or if we do not address these risks successfully, our financial results and results of operations may differ materially from our expectations and our business may suffer.
Our marketing efforts depend significantly on our ability to receive positive references from our existing utility customers.
We operate in an industry with a limited number of buyers and reputation is particularly important as a result. Our customers often serve as references for each other, and they have been known to discuss the performance of our products and solutions with each other. Consequently, our marketing efforts depend significantly on our ability to call on our current utility customers to provide positive references. Given our
19
limited number of utility customers, the loss or dissatisfaction of any customer could substantially harm our brand and reputation, inhibit the market acceptance of our products and solutions and impair our ability to attract new utility customers and maintain existing utility customers. Any of these consequences could harm our business, financial condition and results of operations.
Our business depends substantially on customers renewing, upgrading and expanding their solutions with us. Any decline in our customer renewals, upgrades and expansions may harm our future results of operations.
Our ability to grow depends substantially on our ability to expand our business with existing customers. To date, a significant portion of our growth has resulted from our ability to sell new products and solutions and expand existing products and solutions sold to current customers. We have limited historical data with respect to rates of customer renewals, upgrades and expansions so we may not accurately predict future trends in these areas. Our customers’ renewal rates may decline or fluctuate because of several factors, including their satisfaction or dissatisfaction with our solutions, the prices of our solutions, the prices of solutions offered by our competitors or reductions in our customers’ spending levels due to the macroeconomic environment or other factors. If our customers believe that our service offerings are not sufficiently scalable or effective and do not provide adequate security for the dissemination of information over the Internet, they will not expand their solutions with us, and our profitability and gross margin may be harmed. If our customers do not renew their subscriptions for our solutions, renew on less favorable terms or do not purchase additional functionality or subscriptions, our revenue may grow more slowly than expected or decline.
If the market for our cloud-based delivery model develops more slowly than we expect, our growth may slow or stall, and our results of operations would be harmed.
Use of cloud-based or software-as-a-service (“SaaS”) applications to manage and automate enterprise IT is at an early stage within our industry. We do not know whether the trend of adoption of enterprise SaaS solutions we have experienced in the past will continue in the future. In particular, many utilities have invested substantial personnel and financial resources to integrate legacy software into their businesses over time, and some have been reluctant or unwilling to migrate to SaaS. Furthermore, some utilities have been reluctant or unwilling to use SaaS because they have concerns regarding the risks associated with the security of their data and the reliability of the technology delivery model associated with these solutions. In addition, if other SaaS providers experience security incidents, loss of customer data, disruptions in delivery or other problems, the market for SaaS solutions as a whole, including our service, may be negatively impacted. If the adoption of cloud-based or SaaS solutions does not continue, the market for our solutions may stop developing or may develop more slowly than we expect, either of which would harm our results of operations.
From time to time, we have worked and expect to continue to work with third parties to pursue sales opportunities. If we were unable to establish and maintain these relationships, or if our initiatives with these third parties are unsuccessful, our business and future growth may be harmed.
For some of our existing and anticipated future products and solutions, we expect to maintain and may seek to establish relationships with third parties in order to take advantage of market opportunities. For example, certain third parties act as energy efficiency program administrators to utilities, system integrators and local partners in international markets, and we will need to work with such third parties to maintain or grow our business in certain territories. Our success in such circumstances may depend both on our ability to maintain a relationship with the third party and the third party’s ability to maintain a relationship with the utility. In addition, these third-party vendors may offer competing products, partner with other providers or otherwise choose not to partner with us. In the event that we are unable to establish or maintain new relationships on favorable terms, or at all, our ability to successfully sell our existing and anticipated future products and solutions could be harmed.
20
Security breaches involving our products or solutions, publicized breaches in similar products and solutions offered by others, or the public perception of security risks or vulnerability created by the deployment of new technologies in general, whether or not valid, could harm our business.
The security measures we have integrated into our platform and solutions that are designed to detect unauthorized activity and prevent or minimize security breaches and the unauthorized collection, use and disclosure of personal data may not function as expected and our products and solutions, those of other companies with whose products our products and solutions are integrated or interact, or even the products of other solutions providers may be subject to significant real or perceived security breaches.
Our platform collects, stores, compiles and analyzes potentially sensitive information related to consumers’ energy usage. We store and/or come into contact with sensitive consumer information and data. If, in handling this information, we, our partners or our utility customers fail to comply with privacy or security laws, we could face significant legal, financial, and reputational exposure to claims of government agencies, regulatory bodies, utility customers and consumers whose privacy is compromised. Even the perception that we, our partners or our utility customers have improperly handled sensitive, confidential information could have a negative effect on our business. In addition, third parties may attempt to breach our security measures or inappropriately use or access our software or the network hardware through computer viruses, physical or electronic break-ins, and other means. If a breach is successful, sensitive information may be improperly obtained, manipulated or corrupted, and we may face legal and financial exposure. In addition, a breach could lead to a loss of confidence in our products and solutions and our business could be harmed.
Our products and solutions may also be integrated with or interface with products and solutions sold by third parties, and as a result rely on the security of those products and their secure transmission of proprietary data over the Internet and cellular networks. Because we do not have control over the security measures implemented by third parties, we cannot ensure the complete integrity or security of such third-party products and transmissions.
Concerns about security or customer privacy may result in the adoption of legislation that restricts the implementation of technologies like ours or requires us to make modifications to our products such as limiting how we collect, use and store data, which could significantly limit the deployment of our technologies or result in significant expense to modify our products.
Any real or perceived security breach could harm our reputation and result in significant legal and financial exposure, including increased remediation costs and security protection costs, inhibit market acceptance of our products and solutions, halt or delay the deployment by utilities of our products and solutions, cause us to lose customers, harm our reputation, trigger unfavorable legislation and regulatory action, or inhibit the growth of the overall market for new products and solutions being sold to the utility industry. Any of these risks could harm our business, financial condition and results of operations.
Interruptions or delays in service from our third-party data center facilities, or problems with the third-party hardware or software that we employ, could impair the delivery of our solutions and harm our business.
We currently utilize data center facilities in the United States and Canada that are operated by third parties. These facilities may be vulnerable to damage or interruption from, among other things, fire, natural disaster, power loss, telecommunications failure, war, acts of terrorism, unauthorized entry, human error and computer viruses or other defects. They may also be subject to break-ins, sabotage, intentional acts of vandalism and similar misconduct. We rely on software and hardware technology provided by third parties to enable us to provide these solutions. Any damage to, or failure of, these third-party data centers or the third-party hardware and software we employ, could result in significant and lengthy interruptions in our ability to provide our solutions to our utility customers and their subscribers. We do not carry business interruption insurance sufficient to compensate us for potentially significant losses that result from service interruptions and system failures. Such interruptions and system failures could reduce our revenue and bookings, cause us to issue credits or pay penalties, cause customers to terminate their agreements with us and harm our reputation and our ability to attract new utility customers.
21
If our products contain defects or otherwise fail to perform as expected our reputation could be damaged, we could lose market share and, as a result, our financial condition or results of operations could be harmed.
Our software platform is complex and may contain defects or experience failures due to any number of issues. The satisfactory performance, reliability and availability of our platform is critical to our success. From time to time, we have found defects in our software, and new errors in our existing software may be detected in the future. If any of our products contain a material defect, do not function as anticipated, or do not safeguard customer data consistent with industry standards we may have to devote significant time and resources to find and correct the issue. Any system delays, interruptions or disruptions to our servers caused by telecommunications failures, computer viruses, physical break-ins, domain attacks, hacking or other attempts to harm our systems or servers that results in the unavailability or slowdown of our products or loss of data would reduce the attractiveness of our products. We may also experience interruptions caused by reasons beyond our control. Efforts to correct problems could divert the attention of our management team and other relevant personnel from other important tasks. Such failings might damage our reputation and relationships with utilities; result in the loss of business to competitors; result in fines or regulatory penalties against us; and result in litigation against us.
Our technology, products and solutions have only been developed in the last several years and we have had only limited opportunities to deploy and assess their performance in the field at full scale.
The current generation of our platform and solutions has been developed in the last several years and is continuing to evolve. Deploying and operating our technology is a complex endeavor and, until recently, had been done primarily in pilot programs. As the size, complexity and scope of our deployments have expanded, we have been able to test product performance at a greater scale and in a variety of new geographic settings and environmental conditions. These larger deployments have presented a number of unforeseen operational and technical challenges, which in some cases have caused delays and required us to commit significant resources to address these challenges. As the number, size and complexity of our deployments grow, we may continue to encounter unforeseen operational, technical and other challenges, some of which could cause significant delays and high deployment costs, which in turn may delay our ability to collect revenue, trigger contractual penalties, result in unanticipated expenses or damage to our reputation, each of which could harm our business, financial condition and results of operations.
To date, we have derived our revenue from a limited number of products and solutions. Our efforts to expand our product portfolio may not succeed, and may reduce our revenue growth rate.
To date, we have derived our revenue from a limited number of products and solutions. Any factor adversely affecting sales of one or more of these products and solutions, including market acceptance, product competition, performance and reliability, reputation, price competition and economic and market conditions, could adversely affect our business and results of operations. Our plan to expand our product and solution portfolio may not be successful, which may harm the growth of our business and our results of operations.
Material defects or errors in our data collection and analysis systems could damage our reputation, result in significant costs to us and impair our ability to sell our products.
Our data collection and analysis systems are complex and may contain material defects or errors. In addition, the large amount of data that we collect may cause errors in our data collection and analysis systems. Any defect in our data collection software, network systems, statistical projections or other methodologies could result in:
| • | loss of customers; |
| • | damage to our brand; |
| • | lost or delayed market acceptance and sales of our products and solutions; |
| • | interruptions in the availability of our products and solutions; |
22
| • | the incurrence of substantial costs to correct any material defect or error; |
| • | sales credits, refunds or liability to our customers; |
| • | diversion of development resources; and |
| • | increased warranty and insurance costs. |
Any material defect or error in our data collection systems could adversely affect our reputation and results of operations.
Our customers frequently insist on customized products, which are often difficult for us to deliver in a timely and cost-effective manner. If we are not able to find a long-term solution for customer customization requests, our business and results of operations may suffer.
Our customers often request customized service that is costly and time consuming for us to deliver. While we try to avoid customizing our product for individual customers, customizations continue to take up valuable research and development resources. We are taking steps to make customization requests easier to fulfill, but those efforts may prove to be unsuccessful. If we are unable to make customization requests easier to fulfill, customer satisfaction would be negatively affected and our business and results of operations may suffer.
Our business may be harmed if it is alleged or found that our products infringe the intellectual property rights of others.
Our industry is characterized by the existence of a large number of patents and by litigation based on allegations of infringement or other violations of intellectual property rights. From time to time, third parties have claimed and may continue to claim that we are infringing upon their patents or other intellectual property rights. In addition, we may be contractually obligated to indemnify our utility customers or other third parties that use or resell our products in the event our products are alleged to infringe a third party’s intellectual property rights. In many cases, these indemnification obligations are uncapped. Responding to such claims, regardless of their merit, can be time consuming, costly to defend in litigation, divert management’s attention and resources, damage our reputation and brand and cause us to incur significant expenses. Even if we are indemnified against such costs, the indemnifying party may be unable to uphold its contractual obligations. Further, claims of intellectual property infringement might require us to redesign affected products, delay affected product offerings, enter into costly settlement or license agreements or pay costly damage awards or face a temporary or permanent injunction prohibiting us from marketing, selling or distributing the affected products. If we cannot or do not license the alleged infringed technology on reasonable terms or at all, or substitute similar technology from another source, our revenue and earnings could be harmed. Additionally, our utility customers may not purchase our products if they are concerned that our products infringe third-party intellectual property rights. This could reduce the market opportunity for the sale of our products and solutions. The occurrence of any of these events may harm our business, financial condition and results of operations.
In addition to this general risk, we are aware of specific patents that we could be accused of infringing. We believe we would have valid defenses available to us should we be accused of such infringement, but our defense may not be successful. Even if our defenses are valid, however, an accusation of patent infringement would be time consuming and costly to defend.
The success of our business depends on our ability to protect and enforce our intellectual property rights.
We rely on a combination of patent, trademark, trade dress, copyright, unfair competition and trade secret laws, as well as confidentiality procedures and contractual restrictions, to establish and protect our proprietary rights. These laws, procedures and restrictions provide only limited protection and any of our intellectual property rights may be challenged, invalidated, circumvented, infringed or misappropriated. Further, the laws of
23
certain countries do not protect proprietary rights to the same extent as the laws of the United States and, therefore, in certain jurisdictions, we may be unable to protect our proprietary technology adequately against unauthorized third-party copying, infringement or use, which could harm our competitive position.
In recent years, in the United States and elsewhere, considerable doubt has been cast upon the validity of software patents as a whole. Were the underlying laws to change, such that we were no longer able to patent our software platform, our intellectual property rights might be more difficult to protect.
We cannot ensure that any of our pending applications will be granted or that any patents that may be issued will adequately protect our intellectual property. In addition, third parties have in the past and could in the future bring infringement, invalidity, co-inventorship, re-examination or similar claims with respect to any patents that may be issued to us in the future. Any such claims, whether or not successful, could be extremely costly to defend, divert management’s attention and resources, damage our reputation and brand, and harm our business and results of operations.
We may be required to spend significant resources to monitor and protect our intellectual property rights. In order to protect or enforce our patent rights, protect our trade secrets or know-how, or determine the enforceability, scope and validity of the proprietary rights of others, we may initiate patent litigation or other proceedings against third parties, such as infringement suits or interference proceedings. Any lawsuits or proceedings that we initiate could be expensive, take significant time and divert management’s attention from other business concerns. Litigation and other proceedings also put our patents at risk of being invalidated or interpreted narrowly and our patent applications at risk of not issuing. Additionally, we may provoke third parties to assert claims against us. We may not prevail in any lawsuits or other proceedings that we initiate and the damages or other remedies awarded, if any, may not be commercially valuable. The occurrence of any of these events may harm our business, financial condition and results of operations.
Some of our products rely on technologies developed or licensed by third parties. We may seek to license technology from third parties for future products and solutions. We may not be able to obtain or continue to obtain licenses and technologies from these third parties on commercially reasonable terms or at all. Our inability to retain our current third-party licenses or obtain third-party licenses required to develop new products or product enhancements could require us to obtain alternate technology that may be of lower quality or performance standards or at greater cost, or could require that we change our product and design plans, any of which could limit or delay our ability to manufacture and sell our products.
We use open source software in our products and solutions that may subject our products and solutions to general release or require us to re-engineer our products and solutions, which may harm our business.
We use open source software in connection with our products and solutions. From time to time, companies that incorporate open source software into their products have faced claims challenging the ownership of open source software and compliance with open source license terms. Therefore, we could be subject to suits by parties claiming ownership of what we believe to be open source software or noncompliance with open source licensing terms. Some open source software licenses require users who distribute open source software as part of their software to publicly disclose all or part of the source code to such software and make available any derivative works of the open source code on unfavorable terms or at no cost. Although we attempt to make sure open source software is only used in a manner that would not require us to disclose the source code to the related product or that would not otherwise breach the terms of an open source agreement, such use could inadvertently occur and we may be required to release proprietary source code, pay damages for breach of contract, re-engineer our products, discontinue the sale of products in the event re-engineering cannot be accomplished on a timely basis or take other remedial action that may divert resources away from our development efforts, any of which could harm our business, results of operations and financial condition.
24
If we are unable to protect the confidentiality of our proprietary information, the value of our technology and products could be harmed.
In addition to patent-pending technology, we rely on our unpatented technology and trade secrets. We generally seek to protect this information by confidentiality, non-disclosure and assignment of invention agreements with our employees and contractors and with parties with which we do business. These agreements may be breached and we may not have adequate remedies for any such breach. We cannot be certain that the steps we have taken will prevent unauthorized use or reverse engineering of our technology. Moreover, our trade secrets may be disclosed to or otherwise become known or be independently developed by competitors. To the extent that our employees, contractors or other third parties with whom we do business use intellectual property owned by others in their work for us, disputes may arise as to the rights in related or resulting know-how and inventions. These disputes could result in substantial litigation costs, monetary damages or restrictions on our ability to offer our products and solutions. If our intellectual property is disclosed or misappropriated, it would harm our ability to protect our rights and harm our business, financial condition and results of operations.
Developments in data protection laws and regulations may affect our solutions, which could harm our business.
Our solutions may be subject to data protection laws and regulations that impose a general framework for the collection, processing and use of personal data. Our platform and solutions rely on the transfer of data relating to individual energy usage and may be affected by these laws and regulations. It is unclear how the regulations governing the collection, use and disclosure of personal data in connection with privacy requirements will further develop in the United States and internationally, and to what extent this may affect our solutions. These developments could harm our business, financial condition and results of operations.
We are subject to international business uncertainties that could harm our business and results of operations or slow our growth.
Our ability to grow our business and our future success will depend to a significant extent on our ability to expand our operations and customer base worldwide. Operating in international markets requires significant resources and management attention and, other than our operations in the United Kingdom, France, Sweden, Australia, Hong Kong, Japan and New Zealand, we have limited experience entering new geographic markets. At present, we are opening an office in Odessa, Ukraine, to expand our research and development workforce. The Ukraine has experienced considerable political turmoil and this turmoil may impact our operations, which would in turn compromise our ability to develop our products at the pace and cost that we desire. This and other international efforts may not be successful. International sales and operations are subject to risks such as:
| • | inability to localize our product; |
| • | lack of effectiveness of our solutions in new markets; |
| • | technology compatibility; |
| • | the imposition of government controls; |
| • | government expropriation of facilities; |
| • | lack of a well-established system of laws and enforcement of those laws; |
| • | lack of a legal system free of undue influence or corruption; |
| • | exposure to a business culture in which improper sales practices may be prevalent; |
| • | restrictions on the import or export of critical technology; |
| • | currency exchange rate fluctuations; |
| • | multiple and possibly overlapping tax regimes and adverse tax burdens; |
| • | compliance with anti-corruption and anti-bribery laws such as the U.S. Foreign Corrupt Practices Act or the U.K. Anti-Bribery Act of 2010; |
25
| • | lack of availability of qualified third-party financing; |
| • | generally longer receivable collection periods than in the United States; |
| • | difficulties in staffing and managing foreign operations; |
| • | preference for local vendors; |
| • | burdens of complying with different permitting standards; |
| • | a wide variety of foreign laws and obstacles to the repatriation of earnings and cash; |
| • | difficulties in handling legal disputes in foreign jurisdictions; and |
| • | different or lesser protection of our intellectual property. |
Fluctuations in the value of the U.S. dollar may impact our ability to compete in international markets. International expansion and market acceptance depend on our ability to modify our business approach and technology to take into account such factors as differing customer business models, product requirements and needs, the applicable regulatory and business environment, labor costs and other economic conditions. These factors may harm our future international sales and, consequently, our business, financial condition and results of operations and slow our future growth.
Federal, state and international laws regulating telephone and email marketing practices impose certain obligations on marketers, which could reduce our ability to expand our business.
We make telephone calls and send emails and text messages as part of our solutions. The United States regulates marketing by telephone, text message and email. The Telephone Consumer Protection Act prohibits companies from making telemarketing calls to numbers listed in the Federal Do-Not-Call Registry and imposes other obligations and limitation on making phone calls and sending text messages to consumers. The Federal Controlling the Assault of Non-Solicited Pornography and Marketing Act of 2003 (the “CAN-SPAM Act”) regulates commercial email messages and specifies penalties for the transmission of commercial email messages that do not comply with certain requirements, such as providing an opt-out mechanism for stopping future emails from senders. We may need to comply with such laws and any associated rules and regulations. States and other countries have similar laws related to telemarketing and commercial emails. Additional or modified laws and regulations, or interpretations of existing, modified or new laws, regulations and rules, could prohibit or increase the cost of engaging with energy consumers and impair our ability to expand the use of our solutions, including our demand response solution, to more customers. Failure to comply with obligations and restrictions related to telephone, text message and email marketing could subject us to lawsuits, fines, statutory damages, consent decrees, injunctions, adverse publicity and other losses that could harm our business.
We will incur increased costs and demands upon management as a result of complying with the laws and regulations affecting public companies, which could harm our results of operations and our ability to attract and retain qualified executives and board members.
As a public company, we will incur significant legal, accounting and other expenses that we did not incur as a private company, including costs associated with public company reporting and corporate governance requirements. These requirements include compliance with Section 404 and other provisions of the Sarbanes-Oxley Act of 2002 (the “Sarbanes-Oxley Act”), the Dodd-Frank Wall Street Reform and Consumer Protection Act (the “Dodd-Frank Act”), as well as rules implemented by the Securities and Exchange Commission (“SEC”), the New York Stock Exchange (“NYSE”) and other applicable securities or exchange-related rules and regulations. In addition, our management team will also have to adapt to the requirements of being a public company. We expect complying with these rules and regulations will substantially increase our legal and financial compliance costs and make some activities more difficult, time consuming or costly, particularly when we are no longer an “emerging growth company,” as defined in the Jumpstart Our Business Startups Act of 2012 (the “JOBS Act”).
26
As a public company, we also expect that it may be more difficult and more expensive for us to obtain director and officer liability insurance, and we may be required to accept reduced policy limits and coverage or incur substantially higher costs to obtain the same or similar coverage. As a result, it may be more difficult for us to attract and retain qualified individuals to serve on our board of directors or as our executive officers.
We are an “emerging growth company,” and any decision on our part to comply with certain reduced disclosure requirements applicable to emerging growth companies could make our common stock less attractive to investors.
We are an “emerging growth company,” as defined in the JOBS Act, and we may take advantage of certain exemptions from various reporting requirements that are applicable to other public companies that are not “emerging growth companies” including not being required to comply with the auditor attestation requirements of Section 404 of the Sarbanes-Oxley Act, reduced disclosure obligations regarding executive compensation in our periodic reports and proxy statements, and exemptions from the requirements of holding an annual non-binding advisory vote on executive compensation and nonbinding stockholder approval of any golden parachute payments not previously approved. If we choose not to comply with the auditor attestation requirements of Section 404 of the Sarbanes-Oxley Act, our auditors will not be required to attest to the effectiveness of our internal control over financial reporting. As a result, investors may become less comfortable with the effectiveness of our internal controls and the risk that material weaknesses or other deficiencies in our internal controls go undetected may increase. If we choose to provide reduced disclosures in our periodic reports and proxy statements while we are an emerging growth company, investors would have access to less information and analysis about our executive compensation, which may make it difficult for investors to evaluate our executive compensation practices. We cannot predict if investors will find our common stock less attractive because we may rely on these exemptions and provide reduced disclosure. If some investors find our common stock less attractive as a result, there may be a less active trading market for our common stock and our stock price may be harmed. We will remain an emerging growth company until the earliest to occur of: the last day of the fiscal year in which we have more than $1.0 billion in annual revenue; the date we qualify as a ‘‘large accelerated filer,’’ with at least $700 million of equity securities held by non-affiliates; the issuance, in any three-year period, by us of more than $1.0 billion in non-convertible debt securities; or the last day of the fiscal year ending after the fifth anniversary of our initial public offering.
In addition, Section 107 of the JOBS Act provides that an emerging growth company can take advantage of the extended transition period provided in Section 7(a)(2)(B) of the Securities Act of 1933, as amended (the “Securities Act”), for complying with new or revised accounting standards. In other words, an emerging growth company can delay the adoption of certain accounting standards until those standards would otherwise apply to private companies. However, we have chosen to ‘‘opt out’’ of such extended transition period, and as a result, we will comply with new or revised accounting standards on the relevant dates on which adoption of such standards is required for non-emerging growth companies. Section 107 of the JOBS Act provides that our decision to opt out of the extended transition period for complying with new or revised accounting standards is irrevocable.
We have identified a material weakness in our internal control over financial reporting. Although we expect to make every effort to address this material weakness, we may find that we are unable to improve our internal control over financial reporting, which could make it difficult to maintain an effective system of internal control over financial reporting, reduce the reliability of our financial reporting, harm investor confidence in our company and affect the value of our common stock.
We will be required, pursuant to Section 404 of the Sarbanes-Oxley Act to furnish a report by management on, among other things, the effectiveness of our internal control over financial reporting in the second annual report we file with the SEC. This assessment will need to include disclosure of any material weaknesses identified by our management in our internal control over financial reporting, as well as a statement that our independent registered public accounting firm has issued an opinion on our internal control over financial reporting. However, our auditors will not be required to formally attest to the effectiveness of our internal control over financial reporting pursuant to Section 404 until we are no longer an ‘‘emerging growth company’’ as defined in the JOBS Act if we take advantage of the exemptions available to us through the JOBS Act.
27
We are in the very early stages of the costly and challenging process of compiling the system and processing documentation necessary to perform the evaluation needed to comply with Section 404.
In connection with the preparation of our consolidated financial statements for the year ended December 31, 2013, we and our independent registered public accounting firm identified a material weakness in the design and operation of our internal control over financial reporting. The material weakness relates to our financial statement close process and the lack of sufficient financial accounting and reporting expertise commensurate with our financial reporting requirements during this period. A material weakness is a deficiency, or a combination of deficiencies, in internal control over financial reporting, such that there is reasonable possibility that a material misstatement of a company’s annual or interim financial statements will not be prevented or detected on a timely basis.
We are currently in the process of remediating the material weakness and are taking numerous steps that we believe will address the underlying causes of the material weakness, primarily through the hiring of additional accounting and finance personnel with technical accounting and financial reporting experience, enhancing and segregating duties within our accounting and finance department, and enhancing our internal review procedures during the financial statement close process. If we fail to effectively remediate deficiencies in our control environment or are unable to implement and maintain effective internal control over financial reporting and disclosure controls to meet the demands that will be placed upon us as a public company, including the requirements of Section 404 of the Sarbanes-Oxley Act, we may be unable to accurately report our financial results, or report them within the timeframes required by the SEC.
Even if we are able to report our financial statements accurately and in a timely manner, if we do not make all necessary improvements to address the material weakness, continued disclosure of a material weakness will be required in future filings with the SEC, which could cause our reputation to be harmed and our stock price to decline.
We may not be able to remediate this or any future material weaknesses, or to complete our evaluation, testing and any required remediation in a timely fashion. During the evaluation and testing process, if we identify one or more material weaknesses in our internal control over financial reporting, we will be unable to assert that our internal controls are effective. If we are unable to assert that our internal control over financial reporting is effective, or if our auditors are unable to express an opinion on the effectiveness of our internal controls when they are required to issue such opinion, investors could lose confidence in the accuracy and completeness of our financial reports, which could harm our stock price.
Acquisitions of other businesses, products or technologies could disrupt our business and harm our financial condition and results of operations.
In order to remain competitive, obtain key competencies or accelerate our time to market, we may seek to acquire additional businesses, products or technologies. We have not completed any acquisitions to date and we therefore have no experience in successfully acquiring and integrating additional businesses, products or technologies. If we identify an appropriate acquisition candidate, we may not be successful in negotiating the terms of the acquisition, financing the acquisition or effectively integrating the acquired business, product or technology into our existing business and operations. We may have difficulty integrating acquired technologies or products with our existing products and solutions. Our due diligence may fail to identify all of the problems, liabilities or other shortcomings or challenges of an acquired business, product or technology, including issues related to intellectual property, product quality or product architecture, regulatory compliance practices, revenue recognition or other accounting practices or employee or customer issues. If we finance acquisitions by issuing convertible debt or equity securities, our existing stockholders may be diluted which could affect the market price of our stock. In addition, any acquisitions we are able to complete may not result in the synergies or other benefits we had expected to achieve, which could result in substantial write-offs. Further, contemplating or completing an acquisition and integrating an acquired business, product or technology will significantly divert management and employee time and resources.
28
We may not be able to utilize a significant portion of our net operating loss carryforwards, which could harm our results of operations.
As of December 31, 2013, we had U.S. federal net operating loss carryforwards due to prior period losses of $58.3 million for U.S. federal purposes, which if not utilized will begin to expire in 2027. Realization of these net operating loss carryforwards is dependent upon future income, and there is a risk that our existing carryforwards could expire unused and be unavailable to offset future income tax liabilities, which could harm our results of operations.
In addition, under Section 382 of the Internal Revenue Code of 1986, as amended (the “Code”), our ability to utilize net operating loss carryforwards or other tax attributes, in any taxable year may be limited if we have experienced or experience in connection with this offering or in the future an “ownership change.” A Section 382 “ownership change” generally occurs if one or more stockholders or groups of stockholders who own at least 5% of our stock increase their ownership by more than 50 percentage points over their lowest ownership percentage within a rolling three-year period. Similar rules may apply under state tax laws.
This offering or future issuances of our stock could cause an “ownership change.” It is possible that an ownership change, or any future ownership change, could have a material effect on the use of our net operating loss carryforwards or other tax attributes, which could harm our results of operations.
We may not be able to secure additional financing on favorable terms, or at all, to meet our future capital needs.
In the future, we may require additional capital to respond to business opportunities, challenges, acquisitions or unforeseen circumstances and may determine to engage in equity or debt financings or enter into credit facilities for other reasons. In the future, we may not be able to timely secure debt or equity financing on favorable terms, or at all. Any debt financing obtained by us in the future could involve restrictive covenants relating to our capital raising activities and other financial and operational matters, which may make it more difficult for us to obtain additional capital and to pursue business opportunities, including potential acquisitions. If we raise additional funds through further issuances of equity, convertible debt securities or other securities convertible into equity, our existing stockholders could suffer significant dilution in their percentage ownership of our company, and any new equity securities we issue could have rights, preferences and privileges senior to those of holders of our common stock, including shares of common stock sold in this offering. If we are unable to obtain adequate financing or financing on terms satisfactory to us, when we require it, our ability to continue to grow or support our business and to respond to business challenges could be limited.
Our business could be severely harmed by natural disasters or other catastrophes.
A significant catastrophic event such as war, acts of terrorism, natural disasters, such as earthquakes, fire or floods, loss of power, computer viruses, or global threats, including, but not limited to, the outbreak of epidemic disease, could disrupt our operations and impair deployment of our solutions by our utility customers, interrupt critical functions, cause our suppliers to be unable to meet our demand for parts and equipment, reduce demand for our products, prevent our utility customers from honoring their contractual obligations to us or otherwise harm our business. To the extent that such disruptions or uncertainties result in delays or cancellations of the deployment of our products and solutions, our reputation, business, results of operations and financial condition could be harmed.
Risks Related to Ownership of Our Common Stock and this Offering
Concentration of ownership among our existing executive officers, directors and their affiliates and our 5% stockholders may prevent new investors from influencing significant corporate decisions.
Upon completion of this offering, our executive officers, directors and holders of 5% or more of our outstanding common stock will beneficially own, in the aggregate, approximately % of our outstanding shares
29
of common stock. Some of these persons or entities may have interests that are different from yours. For example, these stockholders may support proposals and actions with which you may disagree or which are not in your interests. These stockholders will be able to exercise a significant level of control over all matters requiring stockholder approval, including the election of directors, amendment of our certificate of incorporation and approval of significant corporate transactions. This control could have the effect of delaying or preventing a change of control of our company or changes in management and will make the approval of certain transactions difficult or impossible without the support of these stockholders, which in turn could reduce the price of our common stock.
An active, liquid and orderly trading market for our common stock may not develop and you could lose all or part of your investment.
Prior to this offering, there has been no public market for shares of our common stock. The initial public offering price of our common stock will be determined through negotiation with the underwriters. This price will not necessarily reflect the price at which investors in the market will be willing to buy and sell our shares of common stock following this offering.
The price of our common stock may be volatile, and you could lose all or part of your investment.
The trading price of our common stock following this offering may fluctuate substantially and may be higher or lower than the initial public offering price. The trading price of our common stock following this offering will depend on a number of factors, including those described in this “Risk Factors” section, many of which are beyond our control and may not be related to our operating performance. These fluctuations could cause you to lose all or part of your investment in our common stock since you might be unable to sell your shares at or above the price you paid in this offering. Factors that could cause fluctuations in the trading price of our common stock include the following:
| • | price and volume fluctuations in the overall stock market from time to time; |
| • | volatility in the market prices and trading volumes of technology stocks; |
| • | changes in operating performance and stock market valuations of other technology companies generally, or those in our industry in particular; |
| • | sales of shares of our common stock by us or our stockholders; |
| • | failure of securities analysts to maintain coverage of us, changes in financial estimates by any securities analysts who follow our company or our failure to meet these estimates or the expectations of investors; |
| • | the financial projections we may provide to the public, any changes in those projections or our failure to meet those projections; |
| • | announcements by us or our competitors of new products; |
| • | the public’s reaction to our press releases, other public announcements and filings with the SEC; |
| • | rumors and market speculation involving us or other companies in our industry; |
| • | actual or anticipated changes in our results of operations or fluctuations in our results of operations; |
| • | actual or anticipated developments in our business, our competitors’ businesses or the competitive landscape generally; |
| • | litigation involving us, our industry or both, or investigations by regulators into our operations or those of our competitors; |
| • | developments or disputes concerning our intellectual property or other proprietary rights; |
| • | announced or completed acquisitions of businesses or technologies by us or our competitors; |
30
| • | new laws or regulations or new interpretations of existing laws or regulations applicable to our business; |
| • | changes in accounting standards, policies, guidelines, interpretations or principles; |
| • | any significant change in our management; and |
| • | general economic conditions and slow or negative growth of our markets. |
In addition, the stock market in general, and the market for technology companies in particular, has experienced extreme price and volume fluctuations that have often been unrelated or disproportionate to the operating performance of those companies. Broad market and industry factors may seriously affect the market price of companies’ stock, including ours, regardless of actual operating performance. These fluctuations may be even more pronounced in the trading market for our stock shortly following this offering. In addition, in the past, following periods of volatility in the overall market and the market price of a particular company’s securities, securities class action litigation has often been instituted against these companies. This litigation, if instituted against us, could result in substantial costs and a diversion of our management’s attention and resources.
A total of , or %, of our total outstanding shares after the offering are restricted from immediate resale, but may be sold in the near future. The large number of shares eligible for public sale or subject to rights requiring us to register them for public sale could depress the market price of our common stock.
The market price of our common stock could decline as a result of sales of a large number of shares of our common stock in the market after this offering, and the perception that these sales could occur may also depress the market price of our common stock. Based on shares outstanding as of December 31, 2013, we will have shares of common stock outstanding after this offering. Of these shares, the common stock sold in this offering will be freely tradable in the United States, except for any shares purchased by our “affiliates” as defined in Rule 144 under the Securities Act of 1933. The holders of substantially all of the shares of outstanding common stock have agreed with the underwriters, subject to certain exceptions described in “Underwriters,” not to dispose of or hedge any of their common stock during the 180-day period beginning on the date of this prospectus, except with the prior written consent of Morgan Stanley & Co. LLC and Goldman, Sachs & Co. After the expiration of the 180-day restricted period, these shares may be sold in the public market in the United States, subject to prior registration in the United States, if required, or reliance upon an exemption from United States registration, including, in the case of shares held by affiliates or control persons, compliance with the volume restrictions of Rule 144.
Upon completion of this offering, stockholders owning an aggregate of 34,593,054 shares will be entitled, under contracts providing for registration rights, to require us to register shares of our common stock owned by them for public sale in the United States. In addition, we intend to file a registration statement to register the approximately shares reserved for future issuance under our equity compensation plans. Upon effectiveness of that registration statement, subject to the satisfaction of applicable exercise periods and, in certain cases, lock-up agreements with the representatives of the underwriters referred to above, the shares of common stock issued upon exercise of outstanding options will be available for immediate resale in the United States in the open market.
As restrictions end or pursuant to registration rights, sales of our common stock may make it more difficult for us to sell equity securities in the future at a time and at a price that we deem appropriate. These sales also could cause our stock price to fall and make it more difficult for you to sell shares of our common stock.
31
Anti-takeover provisions contained in our certificate of incorporation and bylaws, as well as provisions of Delaware Law, could impair a takeover attempt.
Our certificate of incorporation, bylaws and Delaware law contain or will contain provisions which could have the effect of rendering more difficult, delaying or preventing an acquisition deemed undesirable by our board of directors. Our corporate governance documents include or will include provisions:
| • | creating a classified board of directors whose members serve staggered three-year terms; |
| • | authorizing “blank check” preferred stock, which could be issued by our board of directors without stockholder approval and may contain voting, liquidation, dividend and other rights superior to our common stock; |
| • | limiting the liability of, and providing indemnification to, our directors and officers; |
| • | limiting the ability of our stockholders to call and bring business before special meetings; |
| • | requiring advance notice of stockholder proposals for business to be conducted at meetings of our stockholders and for nominations of candidates for election to our board of directors; |
| • | controlling the procedures for the conduct and scheduling of board of directors and stockholder meetings; |
| • | providing our board of directors with the express power to postpone previously scheduled annual meetings and to cancel previously scheduled special meetings; |
| • | establishing that the number of directors is set by the board of directors; |
| • | providing that board vacancies be filled by the board of directors; and |
| • | limiting the ability to remove directors other than for cause. |
These provisions, alone or together, could delay or prevent hostile takeovers and changes in control or changes in our management.
As a Delaware corporation, we are also subject to provisions of Delaware law, including Section 203 of the Delaware General Corporation law, which prevents some stockholders holding more than 15% of our outstanding common stock from engaging in certain business combinations without approval of the holders of substantially all of our outstanding common stock.
Any provision of our certificate of incorporation, bylaws or Delaware law that has the effect of delaying or deterring a change in control could limit the opportunity for our stockholders to receive a premium for their shares of our common stock, and could also affect the price that some investors are willing to pay for our common stock.
We may invest or spend the proceeds of this offering in ways with which you may not agree or in ways that may not yield a return.
The net proceeds from the sale of our shares of common stock by us in this offering may be used for general corporate purposes, including working capital. We may also use a portion of the net proceeds to acquire complementary businesses, products, solutions or technologies. However, we do not have any agreements or commitments for any acquisitions at this time. Our management will have considerable discretion in the application of the net proceeds, and you will not have the opportunity, as part of your investment decision, to assess whether the proceeds are being used appropriately. The net proceeds may be invested with a view towards long-term benefits for our stockholders and this may not increase our results of operations or market value. Until the net proceeds are used, they may be placed in investments that do not produce significant income or that may lose value.
32
Purchasers in this offering will experience immediate and substantial dilution in the book value of their investment.
The assumed initial public offering price of our common stock of $ per share, based on the midpoint of the price range on the cover page of this prospectus, is substantially higher than the net tangible book value per share of our outstanding common stock immediately after this offering. Therefore, if you purchase our common stock in this offering, you will incur immediate dilution of $ in the net tangible book value per share from the price you paid. In addition, following this offering, purchasers who bought shares from us in the offering will have contributed % of the total consideration paid to us by our stockholders to purchase shares of common stock, in exchange for acquiring approximately % of our total outstanding shares as of December 31, 2013 after giving effect to this offering. The exercise of outstanding stock options will result in further dilution.
If securities or industry analysts do not publish or cease publishing research or reports about us, our business or our market, or if they change their recommendations regarding our stock adversely, or if our actual results differ significantly from our guidance, our stock price and trading volume could decline.
The trading market for our common stock will be influenced by the research and reports that industry or securities analysts may publish about us, our business, our market or our competitors. If any of the analysts who cover us change their recommendation regarding our stock adversely, or provide more favorable relative recommendations about our competitors, our stock price would likely decline. If any analyst who covers us were to cease coverage of our company or fail to regularly publish reports on us, we could lose visibility in the financial markets, which in turn could cause our stock price or trading volume to decline.
In addition, from time to time, we may release earnings guidance or other forward-looking statements in our earnings releases, earnings conference calls or otherwise regarding our future performance that represent our management’s estimates as of the date of release. Some or all of the assumptions of any future guidance that we furnish may not materialize or may vary significantly from actual future results. Any failure to meet guidance or analysts’ expectations could have a material adverse effect on the trading price or trading volume of our stock.
We do not expect to declare any dividends in the foreseeable future.
We do not anticipate declaring any cash dividends to holders of our common stock in the foreseeable future. Consequently, investors may need to rely on sales of their common stock after price appreciation, which may never occur, as the only way to realize any future gains on their investment. Investors seeking cash dividends should not purchase our common stock.
33
SPECIAL NOTE REGARDING FORWARD-LOOKING STATEMENTS
This prospectus contains forward-looking statements within the meaning of the federal securities laws, and these statements involve substantial risks and uncertainties. Forward-looking statements generally relate to future events or our future financial or operating performance. In some cases, you can identify forward-looking statements because they contain words such as “may,” “will,” “should,” “expects,” “plans,” “anticipates,” “could,” “intends,” “target,” “projects,” “contemplates,” “believes,” “estimates,” “predicts,” “potential” or “continue” or the negative of these words or other similar terms or expressions that concern our expectations, strategy, plans or intentions. Forward-looking statements contained in this prospectus include, but are not limited to, statements about:
| • | our future financial performance, including our revenue, cost of revenue, gross profit or gross margin and operating expenses; |
| • | the sufficiency of our cash and cash equivalents to meet our liquidity needs; |
| • | our predictions about industry and market trends; |
| • | our ability to increase the number of customers using our software; |
| • | our ability to attract and retain customers to use our products and solutions; |
| • | our ability to successfully expand in our existing markets and into new markets; |
| • | our ability to effectively manage our growth and future expenses; |
| • | our customers’ intention to deploy and further rollout our solutions; |
| • | our ability to maintain, protect and enhance our intellectual property; |
| • | our ability to comply with modified or new laws and regulations applying to our business; and |
| • | the attraction and retention of qualified employees and key personnel. |
We caution you that the foregoing list may not contain all of the forward-looking statements made in this prospectus.
You should not rely upon forward-looking statements as predictions of future events. We have based the forward-looking statements contained in this prospectus primarily on our current expectations and projections about future events and trends that we believe may affect our business, financial condition, results of operations and prospects. The outcome of the events described in these forward-looking statements is subject to risks, uncertainties and other factors described in “Risk Factors” and elsewhere in this prospectus. Moreover, we operate in a very competitive and rapidly changing environment. New risks and uncertainties emerge from time to time, and it is not possible for us to predict all risks and uncertainties that could have an impact on the forward-looking statements contained in this prospectus. The results, events and circumstances reflected in the forward-looking statements may not be achieved or occur, and actual results, events or circumstances could differ materially from those described in the forward-looking statements.
The forward-looking statements made in this prospectus relate only to events as of the date on which the statements are made. We undertake no obligation to update any forward-looking statements made in this prospectus to reflect events or circumstances after the date of this prospectus or to reflect new information or the occurrence of unanticipated events, except as required by law. We may not actually achieve the plans, intentions or expectations disclosed in our forward-looking statements and you should not place undue reliance on our forward-looking statements. Our forward-looking statements do not reflect the potential impact of any future acquisitions, mergers, dispositions, joint ventures or investments we may make.
34
This prospectus contains statistical data, estimates and forecasts that are based on independent industry publications, such as those published by Greentech Media, the Institute for Electric Innovation and Navigant Research, or other publicly available information, as well as other information based on our internal sources. Although we believe that the third-party sources referred to in this prospectus are reliable, neither we nor the underwriters have independently verified the information provided by these third parties. While we are not aware of any misstatements regarding any third-party information presented in this prospectus, their estimates, in particular, as they relate to projections, involve numerous assumptions, are subject to risks and uncertainties, and are subject to change based on various factors, including those discussed under “Risk Factors” and elsewhere in this prospectus.
We estimate that the net proceeds from the sale of shares of our common stock that we are selling in this offering will be approximately $ million, based upon an assumed initial public offering price of $ per share, which is the midpoint of the estimated offering price range set forth on the cover page of this prospectus, and after deducting estimated underwriting discounts and commissions and estimated offering expenses payable by us. If the underwriters’ option to purchase additional shares from us is exercised in full, we estimate that our net proceeds would be approximately $ million, after deducting estimated underwriting discounts and commissions and estimated offering expenses payable by us.
Each $1.00 increase or decrease in the assumed initial public offering price of $ per share would increase or decrease the net proceeds that we receive from this offering by approximately $ million, assuming that the number of shares offered by us, as set forth on the cover page of this prospectus, remains the same and after deducting the estimated underwriting discounts and commissions payable by us. Similarly, each increase or decrease of one million in the number of shares of common stock offered by us would increase or decrease the net proceeds that we receive from this offering by approximately $ million, assuming the assumed initial public offering price remains the same and after deducting the estimated underwriting discounts and commissions payable by us.
The principal purposes of this offering are to create a public market for our common stock and facilitate our future access to the public equity markets. We currently intend to use the net proceeds that we will receive from this offering for working capital and other general corporate purposes, including investing further in our sales and marketing and research and development efforts. We intend to use proceeds from this offering to further grow our business and to fund our growth strategies discussed in this prospectus. We may also use a portion of the net proceeds that we receive to acquire or invest in complementary businesses, products, services, technologies or other assets. We have not entered into any agreements or commitments with respect to any acquisitions or investments at this time.
We cannot specify with certainty the particular uses of the net proceeds that we will receive from this offering or the amounts we actually spend on the uses set forth above. Accordingly, we will have broad discretion in using these proceeds. Pending the use of proceeds from this offering as described above, we plan to invest the net proceeds that we receive in this offering in short-term and intermediate-term interest-bearing obligations, investment-grade investments, certificates of deposit, or direct or guaranteed obligations of the U.S. government.
We have never declared or paid any cash dividend on our capital stock. We currently intend to retain any future earnings and do not expect to pay any dividends in the foreseeable future. Any future determination to declare cash dividends will be made at the discretion of our board of directors, subject to applicable laws, and will depend on a number of factors, including our financial condition, results of operations, capital requirements, contractual restrictions, general business conditions and other factors that our board of directors may deem relevant.
35
The following table sets forth cash and cash equivalents, as well as our capitalization, as of December 31, 2013 as follows:
| • | on an actual basis; |
| • | on a pro forma basis, giving effect to (i) the filing of our amended and restated certificate of incorporation, (ii) the automatic conversion of all outstanding shares of our convertible preferred stock into an aggregate of 19,246,714 shares of common stock and (iii) the automatic conversion of all outstanding debt under a subordinated convertible promissory note with a utility partner dated March 8, 2013 into shares of common stock, based on an assumed initial public offering price of $ per share, which is the midpoint of the estimated offering price range set forth on the cover page of this prospectus, which conversion will occur prior to the completion of this offering, as if such conversion had occurred on December 31, 2013; and |
| • | on a pro forma as adjusted basis, giving effect to the pro forma adjustments set forth above and the sale and issuance by us of shares of common stock in this offering, based on an assumed initial public offering price of $ per share, which is the midpoint of the estimated offering price range set forth on the cover page of this prospectus, and after deducting the estimated underwriting discounts and commissions and estimated offering expenses payable by us. |
The pro forma as adjusted information set forth in the table below is illustrative only and will be adjusted based on the actual initial public offering price and other final terms of this offering. You should read this table together with our financial statements and related notes, and the sections titled “Selected Financial and Other Data” and “Management’s Discussion and Analysis of Financial Condition and Results of Operations” that are included elsewhere in this prospectus.
| December 31, 2013 | ||||||||||||
| Actual | Pro Forma | Pro Forma As Adjusted |
||||||||||
| (In thousands, except share and per share amounts) |
||||||||||||
| Cash and cash equivalents |
$ | 28,819 | $ | $ | ||||||||
|
|
|
|
|
|
|
|||||||
| Notes payable |
2,418 | |||||||||||
| Stockholders’ equity (deficit): |
||||||||||||
| Series A, B and C convertible preferred stock, par value $0.000005 per share: 19,428,252 shares authorized, 19,246,714 shares issued and outstanding, actual; no shares authorized, issued and outstanding, pro forma and pro forma as adjusted |
67,693 | |||||||||||
| Preferred stock, par value $0.000005 per share: no shares authorized, issued and outstanding, actual; 25,000,000 shares authorized, no shares issued and outstanding, pro forma and pro forma as adjusted |
— | |||||||||||
| Common stock, par value $0.000005 per share, 62,000,000 shares authorized, 22,113,125 shares issued and outstanding, actual; 500,000,000 shares authorized, shares issued and outstanding, pro forma; 500,000,000 shares authorized, shares issued and outstanding, pro forma as adjusted |
— | |||||||||||
| Additional paid-in capital |
9,407 | |||||||||||
| Treasury stock |
— | |||||||||||
| Accumulated deficit |
(83,243 | ) | ||||||||||
| Accumulated other comprehensive loss |
(120 | ) | ||||||||||
|
|
|
|
|
|
|
|||||||
| Total stockholders’ equity (deficit) |
(6,263 | ) | ||||||||||
|
|
|
|
|
|
|
|||||||
| Total capitalization |
$ | (3,845 | ) | $ | $ | |||||||
|
|
|
|
|
|
|
|||||||
36
If the underwriters’ option to purchase additional shares from us were exercised in full, pro forma as adjusted cash and cash equivalents, additional paid-in capital, total stockholders’ equity (deficit) and shares issued and outstanding as of December 31, 2013 would be $ million, $ million, $ million and million, respectively.
Each $1.00 increase or decrease in the assumed initial public offering price of $ per share, which is the midpoint of the estimated offering price range set forth on the cover page of this prospectus, would increase or decrease, as applicable, our cash and cash equivalents, additional paid-in capital, and total stockholders’ equity (deficit) by approximately $ million, assuming that the number of shares offered by us, as set forth on the cover page of this prospectus, remains the same and after deducting the estimated underwriting discounts and commissions payable by us.
The number of shares of our common stock outstanding in the table above excludes the following:
| • | 7,789,720 shares of common stock issuable upon the exercise of options to purchase common stock that were outstanding as of December 31, 2013, with a weighted-average exercise price of $3.83 per share; |
| • | 1,093,326 shares of common stock issuable upon the vesting of restricted stock units that were outstanding as of December 31, 2013; |
| • | 283,950 shares of common stock issuable upon the vesting of restricted stock units that were granted after December 31, 2013; and |
| • | 6,529,852 shares of common stock reserved for future issuance under our stock-based compensation plans, consisting of 1,529,852 shares of common stock reserved for future issuance under our 2007 Stock Plan as of December 31, 2013, which shares will be added to the shares to be reserved under our 2014 Stock Incentive Plan, and 5,000,000 shares of common stock reserved for future issuance under our 2014 Stock Incentive Plan, which will become effective in connection with this offering, and shares that become available pursuant to provisions thereof that automatically increase the share reserves under the 2014 Stock Incentive Plan each year. |
37
If you invest in our common stock in this offering, your ownership interest will be diluted to the extent of the difference between the initial public offering price per share of our common stock and the pro forma as adjusted net tangible book value per share of our common stock immediately after this offering. Net tangible book value dilution per share to new investors represents the difference between the amount per share paid by purchasers of shares of common stock in this offering and the pro forma as adjusted net tangible book value per share of common stock immediately after completion of this offering.
Net tangible book value per share is determined by dividing our total tangible assets less our total liabilities by the number of shares of common stock outstanding. Our historical net tangible book value (deficit) as of December 31, 2013 was $(12.6) million, or $(0.57) per share. Our pro forma net tangible book value (deficit) as of December 31, 2013 was $ million, or $ per share, based on the total number of shares of our common stock outstanding as of December 31, 2013, after giving effect to the automatic conversion of all outstanding shares of our convertible preferred stock as of December 31, 2013 into an aggregate of shares of common stock and the automatic conversion of all outstanding debt under a subordinated convertible promissory note with a utility partner dated March 8, 2013, which conversions will occur immediately prior to the completion of this offering.
After giving effect to the sale by us of shares of common stock in this offering at the assumed initial public offering price of $ per share, which is the midpoint of the estimated offering price range set forth on the cover page of this prospectus, and after deducting estimated underwriting discounts and commissions and estimated offering expenses payable by us, our pro forma as adjusted net tangible book value as of December 31, 2013 would have been $ million, or $ per share. This represents an immediate increase in pro forma net tangible book value of $ per share to our existing stockholders and immediate dilution of $ per share to investors purchasing shares of common stock in this offering at the assumed initial public offering price. The following table illustrates this dilution:
| Assumed initial public offering price per share |
$ | |||||||
| Pro forma net tangible book value (deficit) per share as of December 31, 2013 |
$ | |||||||
| Increase in pro forma net tangible book value (deficit) per share attributable to new investors in this offering |
||||||||
|
|
|
|||||||
| Pro forma as adjusted net tangible book value per share immediately after this offering |
||||||||
|
|
|
|||||||
| Dilution per share to new investors in this offering |
$ | |||||||
|
|
|
Each $1.00 increase or decrease in the assumed initial public offering price of $ per share, which is the midpoint of the estimated offering price range set forth on the cover page of this prospectus, would increase or decrease, as applicable, our pro forma as adjusted net tangible book value per share to new investors by $ , and would increase or decrease, as applicable, dilution per share to new investors in this offering by $ , assuming that the number of shares offered by us, as set forth on the cover page of this prospectus, remains the same and after deducting estimated underwriting discounts and commissions payable by us. In addition, to the extent any outstanding options to purchase common stock are exercised, new investors would experience further dilution. If the underwriters exercise their option to purchase additional shares from us in full, the pro forma as adjusted net tangible book value per share of our common stock immediately after this offering would be $ per share, and the dilution in pro forma net tangible book value per share to new investors in this offering would be $ per share.
The following table presents, on a pro forma as adjusted basis as of December 31, 2013, after giving effect to the conversion of all outstanding shares of convertible preferred stock into common stock immediately prior to the completion of this offering, the differences between the existing stockholders and the new investors purchasing shares of our common stock in this offering with respect to the number of shares purchased from us,
38
the total consideration paid or to be paid to us, which includes net proceeds received from the issuance of common stock and convertible preferred stock, cash received from the exercise of stock options, and the average price per share paid or to be paid to us at an assumed offering price of $ per share, which is the midpoint of the estimated offering price range set forth on the cover page of this prospectus, before deducting estimated underwriting discounts and commissions and estimated offering expenses payable by us:
| Shares Purchased | Total Consideration | Average Price Per Share |
||||||||||||||||||
| Number | Percent | Amount | Percent | |||||||||||||||||
| Existing stockholders |
41,359,839 | % | $ | 71,288,961 | % | $ | 1.72 | |||||||||||||
| New investors |
||||||||||||||||||||
|
|
|
|
|
|
|
|
|
|||||||||||||
| Totals |
100 | % | $ | 100 | % | $ | ||||||||||||||
|
|
|
|
|
|
|
|
|
|||||||||||||
Each $1.00 increase or decrease in the assumed initial public offering price of $ per share, which is the midpoint of the estimated offering price range set forth on the cover page of this prospectus, would increase or decrease, as applicable, the total consideration paid by new investors and total consideration paid by all stockholders by approximately $ million, assuming that the number of shares offered by us, as set forth on the cover page of this prospectus, remains the same and after deducting estimated underwriting discounts and commissions payable by us. In addition, to the extent any outstanding options to purchase common stock are exercised, new investors will experience further dilution.
Except as otherwise indicated, the above discussion and tables assume no exercise of the underwriters’ option to purchase additional shares. If the underwriters exercise their option to purchase additional shares in full from us, our existing stockholders would own % and our new investors would own % of the total number of shares of our common stock outstanding upon the completion of this offering.
The number of shares of our common stock to be outstanding after this offering is based on the number of shares of our common stock outstanding as of December 31, 2013 and excludes:
| • | 7,789,720 shares of common stock issuable upon the exercise of options to purchase common stock that were outstanding as of December 31, 2013, with a weighted-average exercise price of $3.83 per share; |
| • | 1,093,326 shares of common stock issuable upon the vesting of restricted stock units that were outstanding as of December 31, 2013; |
| • | 283,950 shares of common stock issuable upon the vesting of restricted stock units that were granted after December 31, 2013; |
| • | shares of common stock issuable upon the conversion of the subordinated convertible promissory note with a utility partner dated March 8, 2013, based on an assumed initial public offering price of $ per share, which is the midpoint of the estimated offering price range set forth on the cover page of this prospectus; and |
| • | 6,529,852 shares of common stock reserved for future issuance under our stock-based compensation plans, consisting of 1,529,852 shares of common stock reserved for future issuance under our 2007 Stock Plan as of December 31, 2013, which shares will be added to the shares to be reserved under our 2014 Stock Incentive Plan, and 5,000,000 shares of common stock reserved for future issuance under our 2014 Stock Incentive Plan, which will become effective in connection with this offering, and shares that become available pursuant to provisions thereof that automatically increase the share reserves under the 2014 Stock Incentive Plan each year. |
39
The following selected statement of operations data for the years ended December 31, 2011, 2012 and 2013 and the balance sheet data as of December 31, 2012 and 2013 have been derived from our audited financial statements included elsewhere in this prospectus. The selected statement of operations data for the year ended December 31, 2010 and the balance sheet data as of December 31, 2011 are derived from our audited consolidated financial statements not included in this prospectus. Our historical results are not necessarily indicative of the results that may be expected in the future. You should read the following selected financial and other data below in conjunction with “Management’s Discussion and Analysis of Financial Condition and Results of Operations” and our financial statements and related notes included elsewhere in this prospectus.
| Year Ended December 31, | ||||||||||||||||
| 2010 | 2011 | 2012 | 2013 | |||||||||||||
| (In thousands, except per share amounts) | ||||||||||||||||
| Consolidated Statements of Operations Data: |
||||||||||||||||
| Revenue |
$ | 10,636 | $ | 28,746 | $ | 51,756 | $ | 88,703 | ||||||||
| Cost of revenue(1) |
4,563 | 13,306 | 18,913 | 31,304 | ||||||||||||
|
|
|
|
|
|
|
|
|
|||||||||
| Gross profit |
6,073 | 15,440 | 32,843 | 57,399 | ||||||||||||
| Operating expenses(1): |
||||||||||||||||
| Sales and marketing |
7,120 | 13,648 | 21,338 | 30,551 | ||||||||||||
| Research and development |
6,837 | 14,372 | 16,134 | 27,087 | ||||||||||||
| General and administrative |
5,780 | 8,716 | 7,730 | 13,578 | ||||||||||||
|
|
|
|
|
|
|
|
|
|||||||||
| Total operating expenses |
19,737 | 36,736 | 45,202 | 71,216 | ||||||||||||
|
|
|
|
|
|
|
|
|
|||||||||
| Operating loss |
(13,664 | ) | (21,296 | ) | (12,359 | ) | (13,817 | ) | ||||||||
| Other income (expense), net |
1 | (1 | ) | 54 | (321 | ) | ||||||||||
|
|
|
|
|
|
|
|
|
|||||||||
| Loss before income taxes |
(13,663 | ) | (21,297 | ) | (12,305 | ) | (14,138 | ) | ||||||||
| Provision for income taxes |
— | — | 27 | 23 | ||||||||||||
|
|
|
|
|
|
|
|
|
|||||||||
| Net loss |
$ | (13,663 | ) | $ | (21,297 | ) | $ | (12,332 | ) | $ | (14,161 | ) | ||||
|
|
|
|
|
|
|
|
|
|||||||||
| Weighted-average common stock outstanding(2): |
||||||||||||||||
| Basic and diluted |
16,398 | 17,836 | 19,442 | 21,121 | ||||||||||||
| Net income (loss) per share(2): |
||||||||||||||||
| Basic and diluted |
$ | (0.83 | ) | $ | (1.19 | ) | $ | (0.63 | ) | $ | (0.67 | ) | ||||
| Pro forma net income (loss) per share (unaudited)(2): |
||||||||||||||||
| Basic and diluted |
$ | |||||||||||||||
| (1) | Stock-based compensation expense was allocated as follows: |
| Year Ended December 31, | ||||||||||||||||
| 2010 | 2011 | 2012 | 2013 | |||||||||||||
| (In thousands) | ||||||||||||||||
| Cost of revenue |
$ | 11 | $ | 87 | $ | 137 | $ | 197 | ||||||||
| Sales and marketing |
120 | 340 | 484 | 1,348 | ||||||||||||
| Research and development |
133 | 382 | 447 | 939 | ||||||||||||
| General and administrative |
122 | 151 | 119 | 1,141 | ||||||||||||
|
|
|
|
|
|
|
|
|
|||||||||
| Total stock-based compensation |
$ | 386 | $ | 960 | $ | 1,187 | $ | 3,625 | ||||||||
|
|
|
|
|
|
|
|
|
|||||||||
| (2) | See Note 10 to our audited financial statements for an explanation of the method used to calculate basic and diluted net loss per share attributable to common stockholders, pro forma basic and diluted net loss per share attributable to common stockholders and the weighted-average number of shares used in the computation of the per share amounts. |
40
| December 31, | ||||||||||||
| 2011 | 2012 | 2013 | ||||||||||
| (In thousands) | ||||||||||||
| Balance Sheet Data: |
||||||||||||
| Cash and cash equivalents |
$ | 28,333 | $ | 24,597 | $ | 28,819 | ||||||
| Working capital (deficit) |
12,062 | (1,729 | ) | (11,851 | ) | |||||||
| Property and equipment, net |
3,403 | 6,127 | 10,813 | |||||||||
| Total assets |
36,779 | 42,637 | 63,135 | |||||||||
| Deferred revenue |
17,132 | 32,395 | 52,390 | |||||||||
| Total indebtedness |
— | — | 3,673 | |||||||||
| Total stockholders’ equity (deficit) |
12,248 | 1,986 | (6,263 | ) | ||||||||
Non-GAAP Financial Measures
Adjusted EBITDA is a financial measure that is not calculated in accordance with GAAP. We define adjusted EBITDA as net loss adjusted to exclude income tax provision, other income (expense), including interest, depreciation and amortization and stock-based compensation. Below, we have provided a reconciliation of adjusted EBITDA to our net loss, the most directly comparable financial measure calculated and presented in accordance with GAAP. Adjusted EBITDA should not be considered as an alternative to net loss or any other measure of financial performance calculated and presented in accordance with GAAP. Our adjusted EBITDA may not be comparable to similarly titled measures of other organizations because other organizations may not calculate adjusted EBITDA in the same manner as we calculate the measure.
For limitations of this non-GAAP financial measure and further explanation of such measure, see “Summary—Summary Financial Data—Other Financial Metrics.”
The following table presents a reconciliation of adjusted EBITDA to our net loss, the most comparable GAAP measure, for each of the periods indicated:
| Year Ended December 31, | ||||||||||||||||
| 2010 | 2011 | 2012 | 2013 | |||||||||||||
| (In thousands) | ||||||||||||||||
| Reconciliation of Net Loss to Adjusted EBITDA: |
||||||||||||||||
| Net loss |
$ | (13,663 | ) | $ | (21,297 | ) | $ | (12,332 | ) | $ | (14,161 | ) | ||||
| Provision for income taxes |
— | — | 27 | 23 | ||||||||||||
| Other (income) expense, including interest |
(1 | ) | 1 | (54 | ) | 321 | ||||||||||
| Depreciation and amortization |
202 | 626 | 1,599 | 3,766 | ||||||||||||
| Stock-based compensation |
386 | 960 | 1,187 | 3,625 | ||||||||||||
|
|
|
|
|
|
|
|
|
|||||||||
| Adjusted EBITDA |
$ | (13,076 | ) | $ | (19,710 | ) | $ | (9,573 | ) | $ | (6,426 | ) | ||||
|
|
|
|
|
|
|
|
|
|||||||||
41
MANAGEMENT’S DISCUSSION AND ANALYSIS OF FINANCIAL CONDITION AND RESULTS OF OPERATIONS
You should read the following discussion and analysis of our financial condition and results of operations together with the “Selected Financial and Other Data” and the consolidated financial statements and related notes that are included elsewhere in this prospectus. This discussion contains forward-looking statements based upon current expectations that involve risks and uncertainties. Our actual results may differ materially from those anticipated in these forward-looking statements as a result of various factors, including those set forth under “Risk Factors” or in other parts of this prospectus.
Overview
Opower is a leading provider of cloud-based software to the $2.2 trillion utility industry. Utilities use our software platform to deliver key customer-facing applications that reduce energy demand and improve customer perception of the utility. Our software analyzes energy data and presents personalized insights to consumers in order to motivate reductions in energy consumption. These reductions are valued as a source of energy much like a conventional power plant. We believe we are poised to transform the way the utility industry meets energy demand.
Our software platform helps redefine the relationship between utilities and their customers, and we have a track record of motivating consumers to take action. Our growth has been fueled by our focus on big data software architecture, user experience and, above all, scalable results. We offer a growing set of integrated software solutions, Opower Energy Efficiency, Opower Customer Engagement, Opower Demand Response and Opower Thermostat Management. As of December 31, 2013, we had 93 customers in eight countries. Our customers include 27 of the 50 largest electric utilities in the United States, including Commonwealth Edison, Duke Energy, First Energy, National Grid, Pacific Gas & Electric, Southern California Edison and Xcel Energy, as well as E.ON, Electricitie de France and Energy Australia internationally. Our leadership position has enabled us to build one of the largest energy datasets in the world: we have energy data from 37% of U.S. households on our platform, as well as data from millions of international households.
We generate revenue primarily from subscription fees from utilities for use on our platform, generally based upon the number of households and businesses served and the solutions selected. Although the number of households and businesses has some impact on our revenue, the number of households or businesses served is not directly correlated with revenue. The price we receive per household or business varies for each customer. For this reason, we do not treat the number of households or businesses served as one of our key performance indicators for our business. However, we do monitor this metric to understand the general adoption of our solutions by our customers.
We deliver our solutions to utilities through our cloud-based platform. New customers typically contract with us for 12 to 36 months and then renew for one year or more. The weighted-average contract term in 2013 was 24.5 months.
Opower was formed in 2007. We currently have four major product solutions.
| • | In 2007, we launched our first solution, Energy Efficiency. This solution focuses on reducing energy consumption through a data analytics-driven, behavioral science-informed program. |
| • | In 2010, we started offering Customer Engagement solutions, which provide utilities with a web application that delivers user-friendly energy consumption and billing information. This solution helps households and businesses make informed decisions, and thereby save money and energy. It offers utilities a better way to engage their customers, and thereby strengthen their brand. |
42
| • | In 2012, we started offering Thermostat Management, which is designed to interact with third-party hardware and to deliver engaging user experiences while also creating energy efficiency and demand response opportunities for our utility customers. |
| • | In 2013, we launched Demand Response, aimed at reducing peak demand for energy while not requiring any hardware installations to function. |
We believe both of these newest solutions, Thermostat Management and Demand Response, offer significant growth potential, but both are still in a nascent stage with an immaterial impact on our revenue to date.
Our growth is driven by acquiring new customers and expanding with existing customers. We continue to grow domestically and internationally. We continue to acquire new customers in the United States and internationally. Our number of utility customers has increased from 63, 61 of which resided in the United States, as of December 31, 2011 to 93 customers in 8 countries as of December 31, 2013. We have expanded with existing customers by cross selling different solutions and adding households and businesses that use our platform. The number of households and businesses on our platform has grown from 1.4 million at December 31, 2010 to 32.1 million at December 31, 2013.
Our investments have yielded significant revenue growth over the past few years. For the years ended December 31, 2011, 2012 and 2013, our revenue was $28.7 million, $51.8 million and $88.7 million, respectively. This represents revenue growth of 71% for our most recent fiscal year. Our net losses for the years ended December 31, 2011, 2012 and 2013 were $21.3 million, $12.3 million and $14.2 million, respectively. We have grown from 162 employees as of December 31, 2010 to 465 employees as of December 31, 2013.
Key Factors Affecting Our Performance
Investing in Growth. We will continue to focus on long-term growth. We believe that our market opportunity is large and underpenetrated and we will continue to invest significantly in sales and marketing to grow our customer base, expand with existing customers, grow internationally and drive additional revenue. We also expect to invest in research and development to enhance our platform and develop complementary solutions. To support our expected growth and our transition to a public company, we plan to invest in other operational and administrative functions. We expect to use the proceeds from this offering to fund these growth strategies and do not expect to be profitable in the near future.
We believe that our sales and marketing, research and development and general and administrative costs will decrease as a percentage of revenue in the long term as we are able to reach economies of scale. With this increased operating leverage, we expect our gross and operating margins to increase in the long term. However, in the short term, we intend to focus on the growth of the business and expect our total operating expenses to increase, and have a short-term negative impact on our adjusted EBITDA and operating margin.
Adding New Utility Customers. Our customer base is a key indicator of our market penetration, growth and future revenue. We believe that we are positioned to grow significantly for many years to come. With 93 customers as of December 31, 2013, we believe we have a substantial opportunity to expand our number of utility customers in the coming years. There are approximately 1,300 utilities worldwide with the scale and customer base that could successfully deploy our solutions. The number of new customers signed may vary period to period for several reasons, including the long length and general inconsistency of our sales cycle.
Expanding with and Cross-Selling to Existing Customers. Our existing customers continue to represent a large opportunity for us to expand to more households and businesses and to cross-sell additional solutions. As of December 31, 2013, only 16% of our customers have licensed more than one of our solutions. Additionally, in December 2013, we delivered our energy efficiency solution to nearly 12 million households across 93 utilities, representing approximately 10% of the 115 million households that those utilities served.
43
Key Performance Indicators for Our Business
We regularly review a number of metrics to measure our performance, formulate financial projections, evaluate growth trends and determine business strategy. In addition to the metrics discussed below, we also review gross margin and operating expenses, which we discuss in the “Basis of Presentation” section.
| Year Ended December 31, | ||||||||||||
| 2011 | 2012 | 2013 | ||||||||||
| (Dollars in thousands) | ||||||||||||
| Financial Metrics: |
||||||||||||
| Revenue |
$ | 28,746 | $ | 51,756 | $ | 88,703 | ||||||
| Period-over-period percentage increase |
80 | % | 71 | % | ||||||||
| Adjusted EBITDA(1) |
$ | (19,710 | ) | $ | (9,573 | ) | $ | (6,426 | ) | |||
| Operating Metrics: |
||||||||||||
| Total customers(2) |
63 | 78 | 93 | |||||||||
| (1) | We define adjusted EBITDA as net loss plus provision for income taxes; other (income) expense, including interest; depreciation and amortization; and stock-based compensation. Adjusted EBITDA is not calculated in accordance with GAAP. A reconciliation of this non-GAAP measure to the most directly comparable GAAP-based measure along with a summary of the definition and its material limitations are included in “Summary—Summary Financial Data—Other Financial Metrics.” |
| (2) | We define our number of customers at the end of a period as the number of distinct buying entities with which we have signed agreements and who have committed to a minimum level of non-refundable fees for which services are to be provided or are being provided. |
Basis of Presentation
Revenue
We offer subscriptions to our cloud-based data analytics platform. We derive our revenue from fees for these subscriptions. Subscription fees primarily pay for the ongoing integration of utility data into our software platform and the analysis and presentation of this data to energy consumers.
We recognize revenue on our subscription fees ratably over the contract term beginning on the date the service is available to the customer, which typically coincides with website launch or first report generation to households and businesses. Our fees are non-refundable once billed, are generally collected in advance of service delivery, and our contracts typically have a term of one to five years. We record amounts that have been billed as deferred revenue and these amounts are recognized evenly over the contract term. Because payment terms may be quarterly for some customers, the annualized value of the orders we enter into with our customers will not be completely reflected in deferred revenue at any single point in time. Accordingly, we do not believe that change in deferred revenue is an accurate indicator of future revenues for a given period of time. Setup fees, which tend not to provide stand-alone value, are recognized over the expected life of the customer relationship. We will continue to evaluate the length of the amortization period of the setup fees as we gain more experience with customers.
Cost of Revenue
Cost of revenue generally consists of information services necessary to perform data analysis, the costs of data center capacity, employee-related expenses, including salaries, benefits and stock-based compensation related to implementing, operating and servicing our internal applications, channel delivery fees, which includes printing and mailing for delivery of reports to utility customers, and amortization of internally capitalized software that delivers our services. In addition, we allocate a portion of overhead costs, including rent, information technology and employee benefit costs, to cost of revenue.
44
Our cost of revenue is expensed as incurred and includes amortization of capitalized software. However, the related revenue for delivery of our services is deferred until commencement of delivery services and is recognized ratably over the related subscription term. Therefore, costs associated with delivering these services are not always expensed in the same period that revenue is recognized. Customer costs tend to be higher in the initial subscription year of a program based on the effort required to develop system integrations and match customer data.
Operating Expenses
Sales and Marketing. Sales and marketing expenses consist primarily of personnel and related expenses for our sales and marketing staff, including salaries, benefits, bonuses, stock-based compensation, travel and commissions. They also include the cost of advertising, online marketing, promotional events, corporate communications, product marketing and other brand-building activities. We expense sales commissions at the time of contract signing.
We intend to continue to invest in sales and marketing activities to expand our business domestically and internationally. We expect to hire additional sales personnel in the United States and internationally. We also intend to expand our sales offices globally, including in the United Kingdom, Singapore and Japan. As we scale our sales and marketing activities in the short to medium term, we expect these expenses to increase in absolute dollars as well as a percentage of revenue.
Research and Development. Research and development costs consist primarily of personnel and related expenses, including salaries, benefits and stock-based compensation, research and development consulting fees and allocated overhead. Development costs other than those qualifying for capitalization as internally developed software are expensed as incurred.
Our research efforts focus on improving our understanding of the way in which energy consumers use energy and the ways in which the behaviors of those users can be influenced. Additionally, development efforts have focused on creating a scalable data analytics platform with the capability of capturing, analyzing and reporting on large amounts of data captured in small intervals. We also continue to focus development efforts on adding new features and applications, and enhancing the functionality of our platform. In the short term, we expect research and development expenses to increase in absolute dollars as well as on a percentage of revenue basis as we add new platform functionality and expand our system infrastructure.
General and Administrative. General and administrative expenses consist primarily of personnel and related expenses for accounting, executive, finance, human resources, legal, information technology and security and recruiting staff, including salaries, benefits, bonuses, stock-based compensation, professional fees, insurance premiums and allocated overhead.
We expect our general and administrative expenses to increase as we continue to expand our operations, hire additional personnel and transition from a private to a public company. As we transition to being a public entity, we expect to incur additional expense related to increased accounting and auditing services, increased outside counsel assistance, increased compliance requirements including filings with the Securities and Exchange Commission, and enhancing our internal control environment.
Other Income and Expenses. Other income and expenses consist primarily of interest income, interest expense and gains and losses related to foreign currency transactions. Interest income is income received primarily from deposits of cash and cash equivalents. Interest expense relates to interest incurred related to capital equipment leasing and on our outstanding note payable. Foreign exchange gains and losses relate to transactions denominated in currencies other than the functional currency of our entities.
45
Results of Operations
The following tables set forth selected consolidated statement of operations data and such data as a percentage of total revenue for each of the periods indicated.
| Year Ended December 31, | ||||||||||||
| 2011 | 2012 | 2013 | ||||||||||
| (In thousands) | ||||||||||||
| Consolidated Statements of Operations Data: |
||||||||||||
| Revenue |
$ | 28,746 | $ | 51,756 | $ | 88,703 | ||||||
| Cost of revenue(1) |
13,306 | 18,913 | 31,304 | |||||||||
|
|
|
|
|
|
|
|||||||
| Gross profit |
15,440 | 32,843 | 57,399 | |||||||||
| Operating expenses(1): |
||||||||||||
| Sales and marketing |
13,648 | 21,338 | 30,551 | |||||||||
| Research and development |
14,372 | 16,134 | 27,087 | |||||||||
| General and administrative |
8,716 | 7,730 | 13,578 | |||||||||
|
|
|
|
|
|
|
|||||||
| Total operating expenses |
36,736 | 45,202 | 71,216 | |||||||||
|
|
|
|
|
|
|
|||||||
| Operating loss |
(21,296 | ) | (12,359 | ) | (13,817 | ) | ||||||
| Other income (expense), net |
(1 | ) | 54 | (321 | ) | |||||||
|
|
|
|
|
|
|
|||||||
| Loss before income taxes |
(21,297 | ) | (12,305 | ) | (14,138 | ) | ||||||
| Provision for income taxes |
— | 27 | 23 | |||||||||
|
|
|
|
|
|
|
|||||||
| Net loss |
$ | (21,297 | ) | $ | (12,332 | ) | $ | (14,161 | ) | |||
|
|
|
|
|
|
|
|||||||
| (1) | Stock-based compensation was allocated as follows: |
| Year Ended December 31, | ||||||||||||
| 2011 | 2012 | 2013 | ||||||||||
| (In thousands) | ||||||||||||
| Cost of revenue |
$ | 87 | $ | 137 | $ | 197 | ||||||
| Sales and marketing |
340 | 484 | 1,348 | |||||||||
| Research and development |
382 | 447 | 939 | |||||||||
| General and administrative |
151 | 119 | 1,141 | |||||||||
|
|
|
|
|
|
|
|||||||
| Total stock-based compensation |
$ | 960 | $ | 1,187 | $ | 3,625 | ||||||
|
|
|
|
|
|
|
|||||||
| Year Ended December 31, | ||||||||||||
| 2011 | 2012 | 2013 | ||||||||||
| Percentage of Revenue: |
||||||||||||
| Cost of revenue |
46 | % | 37 | % | 35 | % | ||||||
| Gross margin |
54 | 63 | 65 | |||||||||
| Operating expenses: |
||||||||||||
| Sales and marketing |
47 | 41 | 34 | |||||||||
| Research and development |
50 | 31 | 31 | |||||||||
| General and administrative |
30 | 15 | 15 | |||||||||
|
|
|
|
|
|
|
|||||||
| Total operating expenses |
127 | 87 | 80 | |||||||||
|
|
|
|
|
|
|
|||||||
| Operating loss |
(74 | ) | (24 | ) | (16 | ) | ||||||
| Other income (expense), net |
— | — | — | |||||||||
|
|
|
|
|
|
|
|||||||
| Loss before income taxes |
(74 | ) | (24 | ) | (16 | ) | ||||||
| Provision for income taxes |
— | — | — | |||||||||
|
|
|
|
|
|
|
|||||||
| Net loss |
(74 | %) | (24 | %) | (16 | )% | ||||||
|
|
|
|
|
|
|
|||||||
46
Years Ended December 31, 2012 and 2013
Revenue
| Year Ended December 31, | ||||||||||||||||
| 2012 | 2013 | $ Change | % Change | |||||||||||||
| (Dollars in thousands) | ||||||||||||||||
| Revenue |
$ | 51,756 | $ | 88,703 | $ | 36,947 | 71 | % | ||||||||
Revenue increased as a result of the addition of new customers and increased customer penetration as compared to the prior year. The number of customers increased from 78 as of December 31, 2012 to 93 as of December 31, 2013. Of the $36.9 million increase in revenue, expansions with existing customers contributed $28.6 million and new customers contributed $8.3 million to revenue for the year ended December 31, 2013. We increased customer penetration through expanding the number of households and businesses on previously deployed solutions and cross selling existing customers additional products. Price changes did not have a material impact on the year-over-year increase in revenue. International revenue was 3% and 10% of revenue for the years ended December 31, 2012 and 2013, respectively. We expect international revenue to continue to increase as a percentage of revenue going forward as we continue to expand our international sales presence.
Cost of Revenue, Gross Profit and Gross Margin
| Year Ended December 31, | ||||||||||||||||
| 2012 | 2013 | $ Change | % Change | |||||||||||||
| (Dollars in thousands) | ||||||||||||||||
| Cost of revenue |
$ | 18,913 | $ | 31,304 | $ | 12,391 | 66 | % | ||||||||
| Gross profit |
32,843 | 57,399 | 24,556 | 75 | % | |||||||||||
| Gross margin |
63 | % | 65 | % | ||||||||||||
The increase in cost of revenue was due to both higher volume and an increased cost of delivery. Specifically, $3.9 million of the increase related to increased volume of services over the prior year. In addition, $3.6 million of the increase was related to a January 2013 U.S. Postal Service determination that mailed home energy reports should be charged first class postage rates for residential delivery. A subsequent modification to our energy reports allowed us to return to standard postage rates during the third quarter of 2013. We expect postage and delivery costs to further decrease as a percentage of revenue as we shift toward digital channels thereby increasing our gross margin in the long term.
Our gross margin improved as we were able to realize lower paper report production costs based on the scale we achieved, partially offset by the $3.6 million increase related to the U.S. Postal Service determination. On an absolute dollar basis, employee compensation and related costs increased by $1.8 million as our headcount increased from December 31, 2012 to December 31, 2013. These new employees were primarily focused on implementing and delivering our services. The new delivery of expanded products including those delivered via digital channels and costs associated with warehousing an increased amount of data increased costs by $1.1 million. The amortization of capitalized internal-use software costs increased by $0.8 million due to continued investment in our software products.
Sales and Marketing
| Year Ended December 31, | ||||||||||||||||
| 2012 | 2013 | $ Change | % Change | |||||||||||||
| (Dollars in thousands) |
||||||||||||||||
| Sales and marketing |
$ | 21,338 | $ | 30,551 | $ | 9,213 | 43 | % | ||||||||
| Percentage of revenue |
41 | % | 34 | % | ||||||||||||
47
From December 31, 2012 to December 31, 2013, the headcount of our sales and marketing staff increased, which combined with higher commission expense related to increased contract bookings, drove $6.3 million of the increased sales and marketing expenses. We also increased spending on sales and marketing-related travel and marketing events by $1.6 million in 2013. Allocations related to information technology and rent, market and regulatory consulting as well as customer relationship management software expenses further increased expenses by $1.0 million in 2013.
We expect sales and marketing expenses to increase in absolute dollars and as a percentage of revenue in the near to medium term, as we continue to increase the size of the sales and marketing staff both domestically and internationally. Additionally, we expect non-headcount driven marketing expenses will increase as we attempt to increase brand awareness and sponsor additional marketing events, including a user conference in February 2014, with the aim of attracting new customers and expanding our footprint with existing customers.
Research and Development
| Year Ended December 31, | ||||||||||||||||
| 2012 | 2013 | $ Change | % Change | |||||||||||||
| (Dollars in thousands) |
||||||||||||||||
| Research and development |
$ | 16,134 | $ | 27,087 | $ | 10,953 | 68 | % | ||||||||
| Percentage of revenue |
31 | % | 31 | % | ||||||||||||
From December 31, 2012 to December 31, 2013, the headcount of our research and development staff increased, which drove $6.3 million of the increased research and development expense. Spending related to external consultants engaged to support product development increased by $2.0 million as compared to the prior year. Increased travel, information technology and rent allocations, as well as development and integrated software, further increased expenses by $1.1 million. Amortization of internally capitalized software related to research activities also increased by $0.7 million over the prior year. Additionally, during the year ended December 31, 2013, we recorded a non-cash impairment of $0.6 million related to a capitalized internal-use software project termination related to the development of a stand-alone mobile app.
We expect research and development expenses will increase in absolute dollars, and in the near term also as a percentage of revenue, as we continue to invest in new product capabilities and focus on developing our products for international markets, which may involve different requirements than domestic markets.
General and Administrative
| Year Ended December 31, | ||||||||||||||||
| 2012 | 2013 | $ Change | % Change | |||||||||||||
| (Dollars in thousands) |
||||||||||||||||
| General and administrative |
$ | 7,730 | $ | 13,578 | $ | 5,848 | 76 | % | ||||||||
| Percentage of revenue |
15 | % | 15 | % | ||||||||||||
From December 31, 2012 to December 31, 2013, headcount increased across our accounting, finance, human resources, legal and recruiting departments, which drove $3.5 million of the increase in general and administrative expenses. This headcount growth was required to support overall company growth. Travel related to international expansion, software for back office systems, financial services and consultants and insurance related to our growth combined to increase expenses by $1.2 million in 2013. External legal fees increased by $0.6 million in conjunction with international expansion and other matters requiring specialist expertise.
We expect general and administrative expenses will continue to grow in absolute dollars as we continue to invest in our infrastructure with a greater number of employees. Additionally, as we plan to become a public reporting company, general and administrative expenses are likely to increase further.
48
Other Income (Expense), Net
| Year Ended December 31, | ||||||||||||||||
| 2012 | 2013 | $ Change | % Change | |||||||||||||
| (Dollars in thousands) |
||||||||||||||||
| Other income (expense), net |
$ | 54 | $ | (321 | ) | $ | (375 | ) | N/M | * | ||||||
| Percentage of revenue |
0 | % | 0 | % | ||||||||||||
*N/M – Not meaningful.
For the year ended December 31, 2013, other income (expense), net, decreased primarily due to interest expense of $0.2 million related to our loan from E.ON SE and usage of capital leases to increase data center capacity. In addition, fluctuation in the value of foreign currency led to a $0.2 million foreign currency loss, primarily related to transactions denominated in Australian Dollars. We continue to monitor our foreign currency exposure to determine whether we should implement a foreign currency hedging program. These losses were partially offset by $0.2 million of rental income related to an office sublease agreement.
Years Ended December 31, 2011 and 2012
Revenue
| Year Ended December 31, | ||||||||||||||||
| 2011 | 2012 | $ Change | % Change | |||||||||||||
| (Dollars in thousands) | ||||||||||||||||
| Revenue |
$ | 28,746 | $ | 51,756 | $ | 23,010 | 80 | % | ||||||||
Existing customers contributed $14.0 million of additional revenue while new customers added $9.0 million in revenue in 2012. The number of customers increased from 63 at December 31, 2011 to 78 at December 31, 2012. International revenue as a percentage of revenue increased from none in 2011 to 3% in 2012.
Cost of Revenue, Gross Profit and Gross Margin
| Year Ended December 31, | ||||||||||||||||
| 2011 | 2012 | $ Change | % Change | |||||||||||||
| (Dollars in thousands) | ||||||||||||||||
| Cost of revenue |
$ | 13,306 | $ | 18,913 | $ | 5,607 | 42 | % | ||||||||
| Gross profit |
15,440 | 32,843 | 17,403 | 113 | % | |||||||||||
| Gross margin |
54 | % | 63 | % | ||||||||||||
The increase in cost of revenue was primarily driven by increased postage costs of $2.6 million, while report production costs held steady as volume increases were offset by volume production discounts, and labor costs increased by $1.3 million over the prior year.
Sales and Marketing
| Year Ended December 31, | ||||||||||||||||
| 2011 | 2012 | $ Change | % Change | |||||||||||||
| (Dollars in thousands) | ||||||||||||||||
| Sales and marketing |
$ | 13,648 | $ | 21,338 | $ | 7,690 | 56 | % | ||||||||
| Percentage of revenue |
47 | % | 41 | % | ||||||||||||
49
Salaries and related expenses drove $5.8 million of the increase in sales and marketing expenses. Of that amount, an increase of $1.6 million related to commissions. Travel, regulatory consultant and allocated rent expenses added $1.4 million of expense in 2012.
Research and Development
| Year Ended December 31, | ||||||||||||||||
| 2011 | 2012 | $ Change | % Change | |||||||||||||
| (Dollars in thousands) | ||||||||||||||||
| Research and development |
$ | 14,372 | $ | 16,134 | $ | 1,762 | 12 | % | ||||||||
| Percentage of revenue |
50 | % | 31 | % | ||||||||||||
This increase was driven mainly by a headcount increase from December 31, 2011 to December 31, 2012. Salaries and related expenses increased by $3.6 million, offset by an increase of $3.0 million for capitalized software, which decreased research and development expenses. The percentage of development expenses that were capitalized increased from 2011 to 2012 due to a change in the nature of our development work, which caused research and development expenses to decrease as a percentage of revenue. We do not expect the trend of declining research and development expenses as a percentage of revenue to continue in the near future. An increase in depreciation related to infrastructure investment as well as increased allocated rent expenses contributed $1.1 million of the increased expense.
General and Administrative
| Year Ended December 31, | ||||||||||||||||
| 2011 | 2012 | $ Change | % Change | |||||||||||||
| (Dollars in thousands) | ||||||||||||||||
| General and administrative |
$ | 8,716 | $ | 7,730 | $ | (986 | ) | (11 | %) | |||||||
| Percentage of revenue |
30 | % | 15 | % | ||||||||||||
The decrease in general and administrative expenses primarily related to $1.0 million decrease in rent expense due to increased allocation of rent expense to other departments based on headcount.
50
Quarterly Results of Operations
The following tables set forth selected unaudited quarterly consolidated statements of operations data for each of the eight quarters in the period ended December 31, 2013. The information for each of these quarters has been prepared on the same basis as the audited annual consolidated financial statements included elsewhere in this prospectus and, in the opinion of management, includes all adjustments, consisting of normal recurring adjustments, necessary for the fair presentation of the results of operations for these periods in accordance with generally accepted accounting principles. This data should be read in conjunction with our audited consolidated financial statements and related notes included elsewhere in this prospectus. These quarterly results of operations are not necessarily indicative of our results of operations for a full year or any future period.
| Three Months Ended | ||||||||||||||||||||||||||||||||
| March 31, 2012 |
June 30, 2012 |
Sept 30, 2012 |
Dec 31, 2012 |
March 31, 2013 |
June 30, 2013 |
Sept 30, 2013 |
Dec 31, 2013 |
|||||||||||||||||||||||||
| (In thousands) | ||||||||||||||||||||||||||||||||
| Consolidated Statements of Operations Data: |
||||||||||||||||||||||||||||||||
| Revenue |
$ | 10,178 | $ | 11,727 | $ | 13,955 | $ | 15,896 | $ | 19,023 | $ | 21,229 | $ | 22,491 | $ | 25,960 | ||||||||||||||||
| Cost of revenue(1) |
4,595 | 3,945 | 5,012 | 5,361 | 7,888 | 7,198 | 7,758 | 8,460 | ||||||||||||||||||||||||
|
|
|
|
|
|
|
|
|
|
|
|
|
|
|
|
|
|||||||||||||||||
| Gross profit |
5,583 | 7,782 | 8,943 | 10,535 | 11,135 | 14,031 | 14,733 | 17,500 | ||||||||||||||||||||||||
|
|
|
|
|
|
|
|
|
|
|
|
|
|
|
|
|
|||||||||||||||||
| Operating expenses(1): |
||||||||||||||||||||||||||||||||
| Sales and marketing |
4,448 | 5,168 | 5,763 | 5,959 | 6,193 | 6,953 | 7,826 | 9,579 | ||||||||||||||||||||||||
| Research and development |
3,692 | 4,026 | 3,998 | 4,418 | 5,380 | 5,622 | 7,242 | 8,843 | ||||||||||||||||||||||||
| General and administrative |
1,692 | 1,707 | 1,966 | 2,365 | 2,380 | 2,786 | 3,242 | 5,170 | ||||||||||||||||||||||||
|
|
|
|
|
|
|
|
|
|
|
|
|
|
|
|
|
|||||||||||||||||
| Total operating expenses |
9,832 | 10,901 | 11,727 | 12,742 | 13,953 | 15,361 | 18,310 | 23,592 | ||||||||||||||||||||||||
|
|
|
|
|
|
|
|
|
|
|
|
|
|
|
|
|
|||||||||||||||||
| Operating loss |
(4,249 | ) | (3,119 | ) | (2,784 | ) | (2,207 | ) | (2,818 | ) | (1,330 | ) | (3,577 | ) | (6,092 | ) | ||||||||||||||||
| Other income (expense), net |
43 | (37 | ) | 51 | (3 | ) | 112 | (640 | ) | 393 | (186 | ) | ||||||||||||||||||||
|
|
|
|
|
|
|
|
|
|
|
|
|
|
|
|
|
|||||||||||||||||
| Loss before income taxes |
(4,206 | ) | (3,156 | ) | (2,733 | ) | (2,210 | ) | (2,706 | ) | (1,970 | ) | (3,184 | ) | (6,278 | ) | ||||||||||||||||
| Provision for income taxes |
— | — | 12 | 15 | 7 | 26 | (9 | ) | (1 | ) | ||||||||||||||||||||||
|
|
|
|
|
|
|
|
|
|
|
|
|
|
|
|
|
|||||||||||||||||
| Net loss |
$ | (4,206 | ) | $ | (3,156 | ) | $ | (2,745 | ) | $ | (2,225 | ) | $ | (2,713 | ) | $ | (1,996 | ) | $ | (3,175 | ) | $ | (6,277 | ) | ||||||||
|
|
|
|
|
|
|
|
|
|
|
|
|
|
|
|
|
|||||||||||||||||
| (1) | Stock-based compensation was allocated as follows: |
| Three Months Ended | ||||||||||||||||||||||||||||||||
| March 31, 2012 |
June 30, 2012 |
Sept 30, 2012 |
Dec 31, 2012 |
March 31, 2013 |
June 30, 2013 |
Sept 30, 2013 |
Dec 31, 2013 |
|||||||||||||||||||||||||
| (In thousands) | ||||||||||||||||||||||||||||||||
| Cost of revenue |
$ | 34 | $ | 31 | $ | 35 | $ | 37 | $ | 34 | $ | 37 | $ | 58 | $ | 68 | ||||||||||||||||
| Sales and marketing |
116 | 118 | 152 | 98 | 80 | 127 | 431 | 710 | ||||||||||||||||||||||||
| Research and development |
98 | 107 | 120 | 122 | 167 | 172 | 323 | 277 | ||||||||||||||||||||||||
| General and administrative |
34 | 31 | 31 | 23 | 31 | 94 | 366 | 650 | ||||||||||||||||||||||||
|
|
|
|
|
|
|
|
|
|
|
|
|
|
|
|
|
|||||||||||||||||
| Total stock-based compensation |
$ | 282 | $ | 287 | $ | 338 | $ | 280 | $ | 312 | $ | 430 | $ | 1,178 | $ | 1,705 | ||||||||||||||||
|
|
|
|
|
|
|
|
|
|
|
|
|
|
|
|
|
|||||||||||||||||
51
| Three Months Ended | ||||||||||||||||||||||||||||||||
| March 31, 2012 |
June 30, 2012 |
Sept 30, 2012 |
Dec 31, 2012 |
March 31, 2013 |
June 30, 2013 |
Sept 30, 2013 |
Dec 31, 2013 |
|||||||||||||||||||||||||
| Percentage of revenue: |
||||||||||||||||||||||||||||||||
| Cost of revenue |
45 | % | 34 | % | 36 | % | 34 | % | 41 | % | 34 | % | 34 | % | 33 | % | ||||||||||||||||
| Gross profit |
55 | 66 | 64 | 66 | 59 | 66 | 66 | 67 | ||||||||||||||||||||||||
| Operating expenses: |
||||||||||||||||||||||||||||||||
| Sales and marketing |
44 | 44 | 41 | 37 | 33 | 33 | 35 | 37 | ||||||||||||||||||||||||
| Research and development |
36 | 34 | 29 | 28 | 28 | 26 | 32 | 34 | ||||||||||||||||||||||||
| General and administrative |
17 | 15 | 14 | 15 | 13 | 13 | 14 | 20 | ||||||||||||||||||||||||
|
|
|
|
|
|
|
|
|
|
|
|
|
|
|
|
|
|||||||||||||||||
| Total operating expenses |
97 | 93 | 84 | 80 | 74 | 72 | 81 | 91 | ||||||||||||||||||||||||
|
|
|
|
|
|
|
|
|
|
|
|
|
|
|
|
|
|||||||||||||||||
| Operating loss |
(42 | ) | (27 | ) | (20 | ) | (14 | ) | (15 | ) | (6 | ) | (16 | ) | (23 | ) | ||||||||||||||||
| Other income (expense), net |
— | — | — | — | 1 | (3 | ) | 2 | (1 | ) | ||||||||||||||||||||||
|
|
|
|
|
|
|
|
|
|
|
|
|
|
|
|
|
|||||||||||||||||
| Loss before income taxes |
(42 | ) | (27 | ) | (20 | ) | (14 | ) | (14 | ) | (9 | ) | (14 | ) | (24 | ) | ||||||||||||||||
| Provision for income taxes |
— | — | — | — | — | — | — | — | ||||||||||||||||||||||||
|
|
|
|
|
|
|
|
|
|
|
|
|
|
|
|
|
|||||||||||||||||
| Net loss |
(42 | %) | (27 | %) | (20 | %) | (14 | %) | (14 | %) | (9 | %) | (14 | %) | (24 | %) | ||||||||||||||||
|
|
|
|
|
|
|
|
|
|
|
|
|
|
|
|
|
|||||||||||||||||
Quarterly Trends
Our quarterly revenue has increased sequentially for all periods presented, primarily due to an increasing number of customers and increased sales to our existing customers. We expect both upselling to the existing customer base as well as new customer acquisition to continue to be a significant driver of revenue growth.
Total costs and expenses increased sequentially for all periods presented, primarily due to increased salary and related costs coinciding with an increase in the number of employees required to run our growing business.
Gross margin has generally increased over time from 55% in the three months ended March 31, 2012 to 67% for the three months ended December 31, 2013. However, gross margin decreased in the three months ended March 31, 2013, primarily due to increased costs related to energy reports delivered by the U.S. Postal Service. In January 2013, the U.S. Postal Service determined that these reports should be charged first class postage rates rather than standard mail rates, thereby increasing our postage cost. These charges continued through June 2013 when we were able to modify our product and energy report postage charges returned to the standard rate as customers converted to modified energy reports. In the long term, we expect gross margin to continue to increase as digital delivery becomes a higher percentage of our product mix. However, in the short to medium term, our gross margin may decrease as we enter new international markets in which we have yet to achieve efficiencies of scale.
Sales and marketing expenses grew sequentially over the periods primarily due to an expanding sales and marketing team and related expenses. While growing, research and development expenses have fluctuated due to increased amounts being capitalized related to software developed for internal use. General and administrative expenses grew sequentially related to increased costs required to support a growing business and will continue to increase as we prepare to be a public company as evidenced by the increased expenses in the third and fourth quarters of 2013 as we prepared for this offering.
Our quarterly results may fluctuate due to various factors affecting our performance. As noted above, we recognize revenue from subscription fees ratably over the term of the contract. Therefore, changes in our contracting activity in the near term may not be apparent as a change to our reported revenue until future periods. Most of our expenses are recorded as period costs and thus factors affecting our cost structure may be reflected in our financial results sooner than changes to our revenue.
52
Liquidity and Capital Resources
As of December 31, 2013, our principal source of liquidity was cash and cash equivalents of $28.8 million, which were held for working capital purposes. Since our inception, we have financed our operations primarily through private placements of preferred stock, customer payments, exercises of options to purchase shares of common stock and, more recently, capital lease obligations and the E.ON SE loan.
In November 2010, we entered into a loan and security agreement for a $3.0 million secured revolving credit facility. In August 2013, we entered into an amended loan agreement increasing the revolving credit facility to $15.0 million. The loan contains various covenants that limit our other indebtedness, investments, liens and transactions. In addition, the loan contains financial covenants that require a minimum adjusted quick ratio and minimum cash balances. As of December 31, 2013, we were in compliance with each of these financial covenants and have not yet drawn on the facility.
In March 2013, we entered into a convertible loan agreement with E.ON SE, one of our utility customers, pursuant to which E.ON SE issued us a $2.5 million loan with an interest rate of 5% per year, compounding annually. The note matures and accumulated interest is due on March 8, 2016. The note becomes convertible into common stock in the event of an initial public offering with independent proceeds exceeding $20.0 million, a qualified private financing with independent proceeds exceeding $10.0 million, or in a non-qualified private financing with proceeds exceeding $10.0 million. In conversion, the loan and accumulated interest may convert at the option of the holder on a dollar value basis at a 12% discount from the offering or financing per share price. If we were to experience a change in control prior to conversion, we would have to repay 1.5 times the principal balance of the note as well as any accrued interest. For the year ended December 31, 2013, we recognized revenue of $1.3 million from our relationship with E.ON SE.
We believe our current cash and cash equivalents, cash flows from operations and amounts available under our loan agreements will be sufficient to meet our working capital and capital expenditure requirements for at least the next 12 months.
The following table summarizes our cash flows for the periods indicated:
| Year Ended December 31, | ||||||||||||
| 2011 | 2012 | 2013 | ||||||||||
| (In thousands) | ||||||||||||
| Net cash provided by (used in) operating activities |
$ | (9,758 | ) | $ | (22 | ) | $ | 6,667 | ||||
| Net cash used in investing activities |
(3,226 | ) | (4,326 | ) | (7,328 | ) | ||||||
| Net cash provided by financing activities |
1,125 | 569 | 4,908 | |||||||||
| Effect of foreign exchange rate changes on cash and cash equivalents |
(17 | ) | 43 | (25 | ) | |||||||
|
|
|
|
|
|
|
|||||||
| Net increase (decrease) in cash and cash equivalents |
$ | (11,876 | ) | $ | (3,736 | ) | $ | 4,222 | ||||
|
|
|
|
|
|
|
|||||||
Operating Activities
For the year ended December 31, 2013, operating activities provided $6.7 million in cash as compared to less than $0.1 million used for the year ended December 31, 2012. Positive cash flows in 2013 were driven largely by slower than anticipated hiring as we continue to seek additional qualified personnel, leading to our headcount being lower than forecasted. For the year ended December 31, 2013, the increase was primarily related to an increase in both deferred revenue of $20.0 million and accrued expenses of $1.9 million, partially offset by a combined $10.4 million increase in accounts receivable and prepaid expenses, all due to the growth in our business.
For the year ended December 31, 2012, operations used less than $0.1 million in cash as compared to a use of $9.8 million for the year ended December 31, 2011. Cash used for operations in 2012 primarily related to our net loss of $12.3 million, which was more than offset by $15.3 million of deferred revenue as subscription fees are typically billed and collected in advance of earning revenue. In 2011, the use was primarily related to our net loss of $21.3 million, which was partially offset by an increase of deferred revenue of $6.7 million and an increase in liabilities of $1.8 million.
53
As we increase investments in sales and marketing and research and development, we expect that we will experience a net usage of cash flows from operations for fiscal year 2014.
Investing Activities
Cash used in investing activities for the year ended December 31, 2013 was $7.3 million compared to $4.3 million for the year ended December 31, 2012. For the year ended December 31, 2012, cash used in investing activities was $4.3 million as compared to $3.2 million in 2011. The primary use of cash for investing activities was for the purchase of equipment in all periods and the payment of salaries relating to the development of capitalized software for internal use.
Financing Activities
Cash provided by financing activities for the year ended December 31, 2013 was $4.9 million compared to $0.6 million for the year ended December 31, 2012. The increase was related to a $2.5 million loan from E.ON SE in 2013 and $2.8 million from the issuance of common stock upon the exercise of stock options. For the year ended December 31, 2012, cash provided by financing activities was $0.6 million as compared to $1.1 million in 2011, a change mainly driven by a $0.5 million decrease in the amount of proceeds received for the sale or issuance of common stock.
Commitments
As of December 31, 2012 and 2013, we had $1.4 million and $1.1 million, respectively, in letters of credit outstanding in favor of certain landlords for office space and collateralized as part of our secured loan agreement. To date, no amounts have been drawn against the letters, which renew annually and mature at various dates through September 2015.
Our principal commitments primarily consist of obligations under leases for office space, obligations under capital leases for equipment and notes payable. As of December 31, 2013, the future non-cancelable minimum payments under these commitments were as follows:
| Payments Due by Period | ||||||||||||||||||||
| Total | Less than 1 Year |
1-2 Years |
3-5 Years |
More than 5 Years |
||||||||||||||||
| Facilities leases |
$ | 8,870 | $ | 4,376 | $ | 2,829 | $ | 1,665 | $ | — | ||||||||||
| Capital lease obligations |
1,355 | 515 | 515 | 325 | — | |||||||||||||||
| Notes payable, including interest |
2,894 | — | — | 2,894 | — | |||||||||||||||
|
|
|
|
|
|
|
|
|
|
|
|||||||||||
| Total |
$ | 13,119 | $ | 4,891 | $ | 3,344 | $ | 4,884 | $ | — | ||||||||||
|
|
|
|
|
|
|
|
|
|
|
|||||||||||
Off-Balance Sheet Arrangements
During the periods presented, we did not have any relationships with unconsolidated entities or financial partnerships, such entities often being referred to as structured finance or special purpose entities established for the purpose of facilitating off-balance sheet arrangements or other contractually narrow or limited purposes.
Critical Accounting Policies and Estimates
We prepare our financial statements and related notes in accordance with generally accepted accounting principles in the United States. Preparing the financial statements requires us to make estimates and assumptions that affect the reported amounts of assets, liabilities, revenue and expenses during the applicable periods. We base our estimates on historical experience and various other factors we believe to be reasonable under the circumstances. On an ongoing basis, we evaluate our estimates and assumptions. Our actual results may differ from these estimates, which may affect future financial statement presentation.
54
We believe the assumptions and estimates associated with the following polices have the greatest potential impact on our financial statements: revenue recognition, stock-based compensation and income taxes.
Revenue Recognition
We generate revenue from the sale of cloud-based software solutions and related services to utilities on a subscription basis. Our software license terms typically last between one and five years in length. Our subscription contracts do not provide the right to take possession of the supporting software and grant limited access to our platform. Therefore, our arrangements are accounted for as service contracts. Revenue is recognized on a straight-line basis over the subscription term once sustained data processing commences. Our arrangements do not include general rights of return.
We begin to recognize revenue when all of the following criteria have been met:
| • | Persuasive evidence of an arrangement exists; |
| • | Delivery has occurred; |
| • | The price is fixed or determinable; and |
| • | Collection is reasonably assured. |
We provide two main subscription service deliverables: (i) data analytics services and (ii) web platform services. Data analytics services provide utility end users with information about their energy consumption through web, mobile applications, text message, email and mail channels. Web, and increasingly mobile platform, services provide utility end users the access to information about usage through a platform accessible via the utility’s web and mobile site as well as through a custom application. Generally, we sell these services in conjunction with one another, however, each service is able to operate independently, may be sold separately and, therefore each of the two main services has standalone value. Because of this standalone value, revenue from these services are recognized separately.
The accounting for the components of our revenue is in accordance with the guidance around multiple element revenue transactions. This guidance requires the allocation of revenue based on Vendor-Specific Objective Evidence (“VSOE”), Third-Party Evidence (“TPE”) or Best Estimate of Sales Price (“BESP”) in descending order. We are not able to determine VSOE or TPE for our deliverables as we do not sell deliverables independently and there are no third-party offerings that reasonably compare to our service. Therefore, we determine the selling prices of subscriptions to our services based on BESP.
In determining BESP, we analyze previous sales of our deliverables. Specifically, we value our product deliverables based on the number of households served or quantity and level of services to be performed. The BESP is the average price per household or per service per year. We review our pricing trends quarterly to ensure revenue is recognized consistently over multiple periods.
After we have determined the BESP of revenue that can be allocated to each deliverable based on the relative selling price method for bundled arrangements, we recognize the revenue for each deliverable based on the type of deliverable. For subscription service deliverables, we recognize the revenue on a straight-line basis over the term of the client arrangement. The weighted-average contract term in 2013 was 24.5 months. If any portion of our fee is contingent on a future deliverable, that portion of the revenue is deferred until the contractual requirement is no longer contingent. For set-up fees we recognize revenue over the expected customer relationship period.
We charge customers set-up fees at the initiation of new contracts. The set-up fees are deferred and recognized ratably over the expected customer relationship period. The corresponding set-up costs are expensed in the periods in which they are incurred.
Deferred revenue represents amounts billed to customers for which revenue has not yet been recognized. Deferred revenue represents unearned fees for which services have not been delivered and are expected to be delivered in the future.
55
Stock-Based Compensation
We recognize compensation related to stock options, including employee, consultant and non-employee director awards in the financial statements based on fair value. We estimate fair value of each option award on the grant date using the Black-Scholes option pricing model. Using this fair value, we recognize share-based compensation expense on a straight-line basis, net of forfeitures, over the requisite service period, which is typically four years. The awards typically expire ten years from the grant date.
Option pricing models require the input of highly subjective assumptions, including the fair value of the underlying common stock, the expected price volatility of the stock, risk-free interest rate, the expected term of the option and the expected stock dividend yield. To value our options, we used our best estimates. These estimates involve inherent uncertainties and the application of substantial judgment. If different assumptions are used, our share-based compensation could be materially different in the future.
We used the following assumptions in valuing our stock options:
Fair Value of Common Stock. Our stock is not publicly traded and, therefore, we must estimate the fair value of common stock as discussed in “—Common Stock Valuations.”
Volatility. We use the historical volatilities of a selected peer group as we do not have sufficient trading history to determine the volatility of our common stock. To select our peer group, we consider public enterprise cloud-based application providers that focus on a particular industry and contain a marketing component within their service offering. We intend to continue to rely on this information until a sufficient amount of historical information regarding the volatility of our own stock becomes available, or unless the circumstances change such that the identified companies are no longer similar to us.
Expected Term. The expected term represents the period that our option awards are expected to be outstanding. As we do not have sufficient historical experience for determining the expected term, we have based our expected term on the simplified method available under GAAP.
Risk-Free Interest Rate. We use the implied yield available on U.S. Treasury zero-coupon bonds with an equivalent remaining term of the options for each option group to represent the risk-free interest rate.
Dividend Yield. We have not paid and do not expect to pay dividends and, therefore, we use a zero-percent dividend rate.
Once we have determined an estimated fair value, we adjust that value for expected forfeitures to represent the value of the award that we expect to vest. We estimate forfeitures based on a historical analysis of our actual forfeiture experience by employee and non-employee class. We recognize the expense on a straight-line basis over the requisite service period of the award. At the end of each period, we review the estimated forfeiture rate and, as applicable, make changes to the rate calculations to reflect new developments.
Our stock-based compensation expense for restricted stock units (“RSUs”) is estimated at the grant date based on the fair value of our common stock. Under our Amended and Restated 2007 Stock Plan, we are able to grant RSUs to domestic and international employees and other service providers. These RSUs vest upon the satisfaction of both a service condition and a performance condition. The standard service condition for RSUs is satisfied over a period of four years. The performance condition will be satisfied on the ear1ier of (i) 180 days after the effective date of this offering or (ii) the date of a change in control. The RSU shares are to be delivered no later than 30 days following the satisfaction of both the service and performance conditions.
Common Stock Valuations
Using the Black-Scholes model to estimate the fair value of share-based awards requires that we also estimate the fair value of the underlying common stock. Our board of directors estimated the fair value of our common stock
56
at the time of each grant of share-based awards. To determine this value, our board of directors has considered input from management and an independent third-party valuation firm. The valuations of our common stock were determined in accordance with the guidelines outlined in the American Institute of Certified Public Accountants (“AICPA”) Practice Aid, Valuation of Privately-Held-Company Equity Securities Issued as Compensation. Since the beginning of 2013, we have received monthly valuation reports of our common stock from an independent third-party valuation firm. The valuation firm has prepared contemporaneous valuation reports at the time of the grant of the share-based award. Our board of directors exercised reasonable judgment and considered numerous objective and subjective factors in making its fair value determinations. These factors include:
| • | contemporaneous valuations performed by an independent third-party valuation firm; |
| • | the prices, rights, preferences and privileges of our convertible preferred stock relative to those of our common stock; |
| • | our actual operating and financial performance; |
| • | current business conditions and projections; |
| • | hiring of key personnel and the experience of our management; |
| • | the history of the company and the introduction of new services; |
| • | our stage of development; |
| • | our likelihood of achieving a liquidity event, such as an initial public offering or merger or acquisition of our company given prevailing market conditions; |
| • | illiquidity of share-based awards involving securities in a private company; |
| • | the market performance of comparable publicly traded companies; and |
| • | the U.S. and global capital market conditions. |
In estimating the value of our common stock, our board of directors determined the equity value of the business by considering both market- and income-based approaches.
The market approach estimates value based on a comparison of the subject company to comparable public companies in a similar line of business. This method determines a market multiple of similar publicly traded companies and uses that multiple to estimate the value of the subject company. We derived the multiple of comparable companies using a ratio of the market value of invested capital less cash to the last twelve month revenue. Generally, a group of five cloud-based platform companies were used in each valuation through August 2013. Management selected these companies in conjunction with the outside valuation firm because they have similar recurring fee models and a meaningful portion of those fees relate to direct-to-consumer marketing.
The income-based approach estimates value based on the expectation of future cash flows that a company will generate and the residual value of the company after the forecasted period. The future cash flows are discounted using a discount rate derived based on companies of a similar type and risk profile. Additionally, we applied a discount to recognize the lack of marketability due to being a closely held company.
The enterprise values determined by the market-based and income-based approaches are then allocated to the common stock using the Option Pricing Method (“OPM”) and the Probability Weighted Expected Return Method (“PWERM”).
The OPM treats common stock and convertible preferred stock as call options on a company’s enterprise value with exercise prices based on the liquidation preferences of the convertible preferred stock. Under this method, the common stock only has value if the funds available for distribution to stockholders exceed the value of the liquidation preference at the time of an assumed liquidity event. The value assigned to the common stock
57
is the remaining value after preferred stock is liquidated. The OPM prices the call option using the Black-Scholes model. The OPM model is used when the range of possible future outcomes is difficult to predict. We only used the OPM model for valuations completed prior to 2012.
The PWERM relies on a forward-looking analysis to predict the possible future value of the company. Under this method, discrete future outcomes, including IPO and non-IPO scenarios, are weighted based on our estimate of the probability of each scenario. The PWERM is used when discrete future outcomes can be predicted with reasonable certainty based on a probability distribution.
For valuations starting in December 2011, we began using the Hybrid Method to determine the common stock value. The Hybrid Method uses similar discrete events as included in the PWERM, but in addition to these discrete events the OPM is also used. The Hybrid Method is useful when certain discrete future outcomes can be predicted but also accounts for less certainty than the OPM model.
Beginning in June 2013, in conjunction with the May 2013 revision of the AICPA guidelines surrounding independent valuations, we identified and modeled discrete scenarios in a traditional PWERM analysis.
The following table summarizes all stock option grants from January 1, 2013 through the date of this prospectus:
| Stock Option Grants |
Number of Shares Underlying Options Granted |
Weighted-Average Exercise Price Per Share |
Estimated Fair Value Per Share used for Financial Reporting |
|||||||||
| February 2013 |
118,000 | $ | 3.19 | $ | 3.19 | |||||||
| April 2013 |
347,750 | 4.19 | 4.19 | |||||||||
| May 2013 |
174,250 | 4.39 | 4.39 | |||||||||
| June 2013 |
309,500 | 4.69 | 4.69 | |||||||||
| July 2013 |
124,000 | 6.07 | 13.44 | |||||||||
| August 2013 |
1,615,082 | 6.62 | 13.44 | |||||||||
| November 2013 |
414,125 | 15.20 | 15.20 | |||||||||
As of December 31, 2013, unrecognized stock-based compensation related to unvested stock options was $19.3 million.
As of December 31, 2013, the board of directors and compensation committee approved a total of 1,093,326 RSUs. Total unrecognized stock-based compensation related to these awards was $15.0 million as of December 31, 2013, however no stock-based compensation expense will be recognized until the qualifying event for the awards’ performance-based vesting becomes probable. In the quarter in which this offering is completed, we will begin recording the unrecognized stock-based compensation expense over a weighted-average period of approximately four years on a straight-line basis, net of estimated forfeitures.
We considered the following factors in connection with determining the fair market value of our common stock at each of the following grant dates:
February 2013 Grants
We determined a fair market value of $3.19 per share. The following considerations were used to complete the valuation:
| • | A hybrid PWERM analysis determined an enterprise value of $181.1 million. |
| • | A discount rate of 35% based on an estimated cost of capital. |
| • | A lack of marketability discount of 30%. |
58
| • | Liquidity events were weighted as 35% for an initial public offering and 65% to a merger, acquisition, or continuation as a private company. |
| • | Benchmarked companies increased relative to the prior valuation. |
April 2013 Grants
We continued to perform consistent with revenue projections in the first quarter of 2013. Higher cost of revenue was offset by less than expected sales and research and development expenses, resulting in increased profitability against projections. We determined a fair market value of $4.19 per share, increasing from the prior valuations due to a continued positive macroeconomic climate, revenue growth consistent with prior projections and reduction in the estimated time to a liquidity event. Our performance increased the likelihood of an initial public offering when estimating specific liquidity events.
The following considerations were used to complete the valuation:
| • | A hybrid PWERM analysis determined an enterprise value of $231.2 million. |
| • | A discount rate of 33% based on an estimated cost of capital. |
| • | A lack of marketability discount of 28%. |
| • | Liquidity events were weighted as 37% for an initial public offering and 63% to a merger, acquisition, or continuation as a private company. |
| • | Benchmarked companies increased relative to the prior valuation. |
May 2013 Grants
We continued to perform consistent with revenue projections in the second quarter of 2013. Higher cost of revenue continued to be offset by less than expected sales and research and development expenses. We determined a fair market value of $4.39 per share, increasing from the prior valuation due to company revenue growth consistent with prior projections and a shorter time to liquidity based on the passage of time, which was partly offset by negative macroeconomic conditions. Our performance continued to increase the likelihood of an initial public offering when estimating specific liquidity events.
The following considerations were used to complete the valuation:
| • | A hybrid PWERM analysis determined an enterprise value of $237.7 million. |
| • | A discount rate of 32% based on an estimated cost of capital. |
| • | A lack of marketability discount of 28%. |
| • | Liquidity events were weighted as 38% for an initial public offering and 62% to a merger, acquisition, or continuation as a private company. |
| • | Benchmarked companies decreased relative to the prior valuation. |
June 2013 Grants
We continued to perform consistent with revenue projections in the second quarter of 2013. Higher cost of revenue continued to be offset by less than expected sales and research and development expenses. We determined a fair market value of $4.69 per share, increasing from the prior valuations due to company revenue growth consistent with prior projections and a shorter time to liquidity based on the passage of time, which was partly offset by negative macroeconomic conditions. Our performance continued to increase the likelihood of an initial public offering when estimating specific liquidity events. As part of this valuation, we included multiple exit scenarios, each with a separate weighting and discount for lack of marketability.
59
The following considerations were used to complete the valuation:
| • | A PWERM analysis determined an enterprise value of $274.8 million. |
| • | A discount rate of 31% based on an estimated cost of capital. |
| • | A weighted-average lack of marketability discount of 24% based on discrete exit scenarios. |
| • | Liquidity events were weighted as 43% for an initial public offering and 57% to a merger, acquisition, or continuation as a private company. |
| • | Benchmarked companies decreased relative to the prior valuation. |
July and August 2013 Grants
We continued to perform consistent with revenue projections in the third quarter of 2013. Cost of revenue returned to expectations and operating expenses were less than projected. We continued to obtain contemporaneous valuations and issue option grants throughout the period. As of September 2013, we estimated the fair market value of our common stock to be $13.44 per share. This increased from the prior valuations mainly due to the reassessment of comparable companies.
The following considerations were used to complete the valuation:
| • | A PWERM analysis determined an enterprise value of $775.8 million. |
| • | A discount rate of 25% based on an estimated cost of capital. |
| • | A weighted-average lack of marketability discount of 18% based on discrete exit scenarios. |
| • | Liquidity events were weighted 65% toward an initial public offering and 35% toward a merger, acquisition, or continuation as a private company. |
Third Quarter Fair Value of Common Stock for Financial Reporting Purposes
During September 2013, we completed the process of selecting investment banking firms. As part of this process, we amended the comparable company group used to estimate the fair value of our common stock using the market approach in order to (i) include additional companies with a software-as-a-service business model, (ii) reflect examples of comparable companies that the underwriters identified to us during our underwriter selection process for this offering and (iii) include certain companies that became public in the first six months of 2013. Due to the difference in valuation of these companies by the market, there was a significant increase in the multiples that management was using to estimate the enterprise value of the company. At the same time as this process was being undertaken, we consented to third-party purchases of shares from existing common shareholders at prices ranging from $13.00 to $15.00. This per-share value of common stock is consistent with the value of $13.44 per share determined as part of our estimate of fair value of common stock in September 2013. Based upon this additional benchmark information and evidence from a secondary market, we concluded that the $13.44 value determined in September 2013 should be utilized and will be applied for financial reporting purposes to value all transactions that occurred in the third quarter of 2013. Management believes that the factors that drove the significant increase were a shift in the manner in which we were viewed by investors and a general increase in the value of cloud-based solution companies during the third quarter of 2013. During the third quarter, we granted options to purchase 1.7 million shares of our common stock, which represents 65% of the total stock-based awards granted in the first nine months of 2013. Based upon an estimated fair value of $13.44, the total fair value of the awards granted in the third quarter of 2013 is $16.1 million.
November 2013 Grants
We continued to perform consistent with revenue projections in the fourth quarter of 2013. Cost of revenue was in line with our expectations and operating expenses were less than projected. We estimated the fair market
60
value of our common stock to be $15.20 per share. This increased from the prior valuations mainly due to revenue growth consistent with prior projections, a shorter time to liquidity based on the passage of time, and the performance of our comparable companies.
The following considerations were used to complete the valuation:
| • | A PWERM analysis determined an enterprise value of $865.0 million. |
| • | A discount rate of 24% based on an estimated cost of capital. |
| • | A weighted-average lack of marketability discount of 14% based on discrete exit scenarios. |
| • | Liquidity events were weighted as 74% for an initial public offering and 26% to a merger, acquisition, or continuation as a private company. |
December 2013 Grants
We continued to perform consistent with revenue projections in the fourth quarter of 2013. Cost of revenue was in line with our expectations and operating expenses were less than projected. We estimated the fair market value of our common stock to be $16.52 per share. This increased from the prior valuations mainly due to revenue growth consistent with prior projections, a shorter time to liquidity based on the passage of time, and the performance of our comparable companies.
The following considerations were used to complete the valuation:
| • | A PWERM analysis determined an enterprise value of $917.0 million. |
| • | A discount rate of 23% based on an estimated cost of capital. |
| • | A weighted-average lack of marketability discount of 12% based on discrete exit scenarios. |
| • | Liquidity events were weighted as 76% for an initial public offering and 24% to a merger, acquisition, or continuation as a private company. |
Income Taxes
We account for income taxes using the asset and liability method. Under the liability method, we determine deferred tax liabilities and assets based on the tax rates expected to be in effect during the years in which the liability is expected to be paid. The primary cause of the difference in the payment of the tax liabilities is a difference between the financial statement value and the tax basis of revenue and expenses. When it is more likely than not that some or all of our net deferred tax assets will not be realized, we record a valuation allowance. In determining the necessity of valuation allowances, we consider our projected future taxable income and the availability of tax planning strategies. We have recorded a full valuation allowance against our U.S. deferred tax assets because we have determined that it is more likely than not that our net deferred tax assets will not be realized. In the future, if we determine that we will be able to realize our net deferred tax assets, we will adjust the allowance, which would increase our income in the period the determination is made.
Quantitative and Qualitative Disclosures about Market Risk
Foreign Currency Exchange Risk
Our results of operations and cash flows are subject to fluctuations due to changes in foreign currency exchange rates, particularly changes in the euro, British Pound Sterling and the Australian Dollar. A 10% fluctuation of foreign currency exchange rates would have an immaterial effect on our results of operations and cash flows. We have hedged a portion of our contracts, but have not instituted a full hedging program. We expect our international operations to continue to grow in the near term, and we are continually monitoring our foreign
61
currency exposure to determine when we should expand the program. The substantial majority of our agreements have been and we expect will continue to be denominated in U.S. dollars.
Interest Rate and Market Sensitivity
We had cash and cash equivalents of $28.8 million as of December 31, 2013. Our investments are considered cash equivalents and primarily consist of money market funds backed by U.S. Treasury Bills and certificates of deposit. The carrying amount of our cash equivalents reasonably approximates fair value due to the short-term maturities of these instruments. The primary objective of our investments is the preservation of capital to fulfill liquidity needs. We do not enter into investments for trading or speculative purposes. Our investments are exposed to market risk due to a fluctuation in interest rates, which may affect our interest income and the fair market value of our investments. Due to the short-term nature of our portfolio, however, we do not believe an immediate 10% increase or decrease in the interest rates would have a material effect on the fair market value of our portfolio. We therefore do not expect our results of operations or cash flow to be materially affected by a sudden change in market interest rates.
We do not believe our cash equivalents have significant risk of default or illiquidity. While we believe our cash equivalents do not contain excessive risk, we cannot assure you that in the future our investments will not be subject to adverse changes in market value. In addition, we maintain significant amounts of cash and cash equivalents at one or more financial institutions that are in excess of federally insured limits and are exposed to counterparty risk.
Inflation Risk
We do not believe that inflation has had a material effect on our business, financial condition or results of operations. Nonetheless, if our costs were to become subject to inflationary pressures, we may not be able to fully offset such higher costs through price increases. Our inability or failure to do so could harm our business, financial condition and results of operations.
62
Overview
Opower is a leading provider of cloud-based software to the $2.2 trillion utility industry. Utilities use our software platform to deliver key customer-facing applications that reduce energy demand and improve customer perception of the utility. Our software analyzes energy data and presents personalized insights to consumers in order to motivate reductions in energy consumption. These reductions are valued as a source of energy much like a conventional power plant. We believe that we are poised to transform the way the utility industry meets energy demand.
Utilities face two critical challenges that our software is built to address. First, utilities are under political, regulatory and environmental pressure to build fewer power plants, find cleaner sources of fuel and keep rates low. In order to accomplish these goals, utilities implement energy efficiency and demand response programs, which reduce overall and peak usage. Regulatory mechanisms support these programs by compensating utilities for reducing usage. Second, utilities need to strengthen their customer relationships. In many parts of the world, utilities compete for customers, and therefore customer engagement is critical. In regulated markets, which include much of the United States, regulators reward utilities for improving customer satisfaction. Utilities committed an estimated $11 billion to energy efficiency, demand response and customer engagement programs in 2013 in an effort to address these two challenges.
Our software is replacing low-tech and hardware-intensive products. Alternative efficiency programs today primarily consist of subsidies for energy efficient products, such as air conditioners and light bulbs. A common residential demand response program is a decades-old hardware switch connected to a pager network that shuts off the consumer’s air conditioner. Utility marketing efforts are often limited to traditional mass market approaches, such as bus stop advertisements and television commercials. We are able to replace these programs because our software offers measurable results and a better return on investment to utilities when scaled. Our approach has improved customer sentiment metrics by a median of 6% and up to 10% in some cases and we helped utilities and their customers save over 1,900 gigawatt hours of energy in 2013.
We can embed our solutions within utilities’ websites, mobile applications and customer service interfaces, and deliver individualized emails, text messages, automated phone calls and mail. In the design of these consumer touch points, we apply behavioral science insights to actionable patterns identified by our proprietary data analytics engine, which analyzes hundreds of billions of energy usage data points. Our cloud-based platform is extensible and configurable, a necessity to accommodate our customers’ diverse needs on a single code base.
We have developed four interconnected solutions on our platform:
| • | 2007: Opower Energy Efficiency – Reports and alerts, via mail and email, that compare consumers’ energy use to their neighbors’ and provide targeted energy saving recommendations. |
| • | 2010: Opower Customer Engagement – Web, mobile, digital alerts and customer service applications that improve customer experience and streamline operations. |
| • | 2012: Opower Thermostat Management – Mobile and web applications that connect to third-party thermostats in order to control and optimize peak and overall HVAC utilization. |
| • | 2013: Opower Demand Response – A zero-hardware solution consisting of near real-time text messages, email and automated phone alerts that motivates peak reductions in energy consumption. |
We generate revenue from utilities by selling primarily multi-year subscriptions to our software. As of December 31, 2013, we served 93 utility customers in eight countries, including 27 of the 50 largest electric utilities in the United States. We have the opportunity to expand within these existing customers; for example, the average penetration of our Energy Efficiency solution is approximately 10% of our utility clients’ customer
63
base. We believe our addressable market includes 1,300 electric and gas utilities worldwide, serving 650 million households and 60 million businesses.
Because our clients often provide us all of their energy data even when launching smaller programs, we currently manage data representing 37% of all U.S. residences. The scale and scope of this data enable us to better optimize the energy-saving performance of our programs and continually improve our pattern-matching algorithms. We share our proprietary cross-utility insights with our utility customers, and they see it as a valued benefit. We believe that as we grow, these network effects will continue to strengthen, and that these advantages give us a defensible leadership position.
We have experienced significant growth since our inception. Through our utility customers, we have increased the households we serve from 1.4 million in 2010 to 32.1 million in 2013. For the years ended December 31, 2011, 2012 and 2013, our revenue was $28.7 million, $51.8 million and $88.7 million, respectively, representing year-over-year revenue growth of 80% and 71%, respectively. We generated more than 90% of our revenue from annual recurring subscription fees in 2013. Because we believe our opportunity is large, we continue to invest significantly in our growth. As a result, we have generated net losses of $21.3 million, $12.3 million and $14.2 million in 2011, 2012 and 2013, respectively.
Utility Industry Background and Our Market Opportunity
Utilities operate in a highly regulated environment. Regulators review and approve capital expenditures and, in most markets, set the rates utilities charge their customers. In particular, regulators increasingly incentivize utilities to pursue energy efficiency and demand response, and place higher priority on better customer experience.
Key Industry Trends Affecting Utilities
Key trends affecting utilities include:
Regulators Prioritizing Energy Efficiency Over New Capacity. More than 25 U.S. states have enacted long-term energy efficiency resource standards, and these states account for over 61% of total U.S. electricity consumption. In order to incentivize efficiency, many states have “decoupled” their utilities, which means the utility’s revenue is no longer driven by energy sales. In non-decoupled states, regulators may incentivize efficiency by allowing the utility to recover the cost of the programs, earn their lost margin on energy sales, and in some cases, earn more on efficiency than they would on energy sales. For example, in California, Massachusetts, and Colorado not only are utilities spending billions of dollars on energy efficiency, they are also earning margins on energy efficiency that are comparable to their margin on delivered electricity. Specifically, they are earning an additional $85.9 million of annual profit from performance incentives, which translates to an additional 6.8% return. We believe this trend is likely to continue as long as efficiency remains less expensive than generation.
Similarly, the European Union adopted an Energy Efficiency Directive in October 2012 in order to ensure the achievement of its commitment to reduce emissions by 20% by 2020. In Asia and Latin America, rapid development, limited supply and government regulation and initiatives are also creating an imperative for energy saving measures.
Increasing Focus on Reducing Peak Demand. As it is for most large network providers, reducing peak demand is valuable for utilities. In fact, it also has become even more valuable as peak supply prices have gone up and as changing regulations have made it easier to sell energy reductions on par with supply. As a result, Navigant Research estimates that the global demand response market will grow to $5.8 billion in 2020. These same dynamics are at play in fast growing regions like Asia and South America, where demand response is needed to prevent shortages and blackouts.
64
Baltimore Gas & Electric’s (BGE’s) recent smart meter case illustrates the value demand response holds out to utilities. Demand response made up 50% of BGE’s smart meter business case, and we estimate that smart meters will deliver $50 million of profit to the utility.
Changing Consumer Expectations. The widespread adoption of smartphones, mobile apps and social networking tools has changed the way consumers interact with their service providers. Yet direct communication between utilities and their customers has largely been limited to a once-a-month bill and negative events, such as power outages. This history has led to low customer satisfaction. Based on Net Promoter Scores, as of 2012, the utility industry had lower customer satisfaction than many other industries, including insurance, mobile telecom service, banking, supermarkets and automotive. The change in consumer expectations has led utilities to seek new communication tools. As a result, utilities are looking for services that can improve their relationship with their customers.
Increasing Data Available to Utilities. Smart meter rollouts continue to accelerate globally. According to a January 2013 IMS Research report, through the end of 2011 over 1.4 billion electricity meters were installed globally, of which 18% were smart meters. IMS projects smart meter penetration will increase to 35% of all electricity meters in 2016. Smart meters generate over 700 times more data than traditional meters, and this increase creates an opportunity for utilities to offer new services and analytics-driven insights for their customers. To date, most utilities have struggled to demonstrate the value of this data to consumers. In addition, the emergence of WiFi-enabled thermostats is likely to increase available energy data even further.
Increasing Competition. Over the past two decades, many countries and some U.S. states have separated the retail sale of energy from the generation, distribution and transmission of power. In these markets, competition among retail providers can be high, and customer retention is a challenge, with some utilities experiencing customer churn of more than 25% per year. In noncompetitive, or regulated, energy markets, other providers, such as rooftop solar contractors, are entering the market with products and services that threaten to disintermediate the utility. Utilities increasingly face the risk of disintermediation due to the rise of distributed generation such as solar power. All of these challenges mean that utilities must build deeper relationships with their customers.
The Opportunity for the Opower Solution
We believe our solutions give utilities greater returns than their historical options and, as a result, we expect to continue to grow our share of these large markets over time.
| • | Energy Efficiency. In the U.S. alone, utilities spent $6.9 billion on electric efficiency in 2012. Since 2007, this spending has grown at a 21% CAGR, according to a July 2013 report from the Institute for Electric Innovation. |
| • | Demand Response. The global demand response market is projected to grow from $3.0 billion in 2013 to $5.8 billion in 2020, representing a CAGR of 10%, according to a second quarter 2013 report published by Navigant Research. |
| • | Customer Engagement. We believe that customer engagement is at the intersection of a number of markets for utilities, including customer billing and information systems, home energy management solutions and smart grid analytics. These markets are expected to grow from $4.1 billion in 2013 to $12.1 billion in 2020, representing a 17% CAGR, according to Navigant Research and Greentech Media. |
Our solutions address a portion of each of these markets. Based on our internal analysis and industry experience, we estimate our addressable market opportunity to be at least $11 billion annually.
65
Key Benefits to Utilities
The key benefits utilities derive from our solutions include:
Low Cost, Large Scale Energy Efficiency. We are able to cost-effectively drive energy efficiency results across millions of homes. As a result, for some utilities, our efficiency solution has become their single biggest source of residential energy savings. We typically deliver savings between $0.03 to $0.07 per kilowatt hour, whereas the average cost of electricity is $0.13 per kilowatt hour. Nearly all of our programs are measured via randomized control trials and validated by third parties.
Low Cost, Large Scale Residential Demand Response. Our software enables utilities to scale residential peak demand reductions by rapidly communicating with energy consumers. We do this by sending millions of customized text messages, emails and automated calls. In 2013, our first program has delivered promising initial results.
Improved Customer Satisfaction. Utilities have implemented our user-friendly solutions to increase customer satisfaction. Our platform delivers greater understanding of and control over energy consumption, which improves customer experience. We have surveyed over 30,000 energy consumers who receive our solutions. These consumers consistently report greater trust in their utility as a source of information, and they believe that the utility wants to help them save energy and money.
Reduced Cost to Serve. Utilities spend $6 billion annually on customer service. With our digital solutions, utilities can communicate with their customers through web and mobile applications, making interactions more cost effective and efficient. We believe this reduces customer service costs. Customer service software has been reducing the cost of service for a wide set of industries, but the utility industry has lagged behind.
Better Customer Engagement Technology. Our platform gives utilities the ability to deploy state-of-the-art technology for their customer communications, allowing them to reach and engage their customers across multiple channels with minimal effort. Much as next generation customer relationship management (“CRM”) software and digital marketing software have delivered significant value to enterprises globally, our solutions help utilities strengthen their relationships with their customers.
Network Effects. We have six years of experience working with industry leading utilities. Our large and growing energy dataset combined with our significant industry experience has caused many utilities to view us as a source of third-party benchmarking and industry knowledge. We believe we have reached a point of recognition in the industry whereby utilities use our data sets and insights in their decision-making.
Our Differentiated Approach
The key components of our differentiated approach are:
Highly Scalable Data Analytics Engine. We have built what we believe to be the most sophisticated data engine serving utilities. As of December 31, 2013, we have collected energy data from 52 million households and businesses aggregated from our utility customers. Our data analytics engine can process and analyze our vast data set and provide personalized insights to the households and businesses that our utility customers serve. For example, our data analytics engine allows us to predict customer bills and separate heating and cooling consumption from base load.
Cloud-Based Architecture. Our solutions are built on a cloud-based architecture and delivered through web and mobile applications, text message, email, phone and mail. We maintain a single version of our code base, that we deploy to all of our customers allowing them to receive new features and updates. In an industry that is accustomed to long term investments, the fact that our software is regularly updated at no added cost is a
66
significant benefit. In addition, all of our products use the same platform, which makes it easier for clients to deploy our solutions cost effectively.
Intuitive User Experience Informed by Behavioral Science. An intuitive user experience and behavioral science are at the core of all of our solutions. We seek to change the habits of consumers by presenting realistic goals, encouragement and rewards. We use more than 40 behavioral science techniques such as loss language, normative comparisons and reciprocity to encourage utility customers to optimize their energy consumption.
Track Record of Measurable Results. We design our products to deliver measurable outcomes, which are necessary for utilities to meet their energy efficiency and demand response targets. We have 189 client years of results, and we believe this track record gives us a significant advantage over our competitors. Our approach to saving has been approved by regulators in 30 states, and that track record has strengthened our brand.
Our Growth Strategy
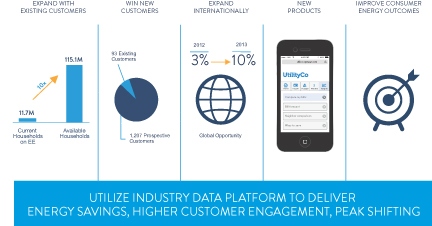
The key elements of our growth strategy include:
Expand With Existing Customers. We see a significant opportunity to grow our revenue simply by expanding our presence within our existing customer base. Currently, our energy efficiency reports are deployed to 10% of households that our utility customers serve. Most of our utility customers initially purchase only one of our four solutions and deploy that initial solution to only a portion of their customers. Because all of our products help utilities improve their engagement with energy consumers, we believe that utilities will derive even greater benefits as they deploy additional solutions. Moreover, once a utility begins to send us its data, we can more easily roll out programs to additional households and businesses. We have a dedicated sales and customer service team to support these expansion opportunities within our customer base, and we plan to expand our domestic direct sales organization.
Win New Customers Globally. As of December 31, 2013, we had 93 utility customers in eight countries, yet we believe that there are approximately 1,300 utilities that could benefit from our solutions. To reach more of these potential customers, we are expanding our sales, marketing and regulatory efforts, in particular internationally. In 2013, the percentage of our revenue generated outside of the U.S. was 10% as compared to 3% in 2012. We recently expanded our international sales capabilities by increasing the size of our direct sales team in Europe. We plan to expand our direct sales organization in Japan, Singapore and the United Kingdom, and we believe that we have a large opportunity in parts of Asia and South America.
67
Develop New Offerings on Our Industry Data Platform. Since we are a trusted partner, our customers often ask us to develop new offerings to meet their growing needs. These requests are increasingly central to our plans for growth. We have made, and will continue to make, significant investments to augment our platform to capture adjacent opportunities. For example, we recently developed our thermostat mobile app as a new solution that complements our other existing solutions. In addition, we believe our data is valuable as a platform for third-party application developers that want to build additional products or enhance their existing products by leveraging our data. Multiple utilities already use our application programming interfaces (“APIs”) to customize their customer engagement.
Focus on Gas and Electric Consumer Outcomes. From the outset, we have designed products that can deliver measurable changes in consumer behavior, which has been core to our success. We believe we can achieve more both with our existing solutions and through new products. We have focused and will continue to focus our research and development efforts to continue to improve outcomes for gas and electric consumers.
68
Our Integrated Solutions
We provide utilities with the ability to meet energy efficiency and demand response targets, and improve customer engagement. Our solutions consist of:
Opower Energy Efficiency
Our energy efficiency solutions motivate customers to use less energy and participate in other energy efficiency programs. We send messages under the utility’s brand to households and businesses via email and mail. We also make web and mobile applications available to both consumers and customer service representatives. These tools take advantage of multiple data sources, which may include historical energy usage, billing data, past customer activity data, parcel data, demographic data, weather data and geo-location data. We deploy our energy efficiency solution in both legacy metering and smart meter environments.

The key outbound components of our energy efficiency solution are:
| • | Energy Reports. Our Energy Reports are sent by mail and email, typically under the utility’s brand. The reports use insights informed by behavioral science and personalized by our data analytics platform to provide customers with feedback on their energy usage. Key features include a comparison of customer’s usage to that of similar homes nearby, and targeted recommendations for how to decrease consumption. We have entered into agreements with utilities to provide similar Energy Reports to small- and medium-sized businesses (“SMBs”). Our SMB reports contain specialized insights and content based on specific business segments. |
| • | Smart Meter-Enabled Alerts and Emails. Smart meter data allows us to provide more frequent outreach and alerts based on customer usage patterns. Our weekly smart meter email reports are sent to energy consumers every week to give them a forecast of their coming bill, see their energy usage by day and get helpful insights on how to adjust their energy usage. Our Unusual Usage Alerts let residential consumers know in advance when they are on track for a high bill. The alerts are sent via email or text. |
69
We believe that our results, and our rigorous measurement of them, have been a key differentiator. Beginning with our very first deployment, we have created separate test and control groups so that we could accurately determine the impact of the information we provide. We generate energy savings of 1.5% to 2.5% per household on average across our programs. While small on a per customer basis, they result in massive savings for our utility customers when aggregated across their customer base. In 2013, our efficiency programs achieved over 1,900 gigawatt hours of energy savings, which includes savings from both electric and gas utilities. At average electricity prices in the United States, this would equate to $234.1 million of bill savings for consumers.
Opower Customer Engagement

Our customer engagement solutions consist of:
Opower Web. Utilities embed our white-label web application into their customer-facing web site, enabling them to offer consumers both an intuitive user experience and better insight into energy consumption. Consumers can create energy savings plans, conduct virtual energy audits of their homes, view historical costs and compare rate plans. In addition, Opower Web provides context by explaining how customers’ energy usage compares to their neighbors’ and offering targeted recommendations for reducing costs. Utilities generally deploy our web applications to their entire residential service base, and often integrate our application with single sign-on authentication.
While our web application does not require smart meters, access to more data allows us to offer consumers greater insight. For example, utilities with smart meters can benefit from our patented usage disaggregation algorithm that separates heating, cooling and baseline energy consumption from a consumer’s energy usage, effectively conducting a remote audit of their home.
CSR Application. Our Customer Service Representatives (“CSR”) solution provides utility customer service representatives with relevant information about customers when they call their utility. The CSR solution allows customer service representatives to create online accounts, enroll customers to receive energy alerts through their preferred communication medium, update customer profiles, and provide energy management advice.
Rates Engine. Our rates engine supports utility adoption of time of use rates by analyzing cost data for energy consumers. It provides consumers with an hourly view of their energy costs, allows them to compare costs to previous months, performs bill forecasts at any point during the billing cycle, and simulates the cost impact of a customer changing rate plans or usage behavior.
70
While described in this section, Opower Web and the Opower CSR application are also key parts of our energy efficiency and demand response solutions.
Opower Demand Response

In 2012, we introduced our demand response solution, which enables utilities that have installed smart meters to broadly engage their residential customer base in demand response programs. Opower Demand Response functionality includes:
Peak Day Alerts. Our peak day alerts notify customers of “peak days” when electricity costs are the highest. These alerts can be delivered via text message, automated call and email.
Peak Day Feedback Reports. Our peak day feedback reports are sent to energy consumers following demand response events and provide detailed information about how a customer performed on a peak usage day. Reports include how much energy a customer saved, how much money the customer has earned and tips for how to save further in the future.
Although we believe our demand response solution offers significant growth potential, it is still in a nascent stage with an immaterial impact on our revenue to date.
71
Opower Thermostat Management
In 2013, we introduced our thermostat software, a web and mobile application for consumers, which is paired with select third-party WiFi-enabled thermostat devices. With our software, utilities can provide their customers with remote control of their WiFi-enabled thermostat device through an intuitive, consumer-centric user interface. This enables utilities to achieve deep energy efficiency and demand response penetration in their residential service territories.

Our thermostat software builds on our expertise in behavioral science and user design to drive energy savings. The software is also integrated with utility-directed demand response programs to deliver automated demand response.
Although we believe our thermostat software offers significant growth potential, it is still in a nascent stage with an immaterial impact on our revenue to date.
Our Technology
From our inception in 2007, we set out to build a proprietary cloud-based software platform for utilities. We believe our platform is more advanced and operates at greater scale than that of any of our competitors. We designed it to manage the large amount of data that utilities store in their internal systems as well as the accelerating volume of data available from today’s smart meters and smart grid infrastructure, and tomorrow’s thermostats and in-home devices. Our platform is capable of analyzing large volumes of data from disparate sources with rapid throughput and high availability in order to provide a variety of personalized, data-rich communications that drive measurable results.
Opower Data Integration System. Our data integration platform allows us to capture more than 100 different data attributes from both utilities and third parties and import both structured and unstructured data formats. We use Hadoop-distributed database technology to store a wide range of data including smart meter, program participation, demographic, weather, housing and geo-location data. This data integration system is capable of large-scale, low-latency imports in near-real time, which enables us to perform time-sensitive operations for our customers, like demand response. Our system imported and validated over 100 billion utility meter reads in 2013.
Big Data Analytics Engine. Our data platform leverages leading technologies such as Hadoop, Hive and HBase to analyze a wide variety of energy and third-party data. We have built our own proprietary batch
72
processing system on top of our Hadoop cluster, it allows us to chain jobs, and start, stop and pause them. These key capabilities were critical for our enterprise applications and are not available today in popular NoSQL systems like Hadoop. We made these investments to surface insights for energy consumers. Our system can predict bills, detect energy usage anomalies and conduct a virtual audit of millions of homes by using a patent pending method of multivariate regression analysis. In addition, the system can utilize the 100 different data attributes to identify similar homes and supply customers with accurate and relevant neighbor comparisons.
Content Personalization Engine. Our engine is being built to sit on top of our big data analytic platform and allow us to target messages to consumers. Three key components in this engine are our event scheduling system, our high-level mark-up language for content design and our real-time segmentation tool. Our event scheduling system will ensure that messages go out at the most effective times and provide event and schedule-triggered messaging. Our high-level markup language will allow us to customize outbound communications with personalized data in very little time. In addition, our real-time segmentation tool automates the creation of customer segments that incorporate our insights into consumer behavior while allowing utilities to gain visibility, choice and speed in creating distinct customer experiences.
Outbound Pipeline. Our platform is capable of delivering millions of outbound messages in short time frames in order to meet the time-sensitive objectives of utilities. Our system synchronizes delivery of content across all channels—email, postal mail, text message and interactive voice response and generates graphically rich, channel-specific messages using lightweight markup language specific to each customer. The system provides high-fidelity monitoring to ensure that issues can be logged and addressed in real time.
Web and Mobile Engagement. In January 2012, we began refactoring our web platform, replacing server-side logic with client-side, Javascript-based rendering. This approach ensures consistency between desktop and mobile web browsers, and allows us to offer our utility clients access to the front-end code to extend and customize as they see fit. This is proving to be a significant advantage as we can significantly modify customer experiences without compromising our core engineering development.
Thermostat Management. Our thermostat platform integrates with select WiFi-enabled thermostat technologies using API-based technology, giving users the ability to control their thermostats with simple and intuitive user interfaces via mobile and the web. The thermostat web application has features for customers to enroll in their utility’s smart thermostat program, automatically recommending efficient settings, then communicating this information back to the utility and to the WiFi-enabled thermostat.
Security. We have been audited and certified as meeting SOC 2 Type 2 standards, which is an external audit and validation of the design and effectiveness of our data security controls. Our datacenters are SSAE-SOC 1 and Tier III certified. We encrypt data in transit via SSL with 128-bit encryption. Our platform is built with a defense in depth strategy, including firewalls, intrusion detection and prevention, role based access controls, and 24 x 7 monitoring. We are certified in accordance with the US-EU Safe Harbor Framework.
73
Our Customers
We market and sell our products and solutions both to regulated and unregulated utilities. As of December 31, 2013, we had 93 utilities in 8 countries using one or more of our products. The following are our top 50 customers as of December 31, 2013 based on revenue in 2013:
Utilities using one or more of our products serve approximately 115 million households giving us a substantial opportunity to expand the amount of data in our platform from existing customers. We count as customers distinct buying entities, which in a few cases include multiple national or regional subsidiaries of large global utilities, as well as utilities for which we provide services through subcontracting arrangements.
Customer Case Studies
The following examples illustrate how our customers use our solutions:
Pacific Gas and Electric
Situation: Pacific Gas and Electric (“PG&E”) is a large investor-owned electric and gas utility with operations primarily in northern California. PG&E is one of the largest utilities in the United States with over 5 million customers, and it generates over $11 billion of revenue annually. PG&E was one of the first utilities in the U.S. to deploy smart meters. To enhance its customers’ experience, PG&E sought solutions that would allow customers to more effectively manage their energy consumption along with their smart meters.
Solutions and Benefits: PG&E initially selected our Customer Engagement solution in 2010. Since then, PG&E has also deployed our Energy Efficiency and our Thermostat Management solutions.
| • | PG&E has deployed our Customer Engagement solution to integrate Opower content into PGE.com for all of its 5 million residential customers and 600,000 small business customers. |
74
| • | Through our Energy Efficiency solution, PG&E mailed home energy reports to 230,000 of its customers in 2011 and increased that amount to over 900,000 customers as of December 31, 2013. These reports compare each household’s energy consumption to that of similar homes and provide customized recommendations to save energy. |
| • | In 2012, PG&E launched a pilot of our Thermostat Management solution. Our thermostat mobile app allows users to control the temperature in their home from anywhere and has succeeded in encouraging more efficient use of energy while driving high levels of customer satisfaction. |
| • | Since deploying our solutions, PG&E customers have saved over 250 GWh of combined electric and gas savings and an estimated $25 million on their electric bills. |
Baltimore Gas & Electric
Situation: Baltimore Gas & Electric (“BGE”) is a large investor-owned electric and gas utility with operations primarily in Maryland. BGE provides service to more than 1.2 million customers and generates approximately $3 billion of revenue annually. In 2010, BGE was assessing ways to maximize return on investment from a smart meter investment. In addition, BGE was evaluating energy efficiency programs that it could deploy across its service territory. In 2012, BGE sought additional opportunities to reduce peak demand.
Solutions and Benefits: In 2010, BGE initially launched an Opower Energy Efficiency pilot to 25,000 households to assess the potential energy savings opportunity. Later in 2010, BGE developed a plan to provide customers with greater benefits from smart meters and chose to deploy our Customer Engagement and Energy Efficiency solutions. In 2012, following a four year pilot, BGE planned to launch peak-time-rebate pricing and communications to its entire residential customer base with smart meters. BGE chose Opower as their strategic partner for this program leveraging the Demand Response solution in the summer of 2013.
| • | BGE is in the process of deploying our Energy Efficiency solution to over 1 million households with mailed and digital home energy reports that motivate a reduction in energy consumption. |
| • | BGE has deployed our Customer Engagement solution to integrate Opower content into BGE.com for all residential and small business customers with smart meters. |
| • | BGE uses our solutions to deliver Unusual Usage Alerts via email, text message and automated voice calls to notify their customers of higher than usual consumption intra-month and provide actionable advice on how to reduce consumption and lower their bill. |
| • | Our Demand Response solution was initially deployed to 300,000 residential customers in 2013 to provide peak-time-rebate pricing to its entire residential customer base with smart meters. We provided real-time alerts through email, text messages and automated voice calls offering consumers personalized insights on how to save energy and money on peak energy days. BGE’s program drove a reduction in consumption on those days. This program will be scaled to include 1.1 million BGE customers by 2015. |
Centerpoint
Situation: Centerpoint is a large investor-owned natural gas delivery company that serves several markets in the United States including Arkansas, Louisiana, Minnesota, Mississippi, Oklahoma and Texas. Centerpoint serves over 5 million customers and generates more than $9 billion of revenue annually. In 2010, Centerpoint was looking for a solution in Minnesota with the goal of delivering energy savings and of promoting other legacy efficiency programs, such as Home Energy Squad, water heaters and low-flow shower heads.
Solution and Benefit: Centerpoint partnered with Opower to create an Energy Efficiency solution which was launched in spring 2010.
| • | The Minnesota Energy Efficiency program that we developed together with Centerpoint grew from 50,000 customers in 2010 to 200,000 customers in 2013. |
75
| • | In the first two years of the program, energy consumers saved $2 million on their gas bill. |
| • | Various promotions ranging from a Tide cold-water detergent coupon to home audits yielded increases in customer participation in utility programs of up to 30%. |
| • | To date, the Opower Energy Efficiency programs deployed by Centerpoint have been expanded 560% since launch and now reach over 330,000 Centerpoint customers in Arkansas, Minnesota and Oklahoma. |
E.ON UK
Situation: E.ON UK is a retail electric and gas provider owned by E.ON SE, a large investor-owned utility with operations primarily in Europe. E.ON UK serves approximately 5 million households across the United Kingdom.
Solution and Benefits: E.ON UK deployed our Customer Engagement solution in 2013 as part of its effort to enhance its brand by providing a superior experience to customers. E.ON UK is seeking to promote customer loyalty and maintain its leadership position in its highly competitive, unregulated retail market.
| • | E.ON UK launched a customer-facing website known as the Saving Energy Toolkit to over 5 million customers using our solution. |
| • | We enable E.ON UK to deliver personalized insights and easy-to-understand information to each of their households detailing their energy consumption. |
Glendale Water and Power
Situation: Glendale Water and Power (“GWP”) is a municipally owned utility serving over 100,000 customers in California.
Solution and Benefits: GWP initially deployed our Energy Efficiency solution in 2009 and in 2011, expanded the use of our platform to include our Customer Engagement solution.
| • | GWP initially launched our Energy Efficiency solution in 2009 to 25,000 customers and has since increased its deployment to 46,000 customers as part of a portfolio of programs to help city residents use less electricity and save money. |
| • | This program has consistently delivered an average savings rate in excess of 2.5% per year, delivering more than $3 million in aggregate savings to GWP customers. |
| • | In 2010, GWP deployed our Customer Engagement solution to all of their 70,000 residential customers in order to provide tools to manage these customers’ energy use. |
Competition
We believe our primary competitors are other energy efficiency and demand response programs that utilities may choose to implement. We often compete to capture a share of the utility’s budget that is set aside for energy efficiency or demand response. To a lesser extent, we also compete with other technology providers such as point solution companies and horizontal software vendors.
Other Energy Efficiency or Demand Response Programs. We often compete with efficiency and demand response programs that utilities can choose to implement. These programs, which vary widely in their approach and their cost to the utility, include CFL light-bulb subsidies, appliance recycling and rebate programs, rebates for building upgrades, renewable energy incentives and load control switches for demand response.
Point Solution Companies. There are a number of companies, such as Aclara, C3 Energy, Nest Labs (which was acquired by Google) and Tendril, that offer point solutions that compete with some of the features present in our platform. Typically, these solutions include web portals, customer care applications and consumer home energy management solutions.
76
Horizontal Software Vendors. Vendors such as Oracle and SAP offer software that can be customized to address some of the needs of utilities. Google, which has contracted to purchase Nest Labs, previously provided energy efficiency software in beta form to energy consumers.
We believe that we generally compare favorably with our competitors because of the breadth of functionality within our software platform, our ability to engage and motivate energy consumers, the amount of utility specific data on our platform and the results that we have demonstrated for existing utility customers.
Our Culture and Employees
We believe that having a strong company culture and set of values is critical to our success. We have assembled an extremely talented group of employees, and we pride ourselves on recruiting elite, mission-driven talent for every part of our organization. We believe that our unique mission is a differentiator and helps us recruit world-class talent.
As of December 31, 2013, we had 465 employees, including 133 in sales, regulatory and marketing, 188 in research and development, and 144 in services, operations and general and administrative capacity. As of December 31, 2013, we had 448 employees in the United States and 17 employees internationally.
Sales, Regulatory and Marketing
As of December 31, 2013, our sales, regulatory and marketing teams were comprised of 133 employees. We expect these teams to grow substantially in pursuit of the large and global market for our solutions. In 2013, our average selling price for a new customer was approximately $1.0 million in license fees per year, with a weighted-average contract term of 24.5 months and a typical sales cycle of 6 to 24 months.
Our sales and regulatory teams are structured regionally, while our marketing team is organized by solution. Together, these commercial teams pursue our growth strategy of addressing new markets, securing new customers, expanding existing customers and rolling out new products and services. We staff these teams to work closely together and size them according to the opportunity we see for each solution in each region on a bottoms-up basis.
Research and Development
As of December 31, 2013, our research and development teams were comprised of 188 employees. We expect these teams to grow substantially in support of our research and development roadmap. Our research and development expenses totaled $14.4 million, $16.1 million and $27.1 million for the years ended December 31, 2011, 2012 and 2013, respectively. We plan to continue to invest significant resources in developing new products and enhancing our existing software platform.
Customer Service
We provide support services for our software, including:
| • | Analytics and Consumer Marketing Services. We assist customers in understanding program results by creating custom segmentations and propensity modeling, performing consumer satisfaction analysis and creating tailored consumer marketing to affect the promotional goals of each utility. |
| • | Enablement and Extensibility Services. We provide enablement services such as data acquisition and integration, single-sign-on (“SSO”) integration, data migration work and services around enabling utilities to use Opower APIs in different elements of their technology programs. |
77
Intellectual Property
We protect our intellectual property through a combination of trademarks, domain names, copyrights, trade secrets and patents, as well as contractual provisions and restrictions on access to our proprietary technology.
We registered “Opower” as a trademark in the United States, Australia, Canada, the European Community, Japan and New Zealand. We also have filed other trademark applications in the United States and certain other jurisdictions, and will pursue additional trademark registrations to the extent we believe it would be beneficial and cost effective.
As of February 28, 2014, we had one issued patent and seven patent applications pending in the United States, which seek to cover proprietary techniques relevant to our products. We intend to pursue additional patent protection to the extent we believe it would be beneficial and cost effective.
We are the registered holder of a variety of domestic and international domain names that include “Opower” and similar variations.
In addition to the protection provided by our intellectual property rights, we enter into confidentiality and proprietary rights agreements with our employees, consultants, contractors and business partners. Our employees and contractors are also subject to invention assignment agreements. We further control the use of our proprietary technology and intellectual property through provisions in both the general and product-specific terms of use on our website.
Facilities
Our corporate headquarters is located in Arlington, Virginia, where we currently lease approximately 52,253 square feet of space under lease agreements that expire in November 2016. We lease approximately 24,394 square feet of space in San Francisco, California under a lease agreement that expires in May 2015. We also lease facilities for our employees in London, United Kingdom, Singapore and Japan.
We anticipate leasing additional office space in all short- and medium-term future periods to support our growth. We intend to further expand our facilities or add new facilities as we add employees and enter new geographic markets, and we believe that suitable additional or alternative space will be available as needed to accommodate any such growth. However, we expect to incur additional expenses in connection with such new or expanded facilities.
Legal Proceedings
We are not a party to any material pending legal proceedings. From time to time we may be subject to legal proceedings and claims arising in the ordinary course of business.
78
Executive Officers and Directors
The following table provides information regarding our executive officers and directors as of February 1, 2014:
| Name |
Age | Position(s) | ||||
| Executive Officers: |
||||||
| Daniel Yates |
36 | Founder, Chairman, Chief Executive Officer and Director | ||||
| Alex Laskey |
37 | Founder, President and Director | ||||
| Thomas G. Kramer |
43 | Chief Financial Officer | ||||
| Alex Kinnier |
38 | Senior Vice President, Product Management and User Experience | ||||
| Jeremy Kirsch |
39 | Senior Vice President, Worldwide Sales, Regulatory and Business Development | ||||
| Rick McPhee |
41 | Senior Vice President, Engineering | ||||
| Roderick Morris |
41 | Senior Vice President, Marketing and Operations | ||||
| Michael Sachse |
36 | General Counsel and Senior Vice President, Regulatory Affairs | ||||
| Non-Employee Directors: |
||||||
| Mark McLaughlin(2)(3) |
48 | Director | ||||
| Dipchand Nishar(2) |
45 | Director | ||||
| Gene Riechers(1) |
58 | Director | ||||
| Marcus Ryu(1)(3) |
40 | Director | ||||
| Jon Sakoda(2) |
36 | Director | ||||
| Harry Weller(1)(3) |
44 | Director | ||||
| (1) | Member of the audit committee. |
| (2) | Member of the compensation committee. |
| (3) | Member of the nominating and governance committee. |
Each executive officer serves at the discretion of our board of directors and holds office until his successor is duly elected and qualified or until his earlier resignation or removal. There are no family relationships among any of our directors or executive officers.
Executive Officers
Daniel Yates co-founded Opower and has served as our Chief Executive Officer since June 2007 and as a member of our board of directors since June 2007. Mr. Yates was appointed our Chairman of the board of directors in February 2014. Prior to founding Opower, Mr. Yates was the founder and chief executive officer at Edusoft, an educational software company that was acquired by Houghton Mifflin Company. Mr. Yates holds a Bachelor of Arts in computer science from Harvard University.
We believe that Mr. Yates is qualified to serve as a member of our board of directors because of his experience and perspective as our Chief Executive Officer and founder.
Alex Laskey co-founded Opower and has served as our President since June 2007 and as a member of our board of directors since June 2007. Mr. Laskey holds a Bachelor of Arts in history of science from Harvard University.
We believe that Mr. Laskey is qualified to serve as a member of our board of directors because of his experience and perspective as our President and founder.
79
Thomas G. Kramer has served as our Chief Financial Officer since November 2011. From 2000 to 2011, Mr. Kramer served as Chief Financial Officer of Cvent, Inc., a cloud-based enterprise software company in the event-management space. Prior to that, Mr. Kramer served as a consultant at the Boston Consulting Group. Mr. Kramer holds a Masters in Business Administration from Harvard Business School and a Masters of Science in economics from the Norwegian School of Economics.
Alex Kinnier has served as our Senior Vice President, Product Management and User Experience since July 2012. From 2011 to 2012, Mr. Kinnier served as a partner at New Enterprise Associates. From 2008 to 2011, Mr. Kinnier served as a partner at Khosla Ventures. Prior to that, Mr. Kinnier was a group product manager at Google Inc. Mr. Kinnier holds a Masters in Business Administration from Harvard Business School and a Bachelor of Arts in chemical engineering from Lehigh University.
Jeremy Kirsch has served as our Senior Vice President, Worldwide Sales, Regulatory and Business Development since July 2008. From 2000 to 2008, Mr. Kirsch held leadership positions in sales, business development and marketing for several technology companies, including L-1 Identity Solutions, Inc., an identity solutions company acquired by Safrom S.A., Viisage Technology, Inc. an identity solutions company, and Art Technology Group, an eCommerce software company acquired by Oracle. Prior to that, Mr. Kirsch was a special operations officer with the United States Navy. Mr. Kirsch holds a Masters in Business Administration from the MIT Sloan School of Management and a Bachelor of Arts in economics from Stanford University.
Rick McPhee has served as our Senior Vice President, Engineering since March 2012. From 2008 to 2012, Mr. McPhee served as vice president, engineering, at Fortify Software, a Hewlett-Packard Company. From 2005 to 2008, Mr. McPhee served as vice president, engineering, at Vormetric, a data security company. Mr. McPhee holds a PhD in computer science from the University of Oxford and a Bachelor of Science in computer science from University of Glasgow.
Roderick Morris has served as our Senior Vice President, Marketing and Operations since September 2012. From April 2010 to August 2012, Mr. Morris served as our Senior Vice President, Consumer Marketing and Operations. From 2009 to 2010, Mr. Morris served as vice president, marketing, at Vovici, a cloud customer feedback company. Mr. Morris holds a Masters in Business Administration from the Graduate School of Business at Stanford University and a Bachelor of Business Administration and a Bachelor of Arts in philosophy from the University of Texas at Austin.
Michael Sachse has served as our General Counsel and Senior Vice President, Regulatory Affairs since June 2013, and has served as our General Counsel and regulatory affairs lead since March 2009. From April 2008 to December 2008, Mr. Sachse served as communications director for Jim Himes for Congress. Prior to that, Mr. Sachse was an attorney at Patterson Belknap. Mr. Sachse holds a Juris Doctorate from Harvard Law School and a Bachelor of Arts in history from Amherst College.
Non-Employee Directors
Mark McLaughlin has served as our director since October 2013. Mr. McLaughlin has served as president and chief executive officer and as a member of the board of directors of Palo Alto Networks, Inc., a network security company, since 2011, and as the chairman of the board of directors since 2012. From August 2009 through 2011, Mr. McLaughlin served as president and chief executive officer and as a director at VeriSign, Inc., a provider of Internet infrastructure services, and from January 2009 to August 2009, Mr. McLaughlin served as president and chief operating officer at VeriSign. From 2000 through 2007, Mr. McLaughlin served in several roles at VeriSign, including as executive vice president, products and marketing. In 2011, President Barack Obama appointed Mr. McLaughlin to serve on the President’s National Security Telecommunications Advisory Committee. Mr. McLaughlin holds a Bachelor of Science from the U.S. Military Academy at West Point and a Juris Doctor from Seattle University School of Law.
We believe that Mr. McLaughlin is qualified to serve as a member of our board of directors because of his experience as a public company executive and his knowledge of the technology industry.
80
Dipchand Nishar has served on our board of directors since August 2013. Mr. Nishar has served as senior vice president, products and user experience at LinkedIn Corporation since 2011, and served as its vice president, products from 2009 until 2011. Prior to that, Mr. Nishar served in several roles, including most recently as the senior director of products for the Asia-Pacific region at Google Inc. from 2003 to 2009. Mr. Nishar holds a Masters in Business Administration from Harvard Business School, Master of Science in electrical engineering from University of Illinois, Urbana-Champaign, and a Bachelor of Technology from the Indian Institute of Technology.
We believe that Mr. Nishar is qualified to serve as a member of our board of directors because of his experience as a public company executive and his knowledge of the technology industry.
Gene Riechers has served on our board of directors since September 2011. Mr. Riechers has served as the vice chairman of EverFi, Inc., an educational technology company, since 2012. From 2002 to 2011, Mr. Riechers was a general partner of Valhalla Partners, a venture capital firm. Mr. Riechers holds a Masters in Business Administration from Loyola College and a Bachelor of Science in accounting from Pennsylvania State University.
We believe that Mr. Riechers is qualified to serve as a member of our board of directors because of his experience as a seasoned investor, a current and former director of many companies and his financial and accounting expertise.
Marcus Ryu has served on our board of directors since August 2013. Mr. Ryu has served as president and chief executive officer of Guidewire Software, Inc., a publicly-traded software company that sells to the insurance industry, since 2010 and as a member of its board of directors since 2001. From 2001 to 2010, Mr. Ryu served in various other management positions at Guidewire. Prior to founding Guidewire, from 2000 to 2001, Mr. Ryu was vice president of strategy at Ariba, Inc., a software-as-a-service provider of collaborative business commerce solutions for buying and selling goods and services. Mr. Ryu holds a Bachelor of Arts in economics from Princeton University and a Bachelor of Philosophy from New College, Oxford University.
We believe that Mr. Ryu is qualified to serve as a member of our board of directors because of his experience as a public company chief executive officer and his knowledge of selling software into a large vertical industry.
Jon Sakoda has served on our board of directors since October 2008. Mr. Sakoda is a partner of New Enterprise Associates, a venture capital firm, which he joined in 2006. Prior to joining New Enterprise Associates, Mr. Sakoda co-founded IMlogic, Inc., which was acquired by Symantec Corporation, and served as its chief technology officer and vice president of products from 2001 to 2006. Prior to that, Mr. Sakoda was an analyst at Goldman, Sachs & Co. Mr. Sakoda currently serves on the board of directors of several private companies. Mr. Sakoda holds a Bachelor of Arts in chemistry from Harvard University.
We believe that Mr. Sakoda is qualified to serve as a member of our board of directors because of his experience as a seasoned investor, a current and former director of many companies and his knowledge of the software industry.
Harry Weller has served on our board of directors since October 2008. Mr. Weller is a general partner of New Enterprise Associates, a venture capital firm, which he joined in 2002. Prior to that, Mr. Weller was a partner of FBR Technology Venture Partners. Mr. Weller currently serves on the board of directors of several private companies. Mr. Weller holds a Masters in Business Administration from Harvard Business School and a Bachelor of Science in physics from Duke University.
We believe that Mr. Weller is qualified to serve as a member of our board of directors because of his experience as a seasoned investor, a current and former director of many companies and his knowledge of the software industry.
81
Codes of Business Conduct and Ethics
Prior to the completion of this offering, our board of directors will adopt a code of business conduct and ethics that will apply to all of our employees, directors and officers, including our Chief Executive Officer, Chief Financial Officer and other executive and senior financial officers.
Board of Directors
Our business and affairs are managed under the direction of our board of directors. The number of directors will be fixed by our board of directors, subject to the terms of our amended and restated certificate of incorporation and amended and restated bylaws that will become effective immediately prior to the completion of this offering. Our board of directors will consist of eight directors, six of whom will qualify as “independent” under NYSE listing standards.
In accordance with our amended and restated certificate of incorporation and our amended and restated bylaws, immediately after the completion of this offering our board of directors will be divided into three classes with staggered three-year terms. Only one class of directors will be elected at each annual meeting of our stockholders, with the other classes continuing for the remainder of their respective three-year terms. Our directors will be divided among the three classes as follows:
| • | the Class I directors will be Messrs. Yates, Riechers and Sakoda, and their terms will expire at the annual meeting of stockholders to be held in 2015; |
| • | the Class II directors will be Messrs. Ryu and Weller, and their terms will expire at the annual meeting of stockholders to be held in 2016; and |
| • | the Class III directors will be Messrs. Laskey, McLaughlin and Nishar, and their terms will expire at the annual meeting of stockholders to be held in 2017. |
Any increase or decrease in the number of directors will be distributed among the three classes so that, as nearly as possible, each class will consist of one-third of the directors.
This classification of our board of directors may have the effect of delaying or preventing changes in control of our company.
Director Independence
Our board of directors has undertaken a review of the independence of each director. Based on information provided by each director concerning his background, employment and affiliations, our board of directors has determined that Messrs. McLaughlin, Nishar, Riechers, Ryu, Sakoda and Weller do not have a relationship that would interfere with the exercise of independent judgment in carrying out the responsibilities of a director and that each of these directors is “independent” as that term is defined under the applicable rules and regulations of the SEC and the listing standards of the NYSE. In making these determinations, our board of directors considered the current and prior relationships that each non-employee director has with our company and all other facts and circumstances our board of directors deemed relevant in determining their independence, including the beneficial ownership of our capital stock by each non-employee director, and the transactions involving them described in “Certain Relationships and Related Party Transactions.”
Lead Independent Director
Our board of directors has appointed Mr. Ryu to serve as our lead independent director. As lead independent director, Mr. Ryu will preside over periodic meetings of our independent directors, serve as a liaison between our Chairman of the board of directors and the independent directors, and perform such additional duties as our board of directors may otherwise determine and delegate.
82
Committees of the Board of Directors
Our board of directors has established an audit committee, a compensation committee and a nominating and governance committee. The composition and responsibilities of each of the committees of our board of directors is described below. Members will serve on these committees until their resignation or until as otherwise determined by our board of directors.
Audit Committee
Immediately following the completion of this offering, our audit committee will consist of Messrs. Riechers, Ryu and Weller, with Mr. Riechers serving as Chairman. The composition of our audit committee meets the requirements for independence under current NYSE listing standards and SEC rules and regulations. Each member of our audit committee meets the financial literacy requirements of the NYSE listing standards. In addition, our board of directors has determined that Mr. Riechers is an audit committee financial expert within the meaning of Item 407(d) of Regulation S-K under the Securities Act. Our audit committee will, among other things:
| • | select a qualified firm to serve as the independent registered public accounting firm to audit our financial statements; |
| • | help to ensure the independence and performance of the independent registered public accounting firm; |
| • | discuss the scope and results of the audit with the independent registered public accounting firm, and review, with management and the independent registered public accounting firm, our interim and year-end results of operations; |
| • | develop procedures for employees to submit concerns anonymously about questionable accounting or audit matters; |
| • | review our policies on risk assessment and risk management; |
| • | review related party transactions; |
| • | obtain and review a report by the independent registered public accounting firm at least annually, that describes our internal control procedures, any material issues with such procedures, and any steps taken to deal with such issues; and |
| • | approve (or, as permitted, pre-approve) all audit and all permissible non-audit services, other than de minimis non-audit services, to be performed by the independent registered public accounting firm. |
Our audit committee will operate under a written charter, to be effective prior to the completion of this offering, that satisfies the applicable rules of the SEC and the listing standards of the NYSE.
Compensation Committee
Immediately following the completion of this offering, our compensation committee will consist of Messrs. McLaughlin, Nishar and Sakoda, with Mr. Sakoda serving as Chairman. The composition of our compensation committee meets the requirements for independence under NYSE listing standards and SEC rules and regulations. Each member of the compensation committee is also a non-employee director, as defined pursuant to Rule 16b-3 promulgated under the Securities Exchange Act of 1934, as amended (the “Exchange Act”), and an outside director, as defined pursuant to Section 162(m) of the Internal Revenue Code. The purpose of our compensation committee is to discharge the responsibilities of our board of directors relating to compensation of our executive officers. Our compensation committee will, among other things:
| • | review, approve and determine, or make recommendations to our board of directors regarding, the compensation of our executive officers; |
| • | administer our stock and equity incentive plans; |
83
| • | review and approve, or make recommendations to our board of directors regarding, incentive compensation and equity plans; and |
| • | establish and review general policies relating to compensation and benefits of our employees. |
Our compensation committee will operate under a written charter, to be effective prior to the completion of this offering, that satisfies the applicable rules of the SEC and the listing standards of the NYSE.
Nominating and Governance Committee
Immediately following the completion of this offering, our nominating and governance committee will consist of Messrs. McLaughlin, Ryu and Weller, with Mr. Weller serving as Chairman. The composition of our nominating and governance committee meets the requirements for independence under NYSE listing standards and SEC rules and regulations. Our nominating and governance committee will, among other things:
| • | identify, evaluate and select, or make recommendations to our board of directors regarding, nominees for election to our board of directors and its committees; |
| • | evaluate the performance of our board of directors and of individual directors; |
| • | consider and make recommendations to our board of directors regarding the composition of our board of directors and its committees; |
| • | review developments in corporate governance practices; |
| • | evaluate the adequacy of our corporate governance practices and reporting; and |
| • | develop and make recommendations to our board of directors regarding corporate governance guidelines and matters. |
The nominating and governance committee will operate under a written charter, to be effective prior to the completion of this offering that satisfies the applicable listing requirements and rules of the NYSE.
Compensation Committee Interlocks and Insider Participation
None of our executive officers currently serves, or in the past year has served, as a member of the board of directors or compensation committee of any entity that has one or more executive officers serving on our board of directors or compensation committee.
84
Overview
The primary objective of our executive compensation program is to attract, motivate and retain employees at the executive level who contribute to our long-term success. We strive to provide compensation packages to our executives that are competitive, reward the achievement of our business objectives and effectively align their interests with those of our stockholders.
Summary Compensation Table
The following table sets forth summary information concerning compensation for the following persons: (i) all persons serving as our principal executive officer during 2013 and (ii) up to two of the most highly compensated of our other executive officers who received compensation during 2013 of at least $100,000 and who were executive officers on December 31, 2013. We refer to these persons as our “named executive officers” elsewhere in this prospectus. The following table includes all compensation earned by the named executive officers for the respective periods, regardless of whether such amounts were actually paid during the period.
| Name and Principal Position |
Year | Salary ($) | Option Awards ($)(1) |
Non-Equity Incentive Plan Compensation($) |
All
Other Compensation($)(2) |
Total ($) | ||||||||||||||||||
| Daniel Yates |
||||||||||||||||||||||||
| Chief Executive Officer and Founder |
2013 | 250,000 | 7,928,934 | (3) | — | 1,200 | 8,180,134 | |||||||||||||||||
| 2012 | 250,000 | — | — | 1,200 | 251,200 | |||||||||||||||||||
| Alexander Laskey |
||||||||||||||||||||||||
| President and Founder |
2013 | 244,198 | 5,549,643 | (4) | — | 7,002 | 5,800,843 | |||||||||||||||||
| Jeremy Kirsch |
||||||||||||||||||||||||
| Senior Vice President of Worldwide Sales, Regulatory and Business Development |
2013 | 240,000 | 193,501 | (5) | 59,000 | (6) | 6,619 | 499,120 | ||||||||||||||||
| (1) | The amounts reported represent the aggregate grant date fair value of the stock options awarded to the named executive officer in the fiscal year indicated, calculated in accordance with ASC Topic 718. Such grant date fair value does not take into account any estimated forfeitures related to service-vesting conditions. The assumptions used in calculating the grant date fair value of the stock options reported in this column are set forth in the notes to our audited financial statements included in this prospectus. |
| (2) | Amounts represent payment of $50 per pay period for parking and public transportation expenses for each of the named executive officers. In addition, for Mr. Laskey, the amount reported includes $5,802 of short-term disability benefits paid by us and, for Mr. Kirsch, the amount reported includes $1,092 for golf clubs given to him on the fifth anniversary of his employment with us as well as an $4,327 for a trip for Mr. Kirsch for meeting or exceeding his sales goals paid by us. |
| (3) | Represents an option to purchase 857,168 shares of common stock. |
| (4) | Represents an option to purchase 603,914 shares of common stock. |
| (5) | Represents an option to purchase 110,000 shares of common stock. |
| (6) | The amount reported reflects bonus payments made to, or earned by, Mr. Kirsch based upon the achievement of certain quantitative sales performance goals as well as qualitative sales management goals for 2013. |
Narrative Disclosure to the Summary Compensation Table
Employment Arrangements with our Named Executive Officers
Jeremy Kirsch. We have entered into an offer letter with Jeremy Kirsch. Mr. Kirsch currently receives a base salary of $240,000 and is eligible to receive a bonus for each six-month period of his employment based upon the achievement of certain performance goals. Pursuant to his employment agreement, if, following the consummation of a “corporate transaction” that constitutes a “triggering event,” each as defined in our Amended
85
and Restated 2007 Stock Plan, or the 2007 Plan, we terminate Mr. Kirsch’s employment with us for any reason other than “cause,” death or “disability,” each as defined in the 2007 Plan, or Mr. Kirsch resigns his employment for “good reason,” as defined in the employment agreement, we will pay Mr. Kirsch severance of $50,000.
Outstanding Equity Awards at 2013 Year-End
The following table sets forth information regarding outstanding equity awards held by our named executive officers as of December 31, 2013. None of our named executive officers held unvested stock awards as of December 31, 2013.
| Option Awards (1) | ||||||||||||||||||||
| Name |
Grant Date |
Number of Securities Underlying Unexercised Options (#) Exercisable |
Number of Securities Underlying Unexercised Options (#) Unexercisable |
Option Exercise Price ($) |
Option Expiration Date |
|||||||||||||||
| Daniel Yates |
8/27/2013 | (2) | 13,850 | 55,400 | 7.22 | 8/27/2018 | ||||||||||||||
| 8/27/2013 | (2)(3) | 787,918 | — | 6.56 | 8/27/2023 | |||||||||||||||
| Alexander Laskey |
8/27/2013 | (2) | 13,850 | 55,400 | 7.22 | 8/27/2018 | ||||||||||||||
| 8/27/2013 | (2)(3) | 534,664 | — | 6.56 | 8/27/2023 | |||||||||||||||
| Jeremy Kirsch |
4/17/2013 | (4)(5) | — | 110,000 | 4.19 | 4/16/2023 | ||||||||||||||
| 9/14/2012 | (5)(6) | 14,166 | 25,834 | 2.59 | 9/13/2022 | |||||||||||||||
| 7/27/2008 | (7) | 747,000 | — | 0.05 | 7/26/2018 | |||||||||||||||
| (1) | Each stock option was granted pursuant to our 2007 Plan. |
| (2) | The shares underlying this option vest as follows: 1/60th of the shares underlying the option vest in equal monthly installments over 24 months beginning on September 30, 2013 and 1/40th of the shares underlying the option vest in equal monthly installments over the following 24 months. |
| (3) | This option contains an early exercise feature and all shares underlying the option were exercisable upon grant. |
| (4) | The shares underlying this option vest as follows: 25% of the shares underlying the option vest and become exercisable on July 1, 2014 and the remaining 75% of the shares underlying the option vest and become exercisable in equal monthly installments over the following 36 months. |
| (5) | Fifty percent of the unvested shares underlying this option will vest and become exercisable as of immediately prior to the closing of a corporate transaction or the date of termination of employment, as applicable, in the event of corporate transaction that constitutes a triggering event (as such terms are defined in the 2007 Plan) if either (i) the successor corporation does not assume or substitute the stock option and the option is not terminated in exchange for a payment of cash, securities and/or other property or (ii) Mr. Kirsch’s continuous service status (as defined in the 2007 Plan) is terminated by us for any reason other than cause (as defined in the 2007 Plan), death or disability (as defined in the 2007 Plan) at any time following the consummation of such triggering event. |
| (6) | The shares underlying this option vest as follows: 25% of the shares underlying the option vested and became exercisable on July 14, 2013 and the remaining 75% of the shares underlying the option vest and become exercisable in equal monthly installments over the following 36 months. |
| (7) | The shares underlying this option vested as follows: 12.5% of the shares underlying the option vested on January 14, 2009, an additional 21.875% of the shares underlying the option vested on July 14, 2009 and the remaining shares underlying the option vested in equal monthly installments over the following 36 months. |
Director Compensation
The following table presents the total compensation for each person who served as a non-employee member of our board of directors during 2013. Other than as set forth in the table and described more fully below, we did not pay any compensation, make any equity awards or non-equity awards to, or pay any other compensation to any of the non-employee members of our board of directors in the year ended December 31, 2013. All of our directors are entitled to reimbursement for reasonable travel expenses incurred in attending our board of directors meetings and committee meetings. Mr. Yates, our CEO and Founder, and Mr. Laskey, our President and Founder, receive no compensation for their service as directors, and the compensation received by Mr. Yates and Mr. Laskey as employees during 2013 is presented in the “Summary Compensation Table” above.
86
| Director Name |
Stock
Awards ($)(1) |
Option
Awards ($)(2) |
Total ($) |
|||||||||
| Mark McLaughlin(3) |
608,000 | — | 608,000 | |||||||||
| Dipchand Nishar(4) |
45,600 | 366,681 | 412,281 | |||||||||
| Gene Riechers(5) |
76,000 | — | 76,000 | |||||||||
| Marcus Ryu(6) |
45,600 | 316,875 | 362,475 | |||||||||
| Jon Sakoda |
— | — | — | |||||||||
| Mark Sugarman |
— | — | — | |||||||||
| Harry Weller |
— | — | — | |||||||||
| (1) | The amounts reported represent the aggregate grant-date fair value of restricted stock units awarded to the director, calculated in accordance with ASC Topic 718. Such grant-date fair value does not take into account any estimated forfeitures related to service-vesting conditions. The assumptions used in calculating the grant date fair value of the restricted stock units reported in this column are set forth in the notes to our audited financial statements included in this prospectus. All of the restricted stock units are subject to both a time-based condition and performance-based vesting, both of which must be satisfied prior to the expiration date in order for the restricted stock units to vest. 1/12th of the total restricted stock units shall satisfy the time-based condition on each of the monthly anniversaries of November 18, 2013, provided that (i) any portion of the restricted stock units that has not satisfied the time-based condition shall immediately satisfy such condition upon termination of the director’s continuous service status (as defined in the 2007 Plan) as a result of his death and (ii) 50% of the portion of the restricted stock units that have not satisfied the time-based condition shall satisfy such condition if (A) a corporate transaction (as defined in the 2007 Plan) has occurred, (B) the restricted stock units have been continued, assumed or substituted following the corporate transaction and (C) the director’s continuous service status is terminated without cause within one year after the consummation of such corporate transaction. The performance-based condition shall be satisfied on the first to occur of (a) a triggering event (as defined in the 2007 Plan) or (ii) the director’s continuous service status through the expiration of the lock-up period immediately following the consummation of this offering. |
| (2) | The amounts reported represent the aggregate grant-date fair value of the stock options awarded to the director, calculated in accordance with ASC Topic 718. Such grant-date fair value does not take into account any estimated forfeitures related to service-vesting conditions. The assumptions used in calculating the grant date fair value of the stock options reported in this column are set forth in the notes to our audited financial statements included in this prospectus. |
| (3) | Mr. McLaughlin was appointed to our board of directors effective October 10, 2013. As of December 31, 2013, Mr. McLaughlin held restricted stock units covering 40,000 shares of our common stock, |
| (4) | Mr. Nishar was appointed to our board of directors effective August 27, 2013. As of December 31, 2013, Mr. Nishar held (i) restricted stock units covering 3,000 shares of our common stock, (ii) an option to purchase 40,000 shares of our common stock, which vests in 12 equal monthly installments beginning on August 27, 2013 and (iii) an option to purchase 2,500 shares of our common stock, which vests in 24 equal monthly installments beginning on April 1, 2013. The stock options held by Mr. Nishar are subject to an early exercise feature. |
| (5) | As of December 31, 2013, Mr. Riechers held (i) restricted stock units covering 5,000 shares of our common stock, (ii) an option to purchase 28,000 shares of our common stock, which became fully vested on December 29, 2011 and (iii) an option to purchase 30,000 shares of our common stock, which vested in 24 equal monthly installments beginning on September 13, 2011. |
| (6) | As of December 31, 2013, Mr. Ryu held (i) restricted stock units covering 3,000 shares of our common stock and (ii) an option to purchase 35,000 shares of our common stock, which vests in 12 equal monthly installments beginning on August 8, 2013 and is subject to an early exercise feature. |
Following the completion of this offering, we intend to implement a formal policy pursuant to which our non-employee directors would be eligible to receive equity awards and annual cash retainers as compensation for service on our board of directors and committees of our board of directors.
Compensation Risk Assessment
We believe that our executive compensation program does not encourage excessive or unnecessary risk taking. This is primarily due to the fact that our compensation programs are designed to encourage our executive officers and other employees to remain focused on both short-term and long-term strategic goals. As a result, we do not believe that our compensation programs are reasonably likely to have a material adverse effect on our company.
87
Employee Benefits Plans
2014 Stock Incentive Plan
Our 2014 Stock Incentive Plan (the “2014 Plan”) was adopted by our board of directors in February 2014 and approved by our stockholders in 2014 and will become effective immediately prior to the completion of this offering. The 2014 Plan will replace the 2007 Plan. The 2014 Plan allows the compensation committee to make equity-based incentive awards to our officers, employees, directors and other key persons (including consultants).
We have initially reserved 5,000,000 shares of our common stock for the issuance of awards under the 2014 Plan. In addition, the number of shares remaining available for grant under our 2007 Plan will be added to the shares available under our 2014 Plan. The 2014 Plan provides that the number of shares reserved and available for issuance under the plan will automatically increase each January 1, beginning on January 1, 2015, by 5% of the outstanding number of shares of our common stock on the immediately preceding December 31 or such lesser number of shares as determined by our compensation committee. This number of shares reserved under the 2014 Plan is subject to adjustment in the event of a stock split, stock dividend or other change in our capitalization.
The shares we issue under the 2014 Plan will be authorized but unissued shares or shares that we reacquire. The shares of common stock underlying any awards that are forfeited, cancelled, held back upon exercise or settlement of an award to satisfy the exercise price or tax withholding, reacquired by us prior to vesting, satisfied without the issuance of stock, expire or are otherwise terminated (other than by exercise) under the 2014 Plan and the 2007 Plan will be added back to the shares of common stock available for issuance under the 2014 Plan.
Stock options and stock appreciation rights with respect to no more than 5,000,000 shares of common stock may be granted to any one individual in any one calendar year and the maximum “performance-based award” payable to any one individual under the 2014 Plan is 5,000,000 shares of stock or $2,000,000 in the case of cash-based awards. The maximum number of shares that may be issued as incentive stock options in any one calendar year period may not exceed 5,000,000 cumulatively increased on January 1, 2015 and on each January 1 thereafter by the lesser of 5% of the outstanding number of shares of our common stock on the immediately preceding December 31 or 5,000,000 shares.
The 2014 Plan will be administered by our compensation committee. Our compensation committee has full power to select, from among the individuals eligible for awards, the individuals to whom awards will be granted, to make any combination of awards to participants, and to determine the specific terms and conditions of each award, subject to the provisions of the 2014 Plan. Persons eligible to participate in the 2014 Plan will be those full or part-time officers, employees, non-employee directors and other key persons (including consultants) as selected from time to time by our compensation committee in its discretion.
The 2014 Plan permits the granting of both (1) options to purchase common stock intended to qualify as incentive stock options under Section 422 of the Code and (2) options that do not so qualify. The option exercise price of each option will be determined by our compensation committee but may not be less than 100% of the fair market value of our common stock on the date of grant. The term of each option will be fixed by our compensation committee and may not exceed ten years from the date of grant. Our compensation committee will determine at what time or times each option may be exercised.
Our compensation committee may award stock appreciation rights subject to such conditions and restrictions as it may determine. Stock appreciation rights entitle the recipient to shares of common stock, or cash, equal to the value of the appreciation in our stock price over the exercise price. The exercise price may not be less than 100% of fair market value of the common stock on the date of grant.
Our compensation committee may award restricted shares of common stock and restricted stock units to participants subject to such conditions and restrictions as it may determine. These conditions and restrictions may include the achievement of certain performance goals and/or continued employment with us through a specified
88
vesting period. Our compensation committee may also grant shares of common stock that are free from any restrictions under the 2014 Plan. Unrestricted stock may be granted to participants in recognition of past services or for other valid consideration and may be issued in lieu of cash compensation due to such participant.
Our compensation committee may grant performance share awards to participants that entitle the recipient to receive awards of common stock upon the achievement of certain performance goals and such other conditions as our compensation committee shall determine. Our compensation committee may grant dividend equivalent rights to participants that entitle the recipient to receive credits for dividends that would be paid if the recipient had held a specified number of shares of common stock.
Our compensation committee may grant cash bonuses under the 2014 Plan to participants, subject to the achievement of certain performance goals.
Our compensation committee may grant awards of restricted stock, restricted stock units, performance shares or cash-based awards under the 2014 Plan that are intended to qualify as “performance-based compensation” under Section 162(m) of the Code. Such awards will only vest or become payable upon the attainment of performance goals that are established by our compensation committee and related to one or more performance criteria. The performance criteria that could be used with respect to any such awards include: total stockholder return, earnings before interest, taxes, depreciation and amortization, net income (loss) (either before or after interest, taxes, depreciation and/or amortization), changes in the market price of our common stock, economic value-added, funds from operations or similar measure, sales or revenue, acquisitions or strategic transactions, operating income (loss), cash flow (including, but not limited to, operating cash flow and free cash flow), return on capital, assets, equity or investment, return on sales, gross or net profit levels, productivity, expense, margins, operating efficiency, customer satisfaction, working capital, earnings (loss) per share of stock, sales or market shares and number of customers, any of which may be measured either in absolute terms or as compared to any incremental increase or as compared to results of a peer group. From and after the time that we become subject to Section 162(m) of the Code, the maximum award that is intended to qualify as “performance-based compensation” under Section 162(m) of the Code that may be made to any one employee during any one calendar year period is 5,000,000 shares of common stock with respect to a stock-based award and $2,000,000 with respect to a cash-based award.
The 2014 Plan provides that upon the effectiveness of a “sale event,” as defined in the 2014 Plan, the successor entity may assume, continue or substitute for outstanding awards, as appropriately adjusted. To the extent that all awards are not assumed or continued or substituted by the successor entity, all such options and stock appreciation rights that are not exercisable immediately prior to the effective time of the sale event shall become fully exercisable as of the effective time of the sale event, all other awards with time-based vesting, conditions or restrictions, shall become fully vested and nonforfeitable as of the effective time of the sale event and all awards with conditions and restrictions relating to the attainment of performance goals may become vested and nonforfeitable in the discretion of the compensation committee and all awards granted under the 2014 Plan shall terminate. In addition, in connection with the termination of the 2014 Plan upon a sale event, we may make or provide for a cash payment to participants holding options and stock appreciation rights equal to the difference between the per share cash consideration payable to stockholders in the sale event and the exercise price of the options or stock appreciation rights.
Our board of directors may amend or discontinue the 2014 Plan and our compensation committee may amend or cancel outstanding awards for purposes of satisfying changes in law or any other lawful purpose, but no such action may adversely affect rights under an award without the holder’s consent. Certain amendments to the 2014 Plan require the approval of our stockholders.
No awards may be granted under the 2014 Plan after the date that is ten years from the date of stockholder approval of the 2014 Plan. No awards under the 2014 Plan have been made prior to the date hereof.
89
Amended and Restated 2007 Stock Plan
Our 2007 Plan was approved by our board of directors in July 2007 and was subsequently approved by our stockholders in August 2007. The 2007 Plan was most recently amended in February 2014. We have reserved an aggregate of 14,835,188 shares of our common stock for the issuance of options under the 2007 Plan. This number is subject to adjustment in the event of a stock split, stock dividend or other change in our capitalization. Effective upon the closing of this offering, our board of directors has determined not to grant any further awards under our 2007 Plan.
Currently, the shares of common stock underlying any awards that are forfeited, canceled, repurchased, expire or are otherwise terminated (other than by exercise) under the 2007 Plan are added to the shares of common stock available for issuance under the 2007 Plan. Upon the effectiveness of the 2014 Plan, such shares will be added to the shares of common stock available for issuance under the 2014 Plan.
Our board of directors has acted as administrator of the 2007 Plan. The administrator has the power to select, from among the individuals eligible for awards, the individuals to whom awards will be granted, and to determine the specific terms and conditions of each award, subject to the provisions of the 2007 Plan. Persons eligible to participate in the 2007 Plan are our employees and consultants as selected from time to time by the administrator in its discretion.
The 2007 Plan permits the granting of (1) options to purchase common stock intended to qualify as incentive stock options under Section 422 of the Code and (2) options that do not so qualify. The administrator determines at what time or times each option may be exercised. In addition, the 2007 Plan permits the granting of restricted shares of common stock and restricted stock units.
Restricted stock units granted under the 2007 Plan are typically subject to both time and performance-based vesting. The performance based vesting is generally achieved upon the first to occur of a triggering event, as defined in the 2007 Plan, or continued service with us through the expiration of the lock-up period following our initial public offering. The time-based vesting generally occurs over four years from the date of grant with 25% of the restricted stock units vesting after one year and the remaining 75% vesting in 12 equal quarterly installments thereafter.
The 2007 Plan provides that upon the occurrence of a “corporate transaction,” as defined in the 2007 Plan, all outstanding stock options will either be assumed or substituted by the successor entity or terminated in exchange for a payment of cash, securities and/or other property equal to the fair market value of the vested portion of the stock option over the aggregate exercise price of the vested portion of such stock option. All stock options that are not assumed or substituted shall terminate upon the consummation of the corporate transaction.
No awards may be granted under the 2007 Plan after the date that is ten years from the date the 2007 Plan was adopted by our board of directors.
Our Board of Directors has also Adopted the UK Sub-Plan to the 2007 Plan (the “UK Sub-Plan”), to Apply to Grants made to Our Employees and Employees of Our United Kingdom Subsidiary who are also Tax Residents of the United Kingdom (the “UK Service Providers”). The UK Sub-Plan Allows us to Grant Options to the UK Service Providers Under the 2007 Plan Under Similar Terms to those in the 2007 Plan.
Senior Executive Cash Incentive Bonus Plan
In February 2014, our board of directors adopted the Senior Executive Cash Incentive Bonus Plan (the “Bonus Plan”). The Bonus Plan provides for cash bonus payments based upon the attainment of performance targets established by our compensation committee. The payment targets will be related to financial and operational measures or objectives with respect to our company (the “Corporate Performance Goals”), as well as individual performance objectives.
90
Our compensation committee may select Corporate Performance Goals from among the following: cash flow (including, but not limited to, operating cash flow and free cash flow); revenue; earnings before interest, taxes, depreciation and amortization; net income (loss) (either before or after interest, taxes, depreciation and/or amortization); changes in the market price of our common stock; economic value-added; funds from operations or similar measure; acquisitions or strategic transactions; operating income (loss); return on capital, assets, equity or investment; stockholder returns; return on sales; gross or net profit levels; productivity; expense efficiency; margins; operating efficiency; customer satisfaction; working capital; earnings (loss) per share of our common stock; bookings, new bookings or renewals; sales or market shares; number of customers; number of new customers or customer references; operating income and/or net annual recurring revenue, any of which may be measured in absolute terms, as compared to any incremental increase, in terms of growth, as compared to results of a peer group, against the market as a whole, compared to applicable market indices and/or measured on a pre-tax or post-tax basis.
Each executive officer who is selected to participate in the Bonus Plan will have a target bonus opportunity set for each performance period. The bonus formulas will be adopted in each performance period by the compensation committee and communicated to each executive. The Corporate Performance Goals will be measured at the end of each performance period after our financial reports have been published or such other appropriate time as the compensation committee determines. If the Corporate Performance Goals and individual performance objectives are met, payments will be made as soon as practicable following the end of each performance period. Subject to the rights contained in any agreement between the executive officer and us, an executive officer must be employed by us on the bonus payment date to be eligible to receive a bonus payment. The Bonus Plan also permits the compensation committee to approve additional bonuses to executive officers in its sole discretion.
401(k) Plan
We maintain a tax-qualified retirement plan (the “401(k) Plan”), that provides eligible employees with an opportunity to save for retirement on a tax-advantaged basis. All participants’ interests in their contributions are 100% vested when contributed. Historically, we have not made any matching contributions to the 401(k) Plan. Pre-tax contributions are allocated to each participant’s individual account and are then invested in selected investment alternatives according to the participants’ directions. The 401(k) Plan is intended to qualify under Sections 401(a) and 501(a) of the Code.
91
CERTAIN RELATIONSHIPS AND RELATED PARTY TRANSACTIONS
In addition to the compensation arrangements, including employment, termination of employment and change in control arrangements and indemnification arrangements, discussed, when required, in the sections titled “Management” and “Executive Compensation” and the registration rights described in the section titled “Description of Capital Stock—Registration Rights,” the following is a description of each transaction since January 1, 2011 and each currently proposed transaction in which:
| • | we have been or are to be a participant; |
| • | the amount involved exceeded or exceeds $120,000; and |
| • | any of our directors, executive officers, or holders of more than 5% of our capital stock, or any immediate family member of, or person sharing the household with, any of these individuals, had or will have a direct or indirect material interest. |
Investor Rights Agreement
On November 24, 2010, we entered into an Amended and Restated Investor Rights Agreement with the holders of our outstanding convertible preferred stock, including entities affiliated with MHS Capital Partners, New Enterprise Associates, Accel Partners and KPCB Holdings, which each hold more than 5% of our outstanding capital stock, and Daniel Yates and Alex Laskey, our co-founders. In addition, the father of Jeremy Kirsch, one of our executive officers, is a limited partner of entities affiliated with MHS Capital Partners. As of December 31, 2013, the holders of 34,644,328 shares of our common stock, including our common stock issuable in connection with the automatic conversion of all outstanding shares of our convertible preferred stock into common stock, are entitled to rights with respect to the registration of their shares following this offering under the Securities Act. See the section titled “Description of Capital Stock—Registration Rights” for more information regarding these registration rights.
Consulting Agreement
On September 12, 2011, we entered into a Consulting Agreement with Gene Riechers, one of our directors, to provide strategic and management consulting for us. This Consulting Agreement terminated on December 23, 2011. In connection with the services provided by Mr. Riechers pursuant to this agreement, we paid Mr. Riechers approximately $82,000 and granted him an option to purchase 28,000 shares of our common stock which became fully vested on December 29, 2011.
Other Transactions
We have granted stock options to our executive officers and certain of our directors. See the sections titled “Executive Compensation—Outstanding Equity Awards at 2013 Year-End” and “Management—Director Compensation” for a description of these options.
We have entered into change in control arrangements with certain of our executive officers that, among other things, provide for certain severance and change in control benefits.
Other than as described above under this section titled “Certain Relationships and Related Person Transactions,” since January 1, 2011, we have not entered into any transactions, nor are there any currently proposed transactions, between us and a related party where the amount involved exceeds, or would exceed, $120,000, and in which any related person had or will have a direct or indirect material interest. We believe the terms of the transactions described above were comparable to terms we could have obtained in arm’s-length dealings with unrelated third parties.
92
Limitation of Liability and Indemnification of Officers and Directors
Prior to the completion of this offering, we expect to adopt an amended and restated certificate of incorporation, which will become effective immediately prior to the completion of this offering, and which will contain provisions that limit the liability of our directors for monetary damages to the fullest extent permitted by Delaware law. Consequently, our directors will not be personally liable to us or our stockholders for monetary damages for any breach of fiduciary duties as directors, except liability for the following:
| • | any breach of their duty of loyalty to our company or our stockholders; |
| • | any act or omission not in good faith or that involves intentional misconduct or a knowing violation of law; |
| • | unlawful payments of dividends or unlawful stock repurchases or redemptions as provided in Section 174 of the Delaware General Corporation Law; or |
| • | any transaction from which they derived an improper personal benefit. |
Any amendment to, or repeal of, these provisions will not eliminate or reduce the effect of these provisions in respect of any act, omission or claim that occurred or arose prior to that amendment or repeal. If the Delaware General Corporation Law is amended to provide for further limitations on the personal liability of directors of corporations, then the personal liability of our directors will be further limited to the greatest extent permitted by the Delaware General Corporation Law.
In addition, prior to the completion of this offering, we expect to adopt amended and restated bylaws which will provide that we will indemnify, to the fullest extent permitted by law, any person who is or was a party or is threatened to be made a party to any action, suit or proceeding by reason of the fact that he or she is or was one of our directors or officers or is or was serving at our request as a director or officer of another corporation, partnership, joint venture, trust, or other enterprise. Our amended and restated bylaws are expected to provide that we may indemnify to the fullest extent permitted by law any person who is or was a party or is threatened to be made a party to any action, suit, or proceeding by reason of the fact that he or she is or was one of our employees or agents or is or was serving at our request as an employee or agent of another corporation, partnership, joint venture, trust or other enterprise. Our amended and restated bylaws will also provide that we must advance expenses incurred by or on behalf of a director or officer in advance of the final disposition of any action or proceeding, subject to very limited exceptions.
Further, prior to the completion of this offering, we expect to enter into indemnification agreements with each of our directors and executive officers that may be broader than the specific indemnification provisions contained in the Delaware General Corporation Law. These indemnification agreements will require us, among other things, to indemnify our directors and executive officers against liabilities that may arise by reason of their status or service. These indemnification agreements will also require us to advance all expenses incurred by the directors and executive officers in investigating or defending any such action, suit or proceeding. We believe that these agreements are necessary to attract and retain qualified individuals to serve as directors and executive officers.
The limitation of liability and indemnification provisions that are expected to be included in our amended and restated certificate of incorporation, amended and restated bylaws and in indemnification agreements that we enter into with our directors and executive officers may discourage stockholders from bringing a lawsuit against our directors and executive officers for breach of their fiduciary duties. They may also reduce the likelihood of derivative litigation against our directors and executive officers, even though an action, if successful, might benefit us and other stockholders. Further, a stockholder’s investment may be harmed to the extent that we pay the costs of settlement and damage awards against directors and executive officers as required by these indemnification provisions. At present, we are not aware of any pending litigation or proceeding involving any person who is or was one of our directors, officers, employees or other agents or is or was serving at our request
93
as a director, officer, employee or agent of another corporation, partnership, joint venture, trust or other enterprise, for which indemnification is sought, and we are not aware of any threatened litigation that may result in claims for indemnification.
We have obtained insurance policies under which, subject to the limitations of the policies, coverage is provided to our directors and executive officers against loss arising from claims made by reason of breach of fiduciary duty or other wrongful acts as a director or executive officer, including claims relating to public securities matters, and to us with respect to payments that may be made by us to these directors and executive officers pursuant to our indemnification obligations or otherwise as a matter of law.
Certain of our non-employee directors may, through their relationships with their employers, be insured and/or indemnified against certain liabilities incurred in their capacity as members of our board of directors.
The underwriting agreement provides for indemnification by the underwriters of us and our officers, directors and employees for certain liabilities arising under the Securities Act or otherwise.
Insofar as indemnification for liabilities arising under the Securities Act may be permitted to directors, officers or persons controlling our company pursuant to the foregoing provisions, we have been informed that, in the opinion of the SEC, such indemnification is against public policy as expressed in the Securities Act and is therefore unenforceable.
Policies and Procedures for Related Party Transactions
Following the completion of this offering, the audit committee of our board of directors will have the primary responsibility for reviewing and approving or disapproving “related party transactions,” which are transactions between us and related persons in which the aggregate amount involved exceeds or may be expected to exceed $120,000 and in which a related person has or will have a direct or indirect material interest. For purposes of this policy, a related person will be defined as a director, executive officer, nominee for director or greater than 5% beneficial owner of our common stock, in each case since the beginning of the most recently completed year, and their immediate family members. Our audit committee charter will provide that the audit committee shall review and approve or disapprove any related party transactions. As of the date of this prospectus, we have not adopted any formal standards, policies or procedures governing the review and approval of related party transactions, but we expect that our audit committee will do so in the future.
All of the transactions described in the foregoing were entered into prior to the adoption of this policy. Accordingly, each was approved by disinterested members of our board of directors after making a determination that the transaction was executed on terms no less favorable than those that could have been obtained from an unrelated third party.
94
The following table sets forth certain information with respect to the beneficial ownership of our common stock as of December 31, 2013, and as adjusted to reflect the sale of common stock offered by us in this offering assuming no exercise of the underwriters’ option to purchase additional shares, for:
| • | each of our named executive officers; |
| • | each of our directors; |
| • | all of our directors and executive officers as a group; and |
| • | each person known by us to be the beneficial owner of more than five percent of any class of our voting securities. |
We have determined beneficial ownership in accordance with the rules of the SEC, and thus it represents sole or shared voting or investment power with respect to our securities. Unless otherwise indicated below, to our knowledge, the persons and entities named in the table have sole voting and sole investment power with respect to all shares that they beneficially owned, subject to community property laws where applicable. We have deemed shares of our common stock subject to options that are currently exercisable or exercisable within 60 days of December 31, 2013 to be outstanding and to be beneficially owned by the person holding the option for the purpose of computing the percentage ownership of that person but have not treated them as outstanding for the purpose of computing the percentage ownership of any other person.
We have based percentage ownership of our common stock before this offering on 41,359,839 shares of our common stock outstanding as of December 31, 2013, which includes 19,246,714 shares of common stock resulting from the automatic conversion of all outstanding shares of our convertible preferred stock upon the completion of this offering, as if this conversion had occurred as of December 31, 2013. Percentage ownership of our common stock after this offering assumes our sale of shares of common stock in this offering.
Unless otherwise indicated, the address of each beneficial owner listed in the table below is c/o Opower, Inc., 1515 North Courthouse Road, 8th Floor, Arlington, Virginia 22201.
| Shares Beneficially Owned Prior to the Offering |
Shares Beneficially Owned After the Offering | |||||||||||
| Number | Percentage | Number | Percentage | |||||||||
| Principal Stockholders: |
||||||||||||
| Entities affiliated with New Enterprise Associates(1) |
8,997,290 | 21.8 | % | |||||||||
| Entities affiliated with MHS(2) |
3,432,718 | 8.3 | ||||||||||
| Entities affiliated with Accel(3) |
2,247,192 | 5.4 | ||||||||||
| Entities affiliated with Kleiner Perkins Caufield & Byers(4) |
2,247,192 | 5.4 | ||||||||||
| Named Executive Officers and Directors: |
||||||||||||
| Daniel Yates(5) |
9,463,474 | 22.4 | ||||||||||
| Jeremy Kirsch(6) |
1,107,833 | 2.6 | ||||||||||
| Alex Laskey(7) |
7,312,122 | 17.4 | ||||||||||
| Mark McLaughlin(8) |
— | — | ||||||||||
| Dipchand Nishar(9) |
52,500 | * | ||||||||||
| Gene Riechers(10) |
58,000 | * | ||||||||||
| Marcus Ryu(11) |
117,000 | * | ||||||||||
| Jon Sakoda |
— | — | ||||||||||
| Harry Weller |
— | — | ||||||||||
| All directors and executive officers as a group (14 persons)(12) |
19,823,570 | 44.8 | ||||||||||
| * | Less than one percent (1%). |
95
| (1) | Consists of (i) 8,989,766 shares of common stock held of record by New Enterprise Associates 12, Limited Partnership (“NEA 12”) and (ii) 7,524 shares of common stock held of record by NEA Ventures 2008, L.P. (“Ven 2008”). The shares directly held by NEA 12 are indirectly beneficially owned by NEA Partners 12, Limited Partnership (“NEA Partners 12”), the sole general partner of NEA 12, NEA 12 GP, LLC (“NEA 12 LLC”), the sole general partner of NEA Partners 12, and each of the individual managers (collectively, the “Managers”) of NEA 12 LLC, who are M. James Barrett, Peter J. Barris, Forest Baskett, Ryan D. Drant, Patrick J. Kerins, Krishna “Kittu” Kolluri and Scott D. Sandell. The Managers share voting and dispositive power with regard to the shares directly held by NEA 12. Karen P. Welsh, the general partner of Ven 2008, shares voting and dispositive power with regard to the shares directly held by Ven 2008. The address of each of the entities identified in this footnote is c/o New Enterprise Associates, Inc., 1954 Greenspring Drive, Suite 600, Timonium, Maryland 21093. |
| (2) | Consists of (i) 3,215,427 shares of common stock held of record by MHS Capital Partners, L.P. and (ii) 217,291 shares of common stock held of record by MHS Capital Principals, L.L.C. MHS Capital Management, L.L.C. is the sole general partner of MHS Capital Partners, L.P. and the sole manager of MHS Capital Principals, L.L.C. Mark Sugarman is the sole member of MHS Capital Management, L.L.C. and may be deemed to share voting and investment power over the shares of common stock held by MHS Capital Partners, L.P. and MHS Capital Principals, L.L.C. The address of each of the entities identified in this footnote is 333 Bush Street, Suite 2250, San Francisco, California 94104. |
| (3) | Consists of (i) 1,913,259 shares of common stock held of record by Accel X L.P., (ii) 143,596 shares of common stock held of record by Accel X Strategic Partners L.P and (iii) 190,337 shares of common stock held of record by Accel Investors 2010 L.L.C. Accel X Associates L.L.C. (“A10A”) is the general partner of Accel X L.P. and Accel X Strategic Partners L.P. Andrew G. Braccia, James W. Breyer, Kevin J. Efrusy, Sameer K. Gandhi, Theresia Gouw, Ping Li, Tracy L. Sedlock and Richard P. Wong are the managing members of A10A and may be deemed to share voting and dispositive power over the shares held by Accel X L.P. and Accel X Strategic Partners L.P. Andrew G. Braccia, James W. Breyer, Kevin J. Efrusy, Sameer K. Gandhi, Theresia Gouw, Ping Li, Tracy L. Sedlock and Richard P. Wong are the managing members of Accel Investors 2010 L.L.C. and may be deemed to share voting and dispositive power over the shares held by Accel Investors 2010 L.L.C. The address of each of the entities identified in this footnote is 428 University Ave Palo Alto, California 94301. |
| (4) | Shares are held for convenience in the name of “KPCB Holdings, Inc. as nominee” for KPCB Green Growth Fund LLC, and individuals and entities each of whom exercise their own voting and dispositive control over such shares. The managing member for KPCB Green Growth Fund, LLC is KPCB GGF Associates, LLC. The voting and dispositive control over these shares is shared by individual managing directors of KPCB GGF Associates, LLC, none of whom has veto power. Mr. Kortlang, a member of the board of directors of KPCB GGF Associates, LLC, may be deemed to share voting and dispositive power with respect to the shares held by KPCB Green Growth Fund, LLC. The address for KPCB Green Growth Fund, LLC is 2750 Sand Hill Road, Menlo Park, California 94025. |
| (5) | Consists of (i) 6,846,582 shares of common stock held of record by Mr. Yates, (ii) 1,700,000 shares of common stock held of record by the Yates-Whitman 2013 Annuity Trust #1, (iii) 50,000 shares of common stock held of record by Ivan Jellinek and Monica Jellinek, who have granted an irrevocable proxy to Mr. Yates, (iv) 1,274 shares of common stock held of record by Pierre Poussard and Mary Winston Nicklin, who have granted an irrevocable proxy to Mr. Yates, (v) 50,000 shares of common stock held of record by Ralph Aaron Yates, Dorit Strauss Yates and Daniel Joseph Yates, Trustees of the Ralph Aaron Yates and Dorit Strauss Yates Declaration of Trust Dated December 19, 1990, who have granted an irrevocable proxy to Mr. Yates, and (vi) 815,618 shares of common stock subject to outstanding options that are exercisable within 60 days of December 31, 2013. |
96
| (6) | Consists of (i) 220,000 shares of common stock held of record by Mr. Kirsch, (ii) 62,500 shares of common stock held of record by The Jeremy E. Kirsch 2013 Five-Year Grantor Retained Annuity Trust, (iii) 62,500 shares of common stock held of record by The Jeremy E. Kirsch 2013 Three-Year Grantor Retained Annuity Trust and (iv) 762,833 shares of common stock subject to outstanding options that are exercisable within 60 days of December 31, 2013. |
| (7) | Consists of (i) 4,649,756 shares of common stock held of record by Mr. Laskey, (ii) 1,900,000 shares of common stock held of record by Laskey-A Investment Trust, (iii) 33,334 shares of common stock held of record by Baruch Farbiarz and Elsa Farbiarz, who have granted an irrevocable proxy to Mr. Laskey, (iv) 33,334 shares of common stock held of record by Adam Farbiarz, who has granted an irrevocable proxy to Mr. Laskey, (v) 50,000 shares of common stock held of record by Jacob Laskey, who has granted an irrevocable proxy to Mr. Laskey, (vi) 33,334 shares of common stock held of record by Michael Farbiarz and Megan Lewis, who have granted an irrevocable proxy to Mr. Laskey, (vii) 50,000 shares of common stock held of record by Richard Laskey and Abbie Laskey, who have granted an irrevocable proxy to Mr. Laskey, and (viii) 562,364 shares of common stock subject to outstanding options that are exercisable within 60 days of December 31, 2013. |
| (8) | Mr. McLaughlin was appointed to our board of directors in October 2013. |
| (9) | Consists of (i) 42,500 shares of common stock held of record by Mr. Nishar and (ii) 10,000 shares of common stock held of record by Nishar Family Trust dated October 8, 2008. |
| (10) | Consists of 58,000 shares of common stock subject to outstanding options that are exercisable within 60 days of December 31, 2013. |
| (11) | Consists of 117,000 shares of common stock held of record by Mr. Ryu. |
| (12) | Consists of (i) 16,946,277 shares of common stock held of record and (ii) 2,877,293 shares of common subject to outstanding options that are exercisable within 60 days of December 31, 2013. |
97
General
The following description summarizes the most important terms of our capital stock, as they are expected to be in effect upon the closing of this offering. We expect to adopt an amended and restated certificate of incorporation and amended and restated bylaws in connection with this offering, and this description summarizes the provisions that are expected to be included in such documents. Because it is only a summary, it does not contain all the information that may be important to you. For a complete description of the matters set forth in “Description of Capital Stock,” you should refer to our amended and restated certificate of incorporation and amended and restated bylaws and investor rights agreement, which are or will be included as exhibits to the registration statement of which this prospectus forms a part, and to the applicable provisions of Delaware law. Immediately following the closing of this offering, our authorized capital stock will consist of 500,000,000 shares of common stock, $0.000005 par value per share, and 25,000,000 shares of undesignated preferred stock, $0.000005 par value per share.
Assuming the conversion of all outstanding shares of our convertible preferred stock into shares of our common stock, which will occur upon the completion of this offering, as of December 31, 2013, there were 41,359,839 shares of our common stock outstanding, held by 245 stockholders of record, and no shares of our convertible preferred stock outstanding. Our board of directors is authorized, without stockholder approval, except as required by the listing standards of the NYSE, to issue additional shares of our capital stock.
Common Stock
Dividend Rights
Subject to preferences that may apply to any shares of preferred stock outstanding at the time, the holders of our common stock are entitled to receive dividends out of funds legally available if our board of directors, in its discretion, determines to issue dividends and then only at the times and in the amounts that our board of directors may determine.
Voting Rights
Holders of our common stock are entitled to one vote for each share held on all matters submitted to a vote of stockholders. We have not provided for cumulative voting for the election of directors in our amended and restated certificate of incorporation. Our amended and restated certificate of incorporation establishes a classified board of directors that is divided into three classes with staggered three-year terms. Only the directors in one class will be subject to election by a plurality of the votes cast at each annual meeting of our stockholders, with the directors in the other classes continuing for the remainder of their respective three-year terms.
No Preemptive or Similar Rights
Our common stock is not entitled to preemptive rights, and is not subject to conversion, redemption or sinking fund provisions.
Right to Receive Liquidation Distributions
If we become subject to a liquidation, dissolution or winding-up, the assets legally available for distribution to our stockholders would be distributable ratably among the holders of our common stock and any participating preferred stock outstanding at that time, subject to prior satisfaction of all outstanding debt and liabilities and the preferential rights of and the payment of liquidation preferences, if any, on any outstanding shares of preferred stock.
98
Preferred Stock
Following this offering, our board of directors will be authorized, subject to limitations prescribed by Delaware law, to issue preferred stock in one or more series, to establish from time to time the number of shares to be included in each series and to fix the designation, powers, preferences and rights of the shares of each series and any of its qualifications, limitations or restrictions, in each case without further vote or action by our stockholders. Our board of directors can also increase or decrease the number of shares of any series of preferred stock, but not below the number of shares of that series then outstanding, without any further vote or action by our stockholders. Our board of directors may authorize the issuance of preferred stock with voting or conversion rights that could adversely affect the voting power or other rights of the holders of our common stock. The issuance of preferred stock, while providing flexibility in connection with possible acquisitions and other corporate purposes, could, among other things, have the effect of delaying, deferring or preventing a change in control of our company and might adversely affect the market price of our common stock and the voting and other rights of the holders of our common stock. We have no current plan to issue any shares of preferred stock.
Equity Awards
As of December 31, 2013, we had outstanding options to purchase an aggregate of 7,789,720 shares of our common stock, with a weighted-average exercise price of $3.83, and 1,093,326 outstanding restricted stock units pursuant to our Amended and Restated 2007 Stock Plan, which was adopted in July 2007 and last amended in February 2014.
Registration Rights
After the completion of this offering, certain holders of our common stock will be entitled to rights with respect to the registration of their shares under the Securities Act of 1933, as amended (the “Securities Act”). These registration rights are contained in our Amended and Restated Investor Rights Agreement (the “IRA”), dated as of November 24, 2010. We, along with certain holders of our common stock and the holders of our Series A, Series B and Series C preferred stock are parties to the IRA. The registration rights set forth in the IRA will expire two years following the completion of this offering, or, with respect to any particular stockholder, when such stockholder is able to sell all of its shares pursuant to Rule 144 of the Securities Act or a similar exemption during any 90-day period. We will pay the registration expenses (other than underwriting discounts, selling commissions and stock transfer taxes) of the holders of the shares registered pursuant to the registrations described below. In an underwritten offering, the managing underwriter, if any, has the right, subject to specified conditions, to limit the number of shares such holders may include. In connection with this offering, each stockholder that has registration rights agreed not to sell or otherwise dispose of any securities without the prior written consent of the underwriters for a period of 180 days after the date of this prospectus. See “Underwriters” for more information regarding such restrictions.
Demand Registration Rights
After the completion of this offering, the holders of approximately 19,246,714 shares of our common stock will be entitled to certain demand registration rights. If we determine that it would be seriously detrimental to our stockholders to effect such a demand registration, we have the right to defer such registration, not more than once in any 12-month period, for a period of up to 120 days. Additionally, we will not be required to effect a demand registration during the period beginning with 90 days prior to our good faith estimate of the date of the filing of, and ending up to 180 days following the effectiveness of, a registration statement relating to the public offering of our common stock.
Piggyback Registration Rights
After the completion of this offering, if we propose to register the offer and sale of our common stock under the Securities Act, in connection with the public offering of such common stock the holders of up to approximately 34,593,054 shares of our common stock will be entitled to certain “piggyback” registration rights allowing the holders to include their shares in such registration, subject to certain marketing and other
99
limitations. As a result, whenever we propose to file a registration statement under the Securities Act, other than with respect to (1) a registration related to a company stock plan, (2) a registration on any form that does not include substantially the same information as would be required to be included in a registration statement covering the public offering of our common stock or (3) a registration in which the only common stock being registered is common stock issuable upon the conversion of debt securities that are also being registered, the holders of these shares are entitled to notice of the registration and have the right, subject to certain limitations, to include their shares in the registration.
S-3 Registration Rights
After the completion of this offering, the holders of up to approximately 19,246,714 shares of our common stock may make a written request that we register the offer and sale of their shares on a registration statement on Form S-3 if we are eligible to file a registration statement on Form S-3 so long as the request covers at least that number of shares with an anticipated offering price, net of underwriting discounts and commissions, of at least $2.0 million. These stockholders may make an unlimited number of requests for registration on Form S-3; however, we will not be required to effect a registration on Form S-3 if we have effected two such registrations within the 12 month period preceding the date of the request. Additionally, if we determine that it would be seriously detrimental to our stockholders to effect such a registration, we have the right to defer such registration, not more than once in any 12-month period, for a period of up to 120 days.
Anti-Takeover Provisions
The provisions of Delaware law, our amended and restated certificate of incorporation and our amended and restated bylaws, which are summarized below, may have the effect of delaying, deferring or discouraging another person from acquiring control of our company. They are also designed, in part, to encourage persons seeking to acquire control of us to negotiate first with our board of directors. We believe that the benefits of increased protection of our potential ability to negotiate with an unfriendly or unsolicited acquirer outweigh the disadvantages of discouraging a proposal to acquire us because negotiation of these proposals could result in an improvement of their terms.
Delaware Law
We are governed by the provisions of Section 203 of the Delaware General Corporation Law. In general, Section 203 prohibits a public Delaware corporation from engaging in a “business combination” with an “interested stockholder” for a period of three years after the date of the transaction in which the person became an interested stockholder, unless the business combination is approved in a prescribed manner. A “business combination” includes mergers, asset sales or other transactions resulting in a financial benefit to the stockholder. An “interested stockholder” is a person who, together with affiliates and associates, owns, or within three years did own, 15% or more of the corporation’s outstanding voting stock. These provisions may have the effect of delaying, deferring or preventing a change in our control.
Amended and Restated Certificate of Incorporation and Amended and Restated Bylaw Provisions
Our amended and restated certificate of incorporation and our amended and restated bylaws will include a number of provisions that could deter hostile takeovers or delay or prevent changes in control of our board of directors or management team, including the following:
| • | Board of Directors Vacancies. Our amended and restated certificate of incorporation and amended and restated bylaws will authorize only our board of directors to fill vacant directorships, including newly created seats. In addition, the number of directors constituting our board of directors will be permitted to be set only by a resolution adopted by a majority vote of our entire board of directors. These provisions would prevent a stockholder from increasing the size of our board of directors and then gaining control of our board of directors by filling the resulting vacancies with its own nominees. This makes it more difficult to change the composition of our board of directors and promotes continuity of management. |
100
| • | Classified Board. Our amended and restated certificate of incorporation and amended and restated bylaws will provide that our board of directors is classified into three classes of directors. A third party may be discouraged from making a tender offer or otherwise attempting to obtain control of us as it is more difficult and time consuming for stockholders to replace a majority of the directors on a classified board of directors. See “Management—Board of Directors.” |
| • | Stockholder Action; Special Meeting of Stockholders. Our amended and restated certificate of incorporation will provide that our stockholders may not take action by written consent, but may only take action at annual or special meetings of our stockholders. As a result, a holder controlling a majority of our capital stock would not be able to amend our amended and restated bylaws or remove directors without holding a meeting of our stockholders called in accordance with our amended and restated bylaws. Our amended and restated bylaws will further provide that special meetings of our stockholders may be called only by a majority of our board of directors, the Chairman of our board of directors, our Chief Executive Officer or our President, thus prohibiting a stockholder from calling a special meeting. These provisions might delay the ability of our stockholders to force consideration of a proposal or for stockholders controlling a majority of our capital stock to take any action, including the removal of directors. |
| • | Advance Notice Requirements for Stockholder Proposals and Director Nominations. Our amended and restated bylaws will provide advance notice procedures for stockholders seeking to bring business before our annual meeting of stockholders or to nominate candidates for election as directors at our annual meeting of stockholders. Our amended and restated bylaws will also specify certain requirements regarding the form and content of a stockholder’s notice. These provisions might preclude our stockholders from bringing matters before our annual meeting of stockholders or from making nominations for directors at our annual meeting of stockholders if the proper procedures are not followed. We expect that these provisions may also discourage or deter a potential acquirer from conducting a solicitation of proxies to elect the acquirer’s own slate of directors or otherwise attempting to obtain control of our company. |
| • | No Cumulative Voting. The Delaware General Corporation Law provides that stockholders are not entitled to cumulate votes in the election of directors unless a corporation’s certificate of incorporation provides otherwise. Our amended and restated certificate of incorporation will not provide for cumulative voting. |
| • | Directors Removed Only for Cause. Our amended and restated certificate of incorporation will provide that stockholders may remove directors only for cause. |
| • | Amendment of Charter Provisions. Any amendment of the above provisions in our amended and restated certificate of incorporation would require approval by holders of at least two-thirds of our then outstanding common stock. |
| • | Issuance of Undesignated Preferred Stock. Our board of directors will have the authority, without further action by the stockholders, to issue up to 25,000,000 shares of undesignated preferred stock with rights and preferences, including voting rights, designated from time to time by our board of directors. The existence of authorized but unissued shares of preferred stock would enable our board of directors to render more difficult or to discourage an attempt to obtain control of us by means of a merger, tender offer, proxy contest or other means. |
Transfer Agent and Registrar
Upon the completion of this offering, the transfer agent and registrar for our common stock will be American Stock Transfer & Trust Company, LLC.
Listing
We have applied for the listing of our common stock on the NYSE under the symbol “OPWR.”
101
SHARES ELIGIBLE FOR FUTURE SALE
Prior to this offering, there has been no public market for our common stock, and we cannot predict the effect, if any, that market sales of shares of our common stock or the availability of shares of our common stock for sale will have on the market price of our common stock prevailing from time to time. Future sales of our common stock in the public market, or the availability of such shares for sale in the public market, could adversely affect market prices prevailing from time to time. As described below, only a limited number of shares will be available for sale shortly after this offering due to contractual and legal restrictions on resale. Nevertheless, sales of our common stock in the public market after such restrictions lapse, or the perception that those sales may occur, could adversely affect the prevailing market price at such time and our ability to raise equity capital in the future.
Following the completion of this offering, based on the number of shares of our capital stock outstanding as of December 31, 2013, we will have a total of shares of our common stock outstanding. Of these outstanding shares, all of the shares of common stock sold in this offering will be freely tradable, except that any shares purchased in this offering by our affiliates, as that term is defined in Rule 144 under the Securities Act, would only be able to be sold in compliance with the Rule 144 limitations described below.
The remaining outstanding shares of our common stock will be deemed “restricted securities” as defined in Rule 144. Restricted securities may be sold in the public market only if they are registered or if they qualify for an exemption from registration under Rule 144 or Rule 701 under the Securities Act, which rules are summarized below. In addition, all of our executive officers, directors and holders of substantially all of our common stock and securities convertible into or exchangeable for our common stock have entered into market standoff agreements with us or lock-up agreements with the underwriters under which they have agreed, subject to specific exceptions, not to sell any of our stock for at least 180 days following the date of this prospectus. As a result of these agreements and the provisions of our investor rights agreement described above under “Description of Capital Stock—Registration Rights,” subject to the provisions of Rule 144 or Rule 701, based on an assumed offering date of December 31, 2013, shares will be available for sale in the public market as follows:
| • | beginning on the date of this prospectus, the shares of common stock sold in this offering will be immediately available for sale in the public market; |
| • | beginning 90 days after the date of this prospectus, additional shares of common stock may become eligible for sale in the public market upon the satisfaction of certain conditions as set forth in “—Lock-Up Agreements,” of which shares would be held by affiliates and subject to the volume and other restrictions of Rule 144, as described below; |
| • | beginning 181 days after the date of this prospectus, additional shares of common stock will become eligible for sale in the public market, of which shares will be held by affiliates and subject to the volume and other restrictions of Rule 144, as described below; and |
| • | the remainder of the shares of common stock will be eligible for sale in the public market from time to time thereafter, subject in some cases to the volume and other restrictions of Rule 144, as described below. |
Lock-Up Agreements
We, our executive officers, directors and holders of substantially all of our common stock and securities convertible into or exchangeable for our common stock, have agreed or will agree that, subject to certain exceptions, for a period of 180 days from the date of this prospectus, we and they will not, without the prior written consent of Morgan Stanley & Co. LLC and Goldman, Sachs & Co., dispose of or hedge any shares or any securities convertible into or exchangeable for shares of our capital stock. Morgan Stanley & Co. LLC and Goldman, Sachs & Co. may, in their discretion, and with our consent, release any of the securities subject to these lock-up agreements at any time. These agreements, and the exceptions thereto, are described in “Underwriters.”
102
Rule 144
In general, under Rule 144 as currently in effect, once we have been subject to the public company reporting requirements of Section 13 or Section 15(d) of the Exchange Act for at least 90 days, a person who is not deemed to have been one of our affiliates for purposes of the Securities Act at any time during the 90 days preceding a sale and who has beneficially owned the shares proposed to be sold for at least six months, including the holding period of any prior owner other than our affiliates, is entitled to sell those shares without complying with the manner of sale, volume limitation or notice provisions of Rule 144, subject to compliance with the public information requirements of Rule 144. If such a person has beneficially owned the shares proposed to be sold for at least one year, including the holding period of any prior owner other than our affiliates, then that person would be entitled to sell those shares without complying with any of the requirements of Rule 144.
In general, under Rule 144, as currently in effect, our affiliates or persons selling shares on behalf of our affiliates are entitled to sell upon expiration of the lock-up agreements described above, within any three-month period, a number of shares that does not exceed the greater of:
| • | 1% of the number of shares of our common stock then outstanding, which will equal approximately shares immediately after this offering; or |
| • | the average weekly trading volume of our common stock during the four calendar weeks preceding the filing of a notice on Form 144 with respect to that sale. |
Sales under Rule 144 by our affiliates or persons selling shares on behalf of our affiliates are also subject to certain manner of sale provisions and notice requirements and to the availability of current public information about us.
Rule 701
Rule 701 generally allows a stockholder who purchased shares of our common stock pursuant to a written compensatory plan or contract and who is not deemed to have been an affiliate of our company during the immediately preceding 90 days to sell these shares in reliance upon Rule 144, but without being required to comply with the public information, holding period, volume limitation or notice provisions of Rule 144. Rule 701 also permits affiliates of our company to sell their Rule 701 shares under Rule 144 without complying with the holding period requirements of Rule 144. All holders of Rule 701 shares, however, are required by that rule to wait until 90 days after the date of this prospectus before selling those shares pursuant to Rule 701.
Registration Rights
Pursuant to an investor rights agreement, the holders of up to 34,593,054 shares of our common stock (including shares issuable upon the conversion of our outstanding convertible preferred stock upon the completion of this offering), or their transferees, will be entitled to certain rights with respect to the registration of the offer and sale of those shares under the Securities Act. See “Description of Capital Stock—Registration Rights” for a description of these registration rights. If the offer and sale of these shares is registered, the shares will be freely tradable without restriction under the Securities Act, and a large number of shares may be sold into the public market.
Registration Statement on Form S-8
We intend to file a registration statement on Form S-8 under the Securities Act to register all of the shares of common stock issued or reserved for issuance under our Amended and Restated 2007 Stock Plan and our 2014 Stock Incentive Plan. We expect to file this registration statement as promptly as possible after the completion of this offering. Shares covered by this registration statement will be eligible for sale in the public market, subject to the Rule 144 limitations applicable to affiliates, vesting restrictions and any applicable lock-up agreements and market standoff agreements.
103
Stock Options
As of December 31, 2013, options to purchase a total of 7,789,720 shares of common stock pursuant to our Amended and Restated 2007 Stock Plan were outstanding, of which options to purchase 4,271,414 shares were exercisable, and no options were outstanding or exercisable under our 2014 Stock Incentive Plan. We intend to file a registration statement on Form S-8 under the Securities Act as promptly as possible after the completion of this offering to register shares that may be issued pursuant to our Amended and Restated 2007 Stock Plan and our 2014 Stock Incentive Plan. The registration statement on Form S-8 is expected to become effective immediately upon filing, and shares covered by the registration statement will then become eligible for sale in the public market, subject to the Rule 144 limitations applicable to affiliates, vesting restrictions and any applicable lock-up agreements and market standoff agreements. See “Executive Compensation—Employee Benefits Plans” for a description of our equity incentive plans.
104
CERTAIN MATERIAL U.S. FEDERAL INCOME TAX CONSEQUENCES
The following is a summary of certain material U.S. federal income tax considerations to non-U.S. holders (as defined below) relating to the acquisition, ownership and disposition of common stock pursuant to this offering. This summary deals only with common stock held as a capital asset (within the meaning of Section 1221 of the Internal Revenue Code of 1986, as amended, (the “Code”)) by a holder and does not discuss the U.S. federal income tax considerations applicable to a holder that is subject to special treatment under U.S. federal income tax laws, including, but not limited to: a dealer in securities or currencies; a bank or other financial institution; a regulated investment company; a real estate investment trust; a tax-exempt organization; an insurance company; a person holding common stock as part of a hedging, integrated, conversion or straddle transaction or a person deemed to sell common stock under the constructive sale provisions of the Code; a trader in securities that has elected the mark-to-market method of accounting; a person liable for alternative minimum tax; an entity that is treated as a partnership for U.S. federal income tax purposes; a person that received such common stock in connection with services provided; a U.S. person whose “functional currency” is not the U.S. dollar; a “controlled foreign corporation”; a “passive foreign investment company”; a corporation that accumulates earnings to avoid U.S. federal income taxes; or certain former citizens or long-term residents of the United States.
This summary is based upon provisions of the Code, applicable U.S. Treasury regulations promulgated thereunder, published rulings and judicial decisions, all as in effect as of the date hereof. Those authorities may be changed, perhaps retroactively, or may be subject to differing interpretations, which could result in U.S. federal income tax consequences different from those discussed below. This summary does not address all aspects of U.S. federal income tax, does not deal with all tax considerations that may be relevant to stockholders in light of their personal circumstances and does not address the Medicare tax imposed on certain investment income or any state, local, foreign, gift, estate or alternative minimum tax considerations. We have not sought any ruling from the Internal Revenue Service (the “IRS”) with respect to the statements made and the conclusions reached in this summary, and there can be no assurance that the IRS will agree with such statements and conclusions.
For purposes of this discussion, a “U.S. holder” is a beneficial holder of common stock that is: an individual who is a citizen or resident of the United States; a corporation (or any other entity treated as a corporation for U.S. federal income tax purposes) created or organized in or under the laws of the United States, any state thereof or the District of Columbia; an estate the income of which is subject to U.S. federal income taxation regardless of its source; or a trust if it (1) is subject to the primary supervision of a court within the United States and one or more U.S. persons have the authority to control all substantial decisions of the trust or (2) has a valid election in effect under applicable U.S. Treasury regulations to be treated as a U.S. person.
For purposes of this discussion a “non-U.S. holder” is a beneficial holder of common stock that is neither a U.S. holder nor a partnership (or any other entity or arrangement that is treated as a partnership) for U.S. federal income tax purposes. However, neither the term U.S. holder nor the term non-U.S. holder includes any entity or other person that is subject to special treatment under the Code. If a partnership (or an entity or arrangement that is treated as a partnership for U.S. federal income tax purposes) holds common stock, the tax treatment of a partner will generally depend upon the status of the partner and the activities of the partnership. A partner of a partnership holding common stock is urged to consult its own tax advisors.
PROSPECTIVE INVESTORS ARE URGED TO CONSULT THEIR OWN TAX ADVISORS CONCERNING THEIR PARTICULAR U.S. FEDERAL INCOME TAX CONSEQUENCES IN LIGHT OF THEIR SPECIFIC SITUATIONS, AS WELL AS THE TAX CONSEQUENCES ARISING UNDER ANY STATE, LOCAL OR NON-U.S. TAX LAWS AND ANY OTHER U.S. FEDERAL TAX LAWS (INCLUDING THE U.S. FEDERAL ESTATE AND GIFT TAX LAWS).
105
Distributions on our Common Stock
Distributions with respect to common stock, if any, generally will constitute dividends for U.S. federal income tax purposes to the extent paid out of current or accumulated earnings and profits, as determined for U.S. federal income tax purposes. Any portion of a distribution in excess of current or accumulated earnings and profits will be treated as a return of capital and will first be applied to reduce the holder’s tax basis in its common stock, but not below zero. Any remaining amount will then be treated as gain from the sale or exchange of the common stock and will be treated as described under the section titled “—Disposition of our Common Stock” below.
Distributions treated as dividends that are paid to a non-U.S. holder, if any, with respect to shares of our common stock will be subject to U.S. federal withholding tax at a rate of 30% (or lower applicable income tax treaty rate) of the gross amount of the dividends unless the dividends are effectively connected with the non-U.S. holder’s conduct of a trade or business in the United States.
If a non-U.S. holder is engaged in a trade or business in the United States and dividends with respect to the common stock are effectively connected with the conduct of that trade or business and, if required by an applicable income tax treaty, are attributable to a U.S. permanent establishment, then although the non-U.S. holder will generally be exempt from the 30% U.S. federal withholding tax, provided certain certification requirements are satisfied, the non-U.S. holder will be subject to U.S. federal income tax on those dividends on a net income basis at regular graduated U.S. federal income tax rates in the same manner as if such holder were a resident of the United States. Any such effectively connected income received by a foreign corporation may, under certain circumstances, be subject to an additional branch profits tax equal to 30% (or lower applicable income tax treaty rate) of its effectively connected earnings and profits for the taxable year, as adjusted under the Code. To claim the exemption from withholding with respect to any such effectively connected income, the non-U.S. holder must generally furnish to us or our paying agent a properly executed IRS Form W-8ECI (or applicable successor form). A non-U.S. holder of shares of common stock who wishes to claim the benefit of an exemption or reduced rate of withholding tax under an applicable treaty must furnish to us or our paying agent a valid IRS Form W-8BEN (or applicable successor form) certifying such holder’s qualification for the exemption or reduced rate. If a non-U.S. holder is eligible for a reduced rate of U.S. withholding tax pursuant to an income tax treaty, it may obtain a refund of any excess amounts withheld by filing an appropriate claim for refund with the Internal Revenue Service. Non-U.S. holders are urged to consult their tax advisors regarding their entitlement to benefits under a relevant income tax treaty.
Disposition of our Common Stock
Non-U.S. holders may recognize gain upon the sale, exchange or other taxable disposition of our common stock. Such gain generally will not be subject to U.S. federal income tax unless: (i) that gain is effectively connected with the non-U.S. holder’s conduct of a trade or business in the United States (and, if required by an applicable income tax treaty, is attributable to a U.S. permanent establishment maintained by the non-U.S. holder); (ii) the non-U.S. holder is a nonresident alien individual who is present in the United States for 183 days or more in the taxable year of that disposition, and certain other conditions are met; or (iii) our common stock constitutes a “U.S. real property interest” by reason of our status as a “U.S. real property holding corporation” for U.S. federal income tax purposes at any time during the shorter of the five-year period preceding the date of disposition or the holder’s holding period for our common stock, and certain other requirements are met. We believe that we are not and we do not anticipate becoming a “U.S. real property holding corporation” (“USRPHC”) for U.S. federal income tax purposes.
Even if we become a USRPHC, however, as long as our common stock is regularly traded on an established securities market, such common stock will be treated as U.S. real property interests only if the non-U.S. holder actually or constructively holds more than 5% of such regularly traded common stock at any time during the shorter of the five-year period preceding such non-U.S. holder’s disposition of, or such non-U.S. holder’s holding period for, our common stock.
106
If a non-U.S. holder is an individual described in clause (i) of the preceding paragraph, the non-U.S. holder will generally be subject to tax on a net income basis at the regular graduated U.S. federal individual income tax rates in the same manner as if such holder were a resident of the United States, unless an applicable income tax treaty provides otherwise. If the non-U.S. holder is an individual described in clause (ii) of the preceding paragraph, the non-U.S. holder will generally be subject to a flat 30% tax on the gain, which may be offset by U.S. source capital losses even though the non-U.S. holder is not considered a resident of the United States, provided that the non-U.S. holder has timely filed U.S. federal income tax returns with respect to such losses. If a non-U.S. holder is a foreign corporation that falls under clause (i) of the preceding paragraph, it will be subject to tax on a net income basis at the regular graduated U.S. federal corporate income tax rates in the same manner as if it were a resident of the United States and, in addition, the non-U.S. holder may be subject to the branch profits tax at a rate equal to 30% (or lower applicable income tax treaty rate) of its effectively connected earnings and profits.
Information Reporting and Backup Withholding Tax
We report to our non-U.S. holders and the IRS the amount of dividends paid during each calendar year and the amount of any tax withheld. All distributions to holders of common stock are subject to any applicable withholding. Information reporting requirements apply even if no withholding was required because the distributions were effectively connected with the non-U.S. holder’s conduct of a United States trade or business or withholding was reduced or eliminated by an applicable income tax treaty. This information also may be made available under a specific treaty or agreement with the tax authorities in the country in which the non-U.S. holder resides or is established. Under U.S. federal income tax law, interest, dividends and other reportable payments may, under certain circumstances, be subject to “backup withholding” at the then applicable rate. Backup withholding, however, generally will not apply to distributions on or gross proceeds from the disposition of our common stock paid to a non-U.S. holder, provided the non-U.S. holder furnishes to us or our paying agent the required certification as to its non-U.S. status, such as by providing a valid IRS Form W-8BEN or IRS Form W-8ECI, or certain other requirements are met. Notwithstanding the foregoing, backup withholding may apply if either we or our paying agent has actual knowledge, or reason to know, that the holder is a U.S. person that is not an exempt recipient. Backup withholding is not an additional tax but merely an advance payment, which may be refunded to the extent it results in an overpayment of tax and the appropriate information is timely supplied to the IRS.
Foreign Account Tax Compliance Act
New rules in the Code will impose withholding taxes on certain types of payments made to “foreign financial institutions” (as specially defined under these rules) and certain other non-U.S. entities if certification, information reporting and other specified requirements are not met. The legislation imposes a 30% withholding tax on “withholdable payments” if they are paid to a foreign financial institution or to a foreign non-financial entity, unless (i) the foreign financial institution undertakes certain diligence and reporting obligations and other specified requirements are satisfied or (ii) the foreign non-financial entity either certifies it does not have any substantial U.S. owners or furnishes identifying information regarding each substantial U.S. owner and other specified requirements are satisfied. “Withholdable payment” generally means (i) any payment of interest, dividends, rents and certain other types of generally passive income if such payment is from sources within the United States and (ii) any gross proceeds from the sale or other disposition of any property of a type that can produce interest or dividends from sources within the United States (including, for example, our common stock). If the payee is a foreign financial institution, it will be required to, among other things, undertake to identify accounts held by certain U.S. persons or U.S.-owned foreign entities, annually report certain information about such accounts and withhold 30% on payments to account holders whose actions prevent it from complying with these reporting and agree to other requirements. If an investor does not provide us with the information necessary to comply with the legislation, it is possible that distributions to such investor that are attributable to withholdable payments, such as dividends, will be subject to the 30% withholding tax. Under final Treasury regulations and administrative guidance, any obligation to withhold from payments made to a foreign financial
107
institution or a foreign non-financial entity under the Foreign Account Tax Compliance Act with respect to dividends on our common stock will not begin until July 1, 2014 and with respect to the gross proceeds of a sale or other disposition of our common stock will not begin until January 1, 2017. An intergovernmental agreement between the United States and an applicable foreign country may modify the requirements described in this paragraph. Prospective investors should consult their own tax advisers regarding this legislation.
108
Under the terms and subject to the conditions in an underwriting agreement dated the date of this prospectus, the underwriters named below, for whom Morgan Stanley & Co. LLC and Goldman, Sachs & Co. are acting as representatives, have severally agreed to purchase, and we have agreed to sell to them the number of shares indicated below:
| Underwriter |
Number of Shares | |
| Morgan Stanley & Co. LLC |
||
| Goldman, Sachs & Co. |
||
| Allen & Company LLC |
||
| Pacific Crest Securities LLC |
||
| Canaccord Genuity Inc. |
||
| Cowen and Company, LLC |
||
|
| ||
| Total |
||
|
|
The underwriters and the representatives are collectively referred to as the “underwriters” and the “representatives,” respectively. The underwriters are offering the shares of common stock subject to their acceptance of the shares from us and subject to prior sale and their right to reject any order in whole or in part. The underwriting agreement provides that the obligations of the several underwriters to pay for and accept delivery of the shares of common stock offered by this prospectus are subject to the approval of certain legal matters by their counsel and to certain other conditions. The underwriters are obligated to take and pay for all of the shares of common stock offered by this prospectus if any such shares are taken. However, the underwriters are not required to take or pay for the shares covered by the underwriters’ option to purchase additional shares described below.
The underwriters initially propose to offer part of the shares of common stock directly to the public at the offering price listed on the cover page of this prospectus and part to certain dealers. After the initial offering of the shares of common stock, the offering price and other selling terms may from time to time be varied by the representatives.
We have granted to the underwriters an option, exercisable for 30 days from the date of this prospectus, to purchase up to additional shares of common stock at the public offering price listed on the cover page of this prospectus, less underwriting discounts and commissions. To the extent the option is exercised, each underwriter will become obligated, subject to certain conditions, to purchase about the same percentage of the additional shares of common stock as the number listed next to the underwriter’s name in the preceding table bears to the total number of shares of common stock listed next to the names of all underwriters in the preceding table.
The following table shows the per share and total public offering price, underwriting discounts and commissions, and proceeds before expenses to us. These amounts are shown assuming both no exercise and full exercise of the underwriters’ option to purchase up to an additional shares of common stock.
| Per Share | Total | |||||||||||
| No Exercise | Full Exercise | |||||||||||
| Public offering price |
$ | $ | $ | |||||||||
| Underwriting discounts and commissions to be paid by us |
$ | $ | $ | |||||||||
| Proceeds, before expenses, to us |
$ | $ | $ | |||||||||
The estimated offering expenses payable by us, exclusive of the underwriting discounts and commissions, are approximately $ . We have agreed to reimburse the underwriters for expenses relating to clearance of this offering with the Financial Industry Regulatory Authority up to $30,000.
109
The underwriters have informed us that they do not intend sales to discretionary accounts to exceed 5% of the total number of shares of common stock offered by them.
We have applied to list our common stock on the NYSE under the trading symbol “OPWR.”
We and all of our directors and officers and the holders of substantially all of our outstanding stock and stock options have agreed or will agree that, without the prior written consent of Morgan Stanley & Co. LLC and Goldman, Sachs & Co. on behalf of the underwriters, we and they will not, during the period ending 180 days after the date of this prospectus, or the restricted period:
| • | offer, pledge, sell, contract to sell, sell any option or contract to purchase, purchase any option or contract to sell, grant any option, right or warrant to purchase, lend or otherwise transfer or dispose of, directly or indirectly, any shares of common stock or any securities convertible into or exercisable or exchangeable for shares of common stock; |
| • | file any registration statement with the Securities and Exchange Commission relating to the offering of any shares of common stock or any securities convertible into or exercisable or exchangeable for common stock; or |
| • | enter into any swap or other arrangement that transfers to another, in whole or in part, any of the economic consequences of ownership of the common stock; |
whether any such transaction described above is to be settled by delivery of common stock or such other securities, in cash or otherwise. In addition, we and each such person agrees that, without the prior written consent of Morgan Stanley & Co. LLC and Goldman, Sachs & Co. on behalf of the underwriters, we or such other person will not, during the restricted period, make any demand for, or exercise any right with respect to, the registration of any shares of common stock or any security convertible into or exercisable or exchangeable for common stock other than a registration statement on Form S-8 with respect to our 2014 Plan and 2007 Plan described in this prospectus.
The lock-up restrictions described in the foregoing do not apply to our directors, officers and other holders of substantially all of our outstanding stock, stock options and warrants with respect to:
| • | transactions relating to shares of common stock or other securities acquired in open market transactions after the completion of the offering of the shares; provided that no filing under Section 16(a) of the Securities Exchange Act of 1934, as amended (the “Exchange Act”) shall be required or shall be voluntarily made in connection with subsequent sales of common stock or other securities acquired in such open market transactions; |
| • | transfers of shares of common stock or any security convertible into or exercisable or exchangeable for common stock (i) to the spouse, domestic partner, parent, child or grandchild (each, an “immediate family member”) of the holder or to a trust formed for the benefit of an immediate family member, (ii) by bona fide gift, will or intestacy, (iii) if the holder is a corporation, partnership or other business entity (A) to another corporation, partnership or other business entity that controls, is controlled by or is under common control with the holder or (B) as part of a disposition, transfer or distribution without consideration by the holder to its equity holders or (iv) if the holder is a trust, to a trustor or beneficiary of the trust; provided that in the case of any transfer or distribution pursuant to this exception, (i) each donee, transferee or distributee shall sign and deliver a lock-up letter substantially in the form entered into by the holder and (ii) no filing under Section 16(a) of the Exchange Act, reporting a reduction in beneficial ownership of shares of common stock, shall be required or shall be voluntarily made during the restricted period; |
| • | the establishment of a trading plan pursuant to Rule 10b5-1 under the Exchange Act for the transfer of shares of common stock, provided that (i) such plan does not provide for the transfer of common stock during the restricted period and (ii) to the extent a public announcement or filing under the Exchange |
110
| Act, if any, is required of or voluntarily made by or on behalf of the holder or us regarding the establishment of such plan, such announcement or filing shall include a statement to the effect that no transfer of common stock may be made under such plan during the restricted period; |
| • | the sale and transfer of shares of common stock by the holders to the underwriters in this offering; |
| • | the receipt by the holders from us of shares of common stock upon the exercise of an option, or the disposition of shares of common stock to us in a transaction solely in connection with the payment of taxes due with respect to the cashless exercise of an option, net settlement of restricted stock units or the vesting of restricted stock, insofar as such option, restricted stock unit or restricted stock was outstanding prior to the date of this prospectus pursuant to a plan or agreement disclosed in this prospectus, provided that no public reports, including but not limited to filings under Section 16 of the Exchange Act, will be required to be filed or will be voluntarily made by the holder within 30 days after the date of this prospectus, and after such 30th day, any public report or filing under Section 16 of the Exchange Act relating to (i) an exercise of a stock option shall clearly indicate in the footnotes thereto that no shares were sold by the reporting person and that the shares received upon exercise of the stock option are subject to a lock-up agreement with the underwriters of this offering and (ii) the disposition of shares of common stock to us in a transaction pursuant to this exception shall clearly indicate in the footnotes thereto that such disposition of shares was solely to us; |
| • | the transfer of shares of common stock or any security convertible into or exercisable or exchangeable for common stock that occurs by operation of law, such as pursuant to a qualified domestic order or in connection with a divorce settlement, provided that each such transferee shall sign and deliver a lock-up letter substantially in the same form as executed by the holder; |
| • | in connection with the conversion of the outstanding preferred stock into shares of common stock immediately prior to the closing of this offering; |
| • | the transfer of shares of common stock to us in connection with the repurchase of shares of common stock issued pursuant to an employee benefit plan disclosed in this prospectus or pursuant to the agreements pursuant to which such shares were issued, provided that no public reports, including but not limited to filings under Section 16 of the Exchange Act, will be required to be filed or will be voluntarily made by the holder within 30 days after the date of this prospectus, and after such 30th day, any public report or filing under Section 16 of the Exchange Act relating to the disposition of shares of common stock to us in a transaction pursuant to this exception shall clearly indicate in the footnotes thereto that such transfer of shares was solely to us; and |
| • | the transfer of shares of common stock or any security convertible into or exercisable or exchangeable for common stock pursuant to a bona fide third party tender offer, merger, consolidation or other similar transaction made to all holders of the common stock involving a change of control of us, provided that until such tender offer, merger, consolidation or other such transaction is completed, the common stock owned by the holder shall otherwise remain subject to the restrictions contained in the lock-up agreement. For purposes of this exception, “change of control” shall mean the transfer (whether by tender offer, merger, consolidation or other similar transaction), in one transaction or a series of related transactions, to a person or group of affiliated persons (other than the underwriters pursuant to this offering), of shares of common stock if, after such transfer, such person or group of affiliated persons would hold at least a majority of the outstanding voting securities of us (or the surviving entity). |
The lock-up restrictions described in the foregoing do not apply solely to us with respect to:
| • | the shares of common stock to be sold by us in this offering; |
| • | the issuance by us of shares of common stock upon the exercise of an option or warrant, settlement of a restricted stock unit or the conversion of a security outstanding on the date hereof pursuant to stock plans or other agreements disclosed in this prospectus; |
111
| • | the issuance by us of shares or options to purchase shares of common stock pursuant to the our equity plans disclosed in this prospectus; |
| • | the filing by us of a registration statement on Form S-8 or a successor form thereto; and |
| • | the entry into an agreement providing for the issuance by us of shares of common stock or any security convertible into or exercisable for shares of common stock in connection with (i) the acquisition by us or any of our subsidiaries of the securities, business, property or other assets of another person or entity or pursuant to an employee benefit plan assumed by us in connection with such acquisition, and the issuance of any such securities pursuant to any such agreement or (ii) joint ventures, commercial relationships or other strategic transactions, and the issuance of any such securities pursuant to any such agreement; provided that in the case of this exception, the aggregate number of shares of common stock that we may sell or issue or agree to sell or issue pursuant this exception shall not exceed % of the total number of shares of our common stock issued and outstanding immediately following the completion of the transactions contemplated in this prospectus and all recipients of shares of common stock or any security convertible into or exercisable for shares of common stock shall enter into a “lock-up” agreement substantially in the form entered into by our other securityholders in connection with this offering. |
Morgan Stanley & Co. LLC and Goldman, Sachs & Co., in their sole discretion, may release the common stock and other securities subject to the lock-up agreements described above in whole or in part at any time with or without notice. In the event Morgan Stanley & Co. LLC and Goldman, Sachs & Co. release any common stock and other securities subject to the lock-up agreements held by our officers and directors, we have agreed to publicly announce the impending release or waiver at least two business days before the effective date of the release or waiver.
In order to facilitate the offering of the common stock, the underwriters may engage in transactions that stabilize, maintain or otherwise affect the price of the common stock. Specifically, the underwriters may sell more shares than they are obligated to purchase under the underwriting agreement, creating a short position. A short sale is covered if the short position is no greater than the number of shares available for purchase by the underwriters under the option. The underwriters can close out a covered short sale by exercising the option or purchasing shares in the open market. In determining the source of shares to close out a covered short sale, the underwriters will consider, among other things, the open market price of shares compared to the price available under the option. The underwriters may also sell shares in excess of the option, creating a naked short position. The underwriters must close out any naked short position by purchasing shares in the open market. A naked short position is more likely to be created if the underwriters are concerned that there may be downward pressure on the price of the common stock in the open market after pricing that could adversely affect investors who purchase in this offering. As an additional means of facilitating this offering, the underwriters may bid for, and purchase, shares of common stock in the open market to stabilize the price of the common stock. These activities may raise or maintain the market price of the common stock above independent market levels or prevent or retard a decline in the market price of the common stock. The underwriters are not required to engage in these activities and may end any of these activities at any time. These activities may be effected in the over-the-counter market or otherwise.
We and the several underwriters have agreed to indemnify each other against certain liabilities, including liabilities under the Securities Act.
A prospectus in electronic format may be made available on websites maintained by one or more underwriters, or selling group members, if any, participating in this offering. The representative may agree to allocate a number of shares of common stock to underwriters for sale to their online brokerage account holders. Internet distributions will be allocated by the representative to underwriters that may make Internet distributions on the same basis as other allocations.
112
The underwriters and their respective affiliates are full service financial institutions engaged in various activities, which may include securities trading, commercial and investment banking, financial advisory, investment management, principal investment, hedging, financing and brokerage activities. Certain of the underwriters and their respective affiliates have, from time to time, performed, and may in the future perform, various financial advisory and investment banking services for us or our affiliates, for which they received or will receive customary fees and expenses.
In the ordinary course of their various business activities, the underwriters and their respective affiliates may make or hold a broad array of investments and actively trade debt and equity securities (or related derivative securities) and financial instruments (including bank loans) for their own account and for the accounts of their customers and may at any time hold long and short positions in such securities and instruments. Such investment and securities activities may involve our securities and instruments (directly, as collateral securing other obligations or otherwise). The underwriters and their respective affiliates may also make investment recommendations and/or publish or express independent research views in respect of such securities or instruments and may at any time hold, or recommend to clients that they acquire, long and/or short positions in such securities and instruments.
Pricing of the Offering
Prior to this offering, there has been no public market for our common stock. The initial public offering price will be determined by negotiations between us and the representatives. Among the factors considered in determining the initial public offering price were our future prospects and those of our industry in general, our sales, earnings and certain other financial and operating information in recent periods, and the price-earnings ratios, price-sales ratios, market prices of securities and certain financial and operating information of companies engaged in activities similar to ours.
Selling Restrictions
European Economic Area
In relation to each Member State of the European Economic Area which has implemented the Prospectus Directive (each, a “Relevant Member State”) an offer to the public of any shares of our common stock may not be made in that Relevant Member State, except that an offer to the public in that Relevant Member State of any shares of our common stock may be made at any time under the following exemptions under the Prospectus Directive, if they have been implemented in that Relevant Member State:
| (a) | to any legal entity which is a qualified investor as defined in the Prospectus Directive; |
| (b) | to fewer than 100 or, if the Relevant Member State has implemented the relevant provision of the 2010 PD Amending Directive, 150, natural or legal persons (other than qualified investors as defined in the Prospectus Directive), as permitted under the Prospectus Directive, subject to obtaining the prior consent of the representatives for any such offer; or |
| (c) | in any other circumstances falling within Article 3(2) of the Prospectus Directive, provided that no such offer of shares of our common stock shall result in a requirement for the publication by us or any underwriter of a prospectus pursuant to Article 3 of the Prospectus Directive. |
For the purposes of this provision, the expression an “offer to the public” in relation to any shares of our common stock in any Relevant Member State means the communication in any form and by any means of sufficient information on the terms of the offer and any shares of our common stock to be offered so as to enable an investor to decide to purchase any shares of our common stock, as the same may be varied in that Member State by any measure implementing the Prospectus Directive in that Member State, the expression “Prospectus Directive” means Directive 2003/71/EC (and amendments thereto, including the 2010 PD Amending Directive, to the extent implemented in the Relevant Member State), and includes any relevant implementing measure in the Relevant Member State, and the expression “2010 PD Amending Directive” means Directive 2010/73/EU.
113
United Kingdom
Each underwriter has represented and agreed that:
| (a) | it has only communicated or caused to be communicated and will only communicate or cause to be communicated an invitation or inducement to engage in investment activity (within the meaning of Section 21 of the Financial Services and Markets Act 2000 (the “FSMA”) received by it in connection with the issue or sale of the shares of our common stock in circumstances in which Section 21(1) of the FSMA does not apply to us; and |
| (b) | it has complied and will comply with all applicable provisions of the FSMA with respect to anything done by it in relation to the shares of our common stock in, from or otherwise involving the United Kingdom. |
Hong Kong
Shares of our common stock may not be offered or sold by means of any document other than (i) in circumstances which do not constitute an offer to the public within the meaning of the Companies Ordinance (Cap.32, Laws of Hong Kong), or (ii) to “professional investors” within the meaning of the Securities and Futures Ordinance (Cap.571, Laws of Hong Kong) and any rules made thereunder, or (iii) in other circumstances which do not result in the document being a “prospectus” within the meaning of the Companies Ordinance (Cap.32, Laws of Hong Kong), and no advertisement, invitation or document relating to shares of our common stock may be issued or may be in the possession of any person for the purpose of issue (in each case whether in Hong Kong or elsewhere), which is directed at, or the contents of which are likely to be accessed or read by, the public in Hong Kong (except if permitted to do so under the laws of Hong Kong) other than with respect to shares of our common stock which are or are intended to be disposed of only to persons outside Hong Kong or only to “professional investors” within the meaning of the Securities and Futures Ordinance (Cap. 571, Laws of Hong Kong) and any rules made thereunder.
Japan
Shares of our common stock have not been and will not be registered under the Financial Instruments and Exchange Law of Japan (the Financial Instruments and Exchange Law) and each underwriter has agreed that it will not offer or sell any shares of our common stock, directly or indirectly, in Japan or to, or for the benefit of, any resident of Japan (which term as used herein means any person resident in Japan, including any corporation or other entity organized under the laws of Japan), or to others for re-offering or resale, directly or indirectly, in Japan or to a resident of Japan, except pursuant to an exemption from the registration requirements of, and otherwise in compliance with, the Financial Instruments and Exchange Law and any other applicable laws, regulations and ministerial guidelines of Japan.
Singapore
This prospectus has not been registered as a prospectus with the Monetary Authority of Singapore. Accordingly, this prospectus and any other document or material in connection with the offer or sale, or invitation for subscription or purchase, of shares of our common stock may not be circulated or distributed, nor may the shares of our common stock be offered or sold, or be made the subject of an invitation for subscription or purchase, whether directly or indirectly, to persons in Singapore other than (i) to an institutional investor under Section 274 of the Securities and Futures Act, Chapter 289 of Singapore (the “SFA”), (ii) to a relevant person, or any person pursuant to Section 275(1A), and in accordance with the conditions, specified in Section 275 of the SFA or (iii) otherwise pursuant to, and in accordance with the conditions of, any other applicable provision of the SFA.
114
Where shares of our common stock are subscribed or purchased under Section 275 by a relevant person which is: (a) a corporation (which is not an accredited investor) the sole business of which is to hold investments and the entire share capital of which is owned by one or more individuals, each of whom is an accredited investor; or (b) a trust (where the trustee is not an accredited investor) whose sole purpose is to hold investments and each beneficiary is an accredited investor, shares, debentures and units of shares and debentures of that corporation or the beneficiaries’ rights and interest in that trust shall not be transferable for 6 months after that corporation or that trust has acquired shares of our common stock under Section 275 except: (1) to an institutional investor under Section 274 of the SFA or to a relevant person, or any person pursuant to Section 275(1A), and in accordance with the conditions, specified in Section 275 of the SFA; (2) where no consideration is given for the transfer; or (3) by operation of law.
115
Goodwin Procter LLP, Menlo Park, California, which has acted as our counsel in connection with this offering, will pass upon the validity of the shares of common stock being offered by this prospectus. The underwriters have been represented by Wilson Sonsini Goodrich & Rosati, Professional Corporation, Washington, District of Columbia.
The consolidated financial statements as of December 31, 2012 and 2013, and for each of the three years in the period ended December 31, 2013, included in this prospectus have been so included in reliance on the report of PricewaterhouseCoopers LLP, an independent registered public accounting firm, given on the authority of said firm as experts in auditing and accounting.
We have filed with the SEC a registration statement on Form S-1 under the Securities Act with respect to the shares of common stock offered by this prospectus. This prospectus, which constitutes a part of the registration statement, does not contain all of the information set forth in the registration statement, some of which is contained in exhibits to the registration statement as permitted by the rules and regulations of the SEC. For further information with respect to us and our common stock, we refer you to the registration statement, including the exhibits filed as a part of the registration statement. Statements contained in this prospectus concerning the contents of any contract or any other document are not necessarily complete. If a contract or document has been filed as an exhibit to the registration statement, please see the copy of the contract or document that has been filed. Each statement in this prospectus relating to a contract or document filed as an exhibit is qualified by the filed exhibit. You may obtain copies of this information by mail from the Public Reference Section of the SEC, 100 F Street, N.E., Room 1580, Washington, D.C. 20549, at prescribed rates. You may obtain information on the operation of the public reference rooms by calling the SEC at 1-800-SEC-0330. The SEC also maintains an Internet website that contains reports, proxy statements and other information about issuers, like us, that file electronically with the SEC. The address of that website is www.sec.gov.
As a result of this offering, we will become subject to the information and reporting requirements of the Securities Exchange Act of 1934 and, in accordance with this law, will file periodic reports, proxy statements and other information with the SEC. These periodic reports, proxy statements and other information will be available for inspection and copying at the SEC’s public reference facilities and the website of the SEC referred to above. We also maintain a website at www.opower.com. Upon completion of this offering, you may access these materials free of charge as soon as reasonably practicable after they are electronically filed with, or furnished to, the SEC. Information contained on our website is not a part of this prospectus and the inclusion of our website address in this prospectus is an inactive textual reference only.
116
OPOWER, INC.
INDEX TO CONSOLIDATED FINANCIAL STATEMENTS
| Page | ||||
| F-2 | ||||
| F-3 | ||||
| F-4 | ||||
| F-5 | ||||
| F-6 | ||||
| F-7 | ||||
| F-8 | ||||
F-1
Report of Independent Registered Public Accounting Firm
To the Board of Directors and Stockholders of Opower, Inc.:
In our opinion, the accompanying consolidated balance sheets and the related consolidated statements of operations, comprehensive loss, stockholders’ equity (deficit), and cash flows present fairly, in all material respects, the financial position of Opower, Inc. and its subsidiaries at December 31, 2013 and 2012, and the results of their operations and their cash flows for each of the three years in the period ended December 31, 2013 in conformity with accounting principles generally accepted in the United States of America. These financial statements are the responsibility of the Company’s management. Our responsibility is to express an opinion on these financial statements based on our audits. We conducted our audits of these statements in accordance with the standards of the Public Company Accounting Oversight Board (United States). Those standards require that we plan and perform the audit to obtain reasonable assurance about whether the financial statements are free of material misstatement. An audit includes examining, on a test basis, evidence supporting the amounts and disclosures in the financial statements, assessing the accounting principles used and significant estimates made by management, and evaluating the overall financial statement presentation. We believe that our audits provide a reasonable basis for our opinion.
/s/ PricewaterhouseCoopers LLP
McLean, Virginia
March 3, 2014
F-2
OPOWER, INC.
(In thousands, except per share amounts)
| December 31, | Pro Forma December 31, 2013 (Note 2) |
|||||||||||
| 2012 | 2013 | |||||||||||
| (Unaudited) | ||||||||||||
| Assets |
||||||||||||
| Current assets |
||||||||||||
| Cash and cash equivalents |
$ | 24,597 | $ | 28,819 | $ | 28,819 | ||||||
| Accounts receivable, net |
10,489 | 20,228 | 20,228 | |||||||||
| Prepaid expenses and other current assets |
1,330 | 1,988 | 1,988 | |||||||||
|
|
|
|
|
|
|
|||||||
| Total current assets |
36,416 | 51,035 | 51,035 | |||||||||
| Property and equipment, net |
6,127 | 10,813 | 10,813 | |||||||||
| Other assets |
94 | 1,287 | 1,287 | |||||||||
|
|
|
|
|
|
|
|||||||
| Total assets |
$ | 42,637 | $ | 63,135 | $ | 63,135 | ||||||
|
|
|
|
|
|
|
|||||||
| Liabilities and Stockholders’ Equity (Deficit) |
||||||||||||
| Current liabilities |
||||||||||||
| Accounts payable |
$ | 1,124 | $ | 1,163 | $ | 1,163 | ||||||
| Accrued expenses |
1,775 | 4,452 | 4,452 | |||||||||
| Deferred revenue |
31,413 | 50,623 | 50,623 | |||||||||
| Accrued compensation and benefits |
3,427 | 4,817 | 4,817 | |||||||||
| Other current liabilities |
406 | 1,831 | 1,831 | |||||||||
|
|
|
|
|
|
|
|||||||
| Total current liabilities |
38,145 | 62,886 | 62,886 | |||||||||
| Deferred revenue |
982 | 1,767 | 1,767 | |||||||||
| Notes payable |
— | 2,418 | — | |||||||||
| Other liabilities |
1,524 | 2,327 | 1,939 | |||||||||
|
|
|
|
|
|
|
|||||||
| Total liabilities |
40,651 | 69,398 | 66,592 | |||||||||
|
|
|
|
|
|
|
|||||||
| Commitments and contingencies (see Note 6) |
||||||||||||
| Stockholders’ Equity (Deficit) |
||||||||||||
| Convertible preferred stock |
||||||||||||
| Series A preferred stock |
||||||||||||
| Par value $0.000005 per share—5,378 shares authorized, issued, and outstanding as of December 31, 2012 and 2013; liquidation preference of $1,545 as of December 31, 2012 and 2013; no shares issued and outstanding pro forma |
1,466 | 1,466 | — | |||||||||
| Series B preferred stock |
||||||||||||
| Par value $0.000005 per share—8,376 shares authorized; 8,251 issued and outstanding as of December 31, 2012 and 2013; liquidation preference of $16,448 as of December 31, 2012 and 2013; no shares issued and outstanding pro forma |
16,355 | 16,355 | — | |||||||||
| Series C preferred stock |
||||||||||||
| Par value $0.000005 per share—5,674 shares authorized; 5,618 issued and outstanding as of December 31, 2012 and 2013; liquidation preference of $50,000 as of December 31, 2012 and 2013; no shares issued and outstanding pro forma |
49,872 | 49,872 | — | |||||||||
|
|
|
|
|
|
|
|||||||
| Total convertible preferred stock |
67,693 | 67,693 | — | |||||||||
|
|
|
|
|
|
|
|||||||
| Common stock, par value $0.000005 per share—62,000 shares authorized; 20,303 and 22,113 issued and outstanding as of December 31, 2012 and 2013, respectively; shares issued and outstanding pro forma |
— | — | — | |||||||||
| Additional paid-in capital |
3,439 | 9,407 | 79,906 | |||||||||
| Treasury stock |
(1 | ) | — | — | ||||||||
| Accumulated deficit |
(69,082 | ) | (83,243 | ) | (83,243 | ) | ||||||
| Accumulated other comprehensive loss |
(63 | ) | (120 | ) | (120 | ) | ||||||
|
|
|
|
|
|
|
|||||||
| Total stockholders’ equity (deficit) |
1,986 | (6,263 | ) | (3,457 | ) | |||||||
|
|
|
|
|
|
|
|||||||
| Total liabilities and stockholders’ equity (deficit) |
$ | 42,637 | $ | 63,135 | $ | 63,135 | ||||||
|
|
|
|
|
|
|
|||||||
The accompanying notes are an integral part of these consolidated financial statements.
F-3
OPOWER, INC.
CONSOLIDATED STATEMENTS OF OPERATIONS
(In thousands, except per share amounts)
| Year Ended December 31, | ||||||||||||
| 2011 | 2012 | 2013 | ||||||||||
| Revenue |
$ | 28,746 | $ | 51,756 | $ | 88,703 | ||||||
| Cost of revenue |
13,306 | 18,913 | 31,304 | |||||||||
|
|
|
|
|
|
|
|||||||
| Gross profit |
15,440 | 32,843 | 57,399 | |||||||||
| Operating expenses |
||||||||||||
| Sales and marketing |
13,648 | 21,338 | 30,551 | |||||||||
| Research and development |
14,372 | 16,134 | 27,087 | |||||||||
| General and administrative |
8,716 | 7,730 | 13,578 | |||||||||
|
|
|
|
|
|
|
|||||||
| Total operating expenses |
36,736 | 45,202 | 71,216 | |||||||||
|
|
|
|
|
|
|
|||||||
| Operating loss |
(21,296 | ) | (12,359 | ) | (13,817 | ) | ||||||
| Other income (expense) |
||||||||||||
| Gain (loss) on foreign currency |
(2 | ) | 54 | (220 | ) | |||||||
| Interest expense |
— | — | (187 | ) | ||||||||
| Other, net |
1 | — | 86 | |||||||||
|
|
|
|
|
|
|
|||||||
| Loss before income taxes |
(21,297 | ) | (12,305 | ) | (14,138 | ) | ||||||
| Provision for income taxes |
— | 27 | 23 | |||||||||
|
|
|
|
|
|
|
|||||||
| Net loss |
$ | (21,297 | ) | $ | (12,332 | ) | $ | (14,161 | ) | |||
|
|
|
|
|
|
|
|||||||
| Weighted-average common stock outstanding |
||||||||||||
| Basic and diluted |
17,836 | 19,442 | 21,121 | |||||||||
| Net loss per share: |
||||||||||||
| Basic and diluted |
$ | (1.19 | ) | $ | (0.63 | ) | $ | (0.67 | ) | |||
| Pro forma weighted-average common stock outstanding |
||||||||||||
| Basic and diluted |
||||||||||||
| Pro forma net loss per share (unaudited): |
||||||||||||
| Basic and diluted |
$ | |||||||||||
The accompanying notes are an integral part of these consolidated financial statements.
F-4
OPOWER, INC.
CONSOLIDATED STATEMENTS OF COMPREHENSIVE LOSS
(In thousands)
| Year Ended December 31, | ||||||||||||
| 2011 | 2012 | 2013 | ||||||||||
| Net loss |
$ | (21,297 | ) | $ | (12,332 | ) | $ | (14,161 | ) | |||
| Other comprehensive income (loss) |
||||||||||||
| Foreign currency translation |
(17 | ) | 51 | (40 | ) | |||||||
| Unrealized gain (loss) on hedge transactions, net |
— | (97 | ) | (17 | ) | |||||||
|
|
|
|
|
|
|
|||||||
| Total other comprehensive loss |
(17 | ) | (46 | ) | (57 | ) | ||||||
|
|
|
|
|
|
|
|||||||
| Total comprehensive loss |
$ | (21,314 | ) | $ | (12,378 | ) | $ | (14,218 | ) | |||
|
|
|
|
|
|
|
|||||||
The accompanying notes are an integral part of these consolidated financial statements.
F-5
OPOWER, INC.
CONSOLIDATED STATEMENTS OF STOCKHOLDERS’ EQUITY (DEFICIT)
(In thousands)
| Convertible Preferred Stock | Additional Paid-in Capital |
Treasury Stock |
Accumulated Deficit |
Accumulated Other Comprehensive Loss |
Total Stockholders’ Equity (Deficit) |
|||||||||||||||||||||||||||||||||||||||||||||||||||||||
| Series A | Series B | Series C | Series SC | Common Stock | ||||||||||||||||||||||||||||||||||||||||||||||||||||||||
| Shares | Amount | Shares | Amount | Shares | Amount | Shares | Amount | Shares | Amount | |||||||||||||||||||||||||||||||||||||||||||||||||||
| Balance at December 31, 2010 |
5,378 | $ | 1,466 | 8,251 | $ | 16,355 | 5,618 | $ | 49,872 | 998 | $ | 90 | 17,130 | $ | — | $ | 74 | $ | — | $ | (35,453 | ) | $ | — | $ | 32,404 | ||||||||||||||||||||||||||||||||||
|
|
|
|
|
|
|
|
|
|
|
|
|
|
|
|
|
|
|
|
|
|
|
|
|
|
|
|
|
|
|
|||||||||||||||||||||||||||||||
| Issuance of common stock |
— | — | — | — | — | — | — | — | 844 | — | 198 | — | — | — | 198 | |||||||||||||||||||||||||||||||||||||||||||||
| Issuance of restricted stock |
— | — | — | — | — | — | — | — | 443 | — | — | — | — | — | — | |||||||||||||||||||||||||||||||||||||||||||||
| Conversion of Series SC preferred shares |
— | — | — | — | — | — | (998 | ) | (90 | ) | 998 | — | 90 | — | — | — | — | |||||||||||||||||||||||||||||||||||||||||||
| Stock-based compensation |
— | — | — | — | — | — | — | — | — | — | 960 | — | — | — | 960 | |||||||||||||||||||||||||||||||||||||||||||||
| Foreign currency translation |
— | — | — | — | — | — | — | — | — | — | — | — | — | (17 | ) | (17 | ) | |||||||||||||||||||||||||||||||||||||||||||
| Net loss |
— | — | — | — | — | — | — | — | — | — | — | — | (21,297 | ) | — | (21,297 | ) | |||||||||||||||||||||||||||||||||||||||||||
|
|
|
|
|
|
|
|
|
|
|
|
|
|
|
|
|
|
|
|
|
|
|
|
|
|
|
|
|
|
|
|||||||||||||||||||||||||||||||
| Balance at December 31, 2011 |
5,378 | $ | 1,466 | 8,251 | $ | 16,355 | 5,618 | $ | 49,872 | — | $ | — | 19,415 | $ | — | $ | 1,322 | $ | — | $ | (56,750 | ) | $ | (17 | ) | $ | 12,248 | |||||||||||||||||||||||||||||||||
|
|
|
|
|
|
|
|
|
|
|
|
|
|
|
|
|
|
|
|
|
|
|
|
|
|
|
|
|
|
|
|||||||||||||||||||||||||||||||
| Issuance of common stock |
— | — | — | — | — | — | — | — | 912 | — | 629 | — | — | — | 629 | |||||||||||||||||||||||||||||||||||||||||||||
| Vesting of restricted stock |
— | — | — | — | — | — | — | — | — | — | 360 | — | — | — | 360 | |||||||||||||||||||||||||||||||||||||||||||||
| Repurchase of common stock |
— | — | — | — | — | — | — | — | (1 | ) | — | — | (1 | ) | — | — | (1 | ) | ||||||||||||||||||||||||||||||||||||||||||
| Tax settlements related to equity-based plans |
— | — | — | — | — | — | — | — | (23 | ) | — | (59 | ) | — | — | — | (59 | ) | ||||||||||||||||||||||||||||||||||||||||||
| Stock-based compensation |
— | — | — | — | — | — | — | — | — | — | 1,187 | — | — | — | 1,187 | |||||||||||||||||||||||||||||||||||||||||||||
| Foreign currency translation |
— | — | — | — | — | — | — | — | — | — | — | — | — | 51 | 51 | |||||||||||||||||||||||||||||||||||||||||||||
| Unrealized loss on hedge transactions, net |
— | — | — | — | — | — | — | — | — | — | — | — | — | (97 | ) | (97 | ) | |||||||||||||||||||||||||||||||||||||||||||
| Net loss |
— | — | — | — | — | — | — | — | — | — | — | — | (12,332 | ) | — | (12,332 | ) | |||||||||||||||||||||||||||||||||||||||||||
|
|
|
|
|
|
|
|
|
|
|
|
|
|
|
|
|
|
|
|
|
|
|
|
|
|
|
|
|
|
|
|||||||||||||||||||||||||||||||
| Balance at December 31, 2012 |
5,378 | $ | 1,466 | 8,251 | $ | 16,355 | 5,618 | $ | 49,872 | — | $ | — | 20,303 | $ | — | $ | 3,439 | $ | (1 | ) | $ | (69,082 | ) | $ | (63 | ) | $ | 1,986 | ||||||||||||||||||||||||||||||||
|
|
|
|
|
|
|
|
|
|
|
|
|
|
|
|
|
|
|
|
|
|
|
|
|
|
|
|
|
|
|
|||||||||||||||||||||||||||||||
| Issuance of common stock |
— | — | — | — | — | — | — | — | 1,810 | — | 1,744 | 1 | — | — | 1,745 | |||||||||||||||||||||||||||||||||||||||||||||
| Vesting of common stock subject to |
— | — | — | — | — | — | — | — | — | — | 478 | — | — | — | 478 | |||||||||||||||||||||||||||||||||||||||||||||
| Stock-based compensation |
— | — | — | — | — | — | — | — | — | — | 3,746 | — | — | — | 3,746 | |||||||||||||||||||||||||||||||||||||||||||||
| Foreign currency translation |
— | — | — | — | — | — | — | — | — | — | — | — | — | (40 | ) | (40 | ) | |||||||||||||||||||||||||||||||||||||||||||
| Unrealized loss on hedge transactions, net |
— | — | — | — | — | — | — | — | — | — | — | — | — | (17 | ) | (17 | ) | |||||||||||||||||||||||||||||||||||||||||||
| Net loss |
— | — | — | — | — | — | — | — | — | — | — | — | (14,161 | ) | — | (14,161 | ) | |||||||||||||||||||||||||||||||||||||||||||
|
|
|
|
|
|
|
|
|
|
|
|
|
|
|
|
|
|
|
|
|
|
|
|
|
|
|
|
|
|
|
|||||||||||||||||||||||||||||||
| Balance at December 31, 2013 |
5,378 | $ | 1,466 | 8,251 | $ | 16,355 | 5,618 | $ | 49,872 | — | $ | — | 22,113 | $ | — | $ | 9,407 | $ | — | $ | (83,243 | ) | $ | (120 | ) | $ | (6,263 | ) | ||||||||||||||||||||||||||||||||
|
|
|
|
|
|
|
|
|
|
|
|
|
|
|
|
|
|
|
|
|
|
|
|
|
|
|
|
|
|
|
|||||||||||||||||||||||||||||||
The accompanying notes are an integral part of these consolidated financial statements.
F-6
OPOWER, INC.
CONSOLIDATED STATEMENTS OF CASH FLOWS
(In thousands)
| Year Ended December 31, | ||||||||||||
| 2011 | 2012 | 2013 | ||||||||||
| Operating Activities |
||||||||||||
| Net loss |
$ | (21,297 | ) | $ | (12,332 | ) | $ | (14,161 | ) | |||
| Adjustments to reconcile net loss to net cash provided by (used in) operating activities: |
||||||||||||
| Depreciation and amortization |
626 | 1,599 | 3,766 | |||||||||
| Stock-based compensation expense |
960 | 1,187 | 3,625 | |||||||||
| Non-cash interest expense |
— | — | 159 | |||||||||
| Asset impairment |
— | — | 640 | |||||||||
| Other |
4 | 3 | 27 | |||||||||
| Changes in assets and liabilities |
||||||||||||
| Accounts receivable |
(1,089 | ) | (6,504 | ) | (9,668 | ) | ||||||
| Prepaid expenses and other current assets |
(359 | ) | (320 | ) | (720 | ) | ||||||
| Other assets |
98 | (44 | ) | (383 | ) | |||||||
| Accounts payable |
998 | (618 | ) | 339 | ||||||||
| Accrued expenses |
431 | 804 | 1,886 | |||||||||
| Accrued compensation and benefits |
1,394 | 1,089 | 1,387 | |||||||||
| Deferred revenue |
6,697 | 15,268 | 19,995 | |||||||||
| Other liabilities |
1,779 | (154 | ) | (225 | ) | |||||||
|
|
|
|
|
|
|
|||||||
| Net cash provided by (used in) operating activities |
(9,758 | ) | (22 | ) | 6,667 | |||||||
|
|
|
|
|
|
|
|||||||
| Investing Activities |
||||||||||||
| Additions to property and equipment |
(3,379 | ) | (4,330 | ) | (7,331 | ) | ||||||
| Proceeds from sale of assets |
2 | 4 | 3 | |||||||||
| Transfers from restricted cash |
151 | — | — | |||||||||
|
|
|
|
|
|
|
|||||||
| Net cash used in investing activities |
(3,226 | ) | (4,326 | ) | (7,328 | ) | ||||||
|
|
|
|
|
|
|
|||||||
| Financing Activities |
||||||||||||
| Proceeds from issuance of common stock |
198 | 629 | 2,797 | |||||||||
| Proceeds from issuance of restricted stock |
927 | — | — | |||||||||
| Repurchase of common stock |
— | (1 | ) | — | ||||||||
| Tax settlements related to equity-based plans |
— | (59 | ) | — | ||||||||
| Issuance of notes payable |
— | — | 2,500 | |||||||||
| Payment of offering costs |
— | — | (273 | ) | ||||||||
| Principal payments on capital lease obligations |
— | — | (116 | ) | ||||||||
|
|
|
|
|
|
|
|||||||
| Net cash provided by financing activities |
1,125 | 569 | 4,908 | |||||||||
|
|
|
|
|
|
|
|||||||
| Effect of exchange rate changes on cash and cash equivalents |
(17 | ) | 43 | (25 | ) | |||||||
| Net increase (decrease) in cash and cash equivalents |
(11,876 | ) | (3,736 | ) | 4,222 | |||||||
| Cash and cash equivalents, beginning of period |
40,209 | 28,333 | 24,597 | |||||||||
|
|
|
|
|
|
|
|||||||
| Cash and cash equivalents, end of period |
$ | 28,333 | $ | 24,597 | $ | 28,819 | ||||||
|
|
|
|
|
|
|
|||||||
| Supplemental disclosure of cash flow information |
||||||||||||
| Cash paid for income taxes, net of tax refunds |
$ | — | $ | 1 | $ | 9 | ||||||
| Cash paid for interest |
— | — | 21 | |||||||||
| Supplemental disclosure of non-cash investing and financing activities |
||||||||||||
| Conversion of Series SC preferred stock |
$ | 90 | $ | — | $ | — | ||||||
| Assets acquired under capital leases |
— | — | 1,432 | |||||||||
| Accrued property and equipment purchases |
— | — | 247 | |||||||||
| Capitalized stock-based compensation |
— | — | 121 | |||||||||
| Vesting of common stock subject to repurchase |
— | — | 478 | |||||||||
| Accrued deferred offering costs |
— | — | 539 | |||||||||
The accompanying notes are an integral part of these consolidated financial statements.
F-7
OPOWER, INC.
NOTES TO CONSOLIDATED FINANCIAL STATEMENTS
1. Company Overview
Opower, Inc. (“Opower” or “the Company”) is a cloud-based software provider to the utility industry. Utilities use the Company’s software platform to deliver key customer-facing applications that reduce energy demand and improve customer perception of the utility. The Company’s software analyzes energy data and presents personalized insights to consumers in order to motivate reductions in energy consumption.
2. Summary of Significant Accounting Policies
Basis of Presentation
The consolidated financial statements include the accounts of Opower and its wholly-owned subsidiaries. All intercompany transactions and balances have been eliminated in consolidation.
Use of Estimates
The preparation of consolidated financial statements in conformity with accounting principles generally accepted in the United States (“GAAP”) requires management to make estimates and assumptions that affect the amounts reported in these consolidated financial statements and accompanying notes. Significant items subject to such estimates include revenue recognition, the useful lives and recoverability of property and equipment, stock-based compensation and income taxes. Actual results could differ significantly from those estimates.
Unaudited Pro Forma Consolidated Balance Sheet
Upon the consummation of the initial public offering contemplated by the Company, all of the outstanding shares of convertible preferred stock will automatically convert into 19.2 million shares of common stock and the notes payable will convert into shares of common stock based upon the midpoint of the price range set forth on the cover of this prospectus. The unaudited pro forma consolidated balance sheet as of December 31, 2013 has been prepared assuming the conversion of the convertible preferred stock and notes payable into common stock.
Cash and Cash Equivalents
The Company considers cash on deposit and all investments with original maturities of three months or less to be cash and cash equivalents.
Accounts Receivable
Accounts receivable are derived from services to be delivered to utility providers and are stated at their net realizable value. Each month the Company reviews its receivables on a customer-by-customer basis and evaluates whether an allowance for doubtful accounts is necessary based on any known or perceived collection issues. Any balances that are eventually deemed uncollectible are written off against the allowance after all means of collection have been exhausted and the potential for recovery is considered remote.
Concentration of Credit Risk
Financial instruments that potentially subject the Company to significant concentration of credit risk consist primarily of cash, cash equivalents and accounts receivable. The Company maintains the majority of its cash and cash equivalents with one financial institution, which management believes to be financially sound and with minimal credit risk. The Company’s deposits periodically exceed amounts guaranteed by the Federal Deposit Insurance Corporation.
F-8
OPOWER, INC.
NOTES TO CONSOLIDATED FINANCIAL STATEMENTS
To manage accounts receivable risk, the Company monitors and evaluates the credit worthiness of its customers and maintains an allowance for doubtful accounts as deemed necessary. Collection efforts from long-established utilities have been historically successful, so the Company believes credit risk to be low.
The following table summarizes those customers who represented at least 10% of revenue or accounts receivable for the periods presented:
| Revenue | Accounts Receivable | |||||||||||||||||||
| Year Ended December 31, |
December 31, | |||||||||||||||||||
| 2011 | 2012 | 2013 | 2012 | 2013 | ||||||||||||||||
| Customer A |
17 | % | 15 | % | 14 | % | * | * | ||||||||||||
| Customer B |
13 | % | 14 | % | 13 | % | 32 | % | 22 | % | ||||||||||
| Customer C |
* | * | * | 10 | % | 10 | % | |||||||||||||
| Customer D |
* | * | 11 | % | * | * | ||||||||||||||
| Customer E |
* | * | * | * | 12 | % | ||||||||||||||
| * = Represented | less than 10% |
Property and Equipment
Property and equipment are stated at cost, less accumulated depreciation and amortization. Major additions or improvements that significantly add to productive capacity or extend the life of an asset are capitalized, whereas repairs and maintenance are expensed as incurred.
Depreciation and amortization are calculated on a straight-line basis over the lesser of the estimated useful life of the related assets or the related capital lease term. The estimated useful lives by asset classification are as follows:
| Equipment |
2 to 5 years | |
| Software |
3 years | |
| Furniture and fixtures |
7 years | |
| Leasehold improvements |
Lesser of remaining term or estimated useful life |
The cost of assets and related depreciation is removed from the related accounts on the balance sheet when assets are sold or disposed. Any related gains or losses on asset disposals are reflected in operating expenses.
Software Development Costs
The Company capitalizes certain software development costs, consisting primarily of personnel and related expenses for employees and third parties who devote time to their respective projects. Internal-use software costs are capitalized during the application development stage, which is when the research stage is complete and management has committed to a project to develop software that will be used for its intended purpose. Any costs incurred during subsequent efforts to significantly upgrade and enhance the functionality of the software are also capitalized. Capitalized software costs are included in property and equipment on the consolidated balance sheets. Amortization of internal-use software costs begins once the project is substantially complete and the software is ready for its intended purpose. These capitalized costs are amortized on a straight-line basis over their estimated useful life.
Evaluation of Long-Lived Assets
The Company evaluates the recoverability of its long-lived assets for impairment whenever events or circumstances indicate that the carrying amount of the assets may not be recoverable. Recoverability of long-
F-9
OPOWER, INC.
NOTES TO CONSOLIDATED FINANCIAL STATEMENTS
lived assets is measured by comparison of the carrying amount of the asset to the future undiscounted cash flows the asset is expected to generate. If the asset is considered to be impaired, the amount of any impairment is measured as the difference between the carrying value and the fair value of the impaired asset. There was no impairment of long-lived assets during the years ended December 31, 2011 and 2012. During the year ended December 31, 2013, we recorded a non-cash asset impairment related to long-lived assets of $0.6 million classified within research and development on the consolidated statements of operations. The charge relates to a capitalized internal-use software project termination.
Fair Value Measurement
The Company applies fair value accounting for all financial assets and liabilities that are reported at fair value in the financial statements on a recurring basis. Fair value is defined as the price that would be received from selling an asset or paid to transfer a liability in an orderly transaction between market participants at the measurement date. The accounting guidance establishes a defined three-tier hierarchy to classify and disclose the fair value of assets and liabilities on both the date of their initial measurement as well as all subsequent periods. The hierarchy prioritizes the inputs used to measure fair value by the lowest level of input that is available and significant to the fair value measurement. The three levels are described as follows:
| • | Level 1: Observable inputs. Quoted prices in active markets for identical assets and liabilities; |
| • | Level 2: Observable inputs other than the quoted price. Includes quoted prices for similar instruments, quoted prices for identical or similar instruments in inactive markets and amounts derived from valuation models where all significant inputs are observable in active markets; and |
| • | Level 3: Unobservable inputs. Includes amounts derived from valuation models where one or more significant inputs are unobservable and require the Company to develop relevant assumptions. |
The Company evaluates its financial assets and liabilities subject to fair value measurements on a recurring basis to determine the appropriate level of classification as of each reporting period.
Derivative Financial Instruments
The Company has entered into derivative contracts to reduce the risk that foreign currency exchange rate fluctuations will adversely affect its cash flows and earnings. These derivative contracts are designed to be hedging instruments, meaning any changes in cash flow are expected to be completely offset by the hedging derivative due to the fact that the critical terms of the forward contracts and forecasted sales transactions are aligned. The Company’s unsettled foreign currency derivative contracts are recorded at their fair value as either assets or liabilities on the consolidated balance sheets and are marked-to-market at the end of each reporting period. Unrealized gains and losses from the cash flow hedges are recognized as part of other comprehensive income to the extent the hedge is effective. These gains and losses are recognized in the consolidated statements of operations in revenue once the forward contracts are settled and the forecasted transaction they are designed to hedge has impacted the statements of operations. Any portions of the hedging arrangement deemed to be ineffective are recognized in the consolidated statements of operations immediately.
The Company entered into a convertible debt agreement that contained certain conversion features and a change in control premium that were deemed to represent derivative financial instruments valued collectively (see Note 5 for further details). The fair value of the derivative was measured at inception and recorded as a non-current liability on the consolidated balance sheet. This derivative financial instrument is re-measured and marked-to-market at the end of each reporting period, and changes in fair value from period to period are recognized within other income (expense), net on the statements of operations.
F-10
OPOWER, INC.
NOTES TO CONSOLIDATED FINANCIAL STATEMENTS
Revenue Recognition
The Company derives its revenue from contractual agreements with utility providers based on a service provided to those utilities, which includes analyzing data provided by the utilities and using that data to encourage utility customers to reduce energy consumption. The Company generates substantially all of its revenue from service contracts.
The Company has assessed its revenue arrangements to determine when multiple deliverables exist and if separate accounting is required for those deliverables. Revenue for subscription-based service contracts is segregated into separate accounting units, the predominant units of which are data analysis and web tools, and recognized on a straight-line basis over the related service period for each accounting unit.
The Company recognizes revenues when the following criteria have been met:
| • | Persuasive evidence of an arrangement exists: A signed contract or any other written documentation from the customer that confirms their explicit acceptance of a specific statement of work is deemed to represent persuasive evidence of an arrangement. |
| • | Delivery has occurred: For data analysis, delivery is considered to have occurred once a data connection with a utility has been configured and reports can be generated. For web tools, delivery is considered to have occurred once the web service is live and accessible by end-users. |
| • | The price is fixed or determinable: The Company considers the contract price to be fixed or determinable once the fees are contractually agreed upon with the customer. |
| • | Collection is reasonably assured: Each customer is evaluated for creditworthiness both at the inception of their arrangement and periodically throughout the period of time over which payments are due. Collection is deemed reasonably assured if the Company expects that the customer has the intent and ability to pay all amounts due, as scheduled. If it is determined that collection is not reasonably assured, revenue is deferred and recognized only upon cash collection. |
Revenue recognition for each contract corresponds directly with the service period. The service period begins from the point at which data analysis is provided to the utility or the web tools application is made available. The revenue recognition start date begins when delivery has occurred, which occurs approximately seven months after a contract is signed. Service may last from one to five years and contracts typically include the ability to terminate for breach of contract, convenience, insolvency or regulatory changes. Annual license fees, which are usually collected in advance of program launch, and data management fees, which are billed quarterly in advance, are both non-refundable.
The Company uses the best estimate of selling price (“BESP”) to determine the relative selling prices for the purpose of allocating consideration received for each contract for accounting purposes. The BESP is determined by a historical analysis of selling prices for similar services provided by the Company. The prices are reviewed quarterly to ensure the accuracy of the estimated value on new contracts.
The Company charges customers set-up fees at the initiation of new contracts. The set-up fees are deferred and recognized ratably over the expected customer relationship period. The corresponding set-up costs are expensed in the periods in which they are incurred.
For contracts that include variable revenue amounts, the related portion of variable revenue is deferred until the amounts are fixed or determinable and the Company is reasonably assured that the amounts due are collectible. In addition, the Company enters into certain contracts that contain performance guarantees or service-level requirements. For contracts with performance guarantees or service-level requirements, the related portion of revenue that may be refunded to the customer is not recognized until the performance criteria are met or the customer’s right to refunds or credits lapses.
F-11
OPOWER, INC.
NOTES TO CONSOLIDATED FINANCIAL STATEMENTS
Deferred Revenue
Deferred revenue consists of amounts billed to or collected from clients for which the related revenue has not yet been recognized due to one or more of the aforementioned revenue recognition criteria having not been met. Deferred revenue to be recognized in the succeeding twelve month period is classified as current deferred revenue and the remaining amounts are classified as non-current deferred revenue.
Cost of Revenue
Cost of revenue consists primarily of report printing and shipping costs, data analysis and communication costs, hosting costs, personnel costs related to software implementation and maintenance, the cost to train and support customers, the cost of licenses to access consolidated information about energy consumers, depreciation of fixed assets and amortization expense associated with capitalized software.
Sales and Marketing Costs
Advertising costs are expensed as incurred and relate to promotional materials for customers and general brand exposure. These costs amounted to $0.6 million, $0.5 million, and $0.5 million for the years ended December 31, 2011, 2012 and 2013, respectively.
Research and Development Costs
Research and development focuses on developing improved data analysis tools, increased effectiveness of communicating information to energy consumers and enhanced website portals for integration with customer websites. Research and development expenses consist primarily of personnel and related expenses and the cost of third party service providers. These costs are expensed as incurred except for software development costs qualifying for capitalization.
Leases
The Company leases all of its office space and enters into various other operating lease agreements in conducting its business. At the inception of each lease, the Company evaluates the lease agreement to determine whether the lease is an operating or capital lease. Operating lease expenses are recognized in the statements of operations on a straight-line basis over the term of the related lease. Some of the Company’s lease agreements may contain renewal options, tenant improvement allowances, rent holidays or rent escalation clauses. When such items are included in a lease agreement, the Company records a deferred rent asset or liability on the consolidated balance sheets equal to the difference between the rent expense and future minimum lease payments due. The rent expense related to these items is recognized on a straight-line basis in the statements of operations over the terms of the leases.
The cost of property and equipment acquired under capital lease arrangements represents the lesser of the present value of the minimum lease payments or the fair value of the leased asset as of the inception of the lease.
Stock-Based Compensation
The Company applies the fair value method to recognize compensation expense for stock-based awards. Using this method, the estimated grant-date fair value of the award is recognized on a straight-line basis over the requisite service period based on the portion of the award that is expected to vest. For non-employee awards, the Company adjusts any unvested portions of the award to fair value at each reporting date.
F-12
OPOWER, INC.
NOTES TO CONSOLIDATED FINANCIAL STATEMENTS
The Company utilizes the Black-Scholes option pricing model to estimate the grant-date fair value of option awards. The exercise price of option awards is set to equal the estimated fair value of the common stock at the date of the grant. In the case of a ten percent or more shareholder, the exercise price is set to equal 110% of the estimated fair value of the common stock at the date of grant. The following weighted-average assumptions are also used to calculate the estimated fair value of option awards:
| • | Expected volatility: The expected volatility of the Company’s shares is estimated using the historical volatility of a peer group of public companies over the most recent period commensurate with the estimated expected term of the awards. The Company’s selected peer group includes public enterprise cloud-based application providers that focus on a particular industry and contain a marketing component within their service offering. |
| • | Expected term: For employee stock option awards, the Company uses an estimated term equal to the weighted period between the vesting period and the contract life of the option. This method is known as the simplified method and is utilized due to the Company’s relatively short history. For non-employees, the Company uses an expected term equal to the remaining contract term. |
| • | Dividend yield: The Company has not paid dividends and does not anticipate paying a cash dividend in the foreseeable future and, accordingly, uses an expected dividend yield of zero. |
| • | Risk-free interest rate: The Company bases the risk-free interest rate on the implied yield available on a U.S. Treasury note with a term equal to the estimated expected term of the awards. |
An estimated forfeiture rate is applied based on an analysis of historical option holder activity. Each quarter, the forfeiture rate is revised as needed to reflect the impact of new forfeitures that occurred.
The Company also may provide restricted stock awards or restricted stock units to employees. Stock-based compensation cost for these awards is measured based on the fair value of the Company’s common stock on the grant date.
Foreign Currency
The Company’s operations located outside of the United States where the local currency is the functional currency are translated into U.S. dollars using the current rate method. Results of operations are translated at the average rate of exchange for the period. Assets and liabilities are translated at the closing rates on the period end date. Gains and losses on translation of these accounts are accumulated and reported as a separate component of equity and other comprehensive income (loss). Gains and losses on foreign currency transactions are recognized in the consolidated statements of operations as a component of other income (expense).
Income Taxes
The Company uses the asset and liability approach for the recognition of deferred tax assets and liabilities for the expected future tax consequences attributable to differences between the carrying amounts of assets and liabilities for financial reporting purposes and their respective tax bases, including net operating loss carryforwards. Deferred tax assets and liabilities are measured using enacted statutory tax rates applicable to the future years in which the deferred amounts are expected to be settled or realized. A valuation allowance is recorded against deferred tax assets when it is more likely than not that a tax benefit will not be realized. In determining whether a valuation allowance is necessary, the Company takes into account factors such as earnings history, expected future earnings, carryback and carryforward periods and tax planning strategies that could potentially enhance the likelihood of deferred tax asset utilization.
F-13
OPOWER, INC.
NOTES TO CONSOLIDATED FINANCIAL STATEMENTS
Tax positions for the Company and its subsidiaries are subject to income tax audits by multiple tax jurisdictions throughout the world. Income tax positions are assessed based upon management’s evaluation of the facts, circumstances and information available at the reporting date, and the Company recognizes the tax benefit if it is more likely than not that the position is sustainable upon examination by the taxing authority based on the technical merits of the issue. The tax benefit recognized is measured as the largest amount of benefit which is greater than 50 percent likely to be realized upon settlement with the taxing authority.
The Company recognizes interest and penalties related to income tax matters in its provision for income taxes. The effect of tax rate changes is recognized in the tax provision within the period the rate changes are enacted.
The Company considers unremitted earnings of foreign subsidiaries to be invested indefinitely. No U.S. income taxes or foreign withholding taxes are provided on such permanently reinvested earnings. Deferred income tax liabilities will be recognized, net of any foreign tax credits, on any foreign subsidiary earnings that are determined to no longer be indefinitely invested. The Company has not estimated the deferred tax liabilities associated with the permanently reinvested earnings as it is impractical to do so.
Comprehensive Loss
Comprehensive loss consists of two components, net loss and other comprehensive income (loss). Other comprehensive income (loss) refers to gains and losses that are recorded as a separate element of stockholders’ equity (deficit) and are excluded from net loss. The Company’s other comprehensive income (loss) is comprised of foreign currency translation adjustments and unrealized gains or losses on hedge transactions.
Net Income (Loss) per Share
The Company’s basic net income (loss) per share attributable to common stockholders is calculated by dividing the net income (loss) attributable to common stockholders by the weighted-average number of shares of common stock outstanding for the period. The weighted-average common shares outstanding is adjusted for shares subject to repurchase such as unvested restricted stock and unvested stock options that have been exercised.
The Company’s diluted net income (loss) per share is calculated by giving effect to all potentially dilutive common stock equivalents when determining the weighted-average number of common shares outstanding. For purposes of the dilutive net income (loss) per share calculation, convertible preferred stock, convertible notes payable, options to purchase common stock, unvested restricted stock and restricted stock units are considered to be common stock equivalents.
The Company has issued securities other than common stock that participate in dividends (“participating securities”), and therefore utilizes the two-class method to calculate net income (loss) per share. These participating securities include convertible preferred stock and unvested common stock subject to repurchase. The two-class method requires a portion of net income to be allocated to the participating securities to determine the net income attributable to common stockholders. Net income attributable to the common stockholders is equal to the net income less assumed periodic preferred stock dividends with any remaining earnings, after deducting assumed dividends, to be allocated on a pro rata basis between the outstanding common and preferred stock as of the end of each period.
Operating Segment
Operating segments are defined as components of a business that can earn revenue and incur expenses for which discrete financial information is available that is evaluated on a regular basis by the chief operating
F-14
OPOWER, INC.
NOTES TO CONSOLIDATED FINANCIAL STATEMENTS
decision maker (“CODM”) to decide how to allocate resources and assess performance. The Company’s CODM, the Chief Executive Officer, reviews consolidated results of operations to make decisions, therefore the Company views its operations and manages its business as one operating segment.
Recently Issued Accounting Standards
In February 2013, FASB issued a new accounting standard requiring disclosure of items reclassified from other comprehensive income (loss) to net income. This guidance is effective for periods beginning after December 15, 2012, and early application is permitted. The Company adopted the guidance effective January 1, 2012 and it did not have a material impact on its consolidated financial statements.
In July 2013, the FASB issued guidance stating that a liability related to an unrecognized tax benefit should be offset against a deferred tax asset for a net operating loss carryforward, a similar tax loss or a tax credit carryforward if such settlement is required or expected in the event the uncertain tax position is disallowed. The new guidance is effective on a prospective basis for annual and interim periods beginning after December 15, 2013, but early adoption and retrospective application are permitted. The Company does not expect that this guidance will have a material effect on its consolidated financial statements.
3. Fair Value Measurements
Derivative Financial Instruments
The following table summarizes the Company’s assets and liabilities measured at fair value on a recurring basis as of December 31, 2012 and December 31, 2013 (in thousands):
| December 31, 2012 | December 31, 2013 | |||||||||||||||||||||||||||||||
| Fair Value | Level 1 | Level 2 | Level 3 | Fair Value | Level 1 | Level 2 | Level 3 | |||||||||||||||||||||||||
| Foreign currency derivative contracts |
$ | (52 | ) | $ | — | $ | (52 | ) | $ | — | $ | (41 | ) | $ | — | $ | (41 | ) | $ | — | ||||||||||||
| Convertible debt derivative |
— | — | — | — | (388 | ) | — | — | (388 | ) | ||||||||||||||||||||||
|
|
|
|
|
|
|
|
|
|
|
|
|
|
|
|
|
|||||||||||||||||
| Total |
$ | (52 | ) | $ | — | $ | (52 | ) | $ | — | $ | (429 | ) | $ | — | $ | (41 | ) | $ | (388 | ) | |||||||||||
|
|
|
|
|
|
|
|
|
|
|
|
|
|
|
|
|
|||||||||||||||||
The foreign currency derivative contracts are classified within Level 2 because they are valued using alternative pricing sources and models utilizing observable market inputs for similar instruments. The fair value measurement of the convertible debt derivative was determined through the use of a probability-weighted expected return model (“PWERM”). The PWERM considers the timing and cash flows related to each potential conversion scenario and applies a percentage likelihood of occurrence in order to develop an estimated fair value for the instrument as a whole. This valuation methodology is based on unobservable estimates and judgments, and therefore is classified as a Level 3 fair value measurement.
F-15
OPOWER, INC.
NOTES TO CONSOLIDATED FINANCIAL STATEMENTS
The following table presents a reconciliation of the convertible debt derivative instrument measured at fair value as of December 31, 2012 and December 31, 2013 using significant unobservable inputs, and the amount of loss recorded in the Company’s consolidated statements of operations as a result of changes in fair value (in thousands):
| Convertible debt derivative |
||||
| Balance as of December 31, 2012 |
$ | — | ||
| Initial valuation on date of issuance |
(241 | ) | ||
| Revaluation |
(147 | ) | ||
|
|
|
|||
| Balance as of December 31, 2013 |
$ | (388 | ) | |
|
|
|
|||
All of the Company’s derivative financial instruments amounts are classified on the consolidated balance sheets as other current liabilities and other liabilities, and none are designated for trading or speculative purposes.
Other Fair Value Disclosures
The fair value of the Company’s notes payable was determined based on a discounted cash flow analysis using Level 2 inputs based on quoted market prices for similar instruments that are not active. As of December 31, 2013, the carrying amount and fair value of the notes payable was $2.4 million (See Note 5 for further discussion).
4. Property and Equipment
The following table provides further detail on property and equipment (in thousands):
| December 31, | ||||||||
| 2012 | 2013 | |||||||
| Equipment |
$ | 2,563 | $ | 4,595 | ||||
| Software |
3,427 | 8,947 | ||||||
| Furniture and fixtures |
266 | 306 | ||||||
| Leasehold improvements |
1,898 | 2,038 | ||||||
| Construction-in-process |
138 | 440 | ||||||
|
|
|
|
|
|||||
| Total property and equipment |
$ | 8,292 | $ | 16,326 | ||||
| Accumulated depreciation and amortization |
(2,165 | ) | (5,513 | ) | ||||
|
|
|
|
|
|||||
| Total property and equipment, net |
$ | 6,127 | $ | 10,813 | ||||
|
|
|
|
|
|||||
As of December 31, 2012, the gross carrying amount of property and equipment included no capital lease obligations. As of December 31, 2013, the gross carrying amount of property and equipment includes computer equipment under capital leases with a cost basis of $1.4 million. Accumulated depreciation related to this computer equipment was $0.2 million as of December 31, 2013, and interest expense for the same period was immaterial. As of December 31, 2013, the total capital lease obligation was $1.3 million and recorded on the consolidated balance sheets as other current liabilities and other liabilities.
Capitalized internal-use software costs are also included in property and equipment. During the years ended December 31, 2012 and 2013, the Company capitalized $3.2 million and $6.3 million of these software development costs, respectively. The net book value of capitalized internal use software was $2.8 million and $6.4 million as of December 31, 2012 and 2013, respectively. Amortization expense related to capitalized internal-use software was $0.5 million and $2.2 million for the year ended December 31, 2012 and 2013, respectively.
F-16
OPOWER, INC.
NOTES TO CONSOLIDATED FINANCIAL STATEMENTS
The following table represents a detailed breakout of depreciation and amortization expense as recorded in the consolidated statements of operations (in thousands):
| Year
Ended December 31, |
||||||||||||
| 2011 | 2012 | 2013 | ||||||||||
| Cost of revenue |
$ | 187 | $ | 453 | $ | 1,503 | ||||||
| Sales and marketing |
83 | 84 | 203 | |||||||||
| Research and development |
123 | 523 | 1,547 | |||||||||
| General and administrative |
233 | 539 | 513 | |||||||||
|
|
|
|
|
|
|
|||||||
| Total |
$ | 626 | $ | 1,599 | $ | 3,766 | ||||||
|
|
|
|
|
|
|
|||||||
5. Debt
Line of Credit—Silicon Valley Bank
In November 2010, the Company entered into a loan and security agreement with Silicon Valley Bank (“SVB”) that included a $3.0 million revolving line of credit. The original agreement contained certain affirmative covenants related to the timely delivery of financial information to SVB, as well as certain customary negative covenants. Amounts drawn on the revolving line of credit would bear interest at a floating rate of prime plus 1%.
In August 2013, the Company renewed its revolving line of credit with SVB for two years, maturing August 2015, and increased the availability under its revolving line to $15.0 million. The amount of borrowings available under the agreement at any time may not exceed 80% of eligible accounts receivable at such time and any amounts borrowed are collateralized by substantially all of the Company’s assets. Amounts drawn on the revolving line of credit bear interest at a floating rate of either the LIBOR plus 200 basis points or the prime rate, at the Company’s election for each draw. The agreement contains certain affirmative covenants related to the timely delivery of financial information to SVB, as well as certain customary negative covenants. The agreement also includes a financial covenant related to the Company’s short-term liquidity. As of December 31, 2013, there were no amounts outstanding under the revolving line of credit, and the Company was in compliance with all financial and non-financial covenants.
Convertible Note
In March 2013, the Company signed a framework agreement for the provision of services to various operating entities with E.ON SE, one of its utility customers. Pursuant to the agreement, E.ON SE provided a $2.5 million loan to the Company and in return received a convertible note equal to the original principal amount of the loan. The note matures on March 8, 2016. Interest on the note accrues at a rate of 5% per annum compounding annually, and is due and payable with the principal amount at the earlier of (i) the time of conversion or (ii) the maturity date.
Conversion of the note into the Company’s common stock occurs automatically on or before the maturity date if the Company either (i) completes an initial public offering or (ii) executes a round of private financing, subject to certain conditions. The value of the conversion will be equal to the principal plus any unpaid interest as of the conversion date, and the number of shares received by E.ON SE will be calculated based on a note conversion price equal to (i) 88% of the IPO price or (ii) 88% of the price paid for the financing round. In the event of a Liquidation Transaction as defined in the Company’s Amended and Restated Certificate of Incorporation prior to the repayment or conversion in full of this Note, the Company shall repay this Note in cash equal to (i) 1.5 times the outstanding principal plus (ii) any accrued but unpaid interest on this Note, at the consummation of such Liquidation Transaction.
F-17
OPOWER, INC.
NOTES TO CONSOLIDATED FINANCIAL STATEMENTS
The conversion feature resulting in a variable number of shares and the put feature related to the change in control represent embedded derivative financial instruments which have been valued as a single compound derivative and are reflected as a non-current liability on the balance sheet. On the date of convertible note issuance, there was an effective discount of $0.2 million on the note.
The following table details the balances associated with the liability components of the notes payable balance as of December 31, 2013 (in thousands):
| December 31, 2013 |
||||
| Notes payable (face value) |
$ | 2,500 | ||
| Accrued interest |
102 | |||
| Unamortized note discount |
(184 | ) | ||
|
|
|
|||
| Notes payable, net |
$ | 2,418 | ||
|
|
|
|||
6. Commitments and Contingencies
Operating and Capital Leases
The Company leases domestic office space in Arlington, Virginia and San Francisco, California, as well as international office space in Japan, Singapore and the United Kingdom. All leases are non-cancelable operating lease agreements that expire at various dates through 2016 and include renewal options.
In June 2013, the Company entered into a master lease agreement with a financing company. The agreement allows for the Company to lease eligible equipment purchases. Each lease has a 36 month term, payable in equal monthly installments with the exception of the first and final payments which are prorated based on a midmonth convention. The Company has accounted for the leases under the master lease agreement as capital leases. The weighted-average interest rate implicit in the leases was 6%.
A summary of gross and net lease commitments as of December 31, 2013 is as follows (in thousands):
| Year ending December 31, |
Operating Leases |
Capital Leases |
||||||
| 2014 |
$ | 4,376 | $ | 515 | ||||
| 2015 |
2,829 | 515 | ||||||
| 2016 |
1,665 | 325 | ||||||
| 2017 |
— | — | ||||||
| 2018 |
— | — | ||||||
|
|
|
|
|
|||||
| $ | 8,870 | $ | 1,355 | |||||
|
|
|
|
|
|||||
| Less: |
||||||||
| Amounts representing interest |
— | 99 | ||||||
| Minimum payments to be received from subleases |
524 | — | ||||||
|
|
|
|
|
|||||
| Total lease obligation |
$ | 8,346 | $ | 1,256 | ||||
|
|
|
|
|
|||||
Rent expense under operating leases was $1.3 million, $2.1 million, and $3.0 million for the years ended December 31, 2011, 2012 and 2013, respectively.
F-18
OPOWER, INC.
NOTES TO CONSOLIDATED FINANCIAL STATEMENTS
Letters of Credit
As of December 31, 2012 and 2013, the Company had outstanding letters of credit totaling $1.4 million and $1.1 million, respectively, in connection with securing its leased office space. The outstanding amounts for Arlington and San Francisco are $1.0 million and $0.1 million, respectively, and both letters of credit remain outstanding as of December 31, 2013.
Contingencies and Indemnifications
In January 2013, the Company received notification from the United States Postal Service (“USPS”) that its energy efficiency reports will no longer be classified as Standard Mail per a review of the required conditions, and therefore subject to a higher postage rate. The Company appealed the USPS decision and was temporarily required to pay first class postage rates for its energy efficiency reports. In June 2013, the Company modified the format of its energy efficiency reports in order to meet the conditions required by the USPS to qualify for standard postage rates going forward.
In the normal course of business, the Company enters into contracts and agreements that may contain representations and warranties and provide for general indemnifications. The Company’s exposure under these agreements is unknown because it involves claims that may be made in the future, but have not yet been made. The Company has not paid any claims or been required to defend any actions related to indemnification obligations. However, the Company could incur costs in the future as a result of indemnification obligations.
In accordance with its bylaws, the Company has indemnification obligations to its officers, directors, employees and agents (other than directors and officers) for certain events or occurrences, subject to certain limits, while they are serving at the Company’s request in such capacity. There have been no claims, and the Company has a director and officer insurance policy that enables it to recover a portion of any future claims.
7. Stockholders’ Equity
The Company had two classes of stock outstanding as of December 31, 2012 and 2013, preferred stock and common stock.
Preferred Stock
The Company is authorized to issue 19.4 million shares of preferred stock, for which an equivalent amount of common shares are reserved for conversion. As of December 31, 2012 and 2013, there were 19.2 million shares of Series A preferred stock (“Series A”), Series B preferred stock (“Series B”) and Series C preferred stock (“Series C”) that remained issued and outstanding.
The following table summarizes all issuances of preferred stock through December 31, 2013 (in thousands, except per share amounts):
| Shares | Price Per Share |
Offering Costs |
Outstanding as of December 31, 2013 |
Conversion Price per Share |
||||||||||||||||||||||||
| Issue Year |
Class | Authorized | Issued | |||||||||||||||||||||||||
| 2010 |
Series C | 5,674 | 5,618 | $ | 8.90 | $ | 128 | 5,618 | $ | 8.90 | ||||||||||||||||||
| 2008 |
Series B | 8,376 | 8,251 | 1.99 | 93 | 8,251 | 1.99 | |||||||||||||||||||||
| 2007 |
Series A | 5,378 | 5,378 | 0.29 | 80 | 5,378 | 0.29 | |||||||||||||||||||||
F-19
OPOWER, INC.
NOTES TO CONSOLIDATED FINANCIAL STATEMENTS
Series A, Series B and Series C preferred stockholders possess the following rights and privileges:
Board of Directors
The holders of Series A and Series B stock shall each be entitled to elect one member of the Board of Directors. Each class may also remove and replace their respective elected director. The holders of Series C stock have no specific Board of Director member election rights; however they are entitled to vote along with common stock holders as a single class on an as-converted basis to elect any remaining directors and fill any vacancies caused by resignation, death or removal of such directors.
Voting
The Series A, Series B and Series C preferred stockholders shall vote together with all other classes and series of stock of the Company as a single class on all actions to be taken by the stockholders of the Company. Series A, Series B and Series C preferred stockholders are entitled to the number of votes equal to the number of shares of common stock to which their shares could be converted.
Conversion
At any time, Series A, Series B and Series C preferred stockholders may convert their shares to common stock on a one-for-one basis (adjusted for dilutive issuances, splits and combinations). Automatic conversion takes place upon the sale of common stock in an underwritten public offering resulting in aggregate cash proceeds to the Company of at least $50.0 million.
Dividends
In the event the Company declares and pays any non-stock dividends on its common stock, the Company must also pay to the holders of Series A, Series B and Series C preferred stock dividends at the same rate as if the preferred shares had been converted to common stock. The Board of Directors may declare and pay dividends to holders of Series A, Series B and Series C preferred stock out of legally available funds prior to any declaration or payment of dividend on common stock. Dividends are non-cumulative and, if declared, would be paid at a rate of $0.02299 per share, $0.15948 per share and $0.712 per share per year on each share of outstanding Series A, Series B and Series C preferred stock, respectively. Any remaining dividends shall be allocated to holders of all classes of stock, pro-rata based on the number of common stock shares held (assuming conversion of all other classes into common stock).
Liquidation preference
Upon any liquidation event (deemed or actual), including a merger, a sale of a majority of the Company’s assets or a majority of its intellectual property, a dissolution or a winding up of the Company, the holders of Series A, Series B and Series C preferred stock shall be entitled to be paid $0.28738 per adjusted share, $1.9935 per adjusted share and $8.90 per adjusted share, respectively, prior to any distribution to holders of common stock. In the case of insufficient funds for preferred payments, the funds would be distributed ratably in proportion to the preferential amounts the preferred stockholders are entitled to receive. In the event of a deemed liquidation event, only the proceeds related to the transaction are required to be distributed. After the preferential payments have been made in full, any additional remaining assets shall be distributed ratably to the holders of common stock.
F-20
OPOWER, INC.
NOTES TO CONSOLIDATED FINANCIAL STATEMENTS
Anti-dilution rights
The conversion prices of Series A, Series B and Series C preferred stock are subject to anti-dilution adjustments to reduce dilution in the event of an equity issuance by the Company (other than Board approved employee incentives, including stock options) at a purchase price less than the then-applicable conversion price of the Series A, Series B and Series C preferred stock, respectively.
Protective provisions
For so long as at least 0.5 million adjusted shares of Series A, at least 0.5 million adjusted shares of Series B or at least 0.5 million adjusted shares of Series C remain outstanding, consent of the holders of at least a majority of the then outstanding Series A, Series B or Series C preferred stock, respectively, shall be required to: (i) alter or change the rights, preferences or privileges of the shares, (ii) increase or decrease the total number of authorized shares, (iii) increase the number of shares reserved for future issuance under the Company’s 2007 Stock Plan or adopt any new stock purchase plan, stock incentive compensation or similar stock plan without approval by a majority of the Board of Directors, (iv) authorize the issuance of any other equity security, including any security convertible into or exercisable for any equity security, having a preference over, or being on a parity with, the respective series of preferred stock with respect to voting, dividends, redemption, conversion or upon liquidation, (v) redeem, purchase or otherwise acquire any shares of common stock (other than pursuant to equity incentive agreements with service providers giving the Company the right to repurchase shares upon the termination of services), (vi) amend or waive any provision of the Company’s Amended and Restated Certificate of Incorporation or Bylaws, (vii) grant, sell or issue any additional shares, options or stock appreciation rights to the founders of the Company without approval by a majority of the Board of Directors, (viii) effect a liquidation transaction, (ix) increase or decrease the size of the Board of Directors and (x) declare or pay any dividend or distribution of capital. For so long as 0.5 million shares of Series A, Series B or Series C preferred stock remain outstanding, the rights of a particular series may not be changed without the approval of a majority of the stockholders within that series, nor may the number of shares authorized within a series be altered without approval by a majority of the holders of that series.
Common Stock
The Company is authorized to issue 62.0 million shares of common stock. As of December 31, 2012 and 2013, there were 20.3 million and 22.1 million shares of common stock issued and outstanding, respectively. Common stock is issued from the pool of authorized stock upon the exercise of stock options or vesting of restricted stock.
The Company is authorized to grant the right to purchase common stock subject to specific conditions and restrictions, otherwise referred to as “restricted stock”. In December 2011, the Company sold 0.4 million shares of restricted stock to its Chief Financial Officer at $2.09 per share, the fair value of the Company’s common stock at that time, for a total purchase price of $0.9 million. The restricted stock vests over a three year period; 36% vests after the first year and the remaining shares vest ratably over the following two years.
F-21
OPOWER, INC.
NOTES TO CONSOLIDATED FINANCIAL STATEMENTS
The following table summarizes the activity of the Company’s outstanding restricted stock for the years ended December 31, 2012 and 2013 (in thousands, expect per share amounts):
| Restricted Shares |
Weighted- Average Grant Date Fair Value |
|||||||
| Balance as of December 31, 2011 |
444 | $ | 2.09 | |||||
| Vested |
(172 | ) | 2.09 | |||||
|
|
|
|||||||
| Balance as of December 31, 2012 |
272 | $ | 2.09 | |||||
|
|
|
|||||||
| Vested |
(159 | ) | 2.09 | |||||
|
|
|
|||||||
| Balance as of December 31, 2013 |
113 | $ | 2.09 | |||||
|
|
|
|||||||
In the event of a termination of services for any reason, any unvested shares of restricted stock are subject to a repurchase option by the Company at the original purchase price. The initial funds received for the restricted common stock are recorded as a liability and are subsequently reclassified to equity over time as the restricted stock vests and they are released from the repurchase option. The total repurchase option liability related to restricted stock was $0.6 million and $0.2 million as of December 31, 2012 and 2013, respectively.
Accumulated Other Comprehensive Income (Loss)
Other comprehensive income (loss) is comprised of certain gains and losses that are excluded from net income under GAAP and instead recorded as a separate element of stockholders’ equity (deficit). The Company’s other comprehensive income consists of foreign currency translation adjustments resulting from the translation of the Company’s foreign subsidiaries whose functional currency is their respective local currency, as well as any unrealized gains or losses on the Company’s unsettled foreign currency derivative contracts.
The following table summarizes the activity for each component of accumulated other comprehensive income (in thousands):
| Foreign currency translation |
Foreign currency derivative instruments |
Accumulated other comprehensive loss |
||||||||||
| Balance as of December 31, 2010 |
$ | — | $ | — | $ | — | ||||||
| Other comprehensive income (loss) |
(17 | ) | — | (17 | ) | |||||||
|
|
|
|
|
|
|
|||||||
| Balance as of December 31, 2011 |
$ | (17 | ) | $ | — | $ | (17 | ) | ||||
|
|
|
|
|
|
|
|||||||
| Other comprehensive income (loss) |
51 | (97 | ) | (46 | ) | |||||||
|
|
|
|
|
|
|
|||||||
| Balance as of December 31, 2012 |
$ | 34 | $ | (97 | ) | $ | (63 | ) | ||||
|
|
|
|
|
|
|
|||||||
| Other comprehensive income (loss) before reclassifications |
(40 | ) | (28 | ) | (68 | ) | ||||||
| Reclassifications to net income |
— | 11 | 11 | |||||||||
|
|
|
|
|
|
|
|||||||
| Other comprehensive income (loss) |
(40 | ) | (17 | ) | (57 | ) | ||||||
|
|
|
|
|
|
|
|||||||
| Balance as of December 31, 2013 |
$ | (6 | ) | $ | (114 | ) | $ | (120 | ) | |||
|
|
|
|
|
|
|
|||||||
Gains (losses) on cash flow hedges are recognized in the consolidated statements of operations in revenue—see Note 2 for further details.
F-22
OPOWER, INC.
NOTES TO CONSOLIDATED FINANCIAL STATEMENTS
8. Stock-Based Compensation
Stock Plan
On August 1, 2007, the Company adopted the 2007 Stock Plan under which eligible employees, officers, directors and consultants of the Company may be granted incentive or non-qualified stock options and restricted stock units (“RSUs”). Employee equity awards generally vest over a four year period and have graded vesting schedules. The vesting terms for non-employee equity awards varies for each individual who is providing services to the Company. RSUs and stock options generally expire seven and ten years from the date of grant, respectively.
As of December 31, 2013, the total shares of common stock reserved for issuance was 16.4 million, 1.5 million of which were available for issuance. During 2013, the Board of Directors approved additions of 4.3 million reserved shares under the 2007 Stock Plan.
Stock Option Activity
Recent stock option activity under the 2007 Stock Plan is summarized in the following table (in thousands, except time period and per share amounts):
| Options Outstanding |
Weighted- Average Exercise Price |
Weighted- Average Remaining Contractual Term (Years) |
Aggregate Intrinsic Value(1) |
|||||||||||||
| Balance as of December 31, 2011 |
6,047 | $ | 1.39 | 8.3 | 6,771 | |||||||||||
| Granted |
2,466 | 2.30 | ||||||||||||||
| Exercised |
(927 | ) | 0.72 | |||||||||||||
| Forfeited |
(604 | ) | 1.99 | |||||||||||||
|
|
|
|||||||||||||||
| Balance at December 31, 2012 |
6,982 | $ | 1.74 | 8.1 | $ | 7,362 | ||||||||||
|
|
|
|||||||||||||||
| Granted |
3,103 | 7.02 | ||||||||||||||
| Exercised |
(1,810 | ) | 1.55 | |||||||||||||
| Forfeited |
(465 | ) | 2.68 | |||||||||||||
| Cancelled |
(20 | ) | 2.13 | |||||||||||||
|
|
|
|||||||||||||||
| Balance at December 31, 2013 |
7,790 | $ | 3.83 | 7.6 | $ | 98,814 | ||||||||||
|
|
|
|||||||||||||||
| Vested and expected to vest after December 31, 2013 |
7,623 | $ | 3.75 | 8.0 | $ | 97,360 | ||||||||||
| Exercisable at December 31, 2013 |
4,271 | 3.16 | 7.6 | 57,062 | ||||||||||||
| (1) | Aggregate intrinsic value represents the difference between the estimated fair value of the underlying common stock and the exercise price of outstanding, in-the-money options. |
The 2007 Stock Plan allows for grants of immediately exercisable stock options. The Company has the right to purchase any unvested, but issued common shares at the original exercise price during the repurchase period following an employee’s termination. The consideration received for an exercise of an unvested option is considered to be a deposit of the exercise price. The related dollar amount is recorded as other current liabilities and other liabilities on the Company’s consolidated balance sheets and will be reclassified to equity as the Company’s repurchase right lapses. There were no stock options subject to repurchase as of December 31, 2012. As of December 31, 2013, there were 0.3 million unvested stock options subject to repurchase at an aggregate exercise price of $0.9 million.
F-23
OPOWER, INC.
NOTES TO CONSOLIDATED FINANCIAL STATEMENTS
The following table summarizes additional information on stock option grants, vesting and exercises (in thousands):
| Year Ended December 31, | ||||||||||||
| 2011 | 2012 | 2013 | ||||||||||
| Total fair value of stock options granted |
$ | 3,487 | $ | 2,491 | $ | 20,919 | ||||||
| Total fair value of shares vested |
764 | 1,172 | 2,427 | |||||||||
| Total intrinsic value of stock options exercised |
1,796 | 1,514 | 8,258 | |||||||||
| Cash received from stock options exercised |
198 | 629 | 2,797 | |||||||||
The Company applied the following weighted-average assumptions to estimate the fair value of employee stock options using the Black-Scholes option pricing model:
| Year Ended December 31, | ||||||||||||
| 2011 | 2012 | 2013 | ||||||||||
| Expected volatility |
50 | % | 43 | % | 51 | % | ||||||
| Expected term (in years) |
5.9 | 6.0 | 6.0 | |||||||||
| Dividend yield |
— | % | — | % | — | % | ||||||
| Risk-free interest rate |
2 | % | 1 | % | 1 | % | ||||||
Non-Employee Stock Options
In certain instances, the Company grants stock options to non-employee board members, consultants or advisors in return for services provided. These options were granted under the 2007 Plan and are included in the option summary tables above.
Stock options granted to non-employees during the years ended December 31, 2012 and 2013 were immaterial. As of December 31, 2013, there were 0.1 million non-employee stock options outstanding at a weighted-average exercise price of $2.66. Of those outstanding non-employee options, 0.1 million were vested and exercisable.
RSU Activity
During 2013, the Company granted 1.1 million RSUs with a weighted-average grant-date fair value of $15.48, all of which remained outstanding as of December 31, 2013. The number of RSUs granted to non-employee board members and consultants as of December 31, 2013 was less than 0.1 million.
Stock-Based Compensation Expense
Stock-based compensation expense is included in the consolidated statements of operations within the following line items (in thousands):
| Year Ended December 31, | ||||||||||||
| 2011 | 2012 | 2013 | ||||||||||
| Cost of revenue |
$ | 87 | $ | 137 | $ | 197 | ||||||
| Sales and marketing |
340 | 484 | 1,348 | |||||||||
| Research and development |
382 | 447 | 939 | |||||||||
| General and administrative |
151 | 119 | 1,141 | |||||||||
|
|
|
|
|
|
|
|||||||
| Total |
$ | 960 | $ | 1,187 | $ | 3,625 | ||||||
|
|
|
|
|
|
|
|||||||
F-24
OPOWER, INC.
NOTES TO CONSOLIDATED FINANCIAL STATEMENTS
As of December 31, 2013, there was $19.3 million of unrecognized stock-based compensation expense related to unvested stock options granted to employees and non-employee service providers which is expected to be recognized over a weighted-average period of 3.0 years. For the year ended December 31, 2013, total capitalized stock-based compensation expense was $0.1 million.
As of December 31, 2013, no stock-based compensation expense had been recognized for RSUs due to a qualifying event for the awards’ performance-based vesting component that was not considered probable as of that date. The total unrecognized stock-based compensation expense relating to these RSUs was $15.0 million as of December 31, 2013.
9. Income Taxes
For the years ended December 31, 2011, 2012 and 2013, the income tax provision for continuing operations is composed of state tax expense and foreign tax expense for the Company’s consolidated international subsidiaries.
The following is a reconciliation of the statutory federal income tax rate to the Company’s effective tax rate for the years ended December 31, 2011, 2012 and 2013:
| December 31, | ||||||||||||
| 2011 | 2012 | 2013 | ||||||||||
| U.S. federal income tax rate |
34 | % | 34 | % | 34 | % | ||||||
| State taxes |
4 | % | 4 | % | 4 | % | ||||||
| Change in valuation allowance |
(37 | %) | (39 | %) | (31 | %) | ||||||
| Changes in state tax rate |
2 | % | 1 | % | 4 | % | ||||||
| Stock compensation |
(1 | %) | (3 | %) | (4 | %) | ||||||
| Meals and entertainment |
(1 | %) | (1 | %) | (2 | %) | ||||||
| Other, net |
(1 | %) | 4 | % | (5 | %) | ||||||
|
|
|
|
|
|
|
|||||||
| Effective tax rate |
— | % | — | % | — | % | ||||||
|
|
|
|
|
|
|
|||||||
F-25
OPOWER, INC.
NOTES TO CONSOLIDATED FINANCIAL STATEMENTS
Temporary differences between the carrying amounts of assets and liabilities used for financial reporting purposes versus those used for income tax purposes are reflected in deferred income taxes. The components of the Company’s deferred tax assets and liabilities, as well as the related valuation allowance as of December 31, 2012 and 2013, are as follows (in thousands):
| December 31, | ||||||||
| 2012 | 2013 | |||||||
| Deferred tax assets |
||||||||
| Accrued compensation and benefits |
$ | 605 | $ | 1,182 | ||||
| Deferred rent liability |
619 | 483 | ||||||
| Stock compensation |
88 | 485 | ||||||
| Deferred income |
523 | 1,017 | ||||||
| Net operating loss carryforward |
18,995 | 23,081 | ||||||
| Other |
17 | 14 | ||||||
|
|
|
|
|
|||||
| Total deferred tax assets |
$ | 20,847 | $ | 26,262 | ||||
|
|
|
|
|
|||||
| Deferred tax liabilities |
||||||||
| Depreciation and amortization |
$ | 852 | $ | 1,854 | ||||
| Other |
51 | 63 | ||||||
|
|
|
|
|
|||||
| Total deferred tax liabilities |
$ | 903 | $ | 1,917 | ||||
|
|
|
|
|
|||||
| Valuation allowance |
(19,944 | ) | (24,345 | ) | ||||
|
|
|
|
|
|||||
| Net deferred tax assets |
$ | — | $ | — | ||||
|
|
|
|
|
|||||
Based on the Company’s limited operating history and cumulative operating losses to date, management believes that it is more likely than not that the Company’s deferred tax assets would not be fully realized. Accordingly, a valuation allowance for the entire deferred tax asset amount has been recorded.
As of December 31, 2013, the Company had U.S. federal net operating loss carryforwards of approximately $58.3 million. These amounts will be available to reduce future taxable income and will begin to expire in 2027. Approximately $0.7 million of the net operating loss carryforwards have not been recognized as they related to benefits associated with stock option exercises that have not reduced current taxes payable.
These net operating loss carryforwards may be used to offset future taxable income and thereby reduce the Company’s U.S. federal income taxes otherwise payable. Section 382 of the Internal Revenue Code of 1986, as amended, (“Section 382”) imposes an annual limit on the ability of a corporation that undergoes an ownership change to use its net operating loss carryforwards to reduce its tax liability. In the event of certain changes in the Company’s stockholder base, the Company’s ability to utilize certain net operating losses to offset future taxable income in any particular year will be limited pursuant to Section 382.
In addition to the Company’s U.S. federal net operating loss carryforwards, the Company also had net operating loss carryforwards in a number of states in which it operates. In the event of an ownership change, the ability to utilize state net operating losses may be limited by annual limitations similar to those described in Section 382.
To date, there have been no tax benefits recognized related to uncertain tax positions. The Company does not anticipate a material change in the unrecognized tax benefits in the next twelve months.
The Company files federal, state and foreign income tax returns in jurisdictions with varying statutes of limitations. Due to its net operating loss carryforwards, the Company’s income tax returns generally remain subject to examination by federal and most state tax authorities.
F-26
OPOWER, INC.
NOTES TO CONSOLIDATED FINANCIAL STATEMENTS
10. Net Income (Loss) Per Share
The following table summarizes the calculation of the Company’s basic and diluted net income (loss) per share under the two-class method attributable to common stockholders during the years ended December 31, 2011, 2012 and 2013 (in thousands, except per share amounts):
| Year Ended December 31, | ||||||||||||
| 2011 | 2012 | 2013 | ||||||||||
| Numerator: |
||||||||||||
| Net loss |
$ | (21,297 | ) | $ | (12,332 | ) | $ | (14,161 | ) | |||
| Non-cumulative dividends to preferred stockholders |
— | — | — | |||||||||
|
|
|
|
|
|
|
|||||||
| Net loss attributable to common stockholders |
$ | (21,297 | ) | $ | (12,332 | ) | $ | (14,161 | ) | |||
|
|
|
|
|
|
|
|||||||
| Denominator: |
||||||||||||
| Weighted-average common stock outstanding, basic |
17,836 | 19,442 | 21,121 | |||||||||
| Effect of potentially dilutive stock options |
— | — | — | |||||||||
|
|
|
|
|
|
|
|||||||
| Weighted-average common stock outstanding, diluted |
17,836 | 19,442 | 21,121 | |||||||||
|
|
|
|
|
|
|
|||||||
| Net loss per share, basic and diluted |
$ | (1.19 | ) | $ | (0.63 | ) | $ | (0.67 | ) | |||
|
|
|
|
|
|
|
|||||||
The Company computes net loss per share of common stock in conformity with the two-class method required for participating securities. The Company considers all series of convertible preferred stock to be participating securities, as the holders of the preferred stock are entitled to receive a non-cumulative dividend on a pari-passu basis in the event that a dividend is paid on common stock. The Company also considers unvested restricted common stock and the shares issued upon the early exercise of stock options that are subject to repurchase to be participating securities, because holders of such shares have dividend rights in the event a dividend is paid on common stock. The holders of all series of convertible preferred stock, and the holders of early exercised shares subject to repurchase do not have a contractual obligation to share in the losses of the Company. As such, the Company’s net losses for the years ended December 31, 2011, 2012 and 2013 were not allocated to these participating securities.
F-27
OPOWER, INC.
NOTES TO CONSOLIDATED FINANCIAL STATEMENTS
Pro Forma Net Income (Loss) per Share (Unaudited)
Pro forma basic and diluted net loss per share were computed to give effect to the automatic conversion of Series A, Series B and Series C convertible preferred stock and the convertible note (see Note 5) using the if-converted method as though the conversion had occurred as of the beginning of the period or the original date of issuance, if later. The following table summarizes the calculation of the Company’s pro forma basic and diluted net income (loss) per share for the year ended December 31, 2013 (in thousands, except per share amounts):
| Pro Forma Year Ended December 31, 2013 |
||||
| Numerator: |
||||
| Net loss |
$ | (14,161 | ) | |
| Non-cumulative dividends to preferred stockholders |
— | |||
|
|
|
|||
| Net loss attributable to common stockholders |
$ | (14,161 | ) | |
|
|
|
|||
| Denominator: |
||||
| Weighted-average common stock outstanding, basic |
21,121 | |||
| Adjustment to reflect assumed conversion of preferred stock |
19,247 | |||
| Adjustment to reflect assumed conversion of convertible debt |
||||
|
|
|
|||
| Pro forma weighted-average common stock outstanding, basic |
||||
| Effect of potentially dilutive stock options and restricted stock |
— | |||
|
|
|
|||
| Pro forma weighted-average common stock outstanding, diluted |
||||
|
|
|
|||
|
|
|
|||
| Pro forma net loss per share, basic and diluted |
||||
|
|
|
|||
Anti-Dilutive Shares Excluded
The following potential shares were excluded from the calculation of diluted net loss per share attributable to common stockholders because their effect would have been anti-dilutive for the periods presented (in thousands):
| Year Ended December 31, | ||||||||||||
| 2011 | 2012 | 2013 | ||||||||||
| Convertible preferred stock |
19,247 | 19,247 | 19,247 | |||||||||
| Stock options |
6,047 | 6,982 | 7,790 | |||||||||
| Restricted stock units |
— | — | 1,093 | |||||||||
| Common stock subject to repurchase |
444 | 272 | 408 | |||||||||
|
|
|
|
|
|
|
|||||||
| 25,738 | 26,501 | 28,538 | ||||||||||
|
|
|
|
|
|
|
|||||||
In addition, the Company has also excluded the convertible note payable from the calculation of diluted net loss per share attributable to common stockholders because the conversion is contingent on future events.
11. Geographic Information
For the years ended December 31, 2012 and 2013, approximately 97% and 90% of the Company’s revenue was generated by customers located in the United States, respectively. There was no international revenue in 2011. All of the Company’s long-lived assets currently reside in the United States.
F-28
OPOWER, INC.
NOTES TO CONSOLIDATED FINANCIAL STATEMENTS
12. Employee Benefit and Retirement Plans
The Company has a defined contribution 401(k) retirement and savings plan (the “401k Plan”) to provide retirement benefits for all eligible employees of the Company. Employees that are at least 21 years of age are eligible to participate in the 401k Plan immediately upon hiring. Under the 401k Plan, eligible employees may contribute up to 100% of either pre-tax compensation or after-tax compensation through a Roth 401(k) deferral contribution, up to the annual Internal Revenue Service dollar limit for the applicable year. To date, the Company has not made any matching contributions to this plan.
13. Valuation and Qualifying Accounts
Changes in valuation and qualifying accounts consisted of the following (in thousands):
| Additions | ||||||||||||||||||||||||
| Beginning Balance |
Charged to Operations |
Charged to Deferred Revenue |
Write-offs | Deductions | Ending Balance |
|||||||||||||||||||
| 2011 |
||||||||||||||||||||||||
| Allowance for doubtful accounts |
$ | — | $ | — | $ | — | $ | — | $ | — | $ | — | ||||||||||||
| Deferred tax valuation allowance |
(7,743 | ) | (7,904 | ) | — | — | — | (15,647 | ) | |||||||||||||||
| 2012 |
||||||||||||||||||||||||
| Allowance for doubtful accounts |
$ | — | $ | — | $ | — | $ | — | $ | — | $ | — | ||||||||||||
| Deferred tax valuation allowance |
(15,647 | ) | (4,297 | ) | — | — | — | (19,944 | ) | |||||||||||||||
| 2013 |
||||||||||||||||||||||||
| Allowance for doubtful accounts |
$ | — | $ | — | $ | (361 | ) | $ | — | $ | — | $ | (361 | ) | ||||||||||
| Deferred tax valuation allowance |
(19,944 | ) | (4,401 | ) | — | — | — | (24,345 | ) | |||||||||||||||
14. Subsequent Events
The Company completed its subsequent events assessment through March 3, 2014.
F-29

OPOWER

PART II
INFORMATION NOT REQUIRED IN PROSPECTUS
| ITEM 13. | OTHER EXPENSES OF ISSUANCE AND DISTRIBUTION. |
The following table sets forth all expenses to be paid by us, other than underwriting discounts and commissions, in connection with this offering. All amounts shown are estimates except for the SEC registration fee, the FINRA filing fee, and the NYSE listing fee.
| SEC registration fee |
$12,880 | |
| FINRA filing fee |
15,500 | |
| NYSE listing fee |
* | |
| Printing and engraving |
* | |
| Legal fees and expenses |
* | |
| Accounting fees and expenses |
* | |
| Custodian transfer agent and registrar fees |
* | |
| Miscellaneous |
* | |
|
| ||
| Total |
$ * | |
|
|
| * | To be completed by amendment. |
| ITEM 14. | INDEMNIFICATION OF DIRECTORS AND OFFICERS. |
Section 145 of the Delaware General Corporation Law authorizes a corporation’s board of directors to grant, and authorizes a court to award, indemnity to officers, directors, and other corporate agents.
Prior to the completion of this offering, we expect to adopt an amended and restated certificate of incorporation, which will become effective immediately prior to the completion of this offering, and which will contain provisions that limit the liability of our directors for monetary damages to the fullest extent permitted by Delaware law. Consequently, our directors will not be personally liable to us or our stockholders for monetary damages for any breach of fiduciary duties as directors, except liability for the following:
| • | any breach of their duty of loyalty to our company or our stockholders; |
| • | any act or omission not in good faith or that involves intentional misconduct or a knowing violation of law; |
| • | unlawful payments of dividends or unlawful stock repurchases or redemptions as provided in Section 174 of the Delaware General Corporation Law; or |
| • | any transaction from which they derived an improper personal benefit. |
Any amendment to, or repeal of, these provisions will not eliminate or reduce the effect of these provisions in respect of any act, omission or claim that occurred or arose prior to that amendment or repeal. If the Delaware General Corporation Law is amended to provide for further limitations on the personal liability of directors of corporations, then the personal liability of our directors will be further limited to the greatest extent permitted by the Delaware General Corporation Law.
In addition, prior to the completion of this offering, we expect to adopt amended and restated bylaws which will provide that we will indemnify, to the fullest extent permitted by law, any person who is or was a party or is threatened to be made a party to any action, suit or proceeding by reason of the fact that he or she is or was one of our directors or officers or is or was serving at our request as a director or officer of another corporation, partnership, joint venture, trust or other enterprise. Our amended and restated bylaws are expected to provide that we may indemnify to the fullest extent permitted by law any person who is or was a party or is threatened to be
II-1
made a party to any action, suit or proceeding by reason of the fact that he or she is or was one of our employees or agents or is or was serving at our request as an employee or agent of another corporation, partnership, joint venture, trust or other enterprise. Our amended and restated bylaws will also provide that we must advance expenses incurred by or on behalf of a director or officer in advance of the final disposition of any action or proceeding, subject to very limited exceptions.
Further, prior to the completion of this offering, we expect to enter into indemnification agreements with each of our directors and executive officers that may be broader than the specific indemnification provisions contained in the Delaware General Corporation Law. These indemnification agreements will require us, among other things, to indemnify our directors and executive officers against liabilities that may arise by reason of their status or service. These indemnification agreements will also require us to advance all expenses incurred by the directors and executive officers in investigating or defending any such action, suit or proceeding. We believe that these agreements are necessary to attract and retain qualified individuals to serve as directors and executive officers.
The limitation of liability and indemnification provisions that are expected to be included in our amended and restated certificate of incorporation, amended and restated bylaws and in indemnification agreements that we enter into with our directors and executive officers may discourage stockholders from bringing a lawsuit against our directors and executive officers for breach of their fiduciary duties. They may also reduce the likelihood of derivative litigation against our directors and executive officers, even though an action, if successful, might benefit us and other stockholders. Further, a stockholder’s investment may be harmed to the extent that we pay the costs of settlement and damage awards against directors and executive officers as required by these indemnification provisions. At present, we are not aware of any pending litigation or proceeding involving any person who is or was one of our directors, officers, employees or other agents or is or was serving at our request as a director, officer, employee or agent of another corporation, partnership, joint venture, trust or other enterprise, for which indemnification is sought, and we are not aware of any threatened litigation that may result in claims for indemnification.
We have obtained insurance policies under which, subject to the limitations of the policies, coverage is provided to our directors and executive officers against loss arising from claims made by reason of breach of fiduciary duty or other wrongful acts as a director or executive officer, including claims relating to public securities matters, and to us with respect to payments that may be made by us to these directors and executive officers pursuant to our indemnification obligations or otherwise as a matter of law.
The underwriting agreement filed as Exhibit 1.1 to this registration statement provides for indemnification by the underwriters of the Registrant and its officers and directors for certain liabilities arising under the Securities Act and otherwise.
| ITEM 15. | RECENT SALES OF UNREGISTERED SECURITIES. |
Since January 1, 2011, we made sales of the following unregistered securities:
From January 1, 2011 through December 31, 2013, we granted to our employees, consultants and other service providers options to purchase an aggregate of 8,230,334 shares of common stock under our Amended and Restated 2007 Stock Plan at exercise prices ranging from $2.09 to $15.20 per share.
From January 1, 2011 through December 31, 2013, we issued and sold to our employees, consultants and other service providers an aggregate of 3,580,918 shares of common stock upon the exercise of options under our Amended and Restated 2007 Stock Plan at exercise prices ranging from $0.045 to $6.56 per share, for an aggregate exercise price of $3,662,263.
From January 1, 2011 through December 31, 2013, we granted to our employees, consultants and other service providers 1,093,326 restricted stock units under our Amended and Restated 2007 Stock Plan.
II-2
In December 2011, we sold to an employee an aggregate of 443,613 shares of restricted common stock under our Amended and Restated 2007 Stock Plan at a price of $2.09 per share for a total purchase price of $927,151.
We believe these transactions were exempt from registration under the Securities Act in reliance upon Section 4(2) of the Securities Act or Regulation D promulgated thereunder, or Rule 701 promulgated under Section 3(b) of the Securities Act as transactions by an issuer not involving any public offering or pursuant to benefit plans and contracts relating to compensation as provided under Rule 701. The recipients of the securities in each of these transactions represented their intentions to acquire the securities for investment only and not with a view to or for sale in connection with any distribution thereof, and appropriate legends were placed upon the stock certificates issued in these transactions. All recipients had adequate access, through their relationships with us, to information about Opower.
| ITEM 16. | EXHIBITS AND FINANCIAL STATEMENT SCHEDULES. |
| (a) | Exhibits. |
See the Exhibit Index on the page immediately following the signature page for a list of exhibits filed as part of this registration statement on Form S-1, which Exhibit Index is incorporated herein by reference.
| (b) | Financial Statement Schedules. |
All schedules are omitted because the required information is either not present, not present in material amounts or is presented within the consolidated financial statements included in the prospectus that is part of this registration statement.
| ITEM 17. | UNDERTAKINGS. |
The undersigned Registrant hereby undertakes to provide to the underwriters at the closing specified in the underwriting agreement certificates in such denominations and registered in such names as required by the underwriters to permit prompt delivery to each purchaser.
Insofar as indemnification by the Registrant for liabilities arising under the Securities Act of 1933, as amended (the “Securities Act”), may be permitted to directors, officers and controlling persons of the Registrant pursuant to the foregoing provisions, or otherwise, the Registrant has been advised that in the opinion of the Securities and Exchange Commission such indemnification is against public policy as expressed in the Securities Act and is, therefore, unenforceable. In the event that a claim for indemnification against such liabilities (other than the payment by the Registrant of expenses incurred or paid by a director, officer or controlling person of the Registrant in the successful defense of any action, suit or proceeding) is asserted by such director, officer or controlling person in connection with the securities being registered, the Registrant will, unless in the opinion of its counsel the matter has been settled by controlling precedent, submit to a court of appropriate jurisdiction the question whether such indemnification by it is against public policy as expressed in the Securities Act and will be governed by the final adjudication of such issue.
The undersigned Registrant hereby undertakes that:
| (1) | For purposes of determining any liability under the Securities Act, the information omitted from the form of prospectus filed as part of this registration statement in reliance upon Rule 430A and contained in a form of prospectus filed by the Registrant pursuant to Rule 424(b)(1) or (4) or 497(h) under the Securities Act shall be deemed to be part of this registration statement as of the time it was declared effective. |
| (2) | For the purpose of determining any liability under the Securities Act, each post-effective amendment that contains a form of prospectus shall be deemed to be a new registration statement relating to the securities offered therein, and the offering of such securities at that time shall be deemed to be the initial bona fide offering thereof. |
II-3
SIGNATURES
Pursuant to the requirements of the Securities Act of 1933, as amended, the registrant has duly caused this Registration Statement to be signed on its behalf by the undersigned, thereunto duly authorized, in the County of Arlington, Commonwealth of Virginia, on March 3, 2014.
| OPOWER, INC. | ||
| By: |
/s/ Daniel Yates | |
| Daniel Yates | ||
| Chief Executive Officer | ||
POWER OF ATTORNEY
KNOW ALL PERSONS BY THESE PRESENTS, that each person whose signature appears below constitutes and appoints Daniel Yates and Thomas Kramer, and each of them, as his true and lawful attorneys-in-fact and agents, with full power of substitution and resubstitution, for him and in his name, place and stead, in any and all capacities, to sign the Registration Statement on Form S-1 of Opower, Inc., and any or all amendments (including post-effective amendments) thereto and any new registration statement with respect to the offering contemplated thereby filed pursuant to Rule 462(b) of the Securities Act of 1933, as amended, and to file the same, with all exhibits thereto, and other documents in connection therewith, with the Securities and Exchange Commission, granting unto said attorneys-in-fact and agents full power and authority to do and perform each and every act and thing requisite or necessary to be done in connection therewith and about the premises, as fully to all intents and purposes as he might or could do in person, hereby ratifying and confirming all that said attorneys-in-fact and agents, or their or his substitute or substitutes, may lawfully do or cause to be done by virtue hereof.
Pursuant to the requirements of the Securities Act of 1933, as amended, this registration statement on Form S-1 has been signed by the following persons in the capacities and on the dates indicated.
| Signature |
Title |
Date | ||
| /s/ Daniel Yates Daniel Yates |
Chief Executive Officer and Director (Principal Executive Officer) |
March 3, 2014 | ||
| /s/ Thomas G. Kramer Thomas G. Kramer |
Chief Financial Officer (Principal Accounting and Financial Officer) |
March 3, 2014 | ||
| /s/ Alex Laskey Alex Laskey |
Director |
March 3, 2014 | ||
| /s/ Mark McLaughlin Mark McLaughlin |
Director |
March 3, 2014 | ||
| /s/ Dipchand Nishar Dipchand Nishar |
Director |
March 3, 2014 | ||
| /s/ Gene Riechers Gene Riechers |
Director |
March 3, 2014 | ||
| /s/ Marcus Ryu Marcus Ryu |
Director |
March 3, 2014 | ||
| /s/ Jon Sakoda Jon Sakoda |
Director |
March 3, 2014 | ||
| /s/ Harry Weller Harry Weller |
Director |
March 3, 2014 | ||
II-4
EXHIBIT INDEX
| Exhibit |
Description | |||
| 1.1 | Form of Underwriting Agreement. | |||
| 3.1 | Amended and Restated Certificate of Incorporation of the Registrant, as currently in effect. | |||
| 3.2 | Form of Amended and Restated Certificate of Incorporation of the Registrant to be in effect immediately prior to the completion of this offering. | |||
| 3.3 | Bylaws of the Registrant, as currently in effect. | |||
| 3.4 | Form of Amended and Restated Bylaws of the Registrant to be adopted immediately prior to the completion of this offering. | |||
| 4.1* | Form of common stock certificate of the Registrant. | |||
| 4.2 | Amended and Restated Investors’ Rights Agreement, dated November 24, 2010, by and among the Registrant and certain of its stockholders. | |||
| 5.1* | Opinion of Goodwin Procter LLP. | |||
| 10.1 | Form of Indemnification Agreement between the Registrant and each of its directors and executive officers. | |||
| 10.2# | Amended and Restated 2007 Stock Plan, as amended, and forms of agreement thereunder. | |||
| 10.3# | 2014 Stock Incentive Plan and forms of agreement thereunder. | |||
| 10.4# | Senior Executive Cash Incentive Bonus Plan | |||
| 10.5 | Deed of Lease between the Registrant and MEPT Courthouse Tower, LLC dated November 3, 2010. | |||
| 10.6# | Offer Letter between the Registrant and Alexander Laskey dated September 21, 2011. | |||
| 10.7# | Employment Agreement between the Registrant and Thomas Kramer dated November 14, 2011. | |||
| 10.8# | Offer Letter between the Registrant and Alex Kinnier dated May 2, 2012. | |||
| 10.9# | Offer Letter between the Registrant and Jeremy Kirsch dated September 21, 2011. | |||
| 10.10# | Offer Letter between the Registrant and Rick McPhee dated February 4, 2012. | |||
| 10.11# | Offer Letter between the Registrant and Roderick Morris dated August 29, 2012. | |||
| 21.1 | Subsidiaries of the Registrant. | |||
| 23.1 | Consent of PricewaterhouseCoopers LLP, independent registered public accounting firm. | |||
| 23.2* | Consent of Goodwin Procter LLP (included in Exhibit 5.1). | |||
| 24.1 | Power of Attorney (see page II-4 of this Registration Statement on Form S-1). | |||
| * | To be filed by amendment. |
| # | Indicates management contract or compensatory plan, contract or agreement. |