Semiannual Report | June 30, 2016
Vanguard Balanced Index Fund
UNITED STATES
SECURITIES AND EXCHANGE COMMISSION
Washington, D.C. 20549
FORM N-CSR
CERTIFIED SHAREHOLDER REPORT
OF
REGISTERED MANAGEMENT INVESTMENT COMPANIES
| Investment Company Act file number: | 811-58431 | |
|
Name of Registrant: |
Vanguard Valley Forge Funds | |
|
Address of Registrant: |
P.O. Box 2600 | |
| Valley Forge, PA 19482 | ||
|
Name and address of agent for service: |
Heidi Stam, Esquire | |
| P.O. Box 876 | ||
| Valley Forge, PA 19482 | ||
|
Registrant’s telephone number, including area code: (610) 669-1000 | ||
|
Date of fiscal year end: December 31 | ||
|
Date of reporting period: January 31, 2016 – June 30, 2016 | ||
|
Item 1: Reports to Shareholders | ||
Semiannual Report | June 30, 2016
Vanguard Balanced Index Fund
Vanguard’s Principles for Investing Success
We want to give you the best chance of investment success. These principles, grounded in Vanguard’s research and experience, can put you on the right path.
Goals. Create clear, appropriate investment goals.
Balance. Develop a suitable asset allocation using broadly diversified funds. Cost. Minimize cost.
Discipline. Maintain perspective and long-term discipline.
A single theme unites these principles: Focus on the things you can control.
We believe there is no wiser course for any investor.
| Contents | |
| Your Fund’s Total Returns. | 1 |
| Chairman’s Letter. | 2 |
| Fund Profile. | 7 |
| Performance Summary. | 9 |
| Financial Statements. | 10 |
| About Your Fund’s Expenses. | 26 |
| Trustees Approve Advisory Arrangement. | 28 |
| Glossary. | 29 |
Please note: The opinions expressed in this report are just that—informed opinions. They should not be considered promises or advice.
Also, please keep in mind that the information and opinions cover the period through the date on the front of this report. Of course, the
risks of investing in your fund are spelled out in the prospectus.
See the Glossary for definitions of investment terms used in this report.
About the cover: Pictured is a sailing block on the Brilliant, a 1932 schooner docked in Mystic, Connecticut. A type of pulley, the
sailing block helps coordinate the setting of the sails. At Vanguard, the intricate coordination of technology and people allows
us to help millions of clients around the world reach their financial goals.
Your Fund’s Total Returns
| Six Months Ended June 30, 2016 | |
| Total | |
| Returns | |
| Vanguard Balanced Index Fund | |
| Investor Shares | 4.52% |
| Admiral™ Shares | 4.59 |
| Institutional Shares | 4.59 |
| Balanced Composite Index | 4.61 |
| Mixed-Asset Target Allocation Growth Funds Average | 2.37 |
For a benchmark description, see the Glossary.
Mixed-Asset Target Allocation Growth Funds Average: Derived from data provided by Lipper, a Thomson Reuters Company.
Admiral Shares carry lower expenses and are available to investors who meet certain account-balance requirements. Institutional Shares are
available to certain institutional investors who meet specific administrative, service, and account-size criteria.
| Your Fund’s Performance at a Glance | ||||
| December 31, 2015, Through June 30, 2016 | ||||
| Distributions Per Share | ||||
| Starting | Ending | Income | Capital | |
| Share Price | Share Price | Dividends | Gains | |
| Vanguard Balanced Index Fund | ||||
| Investor Shares | $29.22 | $30.26 | $0.274 | $0.000 |
| Admiral Shares | 29.22 | 30.26 | 0.294 | 0.000 |
| Institutional Shares | 29.22 | 30.26 | 0.295 | 0.000 |
1

Chairman’s Letter
Dear Shareholder,
U.S. stocks overcame several hurdles en route to gains over the six months ended June 30, 2016. Generally speaking, value stocks outperformed growth stocks and small-capitalization stocks bested larger-caps. U.S. bonds produced impressive results. Lower-rated investment-grade bonds did better than their higher-rated counterparts, and longer-term bonds surpassed those with shorter maturities.
Investor Shares of Vanguard Balanced Index Fund returned 4.52%. The fund tightly tracked the performance of its target benchmark, the Balanced Composite Index, and significantly outpaced the average return of its peers.
The fund’s stock portion accounts for about 60% of the portfolio’s assets. It tracks the performance of the entire U.S. stock market as represented by the CRSP US Total Market Index, which returned 3.66%. The fund’s bond portion makes up most of the rest of the portfolio. It tracks the broad U.S. taxable bond market as represented by the Barclays U.S. Aggregate Float Adjusted Index, which returned 5.52%.
As of June 30, the fund’s 30-day SEC yield for Investor Shares was 1.85%, down from 1.96% on December 31, 2015. Yields for the other share classes were somewhat higher, a result of their lower costs.
2
Stocks waxed and waned through periods of turbulence
Toward the end of the half year, global stock markets dropped sharply then rose after the momentous decision by United Kingdom voters to leave the European Union. The markets already were jittery before the June 23 “Brexit” vote. But volatility spiked afterward, as investors digested the significant global economic implications and the likelihood of extended uncertainty while the separation is carried out.
The broad U.S. stock market returned roughly 4% for the six months. U.S. stocks plunged on news of the referendum’s outcome but quickly reversed. Worries about Brexit’s effect on trade and global economic growth seemed to diminish as expectations increased that major central banks would be responsive to any fallout.
International stocks had a rougher time, returning about –1%. European stocks in particular suffered as the lead-up to the Brexit referendum and subsequent uncertainty hit closer to home. Developed Pacific markets also retreated. Emerging-market stocks were a bright spot, returning nearly 8%.
Bonds rolled to strong returns as investors weighed options
The broad U.S. bond market returned 5.31% as investors sought safe-haven assets amid questionable global economic growth, low inflation, and stock market volatility. Exceptionally low or negative
| Market Barometer | |||
| Total Returns | |||
| Periods Ended June 30, 2016 | |||
| Six | One | Five Years | |
| Months | Year | (Annualized) | |
| Stocks | |||
| Russell 1000 Index (Large-caps) | 3.74% | 2.93% | 11.88% |
| Russell 2000 Index (Small-caps) | 2.22 | -6.73 | 8.35 |
| Russell 3000 Index (Broad U.S. market) | 3.62 | 2.14 | 11.60 |
| FTSE All-World ex US Index (International) | -0.92 | -9.75 | 0.49 |
| Bonds | |||
| Barclays U.S. Aggregate Bond Index (Broad taxable market) | 5.31% | 6.00% | 3.76% |
| Barclays Municipal Bond Index (Broad tax-exempt market) | 4.33 | 7.65 | 5.33 |
| Citigroup Three-Month U.S. Treasury Bill Index | 0.11 | 0.14 | 0.05 |
| CPI | |||
| Consumer Price Index | 1.91% | 1.01% | 1.32% |
3
yields abroad attracted foreign investors to U.S. Treasury debt. The yield of the 10-year U.S. Treasury note closed at 1.47% at the end of June, down from 2.30% at the end of December. (Bond prices and yields move in opposite directions.)
The Federal Reserve has held its target for short-term interest rates steady since raising it by a quarter of a percentage point in December. During the period, the 0.25%–0.5% rate remained historically low and continued to curb returns for money market funds and savings accounts.
International bond markets (as measured by the Barclays Global Aggregate Index ex USD) returned 11.94%. Counter to recent trends, a number of foreign currencies strengthened against the dollar, but returns were solid even without this currency benefit.
Utilities and telecommunications produced impressive results
The equity portion of the Balanced Index Fund reflects the returns of the broad U.S. equity market. It offers wide exposure to growth and value stocks; large-, mid-, and small-capitalization stocks; and all ten industry sectors.
For the most recent six months, seven of the index’s ten market sectors produced positive results. Three of them—oil and gas, telecommunications, and utilities—posted double-digit returns.
| Expense Ratios | ||||
| Your Fund Compared With Its Peer Group | ||||
| Investor | Admiral | Institutional | Peer Group | |
| Shares | Shares | Shares | Average | |
| Balanced Index Fund | 0.22% | 0.08% | 0.07% | 0.90% |
The fund expense ratios shown are from the prospectus dated April 26, 2016, and represent estimated costs for the current fiscal year. For the
six months ended June 30, 2016, the fund’s annualized expense ratios were 0.21% for Investor Shares, 0.08% for Admiral Shares, and 0.07%
for Institutional Shares. The peer-group expense ratio is derived from data provided by Lipper, a Thomson Reuters Company, and captures
information through year-end 2015.
Peer group: Mixed-Asset Target Allocation Growth Funds.
4
Utilities and telecommunications, two of the fund’s smallest-weighted sectors, topped the field with returns of about 24% each. Firms in both industries deliver stable and steady dividend yields. These tend to be attractive to investors seeking income at a time when bond yields are historically low and stock volatility is high.
Industrial, oil and gas, and consumer goods stocks also significantly boosted the fund’s returns. Gains were evident across most of the industrial sector; conglomerates, building materials, transportation, machinery, and defense firms all made solid contributions. As oil and commodity prices have bounced back over the past few months, so have the energy sector’s integrated oil and gas companies and exploration and production firms. Food, household product, and tobacco companies were among the leaders in consumer goods.
The four largest sector weightings were also the fund’s weakest. Consumer services was essentially flat, while technology, health care, and financials each declined about 1%. Airlines lagged in consumer services, and internet and software companies detracted in technology. Lower long-term interest rates have hurt banks, asset managers, consumer finance companies, and investment firms in the financial sector. Biotechnology companies dragged down the health care sector.
Longer-dated bonds were the top performers
The fixed income portion of your fund provides broad exposure to the U.S. bond market. It invests in U.S. Treasury and agency bonds, government mortgage-backed securities, and investment-grade corporate bonds of all maturities (short-, intermediate-, and long-term).
The U.S. Treasury yield curve flattened over the six months. For example, the 2-year Treasury yield slid 49 basis points to 0.58%, and the 10-year Treasury yield fell 83 basis points to 1.47%, a level not seen since 2012. That translated into greater price increases for Treasuries further out on the maturity spectrum. Short- and intermediate-term Treasuries saw some price appreciation but returned less than 4% over the period. Long-term Treasuries, however, returned more than 15%; the bulk of that came from a rise in prices.
Government mortgage-backed securities didn’t fare as well. Their return of just under 3% may have been due in part to the fact that there aren’t as many long-dated maturities in this segment. Concerns about prepayment risk may have played a role as well while interest rates were falling.
Investment-grade corporate bonds returned close to 8%. Utilities and industrial bonds were top performers. Many companies in the energy and metals
5
and mining segments were hard hit by the drop in commodity prices after 2014. But demand for their bonds picked up when prices started moving in the other direction in February. The financial sector, on the other hand, returned less than 5%. Bonds issued by banks were particularly out of favor because lower interest rates tend to weigh on profitability.
A dose of discipline is crucial when markets become volatile
The heightened volatility in capital markets that surrounded the Brexit vote reminds us that nobody can control the markets’ direction or reliably predict where they’ll go in the short term. However, investors can control how they react to such turbulence.
During periods of market adversity, it’s more important than ever to keep sight of one of Vanguard’s key principles: Maintain perspective and long-term discipline. Whether you’re investing for yourself or on behalf of clients, your success is affected greatly by how you respond—or don’t respond—at these times. (You can read Vanguard’s Principles for Investing Success at vanguard.com/research.)
As I’ve written in the past, the best course for long-term investors is generally to ignore daily market moves and not make decisions based on emotion. This is also a good time to evaluate your portfolio and make sure your asset allocation is aligned with your time horizon, goals, and risk tolerance.
The markets are unpredictable and often confounding. Keeping your long-term plans clearly in focus can help you weather these periodic storms.
As always, thank you for investing with Vanguard.
Sincerely,

F. William McNabb III
Chairman and Chief Executive Officer
July 21, 2016
6
Balanced Index Fund
Fund Profile
As of June 30, 2016
| Share-Class Characteristics | |||
| Investor | Admiral | Institutional | |
| Shares | Shares | Shares | |
| Ticker Symbol | VBINX | VBIAX | VBAIX |
| Expense Ratio1 | 0.22% | 0.08% | 0.07% |
| 30-Day SEC Yield | 1.85% | 1.96% | 1.97% |
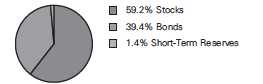
| Equity and Portfolio Characteristics | ||
| CRSP US | ||
| Total Market | ||
| Fund | Index | |
| Number of Stocks | 3,131 | 3,624 |
| Median Market Cap | $53.0B | $51.1B |
| Price/Earnings Ratio | 22.2x | 22.1x |
| Price/Book Ratio | 2.7x | 2.7x |
| Return on Equity | 16.6% | 16.4% |
| Earnings Growth | ||
| Rate | 7.2% | 7.2% |
| Dividend Yield | 2.1% | 2.1% |
| Foreign Holdings | 0.0% | 0.0% |
| Turnover Rate | ||
| (Annualized) | 51% | — |
| Short-Term | ||
| Reserves | 1.4% | — |
| Fixed Income Characteristics | ||
| Barclays | ||
| Aggregate | ||
| Float Adj | ||
| Fund | Index | |
| Number of Bonds | 6,605 | 9,796 |
| Yield to Maturity | ||
| (before expenses) | 1.9% | 1.9% |
| Average Coupon | 3.1% | 3.1% |
| Average Duration | 5.8 years | 5.8 years |
| Average Effective | ||
| Maturity | 8.0 years | 8.0 years |
| Total Fund Volatility Measures | ||
| CRSP US | ||
| Balanced | Total | |
| Composite | Market | |
| Index | Index | |
| R-Squared | 1.00 | 0.97 |
| Beta | 1.00 | 0.59 |
| These measures show the degree and timing of the fund’s | ||
| fluctuations compared with the indexes over 36 months. | ||
| Ten Largest Stocks (% of equity portfolio) | ||
| Apple Inc. | Computer Hardware | 2.3% |
| Alphabet Inc. | Internet | 1.9 |
| Exxon Mobil Corp. | Integrated Oil & Gas | 1.8 |
| Microsoft Corp. | Software | 1.7 |
| Johnson & Johnson | Pharmaceuticals | 1.5 |
| General Electric Co. | Diversified Industrials | 1.3 |
| Amazon.com Inc. | Broadline Retailers | 1.3 |
| Berkshire Hathaway Inc. Reinsurance | 1.3 | |
| AT&T Inc. | Fixed Line | |
| Telecommunications | 1.2 | |
| Facebook Inc. | Internet | 1.1 |
| Top Ten | 15.4% | |
| Top Ten as % of Total Net Assets | 9.3% | |
| The holdings listed exclude any temporary cash investments and | ||
| equity index products. | ||
Fund Asset Allocation
1 The expense ratios shown are from the prospectus dated April 26, 2016, and represent estimated costs for the current fiscal year. For the six
months ended June 30, 2016, the annualized expense ratios were 0.21% for Investor Shares, 0.08% for Admiral Shares, and 0.07% for Institutional
Shares.
7
Balanced Index Fund
| Sector Diversification (% of equity exposure) | ||
| CRSP US | ||
| Total Market | ||
| Fund | Index | |
| Basic Materials | 2.4% | 2.4% |
| Consumer Goods | 10.7 | 10.7 |
| Consumer Services | 13.4 | 13.4 |
| Financials | 18.7 | 18.6 |
| Health Care | 13.5 | 13.5 |
| Industrials | 12.7 | 12.8 |
| Oil & Gas | 6.8 | 6.8 |
| Technology | 15.5 | 15.5 |
| Telecommunications | 2.6 | 2.6 |
| Utilities | 3.7 | 3.7 |
| Sector Diversification (% of fixed income | |
| portfolio) | |
| Asset-Backed | 2.8% |
| Finance | 8.6 |
| Foreign | 5.2 |
| Government Mortgage-Backed | 20.4 |
| Industrial | 17.4 |
| Treasury/Agency | 42.3 |
| Utilities | 2.3 |
| Other | 1.0 |
The agency and mortgage-backed securities sectors may include issues from government-sponsored enterprises; such issues are
generally not backed by the full faith and credit of the U.S. government.
| Distribution by Credit Quality (% of fixed | |
| income portfolio) | |
| U.S. Government | 62.2% |
| Aaa | 6.0 |
| Aa | 4.2 |
| A | 12.6 |
| Baa | 15.0 |
Credit-quality ratings are obtained from Barclays and are from Moody's, Fitch, and S&P. When ratings from all three agencies are
used, the median rating is shown. When ratings from two of the agencies are used, the lower rating for each issue is shown. "Not
Rated" is used to classify securities for which a rating is not available. For more information about these ratings, see the
Glossary entry for Credit Quality.
Equity Investment Focus
![]()
Fixed Income Investment Focus
![]()
8
Balanced Index Fund
Performance Summary
All of the returns in this report represent past performance, which is not a guarantee of future results that may be achieved by the fund. (Current performance may be lower or higher than the performance data cited. For performance data current to the most recent month-end, visit our website at vanguard.com/performance.) Note, too, that both investment returns and principal value can fluctuate widely, so an investor’s shares, when sold, could be worth more or less than their original cost. The returns shown do not reflect taxes that a shareholder would pay on fund distributions or on the sale of fund shares.
Fiscal-Year Total Returns (%): December 31, 2005, Through June 30, 2016
| Average Annual Total Returns: Periods Ended June 30, 2016 | ||||||
| Ten Years | ||||||
| Inception Date | One Year | Five Years | Income | Capital | Total | |
| Investor Shares | 11/9/1992 | 3.87% | 8.48% | 2.49% | 4.30% | 6.79% |
| Admiral Shares | 11/13/2000 | 4.01 | 8.63 | 2.63 | 4.29 | 6.92 |
| Institutional Shares | 12/1/2000 | 4.02 | 8.65 | 2.66 | 4.29 | 6.95 |
See Financial Highlights for dividend and capital gains information.
9
Balanced Index Fund
Financial Statements (unaudited)
Statement of Net Assets—Investments Summary
As of June 30, 2016
This Statement summarizes the fund’s holdings by asset type. Details are reported for each of the fund’s 50 largest individual holdings and for investments that, in total for any issuer, represent more than 1% of the fund’s net assets. The total value of smaller holdings is reported as a single amount within each category.
The fund reports a complete list of its holdings in regulatory filings four times in each fiscal year, at the quarter-ends. For the second and fourth fiscal quarters, the complete listing of the fund’s holdings is available electronically on vanguard.com and on the Securities and Exchange Commission’s website (sec.gov), or you can have it mailed to you without charge by calling 800-662-7447. For the first and third fiscal quarters, the fund files the lists with the SEC on Form N-Q. Shareholders can look up the fund’s Forms N-Q on the SEC’s website. Forms N-Q may also be reviewed and copied at the SEC’s Public Reference Room (see the back cover of this report for further information).
| Market | Percentage | ||
| Value• | of Net | ||
| Shares | ($000) | Assets | |
| Common Stocks | |||
| Basic Materials † | 410,409 | 1.5% | |
| Consumer Goods | |||
| Procter & Gamble Co. | 2,043,202 | 172,998 | 0.6% |
| Coca-Cola Co. | 2,992,635 | 135,656 | 0.5% |
| Philip Morris International Inc. | 1,189,662 | 121,012 | 0.4% |
| PepsiCo Inc. | 1,110,370 | 117,633 | 0.4% |
| Altria Group Inc. | 1,508,749 | 104,043 | 0.4% |
| Consumer Goods—Other † | 1,147,022 | 4.1% | |
| 1,798,364 | 6.4% | ||
| Consumer Services | |||
| * Amazon.com Inc. | 308,097 | 220,480 | 0.8% |
| Home Depot Inc. | 956,499 | 122,135 | 0.4% |
| Comcast Corp. Class A | 1,859,452 | 121,218 | 0.4% |
| Walt Disney Co. | 1,122,101 | 109,764 | 0.4% |
| McDonald’s Corp. | 677,422 | 81,521 | 0.3% |
| Wal-Mart Stores Inc. | 1,085,774 | 79,283 | 0.3% |
| CVS Health Corp. | 825,031 | 78,988 | 0.3% |
| Consumer Services—Other † | 1,445,241 | 5.1% | |
| 2,258,630 | 8.0% | ||
| Financials | |||
| * Berkshire Hathaway Inc. Class B | 1,362,005 | 197,205 | 0.7% |
| JPMorgan Chase & Co. | 2,796,219 | 173,757 | 0.6% |
| Wells Fargo & Co. | 3,505,276 | 165,905 | 0.6% |
| Visa Inc. Class A | 1,462,986 | 108,510 | 0.4% |
| Bank of America Corp. | 7,812,221 | 103,668 | 0.4% |
| Citigroup Inc. | 2,229,007 | 94,488 | 0.3% |
| Financials—Other † | 2,306,032 | 8.1% | |
| 3,149,565 | 11.1% | ||
10
| Balanced Index Fund | ||||
| Market | Percentage | |||
| Value• | of Net | |||
| Shares | ($000) | Assets | ||
| Health Care | ||||
| Johnson & Johnson | 2,112,874 | 256,292 | 0.9% | |
| Pfizer Inc. | 4,668,584 | 164,381 | 0.6% | |
| Merck & Co. Inc. | 2,129,088 | 122,657 | 0.4% | |
| UnitedHealth Group Inc. | 729,847 | 103,054 | 0.4% | |
| Bristol-Myers Squibb Co. | 1,281,501 | 94,254 | 0.3% | |
| Medtronic plc | 1,076,457 | 93,404 | 0.3% | |
| Amgen Inc. | 577,023 | 87,794 | 0.3% | |
| Gilead Sciences Inc. | 1,043,545 | 87,053 | 0.3% | |
| AbbVie Inc. | 1,241,766 | 76,878 | 0.3% | |
| * | Allergan plc | 303,483 | 70,132 | 0.3% |
| Health Care—Other † | 1,124,438 | 4.0% | ||
| 2,280,337 | 8.1% | |||
| Industrials | ||||
| General Electric Co. | 7,112,545 | 223,903 | 0.8% | |
| Honeywell International Inc. | 579,695 | 67,430 | 0.2% | |
| 3M Co. | 463,968 | 81,250 | 0.3% | |
| Industrials—Other † | 1,764,498 | 6.3% | ||
| 2,137,081 | 7.6% | |||
| Oil & Gas | ||||
| Exxon Mobil Corp. | 3,182,670 | 298,344 | 1.0% | |
| Chevron Corp. | 1,443,675 | 151,340 | 0.5% | |
| Schlumberger Ltd. | 1,055,687 | 83,484 | 0.3% | |
| Oil & Gas—Other † | 610,754 | 2.2% | ||
| 1,143,922 | 4.0% | |||
| Technology | ||||
| Apple Inc. | 3,997,977 | 382,207 | 1.4% | |
| Microsoft Corp. | 5,736,226 | 293,523 | 1.0% | |
| * | Facebook Inc. Class A | 1,686,918 | 192,781 | 0.7% |
| * | Alphabet Inc. Class A | 225,604 | 158,719 | 0.6% |
| * | Alphabet Inc. Class C | 224,331 | 155,259 | 0.5% |
| Intel Corp. | 3,629,367 | 119,043 | 0.4% | |
| Cisco Systems Inc. | 3,862,805 | 110,824 | 0.4% | |
| International Business Machines Corp. | 663,520 | 100,709 | 0.4% | |
| Oracle Corp. | 2,405,827 | 98,471 | 0.3% | |
| Technology—Other † | 1,001,063 | 3.5% | ||
| 2,612,599 | 9.2% | |||
| Telecommunications | ||||
| AT&T Inc. | 4,717,622 | 203,848 | 0.7% | |
| Verizon Communications Inc. | 3,127,405 | 174,634 | 0.6% | |
| Telecommunications—Other † | 67,625 | 0.3% | ||
| 446,107 | 1.6% | |||
| Utilities † | 624,990 | 2.2% | ||
| Total Common Stocks (Cost $8,903,596) | 16,862,004 | 59.7%1 | ||
11
| Balanced Index Fund | |||||||
| Face | Market | Percentage | |||||
| Maturity | Amount | Value• | of Net | ||||
| Coupon | Date | ($000) | ($000) | Assets | |||
| U.S. Government and Agency Obligations | |||||||
| U.S. Government Securities | |||||||
| United States Treasury Note/Bond | 0.875% | 5/31/18 | 110,561 | 111,182 | 0.4% | ||
| United States Treasury Note/Bond | 2.750% | 11/15/42 | 73,183 | 80,570 | 0.3% | ||
| United States Treasury Note/Bond | 1.000% | 3/15/19 | 76,767 | 77,426 | 0.3% | ||
| United States Treasury Note/Bond | 2.500% | 5/15/24 | 66,454 | 72,196 | 0.2% | ||
| United States Treasury | |||||||
| Note/Bond | 0.625%–9.125% | 1/31/17–5/15/46 | 3,871,578 | 4,136,361 | 14.6% | ||
| 4,477,735 | 15.8% | ||||||
| Agency Bonds and Notes | |||||||
| 2 | Federal Home Loan | ||||||
| Mortgage Corp. | 0.750%–6.750% | 7/14/17–7/15/32 | 72,595 | 75,421 | 0.3% | ||
| 2 | Federal National | ||||||
| Mortgage Assn. | 0.000%–7.250% | 8/28/17–7/15/37 | 91,321 | 98,699 | 0.4% | ||
| Agency Bonds and Notes—Other † | 93,221 | 0.3% | |||||
| 267,341 | 1.0% | ||||||
| Conventional Mortgage-Backed Securities | |||||||
| 2,3,4 Fannie Mae Pool | 2.000%–10.000% | 8/1/16–7/1/46 | 903,831 | 967,061 | 3.4% | ||
| 2,3,4 Freddie Mac Gold Pool | 2.000%–9.000% | 8/1/16–7/1/46 | 569,050 | 606,430 | 2.2% | ||
| 3,4 | Ginnie Mae I Pool | 3.000%–9.500% | 5/15/17–7/1/46 | 114,735 | 125,491 | 0.4% | |
| 3,4 | Ginnie Mae II Pool | 3.500% | 7/1/46 | 104,405 | 110,800 | 0.4% | |
| 3,4 | Ginnie Mae II Pool | 2.500%–7.000% | 3/20/18–7/1/46 | 452,618 | 483,361 | 1.7% | |
| 2,293,143 | 8.1% | ||||||
| Nonconventional Mortgage-Backed Securities | |||||||
| 2,3,5 Fannie Mae Pool | 1.956%–6.004% | 11/1/33–12/1/43 | 18,770 | 19,687 | 0.1% | ||
| 2,3,5 Freddie Mac Non Gold Pool | 1.735%–5.893% | 11/1/34–11/1/43 | 4,710 | 4,946 | 0.0% | ||
| 3,5 | Ginnie Mae II Pool | 1.750%–4.000% | 7/20/38–12/20/43 | 7,486 | 7,810 | 0.0% | |
| 32,443 | 0.1% | ||||||
| Total U.S. Government and Agency Obligations (Cost $6,798,779) | 7,070,662 | 25.0% | |||||
| 6Asset-Backed/Commercial Mortgage-Backed Securities (Cost $301,237) † | 311,898 | 1.1% | |||||
| Corporate Bonds | |||||||
| Finance | |||||||
| 6 | Banking † | 682,338 | 2.4% | ||||
| 6 | Brokerage † | 26,498 | 0.1% | ||||
| 6 | Finance Companies † | 32,479 | 0.1% | ||||
| Insurance † | 153,909 | 0.6% | |||||
| Real Estate Investment Trusts † | 78,192 | 0.3% | |||||
| 973,416 | 3.5% | ||||||
| Industrial | |||||||
| Basic Industry † | 110,117 | 0.4% | |||||
| 6 | Capital Goods † | 162,196 | 0.6% | ||||
| 6 | Communication † | 300,203 | 1.0% | ||||
| 6 | Consumer Cyclical † | 246,846 | 0.9% | ||||
| 6 | Consumer Noncyclical † | 502,226 | 1.8% | ||||
| Energy | |||||||
| Exxon Mobil Corp. | 1.305%–4.114% | 3/1/18–3/1/46 | 14,300 | 14,856 | 0.1% | ||
| XTO Energy Inc. | 5.500%–6.250% | 8/1/17–6/15/18 | 800 | 856 | 0.0% | ||
| 6 | Energy—Other † | 291,561 | 1.0% | ||||
| 6 | Other Industrial † | 10,596 | 0.0% | ||||
| Technology | |||||||
| Alphabet Inc. | 3.625% | 5/19/21 | 350 | 386 | 0.0% | ||
12
| Balanced Index Fund | |||||||
| Face | Market | Percentage | |||||
| Maturity | Amount | Value• | of Net | ||||
| Coupon | Date | ($000) | ($000) | Assets | |||
| Apple Inc. | 1.000%–4.650% | 5/3/18–2/23/46 | 33,875 | 35,506 | 0.1% | ||
| Microsoft Corp. | 1.000%–5.300% | 5/1/18–11/3/55 | 22,774 | 24,127 | 0.1% | ||
| 6 | Technology—Other † | 179,960 | 0.6% | ||||
| 6 | Transportation † | 79,127 | 0.3% | ||||
| 1,958,563 | 6.9% | ||||||
| Utilities | |||||||
| 6 | Electric † | 233,227 | 0.8% | ||||
| Natural Gas † | 17,874 | 0.1% | |||||
| Other Utility † | 3,212 | 0.0% | |||||
| 254,313 | 0.9% | ||||||
| Total Corporate Bonds (Cost $3,018,265) | 3,186,292 | 11.3% | |||||
| 6Sovereign Bonds (U.S. Dollar-Denominated) (Cost $569,068) † | 590,202 | 2.1% | |||||
| Taxable Municipal Bonds (Cost $94,482) † | 110,876 | 0.4% | |||||
| Shares | |||||||
| Temporary Cash Investments | |||||||
| 7U.S. Government and Agency Obligations † | 5,197 | 0.0% | |||||
| Money Market Fund | |||||||
| 8,9 Vanguard Market Liquidity Fund | 0.538% | 486,384,264 | 486,384 | 1.7% | |||
| Total Temporary Cash Investments (Cost $491,581) | 491,581 | 1.7%1 | |||||
| 10Total Investments (Cost $20,177,008) | 28,623,515 | 101.3% | |||||
| Amount | |||||||
| ($000) | |||||||
| Other Assets and Liabilities | |||||||
| Other Assets | |||||||
| Investment in Vanguard | 2,285 | ||||||
| Receivables for Investment Securities Sold | 138,449 | ||||||
| Receivables for Accrued Income | 86,228 | ||||||
| Receivables for Capital Shares Issued | 22,146 | ||||||
| Other Assets | 1,592 | ||||||
| Total Other Assets | 250,700 | 0.9% | |||||
| Liabilities | |||||||
| Payables for Investment Securities Purchased | (530,528) | ||||||
| Collateral for Securities on Loan | (33,183) | ||||||
| Payables for Capital Shares Redeemed | (23,175) | ||||||
| Payables to Vanguard | (17,514) | ||||||
| Other Liabilities | (5,574) | ||||||
| Total Liabilities | (609,974) | (2.2%) | |||||
| Net Assets | 28,264,241 | 100.0% | |||||
13
| Balanced Index Fund | |
| At June 30, 2016, net assets consisted of: | |
| Amount | |
| ($000) | |
| Paid-in Capital | 19,918,294 |
| Undistributed Net Investment Income | 6,767 |
| Accumulated Net Realized Losses | (108,575) |
| Unrealized Appreciation (Depreciation) | |
| Investment Securities | 8,446,507 |
| Futures Contracts | 1,248 |
| Net Assets | 28,264,241 |
| Investor Shares—Net Assets | |
| Applicable to 106,421,850 outstanding $.001 par value shares of | |
| beneficial interest (unlimited authorization) | 3,220,390 |
| Net Asset Value Per Share—Investor Shares | $30.26 |
| Admiral Shares—Net Assets | |
| Applicable to 565,742,239 outstanding $.001 par value shares of | |
| beneficial interest (unlimited authorization) | 17,120,002 |
| Net Asset Value Per Share—Admiral Shares | $30.26 |
| Institutional Shares—Net Assets | |
| Applicable to 261,824,399 outstanding $.001 par value shares of | |
| beneficial interest (unlimited authorization) | 7,923,849 |
| Net Asset Value Per Share—Institutional Shares | $30.26 |
• See Note A in Notes to Financial Statements.
* Non-income-producing security.
† Represents the aggregate value, by category, of securities that are not among the 50 largest holdings and, in total for any issuer,
represent 1% or less of net assets.
1 The fund invests a portion of its cash reserves in equity markets through the use of index futures contracts. After giving effect
to futures investments, the fund’s effective common stock and temporary cash investment positions represent 59.9% and 1.5%,
respectively, of net assets.
2 The issuer was placed under federal conservatorship in September 2008; since that time, its daily operations have been managed
by the Federal Housing Finance Agency and it receives capital from the U.S. Treasury, as needed to maintain a positive net worth,
in exchange for senior preferred stock.
3 The average or expected maturity is shorter than the final maturity shown because of the possibility of interim principal payments
and prepayments or the possibility of the issue being called.
4 Includes securities purchased on a when-issued or delayed-delivery basis for which the fund has not taken delivery as of
June 30, 2016.
5 Adjustable-rate security.
6 Certain of the fund’s securities are exempt from registration under Rule 144A of the Securities Act of 1933. Such securities may
be sold in transactions exempt from registration, normally to qualified institutional buyers. At June 30, 2016, the aggregate value
of these securities was $109,485,000, representing 0.4% of net assets.
7 Securities with a value of $4,097,000 have been segregated as initial margin for open futures contracts.
8 Includes $33,183,000 of collateral received for securities on loan.
9 Affiliated money market fund available only to Vanguard funds and certain trusts and accounts managed by Vanguard. Rate shown
is the 7-day yield.
10 The total value of securities on loan is $31,616,000.
See accompanying Notes, which are an integral part of the Financial Statements.
14
Balanced Index Fund
Statement of Operations
| Six Months Ended | |
| June 30, 2016 | |
| ($000) | |
| Investment Income | |
| Income | |
| Dividends1 | 167,296 |
| Interest2 | 132,671 |
| Securities Lending | 1,799 |
| Total Income | 301,766 |
| Expenses | |
| The Vanguard Group—Note B | |
| Investment Advisory Services | 1,436 |
| Management and Administrative—Investor Shares | 2,701 |
| Management and Administrative—Admiral Shares | 4,453 |
| Management and Administrative—Institutional Shares | 1,998 |
| Marketing and Distribution—Investor Shares | 365 |
| Marketing and Distribution—Admiral Shares | 775 |
| Marketing and Distribution—Institutional Shares | 74 |
| Custodian Fees | 210 |
| Shareholders’ Reports—Investor Shares | 34 |
| Shareholders’ Reports—Admiral Shares | 45 |
| Shareholders’ Reports—Institutional Shares | 28 |
| Trustees’ Fees and Expenses | 9 |
| Total Expenses | 12,128 |
| Net Investment Income | 289,638 |
| Realized Net Gain (Loss) | |
| Investment Securities Sold | (10,066) |
| Futures Contracts | 6,028 |
| Realized Net Gain (Loss) | (4,038) |
| Change in Unrealized Appreciation (Depreciation) | |
| Investment Securities | 949,218 |
| Futures Contracts | 591 |
| Change in Unrealized Appreciation (Depreciation) | 949,809 |
| Net Increase (Decrease) in Net Assets Resulting from Operations | 1,235,409 |
| 1 Dividends are net of foreign withholding taxes of $12,000. | |
| 2 Interest income from an affiliated company of the fund was $945,000. | |
See accompanying Notes, which are an integral part of the Financial Statements.
15
Balanced Index Fund
Statement of Changes in Net Assets
| Six Months Ended | Year Ended | |
| June 30, | December 31, | |
| 2016 | 2015 | |
| ($000) | ($000) | |
| Increase (Decrease) in Net Assets | ||
| Operations | ||
| Net Investment Income | 289,638 | 531,943 |
| Realized Net Gain (Loss) | (4,038) | 191,247 |
| Change in Unrealized Appreciation (Depreciation) | 949,809 | (612,511) |
| Net Increase (Decrease) in Net Assets Resulting from Operations | 1,235,409 | 110,679 |
| Distributions | ||
| Net Investment Income | ||
| Investor Shares | (28,988) | (60,568) |
| Admiral Shares | (163,224) | (315,875) |
| Institutional Shares | (76,642) | (156,644) |
| Realized Capital Gain | ||
| Investor Shares | — | — |
| Admiral Shares | — | — |
| Institutional Shares | — | — |
| Total Distributions | (268,854) | (533,087) |
| Capital Share Transactions | ||
| Investor Shares | 17,624 | (34,234) |
| Admiral Shares | 810,007 | 1,868,658 |
| Institutional Shares | 202,184 | 177,768 |
| Net Increase (Decrease) from Capital Share Transactions | 1,029,815 | 2,012,192 |
| Total Increase (Decrease) | 1,996,370 | 1,589,784 |
| Net Assets | ||
| Beginning of Period | 26,267,871 | 24,678,087 |
| End of Period1 | 28,264,241 | 26,267,871 |
| 1 Net Assets—End of Period includes undistributed (overdistributed) net investment income of $6,767,000 and ($14,017,000). | ||
See accompanying Notes, which are an integral part of the Financial Statements.
16
Balanced Index Fund
Financial Highlights
| Investor Shares | ||||||
| Six Months | ||||||
| Ended | ||||||
| For a Share Outstanding | June 30, | Year Ended December 31, | ||||
| Throughout Each Period | 2016 | 2015 | 2014 | 2013 | 2012 | 2011 |
| Net Asset Value, Beginning of Period | $29.22 | $29.68 | $27.52 | $23.76 | $21.78 | $21.38 |
| Investment Operations | ||||||
| Net Investment Income | . 297 | .570 | .531 | .473 | .486 | .482 |
| Net Realized and Unrealized Gain (Loss) | ||||||
| on Investments | 1.017 | (.459) | 2.160 | 3.754 | 1.971 | .395 |
| Total from Investment Operations | 1.314 | .111 | 2.691 | 4.227 | 2.457 | .877 |
| Distributions | ||||||
| Dividends from Net Investment Income | (. 274) | (. 571) | (. 531) | (. 467) | (. 477) | (. 477) |
| Distributions from Realized Capital Gains | — | — | — | — | — | — |
| Total Distributions | (. 274) | (. 571) | (. 531) | (. 467) | (. 477) | (. 477) |
| Net Asset Value, End of Period | $30.26 | $29.22 | $29.68 | $27.52 | $23.76 | $21.78 |
| Total Return1 | 4.52% | 0.37% | 9.84% | 17.91% | 11.33% | 4.14% |
| Ratios/Supplemental Data | ||||||
| Net Assets, End of Period (Millions) | $3,220 | $3,090 | $3,174 | $2,974 | $2,844 | $1,921 |
| Ratio of Total Expenses to | ||||||
| Average Net Assets | 0.21% | 0.22% | 0.23% | 0.24% | 0.24% | 0.24% |
| Ratio of Net Investment Income to | ||||||
| Average Net Assets | 2.09% | 1.92% | 1.87% | 1.84% | 2.13% | 2.22% |
| Portfolio Turnover Rate2 | 51% | 61% | 53% | 47% | 43% | 67% |
The expense ratio, net investment income ratio, and turnover rate for the current period have been annualized.
1 Total returns do not include account service fees that may have applied in the periods shown. Fund prospectuses provide information about any applicable account service fees.
2 Includes 11%, 24%, 27%, 27%, 25%, and 23% attributable to mortgage-dollar-roll activity.
See accompanying Notes, which are an integral part of the Financial Statements.
17
Balanced Index Fund
Financial Highlights
| Admiral Shares | ||||||
| Six Months | ||||||
| Ended | ||||||
| For a Share Outstanding | June 30, | Year Ended December 31, | ||||
| Throughout Each Period | 2016 | 2015 | 2014 | 2013 | 2012 | 2011 |
| Net Asset Value, Beginning of Period | $29.22 | $29.68 | $27.52 | $23.76 | $21.78 | $21.38 |
| Investment Operations | ||||||
| Net Investment Income | . 316 | .612 | .572 | .513 | .520 | .514 |
| Net Realized and Unrealized Gain (Loss) | ||||||
| on Investments | 1.018 | (.460) | 2.158 | 3.755 | 1.970 | .395 |
| Total from Investment Operations | 1.334 | .152 | 2.730 | 4.268 | 2.490 | .909 |
| Distributions | ||||||
| Dividends from Net Investment Income | (. 294) | (. 612) | (. 570) | (. 508) | (. 510) | (. 509) |
| Distributions from Realized Capital Gains | — | — | — | — | — | — |
| Total Distributions | (. 294) | (. 612) | (. 570) | (. 508) | (. 510) | (. 509) |
| Net Asset Value, End of Period | $30.26 | $29.22 | $29.68 | $27.52 | $23.76 | $21.78 |
| Total Return1 | 4.59% | 0.51% | 9.99% | 18.10% | 11.49% | 4.29% |
| Ratios/Supplemental Data | ||||||
| Net Assets, End of Period (Millions) | $17,120 | $15,726 | $14,112 | $9,688 | $7,407 | $4,254 |
| Ratio of Total Expenses to | ||||||
| Average Net Assets | 0.08% | 0.08% | 0.09% | 0.09% | 0.10% | 0.10% |
| Ratio of Net Investment Income to | ||||||
| Average Net Assets | 2.22% | 2.06% | 2.01% | 1.99% | 2.27% | 2.36% |
| Portfolio Turnover Rate2 | 51% | 61% | 53% | 47% | 43% | 67% |
The expense ratio, net investment income ratio, and turnover rate for the current period have been annualized.
1 Total returns do not include account service fees that may have applied in the periods shown. Fund prospectuses provide information about any applicable account service fees.
2 Includes 11%, 24%, 27%, 27%, 25%, and 23% attributable to mortgage-dollar-roll activity.
See accompanying Notes, which are an integral part of the Financial Statements.
18
Balanced Index Fund
Financial Highlights
| Institutional Shares | ||||||
| Six Months | ||||||
| Ended | ||||||
| For a Share Outstanding | June 30, | Year Ended December 31, | ||||
| Throughout Each Period | 2016 | 2015 | 2014 | 2013 | 2012 | 2011 |
| Net Asset Value, Beginning of Period | $29.22 | $29.68 | $27.52 | $23.76 | $21.78 | $21.38 |
| Investment Operations | ||||||
| Net Investment Income | . 319 | .615 | .574 | .515 | .523 | .519 |
| Net Realized and Unrealized Gain (Loss) | ||||||
| on Investments | 1.016 | (.460) | 2.159 | 3.755 | 1.971 | .394 |
| Total from Investment Operations | 1.335 | .155 | 2.733 | 4.270 | 2.494 | .913 |
| Distributions | ||||||
| Dividends from Net Investment Income | (. 295) | (. 615) | (. 573) | (. 510) | (. 514) | (. 513) |
| Distributions from Realized Capital Gains | — | — | — | — | — | — |
| Total Distributions | (. 295) | (. 615) | (. 573) | (. 510) | (. 514) | (. 513) |
| Net Asset Value, End of Period | $30.26 | $29.22 | $29.68 | $27.52 | $23.76 | $21.78 |
| Total Return | 4.59% | 0.52% | 10.00% | 18.11% | 11.51% | 4.31% |
| Ratios/Supplemental Data | ||||||
| Net Assets, End of Period (Millions) | $7,924 | $7,452 | $7,392 | $6,938 | $5,554 | $4,224 |
| Ratio of Total Expenses to | ||||||
| Average Net Assets | 0.07% | 0.07% | 0.08% | 0.08% | 0.08% | 0.08% |
| Ratio of Net Investment Income to | ||||||
| Average Net Assets | 2.23% | 2.07% | 2.02% | 2.00% | 2.29% | 2.38% |
| Portfolio Turnover Rate1 | 51% | 61% | 53% | 47% | 43% | 67% |
The expense ratio, net investment income ratio, and turnover rate for the current period have been annualized.
1 Includes 11%, 24%, 27%, 27%, 25%, and 23% attributable to mortgage-dollar-roll activity.
See accompanying Notes, which are an integral part of the Financial Statements.
19
Balanced Index Fund
Notes to Financial Statements
Vanguard Balanced Index Fund is registered under the Investment Company Act of 1940 as an open-end investment company, or mutual fund. Certain of the fund’s investments are in corporate debt instruments; the issuers’ abilities to meet their obligations may be affected by economic developments in their respective industries. The fund offers three classes of shares: Investor Shares, Admiral Shares, and Institutional Shares. Investor Shares are available to any investor who meets the fund’s minimum purchase requirements. Admiral Shares and Institutional Shares are designed for investors who meet certain administrative, service, and account-size criteria.
A. The following significant accounting policies conform to generally accepted accounting principles for U.S. investment companies. The fund consistently follows such policies in preparing its financial statements.
1. Security Valuation: Securities are valued as of the close of trading on the New York Stock Exchange (generally 4 p.m., Eastern time) on the valuation date. Equity securities are valued at the latest quoted sales prices or official closing prices taken from the primary market in which each security trades; such securities not traded on the valuation date are valued at the mean of the latest quoted bid and asked prices. Bonds and temporary cash investments acquired over 60 days to maturity are valued using the latest bid prices or using valuations based on a matrix system (which considers such factors as security prices, yields, maturities, and ratings), both as furnished by independent pricing services. Structured debt securities, including mortgages and asset-backed securities, are valued using the latest bid prices or using valuations based on a matrix system that considers such factors as issuer, tranche, nominal or option-adjusted spreads, weighted average coupon, weighted average maturity, credit enhancements, and collateral. Investments in Vanguard Market Liquidity Fund are valued at that fund’s net asset value. Other temporary cash investments are valued at amortized cost, which approximates market value. Securities for which market quotations are not readily available, or whose values have been materially affected by events occurring before the fund’s pricing time but after the close of the securities’ primary markets, are valued by methods deemed by the board of trustees to represent fair value.
2. Futures Contracts: The fund uses index futures contracts to a limited extent, with the objectives of maintaining full exposure to the stock market, enhancing returns, maintaining liquidity, and minimizing transaction costs. The fund may purchase futures contracts to immediately invest incoming cash in the market, or sell futures in response to cash outflows, thereby simulating a fully invested position in the underlying index while maintaining a cash balance for liquidity. The fund may seek to enhance returns by using futures contracts instead of the underlying securities when futures are believed to be priced more attractively than the underlying securities. The primary risks associated with the use of futures contracts are imperfect correlation between changes in market values of stocks held by the fund and the prices of futures contracts, and the possibility of an illiquid market. Counterparty risk involving futures is mitigated because a regulated clearinghouse is the counterparty instead of the clearing broker. To further mitigate counterparty risk, the fund trades futures contracts on an exchange, monitors the financial strength of its clearing brokers and clearinghouse, and has entered into clearing agreements with its clearing brokers. The clearinghouse imposes initial margin requirements to secure the fund’s performance and requires daily settlement of variation margin representing changes in the market value of each contract.
20
Balanced Index Fund
Futures contracts are valued at their quoted daily settlement prices. The aggregate settlement values of the contracts are not recorded in the Statement of Net Assets. Fluctuations in the value of the contracts are recorded in the Statement of Net Assets as an asset (liability) and in the Statement of Operations as unrealized appreciation (depreciation) until the contracts are closed, when they are recorded as realized futures gains (losses).
During the six months ended June 30, 2016, the fund’s average investments in long and short futures contracts represented less than 1% and 0% of net assets, respectively, based on the average of aggregate settlement values at each quarter-end during the period.
3. To Be Announced (TBA) Transactions: A TBA transaction is an agreement to buy or sell mortgage-backed securities with agreed-upon characteristics (face amount, coupon, maturity) for settlement at a future date. The fund may be a seller of TBA transactions to reduce its exposure to the mortgage-backed securities market or in order to sell mortgage-backed securities it owns under delayed-delivery arrangements. When the fund is a buyer of TBA transactions, it maintains cash or short-term investments in an amount sufficient to meet the purchase price at the settlement date of the TBA transaction. The primary risk associated with TBA transactions is that a counterparty may default on its obligations. The fund mitigates its counterparty risk by, among other things, performing a credit analysis of counterparties, allocating transactions among numerous counterparties, and monitoring its exposure to each counterparty. The fund may also enter into a Master Securities Forward Transaction Agreement (MSFTA) with certain counterparties and require them to transfer collateral as security for their performance. Under an MSFTA, upon a counterparty default (including bankruptcy), the fund may terminate any TBA transactions with that counterparty, determine the net amount owed by either party in accordance with its master netting arrangements, and sell or retain any collateral held up to the net amount owed to the fund under the master netting arrangements.
At June 30, 2016, counterparties had deposited in segregated accounts securities with a value of $274,000 in connection with TBA transactions.
4. Mortgage Dollar Rolls: The fund enters into mortgage-dollar-roll transactions, in which the fund sells mortgage-backed securities to a dealer and simultaneously agrees to purchase similar securities in the future at a predetermined price. The proceeds of the securities sold in mortgage-dollar-roll transactions are typically invested in high-quality short-term fixed income securities. The fund forgoes principal and interest paid on the securities sold, and is compensated by interest earned on the proceeds of the sale and by a lower price on the securities to be repurchased. The fund has also entered into mortgage-dollar-roll transactions in which the fund buys mortgage-backed securities from a dealer pursuant to a TBA transaction and simultaneously agrees to sell similar securities in the future at a predetermined price. The securities bought in mortgage-dollar-roll transactions are used to cover an open TBA sell position. The fund continues to earn interest on mortgage-backed security pools already held and receives a lower price on the securities to be sold in the future. The fund accounts for mortgage-dollar-roll transactions as purchases and sales; as such, these transactions may increase the fund’s portfolio turnover rate. Amounts to be received or paid in connection with open mortgage dollar rolls are included in Receivables for Investment Securities Sold or Payables for Investment Securities Purchased in the Statement of Net Assets.
21
Balanced Index Fund
5. Federal Income Taxes: The fund intends to continue to qualify as a regulated investment company and distribute all of its taxable income. Management has analyzed the fund’s tax positions taken for all open federal income tax years (December 31, 2012–2015), and for the period ended June 30, 2016, and has concluded that no provision for federal income tax is required in the fund’s financial statements.
6. Distributions: Distributions to shareholders are recorded on the ex-dividend date.
7. Securities Lending: To earn additional income, the fund lends its securities to qualified institutional borrowers. Security loans are subject to termination by the fund at any time, and are required to be secured at all times by collateral in an amount at least equal to the market value of securities loaned. Daily market fluctuations could cause the value of loaned securities to be more or less than the value of the collateral received. When this occurs, the collateral is adjusted and settled on the next business day. The fund further mitigates its counterparty risk by entering into securities lending transactions only with a diverse group of prequalified counterparties, monitoring their financial strength, and entering into master securities lending agreements with its counterparties. The master securities lending agreements provide that, in the event of a counterparty’s default (including bankruptcy), the fund may terminate any loans with that borrower, determine the net amount owed, and sell or retain the collateral up to the net amount owed to the fund; however, such actions may be subject to legal proceedings. While collateral mitigates counterparty risk, in the absence of a default the fund may experience delays and costs in recovering the securities loaned. The fund invests cash collateral received in Vanguard Market Liquidity Fund, and records a liability in the Statement of Net Assets for the return of the collateral, during the period the securities are on loan. Securities lending income represents fees charged to borrowers plus income earned on invested cash collateral, less expenses associated with the loan.
8. Credit Facility: The fund and certain other funds managed by The Vanguard Group (“Vanguard”) participate in a $3.1 billion committed credit facility provided by a syndicate of lenders pursuant to a credit agreement that may be renewed annually; each fund is individually liable for its borrowings, if any, under the credit facility. Borrowings may be utilized for temporary and emergency purposes, and are subject to the fund’s regulatory and contractual borrowing restrictions. The participating funds are charged administrative fees and an annual commitment fee of 0.10% of the undrawn amount of the facility; these fees are allocated to the funds based on a method approved by the fund’s board of trustees and included in Management and Administrative expenses on the fund’s Statement of Operations. Any borrowings under this facility bear interest at a rate based upon the higher of the one-month London Interbank Offered Rate, federal funds effective rate, or overnight bank funding rate plus an agreed-upon spread.
The fund had no borrowings outstanding at June 30, 2016, or at any time during the period then ended.
9. Other: Dividend income is recorded on the ex-dividend date. Interest income includes income distributions received from Vanguard Market Liquidity Fund and is accrued daily. Premiums and discounts on debt securities purchased are amortized and accreted, respectively, to interest income over the lives of the respective securities. Security transactions are accounted for on the date securities are bought or sold. Costs used to determine realized gains (losses) on the sale of investment securities are those of the specific securities sold.
22
Balanced Index Fund
Each class of shares has equal rights as to assets and earnings, except that each class separately bears certain class-specific expenses related to maintenance of shareholder accounts (included in Management and Administrative expenses) and shareholder reporting. Marketing and distribution expenses are allocated to each class of shares based on a method approved by the board of trustees. Income, other non-class-specific expenses, and gains and losses on investments are allocated to each class of shares based on its relative net assets.
B. In accordance with the terms of a Funds’ Service Agreement (the “FSA”) between Vanguard and the fund, Vanguard furnishes to the fund investment advisory, corporate management, administrative, marketing, and distribution services at Vanguard’s cost of operations (as defined by the FSA). These costs of operations are allocated to the fund based on methods and guidelines approved by the board of trustees. Vanguard does not require reimbursement in the current period for certain costs of operations (such as deferred compensation/benefits and risk/insurance costs); the fund’s liability for these costs of operations is included in Payables to Vanguard on the Statement of Net Assets.
Upon the request of Vanguard, the fund may invest up to 0.40% of its net assets as capital in Vanguard. At June 30, 2016, the fund had contributed to Vanguard capital in the amount of $2,285,000, representing 0.01% of the fund’s net assets and 0.91% of Vanguard’s capitalization. The fund’s trustees and officers are also directors and employees, respectively, of Vanguard.
C. Various inputs may be used to determine the value of the fund’s investments. These inputs are summarized in three broad levels for financial statement purposes. The inputs or methodologies used to value securities are not necessarily an indication of the risk associated with investing in those securities.
Level 1—Quoted prices in active markets for identical securities.
Level 2—Other significant observable inputs (including quoted prices for similar securities, interest rates, prepayment speeds, credit risk, etc.).
Level 3—Significant unobservable inputs (including the fund’s own assumptions used to determine the fair value of investments).
The following table summarizes the market value of the fund’s investments as of June 30, 2016, based on the inputs used to value them:
| Level 1 | Level 2 | Level 3 | |
| Investments | ($000) | ($000) | ($000) |
| Common Stocks | 16,861,686 | — | 318 |
| U.S. Government and Agency Obligations | — | 7,070,662 | — |
| Asset-Backed/Commercial Mortgage-Backed Securities | — | 311,490 | 408 |
| Corporate Bonds | — | 3,186,292 | — |
| Sovereign Bonds | — | 590,202 | — |
| Taxable Municipal Bonds | — | 110,876 | — |
| Temporary Cash Investments | 486,384 | 5,197 | — |
| Futures Contracts—Assets1 | 1,485 | — | — |
| Futures Contracts—Liabilities1 | (301) | — | — |
| Total | 17,349,254 | 11,274,719 | 726 |
| 1 Represents variation margin on the last day of the reporting period. | |||
23
Balanced Index Fund
D. At June 30, 2016, the aggregate settlement value of open futures contracts and the related unrealized appreciation (depreciation) were:
| ($000) | ||||
| Aggregate | ||||
| Number of | Settlement | Unrealized | ||
| Long (Short) | Value | Appreciation | ||
| Futures Contracts | Expiration | Contracts | Long (Short) | (Depreciation) |
| E-mini S&P 500 Index | September 2016 | 494 | 51,628 | 1,264 |
| E-mini Russell 2000 Index | September 2016 | 77 | 8,835 | (38) |
| E-mini S&P MidCap Index | September 2016 | 63 | 9,405 | 22 |
| 1,248 |
Unrealized appreciation (depreciation) on open futures contracts is required to be treated as realized gain (loss) for tax purposes.
E. Distributions are determined on a tax basis and may differ from net investment income and realized capital gains for financial reporting purposes. Differences may be permanent or temporary. Permanent differences are reclassified among capital accounts in the financial statements to reflect their tax character. Temporary differences arise when certain items of income, expense, gain, or loss are recognized in different periods for financial statement and tax purposes. These differences will reverse at some time in the future. Differences in classification may also result from the treatment of short-term gains as ordinary income for tax purposes.
During the six months ended June 30, 2016, the fund realized $49,511,000 of net capital gains resulting from in-kind redemptions—in which shareholders exchanged fund shares for securities held by the fund rather than for cash. Because such gains are not taxable to the fund, and are not distributed to shareholders, they have been reclassified from accumulated net realized losses to paid-in capital.
The fund’s tax-basis capital gains and losses are determined only at the end of each fiscal year. For tax purposes, at December 31, 2015, the fund had available capital losses totaling $54,369,000 to offset future net capital gains. Of this amount, $15,654,000 is subject to expiration on December 31, 2017. Capital losses of $38,715,000 realized beginning in fiscal 2011 may be carried forward indefinitely under the Regulated Investment Company Modernization Act of 2010, but must be used before any expiring loss carryforwards. The fund will use these capital losses to offset net taxable capital gains, if any, realized during the year ending December 31, 2016; should the fund realize net capital losses for the year, the losses will be added to the loss carryforward balance above.
At June 30, 2016, the cost of investment securities for tax purposes was $20,177,279,000. Net unrealized appreciation of investment securities for tax purposes was $8,446,236,000, consisting of unrealized gains of $8,603,203,000 on securities that had risen in value since their purchase and $156,967,000 in unrealized losses on securities that had fallen in value since their purchase.
F. During the six months ended June 30, 2016, the fund purchased $2,967,314,000 of investment securities and sold $2,078,061,000 of investment securities, other than U.S. government securities and temporary cash investments. Purchases and sales of U.S. government securities were
24
Balanced Index Fund
$5,101,617,000 and $4,884,642,000, respectively. Total purchases and sales include $0 and $83,973,000, respectively, in connection with in-kind purchases and redemptions of the fund’s capital shares.
G. Capital share transactions for each class of shares were:
| Six Months Ended | Year Ended | |||
| June 30, 2016 | December 31, 2015 | |||
| Amount | Shares | Amount | Shares | |
| ($000) | (000) | ($000) | (000) | |
| Investor Shares | ||||
| Issued | 432,603 | 14,798 | 818,847 | 27,504 |
| Issued in Lieu of Cash Distributions | 27,725 | 937 | 58,336 | 1,976 |
| Redeemed | (442,704) | (15,071) | (911,417) | (30,665) |
| Net Increase (Decrease)—Investor Shares | 17,624 | 664 | (34,234) | (1,185) |
| Admiral Shares | ||||
| Issued | 2,002,467 | 68,450 | 4,007,705 | 134,626 |
| Issued in Lieu of Cash Distributions | 152,586 | 5,155 | 295,192 | 10,002 |
| Redeemed | (1,345,046) | (46,016) | (2,434,239) | (81,938) |
| Net Increase (Decrease)—Admiral Shares | 810,007 | 27,589 | 1,868,658 | 62,690 |
| Institutional Shares | ||||
| Issued | 649,420 | 22,137 | 936,232 | 31,483 |
| Issued in Lieu of Cash Distributions | 74,401 | 2,513 | 152,359 | 5,160 |
| Redeemed | (521,637) | (17,808) | (910,823) | (30,700) |
| Net Increase (Decrease)—Institutional Shares | 202,184 | 6,842 | 177,768 | 5,943 |
H. Management has determined that no material events or transactions occurred subsequent to
June 30, 2016, that would require recognition or disclosure in these financial statements.
25
About Your Fund’s Expenses
As a shareholder of the fund, you incur ongoing costs, which include costs for portfolio management, administrative services, and shareholder reports (like this one), among others. Operating expenses, which are deducted from a fund’s gross income, directly reduce the investment return of the fund.
A fund’s expenses are expressed as a percentage of its average net assets. This figure is known as the expense ratio. The following examples are intended to help you understand the ongoing costs (in dollars) of investing in your fund and to compare these costs with those of other mutual funds. The examples are based on an investment of $1,000 made at the beginning of the period shown and held for the entire period.
The accompanying table illustrates your fund’s costs in two ways:
• Based on actual fund return. This section helps you to estimate the actual expenses that you paid over the period. The ”Ending Account Value“ shown is derived from the fund‘s actual return, and the third column shows the dollar amount that would have been paid by an investor who started with $1,000 in the fund. You may use the information here, together with the amount you invested, to estimate the expenses that you paid over the period.
To do so, simply divide your account value by $1,000 (for example, an $8,600 account value divided by $1,000 = 8.6), then multiply the result by the number given for your fund under the heading ”Expenses Paid During Period.“
• Based on hypothetical 5% yearly return. This section is intended to help you compare your fund‘s costs with those of other mutual funds. It assumes that the fund had a yearly return of 5% before expenses, but that the expense ratio is unchanged. In this case—because the return used is not the fund’s actual return—the results do not apply to your investment. The example is useful in making comparisons because the Securities and Exchange Commission requires all mutual funds to calculate expenses based on a 5% return. You can assess your fund’s costs by comparing this hypothetical example with the hypothetical examples that appear in shareholder reports of other funds.
Note that the expenses shown in the table are meant to highlight and help you compare ongoing costs only and do not reflect transaction costs incurred by the fund for buying and selling securities. Further, the expenses do not include any purchase, redemption, or account service fees described in the fund prospectus. If such fees were applied to your account, your costs would be higher. Your fund does not carry a “sales load.”
The calculations assume no shares were bought or sold during the period. Your actual costs may have been higher or lower, depending on the amount of your investment and the timing of any purchases or redemptions.
You can find more information about the fund’s expenses, including annual expense ratios, in the Financial Statements section of this report. For additional information on operating expenses and other shareholder costs, please refer to your fund’s current prospectus.
26
| Six Months Ended June 30, 2016 | |||
| Beginning | Ending | Expenses | |
| Account Value | Account Value | Paid During | |
| Balanced Index Fund | 12/31/2015 | 6/30/2016 | Period |
| Based on Actual Fund Return | |||
| Investor Shares | $1,000.00 | $1,045.20 | $1.07 |
| Admiral Shares | 1,000.00 | 1,045.91 | 0.41 |
| Institutional Shares | 1,000.00 | 1,045.94 | 0.36 |
| Based on Hypothetical 5% Yearly Return | |||
| Investor Shares | $1,000.00 | $1,023.82 | $1.06 |
| Admiral Shares | 1,000.00 | 1,024.47 | 0.40 |
| Institutional Shares | 1,000.00 | 1,024.52 | 0.35 |
The calculations are based on expenses incurred in the most recent six-month period. The fund’s annualized six-month expense ratios for that
period are 0.21% for Investor Shares, 0.08% for Admiral Shares, and 0.07% for Institutional Shares. The dollar amounts shown as “Expenses
Paid” are equal to the annualized expense ratio multiplied by the average account value over the period, multiplied by the number of days in
the most recent six-month period, then divided by the number of days in the most recent 12-month period (182/366).
27
Trustees Approve Advisory Arrangement
The board of trustees of Vanguard Balanced Index Fund has renewed the fund’s investment advisory arrangement with The Vanguard Group, Inc. (Vanguard)—through its Equity Index and Fixed Income Groups. The board determined that continuing the fund’s internalized management structure was in the best interests of the fund and its shareholders.
The board based its decision upon an evaluation of the advisor’s investment staff, portfolio management process, and performance. The trustees considered the factors discussed below, among others. However, no single factor determined whether the board approved the arrangement. Rather, it was the totality of the circumstances that drove the board’s decision.
Nature, extent, and quality of services
The board reviewed the quality of the fund’s investment management services over both the short and long term and took into account the organizational depth and stability of the advisor. The board considered that Vanguard has been managing investments for more than three decades. Both the Equity Index Group and the Fixed Income Group adhere to sound, disciplined investment management processes; each group’s management team has considerable experience, stability, and depth.
The board concluded that Vanguard’s experience, stability, depth, and performance, among other factors, warranted continuation of the advisory arrangement.
Investment performance
The board considered the short- and long-term performance of the fund, including any periods of outperformance or underperformance relative to a target index and peer group. The board concluded that the performance was such that the advisory arrangement should continue. Information about the fund’s most recent performance can be found in the Performance Summary section of this report.
Cost
The board concluded that the fund’s expense ratio was well below the average expense ratio charged by funds in its peer group and that the fund’s advisory fee rate was also well below its peer-group average. Information about the fund’s expenses appears in the About Your Fund’s Expenses section of this report as well as in the Financial Statements section.
The board does not conduct a profitability analysis of Vanguard because of Vanguard’s unique “at-cost” structure. Unlike most other mutual fund management companies, Vanguard is owned by the funds it oversees and produces “profits” only in the form of reduced expenses for fund shareholders.
The benefit of economies of scale
The board concluded that the fund’s at-cost arrangement with Vanguard ensures that the fund will realize economies of scale as it grows, with the cost to shareholders declining as fund assets increase.
The board will consider whether to renew the advisory arrangement again after a one-year period.
28
Glossary
30-Day SEC Yield. A fund’s 30-day SEC yield is derived using a formula specified by the U.S. Securities and Exchange Commission. Under the formula, data related to the fund’s security holdings in the previous 30 days are used to calculate the fund’s hypothetical net income for that period, which is then annualized and divided by the fund’s estimated average net assets over the calculation period. For the purposes of this calculation, a security’s income is based on its current market yield to maturity (for bonds), its actual income (for asset-backed securities), or its projected dividend yield (for stocks). Because the SEC yield represents hypothetical annualized income, it will differ—at times significantly—from the fund’s actual experience. As a result, the fund’s income distributions may be higher or lower than implied by the SEC yield.
Average Coupon. The average interest rate paid on the fixed income securities held by a fund. It is expressed as a percentage of face value.
Average Duration. An estimate of how much the value of the bonds held by a fund will fluctuate in response to a change in interest rates. To see how the value could change, multiply the average duration by the change in rates. If interest rates rise by 1 percentage point, the value of the bonds in a fund with an average duration of five years would decline by about 5%. If rates decrease by a percentage point, the value would rise by 5%.
Average Effective Maturity. The average length of time until fixed income securities held by a fund reach maturity and are repaid, taking into consideration the possibility that the issuer may call the bond before its maturity date. The figure reflects the proportion of fund assets represented by each security; it also reflects any futures contracts held. In general, the longer the average effective maturity, the more a fund’s share price will fluctuate in response to changes in market interest rates.
Beta. A measure of the magnitude of a fund’s past share-price fluctuations in relation to the ups and downs of a given market index. The index is assigned a beta of 1.00. Compared with a given index, a fund with a beta of 1.20 typically would have seen its share price rise or fall by 12% when the index rose or fell by 10%. For this report, beta is based on returns over the past 36 months for both the fund and the index. Note that a fund’s beta should be reviewed in conjunction with its R-squared (see definition). The lower the R-squared, the less correlation there is between the fund and the index, and the less reliable beta is as an indicator of volatility.
Credit Quality. Credit-quality ratings are measured on a scale that generally ranges from AAA (highest) to D (lowest). U.S. Treasury, U.S. Agency, and U.S. Agency mortgage-backed securities appear under “U.S. Government.” Credit-quality ratings are obtained from Barclays and are from Moody’s, Fitch, and S&P. When ratings from all three agencies are used, the median rating is shown. When ratings from two of the agencies are used, the lower rating for each issue is shown. “Not Rated” is used to classify securities for which a rating is not available.
Dividend Yield. The current, annualized rate of dividends paid on a share of stock, divided by its current share price. For a fund, the weighted average yield for stocks it holds. The index yield is based on the current annualized rate of dividends paid on stocks in the index.
Earnings Growth Rate. The average annual rate of growth in earnings over the past five years for the stocks now in a fund.
29
Equity Exposure. A measure that reflects a fund’s investments in stocks and stock futures. Any holdings in short-term reserves are excluded.
Expense Ratio. A fund’s total annual operating expenses expressed as a percentage of the fund’s average net assets. The expense ratio includes management and administrative expenses, but does not include the transaction costs of buying and selling portfolio securities.
Foreign Holdings. The percentage of a fund represented by securities or depositary receipts of companies based outside the United States.
Inception Date. The date on which the assets of a fund (or one of its share classes) are first invested in accordance with the fund’s investment objective. For funds with a subscription period, the inception date is the day after that period ends. Investment performance is measured from the inception date.
Median Market Cap. An indicator of the size of companies in which a fund invests; the midpoint of market capitalization (market price x shares outstanding) of a fund’s stocks, weighted by the proportion of the fund’s assets invested in each stock. Stocks representing half of the fund’s assets have market capitalizations above the median, and the rest are below it.
Price/Book Ratio. The share price of a stock divided by its net worth, or book value, per share. For a fund, the weighted average price/book ratio of the stocks it holds.
Price/Earnings Ratio. The ratio of a stock’s current price to its per-share earnings over the past year. For a fund, the weighted average P/E of the stocks it holds. P/E is an indicator of market expectations about corporate prospects; the higher the P/E, the greater the expectations for a company’s future growth.
R-Squared. A measure of how much of a fund’s past returns can be explained by the returns from the market in general, as measured by a given index. If a fund’s total returns were precisely synchronized with an index’s returns, its R-squared would be 1.00. If the fund’s returns bore no relationship to the index’s returns, its R-squared would be 0. For this report, R-squared is based on returns over the past 36 months for both the fund and the index.
Return on Equity. The annual average rate of return generated by a company during the past five years for each dollar of shareholder’s equity (net income divided by shareholder’s equity). For a fund, the weighted average return on equity for the companies whose stocks it holds.
Short-Term Reserves. The percentage of a fund invested in highly liquid, short-term securities that can be readily converted to cash.
Turnover Rate. An indication of the fund’s trading activity. Funds with high turnover rates incur higher transaction costs and may be more likely to distribute capital gains (which may be taxable to investors). The turnover rate excludes in-kind transactions, which have minimal impact on costs.
Yield to Maturity. The rate of return an investor would receive if the fixed income securities held by a fund were held to their maturity dates.
30
Benchmark Information
Balanced Composite Index: Weighted 60% Dow Jones U.S. Total Stock Market Index (formerly known as the Dow Jones Wilshire 5000 Index) and 40% Lehman Brothers U.S. Aggregate Bond Index through May 31, 2005; 60% MSCI US Broad Market Index and 40% Barclays U.S. Aggregate Bond Index through December 31, 2009; 60% MSCI US Broad Market Index and 40% Barclays U.S. Aggregate Float Adjusted Index through January 14, 2013; and 60% CRSP US Total Market Index and 40% Barclays U.S. Aggregate Float Adjusted Index thereafter.
31
The People Who Govern Your Fund
The trustees of your mutual fund are there to see that the fund is operated and managed in your best interests since, as a shareholder, you are a part owner of the fund. Your fund’s trustees also serve on the board of directors of The Vanguard Group, Inc., which is owned by the Vanguard funds and provides services to them on an at-cost basis.
A majority of Vanguard’s board members are independent, meaning that they have no affiliation with Vanguard or the funds they oversee, apart from the sizable personal investments they have made as private individuals. The independent board members have distinguished backgrounds in business, academia, and public service. Each of the trustees and executive officers oversees 198 Vanguard funds.
The following table provides information for each trustee and executive officer of the fund. More information about the trustees is in the Statement of Additional Information, which can be obtained, without charge, by contacting Vanguard at 800-662-7447, or online at vanguard.com.
| InterestedTrustee1 | Rajiv L. Gupta |
| Born 1945. Trustee Since December 2001.2 Principal | |
| F. William McNabb III | Occupation(s) During the Past Five Years and Other |
| Born 1957. Trustee Since July 2009. Chairman of | Experience: Chairman and Chief Executive Officer |
| the Board. Principal Occupation(s) During the Past | (retired 2009) and President (2006–2008) of |
| Five Years and Other Experience: Chairman of the | Rohm and Haas Co. (chemicals); Director of Tyco |
| Board of The Vanguard Group, Inc., and of each of | International plc (diversified manufacturing and |
| the investment companies served by The Vanguard | services), HP Inc. (printer and personal computer |
| Group, since January 2010; Director of The Vanguard | manufacturing), and Delphi Automotive plc |
| Group since 2008; Chief Executive Officer and | (automotive components); Senior Advisor at |
| President of The Vanguard Group, and of each of | New Mountain Capital. |
| the investment companies served by The Vanguard | |
| Group, since 2008; Director of Vanguard Marketing | Amy Gutmann |
| Corporation; Managing Director of The Vanguard | Born 1949. Trustee Since June 2006. Principal |
| Group (1995–2008). | Occupation(s) During the Past Five Years and |
| Other Experience: President of the University of | |
| IndependentTrustees | Pennsylvania; Christopher H. Browne Distinguished |
| Professor of Political Science, School of Arts and | |
| Emerson U. Fullwood | Sciences, and Professor of Communication, Annenberg |
| Born 1948. Trustee Since January 2008. Principal | School for Communication, with secondary faculty |
| Occupation(s) During the Past Five Years and Other | appointments in the Department of Philosophy, School |
| Experience: Executive Chief Staff and Marketing | of Arts and Sciences, and at the Graduate School of |
| Officer for North America and Corporate Vice President | Education, University of Pennsylvania; Trustee of the |
| (retired 2008) of Xerox Corporation (document manage- | National Constitution Center; Chair of the Presidential |
| ment products and services); Executive in Residence | Commission for the Study of Bioethical Issues. |
| and 2009–2010 Distinguished Minett Professor at | |
| the Rochester Institute of Technology; Lead Director | JoAnn Heffernan Heisen |
| of SPX FLOW, Inc. (multi-industry manufacturing); | Born 1950. Trustee Since July 1998. Principal |
| Director of the United Way of Rochester, the University | Occupation(s) During the Past Five Years and |
| of Rochester Medical Center, Monroe Community | Other Experience: Corporate Vice President and |
| College Foundation, North Carolina A&T University, | Chief Global Diversity Officer (retired 2008) and |
| and Roberts Wesleyan College. | Member of the Executive Committee (1997–2008) |
| of Johnson & Johnson (pharmaceuticals/medical | |
| devices/consumer products); Director of Skytop | |
| Lodge Corporation (hotels) and the Robert Wood | |
| Johnson Foundation; Member of the Advisory | |
| Board of the Institute for Women’s Leadership | |
| at Rutgers University. |
| F. Joseph Loughrey | Executive Officers | |
| Born 1949. Trustee Since October 2009. Principal | ||
| Occupation(s) During the Past Five Years and Other | Glenn Booraem | |
| Experience: President and Chief Operating Officer | Born 1967. Treasurer Since May 2015. Principal | |
| (retired 2009) of Cummins Inc. (industrial machinery); | Occupation(s) During the Past Five Years and | |
| Chairman of the Board of Hillenbrand, Inc. (specialized | Other Experience: Principal of The Vanguard Group, | |
| consumer services), and of Oxfam America; Director | Inc.; Treasurer of each of the investment companies | |
| of SKF AB (industrial machinery), Hyster-Yale Materials | served by The Vanguard Group; Controller of each of | |
| Handling, Inc. (forklift trucks), the Lumina Foundation | the investment companies served by The Vanguard | |
| for Education, and the V Foundation for Cancer | Group (2010–2015); Assistant Controller of each of | |
| Research; Member of the Advisory Council for the | the investment companies served by The Vanguard | |
| College of Arts and Letters and of the Advisory Board | Group (2001–2010). | |
| to the Kellogg Institute for International Studies, both | ||
| at the University of Notre Dame. | Thomas J. Higgins | |
| Born 1957. Chief Financial Officer Since September | ||
| Mark Loughridge | 2008. Principal Occupation(s) During the Past Five | |
| Born 1953. Trustee Since March 2012. Principal | Years and Other Experience: Principal of The Vanguard | |
| Occupation(s) During the Past Five Years and Other | Group, Inc.; Chief Financial Officer of each of the | |
| Experience: Senior Vice President and Chief Financial | investment companies served by The Vanguard Group; | |
| Officer (retired 2013) at IBM (information technology | Treasurer of each of the investment companies served | |
| services); Fiduciary Member of IBM’s Retirement Plan | by The Vanguard Group (1998–2008). | |
| Committee (2004–2013); Director of the Dow Chemical | ||
| Company; Member of the Council on Chicago Booth. | Peter Mahoney | |
| Born 1974. Controller Since May 2015. Principal | ||
| Scott C. Malpass | Occupation(s) During the Past Five Years and | |
| Born 1962. Trustee Since March 2012. Principal | Other Experience: Head of Global Fund Accounting | |
| Occupation(s) During the Past Five Years and Other | at The Vanguard Group, Inc.; Controller of each of the | |
| Experience: Chief Investment Officer and Vice | investment companies served by The Vanguard Group; | |
| President at the University of Notre Dame; Assistant | Head of International Fund Services at The Vanguard | |
| Professor of Finance at the Mendoza College of | Group (2008–2014). | |
| Business at Notre Dame; Member of the Notre Dame | ||
| 403(b) Investment Committee, the Board of Advisors | Heidi Stam | |
| for Spruceview Capital Partners, and the Investment | Born 1956. Secretary Since July 2005. Principal | |
| Advisory Committee of Major League Baseball; Board | Occupation(s) During the Past Five Years and Other | |
| Member of TIFF Advisory Services, Inc., and Catholic | Experience: Managing Director of The Vanguard | |
| Investment Services, Inc. (investment advisors). | Group, Inc.; General Counsel of The Vanguard Group; | |
| Secretary of The Vanguard Group and of each of the | ||
| André F. Perold | investment companies served by The Vanguard Group; | |
| Born 1952. Trustee Since December 2004. Principal | Director and Senior Vice President of Vanguard | |
| Occupation(s) During the Past Five Years and Other | Marketing Corporation. | |
| Experience: George Gund Professor of Finance and | ||
| Banking, Emeritus at the Harvard Business School | Vanguard Senior ManagementTeam | |
| (retired 2011); Chief Investment Officer and Managing | Mortimer J. Buckley | James M. Norris |
| Partner of HighVista Strategies LLC (private investment | Kathleen C. Gubanich | Thomas M. Rampulla |
| firm); Director of Rand Merchant Bank; Overseer of | Martha G. King | Glenn W. Reed |
| the Museum of Fine Arts Boston. | John T. Marcante | Karin A. Risi |
| Chris D. McIsaac | Michael Rollings | |
| Peter F. Volanakis | ||
| Born 1955. Trustee Since July 2009. Principal | ||
| Occupation(s) During the Past Five Years and Other | Chairman Emeritus and Senior Advisor | |
| Experience: President and Chief Operating Officer | ||
| (retired 2010) of Corning Incorporated (communications | ||
| equipment); Trustee of Colby-Sawyer College and | John J. Brennan | |
| Chairman of its Finance and Enrollment Committee; | Chairman, 1996–2009 | |
| Member of the Advisory Board of the Norris Cotton | Chief Executive Officer and President, 1996–2008 | |
| Cancer Center. | ||
| Founder | ||
| John C. Bogle | ||
| Chairman and Chief Executive Officer, 1974–1996 | ||
1 Mr. McNabb is considered an “interested person,” as defined in the Investment Company Act of 1940, because he is an officer of the Vanguard funds.
2 December 2002 for Vanguard Equity Income Fund, the Vanguard Municipal Bond Funds, and the Vanguard State Tax-Exempt Funds.
 | |
| P.O. Box 2600 | |
| Valley Forge, PA 19482-2600 | |
| Connect with Vanguard® > vanguard.com | |
| Fund Information > 800-662-7447 | |
| Direct Investor Account Services > 800-662-2739 | |
| Institutional Investor Services > 800-523-1036 | |
| Text Telephone for People | |
| Who Are Deaf or Hard of Hearing> 800-749-7273 | |
| This material may be used in conjunction | |
| with the offering of shares of any Vanguard | |
| fund only if preceded or accompanied by | |
| the fund’s current prospectus. | |
| All comparative mutual fund data are from Lipper, a | |
| Thomson Reuters Company, or Morningstar, Inc., unless | |
| otherwise noted. | |
| You can obtain a free copy of Vanguard’s proxy voting | |
| guidelines by visiting vanguard.com/proxyreporting or by | |
| calling Vanguard at 800-662-2739. The guidelines are | |
| also available from the SEC’s website, sec.gov. In | |
| addition, you may obtain a free report on how your fund | |
| voted the proxies for securities it owned during the 12 | |
| months ended June 30. To get the report, visit either | |
| vanguard.com/proxyreporting or sec.gov. | |
| You can review and copy information about your fund at | |
| the SEC’s Public Reference Room in Washington, D.C. To | |
| find out more about this public service, call the SEC at | |
| 202-551-8090. Information about your fund is also | |
| available on the SEC’s website, and you can receive | |
| copies of this information, for a fee, by sending a | |
| request in either of two ways: via email addressed to | |
| publicinfo@sec.gov or via regular mail addressed to the | |
| Public Reference Section, Securities and Exchange | |
| Commission, Washington, DC 20549-1520. | |
| © 2016 The Vanguard Group, Inc. | |
| All rights reserved. | |
| Vanguard Marketing Corporation, Distributor. | |
| Q022 082016 | |
Semiannual Report | June 30, 2016
Vanguard Managed Payout Fund
Vanguard’s Principles for Investing Success
We want to give you the best chance of investment success. These principles, grounded in Vanguard’s research and experience, can put you on the right path.
Goals. Create clear, appropriate investment goals.
Balance. Develop a suitable asset allocation using broadly diversified funds. Cost. Minimize cost.
Discipline. Maintain perspective and long-term discipline.
A single theme unites these principles: Focus on the things you can control.
We believe there is no wiser course for any investor.
| Contents | |
| Your Fund’s Total Returns. | 1 |
| Chairman’s Letter. | 2 |
| Advisor’s Report. | 6 |
| Fund Profile. | 9 |
| Performance Summary. | 10 |
| Financial Statements. | 11 |
| About Your Fund’s Expenses. | 22 |
| Trustees Approve Advisory Arrangement. | 24 |
| Glossary. | 25 |
Please note: The opinions expressed in this report are just that—informed opinions. They should not be considered promises or advice.
Also, please keep in mind that the information and opinions cover the period through the date on the front of this report. Of course, the
risks of investing in your fund are spelled out in the prospectus.
See the Glossary for definitions of investment terms used in this report.
About the cover: Pictured is a sailing block on the Brilliant, a 1932 schooner docked in Mystic, Connecticut. A type of pulley, the
sailing block helps coordinate the setting of the sails. At Vanguard, the intricate coordination of technology and people allows
us to help millions of clients around the world reach their financial goals.
Your Fund’s Total Returns
| Six Months Ended June 30, 2016 | |
| Total | |
| Returns | |
| Vanguard Managed Payout Fund | 4.38% |
| Managed Payout Composite Index | 4.03 |
For a benchmark description, see the Glossary.
Vanguard owns a pending patent application for its Managed Payout Fund under U.S. Patent Application No. 2009-0076980-A1.
| Your Fund’s Performance at a Glance | |||||
| December 31, 2015, Through June 30, 2016 | |||||
| Distributions Per Share | |||||
| Starting | Ending | Income | Capital | Return of | |
| Share Price | Share Price | Dividends | Gains | Capital | |
| Vanguard Managed Payout Fund | $17.33 | $17.72 | $0.353 | $0.000 | $0.000 |
The fund pays monthly and other distributions that may include some combination of dividend income, return of capital, and capital gains. The
tax characteristics of these distributions, however, cannot be determined until after the end of the year.
1

Chairman’s Letter
Dear Shareholder,
The six-month period ended June 30, 2016, was a challenging one for many investment strategies, especially as stock markets rode a roller coaster. Nonetheless, the balanced holdings of Vanguard Managed Payout Fund helped it return a solid 4.38%, a bit ahead of its composite benchmark index.
As a reminder, the fund’s benchmark consists of three primary asset classes: 60% equities (36% U.S. and 24% international), 35% fixed income (24.5% U.S. and 10.5% currencyhedged international bonds), and 5% commodities. From time to time, the fund’s advisor, Vanguard Quantitative Equity Group, adjusts its investment allocations, although it made no strategic shifts during the period.
The wide range in returns of the fund’s eight underlying Vanguard funds, plus its small stake in commoditylinked investments, helped underscore the benefits of diversification. For example, commodities advanced by double digits, developed international stock markets were about flat, and Vanguard Market Neutral Fund lost ground.
The road was bumpy again for global stock markets
The longanticipated U.K. referendum on whether to remain in the European Union was the defining event of capital markets during the first half of 2016. Uncertainty before the June 23 “Brexit” vote led
2
to increased volatility in stock markets. Stocks then tumbled sharply after the decision to leave before regaining some ground by the end of June. Because the vote has significant global economic implications, and it will take considerable time for details to be worked out, uncertainty is likely to persist.
The broad U.S. stock market returned roughly 4% for the half year. International stocks had a rougher time, returning about –1%. European stocks in particular slumped as the uncertainty before and after the Brexit vote hit closer to home. Developed Pacific markets also retreated. Emergingmarket stocks were a bright spot, returning nearly 8%.
Bonds rolled to strong returns as investors weighed options
The broad U.S. bond market returned 5.31% as investors sought safehaven assets amid concerns about the global growth pace, low inflation, and stock market volatility. Exceptionally low or negative yields abroad attracted foreign investors to the stillpositive yields offered by U.S. bonds. The yield of the 10year U.S. Treasury note closed at 1.47% at the end of June, down from 2.30% at the end of December. (Bond prices and yields move in opposite directions.)
The Federal Reserve has held its target for shortterm interest rates steady since raising it a quarter percentage point in December. The still historically low
| Market Barometer | |||
| Total Returns | |||
| Periods Ended June 30, 2016 | |||
| Six | One | Five Years | |
| Months | Year | (Annualized) | |
| Stocks | |||
| Russell 1000 Index (Large-caps) | 3.74% | 2.93% | 11.88% |
| Russell 2000 Index (Small-caps) | 2.22 | -6.73 | 8.35 |
| Russell 3000 Index (Broad U.S. market) | 3.62 | 2.14 | 11.60 |
| FTSE All-World ex US Index (International) | -0.92 | -9.75 | 0.49 |
| Bonds | |||
| Barclays U.S. Aggregate Bond Index (Broad taxable market) | 5.31% | 6.00% | 3.76% |
| Barclays Municipal Bond Index (Broad tax-exempt market) | 4.33 | 7.65 | 5.33 |
| Citigroup Three-Month U.S. Treasury Bill Index | 0.11 | 0.14 | 0.05 |
| CPI | |||
| Consumer Price Index | 1.91% | 1.01% | 1.32% |
3
0.25%–0.5% rate continued to curb returns for money market funds and savings accounts.
International bond markets (as measured by the Barclays Global Aggregate Index ex USD) returned 11.94% for U.S. investors. Although Britain’s pound sank to multidecade lows against the dollar after the Brexit vote, some other foreign currencies strengthened during the six months, lifting bond returns when translated into dollars. Even without this currency benefit, international bond results were solid.
In a turnabout, both commodities and emerging-market stocks rose
To meet its investment objective of a 4% target annual distribution rate, Vanguard Managed Payout Fund invests in a welldiversified portfolio that includes traditional Vanguard stock and bond funds, Vanguard funds that seek returns less correlated with the markets, and a small slice of commodities exposure. The sixmonth results for some of these investments differed dramatically from their performance for all of 2015.
The fund’s commoditylinked investments, which constitute only about 5% of its total assets, are a case in point. In 2015, the Bloomberg Commodity Index returned about –25%. Over the first half of 2016, it advanced about 13%, despite another drop in oil prices early in the year.
Emergingmarket stocks displayed a similar pattern. Vanguard Emerging Markets Stock Index Fund returned about –15% in 2015, but a rise approaching 8% made it your fund’s secondbest performer so far this year.
Returns of four underlying funds ranged from more than 5% to more than 6%: Vanguard Global Minimum Volatility Fund, Vanguard Total International Bond Index Fund, Vanguard Total Bond Market II Index Fund, and the relatively new Vanguard Alternative Strategies Fund. Vanguard Total Stock Market Index Fund returned more than 3%, while its international counterpart—Vanguard Total International Stock Index Fund—was about breakeven. Each of those two broad equity funds constituted about 20% of Managed Payout’s assets at the end of June. Vanguard Market Neutral Fund, after an exceptionally strong performance in 2015, returned about –2% for the six months.
For more on your fund’s positioning and the advisor’s strategy during the period, please see the Advisor’s Report that follows this letter.
A dose of discipline is crucial when markets become volatile
The heightened volatility in capital markets that surrounded the Brexit vote reminds us that nobody can control the direction of the markets or reliably predict where they’ll go in the short term. However, investors can control how they react to unstable and turbulent markets.
During periods of market adversity, it’s more important than ever to keep sight of one of Vanguard’s key principles:
4
Maintain perspective and longterm discipline. Whether you’re investing for yourself or on behalf of clients, your success is affected greatly by how you respond—or don’t respond—during turbulent markets. (You can read Vanguard’s Principles for Investing Success at vanguard.com/research.)
As I’ve written in the past, the best course for longterm investors is generally to ignore daily market moves and not make decisions based on emotion. This is also a good time to evaluate your portfolio and make sure your asset allocation is aligned with your time horizon, goals, and risk tolerance. Of course, within the Managed Payout Fund, asset allocation is overseen by our Quantitative Equity Group.
The markets are unpredictable and often confounding. Keeping your longterm plans clearly in focus can help you weather these periodic storms.
Thank you for your confidence in Vanguard.
Sincerely,

F. William McNabb III
Chairman and Chief Executive Officer
July 20, 2016
5
Advisor’s Report
For the six months ended June 30, 2016, Vanguard Managed Payout Fund returned 4.38%, marginally ahead of the 4.03% return of its composite benchmark.
Investment objective
The Managed Payout Fund has two objectives. In any given year, we seek to outperform the benchmark on a riskadjusted basis. Over the long run, we seek to produce an absolute return that matches the 4% target distribution rate plus inflation. For the three and fiveyear periods through June 2016, the fund met both objectives.
As with any active fund, both objectives are challenging, especially achieving the total return objective over time. The Managed Payout Fund’s return can fluctuate significantly over short periods, because it depends on the performance of the stock and bond markets. We do our best to protect investors from shortterm volatility by having a balanced, diversified asset allocation and through our fund selection. At the same time, we always focus on identifying valueadded opportunities using qualitative and quantitative tools within a riskmanaged approach.
Successes and challenges
Most children enjoy a good rollercoaster ride and the feeling of defying gravity, careening up and down without being much in control. The opposite can be said about investors when it comes to their portfolio. On the one hand, volatility can create investing opportunities, but on the other, it is the enemy of asset accumulation and growth. For example, if your portfolio lost 20%, you’d need a 25% recovery to fully recoup your losses. We should always think about returns cumulatively because the path your portfolio takes determines the future value of your assets.
The first half of 2016 was certainly volatile. It began with a negative outlook on Chinese growth and a strong stock selloff that persisted into February. The Federal Reserve’s view then shifted to dovish, and interest rate hawkishness was quickly forgotten by the stock market. Then came the June crash over the United Kingdom’s “Brexit” vote, followed by a swift recovery.
Despite the volatility, the broad U.S. market’s return approached 4%, and the three index funds in the longonly equity basket (Vanguard Total Stock Market Index Fund, Vanguard Total International Stock Index Fund, and Vanguard Emerging Markets Stock Index Fund) all advanced. The actively managed Vanguard Global Minimum Volatility Fund returned more than 6%, well ahead of its benchmark.
Although we matched the total equity weight of the Managed Payout Fund’s composite benchmark, our allocation decisions within equities primarily drove our outperformance. We entered 2016 with a tilt toward emerging markets, based on their attractive valuation. This view was rewarded, as emerging markets outperformed both U.S. and international developed markets—partly because of the depreciating U.S. dollar.
6
We maintained about a 15% stake in Vanguard Global Minimum Volatility Fund, out of concern about stock market volatility. That fund can be expected to outperform the overall global market during sharp downturns while lagging in strong bull markets. The Chicago Board Options Exchange Volatility Index (VIX) spiked in January and February amid extremely volatile crude oil prices and concerns about China’s growth pace, and again in June because of Brexit. June started relatively calm with the VIX at 14.2, but then it spiked to nearly 26 before finishing at 15.6. Instability led to strong relative performance by the Global Minimum Volatility Fund compared with the equity composition of the Managed Payout Fund’s benchmark.
Fixed income markets also saw a lot of action. Uncertainty about the economy and stock markets led the Fed to pull back on further tightening, and interest rates reflected this. The U.S. Treasury 10year yield, which started 2016 at 2.30%, declined to 1.47%.
Geopolitical risk was also reflected in international rates; Brexit was a catalyst that accelerated those yield declines. Central bank policies to combat low inflation and weak growth drove many developed nations’ bonds into record negative nominal yields, including 10year government bonds in Germany, Japan, and Switzerland. As rates continued to fall, Managed Payout’s underlying bond funds performed well.
We entered the year with a belowbenchmark allocation to fixed income, because we did not expect rates to decline further and did not want to tie up our assets in lowcarry products. This view held back our firsthalf results.
However, our underweighting of fixed income allowed us to invest in Vanguard Alternative Strategies Fund, which uses a combination of five alternative strategies that span multiple asset classes: equity, fixed income, currency, and commoditylinked investments. This fund returned more than 5% for the period, beating its benchmark and helping Managed Payout’s return. The alternative premium nature of that underlying investment further diversifies our portfolio to achieve shortand longterm goals.
Over the last several years, Vanguard Market Neutral Fund has provided strong returns, but this period was challenging—especially the second quarter, when it detracted from the Managed Payout Fund’s results.
Commodities, the ugly duckling of 2015, turned into a swan in 2016. They were our bestperforming investment, returning more than 13%. We do not have an active view on commodities, but we believe that this category is an important part of our diversified portfolio.
7
Positioning
We remain strong believers in the attractive relative valuation of emerging markets and maintain our tilt toward their stocks. We expect the Global Minimum Volatility Fund to continue providing some protection from geopolitical volatility. Amid continued low interest rates, the rate carry on global bonds will remain under pressure for the foreseeable future. Given that we do not anticipate robust fixed income returns, we will continue to hold the Market Neutral and Alternative Strategies Funds, mindful that this exposes us to duration risk (relative to the composite benchmark) if rates move even lower.
Market volatility can destroy value but at the same time create opportunities, which we continually evaluate.
Thank you for entrusting us with your investments.
Portfolio Managers:
John Ameriks, Principal
Anatoly Shtekhman, CFA
Vanguard Quantitative Equity Group
July 21, 2016
8
Managed Payout Fund
Fund Profile
As of June 30, 2016
| Total Fund Characteristics | |
| Ticker Symbol | VPGDX |
| 30-Day SEC Yield | 1.68% |
| Acquired Fund Fees and Expenses1 | 0.38% |
| Allocation to Underlying Investments | |
| Vanguard Total International Stock Index | |
| Fund Investor Shares | 20.0% |
| Vanguard Total Stock Market Index Fund | |
| Investor Shares | 20.0 |
| Vanguard Global Minimum Volatility Fund | |
| Investor Shares | 15.4 |
| Vanguard Total Bond Market II Index Fund | |
| Investor Shares | 11.8 |
| Vanguard Alternative Strategies Fund | |
| Investor Shares | 10.1 |
| Vanguard Market Neutral Fund Investor | |
| Shares | 6.8 |
| Vanguard Total International Bond Index | |
| Fund Investor Shares | 5.9 |
| Vanguard Emerging Markets Stock Index | |
| Fund Investor Shares | 5.1 |
| Commodities | 4.9 |
| Total Fund Volatility Measures | ||
| Managed | DJ | |
| Payout | U.S. Total | |
| Composite | Market | |
| Index | FA Index | |
| R-Squared | 0.96 | 0.88 |
| Beta | 0.94 | 0.56 |
| These measures show the degree and timing of the fund’s fluctuations compared with the indexes over 36 months. | ||
Fund Asset Allocation
1 This figure—drawn from the prospectus dated April 26, 2016—represents an estimate of the weighted average of the expense ratios and any
transaction fees charged by the underlying mutual funds (the ”acquired” funds) in which the Managed Payout Fund invests. For the six months ended
June 30, 2016, the fund’s annualized expense figure totals 0.35%, representing the fund’s own annualized expense ratio of 0.02% together with
acquired fund fees and expenses of 0.33%. (Approximately 37% of the total expenses are attributable to the short-sale dividend and borrowing
expenses reported by Vanguard Market Neutral Fund and Vanguard Alternative Strategies Fund.)
9
Managed Payout Fund
Performance Summary
All of the returns in this report represent past performance, which is not a guarantee of future results that may be achieved by the fund. (Current performance may be lower or higher than the performance data cited. For performance data current to the most recent month-end, visit our website at vanguard.com/performance.) Note, too, that both investment returns and principal value can fluctuate widely, so an investor’s shares, when sold, could be worth more or less than their original cost. The returns shown do not reflect taxes that a shareholder would pay on fund distributions or on the sale of fund shares.
Fiscal-Year Total Returns (%): May 2, 2008, Through June 30, 2016
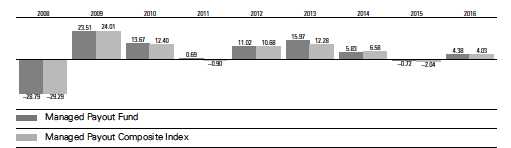
| Average Annual Total Returns: Periods Ended June 30, 2016 | ||||||
| Since Inception | ||||||
| Inception Date | One Year | Five Years | Income | Capital | Total | |
| Managed Payout Fund | 5/2/2008 | 1.41% | 6.16% | 3.00% | 1.40% | 4.40% |
See Financial Highlights for dividend and capital gains information.
10
Managed Payout Fund
Consolidated Financial Statements (unaudited)
Consolidated Statement of Net Assets
As of June 30, 2016
The fund reports a complete list of its holdings in regulatory filings four times in each fiscal year, at the quarter-ends. For the second and fourth fiscal quarters, the lists appear in the fund’s semiannual and annual reports to shareholders. For the first and third fiscal quarters, the fund files the lists with the Securities and Exchange Commission on Form N-Q. Shareholders can look up the fund’s Forms N-Q on the SEC’s website at sec.gov. Forms N-Q may also be reviewed and copied at the SEC’s Public Reference Room (see the back cover of this report for further information).
| Market | ||||
| Value• | ||||
| Shares | ($000) | |||
| Investment Companies (95.2%) | ||||
| U.S. Stock Fund (20.0%) | ||||
| Vanguard Total Stock Market Index Fund Investor Shares | 6,275,516 | 327,268 | ||
| Global Stock Fund (15.4%) | ||||
| Vanguard Global Minimum Volatility Fund Investor Shares | 20,949,483 | 252,022 | ||
| International Stock Funds (25.1%) | ||||
| Vanguard Total International Stock Index Fund Investor Shares | 22,929,557 | 327,434 | ||
| Vanguard Emerging Markets Stock Index Fund Investor Shares | 3,722,508 | 82,826 | ||
| 410,260 | ||||
| U.S. Bond Fund (11.9%) | ||||
| 1 Vanguard Total Bond Market II Index Fund Investor Shares | 17,569,097 | 194,139 | ||
| International Bond Fund (5.9%) | ||||
| Vanguard Total International Bond Index Fund Investor Shares | 8,672,579 | 96,352 | ||
| Alternative Funds (16.9%) | ||||
| Vanguard Alternative Strategies Fund Investor Shares | 7,626,976 | 164,971 | ||
| Vanguard Market Neutral Fund Investor Shares | 9,417,090 | 111,310 | ||
| 276,281 | ||||
| Total Investment Companies (Cost $1,361,724) | 1,556,322 | |||
| Temporary Cash Investments (4.7%) | ||||
| Money Market Fund (0.0%) | ||||
| 1 Vanguard Market Liquidity Fund, 0.538% | 110,701 | 111 | ||
| Face | ||||
| Maturity | Amount | |||
| Coupon | Date | ($000) | ||
| U.S. Government and Agency Obligations (4.7%) | ||||
| 2,3 Fannie Mae Discount Notes | 0.310% | 7/6/16 | 2,154 | 2,154 |
| 2,3 Fannie Mae Discount Notes | 0.320% | 7/19/16 | 500 | 500 |
| 2,3 Fannie Mae Discount Notes | 0.320% | 7/25/16 | 889 | 889 |
| 2,3 Fannie Mae Discount Notes | 0.300% | 8/3/16 | 9,177 | 9,175 |
| 2,3 Fannie Mae Discount Notes | 0.300% | 8/10/16 | 3,100 | 3,099 |
| 2,3 Fannie Mae Discount Notes | 0.300%–0.330% | 8/15/16 | 985 | 985 |
11
Managed Payout Fund
| Face | Market | |||
| Maturity | Amount | Value• | ||
| Coupon | Date | ($000) | ($000) | |
| 2,3 Fannie Mae Discount Notes | 0.310%–0.390% | 8/17/16 | 3,737 | 3,736 |
| 2,3 Fannie Mae Discount Notes | 0.390% | 8/24/16 | 250 | 250 |
| 2,3 Fannie Mae Discount Notes | 0.430% | 9/2/16 | 1,600 | 1,599 |
| 2,3 Fannie Mae Discount Notes | 0.441% | 9/6/16 | 500 | 500 |
| 2,3 Fannie Mae Discount Notes | 0.370% | 9/7/16 | 587 | 587 |
| 3,4 Federal Home Loan Bank Discount Notes | 0.350% | 7/1/16 | 301 | 301 |
| 3,4 Federal Home Loan Bank Discount Notes | 0.350% | 7/7/16 | 860 | 860 |
| 3,4 Federal Home Loan Bank Discount Notes | 0.360% | 7/11/16 | 300 | 300 |
| 3,4 Federal Home Loan Bank Discount Notes | 0.370%–0.380% | 7/14/16 | 1,162 | 1,162 |
| 3,4 Federal Home Loan Bank Discount Notes | 0.400%–0.420% | 7/19/16 | 861 | 861 |
| 3,4 Federal Home Loan Bank Discount Notes | 0.370% | 7/20/16 | 153 | 153 |
| 3,4 Federal Home Loan Bank Discount Notes | 0.380% | 7/21/16 | 259 | 259 |
| 3,4 Federal Home Loan Bank Discount Notes | 0.310%–0.380% | 7/22/16 | 4,359 | 4,358 |
| 3,4 Federal Home Loan Bank Discount Notes | 0.350%–0.400% | 7/27/16 | 1,143 | 1,143 |
| 3,4 Federal Home Loan Bank Discount Notes | 0.310% | 7/29/16 | 640 | 640 |
| 3,4 Federal Home Loan Bank Discount Notes | 0.350% | 8/1/16 | 1,885 | 1,884 |
| 3,4 Federal Home Loan Bank Discount Notes | 0.350%–0.360% | 8/5/16 | 6,247 | 6,245 |
| 3,4 Federal Home Loan Bank Discount Notes | 0.350% | 8/9/16 | 300 | 300 |
| 3,4 Federal Home Loan Bank Discount Notes | 0.460% | 8/12/16 | 1,000 | 1,000 |
| 3,4 Federal Home Loan Bank Discount Notes | 0.350% | 8/15/16 | 300 | 300 |
| 3,4 Federal Home Loan Bank Discount Notes | 0.390% | 9/2/16 | 1,551 | 1,550 |
| 3,4 Federal Home Loan Bank Discount Notes | 0.410%–0.430% | 9/9/16 | 1,300 | 1,299 |
| 3,4 Federal Home Loan Bank Discount Notes | 0.410% | 9/21/16 | 500 | 500 |
| 2,3 Freddie Mac Discount Notes | 0.310%–0.330% | 7/5/16 | 4,603 | 4,603 |
| 2,3 Freddie Mac Discount Notes | 0.300%–0.350% | 7/13/16 | 3,298 | 3,298 |
| 2,3 Freddie Mac Discount Notes | 0.310% | 8/3/16 | 965 | 965 |
| 2,3 Freddie Mac Discount Notes | 0.390%–0.400% | 8/26/16 | 1,555 | 1,554 |
| 2,3 Freddie Mac Discount Notes | 0.411% | 9/2/16 | 300 | 300 |
| 2,3 Freddie Mac Discount Notes | 0.400% | 9/6/16 | 440 | 440 |
| 2,3 Freddie Mac Discount Notes | 0.400% | 9/9/16 | 879 | 878 |
| 2,3 Freddie Mac Discount Notes | 0.370% | 9/13/16 | 3,000 | 2,998 |
| 2,3 Freddie Mac Discount Notes | 0.411% | 10/20/16 | 1,615 | 1,613 |
| 3 United States Treasury Note/Bond | 0.500% | 7/31/16 | 430 | 430 |
| 3,5 United States Treasury Note/Bond | 4.875% | 8/15/16 | 12,677 | 12,746 |
| 3 United States Treasury Note/Bond | 0.875% | 9/15/16 | 951 | 952 |
| 77,366 | ||||
| Total Temporary Cash Investments (Cost $77,473) | 77,477 | |||
| Total Investments (99.9%) (Cost $1,439,197) | 1,633,799 | |||
12
Managed Payout Fund
| Amount | |
| ($000) | |
| Other Assets and Liabilities (0.1%) | |
| Other Assets | |
| Receivables for Investment Securities Sold | 3,199 |
| Receivables for Accrued Income | 4,113 |
| Receivables for Capital Shares Issued | 763 |
| Other Assets | 1 |
| Total Other Assets | 8,076 |
| Liabilities | |
| Payables for Investment Securities Purchased | (4,867) |
| Payables for Capital Shares Redeemed | (739) |
| Payables to Vanguard | (22) |
| Other Liabilities | (3) |
| Total Liabilities | (5,631) |
| Net Assets (100%) | |
| Applicable to 92,353,810 outstanding $.001 par value shares of | |
| beneficial interest (unlimited authorization) | 1,636,244 |
| Net Asset Value Per Share | $17.72 |
| At June 30, 2016, net assets consisted of: | |
| Amount | |
| ($000) | |
| Paid-in Capital | 1,451,443 |
| Overdistributed Net Investment Income | (10,857) |
| Accumulated Net Realized Gains | 1,056 |
| Unrealized Appreciation (Depreciation) | 194,602 |
| Net Assets | 1,636,244 |
• See Note A in Notes to Financial Statements.
1 Affiliated fund available only to Vanguard funds and certain trusts and accounts managed by Vanguard. Rate shown for Vanguard Market
Liquidity Fund is the 7-day yield.
2 The issuer was placed under federal conservatorship in September 2008; since that time, its daily operations have been managed by the
Federal Housing Finance Agency and it receives capital from the U.S. Treasury, as needed to maintain a positive net worth, in exchange
for senior preferred stock.
3 Security is owned by the Vanguard MPF Portfolio, which is a wholly owned subsidiary of the Managed Payout Fund.
4 The issuer operates under a congressional charter; its securities are generally neither guaranteed by the U.S. Treasury nor backed by the
full faith and credit of the U.S. government.
5 Securities with a value of $2,362,000 have been segregated as collateral for open over-the-counter swap contracts.
See accompanying Notes, which are an integral part of the Financial Statements.
13
Managed Payout Fund
Consolidated Statement of Operations
| Six Months Ended | |
| June 30, 2016 | |
| ($000) | |
| Investment Income | |
| Income | |
| Income Distributions Received | 10,887 |
| Interest | 130 |
| Total Income | 11,017 |
| Expenses—Note B | |
| Management and Administrative | 160 |
| Trustees’ Fees and Expenses | 13 |
| Custodian Fees | 6 |
| Total Expenses | 179 |
| Net Investment Income | 10,838 |
| Realized Net Gain (Loss) | |
| Capital Gain Distributions Received | 7 |
| Affiliated Investment Securities Sold | 1,049 |
| Swap Contracts | 10,676 |
| Realized Net Gain (Loss) | 11,732 |
| Change in Unrealized Appreciation (Depreciation) of Investment Securities | 45,513 |
| Net Increase (Decrease) in Net Assets Resulting from Operations | 68,083 |
See accompanying Notes, which are an integral part of the Financial Statements.
14
Managed Payout Fund
Consolidated Statement of Changes in Net Assets
| Six Months Ended | Year Ended | |
| June 30, | December 31, | |
| 2016 | 2015 | |
| ($000) | ($000) | |
| Increase (Decrease) in Net Assets | ||
| Operations | ||
| Net Investment Income | 10,838 | 26,165 |
| Realized Net Gain (Loss) | 11,732 | 9,712 |
| Change in Unrealized Appreciation (Depreciation) | 45,513 | (47,610) |
| Net Increase (Decrease) in Net Assets Resulting from Operations | 68,083 | (11,733) |
| Distributions | ||
| Net Investment Income | (32,371) | (26,568) |
| Realized Capital Gain | — | (28,058) |
| Return of Capital | — | (71,211) |
| Total Distributions | (32,371) | (125,837) |
| Capital Share Transactions | ||
| Issued | 144,107 | 338,003 |
| Issued in Lieu of Cash Distributions | 13,214 | 88,259 |
| Redeemed | (142,188) | (269,800) |
| Net Increase (Decrease) from Capital Share Transactions | 15,133 | 156,462 |
| Total Increase (Decrease) | 50,845 | 18,892 |
| Net Assets | ||
| Beginning of Period | 1,585,399 | 1,566,507 |
| End of Period1 | 1,636,244 | 1,585,399 |
| 1 Net Assets—End of Period includes undistributed (overdistributed) net investment income of ($10,857,000) and $0. | ||
See accompanying Notes, which are an integral part of the Financial Statements.
15
Managed Payout Fund
Consolidated Financial Highlights
| Six Months | ||||||
| Ended | ||||||
| For a Share Outstanding | June 30, | Year Ended December 31, | ||||
| Throughout Each Period | 2016 | 2015 | 2014 | 2013 | 2012 | 2011 |
| Net Asset Value, Beginning of Period | $17.33 | $18.90 | $18.54 | $17.62 | $16.61 | $17.26 |
| Investment Operations | ||||||
| Net Investment Income | .120 | .309 | .3841 | .3261 | .337 | .340 |
| Capital Gain Distributions Received | .000 | .041 | .1521 | .0211 | .027 | .028 |
| Net Realized and Unrealized Gain (Loss) | ||||||
| on Investments | .623 | (.464) | .530 | 2.408 | 1.437 | (.242) |
| Total from Investment Operations | .743 | (.114) | 1.066 | 2.755 | 1.801 | .126 |
| Distributions | ||||||
| Dividends from Net Investment Income | (.353) | (.313) | (.535) | (.439) | (.417) | (.410) |
| Distributions from Realized Capital Gains2 | — | (.319) | (.128) | (.871) | — | — |
| Return of Capital | — | (.824) | (.043) | (.525) | (.374) | (.366) |
| Total Distributions | (.353) | (1.456) | (.706) | (1.835) | (.791) | (.776) |
| Net Asset Value, End of Period | $17.72 | $17.33 | $18.90 | $18.54 | $17.62 | $16.61 |
| Total Return | 4.38% | -0.72% | 5.83% | 15.97% | 11.02% | 0.69% |
| Ratios/Supplemental Data | ||||||
| Net Assets, End of Period (Millions) | $1,636 | $1,585 | $1,567 | $591 | $373 | $293 |
| Ratio of Total Expenses to | ||||||
| Average Net Assets | 0.02% | 0.02% | 0.01% | 0.03% | 0.03%3 | — |
| Acquired Fund Fees and Expenses | 0.33% | 0.32% | 0.37% | 0.31% | 0.40% | 0.39% |
| Ratio of Net Investment Income to | ||||||
| Average Net Assets | 1.38% | 1.64% | 1.99% | 1.76% | 1.96% | 1.97% |
| Portfolio Turnover Rate | 14% | 29% | 23% | 48% | 32% | 33% |
The expense ratio, acquired fund fees and expenses, net investment income ratio, and turnover rate for the current period have been annualized.
1 Calculated based on average shares outstanding.
2 Includes $0, $.319, $.035, $.710, $0, and $0 from long-term capital gains and $0, $0, $.093, $.161, $0, and $0 from short-term capital gains.
Short-term gain distributions are treated as ordinary income for tax purposes.
3 Annualized.
See accompanying Notes, which are an integral part of the Financial Statements.
16
Managed Payout Fund
Notes to Consolidated Financial Statements
Vanguard Managed Payout Fund is registered under the Investment Company Act of 1940 as an open-end investment company, or mutual fund. The fund combines a managed distribution policy with a strategy to invest across a wide spectrum of asset classes and investments that are expected to add diversification and result in a more consistent return pattern than a traditional balanced portfolio of stocks, bonds, and cash. Financial statements and other information about each underlying fund are available on vanguard.com.
The Consolidated Financial Statements include Vanguard MPF Portfolio (“the subsidiary”), which commenced operations on February 23, 2015. The subsidiary is wholly owned by the fund and is a unit trust established in the Cayman Islands under the Trusts Law (2011 Revision) of the Cayman Islands, which is organized to invest in certain commodity-linked investments on behalf of the fund, consistent with the fund’s investment objectives and policies. The commodity-linked investments and other investments held by the subsidiary are subject to the same risks that apply to similar investments if held directly by the fund. As of June 30, 2016, the fund held $80,686,000 in the subsidiary, representing 5% of the fund’s net assets. All inter-fund transactions and balances (including the fund’s investment in the subsidiary) have been eliminated, and the Consolidated Financial Statements include all investments and other accounts of the subsidiary as if held directly by the fund.
A. The following significant accounting policies conform to generally accepted accounting principles for U.S. investment companies. The fund consistently follows such policies in preparing its financial statements.
1. Security Valuation: Investments are valued at the net asset value of each underlying Vanguard fund determined as of the close of the New York Stock Exchange (generally 4 p.m., Eastern time) on the valuation date. Temporary cash investments acquired over 60 days to maturity are valued using the latest bid prices or using valuations based on a matrix system (which considers such factors as security prices, yields, maturities, and ratings), both as furnished by independent pricing services. Other temporary cash investments are valued at amortized cost, which approximates market value.
2. Swap Contracts: The fund gains exposure to commodities through the subsidiary’s investment in swaps that earn the total return on a specified commodity index. Under the terms of the swaps, the subsidiary receives the total return on the specified index (receiving the increase or paying the decrease in the value of the specified index), applied to a notional amount. The subsidiary also pays a floating rate that is based on short-term interest rates, applied to the notional amount. At the same time, the subsidiary invests an amount approximating the notional amount of the swap in high-quality temporary cash investments.
The notional amounts of swap contracts are not recorded in the Consolidated Statement of Net Assets. Swaps are valued daily based on market quotations received from independent pricing services or recognized dealers and the change in value is recorded in the Consolidated Statement of Net Assets and Consolidated Statement of Operations as unrealized appreciation (depreciation) until periodic payments are made, or the termination of the swap, at which time realized gain (loss) is recorded. A risk associated with all types of swaps is the possibility that a counterparty may default on its obligation to pay net amounts due to the subsidiary. The subsidiary’s maximum amount subject to counterparty risk is the unrealized appreciation on the swap contract. The subsidiary mitigates its counterparty risk by entering into swaps only with a diverse group of prequalified counterparties, monitoring their financial strength, entering into master netting arrangements with its counterparties, and requiring its counterparties to transfer collateral as security for their performance. In the event of a counterparty’s default (including bankruptcy), the subsidiary may terminate any swap contracts
17
Managed Payout Fund
with that counterparty, determine the net amount owed by either party in accordance with its master netting arrangements, and sell or retain any collateral held up to the net amount owed to the subsidiary under the master netting arrangements. The swap contracts contain provisions whereby a counterparty may terminate open contracts if the subsidiary’s net assets decline below a certain level, triggering a payment by the subsidiary if the subsidiary is in a net liability position at the time of the termination. The payment amount would be reduced by any collateral the subsidiary has pledged. Any securities pledged as collateral for open contracts are noted in the Consolidated Statement of Net Assets. The value of collateral received or pledged is compared daily to the value of the swap contracts exposure with each counterparty, and any difference, if in excess of a specified minimum transfer amount, is adjusted and settled within two business days.
During the six months ended June 30, 2016, the subsidiary’s average amount of investment in total return swaps represented 5% of net assets, based on the average of notional amounts at each quarter-end during the period.
3. Federal Income Taxes: The fund intends to continue to qualify as a regulated investment company and distribute all of its taxable income. The subsidiary is classified as a foreign corporation for U.S. tax purposes, and, because it does not carry on a U.S. trade or business, is generally not subject to U.S. federal tax. In addition, the subsidiary is not subject to Cayman Islands income tax. The subsidiary will distribute any earnings and profits to the fund each year, and such income will be qualifying income to the fund. Management has analyzed the fund’s tax positions taken for all open federal income tax years (December 31, 2012–2015) and for the period ended June 30, 2016, and has concluded that no provision for federal income tax is required in the fund’s financial statements.
4. Distributions: Distributions to shareholders are recorded on the ex-dividend date. Monthly distributions are determined based on a specified percentage payout rate of 4% of the fund’s average net asset value. The monthly distribution rate is reset annually based on changes in the fund’s average net asset value. Effective January 1, 2016, the monthly distribution rate is $.0589 per share. Distributions declared by the fund are reallocated at fiscal year-end to ordinary income, capital gain, and return of capital to reflect their tax character.
5. Credit Facility: The fund and certain other funds managed by The Vanguard Group (“Vanguard”) participate in a $3.1 billion committed credit facility provided by a syndicate of lenders pursuant to a credit agreement that may be renewed annually; each fund is individually liable for its borrowings, if any, under the credit facility. Borrowings may be utilized for temporary and emergency purposes, and are subject to the fund’s regulatory and contractual borrowing restrictions. The participating funds are charged administrative fees and an annual commitment fee of 0.10% of the undrawn amount of the facility; these fees are allocated to the funds based on a method approved by the fund’s board of trustees and borne by the funds in which the fund invests (see Note B). Any borrowings under this facility bear interest at a rate based upon the higher of the one-month London Interbank Offered Rate, federal funds effective rate, or overnight bank funding rate plus an agreed-upon spread.
The fund had no borrowings outstanding at June 30, 2016, or at any time during the period then ended.
6. Other: Income and capital gain distributions received are recorded on the ex-dividend date. Interest income includes distributions received from Vanguard Market Liquidity Fund and is accrued daily. Premiums and discounts on debt securities purchased are amortized and accreted, respectively, to interest income over the lives of the respective securities. Security transactions are accounted for on the date securities are bought or sold. Costs used to determine realized gains (losses) on the sale of investment securities are those of the specific securities sold.
18
Managed Payout Fund
B. In accordance with the terms of a Funds’ Service Agreement (the “FSA”) between Vanguard and the fund, Vanguard furnishes to the fund investment advisory, corporate management, administrative, marketing, and distribution services at Vanguard’s cost of operations (as defined by the FSA). These costs of operations are allocated to the fund based on methods and guidelines approved by the board of trustees. The FSA provides that expenses otherwise allocable to Vanguard funds-of-funds may be reduced or eliminated to the extent of savings realized by the underlying Vanguard funds. Accordingly, all expenses for services provided by Vanguard to the fund and all other expenses incurred by the fund during the period ended June 30, 2016, were borne by the underlying Vanguard funds in which the fund invests. The fund’s trustees and officers are also trustees and officers, respectively, of the underlying Vanguard funds, as well as directors and employees, respectively, of Vanguard.
Under a separate agreement, Vanguard provides corporate management and administrative services to the subsidiary for an annual fee of 0.40% of average net assets of the subsidiary. In addition, the subsidiary pays an unaffiliated third party, VGMF I (Cayman) Limited, an affiliate of Maples Trustee Services (Cayman) Limited, a fee plus reasonable additional expenses for trustee services. All of the subsidiary’s expenses are reflected in the Consolidated Statement of Operations and in the Ratio of Total Expenses to Average Net Assets in the Consolidated Financial Highlights. Expenses of Vanguard mutual funds in which the fund invests are reflected in the Acquired Fund Fees and Expenses in the Consolidated Financial Highlights.
C. Various inputs may be used to determine the value of the fund’s investments. These inputs are summarized in three broad levels for financial statement purposes. The inputs or methodologies used to value securities are not necessarily an indication of the risk associated with investing in those securities.
Level 1—Quoted prices in active markets for identical securities.
Level 2—Other significant observable inputs (including quoted prices for similar securities, interest rates, prepayment speeds, credit risk, etc.).
Level 3—Significant unobservable inputs (including the fund’s own assumptions used to determine
the fair value of investments).
The following table summarizes the market value of the fund’s investments as of June 30, 2016, based on the inputs used to value them:
| Level 1 | Level 2 | Level 3 | |
| Investments | ($000) | ($000) | ($000) |
| Investment Companies | 1,556,322 | — | — |
| Temporary Cash Investments | 111 | 77,366 | — |
| Total | 1,556,433 | 77,366 | — |
D. At June 30, 2016, the subsidiary had the following open total return swap contracts:
| Floating | Unrealized | ||||
| Notional | Interest Rate | Appreciation | |||
| Termination | Amount | Received | (Depreciation) | ||
| Reference Entity | Date | Counterparty | ($000) | (Paid) | ($000) |
| Credit Suisse Custom 34 | |||||
| Total Return Index | 7/29/16 | CSI | 80,732 | (0.490%) | — |
| CSI—Credit Suisse International. |
19
Managed Payout Fund
E. Distributions are determined on a tax basis and may differ from net investment income and realized capital gains for financial reporting purposes. Differences may be permanent or temporary. Permanent differences are reclassified among capital accounts in the financial statements to reflect their tax character. Temporary differences arise when certain items of income, expense, gain, or loss are recognized in different periods for financial statement and tax purposes. These differences will reverse at some time in the future. Differences in classification may also result from the treatment of short-term gains as ordinary income for tax purposes. The fund’s tax-basis capital gains and losses are determined only at the end of each fiscal year.
Realized and unrealized gains (losses) on certain of the subsidiary’s swap contracts are treated as ordinary income (loss) for tax purposes. Realized gains of $10,676,000 on swap contracts have been reclassified from accumulated net realized gains to overdistributed net investment income.
At June 30, 2016, the cost of investment securities for tax purposes was $1,439,197,000. Net unrealized appreciation of investment securities for tax purposes was $194,602,000, consisting of unrealized gains of $220,540,000 on securities that had risen in value since their purchase and $25,938,000 in unrealized losses on securities that had fallen in value since their purchase.
F. Transactions during the period in affiliated underlying Vanguard funds were as follows:
| Current Period Transactions | ||||||
| Dec. 31, | Proceeds | June 30, | ||||
| 2015 | from | Capital Gain | 2016 | |||
| Market | Purchases | Securities | Distributions | Market | ||
| Value | at Cost | Sold | Income | Received | Value | |
| ($000) | ($000) | ($000) | ($000) | ($000) | ($000) | |
| Vanguard Alternative | ||||||
| Strategies Fund | 161,729 | 7,000 | 12,500 | — | — | 164,971 |
| Vanguard Emerging Markets | ||||||
| Stock Index Fund | 79,099 | 4,163 | 6,300 | 588 | — | 82,826 |
| Vanguard Global Minimum | ||||||
| Volatility Fund | 238,411 | — | 1,600 | — | — | 252,022 |
| Vanguard Market Liquidity Fund | — | NA1 | NA1 | 1 | — | 111 |
| Vanguard Market Neutral Fund | 109,190 | 10,000 | 5,000 | — | — | 111,310 |
| Vanguard Total Bond Market II | ||||||
| Index Fund | 190,276 | 29,494 | 33,587 | 2,250 | 7 | 194,139 |
| Vanguard Total International | ||||||
| Bond Index Fund | 94,632 | 10,564 | 13,700 | 564 | — | 96,352 |
| Vanguard Total International | ||||||
| Stock Index Fund | 316,235 | 36,914 | 22,929 | 4,718 | — | 327,434 |
| Vanguard Total Stock Market | ||||||
| Index Fund | 315,294 | 19,666 | 17,291 | 2,766 | — | 327,268 |
| Total | 1,504,866 | 117,801 | 112,907 | 10,887 | 7 | 1,556,433 |
| 1 Not applicable—purchases and sales are for temporary cash investment purposes. | ||||||
20
Managed Payout Fund
G. Capital shares issued and redeemed were:
| Six Months Ended | Year Ended | |
| June 30, 2016 | December 31, 2015 | |
| Shares | Shares | |
| (000) | (000) | |
| Issued | 8,382 | 18,075 |
| Issued in Lieu of Cash Distributions | 770 | 4,954 |
| Redeemed | (8,297) | (14,436) |
| Net Increase (Decrease) in Shares Outstanding | 855 | 8,593 |
H. Management has determined that no material events or transactions occurred subsequent to June 30, 2016, that would require recognition or disclosure in these financial statements.
21
About Your Fund’s Expenses
As a shareholder of the fund, you incur ongoing costs, which include costs for portfolio management, administrative services, and shareholder reports (like this one), among others. Operating expenses, which are deducted from a fund’s gross income, directly reduce the investment return of the fund.
A fund’s expenses are expressed as a percentage of its average net assets. The Managed Payout Fund, in addition to its own expenses, bears its proportionate share of the costs for the underlying funds in which it invests. These indirect expenses make up the acquired fund fees and expenses, also expressed as a percentage of average net assets.
The following examples are intended to help you understand the ongoing cost (in dollars) of investing in your fund and to compare these costs with those of other mutual funds. The examples are based on an investment of $1,000 made at the beginning of the period shown and held for the entire period. The costs were calculated using the expense ratio and the acquired fund fees and expenses for the Managed Payout Fund.
The accompanying table illustrates your fund’s costs in two ways:
• Based on actual fund return. This section helps you to estimate the actual expenses that you paid over the period. The ”Ending Account Value“ shown is derived from the fund‘s actual return, and the third column shows the dollar amount that would have been paid by an investor who started with $1,000 in the fund. You may use the information here, together with the amount you invested, to estimate the expenses that you paid over the period.
To do so, simply divide your account value by $1,000 (for example, an $8,600 account value divided by $1,000 = 8.6), then multiply the result by the number given for your fund under the heading ”Expenses Paid During Period.“
• Based on hypothetical 5% yearly return. This section is intended to help you compare your fund‘s costs with those of other mutual funds. It assumes that the fund had a yearly return of 5% before expenses, but that the expense ratio is unchanged. In this case—because the return used is not the fund’s actual return—the results do not apply to your investment. The example is useful in making comparisons because the Securities and Exchange Commission requires all mutual funds to calculate expenses based on a 5% return. You can assess your fund’s costs by comparing this hypothetical example with the hypothetical examples that appear in shareholder reports of other funds.
Note that the expenses shown in the table are meant to highlight and help you compare ongoing costs only and do not reflect transaction costs incurred by the fund for buying and selling securities. Further, the expenses do not include any purchase, redemption, or account service fees described in the fund prospectus. If such fees were applied to your account, your costs would be higher. Your fund does not carry a “sales load.”
The calculations assume no shares were bought or sold during the period. Your actual costs may have been higher or lower, depending on the amount of your investment and the timing of any purchases or redemptions.
You can find more information about the fund’s expenses, including annual expense ratios, in the Financial Statements section of this report. For additional information on operating expenses and other shareholder costs, please refer to your fund’s current prospectus.
22
| Six Months Ended June 30, 2016 | |||
| Beginning | Ending | Expenses | |
| Account Value | Account Value | Paid During | |
| Managed Payout Fund | 12/31/2015 | 6/30/2016 | Period |
| Based on Actual Fund Return | $1,000.00 | $1,043.76 | $1.68 |
| Based on Hypothetical 5% Yearly Return | 1,000.00 | 1,023.22 | 1.66 |
These calculations are based on the fund’s expense ratio for the most recent six-month period together with its acquired fund fees and
expenses. The combined, annualized expense figure for the period shown is 0.35%. The dollar amount shown as “Expenses Paid” is equal to
the expense figure multiplied by the average account value over the period, multiplied by the number of days in the most recent six-month
period, then divided by the number of days in the most recent 12-month period (182/366).
23
Trustees Approve Advisory Arrangement
The board of trustees of Vanguard Managed Payout Fund has renewed the fund’s investment advisory arrangement with The Vanguard Group, Inc. (Vanguard)—through its Quantitative Equity Group. The board determined that continuing the fund’s internalized management structure was in the best interests of the fund and its shareholders.
The board based its decision upon an evaluation of the advisor’s investment staff, portfolio management process, and performance. The trustees considered the factors discussed below, among others. However, no single factor determined whether the board approved the arrangement. Rather, it was the totality of the circumstances that drove the board’s decision.
Nature, extent, and quality of services
The board reviewed the quality of the investment management services provided to the fund since its inception in 2008 and took into account the organizational depth and stability of the advisor. The board considered that Vanguard has been managing investments for more than three decades. The Quantitative Equity Group adheres to a sound, disciplined investment management process; the team has considerable experience, stability, and depth.
The board concluded that Vanguard’s experience, stability, depth, and performance, among other factors, warranted continuation of the advisory arrangement.
Investment performance
The board considered the fund’s performance since its inception in 2008, including any periods of outperformance or underperformance relative to a benchmark index. The board concluded that the performance was such that the advisory arrangement should continue. Information about the fund’s most recent performance can be found in the Performance Summary section of this report.
Cost
The board concluded that the expenses of each of the underlying funds in which the Managed Payout Fund invests are well below their peer-group averages. Information about the fund’s expenses and acquired fund fees and expenses appears in the About Your Fund’s Expenses section of this report as well as in the Consolidated Financial Statements section.
The board does not conduct a profitability analysis of Vanguard because of Vanguard’s unique “at-cost” structure. Unlike most other mutual fund management companies, Vanguard is owned by the funds it oversees, and produces “profits” only in the form of reduced expenses for fund shareholders.
The benefit of economies of scale
The board concluded that Vanguard’s at-cost arrangement with the fund and its underlying funds ensures that the fund will realize economies of scale as the assets of the underlying funds grow, with the cost to shareholders declining as assets increase.
The board will consider whether to renew the advisory arrangement again after a one-year period.
24
Glossary
30-Day SEC Yield. A fund’s 30-day SEC yield is derived using a formula specified by the U.S. Securities and Exchange Commission. Under the formula, data related to the fund’s security holdings in the previous 30 days are used to calculate the fund’s hypothetical net income for that period, which is then annualized and divided by the fund’s estimated average net assets over the calculation period. For the purposes of this calculation, a security’s income is based on its current market yield to maturity (for bonds), its actual income (for asset-backed securities), or its projected dividend yield (for stocks). Because the SEC yield represents hypothetical annualized income, it will differ—at times significantly—from the fund’s actual experience. As a result, the fund’s income distributions may be higher or lower than implied by the SEC yield.
Acquired Fund Fees and Expenses. Funds that invest in other Vanguard funds bear proportionate shares of the operating, administrative, and advisory expenses of the underlying funds, and they must pay any fees charged by those funds. The figure for acquired fund fees and expenses represents a weighted average of these underlying costs. Acquired is a term that the Securities and Exchange Commission applies to any mutual fund whose shares are owned by another fund.
Expense Ratio. A fund’s total annual operating expenses expressed as a percentage of the fund’s average net assets. The expense ratio includes management and administrative expenses, but does not include the transaction costs of buying and selling portfolio securities.
Inception Date. The date on which the assets of a fund (or one of its share classes) are first invested in accordance with the fund’s investment objective. For funds with a subscription period, the inception date is the day after that period ends. Investment performance is measured from the inception date.
Benchmark Information
Managed Payout Composite Index: Weighted 36% CRSP US Total Market Index, 24.5% Barclays U.S. Aggregate Float Adjusted Index, 24% FTSE Global All Cap ex US Index, 10.5% Barclays Global Aggregate ex-USD Float Adjusted RIC Capped Index (USD Hedged), and 5% Bloomberg Commodity Index as of May 1, 2015. In prior periods, the composite was 42% CRSP US Total Market Index, 28% Barclays U.S. Aggregate Float Adjusted Index, 18% FTSE Global All Cap ex US Index, 7% Barclays Global Aggregate ex-USD Float Adjusted RIC Capped Index (USD Hedged), and 5% Bloomberg Commodity Index (Dow Jones-UBS Commodity Index through June 30, 2014) through April 30, 2015; and 35% CRSP US Total Market Index (MSCI US Broad Market Index through May 31, 2013), 12% Barclays U.S. Aggregate Float Adjusted Index (Barclays U.S. Aggregate Bond Index through December 31, 2009), 15% FTSE Global All Cap ex US Index (MSCI All Country World ex USA Investable Market Index through May 31, 2013), 3% Barclays Global Aggregate ex-USD Float Adjusted RIC Capped Index (USD Hedged), 15% Citigroup Three-Month U.S. Treasury Bill Index, 10% Dow Jones-UBS Commodity Index, and 10% REIT Spliced Index (MSCI US REIT Index adjusted to include a 2% cash position through April 30, 2009) through January 31, 2014. International stock benchmark returns are adjusted for withholding taxes.
25
This page intentionally left blank.
This page intentionally left blank.
The People Who Govern Your Fund
The trustees of your mutual fund are there to see that the fund is operated and managed in your best interests since, as a shareholder, you are a part owner of the fund. Your fund’s trustees also serve on the board of directors of The Vanguard Group, Inc., which is owned by the Vanguard funds and provides services to them on an at-cost basis.
A majority of Vanguard’s board members are independent, meaning that they have no affiliation with Vanguard or the funds they oversee, apart from the sizable personal investments they have made as private individuals. The independent board members have distinguished backgrounds in business, academia, and public service. Each of the trustees and executive officers oversees 198 Vanguard funds.
The following table provides information for each trustee and executive officer of the fund. More information about the trustees is in the Statement of Additional Information, which can be obtained, without charge, by contacting Vanguard at 800-662-7447, or online at vanguard.com.
| InterestedTrustee1 | Rajiv L. Gupta |
| Born 1945. Trustee Since December 2001.2 Principal | |
| F. William McNabb III | Occupation(s) During the Past Five Years and Other |
| Born 1957. Trustee Since July 2009. Chairman of | Experience: Chairman and Chief Executive Officer |
| the Board. Principal Occupation(s) During the Past | (retired 2009) and President (2006–2008) of |
| Five Years and Other Experience: Chairman of the | Rohm and Haas Co. (chemicals); Director of Tyco |
| Board of The Vanguard Group, Inc., and of each of | International plc (diversified manufacturing and |
| the investment companies served by The Vanguard | services), HP Inc. (printer and personal computer |
| Group, since January 2010; Director of The Vanguard | manufacturing), and Delphi Automotive plc |
| Group since 2008; Chief Executive Officer and | (automotive components); Senior Advisor at |
| President of The Vanguard Group, and of each of | New Mountain Capital. |
| the investment companies served by The Vanguard | |
| Group, since 2008; Director of Vanguard Marketing | Amy Gutmann |
| Corporation; Managing Director of The Vanguard | Born 1949. Trustee Since June 2006. Principal |
| Group (1995–2008). | Occupation(s) During the Past Five Years and |
| Other Experience: President of the University of | |
| IndependentTrustees | Pennsylvania; Christopher H. Browne Distinguished |
| Professor of Political Science, School of Arts and | |
| Emerson U. Fullwood | Sciences, and Professor of Communication, Annenberg |
| Born 1948. Trustee Since January 2008. Principal | School for Communication, with secondary faculty |
| Occupation(s) During the Past Five Years and Other | appointments in the Department of Philosophy, School |
| Experience: Executive Chief Staff and Marketing | of Arts and Sciences, and at the Graduate School of |
| Officer for North America and Corporate Vice President | Education, University of Pennsylvania; Trustee of the |
| (retired 2008) of Xerox Corporation (document manage- | National Constitution Center; Chair of the Presidential |
| ment products and services); Executive in Residence | Commission for the Study of Bioethical Issues. |
| and 2009–2010 Distinguished Minett Professor at | |
| the Rochester Institute of Technology; Lead Director | JoAnn Heffernan Heisen |
| of SPX FLOW, Inc. (multi-industry manufacturing); | Born 1950. Trustee Since July 1998. Principal |
| Director of the United Way of Rochester, the University | Occupation(s) During the Past Five Years and |
| of Rochester Medical Center, Monroe Community | Other Experience: Corporate Vice President and |
| College Foundation, North Carolina A&T University, | Chief Global Diversity Officer (retired 2008) and |
| and Roberts Wesleyan College. | Member of the Executive Committee (1997–2008) |
| of Johnson & Johnson (pharmaceuticals/medical | |
| devices/consumer products); Director of Skytop | |
| Lodge Corporation (hotels) and the Robert Wood | |
| Johnson Foundation; Member of the Advisory | |
| Board of the Institute for Women’s Leadership | |
| at Rutgers University. |
| F. Joseph Loughrey | Executive Officers | |
| Born 1949. Trustee Since October 2009. Principal | ||
| Occupation(s) During the Past Five Years and Other | Glenn Booraem | |
| Experience: President and Chief Operating Officer | Born 1967. Treasurer Since May 2015. Principal | |
| (retired 2009) of Cummins Inc. (industrial machinery); | Occupation(s) During the Past Five Years and | |
| Chairman of the Board of Hillenbrand, Inc. (specialized | Other Experience: Principal of The Vanguard Group, | |
| consumer services), and of Oxfam America; Director | Inc.; Treasurer of each of the investment companies | |
| of SKF AB (industrial machinery), Hyster-Yale Materials | served by The Vanguard Group; Controller of each of | |
| Handling, Inc. (forklift trucks), the Lumina Foundation | the investment companies served by The Vanguard | |
| for Education, and the V Foundation for Cancer | Group (2010–2015); Assistant Controller of each of | |
| Research; Member of the Advisory Council for the | the investment companies served by The Vanguard | |
| College of Arts and Letters and of the Advisory Board | Group (2001–2010). | |
| to the Kellogg Institute for International Studies, both | ||
| at the University of Notre Dame. | Thomas J. Higgins | |
| Born 1957. Chief Financial Officer Since September | ||
| Mark Loughridge | 2008. Principal Occupation(s) During the Past Five | |
| Born 1953. Trustee Since March 2012. Principal | Years and Other Experience: Principal of The Vanguard | |
| Occupation(s) During the Past Five Years and Other | Group, Inc.; Chief Financial Officer of each of the | |
| Experience: Senior Vice President and Chief Financial | investment companies served by The Vanguard Group; | |
| Officer (retired 2013) at IBM (information technology | Treasurer of each of the investment companies served | |
| services); Fiduciary Member of IBM’s Retirement Plan | by The Vanguard Group (1998–2008). | |
| Committee (2004–2013); Director of the Dow Chemical | ||
| Company; Member of the Council on Chicago Booth. | Peter Mahoney | |
| Born 1974. Controller Since May 2015. Principal | ||
| Scott C. Malpass | Occupation(s) During the Past Five Years and | |
| Born 1962. Trustee Since March 2012. Principal | Other Experience: Head of Global Fund Accounting | |
| Occupation(s) During the Past Five Years and Other | at The Vanguard Group, Inc.; Controller of each of the | |
| Experience: Chief Investment Officer and Vice | investment companies served by The Vanguard Group; | |
| President at the University of Notre Dame; Assistant | Head of International Fund Services at The Vanguard | |
| Professor of Finance at the Mendoza College of | Group (2008–2014). | |
| Business at Notre Dame; Member of the Notre Dame | ||
| 403(b) Investment Committee, the Board of Advisors | Heidi Stam | |
| for Spruceview Capital Partners, and the Investment | Born 1956. Secretary Since July 2005. Principal | |
| Advisory Committee of Major League Baseball; Board | Occupation(s) During the Past Five Years and Other | |
| Member of TIFF Advisory Services, Inc., and Catholic | Experience: Managing Director of The Vanguard | |
| Investment Services, Inc. (investment advisors). | Group, Inc.; General Counsel of The Vanguard Group; | |
| Secretary of The Vanguard Group and of each of the | ||
| André F. Perold | investment companies served by The Vanguard Group; | |
| Born 1952. Trustee Since December 2004. Principal | Director and Senior Vice President of Vanguard | |
| Occupation(s) During the Past Five Years and Other | Marketing Corporation. | |
| Experience: George Gund Professor of Finance and | ||
| Banking, Emeritus at the Harvard Business School | Vanguard Senior ManagementTeam | |
| (retired 2011); Chief Investment Officer and Managing | Mortimer J. Buckley | James M. Norris |
| Partner of HighVista Strategies LLC (private investment | Kathleen C. Gubanich | Thomas M. Rampulla |
| firm); Director of Rand Merchant Bank; Overseer of | Martha G. King | Glenn W. Reed |
| the Museum of Fine Arts Boston. | John T. Marcante | Karin A. Risi |
| Chris D. McIsaac | Michael Rollings | |
| Peter F. Volanakis | ||
| Born 1955. Trustee Since July 2009. Principal | ||
| Occupation(s) During the Past Five Years and Other | Chairman Emeritus and Senior Advisor | |
| Experience: President and Chief Operating Officer | ||
| (retired 2010) of Corning Incorporated (communications | John J. Brennan | |
| equipment); Trustee of Colby-Sawyer College and | Chairman, 1996–2009 | |
| Chairman of its Finance and Enrollment Committee; | Chief Executive Officer and President, 1996–2008 | |
| Member of the Advisory Board of the Norris Cotton | ||
| Cancer Center. | Founder | |
| John C. Bogle | ||
| Chairman and Chief Executive Officer, 1974–1996 | ||
1 Mr. McNabb is considered an “interested person,” as defined in the Investment Company Act of 1940, because he is an officer of the Vanguard funds.
2 December 2002 for Vanguard Equity Income Fund, the Vanguard Municipal Bond Funds, and the Vanguard State Tax-Exempt Funds.
 | ||
| P.O. Box 2600 | ||
| Valley Forge, PA 19482-2600 | ||
| Connect with Vanguard® > vanguard.com | ||
| Fund Information > 800-662-7447 | CFA® is a registered trademark owned by CFA Institute. | |
| Direct Investor Account Services > 800-662-2739 | ||
| Institutional Investor Services > 800-523-1036 | ||
| Text Telephone for People | ||
| Who Are Deaf or Hard of Hearing> 800-749-7273 | ||
| This material may be used in conjunction | ||
| with the offering of shares of any Vanguard | ||
| fund only if preceded or accompanied by | ||
| the fund’s current prospectus. | ||
| All comparative mutual fund data are from Lipper, a | ||
| Thomson Reuters Company, or Morningstar, Inc., unless | ||
| otherwise noted. | ||
| You can obtain a free copy of Vanguard’s proxy voting | ||
| guidelines by visiting vanguard.com/proxyreporting or by | ||
| calling Vanguard at 800-662-2739. The guidelines are | ||
| also available from the SEC’s website, sec.gov. In | ||
| addition, you may obtain a free report on how your fund | ||
| voted the proxies for securities it owned during the 12 | ||
| months ended June 30. To get the report, visit either | ||
| vanguard.com/proxyreporting or sec.gov. | ||
| You can review and copy information about your fund at | ||
| the SEC’s Public Reference Room in Washington, D.C. To | ||
| find out more about this public service, call the SEC at | ||
| 202-551-8090. Information about your fund is also | ||
| available on the SEC’s website, and you can receive | ||
| copies of this information, for a fee, by sending a | ||
| request in either of two ways: via email addressed to | ||
| publicinfo@sec.gov or via regular mail addressed to the | ||
| Public Reference Section, Securities and Exchange | ||
| Commission, Washington, DC 20549-1520. | ||
| © 2016 The Vanguard Group, Inc. | ||
| All rights reserved. | ||
| Vanguard Marketing Corporation, Distributor. | ||
| Q14972 082016 | ||
Item 2: Code of Ethics.
Not Applicable.
Item 3: Audit Committee Financial Expert.
Not Applicable.
Item 4: Principal Accountant Fees and Services.
(a) Audit Fees.
Not Applicable.
Item 5: Audit Committee of Listed Registrants.
Not Applicable.
Item 6: Investments.
| Vanguard® Balanced Index Fund | |||
| Schedule of Investments | |||
| June 30, 2016 | |||
| Market | |||
| Value | |||
| Shares | ($000) | ||
| Common Stocks (59.7%)1 | |||
| Basic Materials (1.5%) | |||
| EI du Pont de Nemours & Co. | 669,805 | 43,403 | |
| Dow Chemical Co. | 859,168 | 42,709 | |
| Praxair Inc. | 214,011 | 24,053 | |
| Ecolab Inc. | 202,180 | 23,979 | |
| Air Products & Chemicals Inc. | 156,218 | 22,189 | |
| PPG Industries Inc. | 199,174 | 20,744 | |
| LyondellBasell Industries NV Class A | 263,009 | 19,573 | |
| Newmont Mining Corp. | 405,927 | 15,880 | |
| International Paper Co. | 321,338 | 13,618 | |
| Nucor Corp. | 238,795 | 11,799 | |
| Freeport-McMoRan Inc. | 883,773 | 9,845 | |
| Alcoa Inc. | 998,294 | 9,254 | |
| International Flavors & Fragrances Inc. | 60,733 | 7,657 | |
| Eastman Chemical Co. | 108,155 | 7,344 | |
| Celanese Corp. Class A | 107,411 | 7,030 | |
| Mosaic Co. | 263,541 | 6,899 | |
| Albemarle Corp. | 85,490 | 6,780 | |
| Ashland Inc. | 47,915 | 5,499 | |
| FMC Corp. | 106,839 | 4,948 | |
| RPM International Inc. | 98,624 | 4,926 | |
| Avery Dennison Corp. | 64,964 | 4,856 | |
| Steel Dynamics Inc. | 178,772 | 4,380 | |
| CF Industries Holdings Inc. | 180,099 | 4,340 | |
| WR Grace & Co. | 52,923 | 3,874 | |
| Reliance Steel & Aluminum Co. | 48,561 | 3,734 | |
| Royal Gold Inc. | 49,147 | 3,540 | |
| * | Axalta Coating Systems Ltd. | 127,534 | 3,383 |
| NewMarket Corp. | 7,724 | 3,201 | |
| Olin Corp. | 127,164 | 3,159 | |
| Sensient Technologies Corp. | 36,348 | 2,582 | |
| PolyOne Corp. | 72,364 | 2,550 | |
| CONSOL Energy Inc. | 148,884 | 2,396 | |
| Scotts Miracle-Gro Co. Class A | 33,625 | 2,351 | |
| Domtar Corp. | 57,974 | 2,030 | |
| United States Steel Corp. | 115,734 | 1,951 | |
| Cabot Corp. | 42,448 | 1,938 | |
| Huntsman Corp. | 143,885 | 1,935 | |
| HB Fuller Co. | 43,039 | 1,893 | |
| Compass Minerals International Inc. | 25,045 | 1,858 | |
| US Silica Holdings Inc. | 51,749 | 1,784 | |
| Axiall Corp. | 53,900 | 1,758 | |
| Minerals Technologies Inc. | 30,092 | 1,709 | |
| Hecla Mining Co. | 322,811 | 1,646 | |
| Commercial Metals Co. | 93,031 | 1,572 | |
| Balchem Corp. | 24,471 | 1,460 | |
| Worthington Industries Inc. | 34,333 | 1,452 | |
| * | Cambrex Corp. | 26,265 | 1,359 |
| * | Clearwater Paper Corp. | 20,582 | 1,345 |
| * | GCP Applied Technologies Inc. | 51,623 | 1,344 |
| * | Coeur Mining Inc. | 124,300 | 1,325 |
| Carpenter Technology Corp. | 37,916 | 1,249 | |
| * | Chemtura Corp. | 46,208 | 1,219 |
| Chemours Co. | 147,000 | 1,211 | |
| Westlake Chemical Corp. | 27,626 | 1,186 | |
| * | Stillwater Mining Co. | 97,874 | 1,161 |
| * | Ingevity Corp. | 33,227 | 1,131 |
| Neenah Paper Inc. | 15,588 | 1,128 | |
| Kaiser Aluminum Corp. | 12,438 | 1,124 | |
| ^ | Allegheny Technologies Inc. | 86,200 | 1,099 |
| * | Ferro Corp. | 75,364 | 1,008 |
| Quaker Chemical Corp. | 10,739 | 958 | |
1
| Vanguard® Balanced Index Fund | |||
| Schedule of Investments | |||
| June 30, 2016 | |||
| Market | |||
| Value | |||
| Shares | ($000) | ||
| * | Platform Specialty Products Corp. | 103,100 | 916 |
| Innospec Inc. | 19,307 | 888 | |
| Stepan Co. | 13,316 | 793 | |
| Innophos Holdings Inc. | 18,010 | 760 | |
| *,^ | Cliffs Natural Resources Inc. | 132,955 | 754 |
| * | Kraton Performance Polymers Inc. | 26,421 | 738 |
| KapStone Paper and Packaging Corp. | 54,616 | 711 | |
| * | Univar Inc. | 36,790 | 696 |
| * | Koppers Holdings Inc. | 21,205 | 652 |
| * | AK Steel Holding Corp. | 139,600 | 651 |
| Calgon Carbon Corp. | 45,480 | 598 | |
| Rayonier Advanced Materials Inc. | 43,371 | 589 | |
| PH Glatfelter Co. | 30,014 | 587 | |
| Tredegar Corp. | 35,865 | 578 | |
| A Schulman Inc. | 23,666 | 578 | |
| Chase Corp. | 8,579 | 507 | |
| Aceto Corp. | 22,266 | 487 | |
| Deltic Timber Corp. | 6,307 | 423 | |
| American Vanguard Corp. | 25,911 | 391 | |
| * | OMNOVA Solutions Inc. | 53,353 | 387 |
| * | Ryerson Holding Corp. | 20,950 | 367 |
| * | CSW Industrials Inc. | 10,618 | 346 |
| * | Fairmount Santrol Holdings Inc. | 44,123 | 340 |
| Ferroglobe plc | 38,074 | 328 | |
| SunCoke Energy Inc. | 52,479 | 305 | |
| Hawkins Inc. | 6,172 | 268 | |
| * | Century Aluminum Co. | 41,600 | 263 |
| Tronox Ltd. Class A | 55,079 | 243 | |
| * | Codexis Inc. | 58,079 | 234 |
| * | LSB Industries Inc. | 18,868 | 228 |
| * | Veritiv Corp. | 5,308 | 199 |
| Kronos Worldwide Inc. | 33,870 | 178 | |
| Ampco-Pittsburgh Corp. | 10,863 | 123 | |
| Gold Resource Corp. | 33,890 | 122 | |
| Olympic Steel Inc. | 4,100 | 112 | |
| FutureFuel Corp. | 9,700 | 106 | |
| * | Resolute Forest Products Inc. | 19,423 | 103 |
| KMG Chemicals Inc. | 3,499 | 91 | |
| * | Northern Technologies International Corp. | 7,900 | 87 |
| Synalloy Corp. | 9,475 | 73 | |
| *,^ | Senomyx Inc. | 26,231 | 72 |
| * | Handy & Harman Ltd. | 2,000 | 52 |
| * | NL Industries Inc. | 17,860 | 46 |
| * | Real Industry Inc. | 5,414 | 42 |
| United-Guardian Inc. | 2,401 | 39 | |
| * | General Moly Inc. | 84,279 | 29 |
| * | Solitario Exploration & Royalty Corp. | 24,360 | 13 |
| * | Uranium Energy Corp. | 6,603 | 6 |
| * | Centrus Energy Corp. Class A | 500 | 2 |
| 410,409 | |||
| Consumer Goods (6.4%) | |||
| Procter & Gamble Co. | 2,043,202 | 172,998 | |
| Coca-Cola Co. | 2,992,635 | 135,656 | |
| Philip Morris International Inc. | 1,189,662 | 121,012 | |
| PepsiCo Inc. | 1,110,370 | 117,633 | |
| Altria Group Inc. | 1,508,749 | 104,043 | |
| NIKE Inc. Class B | 1,020,351 | 56,323 | |
| Mondelez International Inc. Class A | 1,132,748 | 51,551 | |
| Colgate-Palmolive Co. | 680,011 | 49,777 | |
| Kraft Heinz Co. | 465,761 | 41,211 | |
| Kimberly-Clark Corp. | 274,882 | 37,791 | |
| Ford Motor Co. | 2,960,134 | 37,209 | |
| Reynolds American Inc. | 658,211 | 35,497 | |
| Monsanto Co. | 334,895 | 34,631 | |
2
| Vanguard® Balanced Index Fund | |||
| Schedule of Investments | |||
| June 30, 2016 | |||
| Market | |||
| Value | |||
| Shares | ($000) | ||
| General Mills Inc. | 450,847 | 32,154 | |
| General Motors Co. | 1,057,850 | 29,937 | |
| Johnson Controls Inc. | 500,068 | 22,133 | |
| Constellation Brands Inc. Class A | 127,595 | 21,104 | |
| Archer-Daniels-Midland Co. | 456,455 | 19,577 | |
| * | Monster Beverage Corp. | 116,861 | 18,781 |
| *,^ | Tesla Motors Inc. | 83,945 | 17,820 |
| Newell Brands Inc. | 361,084 | 17,538 | |
| * | Electronic Arts Inc. | 225,040 | 17,049 |
| Activision Blizzard Inc. | 422,203 | 16,732 | |
| ConAgra Foods Inc. | 326,021 | 15,587 | |
| Estee Lauder Cos. Inc. Class A | 170,914 | 15,557 | |
| Tyson Foods Inc. Class A | 229,761 | 15,346 | |
| Kellogg Co. | 184,017 | 15,025 | |
| Dr Pepper Snapple Group Inc. | 144,823 | 13,994 | |
| Clorox Co. | 99,097 | 13,714 | |
| Molson Coors Brewing Co. Class B | 133,667 | 13,518 | |
| Delphi Automotive plc | 214,278 | 13,414 | |
| VF Corp. | 214,783 | 13,207 | |
| JM Smucker Co. | 86,332 | 13,158 | |
| Mead Johnson Nutrition Co. | 143,057 | 12,982 | |
| Stanley Black & Decker Inc. | 113,430 | 12,616 | |
| Hershey Co. | 108,928 | 12,362 | |
| Genuine Parts Co. | 109,932 | 11,131 | |
| Church & Dwight Co. Inc. | 100,286 | 10,318 | |
| Campbell Soup Co. | 155,090 | 10,318 | |
| Whirlpool Corp. | 58,472 | 9,744 | |
| McCormick & Co. Inc. | 85,503 | 9,121 | |
| * | Mohawk Industries Inc. | 46,044 | 8,737 |
| Coach Inc. | 212,709 | 8,666 | |
| DR Horton Inc. | 271,187 | 8,537 | |
| Mattel Inc. | 259,926 | 8,133 | |
| Brown-Forman Corp. Class B | 74,839 | 7,466 | |
| Hormel Foods Corp. | 201,545 | 7,377 | |
| Hanesbrands Inc. | 292,149 | 7,342 | |
| Hasbro Inc. | 86,225 | 7,242 | |
| Ingredion Inc. | 54,504 | 7,053 | |
| Snap-on Inc. | 44,234 | 6,981 | |
| Lennar Corp. Class A | 149,912 | 6,911 | |
| * | LKQ Corp. | 208,770 | 6,618 |
| Bunge Ltd. | 110,439 | 6,532 | |
| * | WhiteWave Foods Co. Class A | 138,156 | 6,485 |
| * | Michael Kors Holdings Ltd. | 128,746 | 6,370 |
| Harley-Davidson Inc. | 140,327 | 6,357 | |
| PVH Corp. | 63,352 | 5,970 | |
| Lear Corp. | 54,982 | 5,595 | |
| *,^ | Under Armour Inc. Class A | 138,960 | 5,576 |
| * | lululemon athletica Inc. | 73,044 | 5,395 |
| BorgWarner Inc. | 174,366 | 5,147 | |
| * | Under Armour Inc. | 141,255 | 5,142 |
| Goodyear Tire & Rubber Co. | 196,480 | 5,042 | |
| * | Middleby Corp. | 43,654 | 5,031 |
| * | NVR Inc. | 2,793 | 4,972 |
| Leggett & Platt Inc. | 96,056 | 4,909 | |
| PulteGroup Inc. | 249,973 | 4,872 | |
| * | TreeHouse Foods Inc. | 44,745 | 4,593 |
| Leucadia National Corp. | 258,333 | 4,477 | |
| Pinnacle Foods Inc. | 90,045 | 4,168 | |
| * | Hain Celestial Group Inc. | 79,342 | 3,947 |
| * | Post Holdings Inc. | 47,257 | 3,908 |
| Harman International Industries Inc. | 54,185 | 3,892 | |
| Carter's Inc. | 36,261 | 3,861 | |
| Ralph Lauren Corp. Class A | 42,323 | 3,793 | |
| * | Edgewell Personal Care Co. | 44,829 | 3,784 |
3
| Vanguard® Balanced Index Fund | |||
| Schedule of Investments | |||
| June 30, 2016 | |||
| Market | |||
| Value | |||
| Shares | ($000) | ||
| Polaris Industries Inc. | 46,158 | 3,774 | |
| * | WABCO Holdings Inc. | 39,406 | 3,608 |
| Gentex Corp. | 219,674 | 3,394 | |
| Brunswick Corp. | 73,634 | 3,337 | |
| * | Herbalife Ltd. | 53,828 | 3,151 |
| * | Toll Brothers Inc. | 115,426 | 3,106 |
| * | Skechers U.S.A. Inc. Class A | 97,378 | 2,894 |
| Pool Corp. | 29,813 | 2,803 | |
| Flowers Foods Inc. | 138,960 | 2,605 | |
| Energizer Holdings Inc. | 49,729 | 2,561 | |
| * | Take-Two Interactive Software Inc. | 64,929 | 2,462 |
| Thor Industries Inc. | 35,582 | 2,304 | |
| B&G Foods Inc. | 47,677 | 2,298 | |
| * | Vista Outdoor Inc. | 47,846 | 2,284 |
| * | Tempur Sealy International Inc. | 39,294 | 2,174 |
| * | Helen of Troy Ltd. | 21,088 | 2,169 |
| Spectrum Brands Holdings Inc. | 17,999 | 2,147 | |
| CalAtlantic Group Inc. | 55,294 | 2,030 | |
| Vector Group Ltd. | 87,443 | 1,960 | |
| Tupperware Brands Corp. | 34,544 | 1,944 | |
| * | Kate Spade & Co. | 92,128 | 1,899 |
| * | Tenneco Inc. | 40,156 | 1,872 |
| Nu Skin Enterprises Inc. Class A | 40,521 | 1,872 | |
| HNI Corp. | 39,888 | 1,854 | |
| Snyder's-Lance Inc. | 54,627 | 1,851 | |
| Lancaster Colony Corp. | 14,353 | 1,832 | |
| * | Darling Ingredients Inc. | 119,568 | 1,782 |
| Drew Industries Inc. | 20,722 | 1,758 | |
| WD-40 Co. | 14,817 | 1,740 | |
| * | TRI Pointe Group Inc. | 144,715 | 1,711 |
| Visteon Corp. | 25,959 | 1,708 | |
| * | Manitowoc Foodservice Inc. | 96,552 | 1,701 |
| * | Dorman Products Inc. | 26,662 | 1,525 |
| Fresh Del Monte Produce Inc. | 27,156 | 1,478 | |
| Wolverine World Wide Inc. | 70,016 | 1,423 | |
| * | Blue Buffalo Pet Products Inc. | 60,286 | 1,407 |
| J&J Snack Foods Corp. | 11,583 | 1,381 | |
| * | Deckers Outdoor Corp. | 24,006 | 1,381 |
| Pilgrim's Pride Corp. | 54,098 | 1,378 | |
| * | Steven Madden Ltd. | 39,537 | 1,351 |
| * | G-III Apparel Group Ltd. | 29,476 | 1,348 |
| Cooper Tire & Rubber Co. | 44,287 | 1,321 | |
| * | Zynga Inc. Class A | 515,369 | 1,283 |
| Columbia Sportswear Co. | 22,052 | 1,269 | |
| Herman Miller Inc. | 42,085 | 1,258 | |
| MDC Holdings Inc. | 50,207 | 1,222 | |
| Sanderson Farms Inc. | 13,963 | 1,210 | |
| * | Tumi Holdings Inc. | 44,782 | 1,197 |
| Dean Foods Co. | 66,147 | 1,197 | |
| Avon Products Inc. | 313,950 | 1,187 | |
| Dana Holding Corp. | 112,364 | 1,187 | |
| *,^ | Fitbit Inc. Class A | 97,100 | 1,187 |
| ^ | KB Home | 72,628 | 1,105 |
| * | Boston Beer Co. Inc. Class A | 6,384 | 1,092 |
| La-Z-Boy Inc. | 38,861 | 1,081 | |
| * | ACCO Brands Corp. | 100,463 | 1,038 |
| * | Meritage Homes Corp. | 27,145 | 1,019 |
| *,^ | Wayfair Inc. | 25,316 | 987 |
| Universal Corp. | 16,725 | 966 | |
| Calavo Growers Inc. | 14,012 | 939 | |
| * | Cooper-Standard Holding Inc. | 11,858 | 937 |
| ^ | Cal-Maine Foods Inc. | 20,944 | 928 |
| Knoll Inc. | 37,546 | 912 | |
| * | iRobot Corp. | 24,649 | 865 |
4
| Vanguard® Balanced Index Fund | |||
| Schedule of Investments | |||
| June 30, 2016 | |||
| Market | |||
| Value | |||
| Shares | ($000) | ||
| * | Gentherm Inc. | 24,992 | 856 |
| Interface Inc. Class A | 54,773 | 835 | |
| Schweitzer-Mauduit International Inc. | 23,342 | 824 | |
| ^ | Coty Inc. Class A | 30,601 | 795 |
| * | Universal Electronics Inc. | 10,955 | 792 |
| * | American Axle & Manufacturing Holdings Inc. | 54,473 | 789 |
| * | Fossil Group Inc. | 26,540 | 757 |
| * | TiVo Inc. | 76,018 | 753 |
| Steelcase Inc. Class A | 55,028 | 747 | |
| * | Select Comfort Corp. | 34,864 | 745 |
| * | Central Garden & Pet Co. Class A | 33,733 | 732 |
| Oxford Industries Inc. | 12,425 | 703 | |
| *,^ | GoPro Inc. Class A | 63,800 | 690 |
| * | M/I Homes Inc. | 36,370 | 685 |
| * | Seaboard Corp. | 237 | 680 |
| Nutrisystem Inc. | 25,976 | 659 | |
| * | Taylor Morrison Home Corp. Class A | 44,300 | 657 |
| Briggs & Stratton Corp. | 30,814 | 653 | |
| Ethan Allen Interiors Inc. | 19,682 | 650 | |
| * | Crocs Inc. | 55,484 | 626 |
| Winnebago Industries Inc. | 26,569 | 609 | |
| Andersons Inc. | 17,083 | 607 | |
| Coca-Cola Bottling Co. Consolidated | 4,090 | 603 | |
| * | National Beverage Corp. | 9,474 | 595 |
| Standard Motor Products Inc. | 14,547 | 579 | |
| MGP Ingredients Inc. | 14,648 | 560 | |
| * | USANA Health Sciences Inc. | 5,014 | 559 |
| ^ | Tootsie Roll Industries Inc. | 13,955 | 538 |
| Callaway Golf Co. | 49,970 | 510 | |
| * | Cavco Industries Inc. | 5,396 | 506 |
| *,^ | LGI Homes Inc. | 15,044 | 481 |
| Superior Industries International Inc. | 17,647 | 473 | |
| Inter Parfums Inc. | 16,144 | 461 | |
| Orchids Paper Products Co. | 12,153 | 432 | |
| * | Unifi Inc. | 15,391 | 419 |
| Kimball International Inc. Class B | 35,921 | 409 | |
| * | Motorcar Parts of America Inc. | 14,579 | 396 |
| * | Amplify Snack Brands Inc. | 26,110 | 385 |
| Medifast Inc. | 11,307 | 376 | |
| Movado Group Inc. | 17,079 | 370 | |
| * | Nautilus Inc. | 20,736 | 370 |
| * | Federal-Mogul Holdings Corp. | 40,619 | 338 |
| * | Fox Factory Holding Corp. | 19,100 | 332 |
| * | Revlon Inc. Class A | 10,265 | 330 |
| * | Freshpet Inc. | 32,575 | 304 |
| * | DTS Inc. | 11,395 | 301 |
| Culp Inc. | 10,839 | 299 | |
| * | Modine Manufacturing Co. | 33,956 | 299 |
| Phibro Animal Health Corp. Class A | 15,403 | 287 | |
| Titan International Inc. | 45,500 | 282 | |
| * | Perry Ellis International Inc. | 13,920 | 280 |
| * | Nutraceutical International Corp. | 11,999 | 278 |
| * | Lifevantage Corp. | 20,187 | 275 |
| * | Vera Bradley Inc. | 18,662 | 264 |
| * | Iconix Brand Group Inc. | 38,910 | 263 |
| National Presto Industries Inc. | 2,662 | 251 | |
| Libbey Inc. | 15,729 | 250 | |
| * | Stoneridge Inc. | 16,264 | 243 |
| John B Sanfilippo & Son Inc. | 5,657 | 241 | |
| Tower International Inc. | 11,407 | 235 | |
| * | Omega Protein Corp. | 11,680 | 233 |
| * | Vince Holding Corp. | 38,546 | 211 |
| Flexsteel Industries Inc. | 5,296 | 210 | |
| * | Elizabeth Arden Inc. | 15,051 | 207 |
5
| Vanguard® Balanced Index Fund | |||
| Schedule of Investments | |||
| June 30, 2016 | |||
| Market | |||
| Value | |||
| Shares | ($000) | ||
| Bassett Furniture Industries Inc. | 8,483 | 203 | |
| Weyco Group Inc. | 7,270 | 202 | |
| * | William Lyon Homes Class A | 12,500 | 201 |
| * | Primo Water Corp. | 16,420 | 194 |
| * | WCI Communities Inc. | 11,471 | 194 |
| * | Hovnanian Enterprises Inc. Class A | 110,909 | 186 |
| A-Mark Precious Metals Inc. | 10,615 | 172 | |
| Johnson Outdoors Inc. Class A | 6,125 | 157 | |
| Arctic Cat Inc. | 9,186 | 156 | |
| Hooker Furniture Corp. | 6,619 | 142 | |
| * | Farmer Brothers Co. | 4,375 | 140 |
| Oil-Dri Corp. of America | 3,637 | 126 | |
| * | ZAGG Inc. | 23,585 | 124 |
| * | Glu Mobile Inc. | 55,728 | 123 |
| Strattec Security Corp. | 2,925 | 119 | |
| Alico Inc. | 3,661 | 111 | |
| * | Sequential Brands Group Inc. | 13,600 | 109 |
| * | Skullcandy Inc. | 16,400 | 101 |
| * | Eastman Kodak Co. | 5,974 | 96 |
| Lifetime Brands Inc. | 6,025 | 88 | |
| * | Century Communities Inc. | 4,912 | 85 |
| * | Malibu Boats Inc. Class A | 6,763 | 82 |
| * | Inventure Foods Inc. | 10,030 | 78 |
| * | JAKKS Pacific Inc. | 9,900 | 78 |
| * | Lifeway Foods Inc. | 8,078 | 78 |
| * | New Home Co. Inc. | 7,785 | 74 |
| * | Jamba Inc. | 7,035 | 72 |
| Limoneira Co. | 3,951 | 70 | |
| * | Seneca Foods Corp. Class A | 1,893 | 69 |
| Marine Products Corp. | 7,638 | 65 | |
| LS Starrett Co. Class A | 4,950 | 59 | |
| Nature's Sunshine Products Inc. | 6,088 | 58 | |
| Rocky Brands Inc. | 4,880 | 56 | |
| Acme United Corp. | 2,950 | 54 | |
| * | Charles & Colvard Ltd. | 52,713 | 54 |
| * | US Foods Holding Corp. | 2,200 | 53 |
| Golden Enterprises Inc. | 6,718 | 48 | |
| * | Cherokee Inc. | 4,265 | 47 |
| Escalade Inc. | 4,289 | 44 | |
| P&F Industries Inc. Class A | 4,580 | 43 | |
| * | Black Diamond Inc. | 8,914 | 37 |
| Metaldyne Performance Group Inc. | 2,600 | 36 | |
| Superior Uniform Group Inc. | 1,500 | 29 | |
| * | Alliance One International Inc. | 1,839 | 28 |
| * | Natural Alternatives International Inc. | 2,300 | 25 |
| * | Craft Brew Alliance Inc. | 2,154 | 25 |
| * | Dixie Group Inc. | 6,200 | 22 |
| Unique Fabricating Inc. | 1,600 | 21 | |
| * | Zedge Inc. Class B | 3,385 | 16 |
| * | Beazer Homes USA Inc. | 1,455 | 11 |
| * | Willamette Valley Vineyards Inc. | 902 | 8 |
| * | Emerson Radio Corp. | 12,062 | 7 |
| MCBC Holdings Inc. | 434 | 5 | |
| * | Nova Lifestyle Inc. | 10,524 | 4 |
| * | Lipocine Inc. | 1,400 | 4 |
| * | Crystal Rock Holdings Inc. | 1,860 | 1 |
| * | Stanley Furniture Co. Inc. | 364 | 1 |
| 1,798,364 | |||
| Consumer Services (8.0%) | |||
| * | Amazon.com Inc. | 308,097 | 220,480 |
| Home Depot Inc. | 956,499 | 122,135 | |
| Comcast Corp. Class A | 1,859,452 | 121,218 | |
| Walt Disney Co. | 1,122,101 | 109,764 | |
| McDonald's Corp. | 677,422 | 81,521 | |
6
| Vanguard® Balanced Index Fund | |||
| Schedule of Investments | |||
| June 30, 2016 | |||
| Market | |||
| Value | |||
| Shares | ($000) | ||
| Wal-Mart Stores Inc. | 1,085,774 | 79,283 | |
| CVS Health Corp. | 825,031 | 78,988 | |
| Starbucks Corp. | 1,073,270 | 61,305 | |
| Walgreens Boots Alliance Inc. | 662,956 | 55,204 | |
| Lowe's Cos. Inc. | 689,761 | 54,608 | |
| Costco Wholesale Corp. | 337,122 | 52,942 | |
| * | Priceline Group Inc. | 37,963 | 47,393 |
| Time Warner Inc. | 573,315 | 42,162 | |
| TJX Cos. Inc. | 484,344 | 37,406 | |
| * | Charter Communications Inc. Class A | 153,336 | 35,059 |
| McKesson Corp. | 172,064 | 32,116 | |
| Target Corp. | 451,549 | 31,527 | |
| * | Netflix Inc. | 312,566 | 28,594 |
| Kroger Co. | 732,098 | 26,934 | |
| Yum! Brands Inc. | 296,538 | 24,589 | |
| Twenty-First Century Fox Inc. Class A | 836,654 | 22,632 | |
| Delta Air Lines Inc. | 592,318 | 21,578 | |
| * | eBay Inc. | 855,269 | 20,022 |
| Sysco Corp. | 388,214 | 19,698 | |
| Cardinal Health Inc. | 250,393 | 19,533 | |
| Southwest Airlines Co. | 490,419 | 19,229 | |
| * | O'Reilly Automotive Inc. | 70,435 | 19,095 |
| Dollar General Corp. | 199,399 | 18,744 | |
| * | AutoZone Inc. | 22,928 | 18,201 |
| Ross Stores Inc. | 309,192 | 17,528 | |
| CBS Corp. Class B | 313,014 | 17,041 | |
| * | Dollar Tree Inc. | 171,518 | 16,164 |
| Omnicom Group Inc. | 181,611 | 14,800 | |
| Carnival Corp. | 313,434 | 13,854 | |
| Nielsen Holdings plc | 259,081 | 13,464 | |
| Las Vegas Sands Corp. | 301,646 | 13,119 | |
| L Brands Inc. | 188,541 | 12,657 | |
| American Airlines Group Inc. | 437,918 | 12,397 | |
| Viacom Inc. Class B | 271,592 | 11,263 | |
| * | Ulta Salon Cosmetics & Fragrance Inc. | 45,869 | 11,176 |
| AmerisourceBergen Corp. Class A | 139,091 | 11,033 | |
| Expedia Inc. | 94,127 | 10,006 | |
| * | United Continental Holdings Inc. | 231,525 | 9,502 |
| Starwood Hotels & Resorts Worldwide Inc. | 128,453 | 9,499 | |
| Tractor Supply Co. | 103,347 | 9,423 | |
| Hilton Worldwide Holdings Inc. | 417,553 | 9,407 | |
| * | Chipotle Mexican Grill Inc. Class A | 22,941 | 9,240 |
| Royal Caribbean Cruises Ltd. | 132,344 | 8,887 | |
| Twenty-First Century Fox Inc. | 321,079 | 8,749 | |
| * | Liberty Interactive Corp. QVC Group Class A | 343,862 | 8,724 |
| Advance Auto Parts Inc. | 53,004 | 8,567 | |
| * | DISH Network Corp. Class A | 160,957 | 8,434 |
| Marriott International Inc. Class A | 126,709 | 8,421 | |
| * | MGM Resorts International | 358,605 | 8,115 |
| Whole Foods Market Inc. | 252,308 | 8,079 | |
| Macy's Inc. | 235,285 | 7,908 | |
| * | CarMax Inc. | 149,568 | 7,333 |
| Interpublic Group of Cos. Inc. | 297,490 | 6,872 | |
| Best Buy Co. Inc. | 216,208 | 6,616 | |
| Wyndham Worldwide Corp. | 84,846 | 6,044 | |
| * | IHS Inc. Class A | 51,709 | 5,978 |
| Aramark | 177,265 | 5,924 | |
| * | Rite Aid Corp. | 786,550 | 5,891 |
| Foot Locker Inc. | 105,842 | 5,807 | |
| Darden Restaurants Inc. | 90,822 | 5,753 | |
| Wynn Resorts Ltd. | 62,153 | 5,634 | |
| Kohl's Corp. | 146,262 | 5,546 | |
| Alaska Air Group Inc. | 93,583 | 5,455 | |
| * | TripAdvisor Inc. | 84,752 | 5,450 |
7
| Vanguard® Balanced Index Fund | |||
| Schedule of Investments | |||
| June 30, 2016 | |||
| Market | |||
| Value | |||
| Shares | ($000) | ||
| * | Sirius XM Holdings Inc. | 1,325,132 | 5,234 |
| Signet Jewelers Ltd. | 60,870 | 5,016 | |
| Tiffany & Co. | 81,972 | 4,971 | |
| Domino's Pizza Inc. | 37,679 | 4,950 | |
| * | Norwegian Cruise Line Holdings Ltd. | 123,280 | 4,911 |
| Bed Bath & Beyond Inc. | 111,238 | 4,808 | |
| * | Discovery Communications Inc. | 197,089 | 4,701 |
| FactSet Research Systems Inc. | 28,842 | 4,656 | |
| * | Liberty SiriusXM Group | 149,847 | 4,626 |
| Staples Inc. | 501,776 | 4,325 | |
| Sabre Corp. | 157,810 | 4,228 | |
| * | ServiceMaster Global Holdings Inc. | 105,881 | 4,214 |
| News Corp. Class A | 369,750 | 4,197 | |
| H&R Block Inc. | 182,135 | 4,189 | |
| KAR Auction Services Inc. | 99,203 | 4,141 | |
| Casey's General Stores Inc. | 31,233 | 4,107 | |
| * | JetBlue Airways Corp. | 243,869 | 4,038 |
| Service Corp. International | 146,383 | 3,958 | |
| * | Burlington Stores Inc. | 58,234 | 3,885 |
| Scripps Networks Interactive Inc. Class A | 62,127 | 3,869 | |
| * | VCA Inc. | 55,956 | 3,783 |
| Vail Resorts Inc. | 27,267 | 3,769 | |
| * | Copart Inc. | 76,715 | 3,760 |
| TEGNA Inc. | 161,834 | 3,750 | |
| Dun & Bradstreet Corp. | 30,049 | 3,661 | |
| * | Panera Bread Co. Class A | 17,115 | 3,627 |
| Nordstrom Inc. | 95,158 | 3,621 | |
| Gap Inc. | 161,005 | 3,417 | |
| * | Sally Beauty Holdings Inc. | 113,444 | 3,336 |
| Williams-Sonoma Inc. | 63,221 | 3,296 | |
| Six Flags Entertainment Corp. | 55,370 | 3,209 | |
| ^ | Cracker Barrel Old Country Store Inc. | 18,506 | 3,173 |
| * | Hertz Global Holdings Inc. | 282,702 | 3,130 |
| Dick's Sporting Goods Inc. | 66,752 | 3,008 | |
| Dunkin' Brands Group Inc. | 67,791 | 2,957 | |
| Cinemark Holdings Inc. | 76,011 | 2,771 | |
| * | Discovery Communications Inc. Class A | 108,792 | 2,745 |
| * | AutoNation Inc. | 57,236 | 2,689 |
| * | AMC Networks Inc. Class A | 44,372 | 2,681 |
| * | Madison Square Garden Co. Class A | 15,411 | 2,659 |
| * | Sprouts Farmers Market Inc. | 113,026 | 2,588 |
| * | Spirit Airlines Inc. | 56,568 | 2,538 |
| CST Brands Inc. | 58,852 | 2,535 | |
| * | Live Nation Entertainment Inc. | 103,010 | 2,421 |
| Tribune Media Co. Class A | 60,258 | 2,361 | |
| * | Murphy USA Inc. | 31,099 | 2,306 |
| Rollins Inc. | 77,172 | 2,259 | |
| GameStop Corp. Class A | 83,956 | 2,232 | |
| * | DreamWorks Animation SKG Inc. Class A | 54,585 | 2,231 |
| Jack in the Box Inc. | 25,920 | 2,227 | |
| * | Liberty SiriusXM Group | 69,816 | 2,189 |
| Texas Roadhouse Inc. Class A | 46,859 | 2,137 | |
| * | Avis Budget Group Inc. | 66,276 | 2,136 |
| * | Bright Horizons Family Solutions Inc. | 31,797 | 2,108 |
| * | Starz | 70,341 | 2,105 |
| * | Pandora Media Inc. | 167,165 | 2,081 |
| American Eagle Outfitters Inc. | 127,980 | 2,039 | |
| * | Michaels Cos. Inc. | 70,597 | 2,008 |
| Graham Holdings Co. Class B | 4,086 | 2,000 | |
| Brinker International Inc. | 42,830 | 1,950 | |
| * | Beacon Roofing Supply Inc. | 42,472 | 1,931 |
| * | Buffalo Wild Wings Inc. | 13,866 | 1,927 |
| * | JC Penney Co. Inc. | 210,726 | 1,871 |
| Big Lots Inc. | 37,282 | 1,868 | |
8
| Vanguard® Balanced Index Fund | |||
| Schedule of Investments | |||
| June 30, 2016 | |||
| Market | |||
| Value | |||
| Shares | ($000) | ||
| * | Urban Outfitters Inc. | 67,397 | 1,853 |
| * | Yelp Inc. Class A | 59,900 | 1,819 |
| * | Cabela's Inc. | 36,075 | 1,806 |
| Bloomin' Brands Inc. | 99,894 | 1,785 | |
| * | United Natural Foods Inc. | 37,923 | 1,775 |
| John Wiley & Sons Inc. Class A | 33,985 | 1,773 | |
| ^ | Lions Gate Entertainment Corp. | 87,537 | 1,771 |
| * | GrubHub Inc. | 56,800 | 1,765 |
| Dolby Laboratories Inc. Class A | 36,530 | 1,748 | |
| Matthews International Corp. Class A | 30,838 | 1,716 | |
| Meredith Corp. | 33,024 | 1,714 | |
| AMERCO | 4,547 | 1,703 | |
| PriceSmart Inc. | 17,901 | 1,675 | |
| Cable One Inc. | 3,266 | 1,670 | |
| * | WebMD Health Corp. | 28,674 | 1,666 |
| * | Five Below Inc. | 35,867 | 1,665 |
| Wendy's Co. | 169,776 | 1,633 | |
| Sinclair Broadcast Group Inc. Class A | 53,230 | 1,589 | |
| * | Hawaiian Holdings Inc. | 40,724 | 1,546 |
| Chemed Corp. | 11,328 | 1,544 | |
| Allegiant Travel Co. Class A | 10,048 | 1,522 | |
| * | Houghton Mifflin Harcourt Co. | 96,854 | 1,514 |
| ^ | Regal Entertainment Group Class A | 68,404 | 1,508 |
| Cheesecake Factory Inc. | 30,986 | 1,492 | |
| Core-Mark Holding Co. Inc. | 31,624 | 1,482 | |
| Monro Muffler Brake Inc. | 22,902 | 1,456 | |
| Morningstar Inc. | 17,683 | 1,446 | |
| Hillenbrand Inc. | 47,066 | 1,414 | |
| * | Acxiom Corp. | 64,293 | 1,414 |
| Time Inc. | 85,852 | 1,413 | |
| Papa John's International Inc. | 20,676 | 1,406 | |
| * | Grand Canyon Education Inc. | 34,004 | 1,357 |
| New York Times Co. Class A | 109,434 | 1,324 | |
| Interval Leisure Group Inc. | 82,819 | 1,317 | |
| Churchill Downs Inc. | 10,393 | 1,313 | |
| * | Liberty TripAdvisor Holdings Inc. Class A | 58,562 | 1,281 |
| * | Office Depot Inc. | 385,205 | 1,275 |
| Choice Hotels International Inc. | 26,769 | 1,275 | |
| GNC Holdings Inc. Class A | 51,694 | 1,256 | |
| Aaron's Inc. | 56,492 | 1,237 | |
| * | Dave & Buster's Entertainment Inc. | 26,305 | 1,231 |
| * | Diplomat Pharmacy Inc. | 34,644 | 1,213 |
| * | Krispy Kreme Doughnuts Inc. | 57,106 | 1,197 |
| DineEquity Inc. | 13,939 | 1,182 | |
| Sotheby's | 43,128 | 1,182 | |
| DSW Inc. Class A | 55,596 | 1,178 | |
| * | Genesco Inc. | 18,138 | 1,166 |
| Children's Place Inc. | 14,430 | 1,157 | |
| Gannett Co. Inc. | 83,595 | 1,154 | |
| *,^ | SolarCity Corp. | 47,600 | 1,139 |
| SkyWest Inc. | 42,766 | 1,132 | |
| Lithia Motors Inc. Class A | 15,709 | 1,116 | |
| * | Shutterfly Inc. | 23,878 | 1,113 |
| * | Media General Inc. | 64,660 | 1,112 |
| HSN Inc. | 21,959 | 1,074 | |
| * | Hyatt Hotels Corp. Class A | 21,700 | 1,066 |
| Chico's FAS Inc. | 97,894 | 1,048 | |
| Dillard's Inc. Class A | 17,275 | 1,047 | |
| * | Boyd Gaming Corp. | 56,217 | 1,034 |
| * | Groupon Inc. Class A | 312,294 | 1,015 |
| Sonic Corp. | 36,826 | 996 | |
| * | Popeyes Louisiana Kitchen Inc. | 17,987 | 983 |
| * | Penn National Gaming Inc. | 70,093 | 978 |
| Nexstar Broadcasting Group Inc. Class A | 20,476 | 974 | |
9
| Vanguard® Balanced Index Fund | |||
| Schedule of Investments | |||
| June 30, 2016 | |||
| Market | |||
| Value | |||
| Shares | ($000) | ||
| Abercrombie & Fitch Co. | 54,622 | 973 | |
| Penske Automotive Group Inc. | 30,741 | 967 | |
| * | SUPERVALU Inc. | 204,073 | 963 |
| * | Stamps.com Inc. | 10,788 | 943 |
| Marriott Vacations Worldwide Corp. | 13,718 | 940 | |
| * | Express Inc. | 64,500 | 936 |
| SpartanNash Co. | 30,091 | 920 | |
| Extended Stay America Inc. | 61,266 | 916 | |
| * | Diamond Resorts International Inc. | 30,125 | 903 |
| * | Asbury Automotive Group Inc. | 17,089 | 901 |
| Caleres Inc. | 35,828 | 867 | |
| * | EW Scripps Co. Class A | 53,339 | 845 |
| * | Virgin America Inc. | 14,999 | 843 |
| Group 1 Automotive Inc. | 16,723 | 825 | |
| * | Apollo Education Group Inc. | 90,384 | 824 |
| * | Caesars Acquisition Co. Class A | 73,267 | 822 |
| * | Belmond Ltd. Class A | 81,755 | 809 |
| * | Rush Enterprises Inc. Class A | 35,705 | 769 |
| * | comScore Inc. | 32,011 | 764 |
| SeaWorld Entertainment Inc. | 53,000 | 760 | |
| * | Restoration Hardware Holdings Inc. | 26,200 | 751 |
| * | Gray Television Inc. | 69,079 | 750 |
| Finish Line Inc. Class A | 37,093 | 749 | |
| Cato Corp. Class A | 19,785 | 746 | |
| Scholastic Corp. | 18,751 | 743 | |
| DeVry Education Group Inc. | 39,912 | 712 | |
| * | Denny's Corp. | 66,199 | 710 |
| * | Ascena Retail Group Inc. | 101,609 | 710 |
| * | Quotient Technology Inc. | 52,200 | 700 |
| * | Performance Food Group Co. | 25,937 | 698 |
| ClubCorp Holdings Inc. | 52,984 | 689 | |
| Guess? Inc. | 45,663 | 687 | |
| Bob Evans Farms Inc. | 17,820 | 676 | |
| ^ | Buckle Inc. | 25,989 | 675 |
| * | Hibbett Sports Inc. | 19,289 | 671 |
| * | Liberty Media Group | 35,171 | 667 |
| * | MSG Networks Inc. | 42,961 | 659 |
| *,^ | Mattress Firm Holding Corp. | 19,358 | 649 |
| MDC Partners Inc. Class A | 34,796 | 636 | |
| * | Ollie's Bargain Outlet Holdings Inc. | 25,419 | 633 |
| * | BJ's Restaurants Inc. | 14,075 | 617 |
| AMC Entertainment Holdings Inc. | 22,277 | 615 | |
| * | Strayer Education Inc. | 12,190 | 599 |
| International Speedway Corp. Class A | 17,499 | 585 | |
| New Media Investment Group Inc. | 31,832 | 575 | |
| * | Vitamin Shoppe Inc. | 18,521 | 566 |
| * | Pinnacle Entertainment Inc. | 49,913 | 553 |
| * | Fiesta Restaurant Group Inc. | 25,211 | 550 |
| Barnes & Noble Inc. | 46,568 | 529 | |
| * | Zoe's Kitchen Inc. | 14,569 | 528 |
| * | Providence Service Corp. | 11,612 | 521 |
| * | Etsy Inc. | 53,700 | 515 |
| Fred's Inc. Class A | 31,791 | 512 | |
| * | Chuy's Holdings Inc. | 14,662 | 507 |
| Ingles Markets Inc. Class A | 13,209 | 493 | |
| * | TrueCar Inc. | 62,100 | 488 |
| * | Wingstop Inc. | 17,834 | 486 |
| PetMed Express Inc. | 25,701 | 482 | |
| * | Carmike Cinemas Inc. | 15,527 | 468 |
| * | Tile Shop Holdings Inc. | 23,506 | 467 |
| Sonic Automotive Inc. Class A | 27,233 | 466 | |
| Tailored Brands Inc. | 36,707 | 465 | |
| * | La Quinta Holdings Inc. | 40,741 | 464 |
| National CineMedia Inc. | 28,143 | 436 | |
10
| Vanguard® Balanced Index Fund | |||
| Schedule of Investments | |||
| June 30, 2016 | |||
| Market | |||
| Value | |||
| Shares | ($000) | ||
| Capella Education Co. | 7,860 | 414 | |
| Weis Markets Inc. | 8,026 | 406 | |
| * | Red Robin Gourmet Burgers Inc. | 8,221 | 390 |
| * | Rubicon Project Inc. | 28,128 | 384 |
| * | Career Education Corp. | 63,788 | 380 |
| * | Bankrate Inc. | 50,718 | 379 |
| * | Francesca's Holdings Corp. | 33,900 | 375 |
| World Wrestling Entertainment Inc. Class A | 20,153 | 371 | |
| Entercom Communications Corp. Class A | 27,038 | 367 | |
| * | Clean Energy Fuels Corp. | 105,600 | 366 |
| * | XO Group Inc. | 20,857 | 364 |
| * | Potbelly Corp. | 28,950 | 363 |
| Ruth's Hospitality Group Inc. | 21,850 | 349 | |
| * | Liberty Braves Group | 23,720 | 348 |
| Rent-A-Center Inc. | 27,763 | 341 | |
| * | MarineMax Inc. | 19,961 | 339 |
| * | Lumber Liquidators Holdings Inc. | 21,367 | 329 |
| Marcus Corp. | 15,559 | 328 | |
| Carriage Services Inc. Class A | 13,202 | 313 | |
| * | Liberty Media Group Class A | 16,179 | 310 |
| * | Regis Corp. | 24,237 | 302 |
| * | Shake Shack Inc. Class A | 8,059 | 294 |
| * | Del Frisco's Restaurant Group Inc. | 19,976 | 286 |
| * | Scientific Games Corp. Class A | 30,980 | 285 |
| * | Del Taco Restaurants Inc. | 31,200 | 284 |
| * | Planet Fitness Inc. Class A | 14,975 | 283 |
| * | Isle of Capri Casinos Inc. | 15,073 | 276 |
| * | Biglari Holdings Inc. | 680 | 274 |
| * | Daily Journal Corp. | 1,128 | 267 |
| *,^ | Weight Watchers International Inc. | 22,900 | 266 |
| * | SP Plus Corp. | 11,737 | 265 |
| * | tronc Inc. | 19,200 | 265 |
| Shoe Carnival Inc. | 10,511 | 263 | |
| * | Carrols Restaurant Group Inc. | 21,476 | 256 |
| * | TechTarget Inc. | 31,042 | 251 |
| * | Chefs' Warehouse Inc. | 15,709 | 251 |
| Entravision Communications Corp. Class A | 37,271 | 250 | |
| * | Boot Barn Holdings Inc. | 28,400 | 245 |
| * | Smart & Final Stores Inc. | 16,426 | 245 |
| * | RetailMeNot Inc. | 31,200 | 241 |
| * | Eldorado Resorts Inc. | 15,634 | 238 |
| * | Red Rock Resorts Inc. Class A | 10,720 | 236 |
| * | Bojangles' Inc. | 13,819 | 234 |
| * | Ruby Tuesday Inc. | 62,948 | 227 |
| * | FTD Cos. Inc. | 8,853 | 221 |
| * | Party City Holdco Inc. | 15,498 | 216 |
| * | Global Eagle Entertainment Inc. | 32,463 | 216 |
| * | El Pollo Loco Holdings Inc. | 16,500 | 215 |
| * | 1-800-Flowers.com Inc. Class A | 23,555 | 212 |
| * | Full House Resorts Inc. | 102,362 | 207 |
| * | Tuesday Morning Corp. | 29,321 | 206 |
| Blue Nile Inc. | 7,300 | 200 | |
| * | American Public Education Inc. | 6,800 | 191 |
| Haverty Furniture Cos. Inc. | 10,595 | 191 | |
| Pier 1 Imports Inc. | 36,548 | 188 | |
| * | Lindblad Expeditions Holdings Inc. | 19,500 | 188 |
| * | K12 Inc. | 14,900 | 186 |
| * | Barnes & Noble Education Inc. | 17,283 | 175 |
| * | Overstock.com Inc. | 10,886 | 175 |
| Saga Communications Inc. Class A | 4,416 | 175 | |
| * | America's Car-Mart Inc. | 6,119 | 173 |
| * | Kirkland's Inc. | 11,486 | 169 |
| * | TubeMogul Inc. | 13,800 | 164 |
| Stein Mart Inc. | 21,111 | 163 | |
11
| Vanguard® Balanced Index Fund | |||
| Schedule of Investments | |||
| June 30, 2016 | |||
| Market | |||
| Value | |||
| Shares | ($000) | ||
| * | Caesars Entertainment Corp. | 20,800 | 160 |
| * | Angie's List Inc. | 24,490 | 159 |
| * | Conn's Inc. | 20,994 | 158 |
| Collectors Universe Inc. | 7,501 | 148 | |
| * | Liquidity Services Inc. | 18,603 | 146 |
| * | Reading International Inc. Class A | 11,662 | 146 |
| Speedway Motorsports Inc. | 8,106 | 144 | |
| Golden Entertainment Inc. | 12,142 | 142 | |
| Citi Trends Inc. | 9,013 | 140 | |
| * | West Marine Inc. | 16,389 | 138 |
| * | Titan Machinery Inc. | 11,700 | 130 |
| * | Townsquare Media Inc. Class A | 16,400 | 129 |
| * | Monarch Casino & Resort Inc. | 5,883 | 129 |
| * | Destination XL Group Inc. | 27,724 | 127 |
| * | Habit Restaurants Inc. Class A | 7,100 | 116 |
| * | J Alexander's Holdings Inc. | 11,698 | 116 |
| ^ | Natural Health Trends Corp. | 4,000 | 113 |
| * | Intrawest Resorts Holdings Inc. | 8,610 | 112 |
| * | Duluth Holdings Inc. | 4,500 | 110 |
| * | PCM Inc. | 9,786 | 109 |
| Village Super Market Inc. Class A | 3,510 | 101 | |
| * | Leap Wireless International Inc CVR | 39,632 | 100 |
| * | Zumiez Inc. | 6,900 | 99 |
| * | Bravo Brio Restaurant Group Inc. | 12,003 | 98 |
| * | Liberty Braves Group Class A | 6,471 | 97 |
| * | Sears Holdings Corp. | 7,100 | 97 |
| * | Autobytel Inc. | 6,554 | 91 |
| * | Radio One Inc. | 28,183 | 90 |
| * | Sportsman's Warehouse Holdings Inc. | 11,000 | 89 |
| *,^ | Lands' End Inc. | 5,256 | 86 |
| * | Trupanion Inc. | 6,400 | 85 |
| CSS Industries Inc. | 3,040 | 82 | |
| * | Noodles & Co. Class A | 7,600 | 74 |
| McClatchy Co. Class A | 4,700 | 69 | |
| * | Sears Hometown and Outlet Stores Inc. | 10,000 | 67 |
| Winmark Corp. | 663 | 66 | |
| * | Kona Grill Inc. | 6,103 | 65 |
| * | Build-A-Bear Workshop Inc. | 4,746 | 64 |
| * | Remark Media Inc. | 14,727 | 62 |
| * | Avid Technology Inc. | 10,623 | 62 |
| Destination Maternity Corp. | 10,343 | 61 | |
| * | Care.com Inc. | 5,120 | 60 |
| * | CafePress Inc. | 19,289 | 60 |
| * | Luby's Inc. | 10,342 | 52 |
| * | Century Casinos Inc. | 7,747 | 48 |
| CBS Corp. Class A | 800 | 46 | |
| * | Red Lion Hotels Corp. | 5,286 | 38 |
| Ark Restaurants Corp. | 1,599 | 36 | |
| * | ITT Educational Services Inc. | 18,431 | 35 |
| * | Profire Energy Inc. | 30,130 | 33 |
| * | Papa Murphy's Holdings Inc. | 5,000 | 33 |
| * | Emmis Communications Corp. Class A | 37,190 | 27 |
| * | Marchex Inc. Class B | 7,400 | 24 |
| * | Famous Dave's of America Inc. | 4,588 | 23 |
| *,^ | FunctionX Inc. | 77,926 | 22 |
| * | Insignia Systems Inc. | 9,200 | 20 |
| * | Rave Restaurant Group Inc. | 5,000 | 20 |
| * | Adolor Corp. Rights Exp. 07/01/2019 | 34,581 | 18 |
| * | Gaiam Inc. Class A | 2,251 | 17 |
| Clear Channel Outdoor Holdings Inc. Class A | 2,800 | 17 | |
| Big 5 Sporting Goods Corp. | 1,878 | 17 | |
| * | Tilly's Inc. Class A | 2,905 | 17 |
| RCI Hospitality Holdings Inc. | 1,511 | 15 | |
| * | Hemisphere Media Group Inc. Class A | 1,300 | 15 |
12
| Vanguard® Balanced Index Fund | |||
| Schedule of Investments | |||
| June 30, 2016 | |||
| Market | |||
| Value | |||
| Shares | ($000) | ||
| A H Belo Corp. Class A | 3,025 | 15 | |
| TheStreet Inc. | 12,030 | 14 | |
| * | Cambium Learning Group Inc. | 2,620 | 12 |
| * | Lee Enterprises Inc. | 5,325 | 10 |
| * | Nathan's Famous Inc. | 200 | 9 |
| * | Spark Networks Inc. | 5,500 | 9 |
| * | Gaming Partners International Corp. | 800 | 7 |
| Liberty Tax Inc. | 530 | 7 | |
| * | Fogo De Chao Inc. | 537 | 7 |
| * | Live Ventures Inc. | 3,600 | 5 |
| * | New York & Co. Inc. | 2,966 | 4 |
| * | Bridgepoint Education Inc. | 171 | 1 |
| * | SPAR Group Inc. | 1,100 | 1 |
| Beasley Broadcast Group Inc. Class A | 227 | 1 | |
| * | Gerber Scientific Inc. CVR | 16,800 | — |
| 2,258,630 | |||
| Financials (11.1%) | |||
| * | Berkshire Hathaway Inc. Class B | 1,362,005 | 197,205 |
| JPMorgan Chase & Co. | 2,796,219 | 173,757 | |
| Wells Fargo & Co. | 3,505,276 | 165,905 | |
| Visa Inc. Class A | 1,462,986 | 108,510 | |
| Bank of America Corp. | 7,812,221 | 103,668 | |
| Citigroup Inc. | 2,229,007 | 94,488 | |
| MasterCard Inc. Class A | 749,075 | 65,964 | |
| Simon Property Group Inc. | 237,714 | 51,560 | |
| US Bancorp | 1,255,144 | 50,620 | |
| Chubb Ltd. | 338,314 | 44,221 | |
| American International Group Inc. | 814,233 | 43,065 | |
| Goldman Sachs Group Inc. | 284,642 | 42,292 | |
| American Express Co. | 620,665 | 37,712 | |
| American Tower Corporation | 325,833 | 37,018 | |
| PNC Financial Services Group Inc. | 379,276 | 30,869 | |
| Bank of New York Mellon Corp. | 784,793 | 30,489 | |
| Public Storage | 113,460 | 28,999 | |
| Morgan Stanley | 1,107,086 | 28,762 | |
| BlackRock Inc. | 81,117 | 27,785 | |
| Marsh & McLennan Cos. Inc. | 401,582 | 27,492 | |
| MetLife Inc. | 669,100 | 26,650 | |
| Travelers Cos. Inc. | 223,255 | 26,576 | |
| Crown Castle International Corp. | 258,183 | 26,187 | |
| Capital One Financial Corp. | 395,224 | 25,101 | |
| Prudential Financial Inc. | 344,534 | 24,579 | |
| CME Group Inc. | 248,170 | 24,172 | |
| Charles Schwab Corp. | 909,299 | 23,014 | |
| Aflac Inc. | 314,528 | 22,696 | |
| Aon plc | 205,459 | 22,442 | |
| Intercontinental Exchange Inc. | 87,544 | 22,408 | |
| BB&T Corp. | 613,141 | 21,834 | |
| S&P Global Inc. | 203,097 | 21,784 | |
| Welltower Inc. | 273,219 | 20,811 | |
| Equinix Inc. | 52,873 | 20,500 | |
| Allstate Corp. | 288,066 | 20,150 | |
| Prologis Inc. | 397,448 | 19,491 | |
| Equity Residential | 278,892 | 19,210 | |
| AvalonBay Communities Inc. | 105,058 | 18,951 | |
| Ventas Inc. | 258,782 | 18,844 | |
| Weyerhaeuser Co. | 600,011 | 17,862 | |
| Discover Financial Services | 314,531 | 16,856 | |
| * | Berkshire Hathaway Inc. Class A | 74 | 16,056 |
| * | Synchrony Financial | 634,369 | 16,037 |
| SunTrust Banks Inc. | 387,082 | 15,901 | |
| State Street Corp. | 290,315 | 15,654 | |
| Boston Properties Inc. | 117,114 | 15,447 | |
| Progressive Corp. | 423,871 | 14,200 | |
13
| Vanguard® Balanced Index Fund | |||
| Schedule of Investments | |||
| June 30, 2016 | |||
| Market | |||
| Value | |||
| Shares | ($000) | ||
| Hartford Financial Services Group Inc. | 310,408 | 13,776 | |
| Realty Income Corp. | 197,715 | 13,713 | |
| Digital Realty Trust Inc. | 120,527 | 13,136 | |
| T. Rowe Price Group Inc. | 178,294 | 13,010 | |
| General Growth Properties Inc. | 431,062 | 12,854 | |
| M&T Bank Corp. | 107,632 | 12,725 | |
| Vornado Realty Trust | 126,902 | 12,705 | |
| Willis Towers Watson plc | 101,539 | 12,622 | |
| HCP Inc. | 355,996 | 12,595 | |
| Moody's Corp. | 126,537 | 11,858 | |
| Equifax Inc. | 89,115 | 11,442 | |
| Essex Property Trust Inc. | 49,742 | 11,346 | |
| Ameriprise Financial Inc. | 126,173 | 11,337 | |
| Northern Trust Corp. | 166,628 | 11,041 | |
| Fifth Third Bancorp | 614,600 | 10,811 | |
| * | Markel Corp. | 10,331 | 9,843 |
| Macerich Co. | 113,555 | 9,696 | |
| Principal Financial Group Inc. | 233,577 | 9,602 | |
| Host Hotels & Resorts Inc. | 585,492 | 9,491 | |
| Kimco Realty Corp. | 297,941 | 9,349 | |
| Loews Corp. | 221,683 | 9,109 | |
| Franklin Resources Inc. | 271,700 | 9,067 | |
| Cincinnati Financial Corp. | 120,671 | 9,037 | |
| Federal Realty Investment Trust | 54,279 | 8,986 | |
| Regions Financial Corp. | 1,025,656 | 8,728 | |
| Extra Space Storage Inc. | 90,598 | 8,384 | |
| SL Green Realty Corp. | 78,611 | 8,370 | |
| Invesco Ltd. | 322,113 | 8,227 | |
| Citizens Financial Group Inc. | 409,354 | 8,179 | |
| First Republic Bank | 111,577 | 7,809 | |
| Annaly Capital Management Inc. | 693,945 | 7,682 | |
| FNF Group | 203,910 | 7,647 | |
| * | Liberty Broadband Corp. | 127,423 | 7,645 |
| XL Group plc Class A | 223,059 | 7,430 | |
| UDR Inc. | 200,673 | 7,409 | |
| Western Union Co. | 378,710 | 7,264 | |
| Duke Realty Corp. | 270,271 | 7,205 | |
| VEREIT Inc. | 709,489 | 7,194 | |
| Lincoln National Corp. | 183,653 | 7,120 | |
| KeyCorp | 611,618 | 6,758 | |
| * | Arch Capital Group Ltd. | 90,493 | 6,515 |
| Arthur J Gallagher & Co. | 136,136 | 6,480 | |
| Regency Centers Corp. | 74,393 | 6,229 | |
| Iron Mountain Inc. | 152,377 | 6,069 | |
| Mid-America Apartment Communities Inc. | 56,878 | 6,052 | |
| Unum Group | 187,872 | 5,972 | |
| * | Alleghany Corp. | 10,803 | 5,937 |
| * | Affiliated Managers Group Inc. | 41,695 | 5,869 |
| * | Ally Financial Inc. | 340,472 | 5,812 |
| Alexandria Real Estate Equities Inc. | 56,072 | 5,805 | |
| Everest Re Group Ltd. | 31,506 | 5,755 | |
| * | CBRE Group Inc. Class A | 216,508 | 5,733 |
| Nasdaq Inc. | 87,790 | 5,677 | |
| Comerica Inc. | 137,228 | 5,644 | |
| Camden Property Trust | 63,813 | 5,642 | |
| National Retail Properties Inc. | 107,026 | 5,535 | |
| Huntington Bancshares Inc. | 615,894 | 5,506 | |
| New York Community Bancorp Inc. | 358,007 | 5,367 | |
| SEI Investments Co. | 111,494 | 5,364 | |
| Torchmark Corp. | 85,576 | 5,290 | |
| CIT Group Inc. | 163,646 | 5,222 | |
| American Campus Communities Inc. | 98,519 | 5,209 | |
| WP Carey Inc. | 74,958 | 5,204 | |
| TD Ameritrade Holding Corp. | 180,998 | 5,154 | |
14
| Vanguard® Balanced Index Fund | |||
| Schedule of Investments | |||
| June 30, 2016 | |||
| Market | |||
| Value | |||
| Shares | ($000) | ||
| MSCI Inc. Class A | 66,548 | 5,132 | |
| * | E*TRADE Financial Corp. | 215,795 | 5,069 |
| Apartment Investment & Management Co. | 114,067 | 5,037 | |
| Gaming and Leisure Properties Inc. | 145,958 | 5,033 | |
| Omega Healthcare Investors Inc. | 146,352 | 4,969 | |
| Raymond James Financial Inc. | 100,534 | 4,956 | |
| American Capital Agency Corp. | 249,812 | 4,951 | |
| Kilroy Realty Corp. | 72,185 | 4,785 | |
| * | Signature Bank | 38,117 | 4,762 |
| Reinsurance Group of America Inc. Class A | 48,009 | 4,656 | |
| Equity LifeStyle Properties Inc. | 58,072 | 4,649 | |
| Spirit Realty Capital Inc. | 360,459 | 4,603 | |
| DDR Corp. | 246,477 | 4,471 | |
| Brixmor Property Group Inc. | 163,745 | 4,333 | |
| Liberty Property Trust | 107,481 | 4,269 | |
| CBOE Holdings Inc. | 63,461 | 4,228 | |
| Forest City Realty Trust Inc. Class A | 189,260 | 4,222 | |
| Assurant Inc. | 48,174 | 4,158 | |
| Lamar Advertising Co. Class A | 61,540 | 4,080 | |
| Highwoods Properties Inc. | 76,988 | 4,065 | |
| CubeSmart | 131,415 | 4,058 | |
| WR Berkley Corp. | 67,370 | 4,037 | |
| Voya Financial Inc. | 162,468 | 4,023 | |
| MarketAxess Holdings Inc. | 27,355 | 3,977 | |
| Zions Bancorporation | 158,272 | 3,977 | |
| Senior Housing Properties Trust | 190,401 | 3,966 | |
| * | SVB Financial Group | 40,309 | 3,836 |
| Starwood Property Trust Inc. | 182,817 | 3,788 | |
| American Financial Group Inc. | 50,925 | 3,765 | |
| RenaissanceRe Holdings Ltd. | 31,671 | 3,719 | |
| * | Liberty Ventures Class A | 98,729 | 3,660 |
| Axis Capital Holdings Ltd. | 66,268 | 3,645 | |
| Sovran Self Storage Inc. | 34,716 | 3,642 | |
| EPR Properties | 45,099 | 3,639 | |
| Douglas Emmett Inc. | 101,451 | 3,604 | |
| East West Bancorp Inc. | 104,726 | 3,580 | |
| *,^ | Zillow Group Inc. | 97,817 | 3,549 |
| Weingarten Realty Investors | 84,528 | 3,450 | |
| Jones Lang LaSalle Inc. | 35,065 | 3,417 | |
| STORE Capital Corp. | 114,942 | 3,385 | |
| Corrections Corp. of America | 95,656 | 3,350 | |
| Communications Sales & Leasing Inc. | 115,250 | 3,331 | |
| Sun Communities Inc. | 43,452 | 3,330 | |
| Navient Corp. | 277,106 | 3,311 | |
| People's United Financial Inc. | 225,716 | 3,309 | |
| First American Financial Corp. | 81,683 | 3,285 | |
| PacWest Bancorp | 82,318 | 3,275 | |
| Old Republic International Corp. | 169,715 | 3,274 | |
| DCT Industrial Trust Inc. | 67,822 | 3,258 | |
| Healthcare Trust of America Inc. Class A | 100,252 | 3,242 | |
| * | Realogy Holdings Corp. | 111,591 | 3,238 |
| * | Howard Hughes Corp. | 28,252 | 3,230 |
| American Homes 4 Rent Class A | 157,676 | 3,229 | |
| Hospitality Properties Trust | 110,399 | 3,179 | |
| First Horizon National Corp. | 227,650 | 3,137 | |
| CyrusOne Inc. | 56,042 | 3,119 | |
| Healthcare Realty Trust Inc. | 87,975 | 3,078 | |
| Brown & Brown Inc. | 82,088 | 3,076 | |
| Endurance Specialty Holdings Ltd. | 45,661 | 3,067 | |
| Taubman Centers Inc. | 41,319 | 3,066 | |
| Retail Properties of America Inc. | 180,286 | 3,047 | |
| Medical Properties Trust Inc. | 198,641 | 3,021 | |
| Lazard Ltd. Class A | 99,750 | 2,971 | |
| Umpqua Holdings Corp. | 187,833 | 2,906 | |
15
| Vanguard® Balanced Index Fund | |||
| Schedule of Investments | |||
| June 30, 2016 | |||
| Market | |||
| Value | |||
| Shares | ($000) | ||
| Two Harbors Investment Corp. | 338,017 | 2,893 | |
| Cullen/Frost Bankers Inc. | 45,294 | 2,887 | |
| Assured Guaranty Ltd. | 111,980 | 2,841 | |
| Commerce Bancshares Inc. | 59,248 | 2,838 | |
| Tanger Factory Outlet Centers Inc. | 69,786 | 2,804 | |
| DuPont Fabros Technology Inc. | 58,939 | 2,802 | |
| White Mountains Insurance Group Ltd. | 3,307 | 2,784 | |
| Gramercy Property Trust | 301,978 | 2,784 | |
| Prosperity Bancshares Inc. | 53,823 | 2,744 | |
| Eaton Vance Corp. | 77,610 | 2,743 | |
| * | Equity Commonwealth | 92,546 | 2,696 |
| Validus Holdings Ltd. | 55,290 | 2,687 | |
| Investors Bancorp Inc. | 239,073 | 2,649 | |
| First Industrial Realty Trust Inc. | 95,204 | 2,649 | |
| Synovus Financial Corp. | 90,533 | 2,625 | |
| New Residential Investment Corp. | 186,400 | 2,580 | |
| Hanover Insurance Group Inc. | 30,467 | 2,578 | |
| Piedmont Office Realty Trust Inc. Class A | 119,361 | 2,571 | |
| First Niagara Financial Group Inc. | 255,801 | 2,491 | |
| CNO Financial Group Inc. | 141,632 | 2,473 | |
| FirstMerit Corp. | 120,659 | 2,446 | |
| Blackstone Mortgage Trust Inc. Class A | 88,110 | 2,438 | |
| Allied World Assurance Co. Holdings AG | 68,996 | 2,425 | |
| Outfront Media Inc. | 100,118 | 2,420 | |
| Post Properties Inc. | 39,478 | 2,410 | |
| PrivateBancorp Inc. | 54,649 | 2,406 | |
| Equity One Inc. | 74,740 | 2,405 | |
| Aspen Insurance Holdings Ltd. | 51,600 | 2,393 | |
| Legg Mason Inc. | 80,831 | 2,384 | |
| Acadia Realty Trust | 66,095 | 2,348 | |
| Apple Hospitality REIT Inc. | 122,405 | 2,302 | |
| Rayonier Inc. | 87,311 | 2,291 | |
| Popular Inc. | 78,100 | 2,288 | |
| MFA Financial Inc. | 314,403 | 2,286 | |
| Webster Financial Corp. | 66,684 | 2,264 | |
| MB Financial Inc. | 62,231 | 2,258 | |
| BankUnited Inc. | 71,618 | 2,200 | |
| * | Western Alliance Bancorp | 67,021 | 2,188 |
| Federated Investors Inc. Class B | 75,572 | 2,175 | |
| LaSalle Hotel Properties | 92,173 | 2,173 | |
| Bank of the Ozarks Inc. | 57,684 | 2,164 | |
| Sunstone Hotel Investors Inc. | 178,891 | 2,159 | |
| RLI Corp. | 31,324 | 2,154 | |
| Bank of Hawaii Corp. | 31,179 | 2,145 | |
| Chimera Investment Corp. | 136,255 | 2,139 | |
| Brandywine Realty Trust | 126,342 | 2,123 | |
| Education Realty Trust Inc. | 45,845 | 2,115 | |
| * | SLM Corp. | 341,970 | 2,113 |
| Hancock Holding Co. | 80,908 | 2,112 | |
| Physicians Realty Trust | 99,800 | 2,097 | |
| Washington Federal Inc. | 85,635 | 2,077 | |
| ProAssurance Corp. | 38,432 | 2,058 | |
| Urban Edge Properties | 68,662 | 2,050 | |
| Primerica Inc. | 35,649 | 2,041 | |
| Retail Opportunity Investments Corp. | 93,592 | 2,028 | |
| Corporate Office Properties Trust | 68,206 | 2,017 | |
| Wintrust Financial Corp. | 39,359 | 2,007 | |
| Erie Indemnity Co. Class A | 19,917 | 1,979 | |
| Columbia Property Trust Inc. | 92,288 | 1,975 | |
| CoreSite Realty Corp. | 22,197 | 1,969 | |
| RLJ Lodging Trust | 91,471 | 1,962 | |
| Paramount Group Inc. | 122,305 | 1,950 | |
| National Health Investors Inc. | 25,752 | 1,934 | |
| Trustmark Corp. | 77,501 | 1,926 | |
16
| Vanguard® Balanced Index Fund | |||
| Schedule of Investments | |||
| June 30, 2016 | |||
| Market | |||
| Value | |||
| Shares | ($000) | ||
| FNB Corp. | 151,382 | 1,898 | |
| Hudson Pacific Properties Inc. | 64,548 | 1,883 | |
| * | Texas Capital Bancshares Inc. | 40,238 | 1,882 |
| Washington REIT | 59,418 | 1,869 | |
| GEO Group Inc. | 54,060 | 1,848 | |
| Glacier Bancorp Inc. | 69,466 | 1,846 | |
| Radian Group Inc. | 175,926 | 1,833 | |
| QTS Realty Trust Inc. Class A | 32,690 | 1,830 | |
| Associated Banc-Corp | 104,932 | 1,800 | |
| Select Income REIT | 69,237 | 1,799 | |
| WP Glimcher Inc. | 160,562 | 1,797 | |
| United Bankshares Inc. | 47,812 | 1,793 | |
| * | Stifel Financial Corp. | 56,947 | 1,791 |
| AmTrust Financial Services Inc. | 72,537 | 1,777 | |
| IBERIABANK Corp. | 29,711 | 1,775 | |
| Janus Capital Group Inc. | 123,348 | 1,717 | |
| Home BancShares Inc. | 86,752 | 1,717 | |
| Xenia Hotels & Resorts Inc. | 101,265 | 1,699 | |
| Fulton Financial Corp. | 124,807 | 1,685 | |
| Kite Realty Group Trust | 57,929 | 1,624 | |
| First Citizens BancShares Inc. | 6,267 | 1,623 | |
| Pebblebrook Hotel Trust | 61,538 | 1,615 | |
| Care Capital Properties Inc. | 60,983 | 1,598 | |
| DiamondRock Hospitality Co. | 176,410 | 1,593 | |
| South State Corp. | 23,196 | 1,578 | |
| NBT Bancorp Inc. | 54,920 | 1,572 | |
| Cousins Properties Inc. | 151,071 | 1,571 | |
| Mack-Cali Realty Corp. | 57,982 | 1,565 | |
| BancorpSouth Inc. | 68,072 | 1,545 | |
| Interactive Brokers Group Inc. | 43,572 | 1,542 | |
| * | HRG Group Inc. | 112,083 | 1,539 |
| Ryman Hospitality Properties Inc. | 30,341 | 1,537 | |
| First Financial Bankshares Inc. | 46,718 | 1,532 | |
| Empire State Realty Trust Inc. | 80,294 | 1,525 | |
| Colony Capital Inc. Class A | 99,184 | 1,522 | |
| NorthStar Realty Finance Corp. | 133,059 | 1,521 | |
| UMB Financial Corp. | 28,508 | 1,517 | |
| LTC Properties Inc. | 29,299 | 1,516 | |
| International Bancshares Corp. | 57,768 | 1,507 | |
| Selective Insurance Group Inc. | 39,406 | 1,506 | |
| Kennedy-Wilson Holdings Inc. | 79,207 | 1,502 | |
| NorthStar Asset Management Group Inc. | 146,909 | 1,500 | |
| CBL & Associates Properties Inc. | 160,785 | 1,497 | |
| TFS Financial Corp. | 86,350 | 1,487 | |
| Cathay General Bancorp | 52,506 | 1,481 | |
| EastGroup Properties Inc. | 21,413 | 1,476 | |
| * | MGIC Investment Corp. | 247,349 | 1,472 |
| Valley National Bancorp | 160,326 | 1,462 | |
| American Assets Trust Inc. | 34,375 | 1,459 | |
| PS Business Parks Inc. | 13,735 | 1,457 | |
| CVB Financial Corp. | 88,452 | 1,450 | |
| Government Properties Income Trust | 62,718 | 1,446 | |
| Colony Starwood Homes | 46,873 | 1,426 | |
| Lexington Realty Trust | 140,031 | 1,416 | |
| Community Bank System Inc. | 34,227 | 1,406 | |
| Great Western Bancorp Inc. | 44,551 | 1,405 | |
| Sterling Bancorp | 89,353 | 1,403 | |
| American National Insurance Co. | 12,159 | 1,376 | |
| * | Enstar Group Ltd. | 8,430 | 1,366 |
| *,^ | Zillow Group Inc. Class A | 37,054 | 1,358 |
| Invesco Mortgage Capital Inc. | 98,890 | 1,354 | |
| CYS Investments Inc. | 161,472 | 1,352 | |
| * | Blackhawk Network Holdings Inc. | 40,062 | 1,342 |
| Hatteras Financial Corp. | 81,700 | 1,340 | |
17
| Vanguard® Balanced Index Fund | |||
| Schedule of Investments | |||
| June 30, 2016 | |||
| Market | |||
| Value | |||
| Shares | ($000) | ||
| TCF Financial Corp. | 105,067 | 1,329 | |
| LPL Financial Holdings Inc. | 58,836 | 1,326 | |
| EverBank Financial Corp. | 89,027 | 1,323 | |
| Potlatch Corp. | 38,410 | 1,310 | |
| * | Hilltop Holdings Inc. | 62,227 | 1,306 |
| First Midwest Bancorp Inc. | 73,642 | 1,293 | |
| Parkway Properties Inc. | 77,211 | 1,292 | |
| Pinnacle Financial Partners Inc. | 26,153 | 1,278 | |
| Columbia Banking System Inc. | 45,475 | 1,276 | |
| Sabra Health Care REIT Inc. | 61,066 | 1,260 | |
| Chesapeake Lodging Trust | 53,833 | 1,252 | |
| Evercore Partners Inc. Class A | 28,082 | 1,241 | |
| American Capital Mortgage Investment Corp. | 78,338 | 1,237 | |
| Monogram Residential Trust Inc. | 120,142 | 1,227 | |
| ^ | WisdomTree Investments Inc. | 122,283 | 1,197 |
| * | Eagle Bancorp Inc. | 24,785 | 1,192 |
| Argo Group International Holdings Ltd. | 22,950 | 1,191 | |
| Capitol Federal Financial Inc. | 84,270 | 1,176 | |
| First Cash Financial Services Inc. | 22,756 | 1,168 | |
| STAG Industrial Inc. | 48,829 | 1,163 | |
| Waddell & Reed Financial Inc. Class A | 67,429 | 1,161 | |
| Alexander & Baldwin Inc. | 31,926 | 1,154 | |
| LegacyTexas Financial Group Inc. | 42,865 | 1,153 | |
| BGC Partners Inc. Class A | 132,398 | 1,153 | |
| ^ | Chemical Financial Corp. | 30,292 | 1,130 |
| Old National Bancorp | 90,147 | 1,130 | |
| Mercury General Corp. | 20,623 | 1,096 | |
| United Community Banks Inc. | 59,699 | 1,092 | |
| *,^ | Credit Acceptance Corp. | 5,716 | 1,058 |
| Global Net Lease Inc. | 132,438 | 1,053 | |
| Westamerica Bancorporation | 21,107 | 1,040 | |
| Renasant Corp. | 32,017 | 1,035 | |
| Astoria Financial Corp. | 66,561 | 1,020 | |
| BOK Financial Corp. | 16,240 | 1,018 | |
| New York REIT Inc. | 109,164 | 1,010 | |
| Horace Mann Educators Corp. | 29,770 | 1,006 | |
| Boston Private Financial Holdings Inc. | 85,252 | 1,004 | |
| PennyMac Mortgage Investment Trust | 61,265 | 994 | |
| *,^ | LendingClub Corp. | 230,300 | 990 |
| Redwood Trust Inc. | 71,138 | 982 | |
| Pennsylvania REIT | 45,628 | 979 | |
| Terreno Realty Corp. | 37,620 | 973 | |
| Independent Bank Corp. | 21,031 | 961 | |
| Towne Bank | 44,109 | 955 | |
| National General Holdings Corp. | 44,570 | 955 | |
| * | Essent Group Ltd. | 43,500 | 949 |
| * | HealthEquity Inc. | 31,116 | 945 |
| ServisFirst Bancshares Inc. | 19,029 | 940 | |
| Talmer Bancorp Inc. Class A | 48,801 | 935 | |
| Northwest Bancshares Inc. | 63,035 | 935 | |
| Financial Engines Inc. | 36,089 | 934 | |
| Ramco-Gershenson Properties Trust | 47,503 | 932 | |
| First Financial Bancorp | 47,516 | 924 | |
| Kemper Corp. | 29,803 | 923 | |
| Simmons First National Corp. Class A | 19,897 | 919 | |
| * | Genworth Financial Inc. Class A | 355,815 | 918 |
| Franklin Street Properties Corp. | 74,751 | 917 | |
| BBCN Bancorp Inc. | 61,185 | 913 | |
| * | Santander Consumer USA Holdings Inc. | 88,300 | 912 |
| Lakeland Financial Corp. | 19,141 | 900 | |
| American Equity Investment Life Holding Co. | 62,216 | 887 | |
| Park National Corp. | 9,646 | 885 | |
| Navigators Group Inc. | 9,426 | 867 | |
| Chatham Lodging Trust | 38,985 | 857 | |
18
| Vanguard® Balanced Index Fund | |||
| Schedule of Investments | |||
| June 30, 2016 | |||
| Market | |||
| Value | |||
| Shares | ($000) | ||
| WesBanco Inc. | 27,572 | 856 | |
| Meridian Bancorp Inc. | 57,888 | 856 | |
| AMERISAFE Inc. | 13,891 | 850 | |
| Nelnet Inc. Class A | 24,372 | 847 | |
| Rexford Industrial Realty Inc. | 40,081 | 845 | |
| * | MBIA Inc. | 123,687 | 845 |
| Capstead Mortgage Corp. | 86,964 | 844 | |
| * | PRA Group Inc. | 34,740 | 839 |
| First Commonwealth Financial Corp. | 90,842 | 836 | |
| Summit Hotel Properties Inc. | 62,382 | 826 | |
| Yadkin Financial Corp. | 32,676 | 820 | |
| * | Green Dot Corp. Class A | 35,233 | 810 |
| * | Black Knight Financial Services Inc. Class A | 21,479 | 808 |
| Banner Corp. | 18,894 | 804 | |
| WSFS Financial Corp. | 24,835 | 799 | |
| Provident Financial Services Inc. | 40,366 | 793 | |
| Four Corners Property Trust Inc. | 38,138 | 785 | |
| Cash America International Inc. | 18,295 | 780 | |
| * | OneMain Holdings Inc. Class A | 34,065 | 777 |
| * | KCG Holdings Inc. Class A | 58,132 | 773 |
| * | FNFV Group | 67,266 | 772 |
| Stewart Information Services Corp. | 18,408 | 762 | |
| BNC Bancorp | 33,406 | 759 | |
| Union Bankshares Corp. | 29,955 | 740 | |
| ^ | Seritage Growth Properties Class A | 14,817 | 738 |
| ARMOUR Residential REIT Inc. | 36,417 | 728 | |
| First Merchants Corp. | 28,865 | 720 | |
| * | FCB Financial Holdings Inc. Class A | 21,003 | 714 |
| First of Long Island Corp. | 24,167 | 693 | |
| Investors Real Estate Trust | 106,895 | 692 | |
| Ameris Bancorp | 23,224 | 690 | |
| Universal Health Realty Income Trust | 12,057 | 689 | |
| Infinity Property & Casualty Corp. | 8,531 | 688 | |
| * | St. Joe Co. | 38,598 | 684 |
| United Fire Group Inc. | 16,118 | 684 | |
| * | iStar Inc. | 71,217 | 683 |
| * | Beneficial Bancorp Inc. | 53,118 | 676 |
| Southside Bancshares Inc. | 21,424 | 662 | |
| Employers Holdings Inc. | 22,686 | 658 | |
| FelCor Lodging Trust Inc. | 104,179 | 649 | |
| Banc of California Inc. | 35,799 | 648 | |
| CenterState Banks Inc. | 41,016 | 646 | |
| * | Walker & Dunlop Inc. | 28,291 | 644 |
| HFF Inc. Class A | 22,257 | 643 | |
| Wilshire Bancorp Inc. | 60,716 | 633 | |
| RE/MAX Holdings Inc. Class A | 15,709 | 632 | |
| Apollo Commercial Real Estate Finance Inc. | 39,301 | 632 | |
| Tompkins Financial Corp. | 9,691 | 630 | |
| Sandy Spring Bancorp Inc. | 21,437 | 623 | |
| Agree Realty Corp. | 12,865 | 621 | |
| Silver Bay Realty Trust Corp. | 36,392 | 620 | |
| Cohen & Steers Inc. | 15,278 | 618 | |
| Ares Commercial Real Estate Corp. | 50,195 | 617 | |
| Alexander's Inc. | 1,506 | 616 | |
| Flushing Financial Corp. | 30,866 | 614 | |
| *,^ | BofI Holding Inc. | 33,524 | 594 |
| OFG Bancorp | 71,300 | 592 | |
| Safety Insurance Group Inc. | 9,548 | 588 | |
| S&T Bancorp Inc. | 23,800 | 582 | |
| Saul Centers Inc. | 9,308 | 574 | |
| Anworth Mortgage Asset Corp. | 121,510 | 571 | |
| Tier REIT Inc. | 36,875 | 565 | |
| Getty Realty Corp. | 26,188 | 562 | |
| National Storage Affiliates Trust | 26,959 | 561 | |
19
| Vanguard® Balanced Index Fund | |||
| Schedule of Investments | |||
| June 30, 2016 | |||
| Market | |||
| Value | |||
| Shares | ($000) | ||
| TriCo Bancshares | 20,259 | 559 | |
| State Bank Financial Corp. | 27,249 | 554 | |
| New Senior Investment Group Inc. | 51,774 | 553 | |
| Maiden Holdings Ltd. | 44,637 | 546 | |
| * | Customers Bancorp Inc. | 21,681 | 545 |
| Capital Bank Financial Corp. | 18,822 | 542 | |
| Cardinal Financial Corp. | 24,705 | 542 | |
| FBL Financial Group Inc. Class A | 8,929 | 542 | |
| Hersha Hospitality Trust Class A | 31,582 | 542 | |
| * | Third Point Reinsurance Ltd. | 46,083 | 540 |
| Hanmi Financial Corp. | 22,358 | 525 | |
| NRG Yield Inc. | 33,500 | 522 | |
| City Holding Co. | 11,453 | 521 | |
| Hannon Armstrong Sustainable Infrastructure Capital Inc. | 23,758 | 513 | |
| Dime Community Bancshares Inc. | 30,008 | 510 | |
| Oritani Financial Corp. | 31,918 | 510 | |
| * | Flagstar Bancorp Inc. | 20,822 | 508 |
| National Bank Holdings Corp. Class A | 23,983 | 488 | |
| Ashford Hospitality Trust Inc. | 90,855 | 488 | |
| Universal Insurance Holdings Inc. | 26,161 | 486 | |
| Artisan Partners Asset Management Inc. Class A | 17,400 | 482 | |
| * | Piper Jaffray Cos. | 12,632 | 476 |
| Univest Corp. of Pennsylvania | 22,500 | 473 | |
| * | Pacific Premier Bancorp Inc. | 19,424 | 466 |
| First Busey Corp. | 21,758 | 465 | |
| * | Greenlight Capital Re Ltd. Class A | 23,027 | 464 |
| Brookline Bancorp Inc. | 41,790 | 461 | |
| James River Group Holdings Ltd. | 13,500 | 458 | |
| Apollo Residential Mortgage Inc. | 33,924 | 455 | |
| Monmouth Real Estate Investment Corp. | 34,116 | 452 | |
| Rouse Properties Inc. | 24,666 | 450 | |
| Enterprise Financial Services Corp. | 16,118 | 450 | |
| Independent Bank Group Inc. | 10,469 | 449 | |
| *,^ | Nationstar Mortgage Holdings Inc. | 39,500 | 445 |
| New York Mortgage Trust Inc. | 72,600 | 443 | |
| 1st Source Corp. | 13,666 | 443 | |
| * | LendingTree Inc. | 4,965 | 439 |
| Investment Technology Group Inc. | 26,214 | 438 | |
| Northfield Bancorp Inc. | 29,510 | 438 | |
| * | First BanCorp | 108,708 | 432 |
| Kearny Financial Corp. | 34,047 | 428 | |
| Berkshire Hills Bancorp Inc. | 15,821 | 426 | |
| First Community Bancshares Inc. | 18,746 | 421 | |
| BancFirst Corp. | 6,946 | 419 | |
| CoBiz Financial Inc. | 35,515 | 416 | |
| InfraREIT Inc. | 23,300 | 409 | |
| Suffolk Bancorp | 13,005 | 407 | |
| Stock Yards Bancorp Inc. | 14,349 | 405 | |
| Lakeland Bancorp Inc. | 35,332 | 402 | |
| Blue Hills Bancorp Inc. | 26,900 | 397 | |
| Financial Institutions Inc. | 15,207 | 396 | |
| Dynex Capital Inc. | 56,917 | 395 | |
| United Financial Bancorp Inc. | 30,405 | 395 | |
| National Western Life Group Inc. Class A | 2,004 | 391 | |
| Arlington Asset Investment Corp. Class A | 29,186 | 380 | |
| * | Encore Capital Group Inc. | 16,077 | 378 |
| German American Bancorp Inc. | 11,832 | 378 | |
| CareTrust REIT Inc. | 27,330 | 377 | |
| * | TriState Capital Holdings Inc. | 27,357 | 376 |
| Pacific Continental Corp. | 23,812 | 374 | |
| Cedar Realty Trust Inc. | 50,229 | 373 | |
| First Bancorp | 21,221 | 373 | |
| Independent Bank Corp. | 25,554 | 371 | |
| Altisource Residential Corp. | 39,600 | 364 | |
20
| Vanguard® Balanced Index Fund | |||
| Schedule of Investments | |||
| June 30, 2016 | |||
| Market | |||
| Value | |||
| Shares | ($000) | ||
| * | Franklin Financial Network Inc. | 11,602 | 364 |
| CorEnergy Infrastructure Trust Inc. | 12,605 | 364 | |
| Community Trust Bancorp Inc. | 10,390 | 360 | |
| Heartland Financial USA Inc. | 10,197 | 360 | |
| First Potomac Realty Trust | 38,500 | 354 | |
| * | Cowen Group Inc. Class A | 118,562 | 351 |
| ^ | Orchid Island Capital Inc. | 33,300 | 343 |
| MainSource Financial Group Inc. | 15,445 | 341 | |
| First Financial Corp. | 9,206 | 337 | |
| Southwest Bancorp Inc. | 19,829 | 336 | |
| Park Sterling Corp. | 47,225 | 335 | |
| Macatawa Bank Corp. | 44,542 | 330 | |
| Central Pacific Financial Corp. | 13,900 | 328 | |
| Diamond Hill Investment Group Inc. | 1,734 | 327 | |
| Urstadt Biddle Properties Inc. Class A | 13,096 | 325 | |
| One Liberty Properties Inc. | 13,598 | 324 | |
| Virtus Investment Partners Inc. | 4,479 | 319 | |
| PJT Partners Inc. | 13,797 | 317 | |
| Ashford Hospitality Prime Inc. | 22,100 | 312 | |
| Heritage Financial Corp. | 17,775 | 312 | |
| Fidelity Southern Corp. | 19,619 | 307 | |
| Easterly Government Properties Inc. | 15,369 | 303 | |
| * | Global Indemnity plc | 10,932 | 301 |
| Charter Financial Corp. | 22,578 | 300 | |
| Heritage Oaks Bancorp | 36,758 | 292 | |
| Preferred Bank | 9,976 | 288 | |
| Opus Bank | 8,500 | 287 | |
| * | WMIH Corp. | 129,246 | 287 |
| * | Altisource Portfolio Solutions SA | 10,289 | 286 |
| * | Southern First Bancshares Inc. | 11,848 | 286 |
| Old Second Bancorp Inc. | 41,200 | 281 | |
| United Community Financial Corp. | 45,906 | 279 | |
| State National Cos. Inc. | 26,100 | 275 | |
| Republic Bancorp Inc. | 9,937 | 275 | |
| Home Bancorp Inc. | 9,983 | 274 | |
| NexPoint Residential Trust Inc. | 15,066 | 274 | |
| SI Financial Group Inc. | 20,694 | 274 | |
| * | Seacoast Banking Corp. of Florida | 16,785 | 273 |
| Bank of Marin Bancorp | 5,595 | 271 | |
| Sierra Bancorp | 16,207 | 270 | |
| Farmers Capital Bank Corp. | 9,708 | 265 | |
| OneBeacon Insurance Group Ltd. Class A | 19,239 | 265 | |
| * | MoneyGram International Inc. | 38,360 | 263 |
| First Interstate BancSystem Inc. Class A | 9,325 | 262 | |
| Ames National Corp. | 9,754 | 262 | |
| Consolidated-Tomoka Land Co. | 5,500 | 261 | |
| * | Cascade Bancorp | 46,888 | 260 |
| Westwood Holdings Group Inc. | 4,973 | 258 | |
| Bryn Mawr Bank Corp. | 8,806 | 257 | |
| Washington Trust Bancorp Inc. | 6,773 | 257 | |
| TrustCo Bank Corp. NY | 40,057 | 257 | |
| * | World Acceptance Corp. | 5,630 | 257 |
| Armada Hoffler Properties Inc. | 18,554 | 255 | |
| * | Republic First Bancorp Inc. | 58,159 | 251 |
| Federated National Holding Co. | 13,100 | 249 | |
| * | Atlantic Capital Bancshares Inc. | 17,236 | 249 |
| ConnectOne Bancorp Inc. | 15,716 | 247 | |
| * | Hallmark Financial Services Inc. | 21,230 | 246 |
| * | Atlas Financial Holdings Inc. | 14,200 | 245 |
| Ladder Capital Corp. | 19,956 | 243 | |
| Citizens & Northern Corp. | 12,016 | 243 | |
| *,^ | Citizens Inc. | 31,923 | 243 |
| * | Ladenburg Thalmann Financial Services Inc. | 102,733 | 242 |
| * | Sun Bancorp Inc. | 11,720 | 242 |
21
| Vanguard® Balanced Index Fund | |||
| Schedule of Investments | |||
| June 30, 2016 | |||
| Market | |||
| Value | |||
| Shares | ($000) | ||
| Winthrop Realty Trust | 27,169 | 239 | |
| * | Marcus & Millichap Inc. | 9,350 | 238 |
| * | CommunityOne Bancorp | 18,671 | 236 |
| RAIT Financial Trust | 75,172 | 235 | |
| Fidelity & Guaranty Life | 10,100 | 234 | |
| * | Bancorp Inc. | 38,630 | 233 |
| * | First NBC Bank Holding Co. | 13,834 | 232 |
| Capital City Bank Group Inc. | 16,649 | 232 | |
| Virtu Financial Inc. Class A | 12,872 | 232 | |
| Bank Mutual Corp. | 30,162 | 232 | |
| Heritage Commerce Corp. | 21,758 | 229 | |
| Premier Financial Bancorp Inc. | 13,561 | 228 | |
| * | Safeguard Scientifics Inc. | 17,815 | 222 |
| Peoples Bancorp Inc. | 10,181 | 222 | |
| National Bankshares Inc. | 6,344 | 222 | |
| * | INTL. FCStone Inc. | 8,101 | 221 |
| GAIN Capital Holdings Inc. | 34,755 | 220 | |
| ZAIS Financial Corp. | 15,700 | 215 | |
| Marlin Business Services Corp. | 13,089 | 213 | |
| Owens Realty Mortgage Inc. | 12,718 | 212 | |
| OceanFirst Financial Corp. | 11,579 | 210 | |
| Guaranty Bancorp | 12,389 | 207 | |
| Westfield Financial Inc. | 26,868 | 207 | |
| Independence Realty Trust Inc. | 25,027 | 205 | |
| CatchMark Timber Trust Inc. Class A | 16,745 | 205 | |
| Independence Holding Co. | 11,385 | 205 | |
| Mercantile Bank Corp. | 8,524 | 203 | |
| QCR Holdings Inc. | 7,447 | 202 | |
| AG Mortgage Investment Trust Inc. | 13,999 | 202 | |
| First Financial Northwest Inc. | 15,135 | 201 | |
| * | First Bank | 28,666 | 199 |
| * | Ambac Financial Group Inc. | 12,071 | 199 |
| * | EZCORP Inc. Class A | 26,138 | 198 |
| Arrow Financial Corp. | 6,518 | 197 | |
| * | Tejon Ranch Co. | 8,322 | 197 |
| Gladstone Commercial Corp. | 11,598 | 196 | |
| * | Allegiance Bancshares Inc. | 7,790 | 194 |
| Preferred Apartment Communities Inc. Class A | 13,165 | 194 | |
| Heritage Insurance Holdings Inc. | 16,020 | 192 | |
| First Internet Bancorp | 8,035 | 191 | |
| BankFinancial Corp. | 15,767 | 189 | |
| Great Southern Bancorp Inc. | 5,104 | 189 | |
| Arbor Realty Trust Inc. | 26,233 | 189 | |
| Moelis & Co. Class A | 8,370 | 188 | |
| * | NewStar Financial Inc. | 22,031 | 185 |
| Enterprise Bancorp Inc. | 7,609 | 183 | |
| ^ | Blue Capital Reinsurance Holdings Ltd. | 9,734 | 180 |
| National Interstate Corp. | 5,953 | 180 | |
| West Bancorporation Inc. | 9,152 | 170 | |
| RMR Group Inc. Class A | 5,456 | 169 | |
| EMC Insurance Group Inc. | 5,982 | 166 | |
| Waterstone Financial Inc. | 10,594 | 162 | |
| California First National Bancorp | 10,984 | 162 | |
| Camden National Corp. | 3,845 | 161 | |
| First Bancorp Inc. | 7,436 | 160 | |
| Merchants Bancshares Inc. | 5,163 | 157 | |
| Whitestone REIT | 10,400 | 157 | |
| * | HomeStreet Inc. | 7,771 | 155 |
| ESSA Bancorp Inc. | 11,543 | 155 | |
| Resource America Inc. Class A | 15,889 | 154 | |
| ^ | Peoples Financial Services Corp. | 3,941 | 154 |
| CNB Financial Corp. | 8,629 | 154 | |
| FBR & Co. | 10,067 | 150 | |
| * | Atlantic Coast Financial Corp. | 24,886 | 149 |
22
| Vanguard® Balanced Index Fund | |||
| Schedule of Investments | |||
| June 30, 2016 | |||
| Market | |||
| Value | |||
| Shares | ($000) | ||
| Bluerock Residential Growth REIT Inc. Class A | 11,410 | 148 | |
| Stonegate Bank | 4,515 | 146 | |
| Bridge Bancorp Inc. | 4,986 | 142 | |
| State Auto Financial Corp. | 6,441 | 141 | |
| Hennessy Advisors Inc. | 4,200 | 141 | |
| First Defiance Financial Corp. | 3,612 | 140 | |
| Greenhill & Co. Inc. | 8,255 | 133 | |
| Peapack Gladstone Financial Corp. | 7,136 | 132 | |
| UMH Properties Inc. | 11,700 | 132 | |
| Parke Bancorp Inc. | 10,158 | 131 | |
| * | NMI Holdings Inc. Class A | 23,800 | 130 |
| * | Nicolet Bankshares Inc. | 3,396 | 129 |
| Territorial Bancorp Inc. | 4,784 | 127 | |
| HCI Group Inc. | 4,600 | 125 | |
| United Insurance Holdings Corp. | 7,628 | 125 | |
| * | Coastway Bancorp Inc. | 10,010 | 125 |
| * | C1 Financial Inc. | 5,200 | 121 |
| Sotherly Hotels Inc. | 21,370 | 121 | |
| Horizon Bancorp | 4,760 | 120 | |
| * | American River Bankshares | 11,752 | 119 |
| GAMCO Investors Inc. Class A | 3,601 | 118 | |
| Access National Corp. | 5,974 | 117 | |
| Provident Financial Holdings Inc. | 6,338 | 116 | |
| Northrim BanCorp Inc. | 4,388 | 115 | |
| * | CU Bancorp | 5,006 | 114 |
| * | BSB Bancorp Inc. | 4,902 | 111 |
| Fox Chase Bancorp Inc. | 5,447 | 111 | |
| Reis Inc. | 4,375 | 109 | |
| Pzena Investment Management Inc. Class A | 14,284 | 109 | |
| Donegal Group Inc. Class A | 6,422 | 106 | |
| Meta Financial Group Inc. | 2,076 | 106 | |
| * | Westbury Bancorp Inc. | 5,422 | 106 |
| * | Ocwen Financial Corp. | 61,000 | 104 |
| Old Line Bancshares Inc. | 5,764 | 104 | |
| First Bancshares Inc. | 6,000 | 104 | |
| Associated Capital Group Inc. Class A | 3,601 | 103 | |
| * | HomeTrust Bancshares Inc. | 5,580 | 103 |
| Cherry Hill Mortgage Investment Corp. | 6,580 | 102 | |
| * | eHealth Inc. | 7,300 | 102 |
| Penns Woods Bancorp Inc. | 2,387 | 100 | |
| * | First Marblehead Corp. | 19,724 | 96 |
| * | Hampton Roads Bankshares Inc. | 53,206 | 95 |
| Tiptree Financial Inc. Class A | 16,964 | 93 | |
| Baldwin & Lyons Inc. | 3,767 | 93 | |
| Calamos Asset Management Inc. Class A | 12,700 | 93 | |
| Silvercrest Asset Management Group Inc. Class A | 7,359 | 90 | |
| Summit State Bank | 6,666 | 89 | |
| Century Bancorp Inc. Class A | 2,107 | 89 | |
| Clifton Bancorp Inc. | 5,802 | 87 | |
| * | RMG Networks Holding Corp. | 89,200 | 87 |
| Oppenheimer Holdings Inc. Class A | 5,519 | 85 | |
| American National Bankshares Inc. | 3,239 | 82 | |
| MutualFirst Financial Inc. | 2,926 | 80 | |
| AmeriServ Financial Inc. | 25,974 | 78 | |
| * | Forestar Group Inc. | 6,551 | 78 |
| Investors Title Co. | 812 | 77 | |
| First Connecticut Bancorp Inc. | 4,669 | 77 | |
| * | On Deck Capital Inc. | 14,700 | 76 |
| C&F Financial Corp. | 1,595 | 71 | |
| * | PennyMac Financial Services Inc. Class A | 5,650 | 71 |
| * | Emergent Capital Inc. | 20,730 | 70 |
| United Bancshares Inc. | 3,700 | 66 | |
| 2 | Federal Agricultural Mortgage Corp. | 1,811 | 63 |
| * | FRP Holdings Inc. | 1,824 | 63 |
23
| Vanguard® Balanced Index Fund | |||
| Schedule of Investments | |||
| June 30, 2016 | |||
| Market | |||
| Value | |||
| Shares | ($000) | ||
| Newcastle Investment Corp. | 13,426 | 62 | |
| ^ | United Development Funding IV | 18,535 | 59 |
| Atlantic American Corp. | 15,700 | 59 | |
| * | First United Corp. | 5,917 | 58 |
| * | First Foundation Inc. | 2,700 | 58 |
| * | Consumer Portfolio Services Inc. | 14,900 | 56 |
| United Bancorp Inc. | 5,633 | 55 | |
| * | Enova International Inc. | 7,435 | 55 |
| Bar Harbor Bankshares | 1,497 | 53 | |
| First Savings Financial Group Inc. | 1,513 | 52 | |
| * | Impac Mortgage Holdings Inc. | 3,300 | 52 |
| Five Oaks Investment Corp. | 8,913 | 49 | |
| HopFed Bancorp Inc. | 4,115 | 48 | |
| Hingham Institution for Savings | 378 | 46 | |
| 2 | Federal Agricultural Mortgage Corp. Class A | 1,200 | 44 |
| Houlihan Lokey Inc. | 1,814 | 41 | |
| IF Bancorp Inc. | 2,200 | 40 | |
| * | AV Homes Inc. | 3,128 | 38 |
| * | 1st Century Bancshares Inc. | 3,400 | 38 |
| Ellington Residential Mortgage REIT | 2,900 | 38 | |
| Northeast Bancorp | 3,351 | 38 | |
| * | Asta Funding Inc. | 3,563 | 38 |
| * | Ashford Inc. | 669 | 33 |
| MidSouth Bancorp Inc. | 3,241 | 33 | |
| Middleburg Financial Corp. | 1,173 | 32 | |
| Your Community Bankshares Inc. | 800 | 30 | |
| Eastern Virginia Bankshares Inc. | 3,288 | 25 | |
| Salisbury Bancorp Inc. | 798 | 24 | |
| Gladstone Land Corp. | 1,800 | 20 | |
| United Community Bancorp | 1,400 | 20 | |
| MidWestOne Financial Group Inc. | 677 | 19 | |
| * | Triumph Bancorp Inc. | 1,100 | 18 |
| Great Ajax Corp. | 1,239 | 17 | |
| Resource Capital Corp. | 1,225 | 16 | |
| * | Avenue Financial Holdings Inc. | 800 | 16 |
| * | First Acceptance Corp. | 10,492 | 15 |
| Shore Bancshares Inc. | 1,000 | 12 | |
| * | 1347 Property Insurance Holdings Inc. | 1,800 | 11 |
| * | Maui Land & Pineapple Co. Inc. | 1,499 | 11 |
| Jernigan Capital Inc. | 760 | 11 | |
| * | Walter Investment Management Corp. | 3,772 | 10 |
| Citizens First Corp. | 700 | 10 | |
| Carolina Financial Corp. | 500 | 9 | |
| * | Carolina Bank Holdings Inc. | 500 | 9 |
| * | Malvern Bancorp Inc. | 500 | 8 |
| * | Cordia Bancorp Inc. | 1,200 | 6 |
| Bear State Financial Inc. | 600 | 6 | |
| Investar Holding Corp. | 300 | 5 | |
| WVS Financial Corp. | 400 | 4 | |
| * | Atlanticus Holdings Corp. | 746 | 2 |
| US Global Investors Inc. Class A | 1,100 | 2 | |
| * | 1st Constitution Bancorp | 134 | 2 |
| Home Federal Bancorp Inc. | 55 | 1 | |
| * | Ambit Biosciences Corp. CVR Rights | 1,900 | 1 |
| * | PICO Holdings Inc. | 80 | 1 |
| * | Tejon Ranch Co. Warrants Exp. 08/31/2016 | 1,141 | — |
| * | Allen Organ Co. Escrow Shares | 1,400 | — |
| * | Biosante Pharmaceutical Inc CVR | 14,250 | — |
| * | EnSite Power Inc. | 5,088 | — |
| 3,149,565 | |||
| Health Care (8.1%) | |||
| Johnson & Johnson | 2,112,874 | 256,292 | |
| Pfizer Inc. | 4,668,584 | 164,381 | |
| Merck & Co. Inc. | 2,129,088 | 122,657 | |
24
| Vanguard® Balanced Index Fund | |||
| Schedule of Investments | |||
| June 30, 2016 | |||
| Market | |||
| Value | |||
| Shares | ($000) | ||
| UnitedHealth Group Inc. | 729,847 | 103,054 | |
| Bristol-Myers Squibb Co. | 1,281,501 | 94,254 | |
| Medtronic plc | 1,076,457 | 93,404 | |
| Amgen Inc. | 577,023 | 87,794 | |
| Gilead Sciences Inc. | 1,043,545 | 87,053 | |
| AbbVie Inc. | 1,241,766 | 76,878 | |
| * | Allergan plc | 303,483 | 70,132 |
| Eli Lilly & Co. | 763,002 | 60,086 | |
| * | Celgene Corp. | 596,419 | 58,825 |
| Thermo Fisher Scientific Inc. | 303,273 | 44,812 | |
| Abbott Laboratories | 1,127,198 | 44,310 | |
| * | Biogen Inc. | 167,412 | 40,484 |
| * | Express Scripts Holding Co. | 484,034 | 36,690 |
| Aetna Inc. | 268,006 | 32,732 | |
| Becton Dickinson & Co. | 162,719 | 27,595 | |
| Stryker Corp. | 229,938 | 27,553 | |
| Anthem Inc. | 200,902 | 26,386 | |
| Cigna Corp. | 196,370 | 25,133 | |
| * | Boston Scientific Corp. | 1,037,313 | 24,242 |
| * | Regeneron Pharmaceuticals Inc. | 59,035 | 20,617 |
| Humana Inc. | 113,816 | 20,473 | |
| * | HCA Holdings Inc. | 255,796 | 19,699 |
| * | Intuitive Surgical Inc. | 29,207 | 19,318 |
| * | Alexion Pharmaceuticals Inc. | 164,226 | 19,175 |
| Baxter International Inc. | 419,251 | 18,959 | |
| Zimmer Biomet Holdings Inc. | 152,038 | 18,302 | |
| Zoetis Inc. | 371,908 | 17,651 | |
| * | Vertex Pharmaceuticals Inc. | 190,356 | 16,374 |
| * | Edwards Lifesciences Corp. | 162,756 | 16,232 |
| St. Jude Medical Inc. | 206,853 | 16,135 | |
| * | Illumina Inc. | 113,141 | 15,883 |
| * | Mylan NV | 330,317 | 14,283 |
| CR Bard Inc. | 56,070 | 13,185 | |
| DENTSPLY SIRONA Inc. | 183,231 | 11,368 | |
| * | Henry Schein Inc. | 61,485 | 10,871 |
| * | Incyte Corp. | 123,023 | 9,839 |
| * | Laboratory Corp. of America Holdings | 74,011 | 9,641 |
| * | DaVita HealthCare Partners Inc. | 124,676 | 9,640 |
| Universal Health Services Inc. Class B | 69,802 | 9,360 | |
| Perrigo Co. plc | 103,158 | 9,353 | |
| * | BioMarin Pharmaceutical Inc. | 118,929 | 9,253 |
| * | Centene Corp. | 125,939 | 8,988 |
| Quest Diagnostics Inc. | 104,987 | 8,547 | |
| * | Waters Corp. | 59,366 | 8,350 |
| * | Medivation Inc. | 125,939 | 7,594 |
| * | Hologic Inc. | 207,237 | 7,170 |
| ResMed Inc. | 107,529 | 6,799 | |
| * | Jazz Pharmaceuticals plc | 46,335 | 6,548 |
| Cooper Cos. Inc. | 37,759 | 6,478 | |
| * | IDEXX Laboratories Inc. | 68,170 | 6,330 |
| * | Varian Medical Systems Inc. | 70,799 | 5,822 |
| Teleflex Inc. | 32,327 | 5,732 | |
| * | MEDNAX Inc. | 72,984 | 5,286 |
| * | Mallinckrodt plc | 86,162 | 5,237 |
| * | Alkermes plc | 117,229 | 5,067 |
| * | DexCom Inc. | 61,553 | 4,883 |
| STERIS plc | 66,929 | 4,601 | |
| * | Align Technology Inc. | 54,279 | 4,372 |
| West Pharmaceutical Services Inc. | 54,802 | 4,158 | |
| * | Quintiles Transnational Holdings Inc. | 61,718 | 4,031 |
| * | WellCare Health Plans Inc. | 34,746 | 3,728 |
| * | United Therapeutics Corp. | 34,586 | 3,663 |
| * | Envision Healthcare Holdings Inc. | 137,005 | 3,476 |
| * | Amsurg Corp. | 43,095 | 3,342 |
25
| Vanguard® Balanced Index Fund | |||
| Schedule of Investments | |||
| June 30, 2016 | |||
| Market | |||
| Value | |||
| Shares | ($000) | ||
| * | Seattle Genetics Inc. | 81,229 | 3,282 |
| Bio-Techne Corp. | 28,682 | 3,234 | |
| * | Acadia Healthcare Co. Inc. | 57,900 | 3,208 |
| * | Neurocrine Biosciences Inc. | 70,052 | 3,184 |
| * | ABIOMED Inc. | 28,761 | 3,143 |
| * | Alnylam Pharmaceuticals Inc. | 56,538 | 3,137 |
| Patterson Cos. Inc. | 63,895 | 3,060 | |
| * | Charles River Laboratories International Inc. | 35,715 | 2,944 |
| * | Alere Inc. | 67,004 | 2,793 |
| HealthSouth Corp. | 70,829 | 2,750 | |
| * | PAREXEL International Corp. | 41,664 | 2,620 |
| *,^ | OPKO Health Inc. | 259,243 | 2,421 |
| * | Endo International plc | 154,566 | 2,410 |
| * | Prestige Brands Holdings Inc. | 42,929 | 2,378 |
| * | LifePoint Health Inc. | 36,034 | 2,356 |
| * | Ionis Pharmaceuticals Inc. | 95,453 | 2,223 |
| * | NuVasive Inc. | 37,176 | 2,220 |
| * | Team Health Holdings Inc. | 53,239 | 2,165 |
| *,^ | Juno Therapeutics Inc. | 56,260 | 2,163 |
| Hill-Rom Holdings Inc. | 42,549 | 2,147 | |
| * | Bio-Rad Laboratories Inc. Class A | 14,843 | 2,123 |
| * | ACADIA Pharmaceuticals Inc. | 64,578 | 2,096 |
| * | TESARO Inc. | 24,898 | 2,093 |
| * | Medicines Co. | 60,067 | 2,020 |
| * | Masimo Corp. | 37,233 | 1,955 |
| Healthcare Services Group Inc. | 47,125 | 1,950 | |
| * | Brookdale Senior Living Inc. | 125,927 | 1,944 |
| * | Tenet Healthcare Corp. | 67,959 | 1,878 |
| * | Catalent Inc. | 80,862 | 1,859 |
| * | Impax Laboratories Inc. | 63,914 | 1,842 |
| * | Integra LifeSciences Holdings Corp. | 23,062 | 1,840 |
| * | Cepheid | 59,685 | 1,835 |
| * | Akorn Inc. | 62,501 | 1,780 |
| Bruker Corp. | 77,384 | 1,760 | |
| * | Intercept Pharmaceuticals Inc. | 12,300 | 1,755 |
| Cantel Medical Corp. | 25,505 | 1,753 | |
| * | VWR Corp. | 60,117 | 1,737 |
| * | Molina Healthcare Inc. | 34,434 | 1,718 |
| * | Neogen Corp. | 30,482 | 1,715 |
| *,^ | Kite Pharma Inc. | 34,092 | 1,705 |
| * | Ligand Pharmaceuticals Inc. | 14,201 | 1,694 |
| * | Horizon Pharma plc | 102,368 | 1,686 |
| Owens & Minor Inc. | 43,665 | 1,632 | |
| *,^ | Novavax Inc. | 219,880 | 1,599 |
| * | Myriad Genetics Inc. | 50,682 | 1,551 |
| * | Ironwood Pharmaceuticals Inc. Class A | 114,716 | 1,500 |
| * | Nektar Therapeutics | 103,903 | 1,479 |
| * | Penumbra Inc. | 24,100 | 1,434 |
| * | Insulet Corp. | 47,248 | 1,429 |
| * | Halyard Health Inc. | 43,763 | 1,423 |
| * | Exelixis Inc. | 178,780 | 1,396 |
| * | Wright Medical Group NV | 79,117 | 1,374 |
| * | Ophthotech Corp. | 26,152 | 1,335 |
| * | Magellan Health Inc. | 18,946 | 1,246 |
| * | Ultragenyx Pharmaceutical Inc. | 25,292 | 1,237 |
| * | Nevro Corp. | 16,645 | 1,228 |
| * | Depomed Inc. | 61,661 | 1,210 |
| * | HMS Holdings Corp. | 68,186 | 1,201 |
| * | INC Research Holdings Inc. Class A | 30,713 | 1,171 |
| * | Amedisys Inc. | 23,114 | 1,167 |
| * | ICU Medical Inc. | 10,206 | 1,151 |
| * | Air Methods Corp. | 31,635 | 1,133 |
| * | Globus Medical Inc. | 47,139 | 1,123 |
| * | Bluebird Bio Inc. | 25,910 | 1,122 |
26
| Vanguard® Balanced Index Fund | |||
| Schedule of Investments | |||
| June 30, 2016 | |||
| Market | |||
| Value | |||
| Shares | ($000) | ||
| * | TherapeuticsMD Inc. | 129,757 | 1,103 |
| * | Acorda Therapeutics Inc. | 43,191 | 1,102 |
| * | Surgical Care Affiliates Inc. | 22,969 | 1,095 |
| * | NxStage Medical Inc. | 50,272 | 1,090 |
| * | Intra-Cellular Therapies Inc. Class A | 28,072 | 1,090 |
| * | Portola Pharmaceuticals Inc. | 44,800 | 1,057 |
| * | Haemonetics Corp. | 35,802 | 1,038 |
| * | Agios Pharmaceuticals Inc. | 24,579 | 1,030 |
| * | Select Medical Holdings Corp. | 94,155 | 1,023 |
| *,^ | Intrexon Corp. | 41,357 | 1,018 |
| * | Exact Sciences Corp. | 81,566 | 999 |
| Ensign Group Inc. | 46,840 | 984 | |
| * | Radius Health Inc. | 26,700 | 981 |
| * | Alder Biopharmaceuticals Inc. | 38,962 | 973 |
| * | Pacira Pharmaceuticals Inc. | 28,434 | 959 |
| * | Supernus Pharmaceuticals Inc. | 46,174 | 941 |
| * | MacroGenics Inc. | 34,837 | 940 |
| CONMED Corp. | 19,509 | 931 | |
| * | HeartWare International Inc. | 15,864 | 916 |
| * | PRA Health Sciences Inc. | 21,734 | 908 |
| * | Spectranetics Corp. | 48,426 | 906 |
| * | Acceleron Pharma Inc. | 25,970 | 882 |
| * | Emergent BioSolutions Inc. | 30,903 | 869 |
| * | Community Health Systems Inc. | 71,646 | 863 |
| * | Achillion Pharmaceuticals Inc. | 110,203 | 860 |
| * | Natus Medical Inc. | 22,431 | 848 |
| * | ARIAD Pharmaceuticals Inc. | 112,593 | 832 |
| * | Zeltiq Aesthetics Inc. | 30,400 | 831 |
| * | Endologix Inc. | 66,316 | 826 |
| * | PharMerica Corp. | 32,376 | 798 |
| * | Spark Therapeutics Inc. | 15,601 | 798 |
| * | Omnicell Inc. | 23,211 | 794 |
| * | FibroGen Inc. | 48,002 | 788 |
| Abaxis Inc. | 16,612 | 785 | |
| Analogic Corp. | 9,555 | 759 | |
| * | AMAG Pharmaceuticals Inc. | 31,159 | 745 |
| * | LDR Holding Corp. | 20,084 | 742 |
| * | LHC Group Inc. | 17,133 | 741 |
| * | Orthofix International NV | 17,070 | 724 |
| * | Inogen Inc. | 14,309 | 717 |
| * | Celator Pharmaceuticals Inc. | 23,700 | 715 |
| Meridian Bioscience Inc. | 36,345 | 709 | |
| * | Retrophin Inc. | 39,642 | 706 |
| * | Capital Senior Living Corp. | 39,380 | 696 |
| * | Cynosure Inc. Class A | 14,058 | 684 |
| * | Array BioPharma Inc. | 190,060 | 677 |
| * | Vascular Solutions Inc. | 16,127 | 672 |
| * | Repligen Corp. | 24,266 | 664 |
| * | Theravance Biopharma Inc. | 29,221 | 663 |
| * | Halozyme Therapeutics Inc. | 76,318 | 659 |
| * | Anika Therapeutics Inc. | 12,221 | 656 |
| * | Cardiovascular Systems Inc. | 35,533 | 653 |
| * | Sarepta Therapeutics Inc. | 32,879 | 627 |
| *,^ | ZIOPHARM Oncology Inc. | 114,110 | 626 |
| * | Innoviva Inc. | 59,413 | 626 |
| * | Xencor Inc. | 32,602 | 619 |
| * | SciClone Pharmaceuticals Inc. | 46,679 | 610 |
| * | Puma Biotechnology Inc. | 19,843 | 591 |
| * | Merit Medical Systems Inc. | 29,628 | 588 |
| US Physical Therapy Inc. | 9,706 | 584 | |
| * | Five Prime Therapeutics Inc. | 14,000 | 579 |
| * | MiMedx Group Inc. | 71,711 | 572 |
| * | Synergy Pharmaceuticals Inc. | 150,400 | 571 |
| *,^ | Lexicon Pharmaceuticals Inc. | 38,014 | 545 |
27
| Vanguard® Balanced Index Fund | |||
| Schedule of Investments | |||
| June 30, 2016 | |||
| Market | |||
| Value | |||
| Shares | ($000) | ||
| National HealthCare Corp. | 8,371 | 542 | |
| Kindred Healthcare Inc. | 47,911 | 541 | |
| *,^ | Adeptus Health Inc. Class A | 10,440 | 539 |
| * | Healthways Inc. | 46,229 | 534 |
| * | Amphastar Pharmaceuticals Inc. | 33,036 | 533 |
| * | AtriCure Inc. | 37,267 | 527 |
| * | GenMark Diagnostics Inc. | 57,176 | 497 |
| * | Luminex Corp. | 24,212 | 490 |
| * | Dermira Inc. | 16,654 | 487 |
| Atrion Corp. | 1,134 | 485 | |
| * | Triple-S Management Corp. Class B | 19,528 | 477 |
| * | Raptor Pharmaceutical Corp. | 88,359 | 474 |
| * | K2M Group Holdings Inc. | 30,217 | 469 |
| * | Sucampo Pharmaceuticals Inc. Class A | 42,407 | 465 |
| *,^ | Inovio Pharmaceuticals Inc. | 49,399 | 456 |
| * | Amicus Therapeutics Inc. | 83,569 | 456 |
| * | ANI Pharmaceuticals Inc. | 8,169 | 456 |
| * | Corcept Therapeutics Inc. | 82,598 | 451 |
| * | Seres Therapeutics Inc. | 15,345 | 446 |
| * | CorVel Corp. | 10,154 | 438 |
| * | Sage Therapeutics Inc. | 14,542 | 438 |
| *,^ | Novocure Ltd. | 37,517 | 438 |
| * | XenoPort Inc. | 61,931 | 436 |
| * | Genomic Health Inc. | 16,575 | 429 |
| * | Albany Molecular Research Inc. | 31,817 | 428 |
| * | Cerus Corp. | 68,320 | 426 |
| * | Almost Family Inc. | 9,964 | 425 |
| * | Glaukos Corp. | 14,551 | 424 |
| * | HealthStream Inc. | 15,923 | 422 |
| PDL BioPharma Inc. | 134,400 | 422 | |
| * | Progenics Pharmaceuticals Inc. | 99,926 | 422 |
| * | Surgery Partners Inc. | 23,397 | 419 |
| * | Cytokinetics Inc. | 43,700 | 415 |
| * | Merrimack Pharmaceuticals Inc. | 76,489 | 412 |
| * | AngioDynamics Inc. | 28,580 | 411 |
| * | Otonomy Inc. | 25,800 | 410 |
| * | Lannett Co. Inc. | 17,024 | 405 |
| * | Vitae Pharmaceuticals Inc. | 37,400 | 404 |
| * | Vanda Pharmaceuticals Inc. | 35,307 | 395 |
| *,^ | Relypsa Inc. | 20,900 | 387 |
| * | Coherus Biosciences Inc. | 22,635 | 382 |
| * | Pacific Biosciences of California Inc. | 53,898 | 379 |
| * | Bellicum Pharmaceuticals Inc. | 29,128 | 377 |
| * | Geron Corp. | 140,600 | 377 |
| * | Spectrum Pharmaceuticals Inc. | 57,174 | 376 |
| * | Zogenix Inc. | 46,515 | 374 |
| * | Quidel Corp. | 20,812 | 372 |
| * | Celldex Therapeutics Inc. | 83,210 | 365 |
| * | Heron Therapeutics Inc. | 19,900 | 359 |
| Universal American Corp. | 47,228 | 358 | |
| *,^ | AAC Holdings Inc. | 15,500 | 354 |
| Invacare Corp. | 29,000 | 352 | |
| CryoLife Inc. | 29,266 | 346 | |
| * | Arena Pharmaceuticals Inc. | 201,701 | 345 |
| * | Momenta Pharmaceuticals Inc. | 31,700 | 342 |
| *,^ | Editas Medicine Inc. | 13,940 | 340 |
| * | Dynavax Technologies Corp. | 23,050 | 336 |
| * | TG Therapeutics Inc. | 53,212 | 322 |
| * | Teladoc Inc. | 19,886 | 319 |
| * | Cempra Inc. | 19,191 | 316 |
| *,^ | Rockwell Medical Inc. | 40,599 | 307 |
| * | NeoGenomics Inc. | 38,209 | 307 |
| *,^ | Accelerate Diagnostics Inc. | 21,120 | 304 |
| * | Keryx Biopharmaceuticals Inc. | 45,739 | 303 |
28
| Vanguard® Balanced Index Fund | |||
| Schedule of Investments | |||
| June 30, 2016 | |||
| Market | |||
| Value | |||
| Shares | ($000) | ||
| * | OraSure Technologies Inc. | 50,771 | 300 |
| * | Aerie Pharmaceuticals Inc. | 16,900 | 297 |
| * | Enzo Biochem Inc. | 49,579 | 296 |
| * | Insmed Inc. | 29,956 | 295 |
| * | Adamas Pharmaceuticals Inc. | 18,813 | 285 |
| * | Fluidigm Corp. | 31,051 | 280 |
| * | Exactech Inc. | 10,475 | 280 |
| * | BioTelemetry Inc. | 16,900 | 275 |
| * | PharmAthene Inc. | 112,423 | 274 |
| * | MannKind Corp. | 233,357 | 271 |
| * | ConforMIS Inc. | 38,500 | 270 |
| * | Atara Biotherapeutics Inc. | 12,000 | 270 |
| * | Tetraphase Pharmaceuticals Inc. | 59,500 | 256 |
| *,^ | XBiotech Inc. | 11,768 | 246 |
| *,^ | Arrowhead Pharmaceuticals Inc. | 45,544 | 242 |
| * | Rigel Pharmaceuticals Inc. | 103,061 | 230 |
| *,^ | Eagle Pharmaceuticals Inc. | 5,870 | 228 |
| * | Aratana Therapeutics Inc. | 35,600 | 225 |
| * | Trevena Inc. | 35,300 | 222 |
| * | Agenus Inc. | 54,100 | 219 |
| * | Clovis Oncology Inc. | 15,800 | 217 |
| * | Flexion Therapeutics Inc. | 14,400 | 215 |
| * | Esperion Therapeutics Inc. | 21,600 | 213 |
| * | ArQule Inc. | 111,904 | 213 |
| *,^ | MediciNova Inc. | 27,600 | 208 |
| * | Karyopharm Therapeutics Inc. | 30,800 | 207 |
| * | Global Blood Therapeutics Inc. | 12,300 | 204 |
| * | Teligent Inc. | 28,323 | 202 |
| * | Zafgen Inc. | 33,700 | 202 |
| * | Civitas Solutions Inc. | 9,564 | 199 |
| *,^ | Fortress Biotech Inc. | 70,300 | 189 |
| *,^ | Insys Therapeutics Inc. | 14,442 | 187 |
| *,^ | Athersys Inc. | 85,330 | 185 |
| *,^ | Bio-Path Holdings Inc. | 92,672 | 184 |
| *,^ | Omeros Corp. | 17,063 | 179 |
| * | BioScrip Inc. | 69,300 | 177 |
| * | Durect Corp. | 142,232 | 174 |
| * | Sangamo BioSciences Inc. | 29,671 | 172 |
| * | Loxo Oncology Inc. | 7,407 | 172 |
| * | BioCryst Pharmaceuticals Inc. | 59,223 | 168 |
| * | Chimerix Inc. | 42,146 | 166 |
| * | RadNet Inc. | 30,936 | 165 |
| * | Blueprint Medicines Corp. | 8,100 | 164 |
| * | Enanta Pharmaceuticals Inc. | 7,384 | 163 |
| * | Akebia Therapeutics Inc. | 21,309 | 159 |
| * | Heska Corp. | 4,200 | 156 |
| * | Accuray Inc. | 29,849 | 155 |
| * | Aduro Biotech Inc. | 13,678 | 155 |
| * | SurModics Inc. | 6,580 | 154 |
| * | BioSpecifics Technologies Corp. | 3,792 | 151 |
| * | Aimmune Therapeutics Inc. | 13,646 | 148 |
| *,^ | Immunomedics Inc. | 63,470 | 147 |
| * | Natera Inc. | 12,200 | 147 |
| *,^ | InVivo Therapeutics Holdings Corp. | 25,293 | 146 |
| *,^ | Anavex Life Sciences Corp. | 23,475 | 143 |
| * | Quorum Health Corp. | 13,072 | 140 |
| * | Epizyme Inc. | 13,568 | 139 |
| * | Collegium Pharmaceutical Inc. | 10,740 | 127 |
| *,^ | NantKwest Inc. | 20,444 | 127 |
| * | Harvard Bioscience Inc. | 44,129 | 126 |
| * | Minerva Neurosciences Inc. | 12,100 | 124 |
| *,^ | CytRx Corp. | 53,516 | 119 |
| *,^ | Synthetic Biologics Inc. | 64,604 | 116 |
| * | STAAR Surgical Co. | 21,070 | 116 |
29
| Vanguard® Balanced Index Fund | |||
| Schedule of Investments | |||
| June 30, 2016 | |||
| Market | |||
| Value | |||
| Shares | ($000) | ||
| * | Advaxis Inc. | 14,100 | 114 |
| * | RTI Surgical Inc. | 31,405 | 113 |
| * | AVEO Pharmaceuticals Inc. | 112,100 | 108 |
| * | Lion Biotechnologies Inc. | 13,300 | 108 |
| * | Intellia Therapeutics Inc. | 5,000 | 107 |
| * | AxoGen Inc. | 15,500 | 107 |
| * | Revance Therapeutics Inc. | 7,800 | 106 |
| * | Pain Therapeutics Inc. | 48,044 | 105 |
| * | Bovie Medical Corp. | 63,973 | 105 |
| * | Tenax Therapeutics Inc. | 39,800 | 102 |
| * | Sagent Pharmaceuticals Inc. | 6,800 | 102 |
| * | IsoRay Inc. | 115,600 | 101 |
| * | OncoMed Pharmaceuticals Inc. | 8,002 | 98 |
| Psychemedics Corp. | 6,875 | 94 | |
| LeMaitre Vascular Inc. | 6,500 | 93 | |
| * | OvaScience Inc. | 17,600 | 92 |
| * | La Jolla Pharmaceutical Co. | 5,726 | 92 |
| * | Aclaris Therapeutics Inc. | 4,900 | 90 |
| * | Inotek Pharmaceuticals Corp. | 12,000 | 89 |
| Osiris Therapeutics Inc. | 17,249 | 88 | |
| * | PTC Therapeutics Inc. | 12,500 | 88 |
| *,^ | Avexis Inc. | 2,300 | 87 |
| * | Intersect ENT Inc. | 6,700 | 87 |
| * | Tobira Therapeutics Inc. | 6,869 | 86 |
| * | Curis Inc. | 55,000 | 86 |
| * | Aralez Pharmaceuticals Inc. | 25,116 | 83 |
| * | iBio Inc. | 113,000 | 81 |
| *,^ | Trovagene Inc. | 17,591 | 80 |
| * | NanoString Technologies Inc. | 6,079 | 77 |
| * | Organovo Holdings Inc. | 20,322 | 76 |
| *,^ | Sientra Inc. | 11,400 | 75 |
| * | Versartis Inc. | 6,633 | 73 |
| *,^ | Galena Biopharma Inc. | 147,900 | 69 |
| * | Cascadian Therapeutics Inc. | 71,680 | 68 |
| * | Infinity Pharmaceuticals Inc. | 50,510 | 67 |
| Utah Medical Products Inc. | 1,030 | 65 | |
| * | pSivida Corp. | 22,454 | 64 |
| * | REGENXBIO Inc. | 7,873 | 63 |
| * | SeaSpine Holdings Corp. | 5,954 | 62 |
| *,^ | Pernix Therapeutics Holdings Inc. | 136,507 | 61 |
| Daxor Corp. | 7,259 | 58 | |
| * | Pfenex Inc. | 6,888 | 58 |
| * | Edge Therapeutics Inc. | 5,700 | 58 |
| * | Assembly Biosciences Inc. | 10,200 | 57 |
| * | ImmunoGen Inc. | 17,788 | 55 |
| * | Addus HomeCare Corp. | 3,120 | 54 |
| * | Abeona Therapeutics Inc. | 22,600 | 53 |
| * | Medgenics Inc. | 9,225 | 51 |
| * | Provectus Biopharmaceuticals Inc. Class A | 137,700 | 51 |
| * | Peregrine Pharmaceuticals Inc. | 136,113 | 50 |
| * | Ignyta Inc. | 8,710 | 47 |
| * | CytomX Therapeutics Inc. | 4,500 | 46 |
| * | Cara Therapeutics Inc. | 9,400 | 45 |
| * | CTI BioPharma Corp. | 130,632 | 44 |
| * | Voyager Therapeutics Inc. | 4,000 | 44 |
| * | Mateon Therapeutics Inc. | 61,300 | 43 |
| * | Tandem Diabetes Care Inc. | 5,683 | 43 |
| * | Ardelyx Inc. | 4,779 | 42 |
| * | Immune Design Corp. | 5,100 | 42 |
| *,^ | Mast Therapeutics Inc. | 88,377 | 42 |
| * | Cumberland Pharmaceuticals Inc. | 9,063 | 41 |
| * | Antares Pharma Inc. | 38,200 | 40 |
| Digirad Corp. | 7,706 | 40 | |
| * | NewLink Genetics Corp. | 3,431 | 39 |
30
| Vanguard® Balanced Index Fund | |||
| Schedule of Investments | |||
| June 30, 2016 | |||
| Market | |||
| Value | |||
| Shares | ($000) | ||
| * | Biolase Inc. | 32,306 | 38 |
| * | Symmetry Surgical Inc. | 2,776 | 36 |
| * | Selecta Biosciences Inc. | 2,560 | 36 |
| *,^ | Nobilis Health Corp. | 15,600 | 35 |
| * | CytoSorbents Corp. | 7,600 | 35 |
| * | Alphatec Holdings Inc. | 96,538 | 34 |
| * | Catalyst Pharmaceuticals Inc. | 44,127 | 31 |
| * | American Renal Associates Holdings Inc. | 1,060 | 31 |
| * | Neuralstem Inc. | 94,120 | 27 |
| * | Entellus Medical Inc. | 1,296 | 24 |
| * | Vital Therapies Inc. | 3,700 | 23 |
| * | Five Star Quality Care Inc. | 9,634 | 23 |
| * | Avinger Inc. | 1,835 | 22 |
| * | vTv Therapeutics Inc. Class A | 3,224 | 19 |
| * | Cutera Inc. | 1,663 | 19 |
| *,^ | Navidea Biopharmaceuticals Inc. | 34,502 | 18 |
| * | Foundation Medicine Inc. | 973 | 18 |
| * | Chiasma Inc. | 6,085 | 18 |
| * | Axsome Therapeutics Inc. | 2,205 | 17 |
| * | ChemoCentryx Inc. | 3,701 | 17 |
| * | Ohr Pharmaceutical Inc. | 6,000 | 16 |
| *,^ | Northwest Biotherapeutics Inc. | 27,506 | 16 |
| * | Mirati Therapeutics Inc. | 2,900 | 16 |
| * | InfuSystem Holdings Inc. | 5,850 | 15 |
| * | Reata Pharmaceuticals Inc. Class A | 750 | 15 |
| * | ERBA Diagnostics Inc. | 18,017 | 14 |
| * | Wright Medical Group Inc. CVR Exp. 12/31/2049 | 11,147 | 14 |
| * | Cidara Therapeutics Inc. | 1,325 | 14 |
| *,^ | Cesca Therapeutics Inc. | 4,630 | 14 |
| * | T2 Biosystems Inc. | 1,700 | 13 |
| * | Flex Pharma Inc. | 1,080 | 11 |
| * | Apricus Biosciences Inc. | 27,117 | 11 |
| * | Tonix Pharmaceuticals Holding Corp. | 5,300 | 11 |
| * | Vermillion Inc. | 8,534 | 9 |
| * | Calithera Biosciences Inc. | 2,496 | 9 |
| *,^ | Ampio Pharmaceuticals Inc. | 6,400 | 8 |
| * | Catabasis Pharmaceuticals Inc. | 1,900 | 7 |
| * | Oncocyte Corp. | 1,778 | 6 |
| * | Orexigen Therapeutics Inc. | 13,437 | 6 |
| * | Omthera Pharmaceuticals Inc. CVR | 9,400 | 6 |
| * | Invitae Corp. | 713 | 5 |
| * | Presbia plc | 1,100 | 5 |
| * | Ocular Therapeutix Inc. | 920 | 5 |
| * | Alliance HealthCare Services Inc. | 653 | 4 |
| * | Veracyte Inc. | 803 | 4 |
| * | aTyr Pharma Inc. | 1,411 | 4 |
| * | NuPathe Inc. CVR | 6,287 | 4 |
| * | Genesis Healthcare Inc. | 1,829 | 3 |
| * | Neos Therapeutics Inc. | 324 | 3 |
| * | EndoChoice Holdings Inc. | 525 | 3 |
| * | Sequenom Inc. | 2,601 | 2 |
| * | Biostage Inc. | 1,991 | 2 |
| * | Egalet Corp. | 400 | 2 |
| * | Windtree Therapeutics Inc. | 977 | 2 |
| * | Sunesis Pharmaceuticals Inc. | 3,100 | 2 |
| * | Cyclacel Pharmaceuticals Inc. | 200 | 1 |
| * | Corindus Vascular Robotics Inc. | 300 | — |
| * | StemCells Inc. | 816 | — |
| 2,280,337 | |||
| Industrials (7.6%) | |||
| General Electric Co. | 7,112,545 | 223,903 | |
| 3M Co. | 463,968 | 81,250 | |
| Honeywell International Inc. | 579,695 | 67,430 | |
| Boeing Co. | 478,365 | 62,125 | |
31
| Vanguard® Balanced Index Fund | |||
| Schedule of Investments | |||
| June 30, 2016 | |||
| Market | |||
| Value | |||
| Shares | ($000) | ||
| United Technologies Corp. | 605,556 | 62,100 | |
| United Parcel Service Inc. Class B | 529,570 | 57,045 | |
| Union Pacific Corp. | 643,969 | 56,186 | |
| Accenture plc Class A | 481,026 | 54,495 | |
| Lockheed Martin Corp. | 200,525 | 49,764 | |
| Danaher Corp. | 468,357 | 47,304 | |
| Caterpillar Inc. | 443,911 | 33,653 | |
| * | PayPal Holdings Inc. | 882,736 | 32,229 |
| Raytheon Co. | 226,782 | 30,831 | |
| Northrop Grumman Corp. | 138,005 | 30,676 | |
| Automatic Data Processing Inc. | 333,017 | 30,594 | |
| FedEx Corp. | 186,305 | 28,277 | |
| General Dynamics Corp. | 199,857 | 27,828 | |
| Emerson Electric Co. | 488,817 | 25,497 | |
| Illinois Tool Works Inc. | 234,892 | 24,466 | |
| Waste Management Inc. | 342,114 | 22,672 | |
| Eaton Corp. plc | 350,272 | 20,922 | |
| Norfolk Southern Corp. | 226,855 | 19,312 | |
| CSX Corp. | 720,252 | 18,784 | |
| * | Fiserv Inc. | 171,088 | 18,602 |
| Fidelity National Information Services Inc. | 247,867 | 18,263 | |
| Sherwin-Williams Co. | 60,433 | 17,747 | |
| Deere & Co. | 216,868 | 17,575 | |
| * | LinkedIn Corp. Class A | 90,576 | 17,142 |
| TE Connectivity Ltd. | 284,579 | 16,252 | |
| Cummins Inc. | 133,294 | 14,988 | |
| Paychex Inc. | 247,898 | 14,750 | |
| PACCAR Inc. | 266,453 | 13,821 | |
| Tyco International plc | 324,355 | 13,818 | |
| Amphenol Corp. Class A | 238,525 | 13,675 | |
| Roper Technologies Inc. | 75,340 | 12,850 | |
| Ingersoll-Rand plc | 197,216 | 12,559 | |
| Vulcan Materials Co. | 99,193 | 11,939 | |
| Rockwell Automation Inc. | 101,774 | 11,686 | |
| Parker-Hannifin Corp. | 103,497 | 11,183 | |
| Agilent Technologies Inc. | 249,379 | 11,062 | |
| * | TransDigm Group Inc. | 39,521 | 10,421 |
| Fastenal Co. | 218,596 | 9,703 | |
| * | FleetCor Technologies Inc. | 67,741 | 9,696 |
| WW Grainger Inc. | 42,473 | 9,652 | |
| * | Waste Connections Inc. | 133,877 | 9,646 |
| Martin Marietta Materials Inc. | 49,121 | 9,431 | |
| * | Verisk Analytics Inc. Class A | 115,662 | 9,378 |
| Republic Services Inc. Class A | 181,967 | 9,337 | |
| Rockwell Collins Inc. | 100,373 | 8,546 | |
| * | Alliance Data Systems Corp. | 43,407 | 8,504 |
| Dover Corp. | 120,317 | 8,340 | |
| Global Payments Inc. | 116,600 | 8,323 | |
| Acuity Brands Inc. | 33,479 | 8,301 | |
| CH Robinson Worldwide Inc. | 108,730 | 8,073 | |
| AMETEK Inc. | 174,166 | 8,052 | |
| L-3 Communications Holdings Inc. | 53,902 | 7,907 | |
| WestRock Co. | 199,365 | 7,749 | |
| Ball Corp. | 106,498 | 7,699 | |
| Masco Corp. | 248,424 | 7,686 | |
| Kansas City Southern | 83,078 | 7,484 | |
| * | Mettler-Toledo International Inc. | 20,347 | 7,425 |
| Pentair plc | 124,215 | 7,240 | |
| Xerox Corp. | 752,241 | 7,139 | |
| Sealed Air Corp. | 153,769 | 7,069 | |
| Textron Inc. | 192,649 | 7,043 | |
| Total System Services Inc. | 127,175 | 6,754 | |
| * | Stericycle Inc. | 64,475 | 6,713 |
| Fortune Brands Home & Security Inc. | 115,125 | 6,674 | |
32
| Vanguard® Balanced Index Fund | |||
| Schedule of Investments | |||
| June 30, 2016 | |||
| Market | |||
| Value | |||
| Shares | ($000) | ||
| Expeditors International of Washington Inc. | 134,258 | 6,584 | |
| * | Vantiv Inc. Class A | 116,192 | 6,576 |
| Huntington Ingalls Industries Inc. | 37,071 | 6,229 | |
| Cintas Corp. | 62,920 | 6,174 | |
| Valspar Corp. | 55,650 | 6,012 | |
| Xylem Inc. | 130,692 | 5,835 | |
| * | CoStar Group Inc. | 25,811 | 5,644 |
| Broadridge Financial Solutions Inc. | 86,469 | 5,638 | |
| * | Crown Holdings Inc. | 108,735 | 5,510 |
| * | HD Supply Holdings Inc. | 156,660 | 5,455 |
| Jack Henry & Associates Inc. | 62,113 | 5,421 | |
| JB Hunt Transport Services Inc. | 65,931 | 5,336 | |
| Allegion plc | 74,158 | 5,149 | |
| Fluor Corp. | 103,565 | 5,104 | |
| Packaging Corp. of America | 75,822 | 5,075 | |
| Carlisle Cos. Inc. | 47,381 | 5,007 | |
| Flowserve Corp. | 107,293 | 4,846 | |
| AO Smith Corp. | 54,693 | 4,819 | |
| Wabtec Corp. | 68,071 | 4,781 | |
| * | Sensata Technologies Holding NV | 135,975 | 4,744 |
| * | Trimble Navigation Ltd. | 193,173 | 4,706 |
| * | Spirit AeroSystems Holdings Inc. Class A | 109,010 | 4,687 |
| PerkinElmer Inc. | 88,238 | 4,625 | |
| Lennox International Inc. | 31,896 | 4,548 | |
| Hubbell Inc. Class B | 43,119 | 4,548 | |
| IDEX Corp. | 54,803 | 4,499 | |
| * | Jacobs Engineering Group Inc. | 89,506 | 4,458 |
| Avnet Inc. | 108,697 | 4,403 | |
| * | United Rentals Inc. | 64,644 | 4,338 |
| * | Arrow Electronics Inc. | 67,413 | 4,173 |
| Owens Corning | 80,777 | 4,162 | |
| Macquarie Infrastructure Corp. | 55,764 | 4,129 | |
| Orbital ATK Inc. | 46,994 | 4,001 | |
| Sonoco Products Co. | 80,369 | 3,991 | |
| * | Berry Plastics Group Inc. | 101,379 | 3,939 |
| * | AECOM | 121,560 | 3,862 |
| MDU Resources Group Inc. | 159,885 | 3,837 | |
| B/E Aerospace Inc. | 83,047 | 3,835 | |
| * | Keysight Technologies Inc. | 131,455 | 3,824 |
| Robert Half International Inc. | 98,559 | 3,761 | |
| AptarGroup Inc. | 47,094 | 3,727 | |
| Bemis Co. Inc. | 70,046 | 3,607 | |
| Donaldson Co. Inc. | 104,881 | 3,604 | |
| FEI Co. | 33,243 | 3,553 | |
| ManpowerGroup Inc. | 53,985 | 3,473 | |
| FLIR Systems Inc. | 109,672 | 3,394 | |
| Toro Co. | 38,034 | 3,355 | |
| Graco Inc. | 40,419 | 3,193 | |
| Graphic Packaging Holding Co. | 252,224 | 3,163 | |
| Allison Transmission Holdings Inc. | 111,826 | 3,157 | |
| * | Old Dominion Freight Line Inc. | 52,242 | 3,151 |
| Nordson Corp. | 37,489 | 3,134 | |
| * | Genpact Ltd. | 114,263 | 3,067 |
| Curtiss-Wright Corp. | 34,473 | 2,904 | |
| Eagle Materials Inc. | 37,490 | 2,892 | |
| Chicago Bridge & Iron Co. NV | 83,108 | 2,878 | |
| Hexcel Corp. | 69,000 | 2,873 | |
| * | WEX Inc. | 32,341 | 2,868 |
| Booz Allen Hamilton Holding Corp. Class A | 95,988 | 2,845 | |
| Cognex Corp. | 65,274 | 2,813 | |
| Lincoln Electric Holdings Inc. | 47,124 | 2,784 | |
| * | Euronet Worldwide Inc. | 39,700 | 2,747 |
| * | Genesee & Wyoming Inc. Class A | 46,455 | 2,739 |
| * | CoreLogic Inc. | 70,636 | 2,718 |
33
| Vanguard® Balanced Index Fund | |||
| Schedule of Investments | |||
| June 30, 2016 | |||
| Market | |||
| Value | |||
| Shares | ($000) | ||
| Ryder System Inc. | 44,202 | 2,703 | |
| AGCO Corp. | 56,692 | 2,672 | |
| Deluxe Corp. | 39,954 | 2,652 | |
| Watsco Inc. | 18,765 | 2,640 | |
| MAXIMUS Inc. | 47,645 | 2,638 | |
| * | First Data Corp. Class A | 234,682 | 2,598 |
| World Fuel Services Corp. | 54,492 | 2,588 | |
| Oshkosh Corp. | 54,121 | 2,582 | |
| RR Donnelley & Sons Co. | 151,866 | 2,570 | |
| * | Quanta Services Inc. | 110,195 | 2,548 |
| National Instruments Corp. | 92,214 | 2,527 | |
| BWX Technologies Inc. | 70,523 | 2,523 | |
| * | Kirby Corp. | 40,077 | 2,500 |
| MSC Industrial Direct Co. Inc. Class A | 35,223 | 2,485 | |
| CLARCOR Inc. | 40,080 | 2,438 | |
| * | Teledyne Technologies Inc. | 23,669 | 2,344 |
| Woodward Inc. | 40,482 | 2,333 | |
| * | Universal Display Corp. | 33,551 | 2,275 |
| Trinity Industries Inc. | 121,082 | 2,248 | |
| Jabil Circuit Inc. | 120,883 | 2,233 | |
| Crane Co. | 38,913 | 2,207 | |
| HEICO Corp. Class A | 40,861 | 2,192 | |
| * | Clean Harbors Inc. | 41,584 | 2,167 |
| Valmont Industries Inc. | 15,863 | 2,146 | |
| EnerSys | 35,395 | 2,105 | |
| Landstar System Inc. | 30,643 | 2,104 | |
| * | IPG Photonics Corp. | 26,290 | 2,103 |
| ITT Inc. | 65,133 | 2,083 | |
| *,^ | XPO Logistics Inc. | 79,053 | 2,076 |
| Regal Beloit Corp. | 37,619 | 2,071 | |
| * | Louisiana-Pacific Corp. | 118,431 | 2,055 |
| EMCOR Group Inc. | 41,220 | 2,030 | |
| Belden Inc. | 33,553 | 2,026 | |
| * | USG Corp. | 74,464 | 2,008 |
| * | Owens-Illinois Inc. | 108,805 | 1,960 |
| Air Lease Corp. Class A | 73,037 | 1,956 | |
| Littelfuse Inc. | 16,410 | 1,939 | |
| * | Colfax Corp. | 72,597 | 1,921 |
| * | Generac Holdings Inc. | 54,179 | 1,894 |
| Silgan Holdings Inc. | 36,202 | 1,863 | |
| Simpson Manufacturing Co. Inc. | 45,878 | 1,834 | |
| * | WESCO International Inc. | 35,210 | 1,813 |
| * | Zebra Technologies Corp. | 35,389 | 1,773 |
| * | Coherent Inc. | 19,030 | 1,747 |
| * | WageWorks Inc. | 28,800 | 1,723 |
| GATX Corp. | 39,009 | 1,715 | |
| Joy Global Inc. | 80,865 | 1,709 | |
| * | Masonite International Corp. | 25,192 | 1,666 |
| Timken Co. | 53,674 | 1,646 | |
| Terex Corp. | 80,314 | 1,631 | |
| * | TransUnion | 48,732 | 1,630 |
| Covanta Holding Corp. | 99,004 | 1,629 | |
| KBR Inc. | 121,233 | 1,605 | |
| * | Cimpress NV | 17,107 | 1,582 |
| * | Rexnord Corp. | 78,990 | 1,551 |
| UniFirst Corp. | 13,394 | 1,550 | |
| * | On Assignment Inc. | 41,716 | 1,541 |
| Universal Forest Products Inc. | 16,547 | 1,534 | |
| Convergys Corp. | 61,336 | 1,533 | |
| * | Sanmina Corp. | 56,876 | 1,525 |
| Watts Water Technologies Inc. Class A | 25,671 | 1,496 | |
| ABM Industries Inc. | 40,043 | 1,461 | |
| Tetra Tech Inc. | 47,414 | 1,458 | |
| Knight Transportation Inc. | 53,967 | 1,434 | |
34
| Vanguard® Balanced Index Fund | |||
| Schedule of Investments | |||
| June 30, 2016 | |||
| Market | |||
| Value | |||
| Shares | ($000) | ||
| Kennametal Inc. | 64,712 | 1,431 | |
| CEB Inc. | 23,167 | 1,429 | |
| * | AMN Healthcare Services Inc. | 35,706 | 1,427 |
| * | Anixter International Inc. | 26,498 | 1,412 |
| John Bean Technologies Corp. | 22,729 | 1,391 | |
| * | KLX Inc. | 44,880 | 1,391 |
| * | ExlService Holdings Inc. | 26,061 | 1,366 |
| Triumph Group Inc. | 37,237 | 1,322 | |
| * | Moog Inc. Class A | 24,238 | 1,307 |
| * | Cardtronics Inc. | 32,483 | 1,293 |
| Mueller Water Products Inc. Class A | 112,758 | 1,288 | |
| * | Esterline Technologies Corp. | 20,677 | 1,283 |
| Otter Tail Corp. | 38,127 | 1,277 | |
| * | Itron Inc. | 29,579 | 1,275 |
| Mueller Industries Inc. | 39,584 | 1,262 | |
| Granite Construction Inc. | 27,688 | 1,261 | |
| MSA Safety Inc. | 23,976 | 1,259 | |
| Exponent Inc. | 20,665 | 1,207 | |
| G&K Services Inc. Class A | 15,663 | 1,199 | |
| Methode Electronics Inc. | 34,436 | 1,179 | |
| * | FTI Consulting Inc. | 28,883 | 1,175 |
| * | Armstrong World Industries Inc. | 29,993 | 1,174 |
| * | LifeLock Inc. | 72,414 | 1,145 |
| * | ExamWorks Group Inc. | 32,747 | 1,141 |
| Barnes Group Inc. | 34,335 | 1,137 | |
| * | TASER International Inc. | 45,565 | 1,134 |
| Franklin Electric Co. Inc. | 34,217 | 1,131 | |
| Applied Industrial Technologies Inc. | 24,978 | 1,128 | |
| Vishay Intertechnology Inc. | 90,938 | 1,127 | |
| Brink's Co. | 39,282 | 1,119 | |
| Mobile Mini Inc. | 31,740 | 1,099 | |
| Brady Corp. Class A | 35,869 | 1,096 | |
| * | RBC Bearings Inc. | 15,095 | 1,094 |
| * | Smith & Wesson Holding Corp. | 39,887 | 1,084 |
| Forward Air Corp. | 24,340 | 1,084 | |
| * | Ambarella Inc. | 21,265 | 1,080 |
| Essendant Inc. | 35,281 | 1,078 | |
| * | DigitalGlobe Inc. | 50,357 | 1,077 |
| * | MasTec Inc. | 47,883 | 1,069 |
| Insperity Inc. | 13,680 | 1,057 | |
| * | Advisory Board Co. | 29,292 | 1,037 |
| * | Knowles Corp. | 74,961 | 1,025 |
| * | TriNet Group Inc. | 49,199 | 1,023 |
| Tennant Co. | 18,787 | 1,012 | |
| * | Atlas Air Worldwide Holdings Inc. | 24,362 | 1,009 |
| Comfort Systems USA Inc. | 30,768 | 1,002 | |
| Sturm Ruger & Co. Inc. | 15,487 | 991 | |
| AZZ Inc. | 16,492 | 989 | |
| * | Huron Consulting Group Inc. | 16,371 | 989 |
| * | Plexus Corp. | 22,723 | 982 |
| Matson Inc. | 30,157 | 974 | |
| * | Fabrinet | 26,135 | 970 |
| * | Rogers Corp. | 15,840 | 968 |
| Apogee Enterprises Inc. | 20,876 | 968 | |
| * | TopBuild Corp. | 26,319 | 953 |
| * | NeuStar Inc. Class A | 40,159 | 944 |
| US Ecology Inc. | 20,345 | 935 | |
| Kaman Corp. | 21,959 | 934 | |
| * | Swift Transportation Co. | 60,138 | 927 |
| * | Proto Labs Inc. | 16,100 | 927 |
| Aircastle Ltd. | 47,276 | 925 | |
| Actuant Corp. Class A | 40,767 | 922 | |
| * | Summit Materials Inc. Class A | 44,949 | 920 |
| * | Paylocity Holding Corp. | 21,068 | 910 |
35
| Vanguard® Balanced Index Fund | |||
| Schedule of Investments | |||
| June 30, 2016 | |||
| Market | |||
| Value | |||
| Shares | ($000) | ||
| Astec Industries Inc. | 16,171 | 908 | |
| * | Trex Co. Inc. | 20,068 | 901 |
| * | Hub Group Inc. Class A | 23,173 | 889 |
| * | Tutor Perini Corp. | 37,211 | 876 |
| EnPro Industries Inc. | 19,722 | 875 | |
| * | Greatbatch Inc. | 28,256 | 874 |
| AAON Inc. | 31,521 | 867 | |
| * | Headwaters Inc. | 47,158 | 846 |
| * | Imperva Inc. | 19,500 | 839 |
| Heartland Express Inc. | 47,963 | 834 | |
| CIRCOR International Inc. | 14,389 | 820 | |
| * | Builders FirstSource Inc. | 72,684 | 818 |
| * | TriMas Corp. | 45,162 | 813 |
| * | Inovalon Holdings Inc. Class A | 45,052 | 811 |
| * | Sykes Enterprises Inc. | 27,649 | 801 |
| Albany International Corp. | 19,826 | 792 | |
| * | OSI Systems Inc. | 13,359 | 777 |
| * | II-VI Inc. | 40,912 | 768 |
| Korn/Ferry International | 36,892 | 764 | |
| * | Benchmark Electronics Inc. | 35,435 | 749 |
| Cubic Corp. | 18,602 | 747 | |
| * | Gibraltar Industries Inc. | 23,643 | 746 |
| Standex International Corp. | 8,993 | 743 | |
| Badger Meter Inc. | 10,172 | 743 | |
| Quad/Graphics Inc. | 31,733 | 739 | |
| * | MACOM Technology Solutions Holdings Inc. | 22,201 | 732 |
| ManTech International Corp. Class A | 19,300 | 730 | |
| * | Press Ganey Holdings Inc. | 18,449 | 726 |
| Advanced Drainage Systems Inc. | 26,301 | 720 | |
| * | Continental Building Products Inc. | 32,244 | 717 |
| * | PHH Corp. | 53,670 | 715 |
| * | Wabash National Corp. | 56,274 | 715 |
| * | Aerojet Rocketdyne Holdings Inc. | 39,023 | 713 |
| * | American Woodmark Corp. | 10,724 | 712 |
| * | Thermon Group Holdings Inc. | 36,820 | 707 |
| * | Patrick Industries Inc. | 11,627 | 701 |
| * | SPX FLOW Inc. | 26,738 | 697 |
| * | Babcock & Wilcox Enterprises Inc. | 47,238 | 694 |
| ESCO Technologies Inc. | 17,180 | 686 | |
| * | Rofin-Sinar Technologies Inc. | 21,452 | 685 |
| * | US Concrete Inc. | 11,144 | 679 |
| Altra Industrial Motion Corp. | 24,994 | 674 | |
| Greif Inc. Class A | 18,028 | 672 | |
| AVX Corp. | 49,243 | 669 | |
| Raven Industries Inc. | 35,235 | 667 | |
| Werner Enterprises Inc. | 28,843 | 663 | |
| MTS Systems Corp. | 14,688 | 644 | |
| * | BMC Stock Holdings Inc. | 35,590 | 634 |
| * | Aegion Corp. Class A | 32,397 | 632 |
| Sun Hydraulics Corp. | 21,094 | 626 | |
| ^ | Outerwall Inc. | 14,354 | 603 |
| Primoris Services Corp. | 31,454 | 595 | |
| EVERTEC Inc. | 38,031 | 591 | |
| Griffon Corp. | 34,954 | 589 | |
| * | Echo Global Logistics Inc. | 25,855 | 580 |
| Encore Wire Corp. | 15,150 | 565 | |
| Greenbrier Cos. Inc. | 19,181 | 559 | |
| AAR Corp. | 23,594 | 551 | |
| Harsco Corp. | 82,816 | 550 | |
| * | TrueBlue Inc. | 28,829 | 545 |
| Multi-Color Corp. | 8,475 | 537 | |
| Federal Signal Corp. | 41,647 | 536 | |
| * | Navistar International Corp. | 45,500 | 532 |
| * | Aerovironment Inc. | 18,888 | 525 |
36
| Vanguard® Balanced Index Fund | |||
| Schedule of Investments | |||
| June 30, 2016 | |||
| Market | |||
| Value | |||
| Shares | ($000) | ||
| * | Wesco Aircraft Holdings Inc. | 38,593 | 518 |
| Kadant Inc. | 9,937 | 512 | |
| * | Lydall Inc. | 13,206 | 509 |
| * | Team Inc. | 20,003 | 497 |
| McGrath RentCorp | 16,187 | 495 | |
| Manitowoc Co. Inc. | 90,452 | 493 | |
| * | Navigant Consulting Inc. | 30,277 | 489 |
| Materion Corp. | 19,737 | 489 | |
| * | Installed Building Products Inc. | 13,459 | 488 |
| Lindsay Corp. | 7,147 | 485 | |
| Argan Inc. | 11,479 | 479 | |
| Resources Connection Inc. | 31,933 | 472 | |
| * | ICF International Inc. | 11,385 | 466 |
| ArcBest Corp. | 28,505 | 463 | |
| * | FARO Technologies Inc. | 13,577 | 459 |
| CTS Corp. | 25,355 | 454 | |
| * | Air Transport Services Group Inc. | 34,858 | 452 |
| * | MYR Group Inc. | 18,366 | 442 |
| Quanex Building Products Corp. | 23,333 | 434 | |
| * | Boise Cascade Co. | 18,719 | 430 |
| Alamo Group Inc. | 6,371 | 420 | |
| TeleTech Holdings Inc. | 15,473 | 420 | |
| Viad Corp. | 13,356 | 414 | |
| Ennis Inc. | 21,318 | 409 | |
| H&E Equipment Services Inc. | 21,004 | 400 | |
| * | TTM Technologies Inc. | 52,952 | 399 |
| * | SPX Corp. | 26,738 | 397 |
| * | Saia Inc. | 15,607 | 392 |
| Bel Fuse Inc. Class B | 22,061 | 392 | |
| Schnitzer Steel Industries Inc. | 22,117 | 389 | |
| General Cable Corp. | 29,875 | 380 | |
| Global Brass & Copper Holdings Inc. | 13,754 | 375 | |
| * | Astronics Corp. | 10,986 | 365 |
| Insteel Industries Inc. | 12,734 | 364 | |
| Gorman-Rupp Co. | 13,137 | 360 | |
| TAL International Group Inc. | 26,693 | 358 | |
| * | CBIZ Inc. | 33,685 | 351 |
| * | Meritor Inc. | 48,687 | 351 |
| Kforce Inc. | 20,244 | 342 | |
| Kelly Services Inc. Class A | 17,456 | 331 | |
| * | NCI Building Systems Inc. | 20,628 | 330 |
| * | PGT Inc. | 31,304 | 322 |
| * | Veeco Instruments Inc. | 19,418 | 322 |
| * | YRC Worldwide Inc. | 36,466 | 321 |
| Marten Transport Ltd. | 15,709 | 311 | |
| * | Cross Country Healthcare Inc. | 21,647 | 301 |
| VSE Corp. | 4,496 | 300 | |
| Black Box Corp. | 22,600 | 296 | |
| * | Mistras Group Inc. | 12,356 | 295 |
| Overseas Shipholding Group Inc. Class A | 26,720 | 294 | |
| TimkenSteel Corp. | 29,536 | 284 | |
| Textainer Group Holdings Ltd. | 25,300 | 282 | |
| Park-Ohio Holdings Corp. | 9,929 | 281 | |
| Cass Information Systems Inc. | 5,399 | 279 | |
| Hyster-Yale Materials Handling Inc. | 4,652 | 277 | |
| Myers Industries Inc. | 19,177 | 276 | |
| * | Energy Recovery Inc. | 28,699 | 255 |
| * | Armstrong Flooring Inc. | 14,996 | 254 |
| Douglas Dynamics Inc. | 9,704 | 250 | |
| * | Layne Christensen Co. | 30,508 | 247 |
| * | GP Strategies Corp. | 11,233 | 244 |
| * | Monster Worldwide Inc. | 101,700 | 243 |
| Landauer Inc. | 5,900 | 243 | |
| Columbus McKinnon Corp. | 16,443 | 233 | |
37
| Vanguard® Balanced Index Fund | |||
| Schedule of Investments | |||
| June 30, 2016 | |||
| Market | |||
| Value | |||
| Shares | ($000) | ||
| American Railcar Industries Inc. | 5,836 | 230 | |
| Electro Rent Corp. | 14,869 | 229 | |
| * | Engility Holdings Inc. | 10,820 | 229 |
| Allied Motion Technologies Inc. | 9,545 | 222 | |
| * | Perma-Fix Environmental Services | 42,180 | 215 |
| * | Landec Corp. | 19,722 | 212 |
| * | Kimball Electronics Inc. | 16,140 | 201 |
| * | RPX Corp. | 21,800 | 200 |
| Powell Industries Inc. | 4,976 | 196 | |
| * | Multi-Fineline Electronix Inc. | 8,388 | 195 |
| * | Casella Waste Systems Inc. Class A | 24,516 | 192 |
| * | EnerNOC Inc. | 29,640 | 187 |
| NN Inc. | 13,232 | 185 | |
| * | Novanta Inc. | 12,024 | 182 |
| Mesa Laboratories Inc. | 1,476 | 182 | |
| NACCO Industries Inc. Class A | 3,223 | 180 | |
| Graham Corp. | 9,637 | 178 | |
| AEP Industries Inc. | 2,200 | 177 | |
| Miller Industries Inc. | 8,444 | 174 | |
| * | PFSweb Inc. | 17,927 | 170 |
| * | Lionbridge Technologies Inc. | 42,174 | 167 |
| * | Nortek Inc. | 2,800 | 166 |
| United States Lime & Minerals Inc. | 2,799 | 165 | |
| * | Vicor Corp. | 16,344 | 165 |
| * | Ply Gem Holdings Inc. | 10,864 | 158 |
| * | Planet Payment Inc. | 35,142 | 158 |
| Omega Flex Inc. | 4,103 | 156 | |
| * | UFP Technologies Inc. | 6,907 | 156 |
| * | Willis Lease Finance Corp. | 6,897 | 153 |
| Heidrick & Struggles International Inc. | 8,960 | 151 | |
| * | Multi Packaging Solutions International Ltd. | 11,188 | 149 |
| * | Covenant Transportation Group Inc. Class A | 8,013 | 145 |
| * | USA Truck Inc. | 8,261 | 145 |
| Park Electrochemical Corp. | 9,837 | 143 | |
| Celadon Group Inc. | 17,274 | 141 | |
| * | Ducommun Inc. | 6,959 | 138 |
| Barrett Business Services Inc. | 3,291 | 136 | |
| NVE Corp. | 2,268 | 133 | |
| *,^ | MicroVision Inc. | 76,700 | 129 |
| * | Evolent Health Inc. Class A | 6,670 | 128 |
| * | Horizon Global Corp. | 11,184 | 127 |
| * | DXP Enterprises Inc. | 8,421 | 126 |
| * | CRA International Inc. | 4,914 | 124 |
| American Science & Engineering Inc. | 3,200 | 120 | |
| *,^ | Energous Corp. | 8,900 | 115 |
| Spartan Motors Inc. | 18,288 | 114 | |
| * | ServiceSource International Inc. | 28,100 | 113 |
| LSI Industries Inc. | 10,179 | 113 | |
| * | Hill International Inc. | 27,630 | 112 |
| CECO Environmental Corp. | 12,444 | 109 | |
| * | Electro Scientific Industries Inc. | 18,334 | 107 |
| Supreme Industries Inc. Class A | 7,400 | 101 | |
| * | Milacron Holdings Corp. | 6,852 | 99 |
| * | Vishay Precision Group Inc. | 7,362 | 99 |
| * | DHI Group Inc. | 15,600 | 97 |
| * | Image Sensing Systems Inc. | 43,363 | 97 |
| * | Energy Focus Inc. | 14,557 | 91 |
| Crawford & Co. Class B | 10,423 | 88 | |
| FreightCar America Inc. | 6,296 | 88 | |
| * | NV5 Global Inc. | 3,100 | 88 |
| * | American Superconductor Corp. | 10,419 | 88 |
| * | MINDBODY Inc. Class A | 5,356 | 86 |
| * | Lawson Products Inc. | 4,228 | 84 |
| * | Orion Group Holdings Inc. | 15,711 | 83 |
38
| Vanguard® Balanced Index Fund | |||
| Schedule of Investments | |||
| June 30, 2016 | |||
| Market | |||
| Value | |||
| Shares | ($000) | ||
| * | Kratos Defense & Security Solutions Inc. | 18,934 | 78 |
| * | Willdan Group Inc. | 7,200 | 76 |
| * | IES Holdings Inc. | 6,083 | 76 |
| * | Sterling Construction Co. Inc. | 15,000 | 74 |
| * | Lincoln Educational Services Corp. | 48,280 | 72 |
| * | PAM Transportation Services Inc. | 4,524 | 72 |
| Ecology and Environment Inc. | 6,994 | 71 | |
| * | Onvia Inc. | 18,400 | 65 |
| * | Roadrunner Transportation Systems Inc. | 8,600 | 64 |
| * | Xerium Technologies Inc. | 10,010 | 64 |
| Hurco Cos. Inc. | 2,292 | 64 | |
| *,^ | Research Frontiers Inc. | 16,958 | 62 |
| Acacia Research Corp. | 13,873 | 61 | |
| *,^ | Aqua Metals Inc. | 5,100 | 60 |
| * | Heritage-Crystal Clean Inc. | 4,692 | 57 |
| Universal Logistics Holdings Inc. | 4,425 | 57 | |
| Daktronics Inc. | 9,000 | 56 | |
| *,^ | Vertex Energy Inc. | 41,639 | 55 |
| * | Astronics Corp. Class B | 1,647 | 55 |
| * | Sparton Corp. | 2,504 | 55 |
| *,^ | LightPath Technologies Inc. Class A | 30,559 | 53 |
| * | Nuvectra Corp. | 6,952 | 51 |
| * | Intevac Inc. | 8,995 | 51 |
| * | Franklin Covey Co. | 3,286 | 50 |
| * | Key Technology Inc. | 5,155 | 47 |
| * | Air T Inc. | 2,182 | 47 |
| * | Northwest Pipe Co. | 4,297 | 46 |
| * | ARC Document Solutions Inc. | 11,817 | 46 |
| * | PRGX Global Inc. | 8,704 | 45 |
| * | InnerWorkings Inc. | 5,447 | 45 |
| National Research Corp. Class A | 3,281 | 45 | |
| * | TRC Cos. Inc. | 7,085 | 45 |
| * | ExOne Co. | 4,186 | 44 |
| * | LMI Aerospace Inc. | 5,487 | 44 |
| * | General Finance Corp. | 9,883 | 42 |
| Chicago Rivet & Machine Co. | 1,400 | 38 | |
| * | CUI Global Inc. | 7,433 | 38 |
| * | Ameresco Inc. Class A | 8,078 | 35 |
| * | Cotiviti Holdings Inc. | 1,650 | 35 |
| Hudson Global Inc. | 16,731 | 33 | |
| * | Rand Logistics Inc. | 31,669 | 33 |
| * | Maxwell Technologies Inc. | 6,100 | 32 |
| Twin Disc Inc. | 2,898 | 31 | |
| * | Information Services Group Inc. | 8,116 | 30 |
| *,^ | Workhorse Group Inc. | 4,200 | 29 |
| * | Asure Software Inc. | 6,100 | 29 |
| * | Ultralife Corp. | 5,625 | 28 |
| * | Fuel Tech Inc. | 16,944 | 25 |
| * | Continental Materials Corp. | 1,577 | 25 |
| * | Aspen Aerogels Inc. | 4,300 | 21 |
| * | Frequency Electronics Inc. | 2,277 | 21 |
| * | Arotech Corp. | 7,280 | 20 |
| * | AMREP Corp. | 3,574 | 17 |
| * | Orion Energy Systems Inc. | 13,048 | 15 |
| Houston Wire & Cable Co. | 2,866 | 15 | |
| National Research Corp. Class B | 413 | 14 | |
| * | Ballantyne Strong Inc. | 2,500 | 13 |
| * | Napco Security Technologies Inc. | 2,048 | 13 |
| Crawford & Co. Class A | 1,640 | 13 | |
| * | IEC Electronics Corp. | 2,900 | 12 |
| * | Patriot Transportation Holding Inc. | 608 | 12 |
| Hardinge Inc. | 1,155 | 12 | |
| * | Sharps Compliance Corp. | 2,564 | 11 |
| * | CPI Aerostructures Inc. | 1,800 | 11 |
39
| Vanguard® Balanced Index Fund | |||
| Schedule of Investments | |||
| June 30, 2016 | |||
| Market | |||
| Value | |||
| Shares | ($000) | ||
| * | ModusLink Global Solutions Inc. | 8,813 | 11 |
| * | Revolution Lighting Technologies Inc. | 1,480 | 9 |
| *,^ | Eagle Bulk Shipping Inc. | 20,759 | 9 |
| * | CyberOptics Corp. | 593 | 9 |
| * | Wireless Telecom Group Inc. | 5,909 | 8 |
| * | American DG Energy Inc. | 32,428 | 8 |
| Richardson Electronics Ltd. | 1,409 | 7 | |
| * | StarTek Inc. | 1,600 | 7 |
| * | Westport Fuel Systems Inc. | 3,949 | 7 |
| * | Great Lakes Dredge & Dock Corp. | 1,370 | 6 |
| BlueLinx Holdings Inc. | 630 | 4 | |
| * | eMagin Corp. | 2,056 | 4 |
| * | Erickson Inc. | 4,300 | 3 |
| Eastern Co. | 156 | 3 | |
| * | Mattersight Corp. | 191 | 1 |
| * | Iteris Inc. | 200 | 1 |
| * | ClearSign Combustion Corp. | 100 | 1 |
| * | Bazaarvoice Inc. | 90 | — |
| Greif Inc. Class B | 3 | — | |
| * | Cubist Pharmaceuticals, Inc. CVR | 14,500 | — |
| 2,137,081 | |||
| Oil & Gas (4.0%) | |||
| Exxon Mobil Corp. | 3,182,670 | 298,344 | |
| Chevron Corp. | 1,443,675 | 151,340 | |
| Schlumberger Ltd. | 1,055,687 | 83,484 | |
| Occidental Petroleum Corp. | 580,414 | 43,856 | |
| ConocoPhillips | 947,377 | 41,306 | |
| EOG Resources Inc. | 424,160 | 35,383 | |
| Halliburton Co. | 626,283 | 28,364 | |
| Kinder Morgan Inc. | 1,442,530 | 27,004 | |
| Phillips 66 | 339,222 | 26,914 | |
| Anadarko Petroleum Corp. | 386,318 | 20,571 | |
| Spectra Energy Corp. | 527,519 | 19,323 | |
| Pioneer Natural Resources Co. | 124,438 | 18,816 | |
| Valero Energy Corp. | 361,258 | 18,424 | |
| Apache Corp. | 293,608 | 16,345 | |
| Marathon Petroleum Corp. | 412,729 | 15,667 | |
| Baker Hughes Inc. | 340,718 | 15,377 | |
| Devon Energy Corp. | 372,027 | 13,486 | |
| Hess Corp. | 217,507 | 13,072 | |
| Noble Energy Inc. | 342,426 | 12,283 | |
| * | Concho Resources Inc. | 100,758 | 12,017 |
| Williams Cos. Inc. | 521,497 | 11,280 | |
| EQT Corp. | 129,632 | 10,037 | |
| Marathon Oil Corp. | 652,886 | 9,800 | |
| National Oilwell Varco Inc. | 277,590 | 9,341 | |
| Cabot Oil & Gas Corp. | 349,638 | 9,000 | |
| Cimarex Energy Co. | 73,126 | 8,725 | |
| Columbia Pipeline Group Inc. | 305,932 | 7,798 | |
| Tesoro Corp. | 93,931 | 7,037 | |
| * | Newfield Exploration Co. | 155,405 | 6,866 |
| Helmerich & Payne Inc. | 86,926 | 5,835 | |
| Range Resources Corp. | 130,496 | 5,630 | |
| * | Cheniere Energy Inc. | 146,238 | 5,491 |
| * | Diamondback Energy Inc. | 55,922 | 5,101 |
| OGE Energy Corp. | 155,364 | 5,088 | |
| Targa Resources Corp. | 118,800 | 5,006 | |
| * | Southwestern Energy Co. | 366,970 | 4,616 |
| * | FMC Technologies Inc. | 170,336 | 4,543 |
| Murphy Oil Corp. | 138,269 | 4,390 | |
| Core Laboratories NV | 33,408 | 4,139 | |
| * | Antero Resources Corp. | 150,809 | 3,918 |
| Energen Corp. | 78,881 | 3,803 | |
| * | Weatherford International plc | 653,100 | 3,625 |
40
| Vanguard® Balanced Index Fund | |||
| Schedule of Investments | |||
| June 30, 2016 | |||
| Market | |||
| Value | |||
| Shares | ($000) | ||
| ^ | Transocean Ltd. | 302,300 | 3,594 |
| HollyFrontier Corp. | 140,580 | 3,342 | |
| * | Continental Resources Inc. | 72,469 | 3,281 |
| * | Gulfport Energy Corp. | 103,684 | 3,241 |
| QEP Resources Inc. | 180,567 | 3,183 | |
| * | Parsley Energy Inc. Class A | 113,865 | 3,081 |
| * | First Solar Inc. | 58,162 | 2,820 |
| Patterson-UTI Energy Inc. | 127,370 | 2,716 | |
| Oceaneering International Inc. | 80,928 | 2,417 | |
| Superior Energy Services Inc. | 130,081 | 2,395 | |
| * | WPX Energy Inc. | 248,762 | 2,316 |
| Nabors Industries Ltd. | 224,615 | 2,257 | |
| * | PDC Energy Inc. | 34,854 | 2,008 |
| Rowan Cos. plc Class A | 111,751 | 1,974 | |
| * | Chesapeake Energy Corp. | 460,707 | 1,972 |
| Ensco plc Class A | 201,500 | 1,957 | |
| * | RSP Permian Inc. | 55,381 | 1,932 |
| PBF Energy Inc. Class A | 78,796 | 1,874 | |
| * | Rice Energy Inc. | 83,100 | 1,832 |
| * | Dril-Quip Inc. | 31,036 | 1,813 |
| Noble Corp. plc | 211,688 | 1,744 | |
| * | Whiting Petroleum Corp. | 184,588 | 1,709 |
| * | Carrizo Oil & Gas Inc. | 45,583 | 1,634 |
| SM Energy Co. | 58,584 | 1,582 | |
| * | NOW Inc. | 84,952 | 1,541 |
| * | Matador Resources Co. | 75,624 | 1,497 |
| * | Oil States International Inc. | 44,995 | 1,479 |
| Pattern Energy Group Inc. Class A | 58,430 | 1,342 | |
| * | Oasis Petroleum Inc. | 143,186 | 1,337 |
| * | Forum Energy Technologies Inc. | 76,500 | 1,324 |
| * | Memorial Resource Development Corp. | 82,000 | 1,302 |
| SemGroup Corp. Class A | 38,728 | 1,261 | |
| * | McDermott International Inc. | 254,049 | 1,255 |
| * | Laredo Petroleum Inc. | 100,215 | 1,050 |
| * | MRC Global Inc. | 71,617 | 1,018 |
| Denbury Resources Inc. | 262,100 | 941 | |
| Western Refining Inc. | 43,758 | 903 | |
| * | Synergy Resources Corp. | 120,295 | 801 |
| * | Callon Petroleum Co. | 70,849 | 796 |
| * | Helix Energy Solutions Group Inc. | 112,655 | 762 |
| * | SEACOR Holdings Inc. | 12,708 | 736 |
| * | RPC Inc. | 44,829 | 696 |
| Atwood Oceanics Inc. | 55,135 | 690 | |
| * | Unit Corp. | 43,329 | 674 |
| Archrock Inc. | 70,911 | 668 | |
| * | Flotek Industries Inc. | 45,166 | 596 |
| * | Hornbeck Offshore Services Inc. | 62,400 | 520 |
| Diamond Offshore Drilling Inc. | 21,136 | 514 | |
| * | Chart Industries Inc. | 21,132 | 510 |
| *,^ | SunPower Corp. Class A | 32,580 | 505 |
| Delek US Holdings Inc. | 37,619 | 497 | |
| * | TETRA Technologies Inc. | 74,254 | 473 |
| * | Par Pacific Holdings Inc. | 27,800 | 426 |
| *,^ | Sanchez Energy Corp. | 60,300 | 426 |
| * | REX American Resources Corp. | 7,080 | 424 |
| * | Matrix Service Co. | 25,160 | 415 |
| * | Cobalt International Energy Inc. | 305,213 | 409 |
| * | Pacific Ethanol Inc. | 74,800 | 408 |
| * | California Resources Corp. | 32,216 | 393 |
| Alon USA Energy Inc. | 52,737 | 342 | |
| * | Renewable Energy Group Inc. | 37,100 | 328 |
| Panhandle Oil and Gas Inc. Class A | 19,486 | 325 | |
| * | Bill Barrett Corp. | 48,753 | 312 |
| *,^ | EP Energy Corp. Class A | 59,911 | 310 |
41
| Vanguard® Balanced Index Fund | |||
| Schedule of Investments | |||
| June 30, 2016 | |||
| Market | |||
| Value | |||
| Shares | ($000) | ||
| * | Northern Oil and Gas Inc. | 58,526 | 270 |
| Bristow Group Inc. | 23,655 | 270 | |
| * | EXCO Resources Inc. | 207,320 | 270 |
| Green Plains Inc. | 12,176 | 240 | |
| Evolution Petroleum Corp. | 42,128 | 230 | |
| *,^ | Plug Power Inc. | 116,636 | 217 |
| * | Ring Energy Inc. | 23,600 | 208 |
| Tidewater Inc. | 46,100 | 203 | |
| * | Natural Gas Services Group Inc. | 8,711 | 199 |
| *,^ | FuelCell Energy Inc. | 31,766 | 198 |
| * | Trecora Resources | 18,615 | 194 |
| CVR Energy Inc. | 10,729 | 166 | |
| * | Eclipse Resources Corp. | 48,600 | 162 |
| *,^ | W&T Offshore Inc. | 55,700 | 129 |
| *,^ | Bonanza Creek Energy Inc. | 63,574 | 128 |
| Tesco Corp. | 16,637 | 111 | |
| * | Exterran Corp. | 8,556 | 110 |
| * | Gulfmark Offshore Inc. | 34,069 | 107 |
| *,^ | TerraVia Holdings Inc. | 38,601 | 101 |
| * | Pioneer Energy Services Corp. | 21,800 | 100 |
| * | Newpark Resources Inc. | 16,100 | 93 |
| * | Green Brick Partners Inc. | 12,800 | 93 |
| * | PHI Inc. | 4,543 | 81 |
| *,^ | Key Energy Services Inc. | 321,950 | 75 |
| *,^ | Harvest Natural Resources Inc. | 86,200 | 72 |
| Gulf Island Fabrication Inc. | 9,619 | 67 | |
| * | Basic Energy Services Inc. | 39,500 | 66 |
| Adams Resources & Energy Inc. | 1,582 | 61 | |
| *,^ | Comstock Resources Inc. | 68,887 | 58 |
| * | Independence Contract Drilling Inc. | 10,300 | 56 |
| * | Clayton Williams Energy Inc. | 1,988 | 55 |
| * | VAALCO Energy Inc. | 42,330 | 45 |
| * | Resolute Energy Corp. | 14,667 | 44 |
| * | Contango Oil & Gas Co. | 2,931 | 36 |
| * | Amyris Inc. | 79,183 | 36 |
| * | C&J Energy Services Ltd. | 33,400 | 20 |
| * | PrimeEnergy Corp. | 141 | 9 |
| * | Geospace Technologies Corp. | 400 | 7 |
| * | Seventy Seven Energy Inc. | 42,434 | 4 |
| * | Triangle Petroleum Corp. | 13,187 | 4 |
| * | Gastar Exploration Inc. | 1,880 | 2 |
| 1,143,922 | |||
| Technology (9.2%) | |||
| Apple Inc. | 3,997,977 | 382,207 | |
| Microsoft Corp. | 5,736,226 | 293,523 | |
| * | Facebook Inc. Class A | 1,686,918 | 192,781 |
| * | Alphabet Inc. Class A | 225,604 | 158,719 |
| * | Alphabet Inc. Class C | 224,331 | 155,259 |
| Intel Corp. | 3,629,367 | 119,043 | |
| Cisco Systems Inc. | 3,862,805 | 110,824 | |
| International Business Machines Corp. | 663,520 | 100,709 | |
| Oracle Corp. | 2,405,827 | 98,471 | |
| QUALCOMM Inc. | 1,127,557 | 60,403 | |
| Texas Instruments Inc. | 773,535 | 48,462 | |
| Broadcom Ltd. | 298,234 | 46,346 | |
| EMC Corp. | 1,513,135 | 41,112 | |
| * | salesforce.com Inc. | 492,366 | 39,099 |
| * | Adobe Systems Inc. | 383,445 | 36,730 |
| * | Cognizant Technology Solutions Corp. Class A | 463,767 | 26,546 |
| * | Yahoo! Inc. | 653,736 | 24,554 |
| Hewlett Packard Enterprise Co. | 1,318,834 | 24,095 | |
| Applied Materials Inc. | 865,261 | 20,740 | |
| Intuit Inc. | 184,968 | 20,644 | |
| NVIDIA Corp. | 388,601 | 18,268 | |
42
| Vanguard® Balanced Index Fund | |||
| Schedule of Investments | |||
| June 30, 2016 | |||
| Market | |||
| Value | |||
| Shares | ($000) | ||
| Corning Inc. | 852,609 | 17,461 | |
| HP Inc. | 1,323,093 | 16,605 | |
| * | Cerner Corp. | 232,040 | 13,598 |
| Analog Devices Inc. | 234,564 | 13,286 | |
| * | Micron Technology Inc. | 802,282 | 11,039 |
| Symantec Corp. | 498,832 | 10,246 | |
| Lam Research Corp. | 121,090 | 10,179 | |
| * | Red Hat Inc. | 137,740 | 10,000 |
| Western Digital Corp. | 202,572 | 9,574 | |
| * | Autodesk Inc. | 172,486 | 9,338 |
| Skyworks Solutions Inc. | 145,446 | 9,204 | |
| Xilinx Inc. | 195,459 | 9,017 | |
| KLA-Tencor Corp. | 122,331 | 8,961 | |
| * | Citrix Systems Inc. | 110,389 | 8,841 |
| Linear Technology Corp. | 182,477 | 8,491 | |
| Motorola Solutions Inc. | 124,934 | 8,242 | |
| Harris Corp. | 95,391 | 7,959 | |
| CA Inc. | 241,782 | 7,938 | |
| * | ServiceNow Inc. | 117,990 | 7,835 |
| Microchip Technology Inc. | 154,023 | 7,818 | |
| Maxim Integrated Products Inc. | 218,693 | 7,805 | |
| * | Palo Alto Networks Inc. | 63,287 | 7,762 |
| * | Akamai Technologies Inc. | 130,461 | 7,297 |
| * | Twitter Inc. | 421,052 | 7,120 |
| CDK Global Inc. | 118,221 | 6,560 | |
| * | Workday Inc. Class A | 83,992 | 6,272 |
| * | Synopsys Inc. | 114,848 | 6,211 |
| * | F5 Networks Inc. | 54,418 | 6,195 |
| * | VeriSign Inc. | 71,507 | 6,183 |
| Juniper Networks Inc. | 271,310 | 6,102 | |
| * | ANSYS Inc. | 65,705 | 5,963 |
| * | Gartner Inc. | 60,243 | 5,868 |
| * | Qorvo Inc. | 105,563 | 5,833 |
| * | Cadence Design Systems Inc. | 226,748 | 5,510 |
| Seagate Technology plc | 225,002 | 5,481 | |
| Computer Sciences Corp. | 109,941 | 5,459 | |
| * | Splunk Inc. | 100,712 | 5,457 |
| NetApp Inc. | 219,065 | 5,387 | |
| CDW Corp. | 118,110 | 4,734 | |
| * | Ultimate Software Group Inc. | 21,628 | 4,548 |
| * | Tyler Technologies Inc. | 25,592 | 4,266 |
| * | athenahealth Inc. | 30,361 | 4,190 |
| Ingram Micro Inc. | 113,250 | 3,939 | |
| SS&C Technologies Holdings Inc. | 131,356 | 3,688 | |
| IAC/InterActiveCorp | 65,508 | 3,688 | |
| * | PTC Inc. | 97,240 | 3,654 |
| Garmin Ltd. | 86,066 | 3,651 | |
| *,^ | VMware Inc. Class A | 62,803 | 3,594 |
| * | Guidewire Software Inc. | 55,907 | 3,453 |
| * | Manhattan Associates Inc. | 53,274 | 3,416 |
| * | CommScope Holding Co. Inc. | 109,029 | 3,383 |
| * | Fortinet Inc. | 105,267 | 3,325 |
| Brocade Communications Systems Inc. | 357,315 | 3,280 | |
| Marvell Technology Group Ltd. | 337,624 | 3,218 | |
| * | ARRIS International plc | 146,327 | 3,067 |
| Teradyne Inc. | 154,939 | 3,051 | |
| * | Nuance Communications Inc. | 192,855 | 3,014 |
| * | Microsemi Corp. | 88,678 | 2,898 |
| * | ON Semiconductor Corp. | 322,011 | 2,840 |
| CSRA Inc. | 119,759 | 2,806 | |
| DST Systems Inc. | 23,992 | 2,793 | |
| Leidos Holdings Inc. | 57,729 | 2,763 | |
| Blackbaud Inc. | 39,930 | 2,711 | |
| Cypress Semiconductor Corp. | 253,012 | 2,669 | |
43
| Vanguard® Balanced Index Fund | |||
| Schedule of Investments | |||
| June 30, 2016 | |||
| Market | |||
| Value | |||
| Shares | ($000) | ||
| Fair Isaac Corp. | 23,556 | 2,662 | |
| * | Advanced Micro Devices Inc. | 516,227 | 2,653 |
| * | NCR Corp. | 94,567 | 2,626 |
| * | Teradata Corp. | 103,648 | 2,598 |
| Pitney Bowes Inc. | 142,062 | 2,529 | |
| * | ViaSat Inc. | 35,320 | 2,522 |
| * | NetSuite Inc. | 33,627 | 2,448 |
| * | Aspen Technology Inc. | 59,959 | 2,413 |
| * | EPAM Systems Inc. | 36,550 | 2,351 |
| j2 Global Inc. | 34,769 | 2,196 | |
| * | IMS Health Holdings Inc. | 86,118 | 2,184 |
| * | Medidata Solutions Inc. | 45,122 | 2,115 |
| * | Veeva Systems Inc. Class A | 61,844 | 2,110 |
| * | Arista Networks Inc. | 32,194 | 2,073 |
| * | Integrated Device Technology Inc. | 102,656 | 2,066 |
| SYNNEX Corp. | 21,728 | 2,060 | |
| * | Dycom Industries Inc. | 22,880 | 2,054 |
| * | Proofpoint Inc. | 32,391 | 2,044 |
| * | ACI Worldwide Inc. | 103,337 | 2,016 |
| * | Tableau Software Inc. Class A | 41,000 | 2,006 |
| * | Qlik Technologies Inc. | 67,527 | 1,997 |
| * | Cree Inc. | 79,857 | 1,952 |
| * | Cirrus Logic Inc. | 49,969 | 1,938 |
| * | Ellie Mae Inc. | 21,100 | 1,934 |
| Monolithic Power Systems Inc. | 27,753 | 1,896 | |
| * | Fairchild Semiconductor International Inc. Class A | 94,564 | 1,877 |
| * | Demandware Inc. | 24,683 | 1,849 |
| * | Tech Data Corp. | 25,522 | 1,834 |
| * | Ciena Corp. | 97,154 | 1,822 |
| MKS Instruments Inc. | 41,842 | 1,802 | |
| * | FireEye Inc. | 108,200 | 1,782 |
| Mentor Graphics Corp. | 83,757 | 1,781 | |
| * | CACI International Inc. Class A | 19,256 | 1,741 |
| * | Allscripts Healthcare Solutions Inc. | 136,739 | 1,737 |
| Lexmark International Inc. Class A | 44,534 | 1,681 | |
| * | Rackspace Hosting Inc. | 79,864 | 1,666 |
| * | Zendesk Inc. | 62,945 | 1,661 |
| * | Cavium Inc. | 42,384 | 1,636 |
| Science Applications International Corp. | 27,143 | 1,584 | |
| * | NetScout Systems Inc. | 70,890 | 1,577 |
| * | EchoStar Corp. Class A | 38,608 | 1,533 |
| * | Finisar Corp. | 86,879 | 1,521 |
| * | Synaptics Inc. | 28,296 | 1,521 |
| * | CommVault Systems Inc. | 35,146 | 1,518 |
| * | Silicon Laboratories Inc. | 30,884 | 1,505 |
| * | Paycom Software Inc. | 34,756 | 1,502 |
| * | Verint Systems Inc. | 45,223 | 1,498 |
| * | Electronics For Imaging Inc. | 33,417 | 1,438 |
| * | VeriFone Systems Inc. | 76,177 | 1,412 |
| * | Entegris Inc. | 97,283 | 1,408 |
| InterDigital Inc. | 25,128 | 1,399 | |
| * | Cornerstone OnDemand Inc. | 36,565 | 1,392 |
| * | Polycom Inc. | 122,848 | 1,382 |
| Cogent Communications Holdings Inc. | 33,423 | 1,339 | |
| Intersil Corp. Class A | 95,153 | 1,288 | |
| Plantronics Inc. | 29,076 | 1,279 | |
| * | Infinera Corp. | 112,699 | 1,271 |
| * | Fleetmatics Group plc | 27,800 | 1,205 |
| * | NETGEAR Inc. | 25,214 | 1,199 |
| * | Premier Inc. Class A | 36,438 | 1,192 |
| * | Advanced Energy Industries Inc. | 31,369 | 1,191 |
| *,^ | 3D Systems Corp. | 85,970 | 1,177 |
| * | MicroStrategy Inc. Class A | 6,717 | 1,176 |
| * | Syntel Inc. | 25,685 | 1,163 |
44
| Vanguard® Balanced Index Fund | |||
| Schedule of Investments | |||
| June 30, 2016 | |||
| Market | |||
| Value | |||
| Shares | ($000) | ||
| NIC Inc. | 49,827 | 1,093 | |
| * | LogMeIn Inc. | 17,197 | 1,091 |
| * | Semtech Corp. | 45,518 | 1,086 |
| * | Synchronoss Technologies Inc. | 33,665 | 1,073 |
| * | Viavi Solutions Inc. | 161,371 | 1,070 |
| Tessera Technologies Inc. | 34,703 | 1,063 | |
| Diebold Inc. | 42,156 | 1,047 | |
| * | QLogic Corp. | 68,357 | 1,008 |
| * | Marketo Inc. | 28,700 | 999 |
| CSG Systems International Inc. | 24,756 | 998 | |
| * | Rambus Inc. | 81,001 | 979 |
| * | Inphi Corp. | 30,270 | 970 |
| * | HubSpot Inc. | 22,191 | 964 |
| * | GoDaddy Inc. Class A | 30,858 | 962 |
| * | Rovi Corp. | 61,266 | 958 |
| * | BroadSoft Inc. | 23,345 | 958 |
| * | SPS Commerce Inc. | 15,731 | 953 |
| * | Progress Software Corp. | 34,625 | 951 |
| ^ | Ebix Inc. | 19,552 | 937 |
| * | RingCentral Inc. Class A | 47,352 | 934 |
| Power Integrations Inc. | 18,625 | 933 | |
| * | RealPage Inc. | 41,727 | 932 |
| * | Cray Inc. | 31,137 | 932 |
| * | Envestnet Inc. | 27,795 | 926 |
| * | Web.com Group Inc. | 49,682 | 903 |
| * | Lumentum Holdings Inc. | 36,474 | 883 |
| *,^ | Ubiquiti Networks Inc. | 22,454 | 868 |
| * | MaxLinear Inc. | 45,138 | 812 |
| Pegasystems Inc. | 29,872 | 805 | |
| ADTRAN Inc. | 42,633 | 795 | |
| * | 2U Inc. | 26,884 | 791 |
| * | Insight Enterprises Inc. | 30,101 | 783 |
| * | Mercury Systems Inc. | 31,201 | 776 |
| * | Callidus Software Inc. | 38,670 | 773 |
| West Corp. | 38,803 | 763 | |
| * | Cvent Inc. | 21,320 | 762 |
| Monotype Imaging Holdings Inc. | 30,818 | 759 | |
| * | Infoblox Inc. | 39,915 | 749 |
| * | Super Micro Computer Inc. | 29,331 | 729 |
| * | Shutterstock Inc. | 15,200 | 696 |
| * | Gigamon Inc. | 18,400 | 688 |
| * | Xura Inc. | 28,149 | 688 |
| * | Diodes Inc. | 35,676 | 670 |
| * | Lattice Semiconductor Corp. | 124,627 | 667 |
| * | ScanSource Inc. | 17,438 | 647 |
| * | Q2 Holdings Inc. | 22,752 | 638 |
| * | FormFactor Inc. | 70,463 | 633 |
| * | Bottomline Technologies de Inc. | 29,271 | 630 |
| Inteliquent Inc. | 31,544 | 627 | |
| Cabot Microelectronics Corp. | 14,507 | 614 | |
| * | Ixia | 61,069 | 600 |
| * | Qualys Inc. | 19,228 | 573 |
| * | Loral Space & Communications Inc. | 15,999 | 564 |
| * | Rudolph Technologies Inc. | 35,900 | 558 |
| * | Virtusa Corp. | 18,720 | 541 |
| * | Photronics Inc. | 57,874 | 516 |
| * | New Relic Inc. | 17,054 | 501 |
| Brooks Automation Inc. | 43,393 | 487 | |
| * | ePlus Inc. | 5,920 | 484 |
| *,^ | Match Group Inc. | 30,706 | 463 |
| * | Nimble Storage Inc. | 55,295 | 440 |
| * | Perficient Inc. | 21,666 | 440 |
| *,^ | Oclaro Inc. | 88,623 | 432 |
| Quality Systems Inc. | 35,600 | 424 | |
45
| Vanguard® Balanced Index Fund | |||
| Schedule of Investments | |||
| June 30, 2016 | |||
| Market | |||
| Value | |||
| Shares | ($000) | ||
| * | Amkor Technology Inc. | 72,299 | 416 |
| * | VASCO Data Security International Inc. | 25,043 | 410 |
| * | Interactive Intelligence Group Inc. | 10,002 | 410 |
| * | Varonis Systems Inc. | 16,950 | 407 |
| * | Endurance International Group Holdings Inc. | 45,200 | 406 |
| * | Five9 Inc. | 34,058 | 405 |
| * | Imprivata Inc. | 27,567 | 386 |
| * | Unisys Corp. | 52,200 | 380 |
| * | Pure Storage Inc. Class A | 32,887 | 358 |
| * | Carbonite Inc. | 36,712 | 357 |
| Forrester Research Inc. | 9,617 | 354 | |
| Epiq Systems Inc. | 24,184 | 353 | |
| * | Barracuda Networks Inc. | 23,100 | 350 |
| * | PDF Solutions Inc. | 24,976 | 349 |
| * | Axcelis Technologies Inc. | 128,388 | 345 |
| * | CEVA Inc. | 12,676 | 344 |
| * | Applied Micro Circuits Corp. | 53,359 | 343 |
| Computer Programs & Systems Inc. | 8,518 | 340 | |
| * | Hortonworks Inc. | 31,472 | 336 |
| * | Xcerra Corp. | 57,913 | 333 |
| * | Ultratech Inc. | 14,396 | 331 |
| PC Connection Inc. | 13,591 | 323 | |
| * | Silver Spring Networks Inc. | 26,300 | 320 |
| * | CalAmp Corp. | 21,488 | 318 |
| * | Intralinks Holdings Inc. | 48,764 | 317 |
| * | Nanometrics Inc. | 14,833 | 308 |
| * | DSP Group Inc. | 29,016 | 308 |
| * | Rapid7 Inc. | 24,153 | 304 |
| Cohu Inc. | 27,773 | 301 | |
| * | Blucora Inc. | 28,677 | 297 |
| * | Benefitfocus Inc. | 7,655 | 292 |
| * | SunEdison Semiconductor Ltd. | 48,500 | 288 |
| * | Vocera Communications Inc. | 21,666 | 278 |
| * | MeetMe Inc. | 51,649 | 275 |
| * | Sonus Networks Inc. | 31,090 | 270 |
| * | PROS Holdings Inc. | 15,264 | 266 |
| Hackett Group Inc. | 18,781 | 261 | |
| * | Square Inc. | 28,117 | 254 |
| * | SciQuest Inc. | 14,167 | 250 |
| * | InvenSense Inc. | 39,900 | 245 |
| * | RigNet Inc. | 17,900 | 240 |
| * | Gogo Inc. | 28,300 | 237 |
| * | Actua Corp. | 25,930 | 234 |
| * | Extreme Networks Inc. | 68,974 | 234 |
| IXYS Corp. | 22,464 | 230 | |
| *,^ | Box Inc. | 22,140 | 229 |
| * | ChannelAdvisor Corp. | 15,532 | 225 |
| * | Exar Corp. | 27,035 | 218 |
| * | NeoPhotonics Corp. | 22,596 | 215 |
| * | ShoreTel Inc. | 31,587 | 211 |
| * | Boingo Wireless Inc. | 23,230 | 207 |
| * | Vectrus Inc. | 6,838 | 195 |
| * | Zix Corp. | 51,791 | 194 |
| * | NetSol Technologies Inc. | 30,900 | 180 |
| Comtech Telecommunications Corp. | 13,850 | 178 | |
| American Software Inc. | 16,647 | 174 | |
| * | Alpha & Omega Semiconductor Ltd. | 12,523 | 174 |
| * | Hutchinson Technology Inc. | 49,700 | 168 |
| QAD Inc. Class A | 8,720 | 168 | |
| * | KEYW Holding Corp. | 16,400 | 163 |
| * | A10 Networks Inc. | 24,213 | 157 |
| * | Icad Inc. | 29,548 | 154 |
| * | GSI Technology Inc. | 36,975 | 154 |
| * | LivePerson Inc. | 23,500 | 149 |
46
| Vanguard® Balanced Index Fund | |||
| Schedule of Investments | |||
| June 30, 2016 | |||
| Market | |||
| Value | |||
| Shares | ($000) | ||
| * | Tremor Video Inc. | 80,644 | 148 |
| Preformed Line Products Co. | 3,527 | 142 | |
| * | Digi International Inc. | 11,876 | 127 |
| * | Digimarc Corp. | 3,914 | 125 |
| * | Dyax Corp CVR Expire 12/31/2019 | 112,113 | 124 |
| *,^ | Applied Optoelectronics Inc. | 11,100 | 124 |
| * | Exa Corp. | 8,351 | 121 |
| * | Agilysys Inc. | 11,474 | 120 |
| * | Calix Inc. | 17,288 | 119 |
| * | Immersion Corp. | 16,249 | 119 |
| * | Workiva Inc. | 8,600 | 117 |
| * | Intermolecular Inc. | 78,300 | 116 |
| * | Clearfield Inc. | 6,205 | 111 |
| Concurrent Computer Corp. | 20,811 | 109 | |
| * | FalconStor Software Inc. | 103,055 | 108 |
| * | Instructure Inc. | 5,600 | 106 |
| * | Model N Inc. | 7,905 | 106 |
| * | Mitek Systems Inc. | 14,800 | 105 |
| * | Appfolio Inc. | 7,260 | 105 |
| * | Silicon Graphics International Corp. | 20,658 | 104 |
| * | Systemax Inc. | 11,829 | 101 |
| * | Ultra Clean Holdings Inc. | 17,696 | 101 |
| * | Brightcove Inc. | 11,261 | 99 |
| *,^ | VirnetX Holding Corp. | 24,600 | 98 |
| * | Amtech Systems Inc. | 15,449 | 92 |
| * | Covisint Corp. | 40,926 | 89 |
| *,^ | Park City Group Inc. | 9,825 | 88 |
| * | Aviat Networks Inc. | 11,133 | 87 |
| * | Tangoe Inc. | 10,949 | 85 |
| * | inTEST Corp. | 21,900 | 83 |
| * | iPass Inc. | 64,042 | 79 |
| * | Radisys Corp. | 16,911 | 76 |
| * | Westell Technologies Inc. Class A | 106,788 | 75 |
| * | Edgewater Technology Inc. | 8,642 | 75 |
| * | ADDvantage Technologies Group Inc. | 41,902 | 74 |
| * | EMCORE Corp. | 12,381 | 74 |
| * | Imation Corp. | 57,630 | 72 |
| * | KVH Industries Inc. | 9,261 | 71 |
| * | Pendrell Corp. | 138,079 | 70 |
| *,^ | Neonode Inc. | 47,000 | 69 |
| * | PAR Technology Corp. | 13,813 | 66 |
| * | Guidance Software Inc. | 10,347 | 64 |
| * | Sigma Designs Inc. | 9,900 | 64 |
| * | Kopin Corp. | 26,176 | 58 |
| *,^ | TransEnterix Inc. | 46,000 | 56 |
| * | Alarm.com Holdings Inc. | 2,150 | 55 |
| * | Qumu Corp. | 12,191 | 54 |
| * | Apigee Corp. | 4,300 | 53 |
| GlobalSCAPE Inc. | 14,200 | 52 | |
| * | Datalink Corp. | 6,748 | 51 |
| NCI Inc. Class A | 3,378 | 47 | |
| PC-Tel Inc. | 9,837 | 46 | |
| * | CVD Equipment Corp. | 5,349 | 46 |
| Computer Task Group Inc. | 9,180 | 46 | |
| * | USA Technologies Inc. | 9,300 | 40 |
| * | Netlist Inc. | 33,001 | 39 |
| AstroNova Inc. | 2,500 | 38 | |
| LRAD Corp. | 21,083 | 38 | |
| Evolving Systems Inc. | 7,297 | 38 | |
| * | Jive Software Inc. | 9,500 | 36 |
| * | Seachange International Inc. | 11,140 | 36 |
| * | Support.com Inc. | 39,324 | 33 |
| * | BroadVision Inc. | 4,952 | 33 |
| * | MoSys Inc. | 80,210 | 32 |
47
| Vanguard® Balanced Index Fund | |||
| Schedule of Investments | |||
| June 30, 2016 | |||
| Market | |||
| Value | |||
| Shares | ($000) | ||
| * | Limelight Networks Inc. | 20,915 | 31 |
| * | Numerex Corp. Class A | 4,145 | 31 |
| * | Quantum Corp. | 73,266 | 31 |
| * | GigPeak Inc. | 14,292 | 28 |
| * | eGain Corp. | 8,680 | 24 |
| * | Twilio Inc. | 636 | 23 |
| * | Acacia Communications Inc. | 550 | 22 |
| * | Smith Micro Software Inc. | 36,146 | 21 |
| * | Determine Inc. | 12,492 | 19 |
| * | Aerohive Networks Inc. | 2,782 | 18 |
| *,^ | Violin Memory Inc. | 19,900 | 18 |
| * | BSQUARE Corp. | 2,900 | 16 |
| Great Elm Capital Group Inc. | 2,442 | 16 | |
| TESSCO Technologies Inc. | 1,100 | 15 | |
| QAD Inc. Class B | 677 | 12 | |
| * | Telenav Inc. | 1,445 | 7 |
| Simulations Plus Inc. | 800 | 6 | |
| * | Zhone Technologies Inc. | 2,987 | 4 |
| * | Aware Inc. | 422 | 2 |
| * | SunEdison Inc. | 10,248 | 1 |
| * | United Online Inc. | 100 | 1 |
| * | InterCloud Systems Inc. | 626 | — |
| * | Clinical Data Contingent Value Rights | 9,500 | — |
| 2,612,599 | |||
| Telecommunications (1.6%) | |||
| AT&T Inc. | 4,717,622 | 203,848 | |
| Verizon Communications Inc. | 3,127,405 | 174,634 | |
| CenturyLink Inc. | 419,539 | 12,171 | |
| * | Level 3 Communications Inc. | 219,103 | 11,282 |
| * | SBA Communications Corp. Class A | 96,453 | 10,411 |
| * | T-Mobile US Inc. | 217,937 | 9,430 |
| Frontier Communications Corp. | 930,646 | 4,597 | |
| * | Zayo Group Holdings Inc. | 81,388 | 2,273 |
| * | Sprint Corp. | 490,673 | 2,223 |
| Telephone & Data Systems Inc. | 71,273 | 2,114 | |
| Shenandoah Telecommunications Co. | 33,182 | 1,296 | |
| Consolidated Communications Holdings Inc. | 42,798 | 1,166 | |
| * | Cincinnati Bell Inc. | 251,563 | 1,150 |
| * | 8x8 Inc. | 75,672 | 1,106 |
| * | Vonage Holdings Corp. | 158,177 | 965 |
| ATN International Inc. | 11,728 | 913 | |
| Windstream Holdings Inc. | 97,728 | 906 | |
| * | inContact Inc. | 58,774 | 814 |
| * | Iridium Communications Inc. | 77,568 | 689 |
| * | ORBCOMM Inc. | 62,171 | 619 |
| * | GTT Communications Inc. | 29,091 | 538 |
| *,^ | Globalstar Inc. | 362,401 | 438 |
| EarthLink Holdings Corp. | 65,500 | 419 | |
| * | General Communication Inc. Class A | 26,128 | 413 |
| * | United States Cellular Corp. | 10,350 | 406 |
| Spok Holdings Inc. | 14,382 | 276 | |
| * | Alaska Communications Systems Group Inc. | 105,805 | 180 |
| * | Straight Path Communications Inc. Class B | 5,978 | 165 |
| IDT Corp. Class B | 10,156 | 144 | |
| *,^ | pdvWireless Inc. | 6,652 | 142 |
| * | Lumos Networks Corp. | 11,015 | 133 |
| * | Hawaiian Telcom Holdco Inc. | 5,805 | 123 |
| * | FairPoint Communications Inc. | 8,000 | 117 |
| * | Chelsea Therapeutics International Ltd. CVR Exp. 12/31/2016 | 53,188 | 6 |
| 446,107 | |||
| Utilities (2.2%) | |||
| NextEra Energy Inc. | 356,324 | 46,465 | |
| Duke Energy Corp. | 523,818 | 44,938 | |
| Southern Co. | 718,413 | 38,529 | |
48
| Vanguard® Balanced Index Fund | |||
| Schedule of Investments | |||
| June 30, 2016 | |||
| Market | |||
| Value | |||
| Shares | ($000) | ||
| Dominion Resources Inc. | 469,332 | 36,575 | |
| American Electric Power Co. Inc. | 374,158 | 26,225 | |
| Exelon Corp. | 702,397 | 25,539 | |
| PG&E Corp. | 376,642 | 24,075 | |
| Sempra Energy | 179,554 | 20,473 | |
| Edison International | 249,453 | 19,375 | |
| PPL Corp. | 510,433 | 19,269 | |
| Consolidated Edison Inc. | 227,878 | 18,331 | |
| Public Service Enterprise Group Inc. | 385,399 | 17,963 | |
| Xcel Energy Inc. | 373,696 | 16,734 | |
| WEC Energy Group Inc. | 233,202 | 15,228 | |
| Eversource Energy | 239,871 | 14,368 | |
| DTE Energy Co. | 134,481 | 13,330 | |
| FirstEnergy Corp. | 335,274 | 11,704 | |
| American Water Works Co. Inc. | 134,204 | 11,342 | |
| Entergy Corp. | 136,692 | 11,120 | |
| Ameren Corp. | 177,651 | 9,519 | |
| CMS Energy Corp. | 201,357 | 9,234 | |
| ONEOK Inc. | 163,239 | 7,746 | |
| CenterPoint Energy Inc. | 320,363 | 7,689 | |
| SCANA Corp. | 96,674 | 7,314 | |
| AES Corp. | 552,059 | 6,890 | |
| Alliant Energy Corp. | 173,086 | 6,872 | |
| Pinnacle West Capital Corp. | 79,946 | 6,480 | |
| NiSource Inc. | 237,803 | 6,307 | |
| Westar Energy Inc. Class A | 109,203 | 6,125 | |
| UGI Corp. | 133,117 | 6,024 | |
| Atmos Energy Corp. | 73,191 | 5,952 | |
| AGL Resources Inc. | 89,275 | 5,889 | |
| ITC Holdings Corp. | 116,420 | 5,451 | |
| TECO Energy Inc. | 183,873 | 5,082 | |
| Aqua America Inc. | 132,400 | 4,721 | |
| * | Calpine Corp. | 307,639 | 4,538 |
| Vectren Corp. | 74,826 | 3,941 | |
| National Fuel Gas Co. | 68,512 | 3,897 | |
| Piedmont Natural Gas Co. Inc. | 62,483 | 3,756 | |
| Great Plains Energy Inc. | 116,852 | 3,552 | |
| Questar Corp. | 135,306 | 3,433 | |
| Avista Corp. | 75,714 | 3,392 | |
| Portland General Electric Co. | 72,963 | 3,219 | |
| NRG Energy Inc. | 204,000 | 3,058 | |
| IDACORP Inc. | 36,685 | 2,984 | |
| Black Hills Corp. | 45,834 | 2,889 | |
| ALLETE Inc. | 44,311 | 2,864 | |
| Hawaiian Electric Industries Inc. | 87,320 | 2,863 | |
| New Jersey Resources Corp. | 73,672 | 2,840 | |
| WGL Holdings Inc. | 39,410 | 2,790 | |
| ONE Gas Inc. | 40,797 | 2,717 | |
| Southwest Gas Corp. | 32,321 | 2,544 | |
| PNM Resources Inc. | 70,210 | 2,488 | |
| NorthWestern Corp. | 37,935 | 2,393 | |
| Avangrid Inc. | 49,446 | 2,278 | |
| Spire Inc. | 28,840 | 2,043 | |
| South Jersey Industries Inc. | 64,194 | 2,030 | |
| MGE Energy Inc. | 35,518 | 2,007 | |
| Ormat Technologies Inc. | 43,678 | 1,911 | |
| El Paso Electric Co. | 37,036 | 1,751 | |
| * | Dynegy Inc. | 77,000 | 1,327 |
| California Water Service Group | 36,932 | 1,290 | |
| Northwest Natural Gas Co. | 18,407 | 1,193 | |
| Empire District Electric Co. | 34,003 | 1,155 | |
| American States Water Co. | 25,918 | 1,136 | |
| Unitil Corp. | 26,586 | 1,134 | |
| Chesapeake Utilities Corp. | 15,251 | 1,009 | |
49
| Vanguard® Balanced Index Fund | |||
| Schedule of Investments | |||
| June 30, 2016 | |||
| Market | |||
| Value | |||
| Shares | ($000) | ||
| TerraForm Power Inc. Class A | 73,913 | 806 | |
| SJW Corp. | 19,583 | 771 | |
| Middlesex Water Co. | 16,126 | 700 | |
| * | Talen Energy Corp. | 47,921 | 649 |
| York Water Co. | 15,546 | 498 | |
| Connecticut Water Service Inc. | 6,614 | 372 | |
| Artesian Resources Corp. Class A | 10,004 | 339 | |
| Atlantic Power Corp. | 127,320 | 316 | |
| * | Sunrun Inc. | 51,486 | 305 |
| Spark Energy Inc. Class A | 7,300 | 241 | |
| Genie Energy Ltd. Class B | 28,977 | 196 | |
| Delta Natural Gas Co. Inc. | 6,804 | 183 | |
| * | Pure Cycle Corp. | 19,761 | 93 |
| *,^ | Vivint Solar Inc. | 25,967 | 80 |
| * | US Geothermal Inc. | 86,878 | 71 |
| *,^ | Cadiz Inc. | 11,960 | 70 |
| 624,990 | |||
| Total Common Stocks (Cost $8,903,596) | 16,862,004 | ||
| Face | Market | |||
| Maturity | Amount | Value | ||
| Coupon | Date | ($000) | ($000) | |
| U.S. Government and Agency Obligations (25.0%) | ||||
| U.S. Government Securities (15.8%) | ||||
| United States Treasury Note/Bond | 3.125% | 1/31/17 | 311 | 316 |
| United States Treasury Note/Bond | 4.625% | 2/15/17 | 200 | 205 |
| United States Treasury Note/Bond | 8.750% | 5/15/17 | 6,470 | 6,930 |
| United States Treasury Note/Bond | 2.375% | 7/31/17 | 48,626 | 49,583 |
| United States Treasury Note/Bond | 0.875% | 8/15/17 | 31,150 | 31,267 |
| United States Treasury Note/Bond | 4.750% | 8/15/17 | 15,950 | 16,698 |
| United States Treasury Note/Bond | 0.625% | 8/31/17 | 4,741 | 4,746 |
| United States Treasury Note/Bond | 1.875% | 8/31/17 | 15,025 | 15,255 |
| United States Treasury Note/Bond | 1.000% | 9/15/17 | 16,355 | 16,442 |
| United States Treasury Note/Bond | 0.625% | 9/30/17 | 25,425 | 25,453 |
| United States Treasury Note/Bond | 1.875% | 9/30/17 | 22,600 | 22,971 |
| United States Treasury Note/Bond | 0.875% | 10/15/17 | 51,150 | 51,358 |
| United States Treasury Note/Bond | 1.875% | 10/31/17 | 3,120 | 3,174 |
| United States Treasury Note/Bond | 0.875% | 11/15/17 | 26,721 | 26,834 |
| United States Treasury Note/Bond | 4.250% | 11/15/17 | 13,020 | 13,677 |
| United States Treasury Note/Bond | 0.625% | 11/30/17 | 4,050 | 4,053 |
| United States Treasury Note/Bond | 0.875% | 11/30/17 | 20,800 | 20,888 |
| United States Treasury Note/Bond | 1.000% | 12/15/17 | 18,908 | 19,026 |
| United States Treasury Note/Bond | 0.750% | 12/31/17 | 20,143 | 20,197 |
| United States Treasury Note/Bond | 1.000% | 12/31/17 | 1,160 | 1,167 |
| United States Treasury Note/Bond | 0.875% | 1/15/18 | 45,501 | 45,707 |
| United States Treasury Note/Bond | 0.750% | 1/31/18 | 30,553 | 30,639 |
| United States Treasury Note/Bond | 0.875% | 1/31/18 | 2,465 | 2,477 |
| United States Treasury Note/Bond | 2.625% | 1/31/18 | 11,880 | 12,261 |
| United States Treasury Note/Bond | 1.000% | 2/15/18 | 28,000 | 28,188 |
| United States Treasury Note/Bond | 3.500% | 2/15/18 | 31,600 | 33,086 |
| United States Treasury Note/Bond | 0.750% | 2/28/18 | 64,755 | 64,937 |
| United States Treasury Note/Bond | 2.750% | 2/28/18 | 5,000 | 5,180 |
| United States Treasury Note/Bond | 1.000% | 3/15/18 | 18,403 | 18,530 |
| United States Treasury Note/Bond | 0.875% | 3/31/18 | 18,062 | 18,152 |
| United States Treasury Note/Bond | 2.875% | 3/31/18 | 6,159 | 6,402 |
| United States Treasury Note/Bond | 0.750% | 4/15/18 | 23,024 | 23,089 |
| United States Treasury Note/Bond | 0.625% | 4/30/18 | 26,028 | 26,048 |
| United States Treasury Note/Bond | 0.750% | 4/30/18 | 4,649 | 4,663 |
| United States Treasury Note/Bond | 9.125% | 5/15/18 | 3,675 | 4,262 |
| United States Treasury Note/Bond | 0.875% | 5/31/18 | 110,561 | 111,182 |
| United States Treasury Note/Bond | 1.000% | 5/31/18 | 28,887 | 29,113 |
| United States Treasury Note/Bond | 2.375% | 5/31/18 | 885 | 915 |
50
| Vanguard® Balanced Index Fund | ||||
| Schedule of Investments | ||||
| June 30, 2016 | ||||
| Face | Market | |||
| Maturity | Amount | Value | ||
| Coupon | Date | ($000) | ($000) | |
| United States Treasury Note/Bond | 1.125% | 6/15/18 | 7,169 | 7,242 |
| United States Treasury Note/Bond | 0.625% | 6/30/18 | 5,000 | 5,003 |
| United States Treasury Note/Bond | 1.375% | 6/30/18 | 10,285 | 10,442 |
| United States Treasury Note/Bond | 2.375% | 6/30/18 | 14,935 | 15,460 |
| United States Treasury Note/Bond | 0.875% | 7/15/18 | 14,505 | 14,584 |
| United States Treasury Note/Bond | 1.375% | 7/31/18 | 251 | 255 |
| United States Treasury Note/Bond | 2.250% | 7/31/18 | 6,701 | 6,929 |
| United States Treasury Note/Bond | 1.500% | 8/31/18 | 2,675 | 2,726 |
| United States Treasury Note/Bond | 1.000% | 9/15/18 | 10,300 | 10,384 |
| United States Treasury Note/Bond | 1.375% | 9/30/18 | 35,100 | 35,687 |
| United States Treasury Note/Bond | 0.875% | 10/15/18 | 22,550 | 22,673 |
| United States Treasury Note/Bond | 1.250% | 10/31/18 | 16,844 | 17,081 |
| United States Treasury Note/Bond | 1.750% | 10/31/18 | 39,400 | 40,409 |
| United States Treasury Note/Bond | 1.250% | 11/15/18 | 11,290 | 11,451 |
| United States Treasury Note/Bond | 3.750% | 11/15/18 | 671 | 720 |
| United States Treasury Note/Bond | 1.250% | 11/30/18 | 10,250 | 10,397 |
| United States Treasury Note/Bond | 1.375% | 11/30/18 | 1,488 | 1,514 |
| United States Treasury Note/Bond | 1.375% | 12/31/18 | 6,375 | 6,488 |
| United States Treasury Note/Bond | 1.500% | 12/31/18 | 10,650 | 10,870 |
| United States Treasury Note/Bond | 1.125% | 1/15/19 | 4,041 | 4,087 |
| United States Treasury Note/Bond | 1.250% | 1/31/19 | 10,475 | 10,632 |
| United States Treasury Note/Bond | 1.500% | 1/31/19 | 8,425 | 8,601 |
| United States Treasury Note/Bond | 0.750% | 2/15/19 | 47,566 | 47,663 |
| United States Treasury Note/Bond | 2.750% | 2/15/19 | 5,220 | 5,502 |
| United States Treasury Note/Bond | 8.875% | 2/15/19 | 1,850 | 2,247 |
| United States Treasury Note/Bond | 1.375% | 2/28/19 | 17,375 | 17,693 |
| United States Treasury Note/Bond | 1.500% | 2/28/19 | 32,590 | 33,293 |
| United States Treasury Note/Bond | 1.000% | 3/15/19 | 76,767 | 77,426 |
| United States Treasury Note/Bond | 1.500% | 3/31/19 | 17,250 | 17,641 |
| United States Treasury Note/Bond | 1.625% | 3/31/19 | 7,755 | 7,951 |
| United States Treasury Note/Bond | 0.875% | 4/15/19 | 47,330 | 47,559 |
| United States Treasury Note/Bond | 1.250% | 4/30/19 | 297 | 302 |
| United States Treasury Note/Bond | 1.625% | 4/30/19 | 36,004 | 36,932 |
| United States Treasury Note/Bond | 0.875% | 5/15/19 | 20,496 | 20,595 |
| United States Treasury Note/Bond | 3.125% | 5/15/19 | 19,835 | 21,205 |
| United States Treasury Note/Bond | 1.125% | 5/31/19 | 5,525 | 5,593 |
| United States Treasury Note/Bond | 1.500% | 5/31/19 | 26,796 | 27,403 |
| United States Treasury Note/Bond | 0.875% | 6/15/19 | 9,025 | 9,070 |
| United States Treasury Note/Bond | 1.000% | 6/30/19 | 1,502 | 1,515 |
| United States Treasury Note/Bond | 1.625% | 6/30/19 | 25,287 | 25,967 |
| United States Treasury Note/Bond | 0.875% | 7/31/19 | 32,592 | 32,724 |
| United States Treasury Note/Bond | 1.625% | 7/31/19 | 27,861 | 28,614 |
| United States Treasury Note/Bond | 3.625% | 8/15/19 | 18,900 | 20,589 |
| United States Treasury Note/Bond | 8.125% | 8/15/19 | 5,535 | 6,796 |
| United States Treasury Note/Bond | 1.000% | 8/31/19 | 14,175 | 14,288 |
| United States Treasury Note/Bond | 1.625% | 8/31/19 | 11,906 | 12,230 |
| United States Treasury Note/Bond | 1.750% | 9/30/19 | 19,330 | 19,934 |
| United States Treasury Note/Bond | 1.250% | 10/31/19 | 3,800 | 3,861 |
| United States Treasury Note/Bond | 1.500% | 10/31/19 | 55,715 | 57,021 |
| United States Treasury Note/Bond | 3.375% | 11/15/19 | 20,180 | 21,930 |
| United States Treasury Note/Bond | 1.000% | 11/30/19 | 6,025 | 6,065 |
| United States Treasury Note/Bond | 1.500% | 11/30/19 | 35,106 | 35,929 |
| United States Treasury Note/Bond | 1.125% | 12/31/19 | 1,075 | 1,087 |
| United States Treasury Note/Bond | 1.625% | 12/31/19 | 28,033 | 28,808 |
| United States Treasury Note/Bond | 1.375% | 1/31/20 | 2,700 | 2,752 |
| United States Treasury Note/Bond | 3.625% | 2/15/20 | 8,270 | 9,102 |
| United States Treasury Note/Bond | 8.500% | 2/15/20 | 3,269 | 4,167 |
| United States Treasury Note/Bond | 1.375% | 2/29/20 | 17,343 | 17,674 |
| United States Treasury Note/Bond | 1.125% | 3/31/20 | 11,000 | 11,113 |
| United States Treasury Note/Bond | 1.375% | 3/31/20 | 23,575 | 24,024 |
| United States Treasury Note/Bond | 1.125% | 4/30/20 | 18,800 | 18,988 |
| United States Treasury Note/Bond | 1.375% | 4/30/20 | 25,267 | 25,749 |
| United States Treasury Note/Bond | 3.500% | 5/15/20 | 3,560 | 3,913 |
| United States Treasury Note/Bond | 1.375% | 5/31/20 | 18,815 | 19,165 |
51
| Vanguard® Balanced Index Fund | ||||
| Schedule of Investments | ||||
| June 30, 2016 | ||||
| Face | Market | |||
| Maturity | Amount | Value | ||
| Coupon | Date | ($000) | ($000) | |
| United States Treasury Note/Bond | 1.500% | 5/31/20 | 32,693 | 33,459 |
| United States Treasury Note/Bond | 1.625% | 6/30/20 | 27,360 | 28,142 |
| United States Treasury Note/Bond | 1.875% | 6/30/20 | 23,525 | 24,429 |
| United States Treasury Note/Bond | 1.625% | 7/31/20 | 1,115 | 1,147 |
| United States Treasury Note/Bond | 2.000% | 7/31/20 | 6,268 | 6,542 |
| United States Treasury Note/Bond | 2.625% | 8/15/20 | 15,775 | 16,867 |
| United States Treasury Note/Bond | 1.375% | 8/31/20 | 14,177 | 14,438 |
| United States Treasury Note/Bond | 1.375% | 10/31/20 | 14,079 | 14,336 |
| United States Treasury Note/Bond | 1.750% | 10/31/20 | 37,336 | 38,596 |
| United States Treasury Note/Bond | 2.625% | 11/15/20 | 56,233 | 60,257 |
| United States Treasury Note/Bond | 1.625% | 11/30/20 | 22,750 | 23,418 |
| United States Treasury Note/Bond | 2.000% | 11/30/20 | 22,950 | 23,983 |
| United States Treasury Note/Bond | 1.750% | 12/31/20 | 10,644 | 11,012 |
| United States Treasury Note/Bond | 2.375% | 12/31/20 | 22,442 | 23,827 |
| United States Treasury Note/Bond | 1.375% | 1/31/21 | 27,457 | 27,946 |
| United States Treasury Note/Bond | 2.125% | 1/31/21 | 19,996 | 21,027 |
| United States Treasury Note/Bond | 3.625% | 2/15/21 | 12,358 | 13,833 |
| United States Treasury Note/Bond | 7.875% | 2/15/21 | 400 | 525 |
| United States Treasury Note/Bond | 1.125% | 2/28/21 | 23,712 | 23,883 |
| United States Treasury Note/Bond | 2.000% | 2/28/21 | 12,275 | 12,843 |
| United States Treasury Note/Bond | 1.250% | 3/31/21 | 52,060 | 52,678 |
| United States Treasury Note/Bond | 2.250% | 3/31/21 | 12,000 | 12,699 |
| United States Treasury Note/Bond | 1.375% | 4/30/21 | 1,039 | 1,057 |
| United States Treasury Note/Bond | 2.250% | 4/30/21 | 7,075 | 7,490 |
| United States Treasury Note/Bond | 3.125% | 5/15/21 | 29,512 | 32,472 |
| United States Treasury Note/Bond | 1.375% | 5/31/21 | 18,030 | 18,357 |
| United States Treasury Note/Bond | 2.000% | 5/31/21 | 30,378 | 31,816 |
| United States Treasury Note/Bond | 1.125% | 6/30/21 | 40,855 | 41,078 |
| United States Treasury Note/Bond | 2.125% | 6/30/21 | 38,700 | 40,768 |
| United States Treasury Note/Bond | 2.250% | 7/31/21 | 19,600 | 20,770 |
| United States Treasury Note/Bond | 2.125% | 8/15/21 | 19,115 | 20,148 |
| United States Treasury Note/Bond | 2.000% | 8/31/21 | 9,525 | 9,977 |
| United States Treasury Note/Bond | 2.125% | 9/30/21 | 17,325 | 18,262 |
| United States Treasury Note/Bond | 2.000% | 10/31/21 | 20,510 | 21,488 |
| United States Treasury Note/Bond | 2.000% | 11/15/21 | 54,050 | 56,676 |
| United States Treasury Note/Bond | 8.000% | 11/15/21 | 10,770 | 14,666 |
| United States Treasury Note/Bond | 1.875% | 11/30/21 | 15,600 | 16,248 |
| United States Treasury Note/Bond | 2.125% | 12/31/21 | 22,700 | 23,938 |
| United States Treasury Note/Bond | 1.500% | 1/31/22 | 17,975 | 18,343 |
| United States Treasury Note/Bond | 2.000% | 2/15/22 | 6,453 | 6,762 |
| United States Treasury Note/Bond | 1.750% | 2/28/22 | 26,621 | 27,519 |
| United States Treasury Note/Bond | 1.750% | 3/31/22 | 17,879 | 18,477 |
| United States Treasury Note/Bond | 1.750% | 4/30/22 | 10,100 | 10,438 |
| United States Treasury Note/Bond | 1.750% | 5/15/22 | 5,400 | 5,581 |
| United States Treasury Note/Bond | 1.875% | 5/31/22 | 18,550 | 19,298 |
| United States Treasury Note/Bond | 2.125% | 6/30/22 | 19,560 | 20,630 |
| United States Treasury Note/Bond | 2.000% | 7/31/22 | 13,095 | 13,713 |
| United States Treasury Note/Bond | 1.625% | 8/15/22 | 11,985 | 12,292 |
| United States Treasury Note/Bond | 1.875% | 8/31/22 | 10,439 | 10,853 |
| United States Treasury Note/Bond | 1.750% | 9/30/22 | 18,600 | 19,193 |
| United States Treasury Note/Bond | 1.875% | 10/31/22 | 18,380 | 19,104 |
| United States Treasury Note/Bond | 1.625% | 11/15/22 | 17,550 | 17,967 |
| United States Treasury Note/Bond | 2.000% | 11/30/22 | 5,080 | 5,317 |
| United States Treasury Note/Bond | 2.125% | 12/31/22 | 13,429 | 14,159 |
| United States Treasury Note/Bond | 1.750% | 1/31/23 | 27,583 | 28,432 |
| United States Treasury Note/Bond | 2.000% | 2/15/23 | 14,085 | 14,756 |
| United States Treasury Note/Bond | 7.125% | 2/15/23 | 1,100 | 1,514 |
| United States Treasury Note/Bond | 1.500% | 2/28/23 | 37,055 | 37,611 |
| United States Treasury Note/Bond | 1.500% | 3/31/23 | 28,225 | 28,635 |
| United States Treasury Note/Bond | 1.625% | 4/30/23 | 4,285 | 4,383 |
| United States Treasury Note/Bond | 1.750% | 5/15/23 | 36,043 | 37,192 |
| United States Treasury Note/Bond | 1.625% | 5/31/23 | 26,885 | 27,498 |
| United States Treasury Note/Bond | 1.375% | 6/30/23 | 18,125 | 18,224 |
| United States Treasury Note/Bond | 2.500% | 8/15/23 | 34,410 | 37,281 |
52
| Vanguard® Balanced Index Fund | |||||
| Schedule of Investments | |||||
| June 30, 2016 | |||||
| Face | Market | ||||
| Maturity | Amount | Value | |||
| Coupon | Date | ($000) | ($000) | ||
| United States Treasury Note/Bond | 6.250% | 8/15/23 | 16,980 | 22,764 | |
| United States Treasury Note/Bond | 2.750% | 11/15/23 | 20,256 | 22,332 | |
| United States Treasury Note/Bond | 2.750% | 2/15/24 | 16,674 | 18,412 | |
| United States Treasury Note/Bond | 2.500% | 5/15/24 | 66,454 | 72,196 | |
| United States Treasury Note/Bond | 2.375% | 8/15/24 | 33,710 | 36,296 | |
| United States Treasury Note/Bond | 2.250% | 11/15/24 | 36,046 | 38,462 | |
| United States Treasury Note/Bond | 7.500% | 11/15/24 | 675 | 1,004 | |
| United States Treasury Note/Bond | 2.000% | 2/15/25 | 61,048 | 63,890 | |
| United States Treasury Note/Bond | 2.125% | 5/15/25 | 41,761 | 44,123 | |
| United States Treasury Note/Bond | 2.000% | 8/15/25 | 23,772 | 24,860 | |
| United States Treasury Note/Bond | 6.875% | 8/15/25 | 1,163 | 1,707 | |
| United States Treasury Note/Bond | 2.250% | 11/15/25 | 30,347 | 32,391 | |
| United States Treasury Note/Bond | 1.625% | 2/15/26 | 15,735 | 15,919 | |
| United States Treasury Note/Bond | 6.000% | 2/15/26 | 4,345 | 6,121 | |
| United States Treasury Note/Bond | 1.625% | 5/15/26 | 42,239 | 42,780 | |
| United States Treasury Note/Bond | 6.750% | 8/15/26 | 3,095 | 4,636 | |
| United States Treasury Note/Bond | 6.500% | 11/15/26 | 5,910 | 8,757 | |
| United States Treasury Note/Bond | 6.125% | 11/15/27 | 3,275 | 4,835 | |
| United States Treasury Note/Bond | 5.500% | 8/15/28 | 15,445 | 22,086 | |
| United States Treasury Note/Bond | 5.250% | 11/15/28 | 9,875 | 13,901 | |
| United States Treasury Note/Bond | 5.250% | 2/15/29 | 11,313 | 15,999 | |
| United States Treasury Note/Bond | 6.125% | 8/15/29 | 4,420 | 6,764 | |
| United States Treasury Note/Bond | 6.250% | 5/15/30 | 6,570 | 10,327 | |
| United States Treasury Note/Bond | 5.375% | 2/15/31 | 8,700 | 12,903 | |
| United States Treasury Note/Bond | 4.500% | 2/15/36 | 14,500 | 20,885 | |
| United States Treasury Note/Bond | 4.750% | 2/15/37 | 11,100 | 16,513 | |
| United States Treasury Note/Bond | 5.000% | 5/15/37 | 4,403 | 6,768 | |
| United States Treasury Note/Bond | 4.375% | 2/15/38 | 11,742 | 16,743 | |
| United States Treasury Note/Bond | 4.500% | 5/15/38 | 8,000 | 11,605 | |
| United States Treasury Note/Bond | 3.500% | 2/15/39 | 9,301 | 11,743 | |
| United States Treasury Note/Bond | 4.250% | 5/15/39 | 8,883 | 12,418 | |
| United States Treasury Note/Bond | 4.500% | 8/15/39 | 8,684 | 12,560 | |
| United States Treasury Note/Bond | 4.375% | 11/15/39 | 11,686 | 16,616 | |
| United States Treasury Note/Bond | 4.625% | 2/15/40 | 13,760 | 20,236 | |
| United States Treasury Note/Bond | 4.375% | 5/15/40 | 4,450 | 6,336 | |
| United States Treasury Note/Bond | 3.875% | 8/15/40 | 6,685 | 8,878 | |
| United States Treasury Note/Bond | 4.250% | 11/15/40 | 10,317 | 14,457 | |
| United States Treasury Note/Bond | 4.750% | 2/15/41 | 15,588 | 23,404 | |
| United States Treasury Note/Bond | 4.375% | 5/15/41 | 5,450 | 7,787 | |
| United States Treasury Note/Bond | 3.750% | 8/15/41 | 3,500 | 4,571 | |
| United States Treasury Note/Bond | 3.125% | 11/15/41 | 8,128 | 9,606 | |
| United States Treasury Note/Bond | 3.125% | 2/15/42 | 8,523 | 10,080 | |
| United States Treasury Note/Bond | 3.000% | 5/15/42 | 6,425 | 7,427 | |
| United States Treasury Note/Bond | 2.750% | 8/15/42 | 23,725 | 26,161 | |
| United States Treasury Note/Bond | 2.750% | 11/15/42 | 73,183 | 80,570 | |
| United States Treasury Note/Bond | 3.125% | 2/15/43 | 1,942 | 2,291 | |
| United States Treasury Note/Bond | 2.875% | 5/15/43 | 25,010 | 28,136 | |
| United States Treasury Note/Bond | 3.625% | 8/15/43 | 36,486 | 47,107 | |
| United States Treasury Note/Bond | 3.750% | 11/15/43 | 23,554 | 31,095 | |
| United States Treasury Note/Bond | 3.625% | 2/15/44 | 29,063 | 37,487 | |
| United States Treasury Note/Bond | 3.375% | 5/15/44 | 11,816 | 14,574 | |
| United States Treasury Note/Bond | 3.125% | 8/15/44 | 13,001 | 15,315 | |
| United States Treasury Note/Bond | 3.000% | 11/15/44 | 16,069 | 18,487 | |
| United States Treasury Note/Bond | 2.500% | 2/15/45 | 33,593 | 35,005 | |
| United States Treasury Note/Bond | 3.000% | 5/15/45 | 22,139 | 25,467 | |
| United States Treasury Note/Bond | 2.875% | 8/15/45 | 30,367 | 34,105 | |
| United States Treasury Note/Bond | 3.000% | 11/15/45 | 5,078 | 5,844 | |
| United States Treasury Note/Bond | 2.500% | 2/15/46 | 33,409 | 34,819 | |
| United States Treasury Note/Bond | 2.500% | 5/15/46 | 21,200 | 22,118 | |
| 4,477,735 | |||||
| Agency Bonds and Notes (1.0%) | |||||
| 3 | AID-Israel | 5.500% | 12/4/23 | 375 | 472 |
| 3 | AID-Israel | 5.500% | 4/26/24 | 1,400 | 1,774 |
| 3 | AID-Jordan | 1.945% | 6/23/19 | 600 | 621 |
53
| Vanguard® Balanced Index Fund | |||||
| Schedule of Investments | |||||
| June 30, 2016 | |||||
| Face | Market | ||||
| Maturity | Amount | Value | |||
| Coupon | Date | ($000) | ($000) | ||
| 3 | AID-Jordan | 2.503% | 10/30/20 | 750 | 797 |
| 3 | AID-Jordan | 2.578% | 6/30/22 | 320 | 342 |
| 3 | AID-Tunisia | 2.452% | 7/24/21 | 250 | 266 |
| 3 | AID-Ukraine | 1.844% | 5/16/19 | 350 | 360 |
| 3 | AID-Ukraine | 1.847% | 5/29/20 | 700 | 718 |
| 2 | Federal Farm Credit Banks | 1.125% | 9/22/17 | 500 | 503 |
| 2 | Federal Farm Credit Banks | 1.000% | 9/25/17 | 425 | 427 |
| 2 | Federal Farm Credit Banks | 1.125% | 12/18/17 | 500 | 504 |
| 2 | Federal Farm Credit Banks | 1.110% | 2/20/18 | 425 | 428 |
| 2 | Federal Farm Credit Banks | 0.750% | 4/18/18 | 1,500 | 1,502 |
| 2 | Federal Farm Credit Banks | 1.100% | 6/1/18 | 400 | 403 |
| 2 | Federal Farm Credit Banks | 5.150% | 11/15/19 | 3,000 | 3,421 |
| 2 | Federal Farm Credit Banks | 3.500% | 12/20/23 | 500 | 567 |
| 2 | Federal Home Loan Banks | 0.860% | 8/1/17 | 1,000 | 1,003 |
| 2 | Federal Home Loan Banks | 0.750% | 8/28/17 | 2,500 | 2,504 |
| 2 | Federal Home Loan Banks | 4.875% | 9/8/17 | 405 | 425 |
| 2 | Federal Home Loan Banks | 0.625% | 10/26/17 | 5,000 | 5,000 |
| 2 | Federal Home Loan Banks | 5.000% | 11/17/17 | 2,350 | 2,490 |
| 2 | Federal Home Loan Banks | 1.000% | 12/19/17 | 4,000 | 4,021 |
| 2 | Federal Home Loan Banks | 1.375% | 3/9/18 | 2,200 | 2,226 |
| 2 | Federal Home Loan Banks | 0.875% | 3/19/18 | 3,550 | 3,562 |
| 2 | Federal Home Loan Banks | 1.125% | 4/25/18 | 2,000 | 2,016 |
| 2 | Federal Home Loan Banks | 2.750% | 6/8/18 | 1,625 | 1,689 |
| 2 | Federal Home Loan Banks | 0.875% | 6/29/18 | 3,950 | 3,964 |
| 2 | Federal Home Loan Banks | 5.375% | 8/15/18 | 225 | 247 |
| 2 | Federal Home Loan Banks | 1.125% | 6/21/19 | 4,300 | 4,338 |
| 2 | Federal Home Loan Banks | 1.875% | 3/13/20 | 500 | 516 |
| 2 | Federal Home Loan Banks | 4.125% | 3/13/20 | 2,075 | 2,312 |
| 2 | Federal Home Loan Banks | 3.375% | 6/12/20 | 1,825 | 1,991 |
| 2 | Federal Home Loan Banks | 5.250% | 12/11/20 | 1,000 | 1,179 |
| 2 | Federal Home Loan Banks | 1.375% | 2/18/21 | 1,600 | 1,619 |
| 2 | Federal Home Loan Banks | 5.625% | 6/11/21 | 1,600 | 1,940 |
| 2 | Federal Home Loan Banks | 2.125% | 3/10/23 | 3,155 | 3,280 |
| 2 | Federal Home Loan Banks | 2.875% | 6/14/24 | 2,000 | 2,183 |
| 2 | Federal Home Loan Banks | 5.375% | 8/15/24 | 815 | 1,045 |
| 2 | Federal Home Loan Banks | 5.500% | 7/15/36 | 2,775 | 4,015 |
| 4 | Federal Home Loan Mortgage Corp. | 0.750% | 7/14/17 | 6,000 | 6,010 |
| 4 | Federal Home Loan Mortgage Corp. | 1.000% | 7/28/17 | 6,664 | 6,694 |
| 4 | Federal Home Loan Mortgage Corp. | 5.500% | 8/23/17 | 1,300 | 1,373 |
| 4 | Federal Home Loan Mortgage Corp. | 1.000% | 9/29/17 | 8,200 | 8,239 |
| 4 | Federal Home Loan Mortgage Corp. | 5.125% | 11/17/17 | 2,800 | 2,972 |
| 4 | Federal Home Loan Mortgage Corp. | 1.000% | 12/15/17 | 5,000 | 5,026 |
| 4 | Federal Home Loan Mortgage Corp. | 0.750% | 1/12/18 | 1,800 | 1,803 |
| 4 | Federal Home Loan Mortgage Corp. | 0.875% | 3/7/18 | 2,000 | 2,007 |
| 4 | Federal Home Loan Mortgage Corp. | 0.750% | 4/9/18 | 6,000 | 6,007 |
| 4 | Federal Home Loan Mortgage Corp. | 4.875% | 6/13/18 | 2,720 | 2,940 |
| 4 | Federal Home Loan Mortgage Corp. | 3.750% | 3/27/19 | 1,625 | 1,754 |
| 4 | Federal Home Loan Mortgage Corp. | 1.125% | 4/15/19 | 5,000 | 5,044 |
| 4 | Federal Home Loan Mortgage Corp. | 1.750% | 5/30/19 | 2,900 | 2,980 |
| 4 | Federal Home Loan Mortgage Corp. | 1.250% | 8/1/19 | 1,700 | 1,721 |
| 4 | Federal Home Loan Mortgage Corp. | 1.250% | 10/2/19 | 10,975 | 11,100 |
| 4 | Federal Home Loan Mortgage Corp. | 1.375% | 5/1/20 | 1,900 | 1,927 |
| 4 | Federal Home Loan Mortgage Corp. | 2.375% | 1/13/22 | 2,800 | 2,965 |
| 4 | Federal Home Loan Mortgage Corp. | 6.750% | 9/15/29 | 270 | 412 |
| 4 | Federal Home Loan Mortgage Corp. | 6.250% | 7/15/32 | 2,941 | 4,447 |
| 4 | Federal National Mortgage Assn. | 0.875% | 8/28/17 | 2,550 | 2,558 |
| 4 | Federal National Mortgage Assn. | 1.000% | 9/27/17 | 1,000 | 1,005 |
| 4 | Federal National Mortgage Assn. | 0.875% | 12/20/17 | 3,000 | 3,010 |
| 4 | Federal National Mortgage Assn. | 0.875% | 2/8/18 | 6,000 | 6,022 |
| 4 | Federal National Mortgage Assn. | 0.875% | 3/28/18 | 2,000 | 2,007 |
| 4 | Federal National Mortgage Assn. | 0.875% | 5/21/18 | 1,490 | 1,495 |
| 4 | Federal National Mortgage Assn. | 1.125% | 7/20/18 | 3,000 | 3,026 |
| 4 | Federal National Mortgage Assn. | 1.875% | 9/18/18 | 9,997 | 10,249 |
| 4 | Federal National Mortgage Assn. | 1.125% | 10/19/18 | 3,000 | 3,027 |
54
| Vanguard® Balanced Index Fund | |||||
| Schedule of Investments | |||||
| June 30, 2016 | |||||
| Face | Market | ||||
| Maturity | Amount | Value | |||
| Coupon | Date | ($000) | ($000) | ||
| 4 | Federal National Mortgage Assn. | 1.625% | 11/27/18 | 4,370 | 4,462 |
| 4 | Federal National Mortgage Assn. | 1.125% | 12/14/18 | 4,119 | 4,154 |
| 4 | Federal National Mortgage Assn. | 1.375% | 1/28/19 | 2,000 | 2,030 |
| 4 | Federal National Mortgage Assn. | 1.875% | 2/19/19 | 4,000 | 4,113 |
| 4 | Federal National Mortgage Assn. | 1.000% | 2/26/19 | 1,875 | 1,885 |
| 4 | Federal National Mortgage Assn. | 1.750% | 6/20/19 | 4,000 | 4,108 |
| 4 | Federal National Mortgage Assn. | 1.750% | 9/12/19 | 7,000 | 7,193 |
| 4 | Federal National Mortgage Assn. | 0.000% | 10/9/19 | 1,110 | 1,067 |
| 4 | Federal National Mortgage Assn. | 1.750% | 11/26/19 | 1,800 | 1,850 |
| 4 | Federal National Mortgage Assn. | 1.625% | 1/21/20 | 2,000 | 2,048 |
| 4 | Federal National Mortgage Assn. | 1.500% | 6/22/20 | 4,000 | 4,076 |
| 4 | Federal National Mortgage Assn. | 1.500% | 11/30/20 | 4,000 | 4,068 |
| 4 | Federal National Mortgage Assn. | 1.875% | 12/28/20 | 2,000 | 2,067 |
| 4 | Federal National Mortgage Assn. | 1.375% | 2/26/21 | 1,900 | 1,921 |
| 4 | Federal National Mortgage Assn. | 2.625% | 9/6/24 | 2,000 | 2,148 |
| 4 | Federal National Mortgage Assn. | 2.125% | 4/24/26 | 2,100 | 2,162 |
| 4 | Federal National Mortgage Assn. | 7.125% | 1/15/30 | 1,405 | 2,206 |
| 4 | Federal National Mortgage Assn. | 7.250% | 5/15/30 | 2,025 | 3,224 |
| 4 | Federal National Mortgage Assn. | 6.625% | 11/15/30 | 6,320 | 9,664 |
| 4 | Federal National Mortgage Assn. | 5.625% | 7/15/37 | 1,260 | 1,854 |
| 2 | Financing Corp. | 9.800% | 4/6/18 | 500 | 579 |
| 2 | Financing Corp. | 9.650% | 11/2/18 | 475 | 572 |
| Private Export Funding Corp. | 2.250% | 12/15/17 | 200 | 204 | |
| Private Export Funding Corp. | 1.875% | 7/15/18 | 300 | 306 | |
| Private Export Funding Corp. | 4.375% | 3/15/19 | 350 | 382 | |
| Private Export Funding Corp. | 1.450% | 8/15/19 | 350 | 356 | |
| Private Export Funding Corp. | 2.250% | 3/15/20 | 650 | 677 | |
| Private Export Funding Corp. | 2.300% | 9/15/20 | 175 | 183 | |
| Private Export Funding Corp. | 4.300% | 12/15/21 | 175 | 201 | |
| Private Export Funding Corp. | 2.800% | 5/15/22 | 200 | 214 | |
| Private Export Funding Corp. | 2.050% | 11/15/22 | 4,175 | 4,292 | |
| Private Export Funding Corp. | 3.550% | 1/15/24 | 725 | 814 | |
| Private Export Funding Corp. | 2.450% | 7/15/24 | 525 | 547 | |
| Private Export Funding Corp. | 3.250% | 6/15/25 | 175 | 194 | |
| 2 | Tennessee Valley Authority | 4.500% | 4/1/18 | 655 | 697 |
| 2 | Tennessee Valley Authority | 1.750% | 10/15/18 | 600 | 613 |
| 2 | Tennessee Valley Authority | 3.875% | 2/15/21 | 905 | 1,012 |
| 2 | Tennessee Valley Authority | 1.875% | 8/15/22 | 425 | 435 |
| 2 | Tennessee Valley Authority | 2.875% | 9/15/24 | 954 | 1,028 |
| 2 | Tennessee Valley Authority | 6.750% | 11/1/25 | 3,520 | 4,924 |
| 2 | Tennessee Valley Authority | 7.125% | 5/1/30 | 2,000 | 3,065 |
| 2 | Tennessee Valley Authority | 4.650% | 6/15/35 | 500 | 634 |
| 2 | Tennessee Valley Authority | 5.880% | 4/1/36 | 285 | 413 |
| 2 | Tennessee Valley Authority | 5.500% | 6/15/38 | 225 | 316 |
| 2 | Tennessee Valley Authority | 5.250% | 9/15/39 | 425 | 581 |
| 2 | Tennessee Valley Authority | 3.500% | 12/15/42 | 950 | 1,027 |
| 2 | Tennessee Valley Authority | 5.375% | 4/1/56 | 580 | 816 |
| 2 | Tennessee Valley Authority | 4.625% | 9/15/60 | 519 | 650 |
| 2 | Tennessee Valley Authority | 4.250% | 9/15/65 | 700 | 819 |
| 267,341 | |||||
| Conventional Mortgage-Backed Securities (8.1%) | |||||
| 4,5 | Fannie Mae Pool | 2.000% | 10/1/28 | 3,137 | 3,194 |
| 4,5,6 | Fannie Mae Pool | 2.500% | 3/1/27–1/1/43 | 64,992 | 67,442 |
| 4,5,6 | Fannie Mae Pool | 3.000% | 1/1/26–7/1/46 | 198,087 | 207,128 |
| 4,5,6 | Fannie Mae Pool | 3.500% | 9/1/25–7/1/46 | 261,648 | 277,316 |
| 4,5,6 | Fannie Mae Pool | 4.000% | 7/1/18–7/1/46 | 170,518 | 183,489 |
| 4,5 | Fannie Mae Pool | 4.500% | 1/1/18–7/1/46 | 86,143 | 94,184 |
| 4,5 | Fannie Mae Pool | 5.000% | 3/1/17–1/1/44 | 45,393 | 50,320 |
| 4,5 | Fannie Mae Pool | 5.500% | 11/1/16–4/1/40 | 37,625 | 42,370 |
| 4,5 | Fannie Mae Pool | 6.000% | 10/1/16–5/1/41 | 25,354 | 29,055 |
| 4,5 | Fannie Mae Pool | 6.500% | 9/1/16–10/1/39 | 7,698 | 8,846 |
| 4,5 | Fannie Mae Pool | 7.000% | 8/1/16–11/1/37 | 2,900 | 3,338 |
| 4,5 | Fannie Mae Pool | 7.500% | 11/1/22–12/1/32 | 235 | 264 |
| 4,5 | Fannie Mae Pool | 8.000% | 12/1/22–10/1/30 | 52 | 57 |
55
| Vanguard® Balanced Index Fund | |||||
| Schedule of Investments | |||||
| June 30, 2016 | |||||
| Face | Market | ||||
| Maturity | Amount | Value | |||
| Coupon | Date | ($000) | ($000) | ||
| 4,5 | Fannie Mae Pool | 8.500% | 11/1/18–7/1/30 | 38 | 44 |
| 4,5 | Fannie Mae Pool | 9.000% | 7/1/22–6/1/26 | 10 | 12 |
| 4,5 | Fannie Mae Pool | 9.500% | 8/1/20–2/1/25 | 1 | 2 |
| 4,5 | Freddie Mac Gold Pool | 2.000% | 8/1/28–1/1/29 | 2,595 | 2,648 |
| 4,5,6 | Freddie Mac Gold Pool | 2.500% | 4/1/27–2/1/43 | 49,075 | 50,910 |
| 4,5,6 | Freddie Mac Gold Pool | 3.000% | 4/1/23–7/1/46 | 128,132 | 133,864 |
| 4,5,6 | Freddie Mac Gold Pool | 3.500% | 9/1/25–7/1/46 | 165,958 | 175,541 |
| 4,5,6 | Freddie Mac Gold Pool | 4.000% | 7/1/18–7/1/46 | 105,213 | 112,870 |
| 4,5 | Freddie Mac Gold Pool | 4.500% | 1/1/18–7/1/46 | 50,170 | 54,665 |
| 4,5 | Freddie Mac Gold Pool | 5.000% | 4/1/17–10/1/41 | 28,484 | 31,377 |
| 4,5 | Freddie Mac Gold Pool | 5.500% | 5/1/17–6/1/41 | 21,659 | 24,219 |
| 4,5 | Freddie Mac Gold Pool | 6.000% | 1/1/17–5/1/40 | 13,043 | 14,892 |
| 4,5 | Freddie Mac Gold Pool | 6.500% | 8/1/16–3/1/39 | 3,453 | 3,979 |
| 4,5 | Freddie Mac Gold Pool | 7.000% | 10/1/22–12/1/38 | 985 | 1,143 |
| 4,5 | Freddie Mac Gold Pool | 7.500% | 1/1/23–1/1/32 | 151 | 171 |
| 4,5 | Freddie Mac Gold Pool | 8.000% | 1/1/22–1/1/31 | 102 | 118 |
| 4,5 | Freddie Mac Gold Pool | 8.500% | 4/1/20–5/1/30 | 17 | 20 |
| 4,5 | Freddie Mac Gold Pool | 9.000% | 10/1/21–4/1/30 | 13 | 13 |
| 5 | Ginnie Mae I Pool | 3.000% | 1/15/26–5/15/45 | 15,164 | 15,889 |
| 5,6 | Ginnie Mae I Pool | 3.500% | 11/15/25–7/1/46 | 16,055 | 17,105 |
| 5,6 | Ginnie Mae I Pool | 4.000% | 10/15/24–7/1/46 | 22,338 | 24,089 |
| 5 | Ginnie Mae I Pool | 4.500% | 8/15/18–7/1/46 | 27,250 | 30,190 |
| 5 | Ginnie Mae I Pool | 5.000% | 1/15/18–4/15/41 | 17,270 | 19,328 |
| 5 | Ginnie Mae I Pool | 5.500% | 6/15/18–6/15/41 | 8,465 | 9,579 |
| 5 | Ginnie Mae I Pool | 6.000% | 5/15/17–12/15/40 | 5,447 | 6,245 |
| 5 | Ginnie Mae I Pool | 6.500% | 11/15/23–8/15/39 | 1,651 | 1,834 |
| 5 | Ginnie Mae I Pool | 7.000% | 1/15/23–8/15/32 | 697 | 787 |
| 5 | Ginnie Mae I Pool | 7.500% | 10/15/22–3/15/32 | 211 | 239 |
| 5 | Ginnie Mae I Pool | 8.000% | 3/15/22–3/15/32 | 145 | 162 |
| 5 | Ginnie Mae I Pool | 8.500% | 8/15/22–6/15/30 | 20 | 21 |
| 5 | Ginnie Mae I Pool | 9.000% | 11/15/19–2/15/30 | 20 | 21 |
| 5 | Ginnie Mae I Pool | 9.500% | 8/15/20–1/15/25 | 2 | 2 |
| 5 | Ginnie Mae II Pool | 2.500% | 6/20/27–6/20/28 | 2,846 | 2,967 |
| 5,6 | Ginnie Mae II Pool | 3.000% | 2/20/27–7/1/46 | 116,093 | 121,659 |
| 5,6 | Ginnie Mae II Pool | 3.500% | 9/20/25–7/1/46 | 228,457 | 242,872 |
| 5,6 | Ginnie Mae II Pool | 4.000% | 9/20/25–7/1/46 | 116,014 | 124,518 |
| 5 | Ginnie Mae II Pool | 4.500% | 11/20/35–4/20/46 | 52,960 | 57,293 |
| 5 | Ginnie Mae II Pool | 5.000% | 3/20/18–7/20/44 | 27,249 | 29,931 |
| 5 | Ginnie Mae II Pool | 5.500% | 12/20/33–9/20/41 | 8,276 | 9,149 |
| 5 | Ginnie Mae II Pool | 6.000% | 3/20/33–7/20/39 | 3,722 | 4,179 |
| 5 | Ginnie Mae II Pool | 6.500% | 12/20/35–11/20/39 | 1,193 | 1,348 |
| 5 | Ginnie Mae II Pool | 7.000% | 4/20/38–8/20/38 | 213 | 245 |
| 2,293,143 | |||||
| Nonconventional Mortgage-Backed Securities (0.1%) | |||||
| 4,5,7 | Fannie Mae Pool | 1.956% | 4/1/37 | 60 | 62 |
| 4,5,7 | Fannie Mae Pool | 2.083% | 9/1/37 | 173 | 185 |
| 4,5 | Fannie Mae Pool | 2.114% | 3/1/43 | 674 | 691 |
| 4,5,7 | Fannie Mae Pool | 2.126% | 12/1/41 | 256 | 263 |
| 4,5 | Fannie Mae Pool | 2.184% | 6/1/42 | 1,273 | 1,331 |
| 4,5 | Fannie Mae Pool | 2.189% | 6/1/43 | 533 | 550 |
| 4,5 | Fannie Mae Pool | 2.217% | 9/1/42 | 391 | 409 |
| 4,5 | Fannie Mae Pool | 2.222% | 10/1/42 | 309 | 318 |
| 4,5 | Fannie Mae Pool | 2.267% | 7/1/43 | 734 | 759 |
| 4,5,7 | Fannie Mae Pool | 2.341% | 8/1/35 | 165 | 176 |
| 4,5 | Fannie Mae Pool | 2.387% | 7/1/42 | 554 | 574 |
| 4,5 | Fannie Mae Pool | 2.410% | 9/1/40–5/1/42 | 840 | 878 |
| 4,5,7 | Fannie Mae Pool | 2.415% | 6/1/36 | 5 | 5 |
| 4,5 | Fannie Mae Pool | 2.419% | 5/1/43 | 1,261 | 1,312 |
| 4,5,7 | Fannie Mae Pool | 2.439% | 12/1/33 | 45 | 47 |
56
| Vanguard® Balanced Index Fund | |||||
| Schedule of Investments | |||||
| June 30, 2016 | |||||
| Face | Market | ||||
| Maturity | Amount | Value | |||
| Coupon | Date | ($000) | ($000) | ||
| 4,5,7 | Fannie Mae Pool | 2.445% | 7/1/39 | 23 | 24 |
| 4,5,7 | Fannie Mae Pool | 2.450% | 7/1/37 | 29 | 31 |
| 4,5 | Fannie Mae Pool | 2.451% | 10/1/42 | 565 | 584 |
| 4,5 | Fannie Mae Pool | 2.453% | 8/1/40–9/1/43 | 171 | 178 |
| 4,5,7 | Fannie Mae Pool | 2.482% | 9/1/34 | 58 | 60 |
| 4,5,7 | Fannie Mae Pool | 2.485% | 11/1/36 | 204 | 216 |
| 4,5,7 | Fannie Mae Pool | 2.519% | 2/1/36 | 85 | 87 |
| 4,5,7 | Fannie Mae Pool | 2.535% | 10/1/39 | 64 | 67 |
| 4,5,7 | Fannie Mae Pool | 2.544% | 8/1/37–10/1/40 | 282 | 298 |
| 4,5,7 | Fannie Mae Pool | 2.566% | 7/1/42 | 213 | 228 |
| 4,5,7 | Fannie Mae Pool | 2.573% | 12/1/40 | 222 | 234 |
| 4,5,7 | Fannie Mae Pool | 2.576% | 11/1/39 | 40 | 43 |
| 4,5,7 | Fannie Mae Pool | 2.577% | 7/1/36 | 31 | 32 |
| 4,5,7 | Fannie Mae Pool | 2.612% | 12/1/41 | 239 | 256 |
| 4,5 | Fannie Mae Pool | 2.619% | 11/1/41 | 233 | 249 |
| 4,5,7 | Fannie Mae Pool | 2.634% | 1/1/37 | 195 | 209 |
| 4,5,7 | Fannie Mae Pool | 2.674% | 10/1/40 | 98 | 103 |
| 4,5,7 | Fannie Mae Pool | 2.685% | 11/1/33–12/1/40 | 191 | 201 |
| 4,5,7 | Fannie Mae Pool | 2.690% | 11/1/40–12/1/40 | 148 | 156 |
| 4,5,7 | Fannie Mae Pool | 2.710% | 1/1/40 | 149 | 155 |
| 4,5 | Fannie Mae Pool | 2.712% | 1/1/42 | 241 | 256 |
| 4,5 | Fannie Mae Pool | 2.724% | 12/1/43 | 991 | 1,026 |
| 4,5 | Fannie Mae Pool | 2.750% | 3/1/42 | 510 | 536 |
| 4,5 | Fannie Mae Pool | 2.753% | 2/1/41–1/1/42 | 459 | 480 |
| 4,5,7 | Fannie Mae Pool | 2.770% | 11/1/34 | 81 | 85 |
| 4,5 | Fannie Mae Pool | 2.775% | 11/1/41 | 225 | 243 |
| 4,5,7 | Fannie Mae Pool | 2.796% | 1/1/35 | 170 | 182 |
| 4,5,7 | Fannie Mae Pool | 2.805% | 5/1/42 | 128 | 133 |
| 4,5,7 | Fannie Mae Pool | 2.828% | 3/1/41 | 225 | 236 |
| 4,5,7 | Fannie Mae Pool | 2.848% | 5/1/40 | 59 | 61 |
| 4,5 | Fannie Mae Pool | 2.899% | 12/1/40 | 93 | 99 |
| 4,5,7 | Fannie Mae Pool | 2.915% | 3/1/42 | 326 | 351 |
| 4,5,7 | Fannie Mae Pool | 2.939% | 3/1/41 | 175 | 186 |
| 4,5 | Fannie Mae Pool | 2.947% | 2/1/42–9/1/43 | 1,623 | 1,716 |
| 4,5,7 | Fannie Mae Pool | 2.975% | 2/1/42 | 216 | 232 |
| 4,5,7 | Fannie Mae Pool | 2.999% | 5/1/41 | 168 | 177 |
| 4,5,7 | Fannie Mae Pool | 3.043% | 5/1/40 | 29 | 30 |
| 4,5 | Fannie Mae Pool | 3.058% | 2/1/41 | 176 | 186 |
| 4,5 | Fannie Mae Pool | 3.138% | 2/1/41 | 79 | 83 |
| 4,5 | Fannie Mae Pool | 3.359% | 8/1/42 | 374 | 389 |
| 4,5 | Fannie Mae Pool | 3.568% | 4/1/41 | 180 | 189 |
| 4,5 | Fannie Mae Pool | 3.580% | 8/1/39 | 48 | 53 |
| 4,5 | Fannie Mae Pool | 3.582% | 6/1/41 | 61 | 66 |
| 4,5 | Fannie Mae Pool | 3.586% | 7/1/41 | 381 | 407 |
| 4,5 | Fannie Mae Pool | 3.749% | 6/1/41 | 261 | 280 |
| 4,5,7 | Fannie Mae Pool | 3.796% | 8/1/39 | 186 | 193 |
| 4,5 | Fannie Mae Pool | 3.832% | 9/1/40 | 221 | 236 |
| 4,5,7 | Fannie Mae Pool | 4.034% | 11/1/39 | 72 | 77 |
| 4,5,7 | Fannie Mae Pool | 4.282% | 12/1/39 | 132 | 138 |
| 4,5 | Fannie Mae Pool | 4.847% | 3/1/38 | 21 | 22 |
| 4,5 | Fannie Mae Pool | 5.520% | 4/1/37 | 118 | 125 |
| 4,5 | Fannie Mae Pool | 5.852% | 12/1/37 | 111 | 120 |
| 4,5,7 | Fannie Mae Pool | 6.004% | 10/1/37 | 117 | 123 |
| 4,5,7 | Freddie Mac Non Gold Pool | 1.735% | 10/1/37 | 5 | 5 |
| 4,5 | Freddie Mac Non Gold Pool | 2.334% | 5/1/42 | 92 | 95 |
| 4,5,7 | Freddie Mac Non Gold Pool | 2.430% | 1/1/37 | 157 | 166 |
| 4,5,7 | Freddie Mac Non Gold Pool | 2.479% | 7/1/35 | 86 | 91 |
| 4,5,7 | Freddie Mac Non Gold Pool | 2.492% | 10/1/37 | 53 | 56 |
| 4,5,7 | Freddie Mac Non Gold Pool | 2.500% | 1/1/38 | 30 | 32 |
| 4,5,7 | Freddie Mac Non Gold Pool | 2.515% | 12/1/36 | 57 | 60 |
| 4,5 | Freddie Mac Non Gold Pool | 2.548% | 11/1/43 | 554 | 574 |
| 4,5 | Freddie Mac Non Gold Pool | 2.573% | 2/1/42 | 134 | 141 |
| 4,5,7 | Freddie Mac Non Gold Pool | 2.587% | 12/1/34 | 69 | 73 |
| 4,5,7 | Freddie Mac Non Gold Pool | 2.602% | 1/1/35 | 15 | 16 |
57
| Vanguard® Balanced Index Fund | |||||
| Schedule of Investments | |||||
| June 30, 2016 | |||||
| Face | Market | ||||
| Maturity | Amount | Value | |||
| Coupon | Date | ($000) | ($000) | ||
| 4,5,7 | Freddie Mac Non Gold Pool | 2.612% | 12/1/36 | 50 | 52 |
| 4,5,7 | Freddie Mac Non Gold Pool | 2.619% | 12/1/40 | 208 | 215 |
| 4,5,7 | Freddie Mac Non Gold Pool | 2.621% | 11/1/34 | 62 | 66 |
| 4,5,7 | Freddie Mac Non Gold Pool | 2.630% | 6/1/40 | 71 | 73 |
| 4,5,7 | Freddie Mac Non Gold Pool | 2.634% | 12/1/35 | 92 | 97 |
| 4,5,7 | Freddie Mac Non Gold Pool | 2.652% | 2/1/37 | 35 | 37 |
| 4,5,7 | Freddie Mac Non Gold Pool | 2.662% | 3/1/37 | 16 | 17 |
| 4,5 | Freddie Mac Non Gold Pool | 2.750% | 2/1/42 | 270 | 283 |
| 4,5,7 | Freddie Mac Non Gold Pool | 2.755% | 11/1/40–12/1/40 | 123 | 127 |
| 4,5,7 | Freddie Mac Non Gold Pool | 2.762% | 11/1/40 | 96 | 100 |
| 4,5 | Freddie Mac Non Gold Pool | 2.773% | 1/1/41 | 179 | 188 |
| 4,5,7 | Freddie Mac Non Gold Pool | 2.851% | 5/1/36 | 49 | 51 |
| 4,5,7 | Freddie Mac Non Gold Pool | 2.875% | 5/1/38 | 10 | 10 |
| 4,5 | Freddie Mac Non Gold Pool | 2.905% | 12/1/41 | 306 | 322 |
| 4,5,7 | Freddie Mac Non Gold Pool | 2.932% | 6/1/40 | 52 | 56 |
| 4,5,7 | Freddie Mac Non Gold Pool | 2.973% | 2/1/36 | 51 | 53 |
| 4,5,7 | Freddie Mac Non Gold Pool | 2.980% | 3/1/41 | 48 | 51 |
| 4,5,7 | Freddie Mac Non Gold Pool | 2.983% | 10/1/36 | 46 | 48 |
| 4,5,7 | Freddie Mac Non Gold Pool | 3.005% | 5/1/40 | 44 | 47 |
| 4,5,7 | Freddie Mac Non Gold Pool | 3.024% | 2/1/41 | 50 | 54 |
| 4,5,7 | Freddie Mac Non Gold Pool | 3.035% | 2/1/41 | 160 | 170 |
| 4,5 | Freddie Mac Non Gold Pool | 3.054% | 1/1/41 | 55 | 58 |
| 4,5,7 | Freddie Mac Non Gold Pool | 3.068% | 5/1/40 | 38 | 40 |
| 4,5 | Freddie Mac Non Gold Pool | 3.115% | 6/1/41 | 78 | 82 |
| 4,5 | Freddie Mac Non Gold Pool | 3.443% | 3/1/42 | 340 | 361 |
| 4,5 | Freddie Mac Non Gold Pool | 3.591% | 6/1/40 | 97 | 103 |
| 4,5 | Freddie Mac Non Gold Pool | 3.680% | 9/1/40 | 275 | 293 |
| 4,5 | Freddie Mac Non Gold Pool | 4.723% | 9/1/37 | 237 | 245 |
| 4,5 | Freddie Mac Non Gold Pool | 5.258% | 3/1/38 | 122 | 131 |
| 4,5 | Freddie Mac Non Gold Pool | 5.893% | 5/1/37 | 198 | 207 |
| 5,7 | Ginnie Mae II Pool | 1.750% | 4/20/41 | 70 | 72 |
| 5 | Ginnie Mae II Pool | 2.000% | 10/20/38–6/20/43 | 3,653 | 3,805 |
| 5,7 | Ginnie Mae II Pool | 2.250% | 5/20/41 | 74 | 78 |
| 5 | Ginnie Mae II Pool | 2.500% | 1/20/41–1/20/42 | 579 | 590 |
| 5 | Ginnie Mae II Pool | 3.000% | 7/20/38–11/20/41 | 1,116 | 1,179 |
| 5 | Ginnie Mae II Pool | 3.500% | 7/20/41–12/20/43 | 1,443 | 1,504 |
| 5 | Ginnie Mae II Pool | 4.000% | 4/20/41–10/20/41 | 551 | 582 |
| 32,443 | |||||
| Total U.S. Government and Agency Obligations (Cost $6,798,779) | 7,070,662 | ||||
| Asset-Backed/Commercial Mortgage-Backed Securities (1.1%) | |||||
| 5 | AEP Texas Central Transition Funding II LLC 2006-A | 5.170% | 1/1/18 | 140 | 145 |
| 5 | Ally Auto Receivables Trust 2013-2 | 0.790% | 1/15/18 | 27 | 27 |
| 5 | Ally Auto Receivables Trust 2013-2 | 1.240% | 11/15/18 | 100 | 100 |
| 5 | Ally Auto Receivables Trust 2014-1 | 0.970% | 10/15/18 | 189 | 189 |
| 5 | Ally Auto Receivables Trust 2014-1 | 1.530% | 4/15/19 | 150 | 151 |
| 5 | Ally Auto Receivables Trust 2014-3 | 1.280% | 6/17/19 | 350 | 351 |
| 5 | Ally Auto Receivables Trust 2014-3 | 1.720% | 3/16/20 | 150 | 151 |
| 5 | Ally Auto Receivables Trust 2014-SN1 | 0.950% | 6/20/18 | 86 | 86 |
| 5 | Ally Auto Receivables Trust 2014-SN2 | 1.030% | 9/20/17 | 291 | 291 |
| 5 | Ally Auto Receivables Trust 2014-SN2 | 1.210% | 2/20/19 | 200 | 200 |
| 5 | Ally Auto Receivables Trust 2015-1 | 1.390% | 9/16/19 | 125 | 126 |
| 5 | Ally Auto Receivables Trust 2015-1 | 1.750% | 5/15/20 | 125 | 127 |
| 5 | Ally Auto Receivables Trust 2015-2 | 1.490% | 11/15/19 | 325 | 327 |
| 5 | Ally Auto Receivables Trust 2015-2 | 1.840% | 6/15/20 | 175 | 178 |
| 5 | Ally Master Owner Trust Series 2014-4 | 1.430% | 6/17/19 | 425 | 426 |
| 5 | Ally Master Owner Trust Series 2015-3 | 1.630% | 5/15/20 | 550 | 553 |
| 5 | American Express Credit Account Secured Note Trust | ||||
| 2014-3 | 1.490% | 4/15/20 | 625 | 627 | |
| 5 | American Express Credit Account Secured Note Trust | ||||
| 2014-4 | 1.430% | 6/15/20 | 325 | 327 | |
| 5 | AmeriCredit Automobile Receivables Trust 2013-4 | 0.960% | 4/9/18 | 1 | 1 |
| 5 | AmeriCredit Automobile Receivables Trust 2014-1 | 0.900% | 2/8/19 | 33 | 33 |
58
| Vanguard® Balanced Index Fund | |||||
| Schedule of Investments | |||||
| June 30, 2016 | |||||
| Face | Market | ||||
| Maturity | Amount | Value | |||
| Coupon | Date | ($000) | ($000) | ||
| 5 | AmeriCredit Automobile Receivables Trust 2014-1 | 1.680% | 7/8/19 | 50 | 50 |
| 5 | AmeriCredit Automobile Receivables Trust 2014-2 | 0.940% | 2/8/19 | 106 | 106 |
| 5 | AmeriCredit Automobile Receivables Trust 2014-3 | 1.150% | 6/10/19 | 225 | 225 |
| 5 | AmeriCredit Automobile Receivables Trust 2015-2 | 1.270% | 1/8/20 | 275 | 275 |
| 5 | Banc of America Commercial Mortgage Trust 2006-2 | 6.009% | 5/10/45 | 56 | 56 |
| 5 | Banc of America Commercial Mortgage Trust 2006-5 | 5.448% | 9/10/47 | 200 | 201 |
| 5 | Banc of America Commercial Mortgage Trust 2008-1 | 6.436% | 2/10/51 | 1,009 | 1,054 |
| 5 | Banc of America Commercial Mortgage Trust 2015- | ||||
| UBS7 | 3.429% | 9/15/48 | 175 | 187 | |
| 5 | Banc of America Commercial Mortgage Trust 2015- | ||||
| UBS7 | 3.705% | 9/15/48 | 300 | 330 | |
| Bank of Nova Scotia | 2.125% | 9/11/19 | 900 | 922 | |
| Bank of Nova Scotia | 1.850% | 4/14/20 | 1,800 | 1,824 | |
| Bank of Nova Scotia | 1.875% | 4/26/21 | 600 | 606 | |
| 5 | Barclays Dryrock Issuance Trust 2015-2 | 1.560% | 3/15/21 | 300 | 303 |
| 5 | Bear Stearns Commercial Mortgage Securities Trust | ||||
| 2006-PWR13 | 5.582% | 9/11/41 | 160 | 160 | |
| 5 | Bear Stearns Commercial Mortgage Securities Trust | ||||
| 2007-PWR18 | 5.700% | 6/11/50 | 1,021 | 1,049 | |
| 5 | Bear Stearns Commercial Mortgage Securities Trust | ||||
| 2007-TOP26 | 5.471% | 1/12/45 | 301 | 305 | |
| 5 | Bear Stearns Commercial Mortgage Securities Trust | ||||
| 2007-TOP26 | 5.513% | 1/12/45 | 335 | 342 | |
| 5 | Bear Stearns Commercial Mortgage Securities Trust | ||||
| 2007-TOP28 | 5.742% | 9/11/42 | 1,820 | 1,879 | |
| 5 | BMW Vehicle Owner Trust 2014-A | 0.970% | 11/26/18 | 302 | 302 |
| 5 | BMW Vehicle Owner Trust 2014-A | 1.500% | 2/25/21 | 250 | 251 |
| 5 | BMW Vehicle Owner Trust 2015-1 | 1.240% | 12/20/17 | 400 | 400 |
| 5 | BMW Vehicle Owner Trust 2015-2 | 1.400% | 9/20/18 | 400 | 401 |
| 5 | BMW Vehicle Owner Trust 2015-2 | 1.550% | 2/20/19 | 125 | 125 |
| 5 | Capital Auto Receivables Asset Trust 2013-4 | 1.090% | 3/20/18 | 168 | 168 |
| 5 | Capital Auto Receivables Asset Trust 2014-1 | 1.690% | 10/22/18 | 125 | 125 |
| 5 | Capital Auto Receivables Asset Trust 2014-1 | 2.220% | 1/22/19 | 95 | 96 |
| 5 | Capital Auto Receivables Asset Trust 2014-2 | 1.260% | 5/21/18 | 69 | 69 |
| 5 | Capital Auto Receivables Asset Trust 2014-2 | 1.620% | 10/22/18 | 75 | 75 |
| 5 | Capital Auto Receivables Asset Trust 2014-3 | 1.830% | 4/22/19 | 100 | 101 |
| 5 | Capital Auto Receivables Asset Trust 2015-1 | 1.610% | 6/20/19 | 800 | 804 |
| 5 | Capital Auto Receivables Asset Trust 2015-1 | 1.860% | 10/21/19 | 150 | 151 |
| 5 | Capital Auto Receivables Asset Trust 2015-2 | 1.730% | 9/20/19 | 425 | 428 |
| 5 | Capital Auto Receivables Asset Trust 2015-3 | 1.970% | 1/21/20 | 225 | 227 |
| 5 | Capital Auto Receivables Asset Trust 2015-3 | 2.130% | 5/20/20 | 225 | 227 |
| 5 | Capital Auto Receivables Asset Trust 2015-4 | 1.830% | 3/20/20 | 325 | 327 |
| 5 | Capital Auto Receivables Asset Trust 2015-4 | 2.010% | 7/20/20 | 200 | 201 |
| 5 | Capital One Multi-asset Execution Trust 2007-A7 | 5.750% | 7/15/20 | 550 | 579 |
| 5 | Capital One Multi-Asset Execution Trust 2014-A2 | 1.260% | 1/15/20 | 150 | 150 |
| 5 | Capital One Multi-Asset Execution Trust 2014-A5 | 1.480% | 7/15/20 | 525 | 527 |
| 5 | Capital One Multi-Asset Execution Trust 2015-A2 | 2.080% | 3/15/23 | 875 | 901 |
| 5 | Capital One Multi-asset Execution Trust 2015-A5 | 1.600% | 5/17/21 | 400 | 405 |
| 5 | Capital One Multi-asset Execution Trust 2015-A8 | 2.050% | 8/15/23 | 600 | 611 |
| 5 | CarMax Auto Owner Trust 2012-3 | 0.790% | 4/16/18 | 103 | 103 |
| 5 | CarMax Auto Owner Trust 2013-2 | 0.640% | 1/16/18 | 27 | 27 |
| 5 | Carmax Auto Owner Trust 2013-2 | 0.840% | 11/15/18 | 97 | 97 |
| 5 | Carmax Auto Owner Trust 2013-4 | 0.800% | 7/16/18 | 45 | 45 |
| 5 | Carmax Auto Owner Trust 2013-4 | 1.280% | 5/15/19 | 50 | 50 |
| 5 | Carmax Auto Owner Trust 2014-1 | 1.320% | 7/15/19 | 120 | 120 |
| 5 | Carmax Auto Owner Trust 2014-3 | 1.160% | 6/17/19 | 223 | 224 |
| 5 | Carmax Auto Owner Trust 2014-3 | 1.730% | 2/18/20 | 125 | 126 |
| 5 | Carmax Auto Owner Trust 2015-2 | 1.370% | 3/16/20 | 250 | 251 |
| 5 | Carmax Auto Owner Trust 2015-2 | 1.800% | 3/15/21 | 100 | 101 |
| 5 | Carmax Auto Owner Trust 2015-3 | 1.980% | 2/16/21 | 100 | 101 |
| 5 | Carmax Auto Owner Trust 2015-4 | 1.830% | 6/15/21 | 150 | 152 |
| 5 | CD 2006-CD3 Mortgage Trust | 5.617% | 10/15/48 | 621 | 620 |
| 5 | CD 2007-CD5 Mortgage Trust | 5.886% | 11/15/44 | 1,268 | 1,308 |
| 5 | CenterPoint Energy Transition Bond Co. II LLC 2005-A | 5.170% | 8/1/19 | 53 | 54 |
59
| Vanguard® Balanced Index Fund | |||||
| Schedule of Investments | |||||
| June 30, 2016 | |||||
| Face | Market | ||||
| Maturity | Amount | Value | |||
| Coupon | Date | ($000) | ($000) | ||
| 5 | CenterPoint Energy Transition Bond Co. II LLC 2005-A | 5.302% | 8/1/20 | 81 | 88 |
| 5 | CenterPoint Energy Transition Bond Co. IV LLC 2012-1 | 3.028% | 10/15/25 | 800 | 855 |
| 5 | CFCRE Commercial Mortgage Trust 2016-C3 | 3.865% | 1/10/48 | 425 | 469 |
| 5 | CFCRE Commercial Mortgage Trust 2016-C4 | 3.283% | 5/10/58 | 550 | 579 |
| 5 | CFCRE Commercial Mortgage Trust 2016-C4 | 3.691% | 5/10/58 | 400 | 421 |
| 5 | Chase Issuance Trust 2012-A4 | 1.580% | 8/16/21 | 600 | 608 |
| 5 | Chase Issuance Trust 2012-A7 | 2.160% | 9/16/24 | 1,314 | 1,334 |
| 5 | Chase Issuance Trust 2013-A1 | 1.300% | 2/18/20 | 1,050 | 1,056 |
| 5 | Chase Issuance Trust 2013-A8 | 1.010% | 10/15/18 | 775 | 775 |
| 5 | Chase Issuance Trust 2014-A1 | 1.150% | 1/15/19 | 2,450 | 2,455 |
| 5 | Chase Issuance Trust 2014-A2 | 2.770% | 3/15/23 | 900 | 956 |
| 5 | Chase Issuance Trust 2014-A6 | 1.260% | 7/15/19 | 1,075 | 1,073 |
| 5 | Chase Issuance Trust 2014-A7 | 1.380% | 11/15/19 | 800 | 804 |
| 5 | Chase Issuance Trust 2015-A2 | 1.590% | 2/18/20 | 1,830 | 1,850 |
| 5 | Chase Issuance Trust 2015-A4 | 1.840% | 4/15/22 | 600 | 612 |
| 5 | Chase Issuance Trust 2015-A5 | 1.360% | 4/15/20 | 1,225 | 1,234 |
| 5 | Chase Issuance Trust 2016-A2 | 1.370% | 6/15/21 | 775 | 780 |
| 5 | Citibank Credit Card Issuance Trust 2007-A8 | 5.650% | 9/20/19 | 550 | 580 |
| 5 | Citibank Credit Card Issuance Trust 2008-A1 | 5.350% | 2/7/20 | 1,048 | 1,120 |
| 5 | Citibank Credit Card Issuance Trust 2014-A1 | 2.880% | 1/23/23 | 2,350 | 2,502 |
| 5 | Citibank Credit Card Issuance Trust 2014-A4 | 1.230% | 4/24/19 | 875 | 875 |
| 5 | Citibank Credit Card Issuance Trust 2014-A5 | 2.680% | 6/7/23 | 750 | 792 |
| 5 | Citibank Credit Card Issuance Trust 2014-A6 | 2.150% | 7/15/21 | 2,100 | 2,163 |
| 5 | Citibank Credit Card Issuance Trust 2014-A8 | 1.730% | 4/9/20 | 1,250 | 1,266 |
| 5 | Citigroup Commercial Mortgage Trust 2006-C5 | 5.431% | 10/15/49 | 421 | 423 |
| 5 | Citigroup Commercial Mortgage Trust 2006-C5 | 5.462% | 10/15/49 | 230 | 232 |
| 5 | Citigroup Commercial Mortgage Trust 2007-C6 | 5.901% | 12/10/49 | 1,141 | 1,173 |
| 5 | Citigroup Commercial Mortgage Trust 2008-C7 | 6.345% | 12/10/49 | 1,136 | 1,176 |
| 5 | Citigroup Commercial Mortgage Trust 2012-GC8 | 3.024% | 9/10/45 | 600 | 636 |
| 5 | Citigroup Commercial Mortgage Trust 2013-GC11 | 3.093% | 4/10/46 | 100 | 106 |
| 5 | Citigroup Commercial Mortgage Trust 2013-GC11 | 3.422% | 4/10/46 | 100 | 105 |
| 5 | Citigroup Commercial Mortgage Trust 2013-GC15 | 3.161% | 9/10/46 | 225 | 232 |
| 5 | Citigroup Commercial Mortgage Trust 2013-GC15 | 4.371% | 9/10/46 | 225 | 257 |
| 5 | Citigroup Commercial Mortgage Trust 2013-GC15 | 4.649% | 9/10/46 | 350 | 397 |
| 5 | Citigroup Commercial Mortgage Trust 2013-GC17 | 3.675% | 11/10/46 | 75 | 81 |
| 5 | Citigroup Commercial Mortgage Trust 2013-GC17 | 4.131% | 11/10/46 | 275 | 310 |
| 5 | Citigroup Commercial Mortgage Trust 2013-GC17 | 4.544% | 11/10/46 | 100 | 113 |
| 5 | Citigroup Commercial Mortgage Trust 2013-GC17 | 5.095% | 11/10/46 | 100 | 117 |
| 5 | Citigroup Commercial Mortgage Trust 2014-GC19 | 2.790% | 3/10/47 | 129 | 133 |
| 5 | Citigroup Commercial Mortgage Trust 2014-GC19 | 3.552% | 3/10/47 | 75 | 80 |
| 5 | Citigroup Commercial Mortgage Trust 2014-GC19 | 4.023% | 3/10/47 | 125 | 139 |
| 5 | Citigroup Commercial Mortgage Trust 2014-GC19 | 4.345% | 3/10/47 | 125 | 136 |
| 5 | Citigroup Commercial Mortgage Trust 2014-GC21 | 3.855% | 5/10/47 | 200 | 221 |
| 5 | Citigroup Commercial Mortgage Trust 2014-GC21 | 4.328% | 5/10/47 | 150 | 163 |
| 5 | Citigroup Commercial Mortgage Trust 2014-GC23 | 3.622% | 7/10/47 | 300 | 327 |
| 5 | Citigroup Commercial Mortgage Trust 2014-GC25 | 3.635% | 10/10/47 | 650 | 705 |
| 5 | Citigroup Commercial Mortgage Trust 2015-GC27 | 3.137% | 2/10/48 | 800 | 841 |
| 5 | Citigroup Commercial Mortgage Trust 2015-GC27 | 3.571% | 2/10/48 | 325 | 344 |
| 5 | Citigroup Commercial Mortgage Trust 2015-GC29 | 2.674% | 4/10/48 | 150 | 155 |
| 5 | Citigroup Commercial Mortgage Trust 2015-GC29 | 3.192% | 4/10/48 | 650 | 685 |
| 5 | Citigroup Commercial Mortgage Trust 2015-GC29 | 3.758% | 4/10/48 | 318 | 332 |
| 5 | Citigroup Commercial Mortgage Trust 2015-GC31 | 3.762% | 6/10/48 | 350 | 385 |
| 5 | Citigroup Commercial Mortgage Trust 2015-GC33 | 3.778% | 9/10/58 | 425 | 468 |
| 5 | Citigroup Commercial Mortgage Trust 2016-C1 | 3.003% | 5/10/49 | 225 | 234 |
| 5 | Citigroup Commercial Mortgage Trust 2016-C1 | 3.209% | 5/10/49 | 425 | 447 |
| 5 | Citigroup Commercial Mortgage Trust 2016-C32 | 3.616% | 2/10/49 | 800 | 867 |
| 5 | Citigrouputsche Bank Commercial Mortgage Trust | ||||
| 2016-C1 | 3.276% | 5/10/49 | 300 | 319 | |
| 5 | COBALT CMBS Commercial Mortgage Trust 2007-C2 | 5.484% | 4/15/47 | 1,126 | 1,147 |
| 5 | COMM 2012-CCRE2 Mortgage Trust | 3.147% | 8/15/45 | 144 | 153 |
| 5 | COMM 2012-CCRE2 Mortgage Trust | 3.791% | 8/15/45 | 189 | 205 |
| 5,8 | COMM 2012-CCRE3 Mortgage Trust | 3.416% | 10/15/45 | 227 | 241 |
| 5 | COMM 2012-CCRE4 Mortgage Trust | 2.853% | 10/15/45 | 350 | 367 |
| 5 | COMM 2013-CCRE10 Mortgage Trust | 4.210% | 8/10/46 | 160 | 180 |
60
| Vanguard® Balanced Index Fund | |||||
| Schedule of Investments | |||||
| June 30, 2016 | |||||
| Face | Market | ||||
| Maturity | Amount | Value | |||
| Coupon | Date | ($000) | ($000) | ||
| 5 | COMM 2013-CCRE11 Mortgage Trust | 3.047% | 10/10/46 | 200 | 206 |
| 5 | COMM 2013-CCRE11 Mortgage Trust | 3.660% | 10/10/46 | 200 | 215 |
| 5 | COMM 2013-CCRE11 Mortgage Trust | 3.983% | 10/10/46 | 260 | 291 |
| 5 | COMM 2013-CCRE11 Mortgage Trust | 4.258% | 10/10/46 | 330 | 371 |
| 5 | COMM 2013-CCRE11 Mortgage Trust | 4.715% | 10/10/46 | 200 | 229 |
| 5 | COMM 2013-CCRE12 Mortgage Trust | 2.904% | 10/10/46 | 125 | 129 |
| 5 | COMM 2013-CCRE12 Mortgage Trust | 3.623% | 10/10/46 | 125 | 134 |
| 5 | COMM 2013-CCRE12 Mortgage Trust | 3.765% | 10/10/46 | 175 | 192 |
| 5 | COMM 2013-CCRE12 Mortgage Trust | 4.046% | 10/10/46 | 125 | 139 |
| 5 | COMM 2013-CCRE12 Mortgage Trust | 4.300% | 10/10/46 | 75 | 83 |
| 5 | COMM 2013-CCRE12 Mortgage Trust | 4.762% | 10/10/46 | 50 | 55 |
| 5 | COMM 2013-CCRE13 Mortgage Trust | 3.039% | 12/10/18 | 75 | 77 |
| 5 | COMM 2013-CCRE13 Mortgage Trust | 3.706% | 10/10/23 | 50 | 55 |
| 5 | COMM 2013-CCRE13 Mortgage Trust | 4.449% | 12/10/23 | 150 | 168 |
| 5 | COMM 2013-CCRE6 Mortgage Trust | 3.101% | 3/10/46 | 183 | 194 |
| 5 | COMM 2013-CCRE7 Mortgage Trust | 3.213% | 3/10/46 | 150 | 160 |
| 5 | COMM 2013-CCRE8 Mortgage Trust | 3.612% | 6/10/46 | 223 | 242 |
| 5 | COMM 2013-CCRE9 Mortgage Trust | 4.375% | 7/10/45 | 365 | 413 |
| 5 | COMM 2013-CR13 Mortgage Trust | 4.194% | 11/10/23 | 450 | 508 |
| 5 | COMM 2013-LC13 Mortgage Trust | 3.009% | 8/10/46 | 230 | 237 |
| 5 | COMM 2013-LC13 Mortgage Trust | 4.205% | 8/10/46 | 230 | 259 |
| 5 | COMM 2013-LC6 Mortgage Trust | 2.941% | 1/10/46 | 277 | 292 |
| 5 | COMM 2013-LC6 Mortgage Trust | 3.282% | 1/10/46 | 154 | 162 |
| 5 | COMM 2014-CCRE14 Mortgage Trust | 3.147% | 2/10/47 | 350 | 361 |
| 5 | COMM 2014-CCRE14 Mortgage Trust | 4.526% | 2/10/47 | 325 | 367 |
| 5 | COMM 2014-CCRE14 Mortgage Trust | 4.752% | 2/10/47 | 175 | 191 |
| 5 | COMM 2014-CCRE15 Mortgage Trust | 2.928% | 2/10/47 | 327 | 337 |
| 5 | COMM 2014-CCRE15 Mortgage Trust | 3.595% | 2/10/47 | 113 | 121 |
| 5 | COMM 2014-CCRE15 Mortgage Trust | 4.074% | 2/10/47 | 209 | 234 |
| 5 | COMM 2014-CCRE15 Mortgage Trust | 4.865% | 2/10/47 | 105 | 118 |
| 5 | COMM 2014-CCRE19 Mortgage Trust | 3.796% | 8/10/47 | 650 | 715 |
| 5 | COMM 2014-CCRE19 Mortgage Trust | 4.080% | 8/10/47 | 150 | 164 |
| 5 | COMM 2014-CCRE21 Mortgage Trust | 3.095% | 12/10/47 | 320 | 336 |
| 5 | COMM 2014-CCRE21 Mortgage Trust | 3.528% | 12/10/47 | 625 | 675 |
| 5 | COMM 2014-CR14 Mortgage Trust | 4.236% | 2/10/47 | 275 | 311 |
| 5 | COMM 2014-CR17 Mortgage Trust | 3.012% | 5/10/47 | 225 | 233 |
| 5 | COMM 2014-CR17 Mortgage Trust | 3.598% | 5/10/47 | 100 | 106 |
| 5 | COMM 2014-CR17 Mortgage Trust | 3.977% | 5/10/47 | 175 | 195 |
| 5 | COMM 2014-CR17 Mortgage Trust | 4.377% | 5/10/47 | 100 | 109 |
| 5 | COMM 2014-CR18 Mortgage Trust | 3.452% | 7/15/47 | 175 | 186 |
| 5 | COMM 2014-CR18 Mortgage Trust | 3.828% | 7/15/47 | 125 | 138 |
| 5 | COMM 2014-CR18 Mortgage Trust | 4.103% | 7/15/47 | 150 | 165 |
| 5 | COMM 2014-LC15 Mortgage Trust | 2.840% | 4/10/47 | 125 | 129 |
| 5 | COMM 2014-LC15 Mortgage Trust | 4.006% | 4/10/47 | 325 | 361 |
| 5 | COMM 2014-LC17 Mortgage Trust | 3.164% | 10/10/47 | 425 | 445 |
| 5 | COMM 2014-LC17 Mortgage Trust | 3.917% | 10/10/47 | 175 | 194 |
| 5 | COMM 2014-LC19 Mortgage Trust | 3.040% | 2/10/48 | 75 | 78 |
| 5 | COMM 2014-LC19 Mortgage Trust | 3.183% | 2/10/48 | 425 | 449 |
| 5 | COMM 2014-LC19 Mortgage Trust | 3.527% | 2/10/48 | 200 | 213 |
| 5 | COMM 2014-UBS2 Mortgage Trust | 2.820% | 3/10/47 | 90 | 93 |
| 5 | COMM 2014-UBS2 Mortgage Trust | 3.472% | 3/10/47 | 78 | 83 |
| 5 | COMM 2014-UBS2 Mortgage Trust | 3.961% | 3/10/47 | 202 | 223 |
| 5 | COMM 2014-UBS2 Mortgage Trust | 4.199% | 3/10/47 | 57 | 62 |
| 5 | COMM 2014-UBS2 Mortgage Trust | 4.701% | 3/10/47 | 36 | 41 |
| 5 | COMM 2014-UBS3 Mortgage Trust | 2.844% | 6/10/47 | 125 | 129 |
| 5 | COMM 2014-UBS3 Mortgage Trust | 3.819% | 6/10/47 | 350 | 383 |
| 5 | COMM 2014-UBS4 Mortgage Trust | 3.694% | 8/10/47 | 225 | 243 |
| 5 | COMM 2014-UBS4 Mortgage Trust | 3.968% | 8/10/47 | 167 | 176 |
| 5 | COMM 2014-UBS5 Mortgage Trust | 3.838% | 9/10/47 | 500 | 548 |
| 5 | COMM 2014-UBS6 Mortgage Trust | 2.935% | 12/10/47 | 425 | 443 |
| 5 | COMM 2014-UBS6 Mortgage Trust | 3.387% | 12/10/47 | 425 | 452 |
| 5 | COMM 2014-UBS6 Mortgage Trust | 3.644% | 12/10/47 | 800 | 863 |
| 5 | COMM 2014-UBS6 Mortgage Trust | 4.048% | 12/10/47 | 225 | 245 |
| 5 | COMM 2015-CR22 Mortgage Trust | 2.856% | 3/10/48 | 200 | 208 |
61
| Vanguard® Balanced Index Fund | |||||
| Schedule of Investments | |||||
| June 30, 2016 | |||||
| Face | Market | ||||
| Maturity | Amount | Value | |||
| Coupon | Date | ($000) | ($000) | ||
| 5 | COMM 2015-CR22 Mortgage Trust | 3.309% | 3/10/48 | 575 | 608 |
| 5 | COMM 2015-CR22 Mortgage Trust | 3.603% | 3/10/48 | 200 | 212 |
| 5 | COMM 2015-CR23 Mortgage Trust | 3.257% | 5/10/48 | 250 | 265 |
| 5 | COMM 2015-CR23 Mortgage Trust | 3.497% | 5/10/48 | 375 | 403 |
| 5 | COMM 2015-CR23 Mortgage Trust | 3.801% | 5/10/48 | 175 | 189 |
| 5 | COMM 2015-CR25 Mortgage Trust | 3.759% | 8/10/48 | 425 | 465 |
| 5 | COMM 2015-CR26 Mortgage Trust | 3.630% | 10/10/48 | 850 | 919 |
| 5 | COMM 2015-CR27 Mortgage Trust | 3.404% | 10/10/48 | 400 | 427 |
| 5 | COMM 2015-CR27 Mortgage Trust | 3.612% | 10/10/48 | 400 | 432 |
| 5 | COMM 2016-CR28 Mortgage Trust | 3.762% | 2/10/49 | 600 | 657 |
| 5 | COMM 2016-DC2 Mortgage Trust | 3.550% | 2/10/49 | 500 | 532 |
| 5 | Credit Suisse Commercial Mortgage Trust Series 2006- | ||||
| C4 | 5.509% | 9/15/39 | 117 | 117 | |
| 5 | Credit Suisse Commercial Mortgage Trust Series 2006- | ||||
| C5 | 5.311% | 12/15/39 | 322 | 323 | |
| 5 | Credit Suisse Commercial Mortgage Trust Series 2007- | ||||
| C1 | 5.383% | 2/15/40 | 528 | 532 | |
| 5 | CSAIL Commercial Mortgage Trust 2015-C1 | 3.505% | 4/15/50 | 400 | 433 |
| 5 | CSAIL Commercial Mortgage Trust 2015-C1 | 3.791% | 4/15/50 | 200 | 216 |
| 5 | CSAIL Commercial Mortgage Trust 2015-C1 | 4.044% | 4/15/50 | 175 | 187 |
| 5 | CSAIL Commercial Mortgage Trust 2015-C2 | 1.454% | 6/15/57 | 279 | 280 |
| 5 | CSAIL Commercial Mortgage Trust 2015-C2 | 3.504% | 6/15/57 | 550 | 593 |
| 5 | CSAIL Commercial Mortgage Trust 2015-C2 | 3.849% | 6/15/57 | 225 | 244 |
| 5 | CSAIL Commercial Mortgage Trust 2015-C3 | 3.448% | 8/15/48 | 327 | 350 |
| 5 | CSAIL Commercial Mortgage Trust 2015-C3 | 3.718% | 8/15/48 | 425 | 461 |
| 5 | CSAIL Commercial Mortgage Trust 2015-C3 | 4.256% | 8/15/48 | 200 | 212 |
| 5 | CSAIL Commercial Mortgage Trust 2015-C4 | 3.617% | 11/15/48 | 200 | 216 |
| 5 | CSAIL Commercial Mortgage Trust 2015-C4 | 3.808% | 11/15/48 | 325 | 358 |
| 5 | Discover Card Execution Note Trust 2007-A1 | 5.650% | 3/16/20 | 860 | 905 |
| 5 | Discover Card Execution Note Trust 2014-A3 | 1.220% | 10/15/19 | 1,350 | 1,349 |
| 5 | Discover Card Execution Note Trust 2014-A5 | 1.390% | 4/15/20 | 1,175 | 1,179 |
| 5 | Discover Card Execution Note Trust 2015-A2 | 1.900% | 10/17/22 | 1,050 | 1,076 |
| 5 | Discover Card Execution Note Trust 2015-A3 | 1.450% | 3/15/21 | 825 | 833 |
| 5 | Discover Card Execution Note Trust 2015-A4 | 2.190% | 4/17/23 | 825 | 852 |
| 5 | Discover Card Execution Note Trust 2016-A1 | 1.640% | 7/15/21 | 1,200 | 1,218 |
| 4,5 | Fannie Mae-Aces 2010-M1 | 4.450% | 9/25/19 | 155 | 169 |
| 4,5 | Fannie Mae-Aces 2011-M2 | 3.764% | 4/25/21 | 600 | 662 |
| 4,5 | Fannie Mae-Aces 2011-M4 | 3.726% | 6/25/21 | 1,025 | 1,128 |
| 4,5 | Fannie Mae-Aces 2012-M9 | 1.553% | 4/25/22 | 102 | 103 |
| 4,5 | Fannie Mae-Aces 2013-M12 | 2.473% | 3/25/23 | 1,054 | 1,080 |
| 4,5 | Fannie Mae-Aces 2013-M4 | 2.608% | 3/25/22 | 75 | 79 |
| 4,5 | Fannie Mae-Aces 2013-M7 | 2.280% | 12/27/22 | 450 | 462 |
| 4,5 | Fannie Mae-Aces 2014-M1 | 2.323% | 11/25/18 | 1,577 | 1,614 |
| 4,5 | Fannie Mae-Aces 2014-M1 | 3.411% | 7/25/23 | 1,675 | 1,820 |
| 4,5 | Fannie Mae-Aces 2014-M10 | 2.171% | 9/25/19 | 825 | 850 |
| 4,5 | Fannie Mae-Aces 2014-M12 | 2.614% | 10/25/21 | 1,250 | 1,309 |
| 4,5 | Fannie Mae-Aces 2014-M13 | 1.637% | 11/25/17 | 158 | 159 |
| 4,5 | Fannie Mae-Aces 2014-M13 | 2.566% | 8/25/24 | 165 | 174 |
| 4,5 | Fannie Mae-Aces 2014-M13 | 3.021% | 8/25/24 | 475 | 506 |
| 4,5 | Fannie Mae-Aces 2014-M15 | 2.509% | 7/25/22 | 500 | 518 |
| 4,5 | Fannie Mae-Aces 2014-M2 | 1.916% | 6/25/21 | 267 | 270 |
| 4,5 | Fannie Mae-Aces 2014-M3 | 2.613% | 1/25/24 | 459 | 482 |
| 4,5 | Fannie Mae-Aces 2014-M3 | 3.501% | 1/25/24 | 600 | 661 |
| 4,5 | Fannie Mae-Aces 2014-M4 | 3.346% | 3/25/24 | 625 | 685 |
| 4,5 | Fannie Mae-Aces 2014-M6 | 2.679% | 5/25/21 | 1,175 | 1,234 |
| 4,5 | Fannie Mae-Aces 2014-M7 | 3.356% | 6/25/24 | 1,265 | 1,404 |
| 4,5 | Fannie Mae-Aces 2014-M8 | 2.346% | 6/25/24 | 194 | 202 |
| 4,5 | Fannie Mae-Aces 2014-M8 | 3.056% | 6/25/24 | 650 | 693 |
| 4,5 | Fannie Mae-Aces 2014-M9 | 1.462% | 4/25/17 | 704 | 703 |
| 4,5 | Fannie Mae-Aces 2014-M9 | 3.103% | 7/25/24 | 775 | 840 |
| 4,5 | Fannie Mae-Aces 2015-M1 | 1.626% | 2/25/18 | 311 | 313 |
| 4,5 | Fannie Mae-Aces 2015-M1 | 2.532% | 9/25/24 | 1,075 | 1,113 |
| 4,5 | Fannie Mae-Aces 2015-M10 | 3.092% | 4/25/27 | 350 | 374 |
| 4,5 | Fannie Mae-Aces 2015-M12 | 2.885% | 5/25/25 | 850 | 887 |
62
| Vanguard® Balanced Index Fund | |||||
| Schedule of Investments | |||||
| June 30, 2016 | |||||
| Face | Market | ||||
| Maturity | Amount | Value | |||
| Coupon | Date | ($000) | ($000) | ||
| 4,5 | Fannie Mae-Aces 2015-M15 | 2.923% | 10/25/25 | 1,025 | 1,079 |
| 4,5 | Fannie Mae-Aces 2015-M2 | 2.620% | 12/25/24 | 775 | 793 |
| 4,5 | Fannie Mae-Aces 2015-M3 | 2.723% | 10/25/24 | 400 | 418 |
| 4,5 | Fannie Mae-Aces 2015-M7 | 1.550% | 4/25/18 | 225 | 227 |
| 4,5 | Fannie Mae-Aces 2015-M7 | 2.590% | 12/25/24 | 750 | 779 |
| 4,5 | Fannie Mae-Aces 2015-M8 | 2.344% | 1/25/25 | 399 | 417 |
| 4,5 | Fannie Mae-Aces 2015-M8 | 2.900% | 1/25/25 | 425 | 455 |
| 4,5 | Fannie Mae-Aces 2016-M2 | 2.152% | 1/25/23 | 725 | 736 |
| 4,5 | Fannie Mae-Aces 2016-M3 | 2.702% | 2/25/26 | 400 | 418 |
| 4,5 | Fannie Mae-Aces 2016-M4 | 2.576% | 3/25/26 | 400 | 414 |
| 4,5 | Fannie Mae-Aces 2016-M5 | 2.469% | 4/25/26 | 800 | 824 |
| 4,5 | Fannie Mae-Aces 2016-M6 | 2.488% | 5/25/26 | 600 | 616 |
| 4,5 | FHLMC Multifamily Structured Pass Through | ||||
| Certificates K005 | 3.484% | 4/25/19 | 761 | 776 | |
| 4,5 | FHLMC Multifamily Structured Pass Through | ||||
| Certificates K006 | 3.398% | 7/25/19 | 543 | 559 | |
| 4,5 | FHLMC Multifamily Structured Pass Through | ||||
| Certificates K007 | 3.342% | 12/25/19 | 422 | 430 | |
| 4,5 | FHLMC Multifamily Structured Pass Through | ||||
| Certificates K009 | 2.757% | 5/25/20 | 652 | 664 | |
| 4,5 | FHLMC Multifamily Structured Pass Through | ||||
| Certificates K010 | 2.412% | 8/25/18 | 249 | 255 | |
| 4,5 | FHLMC Multifamily Structured Pass Through | ||||
| Certificates K010 | 3.320% | 7/25/20 | 733 | 752 | |
| 4,5 | FHLMC Multifamily Structured Pass Through | ||||
| Certificates K011 | 4.084% | 11/25/20 | 1,775 | 1,963 | |
| 4,5 | FHLMC Multifamily Structured Pass Through | ||||
| Certificates K012 | 4.186% | 12/25/20 | 800 | 895 | |
| 4,5 | FHLMC Multifamily Structured Pass Through | ||||
| Certificates K014 | 3.871% | 4/25/21 | 524 | 579 | |
| 4,5 | FHLMC Multifamily Structured Pass Through | ||||
| Certificates K017 | 2.873% | 12/25/21 | 1,450 | 1,536 | |
| 4,5 | FHLMC Multifamily Structured Pass Through | ||||
| Certificates K019 | 2.272% | 3/25/22 | 585 | 602 | |
| 4,5 | FHLMC Multifamily Structured Pass Through | ||||
| Certificates K020 | 2.373% | 5/25/22 | 100 | 104 | |
| 4,5 | FHLMC Multifamily Structured Pass Through | ||||
| Certificates K021 | 2.396% | 6/25/22 | 915 | 957 | |
| 4,5 | FHLMC Multifamily Structured Pass Through | ||||
| Certificates K021 | 3.490% | 1/25/24 | 50 | 56 | |
| 4,5 | FHLMC Multifamily Structured Pass Through | ||||
| Certificates K026 | 2.510% | 11/25/22 | 1,275 | 1,335 | |
| 4,5 | FHLMC Multifamily Structured Pass Through | ||||
| Certificates K027 | 2.637% | 1/25/23 | 1,275 | 1,347 | |
| 4,5 | FHLMC Multifamily Structured Pass Through | ||||
| Certificates K028 | 2.745% | 1/25/26 | 700 | 739 | |
| 4,5 | FHLMC Multifamily Structured Pass Through | ||||
| Certificates K029 | 3.320% | 2/25/23 | 1,250 | 1,372 | |
| 4,5 | FHLMC Multifamily Structured Pass Through | ||||
| Certificates K030 | 2.779% | 9/25/22 | 1,043 | 1,085 | |
| 4,5 | FHLMC Multifamily Structured Pass Through | ||||
| Certificates K031 | 3.300% | 4/25/23 | 1,260 | 1,383 | |
| 4,5 | FHLMC Multifamily Structured Pass Through | ||||
| Certificates K032 | 3.016% | 2/25/23 | 1,071 | 1,132 | |
| 4,5 | FHLMC Multifamily Structured Pass Through | ||||
| Certificates K033 | 2.871% | 2/25/23 | 1,119 | 1,176 | |
| 4,5 | FHLMC Multifamily Structured Pass Through | ||||
| Certificates K034 | 3.531% | 7/25/23 | 1,208 | 1,344 | |
| 4,5 | FHLMC Multifamily Structured Pass Through | ||||
| Certificates K036 | 3.527% | 10/25/23 | 1,375 | 1,529 | |
| 4,5 | FHLMC Multifamily Structured Pass Through | ||||
| Certificates K038 | 2.604% | 10/25/23 | 377 | 395 | |
| 4,5 | FHLMC Multifamily Structured Pass Through | ||||
| Certificates K038 | 3.389% | 3/25/24 | 1,475 | 1,632 | |
63
| Vanguard® Balanced Index Fund | |||||
| Schedule of Investments | |||||
| June 30, 2016 | |||||
| Face | Market | ||||
| Maturity | Amount | Value | |||
| Coupon | Date | ($000) | ($000) | ||
| 4,5 | FHLMC Multifamily Structured Pass Through | ||||
| Certificates K039 | 2.683% | 12/25/23 | 269 | 282 | |
| 4,5 | FHLMC Multifamily Structured Pass Through | ||||
| Certificates K039 | 3.303% | 7/25/24 | 850 | 937 | |
| 4,5 | FHLMC Multifamily Structured Pass Through | ||||
| Certificates K040 | 2.768% | 4/25/24 | 378 | 400 | |
| 4,5 | FHLMC Multifamily Structured Pass Through | ||||
| Certificates K040 | 3.241% | 9/25/24 | 1,025 | 1,123 | |
| 4,5 | FHLMC Multifamily Structured Pass Through | ||||
| Certificates K041 | 3.171% | 10/25/24 | 1,000 | 1,094 | |
| 4,5 | FHLMC Multifamily Structured Pass Through | ||||
| Certificates K042 | 2.267% | 6/25/24 | 190 | 199 | |
| 4,5 | FHLMC Multifamily Structured Pass Through | ||||
| Certificates K042 | 2.670% | 12/25/24 | 700 | 736 | |
| 4,5 | FHLMC Multifamily Structured Pass Through | ||||
| Certificates K043 | 2.532% | 10/25/23 | 192 | 201 | |
| 4,5 | FHLMC Multifamily Structured Pass Through | ||||
| Certificates K043 | 2.493% | 11/25/24 | 411 | 435 | |
| 4,5 | FHLMC Multifamily Structured Pass Through | ||||
| Certificates K043 | 3.062% | 12/25/24 | 600 | 651 | |
| 4,5 | FHLMC Multifamily Structured Pass Through | ||||
| Certificates K043 | 3.023% | 1/25/25 | 675 | 731 | |
| 4,5 | FHLMC Multifamily Structured Pass Through | ||||
| Certificates K046 | 3.205% | 3/25/25 | 650 | 709 | |
| 4,5 | FHLMC Multifamily Structured Pass Through | ||||
| Certificates K047 | 2.827% | 12/25/24 | 221 | 235 | |
| 4,5 | FHLMC Multifamily Structured Pass Through | ||||
| Certificates K047 | 3.329% | 5/25/25 | 525 | 578 | |
| 4,5 | FHLMC Multifamily Structured Pass Through | ||||
| Certificates K048 | 3.284% | 6/25/25 | 825 | 911 | |
| 4,5 | FHLMC Multifamily Structured Pass Through | ||||
| Certificates K049 | 3.010% | 7/25/25 | 450 | 484 | |
| 4,5 | FHLMC Multifamily Structured Pass Through | ||||
| Certificates K050 | 3.334% | 8/25/25 | 750 | 829 | |
| 4,5 | FHLMC Multifamily Structured Pass Through | ||||
| Certificates K052 | 3.151% | 11/25/25 | 450 | 490 | |
| 4,5 | FHLMC Multifamily Structured Pass Through | ||||
| Certificates K053 | 2.995% | 12/25/25 | 275 | 296 | |
| 4,5 | FHLMC Multifamily Structured Pass Through | ||||
| Certificates K055 | 2.673% | 3/25/26 | 1,000 | 1,048 | |
| 4,5 | FHLMC Multifamily Structured Pass Through | ||||
| Certificates K152 | 3.080% | 1/25/31 | 400 | 414 | |
| 4,5 | FHLMC Multifamily Structured Pass Through | ||||
| Certificates K503 | 1.384% | 1/25/19 | 551 | 552 | |
| 4,5 | FHLMC Multifamily Structured Pass Through | ||||
| Certificates K503 | 2.456% | 8/25/19 | 1,250 | 1,289 | |
| 4,5 | FHLMC Multifamily Structured Pass Through | ||||
| Certificates K504 | 2.566% | 9/25/20 | 400 | 415 | |
| 4,5 | FHLMC Multifamily Structured Pass Through | ||||
| Certificates K702 | 3.154% | 2/25/18 | 1,762 | 1,811 | |
| 4,5 | FHLMC Multifamily Structured Pass Through | ||||
| Certificates K706 | 2.323% | 10/25/18 | 375 | 385 | |
| 4,5 | FHLMC Multifamily Structured Pass Through | ||||
| Certificates K707 | 2.220% | 12/25/18 | 575 | 590 | |
| 4,5 | FHLMC Multifamily Structured Pass Through | ||||
| Certificates K708 | 1.670% | 10/25/18 | 11 | 11 | |
| 4,5 | FHLMC Multifamily Structured Pass Through | ||||
| Certificates K710 | 1.883% | 5/25/19 | 100 | 102 | |
| 4,5 | FHLMC Multifamily Structured Pass Through | ||||
| Certificates K711 | 1.321% | 12/25/18 | 682 | 684 | |
| 4,5 | FHLMC Multifamily Structured Pass Through | ||||
| Certificates K711 | 1.730% | 7/25/19 | 1,675 | 1,696 | |
| 4,5 | FHLMC Multifamily Structured Pass Through | ||||
| Certificates K712 | 1.869% | 11/25/19 | 800 | 817 | |
64
| Vanguard® Balanced Index Fund | |||||
| Schedule of Investments | |||||
| June 30, 2016 | |||||
| Face | Market | ||||
| Maturity | Amount | Value | |||
| Coupon | Date | ($000) | ($000) | ||
| 4,5 | FHLMC Multifamily Structured Pass Through | ||||
| Certificates K713 | 2.313% | 3/25/20 | 2,000 | 2,073 | |
| 4,5 | FHLMC Multifamily Structured Pass Through | ||||
| Certificates K714 | 3.034% | 10/25/20 | 1,630 | 1,735 | |
| 4,5 | FHLMC Multifamily Structured Pass Through | ||||
| Certificates K716 | 3.130% | 6/25/21 | 1,400 | 1,511 | |
| 4,5 | FHLMC Multifamily Structured Pass Through | ||||
| Certificates K716 | 2.413% | 8/25/47 | 250 | 257 | |
| 4,5 | FHLMC Multifamily Structured Pass Through | ||||
| Certificates K717 | 2.991% | 9/25/21 | 800 | 860 | |
| 4,5 | FHLMC Multifamily Structured Pass Through | ||||
| Certificates K718 | 2.375% | 9/25/21 | 812 | 843 | |
| 4,5 | FHLMC Multifamily Structured Pass Through | ||||
| Certificates K718 | 2.791% | 1/25/22 | 800 | 854 | |
| 4,5 | FHLMC Multifamily Structured Pass Through | ||||
| Certificates K722 | 2.183% | 5/25/22 | 400 | 408 | |
| 4,5 | FHLMC Multifamily Structured Pass Through | ||||
| Certificates KW01 | 2.853% | 1/25/26 | 800 | 849 | |
| 4,5 | FHLMC Multifamily Structures Pass Through | ||||
| Certificates K715 | 2.856% | 1/25/21 | 475 | 506 | |
| 4,5 | FHLMC Multifamily Structures Pass Through | ||||
| Certificates K715 | 2.716% | 6/25/22 | 525 | 557 | |
| 5 | Fifth Third Auto 2014-1 | 0.680% | 4/16/18 | 80 | 80 |
| 5 | Fifth Third Auto 2014-1 | 1.420% | 3/16/20 | 425 | 428 |
| 5 | Fifth Third Auto 2014-1 | 1.140% | 10/15/20 | 175 | 175 |
| 5 | Fifth Third Auto 2014-2 | 0.890% | 11/15/18 | 119 | 119 |
| 5 | Fifth Third Auto 2014-2 | 1.380% | 12/15/20 | 100 | 100 |
| 5 | Ford Credit Auto Lease Trust 2014-A | 0.900% | 6/15/17 | 4 | 4 |
| 5 | Ford Credit Auto Lease Trust 2014-A | 1.160% | 8/15/17 | 125 | 125 |
| 5 | Ford Credit Auto Lease Trust 2014-B | 0.890% | 9/15/17 | 97 | 97 |
| 5 | Ford Credit Auto Lease Trust 2015-A | 1.130% | 6/15/18 | 325 | 325 |
| 5 | Ford Credit Auto Lease Trust 2015-A | 1.310% | 8/15/18 | 75 | 75 |
| 5 | Ford Credit Auto Lease Trust 2015-B | 1.380% | 12/15/18 | 300 | 300 |
| 5 | Ford Credit Auto Lease Trust 2015-B | 1.540% | 2/15/19 | 200 | 200 |
| 5 | Ford Credit Auto Owner Trust 2013-B | 0.760% | 8/15/18 | 158 | 158 |
| 5 | Ford Credit Auto Owner Trust 2013-C | 0.820% | 12/15/17 | 25 | 25 |
| 5 | Ford Credit Auto Owner Trust 2013-C | 1.250% | 10/15/18 | 83 | 83 |
| 5 | Ford Credit Auto Owner Trust 2013-D | 0.670% | 4/15/18 | 134 | 134 |
| 5 | Ford Credit Auto Owner Trust 2013-D | 1.110% | 2/15/19 | 100 | 100 |
| 5 | Ford Credit Auto Owner Trust 2014-A | 0.790% | 5/15/18 | 174 | 174 |
| 5 | Ford Credit Auto Owner Trust 2014-A | 1.290% | 4/15/19 | 100 | 100 |
| 5 | Ford Credit Auto Owner Trust 2014-B | 0.900% | 10/15/18 | 237 | 237 |
| 5 | Ford Credit Auto Owner Trust 2014-B | 1.420% | 8/15/19 | 75 | 75 |
| 5 | Ford Credit Auto Owner Trust 2015-A | 1.280% | 9/15/19 | 200 | 201 |
| 5 | Ford Credit Auto Owner Trust 2015-A | 1.640% | 6/15/20 | 50 | 50 |
| 5 | Ford Credit Auto Owner Trust 2015-B | 1.160% | 11/15/19 | 275 | 276 |
| 5 | Ford Credit Auto Owner Trust 2015-B | 1.580% | 8/15/20 | 100 | 101 |
| 5 | Ford Credit Auto Owner Trust 2015-C | 1.410% | 2/15/20 | 200 | 201 |
| 5 | Ford Credit Auto Owner Trust 2015-C | 1.740% | 2/15/21 | 100 | 101 |
| 5 | Ford Credit Floorplan Master Owner Trust A Series | ||||
| 2013-5 | 1.500% | 9/15/18 | 350 | 350 | |
| 5 | Ford Credit Floorplan Master Owner Trust A Series | ||||
| 2014-1 | 1.200% | 2/15/19 | 450 | 451 | |
| 5 | Ford Credit Floorplan Master Owner Trust A Series | ||||
| 2014-4 | 1.400% | 8/15/19 | 850 | 848 | |
| 5 | Ford Credit Floorplan Master Owner Trust A Series | ||||
| 2016-1 | 1.760% | 2/15/21 | 800 | 804 | |
| 5 | GE Capital Credit Card Master Note Trust Series 2012-7 | 1.760% | 9/15/22 | 409 | 413 |
| 5 | GM Financial Leasing Trust 2015-2 | 1.680% | 12/20/18 | 400 | 403 |
| 5 | GM Financial Leasing Trust 2015-2 | 1.850% | 7/22/19 | 200 | 201 |
| 5 | GM Financial Leasing Trust 2015-3 | 1.690% | 3/20/19 | 200 | 202 |
| 5 | GM Financial Leasing Trust 2015-3 | 1.810% | 11/20/19 | 200 | 201 |
| 5 | GM Financial Leasing Trust 2016-1 | 1.790% | 3/20/20 | 425 | 426 |
65
| Vanguard® Balanced Index Fund | |||||
| Schedule of Investments | |||||
| June 30, 2016 | |||||
| Face | Market | ||||
| Maturity | Amount | Value | |||
| Coupon | Date | ($000) | ($000) | ||
| 5 | GM Financial Leasing Trust 2016-2 | 1.620% | 9/20/19 | 375 | 377 |
| 5 | GS Mortgage Securities Trust 2011-GC5 | 3.707% | 8/10/44 | 145 | 158 |
| 5 | GS Mortgage Securities Trust 2012-GC6 | 3.482% | 1/10/45 | 750 | 809 |
| 5 | GS Mortgage Securities Trust 2012-GCJ7 | 3.377% | 5/10/45 | 440 | 472 |
| 5 | GS Mortgage Securities Trust 2012-GCJ9 | 2.773% | 11/10/45 | 325 | 340 |
| 5 | GS Mortgage Securities Trust 2013-GC10 | 2.943% | 2/10/46 | 246 | 258 |
| 5 | GS Mortgage Securities Trust 2013-GC10 | 3.279% | 2/10/46 | 92 | 96 |
| 5 | GS Mortgage Securities Trust 2013-GCJ12 | 3.135% | 6/10/46 | 275 | 293 |
| GS Mortgage Securities Trust 2013-GCJ12 | 3.375% | 6/10/46 | 118 | 124 | |
| 5 | GS Mortgage Securities Trust 2013-GCJ14 | 2.995% | 8/10/46 | 191 | 196 |
| 5 | GS Mortgage Securities Trust 2013-GCJ14 | 3.817% | 8/10/46 | 135 | 145 |
| 5 | GS Mortgage Securities Trust 2013-GCJ14 | 4.243% | 8/10/46 | 675 | 764 |
| 5 | GS Mortgage Securities Trust 2013-GCJ16 | 3.033% | 11/10/46 | 210 | 216 |
| 5 | GS Mortgage Securities Trust 2013-GCJ16 | 3.813% | 11/10/46 | 100 | 109 |
| 5 | GS Mortgage Securities Trust 2013-GCJ16 | 4.271% | 11/10/46 | 125 | 142 |
| 5 | GS Mortgage Securities Trust 2014-GC18 | 4.074% | 1/10/47 | 825 | 921 |
| 5 | GS Mortgage Securities Trust 2014-GC18 | 4.383% | 1/10/47 | 275 | 307 |
| 5 | GS Mortgage Securities Trust 2014-GC18 | 3.467% | 6/10/47 | 175 | 188 |
| 5 | GS Mortgage Securities Trust 2014-GC18 | 3.862% | 6/10/47 | 150 | 166 |
| 5 | GS Mortgage Securities Trust 2014-GC24 | 3.931% | 9/10/47 | 475 | 527 |
| 5 | GS Mortgage Securities Trust 2014-GC24 | 4.641% | 9/10/47 | 125 | 140 |
| 5 | GS Mortgage Securities Trust 2014-GC26 | 2.902% | 11/10/47 | 125 | 130 |
| 5 | GS Mortgage Securities Trust 2014-GC26 | 3.365% | 11/10/47 | 250 | 269 |
| 5 | GS Mortgage Securities Trust 2014-GC26 | 3.629% | 11/10/47 | 800 | 867 |
| 5 | GS Mortgage Securities Trust 2014-GC26 | 3.964% | 11/10/47 | 125 | 135 |
| 5 | GS Mortgage Securities Trust 2014-GC26 | 4.215% | 11/10/47 | 125 | 137 |
| 5 | GS Mortgage Securities Trust 2015-GC28 | 3.396% | 2/10/48 | 500 | 532 |
| 5 | GS Mortgage Securities Trust 2015-GC30 | 2.726% | 5/10/50 | 300 | 311 |
| 5 | GS Mortgage Securities Trust 2015-GC30 | 3.382% | 5/10/50 | 450 | 481 |
| 5 | GS Mortgage Securities Trust 2015-GC32 | 3.513% | 7/10/48 | 425 | 459 |
| 5 | GS Mortgage Securities Trust 2015-GC32 | 3.764% | 7/10/48 | 175 | 193 |
| 5 | GS Mortgage Securities Trust 2015-GC34 | 3.278% | 10/10/48 | 400 | 427 |
| 5 | GS Mortgage Securities Trust 2015-GC34 | 3.506% | 10/10/48 | 400 | 432 |
| 5 | GS Mortgage Securities Trust 2016-GS2 | 3.050% | 5/10/49 | 300 | 314 |
| 5 | Honda Auto Receivables 2013-2 Owner Trust | 0.660% | 6/17/19 | 91 | 91 |
| 5 | Honda Auto Receivables 2013-4 Owner Trust | 0.690% | 9/18/17 | 33 | 33 |
| 5 | Honda Auto Receivables 2013-4 Owner Trust | 1.040% | 2/18/20 | 150 | 150 |
| 5 | Honda Auto Receivables 2014-1 Owner Trust | 0.670% | 11/21/17 | 123 | 123 |
| 5 | Honda Auto Receivables 2014-1 Owner Trust | 1.040% | 2/21/20 | 135 | 135 |
| 5 | Honda Auto Receivables 2014-2 Owner Trust | 0.770% | 3/19/18 | 117 | 117 |
| 5 | Honda Auto Receivables 2014-2 Owner Trust | 1.180% | 5/18/20 | 100 | 100 |
| 5 | Honda Auto Receivables 2014-3 Owner Trust | 0.880% | 6/15/18 | 284 | 284 |
| 5 | Honda Auto Receivables 2015-1 Owner Trust | 1.050% | 10/15/18 | 350 | 351 |
| 5 | Honda Auto Receivables 2015-3 Owner Trust | 1.560% | 10/18/21 | 100 | 101 |
| 5 | Honda Auto Receivables 2015-4 Owner Trust | 1.230% | 9/23/19 | 400 | 402 |
| 5 | Huntington Auto Trust 2015-1 | 1.240% | 9/16/19 | 425 | 426 |
| 5 | Hyundai Auto Receivables Trust 2012-C | 0.730% | 6/15/18 | 58 | 58 |
| 5 | Hyundai Auto Receivables Trust 2013-A | 0.750% | 9/17/18 | 189 | 189 |
| 5 | Hyundai Auto Receivables Trust 2013-B | 1.010% | 2/15/19 | 158 | 158 |
| 5 | Hyundai Auto Receivables Trust 2013-C | 1.550% | 3/15/19 | 320 | 321 |
| 5 | Hyundai Auto Receivables Trust 2014-A | 0.790% | 7/16/18 | 93 | 93 |
| 5 | Hyundai Auto Receivables Trust 2014-B | 0.900% | 12/17/18 | 220 | 220 |
| 5 | Hyundai Auto Receivables Trust 2014-B | 1.460% | 11/15/19 | 90 | 90 |
| 5 | Hyundai Auto Receivables Trust 2015-A | 1.370% | 7/15/20 | 125 | 125 |
| 5 | Hyundai Auto Receivables Trust 2015-C | 1.460% | 2/18/20 | 150 | 151 |
| 5 | Hyundai Auto Receivables Trust 2015-C | 1.780% | 11/15/21 | 100 | 101 |
| 5 | JP Morgan Chase Commercial Mortgage Securities | ||||
| Trust 2005-CIBC11 | 5.588% | 8/12/37 | 13 | 13 | |
| 5 | JP Morgan Chase Commercial Mortgage Securities | ||||
| Trust 2006-LDP7 | 6.184% | 4/17/45 | 134 | 134 | |
| 5 | JP Morgan Chase Commercial Mortgage Securities | ||||
| Trust 2006-LDP8 | 5.440% | 5/15/45 | 225 | 225 | |
| 5 | JP Morgan Chase Commercial Mortgage Securities | ||||
| Trust 2007-CIBC20 | 5.794% | 2/12/51 | 1,339 | 1,385 | |
66
| Vanguard® Balanced Index Fund | |||||
| Schedule of Investments | |||||
| June 30, 2016 | |||||
| Face | Market | ||||
| Maturity | Amount | Value | |||
| Coupon | Date | ($000) | ($000) | ||
| 5 | JP Morgan Chase Commercial Mortgage Securities | ||||
| Trust 2007-LDP12 | 5.882% | 2/15/51 | 1,675 | 1,709 | |
| 5 | JP Morgan Chase Commercial Mortgage Securities | ||||
| Trust 2012-C6 | 3.507% | 5/15/45 | 550 | 595 | |
| 5 | JP Morgan Chase Commercial Mortgage Securities | ||||
| Trust 2012-C8 | 2.829% | 10/15/45 | 1,735 | 1,815 | |
| 5 | JP Morgan Chase Commercial Mortgage Securities | ||||
| Trust 2012-CIBX | 3.483% | 6/15/45 | 433 | 467 | |
| 5 | JP Morgan Chase Commercial Mortgage Securities | ||||
| Trust 2013-C10 | 3.142% | 12/15/47 | 146 | 155 | |
| 5 | JP Morgan Chase Commercial Mortgage Securities | ||||
| Trust 2013-C10 | 3.372% | 12/15/47 | 109 | 115 | |
| 5 | JP Morgan Chase Commercial Mortgage Securities | ||||
| Trust 2013-C16 | 3.674% | 12/15/46 | 150 | 163 | |
| 5 | JP Morgan Chase Commercial Mortgage Securities | ||||
| Trust 2013-C16 | 3.881% | 12/15/46 | 200 | 222 | |
| 5 | JP Morgan Chase Commercial Mortgage Securities | ||||
| Trust 2013-C16 | 4.166% | 12/15/46 | 300 | 338 | |
| 5 | JP Morgan Chase Commercial Mortgage Securities | ||||
| Trust 2013-C16 | 4.517% | 12/15/46 | 150 | 168 | |
| 5 | JP Morgan Chase Commercial Mortgage Securities | ||||
| Trust 2013-C16 | 5.076% | 12/15/46 | 150 | 167 | |
| 5 | JP Morgan Chase Commercial Mortgage Securities | ||||
| Trust 2013-LC11 | 2.960% | 4/15/46 | 673 | 706 | |
| 5 | JP Morgan Chase Commercial Mortgage Securities | ||||
| Trust 2014-C20 | 2.872% | 7/15/47 | 175 | 182 | |
| 5 | JP Morgan Chase Commercial Mortgage Securities | ||||
| Trust 2014-C20 | 3.805% | 7/15/47 | 75 | 82 | |
| 5 | JPMBB Commercial Mortgage Securities Trust 2013- | ||||
| C12 | 3.664% | 7/15/45 | 122 | 133 | |
| 5 | JPMBB Commercial Mortgage Securities Trust 2013- | ||||
| C12 | 4.161% | 7/15/45 | 81 | 89 | |
| 5 | JPMBB Commercial Mortgage Securities Trust 2013- | ||||
| C14 | 3.761% | 8/15/46 | 240 | 261 | |
| 5 | JPMBB Commercial Mortgage Securities Trust 2013- | ||||
| C14 | 4.133% | 8/15/46 | 790 | 888 | |
| 5 | JPMBB Commercial Mortgage Securities Trust 2013- | ||||
| C14 | 4.409% | 8/15/46 | 220 | 247 | |
| 5 | JPMBB Commercial Mortgage Securities Trust 2013- | ||||
| C15 | 2.977% | 11/15/45 | 520 | 537 | |
| 5 | JPMBB Commercial Mortgage Securities Trust 2013- | ||||
| C15 | 3.659% | 11/15/45 | 65 | 71 | |
| 5 | JPMBB Commercial Mortgage Securities Trust 2013- | ||||
| C15 | 4.131% | 11/15/45 | 435 | 490 | |
| 5 | JPMBB Commercial Mortgage Securities Trust 2013- | ||||
| C15 | 4.420% | 11/15/45 | 275 | 307 | |
| 5 | JPMBB Commercial Mortgage Securities Trust 2013- | ||||
| C17 | 3.003% | 1/15/47 | 250 | 259 | |
| 5 | JPMBB Commercial Mortgage Securities Trust 2013- | ||||
| C17 | 3.705% | 1/15/47 | 188 | 204 | |
| 5 | JPMBB Commercial Mortgage Securities Trust 2013- | ||||
| C17 | 4.199% | 1/15/47 | 625 | 706 | |
| 5 | JPMBB Commercial Mortgage Securities Trust 2013- | ||||
| C17 | 4.458% | 1/15/47 | 125 | 140 | |
| 5 | JPMBB Commercial Mortgage Securities Trust 2013- | ||||
| C17 | 5.050% | 1/15/47 | 188 | 218 | |
| 5 | JPMBB Commercial Mortgage Securities Trust 2014- | ||||
| C18 | 4.079% | 2/15/47 | 474 | 531 | |
| 5 | JPMBB Commercial Mortgage Securities Trust 2014- | ||||
| C18 | 4.439% | 2/15/47 | 93 | 104 | |
| 5 | JPMBB Commercial Mortgage Securities Trust 2014- | ||||
| C18 | 4.974% | 2/15/47 | 113 | 128 | |
| 5 | JPMBB Commercial Mortgage Securities Trust 2014- | ||||
| C19 | 3.046% | 4/15/47 | 175 | 183 | |
67
| Vanguard® Balanced Index Fund | |||||
| Schedule of Investments | |||||
| June 30, 2016 | |||||
| Face | Market | ||||
| Maturity | Amount | Value | |||
| Coupon | Date | ($000) | ($000) | ||
| 5 | JPMBB Commercial Mortgage Securities Trust 2014- | ||||
| C19 | 3.669% | 4/15/47 | 225 | 240 | |
| 5 | JPMBB Commercial Mortgage Securities Trust 2014- | ||||
| C19 | 3.996% | 4/15/47 | 225 | 251 | |
| 5 | JPMBB Commercial Mortgage Securities Trust 2014- | ||||
| C19 | 4.243% | 4/15/47 | 175 | 193 | |
| 5 | JPMBB Commercial Mortgage Securities Trust 2014- | ||||
| C19 | 4.110% | 9/15/47 | 175 | 190 | |
| 5 | JPMBB Commercial Mortgage Securities Trust 2014- | ||||
| C21 | 3.428% | 8/15/47 | 109 | 117 | |
| 5 | JPMBB Commercial Mortgage Securities Trust 2014- | ||||
| C21 | 3.775% | 8/15/47 | 100 | 110 | |
| 5 | JPMBB Commercial Mortgage Securities Trust 2014- | ||||
| C21 | 3.996% | 8/15/47 | 75 | 81 | |
| 5 | JPMBB Commercial Mortgage Securities Trust 2014- | ||||
| C22 | 3.801% | 9/15/47 | 650 | 714 | |
| 5 | JPMBB Commercial Mortgage Securities Trust 2014- | ||||
| C23 | 3.934% | 9/15/47 | 319 | 354 | |
| 5 | JPMBB Commercial Mortgage Securities Trust 2014- | ||||
| C23 | 4.202% | 9/15/47 | 188 | 207 | |
| 5 | JPMBB Commercial Mortgage Securities Trust 2014- | ||||
| C24 | 2.940% | 11/15/47 | 200 | 209 | |
| 5 | JPMBB Commercial Mortgage Securities Trust 2014- | ||||
| C24 | 3.638% | 11/15/47 | 150 | 163 | |
| 5 | JPMBB Commercial Mortgage Securities Trust 2014- | ||||
| C24 | 3.914% | 11/15/47 | 300 | 324 | |
| 5 | JPMBB Commercial Mortgage Securities Trust 2014- | ||||
| C25 | 3.672% | 11/15/47 | 750 | 818 | |
| 5 | JPMBB Commercial Mortgage Securities Trust 2014- | ||||
| C25 | 4.065% | 11/15/47 | 200 | 219 | |
| 5 | JPMBB Commercial Mortgage Securities Trust 2014- | ||||
| C26 | 3.018% | 1/15/48 | 400 | 419 | |
| 5 | JPMBB Commercial Mortgage Securities Trust 2014- | ||||
| C26 | 3.494% | 1/15/48 | 600 | 647 | |
| 5 | JPMBB Commercial Mortgage Securities Trust 2014- | ||||
| C26 | 3.800% | 1/15/48 | 200 | 213 | |
| 5 | JPMBB Commercial Mortgage Securities Trust 2014- | ||||
| C26 | 3.951% | 1/15/48 | 200 | 209 | |
| 5 | JPMBB Commercial Mortgage Securities Trust 2015- | ||||
| C27 | 2.734% | 2/15/48 | 325 | 338 | |
| 5 | JPMBB Commercial Mortgage Securities Trust 2015- | ||||
| C27 | 3.017% | 2/15/48 | 409 | 430 | |
| 5 | JPMBB Commercial Mortgage Securities Trust 2015- | ||||
| C27 | 3.179% | 2/15/48 | 218 | 230 | |
| 5 | JPMBB Commercial Mortgage Securities Trust 2015- | ||||
| C28 | 2.773% | 10/15/48 | 400 | 414 | |
| 5 | JPMBB Commercial Mortgage Securities Trust 2015- | ||||
| C28 | 3.227% | 10/15/48 | 500 | 528 | |
| 5 | JPMBB Commercial Mortgage Securities Trust 2015- | ||||
| C28 | 3.532% | 10/15/48 | 100 | 105 | |
| 5 | JPMBB Commercial Mortgage Securities Trust 2015- | ||||
| C29 | 2.921% | 5/15/48 | 400 | 419 | |
| 5 | JPMBB Commercial Mortgage Securities Trust 2015- | ||||
| C29 | 3.304% | 5/15/48 | 215 | 230 | |
| 5 | JPMBB Commercial Mortgage Securities Trust 2015- | ||||
| C29 | 3.611% | 5/15/48 | 350 | 380 | |
| 5 | JPMBB Commercial Mortgage Securities Trust 2015- | ||||
| C30 | 3.559% | 7/15/48 | 425 | 460 | |
| 5 | JPMBB Commercial Mortgage Securities Trust 2015- | ||||
| C30 | 3.822% | 7/15/48 | 425 | 468 | |
| 5 | JPMBB Commercial Mortgage Securities Trust 2015- | ||||
| C30 | 4.226% | 7/15/48 | 200 | 222 | |
| 5 | JPMBB Commercial Mortgage Securities Trust 2015- | ||||
| C31 | 3.540% | 8/15/48 | 203 | 220 | |
68
| Vanguard® Balanced Index Fund | |||||
| Schedule of Investments | |||||
| June 30, 2016 | |||||
| Face | Market | ||||
| Maturity | Amount | Value | |||
| Coupon | Date | ($000) | ($000) | ||
| 5 | JPMBB Commercial Mortgage Securities Trust 2015- | ||||
| C31 | 3.801% | 8/15/48 | 218 | 240 | |
| 5 | JPMBB Commercial Mortgage Securities Trust 2015- | ||||
| C32 | 3.358% | 11/15/48 | 425 | 455 | |
| 5 | JPMBB Commercial Mortgage Securities Trust 2015- | ||||
| C32 | 3.598% | 11/15/48 | 425 | 461 | |
| 5 | JPMBB Commercial Mortgage Securities Trust 2015- | ||||
| C33 | 3.770% | 12/15/48 | 300 | 330 | |
| 5 | JPMBB Commercial Mortgage Securities Trust 2016- | ||||
| C1 | 3.316% | 3/15/49 | 325 | 347 | |
| 5 | JPMCC Commercial Mortgage Securities Trust 2015- | ||||
| JP1 | 3.914% | 1/15/49 | 325 | 363 | |
| 5 | JPMDB WP Glimcher Mall Trust 2016-C2 | 3.144% | 6/15/49 | 300 | 315 |
| 5 | JPMDB WP Glimcher Mall Trust 2016-C2 | 3.484% | 6/15/49 | 150 | 158 |
| 5 | LB-UBS Commercial Mortgage Trust 2006-C6 | 5.372% | 9/15/39 | 308 | 308 |
| 5 | LB-UBS Commercial Mortgage Trust 2006-C6 | 5.413% | 9/15/39 | 250 | 251 |
| 5 | LB-UBS Commercial Mortgage Trust 2006-C7 | 5.347% | 11/15/38 | 189 | 190 |
| 5 | LB-UBS Commercial Mortgage Trust 2006-C7 | 5.378% | 11/15/38 | 180 | 182 |
| 5 | LB-UBS Commercial Mortgage Trust 2007-C1 | 5.424% | 2/15/40 | 2,029 | 2,040 |
| 5 | LB-UBS Commercial Mortgage Trust 2007-C2 | 5.430% | 2/15/40 | 1,138 | 1,152 |
| 5 | LB-UBS Commercial Mortgage Trust 2008-C1 | 6.248% | 4/15/41 | 1,057 | 1,110 |
| 5 | Mercedes-Benz Auto Lease Trust 2015-A | 1.210% | 10/15/20 | 625 | 626 |
| 5 | Mercedes-Benz Auto Lease Trust 2015-B | 1.340% | 7/16/18 | 200 | 201 |
| 5 | Mercedes-Benz Auto Lease Trust 2015-B | 1.530% | 5/17/21 | 125 | 126 |
| 5 | Mercedes-Benz Auto Receivables Trust 2013-1 | 0.780% | 8/15/17 | 3 | 3 |
| 5 | Mercedes-Benz Auto Receivables Trust 2013-1 | 1.130% | 11/15/19 | 83 | 83 |
| 5 | Mercedes-Benz Auto Receivables Trust 2014-1 | 0.870% | 10/15/18 | 142 | 142 |
| 5 | Mercedes-Benz Auto Receivables Trust 2014-1 | 1.310% | 11/16/20 | 75 | 75 |
| 5 | Mercedes-Benz Auto Receivables Trust 2015-1 | 1.340% | 12/16/19 | 250 | 251 |
| 5 | Mercedes-Benz Auto Receivables Trust 2015-1 | 1.750% | 12/15/21 | 75 | 76 |
| 5 | Merrill Lynch Mortgage Trust 2006-C2 | 5.782% | 8/12/43 | 241 | 241 |
| 5 | Merrill Lynch Mortgage Trust 2007-C1 | 6.021% | 6/12/50 | 1,895 | 1,934 |
| 5 | ML-CFC Commercial Mortgage Trust 2006-3 | 5.456% | 7/12/46 | 160 | 160 |
| 5 | ML-CFC Commercial Mortgage Trust 2006-4 | 5.204% | 12/12/49 | 275 | 278 |
| 5 | ML-CFC Commercial Mortgage Trust 2007-5 | 5.378% | 8/12/48 | 1,361 | 1,374 |
| 5 | Morgan Stanley Bank of America Merrill Lynch Trust | ||||
| 2012-C5 | 3.176% | 8/15/45 | 175 | 186 | |
| 5 | Morgan Stanley Bank of America Merrill Lynch Trust | ||||
| 2013-C10 | 4.219% | 7/15/46 | 2,000 | 2,239 | |
| 5 | Morgan Stanley Bank of America Merrill Lynch Trust | ||||
| 2013-C11 | 4.360% | 8/15/46 | 240 | 272 | |
| 5 | Morgan Stanley Bank of America Merrill Lynch Trust | ||||
| 2013-C11 | 4.560% | 8/15/46 | 120 | 134 | |
| 5 | Morgan Stanley Bank of America Merrill Lynch Trust | ||||
| 2013-C12 | 3.001% | 10/15/46 | 320 | 329 | |
| 5 | Morgan Stanley Bank of America Merrill Lynch Trust | ||||
| 2013-C12 | 4.259% | 10/15/46 | 445 | 504 | |
| 5 | Morgan Stanley Bank of America Merrill Lynch Trust | ||||
| 2013-C13 | 2.936% | 11/15/46 | 150 | 155 | |
| 5 | Morgan Stanley Bank of America Merrill Lynch Trust | ||||
| 2013-C13 | 4.039% | 11/15/46 | 300 | 335 | |
| 5 | Morgan Stanley Bank of America Merrill Lynch Trust | ||||
| 2013-C13 | 4.903% | 11/15/46 | 150 | 170 | |
| 5 | Morgan Stanley Bank of America Merrill Lynch Trust | ||||
| 2013-C7 | 2.918% | 2/15/46 | 179 | 188 | |
| 5 | Morgan Stanley Bank of America Merrill Lynch Trust | ||||
| 2013-C7 | 3.214% | 2/15/46 | 36 | 38 | |
| 5 | Morgan Stanley Bank of America Merrill Lynch Trust | ||||
| 2013-C8 | 3.134% | 12/15/48 | 225 | 239 | |
| 5 | Morgan Stanley Bank of America Merrill Lynch Trust | ||||
| 2013-C8 | 3.376% | 12/15/48 | 100 | 105 | |
| 5 | Morgan Stanley Bank of America Merrill Lynch Trust | ||||
| 2013-C9 | 3.102% | 5/15/46 | 150 | 158 | |
69
| Vanguard® Balanced Index Fund | |||||
| Schedule of Investments | |||||
| June 30, 2016 | |||||
| Face | Market | ||||
| Maturity | Amount | Value | |||
| Coupon | Date | ($000) | ($000) | ||
| 5 | Morgan Stanley Bank of America Merrill Lynch Trust | ||||
| 2013-C9 | 3.456% | 5/15/46 | 125 | 132 | |
| 5 | Morgan Stanley Bank of America Merrill Lynch Trust | ||||
| 2014-C14 | 2.916% | 2/15/47 | 175 | 181 | |
| 5 | Morgan Stanley Bank of America Merrill Lynch Trust | ||||
| 2014-C14 | 3.669% | 2/15/47 | 394 | 418 | |
| 5 | Morgan Stanley Bank of America Merrill Lynch Trust | ||||
| 2014-C14 | 4.064% | 2/15/47 | 375 | 420 | |
| 5 | Morgan Stanley Bank of America Merrill Lynch Trust | ||||
| 2014-C14 | 4.802% | 2/15/47 | 150 | 165 | |
| 5 | Morgan Stanley Bank of America Merrill Lynch Trust | ||||
| 2014-C16 | 2.849% | 6/15/47 | 75 | 78 | |
| 5 | Morgan Stanley Bank of America Merrill Lynch Trust | ||||
| 2014-C16 | 3.477% | 6/15/47 | 75 | 80 | |
| 5 | Morgan Stanley Bank of America Merrill Lynch Trust | ||||
| 2014-C16 | 3.892% | 6/15/47 | 325 | 359 | |
| 5 | Morgan Stanley Bank of America Merrill Lynch Trust | ||||
| 2014-C16 | 4.482% | 6/15/47 | 125 | 139 | |
| 5 | Morgan Stanley Bank of America Merrill Lynch Trust | ||||
| 2014-C18 | 3.194% | 10/15/47 | 400 | 419 | |
| 5 | Morgan Stanley Bank of America Merrill Lynch Trust | ||||
| 2014-C18 | 3.923% | 10/15/47 | 100 | 111 | |
| 5 | Morgan Stanley Bank of America Merrill Lynch Trust | ||||
| 2014-C18 | 4.593% | 10/15/47 | 125 | 142 | |
| 5 | Morgan Stanley Bank of America Merrill Lynch Trust | ||||
| 2014-C19 | 3.101% | 12/15/47 | 400 | 419 | |
| 5 | Morgan Stanley Bank of America Merrill Lynch Trust | ||||
| 2014-C19 | 3.326% | 12/15/47 | 225 | 238 | |
| 5 | Morgan Stanley Bank of America Merrill Lynch Trust | ||||
| 2014-C19 | 3.526% | 12/15/47 | 275 | 299 | |
| 5 | Morgan Stanley Bank of America Merrill Lynch Trust | ||||
| 2015-C20 | 3.069% | 2/15/48 | 200 | 209 | |
| 5 | Morgan Stanley Bank of America Merrill Lynch Trust | ||||
| 2015-C20 | 3.249% | 2/15/48 | 725 | 767 | |
| 5 | Morgan Stanley Bank of America Merrill Lynch Trust | ||||
| 2015-C22 | 3.040% | 4/15/48 | 425 | 444 | |
| 5 | Morgan Stanley Bank of America Merrill Lynch Trust | ||||
| 2015-C22 | 3.306% | 4/15/48 | 325 | 341 | |
| 5 | Morgan Stanley Bank of America Merrill Lynch Trust | ||||
| 2015-C22 | 3.883% | 4/15/48 | 200 | 208 | |
| 5 | Morgan Stanley Bank of America Merrill Lynch Trust | ||||
| 2015-C23 | 2.982% | 7/15/50 | 225 | 235 | |
| 5 | Morgan Stanley Bank of America Merrill Lynch Trust | ||||
| 2015-C23 | 3.398% | 7/15/50 | 150 | 160 | |
| 5 | Morgan Stanley Bank of America Merrill Lynch Trust | ||||
| 2015-C23 | 3.719% | 7/15/50 | 450 | 493 | |
| 5 | Morgan Stanley Bank of America Merrill Lynch Trust | ||||
| 2015-C25 | 3.383% | 10/15/48 | 475 | 505 | |
| 5 | Morgan Stanley Bank of America Merrill Lynch Trust | ||||
| 2015-C25 | 3.635% | 10/15/48 | 250 | 273 | |
| 5 | Morgan Stanley Bank of America Merrill Lynch Trust | ||||
| 2015-C26 | 3.323% | 10/15/48 | 275 | 293 | |
| 5 | Morgan Stanley Bank of America Merrill Lynch Trust | ||||
| 2015-C26 | 3.531% | 10/15/48 | 300 | 326 | |
| 5 | Morgan Stanley Bank of America Merrill Lynch Trust | ||||
| 2015-C27 | 3.557% | 12/15/47 | 200 | 216 | |
| 5 | Morgan Stanley Bank of America Merrill Lynch Trust | ||||
| 2015-C27 | 3.753% | 12/15/47 | 250 | 275 | |
| 5 | Morgan Stanley Bank of America Merrill Lynch Trust | ||||
| 2016-C28 | 3.288% | 1/15/49 | 300 | 314 | |
| 5 | Morgan Stanley Bank of America Merrill Lynch Trust | ||||
| 2016-C28 | 3.544% | 1/15/49 | 800 | 866 | |
| 5 | Morgan Stanley Capital I Trust 2005-IQ9 | 4.770% | 7/15/56 | 105 | 106 |
| 5 | Morgan Stanley Capital I Trust 2005-TOP19 | 4.985% | 6/12/47 | 7 | 7 |
70
| Vanguard® Balanced Index Fund | |||||
| Schedule of Investments | |||||
| June 30, 2016 | |||||
| Face | Market | ||||
| Maturity | Amount | Value | |||
| Coupon | Date | ($000) | ($000) | ||
| 5 | Morgan Stanley Capital I Trust 2006-HQ10 | 5.328% | 11/12/41 | 632 | 631 |
| 5 | Morgan Stanley Capital I Trust 2006-HQ9 | 5.793% | 7/12/44 | 150 | 150 |
| 5 | Morgan Stanley Capital I Trust 2006-IQ12 | 5.370% | 12/15/43 | 150 | 151 |
| 5 | Morgan Stanley Capital I Trust 2007-IQ14 | 5.654% | 4/15/49 | 9 | 9 |
| 5 | Morgan Stanley Capital I Trust 2007-IQ14 | 5.692% | 4/15/49 | 1,385 | 1,402 |
| 5 | Morgan Stanley Capital I Trust 2007-IQ16 | 5.809% | 12/12/49 | 1,484 | 1,537 |
| 5 | Morgan Stanley Capital I Trust 2007-TOP25 | 5.544% | 11/12/49 | 340 | 346 |
| 5 | Morgan Stanley Capital I Trust 2007-TOP27 | 5.820% | 6/11/42 | 1,151 | 1,182 |
| 5 | Morgan Stanley Capital I Trust 2012-C4 | 3.244% | 3/15/45 | 650 | 690 |
| 5 | Morgan Stanley Capital I Trust 2012-C4 | 3.773% | 3/15/45 | 225 | 242 |
| 5 | Morgan Stanley Capital I Trust 2015-UBS8 | 3.809% | 12/15/48 | 300 | 332 |
| 8 | National Australia Bank Ltd. | 2.250% | 3/16/21 | 1,200 | 1,232 |
| 5 | Nissan Auto Lease Trust 2014-B | 1.120% | 9/15/17 | 125 | 125 |
| 5 | Nissan Auto Lease Trust 2015-B | 1.540% | 4/16/18 | 300 | 302 |
| 5 | Nissan Auto Lease Trust 2015-B | 1.700% | 4/15/21 | 200 | 201 |
| 5 | Nissan Auto Receivables 2013-A Owner Trust | 0.750% | 7/15/19 | 428 | 428 |
| 5 | Nissan Auto Receivables 2013-B Owner Trust | 0.840% | 11/15/17 | 26 | 26 |
| 5 | Nissan Auto Receivables 2013-B Owner Trust | 1.310% | 10/15/19 | 120 | 120 |
| 5 | Nissan Auto Receivables 2013-C Owner Trust | 0.670% | 8/15/18 | 104 | 104 |
| 5 | Nissan Auto Receivables 2013-C Owner Trust | 1.300% | 6/15/20 | 225 | 226 |
| 5 | Nissan Auto Receivables 2014-A Owner Trust | 0.720% | 8/15/18 | 86 | 86 |
| 5 | Nissan Auto Receivables 2014-A Owner Trust | 1.340% | 8/17/20 | 200 | 201 |
| 5 | Nissan Auto Receivables 2014-B Owner Trust | 1.110% | 5/15/19 | 198 | 198 |
| 5 | Nissan Auto Receivables 2015-B Owner Trust | 1.050% | 10/15/19 | 375 | 376 |
| 5 | Nissan Auto Receivables 2015-B Owner Trust | 1.340% | 3/16/20 | 250 | 251 |
| 5 | Nissan Auto Receivables 2015-B Owner Trust | 1.790% | 1/17/22 | 125 | 127 |
| 5 | Nissan Auto Receivables 2015-C Owner Trust | 1.370% | 5/15/20 | 125 | 126 |
| 5 | Nissan Auto Receivables 2015-C Owner Trust | 1.670% | 2/15/22 | 200 | 202 |
| 5 | Royal Bank of Canada | 1.200% | 9/19/18 | 850 | 852 |
| Royal Bank of Canada | 2.200% | 9/23/19 | 1,800 | 1,844 | |
| 5 | Royal Bank of Canada | 2.000% | 10/1/19 | 2,000 | 2,029 |
| Royal Bank of Canada | 2.100% | 10/14/20 | 3,950 | 4,036 | |
| 5 | Royal Bank of Canada | 1.875% | 2/5/21 | 475 | 481 |
| Royal Bank of Canada | 2.300% | 3/22/21 | 650 | 669 | |
| 5 | Santander Drive Auto Receivables Trust 2013-4 | 1.590% | 10/15/18 | 131 | 131 |
| 5 | Santander Drive Auto Receivables Trust 2014-4 | 1.080% | 9/17/18 | 85 | 85 |
| 5 | Synchrony Credit Card Master Note Trust 2014-1 | 1.610% | 11/15/20 | 250 | 251 |
| 5 | Synchrony Credit Card Master Note Trust 2015-2 | 1.600% | 4/15/21 | 225 | 226 |
| 5 | Synchrony Credit Card Master Note Trust 2016-2 | 2.210% | 5/15/24 | 362 | 368 |
| 5 | TIAA Seasoned Commercial Mortgage Trust 2007-C4 | 5.538% | 8/15/39 | 35 | 35 |
| 8 | Toronto-Dominion Bank | 2.250% | 3/15/21 | 2,000 | 2,053 |
| 5 | Toyota Auto Receivables 2013-A Owner Trust | 0.690% | 11/15/18 | 97 | 97 |
| 5 | Toyota Auto Receivables 2014-A Owner Trust | 1.180% | 6/17/19 | 100 | 100 |
| 5 | Toyota Auto Receivables 2014-B Owner Trust | 0.760% | 3/15/18 | 63 | 63 |
| 5 | Toyota Auto Receivables 2014-B Owner Trust | 1.310% | 9/16/19 | 100 | 100 |
| 5 | Toyota Auto Receivables 2015-6 Owner Trust | 1.300% | 4/15/20 | 200 | 201 |
| 5 | Toyota Auto Receivables 2015-6 Owner Trust | 1.520% | 8/16/21 | 250 | 252 |
| 5 | Toyota Auto Receivables 2015-B Owner Trust | 1.270% | 5/15/19 | 625 | 627 |
| 5 | Toyota Auto Receivables 2015-B Owner Trust | 1.740% | 9/15/20 | 400 | 405 |
| 5 | Toyota Auto Receivables 2015-C Owner Trust | 1.340% | 6/17/19 | 400 | 402 |
| 5 | Toyota Auto Receivables Owner Trust 2015-C | 1.690% | 12/15/20 | 350 | 353 |
| 5 | UBS-Barclays Commercial Mortgage Trust 2013-C5 | 3.185% | 3/10/46 | 290 | 307 |
| 5 | UBS-Barclays Commercial Mortgage Trust 2013-C6 | 3.244% | 4/10/46 | 175 | 186 |
| 5 | UBS-Barclays Commercial Mortgage Trust 2013-C6 | 3.469% | 4/10/46 | 75 | 79 |
| 5 | USAA Auto Owner Trust 2014-1 | 0.580% | 12/15/17 | 26 | 26 |
| 5 | USAA Auto Owner Trust 2014-1 | 0.940% | 5/15/19 | 75 | 75 |
| 5 | Volkswagen Auto Lease Trust 2014-A | 0.800% | 4/20/17 | 19 | 19 |
| 5 | Volkswagen Auto Lease Trust 2014-A | 0.990% | 7/20/18 | 120 | 120 |
| 5 | Volkswagen Auto Loan Enhanced Trust 2013-2 | 0.700% | 4/20/18 | 56 | 56 |
| 5 | Volkswagen Auto Loan Enhanced Trust 2013-2 | 1.160% | 3/20/20 | 75 | 75 |
| 5 | Volkswagen Auto Loan Enhanced Trust 2014-1 | 0.910% | 10/22/18 | 180 | 180 |
| 5 | Volkswagen Auto Loan Enhanced Trust 2014-1 | 1.450% | 9/21/20 | 225 | 225 |
| 5 | Volkswagen Auto Loan Enhanced Trust 2014-2 | 0.950% | 4/22/19 | 625 | 623 |
| 5 | Volkswagen Auto Loan Enhanced Trust 2014-2 | 1.390% | 5/20/21 | 200 | 199 |
71
| Vanguard® Balanced Index Fund | |||||
| Schedule of Investments | |||||
| June 30, 2016 | |||||
| Face | Market | ||||
| Maturity | Amount | Value | |||
| Coupon | Date | ($000) | ($000) | ||
| 5 | Wachovia Bank Commercial Mortgage Trust Series | ||||
| 2005-C21 | 5.467% | 10/15/44 | 5 | 5 | |
| 5 | Wachovia Bank Commercial Mortgage Trust Series | ||||
| 2006-C26 | 6.224% | 6/15/45 | 121 | 121 | |
| 5 | Wachovia Bank Commercial Mortgage Trust Series | ||||
| 2006-C29 | 5.339% | 11/15/48 | 375 | 378 | |
| 5 | Wells Fargo Commercial Mortgage Trust 2012-LC5 | 2.918% | 10/15/45 | 225 | 236 |
| 5 | Wells Fargo Commercial Mortgage Trust 2014-LC16 | 2.819% | 8/15/50 | 125 | 129 |
| 5 | Wells Fargo Commercial Mortgage Trust 2014-LC16 | 3.477% | 8/15/50 | 100 | 107 |
| 5 | Wells Fargo Commercial Mortgage Trust 2014-LC16 | 3.817% | 8/15/50 | 300 | 329 |
| 5 | Wells Fargo Commercial Mortgage Trust 2014-LC16 | 4.020% | 8/15/50 | 50 | 55 |
| 5 | Wells Fargo Commercial Mortgage Trust 2014-LC18 | 2.954% | 12/15/47 | 250 | 260 |
| 5 | Wells Fargo Commercial Mortgage Trust 2014-LC18 | 3.271% | 12/15/47 | 300 | 316 |
| 5 | Wells Fargo Commercial Mortgage Trust 2014-LC18 | 3.405% | 12/15/47 | 400 | 427 |
| 5 | Wells Fargo Commercial Mortgage Trust 2014-LC18 | 3.808% | 12/15/47 | 200 | 219 |
| 5 | Wells Fargo Commercial Mortgage Trust 2015-C26 | 2.991% | 2/15/48 | 400 | 416 |
| 5 | Wells Fargo Commercial Mortgage Trust 2015-C26 | 3.166% | 2/15/48 | 200 | 210 |
| 5 | Wells Fargo Commercial Mortgage Trust 2015-C26 | 3.580% | 2/15/48 | 175 | 182 |
| 5 | Wells Fargo Commercial Mortgage Trust 2015-C27 | 3.190% | 2/15/48 | 1,025 | 1,083 |
| 5 | Wells Fargo Commercial Mortgage Trust 2015-C28 | 3.540% | 5/15/48 | 625 | 675 |
| 5 | Wells Fargo Commercial Mortgage Trust 2015-C28 | 3.872% | 5/15/48 | 117 | 127 |
| 5 | Wells Fargo Commercial Mortgage Trust 2015-C29 | 3.400% | 6/15/48 | 425 | 453 |
| 5 | Wells Fargo Commercial Mortgage Trust 2015-C29 | 3.637% | 6/15/48 | 625 | 674 |
| 5 | Wells Fargo Commercial Mortgage Trust 2015-LC20 | 2.978% | 4/15/50 | 112 | 117 |
| 5 | Wells Fargo Commercial Mortgage Trust 2015-LC20 | 3.184% | 4/15/50 | 825 | 869 |
| 5 | Wells Fargo Commercial Mortgage Trust 2015-LC20 | 3.719% | 4/15/50 | 200 | 206 |
| 5 | Wells Fargo Commercial Mortgage Trust 2015-LC22 | 3.571% | 9/15/58 | 175 | 188 |
| 5 | Wells Fargo Commercial Mortgage Trust 2015-LC22 | 3.839% | 9/15/58 | 275 | 304 |
| 5 | Wells Fargo Commercial Mortgage Trust 2015-LC22 | 4.207% | 9/15/58 | 225 | 245 |
| 5 | Wells Fargo Commercial Mortgage Trust 2015-NSX1 | 2.632% | 5/15/48 | 175 | 181 |
| 5 | Wells Fargo Commercial Mortgage Trust 2015-NSX1 | 2.934% | 5/15/48 | 125 | 130 |
| 5 | Wells Fargo Commercial Mortgage Trust 2015-NSX1 | 3.148% | 5/15/48 | 175 | 185 |
| 5 | Wells Fargo Commercial Mortgage Trust 2015-P2 | 3.656% | 12/15/48 | 325 | 353 |
| 5 | Wells Fargo Commercial Mortgage Trust 2015-P2 | 3.809% | 12/15/48 | 200 | 221 |
| 5 | Wells Fargo Commercial Mortgage Trust 2015-SG1 | 3.789% | 12/15/47 | 300 | 330 |
| 5 | Wells Fargo Commercial Mortgage Trust 2016-C32 | 3.324% | 1/15/59 | 218 | 232 |
| 5 | Wells Fargo Commercial Mortgage Trust 2016-C32 | 3.560% | 1/15/59 | 475 | 513 |
| 5 | Wells Fargo Commercial Mortgage Trust 2016-C33 | 3.426% | 3/15/59 | 150 | 161 |
| 5 | Wells Fargo Commercial Mortgage Trust 2016-C34 | 3.096% | 6/15/49 | 325 | 340 |
| 5 | WFRBS Commercial Mortgage Trust 2012-C6 | 3.440% | 4/15/45 | 450 | 485 |
| 5 | WFRBS Commercial Mortgage Trust 2012-C7 | 3.431% | 6/15/45 | 300 | 324 |
| 5 | WFRBS Commercial Mortgage Trust 2012-C7 | 4.090% | 6/15/45 | 250 | 274 |
| 5 | WFRBS Commercial Mortgage Trust 2012-C8 | 3.001% | 8/15/45 | 175 | 185 |
| 5 | WFRBS Commercial Mortgage Trust 2012-C9 | 2.870% | 11/15/45 | 365 | 383 |
| 5 | WFRBS Commercial Mortgage Trust 2013-C11 | 3.071% | 3/15/45 | 251 | 265 |
| 5 | WFRBS Commercial Mortgage Trust 2013-C12 | 3.198% | 3/15/48 | 109 | 116 |
| 5 | WFRBS Commercial Mortgage Trust 2013-C12 | 3.560% | 3/15/48 | 52 | 55 |
| 5 | WFRBS Commercial Mortgage Trust 2013-C13 | 3.001% | 5/15/45 | 222 | 234 |
| 5 | WFRBS Commercial Mortgage Trust 2013-C13 | 3.345% | 5/15/45 | 44 | 46 |
| 5 | WFRBS Commercial Mortgage Trust 2013-C14 | 3.337% | 6/15/46 | 400 | 428 |
| 5 | WFRBS Commercial Mortgage Trust 2013-C14 | 3.488% | 6/15/46 | 200 | 212 |
| 5 | WFRBS Commercial Mortgage Trust 2013-C15 | 3.720% | 8/15/46 | 160 | 173 |
| 5 | WFRBS Commercial Mortgage Trust 2013-C15 | 4.153% | 8/15/46 | 650 | 731 |
| 5 | WFRBS Commercial Mortgage Trust 2013-C15 | 4.358% | 8/15/46 | 160 | 178 |
| 5 | WFRBS Commercial Mortgage Trust 2013-C16 | 3.223% | 9/15/46 | 290 | 300 |
| 5 | WFRBS Commercial Mortgage Trust 2013-C16 | 3.963% | 9/15/46 | 180 | 196 |
| 5 | WFRBS Commercial Mortgage Trust 2013-C16 | 4.415% | 9/15/46 | 180 | 205 |
| 5 | WFRBS Commercial Mortgage Trust 2013-C16 | 4.668% | 9/15/46 | 290 | 329 |
| 5 | WFRBS Commercial Mortgage Trust 2013-C17 | 2.921% | 12/15/46 | 100 | 103 |
| 5 | WFRBS Commercial Mortgage Trust 2013-C17 | 3.558% | 12/15/46 | 100 | 107 |
| 5 | WFRBS Commercial Mortgage Trust 2013-C17 | 4.023% | 12/15/46 | 100 | 112 |
| 5 | WFRBS Commercial Mortgage Trust 2013-C17 | 4.255% | 12/15/46 | 100 | 111 |
| 5 | WFRBS Commercial Mortgage Trust 2013-C17 | 4.788% | 12/15/46 | 100 | 113 |
| 5 | WFRBS Commercial Mortgage Trust 2013-C18 | 3.027% | 12/15/46 | 100 | 103 |
72
| Vanguard® Balanced Index Fund | |||||
| Schedule of Investments | |||||
| June 30, 2016 | |||||
| Face | Market | ||||
| Maturity | Amount | Value | |||
| Coupon | Date | ($000) | ($000) | ||
| 5 | WFRBS Commercial Mortgage Trust 2013-C18 | 3.651% | 12/15/46 | 200 | 216 |
| 5 | WFRBS Commercial Mortgage Trust 2013-C18 | 4.162% | 12/15/46 | 1,436 | 1,614 |
| 5 | WFRBS Commercial Mortgage Trust 2013-C18 | 4.387% | 12/15/46 | 50 | 56 |
| 5 | WFRBS Commercial Mortgage Trust 2013-C18 | 4.822% | 12/15/46 | 75 | 84 |
| 5 | WFRBS Commercial Mortgage Trust 2013-UBS1 | 2.927% | 3/15/46 | 250 | 258 |
| 5 | WFRBS Commercial Mortgage Trust 2013-UBS1 | 3.591% | 3/15/46 | 150 | 160 |
| 5 | WFRBS Commercial Mortgage Trust 2013-UBS1 | 4.079% | 3/15/46 | 175 | 196 |
| 5 | WFRBS Commercial Mortgage Trust 2013-UBS1 | 4.783% | 3/15/46 | 50 | 57 |
| 5 | WFRBS Commercial Mortgage Trust 2014-C19 | 3.618% | 3/15/47 | 50 | 54 |
| 5 | WFRBS Commercial Mortgage Trust 2014-C19 | 3.660% | 3/15/47 | 75 | 80 |
| 5 | WFRBS Commercial Mortgage Trust 2014-C19 | 4.101% | 3/15/47 | 175 | 196 |
| 5 | WFRBS Commercial Mortgage Trust 2014-C19 | 4.723% | 3/15/47 | 50 | 56 |
| 5 | WFRBS Commercial Mortgage Trust 2014-C20 | 3.036% | 5/15/47 | 100 | 104 |
| 5 | WFRBS Commercial Mortgage Trust 2014-C20 | 3.638% | 5/15/47 | 100 | 108 |
| 5 | WFRBS Commercial Mortgage Trust 2014-C20 | 3.995% | 5/15/47 | 125 | 139 |
| 5 | WFRBS Commercial Mortgage Trust 2014-C20 | 4.176% | 5/15/47 | 125 | 138 |
| 5 | WFRBS Commercial Mortgage Trust 2014-C21 | 3.678% | 8/15/47 | 425 | 463 |
| 5 | WFRBS Commercial Mortgage Trust 2014-C22 | 3.752% | 9/15/57 | 600 | 656 |
| 5 | WFRBS Commercial Mortgage Trust 2014-C22 | 4.371% | 9/15/57 | 100 | 109 |
| 5 | WFRBS Commercial Mortgage Trust 2014-C23 | 3.636% | 10/15/57 | 249 | 269 |
| 5 | WFRBS Commercial Mortgage Trust 2014-C23 | 3.917% | 10/15/57 | 125 | 139 |
| 5 | WFRBS Commercial Mortgage Trust 2014-C23 | 4.210% | 10/15/57 | 75 | 82 |
| 5 | WFRBS Commercial Mortgage Trust 2014-LC14 | 2.862% | 3/15/47 | 120 | 124 |
| 5 | WFRBS Commercial Mortgage Trust 2014-LC14 | 3.522% | 3/15/47 | 300 | 321 |
| 5 | WFRBS Commercial Mortgage Trust 2014-LC14 | 4.045% | 3/15/47 | 725 | 808 |
| 5 | WFRBS Commercial Mortgage Trust 2014-LC14 | 4.351% | 3/15/47 | 300 | 334 |
| 5 | World Omni Auto Receivables Trust 2012-B | 0.810% | 1/15/19 | 117 | 117 |
| 5 | World Omni Auto Receivables Trust 2013-B | 0.830% | 8/15/18 | 49 | 49 |
| 5 | World Omni Auto Receivables Trust 2013-B | 1.320% | 1/15/20 | 75 | 75 |
| 5 | World Omni Auto Receivables Trust 2014-A | 0.940% | 4/15/19 | 128 | 128 |
| 5 | World Omni Auto Receivables Trust 2014-A | 1.530% | 6/15/20 | 200 | 201 |
| 5 | World Omni Auto Receivables Trust 2015-B | 1.490% | 12/15/20 | 200 | 202 |
| 5 | World Omni Auto Receivables Trust 2015-B | 1.840% | 1/17/22 | 200 | 202 |
| 5 | World Omni Automobile Lease Securitization Trust | ||||
| 2014-A | 1.160% | 9/15/17 | 200 | 200 | |
| 5 | World Omni Automobile Lease Securitization Trust | ||||
| 2014-A | 1.370% | 1/15/20 | 50 | 50 | |
| 5 | World Omni Automobile Lease Securitization Trust | ||||
| 2015-A | 1.540% | 10/15/18 | 225 | 226 | |
| Total Asset-Backed/Commercial Mortgage-Backed Securities (Cost $301,237) | 311,898 | ||||
| Corporate Bonds (11.3%) | |||||
| Finance (3.5%) | |||||
| Banking (2.4%) | |||||
| American Express Bank FSB | 6.000% | 9/13/17 | 225 | 237 | |
| American Express Centurion Bank | 6.000% | 9/13/17 | 1,750 | 1,847 | |
| American Express Co. | 6.150% | 8/28/17 | 535 | 565 | |
| American Express Co. | 7.000% | 3/19/18 | 2,200 | 2,397 | |
| American Express Co. | 2.650% | 12/2/22 | 800 | 813 | |
| American Express Co. | 3.625% | 12/5/24 | 750 | 769 | |
| American Express Co. | 4.050% | 12/3/42 | 121 | 126 | |
| American Express Credit Corp. | 2.375% | 3/24/17 | 825 | 834 | |
| American Express Credit Corp. | 2.125% | 7/27/18 | 550 | 559 | |
| American Express Credit Corp. | 2.125% | 3/18/19 | 2,200 | 2,244 | |
| American Express Credit Corp. | 2.250% | 8/15/19 | 300 | 306 | |
| American Express Credit Corp. | 2.375% | 5/26/20 | 1,400 | 1,432 | |
| American Express Credit Corp. | 2.600% | 9/14/20 | 650 | 671 | |
| American Express Credit Corp. | 2.250% | 5/5/21 | 800 | 813 | |
| Australia & New Zealand Banking Group Ltd. | 1.875% | 10/6/17 | 250 | 252 | |
| Australia & New Zealand Banking Group Ltd. | 1.450% | 5/15/18 | 1,650 | 1,656 | |
| Australia & New Zealand Banking Group Ltd. | 2.000% | 11/16/18 | 800 | 811 | |
| Australia & New Zealand Banking Group Ltd. | 2.250% | 6/13/19 | 300 | 306 | |
| Australia & New Zealand Banking Group Ltd. | 2.700% | 11/16/20 | 800 | 830 | |
73
| Vanguard® Balanced Index Fund | ||||
| Schedule of Investments | ||||
| June 30, 2016 | ||||
| Face | Market | |||
| Maturity | Amount | Value | ||
| Coupon | Date | ($000) | ($000) | |
| Australia & New Zealand Banking Group Ltd. | 3.700% | 11/16/25 | 750 | 829 |
| Australia & New Zealand Banking Group Ltd. | 2.300% | 6/1/21 | 2,050 | 2,082 |
| Banco Bilbao Vizcaya Argentaria SA | 3.000% | 10/20/20 | 950 | 968 |
| Bank of America Corp. | 1.700% | 8/25/17 | 600 | 602 |
| Bank of America Corp. | 6.400% | 8/28/17 | 1,370 | 1,446 |
| Bank of America Corp. | 6.000% | 9/1/17 | 376 | 395 |
| Bank of America Corp. | 5.750% | 12/1/17 | 785 | 831 |
| Bank of America Corp. | 2.000% | 1/11/18 | 2,650 | 2,668 |
| Bank of America Corp. | 6.875% | 4/25/18 | 4,330 | 4,726 |
| Bank of America Corp. | 5.650% | 5/1/18 | 4,450 | 4,764 |
| Bank of America Corp. | 2.600% | 1/15/19 | 5,325 | 5,436 |
| Bank of America Corp. | 5.490% | 3/15/19 | 200 | 216 |
| Bank of America Corp. | 2.650% | 4/1/19 | 2,450 | 2,512 |
| Bank of America Corp. | 7.625% | 6/1/19 | 1,124 | 1,299 |
| Bank of America Corp. | 2.250% | 4/21/20 | 1,000 | 1,004 |
| Bank of America Corp. | 5.625% | 7/1/20 | 1,460 | 1,644 |
| Bank of America Corp. | 2.625% | 10/19/20 | 575 | 585 |
| Bank of America Corp. | 5.875% | 1/5/21 | 145 | 166 |
| Bank of America Corp. | 2.625% | 4/19/21 | 2,500 | 2,534 |
| Bank of America Corp. | 5.000% | 5/13/21 | 1,205 | 1,344 |
| Bank of America Corp. | 5.700% | 1/24/22 | 500 | 577 |
| Bank of America Corp. | 3.300% | 1/11/23 | 5,400 | 5,548 |
| Bank of America Corp. | 4.125% | 1/22/24 | 1,400 | 1,508 |
| Bank of America Corp. | 4.000% | 4/1/24 | 1,750 | 1,868 |
| Bank of America Corp. | 4.200% | 8/26/24 | 1,500 | 1,552 |
| Bank of America Corp. | 4.000% | 1/22/25 | 2,240 | 2,281 |
| Bank of America Corp. | 3.950% | 4/21/25 | 1,500 | 1,525 |
| Bank of America Corp. | 3.875% | 8/1/25 | 2,500 | 2,649 |
| Bank of America Corp. | 4.450% | 3/3/26 | 725 | 765 |
| Bank of America Corp. | 4.250% | 10/22/26 | 1,225 | 1,271 |
| Bank of America Corp. | 6.110% | 1/29/37 | 810 | 962 |
| Bank of America Corp. | 7.750% | 5/14/38 | 2,100 | 2,957 |
| Bank of America Corp. | 5.875% | 2/7/42 | 1,150 | 1,452 |
| Bank of America Corp. | 5.000% | 1/21/44 | 2,200 | 2,540 |
| Bank of America Corp. | 4.875% | 4/1/44 | 550 | 627 |
| Bank of America Corp. | 4.750% | 4/21/45 | 350 | 358 |
| Bank of America NA | 1.650% | 3/26/18 | 2,375 | 2,384 |
| Bank of America NA | 1.750% | 6/5/18 | 1,350 | 1,359 |
| Bank of America NA | 2.050% | 12/7/18 | 1,000 | 1,014 |
| Bank of America NA | 6.000% | 10/15/36 | 350 | 446 |
| Bank of Montreal | 1.300% | 7/14/17 | 400 | 401 |
| Bank of Montreal | 1.450% | 4/9/18 | 500 | 502 |
| Bank of Montreal | 1.400% | 4/10/18 | 850 | 854 |
| Bank of Montreal | 1.800% | 7/31/18 | 1,000 | 1,013 |
| Bank of Montreal | 2.375% | 1/25/19 | 575 | 590 |
| Bank of Montreal | 2.550% | 11/6/22 | 450 | 464 |
| Bank of New York Mellon Corp. | 1.969% | 6/20/17 | 200 | 202 |
| Bank of New York Mellon Corp. | 1.300% | 1/25/18 | 1,100 | 1,105 |
| Bank of New York Mellon Corp. | 2.100% | 1/15/19 | 325 | 332 |
| Bank of New York Mellon Corp. | 2.200% | 3/4/19 | 225 | 231 |
| Bank of New York Mellon Corp. | 5.450% | 5/15/19 | 350 | 392 |
| Bank of New York Mellon Corp. | 2.300% | 9/11/19 | 1,900 | 1,945 |
| Bank of New York Mellon Corp. | 4.600% | 1/15/20 | 400 | 441 |
| Bank of New York Mellon Corp. | 2.600% | 8/17/20 | 300 | 311 |
| Bank of New York Mellon Corp. | 2.450% | 11/27/20 | 750 | 771 |
| Bank of New York Mellon Corp. | 2.050% | 5/3/21 | 2,000 | 2,033 |
| Bank of New York Mellon Corp. | 3.550% | 9/23/21 | 625 | 677 |
| Bank of New York Mellon Corp. | 3.650% | 2/4/24 | 150 | 165 |
| Bank of New York Mellon Corp. | 3.250% | 9/11/24 | 600 | 643 |
| Bank of New York Mellon Corp. | 2.800% | 5/4/26 | 1,200 | 1,240 |
| Bank of Nova Scotia | 1.300% | 7/21/17 | 425 | 426 |
| Bank of Nova Scotia | 1.375% | 12/18/17 | 275 | 276 |
| Bank of Nova Scotia | 1.450% | 4/25/18 | 1,625 | 1,631 |
74
| Vanguard® Balanced Index Fund | |||||
| Schedule of Investments | |||||
| June 30, 2016 | |||||
| Face | Market | ||||
| Maturity | Amount | Value | |||
| Coupon | Date | ($000) | ($000) | ||
| Bank of Nova Scotia | 1.700% | 6/11/18 | 500 | 505 | |
| Bank of Nova Scotia | 2.050% | 10/30/18 | 450 | 457 | |
| Bank of Nova Scotia | 1.950% | 1/15/19 | 625 | 634 | |
| Bank of Nova Scotia | 2.050% | 6/5/19 | 550 | 559 | |
| Bank of Nova Scotia | 4.375% | 1/13/21 | 105 | 117 | |
| Bank of Nova Scotia | 2.450% | 3/22/21 | 3,000 | 3,085 | |
| Bank of Nova Scotia | 2.800% | 7/21/21 | 1,475 | 1,541 | |
| Bank of Nova Scotia | 4.500% | 12/16/25 | 950 | 1,001 | |
| Barclays Bank plc | 2.500% | 2/20/19 | 300 | 301 | |
| Barclays Bank plc | 6.750% | 5/22/19 | 735 | 830 | |
| Barclays Bank plc | 5.125% | 1/8/20 | 435 | 473 | |
| Barclays Bank plc | 5.140% | 10/14/20 | 105 | 111 | |
| Barclays Bank plc | 3.750% | 5/15/24 | 450 | 470 | |
| Barclays plc | 2.000% | 3/16/18 | 350 | 349 | |
| Barclays plc | 2.750% | 11/8/19 | 475 | 472 | |
| Barclays plc | 2.875% | 6/8/20 | 750 | 743 | |
| Barclays plc | 3.250% | 1/12/21 | 1,000 | 996 | |
| Barclays plc | 4.375% | 9/11/24 | 750 | 724 | |
| Barclays plc | 3.650% | 3/16/25 | 3,000 | 2,884 | |
| Barclays plc | 4.375% | 1/12/26 | 900 | 908 | |
| Barclays plc | 5.200% | 5/12/26 | 800 | 816 | |
| Barclays plc | 5.250% | 8/17/45 | 950 | 998 | |
| BB&T Corp. | 2.150% | 3/22/17 | 450 | 453 | |
| BB&T Corp. | 1.450% | 1/12/18 | 550 | 552 | |
| BB&T Corp. | 2.050% | 6/19/18 | 350 | 356 | |
| BB&T Corp. | 2.250% | 2/1/19 | 200 | 205 | |
| BB&T Corp. | 6.850% | 4/30/19 | 1,250 | 1,435 | |
| BB&T Corp. | 2.050% | 5/10/21 | 800 | 810 | |
| Bear Stearns Cos. LLC | 6.400% | 10/2/17 | 1,300 | 1,381 | |
| Bear Stearns Cos. LLC | 7.250% | 2/1/18 | 2,085 | 2,272 | |
| BNP Paribas SA | 2.375% | 9/14/17 | 775 | 786 | |
| BNP Paribas SA | 2.700% | 8/20/18 | 150 | 154 | |
| BNP Paribas SA | 2.400% | 12/12/18 | 875 | 893 | |
| BNP Paribas SA | 2.450% | 3/17/19 | 600 | 613 | |
| BNP Paribas SA | 2.375% | 5/21/20 | 1,000 | 1,016 | |
| BNP Paribas SA | 5.000% | 1/15/21 | 2,810 | 3,156 | |
| BNP Paribas SA | 3.250% | 3/3/23 | 675 | 702 | |
| BNP Paribas SA | 4.250% | 10/15/24 | 500 | 510 | |
| BPCE SA | 2.500% | 12/10/18 | 650 | 663 | |
| BPCE SA | 2.500% | 7/15/19 | 700 | 715 | |
| BPCE SA | 2.250% | 1/27/20 | 675 | 686 | |
| BPCE SA | 2.650% | 2/3/21 | 825 | 847 | |
| BPCE SA | 4.000% | 4/15/24 | 1,200 | 1,314 | |
| Branch Banking & Trust Co. | 1.350% | 10/1/17 | 300 | 301 | |
| Branch Banking & Trust Co. | 1.450% | 5/10/19 | 650 | 651 | |
| Branch Banking & Trust Co. | 3.625% | 9/16/25 | 2,600 | 2,761 | |
| Branch Banking & Trust Co. | 3.800% | 10/30/26 | 400 | 441 | |
| Capital One Bank USA NA | 1.300% | 6/5/17 | 550 | 550 | |
| Capital One Bank USA NA | 2.150% | 11/21/18 | 300 | 303 | |
| Capital One Bank USA NA | 2.300% | 6/5/19 | 900 | 912 | |
| Capital One Bank USA NA | 8.800% | 7/15/19 | 625 | 733 | |
| Capital One Bank USA NA | 3.375% | 2/15/23 | 1,140 | 1,166 | |
| Capital One Financial Corp. | 6.750% | 9/15/17 | 130 | 138 | |
| Capital One Financial Corp. | 2.450% | 4/24/19 | 1,800 | 1,832 | |
| Capital One Financial Corp. | 4.750% | 7/15/21 | 280 | 311 | |
| Capital One Financial Corp. | 3.500% | 6/15/23 | 82 | 85 | |
| Capital One Financial Corp. | 3.750% | 4/24/24 | 1,000 | 1,044 | |
| Capital One Financial Corp. | 4.200% | 10/29/25 | 500 | 511 | |
| Capital One NA | 1.500% | 9/5/17 | 300 | 300 | |
| Capital One NA | 1.650% | 2/5/18 | 2,000 | 2,007 | |
| Capital One NA | 1.500% | 3/22/18 | 600 | 598 | |
| Capital One NA | 2.400% | 9/5/19 | 350 | 356 | |
| Capital One NA | 2.950% | 7/23/21 | 510 | 523 | |
| 5,8 | Citicorp Lease Pass-Through Trust 1999-1 | 8.040% | 12/15/19 | 1,700 | 1,997 |
75
| Vanguard® Balanced Index Fund | |||||
| Schedule of Investments | |||||
| June 30, 2016 | |||||
| Face | Market | ||||
| Maturity | Amount | Value | |||
| Coupon | Date | ($000) | ($000) | ||
| Citigroup Inc. | 1.550% | 8/14/17 | 575 | 577 | |
| Citigroup Inc. | 6.125% | 11/21/17 | 1,315 | 1,399 | |
| Citigroup Inc. | 1.850% | 11/24/17 | 1,335 | 1,343 | |
| Citigroup Inc. | 1.800% | 2/5/18 | 800 | 803 | |
| Citigroup Inc. | 1.700% | 4/27/18 | 1,500 | 1,502 | |
| Citigroup Inc. | 6.125% | 5/15/18 | 1,406 | 1,518 | |
| Citigroup Inc. | 2.150% | 7/30/18 | 1,750 | 1,770 | |
| Citigroup Inc. | 2.500% | 9/26/18 | 1,825 | 1,860 | |
| Citigroup Inc. | 2.050% | 12/7/18 | 4,850 | 4,886 | |
| Citigroup Inc. | 2.550% | 4/8/19 | 225 | 230 | |
| Citigroup Inc. | 2.050% | 6/7/19 | 975 | 981 | |
| Citigroup Inc. | 2.500% | 7/29/19 | 575 | 586 | |
| Citigroup Inc. | 2.400% | 2/18/20 | 400 | 404 | |
| Citigroup Inc. | 5.375% | 8/9/20 | 470 | 532 | |
| Citigroup Inc. | 2.700% | 3/30/21 | 2,650 | 2,696 | |
| Citigroup Inc. | 4.050% | 7/30/22 | 125 | 132 | |
| Citigroup Inc. | 3.500% | 5/15/23 | 475 | 484 | |
| Citigroup Inc. | 3.875% | 10/25/23 | 725 | 778 | |
| Citigroup Inc. | 3.750% | 6/16/24 | 2,975 | 3,137 | |
| Citigroup Inc. | 4.000% | 8/5/24 | 725 | 749 | |
| Citigroup Inc. | 3.875% | 3/26/25 | 1,100 | 1,111 | |
| Citigroup Inc. | 3.300% | 4/27/25 | 1,000 | 1,021 | |
| Citigroup Inc. | 4.400% | 6/10/25 | 4,800 | 5,003 | |
| Citigroup Inc. | 5.500% | 9/13/25 | 1,000 | 1,121 | |
| Citigroup Inc. | 4.600% | 3/9/26 | 675 | 713 | |
| Citigroup Inc. | 4.300% | 11/20/26 | 1,250 | 1,294 | |
| Citigroup Inc. | 4.450% | 9/29/27 | 500 | 513 | |
| Citigroup Inc. | 6.625% | 1/15/28 | 800 | 1,010 | |
| Citigroup Inc. | 6.000% | 10/31/33 | 425 | 498 | |
| Citigroup Inc. | 6.125% | 8/25/36 | 1,149 | 1,347 | |
| Citigroup Inc. | 8.125% | 7/15/39 | 1,099 | 1,716 | |
| Citigroup Inc. | 5.875% | 1/30/42 | 1,100 | 1,387 | |
| Citigroup Inc. | 5.300% | 5/6/44 | 725 | 784 | |
| Citizens Bank NA | 1.600% | 12/4/17 | 325 | 322 | |
| Citizens Bank NA | 2.300% | 12/3/18 | 500 | 506 | |
| Citizens Bank NA | 2.500% | 3/14/19 | 1,000 | 1,014 | |
| Citizens Bank NA | 2.450% | 12/4/19 | 325 | 329 | |
| Citizens Financial Group Inc. | 4.300% | 12/3/25 | 400 | 422 | |
| Comerica Bank | 5.200% | 8/22/17 | 300 | 312 | |
| Comerica Bank | 4.000% | 7/27/25 | 200 | 207 | |
| Commonwealth Bank of Australia | 1.400% | 9/8/17 | 850 | 854 | |
| Commonwealth Bank of Australia | 1.900% | 9/18/17 | 250 | 252 | |
| Commonwealth Bank of Australia | 1.625% | 3/12/18 | 2,225 | 2,241 | |
| Commonwealth Bank of Australia | 2.500% | 9/20/18 | 900 | 921 | |
| Commonwealth Bank of Australia | 1.750% | 11/2/18 | 650 | 655 | |
| Commonwealth Bank of Australia | 2.250% | 3/13/19 | 225 | 230 | |
| Commonwealth Bank of Australia | 2.050% | 3/15/19 | 475 | 481 | |
| Commonwealth Bank of Australia | 2.300% | 9/6/19 | 500 | 508 | |
| Commonwealth Bank of Australia | 2.400% | 11/2/20 | 650 | 663 | |
| Commonwealth Bank of Australia | 2.550% | 3/15/21 | 625 | 645 | |
| 8 | Commonwealth Bank of Australia | 4.500% | 12/9/25 | 750 | 786 |
| Compass Bank | 1.850% | 9/29/17 | 225 | 224 | |
| Compass Bank | 6.400% | 10/1/17 | 150 | 157 | |
| Compass Bank | 2.750% | 9/29/19 | 225 | 223 | |
| Cooperatieve Rabobank UA | 1.700% | 3/19/18 | 1,025 | 1,034 | |
| Cooperatieve Rabobank UA | 2.250% | 1/14/19 | 1,000 | 1,020 | |
| Cooperatieve Rabobank UA | 2.250% | 1/14/20 | 2,425 | 2,461 | |
| Cooperatieve Rabobank UA | 4.500% | 1/11/21 | 635 | 706 | |
| Cooperatieve Rabobank UA | 3.875% | 2/8/22 | 1,225 | 1,335 | |
| Cooperatieve Rabobank UA | 3.950% | 11/9/22 | 1,975 | 2,041 | |
| Cooperatieve Rabobank UA | 4.625% | 12/1/23 | 1,675 | 1,769 | |
| Cooperatieve Rabobank UA | 3.375% | 5/21/25 | 1,025 | 1,072 | |
| Cooperatieve Rabobank UA | 4.375% | 8/4/25 | 750 | 783 | |
| Cooperatieve Rabobank UA | 5.250% | 5/24/41 | 135 | 168 | |
76
| Vanguard® Balanced Index Fund | |||||
| Schedule of Investments | |||||
| June 30, 2016 | |||||
| Face | Market | ||||
| Maturity | Amount | Value | |||
| Coupon | Date | ($000) | ($000) | ||
| Cooperatieve Rabobank UA | 5.750% | 12/1/43 | 700 | 825 | |
| Cooperatieve Rabobank UA | 5.250% | 8/4/45 | 250 | 279 | |
| Cooperatieve Rabobank UA/NY | 2.500% | 1/19/21 | 1,775 | 1,819 | |
| Credit Suisse AG | 6.000% | 2/15/18 | 975 | 1,035 | |
| Credit Suisse AG | 1.700% | 4/27/18 | 1,300 | 1,302 | |
| Credit Suisse AG | 2.300% | 5/28/19 | 3,450 | 3,496 | |
| Credit Suisse AG | 5.300% | 8/13/19 | 475 | 524 | |
| Credit Suisse AG | 5.400% | 1/14/20 | 200 | 217 | |
| Credit Suisse AG | 3.000% | 10/29/21 | 800 | 818 | |
| Credit Suisse AG | 3.625% | 9/9/24 | 1,825 | 1,882 | |
| 8 | Credit Suisse Group Funding Guernsey Ltd. | 3.450% | 4/16/21 | 2,630 | 2,669 |
| Credit Suisse Group Funding Guernsey Ltd. | 3.800% | 9/15/22 | 2,000 | 2,012 | |
| 8 | Credit Suisse Group Funding Guernsey Ltd. | 3.800% | 6/9/23 | 975 | 973 |
| Credit Suisse Group Funding Guernsey Ltd. | 3.750% | 3/26/25 | 1,500 | 1,472 | |
| 8 | Credit Suisse Group Funding Guernsey Ltd. | 4.550% | 4/17/26 | 1,300 | 1,354 |
| Credit Suisse Group Funding Guernsey Ltd. | 4.875% | 5/15/45 | 950 | 969 | |
| Credit Suisse USA Inc. | 7.125% | 7/15/32 | 465 | 618 | |
| Deutsche Bank AG | 6.000% | 9/1/17 | 2,360 | 2,465 | |
| Deutsche Bank AG | 1.875% | 2/13/18 | 800 | 797 | |
| Deutsche Bank AG | 2.500% | 2/13/19 | 725 | 727 | |
| Deutsche Bank AG | 2.850% | 5/10/19 | 650 | 651 | |
| Deutsche Bank AG | 2.950% | 8/20/20 | 400 | 400 | |
| Deutsche Bank AG | 3.125% | 1/13/21 | 325 | 322 | |
| Deutsche Bank AG | 3.375% | 5/12/21 | 650 | 653 | |
| Deutsche Bank AG | 3.700% | 5/30/24 | 875 | 872 | |
| Deutsche Bank AG | 4.100% | 1/13/26 | 400 | 399 | |
| Discover Bank | 2.000% | 2/21/18 | 1,100 | 1,104 | |
| Discover Bank | 2.600% | 11/13/18 | 1,200 | 1,219 | |
| Discover Bank | 7.000% | 4/15/20 | 250 | 284 | |
| Discover Bank | 3.200% | 8/9/21 | 350 | 359 | |
| Discover Bank | 4.250% | 3/13/26 | 1,125 | 1,176 | |
| Discover Financial Services | 3.850% | 11/21/22 | 225 | 232 | |
| Discover Financial Services | 3.950% | 11/6/24 | 350 | 361 | |
| Discover Financial Services | 3.750% | 3/4/25 | 375 | 377 | |
| Fifth Third Bancorp | 3.500% | 3/15/22 | 825 | 873 | |
| Fifth Third Bancorp | 4.300% | 1/16/24 | 475 | 507 | |
| Fifth Third Bancorp | 8.250% | 3/1/38 | 710 | 1,061 | |
| Fifth Third Bank | 2.150% | 8/20/18 | 500 | 508 | |
| Fifth Third Bank | 2.300% | 3/15/19 | 500 | 510 | |
| Fifth Third Bank | 2.375% | 4/25/19 | 600 | 615 | |
| Fifth Third Bank | 2.250% | 6/14/21 | 500 | 508 | |
| Fifth Third Bank | 2.875% | 10/1/21 | 1,435 | 1,485 | |
| Fifth Third Bank | 3.850% | 3/15/26 | 1,500 | 1,572 | |
| First Horizon National Corp. | 3.500% | 12/15/20 | 300 | 303 | |
| First Niagara Financial Group Inc. | 6.750% | 3/19/20 | 725 | 825 | |
| FirstMerit Bank NA | 4.270% | 11/25/26 | 450 | 463 | |
| FirstMerit Corp. | 4.350% | 2/4/23 | 125 | 131 | |
| Goldman Sachs Capital I | 6.345% | 2/15/34 | 900 | 1,058 | |
| Goldman Sachs Group Inc. | 5.950% | 1/18/18 | 2,285 | 2,440 | |
| Goldman Sachs Group Inc. | 2.375% | 1/22/18 | 1,225 | 1,242 | |
| Goldman Sachs Group Inc. | 6.150% | 4/1/18 | 100 | 108 | |
| Goldman Sachs Group Inc. | 2.900% | 7/19/18 | 3,425 | 3,515 | |
| Goldman Sachs Group Inc. | 2.625% | 1/31/19 | 1,600 | 1,636 | |
| Goldman Sachs Group Inc. | 7.500% | 2/15/19 | 2,020 | 2,309 | |
| Goldman Sachs Group Inc. | 2.550% | 10/23/19 | 3,500 | 3,578 | |
| Goldman Sachs Group Inc. | 5.375% | 3/15/20 | 1,310 | 1,457 | |
| Goldman Sachs Group Inc. | 2.600% | 4/23/20 | 3,125 | 3,179 | |
| Goldman Sachs Group Inc. | 6.000% | 6/15/20 | 2,590 | 2,953 | |
| Goldman Sachs Group Inc. | 2.750% | 9/15/20 | 975 | 995 | |
| Goldman Sachs Group Inc. | 2.625% | 4/25/21 | 500 | 507 | |
| Goldman Sachs Group Inc. | 5.250% | 7/27/21 | 1,675 | 1,888 | |
| Goldman Sachs Group Inc. | 5.750% | 1/24/22 | 3,925 | 4,552 | |
| Goldman Sachs Group Inc. | 3.625% | 1/22/23 | 1,000 | 1,049 | |
| Goldman Sachs Group Inc. | 4.000% | 3/3/24 | 1,400 | 1,498 | |
77
| Vanguard® Balanced Index Fund | ||||
| Schedule of Investments | ||||
| June 30, 2016 | ||||
| Face | Market | |||
| Maturity | Amount | Value | ||
| Coupon | Date | ($000) | ($000) | |
| Goldman Sachs Group Inc. | 3.850% | 7/8/24 | 1,325 | 1,405 |
| Goldman Sachs Group Inc. | 3.500% | 1/23/25 | 3,225 | 3,315 |
| Goldman Sachs Group Inc. | 3.750% | 2/25/26 | 2,600 | 2,728 |
| Goldman Sachs Group Inc. | 5.950% | 1/15/27 | 630 | 726 |
| Goldman Sachs Group Inc. | 6.125% | 2/15/33 | 1,320 | 1,650 |
| Goldman Sachs Group Inc. | 6.450% | 5/1/36 | 1,125 | 1,327 |
| Goldman Sachs Group Inc. | 6.750% | 10/1/37 | 2,770 | 3,419 |
| Goldman Sachs Group Inc. | 6.250% | 2/1/41 | 2,090 | 2,703 |
| Goldman Sachs Group Inc. | 4.800% | 7/8/44 | 975 | 1,077 |
| Goldman Sachs Group Inc. | 5.150% | 5/22/45 | 2,500 | 2,579 |
| Goldman Sachs Group Inc. | 4.750% | 10/21/45 | 500 | 551 |
| HSBC Bank USA NA | 4.875% | 8/24/20 | 950 | 1,028 |
| HSBC Bank USA NA | 5.875% | 11/1/34 | 675 | 818 |
| HSBC Bank USA NA | 5.625% | 8/15/35 | 625 | 719 |
| HSBC Bank USA NA | 7.000% | 1/15/39 | 300 | 382 |
| HSBC Holdings plc | 3.400% | 3/8/21 | 1,651 | 1,700 |
| HSBC Holdings plc | 5.100% | 4/5/21 | 3,560 | 3,919 |
| HSBC Holdings plc | 2.950% | 5/25/21 | 2,000 | 2,023 |
| HSBC Holdings plc | 4.875% | 1/14/22 | 225 | 247 |
| HSBC Holdings plc | 4.000% | 3/30/22 | 700 | 749 |
| HSBC Holdings plc | 3.600% | 5/25/23 | 800 | 818 |
| HSBC Holdings plc | 4.250% | 3/14/24 | 1,000 | 1,009 |
| HSBC Holdings plc | 4.250% | 8/18/25 | 750 | 756 |
| HSBC Holdings plc | 4.300% | 3/8/26 | 4,070 | 4,316 |
| HSBC Holdings plc | 3.900% | 5/25/26 | 2,000 | 2,057 |
| HSBC Holdings plc | 7.625% | 5/17/32 | 400 | 509 |
| HSBC Holdings plc | 7.350% | 11/27/32 | 400 | 489 |
| HSBC Holdings plc | 6.500% | 5/2/36 | 1,485 | 1,774 |
| HSBC Holdings plc | 6.500% | 9/15/37 | 2,160 | 2,606 |
| HSBC Holdings plc | 6.800% | 6/1/38 | 550 | 688 |
| HSBC Holdings plc | 6.100% | 1/14/42 | 200 | 257 |
| HSBC Holdings plc | 5.250% | 3/14/44 | 1,000 | 1,054 |
| HSBC USA Inc. | 1.500% | 11/13/17 | 150 | 150 |
| HSBC USA Inc. | 1.625% | 1/16/18 | 2,025 | 2,020 |
| HSBC USA Inc. | 2.000% | 8/7/18 | 975 | 977 |
| HSBC USA Inc. | 2.625% | 9/24/18 | 850 | 863 |
| HSBC USA Inc. | 2.375% | 11/13/19 | 1,300 | 1,312 |
| HSBC USA Inc. | 2.350% | 3/5/20 | 1,175 | 1,175 |
| HSBC USA Inc. | 2.750% | 8/7/20 | 500 | 506 |
| HSBC USA Inc. | 5.000% | 9/27/20 | 645 | 693 |
| Huntington Bancshares Inc. | 2.600% | 8/2/18 | 175 | 178 |
| Huntington Bancshares Inc. | 7.000% | 12/15/20 | 450 | 525 |
| Huntington Bancshares Inc. | 3.150% | 3/14/21 | 650 | 675 |
| Huntington National Bank | 1.375% | 4/24/17 | 1,100 | 1,102 |
| Huntington National Bank | 2.000% | 6/30/18 | 250 | 253 |
| Huntington National Bank | 2.200% | 11/6/18 | 500 | 506 |
| Huntington National Bank | 2.400% | 4/1/20 | 250 | 254 |
| Huntington National Bank | 2.875% | 8/20/20 | 800 | 823 |
| Intesa Sanpaolo SPA | 3.875% | 1/16/18 | 525 | 539 |
| Intesa Sanpaolo SPA | 3.875% | 1/15/19 | 1,600 | 1,647 |
| Intesa Sanpaolo SPA | 5.250% | 1/12/24 | 625 | 663 |
| JPMorgan Chase & Co. | 2.000% | 8/15/17 | 1,550 | 1,564 |
| JPMorgan Chase & Co. | 6.000% | 1/15/18 | 4,240 | 4,535 |
| JPMorgan Chase & Co. | 1.800% | 1/25/18 | 75 | 76 |
| JPMorgan Chase & Co. | 1.700% | 3/1/18 | 1,150 | 1,157 |
| JPMorgan Chase & Co. | 1.625% | 5/15/18 | 1,785 | 1,793 |
| JPMorgan Chase & Co. | 2.350% | 1/28/19 | 775 | 793 |
| JPMorgan Chase & Co. | 1.850% | 3/22/19 | 1,465 | 1,480 |
| JPMorgan Chase & Co. | 6.300% | 4/23/19 | 2,285 | 2,569 |
| JPMorgan Chase & Co. | 2.200% | 10/22/19 | 75 | 76 |
| JPMorgan Chase & Co. | 2.250% | 1/23/20 | 3,775 | 3,823 |
| JPMorgan Chase & Co. | 2.750% | 6/23/20 | 3,290 | 3,379 |
| JPMorgan Chase & Co. | 4.400% | 7/22/20 | 905 | 986 |
| JPMorgan Chase & Co. | 4.250% | 10/15/20 | 1,175 | 1,278 |
78
| Vanguard® Balanced Index Fund | |||||
| Schedule of Investments | |||||
| June 30, 2016 | |||||
| Face | Market | ||||
| Maturity | Amount | Value | |||
| Coupon | Date | ($000) | ($000) | ||
| JPMorgan Chase & Co. | 2.550% | 3/1/21 | 800 | 814 | |
| JPMorgan Chase & Co. | 4.625% | 5/10/21 | 835 | 928 | |
| JPMorgan Chase & Co. | 2.400% | 6/7/21 | 400 | 405 | |
| JPMorgan Chase & Co. | 4.350% | 8/15/21 | 1,005 | 1,105 | |
| JPMorgan Chase & Co. | 4.500% | 1/24/22 | 2,675 | 2,967 | |
| JPMorgan Chase & Co. | 3.250% | 9/23/22 | 2,425 | 2,534 | |
| JPMorgan Chase & Co. | 3.200% | 1/25/23 | 4,625 | 4,779 | |
| JPMorgan Chase & Co. | 3.375% | 5/1/23 | 3,325 | 3,384 | |
| JPMorgan Chase & Co. | 2.700% | 5/18/23 | 2,000 | 2,010 | |
| JPMorgan Chase & Co. | 3.875% | 2/1/24 | 1,575 | 1,703 | |
| JPMorgan Chase & Co. | 3.625% | 5/13/24 | 275 | 292 | |
| JPMorgan Chase & Co. | 3.875% | 9/10/24 | 2,000 | 2,074 | |
| JPMorgan Chase & Co. | 3.125% | 1/23/25 | 1,600 | 1,635 | |
| JPMorgan Chase & Co. | 3.300% | 4/1/26 | 3,800 | 3,910 | |
| JPMorgan Chase & Co. | 3.200% | 6/15/26 | 1,125 | 1,151 | |
| JPMorgan Chase & Co. | 4.125% | 12/15/26 | 1,375 | 1,451 | |
| JPMorgan Chase & Co. | 6.400% | 5/15/38 | 1,910 | 2,607 | |
| JPMorgan Chase & Co. | 5.500% | 10/15/40 | 950 | 1,192 | |
| JPMorgan Chase & Co. | 5.600% | 7/15/41 | 950 | 1,206 | |
| JPMorgan Chase & Co. | 5.400% | 1/6/42 | 1,200 | 1,489 | |
| JPMorgan Chase & Co. | 5.625% | 8/16/43 | 900 | 1,057 | |
| JPMorgan Chase & Co. | 4.950% | 6/1/45 | 250 | 275 | |
| JPMorgan Chase Bank NA | 6.000% | 10/1/17 | 1,660 | 1,754 | |
| KeyBank NA | 1.650% | 2/1/18 | 450 | 452 | |
| KeyBank NA | 1.700% | 6/1/18 | 500 | 502 | |
| KeyBank NA | 2.500% | 12/15/19 | 300 | 308 | |
| KeyBank NA | 2.250% | 3/16/20 | 500 | 507 | |
| KeyBank NA | 3.300% | 6/1/25 | 500 | 527 | |
| KeyBank NA/Cleveland OH | 2.350% | 3/8/19 | 500 | 511 | |
| KeyCorp | 2.300% | 12/13/18 | 400 | 407 | |
| KeyCorp | 5.100% | 3/24/21 | 1,310 | 1,471 | |
| Lloyds Bank plc | 4.200% | 3/28/17 | 400 | 409 | |
| Lloyds Bank plc | 1.750% | 3/16/18 | 400 | 399 | |
| Lloyds Bank plc | 1.750% | 5/14/18 | 450 | 449 | |
| Lloyds Bank plc | 2.300% | 11/27/18 | 800 | 804 | |
| Lloyds Bank plc | 2.400% | 3/17/20 | 125 | 126 | |
| Lloyds Bank plc | 6.375% | 1/21/21 | 1,875 | 2,197 | |
| Lloyds Bank plc | 3.500% | 5/14/25 | 800 | 822 | |
| Lloyds Banking Group plc | 4.500% | 11/4/24 | 500 | 510 | |
| 8 | Lloyds Banking Group plc | 4.582% | 12/10/25 | 1,750 | 1,754 |
| Lloyds Banking Group plc | 4.650% | 3/24/26 | 1,300 | 1,312 | |
| 8 | Lloyds Banking Group plc | 5.300% | 12/1/45 | 200 | 206 |
| Manufacturers & Traders Trust Co. | 1.400% | 7/25/17 | 450 | 451 | |
| Manufacturers & Traders Trust Co. | 6.625% | 12/4/17 | 600 | 641 | |
| Manufacturers & Traders Trust Co. | 2.300% | 1/30/19 | 1,550 | 1,584 | |
| Manufacturers & Traders Trust Co. | 2.250% | 7/25/19 | 800 | 817 | |
| Manufacturers & Traders Trust Co. | 2.100% | 2/6/20 | 475 | 482 | |
| Manufacturers & Traders Trust Co. | 2.900% | 2/6/25 | 1,000 | 1,028 | |
| Mitsubishi UFJ Financial Group Inc. | 2.950% | 3/1/21 | 2,550 | 2,644 | |
| Mitsubishi UFJ Financial Group Inc. | 3.850% | 3/1/26 | 1,800 | 1,969 | |
| Morgan Stanley | 5.950% | 12/28/17 | 1,110 | 1,181 | |
| Morgan Stanley | 1.875% | 1/5/18 | 1,100 | 1,106 | |
| Morgan Stanley | 6.625% | 4/1/18 | 3,235 | 3,505 | |
| Morgan Stanley | 2.125% | 4/25/18 | 2,925 | 2,950 | |
| Morgan Stanley | 2.200% | 12/7/18 | 500 | 506 | |
| Morgan Stanley | 2.500% | 1/24/19 | 1,675 | 1,707 | |
| Morgan Stanley | 7.300% | 5/13/19 | 1,390 | 1,596 | |
| Morgan Stanley | 2.375% | 7/23/19 | 2,500 | 2,541 | |
| Morgan Stanley | 5.625% | 9/23/19 | 1,715 | 1,901 | |
| Morgan Stanley | 5.500% | 1/26/20 | 525 | 586 | |
| Morgan Stanley | 2.650% | 1/27/20 | 1,600 | 1,626 | |
| Morgan Stanley | 2.800% | 6/16/20 | 3,000 | 3,071 | |
| Morgan Stanley | 5.500% | 7/24/20 | 650 | 735 | |
| Morgan Stanley | 5.750% | 1/25/21 | 1,335 | 1,524 | |
79
| Vanguard® Balanced Index Fund | ||||
| Schedule of Investments | ||||
| June 30, 2016 | ||||
| Face | Market | |||
| Maturity | Amount | Value | ||
| Coupon | Date | ($000) | ($000) | |
| Morgan Stanley | 2.500% | 4/21/21 | 1,600 | 1,613 |
| Morgan Stanley | 5.500% | 7/28/21 | 1,575 | 1,794 |
| Morgan Stanley | 4.875% | 11/1/22 | 875 | 957 |
| Morgan Stanley | 3.750% | 2/25/23 | 950 | 1,006 |
| Morgan Stanley | 4.100% | 5/22/23 | 2,025 | 2,106 |
| Morgan Stanley | 3.875% | 4/29/24 | 5,150 | 5,512 |
| Morgan Stanley | 3.700% | 10/23/24 | 2,550 | 2,668 |
| Morgan Stanley | 4.000% | 7/23/25 | 1,500 | 1,606 |
| Morgan Stanley | 5.000% | 11/24/25 | 1,000 | 1,095 |
| Morgan Stanley | 3.875% | 1/27/26 | 1,800 | 1,912 |
| Morgan Stanley | 4.350% | 9/8/26 | 1,375 | 1,433 |
| Morgan Stanley | 3.950% | 4/23/27 | 1,500 | 1,512 |
| Morgan Stanley | 7.250% | 4/1/32 | 705 | 977 |
| Morgan Stanley | 6.375% | 7/24/42 | 1,200 | 1,620 |
| Morgan Stanley | 4.300% | 1/27/45 | 2,500 | 2,635 |
| MUFG Americas Holdings Corp. | 1.625% | 2/9/18 | 850 | 852 |
| MUFG Americas Holdings Corp. | 2.250% | 2/10/20 | 750 | 758 |
| MUFG Americas Holdings Corp. | 3.500% | 6/18/22 | 275 | 292 |
| MUFG Americas Holdings Corp. | 3.000% | 2/10/25 | 350 | 356 |
| MUFG Union Bank NA | 2.125% | 6/16/17 | 125 | 126 |
| MUFG Union Bank NA | 2.625% | 9/26/18 | 1,200 | 1,226 |
| MUFG Union Bank NA | 2.250% | 5/6/19 | 300 | 305 |
| Murray Street Investment Trust I | 4.647% | 3/9/17 | 725 | 741 |
| National Australia Bank Ltd. | 2.750% | 3/9/17 | 425 | 430 |
| National Australia Bank Ltd. | 2.300% | 7/25/18 | 750 | 764 |
| National Australia Bank Ltd. | 2.000% | 1/14/19 | 300 | 304 |
| National Australia Bank Ltd. | 2.625% | 1/14/21 | 200 | 207 |
| National Australia Bank Ltd. | 3.000% | 1/20/23 | 325 | 340 |
| National Australia Bank Ltd. | 3.375% | 1/14/26 | 500 | 531 |
| National Bank of Canada | 1.450% | 11/7/17 | 225 | 226 |
| National City Corp. | 6.875% | 5/15/19 | 310 | 351 |
| Northern Trust Co. | 6.500% | 8/15/18 | 75 | 83 |
| Northern Trust Corp. | 3.450% | 11/4/20 | 300 | 322 |
| Northern Trust Corp. | 2.375% | 8/2/22 | 825 | 849 |
| Northern Trust Corp. | 3.950% | 10/30/25 | 525 | 590 |
| People's United Bank NA | 4.000% | 7/15/24 | 275 | 281 |
| People's United Financial Inc. | 3.650% | 12/6/22 | 350 | 357 |
| PNC Bank NA | 4.875% | 9/21/17 | 1,250 | 1,299 |
| PNC Bank NA | 1.500% | 10/18/17 | 525 | 527 |
| PNC Bank NA | 6.000% | 12/7/17 | 350 | 372 |
| PNC Bank NA | 1.500% | 2/23/18 | 425 | 428 |
| PNC Bank NA | 1.600% | 6/1/18 | 500 | 505 |
| PNC Bank NA | 1.850% | 7/20/18 | 500 | 505 |
| PNC Bank NA | 1.800% | 11/5/18 | 1,000 | 1,011 |
| PNC Bank NA | 1.950% | 3/4/19 | 300 | 305 |
| PNC Bank NA | 2.250% | 7/2/19 | 600 | 613 |
| PNC Bank NA | 2.400% | 10/18/19 | 600 | 618 |
| PNC Bank NA | 2.300% | 6/1/20 | 630 | 646 |
| PNC Bank NA | 2.600% | 7/21/20 | 270 | 280 |
| PNC Bank NA | 2.450% | 11/5/20 | 500 | 516 |
| PNC Bank NA | 2.150% | 4/29/21 | 650 | 663 |
| PNC Bank NA | 2.950% | 1/30/23 | 100 | 102 |
| PNC Bank NA | 3.800% | 7/25/23 | 700 | 752 |
| PNC Bank NA | 3.300% | 10/30/24 | 350 | 373 |
| PNC Bank NA | 2.950% | 2/23/25 | 750 | 782 |
| PNC Bank NA | 3.250% | 6/1/25 | 575 | 607 |
| PNC Bank NA | 4.200% | 11/1/25 | 825 | 935 |
| PNC Financial Services Group Inc. | 2.854% | 11/9/22 | 1,800 | 1,863 |
| PNC Financial Services Group Inc. | 3.900% | 4/29/24 | 1,450 | 1,556 |
| PNC Funding Corp. | 6.700% | 6/10/19 | 50 | 57 |
| PNC Funding Corp. | 5.125% | 2/8/20 | 770 | 861 |
| PNC Funding Corp. | 4.375% | 8/11/20 | 800 | 879 |
| PNC Funding Corp. | 3.300% | 3/8/22 | 1,900 | 2,022 |
| Regions Bank | 6.450% | 6/26/37 | 500 | 612 |
80
| Vanguard® Balanced Index Fund | ||||
| Schedule of Investments | ||||
| June 30, 2016 | ||||
| Face | Market | |||
| Maturity | Amount | Value | ||
| Coupon | Date | ($000) | ($000) | |
| Regions Financial Corp. | 2.000% | 5/15/18 | 1,325 | 1,328 |
| Regions Financial Corp. | 3.200% | 2/8/21 | 200 | 206 |
| Royal Bank of Canada | 1.400% | 10/13/17 | 1,075 | 1,079 |
| Royal Bank of Canada | 1.500% | 1/16/18 | 1,375 | 1,381 |
| Royal Bank of Canada | 2.200% | 7/27/18 | 2,375 | 2,423 |
| Royal Bank of Canada | 1.800% | 7/30/18 | 1,000 | 1,011 |
| Royal Bank of Canada | 2.000% | 12/10/18 | 650 | 661 |
| Royal Bank of Canada | 2.350% | 10/30/20 | 950 | 977 |
| Royal Bank of Canada | 2.500% | 1/19/21 | 800 | 829 |
| Royal Bank of Canada | 4.650% | 1/27/26 | 750 | 808 |
| Royal Bank of Scotland Group plc | 4.800% | 4/5/26 | 225 | 230 |
| Santander Bank NA | 2.000% | 1/12/18 | 375 | 374 |
| Santander Holdings USA Inc. | 3.450% | 8/27/18 | 625 | 637 |
| Santander Holdings USA Inc. | 2.700% | 5/24/19 | 1,225 | 1,230 |
| Santander Holdings USA Inc. | 2.650% | 4/17/20 | 250 | 248 |
| Santander Holdings USA Inc. | 4.500% | 7/17/25 | 500 | 516 |
| Santander Issuances SAU | 5.179% | 11/19/25 | 1,700 | 1,693 |
| Santander UK Group Holdings plc | 2.875% | 10/16/20 | 975 | 972 |
| Santander UK Group Holdings plc | 3.125% | 1/8/21 | 800 | 802 |
| Santander UK plc | 1.375% | 3/13/17 | 800 | 798 |
| Santander UK plc | 3.050% | 8/23/18 | 525 | 537 |
| Santander UK plc | 2.500% | 3/14/19 | 2,350 | 2,374 |
| Santander UK plc | 2.350% | 9/10/19 | 675 | 678 |
| Santander UK plc | 2.375% | 3/16/20 | 750 | 751 |
| Santander UK plc | 4.000% | 3/13/24 | 1,200 | 1,289 |
| Skandinaviska Enskilda Banken AB | 2.625% | 3/15/21 | 1,000 | 1,034 |
| Societe Generale SA | 2.750% | 10/12/17 | 550 | 559 |
| Societe Generale SA | 2.625% | 10/1/18 | 450 | 461 |
| State Street Corp. | 4.956% | 3/15/18 | 1,025 | 1,075 |
| State Street Corp. | 1.350% | 5/15/18 | 150 | 151 |
| State Street Corp. | 4.375% | 3/7/21 | 615 | 688 |
| State Street Corp. | 1.950% | 5/19/21 | 500 | 506 |
| State Street Corp. | 3.100% | 5/15/23 | 400 | 413 |
| State Street Corp. | 3.300% | 12/16/24 | 1,000 | 1,076 |
| State Street Corp. | 3.550% | 8/18/25 | 385 | 417 |
| State Street Corp. | 2.650% | 5/19/26 | 500 | 511 |
| Sumitomo Mitsui Banking Corp. | 1.350% | 7/11/17 | 500 | 500 |
| Sumitomo Mitsui Banking Corp. | 1.800% | 7/18/17 | 750 | 754 |
| Sumitomo Mitsui Banking Corp. | 1.500% | 1/18/18 | 1,075 | 1,076 |
| Sumitomo Mitsui Banking Corp. | 1.950% | 7/23/18 | 3,000 | 3,031 |
| Sumitomo Mitsui Banking Corp. | 2.450% | 1/10/19 | 525 | 536 |
| Sumitomo Mitsui Banking Corp. | 2.250% | 7/11/19 | 650 | 659 |
| Sumitomo Mitsui Banking Corp. | 2.450% | 10/20/20 | 300 | 305 |
| Sumitomo Mitsui Banking Corp. | 3.200% | 7/18/22 | 325 | 333 |
| Sumitomo Mitsui Banking Corp. | 3.950% | 7/19/23 | 75 | 82 |
| Sumitomo Mitsui Banking Corp. | 3.950% | 1/10/24 | 725 | 786 |
| Sumitomo Mitsui Banking Corp. | 3.400% | 7/11/24 | 925 | 970 |
| Sumitomo Mitsui Financial Group Inc. | 2.934% | 3/9/21 | 1,275 | 1,328 |
| Sumitomo Mitsui Financial Group Inc. | 3.784% | 3/9/26 | 975 | 1,068 |
| SunTrust Bank | 7.250% | 3/15/18 | 75 | 82 |
| SunTrust Bank | 2.750% | 5/1/23 | 250 | 254 |
| SunTrust Bank | 3.300% | 5/15/26 | 725 | 735 |
| SunTrust Banks Inc. | 2.350% | 11/1/18 | 475 | 482 |
| SunTrust Banks Inc. | 2.500% | 5/1/19 | 1,000 | 1,022 |
| SunTrust Banks Inc. | 2.900% | 3/3/21 | 300 | 310 |
| SVB Financial Group | 3.500% | 1/29/25 | 225 | 229 |
| Svenska Handelsbanken AB | 1.625% | 3/21/18 | 1,375 | 1,384 |
| Svenska Handelsbanken AB | 2.500% | 1/25/19 | 775 | 798 |
| Svenska Handelsbanken AB | 2.250% | 6/17/19 | 850 | 866 |
| Svenska Handelsbanken AB | 2.450% | 3/30/21 | 650 | 668 |
| Synchrony Financial | 1.875% | 8/15/17 | 200 | 200 |
| Synchrony Financial | 2.600% | 1/15/19 | 650 | 656 |
| Synchrony Financial | 3.000% | 8/15/19 | 200 | 204 |
| Synchrony Financial | 2.700% | 2/3/20 | 1,050 | 1,053 |
81
| Vanguard® Balanced Index Fund | |||||
| Schedule of Investments | |||||
| June 30, 2016 | |||||
| Face | Market | ||||
| Maturity | Amount | Value | |||
| Coupon | Date | ($000) | ($000) | ||
| Synchrony Financial | 3.750% | 8/15/21 | 300 | 311 | |
| Synchrony Financial | 4.250% | 8/15/24 | 2,750 | 2,848 | |
| Toronto-Dominion Bank | 1.625% | 3/13/18 | 500 | 505 | |
| Toronto-Dominion Bank | 1.400% | 4/30/18 | 2,675 | 2,688 | |
| Toronto-Dominion Bank | 1.750% | 7/23/18 | 1,550 | 1,566 | |
| Toronto-Dominion Bank | 2.125% | 7/2/19 | 500 | 517 | |
| Toronto-Dominion Bank | 2.250% | 11/5/19 | 1,350 | 1,387 | |
| Toronto-Dominion Bank | 2.500% | 12/14/20 | 400 | 414 | |
| Toronto-Dominion Bank | 2.125% | 4/7/21 | 2,000 | 2,036 | |
| UBS AG | 1.375% | 6/1/17 | 825 | 826 | |
| UBS AG | 1.375% | 8/14/17 | 700 | 700 | |
| UBS AG | 5.875% | 12/20/17 | 215 | 229 | |
| UBS AG | 1.800% | 3/26/18 | 2,700 | 2,723 | |
| UBS AG | 5.750% | 4/25/18 | 135 | 145 | |
| UBS AG | 2.375% | 8/14/19 | 380 | 389 | |
| UBS AG | 2.350% | 3/26/20 | 350 | 359 | |
| UBS AG | 4.875% | 8/4/20 | 250 | 281 | |
| US Bancorp | 2.200% | 4/25/19 | 1,100 | 1,128 | |
| US Bancorp | 2.350% | 1/29/21 | 600 | 618 | |
| US Bancorp | 4.125% | 5/24/21 | 915 | 1,018 | |
| US Bancorp | 3.000% | 3/15/22 | 575 | 612 | |
| US Bancorp | 2.950% | 7/15/22 | 375 | 389 | |
| US Bancorp | 3.600% | 9/11/24 | 150 | 162 | |
| US Bancorp | 3.100% | 4/27/26 | 1,500 | 1,561 | |
| US Bank NA | 1.375% | 9/11/17 | 1,250 | 1,257 | |
| US Bank NA | 1.350% | 1/26/18 | 900 | 905 | |
| US Bank NA | 1.400% | 4/26/19 | 500 | 503 | |
| US Bank NA | 2.125% | 10/28/19 | 1,000 | 1,023 | |
| US Bank NA | 2.800% | 1/27/25 | 1,050 | 1,090 | |
| Wachovia Bank NA | 5.850% | 2/1/37 | 425 | 538 | |
| Wachovia Corp. | 5.750% | 2/1/18 | 985 | 1,053 | |
| Wachovia Corp. | 6.605% | 10/1/25 | 1,000 | 1,255 | |
| Wachovia Corp. | 7.500% | 4/15/35 | 150 | 209 | |
| Wachovia Corp. | 5.500% | 8/1/35 | 200 | 237 | |
| Wachovia Corp. | 6.550% | 10/15/35 | 100 | 127 | |
| Wells Fargo & Co. | 1.150% | 6/2/17 | 450 | 450 | |
| Wells Fargo & Co. | 5.625% | 12/11/17 | 2,135 | 2,272 | |
| Wells Fargo & Co. | 1.500% | 1/16/18 | 1,725 | 1,735 | |
| Wells Fargo & Co. | 2.150% | 1/15/19 | 500 | 510 | |
| Wells Fargo & Co. | 2.600% | 7/22/20 | 2,150 | 2,210 | |
| Wells Fargo & Co. | 2.550% | 12/7/20 | 1,500 | 1,538 | |
| Wells Fargo & Co. | 3.000% | 1/22/21 | 2,050 | 2,146 | |
| Wells Fargo & Co. | 4.600% | 4/1/21 | 6,310 | 7,049 | |
| Wells Fargo & Co. | 3.500% | 3/8/22 | 1,600 | 1,714 | |
| Wells Fargo & Co. | 3.450% | 2/13/23 | 1,675 | 1,729 | |
| Wells Fargo & Co. | 4.125% | 8/15/23 | 1,550 | 1,662 | |
| Wells Fargo & Co. | 3.000% | 4/22/26 | 4,900 | 4,981 | |
| Wells Fargo & Co. | 4.100% | 6/3/26 | 2,875 | 3,072 | |
| Wells Fargo & Co. | 4.300% | 7/22/27 | 1,600 | 1,723 | |
| Wells Fargo & Co. | 5.375% | 11/2/43 | 1,000 | 1,166 | |
| Wells Fargo & Co. | 5.606% | 1/15/44 | 1,500 | 1,797 | |
| Wells Fargo & Co. | 4.650% | 11/4/44 | 1,225 | 1,288 | |
| Wells Fargo & Co. | 3.900% | 5/1/45 | 2,350 | 2,462 | |
| Wells Fargo & Co. | 4.900% | 11/17/45 | 1,300 | 1,424 | |
| Wells Fargo & Co. | 4.400% | 6/14/46 | 650 | 658 | |
| Wells Fargo Bank NA | 6.000% | 11/15/17 | 250 | 266 | |
| Wells Fargo Bank NA | 1.650% | 1/22/18 | 625 | 630 | |
| Wells Fargo Bank NA | 1.750% | 5/24/19 | 975 | 986 | |
| Wells Fargo Bank NA | 5.950% | 8/26/36 | 550 | 702 | |
| Wells Fargo Bank NA | 6.600% | 1/15/38 | 605 | 830 | |
| 5 | Wells Fargo Capital X | 5.950% | 12/1/86 | 425 | 452 |
| Westpac Banking Corp. | 2.000% | 8/14/17 | 1,275 | 1,288 | |
| Westpac Banking Corp. | 1.500% | 12/1/17 | 725 | 729 | |
| Westpac Banking Corp. | 1.600% | 1/12/18 | 1,850 | 1,862 | |
82
| Vanguard® Balanced Index Fund | |||||
| Schedule of Investments | |||||
| June 30, 2016 | |||||
| Face | Market | ||||
| Maturity | Amount | Value | |||
| Coupon | Date | ($000) | ($000) | ||
| Westpac Banking Corp. | 2.250% | 7/30/18 | 250 | 255 | |
| Westpac Banking Corp. | 1.950% | 11/23/18 | 1,000 | 1,013 | |
| Westpac Banking Corp. | 2.250% | 1/17/19 | 875 | 888 | |
| Westpac Banking Corp. | 1.650% | 5/13/19 | 725 | 730 | |
| Westpac Banking Corp. | 4.875% | 11/19/19 | 930 | 1,029 | |
| Westpac Banking Corp. | 2.600% | 11/23/20 | 975 | 1,008 | |
| Westpac Banking Corp. | 2.100% | 5/13/21 | 3,100 | 3,134 | |
| Westpac Banking Corp. | 2.850% | 5/13/26 | 1,450 | 1,474 | |
| Brokerage (0.1%) | |||||
| Affiliated Managers Group Inc. | 4.250% | 2/15/24 | 350 | 370 | |
| Affiliated Managers Group Inc. | 3.500% | 8/1/25 | 750 | 747 | |
| Ameriprise Financial Inc. | 7.300% | 6/28/19 | 200 | 232 | |
| Ameriprise Financial Inc. | 5.300% | 3/15/20 | 125 | 141 | |
| Ameriprise Financial Inc. | 4.000% | 10/15/23 | 725 | 789 | |
| Ameriprise Financial Inc. | 3.700% | 10/15/24 | 350 | 374 | |
| Apollo Investment Corp. | 5.250% | 3/3/25 | 200 | 201 | |
| BGC Partners Inc. | 5.375% | 12/9/19 | 175 | 182 | |
| 8 | BGC Partners Inc. | 5.125% | 5/27/21 | 200 | 202 |
| BlackRock Inc. | 6.250% | 9/15/17 | 425 | 452 | |
| BlackRock Inc. | 5.000% | 12/10/19 | 475 | 533 | |
| BlackRock Inc. | 4.250% | 5/24/21 | 475 | 532 | |
| BlackRock Inc. | 3.375% | 6/1/22 | 475 | 514 | |
| BlackRock Inc. | 3.500% | 3/18/24 | 1,000 | 1,089 | |
| Brookfield Asset Management Inc. | 4.000% | 1/15/25 | 550 | 559 | |
| Brookfield Asset Management Inc. | 7.375% | 3/1/33 | 150 | 182 | |
| Brookfield Finance Inc. | 4.250% | 6/2/26 | 150 | 154 | |
| Charles Schwab Corp. | 3.225% | 9/1/22 | 1,225 | 1,296 | |
| CME Group Inc. | 3.000% | 9/15/22 | 875 | 930 | |
| CME Group Inc. | 3.000% | 3/15/25 | 300 | 312 | |
| CME Group Inc. | 5.300% | 9/15/43 | 325 | 410 | |
| E*TRADE Financial Corp. | 5.375% | 11/15/22 | 350 | 370 | |
| E*TRADE Financial Corp. | 4.625% | 9/15/23 | 300 | 304 | |
| Eaton Vance Corp. | 3.625% | 6/15/23 | 200 | 214 | |
| Franklin Resources Inc. | 1.375% | 9/15/17 | 175 | 176 | |
| Franklin Resources Inc. | 4.625% | 5/20/20 | 225 | 249 | |
| Franklin Resources Inc. | 2.800% | 9/15/22 | 575 | 595 | |
| Franklin Resources Inc. | 2.850% | 3/30/25 | 125 | 128 | |
| Intercontinental Exchange Inc. | 2.500% | 10/15/18 | 425 | 435 | |
| Intercontinental Exchange Inc. | 2.750% | 12/1/20 | 1,200 | 1,257 | |
| Intercontinental Exchange Inc. | 4.000% | 10/15/23 | 350 | 379 | |
| Intercontinental Exchange Inc. | 3.750% | 12/1/25 | 1,000 | 1,079 | |
| Invesco Finance plc | 3.125% | 11/30/22 | 500 | 523 | |
| Invesco Finance plc | 4.000% | 1/30/24 | 650 | 714 | |
| Invesco Finance plc | 5.375% | 11/30/43 | 725 | 860 | |
| Janus Capital Group Inc. | 4.875% | 8/1/25 | 250 | 270 | |
| Jefferies Group LLC | 5.125% | 4/13/18 | 320 | 335 | |
| Jefferies Group LLC | 8.500% | 7/15/19 | 455 | 523 | |
| Jefferies Group LLC | 6.875% | 4/15/21 | 620 | 704 | |
| Jefferies Group LLC | 5.125% | 1/20/23 | 300 | 314 | |
| Jefferies Group LLC | 6.250% | 1/15/36 | 320 | 330 | |
| Jefferies Group LLC | 6.500% | 1/20/43 | 250 | 248 | |
| Lazard Group LLC | 6.850% | 6/15/17 | 61 | 64 | |
| Lazard Group LLC | 4.250% | 11/14/20 | 75 | 80 | |
| Lazard Group LLC | 3.750% | 2/13/25 | 100 | 99 | |
| Legg Mason Inc. | 2.700% | 7/15/19 | 175 | 179 | |
| Legg Mason Inc. | 3.950% | 7/15/24 | 150 | 152 | |
| Legg Mason Inc. | 4.750% | 3/15/26 | 150 | 158 | |
| Legg Mason Inc. | 5.625% | 1/15/44 | 450 | 460 | |
| Leucadia National Corp. | 5.500% | 10/18/23 | 475 | 483 | |
| Leucadia National Corp. | 6.625% | 10/23/43 | 125 | 109 | |
| Nasdaq Inc. | 5.550% | 1/15/20 | 650 | 715 | |
| Nasdaq Inc. | 3.850% | 6/30/26 | 300 | 305 | |
| Nomura Holdings Inc. | 2.750% | 3/19/19 | 625 | 639 | |
83
| Vanguard® Balanced Index Fund | |||||
| Schedule of Investments | |||||
| June 30, 2016 | |||||
| Face | Market | ||||
| Maturity | Amount | Value | |||
| Coupon | Date | ($000) | ($000) | ||
| Nomura Holdings Inc. | 6.700% | 3/4/20 | 900 | 1,044 | |
| NYSE Euronext | 2.000% | 10/5/17 | 200 | 202 | |
| Stifel Financial Corp. | 3.500% | 12/1/20 | 175 | 178 | |
| Stifel Financial Corp. | 4.250% | 7/18/24 | 200 | 203 | |
| TD Ameritrade Holding Corp. | 5.600% | 12/1/19 | 100 | 113 | |
| TD Ameritrade Holding Corp. | 2.950% | 4/1/22 | 600 | 626 | |
| TD Ameritrade Holding Corp. | 3.625% | 4/1/25 | 450 | 481 | |
| Finance Companies (0.1%) | |||||
| AerCap Ireland Capital Ltd. / AerCap Global Aviation | |||||
| Trust | 3.950% | 2/1/22 | 500 | 497 | |
| Air Lease Corp. | 2.125% | 1/15/18 | 300 | 298 | |
| Air Lease Corp. | 3.375% | 1/15/19 | 425 | 432 | |
| Air Lease Corp. | 4.750% | 3/1/20 | 275 | 292 | |
| Air Lease Corp. | 3.875% | 4/1/21 | 1,875 | 1,936 | |
| Air Lease Corp. | 3.375% | 6/1/21 | 25 | 26 | |
| Air Lease Corp. | 3.750% | 2/1/22 | 1,975 | 2,014 | |
| Air Lease Corp. | 4.250% | 9/15/24 | 75 | 77 | |
| Ares Capital Corp. | 4.875% | 11/30/18 | 875 | 915 | |
| Ares Capital Corp. | 3.875% | 1/15/20 | 1,425 | 1,476 | |
| FS Investment Corp. | 4.000% | 7/15/19 | 250 | 252 | |
| FS Investment Corp. | 4.750% | 5/15/22 | 150 | 152 | |
| GATX Corp. | 2.375% | 7/30/18 | 150 | 151 | |
| GATX Corp. | 2.500% | 7/30/19 | 150 | 152 | |
| GATX Corp. | 4.750% | 6/15/22 | 275 | 295 | |
| GATX Corp. | 3.250% | 3/30/25 | 375 | 365 | |
| GATX Corp. | 5.200% | 3/15/44 | 150 | 152 | |
| GATX Corp. | 4.500% | 3/30/45 | 150 | 137 | |
| 8 | GE Capital International Funding Co. | 2.342% | 11/15/20 | 8,120 | 8,391 |
| 8 | GE Capital International Funding Co. | 3.373% | 11/15/25 | 2,212 | 2,414 |
| 8 | GE Capital International Funding Co. | 4.418% | 11/15/35 | 6,907 | 7,738 |
| HSBC Finance Corp. | 6.676% | 1/15/21 | 2,811 | 3,148 | |
| 8 | International Lease Finance Corp. | 7.125% | 9/1/18 | 775 | 851 |
| Prospect Capital Corp. | 5.000% | 7/15/19 | 175 | 173 | |
| Prospect Capital Corp. | 5.875% | 3/15/23 | 150 | 145 | |
| Insurance (0.6%) | |||||
| ACE Capital Trust II | 9.700% | 4/1/30 | 75 | 109 | |
| AEGON Funding Co. LLC | 5.750% | 12/15/20 | 664 | 765 | |
| Aetna Inc. | 1.500% | 11/15/17 | 325 | 326 | |
| Aetna Inc. | 1.700% | 6/7/18 | 1,100 | 1,108 | |
| Aetna Inc. | 2.200% | 3/15/19 | 250 | 255 | |
| Aetna Inc. | 1.900% | 6/7/19 | 1,150 | 1,165 | |
| Aetna Inc. | 3.950% | 9/1/20 | 75 | 81 | |
| Aetna Inc. | 4.125% | 6/1/21 | 320 | 348 | |
| Aetna Inc. | 2.400% | 6/15/21 | 450 | 459 | |
| Aetna Inc. | 2.750% | 11/15/22 | 650 | 663 | |
| Aetna Inc. | 2.800% | 6/15/23 | 200 | 204 | |
| Aetna Inc. | 3.500% | 11/15/24 | 495 | 524 | |
| Aetna Inc. | 3.200% | 6/15/26 | 450 | 462 | |
| Aetna Inc. | 4.250% | 6/15/36 | 750 | 775 | |
| Aetna Inc. | 6.625% | 6/15/36 | 500 | 668 | |
| Aetna Inc. | 6.750% | 12/15/37 | 350 | 475 | |
| Aetna Inc. | 4.500% | 5/15/42 | 450 | 477 | |
| Aetna Inc. | 4.125% | 11/15/42 | 200 | 202 | |
| Aetna Inc. | 4.375% | 6/15/46 | 1,815 | 1,887 | |
| Aflac Inc. | 2.400% | 3/16/20 | 150 | 155 | |
| Aflac Inc. | 4.000% | 2/15/22 | 325 | 359 | |
| Aflac Inc. | 3.625% | 6/15/23 | 1,000 | 1,074 | |
| Aflac Inc. | 3.625% | 11/15/24 | 80 | 86 | |
| Aflac Inc. | 3.250% | 3/17/25 | 300 | 312 | |
| Aflac Inc. | 6.900% | 12/17/39 | 150 | 211 | |
| Aflac Inc. | 6.450% | 8/15/40 | 300 | 402 | |
| Alleghany Corp. | 5.625% | 9/15/20 | 100 | 112 | |
| Alleghany Corp. | 4.950% | 6/27/22 | 425 | 473 | |
84
| Vanguard® Balanced Index Fund | |||||
| Schedule of Investments | |||||
| June 30, 2016 | |||||
| Face | Market | ||||
| Maturity | Amount | Value | |||
| Coupon | Date | ($000) | ($000) | ||
| Alleghany Corp. | 4.900% | 9/15/44 | 375 | 390 | |
| Allied World Assurance Co. Holdings Ltd. | 4.350% | 10/29/25 | 2,450 | 2,504 | |
| Allied World Assurance Co. Ltd. | 5.500% | 11/15/20 | 200 | 223 | |
| Allstate Corp. | 3.150% | 6/15/23 | 550 | 581 | |
| Allstate Corp. | 5.550% | 5/9/35 | 105 | 133 | |
| Allstate Corp. | 4.500% | 6/15/43 | 425 | 494 | |
| 5 | Allstate Corp. | 6.125% | 5/15/67 | 165 | 145 |
| 5 | Allstate Corp. | 6.500% | 5/15/67 | 700 | 760 |
| Alterra Finance LLC | 6.250% | 9/30/20 | 95 | 108 | |
| American Financial Group Inc. | 9.875% | 6/15/19 | 100 | 121 | |
| American International Group Inc. | 5.850% | 1/16/18 | 600 | 640 | |
| American International Group Inc. | 2.300% | 7/16/19 | 650 | 661 | |
| American International Group Inc. | 3.375% | 8/15/20 | 425 | 446 | |
| American International Group Inc. | 6.400% | 12/15/20 | 1,160 | 1,363 | |
| American International Group Inc. | 4.875% | 6/1/22 | 1,425 | 1,588 | |
| American International Group Inc. | 4.125% | 2/15/24 | 650 | 686 | |
| American International Group Inc. | 3.750% | 7/10/25 | 550 | 561 | |
| American International Group Inc. | 3.875% | 1/15/35 | 800 | 757 | |
| American International Group Inc. | 4.700% | 7/10/35 | 325 | 337 | |
| American International Group Inc. | 6.250% | 5/1/36 | 600 | 714 | |
| American International Group Inc. | 4.500% | 7/16/44 | 1,275 | 1,241 | |
| American International Group Inc. | 4.800% | 7/10/45 | 450 | 458 | |
| American International Group Inc. | 4.375% | 1/15/55 | 525 | 487 | |
| 5 | American International Group Inc. | 8.175% | 5/15/68 | 400 | 501 |
| Anthem Inc. | 1.875% | 1/15/18 | 425 | 427 | |
| Anthem Inc. | 7.000% | 2/15/19 | 145 | 164 | |
| Anthem Inc. | 2.250% | 8/15/19 | 550 | 555 | |
| Anthem Inc. | 4.350% | 8/15/20 | 450 | 490 | |
| Anthem Inc. | 3.700% | 8/15/21 | 445 | 475 | |
| Anthem Inc. | 3.125% | 5/15/22 | 550 | 569 | |
| Anthem Inc. | 3.300% | 1/15/23 | 750 | 775 | |
| Anthem Inc. | 3.500% | 8/15/24 | 525 | 544 | |
| Anthem Inc. | 5.950% | 12/15/34 | 300 | 354 | |
| Anthem Inc. | 5.850% | 1/15/36 | 150 | 180 | |
| Anthem Inc. | 6.375% | 6/15/37 | 630 | 799 | |
| Anthem Inc. | 4.625% | 5/15/42 | 575 | 604 | |
| Anthem Inc. | 4.650% | 1/15/43 | 650 | 688 | |
| Anthem Inc. | 5.100% | 1/15/44 | 400 | 450 | |
| Anthem Inc. | 4.650% | 8/15/44 | 525 | 562 | |
| Anthem Inc. | 4.850% | 8/15/54 | 175 | 184 | |
| Aon Corp. | 5.000% | 9/30/20 | 990 | 1,108 | |
| Aon Corp. | 8.205% | 1/1/27 | 50 | 64 | |
| Aon Corp. | 6.250% | 9/30/40 | 150 | 191 | |
| Aon plc | 2.800% | 3/15/21 | 550 | 566 | |
| Aon plc | 4.000% | 11/27/23 | 350 | 371 | |
| Aon plc | 3.500% | 6/14/24 | 425 | 439 | |
| Aon plc | 4.450% | 5/24/43 | 125 | 126 | |
| Aon plc | 4.600% | 6/14/44 | 625 | 637 | |
| Aon plc | 4.750% | 5/15/45 | 300 | 323 | |
| Arch Capital Group Ltd. | 7.350% | 5/1/34 | 500 | 676 | |
| Arch Capital Group US Inc. | 5.144% | 11/1/43 | 275 | 299 | |
| Aspen Insurance Holdings Ltd. | 6.000% | 12/15/20 | 450 | 503 | |
| Aspen Insurance Holdings Ltd. | 4.650% | 11/15/23 | 200 | 212 | |
| Assurant Inc. | 4.000% | 3/15/23 | 225 | 232 | |
| Assurant Inc. | 6.750% | 2/15/34 | 550 | 684 | |
| AXA SA | 8.600% | 12/15/30 | 830 | 1,131 | |
| Axis Specialty Finance LLC | 5.875% | 6/1/20 | 990 | 1,108 | |
| AXIS Specialty Finance plc | 2.650% | 4/1/19 | 150 | 152 | |
| AXIS Specialty Finance plc | 5.150% | 4/1/45 | 150 | 162 | |
| Berkshire Hathaway Finance Corp. | 1.450% | 3/7/18 | 550 | 555 | |
| Berkshire Hathaway Finance Corp. | 1.300% | 5/15/18 | 175 | 176 | |
| Berkshire Hathaway Finance Corp. | 5.400% | 5/15/18 | 2,480 | 2,684 | |
| Berkshire Hathaway Finance Corp. | 2.000% | 8/15/18 | 525 | 538 | |
| Berkshire Hathaway Finance Corp. | 1.700% | 3/15/19 | 500 | 508 | |
85
| Vanguard® Balanced Index Fund | ||||
| Schedule of Investments | ||||
| June 30, 2016 | ||||
| Face | Market | |||
| Maturity | Amount | Value | ||
| Coupon | Date | ($000) | ($000) | |
| Berkshire Hathaway Finance Corp. | 2.900% | 10/15/20 | 1,225 | 1,301 |
| Berkshire Hathaway Finance Corp. | 4.250% | 1/15/21 | 480 | 535 |
| Berkshire Hathaway Finance Corp. | 3.000% | 5/15/22 | 300 | 320 |
| Berkshire Hathaway Finance Corp. | 5.750% | 1/15/40 | 130 | 172 |
| Berkshire Hathaway Finance Corp. | 4.400% | 5/15/42 | 400 | 448 |
| Berkshire Hathaway Finance Corp. | 4.300% | 5/15/43 | 275 | 305 |
| Berkshire Hathaway Inc. | 3.000% | 2/11/23 | 225 | 238 |
| Berkshire Hathaway Inc. | 2.750% | 3/15/23 | 1,450 | 1,498 |
| Berkshire Hathaway Inc. | 3.125% | 3/15/26 | 3,675 | 3,854 |
| Berkshire Hathaway Inc. | 4.500% | 2/11/43 | 925 | 1,046 |
| Brown & Brown Inc. | 4.200% | 9/15/24 | 300 | 304 |
| Chubb Corp. | 5.750% | 5/15/18 | 395 | 428 |
| Chubb Corp. | 6.000% | 5/11/37 | 375 | 509 |
| Chubb INA Holdings Inc. | 5.800% | 3/15/18 | 1,125 | 1,207 |
| Chubb INA Holdings Inc. | 5.900% | 6/15/19 | 340 | 382 |
| Chubb INA Holdings Inc. | 2.300% | 11/3/20 | 250 | 257 |
| Chubb INA Holdings Inc. | 2.875% | 11/3/22 | 650 | 680 |
| Chubb INA Holdings Inc. | 2.700% | 3/13/23 | 350 | 359 |
| Chubb INA Holdings Inc. | 3.350% | 5/15/24 | 275 | 293 |
| Chubb INA Holdings Inc. | 3.150% | 3/15/25 | 700 | 731 |
| Chubb INA Holdings Inc. | 3.350% | 5/3/26 | 950 | 1,012 |
| Chubb INA Holdings Inc. | 4.150% | 3/13/43 | 225 | 251 |
| Chubb INA Holdings Inc. | 4.350% | 11/3/45 | 800 | 917 |
| Cigna Corp. | 5.125% | 6/15/20 | 100 | 111 |
| Cigna Corp. | 4.375% | 12/15/20 | 150 | 163 |
| Cigna Corp. | 4.500% | 3/15/21 | 210 | 230 |
| Cigna Corp. | 4.000% | 2/15/22 | 490 | 529 |
| Cigna Corp. | 3.250% | 4/15/25 | 1,675 | 1,713 |
| Cigna Corp. | 6.150% | 11/15/36 | 325 | 403 |
| Cigna Corp. | 5.875% | 3/15/41 | 235 | 288 |
| Cigna Corp. | 5.375% | 2/15/42 | 190 | 224 |
| Cincinnati Financial Corp. | 6.125% | 11/1/34 | 325 | 397 |
| CNA Financial Corp. | 7.350% | 11/15/19 | 1,102 | 1,269 |
| CNA Financial Corp. | 5.875% | 8/15/20 | 145 | 164 |
| CNA Financial Corp. | 5.750% | 8/15/21 | 175 | 202 |
| Coventry Health Care Inc. | 5.450% | 6/15/21 | 390 | 446 |
| Endurance Specialty Holdings Ltd. | 7.000% | 7/15/34 | 150 | 181 |
| Everest Reinsurance Holdings Inc. | 4.868% | 6/1/44 | 300 | 308 |
| First American Financial Corp. | 4.300% | 2/1/23 | 100 | 102 |
| First American Financial Corp. | 4.600% | 11/15/24 | 350 | 367 |
| Hanover Insurance Group Inc. | 4.500% | 4/15/26 | 300 | 310 |
| Hartford Financial Services Group Inc. | 6.300% | 3/15/18 | 600 | 642 |
| Hartford Financial Services Group Inc. | 6.000% | 1/15/19 | 300 | 329 |
| Hartford Financial Services Group Inc. | 5.125% | 4/15/22 | 100 | 114 |
| Hartford Financial Services Group Inc. | 5.950% | 10/15/36 | 25 | 31 |
| Hartford Financial Services Group Inc. | 6.100% | 10/1/41 | 500 | 617 |
| Hartford Financial Services Group Inc. | 4.300% | 4/15/43 | 500 | 500 |
| Horace Mann Educators Corp. | 4.500% | 12/1/25 | 200 | 210 |
| Humana Inc. | 7.200% | 6/15/18 | 50 | 55 |
| Humana Inc. | 2.625% | 10/1/19 | 150 | 154 |
| Humana Inc. | 3.150% | 12/1/22 | 400 | 411 |
| Humana Inc. | 3.850% | 10/1/24 | 450 | 479 |
| Humana Inc. | 8.150% | 6/15/38 | 325 | 472 |
| Humana Inc. | 4.625% | 12/1/42 | 265 | 276 |
| Humana Inc. | 4.950% | 10/1/44 | 400 | 439 |
| Infinity Property & Casualty Corp. | 5.000% | 9/19/22 | 1,100 | 1,170 |
| Kemper Corp. | 4.350% | 2/15/25 | 500 | 518 |
| Lincoln National Corp. | 8.750% | 7/1/19 | 325 | 386 |
| Lincoln National Corp. | 6.250% | 2/15/20 | 305 | 344 |
| Lincoln National Corp. | 4.850% | 6/24/21 | 300 | 332 |
| Lincoln National Corp. | 4.200% | 3/15/22 | 325 | 348 |
| Lincoln National Corp. | 4.000% | 9/1/23 | 225 | 234 |
| Lincoln National Corp. | 3.350% | 3/9/25 | 200 | 199 |
| Lincoln National Corp. | 6.150% | 4/7/36 | 350 | 412 |
86
| Vanguard® Balanced Index Fund | |||||
| Schedule of Investments | |||||
| June 30, 2016 | |||||
| Face | Market | ||||
| Maturity | Amount | Value | |||
| Coupon | Date | ($000) | ($000) | ||
| Lincoln National Corp. | 6.300% | 10/9/37 | 25 | 30 | |
| Loews Corp. | 2.625% | 5/15/23 | 175 | 176 | |
| Loews Corp. | 3.750% | 4/1/26 | 750 | 795 | |
| Loews Corp. | 6.000% | 2/1/35 | 200 | 247 | |
| Loews Corp. | 4.125% | 5/15/43 | 475 | 481 | |
| Manulife Financial Corp. | 4.900% | 9/17/20 | 475 | 526 | |
| Manulife Financial Corp. | 4.150% | 3/4/26 | 725 | 778 | |
| Manulife Financial Corp. | 5.375% | 3/4/46 | 500 | 590 | |
| Markel Corp. | 4.900% | 7/1/22 | 575 | 639 | |
| Markel Corp. | 3.625% | 3/30/23 | 175 | 181 | |
| Markel Corp. | 5.000% | 3/30/43 | 125 | 134 | |
| Markel Corp. | 5.000% | 4/5/46 | 350 | 369 | |
| Marsh & McLennan Cos. Inc. | 2.550% | 10/15/18 | 225 | 229 | |
| Marsh & McLennan Cos. Inc. | 2.350% | 9/10/19 | 100 | 102 | |
| Marsh & McLennan Cos. Inc. | 2.350% | 3/6/20 | 500 | 510 | |
| Marsh & McLennan Cos. Inc. | 4.800% | 7/15/21 | 545 | 606 | |
| Marsh & McLennan Cos. Inc. | 4.050% | 10/15/23 | 350 | 378 | |
| Marsh & McLennan Cos. Inc. | 3.500% | 3/10/25 | 350 | 363 | |
| Marsh & McLennan Cos. Inc. | 3.750% | 3/14/26 | 375 | 395 | |
| Marsh & McLennan Cos. Inc. | 5.875% | 8/1/33 | 900 | 1,107 | |
| MetLife Inc. | 1.756% | 12/15/17 | 425 | 429 | |
| MetLife Inc. | 1.903% | 12/15/17 | 225 | 227 | |
| MetLife Inc. | 6.817% | 8/15/18 | 580 | 646 | |
| MetLife Inc. | 7.717% | 2/15/19 | 105 | 121 | |
| MetLife Inc. | 4.750% | 2/8/21 | 305 | 342 | |
| MetLife Inc. | 3.048% | 12/15/22 | 725 | 745 | |
| MetLife Inc. | 4.368% | 9/15/23 | 500 | 554 | |
| MetLife Inc. | 3.600% | 4/10/24 | 750 | 791 | |
| MetLife Inc. | 3.000% | 3/1/25 | 500 | 505 | |
| MetLife Inc. | 6.375% | 6/15/34 | 505 | 653 | |
| MetLife Inc. | 5.700% | 6/15/35 | 675 | 821 | |
| MetLife Inc. | 5.875% | 2/6/41 | 440 | 548 | |
| MetLife Inc. | 4.125% | 8/13/42 | 475 | 473 | |
| MetLife Inc. | 4.875% | 11/13/43 | 600 | 660 | |
| MetLife Inc. | 4.721% | 12/15/44 | 1,200 | 1,292 | |
| MetLife Inc. | 4.050% | 3/1/45 | 1,000 | 981 | |
| MetLife Inc. | 4.600% | 5/13/46 | 5 | 5 | |
| 5 | MetLife Inc. | 6.400% | 12/15/66 | 1,505 | 1,599 |
| Montpelier Re Holdings Ltd. | 4.700% | 10/15/22 | 25 | 26 | |
| Old Republic International Corp. | 4.875% | 10/1/24 | 450 | 481 | |
| OneBeacon US Holdings Inc. | 4.600% | 11/9/22 | 350 | 357 | |
| PartnerRe Finance B LLC | 5.500% | 6/1/20 | 200 | 223 | |
| Principal Financial Group Inc. | 8.875% | 5/15/19 | 410 | 484 | |
| Principal Financial Group Inc. | 3.125% | 5/15/23 | 200 | 202 | |
| Principal Financial Group Inc. | 6.050% | 10/15/36 | 200 | 250 | |
| Principal Financial Group Inc. | 4.350% | 5/15/43 | 125 | 127 | |
| 5 | Principal Financial Group Inc. | 4.700% | 5/15/55 | 500 | 488 |
| ProAssurance Corp. | 5.300% | 11/15/23 | 100 | 108 | |
| Progressive Corp. | 3.750% | 8/23/21 | 2,445 | 2,686 | |
| Progressive Corp. | 6.625% | 3/1/29 | 150 | 199 | |
| Progressive Corp. | 3.700% | 1/26/45 | 250 | 259 | |
| Protective Life Corp. | 7.375% | 10/15/19 | 100 | 116 | |
| Protective Life Corp. | 8.450% | 10/15/39 | 175 | 245 | |
| Prudential Financial Inc. | 6.000% | 12/1/17 | 130 | 139 | |
| Prudential Financial Inc. | 2.300% | 8/15/18 | 825 | 842 | |
| Prudential Financial Inc. | 7.375% | 6/15/19 | 455 | 528 | |
| Prudential Financial Inc. | 2.350% | 8/15/19 | 225 | 229 | |
| Prudential Financial Inc. | 5.375% | 6/21/20 | 430 | 485 | |
| Prudential Financial Inc. | 4.500% | 11/15/20 | 75 | 83 | |
| Prudential Financial Inc. | 3.500% | 5/15/24 | 450 | 468 | |
| Prudential Financial Inc. | 5.750% | 7/15/33 | 1,545 | 1,823 | |
| Prudential Financial Inc. | 5.400% | 6/13/35 | 295 | 335 | |
| Prudential Financial Inc. | 5.900% | 3/17/36 | 775 | 929 | |
| Prudential Financial Inc. | 5.700% | 12/14/36 | 505 | 600 | |
87
| Vanguard® Balanced Index Fund | |||||
| Schedule of Investments | |||||
| June 30, 2016 | |||||
| Face | Market | ||||
| Maturity | Amount | Value | |||
| Coupon | Date | ($000) | ($000) | ||
| Prudential Financial Inc. | 6.625% | 12/1/37 | 500 | 646 | |
| Prudential Financial Inc. | 6.625% | 6/21/40 | 250 | 324 | |
| Prudential Financial Inc. | 5.625% | 5/12/41 | 105 | 123 | |
| 5 | Prudential Financial Inc. | 5.875% | 9/15/42 | 525 | 564 |
| 5 | Prudential Financial Inc. | 5.625% | 6/15/43 | 975 | 1,012 |
| Prudential Financial Inc. | 5.100% | 8/15/43 | 225 | 250 | |
| Prudential Financial Inc. | 4.600% | 5/15/44 | 1,500 | 1,597 | |
| 5 | Prudential Financial Inc. | 5.375% | 5/15/45 | 650 | 656 |
| Reinsurance Group of America Inc. | 6.450% | 11/15/19 | 275 | 314 | |
| Reinsurance Group of America Inc. | 5.000% | 6/1/21 | 2,450 | 2,710 | |
| Reinsurance Group of America Inc. | 4.700% | 9/15/23 | 250 | 271 | |
| Reinsurance Group of America Inc. | 3.950% | 9/15/26 | 100 | 103 | |
| StanCorp Financial Group Inc. | 5.000% | 8/15/22 | 50 | 55 | |
| Swiss Re Solutions Holding Corp. | 7.000% | 2/15/26 | 250 | 325 | |
| Torchmark Corp. | 3.800% | 9/15/22 | 200 | 207 | |
| Transatlantic Holdings Inc. | 8.000% | 11/30/39 | 625 | 863 | |
| Travelers Cos. Inc. | 5.800% | 5/15/18 | 910 | 987 | |
| Travelers Cos. Inc. | 3.900% | 11/1/20 | 330 | 362 | |
| Travelers Cos. Inc. | 6.750% | 6/20/36 | 475 | 688 | |
| Travelers Cos. Inc. | 6.250% | 6/15/37 | 145 | 201 | |
| Travelers Cos. Inc. | 5.350% | 11/1/40 | 130 | 167 | |
| Travelers Cos. Inc. | 4.600% | 8/1/43 | 1,000 | 1,191 | |
| Travelers Cos. Inc. | 4.300% | 8/25/45 | 250 | 284 | |
| Trinity Acquisition plc | 6.125% | 8/15/43 | 525 | 586 | |
| UnitedHealth Group Inc. | 1.450% | 7/17/17 | 750 | 754 | |
| UnitedHealth Group Inc. | 6.000% | 2/15/18 | 1,460 | 1,574 | |
| UnitedHealth Group Inc. | 1.900% | 7/16/18 | 1,000 | 1,015 | |
| UnitedHealth Group Inc. | 1.625% | 3/15/19 | 325 | 328 | |
| UnitedHealth Group Inc. | 2.300% | 12/15/19 | 50 | 52 | |
| UnitedHealth Group Inc. | 2.700% | 7/15/20 | 950 | 989 | |
| UnitedHealth Group Inc. | 4.700% | 2/15/21 | 165 | 186 | |
| UnitedHealth Group Inc. | 3.375% | 11/15/21 | 105 | 113 | |
| UnitedHealth Group Inc. | 2.875% | 12/15/21 | 500 | 527 | |
| UnitedHealth Group Inc. | 2.875% | 3/15/22 | 525 | 548 | |
| UnitedHealth Group Inc. | 3.350% | 7/15/22 | 1,550 | 1,659 | |
| UnitedHealth Group Inc. | 2.750% | 2/15/23 | 400 | 411 | |
| UnitedHealth Group Inc. | 2.875% | 3/15/23 | 200 | 208 | |
| UnitedHealth Group Inc. | 3.750% | 7/15/25 | 2,000 | 2,195 | |
| UnitedHealth Group Inc. | 4.625% | 7/15/35 | 300 | 348 | |
| UnitedHealth Group Inc. | 6.500% | 6/15/37 | 200 | 279 | |
| UnitedHealth Group Inc. | 6.625% | 11/15/37 | 325 | 463 | |
| UnitedHealth Group Inc. | 6.875% | 2/15/38 | 1,405 | 2,048 | |
| UnitedHealth Group Inc. | 5.950% | 2/15/41 | 240 | 320 | |
| UnitedHealth Group Inc. | 4.625% | 11/15/41 | 1,050 | 1,199 | |
| UnitedHealth Group Inc. | 4.375% | 3/15/42 | 325 | 362 | |
| UnitedHealth Group Inc. | 3.950% | 10/15/42 | 400 | 419 | |
| UnitedHealth Group Inc. | 4.250% | 3/15/43 | 75 | 82 | |
| UnitedHealth Group Inc. | 4.750% | 7/15/45 | 1,325 | 1,597 | |
| Unum Group | 5.625% | 9/15/20 | 50 | 56 | |
| Unum Group | 3.000% | 5/15/21 | 450 | 461 | |
| Unum Group | 4.000% | 3/15/24 | 200 | 207 | |
| Unum Group | 5.750% | 8/15/42 | 200 | 222 | |
| Validus Holdings Ltd. | 8.875% | 1/26/40 | 150 | 209 | |
| Voya Financial Inc. | 2.900% | 2/15/18 | 515 | 525 | |
| Voya Financial Inc. | 3.650% | 6/15/26 | 250 | 251 | |
| Voya Financial Inc. | 5.700% | 7/15/43 | 350 | 394 | |
| Voya Financial Inc. | 4.800% | 6/15/46 | 300 | 300 | |
| Willis Towers Watson plc | 5.750% | 3/15/21 | 265 | 297 | |
| WR Berkley Corp. | 5.375% | 9/15/20 | 50 | 55 | |
| WR Berkley Corp. | 4.625% | 3/15/22 | 225 | 245 | |
| XLIT Ltd. | 5.750% | 10/1/21 | 545 | 626 | |
| XLIT Ltd. | 6.375% | 11/15/24 | 100 | 121 | |
| XLIT Ltd. | 4.450% | 3/31/25 | 200 | 203 | |
| XLIT Ltd. | 5.250% | 12/15/43 | 100 | 109 | |
88
| Vanguard® Balanced Index Fund | ||||
| Schedule of Investments | ||||
| June 30, 2016 | ||||
| Face | Market | |||
| Maturity | Amount | Value | ||
| Coupon | Date | ($000) | ($000) | |
| XLIT Ltd. | 5.500% | 3/31/45 | 300 | 299 |
| Real Estate Investment Trusts (0.3%) | ||||
| Alexandria Real Estate Equities Inc. | 2.750% | 1/15/20 | 250 | 252 |
| Alexandria Real Estate Equities Inc. | 4.600% | 4/1/22 | 300 | 324 |
| Alexandria Real Estate Equities Inc. | 3.900% | 6/15/23 | 75 | 78 |
| Alexandria Real Estate Equities Inc. | 4.300% | 1/15/26 | 300 | 318 |
| Alexandria Real Estate Equities Inc. | 3.950% | 1/15/27 | 250 | 259 |
| Alexandria Real Estate Equities Inc. | 4.500% | 7/30/29 | 200 | 210 |
| American Campus Communities Operating Partnership | ||||
| LP | 3.350% | 10/1/20 | 250 | 260 |
| American Campus Communities Operating Partnership | ||||
| LP | 4.125% | 7/1/24 | 250 | 265 |
| AvalonBay Communities Inc. | 2.850% | 3/15/23 | 200 | 204 |
| AvalonBay Communities Inc. | 4.200% | 12/15/23 | 175 | 193 |
| AvalonBay Communities Inc. | 3.500% | 11/15/24 | 250 | 264 |
| AvalonBay Communities Inc. | 3.450% | 6/1/25 | 1,300 | 1,370 |
| AvalonBay Communities Inc. | 2.950% | 5/11/26 | 250 | 253 |
| Boston Properties LP | 3.700% | 11/15/18 | 920 | 963 |
| Boston Properties LP | 5.625% | 11/15/20 | 325 | 372 |
| Boston Properties LP | 4.125% | 5/15/21 | 190 | 207 |
| Boston Properties LP | 3.850% | 2/1/23 | 950 | 1,022 |
| Boston Properties LP | 3.125% | 9/1/23 | 1,375 | 1,417 |
| Brandywine Operating Partnership LP | 4.950% | 4/15/18 | 725 | 759 |
| Brandywine Operating Partnership LP | 4.100% | 10/1/24 | 250 | 257 |
| Brandywine Operating Partnership LP | 4.550% | 10/1/29 | 175 | 182 |
| Brixmor Operating Partnership LP | 3.850% | 2/1/25 | 1,475 | 1,478 |
| Brixmor Operating Partnership LP | 4.125% | 6/15/26 | 400 | 411 |
| Camden Property Trust | 4.250% | 1/15/24 | 1,100 | 1,192 |
| CBL & Associates LP | 5.250% | 12/1/23 | 600 | 569 |
| CBL & Associates LP | 4.600% | 10/15/24 | 175 | 160 |
| Columbia Property Trust Operating Partnership LP | 4.150% | 4/1/25 | 100 | 102 |
| Corporate Office Properties LP | 3.700% | 6/15/21 | 200 | 202 |
| Corporate Office Properties LP | 3.600% | 5/15/23 | 200 | 194 |
| CubeSmart LP | 4.375% | 12/15/23 | 350 | 380 |
| CubeSmart LP | 4.000% | 11/15/25 | 160 | 170 |
| DCT Industrial Operating Partnership LP | 4.500% | 10/15/23 | 200 | 212 |
| DDR Corp. | 7.875% | 9/1/20 | 500 | 603 |
| DDR Corp. | 3.500% | 1/15/21 | 225 | 232 |
| DDR Corp. | 4.625% | 7/15/22 | 500 | 541 |
| DDR Corp. | 3.375% | 5/15/23 | 400 | 398 |
| DDR Corp. | 4.250% | 2/1/26 | 250 | 262 |
| Digital Realty Trust LP | 5.250% | 3/15/21 | 1,190 | 1,332 |
| Digital Realty Trust LP | 3.950% | 7/1/22 | 900 | 951 |
| Digital Realty Trust LP | 3.625% | 10/1/22 | 1,580 | 1,635 |
| Duke Realty LP | 3.625% | 4/15/23 | 875 | 923 |
| Duke Realty LP | 3.250% | 6/30/26 | 75 | 76 |
| EPR Properties | 5.750% | 8/15/22 | 75 | 82 |
| EPR Properties | 5.250% | 7/15/23 | 400 | 423 |
| EPR Properties | 4.500% | 4/1/25 | 300 | 298 |
| Equity CommonWealth | 6.650% | 1/15/18 | 1,175 | 1,228 |
| ERP Operating LP | 2.375% | 7/1/19 | 375 | 384 |
| ERP Operating LP | 4.750% | 7/15/20 | 215 | 239 |
| ERP Operating LP | 4.625% | 12/15/21 | 69 | 78 |
| ERP Operating LP | 3.000% | 4/15/23 | 625 | 642 |
| ERP Operating LP | 3.375% | 6/1/25 | 350 | 369 |
| ERP Operating LP | 4.500% | 7/1/44 | 550 | 612 |
| ERP Operating LP | 4.500% | 6/1/45 | 350 | 389 |
| Essex Portfolio LP | 3.375% | 1/15/23 | 1,150 | 1,188 |
| Essex Portfolio LP | 3.250% | 5/1/23 | 50 | 51 |
| Essex Portfolio LP | 3.500% | 4/1/25 | 200 | 208 |
| Essex Portfolio LP | 3.375% | 4/15/26 | 300 | 307 |
| Federal Realty Investment Trust | 3.000% | 8/1/22 | 175 | 182 |
| Federal Realty Investment Trust | 2.750% | 6/1/23 | 325 | 331 |
89
| Vanguard® Balanced Index Fund | ||||
| Schedule of Investments | ||||
| June 30, 2016 | ||||
| Face | Market | |||
| Maturity | Amount | Value | ||
| Coupon | Date | ($000) | ($000) | |
| Federal Realty Investment Trust | 4.500% | 12/1/44 | 1,000 | 1,095 |
| HCP Inc. | 2.625% | 2/1/20 | 1,800 | 1,815 |
| HCP Inc. | 5.375% | 2/1/21 | 180 | 200 |
| HCP Inc. | 3.150% | 8/1/22 | 150 | 149 |
| HCP Inc. | 4.000% | 12/1/22 | 2,135 | 2,224 |
| HCP Inc. | 3.400% | 2/1/25 | 400 | 387 |
| HCP Inc. | 6.750% | 2/1/41 | 175 | 213 |
| Healthcare Realty Trust Inc. | 5.750% | 1/15/21 | 145 | 163 |
| Healthcare Realty Trust Inc. | 3.750% | 4/15/23 | 100 | 100 |
| Healthcare Realty Trust Inc. | 3.875% | 5/1/25 | 375 | 378 |
| Healthcare Trust of America Holdings LP | 3.375% | 7/15/21 | 175 | 179 |
| Healthcare Trust of America Holdings LP | 3.700% | 4/15/23 | 100 | 102 |
| Highwoods Realty LP | 3.200% | 6/15/21 | 500 | 505 |
| Hospitality Properties Trust | 6.700% | 1/15/18 | 1,000 | 1,048 |
| Hospitality Properties Trust | 4.250% | 2/15/21 | 400 | 419 |
| Hospitality Properties Trust | 4.650% | 3/15/24 | 100 | 102 |
| Hospitality Properties Trust | 4.500% | 3/15/25 | 125 | 126 |
| Hospitality Properties Trust | 5.250% | 2/15/26 | 225 | 237 |
| Host Hotels & Resorts LP | 6.000% | 10/1/21 | 1,100 | 1,242 |
| Host Hotels & Resorts LP | 3.750% | 10/15/23 | 240 | 241 |
| Host Hotels & Resorts LP | 4.000% | 6/15/25 | 175 | 177 |
| Kilroy Realty LP | 4.800% | 7/15/18 | 800 | 841 |
| Kilroy Realty LP | 3.800% | 1/15/23 | 100 | 105 |
| Kimco Realty Corp. | 5.700% | 5/1/17 | 375 | 389 |
| Kimco Realty Corp. | 6.875% | 10/1/19 | 50 | 58 |
| Kimco Realty Corp. | 3.200% | 5/1/21 | 500 | 520 |
| Kimco Realty Corp. | 3.125% | 6/1/23 | 550 | 560 |
| Lexington Realty Trust | 4.400% | 6/15/24 | 200 | 206 |
| Liberty Property LP | 3.375% | 6/15/23 | 575 | 582 |
| Liberty Property LP | 4.400% | 2/15/24 | 325 | 350 |
| Liberty Property LP | 3.750% | 4/1/25 | 725 | 749 |
| Mack-Cali Realty LP | 7.750% | 8/15/19 | 750 | 847 |
| Mack-Cali Realty LP | 4.500% | 4/18/22 | 225 | 229 |
| Mid-America Apartments LP | 4.300% | 10/15/23 | 350 | 377 |
| Mid-America Apartments LP | 3.750% | 6/15/24 | 200 | 208 |
| National Retail Properties Inc. | 6.875% | 10/15/17 | 25 | 27 |
| National Retail Properties Inc. | 3.800% | 10/15/22 | 500 | 528 |
| National Retail Properties Inc. | 3.900% | 6/15/24 | 275 | 291 |
| National Retail Properties Inc. | 4.000% | 11/15/25 | 450 | 478 |
| Omega Healthcare Investors Inc. | 4.950% | 4/1/24 | 275 | 289 |
| Omega Healthcare Investors Inc. | 4.500% | 1/15/25 | 175 | 177 |
| Omega Healthcare Investors Inc. | 5.250% | 1/15/26 | 2,250 | 2,379 |
| Omega Healthcare Investors Inc. | 4.500% | 4/1/27 | 1,000 | 990 |
| Piedmont Operating Partnership LP | 3.400% | 6/1/23 | 125 | 124 |
| Piedmont Operating Partnership LP | 4.450% | 3/15/24 | 275 | 285 |
| Post Apartment Homes LP | 3.375% | 12/1/22 | 100 | 102 |
| ProLogis LP | 2.750% | 2/15/19 | 875 | 899 |
| Realty Income Corp. | 2.000% | 1/31/18 | 575 | 580 |
| Realty Income Corp. | 6.750% | 8/15/19 | 935 | 1,071 |
| Realty Income Corp. | 3.250% | 10/15/22 | 100 | 103 |
| Realty Income Corp. | 3.875% | 7/15/24 | 250 | 262 |
| Realty Income Corp. | 4.125% | 10/15/26 | 125 | 134 |
| Regency Centers LP | 3.750% | 6/15/24 | 525 | 548 |
| Retail Opportunity Investments Partnership LP | 5.000% | 12/15/23 | 150 | 158 |
| Retail Properties of America Inc. | 4.000% | 3/15/25 | 475 | 460 |
| Select Income REIT | 2.850% | 2/1/18 | 175 | 176 |
| Select Income REIT | 4.150% | 2/1/22 | 225 | 226 |
| Select Income REIT | 4.500% | 2/1/25 | 250 | 247 |
| Senior Housing Properties Trust | 3.250% | 5/1/19 | 475 | 478 |
| Senior Housing Properties Trust | 4.750% | 5/1/24 | 175 | 178 |
| Simon Property Group LP | 2.150% | 9/15/17 | 200 | 202 |
| Simon Property Group LP | 2.200% | 2/1/19 | 2,700 | 2,762 |
| Simon Property Group LP | 5.650% | 2/1/20 | 1,250 | 1,415 |
| Simon Property Group LP | 4.375% | 3/1/21 | 555 | 617 |
90
| Vanguard® Balanced Index Fund | ||||
| Schedule of Investments | ||||
| June 30, 2016 | ||||
| Face | Market | |||
| Maturity | Amount | Value | ||
| Coupon | Date | ($000) | ($000) | |
| Simon Property Group LP | 4.125% | 12/1/21 | 525 | 582 |
| Simon Property Group LP | 3.375% | 3/15/22 | 250 | 269 |
| Simon Property Group LP | 2.750% | 2/1/23 | 400 | 412 |
| Simon Property Group LP | 3.750% | 2/1/24 | 500 | 547 |
| Simon Property Group LP | 3.300% | 1/15/26 | 100 | 107 |
| Simon Property Group LP | 6.750% | 2/1/40 | 300 | 433 |
| Simon Property Group LP | 4.750% | 3/15/42 | 225 | 260 |
| Sovran Acquisition LP | 3.500% | 7/1/26 | 1,175 | 1,186 |
| Tanger Properties LP | 3.875% | 12/1/23 | 125 | 130 |
| Tanger Properties LP | 3.750% | 12/1/24 | 200 | 206 |
| UDR Inc. | 4.250% | 6/1/18 | 400 | 420 |
| UDR Inc. | 3.700% | 10/1/20 | 150 | 159 |
| UDR Inc. | 4.625% | 1/10/22 | 125 | 139 |
| Ventas Realty LP | 3.125% | 6/15/23 | 850 | 864 |
| Ventas Realty LP | 3.750% | 5/1/24 | 200 | 209 |
| Ventas Realty LP | 5.700% | 9/30/43 | 450 | 521 |
| Ventas Realty LP / Ventas Capital Corp. | 2.000% | 2/15/18 | 325 | 327 |
| Ventas Realty LP / Ventas Capital Corp. | 4.000% | 4/30/19 | 575 | 607 |
| Ventas Realty LP / Ventas Capital Corp. | 2.700% | 4/1/20 | 25 | 26 |
| Ventas Realty LP / Ventas Capital Corp. | 4.750% | 6/1/21 | 1,568 | 1,746 |
| Ventas Realty LP / Ventas Capital Corp. | 4.250% | 3/1/22 | 140 | 151 |
| Ventas Realty LP / Ventas Capital Corp. | 3.250% | 8/15/22 | 500 | 517 |
| Vornado Realty LP | 2.500% | 6/30/19 | 275 | 280 |
| Washington Prime Group LP | 3.850% | 4/1/20 | 200 | 207 |
| Washington REIT | 4.950% | 10/1/20 | 125 | 135 |
| Washington REIT | 3.950% | 10/15/22 | 100 | 102 |
| Weingarten Realty Investors | 3.375% | 10/15/22 | 200 | 205 |
| Weingarten Realty Investors | 3.500% | 4/15/23 | 250 | 252 |
| Weingarten Realty Investors | 4.450% | 1/15/24 | 75 | 80 |
| Welltower Inc. | 4.700% | 9/15/17 | 50 | 52 |
| Welltower Inc. | 2.250% | 3/15/18 | 575 | 581 |
| Welltower Inc. | 4.125% | 4/1/19 | 300 | 318 |
| Welltower Inc. | 4.950% | 1/15/21 | 750 | 827 |
| Welltower Inc. | 5.250% | 1/15/22 | 425 | 475 |
| Welltower Inc. | 3.750% | 3/15/23 | 325 | 337 |
| Welltower Inc. | 4.500% | 1/15/24 | 125 | 135 |
| Welltower Inc. | 4.000% | 6/1/25 | 1,125 | 1,187 |
| Welltower Inc. | 4.250% | 4/1/26 | 450 | 484 |
| Welltower Inc. | 6.500% | 3/15/41 | 200 | 249 |
| Welltower Inc. | 5.125% | 3/15/43 | 175 | 189 |
| WP Carey Inc. | 4.600% | 4/1/24 | 300 | 312 |
| WP Carey Inc. | 4.000% | 2/1/25 | 200 | 195 |
| 973,416 | ||||
| Industrial (6.9%) | ||||
| Basic Industry (0.4%) | ||||
| Agrium Inc. | 6.750% | 1/15/19 | 1,350 | 1,488 |
| Agrium Inc. | 3.150% | 10/1/22 | 2,310 | 2,370 |
| Agrium Inc. | 3.500% | 6/1/23 | 275 | 286 |
| Agrium Inc. | 3.375% | 3/15/25 | 250 | 257 |
| Agrium Inc. | 4.125% | 3/15/35 | 250 | 242 |
| Agrium Inc. | 4.900% | 6/1/43 | 125 | 130 |
| Agrium Inc. | 5.250% | 1/15/45 | 500 | 541 |
| Air Products & Chemicals Inc. | 1.200% | 10/15/17 | 225 | 226 |
| Air Products & Chemicals Inc. | 3.000% | 11/3/21 | 190 | 203 |
| Air Products & Chemicals Inc. | 2.750% | 2/3/23 | 200 | 207 |
| Air Products & Chemicals Inc. | 3.350% | 7/31/24 | 700 | 757 |
| Airgas Inc. | 3.050% | 8/1/20 | 200 | 207 |
| Airgas Inc. | 3.650% | 7/15/24 | 750 | 788 |
| Albemarle Corp. | 3.000% | 12/1/19 | 250 | 254 |
| Albemarle Corp. | 4.500% | 12/15/20 | 50 | 53 |
| Albemarle Corp. | 4.150% | 12/1/24 | 300 | 316 |
| Albemarle Corp. | 5.450% | 12/1/44 | 325 | 337 |
| Barrick Gold Corp. | 4.100% | 5/1/23 | 330 | 348 |
91
| Vanguard® Balanced Index Fund | ||||
| Schedule of Investments | ||||
| June 30, 2016 | ||||
| Face | Market | |||
| Maturity | Amount | Value | ||
| Coupon | Date | ($000) | ($000) | |
| Barrick Gold Corp. | 5.250% | 4/1/42 | 500 | 507 |
| Barrick North America Finance LLC | 4.400% | 5/30/21 | 1,915 | 2,079 |
| Barrick North America Finance LLC | 7.500% | 9/15/38 | 25 | 28 |
| Barrick North America Finance LLC | 5.700% | 5/30/41 | 750 | 766 |
| Barrick North America Finance LLC | 5.750% | 5/1/43 | 1,200 | 1,321 |
| Barrick PD Australia Finance Pty Ltd. | 5.950% | 10/15/39 | 100 | 104 |
| BHP Billiton Finance USA Ltd. | 2.050% | 9/30/18 | 300 | 304 |
| BHP Billiton Finance USA Ltd. | 6.500% | 4/1/19 | 450 | 510 |
| BHP Billiton Finance USA Ltd. | 3.250% | 11/21/21 | 600 | 634 |
| BHP Billiton Finance USA Ltd. | 2.875% | 2/24/22 | 1,025 | 1,065 |
| BHP Billiton Finance USA Ltd. | 3.850% | 9/30/23 | 775 | 845 |
| BHP Billiton Finance USA Ltd. | 4.125% | 2/24/42 | 1,200 | 1,232 |
| BHP Billiton Finance USA Ltd. | 5.000% | 9/30/43 | 1,500 | 1,745 |
| Braskem Finance Ltd. | 6.450% | 2/3/24 | 200 | 202 |
| Cabot Corp. | 2.550% | 1/15/18 | 550 | 556 |
| Cabot Corp. | 3.700% | 7/15/22 | 50 | 52 |
| Celulosa Arauco y Constitucion SA | 4.750% | 1/11/22 | 200 | 216 |
| CF Industries Inc. | 6.875% | 5/1/18 | 475 | 515 |
| CF Industries Inc. | 7.125% | 5/1/20 | 825 | 952 |
| CF Industries Inc. | 3.450% | 6/1/23 | 525 | 525 |
| CF Industries Inc. | 5.150% | 3/15/34 | 1,000 | 975 |
| CF Industries Inc. | 4.950% | 6/1/43 | 375 | 346 |
| CF Industries Inc. | 5.375% | 3/15/44 | 500 | 475 |
| Domtar Corp. | 6.250% | 9/1/42 | 50 | 52 |
| Domtar Corp. | 6.750% | 2/15/44 | 400 | 438 |
| Dow Chemical Co. | 8.550% | 5/15/19 | 1,810 | 2,154 |
| Dow Chemical Co. | 4.250% | 11/15/20 | 1,630 | 1,783 |
| Dow Chemical Co. | 4.125% | 11/15/21 | 185 | 203 |
| Dow Chemical Co. | 3.000% | 11/15/22 | 700 | 715 |
| Dow Chemical Co. | 3.500% | 10/1/24 | 600 | 639 |
| Dow Chemical Co. | 7.375% | 11/1/29 | 100 | 134 |
| Dow Chemical Co. | 4.250% | 10/1/34 | 350 | 361 |
| Dow Chemical Co. | 9.400% | 5/15/39 | 760 | 1,201 |
| Dow Chemical Co. | 5.250% | 11/15/41 | 375 | 417 |
| Dow Chemical Co. | 4.375% | 11/15/42 | 900 | 919 |
| Eastman Chemical Co. | 2.400% | 6/1/17 | 500 | 505 |
| Eastman Chemical Co. | 5.500% | 11/15/19 | 1,100 | 1,220 |
| Eastman Chemical Co. | 2.700% | 1/15/20 | 400 | 411 |
| Eastman Chemical Co. | 3.600% | 8/15/22 | 650 | 683 |
| Eastman Chemical Co. | 4.800% | 9/1/42 | 400 | 415 |
| Eastman Chemical Co. | 4.650% | 10/15/44 | 1,000 | 1,024 |
| Ecolab Inc. | 1.450% | 12/8/17 | 225 | 226 |
| Ecolab Inc. | 1.550% | 1/12/18 | 500 | 502 |
| Ecolab Inc. | 2.000% | 1/14/19 | 200 | 203 |
| Ecolab Inc. | 2.250% | 1/12/20 | 200 | 204 |
| Ecolab Inc. | 4.350% | 12/8/21 | 50 | 57 |
| Ecolab Inc. | 3.250% | 1/14/23 | 200 | 209 |
| Ecolab Inc. | 5.500% | 12/8/41 | 625 | 782 |
| EI du Pont de Nemours & Co. | 6.000% | 7/15/18 | 700 | 765 |
| EI du Pont de Nemours & Co. | 4.625% | 1/15/20 | 300 | 330 |
| EI du Pont de Nemours & Co. | 3.625% | 1/15/21 | 1,420 | 1,530 |
| EI du Pont de Nemours & Co. | 4.250% | 4/1/21 | 350 | 389 |
| EI du Pont de Nemours & Co. | 2.800% | 2/15/23 | 75 | 77 |
| EI du Pont de Nemours & Co. | 6.500% | 1/15/28 | 500 | 637 |
| EI du Pont de Nemours & Co. | 4.900% | 1/15/41 | 450 | 500 |
| EI du Pont de Nemours & Co. | 4.150% | 2/15/43 | 125 | 129 |
| Fibria Overseas Finance Ltd. | 5.250% | 5/12/24 | 250 | 255 |
| FMC Corp. | 3.950% | 2/1/22 | 150 | 157 |
| FMC Corp. | 4.100% | 2/1/24 | 750 | 795 |
| Georgia-Pacific LLC | 8.875% | 5/15/31 | 1,200 | 1,921 |
| Goldcorp Inc. | 2.125% | 3/15/18 | 1,100 | 1,098 |
| Goldcorp Inc. | 3.700% | 3/15/23 | 600 | 610 |
| Goldcorp Inc. | 5.450% | 6/9/44 | 50 | 50 |
| International Flavors & Fragrances Inc. | 3.200% | 5/1/23 | 50 | 51 |
92
| Vanguard® Balanced Index Fund | ||||
| Schedule of Investments | ||||
| June 30, 2016 | ||||
| Face | Market | |||
| Maturity | Amount | Value | ||
| Coupon | Date | ($000) | ($000) | |
| International Paper Co. | 7.500% | 8/15/21 | 910 | 1,118 |
| International Paper Co. | 4.750% | 2/15/22 | 413 | 460 |
| International Paper Co. | 3.650% | 6/15/24 | 400 | 422 |
| International Paper Co. | 3.800% | 1/15/26 | 350 | 367 |
| International Paper Co. | 5.000% | 9/15/35 | 150 | 162 |
| International Paper Co. | 7.300% | 11/15/39 | 805 | 1,059 |
| International Paper Co. | 6.000% | 11/15/41 | 300 | 350 |
| International Paper Co. | 4.800% | 6/15/44 | 500 | 510 |
| International Paper Co. | 5.150% | 5/15/46 | 525 | 566 |
| LYB International Finance BV | 4.000% | 7/15/23 | 500 | 537 |
| LYB International Finance BV | 5.250% | 7/15/43 | 500 | 551 |
| LYB International Finance BV | 4.875% | 3/15/44 | 400 | 425 |
| LyondellBasell Industries NV | 5.000% | 4/15/19 | 1,700 | 1,842 |
| LyondellBasell Industries NV | 6.000% | 11/15/21 | 475 | 556 |
| LyondellBasell Industries NV | 4.625% | 2/26/55 | 950 | 929 |
| Meadwestvaco Corp. | 7.950% | 2/15/31 | 300 | 396 |
| Monsanto Co. | 2.125% | 7/15/19 | 800 | 811 |
| Monsanto Co. | 2.750% | 7/15/21 | 600 | 618 |
| Monsanto Co. | 2.200% | 7/15/22 | 175 | 173 |
| Monsanto Co. | 2.850% | 4/15/25 | 250 | 249 |
| Monsanto Co. | 4.200% | 7/15/34 | 400 | 401 |
| Monsanto Co. | 5.875% | 4/15/38 | 375 | 429 |
| Monsanto Co. | 3.600% | 7/15/42 | 250 | 221 |
| Monsanto Co. | 4.400% | 7/15/44 | 200 | 196 |
| Monsanto Co. | 3.950% | 4/15/45 | 1,300 | 1,205 |
| Monsanto Co. | 4.700% | 7/15/64 | 600 | 542 |
| Mosaic Co. | 3.750% | 11/15/21 | 115 | 122 |
| Mosaic Co. | 4.250% | 11/15/23 | 1,500 | 1,616 |
| Mosaic Co. | 5.450% | 11/15/33 | 100 | 111 |
| Mosaic Co. | 4.875% | 11/15/41 | 130 | 131 |
| Mosaic Co. | 5.625% | 11/15/43 | 150 | 167 |
| Newmont Mining Corp. | 5.125% | 10/1/19 | 475 | 515 |
| Newmont Mining Corp. | 5.875% | 4/1/35 | 325 | 343 |
| Newmont Mining Corp. | 6.250% | 10/1/39 | 500 | 556 |
| Newmont Mining Corp. | 4.875% | 3/15/42 | 950 | 938 |
| Nucor Corp. | 5.750% | 12/1/17 | 385 | 406 |
| Nucor Corp. | 5.850% | 6/1/18 | 875 | 942 |
| Nucor Corp. | 4.125% | 9/15/22 | 200 | 216 |
| Nucor Corp. | 4.000% | 8/1/23 | 325 | 347 |
| Nucor Corp. | 6.400% | 12/1/37 | 325 | 395 |
| Nucor Corp. | 5.200% | 8/1/43 | 400 | 436 |
| Packaging Corp. of America | 3.900% | 6/15/22 | 275 | 292 |
| Packaging Corp. of America | 4.500% | 11/1/23 | 425 | 463 |
| Packaging Corp. of America | 3.650% | 9/15/24 | 500 | 517 |
| Placer Dome Inc. | 6.450% | 10/15/35 | 375 | 407 |
| Plum Creek Timberlands LP | 4.700% | 3/15/21 | 275 | 301 |
| Potash Corp. of Saskatchewan Inc. | 3.250% | 12/1/17 | 675 | 693 |
| Potash Corp. of Saskatchewan Inc. | 4.875% | 3/30/20 | 1,210 | 1,331 |
| Potash Corp. of Saskatchewan Inc. | 3.000% | 4/1/25 | 250 | 252 |
| Potash Corp. of Saskatchewan Inc. | 5.625% | 12/1/40 | 200 | 237 |
| PPG Industries Inc. | 2.300% | 11/15/19 | 700 | 711 |
| PPG Industries Inc. | 3.600% | 11/15/20 | 27 | 28 |
| Praxair Inc. | 4.500% | 8/15/19 | 175 | 193 |
| Praxair Inc. | 4.050% | 3/15/21 | 875 | 971 |
| Praxair Inc. | 3.000% | 9/1/21 | 325 | 347 |
| Praxair Inc. | 2.450% | 2/15/22 | 850 | 882 |
| Praxair Inc. | 2.650% | 2/5/25 | 500 | 518 |
| Praxair Inc. | 3.550% | 11/7/42 | 300 | 300 |
| Rayonier Inc. | 3.750% | 4/1/22 | 125 | 126 |
| Reliance Steel & Aluminum Co. | 4.500% | 4/15/23 | 225 | 230 |
| Rio Tinto Alcan Inc. | 6.125% | 12/15/33 | 325 | 372 |
| Rio Tinto Alcan Inc. | 5.750% | 6/1/35 | 450 | 492 |
| Rio Tinto Finance USA Ltd. | 9.000% | 5/1/19 | 1,075 | 1,293 |
| Rio Tinto Finance USA Ltd. | 4.125% | 5/20/21 | 175 | 190 |
93
| Vanguard® Balanced Index Fund | ||||
| Schedule of Investments | ||||
| June 30, 2016 | ||||
| Face | Market | |||
| Maturity | Amount | Value | ||
| Coupon | Date | ($000) | ($000) | |
| Rio Tinto Finance USA Ltd. | 3.750% | 9/20/21 | 1,000 | 1,071 |
| Rio Tinto Finance USA Ltd. | 3.750% | 6/15/25 | 3,200 | 3,352 |
| Rio Tinto Finance USA Ltd. | 7.125% | 7/15/28 | 225 | 281 |
| Rio Tinto Finance USA Ltd. | 5.200% | 11/2/40 | 565 | 626 |
| Rio Tinto Finance USA plc | 3.500% | 3/22/22 | 200 | 210 |
| Rio Tinto Finance USA plc | 4.750% | 3/22/42 | 625 | 659 |
| Rohm & Haas Co. | 7.850% | 7/15/29 | 300 | 412 |
| RPM International Inc. | 6.125% | 10/15/19 | 75 | 84 |
| RPM International Inc. | 3.450% | 11/15/22 | 250 | 255 |
| Sherwin-Williams Co. | 3.450% | 8/1/25 | 900 | 934 |
| Sherwin-Williams Co. | 4.550% | 8/1/45 | 270 | 292 |
| Southern Copper Corp. | 5.375% | 4/16/20 | 200 | 216 |
| Southern Copper Corp. | 3.875% | 4/23/25 | 350 | 344 |
| Southern Copper Corp. | 7.500% | 7/27/35 | 425 | 461 |
| Southern Copper Corp. | 6.750% | 4/16/40 | 250 | 255 |
| Southern Copper Corp. | 5.875% | 4/23/45 | 2,650 | 2,491 |
| Syngenta Finance NV | 3.125% | 3/28/22 | 250 | 263 |
| Syngenta Finance NV | 4.375% | 3/28/42 | 150 | 145 |
| The Dow Chemical Company | 4.625% | 10/1/44 | 500 | 531 |
| Vale Canada Ltd. | 7.200% | 9/15/32 | 100 | 85 |
| Vale Overseas Ltd. | 5.625% | 9/15/19 | 1,050 | 1,081 |
| Vale Overseas Ltd. | 5.875% | 6/10/21 | 1,000 | 998 |
| Vale Overseas Ltd. | 4.375% | 1/11/22 | 1,045 | 977 |
| Vale Overseas Ltd. | 8.250% | 1/17/34 | 375 | 390 |
| Vale Overseas Ltd. | 6.875% | 11/21/36 | 735 | 669 |
| Vale Overseas Ltd. | 6.875% | 11/10/39 | 860 | 776 |
| Vale SA | 5.625% | 9/11/42 | 2,550 | 2,059 |
| Valspar Corp. | 7.250% | 6/15/19 | 350 | 399 |
| Valspar Corp. | 4.200% | 1/15/22 | 25 | 27 |
| Valspar Corp. | 3.950% | 1/15/26 | 600 | 632 |
| Westlake Chemical Corp. | 3.600% | 7/15/22 | 50 | 51 |
| Westrock MWV LLC | 8.200% | 1/15/30 | 500 | 678 |
| WestRock RKT Co. | 3.500% | 3/1/20 | 1,725 | 1,788 |
| WestRock RKT Co. | 4.900% | 3/1/22 | 250 | 277 |
| Weyerhaeuser Co. | 7.375% | 10/1/19 | 1,075 | 1,237 |
| Weyerhaeuser Co. | 8.500% | 1/15/25 | 150 | 198 |
| Weyerhaeuser Co. | 7.375% | 3/15/32 | 625 | 827 |
| Weyerhaeuser Co. | 6.875% | 12/15/33 | 125 | 155 |
| Worthington Industries Inc. | 4.550% | 4/15/26 | 100 | 104 |
| Yamana Gold Inc. | 4.950% | 7/15/24 | 640 | 630 |
| Capital Goods (0.6%) | ||||
| 3M Co. | 1.375% | 8/7/18 | 325 | 328 |
| 3M Co. | 2.000% | 8/7/20 | 325 | 334 |
| 3M Co. | 3.000% | 8/7/25 | 350 | 382 |
| 3M Co. | 6.375% | 2/15/28 | 350 | 485 |
| 3M Co. | 5.700% | 3/15/37 | 255 | 344 |
| ABB Finance USA Inc. | 2.875% | 5/8/22 | 375 | 393 |
| ABB Finance USA Inc. | 4.375% | 5/8/42 | 150 | 170 |
| Acuity Brands Lighting Inc. | 6.000% | 12/15/19 | 200 | 224 |
| Boeing Capital Corp. | 4.700% | 10/27/19 | 125 | 139 |
| Boeing Co. | 0.950% | 5/15/18 | 125 | 125 |
| Boeing Co. | 6.000% | 3/15/19 | 1,550 | 1,751 |
| Boeing Co. | 4.875% | 2/15/20 | 525 | 590 |
| Boeing Co. | 1.650% | 10/30/20 | 350 | 354 |
| Boeing Co. | 2.200% | 10/30/22 | 2,000 | 2,041 |
| Boeing Co. | 2.600% | 10/30/25 | 1,300 | 1,349 |
| Boeing Co. | 2.250% | 6/15/26 | 250 | 251 |
| Boeing Co. | 6.625% | 2/15/38 | 100 | 145 |
| Boeing Co. | 6.875% | 3/15/39 | 250 | 376 |
| Boeing Co. | 5.875% | 2/15/40 | 295 | 411 |
| Boeing Co. | 3.500% | 3/1/45 | 300 | 307 |
| Boeing Co. | 3.375% | 6/15/46 | 750 | 755 |
| Carlisle Cos. Inc. | 3.750% | 11/15/22 | 175 | 181 |
94
| Vanguard® Balanced Index Fund | |||||
| Schedule of Investments | |||||
| June 30, 2016 | |||||
| Face | Market | ||||
| Maturity | Amount | Value | |||
| Coupon | Date | ($000) | ($000) | ||
| Caterpillar Financial Services Corp. | 1.500% | 2/23/18 | 1,100 | 1,110 | |
| Caterpillar Financial Services Corp. | 1.300% | 3/1/18 | 825 | 826 | |
| Caterpillar Financial Services Corp. | 5.450% | 4/15/18 | 875 | 943 | |
| Caterpillar Financial Services Corp. | 1.800% | 11/13/18 | 550 | 558 | |
| Caterpillar Financial Services Corp. | 7.150% | 2/15/19 | 1,235 | 1,416 | |
| Caterpillar Financial Services Corp. | 1.350% | 5/18/19 | 750 | 754 | |
| Caterpillar Financial Services Corp. | 2.100% | 6/9/19 | 500 | 513 | |
| Caterpillar Financial Services Corp. | 2.250% | 12/1/19 | 300 | 308 | |
| Caterpillar Financial Services Corp. | 2.000% | 3/5/20 | 750 | 769 | |
| Caterpillar Financial Services Corp. | 2.500% | 11/13/20 | 500 | 519 | |
| Caterpillar Financial Services Corp. | 2.750% | 8/20/21 | 200 | 210 | |
| Caterpillar Financial Services Corp. | 3.300% | 6/9/24 | 730 | 781 | |
| Caterpillar Financial Services Corp. | 3.250% | 12/1/24 | 200 | 213 | |
| Caterpillar Inc. | 3.900% | 5/27/21 | 720 | 795 | |
| Caterpillar Inc. | 2.600% | 6/26/22 | 125 | 129 | |
| Caterpillar Inc. | 3.400% | 5/15/24 | 750 | 806 | |
| Caterpillar Inc. | 6.050% | 8/15/36 | 895 | 1,176 | |
| Caterpillar Inc. | 5.200% | 5/27/41 | 500 | 607 | |
| Caterpillar Inc. | 3.803% | 8/15/42 | 1,129 | 1,150 | |
| Caterpillar Inc. | 4.300% | 5/15/44 | 1,000 | 1,098 | |
| Crane Co. | 2.750% | 12/15/18 | 550 | 563 | |
| Crane Co. | 4.450% | 12/15/23 | 400 | 428 | |
| CRH America Inc. | 5.750% | 1/15/21 | 885 | 1,005 | |
| Deere & Co. | 2.600% | 6/8/22 | 700 | 722 | |
| Deere & Co. | 5.375% | 10/16/29 | 455 | 580 | |
| Deere & Co. | 8.100% | 5/15/30 | 150 | 226 | |
| Deere & Co. | 7.125% | 3/3/31 | 400 | 575 | |
| Deere & Co. | 3.900% | 6/9/42 | 500 | 535 | |
| Dover Corp. | 4.300% | 3/1/21 | 145 | 160 | |
| Dover Corp. | 6.600% | 3/15/38 | 350 | 493 | |
| Dover Corp. | 5.375% | 3/1/41 | 480 | 615 | |
| Eaton Corp. | 1.500% | 11/2/17 | 200 | 201 | |
| Eaton Corp. | 5.600% | 5/15/18 | 550 | 591 | |
| Eaton Corp. | 2.750% | 11/2/22 | 575 | 588 | |
| Eaton Corp. | 4.000% | 11/2/32 | 815 | 868 | |
| Eaton Corp. | 4.150% | 11/2/42 | 75 | 80 | |
| Eaton Electric Holdings LLC | 3.875% | 12/15/20 | 150 | 161 | |
| Embraer Netherlands Finance BV | 5.050% | 6/15/25 | 650 | 641 | |
| 8 | Embraer Overseas Ltd. | 5.696% | 9/16/23 | 350 | 362 |
| Emerson Electric Co. | 5.250% | 10/15/18 | 525 | 575 | |
| Emerson Electric Co. | 4.875% | 10/15/19 | 275 | 307 | |
| Emerson Electric Co. | 4.250% | 11/15/20 | 25 | 28 | |
| Emerson Electric Co. | 2.625% | 12/1/21 | 450 | 475 | |
| Emerson Electric Co. | 2.625% | 2/15/23 | 300 | 311 | |
| Emerson Electric Co. | 3.150% | 6/1/25 | 450 | 479 | |
| Emerson Electric Co. | 6.000% | 8/15/32 | 150 | 195 | |
| Emerson Electric Co. | 6.125% | 4/15/39 | 125 | 172 | |
| Emerson Electric Co. | 5.250% | 11/15/39 | 135 | 170 | |
| Exelis Inc. | 4.250% | 10/1/16 | 225 | 226 | |
| Exelis Inc. | 5.550% | 10/1/21 | 200 | 227 | |
| FLIR Systems Inc. | 3.125% | 6/15/21 | 200 | 205 | |
| Flowserve Corp. | 3.500% | 9/15/22 | 1,125 | 1,160 | |
| Flowserve Corp. | 4.000% | 11/15/23 | 375 | 386 | |
| 8 | Fortive Corp. | 1.800% | 6/15/19 | 100 | 101 |
| 8 | Fortive Corp. | 2.350% | 6/15/21 | 200 | 203 |
| 8 | Fortive Corp. | 3.150% | 6/15/26 | 400 | 412 |
| 8 | Fortive Corp. | 4.300% | 6/15/46 | 375 | 399 |
| Fortune Brands Home & Security Inc. | 3.000% | 6/15/20 | 275 | 283 | |
| Fortune Brands Home & Security Inc. | 4.000% | 6/15/25 | 250 | 267 | |
| General Dynamics Corp. | 1.000% | 11/15/17 | 1,100 | 1,104 | |
| General Dynamics Corp. | 3.875% | 7/15/21 | 250 | 275 | |
| General Dynamics Corp. | 2.250% | 11/15/22 | 900 | 921 | |
| General Dynamics Corp. | 3.600% | 11/15/42 | 125 | 132 | |
| General Electric Capital Corp. | 6.000% | 8/7/19 | 1,283 | 1,470 | |
95
| Vanguard® Balanced Index Fund | ||||
| Schedule of Investments | ||||
| June 30, 2016 | ||||
| Face | Market | |||
| Maturity | Amount | Value | ||
| Coupon | Date | ($000) | ($000) | |
| General Electric Capital Corp. | 2.100% | 12/11/19 | 100 | 103 |
| General Electric Capital Corp. | 5.500% | 1/8/20 | 2,739 | 3,117 |
| General Electric Capital Corp. | 2.200% | 1/9/20 | 644 | 664 |
| General Electric Capital Corp. | 5.550% | 5/4/20 | 780 | 901 |
| General Electric Capital Corp. | 4.375% | 9/16/20 | 806 | 900 |
| General Electric Capital Corp. | 4.625% | 1/7/21 | 490 | 556 |
| General Electric Capital Corp. | 5.300% | 2/11/21 | 714 | 825 |
| General Electric Capital Corp. | 4.650% | 10/17/21 | 1,369 | 1,567 |
| General Electric Capital Corp. | 3.150% | 9/7/22 | 318 | 342 |
| General Electric Capital Corp. | 3.100% | 1/9/23 | 841 | 898 |
| General Electric Capital Corp. | 3.450% | 5/15/24 | 338 | 370 |
| General Electric Capital Corp. | 6.750% | 3/15/32 | 1,885 | 2,633 |
| General Electric Capital Corp. | 6.150% | 8/7/37 | 573 | 793 |
| General Electric Capital Corp. | 5.875% | 1/14/38 | 1,887 | 2,560 |
| General Electric Capital Corp. | 6.875% | 1/10/39 | 1,305 | 1,970 |
| General Electric Co. | 5.250% | 12/6/17 | 2,040 | 2,164 |
| General Electric Co. | 2.700% | 10/9/22 | 1,900 | 1,979 |
| General Electric Co. | 3.375% | 3/11/24 | 2,000 | 2,182 |
| General Electric Co. | 4.125% | 10/9/42 | 2,050 | 2,257 |
| General Electric Co. | 4.500% | 3/11/44 | 1,400 | 1,624 |
| Harris Corp. | 1.999% | 4/27/18 | 225 | 226 |
| Harris Corp. | 2.700% | 4/27/20 | 250 | 253 |
| Harris Corp. | 4.400% | 12/15/20 | 1,700 | 1,838 |
| Harris Corp. | 3.832% | 4/27/25 | 550 | 585 |
| Harris Corp. | 4.854% | 4/27/35 | 350 | 381 |
| Harris Corp. | 6.150% | 12/15/40 | 25 | 31 |
| Harris Corp. | 5.054% | 4/27/45 | 325 | 369 |
| Honeywell International Inc. | 5.300% | 3/1/18 | 650 | 696 |
| Honeywell International Inc. | 5.000% | 2/15/19 | 105 | 116 |
| Honeywell International Inc. | 4.250% | 3/1/21 | 805 | 904 |
| Honeywell International Inc. | 3.350% | 12/1/23 | 1,325 | 1,454 |
| Honeywell International Inc. | 5.700% | 3/15/37 | 105 | 139 |
| Honeywell International Inc. | 5.375% | 3/1/41 | 1,855 | 2,425 |
| Hubbell Inc. | 3.350% | 3/1/26 | 300 | 313 |
| Illinois Tool Works Inc. | 6.250% | 4/1/19 | 450 | 509 |
| Illinois Tool Works Inc. | 3.375% | 9/15/21 | 105 | 113 |
| Illinois Tool Works Inc. | 3.500% | 3/1/24 | 430 | 473 |
| Illinois Tool Works Inc. | 4.875% | 9/15/41 | 105 | 127 |
| Illinois Tool Works Inc. | 3.900% | 9/1/42 | 1,225 | 1,324 |
| Ingersoll-Rand Global Holding Co. Ltd. | 6.875% | 8/15/18 | 550 | 611 |
| Ingersoll-Rand Global Holding Co. Ltd. | 2.875% | 1/15/19 | 125 | 129 |
| Ingersoll-Rand Global Holding Co. Ltd. | 4.250% | 6/15/23 | 450 | 500 |
| Ingersoll-Rand Global Holding Co. Ltd. | 5.750% | 6/15/43 | 325 | 400 |
| Ingersoll-Rand Luxembourg Finance SA | 3.550% | 11/1/24 | 100 | 105 |
| Ingersoll-Rand Luxembourg Finance SA | 4.650% | 11/1/44 | 250 | 269 |
| John Deere Capital Corp. | 2.800% | 9/18/17 | 550 | 563 |
| John Deere Capital Corp. | 1.200% | 10/10/17 | 475 | 477 |
| John Deere Capital Corp. | 1.350% | 1/16/18 | 1,500 | 1,511 |
| John Deere Capital Corp. | 1.750% | 8/10/18 | 325 | 329 |
| John Deere Capital Corp. | 5.750% | 9/10/18 | 530 | 584 |
| John Deere Capital Corp. | 1.950% | 1/8/19 | 900 | 918 |
| John Deere Capital Corp. | 2.250% | 4/17/19 | 150 | 154 |
| John Deere Capital Corp. | 1.700% | 1/15/20 | 1,975 | 1,989 |
| John Deere Capital Corp. | 2.050% | 3/10/20 | 750 | 765 |
| John Deere Capital Corp. | 2.450% | 9/11/20 | 275 | 284 |
| John Deere Capital Corp. | 3.900% | 7/12/21 | 125 | 138 |
| John Deere Capital Corp. | 3.150% | 10/15/21 | 305 | 326 |
| John Deere Capital Corp. | 2.750% | 3/15/22 | 75 | 78 |
| John Deere Capital Corp. | 2.800% | 1/27/23 | 275 | 286 |
| John Deere Capital Corp. | 2.800% | 3/6/23 | 1,000 | 1,047 |
| John Deere Capital Corp. | 3.350% | 6/12/24 | 700 | 755 |
| John Deere Capital Corp. | 3.400% | 9/11/25 | 325 | 351 |
| John Deere Capital Corp. | 2.650% | 6/10/26 | 300 | 306 |
| Kennametal Inc. | 2.650% | 11/1/19 | 200 | 200 |
96
| Vanguard® Balanced Index Fund | ||||
| Schedule of Investments | ||||
| June 30, 2016 | ||||
| Face | Market | |||
| Maturity | Amount | Value | ||
| Coupon | Date | ($000) | ($000) | |
| Kennametal Inc. | 3.875% | 2/15/22 | 125 | 127 |
| L-3 Communications Corp. | 5.200% | 10/15/19 | 825 | 899 |
| L-3 Communications Corp. | 4.750% | 7/15/20 | 925 | 997 |
| L-3 Communications Corp. | 4.950% | 2/15/21 | 575 | 629 |
| L-3 Communications Corp. | 3.950% | 5/28/24 | 120 | 126 |
| Lafarge SA | 7.125% | 7/15/36 | 300 | 365 |
| Leggett & Platt Inc. | 3.800% | 11/15/24 | 400 | 423 |
| Legrand France SA | 8.500% | 2/15/25 | 250 | 341 |
| Lockheed Martin Corp. | 1.850% | 11/23/18 | 275 | 279 |
| Lockheed Martin Corp. | 4.250% | 11/15/19 | 855 | 937 |
| Lockheed Martin Corp. | 2.500% | 11/23/20 | 575 | 593 |
| Lockheed Martin Corp. | 3.350% | 9/15/21 | 550 | 589 |
| Lockheed Martin Corp. | 3.100% | 1/15/23 | 270 | 285 |
| Lockheed Martin Corp. | 2.900% | 3/1/25 | 175 | 181 |
| Lockheed Martin Corp. | 3.550% | 1/15/26 | 1,200 | 1,309 |
| Lockheed Martin Corp. | 3.600% | 3/1/35 | 550 | 558 |
| Lockheed Martin Corp. | 4.500% | 5/15/36 | 350 | 396 |
| Lockheed Martin Corp. | 6.150% | 9/1/36 | 1,715 | 2,279 |
| Lockheed Martin Corp. | 5.500% | 11/15/39 | 680 | 844 |
| Lockheed Martin Corp. | 5.720% | 6/1/40 | 316 | 411 |
| Lockheed Martin Corp. | 4.700% | 5/15/46 | 1,300 | 1,526 |
| Martin Marietta Materials Inc. | 6.600% | 4/15/18 | 400 | 427 |
| Mohawk Industries Inc. | 3.850% | 2/1/23 | 550 | 580 |
| Northrop Grumman Corp. | 1.750% | 6/1/18 | 575 | 580 |
| Northrop Grumman Corp. | 5.050% | 8/1/19 | 245 | 271 |
| Northrop Grumman Corp. | 3.500% | 3/15/21 | 125 | 134 |
| Northrop Grumman Corp. | 3.250% | 8/1/23 | 1,000 | 1,072 |
| Northrop Grumman Corp. | 5.050% | 11/15/40 | 475 | 570 |
| Northrop Grumman Corp. | 4.750% | 6/1/43 | 850 | 1,011 |
| Owens Corning | 4.200% | 12/15/22 | 550 | 586 |
| Owens Corning | 4.200% | 12/1/24 | 250 | 262 |
| Parker Hannifin Corp. | 5.500% | 5/15/18 | 1,725 | 1,871 |
| Parker Hannifin Corp. | 3.500% | 9/15/22 | 225 | 246 |
| Parker Hannifin Corp. | 6.250% | 5/15/38 | 75 | 105 |
| Pentair Finance SA | 2.650% | 12/1/19 | 500 | 501 |
| Precision Castparts Corp. | 1.250% | 1/15/18 | 1,650 | 1,658 |
| Precision Castparts Corp. | 2.250% | 6/15/20 | 300 | 309 |
| Precision Castparts Corp. | 2.500% | 1/15/23 | 925 | 956 |
| Precision Castparts Corp. | 3.250% | 6/15/25 | 300 | 322 |
| Precision Castparts Corp. | 3.900% | 1/15/43 | 175 | 190 |
| Precision Castparts Corp. | 4.375% | 6/15/45 | 350 | 415 |
| Raytheon Co. | 6.750% | 3/15/18 | 125 | 137 |
| Raytheon Co. | 3.125% | 10/15/20 | 425 | 455 |
| Raytheon Co. | 2.500% | 12/15/22 | 1,425 | 1,483 |
| Raytheon Co. | 7.200% | 8/15/27 | 75 | 107 |
| Raytheon Co. | 4.875% | 10/15/40 | 225 | 275 |
| Raytheon Co. | 4.700% | 12/15/41 | 925 | 1,110 |
| Republic Services Inc. | 3.800% | 5/15/18 | 735 | 769 |
| Republic Services Inc. | 5.500% | 9/15/19 | 425 | 474 |
| Republic Services Inc. | 5.000% | 3/1/20 | 500 | 555 |
| Republic Services Inc. | 5.250% | 11/15/21 | 50 | 58 |
| Republic Services Inc. | 3.550% | 6/1/22 | 1,300 | 1,405 |
| Republic Services Inc. | 3.200% | 3/15/25 | 500 | 523 |
| Republic Services Inc. | 6.200% | 3/1/40 | 475 | 644 |
| Republic Services Inc. | 5.700% | 5/15/41 | 500 | 638 |
| Rockwell Automation Inc. | 5.650% | 12/1/17 | 25 | 26 |
| Rockwell Automation Inc. | 6.700% | 1/15/28 | 200 | 278 |
| Rockwell Automation Inc. | 6.250% | 12/1/37 | 325 | 442 |
| Rockwell Collins Inc. | 5.250% | 7/15/19 | 50 | 56 |
| Rockwell Collins Inc. | 3.100% | 11/15/21 | 125 | 131 |
| Rockwell Collins Inc. | 4.800% | 12/15/43 | 235 | 283 |
| Roper Technologies Inc. | 2.050% | 10/1/18 | 1,175 | 1,189 |
| Roper Technologies Inc. | 6.250% | 9/1/19 | 1,575 | 1,781 |
| Snap-on Inc. | 6.125% | 9/1/21 | 200 | 243 |
97
| Vanguard® Balanced Index Fund | ||||
| Schedule of Investments | ||||
| June 30, 2016 | ||||
| Face | Market | |||
| Maturity | Amount | Value | ||
| Coupon | Date | ($000) | ($000) | |
| Sonoco Products Co. | 4.375% | 11/1/21 | 65 | 70 |
| Sonoco Products Co. | 5.750% | 11/1/40 | 765 | 915 |
| Spirit AeroSystems Inc. | 3.850% | 6/15/26 | 235 | 244 |
| Stanley Black & Decker Inc. | 2.451% | 11/17/18 | 400 | 409 |
| Stanley Black & Decker Inc. | 3.400% | 12/1/21 | 450 | 482 |
| Stanley Black & Decker Inc. | 5.200% | 9/1/40 | 150 | 177 |
| Textron Inc. | 5.600% | 12/1/17 | 125 | 131 |
| Textron Inc. | 7.250% | 10/1/19 | 650 | 745 |
| Textron Inc. | 4.300% | 3/1/24 | 625 | 677 |
| Textron Inc. | 4.000% | 3/15/26 | 300 | 317 |
| Timken CO | 3.875% | 9/1/24 | 200 | 203 |
| Tyco International Finance SA | 3.900% | 2/14/26 | 500 | 537 |
| United Technologies Corp. | 5.375% | 12/15/17 | 1,575 | 1,676 |
| United Technologies Corp. | 6.125% | 2/1/19 | 1,133 | 1,273 |
| United Technologies Corp. | 4.500% | 4/15/20 | 445 | 496 |
| United Technologies Corp. | 3.100% | 6/1/22 | 1,600 | 1,706 |
| United Technologies Corp. | 6.700% | 8/1/28 | 200 | 269 |
| United Technologies Corp. | 7.500% | 9/15/29 | 100 | 147 |
| United Technologies Corp. | 5.400% | 5/1/35 | 400 | 493 |
| United Technologies Corp. | 6.050% | 6/1/36 | 285 | 380 |
| United Technologies Corp. | 6.125% | 7/15/38 | 1,000 | 1,371 |
| United Technologies Corp. | 5.700% | 4/15/40 | 625 | 820 |
| United Technologies Corp. | 4.500% | 6/1/42 | 2,725 | 3,126 |
| United Technologies Corp. | 4.150% | 5/15/45 | 50 | 55 |
| Valmont Industries Inc. | 5.000% | 10/1/44 | 290 | 269 |
| Valmont Industries Inc. | 5.250% | 10/1/54 | 250 | 225 |
| Vulcan Materials Co. | 7.500% | 6/15/21 | 400 | 481 |
| Vulcan Materials Co. | 4.500% | 4/1/25 | 250 | 267 |
| Waste Management Inc. | 6.100% | 3/15/18 | 1,100 | 1,193 |
| Waste Management Inc. | 4.600% | 3/1/21 | 275 | 305 |
| Waste Management Inc. | 2.400% | 5/15/23 | 350 | 354 |
| Waste Management Inc. | 3.500% | 5/15/24 | 700 | 756 |
| Waste Management Inc. | 3.125% | 3/1/25 | 250 | 263 |
| Waste Management Inc. | 3.900% | 3/1/35 | 250 | 264 |
| Waste Management Inc. | 4.100% | 3/1/45 | 500 | 545 |
| WW Grainger Inc. | 4.600% | 6/15/45 | 1,050 | 1,248 |
| WW Grainger Inc. | 3.750% | 5/15/46 | 325 | 336 |
| Communication (1.0%) | ||||
| 21st Century Fox America Inc. | 6.900% | 3/1/19 | 660 | 749 |
| 21st Century Fox America Inc. | 5.650% | 8/15/20 | 500 | 573 |
| 21st Century Fox America Inc. | 4.500% | 2/15/21 | 435 | 485 |
| 21st Century Fox America Inc. | 3.000% | 9/15/22 | 500 | 522 |
| 21st Century Fox America Inc. | 4.000% | 10/1/23 | 275 | 302 |
| 21st Century Fox America Inc. | 3.700% | 10/15/25 | 400 | 433 |
| 21st Century Fox America Inc. | 6.550% | 3/15/33 | 892 | 1,123 |
| 21st Century Fox America Inc. | 6.200% | 12/15/34 | 975 | 1,213 |
| 21st Century Fox America Inc. | 6.400% | 12/15/35 | 1,500 | 1,907 |
| 21st Century Fox America Inc. | 8.150% | 10/17/36 | 385 | 544 |
| 21st Century Fox America Inc. | 6.150% | 3/1/37 | 345 | 429 |
| 21st Century Fox America Inc. | 6.900% | 8/15/39 | 425 | 569 |
| 21st Century Fox America Inc. | 6.150% | 2/15/41 | 350 | 438 |
| 21st Century Fox America Inc. | 5.400% | 10/1/43 | 1,675 | 1,968 |
| 21st Century Fox America Inc. | 4.750% | 9/15/44 | 450 | 498 |
| America Movil SAB de CV | 5.625% | 11/15/17 | 350 | 368 |
| America Movil SAB de CV | 5.000% | 10/16/19 | 850 | 929 |
| America Movil SAB de CV | 5.000% | 3/30/20 | 710 | 785 |
| America Movil SAB de CV | 3.125% | 7/16/22 | 200 | 205 |
| America Movil SAB de CV | 6.375% | 3/1/35 | 200 | 245 |
| America Movil SAB de CV | 6.125% | 11/15/37 | 300 | 357 |
| America Movil SAB de CV | 6.125% | 3/30/40 | 2,710 | 3,281 |
| America Movil SAB de CV | 4.375% | 7/16/42 | 425 | 428 |
| American Tower Corp. | 4.500% | 1/15/18 | 1,400 | 1,460 |
| American Tower Corp. | 2.800% | 6/1/20 | 600 | 614 |
98
| Vanguard® Balanced Index Fund | |||||
| Schedule of Investments | |||||
| June 30, 2016 | |||||
| Face | Market | ||||
| Maturity | Amount | Value | |||
| Coupon | Date | ($000) | ($000) | ||
| American Tower Corp. | 5.050% | 9/1/20 | 155 | 172 | |
| American Tower Corp. | 3.300% | 2/15/21 | 600 | 625 | |
| American Tower Corp. | 5.900% | 11/1/21 | 1,500 | 1,746 | |
| American Tower Corp. | 5.000% | 2/15/24 | 2,150 | 2,429 | |
| American Tower Corp. | 4.000% | 6/1/25 | 425 | 452 | |
| AT&T Corp. | 8.250% | 11/15/31 | 1,001 | 1,451 | |
| AT&T Inc. | 1.700% | 6/1/17 | 1,975 | 1,984 | |
| AT&T Inc. | 5.500% | 2/1/18 | 2,385 | 2,540 | |
| AT&T Inc. | 5.600% | 5/15/18 | 250 | 269 | |
| AT&T Inc. | 2.375% | 11/27/18 | 950 | 971 | |
| AT&T Inc. | 5.800% | 2/15/19 | 225 | 250 | |
| AT&T Inc. | 2.300% | 3/11/19 | 625 | 638 | |
| AT&T Inc. | 5.875% | 10/1/19 | 1,880 | 2,128 | |
| AT&T Inc. | 5.200% | 3/15/20 | 1,150 | 1,302 | |
| AT&T Inc. | 2.450% | 6/30/20 | 1,950 | 1,989 | |
| AT&T Inc. | 4.600% | 2/15/21 | 425 | 466 | |
| AT&T Inc. | 5.000% | 3/1/21 | 925 | 1,036 | |
| AT&T Inc. | 4.450% | 5/15/21 | 485 | 533 | |
| AT&T Inc. | 3.875% | 8/15/21 | 5,615 | 6,044 | |
| AT&T Inc. | 3.000% | 2/15/22 | 600 | 612 | |
| AT&T Inc. | 3.000% | 6/30/22 | 2,000 | 2,052 | |
| AT&T Inc. | 2.625% | 12/1/22 | 875 | 878 | |
| AT&T Inc. | 3.600% | 2/17/23 | 2,650 | 2,773 | |
| AT&T Inc. | 4.450% | 4/1/24 | 1,075 | 1,182 | |
| AT&T Inc. | 3.950% | 1/15/25 | 2,225 | 2,361 | |
| AT&T Inc. | 4.125% | 2/17/26 | 1,100 | 1,182 | |
| AT&T Inc. | 6.450% | 6/15/34 | 945 | 1,133 | |
| AT&T Inc. | 4.500% | 5/15/35 | 800 | 818 | |
| AT&T Inc. | 6.500% | 9/1/37 | 448 | 551 | |
| AT&T Inc. | 6.300% | 1/15/38 | 885 | 1,065 | |
| AT&T Inc. | 6.400% | 5/15/38 | 550 | 667 | |
| AT&T Inc. | 6.550% | 2/15/39 | 760 | 941 | |
| AT&T Inc. | 6.350% | 3/15/40 | 275 | 328 | |
| AT&T Inc. | 5.350% | 9/1/40 | 2,555 | 2,782 | |
| AT&T Inc. | 6.375% | 3/1/41 | 1,225 | 1,492 | |
| AT&T Inc. | 5.550% | 8/15/41 | 210 | 236 | |
| AT&T Inc. | 5.150% | 3/15/42 | 825 | 890 | |
| AT&T Inc. | 4.300% | 12/15/42 | 1,773 | 1,698 | |
| AT&T Inc. | 4.800% | 6/15/44 | 2,000 | 2,060 | |
| AT&T Inc. | 4.350% | 6/15/45 | 750 | 719 | |
| AT&T Inc. | 4.750% | 5/15/46 | 2,500 | 2,569 | |
| AT&T Inc. | 5.650% | 2/15/47 | 1,250 | 1,433 | |
| AT&T Mobility LLC | 7.125% | 12/15/31 | 400 | 526 | |
| Bellsouth Capital Funding Corp. | 7.875% | 2/15/30 | 328 | 419 | |
| BellSouth LLC | 6.875% | 10/15/31 | 231 | 277 | |
| BellSouth LLC | 6.550% | 6/15/34 | 261 | 308 | |
| BellSouth LLC | 6.000% | 11/15/34 | 119 | 134 | |
| BellSouth Telecommunications LLC | 6.375% | 6/1/28 | 790 | 949 | |
| British Telecommunications plc | 5.950% | 1/15/18 | 1,440 | 1,542 | |
| British Telecommunications plc | 2.350% | 2/14/19 | 200 | 204 | |
| British Telecommunications plc | 9.375% | 12/15/30 | 1,700 | 2,633 | |
| CBS Corp. | 2.300% | 8/15/19 | 350 | 356 | |
| CBS Corp. | 5.750% | 4/15/20 | 360 | 409 | |
| CBS Corp. | 4.300% | 2/15/21 | 550 | 598 | |
| CBS Corp. | 3.375% | 3/1/22 | 725 | 757 | |
| CBS Corp. | 3.700% | 8/15/24 | 575 | 604 | |
| CBS Corp. | 7.875% | 7/30/30 | 300 | 426 | |
| CBS Corp. | 5.500% | 5/15/33 | 200 | 223 | |
| CBS Corp. | 4.850% | 7/1/42 | 225 | 228 | |
| CBS Corp. | 4.900% | 8/15/44 | 550 | 562 | |
| CBS Corp. | 4.600% | 1/15/45 | 650 | 640 | |
| CC Holdings GS V LLC / Crown Castle GS III Corp. | 3.849% | 4/15/23 | 1,000 | 1,065 | |
| 8 | Charter Communications Operating LLC / Charter | ||||
| Communications Operating Capital | 3.579% | 7/23/20 | 850 | 889 | |
99
| Vanguard® Balanced Index Fund | |||||
| Schedule of Investments | |||||
| June 30, 2016 | |||||
| Face | Market | ||||
| Maturity | Amount | Value | |||
| Coupon | Date | ($000) | ($000) | ||
| 8 | Charter Communications Operating LLC / Charter | ||||
| Communications Operating Capital | 4.464% | 7/23/22 | 1,750 | 1,881 | |
| 8 | Charter Communications Operating LLC / Charter | ||||
| Communications Operating Capital | 4.908% | 7/23/25 | 2,950 | 3,214 | |
| 8 | Charter Communications Operating LLC / Charter | ||||
| Communications Operating Capital | 6.384% | 10/23/35 | 1,300 | 1,533 | |
| 8 | Charter Communications Operating LLC / Charter | ||||
| Communications Operating Capital | 6.484% | 10/23/45 | 2,275 | 2,715 | |
| 8 | Charter Communications Operating LLC / Charter | ||||
| Communications Operating Capital | 6.834% | 10/23/55 | 325 | 385 | |
| Comcast Cable Communications Holdings Inc. | 9.455% | 11/15/22 | 1,108 | 1,577 | |
| Comcast Cable Communications LLC | 8.875% | 5/1/17 | 850 | 905 | |
| Comcast Corp. | 5.700% | 5/15/18 | 1,475 | 1,602 | |
| Comcast Corp. | 5.700% | 7/1/19 | 1,305 | 1,475 | |
| Comcast Corp. | 3.125% | 7/15/22 | 100 | 107 | |
| Comcast Corp. | 2.750% | 3/1/23 | 1,625 | 1,699 | |
| Comcast Corp. | 3.600% | 3/1/24 | 350 | 384 | |
| Comcast Corp. | 3.375% | 8/15/25 | 1,000 | 1,078 | |
| Comcast Corp. | 3.150% | 3/1/26 | 3,000 | 3,189 | |
| Comcast Corp. | 4.250% | 1/15/33 | 2,450 | 2,704 | |
| Comcast Corp. | 7.050% | 3/15/33 | 1,000 | 1,402 | |
| Comcast Corp. | 5.650% | 6/15/35 | 1,450 | 1,857 | |
| Comcast Corp. | 6.500% | 11/15/35 | 1,075 | 1,473 | |
| Comcast Corp. | 6.450% | 3/15/37 | 900 | 1,239 | |
| Comcast Corp. | 6.950% | 8/15/37 | 1,220 | 1,760 | |
| Comcast Corp. | 6.400% | 5/15/38 | 600 | 824 | |
| Comcast Corp. | 4.650% | 7/15/42 | 1,410 | 1,619 | |
| Comcast Corp. | 4.500% | 1/15/43 | 225 | 252 | |
| Comcast Corp. | 4.600% | 8/15/45 | 925 | 1,063 | |
| Crown Castle International Corp. | 3.400% | 2/15/21 | 1,600 | 1,672 | |
| Crown Castle International Corp. | 4.875% | 4/15/22 | 550 | 604 | |
| Crown Castle International Corp. | 5.250% | 1/15/23 | 1,000 | 1,123 | |
| Crown Castle International Corp. | 4.450% | 2/15/26 | 1,200 | 1,302 | |
| Crown Castle International Corp. | 3.700% | 6/15/26 | 650 | 669 | |
| Deutsche Telekom International Finance BV | 6.750% | 8/20/18 | 325 | 362 | |
| Deutsche Telekom International Finance BV | 6.000% | 7/8/19 | 675 | 761 | |
| Deutsche Telekom International Finance BV | 8.750% | 6/15/30 | 2,750 | 4,159 | |
| Discovery Communications LLC | 5.050% | 6/1/20 | 1,150 | 1,257 | |
| Discovery Communications LLC | 4.375% | 6/15/21 | 655 | 703 | |
| Discovery Communications LLC | 3.300% | 5/15/22 | 125 | 127 | |
| Discovery Communications LLC | 3.250% | 4/1/23 | 500 | 489 | |
| Discovery Communications LLC | 3.450% | 3/15/25 | 1,000 | 971 | |
| Discovery Communications LLC | 4.900% | 3/11/26 | 500 | 530 | |
| Discovery Communications LLC | 4.875% | 4/1/43 | 125 | 113 | |
| Electronic Arts Inc. | 3.700% | 3/1/21 | 375 | 396 | |
| Grupo Televisa SAB | 6.000% | 5/15/18 | 1,400 | 1,505 | |
| Grupo Televisa SAB | 6.625% | 3/18/25 | 450 | 551 | |
| Grupo Televisa SAB | 6.625% | 1/15/40 | 500 | 565 | |
| GTE Corp. | 6.940% | 4/15/28 | 325 | 420 | |
| Historic TW Inc. | 6.625% | 5/15/29 | 200 | 260 | |
| Interpublic Group of Cos. Inc. | 3.750% | 2/15/23 | 500 | 523 | |
| Interpublic Group of Cos. Inc. | 4.200% | 4/15/24 | 825 | 885 | |
| Koninklijke KPN NV | 8.375% | 10/1/30 | 600 | 836 | |
| Moody's Corp. | 2.750% | 7/15/19 | 400 | 413 | |
| Moody's Corp. | 4.500% | 9/1/22 | 1,300 | 1,447 | |
| Moody's Corp. | 5.250% | 7/15/44 | 275 | 335 | |
| NBCUniversal Media LLC | 5.150% | 4/30/20 | 925 | 1,049 | |
| NBCUniversal Media LLC | 4.375% | 4/1/21 | 205 | 229 | |
| NBCUniversal Media LLC | 2.875% | 1/15/23 | 1,250 | 1,313 | |
| NBCUniversal Media LLC | 6.400% | 4/30/40 | 350 | 485 | |
| NBCUniversal Media LLC | 5.950% | 4/1/41 | 1,075 | 1,430 | |
| NBCUniversal Media LLC | 4.450% | 1/15/43 | 400 | 446 | |
| New Cingular Wireless Services Inc. | 8.750% | 3/1/31 | 155 | 231 | |
| Nippon Telegraph & Telephone Corp. | 1.400% | 7/18/17 | 100 | 100 | |
100
| Vanguard® Balanced Index Fund | ||||
| Schedule of Investments | ||||
| June 30, 2016 | ||||
| Face | Market | |||
| Maturity | Amount | Value | ||
| Coupon | Date | ($000) | ($000) | |
| Omnicom Group Inc. | 6.250% | 7/15/19 | 175 | 199 |
| Omnicom Group Inc. | 4.450% | 8/15/20 | 500 | 552 |
| Omnicom Group Inc. | 3.625% | 5/1/22 | 1,100 | 1,170 |
| Omnicom Group Inc. | 3.650% | 11/1/24 | 900 | 953 |
| Omnicom Group Inc. | 3.600% | 4/15/26 | 1,950 | 2,038 |
| Orange SA | 5.375% | 7/8/19 | 1,025 | 1,138 |
| Orange SA | 4.125% | 9/14/21 | 902 | 995 |
| Orange SA | 9.000% | 3/1/31 | 2,235 | 3,449 |
| Orange SA | 5.375% | 1/13/42 | 575 | 705 |
| Orange SA | 5.500% | 2/6/44 | 575 | 717 |
| Pacific Bell Telephone Co. | 7.125% | 3/15/26 | 200 | 257 |
| Qwest Corp. | 6.500% | 6/1/17 | 275 | 285 |
| Qwest Corp. | 6.750% | 12/1/21 | 410 | 444 |
| Qwest Corp. | 7.250% | 9/15/25 | 175 | 187 |
| Qwest Corp. | 6.875% | 9/15/33 | 1,018 | 998 |
| Qwest Corp. | 7.125% | 11/15/43 | 550 | 534 |
| RELX Capital Inc. | 8.625% | 1/15/19 | 259 | 299 |
| RELX Capital Inc. | 3.125% | 10/15/22 | 705 | 718 |
| Rogers Communications Inc. | 6.800% | 8/15/18 | 950 | 1,052 |
| Rogers Communications Inc. | 3.000% | 3/15/23 | 230 | 238 |
| Rogers Communications Inc. | 4.100% | 10/1/23 | 225 | 249 |
| Rogers Communications Inc. | 3.625% | 12/15/25 | 475 | 508 |
| Rogers Communications Inc. | 4.500% | 3/15/43 | 540 | 572 |
| Rogers Communications Inc. | 5.000% | 3/15/44 | 1,100 | 1,245 |
| S&P Global Inc. | 5.900% | 11/15/17 | 150 | 159 |
| S&P Global Inc. | 3.300% | 8/14/20 | 450 | 471 |
| S&P Global Inc. | 4.000% | 6/15/25 | 450 | 491 |
| S&P Global Inc. | 4.400% | 2/15/26 | 875 | 983 |
| S&P Global Inc. | 6.550% | 11/15/37 | 350 | 426 |
| Scripps Networks Interactive Inc. | 2.750% | 11/15/19 | 500 | 510 |
| Scripps Networks Interactive Inc. | 2.800% | 6/15/20 | 325 | 330 |
| Scripps Networks Interactive Inc. | 3.900% | 11/15/24 | 250 | 263 |
| Telefonica Emisiones SAU | 3.192% | 4/27/18 | 1,025 | 1,037 |
| Telefonica Emisiones SAU | 5.877% | 7/15/19 | 910 | 1,008 |
| Telefonica Emisiones SAU | 5.134% | 4/27/20 | 705 | 782 |
| Telefonica Emisiones SAU | 5.462% | 2/16/21 | 350 | 400 |
| Telefonica Emisiones SAU | 4.570% | 4/27/23 | 1,000 | 1,106 |
| Telefonica Emisiones SAU | 7.045% | 6/20/36 | 1,485 | 1,908 |
| Telefonica Europe BV | 8.250% | 9/15/30 | 750 | 1,080 |
| Thomson Reuters Corp. | 6.500% | 7/15/18 | 50 | 55 |
| Thomson Reuters Corp. | 4.700% | 10/15/19 | 125 | 136 |
| Thomson Reuters Corp. | 4.300% | 11/23/23 | 600 | 659 |
| Thomson Reuters Corp. | 3.350% | 5/15/26 | 500 | 512 |
| Thomson Reuters Corp. | 5.500% | 8/15/35 | 350 | 385 |
| Thomson Reuters Corp. | 5.850% | 4/15/40 | 1,425 | 1,658 |
| Thomson Reuters Corp. | 5.650% | 11/23/43 | 1,375 | 1,620 |
| Time Warner Cable Inc. | 6.750% | 7/1/18 | 475 | 521 |
| Time Warner Cable Inc. | 8.750% | 2/14/19 | 1,250 | 1,459 |
| Time Warner Cable Inc. | 8.250% | 4/1/19 | 700 | 813 |
| Time Warner Cable Inc. | 5.000% | 2/1/20 | 2,045 | 2,223 |
| Time Warner Cable Inc. | 4.125% | 2/15/21 | 500 | 530 |
| Time Warner Cable Inc. | 4.000% | 9/1/21 | 850 | 902 |
| Time Warner Cable Inc. | 6.550% | 5/1/37 | 550 | 644 |
| Time Warner Cable Inc. | 7.300% | 7/1/38 | 1,400 | 1,758 |
| Time Warner Cable Inc. | 6.750% | 6/15/39 | 1,600 | 1,905 |
| Time Warner Cable Inc. | 5.500% | 9/1/41 | 750 | 788 |
| Time Warner Cable Inc. | 4.500% | 9/15/42 | 800 | 746 |
| Time Warner Cos. Inc. | 7.570% | 2/1/24 | 1,000 | 1,271 |
| Time Warner Cos. Inc. | 6.950% | 1/15/28 | 1,795 | 2,326 |
| Time Warner Entertainment Co. LP | 8.375% | 3/15/23 | 800 | 1,033 |
| Time Warner Entertainment Co. LP | 8.375% | 7/15/33 | 650 | 874 |
| Time Warner Inc. | 2.100% | 6/1/19 | 550 | 559 |
| Time Warner Inc. | 4.875% | 3/15/20 | 1,240 | 1,373 |
| Time Warner Inc. | 4.700% | 1/15/21 | 700 | 781 |
101
| Vanguard® Balanced Index Fund | ||||
| Schedule of Investments | ||||
| June 30, 2016 | ||||
| Face | Market | |||
| Maturity | Amount | Value | ||
| Coupon | Date | ($000) | ($000) | |
| Time Warner Inc. | 4.750% | 3/29/21 | 600 | 673 |
| Time Warner Inc. | 4.000% | 1/15/22 | 205 | 221 |
| Time Warner Inc. | 4.050% | 12/15/23 | 75 | 83 |
| Time Warner Inc. | 3.550% | 6/1/24 | 525 | 556 |
| Time Warner Inc. | 3.600% | 7/15/25 | 825 | 875 |
| Time Warner Inc. | 3.875% | 1/15/26 | 350 | 377 |
| Time Warner Inc. | 7.625% | 4/15/31 | 835 | 1,146 |
| Time Warner Inc. | 7.700% | 5/1/32 | 1,840 | 2,565 |
| Time Warner Inc. | 6.200% | 3/15/40 | 150 | 186 |
| Time Warner Inc. | 6.100% | 7/15/40 | 825 | 1,003 |
| Time Warner Inc. | 6.250% | 3/29/41 | 325 | 409 |
| Time Warner Inc. | 5.375% | 10/15/41 | 205 | 236 |
| Time Warner Inc. | 4.900% | 6/15/42 | 250 | 267 |
| Time Warner Inc. | 5.350% | 12/15/43 | 125 | 143 |
| Time Warner Inc. | 4.650% | 6/1/44 | 525 | 553 |
| Time Warner Inc. | 4.850% | 7/15/45 | 200 | 217 |
| Verizon Communications Inc. | 1.100% | 11/1/17 | 200 | 200 |
| Verizon Communications Inc. | 5.500% | 2/15/18 | 925 | 990 |
| Verizon Communications Inc. | 6.100% | 4/15/18 | 155 | 168 |
| Verizon Communications Inc. | 3.650% | 9/14/18 | 2,630 | 2,765 |
| Verizon Communications Inc. | 2.625% | 2/21/20 | 1,223 | 1,266 |
| Verizon Communications Inc. | 4.500% | 9/15/20 | 1,105 | 1,227 |
| Verizon Communications Inc. | 3.450% | 3/15/21 | 300 | 322 |
| Verizon Communications Inc. | 4.600% | 4/1/21 | 2,040 | 2,291 |
| Verizon Communications Inc. | 3.000% | 11/1/21 | 850 | 894 |
| Verizon Communications Inc. | 3.500% | 11/1/21 | 1,040 | 1,119 |
| Verizon Communications Inc. | 2.450% | 11/1/22 | 1,925 | 1,944 |
| Verizon Communications Inc. | 5.150% | 9/15/23 | 5,515 | 6,430 |
| Verizon Communications Inc. | 4.150% | 3/15/24 | 1,300 | 1,433 |
| Verizon Communications Inc. | 3.500% | 11/1/24 | 1,000 | 1,066 |
| Verizon Communications Inc. | 7.750% | 12/1/30 | 785 | 1,104 |
| Verizon Communications Inc. | 6.400% | 9/15/33 | 563 | 719 |
| Verizon Communications Inc. | 5.050% | 3/15/34 | 675 | 750 |
| Verizon Communications Inc. | 4.400% | 11/1/34 | 2,200 | 2,276 |
| Verizon Communications Inc. | 5.850% | 9/15/35 | 500 | 606 |
| Verizon Communications Inc. | 4.272% | 1/15/36 | 1,469 | 1,505 |
| Verizon Communications Inc. | 6.250% | 4/1/37 | 775 | 972 |
| Verizon Communications Inc. | 6.400% | 2/15/38 | 835 | 1,053 |
| Verizon Communications Inc. | 6.900% | 4/15/38 | 225 | 300 |
| Verizon Communications Inc. | 7.350% | 4/1/39 | 1,200 | 1,673 |
| Verizon Communications Inc. | 6.000% | 4/1/41 | 445 | 554 |
| Verizon Communications Inc. | 4.750% | 11/1/41 | 625 | 672 |
| Verizon Communications Inc. | 3.850% | 11/1/42 | 1,250 | 1,181 |
| Verizon Communications Inc. | 6.550% | 9/15/43 | 1,898 | 2,564 |
| Verizon Communications Inc. | 4.862% | 8/21/46 | 2,567 | 2,791 |
| Verizon Communications Inc. | 4.522% | 9/15/48 | 2,716 | 2,831 |
| Verizon Communications Inc. | 5.012% | 8/21/54 | 4,363 | 4,636 |
| Verizon Communications Inc. | 4.672% | 3/15/55 | 4,302 | 4,327 |
| Viacom Inc. | 2.500% | 9/1/18 | 175 | 177 |
| Viacom Inc. | 2.200% | 4/1/19 | 625 | 626 |
| Viacom Inc. | 5.625% | 9/15/19 | 750 | 826 |
| Viacom Inc. | 2.750% | 12/15/19 | 825 | 837 |
| Viacom Inc. | 3.875% | 12/15/21 | 495 | 520 |
| Viacom Inc. | 3.125% | 6/15/22 | 75 | 75 |
| Viacom Inc. | 4.250% | 9/1/23 | 175 | 182 |
| Viacom Inc. | 3.875% | 4/1/24 | 625 | 637 |
| Viacom Inc. | 4.850% | 12/15/34 | 375 | 348 |
| Viacom Inc. | 6.875% | 4/30/36 | 915 | 1,004 |
| Viacom Inc. | 4.375% | 3/15/43 | 1,212 | 976 |
| Viacom Inc. | 5.850% | 9/1/43 | 1,075 | 1,076 |
| Viacom Inc. | 5.250% | 4/1/44 | 650 | 603 |
| Vodafone Group plc | 1.250% | 9/26/17 | 1,000 | 1,000 |
| Vodafone Group plc | 1.500% | 2/19/18 | 1,450 | 1,451 |
| Vodafone Group plc | 4.625% | 7/15/18 | 125 | 133 |
102
| Vanguard® Balanced Index Fund | ||||
| Schedule of Investments | ||||
| June 30, 2016 | ||||
| Face | Market | |||
| Maturity | Amount | Value | ||
| Coupon | Date | ($000) | ($000) | |
| Vodafone Group plc | 5.450% | 6/10/19 | 775 | 857 |
| Vodafone Group plc | 2.500% | 9/26/22 | 200 | 197 |
| Vodafone Group plc | 2.950% | 2/19/23 | 545 | 552 |
| Vodafone Group plc | 7.875% | 2/15/30 | 425 | 568 |
| Vodafone Group plc | 6.250% | 11/30/32 | 350 | 408 |
| Vodafone Group plc | 6.150% | 2/27/37 | 605 | 703 |
| Vodafone Group plc | 4.375% | 2/19/43 | 1,875 | 1,783 |
| Walt Disney Co. | 1.100% | 12/1/17 | 850 | 854 |
| Walt Disney Co. | 1.650% | 1/8/19 | 350 | 357 |
| Walt Disney Co. | 1.850% | 5/30/19 | 725 | 741 |
| Walt Disney Co. | 2.150% | 9/17/20 | 1,100 | 1,138 |
| Walt Disney Co. | 2.300% | 2/12/21 | 550 | 572 |
| Walt Disney Co. | 2.350% | 12/1/22 | 25 | 26 |
| Walt Disney Co. | 3.150% | 9/17/25 | 1,200 | 1,315 |
| Walt Disney Co. | 3.000% | 2/13/26 | 1,000 | 1,077 |
| Walt Disney Co. | 4.375% | 8/16/41 | 225 | 262 |
| Walt Disney Co. | 4.125% | 12/1/41 | 350 | 393 |
| Walt Disney Co. | 3.700% | 12/1/42 | 450 | 478 |
| Walt Disney Co. | 4.125% | 6/1/44 | 1,400 | 1,584 |
| WPP Finance 2010 | 4.750% | 11/21/21 | 221 | 246 |
| WPP Finance 2010 | 3.750% | 9/19/24 | 525 | 557 |
| WPP Finance 2010 | 5.125% | 9/7/42 | 1,050 | 1,119 |
| Consumer Cyclical (0.9%) | ||||
| Advance Auto Parts Inc. | 5.750% | 5/1/20 | 100 | 111 |
| Advance Auto Parts Inc. | 4.500% | 1/15/22 | 175 | 188 |
| Advance Auto Parts Inc. | 4.500% | 12/1/23 | 400 | 430 |
| Alibaba Group Holding Ltd. | 1.625% | 11/28/17 | 1,025 | 1,027 |
| Alibaba Group Holding Ltd. | 2.500% | 11/28/19 | 1,325 | 1,340 |
| Alibaba Group Holding Ltd. | 3.125% | 11/28/21 | 300 | 308 |
| Alibaba Group Holding Ltd. | 3.600% | 11/28/24 | 1,600 | 1,644 |
| Alibaba Group Holding Ltd. | 4.500% | 11/28/34 | 600 | 629 |
| Amazon.com Inc. | 1.200% | 11/29/17 | 650 | 653 |
| Amazon.com Inc. | 2.600% | 12/5/19 | 900 | 939 |
| Amazon.com Inc. | 3.300% | 12/5/21 | 750 | 809 |
| Amazon.com Inc. | 2.500% | 11/29/22 | 475 | 492 |
| Amazon.com Inc. | 3.800% | 12/5/24 | 400 | 448 |
| Amazon.com Inc. | 4.800% | 12/5/34 | 975 | 1,148 |
| Amazon.com Inc. | 4.950% | 12/5/44 | 975 | 1,190 |
| American Honda Finance Corp. | 1.200% | 7/14/17 | 300 | 301 |
| American Honda Finance Corp. | 1.550% | 12/11/17 | 1,700 | 1,715 |
| American Honda Finance Corp. | 1.600% | 7/13/18 | 500 | 506 |
| American Honda Finance Corp. | 2.125% | 10/10/18 | 450 | 462 |
| American Honda Finance Corp. | 2.250% | 8/15/19 | 800 | 825 |
| American Honda Finance Corp. | 2.450% | 9/24/20 | 725 | 753 |
| Automatic Data Processing Inc. | 2.250% | 9/15/20 | 650 | 676 |
| Automatic Data Processing Inc. | 3.375% | 9/15/25 | 675 | 734 |
| AutoNation Inc. | 6.750% | 4/15/18 | 250 | 268 |
| AutoNation Inc. | 5.500% | 2/1/20 | 180 | 197 |
| AutoNation Inc. | 3.350% | 1/15/21 | 500 | 511 |
| AutoNation Inc. | 4.500% | 10/1/25 | 400 | 422 |
| AutoZone Inc. | 7.125% | 8/1/18 | 750 | 835 |
| AutoZone Inc. | 3.700% | 4/15/22 | 600 | 639 |
| AutoZone Inc. | 2.875% | 1/15/23 | 200 | 204 |
| AutoZone Inc. | 3.125% | 7/15/23 | 275 | 285 |
| AutoZone Inc. | 3.250% | 4/15/25 | 260 | 271 |
| AutoZone Inc. | 3.125% | 4/21/26 | 300 | 308 |
| Bed Bath & Beyond Inc. | 3.749% | 8/1/24 | 100 | 101 |
| Bed Bath & Beyond Inc. | 4.915% | 8/1/34 | 175 | 163 |
| Bed Bath & Beyond Inc. | 5.165% | 8/1/44 | 525 | 462 |
| Best Buy Co. Inc. | 5.500% | 3/15/21 | 125 | 133 |
| Block Financial LLC | 4.125% | 10/1/20 | 313 | 322 |
| Block Financial LLC | 5.500% | 11/1/22 | 300 | 324 |
| Block Financial LLC | 5.250% | 10/1/25 | 350 | 367 |
103
| Vanguard® Balanced Index Fund | |||||
| Schedule of Investments | |||||
| June 30, 2016 | |||||
| Face | Market | ||||
| Maturity | Amount | Value | |||
| Coupon | Date | ($000) | ($000) | ||
| BorgWarner Inc. | 4.625% | 9/15/20 | 50 | 54 | |
| BorgWarner Inc. | 3.375% | 3/15/25 | 250 | 256 | |
| BorgWarner Inc. | 4.375% | 3/15/45 | 500 | 515 | |
| Brinker International Inc. | 2.600% | 5/15/18 | 25 | 25 | |
| Brinker International Inc. | 3.875% | 5/15/23 | 350 | 354 | |
| Carnival Corp. | 3.950% | 10/15/20 | 450 | 486 | |
| Coach Inc. | 4.250% | 4/1/25 | 450 | 463 | |
| Costco Wholesale Corp. | 1.125% | 12/15/17 | 1,525 | 1,533 | |
| Costco Wholesale Corp. | 1.750% | 2/15/20 | 25 | 25 | |
| Cummins Inc. | 3.650% | 10/1/23 | 350 | 380 | |
| Cummins Inc. | 7.125% | 3/1/28 | 50 | 70 | |
| Cummins Inc. | 4.875% | 10/1/43 | 400 | 461 | |
| CVS Health Corp. | 1.900% | 7/20/18 | 4,500 | 4,568 | |
| CVS Health Corp. | 2.250% | 12/5/18 | 375 | 384 | |
| CVS Health Corp. | 2.800% | 7/20/20 | 500 | 521 | |
| CVS Health Corp. | 2.125% | 6/1/21 | 1,700 | 1,722 | |
| CVS Health Corp. | 3.500% | 7/20/22 | 950 | 1,023 | |
| CVS Health Corp. | 2.750% | 12/1/22 | 975 | 1,007 | |
| CVS Health Corp. | 4.750% | 12/1/22 | 250 | 285 | |
| CVS Health Corp. | 3.375% | 8/12/24 | 660 | 703 | |
| CVS Health Corp. | 3.875% | 7/20/25 | 2,457 | 2,707 | |
| CVS Health Corp. | 2.875% | 6/1/26 | 1,150 | 1,175 | |
| CVS Health Corp. | 5.300% | 12/5/43 | 500 | 621 | |
| CVS Health Corp. | 5.125% | 7/20/45 | 3,150 | 3,904 | |
| Daimler Finance North America LLC | 8.500% | 1/18/31 | 1,105 | 1,791 | |
| Delphi Automotive plc | 3.150% | 11/19/20 | 350 | 363 | |
| Delphi Automotive plc | 4.250% | 1/15/26 | 700 | 763 | |
| Delphi Corp. | 5.000% | 2/15/23 | 450 | 476 | |
| Delphi Corp. | 4.150% | 3/15/24 | 475 | 508 | |
| Dollar General Corp. | 3.250% | 4/15/23 | 800 | 823 | |
| Dollar General Corp. | 4.150% | 11/1/25 | 500 | 547 | |
| eBay Inc. | 2.500% | 3/9/18 | 100 | 102 | |
| eBay Inc. | 2.200% | 8/1/19 | 1,100 | 1,124 | |
| eBay Inc. | 3.250% | 10/15/20 | 125 | 131 | |
| eBay Inc. | 2.875% | 8/1/21 | 450 | 465 | |
| eBay Inc. | 3.800% | 3/9/22 | 500 | 528 | |
| eBay Inc. | 2.600% | 7/15/22 | 1,000 | 989 | |
| eBay Inc. | 3.450% | 8/1/24 | 800 | 818 | |
| eBay Inc. | 4.000% | 7/15/42 | 400 | 338 | |
| Expedia Inc. | 5.950% | 8/15/20 | 1,750 | 1,959 | |
| Expedia Inc. | 4.500% | 8/15/24 | 335 | 343 | |
| 8 | Expedia Inc. | 5.000% | 2/15/26 | 200 | 208 |
| Ford Motor Co. | 6.625% | 10/1/28 | 575 | 726 | |
| Ford Motor Co. | 6.375% | 2/1/29 | 275 | 334 | |
| Ford Motor Co. | 7.450% | 7/16/31 | 2,425 | 3,240 | |
| Ford Motor Co. | 4.750% | 1/15/43 | 750 | 788 | |
| Ford Motor Co. | 7.400% | 11/1/46 | 300 | 421 | |
| Ford Motor Credit Co. LLC | 4.250% | 2/3/17 | 650 | 661 | |
| Ford Motor Credit Co. LLC | 6.625% | 8/15/17 | 2,025 | 2,138 | |
| Ford Motor Credit Co. LLC | 1.724% | 12/6/17 | 600 | 601 | |
| Ford Motor Credit Co. LLC | 2.145% | 1/9/18 | 2,000 | 2,018 | |
| Ford Motor Credit Co. LLC | 2.375% | 1/16/18 | 163 | 165 | |
| Ford Motor Credit Co. LLC | 5.000% | 5/15/18 | 2,150 | 2,276 | |
| Ford Motor Credit Co. LLC | 2.875% | 10/1/18 | 390 | 400 | |
| Ford Motor Credit Co. LLC | 2.551% | 10/5/18 | 625 | 636 | |
| Ford Motor Credit Co. LLC | 2.597% | 11/4/19 | 750 | 767 | |
| Ford Motor Credit Co. LLC | 8.125% | 1/15/20 | 775 | 923 | |
| Ford Motor Credit Co. LLC | 3.157% | 8/4/20 | 1,100 | 1,137 | |
| Ford Motor Credit Co. LLC | 3.200% | 1/15/21 | 850 | 873 | |
| Ford Motor Credit Co. LLC | 3.336% | 3/18/21 | 1,500 | 1,557 | |
| Ford Motor Credit Co. LLC | 5.875% | 8/2/21 | 1,175 | 1,347 | |
| Ford Motor Credit Co. LLC | 3.219% | 1/9/22 | 2,850 | 2,923 | |
| Ford Motor Credit Co. LLC | 4.250% | 9/20/22 | 575 | 620 | |
| Ford Motor Credit Co. LLC | 4.375% | 8/6/23 | 850 | 922 | |
104
| Vanguard® Balanced Index Fund | ||||
| Schedule of Investments | ||||
| June 30, 2016 | ||||
| Face | Market | |||
| Maturity | Amount | Value | ||
| Coupon | Date | ($000) | ($000) | |
| Ford Motor Credit Co. LLC | 3.664% | 9/8/24 | 500 | 517 |
| Ford Motor Credit Co. LLC | 4.134% | 8/4/25 | 900 | 965 |
| General Motors Co. | 3.500% | 10/2/18 | 425 | 437 |
| General Motors Co. | 4.875% | 10/2/23 | 980 | 1,041 |
| General Motors Co. | 4.000% | 4/1/25 | 325 | 327 |
| General Motors Co. | 5.000% | 4/1/35 | 680 | 680 |
| General Motors Co. | 6.600% | 4/1/36 | 100 | 116 |
| General Motors Co. | 6.250% | 10/2/43 | 960 | 1,070 |
| General Motors Co. | 5.200% | 4/1/45 | 1,995 | 1,989 |
| General Motors Co. | 6.750% | 4/1/46 | 665 | 793 |
| General Motors Financial Co. Inc. | 4.750% | 8/15/17 | 475 | 493 |
| General Motors Financial Co. Inc. | 3.000% | 9/25/17 | 155 | 158 |
| General Motors Financial Co. Inc. | 3.250% | 5/15/18 | 335 | 341 |
| General Motors Financial Co. Inc. | 6.750% | 6/1/18 | 825 | 894 |
| General Motors Financial Co. Inc. | 3.100% | 1/15/19 | 1,150 | 1,172 |
| General Motors Financial Co. Inc. | 2.400% | 5/9/19 | 2,000 | 2,003 |
| General Motors Financial Co. Inc. | 3.500% | 7/10/19 | 1,025 | 1,057 |
| General Motors Financial Co. Inc. | 3.150% | 1/15/20 | 555 | 561 |
| General Motors Financial Co. Inc. | 3.200% | 7/13/20 | 1,600 | 1,598 |
| General Motors Financial Co. Inc. | 3.700% | 11/24/20 | 975 | 1,002 |
| General Motors Financial Co. Inc. | 4.200% | 3/1/21 | 625 | 656 |
| General Motors Financial Co. Inc. | 3.200% | 7/6/21 | 850 | 852 |
| General Motors Financial Co. Inc. | 4.375% | 9/25/21 | 375 | 395 |
| General Motors Financial Co. Inc. | 3.450% | 4/10/22 | 1,515 | 1,511 |
| General Motors Financial Co. Inc. | 3.700% | 5/9/23 | 1,000 | 1,006 |
| General Motors Financial Co. Inc. | 4.250% | 5/15/23 | 525 | 538 |
| General Motors Financial Co. Inc. | 4.000% | 1/15/25 | 650 | 657 |
| General Motors Financial Co. Inc. | 5.250% | 3/1/26 | 575 | 621 |
| Harley-Davidson Inc. | 3.500% | 7/28/25 | 400 | 429 |
| Harley-Davidson Inc. | 4.625% | 7/28/45 | 500 | 559 |
| Harman International Industries Inc. | 4.150% | 5/15/25 | 275 | 287 |
| Home Depot Inc. | 2.250% | 9/10/18 | 725 | 746 |
| Home Depot Inc. | 2.000% | 6/15/19 | 1,300 | 1,337 |
| Home Depot Inc. | 2.000% | 4/1/21 | 2,175 | 2,231 |
| Home Depot Inc. | 4.400% | 4/1/21 | 600 | 676 |
| Home Depot Inc. | 2.625% | 6/1/22 | 840 | 879 |
| Home Depot Inc. | 2.700% | 4/1/23 | 600 | 629 |
| Home Depot Inc. | 3.750% | 2/15/24 | 900 | 1,008 |
| Home Depot Inc. | 3.350% | 9/15/25 | 500 | 545 |
| Home Depot Inc. | 3.000% | 4/1/26 | 1,500 | 1,594 |
| Home Depot Inc. | 5.875% | 12/16/36 | 2,245 | 3,058 |
| Home Depot Inc. | 5.950% | 4/1/41 | 375 | 515 |
| Home Depot Inc. | 4.200% | 4/1/43 | 1,250 | 1,407 |
| Home Depot Inc. | 4.875% | 2/15/44 | 1,250 | 1,529 |
| Home Depot Inc. | 4.250% | 4/1/46 | 620 | 710 |
| Hyatt Hotels Corp. | 3.375% | 7/15/23 | 800 | 810 |
| Johnson Controls Inc. | 1.400% | 11/2/17 | 175 | 176 |
| Johnson Controls Inc. | 5.000% | 3/30/20 | 200 | 219 |
| Johnson Controls Inc. | 4.250% | 3/1/21 | 345 | 372 |
| Johnson Controls Inc. | 3.750% | 12/1/21 | 175 | 186 |
| Johnson Controls Inc. | 3.625% | 7/2/24 | 300 | 318 |
| Johnson Controls Inc. | 6.000% | 1/15/36 | 275 | 326 |
| Johnson Controls Inc. | 5.700% | 3/1/41 | 205 | 240 |
| Johnson Controls Inc. | 5.250% | 12/1/41 | 100 | 112 |
| Johnson Controls Inc. | 4.625% | 7/2/44 | 200 | 212 |
| Johnson Controls Inc. | 4.950% | 7/2/64 | 300 | 300 |
| Kohl's Corp. | 4.000% | 11/1/21 | 845 | 884 |
| Kohl's Corp. | 4.250% | 7/17/25 | 325 | 322 |
| Kohl's Corp. | 5.550% | 7/17/45 | 300 | 276 |
| Lowe's Cos. Inc. | 6.100% | 9/15/17 | 200 | 212 |
| Lowe's Cos. Inc. | 4.625% | 4/15/20 | 445 | 490 |
| Lowe's Cos. Inc. | 3.750% | 4/15/21 | 205 | 227 |
| Lowe's Cos. Inc. | 3.800% | 11/15/21 | 250 | 275 |
| Lowe's Cos. Inc. | 3.120% | 4/15/22 | 450 | 481 |
105
| Vanguard® Balanced Index Fund | ||||
| Schedule of Investments | ||||
| June 30, 2016 | ||||
| Face | Market | |||
| Maturity | Amount | Value | ||
| Coupon | Date | ($000) | ($000) | |
| Lowe's Cos. Inc. | 3.875% | 9/15/23 | 300 | 335 |
| Lowe's Cos. Inc. | 3.125% | 9/15/24 | 300 | 320 |
| Lowe's Cos. Inc. | 3.375% | 9/15/25 | 475 | 519 |
| Lowe's Cos. Inc. | 2.500% | 4/15/26 | 900 | 917 |
| Lowe's Cos. Inc. | 6.875% | 2/15/28 | 192 | 265 |
| Lowe's Cos. Inc. | 5.500% | 10/15/35 | 850 | 1,075 |
| Lowe's Cos. Inc. | 5.800% | 4/15/40 | 1,280 | 1,680 |
| Lowe's Cos. Inc. | 5.125% | 11/15/41 | 100 | 123 |
| Lowe's Cos. Inc. | 4.650% | 4/15/42 | 1,025 | 1,187 |
| Lowe's Cos. Inc. | 5.000% | 9/15/43 | 100 | 123 |
| Lowe's Cos. Inc. | 4.250% | 9/15/44 | 225 | 250 |
| Lowe's Cos. Inc. | 4.375% | 9/15/45 | 475 | 543 |
| Lowe's Cos. Inc. | 3.700% | 4/15/46 | 850 | 874 |
| Macy's Retail Holdings Inc. | 7.450% | 7/15/17 | 300 | 318 |
| Macy's Retail Holdings Inc. | 3.450% | 1/15/21 | 310 | 319 |
| Macy's Retail Holdings Inc. | 3.875% | 1/15/22 | 150 | 154 |
| Macy's Retail Holdings Inc. | 2.875% | 2/15/23 | 530 | 504 |
| Macy's Retail Holdings Inc. | 4.375% | 9/1/23 | 750 | 779 |
| Macy's Retail Holdings Inc. | 3.625% | 6/1/24 | 75 | 73 |
| Macy's Retail Holdings Inc. | 6.900% | 4/1/29 | 475 | 521 |
| Macy's Retail Holdings Inc. | 4.500% | 12/15/34 | 800 | 701 |
| Macy's Retail Holdings Inc. | 6.375% | 3/15/37 | 275 | 283 |
| Macy's Retail Holdings Inc. | 5.125% | 1/15/42 | 275 | 242 |
| Magna International Inc. | 3.625% | 6/15/24 | 450 | 477 |
| Magna International Inc. | 4.150% | 10/1/25 | 300 | 330 |
| Marriott International Inc. | 3.375% | 10/15/20 | 850 | 896 |
| Marriott International Inc. | 2.875% | 3/1/21 | 500 | 517 |
| Marriott International Inc. | 3.125% | 10/15/21 | 350 | 363 |
| Marriott International Inc. | 3.750% | 10/1/25 | 200 | 214 |
| Marriott International Inc. | 2.300% | 1/15/22 | 400 | 402 |
| Marriott International Inc. | 3.125% | 6/15/26 | 595 | 603 |
| MasterCard Inc. | 2.000% | 4/1/19 | 250 | 256 |
| MasterCard Inc. | 3.375% | 4/1/24 | 625 | 678 |
| McDonald's Corp. | 5.300% | 3/15/17 | 400 | 412 |
| McDonald's Corp. | 5.800% | 10/15/17 | 550 | 583 |
| McDonald's Corp. | 5.350% | 3/1/18 | 880 | 940 |
| McDonald's Corp. | 2.100% | 12/7/18 | 200 | 204 |
| McDonald's Corp. | 1.875% | 5/29/19 | 250 | 254 |
| McDonald's Corp. | 2.750% | 12/9/20 | 425 | 443 |
| McDonald's Corp. | 2.625% | 1/15/22 | 410 | 424 |
| McDonald's Corp. | 3.375% | 5/26/25 | 1,480 | 1,574 |
| McDonald's Corp. | 3.700% | 1/30/26 | 1,125 | 1,213 |
| McDonald's Corp. | 4.700% | 12/9/35 | 575 | 648 |
| McDonald's Corp. | 6.300% | 3/1/38 | 100 | 132 |
| McDonald's Corp. | 5.700% | 2/1/39 | 375 | 466 |
| McDonald's Corp. | 3.700% | 2/15/42 | 1,225 | 1,205 |
| McDonald's Corp. | 3.625% | 5/1/43 | 275 | 265 |
| McDonald's Corp. | 4.600% | 5/26/45 | 625 | 698 |
| McDonald's Corp. | 4.875% | 12/9/45 | 1,125 | 1,305 |
| Metropolitan Museum of Art New York Revenue | 3.400% | 7/1/45 | 225 | 238 |
| NIKE Inc. | 2.250% | 5/1/23 | 50 | 51 |
| NIKE Inc. | 3.625% | 5/1/43 | 125 | 132 |
| NIKE Inc. | 3.875% | 11/1/45 | 1,025 | 1,135 |
| Nordstrom Inc. | 4.750% | 5/1/20 | 750 | 816 |
| Nordstrom Inc. | 4.000% | 10/15/21 | 585 | 625 |
| Nordstrom Inc. | 6.950% | 3/15/28 | 200 | 247 |
| Nordstrom Inc. | 5.000% | 1/15/44 | 272 | 266 |
| NVR Inc. | 3.950% | 9/15/22 | 400 | 424 |
| O'Reilly Automotive Inc. | 4.875% | 1/14/21 | 50 | 56 |
| O'Reilly Automotive Inc. | 4.625% | 9/15/21 | 300 | 331 |
| O'Reilly Automotive Inc. | 3.800% | 9/1/22 | 255 | 274 |
| O'Reilly Automotive Inc. | 3.850% | 6/15/23 | 300 | 323 |
| O'Reilly Automotive Inc. | 3.550% | 3/15/26 | 200 | 211 |
| PACCAR Financial Corp. | 1.400% | 11/17/17 | 275 | 277 |
106
| Vanguard® Balanced Index Fund | ||||
| Schedule of Investments | ||||
| June 30, 2016 | ||||
| Face | Market | |||
| Maturity | Amount | Value | ||
| Coupon | Date | ($000) | ($000) | |
| PACCAR Financial Corp. | 1.450% | 3/9/18 | 250 | 252 |
| PACCAR Financial Corp. | 1.750% | 8/14/18 | 75 | 76 |
| PACCAR Financial Corp. | 1.300% | 5/10/19 | 900 | 902 |
| PACCAR Financial Corp. | 2.200% | 9/15/19 | 150 | 154 |
| PACCAR Financial Corp. | 2.500% | 8/14/20 | 225 | 232 |
| PACCAR Financial Corp. | 2.250% | 2/25/21 | 200 | 203 |
| Priceline Group Inc. | 3.600% | 6/1/26 | 1,000 | 1,031 |
| QVC Inc. | 3.125% | 4/1/19 | 525 | 539 |
| QVC Inc. | 5.125% | 7/2/22 | 25 | 27 |
| QVC Inc. | 4.375% | 3/15/23 | 75 | 76 |
| QVC Inc. | 4.850% | 4/1/24 | 525 | 544 |
| QVC Inc. | 5.950% | 3/15/43 | 325 | 302 |
| Ralph Lauren Corp. | 2.125% | 9/26/18 | 200 | 204 |
| Ralph Lauren Corp. | 2.625% | 8/18/20 | 225 | 234 |
| Ross Stores Inc. | 3.375% | 9/15/24 | 150 | 157 |
| Signet UK Finance plc | 4.700% | 6/15/24 | 250 | 244 |
| Staples Inc. | 4.375% | 1/12/23 | 300 | 306 |
| Starbucks Corp. | 2.100% | 2/4/21 | 350 | 360 |
| Starbucks Corp. | 2.700% | 6/15/22 | 350 | 369 |
| Starbucks Corp. | 3.850% | 10/1/23 | 800 | 898 |
| Starbucks Corp. | 2.450% | 6/15/26 | 400 | 404 |
| Starbucks Corp. | 4.300% | 6/15/45 | 175 | 208 |
| Starwood Hotels & Resorts Worldwide Inc. | 3.125% | 2/15/23 | 250 | 253 |
| Starwood Hotels & Resorts Worldwide Inc. | 3.750% | 3/15/25 | 525 | 552 |
| Starwood Hotels & Resorts Worldwide Inc. | 4.500% | 10/1/34 | 175 | 178 |
| Target Corp. | 6.000% | 1/15/18 | 315 | 339 |
| Target Corp. | 2.300% | 6/26/19 | 1,550 | 1,601 |
| Target Corp. | 3.875% | 7/15/20 | 145 | 158 |
| Target Corp. | 2.900% | 1/15/22 | 900 | 956 |
| Target Corp. | 3.500% | 7/1/24 | 925 | 1,022 |
| Target Corp. | 2.500% | 4/15/26 | 700 | 717 |
| Target Corp. | 6.350% | 11/1/32 | 363 | 492 |
| Target Corp. | 6.500% | 10/15/37 | 450 | 638 |
| Target Corp. | 7.000% | 1/15/38 | 300 | 449 |
| Target Corp. | 4.000% | 7/1/42 | 900 | 971 |
| Target Corp. | 3.625% | 4/15/46 | 800 | 818 |
| Tiffany & Co. | 4.900% | 10/1/44 | 175 | 175 |
| TJX Cos. Inc. | 6.950% | 4/15/19 | 175 | 202 |
| TJX Cos. Inc. | 2.750% | 6/15/21 | 400 | 423 |
| TJX Cos. Inc. | 2.500% | 5/15/23 | 700 | 730 |
| Toyota Motor Credit Corp. | 1.250% | 10/5/17 | 1,450 | 1,455 |
| Toyota Motor Credit Corp. | 1.375% | 1/10/18 | 825 | 830 |
| Toyota Motor Credit Corp. | 1.450% | 1/12/18 | 300 | 302 |
| Toyota Motor Credit Corp. | 1.200% | 4/6/18 | 1,000 | 1,004 |
| Toyota Motor Credit Corp. | 2.000% | 10/24/18 | 1,125 | 1,147 |
| Toyota Motor Credit Corp. | 2.100% | 1/17/19 | 1,000 | 1,022 |
| Toyota Motor Credit Corp. | 1.700% | 2/19/19 | 800 | 810 |
| Toyota Motor Credit Corp. | 1.400% | 5/20/19 | 1,500 | 1,508 |
| Toyota Motor Credit Corp. | 2.125% | 7/18/19 | 1,000 | 1,026 |
| Toyota Motor Credit Corp. | 2.150% | 3/12/20 | 1,250 | 1,285 |
| Toyota Motor Credit Corp. | 4.250% | 1/11/21 | 300 | 335 |
| Toyota Motor Credit Corp. | 1.900% | 4/8/21 | 1,000 | 1,013 |
| Toyota Motor Credit Corp. | 2.750% | 5/17/21 | 500 | 524 |
| Toyota Motor Credit Corp. | 3.400% | 9/15/21 | 305 | 332 |
| Toyota Motor Credit Corp. | 3.300% | 1/12/22 | 650 | 700 |
| Toyota Motor Credit Corp. | 2.800% | 7/13/22 | 500 | 526 |
| Toyota Motor Credit Corp. | 2.625% | 1/10/23 | 550 | 575 |
| Under Armour Inc. | 3.250% | 6/15/26 | 295 | 298 |
| VF Corp. | 5.950% | 11/1/17 | 250 | 266 |
| VF Corp. | 3.500% | 9/1/21 | 380 | 413 |
| VF Corp. | 6.450% | 11/1/37 | 300 | 414 |
| Visa Inc. | 1.200% | 12/14/17 | 2,200 | 2,211 |
| Visa Inc. | 2.200% | 12/14/20 | 2,200 | 2,266 |
| Visa Inc. | 2.800% | 12/14/22 | 1,500 | 1,578 |
107
| Vanguard® Balanced Index Fund | ||||
| Schedule of Investments | ||||
| June 30, 2016 | ||||
| Face | Market | |||
| Maturity | Amount | Value | ||
| Coupon | Date | ($000) | ($000) | |
| Visa Inc. | 3.150% | 12/14/25 | 2,725 | 2,900 |
| Visa Inc. | 4.150% | 12/14/35 | 900 | 1,018 |
| Visa Inc. | 4.300% | 12/14/45 | 2,250 | 2,601 |
| Wal-Mart Stores Inc. | 5.800% | 2/15/18 | 655 | 708 |
| Wal-Mart Stores Inc. | 1.125% | 4/11/18 | 2,225 | 2,236 |
| Wal-Mart Stores Inc. | 1.950% | 12/15/18 | 750 | 770 |
| Wal-Mart Stores Inc. | 3.625% | 7/8/20 | 50 | 55 |
| Wal-Mart Stores Inc. | 3.250% | 10/25/20 | 1,135 | 1,227 |
| Wal-Mart Stores Inc. | 4.250% | 4/15/21 | 1,215 | 1,377 |
| Wal-Mart Stores Inc. | 2.550% | 4/11/23 | 575 | 599 |
| Wal-Mart Stores Inc. | 3.300% | 4/22/24 | 225 | 247 |
| Wal-Mart Stores Inc. | 5.875% | 4/5/27 | 2,365 | 3,130 |
| Wal-Mart Stores Inc. | 5.250% | 9/1/35 | 455 | 598 |
| Wal-Mart Stores Inc. | 6.500% | 8/15/37 | 1,910 | 2,764 |
| Wal-Mart Stores Inc. | 6.200% | 4/15/38 | 800 | 1,133 |
| Wal-Mart Stores Inc. | 5.000% | 10/25/40 | 1,265 | 1,579 |
| Wal-Mart Stores Inc. | 5.625% | 4/15/41 | 1,615 | 2,168 |
| Wal-Mart Stores Inc. | 4.000% | 4/11/43 | 1,120 | 1,238 |
| Wal-Mart Stores Inc. | 4.750% | 10/2/43 | 1,625 | 2,003 |
| Wal-Mart Stores Inc. | 4.300% | 4/22/44 | 450 | 525 |
| Walgreen Co. | 5.250% | 1/15/19 | 231 | 250 |
| Walgreen Co. | 3.100% | 9/15/22 | 400 | 412 |
| Walgreen Co. | 4.400% | 9/15/42 | 300 | 304 |
| Walgreens Boots Alliance Inc. | 1.750% | 11/17/17 | 800 | 805 |
| Walgreens Boots Alliance Inc. | 1.750% | 5/30/18 | 800 | 806 |
| Walgreens Boots Alliance Inc. | 2.700% | 11/18/19 | 600 | 620 |
| Walgreens Boots Alliance Inc. | 2.600% | 6/1/21 | 1,000 | 1,019 |
| Walgreens Boots Alliance Inc. | 3.300% | 11/18/21 | 1,500 | 1,573 |
| Walgreens Boots Alliance Inc. | 3.100% | 6/1/23 | 450 | 457 |
| Walgreens Boots Alliance Inc. | 3.800% | 11/18/24 | 1,025 | 1,086 |
| Walgreens Boots Alliance Inc. | 3.450% | 6/1/26 | 1,225 | 1,257 |
| Walgreens Boots Alliance Inc. | 4.500% | 11/18/34 | 500 | 524 |
| Walgreens Boots Alliance Inc. | 4.800% | 11/18/44 | 880 | 943 |
| Walgreens Boots Alliance Inc. | 4.650% | 6/1/46 | 575 | 615 |
| Western Union Co. | 6.200% | 11/17/36 | 325 | 346 |
| Western Union Co. | 6.200% | 6/21/40 | 150 | 155 |
| Wyndham Worldwide Corp. | 2.950% | 3/1/17 | 425 | 429 |
| Wyndham Worldwide Corp. | 2.500% | 3/1/18 | 250 | 253 |
| Wyndham Worldwide Corp. | 4.250% | 3/1/22 | 500 | 529 |
| Wyndham Worldwide Corp. | 3.900% | 3/1/23 | 175 | 180 |
| Consumer Noncyclical (1.8%) | ||||
| Abbott Laboratories | 5.125% | 4/1/19 | 646 | 710 |
| Abbott Laboratories | 2.000% | 3/15/20 | 750 | 759 |
| Abbott Laboratories | 2.550% | 3/15/22 | 500 | 511 |
| Abbott Laboratories | 2.950% | 3/15/25 | 100 | 102 |
| Abbott Laboratories | 6.150% | 11/30/37 | 350 | 461 |
| Abbott Laboratories | 6.000% | 4/1/39 | 200 | 263 |
| Abbott Laboratories | 5.300% | 5/27/40 | 310 | 378 |
| AbbVie Inc. | 1.750% | 11/6/17 | 2,525 | 2,541 |
| AbbVie Inc. | 1.800% | 5/14/18 | 1,950 | 1,963 |
| AbbVie Inc. | 2.000% | 11/6/18 | 1,675 | 1,691 |
| AbbVie Inc. | 2.500% | 5/14/20 | 2,375 | 2,428 |
| AbbVie Inc. | 2.300% | 5/14/21 | 625 | 630 |
| AbbVie Inc. | 2.900% | 11/6/22 | 2,450 | 2,494 |
| AbbVie Inc. | 3.200% | 11/6/22 | 900 | 931 |
| AbbVie Inc. | 2.850% | 5/14/23 | 775 | 785 |
| AbbVie Inc. | 3.600% | 5/14/25 | 2,420 | 2,537 |
| AbbVie Inc. | 3.200% | 5/14/26 | 1,300 | 1,317 |
| AbbVie Inc. | 4.500% | 5/14/35 | 1,495 | 1,561 |
| AbbVie Inc. | 4.300% | 5/14/36 | 500 | 511 |
| AbbVie Inc. | 4.400% | 11/6/42 | 1,714 | 1,747 |
| AbbVie Inc. | 4.700% | 5/14/45 | 2,147 | 2,270 |
| AbbVie Inc. | 4.450% | 5/14/46 | 1,000 | 1,022 |
108
| Vanguard® Balanced Index Fund | |||||
| Schedule of Investments | |||||
| June 30, 2016 | |||||
| Face | Market | ||||
| Maturity | Amount | Value | |||
| Coupon | Date | ($000) | ($000) | ||
| Actavis Funding SCS | 1.300% | 6/15/17 | 1,200 | 1,197 | |
| Actavis Funding SCS | 2.350% | 3/12/18 | 2,850 | 2,887 | |
| Actavis Funding SCS | 2.450% | 6/15/19 | 325 | 329 | |
| Actavis Funding SCS | 3.000% | 3/12/20 | 2,237 | 2,304 | |
| Actavis Funding SCS | 3.450% | 3/15/22 | 1,957 | 2,033 | |
| Actavis Funding SCS | 3.850% | 6/15/24 | 750 | 787 | |
| Actavis Funding SCS | 3.800% | 3/15/25 | 2,557 | 2,657 | |
| Actavis Funding SCS | 4.550% | 3/15/35 | 1,550 | 1,605 | |
| Actavis Funding SCS | 4.850% | 6/15/44 | 1,795 | 1,894 | |
| Actavis Funding SCS | 4.750% | 3/15/45 | 775 | 809 | |
| Actavis Inc. | 1.875% | 10/1/17 | 1,000 | 1,005 | |
| Actavis Inc. | 3.250% | 10/1/22 | 1,300 | 1,326 | |
| Actavis Inc. | 4.625% | 10/1/42 | 1,125 | 1,155 | |
| Agilent Technologies Inc. | 5.000% | 7/15/20 | 200 | 221 | |
| Agilent Technologies Inc. | 3.200% | 10/1/22 | 1,000 | 1,024 | |
| Agilent Technologies Inc. | 3.875% | 7/15/23 | 300 | 317 | |
| Allergan Inc. | 1.350% | 3/15/18 | 175 | 174 | |
| Allergan Inc. | 2.800% | 3/15/23 | 225 | 222 | |
| 5 | Allina Health System | 4.805% | 11/15/45 | 175 | 211 |
| Altria Group Inc. | 9.250% | 8/6/19 | 613 | 755 | |
| Altria Group Inc. | 2.625% | 1/14/20 | 950 | 987 | |
| Altria Group Inc. | 4.750% | 5/5/21 | 950 | 1,084 | |
| Altria Group Inc. | 2.850% | 8/9/22 | 1,150 | 1,205 | |
| Altria Group Inc. | 2.950% | 5/2/23 | 200 | 210 | |
| Altria Group Inc. | 4.000% | 1/31/24 | 100 | 112 | |
| Altria Group Inc. | 9.950% | 11/10/38 | 869 | 1,568 | |
| Altria Group Inc. | 10.200% | 2/6/39 | 778 | 1,448 | |
| Altria Group Inc. | 4.500% | 5/2/43 | 150 | 170 | |
| Altria Group Inc. | 5.375% | 1/31/44 | 775 | 997 | |
| AmerisourceBergen Corp. | 3.500% | 11/15/21 | 850 | 910 | |
| AmerisourceBergen Corp. | 3.400% | 5/15/24 | 300 | 317 | |
| AmerisourceBergen Corp. | 3.250% | 3/1/25 | 375 | 393 | |
| AmerisourceBergen Corp. | 4.250% | 3/1/45 | 400 | 425 | |
| Amgen Inc. | 5.700% | 2/1/19 | 780 | 864 | |
| Amgen Inc. | 2.200% | 5/22/19 | 1,600 | 1,641 | |
| Amgen Inc. | 2.125% | 5/1/20 | 495 | 504 | |
| Amgen Inc. | 3.450% | 10/1/20 | 275 | 294 | |
| Amgen Inc. | 4.100% | 6/15/21 | 1,360 | 1,492 | |
| Amgen Inc. | 3.875% | 11/15/21 | 840 | 916 | |
| Amgen Inc. | 2.700% | 5/1/22 | 225 | 232 | |
| Amgen Inc. | 3.625% | 5/15/22 | 625 | 673 | |
| Amgen Inc. | 3.625% | 5/22/24 | 1,000 | 1,074 | |
| Amgen Inc. | 4.950% | 10/1/41 | 100 | 109 | |
| 8 | Amgen Inc. | 4.563% | 6/15/48 | 2,259 | 2,350 |
| 8 | Amgen Inc. | 4.663% | 6/15/51 | 4,664 | 4,874 |
| Anheuser-Busch Cos. LLC | 5.500% | 1/15/18 | 250 | 266 | |
| Anheuser-Busch Cos. LLC | 6.800% | 8/20/32 | 900 | 1,192 | |
| Anheuser-Busch Cos. LLC | 6.500% | 5/1/42 | 325 | 447 | |
| Anheuser-Busch InBev Finance Inc. | 1.250% | 1/17/18 | 625 | 627 | |
| Anheuser-Busch InBev Finance Inc. | 1.900% | 2/1/19 | 3,000 | 3,050 | |
| Anheuser-Busch InBev Finance Inc. | 2.150% | 2/1/19 | 1,800 | 1,838 | |
| Anheuser-Busch InBev Finance Inc. | 2.650% | 2/1/21 | 4,610 | 4,776 | |
| Anheuser-Busch InBev Finance Inc. | 2.625% | 1/17/23 | 500 | 507 | |
| Anheuser-Busch InBev Finance Inc. | 3.300% | 2/1/23 | 3,945 | 4,146 | |
| Anheuser-Busch InBev Finance Inc. | 3.700% | 2/1/24 | 400 | 431 | |
| Anheuser-Busch InBev Finance Inc. | 3.650% | 2/1/26 | 7,000 | 7,481 | |
| Anheuser-Busch InBev Finance Inc. | 4.700% | 2/1/36 | 4,020 | 4,523 | |
| Anheuser-Busch InBev Finance Inc. | 4.000% | 1/17/43 | 1,000 | 1,035 | |
| Anheuser-Busch InBev Finance Inc. | 4.625% | 2/1/44 | 475 | 537 | |
| Anheuser-Busch InBev Finance Inc. | 4.900% | 2/1/46 | 7,540 | 8,843 | |
| Anheuser-Busch InBev Worldwide Inc. | 1.375% | 7/15/17 | 867 | 870 | |
| Anheuser-Busch InBev Worldwide Inc. | 7.750% | 1/15/19 | 3,020 | 3,494 | |
| Anheuser-Busch InBev Worldwide Inc. | 6.875% | 11/15/19 | 375 | 439 | |
| Anheuser-Busch InBev Worldwide Inc. | 5.375% | 1/15/20 | 1,835 | 2,074 | |
109
| Vanguard® Balanced Index Fund | |||||
| Schedule of Investments | |||||
| June 30, 2016 | |||||
| Face | Market | ||||
| Maturity | Amount | Value | |||
| Coupon | Date | ($000) | ($000) | ||
| Anheuser-Busch InBev Worldwide Inc. | 5.000% | 4/15/20 | 2,265 | 2,535 | |
| Anheuser-Busch InBev Worldwide Inc. | 2.500% | 7/15/22 | 1,850 | 1,880 | |
| Anheuser-Busch InBev Worldwide Inc. | 8.200% | 1/15/39 | 735 | 1,173 | |
| Anheuser-Busch InBev Worldwide Inc. | 6.375% | 1/15/40 | 250 | 335 | |
| Anheuser-Busch InBev Worldwide Inc. | 3.750% | 7/15/42 | 1,750 | 1,756 | |
| Archer-Daniels-Midland Co. | 5.450% | 3/15/18 | 120 | 128 | |
| Archer-Daniels-Midland Co. | 4.479% | 3/1/21 | 631 | 712 | |
| Archer-Daniels-Midland Co. | 5.935% | 10/1/32 | 280 | 355 | |
| Archer-Daniels-Midland Co. | 4.535% | 3/26/42 | 350 | 403 | |
| Archer-Daniels-Midland Co. | 4.016% | 4/16/43 | 300 | 322 | |
| Ascension Health | 3.945% | 11/15/46 | 475 | 511 | |
| 5 | Ascension Health | 4.847% | 11/15/53 | 250 | 314 |
| AstraZeneca plc | 5.900% | 9/15/17 | 285 | 301 | |
| AstraZeneca plc | 1.750% | 11/16/18 | 700 | 710 | |
| AstraZeneca plc | 1.950% | 9/18/19 | 625 | 632 | |
| AstraZeneca plc | 2.375% | 11/16/20 | 1,400 | 1,428 | |
| AstraZeneca plc | 3.375% | 11/16/25 | 1,250 | 1,307 | |
| AstraZeneca plc | 6.450% | 9/15/37 | 1,705 | 2,322 | |
| AstraZeneca plc | 4.375% | 11/16/45 | 900 | 983 | |
| Baptist Health South Florida Obligated Group Revenue | 4.590% | 8/15/21 | 100 | 111 | |
| Baxalta Inc. | 2.000% | 6/22/18 | 225 | 226 | |
| Baxalta Inc. | 2.875% | 6/23/20 | 675 | 686 | |
| Baxalta Inc. | 3.600% | 6/23/22 | 325 | 336 | |
| Baxalta Inc. | 4.000% | 6/23/25 | 1,150 | 1,202 | |
| Baxalta Inc. | 5.250% | 6/23/45 | 705 | 765 | |
| Beam Suntory Inc. | 1.750% | 6/15/18 | 350 | 352 | |
| Beam Suntory Inc. | 3.250% | 5/15/22 | 25 | 26 | |
| Beam Suntory Inc. | 3.250% | 6/15/23 | 50 | 52 | |
| Becton Dickinson & Co. | 1.800% | 12/15/17 | 1,100 | 1,109 | |
| Becton Dickinson & Co. | 5.000% | 5/15/19 | 50 | 55 | |
| Becton Dickinson & Co. | 6.375% | 8/1/19 | 240 | 272 | |
| Becton Dickinson & Co. | 2.675% | 12/15/19 | 775 | 797 | |
| Becton Dickinson & Co. | 3.250% | 11/12/20 | 1,500 | 1,578 | |
| Becton Dickinson & Co. | 3.125% | 11/8/21 | 440 | 461 | |
| Becton Dickinson & Co. | 3.875% | 5/15/24 | 436 | 474 | |
| Becton Dickinson & Co. | 3.734% | 12/15/24 | 1,150 | 1,240 | |
| Becton Dickinson & Co. | 6.000% | 5/15/39 | 400 | 512 | |
| Becton Dickinson & Co. | 4.685% | 12/15/44 | 750 | 848 | |
| Biogen Inc. | 6.875% | 3/1/18 | 225 | 245 | |
| Biogen Inc. | 2.900% | 9/15/20 | 1,460 | 1,521 | |
| Biogen Inc. | 3.625% | 9/15/22 | 1,225 | 1,301 | |
| Biogen Inc. | 4.050% | 9/15/25 | 725 | 784 | |
| Biogen Inc. | 5.200% | 9/15/45 | 1,175 | 1,323 | |
| Boston Scientific Corp. | 2.650% | 10/1/18 | 1,600 | 1,637 | |
| Boston Scientific Corp. | 6.000% | 1/15/20 | 525 | 595 | |
| Boston Scientific Corp. | 3.375% | 5/15/22 | 200 | 208 | |
| Boston Scientific Corp. | 4.125% | 10/1/23 | 125 | 136 | |
| Boston Scientific Corp. | 3.850% | 5/15/25 | 300 | 317 | |
| Boston Scientific Corp. | 7.000% | 11/15/35 | 200 | 261 | |
| Boston Scientific Corp. | 7.375% | 1/15/40 | 400 | 532 | |
| Bottling Group LLC | 5.125% | 1/15/19 | 525 | 577 | |
| Bristol-Myers Squibb Co. | 0.875% | 8/1/17 | 400 | 400 | |
| Bristol-Myers Squibb Co. | 1.750% | 3/1/19 | 175 | 178 | |
| Bristol-Myers Squibb Co. | 2.000% | 8/1/22 | 1,200 | 1,220 | |
| Bristol-Myers Squibb Co. | 3.250% | 11/1/23 | 125 | 138 | |
| Bristol-Myers Squibb Co. | 5.875% | 11/15/36 | 402 | 541 | |
| Bristol-Myers Squibb Co. | 6.125% | 5/1/38 | 85 | 116 | |
| Bristol-Myers Squibb Co. | 3.250% | 8/1/42 | 465 | 463 | |
| Bristol-Myers Squibb Co. | 4.500% | 3/1/44 | 205 | 253 | |
| Brown-Forman Corp. | 1.000% | 1/15/18 | 350 | 350 | |
| Brown-Forman Corp. | 2.250% | 1/15/23 | 100 | 101 | |
| Brown-Forman Corp. | 3.750% | 1/15/43 | 150 | 153 | |
| Brown-Forman Corp. | 4.500% | 7/15/45 | 325 | 372 | |
| Bunge Ltd. Finance Corp. | 8.500% | 6/15/19 | 775 | 910 | |
110
| Vanguard® Balanced Index Fund | |||||
| Schedule of Investments | |||||
| June 30, 2016 | |||||
| Face | Market | ||||
| Maturity | Amount | Value | |||
| Coupon | Date | ($000) | ($000) | ||
| Campbell Soup Co. | 3.050% | 7/15/17 | 50 | 51 | |
| Campbell Soup Co. | 3.300% | 3/19/25 | 700 | 740 | |
| Campbell Soup Co. | 3.800% | 8/2/42 | 200 | 200 | |
| Cardinal Health Inc. | 1.700% | 3/15/18 | 250 | 252 | |
| Cardinal Health Inc. | 1.950% | 6/15/18 | 800 | 808 | |
| Cardinal Health Inc. | 4.625% | 12/15/20 | 590 | 662 | |
| Cardinal Health Inc. | 3.200% | 3/15/23 | 325 | 340 | |
| Cardinal Health Inc. | 3.750% | 9/15/25 | 325 | 355 | |
| Cardinal Health Inc. | 4.600% | 3/15/43 | 175 | 187 | |
| Cardinal Health Inc. | 4.500% | 11/15/44 | 225 | 236 | |
| Cardinal Health Inc. | 4.900% | 9/15/45 | 450 | 503 | |
| Catholic Health Initiatives Colorado GO | 1.600% | 11/1/17 | 200 | 201 | |
| Catholic Health Initiatives Colorado GO | 2.950% | 11/1/22 | 200 | 205 | |
| 5 | Catholic Health Initiatives Colorado GO | 4.350% | 11/1/42 | 650 | 656 |
| Celgene Corp. | 1.900% | 8/15/17 | 250 | 252 | |
| Celgene Corp. | 2.125% | 8/15/18 | 475 | 482 | |
| Celgene Corp. | 2.300% | 8/15/18 | 600 | 611 | |
| Celgene Corp. | 2.250% | 5/15/19 | 450 | 458 | |
| Celgene Corp. | 2.875% | 8/15/20 | 950 | 983 | |
| Celgene Corp. | 3.950% | 10/15/20 | 800 | 863 | |
| Celgene Corp. | 3.250% | 8/15/22 | 500 | 518 | |
| Celgene Corp. | 3.550% | 8/15/22 | 625 | 654 | |
| Celgene Corp. | 4.000% | 8/15/23 | 450 | 480 | |
| Celgene Corp. | 3.625% | 5/15/24 | 650 | 679 | |
| Celgene Corp. | 3.875% | 8/15/25 | 1,575 | 1,682 | |
| Celgene Corp. | 5.700% | 10/15/40 | 75 | 87 | |
| Celgene Corp. | 5.250% | 8/15/43 | 750 | 838 | |
| Celgene Corp. | 4.625% | 5/15/44 | 650 | 669 | |
| Celgene Corp. | 5.000% | 8/15/45 | 1,000 | 1,103 | |
| Children's Hospital Medical Center Ohio GO | 4.268% | 5/15/44 | 150 | 168 | |
| Church & Dwight Co. Inc. | 2.450% | 12/15/19 | 400 | 410 | |
| Cleveland Clinic Foundation Ohio Revenue | 4.858% | 1/1/14 | 325 | 362 | |
| Clorox Co. | 3.800% | 11/15/21 | 225 | 245 | |
| Clorox Co. | 3.500% | 12/15/24 | 600 | 642 | |
| Coca-Cola Bottling Co. Consolidated | 3.800% | 11/25/25 | 350 | 375 | |
| Coca-Cola Co. | 1.150% | 4/1/18 | 757 | 761 | |
| Coca-Cola Co. | 1.650% | 11/1/18 | 425 | 431 | |
| Coca-Cola Co. | 1.375% | 5/30/19 | 400 | 404 | |
| Coca-Cola Co. | 1.875% | 10/27/20 | 750 | 769 | |
| Coca-Cola Co. | 2.450% | 11/1/20 | 800 | 836 | |
| Coca-Cola Co. | 3.150% | 11/15/20 | 1,052 | 1,131 | |
| Coca-Cola Co. | 3.300% | 9/1/21 | 1,210 | 1,313 | |
| Coca-Cola Co. | 3.200% | 11/1/23 | 1,650 | 1,778 | |
| Coca-Cola Co. | 2.875% | 10/27/25 | 1,025 | 1,076 | |
| Coca-Cola Co. | 2.550% | 6/1/26 | 325 | 334 | |
| Coca-Cola Enterprises Inc. | 3.500% | 9/15/20 | 600 | 637 | |
| Coca-Cola Enterprises Inc. | 4.500% | 9/1/21 | 200 | 223 | |
| Coca-Cola Femsa SAB de CV | 4.625% | 2/15/20 | 375 | 405 | |
| Coca-Cola Femsa SAB de CV | 3.875% | 11/26/23 | 1,200 | 1,287 | |
| Coca-Cola Femsa SAB de CV | 5.250% | 11/26/43 | 800 | 949 | |
| Colgate-Palmolive Co. | 1.750% | 3/15/19 | 1,200 | 1,228 | |
| Colgate-Palmolive Co. | 2.450% | 11/15/21 | 165 | 173 | |
| Colgate-Palmolive Co. | 1.950% | 2/1/23 | 500 | 508 | |
| Colgate-Palmolive Co. | 2.100% | 5/1/23 | 275 | 280 | |
| Colgate-Palmolive Co. | 3.250% | 3/15/24 | 375 | 416 | |
| Colgate-Palmolive Co. | 4.000% | 8/15/45 | 375 | 432 | |
| ConAgra Foods Inc. | 3.250% | 9/15/22 | 1,500 | 1,549 | |
| ConAgra Foods Inc. | 3.200% | 1/25/23 | 1,133 | 1,169 | |
| ConAgra Foods Inc. | 7.125% | 10/1/26 | 205 | 268 | |
| ConAgra Foods Inc. | 7.000% | 10/1/28 | 100 | 125 | |
| Covidien International Finance SA | 6.000% | 10/15/17 | 905 | 963 | |
| Covidien International Finance SA | 4.200% | 6/15/20 | 400 | 441 | |
| Covidien International Finance SA | 3.200% | 6/15/22 | 1,500 | 1,604 | |
| CR Bard Inc. | 1.375% | 1/15/18 | 1,825 | 1,832 | |
111
| Vanguard® Balanced Index Fund | ||||
| Schedule of Investments | ||||
| June 30, 2016 | ||||
| Face | Market | |||
| Maturity | Amount | Value | ||
| Coupon | Date | ($000) | ($000) | |
| CR Bard Inc. | 4.400% | 1/15/21 | 90 | 99 |
| CR Bard Inc. | 3.000% | 5/15/26 | 325 | 333 |
| Danaher Corp. | 1.650% | 9/15/18 | 600 | 609 |
| Danaher Corp. | 2.400% | 9/15/20 | 600 | 626 |
| Danaher Corp. | 3.900% | 6/23/21 | 750 | 827 |
| Danaher Corp. | 3.350% | 9/15/25 | 500 | 551 |
| Danaher Corp. | 4.375% | 9/15/45 | 1,200 | 1,400 |
| Delhaize America LLC | 9.000% | 4/15/31 | 175 | 244 |
| Diageo Capital plc | 5.750% | 10/23/17 | 690 | 731 |
| Diageo Capital plc | 4.828% | 7/15/20 | 500 | 562 |
| Diageo Capital plc | 2.625% | 4/29/23 | 2,000 | 2,063 |
| Diageo Capital plc | 5.875% | 9/30/36 | 250 | 325 |
| Diageo Investment Corp. | 2.875% | 5/11/22 | 300 | 314 |
| Diageo Investment Corp. | 4.250% | 5/11/42 | 650 | 710 |
| Dignity Health California GO | 2.637% | 11/1/19 | 200 | 206 |
| Dignity Health California GO | 3.125% | 11/1/22 | 150 | 154 |
| Dignity Health California GO | 3.812% | 11/1/24 | 100 | 108 |
| Dignity Health California GO | 4.500% | 11/1/42 | 550 | 591 |
| Dignity Health California GO | 5.267% | 11/1/64 | 200 | 238 |
| Dr Pepper Snapple Group Inc. | 6.820% | 5/1/18 | 925 | 1,019 |
| Dr Pepper Snapple Group Inc. | 2.600% | 1/15/19 | 40 | 41 |
| Dr Pepper Snapple Group Inc. | 2.000% | 1/15/20 | 500 | 506 |
| Dr Pepper Snapple Group Inc. | 3.400% | 11/15/25 | 250 | 265 |
| Dr Pepper Snapple Group Inc. | 7.450% | 5/1/38 | 200 | 292 |
| Edwards Lifesciences Corp. | 2.875% | 10/15/18 | 375 | 385 |
| Eli Lilly & Co. | 1.250% | 3/1/18 | 650 | 655 |
| Eli Lilly & Co. | 1.950% | 3/15/19 | 750 | 765 |
| Eli Lilly & Co. | 2.750% | 6/1/25 | 525 | 557 |
| Eli Lilly & Co. | 3.700% | 3/1/45 | 775 | 826 |
| Estee Lauder Cos. Inc. | 1.700% | 5/10/21 | 400 | 405 |
| Estee Lauder Cos. Inc. | 2.350% | 8/15/22 | 225 | 231 |
| Estee Lauder Cos. Inc. | 6.000% | 5/15/37 | 150 | 198 |
| Estee Lauder Cos. Inc. | 3.700% | 8/15/42 | 775 | 807 |
| Estee Lauder Cos. Inc. | 4.375% | 6/15/45 | 375 | 429 |
| Express Scripts Holding Co. | 3.300% | 2/25/21 | 175 | 184 |
| Express Scripts Holding Co. | 4.750% | 11/15/21 | 650 | 729 |
| Express Scripts Holding Co. | 3.900% | 2/15/22 | 2,175 | 2,303 |
| Express Scripts Holding Co. | 3.000% | 7/15/23 | 325 | 326 |
| Express Scripts Holding Co. | 4.500% | 2/25/26 | 980 | 1,078 |
| Express Scripts Holding Co. | 3.400% | 3/1/27 | 1,000 | 1,002 |
| Express Scripts Holding Co. | 6.125% | 11/15/41 | 650 | 775 |
| Express Scripts Holding Co. | 4.800% | 7/15/46 | 1,000 | 999 |
| Flowers Foods Inc. | 4.375% | 4/1/22 | 275 | 299 |
| Fomento Economico Mexicano SAB de CV | 4.375% | 5/10/43 | 325 | 338 |
| Genentech Inc. | 5.250% | 7/15/35 | 200 | 257 |
| General Mills Inc. | 1.400% | 10/20/17 | 400 | 402 |
| General Mills Inc. | 5.650% | 2/15/19 | 1,650 | 1,834 |
| General Mills Inc. | 2.200% | 10/21/19 | 200 | 205 |
| General Mills Inc. | 3.150% | 12/15/21 | 425 | 452 |
| General Mills Inc. | 3.650% | 2/15/24 | 325 | 357 |
| General Mills Inc. | 5.400% | 6/15/40 | 245 | 304 |
| Gilead Sciences Inc. | 1.850% | 9/4/18 | 650 | 662 |
| Gilead Sciences Inc. | 2.050% | 4/1/19 | 1,400 | 1,433 |
| Gilead Sciences Inc. | 2.350% | 2/1/20 | 600 | 618 |
| Gilead Sciences Inc. | 2.550% | 9/1/20 | 1,125 | 1,165 |
| Gilead Sciences Inc. | 4.500% | 4/1/21 | 300 | 335 |
| Gilead Sciences Inc. | 4.400% | 12/1/21 | 800 | 903 |
| Gilead Sciences Inc. | 3.250% | 9/1/22 | 625 | 667 |
| Gilead Sciences Inc. | 3.700% | 4/1/24 | 1,500 | 1,625 |
| Gilead Sciences Inc. | 3.500% | 2/1/25 | 825 | 881 |
| Gilead Sciences Inc. | 3.650% | 3/1/26 | 2,100 | 2,284 |
| Gilead Sciences Inc. | 4.600% | 9/1/35 | 500 | 558 |
| Gilead Sciences Inc. | 5.650% | 12/1/41 | 600 | 753 |
| Gilead Sciences Inc. | 4.800% | 4/1/44 | 1,450 | 1,617 |
112
| Vanguard® Balanced Index Fund | ||||
| Schedule of Investments | ||||
| June 30, 2016 | ||||
| Face | Market | |||
| Maturity | Amount | Value | ||
| Coupon | Date | ($000) | ($000) | |
| Gilead Sciences Inc. | 4.500% | 2/1/45 | 975 | 1,059 |
| Gilead Sciences Inc. | 4.750% | 3/1/46 | 1,600 | 1,820 |
| GlaxoSmithKline Capital Inc. | 5.650% | 5/15/18 | 2,895 | 3,137 |
| GlaxoSmithKline Capital Inc. | 2.800% | 3/18/23 | 75 | 79 |
| GlaxoSmithKline Capital Inc. | 5.375% | 4/15/34 | 300 | 379 |
| GlaxoSmithKline Capital Inc. | 6.375% | 5/15/38 | 1,895 | 2,699 |
| GlaxoSmithKline Capital Inc. | 4.200% | 3/18/43 | 300 | 337 |
| GlaxoSmithKline Capital plc | 2.850% | 5/8/22 | 200 | 210 |
| Hasbro Inc. | 6.300% | 9/15/17 | 550 | 582 |
| Hasbro Inc. | 3.150% | 5/15/21 | 200 | 206 |
| Hasbro Inc. | 6.350% | 3/15/40 | 400 | 487 |
| Hasbro Inc. | 5.100% | 5/15/44 | 300 | 320 |
| Hershey Co. | 1.600% | 8/21/18 | 215 | 218 |
| Hershey Co. | 4.125% | 12/1/20 | 215 | 241 |
| Hershey Co. | 2.625% | 5/1/23 | 250 | 254 |
| Hershey Co. | 3.200% | 8/21/25 | 170 | 184 |
| Hillshire Brands Co. | 4.100% | 9/15/20 | 175 | 183 |
| Hormel Foods Corp. | 4.125% | 4/15/21 | 75 | 83 |
| Ingredion Inc. | 4.625% | 11/1/20 | 50 | 55 |
| Ingredion Inc. | 6.625% | 4/15/37 | 75 | 95 |
| JM Smucker Co. | 1.750% | 3/15/18 | 225 | 227 |
| JM Smucker Co. | 2.500% | 3/15/20 | 325 | 335 |
| JM Smucker Co. | 3.500% | 10/15/21 | 480 | 516 |
| JM Smucker Co. | 3.000% | 3/15/22 | 250 | 263 |
| JM Smucker Co. | 3.500% | 3/15/25 | 550 | 592 |
| JM Smucker Co. | 4.250% | 3/15/35 | 400 | 435 |
| JM Smucker Co. | 4.375% | 3/15/45 | 425 | 463 |
| Johnson & Johnson | 1.125% | 11/21/17 | 300 | 302 |
| Johnson & Johnson | 5.150% | 7/15/18 | 125 | 136 |
| Johnson & Johnson | 1.650% | 12/5/18 | 275 | 280 |
| Johnson & Johnson | 1.125% | 3/1/19 | 500 | 503 |
| Johnson & Johnson | 1.875% | 12/5/19 | 300 | 309 |
| Johnson & Johnson | 2.950% | 9/1/20 | 400 | 428 |
| Johnson & Johnson | 1.650% | 3/1/21 | 750 | 762 |
| Johnson & Johnson | 2.450% | 12/5/21 | 200 | 210 |
| Johnson & Johnson | 2.050% | 3/1/23 | 350 | 358 |
| Johnson & Johnson | 6.730% | 11/15/23 | 245 | 323 |
| Johnson & Johnson | 3.375% | 12/5/23 | 650 | 734 |
| Johnson & Johnson | 2.450% | 3/1/26 | 1,225 | 1,265 |
| Johnson & Johnson | 6.950% | 9/1/29 | 975 | 1,471 |
| Johnson & Johnson | 4.950% | 5/15/33 | 550 | 705 |
| Johnson & Johnson | 4.375% | 12/5/33 | 700 | 844 |
| Johnson & Johnson | 3.550% | 3/1/36 | 350 | 386 |
| Johnson & Johnson | 5.950% | 8/15/37 | 645 | 957 |
| Johnson & Johnson | 5.850% | 7/15/38 | 325 | 473 |
| Johnson & Johnson | 4.500% | 9/1/40 | 419 | 520 |
| Johnson & Johnson | 3.700% | 3/1/46 | 1,350 | 1,518 |
| Kaiser Foundation Hospitals | 3.500% | 4/1/22 | 100 | 108 |
| Kaiser Foundation Hospitals | 4.875% | 4/1/42 | 400 | 482 |
| Kellogg Co. | 3.250% | 5/21/18 | 875 | 907 |
| Kellogg Co. | 4.150% | 11/15/19 | 250 | 271 |
| Kellogg Co. | 4.000% | 12/15/20 | 570 | 624 |
| Kellogg Co. | 3.250% | 4/1/26 | 950 | 975 |
| Kellogg Co. | 7.450% | 4/1/31 | 200 | 277 |
| Kellogg Co. | 4.500% | 4/1/46 | 750 | 804 |
| Kimberly-Clark Corp. | 6.125% | 8/1/17 | 200 | 211 |
| Kimberly-Clark Corp. | 1.400% | 2/15/19 | 400 | 405 |
| Kimberly-Clark Corp. | 1.850% | 3/1/20 | 1,325 | 1,355 |
| Kimberly-Clark Corp. | 3.625% | 8/1/20 | 250 | 273 |
| Kimberly-Clark Corp. | 2.150% | 8/15/20 | 100 | 103 |
| Kimberly-Clark Corp. | 3.875% | 3/1/21 | 560 | 617 |
| Kimberly-Clark Corp. | 2.400% | 6/1/23 | 150 | 157 |
| Kimberly-Clark Corp. | 3.050% | 8/15/25 | 100 | 108 |
| Kimberly-Clark Corp. | 2.750% | 2/15/26 | 250 | 262 |
113
| Vanguard® Balanced Index Fund | |||||
| Schedule of Investments | |||||
| June 30, 2016 | |||||
| Face | Market | ||||
| Maturity | Amount | Value | |||
| Coupon | Date | ($000) | ($000) | ||
| Kimberly-Clark Corp. | 5.300% | 3/1/41 | 825 | 1,104 | |
| Kimberly-Clark Corp. | 3.700% | 6/1/43 | 175 | 190 | |
| Koninklijke Philips NV | 5.750% | 3/11/18 | 750 | 803 | |
| Koninklijke Philips NV | 3.750% | 3/15/22 | 825 | 888 | |
| Koninklijke Philips NV | 6.875% | 3/11/38 | 180 | 237 | |
| Koninklijke Philips NV | 5.000% | 3/15/42 | 335 | 364 | |
| Kraft Foods Group Inc. | 2.250% | 6/5/17 | 500 | 505 | |
| Kraft Foods Group Inc. | 6.125% | 8/23/18 | 1,060 | 1,165 | |
| Kraft Foods Group Inc. | 5.375% | 2/10/20 | 78 | 88 | |
| Kraft Foods Group Inc. | 6.875% | 1/26/39 | 725 | 990 | |
| Kraft Foods Group Inc. | 6.500% | 2/9/40 | 600 | 791 | |
| Kraft Foods Group Inc. | 5.000% | 6/4/42 | 1,530 | 1,765 | |
| 8 | Kraft Heinz Foods Co. | 1.600% | 6/30/17 | 775 | 778 |
| 8 | Kraft Heinz Foods Co. | 2.000% | 7/2/18 | 765 | 775 |
| 8 | Kraft Heinz Foods Co. | 2.800% | 7/2/20 | 800 | 830 |
| 8 | Kraft Heinz Foods Co. | 3.500% | 7/15/22 | 250 | 266 |
| 8 | Kraft Heinz Foods Co. | 3.950% | 7/15/25 | 2,025 | 2,202 |
| 8 | Kraft Heinz Foods Co. | 3.000% | 6/1/26 | 1,350 | 1,366 |
| 8 | Kraft Heinz Foods Co. | 5.000% | 7/15/35 | 650 | 745 |
| 8 | Kraft Heinz Foods Co. | 5.200% | 7/15/45 | 775 | 912 |
| 8 | Kraft Heinz Foods Co. | 4.375% | 6/1/46 | 2,575 | 2,706 |
| Kroger Co. | 6.400% | 8/15/17 | 165 | 175 | |
| Kroger Co. | 2.300% | 1/15/19 | 650 | 663 | |
| Kroger Co. | 6.150% | 1/15/20 | 1,010 | 1,161 | |
| Kroger Co. | 3.300% | 1/15/21 | 700 | 744 | |
| Kroger Co. | 2.600% | 2/1/21 | 200 | 208 | |
| Kroger Co. | 2.950% | 11/1/21 | 1,200 | 1,254 | |
| Kroger Co. | 3.850% | 8/1/23 | 325 | 357 | |
| Kroger Co. | 4.000% | 2/1/24 | 400 | 444 | |
| Kroger Co. | 3.500% | 2/1/26 | 250 | 270 | |
| Kroger Co. | 7.700% | 6/1/29 | 200 | 280 | |
| Kroger Co. | 8.000% | 9/15/29 | 750 | 1,079 | |
| Kroger Co. | 6.900% | 4/15/38 | 375 | 518 | |
| Kroger Co. | 5.150% | 8/1/43 | 350 | 413 | |
| Laboratory Corp. of America Holdings | 2.625% | 2/1/20 | 250 | 255 | |
| Laboratory Corp. of America Holdings | 3.200% | 2/1/22 | 375 | 388 | |
| Laboratory Corp. of America Holdings | 3.750% | 8/23/22 | 225 | 237 | |
| Laboratory Corp. of America Holdings | 3.600% | 2/1/25 | 600 | 624 | |
| Laboratory Corp. of America Holdings | 4.700% | 2/1/45 | 550 | 590 | |
| Life Technologies Corp. | 6.000% | 3/1/20 | 485 | 547 | |
| Life Technologies Corp. | 5.000% | 1/15/21 | 275 | 304 | |
| Mattel Inc. | 1.700% | 3/15/18 | 125 | 125 | |
| Mattel Inc. | 2.350% | 5/6/19 | 500 | 508 | |
| Mattel Inc. | 3.150% | 3/15/23 | 75 | 76 | |
| Mattel Inc. | 5.450% | 11/1/41 | 205 | 220 | |
| 5 | Mayo Clinic | 3.774% | 11/15/43 | 625 | 650 |
| 5 | Mayo Clinic | 4.000% | 11/15/47 | 150 | 165 |
| 5 | Mayo Clinic | 4.128% | 11/15/52 | 125 | 142 |
| McCormick & Co. Inc. | 3.900% | 7/15/21 | 100 | 110 | |
| McCormick & Co. Inc. | 3.500% | 9/1/23 | 175 | 189 | |
| McCormick & Co. Inc. | 3.250% | 11/15/25 | 150 | 161 | |
| McKesson Corp. | 7.500% | 2/15/19 | 740 | 850 | |
| McKesson Corp. | 2.284% | 3/15/19 | 700 | 716 | |
| McKesson Corp. | 4.750% | 3/1/21 | 485 | 535 | |
| McKesson Corp. | 2.700% | 12/15/22 | 250 | 253 | |
| McKesson Corp. | 3.796% | 3/15/24 | 100 | 108 | |
| McKesson Corp. | 6.000% | 3/1/41 | 1,025 | 1,296 | |
| Mead Johnson Nutrition Co. | 4.900% | 11/1/19 | 625 | 687 | |
| Mead Johnson Nutrition Co. | 3.000% | 11/15/20 | 500 | 522 | |
| Mead Johnson Nutrition Co. | 4.125% | 11/15/25 | 475 | 518 | |
| Mead Johnson Nutrition Co. | 5.900% | 11/1/39 | 390 | 475 | |
| Medco Health Solutions Inc. | 7.125% | 3/15/18 | 805 | 879 | |
| Medco Health Solutions Inc. | 4.125% | 9/15/20 | 410 | 442 | |
| Medtronic Inc. | 1.500% | 3/15/18 | 500 | 504 | |
114
| Vanguard® Balanced Index Fund | |||||
| Schedule of Investments | |||||
| June 30, 2016 | |||||
| Face | Market | ||||
| Maturity | Amount | Value | |||
| Coupon | Date | ($000) | ($000) | ||
| Medtronic Inc. | 1.375% | 4/1/18 | 1,075 | 1,081 | |
| Medtronic Inc. | 2.500% | 3/15/20 | 2,031 | 2,106 | |
| Medtronic Inc. | 4.125% | 3/15/21 | 410 | 452 | |
| Medtronic Inc. | 3.125% | 3/15/22 | 400 | 426 | |
| Medtronic Inc. | 3.150% | 3/15/22 | 1,350 | 1,439 | |
| Medtronic Inc. | 3.625% | 3/15/24 | 1,650 | 1,814 | |
| Medtronic Inc. | 3.500% | 3/15/25 | 3,000 | 3,281 | |
| Medtronic Inc. | 4.375% | 3/15/35 | 1,592 | 1,799 | |
| Medtronic Inc. | 5.550% | 3/15/40 | 225 | 285 | |
| Medtronic Inc. | 4.500% | 3/15/42 | 438 | 497 | |
| Medtronic Inc. | 4.625% | 3/15/44 | 293 | 343 | |
| Medtronic Inc. | 4.625% | 3/15/45 | 2,575 | 3,015 | |
| Memorial Sloan-Kettering Cancer Center | 4.200% | 7/1/55 | 150 | 170 | |
| Memorial Sloan-Kettering Cancer Center New York GO | 5.000% | 7/1/42 | 100 | 125 | |
| Memorial Sloan-Kettering Cancer Center New York GO | 4.125% | 7/1/52 | 450 | 501 | |
| Merck & Co. Inc. | 1.100% | 1/31/18 | 175 | 176 | |
| Merck & Co. Inc. | 1.850% | 2/10/20 | 1,000 | 1,023 | |
| Merck & Co. Inc. | 3.875% | 1/15/21 | 625 | 686 | |
| Merck & Co. Inc. | 2.350% | 2/10/22 | 100 | 103 | |
| Merck & Co. Inc. | 2.400% | 9/15/22 | 600 | 617 | |
| Merck & Co. Inc. | 2.800% | 5/18/23 | 3,825 | 4,004 | |
| Merck & Co. Inc. | 2.750% | 2/10/25 | 1,250 | 1,308 | |
| Merck & Co. Inc. | 6.550% | 9/15/37 | 260 | 375 | |
| Merck & Co. Inc. | 3.600% | 9/15/42 | 150 | 154 | |
| Merck & Co. Inc. | 4.150% | 5/18/43 | 805 | 902 | |
| Merck & Co. Inc. | 3.700% | 2/10/45 | 2,795 | 2,938 | |
| Merck Sharp & Dohme Corp. | 5.750% | 11/15/36 | 150 | 193 | |
| Molson Coors Brewing Co. | 1.450% | 7/15/19 | 275 | 276 | |
| Molson Coors Brewing Co. | 2.100% | 7/15/21 | 350 | 352 | |
| Molson Coors Brewing Co. | 3.500% | 5/1/22 | 75 | 80 | |
| Molson Coors Brewing Co. | 3.000% | 7/15/26 | 1,250 | 1,251 | |
| Molson Coors Brewing Co. | 5.000% | 5/1/42 | 275 | 308 | |
| Molson Coors Brewing Co. | 4.200% | 7/15/46 | 750 | 755 | |
| Mondelez International Inc. | 6.500% | 8/11/17 | 175 | 185 | |
| Mondelez International Inc. | 6.125% | 2/1/18 | 285 | 307 | |
| Mondelez International Inc. | 2.250% | 2/1/19 | 750 | 768 | |
| Mondelez International Inc. | 5.375% | 2/10/20 | 709 | 805 | |
| Mondelez International Inc. | 4.000% | 2/1/24 | 1,075 | 1,176 | |
| Mondelez International Inc. | 6.500% | 11/1/31 | 225 | 298 | |
| Mondelez International Inc. | 6.500% | 2/9/40 | 580 | 798 | |
| Mylan Inc. | 2.600% | 6/24/18 | 72 | 73 | |
| Mylan Inc. | 2.550% | 3/28/19 | 511 | 517 | |
| Mylan Inc. | 4.200% | 11/29/23 | 825 | 870 | |
| Mylan Inc. | 5.400% | 11/29/43 | 325 | 346 | |
| 8 | Mylan NV | 2.500% | 6/7/19 | 450 | 454 |
| 8 | Mylan NV | 3.150% | 6/15/21 | 975 | 985 |
| 8 | Mylan NV | 3.950% | 6/15/26 | 1,175 | 1,181 |
| New York & Presbyterian Hospital | 3.563% | 8/1/36 | 175 | 184 | |
| New York & Presbyterian Hospital | 4.024% | 8/1/45 | 480 | 523 | |
| New York & Presbyterian Hospital | 4.063% | 8/1/56 | 225 | 243 | |
| New York & Presbyterian Hospital | 4.763% | 8/1/16 | 210 | 222 | |
| Newell Brands Inc. | 2.050% | 12/1/17 | 775 | 781 | |
| Newell Brands Inc. | 2.150% | 10/15/18 | 200 | 203 | |
| Newell Brands Inc. | 2.600% | 3/29/19 | 465 | 477 | |
| Newell Brands Inc. | 2.875% | 12/1/19 | 225 | 232 | |
| Newell Brands Inc. | 3.150% | 4/1/21 | 560 | 583 | |
| Newell Brands Inc. | 3.850% | 4/1/23 | 1,135 | 1,204 | |
| Newell Brands Inc. | 4.000% | 12/1/24 | 400 | 418 | |
| Newell Brands Inc. | 3.900% | 11/1/25 | 350 | 365 | |
| Newell Brands Inc. | 4.200% | 4/1/26 | 1,325 | 1,434 | |
| Newell Brands Inc. | 5.375% | 4/1/36 | 375 | 432 | |
| Newell Brands Inc. | 5.500% | 4/1/46 | 1,450 | 1,726 | |
| Novant Health Inc. | 5.850% | 11/1/19 | 300 | 341 | |
| Novant Health Inc. | 4.371% | 11/1/43 | 475 | 543 | |
115
| Vanguard® Balanced Index Fund | ||||
| Schedule of Investments | ||||
| June 30, 2016 | ||||
| Face | Market | |||
| Maturity | Amount | Value | ||
| Coupon | Date | ($000) | ($000) | |
| Novartis Capital Corp. | 4.400% | 4/24/20 | 225 | 251 |
| Novartis Capital Corp. | 2.400% | 9/21/22 | 1,000 | 1,039 |
| Novartis Capital Corp. | 3.400% | 5/6/24 | 1,000 | 1,094 |
| Novartis Capital Corp. | 3.000% | 11/20/25 | 900 | 956 |
| Novartis Capital Corp. | 4.400% | 5/6/44 | 1,200 | 1,451 |
| Novartis Capital Corp. | 4.000% | 11/20/45 | 1,200 | 1,364 |
| Novartis Securities Investment Ltd. | 5.125% | 2/10/19 | 2,285 | 2,521 |
| NYU Hospitals Center | 4.784% | 7/1/44 | 375 | 429 |
| Partners Healthcare System Inc. | 4.117% | 7/1/55 | 150 | 168 |
| Partners Healthcare System Massachusetts GO | 3.443% | 7/1/21 | 200 | 213 |
| PepsiCo Inc. | 1.250% | 8/13/17 | 500 | 502 |
| PepsiCo Inc. | 1.000% | 10/13/17 | 325 | 326 |
| PepsiCo Inc. | 1.250% | 4/30/18 | 450 | 452 |
| PepsiCo Inc. | 5.000% | 6/1/18 | 375 | 403 |
| PepsiCo Inc. | 7.900% | 11/1/18 | 1,725 | 1,994 |
| PepsiCo Inc. | 2.250% | 1/7/19 | 525 | 541 |
| PepsiCo Inc. | 1.850% | 4/30/20 | 1,475 | 1,497 |
| PepsiCo Inc. | 2.150% | 10/14/20 | 1,075 | 1,104 |
| PepsiCo Inc. | 3.125% | 11/1/20 | 30 | 32 |
| PepsiCo Inc. | 3.000% | 8/25/21 | 1,070 | 1,140 |
| PepsiCo Inc. | 2.750% | 3/5/22 | 2,725 | 2,856 |
| PepsiCo Inc. | 3.600% | 3/1/24 | 600 | 660 |
| PepsiCo Inc. | 2.750% | 4/30/25 | 725 | 749 |
| PepsiCo Inc. | 3.500% | 7/17/25 | 425 | 464 |
| PepsiCo Inc. | 5.500% | 1/15/40 | 500 | 641 |
| PepsiCo Inc. | 4.875% | 11/1/40 | 165 | 197 |
| PepsiCo Inc. | 4.000% | 3/5/42 | 741 | 793 |
| PepsiCo Inc. | 3.600% | 8/13/42 | 725 | 730 |
| PepsiCo Inc. | 4.250% | 10/22/44 | 525 | 584 |
| PepsiCo Inc. | 4.600% | 7/17/45 | 785 | 932 |
| PepsiCo Inc. | 4.450% | 4/14/46 | 575 | 667 |
| PerkinElmer Inc. | 5.000% | 11/15/21 | 340 | 377 |
| Perrigo Co. plc | 2.300% | 11/8/18 | 370 | 373 |
| Perrigo Co. plc | 4.000% | 11/15/23 | 650 | 672 |
| Perrigo Co. plc | 5.300% | 11/15/43 | 125 | 132 |
| Perrigo Finance Unlimited Co. | 3.500% | 3/15/21 | 400 | 416 |
| Perrigo Finance Unlimited Co. | 3.900% | 12/15/24 | 400 | 408 |
| Perrigo Finance Unlimited Co. | 4.375% | 3/15/26 | 375 | 392 |
| Perrigo Finance Unlimited Co. | 4.900% | 12/15/44 | 500 | 498 |
| Pfizer Inc. | 1.200% | 6/1/18 | 700 | 703 |
| Pfizer Inc. | 6.200% | 3/15/19 | 3,035 | 3,428 |
| Pfizer Inc. | 2.100% | 5/15/19 | 750 | 767 |
| Pfizer Inc. | 1.450% | 6/3/19 | 725 | 731 |
| Pfizer Inc. | 1.950% | 6/3/21 | 900 | 913 |
| Pfizer Inc. | 3.000% | 6/15/23 | 450 | 480 |
| Pfizer Inc. | 3.400% | 5/15/24 | 200 | 218 |
| Pfizer Inc. | 2.750% | 6/3/26 | 700 | 720 |
| Pfizer Inc. | 7.200% | 3/15/39 | 410 | 624 |
| Pfizer Inc. | 4.300% | 6/15/43 | 1,500 | 1,683 |
| Pfizer Inc. | 4.400% | 5/15/44 | 800 | 915 |
| Philip Morris International Inc. | 1.250% | 8/11/17 | 225 | 226 |
| Philip Morris International Inc. | 1.125% | 8/21/17 | 75 | 75 |
| Philip Morris International Inc. | 1.250% | 11/9/17 | 375 | 376 |
| Philip Morris International Inc. | 5.650% | 5/16/18 | 2,935 | 3,186 |
| Philip Morris International Inc. | 1.875% | 2/25/21 | 475 | 480 |
| Philip Morris International Inc. | 4.125% | 5/17/21 | 195 | 217 |
| Philip Morris International Inc. | 2.625% | 3/6/23 | 1,050 | 1,086 |
| Philip Morris International Inc. | 2.125% | 5/10/23 | 450 | 451 |
| Philip Morris International Inc. | 3.250% | 11/10/24 | 875 | 937 |
| Philip Morris International Inc. | 3.375% | 8/11/25 | 475 | 515 |
| Philip Morris International Inc. | 2.750% | 2/25/26 | 450 | 464 |
| Philip Morris International Inc. | 6.375% | 5/16/38 | 475 | 656 |
| Philip Morris International Inc. | 4.375% | 11/15/41 | 2,595 | 2,844 |
| Philip Morris International Inc. | 4.500% | 3/20/42 | 450 | 505 |
116
| Vanguard® Balanced Index Fund | |||||
| Schedule of Investments | |||||
| June 30, 2016 | |||||
| Face | Market | ||||
| Maturity | Amount | Value | |||
| Coupon | Date | ($000) | ($000) | ||
| Philip Morris International Inc. | 3.875% | 8/21/42 | 75 | 77 | |
| Philip Morris International Inc. | 4.125% | 3/4/43 | 300 | 320 | |
| Philip Morris International Inc. | 4.250% | 11/10/44 | 600 | 660 | |
| 5 | Procter & Gamble - Esop | 9.360% | 1/1/21 | 573 | 693 |
| Procter & Gamble Co. | 4.700% | 2/15/19 | 485 | 531 | |
| Procter & Gamble Co. | 1.900% | 11/1/19 | 275 | 283 | |
| Procter & Gamble Co. | 1.850% | 2/2/21 | 400 | 410 | |
| Procter & Gamble Co. | 3.100% | 8/15/23 | 1,100 | 1,193 | |
| Procter & Gamble Co. | 6.450% | 1/15/26 | 350 | 475 | |
| Procter & Gamble Co. | 2.700% | 2/2/26 | 400 | 423 | |
| Procter & Gamble Co. | 5.800% | 8/15/34 | 100 | 139 | |
| Procter & Gamble Co. | 5.550% | 3/5/37 | 1,630 | 2,264 | |
| Quest Diagnostics Inc. | 2.700% | 4/1/19 | 650 | 668 | |
| Quest Diagnostics Inc. | 4.750% | 1/30/20 | 300 | 329 | |
| Quest Diagnostics Inc. | 2.500% | 3/30/20 | 160 | 161 | |
| Quest Diagnostics Inc. | 4.250% | 4/1/24 | 200 | 216 | |
| Quest Diagnostics Inc. | 3.500% | 3/30/25 | 225 | 232 | |
| Quest Diagnostics Inc. | 3.450% | 6/1/26 | 275 | 284 | |
| Quest Diagnostics Inc. | 5.750% | 1/30/40 | 61 | 71 | |
| Quest Diagnostics Inc. | 4.700% | 3/30/45 | 125 | 131 | |
| Reynolds American Inc. | 2.300% | 8/21/17 | 2,125 | 2,150 | |
| Reynolds American Inc. | 2.300% | 6/12/18 | 1,450 | 1,473 | |
| Reynolds American Inc. | 8.125% | 6/23/19 | 450 | 534 | |
| Reynolds American Inc. | 3.250% | 6/12/20 | 680 | 719 | |
| Reynolds American Inc. | 4.000% | 6/12/22 | 600 | 651 | |
| Reynolds American Inc. | 4.850% | 9/15/23 | 75 | 86 | |
| Reynolds American Inc. | 4.450% | 6/12/25 | 1,980 | 2,213 | |
| Reynolds American Inc. | 5.700% | 8/15/35 | 500 | 609 | |
| Reynolds American Inc. | 8.125% | 5/1/40 | 400 | 556 | |
| Reynolds American Inc. | 7.000% | 8/4/41 | 75 | 94 | |
| Reynolds American Inc. | 5.850% | 8/15/45 | 1,635 | 2,088 | |
| Sanofi | 1.250% | 4/10/18 | 650 | 654 | |
| Sanofi | 4.000% | 3/29/21 | 1,360 | 1,501 | |
| Southern Baptist Hospital of Florida Inc. | 4.857% | 7/15/45 | 150 | 183 | |
| St. Jude Medical Inc. | 2.000% | 9/15/18 | 355 | 360 | |
| St. Jude Medical Inc. | 2.800% | 9/15/20 | 355 | 367 | |
| St. Jude Medical Inc. | 3.250% | 4/15/23 | 700 | 722 | |
| St. Jude Medical Inc. | 4.750% | 4/15/43 | 450 | 479 | |
| Stryker Corp. | 2.000% | 3/8/19 | 400 | 406 | |
| Stryker Corp. | 4.375% | 1/15/20 | 100 | 109 | |
| Stryker Corp. | 2.625% | 3/15/21 | 500 | 517 | |
| Stryker Corp. | 3.375% | 5/15/24 | 1,000 | 1,057 | |
| Stryker Corp. | 3.375% | 11/1/25 | 825 | 867 | |
| Stryker Corp. | 3.500% | 3/15/26 | 890 | 943 | |
| Stryker Corp. | 4.375% | 5/15/44 | 175 | 186 | |
| Stryker Corp. | 4.625% | 3/15/46 | 1,290 | 1,446 | |
| Sysco Corp. | 5.250% | 2/12/18 | 500 | 531 | |
| Sysco Corp. | 1.900% | 4/1/19 | 325 | 329 | |
| Sysco Corp. | 2.600% | 10/1/20 | 425 | 437 | |
| Sysco Corp. | 2.500% | 7/15/21 | 300 | 306 | |
| Sysco Corp. | 3.750% | 10/1/25 | 175 | 189 | |
| Sysco Corp. | 3.300% | 7/15/26 | 500 | 519 | |
| Sysco Corp. | 5.375% | 9/21/35 | 600 | 714 | |
| Sysco Corp. | 4.850% | 10/1/45 | 125 | 140 | |
| Sysco Corp. | 4.500% | 4/1/46 | 325 | 347 | |
| Teva Pharmaceutical Finance Co. BV | 3.650% | 11/10/21 | 775 | 822 | |
| Teva Pharmaceutical Finance Co. BV | 2.950% | 12/18/22 | 1,533 | 1,556 | |
| Teva Pharmaceutical Finance Co. LLC | 6.150% | 2/1/36 | 220 | 264 | |
| Teva Pharmaceutical Finance IV LLC | 2.250% | 3/18/20 | 175 | 177 | |
| 5 | Texas Health Resources | 4.330% | 11/15/55 | 100 | 113 |
| The Pepsi Bottling Group Inc. | 7.000% | 3/1/29 | 625 | 897 | |
| Thermo Fisher Scientific Inc. | 2.150% | 12/14/18 | 300 | 303 | |
| Thermo Fisher Scientific Inc. | 4.500% | 3/1/21 | 500 | 551 | |
| Thermo Fisher Scientific Inc. | 3.600% | 8/15/21 | 700 | 743 | |
117
| Vanguard® Balanced Index Fund | |||||
| Schedule of Investments | |||||
| June 30, 2016 | |||||
| Face | Market | ||||
| Maturity | Amount | Value | |||
| Coupon | Date | ($000) | ($000) | ||
| Thermo Fisher Scientific Inc. | 3.300% | 2/15/22 | 600 | 623 | |
| Thermo Fisher Scientific Inc. | 3.150% | 1/15/23 | 2,575 | 2,634 | |
| Thermo Fisher Scientific Inc. | 3.000% | 4/15/23 | 475 | 484 | |
| Thermo Fisher Scientific Inc. | 3.650% | 12/15/25 | 425 | 446 | |
| Trinity Health Corp. | 4.125% | 12/1/45 | 225 | 250 | |
| Tupperware Brands Corp. | 4.750% | 6/1/21 | 300 | 323 | |
| Tyson Foods Inc. | 2.650% | 8/15/19 | 500 | 514 | |
| Tyson Foods Inc. | 4.500% | 6/15/22 | 725 | 808 | |
| Tyson Foods Inc. | 3.950% | 8/15/24 | 1,200 | 1,295 | |
| Tyson Foods Inc. | 4.875% | 8/15/34 | 1,300 | 1,440 | |
| Tyson Foods Inc. | 5.150% | 8/15/44 | 300 | 346 | |
| Unilever Capital Corp. | 0.850% | 8/2/17 | 2,100 | 2,099 | |
| Unilever Capital Corp. | 2.200% | 3/6/19 | 150 | 154 | |
| Unilever Capital Corp. | 2.100% | 7/30/20 | 625 | 643 | |
| Unilever Capital Corp. | 4.250% | 2/10/21 | 805 | 899 | |
| Unilever Capital Corp. | 3.100% | 7/30/25 | 550 | 601 | |
| Whirlpool Corp. | 1.650% | 11/1/17 | 50 | 50 | |
| Whirlpool Corp. | 4.850% | 6/15/21 | 200 | 225 | |
| Whirlpool Corp. | 4.700% | 6/1/22 | 775 | 865 | |
| Whirlpool Corp. | 4.000% | 3/1/24 | 175 | 190 | |
| Whirlpool Corp. | 3.700% | 5/1/25 | 400 | 425 | |
| Whirlpool Corp. | 5.150% | 3/1/43 | 150 | 169 | |
| Whirlpool Corp. | 4.500% | 6/1/46 | 488 | 509 | |
| 8 | Whole Foods Market Inc. | 5.200% | 12/3/25 | 1,300 | 1,382 |
| Wyeth LLC | 7.250% | 3/1/23 | 350 | 459 | |
| Wyeth LLC | 6.450% | 2/1/24 | 1,705 | 2,189 | |
| Wyeth LLC | 6.500% | 2/1/34 | 500 | 684 | |
| Wyeth LLC | 6.000% | 2/15/36 | 585 | 780 | |
| Wyeth LLC | 5.950% | 4/1/37 | 1,105 | 1,473 | |
| Zeneca Wilmington Inc. | 7.000% | 11/15/23 | 600 | 777 | |
| Zimmer Biomet Holdings Inc. | 2.000% | 4/1/18 | 750 | 756 | |
| Zimmer Biomet Holdings Inc. | 4.625% | 11/30/19 | 205 | 223 | |
| Zimmer Biomet Holdings Inc. | 2.700% | 4/1/20 | 775 | 783 | |
| Zimmer Biomet Holdings Inc. | 3.375% | 11/30/21 | 25 | 26 | |
| Zimmer Biomet Holdings Inc. | 3.150% | 4/1/22 | 650 | 666 | |
| Zimmer Biomet Holdings Inc. | 3.550% | 4/1/25 | 1,275 | 1,313 | |
| Zimmer Biomet Holdings Inc. | 4.250% | 8/15/35 | 500 | 502 | |
| Zimmer Biomet Holdings Inc. | 5.750% | 11/30/39 | 400 | 473 | |
| Zimmer Biomet Holdings Inc. | 4.450% | 8/15/45 | 700 | 712 | |
| Zoetis Inc. | 1.875% | 2/1/18 | 75 | 75 | |
| Zoetis Inc. | 3.450% | 11/13/20 | 325 | 339 | |
| Zoetis Inc. | 3.250% | 2/1/23 | 1,000 | 1,018 | |
| Zoetis Inc. | 4.500% | 11/13/25 | 350 | 385 | |
| Zoetis Inc. | 4.700% | 2/1/43 | 550 | 544 | |
| Energy (1.1%) | |||||
| Anadarko Finance Co. | 7.500% | 5/1/31 | 500 | 597 | |
| Anadarko Petroleum Corp. | 6.375% | 9/15/17 | 158 | 166 | |
| Anadarko Petroleum Corp. | 8.700% | 3/15/19 | 300 | 342 | |
| Anadarko Petroleum Corp. | 6.950% | 6/15/19 | 50 | 55 | |
| Anadarko Petroleum Corp. | 4.850% | 3/15/21 | 200 | 212 | |
| Anadarko Petroleum Corp. | 5.550% | 3/15/26 | 2,700 | 2,989 | |
| Anadarko Petroleum Corp. | 6.450% | 9/15/36 | 1,000 | 1,144 | |
| Anadarko Petroleum Corp. | 7.950% | 6/15/39 | 125 | 155 | |
| Anadarko Petroleum Corp. | 6.200% | 3/15/40 | 450 | 504 | |
| Anadarko Petroleum Corp. | 4.500% | 7/15/44 | 400 | 365 | |
| Anadarko Petroleum Corp. | 6.600% | 3/15/46 | 500 | 603 | |
| Apache Corp. | 6.900% | 9/15/18 | 500 | 550 | |
| Apache Corp. | 3.625% | 2/1/21 | 265 | 276 | |
| Apache Corp. | 3.250% | 4/15/22 | 862 | 889 | |
| Apache Corp. | 6.000% | 1/15/37 | 725 | 827 | |
| Apache Corp. | 5.100% | 9/1/40 | 850 | 890 | |
| Apache Corp. | 5.250% | 2/1/42 | 475 | 504 | |
| Apache Corp. | 4.750% | 4/15/43 | 900 | 920 | |
118
| Vanguard® Balanced Index Fund | ||||
| Schedule of Investments | ||||
| June 30, 2016 | ||||
| Face | Market | |||
| Maturity | Amount | Value | ||
| Coupon | Date | ($000) | ($000) | |
| Apache Corp. | 4.250% | 1/15/44 | 800 | 774 |
| Apache Finance Canada Corp. | 7.750% | 12/15/29 | 225 | 286 |
| Baker Hughes Inc. | 5.125% | 9/15/40 | 595 | 665 |
| Boardwalk Pipelines LP | 3.375% | 2/1/23 | 325 | 298 |
| Boardwalk Pipelines LP | 4.950% | 12/15/24 | 525 | 517 |
| Boardwalk Pipelines LP | 5.950% | 6/1/26 | 700 | 735 |
| BP Capital Markets plc | 1.375% | 11/6/17 | 975 | 978 |
| BP Capital Markets plc | 1.674% | 2/13/18 | 375 | 378 |
| BP Capital Markets plc | 1.375% | 5/10/18 | 750 | 751 |
| BP Capital Markets plc | 2.241% | 9/26/18 | 900 | 918 |
| BP Capital Markets plc | 4.750% | 3/10/19 | 600 | 650 |
| BP Capital Markets plc | 2.237% | 5/10/19 | 125 | 128 |
| BP Capital Markets plc | 2.315% | 2/13/20 | 375 | 384 |
| BP Capital Markets plc | 4.500% | 10/1/20 | 1,425 | 1,577 |
| BP Capital Markets plc | 4.742% | 3/11/21 | 1,010 | 1,135 |
| BP Capital Markets plc | 3.561% | 11/1/21 | 650 | 699 |
| BP Capital Markets plc | 3.062% | 3/17/22 | 450 | 469 |
| BP Capital Markets plc | 3.245% | 5/6/22 | 1,076 | 1,131 |
| BP Capital Markets plc | 2.500% | 11/6/22 | 325 | 328 |
| BP Capital Markets plc | 2.750% | 5/10/23 | 1,825 | 1,838 |
| BP Capital Markets plc | 3.994% | 9/26/23 | 350 | 379 |
| BP Capital Markets plc | 3.535% | 11/4/24 | 2,335 | 2,463 |
| BP Capital Markets plc | 3.506% | 3/17/25 | 1,100 | 1,163 |
| BP Capital Markets plc | 3.119% | 5/4/26 | 600 | 611 |
| Buckeye Partners LP | 6.050% | 1/15/18 | 25 | 26 |
| Buckeye Partners LP | 2.650% | 11/15/18 | 100 | 101 |
| Buckeye Partners LP | 5.850% | 11/15/43 | 250 | 243 |
| Buckeye Partners LP | 5.600% | 10/15/44 | 175 | 164 |
| Burlington Resources Finance Co. | 7.400% | 12/1/31 | 600 | 788 |
| Canadian Natural Resources Ltd. | 7.200% | 1/15/32 | 500 | 556 |
| Canadian Natural Resources Ltd. | 6.450% | 6/30/33 | 400 | 436 |
| Canadian Natural Resources Ltd. | 5.850% | 2/1/35 | 500 | 510 |
| Canadian Natural Resources Ltd. | 6.500% | 2/15/37 | 500 | 544 |
| Canadian Natural Resources Ltd. | 6.250% | 3/15/38 | 750 | 816 |
| Chevron Corp. | 1.344% | 11/9/17 | 1,000 | 1,004 |
| Chevron Corp. | 1.365% | 3/2/18 | 575 | 578 |
| Chevron Corp. | 1.718% | 6/24/18 | 1,250 | 1,262 |
| Chevron Corp. | 1.790% | 11/16/18 | 1,000 | 1,013 |
| Chevron Corp. | 4.950% | 3/3/19 | 475 | 520 |
| Chevron Corp. | 1.561% | 5/16/19 | 800 | 808 |
| Chevron Corp. | 2.193% | 11/15/19 | 1,800 | 1,849 |
| Chevron Corp. | 1.961% | 3/3/20 | 2,452 | 2,484 |
| Chevron Corp. | 2.419% | 11/17/20 | 600 | 619 |
| Chevron Corp. | 2.100% | 5/16/21 | 1,200 | 1,222 |
| Chevron Corp. | 2.411% | 3/3/22 | 475 | 484 |
| Chevron Corp. | 2.355% | 12/5/22 | 1,825 | 1,854 |
| Chevron Corp. | 3.191% | 6/24/23 | 1,175 | 1,246 |
| Chevron Corp. | 3.326% | 11/17/25 | 200 | 213 |
| Chevron Corp. | 2.954% | 5/16/26 | 1,250 | 1,291 |
| Cimarex Energy Co. | 4.375% | 6/1/24 | 900 | 945 |
| Columbia Pipeline Group Inc. | 2.450% | 6/1/18 | 350 | 351 |
| Columbia Pipeline Group Inc. | 3.300% | 6/1/20 | 500 | 518 |
| Columbia Pipeline Group Inc. | 4.500% | 6/1/25 | 650 | 696 |
| ConocoPhillips | 5.200% | 5/15/18 | 425 | 453 |
| ConocoPhillips | 5.750% | 2/1/19 | 1,985 | 2,181 |
| ConocoPhillips | 6.000% | 1/15/20 | 180 | 204 |
| ConocoPhillips | 5.900% | 10/15/32 | 150 | 176 |
| ConocoPhillips | 5.900% | 5/15/38 | 305 | 365 |
| ConocoPhillips | 6.500% | 2/1/39 | 1,410 | 1,814 |
| ConocoPhillips Canada Funding Co. I | 5.950% | 10/15/36 | 400 | 473 |
| ConocoPhillips Co. | 1.500% | 5/15/18 | 500 | 501 |
| ConocoPhillips Co. | 2.200% | 5/15/20 | 400 | 404 |
| ConocoPhillips Co. | 4.200% | 3/15/21 | 1,000 | 1,081 |
| ConocoPhillips Co. | 2.875% | 11/15/21 | 1,000 | 1,020 |
119
| Vanguard® Balanced Index Fund | ||||
| Schedule of Investments | ||||
| June 30, 2016 | ||||
| Face | Market | |||
| Maturity | Amount | Value | ||
| Coupon | Date | ($000) | ($000) | |
| ConocoPhillips Co. | 2.400% | 12/15/22 | 1,500 | 1,483 |
| ConocoPhillips Co. | 3.350% | 11/15/24 | 365 | 376 |
| ConocoPhillips Co. | 4.950% | 3/15/26 | 3,193 | 3,620 |
| ConocoPhillips Co. | 4.150% | 11/15/34 | 350 | 350 |
| ConocoPhillips Co. | 4.300% | 11/15/44 | 500 | 506 |
| ConocoPhillips Co. | 5.950% | 3/15/46 | 250 | 311 |
| ConocoPhillips Holding Co. | 6.950% | 4/15/29 | 275 | 343 |
| Devon Energy Corp. | 6.300% | 1/15/19 | 1,500 | 1,620 |
| Devon Energy Corp. | 4.000% | 7/15/21 | 300 | 304 |
| Devon Energy Corp. | 3.250% | 5/15/22 | 500 | 485 |
| Devon Energy Corp. | 5.850% | 12/15/25 | 400 | 442 |
| Devon Energy Corp. | 7.950% | 4/15/32 | 525 | 615 |
| Devon Energy Corp. | 5.600% | 7/15/41 | 1,310 | 1,263 |
| Devon Energy Corp. | 4.750% | 5/15/42 | 950 | 846 |
| Devon Financing Co. LLC | 7.875% | 9/30/31 | 425 | 493 |
| Dominion Gas Holdings LLC | 2.800% | 11/15/20 | 500 | 517 |
| Dominion Gas Holdings LLC | 3.550% | 11/1/23 | 250 | 264 |
| Dominion Gas Holdings LLC | 3.600% | 12/15/24 | 250 | 265 |
| Dominion Gas Holdings LLC | 4.800% | 11/1/43 | 500 | 542 |
| Dominion Gas Holdings LLC | 4.600% | 12/15/44 | 400 | 423 |
| Enable Midstream Partners LP | 2.400% | 5/15/19 | 300 | 281 |
| Enable Midstream Partners LP | 3.900% | 5/15/24 | 250 | 223 |
| Enable Midstream Partners LP | 5.000% | 5/15/44 | 350 | 275 |
| Enbridge Energy Partners LP | 9.875% | 3/1/19 | 1,595 | 1,834 |
| Enbridge Energy Partners LP | 5.875% | 10/15/25 | 400 | 441 |
| Enbridge Energy Partners LP | 7.500% | 4/15/38 | 300 | 353 |
| Enbridge Energy Partners LP | 5.500% | 9/15/40 | 350 | 342 |
| Enbridge Inc. | 4.500% | 6/10/44 | 525 | 459 |
| Encana Corp. | 6.500% | 8/15/34 | 1,625 | 1,611 |
| Encana Corp. | 6.625% | 8/15/37 | 500 | 501 |
| Encana Corp. | 6.500% | 2/1/38 | 375 | 373 |
| Energy Transfer Partners LP | 2.500% | 6/15/18 | 300 | 299 |
| Energy Transfer Partners LP | 9.700% | 3/15/19 | 500 | 569 |
| Energy Transfer Partners LP | 9.000% | 4/15/19 | 254 | 285 |
| Energy Transfer Partners LP | 4.150% | 10/1/20 | 1,125 | 1,142 |
| Energy Transfer Partners LP | 4.650% | 6/1/21 | 1,840 | 1,904 |
| Energy Transfer Partners LP | 5.200% | 2/1/22 | 675 | 713 |
| Energy Transfer Partners LP | 3.600% | 2/1/23 | 1,825 | 1,748 |
| Energy Transfer Partners LP | 4.050% | 3/15/25 | 1,000 | 985 |
| Energy Transfer Partners LP | 4.750% | 1/15/26 | 300 | 309 |
| Energy Transfer Partners LP | 4.900% | 3/15/35 | 250 | 225 |
| Energy Transfer Partners LP | 6.625% | 10/15/36 | 150 | 157 |
| Energy Transfer Partners LP | 7.500% | 7/1/38 | 500 | 551 |
| Energy Transfer Partners LP | 6.050% | 6/1/41 | 1,150 | 1,128 |
| Energy Transfer Partners LP | 6.500% | 2/1/42 | 300 | 313 |
| Energy Transfer Partners LP | 5.150% | 2/1/43 | 425 | 380 |
| Energy Transfer Partners LP | 5.150% | 3/15/45 | 250 | 232 |
| Energy Transfer Partners LP | 6.125% | 12/15/45 | 400 | 415 |
| EnLink Midstream Partners LP | 4.400% | 4/1/24 | 425 | 398 |
| EnLink Midstream Partners LP | 4.150% | 6/1/25 | 400 | 372 |
| EnLink Midstream Partners LP | 5.600% | 4/1/44 | 425 | 357 |
| Enterprise Products Operating LLC | 6.300% | 9/15/17 | 175 | 185 |
| Enterprise Products Operating LLC | 6.650% | 4/15/18 | 50 | 54 |
| Enterprise Products Operating LLC | 1.650% | 5/7/18 | 450 | 452 |
| Enterprise Products Operating LLC | 6.500% | 1/31/19 | 50 | 56 |
| Enterprise Products Operating LLC | 2.550% | 10/15/19 | 300 | 308 |
| Enterprise Products Operating LLC | 5.200% | 9/1/20 | 2,235 | 2,513 |
| Enterprise Products Operating LLC | 4.050% | 2/15/22 | 175 | 189 |
| Enterprise Products Operating LLC | 3.350% | 3/15/23 | 350 | 359 |
| Enterprise Products Operating LLC | 3.900% | 2/15/24 | 2,050 | 2,170 |
| Enterprise Products Operating LLC | 3.750% | 2/15/25 | 650 | 682 |
| Enterprise Products Operating LLC | 3.700% | 2/15/26 | 400 | 419 |
| Enterprise Products Operating LLC | 3.950% | 2/15/27 | 400 | 425 |
| Enterprise Products Operating LLC | 6.875% | 3/1/33 | 1,400 | 1,712 |
120
| Vanguard® Balanced Index Fund | |||||
| Schedule of Investments | |||||
| June 30, 2016 | |||||
| Face | Market | ||||
| Maturity | Amount | Value | |||
| Coupon | Date | ($000) | ($000) | ||
| Enterprise Products Operating LLC | 7.550% | 4/15/38 | 450 | 586 | |
| Enterprise Products Operating LLC | 5.950% | 2/1/41 | 495 | 581 | |
| Enterprise Products Operating LLC | 4.850% | 8/15/42 | 850 | 905 | |
| Enterprise Products Operating LLC | 4.450% | 2/15/43 | 600 | 603 | |
| Enterprise Products Operating LLC | 4.850% | 3/15/44 | 1,450 | 1,541 | |
| Enterprise Products Operating LLC | 5.100% | 2/15/45 | 475 | 523 | |
| Enterprise Products Operating LLC | 4.900% | 5/15/46 | 800 | 863 | |
| Enterprise Products Operating LLC | 4.950% | 10/15/54 | 200 | 205 | |
| 5 | Enterprise Products Operating LLC | 7.034% | 1/15/68 | 600 | 629 |
| EOG Resources Inc. | 5.625% | 6/1/19 | 925 | 1,022 | |
| EOG Resources Inc. | 4.100% | 2/1/21 | 150 | 163 | |
| EOG Resources Inc. | 2.625% | 3/15/23 | 2,700 | 2,690 | |
| EQT Corp. | 8.125% | 6/1/19 | 400 | 441 | |
| EQT Corp. | 4.875% | 11/15/21 | 600 | 638 | |
| Exxon Mobil Corp. | 1.439% | 3/1/18 | 2,500 | 2,523 | |
| Exxon Mobil Corp. | 1.305% | 3/6/18 | 2,000 | 2,014 | |
| Exxon Mobil Corp. | 1.819% | 3/15/19 | 237 | 241 | |
| Exxon Mobil Corp. | 1.912% | 3/6/20 | 1,413 | 1,441 | |
| Exxon Mobil Corp. | 2.222% | 3/1/21 | 1,500 | 1,546 | |
| Exxon Mobil Corp. | 2.397% | 3/6/22 | 750 | 771 | |
| Exxon Mobil Corp. | 2.726% | 3/1/23 | 2,000 | 2,086 | |
| Exxon Mobil Corp. | 2.709% | 3/6/25 | 100 | 104 | |
| Exxon Mobil Corp. | 3.043% | 3/1/26 | 1,350 | 1,430 | |
| Exxon Mobil Corp. | 3.567% | 3/6/45 | 650 | 673 | |
| Exxon Mobil Corp. | 4.114% | 3/1/46 | 1,800 | 2,027 | |
| FMC Technologies Inc. | 2.000% | 10/1/17 | 200 | 198 | |
| FMC Technologies Inc. | 3.450% | 10/1/22 | 125 | 119 | |
| Gulf South Pipeline Co. LP | 4.000% | 6/15/22 | 300 | 288 | |
| Halliburton Co. | 2.000% | 8/1/18 | 400 | 403 | |
| Halliburton Co. | 5.900% | 9/15/18 | 25 | 27 | |
| Halliburton Co. | 3.250% | 11/15/21 | 40 | 42 | |
| Halliburton Co. | 3.500% | 8/1/23 | 950 | 985 | |
| Halliburton Co. | 3.800% | 11/15/25 | 2,250 | 2,346 | |
| Halliburton Co. | 4.850% | 11/15/35 | 600 | 649 | |
| Halliburton Co. | 6.700% | 9/15/38 | 580 | 737 | |
| Halliburton Co. | 7.450% | 9/15/39 | 450 | 622 | |
| Halliburton Co. | 4.500% | 11/15/41 | 675 | 675 | |
| Halliburton Co. | 4.750% | 8/1/43 | 150 | 157 | |
| Halliburton Co. | 5.000% | 11/15/45 | 1,200 | 1,313 | |
| Hess Corp. | 8.125% | 2/15/19 | 795 | 888 | |
| Hess Corp. | 3.500% | 7/15/24 | 200 | 193 | |
| Hess Corp. | 7.875% | 10/1/29 | 150 | 179 | |
| Hess Corp. | 7.125% | 3/15/33 | 375 | 415 | |
| Hess Corp. | 6.000% | 1/15/40 | 1,325 | 1,369 | |
| Hess Corp. | 5.600% | 2/15/41 | 825 | 825 | |
| Husky Energy Inc. | 7.250% | 12/15/19 | 505 | 568 | |
| Husky Energy Inc. | 3.950% | 4/15/22 | 300 | 305 | |
| Husky Energy Inc. | 4.000% | 4/15/24 | 500 | 510 | |
| Husky Energy Inc. | 6.800% | 9/15/37 | 300 | 344 | |
| Kerr-McGee Corp. | 6.950% | 7/1/24 | 1,000 | 1,157 | |
| Kerr-McGee Corp. | 7.875% | 9/15/31 | 150 | 178 | |
| Kinder Morgan Energy Partners LP | 5.950% | 2/15/18 | 750 | 792 | |
| Kinder Morgan Energy Partners LP | 2.650% | 2/1/19 | 25 | 25 | |
| Kinder Morgan Energy Partners LP | 6.500% | 4/1/20 | 2,000 | 2,207 | |
| Kinder Morgan Energy Partners LP | 5.800% | 3/1/21 | 750 | 823 | |
| Kinder Morgan Energy Partners LP | 5.000% | 10/1/21 | 1,923 | 2,038 | |
| Kinder Morgan Energy Partners LP | 4.150% | 3/1/22 | 175 | 178 | |
| Kinder Morgan Energy Partners LP | 3.950% | 9/1/22 | 1,125 | 1,140 | |
| Kinder Morgan Energy Partners LP | 3.500% | 9/1/23 | 1,225 | 1,200 | |
| Kinder Morgan Energy Partners LP | 4.250% | 9/1/24 | 425 | 430 | |
| Kinder Morgan Energy Partners LP | 7.300% | 8/15/33 | 175 | 191 | |
| Kinder Morgan Energy Partners LP | 5.800% | 3/15/35 | 300 | 308 | |
| Kinder Morgan Energy Partners LP | 6.500% | 2/1/37 | 400 | 420 | |
| Kinder Morgan Energy Partners LP | 6.950% | 1/15/38 | 335 | 370 | |
121
| Vanguard® Balanced Index Fund | |||||
| Schedule of Investments | |||||
| June 30, 2016 | |||||
| Face | Market | ||||
| Maturity | Amount | Value | |||
| Coupon | Date | ($000) | ($000) | ||
| Kinder Morgan Energy Partners LP | 6.500% | 9/1/39 | 1,575 | 1,648 | |
| Kinder Morgan Energy Partners LP | 6.550% | 9/15/40 | 1,000 | 1,050 | |
| Kinder Morgan Energy Partners LP | 5.000% | 8/15/42 | 275 | 259 | |
| Kinder Morgan Energy Partners LP | 4.700% | 11/1/42 | 1,122 | 1,012 | |
| Kinder Morgan Energy Partners LP | 5.000% | 3/1/43 | 500 | 472 | |
| Kinder Morgan Energy Partners LP | 5.500% | 3/1/44 | 500 | 500 | |
| Kinder Morgan Inc. | 2.000% | 12/1/17 | 350 | 348 | |
| Kinder Morgan Inc. | 3.050% | 12/1/19 | 175 | 177 | |
| Kinder Morgan Inc. | 4.300% | 6/1/25 | 1,000 | 1,023 | |
| Kinder Morgan Inc. | 7.800% | 8/1/31 | 330 | 372 | |
| Kinder Morgan Inc. | 7.750% | 1/15/32 | 600 | 679 | |
| Kinder Morgan Inc. | 5.300% | 12/1/34 | 500 | 491 | |
| Kinder Morgan Inc. | 5.550% | 6/1/45 | 950 | 966 | |
| Kinder Morgan Inc. | 5.050% | 2/15/46 | 328 | 313 | |
| Magellan Midstream Partners LP | 6.550% | 7/15/19 | 625 | 706 | |
| Magellan Midstream Partners LP | 3.200% | 3/15/25 | 700 | 698 | |
| Magellan Midstream Partners LP | 5.000% | 3/1/26 | 450 | 509 | |
| Magellan Midstream Partners LP | 4.200% | 12/1/42 | 150 | 143 | |
| Magellan Midstream Partners LP | 5.150% | 10/15/43 | 350 | 377 | |
| Magellan Midstream Partners LP | 4.200% | 3/15/45 | 100 | 94 | |
| Marathon Oil Corp. | 6.000% | 10/1/17 | 100 | 104 | |
| Marathon Oil Corp. | 5.900% | 3/15/18 | 225 | 234 | |
| Marathon Oil Corp. | 2.700% | 6/1/20 | 500 | 470 | |
| Marathon Oil Corp. | 2.800% | 11/1/22 | 900 | 815 | |
| Marathon Oil Corp. | 6.800% | 3/15/32 | 1,080 | 1,102 | |
| Marathon Oil Corp. | 5.200% | 6/1/45 | 300 | 263 | |
| Marathon Petroleum Corp. | 2.700% | 12/14/18 | 450 | 460 | |
| Marathon Petroleum Corp. | 3.400% | 12/15/20 | 400 | 413 | |
| Marathon Petroleum Corp. | 5.125% | 3/1/21 | 750 | 825 | |
| Marathon Petroleum Corp. | 6.500% | 3/1/41 | 1,250 | 1,333 | |
| Marathon Petroleum Corp. | 4.750% | 9/15/44 | 250 | 213 | |
| Marathon Petroleum Corp. | 5.000% | 9/15/54 | 500 | 418 | |
| 8 | MPLX LP | 4.500% | 7/15/23 | 1,200 | 1,167 |
| 8 | MPLX LP | 4.875% | 12/1/24 | 1,000 | 975 |
| 8 | MPLX LP | 4.875% | 6/1/25 | 500 | 488 |
| Nabors Industries Inc. | 6.150% | 2/15/18 | 870 | 887 | |
| Nabors Industries Inc. | 9.250% | 1/15/19 | 125 | 133 | |
| Nabors Industries Inc. | 5.000% | 9/15/20 | 100 | 94 | |
| Nabors Industries Inc. | 4.625% | 9/15/21 | 1,000 | 915 | |
| National Fuel Gas Co. | 6.500% | 4/15/18 | 750 | 797 | |
| National Fuel Gas Co. | 3.750% | 3/1/23 | 500 | 486 | |
| National Oilwell Varco Inc. | 1.350% | 12/1/17 | 300 | 298 | |
| National Oilwell Varco Inc. | 2.600% | 12/1/22 | 1,575 | 1,469 | |
| National Oilwell Varco Inc. | 3.950% | 12/1/42 | 300 | 237 | |
| Noble Energy Inc. | 8.250% | 3/1/19 | 1,690 | 1,935 | |
| Noble Energy Inc. | 4.150% | 12/15/21 | 875 | 921 | |
| Noble Energy Inc. | 6.000% | 3/1/41 | 1,250 | 1,360 | |
| Noble Energy Inc. | 5.250% | 11/15/43 | 450 | 457 | |
| Occidental Petroleum Corp. | 4.100% | 2/1/21 | 1,700 | 1,864 | |
| Occidental Petroleum Corp. | 3.125% | 2/15/22 | 750 | 785 | |
| Occidental Petroleum Corp. | 3.500% | 6/15/25 | 750 | 798 | |
| Occidental Petroleum Corp. | 3.400% | 4/15/26 | 400 | 422 | |
| Occidental Petroleum Corp. | 4.625% | 6/15/45 | 750 | 851 | |
| Occidental Petroleum Corp. | 4.400% | 4/15/46 | 700 | 770 | |
| Oceaneering International Inc. | 4.650% | 11/15/24 | 300 | 288 | |
| ONEOK Partners LP | 2.000% | 10/1/17 | 625 | 625 | |
| ONEOK Partners LP | 8.625% | 3/1/19 | 400 | 454 | |
| ONEOK Partners LP | 4.900% | 3/15/25 | 450 | 474 | |
| ONEOK Partners LP | 6.650% | 10/1/36 | 360 | 379 | |
| ONEOK Partners LP | 6.125% | 2/1/41 | 1,400 | 1,468 | |
| Panhandle Eastern Pipe Line Co. LP | 6.200% | 11/1/17 | 800 | 832 | |
| Petro-Canada | 6.050% | 5/15/18 | 1,350 | 1,452 | |
| Petro-Canada | 7.875% | 6/15/26 | 100 | 129 | |
| Petro-Canada | 5.350% | 7/15/33 | 450 | 495 | |
122
| Vanguard® Balanced Index Fund | ||||
| Schedule of Investments | ||||
| June 30, 2016 | ||||
| Face | Market | |||
| Maturity | Amount | Value | ||
| Coupon | Date | ($000) | ($000) | |
| Petro-Canada | 5.950% | 5/15/35 | 500 | 592 |
| Petro-Canada | 6.800% | 5/15/38 | 250 | 321 |
| Phillips 66 | 4.300% | 4/1/22 | 1,175 | 1,284 |
| Phillips 66 | 4.650% | 11/15/34 | 300 | 315 |
| Phillips 66 | 5.875% | 5/1/42 | 900 | 1,081 |
| Phillips 66 | 4.875% | 11/15/44 | 1,395 | 1,523 |
| Phillips 66 Partners LP | 2.646% | 2/15/20 | 135 | 136 |
| Phillips 66 Partners LP | 3.605% | 2/15/25 | 350 | 338 |
| Phillips 66 Partners LP | 4.680% | 2/15/45 | 150 | 139 |
| Pioneer Natural Resources Co. | 6.875% | 5/1/18 | 500 | 541 |
| Pioneer Natural Resources Co. | 7.500% | 1/15/20 | 100 | 117 |
| Pioneer Natural Resources Co. | 3.950% | 7/15/22 | 1,075 | 1,127 |
| Pioneer Natural Resources Co. | 4.450% | 1/15/26 | 1,350 | 1,473 |
| Plains All American Pipeline LP / PAA Finance Corp. | 6.500% | 5/1/18 | 50 | 53 |
| Plains All American Pipeline LP / PAA Finance Corp. | 8.750% | 5/1/19 | 925 | 1,056 |
| Plains All American Pipeline LP / PAA Finance Corp. | 5.000% | 2/1/21 | 1,125 | 1,185 |
| Plains All American Pipeline LP / PAA Finance Corp. | 2.850% | 1/31/23 | 300 | 276 |
| Plains All American Pipeline LP / PAA Finance Corp. | 3.600% | 11/1/24 | 2,155 | 2,024 |
| Plains All American Pipeline LP / PAA Finance Corp. | 4.650% | 10/15/25 | 300 | 303 |
| Plains All American Pipeline LP / PAA Finance Corp. | 6.700% | 5/15/36 | 205 | 214 |
| Plains All American Pipeline LP / PAA Finance Corp. | 6.650% | 1/15/37 | 350 | 362 |
| Plains All American Pipeline LP / PAA Finance Corp. | 4.300% | 1/31/43 | 1,350 | 1,072 |
| Regency Energy Partners LP / Regency Energy Finance | ||||
| Corp. | 6.500% | 7/15/21 | 902 | 932 |
| Regency Energy Partners LP / Regency Energy Finance | ||||
| Corp. | 5.875% | 3/1/22 | 1,200 | 1,284 |
| Regency Energy Partners LP / Regency Energy Finance | ||||
| Corp. | 5.000% | 10/1/22 | 1,050 | 1,076 |
| Regency Energy Partners LP / Regency Energy Finance | ||||
| Corp. | 5.500% | 4/15/23 | 500 | 504 |
| Regency Energy Partners LP / Regency Energy Finance | ||||
| Corp. | 4.500% | 11/1/23 | 200 | 196 |
| Repsol Oil & Gas Canada Inc. | 7.750% | 6/1/19 | 445 | 482 |
| Repsol Oil & Gas Canada Inc. | 3.750% | 2/1/21 | 350 | 319 |
| Schlumberger Investment SA | 3.650% | 12/1/23 | 790 | 847 |
| Shell International Finance BV | 1.125% | 8/21/17 | 700 | 701 |
| Shell International Finance BV | 1.250% | 11/10/17 | 650 | 652 |
| Shell International Finance BV | 1.900% | 8/10/18 | 400 | 406 |
| Shell International Finance BV | 1.625% | 11/10/18 | 1,000 | 1,009 |
| Shell International Finance BV | 2.000% | 11/15/18 | 1,550 | 1,576 |
| Shell International Finance BV | 1.375% | 5/10/19 | 650 | 652 |
| Shell International Finance BV | 4.300% | 9/22/19 | 3,000 | 3,262 |
| Shell International Finance BV | 4.375% | 3/25/20 | 625 | 685 |
| Shell International Finance BV | 2.125% | 5/11/20 | 400 | 407 |
| Shell International Finance BV | 2.250% | 11/10/20 | 400 | 409 |
| Shell International Finance BV | 1.875% | 5/10/21 | 1,500 | 1,506 |
| Shell International Finance BV | 2.375% | 8/21/22 | 1,025 | 1,043 |
| Shell International Finance BV | 2.250% | 1/6/23 | 175 | 175 |
| Shell International Finance BV | 3.400% | 8/12/23 | 400 | 426 |
| Shell International Finance BV | 3.250% | 5/11/25 | 400 | 418 |
| Shell International Finance BV | 2.875% | 5/10/26 | 2,000 | 2,031 |
| Shell International Finance BV | 4.125% | 5/11/35 | 2,150 | 2,301 |
| Shell International Finance BV | 6.375% | 12/15/38 | 820 | 1,114 |
| Shell International Finance BV | 5.500% | 3/25/40 | 1,250 | 1,551 |
| Shell International Finance BV | 3.625% | 8/21/42 | 450 | 439 |
| Shell International Finance BV | 4.550% | 8/12/43 | 1,000 | 1,094 |
| Shell International Finance BV | 4.375% | 5/11/45 | 1,600 | 1,740 |
| Shell International Finance BV | 4.000% | 5/10/46 | 1,500 | 1,537 |
| Southern Natural Gas Co. LLC | 8.000% | 3/1/32 | 350 | 388 |
| Southern Natural Gas Co. LLC / Southern Natural | ||||
| Issuing Corp. | 4.400% | 6/15/21 | 1,250 | 1,309 |
| Spectra Energy Capital LLC | 6.200% | 4/15/18 | 850 | 903 |
| Spectra Energy Capital LLC | 8.000% | 10/1/19 | 165 | 189 |
| Spectra Energy Capital LLC | 7.500% | 9/15/38 | 175 | 200 |
123
| Vanguard® Balanced Index Fund | ||||
| Schedule of Investments | ||||
| June 30, 2016 | ||||
| Face | Market | |||
| Maturity | Amount | Value | ||
| Coupon | Date | ($000) | ($000) | |
| Spectra Energy Partners LP | 2.950% | 9/25/18 | 75 | 77 |
| Spectra Energy Partners LP | 3.500% | 3/15/25 | 800 | 822 |
| Spectra Energy Partners LP | 4.500% | 3/15/45 | 700 | 714 |
| Suncor Energy Inc. | 6.100% | 6/1/18 | 100 | 107 |
| Suncor Energy Inc. | 6.500% | 6/15/38 | 1,540 | 2,005 |
| Suncor Energy Inc. | 6.850% | 6/1/39 | 310 | 412 |
| Sunoco Logistics Partners Operations LP | 4.400% | 4/1/21 | 5,050 | 5,293 |
| Sunoco Logistics Partners Operations LP | 4.250% | 4/1/24 | 400 | 400 |
| Sunoco Logistics Partners Operations LP | 5.950% | 12/1/25 | 300 | 335 |
| Sunoco Logistics Partners Operations LP | 6.850% | 2/15/40 | 419 | 444 |
| Sunoco Logistics Partners Operations LP | 4.950% | 1/15/43 | 300 | 275 |
| Sunoco Logistics Partners Operations LP | 5.300% | 4/1/44 | 950 | 937 |
| Texas Eastern Transmission LP | 7.000% | 7/15/32 | 500 | 614 |
| Tosco Corp. | 8.125% | 2/15/30 | 1,350 | 1,800 |
| Total Capital Canada Ltd. | 1.450% | 1/15/18 | 1,225 | 1,233 |
| Total Capital Canada Ltd. | 2.750% | 7/15/23 | 425 | 437 |
| Total Capital International SA | 2.100% | 6/19/19 | 1,900 | 1,946 |
| Total Capital International SA | 2.750% | 6/19/21 | 3,300 | 3,432 |
| Total Capital International SA | 2.875% | 2/17/22 | 1,400 | 1,454 |
| Total Capital International SA | 2.700% | 1/25/23 | 700 | 718 |
| Total Capital International SA | 3.700% | 1/15/24 | 650 | 709 |
| Total Capital International SA | 3.750% | 4/10/24 | 1,000 | 1,096 |
| Total Capital SA | 2.125% | 8/10/18 | 850 | 868 |
| Total Capital SA | 4.450% | 6/24/20 | 425 | 471 |
| Total Capital SA | 4.125% | 1/28/21 | 512 | 562 |
| TransCanada PipeLines Ltd. | 1.625% | 11/9/17 | 200 | 201 |
| TransCanada PipeLines Ltd. | 6.500% | 8/15/18 | 300 | 328 |
| TransCanada PipeLines Ltd. | 3.800% | 10/1/20 | 2,660 | 2,840 |
| TransCanada PipeLines Ltd. | 2.500% | 8/1/22 | 1,000 | 993 |
| TransCanada PipeLines Ltd. | 3.750% | 10/16/23 | 600 | 648 |
| TransCanada PipeLines Ltd. | 4.875% | 1/15/26 | 505 | 577 |
| TransCanada PipeLines Ltd. | 5.600% | 3/31/34 | 800 | 911 |
| TransCanada PipeLines Ltd. | 5.850% | 3/15/36 | 125 | 147 |
| TransCanada PipeLines Ltd. | 6.200% | 10/15/37 | 1,200 | 1,470 |
| TransCanada PipeLines Ltd. | 7.625% | 1/15/39 | 560 | 788 |
| TransCanada PipeLines Ltd. | 6.100% | 6/1/40 | 200 | 243 |
| TransCanada PipeLines Ltd. | 5.000% | 10/16/43 | 1,200 | 1,345 |
| Transcontinental Gas Pipe Line Co. LLC | 6.050% | 6/15/18 | 230 | 243 |
| Valero Energy Corp. | 9.375% | 3/15/19 | 425 | 507 |
| Valero Energy Corp. | 6.125% | 2/1/20 | 850 | 952 |
| Valero Energy Corp. | 3.650% | 3/15/25 | 900 | 902 |
| Valero Energy Corp. | 7.500% | 4/15/32 | 675 | 804 |
| Valero Energy Corp. | 6.625% | 6/15/37 | 855 | 940 |
| Valero Energy Corp. | 4.900% | 3/15/45 | 400 | 370 |
| Western Gas Partners LP | 5.375% | 6/1/21 | 2,850 | 3,014 |
| Western Gas Partners LP | 3.950% | 6/1/25 | 300 | 286 |
| Western Gas Partners LP | 5.450% | 4/1/44 | 600 | 574 |
| Williams Partners LP | 5.250% | 3/15/20 | 1,395 | 1,432 |
| Williams Partners LP | 4.000% | 11/15/21 | 400 | 390 |
| Williams Partners LP | 3.600% | 3/15/22 | 750 | 709 |
| Williams Partners LP | 3.350% | 8/15/22 | 500 | 456 |
| Williams Partners LP | 4.500% | 11/15/23 | 560 | 535 |
| Williams Partners LP | 3.900% | 1/15/25 | 1,200 | 1,096 |
| Williams Partners LP | 4.000% | 9/15/25 | 1,100 | 1,008 |
| Williams Partners LP | 6.300% | 4/15/40 | 475 | 452 |
| Williams Partners LP | 5.800% | 11/15/43 | 700 | 653 |
| Williams Partners LP | 5.400% | 3/4/44 | 300 | 267 |
| Williams Partners LP | 4.900% | 1/15/45 | 325 | 276 |
| Williams Partners LP | 5.100% | 9/15/45 | 950 | 815 |
| Williams Partners LP / ACMP Finance Corp. | 4.875% | 5/15/23 | 450 | 434 |
| Williams Partners LP / ACMP Finance Corp. | 4.875% | 3/15/24 | 500 | 480 |
| XTO Energy Inc. | 6.250% | 8/1/17 | 400 | 423 |
| XTO Energy Inc. | 5.500% | 6/15/18 | 400 | 433 |
124
| Vanguard® Balanced Index Fund | |||||
| Schedule of Investments | |||||
| June 30, 2016 | |||||
| Face | Market | ||||
| Maturity | Amount | Value | |||
| Coupon | Date | ($000) | ($000) | ||
| Other Industrial (0.0%) | |||||
| California Institute of Technology GO | 4.700% | 11/1/11 | 950 | 1,042 | |
| CBRE Services Inc. | 5.000% | 3/15/23 | 500 | 517 | |
| CBRE Services Inc. | 5.250% | 3/15/25 | 275 | 288 | |
| CBRE Services Inc. | 4.875% | 3/1/26 | 375 | 387 | |
| Cintas Corp. No 2 | 6.125% | 12/1/17 | 400 | 428 | |
| Cintas Corp. No 2 | 3.250% | 6/1/22 | 150 | 161 | |
| Fluor Corp. | 3.375% | 9/15/21 | 150 | 159 | |
| Fluor Corp. | 3.500% | 12/15/24 | 1,000 | 1,068 | |
| Howard Hughes Medical Institute Revenue | 3.500% | 9/1/23 | 725 | 800 | |
| 5 | Johns Hopkins University Maryland GO | 4.083% | 7/1/53 | 500 | 555 |
| Massachusetts Institute of Technology GO | 5.600% | 7/1/11 | 400 | 571 | |
| Massachusetts Institute of Technology GO | 4.678% | 7/1/14 | 700 | 835 | |
| 5 | Northwestern University Illinois GO | 3.688% | 12/1/38 | 300 | 327 |
| 5 | Northwestern University Illinois GO | 4.643% | 12/1/44 | 350 | 442 |
| President & Fellows of Harvard College Massachusetts | |||||
| GO | 3.619% | 10/1/37 | 500 | 548 | |
| Trustees of Dartmouth College | 3.474% | 6/1/46 | 800 | 853 | |
| 5 | University of Notre Dame DU LAC Indiana GO | 3.438% | 2/15/45 | 300 | 313 |
| University of Pennsylvania GO | 4.674% | 9/1/12 | 625 | 716 | |
| Wesleyan University Connecticut GO | 4.781% | 7/1/16 | 150 | 162 | |
| 5 | William Marsh Rice University | 3.574% | 5/15/45 | 250 | 269 |
| Yale University Connecticut GO | 2.086% | 4/15/19 | 150 | 155 | |
| Technology (0.8%) | |||||
| Adobe Systems Inc. | 4.750% | 2/1/20 | 325 | 360 | |
| Adobe Systems Inc. | 3.250% | 2/1/25 | 700 | 738 | |
| Alphabet Inc. | 3.625% | 5/19/21 | 350 | 386 | |
| Altera Corp. | 1.750% | 5/15/17 | 150 | 151 | |
| Altera Corp. | 2.500% | 11/15/18 | 625 | 645 | |
| Altera Corp. | 4.100% | 11/15/23 | 750 | 853 | |
| Amphenol Corp. | 1.550% | 9/15/17 | 175 | 175 | |
| Amphenol Corp. | 2.550% | 1/30/19 | 1,650 | 1,681 | |
| Amphenol Corp. | 3.125% | 9/15/21 | 250 | 258 | |
| Amphenol Corp. | 4.000% | 2/1/22 | 75 | 80 | |
| Analog Devices Inc. | 2.875% | 6/1/23 | 1,375 | 1,435 | |
| Apple Inc. | 1.000% | 5/3/18 | 1,300 | 1,303 | |
| Apple Inc. | 2.100% | 5/6/19 | 1,650 | 1,698 | |
| Apple Inc. | 1.550% | 2/7/20 | 1,550 | 1,556 | |
| Apple Inc. | 2.000% | 5/6/20 | 700 | 717 | |
| Apple Inc. | 2.250% | 2/23/21 | 3,200 | 3,294 | |
| Apple Inc. | 2.850% | 5/6/21 | 1,825 | 1,929 | |
| Apple Inc. | 2.150% | 2/9/22 | 2,500 | 2,549 | |
| Apple Inc. | 2.700% | 5/13/22 | 1,500 | 1,573 | |
| Apple Inc. | 2.400% | 5/3/23 | 2,800 | 2,854 | |
| Apple Inc. | 3.450% | 5/6/24 | 1,875 | 2,031 | |
| Apple Inc. | 2.500% | 2/9/25 | 1,300 | 1,322 | |
| Apple Inc. | 3.200% | 5/13/25 | 1,300 | 1,377 | |
| Apple Inc. | 3.250% | 2/23/26 | 2,950 | 3,127 | |
| Apple Inc. | 4.500% | 2/23/36 | 1,000 | 1,128 | |
| Apple Inc. | 3.850% | 5/4/43 | 1,400 | 1,405 | |
| Apple Inc. | 4.450% | 5/6/44 | 1,150 | 1,253 | |
| Apple Inc. | 3.450% | 2/9/45 | 1,275 | 1,198 | |
| Apple Inc. | 4.650% | 2/23/46 | 4,600 | 5,192 | |
| Applied Materials Inc. | 2.625% | 10/1/20 | 475 | 494 | |
| Applied Materials Inc. | 4.300% | 6/15/21 | 2,185 | 2,436 | |
| Applied Materials Inc. | 3.900% | 10/1/25 | 1,000 | 1,110 | |
| Applied Materials Inc. | 5.100% | 10/1/35 | 350 | 401 | |
| Applied Materials Inc. | 5.850% | 6/15/41 | 125 | 152 | |
| Arrow Electronics Inc. | 3.000% | 3/1/18 | 200 | 202 | |
| Arrow Electronics Inc. | 3.500% | 4/1/22 | 325 | 333 | |
| Arrow Electronics Inc. | 4.500% | 3/1/23 | 400 | 425 | |
| Arrow Electronics Inc. | 4.000% | 4/1/25 | 400 | 407 | |
| Autodesk Inc. | 1.950% | 12/15/17 | 550 | 551 | |
125
| Vanguard® Balanced Index Fund | |||||
| Schedule of Investments | |||||
| June 30, 2016 | |||||
| Face | Market | ||||
| Maturity | Amount | Value | |||
| Coupon | Date | ($000) | ($000) | ||
| Autodesk Inc. | 3.125% | 6/15/20 | 225 | 231 | |
| Autodesk Inc. | 3.600% | 12/15/22 | 100 | 102 | |
| Autodesk Inc. | 4.375% | 6/15/25 | 175 | 184 | |
| AVNET Inc. | 4.625% | 4/15/26 | 800 | 831 | |
| Baidu Inc. | 2.750% | 6/9/19 | 350 | 355 | |
| Baidu Inc. | 3.500% | 11/28/22 | 1,500 | 1,546 | |
| Broadridge Financial Solutions Inc. | 3.950% | 9/1/20 | 250 | 266 | |
| Broadridge Financial Solutions Inc. | 3.400% | 6/27/26 | 320 | 324 | |
| CA Inc. | 5.375% | 12/1/19 | 205 | 226 | |
| CA Inc. | 3.600% | 8/1/20 | 800 | 835 | |
| CA Inc. | 4.500% | 8/15/23 | 150 | 164 | |
| Cadence Design Systems Inc. | 4.375% | 10/15/24 | 125 | 130 | |
| Cisco Systems Inc. | 1.400% | 2/28/18 | 1,050 | 1,060 | |
| Cisco Systems Inc. | 4.950% | 2/15/19 | 1,550 | 1,702 | |
| Cisco Systems Inc. | 1.600% | 2/28/19 | 1,650 | 1,675 | |
| Cisco Systems Inc. | 2.125% | 3/1/19 | 1,325 | 1,361 | |
| Cisco Systems Inc. | 4.450% | 1/15/20 | 2,775 | 3,064 | |
| Cisco Systems Inc. | 2.450% | 6/15/20 | 1,000 | 1,041 | |
| Cisco Systems Inc. | 2.200% | 2/28/21 | 2,600 | 2,680 | |
| Cisco Systems Inc. | 2.900% | 3/4/21 | 225 | 239 | |
| Cisco Systems Inc. | 3.625% | 3/4/24 | 400 | 449 | |
| Cisco Systems Inc. | 2.950% | 2/28/26 | 400 | 426 | |
| Cisco Systems Inc. | 5.900% | 2/15/39 | 425 | 577 | |
| Cisco Systems Inc. | 5.500% | 1/15/40 | 1,205 | 1,580 | |
| Corning Inc. | 1.500% | 5/8/18 | 875 | 875 | |
| Corning Inc. | 6.625% | 5/15/19 | 50 | 56 | |
| Corning Inc. | 2.900% | 5/15/22 | 625 | 640 | |
| Corning Inc. | 3.700% | 11/15/23 | 500 | 536 | |
| Corning Inc. | 4.700% | 3/15/37 | 175 | 184 | |
| Corning Inc. | 5.750% | 8/15/40 | 340 | 404 | |
| 8 | Diamond 1 Finance Corp. / Diamond 2 Finance Corp. | 3.480% | 6/1/19 | 2,450 | 2,506 |
| 8 | Diamond 1 Finance Corp. / Diamond 2 Finance Corp. | 4.420% | 6/15/21 | 2,900 | 2,981 |
| 8 | Diamond 1 Finance Corp. / Diamond 2 Finance Corp. | 5.450% | 6/15/23 | 2,700 | 2,790 |
| 8 | Diamond 1 Finance Corp. / Diamond 2 Finance Corp. | 6.020% | 6/15/26 | 2,925 | 3,034 |
| 8 | Diamond 1 Finance Corp. / Diamond 2 Finance Corp. | 8.350% | 7/15/46 | 1,300 | 1,397 |
| EMC Corp. | 1.875% | 6/1/18 | 1,460 | 1,437 | |
| EMC Corp. | 2.650% | 6/1/20 | 1,445 | 1,380 | |
| EMC Corp. | 3.375% | 6/1/23 | 635 | 578 | |
| Equifax Inc. | 6.300% | 7/1/17 | 125 | 131 | |
| Equifax Inc. | 2.300% | 6/1/21 | 2,575 | 2,605 | |
| Equifax Inc. | 3.250% | 6/1/26 | 350 | 361 | |
| Fidelity National Information Services Inc. | 2.000% | 4/15/18 | 100 | 101 | |
| Fidelity National Information Services Inc. | 2.850% | 10/15/18 | 300 | 308 | |
| Fidelity National Information Services Inc. | 3.625% | 10/15/20 | 3,625 | 3,833 | |
| Fidelity National Information Services Inc. | 5.000% | 3/15/22 | 350 | 364 | |
| Fidelity National Information Services Inc. | 3.500% | 4/15/23 | 625 | 645 | |
| Fidelity National Information Services Inc. | 3.875% | 6/5/24 | 325 | 344 | |
| Fidelity National Information Services Inc. | 5.000% | 10/15/25 | 1,450 | 1,646 | |
| Fiserv Inc. | 2.700% | 6/1/20 | 525 | 546 | |
| Fiserv Inc. | 3.850% | 6/1/25 | 700 | 749 | |
| Flextronics International Ltd. | 4.625% | 2/15/20 | 275 | 285 | |
| 8 | Hewlett Packard Enterprise Co. | 2.450% | 10/5/17 | 1,250 | 1,266 |
| 8 | Hewlett Packard Enterprise Co. | 2.850% | 10/5/18 | 2,300 | 2,352 |
| 8 | Hewlett Packard Enterprise Co. | 3.600% | 10/15/20 | 1,625 | 1,697 |
| 8 | Hewlett Packard Enterprise Co. | 4.400% | 10/15/22 | 1,450 | 1,551 |
| 8 | Hewlett Packard Enterprise Co. | 4.900% | 10/15/25 | 2,500 | 2,613 |
| 8 | Hewlett Packard Enterprise Co. | 6.200% | 10/15/35 | 350 | 354 |
| 8 | Hewlett Packard Enterprise Co. | 6.350% | 10/15/45 | 1,450 | 1,441 |
| HP Inc. | 3.750% | 12/1/20 | 113 | 120 | |
| HP Inc. | 4.300% | 6/1/21 | 150 | 159 | |
| HP Inc. | 4.375% | 9/15/21 | 650 | 697 | |
| HP Inc. | 4.650% | 12/9/21 | 2,175 | 2,350 | |
| HP Inc. | 6.000% | 9/15/41 | 610 | 589 | |
| Ingram Micro Inc. | 4.950% | 12/15/24 | 925 | 923 | |
126
| Vanguard® Balanced Index Fund | ||||
| Schedule of Investments | ||||
| June 30, 2016 | ||||
| Face | Market | |||
| Maturity | Amount | Value | ||
| Coupon | Date | ($000) | ($000) | |
| Intel Corp. | 1.350% | 12/15/17 | 4,510 | 4,537 |
| Intel Corp. | 2.450% | 7/29/20 | 500 | 519 |
| Intel Corp. | 1.700% | 5/19/21 | 200 | 202 |
| Intel Corp. | 3.300% | 10/1/21 | 200 | 216 |
| Intel Corp. | 3.100% | 7/29/22 | 625 | 673 |
| Intel Corp. | 2.700% | 12/15/22 | 700 | 735 |
| Intel Corp. | 3.700% | 7/29/25 | 500 | 556 |
| Intel Corp. | 2.600% | 5/19/26 | 775 | 785 |
| Intel Corp. | 4.000% | 12/15/32 | 475 | 512 |
| Intel Corp. | 4.800% | 10/1/41 | 1,205 | 1,369 |
| Intel Corp. | 4.250% | 12/15/42 | 775 | 832 |
| Intel Corp. | 4.900% | 7/29/45 | 900 | 1,048 |
| Intel Corp. | 4.100% | 5/19/46 | 775 | 806 |
| International Business Machines Corp. | 5.700% | 9/14/17 | 4,000 | 4,225 |
| International Business Machines Corp. | 1.250% | 2/8/18 | 2,555 | 2,571 |
| International Business Machines Corp. | 1.950% | 2/12/19 | 675 | 692 |
| International Business Machines Corp. | 1.800% | 5/17/19 | 2,000 | 2,036 |
| International Business Machines Corp. | 1.625% | 5/15/20 | 670 | 677 |
| International Business Machines Corp. | 2.900% | 11/1/21 | 200 | 212 |
| International Business Machines Corp. | 2.875% | 11/9/22 | 500 | 530 |
| International Business Machines Corp. | 3.375% | 8/1/23 | 600 | 651 |
| International Business Machines Corp. | 3.625% | 2/12/24 | 1,400 | 1,528 |
| International Business Machines Corp. | 5.600% | 11/30/39 | 1,114 | 1,409 |
| International Business Machines Corp. | 4.000% | 6/20/42 | 423 | 448 |
| International Business Machines Corp. | 4.700% | 2/19/46 | 1,000 | 1,152 |
| Jabil Circuit Inc. | 5.625% | 12/15/20 | 250 | 267 |
| Juniper Networks Inc. | 3.125% | 2/26/19 | 250 | 257 |
| Juniper Networks Inc. | 3.300% | 6/15/20 | 475 | 491 |
| Juniper Networks Inc. | 4.600% | 3/15/21 | 360 | 387 |
| Juniper Networks Inc. | 4.350% | 6/15/25 | 200 | 207 |
| Juniper Networks Inc. | 5.950% | 3/15/41 | 150 | 150 |
| Keysight Technologies Inc. | 3.300% | 10/30/19 | 350 | 354 |
| Keysight Technologies Inc. | 4.550% | 10/30/24 | 325 | 333 |
| KLA-Tencor Corp. | 2.375% | 11/1/17 | 100 | 101 |
| KLA-Tencor Corp. | 3.375% | 11/1/19 | 100 | 104 |
| KLA-Tencor Corp. | 4.125% | 11/1/21 | 2,000 | 2,127 |
| KLA-Tencor Corp. | 4.650% | 11/1/24 | 400 | 436 |
| Lam Research Corp. | 2.750% | 3/15/20 | 325 | 333 |
| Lam Research Corp. | 2.800% | 6/15/21 | 450 | 463 |
| Lam Research Corp. | 3.450% | 6/15/23 | 500 | 516 |
| Lam Research Corp. | 3.800% | 3/15/25 | 425 | 439 |
| Lam Research Corp. | 3.900% | 6/15/26 | 2,700 | 2,840 |
| Lender Processing Services Inc / Black Knight Lending | ||||
| Solutions Inc | 5.750% | 4/15/23 | 344 | 360 |
| Lexmark International Inc. | 6.650% | 6/1/18 | 375 | 394 |
| Maxim Integrated Products Inc. | 3.375% | 3/15/23 | 50 | 52 |
| Microsoft Corp. | 1.000% | 5/1/18 | 400 | 400 |
| Microsoft Corp. | 1.300% | 11/3/18 | 2,400 | 2,422 |
| Microsoft Corp. | 4.200% | 6/1/19 | 460 | 503 |
| Microsoft Corp. | 3.000% | 10/1/20 | 250 | 267 |
| Microsoft Corp. | 2.000% | 11/3/20 | 1,975 | 2,026 |
| Microsoft Corp. | 2.375% | 2/12/22 | 1,600 | 1,652 |
| Microsoft Corp. | 2.650% | 11/3/22 | 1,650 | 1,720 |
| Microsoft Corp. | 2.125% | 11/15/22 | 225 | 229 |
| Microsoft Corp. | 2.375% | 5/1/23 | 225 | 230 |
| Microsoft Corp. | 3.625% | 12/15/23 | 750 | 831 |
| Microsoft Corp. | 2.700% | 2/12/25 | 925 | 955 |
| Microsoft Corp. | 3.125% | 11/3/25 | 2,000 | 2,139 |
| Microsoft Corp. | 3.500% | 2/12/35 | 1,000 | 1,029 |
| Microsoft Corp. | 4.200% | 11/3/35 | 875 | 983 |
| Microsoft Corp. | 5.200% | 6/1/39 | 229 | 285 |
| Microsoft Corp. | 4.500% | 10/1/40 | 125 | 142 |
| Microsoft Corp. | 5.300% | 2/8/41 | 600 | 756 |
| Microsoft Corp. | 3.500% | 11/15/42 | 850 | 834 |
127
| Vanguard® Balanced Index Fund | ||||
| Schedule of Investments | ||||
| June 30, 2016 | ||||
| Face | Market | |||
| Maturity | Amount | Value | ||
| Coupon | Date | ($000) | ($000) | |
| Microsoft Corp. | 3.750% | 5/1/43 | 185 | 186 |
| Microsoft Corp. | 4.875% | 12/15/43 | 350 | 417 |
| Microsoft Corp. | 3.750% | 2/12/45 | 400 | 406 |
| Microsoft Corp. | 4.450% | 11/3/45 | 2,650 | 2,994 |
| Microsoft Corp. | 4.000% | 2/12/55 | 2,000 | 1,985 |
| Microsoft Corp. | 4.750% | 11/3/55 | 650 | 736 |
| Motorola Solutions Inc. | 3.750% | 5/15/22 | 400 | 399 |
| Motorola Solutions Inc. | 3.500% | 3/1/23 | 1,100 | 1,061 |
| Motorola Solutions Inc. | 4.000% | 9/1/24 | 400 | 392 |
| Motorola Solutions Inc. | 7.500% | 5/15/25 | 75 | 89 |
| Motorola Solutions Inc. | 5.500% | 9/1/44 | 300 | 267 |
| NetApp Inc. | 3.375% | 6/15/21 | 900 | 917 |
| Oracle Corp. | 1.200% | 10/15/17 | 1,150 | 1,154 |
| Oracle Corp. | 5.750% | 4/15/18 | 1,415 | 1,532 |
| Oracle Corp. | 2.375% | 1/15/19 | 525 | 541 |
| Oracle Corp. | 5.000% | 7/8/19 | 1,175 | 1,303 |
| Oracle Corp. | 2.250% | 10/8/19 | 2,850 | 2,938 |
| Oracle Corp. | 1.900% | 9/15/21 | 4,750 | 4,766 |
| Oracle Corp. | 2.500% | 5/15/22 | 1,250 | 1,279 |
| Oracle Corp. | 2.400% | 9/15/23 | 1,720 | 1,724 |
| Oracle Corp. | 3.400% | 7/8/24 | 2,350 | 2,512 |
| Oracle Corp. | 2.950% | 5/15/25 | 1,000 | 1,037 |
| Oracle Corp. | 2.650% | 7/15/26 | 2,925 | 2,929 |
| Oracle Corp. | 3.250% | 5/15/30 | 275 | 292 |
| Oracle Corp. | 4.300% | 7/8/34 | 1,350 | 1,436 |
| Oracle Corp. | 3.900% | 5/15/35 | 1,350 | 1,374 |
| Oracle Corp. | 3.850% | 7/15/36 | 1,475 | 1,483 |
| Oracle Corp. | 6.500% | 4/15/38 | 625 | 852 |
| Oracle Corp. | 6.125% | 7/8/39 | 645 | 847 |
| Oracle Corp. | 5.375% | 7/15/40 | 1,375 | 1,656 |
| Oracle Corp. | 4.500% | 7/8/44 | 775 | 874 |
| Oracle Corp. | 4.125% | 5/15/45 | 400 | 413 |
| Oracle Corp. | 4.000% | 7/15/46 | 2,300 | 2,312 |
| Oracle Corp. | 4.375% | 5/15/55 | 1,000 | 1,043 |
| Pitney Bowes Inc. | 4.625% | 3/15/24 | 1,050 | 1,107 |
| QUALCOMM Inc. | 1.400% | 5/18/18 | 1,000 | 1,009 |
| QUALCOMM Inc. | 2.250% | 5/20/20 | 1,000 | 1,028 |
| QUALCOMM Inc. | 3.000% | 5/20/22 | 1,275 | 1,339 |
| QUALCOMM Inc. | 3.450% | 5/20/25 | 975 | 1,035 |
| QUALCOMM Inc. | 4.650% | 5/20/35 | 475 | 513 |
| QUALCOMM Inc. | 4.800% | 5/20/45 | 1,200 | 1,258 |
| Seagate HDD Cayman | 4.750% | 6/1/23 | 1,500 | 1,267 |
| Seagate HDD Cayman | 4.750% | 1/1/25 | 750 | 592 |
| Seagate HDD Cayman | 4.875% | 6/1/27 | 450 | 325 |
| Symantec Corp. | 4.200% | 9/15/20 | 75 | 78 |
| Symantec Corp. | 3.950% | 6/15/22 | 400 | 405 |
| Telefonaktiebolaget LM Ericsson | 4.125% | 5/15/22 | 475 | 512 |
| Texas Instruments Inc. | 1.650% | 8/3/19 | 1,000 | 1,014 |
| Total System Services Inc. | 2.375% | 6/1/18 | 125 | 126 |
| Total System Services Inc. | 4.800% | 4/1/26 | 675 | 733 |
| Trimble Navigation Ltd. | 4.750% | 12/1/24 | 225 | 236 |
| Tyco Electronics Group SA | 6.550% | 10/1/17 | 355 | 378 |
| Tyco Electronics Group SA | 2.350% | 8/1/19 | 200 | 203 |
| Tyco Electronics Group SA | 3.500% | 2/3/22 | 750 | 792 |
| Tyco Electronics Group SA | 3.450% | 8/1/24 | 350 | 369 |
| Tyco Electronics Group SA | 7.125% | 10/1/37 | 700 | 972 |
| Verisk Analytics Inc. | 4.125% | 9/12/22 | 1,300 | 1,382 |
| Verisk Analytics Inc. | 5.500% | 6/15/45 | 250 | 257 |
| Xerox Corp. | 6.350% | 5/15/18 | 1,580 | 1,680 |
| Xerox Corp. | 2.750% | 3/15/19 | 250 | 249 |
| Xerox Corp. | 5.625% | 12/15/19 | 550 | 588 |
| Xerox Corp. | 2.800% | 5/15/20 | 300 | 289 |
| Xerox Corp. | 4.500% | 5/15/21 | 835 | 842 |
| Xilinx Inc. | 2.125% | 3/15/19 | 325 | 329 |
128
| Vanguard® Balanced Index Fund | |||||
| Schedule of Investments | |||||
| June 30, 2016 | |||||
| Face | Market | ||||
| Maturity | Amount | Value | |||
| Coupon | Date | ($000) | ($000) | ||
| Xilinx Inc. | 3.000% | 3/15/21 | 1,275 | 1,336 | |
| Transportation (0.3%) | |||||
| 5 | American Airlines 2011-1 Class A Pass Through Trust | 5.250% | 7/31/22 | 1,606 | 1,730 |
| 5 | American Airlines 2013-1 Class A Pass Through Trust | 4.000% | 1/15/27 | 236 | 249 |
| 5 | American Airlines 2013-2 Class A Pass Through Trust | 4.950% | 7/15/24 | 1,029 | 1,117 |
| 5 | American Airlines 2014-1 Class A Pass Through Trust | 3.700% | 4/1/28 | 457 | 474 |
| 5 | American Airlines 2015-1 Class A Pass Through Trust | 3.375% | 11/1/28 | 859 | 878 |
| 5 | American Airlines 2015-1 Class B Pass Through Trust | 3.700% | 11/1/24 | 136 | 133 |
| 5 | American Airlines 2015-2 Class AA Pass Through Trust | 3.600% | 9/22/27 | 285 | 300 |
| 5 | American Airlines 2016-1 Class A Pass Through Trust | 4.100% | 1/15/28 | 225 | 238 |
| 5 | American Airlines 2016-1 Class AA Pass Through Trust | 3.575% | 1/15/28 | 500 | 524 |
| 5 | American Airlines 2016-2 Class AA Pass Through Trust | 3.200% | 6/15/28 | 1,000 | 1,035 |
| 5 | BNSF Funding Trust I | 6.613% | 12/15/55 | 325 | 367 |
| Burlington Northern Santa Fe LLC | 5.750% | 3/15/18 | 625 | 674 | |
| Burlington Northern Santa Fe LLC | 3.600% | 9/1/20 | 275 | 296 | |
| Burlington Northern Santa Fe LLC | 4.100% | 6/1/21 | 410 | 453 | |
| Burlington Northern Santa Fe LLC | 3.450% | 9/15/21 | 410 | 444 | |
| Burlington Northern Santa Fe LLC | 3.050% | 3/15/22 | 425 | 453 | |
| Burlington Northern Santa Fe LLC | 3.050% | 9/1/22 | 400 | 426 | |
| Burlington Northern Santa Fe LLC | 3.000% | 3/15/23 | 625 | 659 | |
| Burlington Northern Santa Fe LLC | 3.850% | 9/1/23 | 275 | 306 | |
| Burlington Northern Santa Fe LLC | 3.750% | 4/1/24 | 400 | 443 | |
| Burlington Northern Santa Fe LLC | 3.400% | 9/1/24 | 400 | 435 | |
| Burlington Northern Santa Fe LLC | 3.000% | 4/1/25 | 250 | 264 | |
| Burlington Northern Santa Fe LLC | 3.650% | 9/1/25 | 1,050 | 1,165 | |
| Burlington Northern Santa Fe LLC | 7.000% | 12/15/25 | 700 | 951 | |
| Burlington Northern Santa Fe LLC | 6.200% | 8/15/36 | 125 | 166 | |
| Burlington Northern Santa Fe LLC | 6.150% | 5/1/37 | 400 | 527 | |
| Burlington Northern Santa Fe LLC | 5.750% | 5/1/40 | 450 | 582 | |
| Burlington Northern Santa Fe LLC | 5.050% | 3/1/41 | 375 | 451 | |
| Burlington Northern Santa Fe LLC | 5.400% | 6/1/41 | 925 | 1,143 | |
| Burlington Northern Santa Fe LLC | 4.400% | 3/15/42 | 575 | 638 | |
| Burlington Northern Santa Fe LLC | 4.375% | 9/1/42 | 200 | 221 | |
| Burlington Northern Santa Fe LLC | 4.450% | 3/15/43 | 350 | 391 | |
| Burlington Northern Santa Fe LLC | 5.150% | 9/1/43 | 500 | 613 | |
| Burlington Northern Santa Fe LLC | 4.900% | 4/1/44 | 300 | 358 | |
| Burlington Northern Santa Fe LLC | 4.550% | 9/1/44 | 600 | 685 | |
| Burlington Northern Santa Fe LLC | 4.150% | 4/1/45 | 300 | 326 | |
| Burlington Northern Santa Fe LLC | 4.700% | 9/1/45 | 300 | 352 | |
| Burlington Northern Santa Fe LLC | 3.900% | 8/1/46 | 600 | 634 | |
| Canadian National Railway Co. | 5.850% | 11/15/17 | 175 | 186 | |
| Canadian National Railway Co. | 5.550% | 3/1/19 | 265 | 294 | |
| Canadian National Railway Co. | 2.850% | 12/15/21 | 550 | 581 | |
| Canadian National Railway Co. | 2.750% | 3/1/26 | 750 | 786 | |
| Canadian National Railway Co. | 6.250% | 8/1/34 | 350 | 486 | |
| Canadian National Railway Co. | 6.200% | 6/1/36 | 350 | 482 | |
| Canadian National Railway Co. | 6.375% | 11/15/37 | 350 | 494 | |
| Canadian Pacific Railway Co. | 4.450% | 3/15/23 | 225 | 250 | |
| Canadian Pacific Railway Co. | 2.900% | 2/1/25 | 100 | 102 | |
| Canadian Pacific Railway Co. | 3.700% | 2/1/26 | 450 | 485 | |
| Canadian Pacific Railway Co. | 7.125% | 10/15/31 | 225 | 306 | |
| Canadian Pacific Railway Co. | 5.750% | 3/15/33 | 425 | 501 | |
| Canadian Pacific Railway Co. | 5.950% | 5/15/37 | 775 | 970 | |
| Canadian Pacific Railway Co. | 4.800% | 8/1/45 | 200 | 230 | |
| Canadian Pacific Railway Co. | 6.125% | 9/15/15 | 230 | 289 | |
| Canadian Pacific Railway Ltd. | 4.500% | 1/15/22 | 691 | 764 | |
| Canadian Pacific Railway Ltd. | 5.750% | 1/15/42 | 110 | 135 | |
| 5 | Continental Airlines 2009-2 Class A Pass Through Trust | 7.250% | 5/10/21 | 900 | 1,025 |
| 5 | Continental Airlines 2010-1 Class A Pass Through Trust | 4.750% | 7/12/22 | 864 | 918 |
| 5 | Continental Airlines 2012-1 Class A Pass Through Trust | 4.150% | 10/11/25 | 767 | 809 |
129
| Vanguard® Balanced Index Fund | |||||
| Schedule of Investments | |||||
| June 30, 2016 | |||||
| Face | Market | ||||
| Maturity | Amount | Value | |||
| Coupon | Date | ($000) | ($000) | ||
| 5 | Continental Airlines 2012-2 Class A Pass Through Trust | 4.000% | 4/29/26 | 392 | 415 |
| CSX Corp. | 6.250% | 3/15/18 | 725 | 785 | |
| CSX Corp. | 7.375% | 2/1/19 | 2,065 | 2,376 | |
| CSX Corp. | 3.700% | 10/30/20 | 205 | 220 | |
| CSX Corp. | 4.250% | 6/1/21 | 900 | 987 | |
| CSX Corp. | 3.350% | 11/1/25 | 400 | 425 | |
| CSX Corp. | 6.220% | 4/30/40 | 174 | 234 | |
| CSX Corp. | 5.500% | 4/15/41 | 425 | 533 | |
| CSX Corp. | 4.750% | 5/30/42 | 1,310 | 1,490 | |
| CSX Corp. | 4.400% | 3/1/43 | 93 | 102 | |
| CSX Corp. | 4.100% | 3/15/44 | 800 | 853 | |
| CSX Corp. | 3.950% | 5/1/50 | 650 | 652 | |
| 5 | Delta Air Lines 2007-1 Class A Pass Through Trust | 6.821% | 2/10/24 | 166 | 193 |
| 5 | Delta Air Lines 2009-1 Class A Pass Through Trust | 7.750% | 6/17/21 | 85 | 96 |
| 5 | Delta Air Lines 2010-1 Class A Pass Through Trust | 6.200% | 1/2/20 | 26 | 28 |
| 5 | Delta Air Lines 2010-2 Class A Pass Through Trust | 4.950% | 11/23/20 | 53 | 56 |
| 5 | Delta Air Lines 2012-1 Class A Pass Through Trust | 4.750% | 11/7/21 | 55 | 58 |
| 5 | Delta Air Lines 2015-1 Class AA Pass Through Trust | 3.625% | 7/30/27 | 368 | 388 |
| FedEx Corp. | 8.000% | 1/15/19 | 475 | 553 | |
| FedEx Corp. | 2.625% | 8/1/22 | 50 | 51 | |
| FedEx Corp. | 4.000% | 1/15/24 | 450 | 499 | |
| FedEx Corp. | 3.250% | 4/1/26 | 500 | 521 | |
| FedEx Corp. | 3.900% | 2/1/35 | 200 | 204 | |
| FedEx Corp. | 3.875% | 8/1/42 | 200 | 196 | |
| FedEx Corp. | 4.100% | 4/15/43 | 300 | 303 | |
| FedEx Corp. | 5.100% | 1/15/44 | 500 | 581 | |
| FedEx Corp. | 4.750% | 11/15/45 | 825 | 919 | |
| FedEx Corp. | 4.550% | 4/1/46 | 550 | 596 | |
| FedEx Corp. | 4.500% | 2/1/65 | 150 | 153 | |
| 5 | Hawaiian Airlines 2013-1 Class A Pass Through | ||||
| Certificates | 3.900% | 1/15/26 | 902 | 895 | |
| JB Hunt Transport Services Inc. | 3.300% | 8/15/22 | 400 | 414 | |
| JB Hunt Transport Services Inc. | 3.850% | 3/15/24 | 200 | 213 | |
| 8 | Kansas City Southern | 2.350% | 5/15/20 | 25 | 24 |
| 8 | Kansas City Southern | 3.000% | 5/15/23 | 500 | 509 |
| Kansas City Southern | 3.125% | 6/1/26 | 675 | 689 | |
| 8 | Kansas City Southern | 4.300% | 5/15/43 | 250 | 255 |
| 8 | Kansas City Southern | 4.950% | 8/15/45 | 325 | 364 |
| 5,8 | Latam Airlines 2015-1 Pass Through Trust A | 4.200% | 11/15/27 | 246 | 219 |
| Norfolk Southern Corp. | 5.750% | 4/1/18 | 200 | 215 | |
| Norfolk Southern Corp. | 5.900% | 6/15/19 | 335 | 376 | |
| Norfolk Southern Corp. | 3.250% | 12/1/21 | 325 | 344 | |
| Norfolk Southern Corp. | 2.903% | 2/15/23 | 780 | 806 | |
| Norfolk Southern Corp. | 5.590% | 5/17/25 | 164 | 201 | |
| Norfolk Southern Corp. | 7.800% | 5/15/27 | 100 | 142 | |
| Norfolk Southern Corp. | 4.837% | 10/1/41 | 565 | 649 | |
| Norfolk Southern Corp. | 3.950% | 10/1/42 | 425 | 437 | |
| Norfolk Southern Corp. | 4.450% | 6/15/45 | 275 | 305 | |
| Norfolk Southern Corp. | 4.650% | 1/15/46 | 200 | 231 | |
| Norfolk Southern Corp. | 7.900% | 5/15/97 | 200 | 304 | |
| Norfolk Southern Corp. | 6.000% | 3/15/05 | 275 | 331 | |
| Norfolk Southern Corp. | 6.000% | 5/23/11 | 925 | 1,144 | |
| 5 | Northwest Airlines 2007-1 Class A Pass Through Trust | 7.027% | 5/1/21 | 167 | 189 |
| Ryder System Inc. | 2.450% | 11/15/18 | 1,000 | 1,017 | |
| Ryder System Inc. | 2.350% | 2/26/19 | 1,350 | 1,364 | |
| Ryder System Inc. | 2.550% | 6/1/19 | 800 | 814 | |
| Ryder System Inc. | 2.500% | 5/11/20 | 200 | 204 | |
| Ryder System Inc. | 2.875% | 9/1/20 | 125 | 128 | |
| Southern Railway Co. | 9.750% | 6/15/20 | 116 | 149 | |
| Southwest Airlines Co. | 2.750% | 11/6/19 | 25 | 26 | |
| Southwest Airlines Co. | 2.650% | 11/5/20 | 540 | 557 | |
| 5 | Southwest Airlines Co. 2007-1 Pass Through Trust | 6.150% | 2/1/24 | 102 | 116 |
130
| Vanguard® Balanced Index Fund | |||||
| Schedule of Investments | |||||
| June 30, 2016 | |||||
| Face | Market | ||||
| Maturity | Amount | Value | |||
| Coupon | Date | ($000) | ($000) | ||
| 5 | Spirit Airlines Class A Pass Through Certificates Series | ||||
| 2015-1 | 4.100% | 10/1/29 | 325 | 328 | |
| Trinity Industries Inc. | 4.550% | 10/1/24 | 225 | 208 | |
| Union Pacific Corp. | 1.800% | 2/1/20 | 450 | 457 | |
| Union Pacific Corp. | 2.250% | 6/19/20 | 300 | 309 | |
| Union Pacific Corp. | 2.750% | 4/15/23 | 200 | 209 | |
| Union Pacific Corp. | 3.250% | 1/15/25 | 400 | 433 | |
| Union Pacific Corp. | 3.250% | 8/15/25 | 900 | 978 | |
| Union Pacific Corp. | 2.750% | 3/1/26 | 100 | 104 | |
| Union Pacific Corp. | 6.625% | 2/1/29 | 400 | 560 | |
| Union Pacific Corp. | 3.375% | 2/1/35 | 900 | 906 | |
| Union Pacific Corp. | 4.750% | 9/15/41 | 250 | 295 | |
| Union Pacific Corp. | 4.250% | 4/15/43 | 400 | 443 | |
| Union Pacific Corp. | 4.750% | 12/15/43 | 325 | 384 | |
| Union Pacific Corp. | 4.821% | 2/1/44 | 189 | 227 | |
| Union Pacific Corp. | 4.850% | 6/15/44 | 75 | 90 | |
| Union Pacific Corp. | 4.150% | 1/15/45 | 400 | 440 | |
| Union Pacific Corp. | 4.050% | 11/15/45 | 250 | 271 | |
| Union Pacific Corp. | 4.050% | 3/1/46 | 500 | 548 | |
| Union Pacific Corp. | 3.875% | 2/1/55 | 400 | 406 | |
| Union Pacific Corp. | 4.375% | 11/15/65 | 800 | 858 | |
| 5 | United Airlines 2013-1 Class A Pass Through Trust | 4.300% | 2/15/27 | 649 | 701 |
| 5 | United Airlines 2014-1 Class A Pass Through Trust | 4.000% | 10/11/27 | 707 | 746 |
| United Airlines 2015-1 Class A Pass Through Trust | 3.700% | 6/1/24 | 200 | 207 | |
| 5 | United Airlines 2015-1 Class AA Pass Through Trust | 3.450% | 12/1/27 | 425 | 438 |
| 5 | United Airlines 2016-1 Class AA Pass Through Trust | 3.100% | 7/7/28 | 2,550 | 2,620 |
| United Parcel Service Inc. | 1.125% | 10/1/17 | 800 | 804 | |
| United Parcel Service Inc. | 5.500% | 1/15/18 | 1,000 | 1,069 | |
| United Parcel Service Inc. | 5.125% | 4/1/19 | 175 | 194 | |
| United Parcel Service Inc. | 3.125% | 1/15/21 | 990 | 1,061 | |
| United Parcel Service Inc. | 2.450% | 10/1/22 | 925 | 957 | |
| United Parcel Service Inc. | 6.200% | 1/15/38 | 820 | 1,176 | |
| United Parcel Service Inc. | 4.875% | 11/15/40 | 350 | 441 | |
| United Parcel Service Inc. | 3.625% | 10/1/42 | 675 | 719 | |
| 5 | US Airways 2013-1 Class A Pass Through Trust | 3.950% | 5/15/27 | 174 | 183 |
| 5 | US Airways Inc. 2012-2 Class A Pass Through Trust | 4.625% | 12/3/26 | 60 | 65 |
| 1,958,563 | |||||
| Utilities (0.9%) | |||||
| Electric (0.8%) | |||||
| AEP Texas Central Co. | 6.650% | 2/15/33 | 400 | 516 | |
| Alabama Power Co. | 5.500% | 10/15/17 | 550 | 580 | |
| Alabama Power Co. | 3.550% | 12/1/23 | 700 | 775 | |
| Alabama Power Co. | 2.800% | 4/1/25 | 200 | 208 | |
| Alabama Power Co. | 4.100% | 1/15/42 | 700 | 759 | |
| Alabama Power Co. | 3.850% | 12/1/42 | 125 | 131 | |
| Alabama Power Co. | 4.150% | 8/15/44 | 300 | 329 | |
| Alabama Power Co. | 3.750% | 3/1/45 | 650 | 677 | |
| Alabama Power Co. | 4.300% | 1/2/46 | 250 | 284 | |
| Ameren Corp. | 2.700% | 11/15/20 | 2,025 | 2,085 | |
| Ameren Corp. | 3.650% | 2/15/26 | 465 | 502 | |
| Ameren Illinois Co. | 6.125% | 11/15/17 | 25 | 27 | |
| Ameren Illinois Co. | 2.700% | 9/1/22 | 250 | 261 | |
| Ameren Illinois Co. | 3.250% | 3/1/25 | 275 | 296 | |
| Ameren Illinois Co. | 4.150% | 3/15/46 | 500 | 560 | |
| American Electric Power Co. Inc. | 1.650% | 12/15/17 | 325 | 326 | |
| Appalachian Power Co. | 3.400% | 6/1/25 | 400 | 425 | |
| Appalachian Power Co. | 5.800% | 10/1/35 | 100 | 120 | |
| Appalachian Power Co. | 6.700% | 8/15/37 | 500 | 656 | |
| Appalachian Power Co. | 7.000% | 4/1/38 | 260 | 349 | |
| Arizona Public Service Co. | 3.150% | 5/15/25 | 500 | 534 | |
| Arizona Public Service Co. | 5.500% | 9/1/35 | 150 | 187 | |
| Arizona Public Service Co. | 5.050% | 9/1/41 | 575 | 712 | |
| Arizona Public Service Co. | 4.500% | 4/1/42 | 25 | 29 | |
131
| Vanguard® Balanced Index Fund | |||||
| Schedule of Investments | |||||
| June 30, 2016 | |||||
| Face | Market | ||||
| Maturity | Amount | Value | |||
| Coupon | Date | ($000) | ($000) | ||
| Arizona Public Service Co. | 4.700% | 1/15/44 | 400 | 479 | |
| Arizona Public Service Co. | 4.350% | 11/15/45 | 50 | 57 | |
| Arizona Public Service Co. | 3.750% | 5/15/46 | 650 | 680 | |
| Atlantic City Electric Co. | 7.750% | 11/15/18 | 150 | 172 | |
| Baltimore Gas & Electric Co. | 3.350% | 7/1/23 | 950 | 1,007 | |
| Berkshire Hathaway Energy Co. | 2.000% | 11/15/18 | 125 | 127 | |
| Berkshire Hathaway Energy Co. | 2.400% | 2/1/20 | 200 | 206 | |
| Berkshire Hathaway Energy Co. | 3.750% | 11/15/23 | 525 | 574 | |
| Berkshire Hathaway Energy Co. | 3.500% | 2/1/25 | 500 | 539 | |
| Berkshire Hathaway Energy Co. | 6.125% | 4/1/36 | 975 | 1,291 | |
| Berkshire Hathaway Energy Co. | 5.950% | 5/15/37 | 1,225 | 1,593 | |
| Berkshire Hathaway Energy Co. | 6.500% | 9/15/37 | 370 | 509 | |
| Berkshire Hathaway Energy Co. | 5.150% | 11/15/43 | 475 | 575 | |
| Berkshire Hathaway Energy Co. | 4.500% | 2/1/45 | 500 | 558 | |
| Black Hills Corp. | 2.500% | 1/11/19 | 425 | 434 | |
| Black Hills Corp. | 3.950% | 1/15/26 | 250 | 266 | |
| CenterPoint Energy Houston Electric LLC | 1.850% | 6/1/21 | 1,625 | 1,642 | |
| CenterPoint Energy Houston Electric LLC | 2.250% | 8/1/22 | 250 | 254 | |
| CenterPoint Energy Houston Electric LLC | 3.550% | 8/1/42 | 700 | 718 | |
| 8 | Cleco Corporate Holdings LLC | 3.743% | 5/1/26 | 725 | 747 |
| 8 | Cleco Corporate Holdings LLC | 4.973% | 5/1/46 | 475 | 499 |
| Cleco Power LLC | 6.000% | 12/1/40 | 175 | 219 | |
| Cleveland Electric Illuminating Co. | 7.880% | 11/1/17 | 200 | 216 | |
| Cleveland Electric Illuminating Co. | 5.500% | 8/15/24 | 1,775 | 2,113 | |
| CMS Energy Corp. | 8.750% | 6/15/19 | 500 | 603 | |
| CMS Energy Corp. | 6.250% | 2/1/20 | 600 | 691 | |
| CMS Energy Corp. | 5.050% | 3/15/22 | 500 | 572 | |
| CMS Energy Corp. | 3.875% | 3/1/24 | 175 | 190 | |
| CMS Energy Corp. | 4.700% | 3/31/43 | 350 | 397 | |
| CMS Energy Corp. | 4.875% | 3/1/44 | 300 | 352 | |
| Commonwealth Edison Co. | 6.150% | 9/15/17 | 600 | 637 | |
| Commonwealth Edison Co. | 5.800% | 3/15/18 | 150 | 162 | |
| Commonwealth Edison Co. | 5.900% | 3/15/36 | 100 | 133 | |
| Commonwealth Edison Co. | 6.450% | 1/15/38 | 1,030 | 1,461 | |
| Commonwealth Edison Co. | 4.600% | 8/15/43 | 550 | 649 | |
| Commonwealth Edison Co. | 4.700% | 1/15/44 | 900 | 1,084 | |
| Commonwealth Edison Co. | 3.700% | 3/1/45 | 1,500 | 1,559 | |
| Commonwealth Edison Co. | 3.650% | 6/15/46 | 125 | 128 | |
| Connecticut Light & Power Co. | 5.500% | 2/1/19 | 150 | 166 | |
| Connecticut Light & Power Co. | 6.350% | 6/1/36 | 250 | 342 | |
| Connecticut Light & Power Co. | 4.150% | 6/1/45 | 75 | 84 | |
| Consolidated Edison Co. of New York Inc. | 6.650% | 4/1/19 | 1,100 | 1,256 | |
| Consolidated Edison Co. of New York Inc. | 4.450% | 6/15/20 | 850 | 943 | |
| Consolidated Edison Co. of New York Inc. | 5.300% | 3/1/35 | 300 | 367 | |
| Consolidated Edison Co. of New York Inc. | 5.850% | 3/15/36 | 860 | 1,109 | |
| Consolidated Edison Co. of New York Inc. | 6.200% | 6/15/36 | 400 | 533 | |
| Consolidated Edison Co. of New York Inc. | 6.750% | 4/1/38 | 400 | 570 | |
| Consolidated Edison Co. of New York Inc. | 3.950% | 3/1/43 | 475 | 498 | |
| Consolidated Edison Co. of New York Inc. | 4.450% | 3/15/44 | 1,530 | 1,713 | |
| Consolidated Edison Co. of New York Inc. | 4.500% | 12/1/45 | 375 | 428 | |
| Consolidated Edison Co. of New York Inc. | 3.850% | 6/15/46 | 340 | 354 | |
| Consolidated Edison Inc. | 2.000% | 5/15/21 | 300 | 303 | |
| Constellation Energy Group Inc. | 5.150% | 12/1/20 | 495 | 554 | |
| Consumers Energy Co. | 6.125% | 3/15/19 | 250 | 283 | |
| Consumers Energy Co. | 6.700% | 9/15/19 | 300 | 350 | |
| Consumers Energy Co. | 2.850% | 5/15/22 | 250 | 262 | |
| Consumers Energy Co. | 3.375% | 8/15/23 | 225 | 243 | |
| Consumers Energy Co. | 4.100% | 11/15/45 | 375 | 421 | |
| Consumers Energy Co. | 4.350% | 8/31/64 | 150 | 163 | |
| Delmarva Power & Light Co. | 3.500% | 11/15/23 | 125 | 135 | |
| Delmarva Power & Light Co. | 4.000% | 6/1/42 | 225 | 240 | |
| Dominion Resources Inc. | 1.400% | 9/15/17 | 650 | 650 | |
| Dominion Resources Inc. | 4.450% | 3/15/21 | 125 | 138 | |
| Dominion Resources Inc. | 2.750% | 9/15/22 | 100 | 101 | |
132
| Vanguard® Balanced Index Fund | |||||
| Schedule of Investments | |||||
| June 30, 2016 | |||||
| Face | Market | ||||
| Maturity | Amount | Value | |||
| Coupon | Date | ($000) | ($000) | ||
| Dominion Resources Inc. | 3.900% | 10/1/25 | 425 | 455 | |
| Dominion Resources Inc. | 6.300% | 3/15/33 | 500 | 614 | |
| Dominion Resources Inc. | 5.250% | 8/1/33 | 200 | 222 | |
| Dominion Resources Inc. | 4.900% | 8/1/41 | 550 | 604 | |
| Dominion Resources Inc. | 4.050% | 9/15/42 | 325 | 323 | |
| 5 | Dominion Resources Inc. | 5.750% | 10/1/54 | 375 | 372 |
| Dominion Resources Inc. | 2.500% | 12/1/19 | 400 | 409 | |
| Dominion Resources Inc. | 3.625% | 12/1/24 | 800 | 842 | |
| Dominion Resources Inc. | 4.700% | 12/1/44 | 600 | 651 | |
| DTE Electric Co. | 3.450% | 10/1/20 | 410 | 441 | |
| DTE Electric Co. | 3.900% | 6/1/21 | 100 | 110 | |
| DTE Electric Co. | 2.650% | 6/15/22 | 425 | 442 | |
| DTE Electric Co. | 3.375% | 3/1/25 | 150 | 163 | |
| DTE Electric Co. | 5.700% | 10/1/37 | 125 | 163 | |
| DTE Electric Co. | 3.950% | 6/15/42 | 1,150 | 1,244 | |
| DTE Electric Co. | 3.700% | 6/1/46 | 750 | 789 | |
| DTE Energy Co. | 2.400% | 12/1/19 | 350 | 357 | |
| DTE Energy Co. | 3.500% | 6/1/24 | 525 | 556 | |
| Duke Energy Carolinas LLC | 4.300% | 6/15/20 | 500 | 556 | |
| Duke Energy Carolinas LLC | 3.900% | 6/15/21 | 1,030 | 1,137 | |
| Duke Energy Carolinas LLC | 6.000% | 12/1/28 | 300 | 389 | |
| Duke Energy Carolinas LLC | 6.100% | 6/1/37 | 425 | 565 | |
| Duke Energy Carolinas LLC | 6.000% | 1/15/38 | 25 | 34 | |
| Duke Energy Carolinas LLC | 6.050% | 4/15/38 | 25 | 34 | |
| Duke Energy Carolinas LLC | 5.300% | 2/15/40 | 710 | 901 | |
| Duke Energy Carolinas LLC | 4.250% | 12/15/41 | 800 | 902 | |
| Duke Energy Carolinas LLC | 4.000% | 9/30/42 | 425 | 460 | |
| Duke Energy Corp. | 5.050% | 9/15/19 | 425 | 468 | |
| Duke Energy Corp. | 3.050% | 8/15/22 | 200 | 208 | |
| Duke Energy Corp. | 3.950% | 10/15/23 | 225 | 245 | |
| Duke Energy Corp. | 3.750% | 4/15/24 | 475 | 511 | |
| Duke Energy Corp. | 4.800% | 12/15/45 | 700 | 811 | |
| Duke Energy Florida LLC | 5.650% | 6/15/18 | 50 | 54 | |
| Duke Energy Florida LLC | 4.550% | 4/1/20 | 1,375 | 1,516 | |
| 5 | Duke Energy Florida LLC | 1.196% | 3/1/22 | 200 | 200 |
| 5 | Duke Energy Florida LLC | 1.731% | 9/1/22 | 200 | 200 |
| 5 | Duke Energy Florida LLC | 2.538% | 9/1/29 | 400 | 405 |
| 5 | Duke Energy Florida LLC | 2.858% | 3/1/33 | 200 | 203 |
| 5 | Duke Energy Florida LLC | 3.112% | 9/1/36 | 325 | 330 |
| Duke Energy Florida LLC | 6.350% | 9/15/37 | 525 | 742 | |
| Duke Energy Florida LLC | 6.400% | 6/15/38 | 600 | 853 | |
| Duke Energy Indiana LLC | 3.750% | 7/15/20 | 185 | 201 | |
| Duke Energy Indiana LLC | 6.120% | 10/15/35 | 1,500 | 1,994 | |
| Duke Energy Indiana LLC | 4.200% | 3/15/42 | 475 | 521 | |
| Duke Energy Indiana LLC | 4.900% | 7/15/43 | 250 | 301 | |
| Duke Energy Indiana LLC | 3.750% | 5/15/46 | 1,250 | 1,298 | |
| Duke Energy Ohio Inc. | 3.700% | 6/15/46 | 375 | 384 | |
| Duke Energy Progress LLC | 5.300% | 1/15/19 | 675 | 743 | |
| Duke Energy Progress LLC | 3.000% | 9/15/21 | 750 | 801 | |
| Duke Energy Progress LLC | 2.800% | 5/15/22 | 350 | 367 | |
| Duke Energy Progress LLC | 3.250% | 8/15/25 | 1,800 | 1,947 | |
| Duke Energy Progress LLC | 4.375% | 3/30/44 | 525 | 602 | |
| Duke Energy Progress LLC | 4.150% | 12/1/44 | 300 | 331 | |
| Duke Energy Progress LLC | 4.200% | 8/15/45 | 525 | 589 | |
| Edison International | 3.750% | 9/15/17 | 1,000 | 1,030 | |
| Edison International | 2.950% | 3/15/23 | 950 | 974 | |
| El Paso Electric Co. | 6.000% | 5/15/35 | 175 | 216 | |
| El Paso Electric Co. | 5.000% | 12/1/44 | 250 | 287 | |
| 8 | Emera US Finance LP | 2.150% | 6/15/19 | 150 | 152 |
| 8 | Emera US Finance LP | 2.700% | 6/15/21 | 275 | 280 |
| 8 | Emera US Finance LP | 3.550% | 6/15/26 | 375 | 383 |
| 8 | Emera US Finance LP | 4.750% | 6/15/46 | 1,825 | 1,862 |
| Entergy Arkansas Inc. | 3.750% | 2/15/21 | 1,250 | 1,366 | |
| Entergy Gulf States Louisiana LLC | 6.000% | 5/1/18 | 150 | 163 | |
133
| Vanguard® Balanced Index Fund | |||||
| Schedule of Investments | |||||
| June 30, 2016 | |||||
| Face | Market | ||||
| Maturity | Amount | Value | |||
| Coupon | Date | ($000) | ($000) | ||
| Entergy Gulf States Louisiana LLC | 5.590% | 10/1/24 | 1,500 | 1,811 | |
| Entergy Louisiana LLC | 5.400% | 11/1/24 | 175 | 214 | |
| Entergy Louisiana LLC | 3.050% | 6/1/31 | 525 | 538 | |
| Entergy Louisiana LLC | 4.950% | 1/15/45 | 400 | 422 | |
| Entergy Texas Inc. | 7.125% | 2/1/19 | 300 | 339 | |
| Entergy Texas Inc. | 5.150% | 6/1/45 | 300 | 321 | |
| Eversource Energy | 4.500% | 11/15/19 | 2,357 | 2,583 | |
| Exelon Corp. | 1.550% | 6/9/17 | 250 | 250 | |
| Exelon Corp. | 2.850% | 6/15/20 | 225 | 233 | |
| Exelon Corp. | 2.450% | 4/15/21 | 250 | 254 | |
| Exelon Corp. | 3.950% | 6/15/25 | 500 | 540 | |
| Exelon Corp. | 3.400% | 4/15/26 | 1,500 | 1,568 | |
| Exelon Corp. | 4.950% | 6/15/35 | 800 | 903 | |
| Exelon Corp. | 5.625% | 6/15/35 | 365 | 432 | |
| Exelon Corp. | 5.100% | 6/15/45 | 200 | 228 | |
| Exelon Corp. | 4.450% | 4/15/46 | 500 | 536 | |
| Exelon Generation Co. LLC | 6.200% | 10/1/17 | 430 | 454 | |
| Exelon Generation Co. LLC | 4.000% | 10/1/20 | 575 | 614 | |
| Exelon Generation Co. LLC | 5.600% | 6/15/42 | 1,121 | 1,176 | |
| FirstEnergy Solutions Corp. | 6.800% | 8/15/39 | 275 | 278 | |
| Florida Power & Light Co. | 5.550% | 11/1/17 | 75 | 79 | |
| Florida Power & Light Co. | 2.750% | 6/1/23 | 325 | 342 | |
| Florida Power & Light Co. | 3.250% | 6/1/24 | 300 | 324 | |
| Florida Power & Light Co. | 5.625% | 4/1/34 | 225 | 292 | |
| Florida Power & Light Co. | 4.950% | 6/1/35 | 50 | 61 | |
| Florida Power & Light Co. | 5.950% | 2/1/38 | 175 | 240 | |
| Florida Power & Light Co. | 5.960% | 4/1/39 | 225 | 313 | |
| Florida Power & Light Co. | 4.125% | 2/1/42 | 1,575 | 1,783 | |
| Florida Power & Light Co. | 3.800% | 12/15/42 | 925 | 1,004 | |
| Florida Power & Light Co. | 4.050% | 10/1/44 | 500 | 563 | |
| Georgia Power Co. | 1.950% | 12/1/18 | 450 | 457 | |
| Georgia Power Co. | 2.400% | 4/1/21 | 875 | 904 | |
| Georgia Power Co. | 3.250% | 4/1/26 | 1,800 | 1,912 | |
| Georgia Power Co. | 5.950% | 2/1/39 | 150 | 195 | |
| Georgia Power Co. | 4.750% | 9/1/40 | 125 | 143 | |
| Georgia Power Co. | 4.300% | 3/15/42 | 675 | 739 | |
| Georgia Power Co. | 4.300% | 3/15/43 | 250 | 276 | |
| Great Plains Energy Inc. | 4.850% | 6/1/21 | 1,095 | 1,204 | |
| Iberdrola International BV | 6.750% | 7/15/36 | 175 | 227 | |
| Indiana Michigan Power Co. | 7.000% | 3/15/19 | 300 | 341 | |
| Indiana Michigan Power Co. | 3.200% | 3/15/23 | 475 | 496 | |
| Interstate Power & Light Co. | 3.250% | 12/1/24 | 150 | 161 | |
| Interstate Power & Light Co. | 3.400% | 8/15/25 | 550 | 595 | |
| Interstate Power & Light Co. | 6.250% | 7/15/39 | 100 | 140 | |
| ITC Holdings Corp. | 4.050% | 7/1/23 | 175 | 187 | |
| ITC Holdings Corp. | 5.300% | 7/1/43 | 300 | 335 | |
| Jersey Central Power & Light Co. | 6.150% | 6/1/37 | 200 | 236 | |
| 5 | John Sevier Combined Cycle Generation LLC | 4.626% | 1/15/42 | 165 | 194 |
| Kansas City Power & Light Co. | 6.050% | 11/15/35 | 200 | 253 | |
| Kansas City Power & Light Co. | 5.300% | 10/1/41 | 830 | 994 | |
| Kentucky Utilities Co. | 3.250% | 11/1/20 | 200 | 213 | |
| Kentucky Utilities Co. | 4.650% | 11/15/43 | 875 | 1,037 | |
| LG&E & KU Energy LLC | 3.750% | 11/15/20 | 1,150 | 1,235 | |
| Louisville Gas & Electric Co. | 5.125% | 11/15/40 | 100 | 124 | |
| Louisville Gas & Electric Co. | 4.650% | 11/15/43 | 625 | 744 | |
| MidAmerican Energy Co. | 5.950% | 7/15/17 | 560 | 587 | |
| MidAmerican Energy Co. | 6.750% | 12/30/31 | 725 | 1,010 | |
| MidAmerican Energy Co. | 4.800% | 9/15/43 | 225 | 274 | |
| Mississippi Power Co. | 4.250% | 3/15/42 | 375 | 335 | |
| National Rural Utilities Cooperative Finance Corp. | 10.375% | 11/1/18 | 1,100 | 1,328 | |
| National Rural Utilities Cooperative Finance Corp. | 1.650% | 2/8/19 | 1,050 | 1,062 | |
| National Rural Utilities Cooperative Finance Corp. | 2.300% | 11/15/19 | 75 | 77 | |
| National Rural Utilities Cooperative Finance Corp. | 2.000% | 1/27/20 | 1,300 | 1,323 | |
| National Rural Utilities Cooperative Finance Corp. | 2.350% | 6/15/20 | 900 | 930 | |
134
| Vanguard® Balanced Index Fund | |||||
| Schedule of Investments | |||||
| June 30, 2016 | |||||
| Face | Market | ||||
| Maturity | Amount | Value | |||
| Coupon | Date | ($000) | ($000) | ||
| National Rural Utilities Cooperative Finance Corp. | 2.300% | 11/1/20 | 1,300 | 1,345 | |
| National Rural Utilities Cooperative Finance Corp. | 2.700% | 2/15/23 | 675 | 702 | |
| National Rural Utilities Cooperative Finance Corp. | 3.250% | 11/1/25 | 75 | 81 | |
| National Rural Utilities Cooperative Finance Corp. | 4.023% | 11/1/32 | 789 | 850 | |
| 5 | National Rural Utilities Cooperative Finance Corp. | 4.750% | 4/30/43 | 100 | 98 |
| 5 | National Rural Utilities Cooperative Finance Corp. | 5.250% | 4/20/46 | 325 | 332 |
| Nevada Power Co. | 6.500% | 5/15/18 | 1,200 | 1,317 | |
| Nevada Power Co. | 6.650% | 4/1/36 | 410 | 569 | |
| Nevada Power Co. | 5.450% | 5/15/41 | 500 | 635 | |
| NextEra Energy Capital Holdings Inc. | 2.400% | 9/15/19 | 200 | 204 | |
| NextEra Energy Capital Holdings Inc. | 2.700% | 9/15/19 | 475 | 488 | |
| NextEra Energy Capital Holdings Inc. | 4.500% | 6/1/21 | 1,340 | 1,463 | |
| NextEra Energy Capital Holdings Inc. | 3.625% | 6/15/23 | 1,125 | 1,185 | |
| 5 | NextEra Energy Capital Holdings Inc. | 6.650% | 6/15/67 | 275 | 224 |
| Northern States Power Co. | 2.200% | 8/15/20 | 200 | 207 | |
| Northern States Power Co. | 5.250% | 7/15/35 | 100 | 128 | |
| Northern States Power Co. | 6.250% | 6/1/36 | 650 | 904 | |
| Northern States Power Co. | 6.200% | 7/1/37 | 250 | 352 | |
| Northern States Power Co. | 5.350% | 11/1/39 | 375 | 490 | |
| Northern States Power Co. | 4.125% | 5/15/44 | 100 | 113 | |
| Northern States Power Co. | 4.000% | 8/15/45 | 200 | 226 | |
| Northern States Power Co. | 3.600% | 5/15/46 | 325 | 342 | |
| NorthWestern Corp. | 4.176% | 11/15/44 | 250 | 274 | |
| NSTAR Electric Co. | 5.625% | 11/15/17 | 525 | 556 | |
| NSTAR Electric Co. | 3.250% | 11/15/25 | 175 | 188 | |
| NSTAR Electric Co. | 2.700% | 6/1/26 | 1,800 | 1,831 | |
| NSTAR Electric Co. | 5.500% | 3/15/40 | 550 | 715 | |
| Oglethorpe Power Corp. | 6.100% | 3/15/19 | 200 | 222 | |
| Oglethorpe Power Corp. | 5.950% | 11/1/39 | 100 | 125 | |
| Oglethorpe Power Corp. | 5.375% | 11/1/40 | 380 | 459 | |
| Oglethorpe Power Corp. | 4.550% | 6/1/44 | 300 | 324 | |
| Oglethorpe Power Corp. | 4.250% | 4/1/46 | 125 | 132 | |
| Ohio Edison Co. | 8.250% | 10/15/38 | 400 | 602 | |
| Ohio Power Co. | 6.050% | 5/1/18 | 100 | 108 | |
| Oklahoma Gas & Electric Co. | 5.850% | 6/1/40 | 150 | 193 | |
| Oklahoma Gas & Electric Co. | 3.900% | 5/1/43 | 625 | 634 | |
| Oklahoma Gas & Electric Co. | 4.000% | 12/15/44 | 175 | 186 | |
| Oncor Electric Delivery Co. LLC | 6.800% | 9/1/18 | 330 | 368 | |
| Oncor Electric Delivery Co. LLC | 2.150% | 6/1/19 | 1,075 | 1,093 | |
| Oncor Electric Delivery Co. LLC | 7.000% | 9/1/22 | 200 | 255 | |
| Oncor Electric Delivery Co. LLC | 7.250% | 1/15/33 | 1,100 | 1,586 | |
| Oncor Electric Delivery Co. LLC | 4.550% | 12/1/41 | 500 | 566 | |
| Pacific Gas & Electric Co. | 5.625% | 11/30/17 | 250 | 265 | |
| Pacific Gas & Electric Co. | 8.250% | 10/15/18 | 275 | 317 | |
| Pacific Gas & Electric Co. | 3.500% | 10/1/20 | 410 | 441 | |
| Pacific Gas & Electric Co. | 4.250% | 5/15/21 | 225 | 249 | |
| Pacific Gas & Electric Co. | 3.250% | 9/15/21 | 1,000 | 1,072 | |
| Pacific Gas & Electric Co. | 3.250% | 6/15/23 | 575 | 613 | |
| Pacific Gas & Electric Co. | 3.750% | 2/15/24 | 150 | 165 | |
| Pacific Gas & Electric Co. | 3.400% | 8/15/24 | 625 | 672 | |
| Pacific Gas & Electric Co. | 6.050% | 3/1/34 | 1,235 | 1,647 | |
| Pacific Gas & Electric Co. | 5.800% | 3/1/37 | 1,025 | 1,339 | |
| Pacific Gas & Electric Co. | 6.250% | 3/1/39 | 1,000 | 1,360 | |
| Pacific Gas & Electric Co. | 5.400% | 1/15/40 | 500 | 637 | |
| Pacific Gas & Electric Co. | 4.450% | 4/15/42 | 300 | 338 | |
| Pacific Gas & Electric Co. | 4.600% | 6/15/43 | 225 | 258 | |
| Pacific Gas & Electric Co. | 4.750% | 2/15/44 | 1,000 | 1,182 | |
| Pacific Gas & Electric Co. | 4.250% | 3/15/46 | 375 | 417 | |
| PacifiCorp | 5.650% | 7/15/18 | 300 | 328 | |
| PacifiCorp | 2.950% | 2/1/22 | 1,000 | 1,061 | |
| PacifiCorp | 3.600% | 4/1/24 | 500 | 549 | |
| PacifiCorp | 5.250% | 6/15/35 | 475 | 586 | |
| PacifiCorp | 6.100% | 8/1/36 | 500 | 673 | |
| PacifiCorp | 5.750% | 4/1/37 | 410 | 536 | |
135
| Vanguard® Balanced Index Fund | |||||
| Schedule of Investments | |||||
| June 30, 2016 | |||||
| Face | Market | ||||
| Maturity | Amount | Value | |||
| Coupon | Date | ($000) | ($000) | ||
| PacifiCorp | 6.250% | 10/15/37 | 600 | 829 | |
| PacifiCorp | 4.100% | 2/1/42 | 350 | 386 | |
| PECO Energy Co. | 5.350% | 3/1/18 | 125 | 134 | |
| Pennsylvania Electric Co. | 6.050% | 9/1/17 | 75 | 79 | |
| Pennsylvania Electric Co. | 5.200% | 4/1/20 | 205 | 216 | |
| PG&E Corp. | 2.400% | 3/1/19 | 1,650 | 1,681 | |
| Potomac Electric Power Co. | 6.500% | 11/15/37 | 400 | 561 | |
| PPL Capital Funding Inc. | 3.500% | 12/1/22 | 375 | 395 | |
| PPL Capital Funding Inc. | 3.950% | 3/15/24 | 225 | 242 | |
| PPL Capital Funding Inc. | 5.000% | 3/15/44 | 1,450 | 1,646 | |
| PPL Electric Utilities Corp. | 3.000% | 9/15/21 | 410 | 437 | |
| PPL Electric Utilities Corp. | 6.250% | 5/15/39 | 100 | 141 | |
| PPL Electric Utilities Corp. | 4.750% | 7/15/43 | 200 | 243 | |
| Progress Energy Inc. | 3.150% | 4/1/22 | 500 | 521 | |
| Progress Energy Inc. | 7.750% | 3/1/31 | 625 | 876 | |
| Progress Energy Inc. | 7.000% | 10/30/31 | 200 | 269 | |
| Progress Energy Inc. | 6.000% | 12/1/39 | 285 | 363 | |
| PSEG Power LLC | 5.125% | 4/15/20 | 150 | 164 | |
| PSEG Power LLC | 3.000% | 6/15/21 | 325 | 331 | |
| PSEG Power LLC | 4.150% | 9/15/21 | 50 | 54 | |
| Public Service Co. of Colorado | 5.125% | 6/1/19 | 175 | 195 | |
| Public Service Co. of Colorado | 3.200% | 11/15/20 | 700 | 749 | |
| Public Service Co. of Colorado | 2.900% | 5/15/25 | 500 | 524 | |
| Public Service Co. of Colorado | 3.600% | 9/15/42 | 225 | 234 | |
| Public Service Co. of Colorado | 4.300% | 3/15/44 | 200 | 230 | |
| Public Service Co. of New Hampshire | 3.500% | 11/1/23 | 150 | 161 | |
| Public Service Co. of New Mexico | 3.850% | 8/1/25 | 150 | 161 | |
| Public Service Co. of Oklahoma | 5.150% | 12/1/19 | 600 | 668 | |
| Public Service Co. of Oklahoma | 4.400% | 2/1/21 | 500 | 548 | |
| Public Service Co. of Oklahoma | 6.625% | 11/15/37 | 275 | 355 | |
| Public Service Electric & Gas Co. | 5.300% | 5/1/18 | 394 | 423 | |
| Public Service Electric & Gas Co. | 2.300% | 9/15/18 | 450 | 460 | |
| Public Service Electric & Gas Co. | 1.800% | 6/1/19 | 200 | 203 | |
| Public Service Electric & Gas Co. | 1.900% | 3/15/21 | 200 | 204 | |
| Public Service Electric & Gas Co. | 2.375% | 5/15/23 | 225 | 230 | |
| Public Service Electric & Gas Co. | 3.000% | 5/15/25 | 500 | 534 | |
| Public Service Electric & Gas Co. | 5.375% | 11/1/39 | 300 | 390 | |
| Public Service Electric & Gas Co. | 3.950% | 5/1/42 | 1,525 | 1,693 | |
| Public Service Electric & Gas Co. | 4.000% | 6/1/44 | 100 | 112 | |
| Public Service Electric & Gas Co. | 4.050% | 5/1/45 | 500 | 564 | |
| Public Service Electric & Gas Co. | 3.800% | 3/1/46 | 1,000 | 1,086 | |
| Puget Energy Inc. | 6.500% | 12/15/20 | 250 | 291 | |
| Puget Energy Inc. | 6.000% | 9/1/21 | 400 | 463 | |
| Puget Energy Inc. | 3.650% | 5/15/25 | 1,550 | 1,594 | |
| Puget Sound Energy Inc. | 5.483% | 6/1/35 | 100 | 125 | |
| Puget Sound Energy Inc. | 6.274% | 3/15/37 | 500 | 689 | |
| Puget Sound Energy Inc. | 5.757% | 10/1/39 | 495 | 665 | |
| Puget Sound Energy Inc. | 5.638% | 4/15/41 | 390 | 515 | |
| Puget Sound Energy Inc. | 4.434% | 11/15/41 | 275 | 314 | |
| San Diego Gas & Electric Co. | 3.000% | 8/15/21 | 150 | 160 | |
| San Diego Gas & Electric Co. | 2.500% | 5/15/26 | 350 | 355 | |
| San Diego Gas & Electric Co. | 6.000% | 6/1/26 | 500 | 654 | |
| San Diego Gas & Electric Co. | 5.350% | 5/15/35 | 100 | 126 | |
| San Diego Gas & Electric Co. | 6.125% | 9/15/37 | 252 | 348 | |
| San Diego Gas & Electric Co. | 5.350% | 5/15/40 | 500 | 644 | |
| San Diego Gas & Electric Co. | 4.500% | 8/15/40 | 255 | 298 | |
| San Diego Gas & Electric Co. | 4.300% | 4/1/42 | 150 | 172 | |
| SCANA Corp. | 4.750% | 5/15/21 | 205 | 219 | |
| SCANA Corp. | 4.125% | 2/1/22 | 150 | 156 | |
| 8 | Sierra Pacific Power Co. | 2.600% | 5/1/26 | 300 | 307 |
| Sierra Pacific Power Co. | 6.750% | 7/1/37 | 400 | 573 | |
| South Carolina Electric & Gas Co. | 6.500% | 11/1/18 | 1,100 | 1,229 | |
| South Carolina Electric & Gas Co. | 6.625% | 2/1/32 | 450 | 595 | |
| South Carolina Electric & Gas Co. | 6.050% | 1/15/38 | 150 | 193 | |
136
| Vanguard® Balanced Index Fund | |||||
| Schedule of Investments | |||||
| June 30, 2016 | |||||
| Face | Market | ||||
| Maturity | Amount | Value | |||
| Coupon | Date | ($000) | ($000) | ||
| South Carolina Electric & Gas Co. | 5.450% | 2/1/41 | 100 | 124 | |
| South Carolina Electric & Gas Co. | 4.350% | 2/1/42 | 200 | 217 | |
| South Carolina Electric & Gas Co. | 4.600% | 6/15/43 | 225 | 255 | |
| South Carolina Electric & Gas Co. | 4.100% | 6/15/46 | 830 | 877 | |
| South Carolina Electric & Gas Co. | 4.500% | 6/1/64 | 300 | 311 | |
| South Carolina Electric & Gas Co. | 5.100% | 6/1/65 | 350 | 404 | |
| Southern California Edison Co. | 3.875% | 6/1/21 | 350 | 386 | |
| 5 | Southern California Edison Co. | 1.845% | 2/1/22 | 300 | 298 |
| Southern California Edison Co. | 3.500% | 10/1/23 | 300 | 329 | |
| Southern California Edison Co. | 6.650% | 4/1/29 | 225 | 302 | |
| Southern California Edison Co. | 5.750% | 4/1/35 | 508 | 661 | |
| Southern California Edison Co. | 5.350% | 7/15/35 | 1,460 | 1,816 | |
| Southern California Edison Co. | 4.500% | 9/1/40 | 205 | 237 | |
| Southern California Edison Co. | 3.900% | 12/1/41 | 145 | 156 | |
| Southern California Edison Co. | 4.050% | 3/15/42 | 425 | 466 | |
| Southern California Edison Co. | 3.900% | 3/15/43 | 475 | 514 | |
| Southern California Edison Co. | 4.650% | 10/1/43 | 455 | 552 | |
| Southern California Edison Co. | 3.600% | 2/1/45 | 150 | 156 | |
| Southern Co. | 1.300% | 8/15/17 | 225 | 225 | |
| Southern Co. | 1.550% | 7/1/18 | 375 | 377 | |
| Southern Co. | 1.850% | 7/1/19 | 325 | 329 | |
| Southern Co. | 2.150% | 9/1/19 | 200 | 204 | |
| Southern Co. | 2.750% | 6/15/20 | 400 | 415 | |
| Southern Co. | 2.350% | 7/1/21 | 600 | 612 | |
| Southern Co. | 2.950% | 7/1/23 | 525 | 543 | |
| Southern Co. | 3.250% | 7/1/26 | 1,125 | 1,169 | |
| Southern Co. | 4.250% | 7/1/36 | 875 | 926 | |
| Southern Co. | 4.400% | 7/1/46 | 1,050 | 1,122 | |
| Southern Power Co. | 1.500% | 6/1/18 | 250 | 251 | |
| Southern Power Co. | 2.375% | 6/1/20 | 100 | 102 | |
| Southern Power Co. | 4.150% | 12/1/25 | 175 | 189 | |
| Southern Power Co. | 5.150% | 9/15/41 | 960 | 1,033 | |
| Southern Power Co. | 5.250% | 7/15/43 | 500 | 546 | |
| Southwestern Electric Power Co. | 5.875% | 3/1/18 | 25 | 27 | |
| Southwestern Electric Power Co. | 6.450% | 1/15/19 | 250 | 279 | |
| Southwestern Electric Power Co. | 6.200% | 3/15/40 | 75 | 93 | |
| Southwestern Electric Power Co. | 3.900% | 4/1/45 | 1,500 | 1,486 | |
| Southwestern Public Service Co. | 3.300% | 6/15/24 | 1,850 | 1,979 | |
| Southwestern Public Service Co. | 4.500% | 8/15/41 | 100 | 116 | |
| System Energy Resources Inc. | 4.100% | 4/1/23 | 150 | 159 | |
| Tampa Electric Co. | 6.100% | 5/15/18 | 1,575 | 1,704 | |
| Tampa Electric Co. | 5.400% | 5/15/21 | 175 | 200 | |
| Tampa Electric Co. | 2.600% | 9/15/22 | 75 | 77 | |
| Tampa Electric Co. | 6.550% | 5/15/36 | 150 | 206 | |
| Tampa Electric Co. | 4.200% | 5/15/45 | 500 | 546 | |
| TECO Finance Inc. | 6.572% | 11/1/17 | 330 | 351 | |
| TECO Finance Inc. | 5.150% | 3/15/20 | 125 | 139 | |
| TransAlta Corp. | 6.900% | 5/15/18 | 100 | 103 | |
| TransAlta Corp. | 4.500% | 11/15/22 | 325 | 297 | |
| TransAlta Corp. | 6.500% | 3/15/40 | 175 | 131 | |
| Tri-State Generation & Transmission Assn. Inc. | 3.700% | 11/1/24 | 550 | 586 | |
| Tri-State Generation & Transmission Assn. Inc. | 4.700% | 11/1/44 | 150 | 167 | |
| 8 | Tri-State Generation & Transmission Assn. Inc. | 4.250% | 6/1/46 | 100 | 106 |
| Tucson Electric Power Co. | 5.150% | 11/15/21 | 130 | 147 | |
| Tucson Electric Power Co. | 3.050% | 3/15/25 | 200 | 202 | |
| UIL Holdings Corp. | 4.625% | 10/1/20 | 300 | 325 | |
| Union Electric Co. | 6.700% | 2/1/19 | 235 | 267 | |
| Union Electric Co. | 3.500% | 4/15/24 | 1,450 | 1,574 | |
| Union Electric Co. | 3.900% | 9/15/42 | 425 | 458 | |
| Union Electric Co. | 3.650% | 4/15/45 | 575 | 596 | |
| Virginia Electric & Power Co. | 2.950% | 1/15/22 | 750 | 791 | |
| Virginia Electric & Power Co. | 3.100% | 5/15/25 | 500 | 528 | |
| Virginia Electric & Power Co. | 6.000% | 1/15/36 | 500 | 659 | |
| Virginia Electric & Power Co. | 6.000% | 5/15/37 | 550 | 735 | |
137
| Vanguard® Balanced Index Fund | |||||
| Schedule of Investments | |||||
| June 30, 2016 | |||||
| Face | Market | ||||
| Maturity | Amount | Value | |||
| Coupon | Date | ($000) | ($000) | ||
| Virginia Electric & Power Co. | 6.350% | 11/30/37 | 600 | 830 | |
| Virginia Electric & Power Co. | 8.875% | 11/15/38 | 450 | 755 | |
| Virginia Electric & Power Co. | 4.000% | 1/15/43 | 850 | 909 | |
| Virginia Electric & Power Co. | 4.450% | 2/15/44 | 200 | 229 | |
| WEC Energy Group Inc. | 2.450% | 6/15/20 | 250 | 257 | |
| WEC Energy Group Inc. | 3.550% | 6/15/25 | 750 | 807 | |
| 5 | WEC Energy Group Inc. | 6.250% | 5/15/67 | 1,025 | 802 |
| Westar Energy Inc. | 3.250% | 12/1/25 | 325 | 347 | |
| Westar Energy Inc. | 2.550% | 7/1/26 | 575 | 576 | |
| Westar Energy Inc. | 4.125% | 3/1/42 | 525 | 578 | |
| Westar Energy Inc. | 4.100% | 4/1/43 | 225 | 246 | |
| Westar Energy Inc. | 4.625% | 9/1/43 | 150 | 178 | |
| Westar Energy Inc. | 4.250% | 12/1/45 | 100 | 113 | |
| Wisconsin Electric Power Co. | 4.250% | 12/15/19 | 175 | 191 | |
| Wisconsin Electric Power Co. | 2.950% | 9/15/21 | 635 | 672 | |
| Wisconsin Electric Power Co. | 5.625% | 5/15/33 | 200 | 255 | |
| Wisconsin Electric Power Co. | 4.250% | 6/1/44 | 100 | 112 | |
| Wisconsin Electric Power Co. | 4.300% | 12/15/45 | 125 | 143 | |
| Wisconsin Power & Light Co. | 5.000% | 7/15/19 | 25 | 27 | |
| Wisconsin Power & Light Co. | 2.250% | 11/15/22 | 275 | 277 | |
| Wisconsin Power & Light Co. | 6.375% | 8/15/37 | 300 | 421 | |
| Wisconsin Power & Light Co. | 4.100% | 10/15/44 | 200 | 221 | |
| Wisconsin Public Service Corp. | 1.650% | 12/4/18 | 500 | 507 | |
| Wisconsin Public Service Corp. | 3.671% | 12/1/42 | 75 | 78 | |
| Xcel Energy Inc. | 4.700% | 5/15/20 | 305 | 337 | |
| Xcel Energy Inc. | 3.300% | 6/1/25 | 150 | 158 | |
| Xcel Energy Inc. | 6.500% | 7/1/36 | 635 | 846 | |
| Natural Gas (0.1%) | |||||
| AGL Capital Corp. | 3.500% | 9/15/21 | 1,250 | 1,328 | |
| AGL Capital Corp. | 3.875% | 11/15/25 | 425 | 457 | |
| AGL Capital Corp. | 3.250% | 6/15/26 | 375 | 384 | |
| AGL Capital Corp. | 5.875% | 3/15/41 | 125 | 152 | |
| AGL Capital Corp. | 4.400% | 6/1/43 | 125 | 128 | |
| Atmos Energy Corp. | 8.500% | 3/15/19 | 1,140 | 1,345 | |
| Atmos Energy Corp. | 5.500% | 6/15/41 | 800 | 1,020 | |
| British Transco Finance Inc. | 6.625% | 6/1/18 | 430 | 473 | |
| CenterPoint Energy Resources Corp. | 6.000% | 5/15/18 | 150 | 162 | |
| CenterPoint Energy Resources Corp. | 4.500% | 1/15/21 | 265 | 288 | |
| CenterPoint Energy Resources Corp. | 5.850% | 1/15/41 | 675 | 784 | |
| KeySpan Corp. | 8.000% | 11/15/30 | 200 | 283 | |
| KeySpan Corp. | 5.803% | 4/1/35 | 250 | 303 | |
| NiSource Finance Corp. | 6.400% | 3/15/18 | 314 | 340 | |
| NiSource Finance Corp. | 6.800% | 1/15/19 | 550 | 618 | |
| NiSource Finance Corp. | 5.450% | 9/15/20 | 350 | 396 | |
| NiSource Finance Corp. | 6.125% | 3/1/22 | 450 | 538 | |
| NiSource Finance Corp. | 6.250% | 12/15/40 | 400 | 521 | |
| NiSource Finance Corp. | 5.950% | 6/15/41 | 500 | 625 | |
| NiSource Finance Corp. | 5.800% | 2/1/42 | 300 | 384 | |
| NiSource Finance Corp. | 4.800% | 2/15/44 | 200 | 230 | |
| ONE Gas Inc. | 2.070% | 2/1/19 | 300 | 304 | |
| ONE Gas Inc. | 4.658% | 2/1/44 | 125 | 144 | |
| Piedmont Natural Gas Co. Inc. | 4.650% | 8/1/43 | 150 | 170 | |
| Sempra Energy | 6.150% | 6/15/18 | 750 | 816 | |
| Sempra Energy | 9.800% | 2/15/19 | 250 | 301 | |
| Sempra Energy | 2.400% | 3/15/20 | 300 | 303 | |
| Sempra Energy | 2.850% | 11/15/20 | 1,225 | 1,271 | |
| Sempra Energy | 4.050% | 12/1/23 | 850 | 921 | |
| Sempra Energy | 3.750% | 11/15/25 | 330 | 353 | |
| Sempra Energy | 6.000% | 10/15/39 | 705 | 868 | |
| Southern California Gas Co. | 2.600% | 6/15/26 | 750 | 770 | |
| Southern California Gas Co. | 5.750% | 11/15/35 | 25 | 32 | |
| Southern California Gas Co. | 3.750% | 9/15/42 | 300 | 318 | |
| Southern California Gas Co. | 4.450% | 3/15/44 | 150 | 176 | |
138
| Vanguard® Balanced Index Fund | ||||
| Schedule of Investments | ||||
| June 30, 2016 | ||||
| Face | Market | |||
| Maturity | Amount | Value | ||
| Coupon | Date | ($000) | ($000) | |
| Spire Inc. | 4.700% | 8/15/44 | 350 | 368 |
| Other Utility (0.0%) | ||||
| American Water Capital Corp. | 6.085% | 10/15/17 | 125 | 132 |
| American Water Capital Corp. | 3.850% | 3/1/24 | 1,575 | 1,744 |
| American Water Capital Corp. | 6.593% | 10/15/37 | 500 | 716 |
| American Water Capital Corp. | 4.300% | 12/1/42 | 125 | 141 |
| United Utilities plc | 5.375% | 2/1/19 | 200 | 215 |
| Veolia Environnement SA | 6.750% | 6/1/38 | 200 | 264 |
| 254,313 | ||||
| Total Corporate Bonds (Cost $3,018,265) | 3,186,292 | |||
| Sovereign Bonds (U.S. Dollar-Denominated) (2.1%) | ||||
| African Development Bank | 1.125% | 3/15/17 | 1,550 | 1,554 |
| African Development Bank | 0.875% | 3/15/18 | 1,500 | 1,503 |
| African Development Bank | 1.625% | 10/2/18 | 300 | 306 |
| African Development Bank | 1.000% | 5/15/19 | 1,200 | 1,204 |
| African Development Bank | 1.375% | 2/12/20 | 350 | 354 |
| African Development Bank | 2.375% | 9/23/21 | 1,500 | 1,578 |
| Agricultural Bank Of China | 2.000% | 5/21/18 | 300 | 302 |
| Agricultural Bank Of China | 2.750% | 5/21/20 | 250 | 257 |
| Asian Development Bank | 1.125% | 3/15/17 | 1,325 | 1,329 |
| Asian Development Bank | 0.875% | 4/26/18 | 1,200 | 1,203 |
| Asian Development Bank | 1.125% | 6/5/18 | 2,300 | 2,312 |
| Asian Development Bank | 5.593% | 7/16/18 | 500 | 548 |
| Asian Development Bank | 1.750% | 9/11/18 | 1,650 | 1,684 |
| Asian Development Bank | 1.875% | 10/23/18 | 530 | 543 |
| Asian Development Bank | 1.375% | 1/15/19 | 1,000 | 1,010 |
| Asian Development Bank | 1.750% | 3/21/19 | 575 | 589 |
| Asian Development Bank | 1.875% | 4/12/19 | 1,550 | 1,592 |
| Asian Development Bank | 1.500% | 1/22/20 | 2,500 | 2,536 |
| Asian Development Bank | 1.375% | 3/23/20 | 2,250 | 2,276 |
| Asian Development Bank | 1.625% | 3/16/21 | 2,600 | 2,651 |
| Asian Development Bank | 1.875% | 2/18/22 | 1,850 | 1,896 |
| Asian Development Bank | 2.000% | 1/22/25 | 1,000 | 1,031 |
| Asian Development Bank | 2.000% | 4/24/26 | 400 | 409 |
| 8 Bank of England | 1.250% | 3/14/19 | 150 | 151 |
| Canada | 1.125% | 3/19/18 | 2,100 | 2,115 |
| Canada | 1.625% | 2/27/19 | 800 | 816 |
| CNOOC Finance 2013 Ltd. | 3.000% | 5/9/23 | 1,950 | 1,938 |
| CNOOC Finance 2015 Australia Pty Ltd. | 2.625% | 5/5/20 | 1,500 | 1,506 |
| CNOOC Finance 2015 USA LLC | 3.500% | 5/5/25 | 1,800 | 1,822 |
| CNOOC Nexen Finance 2014 ULC | 1.625% | 4/30/17 | 1,650 | 1,652 |
| CNOOC Nexen Finance 2014 ULC | 4.250% | 4/30/24 | 1,000 | 1,067 |
| CNOOC Nexen Finance 2014 ULC | 4.875% | 4/30/44 | 400 | 448 |
| Corp. Andina de Fomento | 1.500% | 8/8/17 | 900 | 901 |
| Corp. Andina de Fomento | 2.000% | 5/10/19 | 1,800 | 1,810 |
| Corp. Andina de Fomento | 4.375% | 6/15/22 | 1,875 | 2,084 |
| Council Of Europe Development Bank | 1.500% | 6/19/17 | 1,000 | 1,007 |
| Council Of Europe Development Bank | 1.000% | 3/7/18 | 525 | 527 |
| Council Of Europe Development Bank | 1.125% | 5/31/18 | 975 | 980 |
| Council Of Europe Development Bank | 1.625% | 3/10/20 | 1,300 | 1,324 |
| Council Of Europe Development Bank | 1.625% | 3/16/21 | 600 | 609 |
| Ecopetrol SA | 5.875% | 9/18/23 | 1,800 | 1,854 |
| Ecopetrol SA | 4.125% | 1/16/25 | 2,150 | 1,967 |
| Ecopetrol SA | 5.375% | 6/26/26 | 450 | 434 |
| Ecopetrol SA | 7.375% | 9/18/43 | 500 | 499 |
| Ecopetrol SA | 5.875% | 5/28/45 | 1,075 | 934 |
| Emirates Telecommunications Group Co. PJSC | 3.500% | 6/18/24 | 200 | 209 |
| European Bank for Reconstruction & Development | 1.000% | 2/16/17 | 1,000 | 1,002 |
| European Bank for Reconstruction & Development | 0.750% | 9/1/17 | 1,000 | 1,001 |
| European Bank for Reconstruction & Development | 1.000% | 6/15/18 | 700 | 704 |
| European Bank for Reconstruction & Development | 1.000% | 9/17/18 | 400 | 401 |
| European Bank for Reconstruction & Development | 1.625% | 11/15/18 | 50 | 51 |
139
| Vanguard® Balanced Index Fund | ||||
| Schedule of Investments | ||||
| June 30, 2016 | ||||
| Face | Market | |||
| Maturity | Amount | Value | ||
| Coupon | Date | ($000) | ($000) | |
| European Bank for Reconstruction & Development | 1.750% | 6/14/19 | 2,050 | 2,092 |
| European Bank for Reconstruction & Development | 1.750% | 11/26/19 | 500 | 512 |
| European Bank for Reconstruction & Development | 1.500% | 3/16/20 | 1,650 | 1,673 |
| European Bank for Reconstruction & Development | 1.875% | 2/23/22 | 1,300 | 1,337 |
| European Investment Bank | 5.125% | 5/30/17 | 800 | 832 |
| European Investment Bank | 1.625% | 6/15/17 | 100 | 101 |
| European Investment Bank | 1.000% | 8/17/17 | 1,475 | 1,480 |
| European Investment Bank | 1.125% | 9/15/17 | 450 | 452 |
| European Investment Bank | 1.000% | 12/15/17 | 300 | 301 |
| European Investment Bank | 1.000% | 3/15/18 | 4,075 | 4,084 |
| European Investment Bank | 1.250% | 5/15/18 | 3,400 | 3,429 |
| European Investment Bank | 1.000% | 6/15/18 | 3,500 | 3,515 |
| European Investment Bank | 1.125% | 8/15/18 | 2,000 | 2,009 |
| European Investment Bank | 1.625% | 12/18/18 | 3,200 | 3,259 |
| European Investment Bank | 1.875% | 3/15/19 | 4,400 | 4,506 |
| European Investment Bank | 1.750% | 6/17/19 | 4,675 | 4,768 |
| European Investment Bank | 1.125% | 8/15/19 | 2,000 | 2,010 |
| European Investment Bank | 1.625% | 3/16/20 | 4,100 | 4,176 |
| European Investment Bank | 1.375% | 6/15/20 | 2,000 | 2,019 |
| European Investment Bank | 2.875% | 9/15/20 | 5,000 | 5,337 |
| European Investment Bank | 1.625% | 12/15/20 | 2,500 | 2,538 |
| European Investment Bank | 4.000% | 2/16/21 | 4,000 | 4,479 |
| European Investment Bank | 2.000% | 3/15/21 | 3,000 | 3,098 |
| European Investment Bank | 2.500% | 4/15/21 | 3,650 | 3,848 |
| European Investment Bank | 2.125% | 10/15/21 | 350 | 362 |
| European Investment Bank | 2.250% | 8/15/22 | 1,000 | 1,046 |
| European Investment Bank | 3.250% | 1/29/24 | 1,550 | 1,737 |
| European Investment Bank | 1.875% | 2/10/25 | 2,600 | 2,644 |
| European Investment Bank | 2.125% | 4/13/26 | 3,000 | 3,132 |
| Export Development Canada | 1.250% | 10/26/16 | 1,970 | 1,974 |
| Export Development Canada | 0.750% | 12/15/17 | 900 | 900 |
| Export Development Canada | 1.000% | 6/15/18 | 150 | 151 |
| Export Development Canada | 1.500% | 10/3/18 | 1,375 | 1,395 |
| Export Development Canada | 1.250% | 2/4/19 | 800 | 809 |
| Export Development Canada | 1.500% | 5/26/21 | 1,500 | 1,523 |
| Export-Import Bank of Korea | 3.750% | 10/20/16 | 300 | 302 |
| Export-Import Bank of Korea | 2.875% | 9/17/18 | 700 | 719 |
| Export-Import Bank of Korea | 1.750% | 5/26/19 | 1,000 | 1,009 |
| Export-Import Bank of Korea | 2.375% | 8/12/19 | 600 | 613 |
| Export-Import Bank of Korea | 4.000% | 1/29/21 | 1,000 | 1,086 |
| Export-Import Bank of Korea | 2.500% | 5/10/21 | 1,000 | 1,020 |
| Export-Import Bank of Korea | 5.000% | 4/11/22 | 1,475 | 1,696 |
| Export-Import Bank of Korea | 4.000% | 1/14/24 | 2,100 | 2,348 |
| Export-Import Bank of Korea | 3.250% | 11/10/25 | 300 | 322 |
| Export-Import Bank of Korea | 2.625% | 5/26/26 | 600 | 615 |
| FMS Wertmanagement AoeR | 1.125% | 9/5/17 | 700 | 703 |
| FMS Wertmanagement AoeR | 1.000% | 11/21/17 | 475 | 477 |
| FMS Wertmanagement AoeR | 1.625% | 11/20/18 | 1,600 | 1,628 |
| FMS Wertmanagement AoeR | 1.750% | 3/17/20 | 750 | 769 |
| Hydro-Quebec | 1.375% | 6/19/17 | 1,000 | 1,001 |
| Hydro-Quebec | 8.400% | 1/15/22 | 1,235 | 1,635 |
| Hydro-Quebec | 8.050% | 7/7/24 | 1,175 | 1,652 |
| Industrial & Commercial Bank of China Ltd. | 2.351% | 11/13/17 | 500 | 504 |
| Industrial & Commercial Bank of China Ltd. | 3.231% | 11/13/19 | 2,200 | 2,280 |
| Industrial & Commercial Bank of China Ltd. | 2.635% | 5/26/21 | 600 | 608 |
| Inter-American Development Bank | 1.125% | 3/15/17 | 100 | 100 |
| Inter-American Development Bank | 1.000% | 7/14/17 | 1,400 | 1,405 |
| Inter-American Development Bank | 2.375% | 8/15/17 | 250 | 254 |
| Inter-American Development Bank | 0.875% | 3/15/18 | 350 | 350 |
| Inter-American Development Bank | 1.750% | 8/24/18 | 5,105 | 5,199 |
| Inter-American Development Bank | 1.125% | 8/28/18 | 3,700 | 3,719 |
| Inter-American Development Bank | 1.000% | 5/13/19 | 2,800 | 2,805 |
| Inter-American Development Bank | 3.875% | 9/17/19 | 100 | 109 |
| Inter-American Development Bank | 1.250% | 10/15/19 | 1,700 | 1,709 |
140
| Vanguard® Balanced Index Fund | |||||
| Schedule of Investments | |||||
| June 30, 2016 | |||||
| Face | Market | ||||
| Maturity | Amount | Value | |||
| Coupon | Date | ($000) | ($000) | ||
| Inter-American Development Bank | 1.750% | 10/15/19 | 2,200 | 2,247 | |
| Inter-American Development Bank | 3.875% | 2/14/20 | 500 | 549 | |
| Inter-American Development Bank | 1.875% | 6/16/20 | 1,000 | 1,029 | |
| Inter-American Development Bank | 2.125% | 11/9/20 | 350 | 363 | |
| Inter-American Development Bank | 1.750% | 4/14/22 | 3,500 | 3,579 | |
| Inter-American Development Bank | 3.000% | 2/21/24 | 2,600 | 2,873 | |
| Inter-American Development Bank | 7.000% | 6/15/25 | 250 | 339 | |
| Inter-American Development Bank | 2.000% | 6/2/26 | 4,375 | 4,496 | |
| Inter-American Development Bank | 3.875% | 10/28/41 | 800 | 985 | |
| Inter-American Development Bank | 4.375% | 1/24/44 | 450 | 602 | |
| International Bank for Reconstruction & Development | 0.875% | 4/17/17 | 4,750 | 4,756 | |
| International Bank for Reconstruction & Development | 1.125% | 7/18/17 | 950 | 954 | |
| International Bank for Reconstruction & Development | 1.000% | 11/15/17 | 500 | 502 | |
| International Bank for Reconstruction & Development | 1.375% | 4/10/18 | 3,200 | 3,231 | |
| International Bank for Reconstruction & Development | 1.000% | 6/15/18 | 3,500 | 3,508 | |
| International Bank for Reconstruction & Development | 0.875% | 7/19/18 | 4,000 | 4,006 | |
| International Bank for Reconstruction & Development | 1.875% | 3/15/19 | 3,300 | 3,382 | |
| International Bank for Reconstruction & Development | 1.250% | 7/26/19 | 4,500 | 4,554 | |
| International Bank for Reconstruction & Development | 1.875% | 10/7/19 | 1,500 | 1,538 | |
| International Bank for Reconstruction & Development | 1.375% | 3/30/20 | 2,200 | 2,232 | |
| International Bank for Reconstruction & Development | 2.125% | 11/1/20 | 2,200 | 2,291 | |
| International Bank for Reconstruction & Development | 1.625% | 3/9/21 | 600 | 610 | |
| International Bank for Reconstruction & Development | 1.375% | 5/24/21 | 4,000 | 4,036 | |
| International Bank for Reconstruction & Development | 2.250% | 6/24/21 | 1,700 | 1,776 | |
| International Bank for Reconstruction & Development | 1.625% | 2/10/22 | 2,025 | 2,056 | |
| International Bank for Reconstruction & Development | 7.625% | 1/19/23 | 25 | 35 | |
| International Bank for Reconstruction & Development | 2.500% | 11/25/24 | 4,500 | 4,793 | |
| International Bank for Reconstruction & Development | 2.500% | 7/29/25 | 2,500 | 2,679 | |
| International Finance Corp. | 1.125% | 11/23/16 | 2,150 | 2,154 | |
| International Finance Corp. | 1.000% | 4/24/17 | 575 | 576 | |
| International Finance Corp. | 2.125% | 11/17/17 | 950 | 965 | |
| International Finance Corp. | 0.625% | 12/21/17 | 625 | 622 | |
| International Finance Corp. | 1.250% | 7/16/18 | 2,200 | 2,213 | |
| International Finance Corp. | 1.750% | 9/4/18 | 1,300 | 1,321 | |
| International Finance Corp. | 1.750% | 9/16/19 | 1,100 | 1,126 | |
| International Finance Corp. | 1.625% | 7/16/20 | 1,000 | 1,023 | |
| International Finance Corp. | 2.125% | 4/7/26 | 2,000 | 2,079 | |
| 9 | Japan Bank for International Cooperation | 1.125% | 7/19/17 | 650 | 650 |
| 9 | Japan Bank for International Cooperation | 1.750% | 7/31/18 | 925 | 934 |
| 9 | Japan Bank for International Cooperation | 1.750% | 11/13/18 | 3,000 | 3,032 |
| 9 | Japan Bank for International Cooperation | 2.125% | 2/7/19 | 1,000 | 1,021 |
| 9 | Japan Bank for International Cooperation | 1.750% | 5/28/20 | 1,000 | 1,010 |
| 9 | Japan Bank for International Cooperation | 3.375% | 7/31/23 | 325 | 359 |
| 9 | Japan Bank for International Cooperation | 3.000% | 5/29/24 | 650 | 701 |
| 9 | Japan Bank for International Cooperation | 2.125% | 2/10/25 | 2,400 | 2,428 |
| 9 | Japan Bank for International Cooperation | 2.500% | 5/28/25 | 1,000 | 1,054 |
| 9 | Japan Finance Organization for Municipalities | 5.000% | 5/16/17 | 500 | 517 |
| 10 | KFW | 0.875% | 9/5/17 | 2,000 | 2,004 |
| 10 | KFW | 0.875% | 12/15/17 | 1,475 | 1,478 |
| 10 | KFW | 1.000% | 1/26/18 | 2,300 | 2,308 |
| 10 | KFW | 4.375% | 3/15/18 | 3,450 | 3,658 |
| 10 | KFW | 0.875% | 4/19/18 | 5,100 | 5,109 |
| 10 | KFW | 1.000% | 6/11/18 | 2,200 | 2,208 |
| 10 | KFW | 4.500% | 7/16/18 | 350 | 376 |
| 10 | KFW | 1.125% | 8/6/18 | 1,500 | 1,510 |
| 10 | KFW | 1.875% | 4/1/19 | 3,925 | 4,032 |
| 10 | KFW | 4.875% | 6/17/19 | 4,775 | 5,313 |
| 10 | KFW | 1.750% | 10/15/19 | 1,300 | 1,330 |
| 10 | KFW | 4.000% | 1/27/20 | 150 | 165 |
| 10 | KFW | 1.500% | 4/20/20 | 3,550 | 3,606 |
| 10 | KFW | 2.750% | 9/8/20 | 4,500 | 4,790 |
| 10 | KFW | 2.750% | 10/1/20 | 3,200 | 3,404 |
| 10 | KFW | 1.500% | 6/15/21 | 7,100 | 7,191 |
| 10 | KFW | 2.375% | 8/25/21 | 2,710 | 2,851 |
141
| Vanguard® Balanced Index Fund | |||||
| Schedule of Investments | |||||
| June 30, 2016 | |||||
| Face | Market | ||||
| Maturity | Amount | Value | |||
| Coupon | Date | ($000) | ($000) | ||
| 10 | KFW | 2.625% | 1/25/22 | 1,500 | 1,599 |
| 10 | KFW | 2.000% | 10/4/22 | 1,575 | 1,624 |
| 10 | KFW | 2.125% | 1/17/23 | 1,750 | 1,821 |
| 10 | KFW | 2.500% | 11/20/24 | 3,800 | 4,032 |
| 10 | KFW | 2.000% | 5/2/25 | 2,500 | 2,560 |
| 10 | KFW | 0.000% | 4/18/36 | 500 | 299 |
| Korea Development Bank | 4.000% | 9/9/16 | 750 | 754 | |
| Korea Development Bank | 3.875% | 5/4/17 | 1,000 | 1,023 | |
| Korea Development Bank | 4.625% | 11/16/21 | 1,375 | 1,563 | |
| Korea Development Bank | 3.000% | 9/14/22 | 1,400 | 1,476 | |
| Korea Development Bank | 3.750% | 1/22/24 | 1,500 | 1,632 | |
| 10 | Landwirtschaftliche Rentenbank | 2.375% | 9/13/17 | 1,000 | 1,016 |
| 10 | Landwirtschaftliche Rentenbank | 1.000% | 4/4/18 | 1,000 | 999 |
| 10 | Landwirtschaftliche Rentenbank | 1.875% | 9/17/18 | 600 | 609 |
| 10 | Landwirtschaftliche Rentenbank | 1.750% | 4/15/19 | 350 | 355 |
| 10 | Landwirtschaftliche Rentenbank | 1.375% | 10/23/19 | 425 | 425 |
| 10 | Landwirtschaftliche Rentenbank | 2.000% | 1/13/25 | 2,500 | 2,526 |
| 10 | Landwirtschaftliche Rentenbank | 2.375% | 6/10/25 | 975 | 1,014 |
| Nexen Energy ULC | 7.875% | 3/15/32 | 100 | 138 | |
| Nexen Energy ULC | 5.875% | 3/10/35 | 410 | 482 | |
| Nexen Energy ULC | 6.400% | 5/15/37 | 800 | 998 | |
| Nexen Energy ULC | 7.500% | 7/30/39 | 625 | 867 | |
| Nordic Investment Bank | 0.750% | 1/17/18 | 2,700 | 2,701 | |
| Nordic Investment Bank | 1.125% | 3/19/18 | 800 | 806 | |
| Nordic Investment Bank | 1.875% | 6/14/19 | 850 | 872 | |
| North American Development Bank | 2.300% | 10/10/18 | 325 | 332 | |
| North American Development Bank | 4.375% | 2/11/20 | 650 | 710 | |
| North American Development Bank | 2.400% | 10/26/22 | 350 | 358 | |
| 11 | Oesterreichische Kontrollbank AG | 5.000% | 4/25/17 | 300 | 310 |
| 11 | Oesterreichische Kontrollbank AG | 1.125% | 5/29/18 | 1,275 | 1,277 |
| 11 | Oesterreichische Kontrollbank AG | 1.125% | 4/26/19 | 1,200 | 1,197 |
| 11 | Oesterreichische Kontrollbank AG | 1.375% | 2/10/20 | 1,400 | 1,396 |
| 11 | Oesterreichische Kontrollbank AG | 1.500% | 10/21/20 | 2,000 | 2,014 |
| 11 | Oesterreichische Kontrollbank AG | 1.875% | 1/20/21 | 800 | 818 |
| 11 | Oesterreichische Kontrollbank AG | 2.375% | 10/1/21 | 1,000 | 1,036 |
| 5 | Oriental Republic of Uruguay | 4.500% | 8/14/24 | 1,000 | 1,080 |
| 5 | Oriental Republic of Uruguay | 4.375% | 10/27/27 | 375 | 395 |
| 5 | Oriental Republic of Uruguay | 4.125% | 11/20/45 | 2,029 | 1,808 |
| 5 | Oriental Republic of Uruguay | 5.100% | 6/18/50 | 2,050 | 2,043 |
| Petroleos Mexicanos | 5.750% | 3/1/18 | 1,275 | 1,338 | |
| 8 | Petroleos Mexicanos | 5.500% | 2/4/19 | 1,250 | 1,317 |
| Petroleos Mexicanos | 8.000% | 5/3/19 | 1,950 | 2,181 | |
| Petroleos Mexicanos | 6.000% | 3/5/20 | 450 | 485 | |
| Petroleos Mexicanos | 3.500% | 7/23/20 | 500 | 497 | |
| Petroleos Mexicanos | 5.500% | 1/21/21 | 1,830 | 1,933 | |
| 8 | Petroleos Mexicanos | 6.375% | 2/4/21 | 3,429 | 3,721 |
| Petroleos Mexicanos | 6.375% | 2/4/21 | 2,500 | 2,713 | |
| Petroleos Mexicanos | 4.875% | 1/24/22 | 1,125 | 1,148 | |
| Petroleos Mexicanos | 3.500% | 1/30/23 | 950 | 894 | |
| Petroleos Mexicanos | 4.875% | 1/18/24 | 750 | 757 | |
| 5 | Petroleos Mexicanos | 2.290% | 2/15/24 | 160 | 164 |
| Petroleos Mexicanos | 2.378% | 4/15/25 | 180 | 186 | |
| Petroleos Mexicanos | 4.500% | 1/23/26 | 375 | 362 | |
| 8 | Petroleos Mexicanos | 6.875% | 8/4/26 | 4,483 | 5,008 |
| Petroleos Mexicanos | 6.625% | 6/15/35 | 1,000 | 1,036 | |
| Petroleos Mexicanos | 6.625% | 6/15/38 | 375 | 380 | |
| Petroleos Mexicanos | 6.500% | 6/2/41 | 300 | 304 | |
| Petroleos Mexicanos | 5.500% | 6/27/44 | 3,475 | 3,150 | |
| Petroleos Mexicanos | 6.375% | 1/23/45 | 1,000 | 1,001 | |
| Petroleos Mexicanos | 5.625% | 1/23/46 | 2,700 | 2,461 | |
| 12 | Power Sector Assets & Liabilities Management Corp. | 9.625% | 5/15/28 | 140 | 219 |
| Province of British Columbia | 2.650% | 9/22/21 | 500 | 532 | |
| Province of British Columbia | 2.000% | 10/23/22 | 300 | 311 | |
| Province of British Columbia | 2.250% | 6/2/26 | 1,200 | 1,236 | |
142
| Vanguard® Balanced Index Fund | |||||
| Schedule of Investments | |||||
| June 30, 2016 | |||||
| Face | Market | ||||
| Maturity | Amount | Value | |||
| Coupon | Date | ($000) | ($000) | ||
| Province of Manitoba | 1.125% | 6/1/18 | 850 | 855 | |
| Province of Manitoba | 2.100% | 9/6/22 | 300 | 306 | |
| Province of Manitoba | 3.050% | 5/14/24 | 1,600 | 1,731 | |
| Province of Manitoba | 2.125% | 6/22/26 | 850 | 852 | |
| Province of New Brunswick | 2.750% | 6/15/18 | 725 | 746 | |
| Province of Ontario | 1.100% | 10/25/17 | 2,050 | 2,057 | |
| Province of Ontario | 3.150% | 12/15/17 | 100 | 103 | |
| Province of Ontario | 1.200% | 2/14/18 | 1,200 | 1,205 | |
| Province of Ontario | 3.000% | 7/16/18 | 400 | 415 | |
| Province of Ontario | 2.000% | 9/27/18 | 1,650 | 1,683 | |
| Province of Ontario | 1.625% | 1/18/19 | 4,000 | 4,052 | |
| Province of Ontario | 2.000% | 1/30/19 | 1,875 | 1,916 | |
| Province of Ontario | 1.250% | 6/17/19 | 800 | 805 | |
| Province of Ontario | 1.650% | 9/27/19 | 925 | 937 | |
| Province of Ontario | 4.000% | 10/7/19 | 850 | 924 | |
| Province of Ontario | 4.400% | 4/14/20 | 475 | 528 | |
| Province of Ontario | 2.450% | 6/29/22 | 100 | 104 | |
| Province of Ontario | 3.200% | 5/16/24 | 1,000 | 1,092 | |
| Province of Ontario | 2.500% | 4/27/26 | 1,000 | 1,031 | |
| Quebec | 4.625% | 5/14/18 | 2,100 | 2,241 | |
| Quebec | 3.500% | 7/29/20 | 1,530 | 1,658 | |
| Quebec | 2.750% | 8/25/21 | 1,375 | 1,454 | |
| Quebec | 2.625% | 2/13/23 | 2,050 | 2,152 | |
| Quebec | 7.125% | 2/9/24 | 400 | 532 | |
| Quebec | 2.875% | 10/16/24 | 700 | 746 | |
| Quebec | 2.500% | 4/20/26 | 500 | 514 | |
| Quebec | 7.500% | 9/15/29 | 475 | 722 | |
| Republic of Chile | 2.250% | 10/30/22 | 150 | 151 | |
| Republic of Chile | 3.125% | 1/21/26 | 2,960 | 3,049 | |
| Republic of Chile | 3.625% | 10/30/42 | 800 | 799 | |
| Republic of Colombia | 7.375% | 3/18/19 | 825 | 941 | |
| Republic of Colombia | 4.375% | 7/12/21 | 2,130 | 2,276 | |
| 5 | Republic of Colombia | 2.625% | 3/15/23 | 1,125 | 1,087 |
| Republic of Colombia | 4.000% | 2/26/24 | 3,250 | 3,392 | |
| Republic of Colombia | 8.125% | 5/21/24 | 400 | 520 | |
| 5 | Republic of Colombia | 4.500% | 1/28/26 | 500 | 535 |
| Republic of Colombia | 7.375% | 9/18/37 | 1,000 | 1,296 | |
| Republic of Colombia | 6.125% | 1/18/41 | 1,775 | 2,047 | |
| 5 | Republic of Colombia | 5.625% | 2/26/44 | 1,733 | 1,915 |
| 5 | Republic of Colombia | 5.000% | 6/15/45 | 1,525 | 1,582 |
| Republic of Italy | 5.375% | 6/12/17 | 950 | 984 | |
| Republic of Italy | 6.875% | 9/27/23 | 1,500 | 1,882 | |
| Republic of Italy | 5.375% | 6/15/33 | 1,400 | 1,693 | |
| Republic of Korea | 7.125% | 4/16/19 | 1,150 | 1,333 | |
| Republic of Korea | 3.875% | 9/11/23 | 650 | 741 | |
| Republic of Panama | 5.200% | 1/30/20 | 2,045 | 2,260 | |
| 5 | Republic of Panama | 4.000% | 9/22/24 | 600 | 644 |
| 5 | Republic of Panama | 3.750% | 3/16/25 | 1,450 | 1,530 |
| Republic of Panama | 7.125% | 1/29/26 | 900 | 1,184 | |
| Republic of Panama | 9.375% | 4/1/29 | 200 | 305 | |
| 5 | Republic of Panama | 6.700% | 1/26/36 | 2,284 | 3,029 |
| 5 | Republic of Panama | 4.300% | 4/29/53 | 250 | 255 |
| Republic of Peru | 7.125% | 3/30/19 | 700 | 807 | |
| Republic of Peru | 7.350% | 7/21/25 | 1,600 | 2,180 | |
| Republic of Peru | 4.125% | 8/25/27 | 800 | 876 | |
| Republic of Peru | 8.750% | 11/21/33 | 2,635 | 4,139 | |
| 5 | Republic of Peru | 6.550% | 3/14/37 | 600 | 806 |
| Republic of Peru | 5.625% | 11/18/50 | 1,275 | 1,585 | |
| Republic of Poland | 6.375% | 7/15/19 | 3,340 | 3,784 | |
| Republic of Poland | 5.125% | 4/21/21 | 2,725 | 3,058 | |
| Republic of Poland | 5.000% | 3/23/22 | 1,415 | 1,589 | |
| Republic of Poland | 3.000% | 3/17/23 | 2,000 | 2,032 | |
| Republic of Poland | 4.000% | 1/22/24 | 1,225 | 1,316 | |
| Republic of Poland | 3.250% | 4/6/26 | 150 | 153 | |
143
| Vanguard® Balanced Index Fund | ||||
| Schedule of Investments | ||||
| June 30, 2016 | ||||
| Face | Market | |||
| Maturity | Amount | Value | ||
| Coupon | Date | ($000) | ($000) | |
| Republic of South Africa | 6.875% | 5/27/19 | 575 | 640 |
| Republic of South Africa | 5.500% | 3/9/20 | 1,985 | 2,129 |
| Republic of South Africa | 5.875% | 5/30/22 | 100 | 111 |
| Republic of South Africa | 4.665% | 1/17/24 | 3,300 | 3,397 |
| Republic of South Africa | 5.875% | 9/16/25 | 300 | 332 |
| Republic of South Africa | 4.875% | 4/14/26 | 200 | 206 |
| Republic of South Africa | 6.250% | 3/8/41 | 700 | 804 |
| Republic of the Philippines | 8.375% | 6/17/19 | 800 | 954 |
| Republic of the Philippines | 4.000% | 1/15/21 | 3,475 | 3,806 |
| Republic of the Philippines | 4.200% | 1/21/24 | 1,400 | 1,588 |
| Republic of the Philippines | 9.500% | 10/21/24 | 550 | 833 |
| Republic of the Philippines | 10.625% | 3/16/25 | 425 | 697 |
| Republic of the Philippines | 5.500% | 3/30/26 | 1,500 | 1,899 |
| Republic of the Philippines | 9.500% | 2/2/30 | 825 | 1,412 |
| Republic of the Philippines | 7.750% | 1/14/31 | 775 | 1,200 |
| Republic of the Philippines | 6.375% | 1/15/32 | 800 | 1,128 |
| Republic of the Philippines | 6.375% | 10/23/34 | 1,675 | 2,429 |
| Republic of the Philippines | 5.000% | 1/13/37 | 400 | 508 |
| Republic of the Philippines | 3.950% | 1/20/40 | 300 | 345 |
| Republic of the Philippines | 3.700% | 3/1/41 | 534 | 595 |
| Republic of Turkey | 7.500% | 7/14/17 | 1,325 | 1,403 |
| Republic of Turkey | 6.750% | 4/3/18 | 2,100 | 2,255 |
| Republic of Turkey | 7.000% | 3/11/19 | 1,325 | 1,465 |
| Republic of Turkey | 7.000% | 6/5/20 | 1,625 | 1,842 |
| Republic of Turkey | 5.625% | 3/30/21 | 2,175 | 2,368 |
| Republic of Turkey | 5.125% | 3/25/22 | 1,125 | 1,202 |
| Republic of Turkey | 3.250% | 3/23/23 | 2,800 | 2,697 |
| Republic of Turkey | 5.750% | 3/22/24 | 2,500 | 2,781 |
| Republic of Turkey | 7.375% | 2/5/25 | 1,075 | 1,325 |
| Republic of Turkey | 4.250% | 4/14/26 | 1,300 | 1,302 |
| Republic of Turkey | 4.875% | 10/9/26 | 1,200 | 1,265 |
| Republic of Turkey | 11.875% | 1/15/30 | 350 | 610 |
| Republic of Turkey | 8.000% | 2/14/34 | 175 | 235 |
| Republic of Turkey | 6.875% | 3/17/36 | 3,000 | 3,651 |
| Republic of Turkey | 6.750% | 5/30/40 | 1,250 | 1,516 |
| Republic of Turkey | 6.000% | 1/14/41 | 2,150 | 2,400 |
| Republic of Turkey | 4.875% | 4/16/43 | 3,350 | 3,270 |
| Republic of Turkey | 6.625% | 2/17/45 | 1,000 | 1,212 |
| State of Israel | 5.125% | 3/26/19 | 300 | 330 |
| State of Israel | 4.000% | 6/30/22 | 900 | 1,000 |
| State of Israel | 3.150% | 6/30/23 | 1,100 | 1,170 |
| State of Israel | 2.875% | 3/16/26 | 1,500 | 1,547 |
| State of Israel | 4.500% | 1/30/43 | 900 | 1,013 |
| Statoil ASA | 3.125% | 8/17/17 | 1,085 | 1,110 |
| Statoil ASA | 1.250% | 11/9/17 | 600 | 602 |
| Statoil ASA | 1.200% | 1/17/18 | 2,000 | 1,999 |
| Statoil ASA | 1.950% | 11/8/18 | 200 | 203 |
| Statoil ASA | 5.250% | 4/15/19 | 1,510 | 1,662 |
| Statoil ASA | 2.250% | 11/8/19 | 1,000 | 1,024 |
| Statoil ASA | 2.900% | 11/8/20 | 150 | 157 |
| Statoil ASA | 2.750% | 11/10/21 | 1,100 | 1,143 |
| Statoil ASA | 3.150% | 1/23/22 | 125 | 131 |
| Statoil ASA | 2.450% | 1/17/23 | 400 | 404 |
| Statoil ASA | 2.650% | 1/15/24 | 3,775 | 3,825 |
| Statoil ASA | 3.700% | 3/1/24 | 500 | 541 |
| Statoil ASA | 3.250% | 11/10/24 | 550 | 579 |
| Statoil ASA | 7.150% | 1/15/29 | 250 | 346 |
| Statoil ASA | 5.100% | 8/17/40 | 300 | 360 |
| Statoil ASA | 4.250% | 11/23/41 | 325 | 346 |
| Statoil ASA | 3.950% | 5/15/43 | 175 | 182 |
| Statoil ASA | 4.800% | 11/8/43 | 600 | 696 |
| Svensk Exportkredit AB | 1.750% | 5/30/17 | 125 | 126 |
| Svensk Exportkredit AB | 1.250% | 4/12/19 | 1,000 | 1,006 |
| Svensk Exportkredit AB | 1.875% | 6/17/19 | 1,550 | 1,584 |
144
| Vanguard® Balanced Index Fund | ||||
| Schedule of Investments | ||||
| June 30, 2016 | ||||
| Face | Market | |||
| Maturity | Amount | Value | ||
| Coupon | Date | ($000) | ($000) | |
| Svensk Exportkredit AB | 1.875% | 6/23/20 | 600 | 612 |
| Svensk Exportkredit AB | 1.750% | 3/10/21 | 800 | 814 |
| United Mexican States | 5.950% | 3/19/19 | 113 | 126 |
| United Mexican States | 3.500% | 1/21/21 | 940 | 995 |
| United Mexican States | 3.625% | 3/15/22 | 6,050 | 6,378 |
| United Mexican States | 4.000% | 10/2/23 | 2,742 | 2,942 |
| United Mexican States | 3.600% | 1/30/25 | 1,175 | 1,227 |
| United Mexican States | 6.750% | 9/27/34 | 309 | 416 |
| United Mexican States | 6.050% | 1/11/40 | 2,420 | 3,043 |
| United Mexican States | 4.750% | 3/8/44 | 4,592 | 4,910 |
| United Mexican States | 5.550% | 1/21/45 | 1,100 | 1,317 |
| United Mexican States | 4.600% | 1/23/46 | 600 | 629 |
| United Mexican States | 5.750% | 10/12/10 | 4,292 | 4,716 |
| Total Sovereign Bonds (Cost $569,068) | 590,202 | |||
| Taxable Municipal Bonds (0.4%) | ||||
| American Municipal Power Ohio Inc. Revenue | ||||
| (Hydroelectric Projects) | 6.449% | 2/15/44 | 200 | 268 |
| American Municipal Power Ohio Inc. Revenue (Prairie | ||||
| State Energy Campus Project) | 7.834% | 2/15/41 | 100 | 153 |
| American Municipal Power Ohio Inc. Revenue (Prairie | ||||
| State Energy Campus Project) | 6.053% | 2/15/43 | 50 | 65 |
| American Municipal Power Ohio Inc. Revenue (Prairie | ||||
| State Energy Campus Project) | 5.939% | 2/15/47 | 925 | 1,180 |
| American Municipal Power Ohio Inc. Revenue (Prairie | ||||
| State Energy Campus Project) | 6.270% | 2/15/50 | 160 | 209 |
| American Municipal Power Ohio Inc. Revenue (Prairie | ||||
| State Energy Campus Project) | 7.499% | 2/15/50 | 75 | 111 |
| American Municipal Power Ohio Inc. Revenue (Prairie | ||||
| State Energy Campus Project) | 8.084% | 2/15/50 | 175 | 284 |
| Bay Area Toll Authority California Toll Bridge Revenue | ||||
| (San Francisco Bay Area) | 6.793% | 4/1/30 | 100 | 132 |
| Bay Area Toll Authority California Toll Bridge Revenue | ||||
| (San Francisco Bay Area) | 6.918% | 4/1/40 | 175 | 256 |
| Bay Area Toll Authority California Toll Bridge Revenue | ||||
| (San Francisco Bay Area) | 6.263% | 4/1/49 | 1,075 | 1,642 |
| Bay Area Toll Authority California Toll Bridge Revenue | ||||
| (San Francisco Bay Area) | 7.043% | 4/1/50 | 125 | 196 |
| Bay Area Toll Authority California Toll Bridge Revenue | ||||
| (San Francisco Bay Area) | 6.907% | 10/1/50 | 810 | 1,274 |
| California GO | 5.750% | 3/1/17 | 150 | 155 |
| California GO | 6.200% | 10/1/19 | 1,600 | 1,846 |
| California GO | 5.700% | 11/1/21 | 1,000 | 1,195 |
| California GO | 7.500% | 4/1/34 | 2,270 | 3,443 |
| California GO | 7.550% | 4/1/39 | 2,005 | 3,173 |
| California GO | 7.300% | 10/1/39 | 350 | 530 |
| California GO | 7.350% | 11/1/39 | 1,325 | 2,015 |
| California GO | 7.625% | 3/1/40 | 800 | 1,262 |
| California GO | 7.600% | 11/1/40 | 350 | 566 |
| Central Puget Sound WA Regional Transit Authority | ||||
| Sales & Use Tax Revenue | 5.491% | 11/1/39 | 100 | 135 |
| Chicago IL GO | 7.375% | 1/1/33 | 550 | 579 |
| Chicago IL GO | 7.781% | 1/1/35 | 100 | 109 |
| Chicago IL Metropolitan Water Reclamation District GO | 5.720% | 12/1/38 | 350 | 435 |
| Chicago IL O'Hare International Airport Revenue | 6.845% | 1/1/38 | 50 | 57 |
| Chicago IL O'Hare International Airport Revenue | 6.395% | 1/1/40 | 425 | 604 |
| Chicago IL Transit Authority Sales Tax Receipts | ||||
| Revenue | 6.200% | 12/1/40 | 200 | 246 |
| Chicago IL Transit Authority Transfer Tax Receipts | ||||
| Revenue | 6.899% | 12/1/40 | 735 | 957 |
| Chicago IL Wastewater Transmission Revenue | 6.900% | 1/1/40 | 75 | 98 |
| Chicago IL Water Revenue | 6.742% | 11/1/40 | 575 | 747 |
| Clark County NV Airport System Revenue | 6.881% | 7/1/42 | 75 | 86 |
145
| Vanguard® Balanced Index Fund | |||||
| Schedule of Investments | |||||
| June 30, 2016 | |||||
| Face | Market | ||||
| Maturity | Amount | Value | |||
| Coupon | Date | ($000) | ($000) | ||
| Clark County NV Airport System Revenue | 6.820% | 7/1/45 | 275 | 425 | |
| Colorado Bridge Enterprise Revenue | 6.078% | 12/1/40 | 700 | 952 | |
| Commonwealth Financing Authority Pennsylvania | |||||
| Revenue | 6.218% | 6/1/39 | 325 | 410 | |
| Connecticut GO | 5.090% | 10/1/30 | 575 | 686 | |
| Connecticut GO | 5.850% | 3/15/32 | 610 | 793 | |
| Connecticut Special Tax Revenue (Transportation | |||||
| Infrastructure) | 5.459% | 11/1/30 | 150 | 185 | |
| Cook County IL GO | 6.229% | 11/15/34 | 400 | 490 | |
| Curators of the University of Missouri System Facilities | |||||
| Revenue | 5.792% | 11/1/41 | 50 | 72 | |
| Dallas County TX Hospital District Revenue | 5.621% | 8/15/44 | 100 | 135 | |
| Dallas TX Area Rapid Transit Revenue | 4.922% | 12/1/41 | 675 | 858 | |
| Dallas TX Area Rapid Transit Revenue | 5.999% | 12/1/44 | 200 | 289 | |
| Dallas TX Area Rapid Transit Revenue | 5.022% | 12/1/48 | 75 | 99 | |
| Dallas TX Convention Center Hotel Development Corp. | |||||
| Hotel Revenue | 7.088% | 1/1/42 | 1,020 | 1,439 | |
| Dallas TX Independent School District GO | 6.450% | 2/15/35 | 150 | 179 | |
| Dartmouth College New Hampshire GO | 4.750% | 6/1/19 | 15 | 17 | |
| Denver CO City & County School District No. 1 COP | 7.017% | 12/15/37 | 100 | 144 | |
| Denver CO City & County School District No. 1 GO | 5.664% | 12/1/33 | 75 | 100 | |
| District of Columbia Income Tax Revenue | 5.591% | 12/1/34 | 50 | 66 | |
| District of Columbia Income Tax Revenue | 5.582% | 12/1/35 | 75 | 99 | |
| District of Columbia Water & Sewer Authority Public | |||||
| Utility Revenue | 4.814% | 10/1/14 | 925 | 1,080 | |
| Energy Northwest Washington Electric Revenue | |||||
| (Columbia Generating Station) | 2.197% | 7/1/19 | 250 | 257 | |
| Florida Hurricane Catastrophe Fund Finance Corp. | |||||
| Revenue | 2.107% | 7/1/18 | 425 | 432 | |
| Florida Hurricane Catastrophe Fund Finance Corp. | |||||
| Revenue | 2.995% | 7/1/20 | 1,400 | 1,464 | |
| George Washington University District of Columbia GO | 3.485% | 9/15/22 | 500 | 537 | |
| George Washington University District of Columbia GO | 4.300% | 9/15/44 | 400 | 438 | |
| Georgia GO | 4.503% | 11/1/25 | 325 | 374 | |
| Georgia Municipal Electric Power Authority Revenue | 6.637% | 4/1/57 | 610 | 803 | |
| Georgia Municipal Electric Power Authority Revenue | 6.655% | 4/1/57 | 800 | 1,040 | |
| Georgia Municipal Electric Power Authority Revenue | 7.055% | 4/1/57 | 150 | 181 | |
| Houston TX GO | 6.290% | 3/1/32 | 800 | 1,027 | |
| Houston TX Utility System Revenue | 3.828% | 5/15/28 | 275 | 310 | |
| Illinois GO | 5.365% | 3/1/17 | 375 | 384 | |
| Illinois GO | 5.877% | 3/1/19 | 600 | 649 | |
| Illinois GO | 4.950% | 6/1/23 | 1,450 | 1,537 | |
| Illinois GO | 5.100% | 6/1/33 | 3,220 | 3,091 | |
| Illinois GO | 6.630% | 2/1/35 | 480 | 513 | |
| Illinois GO | 6.725% | 4/1/35 | 475 | 513 | |
| Illinois GO | 7.350% | 7/1/35 | 1,500 | 1,679 | |
| Illinois Toll Highway Authority Revenue | 6.184% | 1/1/34 | 300 | 404 | |
| Illinois Toll Highway Authority Revenue | 5.851% | 12/1/34 | 75 | 100 | |
| Indianapolis IN Local Public Improvement Revenue | 6.116% | 1/15/40 | 475 | 663 | |
| 13 | Industry CA Sales Tax Revenue | 5.125% | 1/1/51 | 200 | 220 |
| JobsOhio Beverage System Statewide Liquor Profits | |||||
| Revenue | 3.985% | 1/1/29 | 300 | 339 | |
| JobsOhio Beverage System Statewide Liquor Profits | |||||
| Revenue | 4.532% | 1/1/35 | 225 | 263 | |
| Kansas Development Finance Authority Revenue | 4.727% | 4/15/37 | 500 | 554 | |
| Kentucky Asset/Liability Commission General Fund | |||||
| Revenue | 3.165% | 4/1/18 | 14 | 15 | |
| Los Angeles CA Community College District GO | 6.600% | 8/1/42 | 750 | 1,146 | |
| Los Angeles CA Community College District GO | 6.750% | 8/1/49 | 235 | 374 | |
| Los Angeles CA Department of Airports International | |||||
| Airport Revenue | 6.582% | 5/15/39 | 300 | 418 | |
| Los Angeles CA Department of Water & Power | |||||
| Revenue | 5.716% | 7/1/39 | 100 | 132 | |
146
| Vanguard® Balanced Index Fund | |||||
| Schedule of Investments | |||||
| June 30, 2016 | |||||
| Face | Market | ||||
| Maturity | Amount | Value | |||
| Coupon | Date | ($000) | ($000) | ||
| Los Angeles CA Department of Water & Power | |||||
| Revenue | 6.008% | 7/1/39 | 325 | 435 | |
| Los Angeles CA Department of Water & Power | |||||
| Revenue | 6.166% | 7/1/40 | 100 | 115 | |
| Los Angeles CA Department of Water & Power | |||||
| Revenue | 6.574% | 7/1/45 | 410 | 618 | |
| Los Angeles CA Department of Water & Power | |||||
| Revenue | 6.603% | 7/1/50 | 500 | 777 | |
| Los Angeles CA Unified School District GO | 5.750% | 7/1/34 | 1,060 | 1,403 | |
| Los Angeles CA Unified School District GO | 6.758% | 7/1/34 | 100 | 144 | |
| Los Angeles County CA Metropolitan Transportation | |||||
| Authority Sales Tax Revenue | 5.735% | 6/1/39 | 125 | 165 | |
| Los Angeles County CA Public Works Financing | |||||
| Authority Lease Revenue | 7.488% | 8/1/33 | 200 | 283 | |
| Los Angeles County CA Public Works Financing | |||||
| Authority Lease Revenue | 7.618% | 8/1/40 | 50 | 77 | |
| Maryland Transportation Authority Facilities Projects | |||||
| Revenue | 5.888% | 7/1/43 | 100 | 136 | |
| Massachusetts GO | 4.200% | 12/1/21 | 225 | 252 | |
| Massachusetts GO | 5.456% | 12/1/39 | 845 | 1,147 | |
| Massachusetts School Building Authority Dedicated | |||||
| Sales Tax Revenue | 5.715% | 8/15/39 | 500 | 658 | |
| Massachusetts Transportation Fund Revenue | 5.731% | 6/1/40 | 50 | 68 | |
| Massachusetts Water Pollution Abatement Trust | |||||
| Revenue | 5.192% | 8/1/40 | 435 | 539 | |
| Metropolitan Government of Nashville & Davidson | |||||
| County TN Convention Center Authority Tourism Tax | |||||
| Revenue | 6.731% | 7/1/43 | 100 | 139 | |
| Metropolitan Government of Nashville & Davidson | |||||
| County TN GO | 5.707% | 7/1/34 | 125 | 160 | |
| Metropolitan Washington DC Airports Authority Dulles | |||||
| Toll Road Revenue | 7.462% | 10/1/46 | 575 | 889 | |
| Metropolitan Water District of Southern California | |||||
| Revenue | 6.947% | 7/1/40 | 75 | 90 | |
| Mississippi GO | 5.245% | 11/1/34 | 50 | 63 | |
| Missouri Highways & Transportation Commission Road | |||||
| Revenue | 5.445% | 5/1/33 | 100 | 128 | |
| 14 | New Jersey Economic Development Authority | ||||
| Revenue (State Pension Funding) | 7.425% | 2/15/29 | 1,435 | 1,774 | |
| New Jersey Transportation Trust Fund Authority | |||||
| Transportation System Revenue | 5.754% | 12/15/28 | 460 | 498 | |
| New Jersey Transportation Trust Fund Authority | |||||
| Transportation System Revenue | 6.104% | 12/15/28 | 1,150 | 1,255 | |
| New Jersey Transportation Trust Fund Authority | |||||
| Transportation System Revenue | 6.561% | 12/15/40 | 450 | 534 | |
| New Jersey Turnpike Authority Revenue | 7.414% | 1/1/40 | 375 | 587 | |
| New Jersey Turnpike Authority Revenue | 7.102% | 1/1/41 | 1,705 | 2,593 | |
| New York City NY GO | 6.246% | 6/1/35 | 100 | 115 | |
| New York City NY GO | 5.968% | 3/1/36 | 160 | 218 | |
| New York City NY GO | 5.985% | 12/1/36 | 75 | 101 | |
| New York City NY GO | 5.517% | 10/1/37 | 400 | 522 | |
| New York City NY GO | 6.271% | 12/1/37 | 700 | 988 | |
| New York City NY GO | 5.846% | 6/1/40 | 100 | 138 | |
| New York City NY Municipal Water Finance Authority | |||||
| Water & Sewer System Revenue | 5.750% | 6/15/41 | 100 | 138 | |
| New York City NY Municipal Water Finance Authority | |||||
| Water & Sewer System Revenue | 5.790% | 6/15/41 | 500 | 561 | |
| New York City NY Municipal Water Finance Authority | |||||
| Water & Sewer System Revenue | 5.952% | 6/15/42 | 100 | 143 | |
| New York City NY Municipal Water Finance Authority | |||||
| Water & Sewer System Revenue | 6.011% | 6/15/42 | 75 | 108 | |
| New York City NY Municipal Water Finance Authority | |||||
| Water & Sewer System Revenue | 5.440% | 6/15/43 | 100 | 136 | |
147
| Vanguard® Balanced Index Fund | |||||
| Schedule of Investments | |||||
| June 30, 2016 | |||||
| Face | Market | ||||
| Maturity | Amount | Value | |||
| Coupon | Date | ($000) | ($000) | ||
| New York City NY Municipal Water Finance Authority | |||||
| Water & Sewer System Revenue | 5.882% | 6/15/44 | 1,510 | 2,170 | |
| New York City NY Transitional Finance Authority | |||||
| Building Aid Revenue | 6.828% | 7/15/40 | 250 | 358 | |
| New York City NY Transitional Finance Authority Future | |||||
| Tax Revenue | 5.767% | 8/1/36 | 300 | 393 | |
| New York City NY Transitional Finance Authority Future | |||||
| Tax Revenue | 5.508% | 8/1/37 | 150 | 196 | |
| New York City NY Transitional Finance Authority Future | |||||
| Tax Revenue | 5.572% | 11/1/38 | 625 | 819 | |
| New York Metropolitan Transportation Authority | |||||
| Revenue (Dedicated Tax Fund) | 7.336% | 11/15/39 | 1,225 | 1,942 | |
| New York Metropolitan Transportation Authority | |||||
| Revenue (Dedicated Tax Fund) | 6.089% | 11/15/40 | 50 | 69 | |
| New York Metropolitan Transportation Authority | |||||
| Revenue (Transit Revenue) | 5.871% | 11/15/39 | 100 | 131 | |
| New York Metropolitan Transportation Authority | |||||
| Revenue (Transit Revenue) | 6.648% | 11/15/39 | 585 | 832 | |
| New York State Dormitory Authority Revenue (Personal | |||||
| Income Tax) | 5.500% | 3/15/30 | 530 | 673 | |
| New York State Dormitory Authority Revenue (Personal | |||||
| Income Tax) | 5.628% | 3/15/39 | 95 | 126 | |
| New York State Dormitory Authority Revenue (Personal | |||||
| Income Tax) | 5.389% | 3/15/40 | 100 | 133 | |
| New York State Urban Development Corp. Revenue | |||||
| (Personal Income Tax) | 5.770% | 3/15/39 | 300 | 385 | |
| New York State Urban Development Corp. Revenue | |||||
| (Personal Income Tax) | 5.838% | 3/15/40 | 75 | 98 | |
| New York University Hospitals Center GO | 4.428% | 7/1/42 | 200 | 219 | |
| New York University Hospitals Center Revenue | 5.750% | 7/1/43 | 375 | 494 | |
| North Texas Tollway Authority System Revenue | 6.718% | 1/1/49 | 700 | 1,072 | |
| Ohio State University General Receipts Revenue | 4.910% | 6/1/40 | 175 | 222 | |
| Ohio State University General Receipts Revenue | 3.798% | 12/1/46 | 100 | 109 | |
| Ohio State University General Receipts Revenue | 4.048% | 12/1/56 | 200 | 222 | |
| Ohio State University General Receipts Revenue | 4.800% | 6/1/11 | 665 | 744 | |
| Ohio State University General Receipts Revenue | 5.590% | 12/1/14 | 200 | 246 | |
| Ohio Water Development Authority Water Pollution | |||||
| Control Loan Fund Revenue | 4.879% | 12/1/34 | 100 | 121 | |
| Orange County CA Local Transportation Authority Sales | |||||
| Tax Revenue | 6.908% | 2/15/41 | 75 | 109 | |
| Oregon Department of Transportation Highway User | |||||
| Tax Revenue | 5.834% | 11/15/34 | 225 | 308 | |
| Oregon GO | 5.762% | 6/1/23 | 500 | 587 | |
| Oregon GO | 5.892% | 6/1/27 | 375 | 497 | |
| 15 | Oregon School Boards Association GO | 4.759% | 6/30/28 | 500 | 586 |
| 13 | Oregon School Boards Association GO | 5.528% | 6/30/28 | 125 | 154 |
| Pennsylvania GO | 4.650% | 2/15/26 | 250 | 278 | |
| Pennsylvania GO | 5.350% | 5/1/30 | 400 | 447 | |
| Pennsylvania Public School Building Authority Lease | |||||
| Revenue (School District of Philadelphia) | 5.000% | 9/15/27 | 100 | 110 | |
| Pennsylvania Turnpike Commission Revenue | 5.511% | 12/1/45 | 375 | 493 | |
| Pennsylvania Turnpike Commission Revenue | 5.561% | 12/1/49 | 75 | 101 | |
| Philadelphia PA Industrial Development Authority City | |||||
| Service Agreement Revenue | 3.964% | 4/15/26 | 250 | 258 | |
| Port Authority of New York & New Jersey Revenue | 6.040% | 12/1/29 | 125 | 164 | |
| Port Authority of New York & New Jersey Revenue | 5.647% | 11/1/40 | 800 | 1,052 | |
| Port Authority of New York & New Jersey Revenue | 4.960% | 8/1/46 | 975 | 1,212 | |
| Port Authority of New York & New Jersey Revenue | 5.310% | 8/1/46 | 375 | 411 | |
| Port Authority of New York & New Jersey Revenue | 4.926% | 10/1/51 | 535 | 661 | |
| Port Authority of New York & New Jersey Revenue | 4.458% | 10/1/62 | 1,075 | 1,230 | |
| Port Authority of New York & New Jersey Revenue | 4.810% | 10/15/65 | 150 | 181 | |
| President & Fellows of Harvard College Massachusetts | |||||
| GO | 4.875% | 10/15/40 | 275 | 366 | |
| Princeton University New Jersey GO | 4.950% | 3/1/19 | 1,375 | 1,516 | |
148
| Vanguard® Balanced Index Fund | ||||
| Schedule of Investments | ||||
| June 30, 2016 | ||||
| Face | Market | |||
| Maturity | Amount | Value | ||
| Coupon | Date | ($000) | ($000) | |
| Princeton University New Jersey GO | 5.700% | 3/1/39 | 300 | 426 |
| Regional Transportation District of Colorado Sales Tax | ||||
| Revenue | 5.844% | 11/1/50 | 150 | 219 |
| Rutgers State University New Jersey Revenue | 5.665% | 5/1/40 | 325 | 416 |
| Sacramento CA Public Financing Authority Lease | ||||
| Revenue | 5.637% | 4/1/50 | 350 | 421 |
| Salt River Project Arizona Agricultural Improvement & | ||||
| Power District Revenue | 4.839% | 1/1/41 | 75 | 96 |
| San Antonio TX Electric & Gas Systems Revenue | 5.985% | 2/1/39 | 225 | 318 |
| San Antonio TX Electric & Gas Systems Revenue | 5.718% | 2/1/41 | 100 | 139 |
| San Antonio TX Electric & Gas Systems Revenue | 5.808% | 2/1/41 | 500 | 698 |
| San Antonio TX Electric & Gas Systems Revenue | 4.427% | 2/1/42 | 450 | 540 |
| San Diego County CA Regional Airport Authority | ||||
| Revenue | 5.594% | 7/1/43 | 300 | 342 |
| San Diego County CA Water Authority Revenue | 6.138% | 5/1/49 | 850 | 1,227 |
| San Francisco CA City & County Public Utilities | ||||
| Commission Water Revenue | 6.000% | 11/1/40 | 75 | 99 |
| San Francisco CA City & County Public Utilities | ||||
| Commission Water Revenue | 6.950% | 11/1/50 | 500 | 759 |
| Santa Clara Valley CA Transportation Authority Sales | ||||
| Tax Revenue | 5.876% | 4/1/32 | 645 | 833 |
| Sonoma County CA Pension Obligation Revenue | 6.000% | 12/1/29 | 250 | 310 |
| South Carolina Public Service Authority Revenue | 6.454% | 1/1/50 | 375 | 534 |
| Texas GO | 5.517% | 4/1/39 | 660 | 919 |
| Texas Transportation Commission Revenue | 5.028% | 4/1/26 | 100 | 122 |
| Texas Transportation Commission Revenue | 5.178% | 4/1/30 | 275 | 353 |
| Texas Transportation Commission Revenue | 4.631% | 4/1/33 | 300 | 373 |
| Texas Transportation Commission Revenue | 4.681% | 4/1/40 | 100 | 126 |
| Tufts University Massachusetts GO | 5.017% | 4/15/12 | 550 | 649 |
| University of California Regents General Revenue | 4.601% | 5/15/31 | 500 | 587 |
| University of California Regents Medical Center | ||||
| Revenue | 6.548% | 5/15/48 | 150 | 216 |
| University of California Regents Medical Center | ||||
| Revenue | 6.583% | 5/15/49 | 125 | 181 |
| University of California Revenue | 1.796% | 7/1/19 | 1,400 | 1,432 |
| University of California Revenue | 6.270% | 5/15/31 | 500 | 561 |
| University of California Revenue | 5.770% | 5/15/43 | 410 | 553 |
| University of California Revenue | 4.765% | 5/15/44 | 150 | 162 |
| University of California Revenue | 5.946% | 5/15/45 | 275 | 370 |
| University of California Revenue | 4.858% | 5/15/12 | 330 | 368 |
| University of Massachusetts Building Authority | ||||
| Revenue | 5.450% | 11/1/40 | 75 | 97 |
| University of Southern California GO | 5.250% | 10/1/11 | 200 | 269 |
| University of Texas System Revenue Financing System | ||||
| Revenue | 5.262% | 7/1/39 | 100 | 135 |
| University of Texas System Revenue Financing System | ||||
| Revenue | 6.276% | 8/15/41 | 75 | 85 |
| University of Texas System Revenue Financing System | ||||
| Revenue | 5.134% | 8/15/42 | 150 | 195 |
| University of Virginia Revenue | 6.200% | 9/1/39 | 450 | 670 |
| Utah GO | 4.554% | 7/1/24 | 125 | 145 |
| Utah GO | 3.539% | 7/1/25 | 50 | 56 |
| Virginia Commonwealth Transportation Board Revenue | 5.350% | 5/15/35 | 160 | 199 |
| Washington GO | 5.481% | 8/1/39 | 50 | 67 |
| Washington GO | 5.140% | 8/1/40 | 480 | 637 |
| 13 Wisconsin GO | 5.700% | 5/1/26 | 325 | 399 |
| Total Taxable Municipal Bonds (Cost $94,482) | 110,876 | |||
149
Vanguard® Balanced Index Fund
Schedule of Investments
June 30, 2016
| Market | |||||
| Value | |||||
| Coupon | Shares | ($000) | |||
| Temporary Cash Investments (1.7%)1 | |||||
| Face | |||||
| Maturity | Amount | ||||
| Date | ($000) | ||||
| U.S. Government and Agency Obligations (0.0%) | |||||
| 2 | Federal Home Loan Bank Discount Notes | 0.381% | 8/16/16 | 800 | 800 |
| 2,16 | Federal Home Loan Bank Discount Notes | 0.390% | 9/7/16 | 2,600 | 2,598 |
| 2,16 | Federal Home Loan Bank Discount Notes | 0.446% | 9/14/16 | 800 | 799 |
| 2,16 | Federal Home Loan Bank Discount Notes | 0.400% | 9/16/16 | 500 | 500 |
| 2,16 | Federal Home Loan Bank Discount Notes | 0.531% | 10/19/16 | 500 | 500 |
| 5,197 | |||||
| Shares | |||||
| Money Market Fund (1.7%) | |||||
| 17,18 | Vanguard Market Liquidity Fund | 0.538% | 486,384,264 | 486,384 | |
| Total Temporary Cash Investments (Cost $491,581) | 491,581 | ||||
| Total Investments (101.3%) (Cost $20,177,008) | 28,623,515 | ||||
| Other Assets and Liabilities—Net (-1.3%)18 | (359,274) | ||||
| Net Assets (100%) | 28,264,241 | ||||
* Non-income-producing security.
^ Includes partial security positions on loan to broker-dealers. The total value of securities on loan is $31,616,000.
1 The fund invests a portion of its cash reserves in equity markets through the use of index futures contracts. After giving effect to futures
investments, the fund's effective common stock and temporary cash investment positions represent 59.9% and 1.5%, respectively, of net
assets.
2 The issuer operates under a congressional charter; its securities are generally neither guaranteed by the U.S. Treasury nor backed by the full
faith and credit of the U.S. government.
3 U.S. government-guaranteed.
4 The issuer was placed under federal conservatorship in September 2008; since that time, its daily operations have been managed by the Federal
Housing Finance Agency and it receives capital from the U.S. Treasury, as needed to maintain a positive net worth, in exchange for senior
preferred stock.
5 The average or expected maturity is shorter than the final maturity shown because of the possibility of interim principal payments and
prepayments or the possibility of the issue being called.
6 Includes securities purchased on a when-issued or delayed-delivery basis for which the fund has not taken delivery as of June 30, 2016.
7 Adjustable-rate security.
8 Security exempt from registration under Rule 144A of the Securities Act of 1933. Such securities may be sold in transactions exempt from
registration, normally to qualified institutional buyers. At June 30, 2016, the aggregate value of these securities was $109,485,000, representing
0.4% of net assets.
9 Guaranteed by the Government of Japan.
10 Guaranteed by the Federal Republic of Germany.
11 Guaranteed by the Republic of Austria.
12 Guaranteed by the Republic of the Philippines.
13 Scheduled principal and interest payments are guaranteed by AGM (Assured Guaranty Municipal Corporation).
14 Scheduled principal and interest payments are guaranteed by National Public Finance Guarantee Corp.
15 Scheduled principal and interest payments are guaranteed by AMBAC (Ambac Assurance Corporation).
16 Securities with a value of $4,097,000 have been segregated as initial margin for open futures contracts.
17 Affiliated money market fund available only to Vanguard funds and certain trusts and accounts managed by Vanguard. Rate shown is the 7-day
yield.
18 Includes $33,183,000 of collateral received for securities on loan.
COP—Certificate of Participation.
CVR—Contingent Value Rights.
GO—General Obligation Bond.
REIT—Real Estate Investment Trust.
150
This page intentionally left blank.
151
© 2016 The Vanguard Group, Inc.
All rights reserved.
Vanguard Marketing Corporation, Distributor.
SNA022_082016
Item 7: Disclosure of Proxy Voting Policies and Procedures for Closed-End Management
Investment Companies.
Not Applicable.
Item 8: Portfolio Managers of Closed-End Management Investment Companies.
Not Applicable.
Item 9: Purchase of Equity Securities by Closed-End Management Investment Company and
Affiliated Purchasers.
Not Applicable.
Item 10: Submission of Matters to a Vote of Security Holders.
Not Applicable.
Item 11: Controls and Procedures.
(a) Disclosure Controls and Procedures. The Principal Executive and Financial Officers concluded that the Registrant’s Disclosure Controls and Procedures are effective based on their evaluation of the Disclosure Controls and Procedures as of a date within 90 days of the filing date of this report.
(b) Internal Control Over Financial Reporting. There were no significant changes in Registrant’s Internal Control Over Financial Reporting or in other factors that could significantly affect this control subsequent to the date of the evaluation, including any corrective actions with regard to significant deficiencies and material weaknesses.
Item 12: Exhibits.
(a) Certifications.
Pursuant to the requirements of the Securities Exchange Act of 1934 and the Investment Company Act of 1940, the registrant has duly caused this report to be signed on its behalf by the undersigned, thereunto duly authorized.
| VANGUARD VALLEY FORGE FUNDS | |
| BY: | /s/ F. WILLIAM MCNABB III* |
| F. WILLIAM MCNABB III | |
| CHIEF EXECUTIVE OFFICER | |
| Date: August 17, 2016 | |
Pursuant to the requirements of the Securities Exchange Act of 1934 and the Investment Company Act of 1940, this report has been signed below by the following persons on behalf of the registrant and in the capacities and on the dates indicated.
| VANGUARD VALLEY FORGE FUNDS | |
| BY: | /s/ F. WILLIAM MCNABB III* |
| F. WILLIAM MCNABB III | |
| CHIEF EXECUTIVE OFFICER | |
| Date: August 17, 2016 | |
|
|
VANGUARD VALLEY FORGE FUNDS |
| BY: | /s/ THOMAS J. HIGGINS* |
| THOMAS J. HIGGINS | |
| CHIEF FINANCIAL OFFICER | |
| Date: August 17, 2016 | |
* By: /s/ Heidi Stam
Heidi Stam, pursuant to a Power of Attorney filed on April 22, 2014 see file Number 2-17620, Incorporated by Reference.