SEC.
File Nos. 033-26431
811-05750
UNITED STATES
SECURITIES AND EXCHANGE COMMISSION
Washington, D.C. 20549
____________________
FORM
N-1A
Registration Statement
Under
the Securities Act of 1933
Post-Effective Amendment No. 60
and
Registration Statement
Under
the Investment Company Act of 1940
Amendment No. 62
____________________
AMERICAN
FUNDS SHORT-TERM TAX-EXEMPT BOND FUND
(Exact
Name of Registrant as Specified in Charter)
333 South Hope Street
Los Angeles, California 90071-1406
(Address of Principal Executive Offices)
Registrant's telephone number, including
area code:
(213) 486-9200
____________________
Steven I. Koszalka, Secretary
American Funds Short-Term Tax-Exempt Bond
Fund
333 South Hope Street
Los Angeles, California 90071-1406
(Name and Address of Agent for Service)
Copies to:
Lea Anne Copenhefer
Morgan, Lewis & Bockius LLP
One Federal Street
Boston, MA 02110-1726
(Counsel for the Registrant)
____________________
Approximate date of proposed public offering:
It is proposed that this filing will become effective
on October 1, 2019, pursuant to paragraph (b) of Rule 485.
| |
|
| |
American
Funds Short-Term Tax-Exempt Bond Fund®
Limited Term Tax-Exempt Bond Fund of America®
The Tax-Exempt Bond Fund of America®
American High-Income Municipal Bond Fund®
The Tax-Exempt Fund of California®
American Funds Tax-Exempt Fund of New York®
Prospectus
October
1, 2019 |
 |
| |
| |
|
|
|
|
|
|
| Class |
A |
C |
T |
F-1 |
F-2 |
F-3 |
| American
Funds Short-Term Tax-Exempt Bond Fund |
ASTEX |
N/A |
TAFSX |
FSTTX |
ASTFX |
SFTEX |
| Limited
Term Tax-Exempt Bond Fund of America |
LTEBX |
LTXCX |
TLTTX |
LTXFX |
LTEFX |
FLTEX |
| The
Tax-Exempt Bond Fund of America |
AFTEX |
TEBCX |
TLLLX |
AFTFX |
TEAFX |
TFEBX |
| American
High-Income Municipal Bond Fund |
AMHIX |
AHICX |
TAHHX |
ABHFX |
AHMFX |
HIMFX |
| The
Tax-Exempt Fund of California |
TAFTX |
TECCX |
TTCAX |
TECFX |
TEFEX |
EXCAX |
| American
Funds Tax-Exempt Fund of New York |
NYAAX |
NYACX |
TATEX |
NYAEX |
NYAFX |
TFNYX |
Table
of contents
| |
|
|
Summaries:
American
Funds Short-Term Tax-Exempt Bond Fund 1
Limited
Term Tax-Exempt Bond Fund of America 5
The
Tax-Exempt Bond Fund of America 9
American
High-Income Municipal Bond Fund 13
The
Tax-Exempt Fund of California 17
American
Funds Tax-Exempt Fund of New York 22
Investment
objectives, strategies and risks 27
Management
and organization 33
Shareholder
information 36
Purchase,
exchange and sale of shares 37 |
|
How
to sell shares 39
Distributions
and taxes 41
Choosing
a share class 42
Sales
charges 43
Sales
charge reductions and waivers 46
Rollovers
from retirement plans to IRAs 49
Plans
of distribution 51
Other
compensation to dealers 52
Fund
expenses 53
Financial
highlights 54
Appendices 60 |
| |
| The
U.S. Securities and Exchange Commission has not approved or disapproved of these securities. Further, it has not determined
that this prospectus is accurate or complete. Any representation to the contrary is a criminal offense. |
Beginning
January 1, 2021, as permitted by regulations adopted by the U.S. Securities and Exchange Commission, we intend to no longer mail
paper copies of the fund’s shareholder reports, unless specifically requested from American Funds or your financial intermediary,
such as a broker-dealer or bank. Instead, the reports will be made available on the American Funds website (capitalgroup.com);
you will be notified by mail and provided with a website link to access the report each time a report is posted. If you have already
elected to receive shareholder reports electronically, you will not be affected by this change and do not need to take any action.
If you prefer to receive shareholder reports and other communications electronically, you may update your mailing preferences
with your financial intermediary, or enroll in e-delivery at capitalgroup.com (for accounts held directly with the fund).
You
may elect to receive paper copies of all future reports free of charge. If you invest through a financial intermediary, you may
contact your financial intermediary to request that you continue to receive paper copies of your shareholder reports. If you invest
directly with the fund, you may inform American Funds that you wish to continue receiving paper copies of your shareholder reports
by contacting us at (800) 421-4225. Your election to receive paper reports will apply to all funds held with American Funds or
through your financial intermediary.
American
Funds Short-Term Tax-Exempt Bond Fund
Investment
objective The fund’s investment objective
is to provide you with current income exempt from regular federal income tax, consistent with the maturity and quality standards
described in this prospectus, and to preserve capital.
Fees
and expenses of the fund This table describes
the fees and expenses that you may pay if you buy and hold shares of the fund. In addition to the fees and expenses described
below, you may also be required to pay brokerage commissions on purchases and sales of Class F-2 or F-3 shares of the fund. You
may qualify for sales charge discounts if you and your family invest, or agree to invest in the future, at least $500,000 in American
Funds. More information about these and other discounts is available from your financial professional, in the “Sales charge
reductions and waivers” sections on page 46 of the prospectus and on page 88 of the fund’s statement of additional
information, and in the sales charge waiver appendix to this prospectus.
| |
|
|
|
| Shareholder
fees (fees paid directly from your
investment) |
| Share
class: |
A |
T |
All
F share
classes |
| Maximum
sales charge (load) imposed on purchases (as a percentage of offering price) |
2.50% |
2.50% |
none |
| Maximum
deferred sales charge (load) (as a percentage of the amount redeemed) |
1.001 |
none |
none |
| Maximum
sales charge (load) imposed on reinvested dividends |
none |
none |
none |
| Redemption
or exchange fees |
none |
none |
none |
| |
|
|
|
|
|
| Annual
fund operating expenses (expenses
that you pay each year as a percentage of the value of your investment) |
| Share
class: |
A |
T |
F-1 |
F-2 |
F-3 |
| Management
fees2 |
0.34% |
0.34% |
0.34% |
0.34% |
0.34% |
| Distribution
and/or service (12b-1) fees |
0.15 |
0.25 |
0.25 |
none |
none |
| Other
expenses2 |
0.10 |
0.10 |
0.19 |
0.12 |
0.07 |
| Total
annual fund operating expenses |
0.59 |
0.69 |
0.78 |
0.46 |
0.41 |
1 A
contingent deferred sales charge of 1.00% applies on certain redemptions made within 18 months following purchases of $1 million
or more made without an initial sales charge. Contingent deferred sales charge is calculated based on the lesser of the offering
price and market value of shares being sold.
2 Restated
to reflect current fees.
Example
This example is intended to help you compare the cost of investing in the fund with the cost of investing in other mutual
funds.
The
example assumes that you invest $10,000 in the fund for the time periods indicated and then redeem all of your shares at the end
of those periods. The example also assumes that your investment has a 5% return each year and that the fund’s operating
expenses remain the same. You may be required to pay brokerage commissions on your purchases and sales of Class F-2 or F-3 shares
of the fund, which are not reflected in the example. Although your actual costs may be higher or lower, based on these assumptions
your costs would be:
| |
|
|
|
|
|
| Share
class: |
A |
T |
F-1 |
F-2 |
F-3 |
| 1
year |
$309 |
$
319 |
$
80 |
$
47 |
$
42 |
| 3
years |
434 |
465 |
249 |
148 |
132 |
| 5
years |
571 |
625 |
433 |
258 |
230 |
| 10
years |
969 |
1,087 |
966 |
579 |
518 |
Portfolio
turnover The fund pays transaction costs, such as commissions, when it buys and sells securities (or “turns over”
its portfolio). A higher portfolio turnover rate may indicate higher transaction costs and may result in higher taxes when fund
shares are held in a taxable account. These costs, which are not reflected in annual fund operating expenses or in the example,
affect the fund’s investment results. During the most recent fiscal year, the fund’s portfolio turnover rate was 50%
of the average value of its portfolio.
1 Tax-exempt
income funds / Prospectus
Principal
investment strategies Under normal circumstances,
the fund will invest at least 80% of its assets in, or derive at least 80% of its income from, securities that are exempt from
regular federal income tax and that do not subject you to federal alternative minimum tax. The fund may also invest up to 20%
of its assets in securities that may subject you to federal alternative minimum tax. The fund invests primarily in debt securities
rated AA- or better or Aa3 or better by Nationally Recognized Statistical Rating Organizations designated by the fund’s
investment adviser, or unrated but determined by the fund’s investment adviser to be of equivalent quality. The fund may
also invest in debt securities rated A- or better or A3 or better by Nationally Recognized Statistical Rating Organizations designated
by the fund’s investment adviser, or unrated but determined by the fund’s investment adviser to be of equivalent quality.
Some of the securities in which the fund invests may have credit and liquidity support features, including guarantees and letters
of credit. The fund’s aggregate portfolio will have a dollar-weighted average effective maturity no greater than three years.
The investment
adviser uses a system of multiple portfolio managers in managing the fund’s assets. Under this approach, the portfolio of
the fund is divided into segments managed by individual managers.
The fund
relies on the professional judgment of its investment adviser to make decisions about the fund’s portfolio investments.
The basic investment philosophy of the investment adviser is to seek to invest in attractively priced securities that, in its
opinion, represent good, long-term investment opportunities. The investment adviser believes that an important way to accomplish
this is by analyzing various factors, which may include the credit strength of the issuer, prices of similar securities issued
by comparable issuers, anticipated changes in interest rates, general market conditions and other factors pertinent to the particular
security being evaluated. Securities may be sold when the investment adviser believes that they no longer represent relatively
attractive investment opportunities.
Principal
risks This section describes the principal
risks associated with investing in the fund. You may lose money by investing in the fund. The likelihood of loss may be greater
if you invest for a shorter period of time.
Market
conditions — The prices of, and
the income generated by, the securities held by the fund may decline – sometimes rapidly or unpredictably – due to
various factors, including events or conditions affecting the general economy or particular industries; overall market changes;
local, regional or global political, social or economic instability; governmental, governmental agency or central bank responses
to economic conditions; and currency exchange rate, interest rate and commodity price fluctuations.
Issuer
risks — The prices of, and the
income generated by, securities held by the fund may decline in response to various factors directly related to the issuers of
such securities, including reduced demand for an issuer’s goods or services, poor management performance, major litigation
related to the issuer, changes in government regulations affecting the issuer or its competitive environment and strategic initiatives
such as mergers, acquisitions or dispositions and the market response to any such initiatives.
Investing
in municipal securities — The yield and/or
value of the fund’s investments in municipal securities may be adversely affected by events tied to the municipal securities
markets, which can be very volatile and significantly impacted by unfavorable legislative or political developments and negative
changes in the financial conditions of municipal securities issuers and the economy. To the extent the fund invests in obligations
of a municipal issuer, the volatility, credit quality and performance of the fund may be adversely impacted by local political
and economic conditions of the issuer. For example, a credit rating downgrade, bond default or bankruptcy involving an issuer
within a particular state or territory could affect the market values and marketability of many or all municipal obligations of
that state or territory. Income from municipal securities held by the fund could also be declared taxable because of changes in
tax laws or interpretations by taxing authorities or as a result of noncompliant conduct of a municipal issuer. Additionally,
the relative amount of publicly available information about municipal securities is generally less than that for corporate securities.
Investing
in debt instruments — The prices of,
and the income generated by, bonds and other debt securities held by the fund may be affected by changing interest rates and by
changes in the effective maturities and credit ratings of these securities.
Rising
interest rates will generally cause the prices of bonds and other debt securities to fall. A general rise in interest rates may
cause investors to sell debt securities on a large scale, which could also adversely affect the price and liquidity of debt securities
and could also result in increased redemptions from the fund. Falling interest rates may cause an issuer to redeem, call or refinance
a debt security before its stated maturity, which may result in the fund failing to recoup the full amount of its initial investment
and having to reinvest the proceeds in lower yielding securities. Longer maturity debt securities generally have greater sensitivity
to changes in interest rates and may be subject to greater price fluctuations than shorter maturity debt securities.
Bonds
and other debt securities are also subject to credit risk, which is the possibility that the credit strength of an issuer or guarantor
will weaken or be perceived to be weaker, and/or an issuer of a debt security will fail to make timely payments of principal or
interest and the security will go into default. A downgrade or default affecting any of the fund’s securities could cause
the value of the fund’s shares to decrease. Lower quality debt securities generally have higher rates of interest and may
be subject to greater price fluctuations than higher quality debt securities. Credit risk is gauged, in part, by the credit ratings
of the debt securities in which the fund invests. However, ratings are only the opinions of the rating agencies issuing them and
are not guarantees as to credit quality or an evaluation of market risk. The fund’s investment adviser relies on its own
credit analysts to research issuers and issues in seeking to assess credit and default risks.
Liquidity
risk — Certain fund holdings may
be or become difficult or impossible to sell, particularly during times of market turmoil. Liquidity may be impacted by the lack
of an active market for a holding, legal or contractual restrictions on resale, or the reduced number and capacity of market participants
to make a market in such holding. Market prices for less liquid or illiquid holdings may be volatile, and reduced liquidity may
have an adverse impact on the market price of such holdings. Additionally, the sale of less liquid or illiquid holdings may involve
substantial delays (including delays in settlement) and additional costs and the fund may be unable to sell such holdings when
necessary to meet its liquidity needs or may be forced to sell at a loss.
Credit
and liquidity support — Changes in the
credit quality of banks and financial institutions providing credit and liquidity support features with respect to securities
held by the fund could cause the values of these securities to decline.
Tax-exempt
income funds / Prospectus 2
Investing
in similar municipal bonds — Investing
significantly in municipal obligations of multiple issuers in the same state or backed by revenues of similar types of projects
or industries may make the fund more susceptible to certain economic, political or regulatory occurrences. As a result, the fund
has greater risk of volatility, and greater risk of loss, from these investments.
Management
— The investment adviser to the
fund actively manages the fund’s investments. Consequently, the fund is subject to the risk that the methods and analyses,
including models, tools and data, employed by the investment adviser in this process may be flawed or incorrect and may not produce
the desired results. This could cause the fund to lose value or its investment results to lag relevant benchmarks or other funds
with similar objectives.
Your
investment in the fund is not a bank deposit and is not insured or guaranteed by the Federal Deposit Insurance Corporation or
any other governmental agency, entity or person. You should consider how this fund fits into your overall investment program.
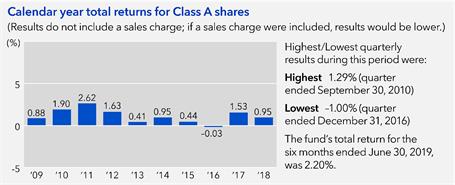
Investment
results The following bar chart shows how
the fund’s investment results have varied from year to year, and the following table shows how the fund’s average
annual total returns for various periods compare with a broad measure of securities market results and other applicable measures
of market results. This information provides some indication of the risks of investing in the fund. The Lipper Short Municipal
Debt Funds Average includes the fund and other funds that disclose investment objectives and/or strategies reasonably comparable
to those of the fund. The results below and on the following page for certain periods shown reflect the operation of the fund
as a money market fund prior to its conversion on August 7, 2009 to a short-term tax-exempt bond fund. Accordingly,
results for such periods are not representative of the fund’s results had the fund been operated as a short-term tax-exempt
bond fund during the entire period. Past investment results (before and after taxes) are not predictive of future investment
results. Updated information on the fund’s investment results can be obtained by visiting capitalgroup.com.
| |
|
|
|
|
| Average
annual total returns For the periods
ended December 31, 2018 (with maximum sales charge): |
| Share
class |
Inception
date |
1
year |
5
years |
10
years |
| A
− Before taxes |
10/24/1989 |
–1.59% |
0.26% |
0.83% |
| −
After taxes on distributions |
|
–1.59 |
0.26 |
0.83 |
| −
After taxes on distributions and sale of fund shares |
–0.37 |
0.47 |
0.89 |
| |
|
|
|
|
|
| Share
classes (before taxes) |
Inception
date |
1
year |
5
years |
10
years |
Lifetime |
| F-1 |
8/27/2009 |
0.72% |
0.54% |
N/A |
0.99% |
| F-2 |
8/12/2009 |
1.00 |
0.80 |
N/A |
1.24 |
| F-3 |
1/27/2017 |
1.09 |
N/A |
N/A |
1.23 |
| |
|
|
|
| Indexes |
1
year |
5
years |
10
years |
| Bloomberg
Barclays Municipal Short 1-5 Years Index (reflects no deductions for sales charges, account fees, expenses or U.S. federal
income taxes) |
1.77% |
1.19% |
1.96% |
| Lipper
Short Municipal Debt Funds Average (reflects no deductions for sales charges, account fees or U.S. federal income taxes) |
1.23 |
0.84 |
1.46 |
Class
A annualized 30-day yield at July 31, 2019: 1.10%
(For current yield information, please call American FundsLine®
at (800) 325-3590.) |
After-tax
returns are shown only for Class A shares; after-tax returns for other share classes will vary. After-tax returns are calculated
using the highest individual federal income tax rates in effect during each year of the periods shown and do not reflect the impact
of state and local taxes. Your actual after-tax returns depend on your individual tax situation and likely will differ from the
results shown above.
3 Tax-exempt
income funds / Prospectus
Management
Investment
adviser Capital Research and Management CompanySM
Portfolio managers The individuals primarily responsible for the portfolio management of the fund are:
| |
|
|
Portfolio
manager/
Fund title (if applicable) |
Portfolio
manager
experience
in
this fund |
Primary
title
with investment adviser |
| Aaron
Applebaum President |
3
years |
Partner
– Capital Fixed Income Investors |
| Mark
Marinella Vice President |
1
year |
Vice
President – Capital Fixed Income Investors |
Purchase
and sale of fund shares The minimum amount
to establish an account for all share classes is $250 and the minimum to add to an account is $50. For accounts with Class F-3
shares held and serviced by the fund’s transfer agent, the minimum investment amount is $1 million.
If
you are a retail investor, you may sell (redeem) shares on any business day through your dealer or financial advisor or by writing
to American Funds Service Company® at P.O. Box 6007, Indianapolis, Indiana 46206-6007; telephoning American
Funds Service Company at (800) 421-4225; faxing American Funds Service Company at (888) 421-4351; or accessing our website
at capitalgroup.com.
Tax
information Fund distributions of interest on
municipal bonds are generally not subject to federal income tax. However, the fund may distribute taxable dividends, including
distributions of short-term capital gains, which are subject to federal taxation as ordinary income. To the extent the fund is
permitted to invest in bonds subject to federal alternative minimum tax, interest on certain bonds may be subject to federal alternative
minimum tax. The fund’s distributions of net long-term capital gains are taxable as long-term capital gains for federal
income tax purposes.
Payments
to broker-dealers and other financial intermediaries If
you purchase shares of the fund through a broker-dealer or other financial intermediary (such as a bank), the fund and the fund’s
distributor or its affiliates may pay the intermediary for the sale of fund shares and related services. These payments may create
a conflict of interest by influencing the broker-dealer or other intermediary and your individual financial advisor to recommend
the fund over another investment. Ask your individual financial advisor or visit your financial intermediary’s website for
more information.
Tax-exempt
income funds / Prospectus 4
Limited
Term Tax-Exempt Bond Fund of America
Investment
objective The fund’s investment objective
is to provide you with current income exempt from regular federal income tax, consistent with the maturity and quality standards
described in this prospectus, and to preserve capital.
Fees
and expenses of the fund This table describes
the fees and expenses that you may pay if you buy and hold shares of the fund. In addition to the fees and expenses described
below, you may also be required to pay brokerage commissions on purchases and sales of Class F-2 or F-3 shares of the fund. You
may qualify for sales charge discounts if you and your family invest, or agree to invest in the future, at least $500,000 in American
Funds. More information about these and other discounts is available from your financial professional, in the “Sales charge
reductions and waivers” sections on page 46 of the prospectus and on page 88 of the fund’s statement of additional
information, and in the sales charge waiver appendix to this prospectus.
| |
|
|
|
|
| Shareholder
fees (fees paid directly from your
investment) |
| Share
class: |
A |
C |
T |
All
F share
classes |
Maximum
sales charge (load) imposed on
purchases (as a percentage of offering price) |
2.50% |
none |
2.50% |
none |
Maximum
deferred sales charge (load)
(as a percentage of the amount redeemed) |
1.001 |
1.00% |
none |
none |
Maximum
sales charge (load) imposed on
reinvested dividends |
none |
none |
none |
none |
| Redemption
or exchange fees |
none |
none |
none |
none |
| |
|
|
|
|
|
|
| Annual
fund operating expenses (expenses
that you pay each year as a percentage of the value of your investment) |
| Share
class: |
A |
C |
T |
F-1 |
F-2 |
F-3 |
| Management
fees |
0.23% |
0.23% |
0.23% |
0.23% |
0.23% |
0.23% |
| Distribution
and/or service (12b-1) fees |
0.30 |
1.00 |
0.25 |
0.25 |
none |
none |
| Other
expenses2 |
0.09 |
0.09 |
0.08 |
0.17 |
0.15 |
0.05 |
| Total
annual fund operating expenses |
0.62 |
1.32 |
0.56 |
0.65 |
0.38 |
0.28 |
1 A
contingent deferred sales charge of 1.00% applies on certain redemptions made within 18 months following purchases of $1 million
or more made without an initial sales charge. Contingent deferred sales charge is calculated based on the lesser of the offering
price and market value of shares being sold.
2 Restated
to reflect current fees.
Example
This example is intended to help you compare the cost of investing in the fund with the cost of investing in other mutual
funds.
The
example assumes that you invest $10,000 in the fund for the time periods indicated and then redeem all of your shares at the end
of those periods. The example also assumes that your investment has a 5% return each year and that the fund’s operating
expenses remain the same. You may be required to pay brokerage commissions on your purchases and sales of Class F-2 or F-3 shares
of the fund, which are not reflected in the example. Although your actual costs may be higher or lower, based on these assumptions
your costs would be:
| |
|
|
|
|
|
|
|
|
|
| Share
class: |
A |
C |
T |
F-1 |
F-2 |
F-3 |
For
the share class listed |
Share
class: |
C |
| 1
year |
$
312 |
$
234 |
$306 |
$
66 |
$
39 |
$
29 |
to
the right, you would pay |
1
year |
$
134 |
| 3
years |
444 |
418 |
425 |
208 |
122 |
90 |
the
following if you did not |
3
years |
418 |
| 5
years |
587 |
723 |
555 |
362 |
213 |
157 |
redeem
your shares: |
5
years |
723 |
| 10
years |
1,005 |
1,590 |
934 |
810 |
480 |
356 |
|
10
years |
1,590 |
Portfolio
turnover The fund pays transaction costs, such as commissions, when it buys and sells securities (or “turns over”
its portfolio). A higher portfolio turnover rate may indicate higher transaction costs and may result in higher taxes when fund
shares are held in a taxable account. These costs, which are not reflected in annual fund operating expenses or in the example,
affect the fund’s investment results. During the most recent fiscal year, the fund’s portfolio turnover rate was 42%
of the average value of its portfolio.
Principal
investment strategies Under normal circumstances,
the fund will invest at least 80% of its assets in, or derive at least 80% of its income from, securities that are exempt from
regular federal income tax and that do not subject you to federal alternative minimum tax. The fund may also invest up to 20%
of its assets in securities that may subject you to federal alternative minimum tax.
The
fund invests primarily in debt securities rated A- or better or A3 or better by Nationally Recognized Statistical Rating Organizations
designated by the fund’s investment adviser, or unrated but determined by the fund’s investment adviser to be of equivalent
quality. The fund may also invest in debt securities rated BBB and Baa by Nationally Recognized Statistical Rating Organizations
designated by the fund’s investment adviser, or unrated but determined by the fund’s investment adviser to be of equivalent
quality. Some of the securities in which the fund invests may have credit and liquidity support features, including guarantees
and letters of credit. The dollar-weighted average effective maturity of the fund’s portfolio is between three and 10 years.
The investment
adviser uses a system of multiple portfolio managers in managing the fund’s assets. Under this approach, the portfolio of
the fund is divided into segments managed by individual managers.
The fund
relies on the professional judgment of its investment adviser to make decisions about the fund’s portfolio investments.
The basic investment philosophy of the investment adviser is to seek to invest in attractively priced securities that, in its
opinion, represent good, long-term investment opportunities. The investment adviser believes that an important way to accomplish
this is by analyzing various factors, which may include the credit strength of the issuer, prices of similar securities issued
by comparable issuers, anticipated changes in interest rates, general market conditions and other factors pertinent to the particular
security being evaluated. Securities may be sold when the investment adviser believes that they no longer represent relatively
attractive investment opportunities.
5 Tax-exempt
income funds / Prospectus
Principal
risks This section describes the principal
risks associated with investing in the fund. You may lose money by investing in the fund. The likelihood of loss may be greater
if you invest for a shorter period of time.
Market
conditions — The prices of, and
the income generated by, the securities held by the fund may decline – sometimes rapidly or unpredictably – due to
various factors, including events or conditions affecting the general economy or particular industries; overall market changes;
local, regional or global political, social or economic instability; governmental, governmental agency or central bank responses
to economic conditions; and currency exchange rate, interest rate and commodity price fluctuations.
Issuer
risks — The prices of, and the
income generated by, securities held by the fund may decline in response to various factors directly related to the issuers of
such securities, including reduced demand for an issuer’s goods or services, poor management performance, major litigation
related to the issuer, changes in government regulations affecting the issuer or its competitive environment and strategic initiatives
such as mergers, acquisitions or dispositions and the market response to any such initiatives.
Investing
in municipal securities — The yield and/or
value of the fund’s investments in municipal securities may be adversely affected by events tied to the municipal securities
markets, which can be very volatile and significantly impacted by unfavorable legislative or political developments and negative
changes in the financial conditions of municipal securities issuers and the economy. To the extent the fund invests in obligations
of a municipal issuer, the volatility, credit quality and performance of the fund may be adversely impacted by local political
and economic conditions of the issuer. For example, a credit rating downgrade, bond default or bankruptcy involving an issuer
within a particular state or territory could affect the market values and marketability of many or all municipal obligations of
that state or territory. Income from municipal securities held by the fund could also be declared taxable because of changes in
tax laws or interpretations by taxing authorities or as a result of noncompliant conduct of a municipal issuer. Additionally,
the relative amount of publicly available information about municipal securities is generally less than that for corporate securities.
Investing
in debt instruments — The prices of,
and the income generated by, bonds and other debt securities held by the fund may be affected by changing interest rates and by
changes in the effective maturities and credit ratings of these securities.
Rising
interest rates will generally cause the prices of bonds and other debt securities to fall. A general rise in interest rates may
cause investors to sell debt securities on a large scale, which could also adversely affect the price and liquidity of debt securities
and could also result in increased redemptions from the fund. Falling interest rates may cause an issuer to redeem, call or refinance
a debt security before its stated maturity, which may result in the fund failing to recoup the full amount of its initial investment
and having to reinvest the proceeds in lower yielding securities. Longer maturity debt securities generally have greater sensitivity
to changes in interest rates and may be subject to greater price fluctuations than shorter maturity debt securities.
Bonds
and other debt securities are also subject to credit risk, which is the possibility that the credit strength of an issuer or guarantor
will weaken or be perceived to be weaker, and/or an issuer of a debt security will fail to make timely payments of principal or
interest and the security will go into default. A downgrade or default affecting any of the fund’s securities could cause
the value of the fund’s shares to decrease. Lower quality debt securities generally have higher rates of interest and may
be subject to greater price fluctuations than higher quality debt securities. Credit risk is gauged, in part, by the credit ratings
of the debt securities in which the fund invests. However, ratings are only the opinions of the rating agencies issuing them and
are not guarantees as to credit quality or an evaluation of market risk. The fund’s investment adviser relies on its own
credit analysts to research issuers and issues in seeking to assess credit and default risks.
Liquidity
risk — Certain fund holdings may
be or become difficult or impossible to sell, particularly during times of market turmoil. Liquidity may be impacted by the lack
of an active market for a holding, legal or contractual restrictions on resale, or the reduced number and capacity of market participants
to make a market in such holding. Market prices for less liquid or illiquid holdings may be volatile, and reduced liquidity may
have an adverse impact on the market price of such holdings. Additionally, the sale of less liquid or illiquid holdings may involve
substantial delays (including delays in settlement) and additional costs and the fund may be unable to sell such holdings when
necessary to meet its liquidity needs or may be forced to sell at a loss.
Credit
and liquidity support — Changes in the
credit quality of banks and financial institutions providing credit and liquidity support features with respect to securities
held by the fund could cause the values of these securities to decline.
Investing
in lower rated debt instruments — Lower
rated bonds and other lower rated debt securities generally have higher rates of interest and involve greater risk of default
or price declines due to changes in the issuer’s creditworthiness than those of higher quality debt securities. The market
prices of these securities may fluctuate more than the prices of higher quality debt securities and may decline significantly
in periods of general economic difficulty.
Investing
in similar municipal bonds — Investing
significantly in municipal obligations of multiple issuers in the same state or backed by revenues of similar types of projects
or industries may make the fund more susceptible to certain economic, political or regulatory occurrences. As a result, the fund
has greater risk of volatility, and greater risk of loss, from these investments.
Management
— The investment adviser to the
fund actively manages the fund’s investments. Consequently, the fund is subject to the risk that the methods and analyses,
including models, tools and data, employed by the investment adviser in this process may be flawed or incorrect and may not produce
the desired results. This could cause the fund to lose value or its investment results to lag relevant benchmarks or other funds
with similar objectives.
Your
investment in the fund is not a bank deposit and is not insured or guaranteed by the Federal Deposit Insurance Corporation or
any other governmental agency, entity or person. You should consider how this fund fits into your overall investment program.
Tax-exempt
income funds / Prospectus 6
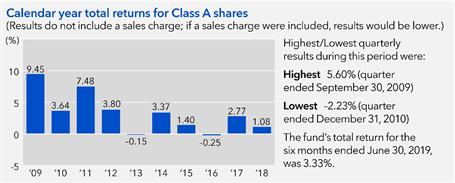
Investment
results The following bar chart shows how
the fund’s investment results have varied from year to year, and the following table shows how the fund’s average
annual total returns for various periods compare with a broad measure of securities market results and other applicable measures
of market results. This information provides some indication of the risks of investing in the fund. The Lipper Short-Intermediate
Municipal Debt Funds Average includes the fund and other funds that disclose investment objectives and/or strategies reasonably
comparable to those of the fund. Past investment results (before and after taxes) are not predictive of future investment results.
Updated information on the fund’s investment results can be obtained by visiting capitalgroup.com.
| |
|
|
|
|
|
| Average
annual total returns For the periods
ended December 31, 2018 (with maximum sales charge): |
| Share
class |
Inception
date |
1
year |
5
years |
10
years |
Lifetime |
| A
− Before taxes |
10/6/1993 |
–1.44% |
1.15% |
2.96% |
3.68% |
| −
After taxes on distributions |
|
–1.44 |
1.15 |
2.96 |
N/A |
| −
After taxes on distributions and sale of fund shares |
–0.05 |
1.39 |
2.89 |
N/A |
| |
|
|
|
|
|
| Share
classes (before taxes) |
Inception
date |
1
year |
5
years |
10
years |
Lifetime |
| C |
3/15/2001 |
–0.66% |
0.91% |
2.45% |
2.70% |
| F-1 |
3/15/2001 |
1.00 |
1.58 |
3.15 |
3.11 |
| F-2 |
8/18/2008 |
1.26 |
1.84 |
3.42 |
3.00 |
| F-3 |
1/27/2017 |
1.37 |
N/A |
N/A |
2.07 |
| |
|
|
|
|
| Indexes |
1
year |
5
years |
10
years |
Lifetime
(from
Class A inception) |
| Bloomberg
Barclays Municipal Short-Intermediate 1-10 Years Index (reflects no deductions for sales charges, account fees, expenses or
U.S. federal income taxes) |
1.69% |
2.12% |
2.99% |
4.03% |
| Lipper
Short-Intermediate Municipal Debt Funds Average (reflects no deductions for sales charges, account fees or U.S. federal income
taxes) |
1.63 |
1.54 |
2.53 |
3.35 |
Class
A annualized 30-day yield at July 31, 2019: 1.19%
(For current yield information, please call American FundsLine®
at (800) 325-3590.) |
After-tax
returns are shown only for Class A shares; after-tax returns for other share classes will vary. After-tax returns are calculated
using the highest individual federal income tax rates in effect during each year of the periods shown and do not reflect the impact
of state and local taxes. Your actual after-tax returns depend on your individual tax situation and likely will differ from the
results shown above.
7 Tax-exempt
income funds / Prospectus
Management
Investment
adviser Capital Research and Management CompanySM
Portfolio managers The individuals primarily responsible for the portfolio management of the fund are:
| |
|
|
Portfolio
manager/
Fund title (if applicable) |
Portfolio
manager
experience
in
this fund |
Primary
title
with investment adviser |
| Mark
Marinella President |
1
year |
Vice
President – Capital Fixed Income Investors |
| Aaron
Applebaum Senior Vice President |
5
years |
Partner
– Capital Fixed Income Investors |
Purchase
and sale of fund shares The minimum amount
to establish an account for all share classes is $250 and the minimum to add to an account is $50. For accounts with Class F-3
shares held and serviced by the fund’s transfer agent, the minimum investment amount is $1 million.
If
you are a retail investor, you may sell (redeem) shares on any business day through your dealer or financial advisor or by writing
to American Funds Service Company® at P.O. Box 6007, Indianapolis, Indiana 46206-6007; telephoning American
Funds Service Company at (800) 421-4225; faxing American Funds Service Company at (888) 421-4351; or accessing our website
at capitalgroup.com.
Tax
information Fund distributions of interest on
municipal bonds are generally not subject to federal income tax. However, the fund may distribute taxable dividends, including
distributions of short-term capital gains, which are subject to federal taxation as ordinary income. To the extent the fund is
permitted to invest in bonds subject to federal alternative minimum tax, interest on certain bonds may be subject to federal alternative
minimum tax. The fund’s distributions of net long-term capital gains are taxable as long-term capital gains for federal
income tax purposes.
Payments
to broker-dealers and other financial intermediaries If
you purchase shares of the fund through a broker-dealer or other financial intermediary (such as a bank), the fund and the fund’s
distributor or its affiliates may pay the intermediary for the sale of fund shares and related services. These payments may create
a conflict of interest by influencing the broker-dealer or other intermediary and your individual financial advisor to recommend
the fund over another investment. Ask your individual financial advisor or visit your financial intermediary’s website for
more information.
Tax-exempt
income funds / Prospectus 8
The
Tax-Exempt Bond Fund of America
Investment
objective The fund’s investment objective
is to provide you with a high level of current income exempt from federal income tax, consistent with the preservation of capital.
Fees
and expenses of the fund This table describes
the fees and expenses that you may pay if you buy and hold shares of the fund. In addition to the fees and expenses described
below, you may also be required to pay brokerage commissions on purchases and sales of Class F-2 or F-3 shares of the fund. You
may qualify for sales charge discounts if you and your family invest, or agree to invest in the future, at least $100,000 in American
Funds. More information about these and other discounts is available from your financial professional, in the “Sales charge
reductions and waivers” sections on page 46 of the prospectus and on page 88 of the fund’s statement of additional
information, and in the sales charge waiver appendix to this prospectus.
| |
|
|
|
|
| Shareholder
fees (fees paid directly from your
investment) |
| Share
class: |
A |
C |
T |
All
F share
classes |
Maximum
sales charge (load) imposed on
purchases (as a percentage of offering price) |
3.75% |
none |
2.50% |
none |
Maximum
deferred sales charge (load)
(as a percentage of the amount redeemed) |
1.001 |
1.00% |
none |
none |
Maximum
sales charge (load) imposed on
reinvested dividends |
none |
none |
none |
none |
| Redemption
or exchange fees |
none |
none |
none |
none |
| |
|
|
|
|
|
|
| Annual
fund operating expenses (expenses
that you pay each year as a percentage of the value of your investment) |
| Share
class: |
A |
C |
T |
F-1 |
F-2 |
F-3 |
| Management
fees |
0.21% |
0.21% |
0.21% |
0.21% |
0.21% |
0.21% |
| Distribution
and/or service (12b-1) fees |
0.25 |
1.00 |
0.25 |
0.25 |
none |
none |
| Other
expenses2 |
0.08 |
0.08 |
0.08 |
0.17 |
0.15 |
0.05 |
| Total
annual fund operating expenses |
0.54 |
1.29 |
0.54 |
0.63 |
0.36 |
0.26 |
1 A
contingent deferred sales charge of 1.00% applies on certain redemptions made within 18 months following purchases of $1 million
or more made without an initial sales charge. Contingent deferred sales charge is calculated based on the lesser of the offering
price and market value of shares being sold.
2 Restated
to reflect current fees.
Example
This example is intended to help you compare the cost of investing in the fund with the cost of investing in other mutual
funds.
The
example assumes that you invest $10,000 in the fund for the time periods indicated and then redeem all of your shares at the end
of those periods. The example also assumes that your investment has a 5% return each year and that the fund’s operating
expenses remain the same. You may be required to pay brokerage commissions on your purchases and sales of Class F-2 or F-3 shares
of the fund, which are not reflected in the example. Although your actual costs may be higher or lower, based on these assumptions
your costs would be:
| |
|
|
|
|
|
|
|
|
|
| Share
class: |
A |
C |
T |
F-1 |
F-2 |
F-3 |
For
the share class listed to the right, you would pay the following if you did not redeem your shares: |
Share
class: |
C |
| 1
year |
$
428 |
$
231 |
$304 |
$
64 |
$
37 |
$
27 |
1
year |
$
131 |
| 3
years |
542 |
409 |
419 |
202 |
116 |
84 |
3
years |
409 |
| 5
years |
665 |
708 |
544 |
351 |
202 |
146 |
5
years |
708 |
| 10
years |
1,027 |
1,556 |
910 |
786 |
456 |
331 |
10
years |
1,556 |
Portfolio
turnover The fund pays transaction costs, such as commissions, when it buys and sells securities (or “turns over”
its portfolio). A higher portfolio turnover rate may indicate higher transaction costs and may result in higher taxes when fund
shares are held in a taxable account. These costs, which are not reflected in annual fund operating expenses or in the example,
affect the fund’s investment results. During the most recent fiscal year, the fund’s portfolio turnover rate was 20%
of the average value of its portfolio.
Principal
investment strategies Under normal circumstances,
the fund will invest at least 80% of its assets in, or derive at least 80% of its income from, securities that are exempt from
regular federal income tax. The fund will not invest in securities that subject you to federal alternative minimum tax. The fund
invests at least 65% in debt securities rated A- or better or A3 or better by Nationally Recognized Statistical Rating Organizations
designated by the fund’s investment adviser, or unrated but determined by the fund’s investment adviser to be of equivalent
quality. The fund may also invest in debt securities rated BBB+ or below and Baa1 or below (including those rated BB+ or below
and Ba1 or below) by Nationally Recognized Statistical Rating Organizations designated by the fund’s investment adviser,
or unrated but determined by the fund’s investment adviser to be of equivalent quality. Securities rated BB+ or below and
Ba1 or below are sometimes referred to as “junk bonds.” Some of the securities in which the fund invests may have
credit and liquidity support features, including guarantees and letters of credit.
The investment
adviser uses a system of multiple portfolio managers in managing the fund’s assets. Under this approach, the portfolio of
the fund is divided into segments managed by individual managers.
The fund
relies on the professional judgment of its investment adviser to make decisions about the fund’s portfolio investments.
The basic investment philosophy of the investment adviser is to seek to invest in attractively priced securities that, in its
opinion, represent good, long-term investment opportunities. The investment adviser believes that an important way to accomplish
this is by analyzing various factors, which may include the credit strength of the issuer, prices of similar securities issued
by comparable issuers, anticipated changes in interest rates, general market conditions and other factors pertinent to the particular
security being evaluated. Securities may be sold when the investment adviser believes that they no longer represent relatively
attractive investment opportunities.
9 Tax-exempt
income funds / Prospectus
Principal
risks This section describes the principal
risks associated with investing in the fund. You may lose money by investing in the fund. The likelihood of loss may be greater
if you invest for a shorter period of time.
Market
conditions — The prices of, and
the income generated by, the securities held by the fund may decline – sometimes rapidly or unpredictably – due to
various factors, including events or conditions affecting the general economy or particular industries; overall market changes;
local, regional or global political, social or economic instability; governmental, governmental agency or central bank responses
to economic conditions; and currency exchange rate, interest rate and commodity price fluctuations.
Issuer
risks — The prices of, and the
income generated by, securities held by the fund may decline in response to various factors directly related to the issuers of
such securities, including reduced demand for an issuer’s goods or services, poor management performance, major litigation
related to the issuer, changes in government regulations affecting the issuer or its competitive environment and strategic initiatives
such as mergers, acquisitions or dispositions and the market response to any such initiatives.
Investing
in municipal securities — The yield and/or
value of the fund’s investments in municipal securities may be adversely affected by events tied to the municipal securities
markets, which can be very volatile and significantly impacted by unfavorable legislative or political developments and negative
changes in the financial conditions of municipal securities issuers and the economy. To the extent the fund invests in obligations
of a municipal issuer, the volatility, credit quality and performance of the fund may be adversely impacted by local political
and economic conditions of the issuer. For example, a credit rating downgrade, bond default or bankruptcy involving an issuer
within a particular state or territory could affect the market values and marketability of many or all municipal obligations of
that state or territory. Income from municipal securities held by the fund could also be declared taxable because of changes in
tax laws or interpretations by taxing authorities or as a result of noncompliant conduct of a municipal issuer. Additionally,
the relative amount of publicly available information about municipal securities is generally less than that for corporate securities.
Investing
in debt instruments — The prices of,
and the income generated by, bonds and other debt securities held by the fund may be affected by changing interest rates and by
changes in the effective maturities and credit ratings of these securities.
Rising
interest rates will generally cause the prices of bonds and other debt securities to fall. A general rise in interest rates may
cause investors to sell debt securities on a large scale, which could also adversely affect the price and liquidity of debt securities
and could also result in increased redemptions from the fund. Falling interest rates may cause an issuer to redeem, call or refinance
a debt security before its stated maturity, which may result in the fund failing to recoup the full amount of its initial investment
and having to reinvest the proceeds in lower yielding securities. Longer maturity debt securities generally have greater sensitivity
to changes in interest rates and may be subject to greater price fluctuations than shorter maturity debt securities.
Bonds
and other debt securities are also subject to credit risk, which is the possibility that the credit strength of an issuer or guarantor
will weaken or be perceived to be weaker, and/or an issuer of a debt security will fail to make timely payments of principal or
interest and the security will go into default. A downgrade or default affecting any of the fund’s securities could cause
the value of the fund’s shares to decrease. Lower quality debt securities generally have higher rates of interest and may
be subject to greater price fluctuations than higher quality debt securities. Credit risk is gauged, in part, by the credit ratings
of the debt securities in which the fund invests. However, ratings are only the opinions of the rating agencies issuing them and
are not guarantees as to credit quality or an evaluation of market risk. The fund’s investment adviser relies on its own
credit analysts to research issuers and issues in seeking to assess credit and default risks.
Liquidity
risk — Certain fund holdings may
be or become difficult or impossible to sell, particularly during times of market turmoil. Liquidity may be impacted by the lack
of an active market for a holding, legal or contractual restrictions on resale, or the reduced number and capacity of market participants
to make a market in such holding. Market prices for less liquid or illiquid holdings may be volatile, and reduced liquidity may
have an adverse impact on the market price of such holdings. Additionally, the sale of less liquid or illiquid holdings may involve
substantial delays (including delays in settlement) and additional costs and the fund may be unable to sell such holdings when
necessary to meet its liquidity needs or may be forced to sell at a loss.
Credit
and liquidity support — Changes in the
credit quality of banks and financial institutions providing credit and liquidity support features with respect to securities
held by the fund could cause the values of these securities to decline.
Investing
in lower rated debt instruments — Lower
rated bonds and other lower rated debt securities generally have higher rates of interest and involve greater risk of default
or price declines due to changes in the issuer’s creditworthiness than those of higher quality debt securities. The market
prices of these securities may fluctuate more than the prices of higher quality debt securities and may decline significantly
in periods of general economic difficulty. These risks may be increased with respect to investments in junk bonds.
Investing
in similar municipal bonds — Investing
significantly in municipal obligations of multiple issuers in the same state or backed by revenues of similar types of projects
or industries may make the fund more susceptible to certain economic, political or regulatory occurrences. As a result, the fund
has greater risk of volatility, and greater risk of loss, from these investments.
Management
— The investment adviser to the
fund actively manages the fund’s investments. Consequently, the fund is subject to the risk that the methods and analyses,
including models, tools and data, employed by the investment adviser in this process may be flawed or incorrect and may not produce
the desired results. This could cause the fund to lose value or its investment results to lag relevant benchmarks or other funds
with similar objectives.
Your investment
in the fund is not a bank deposit and is not insured or guaranteed by the Federal Deposit Insurance Corporation or any other governmental
agency, entity or person. You should consider how this fund fits into your overall investment program.
Tax-exempt
income funds / Prospectus 10
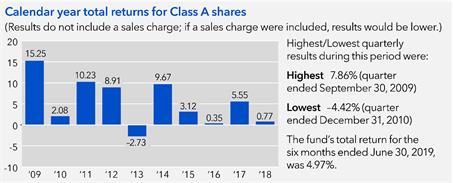
Investment
results The following bar chart shows how
the fund’s investment results have varied from year to year, and the following table shows how the fund’s average
annual total returns for various periods compare with a broad measure of securities market results and other applicable measures
of market results. This information provides some indication of the risks of investing in the fund. The Lipper General & Insured
Municipal Debt Funds Average includes the fund and other funds that disclose investment objectives and/or strategies reasonably
comparable to those of the fund. Past investment results (before and after taxes) are not predictive of future investment results.
Updated information on the fund’s investment results can be obtained by visiting capitalgroup.com.
| |
|
|
|
|
|
| Average
annual total returns For the periods
ended December 31, 2018 (with maximum sales charge): |
| Share
class |
Inception
date |
1
year |
5
years |
10
years |
Lifetime |
| A
− Before taxes |
10/3/1979 |
–3.02% |
3.05% |
4.79% |
6.21% |
| −
After taxes on distributions |
|
–3.02 |
3.05 |
4.79 |
N/A |
| −
After taxes on distributions and sale of fund shares |
–0.68 |
3.08 |
4.58 |
N/A |
| |
|
|
|
|
|
| Share
classes (before taxes) |
Inception
date |
1
year |
5
years |
10
years |
Lifetime |
| C |
3/15/2001 |
–1.00% |
3.02% |
4.36% |
3.68% |
| F-1 |
3/15/2001 |
0.65 |
3.70 |
5.06 |
4.09 |
| F-2 |
8/1/2008 |
0.92 |
3.97 |
5.34 |
4.39 |
| F-3 |
1/27/2017 |
1.02 |
N/A |
N/A |
3.33 |
| |
|
|
|
|
| Indexes |
1
year |
5
years |
10
years |
Lifetime
(from
Class A inception) |
| Bloomberg
Barclays Municipal Bond Index (reflects no deductions for sales charges, account fees, expenses or U.S. federal income taxes) |
1.28% |
3.82% |
4.85% |
N/A |
| Lipper
General & Insured Municipal Debt Funds Average (reflects no deductions for sales charges, account fees or U.S. federal
income taxes) |
0.68 |
3.86 |
5.28 |
6.10% |
Class
A annualized 30-day yield at July 31, 2019: 1.67%
(For current yield information, please call American FundsLine®
at (800) 325-3590.) |
After-tax
returns are shown only for Class A shares; after-tax returns for other share classes will vary. After-tax returns are calculated
using the highest individual federal income tax rates in effect during each year of the periods shown and do not reflect the impact
of state and local taxes. Your actual after-tax returns depend on your individual tax situation and likely will differ from the
results shown above.
Management
Investment
adviser Capital Research and Management CompanySM
Portfolio managers The individuals primarily responsible for the portfolio management of the fund are:
| |
|
|
Portfolio
manager/
Fund title (if applicable) |
Portfolio
manager
experience
in
this fund |
Primary
title
with investment adviser |
| Karl
J. Zeile President and Trustee |
16
years |
Partner
– Capital Fixed Income Investors |
| Chad
M. Rach Senior Vice President |
3
years |
Partner
– Capital Fixed Income Investors |
| |
| |
11 Tax-exempt
income funds / Prospectus
Purchase
and sale of fund shares The minimum amount
to establish an account for all share classes is $250 and the minimum to add to an account is $50. For accounts with Class F-3
shares held and serviced by the fund’s transfer agent, the minimum investment amount is $1 million.
If
you are a retail investor, you may sell (redeem) shares on any business day through your dealer or financial advisor or by writing
to American Funds Service Company® at P.O. Box 6007, Indianapolis, Indiana 46206-6007; telephoning American
Funds Service Company at (800) 421-4225; faxing American Funds Service Company at (888) 421-4351; or accessing our website
at capitalgroup.com.
Tax
information Fund distributions of interest on
municipal bonds are generally not subject to federal income tax. However, the fund may distribute taxable dividends, including
distributions of short-term capital gains, which are subject to federal taxation as ordinary income. To the extent the fund is
permitted to invest in bonds subject to federal alternative minimum tax, interest on certain bonds may be subject to federal alternative
minimum tax. The fund’s distributions of net long-term capital gains are taxable as long-term capital gains for federal
income tax purposes.
Payments
to broker-dealers and other financial intermediaries If
you purchase shares of the fund through a broker-dealer or other financial intermediary (such as a bank), the fund and the fund’s
distributor or its affiliates may pay the intermediary for the sale of fund shares and related services. These payments may create
a conflict of interest by influencing the broker-dealer or other intermediary and your individual financial advisor to recommend
the fund over another investment. Ask your individual financial advisor or visit your financial intermediary’s website for
more information.
Tax-exempt
income funds / Prospectus 12
American
High-Income Municipal Bond Fund
Investment
objective The fund’s investment objective
is to provide you with a high level of current income exempt from regular federal income tax.
Fees
and expenses of the fund This table describes
the fees and expenses that you may pay if you buy and hold shares of the fund. In addition to the fees and expenses described
below, you may also be required to pay brokerage commissions on purchases and sales of Class F-2 or F-3 shares of the fund. You
may qualify for sales charge discounts if you and your family invest, or agree to invest in the future, at least $100,000 in American
Funds. More information about these and other discounts is available from your financial professional, in the “Sales charge
reductions and waivers” sections on page 46 of the prospectus and on page 88 of the fund’s statement of additional
information, and in the sales charge waiver appendix to this prospectus.
| |
|
|
|
|
| Shareholder
fees (fees paid directly from your
investment) |
| Share
class: |
A |
C |
T |
All
F share
classes |
Maximum
sales charge (load) imposed on
purchases (as a percentage of offering price) |
3.75% |
none |
2.50% |
none |
Maximum
deferred sales charge (load)
(as a percentage of the amount redeemed) |
1.001 |
1.00% |
none |
none |
Maximum
sales charge (load) imposed on
reinvested dividends |
none |
none |
none |
none |
| Redemption
or exchange fees |
none |
none |
none |
none |
| |
|
|
|
|
|
|
| Annual
fund operating expenses (expenses
that you pay each year as a percentage of the value of your investment) |
| Share
class: |
A |
C |
T |
F-1 |
F-2 |
F-3 |
| Management
fees |
0.28% |
0.28% |
0.28% |
0.28% |
0.28% |
0.28% |
| Distribution
and/or service (12b-1) fees |
0.30 |
1.00 |
0.25 |
0.25 |
none |
none |
| Other
expenses2 |
0.12 |
0.12 |
0.12 |
0.20 |
0.18 |
0.08 |
| Total
annual fund operating expenses |
0.70 |
1.40 |
0.65 |
0.73 |
0.46 |
0.36 |
1 A
contingent deferred sales charge of 1.00% applies on certain redemptions made within 18 months following purchases of $1 million
or more made without an initial sales charge. Contingent deferred sales charge is calculated based on the lesser of the offering
price and market value of shares being sold.
2 Restated
to reflect current fees.
Example
This example is intended to help you compare the cost of investing in the fund with the cost of investing in other mutual
funds.
The
example assumes that you invest $10,000 in the fund for the time periods indicated and then redeem all of your shares at the end
of those periods. The example also assumes that your investment has a 5% return each year and that the fund’s operating
expenses remain the same. You may be required to pay brokerage commissions on your purchases and sales of Class F-2 or F-3 shares
of the fund, which are not reflected in the example. Although your actual costs may be higher or lower, based on these assumptions
your costs would be:
| |
|
|
|
|
|
|
|
|
|
| Share
class: |
A |
C |
T |
F-1 |
F-2 |
F-3 |
For
the share class listed to the right, you would pay the following if you did not redeem your shares: |
Share
class: |
C |
| 1
year |
$
444 |
$
243 |
$
315 |
$
75 |
$
47 |
$
37 |
1
year |
$
143 |
| 3
years |
590 |
443 |
453 |
233 |
148 |
116 |
3
years |
443 |
| 5
years |
750 |
766 |
603 |
406 |
258 |
202 |
5
years |
766 |
| 10
years |
1,213 |
1,680 |
1,040 |
906 |
579 |
456 |
10
years |
1,680 |
Portfolio
turnover The fund pays transaction costs, such as commissions, when it buys and sells securities (or “turns over”
its portfolio). A higher portfolio turnover rate may indicate higher transaction costs and may result in higher taxes when fund
shares are held in a taxable account. These costs, which are not reflected in annual fund operating expenses or in the example,
affect the fund’s investment results. During the most recent fiscal year, the fund’s portfolio turnover rate was 20%
of the average value of its portfolio.
Principal
investment strategies In seeking to achieve its
objective, the fund may accept prudent risks to capital value to take advantage of opportunities for higher current income on
municipal bonds. Municipal bonds are debt obligations that pay interest that is exempt from federal taxation, with payments made
from a wide variety of sources, including governmental revenue streams and private enterprises.
Under normal
circumstances, the fund will invest at least 80% of its assets in, or derive at least 80% of its income from, securities that
are exempt from regular federal income tax and may subject you to alternative minimum tax. The fund may invest, without limitation,
in securities that may subject you to federal alternative minimum tax. The fund invests at least 50% of its portfolio in debt
securities rated BBB+ or below or Baa1 or below by Nationally Recognized Statistical Rating Organizations designated by the fund’s
investment adviser, or unrated but determined by the fund’s investment adviser to be of equivalent quality. Securities rated
BB+ or below and Ba1 or below are sometimes referred to as “junk bonds.” Some of the securities in which the fund
invests may have credit and liquidity support features, including guarantees and letters of credit.
The
investment adviser uses a system of multiple portfolio managers in managing the fund’s assets. Under this approach, the
portfolio of the fund is divided into segments managed by individual managers.
The
fund relies on the professional judgment of its investment adviser to make decisions about the fund’s portfolio investments.
The basic investment philosophy of the investment adviser is to seek to invest in attractively priced securities that, in its
opinion, represent good, long-term investment opportunities. The investment adviser believes that an important way to accomplish
this is by analyzing various factors, which may include the credit strength of the issuer, prices of similar securities issued
by comparable issuers, anticipated changes
13 Tax-exempt
income funds / Prospectus
in
interest rates, general market conditions and other factors pertinent to the particular security being evaluated. Securities may
be sold when the investment adviser believes that they no longer represent relatively attractive investment opportunities.
Principal
risks This section describes the principal
risks associated with investing in the fund. You may lose money by investing in the fund. The likelihood of loss may be greater
if you invest for a shorter period of time.
Market
conditions — The prices of, and
the income generated by, the securities held by the fund may decline – sometimes rapidly or unpredictably – due to
various factors, including events or conditions affecting the general economy or particular industries; overall market changes;
local, regional or global political, social or economic instability; governmental, governmental agency or central bank responses
to economic conditions; and currency exchange rate, interest rate and commodity price fluctuations.
Issuer
risks — The prices of, and the
income generated by, securities held by the fund may decline in response to various factors directly related to the issuers of
such securities, including reduced demand for an issuer’s goods or services, poor management performance, major litigation
related to the issuer, changes in government regulations affecting the issuer or its competitive environment and strategic initiatives
such as mergers, acquisitions or dispositions and the market response to any such initiatives.
Investing
in municipal securities — The yield and/or
value of the fund’s investments in municipal securities may be adversely affected by events tied to the municipal securities
markets, which can be very volatile and significantly impacted by unfavorable legislative or political developments and negative
changes in the financial conditions of municipal securities issuers and the economy. To the extent the fund invests in obligations
of a municipal issuer, the volatility, credit quality and performance of the fund may be adversely impacted by local political
and economic conditions of the issuer. For example, a credit rating downgrade, bond default or bankruptcy involving an issuer
within a particular state or territory could affect the market values and marketability of many or all municipal obligations of
that state or territory. Income from municipal securities held by the fund could also be declared taxable because of changes in
tax laws or interpretations by taxing authorities or as a result of noncompliant conduct of a municipal issuer. Additionally,
the relative amount of publicly available information about municipal securities is generally less than that for corporate securities.
Investing
in debt instruments — The prices of,
and the income generated by, bonds and other debt securities held by the fund may be affected by changing interest rates and by
changes in the effective maturities and credit ratings of these securities.
Rising
interest rates will generally cause the prices of bonds and other debt securities to fall. A general rise in interest rates may
cause investors to sell debt securities on a large scale, which could also adversely affect the price and liquidity of debt securities
and could also result in increased redemptions from the fund. Falling interest rates may cause an issuer to redeem, call or refinance
a debt security before its stated maturity, which may result in the fund failing to recoup the full amount of its initial investment
and having to reinvest the proceeds in lower yielding securities. Longer maturity debt securities generally have greater sensitivity
to changes in interest rates and may be subject to greater price fluctuations than shorter maturity debt securities.
Bonds
and other debt securities are also subject to credit risk, which is the possibility that the credit strength of an issuer or guarantor
will weaken or be perceived to be weaker, and/or an issuer of a debt security will fail to make timely payments of principal or
interest and the security will go into default. A downgrade or default affecting any of the fund’s securities could cause
the value of the fund’s shares to decrease. Lower quality debt securities generally have higher rates of interest and may
be subject to greater price fluctuations than higher quality debt securities. Credit risk is gauged, in part, by the credit ratings
of the debt securities in which the fund invests. However, ratings are only the opinions of the rating agencies issuing them and
are not guarantees as to credit quality or an evaluation of market risk. The fund’s investment adviser relies on its own
credit analysts to research issuers and issues in seeking to assess credit and default risks.
Liquidity
risk — Certain fund holdings may
be or become difficult or impossible to sell, particularly during times of market turmoil. Liquidity may be impacted by the lack
of an active market for a holding, legal or contractual restrictions on resale, or the reduced number and capacity of market participants
to make a market in such holding. Market prices for less liquid or illiquid holdings may be volatile, and reduced liquidity may
have an adverse impact on the market price of such holdings. Additionally, the sale of less liquid or illiquid holdings may involve
substantial delays (including delays in settlement) and additional costs and the fund may be unable to sell such holdings when
necessary to meet its liquidity needs or may be forced to sell at a loss.
Credit
and liquidity support — Changes in the
credit quality of banks and financial institutions providing credit and liquidity support features with respect to securities
held by the fund could cause the values of these securities to decline.
Investing
in lower rated debt instruments — Lower
rated bonds and other lower rated debt securities generally have higher rates of interest and involve greater risk of default
or price declines due to changes in the issuer’s creditworthiness than those of higher quality debt securities. The market
prices of these securities may fluctuate more than the prices of higher quality debt securities and may decline significantly
in periods of general economic difficulty. These risks may be increased with respect to investments in junk bonds.
Investing
in similar municipal bonds — Investing
significantly in municipal obligations of multiple issuers in the same state or backed by revenues of similar types of projects
or industries may make the fund more susceptible to certain economic, political or regulatory occurrences. As a result, the fund
has greater risk of volatility, and greater risk of loss, from these investments.
Management
— The investment adviser to the
fund actively manages the fund’s investments. Consequently, the fund is subject to the risk that the methods and analyses,
including models, tools and data, employed by the investment adviser in this process may be flawed or incorrect and may not produce
the desired results. This could cause the fund to lose value or its investment results to lag relevant benchmarks or other funds
with similar objectives.
Your investment
in the fund is not a bank deposit and is not insured or guaranteed by the Federal Deposit Insurance Corporation or any other governmental
agency, entity or person. You should consider how this fund fits into your overall investment program.
Tax-exempt
income funds / Prospectus 14
Investment
results The following bar chart shows how
the fund’s investment results have varied from year to year, and the following table shows how the fund’s average
annual total returns for various periods compare with a broad measure of securities market results and other applicable measures
of market results. This information provides some indication of the risks of investing in the fund. The Bloomberg Barclays High
Yield Municipal Bond Index is a market-value-weighted index composed of municipal bonds rated below BBB/Baa. The Lipper High Yield
Municipal Debt Funds Average includes the fund and other funds that disclose investment objectives and/or strategies reasonably
comparable to those of the fund. Past investment results (before and after taxes) are not predictive of future investment results.
Updated information on the fund’s investment results can be obtained by visiting capitalgroup.com.
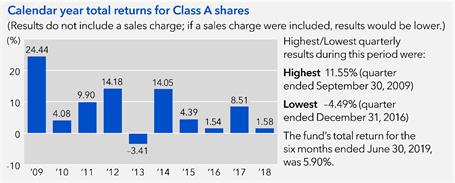
| |
|
|
|
|
|
| Average
annual total returns For the periods
ended December 31, 2018 (with maximum sales charge): |
| Share
class |
Inception
date |
1
year |
5
years |
10
years |
Lifetime |
| A
− Before taxes |
9/26/1994 |
–2.22% |
5.10% |
7.25% |
5.28% |
| −
After taxes on distributions |
|
–2.22 |
5.10 |
7.25 |
N/A |
| −
After taxes on distributions and sale of fund shares |
0.13 |
4.88 |
6.80 |
N/A |
| |
|
|
|
|
|
| Share
classes (before taxes) |
Inception
date |
1
year |
5
years |
10
years |
Lifetime |
| C |
3/15/2001 |
–0.14% |
5.12% |
6.83% |
4.31% |
| F-1 |
3/19/2001 |
1.52 |
5.83 |
7.57 |
4.73 |
| F-2 |
8/12/2008 |
1.79 |
6.11 |
7.85 |
5.54 |
| F-3 |
1/27/2017 |
1.89 |
N/A |
N/A |
5.26 |
| |
|
|
|
|
| Indexes |
1
year |
5
years |
10
years |
Lifetime
(from
Class A inception) |
| Bloomberg
Barclays Municipal Bond Index (reflects no deductions for sales charges, account fees, expenses or U.S. federal income taxes) |
1.28% |
3.82% |
4.85% |
5.21% |
| Bloomberg
Barclays High Yield Municipal Bond Index (reflects no deductions for sales charges, account fees, expenses or U.S. federal
income taxes) |
4.76 |
6.53 |
9.12 |
N/A |
| Lipper
High Yield Municipal Debt Funds Average (reflects no deductions for sales charges, account fees or U.S. federal income taxes) |
1.74 |
5.67 |
7.70 |
4.95 |
Class
A annualized 30-day yield at July 31, 2019: 2.35%
(For current yield information, please call American FundsLine®
at (800) 325-3590.) |
After-tax
returns are shown only for Class A shares; after-tax returns for other share classes will vary. After-tax returns are calculated
using the highest individual federal income tax rates in effect during each year of the periods shown and do not reflect the impact
of state and local taxes. Your actual after-tax returns depend on your individual tax situation and likely will differ from the
results shown above.
15 Tax-exempt
income funds / Prospectus
Management
Investment
adviser Capital Research and Management CompanySM
Portfolio managers The individuals primarily responsible for the portfolio management of the fund are:
| |
|
|
Portfolio
manager/
Fund title (if applicable) |
Portfolio
manager
experience
in
this fund |
Primary
title
with investment adviser |
| Karl
J. Zeile Senior Vice President and Trustee |
15
years |
Partner
– Capital Fixed Income Investors |
| Chad
M. Rach President |
8
years |
Partner
– Capital Fixed Income Investors |
| Jerome
Solomon Senior Vice President |
2
years |
Partner
– Capital Fixed Income Investors |
| |
| |
Purchase
and sale of fund shares The minimum amount
to establish an account for all share classes is $250 and the minimum to add to an account is $50. For accounts with Class F-3
shares held and serviced by the fund’s transfer agent, the minimum investment amount is $1 million.
If
you are a retail investor, you may sell (redeem) shares on any business day through your dealer or financial advisor or by writing
to American Funds Service Company® at P.O. Box 6007, Indianapolis, Indiana 46206-6007; telephoning American
Funds Service Company at (800) 421-4225; faxing American Funds Service Company at (888) 421-4351; or accessing our website
at capitalgroup.com.
Tax
information Fund distributions of interest on
municipal bonds are generally not subject to federal income tax. However, the fund may distribute taxable dividends, including
distributions of short-term capital gains, which are subject to federal taxation as ordinary income. To the extent the fund is
permitted to invest in bonds subject to federal alternative minimum tax, interest on certain bonds may be subject to federal alternative
minimum tax. The fund’s distributions of net long-term capital gains are taxable as long-term capital gains for federal
income tax purposes.
Payments
to broker-dealers and other financial intermediaries If
you purchase shares of the fund through a broker-dealer or other financial intermediary (such as a bank), the fund and the fund’s
distributor or its affiliates may pay the intermediary for the sale of fund shares and related services. These payments may create
a conflict of interest by influencing the broker-dealer or other intermediary and your individual financial advisor to recommend
the fund over another investment. Ask your individual financial advisor or visit your financial intermediary’s website for
more information.
Tax-exempt
income funds / Prospectus 16
The
Tax-Exempt Fund of California
Investment
objectives The fund’s primary investment
objective is to provide you with a high level of current income exempt from regular federal and California state income taxes.
Its secondary objective is preservation of capital.
Fees
and expenses of the fund This table describes
the fees and expenses that you may pay if you buy and hold shares of the fund. In addition to the fees and expenses described
below, you may also be required to pay brokerage commissions on purchases and sales of Class F-2 or F-3 shares of the fund. You
may qualify for sales charge discounts if you and your family invest, or agree to invest in the future, at least $100,000 in American
Funds. More information about these and other discounts is available from your financial professional, in the “Sales charge
reductions and waivers” sections on page 46 of the prospectus and on page 88 of the fund’s statement of additional
information, and in the sales charge waiver appendix to this prospectus.
| |
|
|
|
|
| Shareholder
fees (fees paid directly from your
investment) |
| Share
class: |
A |
C |
T |
All
F share
classes |
Maximum
sales charge (load) imposed on
purchases (as a percentage of offering price) |
3.75% |
none |
2.50% |
none |
Maximum
deferred sales charge (load)
(as a percentage of the amount redeemed) |
1.001 |
1.00% |
none |
none |
Maximum
sales charge (load) imposed on
reinvested dividends |
none |
none |
none |
none |
| Redemption
or exchange fees |
none |
none |
none |
none |
| |
|
|
|
|
|
|
| Annual
fund operating expenses (expenses
that you pay each year as a percentage of the value of your investment) |
| Share
class: |
A |
C |
T |
F-1 |
F-2 |
F-3 |
| Management
fees |
0.29% |
0.29% |
0.29% |
0.29% |
0.29% |
0.29% |
| Distribution
and/or service (12b-1) fees |
0.25 |
1.00 |
0.25 |
0.25 |
none |
none |
| Other
expenses2 |
0.07 |
0.07 |
0.08 |
0.16 |
0.14 |
0.05 |
| Total
annual fund operating expenses |
0.61 |
1.36 |
0.62 |
0.70 |
0.43 |
0.34 |
1 A
contingent deferred sales charge of 1.00% applies on certain redemptions made within 18 months following purchases of $1 million
or more made without an initial sales charge. Contingent deferred sales charge is calculated based on the lesser of the offering
price and market value of shares being sold.
2 Restated
to reflect current fees.
Example
This example is intended to help you compare the cost of investing in the fund with the cost of investing in other mutual
funds.
The
example assumes that you invest $10,000 in the fund for the time periods indicated and then redeem all of your shares at the end
of those periods. The example also assumes that your investment has a 5% return each year and that the fund’s operating
expenses remain the same. You may be required to pay brokerage commissions on your purchases and sales of Class F-2 or F-3 shares
of the fund, which are not reflected in the example. Although your actual costs may be higher or lower, based on these assumptions
your costs would be:
| |
|
|
|
|
|
|
|
|
|
| Share
class: |
A |
C |
T |
F-1 |
F-2 |
F-3 |
For
the share class listed to the right, you would pay the following if you did not redeem your shares: |
Share
class: |
C |
| 1
year |
$
435 |
$
238 |
$
312 |
$
72 |
$
44 |
$
35 |
1
year |
$
138 |
| 3
years |
563 |
431 |
444 |
224 |
138 |
109 |
3
years |
431 |
| 5
years |
703 |
745 |
587 |
390 |
241 |
191 |
5
years |
745 |
| 10
years |
1,109 |
1,635 |
1,005 |
871 |
542 |
431 |
10
years |
1,635 |
Portfolio
turnover The fund pays transaction costs, such as commissions, when it buys and sells securities (or “turns over”
its portfolio). A higher portfolio turnover rate may indicate higher transaction costs and may result in higher taxes when fund
shares are held in a taxable account. These costs, which are not reflected in annual fund operating expenses or in the example,
affect the fund’s investment results. During the most recent fiscal year, the fund’s portfolio turnover rate was 27%
of the average value of its portfolio.
17 Tax-exempt
income funds / Prospectus
Principal
investment strategies The fund seeks to achieve
its objectives by primarily investing in municipal bonds issued by the state of California and its agencies and municipalities.
Consistent with the fund’s objectives, the fund may also invest in municipal securities that are issued by jurisdictions
outside California. Municipal bonds are debt obligations generally issued to obtain funds for various public purposes, including
the construction of public facilities. The fund may also invest in bonds exempt from federal and state taxation that are used
to fund private projects.
Under
normal circumstances, the fund will invest at least 80% of its assets in, or derive at least 80% of its income from, securities
that are exempt from both regular federal and California income taxes and that do not subject you to federal alternative minimum
tax. The fund may also invest up to 20% of its assets in securities that may subject you to federal alternative minimum tax. The
fund is intended primarily for taxable residents of California.
The fund
will invest primarily in debt securities rated BBB- or better or Baa3 or better by Nationally Recognized Statistical Rating Organizations
designated by the fund’s investment adviser, or unrated but determined by the fund’s investment adviser to be of equivalent
quality. The fund may also invest in debt securities rated BB+ or below and Ba1 or below by Nationally Recognized Statistical
Rating Organizations designated by the fund’s investment adviser, or unrated but determined by the fund’s investment
adviser to be of equivalent quality. Such securities are sometimes referred to as “junk bonds.” Some of the securities
in which the fund invests may have credit and liquidity support features, including guarantees and letters of credit.
The
investment adviser uses a system of multiple portfolio managers in managing the fund’s assets. Under this approach, the
portfolio of the fund is divided into segments managed by individual managers.
The
fund relies on the professional judgment of its investment adviser to make decisions about the fund’s portfolio investments.
The basic investment philosophy of the investment adviser is to seek to invest in attractively priced securities that, in its
opinion, represent good, long-term investment opportunities. The investment adviser believes that an important way to accomplish
this is by analyzing various factors, which may include the credit strength of the issuer, prices of similar securities issued
by comparable issuers, anticipated changes in interest rates, general market conditions and other factors pertinent to the particular
security being evaluated. Securities may be sold when the investment adviser believes that they no longer represent relatively
attractive investment opportunities.
Principal
risks This section describes the principal
risks associated with investing in the fund. You may lose money by investing in the fund. The likelihood of loss may be greater
if you invest for a shorter period of time.
Risks
of investing in municipal bonds of issuers within the state of California — Because
the fund invests primarily in securities of issuers within the state of California, the fund is more susceptible to factors adversely
affecting issuers of California securities than a comparable municipal bond mutual fund that does not concentrate its investments
in a single state. For example, in the past, California voters have passed amendments to the state’s constitution and other
measures that limit the taxing and spending authority of California governmental entities, and future voter initiatives may adversely
affect California municipal bonds. More detailed information about the risks of investing in California municipal securities is
contained in the statement of additional information.
Market
conditions — The prices of, and
the income generated by, the securities held by the fund may decline – sometimes rapidly or unpredictably – due to
various factors, including events or conditions affecting the general economy or particular industries; overall market changes;
local, regional or global political, social or economic instability; governmental, governmental agency or central bank responses
to economic conditions; and currency exchange rate, interest rate and commodity price fluctuations.
Issuer
risks — The prices of, and the
income generated by, securities held by the fund may decline in response to various factors directly related to the issuers of
such securities, including reduced demand for an issuer’s goods or services, poor management performance, major litigation
related to the issuer, changes in government regulations affecting the issuer or its competitive environment and strategic initiatives
such as mergers, acquisitions or dispositions and the market response to any such initiatives.
Investing
in municipal securities — The yield and/or
value of the fund’s investments in municipal securities may be adversely affected by events tied to the municipal securities
markets, which can be very volatile and significantly impacted by unfavorable legislative or political developments and negative
changes in the financial conditions of municipal securities issuers and the economy. To the extent the fund invests in obligations
of a municipal issuer, the volatility, credit quality and performance of the fund may be adversely impacted by local political
and economic conditions of the issuer. For example, a credit rating downgrade, bond default or bankruptcy involving an issuer
within a particular state or territory could affect the market values and marketability of many or all municipal obligations of
that state or territory. Income from municipal securities held by the fund could also be declared taxable because of changes in
tax laws or interpretations by taxing authorities or as a result of noncompliant conduct of a municipal issuer. Additionally,
the relative amount of publicly available information about municipal securities is generally less than that for corporate securities.
Investing
in debt instruments — The prices of,
and the income generated by, bonds and other debt securities held by the fund may be affected by changing interest rates and by
changes in the effective maturities and credit ratings of these securities.
Rising
interest rates will generally cause the prices of bonds and other debt securities to fall. A general rise in interest rates may
cause investors to sell debt securities on a large scale, which could also adversely affect the price and liquidity of debt securities
and could also result in increased redemptions from the fund. Falling interest rates may cause an issuer to redeem, call or refinance
a debt security before its stated maturity, which may result in the fund failing to recoup the full amount of its initial investment
and having to reinvest the proceeds in lower yielding securities. Longer maturity debt securities generally have greater sensitivity
to changes in interest rates and may be subject to greater price fluctuations than shorter maturity debt securities.
Bonds
and other debt securities are also subject to credit risk, which is the possibility that the credit strength of an issuer or guarantor
will weaken or be perceived to be weaker, and/or an issuer of a debt security will fail to make timely payments of principal or
interest and the
Tax-exempt
income funds / Prospectus 18
security
will go into default. A downgrade or default affecting any of the fund’s securities could cause the value of the fund’s
shares to decrease. Lower quality debt securities generally have higher rates of interest and may be subject to greater price
fluctuations than higher quality debt securities. Credit risk is gauged, in part, by the credit ratings of the debt securities
in which the fund invests. However, ratings are only the opinions of the rating agencies issuing them and are not guarantees as
to credit quality or an evaluation of market risk. The fund’s investment adviser relies on its own credit analysts to research
issuers and issues in seeking to assess credit and default risks.
Liquidity
risk — Certain fund holdings may
be or become difficult or impossible to sell, particularly during times of market turmoil. Liquidity may be impacted by the lack
of an active market for a holding, legal or contractual restrictions on resale, or the reduced number and capacity of market participants
to make a market in such holding. Market prices for less liquid or illiquid holdings may be volatile, and reduced liquidity may
have an adverse impact on the market price of such holdings. Additionally, the sale of less liquid or illiquid holdings may involve
substantial delays (including delays in settlement) and additional costs and the fund may be unable to sell such holdings when
necessary to meet its liquidity needs or may be forced to sell at a loss.
Credit
and liquidity support — Changes in the
credit quality of banks and financial institutions providing credit and liquidity support features with respect to securities
held by the fund could cause the values of these securities to decline.
Investing
in lower rated debt instruments — Lower
rated bonds and other lower rated debt securities generally have higher rates of interest and involve greater risk of default
or price declines due to changes in the issuer’s creditworthiness than those of higher quality debt securities. The market
prices of these securities may fluctuate more than the prices of higher quality debt securities and may decline significantly
in periods of general economic difficulty. These risks may be increased with respect to investments in junk bonds.
Investing
in similar municipal bonds — Investing
significantly in municipal obligations of multiple issuers in the same state or backed by revenues of similar types of projects
or industries may make the fund more susceptible to certain economic, political or regulatory occurrences. As a result, the fund
has greater risk of volatility, and greater risk of loss, from these investments.
Management
— The investment adviser to the
fund actively manages the fund’s investments. Consequently, the fund is subject to the risk that the methods and analyses,
including models, tools and data, employed by the investment adviser in this process may be flawed or incorrect and may not produce
the desired results. This could cause the fund to lose value or its investment results to lag relevant benchmarks or other funds
with similar objectives.
Your
investment in the fund is not a bank deposit and is not insured or guaranteed by the Federal Deposit Insurance Corporation or
any other governmental agency, entity or person. You should consider how this fund fits into your overall investment program.
19 Tax-exempt
income funds / Prospectus
Investment
results The following bar chart shows how
the fund’s investment results have varied from year to year, and the following table shows how the fund’s average
annual total returns for various periods compare with a broad measure of securities market results and other applicable measures
of market results. This information provides some indication of the risks of investing in the fund. The Lipper California Municipal
Debt Funds Average includes the fund and other funds that disclose investment objectives and/or strategies reasonably comparable
to those of the fund. Past investment results (before and after taxes) are not predictive of future investment results. Updated
information on the fund’s investment results can be obtained by visiting capitalgroup.com.
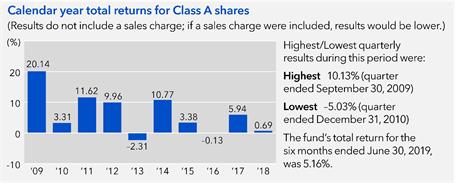
| |
|
|
|
|
|
| Average
annual total returns For the periods
ended December 31, 2018 (with maximum sales charge): |
| Share
class |
Inception
date |
1
year |
5
years |
10
years |
Lifetime |
| A
− Before taxes |
10/28/1986 |
–3.07% |
3.26% |
5.74% |
5.27% |
| −
After taxes on distributions |
|
–3.07 |
3.26 |
5.74 |
N/A |
| −
After taxes on distributions and sale of fund shares |
–0.68 |
3.26 |
5.40 |
N/A |
| |
|
|
|
|
|
| Share
classes (before taxes) |
Inception
date |
1
year |
5
years |
10
years |
Lifetime |
| C |
3/19/2001 |
–1.07% |
3.24% |
5.31% |
3.76% |
| F-1 |
3/20/2001 |
0.57 |
3.93 |
6.02 |
4.18 |
| F-2 |
8/22/2008 |
0.83 |
4.19 |
6.29 |
4.76 |
| F-3 |
1/27/2017 |
0.93 |
N/A |
N/A |
3.50 |
| |
|
|
|
|
| Indexes |
1
year |
5
years |
10
years |
Lifetime
(from
Class A
inception) |
| Bloomberg
Barclays California Municipal Index (reflects no deductions for sales charges, account fees, expenses or U.S. federal income
taxes) |
1.11% |
3.95% |
5.28% |
N/A |
| Lipper
California Municipal Debt Funds Average (reflects no deductions for sales charges, account fees or U.S. federal income taxes) |
0.50 |
4.33 |
5.79 |
5.40% |
Class
A annualized 30-day yield at July 31, 2019: 1.45%
(For current yield information, please call American FundsLine®
at (800) 325-3590.) |
After-tax
returns are shown only for Class A shares; after-tax returns for other share classes will vary. After-tax returns are calculated
using the highest individual federal income tax rates in effect during each year of the periods shown and do not reflect the impact
of state and local taxes. Your actual after-tax returns depend on your individual tax situation and likely will differ from the
results shown above.
Management
Investment
adviser Capital Research and Management CompanySM
Portfolio managers The individuals primarily responsible for the portfolio management of the fund are:
| |
|
|
Portfolio
manager/
Fund title (if applicable) |
Portfolio
manager
experience
in
this fund |
Primary
title
with investment adviser |
| Karl
J. Zeile President and Trustee |
16
years |
Partner
– Capital Fixed Income Investors |
| Mark
Marinella Vice President |
1
year |
Vice
President – Capital Fixed Income Investors |
| |
| |
Tax-exempt
income funds / Prospectus 20
Purchase
and sale of fund shares The minimum amount
to establish an account for all share classes is $1,000 and the minimum to add to an account is $50. For accounts with Class F-3
shares held and serviced by the fund’s transfer agent, the minimum investment amount is $1 million.
If
you are a retail investor, you may sell (redeem) shares on any business day through your dealer or financial advisor or by writing
to American Funds Service Company® at P.O. Box 6007, Indianapolis, Indiana 46206-6007; telephoning American
Funds Service Company at (800) 421-4225; faxing American Funds Service Company at (888) 421-4351; or accessing our website
at capitalgroup.com.
Tax
information Fund distributions of interest on
municipal bonds are generally not subject to federal income tax. However, the fund may distribute taxable dividends, including
distributions of short-term capital gains, which are subject to federal taxation as ordinary income. To the extent the fund is
permitted to invest in bonds subject to federal alternative minimum tax, interest on certain bonds may be subject to federal alternative
minimum tax. The fund’s distributions of net long-term capital gains are taxable as long-term capital gains for federal
income tax purposes.
It is anticipated
that federally exempt-interest dividends paid by the fund and derived from interest on bonds exempt from California income tax
will also be exempt from California state and local income taxes. To the extent the fund’s dividends are derived from interest
on debt obligations not exempt from California income tax, such dividends will be subject to California state and local income
taxes. Moreover, any federally taxable dividends and capital gain distributions may also be subject to state and local taxes.
Payments
to broker-dealers and other financial intermediaries If
you purchase shares of the fund through a broker-dealer or other financial intermediary (such as a bank), the fund and the fund’s
distributor or its affiliates may pay the intermediary for the sale of fund shares and related services. These payments may create
a conflict of interest by influencing the broker-dealer or other intermediary and your individual financial advisor to recommend
the fund over another investment. Ask your individual financial advisor or visit your financial intermediary’s website for
more information.
21 Tax-exempt
income funds / Prospectus
American
Funds Tax-Exempt Fund of New York
Investment
objectives The fund’s primary investment
objective is to provide you with a high level of current income exempt from regular federal, New York state and New York City
income taxes. Its secondary objective is preservation of capital.
Fees
and expenses of the fund This
table describes the fees and expenses that you may pay if you buy and hold shares of the fund. In addition to the fees and expenses
described below, you may also be required to pay brokerage commissions on purchases and sales of Class F-2 or F-3 shares of the
fund. You may qualify for sales charge discounts if you and your family invest, or agree to invest in the future, at least $100,000
in American Funds. More information about these and other discounts is available from your financial professional, in the “Sales
charge reductions and waivers” sections on page 46 of the prospectus and on page 88 of the fund’s statement of
additional information, and in the sales charge waiver appendix to this prospectus.
| |
|
|
|
|
| Shareholder
fees (fees paid directly from your investment) |
| Share
class: |
A |
C |
T |
All
F share
classes |
Maximum
sales charge (load) imposed on
purchases (as a percentage of offering price) |
3.75% |
none |
2.50% |
none |
Maximum
deferred sales charge (load)
(as a percentage of the amount redeemed) |
1.001 |
1.00% |
none |
none |
Maximum
sales charge (load) imposed on
reinvested dividends |
none |
none |
none |
none |
| Redemption
or exchange fees |
none |
none |
none |
none |
| |
|
|
|
|
|
|
| Annual
fund operating expenses (expenses
that you pay each year as a percentage of the value of your investment) |
| Share
class: |
A |
C |
T |
F-1 |
F-2 |
F-3 |
| Management
fees2 |
0.30% |
0.30% |
0.30% |
0.30% |
0.30% |
0.30% |
| Distribution
and/or service (12b-1) fees |
0.25 |
1.00 |
0.25 |
0.25 |
none |
none |
| Other
expenses2 |
0.12 |
0.12 |
0.12 |
0.18 |
0.17 |
0.08 |
| Total
annual fund operating expenses |
0.67 |
1.42 |
0.67 |
0.73 |
0.47 |
0.38 |
| Expense
reimbursement3 |
0.03 |
0.03 |
0.03 |
0.03 |
0.03 |
0.03 |
| Total
annual fund operating expenses after expense reimbursement |
0.64 |
1.39 |
0.64 |
0.70 |
0.44 |
0.35 |
1 A
contingent deferred sales charge of 1.00% applies on certain redemptions made within 18 months following purchases of $1 million
or more made without an initial sales charge. Contingent deferred sales charge is calculated based on the lesser of the offering
price and market value of shares being sold.
2 Restated
to reflect current fees.
3 The
investment adviser is currently reimbursing a portion of the other expenses for each share class. This reimbursement will be in
effect through at least October 1, 2020. The adviser may elect at its discretion to extend, modify or terminate the reimbursement
at that time.
Example
This example is intended to help you compare the cost of investing in the fund with the cost of investing in other mutual
funds.
The example
assumes that you invest $10,000 in the fund for the time periods indicated and then redeem all of your shares at the end of those
periods. The example also assumes that your investment has a 5% return each year and that the fund’s operating expenses
remain the same. The example reflects the expense reimbursement described above through the expiration date of such reimbursement
and total annual fund operating expenses thereafter. You may be required to pay brokerage commissions on your purchases and sales
of Class F-2 or F-3 shares of the fund, which are not reflected in the example. Although your actual costs may be higher or lower,
based on these assumptions your costs would be:
| |
|
|
|
|
|
|
|
|
|
| Share
class: |
A |
C |
T |
F-1 |
F-2 |
F-3 |
For
the share class listed to the right, you would pay the following if you did not redeem your shares: |
Share
class: |
C |
| 1
year |
$
438 |
$
242 |
$314 |
$
72 |
$
45 |
$
36 |
1
year |
$
142 |
| 3
years |
578 |
446 |
456 |
230 |
148 |
119 |
3
years |
446 |
| 5
years |
731 |
773 |
611 |
403 |
260 |
210 |
5
years |
773 |
| 10
years |
1,175 |
1,699 |
1,061 |
904 |
589 |
477 |
10
years |
1,699 |
Portfolio
turnover The fund pays transaction costs, such as commissions, when it buys and sells securities (or “turns over”
its portfolio). A higher portfolio turnover rate may indicate higher transaction costs and may result in higher taxes when fund
shares are held in a taxable account. These costs, which are not reflected in annual fund operating expenses or in the example,
affect the fund’s investment results. During the most recent fiscal year, the fund’s portfolio turnover rate was 16%
of the average value of its portfolio.
Tax-exempt
income funds / Prospectus 22
Principal
investment strategies The fund seeks to achieve
its objectives by primarily investing in municipal bonds issued by the state of New York and its agencies and municipalities.
Consistent with the fund’s objectives, the fund may also invest in municipal securities that are issued by jurisdictions
outside New York. Municipal bonds are debt obligations generally issued to obtain funds for various public purposes, including
the construction of public facilities. The fund may also invest in bonds exempt from federal and state taxation that are used
to fund private projects.
Under normal
circumstances, the fund will invest at least 80% of its assets in, or derive at least 80% of its income from, securities that
are exempt from regular federal, New York state and New York City income taxes and that do not subject you to federal alternative
minimum tax. The fund may also invest up to 20% of its assets in securities that may subject you to federal alternative minimum
tax. The fund is intended primarily for taxable residents of New York.
The
fund will invest primarily in debt securities rated BBB- or better or Baa3 or better by Nationally Recognized Statistical Rating
Organizations designated by the fund's investment adviser, or unrated but determined by the fund's investment adviser to be of
equivalent quality. The fund may also invest in debt securities rated BB+ or below and Ba1 or below by Nationally Recognized Statistical
Rating Organizations designated by the fund's investment adviser, or unrated but determined by the fund's investment adviser to
be of equivalent quality. Such securities are sometimes referred to as “junk bonds.” Some of the securities in which
the fund invests may have credit and liquidity support features, including guarantees and letters of credit.
The fund’s
assets are managed by a team of portfolio managers. Under this approach, the fund’s portfolio managers will work together
to oversee the fund’s entire portfolio.
The fund
relies on the professional judgment of its investment adviser to make decisions about the fund’s portfolio investments.
The basic investment philosophy of the investment adviser is to seek to invest in attractively priced securities that, in its
opinion, represent good, long-term investment opportunities. The investment adviser believes that an important way to accomplish
this is by analyzing various factors, which may include the credit strength of the issuer, prices of similar securities issued
by comparable issuers, anticipated changes in interest rates, general market conditions and other factors pertinent to the particular
security being evaluated. Securities may be sold when the investment adviser believes that they no longer represent relatively
attractive investment opportunities.
Principal
risks This section describes the principal
risks associated with investing in the fund. You may lose money by investing in the fund. The likelihood of loss may be greater
if you invest for a shorter period of time.
Risks
of investing in municipal bonds of issuers within the state of New York —
Because the fund invests primarily in securities of issuers within the state of New York, the fund is more susceptible to factors
adversely affecting issuers of New York securities than a comparable municipal bond mutual fund that does not concentrate its
investments in a single state. For example, such factors may include political policy changes, tax base erosion, state constitutional
limits on tax increases, budget deficits and other financial or economic difficulties, and changes in the credit ratings assigned
to New York’s municipal issuers. New York’s economy and finances may be especially vulnerable to changes in the performance
of the financial services sector, which historically has been volatile. More detailed information about the risks of investing
in New York municipal securities is contained in the statement of additional information.
Market
conditions — The prices of, and
the income generated by, the securities held by the fund may decline – sometimes rapidly or unpredictably – due to
various factors, including events or conditions affecting the general economy or particular industries; overall market changes;
local, regional or global political, social or economic instability; governmental, governmental agency or central bank responses
to economic conditions; and currency exchange rate, interest rate and commodity price fluctuations.
Issuer
risks — The prices of, and the
income generated by, securities held by the fund may decline in response to various factors directly related to the issuers of
such securities, including reduced demand for an issuer’s goods or services, poor management performance, major litigation
related to the issuer, changes in government regulations affecting the issuer or its competitive environment and strategic initiatives
such as mergers, acquisitions or dispositions and the market response to any such initiatives.
Investing
in municipal securities — The yield and/or
value of the fund’s investments in municipal securities may be adversely affected by events tied to the municipal securities
markets, which can be very volatile and significantly impacted by unfavorable legislative or political developments and negative
changes in the financial conditions of municipal securities issuers and the economy. To the extent the fund invests in obligations
of a municipal issuer, the volatility, credit quality and performance of the fund may be adversely impacted by local political
and economic conditions of the issuer. For example, a credit rating downgrade, bond default or bankruptcy involving an issuer
within a particular state or territory could affect the market values and marketability of many or all municipal obligations of
that state or territory. Income from municipal securities held by the fund could also be declared taxable because of changes in
tax laws or interpretations by taxing authorities or as a result of noncompliant conduct of a municipal issuer. Additionally,
the relative amount of publicly available information about municipal securities is generally less than that for corporate securities.
Investing
in debt instruments — The prices of,
and the income generated by, bonds and other debt securities held by the fund may be affected by changing interest rates and by
changes in the effective maturities and credit ratings of these securities.
Rising
interest rates will generally cause the prices of bonds and other debt securities to fall. A general rise in interest rates may
cause investors to sell debt securities on a large scale, which could also adversely affect the price and liquidity of debt securities
and could also result in increased redemptions from the fund. Falling interest rates may cause an issuer to redeem, call or refinance
a debt security before its stated maturity, which may result in the fund failing to recoup the full amount of its initial investment
and having to reinvest the proceeds in lower yielding securities. Longer maturity debt securities generally have greater sensitivity
to changes in interest rates and may be subject to greater price fluctuations than shorter maturity debt securities.
23 Tax-exempt
income funds / Prospectus
Bonds
and other debt securities are also subject to credit risk, which is the possibility that the credit strength of an issuer or guarantor
will weaken or be perceived to be weaker, and/or an issuer of a debt security will fail to make timely payments of principal or
interest and the security will go into default. A downgrade or default affecting any of the fund’s securities could cause
the value of the fund’s shares to decrease. Lower quality debt securities generally have higher rates of interest and may
be subject to greater price fluctuations than higher quality debt securities. Credit risk is gauged, in part, by the credit ratings
of the debt securities in which the fund invests. However, ratings are only the opinions of the rating agencies issuing them and
are not guarantees as to credit quality or an evaluation of market risk. The fund’s investment adviser relies on its own
credit analysts to research issuers and issues in seeking to assess credit and default risks.
Liquidity
risk — Certain fund holdings may
be or become difficult or impossible to sell, particularly during times of market turmoil. Liquidity may be impacted by the lack
of an active market for a holding, legal or contractual restrictions on resale, or the reduced number and capacity of market participants
to make a market in such holding. Market prices for less liquid or illiquid holdings may be volatile, and reduced liquidity may
have an adverse impact on the market price of such holdings. Additionally, the sale of less liquid or illiquid holdings may involve
substantial delays (including delays in settlement) and additional costs and the fund may be unable to sell such holdings when
necessary to meet its liquidity needs or may be forced to sell at a loss.
Credit
and liquidity support — Changes in the
credit quality of banks and financial institutions providing credit and liquidity support features with respect to securities
held by the fund could cause the values of these securities to decline.
Investing
in lower rated debt instruments — Lower
rated bonds and other lower rated debt securities generally have higher rates of interest and involve greater risk of default
or price declines due to changes in the issuer’s creditworthiness than those of higher quality debt securities. The market
prices of these securities may fluctuate more than the prices of higher quality debt securities and may decline significantly
in periods of general economic difficulty. These risks may be increased with respect to investments in junk bonds.
Investing
in similar municipal bonds — Investing
significantly in municipal obligations of multiple issuers in the same state or backed by revenues of similar types of projects
or industries may make the fund more susceptible to certain economic, political or regulatory occurrences. As a result, the fund
has greater risk of volatility, and greater risk of loss, from these investments.
Management
— The investment adviser to the
fund actively manages the fund’s investments. Consequently, the fund is subject to the risk that the methods and analyses,
including models, tools and data, employed by the investment adviser in this process may be flawed or incorrect and may not produce
the desired results. This could cause the fund to lose value or its investment results to lag relevant benchmarks or other funds
with similar objectives.
Your investment
in the fund is not a bank deposit and is not insured or guaranteed by the Federal Deposit Insurance Corporation or any other governmental
agency, entity or person. You should consider how this fund fits into your overall investment program.
Tax-exempt
income funds / Prospectus 24
Investment
results The following bar chart shows how
the fund’s investment results have varied from year to year, and the following table shows how the fund’s average
annual total returns for various periods compare with a broad measure of securities market results and other applicable measures
of market results. This information provides some indication of the risks of investing in the fund. The Lipper New York Municipal
Debt Funds Average includes the fund and other funds that disclose investment objectives and/or strategies reasonably comparable
to those of the fund. Past investment results (before and after taxes) are not predictive of future investment results. Updated
information on the fund’s investment results can be obtained by visiting capitalgroup.com.
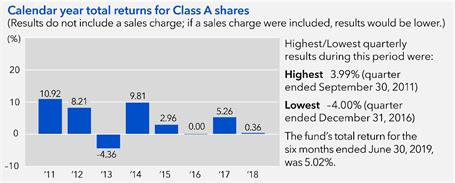
| |
|
|
|
|
| Average
annual total returns For the periods
ended December 31, 2018 (with maximum sales charge): |
| Share
class |
Inception
date |
1
year |
5
years |
Lifetime |
| A
− Before taxes |
11/1/2010 |
–3.39% |
2.83% |
3.02% |
| −
After taxes on distributions |
|
–3.39 |
2.83 |
3.02 |
| −
After taxes on distributions and sale of fund shares |
–1.00 |
2.81 |
2.97 |
| |
|
|
|
|
| Share
classes (before taxes) |
Inception
date |
1
year |
5
years |
Lifetime |
| C |
11/1/2010 |
–1.41% |
2.78% |
2.65% |
| F-1 |
11/1/2010 |
0.29 |
3.59 |
3.43 |
| F-2 |
11/1/2010 |
0.50 |
3.74 |
3.61 |
| F-3 |
1/27/2017 |
0.60 |
N/A |
2.83 |
| |
|
|
|
|
| Indexes |
1
year |
5
years |
Lifetime
(from
Class A
inception) |
| Bloomberg
Barclays New York Municipal Index (reflects no deductions for sales charges, account fees, expenses or U.S. federal income
taxes) |
1.04% |
3.67% |
3.44% |
Lipper
New York Municipal Debt Funds Average (reflects no deductions for
sales charges, account fees or U.S. federal income taxes) |
0.82 |
3.80 |
3.10 |
Class
A annualized 30-day yield at July 31, 2019: 1.80%
(For
current yield information, please call American FundsLine® at (800) 325-3590.) |
After-tax
returns are shown only for Class A shares; after-tax returns for other share classes will vary. After-tax returns are calculated
using the highest individual federal income tax rates in effect during each year of the periods shown and do not reflect the impact
of state and local taxes. Your actual after-tax returns depend on your individual tax situation and likely will differ from the
results shown above.
Management
Investment
adviser Capital Research and Management CompanySM
Portfolio managers The individuals primarily responsible for the portfolio management of the fund are:
| |
|
|
Portfolio
manager/
Fund title (if applicable) |
Portfolio
manager
experience
in
this fund |
Primary
title
with investment adviser |
| Karl
J. Zeile Senior Vice President and Trustee |
9
years |
Partner
– Capital Fixed Income Investors |
| Jerome
Solomon President |
7
years |
Partner
– Capital Fixed Income Investors |
| |
25 Tax-exempt
income funds / Prospectus
Purchase
and sale of fund shares The minimum amount
to establish an account for all share classes is $1,000 and the minimum to add to an account is $50. For accounts with Class F-3
shares held and serviced by the fund’s transfer agent, the minimum investment amount is $1 million.
If
you are a retail investor, you may sell (redeem) shares on any business day through your dealer or financial advisor or by writing
to American Funds Service Company® at P.O. Box 6007, Indianapolis, Indiana 46206-6007; telephoning American
Funds Service Company at (800) 421-4225; faxing American Funds Service Company at (888) 421-4351; or accessing our website
at capitalgroup.com.
Tax
information Fund distributions of interest on
municipal bonds are generally not subject to federal income tax. However, the fund may distribute taxable dividends, including
distributions of short-term capital gains, which are subject to federal taxation as ordinary income. To the extent the fund is
permitted to invest in bonds subject to federal alternative minimum tax, interest on certain bonds may be subject to federal alternative
minimum tax. The fund’s distributions of net long-term capital gains are taxable as long-term capital gains for federal
income tax purposes.
It is anticipated
that federally exempt-interest dividends paid by the fund and derived from interest on bonds exempt from New York income tax will
also be exempt from New York state and local income taxes. To the extent the fund’s dividends are derived from interest
on debt obligations not exempt from New York income tax, such dividends will be subject to New York state and local income taxes.
Moreover, any federally taxable dividends and capital gain distributions may also be subject to state and local taxes.
Payments
to broker-dealers and other financial intermediaries If
you purchase shares of the fund through a broker-dealer or other financial intermediary (such as a bank), the fund and the fund’s
distributor or its affiliates may pay the intermediary for the sale of fund shares and related services. These payments may create
a conflict of interest by influencing the broker-dealer or other intermediary and your individual financial advisor to recommend
the fund over another investment. Ask your individual financial advisor or visit your financial intermediary’s website for
more information.
Tax-exempt
income funds / Prospectus 26
Investment
objectives, strategies and risks Except where
the context indicates otherwise, references to the “fund” apply to each of these tax-exempt bond funds.
American
Funds Short-Term Tax-Exempt Bond Fund The fund’s investment objective is to provide you with current income exempt from
regular federal income tax, consistent with the maturity and quality standards described in this prospectus, and to preserve capital.
Under normal circumstances, the fund will invest at least 80% of its assets in, or derive at least 80% of its income from, securities
that are exempt from regular federal income tax and that do not subject you to federal alternative minimum tax. The fund may also
invest up to 20% of its assets in securities that may subject you to federal alternative minimum tax.
The
fund invests primarily in debt securities rated AA- or better or Aa3 or better by Nationally Recognized Statistical Rating Organizations
designated by the fund’s investment adviser, or unrated but determined by the fund’s investment adviser to be of equivalent
quality. The fund may also invest in debt securities rated A- or better or A3 or better by Nationally Recognized Statistical Rating
Organizations designated by the fund’s investment adviser, or unrated but determined by the fund’s investment adviser
to be of equivalent quality. Some of the securities in which the fund invests may have credit and liquidity support features,
including guarantees and letters of credit. The fund’s aggregate portfolio will have a dollar-weighted average effective
maturity no greater than three years.
Limited
Term Tax-Exempt Bond Fund of America The fund’s investment objective is to provide you with current income exempt from
regular federal income tax, consistent with the maturity and quality standards described in this prospectus, and to preserve capital.
The fund is designed for investors seeking current income exempt from federal income tax. Under normal circumstances, the fund
will invest at least 80% of its assets in, or derive at least 80% of its income from, securities that are exempt from regular
federal income tax and that do not subject you to federal alternative minimum tax. The fund may also invest up to 20% of its assets
in securities that may subject you to federal alternative minimum tax.
The
fund invests primarily in debt securities rated A- or better or A3 or better by Nationally Recognized Statistical Rating Organizations
designated by the fund’s investment adviser, or unrated but determined by the fund’s investment adviser to be of equivalent
quality. The fund may also invest in debt securities rated BBB and Baa by Nationally Recognized Statistical Rating Organizations
designated by the fund’s investment adviser, or unrated but determined by the fund’s investment adviser to be of equivalent
quality. The dollar-weighted average effective maturity of the fund’s portfolio is between three and 10 years.
The
Tax-Exempt Bond Fund of America The fund’s investment objective is to provide you with a high level of current income
exempt from federal income tax, consistent with the preservation of capital. The fund is designed for investors seeking a high
level of current income exempt from federal income tax.
Under
normal circumstances, the fund will invest at least 80% of its assets in, or derive at least 80% of its income from, securities
that are exempt from regular federal income tax. The fund will not invest in securities that subject you to federal alternative
minimum tax. The fund invests at least 65% in debt securities rated A- or better or A3 or better by Nationally Recognized Statistical
Rating Organizations designated by the fund’s investment adviser, or unrated but determined by the fund’s investment
adviser to be of equivalent quality. The fund may also invest in debt securities rated BBB+ or below and Baa1 or below (including
those rated BB+ or below and Ba1 or below) by Nationally Recognized Statistical Rating Organizations designated by the fund’s
investment adviser, or unrated but determined by the fund’s investment adviser to be of equivalent quality. Securities rated
BB+ or below and Ba1 or below are sometimes referred to as “junk bonds.” Some of the securities in which the fund
invests may have credit and liquidity support features, including guarantees and letters of credit. Though investment decisions
regarding the fund’s portfolio may be informed by investment themes on a range of macroeconomic factors, the fund may invest
in debt securities of any maturity or duration.
American
High-Income Municipal Bond Fund The fund’s investment objective is to provide you with a high level of current income
exempt from regular federal income tax. The fund is designed for investors who are able to tolerate greater credit risk and price
fluctuations than investors in funds with higher quality portfolios. In seeking to achieve its objective, the fund may accept
prudent risks to capital value to take advantage of opportunities for higher current income.
Under
normal circumstances, the fund will invest at least 80% of its assets in, or derive at least 80% of its income from, securities
that are exempt from regular federal income tax and may subject you to alternative minimum tax. The fund may invest, without limitation,
in securities that may subject you to federal alternative minimum tax. The fund invests at least 50% of its portfolio in debt
securities rated BBB+ or below or Baa1 or below by Nationally Recognized Statistical Rating Organizations designated by the fund’s
investment adviser, or unrated but determined by the fund’s investment adviser to be of equivalent quality. Securities rated
BB+ or below and Ba1 or below are sometimes referred to as “junk bonds.” Some of the securities in which the fund
invests may have credit and liquidity support features, including guarantees and letters of credit. Though investment decisions
regarding the fund’s portfolio may be informed by investment themes on a range of macroeconomic factors, the fund may invest
in debt securities of any maturity or duration.
27 Tax-exempt
income funds / Prospectus
The
Tax-Exempt Fund of California The fund’s primary investment objective is to provide you with a high level of current
income exempt from regular federal and California state income taxes. Its secondary objective is preservation of capital. The
fund seeks to achieve these objectives by primarily investing in municipal bonds issued by the state of California and its agencies
and municipalities. Consistent with the fund’s objectives, the fund may also invest in municipal securities that are issued
by jurisdictions outside California (including territories and Commonwealths of the United States). The fund is designed for investors
seeking income exempt from federal and California income taxes and capital preservation over the long term, and is intended primarily
for taxable residents of California.
Under normal
circumstances, the fund will invest at least 80% of its assets in, or derive at least 80% of its income from, securities that
are exempt from both regular federal and California income taxes and that do not subject you to federal alternative minimum tax.
The fund may also invest up to 20% of its assets in securities that may subject you to federal alternative minimum tax.
The fund
will invest primarily in debt securities rated BBB- or better or Baa3 or better by Nationally Recognized Statistical Rating Organizations
designated by the fund’s investment adviser, or unrated but determined by the fund’s investment adviser to be of equivalent
quality. The fund may also invest in debt securities rated BB+ or below and Ba1 or below by Nationally Recognized Statistical
Rating Organizations designated by the fund’s investment adviser, or unrated but determined by the fund’s investment
adviser to be of equivalent quality. Such securities are sometimes referred to as “junk bonds.” Some of the securities
in which the fund invests may have credit and liquidity support features, including guarantees and letters of credit. Securities
that are not general obligations of the state or are obligations of issuers in other jurisdictions may have lower ratings than
general obligations of the state. Though investment decisions regarding the fund’s portfolio may be informed by investment
themes on a range of macroeconomic factors, the fund may invest in debt securities of any maturity or duration.
American
Funds Tax-Exempt Fund of New York The fund’s primary investment objective is to provide you with a high level of current
income exempt from regular federal, New York state and New York City income taxes. Its secondary objective is preservation of
capital. The fund seeks to achieve these objectives by primarily investing in municipal bonds issued by the state of New York
and its agencies and municipalities. Consistent with the fund’s objectives, the fund may also invest in municipal securities
that are issued by jurisdictions outside of New York (including territories and Commonwealths of the United States). The fund
is designed for investors seeking income exempt from federal, New York state and New York City income taxes and capital preservation
over the long term, and is intended primarily for taxable residents of New York.
Under
normal circumstances, the fund will invest at least 80% of its assets in, or derive at least 80% of its income from, securities
that are exempt from regular federal, New York state and New York City income taxes and that do not subject you to federal alternative
minimum tax. The fund may also invest up to 20% of its assets in securities that may subject you to federal alternative minimum
tax.
The fund
will invest primarily in debt securities rated BBB- or better or Baa3 or better by Nationally Recognized Statistical Rating Organizations
designated by the fund's investment adviser, or unrated but determined by the fund's investment adviser to be of equivalent quality.
The fund may also invest in debt securities rated BB+ or below and Ba1 or below by Nationally Recognized Statistical Rating Organizations
designated by the fund's investment adviser, or unrated but determined by the fund's investment adviser to be of equivalent quality.
Such securities are sometimes referred to as “junk bonds.” Some of the securities in which the fund invests may have
credit and liquidity support features, including guarantees and letters of credit. Securities that are not general obligations
of the state or are obligations of issuers in other jurisdictions may have lower ratings than general obligations of the state.
Though investment decisions regarding the fund’s portfolio may be informed by investment themes on a range of macroeconomic
factors, the fund may invest in debt securities of any maturity or duration.
Tax-exempt
income funds / Prospectus 28
Municipal
bonds are debt obligations generally issued to obtain funds for various public purposes, including the construction of public
facilities.
A bond’s
effective maturity is the market’s trading assessment of its maturity and represents an estimate of the most likely time
period during which an investor in that bond will receive payment of principal. For example, as market interest rates decline,
issuers may exercise call provisions that shorten the bond’s effective maturity. Conversely, if interest rates rise, effective
maturities tend to lengthen. A portfolio’s dollar-weighted average effective maturity is the weighted average of all effective
maturities in the portfolio, where more weight is given to larger holdings.
The fund
may also hold cash or cash equivalents, including commercial paper and short-term securities issued by the U.S. government, its
agencies and instrumentalities. The percentage of the fund invested in such holdings varies and depends on various factors, including
market conditions and purchases and redemptions of fund shares. The investment adviser may determine that it is appropriate to
invest a substantial portion of the fund’s assets in such instruments in response to certain circumstances, such as periods
of market turmoil. In addition, for temporary defensive purposes, the fund may invest without limitation in such instruments.
A larger percentage of such holdings could moderate the fund’s investment results in a period of rising market prices. Alternatively,
a larger percentage of such holdings could reduce the magnitude of the fund’s loss in a period of falling market prices
and provide liquidity to make additional investments or to meet redemptions.
The
fund’s daily cash balance may be invested in one or more money market or similar funds managed by the investment adviser
or its affiliates (“Central Funds”). Shares of Central Funds are not offered to the public and are only purchased
by the fund’s investment adviser and its affiliates and other funds, investment vehicles and accounts managed by the fund’s
investment adviser and its affiliates. When investing in Central Funds, the fund bears its proportionate share of the expenses
of the Central Funds in which it invests but does not bear additional management fees through its investment in such Central Funds.
The investment results of the portions of the fund’s assets invested in the Central Funds will be based upon the investment
results of the Central Funds.
The
following are principal risks associated with the fund’s investment strategies.
Market
conditions — The prices of, and
the income generated by, the securities held by the fund may decline – sometimes rapidly or unpredictably – due to
various factors, including events or conditions affecting the general economy or particular industries; overall market changes;
local, regional or global political, social or economic instability; governmental, governmental agency or central bank responses
to economic conditions; and currency exchange rate, interest rate and commodity price fluctuations.
Economies
and financial markets throughout the world are interconnected. Economic, financial or political events, trading and tariff arrangements,
wars, terrorism, cybersecurity events, natural disasters and other circumstances in one country or region could have impacts on
global economies or markets. As a result, whether or not the fund invests in securities of issuers located in or with significant
exposure to the countries affected, the value and liquidity of the fund’s investments may be negatively affected by developments
in other countries and regions.
Issuer
risks — The prices of, and the
income generated by, securities held by the fund may decline in response to various factors directly related to the issuers of
such securities, including reduced demand for an issuer’s goods or services, poor management performance, major litigation
related to the issuer, changes in government regulations affecting the issuer or its competitive environment and strategic initiatives
such as mergers, acquisitions or dispositions and the market response to any such initiatives.
Investing
in municipal securities — The yield and/or
value of the fund’s investments in municipal securities may be adversely affected by events tied to the municipal securities
markets, which can be very volatile and significantly impacted by unfavorable legislative or political developments and negative
changes in the financial conditions of municipal securities issuers and the economy. To the extent the fund invests in obligations
of a municipal issuer, the volatility, credit quality and performance of the fund may be adversely impacted by local political
and economic conditions of the issuer. For example, a credit rating downgrade, bond default or bankruptcy involving an issuer
within a particular state or territory could affect the market values and marketability of many or all municipal obligations of
that state or territory. Income from municipal securities held by the fund could also be declared taxable because of changes in
tax laws or interpretations by taxing authorities or as a result of noncompliant conduct of a municipal issuer. Additionally,
the relative amount of publicly available information about municipal securities is generally less than that for corporate securities.
Investing
in debt instruments — The prices of,
and the income generated by, bonds and other debt securities held by the fund may be affected by changing interest rates and by
changes in the effective maturities and credit ratings of these securities.
Rising
interest rates will generally cause the prices of bonds and other debt securities to fall. A general rise in interest rates may
cause investors to sell debt securities on a large scale, which could also adversely affect the price and liquidity of debt securities
and could also result in increased redemptions from the fund. Falling interest rates may cause an issuer to redeem, call or refinance
a debt security before its stated maturity, which may result in the fund failing to recoup the full amount of its initial investment
and having to reinvest the proceeds in lower yielding securities. Longer maturity debt securities generally have greater sensitivity
to changes in interest rates and may be subject to greater price fluctuations than shorter maturity debt securities.
Bonds
and other debt securities are also subject to credit risk, which is the possibility that the credit strength of an issuer or guarantor
will weaken or be perceived to be weaker, and/or an issuer of a debt security will fail to make timely payments of principal or
interest and the security will go into default. A downgrade or default affecting any of the fund’s securities could cause
the value of the fund’s shares to decrease. Lower quality debt securities generally have higher rates of interest and may
be subject to greater price fluctuations than higher quality debt securities. Credit risk is gauged, in part, by the credit ratings
of the debt securities in which the fund invests. However, ratings are only the opinions of the rating agencies issuing them and
are not guarantees as to credit quality or an evaluation of market risk. The fund’s investment adviser relies on its own
credit analysts to research issuers and issues in seeking to assess credit and default risks.
29 Tax-exempt
income funds / Prospectus
Liquidity
risk — Certain fund holdings may
be or become difficult or impossible to sell, particularly during times of market turmoil. Liquidity may be impacted by the lack
of an active market for a holding, legal or contractual restrictions on resale, or the reduced number and capacity of market participants
to make a market in such holding. Market prices for less liquid or illiquid holdings may be volatile, and reduced liquidity may
have an adverse impact on the market price of such holdings. Additionally, the sale of less liquid or illiquid holdings may involve
substantial delays (including delays in settlement) and additional costs and the fund may be unable to sell such holdings when
necessary to meet its liquidity needs or may be forced to sell at a loss.
Credit
and liquidity support — Changes in the
credit quality of banks and financial institutions providing credit and liquidity support features with respect to securities
held by the fund could cause the values of these securities to decline.
Investing
in lower rated debt instruments — Lower
rated bonds and other lower rated debt securities generally have higher rates of interest and involve greater risk of default
or price declines due to changes in the issuer’s creditworthiness than those of higher quality debt securities. The market
prices of these securities may fluctuate more than the prices of higher quality debt securities and may decline significantly
in periods of general economic difficulty. These risks may be increased with respect to investments in lower quality, higher yielding
debt securities rated Ba1 or below and BB+ or below by Nationally Recognized Statistical Rating Organizations designated by the
fund’s investment adviser or unrated but determined by the investment adviser to be of equivalent quality, which securities
are sometimes referred to as “junk bonds.”
Investing
in similar municipal bonds — Investing
significantly in municipal obligations of multiple issuers in the same state or backed by revenues of similar types of projects
or industries may make the fund more susceptible to certain economic, political or regulatory occurrences. As a result, the fund
has greater risk of volatility, and greater risk of loss, from these investments.
Management
— The investment adviser to the
fund actively manages the fund’s investments. Consequently, the fund is subject to the risk that the methods and analyses,
including models, tools and data, employed by the investment adviser in this process may be flawed or incorrect and may not produce
the desired results. This could cause the fund to lose value or its investment results to lag relevant benchmarks or other funds
with similar objectives.
Risks
of investing in municipal bonds of issuers within the state of California — Because
the fund invests primarily in securities of issuers within the state of California, the fund is more susceptible to factors adversely
affecting issuers of California securities than a comparable municipal bond mutual fund that does not concentrate its investments
in a single state. For example, in the past, California voters have passed amendments to the state’s constitution and other
measures that limit the taxing and spending authority of California governmental entities, and future voter initiatives may adversely
affect California municipal bonds. More detailed information about the risks of investing in California municipal securities is
contained in the statement of additional information.
Risks
of investing in municipal bonds of issuers within the state of New York —
Because the fund invests primarily in securities of issuers within the state of New York, the fund is more susceptible to factors
adversely affecting issuers of New York securities than a comparable municipal bond mutual fund that does not concentrate its
investments in a single state. For example, such factors may include political policy changes, tax base erosion, state constitutional
limits on tax increases, budget deficits and other financial or economic difficulties, and changes in the credit ratings assigned
to New York’s municipal issuers. New York’s economy and finances may be especially vulnerable to changes in the performance
of the financial services sector, which historically has been volatile. More detailed information about the risks of investing
in New York municipal securities is contained in the statement of additional information.
The
following are additional risks associated with investing in the fund.
Alternative
minimum tax — The fund (other than The
Tax-Exempt Bond Fund of America) may invest in securities that may subject you to federal alternative minimum tax. Therefore,
while the fund’s distributions from tax-exempt securities are not subject to regular federal income tax, a portion or all
of the distributions may be included in determining a shareholder’s federal alternative minimum tax.
Interest
rate risk — The values and liquidity
of the securities held by the fund may be affected by changing interest rates. For example, the values of these securities may
decline when interest rates rise and increase when interest rates fall. Longer maturity debt securities generally have greater
sensitivity to changes in interest rates and may be subject to greater price fluctuations than shorter maturity debt securities.
The fund may invest in variable and floating rate securities. When the fund holds variable or floating rate securities, a decrease
in market interest rates will adversely affect the income received from such securities and the net asset value of the fund’s
shares. Although the values of such securities are generally less sensitive to interest rate changes than those of other debt
securities, the value of variable and floating rate securities may decline if their interest rates do not rise as quickly, or
as much, as market interest rates. Conversely, floating rate securities will not generally increase in value if interest rates
decline. During periods of extremely low short-term interest rates, the fund may not be able to maintain a positive yield and,
given the current low interest rate environment, risks associated with rising rates are currently heightened.
Investing
in derivatives — The use of derivatives
involves a variety of risks, which may be different from, or greater than, the risks associated with investing in traditional
securities, such as stocks and bonds. Changes in the value of a derivative may not correlate perfectly with, and may be more sensitive
to market events than, the underlying asset, rate or index, and a derivative instrument may expose the fund to losses in excess
of its initial investment. Derivatives may be difficult to value, difficult for the fund to buy or sell at an opportune time or
price and difficult, or even impossible, to terminate or otherwise offset. The fund’s use of derivatives may result in losses
to the fund, and investing in derivatives may reduce the fund’s returns and increase the fund’s price volatility.
The fund’s counterparty to a derivative transaction (including, if applicable, the fund’s clearing broker, the derivatives
exchange or the clearinghouse) may be unable or unwilling to honor its financial obligations in respect of the transaction. In
certain cases, the fund may be hindered or delayed in exercising remedies against or closing out derivative instruments with a
counterparty, which may result in additional losses.
Tax-exempt
income funds / Prospectus 30
Investing
in futures contracts — In addition
to the risks generally associated with investing in derivative instruments, futures contracts are subject to the creditworthiness
of the clearing organizations, exchanges and futures commission merchants with which the fund transacts. Additionally, although
futures require only a small initial investment in the form of a deposit of initial margin, the amount of a potential loss on
a futures contract could greatly exceed the initial amount invested. While futures contracts are generally liquid instruments,
under certain market conditions futures may be deemed to be illiquid. For example, the fund may be temporarily prohibited from
closing out its position in a futures contract if intraday price change limits or limits on trading volume imposed by the applicable
futures exchange are triggered. If the fund is unable to close out a position on a futures contract, the fund would remain subject
to the risk of adverse price movements until the fund is able to close out the futures position. The ability of the fund to successfully
utilize futures contracts may depend in part upon the ability of the fund’s investment adviser to accurately forecast interest
rates and other economic factors and to assess and predict the impact of such economic factors on the futures in which the fund
invests. If the investment adviser incorrectly forecasts economic developments or incorrectly predicts the impact of such developments
on the futures in which it invests, the fund could be exposed to the risk of loss.
Exposure
to country, region, industry or sector —
Subject to the fund’s investment limitations, the fund may have significant exposure to a particular country, region, industry
or sector. Such exposure may cause the fund to be more impacted by risks relating to and developments affecting the country, region,
industry or sector, and thus its net asset value may be more volatile, than a fund without such levels of exposure. For example,
if the fund has significant exposure in a particular country, then social, economic, regulatory or other issues that negatively
affect that country may have a greater impact on the fund than on a fund that is more geographically diversified.
In addition
to the principal investment strategies described above, the fund has other investment practices that are described in the statement
of additional information, which includes a description of other risks related to the fund’s principal investment strategies
and other investment practices. The fund’s investment results will depend on the ability of the fund’s investment
adviser to navigate the risks discussed above as well as those described in the statement of additional information.
Fund
comparative indexes The investment results tables in this prospectus show how the fund’s average annual total returns
compare with various broad measures of market results.
American
Funds Short-Term Tax-Exempt Bond Fund The Bloomberg Barclays Municipal Short 1–5 Years Index is a market-value-weighted
index that includes investment-grade tax-exempt bonds with maturities of one to five years. This index is unmanaged, and its results
include reinvested distributions but do not reflect the effect of sales charges, commissions, account fees, expenses or U.S. federal
income taxes. This index began on July 31, 2005; therefore, results covering periods prior to that date are not shown.
The Lipper Short Municipal Debt Funds Average is composed of funds that invest in municipal debt issues with dollar-weighted average
maturities of less than three years. The results of the underlying funds in the average include reinvestment of dividends and
capital gain distributions, as well as brokerage commissions paid by the funds for portfolio transactions and other fund expenses,
but do not reflect the effect of sales charges, account fees or U.S. federal income taxes.
Limited
Term Tax-Exempt Bond Fund of America The Bloomberg Barclays Municipal Short-Intermediate 1-10 Years Index is a market-value-weighted
index that includes investment grade tax-exempt bonds with maturities of one to 10 years. This index is unmanaged, and its results
include reinvested distributions but do not reflect the effect of sales charges, commissions, account fees, expenses or U.S. federal
income taxes. The Lipper Short-Intermediate Municipal Debt Funds Average is composed of funds that invest in municipal debt issues
with dollar-weighted average maturities of one to five years. The results of the underlying funds in the average include reinvestment
of dividends and capital gain distributions, as well as brokerage commissions paid by the funds for portfolio transactions and
other fund expenses, but do not reflect the effect of sales charges, account fees or U.S. federal income taxes.
The
Tax-Exempt Bond Fund of America The Bloomberg Barclays Municipal Bond Index is a market-value-weighted index designed to represent
the long-term investment-grade tax-exempt bond market. This index is unmanaged, and its results include reinvested distributions
but do not reflect the effect of sales charges, commissions, account fees, expenses or U.S. federal income taxes. This index was
not in existence when the fund’s Class A shares became available; therefore, lifetime results are not shown. The Lipper
General & Insured Municipal Debt Funds Average is composed of funds that invest in municipal debt issues in the top four credit
rating categories. The results of the underlying funds in the average include reinvestment of dividends and capital gain distributions,
as well as brokerage commissions paid by the funds for portfolio transactions and other fund expenses, but do not reflect the
effect of sales charges, account fees or U.S. federal income taxes.
American
High-Income Municipal Bond Fund The Bloomberg Barclays Municipal Bond Index is a market-value-weighted index designed to represent
the long-term investment-grade tax-exempt bond market. This index is unmanaged, and its results include reinvested distributions
but do not reflect the effect of sales charges, commissions, account fees, expenses or U.S. federal income taxes. The Bloomberg
Barclays High Yield Municipal Bond Index is a market-value-weighted index composed of municipal bonds rated below BBB/Baa. This
index is unmanaged, and its results include reinvested distributions but do not reflect the effect of sales charges, commissions,
account fees, expenses or U.S. federal income taxes. This index was not in existence as of the date the fund’s Class A shares
became available; therefore, lifetime results are not shown. The Lipper High Yield Municipal Debt Funds Average is composed of
funds that invest at least 50% of their assets in lower rated municipal debt issues. The results of the underlying funds
in the average include reinvestment of dividends and capital gain distributions, as well as brokerage commissions paid by the
funds for portfolio transactions and other fund expenses, but do not reflect the effect of sales charges, account fees or U.S.
federal income taxes.
The
Tax-Exempt Fund of California The Bloomberg Barclays California Municipal Index is a market-value-weighted index that includes
only investment-grade tax-exempt bonds of issuers within the state of California. This index is unmanaged and its results include
reinvested distributions but do not reflect the effect of sales charges, commissions, account fees, expenses or U.S. federal income
taxes. This index was not in existence when the fund’s Class A shares became available; therefore, lifetime results are
not shown. The Lipper
31 Tax-exempt
income funds / Prospectus
California
Municipal Debt Funds Average is composed of funds that limit their assets to those securities that provide income that is exempt
from taxation in California. The results of the underlying funds in the average include reinvestment of dividends and capital
gain distributions, as well as brokerage commissions paid by the funds for portfolio transactions and other fund expenses, but
do not reflect the effect of sales charges, account fees or U.S. federal income taxes.
American
Funds Tax-Exempt Fund of New York The Bloomberg Barclays New York Municipal Index is a market-value-weighted index that includes
only investment-grade tax-exempt bonds of issuers within the state of New York. This index is unmanaged, and its results include
reinvested distributions but do not reflect the effect of sales charges, commissions, account fees, expenses or U.S. federal income
taxes. The Lipper New York Municipal Debt Funds Average is composed of funds that limit their assets to those securities that
provide income that is exempt from taxation in New York. The results of the underlying funds in the average include reinvestment
of dividends and capital gain distributions, as well as brokerage commissions paid by the funds for portfolio transactions and
other fund expenses, but do not reflect the effect of sales charges, account fees or U.S. federal income taxes.
Fund
results All fund results in this prospectus reflect the reinvestment of dividends and capital gain distributions, if any.
Unless otherwise noted, fund results reflect any fee waivers and/or expense reimbursements in effect during the periods presented.
Tax-exempt
income funds / Prospectus 32
Management
and organization
Investment
adviser Capital Research and Management Company, an experienced investment management organization founded in 1931, serves
as the investment adviser to the fund and other funds, including the American Funds. Capital Research and Management Company is
a wholly owned subsidiary of The Capital Group Companies, Inc. and is located at 333 South Hope Street, Los Angeles,
California 90071. Capital Research and Management Company manages the investment portfolio and business affairs of the fund. The
total management fee paid by the fund to its investment adviser for the most recent fiscal year, as a percentage of average net
assets, appears in the Annual Fund Operating Expenses tables under “Fees and expenses of the fund.” The management
fee for the fund is based on the daily net assets of the fund and the fund’s monthly gross investment income. Please see
the statement of additional information for further details. A discussion regarding the basis for approval of the fund’s
Investment Advisory and Service Agreements by the fund’s board of trustees is contained in the fund’s annual report
to shareholders for the fiscal year ended July 31, 2019.
Capital
Research and Management Company manages equity assets through three equity investment divisions and fixed income assets through
its fixed income investment division, Capital Fixed Income Investors. The three equity investment divisions — Capital International
Investors, Capital Research Global Investors and Capital World Investors — make investment decisions independently of one
another.
The equity
investment divisions may, in the future, be incorporated as wholly owned subsidiaries of Capital Research and Management Company.
In that event, Capital Research and Management Company would continue to be the investment adviser, and day-to-day investment
management of equity assets would continue to be carried out through one or more of these subsidiaries. Although not currently
contemplated, Capital Research and Management Company could incorporate its fixed income investment division in the future and
engage it to provide day-to-day investment management of fixed income assets. Capital Research and Management Company and each
of the funds it advises have received an exemptive order from the U.S. Securities and Exchange Commission that allows Capital
Research and Management Company to use, upon approval of the fund’s board, its management subsidiaries and affiliates to
provide day-to-day investment management services to the fund, including making changes to the management subsidiaries and affiliates
providing such services. The fund’s shareholders have approved this arrangement; however, there is no assurance that Capital
Research and Management Company will incorporate its investment divisions or exercise any authority granted to it under the exemptive
order.
Portfolio
holdings Portfolio holdings information for the fund is available on the American Funds website at capitalgroup.com. A description
of the fund’s policies and procedures regarding disclosure of information about its portfolio holdings is available in the
statement of additional information.
33 Tax-exempt
income funds / Prospectus
The
Capital SystemSM Capital Research and Management Company uses a system of multiple portfolio managers in managing
mutual fund assets. Under this approach, the portfolio of a fund is divided into segments managed by individual managers. In addition,
Capital Research and Management Company’s investment analysts may make investment decisions with respect to a portion of
a fund’s portfolio. Investment decisions are subject to a fund’s objective(s), policies and restrictions and the oversight
of the appropriate investment-related committees of Capital Research and Management Company and its investment divisions.
Certain
senior members of Capital Fixed Income Investors, the investment adviser’s fixed income investment division, serve on the
Portfolio Strategy Group. The group utilizes a research-driven process with input from the investment adviser’s analysts,
portfolio managers and economists to define investment themes on a range of macroeconomic factors, including duration, yield curve
and sector allocation. The investment decisions made by the fund’s portfolio managers are informed by the investment themes
discussed by the group.
The table
below shows the investment experience and role in management of the fund for the fund’s primary portfolio managers. Notwithstanding
The Capital System, the portfolio managers of American Funds Tax-Exempt Fund of New York will work together to oversee the fund's
entire portfolio.
| |
|
|
|
| Portfolio
manager |
Investment
experience |
Experience
in this fund |
Role
in management of the fund |
| Aaron
Applebaum |
Investment
professional for 18 years in total;
12 years with Capital Research and Management Company or affiliate |
|
|
| American
Funds Short-Term Tax-Exempt Bond Fund |
|
3
years |
Serves
as a fixed income portfolio manager |
| Limited
Term Tax-Exempt Bond Fund of America |
|
5
years |
Serves
as a fixed income portfolio manager |
| Mark
Marinella |
Investment
professional for 34 years in total;
6 years with Capital Research and Management Company or affiliate |
|
|
| American
Funds Short-Term Tax-Exempt Bond Fund |
|
1
year |
Serves
as a fixed income portfolio manager |
| Limited
Term Tax-Exempt Bond Fund of America |
|
1
year |
Serves
as a fixed income portfolio manager |
| The
Tax-Exempt Fund of California |
|
1
year |
Serves
as a fixed income portfolio manager |
| Chad
M. Rach |
Investment
professional for 26 years in total;
15 years with Capital Research and Management Company or affiliate |
|
|
| The
Tax-Exempt Bond Fund of America |
|
3
years
(plus 12 years of
prior experience
as an
investment analyst
for the fund) |
Serves
as a fixed income portfolio manager |
| American
High-Income Municipal Bond Fund |
|
8
years
(plus 6 years of
prior experience
as an
investment analyst
for the fund) |
Serves
as a fixed income portfolio manager |
| |
Tax-exempt
income funds / Prospectus 34
| |
|
|
|
| Portfolio
manager |
Investment
experience |
Experience
in this fund |
Role
in management of the fund |
| Jerome
Solomon |
Investment
professional for 27 years in total;
11 years with Capital Research and Management Company or affiliate |
|
|
| American
High-Income Municipal Bond Fund |
|
2
years
(plus 8 years of
prior experience
as an
investment analyst
for the fund) |
Serves
as a fixed income portfolio manager |
American
Funds
Tax-Exempt Fund of
New York |
|
7
years |
Serves
as a fixed income portfolio manager |
| Karl
J. Zeile |
Investment
professional for 28 years in total;
20 years with Capital Research and Management Company or affiliate |
|
|
| The
Tax-Exempt Bond Fund of America |
|
16
years
(plus 4 years of
prior experience
as an
investment analyst
for the fund) |
Serves
as a fixed income portfolio manager |
| American
High-Income Municipal Bond Fund |
|
15
years
(plus 5 years of
prior experience
as an
investment analyst
for the fund) |
Serves
as a fixed income portfolio manager |
| The
Tax-Exempt Fund of California |
|
16
years |
Serves
as a fixed income portfolio manager |
American
Funds
Tax-Exempt Fund of
New York |
|
9
years |
Serves
as a fixed income portfolio manager |
| |
| |
Information
regarding the portfolio managers’ compensation, their ownership of securities in the fund and other accounts they manage
is in the statement of additional information.
35 Tax-exempt
income funds / Prospectus
Certain
privileges and/or services described on the following pages of this prospectus and in the statement of additional information
may not be available to you, depending on your investment dealer. Please see your financial advisor or investment dealer
for more information.
Shareholder
information
Shareholder
services American Funds Service Company, the fund’s transfer agent, offers a wide range of services that you can use
to alter your investment program should your needs or circumstances change. These services may be terminated or modified at any
time upon 60 days’ written notice.
A
more detailed description of policies and services is included in the fund’s statement of additional information and the
owner’s guide sent to new American Funds shareholders entitled Welcome. These documents are available by writing
to or calling American Funds Service Company.
Tax-exempt
income funds / Prospectus 36
Unless
otherwise noted, references to Class F shares refer to Class F-1, F-2, and F-3 shares.
Purchase,
exchange and sale of shares The fund reserves
the right not to make its shares available to tax-deferred retirement plans and accounts. The Tax-Exempt Fund of California
and American Funds Tax-Exempt Fund of New York are intended primarily for taxable residents of California and New York, respectively,
and may not be appropriate for residents of other states and tax-exempt entities.
The
fund’s transfer agent, on behalf of the fund and American Funds Distributors,® the fund’s distributor,
is required by law to obtain certain personal information from you or any other person(s) acting on your behalf in order to verify
your or such person’s identity. If you do not provide the information, the transfer agent may not be able to open your account.
If the transfer agent is unable to verify your identity or that of any other person(s) authorized to act on your behalf, or believes
it has identified potentially criminal activity, the fund and American Funds Distributors reserve the right to close your account
or take such other action they deem reasonable or required by law.
When
purchasing shares, you should designate the fund or funds in which you wish to invest. Subject to the exception below, if no fund
is designated, your money will be held uninvested (without liability to the transfer agent for loss of income or appreciation
pending receipt of proper instructions) until investment instructions are received, but for no more than three business days.
Your investment will be made at the net asset value (plus any applicable sales charge, in the case of Class A or Class T shares)
next determined after investment instructions are received and accepted by the transfer agent. If investment instructions are
not received, your money will be invested in Class A shares (or, if you are investing through a financial intermediary who offers
only Class T shares, in Class T shares) of American Funds U.S. Government Money Market FundSM
on the third business day after receipt of your investment.
If
the amount of your cash investment is $10,000 or less, no fund is designated, and you made a cash investment (excluding exchanges)
within the last 16 months, your money will be invested in the same proportion and in the same fund or funds and in the same class
of shares in which your last cash investment was made.
Different
procedures may apply to certain employer-sponsored arrangements, including, but not limited to, SEPs and SIMPLE IRAs.
Valuing
shares The net asset value of each share class of the fund is the value of a single share of that class. The fund calculates
the net asset value each day the New York Stock Exchange is open for trading as of approximately 4 p.m. New York time, the normal
close of regular trading. If, for example, the New York Stock Exchange closes at 1 p.m. New York time, the fund’s net asset
value would still be determined as of 4 p.m. New York time. In this example, portfolio securities traded on the New York Stock
Exchange would be valued at their closing prices unless the investment adviser determines that a “fair value” adjustment
is appropriate due to subsequent events.
Equity
securities are valued primarily on the basis of market quotations, and debt securities are valued primarily on the basis of prices
from third-party pricing services. Futures contracts are valued primarily on the basis of settlement prices. The fund has adopted
procedures for making fair value determinations if market quotations or prices from third-party pricing services, as applicable,
are not readily available or are not considered reliable. For example, if events occur between the close of markets outside the
United States and the close of regular trading on the New York Stock Exchange that, in the opinion of the investment adviser,
materially affect the value of any of the fund’s equity securities that trade principally in those international markets,
those securities will be valued in accordance with fair value procedures. Similarly, fair value procedures may be employed if
an issuer defaults on its debt securities and there is no market for its securities. Use of these procedures is intended to result
in more appropriate net asset values and, where applicable, to reduce potential arbitrage opportunities otherwise available to
short-term investors.
Your
shares will be purchased at the net asset value (plus any applicable sales charge, in the case of Class A or Class T shares) or
sold at the net asset value next determined after American Funds Service Company receives your request, provided that your request
contains all information and legal documentation necessary to process the transaction. A contingent deferred sales charge may
apply at the time you sell certain Class A and C shares.
Purchase
of Class A and C shares You may generally open an account and purchase shares by contacting any financial advisor (who may
impose transaction charges in addition to those described in this prospectus) authorized to sell the fund’s shares. You
may purchase additional shares in various ways, including through your financial advisor and by mail, telephone, the Internet
and bank wire.
Class C
shares are not offered by American Funds Short-Term Tax-Exempt Bond Fund at this time. For Limited Term Tax-Exempt Bond Fund of
America, Class C shares may be acquired only by exchanging from Class C shares of other American Funds. Direct purchases
of Class C shares of the funds are not permitted.
Automatic
conversion of Class C shares Class C shares automatically convert to Class F-1 shares
in the month of the 10-year anniversary of the purchase date. The Internal Revenue Service currently takes the position that such
automatic conversions are not taxable. Should its position change, the automatic conversion feature may be suspended. If this were
to happen, you would have the option of converting your Class C shares to the Class F-1 shares at the anniversary date described
above. This exchange would be based on the relative net asset values of the two classes in question, without the imposition of
a sales charge or fee, but you might face certain tax consequences as a result.
Purchase
of Class F shares You may generally open an account and purchase Class F shares only through fee-based programs of investment
dealers that have special agreements with the fund’s distributor, through financial intermediaries that have been approved
by, and that have special agreements with, the fund’s distributor to offer Class F shares to self-directed investment
brokerage accounts that may charge a transaction fee, through certain registered investment advisors and through other intermediaries
approved by the fund’s distributor. These intermediaries typically charge ongoing fees for services they provide. Intermediary
fees are not paid by the fund and normally range from .75% to 1.50% of assets annually, depending on the services offered.
37 Tax-exempt
income funds / Prospectus
Class
F-2 and F-3 shares may also be available on brokerage platforms of firms that have agreements with the fund’s distributor
to offer such shares solely when acting as an agent for the investor. An investor transacting in Class F-2 or F-3 shares in these
programs may be required to pay a commission and/or other forms of compensation to the broker. Shares of the fund are available
in other share classes that have different fees and expenses.
In addition,
Class F-3 shares are available to institutional investors, which include, but are not limited to, charitable organizations, governmental
institutions and corporations. For accounts held and serviced by the fund’s transfer agent the minimum investment amount
is $1 million.
Purchase
minimums and maximums Purchase minimums described in this prospectus may be waived in certain cases. In addition, the fund
reserves the right to redeem the shares of any shareholder for their then current net asset value per share if the shareholder’s
aggregate investment in the fund falls below the fund’s minimum initial investment amount. See the statement of additional
information for details.
For
accounts established with an automatic investment plan, the initial purchase minimum of $250 (or $1,000 for The Tax-Exempt Fund
of California and American Funds Tax-Exempt Fund of New York) may be waived if the purchases (including purchases through exchanges
from another fund) made under the plan are sufficient to reach $250 (or $1,000 for The Tax-Exempt Fund of California and American
Funds Tax-Exempt Fund of New York) within five months of account establishment.
The
purchase maximum for Class C shares is $500,000 per transaction. In addition, if you have significant American Funds holdings,
you may not be eligible to invest in Class C shares. Specifically, you may not purchase Class C shares if you are eligible
to purchase Class A shares at the $1 million or more sales charge discount rate (that is, at net asset value). See “Sales
charge reductions and waivers” in this prospectus and the statement of additional information for more details regarding
sales charge discounts.
Exchange
Except for Class T shares or as otherwise described in this prospectus, you may exchange your shares for shares of the same
class of other American Funds without a sales charge. Exchanges of shares from American Funds U.S. Government Money Market Fund
initially purchased without a sales charge to shares of another American Fund will be subject to the appropriate sales charge
applicable to the other fund, unless the American Funds U.S. Government Money Market Fund shares were acquired by an exchange
from a fund having a sales charge or by reinvestment or cross-reinvestment of dividends or capital gain distributions. For purposes
of computing the contingent deferred sales charge on Class C shares, the length of time you have owned your shares will be measured
from the first day of the month in which shares were purchased and will not be affected by any permitted exchange.
Except as
indicated above, Class T shares are not eligible for exchange privileges. Accordingly, an exchange of your Class T shares for
Class T shares of any other American Fund will normally be subject to any applicable sales charges.
Exchanges
have the same tax consequences as ordinary sales and purchases. For example, to the extent you exchange shares held in a taxable
account that are worth more now than what you paid for them, the gain will be subject to taxation.
See
“Transactions by telephone, fax or the Internet” in the section “How to sell shares” of this prospectus
for information regarding electronic exchanges.
Please
see the statement of additional information for details and limitations on moving investments in certain share classes to different
share classes and on moving investments held in certain accounts to different accounts.
Tax-exempt
income funds / Prospectus 38
How
to sell shares
You
may sell (redeem) shares in any of the following ways:
Through
your dealer or financial advisor (certain charges may apply)
· Shares
held for you in your dealer’s name must be sold through the dealer.
· Class
F shares must be sold through intermediaries such as dealers or financial advisors.
Writing
to American Funds Service Company
· Requests
must be signed by the registered shareholder(s).
· A
signature guarantee is required if the redemption is:
— more
than $125,000;
— made
payable to someone other than the registered shareholder(s); or
— sent
to an address other than the address of record or to an address of record that has been changed within the previous 10 days.
· American
Funds Service Company reserves the right to require signature guarantee(s) on any redemption.
· Additional
documentation may be required for redemptions of shares held in corporate, partnership or fiduciary accounts.
Telephoning
or faxing American Funds Service Company or using the Internet
· Redemptions
by telephone, fax or the Internet (including American FundsLine and capitalgroup.com) are limited to $125,000 per American Funds
shareholder each day.
· Checks
must be made payable to the registered shareholder.
· Checks
must be mailed to an address of record that has been used with the account for at least 10 days.
The
fund typically expects to remit redemption proceeds one business day following receipt and acceptance of a redemption order, regardless
of the method the fund uses to make such payment (e.g., check, wire or automated clearing house transfer). However, payment may
take longer than one business day and may take up to seven days as generally permitted by the Investment Company Act of 1940,
as amended (“1940 Act”). Under the 1940 Act, the fund may be permitted to pay redemption proceeds beyond seven days
under certain limited circumstances. In addition, if you recently purchased shares and subsequently request a redemption of those
shares, the fund will pay the available redemption proceeds once a sufficient period of time has passed to reasonably ensure that
checks or drafts, including certified or cashier’s checks, for the shares purchased have cleared (normally seven business
days from the purchase date).
Under
normal conditions, the fund typically expects to meet shareholder redemptions by monitoring the fund’s portfolio and redemption
activities and by regularly holding a reserve of highly liquid assets, such as cash or cash equivalents. The fund may use additional
methods to meet shareholder redemptions, if they become necessary. These methods may include, but are not limited to, the sale
of portfolio assets, the use of overdraft protection afforded by the fund’s custodian bank, borrowing from a line of credit
or from other funds advised by the investment adviser or its affiliates, and making payment with fund securities or other fund
assets rather than in cash (as further discussed in the following paragraph).
Although
payment of redemptions normally will be in cash, the fund’s declaration of trust permits payment of the redemption price
wholly or partly with portfolio securities or other fund assets under conditions and circumstances determined by the fund’s
board of trustees. On the same redemption date, some shareholders may be paid in whole or in part in securities (which may differ
among those shareholders), while other shareholders may be paid entirely in cash. In general,
in-kind redemptions to affiliated shareholders will as closely as practicable represent the affiliated shareholder’s pro
rata share of the fund’s securities, subject to certain exceptions. Securities distributed in-kind to unaffiliated shareholders
will be selected by the investment adviser in a manner the investment adviser deems to be fair and reasonable to the fund’s
shareholders. The disposal of the securities received in-kind may be subject to brokerage costs and, until sold, such securities
remain at market risk and liquidity risk, including the risk that such securities are or become difficult to sell. If the fund
pays your redemption with illiquid or less liquid securities, you will bear the risk of not being able to sell such securities.
Transactions
by telephone, fax or the Internet Generally, you are automatically eligible to redeem or exchange
shares by telephone, fax or the Internet, unless you notify us in writing that you do not want any or all of these services. You
may reinstate these services at any time.
Unless
you decide not to have telephone, fax or Internet services on your account(s), you agree to hold each fund, American Funds Service
Company, any of its affiliates or mutual funds managed by such affiliates, and each of their respective directors, trustees, officers,
employees and agents harmless from any losses, expenses, costs or liabilities (including attorney fees) that may be incurred in
connection with the exercise of these privileges, provided that American Funds Service Company employs reasonable procedures to
confirm that the instructions received from any person with appropriate account information are genuine. If reasonable procedures
are not employed, American Funds Service Company and/or the fund may be liable for losses due to unauthorized or fraudulent instructions.
39 Tax-exempt
income funds / Prospectus
Frequent
trading of fund shares The fund and American Funds Distributors reserve the right to reject
any purchase order for any reason. The fund is not designed to serve as a vehicle for frequent trading. Frequent trading of fund
shares may lead to increased costs to the fund and less efficient management of the fund’s portfolio, potentially resulting
in dilution of the value of the shares held by long-term shareholders. Accordingly, purchases, including those that are part of
exchange activity, that the fund or American Funds Distributors has determined could involve actual or potential harm to the fund
may be rejected.
The
fund, through its transfer agent, American Funds Service Company, maintains surveillance procedures that are designed to detect
frequent trading in fund shares. Under these procedures, various analytics are used to evaluate factors that may be indicative
of frequent trading. For example, transactions in fund shares that exceed certain monetary thresholds may be scrutinized. American
Funds Service Company also may review transactions that occur close in time to other transactions in the same account or in multiple
accounts under common ownership or influence. Trading activity that is identified through these procedures or as a result of any
other information available to the fund will be evaluated to determine whether such activity might constitute frequent trading.
These procedures may be modified from time to time as appropriate to improve the detection of frequent trading, to facilitate
monitoring for frequent trading in particular retirement plans or other accounts and to comply with applicable laws.
In addition
to the fund’s broad ability to restrict potentially harmful trading as described above, the fund’s board of trustees
has adopted a “purchase blocking policy” under which any shareholder redeeming shares having a value of $5,000 or
more from a fund will be precluded from investing in that fund for 30 calendar days after the redemption transaction. This policy
also applies to redemptions and purchases that are part of exchange transactions. Under the fund’s purchase blocking policy,
certain purchases will not be prevented and certain redemptions will not trigger a purchase block, such as:
· purchases
and redemptions of shares having a value of less than $5,000;
· purchases
and redemptions by investment companies managed or sponsored by the fund’s investment adviser or its affiliates, including
reallocations and transactions allowing the investment company to meet its redemptions and purchases;
· retirement
plan contributions, loans and distributions (including hardship withdrawals) identified as such on the retirement plan recordkeeper’s
system;
· purchases
and redemptions in community foundation accounts;
· purchase
transactions involving in-kind transfers of shares of the fund, rollovers, Roth IRA conversions and IRA recharacterizations,
if the entity maintaining the shareholder account is able to identify the transaction as one of these types of transactions; and
· systematic
redemptions and purchases, if the entity maintaining the shareholder account is able to identify the transaction as a systematic
redemption or purchase.
Generally,
purchases and redemptions will not be considered “systematic” unless the transaction is prescheduled for a specific
date.
The
fund reserves the right to waive the purchase blocking policy with respect to specific shareholder accounts if American Funds
Service Company determines that its surveillance procedures are adequate to detect frequent trading in fund shares in such
accounts.
American
Funds Service Company will work with certain intermediaries (such as investment dealers holding shareholder accounts in street
name, retirement plan recordkeepers, insurance company separate accounts and bank trust companies) to apply their own procedures,
provided that American Funds Service Company believes the intermediary’s procedures are reasonably designed to enforce the
frequent trading policies of the fund. You should refer to disclosures provided by the intermediaries with which you have an account
to determine the specific trading restrictions that apply to you.
If
American Funds Service Company identifies any activity that may constitute frequent trading, it reserves the right to contact
the intermediary and request that the intermediary either provide information regarding an account owner’s transactions
or restrict the account owner’s trading. If American Funds Service Company is not satisfied that the intermediary has taken
appropriate action, American Funds Service Company may terminate the intermediary’s ability to transact in fund shares.
There is
no guarantee that all instances of frequent trading in fund shares will be prevented.
Notwithstanding
the fund’s surveillance procedures and purchase blocking policy described above, all transactions in fund shares remain
subject to the right of the fund, American Funds Distributors and American Funds Service Company to restrict potentially abusive
trading generally, including the types of transactions described above that will not be prevented or trigger a block under the
purchase blocking policy. See the statement of additional information for more information about how American Funds Service Company
may address other potentially abusive trading activity in American Funds.
Tax-exempt
income funds / Prospectus 40
Distributions
and taxes
Dividends
and distributions The fund declares daily dividends from net investment income and distributes the accrued dividends, which
may fluctuate, to you each month. Generally, dividends begin accruing on the day payment for shares is received by the fund or
American Funds Service Company.
Capital
gains, if any, are usually distributed in November or December. When a dividend or capital gain is distributed, the net asset
value per share is reduced by the amount of the payment.
You
may elect to reinvest dividends and/or capital gain distributions to purchase additional shares of this fund or other American
Funds, or you may elect to receive them in cash.
Taxes
on dividends and distributions Interest on municipal bonds is generally not included in gross income for federal tax purposes.
Subject to certain requirements, the fund is permitted to pass through to its shareholders the interest earned on municipal bonds
as federally exempt-interest dividends. Taxable dividends, including distributions of short-term capital gains, however, are subject
to federal taxation at the applicable rates for ordinary income. To the extent the fund is permitted to invest in bonds subject
to federal alternative minimum tax, interest earned on certain bonds may be treated as income subject to federal alternative minimum
tax. The fund’s distributions of net long-term capital gains are taxable as long-term capital gains.
Depending
on their state of residence, shareholders of American Funds Short-Term Tax-Exempt Bond Fund, Limited Term Tax-Exempt Bond Fund
of America, The Tax-Exempt Bond Fund of America, and American High-Income Municipal Bond Fund may be able to exempt from state
taxation some or all of the federally tax-exempt income dividends paid by those funds.
Each of
The Tax-Exempt Fund of California and American Funds Tax-Exempt Fund of New York anticipates that the federally exempt interest
dividends paid by the applicable fund and derived from interest on bonds exempt from California and New York income tax, respectively,
will also be exempt from California and New York state income tax, respectively. To the extent the applicable fund’s dividends
are derived from interest on debt obligations that is not exempt from California or New York income tax, however, such dividends
will be subject to applicable state income tax.
Moreover,
any federally taxable dividends and capital gains distributions from the fund may also be subject to state tax.
Any taxable
dividends or capital gain distributions you receive from the fund normally will be taxable to you when made, regardless of whether
you reinvest dividends or capital gain distributions or receive them in cash.
Taxes
on transactions Your redemptions, including exchanges, may result in a capital gain or loss for federal tax purposes.
A capital gain or loss on your investment is the difference between the cost of your shares, including any sales charges,
and the amount you receive when you sell them.
Shareholder
fees Fees borne directly by the fund normally have the effect of reducing a shareholder’s taxable income on distributions.
Please
see your tax advisor for more information.
41 Tax-exempt
income funds / Prospectus
Choosing
a share class The fund offers different classes
of shares through this prospectus. Shares of the fund are available through various investment programs or accounts. However,
tax-exempt funds should generally not serve as investments for tax-deferred retirement plans and accounts. The services or
share classes available to you may vary depending upon how you wish to purchase shares of the fund. Since shares of American Funds
Short-Term Tax-Exempt Bond Fund are only available in Class A, F-1, F-2 and F-3, references to Class C shares are not applicable
to American Funds Short-Term Tax-Exempt Bond Fund.
Each share
class of the fund represents an investment in the same portfolio of securities, but each class has its own sales charge and expense
structure, allowing you to choose the class that best fits your situation. For example, while Class F-1 shares are subject to
12b-1 fees and subtransfer agency fees payable to third-party service providers, Class F-2 shares are subject only to subtransfer
agency fees payable to third-party service providers (and not 12b-1 fees) and Class F-3 shares are not subject to any such additional
fees. The different fee structures allow the investor to choose how to pay for advisory platform expenses. When you purchase
shares of the fund, you should choose a share class. If none is chosen, your investment will be made in Class A shares (or if
you are investing through a financial intermediary who offers only Class T shares, your investment will be made in Class T shares).
Factors
you should consider when choosing a class of shares include:
· how
long you expect to own the shares;
· how
much you intend to invest;
· total
expenses associated with owning shares of each class;
· whether
you qualify for any reduction or waiver of sales charges (for example, Class A or Class T shares may be a less expensive option
over time, particularly if you qualify for a sales charge reduction or waiver);
· whether
you want or need the flexibility to effect exchanges among American Funds without the imposition of a sales charge (for example,
while Class A shares offer such exchange privileges, Class T shares do not);
· whether
you plan to take any distributions in the near future; and
· availability
of share classes:
— Class
C shares are not available to retirement plans that do not currently invest in such shares and that are eligible to invest in
American Funds Class R shares, including retirement plans established under Internal Revenue Code Sections 401(a) (including 401(k)
plans), 403(b) or 457;
— Class
F shares are available (i) to fee-based programs of investment dealers that have special agreements with the fund’s distributor,
(ii) to financial intermediaries that have been approved by, and that have special agreements with, the fund’s distributor
to offer Class F shares to self-directed investment brokerage accounts that may charge a transaction fee, (iii) to certain registered
investment advisors and (iv) to other intermediaries approved by the fund’s distributor; and
— Class
F-3 shares are also available to institutional investors, which include, but are not limited to, charitable organizations, governmental
institutions and corporations. For accounts held and serviced by the fund’s transfer agent the minimum investment amount
is $1 million.
Each
investor’s financial considerations are different. You should speak with your financial advisor to help you decide which
share class is best for you.
Tax-exempt
income funds / Prospectus 42
Sales
charges
Class
A shares The initial sales charge you pay each time you buy Class A shares differs depending upon the amount you invest and
may be reduced or eliminated for larger purchases as indicated below. The “offering price,” the price you pay to buy
shares, includes any applicable sales charge, which will be deducted directly from your investment. Shares acquired through reinvestment
of dividends or capital gain distributions are not subject to an initial sales charge.
Sales
charges for The Tax-Exempt Bond Fund of America, American High-Income Municipal Bond Fund, The Tax-Exempt Fund of California and
American Funds Tax-Exempt Fund of New York
| |
|
|
|
| |
Sales
charge as a
percentage of: |
|
| Investment |
Offering
price |
Net
amount
invested |
Dealer
commission
as a percentage
of offering price |
| Less
than $100,000 |
3.75% |
3.90% |
3.00% |
| $100,000
but less than $250,000 |
3.50 |
3.63 |
2.75 |
| $250,000
but less than $500,000 |
2.50 |
2.56 |
2.00 |
| $500,000
but less than $750,000 |
2.00 |
2.04 |
1.60 |
| $750,000
but less than $1 million |
1.50 |
1.52 |
1.20 |
| $1
million or more and certain other investments described below |
none |
none |
see
below |
Sales
charges for American Funds Short-Term Tax-Exempt Bond Fund and Limited Term Tax-Exempt Bond Fund of America
| |
|
|
|
| |
Sales
charge as a
percentage of: |
|
| Investment |
Offering
price |
Net
amount
invested |
Dealer
commission
as a percentage
of offering price |
| Less
than $500,000 |
2.50% |
2.56% |
2.00% |
| $500,000
but less than $750,000 |
2.00 |
2.04 |
1.60 |
| $750,000
but less than $1 million |
1.50 |
1.52 |
1.20 |
| $1
million or more and certain other investments described below |
none |
none |
see
below |
The sales
charge, expressed as a percentage of the offering price or the net amount invested, may be higher or lower than the percentages
described in the tables above due to rounding. This is because the dollar amount of the sales charge is determined by subtracting
the net asset value of the shares purchased from the offering price, which is calculated to two decimal places using standard
rounding criteria. The impact of rounding will vary with the size of the investment and the net asset value of the shares. Similarly,
any contingent deferred sales charge paid by you on investments in Class A shares may be higher or lower than the 1% charge described
below due to rounding.
Except
as provided below, investments in Class A shares of $1 million or more will be subject to a 1% contingent deferred sales charge
if the shares are sold within 18 months of purchase. The contingent deferred sales charge is based on the original purchase
cost or the current market value of the shares being sold, whichever is less. Class A shares purchased before August 14, 2017
are subject to a contingent deferred sales charge period of 12 months.
Class
A share purchases not subject to sales charges The following investments are not subject to
any initial or contingent deferred sales charge if American Funds Service Company is properly notified of the nature of the investment:
· investments
made by accounts that are part of qualified fee-based programs that purchased Class A shares before the discontinuation of the
relevant investment dealer’s load-waived Class A share program with American Funds and that continue to be held through
fee-based programs;
· rollover
investments from retirement plans to IRAs that are described in the “Rollovers from retirement plans to IRAs” section
of this prospectus; and
· investments
made by accounts held at American Funds Service Company that are no longer associated with a financial advisor may invest in Class A
shares without a sales charge. This includes retirement plans investing in Class A shares, where the plan is no longer associated
with a financial advisor. SIMPLE IRAs and 403(b) custodial accounts that are aggregated at the plan level for Class A sales
charge purposes are not eligible to invest without a sales charge under this policy.
The distributor
may pay dealers a commission of up to 1% on investments made in Class A shares with no initial sales charge. The fund may
reimburse the distributor for these payments through its plans of distribution (see “Plans of distribution” in this
prospectus).
If
requested, American Funds Class A shares will be sold at net asset value to:
(1) currently
registered representatives and assistants directly employed by such representatives, retired registered representatives with respect
to accounts established while active, or full-time employees (collectively, “Eligible Persons”) (and their (a) spouses
or equivalents if recognized under local law, (b) parents and children, including parents and children in step and adoptive relationships,
sons-in-law and daughters-in-law, and (c) parents-in-law, if the Eligible Persons or the spouses, children or parents of the Eligible
Persons are listed in the account registration with the parents-in-law) of dealers who have sales agreements with American Funds
Distributors (or who clear transactions through such dealers), plans for the dealers, and plans that include as participants only
the Eligible Persons, their spouses, parents and/or children;
43 Tax-exempt
income funds / Prospectus
(2) the
supervised persons of currently registered investment advisory firms (“RIAs”) and assistants directly employed by
such RIAs, retired supervised persons of RIAs with respect to accounts established while a supervised person (collectively, “Eligible
Persons”) (and their (a) spouses or equivalents if recognized under local law, (b) parents and children, including parents
and children in step and adoptive relationships, sons-in-law and daughters-in-law and (c) parents-in-law, if the Eligible Persons
or the spouses, children or parents of the Eligible Persons are listed in the account registration with the parents-in-law) of
RIA firms that are authorized to sell shares of the funds, plans for the RIA firms, and plans that include as participants only
the Eligible Persons, their spouses, parents and/or children;
(3) insurance
company separate accounts;
(4) accounts
managed by subsidiaries of The Capital Group Companies, Inc.;
(5) an
individual or entity with a substantial business relationship with The Capital Group Companies, Inc. or its affiliates, or an
individual or entity related or relating to such individual or entity;
(6) wholesalers
and full-time employees directly supporting wholesalers involved in the distribution of insurance company separate accounts whose
underlying investments are managed by any affiliate of The Capital Group Companies, Inc.;
(7) full-time
employees of banks that have sales agreements with American Funds Distributors who are solely dedicated to directly supporting
the sale of mutual funds; and
(8) current
or former clients of Capital Group Private Client Services and their family members who purchase their shares through Capital
Group Private Client Services or American Funds Service Company.
Shares are
offered at net asset value to these persons and organizations due to anticipated economies in sales effort and expense. Once an
account is established under this net asset value privilege, additional investments can be made at net asset value for the life
of the account. Depending on the financial intermediary holding your account, these privileges may be unavailable. Investors should
consult their financial intermediary for further information.
Certain
other investors may qualify to purchase shares without a sales charge, such as employees of The Capital Group Companies, Inc.
and its affiliates. Please see the statement of additional information for further details.
Class
C shares Class C shares are sold without any initial sales charge. American Funds Distributors
pays 1% of the amount invested to dealers who sell Class C shares. A contingent deferred sales charge of 1% applies if Class C
shares are sold within one year of purchase. The contingent deferred sales charge is eliminated one year after purchase.
Any contingent
deferred sales charge paid by you on sales of Class C shares, expressed as a percentage of the applicable redemption amount, may
be higher or lower than the percentages described above due to rounding.
Tax-exempt
income funds / Prospectus 44
Class
T shares The initial sales charge you pay each time you buy Class T shares differs depending upon the amount you invest and
may be reduced for larger purchases as indicated below. The “offering price,” the price you pay to buy shares, includes
any applicable sales charge, which will be deducted directly from your investment. Shares acquired through reinvestment of dividends
or capital gain distributions are not subject to an initial sales charge.
| |
|
|
| |
Sales
charge as a
percentage of: |
| Investment |
Offering
price |
Net
amount
invested |
| Less
than $250,000 |
2.50% |
2.56% |
| $250,000
but less than $500,000 |
2.00 |
2.04 |
| $500,000
but less than $1 million |
1.50 |
1.52 |
| $1
million or more |
1.00 |
1.01 |
The
sales charge, expressed as a percentage of the offering price or the net amount invested, may be higher or lower than the percentages
described in the table above due to rounding. This is because the dollar amount of the sales charge is determined by subtracting
the net asset value of the shares purchased from the offering price, which is calculated to two decimal places using standard
rounding criteria. The impact of rounding will vary with the size of the investment and the net asset value of the shares.
Class
F shares Class F shares are sold without any initial or contingent deferred sales charge.
Contingent
deferred sales charges Shares acquired through reinvestment of dividends or capital gain distributions are not subject to
a contingent deferred sales charge. In addition, the contingent deferred sales charge may be waived in certain circumstances.
See “Contingent deferred sales charge waivers” in the “Sales charge reductions and waivers” section of
this prospectus. For purposes of determining the contingent deferred sales charge, if you sell only some of your shares, shares
that are not subject to any contingent deferred sales charge will be sold first, followed by shares that you have owned the longest.
45 Tax-exempt
income funds / Prospectus
Sales
charge reductions and waivers To receive a reduction
in your Class A initial sales charge, you must let your financial advisor or American Funds Service Company know at the time you
purchase shares that you qualify for such a reduction. If you do not let your advisor or American Funds Service Company know that
you are eligible for a reduction, you may not receive the sales charge discount to which you are otherwise entitled. In order
to determine your eligibility to receive a sales charge discount, it may be necessary for you to provide your advisor or American
Funds Service Company with information and records (including account statements) of all relevant accounts invested in American
Funds. You may need to invest directly through American Funds Service Company in order to receive the sales charge waivers described
in this prospectus. Investors should consult their financial intermediary for further information. Certain financial intermediaries
that distribute shares of American Funds may impose different sales charge waivers than those described in this prospectus. Such
variations in sales charge waivers are described in an appendix to this prospectus titled “Sales charge waivers.”
Note that such sales charge waivers and discounts offered through a particular intermediary, as set forth in the appendix to this
prospectus, are implemented and administered solely by that intermediary. Please contact the applicable intermediary to ensure
that you understand the steps you must take in order to qualify for any available waivers or discounts.
In
addition to the information in this prospectus, you may obtain more information about share classes, sales charges and sales charge
reductions and waivers through a link on the home page of the American Funds website at capitalgroup.com, from the statement of
additional information or from your financial advisor.
Reducing
your Class A initial sales charge Consistent with the policies described in this prospectus,
you and your “immediate family” (your spouse — or equivalent, if recognized under local law, your children under
the age of 21 or disabled adult dependents covered by ABLE accounts) may combine all of your American Funds investments to reduce
Class A sales charges. However, for this purpose, investments representing direct purchases of American Funds U.S. Government
Money Market Fund Class A shares are excluded. Following are different ways that you may qualify for a reduced Class A
sales charge:
Aggregating
accounts To receive a reduced Class A sales charge, investments made by you and your immediate family (see above) may be aggregated
if made for your own account(s) and/or certain other accounts, such as:
· individual-type
employee benefit plans, such as an IRA, single-participant Keogh-type plan, or a participant account of a 403(b) plan that is
treated as an individual-type plan for sales charge purposes (see “Purchases by certain 403(b) plans” under “Rollovers
from retirement plans to IRAs” below);
· SEP
plans and SIMPLE IRA plans established after November 15, 2004, by an employer adopting any plan document other than a prototype
plan produced by American Funds Distributors;
· business
accounts solely controlled by you or your immediate family (for example, you own the entire business);
· trust
accounts established by you or your immediate family (for trusts with only one primary beneficiary, upon the trustor’s death
the trust account may be aggregated with such beneficiary’s own accounts; for trusts with multiple primary beneficiaries,
upon the trustor’s death the trustees of the trust may instruct American Funds Service Company to establish separate trust
accounts for each primary beneficiary; each primary beneficiary’s separate trust account may then be aggregated with such
beneficiary’s own accounts);
· endowments
or foundations established and controlled by you or your immediate family; or
· 529
accounts, which will be aggregated at the account owner level (Class 529-E accounts may only be aggregated with an eligible employer
plan).
Individual
purchases by a trustee(s) or other fiduciary(ies) may also be aggregated if the investments are:
· for
a single trust estate or fiduciary account, including employee benefit plans other than the individual-type employee benefit plans
described above;
· made
for two or more employee benefit plans of a single employer or of affiliated employers as defined in the 1940 Act, excluding the
individual-type employee benefit plans described above;
· for
a diversified common trust fund or other diversified pooled account not specifically formed for the purpose of accumulating fund
shares;
· for
nonprofit, charitable or educational organizations, or any endowments or foundations established and controlled by such organizations,
or any employer-sponsored retirement plans established for the benefit of the employees of such organizations, their endowments,
or their foundations;
· for
participant accounts of a 403(b) plan that is treated as an employer-sponsored plan for sales charge purposes (see “Purchases
by certain 403(b) plans” under “Rollovers from retirement plans to IRAs” below), or made for participant accounts
of two or more such plans, in each case of a single employer or affiliated employers as defined in the 1940 Act; or
· for
a SEP or SIMPLE IRA plan established after November 15, 2004, by an employer adopting a prototype plan produced by American Funds
Distributors.
Purchases
made for nominee or street name accounts (securities held in the name of an investment dealer or another nominee such as a bank
trust department instead of the customer) may not be aggregated with those made for other accounts and may not be aggregated with
other nominee or street name accounts unless otherwise qualified as described above.
Joint
accounts may be aggregated with other accounts belonging to the primary owner and/or his or her immediate family. The primary
owner of a joint account is the individual responsible for taxes on the account.
Concurrent
purchases You may reduce your Class A sales charge by combining simultaneous purchases (including, upon your request, purchases
for gifts) of all classes of shares in American Funds. Shares of American Funds U.S.
Government Money Market Fund purchased through an exchange, reinvestment or cross-reinvestment from a fund having a sales charge
also qualify. However, direct
Tax-exempt
income funds / Prospectus 46
purchases
of American Funds U.S. Government Money Market Fund Class A shares are excluded. If you currently have individual holdings
in American Legacy variable annuity contracts or variable life insurance policies that were established on or before March 31,
2007, you may continue to combine purchases made under such contracts and policies to reduce your Class A sales charge.
Rights
of accumulation Subject to the limitations described in the aggregation policy, you may take into account your accumulated
holdings in all share classes of American Funds to determine your sales charge on investments in accounts eligible to be aggregated.
Direct purchases of American Funds U.S. Government Money Market Fund Class A shares are excluded. Subject to your investment
dealer’s or recordkeeper’s capabilities, your accumulated holdings will be calculated as the higher of (a) the current
value of your existing holdings (the “market value”) as of the day prior to your American Funds investment or (b)
the amount you invested (including reinvested dividends and capital gains, but excluding capital appreciation) less any withdrawals
(the “cost value”). Depending on the entity on whose books your account is held, the value of your holdings in that
account may not be eligible for calculation at cost value. For example, accounts held in nominee or street name may not be eligible
for calculation at cost value and instead may be calculated at market value for purposes of rights of accumulation.
The
value of all of your holdings in accounts established in calendar year 2005 or earlier will be assigned an initial cost value
equal to the market value of those holdings as of the last business day of 2005. Thereafter, the cost value of such accounts will
increase or decrease according to actual investments or withdrawals. You must contact your financial advisor or American Funds
Service Company if you have additional information that is relevant to the calculation of the value of your holdings.
When
determining your American Funds Class A sales charge, if your investment is not in an employer-sponsored retirement plan, you
may also continue to take into account the market value (as of the day prior to your American Funds investment) of your individual
holdings in various American Legacy variable annuity contracts and variable life insurance policies that were established on or
before March 31, 2007. An employer-sponsored retirement plan may also continue to take into account the market value of its investments
in American Legacy Retirement Investment Plans that were established on or before March 31, 2007.
You
may not purchase Class C shares of American High-Income Municipal Bond Fund or American Funds Tax-Exempt Fund of New York if such
combined American Funds and American Funds Legacy holdings cause you to be eligible to purchase Class A shares at the $1 million
or more sales charge discount rate (i.e., at net asset value).
If
you make a gift of American Funds Class A shares, upon your request, you may purchase the shares at the sales charge discount
allowed under rights of accumulation of all of your American Funds and applicable American Legacy accounts.
You
should retain any records necessary to substantiate the historical amounts you have invested.
Statement
of intention You may reduce your Class A sales charge by establishing a statement of intention. A statement of intention is
a nonbinding commitment that allows you to combine all purchases of all American Funds share classes (excluding American Funds
U.S. Government Money Market Fund) that you intend to make over a 13-month period to determine the applicable sales charge; however,
purchases made under a right of reinvestment, appreciation of your holdings, and reinvested dividends and capital gains do not
count as purchases made during the statement period. Your accumulated holdings (as described and calculated under “Rights
of accumulation” above) eligible to be aggregated as of the day immediately before the start of the statement period may
be credited toward satisfying the statement. A portion of your account may be held in escrow to cover additional Class A
sales charges that may be due if your total purchases over the statement period do not qualify you for the applicable sales charge
reduction.
The
statement of intention period starts on the date on which your first purchase made toward satisfying the statement of intention
is processed. Your accumulated holdings (as described above under “Rights of accumulation”) eligible to be aggregated
as of the day immediately before the start of the statement of intention period may be credited toward satisfying the statement
of intention.
You
may revise the commitment you have made in your statement of intention upward at any time during the statement of intention period.
If your prior commitment has not been met by the time of the revision, the statement of intention period during which purchases
must be made will remain unchanged. Purchases made from the date of the revision will receive the reduced sales charge, if any,
resulting from the revised statement of intention. If your prior commitment has been met by the time of the revision, your original
statement of intention will be considered met and a new statement of intention will be established.
The
statement of intention will be considered completed if the shareholder dies within the 13-month statement of intention period.
Commissions to dealers will not be adjusted or paid on the difference between the statement of intention amount and the amount
actually invested before the shareholder’s death.
When
a shareholder elects to use a statement of intention, shares equal to 5% of the dollar amount specified in the statement of intention
may be held in escrow in the shareholder’s account out of the initial purchase (or subsequent purchases, if necessary) by
American Funds Service Company. All dividends and any capital gain distributions on shares held in escrow will be credited to
the shareholder’s account in shares (or paid in cash, if requested). If the intended investment is not completed within
the specified statement of intention period the investments made during the statement period will be adjusted to reflect the difference
between the sales charge actually paid and the sales charge which would have been paid if the total of such purchases had been
made at a single time. Any dealers assigned to the shareholder’s account at the time a purchase was made during the statement
period will receive a corresponding commission adjustment if appropriate.
In
addition, if you currently have individual holdings in American Legacy variable annuity contracts or variable life insurance policies
that were established on or before March 31, 2007, you may continue to apply purchases under such contracts and policies
to a statement of intention.
47 Tax-exempt
income funds / Prospectus
Shareholders
purchasing shares at a reduced sales charge under a statement of intention indicate their acceptance of these terms and those
in the prospectus with their first purchase.
Reducing
your Class T initial sales charge Consistent with the policies described in this prospectus,
the initial sales charge you pay each time you buy Class T shares may differ depending upon the amount you invest and may be reduced
for larger purchases. Additionally, Class T shares acquired through reinvestment of dividends or capital gain distributions are
not subject to an initial sales charge. Sales charges on Class T shares are applied on a transaction-by-transaction basis, and,
accordingly, Class T shares are not eligible for any other sales charge waivers or reductions, including through the aggregation
of Class T shares concurrently purchased by other related accounts or in other American Funds. The sales charge applicable to
Class T shares may not be reduced by establishing a statement of intention, and rights of accumulation are not available for Class
T shares.
Right
of reinvestment If you notify American Funds Service Company prior to the time of reinvestment,
you may reinvest proceeds from a redemption, dividend payment or capital gain distribution without a sales charge in the same
fund or other American Funds, provided that the reinvestment occurs within 90 days after the date of the redemption, dividend
payment or distribution and is made into the same account from which you redeemed the shares or received the dividend payment
or distribution. If the account has been closed, you may reinvest without a sales charge if the new receiving account has the
same registration as the closed account and the reinvestment is made within 90 days after the date of redemption, dividend payment
or distribution.
Proceeds
from a redemption and all dividend payments and capital gain distributions will be reinvested in the same share class from which
the original redemption, dividend payment or distribution was made. Any contingent deferred sales charge on Class A or C shares
will be credited to your account. Redemption proceeds of Class A shares representing direct purchases in American Funds U.S.
Government Money Market Fund that are reinvested in other American Funds will be subject to a sales charge.
Proceeds
will be reinvested at the next calculated net asset value after your request is received by American Funds Service Company, provided
that your request contains all information and legal documentation necessary to process the transaction. For purposes of this
“right of reinvestment policy,” automatic transactions (including, for example, automatic purchases, withdrawals and
payroll deductions) and ongoing retirement plan contributions are not eligible for investment without a sales charge. You may
not reinvest proceeds in American Funds as described in this paragraph if such proceeds are subject to a purchase block as described
under “Frequent trading of fund shares” in this prospectus. This paragraph does not apply to certain rollover investments
as described under “Rollovers from retirement plans to IRAs” in this prospectus. Depending on the financial intermediary
holding your account, your reinvestment privileges may be unavailable or differ from those described in this prospectus. Investors
should consult their financial intermediary for further information.
Tax-exempt
income funds / Prospectus 48
Contingent
deferred sales charge waivers The contingent deferred sales charge on Class A and C shares
will be waived in the following cases:
· permitted
exchanges of shares, except if shares acquired by exchange are then redeemed within the period during which a contingent deferred
sales charge would apply to the initial shares purchased;
· tax-free
returns of excess contributions to IRAs;
· redemptions
due to death or postpurchase disability of the shareholder (this generally excludes accounts registered in the names of trusts
and other entities);
· in
the case of joint tenant accounts, if one joint tenant dies, a surviving joint tenant, at the time he or she notifies American
Funds Service Company of the other joint tenant’s death and removes the decedent’s name from the account, may redeem
shares from the account without incurring a contingent deferred sales charge; however, redemptions made after American Funds Service
Company is notified of the death of a joint tenant will be subject to a contingent deferred sales charge;
· redemptions
due to the complete termination of a trust upon the death of the trustor/grantor or beneficiary, but only if such termination
is specifically provided for in the trust document; and
· the
following types of transactions, if they do not exceed 12% of the value of an account annually:
— required
minimum distributions taken from retirement accounts upon the shareholder’s attainment of age 70½ (required minimum
distributions that continue to be taken by the beneficiary(ies) after the account owner is deceased also qualify for a waiver);
and
— redemptions
through an automatic withdrawal plan (“AWP”) (see “Automatic withdrawals” under “Shareholder account
services and privileges” in the statement of additional information). For each AWP payment, assets that are not subject
to a contingent deferred sales charge, such as shares acquired through reinvestment of dividends and/or capital gain distributions,
will be redeemed first and will count toward the 12% limit. If there is an insufficient amount of assets not subject to a contingent
deferred sales charge to cover a particular AWP payment, shares subject to the lowest contingent deferred sales charge will be
redeemed next until the 12% limit is reached. Any dividends and/or capital gain distributions taken in cash by a shareholder who
receives payments through an AWP will also count toward the 12% limit. In the case of an AWP, the 12% limit is calculated at the
time an automatic redemption is first made, and is recalculated at the time each additional automatic redemption is made. Shareholders
who establish an AWP should be aware that the amount of a payment not subject to a contingent deferred sales charge may vary over
time depending on fluctuations in the value of their accounts. This privilege may be revised or terminated at any time.
For purposes
of this paragraph, “account” means your investment in the applicable class of shares of the particular fund from which
you are making the redemption.
The
contingent deferred sales charge on American Funds Class A shares may be waived in cases where the fund’s transfer agent
determines the benefit to the fund of collecting the contingent deferred sales charge would be outweighed by the cost of applying
it.
Contingent
deferred sales charge waivers are allowed only in the cases listed here and in the statement of additional information.
To
have your Class A or C contingent deferred sales charge waived, you must inform your advisor or American Funds Service Company
at the time you redeem shares that you qualify for such a waiver.
Rollovers
from retirement plans to IRAs The fund reserves
the right not to make its shares available to tax-deferred retirement plans and accounts.
Assets
from retirement plans may be invested in Class A, C or F shares through an IRA rollover, subject to the other provisions of this
prospectus. Class C shares are not available if the assets are being rolled over from investments held in American Funds Recordkeeper
Direct and PlanPremier retirement plan recordkeeping programs.
Rollovers
to IRAs from retirement plans that are rolled into Class A shares will be subject to applicable sales charges. The following
rollovers to Class A shares will be made without a sales charge:
· rollovers
to Capital Bank and Trust CompanySM IRAs if the assets were invested in any
fund managed by the investment adviser or its affiliates at the time of distribution;
· rollovers
to IRAs from 403(b) plans with Capital Bank and Trust Company as custodian; and
· rollovers
to Capital Bank and Trust Company IRAs from investments held in American Funds Recordkeeper Direct and PlanPremier retirement
plan recordkeeping programs.
IRA
rollover assets that roll over without a sales charge as described above will not be subject to a contingent deferred sales charge,
and investment dealers will be compensated solely with an annual service fee that begins to accrue immediately. All other rollovers
invested in Class A shares, as well as future contributions to the IRA, will be subject to sales charges and to the terms and
conditions generally applicable to Class A share investments as described in this prospectus and in the statement of additional
information.
49 Tax-exempt
income funds / Prospectus
Other
sales charge waivers Waivers of all or a portion of the contingent deferred sales charge on Class C shares and the sales charge
on Class A shares will be granted for transactions requested by financial intermediaries as a result of (i) pending or anticipated
regulatory matters that require investor accounts to be moved to a different share class or (ii) conversions of IRAs from brokerage
to advisory accounts investing in Class F shares in cases where new investments in brokerage IRA accounts have been restricted
by the intermediary.
Purchases
by SEP plans and SIMPLE IRA plans Participant accounts in a Simplified Employee Pension (SEP) plan or a Savings Incentive
Match Plan for Employees of Small Employers IRA (SIMPLE IRA) will be aggregated at the plan level for Class A sales charge purposes
if an employer adopts a prototype plan produced by American Funds Distributors or (a) the employer or plan sponsor submits all
contributions for all participating employees in a single contribution transmittal or the contributions are identified as related
to the same plan; (b) each transmittal is accompanied by checks or wire transfers and generally must be submitted through the
transfer agent’s automated contribution system if held on the fund’s books; and (c) if the fund is expected to carry
separate accounts in the name of each plan participant and (i) the employer or plan sponsor notifies the funds’ transfer
agent or the intermediary holding the account that the separate accounts of all plan participants should be linked and (ii) all
new participant accounts are established by submitting the appropriate documentation on behalf of each new participant. Participant
accounts in a SEP or SIMPLE plan that are eligible to aggregate their assets at the plan level may not also aggregate the assets
with their individual accounts.
Purchases
by certain 403(b) plans Tax-exempt funds in general should not serve as retirement plan investments.
A
403(b) plan may not invest in American Funds Class A or C shares unless such plan was invested in Class A or C shares before January
1, 2009.
Participant
accounts of a 403(b) plan that invested in American Funds Class A or C shares and were treated as an individual-type plan for
sales charge purposes before January 1, 2009, may continue to be treated as accounts of an individual-type plan for sales charge
purposes. Participant accounts of a 403(b) plan that invested in American Funds Class A or C shares and were treated as an employer-sponsored
plan for sales charge purposes before January 1, 2009, may continue to be treated as accounts of an employer-sponsored plan for
sales charge purposes. Participant accounts of a 403(b) plan that was established on or after January 1, 2009, are treated as
accounts of an employer-sponsored plan for sales charge purposes.
Moving
between accounts American Funds investments by certain account types may be moved to other account types without incurring
additional Class A sales charges. These transactions include:
·
redemption proceeds from a non-retirement account (for example, a joint tenant account) used to purchase fund shares in an IRA
or other individual-type retirement account;
·
required minimum distributions from an IRA or other individual-type retirement account used to purchase fund shares in a non-retirement
account; and
·
death distributions paid to a beneficiary’s account that are used by the beneficiary to purchase fund shares in a different
account.
These
privileges are generally available only if your account is held directly with the fund’s transfer agent or if the financial
intermediary holding your account has the systems, policies and procedures to support providing the privileges on its systems.
Investors should consult their financial intermediary for further information.
Tax-exempt
income funds / Prospectus 50
Plans
of distribution The fund has plans of distribution,
or “12b-1 plans,” for certain share classes under which it may finance activities intended primarily to sell shares,
provided that the categories of expenses are approved in advance by the fund's board of trustees. The plans provide for payments,
based on annualized percentages of average daily net assets, of:
| |
|
| Up
to: |
Share
class(es) |
| |
Class
A shares: |
| 0.15% |
American
Funds Short-Term Tax-Exempt Bond Fund |
| 0.25% |
The
Tax-Exempt Bond Fund of America, The Tax-Exempt Fund of California |
| 0.30% |
Limited
Term Tax-Exempt Bond Fund of America, American High-Income Municipal Bond Fund, American Funds Tax-Exempt Fund of New York |
| 0.50% |
Class
T and F-1 shares |
| 1.00% |
Class
C shares |
For
all share classes indicated above, up to .25% (.15% for Class A shares of American Funds Short-Term Tax-Exempt Bond Fund) may
be used to pay service fees to qualified dealers for providing certain shareholder services. The amount remaining for each share
class, if any, may be used for distribution expenses.
The
12b-1 fees paid by each applicable share class of each fund, as a percentage of average net assets for the most recent fiscal
year, are indicated in the prospectus in the Annual Fund Operating Expenses table for each fund. Since these fees are paid out
of each fund’s assets on an ongoing basis, over time they may cost you more than paying other types of sales charges or
service fees and reduce the return on your investment. The higher fees for Class C shares may cost you more over time than paying
the initial sales charge for Class A or T shares.
51 Tax-exempt
income funds / Prospectus
Other
compensation to dealers American Funds Distributors,
at its expense, provides additional compensation to investment dealers. These payments may be made, at the discretion of American
Funds Distributors, to no more than the top 60 dealers (or their affiliates) that have sold shares of American Funds. The payment
will be determined using a formula applied consistently to dealers based on their assets under management. The level of payments
made to a qualifying firm under the formula will not exceed .035% of eligible American Funds assets attributable to that dealer.
Class R shares and other retirement assets (for example, IRAs in advisory programs) are generally excluded from the formula. Dealers
may direct American Funds Distributors to exclude additional assets. In addition to the asset-based payment, American Funds Distributors
makes a payment of $5 million to each of the top six firms in terms of American Funds assets under management to recognize the
depth of the commitment each of those firms has made to collaborating with American Funds Distributors on achieving advisor training
and education objectives.
American
Funds Distributors makes these additional compensation payments to support various efforts, including, among other things, to:
· help
defray the costs incurred by qualifying dealers in connection with efforts to educate financial advisors about American Funds
so that they can make recommendations and provide services that are suitable and meet shareholder needs,
· help
defray the costs associated with the dealer firms’ provision of account related services and activities,
· support
the dealer firms’ distribution activities,
· support
meetings, conferences or other training and educational events hosted by the firm, and
· obtain
relevant data regarding financial advisor activities to facilitate American Funds Distributors’ training and education activities.
American
Funds Distributors will, on an annual basis, determine the advisability of continuing these payments.
Firms
receiving additional compensation payments must sign a letter acknowledging the purpose of the payment and generally requiring
the firms to (1) have significant assets invested in American Funds, (2) perform the due diligence necessary to include American
Funds on their platform, (3) not provide financial advisors, branch managers or associated persons with any financial incentives
to promote the sales of one approved fund group over another approved group, (4) provide opportunities for their clients to obtain
individualized advice, (5) provide American Funds Distributors broad access to their financial advisors and product platforms
and work together on mutual business objectives, and (6) work with the fund’s transfer agent to promote operational efficiencies
and to facilitate necessary communication between American Funds and the firm’s clients who own shares of American Funds.
American
Funds Distributors has identified certain firms that provide a self-directed platform for the public as well as clearing, custody
and recordkeeping services for certain other intermediaries. In lieu of the formula described above, these firms receive a payment
of up to .018% of assets under administration (excluding assets where the firm acts as a fiduciary and brokerage clearing assets).
Firms may direct American Funds Distributors to exclude additional assets.
American
Funds Distributors may also make payments, outside of the formulas described above for, among other things, data (including fees
to obtain lists of financial advisors to better tailor training and education opportunities), account-related services, and operational
improvements. In 2018, American Funds Distributors paid the following firms for such information and services amounts that did
not exceed the following amounts:
| |
|
| Fidelity
Investments |
$400,000 |
| LPL
Financial LLC |
$560,000 |
| Morgan
Stanley Wealth Management |
$800,000 |
| PNC
Network |
$50,000 |
| UBS
Financial Services Inc. |
$300,000 |
| Wells
Fargo Advisors |
$450,000 |
American
Funds Distributors may also pay expenses associated with meetings and other training and educational opportunities conducted by
selling dealers, advisory platform providers and other intermediaries to facilitate educating financial advisors and shareholders
about American Funds.
If
investment advisers, distributors or other affiliates of mutual funds pay additional compensation or other incentives to investment
dealers in differing amounts, dealer firms and their advisors may have financial incentives for recommending a particular mutual
fund over other mutual funds or investments. You should consult with your financial advisor and review carefully any disclosure
by your financial advisor’s firm as to compensation received.
Tax-exempt
income funds / Prospectus 52
Fund
expenses In periods of market volatility, assets
of the fund may decline significantly, causing total annual fund operating expenses (as a percentage of the value of your investment)
to become higher than the numbers shown in the Annual Fund Operating Expenses tables in this prospectus.
For
all share classes, “Other expenses” items in the Annual Fund Operating Expenses tables in this prospectus include
fees for administrative services provided by the fund’s investment adviser and its affiliates. Administrative services are
provided by the investment adviser and its affiliates to help assist third parties providing non-distribution services to fund
shareholders. These services include providing in-depth information on the fund and market developments that impact fund investments.
Administrative services also include, but are not limited to, coordinating, monitoring and overseeing third parties that provide
services to fund shareholders. The Administrative Services Agreement between the fund and the investment adviser provides the
fund the ability to charge an administrative services fee of .05% for all share classes. The fund’s investment adviser receives
an administrative services fee at the annual rate of .03% of the average daily net assets of the fund attributable to Class A,
C, T and F shares (which could be increased as noted above) for its provision of administrative services.
The
“Other expenses” items in the Annual Fund Operating Expenses table also include custodial, legal and transfer agent
(and, if applicable, subtransfer agent/recordkeeping) payments and various other expenses applicable to all share classes.
Subtransfer
agent/recordkeeping payments may be made to third parties (including affiliates of the fund’s investment adviser) that provide
subtransfer agent, recordkeeping and/or shareholder services with respect to certain shareholder accounts in lieu of the transfer
agent providing such services. The amount paid for subtransfer agent/recordkeeping services varies depending on the share class
and services provided, and typically ranges from $3 to $18 per account. Although Class F-3 shares are not subject to any subtransfer
agency or recordkeeping fees, Class F-1 and F-2 shares are subject to subtransfer agency fees of up to .12% of fund assets.
53 Tax-exempt
income funds / Prospectus
Financial
highlights The Financial Highlights tables
are intended to help you understand the fund’s results for the past five fiscal years. Certain information reflects financial
results for a single share of a particular class. The total returns in the tables represent the rate that an investor would have
earned or lost on an investment in the fund (assuming reinvestment of all dividends). Where indicated, figures in the tables reflect
the impact, if any, of certain reimbursements from Capital Research and Management Company. For more information about these reimbursements,
see the fund’s statement of additional information and annual reports. The information in the Financial Highlights tables
for American Funds Short-Term Tax-Exempt Bond Fund, Limited Term Tax-Exempt Bond Fund of America, The Tax-Exempt Bond Fund of
America, American High-Income Municipal Bond Fund, The Tax-Exempt Fund of California and American Funds Tax-Exempt Fund of New
York has been audited by PricewaterhouseCoopers LLP. The current report of PricewaterhouseCoopers LLP, along with the fund’s
financial statements, are included in the statement of additional information for the fund, which is available upon request.
American
Funds Short-Term Tax-Exempt Bond Fund
| |
|
|
|
|
|
|
|
|
|
|
|
|
|
|
|
|
|
|
|
|
| |
|
Income
from investment operations1 |
|
|
|
|
|
|
| Period
ended |
Net
asset
value,
beginning
of period |
Net
investment
income |
Net
gains
(losses) on
securities
(both
realized and
unrealized) |
Total
from
investment
operations |
Dividends
(from
net
investment
income) |
Net
asset
value,
end
of period |
Total
return2 |
Net
assets,
end of period
(in millions) |
Ratio
of
expenses
to average
net assets |
Ratio
of
net income
to average
net assets |
| Class
A: |
|
|
|
|
|
|
|
|
|
|
|
|
|
|
|
|
|
|
|
|
| 7/31/2019 |
$10.04 |
|
$.16 |
|
$.15 |
|
$.31 |
|
$(.16 |
) |
$10.19 |
|
3.09 |
% |
$767 |
|
.59 |
% |
1.56 |
% |
| 7/31/2018 |
10.15 |
|
.13 |
|
(.11 |
) |
.02 |
|
(.13 |
) |
10.04 |
|
.24 |
|
752 |
|
.58 |
|
1.33 |
|
| 7/31/2017 |
10.22 |
|
.12 |
|
(.07 |
) |
.05 |
|
(.12 |
) |
10.15 |
|
.46 |
|
739 |
|
.59 |
|
1.15 |
|
| 7/31/2016 |
10.17 |
|
.10 |
|
.05 |
|
.15 |
|
(.10 |
) |
10.22 |
|
1.51 |
|
688 |
|
.59 |
|
1.02 |
|
| 7/31/2015 |
10.25 |
|
.11 |
|
(.08 |
) |
.03 |
|
(.11 |
) |
10.17 |
|
.26 |
|
653 |
|
.58 |
|
1.04 |
|
| Class
T: |
|
|
|
|
|
|
|
|
|
|
|
|
|
|
|
|
|
|
|
|
| 7/31/2019 |
10.04 |
|
.17 |
|
.15 |
|
.32 |
|
(.17 |
) |
10.19 |
|
3.20 |
3 |
— |
4 |
.47 |
3 |
1.67 |
3 |
| 7/31/2018 |
10.15 |
|
.15 |
|
(.11 |
) |
.04 |
|
(.15 |
) |
10.04 |
|
.36 |
3 |
— |
4 |
.47 |
3 |
1.44 |
3 |
| 7/31/20175,6 |
10.11 |
|
.04 |
|
.04 |
|
.08 |
|
(.04 |
) |
10.15 |
|
.82 |
3,7 |
— |
4 |
.15 |
3,7 |
.42 |
3,7 |
| Class
F-1: |
|
|
|
|
|
|
|
|
|
|
|
|
|
|
|
|
|
|
|
|
| 7/31/2019 |
10.04 |
|
.13 |
|
.15 |
|
.28 |
|
(.13 |
) |
10.19 |
|
2.85 |
|
7 |
|
.81 |
|
1.34 |
|
| 7/31/2018 |
10.15 |
|
.11 |
|
(.11 |
) |
— |
8 |
(.11 |
) |
10.04 |
|
.02 |
|
7 |
|
.80 |
|
1.10 |
|
| 7/31/2017 |
10.22 |
|
.09 |
|
(.07 |
) |
.02 |
|
(.09 |
) |
10.15 |
|
.23 |
|
9 |
|
.82 |
|
.92 |
|
| 7/31/2016 |
10.17 |
|
.08 |
|
.05 |
|
.13 |
|
(.08 |
) |
10.22 |
|
1.29 |
|
13 |
|
.81 |
|
.80 |
|
| 7/31/2015 |
10.25 |
|
.08 |
|
(.08 |
) |
— |
8 |
(.08 |
) |
10.17 |
|
.05 |
|
9 |
|
.80 |
|
.83 |
|
| Class
F-2: |
|
|
|
|
|
|
|
|
|
|
|
|
|
|
|
|
|
|
|
|
| 7/31/2019 |
10.04 |
|
.17 |
|
.15 |
|
.32 |
|
(.17 |
) |
10.19 |
|
3.17 |
|
182 |
|
.49 |
|
1.67 |
|
| 7/31/2018 |
10.15 |
|
.14 |
|
(.11 |
) |
.03 |
|
(.14 |
) |
10.04 |
|
.28 |
|
52 |
|
.54 |
|
1.37 |
|
| 7/31/2017 |
10.22 |
|
.12 |
|
(.07 |
) |
.05 |
|
(.12 |
) |
10.15 |
|
.49 |
|
47 |
|
.57 |
|
1.17 |
|
| 7/31/2016 |
10.17 |
|
.11 |
|
.05 |
|
.16 |
|
(.11 |
) |
10.22 |
|
1.55 |
|
80 |
|
.56 |
|
1.06 |
|
| 7/31/2015 |
10.25 |
|
.11 |
|
(.08 |
) |
.03 |
|
(.11 |
) |
10.17 |
|
.29 |
|
64 |
|
.55 |
|
1.08 |
|
| Class
F-3: |
|
|
|
|
|
|
|
|
|
|
|
|
|
|
|
|
|
|
|
|
| 7/31/2019 |
10.04 |
|
.17 |
|
.15 |
|
.32 |
|
(.17 |
) |
10.19 |
|
3.23 |
|
52 |
|
.44 |
|
1.71 |
|
| 7/31/2018 |
10.15 |
|
.15 |
|
(.11 |
) |
.04 |
|
(.15 |
) |
10.04 |
|
.38 |
|
45 |
|
.44 |
|
1.45 |
|
| 7/31/20175,9 |
10.07 |
|
.07 |
|
.08 |
|
.15 |
|
(.07 |
) |
10.15 |
|
1.49 |
7 |
77 |
|
.47 |
10 |
1.35 |
10 |
| |
|
|
|
|
|
| |
Year
ended July 31 |
| 2019 |
2018 |
2017 |
2016 |
2015 |
| Portfolio
turnover rate for all share classes |
50% |
34% |
26% |
21% |
38% |
1 Based
on average shares outstanding.
2 Total
returns exclude any applicable sales charges, including contingent deferred sales charges.
3 All
or a significant portion of assets in this class consisted of seed capital invested by Capital Research and Management Company
and/or its affiliates. Fees for distribution services are not charged or accrued on these seed capital assets. If such fees were
paid by the fund on seed capital assets, fund expenses would have been higher and net income and total return would have been
lower.
4 Amount
less than $1 million.
5 Based
on operations for a period that is less than a full year.
6 Class
T shares began investment operations on April 7, 2017.
7 Not
annualized.
8 Amount
less than $.01.
9 Class
F-3 shares began investment operations on January 27, 2017.
10 Annualized.
Tax-exempt
income funds / Prospectus 54
Limited
Term Tax-Exempt Bond Fund of America
| |
|
|
|
|
|
|
|
|
|
|
|
|
|
|
|
|
|
|
|
|
| |
|
Income
(loss) from investment operations1 |
|
|
|
|
|
|
| Period
ended |
Net
asset
value,
beginning
of period |
Net
investment
income |
Net
gains
(losses) on
securities
(both
realized and
unrealized) |
Total
from
investment
operations |
Dividends
(from
net
investment
income) |
Net
asset
value,
end
of period |
Total
return2 |
Net
assets,
end of period
(in millions) |
Ratio
of
expenses
to average
net assets |
Ratio
of
net income
to average
net assets |
| Class
A: |
|
|
|
|
|
|
|
|
|
|
|
|
|
|
|
|
|
|
|
|
| 7/31/2019 |
$15.52 |
|
$.31 |
|
$.41 |
|
$.72 |
|
$(.31 |
) |
$15.93 |
|
4.71 |
% |
$3,060 |
|
.59 |
% |
2.00 |
% |
| 7/31/2018 |
15.77 |
|
.31 |
|
(.25 |
) |
.06 |
|
(.31 |
) |
15.52 |
|
.40 |
|
3,057 |
|
.59 |
|
2.00 |
|
| 7/31/2017 |
16.04 |
|
.32 |
|
(.27 |
) |
.05 |
|
(.32 |
) |
15.77 |
|
.34 |
|
3,038 |
|
.59 |
|
2.04 |
|
| 7/31/2016 |
15.92 |
|
.35 |
|
.12 |
|
.47 |
|
(.35 |
) |
16.04 |
|
2.97 |
|
3,055 |
|
.59 |
|
2.17 |
|
| 7/31/2015 |
16.10 |
|
.38 |
|
(.18 |
) |
.20 |
|
(.38 |
) |
15.92 |
|
1.23 |
|
2,670 |
|
.57 |
|
2.36 |
|
| Class
C: |
|
|
|
|
|
|
|
|
|
|
|
|
|
|
|
|
|
|
|
|
| 7/31/2019 |
15.52 |
|
.20 |
|
.41 |
|
.61 |
|
(.20 |
) |
15.93 |
|
3.94 |
|
18 |
|
1.33 |
|
1.27 |
|
| 7/31/2018 |
15.77 |
|
.20 |
|
(.25 |
) |
(.05 |
) |
(.20 |
) |
15.52 |
|
(.34 |
) |
20 |
|
1.34 |
|
1.26 |
|
| 7/31/2017 |
16.04 |
|
.20 |
|
(.27 |
) |
(.07 |
) |
(.20 |
) |
15.77 |
|
(.40 |
) |
25 |
|
1.33 |
|
1.30 |
|
| 7/31/2016 |
15.92 |
|
.23 |
|
.12 |
|
.35 |
|
(.23 |
) |
16.04 |
|
2.20 |
|
30 |
|
1.33 |
|
1.43 |
|
| 7/31/2015 |
16.10 |
|
.26 |
|
(.18 |
) |
.08 |
|
(.26 |
) |
15.92 |
|
.47 |
|
30 |
|
1.33 |
|
1.60 |
|
| Class
T: |
|
|
|
|
|
|
|
|
|
|
|
|
|
|
|
|
|
|
|
|
| 7/31/2019 |
15.52 |
|
.35 |
|
.41 |
|
.76 |
|
(.35 |
) |
15.93 |
|
4.99 |
3 |
— |
4 |
.33 |
3 |
2.27 |
3 |
| 7/31/2018 |
15.77 |
|
.36 |
|
(.25 |
) |
.11 |
|
(.36 |
) |
15.52 |
|
.68 |
3 |
— |
4 |
.33 |
3 |
2.26 |
3 |
| 7/31/20175,6 |
15.68 |
|
.12 |
|
.09 |
|
.21 |
|
(.12 |
) |
15.77 |
|
1.32 |
3,7 |
— |
4 |
.10 |
3,7 |
.74 |
3,7 |
| Class
F-1: |
|
|
|
|
|
|
|
|
|
|
|
|
|
|
|
|
|
|
|
|
| 7/31/2019 |
15.52 |
|
.30 |
|
.41 |
|
.71 |
|
(.30 |
) |
15.93 |
|
4.63 |
|
60 |
|
.67 |
|
1.93 |
|
| 7/31/2018 |
15.77 |
|
.30 |
|
(.25 |
) |
.05 |
|
(.30 |
) |
15.52 |
|
.33 |
|
64 |
|
.66 |
|
1.93 |
|
| 7/31/2017 |
16.04 |
|
.31 |
|
(.27 |
) |
.04 |
|
(.31 |
) |
15.77 |
|
.26 |
|
83 |
|
.67 |
|
1.96 |
|
| 7/31/2016 |
15.92 |
|
.33 |
|
.12 |
|
.45 |
|
(.33 |
) |
16.04 |
|
2.88 |
|
90 |
|
.67 |
|
2.09 |
|
| 7/31/2015 |
16.10 |
|
.36 |
|
(.18 |
) |
.18 |
|
(.36 |
) |
15.92 |
|
1.13 |
|
84 |
|
.67 |
|
2.27 |
|
| Class
F-2: |
|
|
|
|
|
|
|
|
|
|
|
|
|
|
|
|
|
|
|
|
| 7/31/2019 |
15.52 |
|
.34 |
|
.41 |
|
.75 |
|
(.34 |
) |
15.93 |
|
4.91 |
|
500 |
|
.39 |
|
2.20 |
|
| 7/31/2018 |
15.77 |
|
.34 |
|
(.25 |
) |
.09 |
|
(.34 |
) |
15.52 |
|
.58 |
|
353 |
|
.41 |
|
2.18 |
|
| 7/31/2017 |
16.04 |
|
.35 |
|
(.27 |
) |
.08 |
|
(.35 |
) |
15.77 |
|
.51 |
|
309 |
|
.42 |
|
2.22 |
|
| 7/31/2016 |
15.92 |
|
.38 |
|
.12 |
|
.50 |
|
(.38 |
) |
16.04 |
|
3.15 |
|
291 |
|
.41 |
|
2.34 |
|
| 7/31/2015 |
16.10 |
|
.40 |
|
(.18 |
) |
.22 |
|
(.40 |
) |
15.92 |
|
1.39 |
|
208 |
|
.41 |
|
2.52 |
|
| Class
F-3: |
|
|
|
|
|
|
|
|
|
|
|
|
|
|
|
|
|
|
|
|
| 7/31/2019 |
15.52 |
|
.36 |
|
.41 |
|
.77 |
|
(.36 |
) |
15.93 |
|
5.02 |
|
308 |
|
.30 |
|
2.29 |
|
| 7/31/2018 |
15.77 |
|
.36 |
|
(.25 |
) |
.11 |
|
(.36 |
) |
15.52 |
|
.70 |
|
187 |
|
.30 |
|
2.29 |
|
| 7/31/20175,8 |
15.59 |
|
.19 |
|
.18 |
|
.37 |
|
(.19 |
) |
15.77 |
|
2.37 |
7 |
112 |
|
.30 |
9 |
2.36 |
9 |
| |
|
|
|
|
|
| |
Year
ended July 31 |
| 2019 |
2018 |
2017 |
2016 |
2015 |
| Portfolio
turnover rate for all share classes |
42% |
28% |
27% |
16% |
19% |
1 Based
on average shares outstanding.
2 Total
returns exclude any applicable sales charges, including contingent deferred sales charges.
3 All
or a significant portion of assets in this class consisted of seed capital invested by Capital Research and Management Company
and/or its affiliates. Fees for distribution services are not charged or accrued on these seed capital assets. If such fees were
paid by the fund on seed capital assets, fund expenses would have been higher and net income and total return would have been
lower.
4 Amount
less than $1 million.
5 Based
on operations for a period that is less than a full year.
6 Class
T shares began investment operations on April 7, 2017.
7 Not
annualized.
8 Class
F-3 shares began investment operations on January 27, 2017.
9 Annualized.
55 Tax-exempt
income funds / Prospectus
The
Tax-Exempt Bond Fund of America
| |
|
|
|
|
|
|
|
|
|
|
|
|
|
|
|
|
|
|
|
|
| |
|
Income
(loss) from investment operations1 |
|
|
|
|
|
|
| Period
ended |
Net
asset
value,
beginning
of period |
Net
investment
income |
Net
gains
(losses) on
securities
(both
realized and
unrealized) |
Total
from
investment
operations |
Dividends
(from
net
investment
income) |
Net
asset
value,
end
of period |
Total
return2 |
Net
assets,
end of period
(in millions) |
Ratio
of
expenses
to average
net assets |
Ratio
of
net income
to average
net assets |
| Class
A: |
|
|
|
|
|
|
|
|
|
|
|
|
|
|
|
|
|
|
|
|
| 7/31/2019 |
$12.81 |
|
$.37 |
|
$.47 |
|
$.84 |
|
$(.36 |
) |
$13.29 |
|
6.71 |
% |
$10,868 |
|
.52 |
% |
2.84 |
% |
| 7/31/2018 |
12.98 |
|
.38 |
|
(.17 |
) |
.21 |
|
(.38 |
) |
12.81 |
|
1.60 |
|
10,102 |
|
.53 |
|
2.91 |
|
| 7/31/2017 |
13.40 |
|
.40 |
|
(.42 |
) |
(.02 |
) |
(.40 |
) |
12.98 |
|
(.09 |
) |
9,692 |
|
.53 |
|
3.12 |
|
| 7/31/2016 |
12.96 |
|
.41 |
|
.44 |
|
.85 |
|
(.41 |
) |
13.40 |
|
6.69 |
|
9,510 |
|
.54 |
|
3.15 |
|
| 7/31/2015 |
12.92 |
|
.42 |
|
.04 |
|
.46 |
|
(.42 |
) |
12.96 |
|
3.62 |
|
7,385 |
|
.54 |
|
3.28 |
|
| Class
C: |
|
|
|
|
|
|
|
|
|
|
|
|
|
|
|
|
|
|
|
|
| 7/31/2019 |
12.81 |
|
.27 |
|
.47 |
|
.74 |
|
(.26 |
) |
13.29 |
|
5.88 |
|
407 |
|
1.31 |
|
2.06 |
|
| 7/31/2018 |
12.98 |
|
.27 |
|
(.17 |
) |
.10 |
|
(.27 |
) |
12.81 |
|
.80 |
|
432 |
|
1.32 |
|
2.12 |
|
| 7/31/2017 |
13.40 |
|
.30 |
|
(.42 |
) |
(.12 |
) |
(.30 |
) |
12.98 |
|
(.88 |
) |
474 |
|
1.32 |
|
2.33 |
|
| 7/31/2016 |
12.96 |
|
.31 |
|
.44 |
|
.75 |
|
(.31 |
) |
13.40 |
|
5.85 |
|
517 |
|
1.33 |
|
2.35 |
|
| 7/31/2015 |
12.92 |
|
.32 |
|
.04 |
|
.36 |
|
(.32 |
) |
12.96 |
|
2.80 |
|
349 |
|
1.33 |
|
2.50 |
|
| Class
T: |
|
|
|
|
|
|
|
|
|
|
|
|
|
|
|
|
|
|
|
|
| 7/31/2019 |
12.81 |
|
.40 |
|
.47 |
|
.87 |
|
(.39 |
) |
13.29 |
|
6.93 |
3 |
— |
4 |
.32 |
3 |
3.05 |
3 |
| 7/31/2018 |
12.98 |
|
.40 |
|
(.17 |
) |
.23 |
|
(.40 |
) |
12.81 |
|
1.83 |
3 |
— |
4 |
.32 |
3 |
3.12 |
3 |
| 7/31/20175,6 |
12.85 |
|
.14 |
|
.13 |
|
.27 |
|
(.14 |
) |
12.98 |
|
2.07 |
3,7 |
— |
4 |
.10 |
3,7 |
1.06 |
3,7 |
| Class
F-1: |
|
|
|
|
|
|
|
|
|
|
|
|
|
|
|
|
|
|
|
|
| 7/31/2019 |
12.81 |
|
.36 |
|
.47 |
|
.83 |
|
(.35 |
) |
13.29 |
|
6.58 |
|
338 |
|
.64 |
|
2.72 |
|
| 7/31/2018 |
12.98 |
|
.36 |
|
(.17 |
) |
.19 |
|
(.36 |
) |
12.81 |
|
1.48 |
|
370 |
|
.65 |
|
2.80 |
|
| 7/31/2017 |
13.40 |
|
.39 |
|
(.43 |
) |
(.04 |
) |
(.38 |
) |
12.98 |
|
(.22 |
) |
461 |
|
.66 |
|
2.99 |
|
| 7/31/2016 |
12.96 |
|
.39 |
|
.44 |
|
.83 |
|
(.39 |
) |
13.40 |
|
6.53 |
|
518 |
|
.67 |
|
3.04 |
|
| 7/31/2015 |
12.92 |
|
.41 |
|
.04 |
|
.45 |
|
(.41 |
) |
12.96 |
|
3.49 |
|
1,474 |
|
.67 |
|
3.16 |
|
| Class
F-2: |
|
|
|
|
|
|
|
|
|
|
|
|
|
|
|
|
|
|
|
|
| 7/31/2019 |
12.81 |
|
.39 |
|
.47 |
|
.86 |
|
(.38 |
) |
13.29 |
|
6.86 |
|
2,778 |
|
.38 |
|
2.98 |
|
| 7/31/2018 |
12.98 |
|
.39 |
|
(.17 |
) |
.22 |
|
(.39 |
) |
12.81 |
|
1.74 |
|
2,177 |
|
.39 |
|
3.05 |
|
| 7/31/2017 |
13.40 |
|
.42 |
|
(.42 |
) |
— |
8 |
(.42 |
) |
12.98 |
|
.03 |
|
1,909 |
|
.41 |
|
3.24 |
|
| 7/31/2016 |
12.96 |
|
.43 |
|
.44 |
|
.87 |
|
(.43 |
) |
13.40 |
|
6.84 |
|
2,879 |
|
.40 |
|
3.26 |
|
| 7/31/2015 |
12.92 |
|
.44 |
|
.04 |
|
.48 |
|
(.44 |
) |
12.96 |
|
3.76 |
|
990 |
|
.41 |
|
3.42 |
|
| Class
F-3: |
|
|
|
|
|
|
|
|
|
|
|
|
|
|
|
|
|
|
|
|
| 7/31/2019 |
12.81 |
|
.41 |
|
.47 |
|
.88 |
|
(.40 |
) |
13.29 |
|
6.97 |
|
6,570 |
|
.27 |
|
3.09 |
|
| 7/31/2018 |
12.98 |
|
.41 |
|
(.17 |
) |
.24 |
|
(.41 |
) |
12.81 |
|
1.84 |
|
5,397 |
|
.28 |
|
3.11 |
|
| 7/31/20175,9 |
12.75 |
|
.22 |
|
.23 |
|
.45 |
|
(.22 |
) |
12.98 |
|
3.54 |
7 |
1,555 |
|
.29 |
10 |
3.34 |
10 |
| |
|
|
|
|
|
| |
Year
ended July 31 |
| 2019 |
2018 |
2017 |
2016 |
2015 |
| Portfolio
turnover rate for all share classes |
20% |
17% |
20% |
13% |
14% |
1 Based
on average shares outstanding.
2 Total
returns exclude any applicable sales charges, including contingent deferred sales charges.
3 All
or a significant portion of assets in this class consisted of seed capital invested by Capital Research and Management Company
and/or its affiliates. Fees for distribution services are not charged or accrued on these seed capital assets. If such fees were
paid by the fund on seed capital assets, fund expenses would have been higher and net income and total return would have been
lower.
4 Amount
less than $1 million.
5 Based
on operations for a period that is less than a full year.
6 Class
T shares began investment operations on April 7, 2017.
7 Not
annualized.
8 Amount
less than $.01.
9 Class
F-3 shares began investment operations on January 27, 2017.
10 Annualized.
Tax-exempt
income funds / Prospectus 56
American
High-Income Municipal Bond Fund
| |
|
|
|
|
|
|
|
|
|
|
|
|
|
|
|
|
|
|
|
|
| |
|
Income
(loss) from investment operations1 |
|
|
|
|
|
|
| Period
ended |
Net
asset
value,
beginning
of period |
Net
investment
income |
Net
gains
(losses) on
securities
(both
realized and
unrealized) |
Total
from
investment
operations |
Dividends
(from
net
investment
income) |
Net
asset
value,
end
of period |
Total
return2 |
Net
assets,
end of period
(in millions) |
Ratio
of
expenses
to average
net assets |
Ratio
of
net income
to average
net assets |
| Class
A: |
|
|
|
|
|
|
|
|
|
|
|
|
|
|
|
|
|
|
|
|
| 7/31/2019 |
$15.78 |
|
$.58 |
|
$.54 |
|
$1.12 |
|
$(.57 |
) |
$16.33 |
|
7.28 |
% |
$4,637 |
|
.68 |
% |
3.67 |
% |
| 7/31/2018 |
15.73 |
|
.59 |
|
.04 |
|
.63 |
|
(.58 |
) |
15.78 |
|
4.05 |
|
4,062 |
|
.68 |
|
3.72 |
|
| 7/31/2017 |
16.21 |
|
.60 |
|
(.49 |
) |
.11 |
|
(.59 |
) |
15.73 |
|
.76 |
|
3,645 |
|
.67 |
|
3.86 |
|
| 7/31/2016 |
15.40 |
|
.63 |
|
.79 |
|
1.42 |
|
(.61 |
) |
16.21 |
|
9.45 |
|
3,519 |
|
.67 |
|
4.02 |
|
| 7/31/2015 |
15.22 |
|
.64 |
|
.17 |
|
.81 |
|
(.63 |
) |
15.40 |
|
5.34 |
|
2,700 |
|
.68 |
|
4.13 |
|
| Class
C: |
|
|
|
|
|
|
|
|
|
|
|
|
|
|
|
|
|
|
|
|
| 7/31/2019 |
15.78 |
|
.47 |
|
.54 |
|
1.01 |
|
(.46 |
) |
16.33 |
|
6.49 |
|
238 |
|
1.41 |
|
2.94 |
|
| 7/31/2018 |
15.73 |
|
.47 |
|
.04 |
|
.51 |
|
(.46 |
) |
15.78 |
|
3.29 |
|
227 |
|
1.43 |
|
2.97 |
|
| 7/31/2017 |
16.21 |
|
.48 |
|
(.49 |
) |
(.01 |
) |
(.47 |
) |
15.73 |
|
.00 |
|
229 |
|
1.43 |
|
3.10 |
|
| 7/31/2016 |
15.40 |
|
.52 |
|
.79 |
|
1.31 |
|
(.50 |
) |
16.21 |
|
8.62 |
|
247 |
|
1.43 |
|
3.26 |
|
| 7/31/2015 |
15.22 |
|
.52 |
|
.17 |
|
.69 |
|
(.51 |
) |
15.40 |
|
4.55 |
|
182 |
|
1.44 |
|
3.37 |
|
| Class
T: |
|
|
|
|
|
|
|
|
|
|
|
|
|
|
|
|
|
|
|
|
| 7/31/2019 |
15.78 |
|
.62 |
|
.54 |
|
1.16 |
|
(.61 |
) |
16.33 |
|
7.55 |
3 |
— |
4 |
.42 |
3 |
3.93 |
3 |
| 7/31/2018 |
15.73 |
|
.63 |
|
.04 |
|
.67 |
|
(.62 |
) |
15.78 |
|
4.34 |
3 |
— |
4 |
.43 |
3 |
3.98 |
3 |
| 7/31/20175,6 |
15.50 |
|
.20 |
|
.23 |
|
.43 |
|
(.20 |
) |
15.73 |
|
2.77 |
3,7 |
— |
4 |
.12 |
3,7 |
1.28 |
3,7 |
| Class
F-1: |
|
|
|
|
|
|
|
|
|
|
|
|
|
|
|
|
|
|
|
|
| 7/31/2019 |
15.78 |
|
.57 |
|
.54 |
|
1.11 |
|
(.56 |
) |
16.33 |
|
7.21 |
|
180 |
|
.74 |
|
3.61 |
|
| 7/31/2018 |
15.73 |
|
.58 |
|
.04 |
|
.62 |
|
(.57 |
) |
15.78 |
|
3.99 |
|
208 |
|
.75 |
|
3.65 |
|
| 7/31/2017 |
16.21 |
|
.59 |
|
(.49 |
) |
.10 |
|
(.58 |
) |
15.73 |
|
.68 |
|
234 |
|
.75 |
|
3.77 |
|
| 7/31/2016 |
15.40 |
|
.62 |
|
.79 |
|
1.41 |
|
(.60 |
) |
16.21 |
|
9.37 |
|
282 |
|
.74 |
|
3.95 |
|
| 7/31/2015 |
15.22 |
|
.62 |
|
.17 |
|
.79 |
|
(.61 |
) |
15.40 |
|
5.27 |
|
207 |
|
.75 |
|
4.06 |
|
| Class
F-2: |
|
|
|
|
|
|
|
|
|
|
|
|
|
|
|
|
|
|
|
|
| 7/31/2019 |
15.78 |
|
.61 |
|
.54 |
|
1.15 |
|
(.60 |
) |
16.33 |
|
7.49 |
|
1,114 |
|
.47 |
|
3.87 |
|
| 7/31/2018 |
15.73 |
|
.62 |
|
.04 |
|
.66 |
|
(.61 |
) |
15.78 |
|
4.26 |
|
798 |
|
.49 |
|
3.91 |
|
| 7/31/2017 |
16.21 |
|
.63 |
|
(.49 |
) |
.14 |
|
(.62 |
) |
15.73 |
|
.93 |
|
605 |
|
.50 |
|
4.05 |
|
| 7/31/2016 |
15.40 |
|
.66 |
|
.79 |
|
1.45 |
|
(.64 |
) |
16.21 |
|
9.65 |
|
775 |
|
.48 |
|
4.18 |
|
| 7/31/2015 |
15.22 |
|
.66 |
|
.17 |
|
.83 |
|
(.65 |
) |
15.40 |
|
5.53 |
|
321 |
|
.49 |
|
4.32 |
|
| Class
F-3: |
|
|
|
|
|
|
|
|
|
|
|
|
|
|
|
|
|
|
|
|
| 7/31/2019 |
15.78 |
|
.63 |
|
.54 |
|
1.17 |
|
(.62 |
) |
16.33 |
|
7.60 |
|
897 |
|
.37 |
|
3.97 |
|
| 7/31/2018 |
15.73 |
|
.64 |
|
.04 |
|
.68 |
|
(.63 |
) |
15.78 |
|
4.37 |
|
646 |
|
.38 |
|
4.02 |
|
| 7/31/20175,8 |
15.30 |
|
.32 |
|
.43 |
|
.75 |
|
(.32 |
) |
15.73 |
|
4.96 |
7 |
421 |
|
.37 |
9 |
4.04 |
9 |
| |
|
|
|
|
|
| |
Year
ended July 31 |
| 2019 |
2018 |
2017 |
2016 |
2015 |
| Portfolio
turnover rate for all share classes |
20% |
24% |
30% |
21% |
23% |
1 Based
on average shares outstanding.
2 Total
returns exclude any applicable sales charges, including contingent deferred sales charges.
3 All
or a significant portion of assets in this class consisted of seed capital invested by Capital Research and Management Company
and/or its affiliates. Fees for distribution services are not charged or accrued on these seed capital assets. If such fees were
paid by the fund on seed capital assets, fund expenses would have been higher and net income and total return would have been
lower.
4 Amount
less than $1 million.
5 Based
on operations for a period that is less than a full year.
6 Class
T shares began investment operations on April 7, 2017.
7 Not
annualized.
8 Class
F-3 shares began investment operations on January 27, 2017.
9 Annualized.
57 Tax-exempt
income funds / Prospectus
The
Tax-Exempt Fund of California
| |
|
|
|
|
|
|
|
|
|
|
|
|
|
|
|
|
|
|
|
|
| |
|
Income
(loss) from investment operations1 |
|
|
|
|
|
|
| Period
ended |
Net
asset
value,
beginning
of period |
Net
investment
income |
Net
gains
(losses) on
securities
(both
realized and
unrealized) |
Total
from
investment
operations |
Dividends
(from
net
investment
income) |
Net
asset
value,
end
of period |
Total
return2 |
Net
assets,
end of period
(in millions) |
Ratio
of
expenses
to average
net assets |
Ratio
of
net income
to average
net assets |
| Class
A: |
|
|
|
|
|
|
|
|
|
|
|
|
|
|
|
|
|
|
|
|
| 7/31/2019 |
$17.43 |
|
$.50 |
|
$.65 |
|
$1.15 |
|
$(.50 |
) |
$18.08 |
|
6.73 |
% |
$1,784 |
|
.59 |
% |
2.88 |
% |
| 7/31/2018 |
17.63 |
|
.51 |
|
(.20 |
) |
.31 |
|
(.51 |
) |
17.43 |
|
1.77 |
|
1,678 |
|
.61 |
|
2.90 |
|
| 7/31/2017 |
18.21 |
|
.54 |
|
(.59 |
) |
(.05 |
) |
(.53 |
) |
17.63 |
|
(.22 |
) |
1,641 |
|
.60 |
|
3.05 |
|
| 7/31/2016 |
17.62 |
|
.57 |
|
.58 |
|
1.15 |
|
(.56 |
) |
18.21 |
|
6.65 |
|
1,678 |
|
.60 |
|
3.17 |
|
| 7/31/2015 |
17.52 |
|
.60 |
|
.09 |
|
.69 |
|
(.59 |
) |
17.62 |
|
3.98 |
|
1,386 |
|
.62 |
|
3.38 |
|
| Class
C: |
|
|
|
|
|
|
|
|
|
|
|
|
|
|
|
|
|
|
|
|
| 7/31/2019 |
17.43 |
|
.36 |
|
.65 |
|
1.01 |
|
(.36 |
) |
18.08 |
|
5.90 |
|
69 |
|
1.38 |
|
2.10 |
|
| 7/31/2018 |
17.63 |
|
.37 |
|
(.20 |
) |
.17 |
|
(.37 |
) |
17.43 |
|
.97 |
|
71 |
|
1.40 |
|
2.11 |
|
| 7/31/2017 |
18.21 |
|
.40 |
|
(.59 |
) |
(.19 |
) |
(.39 |
) |
17.63 |
|
(1.00 |
) |
83 |
|
1.39 |
|
2.26 |
|
| 7/31/2016 |
17.62 |
|
.43 |
|
.58 |
|
1.01 |
|
(.42 |
) |
18.21 |
|
5.82 |
|
97 |
|
1.39 |
|
2.38 |
|
| 7/31/2015 |
17.52 |
|
.46 |
|
.09 |
|
.55 |
|
(.45 |
) |
17.62 |
|
3.16 |
|
78 |
|
1.40 |
|
2.59 |
|
| Class
T: |
|
|
|
|
|
|
|
|
|
|
|
|
|
|
|
|
|
|
|
|
| 7/31/2019 |
17.43 |
|
.54 |
|
.65 |
|
1.19 |
|
(.54 |
) |
18.08 |
|
6.95 |
3 |
— |
4 |
.39 |
3 |
3.09 |
3 |
| 7/31/2018 |
17.63 |
|
.54 |
|
(.20 |
) |
.34 |
|
(.54 |
) |
17.43 |
|
1.98 |
3 |
— |
4 |
.40 |
3 |
3.10 |
3 |
| 7/31/20175,6 |
17.42 |
|
.18 |
|
.21 |
|
.39 |
|
(.18 |
) |
17.63 |
|
2.24 |
3,7 |
— |
4 |
.12 |
3,7 |
1.02 |
3,7 |
| Class
F-1: |
|
|
|
|
|
|
|
|
|
|
|
|
|
|
|
|
|
|
|
|
| 7/31/2019 |
17.43 |
|
.48 |
|
.65 |
|
1.13 |
|
(.48 |
) |
18.08 |
|
6.59 |
|
72 |
|
.72 |
|
2.76 |
|
| 7/31/2018 |
17.63 |
|
.49 |
|
(.20 |
) |
.29 |
|
(.49 |
) |
17.43 |
|
1.64 |
|
75 |
|
.73 |
|
2.77 |
|
| 7/31/2017 |
18.21 |
|
.51 |
|
(.58 |
) |
(.07 |
) |
(.51 |
) |
17.63 |
|
(.35 |
) |
76 |
|
.73 |
|
2.93 |
|
| 7/31/2016 |
17.62 |
|
.55 |
|
.58 |
|
1.13 |
|
(.54 |
) |
18.21 |
|
6.52 |
|
83 |
|
.73 |
|
3.04 |
|
| 7/31/2015 |
17.52 |
|
.58 |
|
.09 |
|
.67 |
|
(.57 |
) |
17.62 |
|
3.85 |
|
63 |
|
.74 |
|
3.26 |
|
| Class
F-2: |
|
|
|
|
|
|
|
|
|
|
|
|
|
|
|
|
|
|
|
|
| 7/31/2019 |
17.43 |
|
.53 |
|
.65 |
|
1.18 |
|
(.53 |
) |
18.08 |
|
6.88 |
|
411 |
|
.45 |
|
3.02 |
|
| 7/31/2018 |
17.63 |
|
.53 |
|
(.20 |
) |
.33 |
|
(.53 |
) |
17.43 |
|
1.89 |
|
257 |
|
.48 |
|
3.03 |
|
| 7/31/2017 |
18.21 |
|
.56 |
|
(.59 |
) |
(.03 |
) |
(.55 |
) |
17.63 |
|
(.09 |
) |
200 |
|
.48 |
|
3.18 |
|
| 7/31/2016 |
17.62 |
|
.60 |
|
.58 |
|
1.18 |
|
(.59 |
) |
18.21 |
|
6.79 |
|
213 |
|
.48 |
|
3.29 |
|
| 7/31/2015 |
17.52 |
|
.62 |
|
.09 |
|
.71 |
|
(.61 |
) |
17.62 |
|
4.10 |
|
134 |
|
.49 |
|
3.51 |
|
| Class
F-3: |
|
|
|
|
|
|
|
|
|
|
|
|
|
|
|
|
|
|
|
|
| 7/31/2019 |
17.43 |
|
.55 |
|
.64 |
|
1.19 |
|
(.54 |
) |
18.08 |
|
6.98 |
|
241 |
|
.36 |
|
3.11 |
|
| 7/31/2018 |
17.63 |
|
.55 |
|
(.20 |
) |
.35 |
|
(.55 |
) |
17.43 |
|
2.01 |
|
174 |
|
.37 |
|
3.13 |
|
| 7/31/20175,8 |
17.27 |
|
.29 |
|
.36 |
|
.65 |
|
(.29 |
) |
17.63 |
|
3.79 |
7 |
124 |
|
.38 |
9 |
3.25 |
9 |
| |
|
|
|
|
|
| |
Year
ended July 31 |
| 2019 |
2018 |
2017 |
2016 |
2015 |
| Portfolio
turnover rate for all share classes |
27% |
14% |
21% |
11% |
17% |
1 Based
on average shares outstanding.
2 Total
returns exclude any applicable sales charges, including contingent deferred sales charges.
3 All
or a significant portion of assets in this class consisted of seed capital invested by Capital Research and Management Company
and/or its affiliates. Fees for distribution services are not charged or accrued on these seed capital assets. If such fees were
paid by the fund on seed capital assets, fund expenses would have been higher and net income and total return would have been
lower.
4 Amount
less than $1 million.
5 Based
on operations for a period that is less than a full year.
6 Class
T shares began investment operations on April 7, 2017.
7 Not
annualized.
8 Class
F-3 shares began investment operations on January 27, 2017.
9 Annualized.
Tax-exempt
income funds / Prospectus 58
American
Funds Tax-Exempt Fund of New York
| |
|
|
|
|
|
|
|
|
|
|
|
|
|
|
|
|
|
|
|
|
|
|
| |
|
Income
(loss) from investment operations1 |
|
|
|
|
|
|
|
| Period
ended |
Net
asset
value,
beginning
of year |
Net
investment
income |
Net
gains
(losses) on
securities
(both
realized and
unrealized) |
Total
from
investment
operations |
Dividends
(from
net
investment
income) |
Net
asset
value,
end
of period |
Total
return2,3 |
Net
assets,
end of period
(in millions) |
Ratio
of
expenses to
average net
assets before
reimbursements |
Ratio
of
expenses to
average net
assets after
reimbursements3 |
Ratio
of
net income
to average
net assets3 |
| Class
A: |
|
|
|
|
|
|
|
|
|
|
|
|
|
|
|
|
|
|
|
|
|
|
| 7/31/2019 |
$10.61 |
|
$.28 |
|
$.41 |
|
$.69 |
|
$(.28 |
) |
$11.02 |
|
6.57 |
% |
$200 |
|
.67 |
% |
.67 |
% |
2.60 |
% |
| 7/31/2018 |
10.80 |
|
.27 |
|
(.19 |
) |
.08 |
|
(.27 |
) |
10.61 |
|
.75 |
4 |
183 |
|
.72 |
4 |
.69 |
4 |
2.52 |
4 |
| 7/31/2017 |
11.12 |
|
.27 |
|
(.32 |
) |
(.05 |
) |
(.27 |
) |
10.80 |
|
(.39 |
)4 |
169 |
|
.74 |
4 |
.69 |
4 |
2.55 |
4 |
| 7/31/2016 |
10.66 |
|
.28 |
|
.45 |
|
.73 |
|
(.27 |
) |
11.12 |
|
6.95 |
4 |
161 |
|
.72 |
4 |
.69 |
4 |
2.54 |
4 |
| 7/31/2015 |
10.58 |
|
.32 |
|
.07 |
|
.39 |
|
(.31 |
) |
10.66 |
|
3.65 |
4 |
124 |
|
.72 |
4 |
.67 |
4 |
2.91 |
4 |
| Class
C: |
|
|
|
|
|
|
|
|
|
|
|
|
|
|
|
|
|
|
|
|
|
|
| 7/31/2019 |
10.61 |
|
.19 |
|
.41 |
|
.60 |
|
(.19 |
) |
11.02 |
|
5.74 |
|
12 |
|
1.46 |
|
1.45 |
|
1.81 |
|
| 7/31/2018 |
10.80 |
|
.19 |
|
(.19 |
) |
— |
5 |
(.19 |
) |
10.61 |
|
(.04 |
) |
12 |
|
1.52 |
|
1.48 |
|
1.73 |
|
| 7/31/2017 |
11.12 |
|
.19 |
|
(.32 |
) |
(.13 |
) |
(.19 |
) |
10.80 |
|
(1.17 |
) |
12 |
|
1.52 |
|
1.48 |
|
1.76 |
|
| 7/31/2016 |
10.66 |
|
.20 |
|
.45 |
|
.65 |
|
(.19 |
) |
11.12 |
|
6.11 |
|
14 |
|
1.51 |
|
1.48 |
|
1.75 |
|
| 7/31/2015 |
10.58 |
|
.23 |
|
.07 |
|
.30 |
|
(.22 |
) |
10.66 |
|
2.79 |
|
10 |
|
1.56 |
|
1.50 |
|
2.07 |
|
| Class
T: |
|
|
|
|
|
|
|
|
|
|
|
|
|
|
|
|
|
|
|
|
|
|
| 7/31/2019 |
10.61 |
|
.30 |
|
.41 |
|
.71 |
|
(.30 |
) |
11.02 |
|
6.78 |
4 |
— |
6 |
.47 |
4 |
.46 |
4 |
2.79 |
4 |
| 7/31/2018 |
10.80 |
|
.29 |
|
(.19 |
) |
.10 |
|
(.29 |
) |
10.61 |
|
.98 |
4 |
— |
6 |
.52 |
4 |
.48 |
4 |
2.73 |
4 |
| 7/31/20177,8 |
10.68 |
|
.09 |
|
.13 |
|
.22 |
|
(.10 |
) |
10.80 |
|
2.02 |
4,9 |
— |
6 |
.19 |
4,9 |
.15 |
4,9 |
.87 |
4,9 |
| Class
F-1: |
|
|
|
|
|
|
|
|
|
|
|
|
|
|
|
|
|
|
|
|
|
|
| 7/31/2019 |
10.61 |
|
.27 |
|
.41 |
|
.68 |
|
(.27 |
) |
11.02 |
|
6.52 |
4 |
2 |
|
.72 |
4 |
.71 |
4 |
2.55 |
4 |
| 7/31/2018 |
10.80 |
|
.26 |
|
(.19 |
) |
.07 |
|
(.26 |
) |
10.61 |
|
.69 |
4 |
2 |
|
.79 |
4 |
.75 |
4 |
2.45 |
4 |
| 7/31/2017 |
11.12 |
|
.27 |
|
(.32 |
) |
(.05 |
) |
(.27 |
) |
10.80 |
|
(.38 |
)4 |
3 |
|
.73 |
4 |
.68 |
4 |
2.56 |
4 |
| 7/31/2016 |
10.66 |
|
.29 |
|
.45 |
|
.74 |
|
(.28 |
) |
11.12 |
|
7.02 |
4 |
2 |
|
.65 |
4 |
.62 |
4 |
2.61 |
4 |
| 7/31/2015 |
10.58 |
|
.31 |
|
.07 |
|
.38 |
|
(.30 |
) |
10.66 |
|
3.58 |
4 |
2 |
|
.80 |
4 |
.74 |
4 |
2.83 |
4 |
| Class
F-2: |
|
|
|
|
|
|
|
|
|
|
|
|
|
|
|
|
|
|
|
|
|
|
| 7/31/2019 |
10.61 |
|
.29 |
|
.41 |
|
.70 |
|
(.29 |
) |
11.02 |
|
6.74 |
|
29 |
|
.51 |
|
.51 |
|
2.75 |
|
| 7/31/2018 |
10.80 |
|
.29 |
|
(.19 |
) |
.10 |
|
(.29 |
) |
10.61 |
|
.89 |
|
16 |
|
.59 |
|
.54 |
|
2.67 |
|
| 7/31/2017 |
11.12 |
|
.29 |
|
(.32 |
) |
(.03 |
) |
(.29 |
) |
10.80 |
|
(.26 |
) |
11 |
|
.58 |
|
.56 |
|
2.68 |
|
| 7/31/2016 |
10.66 |
|
.30 |
|
.45 |
|
.75 |
|
(.29 |
) |
11.12 |
|
7.10 |
|
31 |
|
.58 |
|
.55 |
|
2.68 |
|
| 7/31/2015 |
10.58 |
|
.33 |
|
.07 |
|
.40 |
|
(.32 |
) |
10.66 |
|
3.77 |
|
20 |
|
.61 |
|
.56 |
|
3.02 |
|
| Class
F-3: |
|
|
|
|
|
|
|
|
|
|
|
|
|
|
|
|
|
|
|
|
|
|
| 7/31/2019 |
10.61 |
|
.30 |
|
.41 |
|
.71 |
|
(.30 |
) |
11.02 |
|
6.83 |
|
32 |
|
.42 |
|
.42 |
|
2.84 |
|
| 7/31/2018 |
10.80 |
|
.30 |
|
(.19 |
) |
.11 |
|
(.30 |
) |
10.61 |
|
1.00 |
|
26 |
|
.48 |
|
.44 |
|
2.78 |
|
| 7/31/20177,10 |
10.58 |
|
.15 |
|
.22 |
|
.37 |
|
(.15 |
) |
10.80 |
|
3.54 |
9 |
16 |
|
.58 |
11 |
.45 |
11 |
2.79 |
11 |
| |
|
|
|
|
|
| |
Year
ended July 31 |
| 2019 |
2018 |
2017 |
2016 |
2015 |
| Portfolio
turnover rate for all share classes |
16% |
21% |
27% |
14% |
42% |
1
Based on average shares outstanding.
2 Total
returns exclude any applicable sales charges, including contingent deferred sales charges.
3 This
column reflects the impact, if any, of certain reimbursements from Capital Research and Management Company. During the periods
shown, Capital Research and Management Company reimbursed a portion of miscellaneous fees and expenses.
4 All
or a significant portion of assets in this class consisted of seed capital invested by Capital Research and Management Company
and/or its affiliates. Fees for distribution services are not charged or accrued on these seed capital assets. If such fees were
paid by the fund on seed capital assets, fund expenses would have been higher and net income and total return would have been
lower.
5 Amount
less than $.01.
6 Amount
less than $1 million.
7 Based
on operations for a period that is less than a full year.
8 Class
T shares began investment operations on April 7, 2017.
9 Not
annualized.
10 Class
F-3 shares began investment operations on January 27, 2017.
11 Annualized.
59 Tax-exempt
income funds / Prospectus
Appendix
Sales
charge waivers
The availability
of certain sales charge waivers and discounts will depend on whether you purchase your shares directly from the fund or through
a financial intermediary. Intermediaries may have different policies and procedures regarding the availability of front-end sales
charge waivers or contingent deferred (back-end) sales charge (“CDSC”) waivers, which are discussed below. In all
instances, it is the purchaser’s responsibility to notify the fund or the purchaser’s financial intermediary at the
time of purchase of any relationship or other facts qualifying the purchaser for sales charge waivers or discounts. Please contact
the applicable intermediary with any questions regarding how the intermediary applies the policies described below and to ensure
that you understand what steps you must take to qualify for any available waivers or discounts. For waivers and discounts not
available through a particular intermediary, shareholders will have to purchase fund shares directly from the fund or through
another intermediary to receive these waivers or discounts. If you change intermediaries after
you purchase fund shares, the policies and procedures of the new service provider (either your new intermediary or the fund’s
transfer agent) will apply to your account. Those policies may be more or less favorable than those offered by the intermediary
through which you purchased your fund shares. You should review any policy differences before changing intermediaries.
Merrill
Lynch, Pierce, Fenner & Smith
Effective
April 10, 2017, shareholders purchasing fund shares through a Merrill Lynch platform or account are eligible only for the following
sales charge waivers (front-end sales charge waivers and contingent deferred, or back-end, sales charge waivers) and discounts,
which may differ from those disclosed elsewhere in this fund’s prospectus or SAI.
Front-end
sales charge waivers on Class A shares available at Merrill Lynch
· Employer-sponsored
retirement, deferred compensation and employee benefit plans (including health savings accounts) and trusts used to fund those
plans, provided that the shares are not held in a commission-based brokerage account and shares are held for the benefit of the
plan. Except as provided below, Class A shares are not currently available to new plans described in this waiver. Plans that invested
in Class A shares of any of the funds without any sales charge before April 1, 2004, and that continue to meet the eligibility
requirements in effect as of that date for purchasing Class A shares at net asset value, may continue to purchase American Funds
Class A shares without any initial or contingent deferred sales charge.
· Shares
purchased by or through a 529 Plan. Class A shares are not currently available to the plans described in this waiver
· Shares
purchased through a Merrill Lynch affiliated investment advisory program. Class A shares are not currently available in the
programs described in this waiver
· Shares
purchased by third-party investment advisors on behalf of their advisory clients through Merrill Lynch’s platform. Class
A shares are not currently available in the accounts described in this waiver
· Shares
purchased through reinvestment of capital gains distributions and dividend reinvestment when purchasing shares of the same fund
(but not any other fund within the fund family)
· Shares
exchanged from Class C (i.e. level-load) shares of the same fund in the month of or following the 10-year anniversary of the purchase
date. To the extent that this prospectus elsewhere provides for a waiver with respect to such shares following a shorter holding
period, that waiver will apply to exchanges following such shorter period. To the extent that this prospectus elsewhere provides
for a waiver with respect to exchanges of Class C shares for sales charge waived shares, that waiver will apply to such exchanges
· Employees
and registered representatives of Merrill Lynch or its affiliates and their family members
· Directors
or Trustees of the fund, and employees of the fund’s investment adviser or any of its affiliates, as described in this prospectus
· Shares
purchased from the proceeds of redemptions within the same fund family, provided (1) the repurchase occurs within 90 days following
the redemption, (2) the redemption and purchase occur in the same account, and (3) redeemed shares were subject to a front-end
or deferred sales charge (known as rights of reinstatement)
CDSC
Waivers on Classes A, B and C shares available at Merrill Lynch
· Death
or disability of the shareholder
· Shares
sold as part of a systematic withdrawal plan as described in the fund’s prospectus
· Return
of excess contributions from an IRA Account
· Shares
sold as part of a required minimum distribution for IRA and retirement accounts due to the shareholder reaching age 70½ as
described in the fund’s prospectus
· Shares
sold to pay Merrill Lynch fees but only if the transaction is initiated by Merrill Lynch
· Shares
acquired through a right of reinstatement
· Shares
held in retirement brokerage accounts, that are exchanged for a lower cost share class due to transfer to certain fee based accounts
or platforms (applicable to Class A and C shares only)
Front-end
sales charge discounts available at Merrill Lynch: breakpoints, rights of accumulation and letters of intent
· Breakpoints
as described in this prospectus.
· Rights
of accumulation which entitle shareholders to breakpoint discounts will be automatically calculated based on the aggregated holding
of fund family assets held by accounts within the purchaser’s household at Merrill Lynch. Eligible fund family assets not
held at
Tax-exempt
income funds / Prospectus 60
Merrill
Lynch may be included in the rights of accumulation calculation only if the shareholder notifies his or her financial advisor
about such assets
· Letters
of Intent which allow for breakpoint discounts based on anticipated purchases within a fund family, through Merrill Lynch, over
a 13-month period of time (if applicable)
Morgan
Stanley Wealth Management
Morgan
Stanley Wealth Management Class A share front-end sales charge waiver
Effective
July 1, 2018, Morgan Stanley Wealth Management clients purchasing Class A shares of the fund through Morgan Stanley transactional
brokerage accounts are entitled to a waiver of the front-end sales charge in the following additional circumstances:
· Morgan
Stanley employee and employee-related accounts according to Morgan Stanley’s account linking rules.
· Shares
purchased through reinvestment of dividends and capital gains distributions when purchasing shares of the same fund.
· Class
C (level load) share positions that are no longer subject to a contingent deferred sales charge and are converted to a Class A
share in the same fund pursuant to Morgan Stanley Wealth Management’s share class conversion program.
· Shares
purchased from the proceeds of redemptions within the same fund family under a Rights of Reinstatement provision, provided the
repurchase occurs within 90 days following the redemption, the redemption and purchase occur in the same account, and redeemed
shares were subject to a front-end or deferred sales charge.
Unless
specifically described above, no other front-end sales charge waivers are available to mutual fund purchases by Morgan Stanley
Wealth Management clients.
Morgan
Stanley Wealth Management Class R-4 share employer-sponsored retirement plan eligibility
Employer-sponsored
retirement plans (e.g., 401(k) plans, 457 plans, employer-sponsored 403(b) plans, profit sharing and money purchase pension plans
and defined benefit plans). For purposes of this provision, employer-sponsored retirement plans do not include SEP IRAs, Simple
IRAs, SAR-SEPs or Keogh plans.
Raymond
James & Associates, Inc., Raymond James Financial Services, Inc., and
each
entity’s affiliates (“Raymond James”) Class A share Front-End Sales Charge Waiver
Effective
March 1, 2019, shareholders purchasing fund shares through a Raymond James platform or account, or through an introducing broker-dealer
or independent registered investment adviser for which Raymond James provides trade execution, clearance, and/or custody services,
will be eligible only for the following sales charge waivers (front-end sales charge waivers and contingent deferred, or back-end,
sales charge waivers) and discounts, which may differ from those disclosed elsewhere in this fund’s prospectus or SAI.
Front-end
sales charge waivers on Class A shares available at Raymond James
· Shares
purchased within the same fund family through a systematic reinvestment of capital gains and dividend distributions.
· Employees
and registered representatives of Raymond James or its affiliates and their family members as designated by Raymond James.
· Shares
purchased from the proceeds of redemptions within the same fund family, provided (1) the repurchase occurs within 90 days following
the redemption, (2) the redemption and purchase occur in the same account, and (3) redeemed shares were subject to a front-end
or deferred sales charge (known as Rights of Reinstatement).
· A
shareholder in the Fund’s Class C shares will have their shares converted at net asset value to Class A shares (or the appropriate
share class) of the Fund if the shares are no longer subject to a CDSC and the conversion is in line with the policies and procedures
of Raymond James.
CDSC
Waivers on Classes A and C shares available at Raymond James
· Death
or disability of the shareholder.
· Shares
sold as part of a systematic withdrawal plan as described in the fund’s prospectus.
· Return
of excess contributions from an IRA Account.
· Shares
sold as part of a required minimum distribution for IRA and retirement accounts due to the shareholder reaching age 70½ as
described in the fund’s prospectus.
· Shares
acquired through a right of reinstatement.
Front-end
sales charge discounts available at Raymond James: breakpoints, rights of accumulation and/or letters of intent
· Breakpoints
as described in this prospectus.
· Rights
of accumulation which entitle shareholders to breakpoint discounts will be automatically calculated based on the aggregated holding
of fund family assets held by accounts within the purchaser’s household at Raymond James. Eligible fund family assets not
held at Raymond James may be included in the calculation of rights of accumulation calculation only if the shareholder notifies
his or her financial advisor about such assets.
· Letters
of intent which allow for breakpoint discounts based on anticipated purchases within a fund family, over a 13-month time period.
Eligible fund family assets not held at Raymond James may be included in the calculation of letters of intent only if the shareholder
notifies his or her financial advisor about such assets.
61 Tax-exempt
income funds / Prospectus
Class
A Shares Front-End Sales Charge Waivers Available at Ameriprise Financial:
The
following information applies to Class A shares purchases if you have an account with or otherwise purchase Fund shares through
Ameriprise Financial:
Effective
January 1, 2019, shareholders purchasing Fund shares through an Ameriprise Financial platform or account are eligible for the
following front-end sales charge waivers, which may differ from those disclosed elsewhere in this Fund’s prospectus or SAI:
· Employer-sponsored
retirement plans established prior to April 1, 2004 and that continue to meet the eligibility requirements in effect as of that
date for purchasing Class A shares at net asset value (e.g., 401(k) plans, 457 plans, employer-sponsored 403(b) plans, profit
sharing and money purchase pension plans and defined benefit plans). For purposes of this provision, employer-sponsored retirement
plans do not include SEP IRAs, Simple IRAs or SAR-SEPs.
· Shares
purchased through an Ameriprise Financial investment advisory program (if an Advisory or similar share class for such investment
advisory program is not available).
· Shares
purchased by third-party investment advisors on behalf of their advisory clients through Ameriprise Financial’s platform
(if an Advisory or similar share class for such investment advisory program is not available).
· Shares
purchased through reinvestment of capital gains distributions and dividend reinvestment when purchasing shares of the same Fund
(but not any other fund within the same fund family).
· Shares
exchanged from Class C shares of the same fund in the month of or following the 10-year anniversary of the purchase date. To the
extent that this prospectus elsewhere provides for a waiver with respect to such shares following a shorter holding period, that
waiver will apply to exchanges following such shorter period. To the extent that this prospectus elsewhere provides for a waiver
with respect to exchanges of Class C shares for sales charge waived shares, that waiver will also apply to such exchanges.
· Employees
and registered representatives of Ameriprise Financial or its affiliates and their immediate family members.
· Shares
purchased by or through qualified accounts (including IRAs, Coverdell Education Savings Accounts, as well as 401(k)s, 403(b) TSCAs
subject to ERISA and defined benefit plans established prior to April 1, 2004 that continue to meet the eligibility requirements
in effect as of that date for purchasing Class A shares at net asset value) that are held by a covered family member, defined
as an Ameriprise financial advisor and/or the advisor’s spouse, advisor’s lineal ascendant (mother, father, grandmother,
grandfather, great grandmother, great grandfather), advisor’s lineal descendant (son, step-son, daughter, step-daughter,
grandson, granddaughter, great grandson, great granddaughter) or any spouse of a covered family member who is a lineal descendant.
· Shares
purchased from the proceeds of redemptions within the same fund family, provided (1) the repurchase occurs within 90 days following
the redemption, (2) the redemption and purchase occur in the same account, and (3) redeemed shares were subject to a front-end
or deferred sales charge (i.e. Rights of Reinstatement).
Tax-exempt
income funds / Prospectus 62
Appendix
Moody’s
long-term rating scale
Aaa —
Obligations rated Aaa are judged to be of the highest quality, subject to the lowest level of credit risk.
Aa
— Obligations rated Aa are judged to be of high quality and are subject to very low credit risk.
A
— Obligations rated A are considered upper-medium grade and are subject to low credit risk.
Baa
— Obligations rated Baa are judged to be medium grade and subject to moderate credit risk and as such may possess certain
speculative characteristics.
Ba
— Obligations rated Ba are judged to be speculative and are subject to substantial credit risk.
B
— Obligations rated B are considered speculative and are subject to high credit risk.
Caa
— Obligations rated Caa are judged to be speculative and of poor standing and are subject to very high credit risk.
Ca
— Obligations rated Ca are highly speculative and are likely in, or very near, default, with some prospect of recovery of
principal and interest.
C
— Obligations rated C are the lowest rated and are typically in default, with little prospect for recovery of principal
or interest.
Note: Moody’s
appends numerical modifiers 1, 2 and 3 to each generic rating classification from Aa through Caa. The modifier 1 indicates that
the obligation ranks in the higher end of its generic rating category; the modifier 2 indicates a mid-range ranking; and the modifier
3 indicates a ranking in the lower end of that generic rating category. Additionally, a “(hyb)” indicator is appended
to all ratings of hybrid securities issued by banks, insurers, finance companies and securities firms.
Standard
& Poor’s long-term-issue credit ratings
Standard
& Poor’s Ratings Services (“S&P”) rates the long-term debt securities of various entities in categories
ranging from AAA to D according to quality. The ratings from AA to CCC may be modified by the addition of a plus (+) or minus
(–) sign to show relative standing within the major rating categories. Ratings are described as follows:
AAA
— An obligation rated AAA has the highest rating assigned by S&P. The obligor’s capacity to meet its financial
commitment on the obligation is extremely strong.
AA —
An obligation rated AA differs from the highest rated obligations only in a small degree. The obligor’s capacity to meet
its financial commitment on the obligation is very strong.
A —
An obligation rated A is somewhat more susceptible to the adverse effects of changes in circumstances and economic conditions
than obligations in higher rated categories. However, the obligor’s capacity to meet its financial commitment on the obligation
is still strong.
BBB
— An obligation rated BBB exhibits adequate protection parameters. However, adverse economic conditions or changing circumstances
are more likely to lead to a weakened capacity of the obligor to meet its financial commitment on the obligation.
BB,
B, CCC, CC and C — Obligations rated BB, B, CCC, CC and C are regarded as having significant speculative characteristics.
BB indicates the least degree of speculation and C the highest. While such obligations will likely have some quality and protective
characteristics, these may be outweighed by large uncertainties or major exposures to adverse conditions.
BB —
An obligation rated BB is less vulnerable to nonpayment than other speculative issues. However, it faces major ongoing uncertainties
or exposure to adverse business, financial or economic conditions that could lead to the obligor’s inadequate capacity to
meet its financial commitment on the obligation.
B —
An obligation rated B is more vulnerable to nonpayment than obligations rated BB, but the obligor currently has the capacity to
meet its financial commitment on the obligation. Adverse business, financial or economic conditions will likely impair the obligor’s
capacity or willingness to meet its financial commitment on the obligation.
CCC
— An obligation rated CCC is currently vulnerable to nonpayment and is dependent upon favorable business, financial and
economic conditions for the obligor to meet its financial commitment on the obligation. In the event of adverse business, financial
or economic conditions, the obligor is not likely to have the capacity to meet its financial commitment on the obligation.
CC
— An obligation rated CC is currently highly vulnerable to nonpayment. The CC rating is used when a default has not occurred,
but S&P expects default to be a virtual certainty, regardless of the anticipated time to default.
C
— An obligation rated C is currently highly vulnerable to nonpayment, and the obligation is expected to have lower relative
seniority or lower ultimate recovery compared to obligations that are rated higher.
D
— An obligation rated D is in default or in breach of an imputed promise. For non-hybrid capital instruments, the D rating
category is used when payments on an obligation are not made on the date due, unless S&P believes that such payments will
be made within five business days in the absence of a stated grace period or within the earlier of the stated grace period or
30 calendar days. The D rating also will be used upon the filing of a bankruptcy petition or the taking of similar action and
where default on an obligation is a virtual certainty, for example due to automatic stay provisions. An obligation’s rating
is lowered to D if it is subject to a distressed exchange offer.
Plus
(+) or minus (–) — The ratings from AA to CCC may be modified by the addition of a plus or minus sign to show relative
standing within the major rating categories.
63 Tax-exempt
income funds / Prospectus
NR
— This indicates that no rating has been requested, that there is insufficient information on which to base a rating, or
that S&P does not rate a particular obligation as a matter of policy.
Fitch
Ratings, Inc. long-term credit ratings
AAA —
Highest credit quality. AAA ratings denote the lowest expectation of default risk. They are assigned only in case of exceptionally
strong capacity for payment of financial commitments. This capacity is highly unlikely to be adversely affected by foreseeable
events.
AA —
Very high credit quality. AA ratings denote expectations of very low default risk. They indicate very strong capacity for payment
of financial commitments. This capacity is not significantly vulnerable to foreseeable events.
A —
High credit quality. A ratings denote expectations of low default risk. The capacity for payment of financial commitments is considered
strong. This capacity may, nevertheless, be more vulnerable to changes in circumstances or in economic conditions than is the
case for higher ratings.
BBB
— Good credit quality. BBB ratings indicate that expectations of default risk are low. The capacity for payment of financial
commitments is considered adequate but adverse changes in circumstances and economic conditions are more likely to impair this
capacity.
BB —
Speculative. BB ratings indicate an elevated vulnerability to default risk, particularly in the event of adverse changes in business
or economic conditions over time; however, business or financial flexibility exists which supports the servicing of financial
commitments.
B
— Highly speculative. B ratings indicate that material default risk is present, but a limited margin of safety remains.
Financial commitments are currently being met; however, capacity for continued payment is vulnerable to deterioration in the business
and economic environment.
CCC —
Substantial credit risk. Default is a real possibility.
CC
— Very high levels of credit risk. Default of some kind appears probable.
C —
Exceptionally high levels of credit risk. Default is imminent or inevitable, or the issuer is in standstill. Conditions that are
indicative of a C category rating for an issuer include:
· The
issuer has entered into a grace or cure period following nonpayment of a material financial obligation;
· The
issuer has entered into a temporary negotiated waiver or standstill agreement following a payment default on a material financial
obligation; or
· Fitch
Ratings otherwise believes a condition of RD or D to be imminent or inevitable, including through the formal announcement of a
distressed debt exchange.
Tax-exempt
income funds / Prospectus 64
RD
— Restricted default. RD ratings indicate an issuer that in Fitch Ratings’ opinion has experienced an uncured payment
default on a bond, loan or other material financial obligation but which has not entered into bankruptcy filings, administration,
receivership, liquidation or other formal winding up procedure, and which has not otherwise ceased operating. This would include:
· The
selective payment default on a specific class or currency of debt;
· The
uncured expiry of any applicable grace period, cure period or default forbearance period following a payment default on a bank
loan, capital markets security or other material financial obligation;
· The
extension of multiple waivers or forbearance periods upon a payment default on one or more material financial obligations, either
in series or in parallel; or
· Execution
of a distressed debt exchange on one or more material financial obligations.
D
— Default. D ratings indicate an issuer that in Fitch Ratings’ opinion has entered into bankruptcy filings, administration,
receivership, liquidation or other formal winding up procedure, or which has otherwise ceased business.
Default
ratings are not assigned prospectively to entities or their obligations; within this context, nonpayment on an instrument that
contains a deferral feature or grace period will generally not be considered a default until after the expiration of the deferral
or grace period, unless a default is otherwise driven by bankruptcy or other similar circumstance, or by a distressed debt exchange.
Imminent
default typically refers to the occasion where a payment default has been intimated by the issuer, and is all but inevitable.
This may, for example, be where an issuer has missed a scheduled payment, but (as is typical) has a grace period during which
it may cure the payment default. Another alternative would be where an issuer has formally announced a distressed debt exchange,
but the date of the exchange still lies several days or weeks in the immediate future.
In
all cases, the assignment of a default rating reflects the agency’s opinion as to the most appropriate rating category consistent
with the rest of its universe of ratings, and may differ from the definition of default under the terms of an issuer’s financial
obligations or local commercial practice.
Note:
The modifiers “+” or “–” may be appended to a rating to denote relative status within major rating
categories. Such suffixes are not added to the AAA long-term rating category, or to categories below B.
65 Tax-exempt
income funds / Prospectus
Notes
Tax-exempt
income funds / Prospectus 66
| |
|
|
|
| |
|
|
|
| |
For
shareholder services |
American
Funds Service Company
(800) 421-4225 |
|
| |
For
retirement plan services |
Call
your employer or plan administrator |
|
| |
For
24-hour information |
American
FundsLine
(800) 325-3590
capitalgroup.com |
|
| |
Telephone
calls you have with American Funds may be monitored or recorded for quality assurance, verification and recordkeeping purposes.
By speaking to American Funds on the telephone, you consent to such monitoring and recording. |
|
Annual/Semi-annual
report to shareholders The shareholder reports contain additional information about the fund, including financial statements,
investment results, portfolio holdings, a discussion of market conditions and the fund’s investment strategies, and the
independent registered public accounting firm’s reports (in the annual report).
Statement
of additional information (SAI) and codes of ethics The current SAI, as amended from time to time, contains more detailed
information about the fund, including the fund’s financial statements, and is incorporated by reference into this prospectus.
This means that the current SAI, for legal purposes, is part of this prospectus. The codes of ethics describe the personal investing
policies adopted by the fund, the fund’s investment adviser and its affiliated companies.
The
codes of ethics and current SAI are on file with the U.S. Securities and Exchange Commission (SEC). These and other related materials
about the fund are available for review on the EDGAR database on the SEC’s website at sec.gov or, after payment of
a duplicating fee, via email request to publicinfo@sec.gov. The codes of ethics, current SAI and shareholder reports are also
available, free of charge, on our website, capitalgroup.com.
E-delivery
and household mailings Each year you are automatically sent an updated summary prospectus and annual and semi-annual
reports for the fund. You may also occasionally receive proxy statements for the fund. In order to reduce the volume of mail you
receive, when possible, only one copy of these documents will be sent to shareholders who are part of the same family and share
the same household address. You may elect to receive these documents electronically in lieu of paper form by enrolling in e-delivery
on our website, capitalgroup.com.
If you would
like to opt out of household-based mailings or receive a complimentary copy of the current SAI, codes of ethics or annual/semi-annual
report to shareholders, please call American Funds Service Company at (800) 421-4225 or write to the secretary of the fund at
333 South Hope Street, Los Angeles, California 90071-1406, or for American Funds Tax-Exempt Fund of New York at 6455 Irvine Center
Drive, Irvine, California 92618.
| |
|
| |
| |
| |
 |
MFGEPRX-965-1019P
Litho in USA CGD/DFS/8020
Investment Company File No. 811-05750
Investment Company File No. 811-07888
Investment
Company File No. 811-02421
Investment Company File No. 811-08576
Investment Company File No. 811-04694
Investment
Company File No. 811-22448 |
| |
| |
|
| |
American
Funds Short-Term Tax-Exempt Bond Fund®
Limited Term Tax-Exempt Bond Fund of America®
The Tax-Exempt Bond Fund of America®
American High-Income Municipal Bond Fund®
Prospectus
October
1, 2019 |
 |
| |
| |
|
| Class |
R-6 |
| American
Funds Short-Term Tax-Exempt Bond Fund |
N/A |
| Limited
Term Tax-Exempt Bond Fund of America |
N/A |
| The
Tax-Exempt Bond Fund of America |
N/A |
| American
High-Income Municipal Bond Fund |
N/A |
Table
of contents
| |
|
|
Summaries:
American
Funds Short-Term Tax-Exempt Bond Fund 1
Limited
Term Tax-Exempt Bond Fund of America 6
The
Tax-Exempt Bond Fund of America 11
American
High-Income Municipal Bond Fund 16
Investment
objectives, strategies and risks 21
Management
and organization 24
Purchase,
exchange and sale of shares 27 |
|
How
to sell shares 28
Distributions
and taxes 30
Choosing
a share class 30
Sales
charges 30
Other
compensation to dealers 30
Fund
expenses 31
Financial
highlights 32
Appendix 36 |
| |
| The
U.S. Securities and Exchange Commission has not approved or disapproved of these securities. Further, it has not determined
that this prospectus is accurate or complete. Any representation to the contrary is a criminal offense. |
Beginning
January 1, 2021, as permitted by regulations adopted by the U.S. Securities and Exchange Commission, we intend to no longer mail
paper copies of the fund’s shareholder reports, unless specifically requested from American Funds or your financial intermediary,
such as a broker-dealer or bank. Instead, the reports will be made available on the American Funds website (capitalgroup.com);
you will be notified by mail and provided with a website link to access the report each time a report is posted. If you have already
elected to receive shareholder reports electronically, you will not be affected by this change and do not need to take any action.
If you prefer to receive shareholder reports and other communications electronically, you may update your mailing preferences
with your financial intermediary, or enroll in e-delivery at capitalgroup.com (for accounts held directly with the fund).
You
may elect to receive paper copies of all future reports free of charge. If you invest through a financial intermediary, you may
contact your financial intermediary to request that you continue to receive paper copies of your shareholder reports. If you invest
directly with the fund, you may inform American Funds that you wish to continue receiving paper copies of your shareholder reports
by contacting us at (800) 421-4225. Your election to receive paper reports will apply to all funds held with American Funds or
through your financial intermediary.
American
Funds Short-Term Tax-Exempt Bond Fund
Investment
objective The fund’s investment objective
is to provide you with current income exempt from regular federal income tax, consistent with the maturity and quality standards
described in this prospectus, and to preserve capital.
Fees
and expenses of the fund This table describes the
fees and expenses that you may pay if you buy and hold shares of the fund.
| |
|
| Shareholder
fees (fees paid directly from your investment) |
| Share
class: |
R-6 |
| Maximum
sales charge (load) imposed on purchases (as a percentage of offering price) |
none |
| Maximum
deferred sales charge (load) (as a percentage of the amount redeemed) |
none |
| Maximum
sales charge (load) imposed on reinvested dividends |
none |
| Redemption
or exchange fees |
none |
| |
|
| Annual
fund operating expenses (expenses
that you pay each year as a percentage of the value of your investment) |
| Share
class: |
R-6 |
| Management
fees* |
0.34% |
| Distribution
and/or service (12b-1) fees |
none |
| Other
expenses* |
0.06 |
| Total
annual fund operating expenses |
0.40 |
* Restated
to reflect current fees.
Example
This example is intended to help you compare the cost of investing in the fund with the cost of investing in other mutual
funds.
The
example assumes that you invest $10,000 in the fund for the time periods indicated and then redeem all of your shares at the end
of those periods. The example also assumes that your investment has a 5% return each year and that the fund’s operating
expenses remain the same. Although your actual costs may be higher or lower, based on these assumptions your costs would be:
| |
|
|
|
|
| Share
class |
1
year |
3
years |
5
years |
10
years |
| R-6 |
$41 |
$128 |
$224 |
$505 |
1 Tax-exempt
income funds - Class R-6 / Prospectus
Portfolio
turnover The fund pays transaction costs, such as commissions, when it buys and sells securities (or “turns over”
its portfolio). A higher portfolio turnover rate may indicate higher transaction costs and may result in higher taxes when fund
shares are held in a taxable account. These costs, which are not reflected in annual fund operating expenses or in the example,
affect the fund’s investment results. During the most recent fiscal year, the fund’s portfolio turnover rate was 50%
of the average value of its portfolio.
Principal
investment strategies Under normal circumstances,
the fund will invest at least 80% of its assets in, or derive at least 80% of its income from, securities that are exempt from
regular federal income tax and that do not subject you to federal alternative minimum tax. The fund may also invest up to 20%
of its assets in securities that may subject you to federal alternative minimum tax. The fund invests primarily in debt securities
rated AA- or better or Aa3 or better by Nationally Recognized Statistical Rating Organizations designated by the fund’s
investment adviser, or unrated but determined by the fund’s investment adviser to be of equivalent quality. The fund may
also invest in debt securities rated A- or better or A3 or better by Nationally Recognized Statistical Rating Organizations designated
by the fund’s investment adviser, or unrated but determined by the fund’s investment adviser to be of equivalent quality.
Some of the securities in which the fund invests may have credit and liquidity support features, including guarantees and letters
of credit. The fund’s aggregate portfolio will have a dollar-weighted average effective maturity no greater than three years.
The investment
adviser uses a system of multiple portfolio managers in managing the fund’s assets. Under this approach, the portfolio of
the fund is divided into segments managed by individual managers.
The fund
relies on the professional judgment of its investment adviser to make decisions about the fund’s portfolio investments.
The basic investment philosophy of the investment adviser is to seek to invest in attractively priced securities that, in its
opinion, represent good, long-term investment opportunities. The investment adviser believes that an important way to accomplish
this is by analyzing various factors, which may include the credit strength of the issuer, prices of similar securities issued
by comparable issuers, anticipated changes in interest rates, general market conditions and other factors pertinent to the particular
security being evaluated. Securities may be sold when the investment adviser believes that they no longer represent relatively
attractive investment opportunities.
Tax-exempt
income funds - Class R-6 / Prospectus 2
Principal
risks This section describes the principal
risks associated with investing in the fund. You may lose money by investing in the fund. The likelihood of loss may be greater
if you invest for a shorter period of time.
Market
conditions — The prices of, and
the income generated by, the securities held by the fund may decline – sometimes rapidly or unpredictably – due to
various factors, including events or conditions affecting the general economy or particular industries; overall market changes;
local, regional or global political, social or economic instability; governmental, governmental agency or central bank responses
to economic conditions; and currency exchange rate, interest rate and commodity price fluctuations.
Issuer
risks — The prices of, and the
income generated by, securities held by the fund may decline in response to various factors directly related to the issuers of
such securities, including reduced demand for an issuer’s goods or services, poor management performance, major litigation
related to the issuer, changes in government regulations affecting the issuer or its competitive environment and strategic initiatives
such as mergers, acquisitions or dispositions and the market response to any such initiatives.
Investing
in municipal securities — The yield and/or
value of the fund’s investments in municipal securities may be adversely affected by events tied to the municipal securities
markets, which can be very volatile and significantly impacted by unfavorable legislative or political developments and negative
changes in the financial conditions of municipal securities issuers and the economy. To the extent the fund invests in obligations
of a municipal issuer, the volatility, credit quality and performance of the fund may be adversely impacted by local political
and economic conditions of the issuer. For example, a credit rating downgrade, bond default or bankruptcy involving an issuer
within a particular state or territory could affect the market values and marketability of many or all municipal obligations of
that state or territory. Income from municipal securities held by the fund could also be declared taxable because of changes in
tax laws or interpretations by taxing authorities or as a result of noncompliant conduct of a municipal issuer. Additionally,
the relative amount of publicly available information about municipal securities is generally less than that for corporate securities.
Investing
in debt instruments — The prices of,
and the income generated by, bonds and other debt securities held by the fund may be affected by changing interest rates and by
changes in the effective maturities and credit ratings of these securities.
Rising
interest rates will generally cause the prices of bonds and other debt securities to fall. A general rise in interest rates may
cause investors to sell debt securities on a large scale, which could also adversely affect the price and liquidity of debt securities
and could also result in increased redemptions from the fund. Falling interest rates may cause an issuer to redeem, call or refinance
a debt security before its stated maturity, which may result in the fund failing to recoup the full amount of its initial investment
and having to reinvest the proceeds in lower yielding securities. Longer maturity debt securities generally have greater sensitivity
to changes in interest rates and may be subject to greater price fluctuations than shorter maturity debt securities.
Bonds
and other debt securities are also subject to credit risk, which is the possibility that the credit strength of an issuer or guarantor
will weaken or be perceived to be weaker, and/or an issuer of a debt security will fail to make timely payments of principal or
interest and the security will go into default. A downgrade or default affecting any of the fund’s securities could cause
the value of the fund’s shares to decrease. Lower quality debt securities generally have higher rates of interest and may
be subject to greater price fluctuations than higher quality debt securities. Credit risk is gauged, in part, by the credit ratings
of the debt securities in which the fund invests. However, ratings are only the opinions of the rating agencies issuing them and
are not guarantees as to credit quality or an evaluation of market risk. The fund’s investment adviser relies on its own
credit analysts to research issuers and issues in seeking to assess credit and default risks.
Liquidity
risk — Certain fund holdings may
be or become difficult or impossible to sell, particularly during times of market turmoil. Liquidity may be impacted by the lack
of an active market for a holding, legal or contractual restrictions on resale, or the reduced number and capacity of market participants
to make a market in such holding. Market prices for less liquid or illiquid holdings may be volatile, and reduced liquidity may
have an adverse impact on the market price of such holdings. Additionally, the sale of less liquid or illiquid holdings may involve
substantial delays (including delays in settlement) and additional costs and the fund may be unable to sell such holdings when
necessary to meet its liquidity needs or may be forced to sell at a loss.
Credit
and liquidity support — Changes in the
credit quality of banks and financial institutions providing credit and liquidity support features with respect to securities
held by the fund could cause the values of these securities to decline.
Investing
in similar municipal bonds — Investing
significantly in municipal obligations of multiple issuers in the same state or backed by revenues of similar types of projects
or industries may make the fund more susceptible to certain economic, political or regulatory occurrences. As a result, the fund
has greater risk of volatility, and greater risk of loss, from these investments.
Management
— The investment adviser to the
fund actively manages the fund’s investments. Consequently, the fund is subject to the risk that the methods and analyses,
including models, tools and data, employed by the investment adviser in this process may be flawed or incorrect and may not produce
the desired results. This could cause the fund to lose value or its investment results to lag relevant benchmarks or other funds
with similar objectives.
Your investment
in the fund is not a bank deposit and is not insured or guaranteed by the Federal Deposit Insurance Corporation or any other governmental
agency, entity or person. You should consider how this fund fits into your overall investment program.
3 Tax-exempt
income funds - Class R-6 / Prospectus
Investment
results The following bar chart shows investment
results for the Class R-6 shares of the fund for the first full calendar year such shares were offered, and the following table
shows how the Class R-6 shares’ average annual total returns for various periods compare with a broad measure of securities
market results and other applicable measures of market results. This information provides some indication of the risks of investing
in the fund. The Lipper Short Municipal Debt Funds Average includes the fund and other funds that disclose investment objectives
and/or strategies reasonably comparable to those of the fund. Past investment results (before and after taxes) are not predictive
of future investment results. Updated information on the fund’s investment results can be obtained by visiting capitalgroup.com.
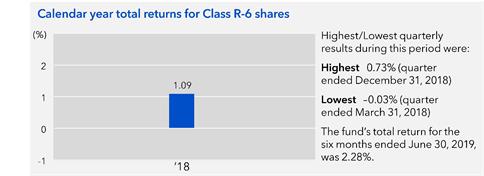
| |
|
|
|
| Average
annual total returns For the periods
ended December 31, 2018 (with maximum sales charge): |
| Share
class |
Inception
date |
1
year |
Lifetime |
| R-6
− Before taxes |
3/17/2017 |
1.09% |
1.17% |
| −
After taxes on distributions |
|
1.09 |
1.17 |
| −
After taxes on distributions and sale of fund shares |
1.29 |
1.25 |
| |
|
|
| Indexes |
1
year |
Lifetime
(from
Class R-6 inception) |
| Bloomberg
Barclays Municipal Short 1-5 Years Index (reflects no deductions for sales charges, account fees, expenses or U.S. federal
income taxes) |
1.77% |
1.34% |
| Lipper
Short Municipal Debt Funds Average (reflects no deductions for sales charges, account fees or U.S. federal income taxes) |
1.23 |
1.11 |
After-tax
returns are calculated using the highest individual federal income tax rates in effect during each year of the periods shown and
do not reflect the impact of state and local taxes. Your actual after-tax returns depend on your individual tax situation and
likely will differ from the results shown above.
Tax-exempt
income funds - Class R-6 / Prospectus 4
Management
Investment
adviser Capital Research and Management CompanySM
Portfolio managers The individuals primarily responsible for the portfolio management of the fund are:
| |
|
|
Portfolio
manager/
Fund title (if applicable) |
Portfolio
manager
experience
in
this fund |
Primary
title
with investment adviser |
| Aaron
Applebaum President |
3
years |
Partner
– Capital Fixed Income Investors |
| Mark
Marinella Vice President |
1
year |
Vice
President – Capital Fixed Income Investors |
| |
| |
Purchase
and sale of fund shares Class R-6 shares are generally
available for purchase only by American Funds Portfolio SeriesSM and other
investment companies deemed appropriate by the fund’s investment adviser.
The
minimum amount to establish an account for all share classes is $250 and the minimum to add to an account is $50.
Tax
information Fund distributions of interest on
municipal bonds are generally not subject to federal income tax. However, the fund may distribute taxable dividends, including
distributions of short-term capital gains, which are subject to federal taxation as ordinary income. To the extent the fund is
permitted to invest in bonds subject to federal alternative minimum tax, interest on certain bonds may be subject to federal alternative
minimum tax. The fund’s distributions of net long-term capital gains are taxable as long-term capital gains for federal
income tax purposes.
Payments
to broker-dealers and other financial intermediaries If
you purchase shares of the fund through a broker-dealer or other financial intermediary (such as a bank), the fund and the fund’s
distributor or its affiliates may pay the intermediary for the sale of fund shares and related services. These payments may create
a conflict of interest by influencing the broker-dealer or other intermediary and your individual financial advisor to recommend
the fund over another investment. Ask your individual financial advisor or visit your financial intermediary’s website for
more information.
5 Tax-exempt
income funds - Class R-6 / Prospectus
Limited
Term Tax-Exempt Bond Fund of America
Investment
objective The fund’s investment objective
is to provide you with current income exempt from regular federal income tax, consistent with the maturity and quality standards
described in this prospectus, and to preserve capital.
Fees
and expenses of the fund This table describes the
fees and expenses that you may pay if you buy and hold shares of the fund.
| |
|
| Shareholder
fees (fees paid directly from your investment) |
| Share
class: |
R-6 |
| Maximum
sales charge (load) imposed on purchases (as a percentage of offering price) |
none |
| Maximum
deferred sales charge (load) (as a percentage of the amount redeemed) |
none |
| Maximum
sales charge (load) imposed on reinvested dividends |
none |
| Redemption
or exchange fees |
none |
| |
|
| Annual
fund operating expenses (expenses
that you pay each year as a percentage of the value of your investment) |
| Share
class: |
R-6 |
| Management
fees |
0.23% |
| Distribution
and/or service (12b-1) fees |
none |
| Other
expenses* |
0.05 |
| Total
annual fund operating expenses |
0.28 |
* Restated
to reflect current fees.
Example
This example is intended to help you compare the cost of investing in the fund with the cost of investing in other mutual
funds.
The
example assumes that you invest $10,000 in the fund for the time periods indicated and then redeem all of your shares at the end
of those periods. The example also assumes that your investment has a 5% return each year and that the fund’s operating
expenses remain the same. Although your actual costs may be higher or lower, based on these assumptions your costs would be:
| |
|
|
|
|
| Share
class |
1
year |
3
years |
5
years |
10
years |
| R-6 |
$29 |
$90 |
$157 |
$356 |
Tax-exempt
income funds - Class R-6 / Prospectus 6
Portfolio
turnover The fund pays transaction costs, such as commissions, when it buys and sells securities (or “turns over”
its portfolio). A higher portfolio turnover rate may indicate higher transaction costs and may result in higher taxes when fund
shares are held in a taxable account. These costs, which are not reflected in annual fund operating expenses or in the example,
affect the fund’s investment results. During the most recent fiscal year, the fund’s portfolio turnover rate was 42%
of the average value of its portfolio.
Principal
investment strategies Under normal circumstances,
the fund will invest at least 80% of its assets in, or derive at least 80% of its income from, securities that are exempt from
regular federal income tax and that do not subject you to federal alternative minimum tax. The fund may also invest up to 20%
of its assets in securities that may subject you to federal alternative minimum tax.
The
fund invests primarily in debt securities rated A- or better or A3 or better by Nationally Recognized Statistical Rating Organizations
designated by the fund’s investment adviser, or unrated but determined by the fund’s investment adviser to be of equivalent
quality. The fund may also invest in debt securities rated BBB and Baa by Nationally Recognized Statistical Rating Organizations
designated by the fund’s investment adviser, or unrated but determined by the fund’s investment adviser to be of equivalent
quality. Some of the securities in which the fund invests may have credit and liquidity support features, including guarantees
and letters of credit. The dollar-weighted average effective maturity of the fund’s portfolio is between three and 10 years.
The investment
adviser uses a system of multiple portfolio managers in managing the fund’s assets. Under this approach, the portfolio of
the fund is divided into segments managed by individual managers.
The fund
relies on the professional judgment of its investment adviser to make decisions about the fund’s portfolio investments.
The basic investment philosophy of the investment adviser is to seek to invest in attractively priced securities that, in its
opinion, represent good, long-term investment opportunities. The investment adviser believes that an important way to accomplish
this is by analyzing various factors, which may include the credit strength of the issuer, prices of similar securities issued
by comparable issuers, anticipated changes in interest rates, general market conditions and other factors pertinent to the particular
security being evaluated. Securities may be sold when the investment adviser believes that they no longer represent relatively
attractive investment opportunities.
7 Tax-exempt
income funds - Class R-6 / Prospectus
Principal
risks This section describes the principal
risks associated with investing in the fund. You may lose money by investing in the fund. The likelihood of loss may be greater
if you invest for a shorter period of time.
Market
conditions — The prices of, and
the income generated by, the securities held by the fund may decline – sometimes rapidly or unpredictably – due to
various factors, including events or conditions affecting the general economy or particular industries; overall market changes;
local, regional or global political, social or economic instability; governmental, governmental agency or central bank responses
to economic conditions; and currency exchange rate, interest rate and commodity price fluctuations.
Issuer
risks — The prices of, and the
income generated by, securities held by the fund may decline in response to various factors directly related to the issuers of
such securities, including reduced demand for an issuer’s goods or services, poor management performance, major litigation
related to the issuer, changes in government regulations affecting the issuer or its competitive environment and strategic initiatives
such as mergers, acquisitions or dispositions and the market response to any such initiatives.
Investing
in municipal securities — The yield and/or
value of the fund’s investments in municipal securities may be adversely affected by events tied to the municipal securities
markets, which can be very volatile and significantly impacted by unfavorable legislative or political developments and negative
changes in the financial conditions of municipal securities issuers and the economy. To the extent the fund invests in obligations
of a municipal issuer, the volatility, credit quality and performance of the fund may be adversely impacted by local political
and economic conditions of the issuer. For example, a credit rating downgrade, bond default or bankruptcy involving an issuer
within a particular state or territory could affect the market values and marketability of many or all municipal obligations of
that state or territory. Income from municipal securities held by the fund could also be declared taxable because of changes in
tax laws or interpretations by taxing authorities or as a result of noncompliant conduct of a municipal issuer. Additionally,
the relative amount of publicly available information about municipal securities is generally less than that for corporate securities.
Investing
in debt instruments — The prices of,
and the income generated by, bonds and other debt securities held by the fund may be affected by changing interest rates and by
changes in the effective maturities and credit ratings of these securities.
Rising
interest rates will generally cause the prices of bonds and other debt securities to fall. A general rise in interest rates may
cause investors to sell debt securities on a large scale, which could also adversely affect the price and liquidity of debt securities
and could also result in increased redemptions from the fund. Falling interest rates may cause an issuer to redeem, call or refinance
a debt security before its stated maturity, which may result in the fund failing to recoup the full amount of its initial investment
and having to reinvest the proceeds in lower yielding securities. Longer maturity debt securities generally have greater sensitivity
to changes in interest rates and may be subject to greater price fluctuations than shorter maturity debt securities.
Bonds
and other debt securities are also subject to credit risk, which is the possibility that the credit strength of an issuer or guarantor
will weaken or be perceived to be weaker, and/or an issuer of a debt security will fail to make timely payments of principal or
interest and the security will go into default. A downgrade or default affecting any of the fund’s securities could cause
the value of the fund’s shares to decrease. Lower quality debt securities generally have higher rates of interest and may
be subject to greater price fluctuations than higher quality debt securities. Credit risk is gauged, in part, by the credit ratings
of the debt securities in which the fund invests. However, ratings are only the opinions of the rating agencies issuing them and
are not guarantees as to credit quality or an evaluation of market risk. The fund’s investment adviser relies on its own
credit analysts to research issuers and issues in seeking to assess credit and default risks.
Liquidity
risk — Certain fund holdings may
be or become difficult or impossible to sell, particularly during times of market turmoil. Liquidity may be impacted by the lack
of an active market for a holding, legal or contractual restrictions on resale, or the reduced number and capacity of market participants
to make a market in such holding. Market prices for less liquid or illiquid holdings may be volatile, and reduced liquidity may
have an adverse impact on the market price of such holdings. Additionally, the sale of less liquid or illiquid holdings may involve
substantial delays (including delays in settlement) and additional costs and the fund may be unable to sell such holdings when
necessary to meet its liquidity needs or may be forced to sell at a loss.
Credit
and liquidity support — Changes in the
credit quality of banks and financial institutions providing credit and liquidity support features with respect to securities
held by the fund could cause the values of these securities to decline.
Investing
in lower rated debt instruments — Lower
rated bonds and other lower rated debt securities generally have higher rates of interest and involve greater risk of default
or price declines due to changes in the issuer’s creditworthiness than those of higher quality debt securities. The market
prices of these securities may fluctuate more than the prices of higher quality debt securities and may decline significantly
in periods of general economic difficulty.
Investing
in similar municipal bonds — Investing
significantly in municipal obligations of multiple issuers in the same state or backed by revenues of similar types of projects
or industries may make the fund more susceptible to certain economic, political or regulatory occurrences. As a result, the fund
has greater risk of volatility, and greater risk of loss, from these investments.
Management
— The investment adviser to the
fund actively manages the fund’s investments. Consequently, the fund is subject to the risk that the methods and analyses,
including models, tools and data, employed by the investment adviser in this process may be flawed or incorrect and may not produce
the desired results. This could cause the fund to lose value or its investment results to lag relevant benchmarks or other funds
with similar objectives.
Your
investment in the fund is not a bank deposit and is not insured or guaranteed by the Federal Deposit Insurance Corporation or
any other governmental agency, entity or person. You should consider how this fund fits into your overall investment program.
Tax-exempt
income funds - Class R-6 / Prospectus 8
Investment
results The following bar chart shows how
investment results for the Class R-6 shares of the fund have varied from year to year, and the following table shows how the Class
R-6 shares’ average annual total returns for various periods compare with a broad measure of securities market results and
other applicable measures of market results. This information provides some indication of the risks of investing in the fund.
The Lipper Short-Intermediate Municipal Debt Funds Average includes the fund and other funds that disclose investment objectives
and/or strategies reasonably comparable to those of the fund. Past investment results (before and after taxes) are not predictive
of future investment results. Updated information on the fund’s investment results can be obtained by visiting capitalgroup.com.
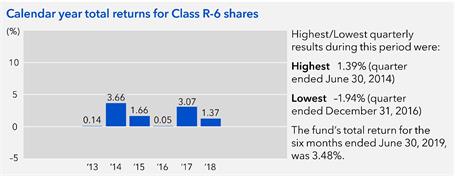
| |
|
|
|
|
| Average
annual total returns For the periods
ended December 31, 2018 (with maximum sales charge): |
| Share
class |
Inception
date |
1
year |
5
years |
Lifetime |
| R-6
− Before taxes |
5/11/2012 |
1.37% |
1.95% |
1.79% |
| −
After taxes on distributions |
|
1.37 |
1.95 |
1.79 |
| −
After taxes on distributions and sale of fund shares |
1.76 |
2.08 |
1.96 |
| |
|
|
|
| Indexes |
1
year |
5
years |
Lifetime
(from
Class R-6 inception) |
| Bloomberg
Barclays Municipal Short-Intermediate 1-10 Years Index (reflects no deductions for sales charges, account fees, expenses or
U.S. federal income taxes) |
1.69% |
2.12% |
1.81% |
| Lipper
Short-Intermediate Municipal Debt Funds Average (reflects no deductions for sales charges, account fees or U.S. federal income
taxes) |
1.63 |
1.54 |
1.23 |
After-tax
returns are calculated using the highest individual federal income tax rates in effect during each year of the periods shown and
do not reflect the impact of state and local taxes. Your actual after-tax returns depend on your individual tax situation and
likely will differ from the results shown above.
9 Tax-exempt
income funds - Class R-6 / Prospectus
Management
Investment
adviser Capital Research and Management CompanySM
Portfolio managers The individuals primarily responsible for the portfolio management of the fund are:
| |
|
|
Portfolio
manager/
Fund title (if applicable) |
Portfolio
manager
experience
in
this fund |
Primary
title
with investment adviser |
| Mark
Marinella President |
1
year |
Vice
President – Capital Fixed Income Investors |
| Aaron
Applebaum Senior Vice President |
5
years |
Partner
– Capital Fixed Income Investors |
| |
Purchase
and sale of fund shares Class R-6 shares are generally
available for purchase only by American Funds Portfolio SeriesSM and other
investment companies deemed appropriate by the fund’s investment adviser.
The minimum
amount to establish an account for all share classes is $250 and the minimum to add to an account is $50.
Tax
information Fund distributions of interest on
municipal bonds are generally not subject to federal income tax. However, the fund may distribute taxable dividends, including
distributions of short-term capital gains, which are subject to federal taxation as ordinary income. To the extent the fund is
permitted to invest in bonds subject to federal alternative minimum tax, interest on certain bonds may be subject to federal alternative
minimum tax. The fund’s distributions of net long-term capital gains are taxable as long-term capital gains for federal
income tax purposes.
Payments
to broker-dealers and other financial intermediaries If
you purchase shares of the fund through a broker-dealer or other financial intermediary (such as a bank), the fund and the fund’s
distributor or its affiliates may pay the intermediary for the sale of fund shares and related services. These payments may create
a conflict of interest by influencing the broker-dealer or other intermediary and your individual financial advisor to recommend
the fund over another investment. Ask your individual financial advisor or visit your financial intermediary’s website for
more information.
Tax-exempt
income funds - Class R-6 / Prospectus 10
The
Tax-Exempt Bond Fund of America
Investment
objective The fund’s investment objective
is to provide you with a high level of current income exempt from federal income tax, consistent with the preservation of capital.
Fees
and expenses of the fund This table describes the
fees and expenses that you may pay if you buy and hold shares of the fund.
| |
|
| Shareholder
fees (fees paid directly from your investment) |
| Share
class: |
R-6 |
| Maximum
sales charge (load) imposed on purchases (as a percentage of offering price) |
none |
| Maximum
deferred sales charge (load) (as a percentage of the amount redeemed) |
none |
| Maximum
sales charge (load) imposed on reinvested dividends |
none |
| Redemption
or exchange fees |
none |
| |
|
| Annual
fund operating expenses (expenses
that you pay each year as a percentage of the value of your investment) |
| Share
class: |
R-6 |
| Management
fees |
0.21% |
| Distribution
and/or service (12b-1) fees |
none |
| Other
expenses* |
0.05 |
| Total
annual fund operating expenses |
0.26 |
* Restated
to reflect current fees.
Example
This example is intended to help you compare the cost of investing in the fund with the cost of investing in other mutual
funds.
The
example assumes that you invest $10,000 in the fund for the time periods indicated and then redeem all of your shares at the end
of those periods. The example also assumes that your investment has a 5% return each year and that the fund’s operating
expenses remain the same. Although your actual costs may be higher or lower, based on these assumptions your costs would be:
| |
|
|
|
|
| Share
class |
1
year |
3
years |
5
years |
10
years |
| R-6 |
$27 |
$84 |
$146 |
$331 |
11 Tax-exempt
income funds - Class R-6 / Prospectus
Portfolio
turnover The fund pays transaction costs, such as commissions, when it buys and sells securities (or “turns over”
its portfolio). A higher portfolio turnover rate may indicate higher transaction costs and may result in higher taxes when fund
shares are held in a taxable account. These costs, which are not reflected in annual fund operating expenses or in the example,
affect the fund’s investment results. During the most recent fiscal year, the fund’s portfolio turnover rate was 20%
of the average value of its portfolio.
Principal
investment strategies Under normal circumstances,
the fund will invest at least 80% of its assets in, or derive at least 80% of its income from, securities that are exempt from
regular federal income tax. The fund will not invest in securities that subject you to federal alternative minimum tax. The fund
invests at least 65% in debt securities rated A- or better or A3 or better by Nationally Recognized Statistical Rating Organizations
designated by the fund’s investment adviser, or unrated but determined by the fund’s investment adviser to be of equivalent
quality. The fund may also invest in debt securities rated BBB+ or below and Baa1 or below (including those rated BB+ or below
and Ba1 or below) by Nationally Recognized Statistical Rating Organizations designated by the fund’s investment adviser,
or unrated but determined by the fund’s investment adviser to be of equivalent quality. Securities rated BB+ or below and
Ba1 or below are sometimes referred to as “junk bonds.” Some of the securities in which the fund invests may have
credit and liquidity support features, including guarantees and letters of credit.
The
investment adviser uses a system of multiple portfolio managers in managing the fund’s assets. Under this approach, the
portfolio of the fund is divided into segments managed by individual managers.
The fund
relies on the professional judgment of its investment adviser to make decisions about the fund’s portfolio investments.
The basic investment philosophy of the investment adviser is to seek to invest in attractively priced securities that, in its
opinion, represent good, long-term investment opportunities. The investment adviser believes that an important way to accomplish
this is by analyzing various factors, which may include the credit strength of the issuer, prices of similar securities issued
by comparable issuers, anticipated changes in interest rates, general market conditions and other factors pertinent to the particular
security being evaluated. Securities may be sold when the investment adviser believes that they no longer represent relatively
attractive investment opportunities.
Tax-exempt
income funds - Class R-6 / Prospectus 12
Principal
risks This section describes the principal
risks associated with investing in the fund. You may lose money by investing in the fund. The likelihood of loss may be greater
if you invest for a shorter period of time.
Market
conditions — The prices of, and
the income generated by, the securities held by the fund may decline – sometimes rapidly or unpredictably – due to
various factors, including events or conditions affecting the general economy or particular industries; overall market changes;
local, regional or global political, social or economic instability; governmental, governmental agency or central bank responses
to economic conditions; and currency exchange rate, interest rate and commodity price fluctuations.
Issuer
risks — The prices of, and the
income generated by, securities held by the fund may decline in response to various factors directly related to the issuers of
such securities, including reduced demand for an issuer’s goods or services, poor management performance, major litigation
related to the issuer, changes in government regulations affecting the issuer or its competitive environment and strategic initiatives
such as mergers, acquisitions or dispositions and the market response to any such initiatives.
Investing
in municipal securities — The yield and/or
value of the fund’s investments in municipal securities may be adversely affected by events tied to the municipal securities
markets, which can be very volatile and significantly impacted by unfavorable legislative or political developments and negative
changes in the financial conditions of municipal securities issuers and the economy. To the extent the fund invests in obligations
of a municipal issuer, the volatility, credit quality and performance of the fund may be adversely impacted by local political
and economic conditions of the issuer. For example, a credit rating downgrade, bond default or bankruptcy involving an issuer
within a particular state or territory could affect the market values and marketability of many or all municipal obligations of
that state or territory. Income from municipal securities held by the fund could also be declared taxable because of changes in
tax laws or interpretations by taxing authorities or as a result of noncompliant conduct of a municipal issuer. Additionally,
the relative amount of publicly available information about municipal securities is generally less than that for corporate securities.
Investing
in debt instruments — The prices of,
and the income generated by, bonds and other debt securities held by the fund may be affected by changing interest rates and by
changes in the effective maturities and credit ratings of these securities.
Rising
interest rates will generally cause the prices of bonds and other debt securities to fall. A general rise in interest rates may
cause investors to sell debt securities on a large scale, which could also adversely affect the price and liquidity of debt securities
and could also result in increased redemptions from the fund. Falling interest rates may cause an issuer to redeem, call or refinance
a debt security before its stated maturity, which may result in the fund failing to recoup the full amount of its initial investment
and having to reinvest the proceeds in lower yielding securities. Longer maturity debt securities generally have greater sensitivity
to changes in interest rates and may be subject to greater price fluctuations than shorter maturity debt securities.
Bonds
and other debt securities are also subject to credit risk, which is the possibility that the credit strength of an issuer or guarantor
will weaken or be perceived to be weaker, and/or an issuer of a debt security will fail to make timely payments of principal or
interest and the security will go into default. A downgrade or default affecting any of the fund’s securities could cause
the value of the fund’s shares to decrease. Lower quality debt securities generally have higher rates of interest and may
be subject to greater price fluctuations than higher quality debt securities. Credit risk is gauged, in part, by the credit ratings
of the debt securities in which the fund invests. However, ratings are only the opinions of the rating agencies issuing them and
are not guarantees as to credit quality or an evaluation of market risk. The fund’s investment adviser relies on its own
credit analysts to research issuers and issues in seeking to assess credit and default risks.
Liquidity
risk — Certain fund holdings may
be or become difficult or impossible to sell, particularly during times of market turmoil. Liquidity may be impacted by the lack
of an active market for a holding, legal or contractual restrictions on resale, or the reduced number and capacity of market participants
to make a market in such holding. Market prices for less liquid or illiquid holdings may be volatile, and reduced liquidity may
have an adverse impact on the market price of such holdings. Additionally, the sale of less liquid or illiquid holdings may involve
substantial delays (including delays in settlement) and additional costs and the fund may be unable to sell such holdings when
necessary to meet its liquidity needs or may be forced to sell at a loss.
Credit
and liquidity support — Changes in the
credit quality of banks and financial institutions providing credit and liquidity support features with respect to securities
held by the fund could cause the values of these securities to decline.
Investing
in lower rated debt instruments — Lower
rated bonds and other lower rated debt securities generally have higher rates of interest and involve greater risk of default
or price declines due to changes in the issuer’s creditworthiness than those of higher quality debt securities. The market
prices of these securities may fluctuate more than the prices of higher quality debt securities and may decline significantly
in periods of general economic difficulty. These risks may be increased with respect to investments in junk bonds.
Investing
in similar municipal bonds — Investing
significantly in municipal obligations of multiple issuers in the same state or backed by revenues of similar types of projects
or industries may make the fund more susceptible to certain economic, political or regulatory occurrences. As a result, the fund
has greater risk of volatility, and greater risk of loss, from these investments.
Management
— The investment adviser to the
fund actively manages the fund’s investments. Consequently, the fund is subject to the risk that the methods and analyses,
including models, tools and data, employed by the investment adviser in this process may be flawed or incorrect and may not produce
the desired results. This could cause the fund to lose value or its investment results to lag relevant benchmarks or other funds
with similar objectives.
Your investment
in the fund is not a bank deposit and is not insured or guaranteed by the Federal Deposit Insurance Corporation or any other governmental
agency, entity or person. You should consider how this fund fits into your overall investment program.
13 Tax-exempt
income funds - Class R-6 / Prospectus
Investment
results The following bar chart shows how
investment results for the Class R-6 shares of the fund have varied from year to year, and the following table shows how the Class
R-6 shares’ average annual total returns for various periods compare with a broad measure of securities market results and
other applicable measures of market results. This information provides some indication of the risks of investing in the fund.
The Lipper General & Insured Municipal Debt Funds Average includes the fund and other funds that disclose investment objectives
and/or strategies reasonably comparable to those of the fund. Past investment results (before and after taxes) are not predictive
of future investment results. Updated information on the fund’s investment results can be obtained by visiting capitalgroup.com.
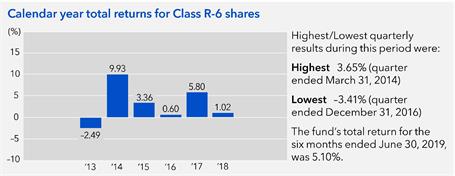
| |
|
|
|
|
| Average
annual total returns For the periods
ended December 31, 2018 (with maximum sales charge): |
| Share
class |
Inception
date |
1
year |
5
years |
Lifetime |
| R-6
− Before taxes |
5/11/2012 |
1.02% |
4.09% |
3.30% |
| −
After taxes on distributions |
|
1.02 |
4.09 |
3.30 |
| −
After taxes on distributions and sale of fund shares |
1.86 |
3.97 |
3.35 |
| |
|
|
|
| Indexes |
1
year |
5
years |
Lifetime
(from
Class R-6 inception) |
| Bloomberg
Barclays Municipal Bond Index (reflects no deductions for sales charges, account fees, expenses or U.S. federal income taxes) |
1.28% |
3.82% |
2.91% |
| Lipper
General & Insured Municipal Debt Funds Average (reflects no deductions for sales charges, account fees or U.S. federal
income taxes) |
0.68 |
3.86 |
2.80 |
After-tax
returns are calculated using the highest individual federal income tax rates in effect during each year of the periods shown and
do not reflect the impact of state and local taxes. Your actual after-tax returns depend on your individual tax situation and
likely will differ from the results shown above.
Tax-exempt
income funds - Class R-6 / Prospectus 14
Management
Investment
adviser Capital Research and Management CompanySM
Portfolio managers The individuals primarily responsible for the portfolio management of the fund are:
| |
|
|
Portfolio
manager/
Fund title (if applicable) |
Portfolio
manager
experience
in
this fund |
Primary
title
with investment adviser |
| Karl
J. Zeile President and Trustee |
16
years |
Partner
– Capital Fixed Income Investors |
| Chad
M. Rach Senior Vice President |
3
years |
Partner
– Capital Fixed Income Investors |
| |
| |
Purchase
and sale of fund shares Class R-6 shares are generally
available for purchase only by American Funds Portfolio SeriesSM and other
investment companies deemed appropriate by the fund’s investment adviser.
The
minimum amount to establish an account for all share classes is $250 and the minimum to add to an account is $50.
Tax
information Fund distributions of interest on
municipal bonds are generally not subject to federal income tax. However, the fund may distribute taxable dividends, including
distributions of short-term capital gains, which are subject to federal taxation as ordinary income. To the extent the fund is
permitted to invest in bonds subject to federal alternative minimum tax, interest on certain bonds may be subject to federal alternative
minimum tax. The fund’s distributions of net long-term capital gains are taxable as long-term capital gains for federal
income tax purposes.
Payments
to broker-dealers and other financial intermediaries If
you purchase shares of the fund through a broker-dealer or other financial intermediary (such as a bank), the fund and the fund’s
distributor or its affiliates may pay the intermediary for the sale of fund shares and related services. These payments may create
a conflict of interest by influencing the broker-dealer or other intermediary and your individual financial advisor to recommend
the fund over another investment. Ask your individual financial advisor or visit your financial intermediary’s website for
more information.
15 Tax-exempt
income funds - Class R-6 / Prospectus
American
High-Income Municipal Bond Fund
Investment
objective The fund’s investment objective
is to provide you with a high level of current income exempt from regular federal income tax.
Fees
and expenses of the fund This table describes the
fees and expenses that you may pay if you buy and hold shares of the fund.
| |
|
| Shareholder
fees (fees paid directly from your investment) |
| Share
class: |
R-6 |
| Maximum
sales charge (load) imposed on purchases (as a percentage of offering price) |
none |
| Maximum
deferred sales charge (load) (as a percentage of the amount redeemed) |
none |
| Maximum
sales charge (load) imposed on reinvested dividends |
none |
| Redemption
or exchange fees |
none |
| |
|
| Annual
fund operating expenses (expenses
that you pay each year as a percentage of the value of your investment) |
| Share
class: |
R-6 |
| Management
fees |
0.28% |
| Distribution
and/or service (12b-1) fees |
none |
| Other
expenses* |
0.07 |
| Total
annual fund operating expenses |
0.35 |
* Restated
to reflect current fees.
Example
This example is intended to help you compare the cost of investing in the fund with the cost of investing in other mutual
funds.
The
example assumes that you invest $10,000 in the fund for the time periods indicated and then redeem all of your shares at the end
of those periods. The example also assumes that your investment has a 5% return each year and that the fund’s operating
expenses remain the same. Although your actual costs may be higher or lower, based on these assumptions your costs would be:
| |
|
|
|
|
| Share
class |
1
year |
3
years |
5
years |
10
years |
| R-6 |
$36 |
$113 |
$197 |
$443 |
Tax-exempt
income funds - Class R-6 / Prospectus 16
Portfolio
turnover The fund pays transaction costs, such as commissions, when it buys and sells securities (or “turns over”
its portfolio). A higher portfolio turnover rate may indicate higher transaction costs and may result in higher taxes when fund
shares are held in a taxable account. These costs, which are not reflected in annual fund operating expenses or in the example,
affect the fund’s investment results. During the most recent fiscal year, the fund’s portfolio turnover rate was 20%
of the average value of its portfolio.
Principal
investment strategies In seeking to achieve its
objective, the fund may accept prudent risks to capital value to take advantage of opportunities for higher current income on
municipal bonds. Municipal bonds are debt obligations that pay interest that is exempt from federal taxation, with payments made
from a wide variety of sources, including governmental revenue streams and private enterprises.
Under
normal circumstances, the fund will invest at least 80% of its assets in, or derive at least 80% of its income from, securities
that are exempt from regular federal income tax and may subject you to alternative minimum tax. The fund may invest, without limitation,
in securities that may subject you to federal alternative minimum tax. The fund invests at least 50% of its portfolio in debt
securities rated BBB+ or below or Baa1 or below by Nationally Recognized Statistical Rating Organizations designated by the fund’s
investment adviser, or unrated but determined by the fund’s investment adviser to be of equivalent quality. Securities rated
BB+ or below and Ba1 or below are sometimes referred to as “junk bonds.” Some of the securities in which the fund
invests may have credit and liquidity support features, including guarantees and letters of credit.
The investment
adviser uses a system of multiple portfolio managers in managing the fund’s assets. Under this approach, the portfolio of
the fund is divided into segments managed by individual managers.
The fund
relies on the professional judgment of its investment adviser to make decisions about the fund’s portfolio investments.
The basic investment philosophy of the investment adviser is to seek to invest in attractively priced securities that, in its
opinion, represent good, long-term investment opportunities. The investment adviser believes that an important way to accomplish
this is by analyzing various factors, which may include the credit strength of the issuer, prices of similar securities issued
by comparable issuers, anticipated changes in interest rates, general market conditions and other factors pertinent to the particular
security being evaluated. Securities may be sold when the investment adviser believes that they no longer represent relatively
attractive investment opportunities.
17 Tax-exempt
income funds - Class R-6 / Prospectus
Principal
risks This section describes the principal
risks associated with investing in the fund. You may lose money by investing in the fund. The likelihood of loss may be greater
if you invest for a shorter period of time.
Market
conditions — The prices of, and
the income generated by, the securities held by the fund may decline – sometimes rapidly or unpredictably – due to
various factors, including events or conditions affecting the general economy or particular industries; overall market changes;
local, regional or global political, social or economic instability; governmental, governmental agency or central bank responses
to economic conditions; and currency exchange rate, interest rate and commodity price fluctuations.
Issuer
risks — The prices of, and the
income generated by, securities held by the fund may decline in response to various factors directly related to the issuers of
such securities, including reduced demand for an issuer’s goods or services, poor management performance, major litigation
related to the issuer, changes in government regulations affecting the issuer or its competitive environment and strategic initiatives
such as mergers, acquisitions or dispositions and the market response to any such initiatives.
Investing
in municipal securities — The yield and/or
value of the fund’s investments in municipal securities may be adversely affected by events tied to the municipal securities
markets, which can be very volatile and significantly impacted by unfavorable legislative or political developments and negative
changes in the financial conditions of municipal securities issuers and the economy. To the extent the fund invests in obligations
of a municipal issuer, the volatility, credit quality and performance of the fund may be adversely impacted by local political
and economic conditions of the issuer. For example, a credit rating downgrade, bond default or bankruptcy involving an issuer
within a particular state or territory could affect the market values and marketability of many or all municipal obligations of
that state or territory. Income from municipal securities held by the fund could also be declared taxable because of changes in
tax laws or interpretations by taxing authorities or as a result of noncompliant conduct of a municipal issuer. Additionally,
the relative amount of publicly available information about municipal securities is generally less than that for corporate securities.
Investing
in debt instruments — The prices of,
and the income generated by, bonds and other debt securities held by the fund may be affected by changing interest rates and by
changes in the effective maturities and credit ratings of these securities.
Rising
interest rates will generally cause the prices of bonds and other debt securities to fall. A general rise in interest rates may
cause investors to sell debt securities on a large scale, which could also adversely affect the price and liquidity of debt securities
and could also result in increased redemptions from the fund. Falling interest rates may cause an issuer to redeem, call or refinance
a debt security before its stated maturity, which may result in the fund failing to recoup the full amount of its initial investment
and having to reinvest the proceeds in lower yielding securities. Longer maturity debt securities generally have greater sensitivity
to changes in interest rates and may be subject to greater price fluctuations than shorter maturity debt securities.
Bonds
and other debt securities are also subject to credit risk, which is the possibility that the credit strength of an issuer or guarantor
will weaken or be perceived to be weaker, and/or an issuer of a debt security will fail to make timely payments of principal or
interest and the security will go into default. A downgrade or default affecting any of the fund’s securities could cause
the value of the fund’s shares to decrease. Lower quality debt securities generally have higher rates of interest and may
be subject to greater price fluctuations than higher quality debt securities. Credit risk is gauged, in part, by the credit ratings
of the debt securities in which the fund invests. However, ratings are only the opinions of the rating agencies issuing them and
are not guarantees as to credit quality or an evaluation of market risk. The fund’s investment adviser relies on its own
credit analysts to research issuers and issues in seeking to assess credit and default risks.
Liquidity
risk — Certain fund holdings may
be or become difficult or impossible to sell, particularly during times of market turmoil. Liquidity may be impacted by the lack
of an active market for a holding, legal or contractual restrictions on resale, or the reduced number and capacity of market participants
to make a market in such holding. Market prices for less liquid or illiquid holdings may be volatile, and reduced liquidity may
have an adverse impact on the market price of such holdings. Additionally, the sale of less liquid or illiquid holdings may involve
substantial delays (including delays in settlement) and additional costs and the fund may be unable to sell such holdings when
necessary to meet its liquidity needs or may be forced to sell at a loss.
Credit
and liquidity support — Changes in the
credit quality of banks and financial institutions providing credit and liquidity support features with respect to securities
held by the fund could cause the values of these securities to decline.
Investing
in lower rated debt instruments — Lower
rated bonds and other lower rated debt securities generally have higher rates of interest and involve greater risk of default
or price declines due to changes in the issuer’s creditworthiness than those of higher quality debt securities. The market
prices of these securities may fluctuate more than the prices of higher quality debt securities and may decline significantly
in periods of general economic difficulty. These risks may be increased with respect to investments in junk bonds.
Investing
in similar municipal bonds — Investing
significantly in municipal obligations of multiple issuers in the same state or backed by revenues of similar types of projects
or industries may make the fund more susceptible to certain economic, political or regulatory occurrences. As a result, the fund
has greater risk of volatility, and greater risk of loss, from these investments.
Management
— The investment adviser to the
fund actively manages the fund’s investments. Consequently, the fund is subject to the risk that the methods and analyses,
including models, tools and data, employed by the investment adviser in this process may be flawed or incorrect and may not produce
the desired results. This could cause the fund to lose value or its investment results to lag relevant benchmarks or other funds
with similar objectives.
Your investment
in the fund is not a bank deposit and is not insured or guaranteed by the Federal Deposit Insurance Corporation or any other governmental
agency, entity or person. You should consider how this fund fits into your overall investment program.
Tax-exempt
income funds - Class R-6 / Prospectus 18
Investment
results The following bar chart shows how
investment results for the Class R-6 shares of the fund have varied from year to year, and the following table shows how the Class
R-6 shares’ average annual total returns for various periods compare with a broad measure of securities market results and
other applicable measures of market results. This information provides some indication of the risks of investing in the fund.
The Bloomberg Barclays High Yield Municipal Bond Index is a market-value-weighted index composed of municipal bonds rated below
BBB/Baa. The Lipper High Yield Municipal Debt Funds Average includes the fund and other funds that disclose investment objectives
and/or strategies reasonably comparable to those of the fund. Past investment results (before and after taxes) are not predictive
of future investment results. Updated information on the fund’s investment results can be obtained by visiting capitalgroup.com.
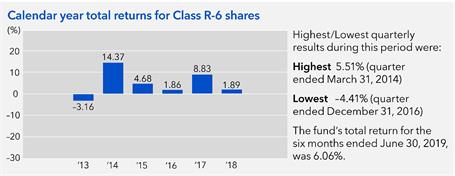
| |
|
|
|
|
| Average
annual total returns For the periods
ended December 31, 2018 (with maximum sales charge): |
| Share
class |
Inception
date |
1
year |
5
years |
Lifetime |
| R-6
− Before taxes |
5/11/2012 |
1.89% |
6.22% |
5.18% |
| −
After taxes on distributions |
|
1.89 |
6.22 |
5.18 |
| −
After taxes on distributions and sale of fund shares |
2.74 |
5.85 |
5.02 |
| |
|
|
|
| Indexes |
1
year |
5
years |
Lifetime
(from
Class R-6 inception) |
| Bloomberg
Barclays Municipal Bond Index (reflects no deductions for sales charges, account fees, expenses or U.S. federal income taxes) |
1.28% |
3.82% |
2.91% |
| Bloomberg
Barclays High Yield Municipal Bond Index (reflects no deductions for sales charges, account fees, expenses or U.S. federal
income taxes) |
4.76 |
6.53 |
5.32 |
| Lipper
High Yield Municipal Debt Funds Average (reflects no deductions for sales charges, account fees or U.S. federal income taxes) |
1.74 |
5.67 |
4.20 |
After-tax
returns are calculated using the highest individual federal income tax rates in effect during each year of the periods shown and
do not reflect the impact of state and local taxes. Your actual after-tax returns depend on your individual tax situation and
likely will differ from the results shown above.
19 Tax-exempt
income funds - Class R-6 / Prospectus
Management
Investment
adviser Capital Research and Management CompanySM
Portfolio managers The individuals primarily responsible for the portfolio management of the fund are:
| |
|
|
Portfolio
manager/
Fund title (if applicable) |
Portfolio
manager
experience
in
this fund |
Primary
title
with investment adviser |
| Karl
J. Zeile Senior Vice President and Trustee |
15
years |
Partner
– Capital Fixed Income Investors |
| Chad
M. Rach President |
8
years |
Partner
– Capital Fixed Income Investors |
| Jerome
Solomon Senior Vice President |
2
years |
Partner
– Capital Fixed Income Investors |
| |
| |
Purchase
and sale of fund shares Class R-6 shares are generally
available for purchase only by American Funds Portfolio SeriesSM and other
investment companies deemed appropriate by the fund’s investment adviser.
The minimum
amount to establish an account for all share classes is $250 and the minimum to add to an account is $50.
Tax
information Fund distributions of interest on
municipal bonds are generally not subject to federal income tax. However, the fund may distribute taxable dividends, including
distributions of short-term capital gains, which are subject to federal taxation as ordinary income. To the extent the fund is
permitted to invest in bonds subject to federal alternative minimum tax, interest on certain bonds may be subject to federal alternative
minimum tax. The fund’s distributions of net long-term capital gains are taxable as long-term capital gains for federal
income tax purposes.
Payments
to broker-dealers and other financial intermediaries If
you purchase shares of the fund through a broker-dealer or other financial intermediary (such as a bank), the fund and the fund’s
distributor or its affiliates may pay the intermediary for the sale of fund shares and related services. These payments may create
a conflict of interest by influencing the broker-dealer or other intermediary and your individual financial advisor to recommend
the fund over another investment. Ask your individual financial advisor or visit your financial intermediary’s website for
more information.
Tax-exempt
income funds - Class R-6 / Prospectus 20
Investment
objectives, strategies and risks Except where
the context indicates otherwise, references to the “fund” apply to each of these tax-exempt bond funds.
American
Funds Short-Term Tax-Exempt Bond Fund The fund’s investment objective is to provide you with current income exempt from
regular federal income tax, consistent with the maturity and quality standards described in this prospectus, and to preserve capital.
Under normal circumstances, the fund will invest at least 80% of its assets in, or derive at least 80% of its income from, securities
that are exempt from regular federal income tax and that do not subject you to federal alternative minimum tax. The fund may also
invest up to 20% of its assets in securities that may subject you to federal alternative minimum tax.
The
fund invests primarily in debt securities rated AA- or better or Aa3 or better by Nationally Recognized Statistical Rating Organizations
designated by the fund’s investment adviser, or unrated but determined by the fund’s investment adviser to be of equivalent
quality. The fund may also invest in debt securities rated A- or better or A3 or better by Nationally Recognized Statistical Rating
Organizations designated by the fund’s investment adviser, or unrated but determined by the fund’s investment adviser
to be of equivalent quality. Some of the securities in which the fund invests may have credit and liquidity support features,
including guarantees and letters of credit. The fund’s aggregate portfolio will have a dollar-weighted average effective
maturity no greater than three years.
Limited
Term Tax-Exempt Bond Fund of America The fund’s investment objective is to provide you with current income exempt from
regular federal income tax, consistent with the maturity and quality standards described in this prospectus, and to preserve capital.
The fund is designed for investors seeking current income exempt from federal income tax. Under normal circumstances, the fund
will invest at least 80% of its assets in, or derive at least 80% of its income from, securities that are exempt from regular
federal income tax and that do not subject you to federal alternative minimum tax. The fund may also invest up to 20% of its assets
in securities that may subject you to federal alternative minimum tax.
The
fund invests primarily in debt securities rated A- or better or A3 or better by Nationally Recognized Statistical Rating Organizations
designated by the fund’s investment adviser, or unrated but determined by the fund’s investment adviser to be of equivalent
quality. The fund may also invest in debt securities rated BBB and Baa by Nationally Recognized Statistical Rating Organizations
designated by the fund’s investment adviser, or unrated but determined by the fund’s investment adviser to be of equivalent
quality. The dollar-weighted average effective maturity of the fund’s portfolio is between three and 10 years.
The
Tax-Exempt Bond Fund of America The fund’s investment objective is to provide you with a high level of current income
exempt from federal income tax, consistent with the preservation of capital. The fund is designed for investors seeking a high
level of current income exempt from federal income tax.
Under
normal circumstances, the fund will invest at least 80% of its assets in, or derive at least 80% of its income from, securities
that are exempt from regular federal income tax. The fund will not invest in securities that subject you to federal alternative
minimum tax. The fund invests at least 65% in debt securities rated A- or better or A3 or better by Nationally Recognized Statistical
Rating Organizations designated by the fund’s investment adviser, or unrated but determined by the fund’s investment
adviser to be of equivalent quality. The fund may also invest in debt securities rated BBB+ or below and Baa1 or below (including
those rated BB+ or below and Ba1 or below) by Nationally Recognized Statistical Rating Organizations designated by the fund’s
investment adviser, or unrated but determined by the fund’s investment adviser to be of equivalent quality. Securities rated
BB+ or below and Ba1 or below are sometimes referred to as “junk bonds.” Some of the securities in which the fund
invests may have credit and liquidity support features, including guarantees and letters of credit. Though investment decisions
regarding the fund’s portfolio may be informed by investment themes on a range of macroeconomic factors, the fund may invest
in debt securities of any maturity or duration.
American
High-Income Municipal Bond Fund The fund’s investment objective is to provide you with a high level of current income
exempt from regular federal income tax. The fund is designed for investors who are able to tolerate greater credit risk and price
fluctuations than investors in funds with higher quality portfolios. In seeking to achieve its objective, the fund may accept
prudent risks to capital value to take advantage of opportunities for higher current income.
Under
normal circumstances, the fund will invest at least 80% of its assets in, or derive at least 80% of its income from, securities
that are exempt from regular federal income tax and may subject you to alternative minimum tax. The fund may invest, without limitation,
in securities that may subject you to federal alternative minimum tax. The fund invests at least 50% of its portfolio in debt
securities rated BBB+ or below or Baa1 or below by Nationally Recognized Statistical Rating Organizations designated by the fund’s
investment adviser, or unrated but determined by the fund’s investment adviser to be of equivalent quality. Securities rated
BB+ or below and Ba1 or below are sometimes referred to as “junk bonds.” Some of the securities in which the fund
invests may have credit and liquidity support features, including guarantees and letters of credit. Though investment decisions
regarding the fund’s portfolio may be informed by investment themes on a range of macroeconomic factors, the fund may invest
in debt securities of any maturity or duration.
Applicable
to all funds Municipal bonds are debt obligations generally issued to obtain funds for various public purposes, including
the construction of public facilities.
A bond’s
effective maturity is the market’s trading assessment of its maturity and represents an estimate of the most likely time
period during which an investor in that bond will receive payment of principal. For example, as market interest rates decline,
issuers may exercise call provisions that shorten the bond’s effective maturity. Conversely, if interest rates rise, effective
maturities tend to lengthen. A portfolio’s dollar-weighted average effective maturity is the weighted average of all effective
maturities in the portfolio, where more weight is given to larger holdings.
The fund
may also hold cash or cash equivalents, including commercial paper and short-term securities issued by the U.S. government, its
agencies and instrumentalities. The percentage of the fund invested in such holdings varies and depends on various factors, including
market conditions and purchases and redemptions of fund shares. The investment adviser may determine that it is appropriate to
invest a
21 Tax-exempt
income funds - Class R-6 / Prospectus
substantial
portion of the fund’s assets in such instruments in response to certain circumstances, such as periods of market turmoil.
In addition, for temporary defensive purposes, the fund may invest without limitation in such instruments. A larger percentage
of such holdings could moderate the fund’s investment results in a period of rising market prices. Alternatively, a larger
percentage of such holdings could reduce the magnitude of the fund’s loss in a period of falling market prices and provide
liquidity to make additional investments or to meet redemptions.
The fund’s
daily cash balance may be invested in one or more money market or similar funds managed by the investment adviser or its affiliates
(“Central Funds”). Shares of Central Funds are not offered to the public and are only purchased by the fund’s
investment adviser and its affiliates and other funds, investment vehicles and accounts managed by the fund’s investment
adviser and its affiliates. When investing in Central Funds, the fund bears its proportionate share of the expenses of the Central
Funds in which it invests but does not bear additional management fees through its investment in such Central Funds. The investment
results of the portions of the fund’s assets invested in the Central Funds will be based upon the investment results of
the Central Funds.
The following
are principal risks associated with the fund’s investment strategies.
Market
conditions — The prices of, and
the income generated by, the securities held by the fund may decline – sometimes rapidly or unpredictably – due to
various factors, including events or conditions affecting the general economy or particular industries; overall market changes;
local, regional or global political, social or economic instability; governmental, governmental agency or central bank responses
to economic conditions; and currency exchange rate, interest rate and commodity price fluctuations.
Economies
and financial markets throughout the world are interconnected. Economic, financial or political events, trading and tariff arrangements,
wars, terrorism, cybersecurity events, natural disasters and other circumstances in one country or region could have impacts on
global economies or markets. As a result, whether or not the fund invests in securities of issuers located in or with significant
exposure to the countries affected, the value and liquidity of the fund’s investments may be negatively affected by developments
in other countries and regions.
Issuer
risks — The prices of, and the
income generated by, securities held by the fund may decline in response to various factors directly related to the issuers of
such securities, including reduced demand for an issuer’s goods or services, poor management performance, major litigation
related to the issuer, changes in government regulations affecting the issuer or its competitive environment and strategic initiatives
such as mergers, acquisitions or dispositions and the market response to any such initiatives.
Investing
in municipal securities — The yield and/or
value of the fund’s investments in municipal securities may be adversely affected by events tied to the municipal securities
markets, which can be very volatile and significantly impacted by unfavorable legislative or political developments and negative
changes in the financial conditions of municipal securities issuers and the economy. To the extent the fund invests in obligations
of a municipal issuer, the volatility, credit quality and performance of the fund may be adversely impacted by local political
and economic conditions of the issuer. For example, a credit rating downgrade, bond default or bankruptcy involving an issuer
within a particular state or territory could affect the market values and marketability of many or all municipal obligations of
that state or territory. Income from municipal securities held by the fund could also be declared taxable because of changes in
tax laws or interpretations by taxing authorities or as a result of noncompliant conduct of a municipal issuer. Additionally,
the relative amount of publicly available information about municipal securities is generally less than that for corporate securities.
Investing
in debt instruments — The prices of,
and the income generated by, bonds and other debt securities held by the fund may be affected by changing interest rates and by
changes in the effective maturities and credit ratings of these securities.
Rising
interest rates will generally cause the prices of bonds and other debt securities to fall. A general rise in interest rates may
cause investors to sell debt securities on a large scale, which could also adversely affect the price and liquidity of debt securities
and could also result in increased redemptions from the fund. Falling interest rates may cause an issuer to redeem, call or refinance
a debt security before its stated maturity, which may result in the fund failing to recoup the full amount of its initial investment
and having to reinvest the proceeds in lower yielding securities. Longer maturity debt securities generally have greater sensitivity
to changes in interest rates and may be subject to greater price fluctuations than shorter maturity debt securities.
Bonds
and other debt securities are also subject to credit risk, which is the possibility that the credit strength of an issuer or guarantor
will weaken or be perceived to be weaker, and/or an issuer of a debt security will fail to make timely payments of principal or
interest and the security will go into default. A downgrade or default affecting any of the fund’s securities could cause
the value of the fund’s shares to decrease. Lower quality debt securities generally have higher rates of interest and may
be subject to greater price fluctuations than higher quality debt securities. Credit risk is gauged, in part, by the credit ratings
of the debt securities in which the fund invests. However, ratings are only the opinions of the rating agencies issuing them and
are not guarantees as to credit quality or an evaluation of market risk. The fund’s investment adviser relies on its own
credit analysts to research issuers and issues in seeking to assess credit and default risks.
Liquidity
risk — Certain fund holdings may
be or become difficult or impossible to sell, particularly during times of market turmoil. Liquidity may be impacted by the lack
of an active market for a holding, legal or contractual restrictions on resale, or the reduced number and capacity of market participants
to make a market in such holding. Market prices for less liquid or illiquid holdings may be volatile, and reduced liquidity may
have an adverse impact on the market price of such holdings. Additionally, the sale of less liquid or illiquid holdings may involve
substantial delays (including delays in settlement) and additional costs and the fund may be unable to sell such holdings when
necessary to meet its liquidity needs or may be forced to sell at a loss.
Credit
and liquidity support — Changes in the
credit quality of banks and financial institutions providing credit and liquidity support features with respect to securities
held by the fund could cause the values of these securities to decline.
Tax-exempt
income funds - Class R-6 / Prospectus 22
Investing
in lower rated debt instruments — Lower
rated bonds and other lower rated debt securities generally have higher rates of interest and involve greater risk of default
or price declines due to changes in the issuer’s creditworthiness than those of higher quality debt securities. The market
prices of these securities may fluctuate more than the prices of higher quality debt securities and may decline significantly
in periods of general economic difficulty. These risks may be increased with respect to investments in lower quality, higher yielding
debt securities rated Ba1 or below and BB+ or below by Nationally Recognized Statistical Rating Organizations designated by the
fund’s investment adviser or unrated but determined by the investment adviser to be of equivalent quality, which securities
are sometimes referred to as “junk bonds.”
Investing
in similar municipal bonds — Investing
significantly in municipal obligations of multiple issuers in the same state or backed by revenues of similar types of projects
or industries may make the fund more susceptible to certain economic, political or regulatory occurrences. As a result, the fund
has greater risk of volatility, and greater risk of loss, from these investments.
Management
— The investment adviser to the
fund actively manages the fund’s investments. Consequently, the fund is subject to the risk that the methods and analyses,
including models, tools and data, employed by the investment adviser in this process may be flawed or incorrect and may not produce
the desired results. This could cause the fund to lose value or its investment results to lag relevant benchmarks or other funds
with similar objectives.
The
following are additional risks associated with investing in the fund.
Alternative
minimum tax — The fund (other than The
Tax-Exempt Bond Fund of America) may invest in securities that may subject you to federal alternative minimum tax. Therefore,
while the fund’s distributions from tax-exempt securities are not subject to regular federal income tax, a portion or all
of the distributions may be included in determining a shareholder’s federal alternative minimum tax.
Interest
rate risk — The values and liquidity
of the securities held by the fund may be affected by changing interest rates. For example, the values of these securities may
decline when interest rates rise and increase when interest rates fall. Longer maturity debt securities generally have greater
sensitivity to changes in interest rates and may be subject to greater price fluctuations than shorter maturity debt securities.
The fund may invest in variable and floating rate securities. When the fund holds variable or floating rate securities, a decrease
in market interest rates will adversely affect the income received from such securities and the net asset value of the fund’s
shares. Although the values of such securities are generally less sensitive to interest rate changes than those of other debt
securities, the value of variable and floating rate securities may decline if their interest rates do not rise as quickly, or
as much, as market interest rates. Conversely, floating rate securities will not generally increase in value if interest rates
decline. During periods of extremely low short-term interest rates, the fund may not be able to maintain a positive yield and,
given the current low interest rate environment, risks associated with rising rates are currently heightened.
Investing
in derivatives — The use of derivatives
involves a variety of risks, which may be different from, or greater than, the risks associated with investing in traditional
securities, such as stocks and bonds. Changes in the value of a derivative may not correlate perfectly with, and may be more sensitive
to market events than, the underlying asset, rate or index, and a derivative instrument may expose the fund to losses in excess
of its initial investment. Derivatives may be difficult to value, difficult for the fund to buy or sell at an opportune time or
price and difficult, or even impossible, to terminate or otherwise offset. The fund’s use of derivatives may result in losses
to the fund, and investing in derivatives may reduce the fund’s returns and increase the fund’s price volatility.
The fund’s counterparty to a derivative transaction (including, if applicable, the fund’s clearing broker, the derivatives
exchange or the clearinghouse) may be unable or unwilling to honor its financial obligations in respect of the transaction. In
certain cases, the fund may be hindered or delayed in exercising remedies against or closing out derivative instruments with a
counterparty, which may result in additional losses.
Investing
in futures contracts — In addition
to the risks generally associated with investing in derivative instruments, futures contracts are subject to the creditworthiness
of the clearing organizations, exchanges and futures commission merchants with which the fund transacts. Additionally, although
futures require only a small initial investment in the form of a deposit of initial margin, the amount of a potential loss on
a futures contract could greatly exceed the initial amount invested. While futures contracts are generally liquid instruments,
under certain market conditions futures may be deemed to be illiquid. For example, the fund may be temporarily prohibited from
closing out its position in a futures contract if intraday price change limits or limits on trading volume imposed by the applicable
futures exchange are triggered. If the fund is unable to close out a position on a futures contract, the fund would remain subject
to the risk of adverse price movements until the fund is able to close out the futures position. The ability of the fund to successfully
utilize futures contracts may depend in part upon the ability of the fund’s investment adviser to accurately forecast interest
rates and other economic factors and to assess and predict the impact of such economic factors on the futures in which the fund
invests. If the investment adviser incorrectly forecasts economic developments or incorrectly predicts the impact of such developments
on the futures in which it invests, the fund could be exposed to the risk of loss.
Exposure
to country, region, industry or sector —
Subject to the fund’s investment limitations, the fund may have significant exposure to a particular country, region, industry
or sector. Such exposure may cause the fund to be more impacted by risks relating to and developments affecting the country, region,
industry or sector, and thus its net asset value may be more volatile, than a fund without such levels of exposure. For example,
if the fund has significant exposure in a particular country, then social, economic, regulatory or other issues that negatively
affect that country may have a greater impact on the fund than on a fund that is more geographically diversified.
In
addition to the principal investment strategies described above, the fund has other investment practices that are described in
the statement of additional information, which includes a description of other risks related to the fund’s principal investment
strategies and other investment practices. The fund’s investment results will depend on the ability of the fund’s
investment adviser to navigate the risks discussed above as well as those described in the statement of additional information.
23 Tax-exempt
income funds - Class R-6 / Prospectus
Fund
comparative indexes The investment results tables in this prospectus show how the fund’s average annual total returns
compare with various broad measures of market results.
American
Funds Short-Term Tax-Exempt Bond Fund The Bloomberg Barclays Municipal Short 1–5 Years Index is a market-value-weighted
index that includes investment-grade tax-exempt bonds with maturities of one to five years. This index is unmanaged, and its results
include reinvested distributions but do not reflect the effect of sales charges, commissions, account fees, expenses or U.S. federal
income taxes. This index began on July 31, 2005; therefore, results covering periods prior to that date are not shown.
The Lipper Short Municipal Debt Funds Average is composed of funds that invest in municipal debt issues with dollar-weighted average
maturities of less than three years. The results of the underlying funds in the average include reinvestment of dividends and
capital gain distributions, as well as brokerage commissions paid by the funds for portfolio transactions and other fund expenses,
but do not reflect the effect of sales charges, account fees or U.S. federal income taxes.
Limited
Term Tax-Exempt Bond Fund of America The Bloomberg Barclays Municipal Short-Intermediate 1-10 Years Index is a market-value-weighted
index that includes investment grade tax-exempt bonds with maturities of one to 10 years. This index is unmanaged, and its results
include reinvested distributions but do not reflect the effect of sales charges, commissions, account fees, expenses or U.S. federal
income taxes. The Lipper Short-Intermediate Municipal Debt Funds Average is composed of funds that invest in municipal debt issues
with dollar-weighted average maturities of one to five years. The results of the underlying funds in the average include reinvestment
of dividends and capital gain distributions, as well as brokerage commissions paid by the funds for portfolio transactions and
other fund expenses, but do not reflect the effect of sales charges, account fees or U.S. federal income taxes.
The Tax-Exempt
Bond Fund of America The Bloomberg Barclays Municipal Bond Index is a market-value-weighted index designed to represent the
long-term investment-grade tax-exempt bond market. This index is unmanaged, and its results include reinvested distributions but
do not reflect the effect of sales charges, commissions, account fees, expenses or U.S. federal income taxes. This index was not
in existence when the fund’s Class A shares became available; therefore, lifetime results are not shown. The Lipper General
& Insured Municipal Debt Funds Average is composed of funds that invest in municipal debt issues in the top four credit rating
categories. The results of the underlying funds in the average include reinvestment of dividends and capital gain distributions,
as well as brokerage commissions paid by the funds for portfolio transactions and other fund expenses, but do not reflect the
effect of sales charges, account fees or U.S. federal income taxes.
American
High-Income Municipal Bond Fund The Bloomberg Barclays Municipal Bond Index is a market-value-weighted index designed to represent
the long-term investment-grade tax-exempt bond market. This index is unmanaged, and its results include reinvested distributions
but do not reflect the effect of sales charges, commissions, account fees, expenses or U.S. federal income taxes. The Bloomberg
Barclays High Yield Municipal Bond Index is a market-value-weighted index composed of municipal bonds rated below BBB/Baa. This
index is unmanaged, and its results include reinvested distributions but do not reflect the effect of sales charges, commissions,
account fees, expenses or U.S. federal income taxes. This index was not in existence as of the date the fund’s Class A shares
became available; therefore, lifetime results are not shown. The Lipper High Yield Municipal Debt Funds Average is composed of
funds that invest at least 50% of their assets in lower rated municipal debt issues. The results of the underlying funds
in the average include reinvestment of dividends and capital gain distributions, as well as brokerage commissions paid by the
funds for portfolio transactions and other fund expenses, but do not reflect the effect of sales charges, account fees or U.S.
federal income taxes.
Fund
results All fund results in this prospectus reflect the reinvestment of dividends and capital gain distributions, if any.
Unless otherwise noted, fund results reflect any fee waivers and/or expense reimbursements in effect during the periods presented.
Management
and organization
Investment
adviser Capital Research and Management Company, an experienced investment management organization founded in 1931, serves
as the investment adviser to the fund and other funds, including the American Funds. Capital Research and Management Company is
a wholly owned subsidiary of The Capital Group Companies, Inc. and is located at 333 South Hope Street, Los Angeles,
California 90071. Capital Research and Management Company manages the investment portfolio and business affairs of the fund. The
total management fee paid by the fund to its investment adviser for the most recent fiscal year, as a percentage of average net
assets, appears in the Annual Fund Operating Expenses tables under “Fees and expenses of the fund.” The management
fee for the fund is based on the daily net assets of the fund and the fund’s monthly gross investment income. Please see
the statement of additional information for further details. A discussion regarding the basis for approval of the fund’s
Investment Advisory and Service Agreement by the fund’s board of trustees is contained in the fund’s annual report
to shareholders for the fiscal year ended July 31, 2019.
Capital
Research and Management Company manages equity assets through three equity investment divisions and fixed income assets through
its fixed income investment division, Capital Fixed Income Investors. The three equity investment divisions — Capital International
Investors, Capital Research Global Investors and Capital World Investors — make investment decisions independently of one
another.
The equity
investment divisions may, in the future, be incorporated as wholly owned subsidiaries of Capital Research and Management Company.
In that event, Capital Research and Management Company would continue to be the investment adviser, and day-to-day investment
management of equity assets would continue to be carried out through one or more of these subsidiaries. Although not currently
contemplated, Capital Research and Management Company could incorporate its fixed income investment division in the future and
engage it to provide day-to-day investment management of fixed income assets. Capital Research and Management Company and each
of the funds it advises have received an exemptive order from the U.S. Securities and Exchange Commission that allows Capital
Research and Management Company to use, upon approval of the fund’s board, its management subsidiaries and affiliates to
provide day-to-day investment management services to the fund, including making changes to the management subsidiaries and affiliates
providing such services. The fund’s shareholders have approved this arrangement; however, there is no assurance that Capital
Research and Management Company will incorporate its investment divisions or exercise any authority granted to it under the exemptive
order.
Tax-exempt
income funds - Class R-6 / Prospectus 24
Portfolio
holdings Portfolio holdings information for the fund is available on the American Funds website at capitalgroup.com. A description
of the fund’s policies and procedures regarding disclosure of information about its portfolio holdings is available in the
statement of additional information.
The
Capital SystemSM Capital Research and Management Company uses a system of multiple portfolio managers in managing
mutual fund assets. Under this approach, the portfolio of a fund is divided into segments managed by individual managers. In addition,
Capital Research and Management Company’s investment analysts may make investment decisions with respect to a portion of
a fund’s portfolio. Investment decisions are subject to a fund’s objective(s), policies and restrictions and the oversight
of the appropriate investment-related committees of Capital Research and Management Company and its investment divisions.
Certain
senior members of Capital Fixed Income Investors, the investment adviser’s fixed income investment division, serve on the
Portfolio Strategy Group. The group utilizes a research-driven process with input from the investment adviser’s analysts,
portfolio managers and economists to define investment themes on a range of macroeconomic factors, including duration, yield curve
and sector allocation. The investment decisions made by the fund’s portfolio managers are informed by the investment themes
discussed by the group.
The
table below shows the investment experience and role in management of the fund for the fund’s primary portfolio managers.
| |
|
|
|
| Portfolio
manager |
Investment
experience |
Experience
in this fund |
Role
in management of the fund |
| Aaron
Applebaum |
Investment
professional for 18 years in total;
12 years with Capital Research and Management Company or affiliate |
|
|
| American
Funds Short-Term Tax-Exempt Bond Fund |
|
3
years |
Serves
as a fixed income portfolio manager |
| Limited
Term Tax-Exempt Bond Fund of America |
|
5
years |
Serves
as a fixed income portfolio manager |
| Mark
Marinella |
Investment
professional for 34 years in total;
6 years with Capital Research and Management Company or affiliate |
|
|
| American
Funds Short-Term Tax-Exempt Bond Fund |
|
1
year |
Serves
as a fixed income portfolio manager |
| Limited
Term Tax-Exempt Bond Fund of America |
|
1
year |
Serves
as a fixed income portfolio manager |
| Chad
M. Rach |
Investment
professional for 26 years in total;
15 years with Capital Research and Management Company or affiliate |
|
|
| The
Tax-Exempt Bond Fund of America |
|
3
years
(plus 12 years of
prior experience
as an
investment analyst
for the fund) |
Serves
as a fixed income portfolio manager |
| American
High-Income Municipal Bond Fund |
|
8
years
(plus 6 years of
prior experience
as an
investment analyst
for the fund) |
Serves
as a fixed income portfolio manager |
| |
25 Tax-exempt
income funds - Class R-6 / Prospectus
| |
|
|
|
| Jerome
Solomon |
Investment
professional for 27 years in total;
11 years with Capital Research and Management Company or affiliate |
|
|
| American
High-Income Municipal Bond Fund |
|
2
years
(plus 8 years of
prior experience
as an
investment analyst
for the fund) |
Serves
as a fixed income portfolio manager |
| Karl
J. Zeile |
Investment
professional for 28 years in total;
20 years with Capital Research and Management Company or affiliate |
|
|
| The
Tax-Exempt Bond Fund of America |
|
16
years
(plus 4 years of
prior experience
as an
investment analyst
for the fund) |
Serves
as a fixed income portfolio manager |
| American
High-Income Municipal Bond Fund |
|
15
years
(plus 5 years of
prior experience
as an
investment analyst
for the fund) |
Serves
as a fixed income portfolio manager |
| |
| |
Information
regarding the portfolio managers’ compensation, their ownership of securities in the fund and other accounts they manage
is in the statement of additional information.
Tax-exempt
income funds - Class R-6 / Prospectus 26
Certain
privileges and/or services described on the following pages of this prospectus and in the statement of additional information
may not be available to you, depending on your investment dealer. Please see your financial advisor or investment dealer
for more information.
Purchase,
exchange and sale of shares The fund’s
transfer agent, on behalf of the fund and American Funds Distributors,® the fund’s distributor, is required
by law to obtain certain personal information from you or any other person(s) acting on your behalf in order to verify your or
such person’s identity. If you do not provide the information, the transfer agent may not be able to open your account.
If the transfer agent is unable to verify your identity or that of any other person(s) authorized to act on your behalf, or believes
it has identified potentially criminal activity, the fund and American Funds Distributors reserve the right to close your account
or take such other action they deem reasonable or required by law.
When
purchasing shares, you should designate the fund or funds in which you wish to invest. Subject to the exception below, if no fund
is designated, your money will be held uninvested (without liability to the transfer agent for loss of income or appreciation
pending receipt of proper instructions) until investment instructions are received, but for no more than three business days.
Your investment will be made at the net asset value (plus any applicable sales charge, in the case of Class A shares) next determined
after investment instructions are received and accepted by the transfer agent. If investment instructions are not received, your
money will be invested in Class A shares of American Funds U.S. Government Money Market Fund® on the third business
day after receipt of your investment.
If
the amount of your cash investment is $10,000 or less, no fund is designated, and you made a cash investment (excluding exchanges)
within the last 16 months, your money will be invested in the same proportion and in the same fund or funds and in the same class
of shares in which your last cash investment was made.
Different
procedures may apply to certain employer-sponsored arrangements, including, but not limited to, SEPs and SIMPLE IRAs.
Valuing
shares The net asset value of each share class of the fund is the value of a single share of that class. The fund calculates
the net asset value each day the New York Stock Exchange is open for trading as of approximately 4 p.m. New York time, the normal
close of regular trading. If, for example, the New York Stock Exchange closes at 1 p.m. New York time, the fund’s net asset
value would still be determined as of 4 p.m. New York time. In this example, portfolio securities traded on the New York Stock
Exchange would be valued at their closing prices unless the investment adviser determines that a “fair value” adjustment
is appropriate due to subsequent events.
Equity
securities are valued primarily on the basis of market quotations, and debt securities are valued primarily on the basis of prices
from third-party pricing services. Futures contracts are valued primarily on the basis of settlement prices. The fund has adopted
procedures for making fair value determinations if market quotations or prices from third-party pricing services, as applicable,
are not readily available or are not considered reliable. For example, if events occur between the close of markets outside the
United States and the close of regular trading on the New York Stock Exchange that, in the opinion of the investment adviser,
materially affect the value of any of the fund’s equity securities that trade principally in those international markets,
those securities will be valued in accordance with fair value procedures. Similarly, fair value procedures may be employed if
an issuer defaults on its debt securities and there is no market for its securities. Use of these procedures is intended to result
in more appropriate net asset values and, where applicable, to reduce potential arbitrage opportunities otherwise available to
short-term investors.
Your
shares will be purchased at the net asset value or sold at the net asset value next determined after American Funds Service Company®
receives your request, provided that your request contains all information and legal documentation necessary to process
the transaction.
Purchase
of Class R shares Class R-6 shares are generally available for purchase only by American Funds Portfolio Series and other
investment companies deemed appropriate by the fund’s investment adviser or distributor. Therefore, any information included
in this prospectus regarding purchases by retirement plans or other group accounts is not applicable.
Purchase
minimums and maximums Purchase minimums described in this prospectus may be waived in certain cases. In addition, the fund
reserves the right to redeem the shares of any shareholder for their then current net asset value per share if the shareholder’s
aggregate investment in the fund falls below the fund’s minimum initial investment amount. See the statement of additional
information for details.
For
accounts established with an automatic investment plan, the initial purchase minimum of $250 may be waived if the purchases (including
purchases through exchanges from another fund) made under the plan are sufficient to reach $250 within five months of account
establishment.
Exchange
Generally, you may exchange your shares for shares of the same class of other American Funds
without a sales charge.
Exchanges
have the same tax consequences as ordinary sales and purchases. For example, to the extent you exchange shares held in a taxable
account that are worth more now than what you paid for them, the gain will be subject to taxation.
See
“Transactions by telephone, fax or the Internet” in the section “How to sell shares” of this prospectus
for information regarding electronic exchanges.
Please see
the statement of additional information for details and limitations on moving investments in certain share classes to different
share classes and on moving investments held in certain accounts to different accounts.
27 Tax-exempt
income funds - Class R-6 / Prospectus
How
to sell shares
You
may sell (redeem) shares in any of the following ways:
Writing
to American Funds Service Company
· Requests
must be signed by the registered shareholder(s).
· A
signature guarantee is required if the redemption is:
— more
than $125,000;
— made
payable to someone other than the registered shareholder(s); or
— sent
to an address other than the address of record or to an address of record that has been changed within the previous 10 days.
· American
Funds Service Company reserves the right to require signature guarantee(s) on any redemption.
· Additional
documentation may be required for redemptions of shares held in corporate, partnership or fiduciary accounts.
Telephoning
or faxing American Funds Service Company or using the Internet
· Redemptions
by telephone, fax or the Internet (including American FundsLine® and capitalgroup.com) are limited to $125,000
per American Funds shareholder each day.
· Checks
must be made payable to the registered shareholder.
· Checks
must be mailed to an address of record that has been used with the account for at least 10 days.
The
fund typically expects to remit redemption proceeds one business day following receipt and acceptance of a redemption order, regardless
of the method the fund uses to make such payment (e.g., check, wire or automated clearing house transfer). However, payment may
take longer than one business day and may take up to seven days as generally permitted by the Investment Company Act of 1940,
as amended (“1940 Act”). Under the 1940 Act, the fund may be permitted to pay redemption proceeds beyond seven days
under certain limited circumstances. In addition, if you recently purchased shares and subsequently request a redemption of those
shares, the fund will pay the available redemption proceeds once a sufficient period of time has passed to reasonably ensure that
checks or drafts, including certified or cashier’s checks, for the shares purchased have cleared (normally seven business
days from the purchase date).
Under
normal conditions, the fund typically expects to meet shareholder redemptions by monitoring the fund’s portfolio and redemption
activities and by regularly holding a reserve of highly liquid assets, such as cash or cash equivalents. The fund may use additional
methods to meet shareholder redemptions, if they become necessary. These methods may include, but are not limited to, the sale
of portfolio assets, the use of overdraft protection afforded by the fund’s custodian bank, borrowing from a line of credit
or from other funds advised by the investment adviser or its affiliates, and making payment with fund securities or other fund
assets rather than in cash (as further discussed in the following paragraph).
Although
payment of redemptions normally will be in cash, the fund’s declaration of trust permits payment of the redemption price
wholly or partly with portfolio securities or other fund assets under conditions and circumstances determined by the fund’s
board of trustees. On the same redemption date, some shareholders may be paid in whole or in part in securities (which may differ
among those shareholders), while other shareholders may be paid entirely in cash. In general,
in-kind redemptions to affiliated shareholders will as closely as practicable represent the affiliated shareholder’s pro
rata share of the fund’s securities, subject to certain exceptions. Securities distributed in-kind to unaffiliated shareholders
will be selected by the investment adviser in a manner the investment adviser deems to be fair and reasonable to the fund’s
shareholders. The disposal of the securities received in-kind may be subject to brokerage costs and, until sold, such securities
remain at market risk and liquidity risk, including the risk that such securities are or become difficult to sell. If the fund
pays your redemption with illiquid or less liquid securities, you will bear the risk of not being able to sell such securities.
Transactions
by telephone, fax or the Internet Generally, you are automatically eligible to redeem or exchange
shares by telephone, fax or the Internet, unless you notify us in writing that you do not want any or all of these services. You
may reinstate these services at any time.
Unless
you decide not to have telephone, fax or Internet services on your account(s), you agree to hold each fund, American Funds Service
Company, any of its affiliates or mutual funds managed by such affiliates, and each of their respective directors, trustees, officers,
employees and agents harmless from any losses, expenses, costs or liabilities (including attorney fees) that may be incurred in
connection with the exercise of these privileges, provided that American Funds Service Company employs reasonable procedures to
confirm that the instructions received from any person with appropriate account information are genuine. If reasonable procedures
are not employed, American Funds Service Company and/or the fund may be liable for losses due to unauthorized or fraudulent instructions.
Frequent
trading of fund shares The fund and American Funds Distributors reserve the right to reject
any purchase order for any reason. The fund is not designed to serve as a vehicle for frequent trading. Frequent trading of fund
shares may lead to increased costs to the fund and less efficient management of the fund’s portfolio, potentially resulting
in dilution of the value of the shares held by long-term shareholders. Accordingly, purchases, including those that are part of
exchange activity, that the fund or American Funds Distributors has determined could involve actual or potential harm to the fund
may be rejected.
The fund,
through its transfer agent, American Funds Service Company, maintains surveillance procedures that are designed to detect frequent
trading in fund shares. Under these procedures, various analytics are used to evaluate factors that may be indicative of frequent
trading. For example, transactions in fund shares that exceed certain monetary thresholds may be scrutinized. American Funds Service
Company also may review transactions that occur close in time to other transactions in the same account or in multiple accounts
under common ownership or influence. Trading activity that is identified through these procedures or as a result of any other
information available to the fund will be evaluated to determine whether such activity might constitute frequent trading. These
procedures may be modified from time to time as appropriate to improve the detection of frequent trading, to facilitate monitoring
for frequent trading in particular retirement plans or other accounts and to comply with applicable laws.
Tax-exempt
income funds - Class R-6 / Prospectus 28
In
addition to the fund’s broad ability to restrict potentially harmful trading as described above, the fund’s board
of trustees has adopted a “purchase blocking policy” under which any shareholder redeeming shares having a value of
$5,000 or more from a fund will be precluded from investing in that fund for 30 calendar days after the redemption transaction.
This policy also applies to redemptions and purchases that are part of exchange transactions. Under the fund’s purchase
blocking policy, certain purchases will not be prevented and certain redemptions will not trigger a purchase block, such as:
· purchases
and redemptions of shares having a value of less than $5,000;
· purchases
and redemptions by investment companies managed or sponsored by the fund’s investment adviser or its affiliates, including
reallocations and transactions allowing the investment company to meet its redemptions and purchases;
· retirement
plan contributions, loans and distributions (including hardship withdrawals) identified as such on the retirement plan recordkeeper’s
system;
· purchases
and redemptions in community foundation accounts;
· purchase
transactions involving in-kind transfers of shares of the fund, rollovers, Roth IRA conversions and IRA recharacterizations,
if the entity maintaining the shareholder account is able to identify the transaction as one of these types of transactions; and
· systematic
redemptions and purchases, if the entity maintaining the shareholder account is able to identify the transaction as a systematic
redemption or purchase.
Generally,
purchases and redemptions will not be considered “systematic” unless the transaction is prescheduled for a specific
date.
The
fund reserves the right to waive the purchase blocking policy with respect to specific shareholder accounts if American Funds
Service Company determines that its surveillance procedures are adequate to detect frequent trading in fund shares in such
accounts.
If
American Funds Service Company identifies any activity that may constitute frequent trading, it reserves the right to contact
the intermediary and request that the intermediary either provide information regarding an account owner’s transactions
or restrict the account owner’s trading. If American Funds Service Company is not satisfied that the intermediary has taken
appropriate action, American Funds Service Company may terminate the intermediary’s ability to transact in fund shares.
There
is no guarantee that all instances of frequent trading in fund shares will be prevented.
Notwithstanding
the fund’s surveillance procedures and purchase blocking policy described above, all transactions in fund shares remain
subject to the right of the fund, American Funds Distributors and American Funds Service Company to restrict potentially abusive
trading generally, including the types of transactions described above that will not be prevented or trigger a block under the
purchase blocking policy. See the statement of additional information for more information about how American Funds Service Company
may address other potentially abusive trading activity in American Funds.
29 Tax-exempt
income funds - Class R-6 / Prospectus
Distributions
and taxes
Dividends
and distributions The fund declares daily dividends from net investment income and distributes the accrued dividends, which
may fluctuate, to you each month. Generally, dividends begin accruing on the day payment for shares is received by the fund or
American Funds Service Company.
Capital
gains, if any, are usually distributed in November or December. When a dividend or capital gain is distributed, the net asset
value per share is reduced by the amount of the payment.
You may
elect to reinvest dividends and/or capital gain distributions to purchase additional shares of this fund or other American Funds,
or you may elect to receive them in cash.
Taxes
on dividends and distributions Interest on municipal bonds is generally not included in gross income for federal tax purposes.
Subject to certain requirements, the fund is permitted to pass through to its shareholders the interest earned on municipal bonds
as federally exempt-interest dividends. Taxable dividends, including distributions of short-term capital gains, however, are subject
to federal taxation at the applicable rates for ordinary income. To the extent the fund is permitted to invest in bonds subject
to federal alternative minimum tax, interest earned on certain bonds may be treated as income subject to federal alternative minimum
tax. The fund’s distributions of net long-term capital gains are taxable as long-term capital gains.
Depending
on their state of residence, shareholders of the fund may be able to exempt from state taxation some or all of the federally tax-exempt
income dividends paid by the fund.
Moreover,
any federally taxable dividends and capital gains distributions from the fund may also be subject to state tax.
Any
taxable dividends or capital gain distributions you receive from the fund normally will be taxable to you when made, regardless
of whether you reinvest dividends or capital gain distributions or receive them in cash.
Taxes
on transactions Your redemptions, including exchanges, may result in a capital gain or loss for federal tax purposes.
A capital gain or loss on your investment is the difference between the cost of your shares, including any sales charges,
and the amount you receive when you sell them.
Shareholder
fees Fees borne directly by the fund normally have the effect of reducing a shareholder’s taxable income on distributions.
Please
see your tax advisor for more information.
Choosing
a share class Class R-6 shares
are generally available for purchase only by American Funds Portfolio Series and other investment companies deemed appropriate
by the fund’s investment adviser or distributor. Therefore, any information included in this prospectus regarding purchases
by retirement plans or other group accounts is not applicable.
Sales
charges
Class
R shares Class R shares are sold without any initial or contingent deferred sales charge. No
dealer compensation is paid from fund assets on sales of Class R-6 shares.
Other
compensation to dealers American Funds Distributors,
at its expense, provides additional compensation to investment dealers. These payments may be made, at the discretion of American
Funds Distributors, to no more than the top 60 dealers (or their affiliates) that have sold shares of American Funds. The payment
will be determined using a formula applied consistently to dealers based on their assets under management. The level of payments
made to a qualifying firm under the formula will not exceed .035% of eligible American Funds assets attributable to that dealer.
Class R shares and other retirement assets (for example, IRAs in advisory programs) are generally excluded from the formula. Dealers
may direct American Funds Distributors to exclude additional assets. In addition to the asset-based payment, American Funds Distributors
makes a payment of $5 million to each of the top six firms in terms of American Funds assets under management to recognize the
depth of the commitment each of those firms has made to collaborating with American Funds Distributors on achieving advisor training
and education objectives.
American
Funds Distributors makes these additional compensation payments to support various efforts, including, among other things, to:
· help
defray the costs incurred by qualifying dealers in connection with efforts to educate financial advisors about American Funds
so that they can make recommendations and provide services that are suitable and meet shareholder needs,
· help
defray the costs associated with the dealer firms’ provision of account related services and activities,
· support
the dealer firms’ distribution activities,
· support
meetings, conferences or other training and educational events hosted by the firm, and
· obtain
relevant data regarding financial advisor activities to facilitate American Funds Distributors’ training and education activities.
American
Funds Distributors will, on an annual basis, determine the advisability of continuing these payments.
Firms
receiving additional compensation payments must sign a letter acknowledging the purpose of the payment and generally requiring
the firms to (1) have significant assets invested in American Funds, (2) perform the due diligence necessary to include American
Funds on their platform, (3) not provide financial advisors, branch managers or associated persons with any financial incentives
to promote the sales of one approved fund group over another approved group, (4) provide opportunities for their clients to obtain
individualized advice, (5) provide American Funds Distributors broad access to their financial advisors and product platforms
and work together on mutual business objectives, and (6) work with the fund’s transfer agent to promote operational efficiencies
and to facilitate necessary communication between American Funds and the firm’s clients who own shares of American Funds.
American
Funds Distributors has identified certain firms that provide a self-directed platform for the public as well as clearing, custody
and recordkeeping services for certain other intermediaries. In lieu of the formula described above, these firms receive a payment
of up to
Tax-exempt
income funds - Class R-6 / Prospectus 30
.018%
of assets under administration (excluding assets where the firm acts as a fiduciary and brokerage clearing assets). Firms may
direct American Funds Distributors to exclude additional assets.
American
Funds Distributors may also make payments, outside of the formulas described above for, among other things, data (including fees
to obtain lists of financial advisors to better tailor training and education opportunities), account-related services, and operational
improvements. In 2018, American Funds Distributors paid the following firms for such information and services amounts that did
not exceed the following amounts:
| |
|
| Fidelity
Investments |
$400,000 |
| LPL
Financial LLC |
$560,000 |
| Morgan
Stanley Wealth Management |
$800,000 |
| PNC
Network |
$50,000 |
| UBS
Financial Services Inc. |
$300,000 |
| Wells
Fargo Advisors |
$450,000 |
American
Funds Distributors may also pay expenses associated with meetings and other training and educational opportunities conducted by
selling dealers, advisory platform providers and other intermediaries to facilitate educating financial advisors and shareholders
about American Funds.
If
investment advisers, distributors or other affiliates of mutual funds pay additional compensation or other incentives to investment
dealers in differing amounts, dealer firms and their advisors may have financial incentives for recommending a particular mutual
fund over other mutual funds or investments. You should consult with your financial advisor and review carefully any disclosure
by your financial advisor’s firm as to compensation received.
Fund
expenses In periods of market volatility, assets
of the fund may decline significantly, causing total annual fund operating expenses (as a percentage of the value of your investment)
to become higher than the numbers shown in the Annual Fund Operating Expenses tables in this prospectus.
“Other
expenses” items in the Annual Fund Operating Expenses tables in this prospectus include fees for administrative services
provided by the fund’s investment adviser and its affiliates. Administrative services are provided by the investment adviser
and its affiliates to help assist third parties providing non-distribution services to fund shareholders. These services include
providing in-depth information on the fund and market developments that impact fund investments. Administrative services also
include, but are not limited to, coordinating, monitoring and overseeing third parties that provide services to fund shareholders.
The Administrative Services Agreement between the fund and the investment adviser provides the fund the ability to charge an administrative
services fee of .05% for all share classes. The fund's investment adviser receives an administrative services fee at the annual
rate of .03% of the average daily net assets of the fund attributable to Class R-6 shares (which could be increased as noted above)
for administrative services provided to this share class.
The
“Other expenses” items in the Annual Fund Operating Expenses table for the fund also include custodial, legal, transfer
agent payments and various other expenses.
31 Tax-exempt
income funds - Class R-6 / Prospectus
Financial
highlights The Financial Highlights tables
are intended to help you understand the fund’s results for the past five fiscal years. Certain information reflects financial
results for a single share of a particular class. The total returns in the tables represent the rate that an investor would have
earned or lost on an investment in the fund (assuming reinvestment of all dividends). The information in the Financial Highlights
tables has been audited by PricewaterhouseCoopers LLP, whose current reports, along with the fund’s financial statements,
are included in the statement of additional information for the fund, which is available upon request.
American
Funds Short-Term Tax-Exempt Bond Fund
| |
|
|
|
|
|
|
|
|
|
|
|
|
|
|
|
|
|
|
|
|
| |
|
Income
from investment operations1 |
|
|
|
|
|
|
| Period
ended |
Net
asset
value,
beginning
of period |
Net
investment
income |
Net
gains
(losses) on
securities
(both
realized and
unrealized) |
Total
from
investment
operations |
Dividends
(from
net
investment
income) |
Net
asset
value,
end
of period |
Total
return2 |
Net
assets,
end of period
(in millions) |
Ratio
of
expenses
to average
net assets |
Ratio
of
net income
to average
net assets |
| Class
A: |
|
|
|
|
|
|
|
|
|
|
|
|
|
|
|
|
|
|
|
|
| 7/31/2019 |
$10.04 |
|
$.16 |
|
$.15 |
|
$.31 |
|
$(.16 |
) |
$10.19 |
|
3.09 |
% |
$767 |
|
.59 |
% |
1.56 |
% |
| 7/31/2018 |
10.15 |
|
.13 |
|
(.11 |
) |
.02 |
|
(.13 |
) |
10.04 |
|
.24 |
|
752 |
|
.58 |
|
1.33 |
|
| 7/31/2017 |
10.22 |
|
.12 |
|
(.07 |
) |
.05 |
|
(.12 |
) |
10.15 |
|
.46 |
|
739 |
|
.59 |
|
1.15 |
|
| 7/31/2016 |
10.17 |
|
.10 |
|
.05 |
|
.15 |
|
(.10 |
) |
10.22 |
|
1.51 |
|
688 |
|
.59 |
|
1.02 |
|
| 7/31/2015 |
10.25 |
|
.11 |
|
(.08 |
) |
.03 |
|
(.11 |
) |
10.17 |
|
.26 |
|
653 |
|
.58 |
|
1.04 |
|
| Class
T: |
|
|
|
|
|
|
|
|
|
|
|
|
|
|
|
|
|
|
|
|
| 7/31/2019 |
10.04 |
|
.17 |
|
.15 |
|
.32 |
|
(.17 |
) |
10.19 |
|
3.20 |
3 |
— |
4 |
.47 |
3 |
1.67 |
3 |
| 7/31/2018 |
10.15 |
|
.15 |
|
(.11 |
) |
.04 |
|
(.15 |
) |
10.04 |
|
.36 |
3 |
— |
4 |
.47 |
3 |
1.44 |
3 |
| 7/31/20175,6 |
10.11 |
|
.04 |
|
.04 |
|
.08 |
|
(.04 |
) |
10.15 |
|
.82 |
3,7 |
— |
4 |
.15 |
3,7 |
.42 |
3,7 |
| Class
F-1: |
|
|
|
|
|
|
|
|
|
|
|
|
|
|
|
|
|
|
|
|
| 7/31/2019 |
10.04 |
|
.13 |
|
.15 |
|
.28 |
|
(.13 |
) |
10.19 |
|
2.85 |
|
7 |
|
.81 |
|
1.34 |
|
| 7/31/2018 |
10.15 |
|
.11 |
|
(.11 |
) |
— |
8 |
(.11 |
) |
10.04 |
|
.02 |
|
7 |
|
.80 |
|
1.10 |
|
| 7/31/2017 |
10.22 |
|
.09 |
|
(.07 |
) |
.02 |
|
(.09 |
) |
10.15 |
|
.23 |
|
9 |
|
.82 |
|
.92 |
|
| 7/31/2016 |
10.17 |
|
.08 |
|
.05 |
|
.13 |
|
(.08 |
) |
10.22 |
|
1.29 |
|
13 |
|
.81 |
|
.80 |
|
| 7/31/2015 |
10.25 |
|
.08 |
|
(.08 |
) |
— |
8 |
(.08 |
) |
10.17 |
|
.05 |
|
9 |
|
.80 |
|
.83 |
|
| Class
F-2: |
|
|
|
|
|
|
|
|
|
|
|
|
|
|
|
|
|
|
|
|
| 7/31/2019 |
10.04 |
|
.17 |
|
.15 |
|
.32 |
|
(.17 |
) |
10.19 |
|
3.17 |
|
182 |
|
.49 |
|
1.67 |
|
| 7/31/2018 |
10.15 |
|
.14 |
|
(.11 |
) |
.03 |
|
(.14 |
) |
10.04 |
|
.28 |
|
52 |
|
.54 |
|
1.37 |
|
| 7/31/2017 |
10.22 |
|
.12 |
|
(.07 |
) |
.05 |
|
(.12 |
) |
10.15 |
|
.49 |
|
47 |
|
.57 |
|
1.17 |
|
| 7/31/2016 |
10.17 |
|
.11 |
|
.05 |
|
.16 |
|
(.11 |
) |
10.22 |
|
1.55 |
|
80 |
|
.56 |
|
1.06 |
|
| 7/31/2015 |
10.25 |
|
.11 |
|
(.08 |
) |
.03 |
|
(.11 |
) |
10.17 |
|
.29 |
|
64 |
|
.55 |
|
1.08 |
|
| Class
F-3: |
|
|
|
|
|
|
|
|
|
|
|
|
|
|
|
|
|
|
|
|
| 7/31/2019 |
10.04 |
|
.17 |
|
.15 |
|
.32 |
|
(.17 |
) |
10.19 |
|
3.23 |
|
52 |
|
.44 |
|
1.71 |
|
| 7/31/2018 |
10.15 |
|
.15 |
|
(.11 |
) |
.04 |
|
(.15 |
) |
10.04 |
|
.38 |
|
45 |
|
.44 |
|
1.45 |
|
| 7/31/20175,9 |
10.07 |
|
.07 |
|
.08 |
|
.15 |
|
(.07 |
) |
10.15 |
|
1.49 |
7 |
77 |
|
.47 |
10 |
1.35 |
10 |
| Class
R-6: |
|
|
|
|
|
|
|
|
|
|
|
|
|
|
|
|
|
|
|
|
| 7/31/2019 |
10.04 |
|
.17 |
|
.15 |
|
.32 |
|
(.17 |
) |
10.19 |
|
3.24 |
|
132 |
|
.43 |
|
1.71 |
|
| 7/31/2018 |
10.15 |
|
.15 |
|
(.11 |
) |
.04 |
|
(.15 |
) |
10.04 |
|
.38 |
|
122 |
|
.44 |
|
1.48 |
|
| 7/31/20175,11 |
10.09 |
|
.05 |
|
.06 |
|
.11 |
|
(.05 |
) |
10.15 |
|
1.20 |
7 |
127 |
|
.17 |
7 |
.51 |
7 |
| |
|
|
|
|
|
| |
Year
ended July 31 |
| 2019 |
2018 |
2017 |
2016 |
2015 |
| Portfolio
turnover rate for all share classes |
50% |
34% |
26% |
21% |
38% |
1 Based
on average shares outstanding.
2 Total
returns exclude any applicable sales charges, including contingent deferred sales charges.
3 All
or a significant portion of assets in this class consisted of seed capital invested by Capital Research and Management Company
and/or its affiliates. Fees for distribution services are not charged or accrued on these seed capital assets. If such fees were
paid by the fund on seed capital assets, fund expenses would have been higher and net income and total return would have been
lower.
4 Amount
less than $1 million.
5 Based
on operations for a period that is less than a full year.
6 Class
T shares began investment operations on April 7, 2017.
7 Not
annualized.
8 Amount
less than $.01.
9 Class
F-3 shares began investment operations on January 27, 2017.
10 Annualized.
11
Class R-6 shares began investment operations
on March 17, 2017.
Tax-exempt
income funds - Class R-6 / Prospectus 32
Limited
Term Tax-Exempt Bond Fund of America
| |
|
|
|
|
|
|
|
|
|
|
|
|
|
|
|
|
|
|
|
|
| |
|
Income
(loss) from investment operations1 |
|
|
|
|
|
|
| Period
ended |
Net
asset
value,
beginning
of period |
Net
investment
income |
Net
gains
(losses) on
securities
(both
realized and
unrealized) |
Total
from
investment
operations |
Dividends
(from
net
investment
income) |
Net
asset
value,
end
of period |
Total
return2 |
Net
assets,
end of period
(in millions) |
Ratio
of
expenses
to average
net assets |
Ratio
of
net income
to average
net assets |
| Class
A: |
|
|
|
|
|
|
|
|
|
|
|
|
|
|
|
|
|
|
|
|
| 7/31/2019 |
$15.52 |
|
$.31 |
|
$.41 |
|
$.72 |
|
$(.31 |
) |
$15.93 |
|
4.71 |
% |
$3,060 |
|
.59 |
% |
2.00 |
% |
| 7/31/2018 |
15.77 |
|
.31 |
|
(.25 |
) |
.06 |
|
(.31 |
) |
15.52 |
|
.40 |
|
3,057 |
|
.59 |
|
2.00 |
|
| 7/31/2017 |
16.04 |
|
.32 |
|
(.27 |
) |
.05 |
|
(.32 |
) |
15.77 |
|
.34 |
|
3,038 |
|
.59 |
|
2.04 |
|
| 7/31/2016 |
15.92 |
|
.35 |
|
.12 |
|
.47 |
|
(.35 |
) |
16.04 |
|
2.97 |
|
3,055 |
|
.59 |
|
2.17 |
|
| 7/31/2015 |
16.10 |
|
.38 |
|
(.18 |
) |
.20 |
|
(.38 |
) |
15.92 |
|
1.23 |
|
2,670 |
|
.57 |
|
2.36 |
|
| Class
C: |
|
|
|
|
|
|
|
|
|
|
|
|
|
|
|
|
|
|
|
|
| 7/31/2019 |
15.52 |
|
.20 |
|
.41 |
|
.61 |
|
(.20 |
) |
15.93 |
|
3.94 |
|
18 |
|
1.33 |
|
1.27 |
|
| 7/31/2018 |
15.77 |
|
.20 |
|
(.25 |
) |
(.05 |
) |
(.20 |
) |
15.52 |
|
(.34 |
) |
20 |
|
1.34 |
|
1.26 |
|
| 7/31/2017 |
16.04 |
|
.20 |
|
(.27 |
) |
(.07 |
) |
(.20 |
) |
15.77 |
|
(.40 |
) |
25 |
|
1.33 |
|
1.30 |
|
| 7/31/2016 |
15.92 |
|
.23 |
|
.12 |
|
.35 |
|
(.23 |
) |
16.04 |
|
2.20 |
|
30 |
|
1.33 |
|
1.43 |
|
| 7/31/2015 |
16.10 |
|
.26 |
|
(.18 |
) |
.08 |
|
(.26 |
) |
15.92 |
|
.47 |
|
30 |
|
1.33 |
|
1.60 |
|
| Class
T: |
|
|
|
|
|
|
|
|
|
|
|
|
|
|
|
|
|
|
|
|
| 7/31/2019 |
15.52 |
|
.35 |
|
.41 |
|
.76 |
|
(.35 |
) |
15.93 |
|
4.99 |
3 |
— |
4 |
.33 |
3 |
2.27 |
3 |
| 7/31/2018 |
15.77 |
|
.36 |
|
(.25 |
) |
.11 |
|
(.36 |
) |
15.52 |
|
.68 |
3 |
— |
4 |
.33 |
3 |
2.26 |
3 |
| 7/31/20175,6 |
15.68 |
|
.12 |
|
.09 |
|
.21 |
|
(.12 |
) |
15.77 |
|
1.32 |
3,7 |
— |
4 |
.10 |
3,7 |
.74 |
3,7 |
| Class
F-1: |
|
|
|
|
|
|
|
|
|
|
|
|
|
|
|
|
|
|
|
|
| 7/31/2019 |
15.52 |
|
.30 |
|
.41 |
|
.71 |
|
(.30 |
) |
15.93 |
|
4.63 |
|
60 |
|
.67 |
|
1.93 |
|
| 7/31/2018 |
15.77 |
|
.30 |
|
(.25 |
) |
.05 |
|
(.30 |
) |
15.52 |
|
.33 |
|
64 |
|
.66 |
|
1.93 |
|
| 7/31/2017 |
16.04 |
|
.31 |
|
(.27 |
) |
.04 |
|
(.31 |
) |
15.77 |
|
.26 |
|
83 |
|
.67 |
|
1.96 |
|
| 7/31/2016 |
15.92 |
|
.33 |
|
.12 |
|
.45 |
|
(.33 |
) |
16.04 |
|
2.88 |
|
90 |
|
.67 |
|
2.09 |
|
| 7/31/2015 |
16.10 |
|
.36 |
|
(.18 |
) |
.18 |
|
(.36 |
) |
15.92 |
|
1.13 |
|
84 |
|
.67 |
|
2.27 |
|
| Class
F-2: |
|
|
|
|
|
|
|
|
|
|
|
|
|
|
|
|
|
|
|
|
| 7/31/2019 |
15.52 |
|
.34 |
|
.41 |
|
.75 |
|
(.34 |
) |
15.93 |
|
4.91 |
|
500 |
|
.39 |
|
2.20 |
|
| 7/31/2018 |
15.77 |
|
.34 |
|
(.25 |
) |
.09 |
|
(.34 |
) |
15.52 |
|
.58 |
|
353 |
|
.41 |
|
2.18 |
|
| 7/31/2017 |
16.04 |
|
.35 |
|
(.27 |
) |
.08 |
|
(.35 |
) |
15.77 |
|
.51 |
|
309 |
|
.42 |
|
2.22 |
|
| 7/31/2016 |
15.92 |
|
.38 |
|
.12 |
|
.50 |
|
(.38 |
) |
16.04 |
|
3.15 |
|
291 |
|
.41 |
|
2.34 |
|
| 7/31/2015 |
16.10 |
|
.40 |
|
(.18 |
) |
.22 |
|
(.40 |
) |
15.92 |
|
1.39 |
|
208 |
|
.41 |
|
2.52 |
|
| Class
F-3: |
|
|
|
|
|
|
|
|
|
|
|
|
|
|
|
|
|
|
|
|
| 7/31/2019 |
15.52 |
|
.36 |
|
.41 |
|
.77 |
|
(.36 |
) |
15.93 |
|
5.02 |
|
308 |
|
.30 |
|
2.29 |
|
| 7/31/2018 |
15.77 |
|
.36 |
|
(.25 |
) |
.11 |
|
(.36 |
) |
15.52 |
|
.70 |
|
187 |
|
.30 |
|
2.29 |
|
| 7/31/20175,8 |
15.59 |
|
.19 |
|
.18 |
|
.37 |
|
(.19 |
) |
15.77 |
|
2.37 |
7 |
112 |
|
.30 |
9 |
2.36 |
9 |
| Class
R-6: |
|
|
|
|
|
|
|
|
|
|
|
|
|
|
|
|
|
|
|
|
| 7/31/2019 |
15.52 |
|
.36 |
|
.41 |
|
.77 |
|
(.36 |
) |
15.93 |
|
5.02 |
|
307 |
|
.29 |
|
2.30 |
|
| 7/31/2018 |
15.77 |
|
.36 |
|
(.25 |
) |
.11 |
|
(.36 |
) |
15.52 |
|
.70 |
|
284 |
|
.30 |
|
2.29 |
|
| 7/31/2017 |
16.04 |
|
.37 |
|
(.27 |
) |
.10 |
|
(.37 |
) |
15.77 |
|
.63 |
|
296 |
|
.30 |
|
2.33 |
|
| 7/31/2016 |
15.92 |
|
.39 |
|
.12 |
|
.51 |
|
(.39 |
) |
16.04 |
|
3.26 |
|
284 |
|
.30 |
|
2.45 |
|
| 7/31/2015 |
16.10 |
|
.42 |
|
(.18 |
) |
.24 |
|
(.42 |
) |
15.92 |
|
1.50 |
|
190 |
|
.31 |
|
2.62 |
|
| |
|
|
|
|
|
| |
Year
ended July 31 |
| 2019 |
2018 |
2017 |
2016 |
2015 |
| Portfolio
turnover rate for all share classes |
42% |
28% |
27% |
16% |
19% |
1 Based
on average shares outstanding.
2 Total
returns exclude any applicable sales charges, including contingent deferred sales charges.
3 All
or a significant portion of assets in this class consisted of seed capital invested by Capital Research and Management Company
and/or its affiliates. Fees for distribution services are not charged or accrued on these seed capital assets. If such fees were
paid by the fund on seed capital assets, fund expenses would have been higher and net income and total return would have been
lower.
4 Amount
less than $1 million.
5 Based
on operations for a period that is less than a full year.
6 Class
T shares began investment operations on April 7, 2017.
7 Not
annualized.
8 Class
F-3 shares began investment operations on January 27, 2017.
9 Annualized.
33 Tax-exempt
income funds - Class R-6 / Prospectus
The
Tax-Exempt Bond Fund of America
| |
|
|
|
|
|
|
|
|
|
|
|
|
|
|
|
|
|
|
|
|
| |
|
Income
(loss) from investment operations1 |
|
|
|
|
|
|
| Period
ended |
Net
asset
value,
beginning
of period |
Net
investment
income |
Net
gains
(losses) on
securities
(both
realized and
unrealized) |
Total
from
investment
operations |
Dividends
(from
net
investment
income) |
Net
asset
value,
end
of period |
Total
return2 |
Net
assets,
end of period
(in millions) |
Ratio
of
expenses
to average
net assets |
Ratio
of
net income
to average
net assets |
| Class
A: |
|
|
|
|
|
|
|
|
|
|
|
|
|
|
|
|
|
|
|
|
| 7/31/2019 |
$12.81 |
|
$.37 |
|
$.47 |
|
$.84 |
|
$(.36 |
) |
$13.29 |
|
6.71 |
% |
$10,868 |
|
.52 |
% |
2.84 |
% |
| 7/31/2018 |
12.98 |
|
.38 |
|
(.17 |
) |
.21 |
|
(.38 |
) |
12.81 |
|
1.60 |
|
10,102 |
|
.53 |
|
2.91 |
|
| 7/31/2017 |
13.40 |
|
.40 |
|
(.42 |
) |
(.02 |
) |
(.40 |
) |
12.98 |
|
(.09 |
) |
9,692 |
|
.53 |
|
3.12 |
|
| 7/31/2016 |
12.96 |
|
.41 |
|
.44 |
|
.85 |
|
(.41 |
) |
13.40 |
|
6.69 |
|
9,510 |
|
.54 |
|
3.15 |
|
| 7/31/2015 |
12.92 |
|
.42 |
|
.04 |
|
.46 |
|
(.42 |
) |
12.96 |
|
3.62 |
|
7,385 |
|
.54 |
|
3.28 |
|
| Class
C: |
|
|
|
|
|
|
|
|
|
|
|
|
|
|
|
|
|
|
|
|
| 7/31/2019 |
12.81 |
|
.27 |
|
.47 |
|
.74 |
|
(.26 |
) |
13.29 |
|
5.88 |
|
407 |
|
1.31 |
|
2.06 |
|
| 7/31/2018 |
12.98 |
|
.27 |
|
(.17 |
) |
.10 |
|
(.27 |
) |
12.81 |
|
.80 |
|
432 |
|
1.32 |
|
2.12 |
|
| 7/31/2017 |
13.40 |
|
.30 |
|
(.42 |
) |
(.12 |
) |
(.30 |
) |
12.98 |
|
(.88 |
) |
474 |
|
1.32 |
|
2.33 |
|
| 7/31/2016 |
12.96 |
|
.31 |
|
.44 |
|
.75 |
|
(.31 |
) |
13.40 |
|
5.85 |
|
517 |
|
1.33 |
|
2.35 |
|
| 7/31/2015 |
12.92 |
|
.32 |
|
.04 |
|
.36 |
|
(.32 |
) |
12.96 |
|
2.80 |
|
349 |
|
1.33 |
|
2.50 |
|
| Class
T: |
|
|
|
|
|
|
|
|
|
|
|
|
|
|
|
|
|
|
|
|
| 7/31/2019 |
12.81 |
|
.40 |
|
.47 |
|
.87 |
|
(.39 |
) |
13.29 |
|
6.93 |
3 |
— |
4 |
.32 |
3 |
3.05 |
3 |
| 7/31/2018 |
12.98 |
|
.40 |
|
(.17 |
) |
.23 |
|
(.40 |
) |
12.81 |
|
1.83 |
3 |
— |
4 |
.32 |
3 |
3.12 |
3 |
| 7/31/20175,6 |
12.85 |
|
.14 |
|
.13 |
|
.27 |
|
(.14 |
) |
12.98 |
|
2.07 |
3,7 |
— |
4 |
.10 |
3,7 |
1.06 |
3,7 |
| Class
F-1: |
|
|
|
|
|
|
|
|
|
|
|
|
|
|
|
|
|
|
|
|
| 7/31/2019 |
12.81 |
|
.36 |
|
.47 |
|
.83 |
|
(.35 |
) |
13.29 |
|
6.58 |
|
338 |
|
.64 |
|
2.72 |
|
| 7/31/2018 |
12.98 |
|
.36 |
|
(.17 |
) |
.19 |
|
(.36 |
) |
12.81 |
|
1.48 |
|
370 |
|
.65 |
|
2.80 |
|
| 7/31/2017 |
13.40 |
|
.39 |
|
(.43 |
) |
(.04 |
) |
(.38 |
) |
12.98 |
|
(.22 |
) |
461 |
|
.66 |
|
2.99 |
|
| 7/31/2016 |
12.96 |
|
.39 |
|
.44 |
|
.83 |
|
(.39 |
) |
13.40 |
|
6.53 |
|
518 |
|
.67 |
|
3.04 |
|
| 7/31/2015 |
12.92 |
|
.41 |
|
.04 |
|
.45 |
|
(.41 |
) |
12.96 |
|
3.49 |
|
1,474 |
|
.67 |
|
3.16 |
|
| Class
F-2: |
|
|
|
|
|
|
|
|
|
|
|
|
|
|
|
|
|
|
|
|
| 7/31/2019 |
12.81 |
|
.39 |
|
.47 |
|
.86 |
|
(.38 |
) |
13.29 |
|
6.86 |
|
2,778 |
|
.38 |
|
2.98 |
|
| 7/31/2018 |
12.98 |
|
.39 |
|
(.17 |
) |
.22 |
|
(.39 |
) |
12.81 |
|
1.74 |
|
2,177 |
|
.39 |
|
3.05 |
|
| 7/31/2017 |
13.40 |
|
.42 |
|
(.42 |
) |
— |
8 |
(.42 |
) |
12.98 |
|
.03 |
|
1,909 |
|
.41 |
|
3.24 |
|
| 7/31/2016 |
12.96 |
|
.43 |
|
.44 |
|
.87 |
|
(.43 |
) |
13.40 |
|
6.84 |
|
2,879 |
|
.40 |
|
3.26 |
|
| 7/31/2015 |
12.92 |
|
.44 |
|
.04 |
|
.48 |
|
(.44 |
) |
12.96 |
|
3.76 |
|
990 |
|
.41 |
|
3.42 |
|
| Class
F-3: |
|
|
|
|
|
|
|
|
|
|
|
|
|
|
|
|
|
|
|
|
| 7/31/2019 |
12.81 |
|
.41 |
|
.47 |
|
.88 |
|
(.40 |
) |
13.29 |
|
6.97 |
|
6,570 |
|
.27 |
|
3.09 |
|
| 7/31/2018 |
12.98 |
|
.41 |
|
(.17 |
) |
.24 |
|
(.41 |
) |
12.81 |
|
1.84 |
|
5,397 |
|
.28 |
|
3.11 |
|
| 7/31/20175,9 |
12.75 |
|
.22 |
|
.23 |
|
.45 |
|
(.22 |
) |
12.98 |
|
3.54 |
7 |
1,555 |
|
.29 |
10 |
3.34 |
10 |
| Class
R-6: |
|
|
|
|
|
|
|
|
|
|
|
|
|
|
|
|
|
|
|
|
| 7/31/2019 |
12.81 |
|
.41 |
|
.47 |
|
.88 |
|
(.40 |
) |
13.29 |
|
6.97 |
|
685 |
|
.27 |
|
3.09 |
|
| 7/31/2018 |
12.98 |
|
.41 |
|
(.17 |
) |
.24 |
|
(.41 |
) |
12.81 |
|
1.85 |
|
550 |
|
.28 |
|
3.15 |
|
| 7/31/2017 |
13.40 |
|
.44 |
|
(.43 |
) |
.01 |
|
(.43 |
) |
12.98 |
|
.15 |
|
380 |
|
.29 |
|
3.36 |
|
| 7/31/2016 |
12.96 |
|
.44 |
|
.44 |
|
.88 |
|
(.44 |
) |
13.40 |
|
6.95 |
|
391 |
|
.29 |
|
3.39 |
|
| 7/31/2015 |
12.92 |
|
.46 |
|
.04 |
|
.50 |
|
(.46 |
) |
12.96 |
|
3.86 |
|
270 |
|
.30 |
|
3.52 |
|
| |
|
|
|
|
|
| |
Year
ended July 31 |
| 2019 |
2018 |
2017 |
2016 |
2015 |
| Portfolio
turnover rate for all share classes |
20% |
17% |
20% |
13% |
14% |
1 Based
on average shares outstanding.
2 Total
returns exclude any applicable sales charges, including contingent deferred sales charges.
3 All
or a significant portion of assets in this class consisted of seed capital invested by Capital Research and Management Company
and/or its affiliates. Fees for distribution services are not charged or accrued on these seed capital assets. If such fees were
paid by the fund on seed capital assets, fund expenses would have been higher and net income and total return would have been
lower.
4 Amount
less than $1 million.
5 Based
on operations for a period that is less than a full year.
6 Class
T shares began investment operations on April 7, 2017.
7 Not
annualized.
8 Amount
less than $.01.
9 Class
F-3 shares began investment operations on January 27, 2017.
10 Annualized.
Tax-exempt
income funds - Class R-6 / Prospectus 34
American
High-Income Municipal Bond Fund
| |
|
|
|
|
|
|
|
|
|
|
|
|
|
|
|
|
|
|
|
|
| |
|
Income
(loss) from investment operations1 |
|
|
|
|
|
|
| Period
ended |
Net
asset
value,
beginning
of period |
Net
investment
income |
Net
gains
(losses) on
securities
(both
realized and
unrealized) |
Total
from
investment
operations |
Dividends
(from
net
investment
income) |
Net
asset
value,
end
of period |
Total
return2 |
Net
assets,
end of period
(in millions) |
Ratio
of
expenses
to average
net assets |
Ratio
of
net income
to average
net assets |
| Class
A: |
|
|
|
|
|
|
|
|
|
|
|
|
|
|
|
|
|
|
|
|
| 7/31/2019 |
$15.78 |
|
$.58 |
|
$.54 |
|
$1.12 |
|
$(.57 |
) |
$16.33 |
|
7.28 |
% |
$4,637 |
|
.68 |
% |
3.67 |
% |
| 7/31/2018 |
15.73 |
|
.59 |
|
.04 |
|
.63 |
|
(.58 |
) |
15.78 |
|
4.05 |
|
4,062 |
|
.68 |
|
3.72 |
|
| 7/31/2017 |
16.21 |
|
.60 |
|
(.49 |
) |
.11 |
|
(.59 |
) |
15.73 |
|
.76 |
|
3,645 |
|
.67 |
|
3.86 |
|
| 7/31/2016 |
15.40 |
|
.63 |
|
.79 |
|
1.42 |
|
(.61 |
) |
16.21 |
|
9.45 |
|
3,519 |
|
.67 |
|
4.02 |
|
| 7/31/2015 |
15.22 |
|
.64 |
|
.17 |
|
.81 |
|
(.63 |
) |
15.40 |
|
5.34 |
|
2,700 |
|
.68 |
|
4.13 |
|
| Class
C: |
|
|
|
|
|
|
|
|
|
|
|
|
|
|
|
|
|
|
|
|
| 7/31/2019 |
15.78 |
|
.47 |
|
.54 |
|
1.01 |
|
(.46 |
) |
16.33 |
|
6.49 |
|
238 |
|
1.41 |
|
2.94 |
|
| 7/31/2018 |
15.73 |
|
.47 |
|
.04 |
|
.51 |
|
(.46 |
) |
15.78 |
|
3.29 |
|
227 |
|
1.43 |
|
2.97 |
|
| 7/31/2017 |
16.21 |
|
.48 |
|
(.49 |
) |
(.01 |
) |
(.47 |
) |
15.73 |
|
.00 |
|
229 |
|
1.43 |
|
3.10 |
|
| 7/31/2016 |
15.40 |
|
.52 |
|
.79 |
|
1.31 |
|
(.50 |
) |
16.21 |
|
8.62 |
|
247 |
|
1.43 |
|
3.26 |
|
| 7/31/2015 |
15.22 |
|
.52 |
|
.17 |
|
.69 |
|
(.51 |
) |
15.40 |
|
4.55 |
|
182 |
|
1.44 |
|
3.37 |
|
| Class
T: |
|
|
|
|
|
|
|
|
|
|
|
|
|
|
|
|
|
|
|
|
| 7/31/2019 |
15.78 |
|
.62 |
|
.54 |
|
1.16 |
|
(.61 |
) |
16.33 |
|
7.55 |
3 |
— |
4 |
.42 |
3 |
3.93 |
3 |
| 7/31/2018 |
15.73 |
|
.63 |
|
.04 |
|
.67 |
|
(.62 |
) |
15.78 |
|
4.34 |
3 |
— |
4 |
.43 |
3 |
3.98 |
3 |
| 7/31/20175,6 |
15.50 |
|
.20 |
|
.23 |
|
.43 |
|
(.20 |
) |
15.73 |
|
2.77 |
3,7 |
— |
4 |
.12 |
3,7 |
1.28 |
3,7 |
| Class
F-1: |
|
|
|
|
|
|
|
|
|
|
|
|
|
|
|
|
|
|
|
|
| 7/31/2019 |
15.78 |
|
.57 |
|
.54 |
|
1.11 |
|
(.56 |
) |
16.33 |
|
7.21 |
|
180 |
|
.74 |
|
3.61 |
|
| 7/31/2018 |
15.73 |
|
.58 |
|
.04 |
|
.62 |
|
(.57 |
) |
15.78 |
|
3.99 |
|
208 |
|
.75 |
|
3.65 |
|
| 7/31/2017 |
16.21 |
|
.59 |
|
(.49 |
) |
.10 |
|
(.58 |
) |
15.73 |
|
.68 |
|
234 |
|
.75 |
|
3.77 |
|
| 7/31/2016 |
15.40 |
|
.62 |
|
.79 |
|
1.41 |
|
(.60 |
) |
16.21 |
|
9.37 |
|
282 |
|
.74 |
|
3.95 |
|
| 7/31/2015 |
15.22 |
|
.62 |
|
.17 |
|
.79 |
|
(.61 |
) |
15.40 |
|
5.27 |
|
207 |
|
.75 |
|
4.06 |
|
| Class
F-2: |
|
|
|
|
|
|
|
|
|
|
|
|
|
|
|
|
|
|
|
|
| 7/31/2019 |
15.78 |
|
.61 |
|
.54 |
|
1.15 |
|
(.60 |
) |
16.33 |
|
7.49 |
|
1,114 |
|
.47 |
|
3.87 |
|
| 7/31/2018 |
15.73 |
|
.62 |
|
.04 |
|
.66 |
|
(.61 |
) |
15.78 |
|
4.26 |
|
798 |
|
.49 |
|
3.91 |
|
| 7/31/2017 |
16.21 |
|
.63 |
|
(.49 |
) |
.14 |
|
(.62 |
) |
15.73 |
|
.93 |
|
605 |
|
.50 |
|
4.05 |
|
| 7/31/2016 |
15.40 |
|
.66 |
|
.79 |
|
1.45 |
|
(.64 |
) |
16.21 |
|
9.65 |
|
775 |
|
.48 |
|
4.18 |
|
| 7/31/2015 |
15.22 |
|
.66 |
|
.17 |
|
.83 |
|
(.65 |
) |
15.40 |
|
5.53 |
|
321 |
|
.49 |
|
4.32 |
|
| Class
F-3: |
|
|
|
|
|
|
|
|
|
|
|
|
|
|
|
|
|
|
|
|
| 7/31/2019 |
15.78 |
|
.63 |
|
.54 |
|
1.17 |
|
(.62 |
) |
16.33 |
|
7.60 |
|
897 |
|
.37 |
|
3.97 |
|
| 7/31/2018 |
15.73 |
|
.64 |
|
.04 |
|
.68 |
|
(.63 |
) |
15.78 |
|
4.37 |
|
646 |
|
.38 |
|
4.02 |
|
| 7/31/20175,8 |
15.30 |
|
.32 |
|
.43 |
|
.75 |
|
(.32 |
) |
15.73 |
|
4.96 |
7 |
421 |
|
.37 |
9 |
4.04 |
9 |
| Class
R-6: |
|
|
|
|
|
|
|
|
|
|
|
|
|
|
|
|
|
|
|
|
| 7/31/2019 |
15.78 |
|
.63 |
|
.54 |
|
1.17 |
|
(.62 |
) |
16.33 |
|
7.61 |
|
686 |
|
.37 |
|
3.98 |
|
| 7/31/2018 |
15.73 |
|
.64 |
|
.04 |
|
.68 |
|
(.63 |
) |
15.78 |
|
4.37 |
|
550 |
|
.38 |
|
4.02 |
|
| 7/31/2017 |
16.21 |
|
.64 |
|
(.49 |
) |
.15 |
|
(.63 |
) |
15.73 |
|
1.05 |
|
380 |
|
.38 |
|
4.16 |
|
| 7/31/2016 |
15.40 |
|
.68 |
|
.79 |
|
1.47 |
|
(.66 |
) |
16.21 |
|
9.76 |
|
269 |
|
.38 |
|
4.31 |
|
| 7/31/2015 |
15.22 |
|
.68 |
|
.17 |
|
.85 |
|
(.67 |
) |
15.40 |
|
5.64 |
|
188 |
|
.39 |
|
4.42 |
|
| |
|
|
|
|
|
| |
Year
ended July 31 |
| 2019 |
2018 |
2017 |
2016 |
2015 |
| Portfolio
turnover rate for all share classes |
20% |
24% |
30% |
21% |
23% |
1 Based
on average shares outstanding.
2 Total
returns exclude any applicable sales charges, including contingent deferred sales charges.
3 All
or a significant portion of assets in this class consisted of seed capital invested by Capital Research and Management Company
and/or its affiliates. Fees for distribution services are not charged or accrued on these seed capital assets. If such fees were
paid by the fund on seed capital assets, fund expenses would have been higher and net income and total return would have been
lower.
4 Amount
less than $1 million.
5 Based
on operations for a period that is less than a full year.
6 Class
T shares began investment operations on April 7, 2017.
7 Not
annualized.
8 Class
F-3 shares began investment operations on January 27, 2017.
9 Annualized.
35 Tax-exempt
income funds - Class R-6 / Prospectus
Appendix
Moody’s
long-term rating scale
Aaa —
Obligations rated Aaa are judged to be of the highest quality, subject to the lowest level of credit risk.
Aa
— Obligations rated Aa are judged to be of high quality and are subject to very low credit risk.
A
— Obligations rated A are considered upper-medium grade and are subject to low credit risk.
Baa
— Obligations rated Baa are judged to be medium grade and subject to moderate credit risk and as such may possess certain
speculative characteristics.
Ba
— Obligations rated Ba are judged to be speculative and are subject to substantial credit risk.
B
— Obligations rated B are considered speculative and are subject to high credit risk.
Caa
— Obligations rated Caa are judged to be speculative and of poor standing and are subject to very high credit risk.
Ca
— Obligations rated Ca are highly speculative and are likely in, or very near, default, with some prospect of recovery of
principal and interest.
C
— Obligations rated C are the lowest rated and are typically in default, with little prospect for recovery of principal
or interest.
Note: Moody’s
appends numerical modifiers 1, 2 and 3 to each generic rating classification from Aa through Caa. The modifier 1 indicates that
the obligation ranks in the higher end of its generic rating category; the modifier 2 indicates a mid-range ranking; and the modifier
3 indicates a ranking in the lower end of that generic rating category. Additionally, a “(hyb)” indicator is appended
to all ratings of hybrid securities issued by banks, insurers, finance companies and securities firms.
Standard
& Poor’s long-term-issue credit ratings
Standard
& Poor’s Ratings Services (“S&P”) rates the long-term debt securities of various entities in categories
ranging from AAA to D according to quality. The ratings from AA to CCC may be modified by the addition of a plus (+) or minus
(–) sign to show relative standing within the major rating categories. Ratings are described as follows:
AAA
— An obligation rated AAA has the highest rating assigned by S&P. The obligor’s capacity to meet its financial
commitment on the obligation is extremely strong.
AA —
An obligation rated AA differs from the highest rated obligations only in a small degree. The obligor’s capacity to meet
its financial commitment on the obligation is very strong.
A —
An obligation rated A is somewhat more susceptible to the adverse effects of changes in circumstances and economic conditions
than obligations in higher rated categories. However, the obligor’s capacity to meet its financial commitment on the obligation
is still strong.
BBB
— An obligation rated BBB exhibits adequate protection parameters. However, adverse economic conditions or changing circumstances
are more likely to lead to a weakened capacity of the obligor to meet its financial commitment on the obligation.
BB,
B, CCC, CC and C — Obligations rated BB, B, CCC, CC and C are regarded as having significant speculative characteristics.
BB indicates the least degree of speculation and C the highest. While such obligations will likely have some quality and protective
characteristics, these may be outweighed by large uncertainties or major exposures to adverse conditions.
BB —
An obligation rated BB is less vulnerable to nonpayment than other speculative issues. However, it faces major ongoing uncertainties
or exposure to adverse business, financial or economic conditions that could lead to the obligor’s inadequate capacity to
meet its financial commitment on the obligation.
B —
An obligation rated B is more vulnerable to nonpayment than obligations rated BB, but the obligor currently has the capacity to
meet its financial commitment on the obligation. Adverse business, financial or economic conditions will likely impair the obligor’s
capacity or willingness to meet its financial commitment on the obligation.
CCC
— An obligation rated CCC is currently vulnerable to nonpayment and is dependent upon favorable business, financial and
economic conditions for the obligor to meet its financial commitment on the obligation. In the event of adverse business, financial
or economic conditions, the obligor is not likely to have the capacity to meet its financial commitment on the obligation.
CC
— An obligation rated CC is currently highly vulnerable to nonpayment. The CC rating is used when a default has not occurred,
but S&P expects default to be a virtual certainty, regardless of the anticipated time to default.
C
— An obligation rated C is currently highly vulnerable to nonpayment, and the obligation is expected to have lower relative
seniority or lower ultimate recovery compared to obligations that are rated higher.
D
— An obligation rated D is in default or in breach of an imputed promise. For non-hybrid capital instruments, the D rating
category is used when payments on an obligation are not made on the date due, unless S&P believes that such payments will
be made within five business days in the absence of a stated grace period or within the earlier of the stated grace period or
30 calendar days. The D rating also will be used upon the filing of a bankruptcy petition or the taking of similar action and
where default on an obligation is a virtual certainty, for example due to automatic stay provisions. An obligation’s rating
is lowered to D if it is subject to a distressed exchange offer.
Plus
(+) or minus (–) — The ratings from AA to CCC may be modified by the addition of a plus or minus sign to show relative
standing within the major rating categories.
Tax-exempt
income funds - Class R-6 / Prospectus 36
NR
— This indicates that no rating has been requested, that there is insufficient information on which to base a rating, or
that S&P does not rate a particular obligation as a matter of policy.
Fitch
Ratings, Inc. long-term credit ratings
AAA —
Highest credit quality. AAA ratings denote the lowest expectation of default risk. They are assigned only in case of exceptionally
strong capacity for payment of financial commitments. This capacity is highly unlikely to be adversely affected by foreseeable
events.
AA —
Very high credit quality. AA ratings denote expectations of very low default risk. They indicate very strong capacity for payment
of financial commitments. This capacity is not significantly vulnerable to foreseeable events.
A —
High credit quality. A ratings denote expectations of low default risk. The capacity for payment of financial commitments is considered
strong. This capacity may, nevertheless, be more vulnerable to changes in circumstances or in economic conditions than is the
case for higher ratings.
BBB
— Good credit quality. BBB ratings indicate that expectations of default risk are low. The capacity for payment of financial
commitments is considered adequate but adverse changes in circumstances and economic conditions are more likely to impair this
capacity.
BB —
Speculative. BB ratings indicate an elevated vulnerability to default risk, particularly in the event of adverse changes in business
or economic conditions over time; however, business or financial flexibility exists which supports the servicing of financial
commitments.
B
— Highly speculative. B ratings indicate that material default risk is present, but a limited margin of safety remains.
Financial commitments are currently being met; however, capacity for continued payment is vulnerable to deterioration in the business
and economic environment.
CCC —
Substantial credit risk. Default is a real possibility.
CC
— Very high levels of credit risk. Default of some kind appears probable.
C —
Exceptionally high levels of credit risk. Default is imminent or inevitable, or the issuer is in standstill. Conditions that are
indicative of a C category rating for an issuer include:
· The
issuer has entered into a grace or cure period following nonpayment of a material financial obligation;
· The
issuer has entered into a temporary negotiated waiver or standstill agreement following a payment default on a material financial
obligation; or
· Fitch
Ratings otherwise believes a condition of RD or D to be imminent or inevitable, including through the formal announcement of a
distressed debt exchange.
37 Tax-exempt
income funds - Class R-6 / Prospectus
RD
— Restricted default. RD ratings indicate an issuer that in Fitch Ratings’ opinion has experienced an uncured payment
default on a bond, loan or other material financial obligation but which has not entered into bankruptcy filings, administration,
receivership, liquidation or other formal winding up procedure, and which has not otherwise ceased operating. This would include:
· The
selective payment default on a specific class or currency of debt;
· The
uncured expiry of any applicable grace period, cure period or default forbearance period following a payment default on a bank
loan, capital markets security or other material financial obligation;
· The
extension of multiple waivers or forbearance periods upon a payment default on one or more material financial obligations, either
in series or in parallel; or
· Execution
of a distressed debt exchange on one or more material financial obligations.
D
— Default. D ratings indicate an issuer that in Fitch Ratings’ opinion has entered into bankruptcy filings, administration,
receivership, liquidation or other formal winding up procedure, or which has otherwise ceased business.
Default
ratings are not assigned prospectively to entities or their obligations; within this context, nonpayment on an instrument that
contains a deferral feature or grace period will generally not be considered a default until after the expiration of the deferral
or grace period, unless a default is otherwise driven by bankruptcy or other similar circumstance, or by a distressed debt exchange.
Imminent
default typically refers to the occasion where a payment default has been intimated by the issuer, and is all but inevitable.
This may, for example, be where an issuer has missed a scheduled payment, but (as is typical) has a grace period during which
it may cure the payment default. Another alternative would be where an issuer has formally announced a distressed debt exchange,
but the date of the exchange still lies several days or weeks in the immediate future.
In
all cases, the assignment of a default rating reflects the agency’s opinion as to the most appropriate rating category consistent
with the rest of its universe of ratings, and may differ from the definition of default under the terms of an issuer’s financial
obligations or local commercial practice.
Note:
The modifiers “+” or “–” may be appended to a rating to denote relative status within major rating
categories. Such suffixes are not added to the AAA long-term rating category, or to categories below B.
Tax-exempt
income funds - Class R-6 / Prospectus 38
| |
|
|
|
| |
|
|
|
| |
For
shareholder services |
American
Funds Service Company
(800) 421-4225 |
|
| |
For
retirement plan services |
Call
your employer or plan administrator |
|
| |
For
24-hour information |
American
FundsLine
(800) 325-3590
capitalgroup.com
For Class R share information, visit
AmericanFundsRetirement.com |
|
| |
Telephone
calls you have with American Funds may be monitored or recorded for quality assurance, verification and recordkeeping purposes.
By speaking to American Funds on the telephone, you consent to such monitoring and recording. |
|
Annual/Semi-annual
report to shareholders The shareholder reports contain additional information about the fund, including financial statements,
investment results, portfolio holdings, a discussion of market conditions and the fund’s investment strategies, and the
independent registered public accounting firm’s reports (in the annual report).
Statement
of additional information (SAI) and codes of ethics The current SAI, as amended from time to time, contains more detailed
information about the fund, including the fund’s financial statements, and is incorporated by reference into this prospectus.
This means that the current SAI, for legal purposes, is part of this prospectus. The codes of ethics describe the personal investing
policies adopted by the fund, the fund’s investment adviser and its affiliated companies.
The codes
of ethics and current SAI are on file with the U.S. Securities and Exchange Commission (SEC). These and other related materials
about the fund are available for review on the EDGAR database on the SEC’s website at sec.gov or, after payment of
a duplicating fee, via email request to publicinfo@sec.gov. The codes of ethics, current SAI and shareholder reports are also
available, free of charge, on our website, capitalgroup.com.
E-delivery
and household mailings Each year you are automatically sent an updated summary prospectus and annual and semi-annual
reports for the fund. You may also occasionally receive proxy statements for the fund. In order to reduce the volume of mail you
receive, when possible, only one copy of these documents will be sent to shareholders who are part of the same family and share
the same household address. You may elect to receive these documents electronically in lieu of paper form by enrolling in e-delivery
on our website, capitalgroup.com.
If
you would like to opt out of household-based mailings or receive a complimentary copy of the current SAI, codes of ethics or annual/semi-annual
report to shareholders, please call American Funds Service Company at (800) 421-4225 or write to the secretary of the fund at
333 South Hope Street, Los Angeles, California 90071-1406.
| |
|
| |
| |
 |
Litho in USA CGD/DFS/8020
Investment Company File No. 811-05750
Investment
Company File No. 811-07888
Investment Company File No. 811-02421
Investment Company File No. 811-08576 |
American
Funds Short-Term Tax-Exempt Bond Fund®
Limited Term Tax-Exempt Bond Fund of America®
The Tax-Exempt Bond Fund of America®
American High-Income Municipal Bond Fund®
The American Funds Tax-Exempt Series IISM
(The Tax-Exempt Fund of California®)
American Funds Tax-Exempt Fund of New York®
Part B
Statement of Additional Information
October
1, 2019
This
document is not a prospectus but should be read in conjunction with the current prospectus of American Funds Short-Term Tax-Exempt
Bond Fund (“STEX”), Limited Term Tax-Exempt Bond Fund of America (“LTEX”), The Tax-Exempt Bond Fund of
America (“TEBF”), American High-Income Municipal Bond Fund (“AHIM”), The American Funds Tax-Exempt Series
II – The Tax-Exempt Fund of California (“TEFCA”), and American Funds Tax-Exempt Fund of New York (“TEFNY”),
dated October 1, 2019, and, where applicable, the Class R-6 prospectus for STEX, LTEX, TEBF and AHIM, dated October 1, 2019. Except
where the context indicates otherwise, all references herein to the “fund” apply to each of the funds listed below.
The prospectus may be obtained from your financial advisor, by calling American Funds Service Company® at (800)
421-4225 or by writing to the funds at the following addresses:
Attention: Secretary
| |
|
| American
Funds Short-Term Tax-Exempt Bond Fund |
|
| Limited
Term Tax-Exempt Bond Fund of America |
|
| The
Tax-Exempt Bond Fund of America |
|
| American
High-Income Municipal Bond Fund |
|
| The American Funds
Tax-Exempt Series II |
|
| (The Tax-Exempt Fund
of California) |
American Funds Tax-Exempt
Fund of New York |
| 333 South Hope Street |
6455 Irvine Center
Drive |
| Los Angeles, California
90071 |
Irvine, California
92618 |
| |
|
|
|
|
|
|
|
| |
Class A |
Class C |
Class T |
Class F-1 |
Class F-2 |
Class F-3 |
Class R-6 |
| American Funds Short-Term
Tax-Exempt Bond Fund |
ASTEX |
N/A |
TAFSX |
FSTTX |
ASTFX |
SFTEX |
N/A |
| Limited Term Tax-Exempt
Bond Fund of America |
LTEBX |
LTXCX |
TLTTX |
LTXFX |
LTEFX |
FLTEX |
N/A |
| The Tax-Exempt Bond
Fund of America |
AFTEX |
TEBCX |
TLLLX |
AFTFX |
TEAFX |
TFEBX |
N/A |
| American High-Income
Municipal Bond Fund |
AMHIX |
AHICX |
TAHHX |
ABHFX |
AHMFX |
HIMFX |
N/A |
| The Tax-Exempt Fund
of California |
TAFTX |
TECCX |
TTCAX |
TECFX |
TEFEX |
EXCAX |
N/A |
| American Funds Tax-Exempt
Fund of New York |
NYAAX |
NYACX |
TATEX |
NYAEX |
NYAFX |
TFNYX |
N/A |
Table
of Contents
| Item |
Page
no. |
| Certain
investment limitations and guidelines |
2 |
| Description
of certain securities, investment techniques and risks |
5 |
| Fund
policies |
20 |
| Management
of the fund |
22 |
| Execution
of portfolio transactions |
69 |
| Disclosure
of portfolio holdings |
72 |
| Price
of shares |
74 |
| Taxes
and distributions |
77 |
| Purchase
and exchange of shares |
80 |
| Sales
charges |
85 |
| Sales
charge reductions and waivers |
88 |
| Selling
shares |
92 |
| Shareholder
account services and privileges |
93 |
| General
information |
96 |
| Appendix |
107 |
Investment
portfolio
Financial statements
Tax-exempt
income funds — Page 1
Certain
investment limitations and guidelines
The following
limitations and guidelines are considered at the time of purchase, under normal circumstances, and are based on a percentage of
each fund’s net assets unless otherwise noted. This summary is not intended to reflect all of the funds’ investment
limitations.
American
Funds Short-Term Tax-Exempt Bond Fund
· The
fund will invest at least 80% of its assets in, or derive at least 80% of its income from, securities exempt from regular federal
income tax and that do not subject shareholders to federal alternative minimum tax.
· The
fund may invest up to 20% of its assets in securities that may subject fund shareholders to federal alternative minimum tax.
· The
fund will invest at least 80% of its assets in bonds (for purposes of this limit, bonds include any debt instrument and cash equivalents,
and may include certain preferred securities).
· The
fund may invest up to 20% of its assets in debt securities rated in the A rating category (by Nationally Recognized Statistical
Rating Organizations (“NRSROs”) designated by the fund’s investment adviser) or unrated but determined by the
fund’s investment adviser to be of equivalent quality. The fund currently intends to look to the ratings from Moody’s
Investors Service, Standard & Poor’s Ratings Services and Fitch Ratings. If rating agencies differ, securities will
be considered to have received the highest of these ratings, consistent with the fund's investment policies.
· The
fund will not purchase debt securities rated BBB+ or below and Baa1 or below (by NRSROs designated by the fund’s investment
adviser) or unrated but determined by the fund’s investment adviser to be of equivalent quality.
· The
fund’s dollar-weighted average effective maturity will be no greater than three years.
Limited
Term Tax-Exempt Bond Fund of America
· The
fund will invest at least 80% of its assets in, or derive at least 80% of its income from, securities exempt from regular federal
income tax and that do not subject fund shareholders to alternative minimum tax.
· The
fund may invest up to 20% of its assets in securities that may subject fund shareholders to federal alternative minimum tax.
· The
fund will invest at least 80% of its assets in bonds (for purposes of this limit, bonds include any debt instrument and cash equivalents,
and may include certain preferred securities).
· The
fund may invest up to 20% of its assets in debt securities in the rating category of BBB and the rating category of Baa (by NRSROs
designated by the fund’s investment adviser) or unrated but determined by the fund’s investment adviser to be of equivalent
quality. The fund currently intends to look to the ratings from Moody’s Investors Service, Standard & Poor’s Ratings
Services and Fitch Ratings. If rating agencies differ, securities will be considered to have received the highest of these ratings,
consistent with the fund's investment policies.
Tax-exempt
income funds — Page 2
· The
fund will not purchase debt securities rated BB+ or below and Ba1 or below (by NRSROs designated by the fund’s investment
adviser) or unrated but determined by the fund’s investment adviser to be of equivalent quality.
· The
dollar-weighted average effective maturity of the fund’s portfolio will be between three and 10 years.
The
Tax-Exempt Bond Fund of America
· The
fund will invest at least 80% of its assets in, or derive at least 80% of its income from, securities exempt from regular federal
income tax.
· The
fund will not invest in securities that subject fund shareholders to federal alternative minimum tax.
· The
fund will invest at least 80% of its assets in bonds (for purposes of this limit, bonds include any debt instrument and cash equivalents,
and may include certain preferred securities).
· The
fund will invest at least 65% of its assets in debt securities rated A- or better or A3 or better (by NRSROs designated by the
fund’s investment adviser) or unrated but determined by the fund’s investment adviser to be of equivalent quality,
including cash and money market instruments. The fund currently intends to look to the ratings from Moody’s Investors Service,
Standard & Poor’s Ratings Services and Fitch Ratings. If rating agencies differ, securities will be considered to have
received the highest of these ratings, consistent with the fund's investment policies.
· The
fund may invest up to 35% of its assets in debt securities rated BBB+ or below and Baa1 or below (by NRSROs designated by the
fund’s investment adviser) or unrated but determined by the fund’s investment adviser to be of equivalent quality.
· The
fund may invest up to 10% of its assets in debt securities rated BB+ or below and Ba1 or below (by NRSROs designated by the fund’s
investment adviser) or unrated but determined by the fund’s investment adviser to be of equivalent quality.
American
High-Income Municipal Bond Fund
· The
fund will invest at least 80% of its assets in, or derive at least 80% of its income from, securities exempt from regular federal
income tax (including securities subject to alternative minimum tax).
· The
fund may invest, without limitation, in securities that may subject fund shareholders to federal alternative minimum tax.
· The
fund will invest at least 80% of its assets in bonds (for purposes of this limit, bonds include any debt instrument and cash equivalents,
and may include certain preferred securities).
· The
fund will invest at least 65% of its assets in debt securities rated A+ or below or A1 or below (by NRSROs designated by the fund’s
investment adviser) or unrated but determined by the fund’s investment adviser to be of equivalent quality. The fund currently
intends to look to the ratings from Moody’s Investors Service, Standard & Poor’s Ratings Services and Fitch Ratings.
If rating agencies differ, securities will be considered to have received the lowest of these ratings, consistent with the fund’s
investment policies.
Tax-exempt
income funds — Page 3
· The
fund will invest at least 50% of its assets in debt securities rated BBB+ or below or Baa1 or below (by NRSROs designated by the
fund’s investment adviser) or unrated but determined by the fund’s investment adviser to be of equivalent quality.
The
Tax-Exempt Fund of California
· The
fund will invest at least 80% of its assets in, or derive at least 80% of its income from, securities that are exempt from both
regular federal and California income taxes and that do not subject fund shareholders to alternative minimum tax.
· The
fund may invest up to 20% of its assets in securities that may subject fund shareholders to federal alternative minimum tax.
· The
fund may invest up to 10% of its assets in debt securities rated BB+ or below and Ba1 or below (by NRSROs designated by the fund’s
investment adviser) or unrated but determined by the fund’s investment adviser to be of equivalent quality. The fund currently
intends to look to the ratings from Moody’s Investors Service, Standard & Poor’s Ratings Services and Fitch Ratings.
If rating agencies differ, securities will be considered to have received the highest of these ratings, consistent with the fund's
investment policies.
American
Funds Tax-Exempt Fund of New York
· The
fund will invest at least 80% of its assets in, or derive at least 80% of its income from, securities that are exempt from regular
federal, New York State and New York City income taxes and that do not subject fund shareholders to alternative minimum tax.
· The
fund may invest up to 20% of its assets in securities that may subject fund shareholders to alternative minimum tax.
· The
fund may invest up to 10% of its assets in debt securities rated BB+ or below and Ba1 or below (by NRSROs designated by the fund’s
investment adviser) or unrated but determined by the fund’s investment adviser to be of equivalent quality. The fund currently
intends to look to the ratings from Moody’s Investors Service, Standard & Poor’s Ratings Services and Fitch Ratings.
If rating agencies differ, securities will be considered to have received the highest of these ratings, consistent with the fund's
investment policies.
*
* * * * *
The
fund may experience difficulty liquidating certain portfolio securities during significant market declines or periods of heavy
redemptions.
Tax-exempt
income funds — Page 4
Description
of certain securities, investment techniques and risks
The descriptions
below are intended to supplement the material in the prospectus under “Investment objectives, strategies and risks.”
Debt
instruments — Debt securities, also known as “fixed income securities,” are used by issuers to borrow money.
Bonds, notes, debentures, asset-backed securities (including those backed by mortgages), and loan participations and assignments
are common types of debt securities. Generally, issuers pay investors periodic interest and repay the amount borrowed either periodically
during the life of the security and/or at maturity. Some debt securities, such as zero coupon bonds, do not pay current interest,
but are purchased at a discount from their face values and their values accrete over time to face value at maturity. Some debt
securities bear interest at rates that are not fixed, but that vary with changes in specified market rates or indices. The market
prices of debt securities fluctuate depending on such factors as interest rates, credit quality and maturity. In general, market
prices of debt securities decline when interest rates rise and increase when interest rates fall. These fluctuations will generally
be greater for longer-term debt securities than for shorter-term debt securities. Prices of these securities can also be affected
by financial contracts held by the issuer or third parties (such as derivatives) relating to the security or other assets or indices.
Lower
rated debt securities, rated Ba1/BB+ or below by Nationally Recognized Statistical Rating Organizations, are described by the
rating agencies as speculative and involve greater risk of default or price changes due to changes in the issuer’s creditworthiness
than higher rated debt securities, or they may already be in default. Such securities are sometimes referred to as “junk
bonds” or high yield bonds. The market prices of these securities may fluctuate more than higher quality securities and
may decline significantly in periods of general economic difficulty. It may be more difficult to dispose of, and to determine
the value of, lower rated debt securities. Investment grade bonds in the ratings categories A or Baa/BBB also may be more susceptible
to changes in market or economic conditions than bonds rated in the highest rating categories.
Certain
additional risk factors relating to debt securities are discussed below:
Sensitivity
to interest rate and economic changes — Debt securities may be sensitive to economic changes, political and corporate
developments, and interest rate changes. In addition, during an economic downturn or a period of rising interest rates, issuers
that are highly leveraged may experience increased financial stress that could adversely affect their ability to meet projected
business goals, to obtain additional financing and to service their principal and interest payment obligations. Periods of economic
change and uncertainty also can be expected to result in increased volatility of market prices and yields of certain debt securities
and derivative instruments. For example, during the financial crisis of 2007-2009, the Federal Reserve implemented a number of
economic policies that impacted, and may continue to impact, interest rates and the market. These policies, as well as potential
actions by governmental entities both in and outside of the U.S., may expose fixed income markets to heightened volatility and
may reduce liquidity for certain investments, which could cause the value of the fund’s portfolio to decline.
Payment
expectations — Debt securities may contain redemption or call provisions. If an issuer exercises these provisions in
a lower interest rate market, the fund may have to replace the security with a lower yielding security, resulting in decreased
income to investors. If the issuer of a debt security defaults on its obligations to pay interest or principal or is the subject
of bankruptcy proceedings, the fund may incur losses or expenses in seeking recovery of amounts owed to it.
Tax-exempt
income funds — Page 5
Liquidity
and valuation — There may be little trading in the secondary market for particular debt securities, which may affect
adversely the fund’s ability to value accurately or dispose of such debt securities. Adverse publicity and investor perceptions,
whether or not based on fundamental analysis, may decrease the value and/or liquidity of debt securities.
The
investment adviser attempts to reduce the risks described above through diversification of the fund’s portfolio and by credit
analysis of each issuer, as well as by monitoring broad economic trends and corporate and legislative developments, but there
can be no assurance that it will be successful in doing so.
Credit
ratings for debt securities provided by rating agencies reflect an evaluation of the safety of principal and interest payments,
not market value risk. The rating of an issuer is a rating agency’s view of past and future potential developments related
to the issuer and may not necessarily reflect actual outcomes. There can be a lag between the time of developments relating to
an issuer and the time a rating is assigned and updated. The investment adviser considers these ratings of securities as one of
many criteria in making its investment decisions.
Bond
rating agencies may assign modifiers (such as +/–) to ratings categories to signify the relative position of a credit within
the rating category. Investment policies that are based on ratings categories should be read to include any security within that
category, without giving consideration to the modifier except where otherwise provided. See the Appendix to this statement of
additional information for more information about credit ratings.
Municipal
bonds — Municipal bonds are debt obligations generally issued to obtain funds for various public purposes, including
the construction of public facilities. Opinions relating to the validity of municipal bonds, exclusion of municipal bond interest
from an investor’s gross income for federal income tax purposes and, where applicable, state and local income tax, are rendered
by bond counsel to the issuing authorities at the time of issuance.
The
two principal classifications of municipal bonds are general obligation bonds and limited obligation or revenue bonds. General
obligation bonds are secured by the issuer’s pledge of its full faith and credit including, if available, its taxing power
for the payment of principal and interest. Issuers of general obligation bonds include states, counties, cities, towns and various
regional or special districts. The proceeds of these obligations are used to fund a wide range of public facilities, such as the
construction or improvement of schools, highways and roads, water and sewer systems and facilities for a variety of other public
purposes. Lease revenue bonds or certificates of participation in leases are payable from annual lease rental payments from a
state or locality. Annual rental payments are payable to the extent such rental payments are appropriated annually.
Typically,
the only security for a limited obligation or revenue bond is the net revenue derived from a particular facility or class of facilities
financed thereby or, in some cases, from the proceeds of a special tax or other special revenues. Revenue bonds have been issued
to fund a wide variety of revenue-producing public capital projects including: electric, gas, water and sewer systems; highways,
bridges and tunnels; port and airport facilities; colleges and universities; hospitals; and convention, recreational, tribal gaming
and housing facilities. Although the security behind these bonds varies widely, many provide additional security in the form of
a debt service reserve fund which may also be used to make principal and interest payments on the issuer's obligations. In addition,
some revenue obligations (as well as general obligations) are insured by a bond insurance company or backed by a letter of credit
issued by a banking institution.
Revenue
bonds also include, for example, pollution control, health care and housing bonds, which, although nominally issued by municipal
authorities, are generally not secured by the taxing power of the municipality but by the revenues of the authority derived from
payments by the private entity which
Tax-exempt
income funds — Page 6
owns
or operates the facility financed with the proceeds of the bonds. Obligations of housing finance authorities have a wide range
of security features, including reserve funds and insured or subsidized mortgages, as well as the net revenues from housing or
other public projects. Many of these bonds do not generally constitute the pledge of the credit of the issuer of such bonds. The
credit quality of such revenue bonds is usually directly related to the credit standing of the user of the facility being financed
or of an institution which provides a guarantee, letter of credit or other credit enhancement for the bond issue.
Municipal
inflation-indexed bonds — The fund may invest in inflation-indexed bonds issued by municipalities. Interest payments
are made to bondholders semi-annually and are made up of two components: a fixed “real coupon” or spread, and a variable
coupon linked to an inflation index. Accordingly, payments will increase or decrease each period as a result of changes in the
inflation index. In a period of deflation payments may decrease to zero, but in any event will not be less than zero.
Insured
municipal bonds — The fund may invest in municipal bonds that are insured generally as to the timely payment of interest
and principal. The insurance for such bonds may be purchased by the bond issuer, the fund or any other party, and is usually purchased
from private, non-governmental insurance companies. Insurance that covers a municipal bond is expected to protect the fund against
losses caused by a bond issuer’s failure to make interest or principal payments. However, insurance does not guarantee the
market value of the bond or the prices of the fund’s shares. Also, the investment adviser cannot be certain that the insurance
company will make payments it guarantees. When rating agencies lower or withdraw the credit rating of the insurer, the insurance
may be providing little or no enhancement of credit or resale value to the municipal bond.
U.S.
Territories and Commonwealth obligations — The fund may invest in obligations of the territories and Commonwealths of
the United States, such as Puerto Rico, the U.S. Virgin Islands, Guam and their agencies and authorities (“territories and
Commonwealth”), to the extent such obligations are exempt from federal income taxes. Adverse political and economic conditions
and developments affecting any territory or Commonwealth may, in turn, negatively affect the value of the fund’s holdings
in such obligations. Territories and Commonwealths face significant fiscal challenges, including persistent government deficits,
underfunded retirement systems, sizable debt service obligations and a high unemployment rate. A restructuring of some or all
of the debt or a decline in market prices of the territories’ and Commonwealths’ debt obligations, may affect the
fund’s investment in these securities. If the economic situation in the territories and Commonwealths persists or worsens,
the volatility, credit quality and performance of the fund could be adversely affected.
Zero
coupon bonds — Municipalities may issue zero coupon securities which are debt obligations that do not entitle the holder
to any periodic payments of interest prior to maturity or a specified date when the securities begin paying current interest.
They are issued and traded at a discount from their face amount or par value, which discount varies depending on the time remaining
until cash payments begin, prevailing interest rates, liquidity of the security, and the perceived credit quality of the issuer.
Pre-refunded
bonds — From time to time, a municipality may refund a bond that it has already issued prior to the original bond’s
call date by issuing a second bond, the proceeds of which are used to purchase U.S. government securities. The securities are
placed in an escrow account pursuant to an agreement between the municipality and an independent escrow agent. The principal and
interest payments on the securities are then used to pay off the original bondholders. The escrow account securities pledged to
pay the principal and interest of the pre-refunded bond do not guarantee the price movement of the bond before maturity. Investment
in pre-refunded bonds held by the fund may subject the fund to interest rate risk, market risk and credit risk.
Tax-exempt
income funds — Page 7
Cash
and cash equivalents — The fund may hold cash and invest in cash equivalents. Cash equivalents include, but are not
limited to: (a) shares of money market or similar funds managed by the investment
adviser or its affiliates; (b) shares of other money market funds; (c)
tax-exempt commercial paper (e.g., short-term notes obligations issued by municipalities that mature, or that may be
redeemed in 270 days or less); (d) municipal notes (e.g., bond anticipation notes,
revenue anticipation notes, and tax anticipation notes issued by municipalities that mature, or that may be redeemed in one year
or less); (e) municipal obligations backed by letters of credit issued by banks
or other financial institutions or government agencies that mature, or that may be redeemed in one year or less; (f) tax-exempt
variable rate debt issued by municipal conduits for corporate obligors; and (g) securities
of the U.S. government, its agencies or instrumentalities that mature, or that may be redeemed in one year or less.
Commercial
paper — The fund may purchase tax-exempt and/or taxable commercial paper. Commercial paper refers to short-term promissory
notes issued by a municipality or corporation to finance its current operations. Such securities normally have maturities of thirteen
months or less and, though commercial paper is often unsecured, commercial paper may be supported by letters of credit, surety
bonds or other forms of collateral. Maturing commercial paper issuances are usually repaid by the issuer from the proceeds of
new commercial paper issuances. As a result, investment in commercial paper is subject to rollover risk, or the risk that the
issuer cannot issue enough new commercial paper to satisfy its outstanding commercial paper. Like all fixed income securities,
commercial paper prices are susceptible to fluctuations in interest rates. If interest rates rise, commercial paper prices will
decline and vice versa. However, the short-term nature of a commercial paper investment makes it less susceptible to volatility
than many other fixed income securities because interest rate risk typically increases as maturity lengths increase. Commercial
paper tends to yield smaller returns than longer-term corporate debt because securities with shorter maturities typically have
lower effective yields than those with longer maturities. As with all fixed income securities, there is a chance that the issuer
will default on its commercial paper obligations and commercial paper may become illiquid or suffer from reduced liquidity in
these or other situations.
Commercial
paper in which the fund may invest includes commercial paper issued in reliance on the exemption from registration afforded by
Section 4(a)(2) of the 1933 Act. Section 4(a)(2) commercial paper has substantially the same price and liquidity characteristics
as commercial paper generally, except that the resale of Section 4(a)(2) commercial paper is limited to institutional investors
who agree that they are purchasing the paper for investment purposes and not with a view to public distribution. Technically,
such a restriction on resale renders Section 4(a)(2) commercial paper a restricted security under the 1933 Act. In practice, however,
Section 4(a)(2) commercial paper typically can be resold as easily as any other unrestricted security held by the fund. Accordingly,
Section 4(a)(2) commercial paper has been generally determined to be liquid under procedures adopted by the fund’s board
of trustees.
Temporary
investments — The fund may invest in short-term municipal obligations of up to one year in maturity when temporary defensive
strategies are used as a result of abnormal market conditions, or when such investments are considered advisable for liquidity.
Generally, the income from such short-term municipal obligations is exempt from federal income tax. Further, a portion of the
fund’s assets may be held in cash or invested in high-quality taxable short-term securities of up to one year in maturity.
Such investments may include: (a) obligations of the U.S. Treasury; (b)
obligations of agencies and instrumentalities of the U.S. government; (c) money
market instruments, such as certificates of deposit issued by domestic banks, corporate commercial paper, and bankers' acceptances;
and (d) repurchase agreements.
Tax-exempt
income funds — Page 8
Forward
commitment, when issued and delayed delivery transactions — The fund may enter into commitments to purchase or sell
securities at a future date. When the fund agrees to purchase such securities, it assumes the risk of any decline in value of
the security from the date of the agreement. If the other party to such a transaction fails to deliver or pay for the securities,
the fund could miss a favorable price or yield opportunity, or could experience a loss.
The
fund will not use these transactions for the purpose of leveraging and will segregate liquid assets that will be marked to market
daily in an amount sufficient to meet its payment obligations in these transactions. Although these transactions will not be entered
into for leveraging purposes, to the extent the fund’s aggregate commitments in connection with these transactions exceed
its segregated assets, the fund temporarily could be in a leveraged position (because it may have an amount greater than its net
assets subject to market risk). Should market values of the fund’s portfolio securities decline while the fund is in a leveraged
position, greater depreciation of its net assets would likely occur than if it were not in such a position. The fund will not
borrow money to settle these transactions and, therefore, will liquidate other portfolio securities in advance of settlement if
necessary to generate additional cash to meet its obligations. After a transaction is entered into, the fund may still dispose
of or renegotiate the transaction. Additionally, prior to receiving delivery of securities as part of a transaction, the fund
may sell such securities.
Derivatives
— In pursuing its investment objective, the fund may invest in derivative instruments. A derivative is a financial instrument,
the value of which depends on, or is otherwise derived from, another underlying variable. Most often, the variable underlying
a derivative is the price of a traded asset, such as a traditional cash security (e.g., a stock or bond), a currency or a commodity;
however, the value of a derivative can be dependent on almost any variable, from the level of an index or a specified rate to
the occurrence (or non-occurrence) of a credit event with respect to a specified reference asset. The fund may take positions
in futures contracts, interest rate swaps and credit default swap indices, each of which is a derivative instrument described
in greater detail below.
Derivative
instruments may be distinguished by the manner in which they trade: some are standardized instruments that trade on an organized
exchange while others are individually negotiated and traded in the over-the-counter (OTC) market. Derivatives also range broadly
in complexity, from simple derivatives to more complex instruments. As a general matter, however, all derivatives — regardless
of the manner in which they trade or their relative complexities — entail certain risks, some of which are different from,
and potentially greater than, the risks associated with investing directly in traditional cash securities.
As
is the case with traditional cash securities, derivative instruments are generally subject to counterparty credit risk; however,
in some cases, derivatives may pose counterparty risks greater than those posed by cash securities. The use of derivatives involves
the risk that a loss may be sustained by the fund as a result of the failure of the fund’s counterparty to make required
payments or otherwise to comply with its contractual obligations. For some derivatives, though, the value of — and, in effect,
the return on — the instrument may be dependent on both the individual credit of the fund’s counterparty and on the
credit of one or more issuers of any underlying assets. If the fund does not correctly evaluate the creditworthiness of its counterparty
and, where applicable, of issuers of any underlying reference assets, the fund’s investment in a derivative instrument may
result in losses. Further, if a fund’s counterparty were to default on its obligations, the fund’s contractual remedies
against such counterparty may be subject to applicable bankruptcy and insolvency laws, which could affect the fund’s rights
as a creditor and delay or impede the fund’s ability to receive the net amount of payments that it is contractually entitled
to receive.
The
value of some derivative instruments in which the fund invests may be particularly sensitive to changes in prevailing interest
rates, currency exchange rates or other market conditions. Like the fund’s other investments, the ability of the fund to
successfully utilize such derivative instruments may depend in part upon the ability of the fund’s investment adviser to
accurately forecast interest rates
Tax-exempt
income funds — Page 9
and
other economic factors. The success of the fund’s derivative investment strategy will also depend on the investment adviser’s
ability to assess and predict the impact of market or economic developments on the derivative instruments in which the fund invests,
in some cases without having had the benefit of observing the performance of a derivative under all possible market conditions.
If the investment adviser incorrectly forecasts such factors and has taken positions in derivative instruments contrary to prevailing
market trends, or if the investment adviser incorrectly predicts the impact of developments on a derivative instrument, the fund
could be exposed to the risk of loss.
Certain
derivatives may also be subject to liquidity and valuation risks. The potential lack of a liquid secondary market for a derivative
(and, particularly, for an OTC derivative) may cause difficulty in valuing or selling the instrument. If a derivative transaction
is particularly large or if the relevant market is illiquid, as is often the case with many privately-negotiated OTC derivatives,
the fund may not be able to initiate a transaction or to liquidate a position at an advantageous time or price. Particularly when
there is no liquid secondary market for the fund’s derivative positions, the fund may encounter difficulty in valuing such
illiquid positions. The value of a derivative instrument does not always correlate perfectly with its underlying asset, rate or
index, and many derivatives, and OTC derivatives in particular, are complex and often valued subjectively. Improper valuations
can result in increased cash payment requirements to counterparties or a loss of value to the fund.
Because
certain derivative instruments may obligate the fund to make one or more potential future payments, which could significantly
exceed the value of the fund’s initial investments in such instruments, derivative instruments may also have a leveraging
effect on the fund’s portfolio. Certain derivatives have the potential for unlimited loss, irrespective of the size of the
fund’s investment in the instrument. When a fund leverages its portfolio, investments in that fund will tend to be more
volatile, resulting in larger gains or losses in response to market changes. In accordance with applicable regulatory requirements,
the fund will generally segregate or earmark liquid assets, or enter into offsetting financial positions, to cover its obligations
under derivative instruments, effectively limiting the risk of leveraging the fund’s portfolio. Because the fund is legally
required to maintain asset coverage or offsetting positions in connection with leveraging derivative instruments, the fund’s
investments in such derivatives may also require the fund to buy or sell portfolio securities at disadvantageous times or prices
in order to comply with applicable requirements.
Futures
— The fund may enter into futures contracts to seek to manage the fund’s interest rate sensitivity by increasing
or decreasing the duration of the fund or a portion of the fund’s portfolio. A futures contract is an agreement to buy or
sell a security or other financial instrument (the “reference asset”) for a set price on a future date. Futures contracts
are standardized, exchange-traded contracts, and, when a futures contract is bought or sold, the fund will incur brokerage fees
and will be required to maintain margin deposits.
Unlike
when the fund purchases or sells a security, such as a stock or bond, no price is paid or received by the fund upon the purchase
or sale of a futures contract. When the fund enters into a futures contract, the fund is required to deposit with its futures
broker, known as a futures commission merchant (FCM), a specified amount of liquid assets in a segregated account in the name
of the FCM at the applicable derivatives clearinghouse or exchange. This amount, known as initial margin, is set by the futures
exchange on which the contract is traded and may be significantly modified during the term of the contract. The initial margin
is in the nature of a performance bond or good faith deposit on the futures contract, which is returned to the fund upon termination
of the contract, assuming all contractual obligations have been satisfied. Additionally, on a daily basis, the fund pays or receives
cash, or variation margin, equal to the daily change in value of the futures contract. Variation margin does not represent a borrowing
or loan by the fund but is instead a settlement between the fund and the FCM of the amount one party would owe the other if the
futures contract expired. In computing daily net asset value, the fund will mark-to-market its open futures positions. In the
event of the bankruptcy or insolvency of an FCM that holds margin on behalf of the fund, the fund may be
Tax-exempt
income funds — Page 10
entitled
to return of margin owed to it only in proportion to the amount received by the FCM’s other customers, potentially resulting
in losses to the fund. An event of bankruptcy or insolvency at a clearinghouse or exchange holding initial margin could also result
in losses for the fund.
When
the fund invests in futures contracts and deposits margin with an FCM, the fund becomes subject to so-called “fellow customer”
risk – that is, the risk that one or more customers of the FCM will default on their obligations and that the resulting
losses will be so great that the FCM will default on its obligations and margin posted by one customer, such as the fund, will
be used to cover a loss caused by a different defaulting customer. Applicable rules generally prohibit the use of one customer’s
funds to meet the obligations of another customer and limit the ability of an FCM to use margin posed by non-defaulting customers
to satisfy losses caused by defaulting customers. As a general matter, an FCM is required to use its own funds to meet a defaulting
customer’s obligations. While a customer’s loss would likely need to be substantial before non-defaulting customers
would be exposed to loss on account of fellow customer risk, applicable rules nevertheless permit the commingling of margin and
do not limit the mutualization of customer losses from investment losses, custodial failures, fraud or other causes. If the loss
is so great that, notwithstanding the application of an FCM’s own funds, there is a shortfall in the amount of customer
funds required to be held in segregation, the FCM could default and be placed into bankruptcy. Under these circumstances, bankruptcy
law provides that non-defaulting customers will share pro rata in any shortfall. A shortfall in customer segregated funds may
also make the transfer of the accounts of non-defaulting customers to another FCM more difficult.
Although
certain futures contracts, by their terms, require actual future delivery of and payment for the reference asset, in practice,
most futures contracts are usually closed out before the delivery date by offsetting purchases or sales of matching futures contracts.
Closing out an open futures contract purchase or sale is effected by entering into an offsetting futures contract sale or purchase,
respectively, for the same aggregate amount of the identical reference asset and the same delivery date with the same FCM. If
the offsetting purchase price is less than the original sale price (in each case taking into account transaction costs, including
brokerage fees), the fund realizes a gain; if it is more, the fund realizes a loss. Conversely, if the offsetting sale price is
more than the original purchase price (in each case taking into account transaction costs, including brokerage fees), the fund
realizes a gain; if it is less, the fund realizes a loss.
The
fund is generally required to segregate liquid assets equivalent to the fund’s outstanding obligations under each futures
contract. With respect to long positions in futures contracts that are not legally required to cash settle, the fund will segregate
or earmark liquid assets in an amount equal to the contract price the fund will be required to pay on settlement less the amount
of margin deposited with an FCM. For short positions in futures contracts that are not legally required to cash settle, the fund
will segregate or earmark liquid assets in an amount that, when added to the amounts deposited with an FCM as margin, equals the
market value of the reference asset underlying the futures contract. With respect to futures contracts that are required to cash
settle, however, the fund is permitted to segregate or earmark liquid assets in an amount that, when added to the amounts deposited
with an FCM as margin, equals the fund’s daily marked-to-market (net) obligation under the contract (i.e., the daily market
value of the contract itself), if any; in other words, the fund may set aside its daily net liability, if any, rather than the
notional value of the futures contract. By segregating or earmarking assets equal only to its net obligation under cash-settled
futures, the fund may be able to utilize these contracts to a greater extent than if the fund were required to segregate or earmark
assets equal to the full contract price or current market value of the futures contract. Such segregation of assets is intended
to ensure that the fund has assets available to satisfy its obligations with respect to futures contracts and to limit any potential
leveraging of the fund’s
Tax-exempt
income funds — Page 11
portfolio.
However, segregation of liquid assets will not limit the fund’s exposure to loss. To maintain a sufficient amount of segregated
assets, the fund may also have to sell less liquid portfolio securities at disadvantageous prices, and the earmarking of liquid
assets will have the effect of limiting the fund’s ability to otherwise invest those assets in other securities or instruments.
The
value of a futures contract tends to increase and decrease in tandem with the value of its underlying reference asset. Purchasing
futures contracts will, therefore, tend to increase the fund’s exposure to positive and negative price fluctuations in the
reference asset, much as if the fund had purchased the reference asset directly. When the fund sells a futures contract, by contrast,
the value of its futures position will tend to move in a direction contrary to the market for the reference asset. Accordingly,
selling futures contracts will tend to offset both positive and negative market price changes, much as if the reference asset
had been sold.
There
is no assurance that a liquid market will exist for any particular futures contract at any particular time. Futures exchanges
may establish daily price fluctuation limits for futures contracts and may halt trading if a contract’s price moves upward
or downward more than the limit in a given day. On volatile trading days, when the price fluctuation limit is reached and a trading
halt is imposed, it may be impossible to enter into new positions or close out existing positions. If the market for a futures
contract is not liquid because of price fluctuation limits or other market conditions, the fund may be prevented from promptly
liquidating unfavorable futures positions and the fund could be required to continue to hold a position until delivery or expiration
regardless of changes in its value, potentially subjecting the fund to substantial losses. Additionally, the fund may not be able
to take other actions or enter into other transactions to limit or reduce its exposure to the position. Under such circumstances,
the fund would remain obligated to meet margin requirements until the position is cleared. As a result, the fund’s access
to other assets held to cover its futures positions could also be impaired.
Although
futures exchanges generally operate similarly in the United States and abroad, foreign futures exchanges may follow trading, settlement
and margin procedures that are different than those followed by futures exchanges in the United States. Futures contracts traded
outside the United States may not involve a clearing mechanism or related guarantees and may involve greater risk of loss than
U.S.-traded contracts, including potentially greater risk of losses due to insolvency of a futures broker, exchange member, or
other party that may owe initial or variation margin to the fund. Margin requirements on foreign futures exchanges may be different
than those of futures exchanges in the United States, and, because initial and variation margin payments may be measured in foreign
currency, a futures contract traded outside the United States may also involve the risk of foreign currency fluctuations.
Interest
rate swaps — The fund may enter into interest rate swaps to seek to manage the interest rate sensitivity of the fund
by increasing or decreasing the duration of the fund or a portion of the fund’s portfolio. An interest rate swap is an agreement
between two parties to exchange or swap payments based on changes in an interest rate or rates. Typically, one interest rate is
fixed and the other is based on a designated short-term interest rate such as the London Interbank Offered Rate (LIBOR), prime
rate or other benchmark. Interest rate swaps generally do not involve the delivery of securities or other principal amounts. Rather,
cash payments are exchanged by the parties based on the application of the designated interest rates to a notional amount, which
is the predetermined dollar principal of the trade upon which payment obligations are computed. Accordingly, the fund’s
current obligation or right under the swap agreement is generally equal to the net amount to be paid or received under the swap
agreement based on the relative value of the position held by each party. The fund will generally segregate assets with a daily
value at least equal to the excess, if any, of the fund’s accrued obligations under the swap agreement over the accrued
amount the fund is
Tax-exempt
income funds — Page 12
entitled
to receive under the agreement, less the value of any posted margin or collateral on deposit with respect to the position.
The
use of interest rate swaps involves certain risks, including losses if interest rate changes are not correctly anticipated by
the fund’s investment adviser. To the extent the fund enters into bilaterally negotiated swap transactions, the fund will
enter into swap agreements only with counterparties that meet certain credit standards; however, if the counterparty’s creditworthiness
deteriorates rapidly and the counterparty defaults on its obligations under the swap agreement or declares bankruptcy, the fund
may lose any amount it expected to receive from the counterparty. Certain interest rate swap transactions are currently subject
to mandatory central clearing or may be eligible for voluntary central clearing. Because clearing interposes a central clearinghouse
as the ultimate counterparty to each participant’s swap, central clearing is intended to decrease (but not eliminate) counterparty
risk relative to uncleared bilateral swaps. Additionally, the term of an interest rate swap can be days, months or years and,
as a result, certain swaps may be less liquid than others.
Credit
default swap indices — In order to assume exposure to a diversified portfolio of credits or to hedge against existing
credit risks, the fund may invest in credit default swap indices (“CDXs”). A CDX is based on a portfolio of credit
default swaps with similar characteristics, such as credit default swaps on high-yield bonds. In a typical CDX transaction, one
party — the protection buyer — is obligated to pay the other party — the protection seller — a stream
of periodic payments over the term of the contract. If a credit event, such as a default or restructuring, occurs with respect
to any of the underlying reference obligations, the protection seller must pay the protection buyer the loss on those credits.
The
fund may enter into a CDX transaction as either protection buyer or protection seller. If the fund is a protection buyer, it would
pay the counterparty a periodic stream of payments over the term of the contract and would not recover any of those payments if
no credit events were to occur with respect to any of the underlying reference obligations. However, if a credit event did occur,
the fund, as a protection buyer, would have the right to deliver the referenced debt obligations or a specified amount of cash,
depending on the terms of the applicable agreement, and to receive the par value of such debt obligations from the counterparty
protection seller. As a protection seller, the fund would receive fixed payments throughout the term of the contract if no credit
events were to occur with respect to any of the underlying reference obligations. If a credit event were to occur, however, the
value of any deliverable obligation received by the fund, coupled with the periodic payments previously received by the fund,
may be less than the full notional value that the fund, as a protection seller, pays to the counterparty protection buyer, effectively
resulting in a loss of value to the fund. Furthermore, as a protection seller, the fund would effectively add leverage to its
portfolio because it would have investment exposure to the notional amount of the swap transaction.
The
use of CDX, like all other swap agreements, is subject to certain risks, including the risk that the fund’s counterparty
will default on its obligations. If such a default were to occur, any contractual remedies that the fund might have may be subject
to applicable bankruptcy laws, which could delay or limit the fund’s recovery. Thus, if the fund’s counterparty to
a CDX transaction defaults on its obligation to make payments thereunder, the fund may lose such payments altogether or collect
only a portion thereof, which collection could involve substantial costs or delays. Certain CDX transactions are subject to mandatory
central clearing or may be eligible for voluntary central clearing. Because clearing interposes a central clearinghouse as the
ultimate counterparty to each participant’s swap, central clearing is intended to decrease (but not eliminate) counterparty
risk relative to uncleared bilateral swaps.
Additionally,
when the fund invests in a CDX as a protection seller, the fund will be indirectly exposed to the creditworthiness of issuers
of the underlying reference obligations in the index.
Tax-exempt
income funds — Page 13
If
the investment adviser to the fund does not correctly evaluate the creditworthiness of issuers of the underlying instruments on
which the CDX is based, the investment could result in losses to the fund.
Pursuant
to regulations and published positions of the U.S. Securities and Exchange Commission, the fund’s obligations under a CDX
agreement will be accrued daily and, where applicable, offset against any amounts owing to the fund. In connection with CDX transactions
in which the fund acts as protection buyer, the fund will segregate liquid assets with a value at least equal to the fund’s
exposure (i.e., any accrued but unpaid net amounts owed by the fund to any counterparty), on a marked-to-market basis, less the
value of any posted margin. When the fund acts as protection seller, the fund will segregate liquid assets with a value at least
equal to the full notional amount of the swap, less the value of any posted margin. Such segregation is intended to ensure that
the fund has assets available to satisfy its obligations with respect to CDX transactions and to limit any potential leveraging
of the fund’s portfolio. However, segregation of liquid assets will not limit the fund’s exposure to loss. To maintain
this required margin, the fund may also have to sell portfolio securities at disadvantageous prices, and the earmarking of liquid
assets will have the effect of limiting the fund’s ability to otherwise invest those assets in other securities or instruments.
Variable
and floating rate obligations — The interest rates payable on certain securities in which the fund may invest may not
be fixed but may fluctuate based upon changes in market rates or credit ratings. Variable and floating rate obligations bear coupon
rates that are adjusted at designated intervals, based on the then current market rates of interest or credit ratings. The rate
adjustment features tend to limit the extent to which the market value of the obligations will fluctuate. When the fund holds
variable or floating rate securities, a decrease in market interest rates will adversely affect the income received from such
securities and the net asset value of the fund’s shares.
Issue
classification — Securities with the same general quality rating and maturity characteristics, but which vary according
to the purpose for which they were issued, often tend to trade at different yields. Correspondingly, securities issued for similar
purposes and with the same general maturity characteristics, but which vary according to the creditworthiness of their respective
issuers, tend to trade at different yields. These yield differentials tend to fluctuate in response to political and economic
developments, as well as temporary imbalances in normal supply/demand relationships. The investment adviser monitors these fluctuations
closely, and will attempt to adjust portfolio concentrations in various issue classifications according to the value disparities
brought about by these yield relationship fluctuations.
The
investment adviser believes that, in general, the market for municipal bonds is less liquid than that for taxable fixed income
securities. Accordingly, the ability of the fund to make purchases and sales of securities in the foregoing manner may, at any
particular time and with respect to any particular securities, be limited or non-existent.
Private
placements — Generally, municipal securities acquired in private placements are subject to contractual restrictions
on resale. Accordingly, all private placements will be considered illiquid unless they have been specifically determined to be
liquid, taking into account factors such as the frequency and volume of trading and the commitment of dealers to make markets
under procedures adopted by each fund’s board of trustees.
Restricted
or illiquid securities — The fund may purchase securities subject to restrictions on resale. Difficulty in selling such
securities may result in a loss or be costly to the fund. Some fund holdings (including some restricted securities) may be deemed
illiquid if the fund expects that a reasonable portion of the holding cannot be sold in seven calendar days or less without the
sale significantly changing the market value of the investment. The determination of whether a holding is considered
Tax-exempt
income funds — Page 14
illiquid
is made by the fund’s adviser under a liquidity risk management program adopted by the fund’s board and administered
by the fund’s adviser. The fund may incur significant additional costs in disposing of illiquid securities.
Investing
in similar municipal bonds — The fund may invest more than 25% of its assets in municipal obligations of issuers located
in the same state or in municipal obligations of the same type that may pay interest on their obligations with revenue from similar
projects. This may make a fund more susceptible to economic, political, or regulatory occurrences that affect such issuers, obligation
types and projects, such as changes in healthcare regulations, environmental considerations, construction cost increases and labor
problems, failure of healthcare facilities to maintain adequate occupancy levels, and inflation. As the similarity in issuers
of municipal obligations held by a fund increases, the fund has greater risk of volatility, and greater risk of loss, from these
investments.
Tax-exempt
securities — While the fund seeks to purchase securities which bear interest that is exempt from federal income taxes
– and in the case of TEFCA and TEFNY, also seeks to purchase securities which bear interest that is exempt from (1) California
income taxes and (2) New York City and New York state taxes, respectively – there are risks that such interest may be reclassified
as taxable by the Internal Revenue Service, or a state tax authority. Actions by the issuer or future legislative, administrative
or court actions also could adversely affect the tax-exempt status of interest paid by such securities. Such reclassifications
or actions could cause interest from a security to become includable in the gross income of the holder of the security, possibly
retroactively, subjecting fund shareholders to increased tax liability. In addition, such reclassifications or actions could cause
the value of a security, and therefore the value of the fund’s shares, to decline.
Securities
subject to alternative minimum tax — The fund (other than TEBF) may invest in tax-exempt securities believed to pay
interest constituting an item of tax preference subject to alternative minimum tax. Therefore, while the fund’s distributions
from tax-exempt securities are not subject to regular federal income tax, a portion or all may be included in determining a shareholder's
federal alternative minimum tax.
Maturity
— In calculating the effective maturity or average life of a particular debt security, a put, call, sinking fund or
other feature will be considered to the extent it results in a security whose market characteristics indicate an effective maturity
or average life that is shorter than its nominal or stated maturity. The investment adviser will consider the impact on effective
maturity of potential changes in the financial condition of issuers and in market interest rates in making investment selections
for the fund.
Adjustment
of maturities — The investment adviser seeks to anticipate movements in interest rates and may adjust the maturity distribution
of the fund’s portfolio accordingly, keeping in mind the fund’s objectives.
Risk
factors relating to California debt obligations — Because TEFCA invests in securities issued by the State of California,
its agencies and municipalities, the fund is more susceptible to developments adversely affecting issuers of California securities
than a municipal bond fund that does not concentrate its investments in a single state. The information below constitutes only
a brief summary and does not purport to be a complete description of risk factors relating to California debt obligations. Certain
information is drawn from official statements relating to securities offerings of the State of California and various local agencies
in California available as of the date of this statement of additional information and is subject to change. The fund assumes
no obligation to independently verify or update this information.
Many
factors including both state and national economic, political, regulatory, social and environmental policies and conditions, which
are not within the control of the issuers of state related
Tax-exempt
income funds — Page 15
bonds,
could have an adverse impact on the financial condition of the state, its various agencies and political subdivisions, as well
as other municipal issuers in California. A variety of events, such as, tax base erosion, state constitutional limits on tax increases,
budget deficits and other financial difficulties, and changes in the credit ratings assigned to California’s municipal issuers
may have an adverse impact on the fund. In addition, natural disasters, such as earthquakes and droughts, may have an adverse
effect on the state’s economy.
California’s
economy and general financial condition affect the ability of state and local governments to raise revenues to make timely payments
on their obligations. Events such as budgetary problems at the state level, fiscal weakness or an overall slowdown in the California
economy could adversely impact the fund. Such events can negatively impact the state’s credit rating, make it more expensive
for the state to borrow money, and impact municipal issuers’ ability to pay their obligations. Such events could also heighten
the risk that prices of debt obligations purchased by the fund, and the fund’s net asset value, will experience greater
volatility.
California
is the most populous state in the nation and has a diverse economy. Major employers include the agriculture, manufacturing, high
technology, services, trade, entertainment and construction sectors. However, certain of California’s significant industries
are sensitive to economic disruptions in their export markets. The state’s rate of economic growth, therefore, could be
adversely affected by any such disruption. A significant downturn in the housing market or U.S. stock market prices could adversely
affect California’s economy by reducing household spending and business investment, particularly in the high technology
sector. Moreover, a large and increasing share of the State of California’s General Fund revenue in the form of income and
capital gains taxes is directly related to, and would be adversely affected by a significant downturn in the performance of, the
stock markets.
Future
California constitutional amendments, legislative measures, executive orders, administrative regulations, court decisions and
voter initiatives could have an adverse effect on the debt obligations of California issuers. The initiative process is used quite
often in California, resulting in numerous initiative items on the ballot for most state and many local elections, any of which
could affect the ability of municipal issuers to pay their obligations. For example, revenue and expenditure limitations adopted
by California voters, such as Propositions 13 (limiting ad valorem taxes on real property and restricting local taxing entities’
ability to raise real property taxes) and 218 (limiting local governments' ability to impose “property related” fees,
assessments and taxes) have constrained local governments’ ability to raise revenue, consequently raising concerns about
whether municipalities have sufficient revenue to pay their debt obligations.
While
the fund’s portfolio managers try to reduce risks by investing in a diversified portfolio of securities, including state
related bonds, it is not possible to predict the extent to which any or all of the factors described above will affect the ability
of the state or other municipal issuers to pay interest or principal on their bonds or the ability of such bonds to maintain market
value or marketability.
Risk
factors relating to New York debt obligations — Because TEFNY invests in securities issued by the State of New York,
its agencies and municipalities, the fund is more susceptible to developments adversely affecting issuers of New York securities
than a municipal bond fund that does not concentrate its investments in a single state. The information below constitutes only
a brief summary and does not purport to be a complete description of risk factors relating to New York debt obligations. Certain
information is drawn from official statements relating to securities offerings of the State of New York and various local agencies
in New York available as of the date of this statement of additional information and is subject to change. The fund assumes no
obligation to independently verify or update this information.
Tax-exempt
income funds — Page 16
Many
factors including both state and national economic, political, regulatory, social and environmental policies and conditions, which
are not within the control of the issuers of state related bonds, could have an adverse impact on the financial condition of the
state, its various agencies and political subdivisions, as well as other municipal issuers in New York. New York’s economy
and general financial condition affect the ability of state and local governments to raise revenues to make timely payments on
their obligations. A variety of events, such as, tax base erosion, state constitutional limits on tax increases, budget deficits
and other financial difficulties, changes in the credit ratings assigned to New York’s municipal issuers and natural disasters
may have an adverse impact on the fund. Such events can negatively impact the state’s credit rating, make it more expensive
for the state to borrow money, and impact issuers’ ability to pay their obligations. Such events could also heighten the
risk that prices of debt obligations purchased by the fund, and the fund’s net asset value, will experience greater volatility.
In
addition, New York State and New York City represent a large portion of the municipal bond market in New York. Therefore, fiscal
and economic challenges facing these entities may have an adverse impact on the overall New York municipal bond market.
The
ability of some New York issuers to make principal and interest payments depends in large part on their ability to raise revenues,
primarily through taxes, and to control spending. Many factors can affect the state’s revenues including the rate of population
growth, unemployment rates, personal income growth, federal aid, and the ability to attract and keep successful businesses. A
number of factors can also affect the state’s spending including the need for infrastructure improvements, increased costs
for education and other services, current debt levels, and the existence of accumulated budget deficits.
While
New York State’s economy is diverse, it has a comparatively large share of the nation’s financial activities, information,
education and health services employment, and a very small share of the nation’s farming and mining activity. Travel and
tourism constitute an important part of the economy. Like the rest of the nation, the state has a declining proportion of its
workforce engaged in manufacturing and an increasing proportion engaged in service industries.
The
services sector, which includes professional and business services, private education and healthcare, leisure and hospitality
services, among others, is the state’s leading economic sector. New York State is more likely to be affected by a recession
that is concentrated in the services sector than other states. Additionally, New York State and New York City’s heavy reliance
on the financial services sector makes it vulnerable to an economic slowdown and volatility in the financial services sector.
Future
New York constitutional amendments, legislative measures, executive orders, administrative regulations, court decisions and voter
initiatives could have an adverse effect on the debt obligations of New York issuers. In addition, if constitutional challenges
to state laws or other court actions are brought against the state or its agencies and municipalities relating to financing, or
the amount and use of taxes, these actions could adversely affect the ability of the state and its political subdivisions to meet
their debt obligations, and may require extraordinary appropriations, expenditure reductions, or both.
While
the fund’s portfolio managers try to reduce risks by investing in a diversified portfolio of securities, including state
related bonds, it is not possible to predict the extent to which any or all of the factors described above will affect the ability
of the state or other municipal issuers to pay interest or principal on their bonds or the ability of such bonds to maintain market
value or marketability.
Risk
of non-compliance with certain federal requirements — The Internal Revenue Code of 1986 (the “Code”) imposes
limitations on the use and investment of the proceeds of state and local governmental bonds and of other funds of the issuers
of such bonds. These limitations must be satisfied on a continuing basis to maintain the exclusion from gross income of interest
on such bonds.
Tax-exempt
income funds — Page 17
The
investment adviser relies on the opinion of bond counsel. Bond counsel qualify their opinions as to the federal tax status of
new issues of bonds by making such opinions contingent on the issuer’s future compliance with these limitations. Any failure
on the part of an issuer to comply could cause the interest on its bonds to become taxable to investors retroactive to the date
the bonds were issued. These restrictions in the Code also may affect the availability of certain municipal securities.
Cybersecurity
risks — With the increased use of technologies such as the Internet to conduct business, the fund has become potentially
more susceptible to operational and information security risks through breaches in cybersecurity. In general, a breach in cybersecurity
can result from either a deliberate attack or an unintentional event. Cybersecurity breaches may involve, among other things,
infection by computer viruses or other malicious software code or unauthorized access to the fund’s digital information
systems, networks or devices through “hacking” or other means, in each case for the purpose of misappropriating assets
or sensitive information (including, for example, personal shareholder information), corrupting data or causing operational disruption
or failures in the physical infrastructure or operating systems that support the fund. Cybersecurity risks also include the risk
of losses of service resulting from external attacks that do not require unauthorized access to the fund’s systems, networks
or devices. For example, denial-of-service attacks on the investment adviser’s or an affiliate’s website could effectively
render the fund’s network services unavailable to fund shareholders and other intended end-users. Any such cybersecurity
breaches or losses of service may cause the fund to lose proprietary information, suffer data corruption or lose operational capacity,
which, in turn, could cause the fund to incur regulatory penalties, reputational damage, additional compliance costs associated
with corrective measures and/or financial loss. While the fund and its investment adviser have established business continuity
plans and risk management systems designed to prevent or reduce the impact of cybersecurity attacks, there are inherent limitations
in such plans and systems due in part to the ever-changing nature of technology and cybersecurity attack tactics, and there is
a possibility that certain risks have not been adequately identified or prepared for.
In
addition, cybersecurity failures by or breaches of the fund’s third-party service providers (including, but not limited
to, the fund’s investment adviser, transfer agent, custodian, administrators and other financial intermediaries) may disrupt
the business operations of the service providers and of the fund, potentially resulting in financial losses, the inability of
fund shareholders to transact business with the fund and of the fund to process transactions, the inability of the fund to calculate
its net asset value, violations of applicable privacy and other laws, rules and regulations, regulatory fines, penalties, reputational
damage, reimbursement or other compensatory costs and/or additional compliance costs associated with implementation of any corrective
measures. The fund and its shareholders could be negatively impacted as a result of any such cybersecurity breaches, and there
can be no assurance that the fund will not suffer losses relating to cybersecurity attacks or other informational security breaches
affecting the fund’s third-party service providers in the future, particularly as the fund cannot control any cybersecurity
plans or systems implemented by such service providers.
Cybersecurity
risks may also impact issuers of securities in which the fund invests, which may cause the fund’s investments in such issuers
to lose value.
Tax-exempt
income funds — Page 18
Interfund
borrowing and lending — Pursuant to an exemptive order issued by the U.S. Securities and Exchange Commission, the fund
may lend money to, and borrow money from, other funds advised by Capital Research and Management Company or its affiliates. The
fund will borrow through the program only when the costs are equal to or lower than the costs of bank loans. The fund will lend
through the program only when the returns are higher than those available from an investment in repurchase agreements. Interfund
loans and borrowings normally extend overnight, but can have a maximum duration of seven days. Loans may be called on one day's
notice. The fund may have to borrow from a bank at a higher interest rate if an interfund loan is called or not renewed. Any delay
in repayment to a lending fund could result in a lost investment opportunity or additional borrowing costs.
*
* * * * *
Portfolio
turnover — Portfolio changes will be made without regard to the length of time particular investments may have been
held. Short-term trading profits are not the fund’s objective, and changes in its investments are generally accomplished
gradually, though short-term transactions may occasionally be made. Higher portfolio turnover may involve correspondingly greater
transaction costs in the form of dealer spreads or brokerage commissions. It may also result in the realization of net capital
gains, which are taxable when distributed to shareholders, unless the shareholder is exempt from taxation or his or her account
is tax-favored.
Fixed
income securities are generally traded on a net basis and usually neither brokerage commissions nor transfer taxes are involved.
Transaction costs are usually reflected in the spread between the bid and asked price.
A
fund’s portfolio turnover rate would equal 100% if each security in the fund’s portfolio were replaced once per year.
| |
|
|
| |
Fiscal
year |
Portfolio
turnover rate* |
| STEX |
2019 |
50% |
| |
2018 |
34 |
| LTEX |
2019 |
42 |
| |
2018 |
28 |
| TEBF |
2019 |
20 |
| |
2018 |
17 |
| AHIM |
2019 |
20 |
| |
2018 |
24 |
| TEFCA |
2019 |
27 |
| |
2018 |
14 |
| TEFNY |
2019 |
16 |
| |
2018 |
21 |
* Increases
(or decreases) in turnover were due to increased (or decreased) trading activity during the period.
See
“Financial highlights” in the fund’s prospectus for annual portfolio turnover rates for each of the last five
fiscal years.
Tax-exempt
income funds — Page 19
Fund
policies
All
percentage limitations in the following fund policies are considered at the time securities are purchased and are based on the
fund’s net assets unless otherwise indicated. None of the following policies involving a maximum percentage of assets will
be considered violated unless the excess occurs immediately after, and is caused by, an acquisition by the fund. In managing the
fund, the fund’s investment adviser may apply more restrictive policies than those listed below.
Fundamental
policies — The fund has adopted the following policies, which may not be changed without approval by holders of a majority
of its outstanding shares. Such majority is currently defined in the Investment Company Act of 1940, as amended (the “1940
Act”), as the vote of the lesser of (a) 67% or more of the voting securities
present at a shareholder meeting, if the holders of more than 50% of the outstanding voting securities are present in person or
by proxy, or (b) more than 50% of the outstanding voting securities.
1. Except
as permitted by (i) the 1940 Act and the rules and regulations thereunder, or
other successor law governing the regulation of registered investment companies, or interpretations or modifications thereof by
the U.S. Securities and Exchange Commission (“SEC”), SEC staff or other authority of competent jurisdiction, or (ii)
exemptive or other relief or permission from the SEC, SEC staff or other authority of competent jurisdiction, the fund may not:
a. Borrow
money;
b. Issue
senior securities;
c. Underwrite
the securities of other issuers;
d. Purchase
or sell real estate or commodities;
e. Make
loans; or
f. Purchase
the securities of any issuer if, as a result of such purchase, such fund’s investments would be concentrated in any particular
industry.
2. The
fund may not invest in companies for the purpose of exercising control or management.
3. The
fund will maintain its status as a tax-exempt fund consistent with (i) the 1940
Act and the rules and regulations thereunder, or other successor law governing the regulation of registered investment companies,
or interpretations or modifications thereof by the SEC, SEC staff or other authority of competent jurisdiction, or (ii)
exemptive or other relief or permission from the SEC, SEC staff or other authority of competent jurisdiction.
Nonfundamental
policies — The following policy may be changed without shareholder approval and applies to STEX, LTEX, TEBF and AHIM
only:
The fund
may not acquire securities of open-end investment companies or unit investment trusts registered under the 1940 Act in reliance
on Sections 12(d)(1)(F) or 12(d)(1)(G) of the 1940 Act.
Tax-exempt
income funds — Page 20
Additional
information about the fund’s policies — The information below is not part of the fund’s fundamental or nonfundamental
policies. This information is intended to provide a summary of what is currently required or permitted by the 1940 Act and the
rules and regulations thereunder, or by the interpretive guidance thereof by the SEC or SEC staff, for particular fundamental
policies of the funds. Information is also provided regarding the fund’s current intention with respect to certain investment
practices permitted by the 1940 Act.
For
purposes of fundamental policy 1a, the fund may borrow money in amounts of up to 33-1/3% of its total assets from banks for any
purpose. Additionally, the fund may borrow up to 5% of its total assets from banks or other lenders for temporary purposes (a
loan is presumed to be for temporary purposes if it is repaid within 60 days and is not extended or renewed). The percentage limitations
in this policy are considered at the time of borrowing and thereafter.
For purposes
of fundamental policies 1a and 1e, the fund may borrow money from, or loan money to, other funds managed by Capital Research and
Management Company or its affiliates to the extent permitted by applicable law and an exemptive order issued by the SEC.
For
purposes of fundamental policy 1b, a senior security does not include any promissory note or evidence of indebtedness if such
loan is for temporary purposes only and in an amount not exceeding 5% of the value of the total assets of the fund at the time
the loan is made (a loan is presumed to be for temporary purposes if it is repaid within 60 days and is not extended or renewed).
Further, to the extent the fund covers its commitments under certain types of agreements and transactions, including derivatives,
mortgage-dollar-roll transactions, sale-buybacks, when-issued, delayed-delivery, or forward commitment transactions, and other
similar trading practices, by segregating or earmarking liquid assets equal in value to the amount of the fund’s commitment
(in accordance with applicable SEC or SEC staff guidance), such agreement or transaction will not be considered a senior security
by the fund.
For
purposes of fundamental policy 1c, the policy will not apply to the fund to the extent the fund may be deemed an underwriter within
the meaning of the 1933 Act in connection with the purchase and sale of fund portfolio securities in the ordinary course of pursuing
its investment objectives and strategies.
For purposes
of fundamental policy 1e, the fund may not lend more than 33-1/3% of its total assets, provided that this limitation shall not
apply to the fund’s purchase of debt obligations.
For purposes
of fundamental policy 1f, the fund may not invest more than 25% of its total assets in the securities of issuers in a particular
industry. This policy does not apply to investments in securities of the U.S. Government, its agencies or government sponsored
enterprises or repurchase agreements with respect thereto. For purposes of diversification, pre-refunded bonds will be treated
as governmental issues.
For purposes
of fundamental policy 3, the fund will, under normal circumstances, invest at least 80% of its assets in, or derive at least 80%
of its income from securities that are exempt from regular federal income tax and do not subject shareholders to the alternative
minimum tax. Additionally, each of STEX, LTEX, TEFCA and TEFNY may only invest up to 20% of its assets in securities that are
subject to the alternative minimum tax. TEBF may not invest in securities that are subject to the alternative minimum tax. AHIM
may invest, without limitation, in securities that may subject fund shareholders to federal alternative minimum tax.
Tax-exempt
income funds — Page 21
Management
of the fund
Board
of trustees and officers
Independent
trustees1
The
fund’s nominating and governance committee and board selects independent trustees with a view toward constituting a board
that, as a body, possesses the qualifications, skills, attributes and experience to appropriately oversee the actions of such
fund’s service providers, decide upon matters of general policy and represent the long-term interests of fund shareholders.
In doing so, they consider the qualifications, skills, attributes and experience of the current board members, with a view toward
maintaining a board that is diverse in viewpoint, experience, education and skills.
The
fund seeks independent trustees who have high ethical standards and the highest levels of integrity and commitment, who have inquiring
and independent minds, mature judgment, good communication skills, and other complementary personal qualifications and skills
that enable them to function effectively in the context of such fund’s board and committee structure and who have the ability
and willingness to dedicate sufficient time to effectively fulfill their duties and responsibilities.
Each
independent trustee has a significant record of accomplishments in governance, business, not-for-profit organizations, government
service, academia, law, accounting or other professions. Although no single list could identify all experience upon which each
fund’s independent trustees draw in connection with their service, the following table summarizes key experience for each
independent trustee. These references to the qualifications, attributes and skills of the trustees are pursuant to the disclosure
requirements of the SEC, and shall not be deemed to impose any greater responsibility or liability on any trustee or the board
as a whole. Notwithstanding the accomplishments listed below, none of the independent trustees is considered an “expert”
within the meaning of the federal securities laws with respect to information in each fund’s registration statement.
Tax-exempt
income funds — Page 22
| |
|
|
|
|
| Name,
year of birth and position with fund (year first elected as a trustee2) |
Principal
occupation(s)
during
the
past five years |
Number
of
portfolios
in fund
complex
overseen
by
trustee |
Other
directorships3
held
by trustee
during the
past five years |
Other
relevant
experience |
William
H. Baribault, 1945
Trustee (2010) |
Chairman
of the Board and CEO, Oakwood Advisors (private investment and consulting); former CEO and President, Richard Nixon Foundation |
88 |
General
Finance Corporation |
· Service
as chief executive officer for multiple companies
· Corporate
board experience
· Service
on advisory and trustee boards for charitable, educational and nonprofit organizations |
James
G. Ellis, 1947
Trustee (STEX–2009; LTEX–2006; TEBF–2006; AHIM–2006; TEFCA–2006; TEFNY–2010) |
Professor
of Marketing and former Dean, Marshall School of Business, University of Southern California |
98 |
Mercury
General Corporation
Former
director of Quiksilver, Inc. (until 2014) |
· Service
as chief executive officer for multiple companies
· Corporate
board experience
· Service
on advisory and trustee boards for charitable, municipal and nonprofit organizations
· MBA |
Nariman
Farvardin, 1956
Trustee (2018) |
President,
Stevens Institute of Technology |
85 |
Former
director of JPMorgan Value Opportunities Fund, Inc. (until 2014) |
· Senior
management experience, educational institution
· Corporate
board experience
· Professor,
electrical and computer engineering
· Service
on advisory boards and councils for educational, nonprofit and governmental organizations
· MS,
PhD, electrical engineering |
Tax-exempt
income funds — Page 23
| |
|
|
|
|
| Name,
year of birth and position with fund (year first elected as a trustee2) |
Principal
occupation(s)
during
the
past five years |
Number
of
portfolios
in fund
complex
overseen
by
trustee |
Other
directorships3
held
by trustee
during the
past five years |
Other
relevant
experience |
Mary
Davis Holt, 1950
Trustee (2015-2016; 2017) |
Principal,
Mary Davis Holt Enterprises, LLC (leadership development consulting); former Partner, Flynn Heath Holt Leadership, LLC (leadership
consulting); former COO, Time Life Inc. (1993–2003) |
85 |
None |
· Service
as chief operations officer, global media company
· Senior
corporate management experience
· Corporate
board experience
· Service
on advisory and trustee boards for educational, business and nonprofit organizations
· MBA |
R.
Clark Hooper, 1946
Trustee (STEX–2005; LTEX–2005; TEBF–2005; AHIM–2005; TEFCA–2005; TEFNY–2010) |
Private
investor |
88 |
Former
director of JPMorgan Value Opportunities Fund, Inc. (until 2014); The Swiss Helvetia Fund, Inc. (until 2016) |
· Senior
regulatory and management experience, National Association of Securities Dealers (now
FINRA)
· Service
on trustee boards for charitable, educational and nonprofit organizations |
Tax-exempt
income funds — Page 24
| |
|
|
|
|
| Name,
year of birth and position with fund (year first elected as a trustee2) |
Principal
occupation(s)
during
the
past five years |
Number
of
portfolios
in fund
complex
overseen
by
trustee |
Other
directorships3
held
by trustee
during the
past five years |
Other
relevant
experience |
Merit
E. Janow, 1958
Trustee (2010) |
Dean
and Professor, Columbia University, School of International and Public Affairs |
87 |
Mastercard
Incorporated; Trimble Inc.
Former
director of The NASDAQ Stock Market LLC (until 2016) |
· Service
with Office of the U.S. Trade Representative and U.S. Department of Justice
· Corporate
board experience
· Service
on advisory and trustee boards for charitable, educational and nonprofit organizations
· Experience
as corporate lawyer
· JD |
Laurel
B. Mitchell, PhD, 1955
Trustee
(STEX–2009; LTEX–2010; TEBF–2010; AHIM–2010; TEFCA–2009;
TEFNY–2010) |
Chair,
California Jump$tart Coalition for Personal Financial Literacy; Professor Emerita and former Distinguished Professor and Director,
Accounting Program, University of Redlands; former part-time faculty, Pomona College |
85 |
None |
· Professor
at multiple universities
· Service
in the Office of Chief Accountant and Enforcement Division of the U.S. Securities and Exchange Commission
· Experience
in corporate management and public accounting
· Service
on advisory and trustee boards for charitable, educational and nonprofit organizations
· PhD,
accounting
· Chartered
Global Management Accountant
· Formerly
licensed as a CPA |
Tax-exempt
income funds — Page 25
| |
|
|
|
|
| Name,
year of birth and position with fund (year first elected as a trustee2) |
Principal
occupation(s)
during
the
past five years |
Number
of
portfolios
in fund
complex
overseen
by
trustee |
Other
directorships3
held
by trustee
during the
past five years |
Other
relevant
experience |
Margaret
Spellings, 1957
Chairman of the Board
(Independent and Non-Executive)
(STEX–2009; LTEX–2010; TEBF–2010;
AHIM–2010; TEFCA–2010; TEFNY–2010) |
CEO,
Texas2036; former President, Margaret Spellings & Company (public policy and strategic consulting); former President,
The University of North Carolina; former President, George W. Bush Foundation |
89 |
Former
director of ClubCorp Holdings, Inc. (until 2017) |
· Former
U.S. Secretary of Education, U.S. Department of Education
· Former
Assistant to the President for Domestic Policy, The White House
· Former
senior advisor to the Governor of Texas
· Service
on advisory and trustee boards for charitable and nonprofit organizations |
Alexandra
Trower, 1964
Trustee
(STEX–2019; LTEX–2019; TEBF–2019; AHIM–2018; TEFCA–2019; TEFNY–2018) |
Executive
Vice President, Global Communications and Corporate Officer, The Estée Lauder Companies |
84 |
None |
· Service
on trustee boards for charitable and nonprofit organizations
· Senior
corporate management experience
· Branding |
Tax-exempt
income funds — Page 26
Interested
trustee(s)4,5
Interested
trustees have similar qualifications, skills and attributes as the independent trustees. Interested trustees are senior executive
officers and/or directors of Capital Research and Management Company or its affiliates. Such management roles with the funds’
service providers also permit the interested trustees to make a significant contribution to the funds’ boards.
| |
|
|
|
Name,
year of birth
and position with fund
(year first elected as a
trustee/officer2) |
Principal
occupation(s)
during the
past five years
and positions
held with affiliated
entities or the
Principal Underwriter
of
the fund |
Number
of
portfolios
in fund
complex
overseen
by trustee |
Other
directorships3
held by trustee
during the
past five years |
Karl
J. Zeile, 1966
President and Trustee
(TEBF-2009; TEFCA-2009)
Senior Vice President and Trustee
(AHIM-2008; TEFNY-2010)
Trustee
(LTEX-2004;
STEX-2011) |
Partner
– Capital Fixed Income Investors, Capital Research and Management Company; Director, The Capital Group Companies, Inc.* |
20 |
None |
Michael
C. Gitlin, 1970
Trustee (2015) |
Vice
Chairman and Director, Capital Research and Management Company; Partner – Capital Fixed Income Investors, Capital Research
and Management Company; Director, The Capital Group Companies, Inc.*; served as Head of Fixed Income at a large investment
management firm prior to joining Capital Research and Management Company in 2015 |
84 |
None |
Other
officers5
| |
|
Name,
year of birth
and position with fund
(year first elected
as an officer2) |
Principal
occupation(s) during the past five years
and positions held with affiliated entities
or the Principal Underwriter of
the funds |
Aaron
Applebaum, 1979
President
(STEX–2016)
Senior Vice President
(LTEX–2016) |
Partner
– Capital Fixed Income Investors, Capital Research and Management Company |
Mark
Marinella, 1958
President (LTEX–2019)
Vice President (STEX and TEFCA–2019) |
Vice
President – Capital Fixed Income Investors, Capital Research and Management Company |
Chad
M. Rach, 1972
President (AHIM–2015)
Senior Vice President (TEBF–2016) |
Partner
– Capital Fixed Income Investors, Capital Research and Management Company; Director, Capital Research and Management
Company |
| |
Tax-exempt
income funds — Page 27
| |
|
Name,
year of birth
and position with fund
(year first elected
as an officer2) |
Principal
occupation(s) during the past five years
and positions held with affiliated entities
or the Principal Underwriter of
the funds |
Jerome
Solomon, 1963
President
(TEFNY–2011)
Senior Vice President
(AHIM–2017) |
Partner
— Capital Fixed Income Investors, Capital Research and Management Company |
Kristine
M. Nishiyama, 1970
Executive Vice President (STEX, LTEX, TEBF, AHIM and TEFCA–2003; TEFNY–2010) |
Senior
Vice President and Senior Counsel – Fund Business Management Group, Capital Research and Management Company; Chair,
Senior Vice President, General Counsel and Director, Capital Bank and Trust Company* |
Steven
I. Koszalka, 1964
Secretary (2010) |
Vice
President – Fund Business Management Group, Capital Research and Management Company |
Brian
C. Janssen, 1972
Treasurer
(STEX, LTEX and AHIM–2015 and TEBF, TEFCA and TEFNY–2012) |
Vice
President – Investment Operations, Capital Research and Management Company |
Jane
Y. Chung, 1974
Assistant Secretary (2014) |
Associate
– Fund Business Management Group, Capital Research and Management Company |
Sandra
Chuon, 1972
Assistant Treasurer (2019) |
Assistant
Vice President, Investment Operations, Capital Research and Management Company |
Gregory
F. Niland, 1971
Assistant Treasurer (2015) |
Vice
President - Investment Operations, Capital Research and Management Company |
* Company
affiliated with Capital Research and Management Company.
1 The
term independent trustee refers to a trustee who is not an “interested person” of the funds within the meaning of
the 1940 Act.
2 Trustees
and officers of the funds serve until their resignation, removal or retirement.
3 This
includes all directorships/trusteeships (other than those in the American Funds or other funds managed by Capital Research and
Management Company or its affiliates) that are held by each trustee as a director/trustee of a public company or a registered
investment company. Unless otherwise noted, all directorships/trusteeships are current.
4 The
term interested trustee refers to a trustee who is an “interested person” of the funds within the meaning of the 1940
Act, on the basis of his or her affiliation with the funds’ investment adviser, Capital Research and Management Company,
or affiliated entities (including the funds’ principal underwriter). The listed individual may not be a trustee of all funds
listed for him or her, but rather may be an officer of one or more such funds.
5 All
of the trustees and/or officers listed are officers and/or directors/trustees of one or more funds for which Capital Research
and Management Company serves as investment adviser.
The
address for all trustees and officers of the fund is 333 South Hope Street, 55th Floor, Los Angeles, California 90071, Attention:
Secretary.
Tax-exempt
income funds — Page 28
Fund
shares owned by trustees as of December 31, 2018:
| |
|
|
|
|
|
|
|
| Name |
Dollar
range1,2
of fund
shares owned |
Aggregate
dollar
range1
of shares
owned in
all funds
in the
American Funds
family overseen
by trustee |
Dollar
range1,2
of
independent
trustees
deferred compensation3 allocated
to fund |
Aggregate
dollar
range1,2
of
independent
trustees
deferred
compensation3 allocated to
all funds
within
American
Funds
family overseen
by trustee |
| Independent
trustees |
| William
H. Baribault |
STEX:
LTEX:
TEBF:
AHIM:
TEFCA:
TEFNY: |
None
None
None
None
None
None |
$50,001
– $100,000 |
STEX:
LTEX:
TEBF:
AHIM:
TEFCA:
TEFNY: |
N/A
N/A
N/A
N/A
N/A
N/A |
Over
$100,000 |
| James
G. Ellis |
STEX:
None
LTEX:
$10,001 – $50,000
TEBF:
$10,001 – $50,000
AHIM:
$10,001 – $50,000
TEFCA:
None
TEFNY:
None |
Over
$100,000 |
STEX:
LTEX:
TEBF:
AHIM:
TEFCA:
TEFNY: |
N/A
N/A
N/A
N/A
N/A
N/A |
N/A |
| Nariman
Farvardin |
STEX:
LTEX:
TEBF:
AHIM:
TEFCA:
TEFNY: |
None
None
None
None
None
None |
Over
$100,000 |
STEX:
LTEX:
TEBF:
AHIM:
TEFCA:
TEFNY: |
N/A
N/A
N/A
N/A
N/A
N/A |
Over
$100,000 |
| Mary
Davis Holt |
STEX:
None
LTEX:
None
TEBF:
$50,001 - $100,000
AHIM:
None
TEFCA:
None
TEFNY:
None |
Over
$100,000 |
STEX:
LTEX:
TEBF:
AHIM:
TEFCA:
TEFNY |
N/A
N/A
N/A
N/A
N/A
N/A |
N/A |
| R.
Clark Hooper |
STEX:
None
LTEX:
None
TEBF:
$10,001 – $50,000
AHIM:
None
TEFCA:
None
TEFNY:
None |
Over
$100,000 |
STEX:
LTEX:
TEBF:
AHIM:
TEFCA:
TEFNY: |
N/A
N/A
N/A
N/A
N/A
N/A |
Over
$100,000 |
| Merit
E. Janow |
STEX:
LTEX:
TEBF:
AHIM:
TEFCA:
TEFNY: |
None
None
None
None
None
None |
Over
$100,000 |
STEX:
LTEX:
TEBF:
AHIM:
TEFCA:
TEFNY: |
N/A
N/A
N/A
N/A
N/A
N/A |
N/A |
Tax-exempt
income funds — Page 29
| |
|
|
|
|
|
|
| Name |
Dollar
range1,2
of fund
shares owned |
Aggregate
dollar
range1
of shares
owned in
all funds
in the
American Funds
family overseen
by trustee |
Dollar
range1,2
of
independent
trustees
deferred compensation3 allocated
to fund |
Aggregate
dollar
range1,2
of
independent
trustees
deferred
compensation3 allocated to
all funds
within
American
Funds
family overseen
by trustee |
| Laurel
B. Mitchell |
STEX:
$1 – $10,000
LTEX:
$1 – $10,000
TEBF:
$1 – $10,000
AHIM:
$1 – $10,000
TEFCA:
$1 – $10,000
TEFNY: None |
Over
$100,000 |
STEX:
LTEX:
TEBF:
AHIM:
TEFCA:
TEFNY: |
N/A
N/A
N/A
N/A
N/A
N/A |
Over
$100,000 |
| Margaret
Spellings |
STEX:
None
LTEX:
None
TEBF:
None
AHIM:
$10,001 – $50,000
TEFCA:
None
TEFNY:
None |
Over
$100,000 |
STEX:
LTEX:
TEBF:
AHIM:
TEFCA:
TEFNY: |
N/A
N/A
N/A
N/A
N/A
N/A |
Over
$100,000 |
| Alexandra
Trower |
STEX:
None
LTEX:
None
TEBF:
None
AHIM:
None
TEFCA:
None
TEFNY:
$10,001 – $50,000 |
Over
$100,000 |
STEX:
LTEX:
TEBF:
AHIM:
TEFCA:
TEFNY: |
N/A
N/A
N/A
N/A
N/A
N/A |
Over
$100,000 |
Tax-exempt
income funds — Page 30
| |
|
|
|
| Name |
Dollar
range1,2
of fund
shares owned |
Aggregate
dollar
range1
of shares
owned in
all funds
in the
American Funds
family overseen
by trustee |
| Interested
trustee |
| Karl
J. Zeile |
STEX:
LTEX:
TEBF:
AHIM:
TEFCA:
TEFNY: |
None
Over $100,000
Over $100,000
Over
$100,000
Over $100,000
None |
Over
$100,000 |
| Michael
C. Gitlin |
STEX:
LTEX:
TEBF:
AHIM:
TEFCA:
TEFNY: |
None
Over $100,000
Over $100,000
Over
$100,000
Over $100,000
None |
Over
$100,000 |
| |
1 Ownership
disclosure is made using the following ranges: None; $1 – $10,000; $10,001 – $50,000; $50,001 – $100,000; and
Over $100,000. The amounts listed for interested trustees include shares owned through The Capital Group Companies, Inc. retirement
plan and 401(k) plan.
2 N/A
indicates that the listed individual, as of December 31, 2018, was not a trustee of a particular fund, did not allocate deferred
compensation to the fund or did not participate in the deferred compensation plan.
3 Eligible
trustees may defer their compensation under a nonqualified deferred compensation plan. Amounts deferred by the trustee accumulate
at an earnings rate determined by the total return of one or more American Funds as designated by the trustee.
Trustee
compensation — No compensation is paid by the fund to any officer or trustee who is a director, officer or employee
of the investment adviser or its affiliates. Except for the independent trustees listed in the “Board of trustees and officers
— Independent trustees” table under the “Management of the fund” section in this statement of additional
information, all other officers and trustees of the fund are directors, officers or employees of the investment adviser or its
affiliates. The boards of funds advised by the investment adviser typically meet either individually or jointly with the boards
of one or more other such funds with substantially overlapping board membership (in each case referred to as a “board cluster”).
The fund typically pays each independent trustee an annual fee, which ranges from $210 to $448 for STEX, $813 to $1,732 for LTEX,
$3,882 to $8,272 for TEBF, $1,335 to $2,845 for AHIM, $462 to $985 for TEFCA and from $38 to $80 for TEFNY, based primarily on
the total number of board clusters on which that independent trustee serves.
In addition,
the fund generally pays independent trustees attendance and other fees for meetings of the board and their committees. Board and
committee chairs receive additional fees for their services.
Independent
trustees also receive attendance fees for certain special joint meetings and information sessions with directors and trustees
of other groupings of funds advised by the investment adviser. The fund and the other funds served by each independent trustee
each pay an equal portion of these attendance fees.
No
pension or retirement benefits are accrued as part of fund expenses. Independent trustees may elect, on a voluntary basis, to
defer all or a portion of their fees through a deferred compensation plan in effect for the fund. The fund also reimburses certain
expenses of the independent trustees.
Tax-exempt
income funds — Page 31
Trustee
compensation earned during the fiscal year ended July 31, 2019:
| |
|
|
|
| Name |
Aggregate
compensation
(including voluntarily
deferred compensation1)
from the funds |
Total
compensation (including
voluntarily deferred
compensation1)
from all funds managed by
Capital
Research and
Management
Company or its affiliates |
| William
H. Baribault2 |
STEX
LTEX
TEBF
AHIM
TEFCA
TEFNY |
$
672
2,620
10,952
4,084
1,460
146 |
$416,845 |
| James
G. Ellis |
STEX
LTEX
TEBF
AHIM
TEFCA
TEFNY |
678
2,642
11,069
4,123
1,473
147 |
451,095 |
| Nariman
Farvardin2 |
STEX
LTEX
TEBF
AHIM
TEFCA
TEFNY |
652
2,543
10,643
3,966
1,418
141 |
365,545 |
Leonard
R. Fuller2
(retired December 31, 2018) |
STEX
LTEX
TEBF
AHIM
TEFCA
TEFNY |
349
1,402
5,263
2,078
768
79 |
203,345 |
| Mary
Davis Holt |
STEX
LTEX
TEBF
AHIM
TEFCA
TEFNY |
634
2,468
10,383
3,859
1,377
137 |
343,045 |
| R.
Clark Hooper2 |
STEX
LTEX
TEBF
AHIM
TEFCA
TEFNY |
671
2,624
10,877
4,074
1,461
146 |
452,020 |
| Merit
E. Janow |
STEX
LTEX
TEBF
AHIM
TEFCA
TEFNY |
607
2,360
9,957
3,696
1,318
131 |
376,345 |
Tax-exempt
income funds — Page 32
| |
|
|
|
| Name |
Aggregate
compensation
(including voluntarily
deferred compensation1)
from the funds |
Total
compensation (including
voluntarily deferred
compensation1)
from all funds managed by
Capital
Research and
Management
Company or its affiliates |
| Laurel
B. Mitchell2 |
STEX
LTEX
TEBF
AHIM
TEFCA
TEFNY |
$
783
3,059
12,719
4,756
1,704
170 |
$340,945 |
Frank
M. Sanchez
(retired December 31, 2018) |
STEX
LTEX
TEBF
AHIM
TEFCA
TEFNY |
451
1,812
6,799
2,684
992
102 |
158,095 |
| Margaret
Spellings2 |
STEX
LTEX
TEBF
AHIM
TEFCA
TEFNY |
625
2,429
10,289
3,811
1,357
135 |
469,870 |
| Alexandra
Trower2 |
STEX
LTEX
TEBF
AHIM
TEFCA
TEFNY |
382
1,429
6,867
12,242
816
453 |
307,095 |
1 Amounts
may be deferred by eligible trustees under a nonqualified deferred compensation plan adopted by STEX, LTEX, TEBF, AHIM and TEFCAs
in 1993 and TEFNY in 2010. Deferred amounts accumulate at an earnings rate determined by the total return of one or more American
Funds as designated by the trustees. Compensation shown in this table for the fiscal year ended July 31, 2019 does not include
earnings on amounts deferred in previous fiscal years. See footnote 2 to this table for more information.
2 Since
the deferred compensation plans’ adoption, the total amount of deferred compensation accrued by the funds (plus earnings
thereon) through the end of the 2019 fiscal year for participating trustees is as follows:
STEX – William H. Baribault ($105), Nariman Farvardin ($1,027), Leonard R. Fuller ($1,188), R. Clark Hooper ($648), Laurel
B. Mitchell ($708), Margaret Spellings ($1,257) and Alexandra Trower ($390);
LTEX – William H. Baribault ($416), Nariman Farvardin ($4,047), Leonard R. Fuller ($41,470), R. Clark Hooper ($2,557), Laurel
B. Mitchell ($2,992), Margaret Spellings ($5,297) and Alexandra Trower ($1,455);
TEBF – William H. Baribault ($1,675), Nariman Farvardin ($134,007), Leonard R. Fuller ($97,877), R. Clark Hooper ($10,266),
Laurel B. Mitchell ($10,089), Margaret Spellings ($17,880) and Alexandra Trower ($6,994);
AHIM – William H. Baribault ($637), Nariman Farvardin ($6,200), Leonard R. Fuller ($31,952), R. Clark Hooper ($3,909), Laurel
B. Mitchell ($3,336), Margaret Spellings ($5,888) and Alexandra Trower ($22,791);
TEFCA – William H. Baribault ($230), Nariman Farvardin ($2,242), Leonard R. Fuller ($39,935), R. Clark Hooper ($1,416),
Laurel B. Mitchell ($1,549), Margaret Spellings ($2,756) and Alexandra Trower ($832); and
TEFNY – William H. Baribault ($23), Nariman Farvardin ($226), Leonard R. Fuller ($157), R. Clark Hooper ($143), Laurel B.
Mitchell ($133), Margaret Spellings ($236) and Alexandra Trower ($854).
Amounts deferred and accumulated earnings thereon are not funded and are general unsecured liabilities of the funds until paid
to the trustees.
Tax-exempt
income funds — Page 33
Fund
organization and the board of trustees — The fund is an open-end, diversified management investment company. American
Funds Short-Term Tax-Exempt Bond Fund was organized as The Tax-Exempt Money Fund of America, a Massachusetts business trust, on
December 5, 1988, and reorganized as a Delaware statutory trust on August 7, 2009. Limited Term Tax-Exempt Bond Fund
of America was organized as a Massachusetts business trust on July 12, 1993 and reorganized as a Delaware statutory trust on November
1, 2010. The Tax-Exempt Bond Fund of America was organized as a Maryland corporation on July 20, 1979 and reorganized as a Delaware
statutory trust on November 1, 2010. American High-Income Municipal Bond Fund was organized as a Maryland corporation on June 14, 1994
and reorganized as a Delaware statutory trust on November 1, 2010. The Tax-Exempt Fund of California was organized as a Massachusetts
business trust on May 30, 1986 and reorganized as a Delaware statutory trust on November 1, 2010. American Funds Tax-Exempt Fund
of New York was organized as a Delaware statutory trust on July 16, 2010. All fund operations are supervised by the fund’s
boards of trustees (“board”) which meets periodically and performs duties required by applicable state and federal
laws.
Delaware
law charges trustees with the duty of managing the business affairs of the trust. Trustees are considered to be fiduciaries of
the trust and owe duties of care and loyalty to the trust and its shareholders.
Independent
board members are paid certain fees for services rendered to each fund as described above. They may elect to defer all or a portion
of these fees through a deferred compensation plan in effect for each fund.
The
fund has several different classes of shares. Shares of each class represent an interest in the same investment portfolio. Each
class has pro rata rights as to voting, redemption, dividends and liquidation, except that each class bears different distribution
expenses and may bear different transfer agent fees and other expenses properly attributable to the particular class as approved
by the board of trustees and set forth in each fund’s rule 18f-3 Plan. Each class’ shareholders have exclusive voting
rights with respect to the respective class’ rule 12b-1 plans adopted in connection with the distribution of shares and
on other matters in which the interests of one class are different from interests in another class. Shares of all classes of the
fund vote together on matters that affect all classes in substantially the same manner. Each class votes as a class on matters
that affect that class alone. In addition, the trustees have the authority to establish new series and classes of shares, and
to split or combine outstanding shares into a greater or lesser number, without shareholder approval.
The
fund does not hold annual meetings of shareholders. However, significant matters that require shareholder approval, such as certain
elections of board members or a change in a fundamental investment policy, will be presented to shareholders at a meeting called
for such purpose. Shareholders have one vote per share owned.
The
fund’s declaration of trust and by-laws, as well as separate indemnification agreements with independent trustees, provide
in effect that, subject to certain conditions, the fund will indemnify its officers and trustees against liabilities or expenses
actually and reasonably incurred by them relating to their service to the fund. However, trustees are not protected from liability
by reason of their willful misfeasance, bad faith, gross negligence or reckless disregard of the duties involved in the conduct
of their office.
Removal
of trustees by shareholders — At any meeting of shareholders, duly called and at which a quorum is present, shareholders
of the fund may, by the affirmative vote of the holders of two-thirds of the votes entitled to be cast, remove any trustee from
office with the fund and may elect a successor or successors to fill any resulting vacancies for the unexpired terms of removed
trustees. In addition, the trustees of the fund will promptly call a meeting of shareholders for the purpose of voting upon the
Tax-exempt
income funds — Page 34
removal
of any trustees of the fund when requested in writing to do so by the record holders of at least 10% of such fund’s outstanding
shares.
Leadership
structure — The board’s chair is currently an independent trustee who is not an “interested person”
of the fund within the meaning of the 1940 Act. The board has determined that an independent chair facilitates oversight and enhances
the effectiveness of the board. The independent chair’s duties include, without limitation, generally presiding at meetings
of the board, approving board meeting schedules and agendas, leading meetings of the independent trustees in executive session,
facilitating communication with committee chairs, and serving as the principal independent trustee contact for fund management
and counsel to the independent trustees and the fund.
Risk
oversight — Day-to-day management of the fund, including risk management, is the responsibility of the fund’s
contractual service providers, including the fund’s investment adviser, principal underwriter/distributor and transfer agent.
Each of these entities is responsible for specific portions of the fund’s operations, including the processes and associated
risks relating to the fund’s investments, integrity of cash movements, financial reporting, operations and compliance. The
board of trustees oversees the service providers’ discharge of their responsibilities, including the processes they use
to manage relevant risks. In that regard, the board receives reports regarding the operations of the fund’s service providers,
including risks. For example, the board receives reports from investment professionals regarding risks related to the fund’s
investments and trading. The board also receives compliance reports from the fund’s and the investment adviser’s chief
compliance officers addressing certain areas of risk.
Committees
of the fund’s board, which are comprised of independent board members, none of whom is an “interested person”
of the fund within the meaning of the 1940 Act, as well as joint committees of independent board members of funds managed by Capital
Research and Management Company, also explore risk management procedures in particular areas and then report back to the full
board. For example, the fund’s audit committee oversees the processes and certain attendant risks relating to financial
reporting, valuation of fund assets, and related controls. Similarly, a joint review and advisory committee oversees certain risk
controls relating to the fund's transfer agency services.
Not all
risks that may affect the fund can be identified or processes and controls developed to eliminate or mitigate their effect. Moreover,
it is necessary to bear certain risks (such as investment-related risks) to achieve the fund’s objectives. As a result of
the foregoing and other factors, the ability of the fund’s service providers to eliminate or mitigate risks is subject to
limitations.
Committees
of the board of trustees — The fund has an audit committee comprised of William H. Baribault, Mary Davis Holt, Laurel
B. Mitchell and Alexandra Trower. The committee provides oversight regarding the funds’ accounting and financial reporting
policies and practices, their internal controls and the internal controls of the funds’ principal service providers. The
committee acts as a liaison between the funds’ independent registered public accounting firm and the full board of trustees.
The audit committee held five meetings during the 2019 fiscal year.
The
fund has a contracts committee comprised of all of its independent board members. The committee’s principal function is
to request, review and consider the information deemed necessary to evaluate the terms of certain agreements between the fund
and their investment adviser or the investment adviser’s affiliates, such as the Investment Advisory and Service Agreement,
Principal Underwriting Agreement, Administrative Services Agreement and Plans of Distribution adopted pursuant to rule 12b-1 under
the 1940 Act, that the fund may enter into, renew or continue, and to make its recommendations to the full board of trustees on
these matters. The contracts committee held one meeting during the 2019 fiscal year.
Tax-exempt
income funds — Page 35
The
fund has a nominating and governance committee comprised of James G. Ellis, Nariman Farvardin, R. Clark Hooper, Merit E. Janow,
and Margaret Spellings. The committee periodically reviews such issues as each board’s composition, responsibilities, committees,
compensation and other relevant issues, and recommends any appropriate changes to the full board of trustees. The committee also
evaluates, selects and nominates independent trustee candidates to the full board of trustees. While the committee normally is
able to identify from its own and other resources an ample number of qualified candidates, it will consider shareholder suggestions
of persons to be considered as nominees to fill future vacancies on the boards. Such suggestions must be sent in writing to the
nominating and governance committee of the fund, addressed to the fund’s secretary, and must be accompanied by complete
biographical and occupational data on the prospective nominee, along with a written consent of the prospective nominee for consideration
of his or her name by the committee. The fund’s nominating and governance committee held three meetings during the 2019
fiscal year.
The
independent board members of the fund have oversight responsibility for the fund and certain other funds managed by the investment
adviser. As part of their oversight responsibility for these funds, each independent board member sits on one of three fund review
committees comprised solely of independent board members. The three committees are divided by portfolio type. Each committee functions
independently and is not a decision making body. The purpose of the committees is to assist the board of each fund in the oversight
of the investment management services provided by the investment adviser. In addition to regularly monitoring and reviewing investment
results, investment activities and strategies used to manage the fund’s assets, the committees also receive reports from
the investment adviser’s Principal Investment Officers for the funds, portfolio managers and other investment personnel
concerning efforts to achieve the fund’s investment objectives. Each committee reports to the full board of the fund.
Proxy
voting procedures and principles — The fund’s investment adviser, in consultation with the fund’s board,
has adopted Proxy Voting Procedures and Principles (the “Principles”) with respect to voting proxies of securities
held by the fund, other American Funds and American Funds Insurance Series. The complete text of these principles is available
on the American Funds website at capitalgroup.com. Proxies are voted by a committee of the appropriate equity investment division
of the investment adviser under authority delegated by the funds’ boards. The Boards of American Funds have established
a Joint Proxy Committee (“JPC”) composed of independent board members from each American Funds board. The JPC’s
role is to facilitate appropriate oversight of the proxy voting process and provide valuable input on corporate governance and
related matters.
The
Principles, which have been in effect in substantially their current form for many years, provide an important framework for analysis
and decision-making by all funds. However, they are not exhaustive and do not address all potential issues. The Principles provide
a certain amount of flexibility so that all relevant facts and circumstances can be considered in connection with every vote.
As a result, each proxy received is voted on a case-by-case basis considering the specific circumstances of each proposal. The
voting process reflects the funds’ understanding of the company’s business, its management and its relationship with
shareholders over time.
The investment
adviser seeks to vote all U.S. proxies; however, in certain circumstances it may be impracticable or impossible to do so. Proxies
for companies outside the U.S. also are voted, provided there is sufficient time and information available. After a proxy statement
is received, the investment adviser prepares a summary of the proposals contained in the proxy statement. A notation of any potential
conflicts of interest also is included in the summary (see below for a description of Capital Research and Management Company’s
special review procedures).
For
proxies of securities managed by a particular equity investment division of the investment adviser, the initial voting recommendation
is made by one or more of the division’s investment analysts familiar with the company and industry. A second recommendation
is made by a proxy coordinator (an
Tax-exempt
income funds — Page 36
investment
analyst or other individual with experience in corporate governance and proxy voting matters) within the appropriate investment
division, based on knowledge of these Principles and familiarity with proxy-related issues. The proxy summary and voting recommendations
are made available to the appropriate proxy voting committee for a final voting decision. In cases where a fund is co-managed
and a security is held by more than one of the investment adviser’s equity investment divisions, the divisions may develop
different voting recommendations for individual ballot proposals. If this occurs, and if permitted by local market conventions,
the fund’s position will generally be voted proportionally by divisional holding, according to their respective decisions.
Otherwise, the outcome will be determined by the equity investment division or divisions with the larger position in the security
as of the record date for the shareholder meeting.
In
addition to its proprietary proxy voting, governance and executive compensation research, Capital Research and Management Company
may utilize research provided by Institutional Shareholder Services, Glass-Lewis & Co. or other third-party advisory firms
on a case-by-case basis. It does not, as a policy, follow the voting recommendations provided by these firms. It periodically
assesses the information provided by the advisory firms and reports to the JPC, as appropriate.
From
time to time the investment adviser may vote proxies issued by, or on proposals sponsored or publicly supported by (a) a
client with substantial assets managed by the investment adviser or its affiliates, (b) an
entity with a significant business relationship with Capital Group, or (c) a
company with a director of an American Fund on its board (each referred to as an “Interested Party”). Other persons
or entities may also be deemed an Interested Party if facts or circumstances appear to give rise to a potential conflict. The
investment adviser analyzes these proxies and proposals on their merits and does not consider these relationships when casting
its vote.
The
investment adviser has developed procedures to identify and address instances where a vote could appear to be influenced by such
a relationship. Under the procedures, prior to a final vote being cast by the investment adviser, the relevant proxy committees’
voting results for proxies issued by Interested Parties are reviewed by a Special Review Committee (“SRC”) of the
investment division voting the proxy if the vote was in favor of the Interested Party.
If
a potential conflict is identified according to the procedure above, the SRC will be provided with a summary of any relevant communications
with the Interested Party, the rationale for the voting decision, information on the organization’s relationship with the
party and any other pertinent information. The SRC will evaluate the information and determine whether the decision was in the
best interest of fund shareholders. It will then accept or override the voting decision or determine alternative action. The SRC
includes senior investment professionals and legal and compliance professionals.
Information
regarding how the fund voted proxies relating to portfolio securities during the 12-month period ended June 30 of each year will
be available on or about September 1 of such year (a) without charge, upon request
by calling American Funds Service Company at (800) 421-4225, (b) on the American
Funds website and (c) on the SEC’s website at sec.gov.
The
following summary sets forth the general positions of American Funds, American Funds Insurance Series and the investment adviser
on various proposals. A copy of the full Principles is available upon request, free of charge, by calling American Funds Service
Company or visiting the American Funds website.
Director
matters — The election of a company’s slate of nominees for director generally is supported. Votes may be withheld
for some or all of the nominees if this is determined to be in the best interest of shareholders or if, in the opinion of the
investment adviser, such nominee
Tax-exempt
income funds — Page 37
has
not fulfilled his or her fiduciary duty. Separation of the chairman and CEO positions also may be supported.
Governance
provisions — Typically, proposals to declassify a board (elect all directors annually) are supported based on the belief
that this increases the directors’ sense of accountability to shareholders. Proposals for cumulative voting generally are
supported in order to promote management and board accountability and an opportunity for leadership change. Proposals designed
to make director elections more meaningful, either by requiring a majority vote or by requiring any director receiving more withhold
votes than affirmative votes to tender his or her resignation, generally are supported.
Shareholder
rights — Proposals to repeal an existing poison pill generally are supported. (There may be certain circumstances, however,
when a proxy voting committee of a fund or an investment division of the investment adviser believes that a company needs to maintain
anti-takeover protection.) Proposals to eliminate the right of shareholders to act by written consent or to take away a shareholder’s
right to call a special meeting typically are not supported.
Compensation
and benefit plans — Option plans are complicated, and many factors are considered in evaluating a plan. Each plan is
evaluated based on protecting shareholder interests and a knowledge of the company and its management. Considerations include
the pricing (or repricing) of options awarded under the plan and the impact of dilution on existing shareholders from past and
future equity awards. Compensation packages should be structured to attract, motivate and retain existing employees and qualified
directors; however, they should not be excessive.
Routine
matters — The ratification of auditors, procedural matters relating to the annual meeting and changes to company name
are examples of items considered routine. Such items generally are voted in favor of management’s recommendations unless
circumstances indicate otherwise.
Tax-exempt
income funds — Page 38
Principal
fund shareholders — The following tables identify those investors who own of record, or are known by the fund to own
beneficially, 5% or more of any class of its shares as of the opening of business on September 1, 2019. Unless otherwise indicated,
the ownership percentages below represent ownership of record rather than beneficial ownership.
American
Funds Short-Term Tax-Exempt Bond Fund
| |
|
|
|
| NAME
AND ADDRESS |
OWNERSHIP |
OWNERSHIP
PERCENTAGE |
EDWARD
D JONES & CO
FOR THE BENEFIT OF CUSTOMERS
OMNIBUS ACCOUNT
SAINT LOUIS MO |
RECORD |
CLASS
A |
37.06% |
| |
CLASS
F-1 |
9.63 |
| |
CLASS
F-3 |
43.28 |
| |
|
|
| |
|
|
|
WELLS
FARGO CLEARING SERVICES LLC
SPECIAL CUSTODY ACCT FOR THE
EXCLUSIVE BENEFIT OF CUSTOMER
SAINT LOUIS MO |
RECORD |
CLASS
A |
9.95 |
| |
|
|
| |
|
|
| |
|
|
| |
|
|
|
UBS
WM USA
OMNIBUS ACCOUNT
WEEHAWKEN NJ |
RECORD |
CLASS
A |
6.93 |
| |
|
|
| |
|
|
| |
|
|
|
PERSHING
LLC
OMNIBUS ACCOUNT
JERSEY CITY NJ |
RECORD |
CLASS
A |
5.55 |
| |
CLASS
F-1 |
5.80 |
| |
CLASS
F-3 |
25.87 |
| |
|
|
|
MORGAN
STANLEY SMITH BARNEY LLC
FOR THE BENEFIT OF ITS CUSTOMERS
OMNIBUS ACCOUNT
NEW YORK NY |
RECORD |
CLASS
A |
5.21 |
| |
|
|
| |
|
|
| |
|
|
| |
|
|
|
TD
AMERITRADE INC FOR THE
EXCLUSIVE BENEFIT OF OUR CLIENTS
OMNIBUS ACCOUNT
OMAHA NE |
RECORD |
CLASS
F-1 |
51.13 |
| |
CLASS
F-3 |
5.53 |
| |
|
|
| |
|
|
| |
|
|
|
CHARLES
SCHWAB & CO INC
OMNIBUS ACCOUNT #1
SAN FRANCISCO CA |
RECORD |
CLASS
F-1 |
9.97 |
| |
|
|
| |
|
|
| |
|
|
|
NATIONAL
FINANCIAL SERVICES LLC
FOR EXCLUSIVE BEN OF OUR CUSTOMERS
OMNIBUS ACCOUNT
JERSEY CITY NJ |
RECORD |
CLASS
F-1 |
6.58 |
| |
|
|
| |
|
|
| |
|
|
| |
|
|
|
LPL
FINANCIAL
--OMNIBUS CUSTOMER ACCOUNT--
SAN DIEGO CA |
RECORD |
CLASS
F-2 |
15.79 |
| |
|
|
| |
|
|
| |
|
|
|
Tax-exempt
income funds — Page 39
| |
|
|
|
| NAME
AND ADDRESS |
OWNERSHIP |
OWNERSHIP
PERCENTAGE |
RAYMOND
JAMES
OMNIBUS FOR MUTUAL FUNDS
HOUSE ACCOUNT
ST PETERSBURG FL |
RECORD |
CLASS
F-2 |
13.15 |
| |
|
|
| |
|
|
| |
|
|
| |
|
|
|
INDIVIDUAL
INVESTOR
NEW YORK NY |
BENEFICIAL |
CLASS
F-2 |
8.77 |
| |
|
|
| |
|
|
|
TRUST
ACCOUNT
HERMOSA BEACH CA |
BENEFICIAL |
CLASS
F-2 |
8.44 |
| |
|
|
| |
|
|
|
BNY
MELLON N A
OMNIBUS ACCOUNT
PITTSBURGH PA |
RECORD |
CLASS
F-3 |
12.83 |
| |
|
|
| |
|
|
| |
|
|
|
CHARLES
SCHWAB & CO INC
OMNIBUS ACCOUNT #2
SAN FRANCISCO CA |
RECORD |
CLASS
F-3 |
7.08 |
| |
|
|
| |
|
|
| |
|
|
|
AMERICAN
FUNDS TAX-EXEMPT
PRESERVATION PORTFOLIO
OMNIBUS ACCOUNT
NORFOLK VA |
RECORD |
CLASS
R-6 |
100.00 |
| |
|
|
| |
|
|
| |
|
|
Limited
Term Tax-Exempt Bond Fund of America
| |
|
|
|
| NAME
AND ADDRESS |
OWNERSHIP |
OWNERSHIP
PERCENTAGE |
EDWARD
D JONES & CO
FOR THE BENEFIT OF CUSTOMERS
OMNIBUS ACCOUNT
SAINT LOUIS MO |
RECORD |
CLASS
A |
41.20% |
| |
CLASS
C |
18.09 |
| |
CLASS
F-3 |
33.01 |
| |
|
|
| |
|
|
|
PERSHING
LLC
OMNIBUS ACCOUNT
JERSEY CITY NJ |
RECORD |
CLASS
A |
9.05 |
| |
CLASS
C |
11.59 |
| |
CLASS
F-1 |
9.23 |
| |
CLASS
F-2 |
13.63 |
| |
CLASS
F-3 |
19.20 |
| |
|
|
|
WELLS
FARGO CLEARING SERVICES LLC
SPECIAL CUSTODY ACCT FOR THE
EXCLUSIVE BENEFIT OF CUSTOMER
SAINT LOUIS MO |
RECORD |
CLASS
A |
8.27 |
| |
CLASS
C |
8.37 |
| |
CLASS
F-2 |
7.52 |
| |
|
|
| |
|
|
|
Tax-exempt
income funds — Page 40
| |
|
|
|
| NAME
AND ADDRESS |
OWNERSHIP |
OWNERSHIP
PERCENTAGE |
NATIONAL
FINANCIAL SERVICES LLC
FOR EXCLUSIVE BEN OF OUR CUSTOMERS
OMNIBUS ACCOUNT
JERSEY CITY NJ |
RECORD |
CLASS
A |
5.56 |
| |
CLASS
F-1 |
25.43 |
| |
CLASS
F-2 |
10.32 |
| |
CLASS
F-3 |
18.05 |
| |
|
|
|
MORGAN
STANLEY SMITH BARNEY LLC
FOR THE BENEFIT OF ITS CUSTOMERS
OMNIBUS ACCOUNT
NEW YORK NY |
RECORD |
CLASS
C |
12.70 |
| |
CLASS
F-2 |
6.63 |
| |
|
|
| |
|
|
| |
|
|
|
LPL
FINANCIAL
--OMNIBUS CUSTOMER ACCOUNT--
SAN DIEGO CA |
RECORD |
CLASS
C |
5.63 |
| |
CLASS
F-2 |
7.22 |
| |
|
|
| |
|
|
|
CHARLES
SCHWAB & CO INC
OMNIBUS ACCOUNT #1
SAN FRANCISCO CA |
RECORD |
CLASS
F-1 |
14.97 |
| |
|
|
| |
|
|
| |
|
|
| |
|
|
|
MLPF&S
FOR THE SOLE BENEFIT OF
ITS CUSTOMERS
OMNIBUS ACCOUNT
JACKSONVILLE FL |
RECORD |
CLASS
F-1 |
8.38 |
| |
CLASS
F-2 |
16.26 |
| |
|
|
| |
|
|
| |
|
|
|
SEI
PRIVATE TRUST CO
C/O GWP US ADVISORS
ACCOUNT
OAKS PA |
RECORD |
CLASS
F-1 |
5.71 |
| |
|
|
| |
|
|
| |
|
|
| |
|
|
|
TD
AMERITRADE INC FOR THE
EXCLUSIVE BENEFIT OF OUR CLIENTS
OMNIBUS ACCOUNT
OMAHA NE |
RECORD |
CLASS
F-1 |
5.36 |
| |
|
|
| |
|
|
| |
|
|
| |
|
|
|
UBS
WM USA
OMNIBUS ACCOUNT
WEEHAWKEN NJ |
RECORD |
CLASS
F-2 |
8.46 |
| |
|
|
| |
|
|
| |
|
|
| |
|
|
| |
|
|
|
INDIVIDUAL
INVESTOR
WASHINGTON DC |
BENEFICIAL |
CLASS
F-2 |
6.91 |
| |
|
|
| |
|
|
| |
|
|
|
RAYMOND
JAMES
OMNIBUS FOR MUTUAL FUNDS
HOUSE ACCOUNT
ST PETERSBURG FL |
RECORD |
CLASS
F-2 |
5.96 |
| |
|
|
| |
|
|
| |
|
|
Tax-exempt
income funds — Page 41
| |
|
|
|
| NAME
AND ADDRESS |
OWNERSHIP |
OWNERSHIP
PERCENTAGE |
| |
|
|
|
CHARLES
SCHWAB & CO INC
OMNIBUS ACCOUNT #2
SAN FRANCISCO CA |
RECORD |
CLASS
F-3 |
12.38 |
| |
|
|
| |
|
|
| |
|
|
|
BNY
MELLON N A
OMNIBUS ACCOUNT
PITTSBURGH PA |
RECORD |
CLASS
F-3 |
5.40 |
| |
|
|
| |
|
|
| |
|
|
|
AMERICAN
FUNDS TAX-EXEMPT
PRESERVATION PORTFOLIO
OMNIBUS ACCOUNT
NORFOLK VA |
RECORD |
CLASS
R-6 |
100.00 |
| |
|
|
| |
|
|
| |
|
|
The
Tax-Exempt Bond Fund of America
| |
|
|
|
| NAME
AND ADDRESS |
OWNERSHIP |
OWNERSHIP
PERCENTAGE |
EDWARD
D JONES & CO
FOR THE BENEFIT OF CUSTOMERS
OMNIBUS ACCOUNT
SAINT LOUIS MO |
RECORD |
CLASS
A |
40.72% |
| |
CLASS
C |
23.80 |
| |
CLASS
F-3 |
26.48 |
| |
|
|
| |
|
|
|
WELLS
FARGO CLEARING SERVICES LLC
SPECIAL CUSTODY ACCT FOR THE
EXCLUSIVE BENEFIT OF CUSTOMER
SAINT LOUIS MO |
RECORD |
CLASS
A |
7.44 |
| |
CLASS
C |
9.97 |
| |
CLASS
F-1 |
5.12 |
| |
|
|
| |
|
|
|
PERSHING
LLC
OMNIBUS ACCOUNT
JERSEY CITY NJ |
RECORD |
CLASS
A |
7.41 |
| |
CLASS
C |
10.24 |
| |
CLASS
F-1 |
8.48 |
| |
CLASS
F-2 |
26.06 |
| |
|
|
|
NATIONAL
FINANCIAL SERVICES LLC
FOR EXCLUSIVE BEN OF OUR CUSTOMERS
OMNIBUS ACCOUNT
JERSEY CITY NJ |
RECORD |
CLASS
A |
5.71 |
| |
CLASS
C |
5.46 |
| |
CLASS
F-1 |
33.02 |
| |
CLASS
F-2 |
14.03 |
| |
|
|
|
CHARLES
SCHWAB & CO INC
SPEC CUSTODY ACCT FBO
CUSTOMERS
SAN FRANCISCO CA |
RECORD |
CLASS
F-1 |
14.21 |
| |
|
|
| |
|
|
| |
|
|
| |
|
|
|
MORGAN
STANLEY SMITH BARNEY LLC
FOR THE BENEFIT OF ITS CUSTOMERS
OMNIBUS ACCOUNT
NEW YORK NY |
RECORD |
CLASS
F-2 |
11.91 |
| |
|
|
| |
|
|
| |
|
|
Tax-exempt
income funds — Page 42
| |
|
|
|
| NAME
AND ADDRESS |
OWNERSHIP |
OWNERSHIP
PERCENTAGE |
| |
|
|
|
UBS
WM USA
OMNIBUS ACCOUNT
WEEHAWKEN NJ |
RECORD |
CLASS
F-2 |
8.14 |
| |
|
|
| |
|
|
| |
|
|
|
LPL
FINANCIAL
--OMNIBUS CUSTOMER ACCOUNT--
SAN DIEGO CA |
RECORD |
CLASS
F-2 |
7.56 |
| |
|
|
| |
|
|
| |
|
|
|
MLPF&S
FOR THE SOLE BENEFIT OF
ITS CUSTOMERS
OMNIBUS ACCOUNT
JACKSONVILLE FL |
RECORD |
CLASS
F-2 |
5.95 |
| |
|
|
| |
|
|
| |
|
|
| |
|
|
|
RAYMOND
JAMES
OMNIBUS FOR MUTUAL FUNDS
HOUSE ACCOUNT
ST PETERSBURG FL |
RECORD |
CLASS
F-2 |
5.75 |
| |
|
|
| |
|
|
| |
|
|
| |
|
|
|
J
P MORGAN SECURITIES LLC
FOR THE EXCLUSIVE BENE OF OUR CUSTS
4 CHASE METROTECH CENTER
OMNIBUS ACCOUNT
BROOKLYN NY |
RECORD |
CLASS
F-3 |
58.74 |
| |
|
|
| |
|
|
| |
|
|
| |
|
|
| |
|
|
|
AMERICAN
FUNDS TAX-ADVANTAGE
INCOME PORTFOLIO
OMNIBUS ACCOUNT
NORFOLK VA |
RECORD |
CLASS
R-6 |
100.00 |
| |
|
|
| |
|
|
| |
|
|
American
High-Income Municipal Bond Fund
| |
|
|
|
| NAME
AND ADDRESS |
OWNERSHIP |
OWNERSHIP
PERCENTAGE |
EDWARD
D JONES & CO
FOR THE BENEFIT OF CUSTOMERS
OMNIBUS ACCOUNT
SAINT LOUIS MO |
RECORD |
CLASS
A |
39.70% |
| |
CLASS
C |
14.23 |
| |
CLASS
F-3 |
34.86 |
| |
|
|
| |
|
|
|
WELLS
FARGO CLEARING SERVICES LLC
SPECIAL CUSTODY ACCT FOR THE
EXCLUSIVE BENEFIT OF CUSTOMER
SAINT LOUIS MO |
RECORD |
CLASS
A |
6.82 |
| |
CLASS
C |
11.47 |
| |
CLASS
F-2 |
5.91 |
| |
|
|
| |
|
|
|
Tax-exempt
income funds — Page 43
| |
|
|
|
| NAME
AND ADDRESS |
OWNERSHIP |
OWNERSHIP
PERCENTAGE |
PERSHING
LLC
OMNIBUS ACCOUNT
JERSEY CITY NJ |
RECORD |
CLASS
A |
6.41 |
| |
CLASS
C |
8.40 |
| |
CLASS
F-1 |
9.06 |
| |
CLASS
F-2 |
12.81 |
| |
CLASS
F-3 |
35.16 |
| |
|
|
|
NATIONAL
FINANCIAL SERVICES LLC
FOR EXCLUSIVE BEN OF OUR CUSTOMERS
OMNIBUS ACCOUNT
JERSEY CITY NJ |
RECORD |
CLASS
A |
5.27 |
| |
CLASS
C |
6.71 |
| |
CLASS
F-1 |
24.38 |
| |
CLASS
F-2 |
15.63 |
| |
CLASS
F-3 |
6.89 |
| |
|
|
|
MORGAN
STANLEY SMITH BARNEY LLC
FOR THE BENEFIT OF ITS CUSTOMERS
OMNIBUS ACCOUNT
NEW YORK NY |
RECORD |
CLASS
C |
5.69 |
| |
CLASS
F-2 |
6.74 |
| |
|
|
| |
|
|
| |
|
|
|
RAYMOND
JAMES
OMNIBUS FOR MUTUAL FUNDS
HOUSE ACCOUNT
ST PETERSBURG FL |
RECORD |
CLASS
C |
5.57 |
| |
CLASS
F-2 |
6.11 |
| |
|
|
| |
|
|
| |
|
|
|
MLPF&S
FOR THE SOLE BENEFIT OF
ITS CUSTOMERS
OMNIBUS ACCOUNT
JACKSONVILLE FL |
RECORD |
CLASS
C |
5.25 |
| |
CLASS
F-2 |
12.07 |
| |
|
|
| |
|
|
|
CHARLES
SCHWAB & CO INC
OMNIBUS ACCOUNT #1
SAN FRANCISCO CA |
RECORD |
CLASS
F-1 |
29.84 |
| |
|
|
| |
|
|
| |
|
|
|
UBS
WM USA
OMNIBUS ACCOUNT
WEEHAWKEN NJ |
RECORD |
CLASS
F-2 |
10.91 |
| |
|
|
| |
|
|
| |
|
|
|
LPL
FINANCIAL
--OMNIBUS CUSTOMER ACCOUNT--
SAN DIEGO CA |
RECORD |
CLASS
F-2 |
6.36 |
| |
|
|
| |
|
|
| |
|
|
|
CHARLES
SCHWAB & CO INC
OMNIBUS ACCOUNT #2
SAN FRANCISCO CA |
RECORD |
CLASS
F-3 |
10.15 |
| |
|
|
| |
|
|
| |
|
|
|
AMERICAN
FUNDS TAX-ADVANTAGE
INCOME PORTFOLIO
OMNIBUS ACCOUNT
NORFOLK VA |
RECORD |
CLASS
R-6 |
100.00 |
| |
|
|
| |
|
|
| |
|
|
Tax-exempt
income funds — Page 44
The
Tax-Exempt Fund of California
| |
|
|
|
| NAME
AND ADDRESS |
OWNERSHIP |
OWNERSHIP
PERCENTAGE |
EDWARD
D JONES & CO
FOR THE BENEFIT OF CUSTOMERS
OMNIBUS ACCOUNT
SAINT LOUIS MO |
RECORD |
CLASS
A |
23.15% |
| |
CLASS
C |
8.74 |
| |
CLASS
F-3 |
8.49 |
| |
|
|
| |
|
|
|
WELLS
FARGO CLEARING SERVICES LLC
SPECIAL CUSTODY ACCT FOR THE
EXCLUSIVE BENEFIT OF CUSTOMER
SAINT LOUIS MO |
RECORD |
CLASS
A |
11.36 |
| |
CLASS
C |
13.09 |
| |
CLASS
F-1 |
6.50 |
| |
CLASS
F-2 |
6.96 |
| |
|
|
|
PERSHING
LLC
OMNIBUS ACCOUNT
JERSEY CITY NJ |
RECORD |
CLASS
A |
7.59 |
| |
CLASS
C |
9.82 |
| |
CLASS
F-1 |
9.96 |
| |
CLASS
F-2 |
6.51 |
| |
CLASS
F-3 |
38.32 |
| |
|
|
|
UBS
WM USA
OMNIBUS ACCOUNT
WEEHAWKEN NJ |
RECORD |
CLASS
A |
5.88 |
| |
CLASS
F-2 |
7.68 |
| |
|
|
| |
|
|
|
MORGAN
STANLEY SMITH BARNEY LLC
FOR THE BENEFIT OF ITS CUSTOMERS
OMNIBUS ACCOUNT
NEW YORK NY |
RECORD |
CLASS
A |
5.53 |
| |
CLASS
C |
10.00 |
| |
CLASS
F-2 |
8.79 |
| |
|
|
| |
|
|
|
MLPF&S
FOR THE SOLE BENEFIT OF
ITS CUSTOMERS
OMNIBUS ACCOUNT
JACKSONVILLE FL |
RECORD |
CLASS
A |
5.45 |
| |
CLASS
C |
8.90 |
| |
CLASS
F-1 |
9.73 |
| |
CLASS
F-2 |
10.80 |
| |
|
|
|
LPL
FINANCIAL
--OMNIBUS CUSTOMER ACCOUNT--
SAN DIEGO CA |
RECORD |
CLASS
C |
5.05 |
| |
CLASS
F-1 |
7.00 |
| |
CLASS
F-2 |
6.39 |
| |
|
|
|
CHARLES
SCHWAB & CO INC
OMNIBUS ACCOUNT #!
SAN FRANCISCO CA |
RECORD |
CLASS
F-1 |
21.95 |
| |
|
|
| |
|
|
|
NATIONAL
FINANCIAL SERVICES LLC
FOR EXCLUSIVE BEN OF OUR CUSTOMERS
OMNIBUS ACCOUNT
JERSEY CITY NJ |
RECORD |
CLASS
F-1 |
14.65 |
| |
CLASS
F-2 |
17.18 |
| |
CLASS
F-3 |
7.84 |
| |
|
|
| |
|
|
|
Tax-exempt
income funds — Page 45
| |
|
|
|
| NAME
AND ADDRESS |
OWNERSHIP |
OWNERSHIP
PERCENTAGE |
CHARLES
SCHWAB & CO INC
OMNIBUS ACCOUNT #2
SAN FRANCISCO CA |
RECORD |
CLASS
F-3 |
32.04 |
| |
|
|
| |
|
|
| |
|
|
|
BNY
MELLON N A
OMNIBUS ACCOUNT
PITTSBURGH PA |
RECORD |
CLASS
F-3 |
6.48 |
| |
|
|
| |
|
|
American
Funds Tax-Exempt Fund of New York
| |
|
|
|
| NAME
AND ADDRESS |
OWNERSHIP |
OWNERSHIP
PERCENTAGE |
CAPITAL
RESEARCH & MANAGEMENT
COMPANY
CORPORATE ACCOUNT
IRVINE CA |
RECORD |
CLASS
A |
16.89% |
| |
CLASS
F-1 |
23.22 |
| |
|
|
| |
|
|
|
PERSHING
LLC
OMNIBUS ACCOUNT
JERSEY CITY NJ |
RECORD |
CLASS
A |
12.41 |
| |
CLASS
C |
23.99 |
| |
CLASS
F-1 |
11.55 |
| |
CLASS
F-2 |
12.43 |
| |
CLASS
F-3 |
81.99 |
| |
|
|
|
MORGAN
STANLEY SMITH BARNEY LLC
FOR THE BENEFIT OF ITS CUSTOMERS
OMNIBUS ACCOUNT
NEW YORK NY |
RECORD |
CLASS
A |
9.53 |
| |
CLASS
C |
6.35 |
| |
|
|
| |
|
|
| |
|
|
|
EDWARD
D JONES & CO
FOR THE BENEFIT OF CUSTOMERS
OMNIBUS ACCOUNT
SAINT LOUIS MO |
RECORD |
CLASS
A |
9.41 |
| |
CLASS
F-3 |
6.53 |
| |
|
|
| |
|
|
| |
|
|
|
J
P MORGAN SECURITIES LLC
FOR THE EXCLUSIVE BENE OF OUR CUSTS
4 CHASE METROTECH CENTER
OMNIBUS ACCOUNT
BROOKLYN NY |
RECORD |
CLASS
A |
6.65 |
| |
|
|
| |
|
|
| |
|
|
| |
|
|
| |
|
|
|
NATIONAL
FINANCIAL SERVICES LLC
FOR EXCLUSIVE BEN OF OUR CUSTOMERS
OMNIBUS ACCOUNT
JERSEY CITY NJ |
RECORD |
CLASS
A |
5.96 |
| |
CLASS
C |
7.48 |
| |
CLASS
F-1 |
19.56 |
| |
CLASS
F-2 |
17.35 |
| |
|
|
|
WELLS
FARGO CLEARING SERVICES LLC
SPECIAL CUSTODY ACCT FOR THE
EXCLUSIVE BENEFIT OF CUSTOMER
SAINT LOUIS MO |
RECORD |
CLASS
A |
5.16 |
| |
CLASS
C |
10.64 |
| |
CLASS
F-2 |
5.30 |
| |
|
|
Tax-exempt
income funds — Page 46
| |
|
|
|
| NAME
AND ADDRESS |
OWNERSHIP |
OWNERSHIP
PERCENTAGE |
| |
|
|
|
LPL
FINANCIAL
--OMNIBUS CUSTOMER ACCOUNT--
SAN DIEGO CA |
RECORD |
CLASS
C |
5.68 |
| |
CLASS
F-1 |
7.14 |
| |
CLASS
F-2 |
22.09 |
| |
|
|
|
RAYMOND
JAMES
OMNIBUS FOR MUTUAL FUNDS
HOUSE ACCOUNT
ST PETERSBURG FL |
RECORD |
CLASS
F-1 |
12.92 |
| |
|
|
| |
|
|
| |
|
|
| |
|
|
|
TD
AMERITRADE INC FOR THE
EXCLUSIVE BENEFIT OF OUR CLIENTS
OMNIBUS ACCOUNT
OMAHA NE |
RECORD |
CLASS
F-2 |
11.19 |
| |
|
|
| |
|
|
| |
|
|
| |
|
|
|
INDIVIDUAL
INVESTOR #1
NEW YORK NY |
BENEFICIAL |
CLASS
F-2 |
6.68 |
| |
|
|
| |
|
|
|
INDIVIDUAL
INVESTOR #2
NEW YORK NY |
BENEFICIAL |
CLASS
F-2 |
5.01 |
| |
|
|
| |
|
|
|
BNY
MELLON N A
OMNIBUS ACCOUNT
PITTSBURGH PA |
RECORD |
CLASS
F-3 |
10.70 |
| |
|
|
| |
|
|
Because
Class T shares are not currently offered to the public, Capital Research and Management Company, the fund’s investment adviser,
owns 100% of the fund‘s outstanding Class T shares.
As
of September 1, 2019, the officers and trustees of the fund, as a group, owned beneficially or of record less than 1% of the outstanding
shares of the fund.
Unless
otherwise noted, references in this statement of additional information to Class F shares refer to all F share classes.
Tax-exempt
income funds — Page 47
Investment
adviser — Capital Research and Management Company, the fund’s investment adviser, founded in 1931, maintains research
facilities in the United States and abroad (Beijing, Geneva, Hong Kong, London, Los Angeles, Mumbai, New York, San Francisco,
Singapore, Tokyo and Washington, D.C.). These facilities are staffed with experienced investment professionals. The investment
adviser is located at 333 South Hope Street, Los Angeles, CA 90071. It is a wholly owned subsidiary of The Capital Group Companies,
Inc., a holding company for several investment management subsidiaries. Capital Research and Management Company manages equity
assets through three equity investment divisions and fixed income assets through its fixed income investment division, Capital
Fixed Income Investors. The three equity investment divisions — Capital World Investors, Capital Research Global Investors
and Capital International Investors — make investment decisions independently of one another. Portfolio managers in Capital
International Investors rely on a research team that also provides investment services to institutional clients and other accounts
advised by affiliates of Capital Research and Management Company. The investment adviser, which is deemed under the Commodity
Exchange Act (the “CEA”) to be the operator of the fund, has claimed an exclusion from the definition of the term
commodity pool operator under the CEA with respect to the fund and, therefore, is not subject to registration or regulation as
such under the CEA with respect to the fund.
Tax-exempt
income funds — Page 48
The
investment adviser has adopted policies and procedures that address issues that may arise as a result of an investment professional’s
management of the fund and other funds and accounts. Potential issues could involve allocation of investment opportunities and
trades among funds and accounts, use of information regarding the timing of fund trades, investment professional compensation
and voting relating to portfolio securities. The investment adviser believes that its policies and procedures are reasonably designed
to address these issues.
Compensation
of investment professionals — As described in the prospectus, the investment adviser uses a system of multiple portfolio
managers in managing fund assets. In addition, for The Tax-Exempt Bond Fund of America, American High-Income Municipal Bond Fund
and The Tax-Exempt Fund of California, Capital Research and Management Company’s investment analysts may make investment
decisions with respect to a portion of a fund’s portfolio, within their research coverage. For the Tax-Exempt Fund of New
York, notwithstanding The Capital SystemSM, the fund’s portfolio managers
will work together to oversee the fund’s entire portfolio.
Portfolio
managers and investment analysts are paid competitive salaries by Capital Research and Management Company. In addition, they may
receive bonuses based on their individual portfolio results. Investment professionals also may participate in profit-sharing plans.
The relative mix of compensation represented by bonuses, salary and profit-sharing plans will vary depending on the individual’s
portfolio results, contributions to the organization and other factors.
To
encourage a long-term focus, bonuses based on investment results are calculated by comparing pretax total investment returns to
relevant benchmarks over the most recent one-, three-, five- and eight-year periods, with increasing weight placed on each succeeding
measurement period. For portfolio managers, benchmarks may include measures of the marketplaces in which the fund invests and
measures of the results of comparable mutual funds. For investment analysts, benchmarks may include relevant market measures and
appropriate industry or sector indexes reflecting their areas of expertise. Capital Research and Management Company makes periodic
subjective assessments of analysts’ contributions to the investment process and this is an element of their overall compensation.
The investment results of the fund’s portfolio managers may be measured against one or more benchmarks, depending on his
or her investment focus, such as:
Tax-exempt
income funds — Page 49
American
Funds Short-Term Tax-Exempt Bond Fund — a custom average consisting of one share class per fund of short municipal debt
funds that disclose investment objectives and strategies comparable to those of the fund and Bloomberg Barclays Municipal Short
1-5 Years Index;
Limited
Term Tax-Exempt Bond Fund of America — a custom average consisting of one share class per fund of short-intermediate municipal
debt funds that disclose investment objectives and strategies comparable to those of the fund and Bloomberg Barclays Municipal
Short-Intermediate 1-10 Years Index;
The
Tax-Exempt Bond Fund of America — a custom average consisting of one share class per fund of general and insured municipal
debt funds that disclose investment objectives and strategies comparable to those of the fund and Bloomberg Barclays Municipal
Bond Index;
American
High-Income Municipal Bond Fund — a custom average consisting of one share class per fund of high yield municipal debt funds
that disclose investment objectives and strategies comparable to those of fund, Bloomberg Barclays Municipal Bond Index, Bloomberg
Barclays Municipal Bond BAA Index and Bloomberg Barclays Municipal High Yield 5% Tobacco Cap 2% Issuer Cap Index;
The
Tax-Exempt Fund of California — a custom average consisting of one share class per fund of California municipal debt funds
that disclose investment objectives and strategies comparable to those of the fund and Bloomberg Barclays California Municipal
Index; and
American
Funds Tax-Exempt Fund of New York — a custom average consisting of one share class per fund of New York municipal debt funds
that disclose investment objectives and strategies comparable to those of the fund and Bloomberg Barclays New York Municipal Index.
From
time to time, Capital Research and Management Company may adjust or customize these benchmarks to better reflect the universe
of comparably managed funds of competitive investment management firms.
Portfolio
manager fund holdings and other managed accounts — As described below, portfolio managers may personally own shares
of the fund. In addition, portfolio managers may manage portions of other mutual funds or accounts advised by Capital Research
and Management Company or its affiliates.
Tax-exempt
income funds — Page 50
The
following table reflects information as of July 31, 2019:
| |
|
|
|
|
|
|
Portfolio
manager |
Dollar
range
of fund
shares
owned1 |
Number
of
other
registered
investment
companies (RICs)
for which
portfolio
manager
is a manager
(assets of RICs
in
billions)2 |
Number
of
other
pooled
investment
vehicles (PIVs)
for which
portfolio
manager
is a manager
(assets of PIVs
in
billions)2 |
Number
of
other
accounts
for which
portfolio
manager
is a manager
(assets of
other accounts
in billions) 2,3 |
| American
Funds Short-Term Tax-Exempt Bond Fund |
| Aaron
Applebaum |
$100,001–
$500,000 |
3 |
$5.0 |
None |
None |
| Mark
Marinella |
$100,001–
$500,000 |
6 |
$8.3 |
None |
211 |
$2.23 |
| Limited
Term Tax-Exempt Bond Fund of America |
| Mark
Marinella |
$100,001–
$500,000 |
6 |
$5.1 |
None |
211 |
$2.23 |
| Aaron
Applebaum |
$500,001–
$1,000,000 |
3 |
$1.8 |
None |
None |
| The
Tax-Exempt Bond Fund of America |
| Karl
J. Zeile |
Over
$1,000,000 |
3 |
$10.7 |
None |
None |
| Chad
M. Rach |
Over
$1,000,000 |
1 |
$7.8 |
None |
None |
Tax-exempt
income funds — Page 51
| |
|
|
|
|
|
|
Portfolio
manager |
Dollar
range
of fund
shares
owned1 |
Number
of
other
registered
investment
companies (RICs)
for which
portfolio
manager
is a manager
(assets of RICs
in
billions)2 |
Number
of
other
pooled
investment
vehicles (PIVs)
for which
portfolio
manager
is a manager
(assets of PIVs
in
billions)2 |
Number
of
other
accounts
for which
portfolio
manager
is a manager
(assets of
other accounts
in billions) 2,3 |
| American
High-Income Municipal Bond Fund |
| Karl
J. Zeile |
Over
$1,000,000 |
3 |
$24.5 |
None |
None |
| Chad
M. Rach |
Over
$1,000,000 |
1 |
$21.6 |
None |
None |
| Jerome
Solomon |
$100,001
– $500,000 |
1 |
$0.3 |
None |
None |
| The
Tax-Exempt Fund of California |
| Karl
J. Zeile |
$500,001
– $1,000,000 |
3 |
$29.7 |
None |
None |
| Mark
Marinella |
$100,001
– $500,000 |
6 |
$6.8 |
None |
211 |
$2.23 |
| American
Funds Tax-Exempt Fund of New York |
| Karl
J. Zeile |
None4 |
3 |
$32.0 |
None |
None |
| Jerome
Solomon |
None4 |
1 |
$7.8 |
None |
None |
1 Ownership
disclosure is made using the following ranges: None; $1 – $10,000; $10,001 – $50,000; $50,001 – $100,000; $100,001
– $500,000; $500,001 – $1,000,000; and Over $1,000,000.
2 Indicates
other RIC(s), PIV(s) or other accounts managed by Capital Research and Management Company or its affiliates for which the portfolio
manager also has significant day to day management responsibilities. Assets noted are the total net assets of the RIC(s), PIV(s)
or other accounts and are not the total assets managed by the individual, which is a substantially lower amount. No RIC, PIV or
other account has an advisory fee that is based on the performance of the RIC, PIV or other account, unless otherwise noted.
3 Personal
brokerage accounts of portfolio managers and their families are not reflected.
4 Funds
are designed primarily for taxable residents in the state of New York. Because the portfolio managers do not reside in this state,
investment in the fund may not be appropriate for their personal portfolio.
The
fund’s investment adviser has adopted policies and procedures to mitigate material conflicts of interest that may arise
in connection with a portfolio manager’s management of the fund, on the one hand, and investments in the other pooled investment
vehicles and other accounts, on the other hand, such as material conflicts relating to the allocation of investment opportunities
that may be suitable for both the fund and such other accounts.
Tax-exempt
income funds — Page 52
Investment
Advisory and Service Agreement — The Investment Advisory and Service Agreement (the “Agreement”) between
the fund and the investment adviser will continue in effect until April 30, 2020, unless sooner terminated, and may be renewed
from year to year thereafter, provided that any such renewal has been specifically approved at least annually by (a)
the board of trustees, or by the vote of a majority (as defined in the 1940 Act) of the outstanding voting securities of the fund,
and (b) the vote of a majority of trustees who are not parties to the Agreement
or interested persons (as defined in the 1940 Act) of any such party, cast in person at a meeting called for the purpose of voting
on such approval. The Agreement provides that the investment adviser has no liability to the fund for its acts or omissions in
the performance of its obligations to the fund not involving willful misconduct, bad faith, gross negligence or reckless disregard
of its obligations under the Agreement. The Agreement also provides that either party has the right to terminate them, without
penalty, upon 60 days’ written notice to the other party, and that the Agreement automatically terminates in the event of
its assignment (as defined in the 1940 Act). In addition, the Agreement provides that the investment adviser may delegate all,
or a portion of, its investment management responsibilities to one or more subsidiary advisers approved by the fund’s board,
pursuant to an agreement between the investment adviser and such subsidiary. Any such subsidiary adviser will be paid solely by
the investment adviser out of its fees.
In addition
to providing investment advisory services, the investment adviser furnishes the services and pays the compensation and travel
expenses of persons to perform the fund’s executive, administrative, clerical and bookkeeping functions, and provides suitable
office space, necessary small office equipment and utilities, general purpose accounting forms, supplies and postage used at the
fund’s offices. The fund pays all expenses not assumed by the investment adviser, including, but not limited to: custodian,
stock transfer and dividend disbursing fees and expenses; shareholder recordkeeping and administrative expenses; costs of the
designing, printing and mailing of reports, prospectuses, proxy statements and notices to their shareholders; taxes; expenses
of the issuance and redemption of fund shares (including stock certificates, registration and qualification fees and expenses);
expenses pursuant to the fund’s plans of distribution (described below); legal and auditing expenses; compensation, fees
and expenses paid to independent trustees; association dues; costs of stationery and forms prepared exclusively for the fund;
and costs of assembling and storing shareholder account data.
Tax-exempt
income funds — Page 53
American
Funds Short-Term Tax-Exempt Bond Fund: Under the Agreement, the investment adviser receives a management fee at the annual
rate of 0.341% of the average daily net assets of the fund. Management fees are paid monthly and accrued daily.
For
the fiscal years ended July 31, 2019, 2018 and 2017, the investment adviser earned from the fund management fees of $3,814,000,
$3,548,000 and $3,121,000, respectively.
Limited
Term Tax-Exempt Bond Fund of America: Under the Agreement, the investment adviser receives
a monthly fee based on the following annualized rates and net asset levels:
| |
|
|
| Rate |
Net
asset level |
| In
excess of |
Up
to |
| 0.30% |
$
0 |
$
60,000,000 |
| 0.18 |
60,000,000 |
1,000,000,000 |
| 0.15 |
1,000,000,000 |
|
The
Agreement also provides for fees based on monthly gross investment income at the following annualized rates:
| |
|
|
| Rate |
Monthly
gross investment income |
| In
excess of |
Up
to |
| 3.00% |
$
0 |
$
3,333,333 |
| 2.50 |
3,333,333 |
|
For
the purposes of such computations under the Agreement, the fund’s gross investment income is determined in accordance with
generally accepted accounting principles and does not reflect any net realized gains or losses on the sale of portfolio securities.
For
the fiscal years ended July 31, 2019, 2018 and 2017, the investment adviser earned from the fund management fees of $9,177,000,
$9,138,000 and $8,770,000, respectively.
Tax-exempt
income funds — Page 54
The
Tax-Exempt Bond Fund of America: Under the Agreement, the investment adviser receives a
monthly fee based on the following annualized rates and net asset levels:
| |
|
|
| Rate |
Net
asset level |
| In
excess of |
Up
to |
| 0.30% |
$
0 |
$
60,000,000 |
| 0.21 |
60,000,000 |
1,000,000,000 |
| 0.18 |
1,000,000,000 |
3,000,000,000 |
| 0.15 |
3,000,000,000 |
6,000,000,000 |
| 0.13 |
6,000,000,000 |
10,000,000,000 |
| 0.12 |
10,000,000,000 |
15,000,000,000 |
| 0.115 |
15,000,000,000 |
21,000,000,000 |
| 0.110 |
21,000,000,000 |
|
The
Agreement also provides for fees based on monthly gross investment income at the following annualized rates:
| |
|
|
| Rate |
Monthly
gross investment income |
| In
excess of |
Up
to |
| 3.00% |
$
0 |
$
3,333,333 |
| 2.50 |
3,333,333 |
8,333,333 |
| 2.00 |
8,333,333 |
|
For
the purposes of such computations under the Agreement, the fund’s gross investment income is determined in accordance with
generally accepted accounting principles and does not reflect any net realized gains or losses on the sale of portfolio securities.
For
the fiscal years ended July 31, 2019, 2018 and 2017, the investment adviser earned from the fund management fees of $40,751,000,
$35,922,000 and $31,128,000, respectively.
Tax-exempt
income funds — Page 55
American
High-Income Municipal Bond Fund: Under the Agreement, the investment adviser receives a
monthly fee based on the following annualized rates and net asset levels:
| |
|
|
| Rate |
Net
asset level |
| In
excess of |
Up
to |
| 0.30% |
$
0 |
$
60,000,000 |
| 0.21 |
60,000,000 |
1,000,000,000 |
| 0.18 |
1,000,000,000 |
3,000,000,000 |
| 0.15 |
3,000,000,000 |
6,000,000,000 |
| 0.14 |
6,000,000,000 |
|
The
Agreement also provides for fees based on monthly gross investment income at the following annualized rates:
| |
|
|
| Rate |
Monthly
gross investment income |
| In
excess of |
Up
to |
| 3.00% |
$
0 |
$
3,333,333 |
| 2.50 |
3,333,333 |
|
For
the purposes of such computations under the Agreement, the fund’s gross investment income is determined in accordance with
generally accepted accounting principles and does not reflect any net realized gains or losses on the sale of portfolio securities.
For
the fiscal years ended July 31, 2019, 2018 and 2017, the investment adviser earned from the fund management fees of $19,255,000,
$17,182,000 and $14,971,000, respectively.
Tax-exempt
income funds — Page 56
The
Tax-Exempt Fund of California: Under the Agreement, the investment adviser receives a monthly
fee based on the following annualized rates and net asset levels:
| |
|
|
| Rate |
Net
asset level |
| In
excess of |
Up
to |
| 0.30% |
$
0 |
$
60,000,000 |
| 0.21 |
60,000,000 |
1,000,000,000 |
| 0.18 |
1,000,000,000 |
|
The
Agreement also provides for fees based on monthly gross investment income at the following annualized rates:
| |
|
|
| Rate |
Monthly
gross investment income |
| In
excess of |
Up
to |
| 3.00% |
$
0 |
$
3,333,333 |
| 2.50 |
3,333,333 |
|
For
the purposes of such computations under the Agreement, the fund’s gross investment income is determined in accordance with
generally accepted accounting principles and does not reflect any net realized gains or losses on the sale of portfolio securities.
For
the fiscal years ended July 31, 2019, 2018 and 2017, the investment adviser earned from the fund management fees of $6,774,000,
$6,453,000, $6,136,000, respectively.
Tax-exempt
income funds — Page 57
American
Funds Tax-Exempt Fund of New York: Under the Agreement, the investment advisor receives a management fee at the annual rate
of 0.204% of the average daily net assets of the fund. Management fees are paid monthly and accrued daily.
The
Agreement also provides for fees based on monthly gross investment income at the following annualized rates:
| |
|
|
| Rate |
Monthly
gross investment income |
| In
excess of |
Up
to |
| 3.00% |
$
0 |
$3,333,333 |
| 2.50 |
3,333,333 |
|
For
the fiscal years ended July 31, 2019, 2018 and 2017 the investment adviser earned from the fund management fees of $806,000, $756,000
and $689,000, respectively.
Fee
waiver - The investment adviser is currently reimbursing a portion of the expenses for each share class of TEFNY. These reimbursements
will be in effect through at least October 1, 2020. The adviser may elect at its discretion to extend, modify or terminate the
reimbursements at that time. For each of the fiscal years ended July 31, 2019, 2018 and 2017, the total expenses reimbursed
by the investment adviser were $7,000, $90,000 and $94,000, respectively.
Tax-exempt
income funds — Page 58
Administrative
services — The investment adviser and its affiliates provide certain administrative services for shareholders of the
fund’s Class A, C, T, F and R-6 shares, to the extent that they are offered by the fund. Administrative services are provided
by the investment adviser and its affiliates to help assist third parties providing non-distribution services to fund shareholders.
These services include providing in-depth information on the fund and market developments that impact fund investments. Administrative
services also include, but are not limited to, coordinating, monitoring and overseeing third parties that provide services to
fund shareholders.
These
services are provided pursuant to an Administrative Services Agreement (the “Administrative Agreement”) between the
fund and the investment adviser relating to the fund’s Class A, C, T, F and R-6 shares, to the extent that they are offered
by the fund. Each fund’s Administrative Agreement will continue in effect until at least April 30, 2020, unless sooner terminated
or renewed. It may be renewed from year to year thereafter, provided that any such renewal has been specifically approved at least
annually by the vote of a majority of the members of the fund’s board who are not parties to the Administrative Agreement
or interested persons (as defined in the 1940 Act) of any such party, cast in person at a meeting called for the purpose of voting
on such approval. The fund may terminate the Administrative Agreement at any time by vote of a majority of independent board members.
The investment adviser has the right to terminate the Administrative Agreement upon 60 days’ written notice to the fund.
The Administrative Agreement automatically terminates in the event of its assignment (as defined in the 1940 Act).
The
Administrative Services Agreement between the fund and the investment adviser provides the fund the ability to charge an administrative
services fee of .05% for all share classes. The fund’s investment adviser receives an administrative services fee at the
annual rate of .03% of the average daily net assets of the fund attributable to Class A, C, T, F and R-6 shares (which could be
increased as noted above) for its provision of administrative services. Administrative services fees are paid monthly and accrued
daily.
Tax-exempt
income funds — Page 59
During
the 2019 fiscal year, administrative services fees were:
| |
|
|
| |
|
Administrative
services fee |
| STEX |
Class
A |
$
88,000 |
| |
Class
T |
—* |
| |
Class
F-1 |
3,000
|
| |
Class
F-2 |
73,000
|
| |
Class
F-3 |
23,000
|
| |
Class
R-6 |
61,000
|
| LTEX |
Class
A |
347,000
|
| |
Class
C |
9,000
|
| |
Class
T |
—* |
| |
Class
F-1 |
29,000
|
| |
Class
F-2 |
209,000
|
| |
Class
F-3 |
119,000
|
| |
Class
R-6 |
141,000
|
| TEBF |
Class
A |
1,196,000
|
| |
Class
C |
195,000
|
| |
Class
T |
—* |
| |
Class
F-1 |
164,000
|
| |
Class
F-2 |
1,142,000
|
| |
Class
F-3 |
2,800,000
|
| |
Class
R-6 |
288,000
|
| AHIM |
Class
A |
499,000
|
| |
Class
C |
109,000
|
| |
Class
T |
—* |
| |
Class
F-1 |
88,000
|
| |
Class
F-2 |
460,000
|
| |
Class
F-3 |
356,000
|
| |
Class
R-6 |
288,000
|
| TEFCA |
Class
A |
196,000
|
| |
Class
C |
32,000
|
| |
Class
T |
—* |
| |
Class
F-1 |
35,000
|
| |
Class
F-2 |
166,000
|
| |
Class
F-3 |
90,000
|
| TEFNY |
Class
A |
22,000
|
| |
Class
C |
5,000
|
| |
Class
T |
—* |
| |
Class
F-1 |
1,000
|
| |
Class
F-2 |
12,000
|
| |
Class
F-3 |
14,000
|
* Amount
less than $1,000.
STEX
did not offer Class C shares in the 2019 fiscal year and is not currently offering C shares.
Tax-exempt
income funds — Page 60
Principal
Underwriter and plans of distribution — American Funds Distributors, Inc. (the “Principal Underwriter”)
is the principal underwriter of the fund’s shares. The Principal Underwriter is located at 333 South Hope Street, Los Angeles,
CA 90071; 6455 Irvine Center Drive, Irvine, CA 92618; 3500 Wiseman Boulevard, San Antonio, TX 78251; and 12811 North Meridian
Street, Carmel, IN 46032.
The Principal
Underwriter receives revenues relating to sales of the fund’s shares, as follows:
· For
Class A shares, the Principal Underwriter receives commission revenue consisting of the balance of the Class A sales charge remaining
after the allowances by the Principal Underwriter to investment dealers.
· For
Class C shares, the Principal Underwriter receives any contingent deferred sales charges that apply during the first year after
purchase.
In addition,
the fund reimburses the Principal Underwriter for advancing immediate service fees to qualified dealers and advisors upon the
sale of Class C shares. The fund also reimburses the Principal Underwriter for service fees paid on a quarterly basis to intermediaries,
such as qualified dealers or financial advisors, in connection with investments in Class T and F-1 shares.
Tax-exempt
income funds — Page 61
Commissions,
revenue or service fees retained by the Principal Underwriter after allowances or compensation to dealers were:
| |
|
|
|
|
|
| |
Fiscal
year |
Commissions,
revenue
or
fees retained |
Allowance
or
compensation
to dealers |
| Class
A |
2019 |
STEX
LTEX
TEBF
AHIM
TEFCA
TEFNY |
$
178,000
546,000
2,408,000
1,208,000
321,000
37,000 |
STEX
LTEX
TEBF
AHIM
TEFCA
TEFNY |
$
691,000
2,119,000
9,199,000
4,695,000
1,243,000
145,000 |
| |
2018 |
STEX
LTEX
TEBF
AHIM
TEFCA
TEFNY |
151,000
698,000
2,832,000
1,240,000
378,000
45,000 |
STEX
LTEX
TEBF
AHIM
TEFCA
TEFNY |
610,000
2,725,000
10,968,000
4,759,000
1,461,000
196,000 |
| |
2017 |
STEX
LTEX
TEBF
AHIM
TEFCA
TEFNY |
193,000
806,000
3,366,000
1,340,000
430,000
74,000 |
STEX
LTEX
TEBF
AHIM
TEFCA
TEFNY |
728,000
3,140,000
12,920,000
5,070,000
1,699,000
265,000 |
| Class
C* |
2019 |
LTEX
TEBF
AHIM
TEFCA
TEFNY |
14,000
—
—
7,000
5,000 |
LTEX
TEBF
AHIM
TEFCA
TEFNY |
—
573,000
384,000
87,000
12,000 |
| |
2018 |
LTEX
TEBF
AHIM
TEFCA
TEFNY |
22,000
68,000
21,000
17,000
— |
LTEX
TEBF
AHIM
TEFCA
TEFNY |
—
735,000
406,000
132,000
22,000 |
| |
2017 |
LTEX
TEBF
AHIM
TEFCA
TEFNY |
44,000
459,000
226,000
91,000
12,000 |
LTEX
TEBF
AHIM
TEFCA
TEFNY |
11,000
987,000
443,000
215,000
23,000 |
* STEX
does not currently offer Class C shares.
Tax-exempt
income funds — Page 62
Plans
of distribution — The fund has adopted plans of distribution (the “Plans”) pursuant to rule 12b-1 under
the 1940 Act. The Plans permit the fund to expend amounts to finance any activity primarily intended to result in the sale of
fund shares, provided the fund’s board of trustees has approved the category of expenses for which payment is being made.
Each
Plan is specific to a particular share class of the fund. As the fund has not adopted a Plan for Class F-2, F-3 or Class
R-6, no 12b-1 fees are paid from Class F-2, F-3 or Class R-6 share assets and the following disclosure is not applicable to these
share classes.
Payments
under the Plans may be made for service-related and/or distribution-related expenses. Service-related expenses include paying
service fees to qualified dealers. Distribution-related expenses include commissions paid to qualified dealers. The amounts actually
paid under the Plans for the past fiscal year, expressed as a percentage of the fund’s average daily net assets attributable
to the applicable share class, are disclosed in the prospectus under “Fees and expenses of the fund.” Further information
regarding the amounts available under each Plan is in the “Plans of Distribution” section of the prospectus.
Following
is a brief description of the Plans:
Class
A — For Class A shares, up to .25% (and, in the case of STEX, up to .15%) of the fund's average daily net assets attributable
to such shares is reimbursed to the Principal Underwriter for paying service-related expenses, and the balance available under
the applicable Plan may be paid to the Principal Underwriter for distribution-related expenses. STEX may annually expend up to
.15%, LTEX and AHIM may annually expend up to .30%, and TEBF and TEFCA may annually expend up to .25% for Class A shares under
the applicable Plan. TEFNY may annually expend up to .30% for Class A shares under the applicable Plan; however, for Class A shares,
the board of trustees has approved payments to the Principal Underwriter of up to .25% of the fund’s average daily net assets,
in the aggregate, for paying service- and distribution-related expenses.
Distribution-related
expenses for Class A shares include dealer commissions and wholesaler compensation paid on sales of shares of $1 million or more
purchased without a sales charge. Commissions on these “no load” purchases (which are described in further detail
under the “Sales Charges” section of this statement of additional information document) in excess of the Class A Plan
limitations and not reimbursed to the Principal Underwriter during the most recent fiscal quarter are recoverable for 15 months,
provided that the reimbursement of such commissions does not cause the fund to exceed the annual expense limit. After 15 months,
these commissions are not recoverable. As of the fund’s most recent fiscal year, unreimbursed expenses that remained subject
to reimbursement under the Plan for Class A shares totaled $1,142,000 or .15% of Class A net assets for STEX, $7,545,000 or .07%
of Class A net assets for TEBF, $363,000 or .01% of Class A net assets for AHIM, $1,516,000 or .08% of Class A net assets for
TEFCA and $50,000 or .02% of Class A net assets for TEFNY.
Class
C — The Plan for Class C shares provide for payments to the Principal Underwriter of up to .25% of each fund’s
average daily net assets attributable to such shares for paying service-related expenses and .75% for distribution-related expenses.
Class
T — For Class T shares, the fund may annually expend up to .50% under the applicable Plan; however, the fund’s
board of trustees has approved payments to the Principal Underwriter of up to .25% of the fund’s average daily net assets
attributable to Class T shares for paying service-related expenses.
Tax-exempt
income funds — Page 63
Class
F-1 — The Plan for Class F-1 shares provide for payments to the Principal Underwriter of up to .25% of each fund’s
average daily net assets attributable to such shares for paying service-related expenses. The fund may annually expend up to .50%
for Class F-1 shares under the applicable Plan; however, for Class F-1 shares, the board of trustees has approved payments to
the Principal Underwriter of up to .25% of each fund’s average daily net assets attributable to such shares for paying service-
and distribution-related expenses.
Payment
of service fees — For purchases of less than $1 million, payment of service fees to investment dealers generally begins
accruing immediately after establishment of an account in Class A or C shares. For purchases of $1 million or more, payment of
service fees to investment dealers generally begins accruing 12 months after establishment of an account in Class A shares. Service
fees are not paid on certain investments made at net asset value including accounts established by registered representatives
and their family members as described in the “Sales charges” section of the prospectus.
During
the 2019 fiscal year, 12b-1 expenses, accrued and paid, and if applicable, unpaid were:
| |
|
|
|
|
| |
12b-1
expenses |
12b-1
unpaid liability
outstanding |
| Class
A |
STEX
LTEX
TEBF
AHIM
TEFCA
TEFNY |
$
1,126,000
8,775,000
25,330,000
12,635,000
4,149,000
457,000 |
STEX
LTEX
TEBF
AHIM
TEFCA
TEFNY |
$
37,000
531,000
1,067,000
936,000
143,000
28,000 |
| Class
C |
LTEX
TEBF
AHIM
TEFCA
TEFNY |
191,000
4,045,000
2,265,000
669,000
111,000 |
LTEX
TEBF
AHIM
TEFCA
TEFNY |
18,000
460,000
240,000
67,000
11,000 |
| Class
T |
STEX
LTEX
TEBF
AHIM
TEFCA
TEFNY |
—
—
—
—
—
— |
STEX
LTEX
TEBF
AHIM
TEFCA
TEFNY |
—
—
—
—
—
— |
| Class
F-1 |
STEX
LTEX
TEBF
AHIM
TEFCA
TEFNY |
17,000
147,000
842,000
451,000
178,000
4,000 |
STEX
LTEX
TEBF
AHIM
TEFCA
TEFNY |
2,000
15,000
90,000
42,000
17,000
—* |
*
Amount less than $1,000.
STEX
did not offer C shares during the 2019 fiscal year and is not currently offering C shares.
Tax-exempt
income funds — Page 64
Approval
of the Plans — As required by rule 12b-1 and the 1940 Act, the Plans (together with the Principal Underwriting Agreement)
have been approved by the full board of trustees and separately by a majority of the independent trustees of the fund who have
no direct or indirect financial interest in the operation of the Plans or the Principal Underwriting Agreement. In addition, the
selection and nomination of independent trustees of the fund are committed to the discretion of the independent trustees during
the existence of the Plans.
Potential
benefits of the Plans to the fund and its shareholders include enabling shareholders to obtain advice and other services from
a financial advisor at a reasonable cost, the likelihood that the Plans will stimulate sales of the fund benefiting the investment
process through growth or stability of assets and the ability of the shareholders to choose among various alternatives in paying
for sales and service. The Plans may not be amended to materially increase the amount spent for distribution without shareholder
approval. Plan expenses are reviewed quarterly by the board of trustees and the Plans must be renewed annually by the board of
trustees.
A portion
of the fund’s 12b-1 expense is paid to financial advisors to compensate them for providing ongoing services. If you have
questions regarding your investment in the fund or need assistance with your account, please contact your financial advisor. If
you need a financial advisor, please call American Funds Distributors at (800) 421-4120 for assistance.
Tax-exempt
income funds — Page 65
Other
compensation to dealers — As of January 2019, the top dealers (or their affiliates)
that American Funds Distributors anticipates will receive additional compensation (as described in the prospectus) include:
| |
|
| Advisor
Group |
|
| FSC
Securities Corporation |
|
| |
| Signator
Investors, Inc. |
|
| |
| Royal
Alliance Associates, Inc. |
|
| SagePoint
Financial, Inc. |
|
| Woodbury
Financial Services, Inc. |
|
| American
Portfolios Financial Services, Inc. |
|
| Ameriprise |
|
| Ameriprise
Financial Services, Inc. |
|
| AXA
Advisors |
|
| AXA
Advisors, LLC |
|
| Cambridge |
|
| Cambridge
Investment Research, Inc. |
|
| Cetera
Financial Group |
|
| Cetera
Advisor Networks LLC |
|
| Cetera
Advisors LLC |
|
| Cetera
Financial Specialists LLC |
|
| Cetera
Investment Services LLC |
|
| CIMAS,
LLC |
|
| First
Allied Securities Inc. |
|
| |
| Legend
Advisory Corporation |
|
| Summit
Brokerage Services, Inc. |
|
| |
| Charles
Schwab Network |
|
| Charles
Schwab & Co., Inc. |
|
| Charles
Schwab Bank |
|
| |
| Commonwealth |
|
| Commonwealth
Financial Network |
|
| D.A.
Davidson & Co. |
|
| Edward
Jones |
|
| Fidelity
Network Group |
|
| Fidelity
Deposit & Discount Bank |
|
| Fidelity
Retirement Network |
|
| National
Financial Services LLC |
|
| Hefren-Tillotson,
Inc. |
|
| HTK |
|
| Hornor,
Townsend & Kent, Inc. |
|
| J.J.B.
Hilliard Lyons |
|
| Hilliard
Lyons Trust Company LLC |
|
| J.J.B.
Hilliard, W. L. Lyons, LLC |
|
| J.P.
Morgan Chase Banc One |
|
| J.P.
Morgan Securities LLC |
|
| JP
Morgan Chase Bank, N.A. |
|
| Janney
Montgomery Scott |
|
| Janney
Montgomery Scott LLC |
|
| |
Tax-exempt
income funds — Page 66
| |
|
| Kestra
Securities |
|
| H.
Beck, Inc. |
|
| Kestra
Investment Services LLC |
|
| NFP
Advisor Services LLC |
|
| Ladenburg
Thalmann Group |
|
| Investacorp,
Inc. |
|
| KMS
Financial Services, Inc. |
|
| Ladenburg
Thalmann Asset Management Inc. |
|
| Ladenburg,
Thalmann & Co., Inc. |
|
| Securities
America, Inc. |
|
| Securities
Service Network Inc. |
|
| Triad
Advisors LLC |
|
| Lincoln
Network |
|
| Lincoln
Financial Advisors Corporation |
|
| |
| Lincoln
Financial Securities Corporation |
|
| LPL
Group |
|
| LPL
Financial LLC |
|
| Mass
Mutual / MML |
|
| MassMutual
Trust Company FSB |
|
| MML
Distributors LLC |
|
| MML
Investors Services, LLC |
|
| The
MassMutual Trust Company FSB |
|
| Merrill
Lynch Banc of America |
|
| Bank
of America |
|
| Bank
of America, NA |
|
| Merrill
Lynch, Pierce, Fenner & Smith Incorporated |
|
| Morgan
Stanley Smith Barney |
|
| |
| Morgan
Stanley Wealth Management |
|
| |
| NMIS |
|
| Northwestern
Mutual Investment Services, LLC |
|
| |
| Park
Avenue Securities LLC |
|
| PFS |
|
| Financial
Sense Securities Inc. |
|
| PFS
Investments Inc. |
|
| PNC
Network |
|
| PNC
Bank, National Association |
|
| PNC
Investments LLC |
|
| Raymond
James Group |
|
| Raymond
James & Associates, Inc. |
|
| Raymond
James Financial Services Inc. |
|
| RBC |
|
| RBC
Capital Markets LLC |
|
| Robert
W. Baird |
|
| Robert
W. Baird & Co, Incorporated |
|
| Stifel,
Nicolaus & Co |
|
| |
| Stifel,
Nicolaus & Company, Incorporated |
|
Tax-exempt
income funds — Page 67
| |
|
| UBS |
|
| UBS
Financial Services, Inc. |
|
| UBS
Securities, LLC |
|
| Voya
Financial |
|
| Voya
Financial Advisors, Inc. |
|
| Wells
Fargo Network |
|
| Wells
Fargo Advisors Financial Network, LLC |
|
| Wells
Fargo Advisors Latin American Channel |
|
| Wells
Fargo Advisors LLC (WBS) |
|
| Wells
Fargo Advisors Private Client Group |
|
| Wells
Fargo Bank, N.A. |
|
| Wells
Fargo Clearing Services LLC |
|
| Wells
Fargo Securities, LLC |
|
Tax-exempt
income funds — Page 68
Execution
of portfolio transactions
The
investment adviser places orders with broker-dealers for the fund’s portfolio transactions. Purchases and sales of equity
securities on a securities exchange or an over-the-counter market are effected through broker-dealers who receive commissions
for their services. Generally, commissions relating to securities traded on foreign exchanges will be higher than commissions
relating to securities traded on U.S. exchanges and may not be subject to negotiation. Equity securities may also be purchased
from underwriters at prices that include underwriting fees. Purchases and sales of fixed income securities are generally made
with an issuer or a primary market maker acting as principal with no stated brokerage commission. The price paid to an underwriter
for fixed income securities includes underwriting fees. Prices for fixed income securities in secondary trades usually include
undisclosed compensation to the market maker reflecting the spread between the bid and ask prices for the securities.
In
selecting broker-dealers, the investment adviser strives to obtain “best execution” (the most favorable total price
reasonably attainable under the circumstances) for the fund’s portfolio transactions, taking into account a variety of factors.
These factors include the size and type of transaction, the nature and character of the markets for the security to be purchased
or sold, the cost, quality, likely speed and reliability of execution and settlement, the broker-dealer’s or execution venue’s
ability to offer liquidity and anonymity and the potential for minimizing market impact. The investment adviser considers these
factors, which involve qualitative judgments, when selecting broker-dealers and execution venues for fund portfolio transactions.
The investment adviser views best execution as a process that should be evaluated over time as part of an overall relationship
with particular broker-dealer firms. The investment adviser and its affiliates negotiate commission rates with broker-dealers
based on what they believe is reasonably necessary to obtain best execution. They seek, on an ongoing basis, to determine what
the reasonable levels of commission rates for execution services are in the marketplace, taking various considerations into account,
including the extent to which a broker-dealer has put its own capital at risk, historical commission rates and commission rates
that other institutional investors are paying. The fund does not consider the investment adviser as having an obligation to obtain
the lowest commission rate available for a portfolio transaction to the exclusion of price, service and qualitative considerations.
Brokerage commissions are only a small part of total execution costs and other factors, such as market impact and speed of execution,
contribute significantly to overall transaction costs.
The
investment adviser may execute portfolio transactions with broker-dealers who provide certain brokerage and/or investment research
services to it but only when in the investment adviser’s judgment the broker-dealer is capable of providing best execution
for that transaction. The investment adviser makes decisions for procurement of research separately and distinctly from decisions
on the choice of brokerage and execution services. The receipt of these research services permits the investment adviser to supplement
its own research and analysis and makes available the views of, and information from, individuals and the research staffs of other
firms. Such views and information may be provided in the form of written reports, telephone contacts and meetings with securities
analysts. These services may include, among other things, reports and other communications with respect to individual companies,
industries, countries and regions, economic, political and legal developments, as well as scheduling meetings with corporate executives
and seminars and conferences related to relevant subject matters. Research services that the investment adviser receives from
broker-dealers may be used by the investment adviser in servicing the fund and other funds and accounts that it advises; however,
not all such services will necessarily benefit the fund.
As
of January 1, 2019, the investment adviser has undertaken to bear the cost of all third-party investment research services for
all client accounts it advises. However, in order to compensate certain U.S. broker-dealers for research consumed, and valued,
by the investment adviser’s investment professionals, the investment adviser continues to operate a limited commission sharing
arrangement with commissions on equity trades for certain registered investment companies it advises. The
Tax-exempt
income funds — Page 69
investment
adviser voluntarily reimburses such registered investment companies for all amounts collected into the commission sharing arrangement.
In order to operate the commission sharing arrangement, the investment adviser may cause such registered investment companies
to pay commissions in excess of what other broker-dealers might have charged for certain portfolio transactions in recognition
of brokerage and/or investment research services. In this regard, the investment adviser has adopted a brokerage allocation procedure
consistent with the requirements of Section 28(e) of the U.S. Securities Exchange Act of 1934. Section 28(e) permits the investment
adviser and its affiliates to cause an account to pay a higher commission to a broker-dealer to compensate the broker-dealer or
another service provider for certain brokerage and/or investment research services provided to the investment adviser and its
affiliates, if the investment adviser and each affiliate makes a good faith determination that such commissions are reasonable
in relation to the value of the services provided by such broker-dealer to the investment adviser and its affiliates in terms
of that particular transaction or the investment adviser’s overall responsibility to the fund and other accounts that it
advises. Certain brokerage and/or investment research services may not necessarily benefit all accounts paying commissions to
each such broker-dealer; therefore, the investment adviser and its affiliates assess the reasonableness of commissions in light
of the total brokerage and investment research services provided to the investment adviser and its affiliates. Further, investment
research services may be used by all investment associates of the investment adviser and its affiliates, regardless of whether
they advise accounts with trading activity that generates eligible commissions.
In
accordance with their internal brokerage allocation procedure, the investment adviser and its affiliates periodically assess the
brokerage and investment research services provided by each broker-dealer and each other service provider from which they receive
such services. As part of its ongoing relationships, the investment adviser and its affiliates routinely meet with firms to discuss
the level and quality of the brokerage and research services provided, as well as the value and cost of such services. In valuing
the brokerage and investment research services the investment adviser and its affiliates receive from broker-dealers and other
research providers in connection with its good faith determination of reasonableness, the investment adviser and its affiliates
take various factors into consideration, including the quantity, quality and usefulness of the services to the investment adviser
and its affiliates. Based on this information and applying their judgment, the investment adviser and its affiliates set an annual
research budget.
Research
analysts and portfolio managers periodically participate in a research poll to determine the usefulness and value of the research
provided by individual broker-dealers and research providers. Based on the results of this research poll, the investment adviser
and its affiliates may, through commission sharing arrangements with certain broker-dealers, direct a portion of commissions paid
to a broker-dealer by the fund and other registered investment companies managed by the investment adviser or its affiliates to
be used to compensate the broker-dealer and/or other research providers for research services they provide. While the investment
adviser and its affiliates may negotiate commission rates and enter into commission sharing arrangements with certain broker-dealers
with the expectation that such broker-dealers will be providing brokerage and research services, none of the investment adviser,
any of its affiliates or any of their clients incurs any obligation to any broker-dealer to pay for research by generating trading
commissions. The investment adviser and its affiliates negotiate prices for certain research that may be paid through commission
sharing arrangements or by themselves with cash.
When
executing portfolio transactions in the same equity security for the funds and accounts, or portions of funds and accounts, over
which the investment adviser, through its equity investment divisions, has investment discretion, each investment division within
the adviser and its affiliates normally aggregates its respective purchases or sales and executes them as part of the same transaction
or series of transactions. When executing portfolio transactions in the same fixed income security for the fund and the other
funds or accounts over which it or one of its affiliated companies has investment discretion, the investment adviser normally
aggregates such purchases or sales and executes them as part of the same transaction or series of transactions. The objective
of aggregating
Tax-exempt
income funds — Page 70
purchases
and sales of a security is to allocate executions in an equitable manner among the funds and other accounts that have concurrently
authorized a transaction in such security. The investment adviser and its affiliates serve as investment adviser for certain accounts
that are designed to be substantially similar to another account. This type of account will often generate a large number of relatively
small trades when it is rebalanced to its reference fund due to differing cash flows or when the account is initially started
up. The investment adviser may not aggregate program trades or electronic list trades executed as part of this process. Non-aggregated
trades performed for these accounts will be allocated entirely to that account. This is done only when the investment adviser
believes doing so will not have a material impact on the price or quality of other transactions.
The investment
adviser currently owns an interest in IEX Group and Luminex Trading and Analytics. The investment adviser may place orders on
these or other exchanges or alternative trading systems in which it, or one of its affiliates, has an ownership interest, provided
such ownership interest is less than five percent of the total ownership interests in the entity. The investment adviser is subject
to the same best execution obligations when trading on any such exchange or alternative trading system.
Purchase
and sale transactions may be effected directly among and between certain funds or accounts advised by the investment adviser or
its affiliates, including the fund. The investment adviser maintains cross-trade policies and procedures and places a cross-trade
only when such a trade is in the best interest of all participating clients and is not prohibited by the participating funds’
or accounts’ investment management agreement or applicable law.
The
investment adviser may place orders for the fund’s portfolio transactions with broker-dealers who have sold shares of the
funds managed by the investment adviser or its affiliated companies; however, it does not consider whether a broker-dealer has
sold shares of the funds managed by the investment adviser or its affiliated companies when placing any such orders for the fund’s
portfolio transactions.
Purchases
and sales of futures contracts for the fund will be effected through executing brokers and FCMs that specialize in the types of
futures contracts that the fund expects to hold. The investment adviser will use reasonable efforts to choose executing brokers
and FCMs capable of providing the services necessary to obtain the most favorable price and execution available. The full range
and quality of services available will be considered in making these determinations. The investment adviser will monitor the executing
brokers and FCMs used for purchases and sales of futures contracts for their ability to execute trades based on many factors,
such as the sizes of the orders, the difficulty of executions, the operational facilities of the firm involved and other factors.
Forward
currency contracts are traded directly between currency traders (usually large commercial banks) and their customers. The cost
to the fund of engaging in such contracts varies with factors such as the currency involved, the length of the contract period
and the market conditions then prevailing. Because such contracts are entered into on a principal basis, their prices usually
include undisclosed compensation to the market maker reflecting the spread between the bid and ask prices for the contracts. The
fund may incur additional fees in connection with the purchase or sale of certain contracts.
No
brokerage commissions were paid on portfolio transactions by STEX, LTEX, TEBF, AHIM, TEFCA and TEFNY for the 2019, 2018 and 2017
fiscal years.
Tax-exempt
income funds — Page 71
Disclosure
of portfolio holdings
The fund’s
investment adviser, on behalf of the fund, has adopted policies and procedures with respect to the disclosure of information about
fund portfolio securities. These policies and procedures have been reviewed by the fund’s board of trustees, and compliance
will be periodically assessed by the board in connection with reporting from the fund’s Chief Compliance Officer.
Under
these policies and procedures, the fund’s complete list of portfolio holdings available for public disclosure, dated as
of the end of each calendar quarter, is permitted to be posted on the American Funds website no earlier than the 10th day after
such calendar quarter. In practice, the publicly disclosed portfolio is typically posted on the American Funds website within
30 days after the end of the calendar quarter. The publicly disclosed portfolio may exclude certain securities when deemed to
be in the best interest of the fund as permitted by applicable regulations. In addition, the fund’s list of top 10 equity
portfolio holdings measured by percentage of net assets, dated as of the end of each calendar month, is permitted to be posted
on the American Funds website no earlier than the 10th day after such month. Such portfolio holdings information may be disclosed
to any person pursuant to an ongoing arrangement to disclose portfolio holdings information to such person no earlier than one
day after the day on which the information is posted on the American Funds website.
Certain
intermediaries are provided additional information about the fund’s management team, including information on the fund’s
portfolio securities they have selected. This information is provided to larger intermediaries that require the information to
make the fund available for investment on the firm’s platform. Intermediaries receiving the information are required to
keep it confidential and use it only to analyze the fund.
The fund’s
custodian, outside counsel, auditor, financial printers, proxy voting service providers, pricing information vendors, consultants
or agents operating under a contract with the investment adviser or its affiliates, co-litigants (such as in connection with a
bankruptcy proceeding related to a fund holding) and certain other third parties described below, each of which requires portfolio
holdings information for legitimate business and fund oversight purposes, may receive fund portfolio holdings information earlier.
See the “General information” section in this statement of additional information for further information about the
fund’s custodian, outside counsel and auditor.
The
fund‘s portfolio holdings, dated as of the end of each calendar month, are made available to up to 20 key broker-dealer
relationships with research departments to help them evaluate the fund for eligibility on approved lists or in model portfolios.
These firms include certain of those listed under the “Other compensation to dealers” section of this statement of
additional information and certain broker-dealer firms that offer trading platforms for registered investment advisers. Monthly
holdings may be provided to these intermediaries no earlier than the 10th day after the end of the calendar month. In practice,
monthly holdings are provided within 30 days after the end of the calendar month. Holdings may also be disclosed more frequently
to certain statistical and data collection agencies including Morningstar, Lipper, Inc., Value Line, Vickers Stock Research, Bloomberg
and Thomson Financial Research.
Affiliated
persons of the fund, including officers of the fund and employees of the investment adviser and its affiliates, who receive portfolio
holdings information are subject to restrictions and limitations on the use and handling of such information pursuant to applicable
codes of ethics, including requirements not to trade in securities based on confidential and proprietary investment information,
to maintain the confidentiality of such information, and to pre-clear securities trades and report securities transactions activity,
as applicable. For more information on these restrictions and limitations, please see the “Code of ethics” section
in this statement of additional information and the Code of Ethics. Third-party service providers of the fund and other entities,
as described in this statement of additional information, receiving such information are subject to confidentiality
Tax-exempt
income funds — Page 72
obligations.
When portfolio holdings information is disclosed other than through the American Funds website to persons not affiliated with
the fund, such persons will be bound by agreements (including confidentiality agreements) or fiduciary or other obligations that
restrict and limit their use of the information to legitimate business uses only. None of the fund, its investment adviser or
any of their affiliates receives compensation or other consideration in connection with the disclosure of information about portfolio
securities.
Subject
to board policies, the authority to disclose a fund’s portfolio holdings, and to establish policies with respect to such
disclosure, resides with the appropriate investment-related committees of the fund’s investment adviser. In exercising their
authority, the committees determine whether disclosure of information about the fund’s portfolio securities is appropriate
and in the best interest of fund shareholders. The investment adviser has implemented policies and procedures to address conflicts
of interest that may arise from the disclosure of fund holdings. For example, the investment adviser’s code of ethics specifically
requires, among other things, the safeguarding of information about fund holdings and contains prohibitions designed to prevent
the personal use of confidential, proprietary investment information in a way that would conflict with fund transactions. In addition,
the investment adviser believes that its current policy of not selling portfolio holdings information and not disclosing such
information to unaffiliated third parties until such holdings have been made public on the American Funds website (other than
to certain fund service providers and other third parties for legitimate business and fund oversight purposes) helps reduce potential
conflicts of interest between fund shareholders and the investment adviser and its affiliates.
The fund’s
investment adviser and its affiliates provide investment advice to clients other than the fund that have investment objectives
that may be substantially similar to those of the fund. These clients also may have portfolios consisting of holdings substantially
similar to those of the fund and generally have access to current portfolio holdings information for their accounts. These clients
do not owe the fund’s investment adviser or the fund a duty of confidentiality with respect to disclosure of their portfolio
holdings.
Tax-exempt
income funds — Page 73
Price
of shares
Shares
are purchased at the offering price or sold at the net asset value price next determined after the purchase or sell order is received
by the fund or the Transfer Agent provided that your request contains all information and legal documentation necessary to process
the transaction. The Transfer Agent may accept written orders for the sale of fund shares on a future date. These orders are subject
to the Transfer Agent’s policies, which generally allow shareholders to provide a written request to sell shares at the
net asset value on a specified date no more than five business days after receipt of the order by the Transfer Agent. Any request
to sell shares on a future date will be rejected if the request is not in writing, if the requested transaction date is more than
five business days after the Transfer Agent receives the request or if the request does not contain all information and legal
documentation necessary to process the transaction.
The
offering or net asset value price is effective for orders received prior to the time of determination of the net asset value and,
in the case of orders placed with dealers or their authorized designees, accepted by the Principal Underwriter, the Transfer Agent,
a dealer or any of their designees. In the case of orders sent directly to the fund or the Transfer Agent, an investment dealer
should be indicated. The dealer is responsible for promptly transmitting purchase and sell orders to the Principal Underwriter.
Orders
received by the investment dealer or authorized designee, the Transfer Agent or the fund after the time of the determination of
the net asset value will be entered at the next calculated offering price. Note that investment dealers or other intermediaries
may have their own rules about share transactions and may have earlier cut-off times than those of the fund. For more information
about how to purchase through your intermediary, contact your intermediary directly.
Prices
that appear in the newspaper do not always indicate prices at which you will be purchasing and redeeming shares of the fund, since
such prices generally reflect the previous day’s closing price, while purchases and redemptions are made at the next calculated
price. The price you pay for shares, the offering price, is based on the net asset value per share, which is calculated once daily
as of approximately 4 p.m. New York time, which is the normal close of trading on the New York Stock Exchange, each day the New
York Stock Exchange is open. If, for example, the New York Stock Exchange closes at 1 p.m. New York time, the fund’s share
price would still be determined as of 4 p.m. New York time. In such example, portfolio securities traded on the New York Stock
Exchange would be valued at their closing prices unless the investment adviser determines that a fair value adjustment is appropriate
due to subsequent events. The New York Stock Exchange is currently closed on weekends and on the following holidays: New Year’s
Day; Martin Luther King Jr. Day; Presidents’ Day; Good Friday; Memorial Day; Independence Day; Labor Day; Thanksgiving;
and Christmas Day. Each share class of the fund has a separately calculated net asset value (and share price).
All
portfolio securities of funds managed by Capital Research and Management Company (other than American Funds U.S. Government Money
Market Fund) are valued, and the net asset values per share for each share class are determined, as indicated below. The fund
follows standard industry practice by typically reflecting changes in its holdings of portfolio securities on the first business
day following a portfolio trade.
Equity
securities, including depositary receipts, are generally valued at the official closing price of, or the last reported sale price
on, the exchange or market on which such securities are traded, as of the close of business on the day the securities are being
valued or, lacking any sales, at the last available bid price. Prices for each security are taken from the principal exchange
or market on which the security trades.
Tax-exempt
income funds — Page 74
Fixed
income securities, including short-term securities, are generally valued at prices obtained from one or more pricing vendors.
The pricing vendors base prices on, among other things, benchmark yields, transactions, bids, offers, quotations from dealers
and trading systems, new issues, underlying equity of the issuer, interest rate volatilities, spreads and other relationships
observed in the markets among comparable securities and proprietary pricing models such as yield measures calculated using factors
such as cash flows, prepayment information, default rates, delinquency and loss assumptions, financial or collateral characteristics
or performance, credit enhancements, liquidation value calculations, specific deal information and other reference data. The fund’s
investment adviser performs certain checks on vendor prices prior to calculation of the fund’s net asset value. When the
investment adviser deems it appropriate to do so (such as when vendor prices are unavailable or not deemed to be representative),
fixed income securities will be valued in good faith at the mean quoted bid and ask prices that are reasonably and timely available
(or bid prices, if ask prices are not available) or at prices for securities of comparable maturity, quality and type.
Securities
with both fixed income and equity characteristics (e.g., convertible bonds, preferred stocks, units comprised of more than one
type of security, etc.), or equity securities traded principally among fixed income dealers, are generally valued in the manner
described above for either equity or fixed income securities, depending on which method is deemed most appropriate by the investment
adviser.
Forward
currency contracts are valued at the mean of representative quoted bid and ask prices, generally based on prices supplied by one
or more pricing vendors.
Futures
contracts are generally valued at the official settlement price of, or the last reported sale price on, the principal exchange
or market on which such instruments are traded, as of the close of business on the day the contracts are being valued or, lacking
any sales, at the last available bid price.
Swaps,
including both interest rate swaps and positions in credit default swap indices, are valued using market quotations or valuations
provided by one or more pricing vendors.
Assets
or liabilities initially expressed in terms of currencies other than U.S. dollars are translated prior to the next determination
of the net asset value of the fund’s shares into U.S. dollars at the prevailing market rates.
Securities
and other assets for which representative market quotations are not readily available or are considered unreliable by the investment
adviser are valued at fair value as determined in good faith under fair value guidelines adopted by authority of the fund’s
board. Subject to board oversight, the fund’s board has appointed the fund’s investment adviser to make fair valuation
determinations, which are directed by a valuation committee established by the fund’s investment adviser. The board receives
regular reports describing fair-valued securities and the valuation methods used.
The valuation
committee has adopted guidelines and procedures (consistent with SEC rules and guidance) to consider certain relevant principles
and factors when making fair value determinations. As a general principle, securities lacking readily available market quotations,
or that have quotations that are considered unreliable by the investment adviser, are valued in good faith by the valuation committee
based upon what the fund might reasonably expect to receive upon their current sale. Fair valuations and valuations of investments
that are not actively trading involve judgment and may differ materially from valuations that would have been used had greater
market activity occurred. The valuation committee considers relevant indications of value that are reasonably and timely available
to it in determining the fair value to be assigned to a particular security, such as the type and cost of the security, contractual
or legal restrictions on resale of the security, relevant financial or business developments of the issuer, actively traded similar
or related securities, conversion or exchange rights on the security, related corporate actions, significant events occurring
after the close of trading in the
Tax-exempt
income funds — Page 75
security
and changes in overall market conditions. The valuation committee employs additional fair value procedures to address issues related
to equity securities that trade principally in markets outside the United States. Such securities may trade in markets that open
and close at different times, reflecting time zone differences. If significant events occur after the close of a market (and before
the fund’s net asset values are next determined) which affect the value of equity securities held in the fund’s portfolio,
appropriate adjustments from closing market prices may be made to reflect these events. Events of this type could include, for
example, earthquakes and other natural disasters or significant price changes in other markets (e.g., U.S. stock markets).
Each
class of shares represents interests in the same portfolio of investments and is identical in all respects to each other class,
except for differences relating to distribution, service and other charges and expenses, certain voting rights, differences relating
to eligible investors, the designation of each class of shares, conversion features and exchange privileges. Expenses attributable
to the fund, but not to a particular class of shares, are borne by each class pro rata based on relative aggregate net assets
of the classes. Expenses directly attributable to a class of shares are borne by that class of shares. Liabilities attributable
to particular share classes, such as liabilities for repurchase of fund shares, are deducted from total assets attributable to
such share classes.
Net
assets so obtained for each share class are then divided by the total number of shares outstanding of that share class, and the
result, rounded to the nearest cent, is the net asset value per share for that class.
Tax-exempt
income funds — Page 76
Taxes
and distributions
Disclaimer:
Some of the following information may
not apply to certain shareholders including those holding fund shares in a tax-deferred account, such as a retirement plan or
education savings account. Shareholders should consult their tax advisors about the application of federal, state and local tax
law in light of their particular situation.
Taxation
as a regulated investment company — The fund intends to qualify each year as a “regulated investment company”
under Subchapter M of the Internal Revenue Code (“Code”) so that it will not be liable for federal tax on income and
capital gains distributed to shareholders. In order to qualify as a regulated investment company, and avoid being subject to federal
income taxes, the fund intends to distribute substantially all of its net investment income and realized net capital gains on
a fiscal year basis, and intends to comply with other tests applicable to regulated investment companies under Subchapter M.
The
Code includes savings provisions allowing the fund to cure inadvertent failures of certain qualification tests required under
Subchapter M. However, should the fund fail to qualify under Subchapter M, the fund would be subject to federal, and possibly
state, corporate taxes on its taxable income and gains.
Amounts
not distributed by the fund on a timely basis in accordance with a calendar year distribution requirement may be subject to a
nondeductible 4% excise tax. Unless an applicable exception applies, to avoid the tax, the fund must distribute during each calendar
year an amount equal to the sum of (a) at least 98% of its ordinary income (not
taking into account any capital gains or losses) for the calendar year, (b) at
least 98.2% of its capital gains in excess of its capital losses for the twelve month period ending on October 31, and (c)
all ordinary income and capital gains for previous years that were not distributed during such years and on which the fund paid
no U.S. federal income tax.
Dividends
paid by the fund from ordinary income or from an excess of net short-term capital gain over net long-term capital loss are taxable
to shareholders as ordinary income dividends.
The
fund may declare a capital gain distribution consisting of the excess of net realized long-term capital gains over net realized
short-term capital losses. Net capital gains for a fiscal year are computed by taking into account any capital loss carryforward
of the fund.
The
fund may retain a portion of net capital gain for reinvestment and may elect to treat such capital gain as having been distributed
to shareholders of the fund. Shareholders may receive a credit for the tax that the fund paid on such undistributed net capital
gain and would increase the basis in their shares of the fund by the difference between the amount of includible gains and the
tax deemed paid by the shareholder.
Distributions
of net capital gain that the fund properly reports as a capital gain distribution generally will be taxable as long-term capital
gain, regardless of the length of time the shares of the fund have been held by a shareholder. Any loss realized upon the redemption
of shares held at the time of redemption for six months or less from the date of their purchase will be treated as a long-term
capital loss to the extent of any capital gain distributions (including any undistributed amounts treated as distributed capital
gains, as described above) during such six-month period.
Capital
gain distributions by the fund result in a reduction in the net asset value of the fund’s shares. Investors should consider
the tax implications of buying shares just prior to a capital gain distribution. The price of shares purchased at that time includes
the amount of the forthcoming distribution. Those purchasing just prior to a distribution will subsequently receive a partial
return of their investment capital upon payment of the distribution, which will be taxable to them.
Tax-exempt
income funds — Page 77
Redemptions
and exchanges of fund shares — Redemptions of shares, including exchanges for shares of other American Funds, may result
in federal, state and local tax consequences (gain or loss) to the shareholder.
Any
loss realized on a redemption or exchange of shares of the fund will be disallowed to the extent substantially identical shares
are reacquired within the 61-day period beginning 30 days before and ending 30 days after the shares are disposed of. Any loss
disallowed under this rule will be added to the shareholder’s tax basis in the new shares purchased.
If a
shareholder exchanges or otherwise disposes of shares of the fund within 90 days of having acquired such shares, and if, as a
result of having acquired those shares, the shareholder subsequently pays a reduced or no sales charge for shares of the fund,
or of a different fund acquired before January 31st of the year following
the year the shareholder exchanged or otherwise disposed of the original fund shares, the sales charge previously incurred in
acquiring the fund’s shares will not be taken into account (to the extent such previous sales charges do not exceed the
reduction in sales charges) for the purposes of determining the amount of gain or loss on the exchange, but will be treated as
having been incurred in the acquisition of such other fund(s).
Tax
consequences applicable to tax-exempt funds — Interest on the municipal securities purchased by the fund is believed
to be free from regular federal income tax based on opinions issued by bond counsel. However, there is no guarantee that the opinion
is correct or that the IRS will agree with the opinion. If interest on a municipal security is not free from regular federal income
tax, then the interest on that security would become taxable. If this were to happen, dividends derived from this interest may
be taxable to shareholders.
By
meeting certain requirements of the Code, the fund qualifies to pay exempt-interest dividends to shareholders. These exempt-interest
dividends are derived from interest income exempt from regular federal income tax, and are not subject to regular federal income
tax when they are distributed to fund shareholders. In addition, to the extent that exempt-interest dividends are derived from
interest on obligations of a state or its political subdivisions, or from interest on qualifying U.S. territorial obligations
(including qualifying obligations of Puerto Rico, the U.S. Virgin Islands or Guam), they also may be exempt from that state’s
personal income taxes.
Distributions
paid by a tax-exempt fund that are designated as exempt-interest dividends will not be subject to regular federal income tax.
Exempt-interest dividends paid by the fund will be reported to both the IRS and shareholders of the fund.
Private
activity bonds are bonds that, although federally tax-exempt, are used for purposes other than those generally performed by governmental
units and that benefit non-governmental entities. Interest on certain private activity bonds, while exempt from regular federal
income tax, is a preference item for taxpayers when determining their alternative minimum tax under the Code and under the income
tax provisions of several states.
The
price of a bond purchased after its original issuance may reflect market discount which, depending on the particular circumstances,
may result in the fund recognizing taxable ordinary income. In determining whether a bond is purchased with market discount, certain
de minimis rules apply.
Tax
consequences of investing in derivatives — The fund may enter into transactions involving derivatives, such as futures
and swaps. Special tax rules may apply to these types of transactions that could defer losses to the fund, accelerate the fund’s
income, alter the holding period of certain securities or change the classification of capital gains. These tax rules may therefore
impact the amount, timing and character of fund distributions.
Tax-exempt
income funds — Page 78
Other
tax considerations — After the end of each calendar year, individual shareholders holding fund shares in taxable accounts
will receive a statement of the federal income tax status of all distributions. Shareholders of the fund also may be subject to
state and local taxes on distributions received from the fund.
For
fund shares acquired on or after January 1, 2012, the fund is required to report cost basis information for redemptions, including
exchanges, to both shareholders and the IRS.
Shareholders
may obtain more information about cost basis online at capitalgroup.com/costbasis.
Under
the backup withholding provisions of the Code, the fund generally will be required to withhold federal income tax on all payments
made to a shareholder if the shareholder either does not furnish the fund with the shareholder’s correct taxpayer identification
number or fails to certify that the shareholder is not subject to backup withholding. Backup withholding also applies if the IRS
notifies the shareholder or the fund that the taxpayer identification number provided by the shareholder is incorrect or that
the shareholder has previously failed to properly report interest or dividend income.
The
foregoing discussion of U.S. federal income tax law relates solely to the application of that law to U.S. persons (i.e., U.S.
citizens and legal residents and U.S. corporations, partnerships, trusts and estates). Each shareholder who is not a U.S. person
should consider the U.S. and foreign tax consequences of ownership of shares of the fund, including the possibility that such
a shareholder may be subject to U.S. withholding taxes.
Tax-exempt
income funds — Page 79
Purchase
and exchange of shares
Purchases
by individuals — As described in the prospectus, you may generally open an account and purchase fund shares by contacting
a financial advisor or investment dealer authorized to sell the fund’s shares. You may make investments by any of the following
means:
Contacting
your financial advisor — Deliver or mail a check to your financial advisor.
By
mail — For initial investments, you may mail a check, made payable to the fund, directly to the address indicated on
the account application. Please indicate an investment dealer on the account application. You may make additional investments
by filling out the “Account Additions” form at the bottom of a recent transaction confirmation and mailing the form,
along with a check made payable to the fund, using the envelope provided with your confirmation.
The
amount of time it takes for us to receive regular U.S. postal mail may vary and there is no assurance that we will receive such
mail on the day you expect. Mailing addresses for regular U.S. postal mail can be found in the prospectus. To send investments
or correspondence to us via overnight mail or courier service, use either of the following addresses:
American
Funds
12711
North Meridian Street
Carmel,
IN 46032-9181
American
Funds
5300
Robin Hood Road
Norfolk,
VA 23513-2407
By
telephone — Using the American FundsLine. Please see the “Shareholder account services and privileges” section
of this statement of additional information for more information regarding this service.
By
Internet — Using capitalgroup.com. Please see the “Shareholder account services and privileges” section
of this statement of additional information for more information regarding this service.
Tax-exempt
income funds — Page 80
By
wire — If you are making a wire transfer, instruct your bank to wire funds to:
Wells
Fargo Bank
ABA
Routing No. 121000248
Account
No. 4600-076178
Your
bank should include the following information when wiring funds:
For
credit to the account of:
American
Funds Service Company
(fund’s
name)
For
further credit to:
(shareholder’s
fund account number)
(shareholder’s
name)
You
may contact American Funds Service Company at (800) 421-4225 if you have questions about making wire transfers.
Other
purchase information — American Funds state tax-exempt funds are qualified for sale only in certain jurisdictions, and
tax-exempt funds in general should not serve as retirement plan investments. The fund and the Principal Underwriter reserve the
right to reject any purchase order.
Class
R-6 shares are generally only available to American Funds Portfolio Series and other registered investment companies approved
by the fund’s investment adviser or distributor.
Purchase
minimums and maximums — All investments are subject to the purchase minimums and maximums described in the prospectus.
As noted in the prospectus, purchase minimums may be waived or reduced in certain cases.
In
the case of American Funds non-tax-exempt funds, the initial purchase minimum of $25 may be waived for the following account types:
· Payroll
deduction retirement plan accounts (such as, but not limited to, 403(b), 401(k), SIMPLE IRA, SARSEP and deferred compensation
plan accounts); and
· Employer-sponsored
CollegeAmerica accounts.
Tax-exempt
income funds — Page 81
The
following account types may be established without meeting the initial purchase minimum:
· Retirement
accounts that are funded with employer contributions; and
· Accounts
that are funded with monies set by court decree.
The
following account types may be established without meeting the initial purchase minimum, but shareholders wishing to invest in
two or more funds must meet the normal initial purchase minimum of each fund:
· Accounts
that are funded with (a) transfers of assets, (b)
rollovers from retirement plans, (c) rollovers from 529 college savings plans
or (d) required minimum distribution automatic exchanges; and
· American
Funds U.S. Government Money Market Fund accounts registered in the name of clients of Capital Group Private Client Services.
Certain
accounts held on the fund’s books, known as omnibus accounts, contain multiple underlying accounts that are invested in
shares of the fund. These underlying accounts are maintained by entities such as financial intermediaries and are subject to the
applicable initial purchase minimums as described in the prospectus and this statement of additional information. However, in
the case where the entity maintaining these accounts aggregates the accounts’ purchase orders for fund shares, such accounts
are not required to meet the fund’s minimum amount for subsequent purchases.
Exchanges
— With the exception of Class T shares, for which rights of exchange are not generally available, you may only exchange
shares without a sales charge into other American Funds within the same share class; however, Class A, C, T or F-1 shares may
also generally be exchanged without a sales charge for the corresponding 529 share class.
Notwithstanding
the above, exchanges from Class A shares of American Funds U.S. Government Money Market Fund may be made to Class C shares of
other American Funds for dollar cost averaging purposes. However, exchanges are not permitted from Class A shares of American
Funds U.S. Government Money Market Fund to Class C shares of (1) American Funds Short-Term Tax-Exempt Bond Fund, (2) Intermediate
Bond Fund of America, (3) Limited Term Tax-Exempt Bond Fund of America, (4) Short-Term Bond Fund of America or (5) American Funds
Inflation Linked Bond Fund.
Exchange
purchases are subject to the minimum investment requirements of the fund purchased and no sales charge generally applies. However,
exchanges of shares from American Funds U.S. Government Money Market Fund are subject to applicable sales charges, unless the
American Funds U.S. Government Money Market Fund shares were acquired by an exchange from a fund having a sales charge, or by
reinvestment or cross-reinvestment of dividends or capital gain distributions.
Exchanges
of Class F shares generally may only be made through fee-based programs of investment firms that have special agreements with
the fund’s distributor and certain registered investment advisors.
You
may exchange shares of other classes by contacting the Transfer Agent, by contacting your investment dealer or financial advisor,
by using American FundsLine or capitalgroup.com, or by telephoning (800) 421-4225 toll-free, or faxing (see “American
Funds Service Company service areas” in the prospectus for the appropriate fax numbers) the Transfer Agent. For more information,
see “Shareholder account services and privileges” in this statement of additional information. These transactions
have the same tax consequences as ordinary sales and purchases.
Shares
held in employer-sponsored retirement plans may be exchanged into other American Funds by contacting your plan administrator or
recordkeeper. Exchange redemptions and purchases are
Tax-exempt
income funds — Page 82
processed
simultaneously at the share prices next determined after the exchange order is received (see “Price of shares” in
this statement of additional information).
Conversion
— Class C shares of the fund automatically convert to Class F-1 shares in the month of the 10-year anniversary of the
purchase date. The board of trustees of the fund reserves the right at any time, without shareholder approval, to amend the conversion
features of the Class C shares, including without limitation, providing for conversion into a different share class or for no
conversion. In making its decision, the board of trustees will consider, among other things, the effect of any such amendment
on shareholders.
Frequent
trading of fund shares — As noted in the prospectus, certain redemptions may trigger a purchase block lasting 30 calendar
days under the fund’s “purchase blocking policy.” Under this policy, systematic redemptions will not trigger
a purchase block and systematic purchases will not be prevented if the entity maintaining the shareholder account is able to identify
the transaction as a systematic redemption or purchase. For purposes of this policy, systematic redemptions include, for example,
regular periodic automatic redemptions and statement of intention escrow share redemptions. Systematic purchases include, for
example, regular periodic automatic purchases and automatic reinvestments of dividends and capital gain distributions. Generally,
purchases and redemptions will not be considered “systematic” unless the transaction is prescheduled for a specific
date.
Other
potentially abusive activity — In addition to implementing purchase blocks, American Funds Service Company will monitor
for other types of activity that could potentially be harmful to the American Funds — for example, short-term trading activity
in multiple funds. When identified, American Funds Service Company will request that the shareholder discontinue the activity.
If the activity continues, American Funds Service Company will freeze the shareholder account to prevent all activity other than
redemptions of fund shares.
Moving
between share classes
If
you wish to “move” your investment between share classes (within the same fund or between different funds), we generally
will process your request as an exchange of the shares you currently hold for shares in the new class or fund. Below is more information
about how sales charges are handled for various scenarios. Class C shares are not currently offered by STEX.
Exchanging
Class C shares for Class A or Class T shares — If you exchange Class C shares for Class A or Class T shares, you are
still responsible for paying any Class C contingent deferred sales charges and applicable Class A or Class T sales charges.
Exchanging
Class C shares for Class F shares — If you are part of a qualified fee-based program or approved self-directed platform
and you wish to exchange your Class C shares for Class F shares to be held in the program, you are still responsible for paying
any applicable Class C contingent deferred sales charges.
Exchanging
Class F shares for Class A shares — You can exchange Class F shares held in a qualified fee-based program for Class
A shares without paying an initial Class A sales charge if you are leaving or have left the fee-based program. You can exchange
Class F shares received in a conversion from Class C shares for Class A shares at any time without paying an initial Class A sales
charge if you notify American Funds Service Company of the conversion when you make your request. If you have already redeemed
your Class F shares, the foregoing requirements apply and you must purchase Class A shares within 90 days after redeeming your
Class F shares to receive the Class A shares without paying an initial Class A sales charge.
Tax-exempt
income funds — Page 83
Exchanging
Class A or Class T shares for Class F shares — If you are part of a qualified fee-based program or approved self-directed
platform and you wish to exchange your Class A or Class T shares for Class F shares to be held in the program, any Class A or
Class T sales charges (including contingent deferred sales charges) that you paid or are payable will not be credited back to
your account.
Exchanging
Class A shares for Class R shares — Provided it is eligible to invest in Class R shares, a retirement plan currently
invested in Class A shares may exchange its shares for Class R shares. Any Class A sales charges that the retirement plan previously
paid will not be credited back to the plan’s account. No contingent deferred sales charge will be assessed as part of the
share class conversion.
Moving
between Class F shares — If you are part of a qualified fee-based program that offers Class F shares, you may exchange
your Class F shares for any other Class F shares to be held in the program. For example, if you hold Class F-2
shares, you may exchange your shares for Class F-1 or Class F-3 shares to be held in the program.
Moving
between other share classes — If you desire to move your investment between share classes and the particular scenario
is not described in this statement of additional information, please contact American Funds Service Company at (800) 421-4225
for more information.
Non-reportable
transactions — Automatic conversions described in the prospectus will be non-reportable for tax purposes. In addition,
an exchange of shares from one share class of a fund to another share class of the same fund will be treated as a non-reportable
exchange for tax purposes, provided that the exchange request is received in writing by American Funds Service Company and processed
as a single transaction.
Tax-exempt
income funds — Page 84
Sales
charges
Class
A purchases
Purchases
by certain 403(b) plans
Tax-exempt
funds in general should not serve as retirement plan investments.
A
403(b) plan may not invest in American Funds Class A or C shares unless such plan was invested in Class A or C shares before January
1, 2009.
Participant
accounts of a 403(b) plan that invested in American Funds Class A or C shares and were treated as an individual-type plan for
sales charge purposes before January 1, 2009, may continue to be treated as accounts of an individual-type plan for sales charge
purposes. Participant accounts of a 403(b) plan that invested in American Funds Class A or C shares and were treated as an employer-sponsored
plan for sales charge purposes before January 1, 2009, may continue to be treated as accounts of an employer-sponsored plan for
sales charge purposes. Participant accounts of a 403(b) plan that was established on or after January 1, 2009, are treated as
accounts of an employer-sponsored plan for sales charge purposes.
Purchases
by SEP plans and SIMPLE IRA plans
Participant
accounts in a Simplified Employee Pension (SEP) plan or a Savings Incentive Match Plan for Employees of Small Employers IRA (SIMPLE
IRA) will be aggregated at the plan level for Class A sales charge purposes if an employer adopts a prototype plan produced by
American Funds Distributors, Inc. or (a) the employer or plan sponsor submits
all contributions for all participating employees in a single contribution transmittal or the contributions are identified as
related to the same plan; (b) each transmittal is accompanied by checks or wire
transfers and generally must be submitted through the transfer agent’s automated contribution system if held on the fund’s
books; and (c) if the fund is expected to carry separate accounts in the name
of each plan participant and (i) the employer or plan sponsor notifies the funds’
transfer agent or the intermediary holding the account that the separate accounts of all plan participants should be linked and
(ii) all new participant accounts are established by submitting the appropriate
documentation on behalf of each new participant. Participant accounts in a SEP or SIMPLE plan that are eligible to aggregate their
assets at the plan level may not also aggregate the assets with their individual accounts.
Tax-exempt
income funds — Page 85
Other
purchases
In
addition, American Funds Class A and Class 529-A shares may be offered at net asset value to companies exchanging securities with
the fund through a merger, acquisition or exchange offer and to certain individuals meeting the criteria described above who invested
in Class A and Class 529-A shares before Class F-2 and Class 529-F-1 shares were made available under this privilege.
Class
F-2 and Class 529-F-1 purchases
If
requested, American Funds Class F-2 and Class 529-F-1 shares will be sold to:
| |
|
|
| |
(1) |
current or retired
directors, trustees, officers and advisory board members of, and certain lawyers who provide services to the funds managed
by Capital Research and Management Company, current or retired employees of The Capital Group Companies, Inc. and its affiliated
companies, certain family members of the above persons, and trusts or plans primarily for such persons; and |
| |
(2) |
The Capital Group
Companies, Inc. and its affiliated companies. |
Once
an account in Class F-2 or Class 529-F-1 is established under this privilege, additional investments can be made in Class F-2
or Class 529-F-1 for the life of the account. Depending on the financial intermediary holding your account, these privileges may
be unavailable. Investors should consult their financial intermediary for further information.
Moving
between accounts — American Funds investments by certain account types may be moved to other account types without incurring
additional Class A sales charges. These transactions include:
· redemption
proceeds from a non-retirement account (for example, a joint tenant account) used to purchase fund shares in an IRA or other individual-type
retirement account;
· required
minimum distributions from an IRA or other individual-type retirement account used to purchase fund shares in a non-retirement
account; and
· death
distributions paid to a beneficiary’s account that are used by the beneficiary to purchase fund shares in a different account.
Investors
may not move investments from a Capital Bank & Trust Company SIMPLE IRA Plus to a Capital Bank & Trust Company SIMPLE
IRA unless it is part of a plan transfer or to a current employer’s Capital Bank & Trust Company SIMPLE IRA plan.
These
privileges are generally available only if your account is held directly with the fund’s transfer agent or if the financial
intermediary holding your account has the systems, policies and procedures to support providing the privileges on its systems.
Investors should consult their financial intermediary for further information.
Loan
repayments — Repayments on loans taken from a retirement plan are not subject to sales charges if American Funds Service
Company is notified of the repayment.
Dealer
commissions and compensation — Commissions (up to 1.00%) are paid to dealers who initiate and are responsible for certain
Class A share purchases not subject to initial sales charges. These purchases consist of a) purchases
of $1 million or more, and b) purchases by employer-sponsored defined
contribution-type retirement plans investing $1 million or more or with 100 or more eligible
Tax-exempt
income funds — Page 86
employees.
Only with respect to TEBF, AHIM, TEFCA and TEFNY, commissions on such investments (other than IRA rollover assets that roll over
at no sales charge under the fund’s IRA rollover policy as described in the prospectus) are paid to dealers at the following
rates: 1.00% on amounts of less than $10 million, .50% on amounts of at least $10 million but less than $25 million
and .25% on amounts of at least $25 million. Commissions are based on cumulative investments over the life of the account with
no adjustment for redemptions, transfers, or market declines. For example, if a shareholder has accumulated investments in excess
of $10 million (but less than $25 million) and subsequently redeems all or a portion of the account(s), purchases following
the redemption will generate a dealer commission of .50%.
Commissions
(up to 1.00%) are paid to dealers who initiate and are responsible for certain Class A share purchases not subject to initial
sales charges. These purchases consist of purchases of $1 million or more and purchases by employer-sponsored defined contribution-type
retirement plans investing $1 million or more or with 100 or more eligible employees. Only with respect to STEX and LTEX,
commissions on such investments (other than IRA rollover assets that roll over at no sales charge under the fund’s IRA rollover
policy as described in the prospectus) are paid to dealers at the following rates: 1.00% on amounts of less than $4 million,
.50% on amounts of at least $4 million but less than $10 million and .25% on amounts of at least $10 million. Commissions
are based on cumulative investments over the life of the account with no adjustment for redemptions, transfers, or market declines.
For example, if a shareholder has accumulated investments in excess of $4 million (but less than $10 million) and subsequently
redeems all or a portion of the account(s), purchases following the redemption will generate a dealer commission of .50%.
A
dealer concession of up to 1% may be paid by the fund under its Class A plan of distribution to reimburse the Principal Underwriter
in connection with dealer and wholesaler compensation paid by it with respect to investments made with no initial sales charge.
Class
C purchases
Direct
purchases of Class C shares of LTEX are not permitted. Class C shares of LTEX may be acquired only by exchanging from Class C
shares of other American Funds.
Tax-exempt
income funds — Page 87
Sales
charge reductions and waivers
Reducing
your Class A sales charge — As described in the prospectus, there are various ways to reduce your sales charge when
purchasing Class A shares. Additional information about Class A sales charge reductions is provided below.
Statement
of intention — By establishing a statement of intention (the "Statement"), you enter into a nonbinding commitment to
purchase shares of American Funds (excluding American Funds U.S. Government Money Market Fund) over a 13-month period and receive
the same sales charge (expressed as a percentage of your purchases) as if all shares had been purchased at once, unless the Statement
is upgraded as described below.
The
Statement period starts on the date on which your first purchase made toward satisfying the Statement is processed. Your accumulated
holdings (as described in the paragraph below titled “Rights of accumulation”) eligible to be aggregated as of the
day immediately before the start of the Statement period may be credited toward satisfying the Statement.
You
may revise the commitment you have made in your Statement upward at any time during the Statement period. If your prior commitment
has not been met by the time of the revision, the Statement period during which purchases must be made will remain unchanged.
Purchases made from the date of the revision will receive the reduced sales charge, if any, resulting from the revised Statement.
If your prior commitment has been met by the time of the revision, your original Statement will be considered met and a new Statement
will be established.
The
Statement will be considered completed if the shareholder dies within the 13-month Statement period. Commissions to dealers will
not be adjusted or paid on the difference between the Statement amount and the amount actually invested before the shareholder’s
death.
When
a shareholder elects to use a Statement, shares equal to 5% of the dollar amount specified in the Statement may be held in escrow
in the shareholder’s account out of the initial purchase (or subsequent purchases, if necessary) by the Transfer Agent.
All dividends and any capital gain distributions on shares held in escrow will be credited to the shareholder’s account
in shares (or paid in cash, if requested). If the intended investment is not completed within the specified Statement period the
investments made during the statement period will be adjusted to reflect the difference between the sales charge actually paid
and the sales charge which would have been paid if the total of such purchases had been made at a single time. Any dealers assigned
to the shareholder’s account at the time a purchase was made during the Statement period will receive a corresponding commission
adjustment if appropriate.
In
addition, if you currently have individual holdings in American Legacy variable annuity contracts or variable life insurance policies
that were established on or before March 31, 2007, you may continue to apply purchases under such contracts and policies
to a Statement.
Shareholders
purchasing shares at a reduced sales charge under a Statement indicate their acceptance of these terms and those in the prospectus
with their first purchase.
Aggregation
— Qualifying investments for aggregation include those made by you and your “immediate family” as defined
in the prospectus, if all parties are purchasing shares for their own accounts and/or:
Tax-exempt
income funds — Page 88
· individual-type
employee benefit plans, such as an IRA, single-participant Keogh-type plan, or a participant account of a 403(b) plan that is
treated as an individual-type plan for sales charge purposes (see “Purchases by certain 403(b) plans” under “Sales
charges” in this statement of additional information);
· SEP
plans and SIMPLE IRA plans established after November 15, 2004, by an employer adopting any plan document other than a prototype
plan produced by American Funds Distributors, Inc.;
· business
accounts solely controlled by you or your immediate family (for example, you own the entire business);
· trust
accounts established by you or your immediate family (for trusts with only one primary beneficiary, upon the trustor’s death
the trust account may be aggregated with such beneficiary’s own accounts; for trusts with multiple primary beneficiaries,
upon the trustor’s death the trustees of the trust may instruct American Funds Service Company to establish separate trust
accounts for each primary beneficiary; each primary beneficiary’s separate trust account may then be aggregated with such
beneficiary’s own accounts);
· endowments
or foundations established and controlled by you or your immediate family; or
· CollegeAmerica®
accounts invested in American Funds other than the funds, which will be aggregated at the account owner level. (Class 529-E
accounts may only be aggregated with an eligible employer plan. For more information about CollegeAmerica and Class 529 shares,
please see the prospectus of American Funds that offer Class 529 shares.)
Individual
purchases by a trustee(s) or other fiduciary(ies) may also be aggregated if the investments are:
· for
a single trust estate or fiduciary account, including employee benefit plans other than the individual-type employee benefit plans
described above;
· made
for two or more employee benefit plans of a single employer or of affiliated employers as defined in the 1940 Act, excluding the
individual-type employee benefit plans described above;
· for
a diversified common trust fund or other diversified pooled account not specifically formed for the purpose of accumulating fund
shares;
· for
nonprofit, charitable or educational organizations, or any endowments or foundations established and controlled by such organizations,
or any employer-sponsored retirement plans established for the benefit of the employees of such organizations, their endowments,
or their foundations;
· for
participant accounts of a 403(b) plan that is treated as an employer-sponsored plan for sales charge purposes (see “Purchases
by certain 403(b) plans” under “Sales charges” in this statement of additional information), or made for participant
accounts of two or more such plans, in each case of a single employer or affiliated employers as defined in the 1940 Act; or
· for
a SEP or SIMPLE IRA plan established after November 15, 2004, by an employer adopting a prototype plan produced by American Funds
Distributors, Inc.
Purchases
made for nominee or street name accounts (securities held in the name of an investment dealer or another nominee such as a bank
trust department instead of the customer) may not be aggregated with those made for other accounts and may not be
Tax-exempt
income funds — Page 89
aggregated
with other nominee or street name accounts unless otherwise qualified as described above.
Joint
accounts may be aggregated with other accounts belonging to the primary owner and/or his or her immediate family. The primary
owner of a joint account is the individual responsible for taxes on the account.
Concurrent
purchases — As described in the prospectus, you may reduce your Class A sales charge by combining purchases of all classes
of shares in American Funds. Shares of American Funds U.S. Government Money Market Fund purchased through an exchange, reinvestment
or cross-reinvestment from a fund having a sales charge also qualify. However, direct purchases of American Funds U.S. Government
Money Market Fund Class A shares are excluded. If you currently have individual holdings in American Legacy variable annuity contracts
or variable life insurance policies that were established on or before March 31, 2007, you may continue to combine purchases made
under such contracts and policies to reduce your Class A sales charge.
Rights
of accumulation — Subject to the limitations described in the aggregation policy, you may take into account your accumulated
holdings in all share classes of American Funds to determine your sales charge on investments in accounts eligible to be aggregated.
Direct purchases of American Funds U.S. Government Money Market Fund Class A shares are excluded. Subject to your investment dealer’s
or recordkeeper’s capabilities, your accumulated holdings will be calculated as the higher of (a)
the current value of your existing holdings (the “market value”) as of the day prior to your American Funds investment
or (b) the amount you invested (including reinvested dividends and capital gains,
but excluding capital appreciation) less any withdrawals (the “cost value”). Depending on the entity on whose books
your account is held, the value of your holdings in that account may not be eligible for calculation at cost value. For example,
accounts held in nominee or street name may not be eligible for calculation at cost value and instead may be calculated at market
value for purposes of rights of accumulation.
The
value of all of your holdings in accounts established in calendar year 2005 or earlier will be assigned an initial cost value
equal to the market value of those holdings as of the last business day of 2005. Thereafter, the cost value of such accounts will
increase or decrease according to actual investments or withdrawals. You must contact your financial advisor or American Funds
Service Company if you have additional information that is relevant to the calculation of the value of your holdings.
When
determining your American Funds Class A sales charge, if your investment is not in an employer-sponsored retirement plan, you
may also continue to take into account the market value (as of the day prior to your American Funds investment) of your individual
holdings in various American Legacy variable annuity contracts and variable life insurance policies that were established on or
before March 31, 2007. An employer-sponsored retirement plan may also continue to take into account the market value of its investments
in American Legacy Retirement Investment Plans that were established on or before March 31, 2007.
You
may not purchase Class C shares of American High-Income Municipal Bond Fund or American Funds Tax-Exempt Fund of New York if such
combined American Funds and American Funds Legacy holdings cause you to be eligible to purchase Class A shares at the $1 million
or more sales charge discount rate (i.e. at net asset value).
Tax-exempt
income funds — Page 90
If
you make a gift of American Funds Class A shares, upon your request, you may purchase the shares at the sales charge discount
allowed under rights of accumulation of all of your American Funds and applicable American Legacy accounts.
Reducing
your Class T sales charge — As described in the prospectus, the initial sales charge you pay each time you buy Class
T shares may differ depending upon the amount you invest and may be reduced for larger purchases. Additionally, Class T shares
acquired through reinvestment of dividends or capital gain distributions are not subject to an initial sales charge. Sales charges
on Class T shares are applied on a transaction-by-transaction basis, and, accordingly, Class T shares are not eligible for any
other sales charge waivers or reductions, including through the aggregation of Class T shares concurrently purchased by other
related accounts or in other American Funds. The sales charge applicable to Class T shares may not be reduced by establishing
a statement of intention, and rights of accumulation are not available for Class T shares.
CDSC
waivers for Class A and C shares — As noted in the prospectus, a contingent deferred sales charge (“CDSC”)
will be waived for redemptions due to death or post-purchase disability of a shareholder (this generally excludes accounts registered
in the names of trusts and other entities). In the case of joint tenant accounts, if one joint tenant dies, a surviving joint
tenant, at the time he or she notifies the Transfer Agent of the other joint tenant’s death and removes the decedent’s
name from the account, may redeem shares from the account without incurring a CDSC. Redemptions made after the Transfer Agent
is notified of the death of a joint tenant will be subject to a CDSC.
In
addition, a CDSC will be waived for the following types of transactions, if they do not exceed 12% of the value of an “account”
(defined below) annually (the “12% limit”):
· Required
minimum distributions taken from retirement accounts upon the shareholder’s attainment of age 70½ (required minimum
distributions that continue to be taken by the beneficiary(ies) after the account owner is deceased also qualify for a waiver).
· Redemptions
through an automatic withdrawal plan (“AWP”) (see “Automatic withdrawals” under “Shareholder account
services and privileges” in this statement of additional information). For each AWP payment, assets that are not subject
to a CDSC, such as shares acquired through reinvestment of dividends and/or capital gain distributions, will be redeemed first
and will count toward the 12% limit. If there is an insufficient amount of assets not subject to a CDSC to cover a particular
AWP payment, shares subject to the lowest CDSC will be redeemed next until the 12% limit is reached. Any dividends and/or capital
gain distributions taken in cash by a shareholder who receives payments through an AWP will also count toward the 12% limit. In
the case of an AWP, the 12% limit is calculated at the time an automatic redemption is first made, and is recalculated at the
time each additional automatic redemption is made. Shareholders who establish an AWP should be aware that the amount of a payment
not subject to a CDSC may vary over time depending on fluctuations in the value of their accounts. This privilege may be revised
or terminated at any time.
For
purposes of this paragraph, “account” means your investment in the applicable class of shares of the particular fund
from which you are making the redemption.
The
CDSC on American Funds Class A shares may be waived in cases where the fund’s transfer agent determines the benefit to the
fund of collecting the CDSC would be outweighed by the cost of applying it.
CDSC
waivers are allowed only in the cases listed here and in the prospectus.
Tax-exempt
income funds — Page 91
Selling
shares
The
methods for selling (redeeming) shares are described more fully in the prospectus. If you wish to sell your shares by contacting
American Funds Service Company directly, any such request must be signed by the registered shareholders. To contact American Funds
Service Company via overnight mail or courier service, see “Purchase and exchange of shares.”
A
signature guarantee may be required for certain redemptions. In such an event, your signature may be guaranteed by a domestic
stock exchange or the Financial Industry Regulatory Authority, bank, savings association or credit union that is an eligible guarantor
institution. The Transfer Agent reserves the right to require a signature guarantee on any redemptions.
Additional
documentation may be required for sales of shares held in corporate, partnership or fiduciary accounts. You must include with
your written request any shares you wish to sell that are in certificate form.
If
you sell Class A or C shares and request a specific dollar amount to be sold, we will sell sufficient shares so that the sale
proceeds, after deducting any applicable CDSC, equals the dollar amount requested.
If
you hold multiple American Funds and a CDSC applies to the shares you are redeeming, the CDSC will be calculated based on the
applicable class of shares of the particular fund from which you are making the redemption.
Redemption
proceeds will not be mailed until sufficient time has passed to provide reasonable assurance that checks or drafts (including
certified or cashier’s checks) for shares purchased have cleared (normally seven business days from the purchase date).
Except for delays relating to clearance of checks for share purchases or in extraordinary circumstances (and as permissible under
the 1940 Act), the fund typically expects to pay redemption proceeds one business day following receipt and acceptance of a redemption
order. Interest will not accrue or be paid on amounts that represent uncashed distribution or redemption checks.
You
may request that redemption proceeds of $1,000 or more from American Funds U.S. Government Money Market Fund be wired to your
bank by writing American Funds Service Company. A signature guarantee is required on all requests to wire funds.
Tax-exempt
income funds — Page 92
Shareholder
account services and privileges
The following
services and privileges are generally available to all shareholders. However, certain services and privileges described in the
prospectus and this statement of additional information may not be available if your account is held with an investment dealer.
Automatic
investment plan — An automatic investment plan enables you to make monthly or quarterly investments in American Funds
through automatic debits from your bank account. To set up a plan, you must fill out an account application and specify the amount
that you would like to invest and the date on which you would like your investments to occur. The plan will begin within 30 days
after your account application is received. Your bank account will be debited on the day or a few days before your investment
is made, depending on the bank’s capabilities. The Transfer Agent will then invest your money into the fund you specified
on or around the date you specified. If the date you specified falls on a weekend or holiday, your money will be invested on the
following business day. However, if the following business day falls in the next month, your money will be invested on the business
day immediately preceding the weekend or holiday. If your bank account cannot be debited due to insufficient funds, a stop-payment
or the closing of the account, the plan may be terminated and the related investment reversed. You may change the amount of the
investment or discontinue the plan at any time by contacting the Transfer Agent.
Automatic
reinvestment — Dividends and capital gain distributions are reinvested in additional shares of the same class and fund
at net asset value unless you indicate otherwise on the account application. You also may elect to have dividends and/or capital
gain distributions paid in cash by informing the fund, the Transfer Agent or your investment dealer.
If
you have elected to receive dividends and/or capital gain distributions in cash, and the postal or other delivery service is unable
to deliver checks to your address of record, or you do not respond to mailings from American Funds Service Company with regard
to uncashed distribution checks, your distribution option may be automatically converted to having all dividends and other distributions
reinvested in additional shares.
Cross-reinvestment
of dividends and distributions — For all share classes, except Class T shares, you may cross-reinvest dividends and
capital gains (distributions) into other American Funds in the same share class at net asset value, subject to the following conditions:
(1) the
aggregate value of your account(s) in the fund(s) paying distributions equals or exceeds $5,000 (this is waived if the value of
the account in the fund receiving the distributions equals or exceeds that fund’s minimum initial investment requirement);
(2) if
the value of the account of the fund receiving distributions is below the minimum initial investment requirement, distributions
must be automatically reinvested; and
(3) if
you discontinue the cross-reinvestment of distributions, the value of the account of the fund receiving distributions must equal
or exceed the minimum initial investment requirement. If you do not meet this requirement within 90 days of notification, the
fund has the right to automatically redeem the account.
Depending
on the financial intermediary holding your account, your reinvestment privileges may be unavailable or differ from those described
in this statement of additional information. Investors should consult their financial intermediary for further information.
Tax-exempt
income funds — Page 93
Automatic
exchanges — For all share classes other than Class T shares, you may automatically exchange shares of the same class
in amounts of $50 or more among any American Funds on any day (or preceding business day if the day falls on a nonbusiness day)
of each month you designate.
Automatic
withdrawals — Depending on the type of account, for all share classes except R shares, you may automatically withdraw
shares from any of the American Funds. You can make automatic withdrawals of $50 or more. You can designate the day of each period
for withdrawals and request that checks be sent to you or someone else. Withdrawals may also be electronically deposited to your
bank account. The Transfer Agent will withdraw your money from the fund you specify on or around the date you specify. If the
date you specified falls on a weekend or holiday, the redemption will take place on the previous business day. However, if the
previous business day falls in the preceding month, the redemption will take place on the following business day after the weekend
or holiday. You should consult with your advisor or intermediary to determine if your account is eligible for automatic withdrawals.
Withdrawal
payments are not to be considered as dividends, yield or income. Generally, automatic investments may not be made into a shareholder
account from which there are automatic withdrawals. Withdrawals of amounts exceeding reinvested dividends and distributions and
increases in share value would reduce the aggregate value of the shareholder’s account. The Transfer Agent arranges for
the redemption by the fund of sufficient shares, deposited by the shareholder with the Transfer Agent, to provide the withdrawal
payment specified.
Redemption
proceeds from an automatic withdrawal plan are not eligible for reinvestment without a sales charge.
Account
statements — Your account is opened in accordance with your registration instructions. Transactions in the account,
such as additional investments, will be reflected on regular confirmation statements from the Transfer Agent. Dividend and capital
gain reinvestments, purchases through automatic investment plans and certain retirement plans, as well as automatic exchanges
and withdrawals, will be confirmed at least quarterly.
American
FundsLine and capitalgroup.com — You may check your share balance, the price of your shares or your most recent account
transaction; redeem shares (up to $125,000 per American Funds shareholder each day) from nonretirement plan accounts; or exchange
shares around the clock with American FundsLine or using capitalgroup.com. To use American FundsLine, call (800) 325-3590
from a TouchTone™ telephone. Redemptions and exchanges through American FundsLine and capitalgroup.com are subject to the
conditions noted above and in “Telephone and Internet purchases, redemptions and exchanges” below. You will need your
fund number (see the list of American Funds under the “General information — fund numbers” section in this
statement of additional information), personal identification number (generally the last four digits of your Social Security number
or other tax identification number associated with your account) and account number.
Generally,
all shareholders are automatically eligible to use these services. However, if you are not currently authorized to do so, you
may complete an American FundsLink Authorization Form. Once you establish this privilege, you, your financial advisor or any person
with your account information may use these services.
Telephone
and Internet purchases, redemptions and exchanges — By using the telephone (including American FundsLine) or the Internet
(including capitalgroup.com), or fax purchase, redemption and/or exchange options, you agree to hold the fund, the Transfer Agent,
any of its affiliates or mutual funds managed by such affiliates, and each of their respective directors, trustees, officers,
employees and agents harmless from any losses, expenses, costs or liabilities (including attorney fees) that may be incurred in
connection with the exercise of these privileges. Generally, all shareholders are
Tax-exempt
income funds — Page 94
automatically
eligible to use these services. However, you may elect to opt out of these services by writing the Transfer Agent (you may also
reinstate them at any time by writing the Transfer Agent). If the Transfer Agent does not employ reasonable procedures to confirm
that the instructions received from any person with appropriate account information are genuine, it and/or the fund may be liable
for losses due to unauthorized or fraudulent instructions. In the event that shareholders are unable to reach the fund by telephone
because of technical difficulties, market conditions or a natural disaster, redemption and exchange requests may be made in writing
only.
Checkwriting
— You may establish check writing privileges for Class A shares (but not Class 529-A shares) of American Funds
U.S. Government Money Market Fund upon meeting the fund’s initial purchase minimum of $1,000. This can be done by using
an account application. If you request check writing privileges, you will be provided with checks that you may use to draw against
your account. These checks may be made payable to anyone you designate and must be signed by the authorized number of registered
shareholders exactly as indicated on your account application.
Redemption
of shares — The fund’s declaration of trust permits the fund to direct the Transfer Agent to redeem the shares
of any shareholder for their then current net asset value per share if at such time the shareholder of record owns shares having
an aggregate net asset value of less than the minimum initial investment amount required of new shareholders as set forth in the
fund's current registration statement under the 1940 Act, and subject to such further terms and conditions as the board of trustees
of the fund may from time to time adopt.
While
payment of redemptions normally will be in cash, the fund’s declaration of trust permits payment of the redemption price
wholly or partly with portfolio securities or other fund assets under conditions and circumstances determined by the fund’s
board of trustees. For example, redemptions could be made in this manner if the board determined that making payments wholly in
cash over a particular period would be unfair and/or harmful to other fund shareholders.
Share
certificates — Shares are credited to your account. The fund does not issue share certificates.
Tax-exempt
income funds — Page 95
General
information
Custodian
of assets — Securities and cash owned by the fund, including proceeds from the sale of shares of the fund and of securities
in the fund’s portfolios, are held by JP Morgan Chase Bank N.A., 270 Park Avenue, New York, NY 10017-2070 for STEX, LTEX,
TEBF, AHIM and TEFCA, and by Bank of New York Mellon, One Wall Street, New York, NY 10286 for TEFNY, as custodian. If the fund
holds securities of issuers outside the U.S., the custodian may hold these securities pursuant to subcustodial arrangements in
banks outside the U.S. or branches of U.S. banks outside the U.S.
Transfer
agent services — American Funds Service Company, a wholly owned subsidiary of the investment adviser, maintains the
records of shareholder accounts, processes purchases and redemptions of the fund’s shares, acts as dividend and capital
gain distribution disbursing agent, and performs other related shareholder service functions. The principal office of American
Funds Service Company is located at 6455 Irvine Center Drive, Irvine, CA 92618. Transfer agent fees are paid according to a fee
schedule, based principally on the number of accounts serviced, contained in a Shareholder Services Agreement between the fund
and American Funds Service Company.
In the
case of certain shareholder accounts, third parties who may be unaffiliated with the investment adviser provide transfer agency
and shareholder services in place of American Funds Service Company. These services are rendered under agreements with American
Funds Service Company or its affiliates and the third parties receive compensation according to such agreements. Compensation
for transfer agency and shareholder services, whether paid to American Funds Service Company or such third parties, is ultimately
paid from fund assets and is reflected in the expenses of the fund as disclosed in the prospectus.
During
the 2019 fiscal year, transfer agent fees, gross of any payments made by American Funds Service Company to third parties, were:
| |
|
|
| |
|
Transfer
agent fee |
| STEX |
Class
A |
$
287,000 |
| |
Class
T |
—* |
| |
Class
F-1 |
9,000
|
| |
Class
F-2 |
86,000
|
| |
Class
F-3 |
1,000
|
| |
Class
R-6 |
—* |
| LTEX |
Class
A |
1,135,000
|
| |
Class
C |
7,000
|
| |
Class
T |
—* |
| |
Class
F-1 |
74,000
|
| |
Class
F-2 |
433,000
|
| |
Class
F-3 |
6,000
|
| |
Class
R-6 |
— |
| TEBF |
Class
A |
3,577,000
|
| |
Class
C |
145,000
|
| |
Class
T |
—* |
| |
Class
F-1 |
418,000
|
| |
Class
F-2 |
2,519,000
|
| |
Class
F-3 |
142,000
|
| |
Class
R-6 |
— |
Tax-exempt
income funds — Page 96
| |
|
|
| |
|
Transfer
agent fee |
| AHIM |
Class
A |
$2,032,000
|
| |
Class
C |
111,000
|
| |
Class
T |
—* |
| |
Class
F-1 |
228,000
|
| |
Class
F-2 |
1,023,000
|
| |
Class
F-3 |
28,000
|
| |
Class
R-6 |
— |
| TEFCA |
Class
A |
365,000
|
| |
Class
C |
15,000
|
| |
Class
T |
—* |
| |
Class
F-1 |
81,000
|
| |
Class
F-2 |
315,000
|
| |
Class
F-3 |
—* |
| TEFNY |
Class
A |
57,000
|
| |
Class
C |
3,000
|
| |
Class
T |
—* |
| |
Class
F-1 |
2,000
|
| |
Class
F-2 |
22,000
|
| |
Class
F-3 |
—* |
*
Amount less than $1,000.
STEX
did not offer Class C shares in the 2019 fiscal year and is not currently offering C shares.
Independent
registered public accounting firm — PricewaterhouseCoopers LLP, 601 South Figueroa Street, Los Angeles, CA 90017, serves
as the fund’s independent registered public accounting firm, providing audit services, preparation of tax returns and review
of certain documents to be filed with the SEC. The financial statements of each fund included in this statement of additional
information from the annual report have been audited by PricewaterhouseCoopers LLP, an independent registered public accounting
firm, as stated in their report appearing herein. Such financial statements have been so included in reliance upon the respective
reports of such firms given upon their authority as experts in accounting and auditing. The selection of the fund’s independent
registered public accounting firm is reviewed and determined annually by the board of trustees.
Independent
legal counsel — Morgan, Lewis & Bockius LLP, One Federal Street, Boston, MA 02110-1726, serves as independent legal
counsel (“counsel”) for the fund and for independent trustees in their capacities as such. A determination with respect
to the independence of the fund’s counsel will be made at least annually by the independent trustees of the fund, as prescribed
by applicable 1940 Act rules.
Prospectuses,
reports to shareholders and proxy statements — The fund’s fiscal year ends on July 31. Shareholders are provided
updated summary prospectuses annually and at least semi-annually with reports showing the fund’s investment portfolio or
summary investment portfolio, financial statements and other information. Shareholders may request a copy of the fund’s
current prospectus at no cost by calling (800) 421-4225 or by sending an email request to prospectus@americanfunds.com. Shareholders
may also access the fund’s current summary prospectus, prospectus, statement of additional information and shareholder reports
at capitalgroup.com/prospectus. The annual financial statements for each fund are audited by the fund’s independent registered
public accounting firm,
Tax-exempt
income funds — Page 97
PricewaterhouseCoopers
LLP. In addition, shareholders may also receive proxy statements for the fund. In an effort to reduce the volume of mail shareholders
receive from the fund when a household owns more than one account, the Transfer Agent has taken steps to eliminate duplicate mailings
of summary prospectuses, shareholder reports and proxy statements. To receive additional copies of a summary prospectus, report
or proxy statement, shareholders should contact the Transfer Agent.
Shareholders
may also elect to receive updated summary prospectuses, annual reports and semi-annual reports electronically by signing up for
electronic delivery on our website, capitalgroup.com. Upon electing the electronic delivery of updated summary prospectuses and
other reports, a shareholder will no longer automatically receive such documents in paper form by mail. A shareholder who elects
electronic delivery is able to cancel this service at any time and return to receiving updated summary prospectuses and other
reports in paper form by mail.
Summary
prospectuses, prospectuses, annual reports and semi-annual reports that are mailed to shareholders by the American Funds organization
are printed with ink containing soy and/or vegetable oil on paper containing recycled fibers.
Codes
of ethics — The fund and Capital Research and Management Company and its affiliated companies, including the fund’s
Principal Underwriter, have adopted codes of ethics that allow for personal investments, including securities in which the fund
may invest from time to time. These codes include a ban on acquisitions of securities pursuant to an initial public offering;
restrictions on acquisitions of private placement securities; preclearance and reporting requirements; review of duplicate confirmation
statements; annual recertification of compliance with codes of ethics; blackout periods on personal investing for certain investment
personnel; ban on short-term trading profits for investment personnel; limitations on service as a director of publicly traded
companies; disclosure of personal securities transactions; and policies regarding political contributions.
Credit
facility — American High-Income Municipal Bond Fund, together with other U.S. registered investment funds managed by
Capital Research and Management Company, has entered into a committed line of credit facility pursuant to which the funds may
borrow up to $1.5 billion as a source of temporary liquidity on a first-come, first-served basis. Under the credit facility, loans
are generally unsecured; however, a borrowing fund must collateralize any borrowings under the facility on an equivalent basis
if it has certain other collateralized borrowings.
Tax-exempt
income funds — Page 98
American
Funds Short-Term Tax-Exempt Bond Fund
Determination
of net asset value, redemption price and maximum offering price per share for Class A shares — July 31, 2019
| |
|
Net
asset value and redemption price per share
(Net assets divided by shares outstanding) |
$10.19 |
| Maximum
offering price per share (100/97.50 of net asset value per share, which takes into account the fund’s current maximum
sales charge) |
$10.45 |
Limited
Term Tax-Exempt Bond Fund of America
Determination
of net asset value, redemption price and maximum offering price per share for Class A shares — July 31, 2019
| |
|
Net
asset value and redemption price per share
(Net assets divided by shares outstanding) |
$15.93 |
| Maximum
offering price per share (100/97.50 of net asset value per share, which takes into account the fund’s current maximum
sales charge) |
$16.34 |
The
Tax-Exempt Bond Fund of America
Determination
of net asset value, redemption price and maximum offering price per share for Class A shares — July 31, 2019
| |
|
Net
asset value and redemption price per share
(Net assets divided by shares outstanding) |
$13.29 |
| Maximum
offering price per share (100/96.25 of net asset value per share, which takes into account the fund’s current maximum
sales charge) |
$13.81 |
American
High-Income Municipal Bond Fund
Determination
of net asset value, redemption price and maximum offering price per share for Class A shares — July 31, 2019
| |
|
Net
asset value and redemption price per share
(Net assets divided by shares outstanding) |
$16.33 |
| Maximum
offering price per share (100/96.25 of net asset value per share, which takes into account the fund’s current maximum
sales charge) |
$16.97 |
Tax-exempt
income funds — Page 99
The
Tax-Exempt Fund of California
Determination
of net asset value, redemption price and maximum offering price per share for Class A shares — July 31, 2019
| |
|
Net
asset value and redemption price per share
(Net assets divided by shares outstanding) |
$18.08 |
| Maximum
offering price per share (100/96.25 of net asset value per share, which takes into account the fund’s current maximum
sales charge) |
$18.78 |
American
Funds Tax-Exempt Fund of New York
Determination
of net asset value, redemption price and maximum offering price per share for Class A shares — July 31, 2019
| |
|
Net
asset value and redemption price per share
(Net assets divided by shares outstanding) |
$11.02 |
| Maximum
offering price per share (100/96.25 of net asset value per share, which takes into account the fund’s current maximum
sales charge) |
$11.45 |
Other
information — The fund reserves the right to modify the privileges described in this statement of additional information
at any time.
The
fund’s financial statements, including the investment portfolio and the reports of the fund’s independent registered
public accounting firms contained in the annual reports, are included in this statement of additional information.
Tax-exempt
income funds — Page 100
Fund
numbers — Here are the fund numbers for use with our automated telephone line, American FundsLine®, or when
making share transactions:
| |
|
|
|
|
|
|
| |
Fund
numbers |
| Fund |
Class
A |
Class
C |
Class
T |
Class
F-1 |
Class
F-2 |
Class
F-3 |
| Stock
and stock/fixed income funds |
|
|
|
|
|
|
| AMCAP
Fund® |
002 |
302 |
43002 |
402 |
602 |
702 |
| American
Balanced Fund® |
011 |
311 |
43011 |
411 |
611 |
711 |
| American
Funds Developing World Growth and Income FundSM |
30100 |
33100 |
43100 |
34100 |
36100 |
37100 |
| American
Funds Global Balanced FundSM |
037 |
337 |
43037 |
437 |
637 |
737 |
| American
Mutual Fund® |
003 |
303 |
43003 |
403 |
603 |
703 |
| Capital
Income Builder® |
012 |
312 |
43012 |
412 |
612 |
712 |
| Capital
World Growth and Income Fund® |
033 |
333 |
43033 |
433 |
633 |
733 |
| EuroPacific
Growth Fund® |
016 |
316 |
43016 |
416 |
616 |
716 |
| Fundamental
Investors® |
010 |
310 |
43010 |
410 |
610 |
710 |
| The
Growth Fund of America® |
005 |
305 |
43005 |
405 |
605 |
705 |
| The
Income Fund of America® |
006 |
306 |
43006 |
406 |
606 |
706 |
| International
Growth and Income FundSM |
034 |
334 |
43034 |
434 |
634 |
734 |
| The
Investment Company of America® |
004 |
304 |
43004 |
404 |
604 |
704 |
| The
New Economy Fund® |
014 |
314 |
43014 |
414 |
614 |
714 |
| New
Perspective Fund® |
007 |
307 |
43007 |
407 |
607 |
707 |
| New
World Fund® |
036 |
336 |
43036 |
436 |
636 |
736 |
| SMALLCAP
World Fund® |
035 |
335 |
43035 |
435 |
635 |
735 |
| Washington
Mutual Investors FundSM |
001 |
301 |
43001 |
401 |
601 |
701 |
| Fixed
income funds |
|
|
|
|
|
|
| American
Funds Emerging Markets Bond Fund® |
30114 |
33114 |
43114 |
34114 |
36114 |
37114 |
| American
Funds Corporate Bond Fund® |
032 |
332 |
43032 |
432 |
632 |
732 |
| American
Funds Inflation Linked Bond Fund® |
060 |
360 |
43060 |
460 |
660 |
760 |
| American
Funds Mortgage Fund® |
042 |
342 |
43042 |
442 |
642 |
742 |
American
Funds Short-Term Tax-Exempt
Bond Fund® |
039 |
N/A |
43039 |
439 |
639 |
739 |
| American
Funds Strategic Bond FundSM |
30112 |
33112 |
43112 |
34112 |
36112 |
37112 |
American
Funds Tax-Exempt Fund of
New York® |
041 |
341 |
43041 |
441 |
641 |
741 |
| American
High-Income Municipal Bond Fund® |
040 |
340 |
43040 |
440 |
640 |
740 |
| American
High-Income Trust® |
021 |
321 |
43021 |
421 |
621 |
721 |
| The
Bond Fund of America® |
008 |
308 |
43008 |
408 |
608 |
708 |
| Capital
World Bond Fund® |
031 |
331 |
43031 |
431 |
631 |
731 |
| Intermediate
Bond Fund of America® |
023 |
323 |
43023 |
423 |
623 |
723 |
Limited
Term Tax-Exempt Bond Fund
of America® |
043 |
343 |
43043 |
443 |
643 |
743 |
| Short-Term
Bond Fund of America® |
048 |
348 |
43048 |
448 |
648 |
748 |
| The
Tax-Exempt Bond Fund of America® |
019 |
319 |
43019 |
419 |
619 |
719 |
| The
Tax-Exempt Fund of California® |
020 |
320 |
43020 |
420 |
620 |
720 |
| U.S.
Government Securities Fund® |
022 |
322 |
43022 |
422 |
622 |
722 |
| Money
market fund |
|
|
|
|
|
|
American
Funds U.S. Government
Money Market FundSM |
059 |
359 |
43059 |
459 |
659 |
759 |
Tax-exempt
income funds — Page 101
| |
|
|
|
|
|
|
| |
Fund
numbers |
| Fund |
Class
529-A |
Class
529-C |
Class
529-E |
Class
529-T |
Class
529-F-1 |
Class
ABLE-A |
| Stock
and stock/fixed income funds |
|
|
|
|
|
|
| AMCAP
Fund |
1002 |
1302 |
1502 |
46002 |
1402 |
N/A |
| American
Balanced Fund |
1011 |
1311 |
1511 |
46011 |
1411 |
N/A |
| American
Funds Developing World Growth and Income Fund |
10100 |
13100 |
15100 |
46100 |
14100 |
N/A |
| American
Funds Global Balanced Fund |
1037 |
1337 |
1537 |
46037 |
1437 |
N/A |
| American
Mutual Fund |
1003 |
1303 |
1503 |
46003 |
1403 |
N/A |
| Capital
Income Builder |
1012 |
1312 |
1512 |
46012 |
1412 |
N/A |
| Capital
World Growth and Income Fund |
1033 |
1333 |
1533 |
46033 |
1433 |
N/A |
| EuroPacific
Growth Fund |
1016 |
1316 |
1516 |
46016 |
1416 |
N/A |
| Fundamental
Investors |
1010 |
1310 |
1510 |
46010 |
1410 |
N/A |
| The
Growth Fund of America |
1005 |
1305 |
1505 |
46005 |
1405 |
N/A |
| The
Income Fund of America |
1006 |
1306 |
1506 |
46006 |
1406 |
N/A |
| International
Growth and Income Fund |
1034 |
1334 |
1534 |
46034 |
1434 |
N/A |
| The
Investment Company of America |
1004 |
1304 |
1504 |
46004 |
1404 |
N/A |
| The
New Economy Fund |
1014 |
1314 |
1514 |
46014 |
1414 |
N/A |
| New
Perspective Fund |
1007 |
1307 |
1507 |
46007 |
1407 |
N/A |
| New
World Fund |
1036 |
1336 |
1536 |
46036 |
1436 |
N/A |
| SMALLCAP
World Fund |
1035 |
1335 |
1535 |
46035 |
1435 |
N/A |
| Washington
Mutual Investors Fund |
1001 |
1301 |
1501 |
46001 |
1401 |
N/A |
| Fixed
income funds |
|
|
|
|
|
|
| American
Funds Emerging Markets Bond Fund |
10114 |
13114 |
15114 |
46114 |
14114 |
N/A |
| American
Funds Corporate Bond Fund |
1032 |
1332 |
1532 |
46032 |
1432 |
N/A |
| American
Funds Inflation Linked Bond Fund |
1060 |
1360 |
1560 |
46060 |
1460 |
N/A |
| American
Funds Mortgage Fund |
1042 |
1342 |
1542 |
46042 |
1442 |
N/A |
| American
Funds Strategic Bond Fund |
10112 |
13112 |
15112 |
46112 |
14112 |
N/A |
| American
High-Income Trust |
1021 |
1321 |
1521 |
46021 |
1421 |
N/A |
| The
Bond Fund of America |
1008 |
1308 |
1508 |
46008 |
1408 |
N/A |
| Capital
World Bond Fund |
1031 |
1331 |
1531 |
46031 |
1431 |
N/A |
| Intermediate
Bond Fund of America |
1023 |
1323 |
1523 |
46023 |
1423 |
N/A |
| Short-Term
Bond Fund of America |
1048 |
1348 |
1548 |
46048 |
1448 |
N/A |
| U.S.
Government Securities Fund |
1022 |
1322 |
1522 |
46022 |
1422 |
N/A |
| Money
market fund |
|
|
|
|
|
|
American
Funds U.S. Government
Money Market Fund |
1059 |
1359 |
1559 |
46059 |
1459 |
48059 |
Tax-exempt
income funds — Page 102
| |
|
|
|
|
|
|
|
|
| |
Fund
numbers |
| Fund |
Class
R-1 |
Class
R-2 |
Class
R-2E |
Class
R-3 |
Class
R-4 |
Class
R-5E |
Class
R-5 |
Class
R-6 |
| Stock
and stock/fixed income funds |
|
|
|
|
|
|
|
|
| AMCAP
Fund |
2102 |
2202 |
4102 |
2302 |
2402 |
2702 |
2502 |
2602 |
| American
Balanced Fund |
2111 |
2211 |
4111 |
2311 |
2411 |
2711 |
2511 |
2611 |
| American
Funds Developing World Growth and Income Fund |
21100 |
22100 |
41100 |
23100 |
24100 |
27100 |
25100 |
26100 |
| American
Funds Global Balanced Fund |
2137 |
2237 |
4137 |
2337 |
2437 |
2737 |
2537 |
2637 |
| American
Mutual Fund |
2103 |
2203 |
4103 |
2303 |
2403 |
2703 |
2503 |
2603 |
| Capital
Income Builder |
2112 |
2212 |
4112 |
2312 |
2412 |
2712 |
2512 |
2612 |
| Capital
World Growth and Income Fund |
2133 |
2233 |
4133 |
2333 |
2433 |
2733 |
2533 |
2633 |
| EuroPacific
Growth Fund |
2116 |
2216 |
4116 |
2316 |
2416 |
2716 |
2516 |
2616 |
| Fundamental
Investors |
2110 |
2210 |
4110 |
2310 |
2410 |
2710 |
2510 |
2610 |
| The
Growth Fund of America |
2105 |
2205 |
4105 |
2305 |
2405 |
2705 |
2505 |
2605 |
| The
Income Fund of America |
2106 |
2206 |
4106 |
2306 |
2406 |
2706 |
2506 |
2606 |
| International
Growth and Income Fund |
2134 |
2234 |
41034 |
2334 |
2434 |
27034 |
2534 |
2634 |
| The
Investment Company of America |
2104 |
2204 |
4104 |
2304 |
2404 |
2704 |
2504 |
2604 |
| The
New Economy Fund |
2114 |
2214 |
4114 |
2314 |
2414 |
2714 |
2514 |
2614 |
| New
Perspective Fund |
2107 |
2207 |
4107 |
2307 |
2407 |
2707 |
2507 |
2607 |
| New
World Fund |
2136 |
2236 |
4136 |
2336 |
2436 |
2736 |
2536 |
2636 |
| SMALLCAP
World Fund |
2135 |
2235 |
4135 |
2335 |
2435 |
2735 |
2535 |
2635 |
| Washington
Mutual Investors Fund |
2101 |
2201 |
4101 |
2301 |
2401 |
2701 |
2501 |
2601 |
| Fixed
income funds |
|
|
|
|
|
|
|
|
| American
Funds Emerging Markets Bond Fund |
21114 |
22114 |
41114 |
23114 |
24114 |
27114 |
25114 |
26114 |
| American
Funds Corporate Bond Fund |
2132 |
2232 |
4132 |
2332 |
2432 |
2732 |
2532 |
2632 |
| American
Funds Inflation Linked Bond Fund |
2160 |
2260 |
4160 |
2360 |
2460 |
2760 |
2560 |
2660 |
| American
Funds Mortgage Fund |
2142 |
2242 |
4142 |
2342 |
2442 |
2742 |
2542 |
2642 |
| American
Funds Strategic Bond Fund |
21112 |
22112 |
41112 |
23112 |
24112 |
27112 |
25112 |
26112 |
| American
High-Income Trust |
2121 |
2221 |
4121 |
2321 |
2421 |
2721 |
2521 |
2621 |
| The
Bond Fund of America |
2108 |
2208 |
4108 |
2308 |
2408 |
2708 |
2508 |
2608 |
| Capital
World Bond Fund |
2131 |
2231 |
4131 |
2331 |
2431 |
2731 |
2531 |
2631 |
| Intermediate
Bond Fund of America |
2123 |
2223 |
4123 |
2323 |
2423 |
2723 |
2523 |
2623 |
| Short-Term
Bond Fund of America |
2148 |
2248 |
4148 |
2348 |
2448 |
2748 |
2548 |
2648 |
| U.S.
Government Securities Fund |
2122 |
2222 |
4122 |
2322 |
2422 |
2722 |
2522 |
2622 |
| Money
market fund |
|
|
|
|
|
|
|
|
American
Funds U.S. Government
Money Market Fund |
2159 |
2259 |
4159 |
2359 |
2459 |
2759 |
2559 |
2659 |
Tax-exempt
income funds — Page 103
| |
|
|
|
|
|
|
| |
Fund
numbers |
| Fund |
Class
A |
Class
C |
Class
T |
Class
F-1 |
Class
F-2 |
Class
F-3 |
| American
Funds Target Date Retirement Series® |
|
|
|
|
|
|
| American
Funds 2060 Target Date Retirement Fund® |
083 |
383 |
43083 |
483 |
683 |
783 |
| American
Funds 2055 Target Date Retirement Fund® |
082 |
382 |
43082 |
482 |
682 |
782 |
| American
Funds 2050 Target Date Retirement Fund® |
069 |
369 |
43069 |
469 |
669 |
769 |
| American
Funds 2045 Target Date Retirement Fund® |
068 |
368 |
43068 |
468 |
668 |
768 |
| American
Funds 2040 Target Date Retirement Fund® |
067 |
367 |
43067 |
467 |
667 |
767 |
| American
Funds 2035 Target Date Retirement Fund® |
066 |
366 |
43066 |
466 |
36066 |
766 |
| American
Funds 2030 Target Date Retirement Fund® |
065 |
365 |
43065 |
465 |
665 |
765 |
| American
Funds 2025 Target Date Retirement Fund® |
064 |
364 |
43064 |
464 |
664 |
764 |
| American
Funds 2020 Target Date Retirement Fund® |
063 |
363 |
43063 |
463 |
663 |
763 |
| American
Funds 2015 Target Date Retirement Fund® |
062 |
362 |
43062 |
462 |
662 |
762 |
| American
Funds 2010 Target Date Retirement Fund® |
061 |
361 |
43061 |
461 |
661 |
761 |
| |
|
|
|
|
|
|
|
|
| |
Fund
numbers |
| Fund |
Class
R-1 |
Class
R-2 |
Class
R-2E |
Class
R-3 |
Class
R-4 |
Class
R-5E |
Class
R-5 |
Class
R-6 |
| American
Funds Target Date Retirement Series® |
|
|
|
|
|
|
|
|
American
Funds 2060
Target Date Retirement Fund® |
2183 |
2283 |
4183 |
2383 |
2483 |
2783 |
2583 |
2683 |
American
Funds 2055
Target Date Retirement Fund® |
2182 |
2282 |
4182 |
2382 |
2482 |
2782 |
2582 |
2682 |
American
Funds 2050
Target Date Retirement Fund® |
2169 |
2269 |
4169 |
2369 |
2469 |
2769 |
2569 |
2669 |
American
Funds 2045
Target Date Retirement Fund® |
2168 |
2268 |
4168 |
2368 |
2468 |
2768 |
2568 |
2668 |
American
Funds 2040
Target Date Retirement Fund® |
2167 |
2267 |
4167 |
2367 |
2467 |
2767 |
2567 |
2667 |
American
Funds 2035
Target Date Retirement Fund® |
2166 |
2266 |
4166 |
2366 |
2466 |
2766 |
2566 |
2666 |
American
Funds 2030
Target Date Retirement Fund® |
2165 |
2265 |
4165 |
2365 |
2465 |
2765 |
2565 |
2665 |
American
Funds 2025
Target Date Retirement Fund® |
2164 |
2264 |
4164 |
2364 |
2464 |
2764 |
2564 |
2664 |
American
Funds 2020
Target Date Retirement Fund® |
2163 |
2263 |
4163 |
2363 |
2463 |
2763 |
2563 |
2663 |
American
Funds 2015
Target Date Retirement Fund® |
2162 |
2262 |
4162 |
2362 |
2462 |
2762 |
2562 |
2662 |
American
Funds 2010
Target Date Retirement Fund® |
2161 |
2261 |
4161 |
2361 |
2461 |
2761 |
2561 |
2661 |
Tax-exempt
income funds — Page 104
| |
|
|
|
|
|
| |
Fund
numbers |
| Fund |
Class
529-A |
Class
529-C |
Class
529-E |
Class
529-T |
Class
529-F-1 |
| American
Funds College Target Date Series® |
|
|
|
|
|
| American
Funds College 2036 FundSM |
10125 |
13125 |
15125 |
46125 |
14125 |
| American
Funds College 2033 Fund® |
10103 |
13103 |
15103 |
46103 |
14103 |
| American
Funds College 2030 Fund® |
1094 |
1394 |
1594 |
46094 |
1494 |
| American
Funds College 2027 Fund® |
1093 |
1393 |
1593 |
46093 |
1493 |
| American
Funds College 2024 Fund® |
1092 |
1392 |
1592 |
46092 |
1492 |
| American
Funds College 2021 Fund® |
1091 |
1391 |
1591 |
46091 |
1491 |
| American
Funds College Enrollment Fund® |
1088 |
1388 |
1588 |
46088 |
1488 |
| |
|
|
|
|
|
|
| |
Fund
numbers |
| Fund |
Class
A |
Class
C |
Class
T |
Class
F-1 |
Class
F-2 |
Class
F-3 |
| American
Funds Portfolio SeriesSM |
|
|
|
|
|
|
| American
Funds Global Growth PortfolioSM |
055 |
355 |
43055 |
455 |
655 |
755 |
| American
Funds Growth PortfolioSM |
053 |
353 |
43053 |
453 |
653 |
753 |
| American
Funds Growth and Income PortfolioSM |
051 |
351 |
43051 |
451 |
651 |
751 |
American
Funds Moderate
Growth and Income PortfolioSM |
050 |
350 |
43050 |
450 |
650 |
750 |
American
Funds Conservative
Growth and Income PortfolioSM |
047 |
347 |
43047 |
447 |
647 |
747 |
American
Funds Tax-Advantaged
Growth and Income PortfolioSM |
046 |
346 |
43046 |
446 |
646 |
746 |
| American
Funds Preservation PortfolioSM |
045 |
345 |
43045 |
445 |
645 |
745 |
| American
Funds Tax-Exempt Preservation PortfolioSM |
044 |
344 |
43044 |
444 |
644 |
744 |
| |
|
|
|
|
|
|
| |
Fund
numbers |
| Fund |
Class
529-A |
Class
529-C |
Class
529-E |
Class
529-T |
Class
529-F-1 |
Class
ABLE-A |
| American
Funds Global Growth Portfolio |
1055 |
1355 |
1555 |
46055 |
1455 |
48055 |
| American
Funds Growth Portfolio |
1053 |
1353 |
1553 |
46053 |
1453 |
48053 |
| American
Funds Growth and Income Portfolio |
1051 |
1351 |
1551 |
46051 |
1451 |
48051 |
American
Funds Moderate
Growth and Income Portfolio |
1050 |
1350 |
1550 |
46050 |
1450 |
48050 |
American
Funds Conservative
Growth and Income Portfolio |
1047 |
1347 |
1547 |
46047 |
1447 |
48047 |
American
Funds Tax-Advantaged
Growth and Income Portfolio |
N/A |
N/A |
N/A |
N/A |
N/A |
N/A |
| American
Funds Preservation Portfolio |
1045 |
1345 |
1545 |
46045 |
1445 |
48045 |
| American
Funds Tax-Exempt Preservation Portfolio |
N/A |
N/A |
N/A |
N/A |
N/A |
N/A |
| |
|
|
|
|
|
|
|
|
| |
Fund
numbers |
| Fund |
Class
R-1 |
Class
R-2 |
Class
R-2E |
Class
R-3 |
Class
R-4 |
Class
R-5E |
Class
R-5 |
Class
R-6 |
| American
Funds Global Growth Portfolio |
2155 |
2255 |
4155 |
2355 |
2455 |
2755 |
2555 |
2655 |
| American
Funds Growth Portfolio |
2153 |
2253 |
4153 |
2353 |
2453 |
2753 |
2553 |
2653 |
| American
Funds Growth and Income Portfolio |
2151 |
2251 |
4151 |
2351 |
2451 |
2751 |
2551 |
2651 |
American
Funds Moderate
Growth and Income Portfolio |
2150 |
2250 |
4150 |
2350 |
2450 |
2750 |
2550 |
2650 |
American
Funds Conservative
Growth and Income Portfolio |
2147 |
2247 |
4147 |
2347 |
2447 |
2747 |
2547 |
2647 |
American
Funds Tax-Advantaged
Growth and Income Portfolio |
N/A |
N/A |
N/A |
N/A |
N/A |
N/A |
N/A |
N/A |
| American
Funds Preservation Portfolio |
2145 |
2245 |
4145 |
2345 |
2445 |
2745 |
2545 |
2645 |
| American
Funds Tax-Exempt Preservation Portfolio |
N/A |
N/A |
N/A |
N/A |
N/A |
N/A |
N/A |
N/A |
Tax-exempt
income funds — Page 105
| |
|
|
|
|
|
|
| |
Fund
numbers |
| Fund |
Class
A |
Class
C |
Class
T |
Class
F-1 |
Class
F-2 |
Class
F-3 |
| American
Funds Retirement Income Portfolio SeriesSM |
|
|
|
|
|
|
| American
Funds Retirement Income Portfolio – ConservativeSM |
30109 |
33109 |
43109 |
34109 |
36109 |
37109 |
| American
Funds Retirement Income Portfolio – ModerateSM |
30110 |
33110 |
43110 |
34110 |
36110 |
37110 |
| American
Funds Retirement Income Portfolio – EnhancedSM |
30111 |
33111 |
43111 |
34111 |
36111 |
37111 |
| |
|
|
|
|
|
|
|
|
| |
Fund
numbers |
| Fund |
Class
R-1 |
Class
R-2 |
Class
R-2E |
Class
R-3 |
Class
R-4 |
Class
R-5E |
Class
R-5 |
Class
R-6 |
| American
Funds Retirement Income Portfolio – Conservative |
21109 |
22109 |
41109 |
23109 |
24109 |
27109 |
25109 |
26109 |
| American
Funds Retirement Income Portfolio – Moderate |
21110 |
22110 |
41110 |
23110 |
24110 |
27110 |
25110 |
26110 |
| American
Funds Retirement Income Portfolio – Enhanced |
21111 |
22111 |
41111 |
23111 |
24111 |
27111 |
25111 |
26111 |
Tax-exempt
income funds — Page 106
Appendix
The
following descriptions of debt security ratings are based on information provided by Moody’s Investors Service and Standard
& Poor’s Ratings Services.
Description
of bond ratings
Moody’s
Municipal
long-term rating definitions
Aaa
Obligations
rated Aaa are judged to be of the highest quality, subject to the lowest level of credit risk.
Aa
Obligations
rated Aa are judged to be of high quality and are subject to very low credit risk.
A
Obligations
rated A are considered upper-medium grade and are subject to low credit risk.
Baa
Obligations
rated Baa are judged to be medium grade and subject to moderate credit risk and as such may possess certain speculative characteristics.
Ba
Obligations
rated Ba are judged to be speculative and are subject to substantial credit risk.
B
Obligations
rated B are considered speculative and are subject to high credit risk.
Caa
Obligations
rated Caa are judged to be speculative and of poor standing and are subject to very high credit risk.
Ca
Obligations
rated Ca are highly speculative and are likely in, or very near, default, with some prospect of recovery of principal and interest.
C
Obligations
rated C are the lowest rated and are typically in default, with little prospect for recovery of principal or interest.
Note:
Moody’s appends numerical modifiers 1, 2 and 3 to each generic rating classification from Aa through Caa. The modifier 1
indicates that the obligation ranks in the higher end of its generic rating category; the modifier 2 indicates a mid-range ranking;
and the modifier 3 indicates a ranking in the lower end of that generic rating category. Additionally, a “(hyb)” indicator
is appended to all ratings of hybrid securities issued by banks, insurers, finance companies and securities firms.
Tax-exempt
income funds — Page 107
Standard
& Poor’s
Long-term issue credit ratings
AAA
An obligation rated AAA has the highest rating assigned by Standard & Poor’s. The obligor’s capacity to meet its
financial commitment on the obligation is extremely strong.
AA
An obligation rated AA differs from the highest-rated obligations only to a small degree. The obligor’s capacity to meet
its financial commitment on the obligation is very strong.
A
An obligation rated A is somewhat more susceptible to the adverse effects of changes in circumstances and economic conditions
than obligations in higher-rated categories. However, the obligor’s capacity to meet its financial commitment on the obligation
is still strong.
BBB
An obligation rated BBB exhibits adequate protection parameters. However, adverse economic conditions or changing circumstances
are more likely to lead to a weakened capacity of the obligor to meet its financial commitment on the obligation.
BB,
B, CCC, CC, and C
Obligations
rated BB, B, CCC, CC, and C are regarded as having significant speculative characteristics. BB indicates the least degree of speculation
and C the highest. While such obligations will likely have some quality and protective characteristics, these may be outweighed
by large uncertainties or major exposures to adverse conditions.
BB
An obligation rated BB is less vulnerable to nonpayment than other speculative issues. However, it faces major ongoing uncertainties
or exposure to adverse business, financial, or economic conditions which could lead to the obligor’s inadequate capacity
to meet its financial commitment on the obligation.
B
An obligation rated B is more vulnerable to nonpayment than obligations rated BB, but the obligor currently has the capacity to
meet its financial commitment on the obligation. Adverse business, financial, or economic conditions will likely impair the obligor’s
capacity or willingness to meet its financial commitment on the obligation.
CCC
An obligation rated CCC is currently vulnerable to nonpayment and is dependent upon favorable business, financial, and economic
conditions for the obligor to meet its financial commitment on the obligation. In the event of adverse business, financial, or
economic conditions, the obligor is not likely to have the capacity to meet its financial commitment on the obligation.
CC
An obligation rated CC is currently highly vulnerable to nonpayment. The CC rating is used when a default has not occurred, but
Standard & Poor’s expects default to be a virtual certainty, regardless of the anticipated time to default.
Tax-exempt
income funds — Page 108
C
An obligation rated C is currently highly vulnerable to nonpayment, and the obligation is expected to have lower relative seniority
or lower ultimate recovery compared to obligations that are rated higher.
D
An obligation rated D is in default or in breach of an imputed promise. For non-hybrid capital instruments, the D rating category
is used when payments on an obligation are not made on the date due, unless Standard & Poor’s believes that such payments
will be made within five business days in the absence of a stated grace period or within the earlier of the stated grace period
or 30 calendar days. The D rating also will be used upon the filing of a bankruptcy petition or the taking of similar action and
where default on an obligation is a virtual certainty, for example due to automatic stay provisions. An obligation’s rating
is lowered to D if it is subject to a distressed exchange offer.
Plus
(+) or minus (–)
The
ratings from AA to CCC may be modified by the addition of a plus or minus sign to show relative standing within the major rating
categories.
NR
This
indicates that no rating has been requested, that there is insufficient information on which to base a rating, or that Standard
& Poor’s does not rate a particular obligation as a matter of policy.
Tax-exempt
income funds — Page 109
Fitch
Ratings, Inc.
Long-term credit ratings
AAA
Highest credit quality. AAA ratings denote the lowest expectation of default risk. They are assigned only in case of exceptionally
strong capacity for payment of financial commitments. This capacity is highly unlikely to be adversely affected by foreseeable
events.
AA
Very high credit quality. AA ratings denote expectations of very low default risk. They indicate very strong capacity for payment
of financial commitments. This capacity is not significantly vulnerable to foreseeable events.
A
High credit quality. A ratings denote expectations of low default risk. The capacity for payment of financial commitments is considered
strong. This capacity may, nevertheless, be more vulnerable to changes in circumstances or in economic conditions than is the
case for higher ratings.
BBB
Good credit quality. BBB ratings indicate that expectations of default risk are low. The capacity for payment of financial commitments
is considered adequate but adverse changes in circumstances and economic conditions are more likely to impair this capacity.
BB
Speculative. BB ratings indicate an elevated vulnerability to default risk, particularly in the event of adverse changes in business
or economic conditions over time; however, business or financial flexibility exists which supports the servicing of financial
commitments.
B
Highly speculative. B ratings indicate that material default risk is present, but a limited margin of safety remains. Financial
commitments are currently being met; however, capacity for continued payment is vulnerable to deterioration in the business and
economic environment.
CCC
Substantial credit risk. Default is a real possibility.
CC
Very high levels of credit risk. Default of some kind appears probable.
C
Exceptionally high levels of credit risk. Default is imminent or inevitable, or the issuer is in standstill. Conditions that are
indicative of a C category rating for an issuer include:
· The
issuer has entered into a grace or cure period following nonpayment of a material financial obligation;
· The
issuer has entered into a temporary negotiated waiver or standstill agreement following a payment default on a material financial
obligation; or
· Fitch
Ratings otherwise believes a condition of RD or D to be imminent or inevitable, including through the formal announcement of a
distressed debt exchange.
Tax-exempt
income funds — Page 110
RD
Restricted default. RD ratings indicate an issuer that in Fitch Ratings’ opinion has experienced an uncured payment default
on a bond, loan or other material financial obligation but which has not entered into bankruptcy filings, administration, receivership,
liquidation or other formal winding up procedure, and which has not otherwise ceased operating. This would include:
· The
selective payment default on a specific class or currency of debt;
· The
uncured expiry of any applicable grace period, cure period or default forbearance period following a payment default on a bank
loan, capital markets security or other material financial obligation;
· The
extension of multiple waivers or forbearance periods upon a payment default on one or more material financial obligations, either
in series or in parallel; or
· Execution
of a distressed debt exchange on one or more material financial obligations.
D
Default. D ratings indicate an issuer that in Fitch Ratings’ opinion has entered into bankruptcy filings, administration,
receivership, liquidation or other formal winding up procedure, or which has otherwise ceased business.
Default
ratings are not assigned prospectively to entities or their obligations; within this context, nonpayment on an instrument that
contains a deferral feature or grace period will generally not be considered a default until after the expiration of the deferral
or grace period, unless a default is otherwise driven by bankruptcy or other similar circumstance, or by a distressed debt exchange.
Imminent
default typically refers to the occasion where a payment default has been intimated by the issuer, and is all but inevitable.
This may, for example, be where an issuer has missed a scheduled payment, but (as is typical) has a grace period during which
it may cure the payment default. Another alternative would be where an issuer has formally announced a distressed debt exchange,
but the date of the exchange still lies several days or weeks in the immediate future.
In all
cases, the assignment of a default rating reflects the agency’s opinion as to the most appropriate rating category consistent
with the rest of its universe of ratings, and may differ from the definition of default under the terms of an issuer’s financial
obligations or local commercial practice.
Note:
The modifiers “+” or “–” may be appended to a rating to denote relative status within major
rating categories. Such suffixes are not added to the AAA long-term rating category, or to categories below B.
Tax-exempt
income funds — Page 111
Description
of note ratings
Moody’s
Municipal
short-term debt ratings
MIG
1
This
designation denotes superior credit quality. Excellent protection is afforded by established cash flows, highly reliable liquidity
support, or demonstrated broad-based access to the market for refinancing.
MIG
2
This
designation denotes strong credit quality. Margins of protection are ample, although not as large as in the preceding group.
MIG
3
This
designation denotes acceptable credit quality. Liquidity and cash-flow protection may be narrow, and market access for refinancing
is likely to be less well-established.
SG
This
designation denotes speculative-grade credit quality. Debt instruments in this category may lack sufficient margins of protection.
Tax-exempt
income funds — Page 112
Standard
& Poor’s
Short-term
issue credit ratings
SP-1
Strong
capacity to pay principal and interest. An issue determined to possess a very strong capacity to pay debt service is given a plus
(+) designation.
SP-2
Satisfactory
capacity to pay principal and interest, with some vulnerability to adverse financial and economic changes over the term of the
notes.
SP-3
Speculative
capacity to pay principal and interest.
Tax-exempt
income funds — Page 113
Description
of commercial paper ratings
Moody’s
Global
short-term rating scale
P-1
Issuers
(or supporting institutions) rated Prime-1 have a superior ability to repay short-term debt obligations.
P-2
Issuers
(or supporting institutions) rated Prime-2 have a strong ability to repay short-term debt obligations.
P-3
Issuers
(or supporting institutions) rated Prime-3 have an acceptable ability to repay short-term obligations.
NP
Issuers
(or supporting institutions) rated Not Prime do not fall within any of the Prime rating categories.
Standard
& Poor’s
Commercial
paper ratings (highest three ratings)
A-1
A
short-term obligation rated A-1 is rated in the highest category by Standard & Poor’s. The obligor’s capacity
to meet its financial commitment on the obligation is strong. Within this category, certain obligations are designated with a
plus sign (+). This indicates that the obligor’s capacity to meet its financial commitment on these obligations is extremely
strong.
A-2
A
short-term obligation rated A-2 is somewhat more susceptible to the adverse effects of changes in circumstances and economic conditions
than obligations in higher rating categories. However, the obligor’s capacity to meet its financial commitment on the obligation
is satisfactory.
A-3
A
short-term obligation rated A-3 exhibits adequate protection parameters. However, adverse economic conditions or changing circumstances
are more likely to lead to a weakened capacity of the obligor to meet its financial commitment on the obligation.
Tax-exempt
income funds — Page 114
American Funds Short-Term Tax-Exempt
Bond Fund®
Investment portfolio
July 31, 2019
Bonds, notes & other debt instruments 92.28%
Alabama 1.11%
| Principal amount
(000)
| Value
(000)
|
| Black Belt Energy Gas Dist., Gas Supply Rev. Bonds, Series 2016-A, 4.00% 2046 (put 2021)
| $2,000
| $2,089
|
| Black Belt Energy Gas Dist., Gas Supply Rev. Bonds, Series 2017-A, 4.00% 2047 (put 2022)
| 5,500
| 5,874
|
| County of Jefferson, Limited Obligation Rev. Ref. Bonds, Series 2017, 5.00% 2019
| 1,875
| 1,883
|
| County of Jefferson, Limited Obligation Rev. Ref. Bonds, Series 2017, 5.00% 2022
| 1,000
| 1,112
|
| County of Jefferson, Limited Obligation Rev. Ref. Bonds, Series 2017, 5.00% 2023
| 1,500
| 1,718
|
|
|
| 12,676
|
| Alaska 0.07%
|
|
|
| Housing Fin. Corp., General Mortgage Rev. Bonds, Series 2016-A, 3.50% 2046
| 760
| 799
|
| Arizona 0.32%
|
|
|
County of Coconino, Pollution Control Corp., Pollution Control Rev. Ref. Bonds, Series 2017-A, AMT,
1.80% 2032
| 1,000
| 1,002
|
| County of Maricopa, Industrial Dev. Auth., Rev. Bonds (Banner Health), Series 2017-B, 5.00% 2048 (put 2022)
| 2,000
| 2,231
|
| McAllister Academic Village LLC, Rev. Ref. Bonds (Arizona State University Hassayampa Academic Village Project), Series 2016, 5.00% 2022
| 400
| 444
|
|
|
| 3,677
|
| California 3.39%
|
|
|
Bay Area Toll Auth., San Francisco Bay Area Toll Bridge Rev. Bonds, Series 2008-A-1,
(SIFMA Municipal Swap Index + 0.90%) 2.30% 2045 (put 2023)1
| 1,250
| 1,268
|
Bay Area Toll Auth., San Francisco Bay Area Toll Bridge Rev. Bonds, Series 2014-G,
(SIFMA Municipal Swap Index + 0.60%) 2.00% 2034 (put 2020)1
| 2,000
| 2,002
|
Bay Area Toll Auth., San Francisco Bay Area Toll Bridge Rev. Bonds, Series 2017-D,
(3-month USD-LIBOR x 0.70 + 0.55%) 2.182% 2045 (put 2021)1
| 500
| 501
|
| Trustees of the California State University, Systemwide Rev. Bonds, Series 2016-B-3, 4.00% 2051 (put 2023)
| 1,500
| 1,657
|
Infrastructure and Econ. Dev. Bank, Rev. Ref. Bonds (J. Paul Getty Trust), Series 2011-A-4,
(3-month USD-LIBOR x 0.70 + 0.37%) 1.993% 2038 (put 2020)1
| 1,500
| 1,502
|
| City of Los Angeles, Dept. of Airports, Los Angeles International Airport, Rev. Bonds, Series 2016-B, AMT, 5.00% 2022
| 2,000
| 2,206
|
| City of Los Angeles, Dept. of Airports, Los Angeles International Airport, Rev. Bonds, Series 2016-B, AMT, 5.00% 2023
| 2,500
| 2,846
|
| City of Los Angeles, Dept. of Airports, Los Angeles International Airport, Rev. Bonds, Series 2018-D, AMT, 5.00% 2022
| 1,000
| 1,103
|
| City of Los Angeles, Dept. of Airports, Los Angeles International Airport, Rev. Bonds, Series 2018-D, AMT, 5.00% 2023
| 2,500
| 2,846
|
| City of Los Angeles, Dept. of Airports, Los Angeles International Airport, Rev. Bonds, Series 2019-A, AMT, 5.00% 2023
| 825
| 939
|
| City of Los Angeles, Dept. of Airports, Los Angeles International Airport, Rev. Bonds, Series 2019-A, AMT, 5.00% 2024
| 1,200
| 1,405
|
| City of Los Angeles, Multi Family Housing Rev. Bonds (Jordan Downs Phase 1B Apartments), Series 2018-A-2, 2.08% 2022 (put 2021)
| 450
| 455
|
| Metropolitan Water Dist. of Southern California, Water Rev. Ref. Bonds, Series 2019-A, 5.00% 2023
| 3,000
| 3,476
|
| Port of Oakland, Rev. Ref. Bonds, Series 2017-D, AMT, 5.00% 2022
| 2,000
| 2,235
|
City of Riverside, Rev. Ref. Water Bonds, Series 2011-A,
(SIFMA Municipal Swap Index + 0.15%) 2.03% 2035 (put 2020)1
| 1,200
| 1,201
|
American Funds Short-Term Tax-Exempt Bond Fund
— Page 1 of 19
Bonds, notes & other debt instruments (continued)
California (continued)
| Principal amount
(000)
| Value
(000)
|
| Sacramento Unified School Dist., G.O. Rev. Ref. Bonds, Series 2014, BAM insured, 5.00% 2024
| $1,300
| $1,513
|
| City of San Jose, Airport Rev. Ref. Bonds, Series 2017-A, AMT, 5.00% 2021
| 1,295
| 1,373
|
| City of San Jose, Airport Rev. Ref. Bonds, Series 2017-A, AMT, 5.00% 2022
| 1,000
| 1,095
|
Statewide Communities Dev. Auth., Multi Family Housing Rev. Bonds (La Mesa Springs Apartments),
Series 2019-E, 1.78% 2021 (put 2020)
| 1,100
| 1,109
|
| Statewide Communities Dev. Auth., Rev. Bonds (Hebrew Home for Aged Disabled), Series 2016, 3.50% 2021
| 1,850
| 1,862
|
Temecula Valley Unified School Dist., Fncg. Auth., Special Tax Rev. Bonds, Series 2015, BAM insured,
5.00% 2019
| 375
| 376
|
| Dept. of Veterans Affairs, Home Purchase Rev. Bonds, Series 2016-B, 3.50% 2045
| 1,155
| 1,217
|
| Dept. of Veterans Affairs, Veterans G.O. Bonds, Series 2019-CS, 4.00% 2049
| 3,000
| 3,325
|
| Dept. of Veterans Affairs, Veterans G.O. Rev. Ref. Bonds, Series 2015-CM, AMT, 2.45% 2031
| 1,120
| 1,122
|
|
|
| 38,634
|
| Colorado 1.81%
|
|
|
| City of Colorado Springs, Utilities System Rev. Ref. Bonds, Series 2011-A-2, 5.00% 2021
| 1,875
| 2,041
|
| City and County of Denver, Airport System Rev. Bonds, Series 2013-A, AMT, 5.00% 2020
| 1,000
| 1,047
|
| City and County of Denver, Dept. of Aviation (Denver International Airport), Rev. Bonds, Series 2016-B, (1-month USD-LIBOR x 0.70 + 0.86%) 2.541% 2031 (put
2019)1
| 1,595
| 1,596
|
| Health Facs. Auth., Hospital Rev. Bonds (Adventist Health System/Sunbelt Obligated Group), Series 2016-C, 5.00% 2036 (put 2023)
| 2,000
| 2,306
|
| Housing and Fin. Auth., Single Family Mortgage Bonds, Series 2017-C, Class I, 4.00% 2048
| 1,710
| 1,834
|
| Housing and Fin. Auth., Single Family Mortgage Bonds, Series 2018-B-1, Class I, 4.00% 2048
| 1,415
| 1,527
|
| Housing and Fin. Auth., Single Family Mortgage Bonds, Series 2018-C, Class I, 4.25% 2048
| 950
| 1,039
|
| Housing and Fin. Auth., Single Family Mortgage Bonds, Series 2019-C, Class I, 4.25% 2049
| 6,470
| 7,108
|
| Housing and Fin. Auth., Single Family Mortgage Bonds, Series 2019-E, Class I, 4.25% 2049
| 2,000
| 2,191
|
|
|
| 20,689
|
| Connecticut 2.09%
|
|
|
| Health and Educational Facs. Auth., Rev. Bonds (Quinnipiac University Issue), Series 2016-M, 5.00% 2022
| 750
| 827
|
| Health and Educational Facs. Auth., Rev. Bonds (Yale University Issue), Series 2015-A, 2.05% 2035 (put 2021)
| 3,750
| 3,818
|
Health and Educational Facs. Auth., Rev. Bonds (Yale University Issue), Series 2017-B-1,
5.00% 2037 (put 2020)2
| 3,575
| 3,703
|
| Housing Fin. Auth., Housing Mortgage Fin. Program Bonds, Series 2014-C-1, 4.00% 2044
| 490
| 513
|
| Housing Fin. Auth., Housing Mortgage Fin. Program Bonds, Series 2016-A-1, 4.00% 2045
| 890
| 937
|
| Housing Fin. Auth., Housing Mortgage Fin. Program Bonds, Series 2016-E-1, 3.50% 2046
| 930
| 974
|
| Housing Fin. Auth., Housing Mortgage Fin. Program Bonds, Series 2017-C-1, 4.00% 2047
| 1,690
| 1,808
|
| Housing Fin. Auth., Housing Mortgage Fin. Program Bonds, Series 2017-D-1, 4.00% 2047
| 615
| 659
|
| Housing Fin. Auth., Housing Mortgage Fin. Program Bonds, Series 2018-A-2, AMT, 4.00% 2041
| 3,355
| 3,604
|
| Housing Fin. Auth., Housing Mortgage Fin. Program Rev. Ref. Bonds, Series 2012-F-2, AMT, 2.75% 2035
| 270
| 274
|
| Housing Fin. Auth., Housing Mortgage Fin. Program Rev. Ref. Bonds, Series 2014-D-1, 4.00% 2044
| 1,210
| 1,251
|
| Housing Fin. Auth., Housing Mortgage Fin. Program Rev. Ref. Bonds, Series 2015-A, 3.50% 2044
| 1,915
| 1,989
|
| Housing Fin. Auth., Housing Mortgage Fin. Program Rev. Ref. Bonds, Series 2015-C-1, 3.50% 2045
| 1,225
| 1,278
|
| Special Tax Obligation Bonds, Transportation Infrastructure Purposes, Series 2018-B, 5.00% 2022
| 2,000
| 2,234
|
|
|
| 23,869
|
| District of Columbia 1.00%
|
|
|
| G.O. Bonds, Series 2015-A, 5.00% 2024
| 5,255
| 6,207
|
| Housing Fin. Agcy., Collateralized Multi Family Housing Rev. Bonds (The Strand Residences), Series 2019, 1.45% 2039 (put 2022)
| 1,250
| 1,252
|
| Income Tax Secured Rev. Bonds, Series 2011-A, 5.00% 2022
| 700
| 763
|
| Metropolitan Washington DC Airports Auth., Airport System Rev. Ref. Bonds, Series 2019-A, AMT, 5.00% 2021
| 1,155
| 1,247
|
| Metropolitan Washington DC Airports Auth., Airport System Rev. Ref. Bonds, Series 2019-A, AMT, 5.00% 2022
| 1,300
| 1,449
|
| Water and Sewer Auth., Public Utility Rev. Bonds, Series 2016-A, 5.00% 2019
| 500
| 503
|
|
|
| 11,421
|
American Funds Short-Term Tax-Exempt Bond Fund
— Page 2 of 19
Bonds, notes & other debt instruments (continued)
Florida 4.09%
| Principal amount
(000)
| Value
(000)
|
| County of Broward, Airport System Rev. Bonds, Series 2017, AMT, 5.00% 2020
| $1,000
| $1,043
|
| County of Broward, Airport System Rev. Bonds, Series 2017, AMT, 5.00% 2023
| 1,100
| 1,258
|
| County of Broward, Airport System Rev. Ref. Bonds, Series 2015-A, AMT, 5.00% 2021
| 1,000
| 1,078
|
City of Cape Coral, Utility Improvement Rev. Ref. Assessment Bonds (Various Areas), Series 2017,
Assured Guaranty Municipal insured, 1.65% 2019
| 1,095
| 1,095
|
| Board of Education, Public Education Capital Outlay Rev. Ref. Bonds, Series 2015-A, 5.00% 2024
| 5,525
| 6,529
|
Housing Fin. Auth., Multi Family Housing Rev. Bonds (Jubilee Courtyards Apartments), Series 2019,
1.45% 2022 (put 2021)
| 1,250
| 1,251
|
| Housing Fin. Corp., Homeowner Mortgage Rev. Bonds (Special Program), Series 2015-A, 3.50% 2046
| 750
| 775
|
| Housing Fin. Corp., Homeowner Mortgage Rev. Bonds, Series 2011-C, 4.50% 2030
| 135
| 138
|
| Housing Fin. Corp., Homeowner Mortgage Rev. Bonds, Series 2017-1, 4.00% 2048
| 1,885
| 2,035
|
| Housing Fin. Corp., Homeowner Mortgage Rev. Bonds, Series 2018-2, 4.25% 2050
| 5,265
| 5,825
|
Housing Fin. Corp., Multi Familiy Mortgage Rev. Bonds (Emerald Villas Phase Two), Series 2019-A,
2.00% 2021
| 1,325
| 1,340
|
Housing Fin. Corp., Multi Family Mortgage Rev. Bonds (Lake Mangonia Apartments), Series 2018-B,
2.00% 2020
| 1,700
| 1,700
|
| City of Jacksonville, Housing Fin. Auth., Multi Family Housing Rev. Bonds (Desert-Silver Project), Series 2018, 2.25% 2021 (put 2020)
| 4,000
| 4,037
|
| JEA, Electric System Rev. Bonds, Series 2012-B, 5.00% 2026 (preref. 2021)
| 4,650
| 5,035
|
| JEA, Water and Sewer System Rev. Bonds, Series 2017-A, 5.00% 2021 (escrowed to maturity)
| 1,240
| 1,344
|
| City of Lakeland, Energy System Rev. Ref. Bonds, Series 2016, 5.00% 2019
| 900
| 906
|
| County of Miami-Dade, Expressway Auth., Toll System Rev. Ref. Bonds, Series 2013-A, 5.00% 2020
| 1,000
| 1,034
|
County of Orange, Housing Fin. Auth., Multi Family Housing Rev. Bonds (Willow Key Apartments),
Series 2019-A, 1.90% 2022 (put 2021)
| 1,905
| 1,920
|
| South Florida Water Management Dist., Certs. of Part., Series 2015, 5.00% 2022
| 1,250
| 1,399
|
| Dept. of Transportation, Right-of-Way Acquisition and Bridge Construction Bonds, Series 2018-A, 5.00% 2021
| 1,570
| 1,687
|
| Dept. of Transportation, Right-of-Way Acquisition and Bridge Construction Rev. Ref. Bonds, Series 2012-A, 4.00% 2028
| 3,560
| 3,741
|
| Dept. of Transportation, Turnpike Rev. Ref. Bonds, Series 2013-A, 5.00% 2021
| 1,325
| 1,423
|
|
|
| 46,593
|
| Georgia 1.56%
|
|
|
| City of Atlanta, Dev. Auth., Student Housing Facs. Rev. Ref. Bonds (Piedmont/Ellis, LLC University Commons Project), Series 2013, 5.00% 2019 (escrowed to maturity)
| 760
| 762
|
County of Burke, Dev. Auth., Pollution Control Rev. Bonds (Georgia Power Co. Plant Vogtle Project),
Series 2012, 1.85% 2049 (put 2019)
| 1,200
| 1,200
|
| City of East Point, Housing Auth., Multi Family Housing Rev. Bonds (Hillcrest Senior Apartments Projects), Series 2018, 2.25% 2022 (put 2021)2
| 6,470
| 6,567
|
County of Floyd, Dev. Auth., Pollution Control Rev. Bonds (Georgia Power Co. Plant Hammond Project),
Series 2010, 2.35% 2022 (put 2020)
| 4,000
| 4,048
|
| G.O. Bonds, Series 2011-C, 5.00% 2021
| 250
| 269
|
| G.O. Bonds, Series 2016-A, 5.00% 2020
| 1,000
| 1,020
|
| Housing and Fin. Auth., Single Family Mortgage Bonds, Series 2014-A-1, 4.00% 2044
| 385
| 402
|
| Housing and Fin. Auth., Single Family Mortgage Bonds, Series 2016-A-1, 3.50% 2046
| 440
| 460
|
| Main Street Natural Gas, Inc., Gas Supply Rev. Bonds, Series 2019-A, 5.00% 2022
| 1,000
| 1,090
|
| Road and Tollway Auth., Federal Highway Grant Anticipation Rev. Ref. Bonds, Series 2017-B, 5.00% 2020
| 1,870
| 1,930
|
|
|
| 17,748
|
| Hawaii 1.09%
|
|
|
| G.O. Bonds, Series 2011-DZ, 5.00% 2024 (preref. 2021)
| 1,545
| 1,684
|
| G.O. Bonds, Series 2011-DZ, 5.00% 2026 (preref. 2021)
| 3,485
| 3,799
|
| G.O. Bonds, Series 2011-DZ, 5.00% 2028 (preref. 2021)
| 2,690
| 2,932
|
American Funds Short-Term Tax-Exempt Bond Fund
— Page 3 of 19
Bonds, notes & other debt instruments (continued)
Hawaii (continued)
| Principal amount
(000)
| Value
(000)
|
City and County of Honolulu, G.O. Bonds (Honolulu Rail Transit Project), Series 2017-H,
(SIFMA Municipal Swap Index + 0.31%) 1.71% 2024 (put 2020)1
| $3,000
| $3,000
|
| Dept. of Transportation, Airports Division, Lease Rev. Certs. of Part., Series 2013, AMT, 5.00% 2019
| 1,000
| 1,000
|
|
|
| 12,415
|
| Illinois 7.18%
|
|
|
| Build Illinois Bonds, Sales Tax Rev. Bonds, Series 2013, 5.00% 2020
| 6,300
| 6,475
|
| Build Illinois Bonds, Sales Tax Rev. Ref. Bonds, Series 2016-D, 4.00% 2021
| 3,000
| 3,106
|
| City of Chicago, Chicago Midway Airport, Rev. Ref. Bonds, Series 2014-A, AMT, 5.00% 2024
| 3,000
| 3,435
|
City of Chicago, O’Hare International Airport, General Airport Rev. Bonds, Series 2011-C,
6.50% 2041 (preref. 2021)
| 2,850
| 3,067
|
City of Chicago, O’Hare International Airport, General Airport Rev. Ref. Bonds, Series 2012-A, AMT,
5.00% 2020
| 1,000
| 1,015
|
| City of Chicago, Wastewater Transmission Rev. Ref. Bonds, Series 2017-B, 5.00% 2021
| 1,500
| 1,575
|
| City of Chicago, Wastewater Transmission Rev. Ref. Bonds, Series 2017-B, 5.00% 2022
| 1,000
| 1,082
|
| City of Chicago, Water Rev. Bonds, Series 2004, 5.00% 2023
| 2,750
| 3,136
|
| City of Chicago, Water Rev. Ref. Bonds (Second Lien), Series 2017-2, 5.00% 2019
| 1,800
| 1,816
|
| City of Chicago, Water Rev. Ref. Bonds, Series 2012, 4.00% 2022
| 2,800
| 3,017
|
Counties of Cook, DuPage, Kane, Lake, McHenry and Will, Regional Transportation Auth.,
G.O. Rev. Ref. Bonds, Series 1997, FGIC-National insured, 6.00% 2020
| 1,030
| 1,070
|
| County of Cook, G.O. Rev. Ref. Bonds, Series 2016-A, 5.00% 2021
| 500
| 537
|
| County of Cook, G.O. Rev. Ref. Bonds, Series 2016-A, 5.00% 2022
| 500
| 551
|
| Fin. Auth., National Rural Utilities Cooperative Fin. Corp., Guaranteed Solid Waste Disposal Rev. Bonds (Prairie Power, Inc. Project), Series 2008-A, 1.75% 2042
(put 2020)
| 3,325
| 3,327
|
| Fin. Auth., Rev. Bonds (Advocate Health Care Network), Series 2014, 5.00% 2019
| 550
| 550
|
| Fin. Auth., Rev. Bonds (Clean Water Initiative Revolving Fund), Series 2017, 5.00% 2023
| 1,000
| 1,127
|
| Fin. Auth., Rev. Bonds (Rush University Medical Center Obligated Group), Series 2015-A, 5.00% 2019
| 1,000
| 1,011
|
| Fin. Auth., Rev. Bonds (Silver Cross Hospital and Medical Centers), Series 2009, 7.00% 2044 (preref. 2019)
| 3,280
| 3,287
|
| Fin. Auth., Rev. Green Bonds (Clean Water Initiative Revolving Fund), Series 2019, 5.00% 2021
| 1,180
| 1,265
|
| Fin. Auth., Rev. Green Bonds (Clean Water Initiative Revolving Fund), Series 2019, 5.00% 2025
| 3,000
| 3,573
|
| Fin. Auth., Rev. Ref. Bonds (Advocate Health Care Network), Series 2008-A-1, 5.00% 2030 (put 2020)
| 4,000
| 4,067
|
| Fin. Auth., Rev. Ref. Bonds (OSF Healthcare System), Series 2015-A, 5.00% 2020
| 2,410
| 2,524
|
| Housing Dev. Auth., Multi Family Housing Rev. Notes (Marshall Field Garden Apartment Homes), Series 2015, (SIFMA Municipal Swap Index + 1.00%) 2.40% 2050 (put
2025)1
| 5,525
| 5,525
|
| Housing Dev. Auth., Rev. Bonds, Series 2019-A, 4.25% 2049
| 500
| 552
|
Board of Trustees of the Illinois State University, Auxiliary Facs. System Rev. Bonds, Series 2016,
Assured Guaranty Municipal insured, 5.00% 2021
| 2,155
| 2,264
|
Metropolitan Pier and Exposition Auth., McCormick Place Expansion Project Rev. Bonds,
Series 2002-A, Assured Guaranty Municipal insured, 5.50% 2023
| 3,145
| 3,433
|
| Railsplitter Tobacco Settlement Auth., Tobacco Settlement Rev. Bonds, Series 2010, 5.25% 2021
| 2,065
| 2,206
|
Railsplitter Tobacco Settlement Auth., Tobacco Settlement Rev. Bonds, Series 2010,
5.50% 2023 (preref. 2021)
| 1,090
| 1,175
|
| Sales Tax Securitization Corp., Sales Tax Securitization Bonds, Series 2018-C, 5.00% 2023
| 500
| 549
|
| Sales Tax Securitization Corp., Sales Tax Securitization Rev. Ref. Bonds, Series 2017-A, 5.00% 2022
| 2,000
| 2,143
|
Southwestern Illinois Dev. Auth., Health Fac. Rev. Bonds (Memorial Group, Inc.), Series 2013,
7.25% 2036 (preref. 2023)
| 2,500
| 3,119
|
| Toll Highway Auth., Toll Highway Rev. Bonds, Series 2014-A, 5.00% 2019
| 1,500
| 1,519
|
| Toll Highway Auth., Toll Highway Rev. Bonds, Series 2014-D, 5.00% 2024
| 1,295
| 1,496
|
| Toll Highway Auth., Toll Highway Rev. Ref. Bonds, Series 2019-A, 5.00% 2023
| 1,325
| 1,486
|
| Toll Highway Auth., Toll Highway Rev. Ref. Bonds, Series 2019-A, 5.00% 2024
| 1,500
| 1,732
|
Board of Trustees of the University of Illinois, Auxiliary Facs. System Rev. Ref. Bonds, Series 2013-A,
5.00% 2021
| 1,945
| 2,063
|
American Funds Short-Term Tax-Exempt Bond Fund
— Page 4 of 19
Bonds, notes & other debt instruments (continued)
Illinois (continued)
| Principal amount
(000)
| Value
(000)
|
| Board of Trustees of the University of Illinois, Rev. Ref. Certs. of Part., Series 2016-A, 4.00% 2019
| $1,015
| $1,016
|
United City of Yorkville, Special Service Area Nos. 2005-108 and 2005-109, Special Tax Rev. Ref. Bonds,
Series 2016, Assured Guaranty Municipal insured, 3.00% 2020
| 932
| 938
|
|
|
| 81,829
|
| Indiana 1.31%
|
|
|
Dev. Fin. Auth., Solid Waste Disposal Rev. Bonds (Waste Management, Inc. Project), Series 2001, AMT,
2.95% 2031 (put 2021)
| 1,000
| 1,029
|
| Fin. Auth., Hospital Rev. Ref. Bonds (Indiana University Health Obligated Group), Series 2016-A, 5.00% 2019
| 1,100
| 1,114
|
| Fin. Auth., Hospital Rev. Ref. Bonds (Parkview Health), Series 2017-A, 5.00% 2023
| 1,335
| 1,537
|
Health Facs. Fncg. Auth., Rev. Bonds (Ascension Health Senior Credit Group), Series 2005-A-1,
2.80% 2027 (put 2019)
| 445
| 445
|
| Hobart Building Corp., First Mortgage Bonds, Series 2006, National insured, 6.50% 2029 (preref. 2020)
| 6,000
| 6,146
|
| Housing and Community Dev. Auth., Single Family Mortgage Rev. Bonds, Series 2019-A, 4.25% 2048
| 2,250
| 2,479
|
City of Whiting, Environmental Facs. Rev. Bonds (BP Products North America, Inc. Project), Series 2008,
1.85% 2044 (put 2019)
| 2,250
| 2,252
|
|
|
| 15,002
|
| Iowa 0.56%
|
|
|
| Fin. Auth., Single Family Mortgage Bonds, Series 2015-A, AMT, 3.50% 2040
| 430
| 443
|
| Fin. Auth., Single Family Mortgage Bonds, Series 2017-A, 4.00% 2047
| 620
| 663
|
| Fin. Auth., State Revolving Fund Rev. Bonds, Series 2011, 5.00% 2026 (preref. 2021)
| 4,945
| 5,328
|
|
|
| 6,434
|
| Kansas 0.35%
|
|
|
Dept. of Transportation, Highway Rev. Bonds, Series 2004-C-4,
(1-month USD-LIBOR x 0.70 + 0.50%) 2.181% 20241
| 4,000
| 4,022
|
| Kentucky 0.67%
|
|
|
Housing Corp., Housing Rev. Bonds (Jefferson Green Apartments Project), Series 2018,
2.20% 2022 (put 2021)
| 4,825
| 4,883
|
| Housing Corp., Housing Rev. Bonds (Westminster Village Project), Series 2019, 2.00% 2022 (put 2021)
| 800
| 807
|
Louisville/Jefferson Metro County Government, Health System Rev. Bonds (Norton Healthcare, Inc.),
Series 2016-A, 5.00% 2022
| 1,755
| 1,951
|
|
|
| 7,641
|
| Louisiana 0.77%
|
|
|
| Aviation Board, General Airport Rev. Ref. Bonds, Series 2017-D-2, AMT, 5.00% 2021
| 400
| 420
|
| Aviation Board, General Airport Rev. Ref. Bonds, Series 2017-D-2, AMT, 5.00% 2023
| 500
| 556
|
Citizens Property Insurance Corp., Assessment Rev. Ref. Bonds, Series 2015,
Assured Guaranty Municipal insured, 5.00% 2021
| 1,500
| 1,603
|
| Local Government Environmental Facs. and Community Dev. Auth., Rev. Ref. Bonds (Louisiana Community and Technical College System Act 391 Projects), Series 2017,
BAM insured, 5.00% 2024
| 1,000
| 1,172
|
Tobacco Settlement Fncg. Corp., Tobacco Settlement Asset-Backed Rev. Ref. Bonds, Series 2013-A,
5.00% 2021
| 4,705
| 4,987
|
|
|
| 8,738
|
| Maine 0.60%
|
|
|
| Housing Auth., Mortgage Purchase Bonds, Series 2016-B-1, 3.50% 2046
| 1,605
| 1,667
|
| Housing Auth., Mortgage Purchase Bonds, Series 2018-F, 4.25% 2048
| 1,095
| 1,206
|
| Housing Auth., Mortgage Purchase Rev. Ref. Bonds, Series 2013-B, 4.00% 2043
| 500
| 518
|
American Funds Short-Term Tax-Exempt Bond Fund
— Page 5 of 19
Bonds, notes & other debt instruments (continued)
Maine (continued)
| Principal amount
(000)
| Value
(000)
|
| Housing Auth., Mortgage Purchase Rev. Ref. Bonds, Series 2014-A-1, AMT, 3.25% 2043
| $345
| $354
|
| Housing Auth., Mortgage Purchase Rev. Ref. Bonds, Series 2015-E-1, AMT, 3.50% 2035
| 2,995
| 3,120
|
|
|
| 6,865
|
| Maryland 0.82%
|
|
|
Community Dev. Administration, Dept. of Housing and Community Dev., Residential Rev. Bonds,
Series 2014-B, AMT, 3.25% 2044
| 2,515
| 2,579
|
Community Dev. Administration, Dept. of Housing and Community Dev., Residential Rev. Bonds,
Series 2018-A, 4.50% 2048
| 3,185
| 3,534
|
County of Montgomery, Housing Opportunities Commission, Single Family Housing Rev. Bonds,
Series 2017-A, 4.00% 2048
| 1,670
| 1,794
|
| Washington Suburban Sanitary Dist., Consolidated Public Improvement Bonds, Series 2012, 5.00% 2021
| 1,335
| 1,430
|
|
|
| 9,337
|
| Massachusetts 2.51%
|
|
|
| Dev. Fin. Agcy., Rev. Bonds (Beth Israel Lahey Health Issue), Series 2019-K, 4.00% 2022
| 500
| 540
|
| Dev. Fin. Agcy., Rev. Bonds (Beth Israel Lahey Health Issue), Series 2019-K, 5.00% 2024
| 500
| 588
|
| Dev. Fin. Agcy., Rev. Bonds (Beth Israel Lahey Health Issue), Series 2019-K, 5.00% 2025
| 1,000
| 1,200
|
| Dev. Fin. Agcy., Rev. Bonds (Harvard University Issue), Series 2010-B-2, 5.25% 2034 (preref. 2021)
| 500
| 531
|
| Dev. Fin. Agcy., Rev. Bonds (Partners HealthCare System Issue), Series 2012-L, 5.00% 2031 (preref. 2021)
| 2,000
| 2,147
|
| Dev. Fin. Agcy., Rev. Bonds (Partners HealthCare System Issue), Series 2017-S, 5.00% 2021
| 3,000
| 3,218
|
| Educational Fncg. Auth., Education Loan Rev. Bonds, Series 2014-I, AMT, 5.00% 2021
| 3,000
| 3,154
|
| Educational Fncg. Auth., Education Loan Rev. Bonds, Series 2016-J, AMT, 5.00% 2024
| 3,000
| 3,482
|
| Educational Fncg. Auth., Education Loan Rev. Bonds, Series 2017-A, AMT, 4.00% 2021
| 1,000
| 1,050
|
| Educational Fncg. Auth., Education Loan Rev. Bonds, Series 2018-B, AMT, 5.00% 2024
| 2,145
| 2,490
|
Housing Fin. Agcy., Multi Family Housing Rev. Bonds (Conduit-Chestnut Park Project), Series 2018-A,
2.40% 2023 (put 2021)
| 590
| 601
|
| Housing Fin. Agcy., Single Family Housing Rev. Bonds, Series 167, 4.00% 2043
| 680
| 707
|
| Housing Fin. Agcy., Single Family Housing Rev. Bonds, Series 169, 4.00% 2044
| 410
| 426
|
| Housing Fin. Agcy., Single Family Housing Rev. Bonds, Series 172, 4.00% 2045
| 795
| 835
|
| Housing Fin. Agcy., Single Family Housing Rev. Bonds, Series 181, 4.00% 2044
| 625
| 659
|
| Housing Fin. Agcy., Single Family Housing Rev. Bonds, Series 183, 3.50% 2046
| 665
| 694
|
| Housing Fin. Agcy., Single Family Housing Rev. Bonds, Series 203, 4.50% 2048
| 1,000
| 1,108
|
| Housing Fin. Agcy., Single Family Housing Rev. Ref. Bonds, Series 160, AMT, 3.75% 2034
| 230
| 235
|
| Housing Fin. Agcy., Single Family Housing Rev. Ref. Bonds, Series 162, 2.75% 2041
| 165
| 166
|
| Housing Fin. Agcy., Single Family Housing Rev. Ref. Bonds, Series 165, 2.65% 2041
| 585
| 590
|
| Housing Fin. Agcy., Single Family Housing Rev. Ref. Bonds, Series 171, 4.00% 2044
| 470
| 490
|
| Housing Fin. Agcy., Single Family Housing Rev. Ref. Bonds, Series 177, AMT, 4.00% 2039
| 2,785
| 2,933
|
| Housing Fin. Agcy., Single Family Housing Rev. Ref. Bonds, Series 188, AMT, 4.00% 2043
| 725
| 777
|
|
|
| 28,621
|
| Michigan 2.64%
|
|
|
| Building Auth., Rev. Ref. Bonds (Facs. Program), Series 2015-I, 5.00% 2021
| 1,400
| 1,492
|
Fin. Auth., Local Government Loan Program Rev. Bonds (Detroit Water and Sewerage Dept., Sewage Disposal System Rev. and Rev. Ref. Local Project Bonds), Series
2014-C-3, Assured Guaranty Municipal insured,
5.00% 2023
| 2,500
| 2,859
|
| Fin. Auth., Local Government Loan Program Rev. Bonds (Detroit Water and Sewerage Dept., Water Supply System Rev. Ref. Local Project), Series 2014-D-1, Assured
Guaranty Municipal insured, 5.00% 2020
| 500
| 517
|
| Hospital Fin. Auth., Hospital Rev. Ref. Bonds (Trinity Health Credit Group), Series 2008-C, 5.00% 2019
| 825
| 835
|
| Hospital Fin. Auth., Hospital Rev. Ref. Bonds (Trinity Health Credit Group), Series 2008-C, 5.00% 2020
| 750
| 788
|
| Housing Dev. Auth., Single Family Mortgage Rev. Bonds, Series 2014-A, 4.00% 2044
| 595
| 625
|
| Housing Dev. Auth., Single Family Mortgage Rev. Bonds, Series 2016-B, 3.50% 2047
| 1,040
| 1,097
|
| Housing Dev. Auth., Single Family Mortgage Rev. Bonds, Series 2017-B, 3.50% 2048
| 3,295
| 3,492
|
| Housing Dev. Auth., Single Family Mortgage Rev. Bonds, Series 2018-A, 4.00% 2048
| 2,580
| 2,791
|
| Housing Dev. Auth., Single Family Mortgage Rev. Bonds, Series 2018-C, 4.25% 2049
| 5,425
| 5,949
|
American Funds Short-Term Tax-Exempt Bond Fund
— Page 6 of 19
Bonds, notes & other debt instruments (continued)
Michigan (continued)
| Principal amount
(000)
| Value
(000)
|
| Housing Dev. Auth., Single Family Mortgage Rev. Bonds, Series 2019-A, 4.25% 2049
| $2,000
| $2,202
|
Livonia Public Schools School Dist., School Building and Site G.O. Bonds, Series 2016,
Assured Guaranty Municipal insured, 5.00% 2020
| 275
| 283
|
Livonia Public Schools School Dist., School Building and Site G.O. Bonds, Series 2016,
Assured Guaranty Municipal insured, 5.00% 2021
| 465
| 496
|
| Board of Trustees of the Michigan State University, Rev. Bonds, Series 2019-B, 4.00% 2024
| 700
| 782
|
| Board of Trustees of the Michigan State University, Rev. Bonds, Series 2019-B, 5.00% 2025
| 800
| 955
|
City of Royal Oak, Hospital Fin. Auth., Hospital Rev. Ref. Bonds
(William Beaumont Hospital Obligated Group), Series 2014-D, 5.00% 2019
| 500
| 501
|
City of Royal Oak, Hospital Fin. Auth., Hospital Rev. Ref. Bonds
(William Beaumont Hospital Obligated Group), Series 2014-D, 5.00% 2020
| 500
| 521
|
Strategic Fund, Limited Obligation Rev. Ref. Bonds (Detroit Edison Co. Exempt Facs. Project),
Series 1995-CC, 1.45% 2030 (put 2021)
| 2,600
| 2,595
|
County of Wayne, Airport Auth., Airport Rev. Ref. Bonds (Detroit Metropolitan Wayne County Airport),
Series 2011-A, AMT, 5.00% 2019
| 1,000
| 1,012
|
County of Wayne, Airport Auth., Airport Rev. Ref. Bonds (Detroit Metropolitan Wayne County Airport),
Series 2015-G, 5.00% 2020
| 250
| 263
|
|
|
| 30,055
|
| Minnesota 2.49%
|
|
|
Housing Fin. Agcy., Homeownership Fin. Bonds (Mortgage-Backed Securities Program), Series 2011-G,
4.25% 2035
| 155
| 158
|
| Housing Fin. Agcy., Residential Housing Fin. Bonds, Series 2012-D, 4.00% 2040
| 260
| 266
|
| Housing Fin. Agcy., Residential Housing Fin. Bonds, Series 2013-A, AMT, 3.00% 2031
| 360
| 367
|
| Housing Fin. Agcy., Residential Housing Fin. Bonds, Series 2014-A, 4.00% 2038
| 690
| 726
|
| Housing Fin. Agcy., Residential Housing Fin. Bonds, Series 2014-C, AMT, 4.00% 2045
| 5,190
| 5,501
|
| Housing Fin. Agcy., Residential Housing Fin. Bonds, Series 2015-A, AMT, 4.00% 2041
| 515
| 541
|
| Housing Fin. Agcy., Residential Housing Fin. Bonds, Series 2015-E, AMT, 3.50% 2046
| 570
| 596
|
| Housing Fin. Agcy., Residential Housing Fin. Bonds, Series 2016-E, 4.00% 2047
| 165
| 175
|
| Housing Fin. Agcy., Residential Housing Fin. Bonds, Series 2017-E, 4.00% 2048
| 885
| 954
|
| Housing Fin. Agcy., Residential Housing Fin. Bonds, Series 2018-B, 4.00% 2048
| 3,640
| 3,958
|
| Housing Fin. Agcy., Residential Housing Fin. Bonds, Series 2018-E, 4.25% 2049
| 4,660
| 5,124
|
| City of Maplewood, Multi Family Housing Rev. Ref. Bonds (Maple Pond Apartments Project), Series 2018-A, 2.20% 2021 (put 2020)
| 1,120
| 1,126
|
City of Minneapolis, Housing and Redev. Auth., Health Care System Rev. Bonds (Allina Health System),
Series 2009-A-2, 5.50% 2024 (preref. 2019)
| 250
| 253
|
| City of Rochester, Health Care Facs. Rev. Bonds (Mayo Clinic), Series 2011-C, 4.50% 2038 (put 2021)
| 4,000
| 4,298
|
| City of St. Paul, Housing and Redev. Auth., Multi Family Housing Rev. Bonds (Millberry Apartments Project), Series 2018-A, 2.20% 2021 (put 2020)
| 2,700
| 2,712
|
| Regents of the University of Minnesota, G.O. Bonds, Series 2011-A, 5.25% 2030 (preref. 2020)
| 500
| 527
|
| Regents of the University of Minnesota, G.O. Rev. Ref. Bonds, Series 2017B, 5.00% 2021
| 1,030
| 1,123
|
|
|
| 28,405
|
| Missouri 0.62%
|
|
|
Housing Dev. Commission, Single Family Mortgage Rev. Bonds (First Place Homeownership Loan Program),
Series 2017-B, 3.25% 2047
| 1,246
| 1,299
|
| Housing Dev. Commission, Single Family Mortgage Rev. Bonds (Special Homeownership Loan Program), Series 2009-C, 4.90% 2036
| 45
| 45
|
| Housing Dev. Commission, Single Family Mortgage Rev. Bonds (Special Homeownership Loan Program), Series 2009-D, 4.80% 2040
| 20
| 20
|
| Housing Dev. Commission, Single Family Mortgage Rev. Bonds (Special Homeownership Loan Program), Series 2009-E-4, 4.25% 2030
| 155
| 159
|
| Housing Dev. Commission, Single Family Mortgage Rev. Bonds (Special Homeownership Loan Program), Series 2014-B, 4.00% 2040
| 705
| 742
|
American Funds Short-Term Tax-Exempt Bond Fund
— Page 7 of 19
Bonds, notes & other debt instruments (continued)
Missouri (continued)
| Principal amount
(000)
| Value
(000)
|
| Housing Dev. Commission, Single Family Mortgage Rev. Bonds (Special Homeownership Loan Program), Series 2015-B-1, AMT, 4.00% 2045
| $2,835
| $3,009
|
Housing Dev. Commission, Single Family Mortgage Rev. Bonds (Special Homeownership Loan Program),
Series 2014-A, 4.00% 2041
| 565
| 593
|
| Metropolitan St. Louis Sewer Dist., Wastewater System Improvement and Rev. Ref. Bonds, Series 2017-A, 4.00% 2020
| 1,130
| 1,155
|
|
|
| 7,022
|
| Montana 0.73%
|
|
|
Fin. Auth., Rev. Bonds (Billings Clinic Obligated Group), Series 2018-C,
(SIFMA Municipal Swap Index + 0.55%) 1.95% 2037 (put 2023)1
| 5,125
| 5,120
|
| Board of Housing, Single Family Homeownership Bonds, Series 2012-A-2, AMT, 4.00% 2038
| 760
| 794
|
| Board of Housing, Single Family Mortgage Bonds, Series 2015-B-2, AMT, 3.50% 2042
| 545
| 568
|
| Board of Housing, Single Family Mortgage Bonds, Series 2019-A, 4.25% 2045
| 1,690
| 1,866
|
|
|
| 8,348
|
| Nebraska 1.40%
|
|
|
| Central Plains Energy Project, Gas Supply Rev. Ref. Bonds, Series 2014, 5.00% 2039 (put 2019)
| 6,700
| 6,780
|
| Investment Fin. Auth., Single Family Housing Rev. Bonds, Series 2013-E, 3.00% 2043
| 590
| 597
|
| Investment Fin. Auth., Single Family Housing Rev. Bonds, Series 2014-A, 3.00% 2044
| 165
| 165
|
| Investment Fin. Auth., Single Family Housing Rev. Bonds, Series 2014-A, 4.00% 2044
| 450
| 473
|
| Investment Fin. Auth., Single Family Housing Rev. Bonds, Series 2015-C, 3.50% 2045
| 1,425
| 1,478
|
| Investment Fin. Auth., Single Family Housing Rev. Bonds, Series 2016-C, 3.50% 2046
| 390
| 411
|
| Investment Fin. Auth., Single Family Housing Rev. Bonds, Series 2018-A, 4.00% 2048
| 1,030
| 1,113
|
| Investment Fin. Auth., Single Family Housing Rev. Bonds, Series 2018-C, 4.00% 2048
| 2,015
| 2,189
|
| Investment Fin. Auth., Single Family Housing Rev. Bonds, Series 2019-B, AMT, 4.00% 2049
| 2,500
| 2,711
|
|
|
| 15,917
|
| Nevada 0.97%
|
|
|
| County of Clark, Airport System Rev. Bonds, Series 2010-D, 5.00% 2021
| 890
| 904
|
| County of Clark, Airport System Rev. Ref. Bonds (McCarran International Airport), Series 2019-A, 5.00% 2023
| 1,300
| 1,487
|
County of Clark, Pollution Control Rev. Ref. Bonds (Southern California Edison Co.), Series 2010,
1.875% 2031 (put 2020)
| 3,000
| 3,005
|
| Las Vegas Valley Water Dist., Limited Tax G.O. Rev. Ref. Bonds, Series 2012-A, 5.00% 2029
| 4,070
| 4,486
|
| City of North Las Vegas, Special Improvement Dist. No. 60 (Aliante), Local Improvement Rev. Ref. Bonds, Series 2016, 2.25% 2021
| 1,190
| 1,210
|
|
|
| 11,092
|
| New Jersey 2.29%
|
|
|
| Educational Facs. Auth., Rev. and Rev. Ref. Bonds (Ramapo College of New Jersey Issue), Series 2017-A, Assured Guaranty Municipal insured, 4.00% 2020
| 1,185
| 1,215
|
| Educational Facs. Auth., Rev. and Rev. Ref. Bonds (Ramapo College of New Jersey Issue), Series 2017-A, Assured Guaranty Municipal insured, 5.00% 2022
| 1,000
| 1,105
|
| Educational Facs. Auth., Rev. and Rev. Ref. Bonds (Ramapo College of New Jersey Issue), Series 2017-A, Assured Guaranty Municipal insured, 5.00% 2023
| 850
| 967
|
Health Care Facs. Fncg. Auth., Rev. Ref. Bonds (Hackensack Meridian Health Obligated Group Issue),
Series 2017-A, 5.00% 2023
| 2,425
| 2,777
|
| Higher Education Student Assistance Auth., Student Loan Rev. Bonds, Series 2016-1-A, AMT, 5.00% 2020
| 750
| 785
|
| Housing and Mortgage Fin. Agcy., Multi Family Housing Conduit Rev. Bonds (Camden Townhouses Project), Series 2017-F, 1.90% 2020 (put 2019)
| 1,000
| 1,000
|
Housing and Mortgage Fin. Agcy., Multi Family Housing Conduit Rev. Bonds (Georgia King Village Project),
Series 2018-E, 2.45% 2021 (put 2020)
| 1,445
| 1,463
|
Housing and Mortgage Fin. Agcy., Multi Family Housing Conduit Rev. Bonds (Oceanport Gardens),
Series 2019-C, 1.58% 2022 (put 2020)
| 1,700
| 1,703
|
| Housing and Mortgage Fin. Agcy., Single Family Housing Rev. Bonds, Series 2018-A, 4.50% 2048
| 5,840
| 6,459
|
American Funds Short-Term Tax-Exempt Bond Fund
— Page 8 of 19
Bonds, notes & other debt instruments (continued)
New Jersey (continued)
| Principal amount
(000)
| Value
(000)
|
| Housing and Mortgage Fin. Agcy., Single Family Housing Rev. Bonds, Series 2019-C, 4.75% 2050
| $1,000
| $1,122
|
| Tobacco Settlement Fncg. Corp., Tobacco Settlement Bonds, Series 2018-A, 5.00% 2020
| 1,295
| 1,330
|
| Tobacco Settlement Fncg. Corp., Tobacco Settlement Bonds, Series 2018-A, 5.00% 2021
| 2,000
| 2,118
|
| Tobacco Settlement Fncg. Corp., Tobacco Settlement Bonds, Series 2018-A, 5.00% 2023
| 2,635
| 2,942
|
Transportation Trust Fund Auth., Federal Highway Reimbursement Rev. Ref. Bonds, Series 2018-A,
5.00% 2022
| 1,000
| 1,096
|
|
|
| 26,082
|
| New Mexico 0.68%
|
|
|
| City of Farmington, Pollution Control Rev. Ref. Bonds (Southern California Edison Co. Four Corners Project), Series 2005-A, 1.875% 2029 (put 2020)
| 550
| 551
|
| City of Farmington, Pollution Control Rev. Ref. Bonds (Southern California Edison Co. Four Corners Project), Series 2005-B, 1.875% 2029 (put 2020)
| 2,250
| 2,254
|
| City of Farmington, Pollution Control Rev. Ref. Bonds (Southern California Edison Co. Four Corners Project), Series 2011, 1.875% 2029 (put 2020)
| 2,000
| 2,003
|
| Mortgage Fin. Auth., Single Family Mortgage Program Bonds, Series 2009-D, Class I, 5.35% 2040
| 95
| 95
|
| Mortgage Fin. Auth., Single Family Mortgage Program Bonds, Series 2012-A, Class I, 4.25% 2043
| 360
| 368
|
| Mortgage Fin. Auth., Single Family Mortgage Program Bonds, Series 2016-A-2, Class I, AMT, 3.50% 2046
| 785
| 826
|
| Mortgage Fin. Auth., Single Family Mortgage Program Bonds, Series 2017-B-2, Class I, AMT, 3.75% 2048
| 825
| 878
|
| Mortgage Fin. Auth., Single Family Mortgage Program Bonds, Series 2019-C-1, Class I, 4.00% 2050
| 720
| 793
|
|
|
| 7,768
|
| New York 6.95%
|
|
|
| Dormitory Auth., School Dist. Rev. Bond Fncg. Program Rev. Bonds, Series 2016-A, 5.00% 2022
| 2,000
| 2,243
|
| Dormitory Auth., School Dist. Rev. Bond Fncg. Program Rev. Bonds, Series 2017-F, 5.00% 2023
| 3,500
| 4,056
|
| Dormitory Auth., State Personal Income Tax Rev. Bonds (General Purpose), Series 2014-A, 5.00% 2020
| 2,000
| 2,042
|
| Housing Fin. Agcy., Affordable Housing Rev. Green Bonds, Series 2017-H, 1.65% 2021
| 1,650
| 1,658
|
| Housing Fin. Agcy., Affordable Housing Rev. Green Bonds, Series 2018-H, 2.75% 2022
| 1,400
| 1,411
|
| Housing Fin. Agcy., Affordable Housing Rev. Green Bonds, Series 2018-I, 2.55% 2022
| 1,750
| 1,773
|
| Housing Fin. Agcy., Affordable Housing Rev. Green Bonds, Series 2018-I, 2.70% 2023
| 1,600
| 1,654
|
Long Island Power Auth., Electric System General Rev. Bonds, Series 2014-C,
(1-month USD-LIBOR x 0.70 + 0.75%) 2.431% 2033 (put 2023)1
| 2,000
| 2,009
|
Metropolitan Transportation Auth., Dedicated Tax Fund Rev. Ref. Bonds, Series 2008-A-2B,
(SIFMA Municipal Swap Index + 0.58%) 1.98% 2031 (put 2019)1
| 2,500
| 2,501
|
| Metropolitan Transportation Auth., Transportation Rev. Bonds, Series 2014-A-1, 4.00% 2019
| 750
| 756
|
| Metropolitan Transportation Auth., Transportation Rev. Bonds, Series 2014-C, 5.00% 2020
| 2,000
| 2,099
|
Metropolitan Transportation Auth., Transportation Rev. Bonds, Series 2014-D-2,
(SIFMA Municipal Swap Index + 0.45%) 1.85% 2044 (put 2022)1
| 4,000
| 3,993
|
Metropolitan Transportation Auth., Transportation Rev. Bonds, Series 2015-A-2,
(SIFMA Municipal Swap Index + 0.58%) 1.98% 2039 (put 2020)1
| 6,250
| 6,255
|
Metropolitan Transportation Auth., Transportation Rev. Ref. Bonds, Series 2002-D-2A,
Assured Guaranty Municipal insured, (1-month USD-LIBOR x 0.69 + 0.68%) 2.337% 2032 (put 2021)1
| 4,000
| 4,023
|
| Mortgage Agcy., Homeowner Mortgage Rev. Bonds, Series 178, 3.50% 2043
| 985
| 1,025
|
| Mortgage Agcy., Homeowner Mortgage Rev. Bonds, Series 191, AMT, 3.50% 2034
| 1,380
| 1,422
|
| Mortgage Agcy., Homeowner Mortgage Rev. Bonds, Series 195, 4.00% 2046
| 2,135
| 2,258
|
| Mortgage Agcy., Homeowner Mortgage Rev. Bonds, Series 197, 3.50% 2044
| 755
| 792
|
| Mortgage Agcy., Homeowner Mortgage Rev. Bonds, Series 200, 3.50% 2045
| 510
| 533
|
| Mortgage Agcy., Homeowner Mortgage Rev. Bonds, Series 203, 3.50% 2047
| 2,225
| 2,348
|
| Mortgage Agcy., Homeowner Mortgage Rev. Bonds, Series 213, 4.25% 2047
| 1,175
| 1,288
|
| Mortgage Agcy., Homeowner Mortgage Rev. Bonds, Series 52, AMT, 3.50% 2030
| 1,515
| 1,576
|
| New York City G.O. Bonds, Fiscal 1994, Series 1994-A-4, 5.00% 2021
| 680
| 733
|
| New York City G.O. Bonds, Fiscal 2015, Series 2015-A, 5.00% 2020
| 1,500
| 1,560
|
| New York City Housing Dev. Corp., Multi Family Housing Rev. Bonds (Sustainable Neighborhood Bonds), Series 2018-L-2, 2.75% 2050 (put 2023)
| 3,625
| 3,765
|
American Funds Short-Term Tax-Exempt Bond Fund
— Page 9 of 19
Bonds, notes & other debt instruments (continued)
New York (continued)
| Principal amount
(000)
| Value
(000)
|
New York City Housing Dev. Corp., Multi Family Housing Rev. Bonds (Sustainable Neighborhood Bonds),
Series 2017-C-2, 1.70% 2021
| $5,250
| $5,258
|
New York City Housing Dev. Corp., Multi Family Housing Rev. Bonds (Sustainable Neighborhood Bonds),
Series 2017-G-2-A, 2.00% 2057 (put 2021)
| 3,000
| 3,022
|
New York City Housing Dev. Corp., Multi Family Housing Rev. Bonds (Sustainable Neighborhood Bonds),
Series 2018-C-2-A, 2.35% 2022
| 2,500
| 2,543
|
| Port Auth., Consolidated Rev. Ref. Bonds, Series 185, AMT, 5.00% 2020
| 2,000
| 2,081
|
| Port Auth., Consolidated Rev. Ref. Bonds, Series 186, AMT, 5.00% 2021
| 2,000
| 2,165
|
Transportation Dev. Corp., Special Fac. Rev. Ref. Bonds (Terminal One Group Association, LP Project),
Series 2015, AMT, 5.00% 2020
| 1,500
| 1,522
|
Transportation Dev. Corp., Special Fac. Rev. Ref. Bonds (Terminal One Group Association, LP Project),
Series 2015, AMT, 5.00% 2021
| 750
| 787
|
Transportation Dev. Corp., Special Fac. Rev. Ref. Bonds (Terminal One Group Association, LP Project),
Series 2015, AMT, 5.00% 2022
| 1,000
| 1,079
|
| Urban Dev. Corp., State Personal Income Tax Rev. Bonds (General Purpose), Series 2013-A-1, 5.00% 2020
| 2,000
| 2,049
|
| Urban Dev. Corp., State Personal Income Tax Rev. Bonds (General Purpose), Series 2013-A-2, 5.00% 2020
| 2,855
| 2,925
|
| Urban Dev. Corp., State Personal Income Tax Rev. Bonds (General Purpose), Series 2013-C, 5.00% 2024
| 1,790
| 2,040
|
|
|
| 79,244
|
| North Carolina 3.94%
|
|
|
| City of Durham, Housing Auth., Multi Family Housing Rev. Bonds (Damar Court Apartments), Series 2017, 1.80% 2021 (put 2020)
| 1,540
| 1,543
|
| G.O. Public Improvement Bonds, Series 2010-A, 5.00% 2020
| 1,500
| 1,545
|
| G.O. Rev. Ref. Bonds, Series 2013-D, 4.00% 2020
| 8,835
| 9,052
|
| G.O. Rev. Ref. Bonds, Series 2013-E, 5.00% 2020
| 3,525
| 3,629
|
| Grant Anticipation Rev. Vehicle Bonds, Series 2019, 5.00% 2021
| 8,135
| 8,628
|
| Housing Fin. Agcy., Home Ownership Rev. Bonds, Series 40, 4.25% 2047
| 3,645
| 4,001
|
| Housing Fin. Agcy., Home Ownership Rev. Ref. Bonds, Series 37-A, AMT, 3.50% 2039
| 1,170
| 1,220
|
| Housing Fin. Agcy., Home Ownership Rev. Ref. Bonds, Series 38-B, 4.00% 2047
| 5,280
| 5,663
|
University of North Carolina at Chapel Hill, General Rev. Bonds, Series 2012-B,
(1-month USD-LIBOR x 0.67 + 0.40%) 2.01% 2041 (put 2022)1
| 5,030
| 5,039
|
| University of North Carolina at Greensboro, General Rev. Ref. Bonds, Series 2011, 5.00% 2036 (preref. 2036)
| 560
| 596
|
County of Wake, Housing Auth., Multi Family Housing Rev. Bonds (Sunnybrook Pointe Apartments),
Series 2017, 1.86% 20202
| 4,000
| 4,006
|
|
|
| 44,922
|
| North Dakota 1.01%
|
|
|
| Housing Fin. Agcy., Homeownership Rev. Bonds (Home Mortgage Fin. Program), Series 2016-D, 3.50% 2046
| 1,350
| 1,427
|
| Housing Fin. Agcy., Housing Fin. Program Bonds (Home Mortgage Fin. Program), Series 2012-A, 3.75% 2042
| 990
| 1,023
|
| Housing Fin. Agcy., Housing Fin. Program Bonds (Home Mortgage Fin. Program), Series 2014-A, 4.00% 2034
| 235
| 246
|
| Housing Fin. Agcy., Housing Fin. Program Bonds (Home Mortgage Fin. Program), Series 2015-A, 4.00% 2038
| 320
| 336
|
| Housing Fin. Agcy., Housing Fin. Program Bonds (Home Mortgage Fin. Program), Series 2015-B, 4.00% 2036
| 260
| 272
|
Housing Fin. Agcy., Housing Fin. Program Bonds (Home Mortgage Fin. Program), Series 2016-B, AMT,
4.00% 2047
| 3,300
| 3,513
|
| Housing Fin. Agcy., Housing Fin. Program Bonds (Home Mortgage Fin. Program), Series 2017-D, 4.00% 2048
| 1,165
| 1,253
|
| Housing Fin. Agcy., Housing Fin. Program Bonds (Home Mortgage Fin. Program), Series 2019-A, 4.25% 2049
| 3,115
| 3,433
|
|
|
| 11,503
|
| Ohio 3.21%
|
|
|
| Akron, Bath and Copley Joint Township Hospital Dist., Hospital Facs. Rev. Bonds (Akron General Health System), Series 2012, 5.00% 2031 (preref. 2022)
| 1,000
| 1,090
|
| G.O. Bonds, Common Schools Bonds, Series 2017-A, 5.00% 2024
| 2,000
| 2,348
|
| G.O. Highway Capital Improvements Bonds (Full Faith and Credit/Highway User Receipts), Series 2018-V, 5.00% 2024
| 3,575
| 4,218
|
| G.O. Rev. Ref. Bonds, Common Schools Bonds, Series 2012-C, 5.00% 2021
| 3,350
| 3,624
|
American Funds Short-Term Tax-Exempt Bond Fund
— Page 10 of 19
Bonds, notes & other debt instruments (continued)
Ohio (continued)
| Principal amount
(000)
| Value
(000)
|
| G.O. Rev. Ref. Bonds, Higher Education Bonds, Series 2016-A, 5.00% 2024
| $1,195
| $1,419
|
Housing Fin. Agcy., Multi Family Housing Rev. Bonds (Neilan Park Apartments Program), Series 2019,
1.75% 2022 (put 2021)
| 2,090
| 2,105
|
| Housing Fin. Agcy., Residential Mortgage Rev. Bonds (Mortgage-Backed Securities Program), Series 2016-D, 4.00% 2047
| 975
| 1,035
|
| Housing Fin. Agcy., Residential Mortgage Rev. Bonds (Mortgage-Backed Securities Program), Series 2016-K, 3.50% 2046
| 1,140
| 1,202
|
| Housing Fin. Agcy., Residential Mortgage Rev. Bonds (Mortgage-Backed Securities Program), Series 2017-D, 4.00% 2048
| 1,750
| 1,878
|
| Housing Fin. Agcy., Residential Mortgage Rev. Bonds (Mortgage-Backed Securities Program), Series 2019-A, 4.50% 2049
| 3,375
| 3,773
|
| Housing Fin. Agcy., Residential Mortgage Rev. Bonds, Series 2017-B, AMT, 4.50% 2047
| 530
| 573
|
| Housing Fin. Agcy., Single Family Mortgage Rev. Bonds, Series 2010-1, 5.00% 2028
| 90
| 91
|
| Housing Fin. Agcy., Single Family Mortgage Rev. Bonds, Series 2011-1, 4.80% 2028
| 75
| 77
|
| Kent State University, Rev. General Receipts Bonds, Series 2016, 4.00% 2022
| 1,000
| 1,075
|
| Major New State Infrastructure Project Rev. Bonds, Series 2016-1, 5.00% 2023
| 1,000
| 1,164
|
| Public Facs. Commission, Higher Education G.O. Rev. Ref. Bonds, Series 2010-A, 5.00% 2021
| 1,710
| 1,842
|
| University of Toledo, General Receipts Bonds, Series 2011-B, 5.00% 2025 (preref. 2021)
| 1,000
| 1,071
|
| Water Dev. Auth., Drinking Water Assistance Fund Rev. Bonds, Series 2019, 5.00% 2023
| 2,800
| 3,261
|
| Water Dev. Auth., Drinking Water Assistance Fund Rev. Bonds, Series 2019, 5.00% 2023
| 1,525
| 1,748
|
Water Dev. Auth., Water Pollution Control Loan Fund Rev. Notes, Series 2017-B,
(SIFMA Municipal Swap Index + 0.22%) 1.62% 20201
| 3,000
| 3,000
|
|
|
| 36,594
|
| Oregon 1.94%
|
|
|
| G.O. Bonds (Veteran’s Welfare Bonds Series 94), Series 2014-H, 4.00% 2044
| 1,355
| 1,400
|
| G.O. Bonds (Veteran’s Welfare Bonds Series 99B), Series 2017-Q, 3.50% 2047
| 2,000
| 2,120
|
Housing and Community Services Dept., Housing Dev. Rev. Bonds (The Henry Apartments Project),
Series 2018-J, 2.20% 2021 (put 2020)
| 7,075
| 7,142
|
Housing and Community Services Dept., Mortgage Rev. Bonds (Single Family Mortgage Program),
Series 2017-A, 4.00% 2047
| 2,095
| 2,252
|
Housing and Community Services Dept., Mortgage Rev. Bonds (Single Family Mortgage Program),
Series 2018-D, 4.75% 2050
| 4,295
| 4,813
|
| Port of Portland, Portland International Airport Rev. Bonds, Series 24-B, AMT, 5.00% 2021
| 1,090
| 1,167
|
| Port of Portland, Portland International Airport Rev. Bonds, Series 25-B, AMT, 5.00% 2023
| 1,000
| 1,138
|
| Port of Portland, Portland International Airport Rev. Bonds, Series 25-B, AMT, 5.00% 2024
| 1,750
| 2,047
|
|
|
| 22,079
|
| Pennsylvania 3.96%
|
|
|
| County of Allegheny, Hospital Dev. Auth., UPMC Rev. Bonds, Series 2019-A, 5.00% 2023
| 2,200
| 2,512
|
| Delaware River Port Auth., Port Dist. Project Rev. Ref. Bonds, Series 2012, 5.00% 2022
| 1,000
| 1,086
|
East Hempfield Township, Industrial Dev. Auth., Rev. and Rev. Ref. Bonds (Willow Valley Communities Project),
Series 2016, 4.00% 2019
| 450
| 454
|
East Hempfield Township, Industrial Dev. Auth., Rev. and Rev. Ref. Bonds (Willow Valley Communities Project),
Series 2016, 4.00% 2020
| 500
| 517
|
| General Auth. of Southcentral Pennsylvania, Rev. Bonds (Wellspan Health Obligated Group), Series 2019-B, (SIFMA Municipal Swap Index + 0.60%) 2.00% 2049 (put
2024)1
| 2,265
| 2,266
|
| Higher Educational Facs. Auth., Rev. Bonds (The Trustees of the University of Pennsylvania), Series 2011-A, 5.00% 2029 (preref. 2021)
| 1,000
| 1,062
|
| Housing Fin. Agcy., Single Family Mortgage Rev. Bonds, Series 2015-117-A, AMT, 3.50% 2040
| 1,025
| 1,066
|
| Housing Fin. Agcy., Single Family Mortgage Rev. Bonds, Series 2015-118-A, AMT, 3.50% 2040
| 4,215
| 4,346
|
| Housing Fin. Agcy., Single Family Mortgage Rev. Bonds, Series 2016-119, 3.50% 2041
| 560
| 582
|
| Housing Fin. Agcy., Single Family Mortgage Rev. Bonds, Series 2016-120, 3.50% 2046
| 650
| 679
|
| Housing Fin. Agcy., Single Family Mortgage Rev. Bonds, Series 2017-122, 4.00% 2046
| 3,680
| 3,920
|
| Housing Fin. Agcy., Single Family Mortgage Rev. Bonds, Series 2017-123-A, AMT, 4.00% 2039
| 1,335
| 1,406
|
American Funds Short-Term Tax-Exempt Bond Fund
— Page 11 of 19
Bonds, notes & other debt instruments (continued)
Pennsylvania (continued)
| Principal amount
(000)
| Value
(000)
|
| Housing Fin. Agcy., Single Family Mortgage Rev. Bonds, Series 2019-128-A, AMT, 4.75% 2033
| $3,465
| $3,783
|
Housing Fin. Agcy., Special Limited Obligation Multi Family Housing Dev. Bonds
(Central Pennsylvania Dev.), Series 2018, 2.45% 2022 (put 2021)
| 5,000
| 5,075
|
| County of Montour, Geisinger Auth. Health System Rev. Bonds (Geisinger Health System), Series 2014-B, (1-month USD-LIBOR x 0.67 + 1.07%) 2.571% 2028 (put
2024)1
| 3,000
| 3,055
|
| City of Philadelphia, G.O. Rev. Ref. Bonds, Series 2009-A, Assured Guaranty insured, 5.50% 2023
| 2,000
| 2,000
|
| City of Philadelphia, Water and Wastewater Rev. Bonds, Series 2017-A, 5.00% 2019
| 1,000
| 1,006
|
| Philadelphia School Dist., G.O. Bonds, Series 2016-F, 5.00% 2020
| 500
| 520
|
| Philadelphia School Dist., G.O. Bonds, Series 2016-F, 5.00% 2021
| 500
| 537
|
| Philadelphia School Dist., G.O. Bonds, Series 2016-F, 5.00% 2022
| 500
| 553
|
City of Pittsburgh, Urban Redev. Auth., Rev. Bonds (Crawford Square Apartments Project), Series 2018,
2.25% 2020 (put 2020)
| 825
| 827
|
| Turnpike Commission, Turnpike Rev. Bonds, Series 2011-E, 5.00% 2026 (preref. 2021)
| 1,000
| 1,090
|
| Turnpike Commission, Turnpike Rev. Bonds, Series 2011-E, 5.00% 2030 (preref. 2021)
| 480
| 523
|
Turnpike Commission, Turnpike Rev. Bonds, Series 2014-B-1,
(SIFMA Municipal Swap Index + 0.98%) 2.38% 20211
| 1,100
| 1,112
|
| Turnpike Commission, Turnpike Rev. Bonds, Series 2016, 5.00% 2021
| 2,000
| 2,137
|
Turnpike Commission, Turnpike Rev. Bonds, Series 2018-B,
(SIFMA Municipal Swap Index + 0.50%) 1.90% 20211
| 3,000
| 3,004
|
|
|
| 45,118
|
| Rhode Island 1.12%
|
|
|
| Commerce Corp., Grant Anticipation Rev. Ref. Bonds (Dept. of Transportation), Series 2016-A, 5.00% 2020
| 1,990
| 2,056
|
| Commerce Corp., Grant Anticipation Rev. Ref. Bonds (Dept. of Transportation), Series 2016-A, 5.00% 2021
| 1,280
| 1,369
|
| Housing and Mortgage Fin. Corp., Homeownership Opportunity Bonds, Series 66-A-1, 4.00% 2033
| 1,745
| 1,817
|
| Housing and Mortgage Fin. Corp., Homeownership Opportunity Bonds, Series 68-C, AMT, 3.50% 2039
| 780
| 812
|
| Housing and Mortgage Fin. Corp., Homeownership Opportunity Bonds, Series 69-B, 4.00% 2048
| 1,035
| 1,127
|
| Student Loan Auth., Student Loan Program Rev. Bonds, Series 2017-A, AMT, 5.00% 2019
| 250
| 253
|
| Student Loan Auth., Student Loan Program Rev. Bonds, Series 2017-A, AMT, 5.00% 2020
| 200
| 209
|
| Student Loan Auth., Student Loan Program Rev. Bonds, Series 2017-A, AMT, 5.00% 2021
| 510
| 549
|
| Student Loan Auth., Student Loan Program Rev. Bonds, Series 2017-A, AMT, 5.00% 2022
| 1,300
| 1,440
|
| Student Loan Auth., Student Loan Program Rev. Bonds, Series 2017-A, AMT, 5.00% 2023
| 650
| 739
|
| Student Loan Auth., Student Loan Program Rev. Bonds, Series 2017-A, AMT, 5.00% 2024
| 2,100
| 2,438
|
|
|
| 12,809
|
| South Carolina 1.71%
|
|
|
City of Charleston, Waterworks and Sewer System Capital Improvement Bonds, Series 2006-B,
1.953% 2035 (put 2022)1
| 5,000
| 5,007
|
County of Charleston, G.O. Capital Improvement Transportation Sales Tax Bonds, Series 2011,
5.00% 2024 (preref. 2021)
| 585
| 636
|
| Housing Fin. and Dev. Auth., Mortgage Rev. Bonds, Series 2017-A, 4.00% 2047
| 2,575
| 2,741
|
| Housing Fin. and Dev. Auth., Mortgage Rev. Bonds, Series 2017-B, 4.00% 2047
| 285
| 306
|
| Housing Fin. and Dev. Auth., Mortgage Rev. Bonds, Series 2018-A, 4.50% 2048
| 1,545
| 1,702
|
| Housing Fin. and Dev. Auth., Mortgage Rev. Ref. Bonds, Series 2016-A, 4.00% 2036
| 105
| 112
|
| Lexington County Health Services Dist., Inc., Hospital Rev. Ref. Bonds, Series 2017, 5.00% 2019
| 250
| 252
|
| Lexington County Health Services Dist., Inc., Hospital Rev. Ref. Bonds, Series 2017, 5.00% 2020
| 250
| 261
|
| Public Service Auth., Rev. Obligations (Santee Cooper), Series 2012-A, 4.00% 2020 (escrowed to maturity)
| 2,945
| 3,057
|
| Public Service Auth., Rev. Obligations (Santee Cooper), Series 2015-C, 5.00% 2021
| 1,500
| 1,626
|
| Public Service Auth., Rev. Ref. Obligations (Santee Cooper), Series 2015-A, 5.00% 2022
| 3,395
| 3,793
|
|
|
| 19,493
|
| South Dakota 0.75%
|
|
|
| Housing Dev. Auth., Homeownership Mortgage Bonds, Series 2013-A, AMT, 3.00% 2030
| 380
| 387
|
| Housing Dev. Auth., Homeownership Mortgage Bonds, Series 2013-E, AMT, 4.00% 2044
| 195
| 203
|
| Housing Dev. Auth., Homeownership Mortgage Bonds, Series 2014-E, 4.00% 2044
| 750
| 788
|
American Funds Short-Term Tax-Exempt Bond Fund
— Page 12 of 19
Bonds, notes & other debt instruments (continued)
South Dakota (continued)
| Principal amount
(000)
| Value
(000)
|
| Housing Dev. Auth., Homeownership Mortgage Bonds, Series 2015-D, 4.00% 2045
| $830
| $879
|
| Housing Dev. Auth., Homeownership Mortgage Bonds, Series 2016-D, 3.50% 2046
| 2,440
| 2,568
|
| Housing Dev. Auth., Homeownership Mortgage Bonds, Series 2018-B, 4.50% 2048
| 910
| 1,010
|
| Housing Dev. Auth., Homeownership Mortgage Rev. Ref. Bonds, Series 2012-A, AMT, 4.50% 2031
| 690
| 718
|
| Housing Dev. Auth., Multi Family Rev. Bonds (Meadowland Apartments), Series 2019, 1.54% 2022 (put 2021)
| 2,000
| 2,002
|
|
|
| 8,555
|
| Tennessee 1.66%
|
|
|
| City of Chattanooga, Health, Educational and Housing Fac. Board, Multi Family Housing Rev. Bonds (Ridgeway Apartments Project), Series 2019, 1.625% 2021 (put 2021)
| 2,000
| 2,010
|
| Housing Dev. Agcy., Homeownership Program Bonds, Series 2012-1-C, 4.50% 2037
| 375
| 389
|
| Housing Dev. Agcy., Homeownership Program Bonds, Series 2012-2-C, 4.00% 2038
| 255
| 263
|
| Housing Dev. Agcy., Homeownership Program Rev. Ref. Bonds, Series 2011-1-A, AMT, 4.50% 2031
| 810
| 842
|
| Housing Dev. Agcy., Homeownership Program Rev. Ref. Bonds, Series 2012-1-A, AMT, 4.50% 2038
| 310
| 321
|
| Housing Dev. Agcy., Residential Fin. Program Bonds, Series 2013-1-C, 3.00% 2038
| 665
| 680
|
| Housing Dev. Agcy., Residential Fin. Program Bonds, Series 2013-2-A, AMT, 4.00% 2043
| 670
| 699
|
| Housing Dev. Agcy., Residential Fin. Program Bonds, Series 2014-1-A, AMT, 4.00% 2039
| 945
| 988
|
| Housing Dev. Agcy., Residential Fin. Program Bonds, Series 2014-2-A, AMT, 4.00% 2045
| 820
| 864
|
| Housing Dev. Agcy., Residential Fin. Program Bonds, Series 2014-2-C, 4.00% 2045
| 630
| 665
|
| Housing Dev. Agcy., Residential Fin. Program Bonds, Series 2015-2-A, 4.00% 2046
| 305
| 324
|
| Housing Dev. Agcy., Residential Fin. Program Bonds, Series 2016-1-B, 3.50% 2047
| 660
| 695
|
| Housing Dev. Agcy., Residential Fin. Program Bonds, Series 2016-2B, 3.50% 2047
| 2,245
| 2,370
|
| Housing Dev. Agcy., Residential Fin. Program Bonds, Series 2017-1, 4.00% 2042
| 1,230
| 1,319
|
| Housing Dev. Agcy., Residential Fin. Program Bonds, Series 2017-B-2, 4.00% 2042
| 2,245
| 2,411
|
| County of Knox, Health, Educational and Housing Fac. Board, Collateralized Multi Family Housing Rev. Bonds (Clear Springs Apartments Project), Series 2019, 1.80%
2022 (put 2021)
| 275
| 277
|
Metropolitan Government of Nashville and Davidson County, Health and Educational Facs. Board, Collateralized Multi Family Housing Rev. Bonds (Trevecca Towers II
Project), Series 2018,
2.00% 2022 (put 2021)
| 2,300
| 2,325
|
County of Shelby, Health, Educational and Housing Fac. Board, Rev. Bonds
(Methodist Le Bonheur Healthcare), Series 2017-A, 5.00% 2022
| 1,330
| 1,464
|
|
|
| 18,906
|
| Texas 14.66%
|
|
|
Austin Independent School Dist., Unlimited Tax School Building and Rev. Ref. Bonds, Series 2019,
5.00% 2024
| 1,500
| 1,776
|
| City of Austin, Airport System Rev. Bonds, Series 2019-B, AMT, 5.00% 2023
| 1,215
| 1,399
|
| Beaumont Independent School Dist., Unlimited Tax Rev. Ref. Bonds, Series 2016, 5.00% 2020
| 1,280
| 1,307
|
County of Bexar, Combination Tax and Rev. Certificates of Obligation, Series 2013-B,
5.00% 2025 (preref. 2023)
| 1,500
| 1,719
|
| County of Bexar, Hospital Dist., Limited Tax Rev. Ref. Bonds, Series 2019, 5.00% 2023
| 1,500
| 1,697
|
| County of Bexar, Hospital Dist., Limited Tax Rev. Ref. Bonds, Series 2019, 5.00% 2024
| 1,000
| 1,166
|
| Birdville Independent School Dist., Unlimited Tax Rev. Ref. Bonds, Series 2019, 5.00% 2023
| 1,275
| 1,447
|
Boerne Public Fac. Corp., Housing Rev. Bonds (LIV at Boerne Senior Apartments), Series 2018,
2.75% 2022 (put 2021)
| 3,035
| 3,128
|
| Canyon Independent School Dist., Unlimited Tax School Building Bonds, Series 2019, 5.00% 2023
| 3,395
| 3,844
|
| Capital Area Housing Fin. Corp., Multi Family Housing Rev. Bonds (Mission Trail at El Camino Real Apartments), Series 2019, 2.10% 2037 (put 2022)
| 4,125
| 4,179
|
Clear Creek Independent School Dist., Unlimited Tax School Building Bonds, Series 2013-B,
3.00% 2032 (put 2019)
| 6,000
| 6,003
|
| Cypress-Fairbanks Independent School Dist., Unlimited Tax Rev. Ref. Bonds, Series 2019, 5.00% 2023
| 3,225
| 3,657
|
Cypress-Fairbanks Independent School Dist., Unlimited Tax School Building Bonds, Series 2014-B-3,
1.40% 2040 (put 2020)
| 750
| 751
|
Cypress-Fairbanks Independent School Dist., Unlimited Tax School Building Bonds, Series 2017-A-2,
2.50% 2036 (put 2019)
| 4,000
| 4,002
|
American Funds Short-Term Tax-Exempt Bond Fund
— Page 13 of 19
Bonds, notes & other debt instruments (continued)
Texas (continued)
| Principal amount
(000)
| Value
(000)
|
Cypress-Fairbanks Independent School Dist., Unlimited Tax School Building Bonds, Series 2017-A-3,
3.00% 2043 (put 2020)
| $2,500
| $2,543
|
Cities of Dallas and Fort Worth, Dallas/Fort Worth International Airport, Joint Rev. Ref. Bonds,
Series 2013-E, AMT, 5.00% 2019
| 2,000
| 2,019
|
Cities of Dallas and Fort Worth, Dallas/Fort Worth International Airport, Joint Rev. Ref. Bonds,
Series 2013-F, 5.00% 2019
| 500
| 505
|
| City of Dallas, Waterworks and Sewer System Rev. Ref. Bonds, Series 2015-A, 5.00% 2029
| 3,910
| 4,711
|
| City of Denton, Utility System Rev. Bonds, Series 2017, 5.00% 2020
| 1,000
| 1,051
|
Fort Bend Independent School Dist., Unlimited Tax School Building Bonds, Series 2015-B,
1.35% 2040 (put 2019)
| 1,940
| 1,940
|
| Frisco Independent School Dist., Unlimited Tax School Building and Rev. Ref. Bonds, Series 2019, 5.00% 2021
| 1,315
| 1,418
|
| G.O. Bonds, College Student Loan Bonds, Series 2013-B, AMT, 5.25% 2022
| 3,155
| 3,523
|
G.O. Bonds, Water Financial Assistance Rev. Ref. Bonds (Water Infrastructure Fund), Series 2019-E-1,
5.00% 2021
| 1,000
| 1,078
|
| G.O. Bonds, Water Financial Assistance Rev. Ref. Bonds, Series 2019-C-1, 5.00% 2021
| 1,000
| 1,078
|
| G.O. Bonds, Water Financial Assistance Rev. Ref. Bonds, Series 2019-C-1, 5.00% 2022
| 3,000
| 3,347
|
County of Harris, Cultural Education Facs. Fin. Corp., Thermal Utility Rev. Ref. Bonds (TECO Project),
Series 2017, 5.00% 2019
| 350
| 354
|
County of Harris, Cultural Education Facs. Fin. Corp., Thermal Utility Rev. Ref. Bonds (TECO Project),
Series 2017, 5.00% 2020
| 1,150
| 1,206
|
County of Harris, Metropolitan Transit Auth., Sales and Use Tax Bonds, Series 2011-A,
5.00% 2023 (preref. 2021)
| 500
| 543
|
County of Harris, Toll Road Rev. Ref. Bonds, Series 2012-B,
(SIFMA Municipal Swap Index + 0.45%) 1.85% 20211
| 4,680
| 4,681
|
Dept. of Housing and Community Affairs, Multi Family Housing Rev. Bonds (Related RD Portfolio),
Series 2018, 2.20% 2021 (put 2020)
| 3,680
| 3,700
|
Dept. of Housing and Community Affairs, Multi Family Housing Rev. Bonds (Springs Apartments),
Series 2018, 2.23% 2021 (put 2020)
| 1,650
| 1,659
|
| Dept. of Housing and Community Affairs, Single Family Mortgage Rev. Bonds, Series 2017-A, 2.835% 2047
| 2,130
| 2,158
|
| City of Houston, Airport System Rev. Ref. Bonds, Series 2018-D, 5.00% 2021
| 2,575
| 2,763
|
| City of Houston, Combined Utility System Rev. Ref. Bonds, Series 2014-C, 5.00% 2020
| 1,000
| 1,031
|
City of Houston, Combined Utility System Rev. Ref. Bonds, Series 2018-C,
(1-month USD-LIBOR x 0.70 + 0.36%) 1.946% 2034 (put 2021)1
| 5,650
| 5,654
|
City of Houston, Higher Education Fin. Corp., Higher Education Rev. Bonds
(Rice University Project), Series 2010-A, 5.00% 2040 (preref. 2020)
| 5,410
| 5,573
|
| City of Houston, Public Improvement Rev. Ref. Bonds, Series 2017-A, 5.00% 2020
| 2,850
| 2,915
|
Houston Independent School Dist., Limited Tax Schoolhouse Bonds, Series 2014-A-1B,
2.20% 2039 (put 2020)
| 1,735
| 1,748
|
| Houston Independent School Dist., Limited Tax Schoolhouse Bonds, Series 2017, 3.00% 2021
| 4,100
| 4,218
|
Hurst-Euless-Bedford Independent School Dist., Unlimited Tax School Building Bonds, Series 2019,
4.00% 2021
| 425
| 450
|
Hurst-Euless-Bedford Independent School Dist., Unlimited Tax School Building Bonds, Series 2019,
5.00% 2023
| 1,115
| 1,284
|
| Katy Independent School Dist., Rev. Ref. Bonds, Series 2014-B, 5.00% 2020
| 1,305
| 1,332
|
| Lake Travis Independent School Dist., Unlimited Tax School Building Bonds, Series 2019, 5.00% 2022
| 1,065
| 1,169
|
| Lake Travis Independent School Dist., Unlimited Tax School Building Bonds, Series 2019, 5.00% 2023
| 1,910
| 2,168
|
| Lewisville Independent School Dist., Unlimited Tax Rev. Ref. Bonds, Series 2017-A, 5.00% 2023
| 2,500
| 2,885
|
| Love Field Airport Modernization Corp., General Airport Rev. Bonds, Series 2015, AMT, 5.00% 2019
| 1,000
| 1,009
|
| Love Field Airport Modernization Corp., General Airport Rev. Bonds, Series 2017, AMT, 5.00% 2021
| 500
| 541
|
| North East Independent School Dist., Unlimited Tax Rev. Bonds, Series 2014, 2.00% 2044 (put 2019)
| 700
| 700
|
| North Texas Tollway Auth., Special Projects System Rev. Bonds, Series 2011-D, 5.00% 2029 (preref. 2021)
| 5,000
| 5,392
|
| North Texas Tollway Auth., System Rev. Ref. Bonds, Series 2019-A, 5.00% 2023
| 2,000
| 2,254
|
| Northside Independent School Dist., School Building and Rev. Ref. Bonds, Series 2019, 5.00% 2023
| 990
| 1,141
|
Northside Independent School Dist., Unlimited Tax School Building Bonds, Series 2011,
2.125% 2040 (put 2020)
| 1,140
| 1,145
|
American Funds Short-Term Tax-Exempt Bond Fund
— Page 14 of 19
Bonds, notes & other debt instruments (continued)
Texas (continued)
| Principal amount
(000)
| Value
(000)
|
Northside Independent School Dist., Unlimited Tax School Building Bonds, Series 2017,
1.45% 2047 (put 2020)
| $3,800
| $3,804
|
Panhandle Regional Housing Fin. Corp., Multi Family Housing Rev. Bonds
(Canyons at 45 West Apartments), Series 2018, 2.00% 2021 (put 2020)
| 1,560
| 1,567
|
| Pflugerville Independent School Dist., Unlimited Tax School Building Bonds, Series 2019-A, 4.00% 2021
| 2,525
| 2,637
|
| Plano Independent School Dist., Unlimited Tax School Building Bonds, Series 2016, 5.00% 2021
| 2,000
| 2,119
|
| Public Fin. Auth., G.O. Rev. Ref. Bonds, Series 2011, 5.00% 2020
| 1,145
| 1,197
|
| Richardson Independent School Dist., Unlimited Tax School Building Bonds, Series 2017, 5.00% 2020
| 700
| 715
|
| Richardson Independent School Dist., Unlimited Tax School Building Bonds, Series 2019, 5.00% 2021
| 2,615
| 2,771
|
| City of San Antonio, Electric and Gas Systems Rev. Ref. Bonds, Series 2015-A, 2.25% 2033 (put 2019)
| 9,000
| 9,027
|
| City of San Antonio, Electric and Gas Systems Rev. Ref. Bonds, Series 2015-B, 2.00% 2033 (put 2021)
| 3,040
| 3,071
|
| City of San Antonio, Electric and Gas Systems Rev. Ref. Bonds, Series 2018, 2.75% 2048 (put 2022)
| 2,525
| 2,635
|
| City of San Antonio, Electric and Gas Systems Rev. Ref. Bonds, Series 2018, 5.00% 2020
| 3,000
| 3,058
|
| Spring Independent School Dist., Unlimited Tax School Building Bonds, Series 2019, 5.00% 2022
| 1,100
| 1,227
|
| County of Tarrant, Cultural Education Facs. Fin. Corp., Hospital Rev. Bonds (Baylor Scott & White Health Project), Series 2016-A, 5.00% 2019
| 1,000
| 1,011
|
| County of Tarrant, Cultural Education Facs. Fin. Corp., Hospital Rev. Bonds (Baylor Scott & White Health Project), Series 2016-A, 5.00% 2020
| 750
| 786
|
| Texas City Independent School Dist., Unlimited Tax School Building Rev. Ref. Bonds, Series 2019, 5.00% 2024
| 1,400
| 1,661
|
Board of Regents of the Texas State University System, Rev. Fncg. System Rev. and Rev. Ref. Bonds,
Series 2017-A, 5.00% 2022
| 800
| 880
|
Transportation Commission, Central Texas Turnpike System Rev. Ref. Bonds, Series 2015-A,
5.00% 2042 (put 2020)
| 2,000
| 2,047
|
| Transportation Commission, Highway Improvement G.O. Bonds, Series 2012-A, 5.00% 2020
| 2,670
| 2,740
|
| Board of Regents of the University of North Texas System, Rev. Fncg. System Rev. Ref. and Improvement Bonds, Series 2017-A, 5.00% 2022
| 1,000
| 1,102
|
| Board of Regents of the University of North Texas System, Rev. Fncg. System Rev. Ref. and Improvement Bonds, Series 2017-A, 5.00% 2023
| 1,000
| 1,137
|
Board of Regents of the University of Texas System, Rev. Fncg. System Rev. Ref. Bonds, Series 2016-I,
5.00% 2019
| 1,750
| 1,752
|
Water Dev. Board, State Water Implementation Rev. Fund, Rev. Bonds (Master Trust), Series 2018-A,
5.00% 2023
| 1,120
| 1,299
|
|
|
| 167,204
|
| Vermont 0.03%
|
|
|
| Housing Fin. Agcy., Multiple Purpose Bonds, Series 2014-A, AMT, 4.00% 2044
| 365
| 387
|
| Virginia 1.57%
|
|
|
College Building Auth., Educational Facs. Rev. Bonds (21st Century College and Equipment Programs),
Series 2012-A, 5.00% 2020
| 1,090
| 1,111
|
College Building Auth., Educational Facs. Rev. Bonds (21st Century College and Equipment Programs),
Series 2019-A, 5.00% 2020
| 2,880
| 2,937
|
College Building Auth., Educational Facs. Rev. Bonds (21st Century College and Equipment Programs),
Series 2019-A, 5.00% 2023
| 3,015
| 3,418
|
| College Building Auth., Educational Facs. Rev. Ref. Bonds (21st Century College and Equipment Programs), Series 2011-A, 4.00% 2032 (preref. 2021)
| 1,000
| 1,044
|
| College Building Auth., Educational Facs. Rev. Ref. Bonds (21st Century College and Equipment Programs), Series 2015-A, 5.00% 2026 (preref. 2025)
| 1,530
| 1,841
|
| Commonwealth Transportation Board, Federal Transportation Grant Anticipation Rev. and Rev. Ref. Notes, Series 2017, 5.00% 2023
| 3,000
| 3,476
|
American Funds Short-Term Tax-Exempt Bond Fund
— Page 15 of 19
Bonds, notes & other debt instruments (continued)
Virginia (continued)
| Principal amount
(000)
| Value
(000)
|
| Commonwealth Transportation Board, Federal Transportation Grant Anticipation Rev. Notes, Series 2013-A, 5.00% 2020
| $3,000
| $3,074
|
County of Wise, Industrial Dev. Auth., Solid Waste and Sewage Disposal Rev. Bonds
(Virginia Electric and Power Co. Project), Series 2009-A, 2.15% 2040 (put 2020)
| 1,000
| 1,009
|
|
|
| 17,910
|
| Washington 2.99%
|
|
|
Central Puget Sound Regional Transit Auth., Sales Tax Improvement Green Bonds, Series 2015-S-2B,
(SIFMA Municipal Swap Index + 0.45%) 1.85% 2045 (put 2023)1
| 6,150
| 6,154
|
| Econ. Dev. Fin. Auth., Solid Waste Disposal Rev. Bonds (Waste Management, Inc. Project), Series 2008, 2.125% 20203
| 2,500
| 2,501
|
| G.O. Bonds, Series 2010-E, 5.00% 2022 (preref. 2020)
| 1,000
| 1,020
|
| G.O. Bonds, Series 2011-B, 5.25% 2036 (preref. 2021)
| 2,030
| 2,156
|
| G.O. Rev. Ref. Bonds, Series 2012-R-C, 5.00% 2020
| 990
| 1,026
|
| G.O. Rev. Ref. Bonds, Series 2018-R-C, 5.00% 2021
| 5,000
| 5,389
|
County of Grant, Public Utility Dist. No. 2, Electric System Rev. Ref. Bonds, Series 2017-N,
2.00% 2044 (put 2020)
| 1,500
| 1,508
|
| Health Care Facs. Auth., Rev. Bonds (Kadlec Regional Medical Center), Series 2012, 5.00% 2042 (preref. 2021)
| 1,185
| 1,289
|
| Health Care Facs. Auth., Rev. Bonds (Providence Health & Services), Series 2012-B, 4.00% 2042 (put 2021)
| 250
| 265
|
| Health Care Facs. Auth., Rev. Ref. Bonds (PeaceHealth), Series 2014-A, 5.00% 2019
| 500
| 505
|
Health Care Facs. Auth., Rev. Ref. Bonds (Providence Health & Services), Series 2012-B,
5.00% 2042 (put 2021)
| 2,550
| 2,751
|
| Housing Fin. Commission, Homeownership Program Bonds, Series 2010-A, 4.70% 2028
| 75
| 76
|
| Housing Fin. Commission, Single Family Program Bonds, Series 2013-1-N, 3.00% 2043
| 130
| 131
|
| Housing Fin. Commission, Single Family Program Bonds, Series 2014-1-N, 3.00% 2037
| 605
| 616
|
| Housing Fin. Commission, Single Family Program Bonds, Series 2014-2A-R, AMT, 3.50% 2044
| 1,165
| 1,201
|
| Housing Fin. Commission, Single Family Program Bonds, Series 2017-1-N, 4.00% 2047
| 785
| 834
|
| Motor Vehicle Fuel Tax G.O. Bonds, Series 2012-E, 5.00% 2021
| 500
| 529
|
| City of Seattle, Municipal Light and Power Improvement Rev. Ref. Bonds, Series 2010-B, 5.00% 2021
| 625
| 637
|
City of Seattle, Municipal Light and Power Improvement Rev. Ref. Bonds, Series 2018-C-2,
(SIFMA Municipal Swap Index + 0.49%) 1.89% 2046 (put 2023)1
| 2,250
| 2,263
|
| Port of Seattle, Intermediate Lien Rev. Bonds, Series 2019, AMT, 5.00% 2022
| 1,000
| 1,095
|
| Port of Seattle, Intermediate Lien Rev. Bonds, Series 2019, AMT, 5.00% 2023
| 1,000
| 1,129
|
| Port of Seattle, Rev. Ref. Bonds, Series 2015-B, 5.00% 2020
| 1,000
| 1,023
|
|
|
| 34,098
|
| West Virginia 0.31%
|
|
|
County of Monongalia, Building Commission, Ref. and Improvement Rev. Bonds
(Monongalia Health System Obligated Group), Series 2015, 5.00% 2020
| 1,135
| 1,167
|
West Virginia University, Improvement Rev. Bonds (West Virginia University Projects), Series 2014-C,
(SIFMA Municipal Swap Index + 0.53%) 1.93% 2041 (put 2019)1
| 2,375
| 2,375
|
|
|
| 3,542
|
| Wisconsin 3.23%
|
|
|
| G.O. Bonds, Series 2013-A, 5.00% 2025 (preref. 2022)
| 5,000
| 5,530
|
| G.O. Bonds, Series 2015-A, 5.00% 2031 (preref. 2023)
| 5,000
| 5,718
|
Health and Educational Facs. Auth., Health Facs. Rev. Bonds (SSM Health Care), Series 2018-B,
5.00% 2038 (put 2023)
| 2,700
| 2,987
|
Health and Educational Facs. Auth., Rev. Bonds (Advocate Aurora Health Care Credit Group),
Series 2018-C-3, (SIFMA Municipal Swap Index + 0.55%) 1.95% 2054 (put 2023)1
| 2,330
| 2,332
|
Health and Educational Facs. Auth., Rev. Bonds (Agnesian HealthCare, Inc.), Series 2013-B,
5.00% 2024 (preref. 2023)
| 1,015
| 1,161
|
| Health and Educational Facs. Auth., Rev. Bonds (Ascension Health Senior Credit Group), Series 2013-B-1, 1.375% 2038 (put 2019)
| 2,070
| 2,071
|
American Funds Short-Term Tax-Exempt Bond Fund
— Page 16 of 19
Bonds, notes & other debt instruments (continued)
Wisconsin (continued)
| Principal amount
(000)
| Value
(000)
|
Health and Educational Facs. Auth., Rev. Bonds (Children’s Hospital of Wisconsin, Inc.), Series 2008-B,
5.375% 2037 (preref. 2020)
| $1,000
| $1,023
|
Health and Educational Facs. Auth., Rev. Bonds (St. John’s Communities, Inc.), Series 2009-A,
7.625% 2039 (preref. 2019)
| 2,000
| 2,015
|
| Housing and Econ. Dev. Auth., Home Ownership Rev. Bonds, Series 2015-A, AMT, 4.00% 2045
| 3,560
| 3,730
|
| Housing and Econ. Dev. Auth., Home Ownership Rev. Bonds, Series 2016-A, AMT, 3.50% 2046
| 4,425
| 4,612
|
| Housing and Econ. Dev. Auth., Home Ownership Rev. Bonds, Series 2017-C, 4.00% 2048
| 1,085
| 1,160
|
| Housing and Econ. Dev. Auth., Home Ownership Rev. Bonds, Series 2018-B, 4.00% 2048
| 1,355
| 1,453
|
| Public Fin. Auth., Solid Waste Disposal Rev. Ref. Bonds (Waste Management, Inc. Project), Series 2016-A-4, AMT, 2.00% 2033 (put 2021)
| 1,500
| 1,512
|
| Public Fin. Auth., Solid Waste Disposal Rev. Ref. Bonds (Waste Management, Inc. Project), Series 2017-A-3, AMT, 1.95% 2027 (put 2019)
| 1,495
| 1,495
|
|
|
| 36,799
|
| Wyoming 0.12%
|
|
|
| Community Dev. Auth., Housing Rev. Bonds, Series 2015-3, 3.00% 2044
| 260
| 267
|
| Community Dev. Auth., Housing Rev. Bonds, Series 2015-6, 4.00% 2045
| 1,105
| 1,156
|
|
|
| 1,423
|
| Total bonds, notes & other debt instruments (cost: $1,038,970,000)
|
| 1,052,285
|
| Short-term securities 7.38%
|
|
|
| Freddie Mac, Multi Family Certificates, Series 2017-M-051, 1.63% 20351
| 1,000
| 1,000
|
| Freddie Mac, Multi Family Certificates, Series 2018-M-046, 1.63% 20351
| 2,880
| 2,880
|
State of Alaska, City of Valdez, Marine Terminal Rev. Ref. Bonds (ExxonMobil Project), Series 2001,
1.47% 20291
| 1,500
| 1,500
|
| State of Florida, Municipal Power Agcy., All-Requirements Power Supply Project Demand Rev. Ref. Bonds, Series 2008-C, 1.49% 20351
| 1,500
| 1,500
|
| State of Idaho, Tax Anticipation Notes, Series 2019, 3.00% 6/30/2020
| 2,000
| 2,032
|
State of Louisiana, Public Facs. Auth., Rev. Bonds (Air Products and Chemicals Project), Series 2008-A,
1.50% 20431
| 17,000
| 17,000
|
| State of Maryland, County of Montgomery, IAM Commercial Paper, Series 2019-A, 1.38% 8/6/2019
| 4,000
| 4,000
|
State of Maryland, County of Montgomery, Rev. Bonds (Trinity Health Credit Group), Series 2013,
1.43% 2041 (put 2019)4
| 3,000
| 3,001
|
State of Massachusetts, Health and Educational Facs. Auth., IAM Commercial Paper (Harvard University),
Series 2019, 1.30% 10/16/2019
| 2,000
| 2,000
|
State of Michigan, Strategic Fund, Demand Limited Obligation Rev. Bonds
(Air Products and Chemicals, Inc. Project), Series 2007, 1.50% 20421
| 1,000
| 1,000
|
State of Mississippi, Business Fin. Corp., Gulf Opportunity Zone Industrial Dev. Rev. Bonds
(Chevron U.S.A. Inc. Project), Series 2007-A, 1.48% 20301
| 13,000
| 13,000
|
State of New Hampshire, Health and Education Facs. Auth., Rev. Ref. Bonds (Dartmouth College Issue),
Series 2007-B, 1.48% 20411
| 3,000
| 3,000
|
State of New York, Metropolitan Transportation Auth., Transportation Rev. Bonds Anticipation Notes,
Series 2019-A, 4.00% 2/3/2020
| 1,500
| 1,521
|
State of New York, Metropolitan Transportation Auth., Transportation Rev. Bonds, Series 2015-E-3,
(SIFMA Municipal Swap Index + 1.70%) 1.47% 20501
| 500
| 500
|
State of New York, New York City G.O. Bonds, Fiscal 2008, Series 2008-C-4,
Assured Guaranty Municipal insured, 1.75% 20271
| 3,900
| 3,900
|
| State of Ohio, Hospital Rev. Bonds (University Hospitals Health System Inc.), Series 2013, 1.62% 20331
| 2,945
| 2,945
|
| State of Pennsylvania, Econ. Dev. Fncg. Auth., Solid Waste Disposal Rev. Bonds (Waste Management, Inc. Project), Series 2013, AMT, 2.15% 2045 (put 2019)4
| 1,865
| 1,865
|
| State of Texas, City of Houston, Tax and Rev. Anticipation Notes, Series 2019, 5.00% 6/26/2020
| 2,000
| 2,069
|
| State of Texas, Tax and Rev. Anticipation Notes, Series 2018, 4.00% 8/29/2019
| 7,825
| 7,840
|
American Funds Short-Term Tax-Exempt Bond Fund
— Page 17 of 19
| Short-term securities (continued)
| Principal amount
(000)
| Value
(000)
|
| State of Texas, Board of Regents of the University of Texas System, IAM Commercial Paper, Series 2019, 1.35% 8/5/2019
| $3,000
| $3,000
|
| State of Texas, Board of Regents of the University of Texas System, IAM Commercial Paper, Series 2019, 1.40% 8/8/2019
| 4,500
| 4,500
|
| State of Wisconsin, Public Fin. Auth., Solid Waste Disposal Rev. Ref. Bonds (Waste Management, Inc. Project), Series 2017-A-2, AMT, 1.95% 2025 (put 2019)4
| 1,820
| 1,820
|
| State of Wyoming, County of Lincoln, Pollution Control Rev. Ref. Bonds (ExxonMobil Project), Series 2014, 1.47% 20441
| 1,000
| 1,000
|
| State of Wyoming, County of Sublette, Pollution Control Rev. Ref. Bonds (ExxonMobil Project), Series 2014, 1.47% 20441
| 1,300
| 1,300
|
| Total short-term securities (cost: $84,160,000)
|
| 84,173
|
| Total investment securities 99.66% (cost: $1,123,130,000)
|
| 1,136,458
|
| Other assets less liabilities 0.34%
|
| 3,920
|
| Net assets 100.00%
|
| $1,140,378
|
Futures contracts
| Contracts
| Type
| Number of
contracts
| Expiration
| Notional
amount5
(000)
| Value at
7/31/20196
(000)
| Unrealized
appreciation
(depreciation)
at 7/31/2019
(000)
|
| 2 Year U.S. Treasury Note Futures
| Long
| 1,289
| October 2019
| $257,800
| $276,369
| $27
|
| 5 Year U.S. Treasury Note Futures
| Short
| 498
| October 2019
| (49,800)
| (58,542)
| (18)
|
|
|
|
|
|
|
| $9
|
| 1
| Coupon rate may change periodically. For short-term securities, the date of the next scheduled coupon rate change is considered to be the maturity date.
|
| 2
| Step bond; coupon rate may change at a later date.
|
| 3
| Acquired in a transaction exempt from registration under Rule 144A of the Securities Act of 1933. May be resold in the U.S. in transactions exempt from registration, normally to
qualified institutional buyers. The total value of all such securities was $2,501,000, which represented .22% of the net assets of the fund.
|
| 4
| For short-term securities, the mandatory put date is considered to be the maturity date.
|
| 5
| Notional amount is calculated based on the number of contracts and notional contract size.
|
| 6
| Value is calculated based on the notional amount and current market price.
|
| Key to abbreviations and symbol
|
|
| Agcy. = Agency
| Fncg. = Financing
|
| AMT = Alternative Minimum Tax
| G.O. = General Obligation
|
| Auth. = Authority
| LIBOR = London Interbank Offered Rate
|
| Certs. of Part. = Certificates of Participation
| LOC = Letter of Credit
|
| Dept. = Department
| Preref. = Prerefunded
|
| Dev. = Development
| Redev. = Redevelopment
|
| Dist. = District
| Ref. = Refunding
|
| Econ. = Economic
| Rev. = Revenue
|
| Fac. = Facility
| SIFMA = Securities Industry and Financial Markets Association
|
| Facs. = Facilities
| USD/$ = U.S. dollars
|
| Fin. = Finance
|
|
American Funds Short-Term Tax-Exempt Bond Fund
— Page 18 of 19
Additional financial disclosures
are included in the fund’s current shareholder report and should be read in conjunction with this report.
Investments are not FDIC-insured, nor
are they deposits of or guaranteed by a bank or any other entity, so they may lose value.
Investors should carefully consider
investment objectives, risks, charges and expenses. This and other important information is contained in the fund prospectus and summary prospectus, which can be obtained from your financial professional and should be
read carefully before investing. You may also call American Funds Service Company (AFS) at (800) 421-4225 or visit the American Funds website at capitalgroup.com.
All Capital Group trademarks
mentioned are owned by The Capital Group Companies, Inc., an affiliated company or fund. All other company and product names mentioned are the property of their respective companies.
American Funds Distributors, Inc.,
member FINRA.
© 2019 Capital Group. All
rights reserved.
| MFGEFPX-039-0919O-S73196
| American Funds Short-Term Tax-Exempt Bond Fund — Page 19 of 19
|
Limited Term Tax-Exempt Bond Fund of
America®
Investment portfolio
July 31, 2019
Bonds, notes & other debt instruments 92.55%
Alabama 1.23%
| Principal amount
(000)
| Value
(000)
|
| 21st Century Auth., Tobacco Settlement Rev. Ref. Bonds, Series 2012-A, 5.00% 2020
| $4,000
| $4,114
|
| 21st Century Auth., Tobacco Settlement Rev. Ref. Bonds, Series 2012-A, 5.00% 2021
| 3,305
| 3,508
|
| Black Belt Energy Gas Dist., Gas Supply Prepay Rev. Bonds (Project No. 4), Series 2019-A, 4.00% 2021
| 1,250
| 1,308
|
| Black Belt Energy Gas Dist., Gas Supply Prepay Rev. Bonds (Project No. 4), Series 2019-A, 4.00% 2022
| 1,650
| 1,763
|
| Black Belt Energy Gas Dist., Gas Supply Prepay Rev. Bonds (Project No. 4), Series 2019-A, 4.00% 2023
| 1,750
| 1,908
|
| Black Belt Energy Gas Dist., Gas Supply Rev. Bonds, Series 2017-A, 4.00% 2047 (put 2022)
| 12,620
| 13,478
|
| Federal Aid Highway Fin. Auth., Federal Highway Grant Anticipation Bonds, Series 2012, 5.00% 2022
| 5,385
| 5,996
|
Federal Aid Highway Fin. Auth., Federal Highway Grant Anticipation Bonds, Series 2012,
5.00% 2023 (preref. 2022)
| 2,500
| 2,796
|
| Federal Aid Highway Fin. Auth., Special Obligation Rev. Bonds, Series 2017-B, 5.00% 2026
| 2,500
| 3,114
|
| County of Jefferson, Limited Obligation Rev. Ref. Bonds, Series 2017, 5.00% 2020
| 2,250
| 2,347
|
| County of Jefferson, Limited Obligation Rev. Ref. Bonds, Series 2017, 5.00% 2025
| 3,000
| 3,600
|
| County of Jefferson, Limited Obligation Rev. Ref. Bonds, Series 2017, 5.00% 2026
| 1,000
| 1,221
|
| -County of Jefferson, Limited Obligation Rev. Ref. Bonds, Series 2017, 5.00% 2027
| 2,000
| 2,460
|
City of Montgomery, Medical Clinic Board, Health Care Fac. Rev. Bonds (Jackson Hospital & Clinic),
Series 2016, 5.00% 2021
| 2,065
| 2,166
|
City of Montgomery, Medical Clinic Board, Health Care Fac. Rev. Bonds (Jackson Hospital & Clinic),
Series 2016, 5.00% 2023
| 1,125
| 1,245
|
| City of Pell, Special Care Facs. Fncg. Auth., Rev. Ref. Bonds (Noland Health Services, Inc.), Series 2012-A, 5.00% 2020
| 1,140
| 1,196
|
|
|
| 52,220
|
| Alaska 0.32%
|
|
|
| Housing Fin. Corp., Collateralized Bonds (Veterans Mortgage Program), Series 2019, 4.00% 2048
| 10,020
| 10,984
|
| Housing Fin. Corp., General Mortgage Rev. Bonds, Series 2016-A, 3.50% 2046
| 2,515
| 2,645
|
|
|
| 13,629
|
| Arizona 0.35%
|
|
|
| City of Glendale, Water and Sewer Rev. Ref. Obligations, Series 2012, 5.00% 2020
| 1,550
| 1,607
|
| City of Glendale, Water and Sewer Rev. Ref. Obligations, Series 2012, 5.00% 2021
| 1,000
| 1,074
|
| Health Facs. Auth., Rev. Bonds (Scottsdale Lincoln Hospitals Project), Series 2014-A, 5.00% 2024
| 1,000
| 1,181
|
Health Facs. Auth., Rev. Ref. Bonds (Phoenix Children’s Hospital), Series 2013-A-1,
(SIFMA Municipal Swap Index + 1.85%) 3.25% 2048 (put 2020)1
| 1,500
| 1,500
|
Industrial Dev. Auth., Student Housing Rev. Bonds (Provident Group - NCCU Properties LLC -
North Carolina Central University), Series 2019-A, BAM insured, 5.00% 2025
| 400
| 472
|
Industrial Dev. Auth., Student Housing Rev. Bonds (Provident Group - NCCU Properties LLC -
North Carolina Central University), Series 2019-A, BAM insured, 5.00% 2026
| 500
| 600
|
Industrial Dev. Auth., Student Housing Rev. Bonds (Provident Group - NCCU Properties LLC -
North Carolina Central University), Series 2019-A, BAM insured, 5.00% 2027
| 400
| 488
|
| County of Maricopa, Industrial Dev. Auth., Rev. Bonds (Banner Health), Series 2017-C, 5.00% 2048 (put 2024)
| 2,000
| 2,355
|
| City of Phoenix, Civic Improvement Corp., Wastewater System Rev. Ref. Bonds, Series 2016, 5.00% 2028
| 2,000
| 2,465
|
| Board of Regents of the University of Arizona, Rev. Ref. Certs. of Part., Series 2012-C, 5.00% 2020
| 3,180
| 3,281
|
|
|
| 15,023
|
| Arkansas 0.02%
|
|
|
Dev. Fin. Auth., Health Care Rev. Bonds (Baptist Memorial Health Care), Series 2015-B-3,
(SIFMA Municipal Swap Index + 1.55%) 2.95% 2044 (put 2022)1
| 1,000
| 1,016
|
Limited Term Tax-Exempt Bond Fund of America
— Page 1 of 37
Bonds, notes & other debt instruments (continued)
California 4.77%
| Principal amount
(000)
| Value
(000)
|
Bay Area Toll Auth., San Francisco Bay Area Toll Bridge Rev. Bonds, Series 2006-C-1,
(SIFMA Municipal Swap Index + 0.90%) 2.30% 2045 (put 2023)1
| $11,500
| $11,663
|
Bay Area Toll Auth., San Francisco Bay Area Toll Bridge Rev. Bonds, Series 2007-C-1,
(SIFMA Municipal Swap Index + 0.90%) 2.30% 2047 (put 2023)1
| 3,500
| 3,546
|
Bay Area Toll Auth., San Francisco Bay Area Toll Bridge Rev. Bonds, Series 2008-B-1,
(SIFMA Municipal Swap Index + 1.10%) 2.50% 2045 (put 2024)1
| 2,500
| 2,568
|
Bay Area Toll Auth., San Francisco Bay Area Toll Bridge Rev. Bonds, Series 2014-G,
(SIFMA Municipal Swap Index + 0.60%) 2.00% 2034 (put 2020)1
| 2,500
| 2,502
|
Bay Area Toll Auth., San Francisco Bay Area Toll Bridge Rev. Bonds, Series 2014-H,
(SIFMA Municipal Swap Index + 0.70%) 2.10% 2034 (put 2021)1
| 10,480
| 10,522
|
Capistrano Unified School Dist., School Facs. Improvement Dist. No. 1, G.O. Bonds,
Capital Appreciation Bonds, 1999 Election, Series 2001-B, Assured Guaranty Municipal insured,
0% 2025
| 8,000
| 6,729
|
| City of Chula Vista, Municipal Fncg. Auth., Special Tax Rev. Ref. Bonds, Series 2015-A, 5.00% 2021
| 975
| 1,051
|
City of El Centro, Fncg. Auth., Wastewater Rev. Ref. Bonds, Series 2014-A,
Assured Guaranty Municipal insured, 5.00% 2028
| 1,000
| 1,168
|
| City of Fontana, Community Facs. Dist. No. 22 (Sierra Hills South), Special Tax Bonds, Series 2014, 5.00% 2022
| 525
| 574
|
| G.O. Bonds, Series 2018, 5.00% 2025
| 5,000
| 6,147
|
Golden State Tobacco Securitization Corp., Enhanced Tobacco Settlement Asset-Backed Bonds,
Capital Appreciation Bonds, Series 2005-A, Assured Guaranty Municipal insured, 0% 2025
| 5,000
| 4,578
|
Golden State Tobacco Securitization Corp., Enhanced Tobacco Settlement Asset-Backed Bonds,
Capital Appreciation Bonds, Series 2005-A, Assured Guaranty Municipal insured, 0% 2026
| 3,850
| 3,441
|
Golden State Tobacco Securitization Corp., Enhanced Tobacco Settlement Asset-Backed Bonds,
Series 2013-A, 5.00% 2020
| 6,100
| 6,302
|
| Health Facs. Fncg. Auth., Rev. Ref. Bonds (Adventist Health System/West), Series 2016-A, 4.00% 2026
| 1,000
| 1,168
|
| Health Facs. Fncg. Auth., Rev. Ref. Bonds (St. Joseph Health System), Series 2009-C, 5.00% 2034 (put 2022)
| 5,500
| 6,148
|
Infrastructure and Econ. Dev. Bank, Rev. Bonds (The Colburn School), Series 2015-A,
(SIFMA Municipal Swap Index + 1.00%) 2.40% 2037 (put 2020)1
| 3,140
| 3,147
|
Infrastructure and Econ. Dev. Bank, Rev. Bonds (The Colburn School), Series 2015-B,
(SIFMA Municipal Swap Index + 1.20%) 2.60% 2037 (put 2022)1
| 5,500
| 5,599
|
| Irvine Unified School Dist., Community Facs. Dist. No. 09-1, Special Tax Bonds, Series 2017-A, BAM insured, 5.00% 2025
| 1,875
| 2,203
|
| City of Jurupa, Public Fncg. Auth., Special Tax Rev. Bonds, Series 2013-A, 5.00% 2021
| 750
| 812
|
| City of Jurupa, Public Fncg. Auth., Special Tax Rev. Bonds, Series 2013-A, 5.00% 2022
| 1,000
| 1,121
|
| City of Lake Elsinore, Public Fncg. Auth., Local Agcy. Rev. Ref. Bonds, Series 2015, 5.00% 2026
| 3,590
| 4,181
|
| City of Lee Lake, Public Fncg. Auth., Special Tax Rev. Ref. Bonds, Series 2013-A, 5.00% 2019
| 1,805
| 1,810
|
| City of Los Angeles, Dept. of Airports, Los Angeles International Airport, Rev. Bonds, Series 2016-B, AMT, 5.00% 2025
| 1,015
| 1,218
|
City of Los Angeles, Dept. of Airports, Los Angeles International Airport, Rev. Bonds, Series 2016-B, AMT,
5.00% 2026
| 1,965
| 2,408
|
City of Los Angeles, Dept. of Airports, Los Angeles International Airport, Rev. Bonds, Series 2016-B, AMT,
5.00% 2027
| 1,250
| 1,522
|
| City of Los Angeles, Dept. of Airports, Los Angeles International Airport, Rev. Bonds, Series 2018-D, AMT, 5.00% 2024
| 4,860
| 5,691
|
| City of Los Angeles, Harbor Dept., Rev. Ref. Bonds, Series 2016-A, AMT, 5.00% 2024
| 1,500
| 1,769
|
| City of Los Angeles, Multi Family Housing Rev. Bonds (Jordan Downs Phase 1B Apartments), Series 2018-A-2, 2.08% 2022 (put 2021)
| 1,000
| 1,011
|
Menifee Union School Dist., Public Fncg. Auth., Special Tax Rev. Bonds, Series 2016-A, BAM insured,
5.00% 2029
| 400
| 477
|
Menifee Union School Dist., Public Fncg. Auth., Special Tax Rev. Bonds, Series 2016-A, BAM insured,
5.00% 2030
| 625
| 740
|
| Metropolitan Water Dist. of Southern California, Water Rev. Ref. Bonds, Series 2019-A, 5.00% 2023
| 4,000
| 4,635
|
| Municipal Fin. Auth., Student Housing Rev. Bonds (CHF-Riverside II, LLC - UCR Student Housing Project), Series 2019, 5.00% 2029
| 855
| 1,083
|
| City of Murrieta, Public Fncg. Auth., Special Tax Rev. Ref. Bonds, Series 2012, 5.00% 2020
| 1,000
| 1,040
|
Limited Term Tax-Exempt Bond Fund of America
— Page 2 of 37
Bonds, notes & other debt instruments (continued)
California (continued)
| Principal amount
(000)
| Value
(000)
|
City of Oakland, Successor Agcy. to the Redev. Agcy., Tax Allocation Rev. Ref. Bonds
(Central Dist. Redev. Project), Series 2013, 5.00% 2020
| $2,500
| $2,606
|
City of Oakland, Successor Agcy. to the Redev. Agcy., Tax Allocation Rev. Ref. Bonds
(Central Dist. Redev. Project), Series 2013, 5.00% 2021
| 2,000
| 2,157
|
| Oakland Unified School Dist., G.O. Rev. Ref. Bonds, Series 2016, 5.00% 2023
| 2,190
| 2,508
|
| Oakland Unified School Dist., G.O. Rev. Ref. Bonds, Series 2016, 5.00% 2025
| 2,040
| 2,466
|
| Oakland Unified School Dist., G.O. Rev. Ref. Bonds, Series 2016, 5.00% 2028
| 1,810
| 2,208
|
| Oakland Unified School Dist., G.O. Rev. Ref. Bonds, Series 2017-A, 5.00% 2022
| 4,275
| 4,749
|
| Port of Oakland, Rev. Ref. Bonds, Series 2012-P, AMT, 5.00% 2022
| 4,000
| 4,402
|
| Port of Oakland, Rev. Ref. Bonds, Series 2012-P, AMT, 5.00% 2023
| 2,750
| 3,021
|
| Palo Alto Unified School Dist., G.O. Bonds, Capital Appreciation Bonds, Series 2008, 0% 2027
| 1,960
| 1,711
|
Palomar Pomerado Health, G.O. Bonds, Capital Appreciation Bonds, 2004 Election, Series 2007-A,
National insured, 0% 2026
| 3,485
| 2,998
|
| Regional Airports Improvement Corp., Facs. Lease Rev. Ref. Bonds (LAXFUEL Corp., Los Angeles International Airport), Series 2012, AMT, 5.00% 2021
| 1,700
| 1,789
|
| Rio Elementary School Dist., Community Facs. Dist. No. 1, Special Tax Bonds, Series 2016, BAM insured, 5.00% 2027
| 835
| 993
|
| Rio Elementary School Dist., Community Facs. Dist. No. 1, Special Tax Bonds, Series 2016, BAM insured, 5.00% 2028
| 405
| 479
|
Riverside Unified School Dist., Fncg. Auth., Special Tax Rev. Ref. Bonds, Series 2015, BAM insured,
5.00% 2029
| 2,250
| 2,648
|
Riverside Unified School Dist., Fncg. Auth., Special Tax Rev. Ref. Bonds, Series 2015, BAM insured,
5.00% 2031
| 1,035
| 1,209
|
City of Sacramento, Community Drainage Facs. Dist. No. 97-1 (North Natomas), Special Tax Bonds,
Series 2015, 5.00% 2027
| 1,500
| 1,792
|
City and County of San Francisco, Airport Commission, San Francisco International Airport,
Second Series Rev. Ref. Bonds, Series 2017-D, AMT, 5.00% 2024
| 5,900
| 6,901
|
City and County of San Francisco, Airport Commission, San Francisco International Airport,
Second Series Rev. Ref. Bonds, Series 2017-D, AMT, 5.00% 2025
| 5,000
| 5,996
|
City and County of San Francisco, Successor Agcy. to the Redev. Agcy., Community Facs. Dist. No. 6
(Mission Bay South Public Improvements), Special Tax Rev. Ref. Bonds, Series 2013-A, 5.00% 2019
| 1,115
| 1,115
|
City and County of San Francisco, Successor Agcy. to the Redev. Agcy., Community Facs. Dist. No. 6
(Mission Bay South Public Improvements), Special Tax Rev. Ref. Bonds, Series 2013-A, 5.00% 2022
| 1,000
| 1,096
|
| San Mateo Community College Dist., G.O. Bonds, Capital Appreciation Bonds, 2005 Election, Series 2006-A, National insured, 0% 2027
| 1,500
| 1,317
|
| City of Santa Fe Springs, Community Dev. Commission, Consolidated Redev. Project, Tax Allocation Bonds, Capital Appreciation Bonds, Series 2006-A, National
insured, 0% 2023
| 4,455
| 4,176
|
Statewide Communities Dev. Auth., Multi Family Housing Rev. Bonds (La Mesa Springs Apartments),
Series 2019-E, 1.78% 2021 (put 2020)
| 3,400
| 3,429
|
Statewide Communities Dev. Auth., Pollution Control Rev. Ref. Bonds (Southern California Edison Co.),
Series 2006-D, 2.625% 2033 (put 2023)
| 1,250
| 1,295
|
Statewide Communities Dev. Auth., Rev. Bonds (American Baptist Homes of the West), Series 2013-A,
5.00% 2023
| 1,300
| 1,436
|
Statewide Communities Dev. Auth., Rev. Bonds (American Baptist Homes of the West), Series 2015,
5.00% 2025
| 2,585
| 3,070
|
| Statewide Communities Dev. Auth., Rev. Bonds (Hebrew Home for Aged Disabled), Series 2016, 3.50% 2021
| 5,400
| 5,434
|
Statewide Communities Dev. Auth., Rev. Bonds (Viamonte Senior Living 1 Project), Series 2018-B,
3.00% 2025
| 1,300
| 1,332
|
Statewide Communities Dev. Auth., Rev. Bonds (Viamonte Senior Living 1 Project), Series 2018-B,
3.00% 2026
| 4,000
| 4,089
|
Sweetwater Union High School Dist., G.O. Bonds, Capital Appreciation Bonds, Series 2004-C,
Assured Guaranty Municipal insured, 0% 2023
| 3,965
| 3,735
|
Tobacco Securitization Auth. of Southern California, Tobacco Settlement Asset-Backed Rev. Ref. Bonds
(San Diego County Tobacco Asset Securitization Corp.), Series 2006-A, 4.75% 2025
| 1,915
| 1,926
|
| Dept. of Veterans Affairs, Veterans G.O. Bonds, Series 2019-CS, 4.00% 2049
| 7,000
| 7,758
|
Limited Term Tax-Exempt Bond Fund of America
— Page 3 of 37
Bonds, notes & other debt instruments (continued)
California (continued)
| Principal amount
(000)
| Value
(000)
|
| Dept. of Veterans Affairs, Veterans G.O. Rev. Ref. Bonds, Series 2015-CM, AMT, 2.45% 2031
| $770
| $771
|
William S. Hart Union High School Dist., G.O. Bonds, Capital Appreciation Bonds, 2008 Election,
Series 2009-A, 0% 2032
| 2,000
| 1,461
|
|
|
| 202,647
|
| Colorado 2.81%
|
|
|
| County of Arapahoe, Gardens of Havana Metropolitan Dist. No. 3, Special Rev. Ref. Bonds, Series 2017-A, 3.625% 2021
| 1,883
| 1,919
|
| City of Aurora, Cornerstar Metropolitan Dist., Limited Tax G.O. Rev. Ref. Bonds (Convertible to Unlimited Tax), Series 2017-A, 3.50% 2021
| 1,000
| 1,015
|
| Colorado Bridge Enterprise, Rev. Bonds (Central 70 Project), Series 2017, AMT, 4.00% 2025
| 3,505
| 3,942
|
| Colorado Bridge Enterprise, Rev. Bonds (Central 70 Project), Series 2017, AMT, 4.00% 2026
| 4,050
| 4,574
|
| City and County of Denver, Airport System Rev. Bonds, Series 2013-A, AMT, 5.00% 2021
| 1,000
| 1,085
|
| City and County of Denver, Airport System Rev. Bonds, Series 2013-A, AMT, 5.00% 2022
| 1,300
| 1,451
|
| City and County of Denver, Airport System Rev. Bonds, Series 2018-A, AMT, 5.00% 2026
| 10,000
| 12,267
|
| City and County of Denver, Airport System Rev. Ref. Bonds, Series 2010-A, 5.00% 2021
| 3,000
| 3,152
|
| City and County of Denver, Denver Convention Center Hotel Auth., Rev. Ref. Bonds, Series 2016, 5.00% 2026
| 2,500
| 2,996
|
| City and County of Denver, Denver Convention Center Hotel Auth., Rev. Ref. Bonds, Series 2016, 5.00% 2029
| 6,500
| 7,644
|
| City and County of Denver, Dept. of Aviation (Denver International Airport), Rev. Bonds, Series 2016-B, (1-month USD-LIBOR x 0.70 + 0.86%) 2.541% 2031 (put
2019)1
| 4,250
| 4,252
|
| City and County of Denver, Park Creek Metropolitan Dist., Limited Property Tax Supported Rev. Ref. Bonds, Series 2015-A, 5.00% 2023
| 1,400
| 1,598
|
| City and County of Denver, Park Creek Metropolitan Dist., Limited Property Tax Supported Rev. Ref. Bonds, Series 2015-A, 5.00% 2024
| 1,080
| 1,264
|
| City and County of Denver, Park Creek Metropolitan Dist., Limited Property Tax Supported Rev. Ref. Bonds, Series 2015-A, 5.00% 2025
| 3,835
| 4,584
|
| City of Denver, Urban Renewal Auth., Stapleton Tax Increment Rev. Bonds, Series 2013-A-1, 5.00% 2021
| 3,800
| 4,130
|
| City of Denver, Urban Renewal Auth., Stapleton Tax Increment Rev. Bonds, Series 2013-A-1, 5.00% 2022
| 4,000
| 4,491
|
E-470 Public Highway Auth., Rev. Bonds, Capital Appreciation Bonds, Series 1997-B, National insured,
0% 2020
| 1,050
| 1,034
|
E-470 Public Highway Auth., Rev. Bonds, Series 2017-B,
(1-month USD-LIBOR x 0.67 + 1.05%) 2.568% 2039 (put 2021)1
| 1,100
| 1,110
|
| Health Facs. Auth., Health Facs. Rev. and Rev. Ref. Bonds (Evangelical Lutheran Good Samaritan Society Project), Series 2015-A, 4.00% 2020 (escrowed to maturity)
| 300
| 307
|
| Health Facs. Auth., Health Facs. Rev. and Rev. Ref. Bonds (Evangelical Lutheran Good Samaritan Society Project), Series 2015-A, 5.00% 2021 (escrowed to maturity)
| 1,200
| 1,280
|
| Health Facs. Auth., Health Facs. Rev. and Rev. Ref. Bonds (Evangelical Lutheran Good Samaritan Society Project), Series 2015-A, 5.00% 2022 (escrowed to maturity)
| 1,500
| 1,653
|
| Health Facs. Auth., Health Facs. Rev. and Rev. Ref. Bonds (Evangelical Lutheran Good Samaritan Society Project), Series 2015-A, 5.00% 2024 (escrowed to maturity)
| 1,500
| 1,751
|
| Health Facs. Auth., Health Facs. Rev. and Rev. Ref. Bonds (Evangelical Lutheran Good Samaritan Society Project), Series 2015-A, 5.00% 2025 (escrowed to maturity)
| 3,000
| 3,584
|
| Health Facs. Auth., Health Facs. Rev. and Rev. Ref. Bonds (Evangelical Lutheran Good Samaritan Society Project), Series 2015-A, 5.00% 2029
| 3,455
| 4,128
|
| Health Facs. Auth., Health Facs. Rev. and Rev. Ref. Bonds (Evangelical Lutheran Good Samaritan Society Project), Series 2017, 5.00% 2025 (escrowed to maturity)
| 1,000
| 1,195
|
| Health Facs. Auth., Health Facs. Rev. and Rev. Ref. Bonds (Evangelical Lutheran Good Samaritan Society Project), Series 2017, 5.00% 2026 (escrowed to maturity)
| 615
| 750
|
| Health Facs. Auth., Health Facs. Rev. and Rev. Ref. Bonds (Evangelical Lutheran Good Samaritan Society Project), Series 2017, 5.00% 2029
| 1,750
| 2,176
|
| Health Facs. Auth., Hospital Rev. Bonds (Adventist Health System/Sunbelt Obligated Group), Series 2016-C, 5.00% 2036 (put 2023)
| 3,000
| 3,459
|
| Health Facs. Auth., Hospital Rev. Bonds (Adventist Health System/Sunbelt Obligated Group), Series 2018-B, 5.00% 2048 (put 2025)
| 5,500
| 6,662
|
Limited Term Tax-Exempt Bond Fund of America
— Page 4 of 37
Bonds, notes & other debt instruments (continued)
Colorado (continued)
| Principal amount
(000)
| Value
(000)
|
Health Facs. Auth., Hospital Rev. Ref. Bonds (Valley View Hospital Association Project), Series 2018,
2.80% 2042 (put 2023)
| $1,800
| $1,871
|
| Health Facs. Auth., Rev. Bonds (Catholic Health Initiatives), Series 2014-B-3, 1.875% 2039 (put 2019)
| 1,000
| 1,000
|
| Health Facs. Auth., Rev. Ref. Bonds (Covenant Retirement Communities, Inc.), Series 2015-A, 5.00% 2021
| 1,765
| 1,904
|
| Housing and Fin. Auth., Single Family Mortgage Bonds, Series 2017-C, Class I, 4.00% 2048
| 3,070
| 3,294
|
| Housing and Fin. Auth., Single Family Mortgage Bonds, Series 2018-C, Class I, 4.25% 2048
| 6,305
| 6,895
|
| Housing and Fin. Auth., Single Family Mortgage Bonds, Series 2019-E, Class I, 4.25% 2049
| 12,960
| 14,199
|
| City of Loveland, Centerra Metropolitan Dist. No. 1, Rev. Ref. Bonds, Series 2017, 5.00% 20202
| 1,000
| 1,034
|
|
|
| 119,650
|
| Connecticut 1.86%
|
|
|
| Health and Educational Facs. Auth., Rev. Bonds (Quinnipiac University Issue), Series 2016-M, 5.00% 2024
| 1,645
| 1,921
|
| Health and Educational Facs. Auth., Rev. Bonds (Quinnipiac University Issue), Series 2016-M, 5.00% 2025
| 1,450
| 1,735
|
Health and Educational Facs. Auth., Rev. Bonds (Yale University Issue), Series 1997-T-2,
1.65% 2029 (put 2020)3
| 1,385
| 1,389
|
| Health and Educational Facs. Auth., Rev. Bonds (Yale University Issue), Series 2015-A, 2.05% 2035 (put 2021)
| 8,905
| 9,066
|
Health and Educational Facs. Auth., Rev. Bonds (Yale University Issue), Series 2017-B-1,
5.00% 2037 (put 2020)3
| 9,535
| 9,877
|
Higher Education Supplemental Loan Auth., Rev. Bonds (Chesla Loan Program), Series 2017-A, AMT,
5.00% 2025
| 1,000
| 1,172
|
| Housing Fin. Auth., Housing Mortgage Fin. Program Bonds, Series 2014-C-1, 4.00% 2044
| 660
| 691
|
| Housing Fin. Auth., Housing Mortgage Fin. Program Bonds, Series 2016-A-1, 4.00% 2045
| 2,465
| 2,596
|
| Housing Fin. Auth., Housing Mortgage Fin. Program Bonds, Series 2016-B-2, AMT, 3.50% 2039
| 1,885
| 1,970
|
| Housing Fin. Auth., Housing Mortgage Fin. Program Bonds, Series 2016-E-1, 3.50% 2046
| 8,370
| 8,770
|
| Housing Fin. Auth., Housing Mortgage Fin. Program Bonds, Series 2016-F-2, AMT, 3.50% 2039
| 2,840
| 2,970
|
| Housing Fin. Auth., Housing Mortgage Fin. Program Bonds, Series 2017-A-1, 4.00% 2047
| 1,545
| 1,653
|
| Housing Fin. Auth., Housing Mortgage Fin. Program Bonds, Series 2017-C-1, 4.00% 2047
| 4,625
| 4,948
|
| Housing Fin. Auth., Housing Mortgage Fin. Program Bonds, Series 2017-D-1, 4.00% 2047
| 2,490
| 2,669
|
| Housing Fin. Auth., Housing Mortgage Fin. Program Bonds, Series 2018-A-2, AMT, 4.00% 2041
| 2,735
| 2,938
|
| Housing Fin. Auth., Housing Mortgage Fin. Program Bonds, Series 2018-C-1, 4.00% 2045
| 7,735
| 8,411
|
| Housing Fin. Auth., Housing Mortgage Fin. Program Bonds, Series 2019-A-1, 4.00% 2045
| 8,900
| 9,750
|
| Housing Fin. Auth., Housing Mortgage Fin. Program Rev. Ref. Bonds, Series 2012-F-2, AMT, 2.75% 2035
| 275
| 279
|
| Housing Fin. Auth., Housing Mortgage Fin. Program Rev. Ref. Bonds, Series 2015-A, 3.50% 2044
| 4,735
| 4,917
|
| Housing Fin. Auth., Housing Mortgage Fin. Program Rev. Ref. Bonds, Series 2015-C-1, 3.50% 2045
| 1,460
| 1,522
|
|
|
| 79,244
|
| District of Columbia 0.81%
|
|
|
| G.O. Bonds, Series 2019-A, 5.00% 2026
| 5,000
| 6,249
|
| G.O. Rev. Ref. Bonds, Series B, XLCA-Assured Guaranty Municipal insured, 5.25% 2020
| 2,000
| 2,069
|
| Hospital Rev. Ref. Bonds (Children’s Hospital Obligated Group Issue), Series 2015, 5.00% 2027
| 1,500
| 1,795
|
| Income Tax Secured Rev. Bonds, Series 2011-A, 5.00% 2029
| 1,765
| 1,918
|
| Metropolitan Washington DC Airports Auth., Airport System Rev. Ref. Bonds, Series 2012-A, AMT, 5.00% 2020
| 3,000
| 3,133
|
| Metropolitan Washington DC Airports Auth., Airport System Rev. Ref. Bonds, Series 2015-B, AMT, 5.00% 2027
| 1,000
| 1,195
|
| Metropolitan Washington DC Airports Auth., Airport System Rev. Ref. Bonds, Series 2017, AMT, 5.00% 2026
| 5,000
| 6,137
|
| Metropolitan Washington DC Airports Auth., Airport System Rev. Ref. Bonds, Series 2019-A, AMT, 5.00% 2023
| 1,750
| 2,009
|
| Metropolitan Washington DC Airports Auth., Airport System Rev. Ref. Bonds, Series 2019-A, AMT, 5.00% 2024
| 2,000
| 2,357
|
| Washington Convention and Sports Auth., Dedicated Tax Rev. Ref. Bonds, Series 2018-A, 5.00% 2027
| 4,900
| 6,198
|
| Washington Convention and Sports Auth., Dedicated Tax Rev. Ref. Bonds, Series 2018-A, 5.00% 2028
| 1,250
| 1,573
|
|
|
| 34,633
|
| Florida 4.40%
|
|
|
| County of Brevard, Educational Facs. Auth., Demand Rev. Bonds (Florida Institute of Technology Project), Series 2014, 5.00% 2023
| 1,100
| 1,238
|
| County of Broward, Airport System Rev. Bonds, Series 2017, AMT, 5.00% 2026
| 2,500
| 3,057
|
| County of Broward, Airport System Rev. Ref. Bonds, Series 2012-P-1, AMT, 5.00% 2024
| 5,000
| 5,557
|
Limited Term Tax-Exempt Bond Fund of America
— Page 5 of 37
Bonds, notes & other debt instruments (continued)
Florida (continued)
| Principal amount
(000)
| Value
(000)
|
City of Cape Coral, Utility Improvement Rev. Ref. Assessment Bonds (Various Areas), Series 2017,
Assured Guaranty Municipal insured, 2.00% 2021
| $1,105
| $1,113
|
City of Cape Coral, Utility Improvement Rev. Ref. Assessment Bonds (Various Areas), Series 2017,
Assured Guaranty Municipal insured, 2.125% 2022
| 1,200
| 1,214
|
City of Cape Coral, Utility Improvement Rev. Ref. Assessment Bonds (Various Areas), Series 2017,
Assured Guaranty Municipal insured, 5.67% 2028 (preref. 2019)
| 2,000
| 2,034
|
| Citizens Property Insurance Corp., High-Risk Account Secured Rev. Ref. Bonds, Series 2015-A-1, 5.00% 2020
| 3,500
| 3,544
|
Citizens Property Insurance Corp., Personal Lines Account/Commercial Lines Account Secured Bonds,
Series 2012-A-1, 5.00% 2020
| 4,500
| 4,644
|
Citizens Property Insurance Corp., Personal Lines Account/Commercial Lines Account Secured Bonds,
Series 2012-A-1, 5.00% 2021
| 1,000
| 1,069
|
County of Collier, Health Facs. Auth., Residential Care Fac. Rev. Bonds (Moorings Inc.), Series 2015-A,
5.00% 2023
| 400
| 454
|
County of Collier, Health Facs. Auth., Residential Care Fac. Rev. Bonds (Moorings Inc.), Series 2015-A,
5.00% 2024
| 500
| 583
|
County of Collier, Health Facs. Auth., Residential Care Fac. Rev. Bonds (Moorings Inc.), Series 2015-A,
5.00% 2025
| 330
| 393
|
County of Collier, Health Facs. Auth., Residential Care Fac. Rev. Bonds (Moorings Inc.), Series 2015-A,
5.00% 2026
| 350
| 415
|
County of Collier, Health Facs. Auth., Residential Care Fac. Rev. Bonds (Moorings Inc.), Series 2015-A,
5.00% 2027
| 240
| 284
|
County of Collier, Health Facs. Auth., Residential Care Fac. Rev. Bonds (Moorings Inc.), Series 2015-A,
5.00% 2028
| 445
| 524
|
| Board of Education, Lottery Rev. Ref. Bonds, Series 2019-A, 5.00% 2023
| 6,520
| 7,486
|
County of Escambia, Health Facs. Auth., Health Care Facs. Rev. Bonds (Baptist Hospital, Inc. Project),
Series 2010-A, 5.125% 2020
| 1,270
| 1,320
|
| Greater Orlando Aviation Auth., Airport Facs. Rev. Bonds, Series 2017-A, AMT, 5.00% 2025
| 1,000
| 1,202
|
| Greater Orlando Aviation Auth., Airport Facs. Rev. Bonds, Series 2017-A, AMT, 5.00% 2026
| 1,000
| 1,226
|
| Greater Orlando Aviation Auth., Airport Facs. Rev. Bonds, Series 2017-A, AMT, 5.00% 2027
| 500
| 623
|
| Greater Orlando Aviation Auth., Airport Facs. Rev. Ref. Bonds, Series 2012-A, AMT, 5.00% 2021
| 3,700
| 3,993
|
Housing Fin. Auth., Multi Family Housing Rev. Bonds (Jubilee Courtyards Apartments), Series 2019,
1.45% 2022 (put 2021)
| 1,250
| 1,252
|
| Housing Fin. Corp., Homeowner Mortgage Rev. Bonds (Special Program), Series 2015-A, 3.50% 2046
| 2,235
| 2,311
|
| Housing Fin. Corp., Homeowner Mortgage Rev. Bonds, Series 2015-1, 4.00% 2047
| 850
| 897
|
| Housing Fin. Corp., Homeowner Mortgage Rev. Bonds, Series 2016-2, 4.00% 2047
| 760
| 805
|
| Housing Fin. Corp., Homeowner Mortgage Rev. Bonds, Series 2017-1, 4.00% 2048
| 11,250
| 12,143
|
| Housing Fin. Corp., Homeowner Mortgage Rev. Bonds, Series 2018-2, 4.25% 2050
| 15,350
| 16,983
|
| City of Miami Beach, Health Facs. Auth., Hospital Rev. Ref. Bonds (Mount Sinai Medical Center of Florida), Series 2012, 5.00% 2019
| 1,650
| 1,667
|
| City of Miami Beach, Health Facs. Auth., Hospital Rev. Ref. Bonds (Mount Sinai Medical Center of Florida), Series 2012, 5.00% 2021
| 1,000
| 1,081
|
| County of Miami-Dade, Aviation Rev. Bonds, Series 2010-A, 5.00% 2021
| 2,250
| 2,354
|
| County of Miami-Dade, Aviation Rev. Ref. Bonds, Series 2012-A, AMT, 5.00% 2020
| 2,000
| 2,088
|
| County of Miami-Dade, Aviation Rev. Ref. Bonds, Series 2012-A, AMT, 5.00% 2021
| 11,600
| 12,507
|
| County of Miami-Dade, Aviation Rev. Ref. Bonds, Series 2014, AMT, 5.00% 2023
| 945
| 1,082
|
| County of Miami-Dade, Aviation Rev. Ref. Bonds, Series 2014-A, AMT, 5.00% 2027
| 1,325
| 1,546
|
| County of Miami-Dade, Expressway Auth., Toll System Rev. Ref. Bonds, Series 2014-B, 5.00% 2022
| 1,750
| 1,927
|
| County of Miami-Dade, Expressway Auth., Toll System Rev. Ref. Bonds, Series 2014-B, 5.00% 2025
| 4,870
| 5,680
|
| County of Miami-Dade, Expressway Auth., Toll System Rev. Ref. Bonds, Series 2014-B, 5.00% 2026
| 5,530
| 6,436
|
County of Miami-Dade, Miami International Airport (Hub of the Americas), Aviation Rev. Ref. Bonds,
Series 2009-A, 5.75% 2022
| 1,500
| 1,511
|
County of Miami-Dade, Miami International Airport (Hub of the Americas), Aviation Rev. Ref. Bonds,
Series 2009-B, 5.75% 2021
| 2,000
| 2,016
|
Municipal Power Agcy., All-Requirements Power Supply Project Rev. Bonds, Series 2009,
5.25% 2020 (preref. 2019)
| 2,430
| 2,446
|
Limited Term Tax-Exempt Bond Fund of America
— Page 6 of 37
Bonds, notes & other debt instruments (continued)
Florida (continued)
| Principal amount
(000)
| Value
(000)
|
| Municipal Power Agcy., All-Requirements Power Supply Project Rev. Bonds, Series 2016-A, 5.00% 2024
| $2,300
| $2,731
|
| County of Orange, Health Facs. Auth., Health Care Facs. Rev. Ref. Bonds (Presbyterian Retirement Communities Project), Series 2016, 5.00% 2031
| 2,450
| 2,749
|
County of Orange, Housing Fin. Auth., Multi Family Housing Rev. Bonds (Willow Key Apartments),
Series 2019-A, 1.90% 2022 (put 2021)
| 2,485
| 2,505
|
| City of Orlando, Utilities Commission, Utility System Rev. Ref. Bonds, Series 2017-A, 5.00% 2027 (put 2020)
| 6,000
| 6,268
|
| Orlando-Orange Expressway Auth., Rev. Ref. Bonds, Series 2012, 5.00% 2020
| 1,500
| 1,553
|
| Orlando-Orange Expressway Auth., Rev. Ref. Bonds, Series 2012-B, 5.00% 2020
| 1,000
| 1,036
|
| Orlando-Orange Expressway Auth., Rev. Ref. Bonds, Series 2012-B, 5.00% 2023
| 1,500
| 1,714
|
County of Palm Beach, Health Facs. Auth., Rev. Bonds (Lifespace Communities, Inc.), Series 2015-C,
5.00% 2022
| 1,690
| 1,820
|
| County of Palm Beach, Solid Waste Auth., Improvement Rev. Bonds, Series 2009, 5.00% 2024 (preref. 2019)
| 980
| 986
|
| Ports Fncg. Commission, Rev. Ref. Bonds (State Transportation Trust Fund), Series 2011-B, AMT, 5.00% 2021
| 2,500
| 2,669
|
| South Florida Water Management Dist., Certs. of Part., Series 2015, 5.00% 2026
| 2,000
| 2,456
|
| City of South Miami, Health Facs. Auth., Hospital Rev. Ref. Bonds (Baptist Health South Florida Obligated Group), Series 2017, 5.00% 2020
| 2,000
| 2,077
|
| City of South Miami, Health Facs. Auth., Hospital Rev. Ref. Bonds (Baptist Health South Florida Obligated Group), Series 2017, 5.00% 2021
| 1,250
| 1,343
|
| City of South Miami, Health Facs. Auth., Hospital Rev. Ref. Bonds (Baptist Health South Florida Obligated Group), Series 2017, 5.00% 2025
| 1,545
| 1,863
|
| City of South Miami, Health Facs. Auth., Hospital Rev. Ref. Bonds (Baptist Health South Florida Obligated Group), Series 2017, 5.00% 2026
| 1,000
| 1,232
|
| City of South Miami, Health Facs. Auth., Hospital Rev. Ref. Bonds (Baptist Health South Florida Obligated Group), Series 2017, 5.00% 2027
| 1,250
| 1,572
|
Southeast Overtown/Park West Community Redev. Agcy., Tax Increment Rev. Bonds, Series 2014-A-1,
5.00% 20202
| 1,000
| 1,021
|
Southeast Overtown/Park West Community Redev. Agcy., Tax Increment Rev. Bonds, Series 2014-A-1,
5.00% 20212
| 2,000
| 2,111
|
Southeast Overtown/Park West Community Redev. Agcy., Tax Increment Rev. Bonds, Series 2014-A-1,
5.00% 20222
| 2,000
| 2,175
|
Southeast Overtown/Park West Community Redev. Agcy., Tax Increment Rev. Bonds, Series 2014-A-1,
5.00% 20232
| 1,000
| 1,115
|
County of Sumter, Industrial Dev. Auth., Hospital Rev. Bonds (Central Florida Health Alliance Projects),
Series 2014-A, 5.00% 2021
| 500
| 533
|
County of Sumter, Industrial Dev. Auth., Hospital Rev. Bonds (Central Florida Health Alliance Projects),
Series 2014-A, 5.00% 2026
| 500
| 568
|
County of Sumter, Industrial Dev. Auth., Hospital Rev. Bonds (Central Florida Health Alliance Projects),
Series 2014-A, 5.00% 2027
| 330
| 373
|
Tolomato Community Dev. Dist., Rev. Ref. Bonds, Series 2019-B, Assured Guaranty Municipal insured,
2.00% 2021
| 935
| 940
|
Tolomato Community Dev. Dist., Rev. Ref. Bonds, Series 2019-B, Assured Guaranty Municipal insured,
2.00% 2023
| 970
| 978
|
Tolomato Community Dev. Dist., Rev. Ref. Bonds, Series 2019-B, Assured Guaranty Municipal insured,
2.00% 2024
| 995
| 1,002
|
Tolomato Community Dev. Dist., Rev. Ref. Bonds, Series 2019-B, Assured Guaranty Municipal insured,
2.00% 2025
| 1,010
| 1,011
|
| Dept. of Transportation, Right-of-Way Acquisition and Bridge Construction Rev. Ref. Bonds, Series 2012-A, 4.00% 2028
| 10,800
| 11,349
|
| Dept. of Transportation, Turnpike Rev. Bonds, Series 2018-A, 5.00% 2026
| 4,000
| 4,974
|
| Dept. of Transportation, Turnpike Rev. Ref. Bonds, Series 2013-A, 5.00% 2021
| 5,180
| 5,564
|
|
|
| 186,993
|
Limited Term Tax-Exempt Bond Fund of America
— Page 7 of 37
Bonds, notes & other debt instruments (continued)
Georgia 2.79%
| Principal amount
(000)
| Value
(000)
|
| City of Atlanta, Tax Allocation Rev. Ref. Bonds (Atlantic Station Project), Series 2017, 5.00% 2019
| $1,200
| $1,214
|
| City of Atlanta, Tax Allocation Rev. Ref. Bonds (Atlantic Station Project), Series 2017, 5.00% 2020
| 1,100
| 1,152
|
| City of Atlanta, Tax Allocation Rev. Ref. Bonds (Atlantic Station Project), Series 2017, 5.00% 2021
| 1,250
| 1,351
|
| City of Atlanta, Tax Allocation Rev. Ref. Bonds (Atlantic Station Project), Series 2017, 5.00% 2022
| 1,000
| 1,112
|
| City of Atlanta, Tax Allocation Rev. Ref. Bonds (Beltline Project), Series 2016-B, 5.00% 2023
| 1,270
| 1,421
|
| City of Atlanta, Tax Allocation Rev. Ref. Bonds (Beltline Project), Series 2016-B, 5.00% 2024
| 2,460
| 2,823
|
| City of Atlanta, Tax Allocation Rev. Ref. Bonds (Beltline Project), Series 2016-B, 5.00% 2025
| 2,620
| 3,082
|
| City of Atlanta, Tax Allocation Rev. Ref. Bonds (Beltline Project), Series 2016-D, 5.00% 2023
| 2,310
| 2,585
|
| City of Atlanta, Tax Allocation Rev. Ref. Bonds (Beltline Project), Series 2016-D, 5.00% 2025
| 2,895
| 3,405
|
City of Atlanta, Water and Wastewater Rev. Bonds, Series 2004, Assured Guaranty Municipal insured,
5.75% 2029
| 7,000
| 9,700
|
County of Burke, Dev. Auth., Pollution Control Rev. Bonds (Georgia Power Co. Plant Vogtle Project),
Series 2012, 1.85% 2049 (put 2019)
| 3,550
| 3,551
|
County of Burke, Dev. Auth., Pollution Control Rev. Bonds (Georgia Power Co. Plant Vogtle Project),
Series 2013, 2.925% 2053 (put 2024)
| 4,400
| 4,599
|
| City of East Point, Housing Auth., Multi Family Housing Rev. Bonds (Hillcrest Senior Apartments Projects), Series 2018, 2.25% 2022 (put 2021)3
| 7,680
| 7,795
|
| G.O. Bonds, Series 2011-C, 5.00% 2021
| 630
| 677
|
| G.O. Bonds, Series 2011-C, 5.00% 2022 (preref. 2021)
| 1,340
| 1,440
|
| G.O. Bonds, Series 2019-A, 5.00% 2028
| 21,000
| 27,165
|
| Housing and Fin. Auth., Single Family Mortgage Bonds, Series 2015-A-1, 3.50% 2045
| 555
| 578
|
| Housing and Fin. Auth., Single Family Mortgage Bonds, Series 2016-A-1, 3.50% 2046
| 1,035
| 1,083
|
| Main Street Natural Gas, Inc., Gas Project Rev. Bonds, Series 2006-B, 5.00% 2020
| 5,000
| 5,113
|
| Main Street Natural Gas, Inc., Gas Supply Rev. Bonds, Series 2018-A, 4.00% 2048 (put 2023)
| 15,000
| 16,386
|
| Main Street Natural Gas, Inc., Gas Supply Rev. Bonds, Series 2019-A, 5.00% 2021
| 820
| 868
|
| Municipal Electric Auth., Power Rev. Bonds, Series 2018-HH, 5.00% 2029
| 2,000
| 2,460
|
| Municipal Electric Auth., Project One Bonds, Series 2011-A, 5.00% 2021
| 11,490
| 12,079
|
Private Colleges and Universities Auth., Rev. Bonds (The Savannah College of Art and Design Projects),
Series 2014, 5.00% 2022
| 1,050
| 1,155
|
Private Colleges and Universities Auth., Rev. Bonds (The Savannah College of Art and Design Projects),
Series 2014, 5.00% 2024
| 2,500
| 2,927
|
| Road and Tollway Auth., Federal Highway Grant Anticipation Rev. Ref. Bonds, Series 2017-B, 5.00% 2020
| 3,000
| 3,096
|
|
|
| 118,817
|
| Guam 0.17%
|
|
|
| A.B. Won Pat International Airport Auth., General Rev. Bonds, Series 2013-C, AMT, 5.00% 2021
| 5,320
| 5,524
|
| A.B. Won Pat International Airport Auth., General Rev. Bonds, Series 2013-C, AMT, 6.25% 2034
| 500
| 579
|
| Waterworks Auth., Water and Wastewater System Rev. Bonds, Series 2016, 5.00% 2026
| 965
| 1,139
|
|
|
| 7,242
|
| Hawaii 0.75%
|
|
|
| G.O. Bonds, Series 2011-DZ, 5.00% 2020
| 1,085
| 1,142
|
| G.O. Bonds, Series 2011-DZ, 5.00% 2020 (escrowed to maturity)
| 760
| 799
|
| G.O. Bonds, Series 2011-DZ, 5.00% 2020 (escrowed to maturity)
| 40
| 42
|
| G.O. Bonds, Series 2011-DZ, 5.00% 2024 (preref. 2021)
| 3,535
| 3,853
|
| G.O. Bonds, Series 2011-DZ, 5.00% 2026 (preref. 2021)
| 6,325
| 6,894
|
| G.O. Bonds, Series 2011-DZ, 5.00% 2027 (preref. 2021)
| 3,745
| 4,082
|
| G.O. Bonds, Series 2011-DZ, 5.00% 2028 (preref. 2021)
| 2,770
| 3,019
|
| G.O. Bonds, Series 2011-DZ, 5.00% 2030 (preref. 2021)
| 2,140
| 2,333
|
| G.O. Rev. Ref. Bonds, Series 2011-EA, 5.00% 2019
| 1,000
| 1,013
|
City and County of Honolulu, G.O. Bonds (Honolulu Rail Transit Project), Series 2017-H,
(SIFMA Municipal Swap Index + 0.31%) 1.71% 2024 (put 2020)1
| 2,500
| 2,500
|
Limited Term Tax-Exempt Bond Fund of America
— Page 8 of 37
Bonds, notes & other debt instruments (continued)
Hawaii (continued)
| Principal amount
(000)
| Value
(000)
|
City and County of Honolulu, G.O. Bonds (Honolulu Rail Transit Project), Series 2017-H,
(SIFMA Municipal Swap Index + 0.32%) 1.72% 2026 (put 2020)1
| $5,000
| $5,001
|
| Dept. of Transportation, Airports Division, Lease Rev. Certs. of Part., Series 2013, AMT, 5.00% 2023
| 1,000
| 1,130
|
|
|
| 31,808
|
| Idaho 0.09%
|
|
|
Housing and Fin. Assn., Grant and Rev. Anticipation Bonds (Federal Highway Trust Fund),
Series 2015-A, 5.00% 2025
| 1,500
| 1,800
|
Housing and Fin. Assn., Grant and Rev. Anticipation Bonds (Federal Highway Trust Fund),
Series 2015-A, 5.00% 2026
| 1,515
| 1,855
|
|
|
| 3,655
|
| Illinois 11.13%
|
|
|
| Build Illinois Bonds, Sales Tax Rev. Bonds, Series 2013, 5.00% 2020
| 1,000
| 1,028
|
| Build Illinois Bonds, Sales Tax Rev. Bonds, Series 2013, 5.00% 2024
| 4,230
| 4,625
|
| Build Illinois Bonds, Sales Tax Rev. Ref. Bonds, Series 2010, 5.00% 2020
| 1,200
| 1,233
|
| Build Illinois Bonds, Sales Tax Rev. Ref. Bonds, Series 2016-C, 4.00% 2025
| 4,515
| 4,877
|
| Build Illinois Bonds, Sales Tax Rev. Ref. Bonds, Series 2016-C, 4.00% 2026
| 11,805
| 12,817
|
| Build Illinois Bonds, Sales Tax Rev. Ref. Bonds, Series 2016-D, 4.00% 2021
| 1,900
| 1,967
|
City of Chicago, Board of Education, Unlimited Tax G.O. Bonds (Dedicated Rev.), Series 2018-A,
Assured Guaranty Municipal insured, 5.00% 2023
| 900
| 1,010
|
| City of Chicago, Chicago Midway Airport, Rev. Ref. Bonds, Series 2014-A, AMT, 5.00% 2023
| 1,000
| 1,116
|
| City of Chicago, Chicago Midway Airport, Rev. Ref. Bonds, Series 2014-A, AMT, 5.00% 2024
| 8,975
| 10,278
|
| City of Chicago, Chicago Midway Airport, Rev. Ref. Bonds, Series 2016-A, AMT, 5.00% 2027
| 500
| 595
|
| City of Chicago, G.O. Rev. Ref. Bonds, Series 2015-C, 5.00% 2024
| 2,480
| 2,707
|
| City of Chicago, G.O. Rev. Ref. Bonds, Series 2015-C, 5.00% 2025
| 1,900
| 2,105
|
| City of Chicago, G.O. Rev. Ref. Bonds, Series 2015-C, 5.00% 2026
| 2,270
| 2,553
|
| City of Chicago, O’Hare International Airport, General Airport Rev. Bonds, Series 2012-B, AMT, 5.00% 2024
| 2,000
| 2,175
|
| City of Chicago, O’Hare International Airport, General Airport Rev. Bonds, Series 2013-A, AMT, 5.00% 2022
| 3,055
| 3,316
|
| City of Chicago, O’Hare International Airport, General Airport Rev. Bonds, Series 2017-D, 5.00% 2026
| 4,000
| 4,854
|
| City of Chicago, O’Hare International Airport, General Airport Rev. Bonds, Series 2017-D, 5.25% 2029
| 1,500
| 1,867
|
City of Chicago, O’Hare International Airport, General Airport Rev. Ref. Bonds, Series 2012-A, AMT,
5.00% 2025
| 6,170
| 6,705
|
City of Chicago, O’Hare International Airport, General Airport Rev. Ref. Bonds, Series 2013-A, AMT,
5.00% 2023
| 5,000
| 5,591
|
City of Chicago, O’Hare International Airport, General Airport Rev. Ref. Bonds, Series 2018-A, AMT,
5.00% 2020
| 1,000
| 1,015
|
| City of Chicago, O’Hare International Airport, Passenger Fac. Charge Rev. Ref. Bonds, Series 2013-B, AMT, 5.00% 2022
| 3,000
| 3,256
|
| City of Chicago, Transit Auth., Capital Grant Receipts Rev. Bonds (Federal Transit Administration Section 5307 Guideway Modernization Formula Funds), Series 2011,
Assured Guaranty insured, 5.00% 2022
| 1,400
| 1,493
|
| City of Chicago, Wastewater Transmission Rev. Bonds, Series 2012, 5.00% 2021
| 850
| 894
|
| City of Chicago, Wastewater Transmission Rev. Ref. Bonds, Series 2008-C, 5.00% 2022
| 760
| 822
|
| City of Chicago, Wastewater Transmission Rev. Ref. Bonds, Series 2014, 5.00% 2022
| 1,100
| 1,190
|
| City of Chicago, Wastewater Transmission Rev. Ref. Bonds, Series 2014, 5.00% 2023
| 1,435
| 1,599
|
| City of Chicago, Wastewater Transmission Rev. Ref. Bonds, Series 2017-B, 5.00% 2024
| 1,500
| 1,714
|
| City of Chicago, Wastewater Transmission Rev. Ref. Bonds, Series 2017-B, 5.00% 2025
| 1,000
| 1,165
|
| City of Chicago, Wastewater Transmission Rev. Ref. Bonds, Series 2017-B, 5.00% 2026
| 1,165
| 1,379
|
| City of Chicago, Water Rev. Bonds, Series 1999, Assured Guaranty Municipal insured, 5.00% 2029
| 1,000
| 1,191
|
| City of Chicago, Water Rev. Bonds, Series 2000, 5.00% 2022
| 10,500
| 11,644
|
| City of Chicago, Water Rev. Bonds, Series 2004, 5.00% 2026
| 5,225
| 6,273
|
| City of Chicago, Water Rev. Bonds, Series 2004, 5.00% 2027
| 1,750
| 2,086
|
| City of Chicago, Water Rev. Ref. Bonds, Series 2012, 5.00% 2025
| 775
| 853
|
| City of Chicago, Water Rev. Ref. Bonds, Series 2014, 5.00% 2023
| 1,010
| 1,152
|
Limited Term Tax-Exempt Bond Fund of America
— Page 9 of 37
Bonds, notes & other debt instruments (continued)
Illinois (continued)
| Principal amount
(000)
| Value
(000)
|
Counties of Cook, DuPage, Kane, Lake, McHenry and Will, Regional Transportation Auth., G.O. Bonds,
Series 2001-A, FGIC-National insured, 5.50% 2020
| $2,000
| $2,077
|
Counties of Cook, DuPage, Kane, Lake, McHenry and Will, Regional Transportation Auth., G.O. Bonds,
Series 2004-A, Assured Guaranty Municipal insured, 5.25% 2025
| 1,935
| 2,330
|
Counties of Cook, DuPage, Kane, Lake, McHenry and Will, Regional Transportation Auth., G.O. Bonds,
Series 2004-A, Assured Guaranty Municipal insured, 5.50% 2026
| 6,800
| 8,490
|
Counties of Cook, DuPage, Kane, Lake, McHenry and Will, Regional Transportation Auth.,
G.O. Rev. Ref. Bonds, Series 1997, FGIC-National insured, 6.00% 2020
| 2,060
| 2,140
|
Counties of Cook, DuPage, Kane, Lake, McHenry and Will, Regional Transportation Auth.,
G.O. Rev. Ref. Bonds, Series 1999, Assured Guaranty Municipal insured, 5.75% 2023
| 1,000
| 1,131
|
| County of Cook, G.O. Rev. Ref. Bonds, Series 2011-A, 5.00% 2019
| 2,500
| 2,526
|
| County of Cook, G.O. Rev. Ref. Bonds, Series 2016-A, 5.00% 2019
| 1,000
| 1,010
|
| County of Cook, G.O. Rev. Ref. Bonds, Series 2016-A, 5.00% 2022
| 1,000
| 1,102
|
| County of Cook, G.O. Rev. Ref. Bonds, Series 2016-A, 5.00% 2026
| 3,400
| 4,039
|
| County of Cook, G.O. Rev. Ref. Bonds, Series 2016-A, Assured Guaranty Municipal insured, 5.00% 2026
| 4,000
| 4,860
|
| Fin. Auth., National Rural Utilities Cooperative Fin. Corp., Guaranteed Solid Waste Disposal Rev. Bonds (Prairie Power, Inc. Project), Series 2008-A, 1.75% 2042
(put 2020)
| 3,020
| 3,022
|
| Fin. Auth., Rev. Bonds (Advocate Health Care Network), Series 2014, 5.00% 2021
| 375
| 403
|
| Fin. Auth., Rev. Bonds (Central DuPage Health), Series 2009, 5.00% 2019 (escrowed to maturity)
| 2,185
| 2,206
|
| Fin. Auth., Rev. Bonds (Clean Water Initiative Revolving Fund), Series 2016, 4.00% 2025
| 5,115
| 5,826
|
| Fin. Auth., Rev. Bonds (Clean Water Initiative Revolving Fund), Series 2016, 4.00% 2026
| 1,100
| 1,261
|
| Fin. Auth., Rev. Bonds (Clean Water Initiative Revolving Fund), Series 2016, 5.00% 2026
| 1,000
| 1,218
|
| Fin. Auth., Rev. Bonds (Clean Water Initiative Revolving Fund), Series 2016, 5.00% 2028
| 10,590
| 12,843
|
| Fin. Auth., Rev. Bonds (Clean Water Initiative Revolving Fund), Series 2017, 5.00% 2027
| 2,000
| 2,487
|
| Fin. Auth., Rev. Bonds (Lifespace Communities, Inc.), Series 2015-A, 5.00% 2020
| 500
| 512
|
| Fin. Auth., Rev. Bonds (Lifespace Communities, Inc.), Series 2015-A, 5.00% 2022
| 200
| 215
|
| Fin. Auth., Rev. Bonds (Lifespace Communities, Inc.), Series 2015-A, 5.00% 2026
| 540
| 613
|
| Fin. Auth., Rev. Bonds (Lifespace Communities, Inc.), Series 2015-A, 5.00% 2028
| 1,060
| 1,196
|
| Fin. Auth., Rev. Bonds (Mercy Health Corp.), Series 2016, 5.00% 2025
| 5,530
| 6,599
|
| Fin. Auth., Rev. Bonds (Mercy Health Corp.), Series 2016, 5.00% 2027
| 5,000
| 5,935
|
| Fin. Auth., Rev. Bonds (Northwest Community Hospital), Series 2016-A, 5.00% 2026
| 1,080
| 1,311
|
| Fin. Auth., Rev. Bonds (Northwest Community Hospital), Series 2016-A, 5.00% 2027
| 1,000
| 1,204
|
| Fin. Auth., Rev. Bonds (Northwestern Memorial Healthcare), Series 2017-B, 5.00% 2057 (put 2022)
| 4,865
| 5,455
|
| Fin. Auth., Rev. Bonds (Presbyterian Homes Obligated Group), Series 2016-A, 5.00% 2024
| 1,920
| 2,192
|
Fin. Auth., Rev. Bonds (Presbyterian Homes Obligated Group), Series 2016-B,
(1-month USD-LIBOR x 0.70 + 1.35%) 3.031% 2036 (put 2021)1
| 2,275
| 2,282
|
| Fin. Auth., Rev. Bonds (Presence Health Network), Series 2016-C, 4.00% 2024
| 4,000
| 4,482
|
| Fin. Auth., Rev. Bonds (Presence Health Network), Series 2016-C, 5.00% 2023
| 1,545
| 1,746
|
| Fin. Auth., Rev. Bonds (Presence Health Network), Series 2016-C, 5.00% 2024
| 1,425
| 1,660
|
| Fin. Auth., Rev. Bonds (Presence Health Network), Series 2016-C, 5.00% 2025
| 950
| 1,133
|
| Fin. Auth., Rev. Bonds (Presence Health Network), Series 2016-C, 5.00% 2026
| 1,065
| 1,299
|
| Fin. Auth., Rev. Bonds (Presence Health Network), Series 2016-C, 5.00% 2027
| 8,640
| 10,744
|
| Fin. Auth., Rev. Bonds (Rehabilitation Institute of Chicago), Series 2013-A, 5.00% 2022
| 1,665
| 1,829
|
| Fin. Auth., Rev. Bonds (Rush University Medical Center Obligated Group), Series 2015-A, 5.00% 2028
| 4,000
| 4,681
|
| Fin. Auth., Rev. Bonds (Rush University Medical Center Obligated Group), Series 2015-A, 5.00% 2029
| 9,500
| 11,057
|
| Fin. Auth., Rev. Bonds (Swedish Covenant Hospital), Series 2016-A, 5.25% 2028
| 1,020
| 1,218
|
| Fin. Auth., Rev. Green Bonds (Clean Water Initiative Revolving Fund), Series 2019, 5.00% 2021
| 4,170
| 4,471
|
| Fin. Auth., Rev. Ref. Bonds (Advocate Health Care Network), Series 2008-A-1, 5.00% 2030 (put 2020)
| 3,000
| 3,050
|
| Fin. Auth., Rev. Ref. Bonds (Loyola University of Chicago), Series 2012-B, 5.00% 2023
| 1,970
| 2,166
|
| Fin. Auth., Rev. Ref. Bonds (OSF Healthcare System), Series 2015-A, 5.00% 2023
| 750
| 861
|
| Fin. Auth., Rev. Ref. Bonds (OSF Healthcare System), Series 2015-A, 5.00% 2026
| 1,165
| 1,384
|
| Fin. Auth., Rev. Ref. Bonds (OSF Healthcare System), Series 2015-A, 5.00% 2029
| 1,500
| 1,755
|
| Fin. Auth., Rev. Ref. Bonds (Provena Health), Series 2009-A, 7.75% 2034 (preref. 2019)
| 990
| 992
|
| Fin. Auth., Rev. Ref. Bonds (Provena Health), Series 2009-A, 7.75% 2034 (preref. 2019)
| 10
| 10
|
| G.O. Bonds, Series 2010, Assured Guaranty Municipal insured, 5.00% 2020
| 2,225
| 2,254
|
Limited Term Tax-Exempt Bond Fund of America
— Page 10 of 37
Bonds, notes & other debt instruments (continued)
Illinois (continued)
| Principal amount
(000)
| Value
(000)
|
| G.O. Bonds, Series 2013, 5.00% 2022
| $1,250
| $1,343
|
| G.O. Bonds, Series 2017-A, 5.00% 2021
| 3,500
| 3,715
|
| G.O. Bonds, Series 2017-B, 5.00% 2019
| 27,420
| 27,622
|
| G.O. Bonds, Series 2017-D, BAM insured, 5.00% 2020
| 9,000
| 9,322
|
| G.O. Bonds, Series 2017-D, BAM insured, 5.00% 2021
| 20,000
| 21,188
|
| G.O. Bonds, Series 2017-D, BAM insured, 5.00% 2024
| 5,500
| 6,073
|
| G.O. Rev. Ref. Bonds, Series 2012, 5.00% 2019
| 6,200
| 6,200
|
| G.O. Rev. Ref. Bonds, Series 2012, 5.00% 2020
| 3,000
| 3,091
|
| Housing Dev. Auth., Homeowner Mortgage Rev. Bonds, Series 2016-B, AMT, 3.50% 2046
| 2,705
| 2,854
|
| Housing Dev. Auth., Homeowner Mortgage Rev. Bonds, Series 2016-C, 3.50% 2046
| 5,420
| 5,742
|
| Housing Dev. Auth., Homeowner Mortgage Rev. Bonds, Series 2018-A-1, 4.00% 2048
| 8,165
| 8,901
|
| Housing Dev. Auth., Multi Family Housing Rev. Notes (Marshall Field Garden Apartment Homes), Series 2015, (SIFMA Municipal Swap Index + 1.00%) 2.40% 2050 (put
2025)1
| 3,625
| 3,625
|
| Housing Dev. Auth., Rev. Bonds, Series 2016-A, 4.00% 2046
| 1,950
| 2,073
|
| Housing Dev. Auth., Rev. Bonds, Series 2017-B, 4.00% 2048
| 2,110
| 2,275
|
| Housing Dev. Auth., Rev. Bonds, Series 2019-A, 4.25% 2049
| 6,470
| 7,140
|
| Housing Dev. Auth., Rev. Bonds, Series 2019-C, 4.00% 2049
| 2,000
| 2,205
|
Board of Trustees of the Illinois State University, Auxiliary Facs. System Rev. Bonds, Series 2016,
Assured Guaranty Municipal insured, 5.00% 2023
| 2,700
| 2,989
|
Metropolitan Pier and Exposition Auth., McCormick Place Expansion Project Rev. Bonds,
Series 2002-A, Assured Guaranty Municipal insured, 5.50% 2023
| 4,345
| 4,743
|
Metropolitan Pier and Exposition Auth., McCormick Place Expansion Project Rev. Ref. Bonds,
Series 2012-B, 5.00% 2020
| 3,905
| 4,066
|
Metropolitan Pier and Exposition Auth., McCormick Place Expansion Project Rev. Ref. Bonds,
Series 2012-B, 5.00% 2026
| 2,230
| 2,398
|
Metropolitan Pier and Exposition Auth., McCormick Place Expansion Project Rev. Ref. Bonds,
Series 2012-B, 5.00% 2028
| 1,000
| 1,072
|
Metropolitan Pier and Exposition Auth., McCormick Place Expansion Project Rev. Ref. Bonds,
Series 2017-B, 5.00% 2025
| 665
| 753
|
Metropolitan Pier and Exposition Auth., McCormick Place Expansion Project Rev. Ref. Bonds,
Series 2017-B, 5.00% 2026
| 1,000
| 1,147
|
Metropolitan Water Reclamation Dist. of Greater Chicago, Unlimited Tax G.O. Rev. Ref. Bonds,
Series 2016-A, 5.00% 2025
| 2,000
| 2,413
|
Metropolitan Water Reclamation Dist. of Greater Chicago, Unlimited Tax G.O. Rev. Ref. Bonds,
Series 2016-A, 5.00% 2026
| 2,500
| 3,071
|
| Municipal Electric Agcy., Power Supply System Rev. Ref. Bonds, Series 2015-A, 5.00% 2027
| 3,000
| 3,555
|
| Railsplitter Tobacco Settlement Auth., Tobacco Settlement Rev. Bonds, Series 2010, 5.25% 2020
| 6,525
| 6,730
|
| Railsplitter Tobacco Settlement Auth., Tobacco Settlement Rev. Bonds, Series 2010, 5.375% 2021
| 1,000
| 1,071
|
Railsplitter Tobacco Settlement Auth., Tobacco Settlement Rev. Bonds, Series 2010,
5.50% 2023 (preref. 2021)
| 12,925
| 13,938
|
| Railsplitter Tobacco Settlement Auth., Tobacco Settlement Rev. Bonds, Series 2017, 5.00% 2023
| 4,800
| 5,420
|
| Railsplitter Tobacco Settlement Auth., Tobacco Settlement Rev. Bonds, Series 2017, 5.00% 2024
| 5,000
| 5,794
|
| Railsplitter Tobacco Settlement Auth., Tobacco Settlement Rev. Bonds, Series 2017, 5.00% 2025
| 5,000
| 5,931
|
| Sales Tax Securitization Corp., Sales Tax Securitization Bonds, Series 2017-A, 5.00% 2027
| 3,000
| 3,551
|
| Sales Tax Securitization Corp., Sales Tax Securitization Bonds, Series 2018-C, 5.00% 2027
| 3,000
| 3,551
|
| Sales Tax Securitization Corp., Sales Tax Securitization Rev. Ref. Bonds, Series 2017-A, 5.00% 2023
| 2,900
| 3,183
|
Southwestern Illinois Dev. Auth., Health Fac. Rev. Bonds (Memorial Group, Inc.), Series 2013,
7.125% 2043 (preref. 2023)
| 2,500
| 3,106
|
Southwestern Illinois Dev. Auth., Health Fac. Rev. Bonds (Memorial Group, Inc.), Series 2013,
7.25% 2036 (preref. 2023)
| 3,080
| 3,842
|
| Toll Highway Auth., Toll Highway Rev. Bonds, Series 2014-A, 5.00% 2021
| 1,250
| 1,357
|
| Toll Highway Auth., Toll Highway Rev. Bonds, Series 2014-D, 5.00% 2024
| 4,375
| 5,052
|
| Toll Highway Auth., Toll Highway Rev. Bonds, Series 2016-B, 5.00% 2027
| 950
| 1,163
|
| Toll Highway Auth., Toll Highway Rev. Ref. Bonds, Series 2019-A, 5.00% 2025
| 1,680
| 1,988
|
| Toll Highway Auth., Toll Highway Rev. Ref. Bonds, Series 2019-A, 5.00% 2026
| 4,000
| 4,827
|
Limited Term Tax-Exempt Bond Fund of America
— Page 11 of 37
Bonds, notes & other debt instruments (continued)
Illinois (continued)
| Principal amount
(000)
| Value
(000)
|
| Toll Highway Auth., Toll Highway Rev. Ref. Bonds, Series 2019-A, 5.00% 2027
| $1,500
| $1,841
|
| Toll Highway Auth., Toll Highway Rev. Ref. Bonds, Series 2019-A, 5.00% 2028
| 2,000
| 2,496
|
Board of Trustees of the University of Illinois, Auxiliary Facs. System Rev. Ref. Bonds, Series 2005-A,
National insured, 5.50% 2023
| 2,700
| 3,093
|
Village of Volo, Special Service Areas Nos. 3 and 6 (Symphony Meadows/Lancaster Falls Projects),
Special Tax Rev. Ref. Bonds, Series 2016, Assured Guaranty Municipal insured, 3.00% 2020
| 624
| 628
|
United City of Yorkville, Special Service Area Nos. 2005-108 and 2005-109, Special Tax Rev. Ref. Bonds,
Series 2016, Assured Guaranty Municipal insured, 2.375% 2022
| 554
| 560
|
United City of Yorkville, Special Service Area Nos. 2005-108 and 2005-109, Special Tax Rev. Ref. Bonds,
Series 2016, Assured Guaranty Municipal insured, 2.625% 2023
| 1,106
| 1,130
|
United City of Yorkville, Special Service Area Nos. 2005-108 and 2005-109, Special Tax Rev. Ref. Bonds,
Series 2016, Assured Guaranty Municipal insured, 3.00% 2021
| 991
| 1,006
|
|
|
| 473,256
|
| Indiana 1.25%
|
|
|
Dev. Fin. Auth., Solid Waste Disposal Rev. Bonds (Waste Management, Inc. Project), Series 2001, AMT,
2.95% 2031 (put 2021)
| 1,000
| 1,029
|
| Fin. Auth., Health System Rev. Bonds (Indiana University Health), Series 2019-C, 5.00% 2022
| 4,000
| 4,503
|
| Fin. Auth., Health System Rev. Bonds (Indiana University Health), Series 2019-C, 5.00% 2023
| 2,825
| 3,282
|
| Fin. Auth., Hospital Rev. Ref. Bonds (Community Health Network Project), Series 2012-A, 5.00% 2020
| 1,460
| 1,501
|
| Fin. Auth., Hospital Rev. Ref. Bonds (Indiana University Health Obligated Group), Series 2016-A, 5.00% 2023
| 1,500
| 1,743
|
| Fin. Auth., Hospital Rev. Ref. Bonds (Indiana University Health Obligated Group), Series 2016-A, 5.00% 2024
| 1,000
| 1,194
|
| Fin. Auth., Hospital Rev. Ref. Bonds (Parkview Health System Obligated Group), Series 2012-A, 5.00% 2021
| 1,940
| 2,062
|
| Fin. Auth., Hospital Rev. Ref. Bonds (Parkview Health System Obligated Group), Series 2012-A, 5.00% 2022
| 1,940
| 2,135
|
Fin. Auth., Hospital Rev. Ref. Bonds (Parkview Health System Obligated Group), Series 2012-A,
5.00% 2021 (escrowed to maturity)
| 60
| 64
|
Fin. Auth., Hospital Rev. Ref. Bonds (Parkview Health System Obligated Group), Series 2012-A,
5.00% 2022 (escrowed to maturity)
| 60
| 66
|
| Fin. Auth., Hospital Rev. Ref. Bonds (Parkview Health), Series 2017-A, 5.00% 2025
| 1,200
| 1,450
|
| Fin. Auth., Hospital Rev. Ref. Bonds (Parkview Health), Series 2017-A, 5.00% 2026
| 1,365
| 1,682
|
| Fin. Auth., Hospital Rev. Ref. Bonds (Parkview Health), Series 2017-A, 5.00% 2027
| 700
| 878
|
| Fin. Auth., Rev. Ref. Bonds (Community Foundation of Northwest Indiana Obligated Group), Series 2015, 5.00% 2026
| 500
| 590
|
| Fin. Auth., Rev. Ref. Bonds (Community Foundation of Northwest Indiana Obligated Group), Series 2015, 5.00% 2027
| 500
| 587
|
| Fin. Auth., Rev. Ref. Bonds (Community Foundation of Northwest Indiana Obligated Group), Series 2015, 5.00% 2028
| 500
| 586
|
| Fin. Auth., Wastewater Utility Rev. Bonds (CWA Auth. Project), Series 2011-B, 5.00% 2019
| 1,000
| 1,006
|
| Gary/Chicago International Airport Auth., Airport Dev. Zone Rev. Bonds, Series 2014, AMT, 5.50% 2025
| 3,630
| 3,643
|
Health Facs. Fncg. Auth., Rev. Bonds (Ascension Health Senior Credit Group), Series 2005-A-1,
2.80% 2027 (put 2019)
| 1,525
| 1,525
|
| Housing and Community Dev. Auth., Single Family Mortgage Rev. Bonds, Series 2016-A-2, AMT, 3.50% 2038
| 1,660
| 1,728
|
| Housing and Community Dev. Auth., Single Family Mortgage Rev. Bonds, Series 2017-A-2, AMT, 4.00% 2039
| 1,360
| 1,426
|
| Housing and Community Dev. Auth., Single Family Mortgage Rev. Bonds, Series 2019-A, 4.25% 2048
| 2,000
| 2,204
|
Indianapolis Local Public Improvement Bond Bank, Rev. Ref. Bonds (Indianapolis Airport Auth. Project),
Series 2014-D, AMT, 5.00% 2022
| 2,000
| 2,166
|
| City of Rockport, Pollution Control Rev. Ref. Bonds (Indiana Michigan Power Co. Project), Series 2002-A, 2.75% 2025
| 1,500
| 1,584
|
| City of Rockport, Pollution Control Rev. Ref. Bonds (Indiana Michigan Power Co. Project), Series 2008-D, 2.05% 2025 (put 2021)
| 1,200
| 1,213
|
| City of Rockport, Pollution Control Rev. Ref. Bonds (Indiana Michigan Power Co. Project), Series 2009-A, 3.05% 2025
| 2,000
| 2,145
|
County of Warrick, Multi Family Housing Rev. Bonds (Newburgh Assisted Living Project), Series 2019,
1.625% 2022 (put 2021)
| 4,250
| 4,270
|
Limited Term Tax-Exempt Bond Fund of America
— Page 12 of 37
Bonds, notes & other debt instruments (continued)
Indiana (continued)
| Principal amount
(000)
| Value
(000)
|
City of Whiting, Environmental Facs. Rev. Bonds (BP Products North America, Inc. Project), Series 2008,
1.85% 2044 (put 2019)
| $4,500
| $4,504
|
City of Whiting, Environmental Facs. Rev. Bonds (BP Products North America, Inc. Project), Series 2015,
AMT, 5.00% 2045 (put 2022)
| 2,000
| 2,220
|
|
|
| 52,986
|
| Iowa 0.17%
|
|
|
| Fin. Auth., Single Family Mortgage Bonds (Mortgage-Backed Securities Program), Series 2019-A, 4.00% 2047
| 4,225
| 4,714
|
| Fin. Auth., Single Family Mortgage Bonds, Series 2015-A, AMT, 3.50% 2040
| 430
| 443
|
| Fin. Auth., Single Family Mortgage Bonds, Series 2017-A, 4.00% 2047
| 2,010
| 2,150
|
|
|
| 7,307
|
| Kansas 0.08%
|
|
|
| Dev. Fin. Auth., Hospital Rev. Ref. Bonds (Adventist Health System/Sunbelt Obligated Group), Series 2009-D, 5.00% 2020
| 1,095
| 1,107
|
| Dev. Fin. Auth., Hospital Rev. Ref. Bonds (Adventist Health System/Sunbelt Obligated Group), Series 2009-D, 5.00% 2020 (preref. 2019)
| 55
| 56
|
City of Wichita, Hospital Facs. Rev. Ref. and Improvement Bonds (Christi Health, Inc.), Series 2011-A,
5.00% 2020 (escrowed to maturity)
| 2,170
| 2,276
|
|
|
| 3,439
|
| Kentucky 0.12%
|
|
|
| Asset/Liability Commission, Project Notes, Federal Highway Trust Fund, Series 2014-A, 5.00% 2024
| 3,000
| 3,538
|
| Health Facs. Auth., Rev. Bonds (Catholic Health Initiatives), Series 2014-B, 2.70% 2039 (put 2021)
| 1,500
| 1,539
|
|
|
| 5,077
|
| Louisiana 1.33%
|
|
|
| Aviation Board, General Airport Rev. Bonds (North Terminal Project), Series 2015-B, AMT, 5.00% 2025
| 1,600
| 1,865
|
| Aviation Board, General Airport Rev. Ref. Bonds, Series 2017-D-2, AMT, 5.00% 2029
| 1,000
| 1,199
|
Citizens Property Insurance Corp., Assessment Rev. Ref. Bonds, Series 2012,
Assured Guaranty Municipal insured, 5.00% 2024 (preref. 2022)
| 1,000
| 1,108
|
Citizens Property Insurance Corp., Assessment Rev. Ref. Bonds, Series 2015,
Assured Guaranty Municipal insured, 5.00% 2022
| 1,250
| 1,381
|
| Citizens Property Insurance Corp., Assessment Rev. Ref. Bonds, Series 2016-A, 5.00% 2025
| 5,400
| 6,498
|
| G.O. Bonds, Series 2011-A, 5.00% 2020
| 6,000
| 6,251
|
| Gasoline and Fuels Tax Rev. Ref. Bonds, Series 2012-A-1, 5.00% 2020
| 2,000
| 2,058
|
| Housing Corp., Single Family Mortgage Bonds (Home Ownership Program), Series 2019-A-1, 4.50% 2049
| 5,985
| 6,667
|
City of New Orleans, Regional Transit Auth., Sales Tax Rev. Bonds, Series 2010,
Assured Guaranty Municipal insured, 5.00% 2020
| 1,250
| 1,310
|
| City of New Orleans, Water Rev. and Rev. Ref. Bonds, Series 2014, 5.00% 2027
| 1,000
| 1,181
|
| City of New Orleans, Water Rev. and Rev. Ref. Bonds, Series 2014, 5.00% 2028
| 900
| 1,058
|
| Public Facs. Auth., Rev. Ref. Bonds (Ochsner Clinic Foundation Project), Series 2015, 5.00% 2021
| 445
| 472
|
City of Shreveport, Water and Sewer Rev. Bonds, Series 2019-B, Assured Guaranty Municipal insured,
3.00% 2022
| 195
| 205
|
City of Shreveport, Water and Sewer Rev. Bonds, Series 2019-B, Assured Guaranty Municipal insured,
4.00% 2023
| 175
| 194
|
City of Shreveport, Water and Sewer Rev. Bonds, Series 2019-B, Assured Guaranty Municipal insured,
4.00% 2025
| 255
| 292
|
City of Shreveport, Water and Sewer Rev. Bonds, Series 2019-B, Assured Guaranty Municipal insured,
5.00% 2024
| 135
| 159
|
City of Shreveport, Water and Sewer Rev. Bonds, Series 2019-B, Assured Guaranty Municipal insured,
5.00% 2026
| 240
| 295
|
Tobacco Settlement Fncg. Corp., Tobacco Settlement Asset-Backed Rev. Ref. Bonds, Series 2013-A,
5.00% 2020
| 5,430
| 5,577
|
Limited Term Tax-Exempt Bond Fund of America
— Page 13 of 37
Bonds, notes & other debt instruments (continued)
Louisiana (continued)
| Principal amount
(000)
| Value
(000)
|
Tobacco Settlement Fncg. Corp., Tobacco Settlement Asset-Backed Rev. Ref. Bonds, Series 2013-A,
5.00% 2021
| $5,915
| $6,270
|
Tobacco Settlement Fncg. Corp., Tobacco Settlement Asset-Backed Rev. Ref. Bonds, Series 2013-A,
5.00% 2022
| 7,235
| 7,896
|
Tobacco Settlement Fncg. Corp., Tobacco Settlement Asset-Backed Rev. Ref. Bonds, Series 2013-A,
5.00% 2023
| 2,160
| 2,422
|
Tobacco Settlement Fncg. Corp., Tobacco Settlement Asset-Backed Rev. Ref. Bonds, Series 2013-A,
5.50% 2029
| 2,015
| 2,019
|
|
|
| 56,377
|
| Maine 0.35%
|
|
|
| Housing Auth., Mortgage Purchase Bonds, Series 2016-B-1, 3.50% 2046
| 3,495
| 3,631
|
| Housing Auth., Mortgage Purchase Bonds, Series 2016-C, 3.50% 2046
| 910
| 952
|
| Housing Auth., Mortgage Purchase Bonds, Series 2018-F, 4.25% 2048
| 4,110
| 4,528
|
| Housing Auth., Mortgage Purchase Bonds, Series 2019-A, 4.00% 2049
| 3,375
| 3,700
|
| Housing Auth., Mortgage Purchase Rev. Ref. Bonds, Series 2013-B, 4.00% 2043
| 320
| 331
|
| Housing Auth., Mortgage Purchase Rev. Ref. Bonds, Series 2015-B, 3.50% 2040
| 595
| 617
|
| Housing Auth., Mortgage Purchase Rev. Ref. Bonds, Series 2015-E-1, AMT, 3.50% 2035
| 1,005
| 1,047
|
|
|
| 14,806
|
| Maryland 1.01%
|
|
|
Community Dev. Administration, Dept. of Housing and Community Dev., Residential Rev. Bonds,
Series 2014-B, AMT, 3.25% 2044
| 430
| 441
|
Community Dev. Administration, Dept. of Housing and Community Dev., Residential Rev. Bonds,
Series 2014-C, 4.00% 2044
| 95
| 100
|
Community Dev. Administration, Dept. of Housing and Community Dev., Residential Rev. Bonds,
Series 2019-A, 4.25% 2049
| 6,885
| 7,571
|
Econ. Dev. Corp., Rev. Ref. Bonds (Constellation Energy Group, Inc. Project), Series 2006-B,
2.55% 2025 (put 2020)
| 2,365
| 2,376
|
Econ. Dev. Corp., Student Housing Rev. Ref. Bonds (Frostburg State University Project), Series 2013,
5.00% 2023
| 1,000
| 1,087
|
| G.O. Rev. Ref. Bonds, State and Local Facs. Loan of 2017, First Series C, 5.00% 2020
| 1,000
| 1,040
|
| Health and Higher Educational Facs. Auth., Rev. Ref. Bonds (MedStar Health Issue), Series 2015, 5.00% 2027
| 5,000
| 5,863
|
County of Montgomery, Housing Opportunities Commission, Program Rev. Bonds, Series 2019-A,
4.00% 2049
| 4,500
| 4,961
|
County of Montgomery, Housing Opportunities Commission, Single Family Housing Rev. Bonds,
Series 2017-A, 4.00% 2048
| 2,905
| 3,121
|
| Transportation Auth., Airport Parking Rev. Ref. Bonds (Baltimore/Washington International Thurgood Marshall Airport Projects), Series 2012-B, AMT, 5.00% 2020
| 8,150
| 8,324
|
| Transportation Auth., Airport Parking Rev. Ref. Bonds (Baltimore/Washington International Thurgood Marshall Airport Projects), Series 2012-B,
AMT, 5.00% 2021
| 7,565
| 8,001
|
|
|
| 42,885
|
| Massachusetts 2.71%
|
|
|
| Dev. Fin. Agcy., Rev. Bonds (Berkshire Health Systems Issue), Series 2012-G, 5.00% 2020
| 1,205
| 1,258
|
| Dev. Fin. Agcy., Rev. Bonds (Berkshire Health Systems Issue), Series 2012-G, 5.00% 2021
| 1,500
| 1,618
|
| Dev. Fin. Agcy., Rev. Bonds (Beth Israel Lahey Health Issue), Series 2019-K, 5.00% 2026
| 1,000
| 1,223
|
| Dev. Fin. Agcy., Rev. Bonds (Beth Israel Lahey Health Issue), Series 2019-K, 5.00% 2027
| 1,500
| 1,864
|
| Dev. Fin. Agcy., Rev. Bonds (Beth Israel Lahey Health Issue), Series 2019-K, 5.00% 2028
| 1,200
| 1,513
|
| Dev. Fin. Agcy., Rev. Bonds (Boston Medical Center Issue), Series 2012-C, 5.25% 2025
| 2,390
| 2,632
|
| Dev. Fin. Agcy., Rev. Bonds (CareGroup Obligated Group Issue), Series 2016-I, 5.00% 2025
| 2,500
| 2,999
|
| Dev. Fin. Agcy., Rev. Bonds (CareGroup Obligated Group Issue), Series 2016-I, 5.00% 2026
| 1,000
| 1,223
|
| Dev. Fin. Agcy., Rev. Bonds (Harvard University Issue), Series 2010-B-2, 5.25% 2034 (preref. 2021)
| 1,855
| 1,970
|
| Dev. Fin. Agcy., Rev. Bonds (Partners HealthCare System Issue), Series 2012-L, 5.00% 2031 (preref. 2021)
| 3,130
| 3,360
|
| Dev. Fin. Agcy., Rev. Bonds (Partners HealthCare System Issue), Series 2017-S-2, 5.00% 2038 (put 2025)
| 5,000
| 5,962
|
Limited Term Tax-Exempt Bond Fund of America
— Page 14 of 37
Bonds, notes & other debt instruments (continued)
Massachusetts (continued)
| Principal amount
(000)
| Value
(000)
|
| Dev. Fin. Agcy., Rev. Bonds (Partners HealthCare System Issue), Series 2017-S-4, 5.00% 2038 (put 2024)
| $2,500
| $2,907
|
| Dev. Fin. Agcy., Rev. Bonds (UMass Memorial Health Care Obligated Group Issue), Series 2016-I, 5.00% 2024
| 2,000
| 2,315
|
| Dev. Fin. Agcy., Rev. Bonds (UMass Memorial Health Care Obligated Group Issue), Series 2016-I, 5.00% 2025
| 1,275
| 1,508
|
| Dev. Fin. Agcy., Rev. Bonds (UMass Memorial Health Care Obligated Group Issue), Series 2016-I, 5.00% 2026
| 1,150
| 1,385
|
| Dev. Fin. Agcy., Rev. Bonds (UMass Memorial Health Care Obligated Group Issue), Series 2016-I, 5.00% 2027
| 1,150
| 1,383
|
| Dev. Fin. Agcy., Rev. Ref. Bonds (Suffolk University Issue), Series 2017, 5.00% 2025
| 1,500
| 1,792
|
| Dev. Fin. Agcy., Rev. Ref. Bonds (Suffolk University Issue), Series 2019, 5.00% 2021
| 575
| 615
|
| Dev. Fin. Agcy., Rev. Ref. Bonds (Suffolk University Issue), Series 2019, 5.00% 2022
| 400
| 441
|
| Dev. Fin. Agcy., Rev. Ref. Bonds (Suffolk University Issue), Series 2019, 5.00% 2023
| 425
| 483
|
| Dev. Fin. Agcy., Rev. Ref. Bonds (Suffolk University Issue), Series 2019, 5.00% 2024
| 350
| 409
|
| Dev. Fin. Agcy., Rev. Ref. Bonds (Tufts Medical Center Issue), Series 2011-I, 6.875% 2041 (preref. 2021)
| 1,395
| 1,507
|
| Dev. Fin. Agcy., Rev. Ref. Bonds (Tufts Medical Center Issue), Series 2011-I, 6.875% 2041 (preref. 2021)
| 1,020
| 1,101
|
| Educational Fncg. Auth., Education Loan Rev. Bonds, Series 2012-J, AMT, 5.00% 2020
| 3,635
| 3,756
|
| Educational Fncg. Auth., Education Loan Rev. Bonds, Series 2014-I, AMT, 5.00% 2022
| 3,000
| 3,260
|
| Educational Fncg. Auth., Education Loan Rev. Bonds, Series 2014-I, AMT, 5.00% 2023
| 3,000
| 3,353
|
| Educational Fncg. Auth., Education Loan Rev. Bonds, Series 2014-I, AMT, 5.00% 2025
| 3,000
| 3,512
|
| Educational Fncg. Auth., Education Loan Rev. Bonds, Series 2016-J, AMT, 3.50% 2033
| 3,590
| 3,716
|
| Educational Fncg. Auth., Education Loan Rev. Bonds, Series 2016-J, AMT, 5.00% 2024
| 4,000
| 4,643
|
| Educational Fncg. Auth., Education Loan Rev. Bonds, Series 2017-A, AMT, 3.625% 2032
| 3,640
| 3,771
|
| Educational Fncg. Auth., Education Loan Rev. Bonds, Series 2017-A, AMT, 5.00% 2022
| 1,000
| 1,104
|
| Educational Fncg. Auth., Education Loan Rev. Bonds, Series 2017-A, AMT, 5.00% 2023
| 2,500
| 2,836
|
| Educational Fncg. Auth., Education Loan Rev. Bonds, Series 2019-B, AMT, 3.00% 2035
| 5,225
| 5,395
|
| Housing Fin. Agcy., Construction Loan Notes, Series 2017-B, 2.05% 2021
| 3,000
| 3,006
|
Housing Fin. Agcy., Multi Family Housing Rev. Bonds (Conduit-Chestnut Park Project), Series 2018-A,
2.40% 2023 (put 2021)
| 2,070
| 2,110
|
| Housing Fin. Agcy., Single Family Housing Rev. Bonds, Series 167, 4.00% 2043
| 510
| 531
|
| Housing Fin. Agcy., Single Family Housing Rev. Bonds, Series 181, 4.00% 2044
| 1,265
| 1,334
|
| Housing Fin. Agcy., Single Family Housing Rev. Bonds, Series 183, 3.50% 2046
| 2,955
| 3,086
|
| Housing Fin. Agcy., Single Family Housing Rev. Bonds, Series 190, 4.00% 2048
| 9,630
| 10,356
|
| Housing Fin. Agcy., Single Family Housing Rev. Bonds, Series 2007, 4.00% 2049
| 1,375
| 1,511
|
| Housing Fin. Agcy., Single Family Housing Rev. Ref. Bonds, Series 171, 4.00% 2044
| 455
| 474
|
| Housing Fin. Agcy., Single Family Housing Rev. Ref. Bonds, Series 177, AMT, 4.00% 2039
| 1,955
| 2,059
|
| Housing Fin. Agcy., Single Family Housing Rev. Ref. Bonds, Series 188, AMT, 4.00% 2043
| 4,290
| 4,600
|
| Port Auth., Rev. Bonds, Series 2012-A, AMT, 5.00% 2021
| 305
| 327
|
| Port Auth., Rev. Bonds, Series 2017-A, AMT, 5.00% 2025
| 5,000
| 5,979
|
| Port Auth., Rev. Bonds, Series 2017-A, AMT, 5.00% 2026
| 2,510
| 3,054
|
|
|
| 115,241
|
| Michigan 3.64%
|
|
|
| Building Auth., Rev. Ref. Bonds (Facs. Program), Series 2015-I, 5.00% 2023
| 3,000
| 3,418
|
City of Detroit, Water and Sewerage Dept., Sewage Disposal System Rev. Ref. Bonds,
Series 2004-A, Assured Guaranty Municipal Insured, 5.25% 2020
| 150
| 155
|
| Fin. Auth., Hospital Rev. Ref. Bonds (Oakwood Obligated Group), Series 2012, 5.00% 2022
| 5,000
| 5,597
|
Fin. Auth., Local Government Loan Program Rev. Bonds (Detroit Water and Sewerage Dept., Sewage Disposal System Rev. and Rev. Ref. Local Project Bonds), Series
2014-C-3, Assured Guaranty Municipal insured,
5.00% 2022
| 5,000
| 5,541
|
Fin. Auth., Local Government Loan Program Rev. Bonds (Detroit Water and Sewerage Dept., Sewage Disposal System Rev. and Rev. Ref. Local Project Bonds), Series
2014-C-3, Assured Guaranty Municipal insured,
5.00% 2023
| 1,215
| 1,389
|
| Fin. Auth., Local Government Loan Program Rev. Bonds (Detroit Water and Sewerage Dept., Sewage Disposal System Rev. and Rev. Ref. Local Project Bonds), Series
2014-C-5, National insured, 5.00% 2020
| 6,970
| 7,211
|
| Fin. Auth., Local Government Loan Program Rev. Bonds (Detroit Water and Sewerage Dept., Sewage Disposal System Rev. Ref. Local Project Bonds), Series 2015-C, 5.00%
2027
| 1,750
| 2,074
|
| Fin. Auth., Student Loan Rev. Ref. Bonds, Series 25-A, AMT, 5.00% 2020
| 1,750
| 1,823
|
| Fin. Auth., Student Loan Rev. Ref. Bonds, Series 25-A, AMT, 5.00% 2021
| 1,650
| 1,772
|
Limited Term Tax-Exempt Bond Fund of America
— Page 15 of 37
Bonds, notes & other debt instruments (continued)
Michigan (continued)
| Principal amount
(000)
| Value
(000)
|
County of Genesee, Water Supply System G.O. Limited Tax Rev. Ref. Bonds, Series 2014, BAM insured,
5.00% 2022
| $515
| $573
|
County of Genesee, Water Supply System G.O. Limited Tax Rev. Ref. Bonds, Series 2014, BAM insured,
5.00% 2023
| 500
| 572
|
County of Genesee, Water Supply System G.O. Limited Tax Rev. Ref. Bonds, Series 2014, BAM insured,
5.00% 2024
| 850
| 985
|
| Grant Anticipation Rev. Ref. Bonds, Series 2016, 5.00% 2024
| 4,500
| 5,253
|
| Great Lakes Water Auth., Water Supply System Rev. Ref. Bonds, Series 2016-C, 5.00% 2028
| 2,000
| 2,441
|
| Great Lakes Water Auth., Water Supply System Rev. Ref. Bonds, Series 2016-C, 5.00% 2029
| 2,000
| 2,430
|
| Hospital Fin. Auth., Hospital Rev. and Rev. Ref. Bonds (Trinity Health Credit Group), Series 2017-A, 5.00% 2021
| 500
| 544
|
| Hospital Fin. Auth., Hospital Rev. and Rev. Ref. Bonds (Trinity Health Credit Group), Series 2017-A, 5.00% 2024
| 1,000
| 1,193
|
| Hospital Fin. Auth., Hospital Rev. and Rev. Ref. Bonds (Trinity Health Credit Group), Series 2017-A, 5.00% 2025
| 1,000
| 1,220
|
| Hospital Fin. Auth., Hospital Rev. and Rev. Ref. Bonds (Trinity Health Credit Group), Series 2017-A, 5.00% 2026
| 1,000
| 1,245
|
Hospital Fin. Auth., Hospital Rev. Ref. Bonds (Ascension Health Senior Credit Group), Series 2010-B,
5.00% 2019
| 2,000
| 2,022
|
Hospital Fin. Auth., Hospital Rev. Ref. Bonds (Ascension Health Senior Credit Group), Series 2010-F-2,
1.90% 2047 (put 2021)
| 1,850
| 1,868
|
| Hospital Fin. Auth., Hospital Rev. Ref. Bonds (Beaumont Health Credit Group), Series 2015, 5.00% 2025
| 4,000
| 4,686
|
| Hospital Fin. Auth., Hospital Rev. Ref. Bonds (Henry Ford Health System), Series 2016, 5.00% 2027
| 5,095
| 6,211
|
| Hospital Fin. Auth., Hospital Rev. Ref. Bonds (McLaren Health Care), Series 2012-A, 5.00% 2021
| 2,000
| 2,136
|
Hospital Fin. Auth., Hospital Rev. Ref. Bonds (McLaren Health Care), Series 2015-D-2,
(1-month USD-LIBOR x 0.68 + 0.75%) 2.29% 2038 (put 2020)1
| 2,000
| 2,006
|
| Hospital Fin. Auth., Hospital Rev. Ref. Bonds (Trinity Health Credit Group), Series 2008-C, 5.00% 2022
| 700
| 787
|
| Housing Dev. Auth., Single Family Mortgage Rev. Bonds, Series 2014-A, 4.00% 2044
| 850
| 893
|
| Housing Dev. Auth., Single Family Mortgage Rev. Bonds, Series 2016-A, 4.00% 2046
| 710
| 753
|
| Housing Dev. Auth., Single Family Mortgage Rev. Bonds, Series 2016-B, 3.50% 2047
| 15,480
| 16,332
|
| Housing Dev. Auth., Single Family Mortgage Rev. Bonds, Series 2017-B, 3.50% 2048
| 2,845
| 3,015
|
| Housing Dev. Auth., Single Family Mortgage Rev. Bonds, Series 2018-A, 4.00% 2048
| 4,300
| 4,651
|
| Housing Dev. Auth., Single Family Mortgage Rev. Bonds, Series 2018-C, 4.25% 2049
| 16,590
| 18,194
|
| Housing Dev. Auth., Single Family Mortgage Rev. Bonds, Series 2019-A, 4.25% 2049
| 12,910
| 14,216
|
| Board of Trustees of the Michigan State University, Rev. Bonds, Series 2019-B, 5.00% 2031
| 2,460
| 3,127
|
City of Saginaw, Hospital Fin. Auth., Hospital Rev. Ref. Bonds (Covenant Medical Center, Inc.),
Series 2010-H, 5.00% 2020
| 2,400
| 2,477
|
County of Wayne, Airport Auth., Airport Rev. Ref. Bonds (Detroit Metropolitan Wayne County Airport),
Series 2011-A, AMT, 5.00% 2019
| 1,000
| 1,012
|
County of Wayne, Airport Auth., Airport Rev. Ref. Bonds (Detroit Metropolitan Wayne County Airport),
Series 2011-A, AMT, 5.00% 2020
| 5,000
| 5,240
|
County of Wayne, Airport Auth., Airport Rev. Ref. Bonds (Detroit Metropolitan Wayne County Airport),
Series 2011-A, AMT, 5.00% 2021
| 10,240
| 11,079
|
County of Wayne, Airport Auth., Airport Rev. Ref. Bonds (Detroit Metropolitan Wayne County Airport),
Series 2011-B, 5.00% 2019
| 1,000
| 1,013
|
County of Wayne, Airport Auth., Airport Rev. Ref. Bonds (Detroit Metropolitan Wayne County Airport),
Series 2012-D, AMT, 5.00% 2019
| 3,560
| 3,603
|
County of Wayne, Airport Auth., Airport Rev. Ref. Bonds (Detroit Metropolitan Wayne County Airport),
Series 2015-F, AMT, 5.00% 2025
| 2,500
| 2,998
|
County of Wayne, Airport Auth., Airport Rev. Ref. Bonds (Detroit Metropolitan Wayne County Airport),
Series 2015-F, AMT, 5.00% 2026
| 1,000
| 1,193
|
|
|
| 154,948
|
| Minnesota 1.39%
|
|
|
City of Brooklyn Center, Multi Family Housing Dev. Bonds (Unity Place Project), Series 2019,
1.95% 2021 (put 2020)
| 1,250
| 1,255
|
| G.O. Bonds, Series 2017-A, 5.00% 2020
| 1,050
| 1,098
|
| G.O. Bonds, Series 2017-B, 5.00% 2023
| 2,870
| 3,330
|
Limited Term Tax-Exempt Bond Fund of America
— Page 16 of 37
Bonds, notes & other debt instruments (continued)
Minnesota (continued)
| Principal amount
(000)
| Value
(000)
|
| Housing Fin. Agcy., Homeownership Fin. Bonds (GNMA and FNMA Pass-Through Program), Series 2017-G, 2.65% 2047
| $9,084
| $9,102
|
| Housing Fin. Agcy., Residential Housing Fin. Bonds, Series 2012-D, 4.00% 2040
| 135
| 138
|
| Housing Fin. Agcy., Residential Housing Fin. Bonds, Series 2013-A, AMT, 3.00% 2031
| 485
| 494
|
| Housing Fin. Agcy., Residential Housing Fin. Bonds, Series 2014-B, 4.00% 2038
| 165
| 175
|
| Housing Fin. Agcy., Residential Housing Fin. Bonds, Series 2014-C, AMT, 4.00% 2045
| 1,740
| 1,844
|
| Housing Fin. Agcy., Residential Housing Fin. Bonds, Series 2015-A, AMT, 4.00% 2041
| 3,315
| 3,480
|
| Housing Fin. Agcy., Residential Housing Fin. Bonds, Series 2015-B, 3.50% 2046
| 2,960
| 3,116
|
| Housing Fin. Agcy., Residential Housing Fin. Bonds, Series 2015-E, AMT, 3.50% 2046
| 595
| 622
|
| Housing Fin. Agcy., Residential Housing Fin. Bonds, Series 2016-E, 4.00% 2047
| 990
| 1,049
|
| Housing Fin. Agcy., Residential Housing Fin. Bonds, Series 2017-E, 4.00% 2048
| 5,095
| 5,492
|
| Housing Fin. Agcy., Residential Housing Fin. Bonds, Series 2018-B, 4.00% 2048
| 2,910
| 3,164
|
| Housing Fin. Agcy., Residential Housing Fin. Bonds, Series 2018-E, 4.25% 2049
| 13,175
| 14,487
|
| Housing Fin. Agcy., Residential Housing Fin. Bonds, Series 2019-B 4.25% 2049
| 4,760
| 5,278
|
City of Minneapolis, Housing and Redev. Auth., Health Care System Rev. Bonds (Allina Health System),
Series 2009-A-2, 5.50% 2024 (preref. 2019)
| 1,000
| 1,012
|
| Regents of the University of Minnesota, G.O. Rev. Ref. Bonds, Series 2017B, 5.00% 2021
| 3,640
| 3,970
|
|
|
| 59,106
|
| Mississippi 0.38%
|
|
|
| Business Fin. Corp., Gulf Opportunity Zone Industrial Dev. Rev. Bonds (Coast Electric Power Association), Series 2007-C, 1.90% 20371
| 1,196
| 1,197
|
Dev. Bank, Special Obligation Bonds (Municipal Energy Agcy. of Mississippi Power Supply Project),
Series 2015-A, Assured Guaranty Municipal insured, 5.00% 2025
| 1,245
| 1,467
|
Dev. Bank, Special Obligation Bonds (Municipal Energy Agcy. of Mississippi Power Supply Project),
Series 2015-A, Assured Guaranty Municipal insured, 5.00% 2026
| 1,045
| 1,255
|
Dev. Bank, Special Obligation Rev. Ref. Bonds (Madison County Highway Ref. Project), Series 2013-C,
5.00% 2020
| 1,750
| 1,778
|
| Gaming Tax Rev. Bonds, Series 2019-A, 5.00% 2024
| 1,000
| 1,180
|
| Gaming Tax Rev. Ref. Bonds, Series 2015-E, 5.00% 2026
| 2,925
| 3,510
|
| Home Corp., Single Family Mortgage Rev. Bonds, Series 2017-C, AMT, 4.00% 2046
| 2,175
| 2,317
|
| Home Corp., Single Family Mortgage Rev. Bonds, Series 2019-A, 4.00% 2048
| 3,105
| 3,404
|
|
|
| 16,108
|
| Missouri 0.72%
|
|
|
Health and Educational Facs. Auth., Health Facs. Rev. Bonds (Saint Luke’s Health System, Inc.),
Series 2016, 5.00% 2025
| 1,500
| 1,811
|
| Housing Dev. Commission, Single Family Mortgage Rev. Bonds (First Place Homeownership Loan Program), Series 2019-A, 4.25% 2047
| 2,000
| 2,218
|
Housing Dev. Commission, Single Family Mortgage Rev. Bonds (First Place Homeownership Loan Program),
Series 2016-B, 3.50% 2041
| 3,395
| 3,558
|
Housing Dev. Commission, Single Family Mortgage Rev. Bonds (First Place Homeownership Loan Program),
Series 2017-B, 3.25% 2047
| 6,313
| 6,584
|
Housing Dev. Commission, Single Family Mortgage Rev. Bonds (First Place Homeownership Loan Program),
Series 2017-C, 3.30% 2047
| 6,796
| 7,095
|
Housing Dev. Commission, Single Family Mortgage Rev. Bonds (First Place Homeownership Loan Program),
Series 2018-A, 4.25% 2049
| 1,715
| 1,886
|
Housing Dev. Commission, Single Family Mortgage Rev. Bonds (Special Homeownership Loan Program),
Series 2015-B-2, 4.00% 2045
| 2,415
| 2,570
|
City of St. Louis, Airport Rev. Ref. Bonds (Lambert-St. Louis International Airport), Series 2017-A,
Assured Guaranty Municipal insured, 5.25% 2025
| 4,000
| 4,885
|
|
|
| 30,607
|
Limited Term Tax-Exempt Bond Fund of America
— Page 17 of 37
Bonds, notes & other debt instruments (continued)
Montana 0.16%
| Principal amount
(000)
| Value
(000)
|
| Board of Housing, Single Family Mortgage Bonds, Series 2015-B-2, AMT, 3.50% 2042
| $545
| $568
|
| Board of Housing, Single Family Mortgage Bonds, Series 2016-A-2, 3.50% 2044
| 1,445
| 1,520
|
| Board of Housing, Single Family Mortgage Bonds, Series 2019-A, 4.25% 2045
| 4,155
| 4,588
|
|
|
| 6,676
|
| Nebraska 1.06%
|
|
|
| Central Plains Energy Project, Gas Supply Rev. Ref. Bonds, Series 2014, 5.00% 2039 (put 2019)
| 11,850
| 11,992
|
| County of Douglas, Hospital Auth. No. 2 (Methodist Health System), Health Facs. Rev. Ref. Bonds, Series 2015, 5.00% 2026
| 1,155
| 1,365
|
| Investment Fin. Auth., Single Family Housing Rev. Bonds, Series 2013-A, 3.00% 2043
| 510
| 518
|
| Investment Fin. Auth., Single Family Housing Rev. Bonds, Series 2013-C, 4.50% 2043
| 10
| 10
|
| Investment Fin. Auth., Single Family Housing Rev. Bonds, Series 2013-E, 3.00% 2043
| 55
| 56
|
| Investment Fin. Auth., Single Family Housing Rev. Bonds, Series 2014-A, 4.00% 2044
| 900
| 947
|
| Investment Fin. Auth., Single Family Housing Rev. Bonds, Series 2015-A, 3.50% 2045
| 2,405
| 2,515
|
| Investment Fin. Auth., Single Family Housing Rev. Bonds, Series 2015-C, 3.50% 2045
| 4,880
| 5,063
|
| Investment Fin. Auth., Single Family Housing Rev. Bonds, Series 2016-C, 3.50% 2046
| 2,740
| 2,886
|
| Investment Fin. Auth., Single Family Housing Rev. Bonds, Series 2016-C, 3.50% 2046
| 2,670
| 2,747
|
| Investment Fin. Auth., Single Family Housing Rev. Bonds, Series 2017-B, AMT, 3.50% 2040
| 4,875
| 5,137
|
| Investment Fin. Auth., Single Family Housing Rev. Bonds, Series 2018-A, 4.00% 2048
| 2,070
| 2,237
|
| Investment Fin. Auth., Single Family Housing Rev. Bonds, Series 2018-C, 4.00% 2048
| 3,735
| 4,057
|
| Investment Fin. Auth., Single Family Housing Rev. Bonds, Series 2019-B, AMT, 4.00% 2049
| 5,000
| 5,422
|
|
|
| 44,952
|
| Nevada 1.70%
|
|
|
| Clark County School Dist., Limited Tax G.O. Building and Rev. Ref. Bonds, Series 2017-A, 5.00% 2026
| 1,000
| 1,222
|
| Clark County School Dist., Limited Tax G.O. Building and Rev. Ref. Bonds, Series 2017-C, 5.00% 2024
| 2,500
| 2,925
|
| Clark County School Dist., Limited Tax G.O. Building and Rev. Ref. Bonds, Series 2017-C, 5.00% 2027
| 3,045
| 3,771
|
| Clark County School Dist., Limited Tax Various Purpose G.O. Bonds, Series 2016-F, 5.00% 2026
| 2,470
| 3,019
|
| County of Clark, Airport System Rev. Bonds, Series 2010-D, 5.00% 2021
| 2,005
| 2,038
|
| County of Clark, Airport System Rev. Ref. Bonds (McCarran International Airport), Series 2019-A, 5.00% 2023
| 4,000
| 4,576
|
| County of Clark, Airport System Rev. Ref. Bonds, Series 2017-C, AMT, 5.00% 2021
| 3,500
| 3,745
|
| County of Clark, Highway Rev. Ref. Bonds (Motor Vehicle Fuel Tax), Series 2011, 5.00% 2020
| 12,320
| 12,756
|
County of Clark, Pollution Control Rev. Ref. Bonds (Southern California Edison Co.), Series 2010,
1.875% 2031 (put 2020)
| 14,035
| 14,057
|
| County of Clark, Rev. Ref. Bonds (Jet Aviation Fuel Tax), Series 2013-A, AMT, 5.00% 2021
| 1,035
| 1,107
|
| County of Clark, Rev. Ref. Bonds (Jet Aviation Fuel Tax), Series 2013-A, AMT, 5.00% 2022
| 2,810
| 3,102
|
| County of Clark, Rev. Ref. Bonds (Jet Aviation Fuel Tax), Series 2013-A, AMT, 5.00% 2023
| 1,000
| 1,120
|
| County of Clark, Rev. Ref. Bonds (Jet Aviation Fuel Tax), Series 2013-A, AMT, 5.00% 2027
| 2,500
| 2,791
|
County of Clark, Special Improvement Dist. No. 121 (Southern Highlands Area),
Local Improvement Rev. Ref. Bonds, Series 2016, 2.25% 2019
| 890
| 890
|
| City of Henderson, Local Improvement Dist. No. T-14 (Anthem), Local Improvement Bonds, Series 2017, 2.375% 2022
| 1,070
| 1,091
|
| City of Henderson, Local Improvement Dist. No. T-14 (Anthem), Local Improvement Bonds, Series 2017, 2.50% 2023
| 1,120
| 1,150
|
City of Henderson, Local Improvement Dist. No. T-17 (Madeira Canyon), Local Improvement Bonds,
Series 2017, 2.00% 2019
| 245
| 245
|
City of Henderson, Local Improvement Dist. No. T-17 (Madeira Canyon), Local Improvement Bonds,
Series 2017, 2.00% 2022
| 970
| 980
|
City of Henderson, Local Improvement Dist. No. T-17 (Madeira Canyon), Local Improvement Bonds,
Series 2017, 2.25% 2024
| 560
| 571
|
City of Henderson, Local Improvement Dist. No. T-17 (Madeira Canyon), Local Improvement Bonds,
Series 2017, 2.50% 2025
| 585
| 603
|
| Housing Division, Single Family Mortgage Rev. Bonds, Series 2019-A, 4.00% 2049
| 2,000
| 2,210
|
| City of Las Vegas, Redev. Agcy., Tax Increment Rev. Ref. Bonds, Series 2016, 5.00% 2025
| 2,185
| 2,590
|
| City of Las Vegas, Redev. Agcy., Tax Increment Rev. Ref. Bonds, Series 2016, 5.00% 2027
| 1,200
| 1,433
|
Limited Term Tax-Exempt Bond Fund of America
— Page 18 of 37
Bonds, notes & other debt instruments (continued)
Nevada (continued)
| Principal amount
(000)
| Value
(000)
|
| City of North Las Vegas, Special Improvement Dist. No. 60 (Aliante), Local Improvement Rev. Ref. Bonds, Series 2016, 2.125% 2020
| $1,680
| $1,699
|
| City of North Las Vegas, Special Improvement Dist. No. 60 (Aliante), Local Improvement Rev. Ref. Bonds, Series 2016, 2.25% 2019
| 1,205
| 1,209
|
County of Washoe, Gas and Water Facs. Rev. Ref. Bonds (Sierra Pacific Power Co. Projects),
Series 2016-B, 3.00% 2036 (put 2022)
| 1,500
| 1,569
|
|
|
| 72,469
|
| New Hampshire 0.15%
|
|
|
| Health and Education Facs. Auth., Rev. Bonds (Elliot Hospital Issue), Series 2016, 5.00% 2019
| 600
| 604
|
| Health and Education Facs. Auth., Rev. Bonds (Elliot Hospital Issue), Series 2016, 5.00% 2024
| 1,250
| 1,461
|
| Health and Education Facs. Auth., Rev. Bonds (Elliot Hospital Issue), Series 2016, 5.00% 2025
| 1,250
| 1,492
|
| Health and Education Facs. Auth., Rev. Bonds (Elliot Hospital Issue), Series 2016, 5.00% 2026
| 1,250
| 1,520
|
| Health and Education Facs. Auth., Rev. Bonds (Elliot Hospital Issue), Series 2016, 5.00% 2027
| 1,250
| 1,507
|
|
|
| 6,584
|
| New Jersey 3.01%
|
|
|
| Econ. Dev. Auth., Rev. Ref. Bonds (Provident Group - Montclair Properties LLC - Montclair State University Student Housing Project), Series 2017, Assured Guaranty
Municipal insured, 5.00% 2023
| 1,000
| 1,129
|
| Econ. Dev. Auth., Rev. Ref. Bonds (Provident Group - Montclair Properties LLC - Montclair State University Student Housing Project), Series 2017, Assured Guaranty
Municipal insured, 5.00% 2024
| 1,000
| 1,160
|
| Econ. Dev. Auth., Rev. Ref. Bonds (Provident Group - Montclair Properties LLC - Montclair State University Student Housing Project), Series 2017, Assured Guaranty
Municipal insured, 5.00% 2026
| 1,000
| 1,208
|
| Econ. Dev. Auth., School Facs. Construction Bonds, Series 2017-DDD, 5.00% 2024
| 1,500
| 1,720
|
| Econ. Dev. Auth., School Facs. Construction Bonds, Series 2017-DDD, 5.00% 2025
| 1,000
| 1,163
|
| Econ. Dev. Auth., School Facs. Construction Bonds, Series 2017-DDD, 5.00% 2026
| 1,000
| 1,172
|
| Econ. Dev. Auth., School Facs. Construction Rev. Ref. Bonds, Series 2015-XX, 5.00% 2024
| 2,990
| 3,429
|
| Econ. Dev. Auth., School Facs. Construction Rev. Ref. Bonds, Series 2015-XX, 5.00% 2025
| 8,000
| 9,302
|
Educational Facs. Auth., Rev. and Rev. Ref. Bonds (Ramapo College of New Jersey Issue),
Series 2017-A, Assured Guaranty Municipal insured, 5.00% 2026
| 1,375
| 1,684
|
Educational Facs. Auth., Rev. and Rev. Ref. Bonds (Ramapo College of New Jersey Issue),
Series 2017-A, Assured Guaranty Municipal insured, 5.00% 2027
| 1,000
| 1,243
|
| Educational Facs. Auth., Rev. and Rev. Ref. Bonds (Stockton University Issue), Series 2016-A, 5.00% 2025
| 3,000
| 3,508
|
Educational Facs. Auth., Rev. and Rev. Ref. Bonds (Stockton University Issue), Series 2016-A,
Assured Guaranty Municipal insured, 5.00% 2026
| 2,885
| 3,434
|
Educational Facs. Auth., Rev. Ref. Bonds (Rowan University Issue), Series 2016-C,
Assured Guaranty Municipal insured, 5.00% 2024
| 2,645
| 3,107
|
| Health Care Facs. Fncg. Auth., Rev. Bonds (Princeton HealthCare System Issue), Series 2016-A, 5.00% 2025
| 1,340
| 1,615
|
| Health Care Facs. Fncg. Auth., Rev. Bonds (Princeton HealthCare System Issue), Series 2016-A, 5.00% 2027
| 1,250
| 1,533
|
Health Care Facs. Fncg. Auth., Rev. Bonds (St. Joseph’s Healthcare System Obligated Group Issue),
Series 2016, 5.00% 2022
| 1,500
| 1,639
|
Health Care Facs. Fncg. Auth., Rev. Ref. Bonds (Hackensack Meridian Health Obligated Group Issue),
Series 2017-A, 5.00% 2025
| 1,000
| 1,208
|
Health Care Facs. Fncg. Auth., Rev. Ref. Bonds (Hackensack Meridian Health Obligated Group Issue),
Series 2017-A, 5.00% 2026
| 900
| 1,110
|
Health Care Facs. Fncg. Auth., Rev. Ref. Bonds (Hackensack Meridian Health Obligated Group Issue),
Series 2017-A, 5.00% 2027
| 1,150
| 1,446
|
| Higher Education Student Assistance Auth., Student Loan Rev. Bonds, Series 2012-1-A, AMT, 5.00% 2021
| 4,000
| 4,315
|
| Higher Education Student Assistance Auth., Student Loan Rev. Bonds, Series 2013-1-A, AMT, 5.00% 2019
| 1,000
| 1,012
|
| Higher Education Student Assistance Auth., Student Loan Rev. Bonds, Series 2016-1-A, AMT, 5.00% 2026
| 1,905
| 2,246
|
| Higher Education Student Assistance Auth., Student Loan Rev. Ref. Bonds, Series 2010-1-A, 5.25% 2019
| 1,000
| 1,014
|
| Higher Education Student Assistance Auth., Student Loan Rev. Ref. Bonds, Series 2011-1, AMT, 5.00% 2019
| 2,500
| 2,529
|
Housing and Mortgage Fin. Agcy., Multi Family Housing Conduit Rev. Bonds (Georgia King Village Project),
Series 2018-E, 2.45% 2021 (put 2020)
| 2,815
| 2,849
|
| Housing and Mortgage Fin. Agcy., Single Family Housing Rev. Bonds, Series 2018-A, 4.50% 2048
| 9,340
| 10,330
|
Limited Term Tax-Exempt Bond Fund of America
— Page 19 of 37
Bonds, notes & other debt instruments (continued)
New Jersey (continued)
| Principal amount
(000)
| Value
(000)
|
| Housing and Mortgage Fin. Agcy., Single Family Housing Rev. Bonds, Series 2019-C, 4.75% 2050
| $7,230
| $8,113
|
| South Jersey Transportation Auth., Transportation System Rev. Bonds, Series 2012, 5.00% 2020
| 1,500
| 1,564
|
| South Jersey Transportation Auth., Transportation System Rev. Bonds, Series 2012, 5.00% 2022
| 5,200
| 5,756
|
| South Jersey Transportation Auth., Transportation System Rev. Bonds, Series 2012-A, 5.00% 2023
| 1,500
| 1,662
|
| South Jersey Transportation Auth., Transportation System Rev. Bonds, Series 2012-A, 5.00% 2024
| 2,500
| 2,766
|
| Tobacco Settlement Fncg. Corp., Tobacco Settlement Bonds, Series 2018-A, 5.00% 2022
| 2,290
| 2,494
|
| Tobacco Settlement Fncg. Corp., Tobacco Settlement Bonds, Series 2018-A, 5.00% 2026
| 3,000
| 3,561
|
| Tobacco Settlement Fncg. Corp., Tobacco Settlement Bonds, Series 2018-A, 5.00% 2027
| 3,140
| 3,786
|
| Tobacco Settlement Fncg. Corp., Tobacco Settlement Bonds, Series 2018-A, 5.00% 2028
| 3,000
| 3,665
|
| Tobacco Settlement Fncg. Corp., Tobacco Settlement Bonds, Series 2018-A, 5.00% 2029
| 3,450
| 4,192
|
| Transit Corp., Grant Anticipation Notes (Federal Transit Administration Section 5307 Urbanized Area Formula Funds), Series 2014-A, 5.00% 2019
| 1,000
| 1,004
|
| Transit Corp., Grant Anticipation Notes (Federal Transit Administration Section 5307 Urbanized Area Formula Funds), Series 2014-A, 5.00% 2020
| 4,000
| 4,164
|
Transportation Trust Fund Auth., Federal Highway Reimbursement Rev. Ref. Bonds, Series 2018-A,
5.00% 2028
| 3,000
| 3,573
|
| Transportation Trust Fund Auth., Transportation System Rev. Ref. Bonds, Series 2006-A, 5.50% 2021
| 4,070
| 4,448
|
| Transportation Trust Fund Auth., Transportation System Rev. Ref. Bonds, Series 2015-AA, 5.00% 2023
| 1,000
| 1,125
|
Turnpike Auth., Turnpike Rev. Bonds, Series 2017-C-5,
(1-month USD-LIBOR x 0.70 + 0.46%) 2.141% 2028 (put 2021)1
| 10,000
| 10,016
|
|
|
| 127,994
|
| New Mexico 0.49%
|
|
|
| City of Farmington, Pollution Control Rev. Ref. Bonds (Southern California Edison Co. Four Corners Project), Series 2005-B, 1.875% 2029 (put 2020)
| 480
| 481
|
| City of Farmington, Pollution Control Rev. Ref. Bonds (Southern California Edison Co. Four Corners Project), Series 2011, 1.875% 2029 (put 2020)
| 3,000
| 3,005
|
| Mortgage Fin. Auth., Single Family Mortgage Program Bonds, Series 2016-A-2, Class I, AMT, 3.50% 2046
| 3,310
| 3,482
|
| Mortgage Fin. Auth., Single Family Mortgage Program Bonds, Series 2017-B-2, Class I, AMT, 3.75% 2048
| 1,480
| 1,575
|
| Mortgage Fin. Auth., Single Family Mortgage Program Bonds, Series 2019-A-1, Class I, 4.25% 2050
| 7,160
| 7,912
|
| Mortgage Fin. Auth., Single Family Mortgage Program Bonds, Series 2019-C-1, Class I, 4.00% 2050
| 3,810
| 4,196
|
|
|
| 20,651
|
| New York 7.35%
|
|
|
Dormitory Auth., Mental Health Services Facs. Improvement Rev. Ref. Bonds, Series 2010-A,
5.00% 2019 (escrowed to maturity)
| 5
| 5
|
| Dormitory Auth., School Dist. Rev. Bond Fncg. Program Rev. Bonds, Series 2017-F, 5.00% 2024
| 2,500
| 2,987
|
| Dormitory Auth., School Dist. Rev. Bond Fncg. Program Rev. Bonds, Series 2017-F, 5.00% 2025
| 750
| 920
|
| Dormitory Auth., State Personal Income Tax Rev. Bonds (General Purpose), Series 2016-D, 5.00% 2025
| 5,000
| 6,025
|
| Dormitory Auth., State Personal Income Tax Rev. Bonds (General Purpose), Series 2017-B, 5.00% 2030
| 9,040
| 11,317
|
| Dormitory Auth., State Personal Income Tax Rev. Bonds (General Purpose), Series 2018-A, 5.00% 2030
| 12,000
| 15,287
|
| Dormitory Auth., State Personal Income Tax Rev. Bonds (General Purpose), Series 2019-A, 5.00% 2028
| 10,000
| 12,777
|
| Dormitory Auth., State Personal Income Tax Rev. Ref. Bonds (General Purpose), Series 2012-A, 5.00% 2022
| 2,000
| 2,260
|
| Energy Research and Dev. Auth., Pollution Control Rev. Bonds (New York State Electric & Gas Corp. Project), Series 2004-A, AMT, 2.375% 2027 (put 2020)
| 3,000
| 3,015
|
| County of Erie, Industrial Dev. Agcy., School Fac. Rev. Bonds (City School Dist. of the City of Buffalo Project), Series 2011-A, 5.00% 2020
| 4,780
| 4,927
|
| County of Erie, Industrial Dev. Agcy., School Fac. Rev. Ref. Bonds (City School Dist. of the City of Buffalo Project), Series 2012-A, 5.00% 2020
| 2,770
| 2,855
|
| Town of Hempstead, Local Dev. Corp., Rev. Bonds (Hofstra University Project), Series 2011, 5.00% 2025
| 1,670
| 1,785
|
| Housing Fin. Agcy., Affordable Housing Rev. Green Bonds, Series 2018-H, 2.75% 2022
| 5,000
| 5,041
|
Long Island Power Auth., Electric System General Rev. Bonds, Series 2014-C,
(1-month USD-LIBOR x 0.70 + 0.75%) 2.431% 2033 (put 2023)1
| 7,700
| 7,735
|
Metropolitan Transportation Auth., Dedicated Tax Fund Rev. Ref. Bonds, Series 2008-A-2B,
(SIFMA Municipal Swap Index + 0.58%) 1.98% 2031 (put 2019)1
| 1,500
| 1,501
|
Limited Term Tax-Exempt Bond Fund of America
— Page 20 of 37
Bonds, notes & other debt instruments (continued)
New York (continued)
| Principal amount
(000)
| Value
(000)
|
| Metropolitan Transportation Auth., Hudson Rail Yards Trust Obligations, Series 2016-A, 5.00% 2046
| $2,320
| $2,342
|
| Metropolitan Transportation Auth., Transportation Rev. Bonds, Series 2012-E, 5.00% 2020
| 3,250
| 3,411
|
| Metropolitan Transportation Auth., Transportation Rev. Bonds, Series 2014-C, 5.00% 2024
| 5,000
| 5,922
|
Metropolitan Transportation Auth., Transportation Rev. Bonds, Series 2014-D-2,
(SIFMA Municipal Swap Index + 0.45%) 1.85% 2044 (put 2022)1
| 7,750
| 7,736
|
| Metropolitan Transportation Auth., Transportation Rev. Bonds, Series 2015-A-1, 5.00% 2027
| 3,150
| 3,739
|
Metropolitan Transportation Auth., Transportation Rev. Bonds, Series 2015-A-2,
(SIFMA Municipal Swap Index + 0.58%) 1.98% 2039 (put 2020)1
| 5,500
| 5,505
|
Metropolitan Transportation Auth., Transportation Rev. Bonds,
Series 2003-B, FGIC-National insured, 5.25% 2020
| 5,500
| 5,789
|
Metropolitan Transportation Auth., Transportation Rev. Ref. Bonds, Series 2002-D-2A,
Assured Guaranty Municipal insured, (1-month USD-LIBOR x 0.69 + 0.68%) 2.337% 2032 (put 2021)1
| 1,400
| 1,408
|
| Mortgage Agcy., Homeowner Mortgage Rev. Bonds, Series 191, AMT, 3.50% 2034
| 210
| 216
|
| Mortgage Agcy., Homeowner Mortgage Rev. Bonds, Series 195, 4.00% 2046
| 2,845
| 3,009
|
| Mortgage Agcy., Homeowner Mortgage Rev. Bonds, Series 197, 3.50% 2044
| 7,780
| 8,165
|
| Mortgage Agcy., Homeowner Mortgage Rev. Bonds, Series 200, 3.50% 2045
| 4,095
| 4,283
|
| Mortgage Agcy., Homeowner Mortgage Rev. Bonds, Series 203, 3.50% 2047
| 6,360
| 6,711
|
| Mortgage Agcy., Homeowner Mortgage Rev. Bonds, Series 206, AMT, 4.00% 2037
| 2,595
| 2,768
|
| Mortgage Agcy., Homeowner Mortgage Rev. Bonds, Series 217, 4.00% 2049
| 16,705
| 18,320
|
| Mortgage Agcy., Homeowner Mortgage Rev. Bonds, Series 48, 2.625% 2041
| 185
| 188
|
| Mortgage Agcy., Homeowner Mortgage Rev. Bonds, Series 52, AMT, 3.50% 2030
| 1,470
| 1,529
|
| County of Nassau, G.O. General Improvement Bonds, Series 2016-B, 5.00% 2024
| 4,000
| 4,741
|
| New York City G.O. Bonds, Fiscal 1994, Series 1994-A-4, 5.00% 2021
| 2,400
| 2,587
|
| New York City G.O. Bonds, Fiscal 2014, Series 2014-G, 5.00% 2023
| 1,500
| 1,728
|
| New York City G.O. Bonds, Fiscal 2015, Series 2014-A, 5.00% 2025
| 3,000
| 3,551
|
| New York City G.O. Bonds, Fiscal 2015, Series 2015-C, 5.00% 2028
| 1,000
| 1,188
|
| New York City G.O. Bonds, Fiscal 2017, Series 2017-C, 5.00% 2026
| 3,500
| 4,355
|
| New York City G.O. Bonds, Fiscal 2017, Series 2017-C, 5.00% 2028
| 4,300
| 5,364
|
| New York City G.O. Bonds, Fiscal 2018, Series 2018-A, 5.00% 2026
| 5,000
| 6,221
|
| New York City Housing Dev. Corp., Multi Family Housing Rev. Bonds (Sustainable Neighborhood Bonds), Series 2018-L-2, 2.75% 2050 (put 2023)
| 5,150
| 5,349
|
| New York City Housing Dev. Corp., Multi Family Housing Rev. Bonds (Sustainable Neighborhood Bonds), Series 2019-E-2, 1.75% 2059 (put 2023)
| 3,500
| 3,523
|
New York City Housing Dev. Corp., Multi Family Housing Rev. Bonds (Sustainable Neighborhood Bonds),
Series 2017-G-2-A, 2.00% 2057 (put 2021)
| 6,250
| 6,297
|
New York City Housing Dev. Corp., Multi Family Housing Rev. Bonds (Sustainable Neighborhood Bonds),
Series 2018-C-2-A, 2.35% 2022
| 7,500
| 7,628
|
| New York City Transitional Fin. Auth., Future Tax Secured Bonds, Fiscal 2015, Series 2015-C, 5.00% 2025
| 2,420
| 2,929
|
| New York City Transitional Fin. Auth., Future Tax Secured Bonds, Fiscal 2015, Series 2015-C, 5.00% 2027
| 5,000
| 6,000
|
New York City Transitional Fin. Auth., Future Tax Secured Multi-Modal Rev. Ref. Bonds,
Fiscal 2003, Series 2003-B, 5.00% 2022
| 1,750
| 1,853
|
New York City Transitional Fin. Auth., Future Tax Secured Rev. Ref. Bonds, Fiscal 2003, Series 2003-A-1,
5.00% 2022
| 1,305
| 1,419
|
Niagara Frontier Transportation Auth., Airport Rev. Ref. Bonds (Buffalo Niagara International Airport),
Series 2014-A, AMT, 4.00% 2022
| 5,185
| 5,514
|
Niagara Frontier Transportation Auth., Airport Rev. Ref. Bonds (Buffalo Niagara International Airport),
Series 2014-A, AMT, 5.00% 2020
| 2,500
| 2,560
|
Niagara Frontier Transportation Auth., Airport Rev. Ref. Bonds (Buffalo Niagara International Airport),
Series 2014-A, AMT, 5.00% 2023
| 2,195
| 2,455
|
| Port Auth., Consolidated Rev. Ref. Bonds, Series 167, AMT, 5.00% 2020
| 4,790
| 4,991
|
| Port Auth., Consolidated Rev. Ref. Bonds, Series 167, AMT, 5.00% 2021
| 3,420
| 3,632
|
| Port Auth., Consolidated Rev. Ref. Bonds, Series 169, AMT, 5.00% 2020
| 5,000
| 5,225
|
| Port Auth., Consolidated Rev. Ref. Bonds, Series 172, AMT, 5.00% 2022
| 2,210
| 2,429
|
| Port Auth., Consolidated Rev. Ref. Bonds, Series 186, AMT, 5.00% 2023
| 5,000
| 5,762
|
| Public Housing Capital Fund Rev. Trust I, Trust Certificates, Series 2012, 4.50% 20222
| 1,278
| 1,294
|
Limited Term Tax-Exempt Bond Fund of America
— Page 21 of 37
Bonds, notes & other debt instruments (continued)
New York (continued)
| Principal amount
(000)
| Value
(000)
|
| Thruway Auth., General Rev. Bonds, Series I, 5.00% 2021
| $4,000
| $4,225
|
Transportation Dev. Corp., Special Fac. Rev. Ref. Bonds (Terminal One Group Association, LP Project),
Series 2015, AMT, 5.00% 2020
| 2,500
| 2,536
|
Transportation Dev. Corp., Special Fac. Rev. Ref. Bonds (Terminal One Group Association, LP Project),
Series 2015, AMT, 5.00% 2021
| 1,250
| 1,311
|
Transportation Dev. Corp., Special Fac. Rev. Ref. Bonds (Terminal One Group Association, LP Project),
Series 2015, AMT, 5.00% 2022
| 2,000
| 2,157
|
Transportation Dev. Corp., Special Fac. Rev. Ref. Bonds (Terminal One Group Association, LP Project),
Series 2015, AMT, 5.00% 2023
| 1,045
| 1,158
|
Transportation Dev. Corp., Special Facs. Rev. Bonds (Delta Air Lines, Inc. LaGuardia Airport Terminals C & D
Redev. Project), Series 2018, AMT, 5.00% 2025
| 10,000
| 11,593
|
| Urban Dev. Corp., State Personal Income Tax Rev. Bonds (General Purpose), Series 2013-A-1, 5.00% 2020
| 5,525
| 5,660
|
| Urban Dev. Corp., State Personal Income Tax Rev. Bonds (General Purpose), Series 2013-A-2, 5.00% 2020
| 7,290
| 7,469
|
| Urban Dev. Corp., State Personal Income Tax Rev. Bonds (General Purpose), Series 2013-C, 5.00% 2024
| 6,725
| 7,662
|
| Urban Dev. Corp., State Personal Income Tax Rev. Bonds (General Purpose), Series 2014-A, 5.00% 2020
| 1,000
| 1,025
|
| Urban Dev. Corp., State Personal Income Tax Rev. Bonds (General Purpose), Series 2014-A, 5.00% 2029
| 1,500
| 1,747
|
| Urban Dev. Corp., State Personal Income Tax Rev. Bonds (General Purpose), Series 2016-A, 5.00% 2025
| 2,000
| 2,418
|
| Urban Dev. Corp., State Personal Income Tax Rev. Bonds (General Purpose), Series 2016-A, 5.00% 2028
| 4,510
| 5,527
|
|
|
| 312,561
|
| North Carolina 1.39%
|
|
|
| G.O. Rev. Ref. Bonds, Series 2013-D, 4.00% 2020
| 4,415
| 4,524
|
| G.O. Rev. Ref. Bonds, Series 2013-E, 5.00% 2020
| 15,850
| 16,319
|
| Grant Anticipation Rev. Vehicle Bonds, Series 2019, 5.00% 2023
| 6,370
| 7,227
|
| Housing Fin. Agcy., Home Ownership Rev. Bonds, Series 40, 4.25% 2047
| 1,000
| 1,098
|
| Housing Fin. Agcy., Home Ownership Rev. Bonds, Series 41, 4.00% 2050
| 3,100
| 3,402
|
| Housing Fin. Agcy., Home Ownership Rev. Ref. Bonds, Series 37-A, AMT, 3.50% 2039
| 3,510
| 3,661
|
| Housing Fin. Agcy., Home Ownership Rev. Ref. Bonds, Series 38-B, 4.00% 2047
| 2,765
| 2,965
|
| Housing Fin. Agcy., Home Ownership Rev. Ref. Bonds, Series 39-B, 4.00% 2048
| 2,845
| 3,087
|
University of North Carolina at Chapel Hill, General Rev. Bonds, Series 2012-B,
(1-month USD-LIBOR x 0.67 + 0.40%) 2.01% 2041 (put 2022)1
| 4,850
| 4,859
|
| University of North Carolina at Greensboro, General Rev. Ref. Bonds, Series 2011, 5.00% 2036 (preref. 2036)
| 1,420
| 1,512
|
County of Wake, Housing Auth., Multi Family Housing Rev. Bonds (Sunnybrook Pointe Apartments),
Series 2017, 1.86% 20203
| 10,500
| 10,515
|
|
|
| 59,169
|
| North Dakota 0.58%
|
|
|
County of Burleigh, Health Care Rev. Bonds (St. Alexius Medical Center Project), Series 2014-A,
5.00% 2023 (preref. 2021)
| 1,435
| 1,538
|
| Housing Fin. Agcy., Homeownership Rev. Bonds (Home Mortgage Fin. Program), Series 2016-D, 3.50% 2046
| 5,440
| 5,750
|
| Housing Fin. Agcy., Housing Fin. Program Bonds (Home Mortgage Fin. Program), Series 2012-A, 3.75% 2042
| 610
| 630
|
| Housing Fin. Agcy., Housing Fin. Program Bonds (Home Mortgage Fin. Program), Series 2014-A, 4.00% 2034
| 375
| 393
|
| Housing Fin. Agcy., Housing Fin. Program Bonds (Home Mortgage Fin. Program), Series 2015-A, 4.00% 2038
| 515
| 540
|
| Housing Fin. Agcy., Housing Fin. Program Bonds (Home Mortgage Fin. Program), Series 2015-B, 4.00% 2036
| 395
| 414
|
| Housing Fin. Agcy., Housing Fin. Program Bonds (Home Mortgage Fin. Program), Series 2015-D, 4.00% 2046
| 4,545
| 4,808
|
Housing Fin. Agcy., Housing Fin. Program Bonds (Home Mortgage Fin. Program), Series 2016-B, AMT,
4.00% 2047
| 1,075
| 1,144
|
| Housing Fin. Agcy., Housing Fin. Program Bonds (Home Mortgage Fin. Program), Series 2017-D, 4.00% 2048
| 5,815
| 6,255
|
| Housing Fin. Agcy., Housing Fin. Program Bonds (Home Mortgage Fin. Program), Series 2017-F, 4.00% 2048
| 920
| 993
|
| Housing Fin. Agcy., Housing Fin. Program Bonds (Home Mortgage Fin. Program), Series 2019-A, 4.25% 2049
| 2,155
| 2,375
|
|
|
| 24,840
|
Limited Term Tax-Exempt Bond Fund of America
— Page 22 of 37
Bonds, notes & other debt instruments (continued)
Ohio 2.92%
| Principal amount
(000)
| Value
(000)
|
| County of Allen, Hospital Facs. Rev. Bonds (Mercy Health), Series 2017-B, 5.00% 2047 (put 2022)
| $9,425
| $10,359
|
| County of Allen, Hospital Facs. Rev. Ref. and Improvement Bonds (Catholic Health Partners), Series 2012-A, 5.00% 2022
| 3,300
| 3,624
|
American Municipal Power, Inc., Combined Hydroelectric Project Rev. Bonds, Series 2018-A,
2.25% 2048 (put 2021)
| 2,300
| 2,328
|
City of Cleveland, Airport System Rev. Bonds, Series 2016-A, Assured Guaranty Municipal insured,
5.00% 2026
| 1,850
| 2,182
|
| City of Cleveland, Airport System Rev. Ref. Bonds, Series 2011-A, 5.00% 2020
| 3,540
| 3,595
|
City of Cleveland, Airport System Rev. Ref. Bonds, Series 2011-A, Assured Guaranty Municipal insured,
5.00% 2021
| 2,345
| 2,468
|
City of Cleveland, Airport System Rev. Ref. Bonds, Series 2016-B, Assured Guaranty Municipal insured,
5.00% 2024
| 1,075
| 1,241
|
| County of Cuyahoga, Hospital Rev. Bonds (MetroHealth System), Series 2017, 5.00% 2025
| 950
| 1,087
|
| County of Cuyahoga, Hospital Rev. Bonds (MetroHealth System), Series 2017, 5.00% 2026
| 1,000
| 1,161
|
| County of Cuyahoga, Hospital Rev. Bonds (MetroHealth System), Series 2017, 5.00% 2027
| 1,500
| 1,766
|
| G.O. Highway Capital Improvements Bonds (Full Faith and Credit/Highway User Receipts), Series 2016-S, 5.00% 2024
| 6,090
| 7,185
|
| G.O. Rev. Ref. Bonds, Common Schools Bonds, Series 2017-B, 5.00% 2025
| 6,000
| 7,329
|
| G.O. Rev. Ref. Bonds, Higher Education Bonds, Series 2016-A, 5.00% 2024
| 1,645
| 1,953
|
| County of Hamilton, Healthcare Facs. Rev. Bonds (Christ Hospital Project), Series 2012, 5.00% 2020
| 2,360
| 2,431
|
| County of Hamilton, Healthcare Facs. Rev. Bonds (Christ Hospital Project), Series 2012, 5.00% 2021
| 1,000
| 1,065
|
Housing Fin. Agcy., Multi Family Housing Rev. Bonds (Neilan Park Apartments Program), Series 2019,
1.75% 2022 (put 2021)
| 1,210
| 1,218
|
| Housing Fin. Agcy., Residential Mortgage Rev. Bonds (Mortgage-Backed Securities Program), Series 2016-D, 4.00% 2047
| 4,520
| 4,798
|
| Housing Fin. Agcy., Residential Mortgage Rev. Bonds (Mortgage-Backed Securities Program), Series 2016-K, 3.50% 2046
| 3,635
| 3,832
|
| Housing Fin. Agcy., Residential Mortgage Rev. Bonds (Mortgage-Backed Securities Program), Series 2017-D, 4.00% 2048
| 8,285
| 8,893
|
| Housing Fin. Agcy., Residential Mortgage Rev. Bonds (Mortgage-Backed Securities Program), Series 2019-A, 4.50% 2049
| 6,665
| 7,451
|
| Housing Fin. Agcy., Residential Mortgage Rev. Bonds, Series 2017-B, AMT, 4.50% 2047
| 2,145
| 2,321
|
| Housing Fin. Agcy., Single Family Mortgage Rev. Bonds, Series 2010-1, 5.00% 2028
| 95
| 96
|
| Kent State University, Rev. General Receipts Bonds, Series 2016, 4.00% 2024
| 5,000
| 5,607
|
Private Activity Bonds (Portsmouth Bypass Project), Series 2015, AMT,
Assured Guaranty Municipal insured, 5.00% 2023
| 1,295
| 1,445
|
Private Activity Bonds (Portsmouth Bypass Project), Series 2015, AMT,
Assured Guaranty Municipal insured, 5.00% 2023
| 1,000
| 1,106
|
Private Activity Bonds (Portsmouth Bypass Project), Series 2015, AMT,
Assured Guaranty Municipal insured, 5.00% 2024
| 1,360
| 1,549
|
Private Activity Bonds (Portsmouth Bypass Project), Series 2015, AMT,
Assured Guaranty Municipal insured, 5.00% 2026
| 850
| 994
|
Private Activity Bonds (Portsmouth Bypass Project), Series 2015, AMT,
Assured Guaranty Municipal insured, 5.00% 2027
| 500
| 583
|
| Public Facs. Commission, Higher Education G.O. Bonds, Series 2015-C, 5.00% 2028
| 9,000
| 10,756
|
| Turnpike and Infrastructure Commission, Rev. Ref. Bonds, Series 1998-A, National insured, 5.50% 2026
| 6,500
| 8,021
|
| Water Dev. Auth., Drinking Water Assistance Fund Rev. Bonds, Series 2019, 5.00% 2023
| 3,700
| 4,309
|
| Water Dev. Auth., Drinking Water Assistance Fund Rev. Bonds, Series 2019, 5.00% 2024
| 3,400
| 4,076
|
| Water Dev. Auth., Drinking Water Assistance Fund Rev. Bonds, Series 2019, 5.00% 2024
| 1,550
| 1,831
|
| Water Dev. Auth., Solid Waste Disposal Rev. Bonds (Waste Management, Inc. Project), Series 2002, AMT, 3.25% 2022
| 3,500
| 3,680
|
Water Dev. Auth., Water Pollution Control Loan Fund Rev. Notes, Series 2017-B,
(SIFMA Municipal Swap Index + 0.22%) 1.62% 20201
| 2,000
| 2,000
|
|
|
| 124,340
|
Limited Term Tax-Exempt Bond Fund of America
— Page 23 of 37
Bonds, notes & other debt instruments (continued)
Oklahoma 0.03%
| Principal amount
(000)
| Value
(000)
|
Trustees of the Tulsa Airports Improvement Trust, General Airport Rev. Bonds,
Series 2015-A, AMT, BAM insured, 5.00% 2021
| $1,355
| $1,441
|
| Oregon 0.34%
|
|
|
| G.O. Bonds (Veteran’s Welfare Bonds Series 94), Series 2014-H, 4.00% 2044
| 750
| 775
|
Housing and Community Services Dept., Mortgage Rev. Bonds (Single Family Mortgage Program),
Series 2016-A, 4.00% 2047
| 730
| 775
|
Housing and Community Services Dept., Mortgage Rev. Bonds (Single Family Mortgage Program),
Series 2017-A, 4.00% 2047
| 6,280
| 6,752
|
Housing and Community Services Dept., Mortgage Rev. Bonds (Single Family Mortgage Program),
Series 2018-A, 4.50% 2049
| 1,880
| 2,065
|
Housing and Community Services Dept., Mortgage Rev. Bonds (Single Family Mortgage Program),
Series 2018-D, 4.75% 2050
| 2,595
| 2,908
|
| Port of Portland, Portland International Airport Rev. Bonds, Series 2010-20-C, AMT, 5.00% 2021
| 1,000
| 1,034
|
|
|
| 14,309
|
| Pennsylvania 5.23%
|
|
|
| County of Allegheny, Airport Auth., Airport Rev. Bonds, Series 2012-A-1, AMT, 5.00% 2024
| 1,025
| 1,105
|
| County of Allegheny, Hospital Dev. Auth., UPMC Rev. Bonds, Series 2019-A, 5.00% 2022
| 1,000
| 1,110
|
| County of Allegheny, Hospital Dev. Auth., UPMC Rev. Bonds, Series 2019-A, 5.00% 2024
| 2,300
| 2,700
|
| County of Chester, G.O. Bonds, Series 2011, 5.00% 2032 (preref. 2021)
| 2,505
| 2,727
|
| Delaware River Joint Toll Bridge Commission, Bridge System Rev. Bonds, Series 2019-A, 5.00% 2029
| 1,000
| 1,304
|
| Delaware River Port Auth., Port Dist. Project Rev. Ref. Bonds, Series 2012, 5.00% 2022
| 1,300
| 1,412
|
| Delaware River Port Auth., Rev. Ref. Bonds (Port Dist. Project), Series 2012, 5.00% 2021
| 3,180
| 3,343
|
| East Hempfield Township, Industrial Dev. Auth., Rev. and Rev. Ref. Bonds (Willow Valley Communities Project), Series 2016, 5.00% 2021
| 650
| 703
|
| East Hempfield Township, Industrial Dev. Auth., Rev. and Rev. Ref. Bonds (Willow Valley Communities Project), Series 2016, 5.00% 2022
| 500
| 557
|
| East Hempfield Township, Industrial Dev. Auth., Rev. and Rev. Ref. Bonds (Willow Valley Communities Project), Series 2016, 5.00% 2024
| 1,000
| 1,172
|
| East Hempfield Township, Industrial Dev. Auth., Rev. and Rev. Ref. Bonds (Willow Valley Communities Project), Series 2016, 5.00% 2025
| 1,000
| 1,196
|
| East Hempfield Township, Industrial Dev. Auth., Rev. and Rev. Ref. Bonds (Willow Valley Communities Project), Series 2016, 5.00% 2026
| 500
| 594
|
| Econ. Dev. Fncg. Auth., Private Activity Rev. Bonds (The Pennsylvania Rapid Bridge Replacement Project), Series 2015, AMT, 5.00% 2024
| 9,180
| 10,463
|
| Econ. Dev. Fncg. Auth., Private Activity Rev. Bonds (The Pennsylvania Rapid Bridge Replacement Project), Series 2015, AMT, 5.00% 2024
| 4,900
| 5,643
|
| Econ. Dev. Fncg. Auth., Private Activity Rev. Bonds (The Pennsylvania Rapid Bridge Replacement Project), Series 2015, AMT, 5.00% 2025
| 5,985
| 6,958
|
| Econ. Dev. Fncg. Auth., Private Activity Rev. Bonds (The Pennsylvania Rapid Bridge Replacement Project), Series 2015, AMT, 5.00% 2026
| 2,315
| 2,728
|
| Econ. Dev. Fncg. Auth., Private Activity Rev. Bonds (The Pennsylvania Rapid Bridge Replacement Project), Series 2015, AMT, 5.00% 2026
| 1,775
| 2,097
|
| Econ. Dev. Fncg. Auth., Solid Waste Disposal Rev. Bonds (Waste Management, Inc. Project), Series 2017-A, AMT, 1.70% 2037 (put 2020)
| 4,000
| 4,008
|
| Econ. Dev. Fncg. Auth., Solid Waste Disposal Rev. Ref. Bonds (Republic Services, Inc. Project), Series 2019-A, AMT, 1.50% 2034 (put 2019)
| 2,500
| 2,501
|
| Econ. Dev. Fncg. Auth., Unemployment Compensation Rev. Bonds, Series 2012-B, 5.00% 2020
| 2,250
| 2,278
|
| Fncg. Auth., Rev. Bonds (Tobacco Master Settlement Payment), Series 2018, 5.00% 2020
| 1,000
| 1,031
|
| Fncg. Auth., Rev. Bonds (Tobacco Master Settlement Payment), Series 2018, 5.00% 2021
| 1,625
| 1,733
|
| Fncg. Auth., Rev. Bonds (Tobacco Master Settlement Payment), Series 2018, 5.00% 2023
| 2,250
| 2,547
|
| G.O. Rev. Ref. Bonds, Second Series 2009, 5.00% 2020
| 2,000
| 2,072
|
Limited Term Tax-Exempt Bond Fund of America
— Page 24 of 37
Bonds, notes & other debt instruments (continued)
Pennsylvania (continued)
| Principal amount
(000)
| Value
(000)
|
| General Auth. of Southcentral Pennsylvania, Rev. Bonds (Wellspan Health Obligated Group), Series 2019-B, (SIFMA Municipal Swap Index + 0.60%) 2.00% 2049 (put
2024)1
| $4,520
| $4,521
|
| Housing Fin. Agcy., Single Family Mortgage Rev. Bonds, Series 2015-117-A, AMT, 3.50% 2040
| 350
| 364
|
| Housing Fin. Agcy., Single Family Mortgage Rev. Bonds, Series 2015-118-A, AMT, 3.50% 2040
| 4,305
| 4,439
|
| Housing Fin. Agcy., Single Family Mortgage Rev. Bonds, Series 2016-119, 3.50% 2041
| 560
| 582
|
| Housing Fin. Agcy., Single Family Mortgage Rev. Bonds, Series 2016-120, 3.50% 2046
| 5,595
| 5,847
|
| Housing Fin. Agcy., Single Family Mortgage Rev. Bonds, Series 2016-121, 3.50% 2046
| 8,330
| 8,721
|
| Housing Fin. Agcy., Single Family Mortgage Rev. Bonds, Series 2017-122, 4.00% 2046
| 7,920
| 8,436
|
| Housing Fin. Agcy., Single Family Mortgage Rev. Bonds, Series 2017-123-A, AMT, 4.00% 2039
| 3,760
| 3,960
|
| Housing Fin. Agcy., Single Family Mortgage Rev. Bonds, Series 2019-128-A, AMT, 4.75% 2033
| 8,980
| 9,804
|
County of Montgomery, Higher Education and Health Auth., Hospital Rev. Bonds
(Abington Memorial Hospital Obligated Group), Series 2012-A, 5.00% 2031 (preref. 2022)
| 1,900
| 2,102
|
County of Montgomery, Higher Education and Health Auth., Rev. Bonds, Series 2018-A,
2.12% 2051 (put 2023)1
| 2,800
| 2,800
|
| County of Montgomery, Industrial Dev. Auth., Health Systems Rev. Bonds (Albert Einstein Healthcare Network Issue), Series 2015-A, 5.00% 2021
| 2,000
| 2,090
|
| County of Montgomery, Industrial Dev. Auth., Health Systems Rev. Bonds (Albert Einstein Healthcare Network Issue), Series 2015-A, 5.25% 2026
| 1,000
| 1,164
|
| County of Montgomery, Industrial Dev. Auth., Pollution Control Rev. Ref. Bonds (PECO Energy Co. Project), Series 1994-B, 2.55% 2029 (Put 2020)
| 1,025
| 1,030
|
| County of Montgomery, Industrial Dev. Auth., Pollution Control Rev. Ref. Bonds (PECO Energy Co. Project), Series 1999-A, 2.50% 2030 (put 2020)
| 3,000
| 3,011
|
| County of Montgomery, Industrial Dev. Auth., Pollution Control Rev. Ref. Bonds (PECO Energy Co. Project), Series 2001-A, AMT, 2.70% 2034 (put 2020)
| 6,900
| 6,925
|
| County of Montgomery, Industrial Dev. Auth., Retirement Communities Rev. Bonds (ACTS Retirement-Life Communities, Inc. Obligated Group), Series 2009-A-1, 5.50%
2019 (escrowed to maturity)
| 975
| 987
|
| County of Montgomery, Industrial Dev. Auth., Retirement Communities Rev. Ref. Bonds (ACTS Retirement-Life Communities, Inc. Obligated Group), Series 2012, 5.00%
2023
| 2,400
| 2,631
|
| County of Montgomery, Industrial Dev. Auth., Retirement Communities Rev. Ref. Bonds (ACTS Retirement-Life Communities, Inc. Obligated Group), Series 2012, 5.00%
2024
| 1,000
| 1,094
|
| County of Northampton, General Purpose Auth., Hospital Rev. Bonds (St. Luke’s University Health Network Project), Series 2018-B, (1-month USD-LIBOR x 0.70 +
1.04%) 2.721% 2048 (put 2022)1
| 2,075
| 2,086
|
| City of Philadelphia, Airport Rev. and Rev. Ref. Bonds, Series 2017-B, AMT, 5.00% 2022
| 1,300
| 1,435
|
| City of Philadelphia, Airport Rev. and Rev. Ref. Bonds, Series 2017-B, AMT, 5.00% 2023
| 1,100
| 1,250
|
| City of Philadelphia, Airport Rev. and Rev. Ref. Bonds, Series 2017-B, AMT, 5.00% 2025
| 1,700
| 2,031
|
| City of Philadelphia, Airport Rev. and Rev. Ref. Bonds, Series 2017-B, AMT, 5.00% 2026
| 2,950
| 3,592
|
| City of Philadelphia, G.O. Rev. Ref. Bonds, Series 2009-A, Assured Guaranty insured, 5.50% 2023
| 3,000
| 3,000
|
| City of Philadelphia, Hospitals and Higher Education Facs. Auth., Hospital Rev. Bonds (Temple University Health System Obligated Group), Series 2017, 5.00% 2023
| 1,000
| 1,108
|
| City of Philadelphia, Hospitals and Higher Education Facs. Auth., Hospital Rev. Bonds (Temple University Health System Obligated Group), Series 2017, 5.00% 2024
| 2,000
| 2,265
|
| City of Philadelphia, Hospitals and Higher Education Facs. Auth., Hospital Rev. Bonds (Temple University Health System Obligated Group), Series 2017, 5.00% 2025
| 2,000
| 2,303
|
| City of Philadelphia, Industrial Dev. Auth., Rev. Bonds (Temple University), Series 2016-1, 5.00% 2028
| 1,000
| 1,181
|
| Philadelphia School Dist., G.O. Bonds, Series 2016-F, 5.00% 2024
| 5,000
| 5,830
|
| Philadelphia School Dist., G.O. Bonds, Series 2016-F, 5.00% 2025
| 3,000
| 3,578
|
City of Pittsburgh, Urban Redev. Auth., Rev. Bonds (Crawford Square Apartments Project), Series 2018,
2.25% 2020 (put 2020)
| 3,240
| 3,249
|
Public School Building Auth., School Lease Rev. Bonds (Philadelphia School Dist. Project), Series 2012,
5.00% 2021
| 2,000
| 2,120
|
Public School Building Auth., School Lease Rev. Bonds (Philadelphia School Dist. Project), Series 2012,
5.00% 2022
| 2,250
| 2,457
|
Public School Building Auth., School Lease Rev. Bonds (Philadelphia School Dist. Project), Series 2012,
5.00% 2023
| 4,250
| 4,638
|
Limited Term Tax-Exempt Bond Fund of America
— Page 25 of 37
Bonds, notes & other debt instruments (continued)
Pennsylvania (continued)
| Principal amount
(000)
| Value
(000)
|
| Saint Mary Hospital Auth., Hospital Rev. and Rev. Ref. Bonds (Trinity Health Credit Group), Series 2019-PA, 5.00% 2029
| $1,000
| $1,268
|
| Susquehanna Area Regional Airport Auth., Airport System Rev. Bonds, Series 2012-A, AMT, 5.00% 2020
| 1,000
| 1,012
|
| Susquehanna Area Regional Airport Auth., Airport System Rev. Bonds, Series 2012-A, AMT, 5.00% 2021
| 2,840
| 2,956
|
| Susquehanna Area Regional Airport Auth., Airport System Rev. Bonds, Series 2012-A, AMT, 5.00% 2022
| 5,355
| 5,722
|
| Transportation Auth., Rev. Ref. Bonds, Series 2017, 5.00% 2028
| 1,475
| 1,863
|
Turnpike Commission, Turnpike Rev. Bonds, Series 2005-A, Assured Guaranty Municipal insured,
5.25% 2025
| 1,500
| 1,838
|
| Turnpike Commission, Turnpike Rev. Bonds, Series 2011-E, 5.00% 2026 (preref. 2021)
| 1,805
| 1,968
|
| Turnpike Commission, Turnpike Rev. Bonds, Series 2011-E, 5.00% 2030 (preref. 2021)
| 1,130
| 1,232
|
Turnpike Commission, Turnpike Rev. Bonds, Series 2014-B-1,
(SIFMA Municipal Swap Index + 0.98%) 2.38% 20211
| 8,775
| 8,866
|
| Turnpike Commission, Turnpike Rev. Bonds, Series 2016, 5.00% 2022
| 5,000
| 5,501
|
| Turnpike Commission, Turnpike Rev. Bonds, Series 2016-A-1, 5.00% 2027
| 1,060
| 1,290
|
| Turnpike Commission, Turnpike Rev. Bonds, Series 2017-A-1, 5.00% 2028
| 1,500
| 1,880
|
| Turnpike Commission, Turnpike Rev. Ref. Bonds, Series 2019, 5.00% 2030
| 1,250
| 1,578
|
County of York, Industrial Dev. Auth., Pollution Control Rev. Ref. Bonds
(Philadelphia Electric Co. Project), Series 1993-A, 2.55% 2036 (put 2020)
| 10,700
| 10,717
|
|
|
| 222,304
|
| Puerto Rico 0.09%
|
|
|
| Industrial, Tourist, Educational, Medical and Environmental Control Facs. Fncg. Auth., Hospital Rev. and Rev. Ref. Bonds (Hospital Auxilio Mutuo Obligated Group
Project), Series 2011-A, 5.00% 2020
| 3,845
| 3,934
|
| Rhode Island 0.81%
|
|
|
| Commerce Corp., Grant Anticipation Rev. Ref. Bonds (Dept. of Transportation), Series 2016-A, 5.00% 2022
| 1,000
| 1,105
|
| Commerce Corp., Grant Anticipation Rev. Ref. Bonds (Dept. of Transportation), Series 2016-A, 5.00% 2023
| 2,500
| 2,842
|
| Health and Educational Building Corp., Hospital Fncg. Rev. Ref. Bonds (Lifespan Obligated Group Issue), Series 2016, 5.00% 2023
| 2,000
| 2,238
|
| Health and Educational Building Corp., Hospital Fncg. Rev. Ref. Bonds (Lifespan Obligated Group Issue), Series 2016, 5.00% 2024
| 2,350
| 2,693
|
| Health and Educational Building Corp., Providence Public Schools Rev. Bond Fncg. Program, Rev. Ref. Bonds (Providence Public Buildings Auth. Issue), Series 2015,
Assured Guaranty Municipal insured, 5.00% 2026
| 2,000
| 2,371
|
| Housing and Mortgage Fin. Corp., Homeownership Opportunity Bonds, Series 66-A-1, 4.00% 2033
| 725
| 755
|
| Housing and Mortgage Fin. Corp., Homeownership Opportunity Bonds, Series 66-A-2, 4.00% 2032
| 500
| 515
|
| Housing and Mortgage Fin. Corp., Homeownership Opportunity Bonds, Series 68-C, AMT, 3.50% 2039
| 2,780
| 2,895
|
| Student Loan Auth., Student Loan Program Rev. Bonds, Series 2014-A, AMT, 5.00% 2019
| 900
| 910
|
| Student Loan Auth., Student Loan Program Rev. Bonds, Series 2014-A, AMT, 5.00% 2020
| 1,250
| 1,307
|
| Student Loan Auth., Student Loan Program Rev. Bonds, Series 2014-A, AMT, 5.00% 2021
| 1,400
| 1,509
|
| Student Loan Auth., Student Loan Program Rev. Bonds, Series 2015-A, AMT, 3.50% 2025
| 3,000
| 3,145
|
| Student Loan Auth., Student Loan Program Rev. Bonds, Series 2015-A, AMT, 3.625% 2026
| 1,000
| 1,049
|
| Student Loan Auth., Student Loan Program Rev. Bonds, Series 2016-A, AMT, 3.00% 2026
| 4,000
| 4,149
|
| Student Loan Auth., Student Loan Program Rev. Bonds, Series 2016-A, AMT, 5.00% 2019
| 400
| 405
|
| Student Loan Auth., Student Loan Program Rev. Bonds, Series 2017-A, AMT, 4.00% 2025
| 2,005
| 2,213
|
| Student Loan Auth., Student Loan Program Rev. Bonds, Series 2017-A, AMT, 4.00% 2026
| 4,000
| 4,361
|
|
|
| 34,462
|
| South Carolina 1.09%
|
|
|
County of Charleston, G.O. Capital Improvement Transportation Sales Tax Bonds, Series 2011,
5.00% 2024 (preref. 2021)
| 1,255
| 1,364
|
| Housing Fin. and Dev. Auth., Mortgage Rev. Bonds, Series 2016-B-2, AMT, 4.00% 2043
| 1,715
| 1,822
|
| Housing Fin. and Dev. Auth., Mortgage Rev. Bonds, Series 2017-A, 4.00% 2047
| 2,990
| 3,182
|
| Housing Fin. and Dev. Auth., Mortgage Rev. Bonds, Series 2017-B, 4.00% 2047
| 1,800
| 1,930
|
| Housing Fin. and Dev. Auth., Mortgage Rev. Bonds, Series 2018-A, 4.50% 2048
| 3,085
| 3,399
|
Limited Term Tax-Exempt Bond Fund of America
— Page 26 of 37
Bonds, notes & other debt instruments (continued)
South Carolina (continued)
| Principal amount
(000)
| Value
(000)
|
| Housing Fin. and Dev. Auth., Mortgage Rev. Ref. Bonds, Series 2016-A, 4.00% 2036
| $1,820
| $1,947
|
| Public Service Auth., Rev. Obligations (Santee Cooper), Series 2012-A, 5.00% 2021
| 515
| 558
|
| Public Service Auth., Rev. Obligations (Santee Cooper), Series 2012-D, 5.00% 2026
| 5,000
| 5,467
|
| Public Service Auth., Rev. Obligations (Santee Cooper), Series 2012-D, 5.00% 2028
| 6,305
| 6,866
|
| Public Service Auth., Rev. Obligations (Santee Cooper), Series 2014-C, 5.00% 2022
| 4,250
| 4,748
|
| Public Service Auth., Rev. Obligations (Santee Cooper), Series 2015-C, 5.00% 2021
| 4,430
| 4,802
|
| Public Service Auth., Rev. Obligations (Santee Cooper), Series 2015-C, 5.00% 2022
| 1,000
| 1,117
|
| Public Service Auth., Rev. Obligations (Santee Cooper), Series 2016-A, 5.00% 2028
| 2,455
| 2,959
|
Public Service Auth., Rev. Ref. Obligations (Santee Cooper), Series 2011-B,
4.00% 2019 (escrowed to maturity)
| 1,000
| 1,010
|
| County of Richland, Environmental Improvement Rev. Ref. Bonds, Series 2014-A, AMT, 3.875% 2023
| 4,900
| 5,220
|
|
|
| 46,391
|
| South Dakota 0.57%
|
|
|
| Housing Dev. Auth., Homeownership Mortgage Bonds, Series 2013-A, AMT, 3.00% 2030
| 360
| 366
|
| Housing Dev. Auth., Homeownership Mortgage Bonds, Series 2013-E, AMT, 4.00% 2044
| 360
| 375
|
| Housing Dev. Auth., Homeownership Mortgage Bonds, Series 2014-E, 4.00% 2044
| 235
| 247
|
| Housing Dev. Auth., Homeownership Mortgage Bonds, Series 2015-D, 4.00% 2045
| 835
| 884
|
| Housing Dev. Auth., Homeownership Mortgage Bonds, Series 2016-B, 3.50% 2046
| 1,005
| 1,055
|
| Housing Dev. Auth., Homeownership Mortgage Bonds, Series 2016-D, 3.50% 2046
| 9,515
| 10,015
|
| Housing Dev. Auth., Homeownership Mortgage Bonds, Series 2018-B, 4.50% 2048
| 3,225
| 3,580
|
| Housing Dev. Auth., Homeownership Mortgage Bonds, Series 2019-B, 4.00% 2049
| 5,200
| 5,694
|
| Housing Dev. Auth., Homeownership Mortgage Rev. Ref. Bonds, Series 2012-D, AMT, 4.00% 2029
| 545
| 560
|
| Housing Dev. Auth., Multi Family Rev. Bonds (Meadowland Apartments), Series 2019, 1.54% 2022 (put 2021)
| 1,500
| 1,502
|
|
|
| 24,278
|
| Tennessee 0.63%
|
|
|
| Housing Dev. Agcy., Homeownership Program Bonds, Series 2015-A, 3.50% 2045
| 560
| 591
|
| Housing Dev. Agcy., Homeownership Program Rev. Ref. Bonds, Series 2011-1-A, AMT, 4.50% 2031
| 650
| 676
|
| Housing Dev. Agcy., Homeownership Program Rev. Ref. Bonds, Series 2012-1-A, AMT, 4.50% 2038
| 240
| 249
|
| Housing Dev. Agcy., Residential Fin. Program Bonds, Series 2013-1-C, 3.00% 2038
| 1,115
| 1,140
|
| Housing Dev. Agcy., Residential Fin. Program Bonds, Series 2013-2-A, AMT, 4.00% 2043
| 670
| 699
|
| Housing Dev. Agcy., Residential Fin. Program Bonds, Series 2014-2-A, AMT, 4.00% 2045
| 245
| 258
|
| Housing Dev. Agcy., Residential Fin. Program Bonds, Series 2014-2-C, 4.00% 2045
| 450
| 475
|
| Housing Dev. Agcy., Residential Fin. Program Bonds, Series 2015-2-A, AMT, 4.00% 2046
| 605
| 641
|
| Housing Dev. Agcy., Residential Fin. Program Bonds, Series 2016-1-A, AMT, 3.50% 2047
| 1,415
| 1,485
|
| Housing Dev. Agcy., Residential Fin. Program Bonds, Series 2016-1-B, 3.50% 2047
| 165
| 174
|
| Housing Dev. Agcy., Residential Fin. Program Bonds, Series 2017-1, 4.00% 2042
| 2,960
| 3,175
|
| Housing Dev. Agcy., Residential Fin. Program Bonds, Series 2017-2A, AMT, 4.00% 2042
| 3,025
| 3,228
|
| Housing Dev. Agcy., Residential Fin. Program Bonds, Series 2017-B-2, 4.00% 2042
| 2,245
| 2,411
|
| Housing Dev. Agcy., Residential Fin. Program Bonds, Series 2019-1, 4.25% 2050
| 2,990
| 3,303
|
| County of Knox, Health, Educational and Housing Fac. Board, Collateralized Multi Family Housing Rev. Bonds (Clear Springs Apartments Project), Series 2019, 1.80%
2022 (put 2021)
| 725
| 730
|
| County of Knox, Health, Educational and Housing Fac. Board, Hospital Rev. Ref. Bonds (Covenant Health), Series 2012-A, 5.00% 2020
| 1,220
| 1,238
|
| County of Knox, Health, Educational and Housing Fac. Board, Hospital Rev. Ref. Bonds (Covenant Health), Series 2012-A, 5.00% 2022
| 3,320
| 3,601
|
| County of Knox, Health, Educational and Housing Fac. Board, Hospital Rev. Ref. Bonds (Covenant Health), Series 2012-A, 5.00% 2023
| 1,000
| 1,118
|
| Tennessee Energy Acquisition Corp., Gas Project Rev. Bonds, Series 2006-C, 5.00% 2021
| 1,580
| 1,655
|
|
|
| 26,847
|
Limited Term Tax-Exempt Bond Fund of America
— Page 27 of 37
Bonds, notes & other debt instruments (continued)
Texas 10.63%
| Principal amount
(000)
| Value
(000)
|
| Abilene Independent School Dist., Unlimited Tax School Building Bonds, Series 2019, 5.00% 2025
| $2,000
| $2,399
|
| Alamo Community College Dist., Limited Tax and Rev. Ref. Bonds, Series 2017, 5.00% 2028
| 8,625
| 10,857
|
Aldine Independent School Dist., Unlimited Tax School Building and Rev. Ref. Bonds, Series 2013,
5.00% 2020
| 1,495
| 1,526
|
| Arlington Higher Education Fin. Corp., Education Rev. Bonds (Uplift Education), Series 2016-A, 2.75% 2026
| 890
| 903
|
| Austin Convention Enterprises, Convention Center Hotel Rev. Ref. Bonds, Series 2017-A, 5.00% 2026
| 1,200
| 1,429
|
Austin Independent School Dist., Unlimited Tax School Building and Rev. Ref. Bonds, Series 2019,
5.00% 2025
| 6,760
| 8,211
|
| City of Austin, Water and Wastewater System Rev. Ref. Bonds, Series 2015-A, 5.00% 2030
| 2,960
| 3,559
|
| City of Austin, Water and Wastewater System Rev. Ref. Bonds, Series 2017, 5.00% 2026
| 1,625
| 2,027
|
County of Bexar, Combination Tax and Rev. Certificates of Obligation, Series 2013-B,
5.00% 2025 (preref. 2023)
| 4,710
| 5,398
|
County of Bexar, Combination Tax and Rev. Certificates of Obligation, Series 2013-B,
5.00% 2043 (preref. 2023)
| 1,500
| 1,719
|
| County of Bexar, Hospital Dist., Limited Tax Rev. Ref. Bonds, Series 2019, 5.00% 2025
| 1,260
| 1,508
|
| County of Bexar, Hospital Dist., Limited Tax Rev. Ref. Bonds, Series 2019, 5.00% 2026
| 4,455
| 5,451
|
| County of Bexar, Hospital Dist., Limited Tax Rev. Ref. Bonds, Series 2019, 5.00% 2031
| 2,000
| 2,494
|
Boerne Public Fac. Corp., Housing Rev. Bonds (LIV at Boerne Senior Apartments), Series 2018,
2.75% 2022 (put 2021)
| 905
| 933
|
| City of Brownsville, Utilities System Rev. Ref. Bonds, Series 2015, 5.00% 2021
| 1,500
| 1,614
|
| Canyon Independent School Dist., Unlimited Tax School Building Bonds, Series 2019, 5.00% 2024
| 1,390
| 1,621
|
| Canyon Independent School Dist., Unlimited Tax School Building Bonds, Series 2019, 5.00% 2025
| 1,875
| 2,243
|
| Canyon Independent School Dist., Unlimited Tax School Building Bonds, Series 2019, 5.00% 2026
| 3,940
| 4,821
|
| Canyon Independent School Dist., Unlimited Tax School Building Bonds, Series 2019, 5.00% 2027
| 2,145
| 2,679
|
| Capital Area Housing Fin. Corp., Multi Family Housing Rev. Bonds (Mission Trail at El Camino Real Apartments), Series 2019, 2.10% 2037 (put 2022)
| 2,995
| 3,034
|
| Carroll Independent School Dist., Unlimited Tax Rev. Ref. Bonds, Series 2019, 5.00% 2026
| 1,000
| 1,228
|
| Central Texas Regional Mobility Auth., Rev. Ref. Bonds, Series 2010, 5.75% 2020
| 1,000
| 1,018
|
| Central Texas Regional Mobility Auth., Rev. Ref. Bonds, Series 2015-B, 5.00% 2045 (put 2021)
| 1,900
| 1,961
|
| Central Texas Regional Mobility Auth., Rev. Ref. Bonds, Series 2016, 5.00% 2024
| 1,000
| 1,142
|
| Central Texas Regional Mobility Auth., Rev. Ref. Bonds, Series 2016, 5.00% 2025
| 1,000
| 1,171
|
| Central Texas Regional Mobility Auth., Rev. Ref. Bonds, Series 2016, 5.00% 2026
| 1,500
| 1,792
|
Clear Creek Independent School Dist., Unlimited Tax School Building Bonds, Series 2013-B,
3.00% 2032 (put 2019)
| 2,015
| 2,016
|
| Clear Creek Independent School Dist., Unlimited Tax School Building Bonds, Series 2018, 5.00% 2027
| 3,000
| 3,755
|
Clear Creek Independent School Dist., Unlimited Tax School Building Rev. Ref. Bonds, Series 2015-A,
5.00% 2025
| 2,000
| 2,398
|
| Clifton Higher Education Fin. Corp., Education Rev. Bonds (Idea Public Schools), Series 2018, 5.00% 2025
| 1,490
| 1,794
|
| Cypress-Fairbanks Independent School Dist., Unlimited Tax Rev. Ref. Bonds, Series 2016, 5.00% 2025
| 3,735
| 4,482
|
| Cypress-Fairbanks Independent School Dist., Unlimited Tax Rev. Ref. Bonds, Series 2019, 5.00% 2024
| 3,100
| 3,624
|
| Cypress-Fairbanks Independent School Dist., Unlimited Tax School Building and Rev. Ref. Bonds, Series 2016, 5.00% 2021
| 1,585
| 1,680
|
Cities of Dallas and Fort Worth, Dallas/Fort Worth International Airport, Joint Rev. Improvement Bonds,
Series 2013-A, AMT, 5.00% 2026
| 1,000
| 1,115
|
| Cities of Dallas and Fort Worth, Dallas/Fort Worth International Airport, Joint Rev. Ref. Bonds, Series 2011-C, 5.00% 2022
| 1,430
| 1,501
|
| Cities of Dallas and Fort Worth, Dallas/Fort Worth International Airport, Joint Rev. Ref. Bonds, Series 2012-B, 5.00% 2021
| 2,500
| 2,625
|
| Cities of Dallas and Fort Worth, Dallas/Fort Worth International Airport, Joint Rev. Ref. Bonds, Series 2014-A, AMT, 5.25% 2026
| 2,000
| 2,318
|
| City of Denton, Utility System Rev. Bonds, Series 2017, 5.00% 2028
| 7,320
| 8,992
|
| Dickinson Independent School Dist., Unlimited Tax Rev. Ref. Bonds, Series 2013, 1.35% 2037 (put 2019)
| 3,000
| 3,000
|
| Fort Bend Independent School Dist., Unlimited Tax Rev. Ref. Bonds, Series 2017-E, 5.00% 2027
| 6,945
| 8,675
|
| Frisco Independent School Dist., Unlimited Tax School Building and Rev. Ref. Bonds, Series 2019, 5.00% 2021
| 4,640
| 5,005
|
| G.O. Bonds, College Student Loan Bonds, Series 2011-A, AMT, 5.00% 2019
| 1,700
| 1,700
|
Limited Term Tax-Exempt Bond Fund of America
— Page 28 of 37
Bonds, notes & other debt instruments (continued)
Texas (continued)
| Principal amount
(000)
| Value
(000)
|
G.O. Bonds, Water Financial Assistance Rev. Ref. Bonds (Water Infrastructure Fund), Series 2019-E-1,
5.00% 2021
| $3,060
| $3,298
|
G.O. Bonds, Water Financial Assistance Rev. Ref. Bonds (Water Infrastructure Fund), Series 2019-E-2,
2.25% 2029
| 9,500
| 9,592
|
| G.O. Bonds, Water Financial Assistance Rev. Ref. Bonds, Series 2019-C-1, 5.00% 2021
| 1,500
| 1,617
|
| Grand Parkway Transportation Corp., Bond Anticipation Notes, Series 2018, 5.00% 2023
| 7,000
| 7,857
|
County of Harris, Cultural Education Facs. Fin. Corp., Hospital Rev. Bonds (Texas Children’s Hospital),
Series 2019-B, 5.00% 2041 (put 2024)
| 4,440
| 5,243
|
County of Harris, Cultural Education Facs. Fin. Corp., Hospital Rev. Bonds
(Memorial Hermann Health System), Series 2014-A, 5.00% 2025
| 2,850
| 3,350
|
| County of Harris, Cultural Education Facs. Fin. Corp., Hospital Rev. Ref. Bonds (Memorial Hermann Health System), Series 2013-B, (SIFMA Municipal Swap Index +
0.90%) 2.30% 20221
| 1,885
| 1,898
|
County of Harris, Sports Auth., Rev. Ref. Bonds, Series 2014-A, Assured Guaranty Municipal insured,
5.00% 2024
| 3,000
| 3,545
|
| County of Harris, Toll Road Rev. Bonds, Series 2009-A, 5.00% 2020
| 1,255
| 1,259
|
County of Harris, Toll Road Rev. Ref. Bonds, Series 2012-B,
(SIFMA Municipal Swap Index + 0.45%) 1.85% 20211
| 3,075
| 3,076
|
| County of Harris, Toll Road Rev. Ref. Bonds, Series 2016-A, 5.00% 2027
| 1,500
| 1,853
|
| Dept. of Housing and Community Affairs, Residential Mortgage Rev. Bonds, Series 2019-A, 4.75% 2049
| 4,360
| 4,899
|
| City of Houston, Airport System Rev. and Rev. Ref. Bonds, Series 2018-A, AMT, 5.00% 2028
| 1,000
| 1,254
|
| City of Houston, Airport System Rev. Ref. Bonds, Series 2011-B, 5.00% 2025
| 1,000
| 1,073
|
| City of Houston, Airport System Rev. Ref. Bonds, Series 2018-C, AMT, 5.00% 2026
| 5,010
| 6,071
|
| City of Houston, Combined Utility System Rev. and Rev. Ref. Bonds, Series 2016-B, 5.00% 2025
| 3,905
| 4,757
|
| City of Houston, Combined Utility System Rev. and Rev. Ref. Bonds, Series 2016-B, 5.00% 2027
| 4,500
| 5,583
|
| City of Houston, Combined Utility System Rev. Ref. Bonds, Series 2015-A, 5.00% 2036
| 3,315
| 3,883
|
City of Houston, Combined Utility System Rev. Ref. Bonds, Series 2018-C,
(1-month USD-LIBOR x 0.70 + 0.36%) 1.946% 2034 (put 2021)1
| 4,350
| 4,353
|
| City of Houston, Downtown Redev. Auth., Tax Increment Contract Rev. Ref. Bonds, Series 2015, BAM insured, 5.00% 2027
| 2,010
| 2,410
|
City of Houston, Higher Education Fin. Corp., Higher Education Rev. Bonds
(Rice University Project), Series 2010-A, 5.00% 2040 (preref. 2020)
| 3,275
| 3,374
|
| City of Houston, Public Improvement Rev. Ref. Bonds, Series 2009-A, 5.00% 2020
| 270
| 271
|
| City of Houston, Public Improvement Rev. Ref. Bonds, Series 2017-A, 5.00% 2022
| 2,250
| 2,469
|
| City of Houston, Public Improvement Rev. Ref. Bonds, Series 2017-A, 5.00% 2024
| 1,500
| 1,752
|
Houston Independent School Dist., Limited Tax Schoolhouse Bonds, Series 2014-A-1B,
2.20% 2039 (put 2020)
| 8,680
| 8,746
|
| Houston Independent School Dist., Limited Tax Schoolhouse Bonds, Series 2017, 3.00% 2021
| 10,580
| 10,885
|
| Houston Independent School Dist., Limited Tax Schoolhouse Rev. Ref. Bonds, Series 2017, 5.00% 2025
| 3,515
| 4,220
|
Hurst-Euless-Bedford Independent School Dist., Unlimited Tax School Building Bonds, Series 2019,
4.00% 2021
| 1,495
| 1,583
|
Hurst-Euless-Bedford Independent School Dist., Unlimited Tax School Building Bonds, Series 2019,
5.00% 2026
| 1,250
| 1,551
|
| Irving Independent School Dist., Unlimited Tax Rev. Ref. Bonds, Series 2015-A, 5.00% 2025
| 1,990
| 2,386
|
| City of Kerrville, Health Facs. Dev. Corp., Hospital Rev. Bonds (Peterson Regional Medical Center Project), Series 2015, 5.00% 2021
| 800
| 856
|
| City of Kerrville, Health Facs. Dev. Corp., Hospital Rev. Bonds (Peterson Regional Medical Center Project), Series 2015, 5.00% 2022
| 1,000
| 1,102
|
| Lake Travis Independent School Dist., Unlimited Tax School Building Bonds, Series 2019, 5.00% 2025
| 1,050
| 1,262
|
| Lake Travis Independent School Dist., Unlimited Tax School Building Bonds, Series 2019, 5.00% 2026
| 1,110
| 1,366
|
| Love Field Airport Modernization Corp., General Airport Rev. Bonds, Series 2017, AMT, 5.00% 2026
| 1,000
| 1,225
|
| Lower Colorado River Auth., Transmission Contract Rev. Ref. Bonds (LCRA Transmission Services Corp. Project), Series 2018, 5.00% 2024
| 2,250
| 2,639
|
| Lufkin Independent School Dist., Unlimited Tax Rev. Ref. Bonds, Series 2018, 5.00% 2027
| 2,095
| 2,654
|
| Mansfield Independent School Dist., Unlimited Tax Rev.Ref. Bonds, Series 2010, 5.00% 2020
| 5,890
| 6,014
|
Limited Term Tax-Exempt Bond Fund of America
— Page 29 of 37
Bonds, notes & other debt instruments (continued)
Texas (continued)
| Principal amount
(000)
| Value
(000)
|
County of Matagorda, Navigation Dist. No. 1, Pollution Control Rev. Ref. Bonds
(Central Power and Light Co. Project), Series 1996, AMT, 1.75% 2030 (put 2020)
| $3,600
| $3,593
|
Municipal Gas Acquisition and Supply Corp. II, Gas Supply Rev. Bonds, Series 2007-B,
(SIFMA Municipal Swap Index + 0.55%) 1.95% 20271
| 2,820
| 2,782
|
| Municipal Gas Acquisition and Supply Corp. III, Gas Supply Rev. Bonds, Series 2012, 5.00% 2021
| 4,000
| 4,309
|
| Municipal Gas Acquisition and Supply Corp. III, Gas Supply Rev. Bonds, Series 2012, 5.00% 2022
| 2,800
| 3,101
|
| Municipal Gas Acquisition and Supply Corp. III, Gas Supply Rev. Bonds, Series 2012, 5.00% 2023
| 2,000
| 2,222
|
| New Hope Cultural Education Facs. Fin. Corp., Hospital Rev. Bonds (Children’s Health System of Texas Project), Series 2017-A, 5.00% 2028
| 1,500
| 1,868
|
| New Hope Cultural Education Facs. Fin. Corp., Retirement Fac. Rev. Bonds (Westminster Project), Series 2016, 5.00% 2022
| 645
| 703
|
| New Hope Cultural Education Facs. Fin. Corp., Retirement Fac. Rev. Bonds (Westminster Project), Series 2016, 5.00% 2023
| 500
| 557
|
| New Hope Cultural Education Facs. Fin. Corp., Retirement Fac. Rev. Bonds (Westminster Project), Series 2016, 5.00% 2024
| 625
| 711
|
| New Hope Cultural Education Facs. Fin. Corp., Retirement Fac. Rev. Bonds (Westminster Project), Series 2016, 5.00% 2027
| 1,000
| 1,139
|
| New Hope Cultural Education Facs. Fin. Corp., Retirement Fac. Rev. Bonds (Westminster Project), Series 2016, 5.00% 2028
| 1,260
| 1,429
|
| New Hope Cultural Education Facs. Fin. Corp., Student Housing Rev. Bonds (CHF-Collegiate Housing Stephenville III, LLC - Tarleton State University Project), Series
2015-A, 5.00% 2030
| 800
| 882
|
| North East Independent School Dist., Unlimited Tax Rev. Ref. Bonds, Series 2015, 5.00% 2026
| 5,000
| 6,037
|
| North East Independent School Dist., Unlimited Tax Rev. Ref. Bonds, Series 2017, 2.375% 2047 (put 2022)
| 3,500
| 3,602
|
| North Texas Tollway Auth., System Rev. Ref. Bonds, Series 2014-A, 5.00% 2022
| 1,000
| 1,092
|
| North Texas Tollway Auth., System Rev. Ref. Bonds, Series 2014-A, 5.00% 2023
| 2,000
| 2,256
|
North Texas Tollway Auth., System Rev. Ref. Bonds, Series 2014-C,
(SIFMA Municipal Swap Index + 0.67%) 2.07% 2038 (put 2020)1
| 3,900
| 3,900
|
| North Texas Tollway Auth., System Rev. Ref. Bonds, Series 2016-A, 5.00% 2026
| 1,600
| 1,845
|
| North Texas Tollway Auth., System Rev. Ref. Bonds, Series 2016-A, 5.00% 2027
| 1,000
| 1,152
|
| North Texas Tollway Auth., System Rev. Ref. Bonds, Series 2016-A, 5.00% 2028
| 2,000
| 2,416
|
| North Texas Tollway Auth., System Rev. Ref. Bonds, Series 2019-A, 5.00% 2027
| 1,000
| 1,239
|
| North Texas Tollway Auth., System Rev. Ref. Bonds, Series 2019-A, 5.00% 2028
| 3,315
| 4,172
|
| North Texas Tollway Auth., System Rev. Ref. Bonds, Series 2019-A, 5.00% 2029
| 2,000
| 2,561
|
| Northwest Independent School Dist., Unlimited Tax Bonds, Series 2019, 5.00% 2021
| 1,330
| 1,409
|
| Northwest Independent School Dist., Unlimited Tax Bonds, Series 2019, 5.00% 2022
| 1,500
| 1,646
|
| Northwest Independent School Dist., Unlimited Tax Bonds, Series 2019, 5.00% 2023
| 530
| 601
|
| Pflugerville Independent School Dist., Unlimited Tax School Building Bonds, Series 2019-A, 5.00% 2022
| 3,170
| 3,480
|
| Pflugerville Independent School Dist., Unlimited Tax School Building Bonds, Series 2019-A, 5.00% 2023
| 1,715
| 1,943
|
| Plano Independent School Dist., Unlimited Tax School Building Bonds, Series 2016, 5.00% 2021
| 5,465
| 5,791
|
| Public Fin. Auth., G.O. Rev. Ref. Bonds, Series 2011, 5.00% 2020
| 3,955
| 4,136
|
| Richardson Independent School Dist., Unlimited Tax School Building Bonds, Series 2017, 5.00% 2020
| 1,000
| 1,021
|
| Richardson Independent School Dist., Unlimited Tax School Building Bonds, Series 2019, 5.00% 2020
| 2,000
| 2,042
|
| City of San Antonio, Airport System Rev. Ref. Bonds, Series 2012, AMT, 4.00% 2021
| 1,000
| 1,048
|
| City of San Antonio, Electric and Gas Systems Rev. Ref. Bonds, Series 2015-A, 2.25% 2033 (put 2019)
| 16,000
| 16,048
|
| City of San Antonio, Electric and Gas Systems Rev. Ref. Bonds, Series 2015-C, 3.00% 2045 (put 2019)
| 4,000
| 4,022
|
| City of San Antonio, Electric and Gas Systems Rev. Ref. Bonds, Series 2015-D, 3.00% 2045 (put 2020)
| 3,000
| 3,066
|
| City of San Antonio, Electric and Gas Systems Rev. Ref. Bonds, Series 2018, 2.75% 2048 (put 2022)
| 1,675
| 1,748
|
City of San Antonio, Passenger Fac. Charge and Airport System Rev. Ref. Bonds, Series 2012, AMT,
5.00% 2020
| 1,680
| 1,738
|
City of San Antonio, Passenger Fac. Charge and Airport System Rev. Ref. Bonds, Series 2012, AMT,
5.00% 2021
| 1,770
| 1,887
|
| Spring Independent School Dist., Unlimited Tax School Building Bonds, Series 2019, 5.00% 2024
| 1,500
| 1,777
|
| Spring Independent School Dist., Unlimited Tax School Building Bonds, Series 2019, 5.00% 2031
| 1,385
| 1,746
|
| County of Tarrant, Cultural Education Facs. Fin. Corp., Hospital Rev. Bonds (Baylor Scott & White Health Project), Series 2016-A, 5.00% 2029
| 5,020
| 6,046
|
Limited Term Tax-Exempt Bond Fund of America
— Page 30 of 37
Bonds, notes & other debt instruments (continued)
Texas (continued)
| Principal amount
(000)
| Value
(000)
|
| County of Tarrant, Health Facs. Dev. Corp., Hospital Rev. Bonds (Cook Children’s Medical Center Project), Series 2010-A, 4.50% 2022
| $500
| $505
|
| Board of Regents of the Texas A&M University System, Permanent University Fund Bonds, Series 2012-A, 5.00% 2021
| 1,500
| 1,611
|
Board of Regents of the Texas A&M University System, Rev. Fncg. System Bonds, Series 2015-B,
5.00% 2025 (preref. 2023)
| 1,585
| 1,815
|
| Texas City Independent School Dist., Unlimited Tax School Building Rev. Ref. Bonds, Series 2019, 5.00% 2025
| 1,500
| 1,817
|
Board of Regents of the Texas State University System, Rev. Fncg. System Rev. and Rev. Ref. Bonds,
Series 2017-A, 5.00% 2026
| 1,250
| 1,539
|
| Transportation Commission, Central Texas Turnpike System Rev. Ref. Bonds, Series 2015-C, 5.00% 2025
| 1,000
| 1,163
|
| Transportation Commission, G.O. Mobility Fund and Rev. Ref. Bonds, Series 2015-A, 5.00% 2025
| 6,000
| 7,309
|
| Transportation Commission, Highway Improvement G.O. Bonds, Series 2012-A, 5.00% 2020
| 7,625
| 7,824
|
| United Independent School Dist., Unlimited Tax School Building Bonds, Series 2019, 5.00% 2020
| 1,255
| 1,305
|
| United Independent School Dist., Unlimited Tax School Building Bonds, Series 2019, 5.00% 2025
| 1,030
| 1,246
|
| United Independent School Dist., Unlimited Tax School Building Bonds, Series 2019, 5.00% 2026
| 1,420
| 1,752
|
| United Independent School Dist., Unlimited Tax School Building Bonds, Series 2019, 5.00% 2027
| 1,490
| 1,871
|
| Board of Regents of the University of Houston System, Consolidated Rev. and Rev. Ref. Bonds, Series 2017-A, 5.00% 2024
| 7,500
| 8,749
|
| Board of Regents of the University of Houston System, Consolidated Rev. and Rev. Ref. Bonds, Series 2017-A, 5.00% 2026
| 2,620
| 3,215
|
| Board of Regents of the University of Houston System, Consolidated Rev. and Rev. Ref. Bonds, Series 2017-C, 5.00% 2028
| 2,500
| 3,042
|
| Board of Regents of the University of North Texas System, Rev. Fncg. System Rev. Ref. and Improvement Bonds, Series 2017-A, 5.00% 2024
| 1,665
| 1,952
|
| Board of Regents of the University of North Texas System, Rev. Fncg. System Rev. Ref. and Improvement Bonds, Series 2017-A, 5.00% 2025
| 1,255
| 1,511
|
| Board of Regents of the University of Texas System, Rev. Fncg. System Bonds, Series 2019-B, 5.00% 2029
| 7,135
| 9,342
|
| Water Dev. Board, State Revolving Rev. Fund, Rev. Bonds, Series 2018, 5.00% 2030
| 2,760
| 3,447
|
Water Dev. Board, State Water Implementation Rev. Fund, Rev. Bonds (Master Trust), Series 2018-A,
5.00% 2023
| 4,085
| 4,662
|
Water Dev. Board, State Water Implementation Rev. Fund, Rev. Bonds (Master Trust), Series 2018-A,
5.00% 2023
| 3,595
| 4,168
|
Water Dev. Board, State Water Implementation Rev. Fund, Rev. Bonds (Master Trust), Series 2018-A,
5.00% 2029
| 6,935
| 8,837
|
|
|
| 452,089
|
| Utah 0.10%
|
|
|
| Housing Corp., Single Family Mortgage Bonds, Class III, Series 2015-D-2, 4.00% 2045
| 3,875
| 4,131
|
| Vermont 0.26%
|
|
|
| Housing Fin. Agcy., Multiple Purpose Bonds, Series 2017-A, AMT, 4.00% 2047
| 2,840
| 3,036
|
| Housing Fin. Agcy., Multiple Purpose Bonds, Series 2018-A, 4.00% 2048
| 1,600
| 1,723
|
| Municipal Bond Bank, Rev. Ref. Bonds, Series 2009-1, 5.00% 2023 (preref. 2019)
| 875
| 886
|
| Student Assistance Corp., Education Loan Rev. Bonds, Series 2017-A, AMT, 5.00% 2022
| 400
| 438
|
| Student Assistance Corp., Education Loan Rev. Bonds, Series 2017-A, AMT, 5.00% 2023
| 1,150
| 1,291
|
| Student Assistance Corp., Education Loan Rev. Bonds, Series 2017-A, AMT, 5.00% 2024
| 850
| 976
|
| Student Assistance Corp., Education Loan Rev. Bonds, Series 2017-A, AMT, 5.00% 2025
| 875
| 1,025
|
| Student Assistance Corp., Education Loan Rev. Bonds, Series 2019-A, AMT, 5.00% 2025
| 1,300
| 1,523
|
|
|
| 10,898
|
Limited Term Tax-Exempt Bond Fund of America
— Page 31 of 37
Bonds, notes & other debt instruments (continued)
Virginia 1.91%
| Principal amount
(000)
| Value
(000)
|
College Building Auth., Educational Facs. Rev. Bonds (21st Century College and Equipment Programs),
Series 2012-A, 5.00% 2020
| $3,860
| $3,936
|
College Building Auth., Educational Facs. Rev. Bonds (21st Century College and Equipment Programs),
Series 2017-A, 5.00% 2020
| 1,320
| 1,346
|
College Building Auth., Educational Facs. Rev. Bonds (21st Century College and Equipment Programs),
Series 2019-A, 5.00% 2020
| 10,215
| 10,415
|
College Building Auth., Educational Facs. Rev. Bonds (21st Century College and Equipment Programs),
Series 2019-A, 5.00% 2023
| 9,000
| 10,204
|
| College Building Auth., Educational Facs. Rev. Ref. Bonds (21st Century College and Equipment Programs), Series 2015-A, 5.00% 2026 (preref. 2025)
| 5,400
| 6,498
|
| Commonwealth Transportation Board, Federal Transportation Grant Anticipation Rev. and Rev. Ref. Notes, Series 2017, 5.00% 2026
| 7,930
| 9,795
|
| Town of Farmville, Industrial Dev. Auth., Educational Facs. Rev. Ref. Bonds (Longwood University Student Housing Project), Series 2018-A, 5.00% 2030
| 1,000
| 1,182
|
| G.O. Bonds, Series 2015-A, 5.00% 2026
| 11,795
| 14,357
|
| G.O. Bonds, Series 2016-B, 5.00% 2021
| 2,075
| 2,223
|
| Town of Louisa, Industrial Dev. Auth., Pollution Control Rev. Ref. Bonds (Virginia Electric and Power Co. Project), Series 2008-A, 1.90% 2035 (put 2023)
| 3,000
| 3,046
|
| City of Richmond, Public Utility Rev. and Rev. Ref. Bonds, Series 2016-A, 5.00% 2028
| 5,500
| 6,721
|
County of Wise, Industrial Dev. Auth., Solid Waste and Sewage Disposal Rev. Bonds
(Virginia Electric and Power Co. Project), Series 2009-A, 2.15% 2040 (put 2020)
| 11,500
| 11,604
|
|
|
| 81,327
|
| Washington 3.30%
|
|
|
| Econ. Dev. Fin. Auth., Solid Waste Disposal Rev. Bonds (Waste Management, Inc. Project), Series 2008, 2.125% 20202
| 4,250
| 4,251
|
| Energy Northwest, Columbia Generating Station Electric Rev. Ref. Bonds, Series 2014-A, 5.00% 2021
| 2,250
| 2,419
|
| Federal Highway Grant Anticipation Rev. Bonds (SR 520 Corridor Program), Series 2014-C, 5.00% 2019
| 1,000
| 1,003
|
| G.O. Bonds, Series 2012-D, 5.00% 2023
| 5,015
| 5,500
|
| G.O. Bonds, Series 2014-A, 5.00% 2024
| 2,390
| 2,753
|
| G.O. Bonds, Series 2017-D, 5.00% 2027
| 7,000
| 8,782
|
| G.O. Bonds, Series 2017-D, 5.00% 2028
| 5,000
| 6,232
|
| G.O. Bonds, Series 2019-C, 5.00% 2031
| 5,000
| 6,408
|
| G.O. Rev. Ref. Bonds, Series 2012-R-C, 5.00% 2020
| 4,680
| 4,849
|
| G.O. Rev. Ref. Bonds, Series 2016-R-B, 5.00% 2029
| 10,205
| 12,323
|
| G.O. Rev. Ref. Bonds, Series 2018-R-D, 5.00% 2027
| 10,000
| 12,675
|
County of Grant, Public Utility Dist. No. 2, Electric System Rev. Ref. Bonds, Series 2017-N,
2.00% 2044 (put 2020)
| 5,000
| 5,027
|
Health Care Facs. Auth., Rev. Bonds (Catholic Health Initiatives), Series 2013-B-1,
(SIFMA Municipal Swap Index + 1.00%) 2.40% 2035 (put 2021)1
| 15,100
| 15,127
|
| Health Care Facs. Auth., Rev. Bonds (Kadlec Regional Medical Center), Series 2012, 5.00% 2042 (preref. 2021)
| 2,805
| 3,051
|
| Health Care Facs. Auth., Rev. Ref. Bonds (PeaceHealth), Series 2014-A, 5.00% 2026
| 1,000
| 1,161
|
Health Care Facs. Auth., Rev. Ref. Bonds (Providence Health & Services), Series 2012-B,
5.00% 2042 (put 2021)
| 1,000
| 1,079
|
| Health Care Facs. Auth., Rev. Ref. Bonds (Providence St. Joseph Health), Series 2018-B, 5.00% 2027
| 2,000
| 2,507
|
| Health Care Facs. Auth., Rev. Ref. Bonds (Seattle Children’s Hospital), Series 2010-B, 5.00% 2021
| 1,235
| 1,289
|
| Housing Fin. Commission, Homeownership Program Bonds, Series 2011-A, 4.50% 2029
| 130
| 132
|
| Housing Fin. Commission, Nonprofit Housing Rev. and Rev. Ref. Bonds (Horizon House Project), Series 2017, 5.00% 20222
| 540
| 575
|
| Housing Fin. Commission, Nonprofit Housing Rev. and Rev. Ref. Bonds (Horizon House Project), Series 2017, 5.00% 20242
| 610
| 678
|
| Housing Fin. Commission, Nonprofit Housing Rev. and Rev. Ref. Bonds (Horizon House Project), Series 2017, 5.00% 20262
| 1,325
| 1,528
|
| Housing Fin. Commission, Single Family Program Bonds, Series 2014-2A-R, AMT, 3.50% 2044
| 330
| 340
|
| Housing Fin. Commission, Single Family Program Bonds, Series 2019-1-N, 4.00% 2049
| 3,325
| 3,645
|
Limited Term Tax-Exempt Bond Fund of America
— Page 32 of 37
Bonds, notes & other debt instruments (continued)
Washington (continued)
| Principal amount
(000)
| Value
(000)
|
| Housing Fin. Commission, Single Family Program Rev. Ref. Bonds, Series 2015-A-R, AMT, 3.50% 2038
| $745
| $772
|
| Motor Vehicle Fuel Tax G.O. Bonds, Series 2012-E, 5.00% 2021
| 1,120
| 1,186
|
| City of Seattle, Municipal Light and Power Improvement Rev. Ref. Bonds, Series 2010-B, 5.00% 2021
| 2,205
| 2,248
|
City of Seattle, Municipal Light and Power Improvement Rev. Ref. Bonds, Series 2018-C-2,
(SIFMA Municipal Swap Index + 0.49%) 1.89% 2046 (put 2023)1
| 4,500
| 4,527
|
| Port of Seattle, Intermediate Lien Rev. Bonds, Series 2017-C, AMT, 5.00% 2026
| 2,500
| 3,039
|
| Port of Seattle, Rev. Bonds, Series 2017-C, AMT, 5.00% 2025
| 2,500
| 2,980
|
| Port of Seattle, Rev. Bonds, Series 2017-C, AMT, 5.00% 2027
| 2,500
| 3,089
|
| Port of Seattle, Rev. Bonds, Series 2018-A, AMT, 5.00% 2025
| 5,250
| 6,257
|
| Port of Seattle, Rev. Bonds, Series 2018-A, AMT, 5.00% 2028
| 4,750
| 5,839
|
| Port of Seattle, Rev. Ref. Bonds, Series 2015-C, AMT, 5.00% 2029
| 1,000
| 1,156
|
| Port of Seattle, Special Fac. Rev. Ref. Bonds (SEATAC Fuel Facs. LLC), Series 2013, AMT, 5.00% 2022
| 1,000
| 1,102
|
| Port of Seattle, Special Fac. Rev. Ref. Bonds (SEATAC Fuel Facs. LLC), Series 2013, AMT, 5.00% 2023
| 1,100
| 1,247
|
| County of Skagit, Public Hospital Dist. No. 1 (Skagit Regional Health), Hospital Rev. Improvement and Rev. Ref. Bonds, Series 2016, 4.00% 2026
| 2,300
| 2,606
|
| Spokane School Dist., Unlimited Tax G.O. Bonds, Series 2011, 5.00% 2030 (preref. 2021)
| 1,000
| 1,089
|
|
|
| 140,471
|
| West Virginia 0.47%
|
|
|
Econ. Dev. Auth., Solid Waste Disposal Facs. Rev. Bonds (Appalachian Power Co. - Amos Project),
Series 2009-B, 2.625% 2042 (put 2022)
| 6,250
| 6,385
|
Econ. Dev. Auth., Solid Waste Disposal Facs. Rev. Bonds (Appalachian Power Co. - Amos Project),
Series 2011-A, AMT, 1.70% 2041 (put 2020)
| 2,900
| 2,899
|
Econ. Dev. Auth., Solid Waste Disposal Facs. Rev. Ref. Bonds (Appalachian Power Co. - Amos Project),
Series 2015-A, 2.55% 2040 (put 2024)
| 1,250
| 1,285
|
Econ. Dev. Auth., Solid Waste Disposal Facs. Rev. Ref. Bonds (Wheeling Power Co. - Mitchell Project),
Series 2013-A, AMT, 3.00% 2037 (put 2022)
| 5,200
| 5,281
|
| County of Harrison, Solid Waste Disposal Rev. Ref. Bonds (Monongahela Power Co. Project), Series 2018-A, AMT, 3.00% 2037 (put 2021)
| 4,000
| 4,024
|
|
|
| 19,874
|
| Wisconsin 3.43%
|
|
|
| G.O. Bonds, Series 2013-A, 5.00% 2025 (preref. 2022)
| 9,250
| 10,231
|
| G.O. Bonds, Series 2015-A, 5.00% 2031 (preref. 2023)
| 12,385
| 14,163
|
Health and Educational Facs. Auth., Health Facs. Rev. Bonds (SSM Health Care), Series 2018-B,
5.00% 2038 (put 2023)
| 11,000
| 12,171
|
Health and Educational Facs. Auth., Rev. Bonds (Advocate Aurora Health Care Credit Group),
Series 2018-C-3, (SIFMA Municipal Swap Index + 0.55%) 1.95% 2054 (put 2023)1
| 5,200
| 5,204
|
Health and Educational Facs. Auth., Rev. Bonds (Advocate Aurora Health Care Credit Group),
Series 2018-C-4, (SIFMA Municipal Swap Index + 0.65%) 2.05% 2054 (put 2024)1
| 4,000
| 4,016
|
| Health and Educational Facs. Auth., Rev. Bonds (Ascension Health Senior Credit Group), Series 2013-B-1, 1.375% 2038 (put 2019)
| 5,105
| 5,107
|
| Health and Educational Facs. Auth., Rev. Bonds (Ascension Health Senior Credit Group), Series 2013-B-3, 5.00% 2043 (put 2020)
| 10,310
| 10,628
|
Health and Educational Facs. Auth., Rev. Bonds (Children’s Hospital of Wisconsin, Inc.), Series 2008-B,
5.375% 2037 (preref. 2020)
| 2,000
| 2,045
|
Health and Educational Facs. Auth., Rev. Bonds (Marshfield Clinic Health System, Inc.), Series 2016-B,
5.00% 2026
| 1,000
| 1,202
|
Health and Educational Facs. Auth., Rev. Bonds (Marshfield Clinic Health System, Inc.), Series 2016-B,
5.00% 2027
| 1,000
| 1,192
|
Health and Educational Facs. Auth., Rev. Ref. Bonds (Aurora Health Care, Inc.), Series 2012-A,
5.00% 2021 (escrowed to maturity)
| 7,765
| 8,347
|
Health and Educational Facs. Auth., Rev. Ref. Bonds (Ministry Health Care, Inc.), Series 2012-C,
5.00% 2021 (escrowed to maturity)
| 1,200
| 1,292
|
Limited Term Tax-Exempt Bond Fund of America
— Page 33 of 37
Bonds, notes & other debt instruments (continued)
Wisconsin (continued)
| Principal amount
(000)
| Value
(000)
|
| Health and Educational Facs. Auth., Rev. Ref. Bonds (ProHealth Care, Inc. Obligated Group), Series 2015, 5.00% 2031
| $1,650
| $1,876
|
| Housing and Econ. Dev. Auth., Home Ownership Mortgage Rev. Bonds, Series 2017-A, 2.69% 2047
| 6,707
| 6,732
|
| Housing and Econ. Dev. Auth., Home Ownership Rev. Bonds, Series 2015-A, AMT, 4.00% 2045
| 4,545
| 4,762
|
| Housing and Econ. Dev. Auth., Home Ownership Rev. Bonds, Series 2016-A, AMT, 3.50% 2046
| 6,250
| 6,515
|
| Housing and Econ. Dev. Auth., Home Ownership Rev. Bonds, Series 2017-C, 4.00% 2048
| 6,065
| 6,483
|
| Housing and Econ. Dev. Auth., Home Ownership Rev. Bonds, Series 2018-B, 4.00% 2048
| 3,430
| 3,677
|
| Housing and Econ. Dev. Auth., Home Ownership Rev. Bonds, Series 2019-A, 4.25% 2049
| 18,210
| 20,095
|
| Housing and Econ. Dev. Auth., Housing Rev. Bonds, Series 2017-A, 1.95% 2047 (put 2020)
| 5,000
| 5,005
|
| County of Milwaukee, Airport Rev. Ref. Bonds, Series 2010-B, AMT, 5.00% 2020
| 1,500
| 1,518
|
| County of Milwaukee, Airport Rev. Ref. Bonds, Series 2016-A, AMT, 5.00% 2023
| 1,475
| 1,691
|
| County of Milwaukee, Airport Rev. Ref. Bonds, Series 2016-A, AMT, 5.00% 2024
| 1,550
| 1,821
|
| Public Fin. Auth., Solid Waste Disposal Rev. Ref. Bonds (Waste Management, Inc. Project), Series 2017-A-3, AMT, 1.95% 2027 (put 2019)
| 8,505
| 8,505
|
| Public Fin. Auth., Student Housing Rev. Bonds (Beyond Boone, LLC - Appalachian State University Project), Series 2019-A, Assured Guaranty Municipal insured, 5.00%
2030
| 630
| 766
|
Public Fin. Auth., Tax Increment Fin. Grant Rev. Bonds (Statler Hilton & Dallas Central Library),
Capital Appreciation Bonds, Series 2016, 0% 2027
| 1,000
| 735
|
|
|
| 145,779
|
| Wyoming 0.20%
|
|
|
| Community Dev. Auth., Housing Rev. Bonds, Series 2015-3, 3.00% 2044
| 430
| 441
|
| Community Dev. Auth., Housing Rev. Bonds, Series 2015-6, 4.00% 2045
| 2,470
| 2,585
|
| Community Dev. Auth., Housing Rev. Bonds, Series 2019-1, 4.00% 2048
| 5,000
| 5,463
|
|
|
| 8,489
|
| Total bonds, notes & other debt instruments (cost: $3,827,712,000)
|
| 3,935,980
|
| Short-term securities 6.89%
|
|
|
| Freddie Mac, Multi Family Certificates, Series 2017-M-051, 1.63% 20351
| 6,000
| 6,000
|
| State of Arizona, Industrial Dev. Auth., Hospital Rev. Ref. Bonds (Phoenix Children’s Hospital), Series 2019-B, 1.49% 20481
| 23,575
| 23,575
|
| State of California, Pollution Control Fncg. Auth., Solid Waste Disposal Rev. Ref. Bonds (Republic Services, Inc. Project), Series 2010-A, AMT, 1.90% 2023 (put
2019)2,4
| 14,705
| 14,705
|
| State of Florida, County of Alachua, Health Facs. Auth., IAM Commercial Paper (Shands HealthCare Project), Series 2019-A, 1.46% 8/6/2019
| 2,000
| 2,000
|
| State of Florida, Lee Memorial Health System Hospital Rev Bonds, Series 2019-B, 1.60% 20491
| 5,000
| 5,000
|
| State of Florida, Mission Econ. Dev. Corp., Solid Waste Disposal Rev. Ref. Bonds (Republic Services, Inc. Project), Series 2012, AMT, 1.90% 2026 (put 2019)4
| 9,500
| 9,500
|
| State of Florida, Municipal Power Agcy., All-Requirements Power Supply Project Demand Rev. Ref. Bonds, Series 2008-C, 1.49% 20351
| 4,000
| 4,000
|
| State of Idaho, Tax Anticipation Notes, Series 2019, 3.00% 6/30/2020
| 6,000
| 6,097
|
State of Louisiana, Public Facs. Auth., Rev. Bonds (Air Products and Chemicals Project), Series 2008-A,
1.50% 20431
| 4,000
| 4,000
|
State of Maryland, Health and Higher Educational Facs. Auth., IAM Commercial Paper, Series 2019,
1.44% 8/6/2019
| 1,590
| 1,590
|
| State of Maryland, County of Montgomery, IAM Commercial Paper, Series 2019-A, 1.34% 10/3/2019
| 16,000
| 16,000
|
| State of Maryland, County of Montgomery, IAM Commercial Paper, Series 2019-A, 1.38% 8/6/2019
| 2,000
| 2,000
|
State of Maryland, County of Montgomery, Rev. Bonds (Trinity Health Credit Group), Series 2013,
1.43% 2041 (put 2019)4
| 6,000
| 6,001
|
State of Massachusetts, Health and Educational Facs. Auth., IAM Commercial Paper (Harvard University),
Series 2019, 1.30% 10/16/2019
| 10,000
| 10,000
|
State of Michigan, Strategic Fund, Demand Limited Obligation Rev. Bonds
(Air Products and Chemicals, Inc. Project), Series 2007, 1.50% 20421
| 7,630
| 7,630
|
Limited Term Tax-Exempt Bond Fund of America
— Page 34 of 37
| Short-term securities (continued)
| Principal amount
(000)
| Value
(000)
|
State of Mississippi, Business Fin. Corp., Gulf Opportunity Zone Industrial Dev. Rev. Bonds
(Chevron U.S.A. Inc. Project), Series 2007-D, 1.48% 20301
| $3,000
| $3,000
|
State of Mississippi, Business Fin. Corp., Gulf Opportunity Zone Industrial Dev. Rev. Bonds
(Chevron U.S.A. Inc. Project), Series 2010-J, 1.48% 20351
| 4,750
| 4,750
|
State of Mississippi, Business Fin. Corp., Gulf Opportunity Zone Industrial Dev. Rev. Bonds
(Chevron U.S.A. Inc. Project), Series 2011-E, 1.48% 20351
| 5,950
| 5,950
|
State of New Hampshire, Health and Education Facs. Auth., Rev. Ref. Bonds (Dartmouth College Issue),
Series 2007-B, 1.48% 20411
| 3,500
| 3,500
|
State of New York, Metropolitan Transportation Auth., Transportation Rev. Bond Anticipation Notes,
Series 2018-A-1, 4.00% 8/15/2019
| 8,500
| 8,507
|
| State of New York, New York City G.O. Bonds, Fiscal 2008, Series 2008-L-5, 1.47% 20351
| 2,000
| 2,000
|
State of New York, New York City Municipal Water Fin. Auth., Water and Sewer System Rev. Bonds,
Fiscal 2012, Series 2012-B, 1.49% 20451
| 3,000
| 3,000
|
| State of New York, New York City Municipal Water Fin. Auth., Water and Sewer System Second General Resolution Rev. Bonds, Fiscal 2008, Series 2008-B-3, 1.47%
20251
| 3,900
| 3,900
|
State of New York, New York City Transitional Fin. Auth., Future Tax Secured Bonds, Fiscal 2016,
Series 2016-A-4, 1.47% 20411
| 2,935
| 2,935
|
State of New York, New York City Transitional Fin. Auth., Recovery Bonds, Fiscal 2003, Series 2002-1-C,
1.47% 20311
| 1,350
| 1,350
|
| State of New York, Thruway Auth., General Rev. Indebtedness Obligation Anticipation Notes, Series 2019-A, 4.00% 2/1/2020
| 10,175
| 10,218
|
| State of New York, Triborough Bridge and Tunnel Auth., General Rev. Bonds (MTA Bridges and Tunnels), Series 2003-B-1, 1.46% 20331
| 5,000
| 5,000
|
State of North Carolina, Capital Facs. Fin. Agcy., IAM Commercial Paper (Duke University), Series 2019,
1.42% 9/4/2019
| 2,000
| 2,000
|
| State of Ohio, Hospital Rev. Bonds (University Hospitals Health System Inc.), Series 2013, 1.62% 20331
| 10,375
| 10,375
|
| State of Pennsylvania, Econ. Dev. Fncg. Auth., Solid Waste Disposal Rev. Bonds (Republic Services, Inc. Project), Series 2014, AMT, 1.60% 2044 (put 2019)4
| 7,950
| 7,953
|
| State of Pennsylvania, Econ. Dev. Fncg. Auth., Solid Waste Disposal Rev. Bonds (Waste Management, Inc. Project), Series 2013, AMT, 2.15% 2045 (put 2019)4
| 11,135
| 11,135
|
State of Rhode Island, Health and Educational Building Corp., Higher Education Facs. Rev. Bonds
(Roger Williams University Issue), Series 2008-B, 1.39% 20381
| 5,000
| 5,000
|
State of Tennessee, County of Montgomery, Public Building Auth., Pooled Fncg. Rev. Bonds
(Tennessee County Loan Pool), Series 2004, Bank of America LOC, 1.53% 20341
| 1,275
| 1,275
|
State of Texas, County of Harris, Industrial Dev. Corp., Pollution Control Rev. Bonds
(Exxon Project), Series 1984-A, 1.47% 20241
| 4,400
| 4,400
|
State of Texas, City of Houston, Combined Utility System IAM Commercial Paper, Series 2019,
1.27% 9/6/2019
| 5,000
| 5,000
|
State of Texas, City of Houston, Combined Utility System IAM Commercial Paper, Series 2019,
1.29% 9/6/2019
| 2,000
| 2,000
|
| State of Texas, City of Houston, Tax and Rev. Anticipation Notes, Series 2019, 5.00% 6/26/2020
| 4,500
| 4,655
|
| State of Texas, County of Jefferson, Port Arthur Navigation Dist., Exempt Facs. Rev. Bonds (Emerald Renewable Diesel LLC Project), Series 2018, AMT, 1.90% 2049
(put 2019)2,4
| 5,000
| 5,002
|
State of Texas, Port Arthur Navigation Dist. Industrial Dev. Corp., Rev. Bonds (Air Products Project),
Series 2005, 1.50% 20401
| 3,000
| 3,000
|
| State of Texas, Tax and Rev. Anticipation Notes, Series 2018, 4.00% 8/29/2019
| 11,695
| 11,718
|
| State of Texas, Board of Regents of the University of Texas System, IAM Commercial Paper, Series 2019, 1.32% 10/4/2019
| 7,000
| 7,000
|
| State of Texas, Board of Regents of the University of Texas System, IAM Commercial Paper, Series 2019, 1.35% 8/5/2019
| 6,000
| 6,000
|
| State of Texas, Board of Regents of the University of Texas System, IAM Commercial Paper, Series 2019, 1.40% 8/8/2019
| 5,500
| 5,500
|
| State of Texas, Board of Regents of the University of Texas System, IAM Commercial Paper, Series 2019, 1.50% 11/4/2019
| 5,000
| 5,000
|
Limited Term Tax-Exempt Bond Fund of America
— Page 35 of 37
| Short-term securities (continued)
| Principal amount
(000)
| Value
(000)
|
State of Texas, Waterworks Auth., Water and Wastewater System IAM Commercial Paper, Series 2019,
1.46% 9/3/2019
| $10,000
| $10,000
|
State of Virginia, Rector and Visitors of the University of Virginia, IAM Commercial Paper, Series 2019,
1.62% 8/6/2019
| 2,000
| 2,000
|
| State of Wisconsin, Public Fin. Auth., Solid Waste Disposal Rev. Ref. Bonds (Waste Management, Inc. Project), Series 2017-A-2, AMT, 1.95% 2025 (put 2019)4
| 10,680
| 10,680
|
| State of Wyoming, County of Sublette, Pollution Control Rev. Ref. Bonds (ExxonMobil Project), Series 2014, 1.47% 20441
| 1,000
| 1,000
|
| Total short-term securities (cost: $292,879,000)
|
| 292,901
|
| Total investment securities 99.44% (cost: $4,120,591,000)
|
| 4,228,881
|
| Other assets less liabilities 0.56%
|
| 23,927
|
| Net assets 100.00%
|
| $4,252,808
|
Futures contracts
| Contracts
| Type
| Number of
contracts
| Expiration
| Notional
amount5
(000)
| Value at
7/31/20196
(000)
| Unrealized
(depreciation)
appreciation
at 7/31/2019
(000)
|
| 2 Year U.S. Treasury Note Futures
| Long
| 5,080
| October 2019
| $1,016,000
| $1,089,184
| $(1,917)
|
| 5 Year U.S. Treasury Note Futures
| Short
| 1,737
| October 2019
| (173,700)
| (204,193)
| 122
|
|
|
|
|
|
|
| $(1,795)
|
| 1
| Coupon rate may change periodically. For short-term securities, the date of the next scheduled coupon rate change is considered to be the maturity date.
|
| 2
| Acquired in a transaction exempt from registration under Rule 144A of the Securities Act of 1933. May be resold in the U.S. in transactions exempt from registration, normally to
qualified institutional buyers. The total value of all such securities was $35,489,000, which represented .83% of the net assets of the fund.
|
| 3
| Step bond; coupon rate may change at a later date.
|
| 4
| For short-term securities, the mandatory put date is considered to be the maturity date.
|
| 5
| Notional amount is calculated based on the number of contracts and notional contract size.
|
| 6
| Value is calculated based on the notional amount and current market price.
|
| Key to abbreviations and symbol
|
|
| Agcy. = Agency
| Fncg. = Financing
|
| AMT = Alternative Minimum Tax
| G.O. = General Obligation
|
| Auth. = Authority
| LIBOR = London Interbank Offered Rate
|
| Certs. of Part. = Certificates of Participation
| LOC = Letter of Credit
|
| Dept. = Department
| Preref. = Prerefunded
|
| Dev. = Development
| Redev. = Redevelopment
|
| Dist. = District
| Ref. = Refunding
|
| Econ. = Economic
| Rev. = Revenue
|
| Fac. = Facility
| SIFMA = Securities Industry and Financial Markets Association
|
| Facs. = Facilities
| USD/$ = U.S. dollars
|
| Fin. = Finance
|
|
Limited Term Tax-Exempt Bond Fund of America
— Page 36 of 37
Additional financial disclosures
are included in the fund’s current shareholder report and should be read in conjunction with this report.
Investments are not FDIC-insured, nor
are they deposits of or guaranteed by a bank or any other entity, so they may lose value.
Investors should carefully consider
investment objectives, risks, charges and expenses. This and other important information is contained in the fund prospectus and summary prospectus, which can be obtained from your financial professional and should be
read carefully before investing. You may also call American Funds Service Company (AFS) at (800) 421-4225 or visit the American Funds website at capitalgroup.com.
All Capital Group trademarks
mentioned are owned by The Capital Group Companies, Inc., an affiliated company or fund. All other company and product names mentioned are the property of their respective companies.
American Funds Distributors, Inc.,
member FINRA.
© 2019 Capital Group. All
rights reserved.
| MFGEFPX-043-0919O-S73124
| Limited Term Tax-Exempt Bond Fund of America — Page 37 of 37
|
The Tax-Exempt Bond Fund of
America®
Investment portfolio
July 31, 2019
Bonds, notes & other debt instruments 93.63%
Alabama 1.20%
| Principal amount
(000)
| Value
(000)
|
| Auburn University, General Fee Rev. Bonds, Series 2018-A, 5.00% 2036
| $4,440
| $5,478
|
| City of Birmingham, Special Care Facs. Fncg. Auth., Rev. Bonds (Ascension Health Senior Credit Group), Series 2016-B, 5.00% 2046
| 500
| 575
|
| City of Birmingham, Water Works Board, Water Rev. Ref. Bonds, Series 2016-B, 5.00% 2035
| 6,450
| 7,699
|
| City of Birmingham, Water Works Board, Water Rev. Ref. Bonds, Series 2016-B, 5.00% 2043
| 23,200
| 27,152
|
Black Belt Energy Gas Dist., Gas Supply Prepay Rev. Bonds (Project No. 3), Series 2018-A,
4.00% 2048 (put 2023)
| 2,500
| 2,712
|
| Black Belt Energy Gas Dist., Gas Supply Rev. Bonds, Series 2017-A, 4.00% 2047 (put 2022)
| 40,000
| 42,718
|
Federal Aid Highway Fin. Auth., Federal Highway Grant Anticipation Bonds, Series 2012,
5.00% 2021
| 10,000
| 10,779
|
Federal Aid Highway Fin. Auth., Federal Highway Grant Anticipation Bonds, Series 2012,
5.00% 2025 (preref. 2022)
| 2,000
| 2,237
|
| County of Houston, Health Care Auth., Hospital Rev. Bonds, Series 2016-A, 5.00% 2030
| 3,000
| 3,468
|
| City of Huntsville, Electric Rev. Bonds, Series 2017-A, 5.00% 2031
| 640
| 788
|
| City of Huntsville, Electric Rev. Bonds, Series 2017-A, 5.00% 2032
| 400
| 490
|
| City of Huntsville, Electric Rev. Bonds, Series 2017-A, 5.00% 2033
| 700
| 854
|
| Incentives Fncg. Auth., Special Obligation Bonds, Series 2009-C, 5.00% 2024
| 2,375
| 2,382
|
| Incentives Fncg. Auth., Special Obligation Bonds, Series 2009-C, 5.00% 2029
| 1,250
| 1,254
|
| County of Jefferson, G.O. Rev. Ref. Bonds, Series 2018-A, 5.00% 2021
| 1,250
| 1,327
|
| County of Jefferson, G.O. Rev. Ref. Bonds, Series 2018-A, 5.00% 2022
| 2,250
| 2,460
|
| County of Jefferson, G.O. Rev. Ref. Bonds, Series 2018-A, 5.00% 2023
| 1,750
| 1,971
|
| County of Jefferson, Limited Obligation Rev. Ref. Bonds, Series 2017, 5.00% 2027
| 3,000
| 3,690
|
| County of Jefferson, Limited Obligation Rev. Ref. Bonds, Series 2017, 5.00% 2028
| 2,500
| 3,063
|
| County of Jefferson, Limited Obligation Rev. Ref. Bonds, Series 2017, 5.00% 2029
| 5,000
| 6,094
|
| County of Jefferson, Limited Obligation Rev. Ref. Bonds, Series 2017, 5.00% 2030
| 5,000
| 6,057
|
| County of Jefferson, Limited Obligation Rev. Ref. Bonds, Series 2017, 5.00% 2031
| 7,500
| 9,038
|
| County of Jefferson, Limited Obligation Rev. Ref. Bonds, Series 2017, 5.00% 2032
| 2,250
| 2,703
|
| County of Jefferson, Limited Obligation Rev. Ref. Bonds, Series 2017, 5.00% 2033
| 5,040
| 6,033
|
| County of Jefferson, Limited Obligation Rev. Ref. Bonds, Series 2017, 5.00% 2034
| 8,200
| 9,780
|
| County of Jefferson, Sewer Rev. Warrants, Series 2013-A, Assured Guaranty Municipal insured, 5.00% 2044
| 22,340
| 25,128
|
| County of Jefferson, Sewer Rev. Warrants, Series 2013-A, Assured Guaranty Municipal insured, 5.25% 2048
| 16,065
| 18,228
|
| County of Jefferson, Sewer Rev. Warrants, Series 2013-D, 6.00% 2042
| 11,300
| 13,371
|
| County of Jefferson, Sewer Rev. Warrants, Series 2013-D, 6.50% 2053
| 13,000
| 15,583
|
| County of Jefferson, Sewer Rev. Warrants, Series 2013-D, 7.00% 2051
| 1,500
| 1,830
|
| Lower Alabama Gas Dist., Gas Project Rev. Bonds, Series 2016-A, 5.00% 2031
| 5,000
| 6,253
|
| Lower Alabama Gas Dist., Gas Project Rev. Bonds, Series 2016-A, 5.00% 2046
| 6,500
| 8,852
|
City of Montgomery, Medical Clinic Board, Health Care Fac. Rev. Bonds (Jackson Hospital & Clinic),
Series 2015, 5.00% 2033
| 2,500
| 2,821
|
City of Selma, Industrial Dev. Board, Gulf Opportunity Zone Bonds (International Paper Co. Project),
Series 2011-A, 5.375% 2035
| 4,000
| 4,326
|
City of Tuscaloosa, Public Educational Building Auth., Student Housing Rev. Ref. Bonds
(University of Alabama Ridgecrest Residential Facs.), Series 2016-B, BAM insured, 3.125% 2036
| 2,680
| 2,733
|
|
|
| 259,927
|
The Tax-Exempt Bond Fund of America — Page 1
of 120
Bonds, notes & other debt instruments (continued)
Alaska 0.12%
| Principal amount
(000)
| Value
(000)
|
| Housing Fin. Corp., General Mortgage Rev. Bonds, Series 2016-A, 3.50% 2046
| $2,290
| $2,408
|
| Housing Fin. Corp., General Mortgage Rev. Bonds, Series 2018-A, 4.00% 2048
| 14,975
| 16,333
|
| International Airport System, Rev. Ref. Bonds, Series 2016-A, 5.00% 2031
| 3,000
| 3,530
|
| International Airport System, Rev. Ref. Bonds, Series 2016-B, 5.00% 2034
| 3,500
| 4,082
|
|
|
| 26,353
|
| Arizona 1.44%
|
|
|
| Agricultural Improvement and Power Dist., Electric System Rev. Bonds (Salt River Project), Series 2017-A, 5.00% 2033
| 6,395
| 7,987
|
| Agricultural Improvement and Power Dist., Electric System Rev. Bonds (Salt River Project), Series 2017-A, 5.00% 2034
| 16,455
| 20,482
|
| Agricultural Improvement and Power Dist., Electric System Rev. Bonds (Salt River Project), Series 2017-A, 5.00% 2035
| 4,265
| 5,289
|
| Agricultural Improvement and Power Dist., Electric System Rev. Bonds (Salt River Project), Series 2017-A, 5.00% 2038
| 1,530
| 1,881
|
Town of Buckeye, Verrado Dist. 1 Community Facs. Dist., Dist. G.O. Rev. Ref. Bonds, Series 2013-A,
5.00% 20231
| 825
| 865
|
Town of Buckeye, Verrado Dist. 1 Community Facs. Dist., Dist. G.O. Rev. Ref. Bonds, Series 2013-A,
6.00% 20271
| 2,000
| 2,155
|
| Certs. of Part., Series 2010-A, Assured Guaranty Municipal insured, 5.25% 2025
| 2,500
| 2,517
|
| City of Glendale, Industrial Dev. Auth., Rev. Bonds (Midwestern University), Series 2010, 5.00% 2035
| 3,130
| 3,213
|
| City of Glendale, Industrial Dev. Auth., Rev. Bonds (Midwestern University), Series 2010, 5.125% 2040
| 6,215
| 6,379
|
| City of Glendale, Industrial Dev. Auth., Rev. Ref. Bonds (Midwestern University), Series 2007, 5.00% 2023
| 3,725
| 4,086
|
| City of Glendale, Industrial Dev. Auth., Rev. Ref. Bonds (Midwestern University), Series 2007, 5.00% 2024
| 2,910
| 3,191
|
| City of Glendale, Industrial Dev. Auth., Rev. Ref. Bonds (Midwestern University), Series 2007, 5.00% 2025
| 2,610
| 2,859
|
| City of Glendale, Industrial Dev. Auth., Rev. Ref. Bonds (Midwestern University), Series 2007, 5.00% 2026
| 1,630
| 1,785
|
| City of Glendale, Industrial Dev. Auth., Rev. Ref. Bonds (Midwestern University), Series 2007, 5.00% 2031
| 4,105
| 4,478
|
| City of Glendale, Industrial Dev. Auth., Rev. Ref. Bonds (Midwestern University), Series 2007, 5.25% 2020
| 1,795
| 1,851
|
| City of Glendale, Industrial Dev. Auth., Rev. Ref. Bonds (Midwestern University), Series 2007, 5.25% 2021
| 1,300
| 1,390
|
| City of Glendale, Industrial Dev. Auth., Rev. Ref. Bonds (Midwestern University), Series 2007, 5.25% 2022
| 2,185
| 2,417
|
| City of Glendale, Water and Sewer Rev. Ref. Obligations, Series 2012, 5.00% 2027
| 1,500
| 1,658
|
Health Facs. Auth., Rev. Ref. Bonds (Phoenix Children’s Hospital), Series 2013-A-1,
(SIFMA Municipal Swap Index + 1.85%) 3.25% 2048 (put 2020)2
| 4,000
| 4,001
|
Industrial Dev. Auth., Education Rev. Bonds (Academies of Math & Science Projects), Series 2017-A,
5.00% 2028
| 3,360
| 3,848
|
Industrial Dev. Auth., Education Rev. Bonds (Academies of Math & Science Projects), Series 2017-A,
5.00% 2042
| 1,000
| 1,141
|
Industrial Dev. Auth., Education Rev. Bonds (Academies of Math & Science Projects), Series 2017-A,
5.00% 2047
| 1,310
| 1,494
|
Industrial Dev. Auth., Education Rev. Bonds (Academies of Math & Science Projects), Series 2017-A,
5.00% 2051
| 1,025
| 1,161
|
| Industrial Dev. Auth., Education Rev. Bonds (Basis School Project), Series 2017-A, 5.125% 20371
| 2,150
| 2,335
|
| Industrial Dev. Auth., Education Rev. Bonds (Basis School Project), Series 2017-A, 5.25% 20471
| 4,555
| 4,913
|
| Industrial Dev. Auth., Education Rev. Bonds (Basis School Project), Series 2017-A, 5.375% 20501
| 4,000
| 4,334
|
| Industrial Dev. Auth., Education Rev. Bonds (Basis School Project), Series 2017-D, 5.00% 20511
| 700
| 748
|
| Industrial Dev. Auth., Education Rev. Bonds (Basis School Project), Series 2017-G, 5.00% 20371
| 1,005
| 1,094
|
| Industrial Dev. Auth., Education Rev. Bonds (Doral Academy of Nevada - Fire Mesa and Red Rock Campus Projects), Series 2019-A, 3.55% 20291
| 625
| 641
|
Industrial Dev. Auth., Student Housing Rev. Bonds (Provident Group - NCCU Properties LLC -
North Carolina Central University), Series 2019-A, BAM insured, 5.00% 2028
| 325
| 403
|
Industrial Dev. Auth., Student Housing Rev. Bonds (Provident Group - NCCU Properties LLC -
North Carolina Central University), Series 2019-A, BAM insured, 5.00% 2030
| 1,130
| 1,403
|
Industrial Dev. Auth., Student Housing Rev. Bonds (Provident Group - NCCU Properties LLC -
North Carolina Central University), Series 2019-A, BAM insured, 5.00% 2032
| 325
| 397
|
The Tax-Exempt Bond Fund of America — Page 2
of 120
Bonds, notes & other debt instruments (continued)
Arizona (continued)
| Principal amount
(000)
| Value
(000)
|
Industrial Dev. Auth., Student Housing Rev. Bonds (Provident Group - NCCU Properties LLC -
North Carolina Central University), Series 2019-A, BAM insured, 5.00% 2033
| $350
| $425
|
Industrial Dev. Auth., Student Housing Rev. Bonds (Provident Group - NCCU Properties LLC -
North Carolina Central University), Series 2019-A, BAM insured, 5.00% 2035
| 1,050
| 1,265
|
Industrial Dev. Auth., Student Housing Rev. Bonds (Provident Group - NCCU Properties LLC -
North Carolina Central University), Series 2019-A, BAM insured, 5.00% 2038
| 1,295
| 1,544
|
Industrial Dev. Auth., Student Housing Rev. Bonds (Provident Group - NCCU Properties LLC -
North Carolina Central University), Series 2019-A, BAM insured, 5.00% 2049
| 1,250
| 1,464
|
Industrial Dev. Auth., Student Housing Rev. Bonds (Provident Group - NCCU Properties LLC -
North Carolina Central University), Series 2019-A, BAM insured, 5.00% 2054
| 4,000
| 4,641
|
Industrial Dev. Auth., Student Housing Rev. Bonds (Provident Group - NCCU Properties LLC -
North Carolina Central University), Series 2019-A, BAM insured, 5.00% 2058
| 3,000
| 3,459
|
| Lottery Rev. Bonds, Series 2010-A, Assured Guaranty Municipal insured, 5.00% 2021
| 8,250
| 8,381
|
| Lottery Rev. Bonds, Series 2010-A, Assured Guaranty Municipal insured, 5.00% 2025
| 5,000
| 5,080
|
| Lottery Rev. Bonds, Series 2010-A, Assured Guaranty Municipal insured, 5.00% 2026
| 2,500
| 2,540
|
| County of Maricopa, Industrial Dev. Auth., Education Rev. Bonds (Benjamin Franklin Charter School Projects), Series 2018-A, 6.00% 20381
| 3,480
| 4,000
|
County of Maricopa, Industrial Dev. Auth., Education Rev. Bonds (GreatHearts Arizona Projects),
Series 2017-A, 4.00% 2023
| 620
| 674
|
County of Maricopa, Industrial Dev. Auth., Education Rev. Bonds (GreatHearts Arizona Projects),
Series 2017-A, 5.00% 2037
| 725
| 854
|
County of Maricopa, Industrial Dev. Auth., Education Rev. Bonds (GreatHearts Arizona Projects),
Series 2017-A, 5.00% 2052
| 750
| 866
|
| County of Maricopa, Industrial Dev. Auth., Rev. Bonds (Banner Health), Series 2017-C, 5.00% 2048 (put 2024)
| 1,000
| 1,177
|
County of Maricopa, Pollution Control Corp., Pollution Control Rev. Ref. Bonds
(El Paso Electric Co. Palo Verde Project), Series 2009-A, 3.60% 2040
| 7,250
| 7,328
|
County of Maricopa, Pollution Control Rev. Ref. Bonds (Southern California Edison Co.), Series 2000-B,
5.00% 2035
| 9,000
| 9,213
|
| McAllister Academic Village LLC, Rev. Ref. Bonds (Arizona State University Hassayampa Academic Village Project), Series 2016, 5.00% 2033
| 5,080
| 6,100
|
| City of Phoenix, Civic Improvement Corp., Airport Rev. Bonds, Series 2010-A, 5.00% 2029 (preref. 2020)
| 5,400
| 5,590
|
| City of Phoenix, Civic Improvement Corp., Airport Rev. Bonds, Series 2010-A, 5.00% 2040 (preref. 2020)
| 12,000
| 12,423
|
| City of Phoenix, Civic Improvement Corp., Airport Rev. Ref. Bonds, Series 2017-D, 5.00% 2032
| 7,320
| 8,953
|
| City of Phoenix, Civic Improvement Corp., Airport Rev. Ref. Bonds, Series 2017-D, 5.00% 2033
| 18,655
| 22,734
|
| City of Phoenix, Civic Improvement Corp., Wastewater System Rev. Ref. Bonds, Series 2016, 5.00% 2031
| 1,500
| 1,820
|
| City of Phoenix, Civic Improvement Corp., Wastewater System Rev. Ref. Bonds, Series 2016, 5.00% 2032
| 2,000
| 2,419
|
| City of Phoenix, Civic Improvement Corp., Wastewater System Rev. Ref. Bonds, Series 2016, 5.00% 2033
| 1,000
| 1,206
|
| City of Phoenix, Civic Improvement Corp., Wastewater System Rev. Ref. Bonds, Series 2016, 5.00% 2034
| 1,000
| 1,203
|
| City of Phoenix, Civic Improvement Corp., Wastewater System Rev. Ref. Bonds, Series 2016, 5.00% 2035
| 2,000
| 2,398
|
| City of Phoenix, Industrial Dev. Auth., Education Fac. Rev. Bonds (Basis Schools, Inc. Project), Series 2015, 5.00% 20351
| 2,675
| 2,871
|
| City of Phoenix, Industrial Dev. Auth., Education Fac. Rev. Bonds (Basis Schools, Inc. Project), Series 2015, 5.00% 20451
| 2,500
| 2,641
|
| City of Phoenix, Industrial Dev. Auth., Education Fac. Rev. Bonds (Basis Schools, Inc. Project), Series 2016-A, 5.00% 20351
| 1,000
| 1,073
|
| City of Phoenix, Industrial Dev. Auth., Education Fac. Rev. Bonds (Basis Schools, Inc. Project), Series 2016-A, 5.00% 20461
| 3,900
| 4,118
|
City of Phoenix, Industrial Dev. Auth., Education Fac. Rev. Bonds (Legacy Traditional Schools Phoenix
Campus), Series 2017-B, 4.00% 20221
| 1,500
| 1,499
|
City of Phoenix, Industrial Dev. Auth., Education Fac. Rev. Bonds (Legacy Traditional Schools Projects),
Series 2014-A, 6.75% 20441
| 1,500
| 1,715
|
City of Phoenix, Industrial Dev. Auth., Education Fac. Rev. Bonds (Legacy Traditional Schools Projects),
Series 2015, 3.00% 20201
| 125
| 125
|
City of Phoenix, Industrial Dev. Auth., Education Fac. Rev. Bonds (Legacy Traditional Schools Projects),
Series 2015, 5.00% 20351
| 910
| 975
|
The Tax-Exempt Bond Fund of America — Page 3
of 120
Bonds, notes & other debt instruments (continued)
Arizona (continued)
| Principal amount
(000)
| Value
(000)
|
City of Phoenix, Industrial Dev. Auth., Education Fac. Rev. Bonds (Legacy Traditional Schools Projects),
Series 2015, 5.00% 20451
| $1,050
| $1,108
|
City of Phoenix, Industrial Dev. Auth., Education Fac. Rev. Bonds (Legacy Traditional Schools Projects),
Series 2016-A, 4.00% 20261
| 2,825
| 2,917
|
City of Phoenix, Industrial Dev. Auth., Education Fac. Rev. Bonds (Legacy Traditional Schools Projects),
Series 2016-A, 5.00% 20361
| 8,535
| 9,217
|
| City of Phoenix, Industrial Dev. Auth., Lease Rev. Bonds (Rowan University Project), Series 2012, 5.00% 2042
| 12,000
| 12,893
|
| City of Phoenix, Industrial Dev. Auth., Lease Rev. Bonds (Rowan University Project), Series 2012, 5.25% 2034
| 15,000
| 16,382
|
County of Pima, Industrial Dev. Auth., Industrial Dev. Rev. Bonds (Tucson Electric Power Co. Project),
Series 2013-A, 4.00% 2029
| 1,140
| 1,206
|
| City of Scottsdale, Municipal Property Corp., Excise Tax Rev. Ref. Bonds, Series 2006, 5.00% 2030
| 8,000
| 10,568
|
City of Tempe, Industrial Dev. Auth., Rev. Ref. Bonds (Friendship Village of Tempe), Series 2012-A,
5.00% 2019
| 500
| 505
|
City of Tempe, Industrial Dev. Auth., Rev. Ref. Bonds (Friendship Village of Tempe), Series 2012-A,
6.25% 2042
| 2,500
| 2,648
|
| Transportation Board, Highway Rev. Ref. Bonds, Series 2011-A, 5.25% 2030 (preref. 2021)
| 5,000
| 5,396
|
| Transportation Board, Highway Rev. Ref. Bonds, Series 2013-A, 5.00% 2023
| 2,000
| 2,224
|
| Transportation Board, Highway Rev. Ref. Bonds, Series 2013-A, 5.00% 2036
| 6,585
| 7,218
|
| City of Tucson, Water System Rev. and Rev. Ref. Obligations, Series 2017, 5.00% 2029
| 1,500
| 1,880
|
| City of Tucson, Water System Rev. and Rev. Ref. Obligations, Series 2017, 5.00% 2030
| 1,250
| 1,557
|
|
|
| 310,889
|
| Arkansas 0.01%
|
|
|
Dev. Fin. Auth., Health Care Rev. Bonds (Baptist Memorial Health Care), Series 2015-B-3,
(SIFMA Municipal Swap Index + 1.55%) 2.95% 2044 (put 2022)2
| 2,750
| 2,793
|
| California 6.73%
|
|
|
| Alameda Corridor Transportation Auth., Rev. Ref. Bonds, Series 2013-A, 5.00% 2024
| 5,000
| 5,788
|
| Alameda Corridor Transportation Auth., Rev. Ref. Bonds, Series 2013-A, 5.00% 2025
| 11,600
| 13,403
|
| Alameda Corridor Transportation Auth., Rev. Ref. Bonds, Series 2016-B, Assured Guaranty Municipal insured, 4.00% 2035
| 2,000
| 2,202
|
| Alameda Corridor Transportation Auth., Rev. Ref. Bonds, Series 2016-B, Assured Guaranty Municipal insured, 5.00% 2035
| 3,400
| 4,029
|
City of Alameda, Community Facs. Dist. No. 2013-1 (Alameda Landing Public Improvements),
Special Tax Bonds, Series 2016, 5.00% 2046
| 500
| 558
|
City of Aliso Viejo, Community Facs. Dist. No. 2005-01 (Glenwood at Aliso Viejo), Special Tax Bonds,
Series 2014, 5.00% 2032
| 1,235
| 1,405
|
City of Aliso Viejo, Community Facs. Dist. No. 2005-01 (Glenwood at Aliso Viejo), Special Tax Bonds,
Series 2014, 5.00% 2033
| 1,330
| 1,510
|
City of Aliso Viejo, Community Facs. Dist. No. 2005-01 (Glenwood at Aliso Viejo), Special Tax Bonds,
Series 2014, 5.00% 2038
| 2,900
| 3,270
|
| Azusa Unified School Dist., G.O. Bonds, 2014 Election, Series 2019-C, 5.00% 2044
| 3,400
| 4,145
|
| City of Azusa, Community Facs. Dist. No. 2005-1 (Rosedale), Improvement Area No. 1, Special Tax Bonds, Series 2007, 5.00% 2037
| 1,860
| 1,866
|
Assn. of Bay Area Governments, Fin. Auth. for Nonprofit Corps., Rev. Ref. Bonds (Sharp HealthCare),
Series 2009-B, 6.00% 2024 (preref. 2019)
| 1,000
| 1,000
|
Assn. of Bay Area Governments, Fin. Auth. for Nonprofit Corps., Rev. Ref. Bonds (Sharp HealthCare),
Series 2009-B, 6.125% 2029 (preref. 2019)
| 1,000
| 1,000
|
Assn. of Bay Area Governments, Fin. Auth. for Nonprofit Corps., Rev. Ref. Bonds
(Episcopal Senior Communities), Series 2011, 6.125% 2041
| 1,715
| 1,844
|
Assn. of Bay Area Governments, Fin. Auth. for Nonprofit Corps., Rev. Ref. Bonds
(Episcopal Senior Communities), Series 2012-A, 5.00% 2047
| 7,315
| 7,783
|
Assn. of Bay Area Governments, Fin. Auth. for Nonprofit Corps., Rev. Ref. Bonds
(Windemere Ranch Infrastructure Fncg. Program), Series 2014-A, 5.00% 2027
| 1,085
| 1,263
|
The Tax-Exempt Bond Fund of America — Page 4
of 120
Bonds, notes & other debt instruments (continued)
California (continued)
| Principal amount
(000)
| Value
(000)
|
Assn. of Bay Area Governments, Fin. Auth. for Nonprofit Corps., Rev. Ref. Bonds
(Windemere Ranch Infrastructure Fncg. Program), Series 2014-A, 5.00% 2029
| $985
| $1,140
|
Assn. of Bay Area Governments, Fin. Auth. for Nonprofit Corps., Rev. Ref. Bonds
(Windemere Ranch Infrastructure Fncg. Program), Series 2014-A, 5.00% 2030
| 300
| 346
|
Assn. of Bay Area Governments, Fin. Auth. for Nonprofit Corps., Senior Living Rev. Bonds
(Odd Fellows Home of California), Series 2012-A, 5.00% 2032
| 4,250
| 4,752
|
Assn. of Bay Area Governments, Fin. Auth. for Nonprofit Corps., Senior Living Rev. Bonds
(Odd Fellows Home of California), Series 2012-A, 5.00% 2042
| 1,000
| 1,107
|
Bay Area Toll Auth., San Francisco Bay Area Toll Bridge Rev. Bonds, Series 2006-C-1,
(SIFMA Municipal Swap Index + 0.90%) 2.30% 2045 (put 2023)2
| 5,000
| 5,071
|
Bay Area Toll Auth., San Francisco Bay Area Toll Bridge Rev. Bonds, Series 2007-C-1,
(SIFMA Municipal Swap Index + 0.90%) 2.30% 2047 (put 2023)2
| 4,950
| 5,014
|
Bay Area Toll Auth., San Francisco Bay Area Toll Bridge Rev. Bonds, Series 2008-A-1,
(SIFMA Municipal Swap Index + 0.90%) 2.30% 2045 (put 2023)2
| 1,150
| 1,166
|
Bay Area Toll Auth., San Francisco Bay Area Toll Bridge Rev. Bonds, Series 2008-B-1,
(SIFMA Municipal Swap Index + 1.10%) 2.50% 2045 (put 2024)2
| 30,850
| 31,691
|
Bay Area Toll Auth., San Francisco Bay Area Toll Bridge Rev. Bonds, Series 2014-H,
(SIFMA Municipal Swap Index + 0.70%) 2.10% 2034 (put 2021)2
| 9,000
| 9,036
|
| Bay Area Toll Auth., San Francisco Bay Area Toll Bridge Rev. Bonds, Series 2017-B, 2.85% 2047 (put 2025)
| 4,400
| 4,721
|
Bay Area Toll Auth., San Francisco Bay Area Toll Bridge Rev. Bonds, Series 2017-D,
(3-month USD-LIBOR x 0.70 + 0.55%) 2.182% 2045 (put 2021)2
| 10,000
| 10,025
|
| Bay Area Toll Auth., San Francisco Bay Area Toll Bridge Rev. Bonds, Series 2017-F-1, 5.00% 2056
| 9,985
| 11,834
|
| Bay Area Toll Auth., San Francisco Bay Area Toll Bridge Rev. Bonds, Series 2019-S-8, 5.00% 2056
| 23,500
| 28,778
|
City of Brea, Successor Agcy. to the Redev. Agcy. (Redev. Project AB), Tax Allocation Rev. Ref. Bonds,
Series 2013, 5.00% 2026
| 1,200
| 1,383
|
| Trustees of the California State University, Systemwide Rev. Ref. Bonds, Series 2011-A, 5.00% 2037
| 4,000
| 4,343
|
City of Carlsbad, Reassessment Dist. No. 2012-1, Limited Obligation Rev. Ref. Bonds, Series 2013,
4.125% 2030
| 1,450
| 1,501
|
City of Carlsbad, Reassessment Dist. No. 2012-1, Limited Obligation Rev. Ref. Bonds, Series 2013,
4.125% 2031
| 800
| 827
|
City of Carlsbad, Reassessment Dist. No. 2012-1, Limited Obligation Rev. Ref. Bonds, Series 2013,
5.00% 2035
| 1,000
| 1,066
|
| City of Carson, Successor Agcy. to the Redev. Agcy., Tax Allocation Rev. Ref. Bonds (Redev. Project Area No.1), Series 2014-A, Assured Guaranty Municipal insured,
4.25% 2033
| 750
| 819
|
| City of Cerritos, Public Fncg. Auth., Tax Allocation Rev. Bonds (Cerritos Redev. Projects), Series 2002-A, AMBAC insured, 5.00% 2020
| 3,000
| 3,128
|
| Chabot-Las Positas Community College Dist., G.O. Rev. Ref. Bonds, Series 2016, 4.00% 2033
| 5,000
| 5,635
|
| Chabot-Las Positas Community College Dist., G.O. Rev. Ref. Bonds, Series 2016, 4.00% 2035
| 5,000
| 5,557
|
City of Chino, Public Fncg. Auth., Local Agcy. Rev. Ref. Bonds, Series 2015-A,
Assured Guaranty Municipal insured, 5.00% 2025
| 1,065
| 1,305
|
City of Chino, Public Fncg. Auth., Local Agcy. Rev. Ref. Bonds, Series 2015-A,
Assured Guaranty Municipal insured, 5.00% 2026
| 225
| 275
|
City of Chino, Public Fncg. Auth., Local Agcy. Rev. Ref. Bonds, Series 2015-A,
Assured Guaranty Municipal insured, 5.00% 2034
| 1,090
| 1,290
|
City of Chino, Public Fncg. Auth., Local Agcy. Rev. Ref. Bonds, Series 2015-A,
Assured Guaranty Municipal insured, 5.00% 2035
| 1,725
| 2,036
|
City of Chino, Successor Agcy. to the Redev. Agcy., Tax Allocation Rev. Ref. Bonds, Series 2014-A,
BAM insured, 5.00% 2028
| 1,370
| 1,595
|
City of Chino, Successor Agcy. to the Redev. Agcy., Tax Allocation Rev. Ref. Bonds, Series 2014-A,
BAM insured, 5.00% 2029
| 1,325
| 1,537
|
| City of Chula Vista, Municipal Fncg. Auth., Special Tax Rev. Ref. Bonds, Series 2013, 5.00% 2034
| 2,360
| 2,634
|
City of Chula Vista, Successor Agcy. to the Redev. Agcy., Tax Allocation Rev. Ref. Bonds, Series 2016,
Assured Guaranty Municipal insured, 5.00% 2028
| 570
| 696
|
City of Chula Vista, Successor Agcy. to the Redev. Agcy., Tax Allocation Rev. Ref. Bonds, Series 2016,
Assured Guaranty Municipal insured, 5.00% 2031
| 1,015
| 1,218
|
The Tax-Exempt Bond Fund of America — Page 5
of 120
Bonds, notes & other debt instruments (continued)
California (continued)
| Principal amount
(000)
| Value
(000)
|
City of Chula Vista, Successor Agcy. to the Redev. Agcy., Tax Allocation Rev. Ref. Bonds, Series 2016,
Assured Guaranty Municipal insured, 5.00% 2032
| $1,070
| $1,280
|
City of Chula Vista, Successor Agcy. to the Redev. Agcy., Tax Allocation Rev. Ref. Bonds, Series 2016,
Assured Guaranty Municipal insured, 5.00% 2033
| 1,125
| 1,340
|
| Educational Facs. Auth., Rev. Bonds (Pitzer College), Series 2009, 6.00% 2040 (preref. 2020)
| 1,840
| 1,902
|
| Educational Facs. Auth., Rev. Bonds (Stanford University), Series 2007-T-1, 5.00% 2039
| 4,425
| 6,280
|
| Educational Facs. Auth., Rev. Bonds (Stanford University), Series 2014-U-6, 5.00% 2045
| 7,550
| 11,032
|
| Educational Facs. Auth., Rev. Bonds (Stanford University), Series 2016-U-7, 5.00% 2046
| 4,000
| 5,869
|
| Educational Facs. Auth., Rev. Ref. Bonds (Chapman University), Series 2011, 5.00% 2026
| 3,070
| 3,267
|
| Educational Facs. Auth., Rev. Ref. Bonds (Chapman University), Series 2011, 5.00% 2031
| 2,405
| 2,554
|
| Educational Facs. Auth., Rev. Ref. Bonds (Chapman University), Series 2015, 5.00% 2045
| 5,000
| 5,754
|
| Educational Facs. Auth., Rev. Ref. Bonds (University of the Pacific), Series 2012-A, 5.00% 2026
| 895
| 972
|
| Educational Facs. Auth., Rev. Ref. Bonds (University of the Pacific), Series 2012-A, 5.00% 2030
| 750
| 813
|
| County of El Dorado, Community Facs. Dist. No. 1992-1 (El Dorado Hills Dev.), Special Tax Rev. Ref. Bonds, Series 2012, 4.00% 2029
| 2,140
| 2,301
|
| El Monte Union High School Dist., G.O. Bonds, 2018 Election, Series 2019-A, 5.00% 2049
| 1,700
| 2,022
|
| City of Elk Grove, Fin. Auth., Special Tax Rev. Bonds, Series 2015, 5.00% 2026
| 1,300
| 1,568
|
| City of Elk Grove, Fin. Auth., Special Tax Rev. Bonds, Series 2015, BAM insured, 5.00% 2034
| 500
| 586
|
| City of Elk Grove, Fin. Auth., Special Tax Rev. Bonds, Series 2015, BAM insured, 5.00% 2035
| 500
| 585
|
| City of Elk Grove, Fin. Auth., Special Tax Rev. Bonds, Series 2015, BAM insured, 5.00% 2038
| 1,500
| 1,746
|
| City of Elk Grove, Fin. Auth., Special Tax Rev. Bonds, Series 2016, 5.00% 2041
| 8,150
| 9,271
|
| City of Elk Grove, Fin. Auth., Special Tax Rev. Bonds, Series 2016, 5.00% 2046
| 5,435
| 6,161
|
Elk Grove Unified School Dist., Community Facs. Dist. No. 1, Special Tax Rev. Ref. Bonds, Series 2012,
4.00% 2033
| 3,000
| 3,152
|
Elk Grove Unified School Dist., Community Facs. Dist. No. 1, Special Tax Rev. Ref. Bonds, Series 2012,
Assured Guaranty Municipal insured, 3.375% 2030
| 1,500
| 1,551
|
| City of Emeryville, Successor Agcy. to the Redev. Agcy., Tax Allocation Rev. Ref. Bonds, Series 2014-A, Assured Guaranty Municipal insured, 5.00% 2032
| 890
| 1,040
|
| City of Emeryville, Successor Agcy. to the Redev. Agcy., Tax Allocation Rev. Ref. Bonds, Series 2014-A, Assured Guaranty Municipal insured, 5.00% 2033
| 775
| 904
|
City of Eureka, Successor Agcy. to the Redev. Agcy., Tax Allocation Rev. Ref. Bonds, Series 2017-B,
5.00% 2022
| 1,000
| 1,120
|
City of Eureka, Successor Agcy. to the Redev. Agcy., Tax Allocation Rev. Ref. Bonds, Series 2017-B,
National insured, 5.00% 2023
| 1,040
| 1,200
|
City of Fillmore, Successor Agcy. to the Redev. Agcy., Tax Allocation Rev. Ref. Bonds, Series 2015,
BAM insured, 5.00% 2027
| 2,670
| 3,264
|
City of Fillmore, Successor Agcy. to the Redev. Agcy., Tax Allocation Rev. Ref. Bonds, Series 2015,
BAM insured, 5.00% 2028
| 3,120
| 3,795
|
| City of Fontana, Community Facs. Dist. No. 22 (Sierra Hills South), Special Tax Bonds, Series 2014, 5.00% 2031
| 880
| 987
|
| City of Fontana, Community Facs. Dist. No. 22 (Sierra Hills South), Special Tax Bonds, Series 2014, 5.00% 2034
| 1,250
| 1,394
|
Foothill/Eastern Transportation Corridor Agcy., Toll Road Rev. Ref. Bonds, Capital Appreciation Bonds,
Series 2015-A, Assured Guaranty Municipal insured, 0% 2034
| 2,000
| 1,325
|
Foothill/Eastern Transportation Corridor Agcy., Toll Road Rev. Ref. Bonds, Capital Appreciation Bonds,
Series 2015-A, Assured Guaranty Municipal insured, 0% 2035
| 2,000
| 1,280
|
| Foothill/Eastern Transportation Corridor Agcy., Toll Road Rev. Ref. Bonds, Series 2013-A, 5.75% 2046
| 10,260
| 11,887
|
| Foothill/Eastern Transportation Corridor Agcy., Toll Road Rev. Ref. Bonds, Series 2013-A, 6.00% 2053
| 24,000
| 28,133
|
| G.O. Bonds, Series 2009, 6.00% 2039
| 10,000
| 10,123
|
| G.O. Bonds, Series 2011, 5.25% 2028
| 10,185
| 11,050
|
| G.O. Bonds, Series 2015, 5.25% 2032
| 10,000
| 12,098
|
Golden State Tobacco Securitization Corp., Enhanced Tobacco Settlement Asset-Backed Bonds,
Capital Appreciation Bonds, Series 2005-A, AMBAC insured, 0% 2027
| 9,460
| 8,207
|
Golden State Tobacco Securitization Corp., Enhanced Tobacco Settlement Asset-Backed Bonds,
Capital Appreciation Bonds, Series 2005-A, Assured Guaranty Municipal insured, 0% 2025
| 10,000
| 9,155
|
Golden State Tobacco Securitization Corp., Enhanced Tobacco Settlement Asset-Backed Bonds,
Capital Appreciation Bonds, Series 2005-A, Assured Guaranty Municipal insured, 0% 2026
| 17,000
| 15,195
|
The Tax-Exempt Bond Fund of America — Page 6
of 120
Bonds, notes & other debt instruments (continued)
California (continued)
| Principal amount
(000)
| Value
(000)
|
Golden State Tobacco Securitization Corp., Enhanced Tobacco Settlement Asset-Backed Bonds,
Series 2018-A, 5.00% 2022
| $4,000
| $4,433
|
Grossmont Union High School Dist., G.O. Bonds, Capital Appreciation Bonds, 2004 Election, Series 2008,
0% 2032
| 9,835
| 7,130
|
| Hayward Unified School Dist., G.O. Bonds, 2019 Election, Series 2019-A, BAM insured, 4.00% 2048
| 8,000
| 8,708
|
| Hayward Unified School Dist., G.O. Bonds, 2019 Election, Series 2019-A, BAM insured, 5.00% 2044
| 7,000
| 8,454
|
| Hayward Unified School Dist., G.O. Rev. Ref. Bonds, 2019 Election, Series 2019-A, BAM insured, 5.00% 2040
| 3,000
| 3,651
|
| Health Facs. Fncg. Auth., Rev. Bonds (Kaiser Permanente), Series 2017-A-2, 5.00% 2047
| 36,065
| 52,039
|
| Health Facs. Fncg. Auth., Rev. Bonds (Providence St. Joseph Health), Series 2016-B-1, 1.25% 2036 (put 2020)
| 4,430
| 4,428
|
| Health Facs. Fncg. Auth., Rev. Bonds (Sutter Health), Series 2018-A, 5.00% 2038
| 2,100
| 2,558
|
| Health Facs. Fncg. Auth., Rev. Green Bonds (Kaiser Permanente), Series 2017-C, 5.00% 2031 (put 2022)
| 2,695
| 3,036
|
| Health Facs. Fncg. Auth., Rev. Ref. Bonds (Catholic Healthcare West), Series 2011-A, 5.25% 2041
| 4,230
| 4,459
|
| Health Facs. Fncg. Auth., Rev. Ref. Bonds (Marshall Medical Center), Series 2015, 5.00% 2024
| 255
| 305
|
| Health Facs. Fncg. Auth., Rev. Ref. Bonds (Marshall Medical Center), Series 2015, 5.00% 2026
| 350
| 418
|
| Health Facs. Fncg. Auth., Rev. Ref. Bonds (Presbyterian Homes and Services, Inc.), Series 2015, 5.00% 2034
| 700
| 825
|
| Health Facs. Fncg. Auth., Rev. Ref. Bonds (St. Joseph Health System), Series 2009-C, 5.00% 2034 (put 2022)
| 9,100
| 10,172
|
| Health Facs. Fncg. Auth., Rev. Ref. Bonds (St. Joseph Health System), Series 2013-A, 5.00% 2033
| 1,300
| 1,473
|
| Health Facs. Fncg. Auth., Rev. Ref. Bonds (Stanford Health Care), Series 2017-A, 5.00% 2032
| 6,000
| 7,534
|
| Health Facs. Fncg. Auth., Rev. Ref. Bonds (Stanford Health Care), Series 2017-A, 5.00% 2035
| 8,500
| 10,503
|
| Health Facs. Fncg. Auth., Rev. Ref. Bonds (Stanford Health Care), Series 2017-A, 5.00% 2036
| 6,000
| 7,374
|
| Health Facs. Fncg. Auth., Rev. Ref. Bonds (Stanford Hospital and Clinics), Series 2012-A, 5.00% 2051
| 13,745
| 14,990
|
| Health Facs. Fncg. Auth., Rev. Ref. Bonds (Sutter Health), Series 2016-B, 4.00% 2038
| 4,000
| 4,379
|
| Health Facs. Fncg. Auth., Rev. Ref. Bonds (Sutter Health), Series 2016-B, 5.00% 2036
| 500
| 603
|
City of Indian Wells, Successor Agcy. to the Redev. Agcy., Tax Allocation Rev. Ref. Bonds
(Consolidated Whitewater Redev. Project Area), Series 2016-A, National insured, 5.00% 2033
| 4,800
| 5,705
|
Infrastructure and Econ. Dev. Bank, Rev. Bonds (The Colburn School), Series 2015-B,
(SIFMA Municipal Swap Index + 1.20%) 2.60% 2037 (put 2022)2
| 19,925
| 20,282
|
| Infrastructure and Econ. Dev. Bank, Rev. Ref. Bonds (Academy of Sciences, San Francisco), Series 2018-C, (3-month USD-LIBOR x 0.70 + 0.38%) 1.966% 2047 (put
2021)2
| 16,475
| 16,509
|
Infrastructure and Econ. Dev. Bank, Rev. Ref. Bonds (J. Paul Getty Trust), Series 2011-A-1,
(3-month USD-LIBOR x 0.70 + 0.20%) 1.881% 2038 (put 2021)2
| 27,000
| 27,019
|
Infrastructure and Econ. Dev. Bank, Rev. Ref. Bonds (J. Paul Getty Trust), Series 2011-A-3,
(3-month USD-LIBOR x 0.70 + 0.37%) 1.993% 2038 (put 2020)2
| 6,000
| 6,007
|
Infrastructure and Econ. Dev. Bank, Rev. Ref. Bonds (J. Paul Getty Trust), Series 2013-A-2,
(3-month USD-LIBOR x 0.70 + 0.33%) 2.011% 2047 (put 2022)2
| 5,870
| 5,880
|
City of Inglewood, Successor Agcy. to the Redev. Agcy., Tax Allocation Bonds (Merged Redev. Project),
Series 2017-A, BAM insured, 5.00% 2028
| 1,000
| 1,245
|
City of Inglewood, Successor Agcy. to the Redev. Agcy., Tax Allocation Bonds (Merged Redev. Project),
Series 2017-A, BAM insured, 5.00% 2030
| 950
| 1,167
|
| City of Irvine, Community Facs. Dist. No. 2013-3 (Great Park), Improvement Area No. 1, Special Tax Bonds, Series 2014, 5.00% 2039
| 1,000
| 1,104
|
| City of Irvine, Reassessment Dist. No. 12-1, Limited Obligation Improvement Bonds, Series 2012, 3.25% 2022
| 100
| 106
|
| City of Irvine, Reassessment Dist. No. 12-1, Limited Obligation Improvement Bonds, Series 2012, 4.00% 2028
| 675
| 722
|
| City of Irvine, Reassessment Dist. No. 12-1, Limited Obligation Improvement Bonds, Series 2012, 5.00% 2023
| 1,235
| 1,381
|
| City of Irvine, Reassessment Dist. No. 13-1, Limited Obligation Improvement Bonds, Series 2013, 5.00% 2020
| 450
| 469
|
| City of Irvine, Reassessment Dist. No. 13-1, Limited Obligation Improvement Bonds, Series 2013, 5.00% 2023
| 1,100
| 1,273
|
| City of Irvine, Reassessment Dist. No. 13-1, Limited Obligation Improvement Bonds, Series 2013, 5.00% 2027
| 325
| 370
|
| City of Irvine, Reassessment Dist. No. 13-1, Limited Obligation Improvement Bonds, Series 2013, 5.00% 2030
| 700
| 789
|
| City of Irvine, Reassessment Dist. No. 15-2, Limited Obligation Improvement Bonds, Series 2015, 5.00% 2032
| 350
| 400
|
| City of Irvine, Reassessment Dist. No. 15-2, Limited Obligation Improvement Bonds, Series 2015, 5.00% 2033
| 585
| 666
|
| City of Irvine, Reassessment Dist. No. 15-2, Limited Obligation Improvement Bonds, Series 2015, 5.00% 2034
| 615
| 699
|
| City of Irvine, Reassessment Dist. No. 15-2, Limited Obligation Improvement Bonds, Series 2015, 5.00% 2035
| 375
| 425
|
| City of Irvine, Reassessment Dist. No. 15-2, Limited Obligation Improvement Bonds, Series 2015, 5.00% 2042
| 1,000
| 1,119
|
| Irvine Unified School Dist., Community Facs. Dist. No. 09-1, Special Tax Bonds, Series 2017-A, BAM insured, 5.00% 2025
| 1,000
| 1,175
|
The Tax-Exempt Bond Fund of America — Page 7
of 120
Bonds, notes & other debt instruments (continued)
California (continued)
| Principal amount
(000)
| Value
(000)
|
| Irvine Unified School Dist., Community Facs. Dist. No. 09-1, Special Tax Bonds, Series 2017-A, BAM insured, 5.00% 2026
| $1,300
| $1,557
|
| Irvine Unified School Dist., Community Facs. Dist. No. 09-1, Special Tax Bonds, Series 2017-A, BAM insured, 5.00% 2027
| 1,085
| 1,320
|
| Irvine Unified School Dist., Community Facs. Dist. No. 09-1, Special Tax Bonds, Series 2017-A, BAM insured, 5.00% 2034
| 1,000
| 1,176
|
| Irvine Unified School Dist., Community Facs. Dist. No. 09-1, Special Tax Bonds, Series 2017-B, BAM insured, 5.00% 2047
| 2,000
| 2,297
|
| Irvine Unified School Dist., Community Facs. Dist. No. 09-1, Special Tax Bonds, Series 2017-B, BAM insured, 5.00% 2051
| 3,000
| 3,409
|
| Irvine Unified School Dist., Community Facs. Dist. No. 09-1, Special Tax Bonds, Series 2017-C, BAM insured, 5.00% 2042
| 1,000
| 1,153
|
| Irvine Unified School Dist., Community Facs. Dist. No. 09-1, Special Tax Bonds, Series 2017-D, BAM insured, 4.00% 2026
| 150
| 167
|
| Irvine Unified School Dist., Community Facs. Dist. No. 09-1, Special Tax Bonds, Series 2017-D, BAM insured, 5.00% 2049
| 1,000
| 1,146
|
| Irvine Unified School Dist., Community Facs. Dist. No. 09-1, Special Tax Bonds, Series 2017-D, BAM insured, 5.00% 2057
| 1,000
| 1,134
|
| Irvine Unified School Dist., Community Facs. Dist. No. 09-1, Special Tax Bonds, Series 2018-A, BAM insured, 5.00% 2032
| 250
| 296
|
| Irvine Unified School Dist., Community Facs. Dist. No. 09-1, Special Tax Bonds, Series 2018-A, BAM insured, 5.00% 2033
| 120
| 142
|
| Irvine Unified School Dist., Community Facs. Dist. No. 09-1, Special Tax Bonds, Series 2018-A, BAM insured, 5.00% 2034
| 475
| 558
|
| Irvine Unified School Dist., Community Facs. Dist. No. 09-1, Special Tax Bonds, Series 2018-A, BAM insured, 5.00% 2035
| 530
| 622
|
| Irvine Unified School Dist., Community Facs. Dist. No. 09-1, Special Tax Bonds, Series 2018-A, BAM insured, 5.00% 2036
| 510
| 596
|
| Irvine Unified School Dist., Community Facs. Dist. No. 09-1, Special Tax Bonds, Series 2018-A, BAM insured, 5.00% 2037
| 705
| 821
|
| Irvine Unified School Dist., Community Facs. Dist. No. 09-1, Special Tax Bonds, Series 2018-A, BAM insured, 5.00% 2038
| 645
| 750
|
| City of Jurupa, Public Fncg. Auth., Special Tax Rev. Bonds, Series 2013-A, 5.25% 2024
| 1,145
| 1,337
|
| City of Jurupa, Public Fncg. Auth., Special Tax Rev. Bonds, Series 2014-A, 5.00% 2026
| 700
| 834
|
| City of Jurupa, Public Fncg. Auth., Special Tax Rev. Bonds, Series 2014-A, 5.00% 2032
| 1,260
| 1,471
|
| City of Jurupa, Public Fncg. Auth., Special Tax Rev. Bonds, Series 2014-A, 5.00% 2042
| 1,250
| 1,422
|
City of La Quinta, Successor Agcy. to the Redev. Agcy., Tax Allocation Rev. Ref. Bonds
(Redev. Project Area Nos. 1 and 2), Series 2013-A, 5.00% 2029
| 1,435
| 1,638
|
City of La Quinta, Successor Agcy. to the Redev. Agcy., Tax Allocation Rev. Ref. Bonds
(Redev. Project Area Nos. 1 and 2), Series 2013-A, 5.00% 2030
| 1,500
| 1,710
|
City of La Quinta, Successor Agcy. to the Redev. Agcy., Tax Allocation Rev. Ref. Bonds
(Redev. Project Area Nos. 1 and 2), Series 2014-A, 5.00% 2033
| 1,890
| 2,216
|
| City of Lake Elsinore, Public Fncg. Auth., Local Agcy. Rev. Ref. Bonds, Series 2015, 5.00% 2035
| 1,330
| 1,507
|
| City of Lake Elsinore, Public Fncg. Auth., Local Agcy. Rev. Ref. Bonds, Series 2015, 5.00% 2040
| 3,240
| 3,634
|
| City of Lancaster, Successor Agcy. to the Redev. Agcy., Combined Redev. Project Areas (Housing Programs), Tax Allocation Rev. Ref. Bonds, Series 2017, 5.00% 2022
| 1,100
| 1,222
|
| City of Lee Lake, Public Fncg. Auth., Special Tax Rev. Ref. Bonds, Series 2013-A, 5.00% 2032
| 3,750
| 4,221
|
| City of Lee Lake, Public Fncg. Auth., Special Tax Rev. Ref. Bonds, Series 2013-A, 5.125% 2035
| 1,250
| 1,404
|
| City of Lee Lake, Public Fncg. Auth., Special Tax Rev. Ref. Bonds, Series 2013-A, 5.25% 2024
| 1,000
| 1,161
|
City of Long Beach, Bond Fin. Auth., Rev. Ref. Bonds (Aquarium of the Pacific Project), Series 2012,
5.00% 2027
| 1,000
| 1,083
|
City of Long Beach, Bond Fin. Auth., Rev. Ref. Bonds (Aquarium of the Pacific Project), Series 2012,
5.00% 2028
| 1,000
| 1,082
|
| City of Long Beach, Harbor Rev. Bonds, Series 2010-A, 5.00% 2025
| 3,000
| 3,094
|
| City of Long Beach, Marina Rev. Bonds (Alamitos Bay Marina Project), Series 2015, 5.00% 2040
| 2,235
| 2,475
|
The Tax-Exempt Bond Fund of America — Page 8
of 120
Bonds, notes & other debt instruments (continued)
California (continued)
| Principal amount
(000)
| Value
(000)
|
Long Beach Unified School Dist., G.O. Rev. Ref. Bonds, Capital Appreciation Bonds, Series 2008-G,
Assured Guaranty insured, 0% 2029
| $3,995
| $3,264
|
City of Los Angeles, Community Facs. Dist. No. 4 (Playa Vista - Phase 1), Special Tax Rev. Ref. Bonds,
Series 2014, 5.00% 2029
| 1,150
| 1,339
|
City of Los Angeles, Community Facs. Dist. No. 4 (Playa Vista - Phase 1), Special Tax Rev. Ref. Bonds,
Series 2014, 5.00% 2030
| 1,000
| 1,159
|
City of Los Angeles, Community Facs. Dist. No. 4 (Playa Vista - Phase 1), Special Tax Rev. Ref. Bonds,
Series 2014, 5.00% 2031
| 700
| 809
|
City of Los Angeles, Dept. of Airports, Los Angeles International Airport, Rev. Bonds, Series 2013-B,
5.00% 2038
| 1,500
| 1,682
|
City of Los Angeles, Dept. of Airports, Los Angeles International Airport, Rev. Bonds, Series 2017-B,
5.00% 2042
| 1,400
| 1,677
|
City of Los Angeles, Dept. of Airports, Los Angeles International Airport, Rev. Bonds, Series 2019-B,
5.00% 2049
| 1,805
| 2,215
|
City of Los Angeles, Dept. of Airports, Los Angeles International Airport, Rev. Ref. Bonds,
Series 2010-A, 5.00% 2035
| 5,000
| 5,154
|
City of Los Angeles, Dept. of Airports, Los Angeles International Airport, Rev. Ref. Bonds,
Series 2015-C, 5.00% 2027
| 1,500
| 1,816
|
| City of Los Angeles, Dept. of Water and Power, Power System Rev. Bonds, Series 2018-D, 5.00% 2043
| 4,505
| 5,512
|
| City of Los Angeles, Dept. of Water and Power, Power System Rev. Bonds, Series 2019-A, 5.00% 2049
| 9,785
| 11,938
|
| City of Los Angeles, Harbor Dept., Rev. Bonds, Series 2009-A, 5.00% 2026
| 6,555
| 6,577
|
| City of Los Angeles, Housing Auth., Mortgage Rev. Ref. Bonds (Property Acquisition Ref.), Series 2009-A, 6.00% 2029
| 1,000
| 1,003
|
| City of Los Angeles, Housing Auth., Mortgage Rev. Ref. Bonds (Property Acquisition Ref.), Series 2009-A, 6.375% 2039
| 3,000
| 3,010
|
City of Los Angeles, Wastewater System Rev. Ref. Bonds, Series 2002-A, FGIC-National insured,
6.00% 2022 (escrowed to maturity)
| 5,000
| 5,713
|
County of Los Angeles, Redev. Ref. Auth., Tax Allocation Rev. Ref. Bonds (Various Redev. Project Areas),
Series 2013-D, Assured Guaranty Municipal insured, 5.00% 2027
| 1,950
| 2,244
|
| Los Angeles Community College Dist., G.O. Bonds, 2008 Election, Series 2010-C, 5.25% 2039 (preref. 2020)
| 2,000
| 2,086
|
Los Angeles County Facs. Inc., Lease Rev. Bonds (Vermont Corridor County Administration Building),
Series 2018-A, 5.00% 2043
| 1,250
| 1,509
|
Los Angeles Unified School Dist., G.O. Bonds (Dedicated Unlimited Ad Valorem Property Tax Bonds),
2005 Election, Series 2018-M-1, 5.25% 2042
| 20,000
| 24,662
|
| Los Rios Community College Dist., G.O. Rev. Ref. Bonds, 2012 Election, Series 2012, 5.00% 2028
| 3,000
| 3,350
|
| M-S-R Energy Auth., Gas Rev. Bonds, Series 2009-B, 6.125% 2029
| 3,000
| 3,828
|
| M-S-R Energy Auth., Gas Rev. Bonds, Series 2009-B, 6.50% 2039
| 2,000
| 3,045
|
Menifee Union School Dist., Public Fncg. Auth., Special Tax Rev. Bonds, Series 2016-A, BAM insured,
3.00% 2031
| 570
| 595
|
Menifee Union School Dist., Public Fncg. Auth., Special Tax Rev. Bonds, Series 2016-A, BAM insured,
4.00% 2020
| 250
| 257
|
Menifee Union School Dist., Public Fncg. Auth., Special Tax Rev. Bonds, Series 2016-A, BAM insured,
5.00% 2032
| 725
| 849
|
Menifee Union School Dist., Public Fncg. Auth., Special Tax Rev. Bonds, Series 2016-A, BAM insured,
5.00% 2033
| 760
| 887
|
Menifee Union School Dist., Public Fncg. Auth., Special Tax Rev. Bonds, Series 2016-A, BAM insured,
5.00% 2034
| 600
| 697
|
Menifee Union School Dist., Public Fncg. Auth., Special Tax Rev. Bonds, Series 2016-A, BAM insured,
5.00% 2036
| 850
| 980
|
| Menifee Union School Dist., Public Fncg. Auth., Special Tax Rev. Bonds, Series 2017-A, National insured, 5.00% 2026
| 1,440
| 1,765
|
| Menifee Union School Dist., Public Fncg. Auth., Special Tax Rev. Bonds, Series 2017-A, National insured, 5.00% 2029
| 1,260
| 1,528
|
| Menifee Union School Dist., Public Fncg. Auth., Special Tax Rev. Bonds, Series 2017-A, National insured, 5.00% 2031
| 250
| 299
|
The Tax-Exempt Bond Fund of America — Page 9
of 120
Bonds, notes & other debt instruments (continued)
California (continued)
| Principal amount
(000)
| Value
(000)
|
| Menifee Union School Dist., Public Fncg. Auth., Special Tax Rev. Bonds, Series 2017-A, National insured, 5.00% 2033
| $345
| $410
|
| Metropolitan Water Dist. of Southern California, Water Rev. Ref. Bonds, Series 2016-A, 5.00% 2033
| 4,390
| 5,306
|
City of Modesto, Irrigation Dist., Electric System Rev. Ref. Bonds, Series 2012-A,
Assured Guaranty Municipal insured, 5.00% 2026
| 2,500
| 2,878
|
| City of Morgan Hill, Successor Agcy. to the Redev. Agcy., Rev. Ref. Bonds, Series 2013-A, 5.00% 2026
| 2,000
| 2,304
|
| The Morongo Band of Mission Indians, Rev. Ref Bonds, Series 2018-B, 5.00% 20421
| 3,025
| 3,401
|
Municipal Fin. Auth., Educational Rev. Bonds (American Heritage Education Foundation Project),
Series 2016-A, 5.00% 2046
| 745
| 836
|
Municipal Fin. Auth., Insured Senior Living Rev. Ref. Bonds (Pilgrim Place in Claremont), Series 2016-A,
5.00% 2031
| 1,810
| 2,219
|
| Municipal Fin. Auth., Rev. Bonds (California Baptist University), Series 2015-A, 5.50% 20451
| 1,600
| 1,841
|
| Municipal Fin. Auth., Rev. Bonds (California Baptist University), Series 2016-A, 5.00% 20361
| 1,500
| 1,722
|
| Municipal Fin. Auth., Rev. Bonds (California Baptist University), Series 2016-A, 5.00% 20461
| 1,500
| 1,693
|
Municipal Fin. Auth., Rev. Ref. Bonds (Azusa Pacific University Project), Series 2011-B,
8.00% 2041 (preref. 2021)1
| 3,400
| 3,793
|
| Municipal Fin. Auth., Rev. Ref. Bonds (Harbor Regional Center Project), Series 2015, 5.00% 2039
| 850
| 974
|
| Municipal Fin. Auth., Rev. Ref. Bonds (HumanGood Obligated Group), Series 2019-A, 4.00% 2030
| 1,000
| 1,135
|
| Municipal Fin. Auth., Rev. Ref. Bonds (HumanGood Obligated Group), Series 2019-A, 4.00% 2032
| 1,000
| 1,121
|
| Municipal Fin. Auth., Rev. Ref. Bonds (HumanGood Obligated Group), Series 2019-A, 4.00% 2038
| 3,750
| 4,091
|
| Municipal Fin. Auth., Rev. Ref. Bonds (HumanGood Obligated Group), Series 2019-A, 5.00% 2044
| 3,250
| 3,783
|
| City of Murrieta, Public Fncg. Auth., Special Tax Rev. Ref. Bonds, Series 2012, 5.00% 2031
| 2,810
| 3,060
|
| Murrieta Valley Unified School Dist., Public Fncg. Auth., Special Tax Rev. Bonds, Series 2016-A, 5.00% 2022
| 1,250
| 1,369
|
| Murrieta Valley Unified School Dist., Public Fncg. Auth., Special Tax Rev. Bonds, Series 2016-A, 5.00% 2024
| 760
| 873
|
| Murrieta Valley Unified School Dist., Public Fncg. Auth., Special Tax Rev. Bonds, Series 2016-A, 5.00% 2026
| 2,620
| 3,126
|
| Murrieta Valley Unified School Dist., Public Fncg. Auth., Special Tax Rev. Bonds, Series 2016-A, 5.00% 2027
| 1,875
| 2,229
|
| Murrieta Valley Unified School Dist., Public Fncg. Auth., Special Tax Rev. Bonds, Series 2016-A, 5.00% 2031
| 1,915
| 2,234
|
| Murrieta Valley Unified School Dist., Public Fncg. Auth., Special Tax Rev. Bonds, Series 2016-A, 5.00% 2032
| 1,175
| 1,367
|
Murrieta Valley Unified School Dist., Public Fncg. Auth., Special Tax Rev. Bonds, Series 2016-A,
Assured Guaranty Municipal insured, 5.00% 2032
| 1,000
| 1,186
|
Murrieta Valley Unified School Dist., Public Fncg. Auth., Special Tax Rev. Bonds, Series 2016-A,
Assured Guaranty Municipal insured, 5.00% 2034
| 2,935
| 3,462
|
Northern California Gas Auth. No. 1, Gas Project Rev. Bonds, Series 2007-B,
(3-month USD-LIBOR + 0.67%) 2.273% 20272
| 18,500
| 18,267
|
| Northern California Power Agcy., Hydroelectric Project No. 1, Rev. Ref. Bonds, Series 2012-A, 5.00% 2032
| 1,400
| 1,548
|
Northern California Power Agcy., Lodi Energy Center Rev. Bonds, Issue One, Series 2010-A,
5.00% 2025 (preref. 2020)
| 5,000
| 5,168
|
City of Oakland, Successor Agcy. to the Redev. Agcy., Tax Allocation Rev. Ref. Bonds
(Central Dist. Redev. Project), Series 2013, 5.00% 2021
| 4,590
| 4,951
|
| Ontario-Montclair School Dist., G.O. Rev. Ref. Bonds, Series 2019-B, 5.00% 2043
| 2,355
| 2,809
|
| City of Orange, Community Facs. Dist. No. 91-2 (Serrano Heights Public Improvements), Special Tax Rev. Ref. Bonds, Series 2013, 5.00% 2026
| 1,070
| 1,184
|
| City of Orange, Community Facs. Dist. No. 91-2 (Serrano Heights Public Improvements), Special Tax Rev. Ref. Bonds, Series 2013, 5.00% 2027
| 1,300
| 1,436
|
| City of Orange, Community Facs. Dist. No. 91-2 (Serrano Heights Public Improvements), Special Tax Rev. Ref. Bonds, Series 2013, 5.00% 2028
| 750
| 829
|
| County of Orange, Community Facs. Dist. No. 2015-1 (Esencia Village), Special Tax Bonds, Series 2015-A, 5.00% 2034
| 750
| 851
|
| County of Orange, Community Facs. Dist. No. 2016-1 (Esencia Village), Special Tax Bonds, Series 2016-A, 5.00% 2041
| 1,250
| 1,422
|
County of Orange, Community Facs. Dist. No. 2017-1 (Esencia Village - Improvement Area No. 1),
Special Tax Bonds, Series 2018-A, 5.00% 2036
| 2,880
| 3,410
|
County of Orange, Community Facs. Dist. No. 2017-1 (Esencia Village - Improvement Area No. 1),
Special Tax Bonds, Series 2018-A, 5.00% 2047
| 6,000
| 6,985
|
The Tax-Exempt Bond Fund of America — Page
10 of 120
Bonds, notes & other debt instruments (continued)
California (continued)
| Principal amount
(000)
| Value
(000)
|
City of Palm Desert, Section 29 Assessment Dist. No. 2004-02, Limited Obligation Improvement Bonds,
Series 2007, 5.10% 2037
| $1,820
| $1,824
|
City of Palmdale, Successor Agcy. to the Redev. Agcy., Tax Allocation Rev. Ref. Bonds, Series 2016-A,
National insured, 5.00% 2030
| 250
| 306
|
Palmdale Elementary School Dist., Community Facs. Dist. No. 90-1, Special Tax Bonds, Series 2017-A,
Assured Guaranty Municipal insured, 5.00% 2041
| 2,250
| 2,649
|
| Palomar Health, G.O. Rev. Ref. Bonds, Series 2017, Assured Guaranty Municipal insured, 5.00% 2047
| 4,000
| 4,680
|
| Palomar Pomerado Health, Certs. of Part., Series 2010, 6.00% 2030 (preref. 2020)
| 7,500
| 7,961
|
Palomar Pomerado Health, G.O. Bonds, Capital Appreciation Bonds, 2004 Election, Series 2009-A,
Assured Guaranty insured, 0% 2028
| 7,000
| 5,720
|
Palomar Pomerado Health, G.O. Bonds, Capital Appreciation Bonds, 2004 Election, Series 2009-A,
Assured Guaranty insured, 0% 2030
| 16,520
| 12,525
|
Palomar Pomerado Health, G.O. Bonds, Capital Appreciation Bonds, 2004 Election, Series 2009-A,
Assured Guaranty insured, 0% 2031
| 3,000
| 2,185
|
| Perris Union High School Dist., Fncg. Auth., Rev. Bonds, Series 2015, 5.00% 2031
| 650
| 736
|
| Perris Union High School Dist., Fncg. Auth., Rev. Bonds, Series 2015, 5.00% 2034
| 1,260
| 1,417
|
| Poway Unified School Dist., Community Facs. Dist. No. 6 (4S Ranch), Special Tax Rev. Ref Bonds, Series 2016, BAM insured, 5.00% 2030
| 1,920
| 2,371
|
| Poway Unified School Dist., Community Facs. Dist. No. 6 (4S Ranch), Special Tax Rev. Ref Bonds, Series 2016, BAM insured, 5.00% 2031
| 2,055
| 2,496
|
| Poway Unified School Dist., Community Facs. Dist. No. 6 (4S Ranch), Special Tax Rev. Ref Bonds, Series 2016, BAM insured, 5.00% 2032
| 2,200
| 2,661
|
| Poway Unified School Dist., Community Facs. Dist. No. 6 (4S Ranch), Special Tax Rev. Ref. Bonds, Series 2016, BAM insured, 5.00% 2033
| 985
| 1,188
|
| Poway Unified School Dist., Public Fncg. Auth., Special Tax Rev. Ref. Bonds, Series 2015-A, 5.00% 2026
| 1,265
| 1,474
|
| Poway Unified School Dist., Public Fncg. Auth., Special Tax Rev. Ref. Bonds, Series 2015-A, 5.00% 2027
| 590
| 685
|
| Poway Unified School Dist., Public Fncg. Auth., Special Tax Rev. Ref. Bonds, Series 2015-B, BAM insured, 4.00% 2036
| 730
| 799
|
| Public Fin. Auth., Rev. Bonds (Henry Mayo Newhall Memorial Hospital), Series 2017, 5.00% 2033
| 500
| 575
|
| Public Works Board, Lease Rev. Bonds (Various Capital Projects), Series 2009-I-1, 5.50% 2023 (preref. 2019)
| 10,000
| 10,114
|
| Public Works Board, Lease Rev. Bonds (Various Capital Projects), Series 2009-I-1, 6.125% 2029 (preref. 2019)
| 3,000
| 3,039
|
| Public Works Board, Lease Rev. Bonds (Various Capital Projects), Series 2012-A, 5.00% 2033
| 2,000
| 2,189
|
| Public Works Board, Lease Rev. Bonds (Various Capital Projects), Series 2012-A, 5.00% 2037
| 3,000
| 3,280
|
| Public Works Board, Lease Rev. Bonds (Various Capital Projects), Series 2013-I, 5.25% 2032
| 2,500
| 2,901
|
City of Rancho Cordova, Community Facs. Dist. No. 2003-1 (Sunridge Anatolia), Special Tax Bonds,
Series 2016, 4.00% 2025
| 1,000
| 1,096
|
City of Rancho Cordova, Community Facs. Dist. No. 2003-1 (Sunridge Anatolia), Special Tax Bonds,
Series 2016, 4.00% 2027
| 425
| 468
|
City of Rancho Cordova, Community Facs. Dist. No. 2003-1 (Sunridge Anatolia), Special Tax Bonds,
Series 2016, 4.00% 2028
| 1,185
| 1,294
|
City of Rancho Cordova, Community Facs. Dist. No. 2003-1 (Sunridge Anatolia), Special Tax Bonds,
Series 2016, 4.00% 2030
| 1,390
| 1,502
|
City of Rancho Cucamonga, Successor Agcy. to the Redev. Agcy., Tax Allocation Rev. Ref. Bonds
(Rancho Redev. Project Area), Series 2014, Assured Guaranty Municipal insured, 5.00% 2031
| 755
| 877
|
City of Rancho Mirage, Successor Agcy. to the Redev. Agcy., Tax Allocation Housing Rev. Ref. Bonds,
Series 2013-A, 5.00% 2023
| 1,835
| 2,100
|
| City of Rancho Santa Fe, Community Services Dist., Rev. Bonds, Series 2016-A, BAM insured, 5.00% 2029
| 1,500
| 1,841
|
| Rio Elementary School Dist., Community Facs. Dist. No. 1, Special Tax Bonds, Series 2013, 5.50% 2039
| 1,340
| 1,491
|
| Rio Elementary School Dist., Community Facs. Dist. No. 1, Special Tax Bonds, Series 2016, BAM insured, 5.00% 2026
| 335
| 400
|
| Rio Elementary School Dist., Community Facs. Dist. No. 1, Special Tax Bonds, Series 2016, BAM insured, 5.00% 2033
| 310
| 368
|
| Rio Elementary School Dist., Community Facs. Dist. No. 1, Special Tax Bonds, Series 2016, BAM insured, 5.00% 2034
| 1,000
| 1,182
|
The Tax-Exempt Bond Fund of America — Page
11 of 120
Bonds, notes & other debt instruments (continued)
California (continued)
| Principal amount
(000)
| Value
(000)
|
Rio Elementary School Dist., Community Facs. Dist. No. 1, Special Tax Rev. Ref. Bonds, Series 2014,
5.00% 2028
| $490
| $555
|
Rio Elementary School Dist., Community Facs. Dist. No. 1, Special Tax Rev. Ref. Bonds, Series 2014,
5.00% 2029
| 540
| 609
|
Rio Elementary School Dist., Community Facs. Dist. No. 1, Special Tax Rev. Ref. Bonds, Series 2014,
5.00% 2035
| 2,375
| 2,642
|
| County of Riverside, Public Fncg. Auth., Tax Allocation Rev. Bonds (Project Area No. 1, Desert Communities and Interstate 215 Corridor Projects), Series 2015-A,
Assured Guaranty Municipal insured, 5.00% 2026
| 1,235
| 1,504
|
| County of Riverside, Public Fncg. Auth., Tax Allocation Rev. Bonds (Project Area No. 1, Desert Communities and Interstate 215 Corridor Projects), Series 2015-A,
Assured Guaranty Municipal insured, 5.00% 2030
| 2,905
| 3,481
|
County of Riverside, Successor Agcy. to the Redev. Agcy., Tax Allocation Housing Rev. Ref. Bonds,
Series 2014-A, Assured Guaranty Municipal insured, 5.00% 2030
| 600
| 704
|
County of Riverside, Successor Agcy. to the Redev. Agcy., Tax Allocation Housing Rev. Ref. Bonds,
Series 2014-A, Assured Guaranty Municipal insured, 5.00% 2033
| 1,000
| 1,161
|
County of Riverside, Successor Agcy. to the Redev. Agcy., Tax Allocation Housing Rev. Ref. Bonds,
Series 2014-A, Assured Guaranty Municipal insured, 5.00% 2034
| 1,000
| 1,158
|
| County of Riverside, Successor Agcy. to the Redev. Agcy., Tax Allocation Rev. Ref. Bonds (Jurupa Valley Redev. Project Area), Series 2015-B, Assured Guaranty
Municipal insured, 4.00% 2037
| 2,500
| 2,702
|
| County of Riverside, Successor Agcy. to the Redev. Agcy., Tax Allocation Rev. Ref. Bonds (Jurupa Valley Redev. Project Area), Series 2015-B, Assured Guaranty
Municipal insured, 5.00% 2029
| 2,560
| 3,098
|
| County of Riverside, Successor Agcy. to the Redev. Agcy., Tax Allocation Rev. Ref. Bonds (Jurupa Valley Redev. Project Area), Series 2015-B, Assured Guaranty
Municipal insured, 5.00% 2031
| 1,500
| 1,802
|
| County of Riverside, Successor Agcy. to the Redev. Agcy., Tax Allocation Rev. Ref. Bonds (Jurupa Valley Redev. Project Area), Series 2016-B, BAM insured, 4.00%
2032
| 1,000
| 1,100
|
Riverside Unified School Dist., Fncg. Auth., Special Tax Rev. Ref. Bonds, Series 2015, BAM insured,
5.00% 2027
| 1,480
| 1,755
|
Riverside Unified School Dist., Fncg. Auth., Special Tax Rev. Ref. Bonds, Series 2015, BAM insured,
5.00% 2028
| 2,135
| 2,518
|
Riverside Unified School Dist., Fncg. Auth., Special Tax Rev. Ref. Bonds, Series 2015, BAM insured,
5.00% 2030
| 2,175
| 2,549
|
Riverside Unified School Dist., Fncg. Auth., Special Tax Rev. Ref. Bonds, Series 2015, BAM insured,
5.00% 2031
| 1,040
| 1,215
|
Riverside Unified School Dist., Fncg. Auth., Special Tax Rev. Ref. Bonds, Series 2015, BAM insured,
5.00% 2032
| 1,115
| 1,298
|
Riverside Unified School Dist., Fncg. Auth., Special Tax Rev. Ref. Bonds, Series 2015, BAM insured,
5.00% 2035
| 1,000
| 1,158
|
City of Roseville, Community Facs. Dist. No. 1 (Westpark), Special Tax Rev. Ref. Bonds, Series 2015,
5.00% 2021
| 1,005
| 1,074
|
City of Roseville, Community Facs. Dist. No. 1 (Westpark), Special Tax Rev. Ref. Bonds, Series 2015,
5.00% 2022
| 500
| 548
|
City of Roseville, Community Facs. Dist. No. 1 (Westpark), Special Tax Rev. Ref. Bonds, Series 2015,
5.00% 2026
| 500
| 584
|
City of Roseville, Community Facs. Dist. No. 1 (Westpark), Special Tax Rev. Ref. Bonds, Series 2015,
5.00% 2037
| 1,750
| 1,975
|
| City of Roseville, Fin. Auth., Electric System Rev. Ref. Bonds, Series 2017-A, 4.00% 2036
| 3,365
| 3,759
|
City of Sacramento, Community Drainage Facs. Dist. No. 97-1 (North Natomas), Special Tax Bonds,
Series 2015, 5.00% 2025
| 100
| 121
|
City of Sacramento, Community Drainage Facs. Dist. No. 97-1 (North Natomas), Special Tax Bonds,
Series 2015, 5.00% 2028
| 1,735
| 2,063
|
City of Sacramento, Community Drainage Facs. Dist. No. 97-1 (North Natomas), Special Tax Bonds,
Series 2015, 5.00% 2035
| 3,000
| 3,464
|
| City of Sacramento, Community Facs. Dist. No. 4 (North Natomas), Special Tax Rev. Ref. Bonds, Series 2013-E, 5.00% 2019
| 1,385
| 1,389
|
| City of Sacramento, Community Facs. Dist. No. 4 (North Natomas), Special Tax Rev. Ref. Bonds, Series 2013-E, 5.25% 2024
| 1,160
| 1,340
|
The Tax-Exempt Bond Fund of America — Page
12 of 120
Bonds, notes & other debt instruments (continued)
California (continued)
| Principal amount
(000)
| Value
(000)
|
| City of Sacramento, Community Facs. Dist. No. 4 (North Natomas), Special Tax Rev. Ref. Bonds, Series 2013-E, 5.25% 2033
| $1,500
| $1,690
|
City of Sacramento, Fncg. Auth., Rev. Ref. Bonds (Master Lease Program Facs.), Series 2006-E,
AMBAC insured, 5.25% 2025
| 7,500
| 9,368
|
| City of Sacramento, Municipal Utility Dist., Electric Rev. Bonds, Series 2013-A, 5.00% 2037
| 1,500
| 1,713
|
| County of Sacramento, Airport System Rev. Ref. Bonds, Series 2016-B, 5.00% 2036
| 1,000
| 1,189
|
| County of Sacramento, Airport System Rev. Ref. Bonds, Series 2016-B, 5.00% 2041
| 4,200
| 4,937
|
| County of Sacramento, Water Fncg. Auth., Rev. Ref. Bonds (Water Agcy. Zones 40 and 41), Series 2007-B, FGIC-National insured, (3-month USD-LIBOR + 0.55%) 2.239%
20342
| 6,295
| 6,075
|
| Sacramento Regional Transit Dist., Farebox Rev. Bonds, Series 2012, 5.00% 2020
| 520
| 532
|
| Sacramento Regional Transit Dist., Farebox Rev. Bonds, Series 2012, 5.00% 2020 (escrowed to maturity)
| 305
| 312
|
| County of San Bernardino, Certs. of Part. (Arrowhead Rev. Ref. Project), Series 2009-A, 5.125% 2024
| 7,000
| 7,000
|
San Bernardino Unified School Dist., G.O. Rev. Ref. Bonds, Series 2013-A,
Assured Guaranty Municipal insured, 5.00% 2026
| 1,000
| 1,149
|
San Bernardino Unified School Dist., G.O. Rev. Ref. Bonds, Series 2013-A,
Assured Guaranty Municipal insured, 5.00% 2027
| 1,000
| 1,147
|
| City of San Buenaventura, Rev. Bonds (Community Memorial Health System), Series 2011, 7.50% 2041
| 19,850
| 22,132
|
City of San Clemente, Community Facs. Dist. No. 2006-1 (Marblehead Coastal), Special Tax Bonds,
Series 2015, 5.00% 2028
| 975
| 1,128
|
| City of San Diego, Public Facs. Fncg. Auth., Water Rev. Bonds, Series 2009-B, 5.00% 2026 (preref. 2019)
| 4,015
| 4,015
|
| County of San Diego, Regional Airport Auth., Airport Rev. Bonds, Series 2010-A, 5.00% 2034
| 1,355
| 1,402
|
City and County of San Francisco, Airport Commission, San Francisco International Airport,
Second Series Rev. Bonds, Series 2009-A, 4.90% 2029
| 4,555
| 4,603
|
City and County of San Francisco, Public Utilities Commission, San Francisco Water Rev. Bonds,
Series 2009-A, 5.00% 2024 (preref. 2019)
| 7,500
| 7,576
|
City and County of San Francisco, Public Utilities Commission, San Francisco Water Rev. Bonds,
Series 2009-A, 5.00% 2029 (preref. 2019)
| 5,665
| 5,722
|
City and County of San Francisco, Redev. Fin. Auth., Tax Allocation Rev. Bonds
(Mission Bay South Redev. Project), Series 2014-A, 5.00% 2031
| 400
| 465
|
| City and County of San Francisco, Rev. Ref. Certs. of Part., Series 2010-A, 5.00% 2026
| 3,020
| 3,159
|
| City of San Jose, Airport Rev. Ref. Bonds, Series 2011-A-2, 5.25% 2034
| 3,000
| 3,185
|
City of San Jose, Redev. Agcy., Housing Set-Aside Tax Allocation Rev. Ref. Bonds
(Merged Area Redev. Project), Series 2010-A-1, 5.00% 2024 (preref. 2020)
| 800
| 832
|
City of San Jose, Redev. Agcy., Housing Set-Aside Tax Allocation Rev. Ref. Bonds
(Merged Area Redev. Project), Series 2010-A-1, 5.125% 2025 (preref. 2020)
| 840
| 875
|
City of San Jose, Redev. Agcy., Housing Set-Aside Tax Allocation Rev. Ref. Bonds
(Merged Area Redev. Project), Series 2010-A-1, 5.50% 2035 (preref. 2020)
| 1,500
| 1,568
|
City of San Ramon, Successor Agcy. to the Redev. Agcy., Tax Allocation Rev. Ref. Bonds, Series 2015-A,
BAM insured, 5.00% 2028
| 400
| 468
|
City of San Ramon, Successor Agcy. to the Redev. Agcy., Tax Allocation Rev. Ref. Bonds, Series 2015-A,
BAM insured, 5.00% 2038
| 2,500
| 2,849
|
| City of Santa Ana, Redev. Agcy., Tax Allocation Bonds, Series 2011-A, 6.00% 2022
| 3,350
| 3,615
|
Santa Ana Unified School Dist., G.O. Bonds, Capital Appreciation Bonds, 2008 Election, Series 2009-B,
Assured Guaranty insured, 0% 2034
| 10,000
| 6,700
|
| City of Santa Clara, Electric Rev. Ref. Bonds, Series 2011-A, 6.00% 2031
| 1,250
| 1,366
|
| County of Santa Cruz, Successor Agcy. to the Redev. Agcy., Tax Allocation Rev. Ref. Bonds, Series 2014-A, 5.00% 2044
| 10,500
| 11,785
|
Saugus Union School Dist., Saugus/Hart School Facs. Fin. Auth., Community Facs. Dist. No. 2006-1,
Special Tax Rev. Bonds, Series 2016, 5.00% 2046
| 1,245
| 1,400
|
School Fin. Auth., Charter School Rev. Bonds (Classical Academies Project), Series 2013-A-1,
7.375% 2043 (preref. 2022)
| 2,975
| 3,500
|
School Fin. Auth., Educational Facs. Rev. Bonds (River Springs Charter School Project), Series 2015-A,
6.375% 20461
| 1,960
| 2,287
|
| Southern California Public Power Auth., Rev. Bonds (Milford Wind Corridor Phase I Project), Series 2010-1, 5.00% 2030
| 3,165
| 3,215
|
The Tax-Exempt Bond Fund of America — Page
13 of 120
Bonds, notes & other debt instruments (continued)
California (continued)
| Principal amount
(000)
| Value
(000)
|
Statewide Communities Dev. Auth., Health Fac. Rev. Bonds (Catholic Healthcare West), Series 2007-F,
Assured Guaranty Municipal insured, 1.75% 20402
| $14,800
| $14,800
|
Statewide Communities Dev. Auth., Pollution Control Rev. Ref. Bonds (Southern California Edison Co.),
Series 2006-A, 1.90% 2028
| 6,740
| 6,754
|
Statewide Communities Dev. Auth., Pollution Control Rev. Ref. Bonds (Southern California Edison Co.),
Series 2006-C, 2.625% 2033 (put 2023)
| 10,000
| 10,359
|
Statewide Communities Dev. Auth., Pollution Control Rev. Ref. Bonds (Southern California Edison Co.),
Series 2006-D, 2.625% 2033 (put 2023)
| 2,600
| 2,693
|
Statewide Communities Dev. Auth., Pollution Control Rev. Ref. Bonds (Southern California Edison Co.),
Series 2010-A, 4.50% 2029
| 4,505
| 4,647
|
Statewide Communities Dev. Auth., Rev. Bonds (American Baptist Homes of the West), Series 2010,
6.00% 2029
| 2,625
| 2,645
|
Statewide Communities Dev. Auth., Rev. Bonds (American Baptist Homes of the West), Series 2010,
6.25% 2039
| 4,200
| 4,233
|
| Statewide Communities Dev. Auth., Rev. Bonds (Huntington Memorial Hospital), Series 2014, 5.00% 2044
| 16,500
| 18,335
|
| Statewide Communities Dev. Auth., Rev. Bonds (Kaiser Permanente), Series 2012-A, 5.00% 2042
| 6,000
| 6,552
|
| Statewide Communities Dev. Auth., Rev. Bonds (Lancer Plaza Project), Series 2013, 5.125% 2023
| 570
| 614
|
Statewide Communities Dev. Auth., Rev. Bonds (Loma Linda University Medical Center), Series 2016-A,
5.00% 20251
| 5,000
| 5,801
|
Statewide Communities Dev. Auth., Rev. Bonds (Loma Linda University Medical Center), Series 2016-A,
5.00% 20411
| 3,425
| 3,824
|
Statewide Communities Dev. Auth., Rev. Bonds (Loma Linda University Medical Center), Series 2016-A,
5.25% 20561
| 1,000
| 1,121
|
Statewide Communities Dev. Auth., Rev. Bonds (Redwoods, a Community of Seniors), Series 2013,
5.375% 2044
| 2,000
| 2,300
|
| Statewide Communities Dev. Auth., Rev. Bonds (Sutter Health), Series 2011-A, 6.00% 2042 (preref. 2020)
| 9,000
| 9,469
|
Statewide Communities Dev. Auth., Rev. Bonds (Viamonte Senior Living 1 Project), Series 2018-B,
3.00% 2025
| 500
| 512
|
Statewide Communities Dev. Auth., Rev. Ref. Bonds (American Baptist Homes of the West), Series 2010,
5.375% 2020
| 845
| 850
|
| Statewide Communities Dev. Auth., Rev. Ref. Bonds (Cottage Health System Obligated Group), Series 2010, 5.25% 2030
| 4,850
| 5,088
|
Statewide Communities Dev. Auth., Rev. Ref. Bonds (Lancer Educational Student Housing Project),
Series 2016-A, 5.00% 20361
| 750
| 841
|
Statewide Communities Dev. Auth., Senior Living Health Fac. Rev. Bonds
(Los Angeles Jewish Home for the Aging - Fountainview at Gonda), Series 2014-A, 5.00% 2034
| 1,000
| 1,128
|
Statewide Communities Dev. Auth., Senior Living Health Fac. Rev. Bonds
(Los Angeles Jewish Home for the Aging - Fountainview at Gonda), Series 2014-A, 5.00% 2044
| 1,450
| 1,627
|
| Statewide Communities Dev. Auth., Senior Living Rev. Ref. Bonds (Southern California Presbyterian Homes), Series 2009, 6.625% 20241
| 1,680
| 1,704
|
| Statewide Communities Dev. Auth., Senior Living Rev. Ref. Bonds (Southern California Presbyterian Homes), Series 2009, 7.25% 20411
| 2,750
| 2,793
|
| Statewide Communities Dev. Auth., Student Housing Rev. Ref. Bonds (CHF-Irvine, LLC - University of California, Irvine East Campus Apartments), Series 2016, 5.00%
2032
| 1,250
| 1,476
|
City of Suisun, Successor Agcy. to the Redev. Agcy., Tax Allocation Rev. Ref. Bonds, Series 2014-B,
BAM insured, 5.00% 2032
| 1,245
| 1,439
|
City of Temecula, Redev. Agcy., Tax Allocation Rev. Ref. Bonds, Series 2017-A,
Assured Guaranty Municipal insured, 5.00% 2030
| 1,220
| 1,510
|
Temecula Valley Unified School Dist., Fncg. Auth., Special Tax Rev. Bonds, Series 2015, BAM insured,
5.00% 2029
| 1,005
| 1,200
|
Temecula Valley Unified School Dist., Fncg. Auth., Special Tax Rev. Bonds, Series 2015, BAM insured,
5.00% 2030
| 630
| 750
|
Temecula Valley Unified School Dist., Fncg. Auth., Special Tax Rev. Bonds, Series 2015, BAM insured,
5.00% 2031
| 1,295
| 1,537
|
The Tax-Exempt Bond Fund of America — Page
14 of 120
Bonds, notes & other debt instruments (continued)
California (continued)
| Principal amount
(000)
| Value
(000)
|
Temecula Valley Unified School Dist., Fncg. Auth., Special Tax Rev. Bonds, Series 2015, BAM insured,
5.00% 2032
| $2,965
| $3,511
|
Temecula Valley Unified School Dist., Fncg. Auth., Special Tax Rev. Bonds, Series 2015, BAM insured,
5.00% 2033
| 2,135
| 2,521
|
Temecula Valley Unified School Dist., Fncg. Auth., Special Tax Rev. Bonds, Series 2015, BAM insured,
5.00% 2035
| 500
| 587
|
City of Thousand Oaks, Community Facs. Dist. No. 1994-1 (Marketplace Public Pedestrian,
Traffic Circulation and Parking Facs.), Special Tax Rev. Ref. Bonds, Series 2012, 5.375% 2031
| 1,010
| 1,063
|
| City of Torrance, Rev. Bonds (Torrance Memorial Medical Center), Series 2010-A, 5.00% 2040
| 3,000
| 3,118
|
| City of Tracy, Successor Agcy. to the Community Dev. Agcy., Tax Allocation Rev. Ref. Bonds, Series 2016, Assured Guaranty Municipal insured, 3.00% 2032
| 2,655
| 2,754
|
| City of Tracy, Successor Agcy. to the Community Dev. Agcy., Tax Allocation Rev. Ref. Bonds, Series 2016, Assured Guaranty Municipal insured, 3.00% 2033
| 1,380
| 1,422
|
| City of Turlock, Irrigation Dist., Rev. Ref. Bonds, Series 2011, 5.50% 2041
| 17,990
| 19,020
|
| City of Turlock, Irrigation Dist., Rev. Ref. Bonds, Series 2016, 5.00% 2035
| 1,000
| 1,199
|
| City of Turlock, Irrigation Dist., Rev. Ref. Bonds, Series 2016, 5.00% 2041
| 8,640
| 10,141
|
| City of Turlock, Irrigation Dist., Rev. Ref. Bonds, Series 2016, 5.00% 2046
| 6,755
| 7,902
|
| City of Tustin, Community Facs. Dist. No. 06-1 (Tustin Legacy/Columbus Villages), Special Tax Rev. Ref. Bonds, Series 2015-A, 5.00% 2035
| 1,215
| 1,419
|
| City of Tustin, Community Facs. Dist. No. 06-1 (Tustin Legacy/Columbus Villages), Special Tax Rev. Ref. Bonds, Series 2015-A, 5.00% 2037
| 1,000
| 1,162
|
| City of Tustin, Community Facs. Dist. No. 06-1 (Tustin Legacy/Columbus Villages), Special Tax Rev. Ref. Bonds, Series 2015-A, 5.00% 2045
| 300
| 335
|
Tustin Unified School Dist., Community Facs. Dist. No. 88-1, Special Tax Rev. Ref. Bonds, Series 2015,
BAM insured, 5.00% 2022
| 1,000
| 1,121
|
Tustin Unified School Dist., Community Facs. Dist. No. 88-1, Special Tax Rev. Ref. Bonds, Series 2015,
BAM insured, 5.00% 2023
| 545
| 631
|
| Tustin Unified School Dist., Community Facs. Dist. No. 97-1, Special Tax Rev. Ref. Bonds, Series 1997-1A, 5.00% 2026
| 1,285
| 1,521
|
| Tustin Unified School Dist., Community Facs. Dist. No. 97-1, Special Tax Rev. Ref. Bonds, Series 1997-1A, 5.00% 2028
| 1,265
| 1,479
|
Tustin Unified School Dist., Community Facs. Dist. No. 97-1, Special Tax Rev. Ref. Bonds, Series 1997-1A,
BAM insured, 5.00% 2033
| 4,000
| 4,689
|
Tustin Unified School Dist., Community Facs. Dist. No. 97-1, Special Tax Rev. Ref. Bonds, Series 1997-1A,
BAM insured, 5.00% 2038
| 2,155
| 2,488
|
Twin Rivers Unified School Dist., G.O. Bonds, Capital Appreciation Bonds, 2006 Election, Series 2016,
Assured Guaranty Municipal insured, 0% 2041
| 5,750
| 2,432
|
| Regents of the University of California, General Rev. Bonds, Series 2019-BB, 5.00% 2049
| 5,000
| 6,160
|
| Regents of the University of California, Limited Project Rev. Bonds, Series 2017-M, 5.00% 2047
| 17,700
| 21,184
|
| Regents of the University of California, Medical Center Pooled Rev. Bonds, Series 2007-C-2, National insured, (3-month USD-LIBOR + 0.61%) 2.467% 20302
| 24,340
| 24,232
|
| Regents of the University of California, Medical Center Pooled Rev. Bonds, Series 2007-C-2, National insured, (3-month USD-LIBOR + 0.67%) 2.357% 20372
| 10,000
| 9,804
|
| Regents of the University of California, Medical Center Pooled Rev. Bonds, Series 2016-L, 4.00% 2037
| 2,300
| 2,538
|
| County of Ventura, Public Fncg. Auth., Lease Rev. Bonds, Series 2013-A, 5.00% 2029
| 3,000
| 3,360
|
| Dept. of Veterans Affairs, Veterans G.O. Rev. Ref. Bonds, Series 2015-CL, 3.50% 2030
| 7,500
| 7,956
|
| City of Vista, Successor Agcy. to the Redev. Agcy., Tax Allocation Rev. Ref. Redev. Bonds, Series 2015-B-1, Assured Guaranty Municipal insured, 5.00% 2026
| 1,140
| 1,375
|
| City of Vista, Successor Agcy. to the Redev. Agcy., Tax Allocation Rev. Ref. Redev. Bonds, Series 2015-B-1, Assured Guaranty Municipal insured, 5.00% 2027
| 1,410
| 1,686
|
Walnut Valley Unified School Dist., G.O. Bonds, Capital Appreciation Bonds, 2007 Election, Series 2011-B,
BAM insured, 0% 2036
| 5,655
| 3,496
|
| City of West Sacramento, Successor Agcy. to the Redev. Agcy., Tax Allocation Rev. Ref. Bonds, Series 2016, 4.00% 2032
| 1,400
| 1,553
|
The Tax-Exempt Bond Fund of America — Page
15 of 120
Bonds, notes & other debt instruments (continued)
California (continued)
| Principal amount
(000)
| Value
(000)
|
| City of West Sacramento, Successor Agcy. to the Redev. Agcy., Tax Allocation Rev. Ref. Bonds, Series 2016, 4.00% 2033
| $1,455
| $1,611
|
| City of West Sacramento, Successor Agcy. to the Redev. Agcy., Tax Allocation Rev. Ref. Bonds, Series 2016, 5.00% 2027
| 350
| 431
|
| City of West Sacramento, Successor Agcy. to the Redev. Agcy., Tax Allocation Rev. Ref. Bonds, Series 2016, 5.00% 2028
| 550
| 675
|
| City of West Sacramento, Successor Agcy. to the Redev. Agcy., Tax Allocation Rev. Ref. Bonds, Series 2016, 5.00% 2029
| 1,205
| 1,473
|
| City of West Sacramento, Successor Agcy. to the Redev. Agcy., Tax Allocation Rev. Ref. Bonds, Series 2016, 5.00% 2031
| 675
| 810
|
Western Riverside Water and Wastewater Fncg. Auth., Local Agcy. Rev. Ref. Bonds, Series 2016-A,
5.00% 2030
| 1,035
| 1,240
|
Western Riverside Water and Wastewater Fncg. Auth., Local Agcy. Rev. Ref. Bonds, Series 2016-A,
5.00% 2034
| 1,165
| 1,367
|
Western Riverside Water and Wastewater Fncg. Auth., Local Agcy. Rev. Ref. Bonds, Series 2016-A,
5.00% 2044
| 1,105
| 1,266
|
City of Westminster, Successor Agcy. to the Redev. Agcy., Commercial Redev. Project No. 1,
Tax Allocation Rev. Ref. Bonds, Series 2016-B, BAM insured, 4.00% 2032
| 3,425
| 3,824
|
City of Westminster, Successor Agcy. to the Redev. Agcy., Commercial Redev. Project No. 1,
Tax Allocation Rev. Ref. Bonds, Series 2016-B, BAM insured, 4.00% 2033
| 3,560
| 3,958
|
City of Westminster, Successor Agcy. to the Redev. Agcy., Commercial Redev. Project No. 1,
Tax Allocation Rev. Ref. Bonds, Series 2016-B, BAM insured, 5.00% 2029
| 1,000
| 1,223
|
City of Westminster, Successor Agcy. to the Redev. Agcy., Commercial Redev. Project No. 1,
Tax Allocation Rev. Ref. Bonds, Series 2016-B, BAM insured, 5.00% 2030
| 1,570
| 1,907
|
| City of Woodland, Community Facs. Dist. No. 2004-1 (Spring Lake), Special Tax Rev. Ref. and Capital Projects Bonds, Series 2016, 4.00% 2041
| 2,560
| 2,674
|
|
|
| 1,457,715
|
| Colorado 2.07%
|
|
|
| County of Arapahoe, Copperleaf Metropolitan Dist. No. 2, Limited Tax G.O. Bonds, Series 2015, 5.75% 2045
| 550
| 577
|
| Arkansas River Power Auth., Power Supply System Rev. Ref. Bonds, Series 2018-A, 5.00% 2038
| 9,900
| 11,515
|
| Arkansas River Power Auth., Power Supply System Rev. Ref. Bonds, Series 2018-A, 5.00% 2043
| 3,250
| 3,749
|
| City of Arvada, Mountain Shadows Metropolitan Dist., Limited Tax G.O. Rev. Ref. and Improvement Bonds, Series 2016, 5.00% 2046
| 1,000
| 1,034
|
| City of Aurora, Southlands Metropolitan Dist. No. 1, G.O. Rev. Ref. Bonds, Series 2017-A-1, 3.00% 2022
| 476
| 481
|
| City of Aurora, Southlands Metropolitan Dist. No. 1, G.O. Rev. Ref. Bonds, Series 2017-A-1, 3.50% 2027
| 500
| 518
|
| City of Aurora, Southlands Metropolitan Dist. No. 1, G.O. Rev. Ref. Bonds, Series 2017-A-1, 5.00% 2037
| 1,175
| 1,312
|
| City of Aurora, Southlands Metropolitan Dist. No. 1, G.O. Rev. Ref. Bonds, Series 2017-A-1, 5.00% 2047
| 3,170
| 3,492
|
City and County of Broomfield, Arista Metropolitan Dist., Limited Tax Rev. Ref. Bonds, Series 2018-A,
5.125% 2048
| 3,925
| 4,109
|
| City and County of Broomfield, Lambertson Farms Metropolitan Dist. No. 1, Improvement Rev. Ref. Bonds, Series 2015, 5.50% 2035
| 1,000
| 1,039
|
| City and County of Broomfield, Lambertson Farms Metropolitan Dist. No. 1, Improvement Rev. Ref. Bonds, Series 2015, 5.75% 2046
| 1,800
| 1,864
|
| City and County of Broomfield, Lambertson Farms Metropolitan Dist. No. 1, Improvement Rev. Ref. Bonds, Series 2015, 6.00% 2050
| 1,650
| 1,722
|
City and County of Broomfield, Palisade Metropolitan Dist. No. 2, Limited Tax G.O. and Rev. Bonds,
Series 2016, 4.375% 2031
| 1,750
| 1,767
|
| City of Centennial, Southglenn Metropolitan Dist., Special Rev. Ref. Bonds, Series 2016, 3.00% 2021
| 2,275
| 2,276
|
| Board of Trustees of the Colorado School of Mines, Institutional Enterprise Rev. Ref. Bonds, Series 2018-A, (1-month USD-LIBOR x 0.67 + 0.50%) 2.109% 20232
| 2,955
| 2,966
|
| City of Colorado Springs, Utilities System Rev. Ref. Bonds, Series 2017-A-2, 5.00% 2042
| 4,000
| 4,828
|
| City of Colorado Springs, Utilities System Rev. Ref. Bonds, Series 2018-A-1, 5.00% 2023
| 2,000
| 2,328
|
| City of Colorado Springs, Utilities System Rev. Ref. Bonds, Series 2018-A-1, 5.00% 2024
| 1,500
| 1,798
|
| City of Colorado Springs, Utilities System Rev. Ref. Bonds, Series 2018-A-1, 5.00% 2025
| 1,000
| 1,226
|
The Tax-Exempt Bond Fund of America — Page
16 of 120
Bonds, notes & other debt instruments (continued)
Colorado (continued)
| Principal amount
(000)
| Value
(000)
|
| City and County of Denver, Airport System Rev. Bonds, Series 2018-A, 5.00% 2048
| $3,000
| $3,617
|
| City and County of Denver, Airport System Rev. Ref. Bonds, Series 2009-A, 5.00% 2031
| 3,000
| 3,031
|
| City and County of Denver, Airport System Rev. Ref. Bonds, Series 2009-A, 5.25% 2036
| 7,000
| 7,079
|
| City and County of Denver, Central Platte Valley Metropolitan Dist., G.O. Rev. Ref. Bonds, Series 2013-A, 5.375% 2033
| 1,750
| 1,987
|
| City and County of Denver, Central Platte Valley Metropolitan Dist., G.O. Rev. Ref. Bonds, Series 2013-A, 5.625% 2038
| 1,310
| 1,486
|
| City and County of Denver, Dedicated Tax Rev. Bonds, Capital Appreciation Bonds, Series 2018-A-2, 0% 2033
| 2,000
| 1,309
|
| City and County of Denver, Dedicated Tax Rev. Bonds, Capital Appreciation Bonds, Series 2018-A-2, 0% 2034
| 2,000
| 1,244
|
| City and County of Denver, Denver Convention Center Hotel Auth., Rev. Ref. Bonds, Series 2016, 5.00% 2031
| 1,500
| 1,742
|
| City and County of Denver, Denver Convention Center Hotel Auth., Rev. Ref. Bonds, Series 2016, 5.00% 2032
| 3,000
| 3,492
|
| City and County of Denver, Denver Convention Center Hotel Auth., Rev. Ref. Bonds, Series 2016, 5.00% 2035
| 2,000
| 2,324
|
| City and County of Denver, Denver Convention Center Hotel Auth., Rev. Ref. Bonds, Series 2016, 5.00% 2036
| 1,500
| 1,740
|
| City and County of Denver, Dept. of Aviation (Denver International Airport), Rev. Bonds, Series 2016-B, (1-month USD-LIBOR x 0.70 + 0.86%) 2.541% 2031 (put
2019)2
| 2,655
| 2,656
|
City and County of Denver, Park Creek Metropolitan Dist., Limited Property Tax Supported Rev. Bonds,
Series 2016-A, National insured, 5.00% 2029
| 1,510
| 1,815
|
| City and County of Denver, Park Creek Metropolitan Dist., Limited Property Tax Supported Rev. Ref. Bonds, Series 2015-A, 5.00% 2028
| 4,485
| 5,300
|
| City and County of Denver, Park Creek Metropolitan Dist., Limited Property Tax Supported Rev. Ref. Bonds, Series 2015-A, 5.00% 2029
| 2,660
| 3,129
|
| City and County of Denver, Park Creek Metropolitan Dist., Limited Property Tax Supported Rev. Ref. Bonds, Series 2015-A, 5.00% 2030
| 1,500
| 1,755
|
| City and County of Denver, Park Creek Metropolitan Dist., Limited Property Tax Supported Rev. Ref. Bonds, Series 2015-A, 5.00% 2031
| 1,000
| 1,165
|
| City and County of Denver, Park Creek Metropolitan Dist., Limited Property Tax Supported Rev. Ref. Bonds, Series 2015-A, 5.00% 2032
| 1,685
| 1,959
|
| City and County of Denver, Park Creek Metropolitan Dist., Limited Property Tax Supported Rev. Ref. Bonds, Series 2015-A, 5.00% 2045
| 1,250
| 1,399
|
| City of Denver, Urban Renewal Auth., Stapleton Tax Increment Rev. Bonds, Series 2013-A-1, 5.00% 2024
| 1,045
| 1,171
|
| City of Denver, Urban Renewal Auth., Stapleton Tax Increment Rev. Bonds, Series 2013-A-1, 5.00% 2025
| 3,500
| 3,921
|
| City of Denver, Urban Renewal Auth., Stapleton Tax Increment Rev. Bonds, Series 2018-A, 5.25% 20391
| 1,335
| 1,416
|
E-470 Public Highway Auth., Rev. Bonds, Capital Appreciation Bonds, Series 1997-B, National insured,
0% 2020
| 1,050
| 1,034
|
E-470 Public Highway Auth., Rev. Bonds, Capital Appreciation Bonds, Series 2000-B, National insured,
0% 2019
| 55
| 55
|
E-470 Public Highway Auth., Rev. Bonds, Capital Appreciation Bonds, Series 2000-B, National insured,
0% 2030
| 15,220
| 11,506
|
E-470 Public Highway Auth., Rev. Bonds, Capital Appreciation Bonds, Series 2004-A, National insured,
0% 2027
| 3,250
| 2,734
|
E-470 Public Highway Auth., Rev. Bonds, Capital Appreciation Bonds, Series 2010-A,
Assured Guaranty Municipal insured, 0% 2035
| 16,260
| 9,896
|
E-470 Public Highway Auth., Rev. Bonds, Series 2017-B,
(1-month USD-LIBOR x 0.67 + 1.05%) 2.568% 2039 (put 2021)2
| 5,550
| 5,603
|
E-470 Public Highway Auth., Rev. Bonds, Series 2019-A,
(1-month USD-LIBOR x 0.67 + 0.42%) 1.938% 2039 (put 2021)2
| 8,510
| 8,515
|
| E-470 Public Highway Auth., Rev. Ref. Bonds, Series 2015-A, 5.00% 2019
| 880
| 883
|
| Educational and Cultural Facs. Auth., Rev. Ref. Bonds (Johnson & Wales University Project), Series 2013-B, 5.00% 2027
| 1,500
| 1,649
|
| Grand River Hospital Dist., Unlimited Tax G.O. Bonds, Series 2018, Assured Guaranty Municipal insured, 5.00% 2023
| 2,050
| 2,359
|
| Health Facs. Auth., Health Care Facs. Rev. Bonds (American Baptist Homes of the Midwest Obligated Group), Series 2013, 8.00% 2043
| 6,300
| 7,156
|
| Health Facs. Auth., Health Facs. Rev. and Rev. Ref. Bonds (Evangelical Lutheran Good Samaritan Society Project), Series 2015-A, 5.00% 2023 (escrowed to maturity)
| 2,000
| 2,269
|
The Tax-Exempt Bond Fund of America — Page
17 of 120
Bonds, notes & other debt instruments (continued)
Colorado (continued)
| Principal amount
(000)
| Value
(000)
|
| Health Facs. Auth., Health Facs. Rev. and Rev. Ref. Bonds (Evangelical Lutheran Good Samaritan Society Project), Series 2015-A, 5.00% 2026 (preref. 2025)
| $100
| $119
|
| Health Facs. Auth., Health Facs. Rev. and Rev. Ref. Bonds (Evangelical Lutheran Good Samaritan Society Project), Series 2015-A, 5.00% 2029
| 1,500
| 1,792
|
| Health Facs. Auth., Health Facs. Rev. and Rev. Ref. Bonds (Evangelical Lutheran Good Samaritan Society Project), Series 2015-A, 5.00% 2030
| 2,140
| 2,557
|
| Health Facs. Auth., Health Facs. Rev. and Rev. Ref. Bonds (Evangelical Lutheran Good Samaritan Society Project), Series 2015-A, 5.00% 2031
| 3,250
| 3,883
|
| Health Facs. Auth., Health Facs. Rev. and Rev. Ref. Bonds (Evangelical Lutheran Good Samaritan Society Project), Series 2015-A, 5.00% 2032
| 1,000
| 1,195
|
| Health Facs. Auth., Health Facs. Rev. and Rev. Ref. Bonds (Evangelical Lutheran Good Samaritan Society Project), Series 2015-A, 5.00% 2033
| 1,600
| 1,911
|
| Health Facs. Auth., Health Facs. Rev. and Rev. Ref. Bonds (Evangelical Lutheran Good Samaritan Society Project), Series 2015-A, 5.00% 2040
| 2,500
| 2,987
|
| Health Facs. Auth., Health Facs. Rev. and Rev. Ref. Bonds (Evangelical Lutheran Good Samaritan Society Project), Series 2015-A, 5.00% 2045 (preref. 2025)
| 5,500
| 6,571
|
| Health Facs. Auth., Health Facs. Rev. and Rev. Ref. Bonds (Evangelical Lutheran Good Samaritan Society Project), Series 2017, 5.00% 2032
| 3,460
| 4,302
|
| Health Facs. Auth., Health Facs. Rev. and Rev. Ref. Bonds (Evangelical Lutheran Good Samaritan Society Project), Series 2017, 5.00% 2033
| 6,910
| 8,592
|
| Health Facs. Auth., Health Facs. Rev. and Rev. Ref. Bonds (Evangelical Lutheran Good Samaritan Society Project), Series 2017, 5.00% 2037 (preref. 2027)
| 2,020
| 2,512
|
Health Facs. Auth., Health Facs. Rev. Bonds (Evangelical Lutheran Good Samaritan Society Project),
Series 2012, 5.00% 2025
| 1,590
| 1,752
|
Health Facs. Auth., Health Facs. Rev. Bonds (Evangelical Lutheran Good Samaritan Society Project),
Series 2012, 5.00% 2033 (preref. 2022)
| 6,160
| 6,788
|
Health Facs. Auth., Health Facs. Rev. Bonds (Evangelical Lutheran Good Samaritan Society Project),
Series 2012, 5.00% 2042 (preref. 2022)
| 31,010
| 34,170
|
Health Facs. Auth., Health Facs. Rev. Bonds (Evangelical Lutheran Good Samaritan Society Project),
Series 2013, 5.625% 2043 (preref. 2023)
| 3,635
| 4,209
|
Health Facs. Auth., Hospital Rev. Bonds (Adventist Health System/Sunbelt Obligated Group), Series 2016-A,
5.00% 2041
| 3,130
| 3,657
|
| Health Facs. Auth., Hospital Rev. Bonds (Adventist Health System/Sunbelt Obligated Group), Series 2016-C, 5.00% 2036 (put 2026)
| 6,200
| 7,656
|
| Health Facs. Auth., Hospital Rev. Bonds (Adventist Health System/Sunbelt Obligated Group), Series 2018-A, 5.00% 2048
| 11,855
| 14,104
|
| Health Facs. Auth., Hospital Rev. Bonds (Adventist Health System/Sunbelt Obligated Group), Series 2018-B, 5.00% 2048 (put 2025)
| 22,500
| 27,252
|
Health Facs. Auth., Hospital Rev. Ref. Bonds (Valley View Hospital Association Project), Series 2018,
2.80% 2042 (put 2023)
| 3,800
| 3,951
|
| Health Facs. Auth., Rev. Bonds (Catholic Health Initiatives), Series 2008-D-1, 6.25% 2033
| 1,000
| 1,008
|
| Health Facs. Auth., Rev. Bonds (Catholic Health Initiatives), Series 2009-B-1, 5.00% 2027 (preref. 2022)
| 1,000
| 1,122
|
| Health Facs. Auth., Rev. Bonds (Catholic Health Initiatives), Series 2015-C-4, (1-month USD-LIBOR + 1.25%) 2.883% 2039 (put 2020)2
| 5,000
| 5,020
|
| Health Facs. Auth., Rev. Bonds (Covenant Retirement Communities, Inc.), Series 2018, 5.00% 2048
| 1,050
| 1,196
|
| Health Facs. Auth., Rev. Bonds (Senior Residences Project), Series 2012, 7.00% 20423
| 2,500
| 1,649
|
| Health Facs. Auth., Rev. Bonds (Senior Residences Project), Series 2012, 7.125% 20473
| 2,665
| 1,758
|
Health Facs. Auth., Rev. Bonds (Total Longterm Care National Obligated Group Project),
Series 2011, 5.00% 2021 (escrowed to maturity)
| 355
| 370
|
| Health Facs. Auth., Rev. Ref. and Improvement Bonds (Frasier Meadows Retirement Community Project), Series 2017-A, 5.25% 2028
| 305
| 360
|
| Health Facs. Auth., Rev. Ref. and Improvement Bonds (Frasier Meadows Retirement Community Project), Series 2017-A, 5.25% 2037
| 500
| 571
|
| Health Facs. Auth., Rev. Ref. Bonds (Christian Living Neighborhoods Project), Series 2016, 5.00% 2025
| 565
| 636
|
| Health Facs. Auth., Rev. Ref. Bonds (Covenant Retirement Communities, Inc.), Series 2012-A, 5.00% 2033
| 8,750
| 9,473
|
The Tax-Exempt Bond Fund of America — Page
18 of 120
Bonds, notes & other debt instruments (continued)
Colorado (continued)
| Principal amount
(000)
| Value
(000)
|
| Health Facs. Auth., Rev. Ref. Bonds (Covenant Retirement Communities, Inc.), Series 2013-A, 5.50% 2028
| $525
| $604
|
| Health Facs. Auth., Rev. Ref. Bonds (Covenant Retirement Communities, Inc.), Series 2013-A, 5.75% 2036
| 4,000
| 4,603
|
| Health Facs. Auth., Rev. Ref. Bonds (Covenant Retirement Communities, Inc.), Series 2015-A, 5.00% 2022
| 470
| 522
|
| Health Facs. Auth., Rev. Ref. Bonds (Covenant Retirement Communities, Inc.), Series 2015-A, 5.00% 2028
| 1,065
| 1,229
|
| Health Facs. Auth., Rev. Ref. Bonds (Covenant Retirement Communities, Inc.), Series 2015-A, 5.00% 2035
| 3,500
| 3,933
|
Health Facs. Auth., Rev. Ref. Bonds (Sisters of Charity of Leavenworth Health System), Series 2013-A,
5.00% 2044
| 10,000
| 11,039
|
| High Performance Transportation Enterprise, C-470 Express Lanes Rev. Bonds, Series 2017, 5.00% 2056
| 5,000
| 5,454
|
| Housing and Fin. Auth., Single Family Mortgage Bonds, Series 2017-C, Class I, 4.00% 2048
| 4,695
| 5,037
|
| Housing and Fin. Auth., Single Family Mortgage Bonds, Series 2018-B-1, Class I, 4.00% 2048
| 8,110
| 8,752
|
| Housing and Fin. Auth., Single Family Mortgage Bonds, Series 2018-C, Class I, 4.25% 2048
| 2,555
| 2,794
|
| Housing and Fin. Auth., Single Family Mortgage Bonds, Series 2019-E, Class I, 4.25% 2049
| 13,500
| 14,790
|
| Housing and Fin. Auth., Single Family Mortgage Bonds, Series 2019-F, Class I, 4.25% 2049
| 1,900
| 2,107
|
| Housing and Fin. Auth., Single Family Mortgage Bonds, Series 2019-H, Class III, 4.25% 2049
| 8,000
| 8,872
|
| City of Lakewood, Plaza Metropolitan Dist. No. 1, Rev. Ref. Bonds, Series 2013, 5.00% 20211
| 1,000
| 1,061
|
| Public Auth. for Colorado Energy, Natural Gas Purchase Rev. Bonds, Series 2008, 6.25% 2028
| 4,000
| 5,131
|
| Public Auth. for Colorado Energy, Natural Gas Purchase Rev. Bonds, Series 2008, 6.50% 2038
| 4,500
| 6,705
|
| Regional Transportation Dist., Certs. of Part., Series 2010-A, 5.375% 2031
| 3,000
| 3,096
|
| Regional Transportation Dist., Certs. of Part., Series 2014-A, 5.00% 2044
| 9,500
| 10,580
|
Regional Transportation Dist., Private Activity Bonds (Denver Transit Partners Eagle P3 Project),
Series 2010, 6.00% 2041
| 22,765
| 23,526
|
Town of Snowmass Village, Base Village Metropolitan Dist. No. 2, Limited Tax G.O. Rev. Ref. Bonds,
Series 2016-A, 5.75% 2046
| 1,575
| 1,655
|
| Regents of the University of Colorado, Hospital Auth., Rev. Bonds, Series 2017-C-1, 4.00% 2047 (put 2020)
| 4,435
| 4,444
|
| Regents of the University of Colorado, University Enterprise Rev. Bonds, Series 2015-A, 5.00% 2031
| 1,000
| 1,185
|
|
|
| 447,239
|
| Connecticut 0.90%
|
|
|
| G.O. Bonds, Series 2014-B, (SIFMA Municipal Swap Index + 0.63%) 2.03% 20202
| 3,375
| 3,384
|
| G.O. Bonds, Series 2018-E, 5.00% 2033
| 4,000
| 4,895
|
| Town of Hamden, Rev. Bonds (Whitney Center Project), Series 2009-A, 7.75% 2043
| 1,000
| 1,014
|
| Harbor Point Infrastructure Improvement Dist., Special Obligation Rev. Ref. Bonds (Harbor Point Project), Series 2010-A, 7.875% 2039 (preref. 2020)
| 1,000
| 1,044
|
| Harbor Point Infrastructure Improvement Dist., Special Obligation Rev. Ref. Bonds (Harbor Point Project), Series 2017, 5.00% 20301
| 11,500
| 13,251
|
| Health and Educational Facs. Auth., Rev. Bonds (Healthcare Fac. Expansion Issue - Church Home of Hartford Inc. Project), Series 2016-A, 5.00% 20531
| 735
| 777
|
| Health and Educational Facs. Auth., Rev. Bonds (Quinnipiac University Issue), Series 2016-M, 5.00% 2025
| 1,460
| 1,747
|
| Health and Educational Facs. Auth., Rev. Bonds (Quinnipiac University Issue), Series 2016-M, 5.00% 2030
| 2,265
| 2,696
|
| Health and Educational Facs. Auth., Rev. Bonds (Quinnipiac University Issue), Series 2016-M, 5.00% 2031
| 3,000
| 3,546
|
| Health and Educational Facs. Auth., Rev. Bonds (Quinnipiac University Issue), Series 2016-M, 5.00% 2035
| 2,895
| 3,381
|
| Health and Educational Facs. Auth., Rev. Bonds (Quinnipiac University Issue), Series 2016-M, 5.00% 2036
| 2,990
| 3,482
|
Health and Educational Facs. Auth., Rev. Bonds (Yale New Haven Health Issue), Series 2014-B,
1.80% 2049 (put 2024)
| 10,000
| 10,182
|
Health and Educational Facs. Auth., Rev. Bonds (Yale University Issue), Series 2003-X-2,
1.80% 2037 (put 2021)
| 7,810
| 7,891
|
| Health and Educational Facs. Auth., Rev. Bonds (Yale University Issue), Series 2014-A, 1.30% 2048 (put 2020)
| 5,000
| 5,005
|
Health and Educational Facs. Auth., Rev. Bonds (Yale University Issue), Series 2017-C-2,
5.00% 2057 (put 2023)
| 15,000
| 16,957
|
| Housing Fin. Auth., Housing Mortgage Fin. Program Bonds, Series 2016-A-1, 4.00% 2045
| 6,270
| 6,604
|
| Housing Fin. Auth., Housing Mortgage Fin. Program Bonds, Series 2016-C-2, 3.375% 2051
| 1,340
| 1,352
|
| Housing Fin. Auth., Housing Mortgage Fin. Program Bonds, Series 2016-E-1, 3.00% 2036
| 5,000
| 5,101
|
| Housing Fin. Auth., Housing Mortgage Fin. Program Bonds, Series 2016-E-1, 3.50% 2046
| 6,520
| 6,831
|
| Housing Fin. Auth., Housing Mortgage Fin. Program Bonds, Series 2017-A-1, 4.00% 2047
| 2,545
| 2,722
|
| Housing Fin. Auth., Housing Mortgage Fin. Program Bonds, Series 2017-C-1, 3.40% 2032
| 3,870
| 4,111
|
The Tax-Exempt Bond Fund of America — Page
19 of 120
Bonds, notes & other debt instruments (continued)
Connecticut (continued)
| Principal amount
(000)
| Value
(000)
|
| Housing Fin. Auth., Housing Mortgage Fin. Program Bonds, Series 2017-C-1, 3.65% 2037
| $4,750
| $5,025
|
| Housing Fin. Auth., Housing Mortgage Fin. Program Bonds, Series 2017-C-1, 4.00% 2047
| 3,785
| 4,049
|
| Housing Fin. Auth., Housing Mortgage Fin. Program Bonds, Series 2017-D-1, 3.20% 2032
| 3,000
| 3,147
|
| Housing Fin. Auth., Housing Mortgage Fin. Program Bonds, Series 2017-D-1, 4.00% 2047
| 4,885
| 5,236
|
| Housing Fin. Auth., Housing Mortgage Fin. Program Bonds, Series 2017-F-1, 4.00% 2047
| 7,185
| 7,757
|
| Housing Fin. Auth., Housing Mortgage Fin. Program Bonds, Series 2018-A-1, 3.50% 2033
| 2,705
| 2,889
|
| Housing Fin. Auth., Housing Mortgage Fin. Program Bonds, Series 2018-C-1, 4.00% 2045
| 13,975
| 15,197
|
| Housing Fin. Auth., Housing Mortgage Fin. Program Bonds, Series 2019-A-1, 4.00% 2045
| 3,000
| 3,286
|
| Housing Fin. Auth., Housing Mortgage Fin. Program Bonds, Series 2019-B-1, 4.00% 2049
| 4,400
| 4,904
|
| Housing Fin. Auth., Housing Mortgage Fin. Program Bonds, Series 2019-D-1, 4.00% 2049
| 6,300
| 7,044
|
| Housing Fin. Auth., Housing Mortgage Fin. Program Rev. Ref. Bonds, Series 2013-B-2, 4.00% 2032
| 2,820
| 2,919
|
| Housing Fin. Auth., Housing Mortgage Fin. Program Rev. Ref. Bonds, Series 2014-D-1, 4.00% 2044
| 2,440
| 2,523
|
| Housing Fin. Auth., Housing Mortgage Fin. Program Rev. Ref. Bonds, Series 2015-A, 3.50% 2044
| 1,890
| 1,963
|
Mohegan Tribe of Indians, Gaming Auth., Priority Distribution Payment Rev. Ref. Bonds, Series 2015,
7.00% 20451
| 1,710
| 1,782
|
Mohegan Tribe of Indians, Gaming Auth., Priority Distribution Payment Rev. Ref. Bonds, Series 2015-A,
6.75% 20451
| 2,738
| 2,934
|
Mohegan Tribe of Indians, Gaming Auth., Priority Distribution Payment Rev. Ref. Bonds, Series 2015-C,
4.75% 20201
| 765
| 773
|
Mohegan Tribe of Indians, Gaming Auth., Priority Distribution Payment Rev. Ref. Bonds, Series 2015-C,
6.25% 20301
| 5,500
| 6,152
|
| Special Tax Obligation Bonds, Transportation Infrastructure Purposes, Series 2008-A, 5.00% 2031
| 10,000
| 12,253
|
|
|
| 195,806
|
| Delaware 0.11%
|
|
|
| Transportation Auth., Rev. Bonds (U.S. 301 Project), Series 2015, 5.00% 2055
| 20,455
| 23,157
|
| District of Columbia 1.21%
|
|
|
| Dulles Toll Road Rev. Bonds (Dulles Metrorail and Capital Improvement Projects), Series 2009-A, 5.00% 2039
| 4,000
| 4,025
|
| Dulles Toll Road Rev. Bonds (Dulles Metrorail and Capital Improvement Projects), Series 2009-A, 5.25% 2044
| 3,000
| 3,020
|
| Dulles Toll Road Rev. Bonds (Dulles Metrorail and Capital Improvement Projects), Series 2010-B, 6.50% 20444
| 2,000
| 2,652
|
| G.O. Bonds, Series 2016-D, 5.00% 2041
| 3,000
| 3,571
|
| G.O. Bonds, Series 2017-D, 5.00% 2035
| 5,000
| 6,086
|
| G.O. Bonds, Series 2017-D, 5.00% 2036
| 8,250
| 10,011
|
| G.O. Bonds, Series 2017-D, 5.00% 2042
| 4,645
| 5,551
|
| G.O. Bonds, Series 2018-A, 5.00% 2026
| 1,000
| 1,240
|
| G.O. Bonds, Series 2018-A, 5.00% 2032
| 7,775
| 9,754
|
| G.O. Bonds, Series 2018-A, 5.00% 2033
| 8,610
| 10,766
|
| G.O. Bonds, Series 2018-A, 5.00% 2035
| 3,655
| 4,528
|
| G.O. Bonds, Series 2019-A, 5.00% 2044
| 5,245
| 6,414
|
| G.O. Rev. Ref. Bonds, Series 2014-C, 5.00% 2038
| 1,800
| 2,069
|
| G.O. Rev. Ref. Bonds, Series 2017-A, 5.00% 2036
| 5,510
| 6,686
|
| G.O. Rev. Ref. Bonds, Series 2017-A, 5.00% 2037
| 2,500
| 3,024
|
| Housing Fin. Agcy., Collateralized Multi Family Housing Rev. Bonds (The Strand Residences), Series 2019, 1.45% 2039 (put 2022)
| 1,250
| 1,252
|
| Income Tax Secured Rev. Ref. Bonds, Series 2009-B, 5.25% 2034
| 5,000
| 5,068
|
| Metropolitan Washington DC Airports Auth., Airport System Rev. Bonds, Series 2010-A, 5.00% 2039
| 1,800
| 1,872
|
Metropolitan Washington DC Airports Auth., Dulles Toll Road Rev. Bonds, Capital Appreciation Bonds,
Series 2009-B, Assured Guaranty Municipal insured, 0% 2031
| 5,100
| 3,586
|
Metropolitan Washington DC Airports Auth., Dulles Toll Road Rev. Bonds, Capital Appreciation Bonds,
Series 2009-B, Assured Guaranty Municipal insured, 0% 2035
| 9,470
| 5,718
|
Metropolitan Washington DC Airports Auth., Dulles Toll Road Rev. Bonds, Capital Appreciation Bonds,
Series 2009-B, Assured Guaranty Municipal insured, 0% 2036
| 5,880
| 3,414
|
The Tax-Exempt Bond Fund of America — Page
20 of 120
Bonds, notes & other debt instruments (continued)
District of Columbia (continued)
| Principal amount
(000)
| Value
(000)
|
Metropolitan Washington DC Airports Auth., Dulles Toll Road Rev. Bonds, Capital Appreciation Bonds,
Series 2009-B, Assured Guaranty Municipal insured, 0% 2038
| $25,280
| $13,502
|
Metropolitan Washington DC Airports Auth., Dulles Toll Road Rev. Bonds, Capital Appreciation Bonds,
Series 2009-B, Assured Guaranty Municipal insured, 0% 2040
| 23,255
| 11,419
|
Metropolitan Washington DC Airports Auth., Dulles Toll Road Rev. Bonds, Capital Appreciation Bonds,
Series 2010-A, Assured Guaranty Municipal insured, 0% 2037
| 40,000
| 22,266
|
Metropolitan Washington DC Airports Auth., Dulles Toll Road Rev. Ref. Bonds
(Dulles Metrorail and Capital Improvement Projects), Series 2014-A, 5.00% 2053
| 4,900
| 5,236
|
| Rev. Bonds (Dist. of Columbia International School Issue), Series 2019, 5.00% 2054
| 1,150
| 1,339
|
| Rev. Bonds (Friendship Public Charter School, Inc. Issue), Series 2016-A, 5.00% 2036
| 1,175
| 1,338
|
| Rev. Bonds (Friendship Public Charter School, Inc. Issue), Series 2016-A, 5.00% 2041
| 400
| 450
|
| Rev. Bonds (KIPP DC Issue), Series 2013-A, 6.00% 2033 (preref. 2023)
| 1,000
| 1,186
|
| Rev. Ref. Bonds (KIPP DC Issue), Series 2017-B, 5.00% 2048
| 2,110
| 2,416
|
| Tax Increment Rev. Bonds (City Market at O Street Project), Series 2011, 5.125% 2041
| 5,700
| 6,037
|
Tobacco Settlement Fncg. Corp., Tobacco Settlement Asset-Backed Bonds, Capital Appreciation Bonds,
Series 2006-A, 0% 2046
| 60,000
| 10,176
|
| Washington Convention and Sports Auth., Dedicated Tax Rev. Ref. Bonds, Series 2018-A, 5.00% 2026
| 5,000
| 6,198
|
| Washington Convention and Sports Auth., Dedicated Tax Rev. Ref. Bonds, Series 2018-A, 5.00% 2028
| 3,750
| 4,718
|
Water and Sewer Auth., Public Utility Rev. Bonds, Series 1998, Assured Guaranty Municipal insured,
5.50% 2023
| 1,500
| 1,646
|
Water and Sewer Auth., Public Utility Rev. Bonds, Series 1998, Assured Guaranty Municipal insured,
5.50% 2028
| 3,925
| 4,999
|
| Water and Sewer Auth., Public Utility Rev. Bonds, Series 2012-A, 5.00% 2037
| 3,000
| 3,311
|
| Water and Sewer Auth., Public Utility Rev. Bonds, Series 2016-A, 5.00% 2037
| 10,570
| 12,466
|
| Water and Sewer Auth., Public Utility Rev. Bonds, Series 2016-A, 5.00% 2039
| 7,630
| 8,960
|
| Water and Sewer Auth., Public Utility Rev. Bonds, Series 2017-B, 5.00% 2030
| 3,750
| 4,651
|
| Water and Sewer Auth., Public Utility Rev. Bonds, Series 2017-B, 5.00% 2031
| 3,750
| 4,621
|
| Water and Sewer Auth., Public Utility Rev. Green Bonds, Series 2017-A, 5.00% 2052
| 17,000
| 20,037
|
| Water and Sewer Auth., Public Utility Rev. Green Bonds, Series 2018-A, 5.00% 2049
| 12,400
| 14,854
|
|
|
| 262,133
|
| Florida 6.42%
|
|
|
County of Alachua, Health Facs. Auth., Health Facs. Rev. Ref. Bonds (Shands HealthCare Project),
Series 2014-A, 5.00% 2036
| 1,285
| 1,453
|
County of Alachua, Health Facs. Auth., Health Facs. Rev. Ref. Bonds (Shands HealthCare Project),
Series 2014-A, 5.00% 2044
| 12,900
| 14,458
|
| City of Atlantic Beach, Health Care Facs. Rev. Bonds (Fleet Landing Project), Series 2018-A, 5.00% 2029
| 420
| 494
|
| City of Atlantic Beach, Health Care Facs. Rev. Bonds (Fleet Landing Project), Series 2018-A, 5.00% 2030
| 435
| 509
|
| City of Atlantic Beach, Health Care Facs. Rev. Bonds (Fleet Landing Project), Series 2018-A, 5.00% 2031
| 460
| 536
|
| City of Atlantic Beach, Health Care Facs. Rev. Bonds (Fleet Landing Project), Series 2018-A, 5.00% 2032
| 480
| 558
|
| City of Atlantic Beach, Health Care Facs. Rev. Bonds (Fleet Landing Project), Series 2018-A, 5.00% 2043
| 735
| 833
|
| City of Atlantic Beach, Health Care Facs. Rev. Bonds (Fleet Landing Project), Series 2018-A, 5.00% 2048
| 1,500
| 1,695
|
| City of Atlantic Beach, Health Care Facs. Rev. Bonds (Fleet Landing Project), Series 2018-A, 5.00% 2053
| 6,300
| 7,076
|
| City of Atlantic Beach, Health Care Facs. Rev. Ref. Bonds (Fleet Landing Project), Series 2013-A, 5.00% 2037
| 2,020
| 2,202
|
Ave Maria Stewardship Community Dist., Capital Improvement Rev. Ref. Bonds, Series 2019,
Assured Guaranty Municipal insured, 2.00% 2026
| 975
| 975
|
Ave Maria Stewardship Community Dist., Capital Improvement Rev. Ref. Bonds, Series 2019,
Assured Guaranty Municipal insured, 2.125% 2027
| 995
| 995
|
Ave Maria Stewardship Community Dist., Capital Improvement Rev. Ref. Bonds, Series 2019,
Assured Guaranty Municipal insured, 2.25% 2028
| 1,020
| 1,019
|
Ave Maria Stewardship Community Dist., Capital Improvement Rev. Ref. Bonds, Series 2019,
Assured Guaranty Municipal insured, 2.375% 2029
| 1,040
| 1,040
|
Ave Maria Stewardship Community Dist., Capital Improvement Rev. Ref. Bonds, Series 2019,
Assured Guaranty Municipal insured, 2.75% 2033
| 2,230
| 2,229
|
The Tax-Exempt Bond Fund of America — Page
21 of 120
Bonds, notes & other debt instruments (continued)
Florida (continued)
| Principal amount
(000)
| Value
(000)
|
Ave Maria Stewardship Community Dist., Capital Improvement Rev. Ref. Bonds, Series 2019,
Assured Guaranty Municipal insured, 3.00% 2038
| $2,930
| $2,936
|
| County of Brevard, Educational Facs. Auth., Demand Rev. Bonds (Florida Institute of Technology Project), Series 2014, 5.00% 2032
| 5,000
| 5,609
|
| County of Brevard, Educational Facs. Auth., Demand Rev. Bonds (Florida Institute of Technology Project), Series 2014, 5.00% 2039
| 4,835
| 5,320
|
County of Brevard, Heritage Isle at Viera Community Dev. Dist., Special Assessment Rev. Ref. Bonds,
Series 2017, Assured Guaranty Municipal insured, 3.20% 2032
| 1,095
| 1,128
|
City of Cape Coral, Utility Improvement Rev. Ref. Assessment Bonds (Various Areas), Series 2017,
Assured Guaranty Municipal insured, 2.25% 2023
| 1,565
| 1,596
|
City of Cape Coral, Utility Improvement Rev. Ref. Assessment Bonds (Various Areas), Series 2017,
Assured Guaranty Municipal insured, 2.50% 2024
| 1,305
| 1,349
|
City of Cape Coral, Utility Improvement Rev. Ref. Assessment Bonds (Various Areas), Series 2017,
Assured Guaranty Municipal insured, 2.75% 2025
| 1,210
| 1,271
|
City of Cape Coral, Utility Improvement Rev. Ref. Assessment Bonds (Various Areas), Series 2017,
Assured Guaranty Municipal insured, 2.75% 2026
| 970
| 1,022
|
City of Cape Coral, Utility Improvement Rev. Ref. Assessment Bonds (Various Areas), Series 2017,
Assured Guaranty Municipal insured, 3.00% 2027
| 675
| 724
|
City of Cape Coral, Utility Improvement Rev. Ref. Assessment Bonds (Various Areas), Series 2017,
Assured Guaranty Municipal insured, 5.67% 2028 (preref. 2019)
| 15,790
| 16,062
|
| Central Florida Expressway Auth., Rev. Bonds, Series 2018, 5.00% 2043
| 3,500
| 4,204
|
| Central Florida Expressway Auth., Rev. Bonds, Series 2018, 5.00% 2048
| 1,565
| 1,867
|
| Central Florida Expressway Auth., Rev. Ref. Bonds, Series 2016-A, 5.00% 2030
| 4,000
| 4,815
|
| Central Florida Expressway Auth., Rev. Ref. Bonds, Series 2016-B, 4.00% 2035
| 21,000
| 23,363
|
| Central Florida Expressway Auth., Rev. Ref. Bonds, Series 2016-B, 4.00% 2040
| 6,720
| 7,298
|
| Central Florida Expressway Auth., Rev. Ref. Bonds, Series 2017, 5.00% 2038
| 9,935
| 11,849
|
| Central Florida Expressway Auth., Rev. Ref. Bonds, Series 2017, 5.00% 2042
| 1,550
| 1,839
|
| Dept. of Children and Family Services, Certs. of Part. (Florida Civil Commitment Center Project), Series 2006, National insured, 5.00% 2019
| 2,900
| 2,910
|
| Dept. of Children and Family Services, Certs. of Part. (Florida Civil Commitment Center Project), Series 2006, National insured, 5.00% 2021
| 3,210
| 3,220
|
| Dept. of Children and Family Services, Certs. of Part. (Florida Civil Commitment Center Project), Series 2006, National insured, 5.00% 2023
| 3,545
| 3,556
|
| Dept. of Children and Family Services, Certs. of Part. (Florida Civil Commitment Center Project), Series 2006, National insured, 5.00% 2024
| 3,725
| 3,737
|
| Dept. of Children and Family Services, Certs. of Part. (Florida Civil Commitment Center Project), Series 2006, National insured, 5.00% 2025
| 3,920
| 3,933
|
| Dept. of Children and Family Services, Certs. of Part. (Florida Civil Commitment Center Project), Series 2006, National insured, 5.00% 2026
| 3,120
| 3,130
|
Citizens Property Insurance Corp., Personal Lines Account/Commercial Lines Account Secured Bonds,
Series 2012-A-1, 5.00% 2021
| 10,500
| 11,228
|
County of Collier, Health Facs. Auth., Residential Care Fac. Rev. Bonds (Moorings Inc.), Series 2015-A,
5.00% 2043
| 10,000
| 11,963
|
County of Collier, Health Facs. Auth., Residential Care Fac. Rev. Bonds (Moorings Inc.), Series 2015-A,
5.00% 2048
| 4,000
| 4,759
|
| County of Collier, Heritage Bay Community Dev. Dist., Capital Improvement Rev. Ref. Bonds, Series 2018-A-1, Assured Guaranty Municipal insured, 2.625% 2023
| 500
| 518
|
| County of Collier, Heritage Bay Community Dev. Dist., Capital Improvement Rev. Ref. Bonds, Series 2018-A-1, Assured Guaranty Municipal insured, 2.75% 2025
| 1,150
| 1,208
|
| County of Collier, Heritage Bay Community Dev. Dist., Capital Improvement Rev. Ref. Bonds, Series 2018-A-1, Assured Guaranty Municipal insured, 3.00% 2027
| 600
| 631
|
| County of Collier, Heritage Bay Community Dev. Dist., Capital Improvement Rev. Ref. Bonds, Series 2018-A-1, Assured Guaranty Municipal insured, 3.00% 2028
| 755
| 792
|
| County of Collier, Heritage Bay Community Dev. Dist., Capital Improvement Rev. Ref. Bonds, Series 2018-A-1, Assured Guaranty Municipal insured, 3.125% 2030
| 240
| 250
|
The Tax-Exempt Bond Fund of America — Page
22 of 120
Bonds, notes & other debt instruments (continued)
Florida (continued)
| Principal amount
(000)
| Value
(000)
|
| County of Collier, Pine Air Lakes Community Dev. Dist., Special Assessment Bonds, Series 2008, 6.75% 2039
| $2,870
| $2,871
|
Town of Davie, Educational Facs. Rev. and Rev. Ref. Bonds (Nova Southeastern University Project),
Series 2018, 5.00% 2038
| 2,500
| 2,941
|
| Dev. Fin. Corp., Healthcare Facs. Rev. Bonds (UF Health - Jacksonville Project), Series 2013-A, 6.00% 2033
| 2,970
| 3,302
|
| Board of Education, Public Education Capital Outlay Rev. Ref. Bonds, Series 2016-D, 5.00% 2023
| 8,065
| 9,239
|
County of Escambia, Health Facs. Auth., Health Care Facs. Rev. Bonds (Baptist Hospital, Inc. Project),
Series 2010-A, 5.75% 2029
| 14,755
| 15,371
|
County of Escambia, Pollution Control Rev. Ref. Bonds (Gulf Power Co. Project), Series 2002,
2.60% 2023
| 2,500
| 2,600
|
| City of Fort Lauderdale, Water and Sewer Rev. Bonds, Series 2018, 4.00% 2041
| 13,920
| 15,417
|
| City of Gainesville, Utilities System Rev. Bonds, Series 2017-A, 5.00% 2032
| 2,000
| 2,474
|
| City of Gainesville, Utilities System Rev. Bonds, Series 2017-A, 5.00% 2033
| 2,500
| 3,083
|
| City of Gainesville, Utilities System Rev. Bonds, Series 2017-A, 5.00% 2036
| 500
| 611
|
| Greater Orlando Aviation Auth., Airport Facs. Rev. Bonds, Series 2010-A, 5.00% 2024
| 1,000
| 1,047
|
| Greater Orlando Aviation Auth., Airport Facs. Rev. Bonds, Series 2016-B, 5.00% 2046
| 21,020
| 24,744
|
| Greater Orlando Aviation Auth., Airport Facs. Rev. Ref. Bonds, Series 2009-C, 5.00% 2023 (preref. 2019)
| 2,465
| 2,481
|
| Greater Orlando Aviation Auth., Airport Facs. Rev. Ref. Bonds, Series 2009-C, 5.00% 2024 (preref. 2019)
| 2,110
| 2,124
|
| Greater Orlando Aviation Auth., Airport Facs. Rev. Ref. Bonds, Series 2009-C, 5.00% 2025 (preref. 2019)
| 2,715
| 2,733
|
| Greater Orlando Aviation Auth., Airport Facs. Rev. Ref. Bonds, Series 2009-C, 5.00% 2026 (preref. 2019)
| 2,855
| 2,873
|
City of Hialeah, Bonterra Community Dev. Dist., Senior Special Assessment Bonds, Series 2017-A-1,
4.00% 2037
| 405
| 435
|
City of Hialeah, Bonterra Community Dev. Dist., Senior Special Assessment Bonds, Series 2017-A-1,
4.125% 2047
| 750
| 800
|
| Higher Educational Facs. Fncg. Auth., Educational Facs. Rev. and Rev. Ref. Bonds (Ringling College Project), Series 2017, 5.00% 2042
| 6,000
| 6,860
|
| Higher Educational Facs. Fncg. Auth., Educational Facs. Rev. and Rev. Ref. Bonds (Ringling College Project), Series 2017, 5.00% 2047
| 8,000
| 9,096
|
| Higher Educational Facs. Fncg. Auth., Educational Facs. Rev. Ref. Bonds (Nova Southeastern University Project), Series 2012-A, 5.00% 2022
| 675
| 739
|
| Higher Educational Facs. Fncg. Auth., Educational Facs. Rev. Ref. Bonds (Nova Southeastern University Project), Series 2012-A, 5.00% 2027
| 2,000
| 2,164
|
| Higher Educational Facs. Fncg. Auth., Educational Facs. Rev. Ref. Bonds (Nova Southeastern University Project), Series 2012-A, 5.00% 2032
| 1,000
| 1,073
|
| Higher Educational Facs. Fncg. Auth., Educational Facs. Rev. Ref. Bonds (Nova Southeastern University Project), Series 2016, 5.00% 2026
| 655
| 788
|
| Higher Educational Facs. Fncg. Auth., Educational Facs. Rev. Ref. Bonds (Nova Southeastern University Project), Series 2016, 5.00% 2030
| 1,150
| 1,344
|
| Higher Educational Facs. Fncg. Auth., Educational Facs. Rev. Ref. Bonds (Nova Southeastern University Project), Series 2016, 5.00% 2031
| 1,500
| 1,745
|
| Higher Educational Facs. Fncg. Auth., Educational Facs. Rev. Ref. Bonds (Nova Southeastern University Project), Series 2016, 5.00% 2033
| 1,300
| 1,500
|
| Higher Educational Facs. Fncg. Auth., Educational Facs. Rev. Ref. Bonds (Nova Southeastern University Project), Series 2016, 5.00% 2035
| 4,580
| 5,242
|
| Higher Educational Facs. Fncg. Auth., Educational Facs. Rev. Ref. Bonds (Nova Southeastern University Project), Series 2016, 5.00% 2036
| 1,380
| 1,575
|
County of Hillsborough, Aviation Auth., Tampa International Airport Customer Fac. Charge Rev. Bonds,
Series 2015-A, 5.00% 2044
| 6,350
| 7,213
|
County of Hillsborough, Aviation Auth., Tampa International Airport Rev. Ref. Bonds, Series 2015-B,
5.00% 2044
| 5,000
| 5,740
|
County of Hillsborough, Aviation Auth., Tampa International Airport Rev. Ref. Bonds, Series 2018-F,
5.00% 2048
| 5,170
| 6,236
|
| County of Hillsborough, Harbor Bay Community Dev. Dist., Capital Improvement Rev. Bonds, Series 2002, 6.75% 2034
| 2,400
| 2,411
|
| Housing Fin. Corp., Homeowner Mortgage Rev. Bonds (Special Program), Series 2011-B, 4.50% 2029
| 95
| 97
|
| Housing Fin. Corp., Homeowner Mortgage Rev. Bonds (Special Program), Series 2014-B, 3.00% 2045
| 1,535
| 1,569
|
The Tax-Exempt Bond Fund of America — Page
23 of 120
Bonds, notes & other debt instruments (continued)
Florida (continued)
| Principal amount
(000)
| Value
(000)
|
| Housing Fin. Corp., Homeowner Mortgage Rev. Bonds (Special Program), Series 2015-A, 3.50% 2046
| $640
| $662
|
| Housing Fin. Corp., Homeowner Mortgage Rev. Bonds, Series 2011-C, 4.50% 2030
| 120
| 122
|
| Housing Fin. Corp., Homeowner Mortgage Rev. Bonds, Series 2015-1, 4.00% 2047
| 4,060
| 4,284
|
| Housing Fin. Corp., Homeowner Mortgage Rev. Bonds, Series 2016-2, 4.00% 2047
| 10,615
| 11,248
|
| Housing Fin. Corp., Homeowner Mortgage Rev. Bonds, Series 2017-1, 4.00% 2048
| 18,055
| 19,489
|
| Housing Fin. Corp., Homeowner Mortgage Rev. Bonds, Series 2018-1, 4.00% 2049
| 2,750
| 2,993
|
| Housing Fin. Corp., Homeowner Mortgage Rev. Bonds, Series 2019-1, 4.00% 2050
| 15,000
| 16,598
|
Housing Fin. Corp., Multi Family Mortgage Rev. Bonds (Lake Mangonia Apartments), Series 2018-B,
2.00% 2020
| 2,650
| 2,651
|
City of Jacksonville, Bartram Park Community Dev. Dist., Special Assessment Rev. Ref. Bonds,
Series 2015-A-1, 4.50% 2035
| 995
| 1,084
|
| City of Jacksonville, Better Jacksonville Sales Tax Rev. Ref. Bonds, Series 2011, 5.00% 2023
| 5,000
| 5,388
|
| City of Jacksonville, Better Jacksonville Sales Tax Rev. Ref. Bonds, Series 2012-A, 5.00% 2028
| 5,000
| 5,527
|
| City of Jacksonville, Better Jacksonville Sales Tax Rev. Ref. Bonds, Series 2012-A, 5.00% 2030
| 5,000
| 5,526
|
| City of Jacksonville, Health Care Facs. Rev. Ref. Bonds (Baptist Health), Series 2019-A, 5.00% 2032
| 2,200
| 2,788
|
| JEA, Electric System Rev. Bonds, Series 2012-A, 4.00% 2031
| 3,200
| 3,307
|
| JEA, Electric System Rev. Bonds, Series 2012-A, 4.00% 2033
| 5,300
| 5,460
|
| JEA, Electric System Rev. Bonds, Series 2017-B, 5.00% 2026
| 4,250
| 5,171
|
| JEA, Electric System Rev. Bonds, Series 2017-B, 5.00% 2031
| 7,935
| 9,648
|
| JEA, Electric System Rev. Bonds, Series 2017-B, 5.00% 2033
| 5,280
| 6,361
|
| JEA, Electric System Rev. Bonds, Series 2017-B-3, 4.00% 2035
| 4,000
| 4,464
|
| JEA, Electric System Rev. Bonds, Series 2017-B-3, 4.00% 2036
| 1,725
| 1,919
|
| JEA, Electric System Rev. Bonds, Series 2017-B-3, 4.00% 2037
| 2,000
| 2,217
|
| JEA, Electric System Rev. Bonds, Series 2017-B-3, 5.00% 2027
| 8,800
| 10,888
|
| JEA, Electric System Rev. Bonds, Series 2017-B-3, 5.00% 2028
| 8,010
| 9,947
|
| JEA, Electric System Rev. Bonds, Series 2017-B-3, 5.00% 2029
| 4,000
| 4,952
|
| JEA, Electric System Rev. Bonds, Series 2017-B-3, 5.00% 2030
| 4,650
| 5,732
|
| JEA, St. Johns River Power Park System Rev. Bonds, Issue 3, Series 2008-2, 5.00% 2037
| 11,325
| 11,359
|
| JEA, Water and Sewer System Rev. Bonds, Series 2017-A, 5.00% 2033
| 5,565
| 6,750
|
| City of Lakeland, Energy System Rev. Ref. Bonds, Series 2016, 5.00% 2034
| 2,085
| 2,471
|
| City of Lakeland, Energy System Rev. Ref. Bonds, Series 2016, 5.00% 2036
| 1,355
| 1,594
|
| Lakewood Ranch Stewardship Dist., Special Assessment Rev. Bonds (Lakewood Centre North), Series 2015, 4.875% 2035
| 1,450
| 1,514
|
| County of Lee, Airport Rev. Ref. Bonds, Series 2015, 5.00% 2033
| 3,340
| 3,928
|
| County of Lee, Industrial Dev. Auth., Healthcare Facs. Rev. Ref. Bonds (Shell Point/Alliance Obligated Group, Shell Point Project), Series 2011-B, 6.125% 2026
| 500
| 552
|
| County of Lee, Industrial Dev. Auth., Healthcare Facs. Rev. Ref. Bonds (Shell Point/Alliance Obligated Group, Shell Point Project), Series 2019, 5.00% 2044
| 5,225
| 6,038
|
| County of Lee, Industrial Dev. Auth., Healthcare Facs. Rev. Ref. Bonds (Shell Point/Alliance Obligated Group, Shell Point Project), Series 2019, 5.00% 2049
| 3,315
| 3,818
|
County of Lee, Transportation Facs. Rev. Ref. Bonds, Series 2014,
Assured Guaranty Municipal insured, 5.00% 2025
| 2,000
| 2,357
|
County of Lee, Transportation Facs. Rev. Ref. Bonds, Series 2014,
Assured Guaranty Municipal insured, 5.00% 2026
| 1,250
| 1,469
|
County of Lee, Transportation Facs. Rev. Ref. Bonds, Series 2014,
Assured Guaranty Municipal insured, 5.00% 2027
| 1,250
| 1,464
|
County of Lee, Transportation Facs. Rev. Ref. Bonds, Series 2014,
Assured Guaranty Municipal insured, 5.00% 2033
| 1,000
| 1,155
|
County of Lee, Transportation Facs. Rev. Ref. Bonds, Series 2014,
Assured Guaranty Municipal insured, 5.00% 2034
| 1,000
| 1,152
|
County of Lee, Transportation Facs. Rev. Ref. Bonds, Series 2014,
Assured Guaranty Municipal insured, 5.00% 2035
| 1,000
| 1,150
|
| Lee Memorial Health System, Hospital Rev. and Rev. Ref. Bonds, Series 2019-A-1, 4.00% 2037
| 3,000
| 3,647
|
| Lee Memorial Health System, Hospital Rev. and Rev. Ref. Bonds, Series 2019-A-1, 5.00% 2033
| 2,350
| 2,925
|
| Lee Memorial Health System, Hospital Rev. and Rev. Ref. Bonds, Series 2019-A-1, 5.00% 2034
| 2,000
| 2,475
|
The Tax-Exempt Bond Fund of America — Page
24 of 120
Bonds, notes & other debt instruments (continued)
Florida (continued)
| Principal amount
(000)
| Value
(000)
|
| Lee Memorial Health System, Hospital Rev. and Rev. Ref. Bonds, Series 2019-A-1, 5.00% 2035
| $2,000
| $2,457
|
| Lee Memorial Health System, Hospital Rev. and Rev. Ref. Bonds, Series 2019-A-1, 5.00% 2036
| 1,750
| 2,139
|
| Lee Memorial Health System, Hospital Rev. and Rev. Ref. Bonds, Series 2019-A-1, 5.00% 2037
| 2,500
| 2,760
|
| County of Manatee, Heritage Harbour North Community Dev. Dist., Capital Improvement Rev. Ref. Bonds, Series 2017-A-1, Assured Guaranty Municipal insured, 5.00%
2022
| 665
| 728
|
| County of Manatee, Heritage Harbour North Community Dev. Dist., Capital Improvement Rev. Ref. Bonds, Series 2017-A-1, Assured Guaranty Municipal insured, 5.00%
2023
| 700
| 790
|
| County of Manatee, Heritage Harbour North Community Dev. Dist., Capital Improvement Rev. Ref. Bonds, Series 2017-A-1, Assured Guaranty Municipal insured, 5.00%
2024
| 645
| 732
|
| County of Manatee, Heritage Harbour North Community Dev. Dist., Capital Improvement Rev. Ref. Bonds, Series 2017-A-1, Assured Guaranty Municipal insured, 5.00%
2025
| 380
| 440
|
| County of Manatee, Heritage Harbour North Community Dev. Dist., Capital Improvement Rev. Ref. Bonds, Series 2017-A-1, Assured Guaranty Municipal insured, 5.00%
2026
| 815
| 961
|
| County of Martin, Health Facs. Auth., Hospital Rev. Bonds (Martin Memorial Medical Center), Series 2012, 5.50% 2042 (preref. 2021)
| 3,250
| 3,566
|
| County of Martin, Health Facs. Auth., Hospital Rev. Bonds (Martin Memorial Medical Center), Series 2015, 5.00% 2045 (preref. 2024)
| 11,300
| 13,435
|
| City of Miami Beach, Health Facs. Auth., Hospital Rev. Ref. Bonds (Mount Sinai Medical Center of Florida), Series 2012, 5.00% 2020
| 1,000
| 1,046
|
| City of Miami Beach, Health Facs. Auth., Hospital Rev. Ref. Bonds (Mount Sinai Medical Center of Florida), Series 2014, 5.00% 2039
| 500
| 559
|
| City of Miami Beach, Parking Rev. Bonds, Series 2015, BAM insured, 5.00% 2040
| 1,190
| 1,385
|
| City of Miami Beach, Parking Rev. Bonds, Series 2015, BAM insured, 5.00% 2045
| 2,500
| 2,890
|
| City of Miami Beach, Redev. Agcy., Tax Increment Rev. and Rev. Ref. Bonds (City Center/Historic Convention Village), Series 2015-A, Assured Guaranty Municipal
insured, 5.00% 2032
| 1,645
| 1,862
|
| City of Miami Beach, Redev. Agcy., Tax Increment Rev. and Rev. Ref. Bonds (City Center/Historic Convention Village), Series 2015-A, Assured Guaranty Municipal
insured, 5.00% 2034
| 1,800
| 2,029
|
| City of Miami Beach, Redev. Agcy., Tax Increment Rev. and Rev. Ref. Bonds (City Center/Historic Convention Village), Series 2015-A, Assured Guaranty Municipal
insured, 5.00% 2040
| 12,850
| 14,567
|
| City of Miami Beach, Redev. Agcy., Tax Increment Rev. and Rev. Ref. Bonds (City Center/Historic Convention Village), Series 2015-A, Assured Guaranty Municipal
insured, 5.00% 2044
| 2,000
| 2,255
|
| City of Miami Beach, Water and Sewer Rev and Rev. Ref. Bonds, Series 2017, 5.00% 2047
| 17,550
| 20,790
|
| County of Miami-Dade, Aviation Rev. Bonds, Series 2010-A, 5.375% 2041 (preref. 2020)
| 4,000
| 4,197
|
| County of Miami-Dade, Aviation Rev. Bonds, Series 2010-A, 5.50% 2041 (preref. 2020)
| 2,800
| 2,942
|
| County of Miami-Dade, Aviation Rev. Bonds, Series 2010-A-1, 5.375% 2035
| 210
| 220
|
| County of Miami-Dade, Aviation Rev. Bonds, Series 2010-A-1, 5.375% 2035 (preref. 2020)
| 790
| 829
|
| County of Miami-Dade, Aviation Rev. Bonds, Series 2010-B, 5.00% 2041
| 5,000
| 5,200
|
| County of Miami-Dade, Aviation Rev. Bonds, Series 2016-A-1, 5.00% 2029
| 3,285
| 3,428
|
| County of Miami-Dade, Aviation Rev. Bonds, Series 2016-A-1, 5.00% 2029 (preref. 2020)
| 270
| 282
|
| County of Miami-Dade, Aviation Rev. Ref. Bonds, Series 2016-A, 5.00% 2035
| 1,850
| 2,203
|
County of Miami-Dade, Educational Facs. Auth., Rev. and Rev. Ref. Bonds (University of Miami Issue),
Series 2015-A, 5.00% 2035
| 1,300
| 1,494
|
County of Miami-Dade, Educational Facs. Auth., Rev. and Rev. Ref. Bonds (University of Miami Issue),
Series 2015-A, 5.00% 2040
| 6,500
| 7,392
|
County of Miami-Dade, Educational Facs. Auth., Rev. and Rev. Ref. Bonds (University of Miami Issue),
Series 2015-A, 5.00% 2045
| 10,000
| 11,315
|
| County of Miami-Dade, Expressway Auth., Toll System Rev. Bonds, Series 2010-A, 5.00% 2040
| 3,050
| 3,143
|
| County of Miami-Dade, Expressway Auth., Toll System Rev. Bonds, Series 2014-A, 5.00% 2029
| 1,415
| 1,624
|
| County of Miami-Dade, Expressway Auth., Toll System Rev. Ref. Bonds, Series 2013-A, 5.00% 2022
| 2,500
| 2,753
|
| County of Miami-Dade, Expressway Auth., Toll System Rev. Ref. Bonds, Series 2013-A, 5.00% 2023
| 2,350
| 2,595
|
| County of Miami-Dade, Expressway Auth., Toll System Rev. Ref. Bonds, Series 2013-A, 5.00% 2024
| 5,000
| 5,527
|
| County of Miami-Dade, Expressway Auth., Toll System Rev. Ref. Bonds, Series 2013-A, 5.00% 2025
| 4,140
| 4,574
|
| County of Miami-Dade, Expressway Auth., Toll System Rev. Ref. Bonds, Series 2013-A, 5.00% 2026
| 4,335
| 4,787
|
| County of Miami-Dade, Expressway Auth., Toll System Rev. Ref. Bonds, Series 2014-A, 5.00% 2039
| 6,485
| 7,285
|
| County of Miami-Dade, Expressway Auth., Toll System Rev. Ref. Bonds, Series 2014-A, 5.00% 2044
| 3,000
| 3,351
|
The Tax-Exempt Bond Fund of America — Page
25 of 120
Bonds, notes & other debt instruments (continued)
Florida (continued)
| Principal amount
(000)
| Value
(000)
|
| County of Miami-Dade, Expressway Auth., Toll System Rev. Ref. Bonds, Series 2014-B, 5.00% 2027
| $3,000
| $3,478
|
| County of Miami-Dade, Expressway Auth., Toll System Rev. Ref. Bonds, Series 2014-B, 5.00% 2030
| 2,000
| 2,297
|
| County of Miami-Dade, Expressway Auth., Toll System Rev. Ref. Bonds, Series 2014-B, 5.00% 2031
| 2,560
| 2,929
|
| County of Miami-Dade, Expressway Auth., Toll System Rev. Ref. Bonds, Series 2016-A, 5.00% 2028
| 3,180
| 3,847
|
| County of Miami-Dade, Expressway Auth., Toll System Rev. Ref. Bonds, Series 2016-A, 5.00% 2029
| 6,200
| 7,465
|
| County of Miami-Dade, Expressway Auth., Toll System Rev. Ref. Bonds, Series 2016-A, 5.00% 2030
| 2,385
| 2,856
|
| County of Miami-Dade, Expressway Auth., Toll System Rev. Ref. Bonds, Series 2016-A, 5.00% 2031
| 3,300
| 3,919
|
| County of Miami-Dade, Expressway Auth., Toll System Rev. Ref. Bonds, Series 2016-A, 5.00% 2032
| 2,000
| 2,361
|
| County of Miami-Dade, Expressway Auth., Toll System Rev. Ref. Bonds, Series 2016-A, 5.00% 2033
| 8,745
| 10,253
|
| County of Miami-Dade, Expressway Auth., Toll System Rev. Ref. Bonds, Series 2016-A, 5.00% 2034
| 1,000
| 1,172
|
County of Miami-Dade, Miami International Airport (Hub of the Americas), Aviation Rev. Ref. Bonds,
Series 2009-A, 5.50% 2036 (preref. 2019)
| 8,000
| 8,058
|
County of Miami-Dade, Miami International Airport (Hub of the Americas), Aviation Rev. Ref. Bonds,
Series 2009-A, 5.75% 2023 (preref. 2019)
| 5,480
| 5,522
|
County of Miami-Dade, Miami International Airport (Hub of the Americas), Aviation Rev. Ref. Bonds,
Series 2009-B, 5.75% 2021
| 2,390
| 2,409
|
| County of Miami-Dade, School Board, Certs. of Part., Series 2006-C, AMBAC insured, 5.00% 2021
| 4,900
| 5,289
|
| County of Miami-Dade, Vizcaya in Kendall Community Dev. Dist., Special Assessment Bonds, Series 2016, 3.75% 2031
| 300
| 314
|
| County of Miami-Dade, Vizcaya in Kendall Community Dev. Dist., Special Assessment Bonds, Series 2016, 4.00% 2036
| 560
| 584
|
| County of Miami-Dade, Vizcaya in Kendall Community Dev. Dist., Special Assessment Bonds, Series 2016, 4.125% 2046
| 1,240
| 1,293
|
| County of Miami-Dade, Water and Sewer System Rev. Bonds, Series 2010, 5.00% 2028 (preref. 2020)
| 8,000
| 8,364
|
| County of Miami-Dade, Water and Sewer System Rev. Bonds, Series 2017-A, 4.00% 2047
| 4,750
| 5,183
|
| County of Miami-Dade, Water and Sewer System Rev. Bonds, Series 2019, 5.00% 2043
| 7,360
| 8,935
|
| County of Miami-Dade, Water and Sewer System Rev. Bonds, Series 2019, 5.00% 2046
| 20,640
| 24,969
|
County of Miami-Dade, Water and Sewer System Rev. Ref. Bonds, Series 2008-B,
Assured Guaranty Municipal insured, 5.25% 2022
| 5,000
| 5,651
|
| County of Miami-Dade, Water and Sewer System Rev. Ref. Bonds, Series 2017-B, 4.00% 2038
| 15,000
| 16,652
|
| Mid-Bay Bridge Auth., Rev. Bonds, Series 2015-A, 5.00% 2024
| 1,750
| 2,028
|
| Mid-Bay Bridge Auth., Rev. Bonds, Series 2015-A, 5.00% 2035
| 7,000
| 7,948
|
| Mid-Bay Bridge Auth., Rev. Bonds, Series 2015-A, 5.00% 2035
| 1,000
| 1,129
|
| Mid-Bay Bridge Auth., Rev. Bonds, Series 2015-A, 5.00% 2040
| 1,750
| 1,962
|
| Mid-Bay Bridge Auth., Rev. Bonds, Series 2015-C, 5.00% 2040
| 1,900
| 2,119
|
| Mid-Bay Bridge Auth., Rev. Ref. Bonds, Series 1993-D, 6.10% 2022 (escrowed to maturity)
| 105
| 118
|
| Midtown Miami Community Dev. Dist., Special Assessment and Rev. Ref. Bonds (Parking Garage Project), Series 2014-A, 5.00% 2029
| 990
| 1,047
|
Midtown Miami Community Dev. Dist., Special Assessment and Rev. Ref. Bonds (Parking Garage Project),
Series 2014-A, 4.25% 2024
| 3,535
| 3,683
|
Municipal Power Agcy., All-Requirements Power Supply Project Rev. Bonds, Series 2009-A,
5.25% 2023 (preref. 2019)
| 3,000
| 3,020
|
Municipal Power Agcy., All-Requirements Power Supply Project Rev. Bonds, Series 2009-A,
5.25% 2026 (preref. 2019)
| 1,500
| 1,510
|
Municipal Power Agcy., All-Requirements Power Supply Project Rev. Bonds, Series 2009-A,
5.50% 2024 (preref. 2019)
| 3,255
| 3,278
|
| Municipal Power Agcy., All-Requirements Power Supply Project Rev. Bonds, Series 2015-B, 5.00% 2027
| 675
| 812
|
| Municipal Power Agcy., All-Requirements Power Supply Project Rev. Bonds, Series 2015-B, 5.00% 2028
| 1,250
| 1,496
|
| Municipal Power Agcy., All-Requirements Power Supply Project Rev. Bonds, Series 2015-B, 5.00% 2031
| 1,715
| 2,031
|
| Municipal Power Agcy., All-Requirements Power Supply Project Rev. Bonds, Series 2016-A, 5.00% 2029
| 6,000
| 7,350
|
| Municipal Power Agcy., All-Requirements Power Supply Project Rev. Bonds, Series 2016-A, 5.00% 2030
| 5,000
| 6,090
|
| Municipal Power Agcy., All-Requirements Power Supply Project Rev. Bonds, Series 2016-A, 5.00% 2031
| 2,000
| 2,424
|
| Municipal Power Agcy., Rev. Ref. Bonds (St. Lucie Project), Series 2012-A, 5.00% 2026
| 2,345
| 2,598
|
| North Broward Hospital Dist., Rev. Bonds (Broward Health), Series 2017-B, 5.00% 2035
| 2,000
| 2,283
|
| North Broward Hospital Dist., Rev. Bonds (Broward Health), Series 2017-B, 5.00% 2036
| 6,965
| 7,918
|
The Tax-Exempt Bond Fund of America — Page
26 of 120
Bonds, notes & other debt instruments (continued)
Florida (continued)
| Principal amount
(000)
| Value
(000)
|
| North Broward Hospital Dist., Rev. Bonds (Broward Health), Series 2017-B, 5.00% 2042
| $12,500
| $14,071
|
| North Broward Hospital Dist., Rev. Bonds (Broward Health), Series 2017-B, 5.00% 2048
| 9,250
| 10,375
|
County of Orange, Health Facs. Auth., Health Care Facs. Rev. Bonds (Presbyterian Retirement Communities
Project), Series 2014, 5.00% 2026
| 2,000
| 2,271
|
County of Orange, Health Facs. Auth., Health Care Facs. Rev. Bonds (Presbyterian Retirement Communities
Project), Series 2015, 5.00% 2028
| 2,110
| 2,434
|
County of Orange, Health Facs. Auth., Health Care Facs. Rev. Bonds (Presbyterian Retirement Communities
Project), Series 2015, 5.00% 2035
| 4,900
| 5,518
|
County of Orange, Health Facs. Auth., Health Care Facs. Rev. Bonds (Presbyterian Retirement Communities
Project), Series 2015, 5.00% 2040
| 6,250
| 6,955
|
County of Orange, Health Facs. Auth., Health Care Facs. Rev. Bonds (Presbyterian Retirement Communities
Project), Series 2015, 5.00% 2045
| 7,900
| 8,734
|
County of Orange, Health Facs. Auth., Health Care Facs. Rev. Bonds (Presbyterian Retirement Communities
Project), Series 2016, 5.00% 2036
| 5,400
| 6,001
|
County of Orange, Health Facs. Auth., Health Care Facs. Rev. Bonds (Presbyterian Retirement Communities
Project), Series 2016, 5.00% 2041
| 6,820
| 7,520
|
County of Orange, Health Facs. Auth., Health Care Facs. Rev. Bonds (Presbyterian Retirement Communities
Project), Series 2016, 5.00% 2047
| 12,720
| 13,967
|
| County of Orange, Health Facs. Auth., Hospital Rev. Bonds (Orlando Health Obligated Group), Series 2019-A, 5.00% 2024
| 4,000
| 4,743
|
| County of Orange, Health Facs. Auth., Hospital Rev. Bonds (Orlando Health Obligated Group), Series 2019-A, 5.00% 2025
| 4,000
| 4,841
|
| County of Orange, Health Facs. Auth., Hospital Rev. Bonds (Orlando Health Obligated Group), Series 2019-A, 5.00% 2026
| 3,000
| 3,702
|
County of Orange, Health Facs. Auth., Hospital Rev. Bonds (Orlando Health, Inc.), Series 2009,
5.25% 2020 (preref. 2019)
| 4,165
| 4,193
|
County of Orange, Health Facs. Auth., Hospital Rev. Ref. Bonds (Orlando Health Obligated Group),
Series 2016-A, 5.00% 2033
| 2,000
| 2,379
|
County of Orange, Health Facs. Auth., Hospital Rev. Ref. Bonds (Orlando Health Obligated Group),
Series 2016-A, 5.00% 2034
| 5,000
| 5,928
|
County of Orange, Health Facs. Auth., Hospital Rev. Ref. Bonds (Orlando Health Obligated Group),
Series 2016-A, 5.00% 2036
| 3,000
| 3,527
|
| Orlando Utilities Commission, Utility System Rev. Ref. Bonds, Series 2012-A, 5.00% 2024
| 1,000
| 1,191
|
| Orlando Utilities Commission, Utility System Rev. Ref. Bonds, Series 2013-A, 5.00% 2020
| 2,000
| 2,091
|
| Orlando Utilities Commission, Utility System Rev. Ref. Bonds, Series 2013-A, 5.00% 2021
| 3,000
| 3,251
|
| Orlando-Orange County Expressway Auth., Rev. Bonds, Series 2010-A, 5.00% 2029 (preref. 2020)
| 5,505
| 5,699
|
| Orlando-Orange County Expressway Auth., Rev. Bonds, Series 2010-A, 5.00% 2035 (preref. 2020)
| 4,550
| 4,710
|
| Orlando-Orange County Expressway Auth., Rev. Bonds, Series 2010-A, 5.00% 2035 (preref. 2020)
| 1,045
| 1,082
|
| Orlando-Orange County Expressway Auth., Rev. Bonds, Series 2010-A, 5.00% 2040 (preref. 2020)
| 1,835
| 1,900
|
| Orlando-Orange County Expressway Auth., Rev. Bonds, Series 2010-A, 5.00% 2040 (preref. 2020)
| 1,165
| 1,206
|
| Orlando-Orange County Expressway Auth., Rev. Bonds, Series 2010-C, 5.00% 2040 (preref. 2020)
| 7,500
| 7,764
|
| Orlando-Orange County Expressway Auth., Rev. Ref. Bonds, Series 2012-B, 5.00% 2024
| 2,000
| 2,274
|
| Orlando-Orange County Expressway Auth., Rev. Ref. Bonds, Series 2013-A, 5.00% 2035
| 27,350
| 30,660
|
| County of Palm Beach, Health Facs. Auth., Retirement Communities Rev. Bonds (ACTS Retirement-Life Communities, Inc. Obligated Group), Series 2010, 5.50% 2033
(preref. 2020)
| 3,500
| 3,693
|
| County of Palm Beach, Health Facs. Auth., Retirement Communities Rev. Bonds (ACTS Retirement-Life Communities, Inc. Obligated Group), Series 2016, 5.00% 2032
| 6,215
| 7,288
|
| County of Palm Beach, Health Facs. Auth., Retirement Communities Rev. Bonds (ACTS Retirement-Life Communities, Inc. Obligated Group), Series 2018-A, 5.00% 2045
| 725
| 830
|
| County of Palm Beach, Health Facs. Auth., Rev. Bonds (Harbour’s Edge Project), Series 2004-B, 4.00% 2034
| 1,200
| 1,201
|
County of Palm Beach, Health Facs. Auth., Rev. Bonds (Lifespace Communities, Inc.), Series 2015-C,
5.00% 2026
| 675
| 767
|
County of Palm Beach, Health Facs. Auth., Rev. Bonds (Lifespace Communities, Inc.), Series 2015-C,
5.00% 2030
| 3,655
| 4,085
|
The Tax-Exempt Bond Fund of America — Page
27 of 120
Bonds, notes & other debt instruments (continued)
Florida (continued)
| Principal amount
(000)
| Value
(000)
|
County of Palm Beach, Health Facs. Auth., Rev. Bonds (Lifespace Communities, Inc.), Series 2015-C,
5.00% 2038
| $2,380
| $2,608
|
County of Palm Beach, Health Facs. Auth., Rev. Bonds (Lifespace Communities, Inc.), Series 2016-B,
5.00% 2036
| 1,250
| 1,396
|
County of Palm Beach, Health Facs. Auth., Rev. Bonds (Lifespace Communities, Inc.), Series 2018-B,
5.00% 2032
| 650
| 743
|
| County of Palm Beach, Solid Waste Auth., Improvement Rev. Bonds, Series 2009, 5.00% 2024 (preref. 2019)
| 2,520
| 2,536
|
| County of Palm Beach, Solid Waste Auth., Improvement Rev. Bonds, Series 2009, 5.00% 2025 (preref. 2019)
| 3,350
| 3,372
|
| County of Palm Beach, Solid Waste Auth., Improvement Rev. Bonds, Series 2009, 5.25% 2021 (preref. 2019)
| 3,095
| 3,116
|
| County of Palm Beach, Solid Waste Auth., Improvement Rev. Bonds, Series 2009, 5.25% 2021 (preref. 2019)
| 905
| 911
|
County of Pasco, Meadow Pointe II Community Dev. Dist., Special Assessment Bonds, Series 2018,
3.875% 2033
| 1,720
| 1,884
|
County of Pasco, Meadow Pointe II Community Dev. Dist., Special Assessment Bonds, Series 2018,
Assured Guarnaty Municipal insured, 2.375% 2020
| 185
| 186
|
County of Pasco, Meadow Pointe II Community Dev. Dist., Special Assessment Bonds, Series 2018,
Assured Guarnaty Municipal insured, 2.50% 2021
| 115
| 117
|
County of Pasco, Meadow Pointe II Community Dev. Dist., Special Assessment Bonds, Series 2018,
Assured Guarnaty Municipal insured, 2.625% 2022
| 145
| 148
|
County of Pasco, Meadow Pointe II Community Dev. Dist., Special Assessment Bonds, Series 2018,
Assured Guarnaty Municipal insured, 2.75% 2023
| 180
| 186
|
County of Pasco, Meadow Pointe II Community Dev. Dist., Special Assessment Bonds, Series 2018,
Assured Guarnaty Municipal insured, 2.875% 2024
| 325
| 340
|
County of Pasco, Meadow Pointe II Community Dev. Dist., Special Assessment Bonds, Series 2018,
Assured Guarnaty Municipal insured, 3.00% 2025
| 350
| 369
|
County of Pasco, Meadow Pointe II Community Dev. Dist., Special Assessment Bonds, Series 2018,
Assured Guarnaty Municipal insured, 3.125% 2026
| 360
| 383
|
County of Pasco, Meadow Pointe II Community Dev. Dist., Special Assessment Bonds, Series 2018,
Assured Guarnaty Municipal insured, 3.25% 2027
| 370
| 396
|
County of Pasco, Meadow Pointe II Community Dev. Dist., Special Assessment Bonds, Series 2018,
Assured Guarnaty Municipal insured, 3.40% 2028
| 385
| 417
|
County of Pasco, Meadow Pointe II Community Dev. Dist., Special Assessment Bonds, Series 2018,
Assured Guarnaty Municipal insured, 3.50% 2029
| 385
| 420
|
County of Pasco, Meadow Pointe II Community Dev. Dist., Special Assessment Bonds, Series 2018,
Assured Guarnaty Municipal insured, 4.125% 2039
| 1,605
| 1,754
|
| County of Pasco, Meadow Pointe IV Community Dev. Dist., Capital Improvement Rev. Bonds, Series 2004-A, 6.00% 20363
| 2,085
| 120
|
| County of Pasco, Meadow Pointe IV Community Dev. Dist., Capital Improvement Rev. Bonds, Series 2005, 5.25% 20153
| 725
| 42
|
| County of Pasco, Meadow Pointe IV Community Dev. Dist., Capital Improvement Rev. Bonds, Series 2007-A, 6.25% 20383
| 3,005
| 173
|
| County of Pasco, Meadow Pointe IV Community Dev. Dist., Capital Improvement Rev. Bonds, Series 2007-B, 6.15% 20143
| 1,385
| 80
|
| County of Pasco, Meadow Pointe IV Community Dev. Dist., Capital Improvement Rev. Bonds, Series 2012, 5.25% 20153
| 590
| 34
|
| County of Pasco, Meadow Pointe IV Community Dev. Dist., Capital Improvement Rev. Bonds, Series 2012-A-1, 6.00% 20364
| 1,050
| 1,084
|
| County of Pasco, Meadow Pointe IV Community Dev. Dist., Capital Improvement Rev. Bonds, Series 2012-A-2, 6.25% 20384
| 2,060
| 2,150
|
| County of Pasco, Meadow Pointe IV Community Dev. Dist., Capital Improvement Rev. Bonds, Series 2012-B, 6.81% 20204
| 275
| 277
|
| County of Pasco, Meadow Pointe IV Community Dev. Dist., Capital Improvement Rev. Bonds, Series 2014-A, 7.25% 20354
| 390
| 427
|
| County of Pasco, Meadow Pointe IV Community Dev. Dist., Capital Improvement Rev. Bonds, Series 2014-B, 7.25% 20224
| 80
| 85
|
| City of Pompano Beach, Rev. Bonds (John Knox Village Project), Series 2015, 5.00% 2039
| 1,200
| 1,317
|
The Tax-Exempt Bond Fund of America — Page
28 of 120
Bonds, notes & other debt instruments (continued)
Florida (continued)
| Principal amount
(000)
| Value
(000)
|
| City of Pompano Beach, Rev. Bonds (John Knox Village Project), Series 2015, 5.00% 2044
| $2,975
| $3,245
|
| City of Port St. Lucie, Utility System Rev. Ref. Bonds, Series 2016, 4.00% 2030
| 1,750
| 1,971
|
| City of Port St. Lucie, Utility System Rev. Ref. Bonds, Series 2016, 4.00% 2031
| 2,000
| 2,241
|
| City of Port St. Lucie, Utility System Rev. Ref. Bonds, Series 2016, 4.00% 2032
| 1,000
| 1,117
|
| City of Port St. Lucie, Utility System Rev. Ref. Bonds, Series 2016, 4.00% 2033
| 2,900
| 3,227
|
Ports Fncg. Commission, Rev. Ref. Bonds (State Transportation Trust Fund - Intermodal Program),
Series 2011-A, 5.00% 2029
| 1,240
| 1,336
|
City of St. Cloud, Gramercy Farms Community Dev. Dist., Special Assessment Bonds, Series 2007-B,
5.10% 20143
| 10,125
| —5
|
City of St. Cloud, Gramercy Farms Community Dev. Dist., Special Assessment Rev. Ref. Bonds,
Capital Appreciation Bonds, Series 2011, 0% 20396,7
| 31,155
| 5,935
|
| City of St. Cloud, Stevens Plantation Community Dev. Dist., Special Assessment Rev. Bonds, Series 2003-B, 6.375% 20133
| 2,525
| 2,020
|
County of St. Johns, Heritage Landing Community Dev. Dist., Special Assessment Rev. Ref. Bonds,
Series 2015, 4.35% 2036
| 1,000
| 1,072
|
| County of St. Johns, Industrial Dev. Auth., Rev. Ref. Bonds (Presbyterian Retirement Communities Project), Series 2010-A, 5.875% 2040 (preref. 2020)
| 3,750
| 3,923
|
| County of St. Johns, Industrial Dev. Auth., Rev. Ref. Bonds (Presbyterian Retirement Communities Project), Series 2010-A, 6.00% 2045 (preref. 2020)
| 2,000
| 2,095
|
County of St. Johns, Marshall Creek Community Dev. Dist., Special Assessment Bonds, Series 2002,
5.00% 2032
| 2,110
| 2,048
|
County of St. Johns, Marshall Creek Community Dev. Dist., Special Assessment Bonds, Series 2016,
6.32% 2045
| 140
| 135
|
| County of Sarasota, Hospital Dist. Rev. Bonds (Sarasota Memorial Hospital Project), Series 2018, 5.00% 2038
| 10,000
| 12,021
|
| South Broward Hospital Dist., Hospital Rev. Ref. Bonds (South Broward Hospital Dist. Obligated Group), Series 2016, 5.00% 2028
| 2,000
| 2,411
|
| South Lake County Hospital Dist., Rev. Ref. Bonds (South Lake Hospital, Inc.), Series 2010, 5.25% 2034
| 1,000
| 1,024
|
| City of South Miami, Health Facs. Auth., Hospital Rev. Ref. Bonds (Baptist Health South Florida Obligated Group), Series 2017, 5.00% 2042
| 8,250
| 9,669
|
| City of South Miami, Health Facs. Auth., Hospital Rev. Ref. Bonds (Baptist Health South Florida Obligated Group), Series 2017, 5.00% 2047
| 8,000
| 9,299
|
Southeast Overtown/Park West Community Redev. Agcy., Tax Increment Rev. Bonds, Series 2014-A-1,
5.00% 20301
| 1,250
| 1,405
|
County of Sumter, Industrial Dev. Auth., Hospital Rev. Bonds (Central Florida Health Alliance Projects),
Series 2014-B, 5.00% 2026
| 550
| 635
|
County of Sumter, Industrial Dev. Auth., Hospital Rev. Bonds (Central Florida Health Alliance Projects),
Series 2014-B, 5.00% 2027
| 1,000
| 1,146
|
| County of Sumter, Village Community Dev. Dist. No. 6, Rev. Ref. Bonds, Series 2017, 4.00% 2022
| 365
| 386
|
| County of Sumter, Village Community Dev. Dist. No. 6, Rev. Ref. Bonds, Series 2017, 4.00% 2023
| 380
| 408
|
| County of Sumter, Village Community Dev. Dist. No. 6, Rev. Ref. Bonds, Series 2017, 4.00% 2024
| 390
| 425
|
| County of Sumter, Village Community Dev. Dist. No. 6, Rev. Ref. Bonds, Series 2017, 4.00% 2025
| 310
| 341
|
| County of Sumter, Village Community Dev. Dist. No. 6, Rev. Ref. Bonds, Series 2017, 4.00% 2026
| 355
| 395
|
| County of Sumter, Village Community Dev. Dist. No. 6, Rev. Ref. Bonds, Series 2017, 4.00% 2027
| 335
| 374
|
| County of Sumter, Village Community Dev. Dist. No. 6, Rev. Ref. Bonds, Series 2017, 4.00% 2028
| 350
| 388
|
| County of Sumter, Village Community Dev. Dist. No. 6, Rev. Ref. Bonds, Series 2017, 4.00% 2029
| 360
| 398
|
Sweetwater Creek Community Dev. Dist., Capital Improvement Rev. Ref. Bonds, Series 2019-A-1,
Assured Guaranty Municipal insured, 2.00% 2024
| 360
| 362
|
Sweetwater Creek Community Dev. Dist., Capital Improvement Rev. Ref. Bonds, Series 2019-A-1,
Assured Guaranty Municipal insured, 2.125% 2026
| 375
| 374
|
Sweetwater Creek Community Dev. Dist., Capital Improvement Rev. Ref. Bonds, Series 2019-A-1,
Assured Guaranty Municipal insured, 2.375% 2028
| 390
| 388
|
Sweetwater Creek Community Dev. Dist., Capital Improvement Rev. Ref. Bonds, Series 2019-A-1,
Assured Guaranty Municipal insured, 2.875% 2033
| 1,000
| 999
|
Sweetwater Creek Community Dev. Dist., Capital Improvement Rev. Ref. Bonds, Series 2019-A-1,
Assured Guaranty Municipal insured, 3.00% 2038
| 1,000
| 984
|
The Tax-Exempt Bond Fund of America — Page
29 of 120
Bonds, notes & other debt instruments (continued)
Florida (continued)
| Principal amount
(000)
| Value
(000)
|
| City of Tallahassee, Energy System Rev. Ref. Bonds, Series 2010, 5.00% 2026
| $2,000
| $2,088
|
| City of Tallahassee, Energy System Rev. Ref. Bonds, Series 2010, 5.00% 2027
| 2,000
| 2,087
|
| City of Tallahassee, Energy System Rev. Ref. Bonds, Series 2010, 5.00% 2028
| 5,000
| 5,215
|
| City of Tallahassee, Energy System Rev. Ref. Bonds, Series 2017, 5.00% 2034
| 2,000
| 2,361
|
| City of Tallahassee, Energy System Rev. Ref. Bonds, Series 2017, 5.00% 2035
| 2,000
| 2,353
|
| City of Tallahassee, Energy System Rev. Ref. Bonds, Series 2017, 5.00% 2037
| 4,525
| 5,288
|
City of Tallahassee, Health Facs. Rev. Ref. Bonds (Tallahassee Memorial HealthCare, Inc. Project),
Series 2015-A, 5.00% 2040
| 2,650
| 2,960
|
City of Tallahassee, Health Facs. Rev. Ref. Bonds (Tallahassee Memorial HealthCare, Inc. Project),
Series 2016-A, 5.00% 2036
| 2,000
| 2,276
|
City of Tallahassee, Health Facs. Rev. Ref. Bonds (Tallahassee Memorial HealthCare, Inc. Project),
Series 2016-A, 5.00% 2041
| 1,025
| 1,153
|
City of Tallahassee, Health Facs. Rev. Ref. Bonds (Tallahassee Memorial HealthCare, Inc. Project),
Series 2016-A, 5.00% 2055
| 1,500
| 1,670
|
| City of Tampa, Health System Rev. Ref. Bonds (Baycare Health System Issue), Series 2010, 5.00% 2023
| 490
| 505
|
City of Tampa, Health System Rev. Ref. Bonds (Baycare Health System Issue), Series 2010,
5.00% 2023 (preref. 2020)
| 510
| 525
|
| City of Tampa, Rev. and Rev. Ref. Bonds (University of Tampa Project), Series 2015, 5.00% 2033
| 1,000
| 1,153
|
| City of Tampa, Rev. and Rev. Ref. Bonds (University of Tampa Project), Series 2015, 5.00% 2035
| 2,000
| 2,294
|
| City of Tampa, Rev. and Rev. Ref. Bonds (University of Tampa Project), Series 2015, 5.00% 2040
| 4,555
| 5,152
|
| City of Tampa, Rev. and Rev. Ref. Bonds (University of Tampa Project), Series 2015, 5.00% 2045
| 1,500
| 1,696
|
City of Tampa, Rev. Ref. and Capital Improvement Cigarette Tax Allocation Bonds
(H. Lee Moffitt Cancer Center Project), Series 2012-A, 4.00% 2033
| 3,000
| 3,158
|
City of Tampa, Rev. Ref. and Capital Improvement Cigarette Tax Allocation Bonds
(H. Lee Moffitt Cancer Center Project), Series 2012-A, 5.00% 2029
| 1,430
| 1,577
|
| Tampa Bay Water Auth., Utility System Rev. Ref. Bonds, Series 2016-C, 5.00% 2027
| 6,425
| 8,173
|
| Tampa-Hillsborough County Expressway Auth., Rev. Bonds, Series 2017, 5.00% 2047
| 14,900
| 17,450
|
| Tampa-Hillsborough County Expressway Auth., Rev. Bonds, Series 2017-C, 5.00% 2048
| 5,000
| 5,947
|
| Tampa-Hillsborough County Expressway Auth., Rev. Ref. Bonds, Series 2012-A, 5.00% 2032
| 4,000
| 4,385
|
| Tampa-Hillsborough County Expressway Auth., Rev. Ref. Bonds, Series 2012-B, 5.00% 2042 (preref. 2022)
| 2,180
| 2,418
|
| Tampa-Hillsborough County Expressway Auth., Rev. Ref. Bonds, Series 2017-B, 4.00% 2042
| 39,670
| 43,698
|
| Tolomato Community Dev. Dist., Rev. Ref. Bonds, Series 2018-A-1, Assured Guaranty Municipal insured, 2.75% 2025
| 1,100
| 1,149
|
| Tolomato Community Dev. Dist., Rev. Ref. Bonds, Series 2018-A-1, Assured Guaranty Municipal insured, 3.00% 2026
| 850
| 900
|
| Tolomato Community Dev. Dist., Rev. Ref. Bonds, Series 2018-A-1, Assured Guaranty Municipal insured, 3.125% 2027
| 1,170
| 1,246
|
| Tolomato Community Dev. Dist., Rev. Ref. Bonds, Series 2018-A-1, Assured Guaranty Municipal insured, 3.25% 2028
| 1,205
| 1,295
|
| Tolomato Community Dev. Dist., Rev. Ref. Bonds, Series 2018-B-1, Assured Guaranty Municipal insured, 2.625% 2024
| 410
| 425
|
| Tolomato Community Dev. Dist., Rev. Ref. Bonds, Series 2018-B-1, Assured Guaranty Municipal insured, 2.75% 2025
| 420
| 438
|
| Tolomato Community Dev. Dist., Rev. Ref. Bonds, Series 2018-B-1, Assured Guaranty Municipal insured, 3.00% 2026
| 435
| 460
|
| Tolomato Community Dev. Dist., Rev. Ref. Bonds, Series 2018-B-1, Assured Guaranty Municipal insured, 3.125% 2027
| 450
| 478
|
| Tolomato Community Dev. Dist., Rev. Ref. Bonds, Series 2018-B-1, Assured Guaranty Municipal insured, 3.25% 2028
| 460
| 494
|
| Tolomato Community Dev. Dist., Rev. Ref. Bonds, Series 2019-A-1, Assured Guaranty Municipal insured, 2.125% 2026
| 2,400
| 2,393
|
| Tolomato Community Dev. Dist., Rev. Ref. Bonds, Series 2019-A-1, Assured Guaranty Municipal insured, 2.25% 2027
| 2,450
| 2,442
|
| Tolomato Community Dev. Dist., Rev. Ref. Bonds, Series 2019-A-1, Assured Guaranty Municipal insured, 2.40% 2028
| 2,510
| 2,505
|
The Tax-Exempt Bond Fund of America — Page
30 of 120
Bonds, notes & other debt instruments (continued)
Florida (continued)
| Principal amount
(000)
| Value
(000)
|
| Tolomato Community Dev. Dist., Rev. Ref. Bonds, Series 2019-A-1, Assured Guaranty Municipal insured, 2.50% 2029
| $2,570
| $2,561
|
| Tolomato Community Dev. Dist., Rev. Ref. Bonds, Series 2019-A-1, Assured Guaranty Municipal insured, 3.00% 2033
| 5,535
| 5,585
|
| Tolomato Community Dev. Dist., Rev. Ref. Bonds, Series 2019-A-1, Assured Guaranty Municipal insured, 3.00% 2037
| 6,240
| 6,179
|
Tolomato Community Dev. Dist., Rev. Ref. Bonds, Series 2019-B, Assured Guaranty Municipal insured,
2.10% 2026
| 1,030
| 1,029
|
Tolomato Community Dev. Dist., Rev. Ref. Bonds, Series 2019-B, Assured Guaranty Municipal insured,
2.25% 2027
| 1,055
| 1,055
|
Tolomato Community Dev. Dist., Rev. Ref. Bonds, Series 2019-B, Assured Guaranty Municipal insured,
2.30% 2028
| 1,080
| 1,074
|
Tolomato Community Dev. Dist., Rev. Ref. Bonds, Series 2019-B, Assured Guaranty Municipal insured,
2.40% 2029
| 1,105
| 1,096
|
Tolomato Community Dev. Dist., Rev. Ref. Bonds, Series 2019-B, Assured Guaranty Municipal insured,
3.00% 2033
| 2,380
| 2,412
|
Tolomato Community Dev. Dist., Rev. Ref. Bonds, Series 2019-B, Assured Guaranty Municipal insured,
3.00% 2040
| 4,030
| 3,935
|
| Dept. of Transportation, Turnpike Rev. Bonds, Series 2018-A, 4.00% 2048
| 3,500
| 3,886
|
| Dept. of Transportation, Turnpike Rev. Ref. Bonds, Series 2017-A, 5.00% 2023
| 17,185
| 19,753
|
| County of Volusia, Educational Facs. Auth., Educational Facs. Rev. Bonds (Stetson University, Inc. Project), Series 2015, 5.00% 2045
| 5,000
| 5,637
|
| County of Volusia, Educational Facs. Auth., Educational Facs. Rev. Ref. Bonds (Embry-Riddle Aeronautical University, Inc. Project), Series 2015-B, 5.00% 2029
| 1,000
| 1,160
|
| County of Volusia, Educational Facs. Auth., Educational Facs. Rev. Ref. Bonds (Embry-Riddle Aeronautical University, Inc. Project), Series 2015-B, 5.00% 2033
| 1,635
| 1,874
|
| County of Volusia, Educational Facs. Auth., Educational Facs. Rev. Ref. Bonds (Embry-Riddle Aeronautical University, Inc. Project), Series 2015-B, 5.00% 2034
| 1,620
| 1,850
|
| County of Volusia, Educational Facs. Auth., Educational Facs. Rev. Ref. Bonds (Embry-Riddle Aeronautical University, Inc. Project), Series 2015-B, 5.00% 2045
| 4,000
| 4,480
|
| Water Pollution Control Fncg. Corp., Water Pollution Control Rev. Bonds, Series 2008-A, 5.10% 2029
| 5,055
| 5,071
|
| City of West Palm Beach, Utility System Rev. Bonds, Series 2017-A, 5.00% 2042
| 7,800
| 9,349
|
City of Winter Garden, Winter Garden Village at Fowler Groves Community Dev. Dist.,
Special Assessment Rev. Ref. Bonds, Series 2016, 3.00% 2024
| 1,530
| 1,541
|
City of Winter Garden, Winter Garden Village at Fowler Groves Community Dev. Dist.,
Special Assessment Rev. Ref. Bonds, Series 2016, 3.75% 2031
| 1,520
| 1,537
|
City of Winter Garden, Winter Garden Village at Fowler Groves Community Dev. Dist.,
Special Assessment Rev. Ref. Bonds, Series 2016, 4.125% 2037
| 945
| 956
|
|
|
| 1,390,063
|
| Georgia 1.97%
|
|
|
| City of Atlanta, Airport General Rev. Bonds, Series 2012-B, 5.00% 2037
| 1,000
| 1,083
|
| City of Atlanta, Airport General Rev. Ref. Bonds, Series 2010-C, 5.00% 2025
| 10,000
| 10,568
|
| City of Atlanta, Airport Passenger Fac. Charge and General Rev. Bonds, Series 2010-B, 5.00% 2024
| 7,000
| 7,116
|
| City of Atlanta, Dev. Auth., Rev. Bonds (Georgia State University Research Foundation - Science Park, LLC Project), Series 2016, 5.00% 2026
| 500
| 615
|
| City of Atlanta, Dev. Auth., Student Housing Facs. Rev. Ref. Bonds (Piedmont/Ellis, LLC University Commons Project), Series 2013, 5.00% 2025 (preref. 2023)
| 1,000
| 1,149
|
| City of Atlanta, Dev. Auth., Student Housing Facs. Rev. Ref. Bonds (Piedmont/Ellis, LLC University Commons Project), Series 2013, 5.00% 2026 (preref. 2023)
| 4,000
| 4,597
|
| City of Atlanta, Dev. Auth., Student Housing Facs. Rev. Ref. Bonds (Piedmont/Ellis, LLC University Commons Project), Series 2013, 5.00% 2027 (preref. 2023)
| 7,165
| 8,234
|
| City of Atlanta, Dev. Auth., Student Housing Rev. Bonds (ADA/CAU Partners, Inc. Project at Clark Atlanta University), Series 2004-A, ACA insured, 6.25% 2024
| 860
| 864
|
| City of Atlanta, Tax Allocation Rev. Ref. Bonds (Atlantic Station Project), Series 2017, 5.00% 2024
| 1,650
| 1,936
|
The Tax-Exempt Bond Fund of America — Page
31 of 120
Bonds, notes & other debt instruments (continued)
Georgia (continued)
| Principal amount
(000)
| Value
(000)
|
| City of Atlanta, Water and Wastewater Rev. and Rev. Ref. Bonds, Series 2018-B, 4.00% 2034
| $1,960
| $2,226
|
| City of Atlanta, Water and Wastewater Rev. and Rev. Ref. Bonds, Series 2018-B, 4.00% 2035
| 1,910
| 2,163
|
| City of Atlanta, Water and Wastewater Rev. and Rev. Ref. Bonds, Series 2018-B, 4.00% 2036
| 2,500
| 2,818
|
| City of Atlanta, Water and Wastewater Rev. and Rev. Ref. Bonds, Series 2018-B, 4.00% 2037
| 4,000
| 4,484
|
| City of Atlanta, Water and Wastewater Rev. and Rev. Ref. Bonds, Series 2018-B, 4.00% 2038
| 9,000
| 10,041
|
| City of Atlanta, Water and Wastewater Rev. Bonds, Series 1999-A, FGIC-National insured, 5.50% 2022
| 21,500
| 23,644
|
| City of Atlanta, Water and Wastewater Rev. Bonds, Series 2001-A, National insured, 5.50% 2027
| 5,450
| 6,802
|
| City of Atlanta, Water and Wastewater Rev. Ref. Bonds, Series 2015, 5.00% 2026
| 1,000
| 1,205
|
| City of Atlanta, Water and Wastewater Rev. Ref. Bonds, Series 2015, 5.00% 2032
| 3,925
| 4,645
|
| City of Atlanta, Water and Wastewater Rev. Ref. Bonds, Series 2015, 5.00% 2040
| 17,280
| 20,110
|
County of Baldwin and City of Milledgeville, Dev. Auth., Student Housing Rev. Ref. Bonds
(Georgia College & State University Foundation Property V, LLC Project), Series 2007, AMBAC insured,
(3-month USD-LIBOR + 0.65%) 2.203% 20332
| 10,000
| 9,503
|
| Counties of Bleckley and Dodge, Joint Dev. Auth., Rev. Ref. Bonds (USG Real Estate Foundation VII, LLC Project), Series 2018, 5.00% 2034
| 1,410
| 1,707
|
| Counties of Bleckley and Dodge, Joint Dev. Auth., Rev. Ref. Bonds (USG Real Estate Foundation VII, LLC Project), Series 2018, 5.00% 2035
| 1,580
| 1,904
|
| Counties of Bleckley and Dodge, Joint Dev. Auth., Rev. Ref. Bonds (USG Real Estate Foundation VII, LLC Project), Series 2018, 5.00% 2036
| 1,230
| 1,479
|
| Counties of Bleckley and Dodge, Joint Dev. Auth., Rev. Ref. Bonds (USG Real Estate Foundation VII, LLC Project), Series 2018, 5.00% 2037
| 1,075
| 1,286
|
County of Burke, Dev. Auth., Pollution Control Rev. Bonds (Georgia Power Co. Plant Vogtle Project),
Series 1995, 2.25% 2032 (put 2023)
| 4,000
| 4,074
|
County of Burke, Dev. Auth., Pollution Control Rev. Bonds (Georgia Power Co. Plant Vogtle Project),
Series 2012, 1.85% 2049 (put 2019)
| 8,000
| 8,002
|
County of Burke, Dev. Auth., Pollution Control Rev. Bonds (Georgia Power Co. Plant Vogtle Project),
Series 2012, 1.85% 2049 (put 2019)
| 1,800
| 1,800
|
County of Burke, Dev. Auth., Pollution Control Rev. Bonds (Georgia Power Co. Plant Vogtle Project),
Series 2013, 2.925% 2053 (put 2024)
| 25,350
| 26,494
|
County of Burke, Dev. Auth., Pollution Control Rev. Bonds (Oglethorpe Power Corp. - Vogtle Project),
Series 2013-A, 2.40% 2040 (put 2020)
| 32,695
| 32,897
|
County of Burke, Dev. Auth., Pollution Control Rev. Bonds (Oglethorpe Power Corp. - Vogtle Project),
Series 2017-C, 4.125% 2045
| 5,000
| 5,283
|
| County of Cobb, Dev. Auth., Parking and Dining Hall Lease Rev. Ref. Bonds (Kennesaw State University Real Estate Foundations Projects), Series 2017, 5.00% 2033
| 1,370
| 1,657
|
| County of Cobb, Dev. Auth., Student Recreation and Activities Center Rev. Bonds (KSU SRAC Real Estate Foundation, LLC Project), Series 2013, 5.00% 2035
| 1,000
| 1,091
|
| County of Cobb, Dev. Auth., Student Recreation and Activities Center Rev. Bonds (KSU SRAC Real Estate Foundation, LLC Project), Series 2013, 5.00% 2038
| 1,500
| 1,635
|
| City of Dahlonega, Downtown Dev. Auth., Rev. Ref. Bonds (North Georgia Mac, LLC Project), Series 2017, 5.00% 2036
| 1,500
| 1,784
|
| County of DeKalb, Hospital Auth., Rev. Ref. Anticipation Certificates (DeKalb Medical Center, Inc. Project), Series 2010, 5.25% 2020
| 4,590
| 4,696
|
| County of DeKalb, Hospital Auth., Rev. Ref. Anticipation Certificates (DeKalb Medical Center, Inc. Project), Series 2010, 6.00% 2030 (preref. 2020)
| 7,950
| 8,346
|
| County of DeKalb, Hospital Auth., Rev. Ref. Anticipation Certificates (DeKalb Medical Center, Inc. Project), Series 2010, 6.125% 2040 (preref. 2020)
| 13,125
| 13,796
|
| County of DeKalb, Water and Sewerage Rev. Bonds (Second Resolution), Series 2011-A, 5.25% 2030
| 2,500
| 2,709
|
| County of DeKalb, Water and Sewerage Rev. Bonds (Second Resolution), Series 2011-A, 5.25% 2031
| 1,500
| 1,625
|
| County of DeKalb, Water and Sewerage Rev. Bonds (Second Resolution), Series 2011-A, 5.25% 2036
| 2,500
| 2,705
|
| County of Fulton, Dev. Auth., Rev. Bonds (TUFF CAUB LLC Project), Series 2007-A, 5.25% 2028
| 3,990
| 3,991
|
County of Gwinnett, Dev. Auth., Certs. of Part. (Gwinnett County Public Schools Project), Series 2006,
National insured, 5.25% 2021
| 5,000
| 5,293
|
County of Gwinnett, Dev. Auth., Certs. of Part. (Gwinnett County Public Schools Project), Series 2006,
National insured, 5.25% 2024
| 2,500
| 2,933
|
The Tax-Exempt Bond Fund of America — Page
32 of 120
Bonds, notes & other debt instruments (continued)
Georgia (continued)
| Principal amount
(000)
| Value
(000)
|
County of Gwinnett, Dev. Auth., Certs. of Part. (Gwinnett County Public Schools Project), Series 2006,
National insured, 5.25% 2025
| $2,500
| $3,016
|
County of Gwinnett, Dev. Auth., Rev. Ref. Bonds (Georgia Gwinnett College Student Housing Project),
Series 2017-A, 5.00% 2031
| 1,000
| 1,218
|
County of Gwinnett, Dev. Auth., Rev. Ref. Bonds (Georgia Gwinnett College Student Housing Project),
Series 2017-A, 5.00% 2034
| 1,500
| 1,804
|
County of Gwinnett, Dev. Auth., Rev. Ref. Bonds (Georgia Gwinnett College Student Housing Project),
Series 2017-A, 5.00% 2036
| 5,405
| 6,468
|
| County of Hall and City of Gainesville, Hospital Auth., Rev. Anticipation Certificates (Northeast Georgia Health System, Inc. Project), Series 2010-A, 5.00% 2030
| 2,930
| 2,985
|
| County of Hall and City of Gainesville, Hospital Auth., Rev. Anticipation Certificates (Northeast Georgia Health System, Inc. Project), Series 2010-A, 5.00% 2030
(preref. 2020)
| 9,415
| 9,613
|
| County of Hall and City of Gainesville, Hospital Auth., Rev. Anticipation Certificates (Northeast Georgia Health System, Inc. Project), Series 2014-B, (SIFMA
Municipal Swap Index + 0.95%) 2.35% 2035 (put 2020)2
| 11,800
| 11,802
|
Higher Education Facs. Auth., Rev. Bonds (USG Real Estate Foundation II, LLC Project), Series 2010-A,
Assured Guaranty Municipal insured, 5.00% 2022
| 1,435
| 1,480
|
Higher Education Facs. Auth., Rev. Bonds (USG Real Estate Foundation II, LLC Project), Series 2010-A,
Assured Guaranty Municipal insured, 5.00% 2022 (preref. 2020)
| 505
| 522
|
Higher Education Facs. Auth., Rev. Bonds (USG Real Estate Foundation II, LLC Project), Series 2015,
5.00% 2030
| 2,250
| 2,634
|
| Housing and Fin. Auth., Single Family Mortgage Bonds, Series 2015-A-1, 3.50% 2045
| 1,860
| 1,938
|
| Housing and Fin. Auth., Single Family Mortgage Bonds, Series 2015-B-1, 3.50% 2045
| 3,725
| 3,891
|
| Housing and Fin. Auth., Single Family Mortgage Bonds, Series 2016-A-1, 3.50% 2046
| 3,650
| 3,820
|
| Housing and Fin. Auth., Single Family Mortgage Bonds, Series 2017-B, 4.00% 2047
| 2,515
| 2,684
|
| Main Street Natural Gas, Inc., Gas Project Rev. Bonds, Series 2006-A, 5.00% 2022
| 2,000
| 2,174
|
| Main Street Natural Gas, Inc., Gas Project Rev. Bonds, Series 2006-B, 5.00% 2021
| 5,000
| 5,278
|
| Main Street Natural Gas, Inc., Gas Supply Rev. Bonds, Series 2018-A, 4.00% 2048 (put 2023)
| 17,500
| 19,117
|
| Main Street Natural Gas, Inc., Gas Supply Rev. Bonds, Series 2018-C, 4.00% 2048 (put 2023)
| 8,000
| 8,771
|
| Main Street Natural Gas, Inc., Gas Supply Rev. Bonds, Series 2019-A, 5.00% 2043
| 1,140
| 1,337
|
| Main Street Natural Gas, Inc., Gas Supply Rev. Bonds, Series 2019-A, 5.00% 2049
| 4,065
| 5,499
|
County of Monroe, Dev. Auth., Pollution Control Rev. Bonds (Oglethorpe Power Corp. Scherer Project),
Series 2013-A, 2.40% 2039 (put 2020)
| 1,550
| 1,560
|
| Municipal Electric Auth., Plant Vogtle Units 3 and 4 Project J Bonds, Series 2015-A, 5.00% 2060
| 6,595
| 7,022
|
| Municipal Electric Auth., Plant Vogtle Units 3 and 4 Project J Bonds, Series 2015-A, 5.50% 2060
| 15,600
| 17,107
|
| Municipal Electric Auth., Plant Vogtle Units 3 and 4 Project J Bonds, Series 2019-A, 5.00% 2049
| 21,920
| 24,312
|
| Municipal Electric Auth., Plant Vogtle Units 3 and 4 Project J Bonds, Series 2019-A, 5.00% 2059
| 3,220
| 3,520
|
| Municipal Electric Auth., Project One Bonds, Series 2011-A, 5.00% 2021
| 3,250
| 3,417
|
Private Colleges and Universities Auth., Rev. Bonds (The Savannah College of Art and Design Projects),
Series 2014, 5.00% 2026
| 4,500
| 5,239
|
Private Colleges and Universities Auth., Rev. Bonds (The Savannah College of Art and Design Projects),
Series 2014, 5.00% 2029
| 1,250
| 1,441
|
Private Colleges and Universities Auth., Rev. Bonds (The Savannah College of Art and Design Projects),
Series 2014, 5.00% 2033
| 1,000
| 1,139
|
Private Colleges and Universities Auth., Rev. Bonds (The Savannah College of Art and Design Projects),
Series 2014, 5.00% 2044
| 2,380
| 2,670
|
| South Regional Joint Dev. Auth., Rev. Ref. Bonds (Valdosta State University Parking and Student Service Center Project), Series 2016-A, 5.00%
2038
| 2,500
| 2,918
|
|
|
| 427,386
|
| Guam 0.27%
|
|
|
| Business Privilege Tax Bonds, Series 2015-D, 5.00% 2039
| 5,000
| 5,455
|
| Business Privilege Tax Rev. Ref. Bonds, Series 2015-D, 5.00% 2030
| 5,000
| 5,609
|
| Business Privilege Tax Rev. Ref. Bonds, Series 2015-D, 5.00% 2031
| 1,000
| 1,116
|
| Hotel Occupancy Tax Rev. Ref. Bonds, Series 2011-A, 6.125% 2031
| 2,000
| 2,138
|
| Hotel Occupancy Tax Rev. Ref. Bonds, Series 2011-A, 6.50% 2040
| 3,000
| 3,210
|
The Tax-Exempt Bond Fund of America — Page
33 of 120
Bonds, notes & other debt instruments (continued)
Guam (continued)
| Principal amount
(000)
| Value
(000)
|
| Limited Obligation Rev. Ref. Bonds (Section 30), Series 2016-A, 5.00% 2022
| $1,415
| $1,545
|
| Limited Obligation Rev. Ref. Bonds (Section 30), Series 2016-A, 5.00% 2027
| 2,615
| 3,036
|
| Port Auth., Port Rev. Bonds, Series 2018-A, 5.00% 2048
| 3,245
| 3,767
|
| Power Auth., Rev. Bonds, Series 2010-A, Assured Guaranty Municipal insured, 5.50% 2030 (preref. 2020)
| 5
| 5
|
| Power Auth., Rev. Bonds, Series 2012-A, Assured Guaranty Municipal insured, 5.00% 2019
| 1,450
| 1,458
|
| Power Auth., Rev. Bonds, Series 2012-A, Assured Guaranty Municipal insured, 5.00% 2034
| 3,430
| 3,664
|
| Power Auth., Rev. Bonds, Series 2014-A, Assured Guaranty Municipal insured, 5.00% 2024
| 745
| 846
|
| Power Auth., Rev. Bonds, Series 2014-A, Assured Guaranty Municipal insured, 5.00% 2028
| 400
| 449
|
| Power Auth., Rev. Bonds, Series 2014-A, Assured Guaranty Municipal insured, 5.00% 2039
| 500
| 564
|
| Power Auth., Rev. Bonds, Series 2014-A, Assured Guaranty Municipal insured, 5.00% 2044
| 750
| 841
|
| Power Auth., Rev. Ref. Bonds, Series 2017-A, 5.00% 2035
| 1,885
| 2,158
|
| Power Auth., Rev. Ref. Bonds, Series 2017-A, 5.00% 2038
| 2,000
| 2,269
|
| Waterworks Auth., Water and Wastewater System Rev. Bonds, Series 2010, 5.625% 2040 (preref. 2020)
| 4,930
| 5,133
|
| Waterworks Auth., Water and Wastewater System Rev. Bonds, Series 2013, 5.25% 2022
| 525
| 576
|
| Waterworks Auth., Water and Wastewater System Rev. Bonds, Series 2013, 5.50% 2043
| 6,100
| 6,684
|
| Waterworks Auth., Water and Wastewater System Rev. Bonds, Series 2016, 5.00% 2021
| 1,000
| 1,060
|
| Waterworks Auth., Water and Wastewater System Rev. Bonds, Series 2016, 5.00% 2046
| 1,730
| 1,929
|
| Waterworks Auth., Water and Wastewater System Rev. Ref. Bonds, Series 2014-A, 5.00% 2021
| 385
| 408
|
| Waterworks Auth., Water and Wastewater System Rev. Ref. Bonds, Series 2017, 5.00% 2024
| 400
| 458
|
| Waterworks Auth., Water and Wastewater System Rev. Ref. Bonds, Series 2017, 5.00% 2028
| 1,000
| 1,191
|
| Waterworks Auth., Water and Wastewater System Rev. Ref. Bonds, Series 2017, 5.00% 2040
| 1,730
| 1,964
|
|
|
| 57,533
|
| Hawaii 0.45%
|
|
|
| Dept. of Budget and Fin., Special Purpose Rev. Bonds (Pacific Health Obligated Group), Series 2010-B, 5.625% 2030 (preref. 2020)
| 1,000
| 1,040
|
Dept. of Budget and Fin., Special Purpose Rev. Bonds (Pacific Health Obligated Group), Series 2013-A,
5.50% 2043
| 17,000
| 19,155
|
Dept. of Budget and Fin., Special Purpose Rev. Ref. Bonds (Hawaiian Electric Co., Inc.), Series 2019,
3.20% 2039
| 10,000
| 10,102
|
| G.O. Bonds, Series 2018-FT, 5.00% 2026
| 7,970
| 9,781
|
| G.O. Bonds, Series 2018-FT, 5.00% 2031
| 7,510
| 9,419
|
City and County of Honolulu, Wastewater System Rev. Bonds (First Bond Resolution), Series 2015-B,
5.00% 2026
| 1,000
| 1,209
|
City and County of Honolulu, Wastewater System Rev. Bonds (First Bond Resolution), Series 2016-A,
5.00% 2029
| 1,000
| 1,224
|
City and County of Honolulu, Wastewater System Rev. Bonds (First Bond Resolution), Series 2016-A,
5.00% 2030
| 2,725
| 3,318
|
City and County of Honolulu, Wastewater System Rev. Bonds (First Bond Resolution), Series 2016-A,
5.00% 2032
| 1,000
| 1,206
|
City and County of Honolulu, Wastewater System Rev. Bonds (First Bond Resolution), Series 2016-A,
5.00% 2033
| 1,650
| 1,985
|
City and County of Honolulu, Wastewater System Rev. Bonds (First Bond Resolution), Series 2016-A,
5.00% 2034
| 1,140
| 1,367
|
City and County of Honolulu, Wastewater System Rev. Bonds (First Bond Resolution), Series 2016-B,
5.00% 2035
| 3,750
| 4,485
|
City and County of Honolulu, Wastewater System Rev. Bonds (First Bond Resolution), Series 2016-B,
5.00% 2036
| 2,500
| 2,977
|
City and County of Honolulu, Wastewater System Rev. Bonds (First Bond Resolution), Series 2016-B,
5.00% 2037
| 2,745
| 3,259
|
City and County of Honolulu, Wastewater System Rev. Bonds (First Bond Resolution), Series 2018-A,
5.00% 2035
| 4,935
| 6,049
|
City and County of Honolulu, Wastewater System Rev. Bonds (First Bond Resolution), Series 2018-A,
5.00% 2036
| 2,500
| 3,054
|
The Tax-Exempt Bond Fund of America — Page
34 of 120
Bonds, notes & other debt instruments (continued)
Hawaii (continued)
| Principal amount
(000)
| Value
(000)
|
City and County of Honolulu, Wastewater System Rev. Bonds (First Bond Resolution), Series 2018-A,
5.00% 2037
| $4,270
| $5,198
|
City and County of Honolulu, Wastewater System Rev. Bonds (First Bond Resolution), Series 2018-A,
5.00% 2047
| 10,000
| 11,967
|
| Board of Regents of the University of Hawaii, University Rev. Bonds, Series 2009-A, 6.00% 2038 (preref. 2019)
| 1,645
| 1,658
|
|
|
| 98,453
|
| Idaho 0.16%
|
|
|
| Health Facs. Auth., Hospital Rev. Bonds (Trinity Health Credit Group), Series 2017-A, 5.00% 2042
| 1,115
| 1,321
|
| Health Facs. Auth., Hospital Rev. Bonds (Trinity Health Credit Group), Series 2017-A, 5.00% 2047
| 6,000
| 7,068
|
| Health Facs. Auth., Rev. Bonds (Kootenai Health Project), Series 2014-A, 4.375% 20341
| 1,750
| 1,865
|
| Health Facs. Auth., Rev. Bonds (Kootenai Health Project), Series 2014-A, 4.75% 20441
| 5,750
| 6,116
|
| Health Facs. Auth., Rev. Bonds (Kootenai Health Project), Series 2017-A, 5.00% 2047
| 13,680
| 15,642
|
| Housing and Fin. Assn., Single Family Mortgage Bonds, Series 2019-A, 4.00% 2050
| 2,385
| 2,622
|
|
|
| 34,634
|
| Illinois 13.78%
|
|
|
| Build Illinois Bonds, Sales Tax Rev. Bonds, Series 2002, FGIC-National insured, 6.00% 2023
| 1,000
| 1,134
|
| Build Illinois Bonds, Sales Tax Rev. Bonds, Series 2010, 5.00% 2021
| 5,750
| 6,057
|
| Build Illinois Bonds, Sales Tax Rev. Bonds, Series 2018-B, 5.00% 2033
| 3,500
| 4,008
|
| Build Illinois Bonds, Sales Tax Rev. Ref. Bonds, Series 2010, 5.00% 2020
| 5,200
| 5,345
|
| Build Illinois Bonds, Sales Tax Rev. Ref. Bonds, Series 2013, 5.00% 2026
| 11,040
| 12,056
|
| Build Illinois Bonds, Sales Tax Rev. Ref. Bonds, Series 2016-C, 4.00% 2024
| 3,070
| 3,285
|
| Build Illinois Bonds, Sales Tax Rev. Ref. Bonds, Series 2016-C, 4.00% 2027
| 13,430
| 14,483
|
| Build Illinois Bonds, Sales Tax Rev. Ref. Bonds, Series 2016-D, 5.00% 2025
| 2,135
| 2,422
|
| Build Illinois Bonds, Sales Tax Rev. Ref. Bonds, Series 2016-D, 5.00% 2026
| 1,010
| 1,160
|
| Build Illinois Bonds, Sales Tax Rev. Ref. Bonds, Series 2016-D, 5.00% 2027
| 1,275
| 1,454
|
| Build Illinois Bonds, Sales Tax Rev. Ref. Bonds, Series 2016-D, 5.00% 2029
| 7,000
| 7,884
|
| City of Chicago, Board of Education, G.O. Rev. Ref. Bonds (Dedicated Rev.), Series 2017-C, 5.00% 2026
| 7,070
| 8,049
|
| City of Chicago, Board of Education, G.O. Rev. Ref. Bonds (Dedicated Rev.), Series 2017-C, 5.00% 2034
| 11,000
| 12,322
|
| City of Chicago, Board of Education, Unlimited Tax G.O. Bonds (Dedicated Alternative Rev.), Series 2015-C, 5.25% 2039
| 5,000
| 5,379
|
| City of Chicago, Board of Education, Unlimited Tax G.O. Bonds (Dedicated Rev.), Series 2016-B, 6.50% 2046
| 1,350
| 1,617
|
| City of Chicago, Board of Education, Unlimited Tax G.O. Bonds (Dedicated Rev.), Series 2017-A, 7.00% 20461
| 20,700
| 25,853
|
| City of Chicago, Board of Education, Unlimited Tax G.O. Bonds (Dedicated Rev.), Series 2017-C, 5.00% 2030
| 10,000
| 11,365
|
| City of Chicago, Board of Education, Unlimited Tax G.O. Bonds (Dedicated Rev.), Series 2017-F, 5.00% 2020
| 2,000
| 2,070
|
City of Chicago, Board of Education, Unlimited Tax G.O. Bonds (Dedicated Rev.), Series 2018-A,
Assured Guaranty Municipal insured, 5.00% 2030
| 1,000
| 1,203
|
City of Chicago, Board of Education, Unlimited Tax G.O. Bonds (Dedicated Rev.), Series 2018-A,
Assured Guaranty Municipal insured, 5.00% 2031
| 2,000
| 2,392
|
City of Chicago, Board of Education, Unlimited Tax G.O. Bonds (Dedicated Rev.), Series 2018-A,
Assured Guaranty Municipal insured, 5.00% 2032
| 2,000
| 2,384
|
| City of Chicago, Board of Education, Unlimited Tax G.O. Bonds (Dedicated Rev.), Series 2018-C, 5.00% 2020
| 1,520
| 1,574
|
City of Chicago, Board of Education, Unlimited Tax G.O. Bonds (Dedicated Rev.), Series 2018-C,
Assured Guaranty Municipal insured, 5.00% 2023
| 6,000
| 6,568
|
City of Chicago, Board of Education, Unlimited Tax G.O. Bonds (Dedicated Rev.), Series 2018-C,
Assured Guaranty Municipal insured, 5.00% 2028
| 13,455
| 16,407
|
| City of Chicago, Board of Education, Unlimited Tax G.O. Bonds (Dedicated Rev.), Series 2018-D, 5.00% 2046
| 6,000
| 6,584
|
| City of Chicago, Board of Education, Unlimited Tax G.O. Rev. Ref. Bonds (Dedicated Rev.), Series 2010-F, 5.00% 2019
| 1,550
| 1,566
|
| City of Chicago, Board of Education, Unlimited Tax G.O. Rev. Ref. Bonds (Dedicated Rev.), Series 2017-B, 7.00% 20421
| 13,115
| 16,428
|
| City of Chicago, Board of Education, Unlimited Tax G.O. Rev. Ref. Bonds (Dedicated Rev.), Series 2017-C, 5.00% 2020
| 5,865
| 6,071
|
The Tax-Exempt Bond Fund of America — Page
35 of 120
Bonds, notes & other debt instruments (continued)
Illinois (continued)
| Principal amount
(000)
| Value
(000)
|
| City of Chicago, Board of Education, Unlimited Tax G.O. Rev. Ref. Bonds (Dedicated Rev.), Series 2017-C, 5.00% 2021
| $3,000
| $3,164
|
| City of Chicago, Board of Education, Unlimited Tax G.O. Rev. Ref. Bonds (Dedicated Rev.), Series 2017-C, 5.00% 2023
| 1,000
| 1,095
|
| City of Chicago, Board of Education, Unlimited Tax G.O. Rev. Ref. Bonds (Dedicated Rev.), Series 2017-C, 5.00% 2025
| 1,000
| 1,127
|
| City of Chicago, Board of Education, Unlimited Tax G.O. Rev. Ref. Bonds (Dedicated Rev.), Series 2017-C, 5.00% 2027
| 3,500
| 4,029
|
| City of Chicago, Board of Education, Unlimited Tax G.O. Rev. Ref. Bonds (Dedicated Rev.), Series 2017-D, 5.00% 2021
| 1,300
| 1,371
|
| City of Chicago, Board of Education, Unlimited Tax G.O. Rev. Ref. Bonds (Dedicated Rev.), Series 2017-D, 5.00% 2031
| 4,000
| 4,525
|
| City of Chicago, Board of Education, Unlimited Tax G.O. Rev. Ref. Bonds (Dedicated Rev.), Series 2017-G, 5.00% 2034
| 10,000
| 11,202
|
| City of Chicago, Board of Education, Unlimited Tax G.O. Rev. Ref. Bonds (Dedicated Rev.), Series 2017-G, 5.00% 2044
| 1,000
| 1,091
|
| City of Chicago, Board of Education, Unlimited Tax G.O. Rev. Ref. Bonds (Dedicated Rev.), Series 2017-H, 5.00% 2036
| 2,000
| 2,226
|
| City of Chicago, Board of Education, Unlimited Tax G.O. Rev. Ref. Bonds (Dedicated Rev.), Series 2017-H, 5.00% 2046
| 20,000
| 21,770
|
| City of Chicago, Board of Education, Unlimited Tax G.O. Rev. Ref. Bonds (Dedicated Rev.), Series 2018-A, 4.00% 2020
| 2,250
| 2,300
|
| City of Chicago, Board of Education, Unlimited Tax G.O. Rev. Ref. Bonds (Dedicated Rev.), Series 2018-A, 5.00% 2026
| 3,000
| 3,416
|
| City of Chicago, Board of Education, Unlimited Tax G.O. Rev. Ref. Bonds (Dedicated Rev.), Series 2018-A, 5.00% 2027
| 1,500
| 1,727
|
| City of Chicago, Board of Education, Unlimited Tax G.O. Rev. Ref. Bonds (Dedicated Rev.), Series 2018-A, 5.00% 2029
| 1,000
| 1,147
|
| City of Chicago, Board of Education, Unlimited Tax G.O. Rev. Ref. Bonds (Dedicated Rev.), Series 2018-A, 5.00% 2030
| 1,000
| 1,140
|
| City of Chicago, Board of Education, Unlimited Tax G.O. Rev. Ref. Bonds (Dedicated Rev.), Series 2018-A, 5.00% 2034
| 1,000
| 1,122
|
| City of Chicago, Board of Education, Unlimited Tax G.O. Rev. Ref. Bonds (Dedicated Rev.), Series 2018-A, 5.00% 2035
| 1,000
| 1,119
|
| City of Chicago, Board of Education, Unlimited Tax G.O. Rev. Ref. Bonds (Dedicated Rev.), Series 2018-A, Assured Guaranty Municipal insured, 5.00% 2025
| 1,500
| 1,751
|
| City of Chicago, Board of Education, Unlimited Tax G.O. Rev. Ref. Bonds (Dedicated Rev.), Series 2018-A, Assured Guaranty Municipal insured, 5.00% 2028
| 3,500
| 4,268
|
| City of Chicago, Board of Education, Unlimited Tax G.O. Rev. Ref. Bonds (Dedicated Rev.), Series 2018-C, Assured Guaranty Municipal insured, 5.00% 2029
| 7,000
| 8,480
|
City of Chicago, Board of Education, Unlimited Tax G.O. Rev. Ref. Bonds (Dedicated Rev.),
Capital Appreciation Bonds, Series 1998-B-1, FGIC insured, 0% 2028
| 5,645
| 4,301
|
| City of Chicago, Chicago Midway Airport, Rev. and Rev. Ref. Bonds, Series 2016-B, 5.00% 2036
| 3,500
| 4,072
|
| City of Chicago, Chicago Midway Airport, Rev. and Rev. Ref. Bonds, Series 2016-B, 5.00% 2037
| 4,215
| 4,891
|
| City of Chicago, Chicago Midway Airport, Rev. and Rev. Ref. Bonds, Series 2016-B, 5.00% 2041
| 12,000
| 13,810
|
| City of Chicago, Chicago Midway Airport, Rev. and Rev. Ref. Bonds, Series 2016-B, 5.00% 2046
| 5,445
| 6,234
|
| City of Chicago, Chicago Midway Airport, Rev. Ref. Bonds, Series 2013-B, 5.25% 2034
| 3,000
| 3,347
|
| City of Chicago, Chicago Midway Airport, Rev. Ref. Bonds, Series 2014-B, 5.00% 2026
| 1,010
| 1,166
|
| City of Chicago, Chicago Midway Airport, Rev. Ref. Bonds, Series 2014-B, 5.00% 2034
| 5,000
| 5,662
|
| City of Chicago, Chicago Midway Airport, Rev. Ref. Bonds, Series 2014-B, 5.00% 2035
| 4,000
| 4,522
|
| City of Chicago, G.O. Bonds (Neighborhoods Alive 21 Program), Series 2002-B, 5.00% 2024
| 1,285
| 1,403
|
| City of Chicago, G.O. Bonds, Series 2003-B, 5.00% 2024
| 2,000
| 2,183
|
| City of Chicago, G.O. Bonds, Series 2015-A, 5.50% 2033
| 3,000
| 3,352
|
| City of Chicago, G.O. Project and Rev. Ref. Bonds, Series 2003-B, 5.00% 2022
| 1,320
| 1,398
|
| City of Chicago, G.O. Project and Rev. Ref. Bonds, Series 2003-B, 5.00% 2026
| 1,795
| 2,000
|
The Tax-Exempt Bond Fund of America — Page
36 of 120
Bonds, notes & other debt instruments (continued)
Illinois (continued)
| Principal amount
(000)
| Value
(000)
|
| City of Chicago, G.O. Project and Rev. Ref. Bonds, Series 2005-D, 5.50% 2034
| $3,675
| $4,096
|
| City of Chicago, G.O. Project and Rev. Ref. Bonds, Series 2014-A, 5.00% 2023
| 825
| 888
|
| City of Chicago, G.O. Project and Rev. Ref. Bonds, Series 2014-A, 5.25% 2030
| 5,490
| 6,005
|
| City of Chicago, G.O. Project and Rev. Ref. Bonds, Series 2017-A, 5.625% 2029
| 5,755
| 6,817
|
| City of Chicago, G.O. Project and Rev. Ref. Bonds, Series 2017-A, 5.625% 2030
| 1,100
| 1,296
|
| City of Chicago, G.O. Project and Rev. Ref. Bonds, Series 2017-A, 6.00% 2038
| 20,000
| 23,442
|
| City of Chicago, G.O. Rev. Ref. Bonds (Emergency Telephone System), Series 1999, FGIC-National insured, 5.25% 2020
| 2,000
| 2,030
|
| City of Chicago, G.O. Rev. Ref. Bonds, Series 2008-C, 5.00% 2034
| 1,120
| 1,123
|
| City of Chicago, G.O. Rev. Ref. Bonds, Series 2009-A, Assured Guaranty Municipal insured, 5.00% 2026
| 5,000
| 5,088
|
| City of Chicago, G.O. Rev. Ref. Bonds, Series 2015-C, 5.00% 2024
| 5,020
| 5,480
|
| City of Chicago, G.O. Rev. Ref. Bonds, Series 2015-C, 5.00% 2025
| 4,000
| 4,432
|
| City of Chicago, G.O. Rev. Ref. Bonds, Series 2015-C, 5.00% 2027
| 2,000
| 2,254
|
| City of Chicago, G.O. Rev. Ref. Bonds, Series 2015-C, 5.00% 2038
| 4,730
| 5,142
|
| City of Chicago, Housing Auth. Bond, Series 2018-A, 5.00% 2032
| 2,000
| 2,414
|
| City of Chicago, Housing Auth. Bond, Series 2018-A, 5.00% 2036
| 1,250
| 1,477
|
| City of Chicago, Housing Auth. Bond, Series 2018-A, 5.00% 2038
| 6,150
| 7,203
|
| City of Chicago, O’Hare International Airport, Customer Fac. Charge Rev. Bonds, Series 2013, 5.25% 2024
| 1,000
| 1,136
|
| City of Chicago, O’Hare International Airport, Customer Fac. Charge Rev. Bonds, Series 2013, 5.50% 2027
| 2,000
| 2,282
|
| City of Chicago, O’Hare International Airport, Customer Fac. Charge Rev. Bonds, Series 2013, 5.75% 2038
| 4,000
| 4,541
|
| City of Chicago, O’Hare International Airport, General Airport Rev. Bonds, Series 2010-F, 5.00% 2035
| 8,515
| 8,637
|
| City of Chicago, O’Hare International Airport, General Airport Rev. Bonds, Series 2010-F, 5.00% 2040
| 1,500
| 1,521
|
| City of Chicago, O’Hare International Airport, General Airport Rev. Bonds, Series 2011-A, 5.75% 2039
| 2,075
| 2,201
|
City of Chicago, O’Hare International Airport, General Airport Rev. Bonds, Series 2011-A,
5.75% 2039 (preref. 2021)
| 12,295
| 13,102
|
City of Chicago, O’Hare International Airport, General Airport Rev. Bonds, Series 2011-C,
5.50% 2031 (preref. 2021)
| 3,000
| 3,186
|
| City of Chicago, O’Hare International Airport, General Airport Rev. Bonds, Series 2013-D, 5.00% 2039
| 10,000
| 11,062
|
| City of Chicago, O’Hare International Airport, General Airport Rev. Bonds, Series 2017-D, 5.00% 2052
| 5,000
| 5,789
|
| City of Chicago, O’Hare International Airport, General Airport Rev. Bonds, Series 2017-D, 5.25% 2032
| 1,000
| 1,224
|
| City of Chicago, O’Hare International Airport, General Airport Rev. Bonds, Series 2018-B, 5.00% 2053
| 50,025
| 60,071
|
| City of Chicago, O’Hare International Airport, General Airport Rev. Ref. Bonds, Series 2015-B, 5.00% 2023
| 1,500
| 1,687
|
| City of Chicago, O’Hare International Airport, General Airport Rev. Ref. Bonds, Series 2015-B, 5.00% 2031
| 5,000
| 5,788
|
| City of Chicago, O’Hare International Airport, General Airport Rev. Ref. Bonds, Series 2015-B, 5.00% 2032
| 3,000
| 3,463
|
| City of Chicago, O’Hare International Airport, General Airport Rev. Ref. Bonds, Series 2015-D, 5.00% 2046
| 1,500
| 1,688
|
| City of Chicago, O’Hare International Airport, General Airport Rev. Ref. Bonds, Series 2016-C, 5.00% 2022
| 2,000
| 2,180
|
| City of Chicago, O’Hare International Airport, General Airport Rev. Ref. Bonds, Series 2016-C, 5.00% 2032
| 500
| 590
|
| City of Chicago, O’Hare International Airport, General Airport Rev. Ref. Bonds, Series 2016-C, 5.00% 2033
| 1,250
| 1,470
|
| City of Chicago, O’Hare International Airport, General Airport Rev. Ref. Bonds, Series 2016-C, 5.00% 2034
| 1,000
| 1,173
|
| City of Chicago, O’Hare International Airport, General Airport Rev. Ref. Bonds, Series 2016-C, 5.00% 2035
| 1,750
| 2,046
|
| City of Chicago, Public Building Commission, Building Rev. Ref. Bonds (Chicago Transit Auth.), Series 2006, AMBAC insured, 5.25% 2023
| 2,000
| 2,226
|
| City of Chicago, Public Building Commission, Building Rev. Ref. Bonds (Chicago Transit Auth.), Series 2006, AMBAC insured, 5.25% 2025
| 1,000
| 1,157
|
| City of Chicago, Public Building Commission, Building Rev. Ref. Bonds (Chicago Transit Auth.), Series 2006, AMBAC insured, 5.25% 2026
| 4,175
| 4,876
|
| City of Chicago, Public Building Commission, Building Rev. Ref. Bonds (Chicago Transit Auth.), Series 2006, AMBAC insured, 5.25% 2027
| 1,000
| 1,183
|
City of Chicago, School Reform Board of Trustees of the Board of Education, Unlimited Tax G.O. Bonds
(Dedicated Tax Rev.), Capital Appreciation Bonds, Series 1998-B-1, National insured, 0% 2019
| 1,300
| 1,290
|
City of Chicago, School Reform Board of Trustees of the Board of Education, Unlimited Tax G.O. Bonds
(Dedicated Tax Rev.), Capital Appreciation Bonds, Series 1998-B-1, National insured, 0% 2022
| 3,185
| 2,940
|
City of Chicago, School Reform Board of Trustees of the Board of Education, Unlimited Tax G.O. Bonds
(Dedicated Tax Rev.), Capital Appreciation Bonds, Series 1998-B-1, National insured, 0% 2031
| 6,675
| 4,482
|
The Tax-Exempt Bond Fund of America — Page
37 of 120
Bonds, notes & other debt instruments (continued)
Illinois (continued)
| Principal amount
(000)
| Value
(000)
|
City of Chicago, School Reform Board of Trustees of the Board of Education, Unlimited Tax G.O. Bonds
(Dedicated Tax Rev.), Capital Appreciation Bonds, Series 1999-A, National insured, 0% 2022
| $2,285
| $2,109
|
City of Chicago, School Reform Board of Trustees of the Board of Education, Unlimited Tax G.O. Bonds
(Dedicated Tax Rev.), Capital Appreciation Bonds, Series 1999-A, National insured, 0% 2023
| 2,585
| 2,324
|
City of Chicago, School Reform Board of Trustees of the Board of Education, Unlimited Tax G.O. Bonds
(Dedicated Tax Rev.), Capital Appreciation Bonds, Series 1999-A, National insured, 0% 2029
| 5,145
| 3,759
|
City of Chicago, School Reform Board of Trustees of the Board of Education, Unlimited Tax G.O. Bonds
(Dedicated Tax Rev.), Capital Appreciation Bonds, Series 1999-A, National insured, 0% 2031
| 4,000
| 2,683
|
City of Chicago, School Reform Board of Trustees of the Board of Education, Unlimited Tax G.O. Bonds
(Dedicated Tax Rev.), Series 2012-A, 5.00% 2042
| 9,815
| 10,251
|
City of Chicago, School Reform Board of Trustees of the Board of Education, Unlimited Tax G.O. Bonds
(Dedicated Tax Rev.), Series 2016-A, 7.00% 2044
| 21,820
| 26,251
|
| City of Chicago, Transit Auth., Sales Tax Receipts Rev. Bonds, Series 2011, 5.00% 2022
| 2,250
| 2,434
|
| City of Chicago, Transit Auth., Sales Tax Receipts Rev. Bonds, Series 2011, 5.25% 2036
| 3,000
| 3,186
|
City of Chicago, Transit Auth., Sales Tax Receipts Rev. Bonds, Series 2014,
Assured Guaranty Municipal insured, 5.25% 2049
| 27,500
| 30,738
|
City of Chicago, Transit Auth., Sales Tax Receipts Rev. Bonds, Series 2017,
Assured Guaranty Municipal insured, 5.00% 2046
| 13,000
| 14,631
|
City of Chicago, Transit Auth., Sales Tax Receipts Rev. Bonds, Series 2017,
Assured Guaranty Municipal insured, 5.00% 2051
| 33,585
| 37,454
|
City of Chicago, Transit Auth., Sales Tax Receipts Rev. Bonds, Series 2017,
Assured Guaranty Municipal insured, 5.00% 2051
| 11,500
| 12,961
|
| City of Chicago, Wastewater Transmission Rev. Bonds, Series 2012, 5.00% 2042
| 7,775
| 8,187
|
| City of Chicago, Wastewater Transmission Rev. Bonds, Series 2012, Assured Guaranty Municipal insured, 5.00% 2037
| 400
| 425
|
| City of Chicago, Wastewater Transmission Rev. Ref. Bonds, Capital Appreciation Bonds, Series 1998-A, National insured, 0% 2025
| 210
| 186
|
| City of Chicago, Wastewater Transmission Rev. Ref. Bonds, Capital Appreciation Bonds, Series 1998-A, National insured, 0% 2026
| 20
| 17
|
| City of Chicago, Wastewater Transmission Rev. Ref. Bonds, Capital Appreciation Bonds, Series 1998-A, National insured, 0% 2027
| 1,760
| 1,464
|
| City of Chicago, Wastewater Transmission Rev. Ref. Bonds, Capital Appreciation Bonds, Series 1998-A, National insured, 0% 2028
| 3,345
| 2,677
|
| City of Chicago, Wastewater Transmission Rev. Ref. Bonds, Series 2001, Assured Guaranty Municipal insured, 5.50% 2030
| 800
| 1,001
|
| City of Chicago, Wastewater Transmission Rev. Ref. Bonds, Series 2008-C, 5.00% 2021
| 1,000
| 1,050
|
| City of Chicago, Wastewater Transmission Rev. Ref. Bonds, Series 2008-C, 5.00% 2023
| 1,975
| 2,201
|
| City of Chicago, Wastewater Transmission Rev. Ref. Bonds, Series 2008-C, 5.00% 2024
| 2,500
| 2,856
|
| City of Chicago, Wastewater Transmission Rev. Ref. Bonds, Series 2008-C, 5.00% 2025
| 4,500
| 5,242
|
| City of Chicago, Wastewater Transmission Rev. Ref. Bonds, Series 2008-C, 5.00% 2027
| 1,000
| 1,150
|
| City of Chicago, Wastewater Transmission Rev. Ref. Bonds, Series 2008-C, 5.00% 2030
| 1,000
| 1,137
|
| City of Chicago, Wastewater Transmission Rev. Ref. Bonds, Series 2008-C, 5.00% 2031
| 2,500
| 2,827
|
| City of Chicago, Wastewater Transmission Rev. Ref. Bonds, Series 2008-C, 5.00% 2032
| 3,000
| 3,379
|
| City of Chicago, Wastewater Transmission Rev. Ref. Bonds, Series 2008-C, 5.00% 2033
| 2,000
| 2,248
|
| City of Chicago, Wastewater Transmission Rev. Ref. Bonds, Series 2008-C, 5.00% 2035
| 1,000
| 1,117
|
| City of Chicago, Wastewater Transmission Rev. Ref. Bonds, Series 2008-C, 5.00% 2039
| 1,000
| 1,106
|
| City of Chicago, Wastewater Transmission Rev. Ref. Bonds, Series 2014, 5.00% 2023
| 100
| 111
|
| City of Chicago, Wastewater Transmission Rev. Ref. Bonds, Series 2017-A, 5.00% 2047
| 21,165
| 23,711
|
| City of Chicago, Wastewater Transmission Rev. Ref. Bonds, Series 2017-B, 5.00% 2031
| 5,000
| 5,864
|
| City of Chicago, Wastewater Transmission Rev. Ref. Bonds, Series 2017-B, 5.00% 2032
| 7,600
| 8,873
|
| City of Chicago, Wastewater Transmission Rev. Ref. Bonds, Series 2017-B, 5.00% 2034
| 9,000
| 10,444
|
| City of Chicago, Wastewater Transmission Rev. Ref. Bonds, Series 2017-B, 5.00% 2038
| 3,915
| 4,460
|
| City of Chicago, Water Rev. Bonds, Series 2000, 5.00% 2028
| 1,000
| 1,185
|
| City of Chicago, Water Rev. Bonds, Series 2000, 5.00% 2029
| 5,000
| 5,895
|
| City of Chicago, Water Rev. Bonds, Series 2000, 5.00% 2030
| 3,785
| 4,437
|
The Tax-Exempt Bond Fund of America — Page
38 of 120
Bonds, notes & other debt instruments (continued)
Illinois (continued)
| Principal amount
(000)
| Value
(000)
|
| City of Chicago, Water Rev. Bonds, Series 2004, 5.00% 2023
| $1,750
| $1,996
|
| City of Chicago, Water Rev. Bonds, Series 2004, 5.00% 2024
| 1,000
| 1,166
|
| City of Chicago, Water Rev. Bonds, Series 2004, 5.00% 2025
| 10,275
| 12,175
|
| City of Chicago, Water Rev. Bonds, Series 2004, 5.00% 2026
| 2,125
| 2,551
|
| City of Chicago, Water Rev. Bonds, Series 2012, 4.00% 2020
| 625
| 646
|
| City of Chicago, Water Rev. Bonds, Series 2012, 5.00% 2026
| 965
| 1,060
|
| City of Chicago, Water Rev. Bonds, Series 2014, 5.00% 2022
| 530
| 588
|
| City of Chicago, Water Rev. Bonds, Series 2014, 5.00% 2030
| 4,750
| 5,382
|
| City of Chicago, Water Rev. Bonds, Series 2014, 5.00% 2031
| 5,135
| 5,808
|
| City of Chicago, Water Rev. Bonds, Series 2016-A-1, 5.00% 2025
| 1,000
| 1,185
|
| City of Chicago, Water Rev. Bonds, Series 2016-A-1, 5.00% 2030
| 3,100
| 3,634
|
| City of Chicago, Water Rev. Bonds, Series 2016-A-1, Assured Guaranty Municipal insured, 5.00% 2025
| 620
| 742
|
| City of Chicago, Water Rev. Ref. Bonds (Second Lien), Series 2014, 5.00% 2039
| 7,500
| 8,312
|
| City of Chicago, Water Rev. Ref. Bonds, Series 2012, 5.00% 2042
| 21,875
| 23,430
|
| City of Chicago, Water Rev. Ref. Bonds, Series 2014, 5.00% 2044
| 3,000
| 3,308
|
| City of Chicago, Water Rev. Ref. Bonds, Series 2017, 5.00% 2027
| 10,000
| 12,144
|
| City of Chicago, Water Rev. Ref. Bonds, Series 2017, 5.00% 2028
| 4,000
| 4,834
|
| City of Chicago, Water Rev. Ref. Bonds, Series 2017, 5.00% 2036
| 1,200
| 1,398
|
| City of Chicago, Water Rev. Ref. Bonds, Series 2017-2, 5.00% 2022
| 1,200
| 1,331
|
| City of Chicago, Water Rev. Ref. Bonds, Series 2017-2, 5.00% 2023
| 650
| 741
|
| City of Chicago, Water Rev. Ref. Bonds, Series 2017-2, Assured Guaranty Municipal insured, 5.00% 2035
| 2,295
| 2,701
|
| City of Chicago, Water Rev. Ref. Bonds, Series 2017-2, Assured Guaranty Municipal insured, 5.00% 2036
| 3,500
| 4,107
|
| City of Chicago, Water Rev. Ref. Bonds, Series 2017-2, Assured Guaranty Municipal insured, 5.00% 2037
| 2,895
| 3,385
|
| Civic Center Bonds, Special State Obligation Bonds, Series 1991, AMBAC insured, 6.25% 2020
| 1,785
| 1,834
|
Counties of Cook, DuPage, Kane, Lake, McHenry and Will, Regional Transportation Auth., G.O. Bonds,
Series 2000-A, MBIA insured, 6.50% 2026
| 15,705
| 19,849
|
Counties of Cook, DuPage, Kane, Lake, McHenry and Will, Regional Transportation Auth., G.O. Bonds,
Series 2003-A, FGIC-National insured, 6.00% 2033
| 17,820
| 24,704
|
Counties of Cook, DuPage, Kane, Lake, McHenry and Will, Regional Transportation Auth., G.O. Bonds,
Series 2003-B, FGIC-National insured, 5.75% 2033
| 9,630
| 12,880
|
Counties of Cook, DuPage, Kane, Lake, McHenry and Will, Regional Transportation Auth., G.O. Bonds,
Series 2004-A, Assured Guaranty Municipal insured, 5.25% 2025
| 8,600
| 10,357
|
Counties of Cook, DuPage, Kane, Lake, McHenry and Will, Regional Transportation Auth., G.O. Bonds,
Series 2004-A, Assured Guaranty Municipal insured, 5.50% 2021
| 8,540
| 9,193
|
Counties of Cook, DuPage, Kane, Lake, McHenry and Will, Regional Transportation Auth., G.O. Bonds,
Series 2004-A, Assured Guaranty Municipal insured, 5.50% 2022
| 6,500
| 7,254
|
Counties of Cook, DuPage, Kane, Lake, McHenry and Will, Regional Transportation Auth., G.O. Bonds,
Series 2004-A, Assured Guaranty Municipal insured, 5.50% 2026
| 4,300
| 5,368
|
Counties of Cook, DuPage, Kane, Lake, McHenry and Will, Regional Transportation Auth., G.O. Bonds,
Series 2004-A, Assured Guaranty Municipal insured, 5.50% 2027
| 11,700
| 14,825
|
Counties of Cook, DuPage, Kane, Lake, McHenry and Will, Regional Transportation Auth., G.O. Bonds,
Series 2004-A, Assured Guaranty Municipal insured, 5.75% 2029
| 15,000
| 19,628
|
Counties of Cook, DuPage, Kane, Lake, McHenry and Will, Regional Transportation Auth., G.O. Bonds,
Series 2017-A, 5.00% 2025
| 15,000
| 17,908
|
| Counties of Cook, DuPage, Kane, Lake, McHenry and Will, Regional Transportation Auth., G.O. Rev. Ref. Bonds, Series 1999, Assured Guaranty Municipal insured, 6.00%
2025
| 5,650
| 6,815
|
Counties of Cook, DuPage, Kane, Lake, McHenry and Will, Regional Transportation Auth.,
G.O. Rev. Ref. Bonds, Series 1997, FGIC-National insured, 6.00% 2020
| 1,965
| 2,041
|
Counties of Cook, DuPage, Kane, Lake, McHenry and Will, Regional Transportation Auth.,
G.O. Rev. Ref. Bonds, Series 1999, Assured Guaranty Municipal insured, 5.75% 2023
| 2,000
| 2,262
|
| County of Cook, Community College Dist. No. 508 (City Colleges of Chicago), Unlimited Tax G.O. Bonds, Series 2013, 5.25% 2043
| 5,150
| 5,423
|
| County of Cook, Community College Dist. No. 508 (City Colleges of Chicago), Unlimited Tax G.O. Bonds, Series 2017, BAM insured, 5.00% 2047
| 9,635
| 10,933
|
| County of Cook, G.O. Rev. Ref. Bonds, Series 2016-A, Assured Guaranty Municipal insured, 5.00% 2026
| 4,000
| 4,860
|
The Tax-Exempt Bond Fund of America — Page
39 of 120
Bonds, notes & other debt instruments (continued)
Illinois (continued)
| Principal amount
(000)
| Value
(000)
|
| County of Cook, G.O. Rev. Ref. Bonds, Series 2016-A, Assured Guaranty Municipal insured, 5.00% 2027
| $8,080
| $9,588
|
| County of Cook, G.O. Rev. Ref. Bonds, Series 2016-A, Assured Guaranty Municipal insured, 5.00% 2028
| 5,895
| 6,969
|
| County of Cook, G.O. Rev. Ref. Bonds, Series 2016-A, Assured Guaranty Municipal insured, 5.00% 2030
| 1,350
| 1,583
|
| County of Cook, G.O. Rev. Ref. Bonds, Series 2016-A, Assured Guaranty Municipal insured, 5.00% 2031
| 4,750
| 5,545
|
| County of Cook, G.O. Rev. Ref. Bonds, Series 2018, 5.00% 2019
| 1,700
| 1,718
|
| County of Cook, G.O. Rev. Ref. Bonds, Series 2018, 5.00% 2020
| 750
| 783
|
| County of Cook, G.O. Rev. Ref. Bonds, Series 2018, 5.00% 2021
| 625
| 671
|
| County of Cook, G.O. Rev. Ref. Bonds, Series 2018, 5.00% 2034
| 1,000
| 1,157
|
| County of Cook, Sales Tax Rev. Bonds, Series 2018, 5.00% 2032
| 8,645
| 10,337
|
| County of Cook, Sales Tax Rev. Bonds, Series 2018, 5.00% 2033
| 5,000
| 5,959
|
| Educational Facs. Auth., Rev. Bonds (University of Chicago), Series 2001-B-1, 1.80% 2036 (put 2020)
| 12,500
| 12,539
|
| Fin. Auth., Academic Fac. Lease Rev. Bonds (Provident Group - UIUC Properties LLC - University of Illinois at Urbana-Champaign Project), Series 2019-A, 5.00% 2032
| 580
| 723
|
| Fin. Auth., Academic Fac. Lease Rev. Bonds (Provident Group - UIUC Properties LLC - University of Illinois at Urbana-Champaign Project), Series 2019-A, 5.00% 2037
| 780
| 952
|
| Fin. Auth., Academic Fac. Lease Rev. Bonds (Provident Group - UIUC Properties LLC - University of Illinois at Urbana-Champaign Project), Series 2019-A, 5.00% 2038
| 760
| 925
|
| Fin. Auth., Academic Fac. Lease Rev. Bonds (Provident Group - UIUC Properties LLC - University of Illinois at Urbana-Champaign Project), Series 2019-A, 5.00% 2044
| 3,250
| 3,908
|
| Fin. Auth., Academic Fac. Lease Rev. Bonds (Provident Group - UIUC Properties LLC - University of Illinois at Urbana-Champaign Project), Series 2019-A, 5.00% 2049
| 5,455
| 6,515
|
| Fin. Auth., Academic Fac. Lease Rev. Bonds (Provident Group - UIUC Properties LLC - University of Illinois at Urbana-Champaign Project), Series 2019-A, 5.00% 2051
| 1,000
| 1,189
|
| Fin. Auth., Health Facs. Rev. Bonds (UnityPoint Health), Series 2016-D, 4.00% 2046
| 2,000
| 2,108
|
| Fin. Auth., Rev. Bonds (Advocate Health Care Network), Series 2012, 5.00% 2042
| 5,315
| 5,700
|
| Fin. Auth., Rev. Bonds (Advocate Health Care Network), Series 2015-B, 5.00% 2027
| 990
| 1,168
|
| Fin. Auth., Rev. Bonds (Art Institute of Chicago), Series 2012-A, 5.00% 2034
| 4,920
| 5,317
|
| Fin. Auth., Rev. Bonds (Art Institute of Chicago), Series 2012-A, 5.00% 2034 (preref. 2022)
| 30
| 33
|
| Fin. Auth., Rev. Bonds (Art Institute of Chicago), Series 2016, 4.00% 2038
| 3,850
| 4,167
|
| Fin. Auth., Rev. Bonds (Art Institute of Chicago), Series 2016, 5.00% 2030
| 2,500
| 2,971
|
| Fin. Auth., Rev. Bonds (Central DuPage Health), Series 2009-B, 5.75% 2039 (preref. 2019)
| 11,520
| 11,651
|
| Fin. Auth., Rev. Bonds (Clean Water Initiative Revolving Fund), Series 2016, 4.00% 2025
| 2,680
| 3,080
|
| Fin. Auth., Rev. Bonds (Clean Water Initiative Revolving Fund), Series 2016, 4.00% 2026
| 5,300
| 6,077
|
| Fin. Auth., Rev. Bonds (Clean Water Initiative Revolving Fund), Series 2016, 5.00% 2027
| 5,000
| 6,086
|
| Fin. Auth., Rev. Bonds (Clean Water Initiative Revolving Fund), Series 2016, 5.00% 2028
| 6,410
| 7,762
|
| Fin. Auth., Rev. Bonds (Clean Water Initiative Revolving Fund), Series 2016, 5.00% 2029
| 8,315
| 10,047
|
| Fin. Auth., Rev. Bonds (Clean Water Initiative Revolving Fund), Series 2016, 5.00% 2029
| 2,700
| 3,255
|
| Fin. Auth., Rev. Bonds (Clean Water Initiative Revolving Fund), Series 2016, 5.00% 2030
| 6,200
| 7,455
|
| Fin. Auth., Rev. Bonds (Clean Water Initiative Revolving Fund), Series 2016, 5.00% 2031
| 3,580
| 4,273
|
| Fin. Auth., Rev. Bonds (Clean Water Initiative Revolving Fund), Series 2017, 5.00% 2026
| 4,875
| 5,936
|
| Fin. Auth., Rev. Bonds (Clean Water Initiative Revolving Fund), Series 2017, 5.00% 2029
| 4,000
| 4,950
|
| Fin. Auth., Rev. Bonds (Clean Water Initiative Revolving Fund), Series 2017, 5.00% 2029
| 2,000
| 2,468
|
| Fin. Auth., Rev. Bonds (Clean Water Initiative Revolving Fund), Series 2017, 5.00% 2030
| 7,420
| 9,131
|
| Fin. Auth., Rev. Bonds (Clean Water Initiative Revolving Fund), Series 2017, 5.00% 2030
| 3,500
| 4,294
|
| Fin. Auth., Rev. Bonds (Clean Water Initiative Revolving Fund), Series 2017, 5.00% 2031
| 7,080
| 8,639
|
| Fin. Auth., Rev. Bonds (Clean Water Initiative Revolving Fund), Series 2017, 5.00% 2032
| 5,000
| 6,080
|
| Fin. Auth., Rev. Bonds (Clean Water Initiative Revolving Fund), Series 2017, 5.00% 2033
| 5,000
| 6,064
|
| Fin. Auth., Rev. Bonds (Clean Water Initiative Revolving Fund), Series 2017, 5.00% 2034
| 5,000
| 6,035
|
| Fin. Auth., Rev. Bonds (Clean Water Initiative Revolving Fund), Series 2017, 5.00% 2035
| 8,180
| 9,842
|
| Fin. Auth., Rev. Bonds (Clean Water Initiative Revolving Fund), Series 2017, 5.00% 2036
| 700
| 839
|
| Fin. Auth., Rev. Bonds (DePaul University), Series 2011-A, 6.125% 2040 (preref. 2021)
| 10,000
| 10,816
|
| Fin. Auth., Rev. Bonds (DePaul University), Series 2016, 5.00% 2030
| 1,000
| 1,201
|
| Fin. Auth., Rev. Bonds (DePaul University), Series 2016, 5.00% 2032
| 1,000
| 1,191
|
| Fin. Auth., Rev. Bonds (DePaul University), Series 2016, 5.00% 2033
| 1,150
| 1,365
|
| Fin. Auth., Rev. Bonds (DePaul University), Series 2016, 5.00% 2034
| 1,310
| 1,550
|
The Tax-Exempt Bond Fund of America — Page
40 of 120
Bonds, notes & other debt instruments (continued)
Illinois (continued)
| Principal amount
(000)
| Value
(000)
|
| Fin. Auth., Rev. Bonds (DePaul University), Series 2016, 5.00% 2036
| $1,000
| $1,176
|
| Fin. Auth., Rev. Bonds (DePaul University), Series 2016, 5.00% 2041
| 3,500
| 4,072
|
| Fin. Auth., Rev. Bonds (Edward-Elmhurst Healthcare), Series 2017-A, 5.00% 2027
| 925
| 1,114
|
| Fin. Auth., Rev. Bonds (Edward-Elmhurst Healthcare), Series 2017-A, 5.00% 2028
| 1,480
| 1,779
|
| Fin. Auth., Rev. Bonds (Edward-Elmhurst Healthcare), Series 2017-A, 5.00% 2029
| 3,000
| 3,587
|
| Fin. Auth., Rev. Bonds (Edward-Elmhurst Healthcare), Series 2017-A, 5.00% 2030
| 5,100
| 6,057
|
| Fin. Auth., Rev. Bonds (Edward-Elmhurst Healthcare), Series 2017-A, 5.00% 2031
| 3,000
| 3,538
|
| Fin. Auth., Rev. Bonds (Edward-Elmhurst Healthcare), Series 2017-A, 5.00% 2032
| 2,500
| 2,932
|
| Fin. Auth., Rev. Bonds (Edward-Elmhurst Healthcare), Series 2017-A, 5.00% 2033
| 9,000
| 10,509
|
| Fin. Auth., Rev. Bonds (Edward-Elmhurst Healthcare), Series 2017-A, 5.00% 2034
| 3,000
| 3,488
|
| Fin. Auth., Rev. Bonds (Edward-Elmhurst Healthcare), Series 2017-A, 5.00% 2035
| 6,710
| 7,765
|
| Fin. Auth., Rev. Bonds (Edward-Elmhurst Healthcare), Series 2017-A, 5.00% 2036
| 7,000
| 8,066
|
| Fin. Auth., Rev. Bonds (Friendship Village Schaumburg), Series 2017, 5.125% 2045
| 2,750
| 2,653
|
| Fin. Auth., Rev. Bonds (Lifespace Communities, Inc.), Series 2015-A, 5.00% 2020
| 695
| 711
|
| Fin. Auth., Rev. Bonds (Lifespace Communities, Inc.), Series 2015-A, 5.00% 2024
| 245
| 275
|
| Fin. Auth., Rev. Bonds (Lifespace Communities, Inc.), Series 2015-A, 5.00% 2025
| 760
| 867
|
| Fin. Auth., Rev. Bonds (Lifespace Communities, Inc.), Series 2015-A, 5.00% 2030
| 1,180
| 1,321
|
| Fin. Auth., Rev. Bonds (Lifespace Communities, Inc.), Series 2015-A, 5.00% 2035
| 1,350
| 1,490
|
| Fin. Auth., Rev. Bonds (Mercy Health Corp.), Series 2016, 4.00% 2035
| 2,000
| 2,130
|
| Fin. Auth., Rev. Bonds (Mercy Health Corp.), Series 2016, 4.00% 2036
| 2,420
| 2,570
|
| Fin. Auth., Rev. Bonds (Mercy Health Corp.), Series 2016, 5.00% 2026
| 3,000
| 3,579
|
| Fin. Auth., Rev. Bonds (Mercy Health Corp.), Series 2016, 5.00% 2027
| 2,990
| 3,549
|
| Fin. Auth., Rev. Bonds (Mercy Health Corp.), Series 2016, 5.00% 2033
| 3,835
| 4,415
|
| Fin. Auth., Rev. Bonds (Mercy Health Corp.), Series 2016, 5.00% 2040
| 5,000
| 5,652
|
| Fin. Auth., Rev. Bonds (Mercy Health Corp.), Series 2016, 5.00% 2046
| 39,370
| 44,212
|
| Fin. Auth., Rev. Bonds (Northwest Community Hospital), Series 2016-A, 4.00% 2037
| 11,520
| 12,338
|
| Fin. Auth., Rev. Bonds (Northwest Community Hospital), Series 2016-A, 4.00% 2038
| 6,140
| 6,560
|
| Fin. Auth., Rev. Bonds (Northwest Community Hospital), Series 2016-A, 5.00% 2026
| 2,000
| 2,428
|
| Fin. Auth., Rev. Bonds (Northwest Community Hospital), Series 2016-A, 5.00% 2032
| 3,290
| 3,844
|
| Fin. Auth., Rev. Bonds (Northwest Community Hospital), Series 2016-A, 5.00% 2033
| 1,425
| 1,658
|
| Fin. Auth., Rev. Bonds (Northwest Community Hospital), Series 2016-A, 5.00% 2034
| 3,240
| 3,753
|
| Fin. Auth., Rev. Bonds (Northwest Community Hospital), Series 2016-A, 5.00% 2035
| 3,335
| 3,851
|
| Fin. Auth., Rev. Bonds (Northwestern Memorial Healthcare), Series 2017-A, 5.00% 2030
| 1,000
| 1,237
|
| Fin. Auth., Rev. Bonds (Northwestern Memorial Healthcare), Series 2017-A, 5.00% 2042
| 7,000
| 8,238
|
| Fin. Auth., Rev. Bonds (Northwestern Memorial Healthcare), Series 2017-B, 5.00% 2057 (put 2022)
| 9,600
| 10,764
|
| Fin. Auth., Rev. Bonds (OSF Healthcare System), Series 2012-A, 5.00% 2028
| 2,275
| 2,477
|
| Fin. Auth., Rev. Bonds (Presbyterian Homes Obligated Group), Series 2016-A, 5.00% 2025
| 2,345
| 2,732
|
| Fin. Auth., Rev. Bonds (Presbyterian Homes Obligated Group), Series 2016-A, 5.00% 2027
| 5,000
| 5,945
|
| Fin. Auth., Rev. Bonds (Presbyterian Homes Obligated Group), Series 2016-A, 5.00% 2028
| 3,250
| 3,847
|
| Fin. Auth., Rev. Bonds (Presbyterian Homes Obligated Group), Series 2016-A, 5.00% 2030
| 1,165
| 1,364
|
| Fin. Auth., Rev. Bonds (Presbyterian Homes Obligated Group), Series 2016-A, 5.00% 2031
| 1,125
| 1,307
|
Fin. Auth., Rev. Bonds (Presbyterian Homes Obligated Group), Series 2016-B,
(1-month USD-LIBOR x 0.70 + 1.35%) 3.031% 2036 (put 2021)2
| 1,775
| 1,781
|
| Fin. Auth., Rev. Bonds (Presence Health Network), Series 2016-C, 4.00% 2041
| 3,995
| 4,348
|
| Fin. Auth., Rev. Bonds (Presence Health Network), Series 2016-C, 4.00% 2041 (preref. 2027)
| 5
| 6
|
| Fin. Auth., Rev. Bonds (Presence Health Network), Series 2016-C, 5.00% 2027
| 1,875
| 2,332
|
| Fin. Auth., Rev. Bonds (Presence Health Network), Series 2016-C, 5.00% 2028
| 5,000
| 6,201
|
| Fin. Auth., Rev. Bonds (Presence Health Network), Series 2016-C, 5.00% 2029
| 2,000
| 2,466
|
| Fin. Auth., Rev. Bonds (Presence Health Network), Series 2016-C, 5.00% 2030
| 7,615
| 9,300
|
| Fin. Auth., Rev. Bonds (Presence Health Network), Series 2016-C, 5.00% 2031
| 3,000
| 3,643
|
| Fin. Auth., Rev. Bonds (Presence Health Network), Series 2016-C, 5.00% 2033
| 2,500
| 3,012
|
| Fin. Auth., Rev. Bonds (Presence Health Network), Series 2016-C, 5.00% 2034
| 1,895
| 2,264
|
| Fin. Auth., Rev. Bonds (Presence Health Network), Series 2016-C, 5.00% 2036
| 1,145
| 1,354
|
| Fin. Auth., Rev. Bonds (Presence Health Network), Series 2016-C, 5.00% 2041
| 2,000
| 2,334
|
| Fin. Auth., Rev. Bonds (Rehabilitation Institute of Chicago), Series 2013-A, 6.00% 2043
| 2,700
| 3,046
|
The Tax-Exempt Bond Fund of America — Page
41 of 120
Bonds, notes & other debt instruments (continued)
Illinois (continued)
| Principal amount
(000)
| Value
(000)
|
| Fin. Auth., Rev. Bonds (Rush University Medical Center Obligated Group), Series 2015-A, 5.00% 2030
| $5,000
| $5,786
|
| Fin. Auth., Rev. Bonds (Rush University Medical Center Obligated Group), Series 2015-A, 5.00% 2034
| 2,500
| 2,852
|
| Fin. Auth., Rev. Bonds (Rush University Medical Center Obligated Group), Series 2015-A, 5.00% 2038
| 7,700
| 8,667
|
| Fin. Auth., Rev. Bonds (Rush University Medical Center Obligated Group), Series 2015-B, 5.00% 2034
| 2,595
| 2,960
|
| Fin. Auth., Rev. Bonds (Silver Cross Hospital and Medical Centers), Series 2009, 6.875% 2038 (preref. 2019)
| 4,500
| 4,509
|
| Fin. Auth., Rev. Bonds (The Cable Foundation), Series 2016-A, 5.00% 2045
| 26,575
| 30,089
|
| Fin. Auth., Rev. Bonds (Trinity Health Credit Group), Series 2011-IL, 5.00% 2030 (preref. 2021)
| 725
| 788
|
| Fin. Auth., Rev. Bonds (University of Chicago Medical Center), Series 2016-A, 5.00% 2026
| 1,610
| 1,976
|
| Fin. Auth., Rev. Bonds (University of Chicago Medical Center), Series 2016-B, 5.00% 2035
| 5,150
| 6,076
|
| Fin. Auth., Rev. Green Bonds (Clean Water Initiative Revolving Fund), Series 2019, 5.00% 2034
| 8,780
| 11,080
|
| Fin. Auth., Rev. Green Bonds (Clean Water Initiative Revolving Fund), Series 2019, 5.00% 2036
| 7,000
| 8,766
|
| Fin. Auth., Rev. Green Bonds (Clean Water Initiative Revolving Fund), Series 2019, 5.00% 2037
| 8,000
| 9,977
|
| Fin. Auth., Rev. Ref. Bonds (Advocate Health Care Network), Series 2014, 5.00% 2033
| 8,500
| 9,693
|
| Fin. Auth., Rev. Ref. Bonds (Anne & Robert H. Lurie Children’s Hospital), Series 2017, 4.00% 2037
| 2,500
| 2,715
|
| Fin. Auth., Rev. Ref. Bonds (Anne & Robert H. Lurie Children’s Hospital), Series 2017, 5.00% 2034
| 1,000
| 1,201
|
| Fin. Auth., Rev. Ref. Bonds (Anne & Robert H. Lurie Children’s Hospital), Series 2017, 5.00% 2035
| 5,900
| 7,053
|
| Fin. Auth., Rev. Ref. Bonds (Art Institute of Chicago), Series 2010-A, 5.25% 2040
| 5,350
| 5,469
|
| Fin. Auth., Rev. Ref. Bonds (Ascension Health Senior Credit Group), Series 2012-A, 5.00% 2042
| 7,500
| 8,092
|
| Fin. Auth., Rev. Ref. Bonds (Bradley University Project), Series 2017-C, 5.00% 2028
| 1,860
| 2,249
|
| Fin. Auth., Rev. Ref. Bonds (Bradley University Project), Series 2017-C, 5.00% 2029
| 650
| 782
|
| Fin. Auth., Rev. Ref. Bonds (Bradley University Project), Series 2017-C, 5.00% 2031
| 1,185
| 1,409
|
| Fin. Auth., Rev. Ref. Bonds (Christian Homes, Inc.), Series 2016, 5.00% 2040
| 1,275
| 1,356
|
| Fin. Auth., Rev. Ref. Bonds (DePaul University), Series 2013, 5.00% 2024
| 600
| 687
|
| Fin. Auth., Rev. Ref. Bonds (DePaul University), Series 2016-A, 4.00% 2040
| 7,500
| 8,142
|
| Fin. Auth., Rev. Ref. Bonds (DePaul University), Series 2016-A, 5.00% 2030
| 1,000
| 1,200
|
| Fin. Auth., Rev. Ref. Bonds (DePaul University), Series 2016-A, 5.00% 2035
| 1,000
| 1,180
|
| Fin. Auth., Rev. Ref. Bonds (Field Museum of Natural History), Series 2019, 2.133% 2034 (put 2022)2
| 32,160
| 32,242
|
| Fin. Auth., Rev. Ref. Bonds (Loyola University of Chicago), Series 2012-B, 5.00% 2025
| 3,000
| 3,284
|
| Fin. Auth., Rev. Ref. Bonds (Loyola University of Chicago), Series 2012-B, 5.00% 2026
| 1,535
| 1,674
|
| Fin. Auth., Rev. Ref. Bonds (Loyola University of Chicago), Series 2012-B, 5.00% 2042
| 9,385
| 10,098
|
| Fin. Auth., Rev. Ref. Bonds (Northwestern Memorial Hospital), Series 2009-A, 6.00% 2039 (preref. 2019)
| 14,545
| 14,570
|
| Fin. Auth., Rev. Ref. Bonds (OSF Healthcare System), Series 2010-A, 6.00% 2039
| 1,765
| 1,836
|
| Fin. Auth., Rev. Ref. Bonds (OSF Healthcare System), Series 2010-A, 6.00% 2039 (preref. 2020)
| 9,475
| 9,830
|
| Fin. Auth., Rev. Ref. Bonds (OSF Healthcare System), Series 2012-A, 5.00% 2022
| 1,290
| 1,418
|
| Fin. Auth., Rev. Ref. Bonds (OSF Healthcare System), Series 2015-A, 5.00% 2031
| 3,500
| 4,054
|
| Fin. Auth., Rev. Ref. Bonds (OSF Healthcare System), Series 2015-A, 5.00% 2032
| 3,500
| 4,036
|
| Fin. Auth., Rev. Ref. Bonds (OSF Healthcare System), Series 2015-A, 5.00% 2034
| 2,000
| 2,291
|
| Fin. Auth., Rev. Ref. Bonds (OSF Healthcare System), Series 2015-A, 5.00% 2045
| 26,890
| 29,956
|
| Fin. Auth., Rev. Ref. Bonds (Provena Health), Series 2009-A, 7.75% 2034 (preref. 2019)
| 14,860
| 14,895
|
| Fin. Auth., Rev. Ref. Bonds (Provena Health), Series 2009-A, 7.75% 2034 (preref. 2019)
| 180
| 180
|
| Fin. Auth., Rev. Ref. Bonds (Provena Health), Series 2010-A, 6.00% 2028 (preref. 2020)
| 14,000
| 14,505
|
| Fin. Auth., Rev. Ref. Bonds (Silver Cross Hospital and Medical Centers), Series 2015-C, 4.125% 2037
| 1,000
| 1,042
|
| Fin. Auth., Rev. Ref. Bonds (Silver Cross Hospital and Medical Centers), Series 2015-C, 5.00% 2035
| 6,745
| 7,632
|
| Fin. Auth., Rev. Ref. Bonds (Silver Cross Hospital and Medical Centers), Series 2015-C, 5.00% 2044
| 10,885
| 12,118
|
| Fin. Auth., Rev. Ref. Bonds (Southern Illinois Healthcare Enterprises, Inc.), Series 2017-C, 5.00% 2026
| 650
| 779
|
| Fin. Auth., Rev. Ref. Bonds (Southern Illinois Healthcare Enterprises, Inc.), Series 2017-C, 5.00% 2032
| 1,600
| 1,884
|
| Fin. Auth., Rev. Ref. Bonds (University of Chicago Medical Center), Series 2009-B, 5.00% 2025
| 6,975
| 7,250
|
| Fin. Auth., Rev. Ref. Bonds (University of Chicago Medical Center), Series 2009-B, 5.00% 2025 (preref. 2020)
| 3,525
| 3,664
|
| Fin. Auth., Rev. Ref. Bonds (University of Chicago Medical Center), Series 2009-B, 5.00% 2026
| 2,660
| 2,763
|
| Fin. Auth., Rev. Ref. Bonds (University of Chicago Medical Center), Series 2009-B, 5.00% 2026 (preref. 2020)
| 1,340
| 1,393
|
| Fin. Auth., Student Housing and Academic Fac. Rev. Bonds (CHF-Chicago, LLC - University of Illinois at Chicago Project), Series 2017-A, 5.00% 2047
| 1,200
| 1,340
|
Fin. Auth., Student Housing Rev. Bonds (CHF-Cook, LLC - Northeastern Illinois University Project),
Series 2015-A, 5.00% 2047
| 1,265
| 1,275
|
The Tax-Exempt Bond Fund of America — Page
42 of 120
Bonds, notes & other debt instruments (continued)
Illinois (continued)
| Principal amount
(000)
| Value
(000)
|
Fin. Auth., Student Housing Rev. Bonds (CHF-DeKalb II, LLC - Northern Illinois University Project),
Series 2011, 6.875% 2043
| $40,015
| $42,545
|
Fin. Auth., Student Housing Rev. Bonds (CHF-Normal, LLC - Illinois State University Project),
Series 2011, 6.75% 2031 (preref. 2021)
| 1,000
| 1,092
|
Fin. Auth., Student Housing Rev. Bonds (CHF-Normal, LLC - Illinois State University Project),
Series 2011, 7.00% 2043 (preref. 2021)
| 12,500
| 13,688
|
| G.O. Bonds, Series 2010, Assured Guaranty Municipal insured, 5.00% 2020
| 1,450
| 1,469
|
| G.O. Bonds, Series 2010, Assured Guaranty Municipal insured, 5.00% 2022
| 230
| 233
|
| G.O. Bonds, Series 2012, 5.00% 2035
| 1,000
| 1,043
|
| G.O. Bonds, Series 2013-A, Assured Guaranty Municipal insured, 5.00% 2022
| 980
| 1,047
|
| G.O. Bonds, Series 2014, 5.00% 2020
| 5,290
| 5,372
|
| G.O. Bonds, Series 2014, 5.00% 2021
| 1,000
| 1,041
|
| G.O. Bonds, Series 2014, 5.00% 2024
| 2,000
| 2,193
|
| G.O. Bonds, Series 2014, 5.00% 2039
| 6,275
| 6,658
|
| G.O. Bonds, Series 2014, Assured Guaranty Municipal insured, 5.00% 2024
| 2,795
| 3,083
|
| G.O. Bonds, Series 2014, Assured Guaranty Municipal insured, 5.00% 2026
| 2,000
| 2,196
|
| G.O. Bonds, Series 2014, Assured Guaranty Municipal insured, 5.00% 2039
| 5,100
| 5,425
|
| G.O. Bonds, Series 2016, 5.00% 2028
| 4,840
| 5,450
|
| G.O. Bonds, Series 2016, 5.00% 2033
| 7,200
| 7,970
|
| G.O. Bonds, Series 2016, 5.00% 2034
| 1,925
| 2,124
|
| G.O. Bonds, Series 2016, 5.00% 2037
| 7,500
| 8,212
|
| G.O. Bonds, Series 2016, 5.00% 2038
| 14,000
| 15,293
|
| G.O. Bonds, Series 2016, Assured Guaranty Municipal insured, 5.00% 2030
| 7,700
| 8,555
|
| G.O. Bonds, Series 2016, Assured Guaranty Municipal insured, 5.00% 2041
| 2,000
| 2,157
|
| G.O. Bonds, Series 2017-A, 5.00% 2023
| 3,000
| 3,284
|
| G.O. Bonds, Series 2017-A, 5.00% 2036
| 11,500
| 12,571
|
| G.O. Bonds, Series 2017-B, 5.00% 2019
| 6,300
| 6,346
|
| G.O. Bonds, Series 2017-C, 5.00% 2029
| 18,250
| 20,510
|
| G.O. Bonds, Series 2017-D, BAM insured, 5.00% 2020
| 4,150
| 4,298
|
| G.O. Bonds, Series 2017-D, BAM insured, 5.00% 2021
| 29,000
| 30,723
|
| G.O. Bonds, Series 2017-D, BAM insured, 5.00% 2024
| 8,000
| 8,834
|
| G.O. Bonds, Series 2017-D, BAM insured, 5.00% 2026
| 25,355
| 28,562
|
| G.O. Bonds, Series 2017-D, BAM insured, 5.00% 2028
| 15,470
| 17,487
|
| G.O. Bonds, Series 2018-A, 5.00% 2020
| 6,000
| 6,137
|
| G.O. Rev. Ref. Bonds, Series 2007, 5.25% 2021
| 2,275
| 2,372
|
| G.O. Rev. Ref. Bonds, Series 2007-B, 5.25% 2020
| 3,475
| 3,523
|
| G.O. Rev. Ref. Bonds, Series 2012, 4.00% 2025
| 1,360
| 1,407
|
| G.O. Rev. Ref. Bonds, Series 2012, 5.00% 2019
| 2,660
| 2,660
|
| G.O. Rev. Ref. Bonds, Series 2012, 5.00% 2020
| 5,000
| 5,152
|
| G.O. Rev. Ref. Bonds, Series 2012, Assured Guaranty Municipal insured, 5.00% 2025
| 4,540
| 4,851
|
| G.O. Rev. Ref. Bonds, Series 2016, 5.00% 2020
| 4,430
| 4,543
|
| G.O. Rev. Ref. Bonds, Series 2016, 5.00% 2020
| 1,250
| 1,269
|
| G.O. Rev. Ref. Bonds, Series 2016, 5.00% 2027
| 10,000
| 11,428
|
| G.O. Rev. Ref. Bonds, Series 2016, 5.00% 2028
| 3,000
| 3,415
|
| G.O. Rev. Ref. Bonds, Series 2018-A, 5.00% 2024
| 2,000
| 2,221
|
| G.O. Rev. Ref. Bonds, Series 2018-A, 5.00% 2025
| 1,320
| 1,486
|
| G.O. Rev. Ref. Bonds, Series 2018-A, 5.00% 2026
| 3,500
| 3,986
|
| G.O. Rev. Ref. Bonds, Series 2018-A, 5.00% 2027
| 3,000
| 3,452
|
| G.O. Rev. Ref. Bonds, Series 2018-A, 5.00% 2028
| 6,000
| 6,970
|
| G.O. Rev. Ref. Bonds, Series 2018-B, 5.00% 2033
| 2,565
| 2,903
|
Health Facs. Auth., Rev. Bonds (Evangelical Hospitals Corp.), Series 1992-C,
6.25% 2022 (escrowed to maturity)
| 2,545
| 2,744
|
| Housing Dev. Auth., Homeowner Mortgage Rev. Bonds, Series 2016-C, 3.50% 2046
| 9,960
| 10,553
|
| Housing Dev. Auth., Homeowner Mortgage Rev. Bonds, Series 2018-A-1, 4.00% 2048
| 26,140
| 28,495
|
| Housing Dev. Auth., Housing Rev. Bonds, Series 2013-A, 2.45% 2043
| 751
| 742
|
The Tax-Exempt Bond Fund of America — Page
43 of 120
Bonds, notes & other debt instruments (continued)
Illinois (continued)
| Principal amount
(000)
| Value
(000)
|
| Housing Dev. Auth., Multi Family Housing Rev. Notes (Marshall Field Garden Apartment Homes), Series 2015, (SIFMA Municipal Swap Index + 1.00%) 2.40% 2050 (put
2025)2
| $27,800
| $27,800
|
| Housing Dev. Auth., Rev. Bonds, Series 2016-A, 4.00% 2046
| 4,060
| 4,316
|
| Housing Dev. Auth., Rev. Bonds, Series 2017-B, 4.00% 2048
| 7,320
| 7,891
|
| Housing Dev. Auth., Rev. Bonds, Series 2019-A, 4.25% 2049
| 7,850
| 8,663
|
Board of Trustees of the Illinois State University, Auxiliary Facs. System Rev. Bonds, Series 2016,
Assured Guaranty Municipal insured, 5.00% 2024
| 2,360
| 2,676
|
Board of Trustees of the Illinois State University, Auxiliary Facs. System Rev. Bonds, Series 2016,
Assured Guaranty Municipal insured, 5.00% 2026
| 2,000
| 2,358
|
Board of Trustees of the Illinois State University, Auxiliary Facs. System Rev. Bonds, Series 2018-A,
Assured Guaranty Municipal insured, 5.00% 2029
| 1,840
| 2,225
|
Board of Trustees of the Illinois State University, Auxiliary Facs. System Rev. Bonds, Series 2018-A,
Assured Guaranty Municipal insured, 5.00% 2032
| 1,000
| 1,184
|
Board of Trustees of the Illinois State University, Auxiliary Facs. System Rev. Bonds, Series 2018-A,
Assured Guaranty Municipal insured, 5.00% 2034
| 1,000
| 1,178
|
Board of Trustees of the Illinois State University, Auxiliary Facs. System Rev. Bonds, Series 2018-A,
Assured Guaranty Municipal insured, 5.00% 2036
| 250
| 292
|
Board of Trustees of the Illinois State University, Auxiliary Facs. System Rev. Bonds, Series 2018-A,
Assured Guaranty Municipal insured, 5.00% 2038
| 425
| 494
|
Board of Trustees of the Illinois State University, Auxiliary Facs. System Rev. Bonds, Series 2018-B,
Assured Guaranty Municipal insured, 5.00% 2020
| 520
| 530
|
Board of Trustees of the Illinois State University, Auxiliary Facs. System Rev. Bonds, Series 2018-B,
Assured Guaranty Municipal insured, 5.00% 2028
| 735
| 892
|
Village of Manhattan, Special Service Area No. 2007-5 (Lakeside Towns at Liberty Center Project),
Special Tax Bonds, Series 2007, 6.125% 20403
| 2,300
| 575
|
Metropolitan Pier and Exposition Auth., Dedicated State Tax Rev. Bonds, Capital Appreciation Bonds,
Series 2002-A, National insured, 0% 2030
| 21,475
| 15,668
|
Metropolitan Pier and Exposition Auth., Dedicated State Tax Rev. Bonds, Capital Appreciation Bonds,
Series 2002-A, National insured, 0% 2030 (escrowed to maturity)
| 1,210
| 980
|
Metropolitan Pier and Exposition Auth., McCormick Place Expansion Project Bonds, Series 2012-A,
5.00% 2042
| 1,500
| 1,579
|
Metropolitan Pier and Exposition Auth., McCormick Place Expansion Project Bonds,
Capital Appreciation Bonds, Series 2002-A, National insured, 0% 2025
| 6,535
| 5,610
|
Metropolitan Pier and Exposition Auth., McCormick Place Expansion Project Bonds,
Capital Appreciation Bonds, Series 2002-A, National insured, 0% 2031
| 2,725
| 1,901
|
Metropolitan Pier and Exposition Auth., McCormick Place Expansion Project Bonds,
Capital Appreciation Bonds, Series 2002-A, National insured, 0% 2034
| 15,000
| 9,272
|
Metropolitan Pier and Exposition Auth., McCormick Place Expansion Project Bonds,
Capital Appreciation Bonds, Series 2002-A, National insured, 0% 2035
| 8,335
| 4,834
|
Metropolitan Pier and Exposition Auth., McCormick Place Expansion Project Bonds,
Series 2010-A, 5.50% 2050 (preref. 2020)
| 2,240
| 2,324
|
Metropolitan Pier and Exposition Auth., McCormick Place Expansion Project Rev. Bonds,
Capital Appreciation Bonds, Series 2002-A, Assured Guaranty Municipal insured, 0% 2029
| 10,000
| 7,591
|
Metropolitan Pier and Exposition Auth., McCormick Place Expansion Project Rev. Ref. Bonds,
Capital Appreciation Bonds, Series 1996-A, National insured, 0% 2025
| 2,825
| 2,461
|
Metropolitan Pier and Exposition Auth., McCormick Place Expansion Project Rev. Ref. Bonds,
Capital Appreciation Bonds, Series 2010-B-1, Assured Guaranty Municipal insured, 0% 2026
| 6,035
| 5,153
|
Metropolitan Pier and Exposition Auth., McCormick Place Expansion Project Rev. Ref. Bonds,
Capital Appreciation Bonds, Series 2010-B-1, Assured Guaranty Municipal insured, 0% 2044
| 37,000
| 15,215
|
Metropolitan Pier and Exposition Auth., McCormick Place Expansion Project Rev. Ref. Bonds,
Capital Appreciation Bonds, Series 2017-A, 0% 2056
| 26,610
| 5,776
|
Metropolitan Pier and Exposition Auth., McCormick Place Expansion Project Rev. Ref. Bonds,
Capital Appreciation Bonds, Series 2017-B, 0% 2054
| 39,165
| 9,400
|
Metropolitan Pier and Exposition Auth., McCormick Place Expansion Project Rev. Ref. Bonds,
Capital Appreciation Bonds, Series 2017-B, Assured Guaranty Municipal insured, 0% 2056
| 30,000
| 7,197
|
The Tax-Exempt Bond Fund of America — Page
44 of 120
Bonds, notes & other debt instruments (continued)
Illinois (continued)
| Principal amount
(000)
| Value
(000)
|
Metropolitan Pier and Exposition Auth., McCormick Place Expansion Project Rev. Ref. Bonds,
Capital Appreciation Bonds, Series 2017-B, BAM insured, 0% 2054
| $25,000
| $6,459
|
Metropolitan Pier and Exposition Auth., McCormick Place Expansion Project Rev. Ref. Bonds,
Series 2010-B-2, 5.00% 2050
| 14,020
| 14,228
|
Metropolitan Pier and Exposition Auth., McCormick Place Expansion Project Rev. Ref. Bonds,
Series 2012-B, 5.00% 2020
| 2,620
| 2,728
|
Metropolitan Pier and Exposition Auth., McCormick Place Expansion Project Rev. Ref. Bonds,
Series 2012-B, 5.00% 2028
| 500
| 536
|
Metropolitan Pier and Exposition Auth., McCormick Place Expansion Project Rev. Ref. Bonds,
Series 2012-B, 5.00% 2052
| 2,000
| 2,098
|
Metropolitan Pier and Exposition Auth., McCormick Place Expansion Project Rev. Ref. Bonds,
Series 2015-B, 5.00% 2035
| 7,015
| 7,732
|
Metropolitan Pier and Exposition Auth., McCormick Place Expansion Project Rev. Ref. Bonds,
Series 2015-B, 5.00% 2040
| 6,870
| 7,496
|
Metropolitan Pier and Exposition Auth., McCormick Place Expansion Project Rev. Ref. Bonds,
Series 2017-A, 5.00% 2057
| 7,500
| 8,281
|
Metropolitan Water Reclamation Dist. of Greater Chicago, Unlimited Tax G.O. Rev. Ref. Bonds,
Series 2007-A, 5.00% 2020
| 6,000
| 6,297
|
| Municipal Electric Agcy., Power Supply System Rev. Ref. Bonds, Series 2015-A, 5.00% 2027
| 3,000
| 3,555
|
| Municipal Electric Agcy., Power Supply System Rev. Ref. Bonds, Series 2015-A, 5.00% 2029
| 7,500
| 8,826
|
| Municipal Electric Agcy., Power Supply System Rev. Ref. Bonds, Series 2015-A, 5.00% 2031
| 10,450
| 12,235
|
| Railsplitter Tobacco Settlement Auth., Tobacco Settlement Rev. Bonds, Series 2010, 5.25% 2020
| 7,500
| 7,736
|
| Railsplitter Tobacco Settlement Auth., Tobacco Settlement Rev. Bonds, Series 2010, 6.00% 2028 (preref. 2021)
| 2,050
| 2,229
|
| Railsplitter Tobacco Settlement Auth., Tobacco Settlement Rev. Bonds, Series 2017, 5.00% 2026
| 5,000
| 6,045
|
| Regional Transportation Auth., G.O. Rev. Ref. Bonds, Series 2017-A, 5.00% 2026
| 15,890
| 19,266
|
| Regional Transportation Auth., G.O. Rev. Ref. Bonds, Series 2017-A, 5.00% 2027
| 5,000
| 6,142
|
| Sales Tax Securitization Corp., Sales Tax Securitization Bonds, Series 2018-A, 5.00% 2032
| 9,520
| 11,123
|
| Sales Tax Securitization Corp., Sales Tax Securitization Bonds, Series 2018-A, 5.00% 2033
| 17,230
| 20,067
|
| Sales Tax Securitization Corp., Sales Tax Securitization Bonds, Series 2018-A, 5.00% 2034
| 8,090
| 9,391
|
| Sales Tax Securitization Corp., Sales Tax Securitization Bonds, Series 2018-A, 5.00% 2035
| 2,675
| 3,094
|
| Sales Tax Securitization Corp., Sales Tax Securitization Bonds, Series 2018-A, 5.00% 2036
| 10,105
| 11,649
|
| Sales Tax Securitization Corp., Sales Tax Securitization Bonds, Series 2018-A, 5.00% 2040
| 20,000
| 22,796
|
| Sales Tax Securitization Corp., Sales Tax Securitization Rev. Ref. Bonds, Series 2017-A, 5.00% 2030
| 1,750
| 2,067
|
Board of Trustees of the Southern Illinois University, Housing and Auxiliary Facs. System Rev. Bonds,
Capital Appreciation Bonds, Series 1999-A, National insured, 0% 2025
| 150
| 129
|
Board of Trustees of the Southern Illinois University, Housing and Auxiliary Facs. System Rev. Bonds,
Series 2012-B-1, 5.00% 2023
| 1,520
| 1,619
|
Board of Trustees of the Southern Illinois University, Housing and Auxiliary Facs. System Rev. Bonds,
Series 2012-B-1, 5.00% 2024
| 1,905
| 2,022
|
Board of Trustees of the Southern Illinois University, Housing and Auxiliary Facs. System Rev. Bonds,
Series 2012-B-1, 5.00% 2025
| 2,005
| 2,124
|
Board of Trustees of the Southern Illinois University, Housing and Auxiliary Facs. System Rev. Bonds,
Series 2012-B-1, 5.00% 2032
| 5,000
| 5,212
|
Southwestern Illinois Dev. Auth., Health Fac. Rev. Bonds (Hospital Sisters Services, Inc. Obligated Group),
Series 2017-A, 5.00% 2027
| 4,155
| 5,123
|
Southwestern Illinois Dev. Auth., Health Fac. Rev. Bonds (Hospital Sisters Services, Inc. Obligated Group),
Series 2017-A, 5.00% 2028
| 4,820
| 6,042
|
Southwestern Illinois Dev. Auth., Health Fac. Rev. Bonds (Memorial Group, Inc.), Series 2013,
7.125% 2043 (preref. 2023)
| 1,000
| 1,242
|
Southwestern Illinois Dev. Auth., Health Fac. Rev. Bonds (Memorial Group, Inc.), Series 2013,
7.25% 2036 (preref. 2023)
| 385
| 480
|
Southwestern Illinois Dev. Auth., Health Fac. Rev. Bonds (Memorial Group, Inc.), Series 2013,
7.625% 2048 (preref. 2023)
| 17,340
| 21,898
|
Sports Facs. Auth., Sports Facs. Rev. Ref. Bonds (State Tax Supported), Series 2014,
Assured Guaranty Municipal insured, 5.25% 2030
| 4,755
| 5,357
|
The Tax-Exempt Bond Fund of America — Page
45 of 120
Bonds, notes & other debt instruments (continued)
Illinois (continued)
| Principal amount
(000)
| Value
(000)
|
Sports Facs. Auth., Sports Facs. Rev. Ref. Bonds (State Tax Supported), Series 2014,
Assured Guaranty Municipal insured, 5.25% 2032
| $1,000
| $1,120
|
| City of Springfield, Electric Rev. Ref. Bonds, Series 2015, Assured Guaranty Municipal insured, 5.00% 2031
| 2,220
| 2,553
|
| City of Springfield, Electric Rev. Ref. Bonds, Series 2015, Assured Guaranty Municipal insured, 5.00% 2032
| 3,000
| 3,439
|
| City of Springfield, Electric Rev. Ref. Bonds, Series 2015, Assured Guaranty Municipal insured, 5.00% 2040
| 6,000
| 6,743
|
| Toll Highway Auth., Toll Highway Rev. Bonds, Series 2013-A, 5.00% 2027
| 2,420
| 2,710
|
| Toll Highway Auth., Toll Highway Rev. Bonds, Series 2013-A, 5.00% 2028
| 1,000
| 1,118
|
| Toll Highway Auth., Toll Highway Rev. Bonds, Series 2013-A, 5.00% 2029
| 5,860
| 6,531
|
| Toll Highway Auth., Toll Highway Rev. Bonds, Series 2013-A, 5.00% 2030
| 7,100
| 7,892
|
| Toll Highway Auth., Toll Highway Rev. Bonds, Series 2013-A, 5.00% 2033
| 2,200
| 2,438
|
| Toll Highway Auth., Toll Highway Rev. Bonds, Series 2013-A, 5.00% 2038
| 34,430
| 37,713
|
| Toll Highway Auth., Toll Highway Rev. Bonds, Series 2014-B, 5.00% 2038
| 2,500
| 2,803
|
| Toll Highway Auth., Toll Highway Rev. Bonds, Series 2014-B, 5.00% 2039
| 3,000
| 3,349
|
| Toll Highway Auth., Toll Highway Rev. Bonds, Series 2014-C, 5.00% 2038
| 850
| 965
|
| Toll Highway Auth., Toll Highway Rev. Bonds, Series 2015-A, 5.00% 2040
| 7,500
| 8,571
|
| Toll Highway Auth., Toll Highway Rev. Bonds, Series 2015-B, 5.00% 2034
| 1,000
| 1,169
|
| Toll Highway Auth., Toll Highway Rev. Bonds, Series 2015-B, 5.00% 2036
| 2,000
| 2,330
|
| Toll Highway Auth., Toll Highway Rev. Bonds, Series 2015-B, 5.00% 2037
| 1,500
| 1,743
|
| Toll Highway Auth., Toll Highway Rev. Bonds, Series 2015-B, 5.00% 2040
| 6,500
| 7,501
|
| Toll Highway Auth., Toll Highway Rev. Bonds, Series 2016-B, 5.00% 2033
| 5,000
| 5,915
|
| Toll Highway Auth., Toll Highway Rev. Bonds, Series 2016-B, 5.00% 2035
| 3,055
| 3,595
|
| Toll Highway Auth., Toll Highway Rev. Bonds, Series 2016-B, 5.00% 2036
| 2,000
| 2,348
|
| Toll Highway Auth., Toll Highway Rev. Bonds, Series 2016-B, 5.00% 2037
| 1,900
| 2,227
|
| Toll Highway Auth., Toll Highway Rev. Bonds, Series 2016-B, 5.00% 2041
| 25,980
| 30,214
|
| Toll Highway Auth., Toll Highway Rev. Bonds, Series 2017-A, 5.00% 2038
| 4,000
| 4,767
|
| Toll Highway Auth., Toll Highway Rev. Bonds, Series 2017-A, 5.00% 2039
| 6,125
| 7,281
|
| Toll Highway Auth., Toll Highway Rev. Bonds, Series 2017-A, 5.00% 2042
| 23,480
| 27,991
|
| Toll Highway Auth., Toll Highway Rev. Bonds, Series 2018-A, 5.00% 2021
| 1,455
| 1,531
|
| Toll Highway Auth., Toll Highway Rev. Ref. Bonds, Series 2010-A-1, 4.50% 2027
| 6,000
| 6,085
|
| Toll Highway Auth., Toll Highway Rev. Ref. Bonds, Series 2010-A-1, 5.00% 2025
| 10,000
| 10,156
|
| Toll Highway Auth., Toll Highway Rev. Ref. Bonds, Series 2010-A-1, 5.00% 2028
| 10,000
| 10,151
|
| Toll Highway Auth., Toll Highway Rev. Ref. Bonds, Series 2010-A-1, 5.00% 2031
| 3,000
| 3,043
|
| Toll Highway Auth., Toll Highway Rev. Ref. Bonds, Series 2019-A, 5.00% 2030
| 2,000
| 2,517
|
| Board of Trustees of the University of Illinois, Auxiliary Facs. System Rev. Bonds, Series 2011-A, 5.25% 2041
| 1,750
| 1,835
|
| Board of Trustees of the University of Illinois, Auxiliary Facs. System Rev. Bonds, Series 2011-A, 5.50% 2031
| 2,000
| 2,124
|
| Board of Trustees of the University of Illinois, Auxiliary Facs. System Rev. Bonds, Series 2014-A, 5.00% 2044
| 9,500
| 10,529
|
| Board of Trustees of the University of Illinois, Auxiliary Facs. System Rev. Bonds, Series 2015-A, 5.00% 2027
| 1,185
| 1,400
|
Board of Trustees of the University of Illinois, Auxiliary Facs. System Rev. Ref. Bonds, Series 2001-A,
AMBAC insured, 5.50% 2021
| 2,670
| 2,854
|
Board of Trustees of the University of Illinois, Auxiliary Facs. System Rev. Ref. Bonds, Series 2005-A,
National insured, 5.50% 2023
| 1,800
| 2,062
|
Board of Trustees of the University of Illinois, Auxiliary Facs. System Rev. Ref. Bonds, Series 2013-A,
5.00% 2020
| 1,615
| 1,655
|
Board of Trustees of the University of Illinois, Auxiliary Facs. System Rev. Ref. Bonds, Series 2013-A,
5.00% 2023
| 3,000
| 3,379
|
Board of Trustees of the University of Illinois, Auxiliary Facs. System Rev. Ref. Bonds, Series 2013-A,
5.00% 2025
| 10,000
| 11,245
|
Board of Trustees of the University of Illinois, Auxiliary Facs. System Rev. Ref. Bonds, Series 2016-A,
4.00% 2032
| 2,930
| 3,151
|
Board of Trustees of the University of Illinois, Auxiliary Facs. System Rev. Ref. Bonds, Series 2016-A,
4.00% 2033
| 4,535
| 4,858
|
Board of Trustees of the University of Illinois, Auxiliary Facs. System Rev. Ref. Bonds, Series 2016-A,
4.00% 2034
| 5,000
| 5,334
|
Board of Trustees of the University of Illinois, Auxiliary Facs. System Rev. Ref. Bonds, Series 2016-A,
Assured Guaranty Municipal insured, 4.00% 2036
| 8,000
| 8,712
|
The Tax-Exempt Bond Fund of America — Page
46 of 120
Bonds, notes & other debt instruments (continued)
Illinois (continued)
| Principal amount
(000)
| Value
(000)
|
Board of Trustees of the University of Illinois, Rev. Ref. Certs. of Part., Series 2008-A,
Assured Guaranty Municipal insured, 5.00% 2025
| $2,315
| $2,322
|
| Board of Trustees of the University of Illinois, Rev. Ref. Certs. of Part., Series 2014-C, 5.00% 2024
| 1,925
| 2,228
|
| Board of Trustees of the University of Illinois, Rev. Ref. Certs. of Part., Series 2016-A, 4.00% 2019
| 2,000
| 2,002
|
| Board of Trustees of the University of Illinois, Rev. Ref. Certs. of Part., Series 2016-A, 5.00% 2020
| 1,000
| 1,038
|
| Board of Trustees of the University of Illinois, Rev. Ref. Certs. of Part., Series 2016-A, 5.00% 2021
| 7,145
| 7,666
|
Village of Volo, Special Service Areas Nos. 3 and 6 (Symphony Meadows/Lancaster Falls Projects),
Special Tax Rev. Ref. Bonds, Series 2016, Assured Guaranty Municipal insured, 2.25% 2022
| 799
| 805
|
Village of Volo, Special Service Areas Nos. 3 and 6 (Symphony Meadows/Lancaster Falls Projects),
Special Tax Rev. Ref. Bonds, Series 2016, Assured Guaranty Municipal insured, 2.50% 2023
| 899
| 915
|
Village of Volo, Special Service Areas Nos. 3 and 6 (Symphony Meadows/Lancaster Falls Projects),
Special Tax Rev. Ref. Bonds, Series 2016, Assured Guaranty Municipal insured, 2.75% 2024
| 949
| 976
|
Village of Volo, Special Service Areas Nos. 3 and 6 (Symphony Meadows/Lancaster Falls Projects),
Special Tax Rev. Ref. Bonds, Series 2016, Assured Guaranty Municipal insured, 2.875% 2025
| 504
| 522
|
Village of Volo, Special Service Areas Nos. 3 and 6 (Symphony Meadows/Lancaster Falls Projects),
Special Tax Rev. Ref. Bonds, Series 2016, Assured Guaranty Municipal insured, 3.00% 2026
| 864
| 902
|
United City of Yorkville, Special Service Area Nos. 2005-108 and 2005-109, Special Tax Rev. Ref. Bonds,
Series 2016, Assured Guaranty Municipal insured, 2.75% 2024
| 1,166
| 1,200
|
United City of Yorkville, Special Service Area Nos. 2005-108 and 2005-109, Special Tax Rev. Ref. Bonds,
Series 2016, Assured Guaranty Municipal insured, 3.00% 2025
| 729
| 761
|
United City of Yorkville, Special Service Area Nos. 2005-108 and 2005-109, Special Tax Rev. Ref. Bonds,
Series 2016, Assured Guaranty Municipal insured, 3.125% 2026
| 1,296
| 1,362
|
United City of Yorkville, Special Service Area Nos. 2005-108 and 2005-109, Special Tax Rev. Ref. Bonds,
Series 2016, Assured Guaranty Municipal insured, 3.25% 2027
| 1,365
| 1,429
|
United City of Yorkville, Special Service Area Nos. 2005-108 and 2005-109, Special Tax Rev. Ref. Bonds,
Series 2016, Assured Guaranty Municipal insured, 4.00% 2036
| 1,000
| 1,048
|
|
|
| 2,983,762
|
| Indiana 1.04%
|
|
|
| Bond Bank, Special Program Gas Rev. Bonds, Series 2007-A, 5.25% 2020
| 985
| 1,028
|
| Fin. Auth., Econ. Dev. Rev. Ref. Bonds (Republic Services, Inc.), Series 2010-B, 1.50% 2028 (put 2019)
| 1,000
| 1,000
|
| Fin. Auth., Environmental Rev. Ref. Bonds (Duke Energy Indiana, Inc. Project), Series 2009-B, 6.00% 2039
| 5,980
| 6,003
|
| Fin. Auth., Health System Rev. Bonds (Franciscan Alliance, Inc.), Series 2016-A, 5.00% 2051
| 19,600
| 22,017
|
| Fin. Auth., Health System Rev. Bonds (Franciscan Alliance, Inc.), Series 2016-B, 5.00% 2041
| 14,800
| 16,804
|
| Fin. Auth., Health System Rev. Bonds (Indiana University Health), Series 2019-B, 2.25% 2058 (put 2025)
| 7,500
| 7,788
|
Fin. Auth., Health System Rev. Bonds (Sisters of St. Francis Health Services, Inc. Obligated Group),
Series 2009-A, 5.25% 2039 (preref. 2019)
| 1,000
| 1,010
|
| Fin. Auth., Hospital Rev. Bonds (Goshen Health), Series 2019-A, 4.00% 2036
| 465
| 511
|
| Fin. Auth., Hospital Rev. Bonds (Goshen Health), Series 2019-A, 4.00% 2038
| 2,045
| 2,232
|
| Fin. Auth., Hospital Rev. Bonds (Goshen Health), Series 2019-A, 4.00% 2043
| 3,250
| 3,498
|
| Fin. Auth., Hospital Rev. Bonds (Goshen Health), Series 2019-A, 5.00% 2034
| 725
| 884
|
| Fin. Auth., Hospital Rev. Bonds (Goshen Health), Series 2019-A, 5.00% 2035
| 1,335
| 1,622
|
Fin. Auth., Midwestern Disaster Relief Rev. Bonds (Ohio Valley Electric Corp. Project), Series 2012-A,
5.00% 2032
| 11,510
| 11,927
|
Fin. Auth., Midwestern Disaster Relief Rev. Bonds (Ohio Valley Electric Corp. Project), Series 2012-A,
5.00% 2039
| 23,765
| 24,629
|
| Fin. Auth., Rev. Bonds (BHI Senior Living Obligated Group), Series 2016-A, 5.25% 2046
| 2,165
| 2,460
|
| Fin. Auth., Rev. Bonds (BHI Senior Living Obligated Group), Series 2018-A, 5.00% 2023
| 250
| 281
|
| Fin. Auth., Rev. Bonds (BHI Senior Living Obligated Group), Series 2018-A, 5.00% 2027
| 1,050
| 1,237
|
| Fin. Auth., Rev. Bonds (BHI Senior Living Obligated Group), Series 2018-A, 5.00% 2028
| 1,100
| 1,291
|
| Fin. Auth., Rev. Bonds (Deaconess Health System Obligated Group), Series 2016-A, 5.00% 2044
| 2,655
| 3,053
|
| Fin. Auth., Rev. Bonds (Greencroft Obligated Group), Series 2013-A, 7.00% 2043
| 1,000
| 1,119
|
| Fin. Auth., Rev. Ref. Bonds (Community Foundation of Northwest Indiana Obligated Group), Series 2015, 5.00% 2036
| 3,000
| 3,423
|
| Fin. Auth., Rev. Ref. Bonds (Trinity Health Credit Group), Series 2010-B, 5.00% 2028 (preref. 2020)
| 2,000
| 2,098
|
The Tax-Exempt Bond Fund of America — Page
47 of 120
Bonds, notes & other debt instruments (continued)
Indiana (continued)
| Principal amount
(000)
| Value
(000)
|
| Fin. Auth., Wastewater Utility Rev. Bonds (CWA Auth. Project), Series 2011-A, 5.25% 2031
| $5,000
| $5,408
|
| City of Franklin, Econ. Dev. Rev. Ref. Bonds (Otterbein Homes Obligated Group), Series 2019-B, 4.00% 2021
| 100
| 105
|
| City of Franklin, Econ. Dev. Rev. Ref. Bonds (Otterbein Homes Obligated Group), Series 2019-B, 4.00% 2022
| 1,100
| 1,179
|
| City of Franklin, Econ. Dev. Rev. Ref. Bonds (Otterbein Homes Obligated Group), Series 2019-B, 5.00% 2026
| 1,600
| 1,921
|
| Health Facs. Fncg. Auth., Rev. Bonds (Ascension Health Senior Credit Group), Series 2001-A-1, 5.00% 2035
| 2,780
| 3,247
|
| Hospital Fin. Auth., Hospital Rev. Ref. Bonds (Indiana University Health Obligated Group), Series 2011-N, 5.00% 2031 (preref. 2021)
| 7,000
| 7,420
|
| Hospital Fin. Auth., Hospital Rev. Ref. Bonds (Indiana University Health Obligated Group), Series 2014-A, 5.00% 2029
| 1,000
| 1,164
|
| Hospital Fin. Auth., Hospital Rev. Ref. Bonds (Indiana University Health Obligated Group), Series 2015-A, 5.00% 2040
| 5,000
| 5,705
|
Hospital Fin. Auth., Hospital Rev. Ref. Bonds (Parkview Health System Obligated Group), Series 2012-A,
5.00% 2029
| 1,405
| 1,532
|
Hospital Fin. Auth., Hospital Rev. Ref. Bonds (Parkview Health System Obligated Group), Series 2012-A,
5.00% 2029 (preref. 2022)
| 45
| 50
|
| Hospital Fin. Auth., Hospital Rev. Ref. Bonds (Parkview Health), Series 2017-A, 5.00% 2028
| 500
| 637
|
| Hospital Fin. Auth., Hospital Rev. Ref. Bonds (Parkview Health), Series 2017-A, 5.00% 2029
| 700
| 902
|
| Hospital Fin. Auth., Hospital Rev. Ref. Bonds (Parkview Health), Series 2017-A, 5.00% 2030
| 325
| 422
|
| Hospital Fin. Auth., Hospital Rev. Ref. Bonds (The Methodist Hospitals, Inc.), Series 2014-A, 5.00% 2025
| 1,000
| 1,130
|
| Hospital Fin. Auth., Hospital Rev. Ref. Bonds (The Methodist Hospitals, Inc.), Series 2014-A, 5.00% 2029
| 1,000
| 1,115
|
| Hospital Fin. Auth., Hospital Rev. Ref. Bonds (The Methodist Hospitals, Inc.), Series 2014-A, 5.00% 2031
| 1,700
| 1,880
|
| Trustees of Indiana University, Consolidated Rev. Ref. Bonds, Series 2012-A, 5.00% 2037
| 1,500
| 1,644
|
Indianapolis Local Public Improvement Bond Bank, Rev. Bonds, Capital Appreciation Bonds,
Series 1999-E, AMBAC insured, 0% 2025
| 2,485
| 2,285
|
Indianapolis Local Public Improvement Bond Bank, Rev. Ref. Bonds (Waterworks Project),
Series 2007-B, National insured, 5.25% 2023
| 10,420
| 11,816
|
Indianapolis Local Public Improvement Bond Bank, Rev. Ref. Bonds (Waterworks Project),
Series 2007-B, National insured, 5.25% 2023
| 6,055
| 6,970
|
| Indianapolis Local Public Improvement Bond Bank, Rev. Ref. Bonds, Series 2011-K, 5.00% 2024
| 2,000
| 2,130
|
| Municipal Power Agcy., Power Supply System Rev. Bonds, Series 2013-A, 5.00% 2042
| 2,750
| 3,063
|
| Municipal Power Agcy., Power Supply System Rev. Bonds, Series 2013-A, 5.25% 2030 (preref. 2023)
| 1,500
| 1,739
|
| Municipal Power Agcy., Power Supply System Rev. Bonds, Series 2013-A, 5.25% 2032 (preref. 2023)
| 2,000
| 2,319
|
| Municipal Power Agcy., Power Supply System Rev. Bonds, Series 2013-A, 5.25% 2038
| 2,000
| 2,259
|
| Municipal Power Agcy., Power Supply System Rev. Bonds, Series 2016-C, 5.00% 2036
| 4,550
| 5,383
|
| Municipal Power Agcy., Power Supply System Rev. Bonds, Series 2016-C, 5.00% 2037
| 5,970
| 7,034
|
| Municipal Power Agcy., Power Supply System Rev. Ref. Bonds, Series 2011-A, 5.00% 2031 (preref. 2021)
| 2,000
| 2,149
|
| Trustees of Purdue University, Certs. of Part., Series 2006, 5.25% 2025
| 1,980
| 2,434
|
| Trustees of Purdue University, Purdue University Student Fee Bonds, Series 2015-BB-1, 5.00% 2032
| 470
| 546
|
| Trustees of Purdue University, Purdue University Student Fee Bonds, Series 2015-BB-1, 5.00% 2033
| 1,530
| 1,773
|
| Trustees of Purdue University, Purdue University Student Fee Bonds, Series 2015-BB-1, 5.00% 2034
| 530
| 613
|
| Trustees of Purdue University, Purdue University Student Fee Rev. Ref. Bonds, Series 2012-AA, 5.00% 2030
| 1,500
| 1,658
|
| City of Rockport, Pollution Control Rev. Ref. Bonds (Indiana Michigan Power Co. Project), Series 2002-A, 2.75% 2025
| 3,200
| 3,379
|
| City of Rockport, Pollution Control Rev. Ref. Bonds (Indiana Michigan Power Co. Project), Series 2009-B, 3.05% 2025
| 11,500
| 12,332
|
| County of Vigo, Hospital Auth., Hospital Rev. Bonds, Series 2011, 8.00% 2041 (preref. 2021)
| 2,575
| 2,931
|
|
|
| 224,189
|
| Iowa 0.37%
|
|
|
| Fin. Auth., Entrance Fee Principal Redemption Bonds (Northcrest, Inc. Project), Series 2018-B, 3.25% 2023
| 1,000
| 1,001
|
| Fin. Auth., Health Facs. Rev. Bonds (UnityPoint Health), Series 2014-C, 4.00% 2033
| 8,650
| 9,164
|
Fin. Auth., Midwestern Disaster Area Rev. Bonds (Iowa Fertilizer Co. Project), Series 2013-B,
5.25% 2050 (put 2037)
| 2,500
| 2,704
|
| Fin. Auth., Midwestern Disaster Area Rev. Ref. Bonds (Iowa Fertilizer Co. Project), Series 2013, 5.00% 2019
| 5,520
| 5,568
|
| Fin. Auth., Midwestern Disaster Area Rev. Ref. Bonds (Iowa Fertilizer Co. Project), Series 2013, 5.25% 2025
| 5,500
| 5,985
|
The Tax-Exempt Bond Fund of America — Page
48 of 120
Bonds, notes & other debt instruments (continued)
Iowa (continued)
| Principal amount
(000)
| Value
(000)
|
| Fin. Auth., Midwestern Disaster Area Rev. Ref. Bonds (Iowa Fertilizer Co. Project), Series 2013, 5.875% 20271
| $7,705
| $8,100
|
| Fin. Auth., Midwestern Disaster Area Rev. Ref. Bonds (Iowa Fertilizer Co. Project), Series 2019, 3.125% 2022
| 2,900
| 2,937
|
| Fin. Auth., Senior Housing Rev. Bonds (Northcrest, Inc. Project), Series 2018-A, 5.00% 2028
| 425
| 471
|
| Fin. Auth., Single Family Mortgage Bonds (Mortgage-Backed Securities Program), Series 2013-1, 2.15% 2043
| 797
| 776
|
| Fin. Auth., Single Family Mortgage Bonds (Mortgage-Backed Securities Program), Series 2018-C, 4.00% 2048
| 2,185
| 2,378
|
| Fin. Auth., Single Family Mortgage Bonds (Mortgage-Backed Securities Program), Series 2019-A, 4.00% 2047
| 5,550
| 6,193
|
| Fin. Auth., Single Family Mortgage Bonds, Series 2016-A, 4.00% 2046
| 2,975
| 3,141
|
| Fin. Auth., Single Family Mortgage Bonds, Series 2017-C, 3.50% 2047
| 7,960
| 8,412
|
| Fin. Auth., Single Family Mortgage Bonds, Series 2018-A, 4.00% 2047
| 3,495
| 3,781
|
| IJOBS Program Special Obligation Bonds, Series 2010-A, 5.00% 2029
| 4,590
| 4,735
|
| PEFA Inc., Gas Project Rev. Bonds, Series 2019, 5.00% 2049 (put 2026)
| 12,000
| 14,259
|
|
|
| 79,605
|
| Kansas 0.78%
|
|
|
| Dev. Fin. Auth., Hospital Rev. Ref. Bonds (Adventist Health System/Sunbelt Obligated Group), Series 2012-A, 5.00% 2032
| 1,500
| 1,636
|
| Dev. Fin. Auth., Rev. Ref. Bonds (Lifespace Communities, Inc.), Series 2010-S, 5.00% 2030
| 5,625
| 5,743
|
| City of Lenexa, Health Care Fac. Rev. Bonds (Lakeview Village, Inc. Project), Series 2018-A, 5.00% 2020
| 435
| 443
|
Dept. of Transportation, Highway Rev. Bonds, Series 2004-C-1,
(1-month USD-LIBOR x 0.70 + 0.30%) 1.981% 20212
| 5,000
| 5,016
|
Dept. of Transportation, Highway Rev. Bonds, Series 2004-C-2,
(1-month USD-LIBOR x 0.70 + 0.35%) 2.031% 20222
| 25,315
| 25,398
|
Dept. of Transportation, Highway Rev. Bonds, Series 2004-C-3,
(1-month USD-LIBOR x 0.70 + 0.40%) 2.081% 20232
| 5,675
| 5,700
|
Dept. of Transportation, Highway Rev. Bonds, Series 2004-C-4,
(1-month USD-LIBOR x 0.70 + 0.50%) 2.181% 20242
| 28,000
| 28,155
|
| Dept. of Transportation, Highway Rev. Ref. Bonds, Series 2012-B, 5.00% 2019
| 10,000
| 10,031
|
University of Kansas Hospital Auth., Health Facs. and Improvement Rev. Bonds
(University of Kansas Health System), Series 2017-A, 5.00% 2047
| 44,740
| 51,955
|
City of Wichita, Sales Tax Special Obligation Rev. Bonds (K-96 Greenwich Star Bond Project),
Series 2013, 7.55% 2033 (preref. 2020)1
| 29,385
| 31,674
|
City of Wichita, Sales Tax Special Obligation Rev. Bonds (K-96 Greenwich Star Bond Project),
Series 2017, 3.00% 2023
| 1,250
| 1,269
|
Unified Government of Wyandotte County, Special Obligation Improvement Rev. Ref. Bonds
(Wyandotte Plaza Redev. Project), Series 2016, 4.00% 2028
| 715
| 735
|
Unified Government of Wyandotte County, Special Obligation Improvement Rev. Ref. Bonds
(Wyandotte Plaza Redev. Project), Series 2016, 5.00% 2034
| 625
| 645
|
|
|
| 168,400
|
| Kentucky 0.75%
|
|
|
| Asset/Liability Commission, Project Notes, Federal Highway Trust Fund, Series 2013-A, 5.25% 2024
| 2,000
| 2,301
|
| Econ. Dev. Fin. Auth., Hospital Rev. Bonds (Baptist Healthcare System Obligated Group), Series 2017-B, 5.00% 2036
| 3,320
| 3,846
|
| Econ. Dev. Fin. Auth., Hospital Rev. Bonds (Baptist Healthcare System Obligated Group), Series 2017-B, 5.00% 2041
| 3,450
| 3,937
|
| Econ. Dev. Fin. Auth., Hospital Rev. Bonds (Baptist Healthcare System Obligated Group), Series 2017-B, 5.00% 2046
| 2,750
| 3,119
|
| Econ. Dev. Fin. Auth., Louisville Arena Project Rev. Ref. Bonds (Louisville Arena Auth., Inc.), Series 2017-A, Assured Guaranty Municipal insured, 4.00% 2041
| 1,000
| 1,080
|
| Econ. Dev. Fin. Auth., Louisville Arena Project Rev. Ref. Bonds (Louisville Arena Auth., Inc.), Series 2017-A, Assured Guaranty Municipal insured, 5.00% 2045
| 13,700
| 15,896
|
| Econ. Dev. Fin. Auth., Louisville Arena Project Rev. Ref. Bonds (Louisville Arena Auth., Inc.), Series 2017-A, Assured Guaranty Municipal insured, 5.00% 2047
| 6,250
| 6,809
|
| Housing Corp., Housing Rev. Bonds, Series 2013-D, 3.50% 2033
| 520
| 544
|
The Tax-Exempt Bond Fund of America — Page
49 of 120
Bonds, notes & other debt instruments (continued)
Kentucky (continued)
| Principal amount
(000)
| Value
(000)
|
Louisville/Jefferson Metro County Government, Health System Rev. Bonds (Norton Healthcare, Inc.),
Series 2016-A, 4.00% 2034
| $5,000
| $5,391
|
Louisville/Jefferson Metro County Government, Health System Rev. Bonds (Norton Healthcare, Inc.),
Series 2016-A, 4.00% 2035
| 21,770
| 23,314
|
Louisville/Jefferson Metro County Government, Health System Rev. Bonds (Norton Healthcare, Inc.),
Series 2016-A, 4.00% 2036
| 21,000
| 22,355
|
Louisville/Jefferson Metro County Government, Health System Rev. Bonds (Norton Healthcare, Inc.),
Series 2016-A, 5.00% 2029
| 4,085
| 4,928
|
Louisville/Jefferson Metro County Government, Health System Rev. Bonds (Norton Healthcare, Inc.),
Series 2016-A, 5.00% 2032
| 6,500
| 7,701
|
Louisville/Jefferson Metro County Government, Health System Rev. Bonds (Norton Healthcare, Inc.),
Series 2016-A, 5.00% 2033
| 1,000
| 1,179
|
| City of Paducah, Electric Plant Board, Rev. Ref. Bonds, Series 2016-A, Assured Guaranty Municipal insured, 5.00% 2027
| 2,000
| 2,428
|
| City of Paducah, Electric Plant Board, Rev. Ref. Bonds, Series 2016-A, Assured Guaranty Municipal insured, 5.00% 2028
| 1,500
| 1,813
|
| City of Paducah, Electric Plant Board, Rev. Ref. Bonds, Series 2016-A, Assured Guaranty Municipal insured, 5.00% 2032
| 2,610
| 3,077
|
| City of Paducah, Electric Plant Board, Rev. Ref. Bonds, Series 2016-A, Assured Guaranty Municipal insured, 5.00% 2033
| 2,185
| 2,561
|
| Public Energy Auth., Gas Supply Rev. Bonds, Series 2018-A, 4.00% 2048 (put 2024)
| 4,800
| 5,237
|
| Public Energy Auth., Gas Supply Rev. Bonds, Series 2018-B, 4.00% 2049 (put 2025)
| 18,000
| 19,950
|
Public Transportation Infrastructure Auth., Toll Rev. Bonds (Downtown Crossing Project), Series 2013-A,
5.75% 2049
| 5,000
| 5,572
|
Public Transportation Infrastructure Auth., Toll Rev. Bonds (Downtown Crossing Project), Series 2013-A,
6.00% 2053
| 18,020
| 20,236
|
|
|
| 163,274
|
| Louisiana 1.59%
|
|
|
| Aviation Board, General Airport Rev. Bonds (North Terminal Project), Series 2015-A, 5.00% 2033
| 845
| 970
|
| Aviation Board, General Airport Rev. Bonds (North Terminal Project), Series 2015-A, 5.00% 2045
| 2,500
| 2,813
|
| Aviation Board, General Airport Rev. Bonds (North Terminal Project), Series 2017-A, 5.00% 2035
| 1,340
| 1,588
|
| Aviation Board, General Airport Rev. Bonds (North Terminal Project), Series 2017-A, 5.00% 2048
| 12,855
| 14,886
|
Citizens Property Insurance Corp., Assessment Rev. Ref. Bonds, Series 2012,
Assured Guaranty Municipal insured, 5.00% 2024 (preref. 2022)
| 1,750
| 1,939
|
| Citizens Property Insurance Corp., Assessment Rev. Ref. Bonds, Series 2016-A, 5.00% 2025
| 3,600
| 4,332
|
| Citizens Property Insurance Corp., Assessment Rev. Ref. Bonds, Series 2016-A, 5.00% 2026
| 12,000
| 14,752
|
Parish of East Baton Rouge, Mortgage Fin. Auth., Single Family Mortgage Rev. Ref. Bonds
(Mortgage-Backed Securities Program), Series 2009-A-2, 5.25% 2039
| 40
| 40
|
| G.O. Bonds, Series 2011-A, 5.00% 2022 (preref. 2020)
| 10,000
| 10,422
|
Greater New Orleans Expressway Commission, Toll Rev. Bonds, Series 2017,
Assured Guaranty Municipal insured, 5.00% 2042
| 4,000
| 4,641
|
Greater New Orleans Expressway Commission, Toll Rev. Bonds, Series 2017,
Assured Guaranty Municipal insured, 5.00% 2047
| 3,320
| 3,839
|
Parish of Jefferson, Hospital Dist. No. 1 (West Jefferson Medical Center), Hospital Rev. Ref. Bonds,
Series 2011-A, 6.00% 2039 (preref. 2021)
| 6,500
| 6,930
|
| Juban Crossing Econ. Dev. Dist., Rev. Ref. Bonds (Drainage Projects), Series 2015-C, 7.00% 20441
| 990
| 1,015
|
| Local Government Environmental Facs. and Community Dev. Auth., Rev. Bonds (Southeastern Louisiana University Student Housing Project), Series 2017, Assured
Guaranty Municipal insured, 5.00% 2030
| 2,000
| 2,447
|
| Local Government Environmental Facs. and Community Dev. Auth., Rev. Bonds (Westlake Chemical Corp. Projects), Series 2009-A, 6.50% 2029
| 1,750
| 1,837
|
| Local Government Environmental Facs. and Community Dev. Auth., Rev. Bonds (Westlake Chemical Corp. Projects), Series 2010-A-1, 6.50% 2035
| 11,275
| 11,921
|
| Local Government Environmental Facs. and Community Dev. Auth., Rev. Bonds (Westlake Chemical Corp. Projects), Series 2010-A-2, 6.50% 2035
| 4,700
| 4,969
|
The Tax-Exempt Bond Fund of America — Page
50 of 120
Bonds, notes & other debt instruments (continued)
Louisiana (continued)
| Principal amount
(000)
| Value
(000)
|
| Local Government Environmental Facs. and Community Dev. Auth., Rev. Ref. Bonds (Louisiana Community and Technical College System Act 391 Projects), Series 2017,
BAM insured, 5.00% 2028
| $2,500
| $3,144
|
| Local Government Environmental Facs. and Community Dev. Auth., Rev. Ref. Bonds (Ragin’ Cajun Facs., Inc. Project), Series 2017, Assured Guaranty Municipal
insured, 5.00% 2030
| 3,940
| 4,837
|
| Local Government Environmental Facs. and Community Dev. Auth., Rev. Ref. Bonds (Ragin’ Cajun Facs., Inc. Project), Series 2017, Assured Guaranty Municipal
insured, 5.00% 2032
| 4,580
| 5,546
|
| Local Government Environmental Facs. and Community Dev. Auth., Rev. Ref. Bonds (Ragin’ Cajun Facs., Inc. Project), Series 2017, Assured Guaranty Municipal
insured, 5.00% 2033
| 4,620
| 5,577
|
| Local Government Environmental Facs. and Community Dev. Auth., Rev. Ref. Bonds (Ragin’ Cajun Facs., Inc. Project), Series 2017, Assured Guaranty Municipal
insured, 5.00% 2034
| 4,895
| 5,887
|
| Local Government Environmental Facs. and Community Dev. Auth., Rev. Ref. Bonds (Ragin’ Cajun Facs., Inc. Project), Series 2017, Assured Guaranty Municipal
insured, 5.00% 2036
| 4,680
| 5,592
|
| Local Government Environmental Facs. and Community Dev. Auth., Rev. Ref. Bonds (Ragin’ Cajun Facs., Inc. Project), Series 2017, Assured Guaranty Municipal
insured, 5.00% 2043
| 1,250
| 1,452
|
Local Government Environmental Facs. and Community Dev. Auth., Rev. Ref. Bonds
(Westlake Chemical Corp. Projects), Series 2017, 3.50% 2032
| 5,165
| 5,398
|
| Local Government Facs. and Community Dev. Auth. (Woman’s Hospital Foundation Project), Hospital Rev. Ref. Bonds, Series 2017-A, 5.00% 2041
| 10,500
| 12,256
|
| Local Government Facs. and Community Dev. Auth. (Woman’s Hospital Foundation Project), Hospital Rev. Ref. Bonds, Series 2017-A, 5.00% 2044
| 9,940
| 11,519
|
| Louisiana Stadium and Exposition Dist., Rev. Ref. Bonds, Series 2013-A, 5.00% 2024
| 2,000
| 2,277
|
| Louisiana Stadium and Exposition Dist., Rev. Ref. Bonds, Series 2013-A, 5.00% 2025
| 5,000
| 5,688
|
| Louisiana Stadium and Exposition Dist., Rev. Ref. Bonds, Series 2013-A, 5.00% 2032
| 2,500
| 2,793
|
| Military Dept., Custodial Receipts, Series 2006, 5.00% 2021
| 5,705
| 5,806
|
City of New Orleans, Regional Transit Auth., Sales Tax Rev. Bonds, Series 2010,
Assured Guaranty Municipal insured, 5.00% 2030
| 1,000
| 1,048
|
| City of New Orleans, Sewerage Service Rev. and Rev. Ref. Bonds, Series 2015, 5.00% 2030
| 900
| 1,044
|
| City of New Orleans, Sewerage Service Rev. and Rev. Ref. Bonds, Series 2015, 5.00% 2033
| 1,000
| 1,150
|
| City of New Orleans, Sewerage Service Rev. and Rev. Ref. Bonds, Series 2015, 5.00% 2034
| 1,000
| 1,146
|
| City of New Orleans, Sewerage Service Rev. and Rev. Ref. Bonds, Series 2015, 5.00% 2040
| 3,000
| 3,374
|
| City of New Orleans, Sewerage Service Rev. and Rev. Ref. Bonds, Series 2015, 5.00% 2040
| 2,000
| 2,256
|
| City of New Orleans, Sewerage Service Rev. and Rev. Ref. Bonds, Series 2015, 5.00% 2045
| 5,000
| 5,595
|
| City of New Orleans, Sewerage Service Rev. and Rev. Ref. Bonds, Series 2015, 5.00% 2045
| 1,350
| 1,515
|
| City of New Orleans, Water Rev. and Rev. Ref. Bonds, Series 2014, 5.00% 2029
| 900
| 1,053
|
| City of New Orleans, Water Rev. and Rev. Ref. Bonds, Series 2014, 5.00% 2032
| 1,000
| 1,156
|
| City of New Orleans, Water Rev. and Rev. Ref. Bonds, Series 2014, 5.00% 2044
| 16,825
| 18,496
|
| Public Facs. Auth., Hospital Rev. Ref. Bonds (Franciscan Missionaries of Our Lady Health System Project), Series 2015-A, 5.00% 2033
| 4,970
| 5,699
|
| Public Facs. Auth., Hospital Rev. Ref. Bonds (Franciscan Missionaries of Our Lady Health System Project), Series 2015-A, 5.00% 2033 (preref. 2025)
| 30
| 36
|
| Public Facs. Auth., Lease Rev. Bonds (Provident Group - Flagship Properties LLC - Louisiana State University Greenhouse Dist. Phase II Project), Series 2017, 5.00%
2052
| 1,000
| 1,139
|
| Public Facs. Auth., Lease Rev. Bonds (Provident Group - Flagship Properties LLC - Louisiana State University Greenhouse Dist. Phase II Project), Series 2017, 5.00%
2057
| 8,395
| 9,483
|
| Public Facs. Auth., Lease Rev. Bonds (Provident Group - Flagship Properties LLC - Louisiana State University Nicholson Gateway Project), Series 2016-A, 5.00% 2046
| 1,100
| 1,252
|
| Public Facs. Auth., Lease Rev. Bonds (Provident Group - Flagship Properties LLC - Louisiana State University Nicholson Gateway Project), Series 2016-A, 5.00% 2051
| 17,590
| 19,797
|
| Public Facs. Auth., Lease Rev. Bonds (Provident Group - Flagship Properties LLC - Louisiana State University Nicholson Gateway Project), Series 2016-A, 5.00% 2056
| 10,780
| 12,083
|
| Public Facs. Auth., Rev. and Rev. Ref. Bonds (Ochsner Clinic Foundation Project), Series 2017, 5.00% 2042
| 5,000
| 5,754
|
| Public Facs. Auth., Rev. and Rev. Ref. Bonds (Ochsner Clinic Foundation Project), Series 2017, 5.00% 2046
| 25,895
| 29,648
|
| Public Facs. Auth., Rev. Bonds (Ochsner Clinic Foundation Project), Series 2011, 6.25% 2031 (preref. 2021)
| 2,500
| 2,724
|
| Public Facs. Auth., Rev. Bonds (Ochsner Clinic Foundation Project), Series 2011, 6.50% 2037 (preref. 2021)
| 2,420
| 2,647
|
| Public Facs. Auth., Rev. Bonds (Ochsner Clinic Foundation Project), Series 2011, 6.75% 2041 (preref. 2021)
| 2,000
| 2,197
|
The Tax-Exempt Bond Fund of America — Page
51 of 120
Bonds, notes & other debt instruments (continued)
Louisiana (continued)
| Principal amount
(000)
| Value
(000)
|
| Public Facs. Auth., Rev. Bonds (Ochsner Clinic Foundation Project), Series 2015, 5.00% 2033
| $3,455
| $3,927
|
| Public Facs. Auth., Rev. Bonds (Ochsner Clinic Foundation Project), Series 2016, 5.00% 2032 (preref. 2026)
| 5
| 6
|
| Public Facs. Auth., Rev. Bonds (Ochsner Clinic Foundation Project), Series 2016, 5.00% 2034 (preref. 2026)
| 10
| 12
|
| Public Facs. Auth., Rev. Ref. Bonds (Entergy Louisiana, LLC Project), Series 2016-B, 3.50% 2030
| 500
| 509
|
Public Facs. Auth., Rev. Ref. Bonds (Nineteenth Judicial Dist. Court Building Project), Series 2015,
Assured Guaranty Municipal insured, 5.25% 2051
| 13,405
| 15,201
|
| Public Facs. Auth., Rev. Ref. Bonds (Ochsner Clinic Foundation Project), Series 2015, 5.00% 2032
| 2,000
| 2,281
|
| Public Facs. Auth., Rev. Ref. Bonds (Ochsner Clinic Foundation Project), Series 2015, 5.00% 2047
| 5,700
| 6,362
|
| Public Facs. Auth., Rev. Ref. Bonds (Ochsner Clinic Foundation Project), Series 2016, 5.00% 2032
| 495
| 577
|
| Public Facs. Auth., Rev. Ref. Bonds (Ochsner Clinic Foundation Project), Series 2016, 5.00% 2034
| 1,490
| 1,723
|
| St. Tammany Public Trust Fncg. Auth., Rev. and Rev. Ref. Bonds (Christwood Project), Series 2014, 5.00% 2024
| 625
| 673
|
| St. Tammany Public Trust Fncg. Auth., Rev. and Rev. Ref. Bonds (Christwood Project), Series 2014, 5.25% 2029
| 1,150
| 1,254
|
City of Shreveport, Water and Sewer Rev. Bonds, Series 2017-B, Assured Guaranty Municipal insured,
5.00% 2036
| 1,250
| 1,492
|
City of Shreveport, Water and Sewer Rev. Bonds, Series 2017-B, Assured Guaranty Municipal insured,
5.00% 2037
| 1,340
| 1,596
|
City of Shreveport, Water and Sewer Rev. Bonds, Series 2017-B, Assured Guaranty Municipal insured,
5.00% 2041
| 1,000
| 1,183
|
City of Shreveport, Water and Sewer Rev. Bonds, Series 2018-C, Assured Guaranty Municipal insured,
5.00% 2029
| 4,300
| 5,363
|
City of Shreveport, Water and Sewer Rev. Bonds, Series 2019-B, Assured Guaranty Municipal insured,
4.00% 2033
| 325
| 370
|
City of Shreveport, Water and Sewer Rev. Bonds, Series 2019-B, Assured Guaranty Municipal insured,
4.00% 2036
| 365
| 408
|
City of Shreveport, Water and Sewer Rev. Bonds, Series 2019-B, Assured Guaranty Municipal insured,
5.00% 2031
| 500
| 620
|
Tobacco Settlement Fncg. Corp., Tobacco Settlement Asset-Backed Rev. Ref. Bonds, Series 2013-A,
5.50% 2029
| 4,035
| 4,043
|
|
|
| 345,005
|
| Maine 0.29%
|
|
|
| Health and Higher Educational Facs. Auth., Rev. Bonds (Eastern Maine Healthcare Systems Obligated Group Issue), Series 2016-A, 5.00% 2046
| 8,750
| 9,692
|
| Health and Higher Educational Facs. Auth., Rev. Bonds (MaineGeneral Medical Center Issue), Series 2011, 6.75% 2036
| 8,000
| 8,659
|
| Health and Higher Educational Facs. Auth., Rev. Bonds (MaineGeneral Medical Center Issue), Series 2011, 6.75% 2041
| 2,000
| 2,158
|
| Health and Higher Educational Facs. Auth., Rev. Bonds (MaineGeneral Medical Center Issue), Series 2011, 7.00% 2041
| 500
| 542
|
| Housing Auth., Mortgage Purchase Bonds, Series 2016-B-1, 3.50% 2046
| 4,375
| 4,545
|
| Housing Auth., Mortgage Purchase Bonds, Series 2016-C, 3.50% 2046
| 4,725
| 4,943
|
| Housing Auth., Mortgage Purchase Bonds, Series 2017-A, 4.00% 2047
| 2,170
| 2,314
|
| Housing Auth., Mortgage Purchase Bonds, Series 2017-B, 4.00% 2047
| 1,895
| 2,026
|
| Housing Auth., Mortgage Purchase Bonds, Series 2017-F, 3.50% 2047
| 2,730
| 2,890
|
| Housing Auth., Mortgage Purchase Bonds, Series 2018-F, 4.25% 2048
| 1,960
| 2,159
|
| Housing Auth., Mortgage Purchase Bonds, Series 2019-A, 4.00% 2049
| 2,415
| 2,648
|
| Housing Auth., Mortgage Purchase Bonds, Series 2019-C, 4.00% 2050
| 7,825
| 8,648
|
| Housing Auth., Mortgage Purchase Rev. Ref. Bonds, Series 2013-B, 4.00% 2043
| 190
| 197
|
| Housing Auth., Mortgage Purchase Rev. Ref. Bonds, Series 2015-B, 3.50% 2040
| 825
| 855
|
| Turnpike Auth., Turnpike Rev. Bonds, Series 2018, 5.00% 2047
| 9,000
| 10,865
|
|
|
| 63,141
|
The Tax-Exempt Bond Fund of America — Page
52 of 120
Bonds, notes & other debt instruments (continued)
Maryland 1.41%
| Principal amount
(000)
| Value
(000)
|
| County of Anne Arundel, Consolidated Special Taxing Dist. Rev. Ref. Bonds (Villages of Dorchester and Farmington Village Projects), Series 2013, 5.00% 2022
| $500
| $554
|
| County of Anne Arundel, Consolidated Special Taxing Dist. Rev. Ref. Bonds (Villages of Dorchester and Farmington Village Projects), Series 2013, 5.00% 2023
| 225
| 257
|
| County of Anne Arundel, Consolidated Special Taxing Dist. Rev. Ref. Bonds (Villages of Dorchester and Farmington Village Projects), Series 2013, 5.00% 2032
| 1,000
| 1,127
|
| County of Baltimore, Rev. Bonds (Oak Crest Village, Inc. Fac.), Series 2016, 5.00% 2029
| 1,000
| 1,189
|
| County of Baltimore, Rev. Bonds (Oak Crest Village, Inc. Fac.), Series 2016, 5.00% 2030
| 1,000
| 1,182
|
| County of Baltimore, Rev. Bonds (Oak Crest Village, Inc. Fac.), Series 2016, 5.00% 2037
| 2,100
| 2,422
|
| Mayor and City Council of Baltimore, Rev. Bonds (Wastewater Projects), Series 2014-C, 5.00% 2032
| 2,000
| 2,338
|
| Mayor and City Council of Baltimore, Rev. Bonds (Wastewater Projects), Series 2014-C, 5.00% 2044
| 5,000
| 5,723
|
| Mayor and City Council of Baltimore, Rev. Bonds (Water Projects), Series 2011-A, 5.00% 2041
| 1,000
| 1,062
|
| Mayor and City Council of Baltimore, Rev. Bonds (Water Projects), Series 2014-A, 5.00% 2044
| 1,500
| 1,711
|
| Mayor and City Council of Baltimore, Rev. Ref. Bonds (Wastewater Projects), Series 2014, 5.00% 2039
| 2,215
| 2,541
|
Mayor and City Council of Baltimore, Rev. Ref. Bonds (Water Projects), Series 1994-A, FGIC insured,
5.00% 2024
| 1,070
| 1,150
|
| Community Dev. Administration, Dept. of Housing and Community Dev., Housing Rev. Bonds, Series 2015-B, 4.05% 2040
| 2,500
| 2,631
|
Community Dev. Administration, Dept. of Housing and Community Dev., Residential Rev. Bonds,
Series 2018-A, 4.50% 2048
| 8,500
| 9,432
|
Community Dev. Administration, Dept. of Housing and Community Dev., Residential Rev. Bonds,
Series 2019-A, 4.25% 2049
| 9,000
| 9,896
|
Community Dev. Administration, Dept. of Housing and Community Dev., Residential Rev. Bonds,
Series 2019-B, 4.00% 2049
| 7,000
| 7,705
|
Community Dev. Administration, Dept. of Housing and Community Dev., Residential Rev. Ref. Bonds,
Series 2015-A, 3.50% 2045
| 2,195
| 2,295
|
| Community Dev. Administration, Dept. of Housing and Community Dev., Single Family Housing Rev. Bonds, Series 2011-B, 4.00% 2027
| 300
| 308
|
| Econ. Dev. Corp., Econ. Dev. Rev. Ref. Bonds (Transportation Facs. Project), Series 2017-A, 5.00% 2027
| 1,350
| 1,645
|
| Econ. Dev. Corp., Econ. Dev. Rev. Ref. Bonds (Transportation Facs. Project), Series 2017-A, 5.00% 2028
| 2,000
| 2,475
|
| Econ. Dev. Corp., Econ. Dev. Rev. Ref. Bonds (Transportation Facs. Project), Series 2017-A, 5.00% 2030
| 1,250
| 1,536
|
| Econ. Dev. Corp., Econ. Dev. Rev. Ref. Bonds (Transportation Facs. Project), Series 2017-A, 5.00% 2031
| 1,000
| 1,213
|
| Econ. Dev. Corp., Econ. Dev. Rev. Ref. Bonds (Transportation Facs. Project), Series 2017-A, 5.00% 2035
| 2,000
| 2,396
|
Econ. Dev. Corp., Rev. Ref. Bonds (Constellation Energy Group, Inc. Project), Series 2006-B,
2.55% 2025 (put 2020)
| 1,835
| 1,843
|
Econ. Dev. Corp., Senior Student Housing Rev. Ref. Bonds (University of Maryland, Baltimore Project),
Series 2015, 5.00% 2035
| 1,000
| 1,095
|
Econ. Dev. Corp., Senior Student Housing Rev. Ref. Bonds (University of Maryland, Baltimore Project),
Series 2015, 5.00% 2039
| 2,605
| 2,835
|
| Econ. Dev. Corp., Student Housing Rev. Bonds (Towson University Project), Series 2012, 5.00% 2027
| 700
| 760
|
| Econ. Dev. Corp., Student Housing Rev. Bonds (Towson University Project), Series 2012, 5.00% 2029
| 250
| 271
|
| Econ. Dev. Corp., Student Housing Rev. Ref. Bonds (Bowie State University Project), Series 2015, 5.00% 20331
| 2,540
| 2,748
|
Econ. Dev. Corp., Student Housing Rev. Ref. Bonds (Frostburg State University Project), Series 2013,
5.00% 2023
| 1,010
| 1,098
|
Econ. Dev. Corp., Student Housing Rev. Ref. Bonds (Frostburg State University Project), Series 2013,
5.00% 2033
| 1,000
| 1,079
|
Econ. Dev. Corp., Student Housing Rev. Ref. Bonds (Morgan State University Project), Series 2012,
5.00% 2034
| 2,930
| 3,066
|
| Econ. Dev. Corp., Student Housing Rev. Ref. Bonds (Towson University Project), Series 2017, 5.00% 2027
| 135
| 162
|
| Econ. Dev. Corp., Student Housing Rev. Ref. Bonds (Towson University Project), Series 2017, 5.00% 2028
| 175
| 209
|
| Econ. Dev. Corp., Student Housing Rev. Ref. Bonds (Towson University Project), Series 2017, 5.00% 2029
| 190
| 226
|
| Econ. Dev. Corp., Student Housing Rev. Ref. Bonds (Towson University Project), Series 2017, 5.00% 2030
| 325
| 384
|
| Econ. Dev. Corp., Student Housing Rev. Ref. Bonds (Towson University Project), Series 2017, 5.00% 2031
| 375
| 441
|
| Econ. Dev. Corp., Student Housing Rev. Ref. Bonds (Towson University Project), Series 2017, 5.00% 2032
| 325
| 380
|
| Econ. Dev. Corp., Student Housing Rev. Ref. Bonds (Towson University Project), Series 2017, 5.00% 2036
| 600
| 692
|
The Tax-Exempt Bond Fund of America — Page
53 of 120
Bonds, notes & other debt instruments (continued)
Maryland (continued)
| Principal amount
(000)
| Value
(000)
|
| Econ. Dev. Corp., Student Housing Rev. Ref. Bonds (Towson University Project), Series 2017, 5.00% 2037
| $1,000
| $1,050
|
Econ. Dev. Corp., Student Housing Rev. Ref. Bonds (University of Maryland, College Park Projects),
Series 2016, Assured Guaranty Municipal insured, 5.00% 2031
| 1,000
| 1,197
|
Econ. Dev. Corp., Student Housing Rev. Ref. Bonds (University of Maryland, College Park Projects),
Series 2016, Assured Guaranty Municipal insured, 4.00% 2024
| 1,350
| 1,517
|
Econ. Dev. Corp., Student Housing Rev. Ref. Bonds (University of Maryland, College Park Projects),
Series 2016, Assured Guaranty Municipal insured, 5.00% 2028
| 920
| 1,118
|
Econ. Dev. Corp., Student Housing Rev. Ref. Bonds (University of Maryland, College Park Projects),
Series 2016, Assured Guaranty Municipal insured, 5.00% 2029
| 900
| 1,088
|
Econ. Dev. Corp., Student Housing Rev. Ref. Bonds (University of Maryland, College Park Projects),
Series 2016, Assured Guaranty Municipal insured, 5.00% 2035
| 2,265
| 2,667
|
Econ. Dev. Corp., Student Housing Rev. Ref. Bonds (University of Maryland, College Park Projects),
Series 2016, Assured Guaranty Municipal insured, 5.00% 2043
| 1,250
| 1,452
|
| County of Frederick, Urbana Community Dev. Auth., Special Obligation Bonds, Series 2010-A, 5.00% 2023
| 2,795
| 2,905
|
| County of Frederick, Urbana Community Dev. Auth., Special Obligation Bonds, Series 2010-A, 5.00% 2024
| 1,000
| 1,039
|
| County of Frederick, Urbana Community Dev. Auth., Special Obligation Bonds, Series 2010-A, 5.00% 2030
| 2,995
| 3,103
|
| G.O. Bonds, State and Local Facs. Loan of 2015, First Series A, 5.00% 2026 (preref. 2023)
| 10,000
| 11,354
|
| G.O. Rev. Ref. Bonds, State and Local Facs. Loan of 2010, First Series B, 5.00% 2022
| 2,000
| 2,046
|
| G.O. Rev. Ref. Bonds, State and Local Facs. Loan of 2017, Second Series B, 5.00% 2026
| 9,475
| 11,817
|
City of Gaithersburg, Econ. Dev. Rev. Ref. Bonds (Asbury Maryland Obligated Group), Series 2009-B,
6.00% 2023
| 1,750
| 1,783
|
Health and Higher Educational Facs. Auth., Rev. Bonds (Adventist HealthCare Issue), Series 2016-A,
5.50% 2046
| 11,900
| 13,849
|
| Health and Higher Educational Facs. Auth., Rev. Bonds (Anne Arundel Health System Issue), Series 2012, 5.00% 2021
| 800
| 856
|
| Health and Higher Educational Facs. Auth., Rev. Bonds (Anne Arundel Health System Issue), Series 2012, 5.00% 2027
| 400
| 441
|
| Health and Higher Educational Facs. Auth., Rev. Bonds (Broadmead Issue), Series 2018-A, 5.00% 2030
| 500
| 585
|
| Health and Higher Educational Facs. Auth., Rev. Bonds (Broadmead Issue), Series 2018-A, 5.00% 2043
| 700
| 793
|
| Health and Higher Educational Facs. Auth., Rev. Bonds (Broadmead Issue), Series 2018-A, 5.00% 2048
| 1,940
| 2,192
|
Health and Higher Educational Facs. Auth., Rev. Bonds (Charlestown Community Issue), Series 2016-A,
5.00% 2036
| 2,835
| 3,310
|
Health and Higher Educational Facs. Auth., Rev. Bonds (Charlestown Community Issue), Series 2016-A,
5.00% 2045
| 13,000
| 14,961
|
Health and Higher Educational Facs. Auth., Rev. Bonds (Johns Hopkins University Issue), Series 2015-A,
5.00% 2028
| 1,650
| 1,987
|
Health and Higher Educational Facs. Auth., Rev. Bonds (LifeBridge Health Issue), Series 2011,
5.50% 2026 (preref. 2021)
| 700
| 757
|
Health and Higher Educational Facs. Auth., Rev. Bonds (LifeBridge Health Issue), Series 2011,
5.75% 2031 (preref. 2021)
| 2,000
| 2,171
|
Health and Higher Educational Facs. Auth., Rev. Bonds (LifeBridge Health Issue), Series 2011,
6.00% 2025 (preref. 2021)
| 425
| 463
|
| Health and Higher Educational Facs. Auth., Rev. Bonds (LifeBridge Health Issue), Series 2016, 5.00% 2047
| 1,000
| 1,145
|
Health and Higher Educational Facs. Auth., Rev. Bonds (Loyola University Maryland Issue), Series 2014,
5.00% 2032
| 165
| 190
|
Health and Higher Educational Facs. Auth., Rev. Bonds (Loyola University Maryland Issue), Series 2014,
5.00% 2027
| 125
| 146
|
Health and Higher Educational Facs. Auth., Rev. Bonds (Loyola University Maryland Issue), Series 2014,
5.00% 2028
| 215
| 251
|
Health and Higher Educational Facs. Auth., Rev. Bonds (Mercy Medical Center Issue),
Series 2012, 5.00% 2031
| 1,000
| 1,077
|
Health and Higher Educational Facs. Auth., Rev. Bonds (Mercy Medical Center Issue),
Series 2016-A, 5.00% 2032
| 800
| 930
|
Health and Higher Educational Facs. Auth., Rev. Bonds (Mercy Medical Center Issue),
Series 2016-A, 5.00% 2033
| 1,000
| 1,159
|
The Tax-Exempt Bond Fund of America — Page
54 of 120
Bonds, notes & other debt instruments (continued)
Maryland (continued)
| Principal amount
(000)
| Value
(000)
|
Health and Higher Educational Facs. Auth., Rev. Bonds (Mercy Medical Center Issue),
Series 2016-A, 5.00% 2034
| $1,800
| $2,075
|
Health and Higher Educational Facs. Auth., Rev. Bonds (Mercy Medical Center Issue),
Series 2016-A, 5.00% 2036
| 1,500
| 1,716
|
Health and Higher Educational Facs. Auth., Rev. Bonds (University of Maryland Medical System Issue),
Series 2015, 5.00% 2028
| 1,035
| 1,224
|
| Health and Higher Educational Facs. Auth., Rev. Ref. Bonds (Carroll Hospital Center Issue), Series 2012-A, 5.00% 2037
| 1,530
| 1,659
|
| Health and Higher Educational Facs. Auth., Rev. Ref. Bonds (MedStar Health Issue), Series 2015, 5.00% 2038
| 9,000
| 10,204
|
| Health and Higher Educational Facs. Auth., Rev. Ref. Bonds (MedStar Health Issue), Series 2015, 5.00% 2042
| 4,470
| 5,046
|
| Health and Higher Educational Facs. Auth., Rev. Ref. Bonds (Mercy Ridge Issue), Series 2007, 4.50% 2022
| 655
| 656
|
| Health and Higher Educational Facs. Auth., Rev. Ref. Bonds (Mercy Ridge Issue), Series 2007, 4.75% 2034
| 3,590
| 3,596
|
Health and Higher Educational Facs. Auth., Rev. Ref. Bonds (Meritus Medical Center), Series 2015,
5.00% 2040
| 1,000
| 1,131
|
Health and Higher Educational Facs. Auth., Rev. Ref. Bonds (Meritus Medical Center), Series 2015,
5.00% 2045
| 1,000
| 1,123
|
| Health and Higher Educational Facs. Auth., Rev. Ref. Bonds (University of Maryland Medical System Issue), Series 2010, 5.00% 2034
| 55
| 55
|
| Health and Higher Educational Facs. Auth., Rev. Ref. Bonds (University of Maryland Medical System Issue), Series 2010, 5.25% 2024
| 785
| 786
|
County of Howard, Special Obligation Bonds (Annapolis Junction Town Center Project), Series 2014,
6.10% 2044
| 1,420
| 1,475
|
| County of Montgomery, Consolidated Public Improvement G.O. Bonds, Series 2012-A, 5.00% 2019
| 10,000
| 10,097
|
| County of Montgomery, Consolidated Public Improvement G.O. Rev. Ref. Bonds, Series 2017-C, 5.00% 2025
| 10,000
| 12,248
|
County of Montgomery, Housing Opportunities Commission, Multi Family Housing Dev. Bonds,
Series 2004-A, 4.65% 2030
| 2,670
| 2,676
|
County of Montgomery, Housing Opportunities Commission, Program Rev. Bonds, Series 2019-A,
4.00% 2049
| 3,000
| 3,307
|
County of Montgomery, Housing Opportunities Commission, Single Family Housing Rev. Bonds,
Series 2012-A, 5.00% 2043
| 220
| 228
|
County of Montgomery, Housing Opportunities Commission, Single Family Housing Rev. Bonds,
Series 2013-A, 4.00% 2031
| 3,175
| 3,344
|
County of Montgomery, Housing Opportunities Commission, Single Family Housing Rev. Bonds,
Series 2017-A, 4.00% 2048
| 980
| 1,053
|
County of Montgomery, Housing Opportunities Commission, Single Family Housing Rev. Bonds,
Series 2018-A, 4.00% 2049
| 4,650
| 5,050
|
| County of Montgomery, Rev. Ref. Bonds (Trinity Health Credit Group), Series 2011, 5.00% 2040
| 1,100
| 1,187
|
| County of Montgomery, Rev. Ref. Bonds (Trinity Health Credit Group), Series 2013, 5.00% 2045
| 1,000
| 1,160
|
| County of Montgomery, Rev. Ref. Bonds (Trinity Health Credit Group), Series 2015, 5.00% 2044
| 3,000
| 3,427
|
| Morgan State University, Public Higher Education Institution of the State of Maryland, Academic Fees and Auxiliary Facs. Fees Rev. Ref. Bonds, Series 2012, 5.00%
2021
| 230
| 247
|
| Morgan State University, Public Higher Education Institution of the State of Maryland, Academic Fees and Auxiliary Facs. Fees Rev. Ref. Bonds, Series 2012, 5.00%
2022
| 360
| 399
|
| Morgan State University, Public Higher Education Institution of the State of Maryland, Academic Fees and Auxiliary Facs. Fees Rev. Ref. Bonds, Series 2012, 5.00%
2023
| 320
| 354
|
| Morgan State University, Public Higher Education Institution of the State of Maryland, Academic Fees and Auxiliary Facs. Fees Rev. Ref. Bonds, Series 2012, 5.00%
2024
| 600
| 663
|
| Morgan State University, Public Higher Education Institution of the State of Maryland, Academic Fees and Auxiliary Facs. Fees Rev. Ref. Bonds, Series 2012, 5.00%
2028
| 300
| 329
|
| Morgan State University, Public Higher Education Institution of the State of Maryland, Academic Fees and Auxiliary Facs. Fees Rev. Ref. Bonds, Series 2012, 5.00%
2030
| 150
| 164
|
| Morgan State University, Public Higher Education Institution of the State of Maryland, Academic Fees and Auxiliary Facs. Fees Rev. Ref. Bonds, Series 2012, 5.00%
2032
| 225
| 246
|
| County of Prince George, Special Obligation Bonds (National Harbor Project), Series 2004, 5.20% 2034
| 6,729
| 6,756
|
| County of Prince George, Special Obligation Bonds (Suitland-Naylor Road Project), Series 2016, 4.75% 20361
| 1,750
| 1,845
|
The Tax-Exempt Bond Fund of America — Page
55 of 120
Bonds, notes & other debt instruments (continued)
Maryland (continued)
| Principal amount
(000)
| Value
(000)
|
County of Prince George, Special Obligation Bonds (Woodview Village Infrastructure Improvements),
Series 1997-A, 4.60% 2021
| $870
| $873
|
County of Prince George, Special Obligation Bonds (Woodview Village Infrastructure Improvements),
Series 1997-A, 4.70% 2026
| 2,545
| 2,552
|
| County of Prince George, Special Obligation Rev. Ref. Bonds (Woodview Village Phase II Infrastructure Improvements), Series 2006, RADIAN insured, 5.00% 2026
| 1,000
| 1,003
|
| County of Prince George, Special Obligation Rev. Ref. Bonds (Woodview Village Phase II Infrastructure Improvements), Series 2006, RADIAN insured, 5.00% 2032
| 1,150
| 1,154
|
| County of Prince George, Special Tax Dist. Bonds (Victoria Falls Project), Series 2005, 5.25% 2035
| 4,250
| 4,296
|
| Transportation Auth., Transportation Facs. Projects Rev. Ref. Bonds, Series 2012, 4.00% 2026
| 1,000
| 1,078
|
| Washington Suburban Sanitary Dist., Consolidated Public Improvement Bonds, Series 2012, 5.00% 2021
| 1,000
| 1,071
|
| Washington Suburban Sanitary Dist., Consolidated Public Improvement Bonds, Series 2014-2, 4.00% 2029
| 1,875
| 2,092
|
| Washington Suburban Sanitary Dist., Consolidated Public Improvement Bonds, Series 2014-2, 4.00% 2043
| 1,500
| 1,612
|
| Washington Suburban Sanitary Dist., Consolidated Public Improvement Bonds, Series 2015, 3.00% 2028
| 3,305
| 3,504
|
Washington Suburban Sanitary Dist., Consolidated Public Improvement Rev. Ref. Bonds, Series 2017,
3.00% 2027
| 11,470
| 12,635
|
Washington Suburban Sanitary Dist., Consolidated Public Improvement Rev. Ref. Bonds, Series 2017,
3.00% 2031
| 15,410
| 16,287
|
|
|
| 305,159
|
| Massachusetts 1.21%
|
|
|
| College Building Auth., Rev. Ref. Bonds, Series 2012-B, 5.00% 2030
| 1,000
| 1,094
|
| Dev. Fin. Agcy., Hospital Rev. Bonds (Healthcare Obligated Group Issue), Series 2013, 5.25% 2041
| 4,500
| 5,041
|
| Dev. Fin. Agcy., Rev. Bonds (Beth Israel Lahey Health Issue), Series 2019-K, 5.00% 2032
| 1,000
| 1,249
|
| Dev. Fin. Agcy., Rev. Bonds (Beth Israel Lahey Health Issue), Series 2019-K, 5.00% 2034
| 1,000
| 1,239
|
| Dev. Fin. Agcy., Rev. Bonds (Beth Israel Lahey Health Issue), Series 2019-K, 5.00% 2035
| 550
| 679
|
| Dev. Fin. Agcy., Rev. Bonds (Beth Israel Lahey Health Issue), Series 2019-K, 5.00% 2036
| 625
| 768
|
| Dev. Fin. Agcy., Rev. Bonds (Beth Israel Lahey Health Issue), Series 2019-K, 5.00% 2037
| 425
| 520
|
| Dev. Fin. Agcy., Rev. Bonds (Beth Israel Lahey Health Issue), Series 2019-K, 5.00% 2038
| 700
| 854
|
| Dev. Fin. Agcy., Rev. Bonds (Boston Medical Center Issue), Series 2015-D, 5.00% 2044
| 2,250
| 2,498
|
| Dev. Fin. Agcy., Rev. Bonds (Boston University Issue), Series 2013-X, 5.00% 2048
| 17,500
| 19,490
|
| Dev. Fin. Agcy., Rev. Bonds (Boston University Issue), Series U-4, 5.60% 2035 (preref. 2019)
| 3,000
| 3,022
|
| Dev. Fin. Agcy., Rev. Bonds (Brandeis University Issue), Series 2010-O-2, 5.00% 2023 (preref. 2019)
| 3,000
| 3,019
|
| Dev. Fin. Agcy., Rev. Bonds (Brandeis University Issue), Series 2010-O-2, 5.00% 2024
| 1,835
| 1,847
|
| Dev. Fin. Agcy., Rev. Bonds (Brandeis University Issue), Series 2010-O-2, 5.00% 2027 (preref. 2019)
| 1,500
| 1,510
|
| Dev. Fin. Agcy., Rev. Bonds (Linden Ponds, Inc. Issue), Capital Appreciation Bonds, Series 2011-B, 0% 2056
| 1,961
| 552
|
| Dev. Fin. Agcy., Rev. Bonds (Partners HealthCare System Issue), Series 2012-L, 5.00% 2031
| 485
| 518
|
| Dev. Fin. Agcy., Rev. Bonds (Partners HealthCare System Issue), Series 2012-L, 5.00% 2031 (preref. 2021)
| 515
| 553
|
| Dev. Fin. Agcy., Rev. Bonds (Partners HealthCare System Issue), Series 2014-M-4, 5.00% 2044
| 6,860
| 7,629
|
| Dev. Fin. Agcy., Rev. Bonds (Partners HealthCare System Issue), Series 2017-S, 4.00% 2036
| 7,500
| 8,415
|
| Dev. Fin. Agcy., Rev. Bonds (Partners HealthCare System Issue), Series 2017-S-1, 4.00% 2041
| 4,805
| 5,308
|
| Dev. Fin. Agcy., Rev. Bonds (Partners HealthCare System Issue), Series 2017-S-2, 5.00% 2038 (put 2025)
| 13,665
| 16,294
|
Dev. Fin. Agcy., Rev. Bonds (Partners HealthCare System Issue), Series 2017-S-3,
(SIFMA Municipal Swap Index + 0.50%) 1.90% 20382
| 1,725
| 1,726
|
| Dev. Fin. Agcy., Rev. Bonds (UMass Memorial Health Care Obligated Group Issue), Series 2016-I, 5.00% 2030
| 2,000
| 2,365
|
| Dev. Fin. Agcy., Rev. Bonds (UMass Memorial Health Care Obligated Group Issue), Series 2016-I, 5.00% 2031
| 1,925
| 2,262
|
| Dev. Fin. Agcy., Rev. Bonds (Wellforce Obligated Issue), Series 2019-A, 5.00% 2029
| 500
| 622
|
| Dev. Fin. Agcy., Rev. Bonds (Wellforce Obligated Issue), Series 2019-A, 5.00% 2030
| 600
| 740
|
| Dev. Fin. Agcy., Rev. Bonds (Wellforce Obligated Issue), Series 2019-A, 5.00% 2031
| 500
| 612
|
| Dev. Fin. Agcy., Rev. Bonds (Wellforce Obligated Issue), Series 2019-A, 5.00% 2034
| 675
| 817
|
| Dev. Fin. Agcy., Rev. Bonds (Wellforce Obligated Issue), Series 2019-A, 5.00% 2036
| 1,000
| 1,198
|
Dev. Fin. Agcy., Rev. Bonds (Wellforce Obligated Issue), Series 2019-A,
Assured Guaranty Municipal insured, 5.00% 2033
| 805
| 978
|
| Dev. Fin. Agcy., Rev. Ref. Bonds (Boston University Issue), Series 2014-Z-1, 1.50% 2019 (escrowed to maturity)
| 1,605
| 1,605
|
| Dev. Fin. Agcy., Rev. Ref. Bonds (Boston University Issue), Series V-1, 5.00% 2029 (preref. 2019)
| 7,800
| 7,850
|
The Tax-Exempt Bond Fund of America — Page
56 of 120
Bonds, notes & other debt instruments (continued)
Massachusetts (continued)
| Principal amount
(000)
| Value
(000)
|
| Dev. Fin. Agcy., Rev. Ref. Bonds (Emerson College Issue), Series 2010-A, 5.00% 2040 (preref. 2020)
| $7,605
| $7,729
|
| Dev. Fin. Agcy., Rev. Ref. Bonds (Emerson College Issue), Series 2010-A, 5.00% 2040 (preref. 2020)
| 770
| 783
|
| Dev. Fin. Agcy., Rev. Ref. Bonds (Orchard Cove, Inc. Issue), Series 2019, 5.00% 2039
| 250
| 282
|
| Dev. Fin. Agcy., Rev. Ref. Bonds (Orchard Cove, Inc. Issue), Series 2019, 5.00% 2049
| 2,700
| 3,025
|
| Dev. Fin. Agcy., Rev. Ref. Bonds (Suffolk University Issue), Series 2017, 5.00% 2030
| 2,500
| 3,007
|
| Dev. Fin. Agcy., Rev. Ref. Bonds (Suffolk University Issue), Series 2017, 5.00% 2032
| 1,250
| 1,487
|
| Dev. Fin. Agcy., Rev. Ref. Bonds (Suffolk University Issue), Series 2017, 5.00% 2034
| 1,000
| 1,180
|
| Dev. Fin. Agcy., Rev. Ref. Bonds (Suffolk University Issue), Series 2019, 5.00% 2029
| 500
| 627
|
| Dev. Fin. Agcy., Rev. Ref. Bonds (Suffolk University Issue), Series 2019, 5.00% 2031
| 1,300
| 1,608
|
| Dev. Fin. Agcy., Rev. Ref. Bonds (Suffolk University Issue), Series 2019, 5.00% 2033
| 1,590
| 1,950
|
| Dev. Fin. Agcy., Rev. Ref. Bonds (Suffolk University Issue), Series 2019, 5.00% 2035
| 1,000
| 1,215
|
| Dev. Fin. Agcy., Rev. Ref. Bonds (Suffolk University Issue), Series 2019, 5.00% 2036
| 445
| 538
|
| Dev. Fin. Agcy., Rev. Ref. Bonds (Suffolk University Issue), Series 2019, 5.00% 2037
| 605
| 729
|
| Dev. Fin. Agcy., Rev. Ref. Bonds (Suffolk University Issue), Series 2019, 5.00% 2038
| 340
| 408
|
| Dev. Fin. Agcy., Rev. Ref. Bonds (Tufts Medical Center Issue), Series 2011-I, 6.75% 2036 (preref. 2021)
| 2,710
| 2,923
|
| Dev. Fin. Agcy., Rev. Ref. Bonds (Tufts Medical Center Issue), Series 2011-I, 6.75% 2036 (preref. 2021)
| 2,585
| 2,787
|
| Dev. Fin. Agcy., Rev. Ref. Bonds (Tufts Medical Center Issue), Series 2011-I, 6.875% 2041 (preref. 2021)
| 3,865
| 4,176
|
| Dev. Fin. Agcy., Rev. Ref. Bonds (Tufts Medical Center Issue), Series 2011-I, 6.875% 2041 (preref. 2021)
| 2,550
| 2,753
|
| Dev. Fin. Agcy., Rev. Ref. Bonds (UMass Memorial Issue), Series 2011-H, 5.50% 2031
| 115
| 123
|
| Dev. Fin. Agcy., Rev. Ref. Bonds (UMass Memorial Issue), Series 2011-H, 5.50% 2031 (preref. 2021)
| 1,565
| 1,695
|
| G.O. Bonds, Consolidated Loan, Series 2018-A, 5.00% 2033
| 10,000
| 12,428
|
| G.O. Bonds, Consolidated Loan, Series 2018-A, 5.00% 2034
| 9,000
| 11,139
|
| G.O. Bonds, Consolidated Loan, Series 2018-A, 5.00% 2039
| 7,500
| 9,106
|
| G.O. Rev. Ref. Bonds, Series 2006-C, Assured Guaranty Municipal insured, 5.25% 2021
| 1,000
| 1,093
|
| Housing Fin. Agcy., Housing Bonds, Series 2009-C, 5.35% 2049
| 4,000
| 4,005
|
| Housing Fin. Agcy., Single Family Housing Rev. Bonds, Series 167, 4.00% 2043
| 635
| 661
|
| Housing Fin. Agcy., Single Family Housing Rev. Bonds, Series 172, 3.65% 2035
| 2,315
| 2,397
|
| Housing Fin. Agcy., Single Family Housing Rev. Bonds, Series 172, 4.00% 2045
| 1,925
| 2,022
|
| Housing Fin. Agcy., Single Family Housing Rev. Bonds, Series 178, 3.50% 2042
| 3,800
| 3,977
|
| Housing Fin. Agcy., Single Family Housing Rev. Bonds, Series 181, 4.00% 2044
| 1,265
| 1,334
|
| Housing Fin. Agcy., Single Family Housing Rev. Bonds, Series 183, 3.50% 2046
| 1,295
| 1,352
|
| Housing Fin. Agcy., Single Family Housing Rev. Bonds, Series 190, 3.15% 2032
| 5,570
| 5,820
|
| Housing Fin. Agcy., Single Family Housing Rev. Bonds, Series 190, 4.00% 2048
| 11,905
| 12,802
|
| Housing Fin. Agcy., Single Family Housing Rev. Bonds, Series 195, 4.00% 2048
| 5,940
| 6,429
|
| Housing Fin. Agcy., Single Family Housing Rev. Bonds, Series 203, 4.50% 2048
| 1,000
| 1,108
|
| Housing Fin. Agcy., Single Family Housing Rev. Ref. Bonds, Series 162, 2.75% 2041
| 580
| 584
|
| Housing Fin. Agcy., Single Family Housing Rev. Ref. Bonds, Series 165, 2.65% 2041
| 965
| 973
|
| Housing Fin. Agcy., Single Family Housing Rev. Ref. Bonds, Series 187, 3.25% 2032
| 4,000
| 4,182
|
| Massachusetts Bay Transportation Auth., Sales Tax Rev. Ref. Bonds, Series 2007-A-1, 5.25% 2032
| 10,000
| 13,785
|
| Port Auth., Special Facs. Rev. Bonds (ConRAC Project), Series 2011-A, 5.125% 2041
| 9,250
| 9,823
|
| Special Obligation Dedicated Tax Rev. Ref. Bonds, Series 2005, FGIC-National insured, 5.00% 2020
| 5,000
| 5,081
|
| Water Resources Auth., General Rev. Ref. Green Bonds, Series 2016-D, 5.00% 2035
| 3,000
| 3,614
|
| Water Resources Auth., General Rev. Ref. Green Bonds, Series 2016-D, 5.00% 2036
| 2,180
| 2,619
|
| Water Resources Auth., General Rev. Ref. Green Bonds, Series 2016-D, 5.00% 2037
| 2,250
| 2,694
|
|
|
| 260,927
|
| Michigan 4.57%
|
|
|
| Building Auth., Rev. Ref. Bonds (Facs. Program), Series 2015-I, 5.00% 2026
| 1,700
| 2,067
|
| Building Auth., Rev. Ref. Bonds (Facs. Program), Series 2015-I, 5.00% 2031
| 10,000
| 11,900
|
| City of Dearborn, Econ. Dev. Corp., Limited Obligation Rev. Ref. Bonds (Henry Ford Village, Inc. Project), Series 2008, 7.00% 2038
| 5,800
| 5,529
|
| City of Detroit, Sewage Disposal System Rev. Ref. Bonds, Series 2006-D, Assured Guaranty Municipal insured, (3-month USD-LIBOR + 0.60%) 2.153% 20322
| 13,660
| 13,696
|
| City of Detroit, Unlimited Tax G.O. Bonds, Series 2018, 5.00% 2027
| 1,000
| 1,131
|
| City of Detroit, Unlimited Tax G.O. Bonds, Series 2018, 5.00% 2030
| 1,300
| 1,470
|
The Tax-Exempt Bond Fund of America — Page
57 of 120
Bonds, notes & other debt instruments (continued)
Michigan (continued)
| Principal amount
(000)
| Value
(000)
|
| City of Detroit, Water and Sewerage Dept., Sewage Disposal System Rev. and Rev. Ref. Bonds, Series 2012-A, 5.00% 2023
| $710
| $781
|
City of Detroit, Water and Sewerage Dept., Sewage Disposal System Rev. and Rev. Ref. Bonds,
Series 2012-A, Assured Guaranty Municipal insured, 5.25% 2039
| 5,900
| 6,418
|
City of Detroit, Water and Sewerage Dept., Sewage Disposal System Rev. Ref. Bonds, Series 2001-B,
Assured Guaranty Municipal Insured, 5.50% 2029
| 10,420
| 13,177
|
| City of Detroit, Water Supply System Rev. Bonds, Series 2011-A, 5.25% 2041
| 14,000
| 14,886
|
Detroit School Dist., Unlimited Tax G.O. School Building and Site Improvement Rev. Ref. Bonds,
Series 1998-C, FGIC insured, 5.25% 2025
| 1,535
| 1,703
|
Detroit School Dist., Unlimited Tax G.O. School Building and Site Improvement Rev. Ref. Bonds,
Series 2005-A, Assured Guaranty Municipal insured, 5.25% 2032
| 20,000
| 26,332
|
Detroit School Dist., Unlimited Tax G.O. School Building and Site Improvement Rev. Ref. Bonds,
Series 2012-A, 5.00% 2026
| 2,000
| 2,192
|
Detroit School Dist., Unlimited Tax G.O. School Building and Site Improvement Rev. Ref. Bonds,
Series 2012-A, 5.00% 2027
| 3,500
| 3,817
|
Detroit School Dist., Unlimited Tax G.O. School Building and Site Improvement Rev. Ref. Bonds,
Series 2012-A, 5.00% 2028
| 3,610
| 3,932
|
Detroit School Dist., Unlimited Tax G.O. School Building and Site Improvement Rev. Ref. Bonds,
Series 2012-A, 5.00% 2030
| 4,000
| 4,350
|
| Fin. Auth., Distributable State Aid Rev. Bonds (Charter County of Wayne Criminal Justice Center Project), Series 2018, 5.00% 2036
| 2,500
| 3,058
|
| Fin. Auth., Distributable State Aid Rev. Bonds (Charter County of Wayne Criminal Justice Center Project), Series 2018, 5.00% 2037
| 1,000
| 1,215
|
| Fin. Auth., Distributable State Aid Rev. Bonds (Charter County of Wayne Criminal Justice Center Project), Series 2018, 5.00% 2038
| 1,000
| 1,211
|
| Fin. Auth., Distributable State Aid Rev. Bonds (Charter County of Wayne Criminal Justice Center Project), Series 2018, 5.00% 2043
| 3,500
| 4,200
|
| Fin. Auth., Hospital Rev. and Rev. Ref. Bonds (Trinity Health Credit Group), Series 2019-MI-1, 5.00% 2048
| 6,560
| 7,812
|
Fin. Auth., Hospital Rev. and Rev. Ref. Bonds (Trinity Health Credit Group), Series 2019-MI-2,
5.00% 2044 (put 2025)
| 5,000
| 5,898
|
| Fin. Auth., Local Government Loan Program Rev. Bonds (Detroit Fin. Recovery Income Tax Local Project Bonds), Series 2014-F-1, 4.50% 2029
| 2,150
| 2,335
|
| Fin. Auth., Local Government Loan Program Rev. Bonds (Detroit Water and Sewerage Dept., Sewage Disposal System Rev. and Rev. Ref. Local Project Bonds), Series
2014-C-1, 5.00% 2044
| 6,050
| 6,501
|
Fin. Auth., Local Government Loan Program Rev. Bonds (Detroit Water and Sewerage Dept., Sewage Disposal System Rev. and Rev. Ref. Local Project Bonds), Series
2014-C-3, Assured Guaranty Municipal insured,
5.00% 2023
| 8,000
| 9,149
|
Fin. Auth., Local Government Loan Program Rev. Bonds (Detroit Water and Sewerage Dept., Sewage Disposal System Rev. Ref. Local Project Bonds), Series 2014-C-3,
Assured Guaranty Municipal insured,
5.00% 2032
| 1,500
| 1,721
|
| Fin. Auth., Local Government Loan Program Rev. Bonds (Detroit Water and Sewerage Dept., Sewage Disposal System Rev. Ref. Local Project Bonds), Series 2015-C, 5.00%
2028
| 1,415
| 1,672
|
| Fin. Auth., Local Government Loan Program Rev. Bonds (Detroit Water and Sewerage Dept., Sewage Disposal System Rev. Ref. Local Project Bonds), Series 2015-C, 5.00%
2032
| 1,355
| 1,575
|
| Fin. Auth., Local Government Loan Program Rev. Bonds (Detroit Water and Sewerage Dept., Sewage Disposal System Rev. Ref. Local Project Bonds), Series 2015-C, 5.00%
2033
| 2,565
| 2,975
|
| Fin. Auth., Local Government Loan Program Rev. Bonds (Detroit Water and Sewerage Dept., Sewage Disposal System Rev. Ref. Local Project Bonds), Series 2015-C, 5.00%
2034
| 3,000
| 3,470
|
| Fin. Auth., Local Government Loan Program Rev. Bonds (Detroit Water and Sewerage Dept., Sewage Disposal System Rev. Ref. Local Project Bonds), Series 2015-C, 5.00%
2035
| 3,000
| 3,461
|
| Fin. Auth., Local Government Loan Program Rev. Bonds (Detroit Water and Sewerage Dept., Water Supply System Rev. Ref. Local Project Bonds), Series 2014-D-4, 5.00%
2034
| 1,425
| 1,622
|
| City of Flint, Hospital Building Auth., Rev. Rental Bonds (Hurley Medical Center), Series 2010, 5.84% 2020
| 400
| 413
|
| City of Flint, Hospital Building Auth., Rev. Rental Bonds (Hurley Medical Center), Series 2013-A, 5.25% 2028
| 3,000
| 3,257
|
| City of Flint, Hospital Building Auth., Rev. Rental Bonds (Hurley Medical Center), Series 2013-A, 5.25% 2039
| 500
| 528
|
The Tax-Exempt Bond Fund of America — Page
58 of 120
Bonds, notes & other debt instruments (continued)
Michigan (continued)
| Principal amount
(000)
| Value
(000)
|
Counties of Genesee, Lapeer and Sanilac, Karegnondi Water Auth., Water Supply System Bonds
(Karegnondi Water Pipeline), Series 2018, 5.00% 2030
| $1,000
| $1,216
|
Counties of Genesee, Lapeer and Sanilac, Karegnondi Water Auth., Water Supply System Bonds
(Karegnondi Water Pipeline), Series 2018, 5.00% 2032
| 1,200
| 1,440
|
Counties of Genesee, Lapeer and Sanilac, Karegnondi Water Auth., Water Supply System Bonds
(Karegnondi Water Pipeline), Series 2018, 5.00% 2035
| 1,580
| 1,869
|
Counties of Genesee, Lapeer and Sanilac, Karegnondi Water Auth., Water Supply System Bonds
(Karegnondi Water Pipeline), Series 2018, 5.00% 2036
| 1,300
| 1,533
|
| Great Lakes Water Auth., Sewage Disposal System Rev. Ref. Bonds, Series 2018-B, 5.00% 2028
| 3,990
| 5,096
|
| Great Lakes Water Auth., Water Supply System Rev. Ref. Bonds, Series 2016-B, 5.00% 2046
| 10,800
| 12,395
|
Great Lakes Water Auth., Water Supply System Rev. Ref. Bonds, Series 2016-B,
Assured Guaranty Municipal insured, 5.00% 2034
| 5,760
| 6,889
|
| Great Lakes Water Auth., Water Supply System Rev. Ref. Bonds, Series 2016-D, 5.00% 2036
| 6,800
| 7,948
|
| Great Lakes Water Auth., Water Supply System Rev. Ref. Bonds, Series 2018-A, 5.00% 2029
| 3,000
| 3,864
|
| Hospital Fin. Auth., Hospital Rev. and Rev. Ref. Bonds (Trinity Health Credit Group), Series 2015, 5.00% 2030
| 5,000
| 5,471
|
| Hospital Fin. Auth., Hospital Rev. and Rev. Ref. Bonds (Trinity Health Credit Group), Series 2015, 5.50% 2026
| 750
| 917
|
| Hospital Fin. Auth., Hospital Rev. and Rev. Ref. Bonds (Trinity Health Credit Group), Series 2017, 5.00% 2028
| 2,000
| 2,494
|
| Hospital Fin. Auth., Hospital Rev. and Rev. Ref. Bonds (Trinity Health Credit Group), Series 2017, 5.00% 2046
| 6,455
| 7,548
|
| Hospital Fin. Auth., Hospital Rev. and Rev. Ref. Bonds (Trinity Health Credit Group), Series 2017-A, 4.00% 2036
| 31,480
| 34,934
|
| Hospital Fin. Auth., Hospital Rev. and Rev. Ref. Bonds (Trinity Health Credit Group), Series 2017-A, 4.00% 2040
| 22,030
| 24,114
|
| Hospital Fin. Auth., Hospital Rev. and Rev. Ref. Bonds (Trinity Health Credit Group), Series 2017-A, 5.00% 2034
| 2,500
| 3,044
|
| Hospital Fin. Auth., Hospital Rev. and Rev. Ref. Bonds (Trinity Health Credit Group), Series 2017-A, 5.00% 2035
| 4,000
| 4,847
|
| Hospital Fin. Auth., Hospital Rev. and Rev. Ref. Bonds (Trinity Health Credit Group), Series 2017-A, 5.00% 2037
| 5,000
| 6,011
|
| Hospital Fin. Auth., Hospital Rev. and Rev. Ref. Bonds (Trinity Health Credit Group), Series 2017-A, 5.00% 2047
| 32,440
| 35,550
|
| Hospital Fin. Auth., Hospital Rev. Bonds (Ascension Health Senior Credit Group), Series 1999-B-3, 4.00% 2027
| 11,375
| 13,475
|
| Hospital Fin. Auth., Hospital Rev. Bonds (Ascension Health Senior Credit Group), Series 1999-B-3, 4.00% 2031
| 4,000
| 4,544
|
| Hospital Fin. Auth., Hospital Rev. Bonds (Ascension Health Senior Credit Group), Series 1999-B-3, 4.00% 2032
| 14,000
| 15,786
|
| Hospital Fin. Auth., Hospital Rev. Bonds (Ascension Health Senior Credit Group), Series 1999-B-3, 4.00% 2033
| 8,000
| 8,995
|
| Hospital Fin. Auth., Hospital Rev. Bonds (Trinity Health Credit Group), Series 2009-B, 5.00% 2048
| 3,705
| 4,008
|
| Hospital Fin. Auth., Hospital Rev. Bonds (Trinity Health Credit Group), Series 2011, 5.00% 2039
| 1,890
| 2,034
|
Hospital Fin. Auth., Hospital Rev. Ref. Bonds (Ascension Health Senior Credit Group), Series 2010-F-1,
4.00% 2047 (put 2023)
| 7,000
| 7,702
|
Hospital Fin. Auth., Hospital Rev. Ref. Bonds (Ascension Health Senior Credit Group), Series 2010-F-2,
1.90% 2047 (put 2021)
| 1,150
| 1,161
|
Hospital Fin. Auth., Hospital Rev. Ref. Bonds (Ascension Health Senior Credit Group), Series 2010-F-3,
4.00% 2047 (put 2024)
| 15,000
| 16,810
|
Hospital Fin. Auth., Hospital Rev. Ref. Bonds (Ascension Health Senior Credit Group), Series 2010-F-5,
2.40% 2047 (put 2023)
| 8,000
| 8,226
|
| Hospital Fin. Auth., Hospital Rev. Ref. Bonds (Beaumont Health Credit Group), Series 2016-A, 5.00% 2044
| 15,010
| 17,074
|
Hospital Fin. Auth., Hospital Rev. Ref. Bonds (Crittenton Hospital Medical Center), Series 2012-A,
5.00% 2039 (preref. 2022)
| 8,315
| 9,199
|
Hospital Fin. Auth., Hospital Rev. Ref. Bonds (Henry Ford Health System), Series 2009,
5.625% 2029 (preref. 2019)
| 1,500
| 1,519
|
| Hospital Fin. Auth., Hospital Rev. Ref. Bonds (Henry Ford Health System), Series 2016, 4.00% 2035
| 3,595
| 3,919
|
| Hospital Fin. Auth., Hospital Rev. Ref. Bonds (Henry Ford Health System), Series 2016, 5.00% 2031
| 4,300
| 5,121
|
| Hospital Fin. Auth., Hospital Rev. Ref. Bonds (Henry Ford Health System), Series 2016, 5.00% 2032
| 1,500
| 1,779
|
| Hospital Fin. Auth., Hospital Rev. Ref. Bonds (Henry Ford Health System), Series 2016, 5.00% 2034
| 1,540
| 1,813
|
| Hospital Fin. Auth., Hospital Rev. Ref. Bonds (Henry Ford Health System), Series 2019-A, 5.00% 2048
| 2,500
| 2,989
|
| Hospital Fin. Auth., Hospital Rev. Ref. Bonds (McLaren Health Care), Series 2012-A, 5.00% 2035
| 1,000
| 1,084
|
Hospital Fin. Auth., Hospital Rev. Ref. Bonds (McLaren Health Care), Series 2015-D-1,
(1-month USD-LIBOR x 0.68 + 0.40%) 1.94% 2030 (put 2021)2
| 14,505
| 14,526
|
Hospital Fin. Auth., Hospital Rev. Ref. Bonds (McLaren Health Care), Series 2015-D-2,
(1-month USD-LIBOR x 0.68 + 0.75%) 2.29% 2038 (put 2020)2
| 6,000
| 6,019
|
| Hospital Fin. Auth., Hospital Rev. Ref. Bonds (McLaren Health Care), Series 2019-A, 4.00% 2044
| 7,500
| 8,152
|
| Hospital Fin. Auth., Hospital Rev. Ref. Bonds (McLaren Health Care), Series 2019-A, 4.00% 2047
| 3,300
| 3,570
|
The Tax-Exempt Bond Fund of America — Page
59 of 120
Bonds, notes & other debt instruments (continued)
Michigan (continued)
| Principal amount
(000)
| Value
(000)
|
| Hospital Fin. Auth., Hospital Rev. Ref. Bonds (MidMichigan Health Credit Group), Series 2014, 5.00% 2039
| $1,000
| $1,117
|
| Hospital Fin. Auth., Hospital Rev. Ref. Bonds (Oakwood Obligated Group), Series 2012, 5.00% 2024
| 9,145
| 10,209
|
| Hospital Fin. Auth., Hospital Rev. Ref. Bonds (Oakwood Obligated Group), Series 2012, 5.00% 2027
| 3,000
| 3,334
|
| Hospital Fin. Auth., Hospital Rev. Ref. Bonds (Sparrow Obligated Group), Series 2015, 5.00% 2029
| 3,000
| 3,513
|
| Hospital Fin. Auth., Hospital Rev. Ref. Bonds (Sparrow Obligated Group), Series 2015, 5.00% 2031
| 1,500
| 1,741
|
| Hospital Fin. Auth., Hospital Rev. Ref. Bonds (Sparrow Obligated Group), Series 2015, 5.00% 2033
| 1,500
| 1,730
|
| Hospital Fin. Auth., Hospital Rev. Ref. Bonds (Sparrow Obligated Group), Series 2015, 5.00% 2034
| 1,500
| 1,724
|
| Hospital Fin. Auth., Hospital Rev. Ref. Bonds (Sparrow Obligated Group), Series 2015, 5.00% 2045
| 1,000
| 1,127
|
| Housing Dev. Auth., Single Family Mortgage Rev. Bonds, Series 2016-A, 4.00% 2046
| 2,115
| 2,244
|
| Housing Dev. Auth., Single Family Mortgage Rev. Bonds, Series 2016-B, 3.35% 2034
| 5,500
| 5,713
|
| Housing Dev. Auth., Single Family Mortgage Rev. Bonds, Series 2016-B, 3.50% 2047
| 26,060
| 27,494
|
| Housing Dev. Auth., Single Family Mortgage Rev. Bonds, Series 2017-B, 3.50% 2048
| 6,110
| 6,475
|
| Housing Dev. Auth., Single Family Mortgage Rev. Bonds, Series 2018-A, 4.00% 2048
| 35,260
| 38,138
|
| Housing Dev. Auth., Single Family Mortgage Rev. Bonds, Series 2018-C, 4.25% 2049
| 25,400
| 27,856
|
| Housing Dev. Auth., Single Family Mortgage Rev. Bonds, Series 2019-A, 3.35% 2034
| 3,000
| 3,153
|
| Housing Dev. Auth., Single Family Mortgage Rev. Bonds, Series 2019-A, 4.25% 2049
| 16,000
| 17,618
|
| County of Kent, Hospital Fin. Auth., Rev. Ref. Bonds (Spectrum Health System), Series 2011-A, 5.00% 2029
| 2,000
| 2,153
|
| City of Kentwood, Econ. Dev. Corp., Limited Obligation Rev. Ref. Bonds (Holland Home Obligated Group), Series 2012, 5.625% 2041
| 500
| 533
|
| City of Lansing, Board of Water and Light, Utility System Rev. Bonds, Series 2019-A, 5.00% 2037
| 4,875
| 6,040
|
| City of Lansing, Board of Water and Light, Utility System Rev. Bonds, Series 2019-A, 5.00% 2038
| 5,120
| 6,319
|
| City of Lansing, Board of Water and Light, Utility System Rev. Bonds, Series 2019-A, 5.00% 2039
| 3,645
| 4,485
|
| City of Lansing, Board of Water and Light, Utility System Rev. Bonds, Series 2019-A, 5.00% 2044
| 44,000
| 53,623
|
| City of Lansing, Board of Water and Light, Utility System Rev. Bonds, Series 2019-A, 5.00% 2048
| 40,000
| 48,513
|
Livonia Public Schools School Dist., School Building and Site G.O. Bonds, Series 2013-I,
Assured Guaranty Municipal insured, 5.00% 2038
| 2,000
| 2,235
|
| Board of Trustees of the Michigan State University, Rev. Bonds, Series 2019-B, 5.00% 2033
| 2,300
| 2,898
|
| Board of Trustees of the Michigan State University, Rev. Bonds, Series 2019-B, 5.00% 2034
| 3,500
| 4,393
|
| Board of Trustees of the Michigan State University, Rev. Bonds, Series 2019-B, 5.00% 2035
| 1,100
| 1,375
|
| Board of Trustees of the Michigan State University, Rev. Bonds, Series 2019-B, 5.00% 2036
| 1,325
| 1,650
|
| Board of Trustees of the Michigan State University, Rev. Bonds, Series 2019-B, 5.00% 2038
| 4,400
| 5,439
|
| Board of Trustees of the Michigan State University, Rev. Bonds, Series 2019-B, 5.00% 2044
| 12,990
| 15,852
|
| Board of Trustees of the Michigan State University, Rev. Bonds, Series 2019-B, 5.00% 2048
| 19,160
| 23,272
|
| Mid-Bay Bridge Auth., Taxable Rev. Bonds, Series 2015-B, 3.10% 2031
| 1,025
| 1,063
|
| Board of Trustees of the Northern Michigan University, General Rev. Bonds, Series 2018-A, 5.00% 2029
| 1,000
| 1,252
|
| City of Royal Oak, Hospital Fin. Auth., Hospital Rev. Ref. Bonds (William Beaumont Hospital Obligated Group), Series 2014-D, 5.00% 2030
| 1,160
| 1,321
|
| City of Saginaw, Hospital Fin. Auth., Hospital Rev. Ref. Bonds (Covenant Medical Center, Inc.), Series 2010-H, 5.00% 2030
| 5,300
| 5,460
|
Strategic Fund, Limited Obligation Rev. Ref. Bonds (Detroit Edison Co. Exempt Facs. Project),
Series 2008-ET-2, 1.45% 2029 (put 2021)
| 2,225
| 2,221
|
Strategic Fund, Limited Obligation Rev. Ref. Bonds (Detroit Edison Co. Exempt Facs. Project),
Series 2008-KT, 5.625% 2020
| 1,500
| 1,557
|
| Tobacco Settlement Fin. Auth., Tobacco Settlement Asset-Backed Rev. Bonds, Series 2008-A, 6.875% 2042
| 8,180
| 8,266
|
| Trunk Line Fund Bonds, Series 2011, 5.00% 2036
| 2,000
| 2,154
|
Regents of the University of Michigan, General Rev. Bonds, Series 2012-E,
(SIFMA Municipal Swap Index + 0.27%) 2.17% 2033 (put 2022)2
| 25,740
| 25,679
|
County of Wayne, Airport Auth., Airport Rev. Bonds (Detroit Metropolitan Wayne County Airport),
Series 2012-A, 5.00% 2032
| 2,500
| 2,775
|
County of Wayne, Airport Auth., Airport Rev. Bonds (Detroit Metropolitan Wayne County Airport),
Series 2012-A, 5.00% 2037
| 7,400
| 8,193
|
County of Wayne, Airport Auth., Airport Rev. Bonds (Detroit Metropolitan Wayne County Airport),
Series 2014-B, 5.00% 2044
| 4,870
| 5,567
|
County of Wayne, Airport Auth., Airport Rev. Bonds (Detroit Metropolitan Wayne County Airport),
Series 2015-D, 5.00% 2040
| 15,800
| 18,226
|
The Tax-Exempt Bond Fund of America — Page
60 of 120
Bonds, notes & other debt instruments (continued)
Michigan (continued)
| Principal amount
(000)
| Value
(000)
|
County of Wayne, Airport Auth., Airport Rev. Bonds (Detroit Metropolitan Wayne County Airport),
Series 2015-D, 5.00% 2045
| $6,500
| $7,476
|
County of Wayne, Airport Auth., Airport Rev. Bonds (Detroit Metropolitan Wayne County Airport),
Series 2017-A, 5.00% 2042
| 1,850
| 2,185
|
County of Wayne, Airport Auth., Airport Rev. Bonds (Detroit Metropolitan Wayne County Airport),
Series 2017-A, 5.00% 2047
| 2,750
| 3,230
|
County of Wayne, Airport Auth., Airport Rev. Bonds (Detroit Metropolitan Wayne County Airport),
Series 2018-A, 5.00% 2030
| 1,300
| 1,635
|
County of Wayne, Airport Auth., Airport Rev. Bonds (Detroit Metropolitan Wayne County Airport),
Series 2018-A, 5.00% 2032
| 1,500
| 1,865
|
County of Wayne, Airport Auth., Airport Rev. Bonds (Detroit Metropolitan Wayne County Airport),
Series 2018-A, 5.00% 2033
| 1,000
| 1,237
|
County of Wayne, Airport Auth., Airport Rev. Bonds (Detroit Metropolitan Wayne County Airport),
Series 2018-A, 5.00% 2034
| 2,000
| 2,463
|
County of Wayne, Airport Auth., Airport Rev. Bonds (Detroit Metropolitan Wayne County Airport),
Series 2018-A, 5.00% 2035
| 4,000
| 4,908
|
County of Wayne, Airport Auth., Airport Rev. Bonds (Detroit Metropolitan Wayne County Airport),
Series 2018-A, 5.00% 2036
| 3,500
| 4,279
|
County of Wayne, Airport Auth., Airport Rev. Bonds (Detroit Metropolitan Wayne County Airport),
Series 2018-A, 5.00% 2037
| 5,585
| 6,804
|
County of Wayne, Airport Auth., Airport Rev. Bonds (Detroit Metropolitan Wayne County Airport),
Series 2018-A, 5.00% 2038
| 3,000
| 3,644
|
County of Wayne, Airport Auth., Airport Rev. Bonds (Detroit Metropolitan Wayne County Airport),
Series 2018-A, 5.00% 2043
| 4,210
| 5,047
|
County of Wayne, Airport Auth., Airport Rev. Ref. Bonds (Detroit Metropolitan Wayne County Airport),
Series 2010-C, 5.00% 2021
| 12,190
| 12,844
|
County of Wayne, Airport Auth., Airport Rev. Ref. Bonds (Detroit Metropolitan Wayne County Airport),
Series 2010-C, 5.00% 2022
| 2,140
| 2,252
|
County of Wayne, Airport Auth., Airport Rev. Ref. Bonds (Detroit Metropolitan Wayne County Airport),
Series 2010-C, 5.50% 2020
| 9,000
| 9,520
|
County of Wayne, Airport Auth., Airport Rev. Ref. Bonds (Detroit Metropolitan Wayne County Airport),
Series 2011-B, 5.00% 2019
| 1,290
| 1,307
|
|
|
| 988,535
|
| Minnesota 0.67%
|
|
|
City of Duluth, Econ. Dev. Auth., Health Care Facs. Rev. Bonds (Essentia Health Obligated Group),
Series 2018-A, 5.00% 2048
| 3,000
| 3,500
|
City of Duluth, Econ. Dev. Auth., Health Care Facs. Rev. Bonds (Essentia Health Obligated Group),
Series 2018-A, 5.00% 2058
| 30,000
| 34,502
|
| G.O. Bonds, Series 2017-A, 5.00% 2020
| 9,725
| 10,170
|
| G.O. Bonds, Series 2019-K, 5.00% 2020 (preref. 2019)
| 1,225
| 1,237
|
| Housing Fin. Agcy., Homeownership Fin. Bonds (GNMA and FNMA Pass-Through Program), Series 2012-B, 2.25% 2042
| 5,308
| 5,208
|
| Housing Fin. Agcy., Homeownership Fin. Bonds (GNMA and FNMA Pass-Through Program), Series 2015-A, 2.80% 2045
| 1,243
| 1,258
|
| Housing Fin. Agcy., Homeownership Fin. Bonds (GNMA and FNMA Pass-Through Program), Series 2017-G, 2.65% 2047
| 29,070
| 29,125
|
Housing Fin. Agcy., Homeownership Fin. Bonds (Mortgage-Backed Securities Program), Series 2010-A,
4.25% 2028
| 45
| 46
|
Housing Fin. Agcy., Homeownership Fin. Bonds (Mortgage-Backed Securities Program), Series 2011-B,
4.50% 2031
| 115
| 118
|
Housing Fin. Agcy., Homeownership Fin. Bonds (Mortgage-Backed Securities Program), Series 2011-D,
4.50% 2034
| 125
| 129
|
Housing Fin. Agcy., Homeownership Fin. Bonds (Mortgage-Backed Securities Program), Series 2011-G,
4.25% 2035
| 150
| 153
|
The Tax-Exempt Bond Fund of America — Page
61 of 120
Bonds, notes & other debt instruments (continued)
Minnesota (continued)
| Principal amount
(000)
| Value
(000)
|
| Housing Fin. Agcy., Homeownership Fin. Bonds, Series 2018-A, 3.30% 2048
| $2,370
| $2,443
|
| Housing Fin. Agcy., Residential Housing Fin. Bonds, Series 2012-D, 4.00% 2040
| 130
| 133
|
| Housing Fin. Agcy., Residential Housing Fin. Bonds, Series 2014-B, 4.00% 2038
| 420
| 445
|
| Housing Fin. Agcy., Residential Housing Fin. Bonds, Series 2015-B, 3.50% 2046
| 12,520
| 13,182
|
| Housing Fin. Agcy., Residential Housing Fin. Bonds, Series 2016-E, 4.00% 2047
| 2,400
| 2,543
|
| Housing Fin. Agcy., Residential Housing Fin. Bonds, Series 2017-B, 4.00% 2047
| 3,755
| 4,007
|
| Housing Fin. Agcy., Residential Housing Fin. Bonds, Series 2017-E, 4.00% 2048
| 4,275
| 4,608
|
| Housing Fin. Agcy., Residential Housing Fin. Bonds, Series 2018-B, 4.00% 2048
| 11,675
| 12,694
|
| Housing Fin. Agcy., Residential Housing Fin. Bonds, Series 2019-B 4.25% 2049
| 5,835
| 6,470
|
| City of Minneapolis, Health Care System Rev. Bonds (Fairview Health Services), Series 2015-A, 5.00% 2033
| 2,575
| 3,016
|
City of Minneapolis, Housing and Redev. Auth., Health Care System Rev. Bonds (Allina Health System),
Series 2009-A-2, 5.50% 2024 (preref. 2019)
| 3,000
| 3,037
|
| City of St. Cloud, Health Care Rev. Bonds (CentraCare Health System), Series 2016-A, 5.00% 2028
| 1,250
| 1,512
|
| City of St. Cloud, Health Care Rev. Bonds (CentraCare Health System), Series 2016-A, 5.00% 2029
| 1,000
| 1,205
|
| City of St. Cloud, Health Care Rev. Bonds (CentraCare Health System), Series 2019, 5.00% 2048
| 1,000
| 1,202
|
City of St. Paul, Housing and Redev. Auth., Hospital Fac. Rev. Bonds (HealthEast Care System Project),
Series 2015-A, 5.00% 2029 (preref. 2025)
| 745
| 906
|
| City of St. Paul, Housing and Redev. Auth., Multi Family Housing Rev. Bonds (Millberry Apartments Project), Series 2018-A, 2.15% 2021 (put 2020)
| 1,000
| 1,000
|
| City of St. Paul, Housing and Redev. Auth., Multi Family Housing Rev. Bonds (Millberry Apartments Project), Series 2018-A, 2.20% 2021 (put 2020)
| 1,450
| 1,456
|
|
|
| 145,305
|
| Mississippi 0.33%
|
|
|
| Business Fin. Corp. Rev. Bonds (Mississippi Power Co. Project), Series 2010, 2.75% 2040 (put 2021)
| 2,750
| 2,784
|
Dev. Bank, Special Obligation Bonds (Municipal Energy Agcy. of Mississippi Power Supply Project),
Series 2015-A, Assured Guaranty Municipal insured, 5.00% 2031
| 1,590
| 1,875
|
Dev. Bank, Special Obligation Bonds (Municipal Energy Agcy. of Mississippi Power Supply Project),
Series 2015-A, Assured Guaranty Municipal insured, 5.00% 2032
| 1,690
| 1,981
|
Dev. Bank, Special Obligation Bonds (Municipal Energy Agcy. of Mississippi Power Supply Project),
Series 2015-A, Assured Guaranty Municipal insured, 5.00% 2033
| 1,275
| 1,490
|
Dev. Bank, Special Obligation Bonds (Municipal Energy Agcy. of Mississippi Power Supply Project),
Series 2015-A, Assured Guaranty Municipal insured, 5.00% 2035
| 1,150
| 1,336
|
Dev. Bank, Special Obligation Rev. Ref. Bonds (Harrison County Highway Ref. Project),
Series 2013-A, 5.00% 2025
| 3,000
| 3,558
|
Dev. Bank, Special Obligation Rev. Ref. Bonds (Madison County Highway Ref. Project),
Series 2013-C, 5.00% 2026
| 4,000
| 4,843
|
| Dev. Bank, Special Obligation Rev. Ref. Bonds (Mississippi Dept. of Corrections Walnut Grove Youth Correctional Fac. Project), Series 2010-C, 5.25% 2027 (preref.
2020)
| 3,000
| 3,124
|
| Gaming Tax Rev. Bonds, Series 2019-A, 5.00% 2032
| 3,000
| 3,731
|
| Gaming Tax Rev. Bonds, Series 2019-A, 5.00% 2033
| 3,600
| 4,464
|
| Gaming Tax Rev. Bonds, Series 2019-A, 5.00% 2035
| 2,000
| 2,461
|
| Gaming Tax Rev. Bonds, Series 2019-A, 5.00% 2037
| 4,000
| 4,879
|
| Gaming Tax Rev. Ref. Bonds, Series 2015-E, 5.00% 2029
| 2,500
| 2,964
|
| Gaming Tax Rev. Ref. Bonds, Series 2015-E, 5.00% 2032
| 7,500
| 8,802
|
| Gaming Tax Rev. Ref. Bonds, Series 2015-E, 5.00% 2034
| 12,960
| 15,144
|
| Home Corp., Homeownership Mortgage Rev. Bonds, Series 2010-A, 4.50% 2031
| 100
| 102
|
| Home Corp., Single Family Mortgage Rev. Bonds, Series 2017-D, 4.00% 2043
| 855
| 913
|
| Home Corp., Single Family Mortgage Rev. Bonds, Series 2019-A, 4.00% 2048
| 3,870
| 4,243
|
| County of Warren, Gulf Opportunity Zone Bonds, Series 2010-A, 5.80% 2034
| 2,000
| 2,061
|
|
|
| 70,755
|
The Tax-Exempt Bond Fund of America — Page
62 of 120
Bonds, notes & other debt instruments (continued)
Missouri 1.03%
| Principal amount
(000)
| Value
(000)
|
Health and Educational Facs. Auth., Health Facs. Rev. Bonds (Children’s Mercy Hospital), Series 2017-A,
4.00% 2042
| $2,575
| $2,718
|
| Health and Educational Facs. Auth., Health Facs. Rev. Bonds (Cox Health Project), Series 2013-A, 5.00% 2038
| 2,000
| 2,227
|
| Health and Educational Facs. Auth., Health Facs. Rev. Bonds (Cox Health Project), Series 2015-A, 5.00% 2034
| 3,200
| 3,706
|
| Health and Educational Facs. Auth., Health Facs. Rev. Bonds (Cox Health Project), Series 2015-A, 5.00% 2039
| 4,000
| 4,516
|
| Health and Educational Facs. Auth., Health Facs. Rev. Bonds (Saint Luke’s Health System, Inc.), Series 2018-A, 5.00% 2043
| 2,000
| 2,355
|
Health and Educational Facs. Auth., Health Facs. Rev. Bonds (SSM Health Care), Series 2010-B,
5.00% 2030 (preref. 2020)
| 2,835
| 2,925
|
| Health and Educational Facs. Auth., Health Facs. Rev. Bonds (SSM Health Care), Series 2014-A, 5.00% 2027
| 1,000
| 1,158
|
Health and Educational Facs. Auth., Health Facs. Rev. Bonds (SSM Health Care), Series 2018-C,
5.00% 2036 (put 2023)
| 17,000
| 18,809
|
Health and Educational Facs. Auth., Rev. Ref. Bonds (St. Anthony’s Medical Center), Series 2015-B,
5.00% 2045
| 3,750
| 4,246
|
| Health and Educational Facs. Auth., Senior Living Facs. Rev. Bonds (Lutheran Senior Services), Series 2010, 5.50% 2042
| 2,250
| 2,281
|
| Health and Educational Facs. Auth., Senior Living Facs. Rev. Bonds (Lutheran Senior Services), Series 2014-A, 5.00% 2024
| 225
| 253
|
| Health and Educational Facs. Auth., Senior Living Facs. Rev. Bonds (Lutheran Senior Services), Series 2016-B, 5.00% 2021
| 210
| 219
|
| Health and Educational Facs. Auth., Senior Living Facs. Rev. Bonds (Lutheran Senior Services), Series 2016-B, 5.00% 2030
| 180
| 206
|
| Health and Educational Facs. Auth., Senior Living Facs. Rev. Bonds (Lutheran Senior Services), Series 2019-A, 5.00% 2024
| 590
| 663
|
| Health and Educational Facs. Auth., Senior Living Facs. Rev. Bonds (Lutheran Senior Services), Series 2019-A, 5.00% 2025
| 1,000
| 1,143
|
| Health and Educational Facs. Auth., Senior Living Facs. Rev. Bonds (Lutheran Senior Services), Series 2019-A, 5.00% 2029
| 1,350
| 1,539
|
| Health and Educational Facs. Auth., Senior Living Facs. Rev. Bonds (Lutheran Senior Services), Series 2019-A, 5.00% 2042
| 500
| 556
|
| Health and Educational Facs. Auth., Senior Living Facs. Rev. Bonds (Lutheran Senior Services), Series 2019-B, 2.875% 2034 (put 2022)
| 1,000
| 1,007
|
Health and Educational Facs. Auth., Senior Living Facs. Rev. Ref. Bonds (Lutheran Senior Services),
Series 2016-A, 5.00% 2028
| 400
| 461
|
Health and Educational Facs. Auth., Senior Living Facs. Rev. Ref. Bonds (Lutheran Senior Services),
Series 2016-A, 5.00% 2029
| 1,000
| 1,147
|
| Housing Dev. Commission, Single Family Mortgage Rev. Bonds (First Place Homeownership Loan Program), Series 2015-C, 4.00% 2036
| 4,500
| 4,770
|
| Housing Dev. Commission, Single Family Mortgage Rev. Bonds (First Place Homeownership Loan Program), Series 2016-A-2, 4.00% 2040
| 13,765
| 14,644
|
| Housing Dev. Commission, Single Family Mortgage Rev. Bonds (First Place Homeownership Loan Program), Series 2017-D, 4.00% 2047
| 4,535
| 4,894
|
| Housing Dev. Commission, Single Family Mortgage Rev. Bonds (First Place Homeownership Loan Program), Series 2019-A, 4.25% 2047
| 5,500
| 6,100
|
| Housing Dev. Commission, Single Family Mortgage Rev. Bonds (First Place Homeownership Loan Program), Series 2019-B, 4.00% 2050
| 4,500
| 4,978
|
Housing Dev. Commission, Single Family Mortgage Rev. Bonds (First Place Homeownership Loan Program),
Series 2016-B, 3.50% 2041
| 2,950
| 3,091
|
Housing Dev. Commission, Single Family Mortgage Rev. Bonds (First Place Homeownership Loan Program),
Series 2017-B, 3.25% 2047
| 5,026
| 5,242
|
Housing Dev. Commission, Single Family Mortgage Rev. Bonds (First Place Homeownership Loan Program),
Series 2017-C, 3.30% 2047
| 7,147
| 7,462
|
Housing Dev. Commission, Single Family Mortgage Rev. Bonds (First Place Homeownership Loan Program),
Series 2018-A, 4.25% 2049
| 3,090
| 3,397
|
The Tax-Exempt Bond Fund of America — Page
63 of 120
Bonds, notes & other debt instruments (continued)
Missouri (continued)
| Principal amount
(000)
| Value
(000)
|
| Housing Dev. Commission, Single Family Mortgage Rev. Bonds (Special Homeownership Loan Program), Series 2009-C, 4.90% 2036
| $45
| $45
|
| Housing Dev. Commission, Single Family Mortgage Rev. Bonds (Special Homeownership Loan Program), Series 2009-D, 4.80% 2040
| 25
| 25
|
| Housing Dev. Commission, Single Family Mortgage Rev. Bonds (Special Homeownership Loan Program), Series 2014-B, 4.00% 2040
| 765
| 805
|
| Housing Dev. Commission, Single Family Mortgage Rev. Bonds (Special Homeownership Loan Program), Series 2015-A, 3.75% 2038
| 705
| 743
|
Housing Dev. Commission, Single Family Mortgage Rev. Bonds (Special Homeownership Loan Program),
Series 2014-A, 4.00% 2041
| 295
| 310
|
Housing Dev. Commission, Single Family Mortgage Rev. Bonds (Special Homeownership Loan Program),
Series 2015-B-2, 4.00% 2045
| 6,455
| 6,870
|
City of St. Louis, Airport Rev. Ref. Bonds (Lambert-St. Louis International Airport), Series 2005,
National insured, 5.50% 2026
| 5,465
| 6,738
|
City of St. Louis, Airport Rev. Ref. Bonds (Lambert-St. Louis International Airport), Series 2005,
National insured, 5.50% 2027
| 6,270
| 8,114
|
City of St. Louis, Airport Rev. Ref. Bonds (Lambert-St. Louis International Airport), Series 2005,
National insured, 5.50% 2028
| 5,080
| 6,713
|
City of St. Louis, Airport Rev. Ref. Bonds (Lambert-St. Louis International Airport), Series 2005,
National insured, 5.50% 2029
| 8,125
| 10,919
|
City of St. Louis, Airport Rev. Ref. Bonds (Lambert-St. Louis International Airport), Series 2005,
National insured, 5.50% 2030
| 14,270
| 19,437
|
City of St. Louis, Airport Rev. Ref. Bonds (Lambert-St. Louis International Airport), Series 2005,
National insured, 5.50% 2031
| 12,255
| 16,889
|
City of St. Louis, Airport Rev. Ref. Bonds (Lambert-St. Louis International Airport), Series 2017-A,
Assured Guaranty Municipal insured, 5.00% 2029
| 1,000
| 1,246
|
City of St. Louis, Airport Rev. Ref. Bonds (Lambert-St. Louis International Airport), Series 2017-A,
Assured Guaranty Municipal insured, 5.00% 2030
| 1,250
| 1,546
|
City of St. Louis, Airport Rev. Ref. Bonds (Lambert-St. Louis International Airport), Series 2017-A,
Assured Guaranty Municipal insured, 5.25% 2025
| 5,000
| 6,106
|
| City of St. Louis, Airport Rev. Ref. Bonds (Lambert-St. Louis International Airport), Series 2019-C, 5.00% 2031
| 2,155
| 2,738
|
| City of St. Louis, Airport Rev. Ref. Bonds (Lambert-St. Louis International Airport), Series 2019-C, 5.00% 2032
| 3,000
| 3,795
|
| City of St. Louis, Airport Rev. Ref. Bonds (Lambert-St. Louis International Airport), Series 2019-C, 5.00% 2033
| 2,400
| 3,025
|
| City of St. Louis, Airport Rev. Ref. Bonds (Lambert-St. Louis International Airport), Series 2019-C, 5.00% 2034
| 1,750
| 2,196
|
| City of St. Louis, Industrial Dev. Auth., Senior Living Facs. Rev. Bonds (St. Andrew’s Resources for Seniors Obligated Group), Series 2015-A, 5.00% 2035
| 1,000
| 1,068
|
| City of St. Louis, Industrial Dev. Auth., Senior Living Facs. Rev. Bonds (St. Andrew’s Resources for Seniors Obligated Group), Series 2015-A, 5.125% 2045
| 1,050
| 1,120
|
| County of St. Louis, Industrial Dev. Auth., Healthcare Facs. Rev. Bonds (Nazareth Living Center), Series 2012, 6.125% 2042
| 1,120
| 1,199
|
| County of St. Louis, Industrial Dev. Auth., Senior Living Facs. Rev. Bonds (Friendship Village St. Louis Obligated Group), Series 2017, 5.00% 2027
| 680
| 795
|
| County of St. Louis, Industrial Dev. Auth., Senior Living Facs. Rev. Bonds (Friendship Village St. Louis Obligated Group), Series 2017, 5.00% 2048
| 1,200
| 1,328
|
| County of St. Louis, Industrial Dev. Auth., Senior Living Facs. Rev. Bonds (Friendship Village St. Louis Obligated Group), Series 2018, 5.25% 2053
| 8,800
| 9,866
|
| County of St. Louis, Transportation Dev. Dist., Transportation Rev. Bonds (Missouri Bottom Road/Taussig Road), Series 2002, 7.20% 20333
| 5,500
| 1,870
|
|
|
| 222,219
|
The Tax-Exempt Bond Fund of America — Page
64 of 120
Bonds, notes & other debt instruments (continued)
Montana 0.11%
| Principal amount
(000)
| Value
(000)
|
Fin. Auth., Rev. Bonds (Billings Clinic Obligated Group), Series 2018-C,
(SIFMA Municipal Swap Index + 0.55%) 1.95% 2037 (put 2023)2
| $13,875
| $13,862
|
| Board of Housing, Single Family Mortgage Bonds, Series 2016-A-2, 3.50% 2044
| 3,585
| 3,771
|
| Board of Housing, Single Family Mortgage Bonds, Series 2018-B, 4.00% 2043
| 3,595
| 3,875
|
| Board of Housing, Single Family Mortgage Bonds, Series 2019-A, 4.25% 2045
| 2,500
| 2,761
|
|
|
| 24,269
|
| Nebraska 0.34%
|
|
|
| Central Plains Energy Project, Gas Project Rev. Bonds (Project No. 3), Series 2012, 5.25% 2037
| 1,275
| 1,394
|
| Central Plains Energy Project, Gas Supply Rev. Ref. Bonds, Series 2014, 5.00% 2039 (put 2019)
| 2,500
| 2,530
|
| County of Douglas, Hospital Auth. No. 2 (Methodist Health System), Health Facs. Rev. Ref. Bonds, Series 2015, 5.00% 2045
| 4,340
| 4,864
|
| County of Douglas, Hospital Auth. No. 2 (Methodist Health System), Health Facs. Rev. Ref. Bonds, Series 2015, 5.00% 2048
| 2,300
| 2,563
|
| Investment Fin. Auth., Single Family Housing Rev. Bonds, Series 2013-A, 3.00% 2043
| 445
| 452
|
| Investment Fin. Auth., Single Family Housing Rev. Bonds, Series 2013-C, 4.50% 2043
| 10
| 10
|
| Investment Fin. Auth., Single Family Housing Rev. Bonds, Series 2013-E, 3.00% 2043
| 65
| 66
|
| Investment Fin. Auth., Single Family Housing Rev. Bonds, Series 2014-A, 3.00% 2044
| 80
| 80
|
| Investment Fin. Auth., Single Family Housing Rev. Bonds, Series 2014-A, 4.00% 2044
| 450
| 473
|
| Investment Fin. Auth., Single Family Housing Rev. Bonds, Series 2015-A, 3.50% 2045
| 4,470
| 4,675
|
| Investment Fin. Auth., Single Family Housing Rev. Bonds, Series 2015-C, 3.50% 2045
| 4,040
| 4,191
|
| Investment Fin. Auth., Single Family Housing Rev. Bonds, Series 2016-A, 3.50% 2046
| 7,945
| 8,334
|
| Investment Fin. Auth., Single Family Housing Rev. Bonds, Series 2016-C, 3.50% 2046
| 5,240
| 5,519
|
| Investment Fin. Auth., Single Family Housing Rev. Bonds, Series 2016-C, 3.50% 2046
| 560
| 576
|
| Investment Fin. Auth., Single Family Housing Rev. Bonds, Series 2018-A, 4.00% 2048
| 10,435
| 11,279
|
| Investment Fin. Auth., Single Family Housing Rev. Bonds, Series 2018-C, 4.00% 2048
| 6,445
| 7,001
|
| Omaha Public Power Dist., Electric System Rev. Bonds, Series 2017-A, 5.00% 2030
| 1,000
| 1,258
|
| Omaha Public Power Dist., Electric System Rev. Bonds, Series 2017-A, 5.00% 2042
| 15,000
| 17,978
|
|
|
| 73,243
|
| Nevada 1.50%
|
|
|
| Clark County School Dist., Limited Tax G.O. Building and Rev. Ref. Bonds, Series 2017-C, 5.00% 2028
| 3,105
| 3,860
|
| Clark County School Dist., Limited Tax G.O. Building and Rev. Ref. Bonds, Series 2017-C, 5.00% 2034
| 3,615
| 4,357
|
| Clark County School Dist., Limited Tax G.O. Rev. Ref. Bonds, Series 2016-A, 5.00% 2023
| 3,305
| 3,765
|
| Clark County School Dist., Limited Tax G.O. Rev. Ref. Bonds, Series 2016-D, 5.00% 2023
| 12,850
| 14,640
|
| County of Clark, Airport System Rev. Bonds, Series 2010-B, 5.125% 2036
| 18,000
| 18,269
|
| County of Clark, Airport System Rev. Bonds, Series 2010-D, 5.00% 2023
| 7,025
| 7,140
|
| County of Clark, Airport System Rev. Ref. Bonds (McCarran International Airport), Series 2019-A, 5.00% 2023
| 3,000
| 3,432
|
| County of Clark, Airport System Rev. Ref. Bonds (McCarran International Airport), Series 2019-A, 5.00% 2024
| 1,750
| 2,059
|
| County of Clark, Airport System Rev. Ref. Bonds, Series 2017-A-2, 5.00% 2040
| 4,000
| 4,758
|
| County of Clark, Highway Rev. Ref. Bonds (Motor Vehicle Fuel Tax), Series 2011, 5.00% 2022
| 10,580
| 11,746
|
County of Clark, Las Vegas-McCarran International Airport, Passenger Fac. Charge Rev. Bonds,
Series 2010-A, 5.00% 2030
| 2,000
| 2,030
|
County of Clark, Las Vegas-McCarran International Airport, Passenger Fac. Charge Rev. Bonds,
Series 2010-A, 5.125% 2034
| 10,980
| 11,147
|
County of Clark, Las Vegas-McCarran International Airport, Passenger Fac. Charge Rev. Ref. Bonds,
Series 2012-B, 5.00% 2028
| 5,780
| 6,377
|
County of Clark, Las Vegas-McCarran International Airport, Passenger Fac. Charge Rev. Ref. Bonds,
Series 2012-B, 5.00% 2033
| 1,885
| 2,064
|
County of Clark, Las Vegas-McCarran International Airport, Passenger Fac. Charge Rev. Ref. Bonds,
Series 2015-C, 5.00% 2022
| 2,125
| 2,357
|
County of Clark, Las Vegas-McCarran International Airport, Passenger Fac. Charge Rev. Ref. Bonds,
Series 2015-C, 5.00% 2027
| 1,000
| 1,254
|
County of Clark, Limited Tax G.O. Crossover Rev. Ref. Bonds (Las Vegas Convention and Visitors Auth.),
Series 2017-C, 5.00% 2026
| 5,515
| 6,816
|
The Tax-Exempt Bond Fund of America — Page
65 of 120
Bonds, notes & other debt instruments (continued)
Nevada (continued)
| Principal amount
(000)
| Value
(000)
|
County of Clark, Limited Tax G.O. Crossover Rev. Ref. Bonds (Las Vegas Convention and Visitors Auth.),
Series 2017-C, 5.00% 2027
| $6,545
| $8,249
|
County of Clark, Limited Tax G.O. Crossover Rev. Ref. Bonds (Las Vegas Convention and Visitors Auth.),
Series 2017-C, 5.00% 2029
| 7,230
| 9,048
|
| County of Clark, Limited Tax G.O. Stadium Improvement Bonds, Series 2018-A, 5.00% 2032
| 3,500
| 4,381
|
| County of Clark, Limited Tax G.O. Stadium Improvement Bonds, Series 2018-A, 5.00% 2033
| 4,250
| 5,302
|
| County of Clark, Limited Tax G.O. Stadium Improvement Bonds, Series 2018-A, 5.00% 2034
| 6,500
| 8,066
|
| County of Clark, Limited Tax G.O. Stadium Improvement Bonds, Series 2018-A, 5.00% 2035
| 5,250
| 6,490
|
| County of Clark, Limited Tax G.O. Stadium Improvement Bonds, Series 2018-A, 5.00% 2036
| 7,350
| 9,056
|
| County of Clark, Limited Tax G.O. Stadium Improvement Bonds, Series 2018-A, 5.00% 2043
| 5,000
| 5,989
|
| County of Clark, Limited Tax G.O. Stadium Improvement Bonds, Series 2018-A, 5.00% 2048
| 15,000
| 17,871
|
County of Clark, Pollution Control Rev. Ref. Bonds (Southern California Edison Co.), Series 2010,
1.875% 2031 (put 2020)
| 11,365
| 11,383
|
County of Clark, Special Improvement Dist. No. 128 (Summerlin Centre), Local Improvement Bonds,
Series 2001-B, 6.75% 2021
| 305
| 308
|
| County of Clark, Special Improvement Dist. No. 142 (Mountain’s Edge), Local Improvement Rev. Ref. Bonds, Series 2012, 5.00% 2019
| 3,075
| 3,075
|
| City of Las Vegas, Redev. Agcy., Tax Increment Rev. Ref. Bonds, Series 2016, 5.00% 2040
| 1,000
| 1,133
|
| City of Las Vegas, Redev. Agcy., Tax Increment Rev. Ref. Bonds, Series 2016, 5.00% 2045
| 1,225
| 1,380
|
| City of Las Vegas, Sales Tax Increment Rev. Bonds, Series 2016, 2.75% 20211
| 95
| 95
|
| City of Las Vegas, Sales Tax Increment Rev. Bonds, Series 2016, 3.50% 20251
| 1,185
| 1,170
|
City of Las Vegas, Special Improvement Dist. No. 607 (Providence), Local Improvement Rev. Ref. Bonds,
Series 2013, 4.00% 2020
| 385
| 390
|
Las Vegas Convention and Visitors Auth., Convention Center Expansion Rev. Bonds, Series 2018-B,
5.00% 2043
| 34,565
| 41,028
|
| Las Vegas Convention and Visitors Auth., Rev. Bonds, Series 2019-B, 5.00% 2022
| 250
| 277
|
| Las Vegas Convention and Visitors Auth., Rev. Bonds, Series 2019-B, 5.00% 2023
| 600
| 686
|
| Las Vegas Convention and Visitors Auth., Rev. Bonds, Series 2019-B, 5.00% 2024
| 425
| 500
|
| Las Vegas Valley Water Dist., Limited Tax G.O. Rev. Ref. Bonds, Series 2011-C, 5.00% 2030
| 8,000
| 8,534
|
| Las Vegas Valley Water Dist., Limited Tax G.O. Water Bonds, Series 2012-B, 5.00% 2032
| 2,000
| 2,200
|
| Las Vegas Valley Water Dist., Limited Tax G.O. Water Bonds, Series 2012-B, 5.00% 2037
| 3,500
| 3,835
|
| Las Vegas Valley Water Dist., Limited Tax G.O. Water Bonds, Series 2012-B, 5.00% 2042
| 1,000
| 1,093
|
Las Vegas Valley Water Dist., Limited Tax G.O. Water Improvement and Rev. Ref. Bonds, Series 2016-A,
5.00% 2031
| 1,600
| 1,933
|
Las Vegas Valley Water Dist., Limited Tax G.O. Water Improvement and Rev. Ref. Bonds, Series 2016-A,
5.00% 2032
| 1,115
| 1,342
|
Las Vegas Valley Water Dist., Limited Tax G.O. Water Improvement and Rev. Ref. Bonds, Series 2016-A,
5.00% 2033
| 2,500
| 3,000
|
Las Vegas Valley Water Dist., Limited Tax G.O. Water Improvement and Rev. Ref. Bonds, Series 2016-A,
5.00% 2034
| 3,500
| 4,185
|
Las Vegas Valley Water Dist., Limited Tax G.O. Water Improvement and Rev. Ref. Bonds, Series 2016-A,
5.00% 2035
| 2,000
| 2,384
|
Las Vegas Valley Water Dist., Limited Tax G.O. Water Improvement and Rev. Ref. Bonds, Series 2016-A,
5.00% 2041
| 18,900
| 22,219
|
Las Vegas Valley Water Dist., Limited Tax G.O. Water Improvement and Rev. Ref. Bonds, Series 2016-A,
5.00% 2046
| 2,235
| 2,610
|
Las Vegas Valley Water Dist., Limited Tax G.O. Water Improvement and Rev. Ref. Bonds, Series 2017-A,
4.00% 2038
| 6,200
| 6,795
|
| City of North Las Vegas, Special Improvement Dist. No. 60 (Aliante), Local Improvement Rev. Ref. Bonds, Series 2016, 2.25% 2022
| 985
| 1,008
|
City of Reno, Hospital Rev. Bonds (Renown Regional Medical Center Project), Series 2004-A,
AMBAC insured, 5.50% 2028
| 150
| 150
|
City of Reno, Sales Tax Rev. Ref. Bonds (ReTRAC-Reno Transportation Rail Access Corridor Project),
Series 2018-A, Assured Guaranty Municipal insured, 5.00% 2028
| 1,000
| 1,246
|
The Tax-Exempt Bond Fund of America — Page
66 of 120
Bonds, notes & other debt instruments (continued)
Nevada (continued)
| Principal amount
(000)
| Value
(000)
|
City of Reno, Sales Tax Rev. Ref. Bonds (ReTRAC-Reno Transportation Rail Access Corridor Project),
Series 2018-A, Assured Guaranty Municipal insured, 5.00% 2031
| $1,000
| $1,239
|
City of Reno, Sales Tax Rev. Ref. Bonds (ReTRAC-Reno Transportation Rail Access Corridor Project),
Series 2018-A, Assured Guaranty Municipal insured, 5.00% 2035
| 1,000
| 1,220
|
| Truckee Meadows Water Auth., Rev. Ref. Bonds, Series 2017, 5.00% 2022
| 2,685
| 2,983
|
| Truckee Meadows Water Auth., Rev. Ref. Bonds, Series 2017, 5.00% 2023
| 2,000
| 2,295
|
| Truckee Meadows Water Auth., Rev. Ref. Bonds, Series 2017, 5.00% 2024
| 2,000
| 2,365
|
| Truckee Meadows Water Auth., Rev. Ref. Bonds, Series 2017, 5.00% 2028
| 5,000
| 6,279
|
| Truckee Meadows Water Auth., Rev. Ref. Bonds, Series 2017, 5.00% 2029
| 1,000
| 1,249
|
| Truckee Meadows Water Auth., Rev. Ref. Bonds, Series 2017, 5.00% 2030
| 1,000
| 1,241
|
County of Washoe, Gas and Water Facs. Rev. Ref. Bonds (Sierra Pacific Power Co. Projects),
Series 2016-B, 3.00% 2036 (put 2022)
| 1,500
| 1,569
|
|
|
| 324,922
|
| New Hampshire 0.23%
|
|
|
Business Fin. Auth., Rev. Bonds (Elliot Hospital Obligated Group Issue), Series 2009-A,
6.00% 2027 (preref. 2019)
| 3,000
| 3,024
|
Business Fin. Auth., Rev. Bonds (Elliot Hospital Obligated Group Issue), Series 2009-A,
6.125% 2039 (preref. 2019)
| 17,115
| 17,254
|
| Health and Education Facs. Auth., Healthcare System Rev. Bonds (Covenant Health Systems Obligated Group Issue), Series 2007-A, 5.25% 2024
| 1,910
| 1,925
|
| Health and Education Facs. Auth., Rev. Bonds (Elliot Hospital Issue), Series 2016, 5.00% 2031
| 1,250
| 1,472
|
| Health and Education Facs. Auth., Rev. Bonds (Southern New Hampshire University), Series 2017, 5.00% 2035
| 1,735
| 1,948
|
| Health and Education Facs. Auth., Rev. Bonds (Southern New Hampshire University), Series 2017, 5.00% 2042
| 2,750
| 3,054
|
| Health and Education Facs. Auth., Rev. Bonds (Southern New Hampshire University), Series 2017, 5.00% 2047
| 5,500
| 6,091
|
Health and Education Facs. Auth., Rev. Bonds (University System of New Hampshire), Series 2015,
5.00% 2032
| 2,565
| 3,015
|
Health and Education Facs. Auth., Rev. Bonds (University System of New Hampshire), Series 2015,
5.00% 2033
| 3,740
| 4,386
|
| National Fin. Auth., Resource Recovery Rev. Ref. Bonds (Covanta Project), Series 2018-B, 4.625% 20421
| 8,000
| 8,279
|
|
|
| 50,448
|
| New Jersey 2.21%
|
|
|
| Atlantic City, Tax Appeal Rev. Ref. Bonds, Series 2017-A, BAM insured, 5.00% 2037
| 750
| 877
|
| County of Camden, Improvement Auth., Health Care Redev. Project, Rev. Bonds (Cooper Health System Obligated Group Issue), Series 2013-A, 5.75% 2042
| 1,335
| 1,489
|
| County of Camden, Improvement Auth., Health Care Redev. Project, Rev. Ref. Bonds (Cooper Health System Obligated Group Issue), Series 2014, 5.00% 2027
| 1,500
| 1,700
|
| County of Camden, Improvement Auth., Health Care Redev. Project, Rev. Ref. Bonds (Cooper Health System Obligated Group Issue), Series 2014, 5.00% 2032
| 1,000
| 1,112
|
| County of Camden, Improvement Auth., Health Care Redev. Project, Rev. Ref. Bonds (Cooper Health System Obligated Group Issue), Series 2014, 5.00% 2034
| 1,000
| 1,106
|
| Casino Reinvestment Dev. Auth., Luxury Tax Rev. Bonds, Series 2014, Assured Guaranty Municipal insured, 5.00% 2028
| 2,690
| 3,033
|
Econ. Dev. Auth., Motor Vehicle Surcharges Rev. Bonds (Special Needs Housing Program),
Capital Apppreciation Bonds, Series 2007-B, XLCA insured, 0% 2026
| 2,085
| 1,758
|
| Econ. Dev. Auth., Rev. Bonds (Provident Group - Kean Properties LLC - Kean University Student Housing Project), Series 2017-A, 5.00% 2050
| 590
| 647
|
| Econ. Dev. Auth., Rev. Bonds (Provident Group - Montclair Properties LLC - Montclair State University Student Housing Project), Series 2010-A, 5.375% 2025 (preref.
2020)
| 4,160
| 4,308
|
| Econ. Dev. Auth., Rev. Bonds (Provident Group - Montclair Properties LLC - Montclair State University Student Housing Project), Series 2010-A, 5.875% 2042 (preref.
2020)
| 5,000
| 5,199
|
| Econ. Dev. Auth., Rev. Ref. Bonds (Cranes Mill Project), Series 2018, 5.00% 2029
| 1,340
| 1,560
|
| Econ. Dev. Auth., Rev. Ref. Bonds (Cranes Mill Project), Series 2018, 5.00% 2049
| 1,250
| 1,395
|
The Tax-Exempt Bond Fund of America — Page
67 of 120
Bonds, notes & other debt instruments (continued)
New Jersey (continued)
| Principal amount
(000)
| Value
(000)
|
| Econ. Dev. Auth., Rev. Ref. Bonds (Provident Group - Montclair Properties LLC - Montclair State University Student Housing Project), Series 2017, Assured Guaranty
Municipal insured, 5.00% 2028
| $950
| $1,158
|
| Econ. Dev. Auth., Rev. Ref. Bonds (Provident Group - Montclair Properties LLC - Montclair State University Student Housing Project), Series 2017, Assured Guaranty
Municipal insured, 5.00% 2030
| 1,500
| 1,804
|
| Econ. Dev. Auth., Rev. Ref. Bonds (Provident Group - Montclair Properties LLC - Montclair State University Student Housing Project), Series 2017, Assured Guaranty
Municipal insured, 5.00% 2031
| 1,000
| 1,196
|
| Econ. Dev. Auth., Rev. Ref. Bonds (Provident Group - Montclair Properties LLC - Montclair State University Student Housing Project), Series 2017, Assured Guaranty
Municipal insured, 5.00% 2037
| 3,250
| 3,810
|
| Econ. Dev. Auth., Rev. Ref. Bonds (Provident Group - Montclair Properties LLC - Montclair State University Student Housing Project), Series 2017, Assured Guaranty
Municipal insured, 5.00% 2042
| 4,500
| 5,216
|
| Econ. Dev. Auth., Rev. Ref. Bonds (Provident Group - Rowan Properties LLC - Rowan University Student Housing Project), Series 2015-A, 5.00% 2030
| 1,500
| 1,659
|
| Econ. Dev. Auth., Rev. Ref. Bonds (Provident Group - Rowan Properties LLC - Rowan University Student Housing Project), Series 2015-A, 5.00% 2048
| 5,500
| 5,898
|
| Econ. Dev. Auth., School Facs. Construction Bonds, Series 2005-K, AMBAC insured, 5.50% 2019
| 2,515
| 2,552
|
| Econ. Dev. Auth., School Facs. Construction Bonds, Series 2016-BBB, 5.50% 2030
| 1,000
| 1,193
|
| Econ. Dev. Auth., School Facs. Construction Bonds, Series 2017-DDD, 5.00% 2027
| 1,000
| 1,187
|
| Econ. Dev. Auth., School Facs. Construction Bonds, Series 2017-DDD, 5.00% 2028
| 1,000
| 1,183
|
| Econ. Dev. Auth., School Facs. Construction Bonds, Series 2017-DDD, 5.00% 2029
| 2,000
| 2,354
|
| Econ. Dev. Auth., School Facs. Construction Bonds, Series 2017-DDD, 5.00% 2030
| 3,000
| 3,509
|
| Econ. Dev. Auth., School Facs. Construction Bonds, Series 2017-DDD, 5.00% 2031
| 1,500
| 1,743
|
| Econ. Dev. Auth., School Facs. Construction Bonds, Series 2017-DDD, 5.00% 2032
| 1,000
| 1,157
|
| Econ. Dev. Auth., School Facs. Construction Bonds, Series 2017-DDD, 5.00% 2033
| 1,500
| 1,730
|
| Econ. Dev. Auth., School Facs. Construction Bonds, Series 2018-FFF, 5.00% 2024
| 1,000
| 1,147
|
| Econ. Dev. Auth., School Facs. Construction Bonds, Series 2018-FFF, 5.00% 2026
| 5,000
| 5,859
|
Econ. Dev. Auth., School Facs. Construction Rev. Ref. Bonds, Series 2013-I,
(SIFMA Municipal Swap Index + 1.60%) 3.00% 20282
| 5,000
| 5,040
|
| Econ. Dev. Auth., School Facs. Construction Rev. Ref. Bonds, Series 2014-PP, 5.00% 2027
| 1,525
| 1,717
|
| Econ. Dev. Auth., School Facs. Construction Rev. Ref. Bonds, Series 2015-XX, 5.00% 2025
| 8,500
| 9,884
|
Econ. Dev. Auth., Transportation Project Sublease Rev. Ref. Bonds (New Jersey Transit Corp. Projects),
Series 2017-B, 5.00% 2024
| 1,550
| 1,792
|
| Educational Facs. Auth., Rev. and Rev. Ref. Bonds (Ramapo College of New Jersey Issue), Series 2017-A, Assured Guaranty Municipal insured, 5.00% 2030
| 1,500
| 1,837
|
| Educational Facs. Auth., Rev. and Rev. Ref. Bonds (Ramapo College of New Jersey Issue), Series 2017-A, Assured Guaranty Municipal insured, 5.00% 2031
| 1,190
| 1,445
|
| Educational Facs. Auth., Rev. and Rev. Ref. Bonds (Ramapo College of New Jersey Issue), Series 2017-A, Assured Guaranty Municipal insured, 5.00% 2033
| 3,000
| 3,619
|
| Educational Facs. Auth., Rev. and Rev. Ref. Bonds (Ramapo College of New Jersey Issue), Series 2017-A, Assured Guaranty Municipal insured, 5.00% 2034
| 3,540
| 4,255
|
| Educational Facs. Auth., Rev. and Rev. Ref. Bonds (Stockton University Issue), Series 2016-A, BAM insured, 5.00% 2027
| 1,125
| 1,349
|
Educational Facs. Auth., Rev. and Rev. Ref. Bonds (Stockton University Issue), Series 2016-A,
Assured Guaranty Municipal insured, 5.00% 2026
| 2,500
| 2,975
|
Educational Facs. Auth., Rev. and Rev. Ref. Bonds (Stockton University Issue), Series 2016-A,
Assured Guaranty Municipal insured, 5.00% 2028
| 4,350
| 5,181
|
Educational Facs. Auth., Rev. and Rev. Ref. Bonds (Stockton University Issue), Series 2016-A,
Assured Guaranty Municipal insured, 5.00% 2035
| 750
| 881
|
| Educational Facs. Auth., Rev. Bonds (Higher Education Capital Improvement Fund Issue), Series 2014-A, 5.00% 2022
| 5,420
| 5,974
|
| Educational Facs. Auth., Rev. Bonds (Stevens Institute of Technology Issue), Series 2017-A, 5.00% 2030
| 2,555
| 3,123
|
| Educational Facs. Auth., Rev. Bonds (Stevens Institute of Technology Issue), Series 2017-A, 5.00% 2031
| 2,740
| 3,323
|
| Educational Facs. Auth., Rev. Ref. Bonds (Kean University Issue), Series 2009-A, 5.50% 2036 (preref. 2019)
| 2,500
| 2,509
|
Educational Facs. Auth., Rev. Ref. Bonds (Kean University Issue), Series 2015-H,
Assured Guaranty Municipal insured, 5.00% 2027
| 1,865
| 2,214
|
The Tax-Exempt Bond Fund of America — Page
68 of 120
Bonds, notes & other debt instruments (continued)
New Jersey (continued)
| Principal amount
(000)
| Value
(000)
|
| Health Care Facs. Fncg. Auth., Rev. and Rev. Ref. Bonds (Trinitas Regional Medical Center Obligated Group Issue), Series 2017-A, 5.00% 2025
| $1,000
| $1,176
|
| Health Care Facs. Fncg. Auth., Rev. and Rev. Ref. Bonds (Trinitas Regional Medical Center Obligated Group Issue), Series 2017-A, 5.00% 2026
| 1,000
| 1,194
|
| Health Care Facs. Fncg. Auth., Rev. and Rev. Ref. Bonds (Trinitas Regional Medical Center Obligated Group Issue), Series 2017-A, 5.00% 2030
| 500
| 586
|
| Health Care Facs. Fncg. Auth., Rev. Bonds (AHS Hospital Corp. Issue), Series 2011, 6.00% 2041 (preref. 2021)
| 1,500
| 1,639
|
| Health Care Facs. Fncg. Auth., Rev. Bonds (Princeton HealthCare System Issue), Series 2016-A, 5.00% 2021
| 500
| 536
|
| Health Care Facs. Fncg. Auth., Rev. Bonds (Princeton HealthCare System Issue), Series 2016-A, 5.00% 2031
| 1,000
| 1,203
|
| Health Care Facs. Fncg. Auth., Rev. Bonds (Princeton HealthCare System Issue), Series 2016-A, 5.00% 2032
| 1,310
| 1,572
|
| Health Care Facs. Fncg. Auth., Rev. Bonds (Princeton HealthCare System Issue), Series 2016-A, 5.00% 2033
| 1,670
| 2,000
|
Health Care Facs. Fncg. Auth., Rev. Bonds (St. Joseph’s Healthcare System Obligated Group Issue),
Series 2016, 5.00% 2031
| 500
| 581
|
Health Care Facs. Fncg. Auth., Rev. Bonds (St. Joseph’s Healthcare System Obligated Group Issue),
Series 2016, 5.00% 2035
| 500
| 574
|
| Health Care Facs. Fncg. Auth., Rev. Ref. Bonds (AHS Hospital Corp. Issue), Series 2016, 5.00% 2020
| 1,000
| 1,035
|
Health Care Facs. Fncg. Auth., Rev. Ref. Bonds (Barnabas Health Issue), Series 2011-A,
5.625% 2032 (preref. 2021)
| 3,000
| 3,253
|
Health Care Facs. Fncg. Auth., Rev. Ref. Bonds (Barnabas Health Issue), Series 2011-A,
5.625% 2037 (preref. 2021)
| 3,500
| 3,795
|
| Health Care Facs. Fncg. Auth., Rev. Ref. Bonds (Barnabas Health Issue), Series 2012-A, 5.00% 2025
| 1,000
| 1,106
|
Health Care Facs. Fncg. Auth., Rev. Ref. Bonds (Hackensack Meridian Health Obligated Group Issue),
Series 2017-A, 5.00% 2032
| 1,000
| 1,222
|
Health Care Facs. Fncg. Auth., Rev. Ref. Bonds (Hackensack Meridian Health Obligated Group Issue),
Series 2017-A, 5.00% 2035
| 1,250
| 1,509
|
Health Care Facs. Fncg. Auth., Rev. Ref. Bonds (Hackensack Meridian Health Obligated Group Issue),
Series 2017-A, 5.00% 2037
| 1,000
| 1,197
|
Health Care Facs. Fncg. Auth., Rev. Ref. Bonds (Hackensack Meridian Health Obligated Group Issue),
Series 2017-A, 5.00% 2039
| 2,500
| 2,970
|
Health Care Facs. Fncg. Auth., Rev. Ref. Bonds (Hackensack Meridian Health Obligated Group Issue),
Series 2017-A, 5.00% 2057
| 1,000
| 1,159
|
Health Care Facs. Fncg. Auth., Rev. Ref. Bonds (RWJ Barnabas Health Obligated Group Issue),
Series 2016-A, 5.00% 2031
| 6,830
| 8,264
|
Health Care Facs. Fncg. Auth., Rev. Ref. Bonds (RWJ Barnabas Health Obligated Group Issue),
Series 2016-A, 5.00% 2033
| 7,000
| 8,420
|
Health Care Facs. Fncg. Auth., Rev. Ref. Bonds (RWJ Barnabas Health Obligated Group Issue),
Series 2016-A, 5.00% 2043
| 6,150
| 7,252
|
Health Care Facs. Fncg. Auth., Rev. Ref. Bonds (St. Peter’s University Hospital Obligated Group Issue),
Series 2011, 6.00% 2026
| 1,100
| 1,175
|
| Higher Education Student Assistance Auth., Student Loan Rev. Ref. Bonds, Series 2019-A, 2.375% 2029
| 8,715
| 8,790
|
| Housing and Mortgage Fin. Agcy., Single Family Housing Rev. Bonds, Series 2018-A, 4.50% 2048
| 39,705
| 43,916
|
| Housing and Mortgage Fin. Agcy., Single Family Housing Rev. Bonds, Series 2019-C, 4.75% 2050
| 19,000
| 21,320
|
| Rutgers State University, G.O. Rev. Ref. Bonds (State University of New Jersey), Series 2009-F, 5.00% 2028
| 7,000
| 7,932
|
| South Jersey Transportation Auth., Transportation System Rev. Bonds, Series 2012-A, 5.00% 2024
| 2,000
| 2,212
|
| South Jersey Transportation Auth., Transportation System Rev. Bonds, Series 2012-A, 5.00% 2025
| 3,400
| 3,753
|
| South Jersey Transportation Auth., Transportation System Rev. Bonds, Series 2012-A, 5.00% 2026
| 2,000
| 2,202
|
| South Jersey Transportation Auth., Transportation System Rev. Bonds, Series 2012-A, 5.00% 2028
| 1,205
| 1,322
|
| South Jersey Transportation Auth., Transportation System Rev. Bonds, Series 2014-A, 5.00% 2030
| 2,040
| 2,323
|
| South Jersey Transportation Auth., Transportation System Rev. Bonds, Series 2014-A, 5.00% 2039
| 14,075
| 15,693
|
| Tobacco Settlement Fncg. Corp., Tobacco Settlement Bonds, Series 2018-A, 5.00% 2024
| 4,120
| 4,706
|
| Tobacco Settlement Fncg. Corp., Tobacco Settlement Bonds, Series 2018-A, 5.00% 2025
| 3,290
| 3,836
|
| Tobacco Settlement Fncg. Corp., Tobacco Settlement Bonds, Series 2018-A, 5.00% 2030
| 5,000
| 6,036
|
| Tobacco Settlement Fncg. Corp., Tobacco Settlement Bonds, Series 2018-A, 5.00% 2032
| 7,000
| 8,354
|
| Tobacco Settlement Fncg. Corp., Tobacco Settlement Bonds, Series 2018-A, 5.00% 2033
| 5,000
| 5,948
|
| Tobacco Settlement Fncg. Corp., Tobacco Settlement Bonds, Series 2018-A, 5.25% 2046
| 3,600
| 4,110
|
The Tax-Exempt Bond Fund of America — Page
69 of 120
Bonds, notes & other debt instruments (continued)
New Jersey (continued)
| Principal amount
(000)
| Value
(000)
|
| Tobacco Settlement Fncg. Corp., Tobacco Settlement Bonds, Series 2018-B, 3.20% 2027
| $7,165
| $7,627
|
Transportation Trust Fund Auth., Federal Highway Reimbursement Rev. Ref. Bonds, Series 2018-A,
5.00% 2022
| 1,500
| 1,645
|
Transportation Trust Fund Auth., Federal Highway Reimbursement Rev. Ref. Bonds, Series 2018-A,
5.00% 2023
| 2,250
| 2,539
|
Transportation Trust Fund Auth., Federal Highway Reimbursement Rev. Ref. Bonds, Series 2018-A,
5.00% 2024
| 2,000
| 2,318
|
Transportation Trust Fund Auth., Federal Highway Reimbursement Rev. Ref. Bonds, Series 2018-A,
5.00% 2030
| 3,500
| 4,107
|
Transportation Trust Fund Auth., Transportation System Bonds, Capital Appreciation Bonds, Series 2006-C,
Assured Guaranty Municipal insured, 0% 2033
| 10,000
| 6,562
|
Transportation Trust Fund Auth., Transportation System Bonds, Capital Appreciation Bonds, Series 2006-C,
Assured Guaranty Municipal insured, 0% 2034
| 16,870
| 10,631
|
Transportation Trust Fund Auth., Transportation System Bonds, Capital Appreciation Bonds, Series 2006-C,
National insured, 0% 2027
| 10,355
| 8,428
|
Transportation Trust Fund Auth., Transportation System Bonds, Capital Appreciation Bonds, Series 2006-C,
National insured, 0% 2031
| 10,000
| 6,971
|
| Transportation Trust Fund Auth., Transportation System Bonds, Capital Appreciation Bonds, Series 2008-A, 0% 2037
| 6,000
| 3,219
|
| Transportation Trust Fund Auth., Transportation System Bonds, Capital Appreciation Bonds, Series 2010-A, 0% 2040
| 28,300
| 13,303
|
Transportation Trust Fund Auth., Transportation System Bonds, Capital Appreciation Bonds, Series 2010-A,
BAM insured, 0% 2027
| 3,785
| 3,106
|
Transportation Trust Fund Auth., Transportation System Bonds, Series 2004-A, FGIC-National insured,
5.75% 2025
| 5,555
| 6,713
|
| Transportation Trust Fund Auth., Transportation System Bonds, Series 2005-B, National insured, 5.50% 2021
| 17,825
| 19,481
|
| Transportation Trust Fund Auth., Transportation System Bonds, Series 2006-A, 5.50% 2023
| 1,450
| 1,695
|
Transportation Trust Fund Auth., Transportation System Bonds, Series 2006-A,
Assured Guaranty Municipal insured, 5.50% 2023
| 10,000
| 11,717
|
| Transportation Trust Fund Auth., Transportation System Bonds, Series 2018-A, 5.00% 2030
| 1,590
| 1,902
|
| Transportation Trust Fund Auth., Transportation System Rev. Ref. Bonds, Series 2006-A, 5.25% 2020
| 10,000
| 10,509
|
| Transportation Trust Fund Auth., Transportation System Rev. Ref. Bonds, Series 2006-A, 5.25% 2021
| 10,000
| 10,871
|
| Transportation Trust Fund Auth., Transportation System Rev. Ref. Bonds, Series 2013-A, 5.00% 2019
| 13,965
| 14,145
|
Turnpike Auth., Turnpike Rev. Bonds, Series 2017-C-6,
(1-month USD-LIBOR x 0.70 + 0.75%) 2.431% 2030 (put 2023)2
| 10,000
| 10,096
|
|
|
| 479,113
|
| New Mexico 0.45%
|
|
|
| County of Bernalillo, Gross Receipts Tax Rev. Ref. Bonds, Series 1998, 5.20% 2021
| 3,180
| 3,328
|
| City of Farmington, Pollution Control Rev. Ref. Bonds (Southern California Edison Co. Four Corners Project), Series 2005-A, 1.875% 2029 (put 2020)
| 24,100
| 24,138
|
| City of Farmington, Pollution Control Rev. Ref. Bonds (Southern California Edison Co. Four Corners Project), Series 2005-B, 1.875% 2029 (put 2020)
| 3,000
| 3,005
|
| G.O. Bonds (Capital Projects), Series 2015, 5.00% 2025 (escrowed to maturity)
| 7,430
| 8,936
|
Hospital Equipment Loan Council, Hospital System Rev. Bonds (Presbyterian Healthcare Services),
Series 2012-A, 5.00% 2042
| 6,350
| 6,893
|
Hospital Equipment Loan Council, Hospital System Rev. Bonds (Presbyterian Healthcare Services),
Series 2015-A, 5.00% 2044
| 3,000
| 3,414
|
Hospital Equipment Loan Council, Hospital System Rev. Bonds (Presbyterian Healthcare Services),
Series 2017-A, 4.00% 2035
| 2,900
| 3,207
|
Hospital Equipment Loan Council, Hospital System Rev. Bonds (Presbyterian Healthcare Services),
Series 2017-A, 4.00% 2037
| 4,000
| 4,387
|
Hospital Equipment Loan Council, Hospital System Rev. Bonds (Presbyterian Healthcare Services),
Series 2017-A, 5.00% 2046
| 5,000
| 5,869
|
The Tax-Exempt Bond Fund of America — Page
70 of 120
Bonds, notes & other debt instruments (continued)
New Mexico (continued)
| Principal amount
(000)
| Value
(000)
|
Hospital Equipment Loan Council, Rev. Ref. Bonds (Haverland Charter Lifestyle Group),
Series 2012, 5.00% 2032
| $1,415
| $1,501
|
| Mortgage Fin. Auth., Single Family Mortgage Program Bonds, Series 2009-D, Class I, 5.35% 2040
| 25
| 25
|
| Mortgage Fin. Auth., Single Family Mortgage Program Bonds, Series 2010-A, Class I, 4.50% 2028
| 85
| 86
|
| Mortgage Fin. Auth., Single Family Mortgage Program Bonds, Series 2010-A, Class I, 4.625% 2025
| 190
| 192
|
| Mortgage Fin. Auth., Single Family Mortgage Program Bonds, Series 2017-B-1, Class I, 3.75% 2048
| 3,995
| 4,292
|
| Mortgage Fin. Auth., Single Family Mortgage Program Bonds, Series 2018-A-1, Class I, 4.00% 2049
| 5,110
| 5,562
|
| Mortgage Fin. Auth., Single Family Mortgage Program Bonds, Series 2018-B-1, Class I, 4.00% 2049
| 8,710
| 9,476
|
| Mortgage Fin. Auth., Single Family Mortgage Program Bonds, Series 2018-C, Class I, 4.00% 2049
| 2,450
| 2,672
|
| Mortgage Fin. Auth., Single Family Mortgage Program Bonds, Series 2019-A-1, Class I, 4.25% 2050
| 1,400
| 1,547
|
| Mortgage Fin. Auth., Single Family Mortgage Program Bonds, Series 2019-C-1, Class I, 4.00% 2050
| 1,450
| 1,597
|
| Mortgage Fin. Auth., Single Family Mortgage Program Bonds, Series 2019-D, Class I, 3.75% 2050
| 5,625
| 6,149
|
| Mortgage Fin. Auth., Single Family Mortgage Program Rev. Ref. Bonds, Series 2009-E, Class I, 5.30% 2040
| 200
| 204
|
|
|
| 96,480
|
| New York 6.82%
|
|
|
Town of Amherst, Dev. Corp., Student Housing Fac. Rev. Ref. Bonds (UBF Faculty-Student Housing Corp. - Greiner and Hadley Rev. Ref. Projects at SUNY Buffalo),
Series 2017-A,
Assured Guaranty Municipal insured, 5.00% 2030
| 1,460
| 1,806
|
Town of Amherst, Dev. Corp., Student Housing Fac. Rev. Ref. Bonds (UBF Faculty-Student Housing Corp. - Greiner and Hadley Rev. Ref. Projects at SUNY Buffalo),
Series 2017-A,
Assured Guaranty Municipal insured, 5.00% 2031
| 1,055
| 1,295
|
| Brooklyn Arena Local Dev. Corp., PILOT Rev. Ref. Bonds (Barclays Center), Series 2016-A, 5.00% 2026
| 2,420
| 2,903
|
| Brooklyn Arena Local Dev. Corp., PILOT Rev. Ref. Bonds (Barclays Center), Series 2016-A, 5.00% 2027
| 5,825
| 7,037
|
| Brooklyn Arena Local Dev. Corp., PILOT Rev. Ref. Bonds (Barclays Center), Series 2016-A, 5.00% 2028
| 7,275
| 8,715
|
Brooklyn Arena Local Dev. Corp., PILOT Rev. Ref. Bonds (Barclays Center), Series 2016-A,
Assured Guaranty Municipal insured, 4.00% 2032
| 1,035
| 1,158
|
Brooklyn Arena Local Dev. Corp., PILOT Rev. Ref. Bonds (Barclays Center), Series 2016-A,
Assured Guaranty Municipal insured, 4.00% 2033
| 1,085
| 1,209
|
Brooklyn Arena Local Dev. Corp., PILOT Rev. Ref. Bonds (Barclays Center), Series 2016-A,
Assured Guaranty Municipal insured, 4.00% 2034
| 1,000
| 1,109
|
Brooklyn Arena Local Dev. Corp., PILOT Rev. Ref. Bonds (Barclays Center), Series 2016-A,
Assured Guaranty Municipal insured, 5.00% 2042
| 25,425
| 29,144
|
| Buffalo and Erie County Industrial Land Dev. Corp., Rev. Bonds (Catholic Health System Obligated Group Project), Series 2015, 5.00% 2040
| 1,500
| 1,715
|
| Convention Center Dev. Corp., Senior Lien Rev. Bonds (Hotel Unit Fee Secured), Capital Appreciation Bonds, Series 2016-A, 0% 2055
| 14,665
| 4,266
|
Convention Center Dev. Corp., Senior Lien Rev. Bonds (Hotel Unit Fee Secured), Capital Appreciation Bonds,
Series 2016-A, 0% 2054
| 26,390
| 7,726
|
| Dormitory Auth., Mental Health Services Facs. Improvement Rev. Ref. Bonds, Series 2010-A, 5.00% 2021
| 5,000
| 5,200
|
| Dormitory Auth., Rev. Bonds (Fordham University), Series 2011-A, 5.50% 2036 (preref. 2021)
| 650
| 706
|
| Dormitory Auth., Rev. Bonds (Icahn School of Medicine at Mount Sinai), Series 2015-A, 5.00% 2031
| 1,000
| 1,171
|
| Dormitory Auth., Rev. Bonds (Icahn School of Medicine at Mount Sinai), Series 2015-A, 5.00% 2033
| 7,500
| 8,731
|
| Dormitory Auth., Rev. Bonds (Icahn School of Medicine at Mount Sinai), Series 2015-A, 5.00% 2040
| 500
| 571
|
| Dormitory Auth., Rev. Bonds (New York University), Series 2018-A, 5.00% 2031
| 1,000
| 1,283
|
| Dormitory Auth., Rev. Bonds (New York University), Series 2018-A, 5.00% 2036
| 1,500
| 1,867
|
| Dormitory Auth., Rev. Bonds (New York University), Series 2018-A, 5.00% 2038
| 2,000
| 2,467
|
Dormitory Auth., Rev. Bonds (North Shore-Long Island Jewish Obligated Group), Series 2011-A,
5.00% 2032 (preref. 2021)
| 11,000
| 11,768
|
| Dormitory Auth., Rev. Bonds (NYU Hospitals Center), Series 2014, 5.00% 2036
| 650
| 738
|
| Dormitory Auth., Rev. Bonds (Orange Regional Medical Center Obligated Group), Series 2015, 5.00% 20311
| 500
| 572
|
| Dormitory Auth., Rev. Ref. Bonds (Mount Sinai Hospital Obligated Group), Series 2010-A, 5.00% 2026
| 1,250
| 1,292
|
Dormitory Auth., School Dist. Rev. Bond Fncg. Program Rev. Bonds, Series 2012-F,
Assured Guaranty Municipal insured, 5.00% 2020
| 1,100
| 1,149
|
| Dormitory Auth., School Dist. Rev. Bond Fncg. Program Rev. Bonds, Series 2016-E, BAM insured, 5.00% 2026
| 1,000
| 1,254
|
The Tax-Exempt Bond Fund of America — Page
71 of 120
Bonds, notes & other debt instruments (continued)
New York (continued)
| Principal amount
(000)
| Value
(000)
|
| Dormitory Auth., School Dist. Rev. Bond Fncg. Program Rev. Bonds, Series 2018-A, 5.00% 2022
| $5,000
| $5,604
|
| Dormitory Auth., Secured Hospital Rev. Ref. Bonds (Interfaith Medical Center), Series 2007, 5.00% 2020
| 3,400
| 3,448
|
| Dormitory Auth., State Personal Income Tax Rev. Bonds (Education), Series 2014-C, Group A, 5.00% 2024
| 5,000
| 5,884
|
| Dormitory Auth., State Personal Income Tax Rev. Bonds (General Purpose), Series 2011-A, 5.00% 2033
| 8,760
| 9,280
|
| Dormitory Auth., State Personal Income Tax Rev. Bonds (General Purpose), Series 2011-C, 5.00% 2041
| 1,890
| 1,999
|
| Dormitory Auth., State Personal Income Tax Rev. Bonds (General Purpose), Series 2014-A, 5.00% 2030
| 2,500
| 2,891
|
| Dormitory Auth., State Personal Income Tax Rev. Bonds (General Purpose), Series 2015-A, 5.00% 2034
| 4,390
| 5,143
|
| Dormitory Auth., State Personal Income Tax Rev. Bonds (General Purpose), Series 2017-A, 5.00% 2032
| 1,500
| 1,833
|
| Dormitory Auth., State Personal Income Tax Rev. Bonds (General Purpose), Series 2017-B, 5.00% 2035
| 18,005
| 21,943
|
| Dormitory Auth., State Personal Income Tax Rev. Bonds (General Purpose), Series 2018-A, 5.00% 2040
| 2,000
| 2,443
|
| Dormitory Auth., State Sales Tax Rev. Bonds, Series 2017-B, 5.00% 2033
| 3,000
| 3,684
|
| Dormitory Auth., State Sales Tax Rev. Bonds, Series 2018-A, 5.00% 2034
| 10,000
| 12,420
|
County of Dutchess, Local Dev. Corp., Rev. Bonds (Health Quest Systems, Inc. Project), Series 2016-B,
4.00% 2041
| 1,250
| 1,339
|
| Energy Research and Dev. Auth., Pollution Control Rev. Bonds (New York State Electric & Gas Corp. Project), Series 1994-B, 2.00% 2029 (put 2020)
| 2,000
| 2,010
|
Environmental Facs. Corp., State Clean Water and Drinking Water Revolving Funds Rev. Bonds
(New York City Water Fin. Auth. Projects - Second Resolution Bonds), Series 2011-B, 5.00% 2036
| 2,500
| 2,664
|
| County of Erie, Industrial Dev. Agcy., School Fac. Rev. Bonds (City School Dist. of the City of Buffalo Project), Series 2011-A, 5.25% 2025
| 500
| 535
|
| County of Erie, Industrial Dev. Agcy., School Fac. Rev. Ref. Bonds (City School Dist. of the City of Buffalo Project), Series 2011-B, 5.00% 2024
| 1,000
| 1,066
|
| County of Erie, Industrial Dev. Agcy., School Fac. Rev. Ref. Bonds (City School Dist. of the City of Buffalo Project), Series 2012-A, 5.00% 2025
| 1,000
| 1,104
|
| County of Erie, Industrial Dev. Agcy., School Fac. Rev. Ref. Bonds (City School Dist. of the City of Buffalo Project), Series 2013-A, 5.00% 2026
| 6,000
| 6,824
|
| County of Erie, Industrial Dev. Agcy., School Fac. Rev. Ref. Bonds (City School Dist. of the City of Buffalo Project), Series 2013-A, 5.00% 2027
| 3,000
| 3,406
|
| Housing Fin. Agcy., Affordable Housing Rev. Bonds, Series 2017-M, 3.65% 2042
| 1,250
| 1,304
|
| Housing Fin. Agcy., Affordable Housing Rev. Green Bonds, Series 2017-D, 3.95% 2037
| 1,000
| 1,069
|
| Hudson Yards Infrastructure Corp., Rev. Bonds, Fiscal 2012, Series 2012-A, 5.25% 2047
| 5,735
| 6,052
|
| Hudson Yards Infrastructure Corp., Rev. Bonds, Fiscal 2012, Series 2012-A, 5.25% 2047 (preref. 2021)
| 265
| 282
|
| Hudson Yards Infrastructure Corp., Rev. Bonds, Fiscal 2012, Series 2012-A, 5.75% 2047
| 3,610
| 3,850
|
| Hudson Yards Infrastructure Corp., Rev. Bonds, Fiscal 2012, Series 2012-A, 5.75% 2047 (preref. 2021)
| 4,685
| 5,026
|
| Liberty Dev. Corp., Liberty Rev. Bonds (Goldman Sachs Headquarters Issue), Series 2005, 5.25% 2035
| 2,020
| 2,711
|
| Liberty Dev. Corp., Liberty Rev. Ref. Bonds (3 World Trade Center Project), Series 2014, Class 2, 5.15% 20341
| 7,750
| 8,687
|
| Liberty Dev. Corp., Liberty Rev. Ref. Bonds (3 World Trade Center Project), Series 2014, Class 2, 5.375% 20401
| 2,700
| 3,031
|
| Liberty Dev. Corp., Liberty Rev. Ref. Bonds (4 World Trade Center Project), Series 2011, 5.00% 2031
| 3,500
| 3,785
|
| Liberty Dev. Corp., Liberty Rev. Ref. Bonds (4 World Trade Center Project), Series 2011, 5.00% 2044
| 4,000
| 4,282
|
| Liberty Dev. Corp., Liberty Rev. Ref. Bonds (7 World Trade Center Project), Series 2012, 5.00% 2043
| 4,000
| 4,317
|
Liberty Dev. Corp., Liberty Rev. Ref. Bonds (Bank of America Tower at One Bryant Park Project),
Series 2010, 5.125% 2044
| 1,000
| 1,017
|
Liberty Dev. Corp., Liberty Rev. Ref. Bonds (Bank of America Tower at One Bryant Park Project),
Series 2010, 6.375% 2049
| 21,050
| 21,514
|
| Long Island Power Auth., Electric System General Rev. Bonds, Series 2003-C, CIFG insured, 5.25% 2029
| 4,000
| 5,226
|
| Long Island Power Auth., Electric System General Rev. Bonds, Series 2012-A, 5.00% 2042
| 3,600
| 3,926
|
| Long Island Power Auth., Electric System General Rev. Bonds, Series 2014-A, 5.00% 2034
| 1,500
| 1,728
|
| Long Island Power Auth., Electric System General Rev. Bonds, Series 2014-A, 5.00% 2039
| 3,995
| 4,566
|
Long Island Power Auth., Electric System General Rev. Bonds, Series 2015-C,
(1-month USD-LIBOR x 0.70 + 0.75%) 2.431% 2033 (put 2023)2
| 62,600
| 62,882
|
| Long Island Power Auth., Electric System General Rev. Bonds, Series 2016-B, 5.00% 2032
| 6,000
| 7,256
|
| Long Island Power Auth., Electric System General Rev. Bonds, Series 2018, 5.00% 2034
| 5,000
| 6,234
|
| Long Island Power Auth., Electric System General Rev. Bonds, Series 2018, 5.00% 2037
| 2,000
| 2,461
|
| Long Island Power Auth., Electric System General Rev. Bonds, Series 2018, 5.00% 2038
| 1,000
| 1,225
|
| Long Island Power Auth., Electric System General Rev. Bonds, Series 2018, 5.00% 2039
| 2,465
| 3,011
|
The Tax-Exempt Bond Fund of America — Page
72 of 120
Bonds, notes & other debt instruments (continued)
New York (continued)
| Principal amount
(000)
| Value
(000)
|
| Metropolitan Transportation Auth., Dedicated Tax Fund Bonds, Series 2009-B, 5.00% 2034 (preref. 2019)
| $1,000
| $1,012
|
| Metropolitan Transportation Auth., Dedicated Tax Fund Bonds, Series 2009-B, 5.25% 2022 (preref. 2019)
| 5,000
| 5,061
|
| Metropolitan Transportation Auth., Dedicated Tax Fund Bonds, Series 2009-B, 5.25% 2030 (preref. 2019)
| 2,000
| 2,025
|
| Metropolitan Transportation Auth., Dedicated Tax Fund Green Bonds, Series 2016-B-1, 5.00% 2036
| 5,000
| 6,005
|
Metropolitan Transportation Auth., Dedicated Tax Fund Rev. Ref. Bonds, Series 2002-B-3C,
(SIFMA Municipal Swap Index + 0.95%) 2.35% 20192
| 8,900
| 8,919
|
Metropolitan Transportation Auth., Dedicated Tax Fund Rev. Ref. Bonds, Series 2002-B-3D,
(SIFMA Municipal Swap Index + 1.00%) 2.40% 20202
| 11,100
| 11,180
|
| Metropolitan Transportation Auth., Hudson Rail Yards Trust Obligations, Series 2016-A, 5.00% 2046
| 1,075
| 1,085
|
| Metropolitan Transportation Auth., Hudson Rail Yards Trust Obligations, Series 2016-A, 5.00% 2051
| 7,500
| 7,965
|
Metropolitan Transportation Auth., Transportation Rev. Bonds, Series 2003-B, FGIC-National insured,
5.25% 2021
| 5,000
| 5,458
|
| Metropolitan Transportation Auth., Transportation Rev. Bonds, Series 2011-D, 5.00% 2036 (preref. 2021)
| 6,000
| 6,552
|
| Metropolitan Transportation Auth., Transportation Rev. Bonds, Series 2014-B, 5.00% 2044
| 13,000
| 14,632
|
Metropolitan Transportation Auth., Transportation Rev. Bonds, Series 2014-D-2,
(SIFMA Municipal Swap Index + 0.45%) 1.85% 2044 (put 2022)2
| 7,500
| 7,487
|
| Metropolitan Transportation Auth., Transportation Rev. Bonds, Series 2015-A-1, 5.00% 2045
| 23,845
| 27,222
|
Metropolitan Transportation Auth., Transportation Rev. Bonds, Series 2015-A-2,
(SIFMA Municipal Swap Index + 0.58%) 1.98% 2039 (put 2020)2
| 13,000
| 13,011
|
| Metropolitan Transportation Auth., Transportation Rev. Bonds, Series 2015-C-1, 5.00% 2035
| 6,000
| 7,015
|
| Metropolitan Transportation Auth., Transportation Rev. Green Bonds, Series 2017-A-1, 5.00% 2032
| 1,500
| 1,821
|
| Metropolitan Transportation Auth., Transportation Rev. Ref. Bond Anticipation Notes, Series 2002-D-2B, Assured Guaranty Municipal insured, (1-month USD-LIBOR x
0.69 + 0.30%) 1.957% 2032 (put 2021)2
| 15,000
| 14,992
|
Metropolitan Transportation Auth., Transportation Rev. Ref. Bonds, Series 2002-D-1,
5.00% 2025 (escrowed to maturity)
| 4,545
| 5,065
|
Metropolitan Transportation Auth., Transportation Rev. Ref. Bonds, Series 2002-D-2A,
Assured Guaranty Municipal insured, (1-month USD-LIBOR x 0.69 + 0.68%) 2.337% 2032 (put 2021)2
| 2,000
| 2,011
|
Metropolitan Transportation Auth., Transportation Rev. Ref. Bonds, Series 2005-D-1,
(1-month USD-LIBOR x 0.67 + 0.65%) 2.259% 2035 (put 2021)2
| 5,000
| 5,013
|
| Metropolitan Transportation Auth., Transportation Rev. Ref. Bonds, Series 2011-C, 5.00% 2023
| 3,405
| 3,686
|
| Metropolitan Transportation Auth., Transportation Rev. Ref. Bonds, Series 2011-C, 5.00% 2023 (preref. 2021)
| 1,595
| 1,742
|
| Metropolitan Transportation Auth., Transportation Rev. Ref. Bonds, Series 2012-D, 5.00% 2024
| 8,000
| 8,946
|
| Metropolitan Transportation Auth., Transportation Rev. Ref. Bonds, Series 2012-D, 5.00% 2029
| 7,000
| 7,762
|
| Metropolitan Transportation Auth., Transportation Rev. Ref. Bonds, Series 2012-D, 5.00% 2032
| 3,105
| 3,436
|
| Metropolitan Transportation Auth., Transportation Rev. Ref. Bonds, Series 2012-F, 5.00% 2030
| 10,000
| 11,071
|
Metropolitan Transportation Auth., Transportation Rev. Ref. Bonds, Series 2014-A-2,
5.00% 2028 (preref. 2023)
| 3,000
| 3,509
|
| Metropolitan Transportation Auth., Transportation Rev. Ref. Bonds, Series 2016-B, 5.00% 2037
| 1,495
| 1,770
|
| Metropolitan Transportation Auth., Transportation Rev. Ref. Bonds, Series 2017-D, 5.00% 2035
| 4,885
| 5,950
|
Metropolitan Transportation Auth., Transportation Rev. Ref. Green Bonds, Capital Appreciation Bonds,
Series 2017-C-2, 0% 2027
| 1,500
| 1,262
|
Metropolitan Transportation Auth., Transportation Rev. Ref. Green Bonds, Capital Appreciation Bonds,
Series 2017-C-2, 0% 2029
| 1,500
| 1,180
|
Metropolitan Transportation Auth., Transportation Rev. Ref. Green Bonds, Capital Appreciation Bonds,
Series 2017-C-2, 0% 2032
| 5,000
| 3,537
|
| Metropolitan Transportation Auth., Transportation Rev. Ref. Green Bonds, Series 2017-A-2, 5.00% 2030
| 1,000
| 1,224
|
| Metropolitan Transportation Auth., Transportation Rev. Ref. Green Bonds, Series 2017-B, 5.00% 2024
| 4,330
| 5,129
|
| Metropolitan Transportation Auth., Transportation Rev. Ref. Green Bonds, Series 2017-C-1, 4.00% 2034
| 2,500
| 2,825
|
| Metropolitan Transportation Auth., Transportation Rev. Ref. Green Bonds, Series 2017-C-1, 4.00% 2035
| 5,000
| 5,621
|
| Metropolitan Transportation Auth., Transportation Rev. Ref. Green Bonds, Series 2017-C-1, 4.00% 2036
| 3,000
| 3,356
|
| Metropolitan Transportation Auth., Transportation Rev. Ref. Green Bonds, Series 2017-C-1, 5.00% 2026
| 10,000
| 12,365
|
| Metropolitan Transportation Auth., Transportation Rev. Ref. Green Bonds, Series 2017-C-1, 5.00% 2028
| 5,500
| 7,010
|
| Metropolitan Transportation Auth., Transportation Rev. Ref. Green Bonds, Series 2017-C-1, 5.00% 2029
| 6,000
| 7,566
|
| Metropolitan Transportation Auth., Transportation Rev. Ref. Green Bonds, Series 2017-C-1, 5.00% 2030
| 1,000
| 1,251
|
| Metropolitan Transportation Auth., Transportation Rev. Ref. Green Bonds, Series 2017-C-1, 5.00% 2031
| 1,000
| 1,242
|
The Tax-Exempt Bond Fund of America — Page
73 of 120
Bonds, notes & other debt instruments (continued)
New York (continued)
| Principal amount
(000)
| Value
(000)
|
| Metropolitan Transportation Auth., Transportation Rev. Ref. Green Bonds, Series 2017-C-1, 5.00% 2033
| $1,000
| $1,229
|
| Metropolitan Transportation Auth., Transportation Rev. Ref. Green Bonds, Series 2019-A-2, 5.00% 2045
| 20,000
| 24,073
|
| County of Monroe, Industrial Dev. Corp., FHA insured Mortgage Rev. Bonds (Unity Hospital of Rochester Project), Series 2010, 5.50% 2040
| 1,000
| 1,063
|
| Mortgage Agcy., Homeowner Mortgage Rev. Bonds, Series 195, 4.00% 2046
| 7,555
| 7,990
|
| Mortgage Agcy., Homeowner Mortgage Rev. Bonds, Series 197, 3.50% 2044
| 5,530
| 5,804
|
| Mortgage Agcy., Homeowner Mortgage Rev. Bonds, Series 200, 3.50% 2045
| 8,665
| 9,062
|
| Mortgage Agcy., Homeowner Mortgage Rev. Bonds, Series 205, 4.00% 2040
| 2,080
| 2,223
|
| Mortgage Agcy., Homeowner Mortgage Rev. Bonds, Series 208, 4.00% 2048
| 29,235
| 31,361
|
| Mortgage Agcy., Homeowner Mortgage Rev. Bonds, Series 48, 2.625% 2041
| 175
| 178
|
| Mortgage Agcy., Homeowner Mortgage Rev. Bonds, Series 54, 4.00% 2047
| 14,170
| 15,116
|
| County of Nassau, G.O. General Improvement Bonds, Series 2016-B, 5.00% 2023
| 510
| 589
|
| County of Nassau, G.O. General Improvement Bonds, Series 2017-B, 5.00% 2030
| 2,760
| 3,396
|
County of Nassau, G.O. General Improvement Bonds, Series 2018-B, Assured Guaranty Municipal insured,
5.00% 2035
| 2,250
| 2,785
|
County of Nassau, G.O. General Improvement Bonds, Series 2018-B, Assured Guaranty Municipal insured,
5.00% 2042
| 2,000
| 2,426
|
| County of Nassau, G.O. General Improvement Rev. Ref. Bonds, Series 2016-A, 5.00% 2027
| 825
| 1,002
|
| County of Nassau, G.O. General Improvement Rev. Ref. Bonds, Series 2016-A, 5.00% 2030
| 750
| 899
|
| New York City G.O. Bonds, Fiscal 2006, Series 2006-J-2, Assured Guaranty Municipal insured, 1.55% 20362
| 2,625
| 2,625
|
| New York City G.O. Bonds, Fiscal 2013, Series 2013-F-1, 5.00% 2037
| 3,000
| 3,350
|
| New York City G.O. Bonds, Fiscal 2013, Series 2013-H, 5.00% 2023
| 2,475
| 2,851
|
| New York City G.O. Bonds, Fiscal 2013, Series 2013-J, 5.00% 2023
| 500
| 576
|
| New York City G.O. Bonds, Fiscal 2014, Series 2014-G, 5.00% 2023
| 2,500
| 2,880
|
| New York City G.O. Bonds, Fiscal 2014, Series 2014-J, 5.00% 2030
| 2,000
| 2,342
|
| New York City G.O. Bonds, Fiscal 2015, Series 2015-A, 5.00% 2024
| 5,500
| 6,526
|
| New York City G.O. Bonds, Fiscal 2015, Series 2015-C, 5.00% 2028
| 1,000
| 1,188
|
| New York City G.O. Bonds, Fiscal 2015, Series 2015-C, 5.00% 2030
| 10,000
| 11,804
|
| New York City G.O. Bonds, Fiscal 2015, Series 2015-C, 5.00% 2032
| 3,500
| 4,100
|
| New York City G.O. Bonds, Fiscal 2015, Series 2015-C, 5.00% 2033
| 1,000
| 1,168
|
| New York City G.O. Bonds, Fiscal 2015, Series 2015-D, 5.00% 2030
| 2,560
| 3,022
|
| New York City G.O. Bonds, Fiscal 2016, Series 2016-A, 5.00% 2026
| 8,000
| 9,706
|
| New York City G.O. Bonds, Fiscal 2016, Series 2016-E, 5.00% 2021
| 1,950
| 2,102
|
| New York City G.O. Bonds, Fiscal 2017, Series 2017-A-1, 5.00% 2030
| 740
| 901
|
| New York City G.O. Bonds, Fiscal 2017, Series 2017-A-1, 5.00% 2037
| 2,000
| 2,378
|
| New York City G.O. Bonds, Fiscal 2017, Series 2017-B-1, 5.00% 2032
| 1,500
| 1,829
|
| New York City G.O. Bonds, Fiscal 2017, Series 2017-B-1, 5.00% 2034
| 1,000
| 1,206
|
| New York City G.O. Bonds, Fiscal 2017, Series 2017-B-1, 5.00% 2037
| 2,500
| 2,992
|
| New York City G.O. Bonds, Fiscal 2017, Series 2017-B-1, 5.00% 2038
| 1,500
| 1,788
|
| New York City G.O. Bonds, Fiscal 2017, Series 2017-B-1, 5.00% 2041
| 1,500
| 1,777
|
| New York City G.O. Bonds, Fiscal 2017, Series 2017-C, 5.00% 2026
| 5,000
| 6,221
|
| New York City G.O. Bonds, Fiscal 2017, Series 2017-C, 5.00% 2028
| 2,200
| 2,744
|
| New York City G.O. Bonds, Fiscal 2018, Series 2018-A, 5.00% 2026
| 10,000
| 12,442
|
| New York City G.O. Bonds, Fiscal 2018, Series 2018-A, 5.00% 2027
| 1,500
| 1,904
|
| New York City G.O. Bonds, Fiscal 2018, Series 2018-A, 5.00% 2028
| 1,000
| 1,263
|
| New York City G.O. Bonds, Fiscal 2018, Series 2018-B-1, 5.00% 2035
| 2,950
| 3,612
|
| New York City G.O. Bonds, Fiscal 2018, Series 2018-C, 5.00% 2026
| 1,500
| 1,866
|
| New York City G.O. Bonds, Fiscal 2018, Series 2018-C, 5.00% 2029
| 4,800
| 6,092
|
| New York City G.O. Bonds, Fiscal 2018, Series 2018-C, 5.00% 2030
| 8,075
| 10,173
|
| New York City G.O. Bonds, Fiscal 2018, Series 2018-C, 5.00% 2031
| 3,620
| 4,533
|
| New York City G.O. Bonds, Fiscal 2018, Series 2018-E-1, 5.00% 2032
| 2,575
| 3,221
|
| New York City G.O. Bonds, Fiscal 2018, Series 2018-E-1, 5.00% 2037
| 6,345
| 7,764
|
| New York City G.O. Bonds, Fiscal 2018, Series 2018-F-1, 5.00% 2037
| 2,000
| 2,450
|
| New York City G.O. Bonds, Fiscal 2019, Series 2019-D-1, 5.00% 2037
| 5,000
| 6,190
|
| New York City G.O. Bonds, Fiscal 2019, Series 2019-E, 5.00% 2033
| 1,000
| 1,264
|
The Tax-Exempt Bond Fund of America — Page
74 of 120
Bonds, notes & other debt instruments (continued)
New York (continued)
| Principal amount
(000)
| Value
(000)
|
| New York City G.O. Bonds, Fiscal 2019, Series 2019-E, 5.00% 2034
| $2,250
| $2,827
|
| New York City Health and Hospitals Corp., Health System Rev. Ref. Bonds, Series 2010-A, 5.00% 2024
| 5,000
| 5,104
|
New York City Housing Dev. Corp., Multi Family Housing Rev. Bonds (8 Spruce Street), Series 2014-E,
3.50% 2048
| 5,260
| 5,473
|
| New York City Housing Dev. Corp., Multi Family Housing Rev. Bonds (Sustainable Neighborhood Bonds), Series 2017-A-1-A, 3.85% 2042
| 2,000
| 2,096
|
| New York City Housing Dev. Corp., Multi Family Housing Rev. Bonds (Sustainable Neighborhood Bonds), Series 2017-C-1, 3.55% 2042
| 8,000
| 8,309
|
| New York City Housing Dev. Corp., Multi Family Housing Rev. Bonds (Sustainable Neighborhood Bonds), Series 2018-L-2, 2.75% 2050 (put 2023)
| 9,725
| 10,102
|
| New York City Housing Dev. Corp., Multi Family Housing Rev. Bonds (Sustainable Neighborhood Bonds), Series 2019-E-2, 1.75% 2059 (put 2023)
| 5,500
| 5,537
|
New York City Housing Dev. Corp., Multi Family Housing Rev. Bonds (Sustainable Neighborhood Bonds),
Series 2017-G-2-A, 2.00% 2057 (put 2021)
| 2,000
| 2,015
|
New York City Municipal Bond Bank Agcy., Special School Purpose Rev. Ref. Bonds (Prior Year Claims),
Series 2012-A, 5.00% 2021
| 2,000
| 2,184
|
New York City Municipal Water Fin. Auth., Water and Sewer System Rev. Bonds, Series 2010-FF,
5.00% 2025
| 895
| 926
|
New York City Municipal Water Fin. Auth., Water and Sewer System Rev. Bonds, Series 2010-FF,
5.00% 2025 (preref. 2020)
| 1,360
| 1,408
|
New York City Municipal Water Fin. Auth., Water and Sewer System Rev. Bonds, Series 2011-EE,
5.375% 2043
| 20,815
| 21,985
|
New York City Municipal Water Fin. Auth., Water and Sewer System Rev. Bonds, Series 2011-EE,
5.375% 2043 (preref. 2020)
| 40,645
| 43,097
|
| New York City Municipal Water Fin. Auth., Water and Sewer System Rev. Bonds, Series 2011-GG, 5.00% 2026
| 205
| 220
|
New York City Municipal Water Fin. Auth., Water and Sewer System Rev. Bonds, Series 2011-GG,
5.00% 2026 (preref. 2021)
| 1,795
| 1,929
|
| New York City Municipal Water Fin. Auth., Water and Sewer System Second General Resolution Rev. Bonds, Fiscal 2011, Series 2011-GG, 5.00% 2043 (preref. 2021)
| 2,000
| 2,149
|
| New York City Municipal Water Fin. Auth., Water and Sewer System Second General Resolution Rev. Bonds, Fiscal 2012, Series 2012-BB, 5.25% 2044 (preref. 2021)
| 3,000
| 3,300
|
| New York City Municipal Water Fin. Auth., Water and Sewer System Second General Resolution Rev. Bonds, Fiscal 2013, Series 2013-BB, 5.00% 2047
| 5,000
| 5,517
|
| New York City Municipal Water Fin. Auth., Water and Sewer System Second General Resolution Rev. Bonds, Fiscal 2017, Series 2017-DD, 5.00% 2047
| 4,000
| 4,736
|
| New York City Municipal Water Fin. Auth., Water and Sewer System Second General Resolution Rev. Bonds, Fiscal 2017, Series 2017-EE, 5.00% 2033
| 4,560
| 5,608
|
| New York City Municipal Water Fin. Auth., Water and Sewer System Second General Resolution Rev. Bonds, Fiscal 2017, Series 2017-EE, 5.00% 2037
| 3,000
| 3,626
|
| New York City Municipal Water Fin. Auth., Water and Sewer System Second General Resolution Rev. Bonds, Fiscal 2018, Series 2018-BB-1, 5.00% 2046
| 12,670
| 15,042
|
| New York City Municipal Water Fin. Auth., Water and Sewer System Second General Resolution Rev. Bonds, Fiscal 2018, Series 2018-CC-1, 5.00% 2048
| 5,000
| 5,921
|
| New York City Municipal Water Fin. Auth., Water and Sewer System Second General Resolution Rev. Bonds, Fiscal 2018, Series 2018-EE, 5.00% 2040
| 5,000
| 6,043
|
| New York City Municipal Water Fin. Auth., Water and Sewer System Second General Resolution Rev. Bonds, Fiscal 2019, Series 2019-DD-1, 5.00% 2049
| 9,000
| 10,815
|
| New York City Transitional Fin. Auth., Building Aid Rev. Bonds, Fiscal 2012, Series 2012-S-1A, 5.00% 2032
| 6,400
| 6,864
|
| New York City Transitional Fin. Auth., Building Aid Rev. Bonds, Fiscal 2013, Series 2013-S-1, 5.00% 2033
| 1,825
| 2,015
|
| New York City Transitional Fin. Auth., Building Aid Rev. Bonds, Fiscal 2016, Series 2016-S-1, 5.00% 2029
| 5,000
| 6,074
|
| New York City Transitional Fin. Auth., Building Aid Rev. Bonds, Fiscal 2018, Series 2018-S-1, 5.00% 2035
| 3,295
| 4,011
|
| New York City Transitional Fin. Auth., Building Aid Rev. Bonds, Fiscal 2018, Series 2018-S-2, 5.00% 2034
| 4,000
| 4,977
|
| New York City Transitional Fin. Auth., Building Aid Rev. Bonds, Fiscal 2018, Series 2018-S-3, 5.00% 2033
| 4,320
| 5,397
|
| New York City Transitional Fin. Auth., Building Aid Rev. Bonds, Fiscal 2018, Series 2018-S-3, 5.00% 2037
| 10,000
| 12,298
|
| New York City Transitional Fin. Auth., Building Aid Rev. Bonds, Fiscal 2018, Series 2018-S-3, 5.00% 2038
| 4,000
| 4,905
|
The Tax-Exempt Bond Fund of America — Page
75 of 120
Bonds, notes & other debt instruments (continued)
New York (continued)
| Principal amount
(000)
| Value
(000)
|
| New York City Transitional Fin. Auth., Building Aid Rev. Bonds, Fiscal 2018, Series 2018-S-4A, 5.00% 2034
| $4,000
| $4,977
|
| New York City Transitional Fin. Auth., Building Aid Rev. Bonds, Fiscal 2018, Series 2018-S-4A, 5.00% 2035
| 3,000
| 3,652
|
| New York City Transitional Fin. Auth., Building Aid Rev. Bonds, Fiscal 2018, Series 2018-S-4A, 5.00% 2037
| 19,250
| 23,674
|
| New York City Transitional Fin. Auth., Building Aid Rev. Bonds, Fiscal 2019, Series 2019-S-1, 4.00% 2037
| 5,135
| 5,792
|
| New York City Transitional Fin. Auth., Building Aid Rev. Bonds, Fiscal 2019, Series 2019-S-3, 5.00% 2035
| 5,000
| 6,193
|
| New York City Transitional Fin. Auth., Future Tax Secured Bonds, Fiscal 2013, Series 2013-F-1, 5.00% 2028
| 1,500
| 1,694
|
| New York City Transitional Fin. Auth., Future Tax Secured Bonds, Fiscal 2013, Series 2013-F-1, 5.00% 2036
| 1,000
| 1,113
|
| New York City Transitional Fin. Auth., Future Tax Secured Bonds, Fiscal 2015, Series 2015-C, 5.00% 2027
| 5,000
| 6,000
|
| New York City Transitional Fin. Auth., Future Tax Secured Bonds, Fiscal 2017, Series 2017-A-1, 5.00% 2035
| 1,000
| 1,196
|
| New York City Transitional Fin. Auth., Future Tax Secured Bonds, Fiscal 2017, Series 2017-C, 5.00% 2031
| 3,750
| 4,629
|
| New York City Transitional Fin. Auth., Future Tax Secured Bonds, Fiscal 2017, Series 2017-E-1, 5.00% 2043
| 2,500
| 2,960
|
| New York City Transitional Fin. Auth., Future Tax Secured Bonds, Fiscal 2017, Series 2017-F-1, 5.00% 2034
| 5,000
| 6,102
|
| New York City Transitional Fin. Auth., Future Tax Secured Bonds, Fiscal 2017, Series 2017-F-1, 5.00% 2035
| 5,000
| 6,077
|
| New York City Transitional Fin. Auth., Future Tax Secured Bonds, Fiscal 2017, Series 2017-F-1, 5.00% 2039
| 1,750
| 2,097
|
| New York City Transitional Fin. Auth., Future Tax Secured Bonds, Fiscal 2018, Series 2018-A-2, 5.00% 2035
| 10,000
| 12,208
|
| New York City Transitional Fin. Auth., Future Tax Secured Bonds, Fiscal 2018, Series 2018-B-1, 5.00% 2033
| 10,000
| 12,313
|
| New York City Transitional Fin. Auth., Future Tax Secured Bonds, Fiscal 2018, Series 2018-B-1, 5.00% 2045
| 2,500
| 2,979
|
| New York City Transitional Fin. Auth., Future Tax Secured Bonds, Fiscal 2019, Series 2019-A-1, 5.00% 2023
| 4,300
| 4,969
|
| New York City Transitional Fin. Auth., Future Tax Secured Bonds, Fiscal 2019, Series 2019-A-1, 5.00% 2035
| 6,000
| 7,448
|
| New York City Transitional Fin. Auth., Future Tax Secured Bonds, Fiscal 2019, Series 2019-A-1, 5.00% 2037
| 3,000
| 3,697
|
| New York City Transitional Fin. Auth., Future Tax Secured Bonds, Fiscal 2019, Series 2019-A-1, 5.00% 2038
| 9,660
| 11,854
|
| New York City Transitional Fin. Auth., Future Tax Secured Bonds, Fiscal 2019, Series 2019-C-1, 5.00% 2034
| 5,000
| 6,322
|
New York City Transitional Fin. Auth., Future Tax Secured Rev. Ref. Bonds, Fiscal 2015, Series 2015-A-1,
5.00% 2037
| 2,500
| 2,897
|
New York City Transitional Fin. Auth., Future Tax Secured Rev. Ref. Bonds, Fiscal 2015, Series 2015-E-1,
5.00% 2031
| 5,000
| 5,918
|
New York City Transitional Fin. Auth., Future Tax Secured Rev. Ref. Bonds, Fiscal 2016, Series 2016-A-1,
5.00% 2034
| 8,000
| 9,480
|
New York City Transitional Fin. Auth., Future Tax Secured Rev. Ref. Bonds, Fiscal 2016, Series 2016-A-1,
5.00% 2036
| 4,000
| 4,714
|
New York City Transitional Fin. Auth., Future Tax Secured Rev. Ref. Bonds, Fiscal 2016, Series 2016-A-1,
5.00% 2037
| 2,000
| 2,348
|
Port Auth., Special Project Bonds (John F. Kennedy International Air Terminal LLC Project), Series 8,
5.00% 2020
| 680
| 701
|
Port Auth., Special Project Bonds (John F. Kennedy International Air Terminal LLC Project), Series 8,
6.00% 2036
| 7,000
| 7,410
|
Port Auth., Special Project Bonds (John F. Kennedy International Air Terminal LLC Project), Series 8,
6.00% 2042
| 13,000
| 13,732
|
| Public Housing Capital Fund Rev. Trust II, Trust Certificates, Series 2012, 4.50% 20221
| 746
| 759
|
| County of Rockland, G.O. Bonds, Series 2014-A, Assured Guaranty Municipal insured, 5.00% 2022
| 1,250
| 1,373
|
| County of Suffolk, Econ. Dev. Corp., Rev. Bonds (Catholic Health Services of Long Island Obligated Group Project), Series 2011, 5.00% 2028
| 2,135
| 2,279
|
| County of Suffolk, Econ. Dev. Corp., Rev. Bonds (Catholic Health Services of Long Island Obligated Group Project), Series 2011, 5.00% 2028 (preref. 2021)
| 365
| 393
|
| County of Suffolk, Rev. Ref. Bonds, Series 2017-A, Assured Guaranty Municipal insured, 5.00% 2026
| 1,000
| 1,223
|
| Thruway Auth., General Rev. Bonds, Series I, 5.00% 2042
| 2,500
| 2,692
|
| Thruway Auth., General Rev. Indebtedness Obligations, Series 2016-A, 5.00% 2032
| 5,000
| 5,995
|
| Thruway Auth., General Rev. Indebtedness Obligations, Series 2016-A, 5.00% 2041
| 3,500
| 4,107
|
| Thruway Auth., General Rev. Indebtedness Obligations, Series 2016-A, 5.00% 2046
| 8,500
| 9,906
|
| Thruway Auth., General Rev. Indebtedness Obligations, Series 2016-A, 5.00% 2051
| 1,600
| 1,836
|
| Thruway Auth., General Rev. Indebtedness Obligations, Series 2016-A, 5.25% 2056
| 3,250
| 3,765
|
| Thruway Auth., General Rev. Ref. Bonds, Series 2018-L, 5.00% 2028
| 1,500
| 1,921
|
| Thruway Auth., General Rev. Ref. Bonds, Series 2018-L, 5.00% 2029
| 2,000
| 2,555
|
| Thruway Auth., General Rev. Ref. Bonds, Series 2018-L, 5.00% 2030
| 1,700
| 2,155
|
The Tax-Exempt Bond Fund of America — Page
76 of 120
Bonds, notes & other debt instruments (continued)
New York (continued)
| Principal amount
(000)
| Value
(000)
|
Triborough Bridge and Tunnel Auth., General Rev. Bonds (MTA Bridges and Tunnels), Series 2017-A,
5.00% 2033
| $2,395
| $2,948
|
Triborough Bridge and Tunnel Auth., General Rev. Bonds (MTA Bridges and Tunnels), Series 2017-A,
5.00% 2034
| 960
| 1,177
|
Triborough Bridge and Tunnel Auth., General Rev. Bonds (MTA Bridges and Tunnels), Series 2017-A,
5.00% 2035
| 1,000
| 1,221
|
| Triborough Bridge and Tunnel Auth., General Rev. Ref. Bonds (MTA Bridges and Tunnels), Series 2013-A, 5.00% 2023
| 2,500
| 2,861
|
| Triborough Bridge and Tunnel Auth., General Rev. Ref. Bonds (MTA Bridges and Tunnels), Series 2017-B, 5.00% 2033
| 3,000
| 3,692
|
| Urban Dev. Corp., State Personal Income Tax Rev. Bonds (General Purpose), Series 2013-D, 5.00% 2021
| 5,000
| 5,318
|
| Urban Dev. Corp., State Personal Income Tax Rev. Bonds (General Purpose), Series 2014-A, 5.00% 2024
| 5,000
| 5,884
|
| Urban Dev. Corp., State Personal Income Tax Rev. Bonds (General Purpose), Series 2014-A, 5.00% 2034
| 5,000
| 5,733
|
| Urban Dev. Corp., State Personal Income Tax Rev. Bonds (General Purpose), Series 2016-A, 5.00% 2028
| 1,750
| 2,145
|
| Urban Dev. Corp., State Personal Income Tax Rev. Bonds (General Purpose), Series 2016-A, 5.00% 2029
| 1,000
| 1,221
|
| Urban Dev. Corp., State Personal Income Tax Rev. Bonds (General Purpose), Series 2016-A, 5.00% 2030
| 3,500
| 4,245
|
| Urban Dev. Corp., State Personal Income Tax Rev. Bonds (General Purpose), Series 2016-A, 5.00% 2031
| 4,500
| 5,430
|
| Urban Dev. Corp., State Personal Income Tax Rev. Bonds (General Purpose), Series 2017-A, 5.00% 2034
| 1,000
| 1,218
|
| Urban Dev. Corp., State Personal Income Tax Rev. Bonds (General Purpose), Series 2017-C, 5.00% 2036
| 16,375
| 19,962
|
| Urban Dev. Corp., State Personal Income Tax Rev. Bonds (General Purpose), Series 2017-C-2, 5.00% 2031
| 12,025
| 15,016
|
| Urban Dev. Corp., State Personal Income Tax Rev. Bonds (General Purpose), Series 2017-C-2, 5.00% 2034
| 12,500
| 15,384
|
| Urban Dev. Corp., State Personal Income Tax Rev. Bonds (General Purpose), Series 2019-A, 5.00% 2039
| 2,500
| 3,062
|
| Utility Debt Securitization Auth., Restructuring Bonds, Series 2013-TE, 5.00% 2030
| 2,500
| 2,898
|
| Utility Debt Securitization Auth., Restructuring Bonds, Series 2016-A, 5.00% 2034
| 5,000
| 6,063
|
| Utility Debt Securitization Auth., Restructuring Bonds, Series 2016-B, 5.00% 2034
| 1,000
| 1,213
|
| Utility Debt Securitization Auth., Restructuring Bonds, Series 2016-B, 5.00% 2035
| 750
| 906
|
| Utility Debt Securitization Auth., Restructuring Bonds, Series 2017, 5.00% 2038
| 5,000
| 6,147
|
| Utility Debt Securitization Auth., Restructuring Bonds, Series 2017, 5.00% 2039
| 4,000
| 4,902
|
| Utility Debt Securitization Auth., Restructuring Bonds, Series 2017, 5.00% 2041
| 31,500
| 38,430
|
|
|
| 1,476,522
|
| North Carolina 0.71%
|
|
|
| Capital Facs. Fin. Agcy., Rev. Ref. Bonds (Johnson & Wales University), Series 2013-A, 5.00% 2022
| 740
| 806
|
Eastern Municipal Power Agcy., Power System Rev. 0Ref. Bonds, Series 1993-B,
6.00% 2022 (escrowed to maturity)
| 2,815
| 3,141
|
Eastern Municipal Power Agcy., Power System Rev. Ref. Bonds, Series 1993-B, FGIC-National insured,
6.00% 2025 (escrowed to maturity)
| 10,225
| 12,814
|
Eastern Municipal Power Agcy., Power System Rev. Ref. Bonds, Series 1993-B, National insured,
6.00% 2026 (escrowed to maturity)
| 2,500
| 3,210
|
Eastern Municipal Power Agcy., Power System Rev. Ref. Bonds, Series 1993-B,
6.00% 2026 (escrowed to maturity)
| 1,990
| 2,555
|
| Grant Anticipation Rev. Vehicle Bonds, Series 2015, 5.00% 2028
| 2,895
| 3,421
|
| Grant Anticipation Rev. Vehicle Bonds, Series 2015, 5.00% 2030
| 3,000
| 3,517
|
| Hospital Fin. Auth., Health Care Rev. Ref. Bonds (Charlotte-Mecklenburg Hospital), Series 2018-A, 4.00% 2038
| 1,635
| 1,784
|
| Hospital Fin. Auth., Health Care Rev. Ref. Bonds (Charlotte-Mecklenburg Hospital), Series 2018-A, 4.00% 2039
| 1,390
| 1,512
|
| Housing Fin. Agcy., Home Ownership Rev. Bonds, Series 40, 4.25% 2047
| 3,390
| 3,721
|
| Housing Fin. Agcy., Home Ownership Rev. Bonds, Series 41, 4.00% 2050
| 5,000
| 5,486
|
| Housing Fin. Agcy., Home Ownership Rev. Ref. Bonds, Series 38-B, 4.00% 2047
| 9,830
| 10,543
|
| Housing Fin. Agcy., Home Ownership Rev. Ref. Bonds, Series 39-B, 4.00% 2048
| 24,970
| 27,099
|
Medical Care Commission, Health Care Facs. First Mortgage Rev. Ref. Bonds (Pines at Davidson),
Series 2019-A, 5.00% 2034
| 1,000
| 1,136
|
Medical Care Commission, Health Care Facs. First Mortgage Rev. Ref. Bonds (Pines at Davidson),
Series 2019-A, 5.00% 2038
| 1,000
| 1,127
|
Medical Care Commission, Health Care Facs. First Mortgage Rev. Ref. Bonds (Pines at Davidson),
Series 2019-A, 5.00% 2049
| 8,520
| 9,516
|
The Tax-Exempt Bond Fund of America — Page
77 of 120
Bonds, notes & other debt instruments (continued)
North Carolina (continued)
| Principal amount
(000)
| Value
(000)
|
| Medical Care Commission, Health Care Facs. Rev. Ref. Bonds (WakeMed), Series 2012-A, 5.00% 2031
| $1,500
| $1,651
|
Medical Care Commission, Retirement Facs. First Mortgage Rev. Bonds (Carolina Village Project),
Series 2017-B, 5.00% 2047
| 4,000
| 4,275
|
| Municipal Power Agcy. No. 1, Catawba Electric Rev. Ref. Bonds, Series 2009-A, 5.00% 2030
| 575
| 577
|
| Municipal Power Agcy. No. 1, Catawba Electric Rev. Ref. Bonds, Series 2010-B, 5.00% 2020
| 3,350
| 3,403
|
| Municipal Power Agcy. No. 1, Catawba Electric Rev. Ref. Bonds, Series 2012-A, 5.00% 2020
| 905
| 919
|
Municipal Power Agcy. No. 1, Catawba Electric Rev. Ref. Bonds, Series 2012-A,
5.00% 2020 (escrowed to maturity)
| 345
| 351
|
University of North Carolina at Chapel Hill, General Rev. Bonds, Series 2012-B,
(1-month USD-LIBOR x 0.67 + 0.40%) 2.01% 2041 (put 2022)2
| 52,050
| 52,147
|
|
|
| 154,711
|
| North Dakota 0.32%
|
|
|
County of Burleigh, Health Care Rev. Bonds (St. Alexius Medical Center Project), Series 2014-A,
5.00% 2024 (preref. 2021)
| 1,210
| 1,297
|
County of Burleigh, Health Care Rev. Bonds (St. Alexius Medical Center Project), Series 2014-A,
5.00% 2035 (preref. 2021)
| 700
| 750
|
| Housing Fin. Agcy., Homeownership Rev. Bonds (Home Mortgage Fin. Program), Series 2016-C, 3.15% 2036
| 1,465
| 1,505
|
| Housing Fin. Agcy., Homeownership Rev. Bonds (Home Mortgage Fin. Program), Series 2016-D, 3.50% 2046
| 4,285
| 4,529
|
| Housing Fin. Agcy., Housing Fin. Program Bonds (Home Mortgage Fin. Program), Series 2012-A, 3.75% 2042
| 725
| 749
|
| Housing Fin. Agcy., Housing Fin. Program Bonds (Home Mortgage Fin. Program), Series 2014-A, 4.00% 2034
| 375
| 393
|
| Housing Fin. Agcy., Housing Fin. Program Bonds (Home Mortgage Fin. Program), Series 2015-A, 4.00% 2038
| 830
| 871
|
| Housing Fin. Agcy., Housing Fin. Program Bonds (Home Mortgage Fin. Program), Series 2015-B, 4.00% 2036
| 2,180
| 2,285
|
| Housing Fin. Agcy., Housing Fin. Program Bonds (Home Mortgage Fin. Program), Series 2015-D, 4.00% 2046
| 5,080
| 5,375
|
| Housing Fin. Agcy., Housing Fin. Program Bonds (Home Mortgage Fin. Program), Series 2017-A, 4.00% 2047
| 4,515
| 4,832
|
| Housing Fin. Agcy., Housing Fin. Program Bonds (Home Mortgage Fin. Program), Series 2017-D, 4.00% 2048
| 3,305
| 3,555
|
| Housing Fin. Agcy., Housing Fin. Program Bonds (Home Mortgage Fin. Program), Series 2017-F, 4.00% 2048
| 7,195
| 7,764
|
| Housing Fin. Agcy., Housing Fin. Program Bonds (Home Mortgage Fin. Program), Series 2018-A, 4.00% 2049
| 15,120
| 16,391
|
| Housing Fin. Agcy., Housing Fin. Program Bonds (Home Mortgage Fin. Program), Series 2019-A, 4.25% 2049
| 2,800
| 3,085
|
| Housing Fin. Agcy., Housing Fin. Program Bonds (Home Mortgage Fin. Program), Series 2019-C, 4.00% 2050
| 10,000
| 11,166
|
| County of Ward, Health Care Facs. Rev. Bonds (Trinity Obligated Group), Series 2017-C, 5.00% 2048
| 5,000
| 5,612
|
|
|
| 70,159
|
| Ohio 2.46%
|
|
|
| Air Quality Dev. Auth., Air Quality Rev. Bonds (Ohio Valley Electric Corp. Project), Series 2009-E, 5.625% 2019
| 12,130
| 12,176
|
Air Quality Dev. Auth., Pollution Control Rev. Ref. Bonds (FirstEnergy Generation Corp. Project),
Series 2009-C, 5.625% 20183
| 8,500
| 8,670
|
| Akron, Bath and Copley Joint Township Hospital Dist., Hospital Facs. Rev. Bonds (Akron General Health System), Series 2012, 3.80% 2027 (preref. 2022)
| 5,460
| 5,703
|
| Akron, Bath and Copley Joint Township Hospital Dist., Hospital Facs. Rev. Bonds (Akron General Health System), Series 2012, 5.00% 2031 (preref. 2022)
| 3,000
| 3,269
|
| Akron, Bath and Copley Joint Township Hospital Dist., Hospital Facs. Rev. Ref. and Improvement Rev. Bonds (Summa Health Obligated Group), Series 2016, 5.25% 2041
| 2,980
| 3,491
|
| County of Allen, Hospital Facs. Rev. Ref. and Improvement Bonds (Catholic Health Partners), Series 2012-A, 5.00% 2033
| 16,000
| 17,411
|
County of Allen, Hospital Facs. Rev. Ref. Bonds (Catholic Healthcare Partners), Series 2010-A,
5.00% 2038 (preref. 2020)
| 5,850
| 6,033
|
| American Municipal Power, Inc., AMP Fremont Energy Center Project Rev. Bonds, Series 2012-B, 5.00% 2037
| 2,000
| 2,159
|
American Municipal Power, Inc., Combined Hydroelectric Project Rev. Bonds, Series 2018-A,
2.25% 2048 (put 2021)
| 2,300
| 2,328
|
Buckeye Tobacco Settlement Fncg. Auth., Tobacco Settlement Asset-Backed Bonds, Series 2007-A-2,
5.875% 2047
| 5,000
| 4,919
|
Buckeye Tobacco Settlement Fncg. Auth., Tobacco Settlement Asset-Backed Bonds, Series 2007-A-2,
6.50% 2047
| 22,115
| 22,294
|
| County of Butler, Hospital Facs. Rev. Bonds (UC Health), Series 2010, 5.50% 2040 (preref. 2020)
| 4,015
| 4,235
|
The Tax-Exempt Bond Fund of America — Page
78 of 120
Bonds, notes & other debt instruments (continued)
Ohio (continued)
| Principal amount
(000)
| Value
(000)
|
| County of Butler, Hospital Facs. Rev. Bonds (UC Health), Series 2010, 5.50% 2040 (preref. 2020)
| $1,985
| $2,094
|
| County of Butler, Hospital Facs. Rev. Bonds (UC Health), Series 2010, 5.75% 2040 (preref. 2020)
| 10,000
| 10,579
|
| County of Butler, Hospital Facs. Rev. Bonds (UC Health), Series 2016, 5.00% 2045
| 6,215
| 7,064
|
| City of Chillicothe, Hospital Facs. Rev. Ref. and Improvement Bonds (Adena Health System Obligated Group Project), Series 2017, 5.00% 2037
| 1,160
| 1,379
|
| City of Chillicothe, Hospital Facs. Rev. Ref. and Improvement Bonds (Adena Health System Obligated Group Project), Series 2017, 5.00% 2047
| 4,495
| 5,240
|
| City of Cleveland, Airport System Rev. Bonds, Series 2006-A, AMBAC insured, 5.25% 2021
| 8,000
| 8,447
|
| City of Cleveland, Airport System Rev. Ref. Bonds, Series 2011-A, 5.00% 2022
| 3,000
| 3,164
|
City of Cleveland, Airport System Rev. Ref. Bonds, Series 2011-A, Assured Guaranty Municipal insured,
5.00% 2021
| 2,000
| 2,105
|
| City of Cleveland, Airport System Rev. Ref. Bonds, Series 2012-A, 5.00% 2026
| 3,000
| 3,257
|
| City of Cleveland, Airport System Rev. Ref. Bonds, Series 2012-A, 5.00% 2027
| 2,300
| 2,494
|
| City of Cleveland, Airport System Rev. Ref. Bonds, Series 2012-A, 5.00% 2028
| 6,500
| 7,038
|
| City of Cleveland, Airport System Rev. Ref. Bonds, Series 2012-A, 5.00% 2029
| 3,000
| 3,243
|
| City of Cleveland, Airport System Rev. Ref. Bonds, Series 2012-A, 5.00% 2030
| 3,655
| 3,946
|
| City of Cleveland, Airport System Rev. Ref. Bonds, Series 2012-A, 5.00% 2031
| 2,000
| 2,156
|
City of Cleveland, Airport System Rev. Ref. Bonds, Series 2012-A, Assured Guaranty Municipal insured,
5.00% 2028
| 4,000
| 4,338
|
City of Cleveland, Airport System Rev. Ref. Bonds, Series 2016-A, Assured Guaranty Municipal insured,
5.00% 2027
| 1,175
| 1,379
|
City of Cleveland, Airport System Rev. Ref. Bonds, Series 2016-A, Assured Guaranty Municipal insured,
5.00% 2028
| 1,525
| 1,783
|
City of Cleveland, Airport System Rev. Ref. Bonds, Series 2016-A, Assured Guaranty Municipal insured,
5.00% 2030
| 2,000
| 2,319
|
City of Cleveland, Airport System Rev. Ref. Bonds, Series 2016-A, Assured Guaranty Municipal insured,
5.00% 2031
| 1,000
| 1,154
|
City of Cleveland, Airport System Rev. Ref. Bonds, Series 2016-B, Assured Guaranty Municipal insured,
5.00% 2023
| 1,260
| 1,414
|
| City of Cleveland, Airport System Rev. Ref. Bonds, Series 2018-B 5.00% 2048
| 5,000
| 5,884
|
| City of Columbus, G.O. Bonds, Series 2012-A, 4.00% 2027 (preref. 2022)
| 3,865
| 4,201
|
| County of Cuyahoga, Hospital Rev. Bonds (MetroHealth System), Series 2017, 5.00% 2052
| 6,750
| 7,513
|
| County of Cuyahoga, Hospital Rev. Bonds (MetroHealth System), Series 2017, 5.00% 2057
| 5,000
| 5,530
|
| County of Cuyahoga, Hospital Rev. Bonds (MetroHealth System), Series 2017, 5.50% 2052
| 10,000
| 11,562
|
County of Franklin, Health Care Facs. Improvement Rev. Bonds (OPRS Communities), Series 2013-A,
6.125% 2040
| 4,250
| 4,702
|
County of Franklin, Health Care Facs. Improvement Rev. Bonds (OPRS Communities),
Series 2013-A, 6.00% 2035
| 2,700
| 2,991
|
County of Franklin, Health Care Facs. Improvement Rev. Bonds (Presbyterian Retirement Services Project),
Series 2010-A, 5.625% 2026
| 2,450
| 2,539
|
| County of Franklin, Rev. Bonds (Trinity Health Credit Group), Series 2017-OH-A, 5.00% 2047
| 15,625
| 18,406
|
| G.O. Bonds, Common Schools Bonds, Series 2017-A, 5.00% 2021
| 5,000
| 5,315
|
| County of Gallia, Hospital Facs. Rev. Ref. and Improvement Bonds (Holzer Health System Obligated Group Project), Series 2012-A, 8.00% 2042
| 2,345
| 2,654
|
| County of Hamilton, Healthcare Facs. Rev. Bonds (Christ Hospital Project), Series 2012, 5.00% 2042
| 3,500
| 3,734
|
| County of Hamilton, Healthcare Facs. Rev. Bonds (Christ Hospital Project), Series 2012, 5.25% 2032
| 4,075
| 4,461
|
| County of Hamilton, Healthcare Improvement and Rev. Ref. Bonds (Life Enriching Communities Project), Series 2016, 5.00% 2031
| 1,345
| 1,514
|
| County of Hamilton, Healthcare Improvement and Rev. Ref. Bonds (Life Enriching Communities Project), Series 2016, 5.00% 2051
| 14,325
| 15,560
|
| County of Hamilton, Sales Tax Rev. Ref. and Improvement Bonds, Capital Appreciation Bonds, Series 2000-B, AMBAC insured, 0% 2027
| 6,180
| 5,261
|
| Higher Educational Facs. Auth., Rev. Bonds (University of Dayton Project), Series 2018-B, 5.00% 2030
| 1,090
| 1,358
|
| Higher Educational Facs. Auth., Rev. Bonds (University of Dayton Project), Series 2018-B, 5.00% 2032
| 1,000
| 1,230
|
| Higher Educational Facs. Auth., Rev. Bonds (University of Dayton Project), Series 2018-B, 5.00% 2034
| 1,040
| 1,270
|
The Tax-Exempt Bond Fund of America — Page
79 of 120
Bonds, notes & other debt instruments (continued)
Ohio (continued)
| Principal amount
(000)
| Value
(000)
|
| Higher Educational Facs. Auth., Rev. Bonds (University of Dayton Project), Series 2018-B, 5.00% 2036
| $1,000
| $1,213
|
| Higher Educational Facs. Auth., Rev. Ref. Bonds (Case Western Reserve University Project), Series 2019-A, (1-month USD-LIBOR x 0.70 + 0.42%) 2.101% 2044 (put
2022)2
| 22,660
| 22,709
|
| Hospital Rev. Bonds (University Hospitals Health System, Inc. Project), Series 2016-A, 5.00% 2032
| 4,000
| 4,686
|
| Hospital Rev. Bonds (University Hospitals Health System, Inc. Project), Series 2016-A, 5.00% 2035
| 1,990
| 2,312
|
| Hospital Rev. Bonds (University Hospitals Health System, Inc. Project), Series 2016-A, 5.00% 2046
| 10,250
| 11,684
|
| Hospital Rev. Ref. Bonds (Cleveland Clinic Health System Obligated Group), Series 2012-A, 5.00% 2038
| 5,000
| 5,384
|
| Hospital Rev. Ref. Bonds (Cleveland Clinic Health System Obligated Group), Series 2017-A, 5.00% 2031
| 1,700
| 2,119
|
| Hospital Rev. Ref. Bonds (Cleveland Clinic Health System Obligated Group), Series 2017-A, 5.00% 2032
| 1,180
| 1,461
|
| Hospital Rev. Ref. Bonds (Cleveland Clinic Health System Obligated Group), Series 2017-A, 5.00% 2033
| 5,025
| 6,192
|
| Hospital Rev. Ref. Bonds (Cleveland Clinic Health System Obligated Group), Series 2019-B, 4.00% 2041
| 3,000
| 3,321
|
| Housing Fin. Agcy., Residential Mortgage Rev. Bonds (Mortgage-Backed Securities Program), Series 2016-D, 4.00% 2047
| 17,085
| 18,135
|
| Housing Fin. Agcy., Residential Mortgage Rev. Bonds (Mortgage-Backed Securities Program), Series 2016-K, 3.50% 2046
| 1,365
| 1,439
|
| Housing Fin. Agcy., Residential Mortgage Rev. Bonds (Mortgage-Backed Securities Program), Series 2017-A, 4.50% 2047
| 8,570
| 9,307
|
| Housing Fin. Agcy., Residential Mortgage Rev. Bonds (Mortgage-Backed Securities Program), Series 2017-D, 4.00% 2048
| 11,735
| 12,596
|
| Housing Fin. Agcy., Residential Mortgage Rev. Bonds (Mortgage-Backed Securities Program), Series 2019-A, 4.50% 2049
| 9,000
| 10,062
|
| Housing Fin. Agcy., Residential Mortgage Rev. Bonds (Mortgage-Backed Securities Program), Series 2019-B, 4.50% 2050
| 8,500
| 9,603
|
| Housing Fin. Agcy., Single Family Mortgage Rev. Bonds, Series 2010-1, 5.00% 2028
| 350
| 353
|
| Housing Fin. Agcy., Single Family Mortgage Rev. Bonds, Series 2011-1, 4.80% 2028
| 80
| 82
|
| Housing Fin. Agcy., Single Family Mortgage Rev. Bonds, Series 2011-2, 4.50% 2028
| 60
| 61
|
| Housing Fin. Agcy., Single Family Mortgage Rev. Bonds, Series 2011-3, 4.50% 2029
| 195
| 200
|
| County of Licking, Health Care Facs. Rev. Ref. Bonds (Kendal Granville), Series 2015-A, 6.00% 2050
| 1,500
| 1,554
|
| County of Lucas, Hospital Rev. Bonds (Promedica Healthcare Obligated Group), Series 2018-A, 5.25% 2048
| 17,750
| 21,023
|
| Major New State Infrastructure Project Rev. Bonds, Series 2012-1, 5.00% 2020
| 1,000
| 1,053
|
| Major New State Infrastructure Project Rev. Bonds, Series 2012-1, 5.00% 2021
| 1,750
| 1,910
|
| County of Muskingum, Hospital Facs. Rev. Ref. Bonds (Genesis HealthCare System Obligated Group Project), Series 2013, 5.00% 2033
| 3,200
| 3,454
|
| County of Muskingum, Hospital Facs. Rev. Ref. Bonds (Genesis HealthCare System Obligated Group Project), Series 2013, 5.00% 2048
| 3,000
| 3,198
|
| Ohio University, General Receipts Bonds, Series 2017-A, 5.00% 2033
| 1,000
| 1,207
|
| Port Auth., Gas Supply Rev. Ref. Bonds, Series 2019, 5.00% 2049 (put 2025)
| 3,000
| 3,507
|
| Public Facs. Commission, Higher Education G.O. Rev. Ref. Bonds, Series 2009-A, 5.00% 2019
| 5,000
| 5,000
|
| Public Facs. Commission, Higher Education G.O. Rev. Ref. Bonds, Series 2017-C, 5.00% 2027
| 5,000
| 6,342
|
| Public Housing Capital Fund Rev. Trust II, Trust Certificates, Series 2012, 5.00% 20221
| 1,089
| 1,096
|
| County of Ross, Hospital Facs. Rev. Ref. and Improvement Bonds (Adena Health System Obligated Group), Series 2019, 5.00% 2039
| 4,000
| 4,848
|
| Southeastern Ohio Port Auth., Hospital Facs. Rev. Ref. and Improvement Bonds (Memorial Health System Obligated Group Project), Series 2012, 6.00% 2042
| 2,000
| 2,144
|
| Turnpike and Infrastructure Commission, Rev. Ref. Bonds, Series 2010-A, 5.25% 2027
| 2,500
| 3,175
|
| Turnpike and Infrastructure Commission, Rev. Ref. Bonds, Series 2013-A-1, 5.00% 2048
| 3,750
| 4,122
|
Turnpike and Infrastructure Commission, Turnpike Rev. Bonds (Infrastructure Projects), Series 2018-A,
4.00% 2038
| 1,775
| 1,945
|
Turnpike and Infrastructure Commission, Turnpike Rev. Bonds (Infrastructure Projects), Series 2018-A,
5.00% 2031
| 12,080
| 15,050
|
Turnpike and Infrastructure Commission, Turnpike Rev. Bonds (Infrastructure Projects), Series 2018-A,
5.00% 2032
| 16,690
| 20,606
|
Turnpike and Infrastructure Commission, Turnpike Rev. Bonds (Infrastructure Projects), Series 2018-A,
5.00% 2033
| 19,230
| 23,613
|
The Tax-Exempt Bond Fund of America — Page
80 of 120
Bonds, notes & other debt instruments (continued)
Ohio (continued)
| Principal amount
(000)
| Value
(000)
|
| County of Warren, Healthcare Facs., Rev. Ref. Bonds (Otterbein Homes Obligated Group), Series 2013-A, 5.75% 2033
| $1,000
| $1,142
|
County of Warren, Healthcare Facs., Rev. Ref. Bonds (Otterbein Homes Obligated Group), Series 2014,
5.00% 2033
| 375
| 423
|
County of Warren, Healthcare Facs., Rev. Ref. Bonds (Otterbein Homes Obligated Group), Series 2014,
5.00% 2034
| 505
| 567
|
| County of Warren, Healthcare Facs., Rev. Ref. Bonds (Otterbein Homes Obligated Group), Series 2016-A, 5.00% 2028
| 200
| 238
|
| County of Warren, Healthcare Facs., Rev. Ref. Bonds (Otterbein Homes Obligated Group), Series 2016-A, 5.00% 2033
| 820
| 953
|
| County of Warren, Healthcare Facs., Rev. Ref. Bonds (Otterbein Homes Obligated Group), Series 2016-A, 5.00% 2034
| 1,000
| 1,157
|
| County of Warren, Healthcare Facs., Rev. Ref. Bonds (Otterbein Homes Obligated Group), Series 2016-A, 5.00% 2035
| 1,000
| 1,151
|
| County of Warren, Healthcare Facs., Rev. Ref. Bonds (Otterbein Homes Obligated Group), Series 2016-A, 5.00% 2036
| 500
| 574
|
County of Warren, Healthcare Facs., Rev. Ref. Bonds (Otterbein Homes Obligated Group), Series 2016-A,
5.00% 2040
| 1,930
| 2,198
|
| County of Warren, Healthcare Facs., Rev. Ref. Bonds (Otterbein Homes Obligated Group), Series 2019-A, 5.00% 2028
| 830
| 1,022
|
| County of Warren, Healthcare Facs., Rev. Ref. Bonds (Otterbein Homes Obligated Group), Series 2019-A, 5.00% 2030
| 800
| 987
|
| Water Dev. Auth., Solid Waste Rev. Bonds (Waste Management Project), Series 2004, 1.55% 2021
| 1,000
| 1,000
|
|
|
| 532,144
|
| Oklahoma 0.23%
|
|
|
| Grand River Dam Auth., Rev. Bonds, Series 2017, 5.00% 2036
| 2,000
| 2,400
|
| Grand River Dam Auth., Rev. Bonds, Series 2017, 5.00% 2039
| 3,530
| 4,200
|
| Grand River Dam Auth., Rev. Ref. Bonds, Series 2016-A, 5.00% 2031
| 5,500
| 6,680
|
Housing Fin. Agcy., Collateralized Rev. Bonds (Green Rural Dev. Portfolio), Series 2018,
1.90% 2021 (put 2020)
| 1,870
| 1,877
|
| Housing Fin. Agcy., Collateralized Rev. Bonds (Windsong Apartments), Series 2018, 2.05% 2021 (put 2020)
| 2,000
| 2,010
|
| Housing Fin. Agcy., Single Family Mortgage Rev. Bonds (Homeownership Loan Program), Series 2012-A, 5.00% 2043
| 250
| 260
|
| Housing Fin. Agcy., Single Family Mortgage Rev. Bonds (Homeownership Loan Program), Series 2019-A, 4.00% 2049
| 5,000
| 5,531
|
| Municipal Power Auth., Power Supply System Rev. Ref. Bonds, Series 2016-A, 5.00% 2031
| 1,300
| 1,545
|
| Municipal Power Auth., Power Supply System Rev. Ref. Bonds, Series 2016-A, 5.00% 2034
| 1,000
| 1,174
|
| Municipal Power Auth., Power Supply System Rev. Ref. Bonds, Series 2016-A, 5.00% 2047
| 3,070
| 3,529
|
| City of Tulsa, Industrial Auth., Rev. Ref. Bonds (University of Tulsa), Series 2009, 6.00% 2027
| 3,000
| 3,021
|
County of Tulsa, Dev. Auth. Rev. Ref. Bonds (St. John Health System, Inc.),
Series 2012, 5.00% 2021 (escrowed to maturity)
| 1,600
| 1,693
|
| Turnpike Auth., Turnpike System Rev. Bonds, Series 2011-B, 5.00% 2029 (preref. 2021)
| 1,650
| 1,741
|
| Turnpike Auth., Turnpike System Rev. Bonds, Series 2017-C, 5.00% 2047
| 8,560
| 10,047
|
| Turnpike Auth., Turnpike System Rev. Bonds, Series 2018-A, 4.00% 2048
| 3,000
| 3,254
|
|
|
| 48,962
|
| Oregon 0.44%
|
|
|
| County of Clackamas, Hospital Fac. Auth., Senior Living Rev. Bonds (Williamette View Project), Series 2017-B, 3.00% 2022
| 1,000
| 1,003
|
| County of Deschutes, Hospital Fac. Auth., Hospital Rev. Bonds (St. Charles Health System, Inc.), Series 2016-A, 5.00% 2048
| 1,650
| 1,861
|
| Facs. Auth., Rev. Bonds (University of Portland Projects), Series 2015-A, 4.00% 2040
| 2,480
| 2,629
|
| Facs. Auth., Rev. Bonds (University of Portland Projects), Series 2015-A, 5.00% 2045
| 2,500
| 2,839
|
| G.O. Bonds (Veteran’s Welfare Bonds Series 96), Series 2015-Q, 4.00% 2045
| 8,270
| 8,788
|
The Tax-Exempt Bond Fund of America — Page
81 of 120
Bonds, notes & other debt instruments (continued)
Oregon (continued)
| Principal amount
(000)
| Value
(000)
|
| G.O. Bonds (Veteran’s Welfare Bonds Series 99B), Series 2017-Q, 3.50% 2047
| $7,165
| $7,596
|
| G.O. Bonds, Series 2017-C, 5.00% 2029
| 5,000
| 6,277
|
| G.O. Bonds, Series 2017-C, 5.00% 2033
| 5,000
| 6,161
|
Housing and Community Services Dept., Mortgage Rev. Bonds (Single Family Mortgage Program),
Series 2016-A, 4.00% 2047
| 9,140
| 9,711
|
Housing and Community Services Dept., Mortgage Rev. Bonds (Single Family Mortgage Program),
Series 2017-A, 4.00% 2047
| 4,255
| 4,575
|
Housing and Community Services Dept., Mortgage Rev. Bonds (Single Family Mortgage Program),
Series 2017-D, 3.50% 2048
| 12,245
| 12,969
|
Housing and Community Services Dept., Mortgage Rev. Bonds (Single Family Mortgage Program),
Series 2018-A, 4.50% 2049
| 3,225
| 3,542
|
Housing and Community Services Dept., Mortgage Rev. Bonds (Single Family Mortgage Program),
Series 2018-C, 4.50% 2049
| 2,350
| 2,596
|
Housing and Community Services Dept., Mortgage Rev. Bonds (Single Family Mortgage Program),
Series 2018-D, 4.75% 2050
| 1,000
| 1,120
|
| City of Klamath Falls, Intercommunity Hospital Auth., Rev. Ref. Bonds (Sky Lakes Medical Center Project), Series 2016, 5.00% 2046
| 1,230
| 1,411
|
County of Polk, Hospital Fac. Auth., Rev. Bonds (Dallas Retirement Village Project), Series 2015-A,
5.375% 2045
| 2,000
| 2,122
|
| Port of Portland, Portland International Airport Passenger Fac. Charge Rev. Bonds, Series 2011-A, 5.50% 2031
| 3,000
| 3,239
|
| Port of Portland, Portland International Airport Rev. Bonds, Series 23, 5.00% 2027
| 1,675
| 2,013
|
| City of Salem, Hospital Fac. Auth., Rev. Bonds (Capital Manor Project), Series 2018, 5.00% 2024
| 210
| 241
|
| City of Salem, Hospital Fac. Auth., Rev. Bonds (Capital Manor Project), Series 2018, 5.00% 2025
| 230
| 270
|
| City of Salem, Hospital Fac. Auth., Rev. Bonds (Capital Manor Project), Series 2018, 5.00% 2026
| 125
| 149
|
| City of Salem, Hospital Fac. Auth., Rev. Bonds (Capital Manor Project), Series 2018, 5.00% 2027
| 125
| 151
|
| City of Salem, Hospital Fac. Auth., Rev. Bonds (Capital Manor Project), Series 2018, 5.00% 2053
| 1,500
| 1,706
|
| City of Salem, Hospital Fac. Auth., Rev. Ref. Bonds (Capital Manor Project), Series 2012, 6.00% 2042
| 1,000
| 1,087
|
| City of Salem, Hospital Fac. Auth., Rev. Ref. Bonds (Capital Manor Project), Series 2012, 6.00% 2047
| 1,250
| 1,356
|
| Tri-County Metropolitan Transportation Dist., Capital Grant Receipt Rev. Bonds, Series 2018-A, 5.00% 2028
| 1,000
| 1,258
|
| Tri-County Metropolitan Transportation Dist., Capital Grant Receipt Rev. Bonds, Series 2018-A, 5.00% 2029
| 2,435
| 3,045
|
| Tri-County Metropolitan Transportation Dist., Capital Grant Receipt Rev. Bonds, Series 2018-A, 5.00% 2030
| 2,075
| 2,578
|
| Tri-County Metropolitan Transportation Dist., Capital Grant Receipt Rev. Bonds, Series 2018-A, 5.00% 2031
| 3,050
| 3,767
|
|
|
| 96,060
|
| Pennsylvania 4.74%
|
|
|
| County of Allegheny, Airport Auth., Airport Rev. Bonds, Series 2014-A, 5.00% 2032
| 1,000
| 1,197
|
| County of Allegheny, Hospital Dev. Auth. Rev. Bonds (Allegheny Health Network Obligated Group Issue), Series 2018-A, 5.00% 2032
| 4,350
| 5,255
|
| County of Allegheny, Hospital Dev. Auth., Rev. Bonds (Allegheny Health Network Obligated Group Issue), Series 2018-A, 5.00% 2033
| 3,500
| 4,199
|
County of Allegheny, Hospital Dev. Auth., Rev. Bonds (University of Pittsburgh Medical Center Issue),
Series 2007-A-1, (3-month USD-LIBOR x 0.67 + 0.82%) 2.547% 20372
| 9,775
| 9,680
|
| County of Allegheny, Hospital Dev. Auth., UPMC Rev. Bonds, Series 2019-A, 4.00% 2035
| 6,100
| 6,813
|
| County of Allegheny, Hospital Dev. Auth., UPMC Rev. Bonds, Series 2019-A, 4.00% 2036
| 6,000
| 6,681
|
| County of Allegheny, Hospital Dev. Auth., UPMC Rev. Bonds, Series 2019-A, 4.00% 2037
| 4,500
| 4,994
|
| County of Allegheny, Hospital Dev. Auth., UPMC Rev. Bonds, Series 2019-A, 5.00% 2021
| 2,500
| 2,681
|
| County of Allegheny, Sanitary Auth., Sewer Rev. Bonds, Series 2018, 4.00% 2035
| 1,000
| 1,122
|
| County of Allegheny, Sanitary Auth., Sewer Rev. Bonds, Series 2018, 4.00% 2036
| 1,250
| 1,398
|
| County of Allegheny, Sanitary Auth., Sewer Rev. Bonds, Series 2018, 4.00% 2038
| 2,000
| 2,222
|
| Allentown City School Dist., Unlimited Tax G.O. Bonds, Series 2018, BAM insured, 5.00% 2028
| 2,565
| 3,181
|
| Allentown City School Dist., Unlimited Tax G.O. Bonds, Series 2018, BAM insured, 5.00% 2029
| 2,995
| 3,697
|
| County of Bucks, Industrial Dev. Auth., Rev. Bonds (Pennswood Village Project), Series 2018-A, 5.00% 2023
| 135
| 151
|
| County of Bucks, Industrial Dev. Auth., Rev. Bonds (Pennswood Village Project), Series 2018-A, 5.00% 2030
| 330
| 376
|
| County of Bucks, Industrial Dev. Auth., Rev. Bonds (Pennswood Village Project), Series 2018-A, 5.00% 2031
| 465
| 528
|
The Tax-Exempt Bond Fund of America — Page
82 of 120
Bonds, notes & other debt instruments (continued)
Pennsylvania (continued)
| Principal amount
(000)
| Value
(000)
|
County of Chester, Health and Education Facs. Auth., Health System Rev. Ref. Bonds
(Jefferson Health System), Series 2010-A, 5.00% 2031 (preref. 2020)
| $3,690
| $3,801
|
| County of Delaware, Industrial Dev. Auth., Rev. Ref. Bonds (Covanta Project), Series 2015-A, 5.00% 2043
| 2,500
| 2,531
|
| Delaware River Joint Toll Bridge Commission, Bridge System Rev. Bonds, Series 2017, 5.00% 2031
| 2,050
| 2,530
|
| Delaware River Joint Toll Bridge Commission, Bridge System Rev. Bonds, Series 2017, 5.00% 2034
| 1,000
| 1,221
|
| Delaware River Joint Toll Bridge Commission, Bridge System Rev. Bonds, Series 2017, 5.00% 2035
| 1,000
| 1,217
|
| Delaware River Joint Toll Bridge Commission, Bridge System Rev. Bonds, Series 2017, 5.00% 2036
| 3,260
| 3,957
|
| Delaware River Joint Toll Bridge Commission, Bridge System Rev. Bonds, Series 2017, 5.00% 2037
| 2,500
| 3,024
|
| Delaware River Joint Toll Bridge Commission, Bridge System Rev. Bonds, Series 2017, 5.00% 2042
| 3,000
| 3,590
|
| Delaware River Joint Toll Bridge Commission, Bridge System Rev. Ref. Bonds, Series 2015, 5.00% 2031
| 350
| 423
|
| Delaware River Port Auth., Rev. Bonds, Series 2018-A, 5.00% 2031
| 1,000
| 1,274
|
| Delaware River Port Auth., Rev. Bonds, Series 2018-A, 5.00% 2032
| 1,250
| 1,581
|
| Delaware River Port Auth., Rev. Bonds, Series 2018-A, 5.00% 2037
| 2,100
| 2,600
|
| Delaware River Port Auth., Rev. Bonds, Series 2018-A, 5.00% 2038
| 2,250
| 2,776
|
| Delaware River Port Auth., Rev. Bonds, Series 2018-A, 5.00% 2039
| 2,250
| 2,766
|
| Delaware River Port Auth., Rev. Bonds, Series 2018-A, 5.00% 2040
| 2,155
| 2,640
|
| Delaware River Port Auth., Rev. Ref. Bonds (Port Dist. Project), Series 2012, 5.00% 2021
| 3,100
| 3,259
|
| City of Doylestown, Hospital Auth., Rev. Bonds (Doylestown Hospital), Series 2016-A, 5.00% 2041
| 4,265
| 4,691
|
| City of Doylestown, Hospital Auth., Rev. Bonds (Doylestown Hospital), Series 2016-A, 5.00% 2046
| 1,630
| 1,783
|
| City of Doylestown, Hospital Auth., Rev. Bonds (Doylestown Hospital), Series 2016-B, 5.00% 2020
| 290
| 297
|
| East Hempfield Township, Industrial Dev. Auth., Rev. and Rev. Ref. Bonds (Willow Valley Communities Project), Series 2016, 5.00% 2026
| 1,385
| 1,647
|
| East Hempfield Township, Industrial Dev. Auth., Rev. and Rev. Ref. Bonds (Willow Valley Communities Project), Series 2016, 5.00% 2027
| 1,380
| 1,632
|
East Hempfield Township, Industrial Dev. Auth., Rev. and Rev. Ref. Bonds (Willow Valley Communities Project),
Series 2016, 4.00% 2019
| 700
| 706
|
| East Hempfield Township, Industrial Dev. Auth., Rev. Bonds (Student Services, Inc. Student Housing Project at Millersville University of Pennsylvania), Series
2013, 5.00% 2030
| 1,000
| 1,074
|
| East Hempfield Township, Industrial Dev. Auth., Rev. Bonds (Student Services, Inc. Student Housing Project at Millersville University of Pennsylvania), Series
2013, 5.00% 2045
| 200
| 210
|
| East Hempfield Township, Industrial Dev. Auth., Rev. Bonds (Student Services, Inc. Student Housing Project at Millersville University of Pennsylvania), Series
2014, 5.00% 2039
| 435
| 464
|
| East Hempfield Township, Industrial Dev. Auth., Rev. Bonds (Student Services, Inc. Student Housing Project at Millersville University of Pennsylvania), Series
2014, 5.00% 2046
| 750
| 795
|
| East Hempfield Township, Industrial Dev. Auth., Rev. Bonds (Student Services, Inc. Student Housing Project at Millersville University of Pennsylvania), Series
2015, 5.00% 2035
| 1,060
| 1,154
|
| East Hempfield Township, Industrial Dev. Auth., Rev. Bonds (Student Services, Inc. Student Housing Project at Millersville University of Pennsylvania), Series
2015, 5.00% 2047
| 1,250
| 1,338
|
| Econ. Dev. Fncg. Auth., UPMC Rev. Bonds, Series 2017-A, 4.00% 2037
| 1,880
| 2,076
|
| Econ. Dev. Fncg. Auth., UPMC Rev. Bonds, Series 2017-A, 5.00% 2031
| 1,000
| 1,232
|
| Econ. Dev. Fncg. Auth., UPMC Rev. Bonds, Series 2017-A, 5.00% 2032
| 1,000
| 1,227
|
Erie County School Dist., Limited Tax G.O. Bonds, Series 2019-A, Assured Guaranty Municipal insured,
5.00% 2030
| 425
| 535
|
Erie County School Dist., Limited Tax G.O. Bonds, Series 2019-C, Assured Guaranty Municipal insured,
5.00% 2029
| 1,000
| 1,264
|
Erie County School Dist., Limited Tax G.O. Bonds, Series 2019-C, Assured Guaranty Municipal insured,
5.00% 2030
| 500
| 629
|
| Fncg. Auth., Rev. Bonds (Tobacco Master Settlement Payment), Series 2018, 5.00% 2024
| 3,000
| 3,482
|
| Fncg. Auth., Rev. Bonds (Tobacco Master Settlement Payment), Series 2018, 5.00% 2025
| 2,500
| 2,962
|
| Fncg. Auth., Rev. Bonds (Tobacco Master Settlement Payment), Series 2018, 5.00% 2026
| 3,000
| 3,619
|
| Fncg. Auth., Rev. Bonds (Tobacco Master Settlement Payment), Series 2018, 5.00% 2027
| 3,000
| 3,683
|
| Fncg. Auth., Rev. Bonds (Tobacco Master Settlement Payment), Series 2018, 5.00% 2028
| 4,000
| 4,993
|
| Fncg. Auth., Rev. Bonds (Tobacco Master Settlement Payment), Series 2018, 5.00% 2029
| 4,000
| 4,964
|
| Fncg. Auth., Rev. Bonds (Tobacco Master Settlement Payment), Series 2018, 5.00% 2030
| 4,000
| 4,931
|
| Fncg. Auth., Rev. Bonds (Tobacco Master Settlement Payment), Series 2018, 5.00% 2031
| 3,500
| 4,287
|
The Tax-Exempt Bond Fund of America — Page
83 of 120
Bonds, notes & other debt instruments (continued)
Pennsylvania (continued)
| Principal amount
(000)
| Value
(000)
|
| Fncg. Auth., Rev. Bonds (Tobacco Master Settlement Payment), Series 2018, 5.00% 2032
| $3,000
| $3,660
|
| Fncg. Auth., Rev. Bonds (Tobacco Master Settlement Payment), Series 2018, 5.00% 2033
| 3,000
| 3,648
|
| Fncg. Auth., Rev. Bonds (Tobacco Master Settlement Payment), Series 2018, 5.00% 2034
| 3,000
| 3,631
|
| Fncg. Auth., Rev. Bonds, Series 2013-B, 5.00% 2036
| 1,500
| 1,621
|
| County of Franklin, Industrial Dev. Auth., Rev. Bonds (Menno-Haven Inc. Project), Series 2018, 5.00% 2022
| 290
| 312
|
| County of Franklin, Industrial Dev. Auth., Rev. Bonds (Menno-Haven Inc. Project), Series 2018, 5.00% 2023
| 500
| 547
|
| County of Franklin, Industrial Dev. Auth., Rev. Bonds (Menno-Haven Inc. Project), Series 2018, 5.00% 2025
| 500
| 563
|
| County of Franklin, Industrial Dev. Auth., Rev. Bonds (Menno-Haven Inc. Project), Series 2018, 5.00% 2027
| 650
| 744
|
| County of Franklin, Industrial Dev. Auth., Rev. Bonds (Menno-Haven Inc. Project), Series 2018, 5.00% 2032
| 1,050
| 1,179
|
| G.O. Rev. Ref. Bonds, Second Series 2018, 5.00% 2022
| 6,000
| 6,593
|
| General Auth. of Southcentral Pennsylvania, Rev. Bonds (Wellspan Health Obligated Group), Series 2019-B, (SIFMA Municipal Swap Index + 0.60%) 2.00% 2049 (put
2024)2
| 13,240
| 13,244
|
Higher Educational Facs. Auth., Health System Rev. Bonds (University of Pennsylvania Health System),
Series 2011-A, 5.75% 2041 (preref. 2021)
| 1,000
| 1,093
|
Higher Educational Facs. Auth., Health System Rev. Bonds (University of Pennsylvania Health System),
Series 2017-A, 4.00% 2034
| 5,500
| 6,144
|
Higher Educational Facs. Auth., Health System Rev. Bonds (University of Pennsylvania Health System),
Series 2017-A, 4.00% 2035
| 7,000
| 7,792
|
Higher Educational Facs. Auth., Health System Rev. Bonds (University of Pennsylvania Health System),
Series 2017-A, 4.00% 2036
| 8,500
| 9,432
|
Higher Educational Facs. Auth., Health System Rev. Bonds (University of Pennsylvania Health System),
Series 2017-A, 5.00% 2042
| 19,000
| 22,465
|
Higher Educational Facs. Auth., Rev. Bonds (Edinboro University Foundation Student Housing Project),
Series 2010, 5.80% 2030 (preref. 2020)
| 1,330
| 1,385
|
Higher Educational Facs. Auth., Rev. Bonds (Edinboro University Foundation Student Housing Project),
Series 2010, 6.00% 2043 (preref. 2020)
| 3,250
| 3,391
|
| Higher Educational Facs. Auth., Rev. Bonds (Shippensburg University Student Services, Inc. Student Housing Project at Shippensburg University of Pennsylvania),
Series 2011, 6.25% 2043 (preref. 2021)
| 690
| 765
|
| Higher Educational Facs. Auth., Rev. Bonds (Shippensburg University Student Services, Inc. Student Housing Project at Shippensburg University of Pennsylvania),
Series 2012, 5.00% 2030 (preref. 2022)
| 1,000
| 1,118
|
| Higher Educational Facs. Auth., Rev. Bonds (Shippensburg University Student Services, Inc. Student Housing Project at Shippensburg University of Pennsylvania),
Series 2012, 5.00% 2044 (preref. 2022)
| 1,980
| 2,214
|
| Higher Educational Facs. Auth., Rev. Bonds (Thomas Jefferson University), Series 2015-A, 5.25% 2050
| 5,400
| 6,133
|
Higher Educational Facs. Auth., Rev. Bonds (Trustees of the University of Pennsylvania), Series 2017-A,
5.00% 2033
| 1,675
| 2,049
|
| Higher Educational Facs. Auth., Rev. Ref. Bonds (Drexel University), Series 2017, 5.00% 2025
| 2,000
| 2,374
|
| Higher Educational Facs. Auth., Student Housing Rev. Bonds (University Properties, Inc. Student Housing Project at East Stroudsburg University of Pennsylvania),
Series 2010, 5.00% 2031
| 6,170
| 6,306
|
| Higher Educational Facs. Auth., Student Housing Rev. Bonds (University Properties, Inc. Student Housing Project at East Stroudsburg University of Pennsylvania),
Series 2010, 5.00% 2042
| 4,000
| 4,071
|
| Housing Fin. Agcy., Single Family Mortgage Rev. Bonds, Series 2015-118-A, 3.80% 2035
| 3,000
| 3,160
|
| Housing Fin. Agcy., Single Family Mortgage Rev. Bonds, Series 2016-119, 3.50% 2041
| 8,390
| 8,725
|
| Housing Fin. Agcy., Single Family Mortgage Rev. Bonds, Series 2016-120, 2.80% 2031
| 5,000
| 5,103
|
| Housing Fin. Agcy., Single Family Mortgage Rev. Bonds, Series 2016-120, 3.50% 2046
| 8,925
| 9,327
|
| Housing Fin. Agcy., Single Family Mortgage Rev. Bonds, Series 2016-121, 2.80% 2031
| 3,320
| 3,388
|
| Housing Fin. Agcy., Single Family Mortgage Rev. Bonds, Series 2016-121, 3.50% 2046
| 14,600
| 15,285
|
| Housing Fin. Agcy., Single Family Mortgage Rev. Bonds, Series 2017-122, 4.00% 2046
| 1,545
| 1,646
|
| Housing Fin. Agcy., Single Family Mortgage Rev. Bonds, Series 2017-124-B, 3.20% 2032
| 6,000
| 6,279
|
| Housing Fin. Agcy., Single Family Mortgage Rev. Bonds, Series 2017-125-B, 3.65% 2042
| 7,500
| 7,834
|
| Housing Fin. Agcy., Single Family Mortgage Rev. Bonds, Series 2017-125-B, 3.70% 2047
| 2,390
| 2,491
|
| Housing Fin. Agcy., Single Family Mortgage Rev. Bonds, Series 2018-126-A, 4.00% 2048
| 22,700
| 24,490
|
| Housing Fin. Agcy., Single Family Mortgage Rev. Bonds, Series 2018-127-B, 3.875% 2038
| 8,000
| 8,595
|
| Housing Fin. Agcy., Single Family Mortgage Rev. Bonds, Series 2019-128-B, 3.50% 2034
| 6,500
| 6,929
|
| Housing Fin. Agcy., Single Family Mortgage Rev. Bonds, Series 2019-128-B, 3.85% 2038
| 4,615
| 4,924
|
The Tax-Exempt Bond Fund of America — Page
84 of 120
Bonds, notes & other debt instruments (continued)
Pennsylvania (continued)
| Principal amount
(000)
| Value
(000)
|
Housing Fin. Agcy., Special Limited Obligation Multi Family Housing Dev. Bonds
(Central Pennsylvania Dev.), Series 2018, 2.45% 2022 (put 2021)
| $4,000
| $4,060
|
Housing Fin. Agcy., Special Limited Obligation Multi Family Housing Dev. Bonds
(Country Commons Apartments), Series 2018, 3.60% 2035
| 6,432
| 7,063
|
| County of Lancaster, Industrial Dev. Auth., Rev. Bonds (Garden Spot Village Project), Series 2013, 5.00% 2023
| 1,100
| 1,202
|
| County of Lancaster, Industrial Dev. Auth., Rev. Bonds (Garden Spot Village Project), Series 2013, 5.375% 2028
| 1,250
| 1,367
|
| County of Lancaster, Industrial Dev. Auth., Rev. Bonds (Garden Spot Village Project), Series 2013, 5.75% 2035
| 1,400
| 1,542
|
| County of Lancaster, Industrial Dev. Auth., Rev. Bonds (Willow Valley Communities Project), Series 2019, 5.00% 2049
| 2,300
| 2,633
|
County of Lehigh, General Purpose Auth., Hospital Rev. Ref. Bonds (Lehigh Valley Health Network),
Series 2016-A, 4.00% 2035
| 20,000
| 21,273
|
| County of Lehigh, Industrial Dev. Auth., Pollution Control Rev. Ref. Bonds (PPL Electric Utilities Corp. Project), Series 2016-A, 1.80% 2029 (put 2022)
| 9,900
| 9,970
|
| County of Lehigh, Industrial Dev. Auth., Pollution Control Rev. Ref. Bonds (PPL Electric Utilities Corp. Project), Series 2016-B, 1.80% 2027 (put 2022)
| 7,000
| 7,084
|
| City of Monroeville, Fin. Auth., UPMC Rev. Bonds, Series 2012, 5.00% 2029
| 3,000
| 3,324
|
County of Montgomery, Higher Education and Health Auth., Hospital Rev. Bonds
(Abington Memorial Hospital Obligated Group), Series 2012-A, 5.00% 2031 (preref. 2022)
| 3,950
| 4,370
|
County of Montgomery, Higher Education and Health Auth., Rev. Bonds (Thomas Jefferson University),
Series 2019, 4.00% 2038
| 1,000
| 1,099
|
County of Montgomery, Higher Education and Health Auth., Rev. Bonds (Thomas Jefferson University),
Series 2019, 4.00% 2039
| 1,000
| 1,094
|
County of Montgomery, Higher Education and Health Auth., Rev. Bonds (Thomas Jefferson University),
Series 2019, 4.00% 2044
| 2,500
| 2,701
|
County of Montgomery, Higher Education and Health Auth., Rev. Bonds (Thomas Jefferson University),
Series 2019, 4.00% 2051
| 3,500
| 3,746
|
County of Montgomery, Higher Education and Health Auth., Rev. Bonds (Thomas Jefferson University),
Series 2019, 5.00% 2033
| 2,000
| 2,484
|
| County of Montgomery, Higher Education and Health Auth., Rev. Bonds, Series 2018-A, 4.00% 2036
| 4,000
| 4,400
|
County of Montgomery, Higher Education and Health Auth., Rev. Bonds, Series 2018-A,
2.12% 2051 (put 2023)2
| 8,600
| 8,600
|
| County of Montgomery, Industrial Dev. Auth., Health Systems Rev. Bonds (Albert Einstein Healthcare Network Issue), Series 2015-A, 5.00% 2024
| 800
| 905
|
| County of Montgomery, Industrial Dev. Auth., Health Systems Rev. Bonds (Albert Einstein Healthcare Network Issue), Series 2015-A, 5.25% 2027
| 1,750
| 2,029
|
| County of Montgomery, Industrial Dev. Auth., Health Systems Rev. Bonds (Albert Einstein Healthcare Network Issue), Series 2015-A, 5.25% 2028
| 2,700
| 3,121
|
| County of Montgomery, Industrial Dev. Auth., Health Systems Rev. Bonds (Albert Einstein Healthcare Network Issue), Series 2015-A, 5.25% 2030
| 1,000
| 1,147
|
| County of Montgomery, Industrial Dev. Auth., Health Systems Rev. Bonds (Albert Einstein Healthcare Network Issue), Series 2015-A, 5.25% 2031
| 5,000
| 5,713
|
| County of Montgomery, Industrial Dev. Auth., Health Systems Rev. Bonds (Albert Einstein Healthcare Network Issue), Series 2015-A, 5.25% 2036
| 5,500
| 6,204
|
| County of Montgomery, Industrial Dev. Auth., Health Systems Rev. Bonds (Albert Einstein Healthcare Network Issue), Series 2015-A, 5.25% 2045
| 6,830
| 7,622
|
| County of Montgomery, Industrial Dev. Auth., Health Systems Rev. Bonds (Albert Einstein Healthcare Network Issue), Series 2015-A, 5.25% 2046
| 2,640
| 2,944
|
| County of Montgomery, Industrial Dev. Auth., Pollution Control Rev. Ref. Bonds (PECO Energy Co. Project), Series 1994-A, 2.55% 2029 (put 2020)
| 3,000
| 3,013
|
| County of Montgomery, Industrial Dev. Auth., Retirement Communities Rev. Bonds (ACTS Retirement-Life Communities, Inc. Obligated Group), Series 2016, 5.00% 2033
| 11,655
| 13,619
|
| County of Montgomery, Industrial Dev. Auth., Retirement Communities Rev. Bonds (ACTS Retirement-Life Communities, Inc. Obligated Group), Series 2016, 5.00% 2036
| 20,500
| 23,763
|
The Tax-Exempt Bond Fund of America — Page
85 of 120
Bonds, notes & other debt instruments (continued)
Pennsylvania (continued)
| Principal amount
(000)
| Value
(000)
|
| County of Montgomery, Industrial Dev. Auth., Retirement Communities Rev. Bonds (Waverly Heights Ltd.), Series 2019, 4.00% 2022
| $145
| $156
|
| County of Montgomery, Industrial Dev. Auth., Retirement Communities Rev. Bonds (Waverly Heights Ltd.), Series 2019, 4.00% 2024
| 100
| 111
|
| County of Montgomery, Industrial Dev. Auth., Retirement Communities Rev. Bonds (Waverly Heights Ltd.), Series 2019, 5.00% 2049
| 2,345
| 2,674
|
| County of Montgomery, Industrial Dev. Auth., Retirement Communities Rev. Ref. Bonds (ACTS Retirement-Life Communities, Inc. Obligated Group), Series 2012, 5.00%
2024
| 2,500
| 2,735
|
| County of Montgomery, Industrial Dev. Auth., Retirement Communities Rev. Ref. Bonds (ACTS Retirement-Life Communities, Inc. Obligated Group), Series 2012, 5.00%
2025
| 1,500
| 1,636
|
| County of Montgomery, Industrial Dev. Auth., Retirement Communities Rev. Ref. Bonds (ACTS Retirement-Life Communities, Inc. Obligated Group), Series 2012, 5.00%
2026
| 3,000
| 3,266
|
| County of Montgomery, Industrial Dev. Auth., Retirement Communities Rev. Ref. Bonds (ACTS Retirement-Life Communities, Inc. Obligated Group), Series 2012, 5.00%
2028
| 500
| 543
|
| County of Montgomery, Industrial Dev. Auth., Rev. Bonds (Foulkeways at Gwynedd Project), Series 2016, 5.00% 2046
| 1,325
| 1,459
|
County of Montgomery, Industrial Dev. Auth., Rev. Bonds (Philadelphia Presbytery Homes, Inc. Project),
Series 2010, 6.50% 2025 (preref. 2021)
| 4,000
| 4,488
|
| County of Montour, Geisinger Auth. Health System Rev. Bonds (Geisinger Health System), Series 2014-B, (1-month USD-LIBOR x 0.67 + 1.07%) 2.571% 2028 (put
2024)2
| 10,500
| 10,693
|
| County of Montour, Geisinger Auth. Health System Rev. Bonds (Geisinger Health System), Series 2017-A-2, 5.00% 2034
| 2,000
| 2,382
|
| County of Montour, Geisinger Auth. Health System Rev. Bonds (Geisinger Health System), Series 2017-A-2, 5.00% 2039
| 4,000
| 4,688
|
| County of Montour, Geisinger Auth. Health System Rev. Bonds (Geisinger Health System), Series 2017-A-2, 5.00% 2045
| 14,400
| 16,726
|
| County of Northampton, General Purpose Auth., Hospital Rev. Bonds (St. Luke’s University Health Network Project), Series 2016-A, 4.00% 2040
| 2,915
| 3,090
|
| County of Northampton, General Purpose Auth., Hospital Rev. Bonds (St. Luke’s University Health Network Project), Series 2016-A, 5.00% 2046
| 4,000
| 4,572
|
| County of Northampton, General Purpose Auth., Hospital Rev. Bonds (St. Luke’s University Health Network Project), Series 2018-A, 5.00% 2043
| 1,000
| 1,174
|
| County of Northampton, General Purpose Auth., Hospital Rev. Bonds (St. Luke’s University Health Network Project), Series 2018-A, 5.00% 2048
| 1,000
| 1,174
|
| County of Northampton, General Purpose Auth., Hospital Rev. Bonds (St. Luke’s University Health Network Project), Series 2018-B, (1-month USD-LIBOR x 0.70 +
1.04%) 2.721% 2048 (put 2022)2
| 3,650
| 3,670
|
| Pennsylvania State University, G.O. Bonds, Series 2016-A, 5.00% 2032
| 1,000
| 1,216
|
| Pennsylvania State University, G.O. Bonds, Series 2016-A, 5.00% 2034
| 1,000
| 1,209
|
| City of Philadelphia, G.O. Bonds, Series 2011, 5.25% 2019
| 1,070
| 1,070
|
| City of Philadelphia, G.O. Bonds, Series 2013-A, 5.25% 2027 (preref. 2021)
| 3,000
| 3,239
|
| City of Philadelphia, G.O. Rev. Ref. Bonds, Series 2009-A, Assured Guaranty insured, 5.50% 2023
| 7,000
| 7,000
|
| City of Philadelphia, Gas Works Rev. Bonds, Thirteenth Series, 5.00% 2028
| 2,000
| 2,368
|
| City of Philadelphia, Gas Works Rev. Bonds, Thirteenth Series, 5.00% 2031
| 1,000
| 1,167
|
| City of Philadelphia, Gas Works Rev. Bonds, Thirteenth Series, 5.00% 2032
| 2,000
| 2,328
|
| City of Philadelphia, Gas Works Rev. Bonds, Thirteenth Series, 5.00% 2034
| 1,000
| 1,158
|
| City of Philadelphia, Gas Works Rev. Ref. Bonds (1998 General Ordinance), Fourteenth Series, 5.00% 2031
| 1,500
| 1,788
|
| City of Philadelphia, Gas Works Rev. Ref. Bonds (1998 General Ordinance), Fourteenth Series, 5.00% 2033
| 2,750
| 3,261
|
| City of Philadelphia, Hospitals and Higher Education Facs. Auth., Hospital Rev. Bonds (Temple University Health System Obligated Group), Series 2012-A, 5.625% 2036
| 1,000
| 1,085
|
| City of Philadelphia, Hospitals and Higher Education Facs. Auth., Hospital Rev. Bonds (Temple University Health System Obligated Group), Series 2012-A, 5.625% 2042
| 12,600
| 13,618
|
| City of Philadelphia, Hospitals and Higher Education Facs. Auth., Hospital Rev. Bonds (Temple University Health System Obligated Group), Series 2017, 5.00% 2027
| 3,500
| 4,136
|
| City of Philadelphia, Hospitals and Higher Education Facs. Auth., Hospital Rev. Bonds (Temple University Health System Obligated Group), Series 2017, 5.00% 2028
| 1,000
| 1,170
|
The Tax-Exempt Bond Fund of America — Page
86 of 120
Bonds, notes & other debt instruments (continued)
Pennsylvania (continued)
| Principal amount
(000)
| Value
(000)
|
| City of Philadelphia, Hospitals and Higher Education Facs. Auth., Hospital Rev. Bonds (Temple University Health System Obligated Group), Series 2017, 5.00% 2029
| $2,185
| $2,542
|
| City of Philadelphia, Industrial Dev. Auth., Hospital Rev. Bonds (Children’s Hospital of Philadelphia Project), Series 2017, 4.00% 2035
| 2,500
| 2,807
|
| City of Philadelphia, Industrial Dev. Auth., Hospital Rev. Bonds (Children’s Hospital of Philadelphia Project), Series 2017, 4.00% 2037
| 4,000
| 4,462
|
| City of Philadelphia, Industrial Dev. Auth., Rev. Bonds (Temple University), Series 2016-1, 5.00% 2027
| 5,625
| 6,678
|
| City of Philadelphia, Industrial Dev. Auth., Rev. Bonds (Temple University), Series 2016-1, 5.00% 2028
| 1,000
| 1,181
|
| City of Philadelphia, Industrial Dev. Auth., Rev. Bonds (Temple University), Series 2016-1, 5.00% 2029
| 2,620
| 3,071
|
| City of Philadelphia, Industrial Dev. Auth., Rev. Bonds (University of the Sciences), Series 2017, 5.00% 2047
| 1,500
| 1,682
|
| City of Philadelphia, Intergovernmental Cooperation Auth., Special Tax Rev. Ref. Bonds (Funding Program), Series 2009, 5.00% 2020
| 6,285
| 6,305
|
| City of Philadelphia, Water and Wastewater Rev. Bonds, Series 2017-A, 5.00% 2034
| 3,915
| 4,731
|
| City of Philadelphia, Water and Wastewater Rev. Bonds, Series 2017-A, 5.00% 2037
| 2,000
| 2,391
|
| City of Philadelphia, Water and Wastewater Rev. Bonds, Series 2017-A, 5.00% 2052
| 4,000
| 4,682
|
| City of Philadelphia, Water and Wastewater Rev. Bonds, Series 2017-A, 5.25% 2052
| 3,000
| 3,586
|
| City of Philadelphia, Water and Wastewater Rev. Ref. Bonds, Series 2017-B, 5.00% 2029
| 4,725
| 5,886
|
| City of Philadelphia, Water and Wastewater Rev. Ref. Bonds, Series 2017-B, 5.00% 2030
| 5,900
| 7,298
|
| City of Philadelphia, Water and Wastewater Rev. Ref. Bonds, Series 2017-B, 5.00% 2031
| 3,560
| 4,365
|
| Philadelphia School Dist., G.O. Bonds, Series 2015-A, 5.00% 2035
| 1,400
| 1,610
|
| Philadelphia School Dist., G.O. Bonds, Series 2016-D, 5.00% 2019
| 1,250
| 1,254
|
| Philadelphia School Dist., G.O. Bonds, Series 2016-F, 5.00% 2024
| 1,185
| 1,382
|
| Philadelphia School Dist., G.O. Bonds, Series 2016-F, 5.00% 2027
| 3,710
| 4,455
|
| Philadelphia School Dist., G.O. Bonds, Series 2016-F, 5.00% 2028
| 14,505
| 17,359
|
| Philadelphia School Dist., G.O. Bonds, Series 2016-F, 5.00% 2029
| 16,620
| 19,790
|
| Philadelphia School Dist., G.O. Bonds, Series 2016-F, 5.00% 2030
| 1,990
| 2,356
|
| Philadelphia School Dist., G.O. Bonds, Series 2018-A, 5.00% 2029
| 1,250
| 1,544
|
| Philadelphia School Dist., G.O. Bonds, Series 2018-A, 5.00% 2031
| 1,600
| 1,950
|
| Philadelphia School Dist., G.O. Bonds, Series 2018-A, 5.00% 2032
| 1,000
| 1,214
|
| Philadelphia School Dist., G.O. Bonds, Series 2018-A, 5.00% 2034
| 1,750
| 2,103
|
| Philadelphia School Dist., G.O. Bonds, Series 2018-A, 5.00% 2037
| 1,850
| 2,199
|
| Philadelphia School Dist., G.O. Bonds, Series 2018-A, Assured Guaranty Municipal insured, 5.00% 2038
| 1,000
| 1,185
|
| Philadelphia School Dist., G.O. Rev. Ref. Bonds, Series 2007-A, FGIC-National insured, 5.00% 2034
| 3,000
| 3,813
|
| Philadelphia School Dist., G.O. Rev. Ref. Bonds, Series 2016-F, 5.00% 2027
| 500
| 600
|
City of Pittsburgh, Urban Redev. Auth., Rev. Bonds (Crawford Square Apartments Project), Series 2018,
2.25% 2020 (put 2020)
| 1,300
| 1,303
|
City of Pittsburgh, Water and Sewer Auth., Water and Sewer System Rev. Ref. Bonds, Series 2019-B,
Assured Guaranty Municipal insured, 5.00% 2032
| 2,000
| 2,633
|
City of Pittsburgh, Water and Sewer Auth., Water and Sewer System Rev. Ref. Bonds, Series 2019-B,
Assured Guaranty Municipal insured, 5.00% 2033
| 1,250
| 1,662
|
Public School Building Auth., School Lease Rev. Bonds (Philadelphia School Dist. Project), Series 2012,
5.00% 2023
| 1,180
| 1,288
|
Public School Building Auth., School Lease Rev. Bonds (Philadelphia School Dist. Project), Series 2012,
5.00% 2025
| 2,000
| 2,178
|
Public School Building Auth., School Lease Rev. Bonds (Philadelphia School Dist. Project), Series 2012,
5.00% 2026
| 1,000
| 1,087
|
Public School Building Auth., School Lease Rev. Bonds (Philadelphia School Dist. Project), Series 2012,
5.00% 2027
| 1,000
| 1,085
|
| Public School Building Auth., School Lease Rev. Ref. Bonds (Philadelphia School Dist. Project), Series 2006-B, Assured Guaranty Municipal insured, 5.00% 2027
| 9,820
| 12,054
|
| Public School Building Auth., School Lease Rev. Ref. Bonds (Philadelphia School Dist. Project), Series 2016-A, Assured Guaranty Municipal insured, 5.00% 2030
| 12,000
| 14,382
|
| Public School Building Auth., School Lease Rev. Ref. Bonds (Philadelphia School Dist. Project), Series 2016-A, Assured Guaranty Municipal insured, 5.00% 2033
| 6,000
| 7,062
|
| Reading School Dist., G.O. Bonds, Series 2017, Assured Guaranty Municipal insured, 5.00% 2035
| 1,000
| 1,184
|
The Tax-Exempt Bond Fund of America — Page
87 of 120
Bonds, notes & other debt instruments (continued)
Pennsylvania (continued)
| Principal amount
(000)
| Value
(000)
|
| Reading School Dist., G.O. Bonds, Series 2017, Assured Guaranty Municipal insured, 5.00% 2037
| $1,750
| $2,053
|
Borough of Sayre, Health Care Facs. Auth., Rev. Bonds (Guthrie Health Issue), Series 2007,
(3-month USD-LIBOR + 0.78%) 2.468% 20242
| 13,475
| 13,538
|
Borough of Sayre, Health Care Facs. Auth., Rev. Bonds (Guthrie Health Issue), Series 2007,
(3-month USD-LIBOR + 0.83%) 2.518% 20312
| 4,520
| 4,488
|
| Scranton School Dist., G.O. Bonds, Series 2017-E, BAM insured, 4.00% 2037
| 1,025
| 1,133
|
| Scranton School Dist., G.O. Bonds, Series 2017-E, BAM insured, 5.00% 2032
| 1,000
| 1,202
|
| Scranton School Dist., G.O. Bonds, Series 2017-E, BAM insured, 5.00% 2033
| 800
| 960
|
| Susquehanna Area Regional Airport Auth., Airport System Rev. Bonds, Series 2012-B, 4.00% 2033
| 14,950
| 15,457
|
Turnpike Commission, Turnpike Rev. Bonds, Series 2014-B-1,
(SIFMA Municipal Swap Index + 0.98%) 2.38% 20212
| 3,000
| 3,031
|
| Turnpike Commission, Turnpike Rev. Bonds, Series 2014-C, 5.00% 2039
| 10,345
| 11,827
|
| Turnpike Commission, Turnpike Rev. Bonds, Series 2016-A-1, 5.00% 2034
| 2,000
| 2,364
|
| Turnpike Commission, Turnpike Rev. Bonds, Series 2016-A-1, 5.00% 2035
| 3,500
| 4,122
|
| Turnpike Commission, Turnpike Rev. Bonds, Series 2016-A-1, 5.00% 2036
| 3,250
| 3,815
|
| Turnpike Commission, Turnpike Rev. Bonds, Series 2016-A-1, 5.00% 2041
| 1,050
| 1,211
|
| Turnpike Commission, Turnpike Rev. Bonds, Series 2016-A-1, 5.00% 2046
| 19,060
| 21,912
|
| Turnpike Commission, Turnpike Rev. Bonds, Series 2017-A-1, 5.00% 2032
| 1,000
| 1,227
|
| Turnpike Commission, Turnpike Rev. Bonds, Series 2017-A-1, 5.00% 2033
| 1,500
| 1,831
|
| Turnpike Commission, Turnpike Rev. Bonds, Series 2017-A-1, 5.00% 2034
| 1,000
| 1,212
|
| Turnpike Commission, Turnpike Rev. Bonds, Series 2017-A-1, 5.00% 2035
| 1,250
| 1,506
|
| Turnpike Commission, Turnpike Rev. Bonds, Series 2017-A-1, 5.00% 2036
| 1,300
| 1,561
|
| Turnpike Commission, Turnpike Rev. Bonds, Series 2017-A-1, 5.00% 2037
| 2,250
| 2,693
|
| Turnpike Commission, Turnpike Rev. Bonds, Series 2017-A-1, 5.00% 2042
| 6,500
| 7,699
|
| Turnpike Commission, Turnpike Rev. Bonds, Series 2017-A-1, 5.00% 2047
| 7,500
| 8,835
|
| Turnpike Commission, Turnpike Rev. Bonds, Series 2017-B-1, 5.00% 2042
| 8,500
| 9,827
|
Turnpike Commission, Turnpike Rev. Bonds, Series 2017-B-2, Assured Guaranty Municipal insured,
5.00% 2033
| 18,730
| 22,475
|
Turnpike Commission, Turnpike Rev. Bonds, Series 2017-B-2, Assured Guaranty Municipal insured,
5.00% 2034
| 6,995
| 8,364
|
| Turnpike Commission, Turnpike Rev. Bonds, Series 2019-A, 5.00% 2038
| 5,000
| 6,008
|
| Turnpike Commission, Turnpike Rev. Bonds, Series 2019-A, 5.00% 2044
| 2,500
| 2,948
|
| University of Pittsburgh - Of the Commonwealth System of Higher Education, PANTHERS, Series 2018, (SIFMA Municipal Swap Index + 0.24%) 1.64% 20212
| 42,235
| 42,173
|
County of Westmoreland, Municipal Auth., Municipal Service Rev. Bonds, Series 2016, BAM insured,
5.00% 2042
| 5,000
| 5,765
|
County of York, Industrial Dev. Auth., Pollution Control Rev. Ref. Bonds
(Philadelphia Electric Co. Project), Series 1993-A, 2.55% 2036 (put 2020)
| 5,000
| 5,008
|
|
|
| 1,025,476
|
| Puerto Rico 0.60%
|
|
|
| Aqueduct and Sewer Auth., Rev. Bonds, Series 2008-A, Assured Guaranty insured, 5.00% 2028
| 3,140
| 3,226
|
| Electric Power Auth., Power Rev. Bonds, Series 2003-NN, National insured, 5.25% 2021
| 2,500
| 2,575
|
Electric Power Auth., Power Rev. Ref. Bonds, Series UU, Assured Guaranty Municipal insured,
(3-month USD-LIBOR x 0.67 + 0.52%) 2.073% 20292
| 18,005
| 17,825
|
Highways and Transportation Auth., Highway Rev. Ref. Bonds, Series 1996-Y,
Assured Guaranty Municipal insured, 6.25% 2021
| 465
| 486
|
Highways and Transportation Auth., Highway Rev. Ref. Bonds, Series 2003-AA-1,
Assured Guaranty Municipal insured, 4.95% 2026
| 545
| 555
|
Highways and Transportation Auth., Highway Rev. Ref. Bonds, Series 2007-N,
Assured Guaranty Municipal insured, 5.50% 2029
| 5,060
| 5,698
|
Highways and Transportation Auth., Transportation Rev. Ref. Bonds, Series 2002-E,
Assured Guaranty Municipal insured, 5.50% 2022
| 1,170
| 1,245
|
Highways and Transportation Auth., Transportation Rev. Ref. Bonds, Series 2007-N,
Assured Guaranty insured, 5.25% 2036
| 10,000
| 11,060
|
The Tax-Exempt Bond Fund of America — Page
88 of 120
Bonds, notes & other debt instruments (continued)
Puerto Rico (continued)
| Principal amount
(000)
| Value
(000)
|
| Industrial, Tourist, Educational, Medical and Environmental Control Facs. Fncg. Auth., Higher Education Rev. and Rev. Ref. Bonds (Inter American University of
Puerto Rico Project), Series 2012, 5.00% 2019
| $1,550
| $1,555
|
| Industrial, Tourist, Educational, Medical and Environmental Control Facs. Fncg. Auth., Higher Education Rev. and Rev. Ref. Bonds (Inter American University of
Puerto Rico Project), Series 2012, 5.00% 2020
| 1,510
| 1,543
|
| Industrial, Tourist, Educational, Medical and Environmental Control Facs. Fncg. Auth., Higher Education Rev. and Rev. Ref. Bonds (Inter American University of
Puerto Rico Project), Series 2012, 5.00% 2022
| 2,275
| 2,395
|
| Industrial, Tourist, Educational, Medical and Environmental Control Facs. Fncg. Auth., Higher Education Rev. and Rev. Ref. Bonds (Inter American University of
Puerto Rico Project), Series 2012, 5.00% 2031
| 1,390
| 1,454
|
| Industrial, Tourist, Educational, Medical and Environmental Control Facs. Fncg. Auth., Higher Education Rev. and Rev. Ref. Bonds (University of the Sacred Heart
Project), Series 2012, 3.25% 2019
| 880
| 878
|
| Industrial, Tourist, Educational, Medical and Environmental Control Facs. Fncg. Auth., Higher Education Rev. and Rev. Ref. Bonds (University of the Sacred Heart
Project), Series 2012, 4.00% 2025
| 990
| 962
|
| Industrial, Tourist, Educational, Medical and Environmental Control Facs. Fncg. Auth., Higher Education Rev. and Rev. Ref. Bonds (University of the Sacred Heart
Project), Series 2012, 4.375% 2031
| 1,870
| 1,820
|
| Industrial, Tourist, Educational, Medical and Environmental Control Facs. Fncg. Auth., Higher Education Rev. Bonds (Inter American University of Puerto Rico
Project), Series 2004, National insured, 4.50% 2029
| 1,280
| 1,282
|
| Industrial, Tourist, Educational, Medical and Environmental Control Facs. Fncg. Auth., Higher Education Rev. Bonds (Inter American University of Puerto Rico
Project), Series 2019, 5.00% 2029
| 2,100
| 2,342
|
| Industrial, Tourist, Educational, Medical and Environmental Control Facs. Fncg. Auth., Higher Education Rev. Bonds (Inter American University of Puerto Rico
Project), Series 2019, 5.00% 2039
| 2,400
| 2,548
|
Industrial, Tourist, Educational, Medical and Environmental Control Facs. Fncg. Auth.,
Hospital Rev. and Rev. Ref. Bonds (Hospital Auxilio Mutuo Obligated Group Project), Series 2011-A,
6.00% 2033
| 8,255
| 8,665
|
| Public Fin. Corp., Commonwealth Appropriation Bonds, Series 2001-E, 6.00% 2026 (escrowed to maturity)
| 3,840
| 4,945
|
| Public Fin. Corp., Commonwealth Appropriation Bonds, Series 2001-E, 6.00% 2026 (escrowed to maturity)4
| 45
| 58
|
| Public Improvement G.O. Rev. Ref. Bonds, Series 2001, Assured Guaranty Municipal insured, 5.25% 2020
| 3,695
| 3,772
|
| Public Improvement G.O. Rev. Ref. Bonds, Series 2001-A, National insured, 5.50% 2020
| 4,745
| 4,831
|
| Sales Tax Fncg. Corp., Sales Tax Rev. Bonds, Capital Appreciation Bonds, Series 2007-A, 0% 20412
| 3,737
| 2,718
|
| Sales Tax Fncg. Corp., Sales Tax Rev. Bonds, Capital Appreciation Bonds, Series 2007-A, 0% 20422
| 3,401
| 2,474
|
| Sales Tax Fncg. Corp., Sales Tax Rev. Bonds, Capital Appreciation Bonds, Series 2007-A, 0% 20462
| 335
| 243
|
Sales Tax Fncg. Corp., Sales Tax Rev. Bonds, Capital Appreciation Bonds, Series 2007-A, Class 2,
AMBAC insured, 0% 20472
| 42,971
| 11,356
|
Sales Tax Fncg. Corp., Sales Tax Rev. Bonds, Capital Appreciation Bonds, Series 2007-A, Class 2,
AMBAC insured, 0% 20542
| 47,210
| 8,945
|
Sales Tax Fncg. Corp., Sales Tax Rev. Restructured Bonds, Capital Appreciation Bonds, Series 2018-A-1,
0% 2024
| 147
| 126
|
Sales Tax Fncg. Corp., Sales Tax Rev. Restructured Bonds, Capital Appreciation Bonds, Series 2018-A-1,
0% 2027
| 250
| 192
|
Sales Tax Fncg. Corp., Sales Tax Rev. Restructured Bonds, Capital Appreciation Bonds, Series 2018-A-1,
0% 2029
| 243
| 171
|
Sales Tax Fncg. Corp., Sales Tax Rev. Restructured Bonds, Capital Appreciation Bonds, Series 2018-A-1,
0% 2031
| 314
| 198
|
Sales Tax Fncg. Corp., Sales Tax Rev. Restructured Bonds, Capital Appreciation Bonds, Series 2018-A-1,
0% 2033
| 353
| 198
|
| Sales Tax Fncg. Corp., Sales Tax Rev. Restructured Bonds, Series 2018-A-1, 5.00% 2058
| 8,000
| 8,020
|
| Sales Tax Fncg. Corp., Sales Tax Rev. Restructured Bonds, Series 2019-A-2, 4.784% 2058
| 6,500
| 6,298
|
| Sales Tax Fncg. Corp., Taxable Sales Tax Rev. Bonds, Capital Appreciation Bonds, Series 2007-A, 0% 20412
| 1,230
| 169
|
| Sales Tax Fncg. Corp., Taxable Sales Tax Rev. Bonds, Capital Appreciation Bonds, Series 2007-A, 0% 20422
| 1,120
| 154
|
| Sales Tax Fncg. Corp., Taxable Sales Tax Rev. Bonds, Capital Appreciation Bonds, Series 2007-A, 0% 20462
| 110
| 15
|
| University of Puerto Rico, University System Rev. Ref. Bonds, Series 2006-P, 5.00% 2023
| 4,600
| 4,577
|
| University of Puerto Rico, University System Rev. Ref. Bonds, Series 2006-P, 5.00% 2026
| 1,250
| 1,234
|
|
|
| 128,808
|
The Tax-Exempt Bond Fund of America — Page
89 of 120
Bonds, notes & other debt instruments (continued)
Rhode Island 0.36%
| Principal amount
(000)
| Value
(000)
|
Clean Water Fin. Agcy., Water Pollution Control Revolving Fund Rev. Bonds (Pooled Loan Issue),
Series 2011-A, 5.00% 2028 (preref. 2020)
| $1,500
| $1,568
|
| Commerce Corp., Airport Rev. Bonds, Series 2016-D, 5.00% 2032
| 640
| 749
|
| Commerce Corp., Airport Rev. Bonds, Series 2016-D, 5.00% 2034
| 1,505
| 1,751
|
| Commerce Corp., Airport Rev. Bonds, Series 2016-D, 5.00% 2036
| 500
| 579
|
| Commerce Corp., Airport Rev. Bonds, Series 2016-D, 5.00% 2037
| 250
| 288
|
| Commerce Corp., Airport Rev. Bonds, Series 2016-D, 5.00% 2041
| 2,130
| 2,435
|
| Commerce Corp., Airport Rev. Bonds, Series 2016-D, 5.00% 2046
| 10,010
| 11,413
|
| Commerce Corp., Grant Anticipation Bonds (Dept. of Transportation), Series 2016-B, 5.00% 2029
| 3,000
| 3,618
|
| Commerce Corp., Grant Anticipation Rev. Ref. Bonds (Dept. of Transportation), Series 2016-A, 5.00% 2021
| 1,250
| 1,337
|
| Commerce Corp., Grant Anticipation Rev. Ref. Bonds (Dept. of Transportation), Series 2016-A, 5.00% 2023
| 1,000
| 1,137
|
| Commerce Corp., Grant Anticipation Rev. Ref. Bonds (Dept. of Transportation), Series 2016-A, 5.00% 2024
| 2,250
| 2,630
|
Depositors Econ. Protection Corp., Special Obligation Rev. Ref. Bonds, Series 1993-A,
5.75% 2021 (escrowed to maturity)
| 2,715
| 2,960
|
Depositors Econ. Protection Corp., Special Obligation Rev. Ref. Bonds, Series 1993-A,
5.75% 2021 (escrowed to maturity)
| 1,210
| 1,319
|
| Econ. Dev. Corp., Airport Rev. Ref. Bonds, Series 2013-B, 5.00% 2022
| 1,600
| 1,757
|
| Econ. Dev. Corp., Airport Rev. Ref. Bonds, Series 2013-B, 5.00% 2023
| 2,990
| 3,369
|
Health and Educational Building Corp., Hospital Fncg. Rev. Bonds (Bryant University), Series 2014,
5.00% 2032
| 1,000
| 1,140
|
Health and Educational Building Corp., Hospital Fncg. Rev. Bonds (Care New England Issue),
Series 2013-A, 6.00% 2033 (preref. 2023)
| 1,250
| 1,489
|
Health and Educational Building Corp., Hospital Fncg. Rev. Ref. Bonds (Care New England Issue),
Series 2016-B, 5.00% 2031
| 2,200
| 2,510
|
Health and Educational Building Corp., Hospital Fncg. Rev. Ref. Bonds (Care New England Issue),
Series 2016-B, 5.00% 2036
| 2,000
| 2,248
|
| Health and Educational Building Corp., Hospital Fncg. Rev. Ref. Bonds (Lifespan Obligated Group Issue), Series 2016, 5.00% 2032
| 2,845
| 3,292
|
Health and Educational Building Corp., Hospital Fncg. Rev. Ref. Bonds (Lifespan Obligated Group Issue),
Series 2016, 5.00% 2025
| 5,500
| 6,438
|
| Health and Educational Building Corp., Providence Public Schools Rev. Bond Fncg. Program, Rev. Ref. Bonds (Providence Public Buildings Auth. Issue), Series 2015,
Assured Guaranty Municipal insured, 5.00% 2026
| 4,000
| 4,742
|
| Housing and Mortgage Fin. Corp., Homeownership Opportunity Bonds, Series 66-A-1, 4.00% 2033
| 2,540
| 2,645
|
| Housing and Mortgage Fin. Corp., Homeownership Opportunity Bonds, Series 69-B, 4.00% 2048
| 9,520
| 10,363
|
| Housing and Mortgage Fin. Corp., Homeownership Opportunity Bonds, Series 70, 4.00% 2049
| 5,665
| 6,240
|
|
|
| 78,017
|
| South Carolina 1.34%
|
|
|
City of Charleston, Waterworks and Sewer System Capital Improvement Bonds, Series 2006-B,
1.953% 2035 (put 2022)2
| 12,000
| 12,017
|
Connector 2000 Association Inc., Toll Road Rev. Bonds, Capital Appreciation Bonds, Series 2011-A-1,
0% 2042
| 2,471
| 540
|
| Fort Mill School Dist., G.O. Bonds, Series 2013-A, 4.00% 2028 (preref. 2023)
| 1,475
| 1,626
|
| Housing Fin. and Dev. Auth., Mortgage Rev. Bonds, Series 2017-B, 4.00% 2047
| 1,815
| 1,946
|
| Housing Fin. and Dev. Auth., Mortgage Rev. Bonds, Series 2018-A, 4.50% 2048
| 1,855
| 2,044
|
| Housing Fin. and Dev. Auth., Mortgage Rev. Ref. Bonds, Series 2014-A-1, 4.00% 2041
| 1,030
| 1,087
|
| Housing Fin. and Dev. Auth., Mortgage Rev. Ref. Bonds, Series 2016-A, 4.00% 2036
| 4,660
| 4,985
|
| Jobs-Econ. Dev. Auth., Econ. Dev. Rev. Bonds (Custodial Receipts), Series 2018, 5.00% 20361,2
| 12,000
| 13,387
|
| Jobs-Econ. Dev. Auth., Health Facs. Rev. Ref. Bonds (Wesley Commons), Series 2016, 5.00% 20261
| 2,100
| 2,283
|
| Jobs-Econ. Dev. Auth., Health Facs. Rev. Ref. Bonds (Wesley Commons), Series 2016, 5.00% 20361
| 2,500
| 2,629
|
| Jobs-Econ. Dev. Auth., Hospital Rev. Bonds (Prisma Health Obligated Group), Series 2018-A, 5.00% 2048
| 32,000
| 37,254
|
| Jobs-Econ. Dev. Auth., Hospital Rev. Ref. and Improvement Rev. Bonds Bonds (Palmetto Health), Series 2019, 5.75% 2039 (preref. 2019)
| 1,475
| 1,475
|
Jobs-Econ. Dev. Auth., Residential Facs. Rev. Ref. Bonds (Episcopal Home Still Hopes), Series 2018-A,
5.00% 2020
| 425
| 432
|
The Tax-Exempt Bond Fund of America — Page
90 of 120
Bonds, notes & other debt instruments (continued)
South Carolina (continued)
| Principal amount
(000)
| Value
(000)
|
| Jobs-Econ. Dev. Auth., Retirement Community Rev. Bonds (ACTS Retirement - Life Communities, Inc. Obligated Group), Series 2018-C, 5.00% 2047
| $1,090
| $1,246
|
Jobs-Econ. Dev. Auth., Student Housing Rev. Bonds (Coastal Housing Foundation, LLC Project),
Series 2009-A, 6.50% 2042 (preref. 2020)
| 4,000
| 4,143
|
| Lexington County Health Services Dist., Inc., Hospital Rev. Bonds, Series 2016, 5.00% 2041
| 5,000
| 5,736
|
| Lexington County Health Services Dist., Inc., Hospital Rev. Ref. Bonds, Series 2011, 5.00% 2021
| 1,125
| 1,218
|
City of Myrtle Beach, Tax Increment Rev. Ref. Bonds (Myrtle Beach Air Force Base Redev. Project Area),
Series 2016, 5.00% 2028
| 1,210
| 1,453
|
| Patriots Energy Group Fncg. Agcy., Gas Supply Rev. Bonds, Series 2018-A, 4.00% 2048 (put 2024)
| 10,000
| 10,992
|
| Piedmont Municipal Power Agcy., Electric Rev. Ref. Bonds, Series 1991, FGIC-National insured, 6.25% 2021
| 4,640
| 4,963
|
| Public Service Auth., Rev. Obligations (Santee Cooper), Series 2011-C, 5.00% 2036
| 2,495
| 2,663
|
| Public Service Auth., Rev. Obligations (Santee Cooper), Series 2012-D, 5.00% 2043
| 15,510
| 16,572
|
| Public Service Auth., Rev. Obligations (Santee Cooper), Series 2013-E, 5.00% 2048
| 2,370
| 2,606
|
| Public Service Auth., Rev. Obligations (Santee Cooper), Series 2013-E, 5.50% 2053
| 7,540
| 8,426
|
| Public Service Auth., Rev. Obligations (Santee Cooper), Series 2014-A, 5.00% 2049
| 10,010
| 11,107
|
| Public Service Auth., Rev. Obligations (Santee Cooper), Series 2014-A, 5.50% 2054
| 10,600
| 11,975
|
| Public Service Auth., Rev. Obligations (Santee Cooper), Series 2014-C, 5.00% 2025
| 2,500
| 2,936
|
| Public Service Auth., Rev. Obligations (Santee Cooper), Series 2014-C, 5.00% 2031
| 1,105
| 1,271
|
| Public Service Auth., Rev. Obligations (Santee Cooper), Series 2014-C, 5.00% 2046
| 255
| 286
|
| Public Service Auth., Rev. Obligations (Santee Cooper), Series 2015-A, 5.00% 2055
| 9,940
| 11,181
|
| Public Service Auth., Rev. Obligations (Santee Cooper), Series 2015-E, 5.25% 2055
| 22,145
| 25,449
|
| Public Service Auth., Rev. Obligations (Santee Cooper), Series 2016-A, 5.00% 2036
| 13,625
| 15,909
|
| Public Service Auth., Rev. Obligations (Santee Cooper), Series 2016-B, 5.00% 2035
| 665
| 786
|
| Public Service Auth., Rev. Obligations (Santee Cooper), Series 2016-B, 5.00% 2056
| 2,545
| 2,920
|
Public Service Auth., Rev. Ref. Obligations (Santee Cooper), Series 2011-B,
4.00% 2019 (escrowed to maturity)
| 1,200
| 1,211
|
| Public Service Auth., Rev. Ref. Obligations (Santee Cooper), Series 2013-B, 5.00% 2038
| 5,405
| 5,992
|
| Public Service Auth., Rev. Ref. Obligations (Santee Cooper), Series 2013-B, 5.125% 2043
| 4,360
| 4,831
|
| Public Service Auth., Rev. Ref. Obligations (Santee Cooper), Series 2014-B, 5.00% 2038
| 3,690
| 4,135
|
Public Service Auth., Rev. Ref. Obligations (Santee Cooper), Series 2014-C,
3.00% 2046 (3.75% on 12/1/2019)4
| 150
| 150
|
| Public Service Auth., Rev. Ref. Obligations (Santee Cooper), Series 2015-A, 5.00% 2028
| 6,695
| 7,877
|
| Public Service Auth., Rev. Ref. Obligations (Santee Cooper), Series 2015-A, 5.00% 2029
| 100
| 117
|
| Public Service Auth., Rev. Ref. Obligations (Santee Cooper), Series 2015-A, 5.00% 2034
| 3,865
| 4,538
|
| Public Service Auth., Rev. Ref. Obligations (Santee Cooper), Series 2016-A, 5.00% 2031
| 2,140
| 2,541
|
Public Service Auth., Rev. Ref. Obligations (Santee Cooper), Series 2016-B,
2.25% 2051 (2.75% on 12/1/2019)4
| 17,680
| 16,909
|
| Public Service Auth., Rev. Ref. Obligations (Santee Cooper), Series 2016-C, 5.00% 2034
| 3,625
| 4,299
|
| Public Service Auth., Rev. Ref. Obligations (Santee Cooper), Series 2016-C, 5.00% 2035
| 2,000
| 2,365
|
| Public Service Auth., Tax-Exempt Rev. Ref. Obligations (Santee Cooper), Series 2016-A, 5.00% 2029
| 2,360
| 2,830
|
| Public Service Auth., Tax-Exempt Rev. Ref. Obligations (Santee Cooper), Series 2016-C, 5.00% 2028
| 2,730
| 3,328
|
| Public Service Auth., Tax-Exempt Rev. Ref. Obligations (Santee Cooper), Series 2016-C, 5.00% 2030
| 3,010
| 3,629
|
|
|
| 290,295
|
| South Dakota 0.55%
|
|
|
| Health and Educational Facs. Auth., Rev. Bonds (Sanford), Series 2014-A, 4.00% 2034
| 26,000
| 27,497
|
| Health and Educational Facs. Auth., Rev. Bonds (Sanford), Series 2014-B, 5.00% 2025
| 600
| 706
|
| Health and Educational Facs. Auth., Rev. Bonds (Sanford), Series 2014-B, 5.00% 2026
| 700
| 819
|
| Health and Educational Facs. Auth., Rev. Bonds (Sanford), Series 2014-B, 5.00% 2044
| 1,750
| 1,958
|
| Health and Educational Facs. Auth., Rev. Bonds (Sanford), Series 2015, 5.00% 2045
| 5,900
| 6,681
|
| Housing Dev. Auth., Homeownership Mortgage Bonds, Series 2014-E, 4.00% 2044
| 2,410
| 2,531
|
| Housing Dev. Auth., Homeownership Mortgage Bonds, Series 2015-D, 4.00% 2045
| 5,985
| 6,334
|
| Housing Dev. Auth., Homeownership Mortgage Bonds, Series 2016-B, 3.50% 2046
| 7,870
| 8,258
|
| Housing Dev. Auth., Homeownership Mortgage Bonds, Series 2016-D, 3.50% 2046
| 10,615
| 11,173
|
| Housing Dev. Auth., Homeownership Mortgage Bonds, Series 2017-D, 3.10% 2032
| 6,900
| 7,200
|
The Tax-Exempt Bond Fund of America — Page
91 of 120
Bonds, notes & other debt instruments (continued)
South Dakota (continued)
| Principal amount
(000)
| Value
(000)
|
| Housing Dev. Auth., Homeownership Mortgage Bonds, Series 2017-D, 4.00% 2047
| $16,045
| $17,255
|
| Housing Dev. Auth., Homeownership Mortgage Bonds, Series 2018-A, 4.00% 2048
| 18,460
| 19,998
|
| Housing Dev. Auth., Homeownership Mortgage Bonds, Series 2019-B, 4.00% 2049
| 3,300
| 3,614
|
| Housing Dev. Auth., Multi Family Rev. Bonds (Meadowland Apartments), Series 2019, 1.54% 2022 (put 2021)
| 4,000
| 4,005
|
|
|
| 118,029
|
| Tennessee 1.13%
|
|
|
City of Chattanooga, Hospital Auth., Hospital Rev. Ref. Bonds (Erlanger Health System), Series 2014,
5.00% 2039
| 4,000
| 4,425
|
City of Chattanooga, Hospital Auth., Hospital Rev. Ref. Bonds (Erlanger Health System), Series 2014,
5.00% 2044
| 2,010
| 2,212
|
| Town of Greeneville, Health and Educational Facs. Board, Hospital Rev. Bonds (Ballad Health), Series 2018-A, 4.00% 2040
| 7,000
| 7,419
|
| Town of Greeneville, Health and Educational Facs. Board, Hospital Rev. Bonds (Ballad Health), Series 2018-A, 5.00% 2035
| 3,175
| 3,790
|
| Housing Dev. Agcy., Homeownership Program Bonds, Series 2012-1-C, 4.50% 2037
| 590
| 613
|
| Housing Dev. Agcy., Homeownership Program Bonds, Series 2012-2-C, 4.00% 2038
| 910
| 939
|
| Housing Dev. Agcy., Homeownership Program Bonds, Series 2015-A, 3.50% 2045
| 6,345
| 6,695
|
| Housing Dev. Agcy., Residential Fin. Program Bonds, Series 2013-1-C, 3.00% 2038
| 2,170
| 2,218
|
| Housing Dev. Agcy., Residential Fin. Program Bonds, Series 2014-2-A, 4.00% 2045
| 1,665
| 1,761
|
| Housing Dev. Agcy., Residential Fin. Program Bonds, Series 2014-2-C, 4.00% 2045
| 1,870
| 1,973
|
| Housing Dev. Agcy., Residential Fin. Program Bonds, Series 2015-2-A, 4.00% 2046
| 2,100
| 2,231
|
| Housing Dev. Agcy., Residential Fin. Program Bonds, Series 2016-1-B, 3.50% 2047
| 1,245
| 1,311
|
| Housing Dev. Agcy., Residential Fin. Program Bonds, Series 2017-1, 4.00% 2042
| 900
| 965
|
| Housing Dev. Agcy., Residential Fin. Program Bonds, Series 2017-3, 3.50% 2048
| 7,500
| 7,936
|
| Housing Dev. Agcy., Residential Fin. Program Bonds, Series 2017-4-B, 4.00% 2048
| 2,820
| 3,038
|
| Housing Dev. Agcy., Residential Fin. Program Bonds, Series 2018-1, 4.00% 2043
| 10,450
| 11,308
|
| Housing Dev. Agcy., Residential Fin. Program Bonds, Series 2018-2, 4.00% 2049
| 13,295
| 14,426
|
| Housing Dev. Agcy., Residential Fin. Program Bonds, Series 2018-3, 4.25% 2049
| 11,785
| 12,904
|
| Housing Dev. Agcy., Residential Fin. Program Bonds, Series 2019-1, 4.25% 2050
| 7,970
| 8,803
|
| Housing Dev. Agcy., Residential Fin. Program Bonds, Series 2019-2, 4.00% 2048
| 20,350
| 22,628
|
| County of Knox, Health, Educational and Housing Fac. Board, Hospital Rev. Ref. Bonds (Covenant Health), Series 2012-A, 5.00% 2021
| 1,325
| 1,391
|
| County of Knox, Health, Educational and Housing Fac. Board, Hospital Rev. Ref. Bonds (Covenant Health), Series 2012-A, 5.00% 2024
| 4,055
| 4,543
|
| Metropolitan Government of Nashville and Davidson County, G.O. Improvement Bonds, Series 2013-A, 5.00% 2027 (preref. 2023)
| 9,390
| 10,620
|
| Metropolitan Government of Nashville and Davidson County, G.O. Improvement Bonds, Series 2013-A, 5.00% 2029 (preref. 2023)
| 31,610
| 35,752
|
| Metropolitan Government of Nashville and Davidson County, G.O. Improvement Bonds, Series 2013-A, 5.00% 2031 (preref. 2023)
| 10,595
| 11,983
|
| Metropolitan Government of Nashville and Davidson County, Health and Educational Facs. Board, Collateralized Multi Family Housing Rev. Bonds (East Webster Street
Apartments Project), Series 2018, 2.05% 2021 (put 2020)
| 2,000
| 2,012
|
Metropolitan Government of Nashville and Davidson County, Health and Educational Facs. Board, Collateralized Multi Family Housing Rev. Bonds (Oakwood Flats
Apartments Project), Series 2018,
2.10% 2021 (put 2020)
| 3,000
| 3,027
|
| Metropolitan Government of Nashville and Davidson County, Health and Educational Facs. Board, Rev. Bonds (Vanderbilt University Medical Center), Series 2017-A,
5.00% 2048
| 4,000
| 4,607
|
| Metropolitan Government of Nashville and Davidson County, Water & Sewer Rev. Bonds, Series 2017-B, 5.00% 2042
| 5,000
| 5,988
|
| Metropolitan Government of Nashville and Davidson County, Water & Sewer Rev. Bonds, Series 2017-B, 5.00% 2046
| 5,000
| 5,968
|
Metropolitan Government of Nashville and Davidson County, Water & Sewer Rev. Green Bonds,
Series 2017-A, 5.00% 2046
| 4,000
| 4,775
|
The Tax-Exempt Bond Fund of America — Page
92 of 120
Bonds, notes & other debt instruments (continued)
Tennessee (continued)
| Principal amount
(000)
| Value
(000)
|
| Tennessee Energy Acquisition Corp., Gas Project Rev. Bonds, Series 2006-A, 5.25% 2019
| $10,000
| $10,029
|
| Tennessee Energy Acquisition Corp., Gas Project Rev. Bonds, Series 2006-A, 5.25% 2020
| 7,500
| 7,781
|
| Tennessee Energy Acquisition Corp., Gas Project Rev. Bonds, Series 2006-C, 5.00% 2020
| 10,000
| 10,163
|
| Tennessee Energy Acquisition Corp., Gas Project Rev. Bonds, Series 2006-C, 5.00% 2027
| 1,885
| 2,245
|
| Tennessee Energy Acquisition Corp., Gas Project Rev. Bonds, Series 2018, 4.00% 20492
| 5,000
| 5,551
|
|
|
| 244,030
|
| Texas 10.35%
|
|
|
Affordable Housing Corp., Single Family Mortgage Rev. Bonds (Texas Heroes Home Loan Program),
Series 2019-A, 4.25% 2049
| 3,625
| 3,998
|
| Aledo Independent School Dist., Unlimited Tax Rev. Ref. Bonds, Series 2016, 5.00% 2036
| 1,000
| 1,181
|
| Alvin Independent School Dist., Unlimited Tax Schoolhouse Rev. Ref. Bonds, Series 2014-C, 5.00% 2021
| 1,000
| 1,059
|
Arlington Higher Education Fin. Corp., Education Rev. and Rev. Ref. Bonds (Harmony Public Schools),
Series 2017-A, 5.00% 2027
| 1,085
| 1,340
|
Arlington Higher Education Fin. Corp., Education Rev. and Rev. Ref. Bonds (Harmony Public Schools),
Series 2017-A, 5.00% 2042
| 2,000
| 2,353
|
| Arlington Higher Education Fin. Corp., Education Rev. and Rev. Ref. Bonds (Uplift Education), Series 2017-A, 5.00% 2034
| 650
| 782
|
| Arlington Higher Education Fin. Corp., Education Rev. and Rev. Ref. Bonds (Uplift Education), Series 2017-A, 5.00% 2036
| 915
| 1,093
|
| Arlington Higher Education Fin. Corp., Education Rev. and Rev. Ref. Bonds (Uplift Education), Series 2017-A, 5.00% 2037
| 1,445
| 1,721
|
| Arlington Higher Education Fin. Corp., Education Rev. and Rev. Ref. Bonds (Uplift Education), Series 2017-A, 5.00% 2047
| 2,625
| 3,077
|
| Arlington Higher Education Fin. Corp., Education Rev. Bonds (Great Hearts America - Texas), Series 2019-A, 4.00% 2034
| 330
| 378
|
| Arlington Higher Education Fin. Corp., Education Rev. Bonds (Great Hearts America - Texas), Series 2019-A, 4.00% 2035
| 1,000
| 1,139
|
| Arlington Higher Education Fin. Corp., Education Rev. Bonds (Great Hearts America - Texas), Series 2019-A, 4.00% 2036
| 375
| 426
|
| Arlington Higher Education Fin. Corp., Education Rev. Bonds (Great Hearts America - Texas), Series 2019-A, 4.00% 2038
| 900
| 1,014
|
| Arlington Higher Education Fin. Corp., Education Rev. Bonds (Great Hearts America - Texas), Series 2019-A, 4.00% 2039
| 470
| 528
|
| Arlington Higher Education Fin. Corp., Education Rev. Bonds (Great Hearts America - Texas), Series 2019-A, 5.00% 2023
| 150
| 171
|
| Arlington Higher Education Fin. Corp., Education Rev. Bonds (Great Hearts America - Texas), Series 2019-A, 5.00% 2024
| 185
| 217
|
| Arlington Higher Education Fin. Corp., Education Rev. Bonds (Great Hearts America - Texas), Series 2019-A, 5.00% 2025
| 195
| 234
|
| Arlington Higher Education Fin. Corp., Education Rev. Bonds (Uplift Education), Series 2016-A, 2.75% 2026
| 1,265
| 1,284
|
| Arlington Higher Education Fin. Corp., Education Rev. Bonds (Uplift Education), Series 2016-A, 5.00% 2036
| 1,000
| 1,131
|
| Arlington Higher Education Fin. Corp., Education Rev. Bonds (Uplift Education), Series 2016-A, 5.00% 2046
| 1,100
| 1,225
|
| Arlington Higher Education Fin. Corp., Education Rev. Bonds (Uplift Education), Series 2017-B, 5.00% 2042
| 4,165
| 4,908
|
| Arlington Higher Education Fin. Corp., Education Rev. Bonds (Uplift Education), Series 2018-A, 5.00% 2037
| 725
| 853
|
| Arlington Higher Education Fin. Corp., Education Rev. Bonds (Uplift Education), Series 2018-A, 5.00% 2048
| 3,345
| 3,855
|
| City of Arlington, Special Tax Rev. Bonds, Series 2018-A, Assured Guaranty Municipal insured, 5.00% 2035
| 2,245
| 2,738
|
| City of Arlington, Special Tax Rev. Bonds, Series 2018-A, Assured Guaranty Municipal insured, 5.00% 2038
| 1,000
| 1,202
|
| City of Arlington, Special Tax Rev. Bonds, Series 2018-A, Assured Guaranty Municipal insured, 5.00% 2043
| 5,000
| 5,928
|
| City of Arlington, Special Tax Rev. Bonds, Series 2018-C, BAM insured, 5.00% 2029
| 1,500
| 1,860
|
| City of Arlington, Special Tax Rev. Bonds, Series 2018-C, BAM insured, 5.00% 2030
| 1,000
| 1,232
|
| City of Arlington, Special Tax Rev. Bonds, Series 2018-C, BAM insured, 5.00% 2031
| 1,100
| 1,347
|
| City of Arlington, Special Tax Rev. Bonds, Series 2018-C, BAM insured, 5.00% 2032
| 1,000
| 1,219
|
| Austin Convention Enterprises, Convention Center Hotel Rev. Ref. Bonds, Series 2017-A, 5.00% 2032
| 1,400
| 1,654
|
| Austin Independent School Dist., Unlimited Tax Rev. Ref. Bonds, Series 2013-A, 5.00% 2027
| 60
| 65
|
The Tax-Exempt Bond Fund of America — Page
93 of 120
Bonds, notes & other debt instruments (continued)
Texas (continued)
| Principal amount
(000)
| Value
(000)
|
| Austin Independent School Dist., Unlimited Tax Rev. Ref. Bonds, Series 2013-A, 5.00% 2027 (preref. 2021)
| $940
| $1,010
|
Austin Independent School Dist., Unlimited Tax School Building and Rev. Ref. Bonds, Series 2017,
5.00% 2028
| 3,085
| 3,802
|
Austin Independent School Dist., Unlimited Tax School Building and Rev. Ref. Bonds, Series 2017,
5.00% 2030
| 3,000
| 3,654
|
Austin Independent School Dist., Unlimited Tax School Building and Rev. Ref. Bonds, Series 2017,
5.00% 2037
| 2,660
| 3,176
|
Austin Independent School Dist., Unlimited Tax School Building and Rev. Ref. Bonds, Series 2019,
5.00% 2032
| 3,500
| 4,394
|
| City of Austin, Airport System Rev. Bonds, Series 2017-A, 5.00% 2032
| 1,100
| 1,329
|
| City of Austin, Airport System Rev. Bonds, Series 2017-A, 5.00% 2033
| 2,220
| 2,675
|
| City of Austin, Airport System Rev. Bonds, Series 2017-A, 5.00% 2034
| 2,000
| 2,401
|
| City of Austin, Airport System Rev. Bonds, Series 2017-A, 5.00% 2035
| 1,125
| 1,347
|
| City of Austin, Airport System Rev. Bonds, Series 2017-A, 5.00% 2036
| 3,605
| 4,303
|
| City of Austin, Airport System Rev. Bonds, Series 2017-A, 5.00% 2037
| 2,000
| 2,380
|
| City of Austin, Airport System Rev. Bonds, Series 2017-A, 5.00% 2041
| 2,500
| 2,951
|
| City of Austin, Electric Utility System Rev. Ref. Bonds, Series 2015-A, 5.00% 2028
| 1,000
| 1,204
|
| City of Austin, Electric Utility System Rev. Ref. Bonds, Series 2015-A, 5.00% 2045
| 5,000
| 5,759
|
| City of Austin, Electric Utility System Rev. Ref. Bonds, Series 2017, 5.00% 2031
| 1,130
| 1,377
|
| City of Austin, Electric Utility System Rev. Ref. Bonds, Series 2017, 5.00% 2032
| 1,000
| 1,214
|
| City of Austin, Electric Utility System Rev. Ref. Bonds, Series 2017, 5.00% 2033
| 1,000
| 1,211
|
| City of Austin, Electric Utility System Rev. Ref. Bonds, Series 2017, 5.00% 2035
| 2,000
| 2,408
|
| City of Austin, Electric Utility System Rev. Ref. Bonds, Series 2019-B, 5.00% 2044
| 15,000
| 18,443
|
| City of Austin, Electric Utility System Rev. Ref. Bonds, Series 2019-B, 5.00% 2049
| 25,000
| 30,611
|
| City of Austin, Water and Wastewater System Rev. Ref. Bonds, Series 2009, 5.125% 2029
| 1,500
| 1,517
|
| City of Austin, Water and Wastewater System Rev. Ref. Bonds, Series 2011, 5.00% 2036
| 1,925
| 2,073
|
| City of Austin, Water and Wastewater System Rev. Ref. Bonds, Series 2015-A, 3.00% 2027
| 1,705
| 1,843
|
| City of Austin, Water and Wastewater System Rev. Ref. Bonds, Series 2016, 5.00% 2028
| 1,000
| 1,234
|
| City of Austin, Water and Wastewater System Rev. Ref. Bonds, Series 2016, 5.00% 2029
| 3,000
| 3,695
|
| City of Austin, Water and Wastewater System Rev. Ref. Bonds, Series 2016, 5.00% 2032
| 4,405
| 5,349
|
| City of Austin, Water and Wastewater System Rev. Ref. Bonds, Series 2016, 5.00% 2035
| 8,185
| 9,853
|
| City of Austin, Water and Wastewater System Rev. Ref. Bonds, Series 2016, 5.00% 2036
| 6,985
| 8,384
|
| City of Austin, Water and Wastewater System Rev. Ref. Bonds, Series 2016, 5.00% 2041
| 26,405
| 31,287
|
| City of Austin, Water and Wastewater System Rev. Ref. Bonds, Series 2016, 5.00% 2045
| 11,795
| 13,898
|
| City of Austin, Water and Wastewater System Rev. Ref. Bonds, Series 2017, 5.00% 2035
| 4,000
| 4,901
|
| City of Austin, Water and Wastewater System Rev. Ref. Bonds, Series 2017, 5.00% 2036
| 3,500
| 4,275
|
| City of Austin, Water and Wastewater System Rev. Ref. Bonds, Series 2017, 5.00% 2037
| 5,000
| 6,086
|
| City of Austin, Water and Wastewater System Rev. Ref. Bonds, Series 2017, 5.00% 2042
| 10,000
| 12,011
|
| City of Austin, Water and Wastewater System Rev. Ref. Bonds, Series 2017, 5.00% 2046
| 5,000
| 5,978
|
| County of Bexar, Hospital Dist., Certificates of Obligation, Series 2018, 5.00% 2026
| 1,800
| 2,203
|
| County of Bexar, Hospital Dist., Certificates of Obligation, Series 2018, 5.00% 2027
| 1,095
| 1,368
|
| County of Bexar, Hospital Dist., Certificates of Obligation, Series 2018, 5.00% 2028
| 1,100
| 1,368
|
| County of Bexar, Hospital Dist., Certificates of Obligation, Series 2018, 5.00% 2033
| 2,000
| 2,424
|
| County of Bexar, Hospital Dist., Certificates of Obligation, Series 2018, 5.00% 2034
| 2,000
| 2,413
|
| County of Bexar, Hospital Dist., Certificates of Obligation, Series 2018, 5.00% 2035
| 6,155
| 7,400
|
| County of Bexar, Hospital Dist., Certificates of Obligation, Series 2018, 5.00% 2036
| 10,150
| 12,166
|
| County of Bexar, Hospital Dist., Limited Tax Rev. Ref. Bonds, Series 2019, 5.00% 2034
| 1,750
| 2,149
|
| County of Bexar, Hospital Dist., Limited Tax Rev. Ref. Bonds, Series 2019, 5.00% 2038
| 4,200
| 5,076
|
| County of Bexar, Limited Tax Rev. Ref. Bonds, Series 2017, 5.00% 2043
| 5,000
| 5,905
|
| County of Bexar, Venue Project Rev. Ref. Bonds (Combined Venue Tax), Series 2019, 5.00% 2022
| 265
| 294
|
| County of Bexar, Venue Project Rev. Ref. Bonds (Combined Venue Tax), Series 2019, 5.00% 2023
| 270
| 309
|
| County of Bexar, Venue Project Rev. Ref. Bonds (Combined Venue Tax), Series 2019, 5.00% 2024
| 250
| 294
|
| County of Bexar, Venue Project Rev. Ref. Bonds (Combined Venue Tax), Series 2019, 5.00% 2025
| 420
| 505
|
| Birdville Independent School Dist., Unlimited Tax Rev. Ref. Bonds, Series 2019, 4.00% 2032
| 4,240
| 4,886
|
| Birdville Independent School Dist., Unlimited Tax Rev. Ref. Bonds, Series 2019, 4.00% 2033
| 2,230
| 2,557
|
The Tax-Exempt Bond Fund of America — Page
94 of 120
Bonds, notes & other debt instruments (continued)
Texas (continued)
| Principal amount
(000)
| Value
(000)
|
| Birdville Independent School Dist., Unlimited Tax Rev. Ref. Bonds, Series 2019, 4.00% 2034
| $2,240
| $2,557
|
City of Brownsville, Utilities System Rev. Ref. Bonds, Series 2016, Assured Guaranty Municipal insured,
5.00% 2027
| 1,965
| 2,375
|
| City of Bryan, Electric System Rev. Ref. and Improvement Bonds, Series 2016, 5.00% 2027
| 700
| 853
|
| City of Bryan, Electric System Rev. Ref. and Improvement Bonds, Series 2016, 5.00% 2028
| 1,100
| 1,336
|
| City of Bryan, Electric System Rev. Ref. Bonds, Series 2017, Assured Guaranty Municipal insured, 5.00% 2029
| 645
| 801
|
| City of Bryan, Electric System Rev. Ref. Bonds, Series 2017, Assured Guaranty Municipal insured, 5.00% 2030
| 1,000
| 1,230
|
| Central Texas Regional Mobility Auth., Rev. Bonds, Series 2010, 5.75% 2025 (preref. 2020)
| 11,945
| 12,172
|
| Central Texas Regional Mobility Auth., Rev. Bonds, Series 2011, 6.00% 2041 (preref. 2021)
| 5,300
| 5,655
|
| Central Texas Regional Mobility Auth., Rev. Bonds, Series 2011, 6.25% 2046 (preref. 2021)
| 10,300
| 11,025
|
| Central Texas Regional Mobility Auth., Rev. Ref. Bonds, Series 2015-A, 5.00% 2031
| 1,000
| 1,161
|
| Central Texas Regional Mobility Auth., Rev. Ref. Bonds, Series 2015-A, 5.00% 2033
| 1,000
| 1,152
|
| Central Texas Regional Mobility Auth., Rev. Ref. Bonds, Series 2015-A, 5.00% 2034
| 1,500
| 1,723
|
| Central Texas Regional Mobility Auth., Rev. Ref. Bonds, Series 2015-A, 5.00% 2040
| 4,100
| 4,649
|
| Central Texas Regional Mobility Auth., Rev. Ref. Bonds, Series 2016, 5.00% 2031
| 6,275
| 7,358
|
| Central Texas Regional Mobility Auth., Rev. Ref. Bonds, Series 2016, 5.00% 2034
| 1,700
| 1,970
|
| Clifton Higher Education Fin. Corp., Education Rev. and Ref. Bonds (Idea Public Schools), Series 2016-A, 5.00% 2046
| 2,000
| 2,318
|
Clifton Higher Education Fin. Corp., Education Rev. and Ref. Bonds (Idea Public Schools), Series 2017,
5.00% 2026
| 1,835
| 2,253
|
| Clifton Higher Education Fin. Corp., Education Rev. Bonds (Idea Public Schools), Series 2012, 5.00% 2032
| 2,415
| 2,592
|
| Clifton Higher Education Fin. Corp., Education Rev. Bonds (Idea Public Schools), Series 2016-B, 5.00% 2024
| 250
| 287
|
| Clifton Higher Education Fin. Corp., Education Rev. Bonds (Idea Public Schools), Series 2018, 5.00% 2048
| 15,470
| 18,418
|
| Clifton Higher Education Fin. Corp., Education Rev. Bonds (Uplift Education), Series 2014A, 4.50% 2044
| 1,465
| 1,510
|
| Colorado River Municipal Water Dist., Water System Rev. Bonds, Series 2011, 5.00% 2028
| 9,175
| 9,681
|
| Port of Corpus Christi Auth. of Nueces County, Rev. Bonds, Series 2018-A, 5.00% 2036
| 1,000
| 1,232
|
| Port of Corpus Christi Auth. of Nueces County, Rev. Bonds, Series 2018-A, 5.00% 2037
| 1,945
| 2,388
|
| Port of Corpus Christi Auth. of Nueces County, Rev. Bonds, Series 2018-A, 5.00% 2038
| 1,775
| 2,173
|
| Port of Corpus Christi Auth. of Nueces County, Rev. Bonds, Series 2018-A, 5.00% 2043
| 9,240
| 11,196
|
| Port of Corpus Christi Auth. of Nueces County, Rev. Bonds, Series 2018-A, 5.00% 2048
| 10,000
| 12,028
|
Cypress-Fairbanks Independent School Dist., Unlimited Tax School Building Bonds, Series 2014-B-3,
1.40% 2040 (put 2020)
| 750
| 751
|
Cities of Dallas and Fort Worth, Dallas/Fort Worth International Airport, Joint Rev. Improvement Bonds,
Series 2013-B, 5.00% 2028
| 8,565
| 9,596
|
Cities of Dallas and Fort Worth, Dallas/Fort Worth International Airport, Joint Rev. Improvement Bonds,
Series 2013-B, 5.00% 2029
| 5,000
| 5,588
|
Cities of Dallas and Fort Worth, Dallas/Fort Worth International Airport, Joint Rev. Improvement Bonds,
Series 2013-B, 5.00% 2031
| 6,540
| 7,279
|
| Cities of Dallas and Fort Worth, Dallas/Fort Worth International Airport, Joint Rev. Ref. Bonds, Series 2012-B, 5.00% 2035
| 2,250
| 2,349
|
| Cities of Dallas and Fort Worth, Dallas/Fort Worth International Airport, Joint Rev. Ref. Bonds, Series 2013-D, 5.25% 2024
| 5,000
| 5,472
|
| City of Dallas, Waterworks and Sewer System Rev. Ref. Bonds, Series 2016-A, 5.00% 2036
| 5,400
| 6,483
|
| City of Dallas, Waterworks and Sewer System Rev. Ref. Bonds, Series 2017, 5.00% 2027
| 1,250
| 1,590
|
| City of Dallas, Waterworks and Sewer System Rev. Ref. Bonds, Series 2017, 5.00% 2042
| 8,700
| 10,457
|
| City of Dallas, Waterworks and Sewer System Rev. Ref. Bonds, Series 2017, 5.00% 2046
| 13,550
| 16,211
|
| Dallas Area Rapid Transit Rev. Ref. Bonds, Series 2019, 5.00% 2031
| 2,500
| 3,258
|
| Dallas Area Rapid Transit Rev. Ref. Bonds, Series 2019, 5.00% 2034
| 6,520
| 8,390
|
| City of Denton, Utility System Rev. Bonds, Series 2017, 5.00% 2029
| 7,000
| 8,542
|
| City of Denton, Utility System Rev. Bonds, Series 2017, 5.00% 2033
| 15,180
| 18,143
|
| City of Denton, Utility System Rev. Bonds, Series 2017, 5.00% 2035
| 11,775
| 13,975
|
| City of Denton, Utility System Rev. Bonds, Series 2017, 5.00% 2036
| 15,135
| 17,910
|
Denton Independent School Dist., Unlimited Tax School Building Bonds, Series 2014-B,
2.00% 2044 (put 2019)
| 1,425
| 1,463
|
| Denton Independent School Dist., Unlimited Tax School Building Bonds, Series 2018, 5.00% 2043
| 6,820
| 8,167
|
The Tax-Exempt Bond Fund of America — Page
95 of 120
Bonds, notes & other debt instruments (continued)
Texas (continued)
| Principal amount
(000)
| Value
(000)
|
| Dickinson Independent School Dist., Unlimited Tax Rev. Ref. Bonds, Series 2013, 1.35% 2037 (put 2019)
| $1,000
| $1,000
|
Fort Bend Independent School Dist., Unlimited Tax School Building Bonds, Series 2019-A,
1.95% 2049 (put 2022)4
| 6,000
| 6,108
|
County of Fort Bend, Industrial Dev. Corp., Industrial Dev. Rev. Bonds (NRG Energy, Inc. Project),
Series 2012-A, 4.75% 2038
| 1,750
| 1,821
|
County of Fort Bend, Industrial Dev. Corp., Industrial Dev. Rev. Bonds (NRG Energy, Inc. Project),
Series 2012-B, 4.75% 2042
| 8,340
| 8,678
|
| Frisco Independent School Dist., Unlimited Tax School Building and Rev. Ref. Bonds, Series 2019, 5.00% 2024
| 2,000
| 2,371
|
| G.O. Bonds, Water Financial Assistance Bonds (Water Infrastructure Fund), Series 2011-A, 5.00% 2021
| 1,400
| 1,509
|
| G.O. Bonds, Water Financial Assistance Bonds (Water Infrastructure Fund), Series 2013-B, 5.00% 2026
| 1,600
| 1,841
|
G.O. Bonds, Water Financial Assistance Rev. Ref. Bonds (State Participation Program), Series 2019-D,
5.00% 2022
| 1,985
| 2,214
|
G.O. Bonds, Water Financial Assistance Rev. Ref. Bonds (Water Infrastructure Fund), Series 2019-E-1,
5.00% 2022
| 7,250
| 8,088
|
G.O. Bonds, Water Financial Assistance Rev. Ref. Bonds (Water Infrastructure Fund), Series 2019-E-2,
2.25% 2029
| 3,500
| 3,534
|
| G.O. Bonds, Water Financial Assistance Rev. Ref. Bonds, Series 2019-C-2, 1.85% 2029
| 3,660
| 3,676
|
| Grand Parkway Transportation Corp., Grand Parkway System Toll Rev. Bonds, Series 2013-B, 5.00% 2053
| 32,800
| 36,454
|
| Grand Parkway Transportation Corp., Grand Parkway System Toll Rev. Bonds, Series 2013-B, 5.25% 2051
| 11,500
| 12,932
|
| County of Gregg, Longview Independent School Dist., Unlimited Tax School Building Bonds, Series 2009, 5.00% 2037 (preref. 2019)
| 1,000
| 1,001
|
County of Harris, Cultural Education Facs. Fin. Corp., First Mortgage Rev. Bonds
(Brazos Presbyterian Homes, Inc. Project), Series 2013-A, 4.00% 2023
| 850
| 894
|
County of Harris, Cultural Education Facs. Fin. Corp., First Mortgage Rev. Bonds
(Brazos Presbyterian Homes, Inc. Project), Series 2013-A, 5.00% 2033
| 1,560
| 1,656
|
County of Harris, Cultural Education Facs. Fin. Corp., First Mortgage Rev. Bonds
(Brazos Presbyterian Homes, Inc. Project), Series 2013-B, 7.00% 2043 (preref. 2023)
| 550
| 655
|
County of Harris, Cultural Education Facs. Fin. Corp., First Mortgage Rev. Bonds
(Brazos Presbyterian Homes, Inc. Project), Series 2016, 5.00% 2048
| 16,455
| 17,850
|
| County of Harris, Cultural Education Facs. Fin. Corp., Hospital Rev. Bonds (Children’s Hospital), Series 2015, 5.00% 2027
| 1,575
| 1,895
|
| County of Harris, Cultural Education Facs. Fin. Corp., Hospital Rev. Bonds (Children’s Hospital), Series 2015, 5.00% 2028
| 1,000
| 1,199
|
| County of Harris, Cultural Education Facs. Fin. Corp., Hospital Rev. Bonds (Children’s Hospital), Series 2015, 5.00% 2032
| 1,000
| 1,175
|
| County of Harris, Cultural Education Facs. Fin. Corp., Hospital Rev. Bonds (Memorial Hermann Health System), Series 2014-A, 5.00% 2027
| 2,800
| 3,261
|
| County of Harris, Cultural Education Facs. Fin. Corp., Hospital Rev. Bonds (Memorial Hermann Health System), Series 2016-A, 5.00% 2040
| 7,575
| 8,681
|
| County of Harris, Cultural Education Facs. Fin. Corp., Hospital Rev. Bonds (Memorial Hermann Health System), Series 2016-A, 5.00% 2046
| 11,125
| 12,662
|
County of Harris, Cultural Education Facs. Fin. Corp., Hospital Rev. Bonds (Texas Children’s Hospital),
Series 2019-A, 3.00% 2039
| 5,000
| 5,041
|
County of Harris, Cultural Education Facs. Fin. Corp., Hospital Rev. Bonds (Texas Children’s Hospital),
Series 2019-B, 5.00% 2041 (put 2024)
| 10,500
| 12,399
|
County of Harris, Cultural Education Facs. Fin. Corp., Hospital Rev. Bonds
(Memorial Hermann Health System), Series 2014-A, 5.00% 2025
| 2,800
| 3,291
|
County of Harris, Cultural Education Facs. Fin. Corp., Thermal Utility Rev. Bonds (TECO Project),
Series 2009-A, 5.25% 2035 (preref. 2019)
| 2,000
| 2,024
|
County of Harris, Cultural Education Facs. Fin. Corp., Thermal Utility Rev. Bonds (TECO Project),
Series 2010, 5.00% 2031
| 1,000
| 1,049
|
County of Harris, Cultural Education Facs. Fin. Corp., Thermal Utility Rev. Ref. Bonds (TECO Project),
Series 2017, 4.00% 2035
| 14,045
| 15,722
|
County of Harris, Cultural Education Facs. Fin. Corp., Thermal Utility Rev. Ref. Bonds (TECO Project),
Series 2017, 5.00% 2027
| 3,100
| 3,887
|
The Tax-Exempt Bond Fund of America — Page
96 of 120
Bonds, notes & other debt instruments (continued)
Texas (continued)
| Principal amount
(000)
| Value
(000)
|
County of Harris, Cultural Education Facs. Fin. Corp., Thermal Utility Rev. Ref. Bonds (TECO Project),
Series 2017, 5.00% 2028
| $2,600
| $3,242
|
County of Harris, Cultural Education Facs. Fin. Corp., Thermal Utility Rev. Ref. Bonds (TECO Project),
Series 2017, 5.00% 2030
| 1,820
| 2,238
|
County of Harris, Cultural Education Facs. Fin. Corp., Thermal Utility Rev. Ref. Bonds (TECO Project),
Series 2017, 5.00% 2031
| 1,250
| 1,528
|
County of Harris, Cultural Education Facs. Fin. Corp., Thermal Utility Rev. Ref. Bonds (TECO Project),
Series 2017, 5.00% 2033
| 3,675
| 4,460
|
| County of Harris, Health Facs. Dev. Corp., Hospital Rev. Ref. Bonds (Houston Methodist Hospital), Series 2015, 5.00% 2045
| 7,600
| 8,609
|
County of Harris, Health Facs. Dev. Corp., Rev. Ref. Bonds (CHRISTUS Health), Series 2005-A-4,
Assured Guaranty Municipal insured, 1.47% 20312
| 21,075
| 21,075
|
| County of Harris, Industrial Dev. Corp., Solid Waste Disposal Rev. Bonds (Deer Park Refining Limited Partnership Project), Series 2006, 5.00% 2023 (preref. 2019)
| 2,500
| 2,532
|
| County of Harris, Metropolitan Transit Auth., Sales and Use Tax Bonds, Series 2011-A, 5.00% 2036
| 7,000
| 7,553
|
County of Harris, Sports Auth., Rev. Ref. Bonds, Series 2014-A, Assured Guaranty Municipal insured,
5.00% 2027
| 1,000
| 1,166
|
County of Harris, Sports Auth., Rev. Ref. Bonds, Series 2014-A, Assured Guaranty Municipal insured,
5.00% 2028
| 1,500
| 1,738
|
County of Harris, Sports Auth., Rev. Ref. Bonds, Series 2014-A, Assured Guaranty Municipal insured,
5.00% 2053
| 1,350
| 1,510
|
| County of Harris, Toll Road Rev. and Rev. Ref. Bonds, Series 2018-A, 4.00% 2048
| 20,000
| 22,102
|
| County of Harris, Toll Road Rev. and Rev. Ref. Bonds, Series 2018-A, 5.00% 2024
| 2,000
| 2,365
|
| County of Harris, Toll Road Rev. and Rev. Ref. Bonds, Series 2018-A, 5.00% 2028
| 2,500
| 3,194
|
| County of Harris, Toll Road Rev. and Rev. Ref. Bonds, Series 2018-A, 5.00% 2029
| 2,500
| 3,175
|
| County of Harris, Toll Road Rev. and Rev. Ref. Bonds, Series 2018-A, 5.00% 2030
| 1,420
| 1,781
|
| County of Harris, Toll Road Rev. and Rev. Ref. Bonds, Series 2018-A, 5.00% 2031
| 5,000
| 6,229
|
| County of Harris, Toll Road Rev. and Rev. Ref. Bonds, Series 2018-A, 5.00% 2032
| 4,515
| 5,604
|
| County of Harris, Toll Road Rev. and Rev. Ref. Bonds, Series 2018-A, 5.00% 2033
| 2,000
| 2,475
|
| County of Harris, Toll Road Rev. and Rev. Ref. Bonds, Series 2018-A, 5.00% 2043
| 5,675
| 6,834
|
County of Harris, Toll Road Rev. Ref. Bonds, Series 2012-B,
(SIFMA Municipal Swap Index + 0.45%) 1.85% 20212
| 24,425
| 24,430
|
| County of Harris, Toll Road Rev. Ref. Bonds, Series 2012-C, 4.00% 2033
| 3,150
| 3,348
|
| County of Harris, Toll Road Rev. Ref. Bonds, Series 2016-A, 5.00% 2041
| 2,000
| 2,349
|
| County of Harris, Toll Road Rev. Ref. Bonds, Series 2016-A, 5.00% 2047
| 7,300
| 8,519
|
County of Harrison, Health Facs. Dev. Corp., Hospital Rev. Bonds (Good Shepherd Health System),
Series 2010, 5.25% 2028 (preref. 2020)
| 1,000
| 1,037
|
| County of Hidalgo, Drainage Dist. No. 1, Unlimited Tax Improvement Bonds, Series 2019, 5.00% 2032
| 1,900
| 2,312
|
| Dept. of Housing and Community Affairs, Residential Mortgage Rev. Bonds, Series 2011-B, 4.25% 2034
| 405
| 417
|
| Dept. of Housing and Community Affairs, Residential Mortgage Rev. Bonds, Series 2019-A, 4.75% 2049
| 8,000
| 8,989
|
| Dept. of Housing and Community Affairs, Single Family Mortgage Rev. Bonds, Series 2017-A, 2.835% 2047
| 10,836
| 10,977
|
| Dept. of Housing and Community Affairs, Single Family Mortgage Rev. Bonds, Series 2018-A, 4.75% 2049
| 4,770
| 5,314
|
| Dept. of Housing and Community Affairs, Single Family Mortgage Rev. Bonds, Series 2019-A, 4.00% 2050
| 8,000
| 8,935
|
| City of Houston, Airport System Rev. and Rev. Ref. Bonds, Series 2018-B, 5.00% 2028
| 1,700
| 2,170
|
| City of Houston, Airport System Rev. and Rev. Ref. Bonds, Series 2018-B, 5.00% 2029
| 7,505
| 9,507
|
| City of Houston, Airport System Rev. and Rev. Ref. Bonds, Series 2018-B, 5.00% 2030
| 3,825
| 4,805
|
| City of Houston, Airport System Rev. Ref. Bonds, Series 2011-B, 5.00% 2025
| 2,000
| 2,147
|
| City of Houston, Airport System Rev. Ref. Bonds, Series 2012-B, 5.00% 2031
| 5,305
| 5,829
|
| City of Houston, Airport System Rev. Ref. Bonds, Series 2018-D, 5.00% 2022
| 1,000
| 1,109
|
| City of Houston, Airport System Rev. Ref. Bonds, Series 2018-D, 5.00% 2033
| 1,000
| 1,237
|
| City of Houston, Airport System Rev. Ref. Bonds, Series 2018-D, 5.00% 2034
| 2,270
| 2,796
|
| City of Houston, Airport System Rev. Ref. Bonds, Series 2018-D, 5.00% 2035
| 2,000
| 2,454
|
| City of Houston, Airport System Rev. Ref. Bonds, Series 2018-D, 5.00% 2037
| 2,500
| 3,045
|
| City of Houston, Airport System Rev. Ref. Bonds, Series 2018-D, 5.00% 2038
| 2,500
| 3,037
|
| City of Houston, Combined Utility System Rev. and Rev. Ref. Bonds, Series 2016-B, 4.00% 2031
| 13,000
| 14,676
|
The Tax-Exempt Bond Fund of America — Page
97 of 120
Bonds, notes & other debt instruments (continued)
Texas (continued)
| Principal amount
(000)
| Value
(000)
|
| City of Houston, Combined Utility System Rev. and Rev. Ref. Bonds, Series 2016-B, 5.00% 2035
| $12,500
| $15,048
|
| City of Houston, Combined Utility System Rev. and Rev. Ref. Bonds, Series 2016-B, 5.00% 2036
| 5,700
| 6,842
|
| City of Houston, Combined Utility System Rev. Ref. Bonds, Series 2011-A, 5.25% 2030 (preref. 2020)
| 1,100
| 1,158
|
| City of Houston, Combined Utility System Rev. Ref. Bonds, Series 2014-C, 5.00% 2025
| 4,080
| 4,779
|
| City of Houston, Combined Utility System Rev. Ref. Bonds, Series 2015-A, 5.00% 2036
| 20,000
| 23,426
|
City of Houston, Combined Utility System Rev. Ref. Bonds, Series 2018-C,
(1-month USD-LIBOR x 0.70 + 0.36%) 1.946% 2034 (put 2021)2
| 20,500
| 20,514
|
| City of Houston, Combined Utility System Rev. Ref. Bonds, Series 2018-D, 5.00% 2030
| 1,850
| 2,351
|
| City of Houston, Combined Utility System Rev. Ref. Bonds, Series 2018-D, 5.00% 2032
| 2,000
| 2,517
|
| City of Houston, Combined Utility System Rev. Ref. Bonds, Series 2018-D, 5.00% 2035
| 3,900
| 4,838
|
| City of Houston, Combined Utility System Rev. Ref. Bonds, Series 2018-D, 5.00% 2036
| 5,420
| 6,699
|
| City of Houston, Combined Utility System Rev. Ref. Bonds, Series 2018-D, 5.00% 2037
| 5,000
| 6,157
|
| City of Houston, Combined Utility System Rev. Ref. Bonds, Series 2018-D, 5.00% 2038
| 10,000
| 12,279
|
| City of Houston, Combined Utility System Rev. Ref. Bonds, Series 2018-D, 5.00% 2039
| 3,475
| 4,255
|
| City of Houston, Combined Utility System Rev. Ref. Bonds, Series 2018-D, 5.00% 2043
| 4,000
| 4,862
|
| City of Houston, Convention and Entertainment Facs. Dept. Hotel Occupancy Tax and Special Rev. and Rev. Ref. Bonds, Series 2019, 5.00% 2024
| 1,640
| 1,933
|
| City of Houston, Downtown Redev. Auth., Tax Increment Contract Rev. Ref. Bonds, Series 2015, BAM insured, 5.00% 2028
| 3,060
| 3,665
|
| City of Houston, Downtown Redev. Auth., Tax Increment Contract Rev. Ref. Bonds, Series 2015, BAM insured, 5.00% 2029
| 1,000
| 1,194
|
| City of Houston, Downtown Redev. Auth., Tax Increment Contract Rev. Ref. Bonds, Series 2015, BAM insured, 5.00% 2030
| 1,000
| 1,190
|
| City of Houston, Downtown Redev. Auth., Tax Increment Contract Rev. Ref. Bonds, Series 2015, BAM insured, 5.00% 2031
| 1,555
| 1,843
|
| City of Houston, Downtown Redev. Auth., Tax Increment Contract Rev. Ref. Bonds, Series 2015, BAM insured, 5.00% 2032
| 1,000
| 1,180
|
| City of Houston, Public Improvement Rev. Ref. Bonds, Series 2017-A, 5.00% 2024
| 2,440
| 2,850
|
| City of Houston, Public Improvement Rev. Ref. Bonds, Series 2017-A, 5.00% 2029
| 10,000
| 12,317
|
| City of Houston, Public Improvement Rev. Ref. Bonds, Series 2017-A, 5.00% 2032
| 1,000
| 1,214
|
City of Houston, Water and Sewer System Rev. Bonds, Capital Appreciation Bonds, Series 1998-A,
Assured Guaranty Municipal insured, 0% 2028
| 16,525
| 13,655
|
City of Houston, Water and Sewer System Rev. Ref. Bonds, Capital Appreciation Bonds, Series 1998-A,
Assured Guaranty Municipal insured, 0% 2019
| 845
| 842
|
City of Houston, Water and Sewer System Rev. Ref. Bonds, Capital Appreciation Bonds, Series 1998-A,
Assured Guaranty Municipal insured, 0% 2019 (escrowed to maturity)
| 2,155
| 2,147
|
| Houston Independent School Dist., Limited Tax Schoolhouse and Rev. Ref. Bonds, Series 2017, 5.00% 2024
| 1,000
| 1,169
|
Houston Independent School Dist., Limited Tax Schoolhouse Bonds, Series 2014-A-1B,
2.20% 2039 (put 2020)
| 8,750
| 8,816
|
Houston Independent School Dist., Limited Tax Schoolhouse Bonds, Series 2014-A-1B,
2.25% 2037 (put 2022)
| 25,000
| 25,657
|
| Houston Independent School Dist., Limited Tax Schoolhouse Bonds, Series 2017, 5.00% 2034
| 2,000
| 2,430
|
Houston Independent School Dist., Limited Tax Schoolhouse Rev. Ref. Bonds, Series 2012,
2.40% 2030 (put 2021)
| 3,000
| 3,058
|
| Houston Independent School Dist., Limited Tax Schoolhouse Rev. Ref. Bonds, Series 2017, 5.00% 2042
| 2,110
| 2,508
|
| Humble Independent School Dist., Unlimited Tax Rev. Ref. Bonds, Series 2016-B, 5.00% 2027
| 7,000
| 8,543
|
Hurst-Euless-Bedford Independent School Dist., Unlimited Tax School Building Bonds, Series 2019,
5.00% 2024
| 1,200
| 1,422
|
| City of Irving, Hospital Auth., Hospital Rev. Bonds (Baylor Scott & White Medical Center-Irving), Series 2017-B, (SIFMA Municipal Swap Index + 1.11%) 2.50%
2044 (put 2023)2
| 500
| 505
|
| Katy Independent School Dist., Unlimited Tax Rev. Ref. Bonds, Series 2016-D, 5.00% 2025
| 1,000
| 1,201
|
| City of Kerrville, Health Facs. Dev. Corp., Hospital Rev. Bonds (Peterson Regional Medical Center Project), Series 2015, 5.00% 2023
| 1,000
| 1,133
|
| City of Kerrville, Health Facs. Dev. Corp., Hospital Rev. Bonds (Peterson Regional Medical Center Project), Series 2015, 5.00% 2030
| 1,000
| 1,155
|
The Tax-Exempt Bond Fund of America — Page
98 of 120
Bonds, notes & other debt instruments (continued)
Texas (continued)
| Principal amount
(000)
| Value
(000)
|
| City of Kerrville, Health Facs. Dev. Corp., Hospital Rev. Bonds (Peterson Regional Medical Center Project), Series 2015, 5.00% 2035
| $3,080
| $3,503
|
La Vernia Higher Education Fin. Corp., Education Rev. Bonds (KIPP, Inc.), Series 2009-A,
6.25% 2039 (preref. 2019)
| 5,460
| 5,470
|
| Laredo Unified School Dist., Unlimited Tax School Building Bonds, Series 2018, 5.00% 2036
| 1,205
| 1,464
|
Leander Independent School Dist., Unlimited Tax School Building Bonds, Capital Appreciation Bonds,
Series 2014-C, 0% 2037 (preref. 2024)
| 1,175
| 561
|
Leander Independent School Dist., Unlimited Tax School Building Bonds, Capital Appreciation Bonds,
Series 2014-C, 0% 2043 (preref. 2024)
| 14,860
| 5,061
|
| Leander Independent School Dist., Unlimited Tax School Building Bonds, Series 2019-C, 5.00% 2024
| 2,680
| 3,174
|
| Lone Star College System, Limited Tax G.O. Bonds, Series 2017-A, 5.00% 2032
| 1,000
| 1,218
|
| Lone Star College System, Limited Tax G.O. Bonds, Series 2017-A, 5.00% 2042
| 4,940
| 5,865
|
| Love Field Airport Modernization Corp., Special Facs. Rev. Bonds (Southwest Airlines Co. - Love Field Modernization Program Project), Series 2010, 5.25% 2040
| 10,525
| 10,927
|
| Lower Colorado River Auth., Rev. Ref. Bonds, Series 2015-D, 5.00% 2029
| 2,150
| 2,540
|
| Lower Colorado River Auth., Rev. Ref. Bonds, Series 2015-D, 5.00% 2031
| 3,000
| 3,512
|
Lower Colorado River Auth., Transmission Contract Rev. Ref. and Improvement Bonds
(LCRA Transmission Services Corp. Project), Series 2010, 5.00% 2030
| 2,520
| 2,591
|
Lower Colorado River Auth., Transmission Contract Rev. Ref. and Improvement Bonds
(LCRA Transmission Services Corp. Project), Series 2010, 5.00% 2040
| 6,550
| 6,722
|
| Lower Colorado River Auth., Transmission Contract Rev. Ref. Bonds (LCRA Transmission Services Corp. Project), Series 2011-A, 5.00% 2041
| 1,500
| 1,582
|
| Lower Colorado River Auth., Transmission Contract Rev. Ref. Bonds (LCRA Transmission Services Corp. Project), Series 2013, 5.00% 2026
| 5,000
| 5,507
|
| Lower Colorado River Auth., Transmission Contract Rev. Ref. Bonds (LCRA Transmission Services Corp. Project), Series 2013-A, 5.00% 2027
| 3,500
| 3,954
|
| Lower Colorado River Auth., Transmission Contract Rev. Ref. Bonds (LCRA Transmission Services Corp. Project), Series 2013-A, 5.00% 2036
| 7,000
| 7,793
|
| Lower Colorado River Auth., Transmission Contract Rev. Ref. Bonds (LCRA Transmission Services Corp. Project), Series 2015, 5.00% 2024
| 880
| 1,032
|
| Lower Colorado River Auth., Transmission Contract Rev. Ref. Bonds (LCRA Transmission Services Corp. Project), Series 2015, 5.00% 2040
| 1,500
| 1,725
|
| Lower Colorado River Auth., Transmission Contract Rev. Ref. Bonds (LCRA Transmission Services Corp. Project), Series 2015, 5.00% 2045
| 5,000
| 5,711
|
| Lower Colorado River Auth., Transmission Contract Rev. Ref. Bonds (LCRA Transmission Services Corp. Project), Series 2016, 4.00% 2034
| 1,300
| 1,429
|
| Lower Colorado River Auth., Transmission Contract Rev. Ref. Bonds (LCRA Transmission Services Corp. Project), Series 2016, 4.00% 2035
| 850
| 934
|
| Lower Colorado River Auth., Transmission Contract Rev. Ref. Bonds (LCRA Transmission Services Corp. Project), Series 2016, 5.00% 2027
| 1,000
| 1,219
|
| Lower Colorado River Auth., Transmission Contract Rev. Ref. Bonds (LCRA Transmission Services Corp. Project), Series 2016, 5.00% 2029
| 1,525
| 1,848
|
| Lower Colorado River Auth., Transmission Contract Rev. Ref. Bonds (LCRA Transmission Services Corp. Project), Series 2016, 5.00% 2046
| 4,000
| 4,649
|
| Lower Colorado River Auth., Transmission Contract Rev. Ref. Bonds (LCRA Transmission Services Corp. Project), Series 2018, 5.00% 2025
| 750
| 876
|
| Lower Colorado River Auth., Transmission Contract Rev. Ref. Bonds (LCRA Transmission Services Corp. Project), Series 2018, 5.00% 2032
| 4,700
| 5,857
|
| Lower Colorado River Auth., Transmission Contract Rev. Ref. Bonds (LCRA Transmission Services Corp. Project), Series 2018, 5.00% 2033
| 1,250
| 1,553
|
| Lower Colorado River Auth., Transmission Contract Rev. Ref. Bonds (LCRA Transmission Services Corp. Project), Series 2018, 5.00% 2034
| 1,240
| 1,533
|
| Lower Colorado River Auth., Transmission Contract Rev. Ref. Bonds (LCRA Transmission Services Corp. Project), Series 2018, 5.00% 2036
| 1,000
| 1,228
|
The Tax-Exempt Bond Fund of America — Page
99 of 120
Bonds, notes & other debt instruments (continued)
Texas (continued)
| Principal amount
(000)
| Value
(000)
|
| Lower Colorado River Auth., Transmission Contract Rev. Ref. Bonds (LCRA Transmission Services Corp. Project), Series 2018, 5.00% 2037
| $3,000
| $3,669
|
| Lower Colorado River Auth., Transmission Contract Rev. Ref. Bonds (LCRA Transmission Services Corp. Project), Series 2018, 5.00% 2043
| 3,250
| 3,910
|
| Lower Colorado River Auth., Transmission Contract Rev. Ref. Bonds (LCRA Transmission Services Corp. Project), Series 2019, 5.00% 2030
| 2,500
| 3,206
|
| Lower Colorado River Auth., Transmission Contract Rev. Ref. Bonds (LCRA Transmission Services Corp. Project), Series 2019, 5.00% 2031
| 2,000
| 2,547
|
| Lower Colorado River Auth., Transmission Contract Rev. Ref. Bonds (LCRA Transmission Services Corp. Project), Series 2019, 5.00% 2032
| 2,000
| 2,533
|
| Lower Colorado River Auth., Transmission Contract Rev. Ref. Bonds (LCRA Transmission Services Corp. Project), Series 2019, 5.00% 2033
| 2,250
| 2,837
|
| Lower Colorado River Auth., Transmission Contract Rev. Ref. Bonds (LCRA Transmission Services Corp. Project), Series 2019, 5.00% 2038
| 1,000
| 1,197
|
| Lower Colorado River Auth., Transmission Contract Rev. Ref. Bonds (LCRA Transmission Services Corp. Project), Series 2019, 5.00% 2039
| 1,000
| 1,194
|
| Lubbock-Cooper Independent School Dist., Unlimited Tax Rev. Ref. Bonds, Series 2015, 5.00% 2041
| 5,000
| 5,749
|
County of Matagorda, Navigation Dist. No. 1, Pollution Control Rev. Ref. Bonds
(AEP Texas Central Co. Project), Series 2005-A, AMBAC insured, 4.40% 2030
| 3,450
| 4,064
|
| Municipal Gas Acquisition and Supply Corp. I, Gas Supply Rev. Bonds, Series 2006-A, 5.25% 2019
| 5,000
| 5,073
|
| Municipal Gas Acquisition and Supply Corp. I, Gas Supply Rev. Bonds, Series 2006-A, 5.25% 2021
| 1,000
| 1,087
|
Municipal Gas Acquisition and Supply Corp. II, Gas Supply Rev. Bonds, Series 2007-A,
(3-month USD-LIBOR + 0.87%) 2.484% 20272
| 18,570
| 18,668
|
Municipal Gas Acquisition and Supply Corp. II, Gas Supply Rev. Bonds, Series 2007-B,
(SIFMA Municipal Swap Index + 0.55%) 1.95% 20272
| 11,285
| 11,133
|
| Municipal Gas Acquisition and Supply Corp. III, Gas Supply Rev. Bonds, Series 2012, 5.00% 2021
| 6,155
| 6,630
|
| Municipal Gas Acquisition and Supply Corp. III, Gas Supply Rev. Bonds, Series 2012, 5.00% 2022
| 1,000
| 1,108
|
| Municipal Gas Acquisition and Supply Corp. III, Gas Supply Rev. Bonds, Series 2012, 5.00% 2026
| 10,000
| 11,041
|
| Municipal Gas Acquisition and Supply Corp. III, Gas Supply Rev. Bonds, Series 2012, 5.00% 2030
| 8,250
| 9,031
|
| Municipal Gas Acquisition and Supply Corp. III, Gas Supply Rev. Bonds, Series 2012, 5.00% 2031
| 1,500
| 1,638
|
| Nacogdoches Independent School Dist., Unlimited Tax School Building Bonds, Series 2019, 5.00% 2049
| 5,220
| 6,227
|
| New Hope Cultural Education Facs. Fin. Corp., Hospital Rev. Bonds (Children’s Health System of Texas Project), Series 2017-A, 4.00% 2033
| 3,000
| 3,341
|
| New Hope Cultural Education Facs. Fin. Corp., Hospital Rev. Bonds (Children’s Health System of Texas Project), Series 2017-A, 4.00% 2036
| 10,000
| 11,020
|
| New Hope Cultural Education Facs. Fin. Corp., Hospital Rev. Bonds (Children’s Health System of Texas Project), Series 2017-A, 4.00% 2037
| 10,000
| 10,981
|
| New Hope Cultural Education Facs. Fin. Corp., Hospital Rev. Bonds (Children’s Health System of Texas Project), Series 2017-A, 5.00% 2047
| 16,070
| 18,869
|
New Hope Cultural Education Facs. Fin. Corp., Retirement Fac. Rev. Bonds (MRC Crestview Project),
Series 2016, 5.00% 2036
| 350
| 378
|
New Hope Cultural Education Facs. Fin. Corp., Retirement Fac. Rev. Bonds (MRC Crestview Project),
Series 2016, 5.00% 2046
| 200
| 213
|
| New Hope Cultural Education Facs. Fin. Corp., Retirement Fac. Rev. Bonds (Wesleyan Homes, Inc. Project), Series 2014, 5.50% 2043
| 1,000
| 1,075
|
| New Hope Cultural Education Facs. Fin. Corp., Retirement Fac. Rev. Bonds (Wesleyan Homes, Inc. Project), Series 2014, 5.50% 2049
| 1,550
| 1,662
|
New Hope Cultural Education Facs. Fin. Corp., Retirement Fac. Rev. Bonds (Westminster Project),
Series 2016, 5.00% 2025
| 760
| 873
|
New Hope Cultural Education Facs. Fin. Corp., Retirement Fac. Rev. Bonds (Westminster Project),
Series 2016, 5.00% 2026
| 735
| 840
|
New Hope Cultural Education Facs. Fin. Corp., Retirement Fac. Rev. Bonds (Westminster Project),
Series 2016, 5.00% 2031
| 1,000
| 1,123
|
New Hope Cultural Education Facs. Fin. Corp., Retirement Fac. Rev. Bonds (Westminster Project),
Series 2016, 5.00% 2040
| 4,300
| 4,748
|
The Tax-Exempt Bond Fund of America — Page
100 of 120
Bonds, notes & other debt instruments (continued)
Texas (continued)
| Principal amount
(000)
| Value
(000)
|
| New Hope Cultural Education Facs. Fin. Corp., Student Housing Rev. Bonds (CHF-Collegiate Housing Island Campus, LLC - Texas A&M University-Corpus Christi
Island Campus Project), Series 2017-A, 5.00% 2030
| $1,150
| $1,231
|
| New Hope Cultural Education Facs. Fin. Corp., Student Housing Rev. Bonds (CHF-Collegiate Housing Island Campus, LLC - Texas A&M University-Corpus Christi
Island Campus Project), Series 2017-A, 5.00% 2037
| 1,500
| 1,566
|
| New Hope Cultural Education Facs. Fin. Corp., Student Housing Rev. Bonds (CHF-Collegiate Housing Island Campus, LLC - Texas A&M University-Corpus Christi
Island Campus Project), Series 2017-A, 5.00% 2042
| 875
| 904
|
| New Hope Cultural Education Facs. Fin. Corp., Student Housing Rev. Bonds (CHF-Collegiate Housing Stephenville II, LLC - Tarleton State University Project), Series
2014-A, 5.00% 2046
| 1,500
| 1,585
|
| New Hope Cultural Education Facs. Fin. Corp., Student Housing Rev. Bonds (CHF-Collegiate Housing Stephenville III, LLC - Tarleton State University Project), Series
2015-A, 5.00% 2047
| 2,000
| 2,135
|
| North East Independent School Dist., Unlimited Tax Rev. Ref. Bonds, Series 2007, 5.25% 2026
| 4,655
| 5,767
|
| North East Independent School Dist., Unlimited Tax Rev. Ref. Bonds, Series 2007, 5.25% 2032
| 8,800
| 12,002
|
| North Central Texas Health Facs. Dev. Corp., Hospital Rev. Ref. Bonds (Children’s Medical Center of Dallas Project), Series 2012, 5.00% 2032 (preref. 2022)
| 3,000
| 3,346
|
| North Harris County Regional Water Auth., Rev. and Rev. Ref. Bonds, Series 2016, 4.00% 2041
| 17,040
| 18,550
|
| North Harris County Regional Water Auth., Rev. and Rev. Ref. Bonds, Series 2016, 5.00% 2031
| 2,100
| 2,544
|
| North Harris County Regional Water Auth., Rev. and Rev. Ref. Bonds, Series 2016, 5.00% 2033
| 2,700
| 3,250
|
| North Harris County Regional Water Auth., Rev. and Rev. Ref. Bonds, Series 2016, 5.00% 2034
| 1,250
| 1,499
|
| North Texas Tollway Auth., Special Projects System Rev. Bonds, Series 2011-D, 5.00% 2029 (preref. 2021)
| 1,970
| 2,125
|
| North Texas Tollway Auth., Special Projects System Rev. Bonds, Series 2011-D, 5.00% 2031 (preref. 2021)
| 6,500
| 7,010
|
North Texas Tollway Auth., System Rev. Ref. Bonds, Capital Appreciation Bonds, Series 2008-D,
MBIA insured, 0% 2032
| 5,360
| 3,991
|
| North Texas Tollway Auth., System Rev. Ref. Bonds, Series 2009-A, 6.00% 2028
| 2,995
| 3,001
|
| North Texas Tollway Auth., System Rev. Ref. Bonds, Series 2009-A, 6.10% 2028
| 940
| 942
|
| North Texas Tollway Auth., System Rev. Ref. Bonds, Series 2009-A, 6.25% 2039
| 935
| 937
|
| North Texas Tollway Auth., System Rev. Ref. Bonds, Series 2010, 6.00% 2034 (preref. 2021)
| 1,500
| 1,601
|
| North Texas Tollway Auth., System Rev. Ref. Bonds, Series 2010, 6.00% 2038 (preref. 2021)
| 5,000
| 5,338
|
| North Texas Tollway Auth., System Rev. Ref. Bonds, Series 2011-B, 5.00% 2038
| 8,000
| 8,361
|
| North Texas Tollway Auth., System Rev. Ref. Bonds, Series 2011-D, 5.00% 2028 (preref. 2021)
| 2,200
| 2,373
|
| North Texas Tollway Auth., System Rev. Ref. Bonds, Series 2012-B, 5.25% 2052
| 8,435
| 9,079
|
| North Texas Tollway Auth., System Rev. Ref. Bonds, Series 2014-A, 5.00% 2022
| 1,000
| 1,092
|
North Texas Tollway Auth., System Rev. Ref. Bonds, Series 2014-C,
(SIFMA Municipal Swap Index + 0.67%) 2.07% 2038 (put 2020)2
| 7,500
| 7,500
|
| North Texas Tollway Auth., System Rev. Ref. Bonds, Series 2015-A, 5.00% 2032
| 7,500
| 8,703
|
| North Texas Tollway Auth., System Rev. Ref. Bonds, Series 2015-A, 5.00% 2034
| 4,500
| 5,198
|
| North Texas Tollway Auth., System Rev. Ref. Bonds, Series 2015-A, 5.00% 2035
| 4,000
| 4,608
|
| North Texas Tollway Auth., System Rev. Ref. Bonds, Series 2015-A, 5.00% 2038
| 1,500
| 1,714
|
| North Texas Tollway Auth., System Rev. Ref. Bonds, Series 2015-B, 5.00% 2040
| 7,200
| 7,963
|
| North Texas Tollway Auth., System Rev. Ref. Bonds, Series 2016-A, 5.00% 2036
| 1,000
| 1,173
|
| North Texas Tollway Auth., System Rev. Ref. Bonds, Series 2016-A, 5.00% 2039
| 6,000
| 6,973
|
| North Texas Tollway Auth., System Rev. Ref. Bonds, Series 2017-A, 5.00% 2033
| 1,440
| 1,740
|
| North Texas Tollway Auth., System Rev. Ref. Bonds, Series 2017-A, 5.00% 2034
| 3,000
| 4,017
|
| North Texas Tollway Auth., System Rev. Ref. Bonds, Series 2017-A, 5.00% 2034
| 2,000
| 2,407
|
| North Texas Tollway Auth., System Rev. Ref. Bonds, Series 2017-A, 5.00% 2035
| 4,500
| 6,063
|
| North Texas Tollway Auth., System Rev. Ref. Bonds, Series 2017-A, 5.00% 2035
| 2,245
| 2,692
|
| North Texas Tollway Auth., System Rev. Ref. Bonds, Series 2017-A, 5.00% 2036
| 2,500
| 2,986
|
| North Texas Tollway Auth., System Rev. Ref. Bonds, Series 2017-A, 5.00% 2037
| 3,000
| 3,571
|
| North Texas Tollway Auth., System Rev. Ref. Bonds, Series 2017-A, 5.00% 2038
| 10,000
| 12,096
|
| North Texas Tollway Auth., System Rev. Ref. Bonds, Series 2017-A, 5.00% 2043
| 43,195
| 51,266
|
| North Texas Tollway Auth., System Rev. Ref. Bonds, Series 2017-B, 5.00% 2033
| 1,000
| 1,203
|
| North Texas Tollway Auth., System Rev. Ref. Bonds, Series 2017-B, 5.00% 2039
| 2,000
| 2,354
|
| North Texas Tollway Auth., System Rev. Ref. Bonds, Series 2017-B, 5.00% 2048
| 2,700
| 3,130
|
Northside Independent School Dist., Unlimited Tax School Building Bonds, Series 2017,
1.45% 2047 (put 2020)
| 4,000
| 4,004
|
The Tax-Exempt Bond Fund of America — Page
101 of 120
Bonds, notes & other debt instruments (continued)
Texas (continued)
| Principal amount
(000)
| Value
(000)
|
Northside Independent School Dist., Unlimited Tax School Building Bonds, Series 2019,
1.60% 2049 (put 2024)
| $2,000
| $2,013
|
| City of Olmos Park, Higher Education Facs. Corp., Higher Education Rev. Improvement and Ref. Bonds (University of the Incarnate Word Project), Series 2012, 5.00%
2026
| 2,075
| 2,298
|
Panhandle Regional Housing Fin. Corp., Multi Family Housing Rev. Bonds
(Canyons at 45 West Apartments), Series 2018, 2.00% 2021 (put 2020)
| 3,065
| 3,078
|
Pasadena Independent School Dist., Unlimited Tax School Building Bonds, Series 2015-B,
1.50% 2044 (put 2024)
| 1,500
| 1,501
|
Pflugerville Independent School Dist., Unlimited Tax School Building Bonds, Series 2014-A,
2.25% 2037 (put 2022)
| 2,000
| 2,056
|
| Prosper Independent School Dist., Unlimited Tax School Building Bonds, Series 2019, 5.00% 2049
| 18,180
| 22,120
|
| Public Fin. Auth., Charter School Fin. Corp. Education Rev. Bonds (Cosmos Foundation Inc.), Series 2010-A, 6.00% 2030 (preref. 2020)
| 1,500
| 1,538
|
| Public Fin. Auth., Rev. Fncg. System Bonds (Texas Southern University), Series 2016, BAM insured, 4.00% 2033
| 665
| 718
|
| Red River Education Fin. Corp., Higher Education Rev. Bonds (St. Edward’s University Project), Series 2016, 4.00% 2041
| 1,500
| 1,554
|
| Richardson Independent School Dist., Unlimited Tax School Building Bonds, Series 2017, 5.00% 2042
| 5,000
| 5,844
|
| Richardson Independent School Dist., Unlimited Tax School Building Bonds, Series 2019, 5.00% 2020
| 2,500
| 2,553
|
| Richardson Independent School Dist., Unlimited Tax School Building Bonds, Series 2019, 5.00% 2021
| 2,750
| 2,914
|
| Richardson Independent School Dist., Unlimited Tax School Building Bonds, Series 2019, 5.00% 2030
| 1,500
| 1,892
|
| SA Energy Acquisition Public Fac. Corp., Gas Supply Rev. Bonds, Series 2007, 5.50% 2022
| 1,225
| 1,356
|
| SA Energy Acquisition Public Fac. Corp., Gas Supply Rev. Bonds, Series 2007, 5.50% 2023
| 1,980
| 2,256
|
| SA Energy Acquisition Public Fac. Corp., Gas Supply Rev. Bonds, Series 2007, 5.50% 2027
| 1,920
| 2,377
|
| City of San Antonio, Electric and Gas Systems Rev. Bonds, Series 2015, 3.00% 2027
| 6,900
| 7,584
|
| City of San Antonio, Electric and Gas Systems Rev. Bonds, Series 2015, 3.00% 2028
| 5,000
| 5,436
|
| City of San Antonio, Electric and Gas Systems Rev. Ref. Bonds, Series 2015-A, 2.25% 2033 (put 2019)
| 4,355
| 4,368
|
| City of San Antonio, Electric and Gas Systems Rev. Ref. Bonds, Series 2016, 5.00% 2026
| 2,500
| 3,069
|
| City of San Antonio, Electric and Gas Systems Rev. Ref. Bonds, Series 2016, 5.00% 2027
| 2,700
| 3,346
|
| City of San Antonio, Electric and Gas Systems Rev. Ref. Bonds, Series 2016, 5.00% 2029
| 10,000
| 12,302
|
| City of San Antonio, Electric and Gas Systems Rev. Ref. Bonds, Series 2018, 2.75% 2048 (put 2022)
| 6,500
| 6,783
|
| City of San Antonio, Electric and Gas Systems Rev. Ref. Bonds, Series 2018-A, 5.00% 2044
| 4,000
| 4,874
|
| City of San Antonio, Electric and Gas Systems Rev. Ref. Bonds, Series 2018-A, 5.00% 2048
| 5,180
| 6,278
|
San Antonio Housing Trust Fin. Corp., Multi Family Housing Rev. Bonds (Alsbury Park Apartments),
Series 2019, 1.375% 2022 (put 2021)
| 4,000
| 4,004
|
| Sherman Independent School Dist., Unlimited Tax School Building Bonds, Series 2018-A, 5.00% 2031
| 4,300
| 5,388
|
| South San Antonio Independent School Dist., Unlimited Tax School Building Bonds, Series 2005, 5.50% 2030
| 7,510
| 9,922
|
| County of Tarrant, Cultural Education Facs. Fin. Corp., Health Resources System Rev. Bonds, Series 2015-A, 4.25% 2052
| 1,000
| 1,066
|
| County of Tarrant, Cultural Education Facs. Fin. Corp., Hospital Rev. Bonds (Baylor Scott & White Health Project), Series 2016-A, 5.00% 2031
| 1,000
| 1,190
|
| County of Tarrant, Cultural Education Facs. Fin. Corp., Hospital Rev. Bonds (Baylor Scott & White Health Project), Series 2016-A, 5.00% 2032
| 2,250
| 2,667
|
| County of Tarrant, Cultural Education Facs. Fin. Corp., Hospital Rev. Bonds (Baylor Scott & White Health Project), Series 2016-A, 5.00% 2037
| 3,250
| 3,786
|
| County of Tarrant, Cultural Education Facs. Fin. Corp., Hospital Rev. Ref. Bonds (Baylor Health Care System Project), Series 2011-A, 5.00% 2030
| 3,000
| 3,222
|
| County of Tarrant, Cultural Education Facs. Fin. Corp., Hospital Rev. Ref. Bonds (Baylor Scott & White Health Project), Series 2013-A, 5.00% 2033
| 1,000
| 1,122
|
| County of Tarrant, Cultural Education Facs. Fin. Corp., Retirement Fac. Rev. Bonds (Air Force Villages Obligated Group), Series 2016, 4.00% 2031
| 6,315
| 6,554
|
| County of Tarrant, Cultural Education Facs. Fin. Corp., Retirement Fac. Rev. Bonds (Barton Creek Senior Living Center, Inc. - Querencia Project), Series 2015,
5.00% 2023
| 1,530
| 1,588
|
| County of Tarrant, Cultural Education Facs. Fin. Corp., Retirement Fac. Rev. Bonds (Barton Creek Senior Living Center, Inc. - Querencia Project), Series 2015, 5.00% 2030
| 4,480
| 4,577
|
The Tax-Exempt Bond Fund of America — Page
102 of 120
Bonds, notes & other debt instruments (continued)
Texas (continued)
| Principal amount
(000)
| Value
(000)
|
| County of Tarrant, Cultural Education Facs. Fin. Corp., Retirement Fac. Rev. Bonds (Barton Creek Senior Living Center, Inc. - Querencia Project), Series 2015,
5.00% 2035
| $1,500
| $1,507
|
| County of Tarrant, Cultural Education Facs. Fin. Corp., Retirement Fac. Rev. Ref. Bonds (Buckingham Senior Living Project), Series 2015-A, 5.25% 20353
| 800
| 558
|
| County of Tarrant, Cultural Education Facs. Fin. Corp., Retirement Fac. Rev. Ref. Bonds (Buckingham Senior Living Project), Series 2015-A, 5.50% 20453
| 2,125
| 1,482
|
County of Tarrant, Cultural Education Facs. Fin. Corp., Rev. Ref. Bonds (Trinity Terrace Project),
Series 2015-A-1, 5.00% 2045
| 2,185
| 2,197
|
Board of Regents of the Texas A&M University System, Rev. Fncg. System Bonds, Series 2015-B,
5.00% 2035 (preref. 2023)
| 1,050
| 1,202
|
| Board of Regents of the Texas A&M University System, Rev. Fncg. System Bonds, Series 2016-E, 5.00% 2024
| 5,165
| 6,093
|
| Board of Regents of the Texas A&M University System, Rev. Fncg. System Bonds, Series 2017-C, 5.00% 2033
| 1,000
| 1,225
|
| Texas City Independent School Dist., Unlimited Tax School Building Rev. Ref. Bonds, Series 2019, 5.00% 2031
| 1,500
| 1,891
|
Board of Regents of the Texas State University System, Rev. Fncg. System Rev. and Rev. Ref. Bonds,
Series 2015-A, 5.00% 2027
| 1,500
| 1,788
|
Board of Regents of the Texas State University System, Rev. Fncg. System Rev. and Rev. Ref. Bonds,
Series 2017-A, 5.00% 2029
| 5,250
| 6,505
|
Board of Regents of the Texas State University System, Rev. Fncg. System Rev. and Rev. Ref. Bonds,
Series 2017-A, 5.00% 2035
| 1,000
| 1,208
|
Board of Regents of the Texas State University System, Rev. Fncg. System Rev. and Rev. Ref. Bonds,
Series 2017-A, 5.00% 2036
| 1,180
| 1,421
|
| Board of Regents of the Texas Tech University System, Rev. Fncg. System Rev. Ref. and Improvement Bonds, Series 2015-A, 5.00% 2033
| 2,000
| 2,329
|
| Tollway Auth., System Rev. Ref. Bonds, Series 2008-I, Assured Guaranty insured, 6.20% 2042
| 5,000
| 6,122
|
Transportation Commission, Central Texas Turnpike System Rev. Ref. Bonds, Series 2015-A,
5.00% 2042 (put 2020)
| 3,500
| 3,582
|
| Transportation Commission, Central Texas Turnpike System Rev. Ref. Bonds, Series 2015-B, 5.00% 2032
| 2,000
| 2,290
|
| Transportation Commission, Central Texas Turnpike System Rev. Ref. Bonds, Series 2015-B, 5.00% 2037
| 4,000
| 4,528
|
| Transportation Commission, Central Texas Turnpike System Rev. Ref. Bonds, Series 2015-C, 5.00% 2030
| 1,000
| 1,142
|
| Transportation Commission, Central Texas Turnpike System Rev. Ref. Bonds, Series 2015-C, 5.00% 2033
| 5,000
| 5,663
|
| Transportation Commission, Central Texas Turnpike System Rev. Ref. Bonds, Series 2015-C, 5.00% 2037
| 8,250
| 9,255
|
| Transportation Commission, G.O. Mobility Fund Bonds, Series 2014-A, 5.00% 2044
| 10,000
| 11,497
|
| Transportation Commission, Highway Improvement G.O. Bonds, Series 2016, 5.00% 2043
| 10,020
| 11,847
|
| Transportation Commission, State Highway 249 System First Tier Toll Rev. Bonds, Capital Appreciation Bonds, Series 2019-A, 0% 2038
| 850
| 398
|
| Transportation Commission, State Highway 249 System First Tier Toll Rev. Bonds, Capital Appreciation Bonds, Series 2019-A, 0% 2039
| 950
| 421
|
| Transportation Commission, State Highway 249 System First Tier Toll Rev. Bonds, Capital Appreciation Bonds, Series 2019-A, 0% 2040
| 800
| 335
|
| Transportation Commission, State Highway 249 System First Tier Toll Rev. Bonds, Capital Appreciation Bonds, Series 2019-A, 0% 2041
| 1,425
| 563
|
| Transportation Commission, State Highway 249 System First Tier Toll Rev. Bonds, Capital Appreciation Bonds, Series 2019-A, 0% 2043
| 2,185
| 773
|
| Transportation Commission, State Highway 249 System First Tier Toll Rev. Bonds, Capital Appreciation Bonds, Series 2019-A, 0% 2044
| 2,850
| 954
|
| County of Travis, Health Facs. Dev. Corp., Rev. Bonds (Westminster Manor Project), Series 2010, 7.00% 2030
| 110
| 114
|
County of Travis, Health Facs. Dev. Corp., Rev. Bonds (Westminster Manor Project), Series 2010,
7.00% 2030 (preref. 2020)
| 800
| 857
|
County of Travis, Health Facs. Dev. Corp., Rev. Bonds (Westminster Manor Project), Series 2010,
7.125% 2040 (preref. 2020)
| 1,750
| 1,877
|
County of Travis, Housing Fin. Corp., Multi Family Housing Rev. Bonds (McKinney Falls Apartments),
Series 2018, 2.00% 20214
| 7,000
| 7,034
|
| Turnpike Auth., Central Texas Turnpike System, Rev. Bonds, Capital Appreciation Bonds, Series 2002-A, AMBAC insured, 0% 2028
| 40,795
| 33,563
|
The Tax-Exempt Bond Fund of America — Page
103 of 120
Bonds, notes & other debt instruments (continued)
Texas (continued)
| Principal amount
(000)
| Value
(000)
|
| Turnpike Auth., Central Texas Turnpike System, Rev. Bonds, Capital Appreciation Bonds, Series 2002-A, AMBAC insured, 0% 2029
| $27,520
| $21,867
|
| United Independent School Dist., Unlimited Tax School Building Bonds, Series 2017, 5.00% 2031
| 1,000
| 1,237
|
| United Independent School Dist., Unlimited Tax School Building Bonds, Series 2017, 5.00% 2032
| 1,000
| 1,235
|
| United Independent School Dist., Unlimited Tax School Building Bonds, Series 2017, 5.00% 2047
| 8,260
| 9,857
|
| United Independent School Dist., Unlimited Tax School Building Bonds, Series 2019, 5.00% 2049
| 4,000
| 4,819
|
| Board of Regents of the University of Houston System, Consolidated Rev. and Rev. Ref. Bonds, Series 2017-A, 5.00% 2026
| 6,000
| 7,363
|
| Board of Regents of the University of Houston System, Consolidated Rev. and Rev. Ref. Bonds, Series 2017-C, 5.00% 2026
| 6,050
| 7,424
|
| Board of Regents of the University of Houston System, Consolidated Rev. and Rev. Ref. Bonds, Series 2017-C, 5.00% 2028
| 7,500
| 9,126
|
| Board of Regents of the University of North Texas System, Rev. Fncg. System Rev. Ref. and Improvement Bonds, Series 2018-A, 5.00% 2031
| 3,040
| 3,791
|
| Board of Regents of the University of North Texas System, Rev. Fncg. System Rev. Ref. and Improvement Bonds, Series 2018-A, 5.00% 2032
| 2,185
| 2,713
|
| Board of Regents of the University of North Texas System, Rev. Fncg. System Rev. Ref. and Improvement Bonds, Series 2018-A, 5.00% 2033
| 2,000
| 2,475
|
| Board of Regents of the University of North Texas System, Rev. Fncg. System Rev. Ref. and Improvement Bonds, Series 2018-A, 5.00% 2036
| 2,000
| 2,448
|
| Board of Regents of the University of North Texas System, Rev. Fncg. System Rev. Ref. and Improvement Bonds, Series 2018-A, 5.00% 2037
| 1,800
| 2,196
|
| Board of Regents of the University of North Texas System, Rev. Fncg. System Rev. Ref. and Improvement Bonds, Series 2018-A, 5.00% 2038
| 2,100
| 2,552
|
| Board of Regents of the University of North Texas System, Rev. Fncg. System Rev. Ref. and Improvement Bonds, Series 2018-A, 5.00% 2039
| 2,125
| 2,571
|
| Board of Regents of the University of North Texas System, Rev. Fncg. System Rev. Ref. and Improvement Bonds, Series 2018-A, 5.00% 2044
| 9,000
| 10,778
|
| Board of Regents of the University of Texas System, Rev. Fncg. System Bonds, Series 2016-E, 5.00% 2027
| 1,000
| 1,267
|
Board of Regents of the University of Texas System, Rev. Fncg. System Rev. Ref. Bonds, Series 2014-B,
5.00% 2028
| 2,000
| 2,343
|
| Waco Education Fin. Corp., Rev. Bonds (Baylor University Issue), Series 2012, 5.00% 2043
| 3,500
| 3,759
|
Water Dev. Board, State Water Implementation Rev. Fund, Rev. Bonds (Master Trust), Series 2015-A,
5.00% 2040
| 11,350
| 13,298
|
Water Dev. Board, State Water Implementation Rev. Fund, Rev. Bonds (Master Trust), Series 2015-A,
5.00% 2045
| 7,295
| 8,503
|
| Water Dev. Board, State Water Implementation Rev. Fund, Rev. Bonds (Master Trust), Series 2016, 5.00% 2046
| 10,000
| 11,846
|
Water Dev. Board, State Water Implementation Rev. Fund, Rev. Bonds (Master Trust), Series 2017-A,
4.00% 2036
| 10,000
| 11,237
|
Water Dev. Board, State Water Implementation Rev. Fund, Rev. Bonds (Master Trust), Series 2017-A,
5.00% 2028
| 2,000
| 2,534
|
Water Dev. Board, State Water Implementation Rev. Fund, Rev. Bonds (Master Trust), Series 2018-A,
4.00% 2032
| 9,445
| 10,858
|
Water Dev. Board, State Water Implementation Rev. Fund, Rev. Bonds (Master Trust), Series 2018-A,
4.00% 2033
| 2,000
| 2,285
|
Water Dev. Board, State Water Implementation Rev. Fund, Rev. Bonds (Master Trust), Series 2018-A,
4.00% 2034
| 6,440
| 7,327
|
Water Dev. Board, State Water Implementation Rev. Fund, Rev. Bonds (Master Trust), Series 2018-A,
4.00% 2035
| 12,810
| 14,521
|
Water Dev. Board, State Water Implementation Rev. Fund, Rev. Bonds (Master Trust), Series 2018-A,
4.00% 2036
| 5,100
| 5,757
|
Water Dev. Board, State Water Implementation Rev. Fund, Rev. Bonds (Master Trust), Series 2018-A,
4.00% 2037
| 15,000
| 16,846
|
Water Dev. Board, State Water Implementation Rev. Fund, Rev. Bonds (Master Trust), Series 2018-A,
4.00% 2038
| 4,000
| 4,473
|
The Tax-Exempt Bond Fund of America — Page
104 of 120
Bonds, notes & other debt instruments (continued)
Texas (continued)
| Principal amount
(000)
| Value
(000)
|
Water Dev. Board, State Water Implementation Rev. Fund, Rev. Bonds (Master Trust), Series 2018-A,
5.00% 2043
| $5,000
| $6,060
|
Water Dev. Board, State Water Implementation Rev. Fund, Rev. Bonds (Master Trust), Series 2018-A,
5.00% 2049
| 10,550
| 12,790
|
| West Travis County Public Utility Agcy., Rev. Ref. Bonds, Series 2017, BAM insured, 4.00% 2033
| 1,100
| 1,235
|
| County of Wood, Central Hospital Dist., Hospital Rev. Bonds (East Texas Medical Center Quitman Project), Series 2011, 6.00% 2041 (preref. 2021)
| 3,295
| 3,624
|
|
|
| 2,239,771
|
| United States 0.16%
|
|
|
| Freddie Mac, Multi Family Certificates, Series 2007-M-012, 1.60% 2051 (put 2022)4
| 3,886
| 3,921
|
| Freddie Mac, Multi Family Certificates, Series 2019-M-049, 3.05% 2034
| 4,000
| 4,229
|
| Freddie Mac, Multi Family Mortgage Bonds, Series 2019-ML-05, Class AUS, 3.40% 2036
| 24,770
| 27,052
|
|
|
| 35,202
|
| Utah 0.16%
|
|
|
| Charter School Fin. Auth., Charter School Rev. Ref. Bonds (Early Light Academy), Series 2017, 5.00% 20371
| 5,185
| 5,546
|
| G.O. Bonds, Series 2013, 5.00% 2023 (preref. 2022)
| 2,800
| 3,115
|
| Housing Corp., Single Family Mortgage Bonds, Class III, Series 2010-B-1, 4.00% 2024
| 130
| 132
|
| Housing Corp., Single Family Mortgage Bonds, Class III, Series 2015-D-2, 4.00% 2045
| 8,620
| 9,189
|
| School Fin. Auth., Charter School Rev. Bonds (Utah Charter Academies Project), Series 2018-A-1, 5.00% 2038
| 730
| 852
|
| School Fin. Auth., Charter School Rev. Bonds (Utah Charter Academies Project), Series 2018-A-1, 5.00% 2043
| 1,150
| 1,330
|
| School Fin. Auth., Charter School Rev. Bonds (Utah Charter Academies Project), Series 2018-A-1, 5.00% 2048
| 1,185
| 1,363
|
| County of Utah, Hospital Rev. Bonds (IHC Health Services, Inc.), Series 2018-A, 5.00% 2032
| 1,000
| 1,252
|
| County of Utah, Hospital Rev. Bonds (IHC Health Services, Inc.), Series 2018-A, 5.00% 2034
| 1,000
| 1,243
|
| County of Utah, Hospital Rev. Bonds (IHC Health Services, Inc.), Series 2018-A, 5.00% 2035
| 1,000
| 1,238
|
| County of Utah, Hospital Rev. Bonds (IHC Health Services, Inc.), Series 2018-A, 5.00% 2036
| 2,000
| 2,468
|
| County of Utah, Hospital Rev. Bonds (IHC Health Services, Inc.), Series 2018-A, 5.00% 2037
| 1,400
| 1,718
|
| County of Utah, Hospital Rev. Bonds (IHC Health Services, Inc.), Series 2018-A, 5.00% 2038
| 1,250
| 1,530
|
| County of Utah, Hospital Rev. Bonds (IHC Health Services, Inc.), Series 2018-A, 5.00% 2039
| 2,190
| 2,673
|
|
|
| 33,649
|
| Vermont 0.09%
|
|
|
| Educational and Health Buildings Fncg. Agcy., Rev. Bonds (The University of Vermont Medical Center Project), Series 2016-A, 5.00% 2031
| 3,300
| 3,925
|
| Educational and Health Buildings Fncg. Agcy., Rev. Bonds (The University of Vermont Medical Center Project), Series 2016-A, 5.00% 2033
| 2,200
| 2,601
|
| Educational and Health Buildings Fncg. Agcy., Rev. Bonds (The University of Vermont Medical Center Project), Series 2016-B, 5.00% 2039
| 1,750
| 2,034
|
| Educational and Health Buildings Fncg. Agcy., Rev. Bonds (The University of Vermont Medical Center Project), Series 2016-B, 5.00% 2046
| 4,300
| 4,952
|
| Housing Fin. Agcy., Multiple Purpose Bonds, Series 2017-D, 4.00% 2048
| 1,090
| 1,164
|
| Housing Fin. Agcy., Multiple Purpose Bonds, Series 2018-A, 4.00% 2048
| 4,000
| 4,307
|
|
|
| 18,983
|
| Virginia 2.42%
|
|
|
| County of Albemarle, Econ. Dev. Auth., Public Fac. Rev. Ref. Bonds, Series 2011, 5.00% 2022
| 2,955
| 3,167
|
| City of Alexandria, Industrial Dev. Auth., Demand Rev. Ref. Bonds (Goodwin House), Series 2015, 5.00% 2045
| 4,000
| 4,420
|
| City of Alexandria, Industrial Dev. Auth., Demand Rev. Ref. Bonds (Goodwin House), Series 2015, 5.00% 2050
| 2,000
| 2,205
|
| County of Arlington, Industrial Dev. Auth., Hospital Rev. Ref. Bonds (Virginia Hospital Center Arlington Health System), Series 2010, 4.25% 2024
| 415
| 425
|
| County of Arlington, Industrial Dev. Auth., Hospital Rev. Ref. Bonds (Virginia Hospital Center Arlington Health System), Series 2010, 5.00% 2031
| 6,355
| 6,536
|
Biotechnology Research Partnership Auth., Lease Rev. Ref. Bonds (Consolidated Laboratories Project),
Series 2009, 5.00% 2021
| 1,000
| 1,081
|
The Tax-Exempt Bond Fund of America — Page
105 of 120
Bonds, notes & other debt instruments (continued)
Virginia (continued)
| Principal amount
(000)
| Value
(000)
|
| County of Botetourt, Industrial Dev. Auth., Residential Care Fac. Rev. Ref. Bonds (Glebe, Inc.), Series 2014-A, 6.00% 2044
| $5,750
| $6,361
|
| Capital Region Airport Commission, Airport Rev. Ref. Bonds, Series 2013-A, 5.00% 2022
| 585
| 646
|
| Capital Region Airport Commission, Airport Rev. Ref. Bonds, Series 2013-A, 5.00% 2023
| 600
| 682
|
| Capital Region Airport Commission, Airport Rev. Ref. Bonds, Series 2016-A, 5.00% 2031
| 1,645
| 1,950
|
City of Chesapeake, Chesapeake Transportation System Toll Road Rev. Ref. Bonds, Series 2012-A,
5.00% 2047
| 2,525
| 2,714
|
City of Chesapeake, Chesapeake Transportation System Toll Road Rev. Ref. Bonds,
Convertible Capital Appreciation Bonds, Series 2012-B, 0% 2040 (4.875% on 7/15/2023)4
| 2,000
| 1,939
|
| County of Chesterfield, Econ. Dev. Auth., Rev. Bonds (Bon Secours Health System, Inc.), Series 2008-C, Assured Guaranty Municipal insured, 5.00% 2042
| 2,500
| 2,614
|
College Building Auth., Educational Facs. Rev. Bonds (21st Century College and Equipment Programs),
Series 2012-A, 5.00% 2023 (preref. 2022)
| 2,000
| 2,193
|
College Building Auth., Educational Facs. Rev. Bonds (21st Century College and Equipment Programs),
Series 2014-A, 5.00% 2023
| 6,810
| 7,721
|
College Building Auth., Educational Facs. Rev. Bonds (21st Century College and Equipment Programs),
Series 2019-A, 5.00% 2021
| 11,800
| 12,491
|
College Building Auth., Educational Facs. Rev. Bonds (21st Century College and Equipment Programs),
Series 2019-A, 5.00% 2022
| 12,395
| 13,590
|
College Building Auth., Educational Facs. Rev. Bonds (Washington and Lee University Project),
Series 2001, 5.375% 2021
| 410
| 426
|
College Building Auth., Educational Facs. Rev. Bonds (Washington and Lee University Project),
Series 2001, 5.75% 2034
| 1,000
| 1,413
|
| College Building Auth., Educational Facs. Rev. Ref. Bonds (21st Century College and Equipment Programs), Series 2017-E, 5.00% 2028
| 9,940
| 12,741
|
| College Building Auth., Educational Facs. Rev. Ref. Bonds (21st Century College and Equipment Programs), Series 2017-E, 5.00% 2029
| 19,000
| 24,271
|
| College Building Auth., Educational Facs. Rev. Ref. Bonds (21st Century College and Equipment Programs), Series 2017-E, 5.00% 2030
| 8,000
| 10,155
|
| College Building Auth., Educational Facs. Rev. Ref. Bonds (21st Century College and Equipment Programs), Series 2017-E, 5.00% 2031
| 11,000
| 13,875
|
College Building Auth., Educational Facs. Rev. Ref. Bonds (Public Higher Education Fncg. Program),
Series 2014, 5.00% 2025
| 4,710
| 5,593
|
College Building Auth., Educational Facs. Rev. Ref. Bonds (Public Higher Education Fncg. Program),
Series 2015-B, 5.00% 2026
| 900
| 1,093
|
College Building Auth., Educational Facs. Rev. Ref. Bonds (Public Higher Education Fncg. Program),
Series 2015-B, 5.00% 2028
| 2,600
| 3,142
|
| College Building Auth., Educational Facs. Rev. Ref. Bonds (Roanoke College), Series 2007, 5.00% 2033
| 1,375
| 1,379
|
| Commonwealth Transportation Board, Federal Transportation Grant Anticipation Rev. and Rev. Ref. Notes, Series 2017, 3.00% 2028
| 5,755
| 6,284
|
| Commonwealth Transportation Board, Federal Transportation Grant Anticipation Rev. and Rev. Ref. Notes, Series 2017, 5.00% 2025
| 10,110
| 12,213
|
| Commonwealth Transportation Board, Federal Transportation Grant Anticipation Rev. and Rev. Ref. Notes, Series 2017, 5.00% 2026
| 5,000
| 6,245
|
| Commonwealth Transportation Board, Federal Transportation Grant Anticipation Rev. Notes, Series 2012-A, 5.00% 2027 (preref. 2022)
| 1,000
| 1,101
|
| Commonwealth Transportation Board, Federal Transportation Grant Anticipation Rev. Notes, Series 2012-B, 5.00% 2023 (preref. 2022)
| 1,545
| 1,730
|
| Commonwealth Transportation Board, Federal Transportation Grant Anticipation Rev. Notes, Series 2012-B, 5.00% 2024 (preref. 2022)
| 1,000
| 1,120
|
Commonwealth Transportation Board, Transportation Capital Projects Rev. Bonds, Series 2011,
5.00% 2025 (preref. 2021)
| 2,250
| 2,406
|
| Commonwealth Transportation Board, Transportation Rev. Ref. Bonds, Series 2012-A, 5.00% 2021
| 2,000
| 2,141
|
| Commonwealth Transportation Board, Transportation Rev. Ref. Bonds, Series 2016-C, 5.00% 2025
| 2,000
| 2,427
|
The Tax-Exempt Bond Fund of America — Page
106 of 120
Bonds, notes & other debt instruments (continued)
Virginia (continued)
| Principal amount
(000)
| Value
(000)
|
| County of Fairfax, Econ. Dev. Auth., Residential Care Facs. Mortgage Rev. Ref. Bonds (Goodwin House Inc.), Series 2016-A, 5.00% 2036
| $175
| $196
|
| County of Fairfax, Econ. Dev. Auth., Transportation Dist. Improvement Rev. Bonds (Silver Line Phase I Project), Series 2011, 5.00% 2024 (preref. 2020)
| 1,500
| 1,539
|
| County of Fairfax, Econ. Dev. Auth., Transportation Dist. Improvement Rev. Bonds (Silver Line Phase I Project), Series 2011, 5.00% 2036 (preref. 2020)
| 1,250
| 1,283
|
| County of Fairfax, Econ. Dev. Auth., Transportation Dist. Improvement Rev. Bonds (Silver Line Phase I Project), Series 2012, 5.00% 2037 (preref. 2020)
| 1,000
| 1,026
|
| County of Fairfax, Industrial Dev. Auth., Health Care Rev. Bonds (Inova Health System Project), Series 2012-A, 5.00% 2035
| 1,000
| 1,094
|
| County of Fairfax, Industrial Dev. Auth., Health Care Rev. Bonds (Inova Health System Project), Series 2012-A, 5.00% 2040
| 2,000
| 2,182
|
| County of Fairfax, Industrial Dev. Auth., Health Care Rev. Bonds (Inova Health System Project), Series 2018-B, 5.00% 2057 (put 2023)
| 16,175
| 18,445
|
County of Fairfax, Industrial Dev. Auth., Health Care Rev. Ref. Bonds (Inova Health System Project),
Series 1993-A, 5.25% 2019
| 670
| 671
|
County of Fairfax, Industrial Dev. Auth., Health Care Rev. Ref. Bonds (Inova Health System Project),
Series 1993-A, Assured Guaranty Municipal insured, 5.25% 2019
| 270
| 270
|
| County of Fairfax, Sewer Rev. Bonds, Series 2012, 5.00% 2021
| 2,055
| 2,213
|
| County of Fairfax, Water Auth., Water Rev. Ref. Bonds, Series 1997, 5.00% 2021
| 430
| 449
|
| County of Fairfax, Water Auth., Water Rev. Ref. Bonds, Series 2005-B, 5.25% 2026
| 1,500
| 1,886
|
| County of Fairfax, Water Auth., Water Rev. Ref. Bonds, Series 2012, 5.00% 2028
| 1,000
| 1,100
|
| Town of Farmville, Industrial Dev. Auth., Educational Facs. Rev. Ref. Bonds (Longwood University Student Housing Project), Series 2018-A, 5.00% 2043
| 2,500
| 2,829
|
| Town of Farmville, Industrial Dev. Auth., Educational Facs. Rev. Ref. Bonds (Longwood University Student Housing Project), Series 2018-A, 5.00% 2048
| 6,390
| 7,202
|
| Town of Farmville, Industrial Dev. Auth., Educational Facs. Rev. Ref. Bonds (Longwood University Student Housing Project), Series 2018-A, 5.00% 2055
| 7,500
| 8,389
|
| Freddie Mac, Multi Family Certificates, Series 2015-M-033, 2.505% 2049
| 8,000
| 8,000
|
| City of Fredericksburg, Econ. Dev. Auth., Hospital Facs. Rev. Ref. Bonds (Mary Washington Healthcare Obligated Group), Series 2014, 5.00% 2031
| 500
| 573
|
| Gateway Community Dev. Auth., Special Assessment Rev. Ref. Bonds, Series 2012, 5.00% 2030
| 1,500
| 1,531
|
| Greater Richmond Convention Center Auth., Hotel Tax Rev. Ref. Bonds, Series 2015, 5.00% 2025
| 1,675
| 2,005
|
| Greater Richmond Convention Center Auth., Hotel Tax Rev. Ref. Bonds, Series 2015, 5.00% 2026
| 3,520
| 4,207
|
| Greater Richmond Convention Center Auth., Hotel Tax Rev. Ref. Bonds, Series 2015, 5.00% 2028
| 1,600
| 1,906
|
| Greater Richmond Convention Center Auth., Hotel Tax Rev. Ref. Bonds, Series 2015, 5.00% 2029
| 1,375
| 1,629
|
| Greater Richmond Convention Center Auth., Hotel Tax Rev. Ref. Bonds, Series 2015, 5.00% 2030
| 1,500
| 1,772
|
| Greater Richmond Convention Center Auth., Hotel Tax Rev. Ref. Bonds, Series 2015, 5.00% 2032
| 1,000
| 1,176
|
| County of Halifax, Industrial Dev. Auth., Recovery Zone Fac. Rev. Bonds (Virginia Electric and Power Co. Project), Series 2010-A, 2.15% 2041 (put 2020)
| 2,000
| 2,018
|
| Hampton Roads Sanitation Dist., Wastewater Rev. Bonds, Series 2012-A, 5.00% 2039 (preref. 2021)
| 800
| 844
|
| Hampton Roads Sanitation Dist., Wastewater Rev. Ref. Bonds, Series 2014-A, 5.00% 2025
| 4,000
| 4,718
|
| County of Hanover, Econ. Dev. Auth., Residential Care Fac. Rev. Ref. Bonds (Covenant Woods), Series 2012-A, 4.00% 2022
| 530
| 545
|
| County of Hanover, Econ. Dev. Auth., Residential Care Fac. Rev. Ref. Bonds (Covenant Woods), Series 2012-A, 5.00% 2042
| 1,000
| 1,036
|
| City of Harrisonburg, Industrial Dev. Auth., Residential Care Fac. Rev. Ref. Bonds (Sunnyside Presbyterian Home), Series 2013-B, 6.50% 2039
| 3,000
| 3,386
|
| County of Henrico, Econ. Dev. Auth., Residential Care Fac. Mortgage Rev. Ref. Bonds (Westminster Canterbury of Richmond), Series 2015, 4.00% 2035
| 1,000
| 1,012
|
County of Henrico, Econ. Dev. Auth., Residential Care Fac. Rev. Bonds (Pinnacle Living), Series 2019-A,
5.00% 2034
| 6,150
| 6,933
|
County of Henrico, Econ. Dev. Auth., Residential Care Fac. Rev. Ref. Bonds (United Methodist Homes),
Series 2012, 5.00% 2021
| 1,000
| 1,051
|
The Tax-Exempt Bond Fund of America — Page
107 of 120
Bonds, notes & other debt instruments (continued)
Virginia (continued)
| Principal amount
(000)
| Value
(000)
|
County of Henrico, Econ. Dev. Auth., Residential Care Fac. Rev. Ref. Bonds (United Methodist Homes),
Series 2012, 5.00% 2022
| $655
| $705
|
County of Henrico, Econ. Dev. Auth., Residential Care Fac. Rev. Ref. Bonds (United Methodist Homes),
Series 2012, 5.00% 2023
| 860
| 924
|
| County of Henrico, Econ. Dev. Auth., Residential Care Fac. Rev. Ref. Bonds (Westminster Canterbury of Richmond), Series 2018, 5.00% 2026
| 1,200
| 1,421
|
| County of Henrico, Econ. Dev. Auth., Residential Care Fac. Rev. Ref. Bonds (Westminster Canterbury of Richmond), Series 2018, 5.00% 2027
| 925
| 1,090
|
| County of Henrico, Econ. Dev. Auth., Residential Care Fac. Rev. Ref. Bonds (Westminster Canterbury of Richmond), Series 2018, 5.00% 2029
| 750
| 878
|
| County of Henrico, Econ. Dev. Auth., Residential Care Fac. Rev. Ref. Bonds (Westminster Canterbury of Richmond), Series 2018, 5.00% 2030
| 810
| 942
|
| County of Henrico, Econ. Dev. Auth., Residential Care Fac. Rev. Ref. Bonds (Westminster Canterbury of Richmond), Series 2018, 5.00% 2031
| 820
| 949
|
| County of Henrico, Econ. Dev. Auth., Residential Care Fac. Rev. Ref. Bonds (Westminster Canterbury of Richmond), Series 2018, 5.00% 2037
| 2,725
| 3,106
|
County of Henrico, Econ. Dev. Auth., Rev. Bonds (Bon Secours Health System, Inc.), Series 2008-B-2,
Assured Guaranty Municipal insured, 5.25% 2042
| 2,000
| 2,101
|
| County of Henrico, G.O. Public Improvement Rev. Ref. Bonds, Series 2010, 5.00% 2025
| 1,630
| 1,690
|
| County of Henrico, Water and Sewer System Rev. Ref. Bonds, Series 2013, 5.00% 2023
| 945
| 1,080
|
| County of Henrico, Water and Sewer System Rev. Ref. Bonds, Series 2013, 5.00% 2024
| 1,000
| 1,142
|
| Heritage Hunt Commercial Community Dev. Auth., Special Assessment Bonds, Series 1999-B, 7.00% 2029
| 550
| 551
|
County of Loudoun, Community Dev. Auth., Special Assessment Bonds (Dulles Town Center Project),
Series 2012, 4.25% 2026
| 1,000
| 1,012
|
| County of Loudoun, G.O. Rev. Ref. Bonds, Series 2010-A, 5.00% 2025
| 1,000
| 1,051
|
| Town of Louisa, Industrial Dev. Auth., Pollution Control Rev. Ref. Bonds (Virginia Electric and Power Co. Project), Series 2008-A, 1.80% 2035 (put 2022)
| 1,650
| 1,663
|
City of Manassas Park, G.O. and Rev. Ref. Bonds, Series 2008, Assured Guaranty Municipal insured,
5.00% 2025
| 260
| 261
|
| Mosaic Dist. Community Dev. Auth., Rev. Bonds, Series 2011-A, 6.875% 2036
| 3,000
| 3,174
|
| New River Valley Regional Jail Auth., Regional Jail Fac. Rev. Ref. Bonds, Series 2016, 5.00% 2031
| 2,000
| 2,423
|
| City of Newport News, Industrial Dev. Auth., Health Systems Rev. Bonds, Series 2017-A, 5.00% 20461
| 15,250
| 16,743
|
| City of Newport News, Industrial Dev. Auth., Health Systems Rev. Ref. Bonds (Custodial Receipts), Series 2015, 5.33% 20451
| 41,100
| 44,745
|
City of Norfolk, Econ. Dev. Auth., Health Care Facs. Rev. Ref. Bonds (Sentara Healthcare), Series 2012-B,
5.00% 2036
| 1,865
| 2,058
|
City of Norfolk, Econ. Dev. Auth., Health Care Facs. Rev. Ref. Bonds (Sentara Healthcare), Series 2012-B,
5.00% 2043
| 1,500
| 1,640
|
| City of Norfolk, Water Rev. Bonds, Series 2015-A, 5.25% 2044
| 2,000
| 2,347
|
| County of Prince William, Industrial Dev. Auth., Health Care Facs. Rev. and Rev. Ref. Bonds (Novant Health Obligated Group - Prince William Hospital), Series
2013-B, 5.00% 2024
| 850
| 952
|
| County of Prince William, Industrial Dev. Auth., Health Care Facs. Rev. and Rev. Ref. Bonds (Novant Health Obligated Group - Prince William Hospital), Series
2013-B, 5.00% 2025
| 900
| 1,007
|
| County of Prince William, Industrial Dev. Auth., Health Care Facs. Rev. and Rev. Ref. Bonds (Novant Health Obligated Group - Prince William Hospital), Series
2013-B, 5.00% 2046
| 1,000
| 1,088
|
County of Prince William, Industrial Dev. Auth., Residential Care Fac. Rev. and Rev. Ref. Bonds
(Westminster at Lake Ridge), Series 2016, 5.00% 2031
| 1,065
| 1,212
|
| Public Building Auth., Public Facs. Rev. Bonds, Series 2009-B, 5.00% 2024 (preref. 2019)
| 2,000
| 2,000
|
| Public Building Auth., Public Facs. Rev. Bonds, Series 2009-B, 5.00% 2027 (preref. 2019)
| 2,000
| 2,000
|
| Public Building Auth., Public Facs. Rev. Bonds, Series 2014-A, 5.00% 2027 (preref. 2024)
| 2,000
| 2,376
|
| Public Building Auth., Public Facs. Rev. Bonds, Series 2015-B, 5.00% 2026
| 1,140
| 1,383
|
| Public School Auth., School Fncg. Bonds (1997 Resolution), Series 2018-A, 5.00% 2028
| 2,000
| 2,597
|
| Public School Auth., School Fncg. Rev. Ref. Bonds (1997 Resolution), Series 2009-A, 5.00% 2019
| 1,000
| 1,000
|
| Public School Auth., School Fncg. Rev. Ref. Bonds (1997 Resolution), Series 2015-A, 5.00% 2026
| 2,000
| 2,433
|
| Public School Auth., School Fncg. Rev. Ref. Bonds (1997 Resolution), Series 2015-A, 5.00% 2028
| 2,000
| 2,418
|
The Tax-Exempt Bond Fund of America — Page
108 of 120
Bonds, notes & other debt instruments (continued)
Virginia (continued)
| Principal amount
(000)
| Value
(000)
|
Public School Auth., Special Obligation Fncg. Bonds (Montgomery County), Series 2011,
5.00% 2022 (preref. 2021)
| $1,000
| $1,056
|
Rappahannock Regional Jail Auth., Fac. Capital Improvement Rev. and Rev. Ref. Bonds, Series 2015,
5.00% 2030
| 1,750
| 2,098
|
Rappahannock Regional Jail Auth., Fac. Capital Improvement Rev. and Rev. Ref. Bonds, Series 2015,
5.00% 2031
| 2,000
| 2,389
|
Rappahannock Regional Jail Auth., Fac. Capital Improvement Rev. and Rev. Ref. Bonds, Series 2015,
5.00% 2032
| 2,250
| 2,680
|
| Resources Auth., Clean Water State Revolving Fund Rev. Bonds, Series 2009, 5.00% 2027 (preref. 2019)
| 1,750
| 1,761
|
| Resources Auth., Clean Water State Revolving Fund Rev. Bonds, Series 2009, 5.00% 2029 (preref. 2019)
| 1,500
| 1,510
|
| Resources Auth., Infrastructure Rev. Bonds (Pooled Fncg. Program), Series 2008-A, 5.00% 2028
| 60
| 60
|
| Resources Auth., Infrastructure Rev. Bonds (Pooled Fncg. Program), Series 2009-A, 5.00% 2028
| 210
| 212
|
| Resources Auth., Infrastructure Rev. Bonds (Pooled Fncg. Program), Series 2009-A, 5.00% 2028 (preref. 2019)
| 820
| 828
|
| Resources Auth., Infrastructure Rev. Bonds (Pooled Fncg. Program), Series 2011-A, 5.00% 2024
| 1,215
| 1,318
|
| Resources Auth., Infrastructure Rev. Bonds (Pooled Fncg. Program), Series 2011-A, 5.00% 2024 (preref. 2021)
| 235
| 255
|
| Resources Auth., Infrastructure Rev. Bonds (Pooled Fncg. Program), Series 2011-B, 5.00% 2027
| 585
| 634
|
| Resources Auth., Infrastructure Rev. Bonds (Pooled Fncg. Program), Series 2011-B, 5.00% 2027 (preref. 2021)
| 1,415
| 1,537
|
| Resources Auth., Infrastructure Rev. Bonds (Pooled Fncg. Program), Series 2014-B, 5.00% 2027
| 1,000
| 1,193
|
Resources Auth., Infrastructure Rev. Ref. Bonds (Pooled Fncg. Program), Series 2009-B,
5.00% 2027 (preref. 2019)
| 1,000
| 1,009
|
| City of Richmond, Public Utility Rev. and Rev. Ref. Bonds, Series 2013-A, 5.00% 2027
| 1,000
| 1,129
|
City of Roanoke, Industrial Dev. Auth., Hospital Rev. Ref. Bonds (Carilion Health System Obligated Group),
Series 2005, Assured Guaranty Municipal insured, 5.00% 2020
| 985
| 1,020
|
City of Roanoke, Industrial Dev. Auth., Hospital Rev. Ref. Bonds (Carilion Health System Obligated Group),
Series 2005, Assured Guaranty Municipal insured, 5.00% 2020 (escrowed to maturity)
| 15
| 16
|
City of Roanoke, Industrial Dev. Auth., Hospital Rev. Ref. Bonds (Carilion Health System Obligated Group),
Series 2005, Assured Guaranty Municipal insured, 5.00% 2038
| 985
| 1,012
|
City of Roanoke, Industrial Dev. Auth., Hospital Rev. Ref. Bonds (Carilion Health System Obligated Group),
Series 2005, Assured Guaranty Municipal insured, 5.00% 2038 (preref. 2020)
| 15
| 16
|
| Small Business Fncg. Auth., Health Care Facs. Rev. Ref. Bonds (Sentara Healthcare), Series 2010, 5.00% 2040
| 7,500
| 7,701
|
| Small Business Fncg. Auth., Residential Care Fac. Rev. Bonds (Pinnacle Living), Series 2017-C, 5.00% 2032
| 2,500
| 2,750
|
| Small Business Fncg. Auth., Residential Care Fac. Rev. Bonds (Pinnacle Living), Series 2017-C, 5.00% 2037
| 2,105
| 2,297
|
| Small Business Fncg. Auth., Residential Care Fac. Rev. Bonds (Pinnacle Living), Series 2017-C, 5.00% 2042
| 2,960
| 3,208
|
| Small Business Fncg. Auth., Residential Care Fac. Rev. Bonds (Pinnacle Living), Series 2017-C, 5.00% 2047
| 5,000
| 5,405
|
| Small Business Fncg. Auth., Residential Care Fac. Rev. Bonds (Pinnacle Living), Series 2017-C, 5.00% 2052
| 5,000
| 5,396
|
| Small Business Fncg. Auth., Rev. Ref. Bonds (Hampton University), Series 2014, 5.25% 2029
| 2,000
| 2,347
|
| City of Spotsylvania, Water and Sewer System Rev. Ref. Bonds, Series 2015, 5.00% 2026
| 3,000
| 3,603
|
| County of Stafford, Econ. Dev. Auth., Hospital Facs. Rev. Ref. Bonds (Mary Washington Healthcare Obligated Group), Series 2016, 5.00% 2032
| 1,500
| 1,774
|
| County of Stafford, Econ. Dev. Auth., Hospital Facs. Rev. Ref. Bonds (Mary Washington Healthcare Obligated Group), Series 2016, 5.00% 2033
| 750
| 884
|
| County of Stafford, Econ. Dev. Auth., Hospital Facs. Rev. Ref. Bonds (Mary Washington Healthcare Obligated Group), Series 2016, 5.00% 2035
| 1,000
| 1,170
|
| Rector and Visitors of the University of Virginia, General Rev. Ref. Pledge Bonds, Series 2011, 5.00% 2030
| 1,000
| 1,081
|
| Rector and Visitors of the University of Virginia, General Rev. Ref. Pledge Bonds, Series 2011, 5.00% 2031
| 1,000
| 1,081
|
Upper Occoquan Sewage Auth., Regional Sewerage System Rev. Bonds, Series 1995-A,
Assured Guaranty Municipal insured, 5.15% 2020
| 220
| 228
|
| Upper Occoquan Sewage Auth., Regional Sewerage System Rev. Ref. Bonds, Series 2014, 4.00% 2033
| 2,630
| 2,916
|
| Upper Occoquan Sewage Auth., Regional Sewerage System Rev. Ref. Bonds, Series 2014, 5.00% 2027
| 2,485
| 3,003
|
| Upper Occoquan Sewage Auth., Regional Sewerage System Rev. Ref. Bonds, Series 2014, 5.00% 2028
| 10,000
| 12,065
|
Virginia Commonwealth University Health System Auth., General Rev. Bonds, Series 2011,
5.00% 2026 (preref. 2021)
| 1,000
| 1,073
|
Virginia Commonwealth University Health System Auth., General Rev. Bonds, Series 2011,
5.00% 2030 (preref. 2021)
| 1,200
| 1,288
|
| Watkins Centre Community Dev. Auth., Rev. Bonds, Series 2007, 5.40% 2020
| 492
| 493
|
The Tax-Exempt Bond Fund of America — Page
109 of 120
Bonds, notes & other debt instruments (continued)
Virginia (continued)
| Principal amount
(000)
| Value
(000)
|
| Western Virginia Regional Jail Auth., Regional Jail Fac. Rev. Ref. Bonds, Series 2015, 5.00% 2025
| $1,115
| $1,360
|
| City of Winchester, Industrial Dev. Auth., Hospital Rev. Ref. Bonds (Valley Health System Obligated Group), Series 2014-A, 5.00% 2044
| 3,000
| 3,281
|
| City of Winchester, Industrial Dev. Auth., Hospital Rev. Ref. Bonds (Valley Health System Obligated Group), Series 2015, 5.00% 2035
| 1,000
| 1,160
|
| City of Winchester, Industrial Dev. Auth., Hospital Rev. Ref. Bonds (Valley Health System Obligated Group), Series 2015, 5.00% 2044
| 2,000
| 2,269
|
County of Wise, Industrial Dev. Auth., Solid Waste and Sewage Disposal Rev. Bonds
(Virginia Electric and Power Co. Project), Series 2009-A, 2.15% 2040 (put 2020)
| 23,750
| 23,966
|
County of Wise, Industrial Dev. Auth., Solid Waste and Sewage Disposal Rev. Bonds
(Virginia Electric and Power Co. Project), Series 2010-A, 1.875% 2040 (put 2020)
| 13,800
| 13,865
|
| County of York, Econ. Dev. Auth., Pollution Control Rev. Ref. Bonds (Virginia Electric and Power Co. Project), Series 2009-A, 1.90% 2033 (put
2023)
| 6,750
| 6,832
|
|
|
| 523,997
|
| Washington 2.66%
|
|
|
| Central Puget Sound Regional Transit Auth., Sales Tax and Motor Vehicle Excise Tax Bonds, Series 1999, FGIC-National insured, 5.25% 2021
| 2,575
| 2,682
|
Central Puget Sound Regional Transit Auth., Sales Tax and Motor Vehicle Excise Tax Green Bonds,
Series 2016-S-1, 5.00% 2031
| 1,000
| 1,221
|
Central Puget Sound Regional Transit Auth., Sales Tax and Motor Vehicle Excise Tax Green Bonds,
Series 2016-S-1, 5.00% 2033
| 1,305
| 1,584
|
Central Puget Sound Regional Transit Auth., Sales Tax and Motor Vehicle Excise Tax Green Bonds,
Series 2016-S-1, 5.00% 2036
| 3,000
| 3,603
|
Central Puget Sound Regional Transit Auth., Sales Tax Improvement and Rev. Ref. Green Bonds,
Series 2015-S-1, 5.00% 2045
| 5,000
| 5,837
|
Central Puget Sound Regional Transit Auth., Sales Tax Improvement Green Bonds, Series 2015-S-2B,
(SIFMA Municipal Swap Index + 0.45%) 1.85% 2045 (put 2023)2
| 6,350
| 6,354
|
| Convention Center Public Facs. Dist., Lodging Tax Bonds, Series 2010-B, 5.00% 2043
| 35,000
| 41,667
|
| Convention Center Public Facs. Dist., Lodging Tax Bonds, Series 2010-B, 5.00% 2048
| 14,980
| 17,672
|
| Energy Northwest, Columbia Generating Station Electric Rev. and Rev. Ref. Bonds, Series 2018-A, 5.00% 2021
| 1,500
| 1,613
|
| Energy Northwest, Electric Rev. Ref. Bonds (Project No. 1), Series 2015-C, National insured, 5.00% 2030
| 1,250
| 1,488
|
| Energy Northwest, Electric Rev. Ref. Bonds (Project No. 1), Series 2017-A, 5.00% 2028
| 10,000
| 12,600
|
| Energy Northwest, Electric Rev. Ref. Bonds (Project No. 3), Series 2015-C, 5.00% 2026
| 1,500
| 1,809
|
| Federal Highway Grant Anticipation Rev. Bonds (SR 520 Corridor Program), Series 2012-F, 5.00% 2023
| 5,000
| 5,582
|
| Federal Highway Grant Anticipation Rev. Bonds (SR 520 Corridor Program), Series 2014-C, 5.00% 2021
| 2,500
| 2,699
|
| G.O. Bonds, Series 2010-A, 5.00% 2028 (preref. 2019)
| 1,000
| 1,000
|
| G.O. Bonds, Series 2016-A-1, 5.00% 2040
| 4,750
| 5,544
|
| G.O. Bonds, Series 2016-C, 5.00% 2021
| 6,000
| 6,352
|
| G.O. Bonds, Series 2017-A, 5.00% 2036
| 5,000
| 5,970
|
| G.O. Bonds, Series 2017-A, 5.00% 2037
| 5,000
| 5,955
|
| G.O. Bonds, Series 2017-D, 5.00% 2035
| 4,120
| 4,975
|
| G.O. Bonds, Series 2018-A, 5.00% 2041
| 9,595
| 11,502
|
| G.O. Bonds, Series 2018-A, 5.00% 2042
| 9,635
| 11,516
|
| G.O. Bonds, Series 2018-C, 5.00% 2026
| 8,525
| 10,483
|
| G.O. Bonds, Series 2018-C, 5.00% 2034
| 5,000
| 6,171
|
| G.O. Bonds, Series 2018-C, 5.00% 2040
| 21,495
| 26,011
|
| G.O. Rev. Ref. Bonds, Series 2017-R-A, 5.00% 2033
| 4,000
| 4,820
|
| G.O. Rev. Ref. Bonds, Series 2018-R-D, 5.00% 2026
| 17,500
| 21,760
|
| G.O. Rev. Ref. Bonds, Series 2018-R-D, 5.00% 2027
| 13,000
| 16,478
|
| G.O. Rev. Ref. Bonds, Series 2018-R-D, 5.00% 2035
| 6,000
| 7,325
|
County of Grant, Public Utility Dist. No. 2, Electric System Rev. Ref. Bonds, Series 2017-N,
2.00% 2044 (put 2020)
| 2,500
| 2,514
|
| County of Grant, Public Utility Dist. No. 2, Electric System Rev. Ref. Bonds, Series 2017-O, 5.00% 2042
| 1,200
| 1,436
|
| County of Grant, Public Utility Dist. No. 2, Electric System Rev. Ref. Bonds, Series 2017-O, 5.00% 2047
| 1,500
| 1,783
|
The Tax-Exempt Bond Fund of America — Page
110 of 120
Bonds, notes & other debt instruments (continued)
Washington (continued)
| Principal amount
(000)
| Value
(000)
|
| County of Grant, Public Utility Dist. No. 2, Priest Rapids Hydroelectric Project Rev. Ref. Bonds, Series 2015-A, 5.00% 2041
| $5,000
| $5,789
|
Health Care Facs. Auth., Rev. Bonds (Catholic Health Initiatives), Series 2013-B-1,
(SIFMA Municipal Swap Index + 1.00%) 2.40% 2035 (put 2021)2
| 49,750
| 49,840
|
| Health Care Facs. Auth., Rev. Bonds (Fred Hutchinson Cancer Research Center), Series 2015, 5.00% 2026
| 1,500
| 1,780
|
| Health Care Facs. Auth., Rev. Bonds (Fred Hutchinson Cancer Research Center), Series 2015, 5.00% 2027
| 1,000
| 1,179
|
| Health Care Facs. Auth., Rev. Bonds (Fred Hutchinson Cancer Research Center), Series 2015, 5.00% 2033
| 1,500
| 1,715
|
Health Care Facs. Auth., Rev. Bonds (Fred Hutchinson Cancer Research Center),
Series 2017-B, (1-month USD-LIBOR x 0.67 + 1.10%) 2.618% 2042 (put 2022)2
| 5,750
| 5,820
|
| Health Care Facs. Auth., Rev. Bonds (Kadlec Regional Medical Center), Series 2012, 5.00% 2032 (preref. 2021)
| 750
| 816
|
| Health Care Facs. Auth., Rev. Bonds (Multicare Health System), Series 2015-A, 5.00% 2031
| 2,335
| 2,760
|
| Health Care Facs. Auth., Rev. Bonds (Multicare Health System), Series 2015-A, 5.00% 2033
| 2,480
| 2,917
|
| Health Care Facs. Auth., Rev. Bonds (Multicare Health System), Series 2015-A, 5.00% 2034
| 2,565
| 3,008
|
| Health Care Facs. Auth., Rev. Bonds (Overlake Hospital Medical Center), Series 2017-A, 5.00% 2042
| 1,000
| 1,170
|
| Health Care Facs. Auth., Rev. Bonds (Seattle Children’s Hospital), Series 2017-A, 5.00% 2047
| 5,315
| 6,279
|
| Health Care Facs. Auth., Rev. Bonds (Virginia Mason Medical Center), Series 2017, 5.00% 2032
| 3,000
| 3,498
|
| Health Care Facs. Auth., Rev. Bonds (Virginia Mason Medical Center), Series 2017, 5.00% 2033
| 1,000
| 1,162
|
| Health Care Facs. Auth., Rev. Bonds (Virginia Mason Medical Center), Series 2017, 5.00% 2036
| 1,000
| 1,151
|
| Health Care Facs. Auth., Rev. Bonds (Yakima Valley Memorial Hospital Association), Series 2016, 5.00% 2031
| 4,625
| 5,254
|
| Health Care Facs. Auth., Rev. Bonds (Yakima Valley Memorial Hospital Association), Series 2016, 5.00% 2036
| 870
| 973
|
| Health Care Facs. Auth., Rev. Bonds (Yakima Valley Memorial Hospital Association), Series 2016, 5.00% 2041
| 645
| 710
|
| Health Care Facs. Auth., Rev. Ref. Bonds (Central Washington Health Services Association), Series 2015, 5.00% 2028
| 1,500
| 1,738
|
| Health Care Facs. Auth., Rev. Ref. Bonds (Central Washington Health Services Association), Series 2015, 5.00% 2029
| 1,750
| 2,024
|
| Health Care Facs. Auth., Rev. Ref. Bonds (Central Washington Health Services Association), Series 2015, 5.00% 2030
| 1,500
| 1,727
|
| Health Care Facs. Auth., Rev. Ref. Bonds (Central Washington Health Services Association), Series 2015, 5.00% 2039
| 4,825
| 5,403
|
Health Care Facs. Auth., Rev. Ref. Bonds (Overlake Hospital Medical Center), Series 2010,
5.70% 2038 (preref. 2020)
| 5,000
| 5,208
|
| Health Care Facs. Auth., Rev. Ref. Bonds (PeaceHealth), Series 2014-A, 5.00% 2027
| 500
| 580
|
Health Care Facs. Auth., Rev. Ref. Bonds (Providence Health & Services), Series 2012-B,
5.00% 2042 (put 2021)
| 1,000
| 1,079
|
| Health Care Facs. Auth., Rev. Ref. Bonds (Providence Health & Services), Series 2014-C, 5.00% 2044
| 5,060
| 5,630
|
| Health Care Facs. Auth., Rev. Ref. Bonds (Providence St. Joseph Health), Series 2018-B, 5.00% 2028
| 2,000
| 2,554
|
| Health Care Facs. Auth., Rev. Ref. Bonds (Providence St. Joseph Health), Series 2018-B, 5.00% 2029
| 3,500
| 4,450
|
| Health Care Facs. Auth., Rev. Ref. Bonds (Providence St. Joseph Health), Series 2018-B, 5.00% 2030
| 4,000
| 5,058
|
| Health Care Facs. Auth., Rev. Ref. Bonds (Providence St. Joseph Health), Series 2018-B, 5.00% 2031
| 2,500
| 3,130
|
| Health Care Facs. Auth., Rev. Ref. Bonds (Providence St. Joseph Health), Series 2018-B, 5.00% 2032
| 3,000
| 3,725
|
| Health Care Facs. Auth., Rev. Ref. Bonds (Providence St. Joseph Health), Series 2018-B, 5.00% 2033
| 3,000
| 3,699
|
| Health Care Facs. Auth., Rev. Ref. Bonds (Seattle Children’s Hospital), Series 2010-B, 5.00% 2020
| 100
| 104
|
Higher Education Facs. Auth., Rev. and Rev. Ref. Bonds (Whitworth University Project), Series 2016-A,
5.00% 2032
| 2,810
| 3,241
|
Higher Education Facs. Auth., Rev. and Rev. Ref. Bonds (Whitworth University Project), Series 2016-A,
5.00% 2034
| 1,510
| 1,731
|
| Higher Education Facs. Auth., Rev. Bonds (Gonzaga University Project), Series 2013-A, 5.25% 2043
| 9,765
| 10,839
|
| Housing Fin. Commission, Homeownership Program Bonds, Series 2010-A, 4.70% 2028
| 65
| 66
|
| Housing Fin. Commission, Homeownership Program Bonds, Series 2011-B, 4.25% 2032
| 535
| 544
|
Housing Fin. Commission, Nonprofit Housing Rev. Ref. Bonds (Emerald Heights Project), Series 2013,
5.00% 2028
| 1,100
| 1,221
|
Housing Fin. Commission, Nonprofit Housing Rev. Ref. Bonds (Herons Key Senior Living Project),
Series 2015-A, 7.00% 20451
| 1,705
| 1,829
|
Housing Fin. Commission, Nonprofit Housing Rev. Ref. Bonds (Horizon House Project), Series 2017,
5.00% 20381
| 2,300
| 2,590
|
The Tax-Exempt Bond Fund of America — Page
111 of 120
Bonds, notes & other debt instruments (continued)
Washington (continued)
| Principal amount
(000)
| Value
(000)
|
Housing Fin. Commission, Nonprofit Housing Rev. Ref. Bonds (Horizon House Project), Series 2017,
5.00% 20431
| $3,400
| $3,803
|
Housing Fin. Commission, Nonprofit Housing Rev. Ref. Bonds (Horizon House Project), Series 2017,
5.00% 20481
| 4,300
| 4,794
|
Housing Fin. Commission, Nonprofit Housing Rev. Ref. Bonds (Rockwood Retirement Project),
Series 2014-A, 7.375% 20441
| 15,880
| 18,180
|
Housing Fin. Commission, Nonprofit Housing Rev. Ref. Bonds (Rockwood Retirement Project),
Series 2014-A, 7.50% 20491
| 6,000
| 6,886
|
| Housing Fin. Commission, Single Family Program Bonds, Series 2013-1-N, 3.00% 2043
| 55
| 56
|
| Housing Fin. Commission, Single Family Program Bonds, Series 2014-1-N, 3.00% 2037
| 120
| 122
|
| Housing Fin. Commission, Single Family Program Bonds, Series 2015-1-N, 3.45% 2030
| 1,165
| 1,241
|
| Housing Fin. Commission, Single Family Program Bonds, Series 2017-1-N, 3.60% 2032
| 2,000
| 2,150
|
| Housing Fin. Commission, Single Family Program Bonds, Series 2017-1-N, 4.00% 2047
| 815
| 866
|
| Housing Fin. Commission, Single Family Program Bonds, Series 2017-2-N, 3.50% 2047
| 2,635
| 2,775
|
| Housing Fin. Commission, Single Family Program Bonds, Series 2019-1-N, 3.375% 2034
| 1,250
| 1,327
|
| Housing Fin. Commission, Single Family Program Bonds, Series 2019-1-N, 4.00% 2049
| 8,000
| 8,770
|
| County of King, Sewer Rev. and Rev. Ref. Bonds, Series 2011-B, 5.00% 2034
| 1,435
| 1,513
|
| County of King, Sewer Rev. and Rev. Ref. Bonds, Series 2011-B, 5.00% 2034 (preref. 2021)
| 5,565
| 5,864
|
| County of King, Sewer Rev. and Rev. Ref. Bonds, Series 2011-B, 5.00% 2034 (preref. 2021)
| 3,000
| 3,165
|
| County of King, Sewer Rev. Ref. Bonds, Series 2015, 5.00% 2040
| 5,050
| 5,803
|
| County of King, Sewer Rev. Ref. Bonds, Series 2017, 5.00% 2033
| 2,500
| 3,065
|
| County of King, Sewer Rev. Ref. Bonds, Series 2017, 5.00% 2034
| 2,625
| 3,206
|
| Motor Vehicle Fuel Tax G.O. Bonds, Series 2010-B, 5.00% 2024 (preref. 2019)
| 6,200
| 6,200
|
| Motor Vehicle Fuel Tax G.O. Bonds, Series 2014-B, 5.00% 2031
| 2,000
| 2,276
|
| Motor Vehicle Fuel Tax G.O. Bonds, Series 2017-B, 5.00% 2036
| 5,000
| 5,970
|
| Motor Vehicle Fuel Tax G.O. Bonds, Series 2017-B, 5.00% 2040
| 5,000
| 5,912
|
| Motor Vehicle Fuel Tax G.O. Bonds, Series 2018-D, 5.00% 2043
| 6,650
| 7,987
|
| Motor Vehicle Fuel Tax G.O. Rev. Ref. Bonds, Series R-2013-B, 5.00% 2025
| 3,000
| 3,332
|
City of Seattle, Municipal Light and Power Improvement Rev. Ref. Bonds, Series 2018-B-2,
(SIFMA Municipal Swap Index + 0.29%) 1.69% 2045 (put 2021)2
| 12,500
| 12,515
|
City of Seattle, Municipal Light and Power Improvement Rev. Ref. Bonds, Series 2018-C-2,
(SIFMA Municipal Swap Index + 0.49%) 1.89% 2046 (put 2023)2
| 19,000
| 19,113
|
| Port of Seattle, Rev. Bonds, Series 1999-A, FGIC-National insured, 5.50% 2019
| 3,630
| 3,643
|
| Port of Seattle, Rev. Ref. Bonds, Series 2010-B, 5.00% 2030
| 2,600
| 2,679
|
| City of Tacoma, Electric System Rev. Bonds, Series 2017, 5.00% 2030
| 1,025
| 1,261
|
| City of Tacoma, Electric System Rev. Bonds, Series 2017, 5.00% 2038
| 1,500
| 1,788
|
| City of Tacoma, Electric System Rev. Bonds, Series 2017, 5.00% 2039
| 1,000
| 1,189
|
| City of Tacoma, Electric System Rev. Bonds, Series 2017, 5.00% 2042
| 3,520
| 4,162
|
| Tobacco Settlement Auth., Tobacco Settlement Rev. Ref. Bonds, Series 2013, 5.25% 2031
| 1,940
| 1,992
|
|
|
| 575,602
|
| West Virginia 0.22%
|
|
|
Econ. Dev. Auth., Solid Waste Disposal Facs. Rev. Bonds (Appalachian Power Co. - Amos Project),
Series 2009-A, 2.625% 2042
| 7,325
| 7,483
|
Econ. Dev. Auth., Solid Waste Disposal Facs. Rev. Ref. Bonds (Appalachian Power Co. - Amos Project),
Series 2015-A, 2.55% 2040 (put 2024)
| 9,250
| 9,509
|
| Hospital Fin. Auth., Hospital Rev. Ref. and Improvement Rev. Bonds (Cabell Huntington Hospital Obligated Group), Series 2018-A, 4.00% 2037
| 6,510
| 6,938
|
| Hospital Fin. Auth., Hospital Rev. Ref. and Improvement Rev. Bonds (Cabell Huntington Hospital Obligated Group), Series 2018-A, 4.00% 2038
| 1,375
| 1,463
|
| Hospital Fin. Auth., Hospital Rev. Ref. and Improvement Rev. Bonds (Cabell Huntington Hospital Obligated Group), Series 2018-A, 4.125% 2047
| 1,500
| 1,584
|
| Hospital Fin. Auth., Hospital Rev. Ref. and Improvement Rev. Bonds (Cabell Huntington Hospital Obligated Group), Series 2018-A, 5.00% 2035
| 1,430
| 1,708
|
The Tax-Exempt Bond Fund of America — Page
112 of 120
Bonds, notes & other debt instruments (continued)
West Virginia (continued)
| Principal amount
(000)
| Value
(000)
|
| Hospital Fin. Auth., Hospital Rev. Ref. and Improvement Rev. Bonds (Cabell Huntington Hospital Obligated Group), Series 2018-A, 5.00% 2036
| $1,500
| $1,781
|
| Hospital Fin. Auth., Hospital Rev. Ref. and Improvement Rev. Bonds (Cabell Huntington Hospital Obligated Group), Series 2018-A, 5.00% 2043
| 8,440
| 9,829
|
| County of Mason, Pollution Control Rev. Bonds (Appalachian Power Co. Project), Series 2003-L, 2.75% 2022
| 8,000
| 8,218
|
|
|
| 48,513
|
| Wisconsin 2.12%
|
|
|
| G.O. Bonds, Series 2012-A, 5.00% 2023 (preref. 2021)
| 8,440
| 9,006
|
| G.O. Bonds, Series 2013-A, 4.00% 2026 (preref. 2022)
| 17,400
| 18,776
|
| G.O. Bonds, Series 2013-A, 4.00% 2027 (preref. 2022)
| 5,000
| 5,396
|
| G.O. Rev. Ref. Bonds, Series 2015-4, 5.00% 2026
| 6,670
| 7,945
|
| G.O. Rev. Ref. Bonds, Series 2017-2, 5.00% 2027
| 5,000
| 6,314
|
Health and Educational Facs. Auth., Health Facs. Rev. Bonds (SSM Health Care), Series 2010-A,
5.25% 2034 (preref. 2020)
| 18,760
| 19,394
|
Health and Educational Facs. Auth., Rev. Bonds (Advocate Aurora Health Care Credit Group),
Series 2018-B, 5.00% 2054 (put 2024)
| 10,000
| 11,538
|
Health and Educational Facs. Auth., Rev. Bonds (Advocate Aurora Health Care Credit Group),
Series 2018-C-2, (SIFMA Municipal Swap Index + 0.45%) 1.85% 2054 (put 2022)2
| 31,145
| 31,106
|
Health and Educational Facs. Auth., Rev. Bonds (Advocate Aurora Health Care Credit Group),
Series 2018-C-3, (SIFMA Municipal Swap Index + 0.55%) 1.95% 2054 (put 2023)2
| 8,250
| 8,257
|
Health and Educational Facs. Auth., Rev. Bonds (Advocate Aurora Health Care Credit Group),
Series 2018-C-4, (SIFMA Municipal Swap Index + 0.65%) 2.05% 2054 (put 2024)2
| 4,200
| 4,217
|
Health and Educational Facs. Auth., Rev. Bonds (Agnesian HealthCare, Inc.), Series 2013-B,
5.00% 2036 (preref. 2023)
| 5,125
| 5,861
|
| Health and Educational Facs. Auth., Rev. Bonds (Agnesian HealthCare, Inc.), Series 2017, 4.00% 2047
| 2,500
| 2,647
|
| Health and Educational Facs. Auth., Rev. Bonds (Agnesian HealthCare, Inc.), Series 2017, 5.00% 2042
| 3,380
| 3,912
|
Health and Educational Facs. Auth., Rev. Bonds (Ascension Health Senior Credit Group), Series 2010-E,
5.00% 2033
| 11,000
| 11,112
|
| Health and Educational Facs. Auth., Rev. Bonds (Ascension Health Senior Credit Group), Series 2012-D, 5.00% 2041
| 7,155
| 7,725
|
| Health and Educational Facs. Auth., Rev. Bonds (Ascension Health Senior Credit Group), Series 2013-B-4, 5.00% 2043 (put 2021)
| 7,000
| 7,464
|
| Health and Educational Facs. Auth., Rev. Bonds (Ascension Health Senior Credit Group), Series 2016-A, 4.00% 2035
| 10,200
| 11,168
|
| Health and Educational Facs. Auth., Rev. Bonds (Ascension Health Senior Credit Group), Series 2016-A, 4.00% 2039
| 18,395
| 19,939
|
| Health and Educational Facs. Auth., Rev. Bonds (Ascension Health Senior Credit Group), Series 2016-A, 5.00% 2035
| 8,710
| 10,250
|
| Health and Educational Facs. Auth., Rev. Bonds (Ascension Health Senior Credit Group), Series 2016-A, 5.00% 2036
| 3,200
| 3,756
|
| Health and Educational Facs. Auth., Rev. Bonds (Ascension Health Senior Credit Group), Series 2016-A, 5.00% 2039
| 9,750
| 11,328
|
| Health and Educational Facs. Auth., Rev. Bonds (Beloit College), Series 2010-A, 6.125% 2035 (preref. 2020)
| 1,230
| 1,280
|
| Health and Educational Facs. Auth., Rev. Bonds (Beloit Health System, Inc.), Series 2016, 5.00% 2041
| 1,590
| 1,784
|
Health and Educational Facs. Auth., Rev. Bonds (Children’s Hospital of Wisconsin, Inc.), Series 2008-B,
5.375% 2037 (preref. 2020)
| 5,000
| 5,113
|
Health and Educational Facs. Auth., Rev. Bonds (Marshfield Clinic Health System, Inc.), Series 2016-B,
5.00% 2046
| 5,150
| 5,763
|
| Health and Educational Facs. Auth., Rev. Bonds (Milwaukee Regional Medical Center Thermal Service, Inc.), Series 2018, 5.00% 2036
| 3,870
| 4,715
|
| Health and Educational Facs. Auth., Rev. Bonds (Milwaukee Regional Medical Center Thermal Service, Inc.), Series 2018, 5.00% 2037
| 3,500
| 4,245
|
| Health and Educational Facs. Auth., Rev. Bonds (Milwaukee Regional Medical Center Thermal Service, Inc.), Series 2018, 5.00% 2044
| 27,200
| 32,460
|
The Tax-Exempt Bond Fund of America — Page
113 of 120
Bonds, notes & other debt instruments (continued)
Wisconsin (continued)
| Principal amount
(000)
| Value
(000)
|
Health and Educational Facs. Auth., Rev. Bonds (The Medical College of Wisconsin, Inc.), Series 2016,
5.00% 2041
| $2,000
| $2,330
|
Health and Educational Facs. Auth., Rev. Ref. Bonds (Aurora Health Care, Inc.), Series 2012-A,
5.00% 2026 (preref. 2021)
| 11,000
| 11,824
|
Health and Educational Facs. Auth., Rev. Ref. Bonds (Aurora Health Care, Inc.), Series 2012-A,
5.00% 2028 (preref. 2021)
| 1,000
| 1,075
|
Health and Educational Facs. Auth., Rev. Ref. Bonds (Aurora Health Care, Inc.), Series 2013-A,
5.125% 2031 (preref. 2023)
| 1,750
| 2,003
|
| Health and Educational Facs. Auth., Rev. Ref. Bonds (Gundersen Lutheran), Series 2011-A, 5.25% 2039
| 9,000
| 9,613
|
Health and Educational Facs. Auth., Rev. Ref. Bonds (Ministry Health Care, Inc.), Series 2012-C,
5.00% 2026 (preref. 2022)
| 30
| 33
|
Health and Educational Facs. Auth., Rev. Ref. Bonds (Ministry Health Care, Inc.), Series 2012-C,
5.00% 2029 (preref. 2022)
| 1,700
| 1,893
|
Health and Educational Facs. Auth., Rev. Ref. Bonds (Ministry Health Care, Inc.), Series 2012-C,
5.00% 2032 (preref. 2022)
| 4,000
| 4,454
|
| Health and Educational Facs. Auth., Rev. Ref. Bonds (ProHealth Care, Inc. Obligated Group), Series 2015, 5.00% 2031
| 460
| 523
|
| Health and Educational Facs. Auth., Rev. Ref. Bonds (ProHealth Care, Inc. Obligated Group), Series 2015, 5.00% 2033
| 500
| 563
|
Health and Educational Facs. Auth., Rev. Ref. Bonds (The Monroe Clinic, Inc.), Series 2016,
4.00% 2031 (preref. 2025)
| 450
| 517
|
| Health and Educational Facs. Auth., Rev. Ref. Bonds (Thedacare, Inc.), Series 2015, 5.00% 2039
| 920
| 1,037
|
| Housing and Econ. Dev. Auth., Home Ownership Mortgage Rev. Bonds, Series 2017-A, 2.69% 2047
| 11,179
| 11,221
|
| Housing and Econ. Dev. Auth., Home Ownership Rev. Bonds, Series 2017-C, 4.00% 2048
| 4,200
| 4,490
|
| Housing and Econ. Dev. Auth., Home Ownership Rev. Bonds, Series 2018-B, 4.00% 2048
| 19,395
| 20,794
|
| Housing and Econ. Dev. Auth., Home Ownership Rev. Bonds, Series 2018-D, 4.00% 2047
| 14,000
| 15,218
|
| Housing and Econ. Dev. Auth., Home Ownership Rev. Bonds, Series 2019-A, 4.25% 2049
| 26,800
| 29,574
|
| County of Milwaukee, Airport Rev. Bonds, Series 2010-A, 5.00% 2034
| 2,000
| 2,026
|
| Public Fin. Auth., Hospital Rev. Bonds (WakeMed), Series 2019-A, 5.00% 2044
| 3,000
| 3,561
|
Public Fin. Auth., Hospital Rev. Ref. Bonds (Renown Regional Medical Center Project), Series 2016-A,
5.00% 2031
| 3,115
| 3,684
|
Public Fin. Auth., Hospital Rev. Ref. Bonds (Renown Regional Medical Center Project), Series 2016-A,
5.00% 2032
| 3,250
| 3,826
|
Public Fin. Auth., Hospital Rev. Ref. Bonds (Renown Regional Medical Center Project), Series 2016-A,
5.00% 2040
| 11,585
| 13,339
|
| Public Fin. Auth., Rev. Bonds (Retirement Housing Foundation), Series 2017-B, 5.00% 2028
| 2,595
| 3,075
|
| Public Fin. Auth., Rev. Bonds (Roseman University of Health Sciences Project), Series 2012, 5.50% 2032
| 1,000
| 1,057
|
| Public Fin. Auth., Student Housing Rev. Bonds (Beyond Boone, LLC - Appalachian State University Project), Series 2019-A, Assured Guaranty Municipal insured, 5.00%
2058
| 2,000
| 2,250
|
| Public Fin. Auth., Student Housing Rev. Bonds (CHF-Cullowhee, LLC - Western Carolina University Project), Series 2015, 5.25% 2047
| 1,000
| 1,076
|
| Public Fin. Auth., Student Housing Rev. Bonds (CHF-Wilmington, LLC - University of North Carolina Project), Series 2018, Assured Guaranty Municipal insured, 5.00%
2053
| 6,340
| 7,316
|
| Public Fin. Auth., Student Housing Rev. Bonds (CHF-Wilmington, LLC - University of North Carolina Project), Series 2018, Assured Guaranty Municipal insured, 5.00%
2058
| 10,000
| 11,280
|
| City of Superior, Limited Obligation Rev. Ref. Bonds (Midwest Energy Resources Co. Project), Series 1991-E, FGIC-National insured, 6.90% 2021
| 8,000
| 8,860
|
| University of Wisconsin, Hospitals and Clinics Auth., Rev. Bonds, Series 2013-A, 5.00% 2038
| 3,000
| 3,318
|
| WPPI Energy, Power Supply System Rev. Ref. Bonds, Series 2013-A, 5.00% 2037
| 3,650
| 4,086
|
|
|
| 458,387
|
The Tax-Exempt Bond Fund of America — Page
114 of 120
Bonds, notes & other debt instruments (continued)
Wyoming 0.03%
| Principal amount
(000)
| Value
(000)
|
| Community Dev. Auth., Housing Rev. Bonds, Series 2015-3, 3.00% 2044
| $200
| $205
|
| Community Dev. Auth., Housing Rev. Bonds, Series 2015-6, 4.00% 2045
| 1,650
| 1,727
|
| Community Dev. Auth., Housing Rev. Bonds, Series 2017-5, 4.00% 2046
| 4,670
| 5,009
|
|
|
| 6,941
|
| Total bonds, notes & other debt instruments (cost: $19,275,165,000)
|
| 20,267,090
|
| Short-term securities 6.21%
|
|
|
| Freddie Mac, Multi Family Certificates, Series 2017-M-051, 1.63% 20352
| 11,000
| 11,000
|
| Freddie Mac, Multi Family Certificates, Series 2017-M-052, 1.63% 20362
| 26,000
| 26,000
|
Freddie Mac, Multi Family Certificates, Series 2018-M-042, Class A,
(SIFMA Municipal Swap Index + 0.30%) 1.65% 20332
| 37,020
| 37,020
|
| Freddie Mac, Multi Family Certificates, Series 2018-M-046, 1.63% 20352
| 16,405
| 16,405
|
State of Alabama, County of Mobile, Industrial Dev. Auth., Pollution Control Rev. Ref. Bonds
(ExxonMobil Project), Series 2002, 1.50% 20322
| 1,000
| 1,000
|
| State of Alaska, City of Valdez, Marine Terminal Rev. Ref. Bonds (Exxon Pipeline Co. Project), Series 1985, 1.47% 20252
| 2,040
| 2,040
|
State of Alaska, City of Valdez, Marine Terminal Rev. Ref. Bonds (ExxonMobil Project), Series 2001,
1.47% 20292
| 22,345
| 22,345
|
| State of Arizona, Industrial Dev. Auth., Hospital Rev. Ref. Bonds (Phoenix Children’s Hospital), Series 2019-B, 1.49% 20482
| 1,000
| 1,000
|
State of Arizona, City of Scottsdale, Industrial Dev. Auth.,Hospital Rev. Bonds (Scottsdale Healthcare),
Series 2006, Assured Guaranty Municipal insured, 2.05% 20452
| 3,925
| 3,925
|
Municipal Fin. Auth., Solid Waste Rev. Ref. Bonds (Republic Services, Inc. Project), Series 2010,
1.48% 2021 (put 2019)
| 2,000
| 2,001
|
| State of California, Pollution Control Fncg. Auth., Solid Waste Disposal Rev. Ref. Bonds (Republic Services, Inc. Project), Series 2010-B, 1.65% 2024 (put
2019)1,8
| 5,655
| 5,655
|
State of California, Dept. of Water Resources, Water System IAM Commercial Paper, Series 2019,
1.48% 8/6/2019
| 3,085
| 3,085
|
| State of Colorado, Tax and Rev. Anticipation Notes, Series 2019, 3.00% 6/26/2020
| 7,000
| 7,115
|
State of Connecticut, Health and Educational Facs. Auth., Rev. Bonds (Yale New Haven Health Issue),
Series 2014-D, 1.40% 20482
| 2,000
| 2,000
|
| State of Florida, County of Alachua, Health Facs. Auth., IAM Commercial Paper (Shands HealthCare Project), Series 2019-A, 1.46% 8/6/2019
| 12,750
| 12,750
|
State of Florida, Capital Facs. Fin. Agcy., Solid Waste Disposal Rev. Ref. Bonds (Republic Services, Inc.),
Series 2010-A, 1.50% 2034 (put 2019)8
| 1,000
| 1,000
|
| State of Florida, Municipal Power Agcy., All-Requirements Power Supply Project Demand Rev. Ref. Bonds, Series 2008-C, 1.49% 20352
| 9,370
| 9,370
|
| State of Georgia, County of Hall and City of Gainesville, Hospital Auth., Rev. Anticipation Certificates (Northeast Georgia Health System, Inc. Project), Series
2017-C, 1.61% 20472
| 9,250
| 9,250
|
| Main Street Natural Gas, Inc., Gas Supply Rev. Bonds, Series 2019-B, 4.00% 2049 (put 2024)
| 30,000
| 33,542
|
State of Idaho, Health Facs. Auth., Hospital Rev. Bonds (CHE Trinity Health Credit Group), Series 2013-ID,
1.75% 2048 (put 2019)
| 6,835
| 6,835
|
| State of Idaho, Tax Anticipation Notes, Series 2019, 3.00% 6/30/2020
| 30,020
| 30,508
|
State of Illinois, City of Chicago, Board of Education, Tax Anticipation Notes, Series 2018-E,
2.207% 12/13/20191,2
| 2,500
| 2,500
|
State of Illinois, Joliet Regional Port Dist., Marine Terminal Rev. Ref. Bonds (Exxon Project), Series 1989,
1.47% 20242
| 10,600
| 10,600
|
| State of Iowa, Fin. Auth., Rev. Bonds (UnityPoint Health), Series 2018-E, 1.47% 20412
| 19,680
| 19,680
|
State of Kentucky, Econ. Dev. Fin. Auth., Solid Waste Rev. Ref. Bonds (Republic Services, Inc. Project),
Series 2010-B, 1.50% 2031 (put 2019)8
| 4,045
| 4,046
|
| State of Louisiana, Parish of East Baton Rouge, Industrial Dev. Board, Gulf Opportunity Zone Rev. Bonds (ExxonMobil Project), Series 2010-B, 1.47% 20402
| 6,500
| 6,500
|
The Tax-Exempt Bond Fund of America — Page
115 of 120
| Short-term securities (continued)
| Principal amount
(000)
| Value
(000)
|
| State of Louisiana, Parish of East Baton Rouge, Industrial Dev. Board, Gulf Opportunity Zone Rev. Bonds (ExxonMobil Project), Series 2011, 1.47% 20512
| $4,505
| $4,505
|
State of Louisiana, Parish of East Baton Rouge, Pollution Control Rev. Ref. Bonds (ExxonMobil Project),
Series 1993, 1.47% 20222
| 18,025
| 18,025
|
State of Louisiana, Parish of East Baton Rouge, Pollution Control Rev. Ref. Bonds (ExxonMobil Project),
Series 2010-A, 1.47% 20352
| 6,500
| 6,500
|
State of Louisiana, Public Facs. Auth., Rev. Bonds (Air Products and Chemicals Project), Series 2008-A,
1.50% 20432
| 16,000
| 16,000
|
State of Maryland, Health and Higher Educational Facs. Auth., IAM Commercial Paper, Series 2019,
1.44% 8/6/2019
| 8,000
| 8,000
|
| State of Maryland, County of Montgomery, IAM Commercial Paper, Series 2019-A, 1.34% 10/3/2019
| 77,000
| 77,000
|
| State of Maryland, County of Montgomery, IAM Commercial Paper, Series 2019-A, 1.38% 8/6/2019
| 7,500
| 7,500
|
| State of Maryland, County of Montgomery, IAM Commercial Paper, Series 2019-B, 1.40% 10/9/2019
| 7,500
| 7,500
|
State of Maryland, County of Montgomery, Rev. Bonds (Trinity Health Credit Group), Series 2013,
1.43% 2041 (put 2019)8
| 11,000
| 11,002
|
State of Massachusetts, Health and Educational Facs. Auth., IAM Commercial Paper (Harvard University),
Series 2019, 1.30% 10/16/2019
| 30,000
| 30,000
|
| State of Massachusetts, Health and Educational Facs. Auth., Rev. Bonds (Partners Healthcare System Issue), Series 2007-C, Assured Guaranty Municipal insured, 1.66%
20422
| 7,530
| 7,530
|
State of Michigan, Fin. Auth., Hospital Rev. Bonds (CHE Trinity Health Credit Group), Series 2013-MI-1,
1.81% 2034 (put 2019)8
| 17,000
| 17,004
|
| State of Michigan, Board of Trustees of the Michigan State University, IAM Commercial Paper, Series 2019, 1.46% 9/5/2019
| 2,910
| 2,910
|
State of Michigan, Strategic Fund, Demand Limited Obligation Rev. Bonds
(Air Products and Chemicals, Inc. Project), Series 2007, 1.50% 20422
| 38,670
| 38,670
|
| State of Minnesota, City of St. Paul, Housing and Redev. Auth., Health Care System Demand Rev. Bonds (Allina Health System), Series 2009-B-1, JPMorgan Chase LOC,
1.46% 20352
| 10,000
| 10,000
|
State of Mississippi, Business Fin. Corp., Gulf Opportunity Zone Industrial Dev. Rev. Bonds
(Chevron U.S.A. Inc. Project), Series 2007-A, 1.48% 20302
| 46,435
| 46,435
|
State of Mississippi, Business Fin. Corp., Gulf Opportunity Zone Industrial Dev. Rev. Bonds
(Chevron U.S.A. Inc. Project), Series 2007-D, 1.48% 20302
| 35,830
| 35,830
|
State of Mississippi, Business Fin. Corp., Gulf Opportunity Zone Industrial Dev. Rev. Bonds
(Chevron U.S.A. Inc. Project), Series 2009-D, 1.48% 20302
| 9,500
| 9,500
|
State of Mississippi, Business Fin. Corp., Gulf Opportunity Zone Industrial Dev. Rev. Bonds
(Chevron U.S.A. Inc. Project), Series 2010-E, 1.41% 20302
| 2,200
| 2,200
|
State of Mississippi, Business Fin. Corp., Gulf Opportunity Zone Industrial Dev. Rev. Bonds
(Chevron U.S.A. Inc. Project), Series 2010-J, 1.48% 20352
| 27,710
| 27,710
|
State of Mississippi, Business Fin. Corp., Gulf Opportunity Zone Industrial Dev. Rev. Bonds
(Chevron U.S.A. Inc. Project), Series 2011-E, 1.48% 20352
| 24,150
| 24,150
|
State of Mississippi, Business Fin. Corp., Gulf Opportunity Zone Industrial Dev. Rev. Bonds
(Chevron U.S.A. Inc. Project), Series 2011-F, 1.48% 20352
| 17,340
| 17,340
|
State of Mississippi, Hospital Equipment and Facs. Auth., Rev. Bonds (Baptist Memorial Health Care),
Series 2004-B-2, 1.80% 2022 (put 2019)8
| 2,500
| 2,502
|
| State of New York, Dormitory Auth., IAM Commercial Paper (Columbia University), Series 2019, 1.55% 9/5/2019
| 2,300
| 2,300
|
State of New York, Metropolitan Transportation Auth., Transportation Rev. Bond Anticipation Notes,
Series 2018-A-1, 4.00% 8/15/2019
| 10,000
| 10,008
|
State of New York, Metropolitan Transportation Auth., Transportation Rev. Bond Anticipation Notes,
Series 2018-B-2, 5.00% 2021
| 5,000
| 5,327
|
| State of New York, New York City G.O. Bonds, Fiscal 2006, Series 2005-E-2, 1.47% 20342
| 7,050
| 7,050
|
| State of New York, New York City G.O. Bonds, Fiscal 2006, Series 2006-H-1, 1.48% 20362
| 500
| 500
|
State of New York, New York City G.O. Bonds, Fiscal 2008, Series 2008-C-4,
Assured Guaranty Municipal insured, 1.75% 20272
| 2,575
| 2,575
|
| State of New York, New York City G.O. Bonds, Fiscal 2008, Series 2008-J-5, 1.47% 20282
| 390
| 390
|
| State of New York, New York City G.O. Bonds, Fiscal 2008, Series 2008-L-3, 1.47% 20362
| 14,465
| 14,465
|
The Tax-Exempt Bond Fund of America — Page
116 of 120
| Short-term securities (continued)
| Principal amount
(000)
| Value
(000)
|
| State of New York, New York City G.O. Bonds, Fiscal 2008, Series 2008-L-5, 1.47% 20352
| $17,315
| $17,315
|
| State of New York, New York City G.O. Bonds, Fiscal 2013, Series 2013-F-3, 1.47% 20422
| 23,105
| 23,105
|
| State of New York, New York City G.O. Bonds, Fiscal 2015, Series 2015-F-6, 1.48% 20442
| 1,500
| 1,500
|
State of New York, New York City Municipal Water Fin. Auth., Water and Sewer System Rev. Bonds,
Fiscal 2012, Series 2012-B, 1.49% 20452
| 38,020
| 38,020
|
| State of New York, New York City Municipal Water Fin. Auth., Water and Sewer System Second General Resolution Rev. Bonds, Fiscal 2008, Series 2008-B-3, 1.47%
20252
| 22,300
| 22,300
|
| State of New York, New York City Municipal Water Fin. Auth., Water and Sewer System Second General Resolution Rev. Bonds, Fiscal 2011, Series 2011-FF-1, 1.47%
20442
| 8,775
| 8,775
|
| State of New York, New York City Municipal Water Fin. Auth., Water and Sewer System Second General Resolution Rev. Bonds, Fiscal 2012, Series 2012-A, 1.52%
20442
| 5,305
| 5,305
|
| State of New York, New York City Municipal Water Fin. Auth., Water and Sewer System Second General Resolution Rev. Bonds, Fiscal 2013, Series 2013-AA-2, 1.40%
20462
| 18,500
| 18,500
|
| State of New York, New York City Municipal Water Fin. Auth., Water and Sewer System Second General Resolution Rev. Bonds, Fiscal 2014, Series 2013-AA-2, 1.48%
20502
| 2,000
| 2,000
|
| State of New York, New York City Municipal Water Fin. Auth., Water and Sewer System Second General Resolution Rev. Bonds, Fiscal 2014, Series 2014-AA-1, 1.48%
20502
| 1,475
| 1,475
|
| State of New York, New York City Municipal Water Fin. Auth., Water and Sewer System Second General Resolution Rev. Bonds, Fiscal 2016, Series 2016-AA-1, 1.47%
20482
| 9,280
| 9,280
|
State of New York, New York City Transitional Fin. Auth., Future Tax Secured Bonds, Fiscal 2016,
Series 2016-A-4, 1.47% 20412
| 4,310
| 4,310
|
State of New York, New York City Transitional Fin. Auth., Future Tax Secured Bonds, Fiscal 2019,
Series 2019-A-4, 1.48% 20452
| 725
| 725
|
| State of New York, New York City Transitional Fin. Auth., Future Tax Secured Rev. Ref. Bonds, Fiscal 2015, Series 2015-E-3, 1.48% 20452
| 1,000
| 1,000
|
State of New York, New York City Transitional Fin. Auth., Future Tax Secured Rev. Ref. Bonds, Fiscal 2015, Series 2015-E-4,
1.47% 20452
| 1,550
| 1,550
|
| State of New York, New York City Transitional Fin. Auth., Future Tax Secured Rev. Ref. Bonds, Fiscal 2016, Series 2016-E-4, 1.48% 20452
| 1,500
| 1,500
|
State of New York, New York City Transitional Fin. Auth., Recovery Bonds, Fiscal 2003, Series 2002-1-C,
1.47% 20312
| 13,820
| 13,820
|
| State of New York, Triborough Bridge and Tunnel Auth., General Rev. Bonds (MTA Bridges and Tunnels), Series 2003-B-1, 1.46% 20332
| 3,600
| 3,600
|
State of North Carolina, Capital Facs. Fin. Agcy., IAM Commercial Paper (Duke University), Series 2019,
1.42% 9/4/2019
| 7,996
| 7,996
|
State of Ohio, County of Franklin, Rev. Bonds (CHE Trinity Health Credit Group), Series 2013-OH,
1.75% 2046 (put 2019)8
| 14,720
| 14,720
|
| State of Ohio, Hospital Rev. Bonds (Cleveland Clinic Health System Obligated Group), Series 2019-D-2, 1.48% 20522
| 2,000
| 2,000
|
| State of Ohio, Hospital Rev. Bonds (University Hospitals Health System Inc.), Series 2013, 1.62% 20332
| 14,720
| 14,720
|
State of Ohio, University of Cincinnati, General Receipts Floating Rate Notes, Series 2018-C,
1.855% 6/1/20202
| 5,000
| 5,000
|
State of Pennsylvania, Econ. Dev. Fncg. Auth., Solid Waste Disposal Rev. Bonds
(Waste Management, Inc. Project), Series 2004-A, 2.15% 2021 (put 2015)
| 2,175
| 2,203
|
State of South Carolina, Jobs-Econ. Dev. Auth., Hospital Rev. Bonds (Prisma Health Obligated Group),
Series 2018-B, 1.48% 20482
| 29,450
| 29,450
|
State of Tennessee, City of Clarksville, Public Building Auth., Pooled Fncg. Rev. Bonds, Series 2003,
Bank of America LOC, 1.52% 20332
| 2,225
| 2,225
|
| State of Tennessee, Metropolitan Government of Nashville and Davidson County, IAM Commercial Paper, Series 2019, 1.48% 10/2/2019
| 12,500
| 12,500
|
State of Tennessee, County of Montgomery, Public Building Auth., Pooled Fncg. Rev. Bonds
(Tennessee County Loan Pool), Series 2002, Bank of America LOC, 1.52% 20322
| 1,715
| 1,715
|
State of Tennessee, County of Montgomery, Public Building Auth., Pooled Fncg. Rev. Bonds
(Tennessee County Loan Pool), Series 2008, Bank of America LOC, 1.52% 20382
| 9,380
| 9,380
|
The Tax-Exempt Bond Fund of America — Page
117 of 120
| Short-term securities (continued)
| Principal amount
(000)
| Value
(000)
|
State of Texas, Gulf Coast Waste Disposal Auth., Pollution Control Rev. Ref. Bonds (Exxon Project),
Series 1989, 1.47% 20242
| $9,705
| $9,705
|
State of Texas, Gulf Coast Waste Disposal Auth., Pollution Control Rev. Ref. Bonds (Exxon Project),
Series 1995, 1.47% 6/1/20202
| 19,000
| 19,000
|
State of Texas, County of Harris, Cultural Education Facs. Fin. Corp., Special Facs. Rev. Ref. Bonds
(Medical Center), Series 2008-A, JPMorgan Chase LOC, 1.48% 20312
| 1,100
| 1,100
|
State of Texas, County of Harris, Industrial Dev. Corp., Pollution Control Rev. Bonds (Exxon Project),
Series 1984-A, 1.47% 20242
| 2,700
| 2,700
|
State of Texas, County of Harris, Industrial Dev. Corp., Pollution Control Rev. Bonds
(Exxon Project), Series 1984-A, 1.47% 20242
| 14,400
| 14,400
|
State of Texas, Harris County Cultural Education Facs. Fin. Corp., Special Facs. Rev. Ref. Bonds
(Medical Center), Series 2008-B-1, JPMorgan Chase LOC, 1.48% 20312
| 5,460
| 5,460
|
State of Texas, City of Houston, Combined Utility System IAM Commercial Paper, Series 2019,
1.27% 9/6/2019
| 5,000
| 5,000
|
State of Texas, City of Houston, Combined Utility System IAM Commercial Paper, Series 2019,
1.27% 9/6/2019
| 10,000
| 10,000
|
State of Texas, City of Houston, Combined Utility System IAM Commercial Paper, Series 2019,
1.29% 9/6/2019
| 3,000
| 3,000
|
| State of Texas, City of Houston, Tax and Rev. Anticipation Notes, Series 2019, 5.00% 6/26/2020
| 13,000
| 13,447
|
State of Texas, County of Jefferson, Port Arthur Navigation Dist., Pollution Control Rev. Ref. Bonds
(Texaco Inc. Project), Series 1994, 1.48% 20242
| 1,300
| 1,300
|
| State of Texas, Lower Colorado River Auth., IAM Commercial Paper, Series 2019, 1.39% 8/6/2019
| 7,000
| 7,000
|
State of Texas, Mission Econ. Dev. Corp., Solid Waste Disposal Rev. Bonds
(Allied Waste North America, Inc. Project), Series 2008-A, 1.48% 1/1/2020 (put 2019)8
| 12,500
| 12,504
|
State of Texas, Port Arthur Navigation Dist. Industrial Dev. Corp., Rev. Bonds (Air Products Project),
Series 2005, 1.50% 20402
| 1,500
| 1,500
|
State of Texas, City of San Antonio, Electric and Gas Systems IAM Commercial Paper, Series 2019,
1.53% 9/5/2019
| 10,000
| 10,000
|
| State of Texas, Tax and Rev. Anticipation Notes, Series 2018, 4.00% 8/29/2019
| 46,255
| 46,346
|
| State of Texas, Board of Regents of the University of Texas System, IAM Commercial Paper, Series 2019, 1.32% 10/4/2019
| 10,000
| 10,000
|
| State of Texas, Board of Regents of the University of Texas System, IAM Commercial Paper, Series 2019, 1.35% 8/5/2019
| 10,000
| 10,000
|
| State of Texas, Board of Regents of the University of Texas System, IAM Commercial Paper, Series 2019, 1.37% 9/5/2019
| 25,000
| 25,000
|
| State of Texas, Board of Regents of the University of Texas System, IAM Commercial Paper, Series 2019, 1.40% 8/8/2019
| 10,000
| 10,000
|
| State of Texas, Board of Regents of the University of Texas System, IAM Commercial Paper, Series 2019, 1.40% 9/4/2019
| 10,000
| 10,000
|
| State of Texas, Board of Regents of the University of Texas System, IAM Commercial Paper, Series 2019, 1.42% 8/12/2019
| 5,000
| 5,000
|
| State of Texas, Board of Regents of the University of Texas System, IAM Commercial Paper, Series 2019, 1.50% 11/4/2019
| 10,000
| 10,000
|
| State of Texas, Board of Regents of the University of Texas System, IAM Commercial Paper, Series 2019, 1.57% 9/12/2019
| 3,000
| 3,000
|
State of Texas, Waterworks Auth., Water and Wastewater System IAM Commercial Paper, Series 2019,
1.46% 9/3/2019
| 5,000
| 5,000
|
State of Virginia, Rector and Visitors of the University of Virginia, IAM Commercial Paper, Series 2019,
1.39% 8/7/2019
| 7,500
| 7,500
|
State of Virginia, Rector and Visitors of the University of Virginia, IAM Commercial Paper, Series 2019,
1.40% 8/5/2019
| 5,500
| 5,500
|
State of Virginia, Rector and Visitors of the University of Virginia, IAM Commercial Paper, Series 2019,
1.62% 8/6/2019
| 11,200
| 11,200
|
| State of Wisconsin, Deforest Area School Dist., Bond Anticipation Notes, Series 2019, 3.00% 12/18/2019
| 8,000
| 8,006
|
| State of Wisconsin, Milton School Dist., Bond Anticipation Notes, Series 2019, 5.00% 8/19/2019
| 5,500
| 5,510
|
The Tax-Exempt Bond Fund of America — Page
118 of 120
| Short-term securities (continued)
| Principal amount
(000)
| Value
(000)
|
| State of Wisconsin, Sun Prairie School Dist., Bond Anticipation Notes, Series 2019, 3.00% 12/31/2019
| $4,000
| $4,005
|
| State of Wyoming, County of Lincoln, Pollution Control Rev. Ref. Bonds (ExxonMobil Project), Series 2014, 1.47% 20442
| 7,400
| 7,400
|
| State of Wyoming, County of Sublette, Pollution Control Rev. Ref. Bonds (ExxonMobil Project), Series 2014, 1.47% 20442
| 4,000
| 4,000
|
| State of Wyoming, County of Uinta, Wyoming Pollution Control Rev. Ref. Bonds (Chevron U.S.A. Inc. Project), Series 1992, 1.48% 20222
| 6,610
| 6,610
|
| Total short-term securities (cost: $1,342,656,000)
|
| 1,343,782
|
| Total investment securities 99.84% (cost: $20,617,821,000)
|
| 21,610,872
|
| Other assets less liabilities 0.16%
|
| 34,765
|
| Net assets 100.00%
|
| $21,645,637
|
Futures contracts
| Contracts
| Type
| Number of
contracts
| Expiration
| Notional
amount9
(000)
| Value at
7/31/201910
(000)
| Unrealized
(depreciation)
appreciation
at 7/31/2019
(000)
|
| 2 Year U.S. Treasury Note Futures
| Long
| 7,183
| October 2019
| $1,436,600
| $1,540,080
| $(3,140)
|
| 5 Year U.S. Treasury Note Futures
| Long
| 1,521
| October 2019
| 152,100
| 178,801
| 1,295
|
| 10 Year Ultra U.S. Treasury Note Futures
| Short
| 507
| September 2019
| (50,700)
| (69,887)
| (1,145)
|
| 10 Year U.S. Treasury Note Futures
| Short
| 5,627
| September 2019
| (562,700)
| (717,003)
| (3,193)
|
| 30 Year Ultra U.S. Treasury Bond Futures
| Short
| 459
| September 2019
| (45,900)
| (81,501)
| (3,004)
|
|
|
|
|
|
|
| $(9,187)
|
| 1
| Acquired in a transaction exempt from registration under Rule 144A of the Securities Act of 1933. May be resold in the U.S. in transactions exempt from registration, normally to
qualified institutional buyers. The total value of all such securities, including those in “Other securities,” was $360,619,000, which represented 1.67% of the net assets of the fund.
|
| 2
| Coupon rate may change periodically. For short-term securities, the date of the next scheduled coupon rate change is considered to be the maturity date.
|
| 3
| Scheduled interest and/or principal payment was not received.
|
| 4
| Step bond; coupon rate may change at a later date.
|
| 5
| Amount less than one thousand.
|
| 6
| Valued under fair value procedures adopted by authority of the board of trustees. The total value of the security was $5,935,000, which represented .03% of the net assets of the fund.
|
| 7
| Value determined using significant unobservable inputs.
|
| 8
| For short-term securities, the mandatory put date is considered to be the maturity date.
|
| 9
| Notional amount is calculated based on the number of contracts and notional contract size.
|
| 10
| Value is calculated based on the notional amount and current market price.
|
| Key to abbreviations and symbol
|
|
| Agcy. = Agency
| Fncg. = Financing
|
| Auth. = Authority
| G.O. = General Obligation
|
| Certs. of Part. = Certificates of Participation
| LIBOR = London Interbank Offered Rate
|
| Dept. = Department
| LOC = Letter of Credit
|
| Dev. = Development
| Preref. = Prerefunded
|
| Dist. = District
| Redev. = Redevelopment
|
| Econ. = Economic
| Ref. = Refunding
|
| Fac. = Facility
| Rev. = Revenue
|
| Facs. = Facilities
| SIFMA = Securities Industry and Financial Markets Association
|
| Fin. = Finance
| USD/$ = U.S. dollars
|
The Tax-Exempt Bond Fund of America — Page
119 of 120
Additional financial disclosures
are included in the fund’s current shareholder report and should be read in conjunction with this report.
Investments are not FDIC-insured, nor
are they deposits of or guaranteed by a bank or any other entity, so they may lose value.
Investors should carefully consider
investment objectives, risks, charges and expenses. This and other important information is contained in the fund prospectus and summary prospectus, which can be obtained from your financial professional and should be
read carefully before investing. You may also call American Funds Service Company (AFS) at (800) 421-4225 or visit the American Funds website at capitalgroup.com.
All Capital Group trademarks
mentioned are owned by The Capital Group Companies, Inc., an affiliated company or fund. All other company and product names mentioned are the property of their respective companies.
American Funds Distributors, Inc.,
member FINRA.
© 2019 Capital Group. All
rights reserved.
| MFGEFPX-019-0919O-S73084
| The Tax-Exempt Bond Fund of America — Page 120 of 120
|
American High-Income Municipal Bond
Fund®
Investment portfolio
July 31, 2019
Bonds, notes & other debt instruments 93.65%
Alabama 0.99%
| Principal amount
(000)
| Value
(000)
|
| City of Birmingham, Special Care Facs. Fncg. Auth., Rev. Bonds (Ascension Health Senior Credit Group), Series 2016-B, 5.00% 2046
| $500
| $575
|
| Black Belt Energy Gas Dist., Gas Supply Rev. Bonds, Series 2017-A, 4.00% 2047 (put 2022)
| 10,000
| 10,680
|
| County of Houston, Health Care Auth., Hospital Rev. Bonds, Series 2016-A, 5.00% 2030
| 5,000
| 5,780
|
| County of Jefferson, Limited Obligation Rev. Ref. Bonds, Series 2017, 5.00% 2032
| 1,000
| 1,201
|
| County of Jefferson, Limited Obligation Rev. Ref. Bonds, Series 2017, 5.00% 2033
| 2,000
| 2,394
|
| County of Jefferson, Sewer Rev. Warrants, Capital Appreciation Warrants, Series 2013-E, 0% 2028
| 250
| 167
|
| County of Jefferson, Sewer Rev. Warrants, Capital Appreciation Warrants, Series 2013-E, 0% 2034
| 2,500
| 1,003
|
| County of Jefferson, Sewer Rev. Warrants, Capital Appreciation Warrants, Series 2013-E, 0% 2035
| 17,475
| 6,448
|
| County of Jefferson, Sewer Rev. Warrants, Capital Appreciation Warrants, Series 2013-E, 0% 2036
| 7,500
| 2,539
|
County of Jefferson, Sewer Rev. Warrants, Capital Appreciation Warrants, Series 2013-F,
0% 2046 (7.75% on 10/1/2023)1
| 2,500
| 2,373
|
| County of Jefferson, Sewer Rev. Warrants, Series 2013-A, Assured Guaranty Municipal insured, 5.00% 2044
| 1,600
| 1,800
|
| County of Jefferson, Sewer Rev. Warrants, Series 2013-A, Assured Guaranty Municipal insured, 5.25% 2048
| 700
| 794
|
| County of Jefferson, Sewer Rev. Warrants, Series 2013-D, 6.00% 2042
| 7,100
| 8,401
|
| County of Jefferson, Sewer Rev. Warrants, Series 2013-D, 6.50% 2053
| 6,000
| 7,192
|
| County of Jefferson, Sewer Rev. Warrants, Series 2013-D, 7.00% 2051
| 520
| 635
|
| Lower Alabama Gas Dist., Gas Project Rev. Bonds, Series 2016-A, 5.00% 2046
| 3,500
| 4,767
|
City of Montgomery, Medical Clinic Board, Health Care Fac. Rev. Bonds (Jackson Hospital & Clinic),
Series 2015, 5.00% 2033
| 2,500
| 2,821
|
City of Montgomery, Medical Clinic Board, Health Care Fac. Rev. Bonds (Jackson Hospital & Clinic),
Series 2016, 5.00% 2036
| 3,400
| 3,804
|
| City of Phenix, Industrial Dev. Board, Environmental Improvement Rev. Ref. Bonds (MeadWestvaco-Mead Coated Board Project), Series 2012-A, AMT, 4.125% 2035
| 6,055
| 6,194
|
| County of Tuscaloosa, Industrial Dev. Auth., Gulf Opportunity Zone Rev. Ref. Bonds (Hunt Refining Co. Project), Series 2019-A, 4.50% 20322
| 4,500
| 4,884
|
| County of Tuscaloosa, Industrial Dev. Auth., Gulf Opportunity Zone Rev. Ref. Bonds (Hunt Refining Co. Project), Series 2019-A, 5.25% 20442
| 2,000
| 2,222
|
|
|
| 76,674
|
| Alaska 0.12%
|
|
|
| Housing Fin. Corp., General Mortgage Rev. Bonds, Series 2018-A, 4.00% 2048
| 3,885
| 4,237
|
| Industrial Dev. and Export Auth., Power Rev. Ref. Bonds, Series 2015, AMT, 5.00% 2033
| 2,000
| 2,171
|
| Industrial Dev. and Export Auth., Power Rev. Ref. Bonds, Series 2015, AMT, 5.00% 2034
| 2,000
| 2,166
|
| International Airport System, Rev. Ref. Bonds, Series 2016-D, AMT, 5.00% 2020
| 1,000
| 1,043
|
|
|
| 9,617
|
| American Samoa 0.16%
|
|
|
| Econ. Dev. Auth., Rev. Ref. Bonds, Series 2015-A, 7.125% 20382
| 11,000
| 12,126
|
| Arizona 2.77%
|
|
|
Town of Buckeye, Verrado Dist. 1 Community Facs. Dist., Dist. G.O. Rev. Ref. Bonds, Series 2013-A,
5.00% 20212
| 500
| 515
|
Town of Buckeye, Verrado Dist. 1 Community Facs. Dist., Dist. G.O. Rev. Ref. Bonds, Series 2013-A,
5.00% 20222
| 500
| 520
|
American High-Income Municipal Bond Fund —
Page 1 of 74
Bonds, notes & other debt instruments (continued)
Arizona (continued)
| Principal amount
(000)
| Value
(000)
|
Town of Buckeye, Verrado Dist. 1 Community Facs. Dist., Dist. G.O. Rev. Ref. Bonds, Series 2013-B,
5.00% 20232
| $260
| $273
|
Town of Buckeye, Verrado Dist. 1 Community Facs. Dist., Dist. G.O. Rev. Ref. Bonds, Series 2013-B,
5.70% 20292
| 770
| 818
|
Town of Buckeye, Verrado Dist. 1 Community Facs. Dist., Dist. G.O. Rev. Ref. Bonds, Series 2013-B,
6.00% 20332
| 700
| 745
|
| City of Glendale, Industrial Dev. Auth., Rev. and Rev. Ref. Bonds (Glencroft Retirement Community Project), Series 2016, 4.25% 2026
| 670
| 693
|
| City of Glendale, Industrial Dev. Auth., Rev. and Rev. Ref. Bonds (Glencroft Retirement Community Project), Series 2016, 5.00% 2036
| 600
| 635
|
| City of Glendale, Industrial Dev. Auth., Rev. and Rev. Ref. Bonds (Glencroft Retirement Community Project), Series 2016, 5.25% 2046
| 1,545
| 1,632
|
Health Facs. Auth., Rev. Ref. Bonds (Phoenix Children’s Hospital), Series 2013-A-1,
(SIFMA Municipal Swap Index + 1.85%) 3.25% 2048 (put 2020)3
| 2,500
| 2,501
|
Industrial Dev. Auth., Education Rev. Bonds (Academies of Math & Science Projects), Series 2017-B,
5.125% 20472
| 2,230
| 2,342
|
Industrial Dev. Auth., Education Rev. Bonds (Academies of Math & Science Projects), Series 2017-B,
5.25% 20512
| 570
| 601
|
Industrial Dev. Auth., Education Rev. Bonds (Academies of Math & Science Projects), Series 2018-B,
5.50% 20382
| 1,200
| 1,301
|
Industrial Dev. Auth., Education Rev. Bonds (Academies of Math & Science Projects), Series 2018-B,
5.625% 20482
| 2,500
| 2,695
|
Industrial Dev. Auth., Education Rev. Bonds (Academies of Math & Science Projects), Series 2018-B,
5.75% 20532
| 3,750
| 4,052
|
| Industrial Dev. Auth., Education Rev. Bonds (Basis School Project), Series 2017-A, 5.125% 20372
| 1,500
| 1,629
|
| Industrial Dev. Auth., Education Rev. Bonds (Basis School Project), Series 2017-A, 5.25% 20472
| 2,450
| 2,642
|
| Industrial Dev. Auth., Education Rev. Bonds (Basis School Project), Series 2017-A, 5.375% 20502
| 6,160
| 6,675
|
| Industrial Dev. Auth., Education Rev. Bonds (Basis School Project), Series 2017-D, 5.00% 20372
| 675
| 735
|
| Industrial Dev. Auth., Education Rev. Bonds (Basis School Project), Series 2017-D, 5.00% 20472
| 1,035
| 1,109
|
| Industrial Dev. Auth., Education Rev. Bonds (Basis School Project), Series 2017-D, 5.00% 20512
| 3,450
| 3,684
|
| Industrial Dev. Auth., Education Rev. Bonds (Basis School Project), Series 2017-G, 4.00% 20272
| 2,600
| 2,744
|
| Industrial Dev. Auth., Education Rev. Bonds (Basis School Project), Series 2017-G, 5.00% 20472
| 2,125
| 2,277
|
| Industrial Dev. Auth., Education Rev. Bonds (Basis School Project), Series 2017-G, 5.00% 20512
| 1,550
| 1,655
|
| Industrial Dev. Auth., Education Rev. Bonds (Doral Academy of Nevada - Fire Mesa and Red Rock Campus Projects), Series 2019-A, 3.55% 20292
| 735
| 754
|
| Industrial Dev. Auth., Education Rev. Bonds (Doral Academy of Nevada - Fire Mesa and Red Rock Campus Projects), Series 2019-A, 5.00% 20392
| 1,325
| 1,446
|
| Industrial Dev. Auth., Education Rev. Bonds (Doral Academy of Nevada - Fire Mesa and Red Rock Campus Projects), Series 2019-A, 5.00% 20492
| 1,550
| 1,672
|
Industrial Dev. Auth., Education Rev. Bonds (Legacy Traditional School Southwest Las Vegas Campus),
Series 2018, 5.25% 20222
| 9,000
| 9,031
|
Industrial Dev. Auth., Education Rev. Bonds (Leman Academy of Excellence Projects), Series 2017-A,
5.00% 20372
| 1,350
| 1,392
|
Industrial Dev. Auth., Education Rev. Bonds (Leman Academy of Excellence Projects), Series 2017-A,
5.25% 20472
| 4,830
| 4,981
|
Industrial Dev. Auth., Education Rev. Bonds (Leman Academy of Excellence Projects), Series 2017-A,
5.25% 20522
| 2,500
| 2,570
|
| Industrial Dev. Auth., Education Rev. Bonds (Pinecrest Academy of Nevada - Horizon, Inspirada and St. Rose Campus Projects), Series 2018-A, 5.75% 20382
| 1,810
| 2,045
|
| Industrial Dev. Auth., Education Rev. Bonds (Pinecrest Academy of Nevada - Horizon, Inspirada and St. Rose Campus Projects), Series 2018-A, 5.75% 20482
| 3,230
| 3,599
|
| Industrial Dev. Auth., Education Rev. Bonds (Somerset Academy of Las Vegas - Lone Mountain Campus Projects), Series 2019-A, 3.75% 20292
| 565
| 583
|
| Industrial Dev. Auth., Education Rev. Bonds (Somerset Academy of Las Vegas - Lone Mountain Campus Projects), Series 2019-A, 5.00% 20392
| 440
| 478
|
American High-Income Municipal Bond Fund —
Page 2 of 74
Bonds, notes & other debt instruments (continued)
Arizona (continued)
| Principal amount
(000)
| Value
(000)
|
| Industrial Dev. Auth., Education Rev. Bonds (Somerset Academy of Las Vegas - Lone Mountain Campus Projects), Series 2019-A, 5.00% 20492
| $700
| $750
|
Industrial Dev. Auth., Student Housing Rev. Bonds (Provident Group - NCCU Properties LLC -
North Carolina Central University), Series 2019-A, BAM insured, 5.00% 2049
| 1,500
| 1,757
|
| County of Maricopa, Industrial Dev. Auth., Education Rev. Bonds (Benjamin Franklin Charter School Projects), Series 2018-A, 6.00% 20382
| 4,000
| 4,598
|
| County of Maricopa, Industrial Dev. Auth., Education Rev. Bonds (Benjamin Franklin Charter School Projects), Series 2018-A, 6.00% 20522
| 3,625
| 4,098
|
| County of Maricopa, Industrial Dev. Auth., Education Rev. Bonds (Paradise Schools Projects), Series 2016, 5.00% 20362
| 2,500
| 2,716
|
| County of Maricopa, Industrial Dev. Auth., Education Rev. Bonds (Paradise Schools Projects), Series 2016, 5.00% 20472
| 4,540
| 4,846
|
County of Maricopa, Pollution Control Corp., Pollution Control Rev. Ref. Bonds
(El Paso Electric Co. Palo Verde Project), Series 2009-A, 3.60% 2040
| 2,000
| 2,021
|
County of Maricopa, Pollution Control Rev. Ref. Bonds (Southern California Edison Co.), Series 2000-B,
5.00% 2035
| 3,000
| 3,071
|
| City of Phoenix, Industrial Dev. Auth., Education Fac. Rev. Bonds (Basis Schools, Inc. Project), Series 2015, 5.00% 20352
| 6,055
| 6,499
|
| City of Phoenix, Industrial Dev. Auth., Education Fac. Rev. Bonds (Basis Schools, Inc. Project), Series 2015, 5.00% 20452
| 5,500
| 5,811
|
| City of Phoenix, Industrial Dev. Auth., Education Fac. Rev. Bonds (Basis Schools, Inc. Project), Series 2016-A, 5.00% 20352
| 1,500
| 1,610
|
| City of Phoenix, Industrial Dev. Auth., Education Fac. Rev. Bonds (Basis Schools, Inc. Project), Series 2016-A, 5.00% 20462
| 7,100
| 7,497
|
| City of Phoenix, Industrial Dev. Auth., Education Fac. Rev. Bonds (Legacy Traditional Schools East Mesa and Cadence Campuses), Series 2017-A, 4.00% 20222
| 18,900
| 18,890
|
City of Phoenix, Industrial Dev. Auth., Education Fac. Rev. Bonds (Legacy Traditional Schools Phoenix
Campus), Series 2017-B, 4.00% 20222
| 7,250
| 7,246
|
City of Phoenix, Industrial Dev. Auth., Education Fac. Rev. Bonds (Legacy Traditional Schools Projects),
Series 2014-A, 5.75% 20242
| 1,250
| 1,348
|
City of Phoenix, Industrial Dev. Auth., Education Fac. Rev. Bonds (Legacy Traditional Schools Projects),
Series 2014-A, 6.50% 20342
| 1,560
| 1,792
|
City of Phoenix, Industrial Dev. Auth., Education Fac. Rev. Bonds (Legacy Traditional Schools Projects),
Series 2014-A, 6.75% 20442
| 6,900
| 7,887
|
City of Phoenix, Industrial Dev. Auth., Education Fac. Rev. Bonds (Legacy Traditional Schools Projects),
Series 2015, 5.00% 20352
| 1,590
| 1,704
|
City of Phoenix, Industrial Dev. Auth., Education Fac. Rev. Bonds (Legacy Traditional Schools Projects),
Series 2015, 5.00% 20452
| 2,250
| 2,373
|
City of Phoenix, Industrial Dev. Auth., Education Fac. Rev. Bonds (Legacy Traditional Schools Projects),
Series 2016-A, 4.00% 20262
| 3,275
| 3,381
|
City of Phoenix, Industrial Dev. Auth., Education Fac. Rev. Bonds (Legacy Traditional Schools Projects),
Series 2016-A, 5.00% 20412
| 10,000
| 10,673
|
City of Phoenix, Industrial Dev. Auth., Education Fac. Rev. Bonds (Legacy Traditional Schools Projects),
Series 2016-A, 5.00% 20462
| 2,500
| 2,656
|
| City of Phoenix, Industrial Dev. Auth., Education Fac. Rev. Bonds (Leman Academy of Excellence - Oro Valley Projects), Series 2018-A, 5.00% 20382
| 3,100
| 3,193
|
| City of Phoenix, Industrial Dev. Auth., Education Fac. Rev. Bonds (Leman Academy of Excellence - Oro Valley Projects), Series 2018-A, 5.25% 20482
| 3,000
| 3,093
|
| City of Phoenix, Industrial Dev. Auth., Education Fac. Rev. Bonds (Leman Academy of Excellence - Oro Valley Projects), Series 2018-A, 5.25% 20532
| 4,980
| 5,118
|
| City of Phoenix, Industrial Dev. Auth., Education Fac. Rev. Bonds (Leman Academy of Excellence - Oro Valley Projects), Series 2019-A, 5.00% 20392
| 410
| 422
|
| City of Phoenix, Industrial Dev. Auth., Education Fac. Rev. Bonds (Leman Academy of Excellence - Oro Valley Projects), Series 2019-A, 5.00% 20492
| 1,185
| 1,213
|
| City of Phoenix, Industrial Dev. Auth., Lease Rev. Bonds (Rowan University Project), Series 2012, 5.25% 2034
| 5,000
| 5,461
|
American High-Income Municipal Bond Fund —
Page 3 of 74
Bonds, notes & other debt instruments (continued)
Arizona (continued)
| Principal amount
(000)
| Value
(000)
|
| County of Pinal, Industrial Dev. Auth., Environmental Facs. Rev. Green Bonds (WOF SW GGP 1 LLC Project), Series 2018, AMT, 7.25% 20332
| $13,500
| $14,804
|
| City of Tempe, Industrial Dev. Auth., Rev. Bonds (Mirabella at ASU Project), Series 2017-A, 6.00% 20372
| 700
| 802
|
| City of Tempe, Industrial Dev. Auth., Rev. Bonds (Mirabella at ASU Project), Series 2017-A, 6.125% 20472
| 1,900
| 2,157
|
City of Tempe, Industrial Dev. Auth., Rev. Ref. Bonds (Friendship Village of Tempe), Series 2012-A,
5.00% 2019
| 500
| 505
|
City of Tempe, Industrial Dev. Auth., Rev. Ref. Bonds (Friendship Village of Tempe), Series 2012-A,
6.25% 2042
| 1,000
| 1,059
|
| County of Yavapai, Industrial Dev. Auth., Solid Waste Disposal Rev. Bonds (Waste Management, Inc. Project), Series 2002, AMT, 2.80% 2027 (put
2021)
| 2,500
| 2,556
|
|
|
| 214,631
|
| Arkansas 0.10%
|
|
|
Dev. Fin. Auth., Health Care Rev. Bonds (Baptist Memorial Health Care), Series 2015-B-3,
(SIFMA Municipal Swap Index + 1.55%) 2.95% 2044 (put 2022)3
| 1,600
| 1,625
|
| Dev. Fin. Auth., Industrial Dev. Rev. Bonds (Big River Steel Project), Series 2019, AMT, 4.50% 20492
| 5,000
| 5,201
|
County of Jefferson, Hospital Rev. Ref. Bonds (Jefferson Regional Medical Center), Series 2011,
Assured Guaranty Municipal insured, 4.00% 2023
| 1,000
| 1,009
|
|
|
| 7,835
|
| California 5.60%
|
|
|
City of Alameda, Community Facs. Dist. No. 2013-1 (Alameda Landing Public Improvements),
Special Tax Bonds, Series 2016, 5.00% 2027
| 100
| 115
|
City of Alameda, Community Facs. Dist. No. 2013-1 (Alameda Landing Public Improvements),
Special Tax Bonds, Series 2016, 5.00% 2031
| 150
| 171
|
City of Alameda, Community Facs. Dist. No. 2013-1 (Alameda Landing Public Improvements),
Special Tax Bonds, Series 2016, 5.00% 2032
| 160
| 182
|
City of Alameda, Community Facs. Dist. No. 2013-1 (Alameda Landing Public Improvements),
Special Tax Bonds, Series 2016, 5.00% 2033
| 320
| 363
|
| City of Alhambra, Rev. Bonds (Atherton Baptist Homes Project), Series 2010-A, 7.50% 2030 (preref. 2020)
| 2,905
| 2,983
|
| City of Anaheim, Public Fncg. Auth., Lease Rev. Bonds (Anaheim Convention Center Expansion Project), Series 2014-A, 5.00% 2046
| 2,000
| 2,285
|
| City of Azusa, Community Facs. Dist. No. 2005-1 (Rosedale), Improvement Area No. 1, Special Tax Bonds, Series 2007, 5.00% 2020
| 775
| 777
|
| City of Azusa, Community Facs. Dist. No. 2005-1 (Rosedale), Improvement Area No. 1, Special Tax Bonds, Series 2007, 5.00% 2037
| 3,540
| 3,551
|
Assn. of Bay Area Governments, Fin. Auth. for Nonprofit Corps., Rev. Ref. Bonds
(Episcopal Senior Communities), Series 2011, 6.00% 2031
| 1,250
| 1,350
|
Assn. of Bay Area Governments, Fin. Auth. for Nonprofit Corps., Rev. Ref. Bonds
(Episcopal Senior Communities), Series 2012-A, 5.00% 2047
| 3,500
| 3,724
|
Bay Area Toll Auth., San Francisco Bay Area Toll Bridge Rev. Bonds, Series 2008-B-1,
(SIFMA Municipal Swap Index + 1.10%) 2.50% 2045 (put 2024)3
| 1,500
| 1,541
|
City of Carlsbad, Reassessment Dist. No. 2012-1, Limited Obligation Rev. Ref. Bonds, Series 2013,
3.70% 2024
| 600
| 625
|
City of Carlsbad, Reassessment Dist. No. 2012-1, Limited Obligation Rev. Ref. Bonds, Series 2013,
3.80% 2025
| 650
| 677
|
City of Carlsbad, Reassessment Dist. No. 2012-1, Limited Obligation Rev. Ref. Bonds, Series 2013,
3.90% 2026
| 625
| 651
|
Center Joint Unified School Dist., G.O. Rev. Ref. Bonds, Capital Appreciation Bonds, Series 2016,
BAM insured, 0% 2029
| 1,000
| 788
|
Center Joint Unified School Dist., G.O. Rev. Ref. Bonds, Capital Appreciation Bonds, Series 2016,
BAM insured, 0% 2030
| 1,100
| 828
|
Center Joint Unified School Dist., G.O. Rev. Ref. Bonds, Capital Appreciation Bonds, Series 2016,
BAM insured, 0% 2031
| 2,000
| 1,440
|
American High-Income Municipal Bond Fund —
Page 4 of 74
Bonds, notes & other debt instruments (continued)
California (continued)
| Principal amount
(000)
| Value
(000)
|
City of Cerritos, Public Fncg. Auth., Rev. Bonds (Los Coyotes Redev. Project Loan), Series 1993-A,
AMBAC insured, 6.50% 2023
| $955
| $1,113
|
| City of Cerritos, Public Fncg. Auth., Tax Allocation Rev. Bonds (Cerritos Redev. Projects), Series 2002-A, AMBAC insured, 5.00% 2020
| 2,500
| 2,607
|
| City of Cerritos, Public Fncg. Auth., Tax Allocation Rev. Bonds (Cerritos Redev. Projects), Series 2002-A, AMBAC insured, 5.00% 2022
| 2,000
| 2,098
|
City of Chula Vista, Industrial Dev. Rev. Ref. Bonds (San Diego Gas & Electric Co.), Series 2004-C,
5.875% 2034
| 1,100
| 1,104
|
| City of Chula Vista, Municipal Fncg. Auth., Special Tax Rev. Ref. Bonds, Series 2013, 5.00% 2034
| 945
| 1,055
|
| Corona-Norco Unified School Dist., Public Fin. Auth., Special Tax Rev. Bonds, Series 2016-05-1, 4.00% 2029
| 615
| 682
|
| Corona-Norco Unified School Dist., Public Fin. Auth., Special Tax Rev. Bonds, Series 2016-05-1, 4.00% 2030
| 640
| 705
|
Duarte Unified School Dist., G.O. Bonds, Capital Appreciation Bonds, 2010 Election, Series 2011-A,
BAM insured, 0% 2036
| 5,520
| 3,210
|
Elk Grove Unified School Dist., Community Facs. Dist. No. 1, Special Tax Rev. Ref. Bonds, Series 2012,
4.00% 2033
| 4,000
| 4,202
|
| City of Fontana, Community Facs. Dist. No. 22 (Sierra Hills South), Special Tax Bonds, Series 2014, 5.00% 2030
| 2,080
| 2,341
|
Foothill/Eastern Transportation Corridor Agcy., Toll Road Rev. Ref. Bonds, Capital Appreciation Bonds,
Series 2013-A, 0% 2042
| 5,000
| 2,240
|
Foothill/Eastern Transportation Corridor Agcy., Toll Road Rev. Ref. Bonds, Capital Appreciation Bonds,
Series 2015-A, Assured Guaranty Municipal insured, 0% 2034
| 4,000
| 2,650
|
Foothill/Eastern Transportation Corridor Agcy., Toll Road Rev. Ref. Bonds, Capital Appreciation Bonds,
Series 2015-A, Assured Guaranty Municipal insured, 0% 2035
| 1,000
| 640
|
| Foothill/Eastern Transportation Corridor Agcy., Toll Road Rev. Ref. Bonds, Convertible Capital Appreciation Bonds, Series 2013-A, 0% 2042 (6.85% on 1/15/2024)1
| 1,250
| 1,279
|
| Foothill/Eastern Transportation Corridor Agcy., Toll Road Rev. Ref. Bonds, Series 2013-A, 5.75% 2046
| 3,000
| 3,476
|
| Foothill/Eastern Transportation Corridor Agcy., Toll Road Rev. Ref. Bonds, Series 2013-A, 6.00% 2053
| 4,000
| 4,689
|
| Foothill/Eastern Transportation Corridor Agcy., Toll Road Rev. Ref. Bonds, Series 2013-C, 6.50% 2043
| 3,500
| 4,143
|
Golden State Tobacco Securitization Corp., Enhanced Tobacco Settlement Asset-Backed Bonds,
Capital Appreciation Bonds, Series 2005-A, AMBAC insured, 0% 2027
| 5,000
| 4,337
|
Golden State Tobacco Securitization Corp., Enhanced Tobacco Settlement Asset-Backed Bonds,
Capital Appreciation Bonds, Series 2007-B, 0% 2047
| 20,000
| 3,176
|
Golden State Tobacco Securitization Corp., Enhanced Tobacco Settlement Asset-Backed Bonds,
Series 2018-A-1, 5.00% 2047
| 1,300
| 1,314
|
Golden State Tobacco Securitization Corp., Enhanced Tobacco Settlement Asset-Backed Bonds,
Series 2018-A-2, 5.00% 2047
| 7,900
| 7,983
|
Grossmont Union High School Dist., G.O. Bonds, Capital Appreciation Bonds, 2004 Election, Series 2008,
0% 2032
| 5,000
| 3,625
|
| Hemet Unified School Dist., Fncg. Auth., Special Tax Rev. Ref. Bonds, Series 2015, 5.00% 2024
| 225
| 258
|
| Hemet Unified School Dist., Fncg. Auth., Special Tax Rev. Ref. Bonds, Series 2015, 5.00% 2028
| 1,220
| 1,397
|
| Hemet Unified School Dist., Fncg. Auth., Special Tax Rev. Ref. Bonds, Series 2015, 5.00% 2032
| 540
| 610
|
| Hemet Unified School Dist., Fncg. Auth., Special Tax Rev. Ref. Bonds, Series 2015, 5.00% 2033
| 580
| 654
|
| Hemet Unified School Dist., Fncg. Auth., Special Tax Rev. Ref. Bonds, Series 2015, 5.00% 2034
| 350
| 393
|
Independent Cities Lease Fin. Auth., Mobile Home Park Rev. Ref. Bonds (Palomar Estates West),
Series 2015, 5.00% 2036
| 1,000
| 1,089
|
Infrastructure and Econ. Dev. Bank, Rev. Ref. Bonds (Pacific Gas and Electric Co.), Series 2008-F,
1.75% 2026 (put 2022)4
| 23,750
| 23,037
|
Infrastructure and Econ. Dev. Bank, Rev. Ref. Bonds (Pacific Gas and Electric Co.), Series 2010-E,
1.75% 2026 (put 2022)4
| 8,215
| 7,969
|
| City of Irvine, Reassessment Dist. No. 15-2, Limited Obligation Improvement Bonds, Series 2015, 5.00% 2032
| 350
| 400
|
| City of Irvine, Reassessment Dist. No. 15-2, Limited Obligation Improvement Bonds, Series 2015, 5.00% 2033
| 590
| 672
|
| City of Irvine, Reassessment Dist. No. 15-2, Limited Obligation Improvement Bonds, Series 2015, 5.00% 2034
| 615
| 699
|
| City of Irvine, Reassessment Dist. No. 15-2, Limited Obligation Improvement Bonds, Series 2015, 5.00% 2035
| 375
| 425
|
| City of La Verne, Rev. Certs. of Part. (Brethren Hillcrest Homes), Series 2014, 5.00% 2024
| 310
| 338
|
| City of La Verne, Rev. Certs. of Part. (Brethren Hillcrest Homes), Series 2014, 5.00% 2025
| 550
| 598
|
| City of La Verne, Rev. Certs. of Part. (Brethren Hillcrest Homes), Series 2014, 5.00% 2026
| 350
| 379
|
American High-Income Municipal Bond Fund —
Page 5 of 74
Bonds, notes & other debt instruments (continued)
California (continued)
| Principal amount
(000)
| Value
(000)
|
| City of Lake Elsinore, Public Fncg. Auth., Local Agcy. Rev. Ref. Bonds, Series 2015, 5.00% 2024
| $415
| $475
|
| City of Lake Elsinore, Public Fncg. Auth., Local Agcy. Rev. Ref. Bonds, Series 2015, 5.00% 2025
| 1,170
| 1,366
|
| City of Lake Elsinore, Public Fncg. Auth., Local Agcy. Rev. Ref. Bonds, Series 2015, 5.00% 2027
| 70
| 81
|
| City of Lake Elsinore, Public Fncg. Auth., Local Agcy. Rev. Ref. Bonds, Series 2015, 5.00% 2031
| 2,685
| 3,073
|
| City of Lake Elsinore, Public Fncg. Auth., Local Agcy. Rev. Ref. Bonds, Series 2015, 5.00% 2035
| 6,540
| 7,409
|
| City of Lee Lake, Public Fncg. Auth., Special Tax Rev. Ref. Bonds, Series 2013-A, 5.125% 2035
| 1,000
| 1,123
|
| City of Lee Lake, Public Fncg. Auth., Special Tax Rev. Ref. Bonds, Series 2013-A, 5.25% 2026
| 2,000
| 2,309
|
| City of Lee Lake, Public Fncg. Auth., Special Tax Rev. Ref. Bonds, Series 2013-B, 5.375% 2035
| 730
| 793
|
| City of Long Beach, Marina Rev. Bonds (Alamitos Bay Marina Project), Series 2015, 5.00% 2045
| 500
| 552
|
| M-S-R Energy Auth., Gas Rev. Bonds, Series 2009-B, 6.50% 2039
| 1,800
| 2,740
|
Moorpark Unified School Dist., G.O. Bonds, Capital Appreciation Bonds, 2008 Election, Series 2011-B,
Assured Guaranty Municipal insured, 0% 2036
| 4,500
| 2,624
|
| The Morongo Band of Mission Indians, Rev. Ref Bonds, Series 2018-B, 5.00% 20422
| 6,415
| 7,212
|
| Municipal Fin. Auth., Charter School Rev. Bonds (Rocketship Education - Multiple Projects), Series 2014-A, 6.00% 2023
| 500
| 533
|
Municipal Fin. Auth., Educational Rev. Bonds (American Heritage Education Foundation Project),
Series 2016-A, 5.00% 2036
| 750
| 854
|
Municipal Fin. Auth., Educational Rev. Bonds (American Heritage Education Foundation Project),
Series 2016-A, 5.00% 2046
| 1,745
| 1,958
|
| Municipal Fin. Auth., Rev. Bonds (California Baptist University), Series 2015-A, 5.25% 20352
| 2,035
| 2,333
|
| Municipal Fin. Auth., Rev. Bonds (California Baptist University), Series 2015-A, 5.50% 20452
| 5,600
| 6,443
|
| Municipal Fin. Auth., Rev. Bonds (California Baptist University), Series 2016-A, 5.00% 20462
| 750
| 846
|
| Municipal Fin. Auth., Rev. Bonds (Caritas Mobile Home Park), Series 2014-A, 5.25% 2039
| 1,200
| 1,353
|
| Municipal Fin. Auth., Rev. Bonds (Caritas Mobile Home Park), Series 2014-B, 5.875% 2049
| 1,000
| 1,093
|
| Municipal Fin. Auth., Rev. Bonds (Harbor Regional Center Project), Series 2009, 8.00% 2029 (preref. 2019)
| 1,420
| 1,444
|
| Municipal Fin. Auth., Rev. Bonds (Harbor Regional Center Project), Series 2009, 8.50% 2039 (preref. 2019)
| 1,000
| 1,018
|
| Municipal Fin. Auth., Rev. Bonds (LINXS APM Project), Series 2018-A, AMT, 4.00% 2047
| 9,600
| 10,237
|
| Municipal Fin. Auth., Rev. Bonds (LINXS APM Project), Series 2018-A, AMT, 5.00% 2047
| 3,205
| 3,744
|
Municipal Fin. Auth., Rev. Ref. Bonds (Azusa Pacific University Project), Series 2011-B,
8.00% 2041 (preref. 2021)2
| 2,500
| 2,789
|
| Municipal Fin. Auth., Rev. Ref. Bonds (Azusa Pacific University Project), Series 2015-B, 5.00% 2026
| 1,065
| 1,202
|
| Municipal Fin. Auth., Rev. Ref. Bonds (Azusa Pacific University Project), Series 2015-B, 5.00% 2030
| 2,505
| 2,782
|
| Municipal Fin. Auth., Rev. Ref. Bonds (William Jessup University), Series 2019, 5.00% 2048
| 725
| 796
|
Municipal Fin. Auth., Solid Waste Disposal Rev. Bonds
(Waste Management, Inc. Project), Series 2017-A, AMT, 2.00% 2044 (put 2020)
| 7,620
| 7,681
|
| City of Murrieta, Public Fncg. Auth., Special Tax Rev. Ref. Bonds, Series 2012, 4.00% 2034
| 1,965
| 2,048
|
Northern California Gas Auth. No. 1, Gas Project Rev. Bonds, Series 2007-B,
(3-month USD-LIBOR + 0.67%) 2.273% 20273
| 12,070
| 11,918
|
County of Orange, Community Facs. Dist. No. 2015-1 (Esencia Village), Special Tax Rev. Ref. Bonds,
Series 2015-A, 5.25% 2045
| 575
| 650
|
| City of Oroville, Hospital Rev. Bonds (Oroville Hospital), Series 2019, 5.25% 2049
| 4,500
| 5,261
|
| City of Oroville, Hospital Rev. Bonds (Oroville Hospital), Series 2019, 5.25% 2054
| 6,800
| 7,929
|
| City of Palm Desert, Section 29 Assessment Dist. (No. 2004-02), Limited Obligation Improvement Bonds, Series 2007, 5.05% 2027
| 1,820
| 1,824
|
| Palomar Health, G.O. Rev. Ref. Bonds, Series 2016, 5.00% 2027
| 2,160
| 2,568
|
| Palomar Pomerado Health, Certs. of Part., Series 2009, 6.75% 2039 (preref. 2019)
| 1,500
| 1,521
|
| Palomar Pomerado Health, Certs. of Part., Series 2010, 6.00% 2041 (preref. 2020)
| 1,000
| 1,061
|
Palomar Pomerado Health, G.O. Bonds, Capital Appreciation Bonds, 2004 Election, Series 2009-A,
Assured Guaranty insured, 0% 2029
| 2,750
| 2,171
|
Palomar Pomerado Health, G.O. Bonds, Capital Appreciation Bonds, 2004 Election, Series 2009-A,
Assured Guaranty insured, 0% 2030
| 9,000
| 6,824
|
Palomar Pomerado Health, G.O. Bonds, Capital Appreciation Bonds, 2004 Election, Series 2009-A,
Assured Guaranty insured, 0% 2031
| 2,500
| 1,821
|
| Perris Union High School Dist., Fncg. Auth., Rev. Bonds, Series 2015, 5.00% 2035
| 3,175
| 3,561
|
| Perris Union High School Dist., Fncg. Auth., Rev. Bonds, Series 2015, 5.00% 2041
| 1,725
| 1,916
|
American High-Income Municipal Bond Fund —
Page 6 of 74
Bonds, notes & other debt instruments (continued)
California (continued)
| Principal amount
(000)
| Value
(000)
|
| Pollution Control Fncg. Auth., Solid Waste Disposal Rev. Bonds, Series 2017, AMT, 8.00% 20392
| $4,450
| $4,843
|
Pollution Control Fncg. Auth., Solid Waste Disposal Rev. Ref. Bonds (Republic Services, Inc. Project),
Series 2017-A-1, AMT, 1.50% 2042 (put 2019)2
| 8,000
| 8,002
|
| Pollution Control Fncg. Auth., Water Furnishing Rev. Bonds (Poseidon Resources (Channelside) LP Desalination Project), Series 2012 Plant Bonds, AMT, 5.00%
20452
| 6,000
| 6,409
|
| Poway Unified School Dist., Public Fncg. Auth., Special Tax Rev. Ref. Bonds, Series 2015-A, 5.00% 2031
| 1,200
| 1,371
|
| Poway Unified School Dist., Public Fncg. Auth., Special Tax Rev. Ref. Bonds, Series 2015-A, 5.00% 2036
| 1,490
| 1,682
|
| Public Fin. Auth., University Housing Rev. Bonds (NCCD - Claremont Properties LLC - Claremont Colleges Project), Series 2017-A, 5.00% 20472
| 1,545
| 1,597
|
Public Works Board, Lease Rev. Bonds (Trustees of the California State University), Series 2013-H,
5.00% 2024 (preref. 2023)
| 20
| 23
|
Public Works Board, Lease Rev. Bonds (Trustees of the California State University), Series 2013-H,
5.00% 2029 (preref. 2023)
| 5
| 6
|
| Public Works Board, Lease Rev. Bonds (Trustees of the California State University, Various California State University Projects), Series 2011-B, 5.00% 2031
(preref. 2021)
| 5
| 5
|
| Public Works Board, Lease Rev. Bonds (Various Capital Projects), Series 2009-I-1, 6.125% 2029 (preref. 2019)
| 6,000
| 6,077
|
City of Rancho Cordova, Community Facs. Dist. No. 2003-1 (Sunridge Anatolia), Special Tax Bonds,
Series 2016, 4.00% 2037
| 500
| 529
|
| Rio Elementary School Dist., Community Facs. Dist. No. 1, Special Tax Bonds, Series 2013, 5.50% 2039
| 1,785
| 1,986
|
Rio Elementary School Dist., Community Facs. Dist. No. 1, Special Tax Rev. Ref. Bonds, Series 2014,
5.00% 2035
| 425
| 473
|
| Community of River Islands, Public Fncg. Auth., Community Facs. Dist. No. 2003-1 (Public Improvements), Special Tax Bonds, Series 2019-A, 5.00% 2038
| 3,750
| 4,221
|
| Community of River Islands, Public Fncg. Auth., Community Facs. Dist. No. 2003-1 (Public Improvements), Special Tax Bonds, Series 2019-A, 5.00% 2048
| 4,545
| 5,067
|
County of Riverside, Redev. Agcy., Tax Allocation Bonds (Jurupa Valley Redev. Project Area),
Capital Appreciation Bonds, Series 2011-B, 0% 2039
| 4,000
| 2,069
|
City of Roseville, Community Facs. Dist. No. 1 (Westpark), Special Tax Rev. Ref. Bonds, Series 2015,
5.00% 2026
| 500
| 584
|
City of Roseville, Community Facs. Dist. No. 1 (Westpark), Special Tax Rev. Ref. Bonds, Series 2015,
5.00% 2030
| 455
| 523
|
City of Roseville, Westpark Community Facs. Dist. No. 1 (Public Facs.), Special Tax Rev. Ref. Bonds,
Series 2015, 5.00% 2027
| 230
| 268
|
City of Roseville, Westpark Community Facs. Dist. No. 1 (Public Facs.), Special Tax Rev. Ref. Bonds,
Series 2015, 5.00% 2029
| 1,000
| 1,156
|
City of Roseville, Westpark Community Facs. Dist. No. 1 (Public Facs.), Special Tax Rev. Ref. Bonds,
Series 2015, 5.00% 2031
| 595
| 681
|
City of Roseville, Westpark Community Facs. Dist. No. 1 (Public Facs.), Special Tax Rev. Ref. Bonds,
Series 2015, 5.00% 2033
| 500
| 570
|
| County of Sacramento, Water Fncg. Auth., Rev. Ref. Bonds (Water Agcy. Zones 40 and 41), Series 2007-B, FGIC-National insured, (3-month USD-LIBOR + 0.55%) 2.239%
20343
| 5,000
| 4,825
|
| City of San Buenaventura, Rev. Bonds (Community Memorial Health System), Series 2011, 7.50% 2041
| 10,290
| 11,473
|
City of San Diego, Community Facs. Dist. No. 4 (Black Mountain Ranch Villages), Special Tax Bonds,
Series 2016, 5.00% 2027
| 355
| 418
|
City of San Diego, Community Facs. Dist. No. 4 (Black Mountain Ranch Villages), Special Tax Bonds,
Series 2016, 5.00% 2028
| 785
| 917
|
City of San Diego, Community Facs. Dist. No. 4 (Black Mountain Ranch Villages), Special Tax Bonds,
Series 2016, 5.00% 2029
| 245
| 286
|
City of San Diego, Community Facs. Dist. No. 4 (Black Mountain Ranch Villages), Special Tax Bonds,
Series 2016, 5.00% 2030
| 245
| 285
|
City and County of San Francisco, Airport Commission, San Francisco International Airport,
Second Series Rev. Bonds, Series 2009-A, 4.90% 2029
| 2,730
| 2,759
|
City and County of San Francisco, Airport Commission, San Francisco International Airport,
Second Series Rev. Bonds, Series 2019-A, AMT, 5.00% 2049
| 7,500
| 8,953
|
American High-Income Municipal Bond Fund —
Page 7 of 74
Bonds, notes & other debt instruments (continued)
California (continued)
| Principal amount
(000)
| Value
(000)
|
| City and County of San Francisco, Redev. Fin. Auth., Tax Allocation Rev. Bonds (Mission Bay South Redev. Project), Series 2009-D, 6.625% 2039 (preref. 2019)
| $1,000
| $1,000
|
| City and County of San Francisco, Redev. Fin. Auth., Tax Allocation Rev. Bonds (Mission Bay South Redev. Project), Series 2011-D, 7.00% 2041 (preref. 2021)
| 1,000
| 1,090
|
| City and County of San Francisco, Redev. Fin. Auth., Tax Allocation Rev. Bonds (Mission Bay South Redev. Project), Series 2016-C, 5.00% 2031
| 665
| 805
|
City and County of San Francisco, Successor Agcy. to the Redev. Agcy., Community Facs. Dist. No. 6
(Mission Bay South Public Improvements), Special Tax Rev. Ref. Bonds, Series 2013-A, 5.00% 2029
| 1,300
| 1,411
|
City and County of San Francisco, Successor Agcy. to the Redev. Agcy., Community Facs. Dist. No. 6
(Mission Bay South Public Improvements), Special Tax Rev. Ref. Bonds, Series 2013-A, 5.00% 2031
| 1,140
| 1,231
|
City and County of San Francisco, Successor Agcy. to the Redev. Agcy., Community Facs. Dist. No. 7
(Hunters Point Shipyard Phase One Improvements), Special Tax Rev. Ref. Bonds, Series 2014,
5.00% 2044
| 1,000
| 1,087
|
| San Joaquin Hills Transportation Corridor Agcy., Toll Road Rev. Ref. Bonds, Series 2014-A, 5.00% 2034
| 2,200
| 2,518
|
| City of San Jose, Airport Rev. Ref. Bonds, Series 2011-A-1, AMT, 5.75% 2034
| 4,000
| 4,269
|
| City of Santa Ana, Redev. Agcy., Tax Allocation Bonds, Series 2011-A, 6.25% 2024
| 1,500
| 1,625
|
| City of Santa Clara, Redev. Agcy., Tax Allocation Bonds (Bayshore North Project), Capital Appreciation Bonds, Series 2011, 0% 2024 (preref. 2021)
| 1,700
| 1,335
|
| City of Santa Clara, Redev. Agcy., Tax Allocation Bonds (Bayshore North Project), Capital Appreciation Bonds, Series 2011, 0% 2025 (preref. 2021)
| 4,000
| 2,897
|
| Community of Santaluz, Community Facs. Dist. No. 2, Improvement Area No. 1, Special Tax Rev. Ref. Bonds, Series 2011-A, 5.10% 2030
| 920
| 988
|
Saugus Union School Dist., Saugus/Hart School Facs. Fin. Auth., Community Facs. Dist. No. 2006-1,
Special Tax Rev. Bonds, Series 2016, 5.00% 2035
| 1,725
| 1,972
|
Saugus Union School Dist., Saugus/Hart School Facs. Fin. Auth., Community Facs. Dist. No. 2006-1,
Special Tax Rev. Bonds, Series 2016, 5.00% 2036
| 1,780
| 2,030
|
School Fin. Auth., Charter School Rev. Bonds (Classical Academies Project), Series 2013-A-1,
7.375% 2043 (preref. 2022)
| 4,460
| 5,247
|
| School Fin. Auth., Charter School Rev. Bonds (Classical Academies Project), Series 2017-A, 4.00% 20272
| 1,000
| 1,070
|
| School Fin. Auth., Charter School Rev. Bonds (Classical Academies Project), Series 2017-A, 5.00% 20442
| 2,000
| 2,208
|
School Fin. Auth., Charter School Rev. Bonds (Equitas Academy Obligated Group), Series 2018-A,
5.00% 20292
| 1,000
| 1,150
|
School Fin. Auth., Charter School Rev. Bonds (Equitas Academy Obligated Group), Series 2018-A,
5.00% 20482
| 1,000
| 1,100
|
| School Fin. Auth., Charter School Rev. Bonds (Larchmont Charter School Project), Series 2018-A, 5.00% 20282
| 595
| 664
|
| School Fin. Auth., Charter School Rev. Bonds (Larchmont Charter School Project), Series 2018-A, 5.00% 20432
| 760
| 819
|
School Fin. Auth., Charter School Rev. Bonds (Rocketship Education Obligated Group), Series 2016-A,
5.00% 20462
| 1,850
| 1,951
|
| School Fin. Auth., Charter School Rev. Bonds (Rocketship Education Obligated Group), Series 2017-A, 5.125% 20472
| 750
| 802
|
School Fin. Auth., Charter School Rev. Bonds (Rocketship Education Obligated Group), Series 2017-A,
5.25% 20522
| 250
| 268
|
School Fin. Auth., Charter School Rev. Bonds (Rocketship Public Schools Obligated Group), Series 2017-G,
5.00% 20372
| 360
| 388
|
School Fin. Auth., Charter School Rev. Bonds (Rocketship Public Schools Obligated Group), Series 2017-G,
5.00% 20472
| 1,470
| 1,573
|
School Fin. Auth., Educational Facs. Rev. Bonds (River Springs Charter School Project), Series 2015-A,
6.375% 20462
| 7,100
| 8,285
|
School Fin. Auth., Educational Facs. Rev. Bonds (River Springs Charter School Project), Series 2015-A,
6.375% 20462
| 440
| 513
|
School Fin. Auth., Educational Facs. Rev. Bonds (River Springs Charter School Project), Series 2017-A,
5.00% 20472
| 1,985
| 2,163
|
School Fin. Auth., Educational Facs. Rev. Bonds (River Springs Charter School Project), Series 2017-A,
5.00% 20522
| 1,350
| 1,462
|
| School Fin. Auth., School Fac. Rev. Ref. Bonds (High Tech High Learning Project), Series 2017-A, 4.00% 20212
| 370
| 387
|
American High-Income Municipal Bond Fund —
Page 8 of 74
Bonds, notes & other debt instruments (continued)
California (continued)
| Principal amount
(000)
| Value
(000)
|
| School Fin. Auth., School Fac. Rev. Ref. Bonds (High Tech High Learning Project), Series 2017-A, 4.00% 20222
| $385
| $410
|
| School Fin. Auth., School Fac. Rev. Ref. Bonds (High Tech High Learning Project), Series 2017-A, 4.00% 20232
| 400
| 434
|
| School Fin. Auth., School Fac. Rev. Ref. Bonds (High Tech High Learning Project), Series 2017-A, 4.00% 20242
| 420
| 462
|
| School Fin. Auth., School Fac. Rev. Ref. Bonds (High Tech High Learning Project), Series 2017-A, 4.00% 20252
| 235
| 261
|
| School Fin. Auth., School Fac. Rev. Ref. Bonds (High Tech High Learning Project), Series 2017-A, 5.00% 20492
| 1,000
| 1,132
|
| City of Seal Beach, Community Facs. Dist. No. 2005-1 (Pacific Gateway Business Center), Special Tax Rev. Ref. Bonds, Series 2016, 3.00% 2027
| 100
| 102
|
| City of Seal Beach, Community Facs. Dist. No. 2005-1 (Pacific Gateway Business Center), Special Tax Rev. Ref. Bonds, Series 2016, 3.00% 2028
| 120
| 123
|
| City of Seal Beach, Community Facs. Dist. No. 2005-1 (Pacific Gateway Business Center), Special Tax Rev. Ref. Bonds, Series 2016, 3.125% 2030
| 175
| 177
|
| City of Seal Beach, Community Facs. Dist. No. 2005-1 (Pacific Gateway Business Center), Special Tax Rev. Ref. Bonds, Series 2016, 3.125% 2031
| 460
| 464
|
| Southern California Logistics Airport Auth., Tax Allocation Parity Bonds (Southern California Logistics Airport Project), Series 2005-A, RADIAN insured, 4.50% 2030
| 120
| 120
|
Statewide Communities Dev. Auth., Pollution Control Rev. Ref. Bonds (Southern California Edison Co.),
Series 2006-C, 2.625% 2033 (put 2023)
| 1,050
| 1,088
|
Statewide Communities Dev. Auth., Pollution Control Rev. Ref. Bonds (Southern California Edison Co.),
Series 2006-D, 2.625% 2033 (put 2023)
| 1,450
| 1,502
|
Statewide Communities Dev. Auth., Pollution Control Rev. Ref. Bonds (Southern California Edison Co.),
Series 2010-A, 4.50% 2029
| 6,000
| 6,189
|
| Statewide Communities Dev. Auth., Rev Bonds (Daughters of Charity Health System - St. Francis Medical Center), Series 2005-G, 5.75% 2035
| 30
| 30
|
Statewide Communities Dev. Auth., Rev. Bonds (American Baptist Homes of the West), Series 2010,
6.00% 2029
| 2,000
| 2,015
|
Statewide Communities Dev. Auth., Rev. Bonds (American Baptist Homes of the West), Series 2010,
6.25% 2039
| 2,500
| 2,520
|
Statewide Communities Dev. Auth., Rev. Bonds (American Baptist Homes of the West), Series 2015,
5.00% 2045
| 850
| 949
|
| Statewide Communities Dev. Auth., Rev. Bonds (California Baptist University), Series 2014-A, 6.375% 2043
| 2,700
| 3,125
|
| Statewide Communities Dev. Auth., Rev. Bonds (Lancer Educational Student Housing Project), Series 2019-A, 5.00% 20342
| 275
| 323
|
| Statewide Communities Dev. Auth., Rev. Bonds (Lancer Educational Student Housing Project), Series 2019-A, 5.00% 20392
| 370
| 428
|
| Statewide Communities Dev. Auth., Rev. Bonds (Lancer Plaza Project), Series 2013, 5.125% 2023
| 1,055
| 1,137
|
Statewide Communities Dev. Auth., Rev. Bonds (Loma Linda University Medical Center), Series 2014-A,
5.25% 2044
| 5,000
| 5,537
|
| Statewide Communities Dev. Auth., Rev. Bonds (Sutter Health), Series 2011-A, 6.00% 2042 (preref. 2020)
| 1,500
| 1,578
|
Statewide Communities Dev. Auth., Rev. Bonds (Terraces at San Joaquin Gardens Project), Series 2012-A,
5.625% 2032
| 1,000
| 1,084
|
Statewide Communities Dev. Auth., Rev. Bonds (Terraces at San Joaquin Gardens Project), Series 2012-A,
6.00% 2042
| 1,000
| 1,087
|
Statewide Communities Dev. Auth., Rev. Ref. Bonds (California Baptist University), Series 2017-A,
5.00% 20322
| 720
| 849
|
Statewide Communities Dev. Auth., Rev. Ref. Bonds (Lancer Educational Student Housing Project),
Series 2016-A, 5.00% 20462
| 3,750
| 4,144
|
| Statewide Communities Dev. Auth., Senior Living Rev. Ref. Bonds (Southern California Presbyterian Homes), Series 2009, 7.00% 20292
| 1,500
| 1,522
|
| Statewide Communities Dev. Auth., Senior Living Rev. Ref. Bonds (Southern California Presbyterian Homes), Series 2009, 7.25% 20412
| 4,500
| 4,571
|
| Statewide Communities Dev. Auth., Student Housing Rev. Bonds (CHF-Irvine, LLC - University of California, Irvine East Campus Apartments), Series 2016, 5.00% 2040
| 1,150
| 1,329
|
Statewide Communities Dev. Auth., Student Housing Rev. Bonds (Custodial Receipts), Series 2017,
4.305% 2032
| 5,425
| 6,055
|
American High-Income Municipal Bond Fund —
Page 9 of 74
Bonds, notes & other debt instruments (continued)
California (continued)
| Principal amount
(000)
| Value
(000)
|
City of Thousand Oaks, Community Facs. Dist. No. 1994-1 (Marketplace Public Pedestrian,
Traffic Circulation and Parking Facs.), Special Tax Rev. Ref. Bonds, Series 2012, 5.00% 2022
| $875
| $922
|
| Regents of the University of California, Medical Center Pooled Rev. Bonds, Series 2016-L, 4.00% 2037
| 2,300
| 2,538
|
|
|
| 434,147
|
| Colorado 5.54%
|
|
|
| County of Adams, Amber Creek Metropolitan Dist., Limited Tax G.O. Bonds, Series 2017-B, 7.75% 20475
| 515
| 527
|
| County of Adams, Amber Creek Metropolitan Dist., Limited Tax G.O. Rev. Ref. and Improvement Bonds, Series 2017-A, 5.00% 2037
| 1,585
| 1,641
|
| County of Adams, Amber Creek Metropolitan Dist., Limited Tax G.O. Rev. Ref. and Improvement Bonds, Series 2017-A, 5.125% 2047
| 575
| 591
|
| County of Adams, Bradburn Metropolitan Dist No. 2, Limited Tax G.O. Bonds, Series 2018-B, 7.25% 20475
| 1,988
| 2,074
|
| County of Adams, Bradburn Metropolitan Dist No. 2, Limited Tax G.O. Rev. Ref. and Improvement Bonds (Convertible to Unlimited Tax), Series 2018-A, 5.00% 2038
| 840
| 894
|
| County of Adams, Bradburn Metropolitan Dist No. 2, Limited Tax G.O. Rev. Ref. and Improvement Bonds (Convertible to Unlimited Tax), Series 2018-A, 5.00% 2047
| 1,200
| 1,265
|
County of Adams, Brighton Crossing Metropolitan Dist. No. 4, Limited Tax G.O. Bonds, Series 2017-B,
7.00% 20475
| 670
| 681
|
County of Adams, Brighton Crossing Metropolitan Dist. No. 4, Limited Tax G.O. Bonds
(Convertible to Unlimited Tax), Series 2017-A, 4.00% 2027
| 1,030
| 1,048
|
County of Adams, Brighton Crossing Metropolitan Dist. No. 4, Limited Tax G.O. Bonds
(Convertible to Unlimited Tax), Series 2017-A, 5.00% 2037
| 1,055
| 1,106
|
County of Adams, Brighton Crossing Metropolitan Dist. No. 4, Limited Tax G.O. Bonds
(Convertible to Unlimited Tax), Series 2017-A, 5.00% 2047
| 1,950
| 2,035
|
County of Adams, Clear Creek Station Metropolitan Dist., Limited Tax G.O. Bonds, Series 2017-B,
7.375% 20475
| 500
| 516
|
| County of Adams, Clear Creek Station Metropolitan Dist., Limited Tax G.O. Rev. Ref. and Improvement Bonds, Series 2017-A, 4.375% 2032
| 790
| 813
|
| County of Adams, Clear Creek Station Metropolitan Dist., Limited Tax G.O. Rev. Ref. and Improvement Bonds, Series 2017-A, 5.00% 2047
| 7,250
| 7,516
|
| County of Adams, Pomponio Terrace Metropolitan Dist., Limited Tax G.O. Bonds, Series 2019-A, 5.00% 2049
| 1,475
| 1,498
|
| County of Adams, Pomponio Terrace Metropolitan Dist., Limited Tax G.O. Bonds, Series 2019-B, 7.75% 20492
| 816
| 820
|
| County of Adams, The Village at Dry Creek Metropolitan Dist. No. 2, Limited Tax G.O. and Special Rev. Bonds, Series 2019, 4.375% 2044
| 1,870
| 1,881
|
| County of Arapahoe, Copperleaf Metropolitan Dist. No. 2, Limited Tax G.O. Bonds, Series 2015, 5.25% 2030
| 500
| 524
|
| County of Arapahoe, Copperleaf Metropolitan Dist. No. 2, Limited Tax G.O. Bonds, Series 2015, 5.75% 2045
| 1,450
| 1,520
|
County of Arapahoe, Cornerstar Metropolitan Dist., Limited Tax G.O. Rev. Ref. Bonds
(Convertible to Unlimited Tax), Series 2017-A, 4.50% 2027
| 1,500
| 1,580
|
| County of Arapahoe, Gardens of Havana Metropolitan Dist. No. 3, Special Rev. Ref. Bonds, Series 2017-A, 4.625% 2027
| 2,690
| 2,832
|
| Arkansas River Power Auth., Power Supply System Rev. Ref. Bonds, Series 2018-A, 5.00% 2033
| 1,685
| 1,997
|
| Arkansas River Power Auth., Power Supply System Rev. Ref. Bonds, Series 2018-A, 5.00% 2038
| 8,500
| 9,887
|
| Arkansas River Power Auth., Power Supply System Rev. Ref. Bonds, Series 2018-A, 5.00% 2043
| 4,750
| 5,480
|
| City of Arvada, Leyden Ranch Metropolitan Dist., G.O. Tax Bonds, Series 2017-A, 5.125% 2047
| 1,135
| 1,193
|
| City of Arvada, Leyden Ranch Metropolitan Dist., G.O. Tax Bonds, Series 2017-B, 7.00% 20475
| 500
| 518
|
| City of Arvada, Leyden Rock Metropolitan Dist. No. 10, Limited Tax G.O. Bonds, Series 2017-C, 10.75% 20495
| 1,026
| 1,035
|
City of Arvada, Leyden Rock Metropolitan Dist. No. 10, Limited Tax G.O. Rev. Ref. and Improvement
Bonds (Convertible to Unlimited Tax), Series 2016-A, 4.00% 2025
| 1,000
| 1,038
|
City of Arvada, Leyden Rock Metropolitan Dist. No. 10, Limited Tax G.O. Rev. Ref. and Improvement
Bonds (Convertible to Unlimited Tax), Series 2016-A, 4.375% 2033
| 2,750
| 2,884
|
City of Arvada, Leyden Rock Metropolitan Dist. No. 10, Limited Tax G.O. Rev. Ref. and Improvement
Bonds (Convertible to Unlimited Tax), Series 2016-A, 5.00% 2045
| 2,250
| 2,346
|
City of Arvada, Leyden Rock Metropolitan Dist. No. 10, Limited Tax G.O. Rev. Ref. and Improvement
Bonds (Convertible to Unlimited Tax), Series 2016-B, 7.25% 20455
| 1,000
| 1,026
|
American High-Income Municipal Bond Fund —
Page 10 of 74
Bonds, notes & other debt instruments (continued)
Colorado (continued)
| Principal amount
(000)
| Value
(000)
|
| City of Arvada, Mountain Shadows Metropolitan Dist., Limited Tax G.O. Rev. Ref. and Improvement Bonds, Series 2016, 5.00% 2035
| $2,000
| $2,094
|
| City of Arvada, Mountain Shadows Metropolitan Dist., Limited Tax G.O. Rev. Ref. and Improvement Bonds, Series 2016, 5.00% 2046
| 1,000
| 1,034
|
City of Arvada, Westown Metropolitan Dist., Limited Tax G.O. Bonds (Convertible to Unlimited Tax),
Series 2017-A, 5.00% 2047
| 1,400
| 1,434
|
| City of Aurora, Forest Trace Metropolitan Dist. No. 3, Limited Tax G.O. Bonds (Convertible to Unlimited Tax), Series 2016-A, 5.00% 2046
| 2,920
| 3,011
|
| City of Aurora, Forest Trace Metropolitan Dist. No. 3, Limited Tax G.O. Bonds, Series 2016-B, 7.25% 20465
| 683
| 685
|
| City of Aurora, International Center Metropolitan Dist. No. 3, Limited Tax G.O. Rev. Ref. and Improvement Bonds (Convertible to Unlimited Tax), Series 2016, 4.625%
2031
| 635
| 645
|
| City of Aurora, International Center Metropolitan Dist. No. 3, Limited Tax G.O. Rev. Ref. and Improvement Bonds (Convertible to Unlimited Tax), Series 2016, 5.00%
2046
| 3,140
| 3,200
|
| City of Aurora, Parkside at City Centre Business Improvement Dist., Special Rev. and Tax Supported Senior Bonds, Series 2019-A, 6.25% 2048
| 13,490
| 13,764
|
City of Aurora, Serenity Ridge Metropolitan Dist. No. 2, Rev. Ref. & Improvement Bonds, Series 2018,
4.50% 2028
| 555
| 570
|
City of Aurora, Serenity Ridge Metropolitan Dist. No. 2, Rev. Ref. & Improvement Bonds, Series 2018,
5.125% 2037
| 550
| 578
|
City of Aurora, Serenity Ridge Metropolitan Dist. No. 2, Rev. Ref. & Improvement Bonds, Series 2018,
7.25% 20355
| 636
| 651
|
| City of Aurora, Serenity Ridge Metropolitan Dist. No. 2, Rev. Ref. & Improvement Bonds, Series 2018-A, 5.125% 2043
| 500
| 522
|
| City of Aurora, Southlands Metropolitan Dist. No. 1, G.O. Rev. Ref. Bonds, Series 2017-A-1, 5.00% 2037
| 2,265
| 2,529
|
| City of Aurora, Southlands Metropolitan Dist. No. 1, G.O. Rev. Ref. Bonds, Series 2017-A-1, 5.00% 2047
| 3,085
| 3,398
|
| City of Aurora, Southlands Metropolitan Dist. No. 1, G.O. Rev. Ref. Bonds, Series 2017-A-2, 5.00% 2037
| 600
| 670
|
| City of Aurora, Tallyn’s Reach Metropolitan Dist. No. 3, Limited Tax G.O. Rev. Ref. and Improvement Bonds, Series 2013, 5.00% 2033
| 504
| 536
|
| City of Aurora, Tallyn’s Reach Metropolitan Dist. No. 3, Limited Tax G.O. Rev. Ref. and Improvement Bonds, Series 2013, 5.125% 2038
| 2,070
| 2,198
|
| City of Aurora, Tallyn’s Reach Metropolitan Dist. No. 3, Limited Tax G.O. Rev. Ref. and Improvement Bonds, Series 2016-A, 6.75% 2038
| 720
| 733
|
| City of Brighton, Bromley Park Metropolitan Dist. No. 2, Limited Tax G.O. Rev. Ref. Bonds, Series 2018-B, 6.375% 2047
| 1,000
| 1,027
|
City and County of Broomfield, Arista Metropolitan Dist., Limited Tax Rev. Ref. Bonds, Series 2018-A,
5.00% 2038
| 2,980
| 3,117
|
City and County of Broomfield, Arista Metropolitan Dist., Limited Tax Rev. Ref. Bonds, Series 2018-A,
5.125% 2048
| 9,825
| 10,285
|
| City and County of Broomfield, Lambertson Farms Metropolitan Dist. No. 1, Improvement Rev. Ref. Bonds, Series 2015, 5.75% 2046
| 4,450
| 4,608
|
| City and County of Broomfield, Lambertson Farms Metropolitan Dist. No. 1, Improvement Rev. Ref. Bonds, Series 2015, 6.00% 2050
| 3,700
| 3,863
|
| City and County of Broomfield, Midcities Metropolitan Dist. No. 2, Special Rev. Ref. Bonds, Series 2016-B, 7.75% 2046
| 1,428
| 1,449
|
City and County of Broomfield, Palisade Metropolitan Dist. No. 2, Limited Tax G.O. and Rev. Bonds,
Series 2016, 4.375% 2031
| 900
| 909
|
City and County of Broomfield, Palisade Metropolitan Dist. No. 2, Limited Tax G.O. and Rev. Bonds,
Series 2016, 5.00% 2046
| 3,000
| 3,078
|
Town of Castle Rock, Promenade at Castle Rock Metropolitan Dist. No. 1, G.O. Bonds, Series 2015-A,
5.75% 2039
| 9,300
| 9,738
|
| City of Centennial, Southglenn Metropolitan Dist., Special Rev. Ref. Bonds, Series 2016, 3.00% 2021
| 433
| 433
|
| City of Centennial, Southglenn Metropolitan Dist., Special Rev. Ref. Bonds, Series 2016, 3.50% 2026
| 500
| 498
|
| City of Centennial, Southglenn Metropolitan Dist., Special Rev. Ref. Bonds, Series 2016, 5.00% 2030
| 3,605
| 3,811
|
| City of Centennial, Southglenn Metropolitan Dist., Special Rev. Ref. Bonds, Series 2016, 5.00% 2036
| 1,620
| 1,684
|
| City of Centennial, Southglenn Metropolitan Dist., Special Rev. Ref. Bonds, Series 2016, 5.00% 2046
| 5,200
| 5,351
|
American High-Income Municipal Bond Fund —
Page 11 of 74
Bonds, notes & other debt instruments (continued)
Colorado (continued)
| Principal amount
(000)
| Value
(000)
|
| Colorado Bridge Enterprise, Rev. Bonds (Central 70 Project), Series 2017, AMT, 4.00% 2030
| $1,505
| $1,691
|
| Colorado Bridge Enterprise, Rev. Bonds (Central 70 Project), Series 2017, AMT, 4.00% 2051
| 4,000
| 4,172
|
Colorado Science and Technology Park Metropolitan Dist. No.1, Rev. Ref. and Improvement Bonds,
Series 2018, 4.375% 2026
| 3,545
| 3,704
|
Colorado Science and Technology Park Metropolitan Dist. No.1, Rev. Ref. and Improvement Bonds,
Series 2018, 5.00% 2033
| 3,040
| 3,221
|
Colorado Science and Technology Park Metropolitan Dist. No.1, Rev. Ref. and Improvement Bonds,
Series 2018, 5.25% 2048
| 3,125
| 3,278
|
City of Commerce City, Buffalo Ridge Metropolitan Dist., Limited Tax G.O. Bonds, Series 2018-B,
7.375% 20475
| 3,488
| 3,593
|
City and County of Denver, 9th Avenue Metropolitan Dist. No. 2, Limited Tax G.O. Bonds, Series 2018,
5.00% 2048
| 2,475
| 2,581
|
| City and County of Denver, Airport System Rev. Bonds, Series 2018-A, AMT, 5.00% 2035
| 5,000
| 6,084
|
| City and County of Denver, Airport System Rev. Bonds, Series 2018-A, AMT, 5.00% 2036
| 2,500
| 3,295
|
| City and County of Denver, Belleview Station Metropolitan Dist. No. 2, G.O. Rev. Ref. and Improvement Bonds, Series 2017, 4.50% 2029
| 1,295
| 1,336
|
| City and County of Denver, Belleview Station Metropolitan Dist. No. 2, G.O. Rev. Ref. and Improvement Bonds, Series 2017, 5.00% 2036
| 605
| 630
|
| City and County of Denver, Belleview Station Metropolitan Dist. No. 2, G.O. Rev. Ref. and Improvement Bonds, Series 2017, 5.125% 2046
| 2,375
| 2,470
|
| City and County of Denver, Central Platte Valley Metropolitan Dist., G.O. Rev. Ref. Bonds, Series 2013-A, 5.625% 2038
| 1,315
| 1,492
|
| City and County of Denver, Central Platte Valley Metropolitan Dist., G.O. Rev. Ref. Bonds, Series 2013-A, 6.00% 2038
| 1,250
| 1,447
|
City and County of Denver, Central Platte Valley Metropolitan Dist., G.O. Rev. Ref. Bonds, Series 2014,
5.00% 2043
| 1,250
| 1,341
|
| City and County of Denver, Denver Convention Center Hotel Auth., Rev. Ref. Bonds, Series 2016, 5.00% 2034
| 2,500
| 2,907
|
| City and County of Denver, Dept. of Aviation, Special Facs. Airport Rev. Ref. Bonds (United Air Lines Project), Series 2017, AMT, 5.00% 2032
| 8,905
| 9,715
|
| City and County of Denver, International Center Metropolitan Dist. No. 14, Limited Tax G.O. Rev. Ref. and Improvement Bonds, Series 2018, 5.875% 2046
| 5,475
| 5,953
|
| City and County of Denver, Park Creek Metropolitan Dist., Limited Property Tax Supported Rev. Ref. Bonds, Series 2015-A, 5.00% 2026
| 2,700
| 3,213
|
| City and County of Denver, Park Creek Metropolitan Dist., Limited Property Tax Supported Rev. Ref. Bonds, Series 2015-A, 5.00% 2027
| 3,500
| 4,150
|
| City and County of Denver, Park Creek Metropolitan Dist., Limited Property Tax Supported Rev. Ref. Bonds, Series 2015-A, 5.00% 2033
| 1,000
| 1,159
|
| City of Denver, Urban Renewal Auth., Stapleton Tax Increment Rev. Bonds, Series 2013-A-1, 5.00% 2024
| 2,000
| 2,242
|
| City of Denver, Urban Renewal Auth., Stapleton Tax Increment Rev. Bonds, Series 2018-A, 5.25% 20392
| 3,750
| 3,979
|
| City of Denver, Urban Renewal Auth., Stapleton Tax Increment Rev. Bonds, Series 2018-A, 5.25% 20392
| 3,430
| 3,639
|
E-470 Public Highway Auth., Rev. Bonds, Capital Appreciation Bonds, Series 2000-B, National insured,
0% 2031
| 1,325
| 958
|
E-470 Public Highway Auth., Rev. Bonds, Capital Appreciation Bonds, Series 2006-B, National insured,
0% 2037
| 5,065
| 2,342
|
| E-470 Public Highway Auth., Rev. Bonds, Capital Appreciation Bonds, Series 2010, 0% 2040
| 3,600
| 1,785
|
E-470 Public Highway Auth., Rev. Bonds, Series 2017-B,
(1-month USD-LIBOR x 0.67 + 1.05%) 2.568% 2039 (put 2021)3
| 1,000
| 1,010
|
County of El Paso, Flying Horse Metropolitan Dist. No. 3, G.O. Limited Tax Rev. Ref. Bonds, Series 2019,
6.00% 20492
| 2,965
| 2,970
|
County of Elbert, Independence Metropolitan Dist. No. 3, Limited Tax G.O. Bonds,
Series 2019-A, 6.25% 2049
| 7,100
| 7,343
|
County of Elbert, Independence Water & Sanitation Dist., Water Activity Enterprise Special Rev. Bonds,
Series 2019, 7.25% 2038
| 6,500
| 6,854
|
City of Fort Collins, Harmony Technology Park Metropolitan Dist. No.2, Limited Tax G.O. Bonds
(Convertible to Unlimited Tax), Series 2017, 5.00% 2047
| 5,270
| 5,428
|
American High-Income Municipal Bond Fund —
Page 12 of 74
Bonds, notes & other debt instruments (continued)
Colorado (continued)
| Principal amount
(000)
| Value
(000)
|
| Health Facs. Auth., Health Care Facs. Rev. Bonds (American Baptist Homes of the Midwest Obligated Group), Series 2013, 8.00% 2043
| $11,100
| $12,608
|
| Health Facs. Auth., Health Facs. Rev. and Rev. Ref. Bonds (Evangelical Lutheran Good Samaritan Society Project), Series 2015-A, 5.00% 2030
| 3,000
| 3,584
|
| Health Facs. Auth., Health Facs. Rev. and Rev. Ref. Bonds (Evangelical Lutheran Good Samaritan Society Project), Series 2015-A, 5.00% 2032
| 1,500
| 1,792
|
| Health Facs. Auth., Health Facs. Rev. and Rev. Ref. Bonds (Evangelical Lutheran Good Samaritan Society Project), Series 2015-A, 5.00% 2033
| 100
| 119
|
| Health Facs. Auth., Health Facs. Rev. and Rev. Ref. Bonds (Evangelical Lutheran Good Samaritan Society Project), Series 2015-A, 5.00% 2036
| 2,360
| 2,819
|
| Health Facs. Auth., Health Facs. Rev. and Rev. Ref. Bonds (Evangelical Lutheran Good Samaritan Society Project), Series 2015-A, 5.00% 2045 (preref. 2025)
| 1,000
| 1,195
|
| Health Facs. Auth., Health Facs. Rev. and Rev. Ref. Bonds (Evangelical Lutheran Good Samaritan Society Project), Series 2017, 5.00% 2028
| 1,500
| 1,865
|
| Health Facs. Auth., Health Facs. Rev. and Rev. Ref. Bonds (Evangelical Lutheran Good Samaritan Society Project), Series 2017, 5.00% 2032
| 1,360
| 1,691
|
| Health Facs. Auth., Health Facs. Rev. and Rev. Ref. Bonds (Evangelical Lutheran Good Samaritan Society Project), Series 2017, 5.00% 2037 (preref. 2027)
| 2,300
| 2,860
|
| Health Facs. Auth., Health Facs. Rev. and Rev. Ref. Bonds (Evangelical Lutheran Good Samaritan Society Project), Series 2017, 5.00% 2042
| 2,100
| 2,611
|
| Health Facs. Auth., Health Facs. Rev. and Rev. Ref. Bonds (Evangelical Lutheran Good Samaritan Society Project), Series 2017, 5.00% 2047 (preref. 2027)
| 3,520
| 4,377
|
Health Facs. Auth., Health Facs. Rev. Bonds (Evangelical Lutheran Good Samaritan Society Project),
Series 2012, 5.00% 2025
| 500
| 551
|
Health Facs. Auth., Health Facs. Rev. Bonds (Evangelical Lutheran Good Samaritan Society Project),
Series 2012, 5.00% 2033 (preref. 2022)
| 145
| 160
|
Health Facs. Auth., Health Facs. Rev. Bonds (Evangelical Lutheran Good Samaritan Society Project),
Series 2012, 5.00% 2042 (preref. 2022)
| 12,140
| 13,377
|
Health Facs. Auth., Health Facs. Rev. Bonds (Evangelical Lutheran Good Samaritan Society Project),
Series 2013, 5.625% 2043 (preref. 2023)
| 4,725
| 5,471
|
Health Facs. Auth., Hospital Rev. Bonds (Adventist Health System/Sunbelt Obligated Group), Series 2016-A,
5.00% 2041
| 1,000
| 1,168
|
| Health Facs. Auth., Rev. Bonds (Covenant Retirement Communities, Inc.), Series 2018, 5.00% 2048
| 2,480
| 2,824
|
| Health Facs. Auth., Rev. Bonds (Senior Residences Project), Series 2012, 7.00% 20424
| 2,500
| 1,649
|
| Health Facs. Auth., Rev. Bonds (Senior Residences Project), Series 2012, 7.125% 20474
| 5,500
| 3,627
|
| Health Facs. Auth., Rev. Ref. and Improvement Bonds (Frasier Meadows Retirement Community Project), Series 2017-A, 5.00% 2027
| 455
| 532
|
| Health Facs. Auth., Rev. Ref. and Improvement Bonds (Frasier Meadows Retirement Community Project), Series 2017-A, 5.25% 2031
| 2,395
| 2,788
|
| Health Facs. Auth., Rev. Ref. and Improvement Bonds (Frasier Meadows Retirement Community Project), Series 2017-A, 5.25% 2032
| 850
| 986
|
| Health Facs. Auth., Rev. Ref. and Improvement Bonds (Frasier Meadows Retirement Community Project), Series 2017-A, 5.25% 2037
| 2,300
| 2,628
|
| Health Facs. Auth., Rev. Ref. and Improvement Bonds (Frasier Meadows Retirement Community Project), Series 2017-A, 5.25% 2047
| 12,230
| 13,686
|
| Health Facs. Auth., Rev. Ref. and Improvement Bonds (Frasier Meadows Retirement Community Project), Series 2017-B, 3.125% 2027
| 1,250
| 1,255
|
| Health Facs. Auth., Rev. Ref. and Improvement Bonds (Frasier Meadows Retirement Community Project), Series 2017-B, 5.00% 2027
| 1,055
| 1,147
|
| Health Facs. Auth., Rev. Ref. Bonds (Christian Living Communities), Series 2012, 5.00% 2020
| 75
| 76
|
| Health Facs. Auth., Rev. Ref. Bonds (Christian Living Neighborhoods Project), Series 2016, 5.00% 2026
| 750
| 842
|
| Health Facs. Auth., Rev. Ref. Bonds (Christian Living Neighborhoods Project), Series 2016, 5.00% 2031
| 2,000
| 2,207
|
| Health Facs. Auth., Rev. Ref. Bonds (Christian Living Neighborhoods Project), Series 2016, 5.00% 2037
| 7,250
| 7,896
|
| Health Facs. Auth., Rev. Ref. Bonds (Covenant Retirement Communities, Inc.), Series 2012-A, 5.00% 2033
| 4,750
| 5,143
|
| Health Facs. Auth., Rev. Ref. Bonds (Covenant Retirement Communities, Inc.), Series 2013-A, 5.50% 2028
| 525
| 604
|
American High-Income Municipal Bond Fund —
Page 13 of 74
Bonds, notes & other debt instruments (continued)
Colorado (continued)
| Principal amount
(000)
| Value
(000)
|
| Health Facs. Auth., Rev. Ref. Bonds (Covenant Retirement Communities, Inc.), Series 2013-A, 5.75% 2036
| $1,000
| $1,151
|
| Health Facs. Auth., Rev. Ref. Bonds (Covenant Retirement Communities, Inc.), Series 2015-A, 5.00% 2029
| 1,500
| 1,720
|
| Health Facs. Auth., Rev. Ref. Bonds (Covenant Retirement Communities, Inc.), Series 2015-A, 5.00% 2035
| 2,500
| 2,809
|
| High Performance Transportation Enterprise, C-470 Express Lanes Rev. Bonds, Series 2017, 5.00% 2051
| 3,250
| 3,556
|
| Housing and Fin. Auth., Single Family Mortgage Bonds, Series 2018-C, Class I, 4.25% 2048
| 1,465
| 1,602
|
City and County of Jefferson, Dinosaur Ridge Metropolitan Dist., Rev. Ref. and Improvement Bonds,
Series 2019, 5.00% 2049
| 3,500
| 3,520
|
| City of Lakewood, Plaza Metropolitan Dist. No. 1, Rev. Ref. Bonds, Series 2013, 5.00% 20202
| 1,500
| 1,558
|
City of Littleton, Littleton Village Metropolitan Dist. No. 2, Special Rev. Ref. Bonds, Series 2018-B,
7.625% 20285
| 1,140
| 1,172
|
| City of Loveland, Centerra Metropolitan Dist. No. 1, Rev. Ref. Bonds, Series 2017, 5.00% 20212
| 1,500
| 1,582
|
| City of Loveland, Centerra Metropolitan Dist. No. 1, Rev. Ref. Bonds, Series 2017, 5.00% 20222
| 1,900
| 2,038
|
Town of Parker, Cottonwood Highlands Metropolitan Dist No. 1, Limited Tax G.O. Bonds
(Convertible to Unlimited Tax), Series 2019-A, 5.00% 2049
| 900
| 926
|
| Town of Parker, Westcreek Metropolitan Dist. No. 2, Limited Tax G.O. Bonds, Series 2019-A, 5.375% 2048
| 800
| 817
|
| Public Auth. for Colorado Energy, Natural Gas Purchase Rev. Bonds, Series 2008, 6.25% 2028
| 2,000
| 2,566
|
| Public Fin. Auth., Rev. Bonds (Denver International Airport Great Hall Project), Series 2017, AMT, 5.00% 2037
| 2,625
| 3,060
|
| Public Fin. Auth., Rev. Bonds (Denver International Airport Great Hall Project), Series 2017, AMT, 5.00% 2049
| 4,500
| 5,133
|
Regional Transportation Dist., Private Activity Bonds (Denver Transit Partners Eagle P3 Project),
Series 2010, 6.00% 2034
| 1,700
| 1,757
|
Regional Transportation Dist., Private Activity Bonds (Denver Transit Partners Eagle P3 Project),
Series 2010, 6.00% 2041
| 13,800
| 14,261
|
Town of Snowmass Village, Base Village Metropolitan Dist. No. 2, Limited Tax G.O. Rev. Ref. Bonds,
Series 2016-A, 5.50% 2036
| 4,750
| 4,995
|
Town of Snowmass Village, Base Village Metropolitan Dist. No. 2, Limited Tax G.O. Rev. Ref. Bonds,
Series 2016-A, 5.75% 2046
| 2,585
| 2,716
|
| City of Thornton, Big Dry Creek Metropolitan Dist., G.O. Bonds, Series 2017, 7.75% 20475
| 644
| 668
|
| City of Thornton, Big Dry Creek Metropolitan Dist., G.O. Bonds, Series 2017-A, 5.75% 2047
| 2,415
| 2,551
|
| Town of Vail, Solaris Metropolitan Dist. No. 3, Limited Tax G.O. Rev. Ref. Bonds (Convertible to Unlimited Tax), Series 2016-A, 5.00% 2036
| 1,335
| 1,400
|
| Town of Vail, Solaris Metropolitan Dist. No. 3, Limited Tax G.O. Rev. Ref. Bonds (Convertible to Unlimited Tax), Series 2016-A, 5.00% 2046
| 6,490
| 6,753
|
| Town of Vail, Solaris Metropolitan Dist. No. 3, Limited Tax G.O. Rev. Ref. Bonds, Series 2016-B, 7.00% 20465
| 1,500
| 1,523
|
County of Weld, Vista Ridge Metropolitan Dist., Limited Tax G.O. Rev. Ref. Bonds, Series 2006-B,
9.50% 2040 (preref. 2021)1
| 2,220
| 2,680
|
|
|
| 429,503
|
| Connecticut 0.91%
|
|
|
| G.O. Bonds, Series 2018-E, 5.00% 2028
| 1,000
| 1,264
|
| Town of Hamden, Rev. Bonds (Whitney Center Project), Series 2009-A, 7.625% 2030
| 995
| 1,009
|
| Town of Hamden, Rev. Bonds (Whitney Center Project), Series 2009-A, 7.75% 2043
| 7,600
| 7,704
|
| Harbor Point Infrastructure Improvement Dist., Special Obligation Rev. Ref. Bonds (Harbor Point Project), Series 2017, 5.00% 20302
| 3,250
| 3,745
|
| Harbor Point Infrastructure Improvement Dist., Special Obligation Rev. Ref. Bonds (Harbor Point Project), Series 2017, 5.00% 20392
| 11,055
| 12,347
|
| Health and Educational Facs. Auth., Rev. Bonds (Healthcare Fac. Expansion Issue - Church Home of Hartford Inc. Project), Series 2016-A, 5.00% 20532
| 1,640
| 1,734
|
Higher Education Supplemental Loan Auth., Rev. Bonds (Chesla Loan Program), Series 2017-A, AMT,
4.00% 2030
| 840
| 903
|
Higher Education Supplemental Loan Auth., Rev. Bonds (Chesla Loan Program), Series 2017-A, AMT,
4.00% 2031
| 840
| 899
|
Higher Education Supplemental Loan Auth., Rev. Bonds (Chesla Loan Program), Series 2017-A, AMT,
4.125% 2032
| 830
| 890
|
Higher Education Supplemental Loan Auth., Rev. Bonds (Chesla Loan Program), Series 2017-A, AMT,
4.125% 2033
| 415
| 444
|
American High-Income Municipal Bond Fund —
Page 14 of 74
Bonds, notes & other debt instruments (continued)
Connecticut (continued)
| Principal amount
(000)
| Value
(000)
|
| Housing Fin. Auth., Housing Mortgage Fin. Program Bonds, Series 2016-B-2, AMT, 3.50% 2039
| $3,785
| $3,956
|
| Housing Fin. Auth., Housing Mortgage Fin. Program Bonds, Series 2016-F-2, AMT, 3.50% 2039
| 1,420
| 1,485
|
| Housing Fin. Auth., Housing Mortgage Fin. Program Bonds, Series 2018-A-2, AMT, 4.00% 2041
| 8,910
| 9,570
|
| Mohegan Tribe of Indians, Gaming Auth., Priority Distribution Payment Bonds, Series 2016-A, 5.50% 20262
| 6,345
| 6,763
|
Mohegan Tribe of Indians, Gaming Auth., Priority Distribution Payment Rev. Ref. Bonds, Series 2015,
7.00% 20452
| 2,495
| 2,600
|
Mohegan Tribe of Indians, Gaming Auth., Priority Distribution Payment Rev. Ref. Bonds, Series 2015-A,
6.75% 20452
| 9,342
| 10,009
|
Mohegan Tribe of Indians, Gaming Auth., Priority Distribution Payment Rev. Ref. Bonds, Series 2015-C,
6.25% 20302
| 4,500
| 5,033
|
|
|
| 70,355
|
| Delaware 0.03%
|
|
|
| Health Facs. Auth., Rev. Bonds (Beebe Medical Center Project), Series 2018, 5.00% 2050
| 2,235
| 2,579
|
| District of Columbia 0.86%
|
|
|
| Dulles Toll Road Rev. Bonds (Dulles Metrorail and Capital Improvement Projects), Series 2010-B, 6.50% 2044
| 5,000
| 6,629
|
Metropolitan Washington DC Airports Auth., Dulles Toll Road Rev. Bonds, Capital Appreciation Bonds,
Series 2009-B, Assured Guaranty Municipal insured, 0% 2035
| 6,000
| 3,623
|
Metropolitan Washington DC Airports Auth., Dulles Toll Road Rev. Bonds, Capital Appreciation Bonds,
Series 2010-A, Assured Guaranty Municipal insured, 0% 2037
| 10,000
| 5,566
|
| Rev. Bonds (DC International School Issue), Series 2019, 5.00% 2039
| 1,000
| 1,193
|
| Rev. Bonds (DC International School Issue), Series 2019, 5.00% 2049
| 1,275
| 1,496
|
| Rev. Bonds (Friendship Public Charter School, Inc. Issue), Series 2016-A, 5.00% 2036
| 2,895
| 3,297
|
| Rev. Bonds (Friendship Public Charter School, Inc. Issue), Series 2016-A, 5.00% 2041
| 1,545
| 1,737
|
| Rev. Bonds (Friendship Public Charter School, Inc. Issue), Series 2016-A, 5.00% 2046
| 3,170
| 3,543
|
| Rev. Bonds (Ingleside at Rock Creek Project), Series 2017-A, 5.00% 2032
| 1,000
| 1,089
|
| Rev. Bonds (Ingleside at Rock Creek Project), Series 2017-A, 5.00% 2052
| 1,750
| 1,856
|
| Rev. Ref. Bonds (KIPP DC Issue), Series 2017-B, 5.00% 2048
| 6,330
| 7,247
|
Tobacco Settlement Fncg. Corp., Tobacco Settlement Asset-Backed Bonds, Capital Appreciation Bonds,
Series 2006-A, 0% 2046
| 173,025
| 29,345
|
|
|
| 66,621
|
| Florida 5.18%
|
|
|
County of Alachua, Health Facs. Auth., Continuing Care Retirement Community Rev. Ref. Bonds
(Oak Hammock at the University of Florida, Inc. Project), Series 2012-A, 8.00% 2032
| 500
| 569
|
County of Alachua, Health Facs. Auth., Continuing Care Retirement Community Rev. Ref. Bonds
(Oak Hammock at the University of Florida, Inc. Project), Series 2012-A, 8.00% 2042
| 2,000
| 2,267
|
County of Alachua, Health Facs. Auth., Continuing Care Retirement Community Rev. Ref. Bonds
(Oak Hammock at the University of Florida, Inc. Project), Series 2012-A, 8.00% 2046
| 1,500
| 1,696
|
| County of Alachua, Health Facs. Auth., Health Facs. Rev. Bonds (Shands HealthCare Project), Series 2007-A, (3-month USD-LIBOR x 0.67 + 0.87%) 2.558% 20373
| 1,745
| 1,684
|
County of Alachua, Health Facs. Auth., Health Facs. Rev. Ref. Bonds (Shands HealthCare Project),
Series 2014-A, 5.00% 2044
| 3,700
| 4,147
|
| City of Atlantic Beach, Health Care Facs. Rev. and Rev. Ref. Bonds (Fleet Landing Project), Series 2013-A, 5.00% 2022
| 105
| 116
|
| City of Atlantic Beach, Health Care Facs. Rev. Bonds (Fleet Landing Project), Series 2018-A, 5.00% 2043
| 365
| 414
|
| City of Atlantic Beach, Health Care Facs. Rev. Bonds (Fleet Landing Project), Series 2018-A, 5.00% 2048
| 3,000
| 3,389
|
| City of Atlantic Beach, Health Care Facs. Rev. Bonds (Fleet Landing Project), Series 2018-A, 5.00% 2053
| 2,450
| 2,752
|
| County of Brevard, Educational Facs. Auth., Demand Rev. Bonds (Florida Institute of Technology Project), Series 2014, 5.00% 2032
| 2,470
| 2,771
|
| County of Brevard, Educational Facs. Auth., Demand Rev. Bonds (Florida Institute of Technology Project), Series 2014, 5.00% 2039
| 750
| 825
|
| County of Broward, Airport System Rev. Ref. Bonds, Series 2013-A, 5.25% 2043
| 2,000
| 2,246
|
American High-Income Municipal Bond Fund —
Page 15 of 74
Bonds, notes & other debt instruments (continued)
Florida (continued)
| Principal amount
(000)
| Value
(000)
|
| County of Broward, Airport System Rev. Ref. Bonds, Series 2015-A, AMT, 5.00% 2034
| $2,000
| $2,318
|
| County of Broward, Airport System Rev. Ref. Bonds, Series 2015-A, AMT, 5.00% 2035
| 2,000
| 2,310
|
City of Cape Coral, Utility Improvement Rev. Ref. Assessment Bonds (Various Areas), Series 2017,
Assured Guaranty Municipal insured, 5.67% 2028 (preref. 2019)
| 5,000
| 5,086
|
Capital Trust Agcy., Educational Facs. Rev. Bonds (Advantage Academy of Hillborough), Series 2019,
4.00% 2024
| 250
| 266
|
Capital Trust Agcy., Educational Facs. Rev. Bonds (Advantage Academy of Hillborough), Series 2019,
5.00% 2029
| 405
| 456
|
Capital Trust Agcy., Educational Facs. Rev. Bonds (Advantage Academy of Hillborough), Series 2019,
5.00% 2039
| 1,770
| 1,927
|
Capital Trust Agcy., Educational Facs. Rev. Bonds (Advantage Academy of Hillborough), Series 2019,
5.00% 2054
| 1,400
| 1,507
|
| Capital Trust Agcy., Educational Facs. Rev. Bonds (Charter Educational Foundation Inc.), Series 2018-A, 5.375% 20382
| 1,105
| 1,227
|
| Capital Trust Agcy., Educational Facs. Rev. Bonds (Charter Educational Foundation Inc.), Series 2018-A, 5.375% 20482
| 2,595
| 2,833
|
| Capital Trust Agcy., Educational Facs. Rev. Bonds (Renaissance Charter School), Series 2017-A, 5.125% 20372
| 5,225
| 5,457
|
| Capital Trust Agcy., Educational Facs. Rev. Bonds (Renaissance Charter School), Series 2017-A, 5.25% 20472
| 10,000
| 10,358
|
Capital Trust Agcy., Educational Facs. Rev. Bonds (Viera Charter Schools Inc. Project), Series 2017-A,
5.00% 20372
| 860
| 918
|
Capital Trust Agcy., Educational Facs. Rev. Bonds (Viera Charter Schools Inc. Project), Series 2017-A,
5.00% 20472
| 1,785
| 1,874
|
Capital Trust Agcy., Educational Facs. Rev. Bonds (Viera Charter Schools Inc. Project), Series 2017-A,
5.00% 20522
| 895
| 933
|
| Central Florida Expressway Auth., Rev. Ref. Bonds, Series 2017, 5.00% 2039
| 1,000
| 1,190
|
County of Collier, Health Facs. Auth., Residential Care Fac. Rev. Bonds (Moorings Inc.), Series 2015-A,
5.00% 2043
| 1,260
| 1,507
|
County of Collier, Health Facs. Auth., Residential Care Fac. Rev. Bonds (Moorings Inc.), Series 2015-A,
5.00% 2048
| 8,000
| 9,518
|
| Dev. Fin. Corp., Healthcare Facs. Rev. Bonds (UF Health - Jacksonville Project), Series 2013-A, 5.50% 2028
| 1,535
| 1,693
|
| Dev. Fin. Corp., Healthcare Facs. Rev. Bonds (UF Health - Jacksonville Project), Series 2013-A, 6.00% 2033
| 11,930
| 13,263
|
Dev. Fin. Corp., Solid Waste Disposal Rev. Bonds (Waste Pro USA, Inc. Project), Series 2017, AMT,
5.00% 2029 (put 2022)2
| 8,330
| 8,841
|
Dev. Fin. Corp., Solid Waste Disposal Rev. Bonds (Waste Pro USA, Inc. Project), Series 2019, AMT,
5.00% 20292
| 3,000
| 3,283
|
Dev. Fin. Corp., Surface Transportation Fac. Rev. Bonds (Virgin Trains USA Passenger Rail Project),
Series 2019-A, 6.50% 2049 (put 2029)1,2
| 4,750
| 4,534
|
Dev. Fin. Corp., Surface Transportation Fac., Rev. Bonds (Virgin Trains USA Passenger Rail Project),
Series 2019-B, AMT, 1.90% 2049 (put 2020)
| 7,525
| 7,532
|
County of Escambia, Health Facs. Auth., Health Care Facs. Rev. Bonds (Baptist Hospital, Inc. Project),
Series 2010-A, 5.75% 2029
| 5,250
| 5,469
|
| Halifax Hospital Medical Center, Hospital Rev. Ref. Bonds, Series 2016, 5.00% 2028
| 1,000
| 1,177
|
| Halifax Hospital Medical Center, Hospital Rev. Ref. Bonds, Series 2016, 5.00% 2030
| 2,750
| 3,200
|
| Higher Educational Facs. Fncg. Auth., Educational Facs. Rev. and Rev. Ref. Bonds (Ringling College Project), Series 2017, 5.00% 2042
| 2,000
| 2,287
|
Higher Educational Facs. Fncg. Auth., Educational Facs. Rev. Bonds (Jacksonville University Project),
Series 2018-A-1, 4.50% 20332
| 2,000
| 2,159
|
Higher Educational Facs. Fncg. Auth., Educational Facs. Rev. Bonds (Jacksonville University Project),
Series 2018-A-1, 4.75% 20382
| 2,150
| 2,325
|
Higher Educational Facs. Fncg. Auth., Educational Facs. Rev. Bonds (Jacksonville University Project),
Series 2018-A-1, 5.00% 20482
| 3,000
| 3,270
|
Higher Educational Facs. Fncg. Auth., Educational Facs. Rev. Bonds (Jacksonville University Project),
Series 2018-B, 5.00% 20532
| 3,000
| 3,242
|
| County of Hillsborough, Harbor Bay Community Dev. Dist., Capital Improvement Rev. Bonds, Series 2002, 6.75% 2034
| 3,105
| 3,120
|
American High-Income Municipal Bond Fund —
Page 16 of 74
Bonds, notes & other debt instruments (continued)
Florida (continued)
| Principal amount
(000)
| Value
(000)
|
| JEA, Water and Sewer System Rev. Bonds, Series 2017-A, 5.00% 2027
| $1,000
| $1,250
|
| Lakewood Ranch Stewardship Dist., Special Assessment Rev. Bonds (Lakewood Centre North), Series 2015, 4.875% 2035
| 485
| 506
|
| Lakewood Ranch Stewardship Dist., Special Assessment Rev. Bonds (Lakewood Centre North), Series 2015, 4.875% 2045
| 2,090
| 2,163
|
| Lakewood Ranch Stewardship Dist., Special Assessment Rev. Bonds (Lakewood National and Polo Run Project), Series 2017, 5.25% 2037
| 1,000
| 1,083
|
| Lakewood Ranch Stewardship Dist., Special Assessment Rev. Bonds (Lakewood National and Polo Run Project), Series 2017, 5.375% 2047
| 1,100
| 1,188
|
| County of Lee, Airport Rev. Ref. Bonds, Series 2010-A, AMT, Assured Guaranty insured, 5.00% 2022
| 1,860
| 1,905
|
| County of Lee, Airport Rev. Ref. Bonds, Series 2011-A, AMT, 5.375% 2032
| 9,935
| 10,646
|
| County of Lee, Industrial Dev. Auth., Healthcare Facs. Rev. Ref. Bonds (Shell Point/Alliance Obligated Group, Shell Point Project), Series 2011-B, 6.50% 2031
| 2,600
| 2,879
|
| County of Lee, Industrial Dev. Auth., Healthcare Facs. Rev. Ref. Bonds (Shell Point/Alliance Obligated Group, Shell Point Project), Series 2019, 5.00% 2039
| 1,975
| 2,305
|
| County of Lee, Industrial Dev. Auth., Healthcare Facs. Rev. Ref. Bonds (Shell Point/Alliance Obligated Group, Shell Point Project), Series 2019, 5.00% 2044
| 250
| 289
|
| County of Lee, Industrial Dev. Auth., Healthcare Facs. Rev. Ref. Bonds (Shell Point/Alliance Obligated Group, Shell Point Project), Series 2019, 5.00% 2049
| 6,555
| 7,550
|
| County of Martin, Health Facs. Auth., Hospital Rev. Bonds (Martin Memorial Medical Center), Series 2012, 5.50% 2042 (preref. 2021)
| 8,445
| 9,267
|
| County of Martin, Health Facs. Auth., Hospital Rev. Bonds (Martin Memorial Medical Center), Series 2015, 5.00% 2045 (preref. 2024)
| 500
| 595
|
County of Martin, Health Facs. Auth., Hospital Rev. Ref. Bonds (Martin Memorial Medical Center),
Series 2012-B, 3.74% 2023 (preref. 2022)
| 250
| 270
|
| City of Miami Beach, Health Facs. Auth., Hospital Rev. Ref. Bonds (Mount Sinai Medical Center of Florida), Series 2012, 5.00% 2021
| 1,000
| 1,081
|
| City of Miami Beach, Health Facs. Auth., Hospital Rev. Ref. Bonds (Mount Sinai Medical Center of Florida), Series 2012, 5.00% 2022
| 1,750
| 1,951
|
| City of Miami Beach, Health Facs. Auth., Hospital Rev. Ref. Bonds (Mount Sinai Medical Center of Florida), Series 2012, 5.00% 2023
| 2,415
| 2,683
|
| City of Miami Beach, Health Facs. Auth., Hospital Rev. Ref. Bonds (Mount Sinai Medical Center of Florida), Series 2014, 5.00% 2039
| 1,500
| 1,677
|
| County of Miami-Dade, Aviation Rev. Ref. Bonds, Series 2012-A, AMT, 5.00% 2024
| 2,000
| 2,226
|
| County of Miami-Dade, Expressway Auth., Toll System Rev. Ref. Bonds, Series 2016-A, 5.00% 2030
| 1,225
| 1,467
|
| County of Miami-Dade, Expressway Auth., Toll System Rev. Ref. Bonds, Series 2016-A, 5.00% 2032
| 1,140
| 1,346
|
| County of Miami-Dade, Miami World Center Community Dev. Dist., Special Assessment Bonds, Series 2017, 4.00% 2023
| 1,000
| 1,030
|
| County of Miami-Dade, Miami World Center Community Dev. Dist., Special Assessment Bonds, Series 2017, 4.75% 2027
| 750
| 808
|
| County of Miami-Dade, Miami World Center Community Dev. Dist., Special Assessment Bonds, Series 2017, 5.125% 2039
| 2,000
| 2,164
|
| County of Miami-Dade, Miami World Center Community Dev. Dist., Special Assessment Bonds, Series 2017, 5.25% 2049
| 2,000
| 2,167
|
| Mid-Bay Bridge Auth., Rev. Bonds, Series 2015-A, 5.00% 2035
| 2,000
| 2,271
|
| Mid-Bay Bridge Auth., Rev. Bonds, Series 2015-A, 5.00% 2035
| 1,000
| 1,129
|
| Mid-Bay Bridge Auth., Rev. Bonds, Series 2015-A, 5.00% 2040
| 1,000
| 1,121
|
| Mid-Bay Bridge Auth., Rev. Bonds, Series 2015-C, 5.00% 2040
| 1,935
| 2,158
|
| Mid-Bay Bridge Auth., Rev. Ref. Bonds, Series 2015-A, 5.00% 2029
| 1,910
| 2,217
|
| Mid-Bay Bridge Auth., Rev. Ref. Bonds, Series 2015-A, 5.00% 2030
| 1,500
| 1,730
|
| Mid-Bay Bridge Auth., Rev. Ref. Bonds, Series 2015-C, 5.00% 2030
| 2,500
| 2,868
|
Midtown Miami Community Dev. Dist., Special Assessment and Rev. Ref. Bonds (Infrastructure Project),
Series 2014-B, 5.00% 2037
| 1,735
| 1,822
|
Midtown Miami Community Dev. Dist., Special Assessment and Rev. Ref. Bonds (Parking Garage Project),
Series 2014-A, 4.25% 2024
| 2,040
| 2,125
|
American High-Income Municipal Bond Fund —
Page 17 of 74
Bonds, notes & other debt instruments (continued)
Florida (continued)
| Principal amount
(000)
| Value
(000)
|
| North Broward Hospital Dist., Rev. Bonds (Broward Health), Series 2017-B, 5.00% 2035
| $3,225
| $3,681
|
| North Broward Hospital Dist., Rev. Bonds (Broward Health), Series 2017-B, 5.00% 2036
| 4,000
| 4,547
|
| North Broward Hospital Dist., Rev. Bonds (Broward Health), Series 2017-B, 5.00% 2042
| 17,500
| 19,699
|
| North Broward Hospital Dist., Rev. Bonds (Broward Health), Series 2017-B, 5.00% 2048
| 11,500
| 12,899
|
City of North Port, West Villages Improvement Dist. (Unit of Dev. No. 2), Special Assessment Bonds,
Series 2005, 5.80% 20361,4
| 5,835
| 4,668
|
County of Orange, Health Facs. Auth., Health Care Facs. Rev. Bonds (Presbyterian Retirement Communities
Project), Series 2014, 5.00% 2026
| 1,965
| 2,232
|
County of Orange, Health Facs. Auth., Health Care Facs. Rev. Bonds (Presbyterian Retirement Communities
Project), Series 2015, 5.00% 2035
| 1,500
| 1,689
|
County of Orange, Health Facs. Auth., Health Care Facs. Rev. Bonds (Presbyterian Retirement Communities
Project), Series 2015, 5.00% 2040
| 3,000
| 3,338
|
County of Orange, Health Facs. Auth., Health Care Facs. Rev. Bonds (Presbyterian Retirement Communities
Project), Series 2015, 5.00% 2045
| 4,300
| 4,754
|
County of Orange, Health Facs. Auth., Health Care Facs. Rev. Bonds (Presbyterian Retirement Communities
Project), Series 2016, 5.00% 2036
| 4,100
| 4,557
|
County of Orange, Health Facs. Auth., Health Care Facs. Rev. Bonds (Presbyterian Retirement Communities
Project), Series 2016, 5.00% 2041
| 4,880
| 5,381
|
County of Orange, Health Facs. Auth., Health Care Facs. Rev. Bonds (Presbyterian Retirement Communities
Project), Series 2016, 5.00% 2047
| 6,280
| 6,896
|
County of Orange, Health Facs. Auth., Hospital Rev. Bonds (Orlando Health, Inc.), Series 2009,
5.25% 2020 (preref. 2019)
| 835
| 841
|
County of Orange, Health Facs. Auth., Hospital Rev. Ref. Bonds (Orlando Health Obligated Group),
Series 2016-A, 5.00% 2033
| 1,240
| 1,475
|
| County of Palm Beach, Health Facs. Auth., Retirement Communities Rev. Bonds (ACTS Retirement-Life Communities, Inc. Obligated Group), Series 2016, 5.00% 2032
| 4,895
| 5,740
|
| County of Palm Beach, Health Facs. Auth., Retirement Communities Rev. Bonds (ACTS Retirement-Life Communities, Inc. Obligated Group), Series 2018-A, 5.00% 2045
| 1,315
| 1,505
|
County of Palm Beach, Health Facs. Auth., Rev. Bonds (Lifespace Communities, Inc.), Series 2015-C,
5.00% 2026
| 1,000
| 1,136
|
County of Palm Beach, Health Facs. Auth., Rev. Bonds (Lifespace Communities, Inc.), Series 2015-C,
5.00% 2028
| 1,920
| 2,166
|
County of Palm Beach, Health Facs. Auth., Rev. Bonds (Lifespace Communities, Inc.), Series 2016-B,
5.00% 2036
| 1,250
| 1,396
|
County of Palm Beach, Health Facs. Auth., Rev. Bonds (Lifespace Communities, Inc.), Series 2018-B,
5.00% 2036
| 2,000
| 2,263
|
| County of Palm Beach, Solid Waste Auth., Improvement Rev. Bonds, Series 2009, 5.00% 2027 (preref. 2019)
| 1,155
| 1,162
|
City of Palm Coast, Palm Coast Park Community Dev. Dist., Special Assessment Bonds, Series 2006,
5.70% 2037
| 2,955
| 2,956
|
City of Palm Coast, Town Center at Palm Coast Community Dev. Dist., Capital Improvement Rev. Bonds,
Series 2005, 6.00% 2036
| 2,890
| 2,902
|
| County of Pasco, Meadow Pointe IV Community Dev. Dist., Capital Improvement Rev. Bonds, Series 2004-A, 6.00% 20364
| 1,035
| 60
|
| County of Pasco, Meadow Pointe IV Community Dev. Dist., Capital Improvement Rev. Bonds, Series 2012-A-1, 6.00% 20361
| 145
| 150
|
| County of Pasco, Meadow Pointe IV Community Dev. Dist., Capital Improvement Rev. Bonds, Series 2012-A-2, 6.25% 20381
| 275
| 287
|
| County of Pasco, Meadow Pointe IV Community Dev. Dist., Capital Improvement Rev. Bonds, Series 2012-B, 6.81% 20201
| 40
| 40
|
| County of Pinellas, Industrial Dev. Auth., Rev. Bonds (Drs. Kiran & Pallavi Patel 2017 Foundation for Global Understanding, Inc., Project), Series 2019, 5.00%
2029
| 1,000
| 1,186
|
| County of Pinellas, Industrial Dev. Auth., Rev. Bonds (Drs. Kiran & Pallavi Patel 2017 Foundation for Global Understanding, Inc., Project), Series 2019, 5.00%
2039
| 2,360
| 2,689
|
County of Polk, Lake Ashton II Community Dev. Dist., Capital Improvement Rev. Bonds, Series 2005-A,
5.375% 2036
| 2,190
| 2,098
|
American High-Income Municipal Bond Fund —
Page 18 of 74
Bonds, notes & other debt instruments (continued)
Florida (continued)
| Principal amount
(000)
| Value
(000)
|
| City of Pompano Beach, Rev. Bonds (John Knox Village Project), Series 2015, 5.00% 2039
| $2,250
| $2,470
|
| City of Pompano Beach, Rev. Bonds (John Knox Village Project), Series 2015, 5.00% 2044
| 3,170
| 3,458
|
| City of Port St. Lucie, Utility System Rev. Ref. Bonds, Series 2016, 4.00% 2036
| 2,000
| 2,199
|
City of St. Cloud, Gramercy Farms Community Dev. Dist., Special Assessment Bonds, Series 2007-B,
5.10% 20144
| 10,260
| —6
|
City of St. Cloud, Gramercy Farms Community Dev. Dist., Special Assessment Rev. Ref. Bonds,
Capital Appreciation Bonds, Series 2011, 0% 20397,8
| 31,560
| 6,012
|
| City of St. Cloud, Stevens Plantation Community Dev. Dist., Special Assessment Rev. Bonds, Series 2003-B, 6.375% 20134
| 2,125
| 1,700
|
| City of St. Cloud, Stevens Plantation Improvement Project Dependent Special Dist., Rev. Bonds, Series 2003, 6.375% 20134
| 2,035
| 1,425
|
| County of St. Johns, Industrial Dev. Auth., Rev. Ref. Bonds (Presbyterian Retirement Communities Project), Series 2010-A, 5.875% 2040 (preref. 2020)
| 3,625
| 3,792
|
County of St. Johns, Marshall Creek Community Dev. Dist., Special Assessment Bonds, Series 2002,
5.00% 2032
| 2,940
| 2,854
|
County of St. Johns, Marshall Creek Community Dev. Dist., Special Assessment Bonds, Series 2016,
6.32% 2045
| 220
| 212
|
County of Sarasota, Health Facs. Auth., Retirement Fac. Rev. Bonds (Village on the Isle Project),
Series 2017-A, 5.00% 2037
| 2,150
| 2,370
|
County of Sarasota, Health Facs. Auth., Retirement Fac. Rev. Bonds (Village on the Isle Project),
Series 2017-A, 5.00% 2042
| 3,200
| 3,506
|
County of Sarasota, Health Facs. Auth., Retirement Fac. Rev. Bonds (Village on the Isle Project),
Series 2017-A, 5.00% 2047
| 3,645
| 3,986
|
County of Sarasota, Health Facs. Auth., Retirement Fac. Rev. Bonds (Village on the Isle Project),
Series 2017-A, 5.00% 2052
| 6,695
| 7,306
|
County of Sarasota, Health Facs. Auth., Retirement Fac. Rev. Bonds (Village on the Isle Project),
Series 2017-B-1, 3.30% 2023
| 1,500
| 1,501
|
County of Sarasota, Health Facs. Auth., Retirement Fac. Rev. Bonds (Village on the Isle Project),
Series 2017-B-2, 2.70% 2022
| 1,100
| 1,100
|
County of Sarasota, Health Facs. Auth., Retirement Fac. Rev. Ref. Bonds (Village on the Isle Project),
Series 2016, 5.00% 2022
| 215
| 228
|
County of Sarasota, Health Facs. Auth., Retirement Fac. Rev. Ref. Bonds (Village on the Isle Project),
Series 2016, 5.00% 2025
| 225
| 254
|
County of Sarasota, Health Facs. Auth., Retirement Fac. Rev. Ref. Bonds (Village on the Isle Project),
Series 2016, 5.00% 2027
| 180
| 205
|
County of Sarasota, Health Facs. Auth., Retirement Fac. Rev. Ref. Bonds (Village on the Isle Project),
Series 2016, 5.00% 2030
| 120
| 136
|
| City of South Miami, Health Facs. Auth., Hospital Rev. Ref. Bonds (Baptist Health South Florida Obligated Group), Series 2017, 5.00% 2047
| 4,350
| 5,056
|
Southeast Overtown/Park West Community Redev. Agcy., Tax Increment Rev. Bonds, Series 2014-A-1,
5.00% 20242
| 1,000
| 1,140
|
Southeast Overtown/Park West Community Redev. Agcy., Tax Increment Rev. Bonds, Series 2014-A-1,
5.00% 20302
| 6,000
| 6,744
|
County of Sumter, Village Community Dev. Dist. No. 6, Rev. Ref. Bonds, Series 2017, BAM insured,
4.00% 2037
| 2,275
| 2,431
|
City of Tallahassee, Health Facs. Rev. Ref. Bonds (Tallahassee Memorial HealthCare, Inc. Project),
Series 2015-A, 5.00% 2040
| 1,350
| 1,508
|
City of Tallahassee, Health Facs. Rev. Ref. Bonds (Tallahassee Memorial HealthCare, Inc. Project),
Series 2016-A, 5.00% 2041
| 1,250
| 1,406
|
City of Tallahassee, Health Facs. Rev. Ref. Bonds (Tallahassee Memorial HealthCare, Inc. Project),
Series 2016-A, 5.00% 2055
| 4,400
| 4,898
|
| City of Tampa, Rev. and Rev. Ref. Bonds (University of Tampa Project), Series 2015, 5.00% 2045
| 3,945
| 4,459
|
| County of Volusia, Educational Facs. Auth., Educational Facs. Rev. Bonds (Stetson University, Inc. Project), Series 2015, 5.00% 2045
| 1,000
| 1,127
|
American High-Income Municipal Bond Fund —
Page 19 of 74
Bonds, notes & other debt instruments (continued)
Florida (continued)
| Principal amount
(000)
| Value
(000)
|
| County of Volusia, Educational Facs. Auth., Educational Facs. Rev. Ref. Bonds (Embry-Riddle Aeronautical University, Inc. Project), Series 2015-B, 5.00% 2030
| $1,500
| $1,733
|
| County of Volusia, Educational Facs. Auth., Educational Facs. Rev. Ref. Bonds (Embry-Riddle Aeronautical University, Inc. Project), Series 2015-B, 5.00% 2031
| 1,520
| 1,750
|
City of Winter Garden, Winter Garden Village at Fowler Groves Community Dev. Dist.,
Special Assessment Rev. Ref. Bonds, Series 2016, 3.75% 2031
| 1,990
| 2,012
|
City of Winter Garden, Winter Garden Village at Fowler Groves Community Dev. Dist.,
Special Assessment Rev. Ref. Bonds, Series 2016, 4.125% 2037
| 2,000
| 2,024
|
|
|
| 401,288
|
| Georgia 1.70%
|
|
|
| City of Atlanta, Dev. Auth., Senior Health Care Facs. Rev. Bonds (Georgia Proton Treatment Center Project), Series 2017-A1, 6.75% 2035
| 1,300
| 1,422
|
| City of Atlanta, Dev. Auth., Senior Health Care Facs. Rev. Bonds (Georgia Proton Treatment Center Project), Series 2017-A1, 7.00% 2040
| 3,000
| 3,320
|
| City of Atlanta, Dev. Auth., Student Housing Rev. Bonds (ADA/CAU Partners, Inc. Project at Clark Atlanta University), Series 2004-A, ACA insured, 6.25% 2024
| 1,285
| 1,291
|
| City of Atlanta, Dev. Auth., Student Housing Rev. Bonds (ADA/CAU Partners, Inc. Project at Clark Atlanta University), Series 2004-A, ACA insured, 6.25% 2036
| 140
| 141
|
County of Burke, Dev. Auth., Pollution Control Rev. Bonds (Georgia Power Co. Plant Vogtle Project),
Series 2013, 2.925% 2053 (put 2024)
| 7,000
| 7,316
|
County of Burke, Dev. Auth., Pollution Control Rev. Bonds (Oglethorpe Power Corp. - Vogtle Project),
Series 2017-C, 4.125% 2045
| 5,000
| 5,283
|
| County of Clayton, Dev. Auth., Special Facs. Rev. Ref. Bonds (Delta Air Lines, Inc. Project), Series 2009-A, 8.75% 2029
| 5,000
| 5,294
|
| County of Cobb, Dev. Auth., Parking and Dining Hall Lease Rev. Ref. Bonds (Kennesaw State University Real Estate Foundations Projects), Series 2017, 5.00% 2033
| 1,000
| 1,210
|
| County of DeKalb, Hospital Auth., Rev. Ref. Anticipation Certificates (DeKalb Medical Center, Inc. Project), Series 2010, 6.00% 2030 (preref. 2020)
| 9,615
| 10,094
|
| County of DeKalb, Hospital Auth., Rev. Ref. Anticipation Certificates (DeKalb Medical Center, Inc. Project), Series 2010, 6.125% 2040 (preref. 2020)
| 8,565
| 9,003
|
| County of Fulton, Dev. Auth., Rev. Bonds (TUFF CAUB LLC Project), Series 2007-A, 5.25% 2028
| 3,020
| 3,021
|
| County of Hall and City of Gainesville, Dev. Auth., Retirement Community Rev. Ref. Bonds (ACTS Retirement-Life Communities, Inc. Obligated Group), Series 2009-A-2,
6.375% 2029 (preref. 2019)
| 710
| 720
|
| County of Hall and City of Gainesville, Hospital Auth., Rev. Anticipation Certificates (Northeast Georgia Health System, Inc. Project), Series 2010-A, 5.00% 2030
| 460
| 469
|
| County of Hall and City of Gainesville, Hospital Auth., Rev. Anticipation Certificates (Northeast Georgia Health System, Inc. Project), Series 2010-A, 5.00% 2030
(preref. 2020)
| 1,540
| 1,572
|
| Housing and Fin. Auth., Single Family Mortgage Bonds, Series 2016-B-2, AMT, 3.50% 2039
| 4,280
| 4,473
|
Counties of Macon and Bibb, Urban Dev. Auth., Rev. Bonds (Academy for Classical Education, Inc.),
Series 2017, 5.75% 20372
| 1,200
| 1,254
|
Counties of Macon and Bibb, Urban Dev. Auth., Rev. Bonds (Academy for Classical Education, Inc.),
Series 2017, 5.875% 20472
| 1,680
| 1,750
|
Counties of Macon and Bibb, Urban Dev. Auth., Rev. Bonds (Academy for Classical Education, Inc.),
Series 2017, 6.00% 20522
| 1,530
| 1,596
|
| Main Street Natural Gas, Inc., Gas Project Rev. Bonds, Series 2007-A, 5.50% 2023
| 1,000
| 1,153
|
| Main Street Natural Gas, Inc., Gas Project Rev. Bonds, Series 2007-A, 5.50% 2026
| 1,000
| 1,237
|
| Main Street Natural Gas, Inc., Gas Supply Rev. Bonds, Series 2018-C, 4.00% 2048 (put 2023)
| 4,000
| 4,386
|
| Main Street Natural Gas, Inc., Gas Supply Rev. Bonds, Series 2019-A, 5.00% 2043
| 860
| 1,009
|
| Main Street Natural Gas, Inc., Gas Supply Rev. Bonds, Series 2019-A, 5.00% 2049
| 1,785
| 2,415
|
| City of Marrietta, Dev. Auth., Rev. Bonds (Life University, Inc. Project), Series 2017-A, 5.00% 20372
| 2,500
| 2,803
|
| Municipal Electric Auth., Plant Vogtle Units 3 and 4 Project J Bonds, Series 2015-A, 5.00% 2060
| 6,740
| 7,176
|
| Municipal Electric Auth., Plant Vogtle Units 3 and 4 Project J Bonds, Series 2015-A, 5.50% 2060
| 19,100
| 20,944
|
| Municipal Electric Auth., Plant Vogtle Units 3 and 4 Project J Bonds, Series 2019-A, 5.00% 2049
| 8,690
| 9,638
|
| Municipal Electric Auth., Plant Vogtle Units 3 and 4 Project J Bonds, Series 2019-A, 5.00% 2059
| 6,780
| 7,412
|
American High-Income Municipal Bond Fund —
Page 20 of 74
Bonds, notes & other debt instruments (continued)
Georgia (continued)
| Principal amount
(000)
| Value
(000)
|
Private Colleges and Universities Auth., Rev. Bonds (The Savannah College of Art and Design Projects),
Series 2014, 5.00% 2029
| $1,000
| $1,152
|
Private Colleges and Universities Auth., Rev. Bonds (The Savannah College of Art and Design Projects),
Series 2014, 5.00% 2044
| 2,000
| 2,244
|
Road and Tollway Auth., Toll Rev. Convertible Bonds (I-75 S Expressway Lanes Project),
Capital Appreciation Bonds, Series 2014-A, 0% 20242
| 2,115
| 1,634
|
Road and Tollway Auth., Toll Rev. Convertible Bonds (I-75 S Expressway Lanes Project),
Capital Appreciation Bonds, Series 2014-A, 0% 20342
| 3,495
| 1,482
|
Road and Tollway Auth., Toll Rev. Convertible Bonds (I-75 S Expressway Lanes Project),
Capital Appreciation Bonds, Series 2014-B, 0% 2049 (7.00% on 6/1/2024)1,2
| 6,755
| 5,086
|
| County of Rockdale, Rev. Ref. Bonds (Pratt Paper (GA), LLC Project), Series 2018, AMT, 4.00% 20382
| 2,500
| 2,622
|
|
|
| 131,622
|
| Guam 0.85%
|
|
|
| A.B. Won Pat International Airport Auth., General Rev. Bonds, Series 2013-C, AMT, 5.00% 2021
| 8,000
| 8,307
|
| A.B. Won Pat International Airport Auth., General Rev. Bonds, Series 2013-C, AMT, 6.25% 2034
| 1,500
| 1,737
|
| A.B. Won Pat International Airport Auth., General Rev. Bonds, Series 2013-C, AMT, 6.375% 2043
| 7,990
| 9,266
|
| Business Privilege Tax Bonds, Series 2011-A, 5.00% 2020
| 650
| 659
|
| Business Privilege Tax Bonds, Series 2011-A, 5.00% 2025
| 1,500
| 1,597
|
| Business Privilege Tax Bonds, Series 2011-A, 5.00% 2026
| 1,430
| 1,519
|
| Business Privilege Tax Bonds, Series 2011-A, 5.00% 2031
| 4,515
| 4,746
|
| Business Privilege Tax Bonds, Series 2011-A, 5.25% 2036
| 540
| 567
|
| Business Privilege Tax Bonds, Series 2012-B-1, 5.00% 2032
| 2,030
| 2,130
|
| Business Privilege Tax Bonds, Series 2012-B-1, 5.00% 2037
| 1,745
| 1,819
|
| Business Privilege Tax Rev. Ref. Bonds, Series 2015-D, 5.00% 2025
| 3,700
| 4,264
|
| Business Privilege Tax Rev. Ref. Bonds, Series 2015-D, 5.00% 2026
| 4,080
| 4,676
|
| Business Privilege Tax Rev. Ref. Bonds, Series 2015-D, 5.00% 2030
| 2,000
| 2,243
|
| Business Privilege Tax Rev. Ref. Bonds, Series 2015-D, 5.00% 2032
| 3,000
| 3,337
|
| Hotel Occupancy Tax Rev. Ref. Bonds, Series 2011-A, 6.125% 2031
| 1,010
| 1,080
|
| Hotel Occupancy Tax Rev. Ref. Bonds, Series 2011-A, 6.50% 2040
| 1,000
| 1,070
|
| Limited Obligation Rev. Ref. Bonds (Section 30), Series 2016-A, 5.00% 2022
| 1,000
| 1,092
|
| Port Auth., Port Rev. Bonds, Series 2018-B, AMT, 5.00% 2024
| 725
| 828
|
| Port Auth., Port Rev. Bonds, Series 2018-B, AMT, 5.00% 2031
| 585
| 695
|
| Port Auth., Port Rev. Bonds, Series 2018-B, AMT, 5.00% 2033
| 465
| 548
|
| Port Auth., Port Rev. Bonds, Series 2018-B, AMT, 5.00% 2035
| 400
| 468
|
| Power Auth., Rev. Bonds, Series 2012-A, Assured Guaranty Municipal insured, 5.00% 2034
| 280
| 299
|
| Power Auth., Rev. Bonds, Series 2014-A, Assured Guaranty Municipal insured, 5.00% 2021
| 495
| 526
|
| Power Auth., Rev. Ref. Bonds, Series 2017-A, 5.00% 2032
| 2,600
| 3,011
|
| Power Auth., Rev. Ref. Bonds, Series 2017-A, 5.00% 2033
| 1,055
| 1,217
|
| Power Auth., Rev. Ref. Bonds, Series 2017-A, 5.00% 2034
| 1,445
| 1,660
|
| Power Auth., Rev. Ref. Bonds, Series 2017-A, 5.00% 2038
| 1,000
| 1,135
|
| Power Auth., Rev. Ref. Bonds, Series 2017-A, 5.00% 2040
| 1,000
| 1,129
|
| Waterworks Auth., Water and Wastewater System Rev. Bonds, Series 2010, 5.625% 2040 (preref. 2020)
| 500
| 521
|
| Waterworks Auth., Water and Wastewater System Rev. Bonds, Series 2013, 5.00% 2028
| 1,300
| 1,428
|
| Waterworks Auth., Water and Wastewater System Rev. Bonds, Series 2013, 5.50% 2043
| 1,750
| 1,918
|
|
|
| 65,492
|
| Hawaii 0.39%
|
|
|
| Airports System Rev. Bonds, Series 2018-A, AMT, 5.00% 2038
| 6,000
| 7,207
|
| Airports System Rev. Bonds, Series 2018-A, AMT, 5.00% 2048
| 5,000
| 5,912
|
Dept. of Budget and Fin., Special Purpose Rev. Ref. Bonds (Hawaiian Electric Co., Inc.),
Series 2017-B, AMT, 4.00% 2037
| 13,800
| 14,424
|
American High-Income Municipal Bond Fund —
Page 21 of 74
Bonds, notes & other debt instruments (continued)
Hawaii (continued)
| Principal amount
(000)
| Value
(000)
|
Dept. of Budget and Fin., Special Purpose Senior Living Rev. Bonds (15 Craigside Project),
Series A, 8.75% 2029 (preref. 2019)
| $825
| $843
|
Dept. of Budget and Fin., Special Purpose Senior Living Rev. Bonds (15 Craigside Project),
Series A, 9.00% 2044 (preref. 2019)
| 2,000
| 2,044
|
|
|
| 30,430
|
| Idaho 0.17%
|
|
|
| Health Facs. Auth., Rev. Bonds (Kootenai Health Project), Series 2014-A, 4.375% 20342
| 2,420
| 2,580
|
| Health Facs. Auth., Rev. Bonds (Kootenai Health Project), Series 2014-A, 4.75% 20442
| 7,015
| 7,461
|
| Health Facs. Auth., Rev. Bonds (Kootenai Health Project), Series 2017-A, 5.00% 2047
| 1,500
| 1,715
|
Housing and Fin. Assn., Facs. Rev. Bonds (Compass Public Charter School, Inc. Project), Series 2018-A,
6.00% 20492
| 1,180
| 1,347
|
|
|
| 13,103
|
| Illinois 14.63%
|
|
|
| Village of Bolingbrook, Special Service Area No. 2019-1, Special Tax Bonds, Series 2019, 5.00% 2033
| 1,645
| 1,724
|
| Village of Bolingbrook, Special Service Area No. 2019-1, Special Tax Bonds, Series 2019, 5.25% 2041
| 4,230
| 4,383
|
| Build Illinois Bonds, Sales Tax Rev. Bonds, Series 2016-A, 4.00% 2028
| 4,685
| 5,017
|
| City of Chicago, Board of Education, Capital Improvement Bonds, Series 2016, 6.00% 2046
| 500
| 588
|
| City of Chicago, Board of Education, Unlimited Tax G.O. Bonds (Dedicated Alternative Rev.), Series 2015-C, 5.25% 2039
| 8,890
| 9,564
|
| City of Chicago, Board of Education, Unlimited Tax G.O. Bonds (Dedicated Rev.), Series 2011-A, 5.50% 2039
| 1,625
| 1,699
|
| City of Chicago, Board of Education, Unlimited Tax G.O. Bonds (Dedicated Rev.), Series 2016-B, 6.50% 2046
| 6,910
| 8,274
|
| City of Chicago, Board of Education, Unlimited Tax G.O. Bonds (Dedicated Rev.), Series 2017-A, 7.00% 20462
| 26,060
| 32,547
|
| City of Chicago, Board of Education, Unlimited Tax G.O. Bonds (Dedicated Rev.), Series 2017-C, 5.00% 2030
| 3,000
| 3,410
|
City of Chicago, Board of Education, Unlimited Tax G.O. Bonds (Dedicated Rev.), Series 2018-A,
Assured Guaranty Municipal insured, 5.00% 2026
| 2,500
| 2,964
|
City of Chicago, Board of Education, Unlimited Tax G.O. Bonds (Dedicated Rev.), Series 2018-A,
Assured Guaranty Municipal insured, 5.00% 2029
| 1,750
| 2,120
|
City of Chicago, Board of Education, Unlimited Tax G.O. Bonds (Dedicated Rev.), Series 2018-A,
Assured Guaranty Municipal insured, 5.00% 2033
| 1,000
| 1,188
|
City of Chicago, Board of Education, Unlimited Tax G.O. Bonds (Dedicated Rev.), Series 2018-C,
Assured Guaranty Municipal insured, 5.00% 2023
| 4,000
| 4,379
|
City of Chicago, Board of Education, Unlimited Tax G.O. Bonds (Dedicated Rev.), Series 2018-C,
Assured Guaranty Municipal insured, 5.00% 2028
| 2,250
| 2,744
|
| City of Chicago, Board of Education, Unlimited Tax G.O. Bonds (Dedicated Rev.), Series 2018-D, 5.00% 2046
| 2,000
| 2,195
|
| City of Chicago, Board of Education, Unlimited Tax G.O. Rev. Ref. Bonds (Dedicated Rev.), Series 2017-B, 6.75% 20302
| 3,500
| 4,461
|
| City of Chicago, Board of Education, Unlimited Tax G.O. Rev. Ref. Bonds (Dedicated Rev.), Series 2017-B, 7.00% 20422
| 28,185
| 35,305
|
| City of Chicago, Board of Education, Unlimited Tax G.O. Rev. Ref. Bonds (Dedicated Rev.), Series 2017-C, 5.00% 2021
| 2,000
| 2,109
|
| City of Chicago, Board of Education, Unlimited Tax G.O. Rev. Ref. Bonds (Dedicated Rev.), Series 2017-C, 5.00% 2024
| 2,000
| 2,224
|
| City of Chicago, Board of Education, Unlimited Tax G.O. Rev. Ref. Bonds (Dedicated Rev.), Series 2017-C, 5.00% 2025
| 4,000
| 4,506
|
| City of Chicago, Board of Education, Unlimited Tax G.O. Rev. Ref. Bonds (Dedicated Rev.), Series 2017-D, 5.00% 2021
| 1,500
| 1,582
|
| City of Chicago, Board of Education, Unlimited Tax G.O. Rev. Ref. Bonds (Dedicated Rev.), Series 2017-F, 5.00% 2024
| 2,000
| 2,224
|
| City of Chicago, Board of Education, Unlimited Tax G.O. Rev. Ref. Bonds (Dedicated Rev.), Series 2017-G, 5.00% 2044
| 5,000
| 5,453
|
| City of Chicago, Board of Education, Unlimited Tax G.O. Rev. Ref. Bonds (Dedicated Rev.), Series 2017-H, 5.00% 2036
| 12,000
| 13,359
|
American High-Income Municipal Bond Fund —
Page 22 of 74
Bonds, notes & other debt instruments (continued)
Illinois (continued)
| Principal amount
(000)
| Value
(000)
|
| City of Chicago, Board of Education, Unlimited Tax G.O. Rev. Ref. Bonds (Dedicated Rev.), Series 2017-H, 5.00% 2046
| $7,800
| $8,490
|
| City of Chicago, Board of Education, Unlimited Tax G.O. Rev. Ref. Bonds (Dedicated Rev.), Series 2018-C, Assured Guaranty Municipal insured, 5.00% 2029
| 3,000
| 3,634
|
City of Chicago, Board of Education, Unlimited Tax G.O. Rev. Ref. Bonds (Dedicated Rev.),
Capital Appreciation Bonds, Series 1998-B-1, FGIC insured, 0% 2028
| 5,470
| 4,168
|
| City of Chicago, Chicago Midway Airport, Rev. and Rev. Ref. Bonds, Series 2016-B, 5.00% 2046
| 2,500
| 2,862
|
| City of Chicago, Chicago Midway Airport, Rev. Ref. Bonds, Series 2014-A, AMT, 5.00% 2031
| 7,500
| 8,462
|
| City of Chicago, Chicago Midway Airport, Rev. Ref. Bonds, Series 2014-A, AMT, 5.00% 2032
| 5,000
| 5,628
|
| City of Chicago, Chicago Midway Airport, Rev. Ref. Bonds, Series 2014-A, AMT, 5.00% 2041
| 12,000
| 13,314
|
| City of Chicago, Chicago Midway Airport, Rev. Ref. Bonds, Series 2016-A, AMT, 5.00% 2027
| 2,310
| 2,749
|
| City of Chicago, Chicago Midway Airport, Rev. Ref. Bonds, Series 2016-A, AMT, 5.00% 2028
| 1,750
| 2,075
|
| City of Chicago, Chicago Midway Airport, Rev. Ref. Bonds, Series 2016-A, AMT, 5.00% 2029
| 2,500
| 2,954
|
| City of Chicago, Chicago Midway Airport, Rev. Ref. Bonds, Series 2016-A, AMT, 5.00% 2031
| 855
| 1,000
|
City of Chicago, G.O. Bonds (City Colleges of Chicago Capital Improvement Project),
Capital Appreciation Bonds, Series 1999, National insured, 0% 2031
| 3,000
| 2,086
|
| City of Chicago, G.O. Bonds (Library), Series 2008-D, 5.00% 2039
| 265
| 266
|
| City of Chicago, G.O. Bonds (Neighborhoods Alive 21 Program), Series 2002-B, 5.50% 2034
| 500
| 557
|
| City of Chicago, G.O. Bonds, Series 2003-B, 5.00% 2024
| 1,000
| 1,092
|
| City of Chicago, G.O. Bonds, Series 2011-A, 5.00% 2040
| 970
| 993
|
| City of Chicago, G.O. Bonds, Series 2011-A, 5.25% 2035
| 500
| 515
|
| City of Chicago, G.O. Bonds, Series 2012-A, 5.00% 2033
| 585
| 610
|
| City of Chicago, G.O. Bonds, Series 2012-C, 5.00% 2023
| 360
| 381
|
| City of Chicago, G.O. Bonds, Series 2014-A, 5.25% 2029
| 3,895
| 4,274
|
| City of Chicago, G.O. Bonds, Series 2015-A, 5.25% 2028
| 500
| 560
|
| City of Chicago, G.O. Bonds, Series 2015-A, 5.50% 2034
| 200
| 223
|
| City of Chicago, G.O. Bonds, Series 2017-A, 5.75% 2033
| 465
| 545
|
| City of Chicago, G.O. Bonds, Series 2019-A, 5.50% 2049
| 10,000
| 11,491
|
| City of Chicago, G.O. Project and Rev. Ref. Bonds, Capital Appreciation Bonds, Series 2008-C, 0% 2030
| 8,000
| 5,563
|
| City of Chicago, G.O. Project and Rev. Ref. Bonds, Capital Appreciation Bonds, Series 2008-C, 0% 2031
| 2,105
| 1,396
|
| City of Chicago, G.O. Project and Rev. Ref. Bonds, Capital Appreciation Bonds, Series 2008-C, 0% 2032
| 725
| 459
|
| City of Chicago, G.O. Project and Rev. Ref. Bonds, Series 2003-B, 5.00% 2022
| 1,000
| 1,059
|
| City of Chicago, G.O. Project and Rev. Ref. Bonds, Series 2005-D, 5.50% 2037
| 250
| 277
|
| City of Chicago, G.O. Project and Rev. Ref. Bonds, Series 2005-D, 5.50% 2040
| 1,450
| 1,597
|
| City of Chicago, G.O. Project and Rev. Ref. Bonds, Series 2014-A, 5.00% 2022
| 100
| 106
|
| City of Chicago, G.O. Project and Rev. Ref. Bonds, Series 2014-A, 5.00% 2035
| 3,140
| 3,361
|
| City of Chicago, G.O. Project and Rev. Ref. Bonds, Series 2014-A, 5.25% 2030
| 4,885
| 5,343
|
| City of Chicago, G.O. Project and Rev. Ref. Bonds, Series 2017-A, 5.625% 2029
| 6,500
| 7,699
|
| City of Chicago, G.O. Project and Rev. Ref. Bonds, Series 2017-A, 6.00% 2038
| 11,170
| 13,092
|
| City of Chicago, G.O. Rev. Ref. Bonds, Series 2015-A, 5.375% 2029
| 1,000
| 1,123
|
| City of Chicago, G.O. Rev. Ref. Bonds, Series 2015-C, 5.00% 2024
| 3,020
| 3,296
|
| City of Chicago, G.O. Rev. Ref. Bonds, Series 2015-C, 5.00% 2027
| 3,105
| 3,500
|
| City of Chicago, G.O. Rev. Ref. Bonds, Series 2015-C, 5.00% 2035
| 1,670
| 1,829
|
| City of Chicago, G.O. Rev. Ref. Bonds, Series 2015-C, 5.00% 2038
| 3,500
| 3,805
|
| City of Chicago, O’Hare International Airport, Customer Fac. Charge Rev. Bonds, Series 2013, 5.50% 2025
| 1,000
| 1,145
|
| City of Chicago, O’Hare International Airport, Customer Fac. Charge Rev. Bonds, Series 2013, 5.50% 2026
| 1,680
| 1,920
|
| City of Chicago, O’Hare International Airport, Customer Fac. Charge Rev. Bonds, Series 2013, 5.75% 2038
| 1,000
| 1,135
|
| City of Chicago, O’Hare International Airport, Customer Fac. Charge Rev. Bonds, Series 2013, 5.75% 2043
| 4,250
| 4,818
|
| City of Chicago, O’Hare International Airport, General Airport Rev. Bonds, Series 2011-A, 5.75% 2039
| 515
| 546
|
City of Chicago, O’Hare International Airport, General Airport Rev. Bonds, Series 2011-A,
5.75% 2039 (preref. 2021)
| 2,070
| 2,206
|
| City of Chicago, O’Hare International Airport, General Airport Rev. Bonds, Series 2017-D, 5.00% 2052
| 1,500
| 1,737
|
City of Chicago, O’Hare International Airport, General Airport Rev. Ref. Bonds, Series 2012-A, AMT,
5.00% 2026
| 3,500
| 3,799
|
American High-Income Municipal Bond Fund —
Page 23 of 74
Bonds, notes & other debt instruments (continued)
Illinois (continued)
| Principal amount
(000)
| Value
(000)
|
City of Chicago, O’Hare International Airport, General Airport Rev. Ref. Bonds, Series 2013-A, AMT,
5.00% 2023
| $5,000
| $5,591
|
City of Chicago, O’Hare International Airport, General Airport Rev. Ref. Bonds, Series 2015-A, AMT,
5.00% 2032
| 4,745
| 5,412
|
City of Chicago, O’Hare International Airport, General Airport Rev. Ref. Bonds, Series 2015-A, AMT,
5.00% 2033
| 1,220
| 1,388
|
City of Chicago, O’Hare International Airport, General Airport Rev. Ref. Bonds, Series 2015-A, AMT,
5.00% 2034
| 3,000
| 3,404
|
City of Chicago, O’Hare International Airport, General Airport Rev. Ref. Bonds, Series 2018-A, AMT,
5.00% 2053
| 3,500
| 4,091
|
| City of Chicago, O’Hare International Airport, Special Facs. Rev. Bonds (Trips Obligated Group), Series 2018, AMT, 5.00% 2048
| 6,250
| 7,213
|
| City of Chicago, Sales Tax Rev. Ref. Bonds, Series 2002, 5.00% 2032 (preref. 2025)
| 145
| 173
|
City of Chicago, School Reform Board of Trustees of the Board of Education, Unlimited Tax G.O. Bonds
(Dedicated Tax Rev.), Capital Appreciation Bonds, Series 1998-B-1, National insured, 0% 2019
| 1,205
| 1,196
|
City of Chicago, School Reform Board of Trustees of the Board of Education, Unlimited Tax G.O. Bonds
(Dedicated Tax Rev.), Capital Appreciation Bonds, Series 1998-B-1, National insured, 0% 2029
| 2,690
| 1,965
|
City of Chicago, School Reform Board of Trustees of the Board of Education, Unlimited Tax G.O. Bonds
(Dedicated Tax Rev.), Capital Appreciation Bonds, Series 1998-B-1, National insured, 0% 2031
| 5,870
| 3,942
|
City of Chicago, School Reform Board of Trustees of the Board of Education, Unlimited Tax G.O. Bonds
(Dedicated Tax Rev.), Capital Appreciation Bonds, Series 1999-A, National insured, 0% 2024
| 2,070
| 1,811
|
City of Chicago, School Reform Board of Trustees of the Board of Education, Unlimited Tax G.O. Bonds
(Dedicated Tax Rev.), Capital Appreciation Bonds, Series 1999-A, National insured, 0% 2025
| 1,200
| 1,015
|
City of Chicago, School Reform Board of Trustees of the Board of Education, Unlimited Tax G.O. Bonds
(Dedicated Tax Rev.), Capital Appreciation Bonds, Series 1999-A, National insured, 0% 2031
| 3,125
| 2,096
|
City of Chicago, School Reform Board of Trustees of the Board of Education, Unlimited Tax G.O. Bonds
(Dedicated Tax Rev.), Series 2011-A, 5.00% 2041
| 12,440
| 12,852
|
City of Chicago, School Reform Board of Trustees of the Board of Education, Unlimited Tax G.O. Bonds
(Dedicated Tax Rev.), Series 2012-A, 5.00% 2042
| 8,635
| 9,019
|
City of Chicago, School Reform Board of Trustees of the Board of Education, Unlimited Tax G.O. Bonds
(Dedicated Tax Rev.), Series 2016-A, 7.00% 2044
| 14,980
| 18,022
|
City of Chicago, Transit Auth., Sales Tax Receipts Rev. Bonds, Series 2017,
Assured Guaranty Municipal insured, 5.00% 2051
| 21,750
| 24,256
|
| City of Chicago, Wastewater Transmission Rev. Bonds (Second Lien), Series 2017-A, 5.00% 2037
| 3,000
| 3,438
|
| City of Chicago, Wastewater Transmission Rev. Bonds, Series 2012, 5.00% 2042
| 6,000
| 6,318
|
| City of Chicago, Wastewater Transmission Rev. Bonds, Series 2014, 5.00% 2020
| 460
| 467
|
| City of Chicago, Wastewater Transmission Rev. Bonds, Series 2014, 5.00% 2024
| 1,000
| 1,142
|
| City of Chicago, Wastewater Transmission Rev. Ref. Bonds, Capital Appreciation Bonds, Series 1998-A, National insured, 0% 2026
| 560
| 481
|
| City of Chicago, Wastewater Transmission Rev. Ref. Bonds, Capital Appreciation Bonds, Series 1998-A, National insured, 0% 2027
| 5,000
| 4,158
|
| City of Chicago, Wastewater Transmission Rev. Ref. Bonds, Series 2008-C, 5.00% 2023
| 1,000
| 1,114
|
| City of Chicago, Water Rev. Bonds, Series 2000, 5.00% 2028
| 1,000
| 1,185
|
| City of Chicago, Water Rev. Bonds, Series 2000, 5.00% 2029
| 1,000
| 1,179
|
| City of Chicago, Water Rev. Bonds, Series 2000, 5.00% 2030
| 700
| 821
|
| City of Chicago, Water Rev. Bonds, Series 2004, 5.00% 2023
| 2,575
| 2,937
|
| City of Chicago, Water Rev. Bonds, Series 2004, 5.00% 2024
| 2,000
| 2,332
|
| City of Chicago, Water Rev. Bonds, Series 2004, 5.00% 2027
| 1,750
| 2,086
|
| City of Chicago, Water Rev. Bonds, Series 2014, 5.00% 2022
| 250
| 277
|
| City of Chicago, Water Rev. Bonds, Series 2014, 5.00% 2033
| 6,200
| 6,981
|
| City of Chicago, Water Rev. Bonds, Series 2016-A-1, 5.00% 2031
| 1,000
| 1,167
|
| City of Chicago, Water Rev. Ref. Bonds (Second Lien), Series 2001, 5.75% 2030
| 3,000
| 3,772
|
| City of Chicago, Water Rev. Ref. Bonds, Series 2012, 5.00% 2042
| 4,370
| 4,681
|
| City of Chicago, Water Rev. Ref. Bonds, Series 2014, 5.00% 2029
| 1,605
| 1,821
|
| City of Chicago, Water Rev. Ref. Bonds, Series 2014, 5.00% 2044
| 500
| 551
|
American High-Income Municipal Bond Fund —
Page 24 of 74
Bonds, notes & other debt instruments (continued)
Illinois (continued)
| Principal amount
(000)
| Value
(000)
|
| City of Chicago, Water Rev. Ref. Bonds, Series 2017-2, Assured Guaranty Municipal insured, 5.00% 2035
| $2,290
| $2,696
|
| City of Chicago, Water Rev. Ref. Bonds, Series 2017-2, Assured Guaranty Municipal insured, 5.00% 2038
| 5,000
| 5,832
|
Counties of Cook, DuPage, Kane, Lake, McHenry and Will, Regional Transportation Auth., G.O. Bonds,
Series 2003-A, FGIC-National insured, 6.00% 2033
| 6,300
| 8,734
|
| Counties of Cook, DuPage, Kane, Lake, McHenry and Will, Regional Transportation Auth., G.O. Rev. Ref. Bonds, Series 1999, Assured Guaranty Municipal insured, 6.00%
2025
| 1,995
| 2,406
|
| County of Cook, Community College Dist. No. 508 (City Colleges of Chicago), Unlimited Tax G.O. Bonds, Series 2013, 5.25% 2043
| 3,000
| 3,159
|
| County of Cook, Community College Dist. No. 508 (City Colleges of Chicago), Unlimited Tax G.O. Bonds, Series 2017, BAM insured, 5.00% 2047
| 7,100
| 8,056
|
County of Cook, Community College Dist. No. 508 (South Suburban College), G.O. Bonds,
Capital Appreciation Bonds, Series 2008, Assured Guaranty insured, 0% 2022
| 1,000
| 939
|
| County of Cook, G.O. Rev. Ref. Bonds, Series 2016-A, 5.00% 2021
| 290
| 311
|
| County of Cook, G.O. Rev. Ref. Bonds, Series 2016-A, Assured Guaranty Municipal insured, 5.00% 2026
| 350
| 425
|
| County of Cook, G.O. Rev. Ref. Bonds, Series 2016-A, Assured Guaranty Municipal insured, 5.00% 2028
| 3,000
| 3,546
|
| County of Cook, G.O. Rev. Ref. Bonds, Series 2016-A, Assured Guaranty Municipal insured, 5.00% 2031
| 3,500
| 4,086
|
| County of DuPage, Special Service Area No. 31 (Monarch Landing Project), Special Tax Bonds, Series 2006, 5.625% 2036
| 4,433
| 4,436
|
| Fin. Auth., Charter School Rev. Ref. and Improvement Rev. Bonds (Chicago International Charter School Project), Series 2017, 5.00% 2037
| 1,500
| 1,686
|
| Fin. Auth., Charter School Rev. Ref. and Improvement Rev. Bonds (Chicago International Charter School Project), Series 2017, 5.00% 2047
| 3,180
| 3,505
|
| Fin. Auth., Rev. Bonds (Benedictine University Project), Series 2013-A, 6.25% 2033
| 4,010
| 4,139
|
| Fin. Auth., Rev. Bonds (Centegra Health System), Series 2014-A, 5.00% 2022
| 40
| 45
|
| Fin. Auth., Rev. Bonds (Centegra Health System), Series 2014-A, 5.00% 2042
| 1,000
| 1,116
|
| Fin. Auth., Rev. Bonds (Christian Homes, Inc.), Series 2010, 6.125% 2027
| 645
| 662
|
| Fin. Auth., Rev. Bonds (Clean Water Initiative Revolving Fund), Series 2017, 5.00% 2036
| 7,530
| 9,022
|
| Fin. Auth., Rev. Bonds (DePaul University), Series 2016, 5.00% 2041
| 1,000
| 1,164
|
| Fin. Auth., Rev. Bonds (Edward-Elmhurst Healthcare), Series 2017-A, 5.00% 2032
| 1,285
| 1,507
|
| Fin. Auth., Rev. Bonds (Edward-Elmhurst Healthcare), Series 2017-A, 5.00% 2035
| 3,750
| 4,340
|
| Fin. Auth., Rev. Bonds (Franciscan Communities, Inc.), Series 2013-A, 5.125% 2043
| 2,405
| 2,537
|
| Fin. Auth., Rev. Bonds (Friendship Village Schaumburg), Series 2017, 5.125% 2045
| 7,250
| 6,995
|
| Fin. Auth., Rev. Bonds (Hospital Sisters Services, Inc. Obligated Group), Series 2012-C, 5.00% 2020
| 230
| 239
|
| Fin. Auth., Rev. Bonds (Lifespace Communities, Inc.), Series 2015-A, 5.00% 2026
| 255
| 290
|
| Fin. Auth., Rev. Bonds (Lifespace Communities, Inc.), Series 2015-A, 5.00% 2045
| 3,500
| 3,800
|
| Fin. Auth., Rev. Bonds (Mercy Health Corp.), Series 2016, 4.00% 2035
| 1,465
| 1,560
|
| Fin. Auth., Rev. Bonds (Mercy Health Corp.), Series 2016, 5.00% 2034
| 3,600
| 4,129
|
| Fin. Auth., Rev. Bonds (Mercy Health Corp.), Series 2016, 5.00% 2040
| 12,000
| 13,565
|
| Fin. Auth., Rev. Bonds (Mercy Health Corp.), Series 2016, 5.00% 2046
| 17,165
| 19,276
|
| Fin. Auth., Rev. Bonds (Northwest Community Hospital), Series 2016-A, 5.00% 2033
| 1,800
| 2,094
|
| Fin. Auth., Rev. Bonds (Northwestern Memorial Hospital), Series 2009-A, 5.75% 2030 (preref. 2019)
| 4,000
| 4,007
|
| Fin. Auth., Rev. Bonds (Northwestern Memorial Hospital), Series 2009-B, 5.75% 2030 (preref. 2019)
| 130
| 130
|
| Fin. Auth., Rev. Bonds (OSF Healthcare System), Series 2012-A, 5.00% 2028
| 1,500
| 1,633
|
| Fin. Auth., Rev. Bonds (OSF Healthcare System), Series 2015-A, 4.125% 2037
| 1,000
| 1,070
|
| Fin. Auth., Rev. Bonds (Presbyterian Homes Obligated Group), Series 2016-A, 5.00% 2025
| 1,135
| 1,338
|
| Fin. Auth., Rev. Bonds (Presbyterian Homes Obligated Group), Series 2016-A, 5.00% 2026
| 1,000
| 1,195
|
| Fin. Auth., Rev. Bonds (Presbyterian Homes Obligated Group), Series 2016-A, 5.00% 2026
| 1,000
| 1,181
|
| Fin. Auth., Rev. Bonds (Presbyterian Homes Obligated Group), Series 2016-A, 5.00% 2028
| 2,240
| 2,652
|
| Fin. Auth., Rev. Bonds (Presbyterian Homes Obligated Group), Series 2016-A, 5.00% 2029
| 3,090
| 3,641
|
| Fin. Auth., Rev. Bonds (Presbyterian Homes Obligated Group), Series 2016-A, 5.00% 2030
| 1,500
| 1,756
|
| Fin. Auth., Rev. Bonds (Presbyterian Homes Obligated Group), Series 2016-A, 5.00% 2031
| 2,270
| 2,637
|
Fin. Auth., Rev. Bonds (Presbyterian Homes Obligated Group), Series 2016-B,
(1-month USD-LIBOR x 0.70 + 1.35%) 3.031% 2036 (put 2021)3
| 800
| 802
|
| Fin. Auth., Rev. Bonds (Presence Health Network), Series 2016-C, 3.75% 2034
| 250
| 266
|
| Fin. Auth., Rev. Bonds (Presence Health Network), Series 2016-C, 4.00% 2041
| 1,755
| 1,910
|
American High-Income Municipal Bond Fund —
Page 25 of 74
Bonds, notes & other debt instruments (continued)
Illinois (continued)
| Principal amount
(000)
| Value
(000)
|
| Fin. Auth., Rev. Bonds (Presence Health Network), Series 2016-C, 4.00% 2041 (preref. 2027)
| $5
| $6
|
| Fin. Auth., Rev. Bonds (Presence Health Network), Series 2016-C, 5.00% 2027
| 1,875
| 2,331
|
| Fin. Auth., Rev. Bonds (Presence Health Network), Series 2016-C, 5.00% 2029
| 9,000
| 11,098
|
| Fin. Auth., Rev. Bonds (Presence Health Network), Series 2016-C, 5.00% 2030
| 1,000
| 1,221
|
| Fin. Auth., Rev. Bonds (Presence Health Network), Series 2016-C, 5.00% 2032
| 4,500
| 5,438
|
| Fin. Auth., Rev. Bonds (Presence Health Network), Series 2016-C, 5.00% 2034
| 1,265
| 1,511
|
| Fin. Auth., Rev. Bonds (Presence Health Network), Series 2016-C, 5.00% 2036
| 3,820
| 4,517
|
| Fin. Auth., Rev. Bonds (Presence Health Network), Series 2016-C, 5.00% 2041
| 2,000
| 2,334
|
| Fin. Auth., Rev. Bonds (Rehabilitation Institute of Chicago), Series 2013-A, 6.00% 2043
| 2,300
| 2,594
|
| Fin. Auth., Rev. Bonds (Rosalind Franklin University Research Building Project), Series 2017-C, 5.00% 2046
| 900
| 1,010
|
| Fin. Auth., Rev. Bonds (Rosalind Franklin University Research Building Project), Series 2017-C, 5.00% 2049
| 1,250
| 1,398
|
| Fin. Auth., Rev. Bonds (Rush University Medical Center Obligated Group), Series 2015-A, 5.00% 2032
| 1,100
| 1,262
|
| Fin. Auth., Rev. Bonds (Rush University Medical Center Obligated Group), Series 2015-A, 5.00% 2038
| 1,500
| 1,688
|
| Fin. Auth., Rev. Bonds (Silver Cross Hospital and Medical Centers), Series 2009, 6.875% 2038 (preref. 2019)
| 1,500
| 1,503
|
| Fin. Auth., Rev. Bonds (Swedish Covenant Hospital), Series 2016-A, 5.00% 2032
| 2,000
| 2,298
|
| Fin. Auth., Rev. Bonds (Swedish Covenant Hospital), Series 2016-A, 5.00% 2033
| 2,000
| 2,292
|
| Fin. Auth., Rev. Bonds (Swedish Covenant Hospital), Series 2016-A, 5.00% 2035
| 2,000
| 2,279
|
| Fin. Auth., Rev. Bonds (Swedish Covenant Hospital), Series 2016-A, 5.00% 2037
| 1,800
| 2,037
|
| Fin. Auth., Rev. Bonds (The Cable Foundation), Series 2016-A, 5.00% 2045
| 6,880
| 7,790
|
| Fin. Auth., Rev. Bonds (Trinity Health Credit Group), Series 2011-IL, 5.00% 2030 (preref. 2021)
| 275
| 299
|
| Fin. Auth., Rev. Ref. Bonds (Anne & Robert H. Lurie Children’s Hospital), Series 2017, 5.00% 2034
| 1,000
| 1,201
|
| Fin. Auth., Rev. Ref. Bonds (Bradley University Project), Series 2017-C, 5.00% 2032
| 1,250
| 1,480
|
| Fin. Auth., Rev. Ref. Bonds (Christian Homes, Inc.), Series 2016, 5.00% 2031
| 1,875
| 2,031
|
| Fin. Auth., Rev. Ref. Bonds (Christian Homes, Inc.), Series 2016, 5.00% 2036
| 1,000
| 1,071
|
| Fin. Auth., Rev. Ref. Bonds (Northwestern Memorial Hospital), Series 2009-A, 6.00% 2039 (preref. 2019)
| 3,500
| 3,506
|
| Fin. Auth., Rev. Ref. Bonds (OSF Healthcare System), Series 2010-A, 6.00% 2039
| 940
| 978
|
| Fin. Auth., Rev. Ref. Bonds (OSF Healthcare System), Series 2010-A, 6.00% 2039 (preref. 2020)
| 5,135
| 5,328
|
| Fin. Auth., Rev. Ref. Bonds (OSF Healthcare System), Series 2015-A, 5.00% 2035
| 5,450
| 6,213
|
| Fin. Auth., Rev. Ref. Bonds (OSF Healthcare System), Series 2015-A, 5.00% 2045
| 2,000
| 2,228
|
| Fin. Auth., Rev. Ref. Bonds (OSF Healthcare System), Series 2018-A, 4.125% 2047
| 2,000
| 2,151
|
| Fin. Auth., Rev. Ref. Bonds (Provena Health), Series 2009-A, 7.75% 2034 (preref. 2019)
| 9,705
| 9,728
|
| Fin. Auth., Rev. Ref. Bonds (Provena Health), Series 2009-A, 7.75% 2034 (preref. 2019)
| 125
| 125
|
| Fin. Auth., Rev. Ref. Bonds (Provena Health), Series 2010-A, 6.00% 2028 (preref. 2020)
| 1,250
| 1,295
|
| Fin. Auth., Rev. Ref. Bonds (Silver Cross Hospital and Medical Centers), Series 2015-C, 4.125% 2037
| 8,710
| 9,078
|
| Fin. Auth., Rev. Ref. Bonds (Silver Cross Hospital and Medical Centers), Series 2015-C, 5.00% 2035
| 3,950
| 4,469
|
| Fin. Auth., Rev. Ref. Bonds (Silver Cross Hospital and Medical Centers), Series 2015-C, 5.00% 2044
| 6,400
| 7,125
|
| Fin. Auth., Rev. Ref. Bonds (Southern Illinois Healthcare Enterprises, Inc.), Series 2017-C, 5.00% 2026
| 250
| 300
|
| Fin. Auth., Rev. Ref. Bonds (University of Chicago Medical Center), Series 2009-B, 5.00% 2025
| 1,995
| 2,074
|
| Fin. Auth., Rev. Ref. Bonds (University of Chicago Medical Center), Series 2009-B, 5.00% 2025 (preref. 2020)
| 1,005
| 1,045
|
| Fin. Auth., Student Housing and Academic Fac. Rev. Bonds (CHF-Chicago, LLC - University of Illinois at Chicago Project), Series 2017-A, 5.00% 2047
| 2,365
| 2,641
|
Fin. Auth., Student Housing Rev. Bonds (CHF-Cook, LLC - Northeastern Illinois University Project),
Series 2015-A, 5.00% 2023
| 775
| 817
|
Fin. Auth., Student Housing Rev. Bonds (CHF-Cook, LLC - Northeastern Illinois University Project),
Series 2015-A, 5.00% 2024
| 815
| 862
|
Fin. Auth., Student Housing Rev. Bonds (CHF-Cook, LLC - Northeastern Illinois University Project),
Series 2015-A, 5.00% 2025
| 730
| 774
|
Fin. Auth., Student Housing Rev. Bonds (CHF-Cook, LLC - Northeastern Illinois University Project),
Series 2015-A, 5.00% 2030
| 2,465
| 2,550
|
Fin. Auth., Student Housing Rev. Bonds (CHF-Cook, LLC - Northeastern Illinois University Project),
Series 2015-A, 5.00% 2035
| 700
| 713
|
Fin. Auth., Student Housing Rev. Bonds (CHF-Cook, LLC - Northeastern Illinois University Project),
Series 2015-A, 5.00% 2047
| 11,500
| 11,593
|
Fin. Auth., Student Housing Rev. Bonds (CHF-DeKalb II, LLC - Northern Illinois University Project),
Series 2011, 5.125% 2020
| 4,440
| 4,506
|
American High-Income Municipal Bond Fund —
Page 26 of 74
Bonds, notes & other debt instruments (continued)
Illinois (continued)
| Principal amount
(000)
| Value
(000)
|
Fin. Auth., Student Housing Rev. Bonds (CHF-DeKalb II, LLC - Northern Illinois University Project),
Series 2011, 5.75% 2021
| $2,000
| $2,103
|
Fin. Auth., Student Housing Rev. Bonds (CHF-DeKalb II, LLC - Northern Illinois University Project),
Series 2011, 6.00% 2024
| 1,000
| 1,057
|
Fin. Auth., Student Housing Rev. Bonds (CHF-DeKalb II, LLC - Northern Illinois University Project),
Series 2011, 6.875% 2043
| 19,125
| 20,334
|
Fin. Auth., Student Housing Rev. Bonds (CHF-Normal, LLC - Illinois State University Project),
Series 2011, 7.00% 2043 (preref. 2021)
| 4,265
| 4,670
|
| G.O. Bonds, Series 2012-A, 5.00% 2028
| 1,000
| 1,051
|
| G.O. Bonds, Series 2013, 5.00% 2021
| 860
| 905
|
| G.O. Bonds, Series 2013, 5.00% 2023
| 685
| 747
|
| G.O. Bonds, Series 2013, 5.50% 2026
| 2,000
| 2,205
|
| G.O. Bonds, Series 2013, 5.50% 2033
| 3,715
| 4,054
|
| G.O. Bonds, Series 2013, 5.50% 2038
| 1,000
| 1,082
|
| G.O. Bonds, Series 2014, 5.00% 2022
| 885
| 942
|
| G.O. Bonds, Series 2014, 5.00% 2024
| 3,000
| 3,290
|
| G.O. Bonds, Series 2014, 5.00% 2026
| 2,025
| 2,215
|
| G.O. Bonds, Series 2014, 5.00% 2027
| 2,000
| 2,249
|
| G.O. Bonds, Series 2014, 5.00% 2039
| 13,550
| 14,376
|
| G.O. Bonds, Series 2014, Assured Guaranty Municipal insured, 5.00% 2039
| 4,100
| 4,361
|
| G.O. Bonds, Series 2016, 5.00% 2025
| 1,000
| 1,116
|
| G.O. Bonds, Series 2016, 5.00% 2028
| 1,500
| 1,689
|
| G.O. Bonds, Series 2016, 5.00% 2033
| 4,000
| 4,428
|
| G.O. Bonds, Series 2016, 5.00% 2038
| 1,000
| 1,092
|
| G.O. Bonds, Series 2016, Assured Guaranty Municipal insured, 5.00% 2030
| 3,000
| 3,333
|
| G.O. Bonds, Series 2016, Assured Guaranty Municipal insured, 5.00% 2041
| 2,125
| 2,292
|
| G.O. Bonds, Series 2017-A, 5.00% 2035
| 3,145
| 3,449
|
| G.O. Bonds, Series 2017-A, 5.00% 2036
| 3,000
| 3,279
|
| G.O. Bonds, Series 2017-B, 5.00% 2019
| 3,550
| 3,576
|
| G.O. Bonds, Series 2017-C, 5.00% 2029
| 9,820
| 11,036
|
| G.O. Bonds, Series 2017-D, 5.00% 2027
| 21,490
| 24,426
|
| G.O. Bonds, Series 2017-D, BAM insured, 5.00% 2021
| 3,335
| 3,533
|
| G.O. Bonds, Series 2017-D, BAM insured, 5.00% 2026
| 10,000
| 11,265
|
| G.O. Bonds, Series 2017-D, BAM insured, 5.00% 2028
| 18,000
| 20,347
|
| G.O. Bonds, Series 2018-A, 5.00% 2020
| 2,650
| 2,711
|
| G.O. Bonds, Series 2019-B, 5.00% 2027
| 5,000
| 5,748
|
| G.O. Rev. Ref. Bonds, Series 2012, 4.00% 2025
| 405
| 419
|
| G.O. Rev. Ref. Bonds, Series 2012, Assured Guaranty Municipal insured, 5.00% 2025
| 4,250
| 4,541
|
| G.O. Rev. Ref. Bonds, Series 2016, 5.00% 2026
| 3,000
| 3,391
|
| G.O. Rev. Ref. Bonds, Series 2016, 5.00% 2028
| 3,000
| 3,415
|
| G.O. Rev. Ref. Bonds, Series 2016, Assured Guaranty Municipal insured, 4.00% 2030
| 750
| 819
|
| G.O. Rev. Ref. Bonds, Series 2018-A, 5.00% 2023
| 2,500
| 2,738
|
| G.O. Rev. Ref. Bonds, Series 2018-A, 5.00% 2025
| 3,750
| 4,222
|
| G.O. Rev. Ref. Bonds, Series 2018-A, 5.00% 2026
| 5,500
| 6,263
|
| G.O. Rev. Ref. Bonds, Series 2018-A, 5.00% 2027
| 2,000
| 2,301
|
| G.O. Rev. Ref. Bonds, Series 2018-A, 5.00% 2028
| 4,000
| 4,647
|
| G.O. Rev. Ref. Bonds, Series 2018-A, 5.00% 2029
| 2,000
| 2,309
|
| G.O. Rev. Ref. Bonds, Series 2018-B, 5.00% 2033
| 3,000
| 3,395
|
| Housing Dev. Auth., Homeowner Mortgage Rev. Bonds, Series 2016-B, AMT, 3.50% 2046
| 3,775
| 3,984
|
| Housing Dev. Auth., Homeowner Mortgage Rev. Bonds, Series 2016-C, 3.50% 2046
| 2,735
| 2,898
|
Board of Trustees of the Illinois State University, Auxiliary Facs. System Rev. Bonds, Series 2016,
Assured Guaranty Municipal insured, 5.00% 2025
| 3,000
| 3,473
|
Board of Trustees of the Illinois State University, Auxiliary Facs. System Rev. Bonds, Series 2016,
Assured Guaranty Municipal insured, 5.00% 2026
| 1,150
| 1,356
|
American High-Income Municipal Bond Fund —
Page 27 of 74
Bonds, notes & other debt instruments (continued)
Illinois (continued)
| Principal amount
(000)
| Value
(000)
|
Board of Trustees of the Illinois State University, Auxiliary Facs. System Rev. Bonds, Series 2018-A,
Assured Guaranty Municipal insured, 5.00% 2027
| $1,140
| $1,364
|
Board of Trustees of the Illinois State University, Auxiliary Facs. System Rev. Bonds, Series 2018-A,
Assured Guaranty Municipal insured, 5.00% 2035
| 750
| 880
|
Board of Trustees of the Illinois State University, Auxiliary Facs. System Rev. Bonds, Series 2018-A,
Assured Guaranty Municipal insured, 5.00% 2039
| 1,165
| 1,350
|
Board of Trustees of the Illinois State University, Auxiliary Facs. System Rev. Bonds, Series 2018-B,
Assured Guaranty Municipal insured, 5.00% 2026
| 620
| 731
|
Board of Trustees of the Illinois State University, Auxiliary Facs. System Rev. Bonds, Series 2018-B,
Assured Guaranty Municipal insured, 5.00% 2029
| 1,610
| 1,946
|
Board of Trustees of the Illinois State University, Auxiliary Facs. System Rev. Bonds, Series 2018-B,
Assured Guaranty Municipal insured, 5.00% 2031
| 780
| 930
|
| Village of Lincolnshire, Special Service Area No. 1 (Sedgebrook Project), Special Tax Bonds, Series 2004, 6.25% 2034
| 1,442
| 1,445
|
Metropolitan Pier and Exposition Auth., Dedicated State Tax Rev. Bonds, Capital Appreciation Bonds,
Series 1994, BAM insured, 0% 2028
| 3,185
| 2,564
|
Metropolitan Pier and Exposition Auth., Dedicated State Tax Rev. Bonds, Capital Appreciation Bonds,
Series 2002-A, National insured, 0% 2030
| 2,435
| 1,777
|
Metropolitan Pier and Exposition Auth., Dedicated State Tax Rev. Bonds, Capital Appreciation Bonds,
Series 2002-A, National insured, 0% 2030 (escrowed to maturity)
| 130
| 105
|
Metropolitan Pier and Exposition Auth., McCormick Place Expansion Project Bonds, Series 2012-A,
5.00% 2042
| 1,500
| 1,579
|
Metropolitan Pier and Exposition Auth., McCormick Place Expansion Project Bonds,
Capital Appreciation Bonds, Series 2002-A, National insured, 0% 2032
| 8,860
| 5,845
|
Metropolitan Pier and Exposition Auth., McCormick Place Expansion Project Bonds,
Capital Appreciation Bonds, Series 2002-A, National insured, 0% 2033
| 10,230
| 6,498
|
Metropolitan Pier and Exposition Auth., McCormick Place Expansion Project Bonds,
Capital Appreciation Bonds, Series 2002-A, National insured, 0% 2034
| 10,000
| 6,181
|
Metropolitan Pier and Exposition Auth., McCormick Place Expansion Project Bonds,
Capital Appreciation Bonds, Series 2002-A, National insured, 0% 2039
| 3,800
| 1,829
|
Metropolitan Pier and Exposition Auth., McCormick Place Expansion Project Bonds,
Capital Appreciation Bonds, Series 2012-B, 0% 2050
| 3,630
| 1,047
|
Metropolitan Pier and Exposition Auth., McCormick Place Expansion Project Bonds,
Capital Appreciation Bonds, Series 2012-B, 0% 2051
| 13,350
| 3,653
|
Metropolitan Pier and Exposition Auth., McCormick Place Expansion Project Rev. Bonds,
Series 2002-A, Assured Guaranty Municipal insured, 5.50% 2023
| 540
| 589
|
Metropolitan Pier and Exposition Auth., McCormick Place Expansion Project Rev. Ref. Bonds,
Capital Appreciation Bonds, Series 1996-A, National insured, 0% 2025
| 2,535
| 2,209
|
Metropolitan Pier and Exposition Auth., McCormick Place Expansion Project Rev. Ref. Bonds,
Capital Appreciation Bonds, Series 2010-B-1, Assured Guaranty Municipal insured, 0% 2027
| 3,500
| 2,893
|
Metropolitan Pier and Exposition Auth., McCormick Place Expansion Project Rev. Ref. Bonds,
Capital Appreciation Bonds, Series 2010-B-1, Assured Guaranty Municipal insured, 0% 2043
| 800
| 344
|
Metropolitan Pier and Exposition Auth., McCormick Place Expansion Project Rev. Ref. Bonds,
Capital Appreciation Bonds, Series 2010-B-1, Assured Guaranty Municipal insured, 0% 2044
| 25,395
| 10,443
|
Metropolitan Pier and Exposition Auth., McCormick Place Expansion Project Rev. Ref. Bonds,
Capital Appreciation Bonds, Series 2010-B-1, Assured Guaranty Municipal insured, 0% 2046
| 3,300
| 1,243
|
Metropolitan Pier and Exposition Auth., McCormick Place Expansion Project Rev. Ref. Bonds,
Capital Appreciation Bonds, Series 2017-A, 0% 2056
| 32,160
| 6,981
|
Metropolitan Pier and Exposition Auth., McCormick Place Expansion Project Rev. Ref. Bonds,
Capital Appreciation Bonds, Series 2017-B, 0% 2054
| 27,760
| 6,663
|
Metropolitan Pier and Exposition Auth., McCormick Place Expansion Project Rev. Ref. Bonds,
Capital Appreciation Bonds, Series 2017-B, Assured Guaranty Municipal insured, 0% 2056
| 19,175
| 4,600
|
Metropolitan Pier and Exposition Auth., McCormick Place Expansion Project Rev. Ref. Bonds,
Series 2010-B-2, 5.00% 2050
| 5,850
| 5,937
|
American High-Income Municipal Bond Fund —
Page 28 of 74
Bonds, notes & other debt instruments (continued)
Illinois (continued)
| Principal amount
(000)
| Value
(000)
|
Metropolitan Pier and Exposition Auth., McCormick Place Expansion Project Rev. Ref. Bonds,
Series 2012-B, 5.00% 2028
| $500
| $536
|
Metropolitan Pier and Exposition Auth., McCormick Place Expansion Project Rev. Ref. Bonds,
Series 2012-B, 5.00% 2052
| 1,470
| 1,542
|
Metropolitan Pier and Exposition Auth., McCormick Place Expansion Project Rev. Ref. Bonds,
Series 2015-B, 5.00% 2035
| 3,000
| 3,306
|
Metropolitan Pier and Exposition Auth., McCormick Place Expansion Project Rev. Ref. Bonds,
Series 2015-B, 5.00% 2040
| 4,000
| 4,364
|
Board of Trustees of the Southern Illinois University, Housing and Auxiliary Facs. System Rev. Bonds,
Capital Appreciation Bonds, Series 1999-A, National insured, 0% 2022
| 4,250
| 3,999
|
Board of Trustees of the Southern Illinois University, Housing and Auxiliary Facs. System Rev. Bonds,
Capital Appreciation Bonds, Series 1999-A, National insured, 0% 2025
| 105
| 90
|
Board of Trustees of the Southern Illinois University, Housing and Auxiliary Facs. System Rev. Bonds,
Capital Appreciation Bonds, Series 1999-A, National insured, 0% 2029
| 1,095
| 795
|
Board of Trustees of the Southern Illinois University, Housing and Auxiliary Facs. System Rev. Bonds,
Series 2008-A, 5.50% 2023
| 500
| 571
|
Board of Trustees of the Southern Illinois University, Housing and Auxiliary Facs. System Rev. Bonds,
Series 2012-A, 4.00% 2028
| 325
| 325
|
Board of Trustees of the Southern Illinois University, Housing and Auxiliary Facs. System Rev. Bonds,
Series 2012-B-1, 5.00% 2020
| 1,890
| 1,920
|
Board of Trustees of the Southern Illinois University, Housing and Auxiliary Facs. System Rev. Bonds,
Series 2012-B-1, 5.00% 2022
| 790
| 835
|
Board of Trustees of the Southern Illinois University, Housing and Auxiliary Facs. System Rev. Bonds,
Series 2012-B-1, 5.00% 2023
| 300
| 319
|
Board of Trustees of the Southern Illinois University, Housing and Auxiliary Facs. System Rev. Bonds,
Series 2012-B-1, 5.00% 2027
| 2,205
| 2,326
|
Board of Trustees of the Southern Illinois University, Housing and Auxiliary Facs. System Rev. Bonds,
Series 2012-B-1, 5.00% 2032
| 3,945
| 4,112
|
Southwestern Illinois Dev. Auth., Health Fac. Rev. Bonds (Hospital Sisters Services, Inc. Obligated Group),
Series 2017-A, 5.00% 2028
| 550
| 689
|
Southwestern Illinois Dev. Auth., Health Fac. Rev. Bonds (Memorial Group, Inc.), Series 2013,
7.625% 2048 (preref. 2023)
| 3,000
| 3,789
|
Sports Facs. Auth., Sports Facs. Rev. Ref. Bonds (State Tax Supported), Capital Appreciation Bonds,
Series 2001, AMBAC insured, 0% 2023
| 2,610
| 2,351
|
Sports Facs. Auth., Sports Facs. Rev. Ref. Bonds (State Tax Supported), Capital Appreciation Bonds,
Series 2001, AMBAC insured, 0% 2025
| 545
| 460
|
Sports Facs. Auth., Sports Facs. Rev. Ref. Bonds (State Tax Supported), Capital Appreciation Bonds,
Series 2001, AMBAC insured, 0% 2026
| 560
| 455
|
Sports Facs. Auth., Sports Facs. Rev. Ref. Bonds (State Tax Supported), Series 2014,
Assured Guaranty Municipal insured, 5.25% 2030
| 6,000
| 6,760
|
Sports Facs. Auth., Sports Facs. Rev. Ref. Bonds (State Tax Supported), Series 2014,
Assured Guaranty Municipal insured, 5.25% 2031
| 2,500
| 2,806
|
Sports Facs. Auth., Sports Facs. Rev. Ref. Bonds (State Tax Supported), Series 2014,
Assured Guaranty Municipal insured, 5.25% 2032
| 1,000
| 1,120
|
| Toll Highway Auth., Toll Highway Rev. Bonds, Series 2015-B, 5.00% 2040
| 4,000
| 4,616
|
| Toll Highway Auth., Toll Highway Rev. Bonds, Series 2016-B, 5.00% 2033
| 1,000
| 1,183
|
| Toll Highway Auth., Toll Highway Rev. Bonds, Series 2016-B, 5.00% 2041
| 2,750
| 3,198
|
| Board of Trustees of the University of Illinois, Auxiliary Facs. System Rev. Bonds, Series 2014-A, 5.00% 2024
| 480
| 555
|
Board of Trustees of the University of Illinois, Auxiliary Facs. System Rev. Ref. Bonds, Series 2013-A,
5.00% 2023
| 2,985
| 3,362
|
Board of Trustees of the University of Illinois, Auxiliary Facs. System Rev. Ref. Bonds, Series 2013-A,
5.00% 2026
| 750
| 843
|
Board of Trustees of the University of Illinois, Auxiliary Facs. System Rev. Ref. Bonds, Series 2016-A,
4.00% 2034
| 2,160
| 2,304
|
American High-Income Municipal Bond Fund —
Page 29 of 74
Bonds, notes & other debt instruments (continued)
Illinois (continued)
| Principal amount
(000)
| Value
(000)
|
Board of Trustees of the University of Illinois, Auxiliary Facs. System Rev. Ref. Bonds, Series 2016-A,
5.00% 2025
| $1,000
| $1,186
|
Board of Trustees of the University of Illinois, Auxiliary Facs. System Rev. Ref. Bonds, Series 2016-A,
Assured Guaranty Municipal insured, 4.00% 2036
| 5,000
| 5,445
|
| Board of Trustees of the University of Illinois, Rev. Ref. Certs. of Part., Series 2014-C, 5.00% 2023
| 775
| 872
|
| Board of Trustees of the University of Illinois, Rev. Ref. Certs. of Part., Series 2016-A, 5.00% 2020
| 120
| 125
|
Village of Volo, Special Service Areas Nos. 3 and 6 (Symphony Meadows/Lancaster Falls Projects),
Special Tax Rev. Ref. Bonds, Series 2016, Assured Guaranty Municipal insured, 3.125% 2027
| 1,129
| 1,175
|
Village of Volo, Special Service Areas Nos. 3 and 6 (Symphony Meadows/Lancaster Falls Projects),
Special Tax Rev. Ref. Bonds, Series 2016, Assured Guaranty Municipal insured, 4.00% 2036
| 1,246
| 1,312
|
Village of Volo, Special Service Areas Nos. 3 and 6 (Symphony Meadows/Lancaster Falls Projects),
Special Tax Rev. Ref. Bonds, Series 2016, Assured Guaranty Municipal insured, 5.00% 2034
| 4,993
| 5,738
|
United City of Yorkville, Special Service Area Nos. 2005-108 and 2005-109, Special Tax Rev. Ref. Bonds,
Series 2016, Assured Guaranty Municipal insured, 4.00% 2036
| 7,551
| 7,914
|
United City of Yorkville, Special Service Area Nos. 2005-108 and 2005-109, Special Tax Rev. Ref. Bonds,
Series 2016, Assured Guaranty Municipal insured, 5.00% 2032
| 4,331
| 5,010
|
|
|
| 1,134,482
|
| Indiana 1.76%
|
|
|
Dev. Fin. Auth., Solid Waste Disposal Rev. Bonds (Waste Management, Inc. Project), Series 2001, AMT,
2.95% 2031 (put 2021)
| 1,000
| 1,030
|
| Fin. Auth., Environmental Rev. Ref. Bonds (Duke Energy Indiana, Inc. Project), Series 2009-B, 6.00% 2039
| 9,000
| 9,034
|
| Fin. Auth., Facs. Rev. Ref. Green Bonds (RES Polyflow Project), Series 2019, AMT, 7.00% 20392
| 6,000
| 6,151
|
| Fin. Auth., Health Facs. Rev. Bonds (Good Samaritan Hospital Project), Series 2016-A, 5.50% 2041
| 2,000
| 2,224
|
| Fin. Auth., Health System Rev. Bonds (Franciscan Alliance, Inc.), Series 2016-A, 5.00% 2051
| 1,500
| 1,685
|
Fin. Auth., Midwestern Disaster Relief Rev. Bonds (Ohio Valley Electric Corp. Project), Series 2012-A,
5.00% 2032
| 17,560
| 18,196
|
Fin. Auth., Midwestern Disaster Relief Rev. Bonds (Ohio Valley Electric Corp. Project), Series 2012-A,
5.00% 2039
| 10,100
| 10,467
|
Fin. Auth., Private Activity Bonds (Ohio River Bridges East End Crossing Project), Series 2013-A, AMT,
5.00% 2035
| 3,000
| 3,300
|
Fin. Auth., Private Activity Bonds (Ohio River Bridges East End Crossing Project), Series 2013-A, AMT,
5.00% 2044
| 7,225
| 7,862
|
Fin. Auth., Private Activity Bonds (Ohio River Bridges East End Crossing Project), Series 2013-A, AMT,
5.00% 2048
| 3,250
| 3,528
|
Fin. Auth., Private Activity Bonds (Ohio River Bridges East End Crossing Project), Series 2013-A, AMT,
5.25% 2051
| 3,410
| 3,730
|
| Fin. Auth., Rev. Bonds (BHI Senior Living Obligated Group), Series 2016-A, 5.25% 2046
| 6,750
| 7,669
|
| Fin. Auth., Rev. Bonds (BHI Senior Living Obligated Group), Series 2018-A, 5.00% 2033
| 2,410
| 2,776
|
| Fin. Auth., Rev. Bonds (BHI Senior Living Obligated Group), Series 2018-A, 5.00% 2038
| 2,395
| 2,726
|
| Fin. Auth., Rev. Bonds (BHI Senior Living Obligated Group), Series 2018-A, 5.00% 2043
| 4,000
| 4,518
|
| Fin. Auth., Rev. Bonds (BHI Senior Living Obligated Group), Series 2018-A, 5.00% 2048
| 4,500
| 5,067
|
| Fin. Auth., Rev. Bonds (Greencroft Obligated Group), Series 2013-A, 6.50% 2033
| 215
| 239
|
| Fin. Auth., Rev. Bonds (Greencroft Obligated Group), Series 2013-A, 7.00% 2043
| 3,705
| 4,146
|
| Fin. Auth., Rev. Ref. Bonds (Community Foundation of Northwest Indiana Obligated Group), Series 2015, 5.00% 2036
| 3,730
| 4,256
|
| City of Franklin, Econ. Dev. Rev. Ref. Bonds (Otterbein Homes Obligated Group), Series 2019-B, 5.00% 2029
| 635
| 786
|
| City of Franklin, Econ. Dev. Rev. Ref. Bonds (Otterbein Homes Obligated Group), Series 2019-B, 5.00% 2031
| 700
| 854
|
| Gary/Chicago International Airport Auth., Airport Dev. Zone Rev. Bonds, Series 2014, AMT, 5.00% 2039
| 2,500
| 2,758
|
| Gary/Chicago International Airport Auth., Airport Dev. Zone Rev. Bonds, Series 2014, AMT, 5.25% 2034
| 1,000
| 1,129
|
| Hospital Fin. Auth., Hospital Rev. Ref. Bonds (Indiana University Health Obligated Group), Series 2011-N, 5.00% 2031 (preref. 2021)
| 4,000
| 4,240
|
| Hospital Fin. Auth., Hospital Rev. Ref. Bonds (The Methodist Hospitals, Inc.), Series 2014-A, 5.00% 2028
| 2,500
| 2,797
|
| Housing and Community Dev. Auth., Single Family Mortgage Rev. Bonds, Series 2016-A-2, AMT, 3.50% 2038
| 2,750
| 2,863
|
| Housing and Community Dev. Auth., Single Family Mortgage Rev. Bonds, Series 2017-A-2, AMT, 4.00% 2039
| 735
| 771
|
American High-Income Municipal Bond Fund —
Page 30 of 74
Bonds, notes & other debt instruments (continued)
Indiana (continued)
| Principal amount
(000)
| Value
(000)
|
County of Knox, Econ. Dev. Rev. and Ref. Bonds (Good Samaritan Hospital Project), Series 2012-A,
5.00% 2023
| $1,000
| $1,066
|
County of Knox, Econ. Dev. Rev. and Ref. Bonds (Good Samaritan Hospital Project), Series 2012-A,
5.00% 2025
| 1,570
| 1,669
|
| City of Valparaiso, Exempt Facs. Rev. Bonds (Pratt Paper, LLC Project), Series 2013, AMT, 7.00% 2044
| 3,080
| 3,608
|
City of Whiting, Environmental Facs. Rev. Bonds (BP Products North America, Inc. Project), Series 2015,
AMT, 5.00% 2045 (put 2022)
| 3,000
| 3,330
|
City of Whiting, Environmental Facs. Rev. Bonds (BP Products North America, Inc. Project), Series 2016-A,
AMT, 5.00% 2046 (put 2023)
| 3,000
| 3,357
|
| City of Whiting, Environmental Facs. Rev. Ref. Bonds (BP Products North America, Inc. Project), Series 2019-A, AMT, 5.00% 2044 (put 2026)
| 7,000
| 8,410
|
|
|
| 136,242
|
| Iowa 1.01%
|
|
|
Fin. Auth., Midwestern Disaster Area Rev. Bonds (Iowa Fertilizer Co. Project), Series 2013-A,
5.25% 2050 (put 2033)
| 1,585
| 1,691
|
Fin. Auth., Midwestern Disaster Area Rev. Bonds (Iowa Fertilizer Co. Project), Series 2013-B,
5.25% 2050 (put 2037)
| 8,470
| 9,162
|
| Fin. Auth., Midwestern Disaster Area Rev. Ref. Bonds (Iowa Fertilizer Co. Project), Series 2013, 5.00% 2019
| 4,430
| 4,469
|
| Fin. Auth., Midwestern Disaster Area Rev. Ref. Bonds (Iowa Fertilizer Co. Project), Series 2013, 5.25% 2025
| 12,450
| 13,548
|
| Fin. Auth., Midwestern Disaster Area Rev. Ref. Bonds (Iowa Fertilizer Co. Project), Series 2013, 5.875% 20262
| 2,320
| 2,439
|
| Fin. Auth., Midwestern Disaster Area Rev. Ref. Bonds (Iowa Fertilizer Co. Project), Series 2019, 3.125% 2022
| 2,500
| 2,532
|
| Fin. Auth., Rev. Bonds (Lifespace Communities, Inc.), Series 2016-A, 5.00% 2036
| 1,250
| 1,392
|
| Fin. Auth., Rev. Bonds (Lifespace Communities, Inc.), Series 2018-A, 5.00% 2043
| 1,500
| 1,658
|
| Fin. Auth., Rev. Bonds (Lifespace Communities, Inc.), Series 2018-A, 5.00% 2048
| 7,000
| 7,713
|
| Fin. Auth., Senior Housing Rev. Bonds (Northcrest, Inc. Project), Series 2018-A, 5.00% 2028
| 1,150
| 1,276
|
| Fin. Auth., Senior Housing Rev. Bonds (Northcrest, Inc. Project), Series 2018-A, 5.00% 2033
| 1,000
| 1,095
|
| Fin. Auth., Senior Housing Rev. Bonds (Northcrest, Inc. Project), Series 2018-A, 5.00% 2038
| 1,000
| 1,086
|
| Fin. Auth., Senior Housing Rev. Bonds (Northcrest, Inc. Project), Series 2018-A, 5.00% 2048
| 2,500
| 2,690
|
| Student Loan Liquidity Corp., Student Loan Rev. Ref. Bonds, Series 2018-A, AMT, 3.75% 2033
| 23,000
| 23,894
|
| Tobacco Settlement Auth., Tobacco Settlement Asset-Backed Bonds, Series 2005-C, 5.625% 2046
| 3,525
| 3,525
|
|
|
| 78,170
|
| Kansas 0.32%
|
|
|
| Dev. Fin. Auth., Rev. Ref. Bonds (Lifespace Communities, Inc.), Series 2010-S, 5.00% 2030
| 1,920
| 1,960
|
| City of Lenexa, Health Care Fac. Rev. Bonds (Lakeview Village, Inc. Project), Series 2017-A, 5.00% 2043
| 4,000
| 4,366
|
| City of Lenexa, Health Care Fac. Rev. Bonds (Lakeview Village, Inc. Project), Series 2018-A, 5.00% 2027
| 750
| 853
|
| City of Lenexa, Health Care Fac. Rev. Bonds (Lakeview Village, Inc. Project), Series 2018-A, 5.00% 2029
| 1,205
| 1,362
|
| City of Lenexa, Health Care Fac. Rev. Bonds (Lakeview Village, Inc. Project), Series 2018-A, 5.00% 2031
| 1,330
| 1,492
|
| City of Lenexa, Health Care Fac. Rev. Bonds (Lakeview Village, Inc. Project), Series 2018-A, 5.00% 2039
| 5,660
| 6,227
|
City of Wichita, Sales Tax Special Obligation Rev. Bonds (K-96 Greenwich Star Bond Project),
Series 2017, 3.00% 2023
| 680
| 690
|
City of Wichita, Sales Tax Special Obligation Rev. Bonds (K-96 Greenwich Star Bond Project),
Series 2017, 4.20% 2027
| 5,000
| 5,082
|
Unified Government of Wyandotte County, Special Obligation Improvement Rev. Ref. Bonds
(Wyandotte Plaza Redev. Project), Series 2016, 4.00% 2028
| 670
| 689
|
Unified Government of Wyandotte County, Special Obligation Improvement Rev. Ref. Bonds
(Wyandotte Plaza Redev. Project), Series 2016, 5.00% 2034
| 2,125
| 2,192
|
|
|
| 24,913
|
American High-Income Municipal Bond Fund —
Page 31 of 74
Bonds, notes & other debt instruments (continued)
Kentucky 0.97%
| Principal amount
(000)
| Value
(000)
|
| City of Ashland, Medical Center Rev. Bonds (Ashland Hospital Corp. dba King’s Daughters Medical Center Project), Series 2016-A, 4.00% 2032
| $500
| $514
|
| City of Ashland, Medical Center Rev. Bonds (Ashland Hospital Corp. dba King’s Daughters Medical Center Project), Series 2016-A, 4.00% 2036
| 2,000
| 2,041
|
| City of Ashland, Medical Center Rev. Bonds (Ashland Hospital Corp. dba King’s Daughters Medical Center Project), Series 2016-A, 5.00% 2028
| 1,260
| 1,445
|
| City of Ashland, Medical Center Rev. Bonds (Ashland Hospital Corp. dba King’s Daughters Medical Center Project), Series 2016-A, 5.00% 2030
| 1,110
| 1,257
|
| City of Ashland, Medical Center Rev. Bonds (Ashland Hospital Corp. dba King’s Daughters Medical Center Project), Series 2016-A, 5.00% 2040
| 4,295
| 4,696
|
Econ. Dev. Fin. Auth., Healthcare Facs. Rev. and Rev. Ref. Bonds (Rosedale Green Project), Series 2015,
5.50% 2035
| 1,750
| 1,865
|
Econ. Dev. Fin. Auth., Healthcare Facs. Rev. and Rev. Ref. Bonds (Rosedale Green Project), Series 2015,
5.75% 2045
| 6,515
| 6,956
|
Econ. Dev. Fin. Auth., Healthcare Facs. Rev. and Rev. Ref. Bonds (Rosedale Green Project), Series 2015,
5.75% 2050
| 2,650
| 2,822
|
| Econ. Dev. Fin. Auth., Hospital Rev. Bonds (Baptist Healthcare System Obligated Group), Series 2017-B, 5.00% 2041
| 4,250
| 4,850
|
| Econ. Dev. Fin. Auth., Hospital Rev. Bonds (Baptist Healthcare System Obligated Group), Series 2017-B, 5.00% 2046
| 8,350
| 9,470
|
Econ. Dev. Fin. Auth., Hospital Rev. Bonds (Baptist Healthcare System Obligated Group), Series 2017-B,
5.00% 2034
| 2,720
| 3,171
|
| Econ. Dev. Fin. Auth., Louisville Arena Project Rev. Ref. Bonds (Louisville Arena Auth., Inc.), Series 2017-A, Assured Guaranty Municipal insured, 5.00% 2045
| 10,000
| 11,603
|
| Econ. Dev. Fin. Auth., Louisville Arena Project Rev. Ref. Bonds (Louisville Arena Auth., Inc.), Series 2017-A, Assured Guaranty Municipal insured, 5.00% 2047
| 1,500
| 1,634
|
| Higher Education Student Loan Corp., Student Loan Rev. Bonds, Series 2017-A, AMT, 3.00% 2029
| 1,925
| 1,980
|
Louisville/Jefferson Metro County Government, Health System Rev. Bonds (Norton Healthcare, Inc.),
Series 2016-A, 5.00% 2029
| 2,550
| 3,076
|
| City of Paducah, Electric Plant Board, Rev. Ref. Bonds, Series 2016-A, Assured Guaranty Municipal insured, 5.00% 2028
| 500
| 604
|
| City of Paducah, Electric Plant Board, Rev. Ref. Bonds, Series 2016-A, Assured Guaranty Municipal insured, 5.00% 2035
| 1,500
| 1,736
|
| Public Energy Auth., Gas Supply Rev. Bonds, Series 2018-A, 4.00% 2048 (put 2024)
| 6,600
| 7,200
|
Public Transportation Infrastructure Auth., Toll Rev. Bonds (Downtown Crossing Project), Series 2013-A,
5.75% 2049
| 1,885
| 2,101
|
Public Transportation Infrastructure Auth., Toll Rev. Bonds (Downtown Crossing Project), Series 2013-A,
6.00% 2053
| 5,500
| 6,176
|
|
|
| 75,197
|
| Louisiana 1.16%
|
|
|
| Aviation Board, General Airport Rev. Bonds (North Terminal Project), Series 2015-B, AMT, 5.00% 2031
| 1,000
| 1,141
|
| Aviation Board, General Airport Rev. Bonds (North Terminal Project), Series 2015-B, AMT, 5.00% 2035
| 1,785
| 2,015
|
| Aviation Board, General Airport Rev. Bonds (North Terminal Project), Series 2015-B, AMT, 5.00% 2040
| 7,000
| 7,819
|
| Aviation Board, General Airport Rev. Ref. Bonds, Series 2017-D-2, AMT, 5.00% 2030
| 300
| 357
|
| Aviation Board, General Airport Rev. Ref. Bonds, Series 2017-D-2, AMT, 5.00% 2031
| 400
| 474
|
| Aviation Board, General Airport Rev. Ref. Bonds, Series 2017-D-2, AMT, 5.00% 2032
| 500
| 589
|
| Aviation Board, General Airport Rev. Ref. Bonds, Series 2017-D-2, AMT, 5.00% 2033
| 1,100
| 1,292
|
| Citizens Property Insurance Corp., Assessment Rev. Ref. Bonds, Series 2016-A, 5.00% 2025
| 5,000
| 6,017
|
Parish of Jefferson, Hospital Dist. No. 1 (West Jefferson Medical Center), Hospital Rev. Ref. Bonds,
Series 2011-A, 6.00% 2039 (preref. 2021)
| 2,365
| 2,522
|
| Juban Crossing Econ. Dev. Dist., Rev. Ref. Bonds (Drainage Projects), Series 2015-B, 7.00% 20442
| 3,090
| 3,166
|
| Juban Crossing Econ. Dev. Dist., Rev. Ref. Bonds (Drainage Projects), Series 2015-C, 7.00% 20442
| 10,510
| 10,770
|
| Juban Crossing Econ. Dev. Dist., Rev. Ref. Bonds (Road Projects), Series 2015-A, 7.00% 20442
| 3,000
| 3,074
|
American High-Income Municipal Bond Fund —
Page 32 of 74
Bonds, notes & other debt instruments (continued)
Louisiana (continued)
| Principal amount
(000)
| Value
(000)
|
| Local Government Environmental Facs. and Community Dev. Auth., Rev. Bonds (Westlake Chemical Corp. Projects), Series 2010-A-1, 6.50% 2035
| $5,750
| $6,079
|
| Local Government Environmental Facs. and Community Dev. Auth., Rev. Bonds (Westlake Chemical Corp. Projects), Series 2010-A-2, 6.50% 2035
| 2,850
| 3,013
|
| Local Government Environmental Facs. and Community Dev. Auth., Rev. Ref. Bonds (Ragin’ Cajun Facs., Inc. Project), Series 2017, Assured Guaranty Municipal
insured, 5.00% 2039
| 1,000
| 1,177
|
Local Government Environmental Facs. and Community Dev. Auth., Rev. Ref. Bonds
(Westlake Chemical Corp. Projects), Series 2017, 3.50% 2032
| 5,000
| 5,226
|
| Memorial Hospital Service Dist. Of Calcasieu Parish, Hospital Rev. Ref. Bonds (Lake Charles Memorial Hospital Project), Series 2019, 5.00% 2029
| 1,000
| 1,211
|
| Memorial Hospital Service Dist. Of Calcasieu Parish, Hospital Rev. Ref. Bonds (Lake Charles Memorial Hospital Project), Series 2019, 5.00% 2034
| 2,000
| 2,373
|
| Memorial Hospital Service Dist. Of Calcasieu Parish, Hospital Rev. Ref. Bonds (Lake Charles Memorial Hospital Project), Series 2019, 5.00% 2039
| 2,000
| 2,327
|
| City of New Orleans, Sewerage Service Rev. and Rev. Ref. Bonds, Series 2015, 5.00% 2045
| 500
| 561
|
| Public Facs. Auth., Lease Rev. Bonds (Provident Group - Flagship Properties LLC - Louisiana State University Greenhouse Dist. Phase II Project), Series 2017, 5.00%
2042
| 2,000
| 2,315
|
| Public Facs. Auth., Lease Rev. Bonds (Provident Group - Flagship Properties LLC - Louisiana State University Greenhouse Dist. Phase II Project), Series 2017, 5.00%
2052
| 800
| 911
|
| Public Facs. Auth., Lease Rev. Bonds (Provident Group - Flagship Properties LLC - Louisiana State University Nicholson Gateway Project), Series 2016-A, 5.00% 2051
| 10,460
| 11,773
|
| Public Facs. Auth., Lease Rev. Bonds (Provident Group - Flagship Properties LLC - Louisiana State University Nicholson Gateway Project), Series 2016-A, 5.00% 2056
| 1,000
| 1,121
|
| Public Facs. Auth., Rev. Bonds (Ochsner Clinic Foundation Project), Series 2016, 5.00% 2032 (preref. 2026)
| 10
| 12
|
| Public Facs. Auth., Rev. Ref. Bonds (Entergy Louisiana, LLC Project), Series 2016-B, 3.50% 2030
| 500
| 509
|
Public Facs. Auth., Rev. Ref. Bonds (Nineteenth Judicial Dist. Court Building Project), Series 2015,
Assured Guaranty Municipal insured, 5.25% 2051
| 1,000
| 1,134
|
| Public Facs. Auth., Rev. Ref. Bonds (Ochsner Clinic Foundation Project), Series 2016, 5.00% 2032
| 890
| 1,038
|
| Public Facs. Auth., Rev. Ref. Bonds (Ochsner Clinic Foundation Project), Series 2016, 5.00% 2033
| 1,620
| 1,882
|
Public Facs. Auth., Rev. Ref. Bonds (Ochsner Clinic Foundation Project), Series 2016,
5.00% 2033 (preref. 2026)
| 15
| 18
|
| Parish of St. Charles, Gulf Opportunity Zone Rev. Bonds (Valero Project), Series 2010, 4.00% 2040 (put 2022)
| 5,500
| 5,801
|
| St. Tammany Public Trust Fncg. Auth., Rev. and Rev. Ref. Bonds (Christwood Project), Series 2014, 5.00% 2024
| 625
| 672
|
| St. Tammany Public Trust Fncg. Auth., Rev. and Rev. Ref. Bonds (Christwood Project), Series 2014, 5.25% 2037
| 1,750
| 1,881
|
|
|
| 90,270
|
| Maine 0.36%
|
|
|
Fin. Auth., Solid Waste Disposal Rev. Bonds (Casella Waste Systems, Inc. Project), Series 2005-R-3, AMT,
5.25% 20252
| 2,000
| 2,232
|
| Fin. Auth., Solid Waste Disposal Rev. Bonds (Casella Waste Systems, Inc. Project), Series 2015-R-2, AMT, 4.375% 2035 (put 2025)2
| 250
| 269
|
| Health and Higher Educational Facs. Auth., Rev. Bonds (Eastern Maine Healthcare Systems Obligated Group Issue), Series 2016-A, 5.00% 2041
| 1,800
| 1,999
|
| Health and Higher Educational Facs. Auth., Rev. Bonds (Eastern Maine Healthcare Systems Obligated Group Issue), Series 2016-A, 5.00% 2046
| 1,000
| 1,107
|
| Health and Higher Educational Facs. Auth., Rev. Bonds (Eastern Maine Medical Center Obligated Group Issue), Series 2013, 5.00% 2027
| 485
| 534
|
| Health and Higher Educational Facs. Auth., Rev. Bonds (Eastern Maine Medical Center Obligated Group Issue), Series 2013, 5.00% 2043
| 5,970
| 6,400
|
| Health and Higher Educational Facs. Auth., Rev. Bonds (MaineGeneral Medical Center Issue), Series 2011, 5.25% 2021
| 250
| 264
|
| Health and Higher Educational Facs. Auth., Rev. Bonds (MaineGeneral Medical Center Issue), Series 2011, 6.75% 2036
| 4,000
| 4,330
|
| Health and Higher Educational Facs. Auth., Rev. Bonds (MaineGeneral Medical Center Issue), Series 2011, 6.75% 2041
| 3,375
| 3,641
|
American High-Income Municipal Bond Fund —
Page 33 of 74
Bonds, notes & other debt instruments (continued)
Maine (continued)
| Principal amount
(000)
| Value
(000)
|
| Health and Higher Educational Facs. Auth., Rev. Bonds (MaineGeneral Medical Center Issue), Series 2011, 7.00% 2041
| $1,500
| $1,627
|
| Housing Auth., Mortgage Purchase Rev. Ref. Bonds, Series 2014-C-1, AMT, 3.50% 2044
| 1,735
| 1,804
|
| City of Portland, General Airport Rev. Ref. Bonds, Series 2016, 5.00% 2031
| 1,090
| 1,262
|
| City of Portland, General Airport Rev. Ref. Bonds, Series 2016, 5.00% 2034
| 1,000
| 1,147
|
| City of Portland, General Airport Rev. Ref. Bonds, Series 2016, 5.00% 2035
| 1,000
| 1,143
|
|
|
| 27,759
|
| Maryland 1.07%
|
|
|
| County of Baltimore, Rev. Bonds (Oak Crest Village, Inc. Fac.), Series 2016, 5.00% 2037
| 2,100
| 2,422
|
| Mayor and City Council of Baltimore, Special Obligation Rev. Ref. Bonds, Series 2017-A, 4.00% 2027
| 475
| 504
|
| Mayor and City Council of Baltimore, Special Obligation Rev. Ref. Bonds, Series 2017-A, 4.50% 2033
| 3,900
| 4,155
|
| Mayor and City Council of Baltimore, Special Obligation Rev. Ref. Bonds, Series 2017-A, 5.00% 2038
| 1,725
| 1,882
|
Community Dev. Administration, Dept. of Housing and Community Dev., Residential Rev. Bonds,
Series 2014-B, AMT, 3.25% 2044
| 580
| 595
|
Community Dev. Administration, Dept. of Housing and Community Dev., Residential Rev. Ref. Bonds,
Series 2014-D, AMT, 4.00% 2036
| 2,575
| 2,703
|
| Econ. Dev. Corp., Econ. Dev. Rev. Bonds (Terminal Project), Series 2019-A, AMT, 5.00% 2044
| 500
| 592
|
| Econ. Dev. Corp., Econ. Dev. Rev. Bonds (Terminal Project), Series 2019-A, AMT, 5.00% 2049
| 1,250
| 1,473
|
| Econ. Dev. Corp., Econ. Dev. Rev. Ref. Bonds (Transportation Facs. Project), Series 2017-A, 5.00% 2029
| 1,850
| 2,289
|
| Econ. Dev. Corp., Econ. Dev. Rev. Ref. Bonds (Transportation Facs. Project), Series 2017-A, 5.00% 2032
| 1,000
| 1,208
|
| Econ. Dev. Corp., Special Obligation Bonds (Metro Centre at Owings Mills Project), Series 2017, 4.375% 2036
| 3,560
| 3,698
|
| Econ. Dev. Corp., Special Obligation Bonds (Metro Centre at Owings Mills Project), Series 2017, 4.50% 2044
| 6,850
| 7,112
|
| Econ. Dev. Corp., Student Housing Rev. Ref. Bonds (Bowie State University Project), Series 2015, 3.00% 20202
| 225
| 226
|
| Econ. Dev. Corp., Student Housing Rev. Ref. Bonds (Bowie State University Project), Series 2015, 5.00% 20252
| 2,100
| 2,264
|
| Econ. Dev. Corp., Student Housing Rev. Ref. Bonds (Bowie State University Project), Series 2015, 5.00% 20292
| 1,680
| 1,833
|
Econ. Dev. Corp., Student Housing Rev. Ref. Bonds (Frostburg State University Project), Series 2013,
5.00% 2033
| 1,000
| 1,079
|
Econ. Dev. Corp., Student Housing Rev. Ref. Bonds (Morgan State University Project), Series 2012,
5.00% 2034
| 1,500
| 1,570
|
Health and Higher Educational Facs. Auth., Rev. Bonds (Adventist HealthCare Issue), Series 2016-A,
5.50% 2036
| 8,000
| 9,539
|
| Health and Higher Educational Facs. Auth., Rev. Bonds (Broadmead Issue), Series 2018-A, 5.00% 2048
| 4,500
| 5,085
|
| County of Howard, Special Obligation Bonds (Downtown Columbia), Series 2017-A, 4.00% 20282
| 550
| 583
|
| County of Howard, Special Obligation Bonds (Downtown Columbia), Series 2017-A, 4.125% 20342
| 750
| 785
|
| County of Howard, Special Obligation Bonds (Downtown Columbia), Series 2017-A, 4.375% 20392
| 2,000
| 2,100
|
| County of Howard, Special Obligation Bonds (Downtown Columbia), Series 2017-A, 4.50% 20472
| 10,000
| 10,473
|
| County of Prince George, Rev. Auth., Special Obligation Bonds (Suitland-Naylor Road Project), Series 2016, 5.00% 20462
| 2,500
| 2,646
|
| County of Prince George, Special Obligation Bonds (Hampton Park Project), Series 2019-A, 4.00% 20312
| 750
| 781
|
| County of Prince George, Special Obligation Bonds (Hampton Park Project), Series 2019-A, 4.25% 20392
| 2,150
| 2,217
|
| County of Prince George, Special Obligation Bonds (Hampton Park Project), Series 2019-A, 4.375% 20482
| 5,330
| 5,470
|
| County of Prince George, Special Obligation Bonds (National Harbor Project), Series 2004, 5.20% 2034
| 7,119
| 7,148
|
| County of Prince George, Special Tax Dist. Bonds (Victoria Falls Project), Series 2005, 5.25% 2035
| 874
| 883
|
|
|
| 83,315
|
| Massachusetts 1.29%
|
|
|
| Dev. Fin. Agcy., Rev. Bonds (Boston Medical Center Issue), Series 2015-D, 5.00% 2044
| 1,500
| 1,665
|
| Dev. Fin. Agcy., Rev. Bonds (Brandeis University Issue), Series 2010-O-2, 5.00% 2024
| 165
| 166
|
| Dev. Fin. Agcy., Rev. Bonds (Linden Ponds, Inc. Issue), Capital Appreciation Bonds, Series 2011-B, 0% 2056
| 4,533
| 1,276
|
| Dev. Fin. Agcy., Rev. Bonds (Linden Ponds, Inc. Issue), Series 2018, 5.00% 20282
| 2,835
| 3,200
|
| Dev. Fin. Agcy., Rev. Bonds (Linden Ponds, Inc. Issue), Series 2018, 5.00% 20332
| 4,000
| 4,427
|
| Dev. Fin. Agcy., Rev. Bonds (Linden Ponds, Inc. Issue), Series 2018, 5.00% 20382
| 4,250
| 4,653
|
| Dev. Fin. Agcy., Rev. Bonds (Linden Ponds, Inc. Issue), Series 2018, 5.125% 20462
| 7,825
| 8,557
|
| Dev. Fin. Agcy., Rev. Bonds (Partners HealthCare System Issue), Series 2017-S, 4.00% 2036
| 2,500
| 2,805
|
American High-Income Municipal Bond Fund —
Page 34 of 74
Bonds, notes & other debt instruments (continued)
Massachusetts (continued)
| Principal amount
(000)
| Value
(000)
|
| Dev. Fin. Agcy., Rev. Bonds (UMass Memorial Health Care Obligated Group Issue), Series 2016-I, 5.00% 2029
| $1,800
| $2,143
|
| Dev. Fin. Agcy., Rev. Bonds (UMass Memorial Health Care Obligated Group Issue), Series 2016-I, 5.00% 2036
| 3,500
| 4,040
|
| Dev. Fin. Agcy., Rev. Bonds (Wellforce Obligated Issue), Series 2019-A, 5.00% 2038
| 500
| 595
|
| Dev. Fin. Agcy., Rev. Bonds (Wellforce Obligated Issue), Series 2019-A, 5.00% 2044
| 750
| 879
|
| Dev. Fin. Agcy., Rev. Ref. Bonds (Emerson College Issue), Series 2010-A, 5.00% 2040 (preref. 2020)
| 2,995
| 3,044
|
| Dev. Fin. Agcy., Rev. Ref. Bonds (Emerson College Issue), Series 2010-A, 5.00% 2040 (preref. 2020)
| 270
| 274
|
| Dev. Fin. Agcy., Rev. Ref. Bonds (Newbridge Charles Issue), Series 2017, 5.00% 20472
| 1,800
| 1,980
|
| Dev. Fin. Agcy., Rev. Ref. Bonds (Tufts Medical Center Issue), Series 2011-I, 6.75% 2036 (preref. 2021)
| 5,475
| 5,906
|
| Dev. Fin. Agcy., Rev. Ref. Bonds (Tufts Medical Center Issue), Series 2011-I, 6.75% 2036 (preref. 2021)
| 4,505
| 4,857
|
| Dev. Fin. Agcy., Rev. Ref. Bonds (Tufts Medical Center Issue), Series 2011-I, 6.875% 2041 (preref. 2021)
| 3,610
| 3,901
|
| Dev. Fin. Agcy., Rev. Ref. Bonds (Tufts Medical Center Issue), Series 2011-I, 6.875% 2041 (preref. 2021)
| 2,390
| 2,581
|
| Educational Fncg. Auth., Education Loan Rev. Bonds, Series 2016-J, AMT, 3.50% 2033
| 13,645
| 14,126
|
| Educational Fncg. Auth., Education Loan Rev. Bonds, Series 2016-J, AMT, 5.00% 2024
| 4,000
| 4,643
|
| Educational Fncg. Auth., Education Loan Rev. Bonds, Series 2017-A, AMT, 3.625% 2032
| 7,655
| 7,932
|
| Educational Fncg. Auth., Education Loan Rev. Bonds, Series 2018-B, AMT, 3.625% 2034
| 3,000
| 3,200
|
| Educational Fncg. Auth., Education Loan Rev. Bonds, Series 2019-B, AMT, 3.00% 2035
| 5,000
| 5,163
|
| Health and Educational Facs. Auth., Rev. Bonds (UMass Memorial Issue), Series 2010-G, 5.00% 2021
| 405
| 418
|
| Health and Educational Facs. Auth., Rev. Ref. Bonds (Merrimack College Issue), Series 2017, 5.00% 2047
| 1,250
| 1,388
|
Health and Educational Facs. Auth., Rev. Ref. Bonds (Northeastern University Issue), Series 2010-A,
5.00% 2035
| 1,800
| 1,866
|
| Housing Fin. Agcy., Single Family Housing Rev. Ref. Bonds, Series 177, AMT, 4.00% 2039
| 2,355
| 2,480
|
| Housing Fin. Agcy., Single Family Housing Rev. Ref. Bonds, Series 188, AMT, 4.00% 2043
| 1,555
| 1,667
|
|
|
| 99,832
|
| Michigan 2.61%
|
|
|
| City of Dearborn, Econ. Dev. Corp., Limited Obligation Rev. Ref. Bonds (Henry Ford Village, Inc. Project), Series 2008, 7.00% 2038
| 2,500
| 2,383
|
| City of Dearborn, Econ. Dev. Corp., Limited Obligation Rev. Ref. Bonds (Henry Ford Village, Inc. Project), Series 2008, 7.125% 2043
| 6,525
| 6,204
|
| City of Dearborn, Econ. Dev. Corp., Limited Obligation Rev. Ref. Bonds (Henry Ford Village, Inc. Project), Series 2017, 7.50% 20442
| 6,700
| 6,543
|
| City of Detroit, Unlimited Tax G.O. Bonds, Series 2018, 5.00% 2020
| 500
| 509
|
| City of Detroit, Unlimited Tax G.O. Bonds, Series 2018, 5.00% 2021
| 1,000
| 1,042
|
| City of Detroit, Unlimited Tax G.O. Bonds, Series 2018, 5.00% 2024
| 500
| 548
|
| City of Detroit, Unlimited Tax G.O. Bonds, Series 2018, 5.00% 2025
| 1,350
| 1,499
|
| City of Detroit, Unlimited Tax G.O. Bonds, Series 2018, 5.00% 2029
| 250
| 284
|
| City of Detroit, Unlimited Tax G.O. Bonds, Series 2018, 5.00% 2030
| 500
| 565
|
| City of Detroit, Unlimited Tax G.O. Bonds, Series 2018, 5.00% 2032
| 1,000
| 1,115
|
| City of Detroit, Unlimited Tax G.O. Bonds, Series 2018, 5.00% 2033
| 500
| 556
|
| City of Detroit, Unlimited Tax G.O. Bonds, Series 2018, 5.00% 2034
| 1,250
| 1,387
|
| City of Detroit, Unlimited Tax G.O. Bonds, Series 2018, 5.00% 2036
| 1,565
| 1,724
|
| City of Detroit, Unlimited Tax G.O. Bonds, Series 2018, 5.00% 2037
| 500
| 549
|
| City of Detroit, Unlimited Tax G.O. Bonds, Series 2018, 5.00% 2038
| 1,300
| 1,424
|
City of Detroit, Water and Sewerage Dept., Sewage Disposal System Rev. and Rev. Ref. Bonds,
Series 2012-A, Assured Guaranty Municipal insured, 5.25% 2039
| 4,850
| 5,276
|
Detroit School Dist., Unlimited Tax G.O. School Building and Site Improvement Rev. Ref. Bonds,
Series 2012-A, 5.00% 2026
| 1,000
| 1,096
|
| Fin. Auth., Local Government Loan Program Rev. Bonds (Detroit Fin. Recovery Income Tax Local Project Bonds), Series 2014-F-1, 4.50% 2029
| 2,600
| 2,823
|
| Fin. Auth., Local Government Loan Program Rev. Bonds (Detroit Water and Sewerage Dept., Sewage Disposal System Rev. and Rev. Ref. Local Project Bonds), Series
2014-C-1, 5.00% 2044
| 2,625
| 2,821
|
| Fin. Auth., Local Government Loan Program Rev. Bonds (Detroit Water and Sewerage Dept., Sewage Disposal System Rev. and Rev. Ref. Local Project Bonds), Series
2014-C-6, 5.00% 2033
| 2,000
| 2,274
|
| Fin. Auth., Local Government Loan Program Rev. Bonds (Detroit Water and Sewerage Dept., Sewage Disposal System Rev. Ref. Local Project Bonds), Series 2015-C, 5.00% 2032
| 500
| 581
|
American High-Income Municipal Bond Fund —
Page 35 of 74
Bonds, notes & other debt instruments (continued)
Michigan (continued)
| Principal amount
(000)
| Value
(000)
|
| Fin. Auth., Local Government Loan Program Rev. Bonds (Detroit Water and Sewerage Dept., Sewage Disposal System Rev. Ref. Local Project Bonds), Series 2015-C, 5.00%
2034
| $2,000
| $2,313
|
| Fin. Auth., Local Government Loan Program Rev. Bonds (Detroit Water and Sewerage Dept., Sewage Disposal System Rev. Ref. Local Project Bonds), Series 2015-C, 5.00%
2035
| 1,500
| 1,730
|
| Fin. Auth., Local Government Loan Program Rev. Bonds (Detroit Water and Sewerage Dept., Water Supply System Rev. Ref. Local Project Bonds), Series 2014-D-4, 5.00%
2034
| 1,000
| 1,139
|
| Fin. Auth., Student Loan Rev. Ref. Bonds, Series 25-A, AMT, 4.00% 2030
| 2,550
| 2,675
|
| Fin. Auth., Student Loan Rev. Ref. Bonds, Series 25-A, AMT, 4.00% 2031
| 1,000
| 1,046
|
| Fin. Auth., Student Loan Rev. Ref. Bonds, Series 25-A, AMT, 5.00% 2021
| 1,500
| 1,611
|
| Fin. Auth., Student Loan Rev. Ref. Bonds, Series 25-A, AMT, 5.00% 2022
| 3,150
| 3,476
|
| City of Flint, Hospital Building Auth., Rev. Ref. Bonds (Hurley Medical Center), Series 2013-B, 4.75% 2023
| 2,175
| 2,259
|
| City of Flint, Hospital Building Auth., Rev. Rental Bonds (Hurley Medical Center), Series 2010, 5.84% 2020
| 100
| 103
|
| City of Flint, Hospital Building Auth., Rev. Rental Bonds (Hurley Medical Center), Series 2010, 7.375% 2035
| 1,550
| 1,618
|
| City of Flint, Hospital Building Auth., Rev. Rental Bonds (Hurley Medical Center), Series 2010, 7.50% 2039
| 1,750
| 1,825
|
| City of Flint, Hospital Building Auth., Rev. Rental Bonds (Hurley Medical Center), Series 2013-A, 5.00% 2023
| 1,915
| 2,045
|
| City of Flint, Hospital Building Auth., Rev. Rental Bonds (Hurley Medical Center), Series 2013-A, 5.25% 2028
| 4,000
| 4,343
|
| City of Flint, Hospital Building Auth., Rev. Rental Bonds (Hurley Medical Center), Series 2013-A, 5.25% 2039
| 2,775
| 2,930
|
City of Grand Rapids, Econ. Dev. Corp., Rev. Ref. Bonds (Beacon Hill Estate Project), Series 2017-A,
4.00% 2027
| 2,770
| 2,907
|
City of Grand Rapids, Econ. Dev. Corp., Rev. Ref. Bonds (Beacon Hill Estate Project), Series 2017-A,
5.00% 2032
| 1,055
| 1,149
|
City of Grand Rapids, Econ. Dev. Corp., Rev. Ref. Bonds (Beacon Hill Estate Project), Series 2017-A,
5.00% 2037
| 1,200
| 1,290
|
City of Grand Rapids, Econ. Dev. Corp., Rev. Ref. Bonds (Beacon Hill Estate Project), Series 2017-A,
5.00% 2047
| 5,165
| 5,465
|
City of Grand Rapids, Econ. Dev. Corp., Rev. Ref. Bonds (Beacon Hill Estate Project), Series 2017-A,
5.00% 2052
| 4,740
| 4,998
|
| Great Lakes Water Auth., Water Supply System Rev. Ref. Bonds, Series 2016-B, 5.00% 2046
| 5,000
| 5,738
|
| Hospital Fin. Auth., Hospital Rev. and Rev. Ref. Bonds (Trinity Health Credit Group), Series 2015, 5.50% 2026
| 1,250
| 1,529
|
| Hospital Fin. Auth., Hospital Rev. and Rev. Ref. Bonds (Trinity Health Credit Group), Series 2017-A, 4.00% 2040
| 5,000
| 5,473
|
| Hospital Fin. Auth., Hospital Rev. and Rev. Ref. Bonds (Trinity Health Credit Group), Series 2017-A, 5.00% 2047
| 1,400
| 1,534
|
| Hospital Fin. Auth., Hospital Rev. Bonds (Trinity Health Credit Group), Series 2009-B, 5.00% 2048
| 2,000
| 2,164
|
| Hospital Fin. Auth., Hospital Rev. Bonds (Trinity Health Credit Group), Series 2011, 5.00% 2039
| 1,890
| 2,034
|
Hospital Fin. Auth., Hospital Rev. Ref. Bonds (Crittenton Hospital Medical Center), Series 2012-A,
5.00% 2039 (preref. 2022)
| 2,270
| 2,511
|
Hospital Fin. Auth., Hospital Rev. Ref. Bonds (Henry Ford Health System), Series 2009,
5.75% 2039 (preref. 2019)
| 4,500
| 4,559
|
| Hospital Fin. Auth., Hospital Rev. Ref. Bonds (Henry Ford Health System), Series 2016, 5.00% 2037
| 3,500
| 4,073
|
| Hospital Fin. Auth., Hospital Rev. Ref. Bonds (Henry Ford Health System), Series 2016, 5.00% 2041
| 2,005
| 2,329
|
| Hospital Fin. Auth., Hospital Rev. Ref. Bonds (McLaren Health Care), Series 2019-A, 4.00% 2047
| 1,700
| 1,839
|
| Hospital Fin. Auth., Hospital Rev. Ref. Bonds (Oakwood Obligated Group), Series 2012, 5.00% 2027
| 1,090
| 1,211
|
| Housing Dev. Auth., Single Family Mortgage Rev. Bonds, Series 2016-B, 3.35% 2034
| 3,000
| 3,116
|
| Housing Dev. Auth., Single Family Mortgage Rev. Bonds, Series 2016-B, 3.50% 2047
| 1,045
| 1,103
|
| City of Kentwood, Econ. Dev. Corp., Limited Obligation Rev. Ref. Bonds (Holland Home Obligated Group), Series 2012, 5.125% 2032
| 1,000
| 1,002
|
| City of Kentwood, Econ. Dev. Corp., Limited Obligation Rev. Ref. Bonds (Holland Home Obligated Group), Series 2012, 5.375% 2041
| 1,270
| 1,272
|
| City of Kentwood, Econ. Dev. Corp., Limited Obligation Rev. Ref. Bonds (Holland Home Obligated Group), Series 2012, 5.625% 2041
| 4,775
| 5,089
|
| City of Kentwood, Econ. Dev. Corp., Limited Obligation Rev. Ref. Bonds (Holland Home Obligated Group), Series 2016, 5.00% 2037
| 2,750
| 3,090
|
| City of Saginaw, Hospital Fin. Auth., Hospital Rev. Ref. Bonds (Covenant Medical Center, Inc.), Series 2010-H, 5.00% 2030
| 2,700
| 2,782
|
Strategic Fund, Limited Obligation Rev. Bonds (Detroit Renewable Power Project), Series 2018, AMT,
7.00% 20302
| 2,700
| 3,059
|
American High-Income Municipal Bond Fund —
Page 36 of 74
Bonds, notes & other debt instruments (continued)
Michigan (continued)
| Principal amount
(000)
| Value
(000)
|
| Strategic Fund, Limited Obligation Rev. Bonds (Detroit Thermal Project), Series 2018, AMT, 7.00% 20302
| $6,370
| $7,217
|
Strategic Fund, Limited Obligation Rev. Bonds (I-75 Improvement Project), Series 2018,
Assured Guaranty Municipal insured, AMT, 5.00% 2043
| 5,000
| 5,873
|
Strategic Fund, Limited Obligation Rev. Bonds (I-75 Improvement Project), Series 2018,
Assured Guaranty Municipal insured, AMT, 5.00% 2048
| 2,750
| 3,214
|
Strategic Fund, Limited Obligation Rev. Ref. Bonds (Detroit Edison Co. Exempt Facs. Project),
Series 2008-ET-2, 1.45% 2029 (put 2021)
| 1,950
| 1,946
|
Strategic Fund, Limited Obligation Rev. Ref. Bonds (Detroit Edison Co. Exempt Facs. Project),
Series 2008-KT, 5.625% 2020
| 1,800
| 1,868
|
| Tobacco Settlement Fin. Auth., Tobacco Settlement Asset-Backed Rev. Bonds, Series 2007-A, 6.00% 2048
| 10,095
| 10,150
|
| Tobacco Settlement Fin. Auth., Tobacco Settlement Asset-Backed Rev. Bonds, Series 2008-A, 6.875% 2042
| 7,270
| 7,347
|
County of Wayne, Airport Auth., Airport Rev. Bonds (Detroit Metropolitan Wayne County Airport),
Series 2012-B, AMT, 5.00% 2037
| 2,000
| 2,194
|
County of Wayne, Airport Auth., Airport Rev. Bonds (Detroit Metropolitan Wayne County Airport),
Series 2014-C, AMT, 5.00% 2044
| 1,000
| 1,132
|
County of Wayne, Airport Auth., Airport Rev. Ref. Bonds (Detroit Metropolitan Wayne County Airport),
Series 2012-D, AMT, 5.00% 2028
| 12,000
| 13,290
|
County of Wayne, Airport Auth., Airport Rev. Ref. Bonds (Detroit Metropolitan Wayne County Airport),
Series 2015-F, AMT, 5.00% 2030
| 3,000
| 3,511
|
County of Wayne, Airport Auth., Airport Rev. Ref. Bonds (Detroit Metropolitan Wayne County Airport),
Series 2015-F, AMT, 5.00% 2032
| 1,000
| 1,162
|
County of Wayne, Airport Auth., Airport Rev. Ref. Bonds (Detroit Metropolitan Wayne County Airport),
Series 2015-F, AMT, 5.00% 2034
| 1,500
| 1,734
|
|
|
| 202,270
|
| Minnesota 0.30%
|
|
|
City of Duluth, Econ. Dev. Auth., Health Care Facs. Rev. Bonds (Essentia Health Obligated Group),
Series 2018-A, 5.00% 2058
| 5,000
| 5,750
|
| Higher Education Supplemental Loan Auth., Rev. Bonds, Series 2018, AMT, 4.00% 2037
| 8,500
| 9,116
|
| Housing Fin. Agcy., Residential Housing Fin. Bonds, Series 2013-A, AMT, 3.00% 2031
| 315
| 321
|
| Housing Fin. Agcy., Residential Housing Fin. Bonds, Series 2014-C, AMT, 4.00% 2045
| 970
| 1,028
|
| Housing Fin. Agcy., Residential Housing Fin. Bonds, Series 2015-E, AMT, 3.50% 2046
| 2,870
| 3,002
|
City of Minneapolis, Housing and Redev. Auth., Health Care System Rev. Bonds (Allina Health System),
Series 2009-A-2, 5.50% 2024 (preref. 2019)
| 2,000
| 2,025
|
| City of St. Paul, Housing and Redev. Auth., Charter School Lease Rev. Bonds (Great River School Project), Series 2017-A, 4.75% 20292
| 250
| 265
|
| City of St. Paul, Housing and Redev. Auth., Charter School Lease Rev. Bonds (Great River School Project), Series 2017-A, 5.25% 20332
| 140
| 151
|
| City of St. Paul, Housing and Redev. Auth., Charter School Lease Rev. Bonds (Great River School Project), Series 2017-A, 5.50% 20522
| 1,600
| 1,702
|
|
|
| 23,360
|
| Mississippi 0.23%
|
|
|
Business Fin. Corp., Solid Waste Disposal, Rev. Bonds (Waste Pro USA, Inc. Project), Series 2017, AMT,
5.00% 2036 (put 2022)2
| 3,500
| 3,715
|
Dev. Bank, Special Obligation Bonds (Municipal Energy Agcy. of Mississippi Power Supply Project),
Series 2015-A, Assured Guaranty Municipal insured, 5.00% 2034
| 1,000
| 1,165
|
Hospital Equipment and Facs. Auth., Rev. Bonds (Baptist Memorial Health Care), Series 2016-A,
5.00% 2046
| 2,500
| 2,788
|
County of Warren, Gulf Opportunity Zone Bonds (International Paper Co. Project), Series 2011-A,
5.375% 2035
| 5,100
| 5,516
|
| County of Warren, Gulf Opportunity Zone Rev. Ref. Bonds (International Paper Co. Project), Series 2018, 2.90% 2032 (put 2023)
| 4,750
| 4,916
|
|
|
| 18,100
|
American High-Income Municipal Bond Fund —
Page 37 of 74
Bonds, notes & other debt instruments (continued)
Missouri 1.50%
| Principal amount
(000)
| Value
(000)
|
| County of Cape Girardeau, Industrial Dev. Auth., Health Facs. Rev. Bonds (Southeast Missouri Hospital Association), Series 2016-A, 6.00% 2033
| $4,465
| $5,127
|
| Health and Educational Facs. Auth., Health Facs. Rev. Bonds (Bethesda Health Group, Inc.), Series 2015, 5.00% 2040
| 1,650
| 1,779
|
| Health and Educational Facs. Auth., Health Facs. Rev. Bonds (Bethesda Health Group, Inc.), Series 2015, 5.00% 2045
| 1,300
| 1,399
|
Health and Educational Facs. Auth., Rev. Ref. Bonds (St. Anthony’s Medical Center), Series 2015-B,
5.00% 2045
| 1,320
| 1,495
|
| Health and Educational Facs. Auth., Senior Living Facs. Rev. Bonds (Christian Horizons Obligated Group), Series 2018, 5.00% 2036
| 1,500
| 1,625
|
| Health and Educational Facs. Auth., Senior Living Facs. Rev. Bonds (Christian Horizons Obligated Group), Series 2018, 5.00% 2040
| 2,000
| 2,150
|
| Health and Educational Facs. Auth., Senior Living Facs. Rev. Bonds (Lutheran Senior Services), Series 2010, 5.50% 2042
| 2,000
| 2,027
|
| Health and Educational Facs. Auth., Senior Living Facs. Rev. Bonds (Lutheran Senior Services), Series 2011, 6.00% 2041
| 1,000
| 1,050
|
| Health and Educational Facs. Auth., Senior Living Facs. Rev. Bonds (Lutheran Senior Services), Series 2019-A, 5.00% 2034
| 2,500
| 2,820
|
| Health and Educational Facs. Auth., Senior Living Facs. Rev. Bonds (Lutheran Senior Services), Series 2019-A, 5.00% 2042
| 5,600
| 6,231
|
| Health and Educational Facs. Auth., Senior Living Facs. Rev. Bonds (Lutheran Senior Services), Series 2019-B, 2.875% 2034 (put 2022)
| 2,600
| 2,617
|
Health and Educational Facs. Auth., Senior Living Facs. Rev. Ref. Bonds (Lutheran Senior Services),
Series 2016-A, 5.00% 2030
| 415
| 474
|
Health and Educational Facs. Auth., Senior Living Facs. Rev. Ref. Bonds (Lutheran Senior Services),
Series 2016-A, 5.00% 2046
| 825
| 911
|
| Housing Dev. Commission, Single Family Mortgage Rev. Bonds (Special Homeownership Loan Program), Series 2015-B-1, AMT, 4.00% 2045
| 3,060
| 3,247
|
| City of Lee’s Summit, Special Obligation Tax Increment and Special Dist. Rev. Ref. and Improvement Bonds (Summit Fair Project), Series 2017, 3.50% 20232
| 940
| 946
|
| City of Lee’s Summit, Special Obligation Tax Increment and Special Dist. Rev. Ref. and Improvement Bonds (Summit Fair Project), Series 2017, 4.00% 20272
| 1,850
| 1,864
|
City of Maryland Heights, Industrial Dev. Auth. Rev. Bonds (St. Louis Community Ice Center Project),
Series 2018-A, 4.375% 2030
| 1,000
| 1,059
|
City of Maryland Heights, Industrial Dev. Auth. Rev. Bonds (St. Louis Community Ice Center Project),
Series 2018-A, 5.00% 2039
| 3,500
| 3,801
|
City of Maryland Heights, Industrial Dev. Auth. Rev. Bonds (St. Louis Community Ice Center Project),
Series 2018-A, 5.00% 2049
| 8,500
| 9,127
|
| Move Rolla Transportation Dev. Dist., Sales Tax Rev. Bonds, Series 2017, 3.75% 2029
| 2,245
| 2,419
|
| Move Rolla Transportation Dev. Dist., Sales Tax Rev. Bonds, Series 2017, 4.50% 2036
| 750
| 810
|
City of St. Louis, Airport Rev. Ref. Bonds (Lambert-St. Louis International Airport), Series 2005,
National insured, 5.50% 2026
| 2,500
| 3,082
|
City of St. Louis, Airport Rev. Ref. Bonds (Lambert-St. Louis International Airport), Series 2005,
National insured, 5.50% 2027
| 3,275
| 4,238
|
City of St. Louis, Airport Rev. Ref. Bonds (Lambert-St. Louis International Airport), Series 2005,
National insured, 5.50% 2028
| 2,400
| 3,172
|
City of St. Louis, Airport Rev. Ref. Bonds (Lambert-St. Louis International Airport), Series 2005,
National insured, 5.50% 2029
| 1,000
| 1,344
|
City of St. Louis, Airport Rev. Ref. Bonds (Lambert-St. Louis International Airport), Series 2005,
National insured, 5.50% 2030
| 4,255
| 5,796
|
City of St. Louis, Airport Rev. Ref. Bonds (Lambert-St. Louis International Airport), Series 2005,
National insured, 5.50% 2031
| 2,000
| 2,756
|
City of St. Louis, Airport Rev. Ref. Bonds (Lambert-St. Louis International Airport), Series 2012,
AMT, 5.00% 2032
| 1,685
| 1,840
|
American High-Income Municipal Bond Fund —
Page 38 of 74
Bonds, notes & other debt instruments (continued)
Missouri (continued)
| Principal amount
(000)
| Value
(000)
|
City of St. Louis, Airport Rev. Ref. Bonds (Lambert-St. Louis International Airport), Series 2017-B,
AMT, Assured Guaranty Municipal insured, 5.00% 2027
| $1,500
| $1,864
|
| City of St. Louis, Industrial Dev. Auth., Dev. Fncg. Rev. Bonds (Ballpark Village Dev. Project), Series 2017-A, 4.75% 2047
| 1,000
| 1,062
|
| City of St. Louis, Industrial Dev. Auth., Senior Living Facs. Rev. Bonds (St. Andrew’s Resources for Seniors Obligated Group), Series 2015-A, 5.00% 2025
| 1,620
| 1,730
|
| City of St. Louis, Industrial Dev. Auth., Senior Living Facs. Rev. Bonds (St. Andrew’s Resources for Seniors Obligated Group), Series 2015-A, 5.00% 2035
| 1,260
| 1,346
|
| City of St. Louis, Industrial Dev. Auth., Senior Living Facs. Rev. Bonds (St. Andrew’s Resources for Seniors Obligated Group), Series 2015-A, 5.125% 2045
| 4,200
| 4,481
|
| County of St. Louis, Industrial Dev. Auth., Healthcare Facs. Rev. Bonds (Nazareth Living Center), Series 2012, 6.125% 2042
| 1,000
| 1,071
|
| County of St. Louis, Industrial Dev. Auth., Healthcare Facs. Rev. Bonds (Nazareth Living Center), Series 2015-A, 5.00% 2030
| 1,000
| 1,081
|
| County of St. Louis, Industrial Dev. Auth., Healthcare Facs. Rev. Bonds (Nazareth Living Center), Series 2015-A, 5.00% 2035
| 1,400
| 1,487
|
| County of St. Louis, Industrial Dev. Auth., Healthcare Facs. Rev. Bonds (Nazareth Living Center), Series 2015-A, 5.125% 2045
| 2,000
| 2,112
|
| County of St. Louis, Industrial Dev. Auth., Senior Living Facs. Rev. Bonds (Friendship Village St. Louis Obligated Group), Series 2017, 5.00% 2048
| 5,110
| 5,657
|
| County of St. Louis, Industrial Dev. Auth., Senior Living Facs. Rev. Bonds (Friendship Village St. Louis Obligated Group), Series 2018, 5.00% 2038
| 1,000
| 1,118
|
| County of St. Louis, Industrial Dev. Auth., Senior Living Facs. Rev. Bonds (Friendship Village St. Louis Obligated Group), Series 2018, 5.125% 2049
| 1,335
| 1,491
|
| County of St. Louis, Industrial Dev. Auth., Senior Living Facs. Rev. Bonds (Friendship Village St. Louis Obligated Group), Series 2018, 5.25% 2053
| 8,785
| 9,849
|
| County of St. Louis, Industrial Dev. Auth., Senior Living Facs. Rev. Bonds (Friendship Village Sunset Hills), Series 2012, 5.00% 2032
| 1,020
| 1,085
|
| County of St. Louis, Transportation Dev. Dist., Transportation Rev. Bonds (Missouri Bottom Road/Taussig Road), Series 2002, 7.20% 20334
| 3,300
| 1,122
|
| County of Stoddard, Industrial Dev. Auth., Health Facs. Rev. Bonds (Southeast Missouri Hospital Association), Series 2016-B, 6.00% 2037
| 4,075
| 4,649
|
|
|
| 116,411
|
| Montana 0.03%
|
|
|
| Board of Housing, Single Family Mortgage Bonds, Series 2017-B-1, AMT, 4.00% 2048
| 2,175
| 2,301
|
| Nebraska 0.12%
|
|
|
| County of Douglas, Hospital Auth. No. 2 (Methodist Health System), Health Facs. Rev. Ref. Bonds, Series 2015, 5.00% 2048
| 2,350
| 2,618
|
| Investment Fin. Auth., Single Family Housing Rev. Bonds, Series 2017-B, AMT, 3.50% 2040
| 1,640
| 1,728
|
| Investment Fin. Auth., Single Family Housing Rev. Bonds, Series 2018-C, 4.00% 2048
| 2,155
| 2,341
|
| Investment Fin. Auth., Single Family Housing Rev. Bonds, Series 2019-B, AMT, 4.00% 2049
| 2,500
| 2,711
|
|
|
| 9,398
|
| Nevada 0.86%
|
|
|
Dept. of Business and Industry, Charter School Rev. Bonds (Doral Academy of Nevada),
Series 2017-A, 5.00% 20372
| 1,000
| 1,075
|
Dept. of Business and Industry, Charter School Rev. Bonds (Doral Academy of Nevada),
Series 2017-A, 5.00% 20472
| 1,400
| 1,487
|
| Dept. of Business and Industry, Environmental Improvement Rev. Bonds (Fulcrum Sierra Biofuels LLC Project), Series 2017, AMT, 5.875% 20272
| 3,000
| 3,329
|
| Dept. of Business and Industry, Environmental Improvement Rev. Bonds (Fulcrum Sierra Biofuels LLC Project), Series 2018, AMT, 6.95% 20382
| 7,375
| 8,422
|
American High-Income Municipal Bond Fund —
Page 39 of 74
Bonds, notes & other debt instruments (continued)
Nevada (continued)
| Principal amount
(000)
| Value
(000)
|
| Dept. of Business and Industry, Lease Rev. Bonds (Somerset Academy), Series 2018-A, 4.50% 20292
| $750
| $801
|
| Dept. of Business and Industry, Lease Rev. Bonds (Somerset Academy), Series 2018-A, 5.00% 20382
| 1,000
| 1,070
|
| Dept. of Business and Industry, Lease Rev. Bonds (Somerset Academy), Series 2018-A, 5.00% 20482
| 1,000
| 1,057
|
| Dept. of Business and Industry, Solid Waste Disposal Rev. Bonds (Republic Services, Inc. Project), Series 2001, AMT, 1.875% 2026 (put 2019)2
| 2,700
| 2,704
|
County of Clark, Pollution Control Rev. Ref. Bonds (Southern California Edison Co.), Series 2010,
1.875% 2031 (put 2020)
| 5,500
| 5,509
|
| County of Clark, Rev. Ref. Bonds (Jet Aviation Fuel Tax), Series 2013-A, AMT, 5.00% 2028
| 2,000
| 2,229
|
| County of Clark, Special Improvement Dist. No. 121 (Southern Highlands Area), Local Improvement Rev. Ref. Bonds, Series 2016, 2.50% 2020
| 445
| 447
|
| County of Clark, Special Improvement Dist. No. 121 (Southern Highlands Area), Local Improvement Rev. Ref. Bonds, Series 2016, 2.50% 2021
| 265
| 266
|
| County of Clark, Special Improvement Dist. No. 121 (Southern Highlands Area), Local Improvement Rev. Ref. Bonds, Series 2016, 2.75% 2022
| 375
| 378
|
| County of Clark, Special Improvement Dist. No. 121 (Southern Highlands Area), Local Improvement Rev. Ref. Bonds, Series 2016, 2.75% 2023
| 385
| 387
|
| County of Clark, Special Improvement Dist. No. 121 (Southern Highlands Area), Local Improvement Rev. Ref. Bonds, Series 2016, 3.00% 2024
| 400
| 404
|
| County of Clark, Special Improvement Dist. No. 121 (Southern Highlands Area), Local Improvement Rev. Ref. Bonds, Series 2016, 3.00% 2025
| 415
| 416
|
| County of Clark, Special Improvement Dist. No. 142 (Mountain’s Edge), Local Improvement Rev. Ref. Bonds, Series 2012, 5.00% 2020
| 1,080
| 1,113
|
| County of Clark, Special Improvement Dist. No. 142 (Mountain’s Edge), Local Improvement Rev. Ref. Bonds, Series 2012, 5.00% 2021
| 1,155
| 1,226
|
| County of Clark, Special Improvement Dist. No. 151 (Summerlin-Mesa), Local Improvement Rev. Ref. Bonds, Series 2015, 4.00% 2020
| 1,130
| 1,146
|
| City of Henderson, Local Improvement Dist. No. T-16 (Falls at Lake Las Vegas), Limited Obligation Improvement Bonds, Series 2005, 5.125% 2025
| 2,550
| 2,442
|
| City of Las Vegas, Redev. Agcy., Tax Increment Rev. Ref. Bonds, Series 2016, 5.00% 2030
| 1,375
| 1,612
|
| City of Las Vegas, Redev. Agcy., Tax Increment Rev. Ref. Bonds, Series 2016, 5.00% 2031
| 1,465
| 1,701
|
| City of Las Vegas, Redev. Agcy., Tax Increment Rev. Ref. Bonds, Series 2016, 5.00% 2045
| 1,225
| 1,380
|
| City of Las Vegas, Sales Tax Increment Rev. Bonds, Series 2016, 2.75% 20212
| 135
| 135
|
| City of Las Vegas, Sales Tax Increment Rev. Bonds, Series 2016, 3.50% 20252
| 3,030
| 2,992
|
City of Las Vegas, Special Improvement Dist. No. 607 (Providence), Local Improvement Rev. Ref. Bonds,
Series 2013, 4.25% 2024
| 200
| 211
|
City of Las Vegas, Special Improvement Dist. No. 607 (Providence), Local Improvement Rev. Ref. Bonds,
Series 2013, 5.00% 2022
| 370
| 394
|
City of Las Vegas, Special Improvement Dist. No. 607 (Providence), Local Improvement Rev. Ref. Bonds,
Series 2013, 5.00% 2023
| 325
| 351
|
City of Las Vegas, Special Improvement Dist. No. 607 (Providence), Local Improvement Rev. Ref. Bonds,
Series 2013, 5.00% 2024
| 205
| 224
|
| City of Las Vegas, Special Improvement Dist. No. 812 (Summerlin Village 24), Local Improvement Rev. Ref. Bonds, Series 2015, 4.00% 2022
| 1,105
| 1,150
|
| City of Las Vegas, Special Improvement Dist. No. 812 (Summerlin Village 24), Local Improvement Rev. Ref. Bonds, Series 2015, 4.50% 2025
| 660
| 712
|
| City of Las Vegas, Special Improvement Dist. No. 812 (Summerlin Village 24), Local Improvement Rev. Ref. Bonds, Series 2015, 5.00% 2026
| 695
| 767
|
| City of Las Vegas, Special Improvement Dist. No. 812 (Summerlin Village 24), Local Improvement Rev. Ref. Bonds, Series 2015, 5.00% 2029
| 1,645
| 1,784
|
| City of Las Vegas, Special Improvement Dist. No. 812 (Summerlin Village 24), Local Improvement Rev. Ref. Bonds, Series 2015, 5.00% 2035
| 1,620
| 1,723
|
| City of Las Vegas, Special Improvement Dist. No. 813 (Summerlin Village 26), Local Improvement Bonds, Series 2017, 3.00% 2023
| 220
| 222
|
| City of Las Vegas, Special Improvement Dist. No. 813 (Summerlin Village 26), Local Improvement Bonds, Series 2017, 3.00% 2024
| 165
| 166
|
American High-Income Municipal Bond Fund —
Page 40 of 74
Bonds, notes & other debt instruments (continued)
Nevada (continued)
| Principal amount
(000)
| Value
(000)
|
| City of Las Vegas, Special Improvement Dist. No. 813 (Summerlin Village 26), Local Improvement Bonds, Series 2017, 3.00% 2025
| $255
| $254
|
| City of Las Vegas, Special Improvement Dist. No. 813 (Summerlin Village 26), Local Improvement Bonds, Series 2017, 3.25% 2026
| 250
| 249
|
| City of Las Vegas, Special Improvement Dist. No. 813 (Summerlin Village 26), Local Improvement Bonds, Series 2017, 3.50% 2027
| 270
| 272
|
| City of Las Vegas, Special Improvement Dist. No. 813 (Summerlin Village 26), Local Improvement Bonds, Series 2017, 3.50% 2028
| 250
| 250
|
| City of Las Vegas, Special Improvement Dist. No. 813 (Summerlin Village 26), Local Improvement Bonds, Series 2017, 4.00% 2033
| 1,260
| 1,277
|
| City of Las Vegas, Special Improvement Dist. No. 813 (Summerlin Village 26), Local Improvement Bonds, Series 2017, 4.25% 2037
| 1,075
| 1,092
|
| City of Las Vegas, Special Improvement Dist. No. 813 (Summerlin Village 26), Local Improvement Bonds, Series 2017, 4.375% 2042
| 1,365
| 1,381
|
| City of Las Vegas, Special Improvement Dist. No. 813 (Summerlin Village 26), Local Improvement Bonds, Series 2017, 4.50% 2047
| 1,640
| 1,667
|
| City of Las Vegas, Special Improvement Dist. Nos. 808 and 810 (Summerlin Village 23B), Local Improvement Rev. Ref. Bonds, Series 2014, 5.00% 2026
| 895
| 969
|
| City of Las Vegas, Special Improvement Dist. Nos. 808 and 810 (Summerlin Village 23B), Local Improvement Rev. Ref. Bonds, Series 2014, 5.00% 2028
| 360
| 386
|
| City of Las Vegas, Special Improvement Dist. Nos. 808 and 810 (Summerlin Village 23B), Local Improvement Rev. Ref. Bonds, Series 2014, 5.00% 2029
| 630
| 672
|
| City of Las Vegas, Special Improvement Dist. Nos. 808 and 810 (Summerlin Village 23B), Local Improvement Rev. Ref. Bonds, Series 2014, 5.00% 2031
| 130
| 138
|
City of North Las Vegas, Special Improvement Dist. No. 64 (Valley Vista), Local Improvement Bonds,
Series 2019, 3.50% 2021
| 120
| 122
|
City of North Las Vegas, Special Improvement Dist. No. 64 (Valley Vista), Local Improvement Bonds,
Series 2019, 3.50% 2022
| 150
| 153
|
City of North Las Vegas, Special Improvement Dist. No. 64 (Valley Vista), Local Improvement Bonds,
Series 2019, 3.50% 2023
| 125
| 128
|
City of North Las Vegas, Special Improvement Dist. No. 64 (Valley Vista), Local Improvement Bonds,
Series 2019, 3.50% 2024
| 130
| 133
|
City of North Las Vegas, Special Improvement Dist. No. 64 (Valley Vista), Local Improvement Bonds,
Series 2019, 3.75% 2025
| 150
| 155
|
City of North Las Vegas, Special Improvement Dist. No. 64 (Valley Vista), Local Improvement Bonds,
Series 2019, 3.75% 2026
| 200
| 207
|
City of North Las Vegas, Special Improvement Dist. No. 64 (Valley Vista), Local Improvement Bonds,
Series 2019, 3.75% 2027
| 265
| 273
|
City of North Las Vegas, Special Improvement Dist. No. 64 (Valley Vista), Local Improvement Bonds,
Series 2019, 3.875% 2028
| 415
| 430
|
City of North Las Vegas, Special Improvement Dist. No. 64 (Valley Vista), Local Improvement Bonds,
Series 2019, 4.00% 2029
| 215
| 224
|
City of North Las Vegas, Special Improvement Dist. No. 64 (Valley Vista), Local Improvement Bonds,
Series 2019, 4.00% 2030
| 350
| 362
|
City of North Las Vegas, Special Improvement Dist. No. 64 (Valley Vista), Local Improvement Bonds,
Series 2019, 4.25% 2034
| 630
| 654
|
City of North Las Vegas, Special Improvement Dist. No. 64 (Valley Vista), Local Improvement Bonds,
Series 2019, 4.50% 2039
| 800
| 835
|
City of North Las Vegas, Special Improvement Dist. No. 64 (Valley Vista), Local Improvement Bonds,
Series 2019, 4.625% 2043
| 675
| 705
|
American High-Income Municipal Bond Fund —
Page 41 of 74
Bonds, notes & other debt instruments (continued)
Nevada (continued)
| Principal amount
(000)
| Value
(000)
|
City of North Las Vegas, Special Improvement Dist. No. 64 (Valley Vista), Local Improvement Bonds,
Series 2019, 4.625% 2049
| $1,000
| $1,039
|
City of Reno, Sales Tax Rev. Ref. Bonds (ReTRAC-Reno Transportation Rail Access Corridor Project),
Series 2018-B, Assured Guaranty Municipal insured, 4.125% 2058
| 1,250
| 1,335
|
|
|
| 66,794
|
| New Hampshire 0.25%
|
|
|
Business Fin. Auth., Rev. Bonds (Elliot Hospital Obligated Group Issue), Series 2009-A,
6.125% 2039 (preref. 2019)
| 1,445
| 1,457
|
| Business Fin. Auth., Solid Waste Disposal Rev. Bonds (Waste Management, Inc. Project), Series 2003, AMT, 3.125% 20241
| 2,750
| 2,934
|
| Health and Education Facs. Auth., Healthcare System Rev. Bonds (Covenant Health Systems Obligated Group Issue), Series 2007-A, 5.00% 2027
| 150
| 151
|
| Health and Education Facs. Auth., Rev. Bonds (Elliot Hospital Issue), Series 2016, 5.00% 2031
| 1,250
| 1,472
|
| Health and Education Facs. Auth., Rev. Bonds (Rivermead Issue), Series 2011-A, 6.875% 2041
| 2,625
| 2,784
|
| National Fin. Auth., Resource Recovery Rev. Ref. Bonds (Covanta Project), Series 2018-A, AMT, 4.00% 20272
| 2,000
| 2,079
|
| National Fin. Auth., Resource Recovery Rev. Ref. Bonds (Covanta Project), Series 2018-B, 4.625% 20422
| 1,000
| 1,035
|
| National Fin. Auth., Resource Recovery Rev. Ref. Bonds (Covanta Project), Series 2018-C, AMT, 4.875% 20422
| 5,000
| 5,210
|
| National Fin. Auth., Solid Waste Disposal Rev. Ref. Bonds (Waste Management, Inc. Project), Series 2019-A-4, AMT, 2.15% 2038 (put 2024)
| 2,000
| 2,038
|
|
|
| 19,160
|
| New Jersey 4.00%
|
|
|
| Atlantic City, Tax Appeal Rev. Ref. Bonds, Series 2017-B, Assured Guaranty Municipal insured, 5.00% 2032
| 1,200
| 1,426
|
| County of Camden, Improvement Auth., Health Care Redev. Project, Rev. Bonds (Cooper Health System Obligated Group Issue), Series 2013-A, 5.75% 2042
| 2,665
| 2,973
|
| County of Camden, Improvement Auth., Health Care Redev. Project, Rev. Ref. Bonds (Cooper Health System Obligated Group Issue), Series 2014, 5.00% 2032
| 555
| 617
|
| Casino Reinvestment Dev. Auth., Luxury Tax Rev. Bonds, Series 2014, Assured Guaranty Municipal insured, 5.25% 2039
| 2,500
| 2,734
|
| Casino Reinvestment Dev. Auth., Luxury Tax Rev. Bonds, Series 2014, Assured Guaranty Municipal insured, 5.25% 2044
| 1,000
| 1,092
|
Casino Reinvestment Dev. Auth., Luxury Tax Rev. Bonds, Series 2014, Assured Guaranty Municipal insured,
5.00% 2024
| 2,250
| 2,593
|
Casino Reinvestment Dev. Auth., Luxury Tax Rev. Bonds, Series 2014, Assured Guaranty Municipal insured,
5.00% 2026
| 1,500
| 1,706
|
Casino Reinvestment Dev. Auth., Luxury Tax Rev. Bonds, Series 2014, Assured Guaranty Municipal insured,
5.00% 2027
| 1,000
| 1,132
|
Casino Reinvestment Dev. Auth., Luxury Tax Rev. Bonds, Series 2014, Assured Guaranty Municipal insured,
5.00% 2029
| 1,180
| 1,325
|
Econ. Dev. Auth., Energy Fac. Rev. Bonds (UMM Energy Partners, LLC Project), Series 2012-A, AMT,
5.00% 2037
| 7,050
| 7,477
|
Econ. Dev. Auth., Energy Fac. Rev. Bonds (UMM Energy Partners, LLC Project), Series 2012-A, AMT,
5.125% 2043
| 750
| 796
|
Econ. Dev. Auth., Private Activity Bonds (Goethals Bridge Replacement Project), Series 2013, AMT,
5.375% 2043
| 7,725
| 8,644
|
Econ. Dev. Auth., Private Activity Bonds (Goethals Bridge Replacement Project), Series 2013, AMT,
5.625% 2052
| 3,940
| 4,423
|
| Econ. Dev. Auth., Rev. Bonds (Foundation Academy Charter School Project), Series 2018-A, 5.00% 2050
| 1,100
| 1,220
|
| Econ. Dev. Auth., Rev. Bonds (Provident Group - Kean Properties LLC - Kean University Student Housing Project), Series 2017-A, 5.00% 2027
| 1,000
| 1,154
|
| Econ. Dev. Auth., Rev. Bonds (Provident Group - Kean Properties LLC - Kean University Student Housing Project), Series 2017-A, 5.00% 2037
| 1,250
| 1,395
|
| Econ. Dev. Auth., Rev. Bonds (Provident Group - Kean Properties LLC - Kean University Student Housing Project), Series 2017-A, 5.00% 2047
| 3,500
| 3,845
|
American High-Income Municipal Bond Fund —
Page 42 of 74
Bonds, notes & other debt instruments (continued)
New Jersey (continued)
| Principal amount
(000)
| Value
(000)
|
| Econ. Dev. Auth., Rev. Bonds (Provident Group - Kean Properties LLC - Kean University Student Housing Project), Series 2017-A, 5.00% 2050
| $1,590
| $1,743
|
| Econ. Dev. Auth., Rev. Bonds (Provident Group - Montclair Properties LLC - Montclair State University Student Housing Project), Series 2010-A, 5.875% 2042 (preref.
2020)
| 2,500
| 2,599
|
| Econ. Dev. Auth., Rev. Ref. Bonds (Cranes Mill Project), Series 2018, 5.00% 2029
| 1,200
| 1,397
|
| Econ. Dev. Auth., Rev. Ref. Bonds (Cranes Mill Project), Series 2018, 5.00% 2034
| 2,025
| 2,310
|
| Econ. Dev. Auth., Rev. Ref. Bonds (Cranes Mill Project), Series 2018, 5.00% 2039
| 1,685
| 1,898
|
| Econ. Dev. Auth., Rev. Ref. Bonds (Cranes Mill Project), Series 2018, 5.00% 2049
| 3,810
| 4,252
|
| Econ. Dev. Auth., Rev. Ref. Bonds (Motor Vehicle Surcharges), Series 2017-A, BAM insured, 5.00% 2027
| 3,250
| 3,974
|
| Econ. Dev. Auth., Rev. Ref. Bonds (Provident Group - Montclair Properties LLC - Montclair State University Student Housing Project), Series 2017, Assured Guaranty
Municipal insured, 5.00% 2037
| 2,750
| 3,224
|
| Econ. Dev. Auth., Rev. Ref. Bonds (Provident Group - Rowan Properties LLC - Rowan University Student Housing Project), Series 2015-A, 5.00% 2024
| 2,050
| 2,267
|
| Econ. Dev. Auth., Rev. Ref. Bonds (Provident Group - Rowan Properties LLC - Rowan University Student Housing Project), Series 2015-A, 5.00% 2030
| 1,000
| 1,106
|
| Econ. Dev. Auth., Rev. Ref. Bonds (Provident Group - Rowan Properties LLC - Rowan University Student Housing Project), Series 2015-A, 5.00% 2035
| 3,750
| 4,089
|
| Econ. Dev. Auth., Rev. Ref. Bonds (Provident Group - Rowan Properties LLC - Rowan University Student Housing Project), Series 2015-A, 5.00% 2048
| 2,150
| 2,306
|
| Econ. Dev. Auth., School Facs. Construction Bonds, Series 2005-K, AMBAC insured, 5.50% 2019
| 2,075
| 2,106
|
| Econ. Dev. Auth., School Facs. Construction Bonds, Series 2015-WW, 5.25% 2033
| 2,500
| 2,836
|
| Econ. Dev. Auth., School Facs. Construction Bonds, Series 2016-AAA, 5.50% 2031
| 2,000
| 2,371
|
| Econ. Dev. Auth., School Facs. Construction Bonds, Series 2017-DDD, 5.00% 2034
| 1,500
| 1,722
|
| Econ. Dev. Auth., School Facs. Construction Bonds, Series 2017-DDD, 5.00% 2035
| 1,275
| 1,458
|
| Econ. Dev. Auth., School Facs. Construction Bonds, Series 2018-FFF, 5.00% 2026
| 3,235
| 3,791
|
| Econ. Dev. Auth., School Facs. Construction Rev. Bonds, Series 2013-NN, 5.00% 2024
| 2,000
| 2,219
|
Econ. Dev. Auth., School Facs. Construction Rev. Ref. Bonds, Series 2013-I,
(SIFMA Municipal Swap Index + 1.60%) 3.00% 20283
| 13,970
| 14,081
|
| Econ. Dev. Auth., School Facs. Construction Rev. Ref. Bonds, Series 2015-XX, 5.00% 2021
| 125
| 133
|
| Econ. Dev. Auth., School Facs. Construction Rev. Ref. Bonds, Series 2015-XX, 5.00% 2025
| 10,500
| 12,209
|
| Econ. Dev. Auth., School Facs. Rev. Bonds (Beloved Community Charter School), Series 2019-A, 4.00% 20292
| 670
| 705
|
| Econ. Dev. Auth., School Facs. Rev. Bonds (Beloved Community Charter School), Series 2019-A, 5.00% 20392
| 825
| 887
|
| Econ. Dev. Auth., School Facs. Rev. Bonds (Beloved Community Charter School), Series 2019-A, 5.00% 20492
| 930
| 993
|
| Econ. Dev. Auth., School Facs. Rev. Bonds (Beloved Community Charter School), Series 2019-A, 5.00% 20542
| 725
| 768
|
| Econ. Dev. Auth., Special Fac. Rev. Bonds (Continental Airlines, Inc. Project), Series 1999, AMT, 4.875% 2019
| 6,960
| 6,984
|
| Econ. Dev. Auth., Special Fac. Rev. Bonds (Continental Airlines, Inc. Project), Series 1999, AMT, 5.125% 2023
| 3,500
| 3,796
|
| Econ. Dev. Auth., Special Fac. Rev. Bonds (Continental Airlines, Inc. Project), Series 1999, AMT, 5.25% 2029
| 16,300
| 17,900
|
| Econ. Dev. Auth., Special Fac. Rev. Bonds (Continental Airlines, Inc. Project), Series 2000-B, AMT, 5.625% 2030
| 3,750
| 4,319
|
| Econ. Dev. Auth., Special Fac. Rev. Bonds (Continental Airlines, Inc. Project), Series 2003, AMT, 5.50% 2033
| 3,500
| 3,913
|
Econ. Dev. Auth., Special Fac. Rev. Ref. Bonds (Continental Airlines, Inc. Project), Series 2012, AMT,
5.75% 2027
| 4,500
| 4,990
|
| Educational Facs. Auth., Rev. and Rev. Ref. Bonds (Stockton University Issue), Series 2016-A, 5.00% 2030
| 1,770
| 2,087
|
| County of Essex, Improvement Auth., Solid Waste Disposal Rev. Bonds (Covanta Project), Series 2015, AMT, 5.25% 20452
| 600
| 605
|
| Health Care Facs. Fncg. Auth., Rev. and Rev. Ref. Bonds (Trinitas Regional Medical Center Obligated Group Issue), Series 2017-A, 5.00% 2024
| 1,000
| 1,154
|
| Health Care Facs. Fncg. Auth., Rev. and Rev. Ref. Bonds (Trinitas Regional Medical Center Obligated Group Issue), Series 2017-A, 5.00% 2027
| 1,000
| 1,191
|
| Health Care Facs. Fncg. Auth., Rev. and Rev. Ref. Bonds (Trinitas Regional Medical Center Obligated Group Issue), Series 2017-A, 5.00% 2030
| 500
| 586
|
| Health Care Facs. Fncg. Auth., Rev. Bonds (AHS Hospital Corp. Issue), Series 2011, 6.00% 2041 (preref. 2021)
| 1,000
| 1,092
|
| Health Care Facs. Fncg. Auth., Rev. Bonds (Princeton HealthCare System Issue), Series 2016-A, 5.00% 2034
| 1,000
| 1,195
|
Health Care Facs. Fncg. Auth., Rev. Bonds (St. Joseph’s Healthcare System Obligated Group Issue),
Series 2016, 5.00% 2031
| 1,700
| 1,975
|
American High-Income Municipal Bond Fund —
Page 43 of 74
Bonds, notes & other debt instruments (continued)
New Jersey (continued)
| Principal amount
(000)
| Value
(000)
|
Health Care Facs. Fncg. Auth., Rev. Bonds (St. Joseph’s Healthcare System Obligated Group Issue),
Series 2016, 5.00% 2035
| $500
| $574
|
Health Care Facs. Fncg. Auth., Rev. Ref. Bonds (St. Peter’s University Hospital Obligated Group Issue),
Series 2011, 6.00% 2026
| 2,080
| 2,221
|
Health Care Facs. Fncg. Auth., Rev. Ref. Bonds (St. Peter’s University Hospital Obligated Group Issue),
Series 2011, 6.25% 2035
| 3,110
| 3,317
|
Health Care Facs. Fncg. Auth., State Contract Rev. Ref. Bonds (Hospital Asset Transformation Program),
Series 2017, 5.00% 2036
| 2,000
| 2,296
|
| Higher Education Student Assistance Auth., Student Loan Rev. Bonds, Series 2013-1-A, AMT, 3.75% 2026
| 535
| 562
|
| Higher Education Student Assistance Auth., Student Loan Rev. Bonds, Series 2013-1-A, AMT, 4.00% 2020
| 3,000
| 3,099
|
| Higher Education Student Assistance Auth., Student Loan Rev. Bonds, Series 2015-1-A, AMT, 4.00% 2027
| 4,000
| 4,374
|
| Higher Education Student Assistance Auth., Student Loan Rev. Bonds, Series 2016-1-A, AMT, 3.50% 2032
| 1,375
| 1,440
|
| Higher Education Student Assistance Auth., Student Loan Rev. Bonds, Series 2016-1-A, AMT, 5.00% 2024
| 1,000
| 1,165
|
| Higher Education Student Assistance Auth., Student Loan Rev. Bonds, Series 2016-1-A, AMT, 5.00% 2025
| 1,000
| 1,187
|
| Higher Education Student Assistance Auth., Student Loan Rev. Bonds, Series 2019-B, AMT, 3.25% 2039
| 10,000
| 10,090
|
| Housing and Mortgage Fin. Agcy., Single Family Housing Rev. Bonds, Series 2019-C, 4.75% 2050
| 1,500
| 1,683
|
| South Jersey Port Corp., Marine Terminal Rev. Bonds, Series 2017-B, AMT, 5.00% 2042
| 500
| 568
|
| South Jersey Port Corp., Marine Terminal Rev. Bonds, Series 2017-B, AMT, 5.00% 2048
| 875
| 988
|
| South Jersey Transportation Auth., Transportation System Rev. Bonds, Series 2012-A, 5.00% 2026
| 1,920
| 2,114
|
| South Jersey Transportation Auth., Transportation System Rev. Bonds, Series 2012-A, 5.00% 2029
| 1,200
| 1,313
|
| South Jersey Transportation Auth., Transportation System Rev. Bonds, Series 2014-A, 5.00% 2025
| 400
| 464
|
| South Jersey Transportation Auth., Transportation System Rev. Bonds, Series 2014-A, 5.00% 2027
| 990
| 1,140
|
| South Jersey Transportation Auth., Transportation System Rev. Bonds, Series 2014-A, 5.00% 2033
| 2,300
| 2,598
|
| South Jersey Transportation Auth., Transportation System Rev. Bonds, Series 2014-A, 5.00% 2039
| 12,650
| 14,104
|
| Tobacco Settlement Fncg. Corp., Tobacco Settlement Bonds, Series 2018-A, 5.00% 2046
| 3,100
| 3,468
|
| Tobacco Settlement Fncg. Corp., Tobacco Settlement Bonds, Series 2018-A, 5.25% 2046
| 1,210
| 1,381
|
| Tobacco Settlement Fncg. Corp., Tobacco Settlement Bonds, Series 2018-B, 3.20% 2027
| 2,310
| 2,459
|
| Tobacco Settlement Fncg. Corp., Tobacco Settlement Bonds, Series 2018-B, 5.00% 2046
| 4,500
| 4,876
|
Transportation Trust Fund Auth., Federal Highway Reimbursement Rev. Ref. Bonds, Series 2018-A,
5.00% 2023
| 1,000
| 1,128
|
Transportation Trust Fund Auth., Federal Highway Reimbursement Rev. Ref. Bonds, Series 2018-A,
5.00% 2029
| 4,000
| 4,730
|
Transportation Trust Fund Auth., Federal Highway Reimbursement Rev. Ref. Bonds, Series 2018-A,
5.00% 2031
| 4,500
| 5,240
|
| Transportation Trust Fund Auth., Transportation System Bonds, Capital Appreciation Bonds, Series 2006-C, AMBAC insured, 0% 2035
| 3,375
| 2,006
|
| Transportation Trust Fund Auth., Transportation System Bonds, Capital Appreciation Bonds, Series 2006-C, AMBAC insured, 0% 2036
| 9,400
| 5,358
|
Transportation Trust Fund Auth., Transportation System Bonds, Capital Appreciation Bonds, Series 2006-C,
Assured Guaranty Municipal insured, 0% 2034
| 17,220
| 10,851
|
Transportation Trust Fund Auth., Transportation System Bonds, Capital Appreciation Bonds, Series 2006-C,
National insured, 0% 2031
| 12,065
| 8,411
|
| Transportation Trust Fund Auth., Transportation System Bonds, Capital Appreciation Bonds, Series 2008-A, 0% 2035
| 4,000
| 2,339
|
| Transportation Trust Fund Auth., Transportation System Bonds, Capital Appreciation Bonds, Series 2009-A, 0% 2039
| 10,855
| 5,329
|
| Transportation Trust Fund Auth., Transportation System Bonds, Capital Appreciation Bonds, Series 2009-C, BAM insured, 0% 2032
| 1,260
| 858
|
Transportation Trust Fund Auth., Transportation System Bonds, Capital Appreciation Bonds, Series 2010-A,
BAM insured, 0% 2027
| 8,245
| 6,767
|
| Transportation Trust Fund Auth., Transportation System Bonds, Capital Appreciation Bonds, Series 2010-B, 0% 2027
| 965
| 780
|
| Transportation Trust Fund Auth., Transportation System Bonds, Series 2005-B, National insured, 5.50% 2021
| 5,950
| 6,503
|
| Transportation Trust Fund Auth., Transportation System Bonds, Series 2018-A, 5.00% 2030
| 2,000
| 2,392
|
| Transportation Trust Fund Auth., Transportation System Bonds, Series 2018-A, 5.00% 2032
| 2,240
| 2,655
|
American High-Income Municipal Bond Fund —
Page 44 of 74
Bonds, notes & other debt instruments (continued)
New Jersey (continued)
| Principal amount
(000)
| Value
(000)
|
| Transportation Trust Fund Auth., Transportation System Bonds, Series 2019-AA, 5.00% 2046
| $2,000
| $2,274
|
| Transportation Trust Fund Auth., Transportation System Rev. Ref. Bonds, Series 2013-A, 5.00% 2019
| 1,230
| 1,246
|
|
|
| 310,131
|
| New Mexico 0.23%
|
|
|
| City of Farmington, Pollution Control Rev. Ref. Bonds (Southern California Edison Co. Four Corners Project), Series 2005-A, 1.875% 2029 (put 2020)
| 5,000
| 5,008
|
| City of Farmington, Pollution Control Rev. Ref. Bonds (Southern California Edison Co. Four Corners Project), Series 2005-B, 1.875% 2029 (put 2020)
| 3,000
| 3,005
|
Hospital Equipment Loan Council, Rev. Ref. Bonds (Haverland Charter Lifestyle Group),
Series 2012, 5.00% 2032
| 2,000
| 2,121
|
Hospital Equipment Loan Council, Rev. Ref. Bonds (Haverland Charter Lifestyle Group),
Series 2012, 5.00% 2042
| 1,500
| 1,574
|
| Mortgage Fin. Auth., Single Family Mortgage Program Bonds, Series 2009-D, Class I, 5.35% 2040
| 25
| 25
|
| Mortgage Fin. Auth., Single Family Mortgage Program Bonds, Series 2010-A, Class I, 4.625% 2025
| 165
| 167
|
| Mortgage Fin. Auth., Single Family Mortgage Program Bonds, Series 2016-A-2, Class I, AMT, 3.50% 2046
| 2,895
| 3,046
|
| Mortgage Fin. Auth., Single Family Mortgage Program Bonds, Series 2016-C-2, Class I, AMT, 3.50% 2045
| 1,880
| 1,982
|
Mortgage Fin. Auth., Single Family Mortgage Program Rev. Ref. Bonds, Series 2012-B-1, Class I, AMT,
3.75% 2043
| 730
| 752
|
|
|
| 17,680
|
| New York 3.25%
|
|
|
| Brooklyn Arena Local Dev. Corp., PILOT Rev. Ref. Bonds (Barclays Center), Series 2016-A, 5.00% 2026
| 2,500
| 2,999
|
Brooklyn Arena Local Dev. Corp., PILOT Rev. Ref. Bonds (Barclays Center), Series 2016-A,
Assured Guaranty Municipal insured, 5.00% 2042
| 6,675
| 7,651
|
| Buffalo and Erie County Industrial Land Dev. Corp., Rev. Bonds (Catholic Health System Obligated Group Project), Series 2015, 5.00% 2040
| 600
| 686
|
| Buffalo and Erie County Industrial Land Dev. Corp., Rev. Bonds (Catholic Health System Obligated Group Project), Series 2015, 5.25% 2035
| 500
| 586
|
Build NYC Resource Corp., Rev. Bonds (Bronx Charter School for Excellence Project), Series 2013-A,
5.50% 2043
| 500
| 539
|
Build NYC Resource Corp., Rev. Ref. Bonds (Albert Einstein School of Medicine, Inc. Project),
Series 2015, 5.50% 20452
| 7,300
| 8,148
|
Build NYC Resource Corp., Solid Waste Disposal Rev. Bonds (Pratt Paper (NY), Inc. Project),
Series 2014, AMT, 3.75% 20202
| 195
| 197
|
Build NYC Resource Corp., Solid Waste Disposal Rev. Bonds (Pratt Paper (NY), Inc. Project),
Series 2014, AMT, 4.50% 20252
| 450
| 500
|
Build NYC Resource Corp., Solid Waste Disposal Rev. Bonds (Pratt Paper (NY), Inc. Project),
Series 2014, AMT, 5.00% 20352
| 1,150
| 1,262
|
| Convention Center Dev. Corp., Senior Lien Rev. Bonds (Hotel Unit Fee Secured), Capital Appreciation Bonds, Series 2016-A, 0% 2049
| 4,020
| 1,473
|
| Convention Center Dev. Corp., Senior Lien Rev. Bonds (Hotel Unit Fee Secured), Capital Appreciation Bonds, Series 2016-A, 0% 2055
| 10,000
| 2,909
|
Convention Center Dev. Corp., Subordinated Lien Rev. Bonds (Hotel Unit Fee Secured),
Capital Appreciation Bonds, Series 2016-B, 0% 2055
| 4,265
| 1,193
|
Convention Center Dev. Corp., Subordinated Lien Rev. Bonds (Hotel Unit Fee Secured),
Capital Appreciation Bonds, Series 2016-B, Assured Guaranty Municipal insured, 0% 2048
| 2,305
| 883
|
Dormitory Auth., Mental Health Services Facs. Improvement Rev. Ref. Bonds, Series 2010-A,
5.00% 2024 (preref. 2020)
| 5
| 5
|
| Dormitory Auth., Rev. Bonds (Culinary Institute of America), Series 2013, 5.50% 2033
| 500
| 568
|
| Dormitory Auth., Rev. Bonds (Icahn School of Medicine at Mount Sinai), Series 2015-A, 5.00% 2040
| 250
| 285
|
| Dormitory Auth., Rev. Bonds (New School), Series 2015-A, 5.00% 2050
| 1,000
| 1,130
|
Dormitory Auth., Rev. Bonds (North Shore-Long Island Jewish Obligated Group), Series 2011-A,
5.00% 2032 (preref. 2021)
| 4,000
| 4,279
|
| Dormitory Auth., Rev. Bonds (Orange Regional Medical Center Obligated Group), Series 2015, 5.00% 20312
| 500
| 572
|
American High-Income Municipal Bond Fund —
Page 45 of 74
Bonds, notes & other debt instruments (continued)
New York (continued)
| Principal amount
(000)
| Value
(000)
|
| Dormitory Auth., Rev. Bonds (Orange Regional Medical Center Obligated Group), Series 2015, 5.00% 20322
| $500
| $571
|
| Dormitory Auth., Rev. Bonds (Orange Regional Medical Center Obligated Group), Series 2015, 5.00% 20332
| 1,200
| 1,367
|
| Dormitory Auth., Rev. Bonds (Orange Regional Medical Center Obligated Group), Series 2015, 5.00% 20342
| 1,200
| 1,361
|
| Dormitory Auth., Rev. Bonds (Orange Regional Medical Center Obligated Group), Series 2015, 5.00% 20352
| 1,000
| 1,132
|
Environmental Facs. Corp., Solid Waste Disposal Rev. Bonds (Casella Waste Systems, Inc. Project),
Series 2017, AMT, 3.75% 2044 (put 2019)2
| 1,160
| 1,167
|
| City of Glen Cove, Local Econ. Assistance Corp., Rev. Bonds (Garvies Point Public Improvement Project), Convertible Capital Appreciation Bonds, Series 2016-C, 0%
2055 (5.62% on 1/1/2024)1
| 16,320
| 15,061
|
| Hudson Yards Infrastructure Corp., Rev. Bonds, Fiscal 2012, Series 2012-A, 5.25% 2047
| 1,435
| 1,514
|
| Hudson Yards Infrastructure Corp., Rev. Bonds, Fiscal 2012, Series 2012-A, 5.25% 2047 (preref. 2021)
| 110
| 117
|
| Hudson Yards Infrastructure Corp., Rev. Bonds, Fiscal 2012, Series 2012-A, 5.75% 2047
| 1,140
| 1,216
|
| Hudson Yards Infrastructure Corp., Rev. Bonds, Fiscal 2012, Series 2012-A, 5.75% 2047 (preref. 2021)
| 350
| 376
|
County of Jefferson, Civic Fac. Dev. Corp., Rev. Bonds (Samaritan Medical Center Project), Series 2017-A,
4.00% 2042
| 1,750
| 1,807
|
| Liberty Dev. Corp., Liberty Rev. Ref. Bonds (3 World Trade Center Project), Series 2014, Class 1, 5.00% 20442
| 3,950
| 4,341
|
| Liberty Dev. Corp., Liberty Rev. Ref. Bonds (3 World Trade Center Project), Series 2014, Class 2, 5.15% 20342
| 7,500
| 8,407
|
| Liberty Dev. Corp., Liberty Rev. Ref. Bonds (3 World Trade Center Project), Series 2014, Class 2, 5.375% 20402
| 4,660
| 5,231
|
| Liberty Dev. Corp., Liberty Rev. Ref. Bonds (4 World Trade Center Project), Series 2011, 5.75% 2051
| 1,000
| 1,095
|
Liberty Dev. Corp., Liberty Rev. Ref. Bonds (Bank of America Tower at One Bryant Park Project),
Series 2010, 6.375% 2049
| 13,360
| 13,655
|
New York City Housing Dev. Corp., Multi Family Housing Rev. Bonds (8 Spruce Street), Series 2014-E,
3.50% 2048
| 1,600
| 1,665
|
New York City Housing Dev. Corp., Multi Family Housing Rev. Bonds (8 Spruce Street), Series 2014-F,
4.50% 2048
| 10,250
| 10,864
|
New York City Industrial Dev. Agcy., Airport Facs. Rev. Ref. Bonds (Transportation Infrastructure
Properties, LLC Obligated Group), Series 2012-A, AMT, 5.00% 2028
| 2,000
| 2,162
|
| Niagara Area Dev. Corp., Solid Waste Disposal Fac. Rev. Ref. Bonds (Covanta Project), Series 2018-A, AMT, 4.75% 20422
| 3,000
| 3,113
|
Niagara Frontier Transportation Auth., Airport Rev. Ref. Bonds (Buffalo Niagara International Airport),
Series 2014-A, AMT, 5.00% 2020
| 2,405
| 2,462
|
Niagara Frontier Transportation Auth., Airport Rev. Ref. Bonds (Buffalo Niagara International Airport),
Series 2014-A, AMT, 5.00% 2029
| 1,200
| 1,363
|
County of Onondaga, Resource Recovery Agcy., Rev. Ref. Bonds, Series 2015-A, AMT,
Assured Guaranty Municipal insured, 5.00% 2030
| 1,490
| 1,717
|
Onondaga Civic Dev. Corp., Rev. Bonds (St. Joseph’s Hospital Health Center Project), Series 2012,
5.00% 2042 (preref. 2022)
| 1,000
| 1,112
|
| Port Auth., Consolidated Bonds, Series 207, AMT, 5.00% 2032
| 5,000
| 6,158
|
Port Auth., Special Project Bonds (John F. Kennedy International Air Terminal LLC Project),
Series 8, 6.00% 2036
| 2,650
| 2,805
|
Port Auth., Special Project Bonds (John F. Kennedy International Air Terminal LLC Project),
Series 8, 6.00% 2042
| 5,500
| 5,810
|
| County of Rockland, G.O. Bonds, Series 2014-A, Assured Guaranty Municipal insured, 5.00% 2024
| 300
| 351
|
| Tompkins County Dev. Corp., Rev. Bonds (Tompkins Cortland Community College Foundation, Inc. Project), Series 2013-A, 5.00% 2027
| 215
| 140
|
| Tompkins County Dev. Corp., Rev. Bonds (Tompkins Cortland Community College Foundation, Inc. Project), Series 2013-A, 5.00% 2032
| 85
| 55
|
| Tompkins County Dev. Corp., Tax-Exempt Rev. Bonds (Tompkins Cortland Community College Foundation, Inc. Project), Series 2013-A, 5.00% 2021
| 1,000
| 650
|
Transportation Dev. Corp., Special Fac. Rev. Ref. Bonds (American Airlines, Inc.
John F. Kennedy International Airport Project), Series 2016, AMT, 5.00% 2019
| 1,000
| 1,000
|
Transportation Dev. Corp., Special Fac. Rev. Ref. Bonds (American Airlines, Inc.
John F. Kennedy International Airport Project), Series 2016, AMT, 5.00% 2020
| 15,850
| 16,343
|
Transportation Dev. Corp., Special Fac. Rev. Ref. Bonds (American Airlines, Inc.
John F. Kennedy International Airport Project), Series 2016, AMT, 5.00% 2026
| 12,220
| 12,929
|
American High-Income Municipal Bond Fund —
Page 46 of 74
Bonds, notes & other debt instruments (continued)
New York (continued)
| Principal amount
(000)
| Value
(000)
|
Transportation Dev. Corp., Special Fac. Rev. Ref. Bonds (American Airlines, Inc.
John F. Kennedy International Airport Project), Series 2016, AMT, 5.00% 2031
| $5,500
| $5,789
|
Transportation Dev. Corp., Special Fac. Rev. Ref. Bonds (Terminal One Group Association, LP Project),
Series 2015, AMT, 5.00% 2023
| 560
| 621
|
| Transportation Dev. Corp., Special Facs. Bonds (LaGuardia Airport Terminal B Redev. Project), Series 2016-A, AMT, 4.00% 2032
| 2,000
| 2,128
|
| Transportation Dev. Corp., Special Facs. Bonds (LaGuardia Airport Terminal B Redev. Project), Series 2016-A, AMT, 4.00% 2033
| 4,500
| 4,778
|
| Transportation Dev. Corp., Special Facs. Bonds (LaGuardia Airport Terminal B Redev. Project), Series 2016-A, AMT, 5.00% 2041
| 3,250
| 3,602
|
| Transportation Dev. Corp., Special Facs. Bonds (LaGuardia Airport Terminal B Redev. Project), Series 2016-A, AMT, 5.00% 2046
| 3,300
| 3,639
|
| Transportation Dev. Corp., Special Facs. Bonds (LaGuardia Airport Terminal B Redev. Project), Series 2016-A, AMT, 5.25% 2050
| 16,950
| 18,841
|
| Transportation Dev. Corp., Special Facs. Rev. Bonds (Delta Air Lines, Inc. LaGuardia Airport Terminals C & D Redev. Project), Series 2018, AMT 5.00% 2026
| 1,110
| 1,312
|
| Transportation Dev. Corp., Special Facs. Rev. Bonds (Delta Air Lines, Inc. LaGuardia Airport Terminals C & D Redev. Project), Series 2018, AMT 5.00% 2029
| 7,000
| 8,503
|
| Transportation Dev. Corp., Special Facs. Rev. Bonds (Delta Air Lines, Inc. LaGuardia Airport Terminals C & D Redev. Project), Series 2018, AMT 5.00% 2031
| 10,000
| 11,996
|
| Transportation Dev. Corp., Special Facs. Rev. Bonds (Delta Air Lines, Inc. LaGuardia Airport Terminals C & D Redev. Project), Series 2018, AMT, 4.00% 2036
| 5,000
| 5,394
|
| Transportation Dev. Corp., Special Facs. Rev. Bonds (Delta Air Lines, Inc. LaGuardia Airport Terminals C & D Redev. Project), Series 2018, AMT, 5.00% 2030
| 3,500
| 4,225
|
| Transportation Dev. Corp., Special Facs. Rev. Bonds (Delta Air Lines, Inc. LaGuardia Airport Terminals C & D Redev. Project), Series 2018, AMT, 5.00% 2032
| 9,000
| 10,743
|
| Urban Dev. Corp., State Personal Income Tax Rev. Bonds (General Purpose), Series 2019-A, 5.00% 2039
| 1,500
| 1,838
|
| County of Westchester, Local Dev. Corp., Rev. Bonds (Westchester Medical Center Obligated Group Project), Series 2016, 5.00% 2046
| 3,000
| 3,351
|
|
|
| 251,742
|
| North Carolina 0.22%
|
|
|
Eastern Municipal Power Agcy., Power System Rev. Ref. Bonds, Series 1993-B,
6.00% 2026 (escrowed to maturity)
| 1,000
| 1,284
|
| Housing Fin. Agcy., Home Ownership Rev. Ref. Bonds, Series 37-A, AMT, 3.50% 2039
| 3,675
| 3,833
|
| Medical Care Commission, Health Care Facs. First Mortgage Rev. Ref. Bonds (Lutheran Services for the Aging), Series 2012-A, 4.75% 2032
| 1,500
| 1,574
|
Medical Care Commission, Health Care Facs. First Mortgage Rev. Ref. Bonds (Pennybyrn at Maryfield),
Series 2015, 5.00% 2020
| 725
| 750
|
Medical Care Commission, Health Care Facs. First Mortgage Rev. Ref. Bonds (Pennybyrn at Maryfield),
Series 2015, 5.00% 2025
| 500
| 569
|
Medical Care Commission, Health Care Facs. First Mortgage Rev. Ref. Bonds (Pennybyrn at Maryfield),
Series 2015, 5.00% 2030
| 1,900
| 2,063
|
Medical Care Commission, Health Care Facs. First Mortgage Rev. Ref. Bonds (Pennybyrn at Maryfield),
Series 2015, 5.00% 2035
| 1,000
| 1,063
|
Medical Care Commission, Retirement Facs. First Mortgage Rev. Bonds (Carolina Village Project),
Series 2017-B, 5.00% 2047
| 5,230
| 5,590
|
|
|
| 16,726
|
American High-Income Municipal Bond Fund —
Page 47 of 74
Bonds, notes & other debt instruments (continued)
North Dakota 0.19%
| Principal amount
(000)
| Value
(000)
|
County of Burleigh, Health Care Rev. Bonds (St. Alexius Medical Center Project), Series 2014-A,
5.00% 2031 (preref. 2021)
| $1,200
| $1,286
|
County of Burleigh, Health Care Rev. Bonds (St. Alexius Medical Center Project), Series 2014-A,
5.00% 2035 (preref. 2021)
| 500
| 536
|
Housing Fin. Agcy., Housing Fin. Program Bonds (Home Mortgage Fin. Program), Series 2016-B, AMT,
4.00% 2047
| 4,340
| 4,620
|
| County of Ward, Health Care Facs. Rev. Bonds (Trinity Obligated Group), Series 2017-C, 5.00% 2043
| 4,900
| 5,529
|
| County of Ward, Health Care Facs. Rev. Bonds (Trinity Obligated Group), Series 2017-C, 5.00% 2053
| 2,500
| 2,789
|
|
|
| 14,760
|
| Ohio 4.65%
|
|
|
| Air Quality Dev. Auth., Air Quality Rev. Bonds (Ohio Valley Electric Corp. Project), Series 2009-E, 5.625% 2019
| 9,840
| 9,877
|
| Air Quality Dev. Auth., Exempt Facs. Rev. Bonds (AMG Vanadium Project), Series 2019, AMT, 5.00% 20492
| 10,500
| 11,295
|
Air Quality Dev. Auth., Exempt Facs. Rev. Bonds (Pratt Paper (OH), LLC Project), Series 2017, AMT,
4.25% 20382
| 1,850
| 1,974
|
Air Quality Dev. Auth., Exempt Facs. Rev. Bonds (Pratt Paper (OH), LLC Project), Series 2017, AMT,
4.50% 20482
| 2,500
| 2,672
|
Air Quality Dev. Auth., Pollution Control Rev. Ref. Bonds (FirstEnergy Generation Corp. Project),
Series 2009-C, 5.625% 20184
| 12,465
| 12,714
|
| Akron, Bath and Copley Joint Township Hospital Dist., Hospital Facs. Rev. Bonds (Akron General Health System), Series 2012, 3.80% 2027 (preref. 2022)
| 1,570
| 1,640
|
American Municipal Power, Inc., Combined Hydroelectric Project Rev. Bonds, Series 2018-A,
2.25% 2048 (put 2021)
| 950
| 962
|
Buckeye Tobacco Settlement Fncg. Auth., Tobacco Settlement Asset-Backed Bonds, Series 2007-A-2,
5.875% 2047
| 50,995
| 50,166
|
Buckeye Tobacco Settlement Fncg. Auth., Tobacco Settlement Asset-Backed Bonds, Series 2007-A-2,
6.50% 2047
| 62,990
| 63,500
|
Buckeye Tobacco Settlement Fncg. Auth., Tobacco Settlement Asset-Backed Bonds, Series 2007-A-3,
6.25% 20371
| 7,875
| 7,933
|
| County of Butler, Hospital Facs. Rev. Bonds (UC Health), Series 2010, 5.50% 2040 (preref. 2020)
| 2,330
| 2,458
|
| County of Butler, Hospital Facs. Rev. Bonds (UC Health), Series 2010, 5.50% 2040 (preref. 2020)
| 1,710
| 1,804
|
| County of Butler, Hospital Facs. Rev. Bonds (UC Health), Series 2016, 5.00% 2045
| 6,060
| 6,888
|
| City of Centerville, Health Care Improvement and Rev. Ref. Bonds, Series 2017, 5.25% 2037
| 3,250
| 3,583
|
| City of Centerville, Health Care Improvement and Rev. Ref. Bonds, Series 2017, 5.25% 2047
| 3,695
| 4,016
|
| City of Centerville, Health Care Improvement and Rev. Ref. Bonds, Series 2017, 5.25% 2050
| 2,400
| 2,604
|
| City of Cleveland, Airport System Rev. Ref. Bonds, Series 2011-A, 5.00% 2020
| 3,535
| 3,590
|
| City of Cleveland, Airport System Rev. Ref. Bonds, Series 2012-A, 5.00% 2025
| 1,095
| 1,190
|
| City of Cleveland, Airport System Rev. Ref. Bonds, Series 2012-A, 5.00% 2026
| 1,000
| 1,086
|
| City of Cleveland, Airport System Rev. Ref. Bonds, Series 2012-A, 5.00% 2027
| 2,500
| 2,711
|
| City of Cleveland, Airport System Rev. Ref. Bonds, Series 2012-A, 5.00% 2030
| 1,000
| 1,080
|
| City of Cleveland, Airport System Rev. Ref. Bonds, Series 2012-A, 5.00% 2031
| 1,000
| 1,078
|
City of Cleveland, Airport System Rev. Ref. Bonds, Series 2016-A, Assured Guaranty Municipal insured,
5.00% 2027
| 1,000
| 1,174
|
City of Cleveland, Airport System Rev. Ref. Bonds, Series 2016-A, Assured Guaranty Municipal insured,
5.00% 2029
| 2,000
| 2,330
|
| County of Cuyahoga, Hospital Rev. Bonds (MetroHealth System), Series 2017, 5.00% 2037
| 2,450
| 2,773
|
| County of Cuyahoga, Hospital Rev. Bonds (MetroHealth System), Series 2017, 5.00% 2052
| 7,750
| 8,626
|
| County of Cuyahoga, Hospital Rev. Bonds (MetroHealth System), Series 2017, 5.00% 2057
| 6,000
| 6,636
|
| County of Cuyahoga, Hospital Rev. Bonds (MetroHealth System), Series 2017, 5.50% 2052
| 4,000
| 4,625
|
Dev. Fin. Agcy., Solid Waste Disposal Rev. Bonds (Waste Management, Inc. Project), Series 2002, AMT,
5.60% 2032 (put 2019)
| 950
| 952
|
County of Franklin, Health Care Facs. Improvement Rev. Bonds (OPRS Communities), Series 2013-A,
5.25% 2028
| 250
| 250
|
County of Franklin, Health Care Facs. Improvement Rev. Bonds (OPRS Communities), Series 2013-A,
6.125% 2040
| 2,350
| 2,600
|
American High-Income Municipal Bond Fund —
Page 48 of 74
Bonds, notes & other debt instruments (continued)
Ohio (continued)
| Principal amount
(000)
| Value
(000)
|
County of Franklin, Health Care Facs. Improvement Rev. Bonds (Presbyterian Retirement Services Project),
Series 2010-A, 5.625% 2026
| $4,400
| $4,560
|
| County of Franklin, Health Care Facs. Rev. Bonds (OPRS Communities), Series 2016-C, 5.00% 2038
| 3,000
| 3,392
|
| County of Gallia, Hospital Facs. Rev. Ref. and Improvement Bonds (Holzer Health System Obligated Group Project), Series 2012-A, 8.00% 2042
| 7,965
| 9,013
|
| County of Hamilton, Healthcare Facs. Rev. Bonds (Christ Hospital Project), Series 2012, 5.00% 2042
| 1,500
| 1,600
|
| County of Hamilton, Healthcare Improvement and Rev. Ref. Bonds (Life Enriching Communities Project), Series 2016, 5.00% 2031
| 4,360
| 4,909
|
| County of Hamilton, Healthcare Improvement and Rev. Ref. Bonds (Life Enriching Communities Project), Series 2016, 5.00% 2046
| 3,870
| 4,236
|
| County of Hamilton, Healthcare Improvement and Rev. Ref. Bonds (Life Enriching Communities Project), Series 2016, 5.00% 2051
| 6,325
| 6,870
|
County of Hamilton, Healthcare Rev. Bonds (Life Enriching Communities Project), Series 2011-A,
6.625% 2046 (preref. 2021)
| 1,000
| 1,076
|
| County of Hamilton, Healthcare Rev. Bonds (Life Enriching Communities Project), Series 2017-A, 5.00% 2047
| 1,250
| 1,379
|
| County of Hamilton, Healthcare Rev. Bonds (Life Enriching Communities Project), Series 2017-A, 5.00% 2052
| 1,125
| 1,235
|
| County of Licking, Health Care Facs. Rev. Ref. Bonds (Kendal Granville), Series 2015-A, 6.00% 2050
| 3,560
| 3,689
|
| County of Licking, Health Care Facs. Rev. Ref. Bonds (Kendal Granville), Series 2015-A, 6.125% 2042
| 7,000
| 7,311
|
| County of Lucas, Hospital Rev. Bonds (Promedica Healthcare Obligated Group), Series 2018-A, 5.25% 2048
| 16,250
| 19,246
|
| County of Muskingum, Hospital Facs. Rev. Bonds (Genesis HealthCare System Obligated Group Project), Series 2013, 5.00% 2020
| 135
| 137
|
| County of Muskingum, Hospital Facs. Rev. Bonds (Genesis HealthCare System Obligated Group Project), Series 2013, 5.00% 2021
| 725
| 757
|
| County of Muskingum, Hospital Facs. Rev. Ref. Bonds (Genesis HealthCare System Obligated Group Project), Series 2013, 5.00% 2033
| 2,765
| 2,985
|
| County of Muskingum, Hospital Facs. Rev. Ref. Bonds (Genesis HealthCare System Obligated Group Project), Series 2013, 5.00% 2044
| 2,000
| 2,136
|
| County of Muskingum, Hospital Facs. Rev. Ref. Bonds (Genesis HealthCare System Obligated Group Project), Series 2013, 5.00% 2048
| 9,360
| 9,977
|
| Private Activity Bonds (Portsmouth Bypass Project), Series 2015, AMT, Assured Guaranty Municipal insured, 5.00% 2039
| 120
| 132
|
| Private Activity Bonds (Portsmouth Bypass Project), Series 2015, AMT, Assured Guaranty Municipal insured, 5.00% 2053
| 20,455
| 22,207
|
| Southeastern Ohio Port Auth., Hospital Facs. Improvement Rev. Bonds (Memorial Health System Obligated Group Project), Series 2015, 5.00% 2020
| 350
| 361
|
| Southeastern Ohio Port Auth., Hospital Facs. Rev. Ref. and Improvement Bonds (Memorial Health System Obligated Group Project), Series 2012, 5.75% 2032
| 7,615
| 8,280
|
| Southeastern Ohio Port Auth., Hospital Facs. Rev. Ref. and Improvement Bonds (Memorial Health System Obligated Group Project), Series 2012, 6.00% 2042
| 14,450
| 15,491
|
| Southeastern Ohio Port Auth., Hospital Facs. Rev. Ref. and Improvement Bonds (Memorial Health System Obligated Group Project), Series 2015, 5.00% 2035
| 850
| 923
|
| Southeastern Ohio Port Auth., Hospital Facs. Rev. Ref. and Improvement Bonds (Memorial Health System Obligated Group Project), Series 2015, 5.00% 2043
| 750
| 785
|
County of Warren, Healthcare Facs., Rev. Ref. Bonds (Otterbein Homes Obligated Group), Series 2016-A,
5.00% 2040
| 1,575
| 1,793
|
| County of Warren, Healthcare Facs., Rev. Ref. Bonds (Otterbein Homes Obligated Group), Series 2019-A, 5.00% 2032
| 1,070
| 1,306
|
|
|
| 360,573
|
| Oklahoma 0.63%
|
|
|
| County of Comanche, Hospital Auth., Hospital Rev. Ref. Bonds, Series 2015, 5.00% 2029
| 945
| 1,037
|
| Dev. Fin. Auth., Rev. Bonds (Provident Education Resources Inc. - Cross Village Student Housing Project), Series 2017-A, 5.00% 2047
| 3,175
| 2,350
|
| Dev. Fin. Auth., Rev. Bonds (Provident Education Resources Inc. - Cross Village Student Housing Project), Series 2017-A, 5.00% 2052
| 500
| 330
|
American High-Income Municipal Bond Fund —
Page 49 of 74
Bonds, notes & other debt instruments (continued)
Oklahoma (continued)
| Principal amount
(000)
| Value
(000)
|
| Dev. Fin. Auth., Rev. Bonds (Provident Education Resources Inc. - Cross Village Student Housing Project), Series 2017-A, 5.25% 2057
| $1,500
| $990
|
| Fort Sill Apache Tribe, Econ. Dev. Auth., Gaming Enterprise Rev. Bonds, Series 2011-A, 8.50% 20262
| 6,370
| 7,120
|
| City of Tulsa, Industrial Auth., Rev. Ref. Bonds (University of Tulsa), Series 2009, 6.00% 2027
| 1,285
| 1,294
|
Trustees of the Tulsa Airports Improvement Trust, General Airport Rev. Bonds, Series 2015-A, AMT,
BAM insured, 5.00% 2023
| 1,785
| 2,011
|
Trustees of the Tulsa Airports Improvement Trust, General Airport Rev. Bonds, Series 2015-A, AMT,
BAM insured, 5.00% 2035
| 1,000
| 1,118
|
Trustees of the Tulsa Airports Improvement Trust, General Airport Rev. Bonds, Series 2015-A, AMT,
BAM insured, 5.00% 2045
| 2,480
| 2,750
|
| Trustees of the Tulsa Municipal Airport Trust, American Airlines Inc. Rev. Ref. Bonds, Series 2001-B, AMT, 5.50% 2035
| 15,875
| 17,316
|
| Trustees of the Tulsa Municipal Airport Trust, American Airlines Inc. Rev. Ref. Bonds, Series 2013-B, AMT, 5.50% 2035
| 520
| 567
|
| Trustees of the Tulsa Municipal Airport Trust, Rev. Ref. Bonds, Series 2015, AMT, 5.00% 2035 (put 2025)
| 10,750
| 12,051
|
|
|
| 48,934
|
| Oregon 0.51%
|
|
|
Business Dev. Commission, Econ. Dev. Rev. Bonds (Red Rock Biofuels LLC Clean Energy Project),
Series 2017-A-248, AMT, 6.50% 20312
| 8,000
| 7,526
|
Business Dev. Commission, Econ. Dev. Rev. Bonds (Red Rock Biofuels LLC Clean Energy Project),
Series 2018-D-248, AMT, 6.50% 20312
| 13,405
| 12,611
|
| County of Clackamas, Hospital Fac. Auth., Senior Living Rev. Bonds (Williamette View Project), Series 2017-A, 3.00% 2019
| 445
| 447
|
| County of Clackamas, Hospital Fac. Auth., Senior Living Rev. Bonds (Williamette View Project), Series 2017-A, 4.00% 2020
| 460
| 472
|
| County of Clackamas, Hospital Fac. Auth., Senior Living Rev. Bonds (Williamette View Project), Series 2017-A, 4.00% 2020
| 450
| 457
|
| County of Clackamas, Hospital Fac. Auth., Senior Living Rev. Bonds (Williamette View Project), Series 2017-A, 4.00% 2021
| 485
| 507
|
| County of Clackamas, Hospital Fac. Auth., Senior Living Rev. Bonds (Williamette View Project), Series 2017-A, 4.00% 2021
| 235
| 243
|
| County of Clackamas, Hospital Fac. Auth., Senior Living Rev. Bonds (Williamette View Project), Series 2017-A, 4.00% 2022
| 370
| 394
|
| County of Clackamas, Hospital Fac. Auth., Senior Living Rev. Bonds (Williamette View Project), Series 2017-A, 4.00% 2023
| 260
| 279
|
| County of Clackamas, Hospital Fac. Auth., Senior Living Rev. Bonds (Williamette View Project), Series 2017-A, 4.00% 2026
| 200
| 221
|
| County of Clackamas, Hospital Fac. Auth., Senior Living Rev. Bonds (Williamette View Project), Series 2017-B, 3.00% 2022
| 2,500
| 2,507
|
Housing and Community Services Dept., Mortgage Rev. Bonds (Single Family Mortgage Program),
Series 2017-E, AMT, 3.50% 2040
| 2,470
| 2,604
|
| City of Klamath Falls, Intercommunity Hospital Auth., Rev. Ref. Bonds (Sky Lakes Medical Center Project), Series 2016, 5.00% 2027
| 200
| 242
|
| City of Klamath Falls, Intercommunity Hospital Auth., Rev. Ref. Bonds (Sky Lakes Medical Center Project), Series 2016, 5.00% 2028
| 265
| 319
|
| City of Klamath Falls, Intercommunity Hospital Auth., Rev. Ref. Bonds (Sky Lakes Medical Center Project), Series 2016, 5.00% 2029
| 235
| 282
|
| City of Klamath Falls, Intercommunity Hospital Auth., Rev. Ref. Bonds (Sky Lakes Medical Center Project), Series 2016, 5.00% 2030
| 200
| 239
|
| City of Klamath Falls, Intercommunity Hospital Auth., Rev. Ref. Bonds (Sky Lakes Medical Center Project), Series 2016, 5.00% 2031
| 200
| 237
|
| City of Klamath Falls, Intercommunity Hospital Auth., Rev. Ref. Bonds (Sky Lakes Medical Center Project), Series 2016, 5.00% 2032
| 270
| 319
|
| County of Polk, Hospital Fac. Auth., Rev. Bonds (Dallas Retirement Village Project), Series 2015-A, 5.50% 2050
| 5,080
| 5,422
|
American High-Income Municipal Bond Fund —
Page 50 of 74
Bonds, notes & other debt instruments (continued)
Oregon (continued)
| Principal amount
(000)
| Value
(000)
|
| City of Salem, Hospital Fac. Auth., Rev. Bonds (Capital Manor Project), Series 2018, 5.00% 2033
| $550
| $643
|
| City of Salem, Hospital Fac. Auth., Rev. Bonds (Capital Manor Project), Series 2018, 5.00% 2048
| 1,000
| 1,141
|
County of Yamhill, Hospital Auth., Rev. and Rev. Ref. Bonds (Friendsview Retirement Community),
Series 2016-A, 5.00% 2036
| 625
| 697
|
County of Yamhill, Hospital Auth., Rev. and Rev. Ref. Bonds (Friendsview Retirement Community),
Series 2016-A, 5.00% 2046
| 1,750
| 1,930
|
|
|
| 39,739
|
| Pennsylvania 5.56%
|
|
|
| County of Allegheny, Hospital Dev. Auth., Rev. Bonds (Allegheny Health Network Obligated Group Issue), Series 2018-A, 5.00% 2033
| 3,500
| 4,199
|
County of Allegheny, Hospital Dev. Auth., Rev. Bonds (University of Pittsburgh Medical Center Issue),
Series 2007-A-1, (3-month USD-LIBOR x 0.67 + 0.82%) 2.547% 20373
| 6,000
| 5,942
|
| Allentown City School Dist., Unlimited Tax G.O. Bonds, Series 2018, BAM insured, 5.00% 2028
| 2,500
| 3,101
|
| City of Allentown, Dev. Auth., Rev. Bonds (Academy Charter), Series 2017-A, 6.25% 20472
| 5,500
| 5,588
|
City of Allentown, Neighborhood Improvement Zone Dev. Auth., Tax Rev. Bonds (City Center Project),
Series 2018, 5.00% 20422
| 1,500
| 1,663
|
County of Berks, Industrial Dev. Auth., Healthcare Facs. Rev. Bonds (The Highlands at Wyomissing),
Series 2018, 5.00% 2038
| 1,000
| 1,125
|
| County of Bucks, Industrial Dev. Auth., Rev. Bonds (Pennswood Village Project), Series 2018-A, 5.00% 2029
| 1,035
| 1,184
|
| County of Bucks, Industrial Dev. Auth., Rev. Bonds (Pennswood Village Project), Series 2018-A, 5.00% 2032
| 250
| 283
|
| County of Bucks, Industrial Dev. Auth., Rev. Bonds (Pennswood Village Project), Series 2018-A, 5.00% 2033
| 415
| 469
|
| County of Bucks, Industrial Dev. Auth., Solid Waste Rev. Bonds (Waste Management, Inc. Project), Series 2002, AMT, 2.75% 2022 (put 2019)
| 5,000
| 5,183
|
County of Chester, Health and Education Facs. Auth., Rev. Bonds (Simpson Senior Services Project),
Series 2015-A, 5.00% 2030
| 1,000
| 1,053
|
County of Chester, Health and Education Facs. Auth., Rev. Bonds (Simpson Senior Services Project),
Series 2015-A, 5.00% 2035
| 1,000
| 1,042
|
County of Chester, Health and Education Facs. Auth., Rev. Bonds (Simpson Senior Services Project),
Series 2015-A, 5.25% 2045
| 3,860
| 4,063
|
| County of Chester, Industrial Dev. Auth., Rev. Bonds (Avon Grove Charter School Project), Series 2017-A, 5.00% 2047
| 1,160
| 1,269
|
| County of Chester, Industrial Dev. Auth., Rev. Bonds (Avon Grove Charter School Project), Series 2017-A, 5.00% 2051
| 645
| 703
|
County of Chester, Industrial Dev. Auth., Rev. Bonds (Woodlands Greystone Project), Series 2018,
4.375% 20282
| 275
| 285
|
County of Chester, Industrial Dev. Auth., Rev. Bonds (Woodlands Greystone Project), Series 2018,
5.00% 20382
| 1,602
| 1,695
|
County of Chester, Industrial Dev. Auth., Rev. Bonds (Woodlands Greystone Project), Series 2018,
5.125% 20482
| 5,415
| 5,721
|
County of Crawford, Hospital Auth., Rev. Bonds (Meadville Medical Center Project), Series 2016-A,
6.00% 2036
| 1,515
| 1,752
|
County of Crawford, Hospital Auth., Rev. Bonds (Meadville Medical Center Project), Series 2016-A,
6.00% 2046
| 7,500
| 8,573
|
County of Crawford, Hospital Auth., Rev. Bonds (Meadville Medical Center Project), Series 2016-A,
6.00% 2051
| 7,005
| 7,948
|
| County of Cumberland, Municipal Auth., Rev. Bonds (Diakon Lutheran Social Ministries Project), Series 2016, 5.00% 2030
| 1,000
| 1,139
|
| County of Cumberland, Municipal Auth., Rev. Bonds (Diakon Lutheran Social Ministries Project), Series 2016, 5.00% 2033
| 1,610
| 1,810
|
| County of Dauphin, General Auth., Health System Rev. Bonds (Pinnacle Health System Project), Series 2016-A, 5.00% 2034
| 1,245
| 1,463
|
| County of Dauphin, General Auth., Health System Rev. Bonds (Pinnacle Health System Project), Series 2016-A, 5.00% 2036
| 500
| 584
|
| City of Doylestown, Hospital Auth., Rev. Bonds (Doylestown Hospital), Series 2016-A, 5.00% 2041
| 6,550
| 7,205
|
American High-Income Municipal Bond Fund —
Page 51 of 74
Bonds, notes & other debt instruments (continued)
Pennsylvania (continued)
| Principal amount
(000)
| Value
(000)
|
| City of Doylestown, Hospital Auth., Rev. Bonds (Doylestown Hospital), Series 2016-A, 5.00% 2046
| $7,370
| $8,063
|
| City of Doylestown, Hospital Auth., Rev. Bonds (Doylestown Hospital), Series 2016-B, 5.00% 2021
| 1,215
| 1,279
|
| East Hempfield Township, Industrial Dev. Auth., Rev. and Rev. Ref. Bonds (Willow Valley Communities Project), Series 2016, 5.00% 2027
| 500
| 591
|
| East Hempfield Township, Industrial Dev. Auth., Rev. and Rev. Ref. Bonds (Willow Valley Communities Project), Series 2016, 5.00% 2028
| 915
| 1,077
|
| East Hempfield Township, Industrial Dev. Auth., Rev. and Rev. Ref. Bonds (Willow Valley Communities Project), Series 2016, 5.00% 2029
| 300
| 352
|
| East Hempfield Township, Industrial Dev. Auth., Rev. Bonds (Student Services, Inc. Student Housing Project at Millersville University of Pennsylvania), Series
2013, 5.00% 2035
| 1,000
| 1,061
|
| East Hempfield Township, Industrial Dev. Auth., Rev. Bonds (Student Services, Inc. Student Housing Project at Millersville University of Pennsylvania), Series
2013, 5.00% 2045
| 2,750
| 2,884
|
| East Hempfield Township, Industrial Dev. Auth., Rev. Bonds (Student Services, Inc. Student Housing Project at Millersville University of Pennsylvania), Series
2014, 5.00% 2029
| 730
| 800
|
| East Hempfield Township, Industrial Dev. Auth., Rev. Bonds (Student Services, Inc. Student Housing Project at Millersville University of Pennsylvania), Series
2014, 5.00% 2034
| 875
| 943
|
| East Hempfield Township, Industrial Dev. Auth., Rev. Bonds (Student Services, Inc. Student Housing Project at Millersville University of Pennsylvania), Series
2014, 5.00% 2039
| 440
| 469
|
| East Hempfield Township, Industrial Dev. Auth., Rev. Bonds (Student Services, Inc. Student Housing Project at Millersville University of Pennsylvania), Series
2014, 5.00% 2046
| 3,850
| 4,080
|
| East Hempfield Township, Industrial Dev. Auth., Rev. Bonds (Student Services, Inc. Student Housing Project at Millersville University of Pennsylvania), Series
2015, 5.00% 2025
| 4,490
| 4,838
|
| East Hempfield Township, Industrial Dev. Auth., Rev. Bonds (Student Services, Inc. Student Housing Project at Millersville University of Pennsylvania), Series
2015, 5.00% 2030
| 825
| 912
|
| East Hempfield Township, Industrial Dev. Auth., Rev. Bonds (Student Services, Inc. Student Housing Project at Millersville University of Pennsylvania), Series
2015, 5.00% 2047
| 2,500
| 2,675
|
| Econ. Dev. Fncg. Auth., Exempt Facs. Rev. Ref. Bonds (National Gypsum Co.), Series 2014, AMT, 5.50% 2044
| 4,500
| 4,786
|
Econ. Dev. Fncg. Auth., Exempt Facs. Rev. Ref. Bonds (PPL Energy Supply, LLC Project), Series 2009-C,
5.00% 2037 (put 2020)
| 9,775
| 9,989
|
| Econ. Dev. Fncg. Auth., Private Activity Rev. Bonds (The Pennsylvania Rapid Bridge Replacement Project), Series 2015, AMT, 5.00% 2029
| 5,000
| 5,827
|
| Econ. Dev. Fncg. Auth., Private Activity Rev. Bonds (The Pennsylvania Rapid Bridge Replacement Project), Series 2015, AMT, 5.00% 2034
| 16,300
| 18,661
|
| Econ. Dev. Fncg. Auth., Private Activity Rev. Bonds (The Pennsylvania Rapid Bridge Replacement Project), Series 2015, AMT, 5.00% 2038
| 11,690
| 13,320
|
| Econ. Dev. Fncg. Auth., Private Activity Rev. Bonds (The Pennsylvania Rapid Bridge Replacement Project), Series 2015, AMT, 5.00% 2042
| 1,000
| 1,124
|
Econ. Dev. Fncg. Auth., Solid Waste Disposal Rev. Bonds (CarbonLite P, LLC Project), Series 2019, AMT,
5.25% 20262
| 2,500
| 2,588
|
Econ. Dev. Fncg. Auth., Solid Waste Disposal Rev. Bonds (CarbonLite P, LLC Project), Series 2019, AMT,
5.75% 20362
| 6,790
| 7,176
|
Econ. Dev. Fncg. Auth., Solid Waste Disposal Rev. Bonds (Waste Management, Inc. Project), Series 2011,
AMT, 2.15% 2041 (put 2024)
| 3,000
| 3,060
|
| Econ. Dev. Fncg. Auth., Solid Waste Disposal Rev. Bonds (Waste Management, Inc. Project), Series 2017-A, AMT, 1.70% 2037 (put 2020)
| 4,950
| 4,960
|
| Econ. Dev. Fncg. Auth., Solid Waste Disposal Rev. Ref. Bonds (Republic Services, Inc. Project), Series 2019-A, AMT, 1.50% 2034 (put 2019)
| 3,600
| 3,601
|
Erie County School Dist., Limited Tax G.O. Bonds, Series 2019-A, Assured Guaranty Municipal insured,
5.00% 2029
| 300
| 379
|
Erie County School Dist., Limited Tax G.O. Bonds, Series 2019-A, Assured Guaranty Municipal insured,
5.00% 2031
| 525
| 654
|
Erie County School Dist., Limited Tax G.O. Bonds, Series 2019-A, Assured Guaranty Municipal insured,
5.00% 2034
| 825
| 1,012
|
| Fncg. Auth., Rev. Bonds (Tobacco Master Settlement Payment), Series 2018, 5.00% 2035
| 2,500
| 3,012
|
| County of Franklin, Industrial Dev. Auth. Rev. Bonds (Menno-Haven Inc. Project), Series 2018, 5.00% 2029
| 815
| 927
|
American High-Income Municipal Bond Fund —
Page 52 of 74
Bonds, notes & other debt instruments (continued)
Pennsylvania (continued)
| Principal amount
(000)
| Value
(000)
|
| County of Franklin, Industrial Dev. Auth. Rev. Bonds (Menno-Haven Inc. Project), Series 2018, 5.00% 2038
| $500
| $553
|
| County of Franklin, Industrial Dev. Auth. Rev. Bonds (Menno-Haven Inc. Project), Series 2018, 5.00% 2043
| 1,000
| 1,097
|
| County of Franklin, Industrial Dev. Auth. Rev. Bonds (Menno-Haven Inc. Project), Series 2018, 5.00% 2048
| 1,300
| 1,422
|
| County of Franklin, Industrial Dev. Auth. Rev. Bonds (Menno-Haven Inc. Project), Series 2018, 5.00% 2053
| 1,900
| 2,073
|
County of Franklin, Industrial Dev. Auth. Rev. Bonds (Menno-Haven Inc. Project), Series 2018, AMT,
5.00% 2030
| 1,000
| 1,132
|
Higher Educational Facs. Auth., Health System Rev. Bonds (University of Pennsylvania Health System),
Series 2011-A, 5.75% 2041 (preref. 2021)
| 1,500
| 1,639
|
Higher Educational Facs. Auth., Health System Rev. Bonds (University of Pennsylvania Health System),
Series 2017-A, 5.00% 2042
| 1,000
| 1,182
|
Higher Educational Facs. Auth., Rev. Bonds (Edinboro University Foundation Student Housing Project),
Series 2010, 6.00% 2043 (preref. 2020)
| 6,700
| 6,991
|
| Higher Educational Facs. Auth., Rev. Bonds (Shippensburg University Student Services, Inc. Student Housing Project at Shippensburg University of Pennsylvania),
Series 2011, 6.25% 2043 (preref. 2021)
| 4,690
| 5,198
|
| Higher Educational Facs. Auth., Rev. Bonds (Shippensburg University Student Services, Inc. Student Housing Project at Shippensburg University of Pennsylvania),
Series 2012, 5.00% 2044 (preref. 2022)
| 4,260
| 4,764
|
| Higher Educational Facs. Auth., Rev. Bonds (Thomas Jefferson University), Series 2015-A, 5.25% 2050
| 2,400
| 2,726
|
| Higher Educational Facs. Auth., Student Housing Rev. Bonds (University Properties, Inc. Student Housing Project at East Stroudsburg University of Pennsylvania),
Series 2010, 5.00% 2031
| 4,925
| 5,034
|
| Higher Educational Facs. Auth., Student Housing Rev. Bonds (University Properties, Inc. Student Housing Project at East Stroudsburg University of Pennsylvania),
Series 2010, 5.00% 2042
| 7,890
| 8,031
|
| Higher Educational Facs. Auth., Student Housing Rev. Bonds (University Properties, Inc. Student Housing Project at East Stroudsburg University of Pennsylvania),
Series 2016-A, 5.00% 2026
| 570
| 665
|
| Higher Educational Facs. Auth., Student Housing Rev. Bonds (University Properties, Inc. Student Housing Project at East Stroudsburg University of Pennsylvania),
Series 2016-A, 5.00% 2031
| 1,450
| 1,654
|
| Housing Fin. Agcy., Single Family Mortgage Rev. Bonds, Series 2017-123-A, AMT, 4.00% 2039
| 3,140
| 3,307
|
| Housing Fin. Agcy., Single Family Mortgage Rev. Bonds, Series 2017-124-A, AMT, 4.00% 2038
| 7,175
| 7,557
|
| Housing Fin. Agcy., Single Family Mortgage Rev. Bonds, Series 2019-128-A, AMT, 4.75% 2033
| 10,060
| 10,983
|
Industrial Dev. Auth., Senior Living Facs. Rev. Bonds (Wesley Enhanced Living Obligated Group),
Series 2017-A, 5.00% 2032
| 400
| 441
|
Industrial Dev. Auth., Senior Living Facs. Rev. Bonds (Wesley Enhanced Living Obligated Group),
Series 2017-A, 5.00% 2037
| 500
| 543
|
| County of Lancaster, Industrial Dev. Auth., Rev. Bonds (Garden Spot Village Project), Series 2013, 5.75% 2035
| 1,000
| 1,102
|
| County of Lancaster, Industrial Dev. Auth., Rev. Bonds (Willow Valley Communities Project), Series 2019, 5.00% 2044
| 1,850
| 2,125
|
County of Montgomery, Higher Education and Health Auth., Rev. Bonds (Thomas Jefferson University),
Series 2019, 4.00% 2037
| 1,000
| 1,102
|
County of Montgomery, Higher Education and Health Auth., Rev. Bonds (Thomas Jefferson University),
Series 2019, 4.00% 2049
| 1,000
| 1,074
|
County of Montgomery, Higher Education and Health Auth., Rev. Ref. Bonds (Philadelphia Presbytery
Homes, Inc. Project), Series 2017, 5.00% 2037
| 780
| 858
|
County of Montgomery, Higher Education and Health Auth., Rev. Ref. Bonds (Philadelphia Presbytery
Homes, Inc. Project), Series 2017, 5.00% 2047
| 3,055
| 3,326
|
| County of Montgomery, Industrial Dev. Auth., Health Systems Rev. Bonds (Albert Einstein Healthcare Network Issue), Series 2015-A, 5.25% 2028
| 1,500
| 1,734
|
| County of Montgomery, Industrial Dev. Auth., Health Systems Rev. Bonds (Albert Einstein Healthcare Network Issue), Series 2015-A, 5.25% 2036
| 4,980
| 5,617
|
| County of Montgomery, Industrial Dev. Auth., Health Systems Rev. Bonds (Albert Einstein Healthcare Network Issue), Series 2015-A, 5.25% 2045
| 14,440
| 16,115
|
| County of Montgomery, Industrial Dev. Auth., Health Systems Rev. Bonds (Albert Einstein Healthcare Network Issue), Series 2015-A, 5.25% 2046
| 2,060
| 2,297
|
| County of Montgomery, Industrial Dev. Auth., Pollution Control Rev. Ref. Bonds (PECO Energy Co. Project), Series 1999-B, AMT, 2.70% 2034 (put 2020)
| 3,850
| 3,864
|
| County of Montgomery, Industrial Dev. Auth., Pollution Control Rev. Ref. Bonds (PECO Energy Co. Project), Series 2001-A, AMT, 2.70% 2034 (put 2020)
| 2,000
| 2,007
|
American High-Income Municipal Bond Fund —
Page 53 of 74
Bonds, notes & other debt instruments (continued)
Pennsylvania (continued)
| Principal amount
(000)
| Value
(000)
|
| County of Montgomery, Industrial Dev. Auth., Retirement Communities Rev. Bonds (ACTS Retirement-Life Communities, Inc. Obligated Group), Series 2009-A-1, 6.25%
2029 (preref. 2019)
| $725
| $736
|
| County of Montgomery, Industrial Dev. Auth., Retirement Communities Rev. Bonds (ACTS Retirement-Life Communities, Inc. Obligated Group), Series 2016, 5.00% 2033
| 3,360
| 3,926
|
| County of Montgomery, Industrial Dev. Auth., Retirement Communities Rev. Bonds (ACTS Retirement-Life Communities, Inc. Obligated Group), Series 2016, 5.00% 2036
| 5,250
| 6,086
|
| County of Montgomery, Industrial Dev. Auth., Retirement Communities Rev. Bonds (Waverly Heights Ltd.), Series 2019, 5.00% 2044
| 900
| 1,030
|
| County of Montgomery, Industrial Dev. Auth., Retirement Communities Rev. Ref. Bonds (ACTS Retirement-Life Communities, Inc. Obligated Group), Series 2012, 5.00%
2027
| 2,500
| 2,718
|
| County of Montgomery, Industrial Dev. Auth., Retirement Communities Rev. Ref. Bonds (ACTS Retirement-Life Communities, Inc. Obligated Group), Series 2012, 5.00%
2028
| 2,800
| 3,040
|
| County of Northampton, General Purpose Auth., Hospital Rev. Bonds (St. Luke’s University Health Network Project), Series 2016-A, 5.00% 2046
| 1,000
| 1,143
|
| County of Northampton, General Purpose Auth., Hospital Rev. Bonds (St. Luke’s University Health Network Project), Series 2018-B, (1-month USD-LIBOR x 0.70 +
1.04%) 2.721% 2048 (put 2022)3
| 600
| 603
|
| City of Philadelphia, G.O. Rev. Ref. Bonds, Series 2009-A, Assured Guaranty insured, 5.50% 2023
| 4,000
| 4,000
|
| City of Philadelphia, Hospitals and Higher Education Facs. Auth., Hospital Rev. Bonds (Temple University Health System Obligated Group), Series 2012-A, 5.625% 2036
| 3,885
| 4,215
|
| City of Philadelphia, Hospitals and Higher Education Facs. Auth., Hospital Rev. Bonds (Temple University Health System Obligated Group), Series 2012-A, 5.625% 2042
| 12,320
| 13,316
|
| City of Philadelphia, Hospitals and Higher Education Facs. Auth., Hospital Rev. Bonds (Temple University Health System Obligated Group), Series 2017, 5.00% 2021
| 250
| 264
|
| City of Philadelphia, Hospitals and Higher Education Facs. Auth., Hospital Rev. Bonds (Temple University Health System Obligated Group), Series 2017, 5.00% 2027
| 1,500
| 1,773
|
| City of Philadelphia, Hospitals and Higher Education Facs. Auth., Hospital Rev. Bonds (Temple University Health System Obligated Group), Series 2017, 5.00% 2028
| 1,000
| 1,170
|
| City of Philadelphia, Hospitals and Higher Education Facs. Auth., Hospital Rev. Bonds (Temple University Health System Obligated Group), Series 2017, 5.00% 2030
| 2,730
| 3,157
|
| City of Philadelphia, Hospitals and Higher Education Facs. Auth., Hospital Rev. Bonds (Temple University Health System Obligated Group), Series 2017, 5.00% 2031
| 1,000
| 1,147
|
| City of Philadelphia, Hospitals and Higher Education Facs. Auth., Hospital Rev. Bonds (Temple University Health System Obligated Group), Series 2017, 5.00% 2033
| 1,000
| 1,135
|
| City of Philadelphia, Industrial Dev. Auth., Rev. Bonds (University of the Sciences), Series 2017, 5.00% 2047
| 4,925
| 5,522
|
| Philadelphia School Dist., G.O. Bonds, Series 2011-E, 5.25% 2023
| 300
| 312
|
| Philadelphia School Dist., G.O. Bonds, Series 2016-F, 5.00% 2028
| 6,100
| 7,300
|
| Philadelphia School Dist., G.O. Bonds, Series 2016-F, 5.00% 2029
| 4,500
| 5,358
|
| Philadelphia School Dist., G.O. Bonds, Series 2016-F, 5.00% 2030 (preref. 2026)
| 10
| 12
|
| Philadelphia School Dist., G.O. Bonds, Series 2016-F, 5.00% 2036
| 1,000
| 1,161
|
| Philadelphia School Dist., G.O. Bonds, Series 2016-F, 5.00% 2037
| 1,500
| 1,736
|
| Philadelphia School Dist., G.O. Bonds, Series 2016-F, 5.00% 2038
| 1,000
| 1,155
|
| Philadelphia School Dist., G.O. Bonds, Series 2018-A, 5.00% 2028
| 745
| 926
|
| Philadelphia School Dist., G.O. Bonds, Series 2018-A, 5.00% 2034
| 1,270
| 1,526
|
| Philadelphia School Dist., G.O. Bonds, Series 2018-A, Assured Guaranty Municipal insured, 5.00% 2038
| 1,000
| 1,185
|
| Philadelphia School Dist., G.O. Rev. Ref. Bonds, Series 2007-A, FGIC-National insured, 5.00% 2034
| 7,000
| 8,898
|
| Public School Building Auth., School Lease Rev. Ref. Bonds (Philadelphia School Dist. Project), Series 2016-A, Assured Guaranty Municipal insured, 5.00% 2030
| 5,000
| 5,992
|
| Reading School Dist., G.O. Bonds, Series 2017, Assured Guaranty Municipal insured, 5.00% 2027
| 275
| 336
|
| Reading School Dist., G.O. Bonds, Series 2017, Assured Guaranty Municipal insured, 5.00% 2028
| 275
| 334
|
| Reading School Dist., G.O. Bonds, Series 2017, Assured Guaranty Municipal insured, 5.00% 2036
| 1,100
| 1,298
|
| Reading School Dist., G.O. Bonds, Series 2017, Assured Guaranty Municipal insured, 5.00% 2038
| 1,000
| 1,166
|
| Scranton School Dist., G.O. Bonds, Series 2017-E, BAM insured, 5.00% 2034
| 825
| 988
|
| Scranton School Dist., G.O. Bonds, Series 2017-E, BAM insured, 5.00% 2035
| 750
| 895
|
| Susquehanna Area Regional Airport Auth., Airport System Rev. Bonds, Series 2012-A, AMT, 5.00% 2020
| 3,855
| 3,901
|
| Susquehanna Area Regional Airport Auth., Airport System Rev. Bonds, Series 2012-A, AMT, 5.00% 2023
| 4,120
| 4,514
|
American High-Income Municipal Bond Fund —
Page 54 of 74
Bonds, notes & other debt instruments (continued)
Pennsylvania (continued)
| Principal amount
(000)
| Value
(000)
|
| Susquehanna Area Regional Airport Auth., Airport System Rev. Bonds, Series 2012-A, AMT, 5.00% 2027
| $10,210
| $11,172
|
| Susquehanna Area Regional Airport Auth., Airport System Rev. Bonds, Series 2012-B, 4.00% 2033
| 650
| 672
|
| Susquehanna Area Regional Airport Auth., Airport System Rev. Bonds, Series 2017, AMT, 5.00% 2035
| 4,685
| 5,396
|
| Susquehanna Area Regional Airport Auth., Airport System Rev. Bonds, Series 2017, AMT, 5.00% 2038
| 4,450
| 5,075
|
Turnpike Commission, Turnpike Rev. Bonds, Series 2017-B-2, Assured Guaranty Municipal insured,
5.00% 2033
| 1,000
| 1,200
|
| Turnpike Commission, Turnpike Rev. Bonds, Series 2019-A, 4.00% 2049
| 2,500
| 2,718
|
| Turnpike Commission, Turnpike Rev. Bonds, Series 2019-A, 4.00% 2049
| 2,000
| 2,152
|
| County of Washington, Redev. Auth., Redev. Rev. Ref. Bonds (Victory Centre Tax Increment Fncg. Project), Series 2018, 4.00% 2023
| 705
| 714
|
| County of Washington, Redev. Auth., Redev. Rev. Ref. Bonds (Victory Centre Tax Increment Fncg. Project), Series 2018, 5.00% 2028
| 850
| 900
|
| Wilkes-Barre Area School Dist., G.O. Bonds, Series 2019, BAM insured, 5.00% 2059
| 2,000
| 2,348
|
|
|
| 430,676
|
| Puerto Rico 4.00%
|
|
|
| Aqueduct and Sewer Auth., Rev. Bonds, Series 2012-A, 5.25% 2042
| 12,265
| 12,418
|
| Electric Power Auth., Power Rev. Bonds, Series 2003-NN, National insured, 5.25% 2021
| 1,000
| 1,030
|
| Electric Power Auth., Power Rev. Bonds, Series 2005-RR, Assured Guaranty insured, 5.00% 2028
| 3,040
| 3,123
|
| Electric Power Auth., Power Rev. Bonds, Series 2005-SS, Assured Guaranty Municipal insured, 5.00% 2030
| 145
| 149
|
| Electric Power Auth., Power Rev. Bonds, Series 2008-WW, 5.50% 20274
| 3,000
| 2,284
|
| Electric Power Auth., Power Rev. Bonds, Series 2010-AAA, 5.25% 20284
| 770
| 587
|
| Electric Power Auth., Power Rev. Bonds, Series 2010-AAA, 5.25% 20284
| 20
| 15
|
| Electric Power Auth., Power Rev. Bonds, Series 2010-CCC, 5.00% 20244
| 1,000
| 760
|
| Electric Power Auth., Power Rev. Bonds, Series 2010-XX, 5.25% 20354
| 2,190
| 1,670
|
| Electric Power Auth., Power Rev. Bonds, Series 2010-XX, 5.25% 20404
| 17,200
| 13,115
|
| Electric Power Auth., Power Rev. Bonds, Series 2012-A, 5.00% 20424
| 1,000
| 760
|
| Electric Power Auth., Power Rev. Bonds, Series 2012-A, 5.05% 20424
| 1,885
| 1,433
|
| Electric Power Auth., Power Rev. Ref. Bonds, Series 2002-MM, National insured, 5.00% 2020
| 845
| 857
|
| Electric Power Auth., Power Rev. Ref. Bonds, Series 2003-NN, National insured, 4.75% 2033
| 715
| 715
|
| Electric Power Auth., Power Rev. Ref. Bonds, Series 2007-VV, National insured, 5.25% 2025
| 775
| 823
|
| Electric Power Auth., Power Rev. Ref. Bonds, Series 2007-VV, National insured, 5.25% 2030
| 475
| 507
|
Electric Power Auth., Power Rev. Ref. Bonds, Series 2010-DDD, Assured Guaranty Municipal insured,
3.65% 2024
| 120
| 120
|
Electric Power Auth., Power Rev. Ref. Bonds, Series UU, Assured Guaranty Municipal insured,
(3-month USD-LIBOR x 0.67 + 0.52%) 2.073% 20293
| 11,180
| 11,068
|
Highways and Transportation Auth., Highway Rev. Ref. Bonds, Series 2003-AA-1,
Assured Guaranty Municipal insured, 4.95% 2026
| 545
| 554
|
Highways and Transportation Auth., Highway Rev. Ref. Bonds, Series 2007-CC,
Assured Guaranty Municipal insured, 5.25% 2032
| 970
| 1,076
|
Highways and Transportation Auth., Highway Rev. Ref. Bonds, Series 2007-CC,
Assured Guaranty Municipal insured, 5.25% 2033
| 615
| 683
|
Highways and Transportation Auth., Highway Rev. Ref. Bonds, Series 2007-CC,
Assured Guaranty Municipal insured, 5.25% 2036
| 1,040
| 1,150
|
Highways and Transportation Auth., Highway Rev. Ref. Bonds, Series 2007-CC,
Assured Guaranty Municipal insured, 5.50% 2029
| 210
| 236
|
Highways and Transportation Auth., Highway Rev. Ref. Bonds, Series 2007-CC,
Assured Guaranty Municipal insured, 5.50% 2031
| 385
| 436
|
| Highways and Transportation Auth., Transportation Rev. Bonds, Series 2004-J, National insured, 5.00% 2029
| 1,075
| 1,084
|
Highways and Transportation Auth., Transportation Rev. Ref. Bonds, Series 2005-L, AMBAC insured,
5.25% 2038
| 1,445
| 1,555
|
Highways and Transportation Auth., Transportation Rev. Ref. Bonds, Series 2007-N, AMBAC insured,
3.116% 20283
| 13,165
| 12,145
|
Highways and Transportation Auth., Transportation Rev. Ref. Bonds, Series 2007-N,
Assured Guaranty insured, 5.25% 2036
| 8,885
| 9,827
|
American High-Income Municipal Bond Fund —
Page 55 of 74
Bonds, notes & other debt instruments (continued)
Puerto Rico (continued)
| Principal amount
(000)
| Value
(000)
|
Highways and Transportation Auth., Transportation Rev. Ref. Bonds, Series 2007-N,
Assured Guaranty Municipal insured, 5.50% 2026
| $685
| $760
|
| Industrial, Tourist, Educational, Medical and Environmental Control Facs. Fncg. Auth., Higher Education Rev. and Rev. Ref. Bonds (Ana G. Méndez University
System Project), Series 2002, 5.375% 2021
| 55
| 55
|
| Industrial, Tourist, Educational, Medical and Environmental Control Facs. Fncg. Auth., Higher Education Rev. and Rev. Ref. Bonds (Ana G. Méndez University
System Project), Series 2002, 5.50% 2031
| 6,815
| 6,817
|
| Industrial, Tourist, Educational, Medical and Environmental Control Facs. Fncg. Auth., Higher Education Rev. and Rev. Ref. Bonds (Ana G. Méndez University
System Project), Series 2006, 5.00% 2021
| 1,125
| 1,126
|
| Industrial, Tourist, Educational, Medical and Environmental Control Facs. Fncg. Auth., Higher Education Rev. and Rev. Ref. Bonds (Ana G. Méndez University
System Project), Series 2006, 5.00% 2026
| 255
| 255
|
| Industrial, Tourist, Educational, Medical and Environmental Control Facs. Fncg. Auth., Higher Education Rev. and Rev. Ref. Bonds (Ana G. Méndez University
System Project), Series 2006, 5.00% 2036
| 520
| 515
|
| Industrial, Tourist, Educational, Medical and Environmental Control Facs. Fncg. Auth., Higher Education Rev. and Rev. Ref. Bonds (Ana G. Méndez University
System Project), Series 2012, 5.00% 2027
| 6,200
| 6,270
|
| Industrial, Tourist, Educational, Medical and Environmental Control Facs. Fncg. Auth., Higher Education Rev. and Rev. Ref. Bonds (Ana G. Méndez University
System Project), Series 2012, 5.125% 2032
| 3,750
| 3,764
|
| Industrial, Tourist, Educational, Medical and Environmental Control Facs. Fncg. Auth., Higher Education Rev. and Rev. Ref. Bonds (Ana G. Méndez University
System Project), Series 2012, 5.375% 2042
| 6,455
| 6,471
|
| Industrial, Tourist, Educational, Medical and Environmental Control Facs. Fncg. Auth., Higher Education Rev. and Rev. Ref. Bonds (Inter American University of
Puerto Rico Project), Series 2004, National insured, 4.25% 2024
| 550
| 551
|
| Industrial, Tourist, Educational, Medical and Environmental Control Facs. Fncg. Auth., Higher Education Rev. and Rev. Ref. Bonds (Inter American University of
Puerto Rico Project), Series 2012, 5.00% 2019
| 1,500
| 1,505
|
| Industrial, Tourist, Educational, Medical and Environmental Control Facs. Fncg. Auth., Higher Education Rev. and Rev. Ref. Bonds (Inter American University of
Puerto Rico Project), Series 2012, 5.00% 2020
| 3,485
| 3,560
|
| Industrial, Tourist, Educational, Medical and Environmental Control Facs. Fncg. Auth., Higher Education Rev. and Rev. Ref. Bonds (Inter American University of
Puerto Rico Project), Series 2012, 5.00% 2021
| 2,420
| 2,512
|
| Industrial, Tourist, Educational, Medical and Environmental Control Facs. Fncg. Auth., Higher Education Rev. and Rev. Ref. Bonds (Inter American University of
Puerto Rico Project), Series 2012, 5.00% 2022
| 1,000
| 1,053
|
| Industrial, Tourist, Educational, Medical and Environmental Control Facs. Fncg. Auth., Higher Education Rev. and Rev. Ref. Bonds (Inter American University of
Puerto Rico Project), Series 2012, 5.00% 2031
| 1,700
| 1,778
|
| Industrial, Tourist, Educational, Medical and Environmental Control Facs. Fncg. Auth., Higher Education Rev. and Rev. Ref. Bonds (University of the Sacred Heart
Project), Series 2012, 4.00% 2023
| 960
| 926
|
| Industrial, Tourist, Educational, Medical and Environmental Control Facs. Fncg. Auth., Higher Education Rev. and Rev. Ref. Bonds (University of the Sacred Heart
Project), Series 2012, 4.00% 2024
| 300
| 293
|
| Industrial, Tourist, Educational, Medical and Environmental Control Facs. Fncg. Auth., Higher Education Rev. and Rev. Ref. Bonds (University of the Sacred Heart
Project), Series 2012, 4.00% 2026
| 825
| 798
|
| Industrial, Tourist, Educational, Medical and Environmental Control Facs. Fncg. Auth., Higher Education Rev. and Rev. Ref. Bonds (University of the Sacred Heart
Project), Series 2012, 4.125% 2027
| 995
| 976
|
| Industrial, Tourist, Educational, Medical and Environmental Control Facs. Fncg. Auth., Higher Education Rev. and Rev. Ref. Bonds (University of the Sacred Heart
Project), Series 2012, 4.375% 2031
| 1,025
| 998
|
| Industrial, Tourist, Educational, Medical and Environmental Control Facs. Fncg. Auth., Higher Education Rev. and Rev. Ref. Bonds (University of the Sacred Heart
Project), Series 2012, 5.00% 2042
| 1,400
| 1,373
|
| Industrial, Tourist, Educational, Medical and Environmental Control Facs. Fncg. Auth., Higher Education Rev. Bonds (Inter American University of Puerto Rico
Project), Series 2004, National insured, 4.50% 2029
| 2,230
| 2,233
|
| Industrial, Tourist, Educational, Medical and Environmental Control Facs. Fncg. Auth., Higher Education Rev. Bonds (Inter American University of Puerto Rico
Project), Series 2019, 5.00% 2022
| 1,500
| 1,579
|
| Industrial, Tourist, Educational, Medical and Environmental Control Facs. Fncg. Auth., Higher Education Rev. Bonds (Inter American University of Puerto Rico
Project), Series 2019, 5.00% 2023
| 1,600
| 1,709
|
| Industrial, Tourist, Educational, Medical and Environmental Control Facs. Fncg. Auth., Higher Education Rev. Bonds (Inter American University of Puerto Rico
Project), Series 2019, 5.00% 2024
| 1,700
| 1,839
|
| Industrial, Tourist, Educational, Medical and Environmental Control Facs. Fncg. Auth., Higher Education Rev. Bonds (Inter American University of Puerto Rico
Project), Series 2019, 5.00% 2025
| 1,800
| 1,961
|
| Industrial, Tourist, Educational, Medical and Environmental Control Facs. Fncg. Auth., Higher Education Rev. Bonds (Inter American University of Puerto Rico Project), Series 2019,
5.00% 2026
| 1,900
| 2,083
|
American High-Income Municipal Bond Fund —
Page 56 of 74
Bonds, notes & other debt instruments (continued)
Puerto Rico (continued)
| Principal amount
(000)
| Value
(000)
|
| Industrial, Tourist, Educational, Medical and Environmental Control Facs. Fncg. Auth., Higher Education Rev. Bonds (Inter American University of Puerto Rico
Project), Series 2019, 5.00% 2027
| $1,900
| $2,096
|
| Industrial, Tourist, Educational, Medical and Environmental Control Facs. Fncg. Auth., Higher Education Rev. Bonds (Inter American University of Puerto Rico
Project), Series 2019, 5.00% 2028
| 2,000
| 2,220
|
| Industrial, Tourist, Educational, Medical and Environmental Control Facs. Fncg. Auth., Higher Education Rev. Bonds (Inter American University of Puerto Rico
Project), Series 2019, 5.00% 2034
| 2,200
| 2,379
|
| Industrial, Tourist, Educational, Medical and Environmental Control Facs. Fncg. Auth., Higher Education Rev. Bonds (Inter American University of Puerto Rico
Project), Series 2019, 5.00% 2044
| 2,500
| 2,616
|
Industrial, Tourist, Educational, Medical and Environmental Control Facs. Fncg. Auth., Higher Education Rev.
and Rev. Ref. Bonds (University of the Sacred Heart Project), Series 2012, 5.00% 2020
| 50
| 50
|
| Industrial, Tourist, Educational, Medical and Environmental Control Facs. Fncg. Auth., Hospital Rev. and Rev. Ref. Bonds (Hospital Auxilio Mutuo Obligated Group
Project), Series 2011-A, 5.00% 2021
| 2,270
| 2,370
|
Industrial, Tourist, Educational, Medical and Environmental Control Facs. Fncg. Auth.,
Hospital Rev. and Rev. Ref. Bonds (Hospital Auxilio Mutuo Obligated Group Project), Series 2011-A,
6.00% 2033
| 15,180
| 15,934
|
Infrastructure Fncg. Auth., Special Tax Rev. Bonds, Capital Appreciation Bonds, Series 2005-A,
Assured Guaranty Municipal insured, 0% 2036
| 1,325
| 534
|
| Infrastructure Fncg. Auth., Special Tax Rev. Ref. Bonds, Series 2005-C, AMBAC insured, 5.50% 2024
| 215
| 232
|
| Infrastructure Fncg. Auth., Special Tax Rev. Ref. Bonds, Series 2005-C, AMBAC insured, 5.50% 2025
| 1,130
| 1,232
|
| Public Building Auth., Rev. Ref. Bonds, Series 1993-L, National insured, 5.50% 2021
| 1,079
| 1,106
|
| Public Improvement G.O. Bonds, Series 2001-A, Assured Guaranty insured, 5.50% 2029
| 4,875
| 5,461
|
| Public Improvement G.O. Rev. Ref. Bonds, Series 2001-A, National insured, 5.50% 2020
| 3,685
| 3,752
|
| Public Improvement G.O. Rev. Ref. Bonds, Series 2007-A, National insured, 5.50% 2020
| 3,255
| 3,314
|
| Public Improvement G.O. Rev. Ref. Bonds, Series 2012-A, Assured Guaranty Municipal insured, 5.00% 2035
| 2,565
| 2,674
|
| Public Improvement G.O. Rev. Ref. Bonds, Series 2012-A, Assured Guaranty Municipal insured, 5.00% 20414
| 4,560
| 2,799
|
| Sales Tax Fncg. Corp., Sales Tax Rev. Bonds, Capital Appreciation Bonds, Series 2007-A, 0% 20413
| 2,961
| 2,154
|
| Sales Tax Fncg. Corp., Sales Tax Rev. Bonds, Capital Appreciation Bonds, Series 2007-A, 0% 20423
| 2,157
| 1,569
|
| Sales Tax Fncg. Corp., Sales Tax Rev. Bonds, Capital Appreciation Bonds, Series 2007-A, 0% 20433
| 1,468
| 1,068
|
| Sales Tax Fncg. Corp., Sales Tax Rev. Bonds, Capital Appreciation Bonds, Series 2007-A, 0% 20443
| 4,312
| 3,137
|
| Sales Tax Fncg. Corp., Sales Tax Rev. Bonds, Capital Appreciation Bonds, Series 2007-A, 0% 20463
| 4,403
| 3,203
|
Sales Tax Fncg. Corp., Sales Tax Rev. Bonds, Capital Appreciation Bonds, Series 2007-A, Class 2,
AMBAC insured, 0% 20473
| 26,620
| 7,035
|
Sales Tax Fncg. Corp., Sales Tax Rev. Bonds, Capital Appreciation Bonds, Series 2007-A, Class 2,
AMBAC insured, 0% 20543
| 77,876
| 14,756
|
| Sales Tax Fncg. Corp., Sales Tax Rev. Bonds, Series 2018-A-1, 4.75% 2053
| 2,029
| 1,989
|
Sales Tax Fncg. Corp., Sales Tax Rev. Restructured Bonds, Capital Appreciation Bonds, Series 2018-A-1,
0% 2024
| 301
| 258
|
Sales Tax Fncg. Corp., Sales Tax Rev. Restructured Bonds, Capital Appreciation Bonds, Series 2018-A-1,
0% 2027
| 511
| 393
|
Sales Tax Fncg. Corp., Sales Tax Rev. Restructured Bonds, Capital Appreciation Bonds, Series 2018-A-1,
0% 2029
| 498
| 351
|
Sales Tax Fncg. Corp., Sales Tax Rev. Restructured Bonds, Capital Appreciation Bonds, Series 2018-A-1,
0% 2031
| 641
| 404
|
Sales Tax Fncg. Corp., Sales Tax Rev. Restructured Bonds, Capital Appreciation Bonds, Series 2018-A-1,
0% 2033
| 723
| 406
|
Sales Tax Fncg. Corp., Sales Tax Rev. Restructured Bonds, Capital Appreciation Bonds, Series 2018-A-1,
0% 2046
| 7,674
| 1,773
|
Sales Tax Fncg. Corp., Sales Tax Rev. Restructured Bonds, Capital Appreciation Bonds, Series 2018-A-1,
0% 2051
| 6,964
| 1,187
|
| Sales Tax Fncg. Corp., Sales Tax Rev. Restructured Bonds, Series 2018-A-1, 5.00% 2058
| 36,184
| 36,273
|
| Sales Tax Fncg. Corp., Sales Tax Rev. Restructured Bonds, Series 2019-A-2, 4.329% 2040
| 3,731
| 3,642
|
| Sales Tax Fncg. Corp., Sales Tax Rev. Restructured Bonds, Series 2019-A-2, 4.536% 2053
| 22
| 21
|
| Sales Tax Fncg. Corp., Sales Tax Rev. Restructured Bonds, Series 2019-A-2, 4.784% 2058
| 8,413
| 8,151
|
| Sales Tax Fncg. Corp., Taxable Sales Tax Rev. Bonds, Capital Appreciation Bonds, Series 2007-A, 0% 20413
| 975
| 134
|
| Sales Tax Fncg. Corp., Taxable Sales Tax Rev. Bonds, Capital Appreciation Bonds, Series 2007-A, 0% 20423
| 710
| 98
|
American High-Income Municipal Bond Fund —
Page 57 of 74
Bonds, notes & other debt instruments (continued)
Puerto Rico (continued)
| Principal amount
(000)
| Value
(000)
|
| Sales Tax Fncg. Corp., Taxable Sales Tax Rev. Bonds, Capital Appreciation Bonds, Series 2007-A, 0% 20433
| $483
| $66
|
| Sales Tax Fncg. Corp., Taxable Sales Tax Rev. Bonds, Capital Appreciation Bonds, Series 2007-A, 0% 20443
| 1,420
| 195
|
| Sales Tax Fncg. Corp., Taxable Sales Tax Rev. Bonds, Capital Appreciation Bonds, Series 2007-A, 0% 20463
| 1,450
| 199
|
| Sales Tax Fncg. Corp., Trust Certificates, Capital Appreciation Certificates, Series 2019, Class 2, 0% 20543
| 635
| 131
|
| University of Puerto Rico, University System Rev. Bonds, Series 2006-Q, 5.00% 2023
| 1,000
| 995
|
| University of Puerto Rico, University System Rev. Bonds, Series 2006-Q, 5.00% 2024
| 865
| 859
|
| University of Puerto Rico, University System Rev. Bonds, Series 2006-Q, 5.00% 2025
| 645
| 639
|
| University of Puerto Rico, University System Rev. Bonds, Series 2006-Q, 5.00% 2026
| 520
| 514
|
| University of Puerto Rico, University System Rev. Bonds, Series 2006-Q, 5.00% 2030
| 914
| 889
|
| University of Puerto Rico, University System Rev. Bonds, Series 2006-Q, 5.00% 2036
| 1,950
| 1,877
|
| University of Puerto Rico, University System Rev. Ref. Bonds, Series 2006-P, 5.00% 2020
| 2,865
| 2,865
|
| University of Puerto Rico, University System Rev. Ref. Bonds, Series 2006-P, 5.00% 2021
| 645
| 644
|
| University of Puerto Rico, University System Rev. Ref. Bonds, Series 2006-P, 5.00% 2022
| 1,990
| 1,985
|
| University of Puerto Rico, University System Rev. Ref. Bonds, Series 2006-P, 5.00% 2023
| 5,685
| 5,657
|
| University of Puerto Rico, University System Rev. Ref. Bonds, Series 2006-P, 5.00% 2024
| 4,625
| 4,590
|
| University of Puerto Rico, University System Rev. Ref. Bonds, Series 2006-P, 5.00% 2025
| 260
| 257
|
| University of Puerto Rico, University System Rev. Ref. Bonds, Series 2006-P, 5.00% 2026
| 1,450
| 1,432
|
| University of Puerto Rico, University System Rev. Ref. Bonds, Series 2006-P, 5.00% 2030
| 7,380
| 7,177
|
| University of Puerto Rico, University System Rev. Ref. Bonds, Series 2006-P, National insured, 5.00% 2024
| 50
| 51
|
| University of Puerto Rico, University System Rev. Ref. Bonds, Series 2006-P, National insured, 5.00% 2025
| 105
| 106
|
| University of Puerto Rico, University System Rev. Ref. Bonds, Series 2006-Q, 5.00% 2020
| 7,130
| 7,130
|
| University of Puerto Rico, University System Rev. Ref. Bonds, Series 2006-Q, 5.00% 2021
| 700
| 699
|
| University of Puerto Rico, University System Rev. Ref. Bonds, Series 2006-Q, 5.00% 2022
| 60
| 60
|
|
|
| 309,728
|
| Rhode Island 1.02%
|
|
|
| Commerce Corp., Airport Rev. Bonds, Series 2016-D, 5.00% 2030
| 500
| 590
|
| Commerce Corp., Airport Rev. Bonds, Series 2016-D, 5.00% 2041
| 500
| 572
|
Health and Educational Building Corp., Hospital Fncg. Rev. Ref. Bonds (Care New England Issue),
Series 2016-B, 5.00% 2031
| 11,410
| 13,017
|
Health and Educational Building Corp., Hospital Fncg. Rev. Ref. Bonds (Care New England Issue),
Series 2016-B, 5.00% 2036
| 11,450
| 12,871
|
| Health and Educational Building Corp., Hospital Fncg. Rev. Ref. Bonds (Lifespan Obligated Group Issue), Series 2016, 5.00% 2029
| 1,380
| 1,623
|
| Housing and Mortgage Fin. Corp., Homeownership Opportunity Bonds, Series 68-C, AMT, 3.50% 2039
| 8,215
| 8,556
|
| Student Loan Auth., Student Loan Program Rev. Bonds, Series 2015-A, AMT, 3.625% 2026
| 1,000
| 1,049
|
| Student Loan Auth., Student Loan Program Rev. Bonds, Series 2015-A, AMT, 4.00% 2027
| 2,500
| 2,636
|
| Student Loan Auth., Student Loan Program Rev. Bonds, Series 2015-A, AMT, 4.00% 2028
| 1,000
| 1,053
|
| Student Loan Auth., Student Loan Program Rev. Bonds, Series 2016-A, AMT, 3.125% 2027
| 1,500
| 1,551
|
| Student Loan Auth., Student Loan Program Rev. Bonds, Series 2016-A, AMT, 3.25% 2028
| 1,500
| 1,559
|
| Student Loan Auth., Student Loan Program Rev. Bonds, Series 2017-A, AMT, 3.80% 2031
| 2,635
| 2,770
|
| Student Loan Auth., Student Loan Program Rev. Bonds, Series 2017-A, AMT, 4.00% 2027
| 2,950
| 3,194
|
| Student Loan Auth., Student Loan Program Rev. Bonds, Series 2018-A, AMT, 3.50% 2034
| 9,055
| 9,460
|
| Student Loan Auth., Student Loan Program Rev. Bonds, Series 2019-A, AMT, 2.875% 2035
| 5,000
| 5,112
|
Tobacco Settlement Fin. Corp., Tobacco Settlement Asset-Backed Bonds, Capital Appreciation Bonds,
Series 2007-A, 0% 2052
| 119,630
| 13,530
|
|
|
| 79,143
|
| South Carolina 1.81%
|
|
|
| Connector 2000 Association Inc., Toll Road Rev. Bonds, Capital Appreciation Bonds, Series 2011-A, 0% 2021
| 73
| 66
|
| Connector 2000 Association Inc., Toll Road Rev. Bonds, Capital Appreciation Bonds, Series 2011-A, 0% 2022
| 528
| 449
|
Connector 2000 Association Inc., Toll Road Rev. Bonds, Capital Appreciation Bonds, Series 2011-A-1,
0% 2032
| 3,084
| 1,411
|
Connector 2000 Association Inc., Toll Road Rev. Bonds, Capital Appreciation Bonds, Series 2011-A-1,
0% 2042
| 19,539
| 4,274
|
American High-Income Municipal Bond Fund —
Page 58 of 74
Bonds, notes & other debt instruments (continued)
South Carolina (continued)
| Principal amount
(000)
| Value
(000)
|
Connector 2000 Association Inc., Toll Road Rev. Bonds, Capital Appreciation Bonds, Series 2011-A-1,
0% 2051
| $25
| $2
|
| Housing Fin. and Dev. Auth., Mortgage Rev. Bonds, Series 2016-B-2, AMT, 4.00% 2043
| 4,330
| 4,601
|
| Jobs-Econ. Dev. Auth., Econ. Dev. Rev. Bonds (Custodial Receipts), Series 2018, 5.00% 20362,3
| 3,000
| 3,347
|
| Jobs-Econ. Dev. Auth., Econ. Dev. Rev. Bonds (Custodial Receipts), Series 2018, 5.00% 20412,3
| 8,330
| 9,185
|
Jobs-Econ. Dev. Auth., First Mortgage Health Care Facs. Rev. Ref. Bonds (The Lutheran Homes of
South Carolina, Inc.), Series 2017, 5.00% 2042
| 1,855
| 1,984
|
| Jobs-Econ. Dev. Auth., Health Facs. Rev. Ref. Bonds (Wesley Commons), Series 2016, 5.00% 20362
| 2,000
| 2,103
|
| Jobs-Econ. Dev. Auth., Health Facs. Rev. Ref. Bonds (Wesley Commons), Series 2016, 5.00% 20412
| 6,000
| 6,283
|
| Jobs-Econ. Dev. Auth., Hospital Rev. Bonds (Prisma Health Obligated Group), Series 2018-A, 5.00% 2048
| 4,500
| 5,239
|
| Jobs-Econ. Dev. Auth., Residential Facs. Rev. Bonds (Episcopal Home Still Hopes), Series 2017, 5.00% 2047
| 5,700
| 6,162
|
| Jobs-Econ. Dev. Auth., Residential Facs. Rev. Bonds (Episcopal Home Still Hopes), Series 2017, 5.00% 2052
| 5,055
| 5,451
|
Jobs-Econ. Dev. Auth., Residential Facs. Rev. Ref. Bonds (Episcopal Home Still Hopes), Series 2018-A,
5.00% 2031
| 2,040
| 2,251
|
Jobs-Econ. Dev. Auth., Residential Facs. Rev. Ref. Bonds (Episcopal Home Still Hopes), Series 2018-A,
5.00% 2032
| 2,135
| 2,350
|
Jobs-Econ. Dev. Auth., Residential Facs. Rev. Ref. Bonds (Episcopal Home Still Hopes), Series 2018-A,
5.00% 2038
| 9,035
| 9,837
|
Jobs-Econ. Dev. Auth., Residential Facs. Rev. Ref. Bonds (Episcopal Home Still Hopes), Series 2018-A,
5.00% 2048
| 3,500
| 3,777
|
Jobs-Econ. Dev. Auth., Student Housing Rev. Bonds (Coastal Housing Foundation, LLC Project),
Series 2009-A, 6.50% 2042 (preref. 2020)
| 4,000
| 4,143
|
| Patriots Energy Group Fncg. Agcy., Gas Supply Rev. Bonds, Series 2018-A, 4.00% 2048 (put 2024)
| 5,000
| 5,496
|
| Public Service Auth., Rev. Obligations (Santee Cooper), Series 2011-C, 5.00% 2036
| 3,450
| 3,682
|
| Public Service Auth., Rev. Obligations (Santee Cooper), Series 2012-D, 5.00% 2043
| 6,420
| 6,860
|
| Public Service Auth., Rev. Obligations (Santee Cooper), Series 2013-E, 5.00% 2048
| 2,055
| 2,260
|
| Public Service Auth., Rev. Obligations (Santee Cooper), Series 2014-A, 5.00% 2049
| 1,000
| 1,110
|
| Public Service Auth., Rev. Obligations (Santee Cooper), Series 2014-A, 5.50% 2054
| 2,430
| 2,745
|
| Public Service Auth., Rev. Obligations (Santee Cooper), Series 2014-C, 5.00% 2046
| 100
| 112
|
| Public Service Auth., Rev. Obligations (Santee Cooper), Series 2015-A, 5.00% 2055
| 3,525
| 3,965
|
| Public Service Auth., Rev. Obligations (Santee Cooper), Series 2015-E, 5.25% 2055
| 10,280
| 11,813
|
| Public Service Auth., Rev. Obligations (Santee Cooper), Series 2016-A, 5.00% 2032
| 715
| 847
|
| Public Service Auth., Rev. Obligations (Santee Cooper), Series 2016-B, 5.00% 2035
| 250
| 296
|
| Public Service Auth., Rev. Obligations (Santee Cooper), Series 2016-B, 5.00% 2041
| 3,350
| 3,906
|
Public Service Auth., Rev. Ref. Obligations (Santee Cooper), Series 2011-B,
4.00% 2019 (escrowed to maturity)
| 1,000
| 1,010
|
| Public Service Auth., Rev. Ref. Obligations (Santee Cooper), Series 2013-B, 5.125% 2043
| 2,215
| 2,454
|
| Public Service Auth., Rev. Ref. Obligations (Santee Cooper), Series 2014-B, 5.00% 2038
| 3,000
| 3,361
|
| Public Service Auth., Rev. Ref. Obligations (Santee Cooper), Series 2014-C, 5.00% 2039
| 100
| 113
|
| Public Service Auth., Rev. Ref. Obligations (Santee Cooper), Series 2015-A, 5.00% 2034
| 6,275
| 7,368
|
Public Service Auth., Rev. Ref. Obligations (Santee Cooper), Series 2016-B,
2.25% 2051 (2.75% on 12/1/2019)1
| 8,260
| 7,900
|
| Public Service Auth., Rev. Ref. Obligations (Santee Cooper), Series 2016-C, 5.00% 2031
| 2,010
| 2,412
|
|
|
| 140,625
|
| South Dakota 0.08%
|
|
|
| Housing Dev. Auth., Homeownership Mortgage Bonds, Series 2014-A, AMT, 4.00% 2044
| 1,280
| 1,339
|
| Housing Dev. Auth., Homeownership Mortgage Bonds, Series 2017-E, AMT, 4.00% 2039
| 4,150
| 4,414
|
| Housing Dev. Auth., Homeownership Mortgage Rev. Ref. Bonds, Series 2012-D, AMT, 4.00% 2029
| 540
| 554
|
|
|
| 6,307
|
American High-Income Municipal Bond Fund —
Page 59 of 74
Bonds, notes & other debt instruments (continued)
Tennessee 0.28%
| Principal amount
(000)
| Value
(000)
|
City of Chattanooga, Hospital Auth., Hospital Rev. Ref. Bonds (Erlanger Health System), Series 2014,
5.00% 2039
| $2,815
| $3,114
|
| Housing Dev. Agcy., Residential Fin. Program Bonds, Series 2014-2-A, AMT, 4.00% 2045
| 2,035
| 2,144
|
| Housing Dev. Agcy., Residential Fin. Program Bonds, Series 2016-1-A, AMT, 3.50% 2047
| 2,760
| 2,897
|
| City of Memphis, Airport Auth., Airport Rev. Ref. Bonds, Series 2010-B, AMT, 5.625% 2020
| 1,685
| 1,750
|
| City of Memphis, Airport Auth., Airport Rev. Ref. Bonds, Series 2010-B, AMT, 5.75% 2024
| 1,000
| 1,041
|
| City of Memphis, Airport Auth., Airport Rev. Ref. Bonds, Series 2011-A-1, AMT, 6.00% 2021
| 1,495
| 1,625
|
| City of Memphis, Airport Auth., Airport Rev. Ref. Bonds, Series 2011-A-1, AMT, 6.00% 2022
| 1,000
| 1,092
|
| Metropolitan Dev. and Housing Agcy., Tennessee Tax Increment Rev. Bonds (Fifth & Broadway Dev. Project), Series 2018, 5.125% 20362
| 750
| 819
|
| Metropolitan Government of Nashville and Davidson County, G.O. Improvement Bonds, Series 2013-A, 5.00% 2027 (preref. 2023)
| 490
| 554
|
| County of Shelby, Health, Educational and Housing Fac. Board, Residential Care Fac. Mortgage Rev. Ref. Bonds (Village at Germantown), Series 2012, 5.375% 2047
| 1,735
| 1,800
|
| Tennessee Energy Acquisition Corp., Gas Project Rev. Bonds, Series 2006-C, 5.00% 2020
| 5,000
| 5,082
|
|
|
| 21,918
|
| Texas 5.86%
|
|
|
| Arlington Higher Education Fin. Corp., Education Rev. Bonds (UME Preparatory Academy), Series 2017-A, 5.00% 2038
| 1,000
| 1,049
|
| Arlington Higher Education Fin. Corp., Education Rev. Bonds (UME Preparatory Academy), Series 2017-A, 5.00% 2048
| 2,685
| 2,780
|
| Arlington Higher Education Fin. Corp., Education Rev. Bonds (UME Preparatory Academy), Series 2017-A, 5.00% 2053
| 1,375
| 1,419
|
| Arlington Higher Education Fin. Corp., Education Rev. Bonds (Uplift Education), Series 2016-A, 2.75% 2026
| 2,615
| 2,654
|
| Arlington Higher Education Fin. Corp., Education Rev. Bonds (Uplift Education), Series 2016-A, 5.00% 2036
| 3,370
| 3,810
|
| Arlington Higher Education Fin. Corp., Education Rev. Bonds (Uplift Education), Series 2016-A, 5.00% 2046
| 3,745
| 4,169
|
| Arlington Higher Education Fin. Corp., Education Rev. Bonds (Uplift Education), Series 2016-A, 5.00% 2051
| 4,100
| 4,550
|
| Austin Convention Enterprises, Convention Center Hotel Rev. Ref. Bonds, Series 2017-A, 5.00% 2030
| 1,600
| 1,902
|
| City of Austin, Airport System Rev. Bonds, Series 2014, AMT, 5.00% 2044
| 2,750
| 3,125
|
| Brazoria Health Facs. Dev. Corp., Hospital Rev. Ref. Bonds (Brazosport Regional Health System), Series 2012, 5.25% 2032 (preref. 2022)
| 750
| 834
|
| Central Texas Regional Mobility Auth., Rev. Bonds, Series 2010, 5.75% 2025 (preref. 2020)
| 1,000
| 1,019
|
| Central Texas Regional Mobility Auth., Rev. Bonds, Series 2011, 6.00% 2041 (preref. 2021)
| 3,000
| 3,201
|
| Central Texas Regional Mobility Auth., Rev. Bonds, Series 2011, 6.25% 2046 (preref. 2021)
| 2,200
| 2,355
|
| Clifton Higher Education Fin. Corp., Education Rev. Bonds (Idea Public Schools), Series 2012, 5.00% 2032
| 2,400
| 2,576
|
| Clifton Higher Education Fin. Corp., Education Rev. Bonds (Idea Public Schools), Series 2013, 6.00% 2033
| 1,000
| 1,146
|
| Clifton Higher Education Fin. Corp., Education Rev. Bonds (Idea Public Schools), Series 2016-B, 5.00% 2028
| 500
| 590
|
City of Decatur, Hospital Auth., Hospital Rev. Bonds (Wise Regional Health System), Series 2014-A,
5.00% 2034
| 1,850
| 2,046
|
City of Decatur, Hospital Auth., Hospital Rev. Bonds (Wise Regional Health System), Series 2014-A,
5.25% 2044
| 4,200
| 4,599
|
County of Fort Bend, Industrial Dev. Corp., Industrial Dev. Rev. Bonds (NRG Energy, Inc. Project),
Series 2012-A, 4.75% 2038
| 4,500
| 4,682
|
County of Fort Bend, Industrial Dev. Corp., Industrial Dev. Rev. Bonds (NRG Energy, Inc. Project),
Series 2012-B, 4.75% 2042
| 5,000
| 5,202
|
| County of Gregg, Health Facs. Dev. Corp., Hospital Rev. Bonds (Good Shepherd Health System Obligated Group), Series 2012-C, 3.82% 2025 (preref. 2022)
| 3,385
| 3,582
|
| County of Gregg, Health Facs. Dev. Corp., Hospital Rev. Bonds (Good Shepherd Health System Obligated Group), Series 2012-C, 5.00% 2032 (preref. 2022)
| 925
| 1,025
|
Gulf Coast Industrial Dev. Auth., Solid Waste Disposal Rev. Bonds (CITGO Petroleum Corp. Project),
Series 1995, AMT, 4.875% 2025
| 4,215
| 4,293
|
County of Harris, Cultural Education Facs. Fin. Corp., First Mortgage Rev. Bonds
(Brazos Presbyterian Homes, Inc. Project), Series 2013-A, 5.00% 2033
| 275
| 292
|
American High-Income Municipal Bond Fund —
Page 60 of 74
Bonds, notes & other debt instruments (continued)
Texas (continued)
| Principal amount
(000)
| Value
(000)
|
County of Harris, Cultural Education Facs. Fin. Corp., First Mortgage Rev. Bonds
(Brazos Presbyterian Homes, Inc. Project), Series 2013-A, 5.00% 2038
| $510
| $538
|
County of Harris, Cultural Education Facs. Fin. Corp., First Mortgage Rev. Bonds
(Brazos Presbyterian Homes, Inc. Project), Series 2013-A, 5.00% 2043
| 1,240
| 1,301
|
County of Harris, Cultural Education Facs. Fin. Corp., First Mortgage Rev. Bonds
(Brazos Presbyterian Homes, Inc. Project), Series 2016, 5.00% 2037
| 2,530
| 2,777
|
County of Harris, Cultural Education Facs. Fin. Corp., First Mortgage Rev. Bonds
(Brazos Presbyterian Homes, Inc. Project), Series 2016, 5.00% 2048
| 21,330
| 23,138
|
| County of Harris, Cultural Education Facs. Fin. Corp., Rev. Ref. Bonds (Young Men’s Christian Assn. of the Greater Houston Area), Series 2013-A, 5.00% 2033
| 1,400
| 1,494
|
| County of Harris, Cultural Education Facs. Fin. Corp., Rev. Ref. Bonds (Young Men’s Christian Assn. of the Greater Houston Area), Series 2013-A, 5.00% 2038
| 3,500
| 3,735
|
| County of Harris, Sports Auth., Rev. Ref. Bonds, Capital Appreciation Bonds, Series 2014-A, 0% 2042
| 1,000
| 425
|
| County of Harris, Sports Auth., Rev. Ref. Bonds, Capital Appreciation Bonds, Series 2014-A, 0% 2050
| 1,500
| 417
|
County of Harris, Sports Auth., Rev. Ref. Bonds, Series 2014-A, Assured Guaranty Municipal insured,
5.00% 2053
| 1,000
| 1,119
|
County of Harrison, Health Facs. Dev. Corp., Hospital Rev. Bonds (Good Shepherd Health System),
Series 2010, 5.25% 2028 (preref. 2020)
| 1,000
| 1,037
|
| Dept. of Housing and Community Affairs, Single Family Mortgage Rev. Bonds, Series 2018-A, 4.75% 2049
| 3,975
| 4,428
|
| City of Houston, Airport System Rev. and Rev. Ref. Bonds, Series 2018-B, 5.00% 2027
| 1,995
| 2,501
|
| City of Houston, Airport System Rev. Ref. Bonds, Series 2012-A, AMT, 5.00% 2032
| 1,000
| 1,090
|
| City of Houston, Airport System Special Facs. Rev. Bonds (Continental Airlines, Inc. Terminal Improvement Projects), Series 2011, AMT, 6.50% 2030
| 9,300
| 10,053
|
| City of Houston, Airport System Special Facs. Rev. Bonds (Continental Airlines, Inc. Terminal Improvement Projects), Series 2011, AMT, 6.625% 2038
| 3,000
| 3,228
|
| City of Houston, Airport System Special Facs. Rev. Bonds (United Airlines, Inc. Terminal Improvement Projects), Series 2018-C, AMT, 5.00% 2028
| 15,000
| 17,971
|
City of Houston, Airport System Special Facs. Rev. Ref. Bonds (United Airlines, Inc. Terminal E Project),
Series 2014, AMT, 4.50% 2020
| 1,000
| 1,025
|
City of Houston, Airport System Special Facs. Rev. Ref. Bonds (United Airlines, Inc. Terminal E Project),
Series 2014, AMT, 4.75% 2024
| 5,500
| 6,025
|
City of Houston, Airport System Special Facs. Rev. Ref. Bonds (United Airlines, Inc. Terminal E Project),
Series 2014, AMT, 5.00% 2029
| 6,745
| 7,555
|
| City of Houston, Airport System Special Facs. Rev. Ref. Bonds (United Airlines, Inc. Terminal Improvement Projects), Series 2015-B-1, AMT, 5.00% 2030
| 3,000
| 3,372
|
| City of Houston, Airport System Special Facs. Rev. Ref. Bonds (United Airlines, Inc. Terminal Improvement Projects), Series 2015-B-2, AMT, 5.00% 2020
| 4,810
| 4,940
|
| City of Houston, Airport System Special Facs. Rev. Ref. Bonds (United Airlines, Inc. Terminal Improvement Projects), Series 2015-C, AMT, 5.00% 2020
| 8,485
| 8,714
|
| City of Houston, Combined Utility System Rev. Ref. Bonds, Series 2014-C, 5.00% 2025
| 1,670
| 1,956
|
City of Houston, Combined Utility System Rev. Ref. Bonds, Series 2018-C,
(1-month USD-LIBOR x 0.70 + 0.36%) 1.946% 2034 (put 2021)3
| 3,500
| 3,502
|
| City of Irving, Hospital Auth., Hospital Rev. Bonds (Baylor Scott & White Medical Center-Irving), Series 2017-A, 5.00% 2033
| 1,000
| 1,153
|
| City of Irving, Hospital Auth., Hospital Rev. Bonds (Baylor Scott & White Medical Center-Irving), Series 2017-A, 5.00% 2044
| 1,000
| 1,123
|
| City of Irving, Hospital Auth., Hospital Rev. Bonds (Baylor Scott & White Medical Center-Irving), Series 2017-B, (SIFMA Municipal Swap Index + 1.11%) 2.50%
2044 (put 2023)3
| 1,500
| 1,515
|
| City of Kerrville, Health Facs. Dev. Corp., Hospital Rev. Bonds (Peterson Regional Medical Center Project), Series 2015, 5.00% 2024
| 1,000
| 1,162
|
| City of Kerrville, Health Facs. Dev. Corp., Hospital Rev. Bonds (Peterson Regional Medical Center Project), Series 2015, 5.00% 2025
| 1,000
| 1,186
|
| City of Kerrville, Health Facs. Dev. Corp., Hospital Rev. Bonds (Peterson Regional Medical Center Project), Series 2015, 5.00% 2030
| 3,450
| 3,983
|
American High-Income Municipal Bond Fund —
Page 61 of 74
Bonds, notes & other debt instruments (continued)
Texas (continued)
| Principal amount
(000)
| Value
(000)
|
| Love Field Airport Modernization Corp., Special Facs. Rev. Bonds (Southwest Airlines Co. - Love Field Modernization Program Project), Series 2010, 5.25% 2040
| $2,750
| $2,855
|
County of Matagorda, Navigation Dist. No. 1, Rev. Ref. Bonds (Houston Lighting & Power Co. Project),
Series 1997, AMT, AMBAC insured, 5.125% 2028
| 3,280
| 4,113
|
| Mission Econ. Dev. Corp., Rev. Bonds (Natgasoline Project), Series 2018, AMT, 4.625% 20312
| 11,000
| 11,782
|
Mission Econ. Dev. Corp., Solid Waste Disposal Rev. Bonds (Waste Management, Inc. Project),
Series 2008, AMT, 2.50% 2020
| 2,500
| 2,502
|
Municipal Gas Acquisition and Supply Corp. II, Gas Supply Rev. Bonds, Series 2007-B,
(SIFMA Municipal Swap Index + 0.55%) 1.95% 20273
| 2,820
| 2,782
|
| Municipal Gas Acquisition and Supply Corp. III, Gas Supply Rev. Bonds, Series 2012, 5.00% 2026
| 5,000
| 5,521
|
| Municipal Gas Acquisition and Supply Corp. III, Gas Supply Rev. Bonds, Series 2012, 5.00% 2030
| 3,500
| 3,831
|
| Municipal Gas Acquisition and Supply Corp. III, Gas Supply Rev. Bonds, Series 2012, 5.00% 2031
| 1,500
| 1,638
|
New Hope Cultural Education Facs. Fin. Corp., Capital Improvement Rev. Bonds (CHF-Collegiate Housing Denton, LLC - Texas Woman’s University Housing Project),
Series 2018-A-1,
Assured Guaranty Municipal insured, 5.00% 2058
| 1,650
| 1,861
|
New Hope Cultural Education Facs. Fin. Corp., Retirement Fac. Rev. Bonds (MRC Crestview Project),
Series 2016, 5.00% 2031
| 1,020
| 1,116
|
New Hope Cultural Education Facs. Fin. Corp., Retirement Fac. Rev. Bonds (MRC Crestview Project),
Series 2016, 5.00% 2046
| 4,350
| 4,639
|
| New Hope Cultural Education Facs. Fin. Corp., Retirement Fac. Rev. Bonds (MRC Senior Living - The Langford Project), Series 2016-A, 5.375% 2036
| 500
| 536
|
| New Hope Cultural Education Facs. Fin. Corp., Retirement Fac. Rev. Bonds (MRC Senior Living - The Langford Project), Series 2016-A, 5.50% 2046
| 800
| 849
|
| New Hope Cultural Education Facs. Fin. Corp., Retirement Fac. Rev. Bonds (MRC Senior Living - The Langford Project), Series 2016-A, 5.50% 2052
| 1,150
| 1,216
|
| New Hope Cultural Education Facs. Fin. Corp., Retirement Fac. Rev. Bonds (Presbyterian Village North Project), Series 2018, 5.00% 2019
| 410
| 412
|
| New Hope Cultural Education Facs. Fin. Corp., Retirement Fac. Rev. Bonds (Wesleyan Homes, Inc. Project), Series 2014, 5.50% 2035
| 100
| 108
|
| New Hope Cultural Education Facs. Fin. Corp., Retirement Fac. Rev. Bonds (Wesleyan Homes, Inc. Project), Series 2014, 5.50% 2043
| 3,700
| 3,979
|
| New Hope Cultural Education Facs. Fin. Corp., Retirement Fac. Rev. Bonds (Wesleyan Homes, Inc. Project), Series 2014, 5.50% 2049
| 1,150
| 1,233
|
New Hope Cultural Education Facs. Fin. Corp., Retirement Fac. Rev. Bonds (Westminster Project),
Series 2016, 5.00% 2025
| 350
| 402
|
New Hope Cultural Education Facs. Fin. Corp., Retirement Fac. Rev. Bonds (Westminster Project),
Series 2016, 5.00% 2026
| 330
| 377
|
New Hope Cultural Education Facs. Fin. Corp., Retirement Fac. Rev. Bonds (Westminster Project),
Series 2016, 5.00% 2031
| 1,410
| 1,584
|
New Hope Cultural Education Facs. Fin. Corp., Retirement Fac. Rev. Bonds (Westminster Project),
Series 2016, 5.00% 2040
| 4,900
| 5,410
|
| New Hope Cultural Education Facs. Fin. Corp., Student Housing Rev. Bonds (CHF-Collegiate Housing Corpus Christi II, LLC - Texas A&M University-Corpus Christi
Project), Series 2016-A, 5.00% 2036
| 2,540
| 2,598
|
| New Hope Cultural Education Facs. Fin. Corp., Student Housing Rev. Bonds (CHF-Collegiate Housing Corpus Christi II, LLC - Texas A&M University-Corpus Christi
Project), Series 2016-A, 5.00% 2048
| 1,000
| 1,007
|
| New Hope Cultural Education Facs. Fin. Corp., Student Housing Rev. Bonds (CHF-Collegiate Housing Island Campus, LLC - Texas A&M University-Corpus Christi
Island Campus Project), Series 2017-A, 5.00% 2030
| 1,150
| 1,231
|
| New Hope Cultural Education Facs. Fin. Corp., Student Housing Rev. Bonds (CHF-Collegiate Housing Island Campus, LLC - Texas A&M University-Corpus Christi
Island Campus Project), Series 2017-A, 5.00% 2031
| 800
| 852
|
| New Hope Cultural Education Facs. Fin. Corp., Student Housing Rev. Bonds (CHF-Collegiate Housing Island Campus, LLC - Texas A&M University-Corpus Christi
Island Campus Project), Series 2017-A, 5.00% 2032
| 855
| 907
|
| New Hope Cultural Education Facs. Fin. Corp., Student Housing Rev. Bonds (CHF-Collegiate Housing Island Campus, LLC - Texas A&M University-Corpus Christi
Island Campus Project), Series 2017-A, 5.00% 2037
| 6,310
| 6,587
|
| New Hope Cultural Education Facs. Fin. Corp., Student Housing Rev. Bonds (CHF-Collegiate Housing Island Campus, LLC - Texas A&M University-Corpus Christi Island Campus Project),
Series 2017-A, 5.00% 2042
| 9,405
| 9,719
|
American High-Income Municipal Bond Fund —
Page 62 of 74
Bonds, notes & other debt instruments (continued)
Texas (continued)
| Principal amount
(000)
| Value
(000)
|
| New Hope Cultural Education Facs. Fin. Corp., Student Housing Rev. Bonds (CHF-Collegiate Housing Stephenville II, LLC - Tarleton State University Project), Series
2014-A, 5.00% 2039
| $2,250
| $2,391
|
| New Hope Cultural Education Facs. Fin. Corp., Student Housing Rev. Bonds (CHF-Collegiate Housing Stephenville II, LLC - Tarleton State University Project), Series
2014-A, 5.00% 2046
| 5,265
| 5,565
|
| New Hope Cultural Education Facs. Fin. Corp., Student Housing Rev. Bonds (CHF-Collegiate Housing Stephenville III, LLC - Tarleton State University Project), Series
2015-A, 5.00% 2030
| 1,800
| 1,984
|
| New Hope Cultural Education Facs. Fin. Corp., Student Housing Rev. Bonds (CHF-Collegiate Housing Stephenville III, LLC - Tarleton State University Project), Series
2015-A, 5.00% 2035
| 1,800
| 1,954
|
| New Hope Cultural Education Facs. Fin. Corp., Student Housing Rev. Bonds (CHF-Collegiate Housing Stephenville III, LLC - Tarleton State University Project), Series
2015-A, 5.00% 2047
| 8,870
| 9,468
|
Newark Higher Education Fin. Corp., Education Rev. Bonds (Austin Achieve Public School, Inc.),
Series 2017-A, 5.00% 2032
| 750
| 780
|
Newark Higher Education Fin. Corp., Education Rev. Bonds (Austin Achieve Public School, Inc.),
Series 2017-A, 5.00% 2037
| 600
| 620
|
Newark Higher Education Fin. Corp., Education Rev. Bonds (Austin Achieve Public School, Inc.),
Series 2017-A, 5.00% 2042
| 1,000
| 1,028
|
Newark Higher Education Fin. Corp., Education Rev. Bonds (Austin Achieve Public School, Inc.),
Series 2017-A, 5.25% 2048
| 3,460
| 3,575
|
| North Harris County Regional Water Auth., Rev. and Rev. Ref. Bonds, Series 2016, 5.00% 2033
| 500
| 602
|
| North Harris County Regional Water Auth., Rev. and Rev. Ref. Bonds, Series 2016, 5.00% 2034
| 1,250
| 1,499
|
| North Texas Tollway Auth., Special Projects System Rev. Bonds, Series 2011-D, 5.00% 2029 (preref. 2021)
| 735
| 793
|
| North Texas Tollway Auth., System Rev. Ref. Bonds, Series 2009-A, 6.00% 2028
| 560
| 561
|
| North Texas Tollway Auth., System Rev. Ref. Bonds, Series 2010, 6.00% 2034 (preref. 2021)
| 1,500
| 1,602
|
| North Texas Tollway Auth., System Rev. Ref. Bonds, Series 2015-A, 5.00% 2032
| 4,500
| 5,222
|
| North Texas Tollway Auth., System Rev. Ref. Bonds, Series 2015-A, 5.00% 2034
| 2,000
| 2,310
|
| North Texas Tollway Auth., System Rev. Ref. Bonds, Series 2015-A, 5.00% 2035
| 1,000
| 1,152
|
| North Texas Tollway Auth., System Rev. Ref. Bonds, Series 2015-A, 5.00% 2038
| 1,000
| 1,143
|
| North Texas Tollway Auth., System Rev. Ref. Bonds, Series 2017-A, 5.00% 2039
| 10,000
| 12,047
|
| Red River Education Fin. Corp., Higher Education Rev. Bonds (St. Edward’s University Project), Series 2016, 4.00% 2036
| 500
| 525
|
| Red River Health Facs. Dev. Corp., Retirement Fac. Rev. Bonds (MRC The Crossings Project), Series 2014-A, 7.75% 2044
| 3,315
| 3,874
|
| Red River Health Facs. Dev. Corp., Retirement Fac. Rev. Bonds (MRC The Crossings Project), Series 2014-A, 8.00% 2049
| 3,355
| 3,969
|
| SA Energy Acquisition Public Fac. Corp., Gas Supply Rev. Bonds, Series 2007, 5.50% 2020
| 1,000
| 1,037
|
| SA Energy Acquisition Public Fac. Corp., Gas Supply Rev. Bonds, Series 2007, 5.50% 2027
| 1,360
| 1,683
|
| Sam Rayburn Municipal Power Agcy., Power Supply System Rev. Ref. Bonds, Series 2012, 5.00% 2021
| 2,875
| 3,059
|
| City of Sanger, Industrial Dev. Corp., Industrial Dev. Rev. Ref. Bonds (Texas Pellets Project), Series 2012-B, AMT, 8.00% 20384
| 3,110
| 778
|
| Surface Transportation Corp., Private Activity Rev. Bonds (NTE Mobility Partners Segments 3 LLC Segment 3C Project), Series 2019, AMT, 5.00% 2058
| 5,000
| 5,735
|
| County of Tarrant, Cultural Education Facs. Fin. Corp., Retirement Fac. Rev. Bonds (Air Force Villages Obligated Group), Series 2016, 4.00% 2027
| 9,890
| 10,402
|
| County of Tarrant, Cultural Education Facs. Fin. Corp., Retirement Fac. Rev. Bonds (Air Force Villages Obligated Group), Series 2016, 4.00% 2031
| 5,500
| 5,708
|
| County of Tarrant, Cultural Education Facs. Fin. Corp., Retirement Fac. Rev. Bonds (Air Force Villages Obligated Group), Series 2016, 5.00% 2037
| 5,750
| 6,275
|
| County of Tarrant, Cultural Education Facs. Fin. Corp., Retirement Fac. Rev. Bonds (Air Force Villages Obligated Group), Series 2016, 5.00% 2045
| 12,115
| 13,086
|
| County of Tarrant, Cultural Education Facs. Fin. Corp., Retirement Fac. Rev. Bonds (Barton Creek Senior Living Center, Inc. - Querencia Project), Series 2015,
5.00% 2024
| 1,610
| 1,680
|
| County of Tarrant, Cultural Education Facs. Fin. Corp., Retirement Fac. Rev. Bonds (Barton Creek Senior Living Center, Inc. - Querencia Project), Series 2015,
5.00% 2030
| 1,650
| 1,686
|
| County of Tarrant, Cultural Education Facs. Fin. Corp., Retirement Fac. Rev. Bonds (Barton Creek Senior Living Center, Inc. - Querencia Project), Series 2015, 5.00% 2040
| 1,375
| 1,373
|
American High-Income Municipal Bond Fund —
Page 63 of 74
Bonds, notes & other debt instruments (continued)
Texas (continued)
| Principal amount
(000)
| Value
(000)
|
| County of Tarrant, Cultural Education Facs. Fin. Corp., Retirement Fac. Rev. Bonds (Buckingham Senior Living Community, Inc. Project), Series 2007, 5.75% 20374
| $7,170
| $5,002
|
| County of Tarrant, Cultural Education Facs. Fin. Corp., Retirement Fac. Rev. Bonds (Buckner Senior Living), Series 2017-B-3, 3.875% 2022
| 2,750
| 2,751
|
| County of Tarrant, Cultural Education Facs. Fin. Corp., Retirement Fac. Rev. Bonds (Northwest Senior Housing Corp.), Series 2017, 5.25% 2047
| 4,280
| 4,384
|
| County of Tarrant, Cultural Education Facs. Fin. Corp., Retirement Fac. Rev. Bonds (The Stayton at Museum Way Project), Series 2009-A, 8.00% 20214
| 70
| 67
|
| County of Tarrant, Cultural Education Facs. Fin. Corp., Retirement Fac. Rev. Ref. Bonds (Buckingham Senior Living Project), Series 2015-A, 5.25% 20354
| 900
| 628
|
| County of Tarrant, Cultural Education Facs. Fin. Corp., Retirement Fac. Rev. Ref. Bonds (Buckingham Senior Living Project), Series 2015-A, 5.50% 20454
| 625
| 436
|
County of Tarrant, Cultural Education Facs. Fin. Corp., Rev. Ref. Bonds (Trinity Terrace Project),
Series 2015-A-1, 5.00% 2045
| 2,190
| 2,202
|
County of Tarrant, Cultural Education Facs. Fin. Corp., Rev. Ref. Bonds (Trinity Terrace Project),
Series 2015-B, 5.00% 2036
| 1,000
| 1,018
|
| Transportation Commission, Central Texas Turnpike System Rev. Ref. Bonds, Series 2015-C, 5.00% 2030
| 2,000
| 2,284
|
| Transportation Commission, Central Texas Turnpike System Rev. Ref. Bonds, Series 2015-C, 5.00% 2032
| 5,000
| 5,676
|
| Transportation Commission, Central Texas Turnpike System Rev. Ref. Bonds, Series 2015-C, 5.00% 2037
| 5,000
| 5,609
|
| Transportation Commission, State Highway 249 System First Tier Toll Rev. Bonds, Capital Appreciation Bonds, Series 2019-A, 0% 2041
| 430
| 170
|
| Transportation Commission, State Highway 249 System First Tier Toll Rev. Bonds, Capital Appreciation Bonds, Series 2019-A, 0% 2042
| 2,370
| 886
|
| County of Travis, Health Facs. Dev. Corp., Rev. Bonds (Westminster Manor Project), Series 2010, 7.00% 2030
| 315
| 326
|
County of Travis, Health Facs. Dev. Corp., Rev. Bonds (Westminster Manor Project), Series 2010,
7.00% 2030 (preref. 2020)
| 805
| 862
|
County of Travis, Health Facs. Dev. Corp., Rev. Bonds (Westminster Manor Project), Series 2010,
7.125% 2040 (preref. 2020)
| 3,750
| 4,021
|
| Turnpike Auth., Central Texas Turnpike System, Rev. Bonds, Capital Appreciation Bonds, Series 2002-A, AMBAC insured, 0% 2027
| 3,280
| 2,805
|
| Turnpike Auth., Central Texas Turnpike System, Rev. Bonds, Capital Appreciation Bonds, Series 2002-A, AMBAC insured, 0% 2028
| 17,800
| 14,645
|
| Turnpike Auth., Central Texas Turnpike System, Rev. Bonds, Capital Appreciation Bonds, Series 2002-A, AMBAC insured, 0% 2029
| 10,500
| 8,343
|
| County of Wood, Central Hospital Dist., Hospital Rev. Bonds (East Texas Medical Center Quitman Project), Series 2011, 6.00% 2041 (preref. 2021)
| 9,035
| 9,936
|
|
|
| 454,227
|
| United States 0.07%
|
|
|
| Freddie Mac, Multi Family Certificates, Series 2010-M-024, AMT, 2.304% 2027
| 3,000
| 3,000
|
| Freddie Mac, Multi Family Mortgage Bonds, Series 2019-ML-05, Class AUS, 3.40% 2036
| 2,133
| 2,329
|
|
|
| 5,329
|
| Utah 0.46%
|
|
|
| Charter School Fin. Auth., Charter School Rev. Ref. Bonds (Early Light Academy), Series 2017, 5.00% 20462
| 7,405
| 7,817
|
| Hideout Local Dist. No. 1, Special Assessment Bonds, Series 2017, 6.75% 20372
| 27,420
| 28,083
|
|
|
| 35,900
|
| Vermont 0.39%
|
|
|
| Econ. Dev. Auth., Solid Waste Disposal Rev. Bonds (Casella Waste Systems, Inc. Project), Series 2013, AMT, 4.625% 2036 (put 2028)2
| 250
| 277
|
| Student Assistance Corp., Education Loan Rev. Bonds, Series 2017-A, AMT, 3.75% 2028
| 2,650
| 2,842
|
| Student Assistance Corp., Education Loan Rev. Bonds, Series 2017-A, AMT, 4.00% 2029
| 3,090
| 3,348
|
| Student Assistance Corp., Education Loan Rev. Bonds, Series 2017-A, AMT, 4.00% 2030
| 1,770
| 1,904
|
| Student Assistance Corp., Education Loan Rev. Bonds, Series 2017-A, AMT, 4.00% 2031
| 970
| 1,034
|
American High-Income Municipal Bond Fund —
Page 64 of 74
Bonds, notes & other debt instruments (continued)
Vermont (continued)
| Principal amount
(000)
| Value
(000)
|
| Student Assistance Corp., Education Loan Rev. Bonds, Series 2017-A, AMT, 4.00% 2032
| $530
| $566
|
| Student Assistance Corp., Education Loan Rev. Bonds, Series 2017-A, AMT, 5.00% 2027
| 2,150
| 2,597
|
| Student Assistance Corp., Education Loan Rev. Bonds, Series 2018-A, AMT, 3.625% 2029
| 1,000
| 1,051
|
| Student Assistance Corp., Education Loan Rev. Bonds, Series 2018-A, AMT, 3.75% 2030
| 790
| 836
|
| Student Assistance Corp., Education Loan Rev. Bonds, Series 2018-A, AMT, 4.00% 2031
| 500
| 532
|
| Student Assistance Corp., Education Loan Rev. Bonds, Series 2018-A, AMT, 4.00% 2032
| 400
| 425
|
| Student Assistance Corp., Education Loan Rev. Bonds, Series 2018-A, AMT, 4.375% 2046
| 1,850
| 1,938
|
| Student Assistance Corp., Education Loan Rev. Bonds, Series 2018-A, AMT, 5.00% 2025
| 300
| 351
|
| Student Assistance Corp., Education Loan Rev. Bonds, Series 2018-A, AMT, 5.00% 2026
| 500
| 595
|
| Student Assistance Corp., Education Loan Rev. Bonds, Series 2018-A, AMT, 5.00% 2027
| 300
| 355
|
| Student Assistance Corp., Education Loan Rev. Bonds, Series 2018-A, AMT, 5.00% 2028
| 500
| 589
|
| Student Assistance Corp., Education Loan Rev. Bonds, Series 2019-A, AMT, 3.00% 2035
| 8,275
| 8,437
|
| Student Assistance Corp., Education Loan Rev. Bonds, Series 2019-B, AMT, 4.00% 2047
| 2,150
| 2,202
|
|
|
| 29,879
|
| Virgin Islands 0.03%
|
|
|
| Public Fin. Auth., Rev. Bonds (Matching Fund Loan Note - Diageo Project), Series 2009-A, 6.625% 2029
| 2,500
| 2,506
|
| Virginia 2.31%
|
|
|
| City of Alexandria, Industrial Dev. Auth., Demand Rev. Ref. Bonds (Goodwin House), Series 2015, 5.00% 2045
| 3,000
| 3,315
|
| County of Botetourt, Industrial Dev. Auth., Residential Care Fac. Rev. Ref. Bonds (Glebe, Inc.), Series 2014-A, 6.00% 2044
| 3,000
| 3,319
|
City of Chesapeake, Chesapeake Transportation System Toll Road Rev. Ref. Bonds,
Convertible Capital Appreciation Bonds, Series 2012-B, 0% 2040 (4.875% on 7/15/2023)1
| 1,500
| 1,454
|
| Town of Farmville, Industrial Dev, Auth., Educational Facs. Rev. Ref. Bonds (Longwood University Student Housing Project), Series 2018-A, 5.00% 2038
| 3,250
| 3,725
|
| Town of Farmville, Industrial Dev. Auth., Educational Facs. Rev. Ref. Bonds (Longwood University Student Housing Project), Series 2018-A, 5.00% 2043
| 2,500
| 2,828
|
| Town of Farmville, Industrial Dev. Auth., Educational Facs. Rev. Ref. Bonds (Longwood University Student Housing Project), Series 2018-A, 5.00% 2048
| 4,000
| 4,508
|
| Town of Farmville, Industrial Dev. Auth., Educational Facs. Rev. Ref. Bonds (Longwood University Student Housing Project), Series 2018-A, 5.00% 2055
| 9,805
| 10,967
|
| County of Hanover, Econ. Dev. Auth., Residential Care Fac. Rev. Ref. Bonds (Covenant Woods), Series 2012-A, 5.00% 2042
| 1,000
| 1,036
|
| County of Hanover, Econ. Dev. Auth., Residential Care Fac. Rev. Ref. Bonds (Covenant Woods), Series 2018, 5.00% 2048
| 1,400
| 1,512
|
| County of Hanover, Econ. Dev. Auth., Residential Care Fac. Rev. Ref. Bonds (Covenant Woods), Series 2018, 5.00% 2051
| 2,375
| 2,562
|
| City of Harrisonburg, Industrial Dev. Auth., Residential Care Fac. Rev. Ref. Bonds (Sunnyside Presbyterian Home), Series 2013-B, 6.50% 2039
| 1,000
| 1,128
|
County of Henrico, Econ. Dev. Auth., Residential Care Fac. Rev. Bonds (Pinnacle Living), Series 2019-A,
5.00% 2034
| 1,000
| 1,127
|
County of Henrico, Econ. Dev. Auth., Residential Care Fac. Rev. Bonds (Pinnacle Living), Series 2019-A,
5.00% 2039
| 5,970
| 6,659
|
County of Henrico, Econ. Dev. Auth., Residential Care Fac. Rev. Bonds (Pinnacle Living), Series 2019-A,
5.00% 2044
| 2,045
| 2,264
|
County of Henrico, Econ. Dev. Auth., Residential Care Fac. Rev. Bonds (Pinnacle Living), Series 2019-A,
5.00% 2049
| 4,070
| 4,494
|
County of Henrico, Econ. Dev. Auth., Residential Care Fac. Rev. Bonds (Pinnacle Living), Series 2019-A,
5.00% 2052
| 1,970
| 2,172
|
County of Henrico, Econ. Dev. Auth., Residential Care Fac. Rev. Ref. Bonds (Lifespire of Virginia),
Series 2017-C, 5.00% 2037
| 1,445
| 1,625
|
County of Henrico, Econ. Dev. Auth., Residential Care Fac. Rev. Ref. Bonds (Lifespire of Virginia),
Series 2017-C, 5.00% 2047
| 6,600
| 7,285
|
American High-Income Municipal Bond Fund —
Page 65 of 74
Bonds, notes & other debt instruments (continued)
Virginia (continued)
| Principal amount
(000)
| Value
(000)
|
County of Henrico, Econ. Dev. Auth., Residential Care Fac. Rev. Ref. Bonds (United Methodist Homes),
Series 2012, 5.00% 2020
| $365
| $374
|
| Heritage Hunt Commercial Community Dev. Auth., Special Assessment Bonds, Series 1999-B, 7.00% 2029
| 367
| 367
|
| Mosaic Dist. Community Dev. Auth., Rev. Bonds, Series 2011-A, 6.875% 2036
| 1,210
| 1,280
|
City of Newport News, Econ. Dev. Auth., Residential Care Facs. Rev. Ref. Bonds (Lifespare of Virginia),
Series 2016, 5.00% 2038
| 200
| 215
|
| City of Newport News, Industrial Dev. Auth., Health Systems Rev. Bonds, Series 2017-A, 5.00% 20462
| 9,250
| 10,156
|
| City of Newport News, Industrial Dev. Auth., Health Systems Rev. Ref. Bonds (Custodial Receipts), Series 2015, 5.33% 20452
| 27,900
| 30,374
|
| County of Norfolk, Redev. and Housing Auth. Bonds (Fort Norfolk Retirement Community Inc.), Series 2019, 5.00% 2049
| 7,500
| 8,087
|
| County of Norfolk, Redev. and Housing Auth. Bonds (Fort Norfolk Retirement Community Inc.), Series 2019, 5.25% 2054
| 8,000
| 8,673
|
| Peninsula Town Center Community Dev. Auth., Special Obligation Rev. Ref. Bonds, Series 2018, 4.00% 20232
| 445
| 460
|
| Peninsula Town Center Community Dev. Auth., Special Obligation Rev. Ref. Bonds, Series 2018, 4.50% 20282
| 725
| 785
|
| Peninsula Town Center Community Dev. Auth., Special Obligation Rev. Ref. Bonds, Series 2018, 5.00% 20372
| 1,500
| 1,641
|
| Peninsula Town Center Community Dev. Auth., Special Obligation Rev. Ref. Bonds, Series 2018, 5.00% 20452
| 2,350
| 2,550
|
County of Prince William, Industrial Dev. Auth., Residential Care Fac. Rev. and Rev. Ref. Bonds
(Westminster at Lake Ridge), Series 2016, 5.00% 2031
| 635
| 723
|
County of Prince William, Industrial Dev. Auth., Residential Care Fac. Rev. and Rev. Ref. Bonds
(Westminster at Lake Ridge), Series 2016, 5.00% 2046
| 880
| 974
|
Small Business Fncg. Auth., Private Activity Rev. Bonds (Transform 66 P3 Project), Series 2017, AMT,
5.00% 2049
| 2,000
| 2,280
|
Small Business Fncg. Auth., Private Activity Rev. Bonds (Transform 66 P3 Project), Series 2017, AMT,
5.00% 2052
| 7,000
| 7,953
|
| Small Business Fncg. Auth., Residential Care Fac. Rev. Bonds (Pinnacle Living), Series 2017-C, 5.00% 2032
| 1,425
| 1,568
|
| Small Business Fncg. Auth., Residential Care Fac. Rev. Bonds (Pinnacle Living), Series 2017-C, 5.00% 2037
| 4,075
| 4,447
|
| Small Business Fncg. Auth., Residential Care Fac. Rev. Bonds (Pinnacle Living), Series 2017-C, 5.00% 2042
| 3,500
| 3,793
|
| Small Business Fncg. Auth., Residential Care Fac. Rev. Bonds (Pinnacle Living), Series 2017-C, 5.00% 2047
| 4,510
| 4,876
|
| Small Business Fncg. Auth., Residential Care Fac. Rev. Bonds (Pinnacle Living), Series 2017-C, 5.00% 2052
| 8,425
| 9,092
|
| Small Business Fncg. Auth., Rev. Bonds (95 Express Lane LLC Project), Series 2019, AMT, 5.00% 2044
| 1,000
| 1,062
|
| Small Business Fncg. Auth., Rev. Bonds (95 Express Lane LLC Project), Series 2019, AMT, 5.00% 2049
| 2,000
| 2,122
|
| Small Business Fncg. Auth., Rev. Bonds (Elizabeth River Crossings Opco, LLC Project), Series 2012, AMT, 5.25% 2032
| 6,940
| 7,577
|
| Small Business Fncg. Auth., Rev. Ref. Bonds (Hampton University), Series 2014, 5.25% 2029
| 2,250
| 2,640
|
Small Business Fncg. Auth., Solid Waste Disposal Rev. Bonds (Covanta Project), Series 2018-C, AMT,
5.00% 20481,2
| 1,500
| 1,571
|
| County of Stafford, Econ. Dev. Auth., Hospital Facs. Rev. Ref. Bonds (Mary Washington Healthcare Obligated Group), Series 2016, 5.00% 2036
| 1,000
| 1,167
|
| Watkins Centre Community Dev. Auth., Rev. Bonds, Series 2007, 5.40% 2020
| 242
| 242
|
|
|
| 179,029
|
| Washington 1.46%
|
|
|
| Convention Center Public Facs. Dist., Lodging Tax Bonds, Series 2010-B, 5.00% 2043
| 5,000
| 5,952
|
| Convention Center Public Facs. Dist., Lodging Tax Bonds, Series 2010-B, 5.00% 2048
| 10,000
| 11,797
|
| Econ. Dev. Fin. Auth., Solid Waste Disposal Rev. Bonds (Waste Management, Inc. Project), Series 2008, 2.125% 20202
| 1,250
| 1,250
|
Health Care Facs. Auth., Rev. Bonds (Catholic Health Initiatives), Series 2013-B-1,
(SIFMA Municipal Swap Index + 1.00%) 2.40% 2035 (put 2021)3
| 7,375
| 7,388
|
| Health Care Facs. Auth., Rev. Bonds (Kadlec Regional Medical Center), Series 2012, 5.00% 2042 (preref. 2021)
| 1,250
| 1,360
|
| Health Care Facs. Auth., Rev. Bonds (Yakima Valley Memorial Hospital Association), Series 2016, 5.00% 2036
| 2,620
| 2,929
|
| Health Care Facs. Auth., Rev. Bonds (Yakima Valley Memorial Hospital Association), Series 2016, 5.00% 2041
| 1,920
| 2,114
|
| Housing Fin. Commission, Nonprofit Housing Rev. and Rev. Ref. Bonds (Horizon House Project), Series 2017, 5.00% 20312
| 1,000
| 1,150
|
American High-Income Municipal Bond Fund —
Page 66 of 74
Bonds, notes & other debt instruments (continued)
Washington (continued)
| Principal amount
(000)
| Value
(000)
|
| Housing Fin. Commission, Nonprofit Housing Rev. and Rev. Ref. Bonds (Horizon House Project), Series 2017, 5.00% 20332
| $1,050
| $1,197
|
| Housing Fin. Commission, Nonprofit Housing Rev. Bonds (Hearthstone Project), Series 2018-B, 3.125% 20232
| 2,500
| 2,501
|
Housing Fin. Commission, Nonprofit Housing Rev. Ref. Bonds (Herons Key Senior Living Project),
Series 2015-A, 6.50% 20302
| 800
| 863
|
Housing Fin. Commission, Nonprofit Housing Rev. Ref. Bonds (Herons Key Senior Living Project),
Series 2015-A, 6.75% 20352
| 1,630
| 1,756
|
Housing Fin. Commission, Nonprofit Housing Rev. Ref. Bonds (Herons Key Senior Living Project),
Series 2015-A, 7.00% 20452
| 4,170
| 4,473
|
Housing Fin. Commission, Nonprofit Housing Rev. Ref. Bonds (Herons Key Senior Living Project),
Series 2015-A, 7.00% 20502
| 1,625
| 1,739
|
Housing Fin. Commission, Nonprofit Housing Rev. Ref. Bonds (Horizon House Project), Series 2017,
5.00% 20382
| 2,350
| 2,646
|
Housing Fin. Commission, Nonprofit Housing Rev. Ref. Bonds (Horizon House Project), Series 2017,
5.00% 20432
| 3,100
| 3,468
|
Housing Fin. Commission, Nonprofit Housing Rev. Ref. Bonds (Horizon House Project), Series 2017,
5.00% 20482
| 2,700
| 3,010
|
| Housing Fin. Commission, Nonprofit Housing Rev. Ref. Bonds (Judson Park Project), Series 2018, 5.00% 20332
| 250
| 275
|
| Housing Fin. Commission, Nonprofit Housing Rev. Ref. Bonds (Judson Park Project), Series 2018, 5.00% 20482
| 750
| 805
|
Housing Fin. Commission, Nonprofit Housing Rev. Ref. Bonds (Rockwood Retirement Project),
Series 2014-A, 7.375% 20442
| 7,000
| 8,014
|
Housing Fin. Commission, Nonprofit Housing Rev. Ref. Bonds (Rockwood Retirement Project),
Series 2014-A, 7.50% 20492
| 9,090
| 10,433
|
| Housing Fin. Commission, Single Family Program Bonds, Series 2014-2A-R, AMT, 3.50% 2044
| 1,175
| 1,211
|
| Kalispel Tribe of Indians, Priority Distribution Payment Bonds, Series 2018-A, 5.00% 20322
| 1,955
| 2,181
|
| Kalispel Tribe of Indians, Priority Distribution Payment Bonds, Series 2018-A, 5.25% 20382
| 6,245
| 6,906
|
| Kalispel Tribe of Indians, Priority Distribution Payment Bonds, Series 2018-B, 5.00% 20322
| 600
| 669
|
| Kalispel Tribe of Indians, Priority Distribution Payment Bonds, Series 2018-B, 5.25% 20382
| 600
| 664
|
| Port of Seattle, Industrial Dev. Corp., Special Facs. Rev. Ref. Bonds (Delta Air Lines, Inc. Project), Series 2012, AMT, 5.00% 2030
| 4,825
| 5,269
|
| Port of Seattle, Rev. Ref. Bonds, Series 2015-C, AMT, 5.00% 2035
| 1,500
| 1,700
|
| Port of Seattle, Special Fac. Rev. Ref. Bonds (SEATAC Fuel Facs. LLC), Series 2013, AMT, 5.00% 2030
| 2,000
| 2,230
|
| Port of Seattle, Special Fac. Rev. Ref. Bonds (SEATAC Fuel Facs. LLC), Series 2013, AMT, 5.00% 2031
| 2,000
| 2,203
|
| County of Skagit, Public Hospital Dist. No. 1 (Skagit Regional Health), Hospital Rev. Improvement and Rev. Ref. Bonds, Series 2013-A, 5.00% 2037
| 4,000
| 4,362
|
| County of Skagit, Public Hospital Dist. No. 1 (Skagit Regional Health), Hospital Rev. Improvement and Rev. Ref. Bonds, Series 2016, 4.00% 2025
| 500
| 562
|
| County of Skagit, Public Hospital Dist. No. 1 (Skagit Regional Health), Hospital Rev. Improvement and Rev. Ref. Bonds, Series 2016, 5.00% 2027
| 1,000
| 1,179
|
| County of Skagit, Public Hospital Dist. No. 1 (Skagit Regional Health), Hospital Rev. Improvement and Rev. Ref. Bonds, Series 2016, 5.00% 2028
| 2,440
| 2,867
|
| County of Skagit, Public Hospital Dist. No. 1 (Skagit Regional Health), Hospital Rev. Improvement and Rev. Ref. Bonds, Series 2016, 5.00% 2029
| 1,000
| 1,168
|
| County of Skagit, Public Hospital Dist. No. 1 (Skagit Regional Health), Hospital Rev. Improvement and Rev. Ref. Bonds, Series 2016, 5.00% 2030
| 1,500
| 1,741
|
| County of Skagit, Public Hospital Dist. No. 1 (Skagit Regional Health), Hospital Rev. Improvement and Rev. Ref. Bonds, Series 2016, 5.00% 2031
| 1,500
| 1,729
|
| County of Skagit, Public Hospital Dist. No. 1 (Skagit Regional Health), Hospital Rev. Improvement and Rev. Ref. Bonds, Series 2016, 5.00% 2032
| 1,500
| 1,720
|
|
|
| 113,481
|
American High-Income Municipal Bond Fund —
Page 67 of 74
Bonds, notes & other debt instruments (continued)
West Virginia 0.29%
| Principal amount
(000)
| Value
(000)
|
Econ. Dev. Auth., Solid Waste Disposal Facs. Rev. Bonds (Appalachian Power Co. - Amos Project),
Series 2011-A, AMT, 1.70% 2041 (put 2020)
| $2,100
| $2,099
|
Econ. Dev. Auth., Solid Waste Disposal Facs. Rev. Ref. Bonds (Wheeling Power Co. - Mitchell Project),
Series 2013-A, AMT, 3.00% 2037 (put 2022)
| 6,550
| 6,652
|
| County of Harrison, Solid Waste Disposal Rev. Ref. Bonds (Monongahela Power Co. Project), Series 2018-A, AMT, 3.00% 2037 (put 2021)
| 6,000
| 6,036
|
| Hospital Fin. Auth., Hospital Rev. Ref. and Improvement Rev. Bonds (Cabell Huntington Hospital Obligated Group), Series 2018-A, 4.125% 2047
| 2,000
| 2,112
|
| Hospital Fin. Auth., Hospital Rev. Ref. and Improvement Rev. Bonds (Cabell Huntington Hospital Obligated Group), Series 2018-A, 5.00% 2043
| 4,700
| 5,474
|
|
|
| 22,373
|
| Wisconsin 2.51%
|
|
|
Health and Educational Facs. Auth., Rev. Bonds (Advocate Aurora Health Care Credit Group),
Series 2018-C-3, (SIFMA Municipal Swap Index + 0.55%) 1.95% 2054 (put 2023)3
| 6,750
| 6,756
|
Health and Educational Facs. Auth., Rev. Bonds (Agnesian HealthCare, Inc.), Series 2013-B,
5.00% 2036 (preref. 2023)
| 2,000
| 2,287
|
| Health and Educational Facs. Auth., Rev. Bonds (Ascension Health Senior Credit Group), Series 2016-A, 4.00% 2039
| 500
| 542
|
| Health and Educational Facs. Auth., Rev. Bonds (Ascension Health Senior Credit Group), Series 2016-A, 5.00% 2039
| 1,000
| 1,162
|
| Health and Educational Facs. Auth., Rev. Bonds (Benevolent Corporation Cedar Community), Series 2017, 5.00% 2023
| 1,085
| 1,170
|
| Health and Educational Facs. Auth., Rev. Bonds (Benevolent Corporation Cedar Community), Series 2017, 5.00% 2024
| 1,165
| 1,269
|
| Health and Educational Facs. Auth., Rev. Bonds (Benevolent Corporation Cedar Community), Series 2017, 5.00% 2025
| 1,225
| 1,348
|
| Health and Educational Facs. Auth., Rev. Bonds (Benevolent Corporation Cedar Community), Series 2017, 5.00% 2026
| 1,285
| 1,427
|
| Health and Educational Facs. Auth., Rev. Bonds (Benevolent Corporation Cedar Community), Series 2017, 5.00% 2027
| 1,350
| 1,505
|
| Health and Educational Facs. Auth., Rev. Bonds (Benevolent Corporation Cedar Community), Series 2017, 5.00% 2029
| 1,485
| 1,641
|
| Health and Educational Facs. Auth., Rev. Bonds (Benevolent Corporation Cedar Community), Series 2017, 5.00% 2031
| 1,640
| 1,798
|
| Health and Educational Facs. Auth., Rev. Bonds (Benevolent Corporation Cedar Community), Series 2017, 5.00% 2037
| 1,220
| 1,313
|
Health and Educational Facs. Auth., Rev. Bonds (Children’s Hospital of Wisconsin, Inc.), Series 2008-B,
5.375% 2037 (preref. 2020)
| 2,000
| 2,045
|
| Health and Educational Facs. Auth., Rev. Bonds (Clement Manor, Inc.), Series 2019, 5.00% 2049
| 3,750
| 3,759
|
Health and Educational Facs. Auth., Rev. Bonds (Marshfield Clinic Health System, Inc.), Series 2016-B,
5.00% 2034
| 1,800
| 2,076
|
Health and Educational Facs. Auth., Rev. Bonds (Marshfield Clinic Health System, Inc.), Series 2016-B,
5.00% 2042
| 2,215
| 2,486
|
Health and Educational Facs. Auth., Rev. Bonds (Marshfield Clinic Health System, Inc.), Series 2016-B,
5.00% 2046
| 3,205
| 3,587
|
Health and Educational Facs. Auth., Rev. Bonds (Marshfield Clinic Health System, Inc.), Series 2017-C,
5.00% 2047
| 6,000
| 6,779
|
| Health and Educational Facs. Auth., Rev. Bonds (Milwaukee Regional Medical Center Thermal Service, Inc.), Series 2018, 5.00% 2044
| 1,600
| 1,909
|
Health and Educational Facs. Auth., Rev. Bonds (St. John’s Communities, Inc.), Series 2009-A,
7.625% 2039 (preref. 2019)
| 1,000
| 1,008
|
Health and Educational Facs. Auth., Rev. Ref. Bonds (The Monroe Clinic, Inc.), Series 2016,
4.00% 2033 (preref. 2025)
| 550
| 632
|
| Housing and Econ. Dev. Auth., Home Ownership Rev. Bonds, Series 2016-A, AMT, 3.50% 2046
| 13,425
| 13,993
|
American High-Income Municipal Bond Fund —
Page 68 of 74
Bonds, notes & other debt instruments (continued)
Wisconsin (continued)
| Principal amount
(000)
| Value
(000)
|
| Housing and Econ. Dev. Auth., Home Ownership Rev. Bonds, Series 2016-E, AMT, 3.50% 2046
| $3,500
| $3,669
|
| Public Fin. Auth., Airport Facs. Rev. Ref. Bonds (Transportation Infrastructure Properties, LLC Obligated Group), Series 2012-B, AMT, 5.00% 2022
| 45
| 48
|
| Public Fin. Auth., Airport Facs. Rev. Ref. Bonds (Transportation Infrastructure Properties, LLC Obligated Group), Series 2012-B, AMT, 5.00% 2042
| 450
| 480
|
Public Fin. Auth., Charter School Rev. Bonds (American Preparatory Academy - Las Vegas Project),
Series 2017-A, 5.375% 20472
| 5,000
| 5,457
|
Public Fin. Auth., Charter School Rev. Bonds (American Preparatory Academy - Las Vegas Project),
Series 2017-B, 5.375% 20522
| 2,000
| 2,176
|
| Public Fin. Auth., Education Rev. Bonds (North Carolina Leadership Academy), Series 2019-A, 5.00% 20392
| 820
| 868
|
| Public Fin. Auth., Education Rev. Bonds (North Carolina Leadership Academy), Series 2019-A, 5.00% 20492
| 520
| 546
|
| Public Fin. Auth., Education Rev. Bonds (North Carolina Leadership Academy), Series 2019-A, 5.00% 20542
| 1,365
| 1,424
|
| Public Fin. Auth., Exempt Facs. Rev. Ref. Bonds (Celanese Project), Series 2016-A, AMT, 5.00% 20242
| 1,605
| 1,778
|
| Public Fin. Auth., Exempt Facs. Rev. Ref. Bonds (Celanese Project), Series 2016-A, AMT, 5.00% 20252
| 1,000
| 1,148
|
| Public Fin. Auth., Exempt Facs. Rev. Ref. Bonds (National Gypsum Co.), Series 2014, AMT, 5.25% 2030
| 3,000
| 3,302
|
| Public Fin. Auth., Exempt Facs. Rev. Ref. Bonds (National Gypsum Co.), Series 2016, AMT, 4.00% 2035
| 9,200
| 9,495
|
Public Fin. Auth., Limited Obligation Grant Rev. Bonds (American Dream at Meadowlands Project),
Series 2017-A, 6.25% 20272
| 2,000
| 2,276
|
Public Fin. Auth., Limited Obligation Grant Rev. Bonds (American Dream at Meadowlands Project),
Series 2017-A, 6.75% 20312
| 2,750
| 3,249
|
Public Fin. Auth., Limited Obligation PILOT Rev. Bonds (American Dream at Meadowlands Project),
Series 2017, 7.00% 20502
| 4,000
| 4,780
|
Public Fin. Auth., Retirement Community Rev. Bonds (Evergreens Obligated Group), Series 2019-A,
5.00% 2044
| 1,750
| 1,994
|
Public Fin. Auth., Retirement Community Rev. Bonds (Evergreens Obligated Group), Series 2019-A,
5.00% 2049
| 1,500
| 1,704
|
| Public Fin. Auth., Rev. Bonds (Denver International Airport Great Hall Project), Series 2017, AMT, 5.00% 2026
| 1,000
| 1,184
|
| Public Fin. Auth., Rev. Bonds (Prime Healthcare Foundation), Series 2018, 5.35% 2045
| 1,000
| 1,152
|
| Public Fin. Auth., Rev. Bonds (Retirement Housing Foundation), Series 2017-B, 5.00% 2027
| 2,345
| 2,750
|
| Public Fin. Auth., Rev. Bonds (Roseman University of Health Sciences Project), Series 2012, 5.50% 2032
| 500
| 529
|
| Public Fin. Auth., Rev. Bonds (Roseman University of Health Sciences Project), Series 2012, 5.75% 2042
| 5,000
| 5,267
|
| Public Fin. Auth., Rev. Bonds (Roseman University of Health Sciences Project), Series 2015, 5.75% 2035
| 3,000
| 3,357
|
| Public Fin. Auth., Rev. Bonds (Roseman University of Health Sciences Project), Series 2015, 5.875% 2045
| 6,250
| 6,935
|
| Public Fin. Auth., Rev. Bonds (Wilson Preparatory Academy), Series 2019-A, 4.125% 20292
| 545
| 564
|
| Public Fin. Auth., Rev. Bonds (Wilson Preparatory Academy), Series 2019-A, 5.00% 20392
| 500
| 521
|
| Public Fin. Auth., Rev. Bonds (Wilson Preparatory Academy), Series 2019-A, 5.00% 20492
| 1,100
| 1,137
|
| Public Fin. Auth., Senior Living Rev. Bonds (Mary’s Woods at Marylhurst Project), Series 2017-A, 5.00% 20322
| 1,280
| 1,418
|
| Public Fin. Auth., Senior Living Rev. Bonds (Mary’s Woods at Marylhurst Project), Series 2017-A, 5.25% 20372
| 650
| 720
|
| Public Fin. Auth., Senior Living Rev. Bonds (Mary’s Woods at Marylhurst Project), Series 2017-A, 5.25% 20422
| 250
| 274
|
| Public Fin. Auth., Senior Living Rev. Bonds (Mary’s Woods at Marylhurst Project), Series 2017-A, 5.25% 20472
| 900
| 984
|
| Public Fin. Auth., Senior Living Rev. Bonds (Mary’s Woods at Marylhurst Project), Series 2017-A, 5.25% 20522
| 2,300
| 2,507
|
| Public Fin. Auth., Senior Living Rev. Bonds (Rose Villa Project), Series 2014-A, 5.50% 20342
| 1,000
| 1,071
|
| Public Fin. Auth., Senior Living Rev. Bonds (Rose Villa Project), Series 2014-A, 5.75% 20442
| 1,800
| 1,946
|
| Public Fin. Auth., Solid Waste Disposal Rev. Ref. Bonds (Waste Management, Inc. Project), Series 2016-A-4, AMT, 2.00% 2033 (put 2021)
| 1,500
| 1,512
|
| Public Fin. Auth., Solid Waste Disposal Rev. Ref. Bonds (Waste Management, Inc. Project), Series 2017-A-3, AMT, 1.95% 2027 (put 2019)
| 2,000
| 2,000
|
| Public Fin. Auth., Student Housing Rev. Bonds (Beyond Boone, LLC - Appalachian State University Project), Series 2019-A, Assured Guaranty Municipal insured, 5.00%
2054
| 1,700
| 1,960
|
| Public Fin. Auth., Student Housing Rev. Bonds (CHF-Cullowhee, LLC - Western Carolina University Project), Series 2015, 5.00% 2035
| 1,000
| 1,075
|
| Public Fin. Auth., Student Housing Rev. Bonds (CHF-Cullowhee, LLC - Western Carolina University Project), Series 2015, 5.25% 2047
| 2,000
| 2,151
|
| Public Fin. Auth., Student Housing Rev. Bonds (CHF-Cullowhee, LLC - Western Carolina University Project), Series 2015-A, 5.00% 2030
| 2,140
| 2,327
|
American High-Income Municipal Bond Fund —
Page 69 of 74
Bonds, notes & other debt instruments (continued)
Wisconsin (continued)
| Principal amount
(000)
| Value
(000)
|
| Public Fin. Auth., Student Housing Rev. Bonds (CHF-Wilmington, LLC - University of North Carolina Project), Series 2018, Assured Guaranty Municipal insured, 5.00%
2053
| $6,730
| $7,766
|
Public Fin. Auth., Student Housing Rev. Bonds (NC A&T Real Estate Foundation, LLC), Series 2019-A,
5.00% 2034
| 4,135
| 4,819
|
Public Fin. Auth., Student Housing Rev. Bonds (NC A&T Real Estate Foundation, LLC), Series 2019-A,
5.00% 2039
| 2,045
| 2,344
|
Public Fin. Auth., Student Housing Rev. Bonds (NC A&T Real Estate Foundation, LLC), Series 2019-A,
5.00% 2044
| 1,350
| 1,529
|
Public Fin. Auth., Student Housing Rev. Bonds (NC A&T Real Estate Foundation, LLC), Series 2019-A,
5.00% 2049
| 3,625
| 4,090
|
Public Fin. Auth., Tax Increment Fin. Grant Rev. Bonds (Statler Hilton & Dallas Central Library),
Capital Appreciation Bonds, Series 2016, 0% 2027
| 15,115
| 11,116
|
Public Fin. Auth., Tax Increment Fin. Grant Rev. Bonds (Statler Hilton & Dallas Central Library),
Capital Appreciation Bonds, Series 2016, 0% 2028
| 8,975
| 6,306
|
Public Fin. Auth., Tax Increment Fin. Grant Rev. Bonds (Statler Hilton & Dallas Central Library),
Capital Appreciation Bonds, Series 2016, 0% 2029
| 12,855
| 8,582
|
|
|
| 194,779
|
| Total bonds, notes & other debt instruments (cost: $6,875,834,000)
|
| 7,260,182
|
| Short-term securities 5.96%
|
|
|
| Freddie Mac, Multi Family Certificates, Series 2017-M-051, 1.63% 20353
| 9,095
| 9,095
|
State of Alabama, County of Mobile, Industrial Dev. Auth., Pollution Control Rev. Ref. Bonds
(ExxonMobil Project), Series 2002, 1.50% 20323
| 1,000
| 1,000
|
State of Alaska, City of Valdez, Marine Terminal Rev. Ref. Bonds (ExxonMobil Project), Series 2001,
1.47% 20293
| 1,070
| 1,070
|
| State of California, Pollution Control Fncg. Auth., Solid Waste Disposal Rev. Ref. Bonds (Republic Services, Inc. Project), Series 2010-A, AMT, 1.90% 2023 (put
2019)2,9
| 10,000
| 10,000
|
State of California, Statewide Communities Dev. Auth., Multi Family Housing Rev. Ref. Bonds
(Westgate Pasadena Apartments Project), Series 2013-B, AMT, 1.66% 20423
| 5,000
| 5,000
|
| State of Colorado, Tax and Rev. Anticipation Notes, Series 2019, 3.00% 6/26/2020
| 3,000
| 3,049
|
| State of Florida, County of Alachua, Health Facs. Auth., IAM Commercial Paper (Shands HealthCare Project), Series 2019-A, 1.46% 8/6/2019
| 4,000
| 4,000
|
| State of Florida, Municipal Power Agcy., All-Requirements Power Supply Project Demand Rev. Ref. Bonds, Series 2008-C, 1.49% 20353
| 1,000
| 1,000
|
| State of Idaho, Tax Anticipation Notes, Series 2019, 3.00% 6/30/2020
| 12,000
| 12,195
|
State of Illinois, City of Chicago, Board of Education, Tax Anticipation Notes, Series 2018-E,
2.207% 12/13/20192,3
| 2,500
| 2,500
|
| State of Louisiana, Parish of East Baton Rouge, Industrial Dev. Board, Gulf Opportunity Zone Rev. Bonds (ExxonMobil Project), Series 2010-B, 1.47% 20403
| 2,200
| 2,200
|
State of Louisiana, Parish of East Baton Rouge, Pollution Control Rev. Ref. Bonds (ExxonMobil Project),
Series 1993, 1.47% 20223
| 5,000
| 5,000
|
State of Louisiana, Parish of East Baton Rouge, Pollution Control Rev. Ref. Bonds (ExxonMobil Project),
Series 2010-A, 1.47% 20353
| 5,700
| 5,700
|
State of Louisiana, Public Facs. Auth., Rev. Bonds (Air Products and Chemicals Project), Series 2006,
1.50% 20403
| 1,000
| 1,000
|
State of Louisiana, Public Facs. Auth., Rev. Bonds (Air Products and Chemicals Project), Series 2008,
1.50% 20433
| 1,100
| 1,100
|
State of Louisiana, Public Facs. Auth., Rev. Bonds (Air Products and Chemicals Project), Series 2008-A,
1.50% 20433
| 5,350
| 5,350
|
State of Maryland, Health and Higher Educational Facs. Auth., IAM Commercial Paper, Series 2019,
1.44% 8/6/2019
| 2,000
| 2,000
|
| State of Maryland, County of Montgomery, IAM Commercial Paper, Series 2019-A, 1.34% 10/3/2019
| 30,000
| 30,000
|
| State of Maryland, County of Montgomery, IAM Commercial Paper, Series 2019-A, 1.38% 8/6/2019
| 1,500
| 1,500
|
American High-Income Municipal Bond Fund —
Page 70 of 74
| Short-term securities (continued)
| Principal amount
(000)
| Value
(000)
|
| State of Maryland, County of Montgomery, IAM Commercial Paper, Series 2019-B, 1.40% 10/9/2019
| $7,500
| $7,500
|
State of Maryland, County of Montgomery, Rev. Bonds (Trinity Health Credit Group), Series 2013,
1.43% 2041 (put 2019)9
| 5,000
| 5,001
|
State of Massachusetts, Health and Educational Facs. Auth., IAM Commercial Paper (Harvard University),
Series 2019, 1.30% 10/16/2019
| 15,000
| 15,000
|
State of Michigan, Strategic Fund, Demand Limited Obligation Rev. Bonds
(Air Products and Chemicals, Inc. Project), Series 2007, 1.50% 20423
| 11,000
| 11,000
|
| State of Minnesota, City of St. Paul, Housing and Redev. Auth., Health Care System Demand Rev. Bonds (Allina Health System), Series 2009-B-1, JPMorgan Chase LOC,
1.46% 20353
| 3,510
| 3,510
|
State of Mississippi, Business Fin. Corp., Gulf Opportunity Zone Industrial Dev. Rev. Bonds
(Chevron U.S.A. Inc. Project), Series 2007-D, 1.48% 20303
| 25,900
| 25,900
|
State of Mississippi, Business Fin. Corp., Gulf Opportunity Zone Industrial Dev. Rev. Bonds
(Chevron U.S.A. Inc. Project), Series 2009-D, 1.48% 20303
| 2,300
| 2,300
|
State of Mississippi, Business Fin. Corp., Gulf Opportunity Zone Industrial Dev. Rev. Bonds
(Chevron U.S.A. Inc. Project), Series 2010-J, 1.48% 20353
| 12,000
| 12,000
|
State of Mississippi, Business Fin. Corp., Gulf Opportunity Zone Industrial Dev. Rev. Bonds
(Chevron U.S.A. Inc. Project), Series 2010-K, 1.52% 20353
| 3,500
| 3,500
|
State of Mississippi, Business Fin. Corp., Gulf Opportunity Zone Industrial Dev. Rev. Bonds
(Chevron U.S.A. Inc. Project), Series 2011-F, 1.48% 20353
| 6,900
| 6,900
|
State of Mississippi, Business Fin. Corp., Gulf Opportunity Zone Industrial Dev. Rev. Bonds
(Chevron U.S.A. Inc. Project), Series 2011-G, 1.52% 20353
| 14,000
| 14,000
|
| State of Nebraska, County of Lancaster, Hospital Auth. No. 1, Hospital Rev. Ref. Bonds (BryanLGH Medical Center), Series 2008-B-1, 1.47% 20313
| 9,105
| 9,105
|
State of New Hampshire, Health and Education Facs. Auth., Rev. Ref. Bonds (Dartmouth College Issue),
Series 2007-B, 1.48% 20413
| 4,000
| 4,000
|
State of New York, Metropolitan Transportation Auth., Transportation Rev. Bonds, Series 2015-E-3,
(SIFMA Municipal Swap Index + 1.70%) 1.47% 20503
| 2,905
| 2,905
|
| State of New York, New York City G.O. Bonds, Fiscal 2006, Series 2006-H-1, 1.48% 20363
| 6,180
| 6,180
|
State of New York, New York City G.O. Bonds, Fiscal 2008, Series 2008-C-4,
Assured Guaranty Municipal insured, 1.75% 20273
| 10,700
| 10,700
|
| State of New York, New York City G.O. Bonds, Fiscal 2008, Series 2008-L-5, 1.47% 20353
| 5,465
| 5,465
|
| State of New York, New York City G.O. Bonds, Fiscal 2013, Series 2013-F-3, 1.47% 20423
| 6,500
| 6,500
|
| State of New York, New York City G.O. Bonds, Fiscal 2014, Series 2014-D-3, 1.48% 20383
| 1,000
| 1,000
|
| State of New York, New York City G.O. Bonds, Fiscal 2015, Series 2015-F-6, 1.48% 20443
| 1,000
| 1,000
|
| State of New York, New York City Municipal Water Fin. Auth., Water and Sewer System Second General Resolution Rev. Bonds, Fiscal 2008, Series 2007-BB-2, 1.47%
20353
| 7,340
| 7,340
|
| State of New York, New York City Municipal Water Fin. Auth., Water and Sewer System Second General Resolution Rev. Bonds, Fiscal 2015, Series 2015-BB-1, 1.47%
20493
| 4,475
| 4,475
|
| State of New York, New York City Municipal Water Fin. Auth., Water and Sewer System Second General Resolution Rev. Bonds, Fiscal 2016, Series 2016-AA-1, 1.47%
20483
| 7,000
| 7,000
|
| State of New York, New York City Transitional Fin. Auth., Future Tax Secured Rev. Ref. Bonds, Fiscal 2015, Series 2015-E-3, 1.48% 20453
| 2,000
| 2,000
|
| State of New York, New York City Transitional Fin. Auth., Future Tax Secured Rev. Ref. Bonds, Fiscal 2016, Series 2016-E-4, 1.48% 20453
| 12,500
| 12,500
|
State of New York, New York City Transitional Fin. Auth., Recovery Bonds, Fiscal 2003, Series 2002-1-C,
1.47% 20313
| 1,600
| 1,600
|
State of North Carolina, Metropolitan Government of Nashville and Davidson County,
IAM Commercial Paper, Series 2019, 1.48% 10/2/2019
| 10,000
| 10,000
|
State of Ohio, Hospital Rev. Bonds (Cleveland Clinic Health System Obligated Group), Series 2019-F,
1.48% 20523
| 2,800
| 2,800
|
| State of Pennsylvania, Econ. Dev. Fncg. Auth., Solid Waste Disposal Rev. Bonds (Republic Services, Inc. Project), Series 2014, AMT, 1.60% 2044 (put 2019)9
| 12,300
| 12,304
|
| State of Pennsylvania, Econ. Dev. Fncg. Auth., Solid Waste Disposal Rev. Bonds (Waste Management, Inc. Project), Series 2013, AMT, 2.15% 2045 (put 2019)9
| 2,000
| 2,000
|
American High-Income Municipal Bond Fund —
Page 71 of 74
| Short-term securities (continued)
| Principal amount
(000)
| Value
(000)
|
State of Rhode Island, Health and Educational Building Corp., Higher Education Facs. Rev. Bonds
(Roger Williams University Issue), Series 2008-B, 1.39% 20383
| $5,000
| $5,000
|
State of South Carolina, Jobs-Econ. Dev. Auth., Hospital Rev. Bonds (Prisma Health Obligated Group),
Series 2018-B, 1.48% 20483
| 15,500
| 15,500
|
State of Tennessee, County of Montgomery, Public Building Auth., Pooled Fncg. Rev. Bonds
(Tennessee County Loan Pool), Series 2004, Bank of America LOC, 1.53% 20343
| 1,225
| 1,225
|
State of Tennessee, County of Montgomery, Public Building Auth., Pooled Fncg. Rev. Bonds
(Tennessee County Loan Pool), Series 2002, Bank of America LOC, 1.52% 20323
| 4,000
| 4,000
|
State of Texas, Gulf Coast Waste Disposal Auth., Pollution Control Rev. Ref. Bonds (Exxon Project),
Series 1995, 1.47% 6/1/20203
| 1,500
| 1,500
|
State of Texas, County of Harris, Cultural Education Facs. Fin. Corp., Special Facs. Rev. Ref. Bonds
(Medical Center), Series 2008-A, JPMorgan Chase LOC, 1.48% 20313
| 7,345
| 7,345
|
| State of Texas, County of Harris, Health Facs. Dev. Corp., Rev. Ref. Bonds (CHRISTUS Health), Series 2005-A-4, Assured Guaranty Municipal insured, 1.47% 20313
| 1,400
| 1,400
|
State of Texas, County of Harris, Industrial Dev. Corp., Pollution Control Rev. Bonds
(Exxon Project), Series 1984-A, 1.47% 20243
| 1,100
| 1,100
|
State of Texas, City of Houston, Combined Utility System IAM Commercial Paper, Series 2019,
1.27% 9/6/2019
| 10,000
| 10,000
|
| State of Texas, City of Houston, Tax and Rev. Anticipation Notes, Series 2019, 5.00% 6/26/2020
| 5,500
| 5,689
|
| State of Texas, County of Jefferson, Port Arthur Navigation Dist., Exempt Facs. Rev. Bonds (Emerald Renewable Diesel LLC Project), Series 2018, AMT, 1.90% 2049
(put 2019)2
| 5,000
| 5,002
|
State of Texas, County of Jefferson, Port Arthur Navigation Dist., Pollution Control Rev. Ref. Bonds
(Texaco Inc. Project), Series 1994, 1.48% 20243
| 17,400
| 17,400
|
| State of Texas, Lower Colorado River Auth., IAM Commercial Paper, Series 2019, 1.39% 8/6/2019
| 7,000
| 7,000
|
State of Texas, Port Arthur Navigation Dist. Industrial Dev. Corp., Rev. Bonds (Air Products Project),
Series 2005, 1.50% 20403
| 500
| 500
|
State of Texas, City of San Antonio, Electric and Gas Systems IAM Commercial Paper, Series 2019,
1.53% 9/5/2019
| 4,000
| 4,000
|
| State of Texas, Tax and Rev. Anticipation Notes, Series 2018, 4.00% 8/29/2019
| 16,965
| 16,999
|
| State of Texas, Board of Regents of the University of Texas System, IAM Commercial Paper, Series 2019, 1.32% 10/4/2019
| 8,000
| 8,000
|
| State of Texas, Board of Regents of the University of Texas System, IAM Commercial Paper, Series 2019, 1.35% 8/5/2019
| 3,520
| 3,520
|
| State of Texas, Board of Regents of the University of Texas System, IAM Commercial Paper, Series 2019, 1.40% 8/8/2019
| 5,000
| 5,000
|
| State of Texas, Board of Regents of the University of Texas System, IAM Commercial Paper, Series 2019, 1.50% 11/4/2019
| 5,000
| 5,000
|
State of Virginia, Rector and Visitors of the University of Virginia, IAM Commercial Paper, Series 2019,
1.62% 8/6/2019
| 5,000
| 5,000
|
| State of Wisconsin, Public Fin. Auth., Solid Waste Disposal Rev. Ref. Bonds (Waste Management, Inc. Project), Series 2017-A-1, AMT, 1.95% 2023 (put 2019)9
| 2,000
| 2,000
|
| State of Wisconsin, Public Fin. Auth., Solid Waste Disposal Rev. Ref. Bonds (Waste Management, Inc. Project), Series 2017-A-2, AMT, 1.95% 2025 (put 2019)9
| 3,500
| 3,500
|
| State of Wyoming, County of Lincoln, Pollution Control Rev. Ref. Bonds (ExxonMobil Project), Series 2014, 1.47% 20443
| 3,125
| 3,125
|
| State of Wyoming, County of Uinta, Wyoming Pollution Control Rev. Ref. Bonds (Chevron U.S.A. Inc. Project), Series 1992, 1.48% 20223
| 4,500
| 4,500
|
| Total short-term securities (cost: $461,498,000)
|
| 461,549
|
| Total investment securities 99.61% (cost: $7,337,332,000)
|
| 7,721,731
|
| Other assets less liabilities 0.39%
|
| 30,523
|
| Net assets 100.00%
|
| $7,752,254
|
American High-Income Municipal Bond Fund —
Page 72 of 74
Futures contracts
| Contracts
| Type
| Number of
contracts
| Expiration
| Notional
amount10
(000)
| Value at
7/31/201911
(000)
| Unrealized
(depreciation)
appreciation
at 7/31/2019
(000)
|
| 2 Year U.S. Treasury Note Futures
| Long
| 2,013
| October 2019
| $402,600
| $431,600
| $(621)
|
| 5 Year U.S. Treasury Note Futures
| Long
| 1,464
| October 2019
| 146,400
| 172,100
| 1,516
|
| 10 Year U.S. Treasury Note Futures
| Short
| 1,166
| September 2019
| (116,600)
| (148,574)
| (431)
|
| 30 Year Ultra U.S. Treasury Bond Futures
| Short
| 133
| September 2019
| (13,300)
| (23,616)
| (829)
|
|
|
|
|
|
|
| $(365)
|
| 1
| Step bond; coupon rate may change at a later date.
|
| 2
| Acquired in a transaction exempt from registration under Rule 144A of the Securities Act of 1933. May be resold in the U.S. in transactions exempt from registration, normally to
qualified institutional buyers. The total value of all such securities was $986,843,000, which represented 12.73% of the net assets of the fund.
|
| 3
| Coupon rate may change periodically. For short-term securities, the date of the next scheduled coupon rate change is considered to be the maturity date.
|
| 4
| Scheduled interest and/or principal payment was not received.
|
| 5
| Scheduled interest payment was not received. Coupon payments are paid at the election of the issuer and any unpaid amounts are accumulated.
|
| 6
| Amount less than one thousand.
|
| 7
| Valued under fair value procedures adopted by authority of the board of trustees. The total value of the security was $6,012,000, which represented .08% of the net assets of the fund.
|
| 8
| Value determined using significant unobservable inputs.
|
| 9
| For short-term securities, the mandatory put date is considered to be the maturity date.
|
| 10
| Notional amount is calculated based on the number of contracts and notional contract size.
|
| 11
| Value is calculated based on the notional amount and current market price.
|
| Key to abbreviations and symbol
|
|
| Agcy. = Agency
| Fncg. = Financing
|
| AMT = Alternative Minimum Tax
| G.O. = General Obligation
|
| Auth. = Authority
| LIBOR = London Interbank Offered Rate
|
| Certs. of Part. = Certificates of Participation
| LOC = Letter of Credit
|
| Dept. = Department
| Preref. = Prerefunded
|
| Dev. = Development
| Redev. = Redevelopment
|
| Dist. = District
| Ref. = Refunding
|
| Econ. = Economic
| Rev. = Revenue
|
| Fac. = Facility
| SIFMA = Securities Industry and Financial Markets Association
|
| Facs. = Facilities
| USD/$ = U.S. dollars
|
| Fin. = Finance
|
|
American High-Income Municipal Bond Fund —
Page 73 of 74
Additional financial disclosures
are included in the fund’s current shareholder report and should be read in conjunction with this report.
Investments are not FDIC-insured, nor
are they deposits of or guaranteed by a bank or any other entity, so they may lose value.
Investors should carefully consider
investment objectives, risks, charges and expenses. This and other important information is contained in the fund prospectus and summary prospectus, which can be obtained from your financial professional and should be
read carefully before investing. You may also call American Funds Service Company (AFS) at (800) 421-4225 or visit the American Funds website at capitalgroup.com.
All Capital Group trademarks
mentioned are owned by The Capital Group Companies, Inc., an affiliated company or fund. All other company and product names mentioned are the property of their respective companies.
American Funds Distributors, Inc.,
member FINRA.
© 2019 Capital Group. All
rights reserved.
| MFGEFPX-040-0919O-S73119
| American High-Income Municipal Bond Fund — Page 74 of 74
|
The Tax-Exempt Fund of
California®
Investment portfolio
July 31, 2019
Bonds, notes & other debt instruments 94.34%
California 92.76%
State issuers 36.35%
| Principal amount
(000)
| Value
(000)
|
| Trustees of the California State University, Systemwide Rev. Bonds, Series 2016-B-2, 4.00% 2049 (put 2021)
| $5,000
| $5,250
|
| Trustees of the California State University, Systemwide Rev. Ref. Bonds, Series 2012-A, 5.00% 2027
| 3,000
| 3,380
|
| Educational Facs. Auth., Rev. Bonds (Art Center College of Design), Series 2018-A, 5.00% 2032
| 950
| 1,166
|
| Educational Facs. Auth., Rev. Bonds (Art Center College of Design), Series 2018-A, 5.00% 2034
| 760
| 925
|
| Educational Facs. Auth., Rev. Bonds (Art Center College of Design), Series 2018-A, 5.00% 2035
| 1,300
| 1,576
|
| Educational Facs. Auth., Rev. Bonds (Art Center College of Design), Series 2018-A, 5.00% 2036
| 1,000
| 1,208
|
| Educational Facs. Auth., Rev. Bonds (Art Center College of Design), Series 2018-A, 5.00% 2037
| 1,265
| 1,521
|
| Educational Facs. Auth., Rev. Bonds (Art Center College of Design), Series 2018-A, 5.00% 2038
| 1,140
| 1,367
|
| Educational Facs. Auth., Rev. Bonds (Art Center College of Design), Series 2018-A, 5.00% 2044
| 4,000
| 4,747
|
| Educational Facs. Auth., Rev. Bonds (Chapman University), Series 2017-B, 4.00% 2047
| 10,575
| 11,339
|
| Educational Facs. Auth., Rev. Bonds (Pitzer College), Series 2009, 5.00% 2021 (preref. 2020)
| 1,625
| 1,669
|
| Educational Facs. Auth., Rev. Bonds (Pitzer College), Series 2009, 6.00% 2040 (preref. 2020)
| 1,400
| 1,447
|
| Educational Facs. Auth., Rev. Bonds (University of San Francisco), Series 2018-A, 5.00% 2043
| 1,000
| 1,208
|
| Educational Facs. Auth., Rev. Bonds (University of San Francisco), Series 2018-A, 5.00% 2053
| 3,985
| 4,721
|
| Educational Facs. Auth., Rev. Ref. Bonds (Chapman University), Series 2011, 5.00% 2026
| 3,000
| 3,193
|
| Educational Facs. Auth., Rev. Ref. Bonds (Chapman University), Series 2011, 5.00% 2031
| 11,795
| 12,528
|
| Educational Facs. Auth., Rev. Ref. Bonds (Chapman University), Series 2015, 5.00% 2032
| 2,500
| 2,942
|
Educational Facs. Auth., Rev. Ref. Bonds (Loyola Marymount University), Capital Appreciation Bonds,
Series 2001-A, National insured, 0% 2033
| 2,000
| 1,358
|
| Educational Facs. Auth., Rev. Ref. Bonds (Occidental College), Series 2013-A, 5.00% 2029
| 3,265
| 3,758
|
| Educational Facs. Auth., Rev. Ref. Bonds (Stanford University), Series 2009-T-5, 5.00% 2023
| 2,000
| 2,292
|
| Educational Facs. Auth., Rev. Ref. Bonds (University of Redlands), Series 2014-A, 5.00% 2026
| 1,035
| 1,227
|
| Educational Facs. Auth., Rev. Ref. Bonds (University of the Pacific), Series 2015, 5.00% 2030
| 1,000
| 1,200
|
| Educational Facs. Auth., Rev. Ref. Bonds (University of the Pacific), Series 2015, 5.00% 2032
| 2,500
| 2,980
|
| G.O. Bonds, Series 2009, 6.00% 2039
| 2,000
| 2,025
|
| G.O. Bonds, Series 2011, 5.25% 2028
| 2,000
| 2,170
|
| G.O. Bonds, Series 2013, (SIFMA Municipal Swap Index + 0.38%) 1.78% 2027 (put 2027)1
| 2,000
| 2,006
|
| G.O. Bonds, Series 2013-E, (1-month USD-LIBOR + 0.43%) 1.83% 2029 (put 2023)1
| 1,500
| 1,507
|
| G.O. Bonds, Series 2015, 5.25% 2032
| 5,000
| 6,049
|
| G.O. Rev. Ref. Bonds, Series 2016, 5.00% 2025
| 7,120
| 8,736
|
| G.O. Rev. Ref. Bonds, Series 2019, 5.00% 2026
| 7,500
| 9,311
|
Golden State Tobacco Securitization Corp., Enhanced Tobacco Settlement Asset-Backed Bonds,
Capital Appreciation Bonds, Series 2005-A, AMBAC insured, 0% 2027
| 3,460
| 3,002
|
Golden State Tobacco Securitization Corp., Enhanced Tobacco Settlement Asset-Backed Bonds,
Capital Appreciation Bonds, Series 2005-A, Assured Guaranty Municipal insured, 0% 2026
| 12,600
| 11,262
|
Golden State Tobacco Securitization Corp., Enhanced Tobacco Settlement Asset-Backed Bonds,
Series 2015-A, 5.00% 2032
| 3,250
| 3,872
|
Golden State Tobacco Securitization Corp., Enhanced Tobacco Settlement Asset-Backed Bonds,
Series 2015-A, 5.00% 2033
| 1,950
| 2,299
|
Golden State Tobacco Securitization Corp., Enhanced Tobacco Settlement Asset-Backed Bonds,
Series 2015-A, 5.00% 2045
| 3,580
| 4,126
|
Golden State Tobacco Securitization Corp., Enhanced Tobacco Settlement Asset-Backed Bonds,
Series 2018-A, 5.00% 2022
| 3,640
| 4,034
|
Golden State Tobacco Securitization Corp., Enhanced Tobacco Settlement Asset-Backed Bonds,
Series 2018-A-1, 5.00% 2047
| 2,450
| 2,476
|
The Tax-Exempt Fund of California — Page 1
of 31
Bonds, notes & other debt instruments (continued)
California (continued)
State issuers (continued)
| Principal amount
(000)
| Value
(000)
|
Golden State Tobacco Securitization Corp., Enhanced Tobacco Settlement Asset-Backed Bonds,
Series 2018-A-2, 5.00% 2047
| $4,250
| $4,295
|
| Health Facs. Fncg. Auth., Rev. Bonds (Cedars-Sinai Medical Center), Series 2016-A, 5.00% 2036
| 500
| 601
|
| Health Facs. Fncg. Auth., Rev. Bonds (Children’s Hospital of Orange County), Series 2011-A, 5.25% 2041
| 2,000
| 2,171
|
| Health Facs. Fncg. Auth., Rev. Bonds (El Camino Hospital), Series 2017, 5.00% 2042
| 2,500
| 2,942
|
| Health Facs. Fncg. Auth., Rev. Bonds (Episcopal Home), Series 2002-B, 6.00% 2032 (preref. 2020)
| 3,600
| 3,690
|
| Health Facs. Fncg. Auth., Rev. Bonds (Kaiser Permanente), Series 2017-A-2, 4.00% 2044
| 12,940
| 14,186
|
| Health Facs. Fncg. Auth., Rev. Bonds (Kaiser Permanente), Series 2017-A-2, 5.00% 2047
| 3,500
| 5,050
|
| Health Facs. Fncg. Auth., Rev. Bonds (Lucile Salter Packard Children’s Hospital at Stanford), Series 2014-A, 5.00% 2043
| 1,000
| 1,127
|
| Health Facs. Fncg. Auth., Rev. Bonds (Lucile Salter Packard Children’s Hospital at Stanford), Series 2016-B, 5.00% 2055
| 2,000
| 2,321
|
| Health Facs. Fncg. Auth., Rev. Bonds (Lucile Salter Packard Children’s Hospital at Stanford), Series 2017-A, 5.00% 2042
| 1,475
| 1,758
|
| Health Facs. Fncg. Auth., Rev. Bonds (Lucile Salter Packard Children’s Hospital at Stanford), Series 2017-A, 5.00% 2056
| 2,000
| 2,367
|
| Health Facs. Fncg. Auth., Rev. Bonds (Presbyterian Homes and Services, Inc.), Series 2015, 5.00% 2022
| 100
| 111
|
| Health Facs. Fncg. Auth., Rev. Bonds (Presbyterian Homes and Services, Inc.), Series 2015, 5.00% 2031
| 400
| 475
|
| Health Facs. Fncg. Auth., Rev. Bonds (Presbyterian Homes and Services, Inc.), Series 2015, 5.00% 2039
| 400
| 464
|
| Health Facs. Fncg. Auth., Rev. Bonds (Providence St. Joseph Health), Series 2016-A, 4.00% 2034
| 500
| 554
|
| Health Facs. Fncg. Auth., Rev. Bonds (Providence St. Joseph Health), Series 2016-A, 4.00% 2036
| 650
| 716
|
| Health Facs. Fncg. Auth., Rev. Bonds (Providence St. Joseph Health), Series 2016-B-2, 4.00% 2036 (put 2024)
| 2,000
| 2,269
|
| Health Facs. Fncg. Auth., Rev. Bonds (Rady Children’s Hospital - San Diego), Series 2011, 5.25% 2041
| 5,000
| 5,376
|
| Health Facs. Fncg. Auth., Rev. Bonds (Sutter Health), Series 2011-D, 5.25% 2031
| 2,000
| 2,162
|
| Health Facs. Fncg. Auth., Rev. Bonds (Sutter Health), Series 2018-A, 5.00% 2034
| 1,000
| 1,241
|
| Health Facs. Fncg. Auth., Rev. Bonds (Sutter Health), Series 2018-A, 5.00% 2035
| 1,500
| 1,852
|
| Health Facs. Fncg. Auth., Rev. Bonds (Sutter Health), Series 2018-A, 5.00% 2036
| 2,000
| 2,461
|
| Health Facs. Fncg. Auth., Rev. Bonds (Sutter Health), Series 2018-A, 5.00% 2037
| 1,000
| 1,224
|
| Health Facs. Fncg. Auth., Rev. Green Bonds (Kaiser Permanente), Series 2017-C, 5.00% 2031 (put 2022)
| 1,000
| 1,127
|
| Health Facs. Fncg. Auth., Rev. Ref. Bonds (Catholic Healthcare West), Series 2011-A, 5.25% 2041
| 2,000
| 2,108
|
| Health Facs. Fncg. Auth., Rev. Ref. Bonds (Cedars-Sinai Medical Center), Series 2015, 5.00% 2030
| 500
| 606
|
| Health Facs. Fncg. Auth., Rev. Ref. Bonds (Cedars-Sinai Medical Center), Series 2015, 5.00% 2031
| 1,300
| 1,569
|
| Health Facs. Fncg. Auth., Rev. Ref. Bonds (El Camino Hospital), Series 2015-A, 5.00% 2030
| 3,000
| 3,565
|
| Health Facs. Fncg. Auth., Rev. Ref. Bonds (El Camino Hospital), Series 2015-A, 5.00% 2040
| 8,700
| 9,951
|
| Health Facs. Fncg. Auth., Rev. Ref. Bonds (Memorial Health Services), Series 2012-A, 5.00% 2033
| 1,000
| 1,111
|
| Health Facs. Fncg. Auth., Rev. Ref. Bonds (St. Joseph Health System), Series 2013-C, 5.00% 2043 (put 2019)
| 2,000
| 2,016
|
| Health Facs. Fncg. Auth., Rev. Ref. Bonds (Stanford Health Care), Series 2017-A, 5.00% 2031
| 5,000
| 6,308
|
| Health Facs. Fncg. Auth., Rev. Ref. Bonds (Stanford Health Care), Series 2017-A, 5.00% 2034
| 9,000
| 11,182
|
Health Facs. Fncg. Auth., Rev. Ref. Bonds (Stanford Hospital and Clinics), Series 2010-B,
5.25% 2031 (preref. 2020)
| 4,475
| 4,719
|
| Health Facs. Fncg. Auth., Rev. Ref. Bonds (Sutter Health), Series 2008-A, 5.25% 2022
| 2,000
| 2,000
|
| Health Facs. Fncg. Auth., Rev. Ref. Bonds (Sutter Health), Series 2016-A, 5.00% 2033
| 1,000
| 1,195
|
| Health Facs. Fncg. Auth., Rev. Ref. Bonds (Sutter Health), Series 2016-A, 5.00% 2034
| 2,000
| 2,384
|
| Health Facs. Fncg. Auth., Rev. Ref. Bonds (Sutter Health), Series 2016-A, 5.00% 2035
| 2,000
| 2,373
|
| Health Facs. Fncg. Auth., Rev. Ref. Bonds (Sutter Health), Series 2016-B, 4.00% 2038
| 4,165
| 4,560
|
| Health Facs. Fncg. Auth., Rev. Ref. Bonds (Sutter Health), Series 2016-B, 5.00% 2035
| 1,000
| 1,211
|
| Health Facs. Fncg. Auth., Rev. Ref. Bonds (Sutter Health), Series 2016-B, 5.00% 2046
| 3,000
| 3,533
|
| Imperial Irrigation Dist., Electric System Rev. Ref. Bonds, Series 2016-B-2, 4.00% 2032
| 1,830
| 2,078
|
| Imperial Irrigation Dist., Electric System Rev. Ref. Bonds, Series 2016-B-2, 5.00% 2041
| 1,425
| 1,690
|
| Imperial Irrigation Dist., Electric System Rev. Ref. Bonds, Series 2017, 4.00% 2036
| 6,915
| 7,779
|
| Imperial Irrigation Dist., Electric System Rev. Ref. Bonds, Series 2017, 4.00% 2041
| 2,200
| 2,426
|
| Independent Cities Fin. Auth., Mobile Home Park Rev. Ref. Bonds (San Juan Mobile Estates), Series 2015, 5.00% 2030
| 2,000
| 2,295
|
The Tax-Exempt Fund of California — Page 2
of 31
Bonds, notes & other debt instruments (continued)
California (continued)
State issuers (continued)
| Principal amount
(000)
| Value
(000)
|
| Infrastructure and Econ. Dev. Bank, Rev. Bonds (Performing Arts Center of Los Angeles County), Series 2007, 5.00% 2027
| $1,000
| $1,003
|
| Infrastructure and Econ. Dev. Bank, Rev. Bonds (Performing Arts Center of Los Angeles County), Series 2007, 5.00% 2037
| 1,500
| 1,505
|
| Infrastructure and Econ. Dev. Bank, Rev. Bonds (Stanford Consortium Project), Series 2016-A, 5.00% 2030
| 1,080
| 1,326
|
| Infrastructure and Econ. Dev. Bank, Rev. Bonds (Stanford Consortium Project), Series 2016-A, 5.00% 2031
| 1,230
| 1,493
|
| Infrastructure and Econ. Dev. Bank, Rev. Bonds (Stanford Consortium Project), Series 2016-A, 5.00% 2032
| 1,140
| 1,379
|
| Infrastructure and Econ. Dev. Bank, Rev. Bonds (Stanford Consortium Project), Series 2016-A, 5.00% 2033
| 1,105
| 1,333
|
Infrastructure and Econ. Dev. Bank, Rev. Bonds (The Colburn School), Series 2015-B,
(SIFMA Municipal Swap Index + 1.20%) 2.60% 2037 (put 2022)1
| 8,500
| 8,652
|
| Infrastructure and Econ. Dev. Bank, Rev. Ref. Bonds (Academy of Sciences, San Francisco), Series 2018-C, (3-month USD-LIBOR x 0.70 + 0.38%) 1.966% 2047 (put
2021)1
| 4,925
| 4,935
|
Infrastructure and Econ. Dev. Bank, Rev. Ref. Bonds (Segerstrom Center for the Arts), Series 2016-B,
5.00% 2023
| 1,000
| 1,147
|
| Infrastructure and Econ. Dev. Bank, Rev. Ref. Bonds (Segerstrom Center for the Arts), Series 2017, 5.00% 2028
| 2,000
| 2,541
|
| Metropolitan Water Dist. of Southern California, Water Rev. Ref. Bonds, Series 2019-A, 5.00% 2025
| 10,000
| 12,314
|
Municipal Fin. Auth., Charter School Rev. Bonds (Bella Mente Montessori Academy), Series 2018-A,
ACA insured, 5.00% 20482
| 1,150
| 1,303
|
Municipal Fin. Auth., Educational Rev. Bonds (American Heritage Education Foundation Project),
Series 2016-A, 5.00% 2036
| 500
| 569
|
Municipal Fin. Auth., Educational Rev. Bonds (American Heritage Education Foundation Project),
Series 2016-A, 5.00% 2046
| 2,000
| 2,244
|
Municipal Fin. Auth., Insured Senior Living Rev. Ref. Bonds (Pilgrim Place in Claremont), Series 2016-A,
5.00% 2031
| 500
| 613
|
Municipal Fin. Auth., Jurupa Lease Rev. Ref. Bonds (Wineville Unified School Dist.), Series 2015-A,
BAM insured, 5.00% 2042
| 4,500
| 5,181
|
| Municipal Fin. Auth., Rev. Bonds (Biola University), Series 2013, 5.00% 2042
| 1,000
| 1,104
|
| Municipal Fin. Auth., Rev. Bonds (California Baptist University), Series 2015-A, 5.375% 20402
| 2,335
| 2,685
|
| Municipal Fin. Auth., Rev. Bonds (California Baptist University), Series 2015-A, 5.50% 20452
| 2,800
| 3,222
|
| Municipal Fin. Auth., Rev. Bonds (California Baptist University), Series 2016-A, 4.00% 20212
| 850
| 870
|
| Municipal Fin. Auth., Rev. Bonds (California Baptist University), Series 2016-A, 5.00% 20362
| 3,500
| 4,019
|
| Municipal Fin. Auth., Rev. Bonds (California Baptist University), Series 2016-A, 5.00% 20462
| 750
| 846
|
| Municipal Fin. Auth., Rev. Bonds (California Lutheran University), Series 2018, 5.00% 2027
| 300
| 372
|
| Municipal Fin. Auth., Rev. Bonds (California Lutheran University), Series 2018, 5.00% 2028
| 150
| 190
|
| Municipal Fin. Auth., Rev. Bonds (California Lutheran University), Series 2018, 5.00% 2029
| 225
| 282
|
| Municipal Fin. Auth., Rev. Bonds (California Lutheran University), Series 2018, 5.00% 2030
| 225
| 280
|
| Municipal Fin. Auth., Rev. Bonds (California Lutheran University), Series 2018, 5.00% 2031
| 200
| 247
|
| Municipal Fin. Auth., Rev. Bonds (California Lutheran University), Series 2018, 5.00% 2032
| 225
| 276
|
| Municipal Fin. Auth., Rev. Bonds (California Lutheran University), Series 2018, 5.00% 2033
| 225
| 275
|
| Municipal Fin. Auth., Rev. Bonds (Caritas Mobile Home Park), Series 2014-A, 5.25% 2049
| 1,750
| 1,948
|
| Municipal Fin. Auth., Rev. Bonds (Channing House Project), Series 2017-A, 5.00% 2033
| 1,000
| 1,217
|
| Municipal Fin. Auth., Rev. Bonds (Community Medical Centers), Series 2017-A, 5.00% 2022
| 1,300
| 1,422
|
| Municipal Fin. Auth., Rev. Bonds (Community Medical Centers), Series 2017-A, 5.00% 2027
| 690
| 853
|
| Municipal Fin. Auth., Rev. Bonds (Emerson College), Series 2017-B, 5.00% 2035
| 1,500
| 1,796
|
| Municipal Fin. Auth., Rev. Bonds (Harbor Regional Center Project), Series 2009, 8.00% 2029 (preref. 2019)
| 1,500
| 1,526
|
| Municipal Fin. Auth., Rev. Bonds (LINXS APM Project), Series 2018-A, AMT, 4.00% 2047
| 3,900
| 4,159
|
| Municipal Fin. Auth., Rev. Bonds (LINXS APM Project), Series 2018-A, AMT, 5.00% 2025
| 1,585
| 1,876
|
| Municipal Fin. Auth., Rev. Bonds (LINXS APM Project), Series 2018-A, AMT, 5.00% 2031
| 2,695
| 3,271
|
| Municipal Fin. Auth., Rev. Bonds (LINXS APM Project), Series 2018-A, AMT, 5.00% 2034
| 1,320
| 1,585
|
| Municipal Fin. Auth., Rev. Bonds (LINXS APM Project), Series 2018-A, AMT, 5.00% 2035
| 1,000
| 1,196
|
| Municipal Fin. Auth., Rev. Bonds (LINXS APM Project), Series 2018-A, AMT, 5.00% 2043
| 3,000
| 3,520
|
| Municipal Fin. Auth., Rev. Bonds (LINXS APM Project), Series 2018-A, AMT, 5.00% 2047
| 8,705
| 10,169
|
| Municipal Fin. Auth., Rev. Bonds (Mt. San Antonio Gardens Project), Series 2019, 4.00% 2020
| 260
| 268
|
| Municipal Fin. Auth., Rev. Bonds (Pomona College), Series 2017, 4.00% 2048
| 1,550
| 1,708
|
The Tax-Exempt Fund of California — Page 3
of 31
Bonds, notes & other debt instruments (continued)
California (continued)
State issuers (continued)
| Principal amount
(000)
| Value
(000)
|
| Municipal Fin. Auth., Rev. Bonds (Retirement Housing Foundation), Series 2017-A, 5.00% 2029
| $390
| $495
|
| Municipal Fin. Auth., Rev. Bonds (Retirement Housing Foundation), Series 2017-A, 5.00% 2030
| 250
| 320
|
| Municipal Fin. Auth., Rev. Bonds (Retirement Housing Foundation), Series 2017-A, 5.00% 2031
| 1,250
| 1,609
|
| Municipal Fin. Auth., Rev. Bonds (Retirement Housing Foundation), Series 2017-A, 5.00% 2032
| 925
| 1,199
|
| Municipal Fin. Auth., Rev. Bonds (University of La Verne), Series 2010-A, 5.75% 2025 (preref. 2020)
| 2,100
| 2,184
|
| Municipal Fin. Auth., Rev. Bonds (University of La Verne), Series 2010-A, 6.125% 2030 (preref. 2020)
| 1,000
| 1,043
|
| Municipal Fin. Auth., Rev. Bonds (University of La Verne), Series 2017-A, 5.00% 2029
| 1,000
| 1,245
|
| Municipal Fin. Auth., Rev. Bonds (University of La Verne), Series 2017-A, 5.00% 2030
| 1,500
| 1,856
|
| Municipal Fin. Auth., Rev. Bonds (University of La Verne), Series 2017-A, 5.00% 2031
| 650
| 796
|
| Municipal Fin. Auth., Rev. Bonds (University of La Verne), Series 2017-A, 5.00% 2032
| 1,000
| 1,216
|
| Municipal Fin. Auth., Rev. Bonds (University of La Verne), Series 2017-A, 5.00% 2033
| 1,000
| 1,210
|
| Municipal Fin. Auth., Rev. Bonds (University of La Verne), Series 2017-A, 5.00% 2035
| 1,000
| 1,200
|
| Municipal Fin. Auth., Rev. Bonds (University of La Verne), Series 2017-A, 5.00% 2036
| 1,150
| 1,374
|
| Municipal Fin. Auth., Rev. Bonds (University of La Verne), Series 2017-A, 5.00% 2043
| 4,380
| 5,151
|
Municipal Fin. Auth., Rev. Ref. Bonds (Azusa Pacific University Project), Series 2011-B,
8.00% 2041 (preref. 2021)2
| 4,150
| 4,630
|
| Municipal Fin. Auth., Rev. Ref. Bonds (Azusa Pacific University Project), Series 2015-B, 5.00% 2023
| 600
| 655
|
| Municipal Fin. Auth., Rev. Ref. Bonds (Azusa Pacific University Project), Series 2015-B, 5.00% 2024
| 600
| 668
|
| Municipal Fin. Auth., Rev. Ref. Bonds (Azusa Pacific University Project), Series 2015-B, 5.00% 2028
| 1,135
| 1,269
|
| Municipal Fin. Auth., Rev. Ref. Bonds (Azusa Pacific University Project), Series 2015-B, 5.00% 2029
| 1,390
| 1,549
|
| Municipal Fin. Auth., Rev. Ref. Bonds (Biola University), Series 2017, 5.00% 2030
| 750
| 914
|
| Municipal Fin. Auth., Rev. Ref. Bonds (Biola University), Series 2017, 5.00% 2033
| 500
| 602
|
| Municipal Fin. Auth., Rev. Ref. Bonds (Biola University), Series 2017, 5.00% 2034
| 440
| 528
|
| Municipal Fin. Auth., Rev. Ref. Bonds (Biola University), Series 2017, 5.00% 2039
| 615
| 727
|
| Municipal Fin. Auth., Rev. Ref. Bonds (Eisenhower Medical Center), Series 2017-A, 5.00% 2033
| 650
| 773
|
| Municipal Fin. Auth., Rev. Ref. Bonds (Eisenhower Medical Center), Series 2017-A, 5.00% 2034
| 2,675
| 3,168
|
| Municipal Fin. Auth., Rev. Ref. Bonds (Eisenhower Medical Center), Series 2017-A, 5.00% 2035
| 2,000
| 2,358
|
| Municipal Fin. Auth., Rev. Ref. Bonds (Eisenhower Medical Center), Series 2017-A, 5.00% 2036
| 1,000
| 1,174
|
| Municipal Fin. Auth., Rev. Ref. Bonds (Eisenhower Medical Center), Series 2017-A, 5.00% 2037
| 1,250
| 1,460
|
| Municipal Fin. Auth., Rev. Ref. Bonds (Eisenhower Medical Center), Series 2017-A, 5.00% 2042
| 1,250
| 1,443
|
| Municipal Fin. Auth., Rev. Ref. Bonds (Eisenhower Medical Center), Series 2017-A, 5.00% 2047
| 1,000
| 1,146
|
| Municipal Fin. Auth., Rev. Ref. Bonds (Eisenhower Medical Center), Series 2017-B, 5.00% 2033
| 1,450
| 1,725
|
| Municipal Fin. Auth., Rev. Ref. Bonds (Eisenhower Medical Center), Series 2017-B, 5.00% 2034
| 600
| 711
|
| Municipal Fin. Auth., Rev. Ref. Bonds (Eisenhower Medical Center), Series 2017-B, 5.00% 2035
| 625
| 737
|
| Municipal Fin. Auth., Rev. Ref. Bonds (Eisenhower Medical Center), Series 2017-B, 5.00% 2036
| 600
| 704
|
| Municipal Fin. Auth., Rev. Ref. Bonds (Eisenhower Medical Center), Series 2017-B, 5.00% 2037
| 600
| 701
|
| Municipal Fin. Auth., Rev. Ref. Bonds (Eisenhower Medical Center), Series 2017-B, 5.00% 2042
| 1,000
| 1,154
|
| Municipal Fin. Auth., Rev. Ref. Bonds (Eisenhower Medical Center), Series 2017-B, 5.00% 2047
| 4,010
| 4,597
|
| Municipal Fin. Auth., Rev. Ref. Bonds (Harbor Regional Center Project), Series 2015, 5.00% 2032
| 1,500
| 1,759
|
| Municipal Fin. Auth., Rev. Ref. Bonds (Harbor Regional Center Project), Series 2015, 5.00% 2039
| 1,000
| 1,146
|
| Municipal Fin. Auth., Rev. Ref. Bonds (HumanGood Obligated Group), Series 2019-A, 4.00% 2031
| 1,000
| 1,128
|
| Municipal Fin. Auth., Rev. Ref. Bonds (HumanGood Obligated Group), Series 2019-A, 4.00% 2033
| 1,250
| 1,396
|
| Municipal Fin. Auth., Rev. Ref. Bonds (HumanGood Obligated Group), Series 2019-A, 4.00% 2034
| 750
| 832
|
| Municipal Fin. Auth., Rev. Ref. Bonds (HumanGood Obligated Group), Series 2019-A, 4.00% 2035
| 1,185
| 1,308
|
| Municipal Fin. Auth., Rev. Ref. Bonds (HumanGood Obligated Group), Series 2019-A, 4.00% 2036
| 2,000
| 2,197
|
| Municipal Fin. Auth., Rev. Ref. Bonds (HumanGood Obligated Group), Series 2019-A, 4.00% 2037
| 2,850
| 3,117
|
| Municipal Fin. Auth., Rev. Ref. Bonds (HumanGood Obligated Group), Series 2019-A, 4.00% 2039
| 2,750
| 2,995
|
| Municipal Fin. Auth., Rev. Ref. Bonds (HumanGood Obligated Group), Series 2019-A, 5.00% 2044
| 4,500
| 5,238
|
| Municipal Fin. Auth., Rev. Ref. Bonds (Inland Regional Center Project), Series 2015, 5.00% 2032
| 3,000
| 3,492
|
| Municipal Fin. Auth., Rev. Ref. Bonds (Inland Regional Center Project), Series 2015, 5.00% 2037
| 4,000
| 4,581
|
| Municipal Fin. Auth., Rev. Ref. Bonds (Inland Regional Center Project), Series 2015, 5.00% 2045
| 4,000
| 4,517
|
| Municipal Fin. Auth., Rev. Ref. Bonds (University of San Diego), Series 2011-B, 5.00% 2031
| 1,750
| 1,886
|
| Municipal Fin. Auth., Rev. Ref. Bonds (University of San Diego), Series 2012-A, 5.00% 2031
| 1,475
| 1,638
|
| Municipal Fin. Auth., Rev. Ref. Bonds (University of San Diego), Series 2012-A, 5.00% 2032
| 1,000
| 1,109
|
The Tax-Exempt Fund of California — Page 4
of 31
Bonds, notes & other debt instruments (continued)
California (continued)
State issuers (continued)
| Principal amount
(000)
| Value
(000)
|
| Municipal Fin. Auth., Rev. Ref. Bonds (William Jessup University), Series 2019, 5.00% 2039
| $1,000
| $1,113
|
| Municipal Fin. Auth., Rev. Ref. Bonds (William Jessup University), Series 2019, 5.00% 2048
| 2,000
| 2,195
|
Municipal Fin. Auth., Solid Waste Disposal Rev. Bonds
(Waste Management, Inc. Project), Series 2017-A, AMT, 2.00% 2044 (put 2020)
| 4,900
| 4,939
|
Municipal Fin. Auth., Student Housing Rev. Bonds
(CHF-Davis I, LLC - West Village Student Housing Project), Series 2018, 5.00% 2040
| 4,610
| 5,489
|
Municipal Fin. Auth., Student Housing Rev. Bonds
(CHF-Davis I, LLC - West Village Student Housing Project), Series 2018, 5.00% 2043
| 6,525
| 7,697
|
Municipal Fin. Auth., Student Housing Rev. Bonds
(CHF-Riverside I, LLC - UCR Student Housing Project), Series 2018, 5.00% 2043
| 2,000
| 2,359
|
Municipal Fin. Auth., Student Housing Rev. Bonds
(CHF-Riverside I, LLC - UCR Student Housing Project), Series 2018, 5.00% 2052
| 7,500
| 8,783
|
Municipal Fin. Auth., Student Housing Rev. Bonds
(CHF-Riverside II, LLC - UCR Student Housing Project), Series 2019, 5.00% 2049
| 2,510
| 2,992
|
Municipal Fin. Auth., Student Housing Rev. Bonds
(CHF-Riverside II, LLC - UCR Student Housing Project), Series 2019, 5.00% 2052
| 3,500
| 4,154
|
Northern California Gas Auth. No. 1, Gas Project Rev. Bonds, Series 2007-B,
(3-month USD-LIBOR + 0.67%) 2.273% 20271
| 5,700
| 5,628
|
| Northern California Power Agcy., Hydroelectric Project No. 1, Rev. Ref. Bonds, Series 2012-A, 5.00% 2029
| 1,570
| 1,742
|
| Northern California Power Agcy., Hydroelectric Project No. 1, Rev. Ref. Bonds, Series 2012-A, 5.00% 2030
| 1,000
| 1,108
|
| Northern California Power Agcy., Lodi Energy Center Rev. Bonds, Issue One, Series 2010-A, 5.00% 2020
| 1,425
| 1,474
|
Northern California Power Agcy., Lodi Energy Center Rev. Bonds, Issue One, Series 2010-A,
5.00% 2025 (preref. 2020)
| 4,200
| 4,341
|
| Pollution Control Fncg. Auth., Rev. Bonds (San Jose Water Co. Project), Series 2016, AMT, 4.75% 2046
| 11,475
| 12,906
|
Pollution Control Fncg. Auth., Solid Waste Disposal Rev. Ref. Bonds (Waste Management, Inc. Project),
Series 2015-B-2, AMT, 3.125% 2040 (put 2025)
| 2,000
| 2,165
|
Pollution Control Fncg. Auth., Water Furnishing Rev. Bonds
(San Diego County Water Auth. Desalination Project Pipeline), Series 2019, 5.00% 20232
| 1,085
| 1,238
|
| Public Fin. Auth., Reassessment Rev. Ref. Bonds, Series 2019, 5.00% 2021
| 450
| 482
|
| Public Fin. Auth., Reassessment Rev. Ref. Bonds, Series 2019, 5.00% 2023
| 1,080
| 1,215
|
| Public Fin. Auth., Reassessment Rev. Ref. Bonds, Series 2019, 5.00% 2025
| 225
| 264
|
| Public Fin. Auth., Reassessment Rev. Ref. Bonds, Series 2019, 5.00% 2027
| 1,375
| 1,669
|
| Public Fin. Auth., Reassessment Rev. Ref. Bonds, Series 2019, 5.00% 2029
| 1,000
| 1,240
|
| Public Fin. Auth., Rev. Bonds (Henry Mayo Newhall Memorial Hospital), Series 2017, 5.00% 2023
| 200
| 224
|
| Public Fin. Auth., Rev. Bonds (Henry Mayo Newhall Memorial Hospital), Series 2017, 5.00% 2037
| 2,000
| 2,274
|
| Public Fin. Auth., Rev. Bonds (Henry Mayo Newhall Memorial Hospital), Series 2017, 5.00% 2047
| 4,750
| 5,323
|
Public Works Board, Lease Rev. Bonds (Dept. of Corrections, Various State Prisons), Series 2017-D,
5.00% 2026
| 2,560
| 3,201
|
Public Works Board, Lease Rev. Bonds (Dept. of Corrections, Various State Prisons), Series 2017-D,
5.00% 2027
| 1,800
| 2,295
|
| Public Works Board, Lease Rev. Bonds (Various Capital Projects), Series 2009-I-1, 6.125% 2029 (preref. 2019)
| 2,000
| 2,026
|
| Public Works Board, Lease Rev. Bonds (Various Capital Projects), Series 2010-A-1, 5.75% 2030 (preref. 2020)
| 1,400
| 1,440
|
| Public Works Board, Lease Rev. Bonds (Various Capital Projects), Series 2010-A-1, 6.00% 2035 (preref. 2020)
| 2,000
| 2,059
|
| Public Works Board, Lease Rev. Bonds (Various Capital Projects), Series 2012-A, 5.00% 2033
| 1,500
| 1,642
|
| Public Works Board, Lease Rev. Bonds (Various Capital Projects), Series 2012-A, 5.00% 2037
| 4,500
| 4,920
|
| Public Works Board, Lease Rev. Ref. Bonds (Dept. of Corrections and Rehabilitation, State Prison - Monterey County (Soledad II)), Series 2006-F, FGIC-National
insured, 5.25% 2019
| 1,500
| 1,516
|
| Public Works Board, Lease Rev. Ref. Bonds (Regents of the University of California), Series 2007-A, FGIC-National insured, 5.25% 2023 (escrowed to maturity)
| 1,890
| 2,204
|
| RNR School Fncg. Auth., Community Facs. Dist. No. 92-1, Special Tax Bonds, Series 2017-A, BAM insured, 5.00% 2037
| 1,500
| 1,768
|
| RNR School Fncg. Auth., Community Facs. Dist. No. 92-1, Special Tax Bonds, Series 2017-A, BAM insured, 5.00% 2041
| 3,000
| 3,494
|
The Tax-Exempt Fund of California — Page 5
of 31
Bonds, notes & other debt instruments (continued)
California (continued)
State issuers (continued)
| Principal amount
(000)
| Value
(000)
|
School Fin. Auth., Charter School Rev. Bonds (Classical Academies Project), Series 2013-A-1,
7.375% 2043 (preref. 2022)
| $3,465
| $4,076
|
| School Fin. Auth., Charter School Rev. Bonds (Classical Academies Project), Series 2017-A, 4.00% 20272
| 750
| 803
|
| School Fin. Auth., Charter School Rev. Bonds (Classical Academies Project), Series 2017-A, 5.00% 20322
| 2,500
| 2,842
|
| School Fin. Auth., Charter School Rev. Bonds (Classical Academies Project), Series 2017-A, 5.00% 20372
| 1,485
| 1,663
|
| School Fin. Auth., Charter School Rev. Bonds (Classical Academies Project), Series 2017-A, 5.00% 20442
| 805
| 889
|
School Fin. Auth., Charter School Rev. Bonds (Downtown College Prep Obligated Group), Series 2016,
4.75% 20362
| 1,365
| 1,458
|
School Fin. Auth., Charter School Rev. Bonds (Equitas Academy Obligated Group), Series 2018-A,
5.00% 20292
| 3,345
| 3,846
|
School Fin. Auth., Charter School Rev. Bonds (Equitas Academy Obligated Group), Series 2018-A,
5.00% 20412
| 3,000
| 3,323
|
School Fin. Auth., Charter School Rev. Bonds (Equitas Academy Obligated Group), Series 2018-A,
5.00% 20482
| 2,795
| 3,076
|
| School Fin. Auth., Charter School Rev. Bonds (Larchmont Charter School Project), Series 2018-A, 5.00% 20552
| 1,000
| 1,067
|
School Fin. Auth., Charter School Rev. Bonds (Rocketship Education Obligated Group), Series 2016-A,
5.00% 20362
| 1,000
| 1,064
|
School Fin. Auth., Charter School Rev. Bonds (Rocketship Education Obligated Group), Series 2016-A,
5.00% 20462
| 750
| 791
|
School Fin. Auth., Charter School Rev. Bonds (Rocketship Education Obligated Group), Series 2017-A,
5.00% 20342
| 750
| 807
|
School Fin. Auth., Charter School Rev. Bonds (Rocketship Public Schools Obligated Group), Series 2017-G,
5.00% 20302
| 315
| 346
|
School Fin. Auth., Charter School Rev. Bonds (Rocketship Public Schools Obligated Group), Series 2017-G,
5.00% 20472
| 250
| 268
|
School Fin. Auth., Educational Facs. Rev. Bonds (River Springs Charter School Project), Series 2015-A,
6.375% 20462
| 4,300
| 5,017
|
School Fin. Auth., Educational Facs. Rev. Bonds (River Springs Charter School Project), Series 2017-A,
5.00% 20302
| 1,950
| 2,217
|
School Fin. Auth., Educational Facs. Rev. Bonds (River Springs Charter School Project), Series 2017-A,
5.00% 20372
| 2,105
| 2,337
|
| School Fin. Auth., School Fac. Rev. Bonds (KIPP LA Projects), Series 2017-A, 5.00% 20372
| 590
| 691
|
| School Fin. Auth., School Fac. Rev. Bonds (KIPP Social), Series 2019-A, 5.00% 20542
| 2,150
| 2,517
|
| School Fin. Auth., School Fac. Rev. Ref. Bonds (High Tech High Learning Project), Series 2017-A, 5.00% 20372
| 1,455
| 1,673
|
| School Fin. Auth., School Fac. Rev. Ref. Bonds (High Tech High Learning Project), Series 2017-A, 5.00% 20492
| 5,400
| 6,111
|
| Southern California Home Fncg. Auth., Single Family Mortgage Rev. Bonds, Series 2007-A, AMT, 5.80% 2049
| 40
| 40
|
| Southern California Public Power Auth., Gas Project Rev. Bonds (Project No. 1), Series 2007-A, 5.25% 2025
| 3,000
| 3,571
|
| Southern California Public Power Auth., Rev. Bonds (Milford Wind Corridor Phase I Project), Series 2010-1, 5.00% 2030
| 2,000
| 2,031
|
| Southern California Public Power Auth., Rev. Bonds (Milford Wind Corridor Phase II Project), Series 2011-1, 5.25% 2028
| 2,500
| 2,701
|
Southern California Public Power Auth., Rev. Ref. Bonds (Magnolia Power Project A), Series 2017-1,
2.00% 2036 (put 2020)
| 4,500
| 4,521
|
Statewide Communities Dev. Auth., Health Fac. Rev. Bonds (Los Angeles Jewish Home for the Aging),
Series 2008, 5.00% 2028
| 1,500
| 1,501
|
Statewide Communities Dev. Auth., Health Fac. Rev. Bonds (Los Angeles Jewish Home for the Aging),
Series 2008, 5.00% 2037
| 2,000
| 2,001
|
Statewide Communities Dev. Auth., Health Fac. Rev. Ref. Bonds (Los Angeles Jewish Home for the Aging),
Series 2019-A, 4.00% 2024
| 300
| 344
|
Statewide Communities Dev. Auth., Health Fac. Rev. Ref. Bonds (Los Angeles Jewish Home for the Aging),
Series 2019-A, 4.00% 2025
| 275
| 320
|
Statewide Communities Dev. Auth., Health Fac. Rev. Ref. Bonds (Los Angeles Jewish Home for the Aging),
Series 2019-A, 4.00% 2026
| 370
| 437
|
The Tax-Exempt Fund of California — Page 6
of 31
Bonds, notes & other debt instruments (continued)
California (continued)
State issuers (continued)
| Principal amount
(000)
| Value
(000)
|
Statewide Communities Dev. Auth., Health Fac. Rev. Ref. Bonds (Los Angeles Jewish Home for the Aging),
Series 2019-A, 5.00% 2034
| $750
| $957
|
Statewide Communities Dev. Auth., Health Fac. Rev. Ref. Bonds (Los Angeles Jewish Home for the Aging),
Series 2019-A, 5.00% 2037
| 735
| 927
|
| Statewide Communities Dev. Auth., Hospital Rev. Ref. Bonds (Methodist Hospital of Southern California), Series 2018, 5.00% 2030
| 2,585
| 3,141
|
| Statewide Communities Dev. Auth., Hospital Rev. Ref. Bonds (Methodist Hospital of Southern California), Series 2018, 5.00% 2032
| 1,165
| 1,396
|
| Statewide Communities Dev. Auth., Hospital Rev. Ref. Bonds (Methodist Hospital of Southern California), Series 2018, 5.00% 2038
| 1,000
| 1,174
|
| Statewide Communities Dev. Auth., Hospital Rev. Ref. Bonds (Methodist Hospital of Southern California), Series 2018, 5.00% 2043
| 2,000
| 2,332
|
| Statewide Communities Dev. Auth., Hospital Rev. Ref. Bonds (Methodist Hospital of Southern California), Series 2018, 5.00% 2048
| 1,500
| 1,740
|
| Statewide Communities Dev. Auth., Mortgage Rev. Bonds (Methodist Hospital of Southern California Project), Series 2009, FHA insured, 6.625% 2029 (preref. 2019)
| 2,235
| 2,235
|
Statewide Communities Dev. Auth., Multi Family Housing Rev. Bonds (La Mesa Springs Apartments),
Series 2019-E, 1.78% 2021 (put 2020)
| 7,000
| 7,060
|
Statewide Communities Dev. Auth., Pollution Control Rev. Ref. Bonds (Southern California Edison Co.),
Series 2006-A, 1.90% 2028
| 1,250
| 1,253
|
Statewide Communities Dev. Auth., Pollution Control Rev. Ref. Bonds (Southern California Edison Co.),
Series 2006-D, 2.625% 2033 (put 2023)
| 6,875
| 7,122
|
Statewide Communities Dev. Auth., Pollution Control Rev. Ref. Bonds (Southern California Edison Co.),
Series 2010-A, 4.50% 2029
| 2,905
| 2,996
|
| Statewide Communities Dev. Auth., Rev. Bonds (Adventist Health System/West), Series 2015-A, 5.00% 2031
| 2,000
| 2,395
|
| Statewide Communities Dev. Auth., Rev. Bonds (Adventist Health System/West), Series 2015-A, 5.00% 2032
| 2,115
| 2,515
|
| Statewide Communities Dev. Auth., Rev. Bonds (Adventist Health System/West), Series 2015-A, 5.00% 2035
| 3,000
| 3,524
|
| Statewide Communities Dev. Auth., Rev. Bonds (Adventist Health System/West), Series 2018-A, 4.00% 2042
| 1,240
| 1,336
|
| Statewide Communities Dev. Auth., Rev. Bonds (Adventist Health System/West), Series 2018-A, 5.00% 2032
| 1,000
| 1,233
|
| Statewide Communities Dev. Auth., Rev. Bonds (Adventist Health System/West), Series 2018-A, 5.00% 2033
| 1,150
| 1,411
|
| Statewide Communities Dev. Auth., Rev. Bonds (Adventist Health System/West), Series 2018-A, 5.00% 2035
| 1,465
| 1,779
|
Statewide Communities Dev. Auth., Rev. Bonds (American Baptist Homes of the West), Series 2010,
6.00% 2029
| 1,125
| 1,134
|
Statewide Communities Dev. Auth., Rev. Bonds (American Baptist Homes of the West), Series 2010,
6.25% 2039
| 5,300
| 5,342
|
Statewide Communities Dev. Auth., Rev. Bonds (American Baptist Homes of the West), Series 2015,
5.00% 2021
| 335
| 360
|
Statewide Communities Dev. Auth., Rev. Bonds (American Baptist Homes of the West), Series 2015,
5.00% 2022
| 250
| 276
|
Statewide Communities Dev. Auth., Rev. Bonds (American Baptist Homes of the West), Series 2015,
5.00% 2045
| 1,700
| 1,898
|
Statewide Communities Dev. Auth., Rev. Bonds (Buck Institute for Research on Aging), Series 2014,
Assured Guaranty Municipal insured, 5.00% 2049
| 5,250
| 5,959
|
Statewide Communities Dev. Auth., Rev. Bonds (Covenant Retirement Communities, Inc.), Series 2013-C,
5.625% 2036
| 2,000
| 2,291
|
| Statewide Communities Dev. Auth., Rev. Bonds (Front Porch Communities and Services), Series 2017-A, 5.00% 2029
| 405
| 497
|
| Statewide Communities Dev. Auth., Rev. Bonds (Front Porch Communities and Services), Series 2017-A, 5.00% 2047
| 1,500
| 1,742
|
| Statewide Communities Dev. Auth., Rev. Bonds (Hebrew Home for Aged Disabled), Series 2016, 5.00% 2036
| 3,500
| 4,175
|
| Statewide Communities Dev. Auth., Rev. Bonds (Huntington Memorial Hospital), Series 2014, 5.00% 2044
| 8,500
| 9,445
|
| Statewide Communities Dev. Auth., Rev. Bonds (Huntington Memorial Hospital), Series 2018, 4.00% 2048
| 500
| 531
|
| Statewide Communities Dev. Auth., Rev. Bonds (John Muir Health), Series 2016-A, 4.00% 2046
| 1,820
| 1,926
|
| Statewide Communities Dev. Auth., Rev. Bonds (John Muir Health), Series 2016-A, 4.00% 2051
| 2,750
| 2,898
|
The Tax-Exempt Fund of California — Page 7
of 31
Bonds, notes & other debt instruments (continued)
California (continued)
State issuers (continued)
| Principal amount
(000)
| Value
(000)
|
| Statewide Communities Dev. Auth., Rev. Bonds (Kaiser Permanente), Series 2012-A, 5.00% 2042
| $6,500
| $7,097
|
| Statewide Communities Dev. Auth., Rev. Bonds (Lancer Educational Student Housing Project), Series 2019-A, 5.00% 20342
| 100
| 118
|
| Statewide Communities Dev. Auth., Rev. Bonds (Lancer Educational Student Housing Project), Series 2019-A, 5.00% 20392
| 105
| 121
|
| Statewide Communities Dev. Auth., Rev. Bonds (Lancer Educational Student Housing Project), Series 2019-A, 5.00% 20512
| 1,440
| 1,641
|
| Statewide Communities Dev. Auth., Rev. Bonds (Lancer Plaza Project), Series 2013, 5.625% 2033
| 1,350
| 1,528
|
| Statewide Communities Dev. Auth., Rev. Bonds (Lancer Plaza Project), Series 2013, 5.875% 2043
| 935
| 1,053
|
Statewide Communities Dev. Auth., Rev. Bonds (Loma Linda University Medical Center), Series 2014-A,
5.25% 2044
| 4,155
| 4,601
|
Statewide Communities Dev. Auth., Rev. Bonds (Loma Linda University Medical Center), Series 2016-A,
5.25% 20562
| 1,400
| 1,570
|
Statewide Communities Dev. Auth., Rev. Bonds (Loma Linda University Medical Center), Series 2018-A,
5.50% 20582
| 1,000
| 1,164
|
| Statewide Communities Dev. Auth., Rev. Bonds (Redlands Community Hospital), Series 2016, 5.00% 2029
| 625
| 752
|
| Statewide Communities Dev. Auth., Rev. Bonds (Redlands Community Hospital), Series 2016, 5.00% 2031
| 1,135
| 1,351
|
| Statewide Communities Dev. Auth., Rev. Bonds (Redlands Community Hospital), Series 2016, 5.00% 2032
| 1,500
| 1,781
|
| Statewide Communities Dev. Auth., Rev. Bonds (Sutter Health), Series 2011-A, 5.25% 2024 (preref. 2020)
| 1,000
| 1,044
|
Statewide Communities Dev. Auth., Rev. Bonds (Terraces at San Joaquin Gardens Project), Series 2012-A,
6.00% 2042
| 1,750
| 1,902
|
Statewide Communities Dev. Auth., Rev. Bonds (Terraces at San Joaquin Gardens Project), Series 2012-A,
6.00% 2047
| 2,000
| 2,170
|
Statewide Communities Dev. Auth., Rev. Bonds (Viamonte Senior Living 1 Project), Series 2018-B,
3.00% 2025
| 1,500
| 1,537
|
Statewide Communities Dev. Auth., Rev. Bonds (Viamonte Senior Living 1 Project), Series 2018-B,
3.00% 2026
| 4,000
| 4,089
|
Statewide Communities Dev. Auth., Rev. Ref. Bonds (California Baptist University), Series 2017-A,
5.00% 20322
| 2,025
| 2,389
|
Statewide Communities Dev. Auth., Rev. Ref. Bonds (California Baptist University), Series 2017-A,
5.00% 20412
| 11,920
| 13,716
|
| Statewide Communities Dev. Auth., Rev. Ref. Bonds (Cottage Health System Obligated Group), Series 2010, 5.00% 2040
| 2,000
| 2,075
|
| Statewide Communities Dev. Auth., Rev. Ref. Bonds (Enloe Medical Center), Series 2015, 5.00% 2031
| 1,000
| 1,196
|
| Statewide Communities Dev. Auth., Rev. Ref. Bonds (Enloe Medical Center), Series 2015, 5.00% 2034
| 500
| 592
|
| Statewide Communities Dev. Auth., Rev. Ref. Bonds (Enloe Medical Center), Series 2015, 5.00% 2035
| 5,050
| 5,960
|
| Statewide Communities Dev. Auth., Rev. Ref. Bonds (Episcopal Communities and Services), Series 2012, 5.00% 2032
| 700
| 761
|
| Statewide Communities Dev. Auth., Rev. Ref. Bonds (Episcopal Communities and Services), Series 2012, 5.00% 2047
| 2,100
| 2,251
|
Statewide Communities Dev. Auth., Rev. Ref. Bonds (Huntington Memorial Hospital), Series 2014-B,
5.00% 2031
| 1,750
| 1,994
|
Statewide Communities Dev. Auth., Rev. Ref. Bonds (Lancer Educational Student Housing Project),
Series 2016-A, 4.00% 20262
| 3,385
| 3,618
|
Statewide Communities Dev. Auth., Rev. Ref. Bonds (Lancer Educational Student Housing Project),
Series 2016-A, 5.00% 20362
| 3,500
| 3,925
|
Statewide Communities Dev. Auth., Rev. Ref. Bonds (Lancer Educational Student Housing Project),
Series 2016-A, 5.00% 20462
| 2,250
| 2,486
|
| Statewide Communities Dev. Auth., Rev. Ref. Bonds (Rady Children’s Hospital), Series 2016-B, 5.00% 2027
| 640
| 817
|
| Statewide Communities Dev. Auth., Rev. Ref. Bonds (Trinity Health Credit Group), Series 2011, 5.00% 2041
| 1,500
| 1,616
|
Statewide Communities Dev. Auth., Senior Living Health Fac. Rev. Bonds
(Los Angeles Jewish Home for the Aging - Fountainview at Gonda), Series 2014-A, 5.00% 2044
| 1,000
| 1,122
|
| Statewide Communities Dev. Auth., Senior Living Rev. Ref. Bonds (Southern California Presbyterian Homes), Series 2009, 7.25% 20412
| 2,000
| 2,031
|
The Tax-Exempt Fund of California — Page 8
of 31
Bonds, notes & other debt instruments (continued)
California (continued)
State issuers (continued)
| Principal amount
(000)
| Value
(000)
|
Statewide Communities Dev. Auth., Student Housing Rev. Bonds (Custodial Receipts), Series 2017,
4.305% 2032
| $10,075
| $11,245
|
| Statewide Communities Dev. Auth., Student Housing Rev. Ref. Bonds (CHF-Irvine, LLC - University of California, Irvine East Campus Apartments), Series 2016, 5.00%
2029
| 1,000
| 1,198
|
| Statewide Communities Dev. Auth., Student Housing Rev. Ref. Bonds (CHF-Irvine, LLC - University of California, Irvine East Campus Apartments), Series 2016, 5.00%
2030
| 1,500
| 1,788
|
| Statewide Communities Dev. Auth., Student Housing Rev. Ref. Bonds (CHF-Irvine, LLC - University of California, Irvine East Campus Apartments), Series 2016, 5.00%
2035
| 1,250
| 1,464
|
| Statewide Communities Dev. Auth., Student Housing Rev. Ref. Bonds (CHF-Irvine, LLC - University of California, Irvine East Campus Apartments, Phase I), Series
2011, 5.375% 2038
| 1,260
| 1,348
|
Tobacco Securitization Auth. of Southern California, Tobacco Settlement Asset-Backed Rev. Ref. Bonds
(San Diego County Tobacco Asset Securitization Corp.), Series 2006-A, 5.00% 2037
| 5,930
| 5,965
|
Tobacco Securitization Auth. of Southern California, Tobacco Settlement Asset-Backed Rev. Ref. Bonds
(San Diego County Tobacco Asset Securitization Corp.), Series 2006-A, 5.125% 2046
| 7,800
| 7,820
|
Transmission Agcy. of Northern California, Rev. Ref. Bonds (California-Oregon Transmission Project),
Series 2009-A, 5.00% 2022
| 895
| 898
|
Transmission Agcy. of Northern California, Rev. Ref. Bonds (California-Oregon Transmission Project),
Series 2016-A, 5.00% 2037
| 2,000
| 2,363
|
Transmission Agcy. of Northern California, Rev. Ref. Bonds (California-Oregon Transmission Project),
Series 2016-A, 5.00% 2038
| 1,000
| 1,178
|
Transmission Agcy. of Northern California, Rev. Ref. Bonds (California-Oregon Transmission Project),
Series 2016-A, 5.00% 2039
| 1,000
| 1,177
|
| Regents of the University of California, General Rev. Bonds, Series 2019-BB, 5.00% 2049
| 1,000
| 1,232
|
| Regents of the University of California, Limited Project Rev. Bonds, Series 2016-K, 5.00% 2034
| 750
| 906
|
| Regents of the University of California, Limited Project Rev. Bonds, Series 2016-K, 5.00% 2035
| 3,750
| 4,511
|
| Regents of the University of California, Limited Project Rev. Ref. Bonds, Series 2018-O, 5.00% 2048
| 1,900
| 2,300
|
| Regents of the University of California, Medical Center Pooled Rev. Bonds, Series 2007-C-2, National insured, (3-month USD-LIBOR + 0.67%) 2.357% 20371
| 5,100
| 5,000
|
| Regents of the University of California, Medical Center Pooled Rev. Bonds, Series 2016-L, 4.00% 2038
| 1,000
| 1,099
|
| Dept. of Veterans Affairs, Home Purchase Rev. Bonds, Series 2016-B, 3.50% 2045
| 1,790
| 1,886
|
| Dept. of Veterans Affairs, Home Purchase Rev. Bonds, Series 2019-A, 4.00% 2049
| 6,695
| 7,356
|
| Dept. of Veterans Affairs, Veterans G.O. Bonds, Series 2018-CR, 4.00% 2048
| 17,915
| 19,666
|
| Dept. of Veterans Affairs, Veterans G.O. Bonds, Series 2019-CS, 4.00% 2049
| 16,000
| 17,733
|
| Dept. of Veterans Affairs, Veterans G.O. Rev. Ref. Bonds, Series 2015-CM, AMT, 2.45% 2031
| 3,590
| 3,596
|
| Dept. of Veterans Affairs, Veterans G.O. Rev. Ref. Bonds, Series 2016-CN, 3.50% 2045
| 7,360
| 7,710
|
| Dept. of Water Resources, Water System Rev. Bonds (Central Valley Project), Series 2016-AW, 4.00% 2035
| 20,840
| 23,893
|
|
|
| 936,754
|
| City, county & other issuers 56.41%
|
|
|
City of Adelanto, Public Utility Auth., Rev. Ref. Bonds (Utility System Project), Series 2017-A,
Assured Guaranty Municipal insured, 5.00% 2039
| 2,000
| 2,415
|
| Alameda Corridor Transportation Auth., Rev. Ref. Bonds, Series 2013-A, 5.00% 2025
| 1,200
| 1,387
|
| Alameda Corridor Transportation Auth., Rev. Ref. Bonds, Series 2013-A, 5.00% 2026
| 6,375
| 7,346
|
| Alameda Corridor Transportation Auth., Rev. Ref. Bonds, Series 2016-B, 5.00% 2036
| 1,000
| 1,165
|
| Alameda Corridor Transportation Auth., Rev. Ref. Bonds, Series 2016-B, 5.00% 2037
| 3,790
| 4,402
|
| Alameda Corridor Transportation Auth., Rev. Ref. Bonds, Series 2016-B, Assured Guaranty Municipal insured, 4.00% 2035
| 2,500
| 2,752
|
| Alameda Corridor Transportation Auth., Rev. Ref. Bonds, Series 2016-B, Assured Guaranty Municipal insured, 4.00% 2037
| 2,000
| 2,180
|
| Alameda Corridor Transportation Auth., Rev. Ref. Bonds, Series 2016-B, Assured Guaranty Municipal insured, 5.00% 2036
| 1,500
| 1,772
|
City of Alameda, Community Facs. Dist. No. 2013-1 (Alameda Landing Public Improvements),
Special Tax Bonds, Series 2016, 5.00% 2042
| 1,000
| 1,118
|
The Tax-Exempt Fund of California — Page 9
of 31
Bonds, notes & other debt instruments (continued)
California (continued)
City, county & other issuers (continued)
| Principal amount
(000)
| Value
(000)
|
City of Alameda, Community Facs. Dist. No. 2013-1 (Alameda Landing Public Improvements),
Special Tax Bonds, Series 2016, 5.00% 2046
| $500
| $558
|
| City of Alhambra, Rev. Bonds (Atherton Baptist Homes Project), Series 2010-A, 7.625% 2040 (preref. 2020)
| 2,625
| 2,697
|
| City of Alhambra, Rev. Ref. Bonds (Atherton Baptist Homes Project), Series 2016, 5.00% 2029
| 500
| 591
|
| City of Anaheim, Housing and Public Improvements Auth., Rev. Ref. Bonds, Series 2017-B, 5.00% 2024
| 1,400
| 1,603
|
City of Anaheim, Public Fncg. Auth., Rev. Ref. Bonds (Electric Distribution System Ref.), Series 2012-A,
5.00% 2027 (preref. 2022)
| 3,500
| 3,952
|
| Azusa Unified School Dist., G.O. Bonds, 2014 Election, Series 2019-C, 5.00% 2044
| 1,000
| 1,219
|
| City of Azusa, Community Facs. Dist. No. 2005-1 (Rosedale), Improvement Area No. 1, Special Tax Bonds, Series 2007, 5.00% 2027
| 1,110
| 1,114
|
| Baldwin Park Unified School Dist., G.O. Rev. Ref. Bonds, Series 2016, Assured Guaranty Municipal insured, 4.00% 2031
| 6,420
| 7,277
|
Banning Unified School Dist., G.O. Rev. Bonds, Series 2017-A, Assured Guaranty Municipal insured,
5.00% 2035
| 955
| 1,161
|
Banning Unified School Dist., G.O. Rev. Ref. Bonds, Series 2016, Assured Guaranty Municipal insured,
4.00% 2031
| 1,500
| 1,692
|
Banning Unified School Dist., G.O. Rev. Ref. Bonds, Series 2016, Assured Guaranty Municipal insured,
4.00% 2032
| 1,000
| 1,121
|
Assn. of Bay Area Governments, Fin. Auth. for Nonprofit Corps., Rev. Bonds
(Casa de las Campanas, Inc.), Series 2010, 6.00% 2037
| 2,200
| 2,313
|
Assn. of Bay Area Governments, Fin. Auth. for Nonprofit Corps., Rev. Bonds
(Channing House), Series 2010, 6.00% 2030 (preref. 2020)
| 2,000
| 2,079
|
Assn. of Bay Area Governments, Fin. Auth. for Nonprofit Corps., Rev. Bonds
(Channing House), Series 2010, 6.125% 2040 (preref. 2020)
| 3,000
| 3,121
|
Assn. of Bay Area Governments, Fin. Auth. for Nonprofit Corps., Rev. Ref. Bonds
(Episcopal Senior Communities), Series 2011, 6.125% 2041
| 3,000
| 3,226
|
Assn. of Bay Area Governments, Fin. Auth. for Nonprofit Corps., Rev. Ref. Bonds
(Episcopal Senior Communities), Series 2012-A, 5.00% 2047
| 4,000
| 4,256
|
Assn. of Bay Area Governments, Fin. Auth. for Nonprofit Corps., Rev. Ref. Bonds
(Episcopal Senior Communities), Series 2012-B, 5.00% 2021
| 515
| 552
|
Assn. of Bay Area Governments, Fin. Auth. for Nonprofit Corps., Rev. Ref. Bonds
(Episcopal Senior Communities), Series 2012-B, 5.00% 2023
| 80
| 88
|
Assn. of Bay Area Governments, Fin. Auth. for Nonprofit Corps., Rev. Ref. Bonds
(Eskaton Properties Inc. Obligated Group), Series 2013, 5.00% 2021
| 1,000
| 1,080
|
Assn. of Bay Area Governments, Fin. Auth. for Nonprofit Corps., Rev. Ref. Bonds
(Sharp HealthCare), Series 2009-B, 6.25% 2039 (preref. 2019)
| 4,000
| 4,000
|
Assn. of Bay Area Governments, Fin. Auth. for Nonprofit Corps., Rev. Ref. Bonds
(Sharp HealthCare), Series 2011-A, 6.00% 2030
| 1,000
| 1,097
|
Assn. of Bay Area Governments, Fin. Auth. for Nonprofit Corps., Rev. Ref. Bonds
(Sharp HealthCare), Series 2014-A, 5.00% 2043
| 1,000
| 1,126
|
Assn. of Bay Area Governments, Fin. Auth. for Nonprofit Corps., Senior Living Rev. Bonds
(Odd Fellows Home of California), Series 2012-A, 5.00% 2032
| 5,000
| 5,591
|
Bay Area Toll Auth., San Francisco Bay Area Toll Bridge Rev. Bonds, Series 2006-C-1,
(SIFMA Municipal Swap Index + 0.90%) 2.30% 2045 (put 2023)1
| 1,400
| 1,420
|
Bay Area Toll Auth., San Francisco Bay Area Toll Bridge Rev. Bonds, Series 2008-B-1,
(SIFMA Municipal Swap Index + 1.10%) 2.50% 2045 (put 2024)1
| 7,900
| 8,115
|
Bay Area Toll Auth., San Francisco Bay Area Toll Bridge Rev. Bonds, Series 2014-G,
(SIFMA Municipal Swap Index + 0.60%) 2.00% 2034 (put 2020)1
| 825
| 826
|
Bay Area Toll Auth., San Francisco Bay Area Toll Bridge Rev. Bonds, Series 2014-H,
(SIFMA Municipal Swap Index + 0.70%) 2.10% 2034 (put 2021)1
| 4,000
| 4,016
|
Bay Area Toll Auth., San Francisco Bay Area Toll Bridge Rev. Bonds, Series 2017-D,
(3-month USD-LIBOR x 0.70 + 0.55%) 2.182% 2045 (put 2021)1
| 2,100
| 2,105
|
| Bay Area Toll Auth., San Francisco Bay Area Toll Bridge Rev. Bonds, Series 2017-F-1, 5.00% 2056
| 3,510
| 4,160
|
| Bay Area Toll Auth., San Francisco Bay Area Toll Bridge Rev. Bonds, Series 2019-S-8, 5.00% 2056
| 16,500
| 20,206
|
The Tax-Exempt Fund of California — Page 10
of 31
Bonds, notes & other debt instruments (continued)
California (continued)
City, county & other issuers (continued)
| Principal amount
(000)
| Value
(000)
|
| Bay Area Toll Auth., San Francisco Bay Area Toll Bridge Rev. Bonds, Series 2019-S-H, 5.00% 2044
| $1,000
| $1,227
|
| Bay Area Toll Auth., San Francisco Bay Area Toll Bridge Rev. Ref. Bonds, Series 2014-F-1, 5.00% 2054
| 1,475
| 1,668
|
City of Beaumont, Community Facs. Dist. No. 2016-1 (Fairway Canyon), Special Tax Bonds,
Series 2019, 5.00% 2044
| 600
| 685
|
City of Beaumont, Community Facs. Dist. No. 2016-2 (Sundance), Special Tax Rev. Bonds,
Series 2019, 5.00% 2044
| 1,000
| 1,132
|
City of Beaumont, Community Facs. Dist. No. 2016-2 (Sundance), Special Tax Rev. Bonds,
Series 2019, 5.00% 2049
| 1,000
| 1,128
|
City of Beaumont, Community Facs. Dist. No. 93-1 (Improvement Area No. 8C), Special Tax Bonds,
Series 2018-A, 5.00% 2043
| 1,605
| 1,834
|
City of Beaumont, Community Facs. Dist. No. 93-1 (Improvement Area No. 8C), Special Tax Bonds,
Series 2018-A, 5.00% 2048
| 5,715
| 6,500
|
City of Beaumont, Community Facs. Dist. No. 93-1 (Improvement Area No. 8D), Special Tax Bonds,
Series 2018-A, 5.00% 2043
| 565
| 646
|
City of Beaumont, Community Facs. Dist. No. 93-1 (Improvement Area No. 8D), Special Tax Bonds,
Series 2018-A, 5.00% 2048
| 1,000
| 1,137
|
City of Beaumont, Community Facs. Dist. No. 93-1 (Improvement Area No. 8E), Special Tax Bonds,
Series 2019, 5.00% 2048
| 2,500
| 2,843
|
California County Tobacco Securitization Agcy., Tobacco Settlement Asset-Backed Bonds
(Alameda County Tobacco Asset Securitization Corp.), Series 2002, 5.75% 2029
| 175
| 177
|
City of Carlsbad, Reassessment Dist. No. 2012-1, Limited Obligation Rev. Ref. Bonds, Series 2013,
4.25% 2032
| 1,350
| 1,398
|
City of Carlsbad, Reassessment Dist. No. 2012-1, Limited Obligation Rev. Ref. Bonds, Series 2013,
5.00% 2035
| 1,300
| 1,386
|
City of Cathedral City, Public Fncg. Auth., Tax Allocation Housing Rev. Bonds
(2006 Merged Redev. Project Area), Series 2007-C, 5.00% 2030
| 3,675
| 3,682
|
City of Cathedral City, Successor Agcy. to the Redev. Agcy., Tax Allocation Housing Rev. Ref. Bonds
(Merged Redev. Project Area), Series 2014-B, Assured Guaranty Municipal insured, 5.00% 2030
| 1,050
| 1,217
|
Centinela Valley Union High School Dist., G.O. Rev. Ref. Bonds, Series 2016-C,
Assured Guaranty Municipal insured, 4.00% 2033
| 2,500
| 2,818
|
| Cerritos Community College Dist., G.O. Bonds, 2004 Election, Series 2012-D, 5.00% 2038
| 1,000
| 1,100
|
| City of Cerritos, Public Fncg. Auth., Tax Allocation Rev. Bonds (Cerritos Redev. Projects), Series 2002-A, AMBAC insured, 5.00% 2019
| 1,000
| 1,029
|
| City of Cerritos, Public Fncg. Auth., Tax Allocation Rev. Bonds (Cerritos Redev. Projects), Series 2002-A, AMBAC insured, 5.00% 2020
| 1,500
| 1,564
|
| City of Cerritos, Public Fncg. Auth., Tax Allocation Rev. Bonds (Cerritos Redev. Projects), Series 2002-A, AMBAC insured, 5.00% 2021
| 500
| 525
|
| Chabot-Las Positas Community College Dist., G.O. Rev. Ref. Bonds, Series 2017-A, 4.00% 2042
| 1,500
| 1,643
|
Chaffey Joint Union High School Dist., G.O. Bonds, Capital Appreciation Bonds, 2012 Election,
Series 2019-D, 0% 2027
| 895
| 768
|
City of Chino, Public Fncg. Auth., Local Agcy. Rev. Ref. Bonds, Series 2015-A,
Assured Guaranty Municipal insured, 5.00% 2030
| 1,010
| 1,213
|
City of Chino, Public Fncg. Auth., Local Agcy. Rev. Ref. Bonds, Series 2015-A,
Assured Guaranty Municipal insured, 5.00% 2031
| 500
| 599
|
City of Chula Vista, Industrial Dev. Rev. Ref. Bonds (San Diego Gas & Electric Co.), Series 2004-C,
5.875% 2034
| 2,260
| 2,269
|
| City of Chula Vista, Municipal Fncg. Auth., Special Tax Rev. Ref. Bonds, Series 2013, 5.00% 2021
| 970
| 1,046
|
| City of Chula Vista, Municipal Fncg. Auth., Special Tax Rev. Ref. Bonds, Series 2013, 5.00% 2022
| 1,455
| 1,620
|
City of Chula Vista, Successor Agcy. to the Redev. Agcy., Tax Allocation Rev. Ref. Bonds, Series 2016,
Assured Guaranty Municipal insured, 5.00% 2029
| 890
| 1,084
|
City of Chula Vista, Successor Agcy. to the Redev. Agcy., Tax Allocation Rev. Ref. Bonds, Series 2016,
Assured Guaranty Municipal insured, 5.00% 2030
| 920
| 1,112
|
City of Chula Vista, Successor Agcy. to the Redev. Agcy., Tax Allocation Rev. Ref. Bonds, Series 2016,
Assured Guaranty Municipal insured, 5.00% 2034
| 1,180
| 1,401
|
The Tax-Exempt Fund of California — Page 11
of 31
Bonds, notes & other debt instruments (continued)
California (continued)
City, county & other issuers (continued)
| Principal amount
(000)
| Value
(000)
|
| City of Clovis, Wastewater Rev. Bonds, Series 2017, BAM insured, 5.00% 2034
| $665
| $818
|
| City of Clovis, Wastewater Rev. Bonds, Series 2017, BAM insured, 5.00% 2035
| 965
| 1,184
|
| City of Clovis, Wastewater Rev. Bonds, Series 2017, BAM insured, 5.00% 2036
| 1,155
| 1,412
|
| City of Clovis, Wastewater Rev. Bonds, Series 2017, BAM insured, 5.00% 2037
| 1,150
| 1,401
|
| City of Clovis, Wastewater Rev. Bonds, Series 2017, BAM insured, 5.00% 2038
| 515
| 626
|
Coachella Valley Unified School Dist., G.O. Bonds, 2005 Election, Series 2016-E,
Assured Guaranty Municipal insured, 4.00% 2045
| 6,555
| 7,082
|
| Colton Joint Unified School Dist., G.O. Bonds, 2008 Election, Series 2016-D, BAM insured, 4.00% 2030
| 1,300
| 1,487
|
| Colton Joint Unified School Dist., G.O. Bonds, 2008 Election, Series 2016-D, BAM insured, 4.00% 2031
| 1,200
| 1,364
|
| Compton Community College Dist., G.O. Rev. Ref. Bonds, Series 2018-A, BAM insured, 5.00% 2032
| 1,065
| 1,291
|
| Compton Community College Dist., G.O. Rev. Ref. Bonds, Series 2018-A, BAM insured, 5.00% 2033
| 1,080
| 1,303
|
| Compton Community College Dist., G.O. Rev. Ref. Bonds, Series 2018-A, BAM insured, 5.00% 2034
| 1,355
| 1,626
|
| Compton Community College Dist., G.O. Rev. Ref. Bonds, Series 2018-A, BAM insured, 5.00% 2035
| 1,515
| 1,813
|
| Compton Community College Dist., G.O. Rev. Ref. Bonds, Series 2018-A, BAM insured, 5.00% 2037
| 1,875
| 2,228
|
| Compton Community College Dist., G.O. Rev. Ref. Bonds, Series 2018-A, BAM insured, 5.00% 2038
| 2,075
| 2,457
|
| City of Concord, Successor Agcy. of the Redev. Agcy., Rev. Ref. Bonds, Series 2014, BAM insured, 5.00% 2023
| 925
| 1,049
|
County of Contra Costa, Transportation Auth., Sales Tax Rev. Ref. Bonds, Series 2018-A,
(1-month USD-LIBOR x 0.70 + 0.25%) 1.931% 2034 (put 2021)1
| 11,675
| 11,686
|
| City of Corona, Community Facs. Dist. No. 2018-1 (Bedford), Special Tax Bonds, Series 2018-A, 5.00% 2034
| 800
| 909
|
Corona-Norco Unified School Dist., Community Facs. Dist. No. 05-1, Special Tax Bonds, Series 2016,
5.00% 2024
| 255
| 294
|
Corona-Norco Unified School Dist., Community Facs. Dist. No. 05-1, Special Tax Bonds, Series 2016,
5.00% 2025
| 530
| 623
|
Corona-Norco Unified School Dist., Community Facs. Dist. No. 05-1, Special Tax Bonds, Series 2016,
5.00% 2036
| 2,010
| 2,312
|
| Cotati-Rohnert Park Unified School Dist., G.O. Bonds, 2014 Election, Series 2018-E, BAM insured, 4.00% 2043
| 2,000
| 2,179
|
Eastern Municipal Water Dist., Community Facs. Dist. No. 2013-64 (Atherton and Terracina),
Special Tax Bonds, Series 2019, 5.00% 2045
| 850
| 971
|
Eastern Municipal Water Dist., Rev. Ref. Water and Wastewater Rev. Bonds, Series 2018-B,
(1-month USD-LIBOR x 0.70 + 0.30%) 1.981% 2030 (put 2021)1
| 4,770
| 4,776
|
County of El Dorado, Community Facs. Dist. No. 1992-1 (El Dorado Hills Dev.), Special Tax Rev. Ref. Bonds,
Series 2012, 5.00% 2024
| 1,500
| 1,669
|
County of El Dorado, Community Facs. Dist. No. 1992-1 (El Dorado Hills Dev.), Special Tax Rev. Ref. Bonds,
Series 2012, 5.00% 2025
| 2,585
| 2,868
|
| El Monte Union High School Dist., G.O. Bonds, 2018 Election, Series 2019-A, 5.00% 2049
| 3,300
| 3,926
|
| City of Elk Grove, Fin. Auth., Special Tax Rev. Bonds, Series 2015, BAM insured, 5.00% 2032
| 1,000
| 1,181
|
| City of Elk Grove, Fin. Auth., Special Tax Rev. Bonds, Series 2015, BAM insured, 5.00% 2033
| 1,000
| 1,178
|
| City of Elk Grove, Fin. Auth., Special Tax Rev. Bonds, Series 2015, BAM insured, 5.00% 2034
| 1,000
| 1,171
|
| City of Elk Grove, Fin. Auth., Special Tax Rev. Bonds, Series 2015, BAM insured, 5.00% 2035
| 1,000
| 1,170
|
| City of Elk Grove, Fin. Auth., Special Tax Rev. Bonds, Series 2016, 4.00% 2020
| 250
| 256
|
| City of Elk Grove, Fin. Auth., Special Tax Rev. Bonds, Series 2016, 4.00% 2032
| 2,500
| 2,695
|
| City of Elk Grove, Fin. Auth., Special Tax Rev. Bonds, Series 2016, 5.00% 2041
| 4,680
| 5,324
|
| City of Elk Grove, Fin. Auth., Special Tax Rev. Bonds, Series 2016, 5.00% 2046
| 8,065
| 9,142
|
| City of Elk Grove, Fin. Auth., Special Tax Rev. Bonds, Series 2018, 5.00% 2033
| 945
| 1,096
|
| City of Elk Grove, Fin. Auth., Special Tax Rev. Bonds, Series 2018, 5.00% 2035
| 1,150
| 1,326
|
| City of Elk Grove, Fin. Auth., Special Tax Rev. Bonds, Series 2018, 5.00% 2043
| 1,040
| 1,182
|
| City of Elk Grove, Fin. Auth., Special Tax Rev. Bonds, Series 2018, 5.00% 2048
| 2,500
| 2,827
|
Elk Grove Unified School Dist., Community Facs. Dist. No. 1, Special Tax Rev. Ref. Bonds, Series 2012,
4.00% 2033
| 2,535
| 2,663
|
| City of Emeryville, Successor Agcy. to the Redev. Agcy., Tax Allocation Rev. Ref. Bonds, Series 2014-A, Assured Guaranty Municipal insured, 5.00% 2023
| 1,500
| 1,736
|
| City of Emeryville, Successor Agcy. to the Redev. Agcy., Tax Allocation Rev. Ref. Bonds, Series 2014-A, Assured Guaranty Municipal insured, 5.00% 2026
| 2,000
| 2,378
|
| Fairfield-Suisun Unified School Dist., G.O. Bonds, 2016 Election, Series 2018, 4.00% 2041
| 5,760
| 6,281
|
The Tax-Exempt Fund of California — Page 12
of 31
Bonds, notes & other debt instruments (continued)
California (continued)
City, county & other issuers (continued)
| Principal amount
(000)
| Value
(000)
|
| Folsom Cordova Unified School Dist., School Facs. Improvement Dist. No. 1, Capital Appreciation Bonds, Series 2004-B, National insured, 0% 2026
| $1,000
| $875
|
| City of Fontana, Community Facs. Dist. No. 31 (Citrus Heights North), Special Tax Rev. Ref. Bonds, Series 2018, 5.00% 2034
| 1,255
| 1,455
|
Foothill/Eastern Transportation Corridor Agcy., Toll Road Rev. Ref. Bonds, Capital Appreciation Bonds,
Series 2015-A, Assured Guaranty Municipal insured, 0% 2035
| 2,000
| 1,280
|
| Foothill/Eastern Transportation Corridor Agcy., Toll Road Rev. Ref. Bonds, Series 2013-A, 6.00% 2053
| 5,275
| 6,183
|
| Foothill/Eastern Transportation Corridor Agcy., Toll Road Rev. Ref. Bonds, Series 2013-B-1, 3.95% 2053
| 3,500
| 3,690
|
| Foothill/Eastern Transportation Corridor Agcy., Toll Road Rev. Ref. Bonds, Series 2013-B-2, 3.50% 2053
| 3,500
| 3,552
|
| Foothill/Eastern Transportation Corridor Agcy., Toll Road Rev. Ref. Bonds, Series 2014-A, 6.00% 2049
| 5,800
| 6,809
|
| City of Fremont, Community Facs. Dist. No. 1 (Pacific Commons), Special Tax Rev. Ref. Bonds, Series 2015, 5.00% 2030
| 2,220
| 2,550
|
| City of Fremont, Community Facs. Dist. No. 2 (Warm Springs Public Facs.), Special Tax Bonds, Series 2019, 5.00% 2044
| 1,000
| 1,142
|
| City of Fremont, Community Facs. Dist. No. 2 (Warm Springs Public Facs.), Special Tax Bonds, Series 2019, 5.00% 2049
| 1,550
| 1,765
|
Fresno Joint Powers Fin. Auth., Rev. Ref. Bonds (Master Lease Projects), Series 2017-A,
Assured Guaranty Municipal insured, 5.00% 2029
| 1,000
| 1,231
|
| Fresno Unified School Dist., G.O. Bonds, Series 2016-A, 4.00% 2034
| 3,000
| 3,365
|
| Fresno Unified School Dist., G.O. Bonds, Series 2018-A, 5.00% 2039
| 1,830
| 2,183
|
City of Garden Grove, Successor Agcy. to the Community Dev. Agcy., Tax Allocation Bonds, Series 2016,
BAM insured, 5.00% 2029
| 1,500
| 1,840
|
City of Glendale, Successor Agcy. to the Redev. Agcy., Tax Allocation Rev. Ref. Bonds
(Central Glendale Redev. Project), Series 2016, BAM insured, 4.00% 2023
| 500
| 562
|
Golden Empire Schools, Fin. Auth., Lease Rev. Ref. Notes (Kern High School Dist. Projects), Series 2018,
5.00% 2021
| 2,000
| 2,137
|
Grossmont Union High School Dist., G.O. Bonds, Capital Appreciation Bonds, 2004 Election, Series 2008,
0% 2032
| 7,000
| 5,075
|
Hacienda La Puente Unified School Dist., Facs. Fncg. Auth., G.O. Rev. Bonds, Series 2007,
Assured Guaranty Municipal insured, 5.00% 2025
| 3,170
| 3,906
|
| Hartnell Community College Dist., G.O. Bonds, 2016 Election, Series 2017-A, 4.00% 2047
| 4,555
| 4,970
|
| Hayward Unified School Dist., G.O. Bonds, 2019 Election, Series 2019-A, BAM insured, 5.00% 2044
| 8,000
| 9,662
|
| Hayward Unified School Dist., G.O. Rev. Ref. Bonds, 2019 Election, Series 2019-A, BAM insured, 5.00% 2040
| 1,000
| 1,217
|
| Hemet Unified School Dist., Fncg. Auth., Special Tax Rev. Ref. Bonds, Series 2015, 5.00% 2039
| 1,850
| 2,060
|
City of Indian Wells, Successor Agcy. to the Redev. Agcy., Tax Allocation Rev. Ref. Bonds
(Consolidated Whitewater Redev. Project Area), Series 2016-A, National insured, 4.00% 2030
| 1,250
| 1,399
|
City of Indian Wells, Successor Agcy. to the Redev. Agcy., Tax Allocation Rev. Ref. Bonds
(Consolidated Whitewater Redev. Project Area), Series 2016-A, National insured, 4.00% 2031
| 1,250
| 1,388
|
City of Inglewood, Successor Agcy. to the Redev. Agcy., Tax Allocation Bonds (Merged Redev. Project),
Series 2017-A, BAM insured, 5.00% 2031
| 250
| 304
|
City of Inglewood, Successor Agcy. to the Redev. Agcy., Tax Allocation Bonds (Merged Redev. Project),
Series 2017-A, BAM insured, 5.00% 2033
| 1,250
| 1,506
|
City of Inglewood, Successor Agcy. to the Redev. Agcy., Tax Allocation Bonds (Merged Redev. Project),
Series 2017-A, BAM insured, 5.00% 2034
| 500
| 600
|
City of Inglewood, Successor Agcy. to the Redev. Agcy., Tax Allocation Bonds (Merged Redev. Project),
Series 2017-A, BAM insured, 5.00% 2035
| 415
| 495
|
City of Inglewood, Successor Agcy. to the Redev. Agcy., Tax Allocation Bonds (Merged Redev. Project),
Series 2017-A, BAM insured, 5.00% 2038
| 1,000
| 1,182
|
| Inglewood Unified School Dist., G.O. Rev. Ref. Bonds, 2012 Election, Series 2018-B, BAM insured, 5.00% 2029
| 230
| 278
|
| Inglewood Unified School Dist., G.O. Rev. Ref. Bonds, 2012 Election, Series 2018-B, BAM insured, 5.00% 2030
| 500
| 600
|
| Inglewood Unified School Dist., G.O. Rev. Ref. Bonds, 2012 Election, Series 2018-B, BAM insured, 5.00% 2033
| 500
| 590
|
| Inglewood Unified School Dist., G.O. Rev. Ref. Bonds, 2012 Election, Series 2018-B, BAM insured, 5.00% 2034
| 685
| 805
|
| Inglewood Unified School Dist., G.O. Rev. Ref. Bonds, 2012 Election, Series 2018-B, BAM insured, 5.00% 2036
| 800
| 935
|
| Inglewood Unified School Dist., G.O. Rev. Ref. Bonds, 2012 Election, Series 2018-B, BAM insured, 5.00% 2038
| 650
| 754
|
The Tax-Exempt Fund of California — Page 13
of 31
Bonds, notes & other debt instruments (continued)
California (continued)
City, county & other issuers (continued)
| Principal amount
(000)
| Value
(000)
|
| City of Irvine, Community Facs. Dist. No. 2013-3 (Great Park), Improvement Area No. 1, Special Tax Bonds, Series 2014, 5.00% 2044
| $2,705
| $2,974
|
| City of Irvine, Community Facs. Dist. No. 2013-3 (Great Park), Improvement Area No. 1, Special Tax Bonds, Series 2014, 5.00% 2049
| 1,000
| 1,095
|
| City of Irvine, Community Facs. Dist. No. 2013-3 (Great Park), Improvement Area No. 4, Special Tax Bonds, Series 2016, 4.00% 2028
| 825
| 897
|
| City of Irvine, Community Facs. Dist. No. 2013-3 (Great Park), Improvement Area No. 4, Special Tax Bonds, Series 2016, 4.00% 2031
| 400
| 430
|
| City of Irvine, Community Facs. Dist. No. 2013-3 (Great Park), Improvement Area No. 4, Special Tax Bonds, Series 2016, 4.00% 2033
| 1,615
| 1,731
|
| City of Irvine, Community Facs. Dist. No. 2013-3 (Great Park), Improvement Area No. 8, Special Tax Bonds, Series 2018, 5.00% 2035
| 550
| 637
|
| City of Irvine, Community Facs. Dist. No. 2013-3 (Great Park), Improvement Area No. 8, Special Tax Bonds, Series 2018, 5.00% 2037
| 650
| 750
|
| City of Irvine, Community Facs. Dist. No. 2013-3 (Great Park), Improvement Area No. 8, Special Tax Bonds, Series 2018, 5.00% 2038
| 1,000
| 1,151
|
| City of Irvine, Community Facs. Dist. No. 2013-3 (Great Park), Improvement Area No. 8, Special Tax Bonds, Series 2018, 5.00% 2043
| 2,670
| 3,054
|
| City of Irvine, Community Facs. Dist. No. 2013-3 (Great Park), Improvement Area No. 8, Special Tax Bonds, Series 2018, 5.00% 2048
| 5,250
| 5,981
|
| City of Irvine, Community Facs. Dist. No. 2013-3 (Great Park), Improvement Area No. 8, Special Tax Bonds, Series 2018, Assured Guaranty Municipal insured, 5.00%
2051
| 1,250
| 1,461
|
| City of Irvine, Reassessment Dist. No. 12-1, Limited Obligation Improvement Bonds, Series 2012, 4.00% 2020
| 1,000
| 1,032
|
| City of Irvine, Reassessment Dist. No. 12-1, Limited Obligation Improvement Bonds, Series 2013, 5.00% 2024
| 825
| 952
|
| City of Irvine, Reassessment Dist. No. 12-1, Limited Obligation Improvement Bonds, Series 2013, 5.00% 2025
| 710
| 816
|
| City of Irvine, Reassessment Dist. No. 12-1, Limited Obligation Improvement Bonds, Series 2013, 5.00% 2028
| 1,050
| 1,191
|
| City of Irvine, Reassessment Dist. No. 12-1, Limited Obligation Improvement Bonds, Series 2015, 5.00% 2024
| 2,250
| 2,684
|
| City of Irvine, Reassessment Dist. No. 12-1, Limited Obligation Improvement Bonds, Series 2015, 5.00% 2029
| 2,600
| 3,006
|
| City of Irvine, Reassessment Dist. No. 12-1, Limited Obligation Improvement Bonds, Series 2015, 5.00% 2030
| 1,700
| 1,955
|
| City of Irvine, Reassessment Dist. No. 12-1, Limited Obligation Improvement Bonds, Series 2015, 5.00% 2031
| 1,500
| 1,717
|
| City of Irvine, Reassessment Dist. No. 15-2, Limited Obligation Improvement Bonds, Series 2015, 5.00% 2032
| 800
| 913
|
| City of Irvine, Reassessment Dist. No. 15-2, Limited Obligation Improvement Bonds, Series 2015, 5.00% 2042
| 1,000
| 1,119
|
| City of Irvine, Reassessment Dist. No. 19-1, Limited Obligation Improvement Bonds, Series 2019, 4.00% 2036
| 1,000
| 1,148
|
| City of Irvine, Reassessment Dist. No. 19-1, Limited Obligation Improvement Bonds, Series 2019, 4.00% 2037
| 1,285
| 1,466
|
| City of Irvine, Reassessment Dist. No. 19-1, Limited Obligation Improvement Bonds, Series 2019, 5.00% 2026
| 330
| 412
|
| City of Irvine, Reassessment Dist. No. 19-1, Limited Obligation Improvement Bonds, Series 2019, 5.00% 2027
| 375
| 477
|
| City of Irvine, Reassessment Dist. No. 19-1, Limited Obligation Improvement Bonds, Series 2019, 5.00% 2028
| 525
| 680
|
| City of Irvine, Reassessment Dist. No. 19-1, Limited Obligation Improvement Bonds, Series 2019, 5.00% 2029
| 500
| 657
|
| City of Irvine, Reassessment Dist. No. 19-1, Limited Obligation Improvement Bonds, Series 2019, 5.00% 2030
| 350
| 457
|
| City of Irvine, Reassessment Dist. No. 19-1, Limited Obligation Improvement Bonds, Series 2019, 5.00% 2031
| 330
| 428
|
| City of Irvine, Reassessment Dist. No. 19-1, Limited Obligation Improvement Bonds, Series 2019, 5.00% 2032
| 340
| 437
|
| City of Irvine, Reassessment Dist. No. 19-1, Limited Obligation Improvement Bonds, Series 2019, 5.00% 2034
| 770
| 977
|
| City of Irvine, Reassessment Dist. No. 19-1, Limited Obligation Improvement Bonds, Series 2019, 5.00% 2044
| 1,000
| 1,228
|
Irvine Unified School Dist., Community Facs. Dist. No. 01-1, Special Tax Rev. Ref. Bonds, Series 2015,
BAM insured, 5.00% 2031
| 2,000
| 2,323
|
| Irvine Unified School Dist., Community Facs. Dist. No. 09-1, Special Tax Bonds, Series 2017-A, BAM insured, 5.00% 2023
| 1,000
| 1,125
|
| Irvine Unified School Dist., Community Facs. Dist. No. 09-1, Special Tax Bonds, Series 2017-A, BAM insured, 5.00% 2024
| 2,000
| 2,303
|
| Irvine Unified School Dist., Community Facs. Dist. No. 09-1, Special Tax Bonds, Series 2017-A, BAM insured, 5.00% 2029
| 200
| 240
|
| Irvine Unified School Dist., Community Facs. Dist. No. 09-1, Special Tax Bonds, Series 2017-A, BAM insured, 5.00% 2030
| 370
| 442
|
The Tax-Exempt Fund of California — Page 14
of 31
Bonds, notes & other debt instruments (continued)
California (continued)
City, county & other issuers (continued)
| Principal amount
(000)
| Value
(000)
|
| Irvine Unified School Dist., Community Facs. Dist. No. 09-1, Special Tax Bonds, Series 2017-A, BAM insured, 5.00% 2031
| $420
| $499
|
| Irvine Unified School Dist., Community Facs. Dist. No. 09-1, Special Tax Bonds, Series 2017-A, BAM insured, 5.00% 2032
| 450
| 533
|
| Irvine Unified School Dist., Community Facs. Dist. No. 09-1, Special Tax Bonds, Series 2017-B, BAM insured, 5.00% 2032
| 175
| 207
|
| Irvine Unified School Dist., Community Facs. Dist. No. 09-1, Special Tax Bonds, Series 2017-B, BAM insured, 5.00% 2033
| 245
| 289
|
| Irvine Unified School Dist., Community Facs. Dist. No. 09-1, Special Tax Bonds, Series 2017-B, BAM insured, 5.00% 2034
| 250
| 294
|
| Irvine Unified School Dist., Community Facs. Dist. No. 09-1, Special Tax Bonds, Series 2017-B, BAM insured, 5.00% 2035
| 250
| 293
|
| Irvine Unified School Dist., Community Facs. Dist. No. 09-1, Special Tax Bonds, Series 2017-B, BAM insured, 5.00% 2036
| 350
| 409
|
| Irvine Unified School Dist., Community Facs. Dist. No. 09-1, Special Tax Bonds, Series 2017-B, BAM insured, 5.00% 2037
| 270
| 315
|
| Irvine Unified School Dist., Community Facs. Dist. No. 09-1, Special Tax Bonds, Series 2017-B, BAM insured, 5.00% 2042
| 1,000
| 1,153
|
| Irvine Unified School Dist., Community Facs. Dist. No. 09-1, Special Tax Bonds, Series 2017-C, BAM insured, 4.00% 2053
| 1,250
| 1,309
|
| Irvine Unified School Dist., Community Facs. Dist. No. 09-1, Special Tax Bonds, Series 2017-C, BAM insured, 5.00% 2042
| 1,000
| 1,153
|
| Irvine Unified School Dist., Community Facs. Dist. No. 09-1, Special Tax Bonds, Series 2017-D, BAM insured, 5.00% 2057
| 1,665
| 1,888
|
| Irvine Unified School Dist., Community Facs. Dist. No. 09-1, Special Tax Bonds, Series 2018-A, BAM insured, 5.00% 2039
| 820
| 950
|
| Irvine Unified School Dist., Community Facs. Dist. No. 09-1, Special Tax Bonds, Series 2018-A, BAM insured, 5.00% 2040
| 810
| 936
|
| Irvine Unified School Dist., Community Facs. Dist. No. 09-1, Special Tax Bonds, Series 2018-A, BAM insured, 5.00% 2045
| 1,500
| 1,727
|
| City of Jurupa, Public Fncg. Auth., Special Tax Rev. Bonds, Series 2014-A, 5.00% 2027
| 2,000
| 2,379
|
| City of Jurupa, Public Fncg. Auth., Special Tax Rev. Bonds, Series 2014-A, 5.00% 2042
| 1,000
| 1,138
|
| Jurupa Unified School Dist., Community Facs. Dist. No. 11, Special Tax Bonds, Series 2018-B, 5.00% 2043
| 1,165
| 1,333
|
| Jurupa Unified School Dist., Community Facs. Dist. No. 11, Special Tax Bonds, Series 2018-B, 5.00% 2048
| 2,265
| 2,581
|
| Jurupa Unified School Dist., Community Facs. Dist. No. 17, Special Tax Bonds, Series 2018-A, 5.00% 2048
| 1,815
| 2,068
|
City of La Quinta, Successor Agcy. to the Redev. Agcy., Tax Allocation Rev. Ref. Bonds
(Redev. Project Area Nos. 1 and 2), Series 2013-A, 5.00% 2028
| 2,130
| 2,436
|
City of La Quinta, Successor Agcy. to the Redev. Agcy., Tax Allocation Rev. Ref. Bonds
(Redev. Project Area Nos. 1 and 2), Series 2014-A, 5.00% 2029
| 1,000
| 1,183
|
City of La Quinta, Successor Agcy. to the Redev. Agcy., Tax Allocation Rev. Ref. Bonds
(Redev. Project Area Nos. 1 and 2), Series 2014-A, 5.00% 2032
| 1,515
| 1,781
|
City of La Quinta, Successor Agcy. to the Redev. Agcy., Tax Allocation Rev. Ref. Bonds
(Redev. Project Area Nos. 1 and 2), Series 2014-A, 5.00% 2034
| 2,150
| 2,508
|
| City of La Verne, Rev. Certs. of Part. (Brethren Hillcrest Homes), Series 2014, 5.00% 2036
| 1,350
| 1,435
|
| City of Lake Elsinore, Public Fncg. Auth., Local Agcy. Rev. Ref. Bonds, Series 2015, 5.00% 2029
| 4,570
| 5,266
|
| City of Lake Elsinore, Public Fncg. Auth., Local Agcy. Rev. Ref. Bonds, Series 2015, 5.00% 2035
| 1,375
| 1,558
|
| City of Lake Elsinore, School Fncg. Auth., Special Tax Rev. Bonds, Series 2017-A, 5.00% 2025
| 260
| 317
|
| City of Lake Elsinore, School Fncg. Auth., Special Tax Rev. Bonds, Series 2017-A, 5.00% 2026
| 435
| 543
|
| City of Lake Elsinore, School Fncg. Auth., Special Tax Rev. Bonds, Series 2017-A, 5.00% 2027
| 600
| 766
|
| City of Lake Elsinore, School Fncg. Auth., Special Tax Rev. Bonds, Series 2017-A, 5.00% 2028
| 400
| 508
|
| City of Lake Elsinore, School Fncg. Auth., Special Tax Rev. Bonds, Series 2017-A, 5.00% 2029
| 480
| 606
|
| City of Lake Elsinore, School Fncg. Auth., Special Tax Rev. Bonds, Series 2017-A, 5.00% 2030
| 500
| 628
|
| City of Lee Lake, Public Fncg. Auth., Special Tax Rev. Ref. Bonds, Series 2013-A, 5.25% 2027
| 2,000
| 2,303
|
The Tax-Exempt Fund of California — Page 15
of 31
Bonds, notes & other debt instruments (continued)
California (continued)
City, county & other issuers (continued)
| Principal amount
(000)
| Value
(000)
|
City of Long Beach, Bond Fin. Auth., Rev. Ref. Bonds (Aquarium of the Pacific Project), Series 2012,
5.00% 2021
| $1,220
| $1,328
|
City of Long Beach, Bond Fin. Auth., Rev. Ref. Bonds (Aquarium of the Pacific Project), Series 2012,
5.00% 2024
| 1,000
| 1,086
|
City of Long Beach, Bond Fin. Auth., Rev. Ref. Bonds (Aquarium of the Pacific Project), Series 2012,
5.00% 2025
| 1,000
| 1,086
|
City of Long Beach, Bond Fin. Auth., Rev. Ref. Bonds (Aquarium of the Pacific Project), Series 2012,
5.00% 2026
| 1,000
| 1,085
|
| City of Long Beach, Harbor Rev. Bonds, Series 2017-A, AMT, 5.00% 2031
| 1,210
| 1,477
|
| City of Long Beach, Harbor Rev. Bonds, Series 2017-A, AMT, 5.00% 2032
| 1,750
| 2,127
|
| City of Long Beach, Harbor Rev. Bonds, Series 2017-A, AMT, 5.00% 2033
| 1,350
| 1,636
|
| City of Long Beach, Harbor Rev. Bonds, Series 2017-B, AMT, 5.00% 2043
| 500
| 588
|
| City of Long Beach, Harbor Rev. Bonds, Series 2019-A, 5.00% 2033
| 1,500
| 1,938
|
| City of Long Beach, Harbor Rev. Bonds, Series 2019-A, 5.00% 2035
| 1,870
| 2,393
|
| City of Long Beach, Marina Rev. Bonds (Alamitos Bay Marina Project), Series 2015, 5.00% 2034
| 1,125
| 1,267
|
| City of Long Beach, Marina Rev. Bonds (Alamitos Bay Marina Project), Series 2015, 5.00% 2045
| 1,750
| 1,934
|
| Long Beach Community College Dist., G.O. Bonds, 2008 Election, Series 2012-B, 5.00% 2026 (preref. 2022)
| 3,575
| 4,013
|
| Long Beach Unified School Dist., G.O. Bonds, 2008 Election, Series 2017-E, 5.00% 2040
| 3,655
| 4,358
|
| Long Beach Unified School Dist., G.O. Rev. Ref. Bonds, 2016 Election, Series 2016, 4.00% 2031
| 3,720
| 4,238
|
City of Los Angeles, Community Facs. Dist. No. 4 (Playa Vista - Phase 1), Special Tax Rev. Ref. Bonds,
Series 2014, 5.00% 2026
| 1,000
| 1,178
|
City of Los Angeles, Community Facs. Dist. No. 4 (Playa Vista - Phase 1), Special Tax Rev. Ref. Bonds,
Series 2014, 5.00% 2027
| 2,000
| 2,348
|
City of Los Angeles, Community Facs. Dist. No. 4 (Playa Vista - Phase 1), Special Tax Rev. Ref. Bonds,
Series 2014, 5.00% 2028
| 1,700
| 1,984
|
| City of Los Angeles, Community Redev. Agcy., Lease Rev. Bonds (Vermont Manchester Social Services Project), Series 2005, AMBAC insured, 5.00% 2024
| 3,250
| 3,261
|
City of Los Angeles, Dept. of Airports, Los Angeles International Airport, Rev. Bonds, Series 2010-B,
5.00% 2035
| 1,000
| 1,031
|
| City of Los Angeles, Dept. of Airports, Los Angeles International Airport, Rev. Bonds, Series 2015-A, AMT, 5.00% 2027
| 1,250
| 1,485
|
| City of Los Angeles, Dept. of Airports, Los Angeles International Airport, Rev. Bonds, Series 2015-A, AMT, 5.00% 2029
| 1,560
| 1,840
|
| City of Los Angeles, Dept. of Airports, Los Angeles International Airport, Rev. Bonds, Series 2016-A, AMT, 4.00% 2034
| 1,000
| 1,118
|
| City of Los Angeles, Dept. of Airports, Los Angeles International Airport, Rev. Bonds, Series 2016-A, AMT, 5.00% 2035
| 1,000
| 1,178
|
| City of Los Angeles, Dept. of Airports, Los Angeles International Airport, Rev. Bonds, Series 2016-A, AMT, 5.00% 2042
| 1,000
| 1,160
|
| City of Los Angeles, Dept. of Airports, Los Angeles International Airport, Rev. Bonds, Series 2016-B, AMT, 5.00% 2029
| 1,450
| 1,750
|
| City of Los Angeles, Dept. of Airports, Los Angeles International Airport, Rev. Bonds, Series 2016-B, AMT, 5.00% 2031
| 2,395
| 2,857
|
| City of Los Angeles, Dept. of Airports, Los Angeles International Airport, Rev. Bonds, Series 2016-B, AMT, 5.00% 2033
| 500
| 593
|
| City of Los Angeles, Dept. of Airports, Los Angeles International Airport, Rev. Bonds, Series 2017-A, AMT, 5.00% 2030
| 1,000
| 1,226
|
| City of Los Angeles, Dept. of Airports, Los Angeles International Airport, Rev. Bonds, Series 2017-A, AMT, 5.00% 2032
| 1,000
| 1,211
|
| City of Los Angeles, Dept. of Airports, Los Angeles International Airport, Rev. Bonds, Series 2017-A, AMT, 5.00% 2033
| 1,000
| 1,208
|
| City of Los Angeles, Dept. of Airports, Los Angeles International Airport, Rev. Bonds, Series 2017-A, AMT, 5.00% 2034
| 1,250
| 1,504
|
The Tax-Exempt Fund of California — Page 16
of 31
Bonds, notes & other debt instruments (continued)
California (continued)
City, county & other issuers (continued)
| Principal amount
(000)
| Value
(000)
|
| City of Los Angeles, Dept. of Airports, Los Angeles International Airport, Rev. Bonds, Series 2017-A, AMT, 5.00% 2035
| $1,000
| $1,199
|
| City of Los Angeles, Dept. of Airports, Los Angeles International Airport, Rev. Bonds, Series 2017-A, AMT, 5.00% 2036
| 1,400
| 1,674
|
| City of Los Angeles, Dept. of Airports, Los Angeles International Airport, Rev. Bonds, Series 2017-A, AMT, 5.00% 2037
| 1,260
| 1,502
|
| City of Los Angeles, Dept. of Airports, Los Angeles International Airport, Rev. Bonds, Series 2018-A, AMT, 5.00% 2033
| 1,255
| 1,542
|
| City of Los Angeles, Dept. of Airports, Los Angeles International Airport, Rev. Bonds, Series 2018-A, AMT, 5.00% 2036
| 1,345
| 1,634
|
| City of Los Angeles, Dept. of Airports, Los Angeles International Airport, Rev. Bonds, Series 2018-A, AMT, 5.00% 2037
| 1,450
| 1,755
|
| City of Los Angeles, Dept. of Airports, Los Angeles International Airport, Rev. Bonds, Series 2018-A, AMT, 5.00% 2044
| 2,880
| 3,436
|
| City of Los Angeles, Dept. of Airports, Los Angeles International Airport, Rev. Bonds, Series 2018-B, AMT, 5.00% 2032
| 5,000
| 6,176
|
| City of Los Angeles, Dept. of Airports, Los Angeles International Airport, Rev. Bonds, Series 2018-C, AMT, 5.00% 2032
| 3,450
| 4,222
|
| City of Los Angeles, Dept. of Airports, Los Angeles International Airport, Rev. Bonds, Series 2018-D, AMT, 5.00% 2023
| 2,000
| 2,277
|
| City of Los Angeles, Dept. of Airports, Los Angeles International Airport, Rev. Bonds, Series 2018-D, AMT, 5.00% 2033
| 5,880
| 7,361
|
| City of Los Angeles, Dept. of Airports, Los Angeles International Airport, Rev. Bonds, Series 2019-A, AMT, 5.00% 2031
| 2,345
| 2,965
|
City of Los Angeles, Dept. of Airports, Los Angeles International Airport, Rev. Ref. Bonds, Series 2010-A,
5.00% 2029
| 2,000
| 2,062
|
| City of Los Angeles, Dept. of Water and Power, Power System Rev. Bonds, Series 2019-A, 5.00% 2045
| 2,000
| 2,453
|
| City of Los Angeles, Dept. of Water and Power, Power System Rev. Bonds, Series 2019-A, 5.00% 2049
| 5,000
| 6,100
|
| City of Los Angeles, Harbor Dept., Rev. Bonds, Series 2009-A, 5.00% 2027
| 2,000
| 2,007
|
| City of Los Angeles, Harbor Dept., Rev. Bonds, Series 2009-B, 5.25% 2039 (preref. 2019)
| 1,000
| 1,000
|
| City of Los Angeles, Harbor Dept., Rev. Bonds, Series 2014-B, AMT, 5.00% 2032
| 3,000
| 3,458
|
| City of Los Angeles, Harbor Dept., Rev. Ref. Bonds, Series 2011-A, AMT, 5.00% 2021
| 1,460
| 1,569
|
| City of Los Angeles, Harbor Dept., Rev. Ref. Bonds, Series 2011-B, 5.00% 2023
| 1,000
| 1,081
|
| City of Los Angeles, Harbor Dept., Rev. Ref. Bonds, Series 2016-A, AMT, 5.00% 2021
| 1,000
| 1,075
|
| City of Los Angeles, Harbor Dept., Rev. Ref. Bonds, Series 2016-A, AMT, 5.00% 2024
| 2,000
| 2,359
|
| City of Los Angeles, Housing Auth., Mortgage Rev. Ref. Bonds (Property Acquisition Ref.), Series 2009-A, 6.375% 2039
| 2,000
| 2,007
|
County of Los Angeles, Metropolitan Transportation Auth., Proposition C Sales Tax Rev. Ref. Bonds,
Series 2019-C, 5.00% 2023
| 2,180
| 2,528
|
| County of Los Angeles, Redev. Ref. Auth., Tax Allocation Rev. Ref. Bonds (Bunker Hill Project), Series 2014-C, Assured Guaranty Municipal insured, 5.00% 2027
| 1,000
| 1,199
|
| County of Los Angeles, Sanitation Dist. Fncg. Auth., Capital Projects Rev. Bonds (Dist. No. 14), Series 2015-A, 5.00% 2032
| 2,000
| 2,377
|
| Los Angeles Community College Dist., G.O. Bonds, 2008 Election, Series 2010-C, 5.25% 2039 (preref. 2020)
| 1,000
| 1,043
|
Los Angeles County Facs. Inc., Lease Rev. Bonds (Vermont Corridor County Administration Building),
Series 2018-A, 5.00% 2043
| 1,000
| 1,207
|
Los Angeles County Facs. Inc., Lease Rev. Bonds (Vermont Corridor County Administration Building),
Series 2018-A, 5.00% 2051
| 1,500
| 1,795
|
Los Angeles Unified School Dist., G.O. Bonds (Dedicated Unlimited Ad Valorem Property Tax Bonds),
2005 Election, Series 2018-B-1, 5.00% 2032
| 1,465
| 1,830
|
Los Angeles Unified School Dist., G.O. Bonds (Dedicated Unlimited Ad Valorem Property Tax Bonds),
2005 Election, Series 2018-M-1, 5.25% 2042
| 6,115
| 7,540
|
Los Angeles Unified School Dist., G.O. Bonds (Dedicated Unlimited Ad Valorem Property Tax Bonds),
2008 Election, Series 2018-B-1, 5.25% 2042
| 2,000
| 2,466
|
The Tax-Exempt Fund of California — Page 17
of 31
Bonds, notes & other debt instruments (continued)
California (continued)
City, county & other issuers (continued)
| Principal amount
(000)
| Value
(000)
|
| Los Angeles Unified School Dist., G.O. Rev. Ref. Bonds, Series 2017-A, 5.00% 2026
| $4,000
| $4,950
|
| Los Angeles Unified School Dist., G.O. Rev. Ref. Bonds, Series 2019-A, 5.00% 2032
| 3,000
| 3,863
|
| Los Rios Community College Dist., G.O. Rev. Ref. Bonds, 2012 Election, Series 2012, 5.00% 2028
| 3,000
| 3,350
|
| M-S-R Energy Auth., Gas Rev. Bonds, Series 2009-B, 6.50% 2039
| 2,100
| 3,197
|
| Menifee Union School Dist., Community Facs. Dist. No. 2011-1, Improvement Area No. 3, Special Tax Bonds, Series 2018, 4.00% 2032
| 430
| 467
|
| Menifee Union School Dist., Community Facs. Dist. No. 2011-1, Improvement Area No. 3, Special Tax Bonds, Series 2018, 4.00% 2033
| 470
| 509
|
| Menifee Union School Dist., Community Facs. Dist. No. 2011-1, Improvement Area No. 3, Special Tax Bonds, Series 2018, 4.00% 2034
| 515
| 555
|
Menifee Union School Dist., Public Fncg. Auth., Special Tax Rev. Bonds, Series 2016-A, BAM insured,
5.00% 2034
| 1,000
| 1,161
|
Menifee Union School Dist., Public Fncg. Auth., Special Tax Rev. Bonds, Series 2016-A, BAM insured,
5.00% 2038
| 1,100
| 1,258
|
City of Merced, Irrigation Dist., Electric System Rev. Ref. Bonds, Series 2015-A,
Assured Guaranty Municipal insured, 5.00% 2030
| 2,065
| 2,472
|
City of Merced, Irrigation Dist., Electric System Rev. Ref. Bonds, Series 2015-A,
Assured Guaranty Municipal insured, 5.00% 2031
| 560
| 669
|
| Montebello Unified School Dist., G.O. Rev. Bonds, Series 2016-A, 5.00% 2034
| 1,095
| 1,305
|
| Montebello Unified School Dist., G.O. Rev. Bonds, Series 2016-A, 5.00% 2035
| 1,465
| 1,740
|
| Montebello Unified School Dist., G.O. Rev. Bonds, Series 2016-A, 5.00% 2036
| 1,290
| 1,528
|
| Montebello Unified School Dist., G.O. Rev. Ref. Bonds, Series 2015, 5.00% 2033
| 2,505
| 2,912
|
Monterey Peninsula Community College Dist., G.O. Rev. Ref. Bonds, Capital Appreciation Bonds,
Series 2016, 0% 2028
| 1,500
| 1,237
|
| Monterey Peninsula Community College Dist., G.O. Rev. Ref. Bonds, Series 2016, 4.00% 2033
| 3,165
| 3,540
|
Moorpark Unified School Dist., G.O. Bonds, Capital Appreciation Bonds, 2008 Election, Series 2011-B,
Assured Guaranty Municipal insured, 0% 2036
| 2,000
| 1,166
|
| Moreno Valley Unified School Dist., Fin. Auth. Special Tax Rev. Bonds, Series 2018-A, 5.00% 2028
| 1,090
| 1,270
|
| Moreno Valley Unified School Dist., Fin. Auth. Special Tax Rev. Bonds, Series 2018-A, 5.00% 2030
| 1,280
| 1,487
|
| Moreno Valley Unified School Dist., Fin. Auth. Special Tax Rev. Bonds, Series 2018-A, 5.00% 2032
| 1,480
| 1,707
|
| Moreno Valley Unified School Dist., Fin. Auth. Special Tax Rev. Bonds, Series 2018-A, 5.00% 2034
| 1,720
| 1,974
|
| Moreno Valley Unified School Dist., Fin. Auth. Special Tax Rev. Bonds, Series 2018-A, 5.00% 2035
| 925
| 1,059
|
| City of Morgan Hill, Successor Agcy. to the Redev. Agcy., Rev. Ref. Bonds, Series 2013-A, 5.00% 2031
| 3,000
| 3,425
|
| Mountain View Shoreline Regional Park Community, Rev. Bonds, Series 2011-A, 5.625% 2035
| 1,300
| 1,408
|
| City of Murrieta, Public Fncg. Auth., Special Tax Rev. Ref. Bonds, Series 2012, 5.00% 2022
| 1,000
| 1,110
|
| City of Murrieta, Public Fncg. Auth., Special Tax Rev. Ref. Bonds, Series 2012, 5.00% 2024
| 1,000
| 1,106
|
| City of Murrieta, Public Fncg. Auth., Special Tax Rev. Ref. Bonds, Series 2012, 5.00% 2031
| 3,000
| 3,267
|
| Murrieta Valley Unified School Dist., G.O. Rev. Ref. Bonds, Series 2016, BAM insured, 5.00% 2030
| 1,250
| 1,520
|
| Murrieta Valley Unified School Dist., Public Fncg. Auth., Special Tax Rev. Bonds, Series 2016-A, 4.00% 2021
| 1,000
| 1,046
|
| Murrieta Valley Unified School Dist., Public Fncg. Auth., Special Tax Rev. Bonds, Series 2016-A, 5.00% 2025
| 2,795
| 3,271
|
| Murrieta Valley Unified School Dist., Public Fncg. Auth., Special Tax Rev. Bonds, Series 2016-A, 5.00% 2026
| 400
| 477
|
| Murrieta Valley Unified School Dist., Public Fncg. Auth., Special Tax Rev. Bonds, Series 2016-A, 5.00% 2027
| 300
| 357
|
| Murrieta Valley Unified School Dist., Public Fncg. Auth., Special Tax Rev. Bonds, Series 2016-A, 5.00% 2028
| 3,320
| 3,931
|
| Murrieta Valley Unified School Dist., Public Fncg. Auth., Special Tax Rev. Bonds, Series 2016-A, 5.00% 2029
| 3,520
| 4,148
|
| Murrieta Valley Unified School Dist., Public Fncg. Auth., Special Tax Rev. Bonds, Series 2016-A, 5.00% 2030
| 1,750
| 2,051
|
Murrieta Valley Unified School Dist., Public Fncg. Auth., Special Tax Rev. Bonds, Series 2016-A,
Assured Guaranty Municipal insured, 5.00% 2033
| 2,790
| 3,300
|
| Natomas Unified School Dist., G.O. Bonds, Series 2017, BAM insured, 5.00% 2032
| 1,000
| 1,211
|
| New Haven Unified School Dist., G.O. Bonds, 2014 Election, Series 2017-B, 4.00% 2047
| 4,000
| 4,340
|
City of Norco, Community Facs. Dist. No. 2001-1 (Norco Ridge Ranch), Special Tax Rev. Ref. Bonds,
Series 2017, BAM insured, 5.00% 2033
| 1,000
| 1,215
|
| Oak Park Unified School Dist., G.O. Bonds, 2016 Election, Series 2018-B, 5.00% 2047
| 1,095
| 1,319
|
| Oakland Unified School Dist., G.O. Bonds, 2006 Election, Series 2016-A, 5.00% 2026
| 6,250
| 7,715
|
| Oakland Unified School Dist., G.O. Bonds, 2012 Election, Series 2013, 6.625% 2038 (preref. 2021)
| 1,200
| 1,335
|
The Tax-Exempt Fund of California — Page 18
of 31
Bonds, notes & other debt instruments (continued)
California (continued)
City, county & other issuers (continued)
| Principal amount
(000)
| Value
(000)
|
| Oakland Unified School Dist., G.O. Bonds, 2012 Election, Series 2015-A, 5.00% 2030
| $1,250
| $1,475
|
| Oakland Unified School Dist., G.O. Bonds, 2012 Election, Series 2015-A, 5.00% 2031
| 1,500
| 1,758
|
| Oakland Unified School Dist., G.O. Bonds, 2012 Election, Series 2015-A, 5.00% 2040
| 5,550
| 6,333
|
| Oakland Unified School Dist., G.O. Rev. Ref. Bonds (Measure J), Series 2017-C, 5.00% 2031
| 2,015
| 2,448
|
| Oakland Unified School Dist., G.O. Rev. Ref. Bonds (Measure J), Series 2017-C, 5.00% 2035
| 3,245
| 3,874
|
| Oakland Unified School Dist., G.O. Rev. Ref. Bonds (Measure J), Series 2017-C, 5.00% 2036
| 2,000
| 2,381
|
Oakland Unified School Dist., G.O. Rev. Ref. Bonds, Series 2015, Assured Guaranty Municipal insured,
5.00% 2024
| 2,225
| 2,629
|
| Oakland Unified School Dist., G.O. Rev. Ref. Bonds, Series 2016, 5.00% 2024
| 2,485
| 2,930
|
| Oakland Unified School Dist., G.O. Rev. Ref. Bonds, Series 2016, 5.00% 2027
| 2,000
| 2,433
|
| Oakland Unified School Dist., G.O. Rev. Ref. Bonds, Series 2016, 5.00% 2031
| 2,145
| 2,556
|
| Oakland Unified School Dist., G.O. Rev. Ref. Bonds, Series 2017-A, 5.00% 2022
| 4,025
| 4,471
|
| Oakland Unified School Dist., G.O. Rev. Ref. Bonds, Series 2017-A, 5.00% 2025
| 1,800
| 2,176
|
| Port of Oakland, Rev. Ref. Bonds, Series 2011-O, AMT, 5.00% 2021
| 1,250
| 1,332
|
| Port of Oakland, Rev. Ref. Bonds, Series 2012-P, AMT, 5.00% 2026
| 2,100
| 2,307
|
| Port of Oakland, Rev. Ref. Bonds, Series 2017-D, AMT, 5.00% 2022
| 1,645
| 1,839
|
| Port of Oakland, Rev. Ref. Bonds, Series 2017-D, AMT, 5.00% 2023
| 4,825
| 5,559
|
| Port of Oakland, Rev. Ref. Bonds, Series 2017-D, AMT, 5.00% 2024
| 2,570
| 3,041
|
| Port of Oakland, Rev. Ref. Bonds, Series 2017-D, AMT, 5.00% 2027
| 4,895
| 6,172
|
| Port of Oakland, Rev. Ref. Bonds, Series 2017-D, AMT, 5.00% 2028
| 500
| 626
|
| Port of Oakland, Rev. Ref. Bonds, Series 2017-D, AMT, 5.00% 2029
| 250
| 311
|
| Ohlone Community College Dist., G.O. Bonds, 2010 Election, Series 2016-C, 4.00% 2033
| 1,000
| 1,135
|
| Ohlone Community College Dist., G.O. Bonds, 2010 Election, Series 2016-C, 4.00% 2034
| 1,000
| 1,129
|
| Ohlone Community College Dist., G.O. Bonds, 2010 Election, Series 2016-C, 4.00% 2035
| 1,000
| 1,122
|
| Ohlone Community College Dist., G.O. Rev. Ref. Bonds, Series 2012, 5.00% 2026
| 1,750
| 1,960
|
| City of Ontario, Community Facs. Dist. No. 38 (Park and Turner NE Facs.), Special Tax Ref. Bonds, Series 2019, 5.00% 2044
| 1,000
| 1,141
|
| City of Ontario, Community Facs. Dist. No. 38 (Park and Turner NE Facs.), Special Tax Ref. Bonds, Series 2019, 5.00% 2049
| 2,000
| 2,272
|
City of Orange, Community Facs. Dist. No. 91-2 (Serrano Heights Public Improvements),
Special Tax Rev. Ref. Bonds, Series 2013, 5.00% 2024
| 820
| 912
|
City of Orange, Community Facs. Dist. No. 91-2 (Serrano Heights Public Improvements),
Special Tax Rev. Ref. Bonds, Series 2013, 5.00% 2025
| 1,720
| 1,907
|
| County of Orange, Airport Private Activity Rev. Ref. Bonds, Series 2019-A, 5.00% 2026
| 1,500
| 1,882
|
| County of Orange, Airport Private Activity Rev. Ref. Bonds, Series 2019-B, 5.00% 2026
| 1,000
| 1,255
|
County of Orange, Community Facs. Dist. No. 2004-1 (Ladera Ranch), Special Tax Rev. Ref. Bonds,
Series 2014-A, 5.00% 2034
| 2,100
| 2,270
|
County of Orange, Community Facs. Dist. No. 2015-1 (Esencia Village), Special Tax Rev. Ref. Bonds,
Series 2015-A, 5.00% 2029
| 1,000
| 1,152
|
County of Orange, Community Facs. Dist. No. 2015-1 (Esencia Village), Special Tax Rev. Ref. Bonds,
Series 2015-A, 5.00% 2033
| 1,400
| 1,593
|
County of Orange, Community Facs. Dist. No. 2015-1 (Esencia Village), Special Tax Rev. Ref. Bonds,
Series 2015-A, 5.25% 2045
| 675
| 763
|
County of Orange, Community Facs. Dist. No. 2017-1 (Esencia Village), Improvement Area No. 1,
Special Tax Bonds, Series 2018-A, 5.00% 2042
| 5,000
| 5,847
|
| City of Oroville, Hospital Rev. Bonds (Oroville Hospital), Series 2019, 5.25% 2049
| 7,210
| 8,429
|
| Oxnard Unified School Dist., G.O. Rev. Ref. Bonds, Series 2017-A, BAM insured, 5.00% 2036
| 2,000
| 2,436
|
| Oxnard Unified School Dist., G.O. Rev. Ref. Bonds, Series 2017-A, BAM insured, 5.00% 2045
| 4,750
| 5,678
|
| City of Palm Desert, Section 29 Assessment Dist. (No. 2004-02), Limited Obligation Improvement Bonds, Series 2007, 5.05% 2027
| 2,740
| 2,746
|
City of Palm Desert, Section 29 Assessment Dist. No. 2004-02, Limited Obligation Improvement Bonds,
Series 2007, 5.10% 2037
| 1,820
| 1,824
|
City of Palmdale, Successor Agcy. to the Redev. Agcy., Tax Allocation Rev. Ref. Bonds, Series 2016-B,
National insured, 5.00% 2031
| 1,000
| 1,216
|
The Tax-Exempt Fund of California — Page 19
of 31
Bonds, notes & other debt instruments (continued)
California (continued)
City, county & other issuers (continued)
| Principal amount
(000)
| Value
(000)
|
City of Palmdale, Successor Agcy. to the Redev. Agcy., Tax Allocation Rev. Ref. Bonds, Series 2016-B,
National insured, 5.00% 2032
| $1,000
| $1,212
|
| Palmdale Elementary School Dist., Community Facs. Dist. No. 90-1, Special Tax Bonds, Capital Appreciation Bonds, Series 1999, Assured Guaranty Municipal insured,
0% 2038
| 1,190
| 652
|
| Palmdale Elementary School Dist., Community Facs. Dist. No. 90-1, Special Tax Bonds, Capital Appreciation Bonds, Series 1999, Assured Guaranty Municipal insured,
0% 2039
| 240
| 126
|
| Palmdale Elementary School Dist., Community Facs. Dist. No. 90-1, Special Tax Bonds, Capital Appreciation Bonds, Series 2012-A, Assured Guaranty Municipal insured,
0% 2032
| 255
| 177
|
| Palmdale Elementary School Dist., Community Facs. Dist. No. 90-1, Special Tax Bonds, Capital Appreciation Bonds, Series 2012-A, Assured Guaranty Municipal insured,
0% 2037
| 1,600
| 911
|
| Palmdale Elementary School Dist., Community Facs. Dist. No. 90-1, Special Tax Bonds, Capital Appreciation Bonds, Series 2012-A, Assured Guaranty Municipal insured,
0% 2038
| 1,505
| 824
|
| Palmdale Elementary School Dist., Community Facs. Dist. No. 90-1, Special Tax Bonds, Capital Appreciation Bonds, Series 2012-A, Assured Guaranty Municipal insured,
0% 2039
| 840
| 441
|
Palmdale Elementary School Dist., Community Facs. Dist. No. 90-1, Special Tax Bonds, Series 2017-A,
Assured Guaranty Municipal insured, 5.00% 2041
| 2,975
| 3,502
|
| Palomar Community College Dist., Rev. Ref. Bonds, Series 2015, 5.00% 2032
| 3,000
| 3,555
|
| Palomar Health, G.O. Rev. Ref. Bonds, Series 2016, 5.00% 2025
| 1,000
| 1,179
|
| Palomar Health, G.O. Rev. Ref. Bonds, Series 2016, 5.00% 2039
| 1,320
| 1,495
|
| Palomar Health, G.O. Rev. Ref. Bonds, Series 2016-A, 5.00% 2034
| 970
| 1,141
|
| Palomar Health, G.O. Rev. Ref. Bonds, Series 2016-B, 4.00% 2030
| 1,000
| 1,123
|
| Palomar Health, G.O. Rev. Ref. Bonds, Series 2016-B, 4.00% 2031
| 1,000
| 1,117
|
| Palomar Health, G.O. Rev. Ref. Bonds, Series 2017, Assured Guaranty Municipal insured, 5.00% 2042
| 3,375
| 3,800
|
| Palomar Pomerado Health, Certs. of Part., Series 2009, 6.75% 2039 (preref. 2019)
| 3,500
| 3,549
|
| Palomar Pomerado Health, Certs. of Part., Series 2010, 6.00% 2030 (preref. 2020)
| 1,500
| 1,592
|
| Palomar Pomerado Health, Certs. of Part., Series 2010, 6.00% 2041 (preref. 2020)
| 2,585
| 2,744
|
Palomar Pomerado Health, G.O. Bonds, Capital Appreciation Bonds, 2004 Election, Series 2009-A,
Assured Guaranty insured, 0% 2028
| 3,000
| 2,451
|
Palomar Pomerado Health, G.O. Bonds, Capital Appreciation Bonds, 2004 Election, Series 2009-A,
Assured Guaranty insured, 0% 2029
| 9,350
| 7,380
|
Palomar Pomerado Health, G.O. Bonds, Capital Appreciation Bonds, 2004 Election, Series 2009-A,
Assured Guaranty insured, 0% 2031
| 3,000
| 2,185
|
| Pasadena Unified School Dist., G.O. Bonds, 2008 Election, Series 2016, 4.00% 2036
| 2,250
| 2,494
|
| Paso Robles Joint Unified School Dist., G.O. Rev. Ref. Bonds, Series 2016, BAM insured, 4.00% 2028
| 915
| 1,061
|
| Peninsula Corridor Joint Powers Board, Farebox Rev. Bonds, Series 2019-A, 5.00% 2049
| 9,035
| 10,514
|
City of Perris, Joint Powers Auth., Local Agcy. Rev. Ref. Bonds (CFD No. 2001-1 IA Nos. 4 and 5;
CFD No. 2005-1 IA No. 4), Series 2017-B, 5.00% 2024
| 990
| 1,133
|
City of Perris, Joint Powers Auth., Local Agcy. Rev. Ref. Bonds (CFD No. 2001-1 IA Nos. 4 and 5;
CFD No. 2005-1 IA No. 4), Series 2017-B, 5.00% 2025
| 940
| 1,099
|
City of Perris, Joint Powers Auth., Local Agcy. Rev. Ref. Bonds (CFD No. 2001-1 IA Nos. 4 and 5;
CFD No. 2005-1 IA No. 4), Series 2017-B, 5.00% 2029
| 1,265
| 1,518
|
City of Perris, Joint Powers Auth., Local Agcy. Rev. Ref. Bonds (CFD No. 2001-1 IA Nos. 4 and 5;
CFD No. 2005-1 IA No. 4), Series 2017-B, 5.00% 2033
| 1,480
| 1,746
|
City of Perris, Joint Powers Auth., Local Agcy. Rev. Ref. Bonds (CFD No. 2001-1 IA Nos. 4 and 5;
CFD No. 2005-1 IA No. 4), Series 2017-B, 5.00% 2035
| 1,000
| 1,171
|
City of Perris, Joint Powers Auth., Local Agcy. Rev. Ref. Bonds (CFD No. 2001-1 IA Nos. 4 and 5;
CFD No. 2005-1 IA No. 4), Series 2017-B, 5.00% 2037
| 1,325
| 1,541
|
| Perris Union High School Dist., Fncg. Auth., Rev. Bonds, Series 2015, 5.00% 2031
| 1,325
| 1,499
|
| Perris Union High School Dist., Fncg. Auth., Rev. Bonds, Series 2015, 5.00% 2032
| 2,675
| 3,021
|
| Perris Union High School Dist., Fncg. Auth., Rev. Bonds, Series 2015, 5.00% 2033
| 2,885
| 3,251
|
| Perris Union High School Dist., Fncg. Auth., Rev. Bonds, Series 2015, 5.00% 2034
| 1,490
| 1,675
|
| Perris Union High School Dist., Fncg. Auth., Rev. Bonds, Series 2015, 5.00% 2041
| 2,000
| 2,222
|
| City of Poway, Successor Agcy. to the Redev. Agcy., Tax Allocation Rev. Ref. Bonds (Paguay Redev. Project), Series 2015-A, 5.00% 2030
| 1,590
| 2,107
|
The Tax-Exempt Fund of California — Page 20
of 31
Bonds, notes & other debt instruments (continued)
California (continued)
City, county & other issuers (continued)
| Principal amount
(000)
| Value
(000)
|
| City of Poway, Successor Agcy. to the Redev. Agcy., Tax Allocation Rev. Ref. Bonds (Paguay Redev. Project), Series 2015-A, 5.00% 2031
| $500
| $669
|
| Poway Unified School Dist., Community Facs. Dist. No. 6 (4S Ranch), Special Tax Rev. Ref Bonds, Series 2012, BAM insured, 5.00% 2033
| 975
| 1,077
|
| Poway Unified School Dist., Community Facs. Dist. No. 6 (4S Ranch), Special Tax Rev. Ref Bonds, Series 2012, BAM insured, 5.00% 2036
| 520
| 573
|
| Poway Unified School Dist., Community Facs. Dist. No. 6 (4S Ranch), Special Tax Rev. Ref. Bonds, Series 2016, BAM insured, 5.00% 2034
| 995
| 1,195
|
| Poway Unified School Dist., Public Fncg. Auth., Special Tax Rev. Bonds, Series 2013, 5.00% 2030
| 990
| 1,138
|
| Poway Unified School Dist., Public Fncg. Auth., Special Tax Rev. Ref. Bonds, Series 2015-A, 5.00% 2030
| 1,345
| 1,543
|
| Poway Unified School Dist., Public Fncg. Auth., Special Tax Rev. Ref. Bonds, Series 2015-A, 5.00% 2032
| 1,600
| 1,824
|
| Poway Unified School Dist., Public Fncg. Auth., Special Tax Rev. Ref. Bonds, Series 2015-A, 5.00% 2034
| 995
| 1,128
|
| Poway Unified School Dist., Public Fncg. Auth., Special Tax Rev. Ref. Bonds, Series 2015-A, 5.00% 2035
| 995
| 1,126
|
| Poway Unified School Dist., Public Fncg. Auth., Special Tax Rev. Ref. Bonds, Series 2015-B, BAM insured, 5.00% 2030
| 990
| 1,193
|
| Poway Unified School Dist., Public Fncg. Auth., Special Tax Rev. Ref. Bonds, Series 2015-B, BAM insured, 5.00% 2033
| 1,225
| 1,459
|
| Poway Unified School Dist., Public Fncg. Auth., Special Tax Rev. Ref. Bonds, Series 2016-A, 5.00% 2030
| 1,850
| 2,260
|
Poway Unified School Dist., School Facs. Improvement Dist. No. 2007-1, G.O. Bonds,
Capital Appreciation Bonds, 2008 Election, Series 2011-B, 0% 2035
| 3,500
| 2,334
|
Public Fin. Auth., Charter School Rev. Bonds (LaVerne Elementary Preparatory Academy Project),
Series 2019-A, 5.00% 20392
| 1,370
| 1,408
|
Public Fin. Auth., Charter School Rev. Bonds (LaVerne Elementary Preparatory Academy Project),
Series 2019-A, 5.00% 20492
| 1,900
| 1,945
|
City of Rancho Cordova, Community Facs. Dist. No. 2003-1 (Sunridge Anatolia), Special Tax Bonds,
Series 2016, 4.00% 2037
| 500
| 529
|
City of Rancho Cucamonga, Successor Agcy. to the Redev. Agcy., Tax Allocation Rev. Ref. Bonds
(Rancho Redev. Project Area), Series 2014, Assured Guaranty Municipal insured, 5.00% 2025
| 1,500
| 1,785
|
City of Rancho Cucamonga, Successor Agcy. to the Redev. Agcy., Tax Allocation Rev. Ref. Bonds
(Rancho Redev. Project Area), Series 2014, Assured Guaranty Municipal insured, 5.00% 2026
| 1,000
| 1,184
|
City of Rancho Cucamonga, Successor Agcy. to the Redev. Agcy., Tax Allocation Rev. Ref. Bonds
(Rancho Redev. Project Area), Series 2014, Assured Guaranty Municipal insured, 5.00% 2029
| 4,065
| 4,772
|
| City of Redding, Electric System Rev. Ref. Bonds, Series 2017, 5.00% 2027
| 1,250
| 1,606
|
| City of Redding, Electric System Rev. Ref. Bonds, Series 2017, 5.00% 2028
| 1,000
| 1,281
|
| City of Redding, Electric System Rev. Ref. Bonds, Series 2017, 5.00% 2029
| 1,250
| 1,593
|
| City of Redding, Redev. Agcy., Tax Allocation Bonds (SHASTEC Redev. Project), Series 2006, 5.00% 2029
| 655
| 657
|
| City of Redding, Redev. Agcy., Tax Allocation Bonds (SHASTEC Redev. Project), Series 2006, 5.00% 2036
| 1,585
| 1,643
|
| City of Richmond, Wastewater Rev. Ref. Bonds, Series 2019-B, 5.00% 2032
| 1,360
| 1,760
|
| City of Richmond, Wastewater Rev. Ref. Bonds, Series 2019-B, 5.00% 2033
| 1,065
| 1,371
|
| City of Richmond, Wastewater Rev. Ref. Bonds, Series 2019-B, 5.00% 2034
| 1,505
| 1,925
|
| Rio Elementary School Dist., Community Facs. Dist. No. 1, Special Tax Bonds, Series 2013, 5.50% 2039
| 2,455
| 2,732
|
Rio Hondo Community College Dist., G.O. Bonds, Capital Appreciation Bonds, 2004 Election, Series 2010-C,
0% 2028
| 1,000
| 841
|
| Community of River Islands, Public Fncg. Auth., Community Facs. Dist. No. 2003-1 (Public Improvements), Special Tax Bonds, Series 2019-A, 5.00% 2043
| 3,035
| 3,389
|
| Community of River Islands, Public Fncg. Auth., Community Facs. Dist. No. 2003-1 (Public Improvements), Special Tax Bonds, Series 2019-A, 5.00% 2048
| 6,000
| 6,689
|
| City of Riverside, Sewer Rev. Bonds, Series 2015-A, 5.00% 2031
| 2,500
| 3,013
|
City of Riverside, Successor Agcy. to the Redev. Agcy., Tax Allocation Rev. Ref. Bonds, Series 2014-A,
5.00% 2022
| 1,605
| 1,804
|
| County of Riverside, Public Fncg. Auth., Tax Allocation Rev. Bonds (Project Area No. 1, Desert Communities and Interstate 215 Corridor Projects), Series 2016-A,
BAM insured, 5.00% 2026
| 2,500
| 3,044
|
| County of Riverside, Successor Agcy. to the Redev. Agcy., Tax Allocation Rev. Ref. Bonds (Jurupa Valley Redev. Project Area), Series 2015-B, Assured Guaranty Municipal insured, 5.00%
2028
| 2,000
| 2,434
|
The Tax-Exempt Fund of California — Page 21
of 31
Bonds, notes & other debt instruments (continued)
California (continued)
City, county & other issuers (continued)
| Principal amount
(000)
| Value
(000)
|
| County of Riverside, Transportation Commission, Toll Rev. Bonds, Series 2013-A, 5.75% 2044
| $2,500
| $2,769
|
| County of Riverside, Transportation Commission, Toll Rev. Bonds, Series 2013-A, 5.75% 2048
| 3,000
| 3,319
|
Riverside Unified School Dist., Fncg. Auth., Special Tax Rev. Ref. Bonds, Series 2015, BAM insured,
5.00% 2032
| 1,100
| 1,281
|
Riverside Unified School Dist., Fncg. Auth., Special Tax Rev. Ref. Bonds, Series 2015, BAM insured,
5.00% 2033
| 2,315
| 2,692
|
Riverside Unified School Dist., Fncg. Auth., Special Tax Rev. Ref. Bonds, Series 2015, BAM insured,
5.00% 2034
| 1,500
| 1,740
|
Riverside Unified School Dist., Fncg. Auth., Special Tax Rev. Ref. Bonds, Series 2015, BAM insured,
5.00% 2035
| 890
| 1,030
|
Robla School Dist., G.O. Bonds, 2018 Election, Series 2019-A, Assured Guaranty Municipal insured,
5.00% 2044
| 4,690
| 5,589
|
| Romoland School Dist., Special Tax Community Facs. Dist. No. 2006-1 (Brendle Mills), Special Tax Bonds, Series 2017, 5.00% 2039
| 990
| 1,148
|
Romoland School Dist., Special Tax Community Facs. Dist. No. 91-1, Special Tax Bonds, Series 2017,
5.00% 2027
| 250
| 301
|
Romoland School Dist., Special Tax Community Facs. Dist. No. 91-1, Special Tax Bonds, Series 2017,
5.00% 2028
| 360
| 431
|
Romoland School Dist., Special Tax Community Facs. Dist. No. 91-1, Special Tax Bonds, Series 2017,
5.00% 2030
| 760
| 904
|
Romoland School Dist., Special Tax Community Facs. Dist. No. 91-1, Special Tax Bonds, Series 2017,
5.00% 2031
| 830
| 984
|
Romoland School Dist., Special Tax Community Facs. Dist. No. 91-1, Special Tax Bonds, Series 2017,
5.00% 2032
| 900
| 1,064
|
Romoland School Dist., Special Tax Community Facs. Dist. No. 91-1, Special Tax Bonds, Series 2017,
5.00% 2033
| 975
| 1,148
|
Romoland School Dist., Special Tax Community Facs. Dist. No. 91-1, Special Tax Bonds, Series 2017,
5.00% 2034
| 855
| 1,004
|
Romoland School Dist., Special Tax Community Facs. Dist. No. 91-1, Special Tax Bonds, Series 2017,
5.00% 2035
| 1,140
| 1,335
|
Romoland School Dist., Special Tax Community Facs. Dist. No. 91-1, Special Tax Bonds, Series 2017,
5.00% 2037
| 1,000
| 1,165
|
Romoland School Dist., Special Tax Community Facs. Dist. No. 91-1, Special Tax Bonds, Series 2017,
5.00% 2041
| 1,255
| 1,449
|
| City of Roseville, Community Facs. Dist. No. 1 (Fiddyment Ranch), Special Tax Rev. Ref. Bonds, Series 2017-A, 5.00% 2031
| 1,000
| 1,190
|
| City of Roseville, Community Facs. Dist. No. 1 (Fiddyment Ranch), Special Tax Rev. Ref. Bonds, Series 2017-A, 5.00% 2032
| 1,635
| 1,937
|
City of Roseville, Community Facs. Dist. No. 1 (The Fountains), Special Tax Rev. Ref. Bonds, Series 2016,
5.00% 2038
| 1,650
| 1,887
|
City of Roseville, Community Facs. Dist. No. 1 (Westpark), Special Tax Rev. Ref. Bonds, Series 2015,
5.00% 2023
| 1,000
| 1,122
|
City of Roseville, Community Facs. Dist. No. 1 (Westpark), Special Tax Rev. Ref. Bonds, Series 2015,
5.00% 2024
| 1,005
| 1,155
|
City of Roseville, Community Facs. Dist. No. 1 (Westpark), Special Tax Rev. Ref. Bonds, Series 2015,
5.00% 2028
| 1,000
| 1,161
|
City of Roseville, Community Facs. Dist. No. 1 (Westpark), Special Tax Rev. Ref. Bonds, Series 2015,
5.00% 2030
| 500
| 575
|
City of Roseville, Community Facs. Dist. No. 1 (Westpark), Special Tax Rev. Ref. Bonds, Series 2015,
5.00% 2032
| 2,000
| 2,285
|
| City of Roseville, Natural Gas Fncg. Auth., Gas Rev. Bonds, Series 2007, 5.00% 2022
| 4,920
| 5,341
|
| City of Roseville, Natural Gas Fncg. Auth., Gas Rev. Bonds, Series 2007, 5.00% 2024
| 3,300
| 3,777
|
| City of Sacramento, Cogeneration Auth., Cogeneration Project Rev. Ref. Bonds (Procter & Gamble Project), Series 2009, 5.25% 2020
| 995
| 1,035
|
The Tax-Exempt Fund of California — Page 22
of 31
Bonds, notes & other debt instruments (continued)
California (continued)
City, county & other issuers (continued)
| Principal amount
(000)
| Value
(000)
|
| City of Sacramento, Cogeneration Auth., Cogeneration Project Rev. Ref. Bonds (Procter & Gamble Project), Series 2009, 5.25% 2021
| $900
| $974
|
City of Sacramento, Community Facs. Dist. No. 2006-02 (Natomas), Special Tax Bonds, Series 2016,
5.00% 2041
| 235
| 267
|
City of Sacramento, Community Facs. Dist. No. 2006-02 (Natomas), Special Tax Bonds, Series 2016,
5.00% 2046
| 1,750
| 1,984
|
| City of Sacramento, Community Facs. Dist. No. 4 (North Natomas), Special Tax Rev. Ref. Bonds, Series 2013-E, 5.00% 2030
| 1,250
| 1,409
|
| City of Sacramento, Community Facs. Dist. No. 4 (North Natomas), Special Tax Rev. Ref. Bonds, Series 2013-E, 5.25% 2025
| 2,565
| 2,952
|
City of Sacramento, Housing Auth., Multi Family Housing Rev. Bonds (Imperial Tower Project),
Series 2018-C, 2.15% 2021 (put 2020)
| 1,000
| 1,007
|
| City of Sacramento, Municipal Utility Dist., Electric Rev. Bonds, Series 2013-A, 5.00% 2041
| 4,500
| 5,096
|
| City of Sacramento, Regional Transit Dist., Farebox Rev. Bonds, Series 2012, 5.00% 2036
| 460
| 477
|
| City of Sacramento, Regional Transit Dist., Farebox Rev. Bonds, Series 2012, 5.00% 2036 (preref. 2020)
| 540
| 564
|
| City of Sacramento, Regional Transit Dist., Farebox Rev. Bonds, Series 2012, 5.00% 2042
| 1,875
| 1,943
|
| City of Sacramento, Regional Transit Dist., Farebox Rev. Bonds, Series 2012, 5.00% 2042 (preref. 2020)
| 1,125
| 1,174
|
| County of Sacramento, Airport System Rev. Ref. Bonds, Series 2016-B, 5.00% 2036
| 1,000
| 1,189
|
| County of Sacramento, Airport System Rev. Ref. Bonds, Series 2016-B, 5.00% 2041
| 2,200
| 2,586
|
| County of Sacramento, Airport System Rev. Ref. Bonds, Series 2018-C, AMT, 5.00% 2033
| 3,000
| 3,701
|
| County of Sacramento, Airport System Rev. Ref. Bonds, Series 2018-C, AMT, 5.00% 2034
| 3,000
| 3,684
|
| County of Sacramento, Airport System Rev. Ref. Bonds, Series 2018-C, AMT, 5.00% 2035
| 4,000
| 4,890
|
| County of Sacramento, Community Facs. Dist. No. 2004-1 (McClellan Park), Special Tax Bonds, Series 2017, 5.00% 2040
| 1,960
| 2,259
|
| County of Sacramento, Community Facs. Dist. No. 2005-2 (North Vineyard Station No. 1), Special Tax Bonds, Series 2016, 5.00% 2040
| 1,090
| 1,241
|
| County of Sacramento, Sanitation Dist. Fncg. Auth., Rev. Ref. Bonds (Sacramento Regional County Sanitation Dist.), Series 2007-B, FGIC-National insured, (3-month
USD-LIBOR + 0.53%) 2.218% 20351
| 13,500
| 13,392
|
| County of Sacramento, Single Family Mortgage Rev. Bonds (GNMA Mortgage-backed Securities Program), Series 1987-A, AMT, 9.00% 2019 (escrowed to maturity)
| 1,500
| 1,528
|
| County of Sacramento, Water Fncg. Auth., Rev. Ref. Bonds (Water Agcy. Zones 40 and 41), Series 2007-B, FGIC-National insured, (3-month USD-LIBOR + 0.55%) 2.239%
20341
| 5,000
| 4,825
|
Sacramento Area Flood Control Agcy., Consolidated Capital Assessment Dist. No. 2, Rev. Bonds,
Series 2016-A, 5.00% 2041
| 1,000
| 1,187
|
Sacramento Unified School Dist., G.O. Bonds, Capital Appreciation Bonds, 2002 Election, Series 2007,
Assured Guaranty Municipal insured, 0% 2028
| 6,525
| 5,311
|
| County of San Bernardino, Community Facs. Dist. No. 2006-1 (Lytle Creek North), Improvement Area No. 6, Special Tax Bonds, Series 2018, 5.00% 2043
| 1,860
| 2,125
|
| County of San Bernardino, Community Facs. Dist. No. 2006-1 (Lytle Creek North), Improvement Area No. 6, Special Tax Bonds, Series 2018, 5.00% 2048
| 1,775
| 2,019
|
San Bernardino Unified School Dist., G.O. Rev. Ref. Bonds, Series 2013-A,
Assured Guaranty Municipal insured, 5.00% 2025
| 1,000
| 1,150
|
San Bernardino Unified School Dist., G.O. Rev. Ref. Bonds, Series 2013-A,
Assured Guaranty Municipal insured, 5.00% 2028
| 1,245
| 1,424
|
San Bernardino Unified School Dist., G.O. Rev. Ref. Bonds, Series 2017-D,
Assured Guaranty Municipal insured, 4.00% 2042
| 2,175
| 2,354
|
| City of San Buenaventura, Rev. Bonds (Community Memorial Health System), Series 2011, 7.50% 2041
| 10,825
| 12,069
|
City of San Clemente, Community Facs. Dist. No. 2006-1 (Marblehead Coastal), Special Tax Bonds,
Series 2015, 5.00% 2030
| 250
| 287
|
City of San Clemente, Community Facs. Dist. No. 2006-1 (Marblehead Coastal), Special Tax Bonds,
Series 2015, 5.00% 2031
| 490
| 560
|
City of San Clemente, Community Facs. Dist. No. 2006-1 (Marblehead Coastal), Special Tax Bonds,
Series 2015, 5.00% 2032
| 495
| 564
|
The Tax-Exempt Fund of California — Page 23
of 31
Bonds, notes & other debt instruments (continued)
California (continued)
City, county & other issuers (continued)
| Principal amount
(000)
| Value
(000)
|
City of San Diego, Community Facs. Dist. No. 4 (Black Mountain Ranch Villages), Special Tax Bonds,
Series 2016, 5.00% 2037
| $980
| $1,119
|
County of San Diego, Association of Governments Capital Grant Receipts, Rev. Green Bonds
(Mid-Coast Corridor Transit Project), Series 2019-A, 5.00% 2024
| 3,750
| 4,334
|
County of San Diego, Association of Governments Capital Grant Receipts, Rev. Green Bonds
(Mid-Coast Corridor Transit Project), Series 2019-A, 5.00% 2025
| 2,000
| 2,372
|
County of San Diego, Association of Governments Capital Grant Receipts, Rev. Green Bonds
(Mid-Coast Corridor Transit Project), Series 2019-A, 5.00% 2026
| 4,750
| 5,767
|
County of San Diego, Certs. of Part. (Salk Institute for Biological Studies), Series 2010,
5.125% 2040 (preref. 2020)
| 3,000
| 3,110
|
County of San Diego, Certs. of Part. (Salk Institute for Biological Studies), Series 2010,
5.25% 2030 (preref. 2020)
| 2,000
| 2,076
|
| County of San Diego, Regional Airport Auth., Airport Rev. Bonds, Series 2010-A, 5.00% 2028
| 1,000
| 1,035
|
| County of San Diego, Regional Airport Auth., Airport Rev. Bonds, Series 2013-B, AMT, 5.00% 2043
| 2,000
| 2,230
|
| County of San Diego, Regional Airport Auth., Airport Rev. Bonds, Series 2017-A, 5.00% 2035
| 1,000
| 1,218
|
| County of San Diego, Regional Airport Auth., Airport Rev. Bonds, Series 2017-B, AMT, 5.00% 2047
| 1,000
| 1,180
|
| County of San Diego, Regional Airport Auth., Airport Rev. Bonds, Series 2017-B, AMT, 5.00% 2029
| 1,980
| 2,461
|
| County of San Diego, Regional Airport Auth., Airport Rev. Bonds, Series 2017-B, AMT, 5.00% 2035
| 2,495
| 3,015
|
| County of San Diego, Regional Airport Auth., Airport Rev. Bonds, Series 2017-B, AMT, 5.00% 2036
| 750
| 904
|
| County of San Diego, Regional Airport Auth., Airport Rev. Bonds, Series 2017-B, AMT, 5.00% 2037
| 750
| 901
|
| San Diego Community College Dist., G.O. Rev. Ref. Bonds, Series 2016, 4.00% 2032
| 2,910
| 3,337
|
| San Diego Unified School Dist., G.O. Bonds, 2012 Election, Series 2013-C, 5.00% 2035
| 2,000
| 2,287
|
San Diego Unified School Dist., G.O. Dedicated Unlimited Ad Valorem Property Tax Bonds,
Series 2016-SR-1, 4.00% 2032
| 1,000
| 1,145
|
City and County of San Francisco, Airport Commission, San Francisco International Airport,
Second Series Rev. Bonds, Series 2009-A, 4.90% 2029
| 4,560
| 4,608
|
City and County of San Francisco, Airport Commission, San Francisco International Airport,
Second Series Rev. Bonds, Series 2016-B, AMT, 5.00% 2046
| 4,000
| 4,589
|
City and County of San Francisco, Airport Commission, San Francisco International Airport,
Second Series Rev. Bonds, Series 2019-A, AMT, 5.00% 2049
| 10,000
| 11,937
|
City and County of San Francisco, Airport Commission, San Francisco International Airport,
Second Series Rev. Ref. Bonds, Series 2010-F, 5.00% 2040
| 3,000
| 3,081
|
City and County of San Francisco, Airport Commission, San Francisco International Airport,
Second Series Rev. Ref. Bonds, Series 2011-F, AMT, 5.00% 2028
| 2,630
| 2,795
|
City and County of San Francisco, Airport Commission, San Francisco International Airport,
Second Series Rev. Ref. Bonds, Series 2012-A, AMT, 5.00% 2028
| 1,000
| 1,098
|
City and County of San Francisco, Airport Commission, San Francisco International Airport,
Second Series Rev. Ref. Bonds, Series 2012-A, AMT, 5.00% 2030
| 1,000
| 1,094
|
City and County of San Francisco, Airport Commission, San Francisco International Airport,
Second Series Rev. Ref. Bonds, Series 2016-A, 5.00% 2029
| 1,375
| 1,696
|
City and County of San Francisco, Airport Commission, San Francisco International Airport,
Second Series Rev. Ref. Bonds, Series 2017-A, AMT, 5.00% 2042
| 2,000
| 2,342
|
City and County of San Francisco, Airport Commission, San Francisco International Airport,
Second Series Rev. Ref. Bonds, Series 2017-A, AMT, 5.00% 2047
| 3,000
| 3,490
|
City and County of San Francisco, Airport Commission, San Francisco International Airport,
Second Series Rev. Ref. Bonds, Series 2017-D, AMT, 5.00% 2027
| 1,000
| 1,249
|
City and County of San Francisco, Airport Commission, San Francisco International Airport,
Special Facs. Lease Rev. Bonds (SFO Fuel Company LLC), Series 2019-A, AMT, 5.00% 2027
| 2,000
| 2,451
|
City and County of San Francisco, Certs. of Part. (Moscone Convention Center Expansion Project),
Series 2017-B, 4.00% 2038
| 2,000
| 2,181
|
City and County of San Francisco, Public Utilities Commission, San Francisco Water Rev. Bonds,
Series 2009-A, 5.00% 2024 (preref. 2019)
| 2,000
| 2,020
|
City and County of San Francisco, Public Utilities Commission, Wastewater Rev. Green Bonds,
Series 2016-A, 4.00% 2037
| 6,575
| 7,245
|
The Tax-Exempt Fund of California — Page 24
of 31
Bonds, notes & other debt instruments (continued)
California (continued)
City, county & other issuers (continued)
| Principal amount
(000)
| Value
(000)
|
City and County of San Francisco, Public Utilities Commission, Wastewater Rev. Green Bonds,
Series 2018-C, 2.125% 2048 (put 2023)
| $2,000
| $2,059
|
| City and County of San Francisco, Redev. Fin. Auth., Tax Allocation Rev. Bonds (Mission Bay North Redev. Project), Series 2011-C, 6.75% 2033 (preref. 2021)
| 500
| 543
|
| City and County of San Francisco, Redev. Fin. Auth., Tax Allocation Rev. Bonds (Mission Bay North Redev. Project), Series 2011-C, 6.75% 2041 (preref. 2021)
| 1,875
| 2,038
|
| City and County of San Francisco, Redev. Fin. Auth., Tax Allocation Rev. Bonds (Mission Bay South Redev. Project), Series 2009-D, 6.50% 2030 (preref. 2019)
| 975
| 975
|
| City and County of San Francisco, Redev. Fin. Auth., Tax Allocation Rev. Bonds (Mission Bay South Redev. Project), Series 2011-D, 7.00% 2033 (preref. 2021)
| 810
| 883
|
| City and County of San Francisco, Redev. Fin. Auth., Tax Allocation Rev. Bonds (Mission Bay South Redev. Project), Series 2011-D, 7.00% 2041 (preref. 2021)
| 2,500
| 2,725
|
| City and County of San Francisco, Redev. Fin. Auth., Tax Allocation Rev. Bonds (Mission Bay South Redev. Project), Series 2014-A, 5.00% 2043
| 2,100
| 2,374
|
| City and County of San Francisco, Redev. Fin. Auth., Tax Allocation Rev. Bonds (Mission Bay South Redev. Project), Series 2016-B, 5.00% 2031
| 425
| 514
|
| City and County of San Francisco, Redev. Fin. Auth., Tax Allocation Rev. Bonds (Mission Bay South Redev. Project), Series 2016-C, 5.00% 2033
| 1,000
| 1,198
|
| City and County of San Francisco, Redev. Fin. Auth., Tax Allocation Rev. Bonds (Mission Bay South Redev. Project), Series 2016-C, National insured, 5.00% 2041
| 2,100
| 2,441
|
City and County of San Francisco, Successor Agcy. to the Redev. Agcy., Community Facs. Dist. No. 6
(Mission Bay South Public Improvements), Special Tax Rev. Ref. Bonds, Series 2013-A, 5.00% 2024
| 1,510
| 1,651
|
City and County of San Francisco, Successor Agcy. to the Redev. Agcy., Community Facs. Dist. No. 6
(Mission Bay South Public Improvements), Special Tax Rev. Ref. Bonds, Series 2013-A, 5.00% 2028
| 1,400
| 1,522
|
City and County of San Francisco, Successor Agcy. to the Redev. Agcy., Community Facs. Dist. No. 7
(Hunters Point Shipyard Phase One Improvements), Special Tax Rev. Ref. Bonds, Series 2014,
5.00% 2039
| 4,515
| 4,922
|
City and County of San Francisco, Successor Agcy. to the Redev. Agcy., Community Facs. Dist. No. 7
(Hunters Point Shipyard Phase One Improvements), Special Tax Rev. Ref. Bonds, Series 2014,
5.00% 2044
| 4,000
| 4,347
|
| City of San Francisco, Municipal Transportation Agcy., Rev. Bonds, Series 2012-B, 5.00% 2042
| 5,000
| 5,437
|
City of San Jacinto, Community Facs. Dist. No. 2002-1 (Rancho San Jacinto Phase 2),
Special Tax Rev. Ref. Bonds, Series 2016, 5.00% 2027
| 900
| 1,062
|
| San Jacinto Unified School Dist., Fncg. Auth., Special Tax Rev. Bonds, Series 2019, 5.00% 2028
| 380
| 460
|
| San Jacinto Unified School Dist., Fncg. Auth., Special Tax Rev. Bonds, Series 2019, 5.00% 2030
| 200
| 239
|
| San Jacinto Unified School Dist., Fncg. Auth., Special Tax Rev. Bonds, Series 2019, 5.00% 2031
| 550
| 656
|
| San Jacinto Unified School Dist., Fncg. Auth., Special Tax Rev. Bonds, Series 2019, 5.00% 2033
| 750
| 889
|
| San Jacinto Unified School Dist., Fncg. Auth., Special Tax Rev. Bonds, Series 2019, 5.00% 2044
| 2,400
| 2,781
|
| San Jacinto Unified School Dist., Fncg. Auth., Special Tax Rev. Bonds, Series 2019, 5.00% 2049
| 2,650
| 3,056
|
| San Jacinto Unified School Dist., Fncg. Auth., Special Tax Rev. Ref. Bonds, Series 2017, 5.00% 2034
| 765
| 867
|
| San Jacinto Unified School Dist., Fncg. Auth., Special Tax Rev. Ref. Bonds, Series 2017, 5.00% 2035
| 200
| 226
|
| San Joaquin Hills Transportation Corridor Agcy., Toll Road Rev. Ref. Bonds, Series 2014-A, 5.00% 2034
| 2,300
| 2,632
|
| City of San Jose, Airport Rev. Ref. Bonds, Series 2011-A-1, AMT, 5.50% 2030
| 8,000
| 8,525
|
| City of San Jose, Airport Rev. Ref. Bonds, Series 2011-A-2, 5.25% 2034
| 4,900
| 5,203
|
| City of San Jose, Airport Rev. Ref. Bonds, Series 2017-A, AMT, 5.00% 2020
| 2,080
| 2,126
|
| City of San Jose, Airport Rev. Ref. Bonds, Series 2017-A, AMT, 5.00% 2035
| 2,000
| 2,382
|
| City of San Jose, Airport Rev. Ref. Bonds, Series 2017-A, AMT, 5.00% 2037
| 1,000
| 1,184
|
| City of San Jose, Airport Rev. Ref. Bonds, Series 2017-A, AMT, 5.00% 2041
| 1,500
| 1,758
|
| City of San Jose, Airport Rev. Ref. Bonds, Series 2017-A, AMT, 5.00% 2047
| 10,000
| 11,628
|
| San Juan Unified School Dist., G.O. Bonds, 2012 Election, Series 2019, 4.00% 2029
| 2,470
| 2,909
|
| San Leandro Unified School Dist., G.O. Bonds, Series 2019-B, BAM insured, 5.00% 2032
| 375
| 470
|
| San Leandro Unified School Dist., G.O. Bonds, Series 2019-B, BAM insured, 5.00% 2033
| 355
| 443
|
City of San Marcos, Successor Agcy. to the Redev. Agcy., Tax Allocation Rev. Ref. Bonds, Series 2015-A,
5.00% 2023
| 900
| 1,049
|
The Tax-Exempt Fund of California — Page 25
of 31
Bonds, notes & other debt instruments (continued)
California (continued)
City, county & other issuers (continued)
| Principal amount
(000)
| Value
(000)
|
City of San Marcos, Successor Agcy. to the Redev. Agcy., Tax Allocation Rev. Ref. Bonds, Series 2015-A,
5.00% 2024
| $150
| $180
|
City of San Marcos, Successor Agcy. to the Redev. Agcy., Tax Allocation Rev. Ref. Bonds, Series 2015-A,
5.00% 2029
| 2,000
| 2,432
|
| San Marcos Unified School Dist., G.O. Rev. Ref. Bonds, Series 2017, 5.00% 2034
| 2,115
| 2,619
|
| San Marcos Unified School Dist., G.O. Rev. Ref. Bonds, Series 2017, 5.00% 2035
| 1,280
| 1,580
|
City of San Ramon, Successor Agcy. to the Redev. Agcy., Tax Allocation Rev. Ref. Bonds, Series 2015-A,
BAM insured, 5.00% 2038
| 2,000
| 2,279
|
| City of Santa Ana, Redev. Agcy., Tax Allocation Bonds, Series 2011-A, 6.25% 2024
| 3,500
| 3,791
|
| City of Santa Clara, Electric Rev. Ref. Bonds, Series 2011-A, 5.25% 2032
| 2,000
| 2,158
|
| City of Santa Clara, Electric Rev. Ref. Bonds, Series 2011-A, 6.00% 2031
| 1,250
| 1,366
|
| City of Santa Clara, Redev. Agcy., Tax Allocation Bonds (Bayshore North Project), Capital Appreciation Bonds, Series 2011, 0% 2024 (preref. 2021)
| 4,310
| 3,386
|
| City of Santa Clara, Redev. Agcy., Tax Allocation Bonds (Bayshore North Project), Capital Appreciation Bonds, Series 2011, 0% 2025 (preref. 2021)
| 4,000
| 2,897
|
| County of Santa Cruz, Successor Agcy. to the Redev. Agcy., Tax Allocation Rev. Ref. Bonds, Series 2014-A, 5.00% 2044
| 3,750
| 4,209
|
| City of Santa Fe Springs, Community Dev. Commission, Consolidated Redev. Project, Tax Allocation Bonds, Capital Appreciation Bonds, Series 2006-A, National
insured, 0% 2022
| 1,135
| 1,083
|
Santa Margarita Water Dist., Community Facs. Dist. No. 99-1 (Talega), Special Tax Rev. Ref. Bonds,
Series 2014-B, 5.00% 2026
| 835
| 952
|
Santa Margarita Water Dist., Community Facs. Dist. No. 99-1 (Talega), Special Tax Rev. Ref. Bonds,
Series 2014-B, 5.00% 2029
| 2,150
| 2,427
|
Santa Margarita Water Dist., Community Facs. Dist. No. 99-1 (Talega), Special Tax Rev. Ref. Bonds,
Series 2014-B, 5.00% 2038
| 460
| 509
|
| City of Santa Monica, Redev. Agcy., Tax Allocation Bonds (Earthquake Recovery Redev. Project), Series 2011, 5.00% 2032
| 2,000
| 2,149
|
| City of Santa Monica, Redev. Agcy., Tax Allocation Bonds (Earthquake Recovery Redev. Project), Series 2011, 5.875% 2036
| 1,250
| 1,362
|
| City of Santa Monica, Redev. Agcy., Tax Allocation Bonds (Earthquake Recovery Redev. Project), Series 2011, 5.875% 2042
| 2,500
| 2,718
|
| Community of Santaluz, Community Facs. Dist. No. 2, Improvement Area No. 1, Special Tax Rev. Ref. Bonds, Series 2011-A, 5.00% 2028
| 875
| 938
|
| Community of Santaluz, Community Facs. Dist. No. 2, Improvement Area No. 1, Special Tax Rev. Ref. Bonds, Series 2011-A, 5.00% 2029
| 1,405
| 1,506
|
City of Santee, Community Facs. Dist. Number 2017-1, Special Tax Bonds (Weston Infrastructure),
Series 2019, 5.00% 2027
| 195
| 237
|
City of Santee, Community Facs. Dist. Number 2017-1, Special Tax Bonds (Weston Infrastructure),
Series 2019, 5.00% 2028
| 205
| 248
|
City of Santee, Community Facs. Dist. Number 2017-1, Special Tax Bonds (Weston Infrastructure),
Series 2019, 5.00% 2034
| 350
| 415
|
City of Santee, Community Facs. Dist. Number 2017-1, Special Tax Bonds (Weston Infrastructure),
Series 2019, 5.00% 2049
| 1,940
| 2,240
|
Saugus Union School Dist., Saugus/Hart School Facs. Fin. Auth., Community Facs. Dist. No. 2006-1,
Special Tax Rev. Bonds, Series 2016, 5.00% 2033
| 1,240
| 1,425
|
Saugus Union School Dist., Saugus/Hart School Facs. Fin. Auth., Community Facs. Dist. No. 2006-1,
Special Tax Rev. Bonds, Series 2016, 5.00% 2041
| 3,720
| 4,199
|
Saugus Union School Dist., Saugus/Hart School Facs. Fin. Auth., Community Facs. Dist. No. 2006-1,
Special Tax Rev. Bonds, Series 2016, 5.00% 2046
| 3,495
| 3,930
|
City of Signal Hill, Successor Agcy. to the Redev. Agcy., Tax Allocation Rev. Ref. Bonds,
Capital Appreciation Bonds, Series 2015-A, BAM insured, 5.00% 2022
| 1,000
| 1,121
|
| Sonoma-Marin Area Rail Transit Dist., Measure Q Sales Tax Rev. Bonds, Series 2011-A, 5.00% 2028
| 3,500
| 3,852
|
| South Orange County Public Fncg. Auth., Central Utility Fac. Lease Rev. Bonds, Series 2016, 5.00% 2031
| 1,250
| 1,515
|
| South Orange County Public Fncg. Auth., Central Utility Fac. Lease Rev. Bonds, Series 2016, 5.00% 2032
| 1,750
| 2,112
|
The Tax-Exempt Fund of California — Page 26
of 31
Bonds, notes & other debt instruments (continued)
California (continued)
City, county & other issuers (continued)
| Principal amount
(000)
| Value
(000)
|
| South Orange County Public Fncg. Auth., Central Utility Fac. Lease Rev. Bonds, Series 2016, 5.00% 2035
| $2,000
| $2,382
|
| South Placer Wastewater Auth., Wastewater Rev. Ref. Bonds, Series 2011-C, 5.25% 2023 (preref. 2020)
| 600
| 632
|
| Southwestern Community College Dist., G.O. Rev. Ref. Bonds (2019 Crossover), Series 2016-B, 4.00% 2035
| 500
| 556
|
| City of Stockton, Public Fncg. Auth., Wastewater Rev. Ref. Bonds (1998 Wastewater Project and 2003 Wastewater Project), Series 2014, BAM insured, 5.00% 2024
| 500
| 592
|
| City of Stockton, Public Fncg. Auth., Wastewater Rev. Ref. Bonds (1998 Wastewater Project and 2003 Wastewater Project), Series 2014, BAM insured, 5.00% 2028
| 1,000
| 1,175
|
| Stockton Unified School Dist., G.O. Rev. Ref. Bonds, Series 2016, 5.00% 2029
| 4,000
| 4,847
|
| Stockton Unified School Dist., G.O. Rev. Ref. Bonds, Series 2016, 5.00% 2031
| 7,800
| 9,346
|
| Sweetwater Union High School Dist., G.O. Rev. Ref. Bonds, Series 2016, 4.00% 2047
| 4,750
| 5,027
|
| Sweetwater Union High School Dist., G.O. Rev. Ref. Bonds, Series 2016, 5.00% 2032
| 5,000
| 5,830
|
| Sweetwater Union High School Dist., G.O. Rev. Ref. Bonds, Series 2016, 5.00% 2034
| 2,075
| 2,403
|
| Sweetwater Union High School Dist., G.O. Rev. Ref. Bonds, Series 2016, 5.00% 2036
| 1,000
| 1,148
|
| Temecula Valley Unified School Dist., Fncg. Auth., Rev. Bonds, Series 2015, BAM insured, 5.00% 2050
| 1,000
| 1,132
|
Temecula Valley Unified School Dist., Fncg. Auth., Special Tax Rev. Bonds, Series 2015, BAM insured,
5.00% 2030
| 1,000
| 1,191
|
Temecula Valley Unified School Dist., Fncg. Auth., Special Tax Rev. Bonds, Series 2015, BAM insured,
5.00% 2031
| 1,500
| 1,781
|
Temecula Valley Unified School Dist., Fncg. Auth., Special Tax Rev. Bonds, Series 2015, BAM insured,
5.00% 2033
| 1,000
| 1,181
|
Temecula Valley Unified School Dist., Fncg. Auth., Special Tax Rev. Bonds, Series 2015, BAM insured,
5.00% 2034
| 2,065
| 2,432
|
Temecula Valley Unified School Dist., Fncg. Auth., Special Tax Rev. Bonds, Series 2015, BAM insured,
5.00% 2040
| 1,600
| 1,850
|
Temecula Valley Unified School Dist., G.O. Bonds, 2012 Election, Series 2016-B,
Assured Guaranty Municipal insured, 4.00% 2045
| 1,400
| 1,496
|
City of Thousand Oaks, Community Facs. Dist. No. 1994-1 (Marketplace Public Pedestrian,
Traffic Circulation and Parking Facs.), Special Tax Rev. Ref. Bonds, Series 2012, 5.00% 2022
| 690
| 727
|
City of Thousand Oaks, Community Facs. Dist. No. 1994-1 (Marketplace Public Pedestrian,
Traffic Circulation and Parking Facs.), Special Tax Rev. Ref. Bonds, Series 2012, 5.375% 2031
| 3,265
| 3,437
|
| City of Torrance, Rev. Bonds (Torrance Memorial Medical Center), Series 2010-A, 5.00% 2040
| 5,185
| 5,388
|
| City of Tracy, Community Facs. Dist. No. 2006-01, Special Tax Rev. Ref. Bonds (NEI Phase II), Series 2019, 5.00% 2028
| 455
| 558
|
| City of Tracy, Community Facs. Dist. No. 2006-01, Special Tax Rev. Ref. Bonds (NEI Phase II), Series 2019, 5.00% 2030
| 535
| 661
|
| City of Tracy, Community Facs. Dist. No. 2006-01, Special Tax Rev. Ref. Bonds (NEI Phase II), Series 2019, 5.00% 2032
| 1,000
| 1,226
|
| City of Tracy, Community Facs. Dist. No. 2006-01, Special Tax Rev. Ref. Bonds (NEI Phase II), Series 2019, 5.00% 2034
| 1,380
| 1,680
|
| City of Tulare, Sewer Rev. Ref. Bonds, Series 2016, Assured Guaranty Municipal insured, 4.00% 2034
| 2,235
| 2,476
|
| City of Tulare, Sewer Rev. Ref. Bonds, Series 2016, Assured Guaranty Municipal insured, 4.00% 2035
| 1,320
| 1,457
|
| City of Turlock, Irrigation Dist., Rev. Ref. Bonds, Series 2010-A, 5.00% 2035 (preref. 2020)
| 2,000
| 2,034
|
| City of Turlock, Irrigation Dist., Rev. Ref. Bonds, Series 2011, 5.50% 2041
| 3,000
| 3,172
|
| City of Turlock, Irrigation Dist., Rev. Ref. Bonds, Series 2016, 5.00% 2036
| 2,000
| 2,388
|
| City of Tustin, Community Facs. Dist. No. 06-1 (Tustin Legacy/Columbus Villages), Special Tax Rev. Ref. Bonds, Series 2015-A, 4.00% 2035
| 250
| 263
|
| City of Tustin, Community Facs. Dist. No. 06-1 (Tustin Legacy/Columbus Villages), Special Tax Rev. Ref. Bonds, Series 2015-A, 5.00% 2030
| 2,750
| 3,161
|
| City of Tustin, Community Facs. Dist. No. 06-1 (Tustin Legacy/Columbus Villages), Special Tax Rev. Ref. Bonds, Series 2015-A, 5.00% 2031
| 1,000
| 1,181
|
| City of Tustin, Community Facs. Dist. No. 06-1 (Tustin Legacy/Columbus Villages), Special Tax Rev. Ref. Bonds, Series 2015-A, 5.00% 2033
| 1,135
| 1,332
|
| City of Tustin, Community Facs. Dist. No. 06-1 (Tustin Legacy/Columbus Villages), Special Tax Rev. Ref. Bonds, Series 2015-A, 5.00% 2040
| 750
| 841
|
The Tax-Exempt Fund of California — Page 27
of 31
Bonds, notes & other debt instruments (continued)
California (continued)
City, county & other issuers (continued)
| Principal amount
(000)
| Value
(000)
|
| Tustin Unified School Dist., Community Facs. Dist. No. 97-1, Special Tax Rev. Ref. Bonds, Series 1997-1A, 5.00% 2028
| $3,000
| $3,508
|
| Tustin Unified School Dist., Community Facs. Dist. No. 97-1, Special Tax Rev. Ref. Bonds, Series 1997-1A, 5.00% 2029
| 1,000
| 1,164
|
| Tustin Unified School Dist., Community Facs. Dist. No. 97-1, Special Tax Rev. Ref. Bonds, Series 1997-1A, 5.00% 2030
| 1,535
| 1,779
|
Tustin Unified School Dist., Community Facs. Dist. No. 97-1, Special Tax Rev. Ref. Bonds, Series 1997-1A,
BAM insured, 5.00% 2038
| 2,500
| 2,886
|
Twin Rivers Unified School Dist., G.O. Bonds, Capital Appreciation Bonds, 2006 Election, Series 2016,
Assured Guaranty Municipal insured, 0% 2041
| 15,700
| 6,640
|
Upland Unified School Dist., G.O. Bonds, Capital Appreciation Bonds, 2008 Election, Series 2008-A,
Assured Guaranty Municipal insured, 0% 2030
| 4,625
| 3,639
|
| Upper Santa Clara Valley Joint Powers Auth., Rev. Bonds, Series 2016-A, 5.00% 2046
| 2,120
| 2,487
|
Val Verde Unified School Dist., G.O. Bonds, 2012 Election, Series 2016-C,
Assured Guaranty Municipal insured, 4.00% 2045
| 1,550
| 1,662
|
| County of Ventura, Public Fncg. Auth., Lease Rev. Bonds, Series 2013-A, 5.00% 2043
| 3,000
| 3,334
|
Victor Elementary School Dist., Community Facs. Dist. No. 2005-1, Special Tax Bonds, Series 2018,
5.00% 2046
| 1,250
| 1,448
|
| Victor Valley Union High School Dist., G.O. Rev. Ref. Bonds, Series 2016-A, BAM insured, 4.00% 2031
| 1,000
| 1,135
|
Victor Valley Union High School Dist., G.O. Rev. Ref. Bonds, Series 2016-B,
Assured Guaranty Municipal insured, 4.00% 2035
| 3,630
| 4,037
|
Victor Valley Union High School Dist., G.O. Rev. Ref. Bonds, Series 2016-B,
Assured Guaranty Municipal insured, 4.00% 2036
| 1,665
| 1,842
|
Victor Valley Union High School Dist., G.O. Rev. Ref. Bonds, Series 2016-B,
Assured Guaranty Municipal insured, 4.00% 2037
| 3,800
| 4,186
|
| City of Walnut, Energy Center Auth., Rev. Ref. Bonds, Series 2010-A, 5.00% 2035
| 2,000
| 2,030
|
| Washington Township Health Care Dist., Rev. Bonds, Series 2010-A, 5.00% 2025
| 1,500
| 1,549
|
| Washington Township Health Care Dist., Rev. Bonds, Series 2010-A, 5.25% 2030
| 1,400
| 1,449
|
| Washington Township Health Care Dist., Rev. Bonds, Series 2017-A, 5.00% 2042
| 1,000
| 1,154
|
| Washington Township Health Care Dist., Rev. Bonds, Series 2017-B, 5.00% 2029
| 600
| 725
|
West Contra Costa Unified School Dist., G.O. Rev. Ref. Bonds, Capital Appreciation Bonds, Series 2010-D-2,
Assured Guaranty Municipal insured, 0% 2036
| 6,000
| 3,719
|
| West Contra Costa Unified School Dist., G.O. Rev. Ref. Bonds, Series 2012, 5.00% 2027
| 3,000
| 3,340
|
| West Contra Costa Unified School Dist., G.O. Rev. Ref. Bonds, Series 2012, 5.00% 2032
| 3,500
| 3,877
|
City of West Hollywood, Community Dev. Commission, Tax Allocation Bonds (East Side Redev. Project),
Series 2011-A, 7.50% 2042
| 1,250
| 1,412
|
| Western Riverside Water and Wastewater Fncg. Auth., Local Agcy. Rev. Bonds, Series 2017-A, 5.00% 2042
| 1,150
| 1,271
|
Western Riverside Water and Wastewater Fncg. Auth., Local Agcy. Rev. Ref. Bonds, Series 2016-A,
5.00% 2030
| 600
| 719
|
Western Riverside Water and Wastewater Fncg. Auth., Local Agcy. Rev. Ref. Bonds, Series 2016-A,
5.00% 2032
| 1,240
| 1,468
|
Westminster School Dist., G.O. Bonds, Capital Appreciation Bonds, 2008 Election, Series 2009-A-1,
Assured Guaranty insured, 0% 2025
| 1,640
| 1,490
|
| City of Westminster, Successor Agcy. to the Redev. Agcy., Commercial Redev. Project No. 1, Tax Allocation Rev. Ref. Bonds, Series 2016-B, BAM insured, 4.00% 2031
| 3,105
| 3,484
|
| City of Westminster, Successor Agcy. to the Redev. Agcy., Commercial Redev. Project No. 1, Tax Allocation Rev. Ref. Bonds, Series 2016-B, BAM insured, 4.00% 2035
| 2,220
| 2,453
|
| City of Whittier, Health Fac. Rev. Bonds (PIH Health), Series 2014, 5.00% 2044
| 10,000
| 11,071
|
| City of Woodland, Community Facs. Dist. No. 2004-1 (Spring Lake), Special Tax Rev. Ref. and Capital Projects Bonds, Series 2019, 5.00% 2033
| 1,380
| 1,600
|
| City of Woodland, Community Facs. Dist. No. 2004-1 (Spring Lake), Special Tax Rev. Ref. and Capital Projects Bonds, Series 2019, 5.00% 2038
| 1,575
| 1,798
|
The Tax-Exempt Fund of California — Page 28
of 31
Bonds, notes & other debt instruments (continued)
California (continued)
City, county & other issuers (continued)
| Principal amount
(000)
| Value
(000)
|
| City of Woodland, Community Facs. Dist. No. 2004-1 (Spring Lake), Special Tax Rev. Ref. and Capital Projects Bonds, Series 2019, 5.00% 2044
| $1,600
| $1,822
|
| City of Woodland, Community Facs. Dist. No. 2004-1 (Spring Lake), Special Tax Rev. Ref. and Capital Projects Bonds, Series 2019, 5.00% 2048
| 1,800
| 2,045
|
|
|
| 1,453,650
|
| Guam 0.34%
|
|
|
| Hotel Occupancy Tax Rev. Ref. Bonds, Series 2011-A, 6.50% 2040
| 4,000
| 4,279
|
| Port Auth., Port Rev. Bonds, Series 2018-B, AMT, 5.00% 2037
| 400
| 465
|
| Power Auth., Rev. Ref. Bonds, Series 2017-A, 5.00% 2036
| 1,300
| 1,484
|
| Power Auth., Rev. Ref. Bonds, Series 2017-A, 5.00% 2037
| 1,200
| 1,365
|
| Power Auth., Rev. Ref. Bonds, Series 2017-A, 5.00% 2040
| 1,000
| 1,129
|
|
|
| 8,722
|
| Puerto Rico 0.50%
|
|
|
Industrial, Tourist, Educational, Medical and Environmental Control Facs. Fncg. Auth.,
Hospital Rev. and Rev. Ref. Bonds (Hospital Auxilio Mutuo Obligated Group Project), Series 2011-A,
6.00% 2033
| 7,900
| 8,292
|
Industrial, Tourist, Educational, Medical and Environmental Control Facs. Fncg. Auth.,
Higher Education Rev. and Rev. Ref. Bonds (University of the Sacred Heart Project), Series 2012,
5.00% 2021
| 500
| 495
|
| Public Fin. Corp., Commonwealth Appropriation Bonds, Series 2001-E, 6.00% 2026 (escrowed to maturity)
| 1,830
| 2,357
|
| Public Fin. Corp., Commonwealth Appropriation Bonds, Series 2001-E, 6.00% 2026 (escrowed to maturity)3
| 170
| 219
|
| University of Puerto Rico, University System Rev. Ref. Bonds, Series 2006-P, 5.00% 2026
| 1,500
| 1,481
|
|
|
| 12,844
|
| United States 0.74%
|
|
|
| Freddie Mac, Multi Family Mortgage Bonds, Series 2019-ML-05, Class A-CA, 3.35% 2033
| 15,470
| 16,881
|
| Freddie Mac, Multi Family Certificates, Series 2019-M-049, 3.05% 2034
| 2,000
| 2,115
|
|
|
| 18,996
|
| Total bonds, notes & other debt instruments (cost: $2,301,503,000)
|
| 2,430,966
|
| Short-term securities 6.06%
|
|
|
| Chula Vista Elementary School Dist., G.O. Capital Anticipation Notes, Series 2019, 0% 2023
| 5,500
| 5,195
|
| Fin. Auth., Recovery Zone Fac. Bonds (Chevron U.S.A. Inc. Project), Series 2010-A, 1.44% 20351
| 8,400
| 8,400
|
| IAM Commercial Paper, Series 2019, 1.34% 8/6/2019
| 2,000
| 2,000
|
Irvine Ranch Water Dist., Improvement Dist. Nos. 105, 140, 240 and 250, Consolidated G.O. Bonds,
Series 1993, 1.40% 20331
| 2,900
| 2,900
|
City of Los Angeles, Dept. of Water and Power, Power System Demand Rev. Bonds, Series 2002-A-1,
1.39% 20351
| 13,000
| 13,000
|
City of Los Angeles, Dept. of Water and Power, Power System Demand Rev. Bonds, Series 2002-A-2,
1.39% 20351
| 17,020
| 17,020
|
City of Los Angeles, Dept. of Water and Power, Power System Demand Rev. Bonds, Series 2002-A-3,
1.41% 20351
| 3,000
| 3,000
|
City of Los Angeles, Dept. of Water and Power, Power System Demand Rev. Bonds, Series 2002-A-6,
1.46% 20351
| 4,000
| 4,000
|
| County of Los Angeles, IAM Commercial Paper, Series 2019, 1.31% 9/5/2019
| 8,000
| 8,000
|
| County of Los Angeles, IAM Commercial Paper, Series 2019, 1.40% 8/22/2019
| 2,200
| 2,200
|
| County of Los Angeles, Tax and Rev. Anticipation Notes, Series 2019, 5.00% 6/30/2020
| 18,600
| 19,268
|
| Metropolitan Water Dist. of Southern California, Water Rev. Ref. Bonds, Series 2016-B-1, 1.41% 20371
| 5,000
| 5,000
|
| Municipal Fin. Auth., Exempt Facs. Rev. Ref. Bonds (ExxonMobil Project), Series 2007, AMT, 1.48% 20291
| 2,100
| 2,100
|
The Tax-Exempt Fund of California — Page 29
of 31
| Short-term securities (continued)
| Principal amount
(000)
| Value
(000)
|
| Pollution Control Fncg. Auth., Environmental Impact Rev. Bonds (Air Products and Chemicals, Inc. Project), Series 1997-B, 1.47% 20421
| $6,000
| $6,000
|
| County of Riverside, Tax and Rev. Anticipation Notes, Series 2019, 5.00% 6/30/2020
| 450
| 466
|
| City of San Diego, IAM Commercial Paper, Series 2019, 1.68% 8/6/2019
| 8,915
| 8,915
|
| South Bay Union School Dist., G.O. Capital Anticipation Notes, Series 2019, 0% 2022
| 2,000
| 1,915
|
Statewide Communities Dev. Auth., Pollution Control Rev. Ref. Bonds
(Chevron U.S.A. Inc. Project), Series 2002, 1.44% 20241
| 11,685
| 11,685
|
| University of California, IAM Commercial Paper, Series 2019-A-2, 1.17% 10/8/2019
| 4,000
| 4,000
|
| University of California, IAM Commercial Paper, Series 2019-A-2, 1.23% 10/8/2019
| 12,000
| 12,000
|
| University of California, IAM Commercial Paper, Series 2019-A-2, 1.40% 10/24/2019
| 2,000
| 2,000
|
| University of California, IAM Commercial Paper, Series 2019-A-2, 1.40% 10/25/2019
| 2,250
| 2,250
|
| Dept. of Water Resources, IAM Commercial Paper, Series 2019, 1.35% 9/6/2019
| 15,000
| 15,000
|
| Total short-term securities (cost: $156,251,000)
|
| 156,314
|
| Total investment securities 100.40% (cost: $2,457,754,000)
|
| 2,587,280
|
| Other assets less liabilities (0.40%)
|
| (10,399)
|
| Net assets 100.00%
|
| $2,576,881
|
Futures contracts
| Contracts
| Type
| Number of
contracts
| Expiration
| Notional
amount4
(000)
| Value at
7/31/20195
(000)
| Unrealized
(depreciation)
appreciation
at 7/31/2019
(000)
|
| 2 Year U.S. Treasury Note Futures
| Long
| 2,040
| October 2019
| $408,000
| $437,389
| $(1,228)
|
| 5 Year U.S. Treasury Note Futures
| Short
| 569
| October 2019
| (56,900)
| (66,889)
| 59
|
| 10 Year Ultra U.S. Treasury Note Futures
| Short
| 100
| September 2019
| (10,000)
| (13,784)
| 3
|
|
|
|
|
|
|
| $(1,166)
|
| 1
| Coupon rate may change periodically. For short-term securities, the date of the next scheduled coupon rate change is considered to be the maturity date.
|
| 2
| Acquired in a transaction exempt from registration under Rule 144A of the Securities Act of 1933. May be resold in the U.S. in transactions exempt from registration, normally to
qualified institutional buyers. The total value of all such securities was $97,751,000, which represented 3.79% of the net assets of the fund.
|
| 3
| Step bond; coupon rate may change at a later date.
|
| 4
| Notional amount is calculated based on the number of contracts and notional contract size.
|
| 5
| Value is calculated based on the notional amount and current market price.
|
| Key to abbreviations and symbol
|
|
| Agcy. = Agency
| Fncg. = Financing
|
| AMT = Alternative Minimum Tax
| G.O. = General Obligation
|
| Auth. = Authority
| LIBOR = London Interbank Offered Rate
|
| Certs. of Part. = Certificates of Participation
| LOC = Letter of Credit
|
| Dept. = Department
| Preref. = Prerefunded
|
| Dev. = Development
| Redev. = Redevelopment
|
| Dist. = District
| Ref. = Refunding
|
| Econ. = Economic
| Rev. = Revenue
|
| Fac. = Facility
| SIFMA = Securities Industry and Financial Markets Association
|
| Facs. = Facilities
| USD/$ = U.S. dollars
|
| Fin. = Finance
|
|
The Tax-Exempt Fund of California — Page 30
of 31
Additional financial disclosures
are included in the fund’s current shareholder report and should be read in conjunction with this report.
Investments are not FDIC-insured, nor
are they deposits of or guaranteed by a bank or any other entity, so they may lose value.
Investors should carefully consider
investment objectives, risks, charges and expenses. This and other important information is contained in the fund prospectus and summary prospectus, which can be obtained from your financial professional and should be
read carefully before investing. You may also call American Funds Service Company (AFS) at (800) 421-4225 or visit the American Funds website at capitalgroup.com.
All Capital Group trademarks
mentioned are owned by The Capital Group Companies, Inc., an affiliated company or fund. All other company and product names mentioned are the property of their respective companies.
American Funds Distributors, Inc.,
member FINRA.
© 2019 Capital Group. All
rights reserved.
| MFGEFPX-020-0919O-S73130
| The Tax-Exempt Fund of California — Page 31 of 31
|
American Funds Tax-Exempt Fund of New
York®
Investment portfolio
July 31, 2019
Bonds, notes & other debt instruments 93.38%
New York 91.22%
State issuers 46.34%
| Principal amount
(000)
| Value
(000)
|
| Convention Center Dev. Corp., Rev. Ref. Bonds (Hotel Unit Fee Secured), Series 2015, 5.00% 2030
| $300
| $361
|
| Convention Center Dev. Corp., Rev. Ref. Bonds (Hotel Unit Fee Secured), Series 2015, 5.00% 2035
| 840
| 993
|
Convention Center Dev. Corp., Subordinated Lien Rev. Bonds (Hotel Unit Fee Secured),
Capital Appreciation Bonds, Series 2016-B, 0% 2048
| 3,540
| 1,295
|
| Dormitory Auth., Lease Rev. Bonds (State University of New York Dormitory Facs.), Series 2010-A, 5.00% 2035
| 1,000
| 1,033
|
| Dormitory Auth., Rev. Bonds (Catholic Health System Obligated Group), Series 2019-A, 4.00% 2037
| 1,000
| 1,102
|
| Dormitory Auth., Rev. Bonds (Culinary Institute of America), Series 2013, 5.50% 2033
| 500
| 568
|
| Dormitory Auth., Rev. Bonds (Fordham University), Series 2011-A, 5.50% 2036 (preref. 2021)
| 1,000
| 1,087
|
| Dormitory Auth., Rev. Bonds (Fordham University), Series 2017, 4.00% 2034
| 885
| 994
|
| Dormitory Auth., Rev. Bonds (Icahn School of Medicine at Mount Sinai), Series 2015-A, 5.00% 2031
| 500
| 586
|
| Dormitory Auth., Rev. Bonds (Icahn School of Medicine at Mount Sinai), Series 2015-A, 5.00% 2035
| 1,000
| 1,157
|
| Dormitory Auth., Rev. Bonds (Icahn School of Medicine at Mount Sinai), Series 2015-A, 5.00% 2040
| 250
| 285
|
| Dormitory Auth., Rev. Bonds (Memorial Sloan-Kettering Cancer Center), Series 2017-1, 5.00% 2027
| 750
| 962
|
| Dormitory Auth., Rev. Bonds (Montefiore Obligated Group), Series 2018-A, 5.00% 2031
| 1,000
| 1,229
|
| Dormitory Auth., Rev. Bonds (New School), Series 2015-A, 5.00% 2032
| 1,000
| 1,174
|
| Dormitory Auth., Rev. Bonds (New School), Series 2016-A, 5.00% 2035
| 500
| 595
|
| Dormitory Auth., Rev. Bonds (New York University), Series 2018-A, 5.00% 2032
| 500
| 637
|
| Dormitory Auth., Rev. Bonds (New York University), Series 2019-A, 5.00% 2049
| 1,500
| 1,841
|
Dormitory Auth., Rev. Bonds (North Shore-Long Island Jewish Obligated Group), Series 2011-A,
5.00% 2032 (preref. 2021)
| 1,500
| 1,605
|
| Dormitory Auth., Rev. Bonds (NYU Hospitals Center), Series 2011-A, 6.00% 2040 (preref. 2020)
| 1,000
| 1,045
|
| Dormitory Auth., Rev. Bonds (NYU Hospitals Center), Series 2014, 5.00% 2022
| 200
| 222
|
| Dormitory Auth., Rev. Bonds (NYU Hospitals Center), Series 2014, 5.00% 2034
| 1,000
| 1,143
|
| Dormitory Auth., Rev. Bonds (NYU Hospitals Center), Series 2016-A, 5.00% 2033
| 400
| 475
|
| Dormitory Auth., Rev. Bonds (Orange Regional Medical Center Obligated Group), Series 2015, 5.00% 20321
| 600
| 685
|
| Dormitory Auth., Rev. Bonds (Orange Regional Medical Center Obligated Group), Series 2015, 5.00% 20401
| 1,000
| 1,119
|
| Dormitory Auth., Rev. Bonds (Orange Regional Medical Center Obligated Group), Series 2017, 5.00% 20311
| 1,000
| 1,183
|
| Dormitory Auth., Rev. Bonds (Orange Regional Medical Center Obligated Group), Series 2017, 5.00% 20351
| 1,000
| 1,165
|
| Dormitory Auth., Rev. Bonds (Skidmore College), Series 2011-A, 5.50% 2041
| 1,110
| 1,193
|
| Dormitory Auth., Rev. Bonds (State University of New York Dormitory Facs.), Series 2017-A, 5.00% 2030
| 750
| 935
|
| Dormitory Auth., Rev. Bonds (State University of New York Dormitory Facs.), Series 2017-A, 5.00% 2032
| 500
| 617
|
Dormitory Auth., Rev. Bonds (Touro College and University System Obligated Group), Series 2014-A,
5.50% 2039
| 1,000
| 1,122
|
Dormitory Auth., Rev. Bonds (Touro College and University System Obligated Group), Series 2017,
5.00% 2038
| 500
| 573
|
| Dormitory Auth., Rev. Ref. Bonds (Mount Sinai School of Medicine of New York University), Series 2010-A, 5.00% 2021
| 1,000
| 1,033
|
| Dormitory Auth., School Dist. Rev. Bond Fncg. Program Rev. Bonds, Series 2011-A, 5.00% 2024
| 25
| 27
|
| Dormitory Auth., School Dist. Rev. Bond Fncg. Program Rev. Bonds, Series 2011-A, 5.00% 2024 (preref. 2021)
| 475
| 516
|
Dormitory Auth., School Dist. Rev. Bond Fncg. Program Rev. Bonds, Series 2013-E,
Assured Guaranty Municipal insured, 5.00% 2022
| 1,000
| 1,125
|
| Dormitory Auth., State Personal Income Tax Rev. Bonds (Education), Series 2014-E, 5.00% 2032
| 750
| 880
|
| Dormitory Auth., State Personal Income Tax Rev. Bonds (General Purpose), Series 2015-E, 5.00% 2020
| 35
| 36
|
| Dormitory Auth., State Personal Income Tax Rev. Bonds (General Purpose), Series 2017-B, 5.00% 2041
| 750
| 897
|
| Dormitory Auth., State Personal Income Tax Rev. Bonds (General Purpose), Series 2017-B, 5.00% 2042
| 1,130
| 1,350
|
| Dormitory Auth., State Personal Income Tax Rev. Bonds (General Purpose), Series 2018-A, 5.25% 2037
| 1,000
| 1,263
|
American Funds Tax-Exempt Fund of New York —
Page 1 of 10
Bonds, notes & other debt instruments (continued)
New York (continued)
State issuers (continued)
| Principal amount
(000)
| Value
(000)
|
| Dormitory Auth., State Personal Income Tax Rev. Bonds (General Purpose), Series 2019-A, 5.00% 2028
| $1,000
| $1,278
|
| Dormitory Auth., State Personal Income Tax Rev. Bonds (General Purpose), Series 2019-A, 5.00% 2047
| 1,500
| 1,822
|
| Dormitory Auth., State Sales Tax Rev. Bonds, Series 2017-B, 5.00% 2033
| 1,000
| 1,228
|
| Dormitory Auth., State Sales Tax Rev. Bonds, Series 2018-A, 5.00% 2036
| 1,000
| 1,230
|
| Dormitory Auth., State Sales Tax Rev. Bonds, Series 2018-A, 5.00% 2039
| 1,000
| 1,215
|
| Dormitory Auth., State Sales Tax Rev. Bonds, Series 2018-E, 5.00% 2048
| 1,500
| 1,809
|
| Energy Research and Dev. Auth., Pollution Control Rev. Bonds (New York State Electric & Gas Corp. Project), Series 2005-B, AMT, 2.375% 2026 (put 2020)
| 300
| 301
|
| Energy Research and Dev. Auth., Pollution Control Rev. Bonds (Rochester Gas and Electric Corp. Project), Series 1997-A, AMT, 3.00% 2032 (put 2025)
| 1,000
| 1,077
|
| Environmental Facs. Corp., Rev. Green Bonds (Revolving Funds), Series 2016-B, 4.00% 2036
| 1,950
| 2,182
|
Environmental Facs. Corp., Solid Waste Disposal Rev. Bonds (Casella Waste Systems, Inc. Project),
Series 2014-R-2, AMT, 3.125% 2044 (put 2026)1
| 500
| 503
|
Environmental Facs. Corp., Solid Waste Disposal Rev. Bonds (Casella Waste Systems, Inc. Project),
Series 2017, AMT, 3.75% 2044 (put 2019)1
| 500
| 503
|
| Housing Fin. Agcy., Affordable Housing Rev. Bonds, Series 2017-M, 3.65% 2042
| 750
| 783
|
| Housing Fin. Agcy., Affordable Housing Rev. Green Bonds, Series 2019-D, 3.55% 2039
| 1,000
| 1,050
|
| Liberty Dev. Corp., Liberty Rev. Bonds (Goldman Sachs Headquarters Issue), Series 2005, 5.25% 2035
| 1,250
| 1,678
|
| Liberty Dev. Corp., Liberty Rev. Ref. Bonds (3 World Trade Center Project), Series 2014, Class 2, 5.15% 20341
| 1,250
| 1,401
|
| Liberty Dev. Corp., Liberty Rev. Ref. Bonds (3 World Trade Center Project), Series 2014, Class 2, 5.375% 20401
| 350
| 393
|
| Liberty Dev. Corp., Liberty Rev. Ref. Bonds (3 World Trade Center Project), Series 2014, Class 3, 7.25% 20441
| 375
| 448
|
| Liberty Dev. Corp., Liberty Rev. Ref. Bonds (4 World Trade Center Project), Series 2011, 5.00% 2031
| 1,500
| 1,622
|
Liberty Dev. Corp., Liberty Rev. Ref. Bonds (Bank of America Tower at One Bryant Park Project),
Series 2010, 6.375% 2049
| 1,500
| 1,533
|
| Long Island Power Auth., Electric System General Rev. Bonds, Series 2011-A, 5.00% 2038 (preref. 2021)
| 500
| 535
|
| Long Island Power Auth., Electric System General Rev. Bonds, Series 2015-B, 5.00% 2035
| 1,215
| 1,425
|
| Long Island Power Auth., Electric System General Rev. Bonds, Series 2015-B, 5.00% 2038
| 750
| 873
|
Long Island Power Auth., Electric System General Rev. Bonds, Series 2015-C,
(1-month USD-LIBOR x 0.70 + 0.75%) 2.431% 2033 (put 2023)2
| 1,500
| 1,507
|
| Long Island Power Auth., Electric System General Rev. Bonds, Series 2017, 5.00% 2035
| 1,000
| 1,221
|
| Long Island Power Auth., Electric System General Rev. Bonds, Series 2017, 5.00% 2047
| 3,225
| 3,839
|
| Long Island Power Auth., Electric System General Rev. Bonds, Series 2018, 5.00% 2036
| 500
| 618
|
Metropolitan Transportation Auth., Dedicated Tax Fund Rev. Ref. Bonds, Series 2002-B-3D,
(SIFMA Municipal Swap Index + 1.00%) 2.40% 20202
| 2,000
| 2,014
|
| Metropolitan Transportation Auth., Hudson Rail Yards Trust Obligations, Series 2016-A, 5.00% 2046
| 270
| 272
|
| Metropolitan Transportation Auth., Hudson Rail Yards Trust Obligations, Series 2016-A, 5.00% 2051
| 500
| 531
|
| Metropolitan Transportation Auth., Hudson Rail Yards Trust Obligations, Series 2016-A, 5.00% 2056
| 750
| 830
|
| Metropolitan Transportation Auth., Transportation Rev. Bonds, Series 2014-D-1, 5.00% 2039
| 250
| 285
|
Metropolitan Transportation Auth., Transportation Rev. Bonds, Series 2015-A-2,
(SIFMA Municipal Swap Index + 0.58%) 1.98% 2039 (put 2020)2
| 500
| 500
|
| Metropolitan Transportation Auth., Transportation Rev. Bonds, Series 2015-C-1, 5.00% 2035
| 1,750
| 2,046
|
| Metropolitan Transportation Auth., Transportation Rev. Bonds, Series 2015-C-1, 5.25% 2030
| 280
| 339
|
| Metropolitan Transportation Auth., Transportation Rev. Green Bonds, Series 2016-A-2, 5.00% 2026
| 560
| 692
|
| Metropolitan Transportation Auth., Transportation Rev. Green Bonds, Series 2017-A-1, 5.00% 2027
| 700
| 882
|
| Metropolitan Transportation Auth., Transportation Rev. Green Bonds, Series 2017-A-1, 5.25% 2057
| 750
| 887
|
Metropolitan Transportation Auth., Transportation Rev. Ref. Bonds, Series 2002-D-2A,
Assured Guaranty Municipal insured, (1-month USD-LIBOR x 0.69 + 0.68%) 2.337% 2032 (put 2021)2
| 600
| 603
|
Metropolitan Transportation Auth., Transportation Rev. Ref. Green Bonds, Capital Appreciation Bonds,
Series 2017-C-2, 0% 2029
| 1,500
| 1,180
|
| Metropolitan Transportation Auth., Transportation Rev. Ref. Green Bonds, Series 2017-C-1, 4.00% 2034
| 1,000
| 1,130
|
| Metropolitan Transportation Auth., Transportation Rev. Ref. Green Bonds, Series 2017-C-1, 5.00% 2026
| 565
| 699
|
| Metropolitan Transportation Auth., Transportation Rev. Ref. Green Bonds, Series 2017-C-1, 5.00% 2028
| 750
| 956
|
| Mortgage Agcy., Homeowner Mortgage Rev. Bonds, Series 178, 3.50% 2043
| 265
| 276
|
| Mortgage Agcy., Homeowner Mortgage Rev. Bonds, Series 191, AMT, 3.50% 2034
| 285
| 294
|
American Funds Tax-Exempt Fund of New York —
Page 2 of 10
Bonds, notes & other debt instruments (continued)
New York (continued)
State issuers (continued)
| Principal amount
(000)
| Value
(000)
|
| Mortgage Agcy., Homeowner Mortgage Rev. Bonds, Series 194, AMT, 3.50% 2035
| $420
| $435
|
| Mortgage Agcy., Homeowner Mortgage Rev. Bonds, Series 195, 4.00% 2046
| 1,400
| 1,481
|
| Mortgage Agcy., Homeowner Mortgage Rev. Bonds, Series 197, 3.50% 2044
| 700
| 735
|
| Mortgage Agcy., Homeowner Mortgage Rev. Bonds, Series 200, 3.50% 2045
| 255
| 267
|
| Mortgage Agcy., Homeowner Mortgage Rev. Bonds, Series 203, 3.50% 2047
| 905
| 955
|
| Mortgage Agcy., Homeowner Mortgage Rev. Bonds, Series 206, AMT, 4.00% 2037
| 610
| 651
|
| Mortgage Agcy., Homeowner Mortgage Rev. Bonds, Series 208, 4.00% 2048
| 565
| 606
|
| Mortgage Agcy., Homeowner Mortgage Rev. Bonds, Series 213, 4.25% 2047
| 500
| 548
|
| Mortgage Agcy., Homeowner Mortgage Rev. Bonds, Series 217, 4.00% 2049
| 1,000
| 1,097
|
| Mortgage Agcy., Homeowner Mortgage Rev. Bonds, Series 46, 5.00% 2029
| 20
| 20
|
| Mortgage Agcy., Homeowner Mortgage Rev. Bonds, Series 48, 2.625% 2041
| 995
| 1,011
|
| Mortgage Agcy., Homeowner Mortgage Rev. Bonds, Series 52, AMT, 3.50% 2030
| 715
| 744
|
| Mortgage Agcy., Homeowner Mortgage Rev. Bonds, Series 54, 4.00% 2047
| 1,545
| 1,648
|
| Mortgage Agcy., Homeowner Mortgage Rev. Ref. Bonds, Series 45, 4.50% 2029
| 55
| 56
|
| Port Auth., Consolidated Bonds, Series 166, 5.00% 2031
| 1,000
| 1,051
|
| Port Auth., Consolidated Bonds, Series 205, 5.00% 2047
| 1,000
| 1,201
|
| Port Auth., Consolidated Rev. Ref. Bonds, Series 167, AMT, 5.00% 2025
| 1,000
| 1,058
|
| Port Auth., Consolidated Rev. Ref. Bonds, Series 172, AMT, 5.00% 2034
| 500
| 542
|
| Port Auth., Consolidated Rev. Ref. Bonds, Series 186, AMT, 5.00% 2044
| 500
| 566
|
Port Auth., Special Project Bonds (John F. Kennedy International Air Terminal LLC Project), Series 8,
5.00% 2020
| 680
| 701
|
| Power Auth., Rev. Ref. Bonds, Series 2011-A, 5.00% 2038
| 1,500
| 1,623
|
| Thruway Auth., General Rev. Bonds, Series 2014-J, 5.00% 2027
| 1,000
| 1,159
|
| Thruway Auth., General Rev. Indebtedness Obligations, Series 2016-A, 5.25% 2056
| 250
| 290
|
Transportation Dev. Corp., Special Fac. Rev. Ref. Bonds (American Airlines, Inc.
John F. Kennedy International Airport Project), Series 2016, AMT, 5.00% 2020
| 1,125
| 1,160
|
Transportation Dev. Corp., Special Fac. Rev. Ref. Bonds (American Airlines, Inc.
John F. Kennedy International Airport Project), Series 2016, AMT, 5.00% 2021
| 610
| 647
|
Transportation Dev. Corp., Special Fac. Rev. Ref. Bonds (American Airlines, Inc.
John F. Kennedy International Airport Project), Series 2016, AMT, 5.00% 2026
| 500
| 529
|
Transportation Dev. Corp., Special Fac. Rev. Ref. Bonds (American Airlines, Inc.
John F. Kennedy International Airport Project), Series 2016, AMT, 5.00% 2031
| 2,500
| 2,632
|
Transportation Dev. Corp., Special Fac. Rev. Ref. Bonds (Terminal One Group Association, LP Project),
Series 2015, AMT, 5.00% 2021
| 280
| 294
|
Transportation Dev. Corp., Special Fac. Rev. Ref. Bonds (Terminal One Group Association, LP Project),
Series 2015, AMT, 5.00% 2022
| 1,000
| 1,079
|
Transportation Dev. Corp., Special Fac. Rev. Ref. Bonds (Terminal One Group Association, LP Project),
Series 2015, AMT, 5.00% 2023
| 500
| 554
|
| Transportation Dev. Corp., Special Facs. Bonds (LaGuardia Airport Terminal B Redev. Project), Series 2016-A, AMT, 5.00% 2034
| 500
| 561
|
| Transportation Dev. Corp., Special Facs. Bonds (LaGuardia Airport Terminal B Redev. Project), Series 2016-A, AMT, 5.00% 2046
| 1,000
| 1,103
|
| Transportation Dev. Corp., Special Facs. Bonds (LaGuardia Airport Terminal B Redev. Project), Series 2016-A, AMT, 5.25% 2050
| 500
| 556
|
| Transportation Dev. Corp., Special Facs. Rev. Bonds (Delta Air Lines, Inc. LaGuardia Airport Terminals C & D Redev. Project), Series 2018, AMT, 4.00% 2036
| 500
| 539
|
| Transportation Dev. Corp., Special Facs. Rev. Bonds (Delta Air Lines, Inc. LaGuardia Airport Terminals C & D Redev. Project), Series 2018, AMT, 5.00% 2030
| 1,500
| 1,811
|
| Transportation Dev. Corp., Special Facs. Rev. Bonds (Delta Air Lines, Inc. LaGuardia Airport Terminals C & D Redev. Project), Series 2018, AMT, 5.00% 2036
| 1,045
| 1,233
|
Triborough Bridge and Tunnel Auth., General Rev. Bonds (MTA Bridges and Tunnels), Series 2018-A,
5.00% 2030
| 650
| 877
|
Triborough Bridge and Tunnel Auth., General Rev. Bonds (MTA Bridges and Tunnels), Series 2018-A,
5.00% 2046
| 1,000
| 1,208
|
American Funds Tax-Exempt Fund of New York —
Page 3 of 10
Bonds, notes & other debt instruments (continued)
New York (continued)
State issuers (continued)
| Principal amount
(000)
| Value
(000)
|
| Urban Dev. Corp., State Personal Income Tax Rev. Bonds (General Purpose), Series 2014-A, 5.00% 2027
| $750
| $876
|
| Urban Dev. Corp., State Personal Income Tax Rev. Bonds (General Purpose), Series 2016-A, 5.00% 2026
| 1,500
| 1,852
|
| Urban Dev. Corp., State Personal Income Tax Rev. Bonds (General Purpose), Series 2016-A, 5.00% 2032
| 1,000
| 1,202
|
| Urban Dev. Corp., State Personal Income Tax Rev. Bonds (General Purpose), Series 2019-A, 5.00% 2036
| 1,500
| 1,860
|
| Urban Dev. Corp., State Personal Income Tax Rev. Bonds (General Purpose), Series 2019-A, 5.00% 2042
| 1,345
| 1,633
|
| Utility Debt Securitization Auth., Restructuring Bonds, Series 2016-A, 5.00% 2035
| 1,170
| 1,413
|
| Utility Debt Securitization Auth., Restructuring Bonds, Series 2017, 5.00% 2040
| 750
| 916
|
| Utility Debt Securitization Auth., Restructuring Bonds, Series 2017, 5.00% 2041
| 1,500
| 1,830
|
|
|
| 127,408
|
| City, county & other issuers 44.88%
|
|
|
| City of Albany, Capital Resource Corp., Rev. Bonds (Empire Commons Student Housing, Inc. Ref. Project), Series 2016-A, 5.00% 2032
| 400
| 478
|
City of Albany, Capital Resource Corp., Rev. Bonds (St. Peter’s Hospital of the City of Albany Project),
Series 2011, 6.25% 2038 (preref. 2020)
| 1,000
| 1,066
|
| Town of Amherst, Dev. Corp., Fac. Rev. Bonds (Daemen College Projects), Series 2018, 5.00% 2023
| 540
| 598
|
Town of Amherst, Dev. Corp., Student Housing Fac. Rev. Ref. Bonds (UBF Faculty-Student Housing Corp. - Greiner and Hadley Rev. Ref. Projects at SUNY Buffalo),
Series 2017-A,
Assured Guaranty Municipal insured, 5.00% 2030
| 500
| 618
|
| Brooklyn Arena Local Dev. Corp., PILOT Rev. Ref. Bonds (Barclays Center), Series 2016-A, 5.00% 2026
| 500
| 600
|
| Brooklyn Arena Local Dev. Corp., PILOT Rev. Ref. Bonds (Barclays Center), Series 2016-A, 5.00% 2027
| 750
| 906
|
Brooklyn Arena Local Dev. Corp., PILOT Rev. Ref. Bonds (Barclays Center), Series 2016-A,
Assured Guaranty Municipal insured, 4.00% 2034
| 240
| 266
|
Brooklyn Arena Local Dev. Corp., PILOT Rev. Ref. Bonds (Barclays Center), Series 2016-A,
Assured Guaranty Municipal insured, 5.00% 2030
| 500
| 594
|
Brooklyn Arena Local Dev. Corp., PILOT Rev. Ref. Bonds (Barclays Center), Series 2016-A,
Assured Guaranty Municipal insured, 5.00% 2042
| 1,500
| 1,719
|
Buffalo and Erie County Industrial Land Dev. Corp., Rev. Bonds (Buffalo State College Foundation
Housing Corp. Project), Series 2011-A, 5.375% 2041
| 1,400
| 1,488
|
| Buffalo and Erie County Industrial Land Dev. Corp., Rev. Bonds (Catholic Health System Obligated Group Project), Series 2015, 5.00% 2023
| 1,600
| 1,819
|
| Buffalo and Erie County Industrial Land Dev. Corp., Rev. Bonds (Catholic Health System Obligated Group Project), Series 2015, 5.00% 2024
| 275
| 322
|
| Buffalo and Erie County Industrial Land Dev. Corp., Rev. Bonds (Catholic Health System Obligated Group Project), Series 2015, 5.00% 2040
| 1,050
| 1,200
|
| Buffalo and Erie County Industrial Land Dev. Corp., Rev. Bonds (Catholic Health System Obligated Group Project), Series 2015, 5.25% 2035
| 500
| 586
|
Buffalo and Erie County Industrial Land Dev. Corp., Rev. Bonds (Tapestry Charter School Project),
Series 2017-A, 5.00% 2047
| 500
| 542
|
Build NYC Resource Corp., Rev. Bonds (Bronx Charter School for Excellence Project), Series 2013-A,
4.00% 2021
| 525
| 540
|
Build NYC Resource Corp., Rev. Bonds (Bronx Charter School for Excellence Project), Series 2013-A,
4.00% 2022
| 545
| 569
|
Build NYC Resource Corp., Rev. Bonds (Bronx Charter School for Excellence Project), Series 2013-A,
5.50% 2043
| 1,000
| 1,077
|
| Build NYC Resource Corp., Rev. Bonds (YMCA of Greater New York Project), Series 2015, 5.00% 2040
| 500
| 568
|
Build NYC Resource Corp., Solid Waste Disposal Rev. Bonds (Pratt Paper (NY), Inc. Project),
Series 2014, AMT, 4.50% 20251
| 450
| 500
|
Build NYC Resource Corp., Solid Waste Disposal Rev. Bonds (Pratt Paper (NY), Inc. Project),
Series 2014, AMT, 5.00% 20351
| 950
| 1,042
|
| Village of Dobbs Ferry, Local Dev. Corp., Rev. Bonds (Mercy College Project), Series 2014, 5.00% 2039
| 1,625
| 1,833
|
| Village of Dobbs Ferry, Local Dev. Corp., Rev. Bonds (Mercy College Project), Series 2014, 5.00% 2044
| 500
| 561
|
County of Dutchess, Local Dev. Corp., Rev. Bonds (Health Quest Systems, Inc. Project), Series 2016-B,
4.00% 2041
| 750
| 803
|
American Funds Tax-Exempt Fund of New York —
Page 4 of 10
Bonds, notes & other debt instruments (continued)
New York (continued)
City, county & other issuers (continued)
| Principal amount
(000)
| Value
(000)
|
County of Dutchess, Local Dev. Corp., Rev. Ref. Bonds (Health Quest Systems, Inc. Project), Series 2010,
5.75% 2030
| $500
| $523
|
County of Dutchess, Local Dev. Corp., Rev. Ref. Bonds (Health Quest Systems, Inc. Project), Series 2010,
5.75% 2040
| 1,000
| 1,044
|
| County of Dutchess, Local Dev. Corp., Rev. Ref. Bonds (Health Quest Systems, Inc. Project), Series 2014-A, 5.00% 2028
| 430
| 495
|
| County of Erie, Industrial Dev. Agcy., School Fac. Rev. Bonds (City School Dist. of the City of Buffalo Project), Series 2011-A, 5.25% 2025
| 500
| 535
|
| County of Erie, Industrial Dev. Agcy., School Fac. Rev. Ref. Bonds (City School Dist. of the City of Buffalo Project), Series 2013-A, 5.00% 2027
| 790
| 897
|
| City of Glen Cove, Local Econ. Assistance Corp., Rev. Bonds (Garvies Point Public Improvement Project), Convertible Capital Appreciation Bonds, Series 2016-C, 0%
2055 (5.62% on 1/1/2024)3
| 500
| 461
|
| Town of Hempstead, Local Dev. Corp., Rev. Bonds (Hofstra University Project), Series 2011, 5.00% 2027
| 800
| 855
|
| Town of Hempstead, Local Dev. Corp., Rev. Bonds (Hofstra University Project), Series 2011, 5.00% 2041
| 800
| 847
|
| Town of Hempstead, Local Dev. Corp., Rev. Ref. Bonds (Molloy College Project), Series 2017, 5.00% 2033
| 480
| 565
|
| Town of Hempstead, Local Dev. Corp., Rev. Ref. Bonds (Molloy College Project), Series 2017, 5.00% 2034
| 810
| 951
|
| Town of Hempstead, Local Dev. Corp., Rev. Ref. Bonds (Molloy College Project), Series 2017, 5.00% 2037
| 630
| 733
|
| Hudson Yards Infrastructure Corp., Rev. Bonds, Fiscal 2012, Series 2012-A, 5.25% 2047
| 955
| 1,008
|
| Hudson Yards Infrastructure Corp., Rev. Bonds, Fiscal 2012, Series 2012-A, 5.25% 2047 (preref. 2021)
| 45
| 48
|
| Hudson Yards Infrastructure Corp., Rev. Bonds, Fiscal 2012, Series 2012-A, 5.75% 2047
| 435
| 464
|
| Hudson Yards Infrastructure Corp., Rev. Bonds, Fiscal 2012, Series 2012-A, 5.75% 2047 (preref. 2021)
| 565
| 606
|
| Hudson Yards Infrastructure Corp., Rev. Bonds, Fiscal 2017, Series 2017-A, 5.00% 2033
| 2,700
| 3,323
|
| Hudson Yards Infrastructure Corp., Rev. Bonds, Fiscal 2017, Series 2017-A, 5.00% 2035
| 1,000
| 1,222
|
| County of Jefferson, Civic Fac. Dev. Corp., Rev. Bonds (Samaritan Medical Center Project), Series 2017-A, 4.00% 2047
| 500
| 514
|
County of Jefferson, Civic Fac. Dev. Corp., Rev. Bonds (Samaritan Medical Center Project), Series 2017-A,
4.00% 2042
| 500
| 516
|
County of Jefferson, Civic Fac. Dev. Corp., Rev. Bonds (Samaritan Medical Center Project), Series 2017-A,
5.00% 2037
| 1,000
| 1,157
|
| County of Monroe, Industrial Dev. Corp., Rev. Bonds (Highland Hospital of Rochester Project), Series 2015, 5.00% 2033
| 430
| 494
|
| County of Monroe, Industrial Dev. Corp., Rev. Bonds (Highland Hospital of Rochester Project), Series 2015, 5.00% 2034
| 380
| 435
|
| County of Nassau, G.O. Bonds, Series 2014-A, 5.00% 2028
| 1,250
| 1,445
|
| County of Nassau, G.O. Bonds, Series 2016-B, 5.00% 2025
| 1,000
| 1,212
|
| County of Nassau, G.O. General Improvement Bonds, Series 2017-A, 5.00% 2030
| 1,000
| 1,226
|
County of Nassau, G.O. General Improvement Bonds, Series 2018-B, Assured Guaranty Municipal insured,
5.00% 2035
| 750
| 928
|
| County of Nassau, G.O. General Improvement Bonds, Series 2019-A, Assured Guaranty Municipal insured, 5.00% 2032
| 750
| 956
|
| County of Nassau, G.O. General Improvement Rev. Ref. Bonds, Series 2016-A, 5.00% 2027
| 500
| 607
|
| County of Nassau, G.O. General Improvement Rev. Ref. Bonds, Series 2016-A, 5.00% 2030
| 1,795
| 2,151
|
| County of Nassau, Local Econ. Assistance Corp., Rev. Ref. Bonds (Winthrop-University Hospital Association Project), Series 2012, 5.00% 2037
| 500
| 536
|
| County of Nassau, Tobacco Settlement Corp., Tobacco Settlement Asset-Backed Bonds, Series 2006-A-3, 5.00% 2035
| 600
| 581
|
| County of Nassau, Tobacco Settlement Corp., Tobacco Settlement Asset-Backed Bonds, Series 2006-A-3, 5.125% 2046
| 705
| 683
|
| City of New Rochelle, Local Dev. Rev. Bonds (Iona College Project), Series 2015-A, 5.00% 2045
| 250
| 279
|
| New York City G.O. Bonds, Fiscal 2010, Series 2010-C, 4.00% 2019
| 145
| 145
|
| New York City G.O. Bonds, Fiscal 2011, Series 2011-B, 5.00% 2019
| 350
| 350
|
| New York City G.O. Bonds, Fiscal 2015, Series 2015-C, 5.00% 2033
| 1,000
| 1,168
|
| New York City G.O. Bonds, Fiscal 2016, Series 2016-A, 5.00% 2026
| 1,000
| 1,213
|
| New York City G.O. Bonds, Fiscal 2016, Series 2016-C, 5.00% 2031
| 1,000
| 1,197
|
American Funds Tax-Exempt Fund of New York —
Page 5 of 10
Bonds, notes & other debt instruments (continued)
New York (continued)
City, county & other issuers (continued)
| Principal amount
(000)
| Value
(000)
|
| New York City G.O. Bonds, Fiscal 2017, Series 2017-A-1, 5.00% 2034
| $1,000
| $1,199
|
| New York City G.O. Bonds, Fiscal 2018, Series 2018-A, 5.00% 2027
| 1,500
| 1,904
|
| New York City G.O. Bonds, Fiscal 2018, Series 2018-C, 5.00% 2031
| 1,000
| 1,252
|
| New York City G.O. Bonds, Fiscal 2018, Series 2018-C, 5.00% 2032
| 1,720
| 2,144
|
| New York City G.O. Bonds, Fiscal 2018, Series 2018-E-1, 5.00% 2037
| 1,150
| 1,407
|
| New York City G.O. Bonds, Fiscal 2019, Series 2019-D-1, 5.00% 2037
| 750
| 929
|
| New York City Health and Hospitals Corp., Health System Rev. Ref. Bonds, Series 2010-A, 5.00% 2021
| 540
| 551
|
| New York City Health and Hospitals Corp., Health System Rev. Ref. Bonds, Series 2010-A, 5.00% 2025
| 500
| 510
|
New York City Housing Dev. Corp., Multi Family Housing Rev. Bonds (8 Spruce Street), Series 2014-E,
3.50% 2048
| 1,670
| 1,738
|
New York City Housing Dev. Corp., Multi Family Housing Rev. Bonds (8 Spruce Street), Series 2014-F,
4.50% 2048
| 500
| 530
|
| New York City Housing Dev. Corp., Multi Family Housing Rev. Bonds (Sustainable Neighborhood Bonds), Series 2018-L-2, 2.75% 2050 (put 2023)
| 500
| 519
|
| New York City Housing Dev. Corp., Multi Family Housing Rev. Bonds (Sustainable Neighborhood Bonds), Series 2019-E-2, 1.75% 2059 (put 2023)
| 1,000
| 1,007
|
New York City Housing Dev. Corp., Multi Family Housing Rev. Bonds (Sustainable Neighborhood Bonds),
Series 2015-H, 2.95% 2045 (put 2026)
| 750
| 792
|
New York City Housing Dev. Corp., Multi Family Housing Rev. Bonds (Sustainable Neighborhood Bonds),
Series 2017-A-1-A, 3.80% 2037
| 885
| 938
|
New York City Housing Dev. Corp., Multi Family Housing Rev. Bonds (Sustainable Neighborhood Bonds),
Series 2017-C-2, 1.70% 2021
| 400
| 401
|
New York City Housing Dev. Corp., Multi Family Housing Rev. Bonds (Sustainable Neighborhood Bonds),
Series 2017-G-2-A, 2.00% 2057 (put 2021)
| 750
| 756
|
New York City Industrial Dev. Agcy., Airport Facs. Rev. Ref. Bonds (Transportation Infrastructure
Properties, LLC Obligated Group), Series 2012-A, AMT, 5.00% 2022
| 15
| 16
|
New York City Industrial Dev. Agcy., Airport Facs. Rev. Ref. Bonds (Transportation Infrastructure
Properties, LLC Obligated Group), Series 2012-A, AMT, 5.00% 2028
| 250
| 270
|
New York City Municipal Water Fin. Auth., Water and Sewer System Rev. Bonds, Series 2011-EE,
5.375% 2043
| 590
| 623
|
New York City Municipal Water Fin. Auth., Water and Sewer System Rev. Bonds, Series 2011-EE,
5.375% 2043 (preref. 2020)
| 1,150
| 1,219
|
| New York City Municipal Water Fin. Auth., Water and Sewer System Second General Resolution Rev. Bonds, Fiscal 2015, Series 2015-EE, 5.00% 2045
| 500
| 571
|
| New York City Municipal Water Fin. Auth., Water and Sewer System Second General Resolution Rev. Bonds, Fiscal 2015, Series 2015-HH, 5.00% 2039
| 500
| 585
|
| New York City Municipal Water Fin. Auth., Water and Sewer System Second General Resolution Rev. Bonds, Fiscal 2017, Series 2017-DD, 5.00% 2047
| 1,055
| 1,249
|
| New York City Municipal Water Fin. Auth., Water and Sewer System Second General Resolution Rev. Bonds, Fiscal 2017, Series 2017-EE, 5.00% 2033
| 750
| 922
|
| New York City Municipal Water Fin. Auth., Water and Sewer System Second General Resolution Rev. Bonds, Fiscal 2018, Series 2018-BB-1, 5.00% 2046
| 1,250
| 1,484
|
| New York City Municipal Water Fin. Auth., Water and Sewer System Second General Resolution Rev. Bonds, Fiscal 2018, Series 2018-EE, 5.00% 2040
| 2,000
| 2,417
|
| New York City Municipal Water Fin. Auth., Water and Sewer System Second General Resolution Rev. Bonds, Fiscal 2019, Series 2019-DD-1, 5.25% 2049
| 1,500
| 1,846
|
| New York City Municipal Water Fin. Auth., Water and Sewer System Second General Resolution Rev. Bonds, Fiscal 2019, Series 2019-FF-2, 5.00% 2040
| 1,000
| 1,239
|
| New York City Municipal Water Fin. Auth., Water and Sewer System Second General Resolution Rev. Ref. Bonds, Fiscal 2017, Series 2017-EE, 5.00% 2036
| 750
| 910
|
| New York City Transitional Fin. Auth., Building Aid Rev. Bonds, Fiscal 2018, Series 2018-S-2, 5.00% 2036
| 590
| 715
|
| New York City Transitional Fin. Auth., Building Aid Rev. Bonds, Fiscal 2018, Series 2018-S-4A, 5.00% 2037
| 750
| 922
|
| New York City Transitional Fin. Auth., Building Aid Rev. Bonds, Fiscal 2019, Series 2019-S-1, 5.00% 2043
| 1,000
| 1,213
|
| New York City Transitional Fin. Auth., Building Aid Rev. Bonds, Fiscal 2019, Series 2019-S-3, 5.00% 2036
| 1,000
| 1,234
|
American Funds Tax-Exempt Fund of New York —
Page 6 of 10
Bonds, notes & other debt instruments (continued)
New York (continued)
City, county & other issuers (continued)
| Principal amount
(000)
| Value
(000)
|
| New York City Transitional Fin. Auth., Future Tax Secured Bonds, Fiscal 2011, Series 2011-C, 5.25% 2025
| $700
| $736
|
New York City Transitional Fin. Auth., Future Tax Secured Bonds, Fiscal 2011, Series 2011-C,
5.25% 2025 (preref. 2020)
| 300
| 316
|
| New York City Transitional Fin. Auth., Future Tax Secured Bonds, Fiscal 2017, Series 2017-C, 5.00% 2032
| 1,000
| 1,229
|
| New York City Transitional Fin. Auth., Future Tax Secured Bonds, Fiscal 2017, Series 2017-E-1, 5.00% 2043
| 1,000
| 1,184
|
| New York City Transitional Fin. Auth., Future Tax Secured Bonds, Fiscal 2017, Series 2017-F-1, 5.00% 2039
| 750
| 899
|
| New York City Transitional Fin. Auth., Future Tax Secured Bonds, Fiscal 2017, Series 2017-F-1, 5.00% 2042
| 1,000
| 1,191
|
| New York City Transitional Fin. Auth., Future Tax Secured Bonds, Fiscal 2018, Series 2018-A-3, 4.00% 2042
| 1,080
| 1,191
|
| New York City Transitional Fin. Auth., Future Tax Secured Bonds, Fiscal 2019, Series 2019-A-1, 5.00% 2036
| 2,380
| 2,945
|
| New York City Transitional Fin. Auth., Future Tax Secured Bonds, Fiscal 2019, Series 2019-C-1, 5.00% 2034
| 750
| 948
|
New York City Transitional Fin. Auth., Future Tax Secured Rev. Ref. Bonds, Fiscal 2016, Series 2016-C,
5.00% 2026
| 1,000
| 1,223
|
| Niagara Area Dev. Corp., Solid Waste Disposal Fac. Rev. Ref. Bonds (Covanta Project), Series 2018-A, AMT, 4.75% 20421
| 1,000
| 1,038
|
Niagara Area Dev. Corp., Solid Waste Disposal Fac. Rev. Ref. Bonds (Covanta Project), Series 2018-B,
3.50% 20241
| 650
| 673
|
Niagara Frontier Transportation Auth., Airport Rev. Ref. Bonds (Buffalo Niagara International Airport),
Series 2014-A, AMT, 5.00% 2027
| 600
| 686
|
Niagara Frontier Transportation Auth., Airport Rev. Ref. Bonds (Buffalo Niagara International Airport),
Series 2014-A, AMT, 5.00% 2028
| 500
| 570
|
Niagara Frontier Transportation Auth., Airport Rev. Ref. Bonds (Buffalo Niagara International Airport),
Series 2014-A, AMT, 5.00% 2029
| 700
| 795
|
Niagara Frontier Transportation Auth., Airport Rev. Ref. Bonds (Buffalo Niagara International Airport),
Series 2019-A, AMT, 5.00% 2031
| 1,000
| 1,230
|
County of Onondaga, Resource Recovery Agcy., Rev. Ref. Bonds, Series 2015-A, AMT,
Assured Guaranty Municipal insured, 5.00% 2025
| 500
| 587
|
County of Onondaga, Resource Recovery Agcy., Rev. Ref. Bonds, Series 2015-A, AMT,
Assured Guaranty Municipal insured, 5.00% 2030
| 1,750
| 2,016
|
| County of Rockland, G.O. Bonds, Series 2014-A, Assured Guaranty Municipal insured, 5.00% 2024
| 1,000
| 1,170
|
| Town of Southold, Local Dev. Corp., Rev. Bonds (Peconic Landing at Southold, Inc. Project), Series 2015, 5.00% 2045
| 1,500
| 1,579
|
| County of Suffolk, Econ. Dev. Corp., Rev. Bonds (Catholic Health Services of Long Island Obligated Group Project), Series 2011, 5.00% 2028
| 850
| 908
|
| County of Suffolk, Econ. Dev. Corp., Rev. Bonds (Catholic Health Services of Long Island Obligated Group Project), Series 2011, 5.00% 2028 (preref. 2021)
| 150
| 161
|
| County of Suffolk, Econ. Dev. Corp., Rev. Ref. Bonds (Peconic Landing at Southold, Inc. Project), Series 2010, 5.875% 2030
| 1,000
| 1,048
|
| County of Suffolk, Rev. Ref. Bonds, Series 2017-A, Assured Guaranty Municipal insured, 5.00% 2026
| 540
| 660
|
| Suffolk Tobacco Asset Securitization Corp., Tobacco Settlement Asset-Backed Rev. Ref. Bonds, Series 2012-B, 5.00% 2032
| 750
| 792
|
| County of Tompkins, Dev. Corp., Continuing Care Retirement Community Rev. Bonds (Kendal at Ithaca, Inc.), Series 2014-A, 5.00% 2044
| 915
| 993
|
| TSASC, Inc., Tobacco Settlement Bonds, Series 2017-A, 5.00% 2022
| 1,000
| 1,088
|
| TSASC, Inc., Tobacco Settlement Bonds, Series 2017-A, 5.00% 2025
| 750
| 870
|
| County of Westchester, Health Care Corp., Rev. Bonds, Series 2010-B, 6.00% 2030
| 130
| 137
|
| County of Westchester, Health Care Corp., Rev. Bonds, Series 2010-B, 6.00% 2030 (preref. 2020)
| 870
| 923
|
| County of Westchester, Health Care Corp., Rev. Bonds, Series 2011-A, 5.00% 2021
| 100
| 108
|
County of Westchester, Local Dev. Corp., Rev. Bonds (Purchase Housing Corp. II Project), Series 2017,
5.00% 2037
| 1,000
| 1,168
|
County of Westchester, Local Dev. Corp., Rev. Bonds (Purchase Housing Corp. II Project), Series 2017,
5.00% 2047
| 1,000
| 1,152
|
| County of Westchester, Local Dev. Corp., Rev. Bonds (Westchester Medical Center Obligated Group Project), Series 2016, 5.00% 2034
| 1,150
| 1,312
|
American Funds Tax-Exempt Fund of New York —
Page 7 of 10
Bonds, notes & other debt instruments (continued)
New York (continued)
City, county & other issuers (continued)
| Principal amount
(000)
| Value
(000)
|
| County of Westchester, Local Dev. Corp., Rev. Bonds (Westchester Medical Center Obligated Group Project), Series 2016, 5.00% 2046
| $1,000
| $1,117
|
| County of Westchester, Local Dev. Corp., Rev. Ref. Bonds (Pace University), Series 2014-A, 5.50% 2042
| 450
| 499
|
| City of Yonkers, G.O. Bonds, Series 2011-A, 5.00% 2019
| 1,000
| 1,007
|
| City of Yonkers, G.O. Bonds, Series 2015-B, Assured Guaranty Municipal insured, 5.00% 2024
| 490
| 578
|
|
|
| 123,404
|
|
|
| 250,812
|
| Guam 1.01%
|
|
|
| A.B. Won Pat International Airport Auth., General Rev. Bonds, Series 2013-C, AMT, 6.375% 2043
| 500
| 580
|
| Hotel Occupancy Tax Rev. Ref. Bonds, Series 2011-A, 6.125% 2031
| 500
| 534
|
| Limited Obligation Rev. Ref. Bonds (Section 30), Series 2016-A, 5.00% 2022
| 500
| 546
|
| Power Auth., Rev. Ref. Bonds, Series 2017-A, 5.00% 2040
| 500
| 565
|
| Waterworks Auth., Water and Wastewater System Rev. Bonds, Series 2013, 5.00% 2028
| 250
| 275
|
| Waterworks Auth., Water and Wastewater System Rev. Bonds, Series 2014-A, 5.00% 2029
| 250
| 279
|
|
|
| 2,779
|
| Puerto Rico 1.15%
|
|
|
| Electric Power Auth., Power Rev. Ref. Bonds, Series 2002-MM, National insured, 5.00% 2020
| 365
| 370
|
Highways and Transportation Auth., Highway Rev. Ref. Bonds, Series 2003-AA-1,
Assured Guaranty Municipal insured, 4.95% 2026
| 265
| 270
|
Highways and Transportation Auth., Transportation Rev. Ref. Bonds, Series 2002-D,
Assured Guaranty Municipal insured, 5.00% 2032
| 660
| 675
|
| Industrial, Tourist, Educational, Medical and Environmental Control Facs. Fncg. Auth., Higher Education Rev. and Rev. Ref. Bonds (Inter American University of
Puerto Rico Project), Series 2012, 5.00% 2021
| 200
| 208
|
| Industrial, Tourist, Educational, Medical and Environmental Control Facs. Fncg. Auth., Higher Education Rev. and Rev. Ref. Bonds (Inter American University of
Puerto Rico Project), Series 2012, 5.00% 2031
| 750
| 785
|
Industrial, Tourist, Educational, Medical and Environmental Control Facs. Fncg. Auth., Higher Education Rev.
and Rev. Ref. Bonds (University of the Sacred Heart Project), Series 2012, 5.00% 2020
| 250
| 248
|
Industrial, Tourist, Educational, Medical and Environmental Control Facs. Fncg. Auth.,
Hospital Rev. and Rev. Ref. Bonds (Hospital Auxilio Mutuo Obligated Group Project), Series 2011-A,
6.00% 2033
| 250
| 262
|
| University of Puerto Rico, University System Rev. Ref. Bonds, Series 2006-Q, 5.00% 2020
| 350
| 350
|
|
|
| 3,168
|
| Total bonds, notes & other debt instruments (cost: $243,770,000)
|
| 256,759
|
| Short-term securities 5.59%
|
|
|
Dormitory Auth., IAM Commercial Paper (Columbia University), Series 2019,
1.55% 9/5/2019
| 2,000
| 2,000
|
Metropolitan Transportation Auth., Transportation Rev. Bond Anticipation Notes, Series 2018-A-1,
4.00% 8/15/2019
| 1,500
| 1,501
|
| New York City G.O. Bonds, Fiscal 2006, Series 2005-E-2, 1.47% 20342
| 2,000
| 2,000
|
New York City G.O. Bonds, Fiscal 2008, Series 2008-C-4,
Assured Guaranty Municipal insured, 1.75% 20272
| 1,000
| 1,000
|
| New York City G.O. Bonds, Fiscal 2008, Series 2008-L-5, 1.47% 20352
| 3,500
| 3,500
|
| New York City G.O. Bonds, Fiscal 2013, Series 2013-F-3, 1.47% 20422
| 500
| 500
|
New York City Transitional Fin. Auth., Future Tax Secured Rev. Ref. Bonds, Fiscal 2015, Series 2015-E-4,
1.47% 2045
| 600
| 600
|
New York City Transitional Fin. Auth., Future Tax Secured Rev. Ref. Bonds, Fiscal 2016, Series 2016-E-4,
1.48% 20452
| 125
| 125
|
American Funds Tax-Exempt Fund of New York —
Page 8 of 10
| Short-term securities (continued)
| Principal amount
(000)
| Value
(000)
|
| City of Syracuse, Industrial Dev. Agcy., Civic Fac. Rev. Bonds (Syracuse University Project), Series 2008-A-1, 1.44% 20372
| $900
| $900
|
| City of Syracuse, Industrial Dev. Agcy., Civic Fac. Rev. Bonds (Syracuse University Project), Series 2008-A-2, JPMorgan Chase LOC, 1.44%
20372
| 3,250
| 3,250
|
| Total short-term securities (cost: $15,376,000)
|
| 15,376
|
| Total investment securities 98.97% (cost: $259,146,000)
|
| 272,135
|
| Other assets less liabilities 1.03%
|
| 2,819
|
| Net assets 100.00%
|
| $274,954
|
| Contracts
| Type
| Number of
contracts
| Expiration
| Notional
amount4
(000)
| Value at
7/31/20195
(000)
| Unrealized
depreciation
at 7/31/2019
(000)
|
| 5 Year U.S. Treasury Note Futures
| Long
| 14
| October 2019
| $1,400
| $1,646
| $(2)
|
| 10 Year U.S. Treasury Note Futures
| Long
| 8
| September 2019
| 800
| 1,019
| —6
|
|
|
|
|
|
|
| $(2)
|
| 1
| Acquired in a transaction exempt from registration under Rule 144A of the Securities Act of 1933. May be resold in the U.S. in transactions exempt from registration, normally to
qualified institutional buyers. The total value of all such securities was $10,653,000, which represented 3.87% of the net assets of the fund.
|
| 2
| Coupon rate may change periodically. For short-term securities, the date of the next scheduled coupon rate change is considered to be the maturity date.
|
| 3
| Step bond; coupon rate may change at a later date.
|
| 4
| Notional amount is calculated based on the number of contracts and notional contract size.
|
| 5
| Value is calculated based on the notional amount and current market price.
|
| 6
| Amount less than one thousand.
|
| Key to abbreviations and symbol
|
|
| Agcy. = Agency
| Fncg. = Financing
|
| AMT = Alternative Minimum Tax
| G.O. = General Obligation
|
| Auth. = Authority
| LIBOR = London Interbank Offered Rate
|
| Certs. of Part. = Certificates of Participation
| LOC = Letter of Credit
|
| Dept. = Department
| Preref. = Prerefunded
|
| Dev. = Development
| Redev. = Redevelopment
|
| Dist. = District
| Ref. = Refunding
|
| Econ. = Economic
| Rev. = Revenue
|
| Fac. = Facility
| SIFMA = Securities Industry and Financial Markets Association
|
| Facs. = Facilities
| USD/$ = U.S. dollars
|
| Fin. = Finance
|
|
American Funds Tax-Exempt Fund of New York —
Page 9 of 10
Additional financial disclosures
are included in the fund’s current shareholder report and should be read in conjunction with this report.
Investments are not FDIC-insured, nor
are they deposits of or guaranteed by a bank or any other entity, so they may lose value.
Investors should carefully consider
investment objectives, risks, charges and expenses. This and other important information is contained in the fund prospectus and summary prospectus, which can be obtained from your financial professional and should be
read carefully before investing. You may also call American Funds Service Company (AFS) at (800) 421-4225 or visit the American Funds website at capitalgroup.com.
All Capital Group trademarks
mentioned are owned by The Capital Group Companies, Inc., an affiliated company or fund. All other company and product names mentioned are the property of their respective companies.
American Funds Distributors, Inc.,
member FINRA.
© 2019 Capital Group. All
rights reserved.
| MFGEFPX-041-0919O-S73202
| American Funds Tax-Exempt Fund of New York — Page 10 of 10
|
Report of Independent Registered Public Accounting
Firm
To the Board of Trustees and Shareholders of American Funds Short-Term
Tax-Exempt Bond Fund, Limited Term Tax-Exempt Bond Fund of America, The Tax-Exempt Bond Fund of America, American High-Income Municipal
Bond Fund and American Funds Tax-Exempt Fund of New York and to the Board of Trustees of The American Funds Tax-Exempt Series II
and Shareholders of The Tax-Exempt Fund of California
Opinions on the Financial Statements
We have audited the accompanying statements of assets and liabilities,
including the summary investment portfolios, of American Funds Short-Term Tax-Exempt Bond Fund, Limited
Term Tax-Exempt Bond Fund of America, The Tax-Exempt Bond Fund of America, American High-Income Municipal Bond Fund, The Tax-Exempt
Fund of California and American Funds Tax-Exempt Fund of New York (the "Funds")
as of July 31, 2019, the related statements of operations for the year ended July 31, 2019, the statements of changes in net assets
for each of the two years in the period ended July 31, 2019, including the related notes, and the financial highlights for each
of the periods indicated therein (included in Item 1 of this Form N-CSR) and the investment portfolios (included in Item 6 of this
Form N-CSR) as of July 31, 2019 (collectively referred to as the “financial statements”). In our opinion, the financial
statements present fairly, in all material respects, the financial position of each of the Funds as of July 31, 2019, the results
of each of their operations for the year then ended, the changes in each of their net assets for each of the two years in the period
ended July 31, 2019 and each of the financial highlights for each of the periods indicated therein in conformity with accounting
principles generally accepted in the United States of America.
Basis for Opinions
These financial statements are the responsibility of the Funds’
management. Our responsibility is to express an opinion on the Funds’ financial statements based on our audits. We are a
public accounting firm registered with the Public Company Accounting Oversight Board (United States) (“PCAOB”) and
are required to be independent with respect to the Funds in accordance with the U.S. federal securities laws and the applicable
rules and regulations of the Securities and Exchange Commission and the PCAOB.
We conducted our audits of these financial statements in accordance
with the standards of the PCAOB. Those standards require that we plan and perform the audit to obtain reasonable assurance about
whether the financial statements are free of material misstatement, whether due to error or fraud.
Our audits included performing procedures to assess the risks of
material misstatement of the financial statements, whether due to error or fraud, and performing procedures that respond to those
risks. Such procedures included examining, on a test basis, evidence regarding the amounts and disclosures in the financial statements.
Our audits also included evaluating the accounting principles used and significant estimates made by management, as well as evaluating
the overall presentation of the financial statements. Our procedures included confirmation of securities owned as of July 31, 2019
by correspondence with the custodians and brokers; when replies were not received from brokers, we performed other auditing procedures.
We believe that our audits provide a reasonable basis for our opinions.
/s/ PricewaterhouseCoopers LLP
Los Angeles, California
September 16, 2019
We have served as the auditor of one or more investment companies
in The Capital Group Companies Investment Company Complex since 1934.
American Funds Short-Term Tax-Exempt Bond Fund
Summary investment portfolio July 31, 2019
| Bonds, notes & other debt instruments
92.28% | Principal amount
(000) | | |
Value
(000) | |
| Alabama 1.11% | |
| | |
| |
| Black Belt Energy Gas Dist., Gas Supply Rev.
Bonds, Series 2017-A, 4.00% 2047 (put 2022) | |
$ | 5,500 | | |
$ | 5,874 | |
| Other securities | |
| | | |
| 6,802 | |
| | |
| | | |
| 12,676 | |
| | |
| | | |
| | |
| Colorado 1.81% | |
| | | |
| | |
| Housing and Fin. Auth., Single Family Mortgage Bonds,
Series 2017-C, Class I, 4.00% 2048 | |
| 1,710 | | |
| 1,834 | |
| Housing and Fin. Auth., Single Family Mortgage Bonds,
Series 2018-B-1, Class I, 4.00% 2048 | |
| 1,415 | | |
| 1,527 | |
| Housing and Fin. Auth., Single Family Mortgage Bonds,
Series 2018-C, Class I, 4.25% 2048 | |
| 950 | | |
| 1,039 | |
| Housing and Fin. Auth., Single Family Mortgage Bonds,
Series 2019-C, Class I, 4.25% 2049 | |
| 6,470 | | |
| 7,108 | |
| Other securities | |
| | | |
| 9,181 | |
| | |
| | | |
| 20,689 | |
| | |
| | | |
| | |
| District of Columbia 1.00% | |
| | | |
| | |
| G.O. Bonds, Series 2015-A, 5.00% 2024 | |
| 5,255 | | |
| 6,207 | |
| Other securities | |
| | | |
| 5,214 | |
| | |
| | | |
| 11,421 | |
| | |
| | | |
| | |
| Florida 4.09% | |
| | | |
| | |
| Board of Education, Public Education Capital Outlay Rev.
Ref. Bonds, Series 2015-A, 5.00% 2024 | |
| 5,525 | | |
| 6,529 | |
| Housing Fin. Corp., Homeowner Mortgage Rev. Bonds, Series
2018-2, 4.25% 2050 | |
| 5,265 | | |
| 5,825 | |
| JEA, Electric System Rev. Bonds, Series 2012-B, 5.00%
2026 (preref. 2021) | |
| 4,650 | | |
| 5,035 | |
| Other securities | |
| | | |
| 29,204 | |
| | |
| | | |
| 46,593 | |
| | |
| | | |
| | |
| Georgia 1.56% | |
| | | |
| | |
| City of East Point, Housing Auth., Multi Family Housing
Rev. Bonds (Hillcrest Senior Apartments Projects), Series 2018, 2.25% 2022 (put 2021)1 | |
| 6,470 | | |
| 6,567 | |
| Other securities | |
| | | |
| 11,181 | |
| | |
| | | |
| 17,748 | |
| | |
| | | |
| | |
| Illinois 7.18% | |
| | | |
| | |
| Build Illinois Bonds, Sales Tax Rev. Bonds, Series 2013,
5.00% 2020 | |
| 6,300 | | |
| 6,475 | |
| Fin. Auth., National Rural Utilities Cooperative Fin.
Corp., Guaranteed Solid Waste Disposal Rev. Bonds (Prairie Power, Inc. Project), Series 2008-A, 1.75% 2042 (put 2020) | |
| 3,325 | | |
| 3,327 | |
| Fin. Auth., Rev. Bonds (Advocate Health Care Network),
Series 2014, 5.00% 2019 | |
| 550 | | |
| 550 | |
| Fin. Auth., Rev. Bonds (Clean Water Initiative Revolving
Fund), Series 2017, 5.00% 2023 | |
| 1,000 | | |
| 1,127 | |
| Fin. Auth., Rev. Bonds (Rush University Medical Center
Obligated Group), Series 2015-A, 5.00% 2019 | |
| 1,000 | | |
| 1,011 | |
| Fin. Auth., Rev. Bonds (Silver Cross Hospital and Medical
Centers), Series 2009, 7.00% 2044 (preref. 2019) | |
| 3,280 | | |
| 3,287 | |
| Fin. Auth., Rev. Green Bonds (Clean Water Initiative
Revolving Fund), Series 2019, 5.00% 2021 | |
| 1,180 | | |
| 1,265 | |
| Fin. Auth., Rev. Green Bonds (Clean Water Initiative
Revolving Fund), Series 2019, 5.00% 2025 | |
| 3,000 | | |
| 3,573 | |
| Fin. Auth., Rev. Ref. Bonds (Advocate Health Care Network),
Series 2008-A-1, 5.00% 2030 (put 2020) | |
| 4,000 | | |
| 4,067 | |
| Fin. Auth., Rev. Ref. Bonds (OSF Healthcare System),
Series 2015-A, 5.00% 2020 | |
| 2,410 | | |
| 2,524 | |
| Housing Dev. Auth., Multi Family Housing Rev. Notes (Marshall
Field Garden Apartment Homes), Series 2015, (SIFMA Municipal Swap Index + 1.00%) 2.40% 2050 (put 2025)2 | |
| 5,525 | | |
| 5,525 | |
| Other securities | |
| | | |
| 49,098 | |
| | |
| | | |
| 81,829 | |
| | |
| | | |
| | |
| Indiana 1.31% | |
| | | |
| | |
| Hobart Building Corp., First Mortgage Bonds, Series 2006,
National insured, 6.50% 2029 (preref. 2020) | |
| 6,000 | | |
| 6,146 | |
| Other securities | |
| | | |
| 8,856 | |
| | |
| | | |
| 15,002 | |
| American Funds Tax-Exempt Funds |
17 |
American Funds Short-Term Tax-Exempt Bond Fund
| Bonds, notes & other debt instruments
(continued) | Principal amount
(000) | | |
Value
(000) | |
| Iowa 0.56% | |
| | | |
| | |
| Fin. Auth., State Revolving Fund Rev. Bonds, Series 2011, 5.00% 2026 (preref. 2021) | |
$ | 4,945 | | |
$ | 5,328 | |
| Other securities | |
| | | |
| 1,106 | |
| | |
| | | |
| 6,434 | |
| | |
| | | |
| | |
| Kentucky 0.67% | |
| | | |
| | |
| Housing Corp., Housing Rev. Bonds (Jefferson Green Apartments Project), Series 2018, 2.20% 2022
(put 2021) | |
| 4,825 | | |
| 4,883 | |
| Other securities | |
| | | |
| 2,758 | |
| | |
| | | |
| 7,641 | |
| | |
| | | |
| | |
| Louisiana 0.77% | |
| | | |
| | |
| Tobacco Settlement Fncg. Corp., Tobacco Settlement Asset-Backed Rev. Ref. Bonds, Series 2013-A,
5.00% 2021 | |
| 4,705 | | |
| 4,987 | |
| Other securities | |
| | | |
| 3,751 | |
| | |
| | | |
| 8,738 | |
| | |
| | | |
| | |
| Michigan 2.64% | |
| | | |
| | |
| Housing Dev. Auth., Single Family Mortgage Rev. Bonds, Series 2014-A, 4.00% 2044 | |
| 595 | | |
| 625 | |
| Housing Dev. Auth., Single Family Mortgage Rev. Bonds, Series 2016-B, 3.50% 2047 | |
| 1,040 | | |
| 1,097 | |
| Housing Dev. Auth., Single Family Mortgage Rev. Bonds, Series 2017-B, 3.50% 2048 | |
| 3,295 | | |
| 3,492 | |
| Housing Dev. Auth., Single Family Mortgage Rev. Bonds, Series 2018-A, 4.00% 2048 | |
| 2,580 | | |
| 2,791 | |
| Housing Dev. Auth., Single Family Mortgage Rev. Bonds, Series 2018-C, 4.25% 2049 | |
| 5,425 | | |
| 5,949 | |
| Housing Dev. Auth., Single Family Mortgage Rev. Bonds, Series 2019-A, 4.25% 2049 | |
| 2,000 | | |
| 2,202 | |
| Other securities | |
| | | |
| 13,899 | |
| | |
| | | |
| 30,055 | |
| | |
| | | |
| | |
| Minnesota 2.49% | |
| | | |
| | |
| Housing Fin. Agcy., Homeownership Fin. Bonds (Mortgage-Backed Securities Program), Series 2011-G,
4.25% 2035 | |
| 155 | | |
| 158 | |
| Housing Fin. Agcy., Residential Housing Fin. Bonds, Series 2012-D, 4.00% 2040 | |
| 260 | | |
| 266 | |
| Housing Fin. Agcy., Residential Housing Fin. Bonds, Series 2013-A, AMT, 3.00% 2031 | |
| 360 | | |
| 367 | |
| Housing Fin. Agcy., Residential Housing Fin. Bonds, Series 2014-A, 4.00% 2038 | |
| 690 | | |
| 726 | |
| Housing Fin. Agcy., Residential Housing Fin. Bonds, Series 2014-C, AMT, 4.00% 2045 | |
| 5,190 | | |
| 5,501 | |
| Housing Fin. Agcy., Residential Housing Fin. Bonds, Series 2015-A, AMT, 4.00% 2041 | |
| 515 | | |
| 541 | |
| Housing Fin. Agcy., Residential Housing Fin. Bonds, Series 2015-E, AMT, 3.50% 2046 | |
| 570 | | |
| 596 | |
| Housing Fin. Agcy., Residential Housing Fin. Bonds, Series 2016-E, 4.00% 2047 | |
| 165 | | |
| 175 | |
| Housing Fin. Agcy., Residential Housing Fin. Bonds, Series 2017-E, 4.00% 2048 | |
| 885 | | |
| 954 | |
| Housing Fin. Agcy., Residential Housing Fin. Bonds, Series 2018-E, 4.25% 2049 | |
| 4,660 | | |
| 5,124 | |
| City of Rochester, Health Care Facs. Rev. Bonds (Mayo Clinic), Series 2011-C, 4.50% 2038 (put
2021) | |
| 4,000 | | |
| 4,298 | |
| Other securities | |
| | | |
| 9,699 | |
| | |
| | | |
| 28,405 | |
| | |
| | | |
| | |
| Montana 0.73% | |
| | | |
| | |
| Fin. Auth., Rev. Bonds (Billings Clinic Obligated Group), Series 2018-C, (SIFMA Municipal Swap
Index + 0.55%) 1.95% 2037 (put 2023)2 | |
| 5,125 | | |
| 5,120 | |
| Other securities | |
| | | |
| 3,228 | |
| | |
| | | |
| 8,348 | |
| | |
| | | |
| | |
| Nebraska 1.40% | |
| | | |
| | |
| Central Plains Energy Project, Gas Supply
Rev. Ref. Bonds, Series 2014, 5.00% 2039 (put 2019) | |
| 6,700 | | |
| 6,780 | |
| Other securities | |
| | | |
| 9,137 | |
| | |
| | | |
| 15,917 | |
| | |
| | | |
| | |
| Nevada 0.97% | |
| | | |
| | |
| Las Vegas Valley Water Dist., Limited Tax G.O. Rev. Ref. Bonds, Series 2012-A, 5.00% 2029 | |
| 4,070 | | |
| 4,486 | |
| Other securities | |
| | | |
| 6,606 | |
| | |
| | | |
| 11,092 | |
| 18 |
American Funds Tax-Exempt Funds |
American Funds Short-Term Tax-Exempt Bond Fund
| | Principal amount
(000) | | |
Value
(000) | |
| New Jersey 2.29% | |
| | | |
| | |
| Housing and Mortgage Fin. Agcy., Single Family Housing Rev. Bonds, Series 2018-A,
4.50% 2048 | |
$ | 5,840 | | |
$ | 6,459 | |
| Other securities | |
| | | |
| 19,623 | |
| | |
| | | |
| 26,082 | |
| | |
| | | |
| | |
| New York 6.95% | |
| | | |
| | |
| Metropolitan Transportation Auth., Dedicated Tax Fund Rev. Ref. Bonds, Series 2008-A-2B, (SIFMA
Municipal Swap Index + 0.58%) 1.98% 2031 (put 2019)2 | |
| 2,500 | | |
| 2,501 | |
| Metropolitan Transportation Auth., Transportation Rev. Bonds, Series 2014-A-1, 4.00% 2019 | |
| 750 | | |
| 756 | |
| Metropolitan Transportation Auth., Transportation Rev. Bonds, Series 2014-C, 5.00% 2020 | |
| 2,000 | | |
| 2,099 | |
| Metropolitan Transportation Auth., Transportation Rev. Bonds, Series 2014-D-2, (SIFMA Municipal
Swap Index + 0.45%) 1.85% 2044 (put 2022)2 | |
| 4,000 | | |
| 3,993 | |
| Metropolitan Transportation Auth., Transportation Rev. Bonds, Series 2015-A-2, (SIFMA Municipal
Swap Index + 0.58%) 1.98% 2039 (put 2020)2 | |
| 6,250 | | |
| 6,255 | |
| Metropolitan Transportation Auth., Transportation Rev. Ref. Bonds, Series 2002-D-2A, Assured
Guaranty Municipal insured, (1-month USD-LIBOR x 0.69 + 0.68%) 2.337% 2032 (put 2021)2 | |
| 4,000 | | |
| 4,023 | |
| New York City Housing Dev. Corp., Multi Family Housing Rev. Bonds (Sustainable Neighborhood Bonds),
Series 2018-L-2, 2.75% 2050 (put 2023) | |
| 3,625 | | |
| 3,765 | |
| New York City Housing Dev. Corp., Multi Family Housing Rev. Bonds (Sustainable Neighborhood Bonds),
Series 2017-C-2, 1.70% 2021 | |
| 5,250 | | |
| 5,258 | |
| New York City Housing Dev. Corp., Multi Family Housing Rev. Bonds (Sustainable Neighborhood Bonds),
Series 2017-G-2-A, 2.00% 2057 (put 2021) | |
| 3,000 | | |
| 3,022 | |
| New York City Housing Dev. Corp., Multi Family Housing Rev. Bonds (Sustainable Neighborhood Bonds),
Series 2018-C-2-A, 2.35% 2022 | |
| 2,500 | | |
| 2,543 | |
| Other securities | |
| | | |
| 45,029 | |
| | |
| | | |
| 79,244 | |
| | |
| | | |
| | |
| North Carolina 3.94% | |
| | | |
| | |
| G.O. Public Improvement Bonds, Series 2010-A, 5.00% 2020 | |
| 1,500 | | |
| 1,545 | |
| G.O. Rev. Ref. Bonds, Series 2013-D, 4.00% 2020 | |
| 8,835 | | |
| 9,052 | |
| G.O. Rev. Ref. Bonds, Series 2013-E, 5.00% 2020 | |
| 3,525 | | |
| 3,629 | |
| Grant Anticipation Rev. Vehicle Bonds, Series 2019, 5.00% 2021 | |
| 8,135 | | |
| 8,628 | |
| Housing Fin. Agcy., Home Ownership Rev. Ref. Bonds, Series 38-B, 4.00% 2047 | |
| 5,280 | | |
| 5,663 | |
| University of North Carolina at Chapel Hill, General Rev. Bonds, Series 2012-B, (1-month USD-LIBOR
x 0.67 + 0.40%) 2.01% 2041 (put 2022)2 | |
| 5,030 | | |
| 5,039 | |
| Other securities | |
| | | |
| 11,366 | |
| | |
| | | |
| 44,922 | |
| | |
| | | |
| | |
| Ohio 3.21% | |
| | | |
| | |
| G.O. Bonds, Common Schools Bonds, Series 2017-A, 5.00% 2024 | |
| 2,000 | | |
| 2,348 | |
| G.O. Highway Capital Improvements Bonds (Full Faith and Credit/Highway User Receipts), Series
2018-V, 5.00% 2024 | |
| 3,575 | | |
| 4,218 | |
| G.O. Rev. Ref. Bonds, Common Schools Bonds, Series 2012-C, 5.00% 2021 | |
| 3,350 | | |
| 3,624 | |
| G.O. Rev. Ref. Bonds, Higher Education Bonds, Series 2016-A, 5.00% 2024 | |
| 1,195 | | |
| 1,419 | |
| Major New State Infrastructure Project Rev. Bonds, Series 2016-1, 5.00% 2023 | |
| 1,000 | | |
| 1,164 | |
| Public Facs. Commission, Higher Education G.O. Rev. Ref. Bonds, Series 2010-A, 5.00% 2021 | |
| 1,710 | | |
| 1,842 | |
| Other securities | |
| | | |
| 21,979 | |
| | |
| | | |
| 36,594 | |
| | |
| | | |
| | |
| Oregon 1.94% | |
| | | |
| | |
| Housing and Community Services Dept., Housing Dev. Rev. Bonds (The Henry Apartments Project),
Series 2018-J, 2.20% 2021 (put 2020) | |
| 7,075 | | |
| 7,142 | |
| Housing and Community Services Dept., Mortgage Rev. Bonds (Single Family Mortgage Program), Series
2017-A, 4.00% 2047 | |
| 2,095 | | |
| 2,252 | |
| Housing and Community Services Dept., Mortgage Rev. Bonds (Single Family Mortgage Program), Series
2018-D, 4.75% 2050 | |
| 4,295 | | |
| 4,813 | |
| Other securities | |
| | | |
| 7,872 | |
| | |
| | | |
| 22,079 | |
| American Funds Tax-Exempt Funds |
19 |
American Funds Short-Term Tax-Exempt Bond Fund
| Bonds, notes & other debt instruments (continued) | Principal amount
(000) | | |
Value
(000) | |
| Pennsylvania 3.96% | |
| | | |
| | |
| Housing Fin. Agcy., Single Family Mortgage Rev. Bonds, Series 2015-117-A, AMT, 3.50%
2040 | |
$ | 1,025 | | |
$ | 1,066 | |
| Housing Fin. Agcy., Single Family Mortgage Rev. Bonds, Series 2015-118-A, AMT, 3.50% 2040 | |
| 4,215 | | |
| 4,346 | |
| Housing Fin. Agcy., Single Family Mortgage Rev. Bonds, Series 2016-119, 3.50% 2041 | |
| 560 | | |
| 582 | |
| Housing Fin. Agcy., Single Family Mortgage Rev. Bonds, Series 2016-120, 3.50% 2046 | |
| 650 | | |
| 679 | |
| Housing Fin. Agcy., Single Family Mortgage Rev. Bonds, Series 2017-122, 4.00% 2046 | |
| 3,680 | | |
| 3,920 | |
| Housing Fin. Agcy., Single Family Mortgage Rev. Bonds, Series 2017-123-A, AMT, 4.00% 2039 | |
| 1,335 | | |
| 1,406 | |
| Housing Fin. Agcy., Single Family Mortgage Rev. Bonds, Series 2019-128-A, AMT, 4.75% 2033 | |
| 3,465 | | |
| 3,783 | |
| Housing Fin. Agcy., Special Limited Obligation Multi Family Housing Dev. Bonds (Central Pennsylvania
Dev.), Series 2018, 2.45% 2022 (put 2021) | |
| 5,000 | | |
| 5,075 | |
| Other securities | |
| | | |
| 24,261 | |
| | |
| | | |
| 45,118 | |
| | |
| | | |
| | |
| South Carolina 1.71% | |
| | | |
| | |
| City of Charleston, Waterworks and Sewer System Capital Improvement Bonds, Series 2006-B, 1.953%
2035 (put 2022)2 | |
| 5,000 | | |
| 5,007 | |
| Other securities | |
| | | |
| 14,486 | |
| | |
| | | |
| 19,493 | |
| | |
| | | |
| | |
| Tennessee 1.66% | |
| | | |
| | |
| Housing Dev. Agcy., Homeownership Program Bonds, Series 2012-2-C, 4.00% 2038 | |
| 255 | | |
| 263 | |
| Housing Dev. Agcy., Homeownership Program Rev. Ref. Bonds, Series 2011-1-A, AMT, 4.50% 2031 | |
| 810 | | |
| 842 | |
| Housing Dev. Agcy., Residential Fin. Program Bonds, Series 2013-1-C, 3.00% 2038 | |
| 665 | | |
| 680 | |
| Housing Dev. Agcy., Residential Fin. Program Bonds, Series 2013-2-A, AMT, 4.00% 2043 | |
| 670 | | |
| 699 | |
| Housing Dev. Agcy., Residential Fin. Program Bonds, Series 2014-1-A, AMT, 4.00% 2039 | |
| 945 | | |
| 988 | |
| Housing Dev. Agcy., Residential Fin. Program Bonds, Series 2014-2-A, AMT, 4.00% 2045 | |
| 820 | | |
| 864 | |
| Housing Dev. Agcy., Residential Fin. Program Bonds, Series 2014-2-C, 4.00% 2045 | |
| 630 | | |
| 665 | |
| Housing Dev. Agcy., Residential Fin. Program Bonds, Series 2015-2-A, 4.00% 2046 | |
| 305 | | |
| 324 | |
| Housing Dev. Agcy., Residential Fin. Program Bonds, Series 2016-1-B, 3.50% 2047 | |
| 660 | | |
| 695 | |
| Housing Dev. Agcy., Residential Fin. Program Bonds, Series 2016-2B, 3.50% 2047 | |
| 2,245 | | |
| 2,370 | |
| Housing Dev. Agcy., Residential Fin. Program Bonds, Series 2017-1, 4.00% 2042 | |
| 1,230 | | |
| 1,319 | |
| Housing Dev. Agcy., Residential Fin. Program Bonds, Series 2017-B-2, 4.00% 2042 | |
| 2,245 | | |
| 2,411 | |
| Other securities | |
| | | |
| 6,786 | |
| | |
| | | |
| 18,906 | |
| | |
| | | |
| | |
| Texas 14.66% | |
| | | |
| | |
| Clear Creek Independent School Dist., Unlimited Tax School Building Bonds, Series 2013-B, 3.00%
2032 (put 2019) | |
| 6,000 | | |
| 6,003 | |
| City of Dallas, Waterworks and Sewer System Rev. Ref. Bonds, Series 2015-A, 5.00% 2029 | |
| 3,910 | | |
| 4,711 | |
| G.O. Bonds, College Student Loan Bonds, Series 2013-B, AMT, 5.25% 2022 | |
| 3,155 | | |
| 3,523 | |
| G.O. Bonds, Water Financial Assistance Rev. Ref. Bonds (Water Infrastructure Fund), Series 2019-E-1,
5.00% 2021 | |
| 1,000 | | |
| 1,078 | |
| G.O. Bonds, Water Financial Assistance Rev. Ref. Bonds, Series 2019-C-1, 5.00% 2021 | |
| 1,000 | | |
| 1,078 | |
| G.O. Bonds, Water Financial Assistance Rev. Ref. Bonds, Series 2019-C-1, 5.00% 2022 | |
| 3,000 | | |
| 3,347 | |
| County of Harris, Toll Road Rev. Ref. Bonds, Series 2012-B, (SIFMA Municipal Swap Index + 0.45%)
1.85% 20212 | |
| 4,680 | | |
| 4,681 | |
| City of Houston, Airport System Rev. Ref. Bonds, Series 2018-D, 5.00% 2021 | |
| 2,575 | | |
| 2,763 | |
| City of Houston, Combined Utility System Rev. Ref. Bonds, Series 2014-C, 5.00% 2020 | |
| 1,000 | | |
| 1,031 | |
| City of Houston, Combined Utility System Rev. Ref. Bonds, Series 2018-C, (1-month USD-LIBOR x
0.70 + 0.36%) 1.946% 2034 (put 2021)2 | |
| 5,650 | | |
| 5,654 | |
| City of Houston, Higher Education Fin. Corp., Higher Education Rev. Bonds (Rice University Project),
Series 2010-A, 5.00% 2040 (preref. 2020) | |
| 5,410 | | |
| 5,573 | |
| City of Houston, Public Improvement Rev. Ref. Bonds, Series 2017-A, 5.00% 2020 | |
| 2,850 | | |
| 2,915 | |
| Houston Independent School Dist., Limited Tax Schoolhouse Bonds, Series 2017, 3.00% 2021 | |
| 4,100 | | |
| 4,218 | |
| North Texas Tollway Auth., Special Projects System Rev. Bonds, Series 2011-D, 5.00% 2029 (preref.
2021) | |
| 5,000 | | |
| 5,392 | |
| Public Fin. Auth., G.O. Rev. Ref. Bonds, Series 2011, 5.00% 2020 | |
| 1,145 | | |
| 1,197 | |
| City of San Antonio, Electric and Gas Systems Rev. Ref. Bonds, Series 2015-A, 2.25% 2033 (put
2019) | |
| 9,000 | | |
| 9,027 | |
| 20 |
American Funds Tax-Exempt Funds |
American Funds Short-Term Tax-Exempt Bond Fund
| | Principal amount
(000) | | |
Value
(000) | |
| City of San Antonio, Electric and Gas Systems
Rev. Ref. Bonds, Series 2015-B, 2.00% 2033 (put 2021) | |
$ | 3,040 | | |
$ | 3,071 | |
| Transportation Commission, Highway Improvement G.O. Bonds,
Series 2012-A, 5.00% 2020 | |
| 2,670 | | |
| 2,740 | |
| Other securities | |
| | | |
| 99,202 | |
| | |
| | | |
| 167,204 | |
| | |
| | | |
| | |
| Washington 2.99% | |
| | | |
| | |
| Central Puget Sound Regional Transit Auth., Sales Tax
Improvement Green Bonds, Series 2015-S-2B, (SIFMA Municipal Swap Index + 0.45%) 1.85% 2045 (put 2023)2 | |
| 6,150 | | |
| 6,154 | |
| G.O. Rev. Ref. Bonds, Series 2018-R-C, 5.00% 2021 | |
| 5,000 | | |
| 5,389 | |
| Other securities | |
| | | |
| 22,555 | |
| | |
| | | |
| 34,098 | |
| | |
| | | |
| | |
| Wisconsin 3.23% | |
| | | |
| | |
| G.O. Bonds, Series 2013-A, 5.00% 2025 (preref. 2022) | |
| 5,000 | | |
| 5,530 | |
| G.O. Bonds, Series 2015-A, 5.00% 2031 (preref. 2023) | |
| 5,000 | | |
| 5,718 | |
| Health and Educational Facs. Auth., Health Facs. Rev.
Bonds (SSM Health Care), Series 2018-B, 5.00% 2038 (put 2023) | |
| 2,700 | | |
| 2,987 | |
| Health and Educational Facs. Auth., Rev. Bonds (Advocate
Aurora Health Care Credit Group), Series 2018-C-3, (SIFMA Municipal Swap Index + 0.55%) 1.95% 2054 (put 2023)2 | |
| 2,330 | | |
| 2,332 | |
| Health and Educational Facs. Auth., Rev. Bonds (Agnesian
HealthCare, Inc.), Series 2013-B, 5.00% 2024 (preref. 2023) | |
| 1,015 | | |
| 1,161 | |
| Health and Educational Facs. Auth., Rev. Bonds (Ascension
Health Senior Credit Group), Series 2013-B-1, 1.375% 2038 (put 2019) | |
| 2,070 | | |
| 2,071 | |
| Health and Educational Facs. Auth., Rev. Bonds (Children’s
Hospital of Wisconsin, Inc.), Series 2008-B, 5.375% 2037 (preref. 2020) | |
| 1,000 | | |
| 1,023 | |
| Health and Educational Facs. Auth., Rev. Bonds (St. John’s
Communities, Inc.), Series 2009-A, 7.625% 2039 (preref. 2019) | |
| 2,000 | | |
| 2,015 | |
| Housing and Econ. Dev. Auth., Home Ownership Rev. Bonds,
Series 2016-A, AMT, 3.50% 2046 | |
| 4,425 | | |
| 4,612 | |
| Other securities | |
| | | |
| 9,350 | |
| | |
| | | |
| 36,799 | |
| | |
| | | |
| | |
| Other states & U.S. territories
17.45% | |
| | | |
| | |
| Other securities | |
| | | |
| 199,158 | |
| | |
| | | |
| | |
| Total bonds, notes & other debt instruments
(cost: $1,038,970,000) | |
| | | |
| 1,052,285 | |
| | |
| | | |
| | |
| Short-term securities
7.38% | |
| | | |
| | |
| State of Louisiana, Public Facs. Auth., Rev. Bonds (Air
Products and Chemicals Project), Series 2008-A, 1.50% 20432 | |
| 17,000 | | |
| 17,000 | |
| State of Maryland, County of Montgomery, IAM Commercial
Paper, Series 2019-A, 1.38% 8/6/2019 | |
| 4,000 | | |
| 4,000 | |
| State of Maryland, County of Montgomery, Rev. Bonds (Trinity
Health Credit Group), Series 2013, 1.43% 2041 (put 2019)3 | |
| 3,000 | | |
| 3,001 | |
| State of Mississippi, Business Fin. Corp., Gulf Opportunity
Zone Industrial Dev. Rev. Bonds (Chevron U.S.A. Inc. Project), Series 2007-A, 1.48% 20302 | |
| 13,000 | | |
| 13,000 | |
| State of New York, Metropolitan Transportation Auth.,
Transportation Rev. Bonds Anticipation Notes, Series 2019-A, 4.00% 2/3/2020 | |
| 1,500 | | |
| 1,521 | |
| State of New York, Metropolitan Transportation Auth.,
Transportation Rev. Bonds, Series 2015-E-3, (SIFMA Municipal Swap Index + 1.70%) 1.47% 20502 | |
| 500 | | |
| 500 | |
| State of Ohio, Hospital Rev. Bonds (University Hospitals
Health System Inc.), Series 2013, 1.62% 20332 | |
| 2,945 | | |
| 2,945 | |
| State of Texas, City of Houston, Tax and Rev. Anticipation
Notes, Series 2019, 5.00% 6/26/2020 | |
| 2,000 | | |
| 2,069 | |
| State of Texas, Tax and Rev. Anticipation Notes, Series
2018, 4.00% 8/29/2019 | |
| 7,825 | | |
| 7,840 | |
| American Funds Tax-Exempt Funds |
21 |
American Funds Short-Term Tax-Exempt Bond Fund
| Short-term securities (continued) | Principal amount
(000) | | |
Value
(000) | |
| State of Texas, Board of Regents of the University of Texas System, IAM Commercial Paper, Series 2019, 1.35% 8/5/2019 | |
$ | 3,000 | | |
$ | 3,000 | |
| State of Texas, Board of Regents of the University of Texas System, IAM Commercial Paper, Series 2019, 1.40% 8/8/2019 | |
| 4,500 | | |
| 4,500 | |
| Other securities | |
| | | |
| 24,797 | |
| | |
| | | |
| | |
| Total short-term securities (cost: $84,160,000) | |
| | | |
| 84,173 | |
| Total investment securities 99.66% (cost: $1,123,130,000) | |
| | | |
| 1,136,458 | |
| Other assets less liabilities 0.34% | |
| | | |
| 3,920 | |
| | |
| | | |
| | |
| Net assets 100.00% | |
| | | |
$ | 1,140,378 | |
This summary investment portfolio is designed to streamline the report
and help investors better focus on the fund’s principal holdings. See the inside back cover for details on how to obtain
a complete schedule of portfolio holdings.
“Other securities” includes all issues that are not disclosed
separately in the summary investment portfolio. “Other securities” also includes a security (with a value of $2,501,000,
which represented .22% of the net assets of the fund) which was acquired in transactions exempt from registration under Rule 144A
of the Securities Act of 1933 and may be resold in the U.S. in transactions exempt from registration, normally to qualified institutional
buyers.
| Futures contracts | |
| |
| |
|
| |
| | |
| | |
| |
| | |
| |
| |
|
| |
| | |
| | |
| |
| | |
| |
| |
|
| |
| | |
| | |
Unrealized | |
| | |
| |
| |
|
| |
| | |
| | |
appreciation | |
| | |
| |
| |
|
| |
Notional | | |
Value at | | |
(depreciation) | |
| | |
| |
Number of | |
|
| |
amount | 4 | |
7/31/2019 | 5 | |
at 7/31/2019 | |
| Contracts | |
Type | |
contracts | |
|
Expiration | |
(000) | | |
(000) | | |
(000) | |
| 2 Year U.S. Treasury Note Futures | |
Long | |
|
1,289 | |
|
October 2019 | |
| $257,800 | | |
| $276,369 | | |
|
$ | 27 | |
| 5 Year U.S. Treasury Note Futures | |
Short | |
|
498 | |
|
October 2019 | |
| (49,800 | ) | |
| (58,542 | ) | |
|
| (18 | ) |
| | |
| |
|
| |
|
| |
| | | |
| | | |
|
$ | 9 | |
| 1 |
Step bond; coupon rate may change at a later date. |
| 2 |
Coupon rate may change periodically. For short-term securities, the date of the next scheduled coupon rate change is considered
to be the maturity date. |
| 3 |
For short-term securities, the mandatory put date is considered to be the maturity date. |
| 4 |
Notional amount is calculated based on the number of contracts and notional contract size. |
| 5 |
Value is calculated based on the notional amount and current market price. |
Key to abbreviations and symbol
Agcy. = Agency
AMT = Alternative Minimum Tax
Auth. = Authority
Certs. of Part. = Certificates of Participation
Dept. = Department
Dev. = Development
Dist. = District
Econ. = Economic
Fac. = Facility
Facs. = Facilities
Fin. = Finance
Fncg. = Financing
G.O. = General Obligation
LIBOR = London Interbank Offered Rate
LOC = Letter of Credit
Preref. = Prerefunded
Redev. = Redevelopment
Ref. = Refunding
Rev. = Revenue
SIFMA = Securities Industry and Financial Markets Association
USD/$ = U.S. dollars
See notes to financial statements.
| 22 |
American Funds Tax-Exempt Funds |
Limited Term Tax-Exempt Bond Fund of America
Summary investment portfolio July 31, 2019
| Bonds,
notes & other debt instruments 92.55% | Principal amount
(000) | | |
Value
(000) | |
| Alabama 1.23% | |
| | | |
| | |
| Black Belt Energy Gas Dist., Gas Supply Rev. Bonds, Series 2017-A, 4.00% 2047 (put 2022) | |
$ | 12,620 | | |
$ | 13,478 | |
| Other securities | |
| | | |
| 38,742 | |
| | |
| | | |
| 52,220 | |
| | |
| | | |
| | |
| Alaska 0.32% | |
| | | |
| | |
| Housing Fin. Corp., Collateralized Bonds (Veterans Mortgage Program), Series 2019, 4.00% 2048 | |
| 10,020 | | |
| 10,984 | |
| Other securities | |
| | | |
| 2,645 | |
| | |
| | | |
| 13,629 | |
| | |
| | | |
| | |
| California 4.77% | |
| | | |
| | |
| Bay Area Toll Auth., San Francisco Bay Area Toll Bridge Rev. Bonds, Series 2006-C-1, (SIFMA Municipal Swap Index + 0.90%) 2.30% 2045 (put 2023)1 | |
| 11,500 | | |
| 11,663 | |
| Other securities | |
| | | |
| 190,984 | |
| | |
| | | |
| 202,647 | |
| | |
| | | |
| | |
| Colorado 2.81% | |
| | | |
| | |
| City and County of Denver, Airport System Rev. Bonds, Series 2018-A, AMT, 5.00% 2026 | |
| 10,000 | | |
| 12,267 | |
| Housing and Fin. Auth., Single Family Mortgage Bonds, Series 2019-E, Class I, 4.25% 2049 | |
| 12,960 | | |
| 14,199 | |
| Other securities | |
| | | |
| 93,184 | |
| | |
| | | |
| 119,650 | |
| | |
| | | |
| | |
| Connecticut 1.86% | |
| | | |
| | |
| Housing Fin. Auth., Housing Mortgage Fin. Program Bonds, Series 2016-A-1, 4.00% 2045 | |
| 2,465 | | |
| 2,596 | |
| Housing Fin. Auth., Housing Mortgage Fin. Program Bonds, Series 2016-B-2, AMT, 3.50% 2039 | |
| 1,885 | | |
| 1,970 | |
| Housing Fin. Auth., Housing Mortgage Fin. Program Bonds, Series 2016-E-1, 3.50% 2046 | |
| 8,370 | | |
| 8,770 | |
| Housing Fin. Auth., Housing Mortgage Fin. Program Bonds, Series 2016-F-2, AMT, 3.50% 2039 | |
| 2,840 | | |
| 2,970 | |
| Housing Fin. Auth., Housing Mortgage Fin. Program Bonds, Series 2017-A-1, 4.00% 2047 | |
| 1,545 | | |
| 1,653 | |
| Housing Fin. Auth., Housing Mortgage Fin. Program Bonds, Series 2017-C-1, 4.00% 2047 | |
| 4,625 | | |
| 4,948 | |
| Housing Fin. Auth., Housing Mortgage Fin. Program Bonds, Series 2017-D-1, 4.00% 2047 | |
| 2,490 | | |
| 2,669 | |
| Housing Fin. Auth., Housing Mortgage Fin. Program Bonds, Series 2018-A-2, AMT, 4.00% 2041 | |
| 2,735 | | |
| 2,938 | |
| Housing Fin. Auth., Housing Mortgage Fin. Program Bonds, Series 2018-C-1, 4.00% 2045 | |
| 7,735 | | |
| 8,411 | |
| Housing Fin. Auth., Housing Mortgage Fin. Program Bonds, Series 2019-A-1, 4.00% 2045 | |
| 8,900 | | |
| 9,750 | |
| Housing Fin. Auth., Housing Mortgage Fin. Program Rev. Ref. Bonds, Series 2015-C-1, 3.50% 2045 | |
| 1,460 | | |
| 1,522 | |
| Other securities | |
| | | |
| 31,047 | |
| | |
| | | |
| 79,244 | |
| | |
| | | |
| | |
| Florida 4.40% | |
| | | |
| | |
| Housing Fin. Corp., Homeowner Mortgage Rev. Bonds, Series 2017-1, 4.00% 2048 | |
| 11,250 | | |
| 12,143 | |
| Housing Fin. Corp., Homeowner Mortgage Rev. Bonds, Series 2018-2, 4.25% 2050 | |
| 15,350 | | |
| 16,983 | |
| County of Miami-Dade, Aviation Rev. Ref. Bonds, Series 2012-A, AMT, 5.00% 2021 | |
| 11,600 | | |
| 12,507 | |
| Dept. of Transportation, Right-of-Way Acquisition and Bridge Construction Rev. Ref. Bonds, Series 2012-A, 4.00% 2028 | |
| 10,800 | | |
| 11,349 | |
| Other securities | |
| | | |
| 134,011 | |
| | |
| | | |
| 186,993 | |
| | |
| | | |
| | |
| Georgia 2.79% | |
| | | |
| | |
| G.O. Bonds, Series 2019-A, 5.00% 2028 | |
| 21,000 | | |
| 27,165 | |
| Main Street Natural Gas, Inc., Gas Supply Rev. Bonds, Series 2018-A, 4.00% 2048 (put 2023) | |
| 15,000 | | |
| 16,386 | |
| Municipal Electric Auth., Project One Bonds, Series 2011-A, 5.00% 2021 | |
| 11,490 | | |
| 12,079 | |
| Other securities | |
| | | |
| 63,187 | |
| | |
| | | |
| 118,817 | |
| | |
| | | |
| | |
| Illinois 11.13% | |
| | | |
| | |
| Build Illinois Bonds, Sales Tax Rev. Bonds, Series 2013, 5.00% 2020 | |
| 1,000 | | |
| 1,028 | |
| Build Illinois Bonds, Sales Tax Rev. Bonds, Series 2013, 5.00% 2024 | |
| 4,230 | | |
| 4,625 | |
| Build Illinois Bonds, Sales Tax Rev. Ref. Bonds, Series 2010, 5.00% 2020 | |
| 1,200 | | |
| 1,233 | |
| Build Illinois Bonds, Sales Tax Rev. Ref. Bonds, Series 2016-C, 4.00% 2025 | |
| 4,515 | | |
| 4,877 | |
| American Funds Tax-Exempt Funds |
23 |
Limited Term Tax-Exempt Bond Fund of America
| Bonds, notes &
other debt instruments (continued) | Principal amount
(000) | | |
Value
(000) | |
| Illinois (continued) | |
| | | |
| | |
| Build Illinois Bonds, Sales Tax Rev. Ref. Bonds, Series 2016-C, 4.00% 2026 | |
$ | 11,805 | | |
$ | 12,817 | |
| Build Illinois Bonds, Sales Tax Rev. Ref. Bonds, Series 2016-D, 4.00% 2021 | |
| 1,900 | | |
| 1,967 | |
| City of Chicago, Water Rev. Bonds, Series 2000, 5.00% 2022 | |
| 10,500 | | |
| 11,644 | |
| Fin. Auth., National Rural Utilities Cooperative Fin. Corp., Guaranteed Solid Waste Disposal Rev. Bonds (Prairie Power, Inc. Project), Series 2008-A, 1.75% 2042 (put 2020) | |
| 3,020 | | |
| 3,022 | |
| Fin. Auth., Rev. Bonds (Advocate Health Care Network), Series 2014, 5.00% 2021 | |
| 375 | | |
| 403 | |
| Fin. Auth., Rev. Bonds (Central DuPage Health), Series 2009, 5.00% 2019 (escrowed to maturity) | |
| 2,185 | | |
| 2,206 | |
| Fin. Auth., Rev. Bonds (Clean Water Initiative Revolving Fund), Series 2016, 4.00% 2025 | |
| 5,115 | | |
| 5,826 | |
| Fin. Auth., Rev. Bonds (Clean Water Initiative Revolving Fund), Series 2016, 4.00% 2026 | |
| 1,100 | | |
| 1,261 | |
| Fin. Auth., Rev. Bonds (Clean Water Initiative Revolving Fund), Series 2016, 5.00% 2026 | |
| 1,000 | | |
| 1,218 | |
| Fin. Auth., Rev. Bonds (Clean Water Initiative Revolving Fund), Series 2016, 5.00% 2028 | |
| 10,590 | | |
| 12,843 | |
| Fin. Auth., Rev. Bonds (Clean Water Initiative Revolving Fund), Series 2017, 5.00% 2027 | |
| 2,000 | | |
| 2,487 | |
| Fin. Auth., Rev. Bonds (Lifespace Communities, Inc.), Series 2015-A, 5.00% 2020 | |
| 500 | | |
| 512 | |
| Fin. Auth., Rev. Bonds (Lifespace Communities, Inc.), Series 2015-A, 5.00% 2022 | |
| 200 | | |
| 215 | |
| Fin. Auth., Rev. Bonds (Lifespace Communities, Inc.), Series 2015-A, 5.00% 2026 | |
| 540 | | |
| 613 | |
| Fin. Auth., Rev. Bonds (Lifespace Communities, Inc.), Series 2015-A, 5.00% 2028 | |
| 1,060 | | |
| 1,196 | |
| Fin. Auth., Rev. Bonds (Northwest Community Hospital), Series 2016-A, 5.00% 2026 | |
| 1,080 | | |
| 1,311 | |
| Fin. Auth., Rev. Bonds (Northwest Community Hospital), Series 2016-A, 5.00% 2027 | |
| 1,000 | | |
| 1,204 | |
| Fin. Auth., Rev. Bonds (Northwestern Memorial Healthcare), Series 2017-B, 5.00% 2057 (put 2022) | |
| 4,865 | | |
| 5,455 | |
| Fin. Auth., Rev. Bonds (Presbyterian Homes Obligated Group), Series 2016-A, 5.00% 2024 | |
| 1,920 | | |
| 2,192 | |
| Fin. Auth., Rev. Bonds (Presbyterian Homes Obligated Group), Series 2016-B, (1-month USD-LIBOR x 0.70 + 1.35%) 3.031% 2036 (put 2021)1 | |
| 2,275 | | |
| 2,282 | |
| Fin. Auth., Rev. Bonds (Presence Health Network), Series 2016-C, 4.00% 2024 | |
| 4,000 | | |
| 4,482 | |
| Fin. Auth., Rev. Bonds (Presence Health Network), Series 2016-C, 5.00% 2023 | |
| 1,545 | | |
| 1,746 | |
| Fin. Auth., Rev. Bonds (Presence Health Network), Series 2016-C, 5.00% 2024 | |
| 1,425 | | |
| 1,660 | |
| Fin. Auth., Rev. Bonds (Presence Health Network), Series 2016-C, 5.00% 2025 | |
| 950 | | |
| 1,133 | |
| Fin. Auth., Rev. Bonds (Presence Health Network), Series 2016-C, 5.00% 2026 | |
| 1,065 | | |
| 1,299 | |
| Fin. Auth., Rev. Bonds (Presence Health Network), Series 2016-C, 5.00% 2027 | |
| 8,640 | | |
| 10,744 | |
| Fin. Auth., Rev. Bonds (Rehabilitation Institute of Chicago), Series 2013-A, 5.00% 2022 | |
| 1,665 | | |
| 1,829 | |
| Fin. Auth., Rev. Bonds (Rush University Medical Center Obligated Group), Series 2015-A, 5.00% 2028 | |
| 4,000 | | |
| 4,681 | |
| Fin. Auth., Rev. Bonds (Rush University Medical Center Obligated Group), Series 2015-A, 5.00% 2029 | |
| 9,500 | | |
| 11,057 | |
| Fin. Auth., Rev. Bonds (Swedish Covenant Hospital), Series 2016-A, 5.25% 2028 | |
| 1,020 | | |
| 1,218 | |
| Fin. Auth., Rev. Green Bonds (Clean Water Initiative Revolving Fund), Series 2019, 5.00% 2021 | |
| 4,170 | | |
| 4,471 | |
| Fin. Auth., Rev. Ref. Bonds (Advocate Health Care Network), Series 2008-A-1, 5.00% 2030 (put 2020) | |
| 3,000 | | |
| 3,050 | |
| Fin. Auth., Rev. Ref. Bonds (Loyola University of Chicago), Series 2012-B, 5.00% 2023 | |
| 1,970 | | |
| 2,166 | |
| Fin. Auth., Rev. Ref. Bonds (OSF Healthcare System), Series 2015-A, 5.00% 2023 | |
| 750 | | |
| 861 | |
| Fin. Auth., Rev. Ref. Bonds (OSF Healthcare System), Series 2015-A, 5.00% 2026 | |
| 1,165 | | |
| 1,384 | |
| Fin. Auth., Rev. Ref. Bonds (OSF Healthcare System), Series 2015-A, 5.00% 2029 | |
| 1,500 | | |
| 1,755 | |
| Fin. Auth., Rev. Ref. Bonds (Provena Health), Series 2009-A, 7.75% 2034 (preref. 2019) | |
| 990 | | |
| 992 | |
| Fin. Auth., Rev. Ref. Bonds (Provena Health), Series 2009-A, 7.75% 2034 (preref. 2019) | |
| 10 | | |
| 10 | |
| G.O. Bonds, Series 2010, Assured Guaranty Municipal insured, 5.00% 2020 | |
| 2,225 | | |
| 2,254 | |
| G.O. Bonds, Series 2013, 5.00% 2022 | |
| 1,250 | | |
| 1,343 | |
| G.O. Bonds, Series 2017-A, 5.00% 2021 | |
| 3,500 | | |
| 3,715 | |
| G.O. Bonds, Series 2017-B, 5.00% 2019 | |
| 27,420 | | |
| 27,622 | |
| G.O. Bonds, Series 2017-D, BAM insured, 5.00% 2020 | |
| 9,000 | | |
| 9,322 | |
| G.O. Bonds, Series 2017-D, BAM insured, 5.00% 2021 | |
| 20,000 | | |
| 21,188 | |
| G.O. Bonds, Series 2017-D, BAM insured, 5.00% 2024 | |
| 5,500 | | |
| 6,073 | |
| G.O. Rev. Ref. Bonds, Series 2012, 5.00% 2019 | |
| 6,200 | | |
| 6,200 | |
| G.O. Rev. Ref. Bonds, Series 2012, 5.00% 2020 | |
| 3,000 | | |
| 3,091 | |
| Railsplitter Tobacco Settlement Auth., Tobacco Settlement Rev. Bonds, Series 2010, 5.50% 2023 (preref. 2021) | |
| 12,925 | | |
| 13,938 | |
| Other securities | |
| | | |
| 241,535 | |
| | |
| | | |
| 473,256 | |
| 24 |
American Funds Tax-Exempt Funds |
Limited Term Tax-Exempt Bond Fund of America
| | Principal amount
(000) | | |
Value
(000) | |
| Michigan 3.64% | |
| | | |
| | |
| Housing Dev. Auth., Single Family Mortgage Rev. Bonds, Series 2014-A, 4.00% 2044 | |
$ | 850 | | |
$ | 893 | |
| Housing Dev. Auth., Single Family Mortgage Rev. Bonds, Series 2016-A, 4.00% 2046 | |
| 710 | | |
| 753 | |
| Housing Dev. Auth., Single Family Mortgage Rev. Bonds, Series 2016-B, 3.50% 2047 | |
| 15,480 | | |
| 16,332 | |
| Housing Dev. Auth., Single Family Mortgage Rev. Bonds, Series 2017-B, 3.50% 2048 | |
| 2,845 | | |
| 3,015 | |
| Housing Dev. Auth., Single Family Mortgage Rev. Bonds, Series 2018-A, 4.00% 2048 | |
| 4,300 | | |
| 4,651 | |
| Housing Dev. Auth., Single Family Mortgage Rev. Bonds, Series 2018-C, 4.25% 2049 | |
| 16,590 | | |
| 18,194 | |
| Housing Dev. Auth., Single Family Mortgage Rev. Bonds, Series 2019-A, 4.25% 2049 | |
| 12,910 | | |
| 14,216 | |
| County of Wayne, Airport Auth., Airport Rev. Ref. Bonds (Detroit Metropolitan Wayne County Airport), Series 2011-A, AMT, 5.00% 2021 | |
| 10,240 | | |
| 11,079 | |
| Other securities | |
| | | |
| 85,815 | |
| | |
| | | |
| 154,948 | |
| | |
| | | |
| | |
| Minnesota 1.39% | |
| | | |
| | |
| Housing Fin. Agcy., Homeownership Fin. Bonds (GNMA and FNMA Pass-Through Program), Series 2017-G, 2.65% 2047 | |
| 9,084 | | |
| 9,102 | |
| Housing Fin. Agcy., Residential Housing Fin. Bonds, Series 2012-D, 4.00% 2040 | |
| 135 | | |
| 138 | |
| Housing Fin. Agcy., Residential Housing Fin. Bonds, Series 2013-A, AMT, 3.00% 2031 | |
| 485 | | |
| 494 | |
| Housing Fin. Agcy., Residential Housing Fin. Bonds, Series 2014-B, 4.00% 2038 | |
| 165 | | |
| 175 | |
| Housing Fin. Agcy., Residential Housing Fin. Bonds, Series 2014-C, AMT, 4.00% 2045 | |
| 1,740 | | |
| 1,844 | |
| Housing Fin. Agcy., Residential Housing Fin. Bonds, Series 2015-A, AMT, 4.00% 2041 | |
| 3,315 | | |
| 3,480 | |
| Housing Fin. Agcy., Residential Housing Fin. Bonds, Series 2015-B, 3.50% 2046 | |
| 2,960 | | |
| 3,116 | |
| Housing Fin. Agcy., Residential Housing Fin. Bonds, Series 2015-E, AMT, 3.50% 2046 | |
| 595 | | |
| 622 | |
| Housing Fin. Agcy., Residential Housing Fin. Bonds, Series 2016-E, 4.00% 2047 | |
| 990 | | |
| 1,049 | |
| Housing Fin. Agcy., Residential Housing Fin. Bonds, Series 2017-E, 4.00% 2048 | |
| 5,095 | | |
| 5,492 | |
| Housing Fin. Agcy., Residential Housing Fin. Bonds, Series 2018-E, 4.25% 2049 | |
| 13,175 | | |
| 14,487 | |
| Housing Fin. Agcy., Residential Housing Fin. Bonds, Series 2019-B 4.25% 2049 | |
| 4,760 | | |
| 5,278 | |
| Other securities | |
| | | |
| 13,829 | |
| | |
| | | |
| 59,106 | |
| | |
| | | |
| | |
| Nebraska 1.06% | |
| | | |
| | |
| Central Plains Energy Project, Gas Supply Rev. Ref. Bonds, Series 2014, 5.00% 2039 (put 2019) | |
| 11,850 | | |
| 11,992 | |
| Other securities | |
| | | |
| 32,960 | |
| | |
| | | |
| 44,952 | |
| | |
| | | |
| | |
| Nevada 1.70% | |
| | | |
| | |
| County of Clark, Highway Rev. Ref. Bonds (Motor Vehicle Fuel Tax), Series 2011, 5.00% 2020 | |
| 12,320 | | |
| 12,756 | |
| County of Clark, Pollution Control Rev. Ref. Bonds (Southern California Edison Co.), Series 2010, 1.875% 2031 (put 2020) | |
| 14,035 | | |
| 14,057 | |
| Other securities | |
| | | |
| 45,656 | |
| | |
| | | |
| 72,469 | |
| | |
| | | |
| | |
| New York 7.35% | |
| | | |
| | |
| Dormitory Auth., Mental Health Services Facs. Improvement Rev. Ref. Bonds, Series 2010-A, 5.00% 2019 (escrowed to maturity) | |
| 5 | | |
| 5 | |
| Dormitory Auth., School Dist. Rev. Bond Fncg. Program Rev. Bonds, Series 2017-F, 5.00% 2024 | |
| 2,500 | | |
| 2,987 | |
| Dormitory Auth., School Dist. Rev. Bond Fncg. Program Rev. Bonds, Series 2017-F, 5.00% 2025 | |
| 750 | | |
| 920 | |
| Dormitory Auth., State Personal Income Tax Rev. Bonds (General Purpose), Series 2016-D, 5.00% 2025 | |
| 5,000 | | |
| 6,025 | |
| Dormitory Auth., State Personal Income Tax Rev. Bonds (General Purpose), Series 2017-B, 5.00% 2030 | |
| 9,040 | | |
| 11,317 | |
| Dormitory Auth., State Personal Income Tax Rev. Bonds (General Purpose), Series 2018-A, 5.00% 2030 | |
| 12,000 | | |
| 15,287 | |
| Dormitory Auth., State Personal Income Tax Rev. Bonds (General Purpose), Series 2019-A, 5.00% 2028 | |
| 10,000 | | |
| 12,777 | |
| Dormitory Auth., State Personal Income Tax Rev. Ref. Bonds (General Purpose), Series 2012-A, 5.00% 2022 | |
| 2,000 | | |
| 2,260 | |
| Metropolitan Transportation Auth., Dedicated Tax Fund Rev. Ref. Bonds, Series 2008-A-2B, (SIFMA Municipal Swap Index + 0.58%) 1.98% 2031 (put 2019)1 | |
| 1,500 | | |
| 1,501 | |
| Metropolitan Transportation Auth., Transportation Rev. Bonds, Series 2003-B, FGIC-National insured, 5.25% 2020 | |
| 5,500 | | |
| 5,789 | |
| American Funds Tax-Exempt Funds |
25 |
Limited Term Tax-Exempt Bond Fund of America
| Bonds,
notes & other debt instruments (continued) | Principal amount
(000) | | |
Value
(000) | |
| New York (continued) | |
| | | |
| | |
| Metropolitan Transportation Auth., Transportation Rev. Bonds, Series 2012-E, 5.00% 2020 | |
$ | 3,250 | | |
$ | 3,411 | |
| Metropolitan Transportation Auth., Transportation Rev. Bonds, Series 2014-C, 5.00% 2024 | |
| 5,000 | | |
| 5,922 | |
| Metropolitan Transportation Auth., Transportation Rev. Bonds, Series 2014-D-2, (SIFMA Municipal Swap Index + 0.45%) 1.85% 2044 (put 2022)1 | |
| 7,750 | | |
| 7,736 | |
| Metropolitan Transportation Auth., Transportation Rev. Bonds, Series 2015-A-1, 5.00% 2027 | |
| 3,150 | | |
| 3,739 | |
| Metropolitan Transportation Auth., Transportation Rev. Bonds, Series 2015-A-2, (SIFMA Municipal Swap Index + 0.58%) 1.98% 2039 (put 2020)1 | |
| 5,500 | | |
| 5,505 | |
| Metropolitan Transportation Auth., Transportation Rev. Ref. Bonds, Series 2002-D-2A, Assured Guaranty Municipal insured, (1-month USD-LIBOR x 0.69 + 0.68%) 2.337% 2032 (put 2021)1 | |
| 1,400 | | |
| 1,408 | |
| Mortgage Agcy., Homeowner Mortgage Rev. Bonds, Series 191, AMT, 3.50% 2034 | |
| 210 | | |
| 216 | |
| Mortgage Agcy., Homeowner Mortgage Rev. Bonds, Series 195, 4.00% 2046 | |
| 2,845 | | |
| 3,009 | |
| Mortgage Agcy., Homeowner Mortgage Rev. Bonds, Series 197, 3.50% 2044 | |
| 7,780 | | |
| 8,165 | |
| Mortgage Agcy., Homeowner Mortgage Rev. Bonds, Series 200, 3.50% 2045 | |
| 4,095 | | |
| 4,283 | |
| Mortgage Agcy., Homeowner Mortgage Rev. Bonds, Series 203, 3.50% 2047 | |
| 6,360 | | |
| 6,711 | |
| Mortgage Agcy., Homeowner Mortgage Rev. Bonds, Series 206, AMT, 4.00% 2037 | |
| 2,595 | | |
| 2,768 | |
| Mortgage Agcy., Homeowner Mortgage Rev. Bonds, Series 217, 4.00% 2049 | |
| 16,705 | | |
| 18,320 | |
| Mortgage Agcy., Homeowner Mortgage Rev. Bonds, Series 48, 2.625% 2041 | |
| 185 | | |
| 188 | |
| Mortgage Agcy., Homeowner Mortgage Rev. Bonds, Series 52, AMT, 3.50% 2030 | |
| 1,470 | | |
| 1,529 | |
| Transportation Dev. Corp., Special Facs. Rev. Bonds (Delta Air Lines, Inc. LaGuardia Airport Terminals C & D Redev. Project), Series 2018, AMT, 5.00% 2025 | |
| 10,000 | | |
| 11,593 | |
| Other securities | |
| | | |
| 169,190 | |
| | |
| | | |
| 312,561 | |
| | |
| | | |
| | |
| North Carolina 1.39% | |
| | | |
| | |
| G.O. Rev. Ref. Bonds, Series 2013-E, 5.00% 2020 | |
| 15,850 | | |
| 16,319 | |
| Other securities | |
| | | |
| 42,850 | |
| | |
| | | |
| 59,169 | |
| | |
| | | |
| | |
| Ohio 2.92% | |
| | | |
| | |
| G.O. Highway Capital Improvements Bonds (Full Faith and Credit/Highway User Receipts), Series 2016-S, 5.00% 2024 | |
| 6,090 | | |
| 7,185 | |
| G.O. Rev. Ref. Bonds, Common Schools Bonds, Series 2017-B, 5.00% 2025 | |
| 6,000 | | |
| 7,329 | |
| G.O. Rev. Ref. Bonds, Higher Education Bonds, Series 2016-A, 5.00% 2024 | |
| 1,645 | | |
| 1,953 | |
| Private Activity Bonds (Portsmouth Bypass Project), Series 2015, AMT, Assured Guaranty Municipal insured, 5.00% 2023 | |
| 1,295 | | |
| 1,445 | |
| Private Activity Bonds (Portsmouth Bypass Project), Series 2015, AMT, Assured Guaranty Municipal insured, 5.00% 2023 | |
| 1,000 | | |
| 1,106 | |
| Private Activity Bonds (Portsmouth Bypass Project), Series 2015, AMT, Assured Guaranty Municipal insured, 5.00% 2024 | |
| 1,360 | | |
| 1,549 | |
| Private Activity Bonds (Portsmouth Bypass Project), Series 2015, AMT, Assured Guaranty Municipal insured, 5.00% 2026 | |
| 850 | | |
| 994 | |
| Private Activity Bonds (Portsmouth Bypass Project), Series 2015, AMT, Assured Guaranty Municipal insured, 5.00% 2027 | |
| 500 | | |
| 583 | |
| Public Facs. Commission, Higher Education G.O. Bonds, Series 2015-C, 5.00% 2028 | |
| 9,000 | | |
| 10,756 | |
| Water Dev. Auth., Solid Waste Disposal Rev. Bonds (Waste Management, Inc. Project), Series 2002, AMT, 3.25% 2022 | |
| 3,500 | | |
| 3,680 | |
| Other securities | |
| | | |
| 87,760 | |
| | |
| | | |
| 124,340 | |
| | |
| | | |
| | |
| Pennsylvania 5.23% | |
| | | |
| | |
| Econ. Dev. Fncg. Auth., Private Activity Rev. Bonds (The Pennsylvania Rapid Bridge Replacement Project), Series 2015, AMT, 5.00% 2024 | |
| 9,180 | | |
| 10,463 | |
| Econ. Dev. Fncg. Auth., Private Activity Rev. Bonds (The Pennsylvania Rapid Bridge Replacement Project), Series 2015, AMT, 5.00% 2024 | |
| 4,900 | | |
| 5,643 | |
| Econ. Dev. Fncg. Auth., Private Activity Rev. Bonds (The Pennsylvania Rapid Bridge Replacement Project), Series 2015, AMT, 5.00% 2025 | |
| 5,985 | | |
| 6,958 | |
| Econ. Dev. Fncg. Auth., Private Activity Rev. Bonds (The Pennsylvania Rapid Bridge Replacement Project), Series 2015, AMT, 5.00% 2026 | |
| 2,315 | | |
| 2,728 | |
| Econ. Dev. Fncg. Auth., Private Activity Rev. Bonds (The Pennsylvania Rapid Bridge Replacement Project), Series 2015, AMT, 5.00% 2026 | |
| 1,775 | | |
| 2,097 | |
| Econ. Dev. Fncg. Auth., Solid Waste Disposal Rev. Bonds (Waste Management, Inc. Project), Series 2017-A, AMT, 1.70% 2037 (put 2020) | |
| 4,000 | | |
| 4,008 | |
| 26 |
American Funds Tax-Exempt Funds |
Limited Term Tax-Exempt Bond Fund of America
| | Principal amount
(000) | | |
Value
(000) | |
| Econ. Dev. Fncg. Auth., Solid Waste Disposal Rev. Ref. Bonds (Republic Services, Inc. Project), Series 2019-A, AMT, 1.50% 2034 (put 2019) | |
$ | 2,500 | | |
$ | 2,501 | |
| Econ. Dev. Fncg. Auth., Unemployment Compensation Rev. Bonds, Series 2012-B, 5.00% 2020 | |
| 2,250 | | |
| 2,278 | |
| Other securities | |
| | | |
| 185,628 | |
| | |
| | | |
| 222,304 | |
| | |
| | | |
| | |
| Texas 10.63% | |
| | | |
| | |
| G.O. Bonds, College Student Loan Bonds, Series 2011-A, AMT, 5.00% 2019 | |
| 1,700 | | |
| 1,700 | |
| G.O. Bonds, Water Financial Assistance Rev. Ref. Bonds (Water Infrastructure Fund), Series 2019-E-1, 5.00% 2021 | |
| 3,060 | | |
| 3,298 | |
| G.O. Bonds, Water Financial Assistance Rev. Ref. Bonds (Water Infrastructure Fund), Series 2019-E-2, 2.25% 2029 | |
| 9,500 | | |
| 9,592 | |
| G.O. Bonds, Water Financial Assistance Rev. Ref. Bonds, Series 2019-C-1, 5.00% 2021 | |
| 1,500 | | |
| 1,617 | |
| Public Fin. Auth., G.O. Rev. Ref. Bonds, Series 2011, 5.00% 2020 | |
| 3,955 | | |
| 4,136 | |
| City of San Antonio, Electric and Gas Systems Rev. Ref. Bonds, Series 2015-A, 2.25% 2033 (put 2019) | |
| 16,000 | | |
| 16,048 | |
| Transportation Commission, G.O. Mobility Fund and Rev. Ref. Bonds, Series 2015-A, 5.00% 2025 | |
| 6,000 | | |
| 7,309 | |
| Transportation Commission, Highway Improvement G.O. Bonds, Series 2012-A, 5.00% 2020 | |
| 7,625 | | |
| 7,824 | |
| Other securities | |
| | | |
| 400,565 | |
| | |
| | | |
| 452,089 | |
| | |
| | | |
| | |
| Virginia 1.91% | |
| | | |
| | |
| G.O. Bonds, Series 2015-A, 5.00% 2026 | |
| 11,795 | | |
| 14,357 | |
| County of Wise, Industrial Dev. Auth., Solid Waste and Sewage Disposal Rev. Bonds (Virginia Electric and Power Co. Project), Series 2009-A, 2.15% 2040 (put 2020) | |
| 11,500 | | |
| 11,604 | |
| Other securities | |
| | | |
| 55,366 | |
| | |
| | | |
| 81,327 | |
| | |
| | | |
| | |
| Washington 3.30% | |
| | | |
| | |
| Federal Highway Grant Anticipation Rev. Bonds (SR 520 Corridor Program), Series 2014-C, 5.00% 2019 | |
| 1,000 | | |
| 1,003 | |
| G.O. Bonds, Series 2012-D, 5.00% 2023 | |
| 5,015 | | |
| 5,500 | |
| G.O. Bonds, Series 2014-A, 5.00% 2024 | |
| 2,390 | | |
| 2,753 | |
| G.O. Bonds, Series 2017-D, 5.00% 2027 | |
| 7,000 | | |
| 8,782 | |
| G.O. Bonds, Series 2017-D, 5.00% 2028 | |
| 5,000 | | |
| 6,232 | |
| G.O. Bonds, Series 2019-C, 5.00% 2031 | |
| 5,000 | | |
| 6,408 | |
| G.O. Rev. Ref. Bonds, Series 2012-R-C, 5.00% 2020 | |
| 4,680 | | |
| 4,849 | |
| G.O. Rev. Ref. Bonds, Series 2016-R-B, 5.00% 2029 | |
| 10,205 | | |
| 12,323 | |
| G.O. Rev. Ref. Bonds, Series 2018-R-D, 5.00% 2027 | |
| 10,000 | | |
| 12,675 | |
| Health Care Facs. Auth., Rev. Bonds (Catholic Health Initiatives), Series 2013-B-1, (SIFMA Municipal Swap Index + 1.00%) 2.40% 2035 (put 2021)1 | |
| 15,100 | | |
| 15,127 | |
| Motor Vehicle Fuel Tax G.O. Bonds, Series 2012-E, 5.00% 2021 | |
| 1,120 | | |
| 1,186 | |
| Other securities | |
| | | |
| 63,633 | |
| | |
| | | |
| 140,471 | |
| | |
| | | |
| | |
| Wisconsin 3.43% | |
| | | |
| | |
| G.O. Bonds, Series 2015-A, 5.00% 2031 (preref. 2023) | |
| 12,385 | | |
| 14,163 | |
| Health and Educational Facs. Auth., Health Facs. Rev. Bonds (SSM Health Care), Series 2018-B, 5.00% 2038 (put 2023) | |
| 11,000 | | |
| 12,171 | |
| Health and Educational Facs. Auth., Rev. Bonds (Advocate Aurora Health Care Credit Group), Series 2018-C-3, (SIFMA Municipal Swap Index + 0.55%) 1.95% 2054 (put 2023)1 | |
| 5,200 | | |
| 5,204 | |
| Health and Educational Facs. Auth., Rev. Bonds (Advocate Aurora Health Care Credit Group), Series 2018-C-4, (SIFMA Municipal Swap Index + 0.65%) 2.05% 2054 (put 2024)1 | |
| 4,000 | | |
| 4,016 | |
| Health and Educational Facs. Auth., Rev. Bonds (Ascension Health Senior Credit Group), Series 2013-B-1, 1.375% 2038 (put 2019) | |
| 5,105 | | |
| 5,107 | |
| Health and Educational Facs. Auth., Rev. Bonds (Ascension Health Senior Credit Group), Series 2013-B-3, 5.00% 2043 (put 2020) | |
| 10,310 | | |
| 10,628 | |
| Health and Educational Facs. Auth., Rev. Bonds (Children’s Hospital of Wisconsin, Inc.), Series 2008-B, 5.375% 2037 (preref. 2020) | |
| 2,000 | | |
| 2,045 | |
| American Funds Tax-Exempt Funds |
27 |
Limited Term Tax-Exempt Bond Fund of America
| Bonds,
notes & other debt instruments (continued) | Principal amount
(000) | | |
Value
(000) | |
| Wisconsin (continued) | |
| | | |
| | |
| Health and Educational Facs. Auth., Rev. Bonds (Marshfield Clinic Health System, Inc.), Series 2016-B, 5.00% 2026 | |
$ | 1,000 | | |
$ | 1,202 | |
| Health and Educational Facs. Auth., Rev. Bonds (Marshfield Clinic Health System, Inc.), Series 2016-B, 5.00% 2027 | |
| 1,000 | | |
| 1,192 | |
| Health and Educational Facs. Auth., Rev. Ref. Bonds (Aurora Health Care, Inc.), Series 2012-A, 5.00% 2021 (escrowed to maturity) | |
| 7,765 | | |
| 8,347 | |
| Health and Educational Facs. Auth., Rev. Ref. Bonds (Ministry Health Care, Inc.), Series 2012-C, 5.00% 2021 (escrowed to maturity) | |
| 1,200 | | |
| 1,292 | |
| Health and Educational Facs. Auth., Rev. Ref. Bonds (ProHealth Care, Inc. Obligated Group), Series 2015, 5.00% 2031 | |
| 1,650 | | |
| 1,876 | |
| Housing and Econ. Dev. Auth., Home Ownership Mortgage Rev. Bonds, Series 2017-A, 2.69% 2047 | |
| 6,707 | | |
| 6,732 | |
| Housing and Econ. Dev. Auth., Home Ownership Rev. Bonds, Series 2015-A, AMT, 4.00% 2045 | |
| 4,545 | | |
| 4,762 | |
| Housing and Econ. Dev. Auth., Home Ownership Rev. Bonds, Series 2016-A, AMT, 3.50% 2046 | |
| 6,250 | | |
| 6,515 | |
| Housing and Econ. Dev. Auth., Home Ownership Rev. Bonds, Series 2017-C, 4.00% 2048 | |
| 6,065 | | |
| 6,483 | |
| Housing and Econ. Dev. Auth., Home Ownership Rev. Bonds, Series 2019-A, 4.25% 2049 | |
| 18,210 | | |
| 20,095 | |
| Other securities | |
| | | |
| 33,949 | |
| | |
| | | |
| 145,779 | |
| | |
| | | |
| | |
| Other states & U.S. territories 19.29% | |
| | | |
| | |
| Other securities | |
| | | |
| 820,009 | |
| | |
| | | |
| | |
| Total bonds, notes & other debt instruments (cost: $3,827,712,000) | |
| | | |
| 3,935,980 | |
| | |
| | | |
| | |
| Short-term
securities 6.89% | |
| | | |
| | |
| State of Arizona, Industrial Dev. Auth., Hospital Rev. Ref. Bonds (Phoenix Children’s Hospital), Series 2019-B, 1.49% 20481 | |
| 23,575 | | |
| 23,575 | |
| State of California, Pollution Control Fncg. Auth., Solid Waste Disposal Rev. Ref. Bonds (Republic Services, Inc. Project), Series 2010-A, AMT, 1.90% 2023 (put 2019)2,3 | |
| 14,705 | | |
| 14,705 | |
| State of Maryland, County of Montgomery, IAM Commercial Paper, Series 2019-A, 1.34%10/3/2019 | |
| 16,000 | | |
| 16,000 | |
| State of Maryland, County of Montgomery, IAM Commercial Paper, Series 2019-A, 1.38%8/6/2019 | |
| 2,000 | | |
| 2,000 | |
| State of Maryland, County of Montgomery, Rev. Bonds (Trinity Health Credit Group), Series 2013, 1.43% 2041 (put 2019)2 | |
| 6,000 | | |
| 6,001 | |
| State of Mississippi, Business Fin. Corp., Gulf Opportunity Zone Industrial Dev. Rev. Bonds (Chevron U.S.A. Inc. Project), Series 2007-D, 1.48% 20301 | |
| 3,000 | | |
| 3,000 | |
| State of Mississippi, Business Fin. Corp., Gulf Opportunity Zone Industrial Dev. Rev. Bonds (Chevron U.S.A. Inc. Project), Series 2010-J, 1.48% 20351 | |
| 4,750 | | |
| 4,750 | |
| State of Mississippi, Business Fin. Corp., Gulf Opportunity Zone Industrial Dev. Rev. Bonds (Chevron U.S.A. Inc. Project), Series 2011-E, 1.48% 20351 | |
| 5,950 | | |
| 5,950 | |
| State of New York, Metropolitan Transportation Auth., Transportation Rev. Bond Anticipation Notes, Series 2018-A-1, 4.00% 8/15/2019 | |
| 8,500 | | |
| 8,507 | |
| State of Ohio, Hospital Rev. Bonds (University Hospitals Health System Inc.), Series 2013, 1.62% 20331 | |
| 10,375 | | |
| 10,375 | |
| State of Pennsylvania, Econ. Dev. Fncg. Auth., Solid Waste Disposal Rev. Bonds (Republic Services, Inc. Project), Series 2014, AMT, 1.60% 2044 (put 2019)2 | |
| 7,950 | | |
| 7,953 | |
| State of Pennsylvania, Econ. Dev. Fncg. Auth., Solid Waste Disposal Rev. Bonds (Waste Management, Inc. Project), Series 2013, AMT, 2.15% 2045 (put 2019)2 | |
| 11,135 | | |
| 11,135 | |
| State of Texas, City of Houston, Combined Utility System IAM Commercial Paper, Series 2019, 1.27% 9/6/2019 | |
| 5,000 | | |
| 5,000 | |
| State of Texas, City of Houston, Combined Utility System IAM Commercial Paper, Series 2019, 1.29% 9/6/2019 | |
| 2,000 | | |
| 2,000 | |
| State of Texas, City of Houston, Tax and Rev. Anticipation Notes, Series 2019, 5.00%6/26/2020 | |
| 4,500 | | |
| 4,655 | |
| State of Texas, Tax and Rev. Anticipation Notes, Series 2018, 4.00% 8/29/2019 | |
| 11,695 | | |
| 11,718 | |
| State of Texas, Board of Regents of the University of Texas System, IAM Commercial Paper, Series 2019, 1.32% 10/4/2019 | |
| 7,000 | | |
| 7,000 | |
| 28 |
American Funds Tax-Exempt Funds |
Limited Term Tax-Exempt Bond Fund of America
| | Principal amount
(000) | | |
Value
(000) | |
| State of Texas, Board of Regents of the University of Texas System, IAM Commercial Paper, Series 2019, 1.35% 8/5/2019 | |
$ | 6,000 | | |
$ | 6,000 | |
| State of Texas, Board of Regents of the University of Texas System, IAM Commercial Paper, Series 2019, 1.40% 8/8/2019 | |
| 5,500 | | |
| 5,500 | |
| State of Texas, Board of Regents of the University of Texas System, IAM Commercial Paper, Series 2019, 1.50% 11/4/2019 | |
| 5,000 | | |
| 5,000 | |
| Other securities | |
| | | |
| 132,077 | |
| | |
| | | |
| | |
| Total short-term securities (cost: $292,879,000) | |
| | | |
| 292,901 | |
| Total investment securities 99.44% (cost: $4,120,591,000) | |
| | | |
| 4,228,881 | |
| Other assets less liabilities 0.56% | |
| | | |
| 23,927 | |
| | |
| | | |
| | |
| Net assets 100.00% | |
| | | |
$ | 4,252,808 | |
This summary investment portfolio is designed to streamline the
report and help investors better focus on the fund’s principal holdings. See the inside back cover for details on how to
obtain a complete schedule of portfolio holdings.
“Other securities” includes all issues that are not
disclosed separately in the summary investment portfolio.
Futures contracts
| Contracts | |
Type |
| |
Number of
contracts |
| |
Expiration | |
Notional
amount
(000) | 4
| |
Value
at
7/31/2019
(000) | 5
|
| Unrealized
(depreciation)
appreciation
at 7/31/2019
(000) | |
| 2 Year U.S. Treasury Note Futures | |
Long |
| |
5,080 |
| |
October 2019 | |
| $1,016,000 | | |
| $1,089,184 | |
| |
$ | (1,917 | ) |
| 5 Year U.S. Treasury Note Futures | |
Short |
| |
1,737 |
| |
October 2019 | |
| (173,700 | ) | |
| (204,193 | ) |
| |
| 122 | |
| | |
|
| |
|
| |
| |
| | | |
| | |
| |
$ | (1,795 | ) |
| 1 | Coupon rate may change periodically. For short-term securities, the date of the next scheduled coupon rate change is considered
to be the maturity date. |
| 2 | For short-term securities, the mandatory put date is considered to be the maturity date. |
| 3 | Acquired in a transaction exempt from registration under Rule 144A of the Securities Act of 1933. May be resold in the U.S.
in transactions exempt from registration, normally to qualified institutional buyers. The total value of all such securities, including
those in “Other securities,” was $35,489,000, which represented .83% of the net assets of the fund. |
| 4 | Notional amount is calculated based on the number of contracts and notional contract size. |
| 5 | Value is calculated based on the notional amount and current market price. |
Key to abbreviations and symbol
Agcy. = Agency
AMT = Alternative Minimum Tax
Auth. = Authority
Certs. of Part. = Certificates of Participation
Dept. = Department
Dev. = Development
Dist. = District
Econ. = Economic
Fac. = Facility
Facs. = Facilities
Fin. = Finance
Fncg. = Financing
G.O. = General Obligation
LIBOR = London Interbank Offered Rate
LOC = Letter of Credit
Preref. = Prerefunded
Redev. = Redevelopment
Ref. = Refunding
Rev. = Revenue
SIFMA = Securities Industry and Financial Markets Association
USD/$ = U.S. dollars
See notes to financial statements.
| American Funds Tax-Exempt Funds |
29 |
The Tax-Exempt Bond Fund of America
Summary investment portfolio July 31, 2019
| Bonds, notes & other debt instruments 93.63% | |
Principal amount
(000) | | |
Value
(000) | |
| Alabama 1.20% | |
| | | |
| | |
| Black Belt Energy Gas Dist., Gas Supply Rev. Bonds, Series 2017-A, 4.00% 2047 (put 2022) | |
$ | 40,000 | | |
$ | 42,718 | |
| Other securities | |
| | | |
| 217,209 | |
| | |
| | | |
| 259,927 | |
| | |
| | | |
| | |
| California 6.73% | |
| | | |
| | |
| Bay Area Toll Auth., San Francisco Bay Area Toll Bridge Rev. Bonds, Series 2008-B-1, (SIFMA Municipal Swap Index + 1.10%) 2.50% 2045 (put 2024)1 | |
| 30,850 | | |
| 31,691 | |
| Health Facs. Fncg. Auth., Rev. Bonds (Kaiser Permanente), Series 2017-A-2, 5.00% 2047 | |
| 36,065 | | |
| 52,039 | |
| Other securities | |
| | | |
| 1,373,985 | |
| | |
| | | |
| 1,457,715 | |
| | |
| | | |
| | |
| Colorado 2.07% | |
| | | |
| | |
| Health Facs. Auth., Health Facs. Rev. Bonds (Evangelical Lutheran Good Samaritan Society Project), Series 2012, 5.00% 2042 (preref. 2022) | |
| 31,010 | | |
| 34,170 | |
| Other securities | |
| | | |
| 413,069 | |
| | |
| | | |
| 447,239 | |
| | |
| | | |
| | |
| Florida 6.42% | |
| | | |
| | |
| Tampa-Hillsborough County Expressway Auth., Rev. Ref. Bonds, Series 2017-B, 4.00% 2042 | |
| 39,670 | | |
| 43,698 | |
| Other securities | |
| | | |
| 1,346,365 | |
| | |
| | | |
| 1,390,063 | |
| | |
| | | |
| | |
| Georgia 1.97% | |
| | | |
| | |
| County of Burke, Dev. Auth., Pollution Control Rev. Bonds (Oglethorpe Power Corp. - Vogtle Project), Series 2013-A, 2.40% 2040 (put 2020) | |
| 32,695 | | |
| 32,897 | |
| Other securities | |
| | | |
| 394,489 | |
| | |
| | | |
| 427,386 | |
| | |
| | | |
| | |
| Illinois 13.78% | |
| | | |
| | |
| Build Illinois Bonds, Sales Tax Rev. Bonds, Series 2002, FGIC-National insured, 6.00% 2023 | |
| 1,000 | | |
| 1,134 | |
| Build Illinois Bonds, Sales Tax Rev. Bonds, Series 2010, 5.00% 2021 | |
| 5,750 | | |
| 6,057 | |
| Build Illinois Bonds, Sales Tax Rev. Bonds, Series 2018-B, 5.00% 2033 | |
| 3,500 | | |
| 4,008 | |
| Build Illinois Bonds, Sales Tax Rev. Ref. Bonds, Series 2010, 5.00% 2020 | |
| 5,200 | | |
| 5,345 | |
| Build Illinois Bonds, Sales Tax Rev. Ref. Bonds, Series 2013, 5.00% 2026 | |
| 11,040 | | |
| 12,056 | |
| Build Illinois Bonds, Sales Tax Rev. Ref. Bonds, Series 2016-C, 4.00% 2024 | |
| 3,070 | | |
| 3,285 | |
| Build Illinois Bonds, Sales Tax Rev. Ref. Bonds, Series 2016-C, 4.00% 2027 | |
| 13,430 | | |
| 14,483 | |
| Build Illinois Bonds, Sales Tax Rev. Ref. Bonds, Series 2016-D, 5.00% 2025 | |
| 2,135 | | |
| 2,422 | |
| Build Illinois Bonds, Sales Tax Rev. Ref. Bonds, Series 2016-D, 5.00% 2026 | |
| 1,010 | | |
| 1,160 | |
| Build Illinois Bonds, Sales Tax Rev. Ref. Bonds, Series 2016-D, 5.00% 2027 | |
| 1,275 | | |
| 1,454 | |
| Build Illinois Bonds, Sales Tax Rev. Ref. Bonds, Series 2016-D, 5.00% 2029 | |
| 7,000 | | |
| 7,884 | |
| City of Chicago, Board of Education, G.O. Rev. Ref. Bonds (Dedicated Rev.), Series 2017-C, 5.00% 2026 | |
| 7,070 | | |
| 8,049 | |
| City of Chicago, Board of Education, G.O. Rev. Ref. Bonds (Dedicated Rev.), Series 2017-C, 5.00% 2034 | |
| 11,000 | | |
| 12,322 | |
| City of Chicago, Board of Education, Unlimited Tax G.O. Bonds (Dedicated Alternative Rev.), Series 2015-C, 5.25% 2039 | |
| 5,000 | | |
| 5,379 | |
| City of Chicago, Board of Education, Unlimited Tax G.O. Bonds (Dedicated Rev.), Series 2016-B, 6.50% 2046 | |
| 1,350 | | |
| 1,617 | |
| City of Chicago, Board of Education, Unlimited Tax G.O. Bonds (Dedicated Rev.), Series 2017-A, 7.00% 20462 | |
| 20,700 | | |
| 25,853 | |
| City of Chicago, Board of Education, Unlimited Tax G.O. Bonds (Dedicated Rev.), Series 2017-C, 5.00% 2030 | |
| 10,000 | | |
| 11,365 | |
| City of Chicago, Board of Education, Unlimited Tax G.O. Bonds (Dedicated Rev.), Series 2017-F, 5.00% 2020 | |
| 2,000 | | |
| 2,070 | |
| City of Chicago, Board of Education, Unlimited Tax G.O. Bonds (Dedicated Rev.), Series 2018-A, Assured Guaranty Municipal insured, 5.00% 2030 | |
| 1,000 | | |
| 1,203 | |
| City of Chicago, Board of Education, Unlimited Tax G.O. Bonds (Dedicated Rev.), Series 2018-A, Assured Guaranty Municipal insured, 5.00% 2031 | |
| 2,000 | | |
| 2,392 | |
| City of Chicago, Board of Education, Unlimited Tax G.O. Bonds (Dedicated Rev.), Series 2018-A, Assured Guaranty Municipal insured, 5.00% 2032 | |
| 2,000 | | |
| 2,384 | |
| City of Chicago, Board of Education, Unlimited Tax G.O. Bonds (Dedicated Rev.), Series 2018-C, 5.00% 2020 | |
| 1,520 | | |
| 1,574 | |
| |
|
| 30 |
American Funds Tax-Exempt Funds |
The Tax-Exempt Bond Fund of America
| | |
Principal amount
(000) | | |
Value
(000) | |
| City of Chicago, Board of Education, Unlimited Tax G.O. Bonds (Dedicated Rev.), Series 2018-C, Assured Guaranty Municipal insured, 5.00% 2023 | |
$ | 6,000 | | |
$ | 6,568 | |
| City of Chicago, Board of Education, Unlimited Tax G.O. Bonds (Dedicated Rev.), Series 2018-C, Assured Guaranty Municipal insured, 5.00% 2028 | |
| 13,455 | | |
| 16,407 | |
| City of Chicago, Board of Education, Unlimited Tax G.O. Bonds (Dedicated Rev.), Series 2018-D, 5.00% 2046 | |
| 6,000 | | |
| 6,584 | |
| City of Chicago, Board of Education, Unlimited Tax G.O. Rev. Ref. Bonds (Dedicated Rev.), Capital Appreciation Bonds, Series 1998-B-1, FGIC insured, 0% 2028 | |
| 5,645 | | |
| 4,301 | |
| City of Chicago, Board of Education, Unlimited Tax G.O. Rev. Ref. Bonds (Dedicated Rev.), Series 2010-F, 5.00% 2019 | |
| 1,550 | | |
| 1,566 | |
| City of Chicago, Board of Education, Unlimited Tax G.O. Rev. Ref. Bonds (Dedicated Rev.), Series 2017-B, 7.00% 20422 | |
| 13,115 | | |
| 16,428 | |
| City of Chicago, Board of Education, Unlimited Tax G.O. Rev. Ref. Bonds (Dedicated Rev.), Series 2017-C, 5.00% 2020 | |
| 5,865 | | |
| 6,071 | |
| City of Chicago, Board of Education, Unlimited Tax G.O. Rev. Ref. Bonds (Dedicated Rev.), Series 2017-C, 5.00% 2021 | |
| 3,000 | | |
| 3,164 | |
| City of Chicago, Board of Education, Unlimited Tax G.O. Rev. Ref. Bonds (Dedicated Rev.), Series 2017-C, 5.00% 2023 | |
| 1,000 | | |
| 1,095 | |
| City of Chicago, Board of Education, Unlimited Tax G.O. Rev. Ref. Bonds (Dedicated Rev.), Series 2017-C, 5.00% 2025 | |
| 1,000 | | |
| 1,127 | |
| City of Chicago, Board of Education, Unlimited Tax G.O. Rev. Ref. Bonds (Dedicated Rev.), Series 2017-C, 5.00% 2027 | |
| 3,500 | | |
| 4,029 | |
| City of Chicago, Board of Education, Unlimited Tax G.O. Rev. Ref. Bonds (Dedicated Rev.), Series 2017-D, 5.00% 2021 | |
| 1,300 | | |
| 1,371 | |
| City of Chicago, Board of Education, Unlimited Tax G.O. Rev. Ref. Bonds (Dedicated Rev.), Series 2017-D, 5.00% 2031 | |
| 4,000 | | |
| 4,525 | |
| City of Chicago, Board of Education, Unlimited Tax G.O. Rev. Ref. Bonds (Dedicated Rev.), Series 2017-G, 5.00% 2034 | |
| 10,000 | | |
| 11,202 | |
| City of Chicago, Board of Education, Unlimited Tax G.O. Rev. Ref. Bonds (Dedicated Rev.), Series 2017-G, 5.00% 2044 | |
| 1,000 | | |
| 1,091 | |
| City of Chicago, Board of Education, Unlimited Tax G.O. Rev. Ref. Bonds (Dedicated Rev.), Series 2017-H, 5.00% 2036 | |
| 2,000 | | |
| 2,226 | |
| City of Chicago, Board of Education, Unlimited Tax G.O. Rev. Ref. Bonds (Dedicated Rev.), Series 2017-H, 5.00% 2046 | |
| 20,000 | | |
| 21,770 | |
| City of Chicago, Board of Education, Unlimited Tax G.O. Rev. Ref. Bonds (Dedicated Rev.), Series 2018-A, 4.00% 2020 | |
| 2,250 | | |
| 2,300 | |
| City of Chicago, Board of Education, Unlimited Tax G.O. Rev. Ref. Bonds (Dedicated Rev.), Series 2018-A, 5.00% 2026 | |
| 3,000 | | |
| 3,416 | |
| City of Chicago, Board of Education, Unlimited Tax G.O. Rev. Ref. Bonds (Dedicated Rev.), Series 2018-A, 5.00% 2027 | |
| 1,500 | | |
| 1,727 | |
| City of Chicago, Board of Education, Unlimited Tax G.O. Rev. Ref. Bonds (Dedicated Rev.), Series 2018-A, 5.00% 2029 | |
| 1,000 | | |
| 1,147 | |
| City of Chicago, Board of Education, Unlimited Tax G.O. Rev. Ref. Bonds (Dedicated Rev.), Series 2018-A, 5.00% 2030 | |
| 1,000 | | |
| 1,140 | |
| City of Chicago, Board of Education, Unlimited Tax G.O. Rev. Ref. Bonds (Dedicated Rev.), Series 2018-A, 5.00% 2034 | |
| 1,000 | | |
| 1,122 | |
| City of Chicago, Board of Education, Unlimited Tax G.O. Rev. Ref. Bonds (Dedicated Rev.), Series 2018-A, 5.00% 2035 | |
| 1,000 | | |
| 1,119 | |
| City of Chicago, Board of Education, Unlimited Tax G.O. Rev. Ref. Bonds (Dedicated Rev.), Series 2018-A, Assured Guaranty Municipal insured, 5.00% 2025 | |
| 1,500 | | |
| 1,751 | |
| City of Chicago, Board of Education, Unlimited Tax G.O. Rev. Ref. Bonds (Dedicated Rev.), Series 2018-A, Assured Guaranty Municipal insured, 5.00% 2028 | |
| 3,500 | | |
| 4,268 | |
| City of Chicago, Board of Education, Unlimited Tax G.O. Rev. Ref. Bonds (Dedicated Rev.), Series 2018-C, Assured Guaranty Municipal insured, 5.00% 2029 | |
| 7,000 | | |
| 8,480 | |
| City of Chicago, G.O. Bonds (Neighborhoods Alive 21 Program), Series 2002-B, 5.00% 2024 | |
| 1,285 | | |
| 1,403 | |
| City of Chicago, G.O. Bonds, Series 2003-B, 5.00% 2024 | |
| 2,000 | | |
| 2,183 | |
| City of Chicago, G.O. Bonds, Series 2015-A, 5.50% 2033 | |
| 3,000 | | |
| 3,352 | |
| City of Chicago, G.O. Project and Rev. Ref. Bonds, Series 2003-B, 5.00% 2022 | |
| 1,320 | | |
| 1,398 | |
| City of Chicago, G.O. Project and Rev. Ref. Bonds, Series 2003-B, 5.00% 2026 | |
| 1,795 | | |
| 2,000 | |
| City of Chicago, G.O. Project and Rev. Ref. Bonds, Series 2005-D, 5.50% 2034 | |
| 3,675 | | |
| 4,096 | |
| City of Chicago, G.O. Project and Rev. Ref. Bonds, Series 2014-A, 5.00% 2023 | |
| 825 | | |
| 888 | |
| City of Chicago, G.O. Project and Rev. Ref. Bonds, Series 2014-A, 5.25% 2030 | |
| 5,490 | | |
| 6,005 | |
| City of Chicago, G.O. Project and Rev. Ref. Bonds, Series 2017-A, 5.625% 2029 | |
| 5,755 | | |
| 6,817 | |
| |
|
| American Funds Tax-Exempt Funds |
31 |
The Tax-Exempt Bond Fund of America
| Bonds, notes & other debt instruments (continued) | |
Principal amount
(000) | | |
Value
(000) | |
| Illinois (continued) | |
| | | |
| | |
| City of Chicago, G.O. Project and Rev. Ref. Bonds, Series 2017-A, 5.625% 2030 | |
$ | 1,100 | | |
$ | 1,296 | |
| City of Chicago, G.O. Project and Rev. Ref. Bonds, Series 2017-A, 6.00% 2038 | |
| 20,000 | | |
| 23,442 | |
| City of Chicago, G.O. Rev. Ref. Bonds (Emergency Telephone System), Series 1999, FGIC-National insured, 5.25% 2020 | |
| 2,000 | | |
| 2,030 | |
| City of Chicago, G.O. Rev. Ref. Bonds, Series 2008-C, 5.00% 2034 | |
| 1,120 | | |
| 1,123 | |
| City of Chicago, G.O. Rev. Ref. Bonds, Series 2009-A, Assured Guaranty Municipal insured, 5.00% 2026 | |
| 5,000 | | |
| 5,088 | |
| City of Chicago, G.O. Rev. Ref. Bonds, Series 2015-C, 5.00% 2024 | |
| 5,020 | | |
| 5,480 | |
| City of Chicago, G.O. Rev. Ref. Bonds, Series 2015-C, 5.00% 2025 | |
| 4,000 | | |
| 4,432 | |
| City of Chicago, G.O. Rev. Ref. Bonds, Series 2015-C, 5.00% 2027 | |
| 2,000 | | |
| 2,254 | |
| City of Chicago, G.O. Rev. Ref. Bonds, Series 2015-C, 5.00% 2038 | |
| 4,730 | | |
| 5,142 | |
| City of Chicago, O’Hare International Airport, General Airport Rev. Bonds, Series 2018-B, 5.00% 2053 | |
| 50,025 | | |
| 60,071 | |
| City of Chicago, School Reform Board of Trustees of the Board of Education, Unlimited Tax G.O. Bonds (Dedicated Tax Rev.), Capital Appreciation Bonds, Series 1998-B-1, National insured, 0% 2019 | |
| 1,300 | | |
| 1,290 | |
| City of Chicago, School Reform Board of Trustees of the Board of Education, Unlimited Tax G.O. Bonds (Dedicated Tax Rev.), Capital Appreciation Bonds, Series 1998-B-1, National insured, 0% 2022 | |
| 3,185 | | |
| 2,940 | |
| City of Chicago, School Reform Board of Trustees of the Board of Education, Unlimited Tax G.O. Bonds (Dedicated Tax Rev.), Capital Appreciation Bonds, Series 1998-B-1, National insured, 0% 2031 | |
| 6,675 | | |
| 4,482 | |
| City of Chicago, School Reform Board of Trustees of the Board of Education, Unlimited Tax G.O. Bonds (Dedicated Tax Rev.), Capital Appreciation Bonds, Series 1999-A, National insured, 0% 2022 | |
| 2,285 | | |
| 2,109 | |
| City of Chicago, School Reform Board of Trustees of the Board of Education, Unlimited Tax G.O. Bonds (Dedicated Tax Rev.), Capital Appreciation Bonds, Series 1999-A, National insured, 0% 2023 | |
| 2,585 | | |
| 2,324 | |
| City of Chicago, School Reform Board of Trustees of the Board of Education, Unlimited Tax G.O. Bonds (Dedicated Tax Rev.), Capital Appreciation Bonds, Series 1999-A, National insured, 0% 2029 | |
| 5,145 | | |
| 3,759 | |
| City of Chicago, School Reform Board of Trustees of the Board of Education, Unlimited Tax G.O. Bonds (Dedicated Tax Rev.), Capital Appreciation Bonds, Series 1999-A, National insured, 0% 2031 | |
| 4,000 | | |
| 2,683 | |
| City of Chicago, School Reform Board of Trustees of the Board of Education, Unlimited Tax G.O. Bonds (Dedicated Tax Rev.), Series 2012-A, 5.00% 2042 | |
| 9,815 | | |
| 10,251 | |
| City of Chicago, School Reform Board of Trustees of the Board of Education, Unlimited Tax G.O. Bonds (Dedicated Tax Rev.), Series 2016-A, 7.00% 2044 | |
| 21,820 | | |
| 26,251 | |
| City of Chicago, Transit Auth., Sales Tax Receipts Rev. Bonds, Series 2017, Assured Guaranty Municipal insured, 5.00% 2051 | |
| 33,585 | | |
| 37,454 | |
| City of Chicago, Wastewater Transmission Rev. Bonds, Series 2012, 5.00% 2042 | |
| 7,775 | | |
| 8,187 | |
| City of Chicago, Wastewater Transmission Rev. Ref. Bonds, Capital Appreciation Bonds, Series 1998-A, National insured, 0% 2025 | |
| 210 | | |
| 186 | |
| City of Chicago, Wastewater Transmission Rev. Ref. Bonds, Capital Appreciation Bonds, Series 1998-A, National insured, 0% 2026 | |
| 20 | | |
| 17 | |
| City of Chicago, Wastewater Transmission Rev. Ref. Bonds, Capital Appreciation Bonds, Series 1998-A, National insured, 0% 2027 | |
| 1,760 | | |
| 1,464 | |
| City of Chicago, Wastewater Transmission Rev. Ref. Bonds, Capital Appreciation Bonds, Series 1998-A, National insured, 0% 2028 | |
| 3,345 | | |
| 2,677 | |
| City of Chicago, Wastewater Transmission Rev. Ref. Bonds, Series 2001, Assured Guaranty Municipal insured, 5.50% 2030 | |
| 800 | | |
| 1,001 | |
| City of Chicago, Wastewater Transmission Rev. Ref. Bonds, Series 2008-C, 5.00% 2021 | |
| 1,000 | | |
| 1,050 | |
| City of Chicago, Wastewater Transmission Rev. Ref. Bonds, Series 2008-C, 5.00% 2023 | |
| 1,975 | | |
| 2,201 | |
| City of Chicago, Wastewater Transmission Rev. Ref. Bonds, Series 2008-C, 5.00% 2024 | |
| 2,500 | | |
| 2,856 | |
| City of Chicago, Wastewater Transmission Rev. Ref. Bonds, Series 2008-C, 5.00% 2025 | |
| 4,500 | | |
| 5,242 | |
| City of Chicago, Wastewater Transmission Rev. Ref. Bonds, Series 2008-C, 5.00% 2027 | |
| 1,000 | | |
| 1,150 | |
| City of Chicago, Wastewater Transmission Rev. Ref. Bonds, Series 2008-C, 5.00% 2030 | |
| 1,000 | | |
| 1,137 | |
| City of Chicago, Wastewater Transmission Rev. Ref. Bonds, Series 2008-C, 5.00% 2031 | |
| 2,500 | | |
| 2,827 | |
| City of Chicago, Wastewater Transmission Rev. Ref. Bonds, Series 2008-C, 5.00% 2032 | |
| 3,000 | | |
| 3,379 | |
| City of Chicago, Wastewater Transmission Rev. Ref. Bonds, Series 2008-C, 5.00% 2033 | |
| 2,000 | | |
| 2,248 | |
| City of Chicago, Wastewater Transmission Rev. Ref. Bonds, Series 2008-C, 5.00% 2039 | |
| 1,000 | | |
| 1,106 | |
| City of Chicago, Wastewater Transmission Rev. Ref. Bonds, Series 2014, 5.00% 2023 | |
| 100 | | |
| 111 | |
| City of Chicago, Wastewater Transmission Rev. Ref. Bonds, Series 2017-A, 5.00% 2047 | |
| 21,165 | | |
| 23,711 | |
| City of Chicago, Wastewater Transmission Rev. Ref. Bonds, Series 2017-B, 5.00% 2031 | |
| 5,000 | | |
| 5,864 | |
| |
|
| 32 |
American Funds Tax-Exempt Funds |
The Tax-Exempt Bond Fund of America
| | |
Principal amount
(000) | | |
Value
(000) | |
| City of Chicago, Wastewater Transmission Rev. Ref. Bonds, Series 2017-B, 5.00% 2032 | |
$ | 7,600 | | |
$ | 8,873 | |
| City of Chicago, Wastewater Transmission Rev. Ref. Bonds, Series 2017-B, 5.00% 2034 | |
| 9,000 | | |
| 10,444 | |
| City of Chicago, Wastewater Transmission Rev. Ref. Bonds, Series 2017-B, 5.00% 2038 | |
| 3,915 | | |
| 4,460 | |
| City of Chicago, Water Rev. Bonds, Series 2004, 5.00% 2023 | |
| 1,750 | | |
| 1,996 | |
| City of Chicago, Water Rev. Bonds, Series 2004, 5.00% 2024 | |
| 1,000 | | |
| 1,166 | |
| City of Chicago, Water Rev. Bonds, Series 2004, 5.00% 2025 | |
| 10,275 | | |
| 12,175 | |
| City of Chicago, Water Rev. Bonds, Series 2004, 5.00% 2026 | |
| 2,125 | | |
| 2,551 | |
| City of Chicago, Water Rev. Bonds, Series 2012, 4.00% 2020 | |
| 625 | | |
| 646 | |
| City of Chicago, Water Rev. Bonds, Series 2012, 5.00% 2026 | |
| 965 | | |
| 1,060 | |
| City of Chicago, Water Rev. Bonds, Series 2014, 5.00% 2022 | |
| 530 | | |
| 588 | |
| City of Chicago, Water Rev. Bonds, Series 2014, 5.00% 2030 | |
| 4,750 | | |
| 5,382 | |
| City of Chicago, Water Rev. Bonds, Series 2014, 5.00% 2031 | |
| 5,135 | | |
| 5,808 | |
| City of Chicago, Water Rev. Ref. Bonds (Second Lien), Series 2014, 5.00% 2039 | |
| 7,500 | | |
| 8,312 | |
| City of Chicago, Water Rev. Ref. Bonds, Series 2012, 5.00% 2042 | |
| 21,875 | | |
| 23,430 | |
| City of Chicago, Water Rev. Ref. Bonds, Series 2014, 5.00% 2044 | |
| 3,000 | | |
| 3,308 | |
| Civic Center Bonds, Special State Obligation Bonds, Series 1991, AMBAC insured, 6.25% 2020 | |
| 1,785 | | |
| 1,834 | |
| Fin. Auth., Academic Fac. Lease Rev. Bonds (Provident Group - UIUC Properties LLC - University of Illinois at Urbana-Champaign Project), Series 2019-A, 5.00% 2032 | |
| 580 | | |
| 723 | |
| Fin. Auth., Academic Fac. Lease Rev. Bonds (Provident Group - UIUC Properties LLC - University of Illinois at Urbana-Champaign Project), Series 2019-A, 5.00% 2037 | |
| 780 | | |
| 952 | |
| Fin. Auth., Academic Fac. Lease Rev. Bonds (Provident Group - UIUC Properties LLC - University of Illinois at Urbana-Champaign Project), Series 2019-A, 5.00% 2038 | |
| 760 | | |
| 925 | |
| Fin. Auth., Academic Fac. Lease Rev. Bonds (Provident Group - UIUC Properties LLC - University of Illinois at Urbana-Champaign Project), Series 2019-A, 5.00% 2044 | |
| 3,250 | | |
| 3,908 | |
| Fin. Auth., Academic Fac. Lease Rev. Bonds (Provident Group - UIUC Properties LLC - University of Illinois at Urbana-Champaign Project), Series 2019-A, 5.00% 2049 | |
| 5,455 | | |
| 6,515 | |
| Fin. Auth., Academic Fac. Lease Rev. Bonds (Provident Group - UIUC Properties LLC - University of Illinois at Urbana-Champaign Project), Series 2019-A, 5.00% 2051 | |
| 1,000 | | |
| 1,189 | |
| Fin. Auth., Health Facs. Rev. Bonds (UnityPoint Health), Series 2016-D, 4.00% 2046 | |
| 2,000 | | |
| 2,108 | |
| Fin. Auth., Rev. Bonds (Advocate Health Care Network), Series 2012, 5.00% 2042 | |
| 5,315 | | |
| 5,700 | |
| Fin. Auth., Rev. Bonds (Advocate Health Care Network), Series 2015-B, 5.00% 2027 | |
| 990 | | |
| 1,168 | |
| Fin. Auth., Rev. Bonds (Art Institute of Chicago), Series 2012-A, 5.00% 2034 | |
| 4,920 | | |
| 5,317 | |
| Fin. Auth., Rev. Bonds (Art Institute of Chicago), Series 2012-A, 5.00% 2034 (preref. 2022) | |
| 30 | | |
| 33 | |
| Fin. Auth., Rev. Bonds (Art Institute of Chicago), Series 2016, 4.00% 2038 | |
| 3,850 | | |
| 4,167 | |
| Fin. Auth., Rev. Bonds (Art Institute of Chicago), Series 2016, 5.00% 2030 | |
| 2,500 | | |
| 2,971 | |
| Fin. Auth., Rev. Bonds (Central DuPage Health), Series 2009-B, 5.75% 2039 (preref. 2019) | |
| 11,520 | | |
| 11,651 | |
| Fin. Auth., Rev. Bonds (Clean Water Initiative Revolving Fund), Series 2016, 4.00% 2025 | |
| 2,680 | | |
| 3,080 | |
| Fin. Auth., Rev. Bonds (Clean Water Initiative Revolving Fund), Series 2016, 4.00% 2026 | |
| 5,300 | | |
| 6,077 | |
| Fin. Auth., Rev. Bonds (Clean Water Initiative Revolving Fund), Series 2016, 5.00% 2027 | |
| 5,000 | | |
| 6,086 | |
| Fin. Auth., Rev. Bonds (Clean Water Initiative Revolving Fund), Series 2016, 5.00% 2028 | |
| 6,410 | | |
| 7,762 | |
| Fin. Auth., Rev. Bonds (Clean Water Initiative Revolving Fund), Series 2016, 5.00% 2029 | |
| 8,315 | | |
| 10,047 | |
| Fin. Auth., Rev. Bonds (Clean Water Initiative Revolving Fund), Series 2016, 5.00% 2029 | |
| 2,700 | | |
| 3,255 | |
| Fin. Auth., Rev. Bonds (Clean Water Initiative Revolving Fund), Series 2016, 5.00% 2030 | |
| 6,200 | | |
| 7,455 | |
| Fin. Auth., Rev. Bonds (Clean Water Initiative Revolving Fund), Series 2016, 5.00% 2031 | |
| 3,580 | | |
| 4,273 | |
| Fin. Auth., Rev. Bonds (Clean Water Initiative Revolving Fund), Series 2017, 5.00% 2026 | |
| 4,875 | | |
| 5,936 | |
| Fin. Auth., Rev. Bonds (Clean Water Initiative Revolving Fund), Series 2017, 5.00% 2029 | |
| 4,000 | | |
| 4,950 | |
| Fin. Auth., Rev. Bonds (Clean Water Initiative Revolving Fund), Series 2017, 5.00% 2029 | |
| 2,000 | | |
| 2,468 | |
| Fin. Auth., Rev. Bonds (Clean Water Initiative Revolving Fund), Series 2017, 5.00% 2030 | |
| 7,420 | | |
| 9,131 | |
| Fin. Auth., Rev. Bonds (Clean Water Initiative Revolving Fund), Series 2017, 5.00% 2030 | |
| 3,500 | | |
| 4,294 | |
| Fin. Auth., Rev. Bonds (Clean Water Initiative Revolving Fund), Series 2017, 5.00% 2031 | |
| 7,080 | | |
| 8,639 | |
| Fin. Auth., Rev. Bonds (Clean Water Initiative Revolving Fund), Series 2017, 5.00% 2032 | |
| 5,000 | | |
| 6,080 | |
| Fin. Auth., Rev. Bonds (Clean Water Initiative Revolving Fund), Series 2017, 5.00% 2033 | |
| 5,000 | | |
| 6,064 | |
| Fin. Auth., Rev. Bonds (Clean Water Initiative Revolving Fund), Series 2017, 5.00% 2034 | |
| 5,000 | | |
| 6,035 | |
| Fin. Auth., Rev. Bonds (Clean Water Initiative Revolving Fund), Series 2017, 5.00% 2035 | |
| 8,180 | | |
| 9,842 | |
| Fin. Auth., Rev. Bonds (Clean Water Initiative Revolving Fund), Series 2017, 5.00% 2036 | |
| 700 | | |
| 839 | |
| Fin. Auth., Rev. Bonds (DePaul University), Series 2011-A, 6.125% 2040 (preref. 2021) | |
| 10,000 | | |
| 10,816 | |
| Fin. Auth., Rev. Bonds (DePaul University), Series 2016, 5.00% 2030 | |
| 1,000 | | |
| 1,201 | |
| Fin. Auth., Rev. Bonds (DePaul University), Series 2016, 5.00% 2032 | |
| 1,000 | | |
| 1,191 | |
| Fin. Auth., Rev. Bonds (DePaul University), Series 2016, 5.00% 2033 | |
| 1,150 | | |
| 1,365 | |
| Fin. Auth., Rev. Bonds (DePaul University), Series 2016, 5.00% 2034 | |
| 1,310 | | |
| 1,550 | |
| Fin. Auth., Rev. Bonds (DePaul University), Series 2016, 5.00% 2036 | |
| 1,000 | | |
| 1,176 | |
| Fin. Auth., Rev. Bonds (DePaul University), Series 2016, 5.00% 2041 | |
| 3,500 | | |
| 4,072 | |
| Fin. Auth., Rev. Bonds (Edward-Elmhurst Healthcare), Series 2017-A, 5.00% 2027 | |
| 925 | | |
| 1,114 | |
| |
|
| American Funds Tax-Exempt Funds |
33 |
The Tax-Exempt Bond Fund of America
| Bonds, notes & other debt instruments (continued) | |
Principal amount
(000) | | |
Value
(000) | |
| Illinois (continued) | |
| | | |
| | |
| Fin. Auth., Rev. Bonds (Edward-Elmhurst Healthcare), Series 2017-A, 5.00% 2028 | |
$ | 1,480 | | |
$ | 1,779 | |
| Fin. Auth., Rev. Bonds (Edward-Elmhurst Healthcare), Series 2017-A, 5.00% 2029 | |
| 3,000 | | |
| 3,587 | |
| Fin. Auth., Rev. Bonds (Edward-Elmhurst Healthcare), Series 2017-A, 5.00% 2030 | |
| 5,100 | | |
| 6,057 | |
| Fin. Auth., Rev. Bonds (Edward-Elmhurst Healthcare), Series 2017-A, 5.00% 2031 | |
| 3,000 | | |
| 3,538 | |
| Fin. Auth., Rev. Bonds (Edward-Elmhurst Healthcare), Series 2017-A, 5.00% 2032 | |
| 2,500 | | |
| 2,932 | |
| Fin. Auth., Rev. Bonds (Edward-Elmhurst Healthcare), Series 2017-A, 5.00% 2033 | |
| 9,000 | | |
| 10,509 | |
| Fin. Auth., Rev. Bonds (Edward-Elmhurst Healthcare), Series 2017-A, 5.00% 2034 | |
| 3,000 | | |
| 3,488 | |
| Fin. Auth., Rev. Bonds (Edward-Elmhurst Healthcare), Series 2017-A, 5.00% 2035 | |
| 6,710 | | |
| 7,765 | |
| Fin. Auth., Rev. Bonds (Edward-Elmhurst Healthcare), Series 2017-A, 5.00% 2036 | |
| 7,000 | | |
| 8,066 | |
| Fin. Auth., Rev. Bonds (Friendship Village Schaumburg), Series 2017, 5.125% 2045 | |
| 2,750 | | |
| 2,653 | |
| Fin. Auth., Rev. Bonds (Lifespace Communities, Inc.), Series 2015-A, 5.00% 2020 | |
| 695 | | |
| 711 | |
| Fin. Auth., Rev. Bonds (Lifespace Communities, Inc.), Series 2015-A, 5.00% 2024 | |
| 245 | | |
| 275 | |
| Fin. Auth., Rev. Bonds (Lifespace Communities, Inc.), Series 2015-A, 5.00% 2025 | |
| 760 | | |
| 867 | |
| Fin. Auth., Rev. Bonds (Lifespace Communities, Inc.), Series 2015-A, 5.00% 2030 | |
| 1,180 | | |
| 1,321 | |
| Fin. Auth., Rev. Bonds (Lifespace Communities, Inc.), Series 2015-A, 5.00% 2035 | |
| 1,350 | | |
| 1,490 | |
| Fin. Auth., Rev. Bonds (Mercy Health Corp.), Series 2016, 4.00% 2036 | |
| 2,420 | | |
| 2,570 | |
| Fin. Auth., Rev. Bonds (Mercy Health Corp.), Series 2016, 5.00% 2026 | |
| 3,000 | | |
| 3,579 | |
| Fin. Auth., Rev. Bonds (Mercy Health Corp.), Series 2016, 5.00% 2046 | |
| 39,370 | | |
| 44,212 | |
| Fin. Auth., Rev. Bonds (Northwest Community Hospital), Series 2016-A, 4.00% 2037 | |
| 11,520 | | |
| 12,338 | |
| Fin. Auth., Rev. Bonds (Northwest Community Hospital), Series 2016-A, 4.00% 2038 | |
| 6,140 | | |
| 6,560 | |
| Fin. Auth., Rev. Bonds (Northwest Community Hospital), Series 2016-A, 5.00% 2026 | |
| 2,000 | | |
| 2,428 | |
| Fin. Auth., Rev. Bonds (Northwest Community Hospital), Series 2016-A, 5.00% 2032 | |
| 3,290 | | |
| 3,844 | |
| Fin. Auth., Rev. Bonds (Northwest Community Hospital), Series 2016-A, 5.00% 2033 | |
| 1,425 | | |
| 1,658 | |
| Fin. Auth., Rev. Bonds (Northwest Community Hospital), Series 2016-A, 5.00% 2034 | |
| 3,240 | | |
| 3,753 | |
| Fin. Auth., Rev. Bonds (Northwest Community Hospital), Series 2016-A, 5.00% 2035 | |
| 3,335 | | |
| 3,851 | |
| Fin. Auth., Rev. Bonds (Northwestern Memorial Healthcare), Series 2017-A, 5.00% 2030 | |
| 1,000 | | |
| 1,237 | |
| Fin. Auth., Rev. Bonds (Northwestern Memorial Healthcare), Series 2017-A, 5.00% 2042 | |
| 7,000 | | |
| 8,238 | |
| Fin. Auth., Rev. Bonds (Northwestern Memorial Healthcare), Series 2017-B, 5.00% 2057 (put 2022) | |
| 9,600 | | |
| 10,764 | |
| Fin. Auth., Rev. Bonds (OSF Healthcare System), Series 2012-A, 5.00% 2028 | |
| 2,275 | | |
| 2,477 | |
| Fin. Auth., Rev. Bonds (Presbyterian Homes Obligated Group), Series 2016-A, 5.00% 2025 | |
| 2,345 | | |
| 2,732 | |
| Fin. Auth., Rev. Bonds (Presbyterian Homes Obligated Group), Series 2016-A, 5.00% 2027 | |
| 5,000 | | |
| 5,945 | |
| Fin. Auth., Rev. Bonds (Presbyterian Homes Obligated Group), Series 2016-A, 5.00% 2028 | |
| 3,250 | | |
| 3,847 | |
| Fin. Auth., Rev. Bonds (Presbyterian Homes Obligated Group), Series 2016-A, 5.00% 2030 | |
| 1,165 | | |
| 1,364 | |
| Fin. Auth., Rev. Bonds (Presbyterian Homes Obligated Group), Series 2016-A, 5.00% 2031 | |
| 1,125 | | |
| 1,307 | |
| Fin. Auth., Rev. Bonds (Presbyterian Homes Obligated Group), Series 2016-B, (1-month USD-LIBOR x 0.70 + 1.35%) 3.031% 2036 (put 2021)1 | |
| 1,775 | | |
| 1,781 | |
| Fin. Auth., Rev. Bonds (Presence Health Network), Series 2016-C, 4.00% 2041 | |
| 3,995 | | |
| 4,348 | |
| Fin. Auth., Rev. Bonds (Presence Health Network), Series 2016-C, 4.00% 2041 (preref. 2027) | |
| 5 | | |
| 6 | |
| Fin. Auth., Rev. Bonds (Presence Health Network), Series 2016-C, 5.00% 2027 | |
| 1,875 | | |
| 2,332 | |
| Fin. Auth., Rev. Bonds (Presence Health Network), Series 2016-C, 5.00% 2028 | |
| 5,000 | | |
| 6,201 | |
| Fin. Auth., Rev. Bonds (Presence Health Network), Series 2016-C, 5.00% 2029 | |
| 2,000 | | |
| 2,466 | |
| Fin. Auth., Rev. Bonds (Presence Health Network), Series 2016-C, 5.00% 2030 | |
| 7,615 | | |
| 9,300 | |
| Fin. Auth., Rev. Bonds (Presence Health Network), Series 2016-C, 5.00% 2031 | |
| 3,000 | | |
| 3,643 | |
| Fin. Auth., Rev. Bonds (Presence Health Network), Series 2016-C, 5.00% 2033 | |
| 2,500 | | |
| 3,012 | |
| Fin. Auth., Rev. Bonds (Presence Health Network), Series 2016-C, 5.00% 2034 | |
| 1,895 | | |
| 2,264 | |
| Fin. Auth., Rev. Bonds (Presence Health Network), Series 2016-C, 5.00% 2036 | |
| 1,145 | | |
| 1,354 | |
| Fin. Auth., Rev. Bonds (Presence Health Network), Series 2016-C, 5.00% 2041 | |
| 2,000 | | |
| 2,334 | |
| Fin. Auth., Rev. Bonds (Rehabilitation Institute of Chicago), Series 2013-A, 6.00% 2043 | |
| 2,700 | | |
| 3,046 | |
| Fin. Auth., Rev. Bonds (Rush University Medical Center Obligated Group), Series 2015-A, 5.00% 2030 | |
| 5,000 | | |
| 5,786 | |
| Fin. Auth., Rev. Bonds (Rush University Medical Center Obligated Group), Series 2015-A, 5.00% 2034 | |
| 2,500 | | |
| 2,852 | |
| Fin. Auth., Rev. Bonds (Rush University Medical Center Obligated Group), Series 2015-A, 5.00% 2038 | |
| 7,700 | | |
| 8,667 | |
| Fin. Auth., Rev. Bonds (Rush University Medical Center Obligated Group), Series 2015-B, 5.00% 2034 | |
| 2,595 | | |
| 2,960 | |
| Fin. Auth., Rev. Bonds (Silver Cross Hospital and Medical Centers), Series 2009, 6.875% 2038 (preref. 2019) | |
| 4,500 | | |
| 4,509 | |
| Fin. Auth., Rev. Bonds (The Cable Foundation), Series 2016-A, 5.00% 2045 | |
| 26,575 | | |
| 30,089 | |
| Fin. Auth., Rev. Bonds (Trinity Health Credit Group), Series 2011-IL, 5.00% 2030 (preref. 2021) | |
| 725 | | |
| 788 | |
| Fin. Auth., Rev. Bonds (University of Chicago Medical Center), Series 2016-A, 5.00% 2026 | |
| 1,610 | | |
| 1,976 | |
| Fin. Auth., Rev. Bonds (University of Chicago Medical Center), Series 2016-B, 5.00% 2035 | |
| 5,150 | | |
| 6,076 | |
| |
|
| 34 |
American Funds Tax-Exempt Funds |
The Tax-Exempt Bond Fund of America
| | |
Principal amount
(000) | | |
Value
(000) | |
| Fin. Auth., Rev. Green Bonds (Clean Water Initiative Revolving Fund), Series 2019, 5.00% 2034 | |
$ | 8,780 | | |
$ | 11,080 | |
| Fin. Auth., Rev. Green Bonds (Clean Water Initiative Revolving Fund), Series 2019, 5.00% 2036 | |
| 7,000 | | |
| 8,766 | |
| Fin. Auth., Rev. Green Bonds (Clean Water Initiative Revolving Fund), Series 2019, 5.00% 2037 | |
| 8,000 | | |
| 9,977 | |
| Fin. Auth., Rev. Ref. Bonds (Advocate Health Care Network), Series 2014, 5.00% 2033 | |
| 8,500 | | |
| 9,693 | |
| Fin. Auth., Rev. Ref. Bonds (Anne & Robert H. Lurie Children’s Hospital), Series 2017, 4.00% 2037 | |
| 2,500 | | |
| 2,715 | |
| Fin. Auth., Rev. Ref. Bonds (Anne & Robert H. Lurie Children’s Hospital), Series 2017, 5.00% 2034 | |
| 1,000 | | |
| 1,201 | |
| Fin. Auth., Rev. Ref. Bonds (Anne & Robert H. Lurie Children’s Hospital), Series 2017, 5.00% 2035 | |
| 5,900 | | |
| 7,053 | |
| Fin. Auth., Rev. Ref. Bonds (Art Institute of Chicago), Series 2010-A, 5.25% 2040 | |
| 5,350 | | |
| 5,469 | |
| Fin. Auth., Rev. Ref. Bonds (Ascension Health Senior Credit Group), Series 2012-A, 5.00% 2042 | |
| 7,500 | | |
| 8,092 | |
| Fin. Auth., Rev. Ref. Bonds (Bradley University Project), Series 2017-C, 5.00% 2028 | |
| 1,860 | | |
| 2,249 | |
| Fin. Auth., Rev. Ref. Bonds (Bradley University Project), Series 2017-C, 5.00% 2029 | |
| 650 | | |
| 782 | |
| Fin. Auth., Rev. Ref. Bonds (Bradley University Project), Series 2017-C, 5.00% 2031 | |
| 1,185 | | |
| 1,409 | |
| Fin. Auth., Rev. Ref. Bonds (Christian Homes, Inc.), Series 2016, 5.00% 2040 | |
| 1,275 | | |
| 1,356 | |
| Fin. Auth., Rev. Ref. Bonds (DePaul University), Series 2013, 5.00% 2024 | |
| 600 | | |
| 687 | |
| Fin. Auth., Rev. Ref. Bonds (DePaul University), Series 2016-A, 4.00% 2040 | |
| 7,500 | | |
| 8,142 | |
| Fin. Auth., Rev. Ref. Bonds (DePaul University), Series 2016-A, 5.00% 2030 | |
| 1,000 | | |
| 1,200 | |
| Fin. Auth., Rev. Ref. Bonds (DePaul University), Series 2016-A, 5.00% 2035 | |
| 1,000 | | |
| 1,180 | |
| Fin. Auth., Rev. Ref. Bonds (Field Museum of Natural History), Series 2019, 2.133% 2034 (put 2022)1 | |
| 32,160 | | |
| 32,242 | |
| Fin. Auth., Rev. Ref. Bonds (Loyola University of Chicago), Series 2012-B, 5.00% 2025 | |
| 3,000 | | |
| 3,284 | |
| Fin. Auth., Rev. Ref. Bonds (Loyola University of Chicago), Series 2012-B, 5.00% 2026 | |
| 1,535 | | |
| 1,674 | |
| Fin. Auth., Rev. Ref. Bonds (Loyola University of Chicago), Series 2012-B, 5.00% 2042 | |
| 9,385 | | |
| 10,098 | |
| Fin. Auth., Rev. Ref. Bonds (Northwestern Memorial Hospital), Series 2009-A, 6.00% 2039 (preref. 2019) | |
| 14,545 | | |
| 14,570 | |
| Fin. Auth., Rev. Ref. Bonds (OSF Healthcare System), Series 2010-A, 6.00% 2039 | |
| 1,765 | | |
| 1,836 | |
| Fin. Auth., Rev. Ref. Bonds (OSF Healthcare System), Series 2010-A, 6.00% 2039 (preref. 2020) | |
| 9,475 | | |
| 9,830 | |
| Fin. Auth., Rev. Ref. Bonds (OSF Healthcare System), Series 2012-A, 5.00% 2022 | |
| 1,290 | | |
| 1,418 | |
| Fin. Auth., Rev. Ref. Bonds (OSF Healthcare System), Series 2015-A, 5.00% 2031 | |
| 3,500 | | |
| 4,054 | |
| Fin. Auth., Rev. Ref. Bonds (OSF Healthcare System), Series 2015-A, 5.00% 2032 | |
| 3,500 | | |
| 4,036 | |
| Fin. Auth., Rev. Ref. Bonds (OSF Healthcare System), Series 2015-A, 5.00% 2034 | |
| 2,000 | | |
| 2,291 | |
| Fin. Auth., Rev. Ref. Bonds (OSF Healthcare System), Series 2015-A, 5.00% 2045 | |
| 26,890 | | |
| 29,956 | |
| Fin. Auth., Rev. Ref. Bonds (Provena Health), Series 2009-A, 7.75% 2034 (preref. 2019) | |
| 14,860 | | |
| 14,895 | |
| Fin. Auth., Rev. Ref. Bonds (Provena Health), Series 2009-A, 7.75% 2034 (preref. 2019) | |
| 180 | | |
| 180 | |
| Fin. Auth., Rev. Ref. Bonds (Provena Health), Series 2010-A, 6.00% 2028 (preref. 2020) | |
| 14,000 | | |
| 14,505 | |
| Fin. Auth., Rev. Ref. Bonds (Silver Cross Hospital and Medical Centers), Series 2015-C, 4.125% 2037 | |
| 1,000 | | |
| 1,042 | |
| Fin. Auth., Rev. Ref. Bonds (Silver Cross Hospital and Medical Centers), Series 2015-C, 5.00% 2035 | |
| 6,745 | | |
| 7,632 | |
| Fin. Auth., Rev. Ref. Bonds (Silver Cross Hospital and Medical Centers), Series 2015-C, 5.00% 2044 | |
| 10,885 | | |
| 12,118 | |
| Fin. Auth., Rev. Ref. Bonds (Southern Illinois Healthcare Enterprises, Inc.), Series 2017-C, 5.00% 2026 | |
| 650 | | |
| 779 | |
| Fin. Auth., Rev. Ref. Bonds (Southern Illinois Healthcare Enterprises, Inc.), Series 2017-C, 5.00% 2032 | |
| 1,600 | | |
| 1,884 | |
| Fin. Auth., Rev. Ref. Bonds (University of Chicago Medical Center), Series 2009-B, 5.00% 2025 | |
| 6,975 | | |
| 7,250 | |
| Fin. Auth., Rev. Ref. Bonds (University of Chicago Medical Center), Series 2009-B, 5.00% 2025 (preref. 2020) | |
| 3,525 | | |
| 3,664 | |
| Fin. Auth., Rev. Ref. Bonds (University of Chicago Medical Center), Series 2009-B, 5.00% 2026 | |
| 2,660 | | |
| 2,763 | |
| Fin. Auth., Rev. Ref. Bonds (University of Chicago Medical Center), Series 2009-B, 5.00% 2026 (preref. 2020) | |
| 1,340 | | |
| 1,393 | |
| Fin. Auth., Student Housing and Academic Fac. Rev. Bonds (CHF-Chicago, LLC - University of Illinois at Chicago Project), Series 2017-A, 5.00% 2047 | |
| 1,200 | | |
| 1,340 | |
| |
|
| American Funds Tax-Exempt Funds |
35 |
The Tax-Exempt Bond Fund of America
| Bonds, notes & other debt instruments (continued) | |
Principal amount
(000) | | |
Value
(000) | |
| Illinois (continued) | |
| | | |
| | |
| Fin. Auth., Student Housing Rev. Bonds (CHF-Cook, LLC - Northeastern Illinois University Project), Series 2015-A, 5.00% 2047 | |
$ | 1,265 | | |
$ | 1,275 | |
| Fin. Auth., Student Housing Rev. Bonds (CHF-DeKalb II, LLC - Northern Illinois University Project), Series 2011, 6.875% 2043 | |
| 40,015 | | |
| 42,545 | |
| Fin. Auth., Student Housing Rev. Bonds (CHF-Normal, LLC - Illinois State University Project), Series 2011, 6.75% 2031 (preref. 2021) | |
| 1,000 | | |
| 1,092 | |
| Fin. Auth., Student Housing Rev. Bonds (CHF-Normal, LLC - Illinois State University Project), Series 2011, 7.00% 2043 (preref. 2021) | |
| 12,500 | | |
| 13,688 | |
| G.O. Bonds, Series 2010, Assured Guaranty Municipal insured, 5.00% 2020 | |
| 1,450 | | |
| 1,469 | |
| G.O. Bonds, Series 2010, Assured Guaranty Municipal insured, 5.00% 2022 | |
| 230 | | |
| 233 | |
| G.O. Bonds, Series 2012, 5.00% 2035 | |
| 1,000 | | |
| 1,043 | |
| G.O. Bonds, Series 2013-A, Assured Guaranty Municipal insured, 5.00% 2022 | |
| 980 | | |
| 1,047 | |
| G.O. Bonds, Series 2014, 5.00% 2020 | |
| 5,290 | | |
| 5,372 | |
| G.O. Bonds, Series 2014, 5.00% 2021 | |
| 1,000 | | |
| 1,041 | |
| G.O. Bonds, Series 2014, 5.00% 2024 | |
| 2,000 | | |
| 2,193 | |
| G.O. Bonds, Series 2014, 5.00% 2039 | |
| 6,275 | | |
| 6,658 | |
| G.O. Bonds, Series 2014, Assured Guaranty Municipal insured, 5.00% 2024 | |
| 2,795 | | |
| 3,083 | |
| G.O. Bonds, Series 2014, Assured Guaranty Municipal insured, 5.00% 2026 | |
| 2,000 | | |
| 2,196 | |
| G.O. Bonds, Series 2014, Assured Guaranty Municipal insured, 5.00% 2039 | |
| 5,100 | | |
| 5,425 | |
| G.O. Bonds, Series 2016, 5.00% 2028 | |
| 4,840 | | |
| 5,450 | |
| G.O. Bonds, Series 2016, 5.00% 2033 | |
| 7,200 | | |
| 7,970 | |
| G.O. Bonds, Series 2016, 5.00% 2034 | |
| 1,925 | | |
| 2,124 | |
| G.O. Bonds, Series 2016, 5.00% 2037 | |
| 7,500 | | |
| 8,212 | |
| G.O. Bonds, Series 2016, 5.00% 2038 | |
| 14,000 | | |
| 15,293 | |
| G.O. Bonds, Series 2016, Assured Guaranty Municipal insured, 5.00% 2030 | |
| 7,700 | | |
| 8,555 | |
| G.O. Bonds, Series 2016, Assured Guaranty Municipal insured, 5.00% 2041 | |
| 2,000 | | |
| 2,157 | |
| G.O. Bonds, Series 2017-A, 5.00% 2023 | |
| 3,000 | | |
| 3,284 | |
| G.O. Bonds, Series 2017-A, 5.00% 2036 | |
| 11,500 | | |
| 12,571 | |
| G.O. Bonds, Series 2017-B, 5.00% 2019 | |
| 6,300 | | |
| 6,346 | |
| G.O. Bonds, Series 2017-C, 5.00% 2029 | |
| 18,250 | | |
| 20,510 | |
| G.O. Bonds, Series 2017-D, BAM insured, 5.00% 2020 | |
| 4,150 | | |
| 4,298 | |
| G.O. Bonds, Series 2017-D, BAM insured, 5.00% 2021 | |
| 29,000 | | |
| 30,723 | |
| G.O. Bonds, Series 2017-D, BAM insured, 5.00% 2024 | |
| 8,000 | | |
| 8,834 | |
| G.O. Bonds, Series 2017-D, BAM insured, 5.00% 2026 | |
| 25,355 | | |
| 28,562 | |
| G.O. Bonds, Series 2017-D, BAM insured, 5.00% 2028 | |
| 15,470 | | |
| 17,487 | |
| G.O. Bonds, Series 2018-A, 5.00% 2020 | |
| 6,000 | | |
| 6,137 | |
| G.O. Rev. Ref. Bonds, Series 2007, 5.25% 2021 | |
| 2,275 | | |
| 2,372 | |
| G.O. Rev. Ref. Bonds, Series 2007-B, 5.25% 2020 | |
| 3,475 | | |
| 3,523 | |
| G.O. Rev. Ref. Bonds, Series 2012, 4.00% 2025 | |
| 1,360 | | |
| 1,407 | |
| G.O. Rev. Ref. Bonds, Series 2012, 5.00% 2019 | |
| 2,660 | | |
| 2,660 | |
| G.O. Rev. Ref. Bonds, Series 2012, 5.00% 2020 | |
| 5,000 | | |
| 5,152 | |
| G.O. Rev. Ref. Bonds, Series 2012, Assured Guaranty Municipal insured, 5.00% 2025 | |
| 4,540 | | |
| 4,851 | |
| G.O. Rev. Ref. Bonds, Series 2016, 5.00% 2020 | |
| 4,430 | | |
| 4,543 | |
| G.O. Rev. Ref. Bonds, Series 2016, 5.00% 2020 | |
| 1,250 | | |
| 1,269 | |
| G.O. Rev. Ref. Bonds, Series 2016, 5.00% 2027 | |
| 10,000 | | |
| 11,428 | |
| G.O. Rev. Ref. Bonds, Series 2016, 5.00% 2028 | |
| 3,000 | | |
| 3,415 | |
| G.O. Rev. Ref. Bonds, Series 2018-A, 5.00% 2024 | |
| 2,000 | | |
| 2,221 | |
| G.O. Rev. Ref. Bonds, Series 2018-A, 5.00% 2025 | |
| 1,320 | | |
| 1,486 | |
| G.O. Rev. Ref. Bonds, Series 2018-A, 5.00% 2026 | |
| 3,500 | | |
| 3,986 | |
| G.O. Rev. Ref. Bonds, Series 2018-A, 5.00% 2027 | |
| 3,000 | | |
| 3,452 | |
| G.O. Rev. Ref. Bonds, Series 2018-A, 5.00% 2028 | |
| 6,000 | | |
| 6,970 | |
| G.O. Rev. Ref. Bonds, Series 2018-B, 5.00% 2033 | |
| 2,565 | | |
| 2,903 | |
| Toll Highway Auth., Toll Highway Rev. Bonds, Series 2013-A, 5.00% 2038 | |
| 34,430 | | |
| 37,713 | |
| Other securities | |
| | | |
| 1,216,115 | |
| | |
| | | |
| 2,983,762 | |
| | |
| | | |
| | |
| Kansas 0.78% | |
| | | |
| | |
| University of Kansas Hospital Auth., Health Facs. and Improvement Rev. Bonds (University of Kansas Health System), Series 2017-A, 5.00% 2047 | |
| 44,740 | | |
| 51,955 | |
| City of Wichita, Sales Tax Special Obligation Rev. Bonds (K-96 Greenwich Star Bond Project), Series 2013, 7.55% 2033 (preref. 2020)2 | |
| 29,385 | | |
| 31,674 | |
| Other securities | |
| | | |
| 84,771 | |
| | |
| | | |
| 168,400 | |
| |
|
| 36 |
American Funds Tax-Exempt Funds |
The Tax-Exempt Bond Fund of America
| | |
Principal amount
(000) | | |
Value
(000) | |
| Michigan 4.57% | |
| | | |
| | |
| Fin. Auth., Distributable State Aid Rev. Bonds (Charter County of Wayne Criminal Justice Center Project), Series 2018, 5.00% 2036 | |
$ | 2,500 | | |
$ | 3,058 | |
| Fin. Auth., Distributable State Aid Rev. Bonds (Charter County of Wayne Criminal Justice Center Project), Series 2018, 5.00% 2037 | |
| 1,000 | | |
| 1,215 | |
| Fin. Auth., Distributable State Aid Rev. Bonds (Charter County of Wayne Criminal Justice Center Project), Series 2018, 5.00% 2038 | |
| 1,000 | | |
| 1,211 | |
| Fin. Auth., Distributable State Aid Rev. Bonds (Charter County of Wayne Criminal Justice Center Project), Series 2018, 5.00% 2043 | |
| 3,500 | | |
| 4,200 | |
| Fin. Auth., Hospital Rev. and Rev. Ref. Bonds (Trinity Health Credit Group), Series 2019-MI-1, 5.00% 2048 | |
| 6,560 | | |
| 7,812 | |
| Fin. Auth., Hospital Rev. and Rev. Ref. Bonds (Trinity Health Credit Group), Series 2019-MI-2, 5.00% 2044 (put 2025) | |
| 5,000 | | |
| 5,898 | |
| Fin. Auth., Local Government Loan Program Rev. Bonds (Detroit Fin. Recovery Income Tax Local Project Bonds), Series 2014-F-1, 4.50% 2029 | |
| 2,150 | | |
| 2,335 | |
| Fin. Auth., Local Government Loan Program Rev. Bonds (Detroit Water and Sewerage Dept., Sewage Disposal System Rev. and Rev. Ref. Local Project Bonds), Series 2014-C-1, 5.00% 2044 | |
| 6,050 | | |
| 6,501 | |
| Fin. Auth., Local Government Loan Program Rev. Bonds (Detroit Water and Sewerage Dept., Sewage Disposal System Rev. and Rev. Ref. Local Project Bonds), Series 2014-C-3, Assured Guaranty Municipal insured, 5.00% 2023 | |
| 8,000 | | |
| 9,149 | |
| Fin. Auth., Local Government Loan Program Rev. Bonds (Detroit Water and Sewerage Dept., Sewage Disposal System Rev. Ref. Local Project Bonds), Series 2014-C-3, Assured Guaranty Municipal insured, 5.00% 2032 | |
| 1,500 | | |
| 1,721 | |
| Fin. Auth., Local Government Loan Program Rev. Bonds (Detroit Water and Sewerage Dept., Sewage Disposal System Rev. Ref. Local Project Bonds), Series 2015-C, 5.00% 2028 | |
| 1,415 | | |
| 1,672 | |
| Fin. Auth., Local Government Loan Program Rev. Bonds (Detroit Water and Sewerage Dept., Sewage Disposal System Rev. Ref. Local Project Bonds), Series 2015-C, 5.00% 2032 | |
| 1,355 | | |
| 1,575 | |
| Fin. Auth., Local Government Loan Program Rev. Bonds (Detroit Water and Sewerage Dept., Sewage Disposal System Rev. Ref. Local Project Bonds), Series 2015-C, 5.00% 2033 | |
| 2,565 | | |
| 2,975 | |
| Fin. Auth., Local Government Loan Program Rev. Bonds (Detroit Water and Sewerage Dept., Sewage Disposal System Rev. Ref. Local Project Bonds), Series 2015-C, 5.00% 2034 | |
| 3,000 | | |
| 3,470 | |
| Fin. Auth., Local Government Loan Program Rev. Bonds (Detroit Water and Sewerage Dept., Sewage Disposal System Rev. Ref. Local Project Bonds), Series 2015-C, 5.00% 2035 | |
| 3,000 | | |
| 3,461 | |
| Fin. Auth., Local Government Loan Program Rev. Bonds (Detroit Water and Sewerage Dept., Water Supply System Rev. Ref. Local Project Bonds), Series 2014-D-4, 5.00% 2034 | |
| 1,425 | | |
| 1,622 | |
| Hospital Fin. Auth., Hospital Rev. and Rev. Ref. Bonds (Trinity Health Credit Group), Series 2015, 5.00% 2030 | |
| 5,000 | | |
| 5,471 | |
| Hospital Fin. Auth., Hospital Rev. and Rev. Ref. Bonds (Trinity Health Credit Group), Series 2015, 5.50% 2026 | |
| 750 | | |
| 917 | |
| Hospital Fin. Auth., Hospital Rev. and Rev. Ref. Bonds (Trinity Health Credit Group), Series 2017, 5.00% 2028 | |
| 2,000 | | |
| 2,494 | |
| Hospital Fin. Auth., Hospital Rev. and Rev. Ref. Bonds (Trinity Health Credit Group), Series 2017, 5.00% 2046 | |
| 6,455 | | |
| 7,548 | |
| Hospital Fin. Auth., Hospital Rev. and Rev. Ref. Bonds (Trinity Health Credit Group), Series 2017-A, 4.00% 2036 | |
| 31,480 | | |
| 34,934 | |
| Hospital Fin. Auth., Hospital Rev. and Rev. Ref. Bonds (Trinity Health Credit Group), Series 2017-A, 4.00% 2040 | |
| 22,030 | | |
| 24,114 | |
| Hospital Fin. Auth., Hospital Rev. and Rev. Ref. Bonds (Trinity Health Credit Group), Series 2017-A, 5.00% 2034 | |
| 2,500 | | |
| 3,044 | |
| Hospital Fin. Auth., Hospital Rev. and Rev. Ref. Bonds (Trinity Health Credit Group), Series 2017-A, 5.00% 2035 | |
| 4,000 | | |
| 4,847 | |
| Hospital Fin. Auth., Hospital Rev. and Rev. Ref. Bonds (Trinity Health Credit Group), Series 2017-A, 5.00% 2037 | |
| 5,000 | | |
| 6,011 | |
| Hospital Fin. Auth., Hospital Rev. and Rev. Ref. Bonds (Trinity Health Credit Group), Series 2017-A, 5.00% 2047 | |
| 32,440 | | |
| 35,550 | |
| Hospital Fin. Auth., Hospital Rev. Bonds (Trinity Health Credit Group), Series 2011, 5.00% 2039 | |
| 1,890 | | |
| 2,034 | |
| |
|
| American Funds Tax-Exempt Funds |
37 |
The Tax-Exempt Bond Fund of America
| Bonds, notes & other debt instruments (continued) | |
Principal amount
(000) | | |
Value
(000) | |
| Michigan (continued) | |
| | | |
| | |
| Hospital Fin. Auth., Hospital Rev. Ref. Bonds (Beaumont Health Credit Group), Series 2016-A, 5.00% 2044 | |
$ | 15,010 | | |
$ | 17,074 | |
| Hospital Fin. Auth., Hospital Rev. Ref. Bonds (Crittenton Hospital Medical Center), Series 2012-A, 5.00% 2039 (preref. 2022) | |
| 8,315 | | |
| 9,199 | |
| Hospital Fin. Auth., Hospital Rev. Ref. Bonds (Henry Ford Health System), Series 2016, 4.00% 2035 | |
| 3,595 | | |
| 3,919 | |
| Hospital Fin. Auth., Hospital Rev. Ref. Bonds (Henry Ford Health System), Series 2016, 5.00% 2031 | |
| 4,300 | | |
| 5,121 | |
| Hospital Fin. Auth., Hospital Rev. Ref. Bonds (Henry Ford Health System), Series 2016, 5.00% 2032 | |
| 1,500 | | |
| 1,779 | |
| Hospital Fin. Auth., Hospital Rev. Ref. Bonds (Henry Ford Health System), Series 2016, 5.00% 2034 | |
| 1,540 | | |
| 1,813 | |
| Hospital Fin. Auth., Hospital Rev. Ref. Bonds (Henry Ford Health System), Series 2019-A, 5.00% 2048 | |
| 2,500 | | |
| 2,989 | |
| Hospital Fin. Auth., Hospital Rev. Ref. Bonds (McLaren Health Care), Series 2015-D-1, (1-month USD-LIBOR x 0.68 + 0.40%) 1.94% 2030 (put 2021)1 | |
| 14,505 | | |
| 14,526 | |
| Hospital Fin. Auth., Hospital Rev. Ref. Bonds (McLaren Health Care), Series 2015-D-2, (1-month USD-LIBOR x 0.68 + 0.75%) 2.29% 2038 (put 2020)1 | |
| 6,000 | | |
| 6,019 | |
| Hospital Fin. Auth., Hospital Rev. Ref. Bonds (McLaren Health Care), Series 2019-A, 4.00% 2044 | |
| 7,500 | | |
| 8,152 | |
| Hospital Fin. Auth., Hospital Rev. Ref. Bonds (McLaren Health Care), Series 2019-A, 4.00% 2047 | |
| 3,300 | | |
| 3,570 | |
| Hospital Fin. Auth., Hospital Rev. Ref. Bonds (MidMichigan Health Credit Group), Series 2014, 5.00% 2039 | |
| 1,000 | | |
| 1,117 | |
| Hospital Fin. Auth., Hospital Rev. Ref. Bonds (Oakwood Obligated Group), Series 2012, 5.00% 2024 | |
| 9,145 | | |
| 10,209 | |
| Hospital Fin. Auth., Hospital Rev. Ref. Bonds (Oakwood Obligated Group), Series 2012, 5.00% 2027 | |
| 3,000 | | |
| 3,334 | |
| Hospital Fin. Auth., Hospital Rev. Ref. Bonds (Sparrow Obligated Group), Series 2015, 5.00% 2029 | |
| 3,000 | | |
| 3,513 | |
| Hospital Fin. Auth., Hospital Rev. Ref. Bonds (Sparrow Obligated Group), Series 2015, 5.00% 2031 | |
| 1,500 | | |
| 1,741 | |
| Hospital Fin. Auth., Hospital Rev. Ref. Bonds (Sparrow Obligated Group), Series 2015, 5.00% 2033 | |
| 1,500 | | |
| 1,730 | |
| Hospital Fin. Auth., Hospital Rev. Ref. Bonds (Sparrow Obligated Group), Series 2015, 5.00% 2034 | |
| 1,500 | | |
| 1,724 | |
| Hospital Fin. Auth., Hospital Rev. Ref. Bonds (Sparrow Obligated Group), Series 2015, 5.00% 2045 | |
| 1,000 | | |
| 1,127 | |
| Housing Dev. Auth., Single Family Mortgage Rev. Bonds, Series 2018-A, 4.00% 2048 | |
| 35,260 | | |
| 38,138 | |
| City of Lansing, Board of Water and Light, Utility System Rev. Bonds, Series 2019-A, 5.00% 2044 | |
| 44,000 | | |
| 53,623 | |
| City of Lansing, Board of Water and Light, Utility System Rev. Bonds, Series 2019-A, 5.00% 2048 | |
| 40,000 | | |
| 48,513 | |
| Tobacco Settlement Fin. Auth., Tobacco Settlement Asset-Backed Rev. Bonds, Series 2008-A, 6.875% 2042 | |
| 8,180 | | |
| 8,266 | |
| Other securities | |
| | | |
| 556,500 | |
| | |
| | | |
| 988,535 | |
| | |
| | | |
| | |
| Minnesota 0.67% | |
| | | |
| | |
| City of Duluth, Econ. Dev. Auth., Health Care Facs. Rev. Bonds (Essentia Health Obligated Group), Series 2018-A, 5.00% 2058 | |
| 30,000 | | |
| 34,502 | |
| Other securities | |
| | | |
| 110,803 | |
| | |
| | | |
| 145,305 | |
| | |
| | | |
| | |
| Nevada 1.50% | |
| | | |
| | |
| Las Vegas Convention and Visitors Auth., Convention Center Expansion Rev. Bonds, Series 2018-B, 5.00% 2043 | |
| 34,565 | | |
| 41,028 | |
| Other securities | |
| | | |
| 283,894 | |
| | |
| | | |
| 324,922 | |
| |
|
| 38 |
American Funds Tax-Exempt Funds |
The Tax-Exempt Bond Fund of America
| | |
Principal amount
(000) | | |
Value
(000) | |
| New Jersey 2.21% | |
| | | |
| | |
| Housing and Mortgage Fin. Agcy., Single Family Housing Rev. Bonds, Series 2018-A, 4.50% 2048 | |
$ | 39,705 | | |
$ | 43,916 | |
| Other securities | |
| | | |
| 435,197 | |
| | |
| | | |
| 479,113 | |
| | |
| | | |
| | |
| New York 6.82% | |
| | | |
| | |
| Long Island Power Auth., Electric System General Rev. Bonds, Series 2015-C, (1-month USD-LIBOR x 0.70 + 0.75%) 2.431% 2033 (put 2023)1 | |
| 62,600 | | |
| 62,882 | |
| Metropolitan Transportation Auth., Dedicated Tax Fund Bonds, Series 2009-B, 5.00% 2034 (preref. 2019) | |
| 1,000 | | |
| 1,012 | |
| Metropolitan Transportation Auth., Dedicated Tax Fund Bonds, Series 2009-B, 5.25% 2022 (preref. 2019) | |
| 5,000 | | |
| 5,061 | |
| Metropolitan Transportation Auth., Dedicated Tax Fund Bonds, Series 2009-B, 5.25% 2030 (preref. 2019) | |
| 2,000 | | |
| 2,025 | |
| Metropolitan Transportation Auth., Dedicated Tax Fund Green Bonds, Series 2016-B-1, 5.00% 2036 | |
| 5,000 | | |
| 6,005 | |
| Metropolitan Transportation Auth., Dedicated Tax Fund Rev. Ref. Bonds, Series 2002-B-3C, (SIFMA Municipal Swap Index + 0.95%) 2.35% 20191 | |
| 8,900 | | |
| 8,919 | |
| Metropolitan Transportation Auth., Dedicated Tax Fund Rev. Ref. Bonds, Series 2002-B-3D, (SIFMA Municipal Swap Index + 1.00%) 2.40% 20201 | |
| 11,100 | | |
| 11,180 | |
| Metropolitan Transportation Auth., Transportation Rev. Bonds, Series 2003-B, FGIC-National insured, 5.25% 2021 | |
| 5,000 | | |
| 5,458 | |
| Metropolitan Transportation Auth., Transportation Rev. Bonds, Series 2011-D, 5.00% 2036 (preref. 2021) | |
| 6,000 | | |
| 6,552 | |
| Metropolitan Transportation Auth., Transportation Rev. Bonds, Series 2014-B, 5.00% 2044 | |
| 13,000 | | |
| 14,632 | |
| Metropolitan Transportation Auth., Transportation Rev. Bonds, Series 2014-D-2, (SIFMA Municipal Swap Index + 0.45%) 1.85% 2044 (put 2022)1 | |
| 7,500 | | |
| 7,487 | |
| Metropolitan Transportation Auth., Transportation Rev. Bonds, Series 2015-A-1, 5.00% 2045 | |
| 23,845 | | |
| 27,222 | |
| Metropolitan Transportation Auth., Transportation Rev. Bonds, Series 2015-A-2, (SIFMA Municipal Swap Index + 0.58%) 1.98% 2039 (put 2020)1 | |
| 13,000 | | |
| 13,011 | |
| Metropolitan Transportation Auth., Transportation Rev. Bonds, Series 2015-C-1, 5.00% 2035 | |
| 6,000 | | |
| 7,015 | |
| Metropolitan Transportation Auth., Transportation Rev. Green Bonds, Series 2017-A-1, 5.00% 2032 | |
| 1,500 | | |
| 1,821 | |
| Metropolitan Transportation Auth., Transportation Rev. Ref. Bond Anticipation Notes, Series 2002-D-2B, Assured Guaranty Municipal insured, (1-month USD-LIBOR x 0.69 + 0.30%) 1.957% 2032 (put 2021)1 | |
| 15,000 | | |
| 14,992 | |
| Metropolitan Transportation Auth., Transportation Rev. Ref. Bonds, Series 2002-D-1, 5.00% 2025 (escrowed to maturity) | |
| 4,545 | | |
| 5,065 | |
| Metropolitan Transportation Auth., Transportation Rev. Ref. Bonds, Series 2002-D-2A, Assured Guaranty Municipal insured, (1-month USD-LIBOR x 0.69 + 0.68%) 2.337% 2032 (put 2021)1 | |
| 2,000 | | |
| 2,011 | |
| Metropolitan Transportation Auth., Transportation Rev. Ref. Bonds, Series 2005-D-1, (1-month USD-LIBOR x 0.67 + 0.65%) 2.259% 2035 (put 2021)1 | |
| 5,000 | | |
| 5,013 | |
| Metropolitan Transportation Auth., Transportation Rev. Ref. Bonds, Series 2011-C, 5.00% 2023 | |
| 3,405 | | |
| 3,686 | |
| Metropolitan Transportation Auth., Transportation Rev. Ref. Bonds, Series 2011-C, 5.00% 2023 (preref. 2021) | |
| 1,595 | | |
| 1,742 | |
| Metropolitan Transportation Auth., Transportation Rev. Ref. Bonds, Series 2012-D, 5.00% 2024 | |
| 8,000 | | |
| 8,946 | |
| Metropolitan Transportation Auth., Transportation Rev. Ref. Bonds, Series 2012-D, 5.00% 2029 | |
| 7,000 | | |
| 7,762 | |
| Metropolitan Transportation Auth., Transportation Rev. Ref. Bonds, Series 2012-D, 5.00% 2032 | |
| 3,105 | | |
| 3,436 | |
| Metropolitan Transportation Auth., Transportation Rev. Ref. Bonds, Series 2012-F, 5.00% 2030 | |
| 10,000 | | |
| 11,071 | |
| Metropolitan Transportation Auth., Transportation Rev. Ref. Bonds, Series 2014-A-2, 5.00% 2028 (preref. 2023) | |
| 3,000 | | |
| 3,509 | |
| Metropolitan Transportation Auth., Transportation Rev. Ref. Bonds, Series 2016-B, 5.00% 2037 | |
| 1,495 | | |
| 1,770 | |
| Metropolitan Transportation Auth., Transportation Rev. Ref. Bonds, Series 2017-D, 5.00% 2035 | |
| 4,885 | | |
| 5,950 | |
| Metropolitan Transportation Auth., Transportation Rev. Ref. Green Bonds, Capital Appreciation Bonds, Series 2017-C-2, 0% 2027 | |
| 1,500 | | |
| 1,262 | |
| American Funds Tax-Exempt Funds |
39 |
The Tax-Exempt Bond Fund of America
| Bonds, notes & other debt instruments (continued) | |
Principal amount
(000) | | |
Value
(000) | |
| New York (continued) | |
| | | |
| | |
| Metropolitan Transportation Auth., Transportation Rev. Ref. Green Bonds, Capital Appreciation Bonds, Series 2017-C-2, 0% 2029 | |
$ | 1,500 | | |
$ | 1,180 | |
| Metropolitan Transportation Auth., Transportation Rev. Ref. Green Bonds, Capital Appreciation Bonds, Series 2017-C-2, 0% 2032 | |
| 5,000 | | |
| 3,537 | |
| Metropolitan Transportation Auth., Transportation Rev. Ref. Green Bonds, Series 2017-A-2, 5.00% 2030 | |
| 1,000 | | |
| 1,224 | |
| Metropolitan Transportation Auth., Transportation Rev. Ref. Green Bonds, Series 2017-B, 5.00% 2024 | |
| 4,330 | | |
| 5,129 | |
| Metropolitan Transportation Auth., Transportation Rev. Ref. Green Bonds, Series 2017-C-1, 4.00% 2034 | |
| 2,500 | | |
| 2,825 | |
| Metropolitan Transportation Auth., Transportation Rev. Ref. Green Bonds, Series 2017-C-1, 4.00% 2035 | |
| 5,000 | | |
| 5,621 | |
| Metropolitan Transportation Auth., Transportation Rev. Ref. Green Bonds, Series 2017-C-1, 4.00% 2036 | |
| 3,000 | | |
| 3,356 | |
| Metropolitan Transportation Auth., Transportation Rev. Ref. Green Bonds, Series 2017-C-1, 5.00% 2026 | |
| 10,000 | | |
| 12,365 | |
| Metropolitan Transportation Auth., Transportation Rev. Ref. Green Bonds, Series 2017-C-1, 5.00% 2028 | |
| 5,500 | | |
| 7,010 | |
| Metropolitan Transportation Auth., Transportation Rev. Ref. Green Bonds, Series 2017-C-1, 5.00% 2029 | |
| 6,000 | | |
| 7,566 | |
| Metropolitan Transportation Auth., Transportation Rev. Ref. Green Bonds, Series 2017-C-1, 5.00% 2030 | |
| 1,000 | | |
| 1,251 | |
| Metropolitan Transportation Auth., Transportation Rev. Ref. Green Bonds, Series 2017-C-1, 5.00% 2031 | |
| 1,000 | | |
| 1,242 | |
| Metropolitan Transportation Auth., Transportation Rev. Ref. Green Bonds, Series 2017-C-1, 5.00% 2033 | |
| 1,000 | | |
| 1,229 | |
| Metropolitan Transportation Auth., Transportation Rev. Ref. Green Bonds, Series 2019-A-2, 5.00% 2045 | |
| 20,000 | | |
| 24,073 | |
| Mortgage Agcy., Homeowner Mortgage Rev. Bonds, Series 208, 4.00% 2048 | |
| 29,235 | | |
| 31,361 | |
| New York City Municipal Water Fin. Auth., Water and Sewer System Rev. Bonds, Series 2010-FF, 5.00% 2025 | |
| 895 | | |
| 926 | |
| New York City Municipal Water Fin. Auth., Water and Sewer System Rev. Bonds, Series 2010-FF, 5.00% 2025 (preref. 2020) | |
| 1,360 | | |
| 1,408 | |
| New York City Municipal Water Fin. Auth., Water and Sewer System Rev. Bonds, Series 2011-EE, 5.375% 2043 | |
| 20,815 | | |
| 21,985 | |
| New York City Municipal Water Fin. Auth., Water and Sewer System Rev. Bonds, Series 2011-EE, 5.375% 2043 (preref. 2020) | |
| 40,645 | | |
| 43,097 | |
| New York City Municipal Water Fin. Auth., Water and Sewer System Rev. Bonds, Series 2011-GG, 5.00% 2026 | |
| 205 | | |
| 220 | |
| New York City Municipal Water Fin. Auth., Water and Sewer System Rev. Bonds, Series 2011-GG, 5.00% 2026 (preref. 2021) | |
| 1,795 | | |
| 1,929 | |
| New York City Municipal Water Fin. Auth., Water and Sewer System Second General Resolution Rev. Bonds, Fiscal 2011, Series 2011-GG, 5.00% 2043 (preref. 2021) | |
| 2,000 | | |
| 2,149 | |
| New York City Municipal Water Fin. Auth., Water and Sewer System Second General Resolution Rev. Bonds, Fiscal 2012, Series 2012-BB, 5.25% 2044 (preref. 2021) | |
| 3,000 | | |
| 3,300 | |
| New York City Municipal Water Fin. Auth., Water and Sewer System Second General Resolution Rev. Bonds, Fiscal 2013, Series 2013-BB, 5.00% 2047 | |
| 5,000 | | |
| 5,517 | |
| New York City Municipal Water Fin. Auth., Water and Sewer System Second General Resolution Rev. Bonds, Fiscal 2017, Series 2017-DD, 5.00% 2047 | |
| 4,000 | | |
| 4,736 | |
| New York City Municipal Water Fin. Auth., Water and Sewer System Second General Resolution Rev. Bonds, Fiscal 2017, Series 2017-EE, 5.00% 2033 | |
| 4,560 | | |
| 5,608 | |
| New York City Municipal Water Fin. Auth., Water and Sewer System Second General Resolution Rev. Bonds, Fiscal 2017, Series 2017-EE, 5.00% 2037 | |
| 3,000 | | |
| 3,626 | |
| New York City Municipal Water Fin. Auth., Water and Sewer System Second General Resolution Rev. Bonds, Fiscal 2018, Series 2018-BB-1, 5.00% 2046 | |
| 12,670 | | |
| 15,042 | |
| New York City Municipal Water Fin. Auth., Water and Sewer System Second General Resolution Rev. Bonds, Fiscal 2018, Series 2018-CC-1, 5.00% 2048 | |
| 5,000 | | |
| 5,921 | |
| New York City Municipal Water Fin. Auth., Water and Sewer System Second General Resolution Rev. Bonds, Fiscal 2018, Series 2018-EE, 5.00% 2040 | |
| 5,000 | | |
| 6,043 | |
| New York City Municipal Water Fin. Auth., Water and Sewer System Second General Resolution Rev. Bonds, Fiscal 2019, Series 2019-DD-1, 5.00% 2049 | |
| 9,000 | | |
| 10,815 | |
| New York City Transitional Fin. Auth., Building Aid Rev. Bonds, Fiscal 2012, Series 2012-S-1A, 5.00% 2032 | |
| 6,400 | | |
| 6,864 | |
| 40 |
American Funds Tax-Exempt Funds |
The Tax-Exempt Bond Fund of America
| | |
Principal amount
(000) | | |
Value
(000) | |
| New York City Transitional Fin. Auth., Building Aid Rev. Bonds, Fiscal 2013, Series 2013-S-1, 5.00% 2033 | |
$ | 1,825 | | |
$ | 2,015 | |
| New York City Transitional Fin. Auth., Building Aid Rev. Bonds, Fiscal 2018, Series 2018-S-1, 5.00% 2035 | |
| 3,295 | | |
| 4,011 | |
| New York City Transitional Fin. Auth., Building Aid Rev. Bonds, Fiscal 2018, Series 2018-S-2, 5.00% 2034 | |
| 4,000 | | |
| 4,977 | |
| New York City Transitional Fin. Auth., Building Aid Rev. Bonds, Fiscal 2018, Series 2018-S-3, 5.00% 2033 | |
| 4,320 | | |
| 5,397 | |
| New York City Transitional Fin. Auth., Building Aid Rev. Bonds, Fiscal 2018, Series 2018-S-3, 5.00% 2037 | |
| 10,000 | | |
| 12,298 | |
| New York City Transitional Fin. Auth., Building Aid Rev. Bonds, Fiscal 2018, Series 2018-S-3, 5.00% 2038 | |
| 4,000 | | |
| 4,905 | |
| New York City Transitional Fin. Auth., Building Aid Rev. Bonds, Fiscal 2018, Series 2018-S-4A, 5.00% 2034 | |
| 4,000 | | |
| 4,977 | |
| New York City Transitional Fin. Auth., Building Aid Rev. Bonds, Fiscal 2018, Series 2018-S-4A, 5.00% 2035 | |
| 3,000 | | |
| 3,652 | |
| New York City Transitional Fin. Auth., Building Aid Rev. Bonds, Fiscal 2018, Series 2018-S-4A, 5.00% 2037 | |
| 19,250 | | |
| 23,674 | |
| New York City Transitional Fin. Auth., Building Aid Rev. Bonds, Fiscal 2019, Series 2019-S-1, 4.00% 2037 | |
| 5,135 | | |
| 5,792 | |
| New York City Transitional Fin. Auth., Building Aid Rev. Bonds, Fiscal 2019, Series 2019-S-3, 5.00% 2035 | |
| 5,000 | | |
| 6,193 | |
| New York City Transitional Fin. Auth., Future Tax Secured Bonds, Fiscal 2013, Series 2013-F-1, 5.00% 2028 | |
| 1,500 | | |
| 1,694 | |
| New York City Transitional Fin. Auth., Future Tax Secured Bonds, Fiscal 2013, Series 2013-F-1, 5.00% 2036 | |
| 1,000 | | |
| 1,113 | |
| New York City Transitional Fin. Auth., Future Tax Secured Bonds, Fiscal 2015, Series 2015-C, 5.00% 2027 | |
| 5,000 | | |
| 6,000 | |
| New York City Transitional Fin. Auth., Future Tax Secured Bonds, Fiscal 2017, Series 2017-A-1, 5.00% 2035 | |
| 1,000 | | |
| 1,196 | |
| New York City Transitional Fin. Auth., Future Tax Secured Bonds, Fiscal 2017, Series 2017-C, 5.00% 2031 | |
| 3,750 | | |
| 4,629 | |
| New York City Transitional Fin. Auth., Future Tax Secured Bonds, Fiscal 2017, Series 2017-E-1, 5.00% 2043 | |
| 2,500 | | |
| 2,960 | |
| New York City Transitional Fin. Auth., Future Tax Secured Bonds, Fiscal 2017, Series 2017-F-1, 5.00% 2034 | |
| 5,000 | | |
| 6,102 | |
| New York City Transitional Fin. Auth., Future Tax Secured Bonds, Fiscal 2017, Series 2017-F-1, 5.00% 2035 | |
| 5,000 | | |
| 6,077 | |
| New York City Transitional Fin. Auth., Future Tax Secured Bonds, Fiscal 2017, Series 2017-F-1, 5.00% 2039 | |
| 1,750 | | |
| 2,097 | |
| New York City Transitional Fin. Auth., Future Tax Secured Bonds, Fiscal 2018, Series 2018-A-2, 5.00% 2035 | |
| 10,000 | | |
| 12,208 | |
| New York City Transitional Fin. Auth., Future Tax Secured Bonds, Fiscal 2018, Series 2018-B-1, 5.00% 2033 | |
| 10,000 | | |
| 12,313 | |
| New York City Transitional Fin. Auth., Future Tax Secured Bonds, Fiscal 2018, Series 2018-B-1, 5.00% 2045 | |
| 2,500 | | |
| 2,979 | |
| New York City Transitional Fin. Auth., Future Tax Secured Bonds, Fiscal 2019, Series 2019-A-1, 5.00% 2023 | |
| 4,300 | | |
| 4,969 | |
| New York City Transitional Fin. Auth., Future Tax Secured Bonds, Fiscal 2019, Series 2019-A-1, 5.00% 2035 | |
| 6,000 | | |
| 7,448 | |
| New York City Transitional Fin. Auth., Future Tax Secured Bonds, Fiscal 2019, Series 2019-A-1, 5.00% 2037 | |
| 3,000 | | |
| 3,697 | |
| New York City Transitional Fin. Auth., Future Tax Secured Bonds, Fiscal 2019, Series 2019-A-1, 5.00% 2038 | |
| 9,660 | | |
| 11,854 | |
| New York City Transitional Fin. Auth., Future Tax Secured Bonds, Fiscal 2019, Series 2019-C-1, 5.00% 2034 | |
| 5,000 | | |
| 6,322 | |
| New York City Transitional Fin. Auth., Future Tax Secured Rev. Ref. Bonds, Fiscal 2015, Series 2015-A-1, 5.00% 2037 | |
| 2,500 | | |
| 2,897 | |
| New York City Transitional Fin. Auth., Future Tax Secured Rev. Ref. Bonds, Fiscal 2015, Series 2015-E-1, 5.00% 2031 | |
| 5,000 | | |
| 5,918 | |
| New York City Transitional Fin. Auth., Future Tax Secured Rev. Ref. Bonds, Fiscal 2016, Series 2016-A-1, 5.00% 2034 | |
| 8,000 | | |
| 9,480 | |
| New York City Transitional Fin. Auth., Future Tax Secured Rev. Ref. Bonds, Fiscal 2016, Series 2016-A-1, 5.00% 2036 | |
| 4,000 | | |
| 4,714 | |
| American Funds Tax-Exempt Funds |
41 |
The Tax-Exempt Bond Fund of America
| Bonds, notes & other debt instruments (continued) | Principal amount
(000) | | |
Value
(000) | |
| New York (continued) | |
| | | |
| | |
| New York City Transitional Fin. Auth., Future Tax Secured Rev. Ref. Bonds, Fiscal 2016, Series 2016-A-1, 5.00% 2037 | |
$ | 2,000 | | |
$ | 2,348 | |
| Utility Debt Securitization Auth., Restructuring Bonds, Series 2017, 5.00% 2041 | |
| 31,500 | | |
| 38,430 | |
| Other securities | |
| | | |
| 736,534 | |
| | |
| | | |
| 1,476,522 | |
| | |
| | | |
| | |
| North Carolina 0.71% | |
| | | |
| | |
| University of North Carolina at Chapel Hill, General Rev. Bonds, Series 2012-B, (1-month USD-LIBOR x 0.67 + 0.40%) 2.01% 2041 (put 2022)1 | |
| 52,050 | | |
| 52,147 | |
| Other securities | |
| | | |
| 102,564 | |
| | |
| | | |
| 154,711 | |
| | |
| | | |
| | |
| Pennsylvania 4.74% | |
| | | |
| | |
| University of Pittsburgh - Of the Commonwealth System of Higher Education, PANTHERS, Series 2018, (SIFMA Municipal Swap Index + 0.24%) 1.64% 20211 | |
| 42,235 | | |
| 42,173 | |
| Other securities | |
| | | |
| 983,303 | |
| | |
| | | |
| 1,025,476 | |
| | |
| | | |
| | |
| South Carolina 1.34% | |
| | | |
| | |
| Jobs-Econ. Dev. Auth., Hospital Rev. Bonds (Prisma Health Obligated Group), Series 2018-A, 5.00% 2048 | |
| 32,000 | | |
| 37,254 | |
| Other securities | |
| | | |
| 253,041 | |
| | |
| | | |
| 290,295 | |
| | |
| | | |
| | |
| Tennessee 1.13% | |
| | | |
| | |
| Metropolitan Government of Nashville and Davidson County, G.O. Improvement Bonds, Series 2013-A, 5.00% 2029 (preref. 2023) | |
| 31,610 | | |
| 35,752 | |
| Other securities | |
| | | |
| 208,278 | |
| | |
| | | |
| 244,030 | |
| | |
| | | |
| | |
| Texas 10.35% | |
| | | |
| | |
| City of Austin, Water and Wastewater System Rev. Ref. Bonds, Series 2016, 5.00% 2041 | |
| 26,405 | | |
| 31,287 | |
| Grand Parkway Transportation Corp., Grand Parkway System Toll Rev. Bonds, Series 2013-B, 5.00% 2053 | |
| 32,800 | | |
| 36,454 | |
| North Texas Tollway Auth., System Rev. Ref. Bonds, Series 2017-A, 5.00% 2043 | |
| 43,195 | | |
| 51,266 | |
| Turnpike Auth., Central Texas Turnpike System, Rev. Bonds, Capital Appreciation Bonds, Series 2002-A, AMBAC insured, 0% 2028 | |
| 40,795 | | |
| 33,563 | |
| Other securities | |
| | | |
| 2,087,201 | |
| | |
| | | |
| 2,239,771 | |
| | |
| | | |
| | |
| Virginia 2.42% | |
| | | |
| | |
| City of Newport News, Industrial Dev. Auth., Health Systems Rev. Ref. Bonds (Custodial Receipts), Series 2015, 5.33% 20452 | |
| 41,100 | | |
| 44,745 | |
| Other securities | |
| | | |
| 479,252 | |
| | |
| | | |
| 523,997 | |
| | |
| | | |
| | |
| Washington 2.66% | |
| | | |
| | |
| Convention Center Public Facs. Dist., Lodging Tax Bonds, Series 2010-B, 5.00% 2043 | |
| 35,000 | | |
| 41,667 | |
| Health Care Facs. Auth., Rev. Bonds (Catholic Health Initiatives), Series 2013-B-1, (SIFMA Municipal Swap Index + 1.00%) 2.40% 2035 (put 2021)1 | |
| 49,750 | | |
| 49,840 | |
| Other securities | |
| | | |
| 484,095 | |
| | |
| | | |
| 575,602 | |
| | |
| | | |
| | |
| Wisconsin 2.12% | |
| | | |
| | |
| Health and Educational Facs. Auth., Rev. Bonds (Advocate Aurora Health Care Credit Group), Series 2018-C-2, (SIFMA Municipal Swap Index + 0.45%) 1.85% 2054 (put 2022)1 | |
| 31,145 | | |
| 31,106 | |
| Health and Educational Facs. Auth., Rev. Bonds
(Milwaukee Regional Medical Center Thermal Service, Inc.), Series 2018, 5.00% 2044 | |
| 27,200 | | |
| 32,460 | |
| Other securities | |
| | | |
| 394,821 | |
| | |
| | | |
| 458,387 | |
| 42 |
American Funds Tax-Exempt Funds |
The Tax-Exempt Bond Fund of America
| | Principal amount
(000) | | |
Value
(000) | |
| Other states & U.S. territories 19.44% | |
| | | |
| | |
| Other securities | |
| | | |
$ | 4,205,932 | |
| | |
| | | |
| | |
| Total bonds, notes & other
debt instruments (cost: $19,275,165,000) | |
| | | |
| 20,267,090 | |
| | |
| | | |
| | |
| Short-term securities 6.21% | |
| | | |
| | |
| Freddie Mac, Multi Family Certificates, Series 2017-M-051, 1.63% 20351 | |
$ | 11,000 | | |
| 11,000 | |
| Freddie Mac, Multi Family Certificates, Series 2017-M-052, 1.63% 20361 | |
| 26,000 | | |
| 26,000 | |
| Freddie Mac, Multi Family Certificates, Series 2018-M-042, Class A, (SIFMA Municipal Swap Index + 0.30%) 1.65% 20331 | |
| 37,020 | | |
| 37,020 | |
| Freddie Mac, Multi Family Certificates, Series 2018-M-046, 1.63% 20351 | |
| 16,405 | | |
| 16,405 | |
| Main Street Natural Gas, Inc., Gas Supply Rev. Bonds, Series 2019-B, 4.00% 2049 (put 2024) | |
| 30,000 | | |
| 33,542 | |
| State of Illinois, City of Chicago, Board of Education, Tax Anticipation Notes, Series 2018-E, 2.207% 12/13/20191,2 | |
| 2,500 | | |
| 2,500 | |
| State of Maryland, County of Montgomery, IAM Commercial Paper, Series 2019-A, 1.34% 10/3/2019 | |
| 77,000 | | |
| 77,000 | |
| State of Maryland, County of Montgomery, IAM Commercial Paper, Series 2019-A, 1.38% 8/6/2019 | |
| 7,500 | | |
| 7,500 | |
| State of Maryland, County of Montgomery, IAM Commercial Paper, Series 2019-B, 1.40% 10/9/2019 | |
| 7,500 | | |
| 7,500 | |
| State of Maryland, County of Montgomery, Rev. Bonds (Trinity Health Credit Group), Series 2013, 1.43% 2041 (put 2019)3 | |
| 11,000 | | |
| 11,002 | |
| State of Massachusetts, Health and Educational Facs. Auth., IAM Commercial Paper (Harvard University), Series 2019, 1.30% 10/16/2019 | |
| 30,000 | | |
| 30,000 | |
| State of Massachusetts, Health and Educational Facs. Auth., Rev. Bonds (Partners Healthcare System Issue), Series 2007-C, Assured Guaranty Municipal insured, 1.66% 20421 | |
| 7,530 | | |
| 7,530 | |
| State of Michigan, Fin. Auth., Hospital Rev. Bonds (CHE Trinity Health Credit Group), Series 2013-MI-1, 1.81% 2034 (put 2019)3 | |
| 17,000 | | |
| 17,004 | |
| State of Michigan, Strategic Fund, Demand Limited Obligation Rev. Bonds (Air Products and Chemicals, Inc. Project), Series 2007, 1.50% 20421 | |
| 38,670 | | |
| 38,670 | |
| State of Mississippi, Business Fin. Corp., Gulf Opportunity Zone Industrial Dev. Rev. Bonds (Chevron U.S.A. Inc. Project), Series 2007-A, 1.48% 20301 | |
| 46,435 | | |
| 46,435 | |
| State of Mississippi, Business Fin. Corp., Gulf Opportunity Zone Industrial Dev. Rev. Bonds (Chevron U.S.A. Inc. Project), Series 2007-D, 1.48% 20301 | |
| 35,830 | | |
| 35,830 | |
| State of Mississippi, Business Fin. Corp., Gulf Opportunity Zone Industrial Dev. Rev. Bonds (Chevron U.S.A. Inc. Project), Series 2009-D, 1.48% 20301 | |
| 9,500 | | |
| 9,500 | |
| State of Mississippi, Business Fin. Corp., Gulf Opportunity Zone Industrial Dev. Rev. Bonds (Chevron U.S.A. Inc. Project), Series 2010-E, 1.41% 20301 | |
| 2,200 | | |
| 2,200 | |
| State of Mississippi, Business Fin. Corp., Gulf Opportunity Zone Industrial Dev. Rev. Bonds (Chevron U.S.A. Inc. Project), Series 2010-J, 1.48% 20351 | |
| 27,710 | | |
| 27,710 | |
| State of Mississippi, Business Fin. Corp., Gulf Opportunity Zone Industrial Dev. Rev. Bonds (Chevron U.S.A. Inc. Project), Series 2011-E, 1.48% 20351 | |
| 24,150 | | |
| 24,150 | |
| State of Mississippi, Business Fin. Corp., Gulf Opportunity Zone Industrial Dev. Rev. Bonds (Chevron U.S.A. Inc. Project), Series 2011-F, 1.48% 20351 | |
| 17,340 | | |
| 17,340 | |
| State of New York, Metropolitan Transportation Auth., Transportation Rev. Bond Anticipation Notes, Series 2018-A-1, 4.00% 8/15/2019 | |
| 10,000 | | |
| 10,008 | |
| State of New York, Metropolitan Transportation Auth., Transportation Rev. Bond Anticipation Notes, Series 2018-B-2, 5.00% 2021 | |
| 5,000 | | |
| 5,327 | |
| State of New York, New York City G.O. Bonds, Fiscal 2006, Series 2005-E-2, 1.47% 20341 | |
| 7,050 | | |
| 7,050 | |
| State of New York, New York City G.O. Bonds, Fiscal 2006, Series 2006-H-1, 1.48% 20361 | |
| 500 | | |
| 500 | |
| State of New York, New York City G.O. Bonds, Fiscal 2008, Series 2008-C-4, Assured Guaranty Municipal insured, 1.75% 20271 | |
| 2,575 | | |
| 2,575 | |
| State of New York, New York City G.O. Bonds, Fiscal 2008, Series 2008-J-5, 1.47% 20281 | |
| 390 | | |
| 390 | |
| State of New York, New York City G.O. Bonds, Fiscal 2008, Series 2008-L-3, 1.47% 20361 | |
| 14,465 | | |
| 14,465 | |
| State of New York, New York City G.O. Bonds, Fiscal 2008, Series 2008-L-5, 1.47% 20351 | |
| 17,315 | | |
| 17,315 | |
| State of New York, New York City G.O. Bonds, Fiscal 2013, Series 2013-F-3, 1.47% 20421 | |
| 23,105 | | |
| 23,105 | |
| State of New York, New York City G.O. Bonds, Fiscal 2015, Series 2015-F-6, 1.48% 20441 | |
| 1,500 | | |
| 1,500 | |
| State of New York, New York City Municipal Water Fin. Auth., Water and Sewer System Rev. Bonds, Fiscal 2012, Series 2012-B, 1.49% 20451 | |
| 38,020 | | |
| 38,020 | |
| State of New York, New York City Municipal Water Fin. Auth., Water and Sewer System Second General Resolution Rev. Bonds, Fiscal 2008, Series 2008-B-3, 1.47% 20251 | |
| 22,300 | | |
| 22,300 | |
| American Funds Tax-Exempt Funds |
43 |
The Tax-Exempt Bond Fund of America
| Short-term securities (continued) | Principal amount
(000) | | |
Value
(000) | |
| State of New York, New York City Municipal Water Fin. Auth., Water and Sewer System Second General Resolution Rev. Bonds, Fiscal 2011, Series 2011-FF-1, 1.47% 20441 | |
$ | 8,775 | | |
$ | 8,775 | |
| State of New York, New York City Municipal Water Fin. Auth., Water and Sewer System Second General Resolution Rev. Bonds, Fiscal 2012, Series 2012-A, 1.52% 20441 | |
| 5,305 | | |
| 5,305 | |
| State of New York, New York City Municipal Water Fin. Auth., Water and Sewer System Second General Resolution Rev. Bonds, Fiscal 2013, Series 2013-AA-2, 1.40% 20461 | |
| 18,500 | | |
| 18,500 | |
| State of New York, New York City Municipal Water Fin. Auth., Water and Sewer System Second General Resolution Rev. Bonds, Fiscal 2014, Series 2013-AA-2, 1.48% 20501 | |
| 2,000 | | |
| 2,000 | |
| State of New York, New York City Municipal Water Fin. Auth., Water and Sewer System Second General Resolution Rev. Bonds, Fiscal 2014, Series 2014-AA-1, 1.48% 20501 | |
| 1,475 | | |
| 1,475 | |
| State of New York, New York City Municipal Water Fin. Auth., Water and Sewer System Second General Resolution Rev. Bonds, Fiscal 2016, Series 2016-AA-1, 1.47% 20481 | |
| 9,280 | | |
| 9,280 | |
| State of New York, New York City Transitional Fin. Auth., Future Tax Secured Bonds, Fiscal 2016, Series 2016-A-4, 1.47% 20411 | |
| 4,310 | | |
| 4,310 | |
| State of New York, New York City Transitional Fin. Auth., Future Tax Secured Bonds, Fiscal 2019, Series 2019-A-4, 1.48% 20451 | |
| 725 | | |
| 725 | |
| State of New York, New York City Transitional Fin. Auth., Future Tax Secured Rev. Ref. Bonds, Fiscal 2015, Series 2015-E-3, 1.48% 20451 | |
| 1,000 | | |
| 1,000 | |
| State of New York, New York City Transitional Fin. Auth., Future Tax Secured Rev. Ref. Bonds, Fiscal 2015, Series 2015-E-4, 1.47% 20451 | |
| 1,550 | | |
| 1,550 | |
| State of New York, New York City Transitional Fin. Auth., Future Tax Secured Rev. Ref. Bonds, Fiscal 2016, Series 2016-E-4, 1.48% 20451 | |
| 1,500 | | |
| 1,500 | |
| State of New York, New York City Transitional Fin. Auth., Recovery Bonds, Fiscal 2003, Series 2002-1-C, 1.47% 20311 | |
| 13,820 | | |
| 13,820 | |
| State of Texas, City of Houston, Combined Utility System IAM Commercial Paper, Series 2019, 1.27% 9/6/2019 | |
| 10,000 | | |
| 10,000 | |
| State of Texas, City of Houston, Combined Utility System IAM Commercial Paper, Series 2019, 1.27% 9/6/2019 | |
| 5,000 | | |
| 5,000 | |
| State of Texas, City of Houston, Combined Utility System IAM Commercial Paper, Series 2019, 1.29% 9/6/2019 | |
| 3,000 | | |
| 3,000 | |
| State of Texas, City of Houston, Tax and Rev. Anticipation Notes, Series 2019, 5.00% 6/26/2020 | |
| 13,000 | | |
| 13,447 | |
| State of Texas, Tax and Rev. Anticipation Notes, Series 2018, 4.00% 8/29/2019 | |
| 46,255 | | |
| 46,346 | |
| State of Texas, Board of Regents of the University of Texas System, IAM Commercial Paper, Series 2019, 1.32% 10/4/2019 | |
| 10,000 | | |
| 10,000 | |
| State of Texas, Board of Regents of the University of Texas System, IAM Commercial Paper, Series 2019, 1.35% 8/5/2019 | |
| 10,000 | | |
| 10,000 | |
| State of Texas, Board of Regents of the University of Texas System, IAM Commercial Paper, Series 2019, 1.37% 9/5/2019 | |
| 25,000 | | |
| 25,000 | |
| State of Texas, Board of Regents of the University of Texas System, IAM Commercial Paper, Series 2019, 1.40% 8/8/2019 | |
| 10,000 | | |
| 10,000 | |
| State of Texas, Board of Regents of the University of Texas System, IAM Commercial Paper, Series 2019, 1.40% 9/4/2019 | |
| 10,000 | | |
| 10,000 | |
| State of Texas, Board of Regents of the University of Texas System, IAM Commercial Paper, Series 2019, 1.42% 8/12/2019 | |
| 5,000 | | |
| 5,000 | |
| State of Texas, Board of Regents of the University of Texas System, IAM Commercial Paper, Series 2019, 1.50% 11/4/2019 | |
| 10,000 | | |
| 10,000 | |
| State of Texas, Board of Regents of the University of Texas System, IAM Commercial Paper, Series 2019, 1.57% 9/12/2019 | |
| 3,000 | | |
| 3,000 | |
| Other securities | |
| | | |
| 486,356 | |
| | |
| | | |
| | |
| Total short-term securities
(cost: $1,342,656,000) | |
| | | |
| 1,343,782 | |
| Total investment securities
99.84% (cost: $20,617,821,000) | |
| | | |
| 21,610,872 | |
| Other assets less liabilities 0.16% | |
| | | |
| 34,765 | |
| | |
| | | |
| | |
| Net assets 100.00% | |
| | | |
$ | 21,645,637 | |
This summary investment portfolio is designed to streamline the
report and help investors better focus on the fund’s principal holdings. See the inside back cover for details on how to
obtain a complete schedule of portfolio holdings.
“Other securities” includes all issues that are not
disclosed separately in the summary investment portfolio. “Other securities” includes a security which was valued under
fair value procedures adopted by authority of the board of trustees. The total value of the security which was valued under fair
value procedures was $5,935,000, which represented .03% of the net assets of the fund.
| 44 |
American Funds Tax-Exempt Funds |
The Tax-Exempt Bond Fund of America
Futures contracts
| Contracts | |
Type | |
Number of
contracts | |
Expiration | |
Notional
amount
(000) | 4
| |
Value at
7/31/2019
(000) | 5
| Unrealized
(depreciation)
appreciation
at 7/31/2019
(000) | |
| 2
Year U.S. Treasury Note Futures | |
Long | |
7,183 | |
October 2019 | |
$1,436,600 | | |
$1,540,080 | | |
$ | (3,140 | ) |
| 5 Year U.S.
Treasury Note Futures | |
Long | |
1,521 | |
October 2019 | |
152,100 | | |
178,801 | | |
| 1,295 | |
| 10 Year Ultra
U.S. Treasury Note Futures | |
Short | |
507 | |
September 2019 | |
(50,700 | ) | |
(69,887 | ) | |
| (1,145 | ) |
| 10 Year U.S.
Treasury Note Futures | |
Short | |
5,627 | |
September 2019 | |
(562,700 | ) | |
(717,003 | ) | |
| (3,193 | ) |
| 30
Year Ultra U.S. Treasury Bond Futures | |
Short | |
459 | |
September 2019 | |
(45,900 | ) | |
(81,501 | ) | |
| (3,004 | ) |
| | |
| |
| |
| |
| | |
| | |
$ | (9,187 | ) |
| 1 |
Coupon rate may change periodically. For short-term securities, the date of the next scheduled coupon rate change is considered to be the maturity date. |
| 2 |
Acquired in a transaction exempt from registration under Rule 144A of the Securities Act of 1933. May be resold in the U.S. in transactions exempt from registration, normally to qualified institutional buyers. The total value of all such securities, including those in “Other securities,” was $360,619,000, which represented 1.67% of the net assets of the fund. |
| 3 |
For short-term securities, the mandatory put date is considered to be the maturity date. |
| 4 |
Notional amount is calculated based on the number of contracts and notional contract size. |
| 5 |
Value is calculated based on the notional amount and current market price. |
Key to abbreviations and symbol
Agcy. = Agency
Auth. = Authority
Certs. of Part. = Certificates of Participation
Dept. = Department
Dev. = Development
Dist. = District
Econ. = Economic
Fac. = Facility
Facs. = Facilities
Fin. = Finance
Fncg. = Financing
G.O. = General Obligation
LIBOR = London Interbank Offered Rate
LOC = Letter of Credit
Preref. = Prerefunded
Redev. = Redevelopment
Ref. = Refunding
Rev. = Revenue
SIFMA = Securities Industry and Financial Markets Association
USD/$ = U.S. dollars
See notes to financial statements.
| American Funds Tax-Exempt Funds |
45 |
American High-Income Municipal Bond Fund
Summary investment portfolio July 31, 2019
| Bonds, notes & other debt instruments 93.65% | |
Principal amount
(000) | | |
Value
(000) | |
| Arizona 2.77% | |
| | | |
| | |
| City of Phoenix, Industrial Dev. Auth., Education Fac. Rev. Bonds (Basis Schools, Inc. Project), Series 2015, 5.00% 20351 | |
$ | 6,055 | | |
$ | 6,499 | |
| City of Phoenix, Industrial Dev. Auth., Education Fac. Rev. Bonds (Basis Schools, Inc. Project), Series 2015, 5.00% 20451 | |
| 5,500 | | |
| 5,811 | |
| City of Phoenix, Industrial Dev. Auth., Education Fac. Rev. Bonds (Basis Schools, Inc. Project), Series 2016-A, 5.00% 20351 | |
| 1,500 | | |
| 1,610 | |
| City of Phoenix, Industrial Dev. Auth., Education Fac. Rev. Bonds (Basis Schools, Inc. Project), Series 2016-A, 5.00% 20461 | |
| 7,100 | | |
| 7,497 | |
| City of Phoenix, Industrial Dev. Auth., Education Fac. Rev. Bonds (Legacy Traditional Schools East Mesa and Cadence Campuses), Series 2017-A, 4.00% 20221 | |
| 18,900 | | |
| 18,890 | |
| City of Phoenix, Industrial Dev. Auth., Education Fac. Rev. Bonds (Legacy Traditional Schools Phoenix Campus), Series 2017-B, 4.00% 20221 | |
| 7,250 | | |
| 7,246 | |
| City of Phoenix, Industrial Dev. Auth., Education Fac. Rev. Bonds (Legacy Traditional Schools Projects), Series 2014-A, 5.75% 20241 | |
| 1,250 | | |
| 1,348 | |
| City of Phoenix, Industrial Dev. Auth., Education Fac. Rev. Bonds (Legacy Traditional Schools Projects), Series 2014-A, 6.50% 20341 | |
| 1,560 | | |
| 1,792 | |
| City of Phoenix, Industrial Dev. Auth., Education Fac. Rev. Bonds (Legacy Traditional Schools Projects), Series 2014-A, 6.75% 20441 | |
| 6,900 | | |
| 7,887 | |
| City of Phoenix, Industrial Dev. Auth., Education Fac. Rev. Bonds (Legacy Traditional Schools Projects), Series 2015, 5.00% 20351 | |
| 1,590 | | |
| 1,704 | |
| City of Phoenix, Industrial Dev. Auth., Education Fac. Rev. Bonds (Legacy Traditional Schools Projects), Series 2015, 5.00% 20451 | |
| 2,250 | | |
| 2,373 | |
| City of Phoenix, Industrial Dev. Auth., Education Fac. Rev. Bonds (Legacy Traditional Schools Projects), Series 2016-A, 4.00% 20261 | |
| 3,275 | | |
| 3,381 | |
| City of Phoenix, Industrial Dev. Auth., Education Fac. Rev. Bonds (Legacy Traditional Schools Projects), Series 2016-A, 5.00% 20411 | |
| 10,000 | | |
| 10,673 | |
| City of Phoenix, Industrial Dev. Auth., Education Fac. Rev. Bonds (Legacy Traditional Schools Projects), Series 2016-A, 5.00% 20461 | |
| 2,500 | | |
| 2,656 | |
| City of Phoenix, Industrial Dev. Auth., Education Fac. Rev. Bonds (Leman Academy of Excellence - Oro Valley Projects), Series 2018-A, 5.00% 20381 | |
| 3,100 | | |
| 3,193 | |
| City of Phoenix, Industrial Dev. Auth., Education Fac. Rev. Bonds (Leman Academy of Excellence - Oro Valley Projects), Series 2018-A, 5.25% 20481 | |
| 3,000 | | |
| 3,093 | |
| City of Phoenix, Industrial Dev. Auth., Education Fac. Rev. Bonds (Leman Academy of Excellence - Oro Valley Projects), Series 2018-A, 5.25% 20531 | |
| 4,980 | | |
| 5,118 | |
| City of Phoenix, Industrial Dev. Auth., Education Fac. Rev. Bonds (Leman Academy of Excellence - Oro Valley Projects), Series 2019-A, 5.00% 20391 | |
| 410 | | |
| 422 | |
| City of Phoenix, Industrial Dev. Auth., Education Fac. Rev. Bonds (Leman Academy of Excellence - Oro Valley Projects), Series 2019-A, 5.00% 20491 | |
| 1,185 | | |
| 1,213 | |
| City of Phoenix, Industrial Dev. Auth., Lease Rev. Bonds (Rowan University Project), Series 2012, 5.25% 2034 | |
| 5,000 | | |
| 5,461 | |
| County of Pinal, Industrial Dev. Auth., Environmental Facs. Rev. Green Bonds (WOF SW GGP 1 LLC Project), Series 2018, AMT, 7.25% 20331 | |
| 13,500 | | |
| 14,804 | |
| Other securities | |
| | | |
| 101,960 | |
| | |
| | | |
| 214,631 | |
| | |
| | | |
| | |
| California 5.60% | |
| | | |
| | |
| Infrastructure and Econ. Dev. Bank, Rev. Ref. Bonds (Pacific Gas and Electric Co.), Series 2008-F, 1.75% 2026 (put 2022)2 | |
| 23,750 | | |
| 23,037 | |
| Other securities | |
| | | |
| 411,110 | |
| | |
| | | |
| 434,147 | |
| | |
| | | |
| | |
| Colorado 5.54% | |
| | | |
| | |
| Health Facs. Auth., Health Care Facs. Rev. Bonds (American Baptist Homes of the Midwest Obligated Group), Series 2013, 8.00% 2043 | |
| 11,100 | | |
| 12,608 | |
| Health Facs. Auth., Health Facs. Rev. and Rev. Ref. Bonds (Evangelical Lutheran Good Samaritan Society Project), Series 2015-A, 5.00% 2030 | |
| 3,000 | | |
| 3,584 | |
| Health Facs. Auth., Health Facs. Rev. and Rev. Ref. Bonds (Evangelical Lutheran Good Samaritan Society Project), Series 2015-A, 5.00% 2032 | |
| 1,500 | | |
| 1,792 | |
| Health Facs. Auth., Health Facs. Rev. and Rev. Ref. Bonds (Evangelical Lutheran Good Samaritan Society Project), Series 2015-A, 5.00% 2033 | |
| 100 | | |
| 119 | |
| Health Facs. Auth., Health Facs. Rev. and Rev. Ref. Bonds (Evangelical Lutheran Good Samaritan Society Project), Series 2015-A, 5.00% 2036 | |
| 2,360 | | |
| 2,819 | |
| Health Facs. Auth., Health Facs. Rev. and Rev. Ref. Bonds (Evangelical Lutheran Good Samaritan Society Project), Series 2015-A, 5.00% 2045 (preref. 2025) | |
| 1,000 | | |
| 1,195 | |
| 46 |
American Funds Tax-Exempt Funds |
American High-Income Municipal Bond Fund
| | |
Principal amount
(000) | | |
Value
(000) | |
| Health Facs. Auth., Health Facs. Rev. and Rev. Ref. Bonds (Evangelical Lutheran Good Samaritan Society Project), Series 2017, 5.00% 2028 | |
$ | 1,500 | | |
$ | 1,865 | |
| Health Facs. Auth., Health Facs. Rev. and Rev. Ref. Bonds (Evangelical Lutheran Good Samaritan Society Project), Series 2017, 5.00% 2032 | |
| 1,360 | | |
| 1,691 | |
| Health Facs. Auth., Health Facs. Rev. and Rev. Ref. Bonds (Evangelical Lutheran Good Samaritan Society Project), Series 2017, 5.00% 2037 (preref. 2027) | |
| 2,300 | | |
| 2,860 | |
| Health Facs. Auth., Health Facs. Rev. and Rev. Ref. Bonds (Evangelical Lutheran Good Samaritan Society Project), Series 2017, 5.00% 2042 | |
| 2,100 | | |
| 2,611 | |
| Health Facs. Auth., Health Facs. Rev. and Rev. Ref. Bonds (Evangelical Lutheran Good Samaritan Society Project), Series 2017, 5.00% 2047 (preref. 2027) | |
| 3,520 | | |
| 4,377 | |
| Health Facs. Auth., Health Facs. Rev. Bonds (Evangelical Lutheran Good Samaritan Society Project), Series 2012, 5.00% 2025 | |
| 500 | | |
| 551 | |
| Health Facs. Auth., Health Facs. Rev. Bonds (Evangelical Lutheran Good Samaritan Society Project), Series 2012, 5.00% 2033 (preref. 2022) | |
| 145 | | |
| 160 | |
| Health Facs. Auth., Health Facs. Rev. Bonds (Evangelical Lutheran Good Samaritan Society Project), Series 2012, 5.00% 2042 (preref. 2022) | |
| 12,140 | | |
| 13,377 | |
| Health Facs. Auth., Health Facs. Rev. Bonds (Evangelical Lutheran Good Samaritan Society Project), Series 2013, 5.625% 2043 (preref. 2023) | |
| 4,725 | | |
| 5,471 | |
| Health Facs. Auth., Hospital Rev. Bonds (Adventist Health System/Sunbelt Obligated Group), Series 2016-A, 5.00% 2041 | |
| 1,000 | | |
| 1,168 | |
| Health Facs. Auth., Rev. Bonds (Covenant Retirement Communities, Inc.), Series 2018, 5.00% 2048 | |
| 2,480 | | |
| 2,824 | |
| Health Facs. Auth., Rev. Bonds (Senior Residences Project), Series 2012, 7.00% 20422 | |
| 2,500 | | |
| 1,649 | |
| Health Facs. Auth., Rev. Bonds (Senior Residences Project), Series 2012, 7.125% 20472 | |
| 5,500 | | |
| 3,627 | |
| Health Facs. Auth., Rev. Ref. and Improvement Bonds (Frasier Meadows Retirement Community Project), Series 2017-A, 5.00% 2027 | |
| 455 | | |
| 532 | |
| Health Facs. Auth., Rev. Ref. and Improvement Bonds (Frasier Meadows Retirement Community Project), Series 2017-A, 5.25% 2031 | |
| 2,395 | | |
| 2,788 | |
| Health Facs. Auth., Rev. Ref. and Improvement Bonds (Frasier Meadows Retirement Community Project), Series 2017-A, 5.25% 2032 | |
| 850 | | |
| 986 | |
| Health Facs. Auth., Rev. Ref. and Improvement Bonds (Frasier Meadows Retirement Community Project), Series 2017-A, 5.25% 2037 | |
| 2,300 | | |
| 2,628 | |
| Health Facs. Auth., Rev. Ref. and Improvement Bonds (Frasier Meadows Retirement Community Project), Series 2017-A, 5.25% 2047 | |
| 12,230 | | |
| 13,686 | |
| Health Facs. Auth., Rev. Ref. and Improvement Bonds (Frasier Meadows Retirement Community Project), Series 2017-B, 3.125% 2027 | |
| 1,250 | | |
| 1,255 | |
| Health Facs. Auth., Rev. Ref. and Improvement Bonds (Frasier Meadows Retirement Community Project), Series 2017-B, 5.00% 2027 | |
| 1,055 | | |
| 1,147 | |
| Health Facs. Auth., Rev. Ref. Bonds (Christian Living Communities), Series 2012, 5.00% 2020 | |
| 75 | | |
| 76 | |
| Health Facs. Auth., Rev. Ref. Bonds (Christian Living Neighborhoods Project), Series 2016, 5.00% 2026 | |
| 750 | | |
| 842 | |
| Health Facs. Auth., Rev. Ref. Bonds (Christian Living Neighborhoods Project), Series 2016, 5.00% 2031 | |
| 2,000 | | |
| 2,207 | |
| Health Facs. Auth., Rev. Ref. Bonds (Christian Living Neighborhoods Project), Series 2016, 5.00% 2037 | |
| 7,250 | | |
| 7,896 | |
| Health Facs. Auth., Rev. Ref. Bonds (Covenant Retirement Communities, Inc.), Series 2012-A, 5.00% 2033 | |
| 4,750 | | |
| 5,143 | |
| Health Facs. Auth., Rev. Ref. Bonds (Covenant Retirement Communities, Inc.), Series 2013-A, 5.50% 2028 | |
| 525 | | |
| 604 | |
| Health Facs. Auth., Rev. Ref. Bonds (Covenant Retirement Communities, Inc.), Series 2013-A, 5.75% 2036 | |
| 1,000 | | |
| 1,151 | |
| Health Facs. Auth., Rev. Ref. Bonds (Covenant Retirement Communities, Inc.), Series 2015-A, 5.00% 2029 | |
| 1,500 | | |
| 1,720 | |
| Health Facs. Auth., Rev. Ref. Bonds (Covenant Retirement Communities, Inc.), Series 2015-A, 5.00% 2035 | |
| 2,500 | | |
| 2,809 | |
| Public Fin. Auth., Rev. Bonds (Denver International Airport Great Hall Project), Series 2017, AMT, 5.00% 2037 | |
| 2,625 | | |
| 3,060 | |
| Public Fin. Auth., Rev. Bonds (Denver International Airport Great Hall Project), Series 2017, AMT, 5.00% 2049 | |
| 4,500 | | |
| 5,133 | |
| Other securities | |
| | | |
| 311,492 | |
| | |
| | | |
| 429,503 | |
| American Funds Tax-Exempt Funds |
47 |
American High-Income Municipal Bond Fund
| Bonds, notes & other debt instruments (continued) | |
Principal amount
(000) | | |
Value
(000) | |
| District of Columbia 0.86% | |
| | | |
| | |
| Tobacco Settlement Fncg. Corp., Tobacco Settlement Asset-Backed Bonds, Capital Appreciation Bonds, Series 2006-A, 0% 2046 | |
$ | 173,025 | | |
$ | 29,345 | |
| Other securities | |
| | | |
| 37,276 | |
| | |
| | | |
| 66,621 | |
| | |
| | | |
| | |
| Florida 5.18% | |
| | | |
| | |
| North Broward Hospital Dist., Rev. Bonds (Broward Health), Series 2017-B, 5.00% 2042 | |
| 17,500 | | |
| 19,699 | |
| Other securities | |
| | | |
| 381,589 | |
| | |
| | | |
| 401,288 | |
| | |
| | | |
| | |
| Georgia 1.70% | |
| | | |
| | |
| Municipal Electric Auth., Plant Vogtle Units 3 and 4 Project J Bonds, Series 2015-A, 5.50% 2060 | |
| 19,100 | | |
| 20,944 | |
| Other securities | |
| | | |
| 110,678 | |
| | |
| | | |
| 131,622 | |
| | |
| | | |
| | |
| Hawaii 0.39% | |
| | | |
| | |
| Dept. of Budget and Fin., Special Purpose Rev. Ref. Bonds (Hawaiian Electric Co., Inc.), Series 2017-B, AMT, 4.00% 2037 | |
| 13,800 | | |
| 14,424 | |
| Other securities | |
| | | |
| 16,006 | |
| | |
| | | |
| 30,430 | |
| | |
| | | |
| | |
| Illinois 14.63% | |
| | | |
| | |
| Build Illinois Bonds, Sales Tax Rev. Bonds, Series 2016-A, 4.00% 2028 | |
| 4,685 | | |
| 5,017 | |
| City of Chicago, Board of Education, Capital Improvement Bonds, Series 2016, 6.00% 2046 | |
| 500 | | |
| 588 | |
| City of Chicago, Board of Education, Unlimited Tax G.O. Bonds (Dedicated Alternative Rev.), Series 2015-C, 5.25% 2039 | |
| 8,890 | | |
| 9,564 | |
| City of Chicago, Board of Education, Unlimited Tax G.O. Bonds (Dedicated Rev.), Series 2011-A, 5.50% 2039 | |
| 1,625 | | |
| 1,699 | |
| City of Chicago, Board of Education, Unlimited Tax G.O. Bonds (Dedicated Rev.), Series 2016-B, 6.50% 2046 | |
| 6,910 | | |
| 8,274 | |
| City of Chicago, Board of Education, Unlimited Tax G.O. Bonds (Dedicated Rev.), Series 2017-A, 7.00% 20461 | |
| 26,060 | | |
| 32,547 | |
| City of Chicago, Board of Education, Unlimited Tax G.O. Bonds (Dedicated Rev.), Series 2017-C, 5.00% 2030 | |
| 3,000 | | |
| 3,410 | |
| City of Chicago, Board of Education, Unlimited Tax G.O. Bonds (Dedicated Rev.), Series 2018-A, Assured Guaranty Municipal insured, 5.00% 2026 | |
| 2,500 | | |
| 2,964 | |
| City of Chicago, Board of Education, Unlimited Tax G.O. Bonds (Dedicated Rev.), Series 2018-A, Assured Guaranty Municipal insured, 5.00% 2029 | |
| 1,750 | | |
| 2,120 | |
| City of Chicago, Board of Education, Unlimited Tax G.O. Bonds (Dedicated Rev.), Series 2018-A, Assured Guaranty Municipal insured, 5.00% 2033 | |
| 1,000 | | |
| 1,188 | |
| City of Chicago, Board of Education, Unlimited Tax G.O. Bonds (Dedicated Rev.), Series 2018-C, Assured Guaranty Municipal insured, 5.00% 2023 | |
| 4,000 | | |
| 4,379 | |
| City of Chicago, Board of Education, Unlimited Tax G.O. Bonds (Dedicated Rev.), Series 2018-C, Assured Guaranty Municipal insured, 5.00% 2028 | |
| 2,250 | | |
| 2,744 | |
| City of Chicago, Board of Education, Unlimited Tax G.O. Bonds (Dedicated Rev.), Series 2018-D, 5.00% 2046 | |
| 2,000 | | |
| 2,195 | |
| City of Chicago, Board of Education, Unlimited Tax G.O. Rev. Ref. Bonds (Dedicated Rev.), Capital Appreciation Bonds, Series 1998-B-1, FGIC insured, 0% 2028 | |
| 5,470 | | |
| 4,168 | |
| City of Chicago, Board of Education, Unlimited Tax G.O. Rev. Ref. Bonds (Dedicated Rev.), Series 2017-B, 6.75% 20301 | |
| 3,500 | | |
| 4,461 | |
| City of Chicago, Board of Education, Unlimited Tax G.O. Rev. Ref. Bonds (Dedicated Rev.), Series 2017-B, 7.00% 20421 | |
| 28,185 | | |
| 35,305 | |
| City of Chicago, Board of Education, Unlimited Tax G.O. Rev. Ref. Bonds (Dedicated Rev.), Series 2017-C, 5.00% 2021 | |
| 2,000 | | |
| 2,109 | |
| City of Chicago, Board of Education, Unlimited Tax G.O. Rev. Ref. Bonds (Dedicated Rev.), Series 2017-C, 5.00% 2024 | |
| 2,000 | | |
| 2,224 | |
| City of Chicago, Board of Education, Unlimited Tax G.O. Rev. Ref. Bonds (Dedicated Rev.), Series 2017-C, 5.00% 2025 | |
| 4,000 | | |
| 4,506 | |
| City of Chicago, Board of Education, Unlimited Tax G.O. Rev. Ref. Bonds (Dedicated Rev.), Series 2017-D, 5.00% 2021 | |
| 1,500 | | |
| 1,582 | |
| City of Chicago, Board of Education, Unlimited Tax G.O. Rev. Ref. Bonds (Dedicated Rev.), Series 2017-F, 5.00% 2024 | |
| 2,000 | | |
| 2,224 | |
| 48 |
American Funds Tax-Exempt Funds |
American High-Income Municipal Bond Fund
| | |
Principal amount
(000) | | |
Value
(000) | |
| City of Chicago, Board of Education, Unlimited Tax G.O. Rev. Ref. Bonds (Dedicated Rev.), Series 2017-G, 5.00% 2044 | |
$ | 5,000 | | |
$ | 5,453 | |
| City of Chicago, Board of Education, Unlimited Tax G.O. Rev. Ref. Bonds (Dedicated Rev.), Series 2017-H, 5.00% 2036 | |
| 12,000 | | |
| 13,359 | |
| City of Chicago, Board of Education, Unlimited Tax G.O. Rev. Ref. Bonds (Dedicated Rev.), Series 2017-H, 5.00% 2046 | |
| 7,800 | | |
| 8,490 | |
| City of Chicago, Board of Education, Unlimited Tax G.O. Rev. Ref. Bonds (Dedicated Rev.), Series 2018-C, Assured Guaranty Municipal insured, 5.00% 2029 | |
| 3,000 | | |
| 3,634 | |
| City of Chicago, G.O. Bonds (City Colleges of Chicago Capital Improvement Project), Capital Appreciation Bonds, Series 1999, National insured, 0% 2031 | |
| 3,000 | | |
| 2,086 | |
| City of Chicago, G.O. Bonds (Library), Series 2008-D, 5.00% 2039 | |
| 265 | | |
| 266 | |
| City of Chicago, G.O. Bonds (Neighborhoods Alive 21 Program), Series 2002-B, 5.50% 2034 | |
| 500 | | |
| 557 | |
| City of Chicago, G.O. Bonds, Series 2003-B, 5.00% 2024 | |
| 1,000 | | |
| 1,092 | |
| City of Chicago, G.O. Bonds, Series 2011-A, 5.00% 2040 | |
| 970 | | |
| 993 | |
| City of Chicago, G.O. Bonds, Series 2011-A, 5.25% 2035 | |
| 500 | | |
| 515 | |
| City of Chicago, G.O. Bonds, Series 2012-A, 5.00% 2033 | |
| 585 | | |
| 610 | |
| City of Chicago, G.O. Bonds, Series 2012-C, 5.00% 2023 | |
| 360 | | |
| 381 | |
| City of Chicago, G.O. Bonds, Series 2014-A, 5.25% 2029 | |
| 3,895 | | |
| 4,274 | |
| City of Chicago, G.O. Bonds, Series 2015-A, 5.25% 2028 | |
| 500 | | |
| 560 | |
| City of Chicago, G.O. Bonds, Series 2015-A, 5.50% 2034 | |
| 200 | | |
| 223 | |
| City of Chicago, G.O. Bonds, Series 2017-A, 5.75% 2033 | |
| 465 | | |
| 545 | |
| City of Chicago, G.O. Bonds, Series 2019-A, 5.50% 2049 | |
| 10,000 | | |
| 11,491 | |
| City of Chicago, G.O. Project and Rev. Ref. Bonds, Capital Appreciation Bonds, Series 2008-C, 0% 2030 | |
| 8,000 | | |
| 5,563 | |
| City of Chicago, G.O. Project and Rev. Ref. Bonds, Capital Appreciation Bonds, Series 2008-C, 0% 2031 | |
| 2,105 | | |
| 1,396 | |
| City of Chicago, G.O. Project and Rev. Ref. Bonds, Capital Appreciation Bonds, Series 2008-C, 0% 2032 | |
| 725 | | |
| 459 | |
| City of Chicago, G.O. Project and Rev. Ref. Bonds, Series 2003-B, 5.00% 2022 | |
| 1,000 | | |
| 1,059 | |
| City of Chicago, G.O. Project and Rev. Ref. Bonds, Series 2005-D, 5.50% 2037 | |
| 250 | | |
| 277 | |
| City of Chicago, G.O. Project and Rev. Ref. Bonds, Series 2005-D, 5.50% 2040 | |
| 1,450 | | |
| 1,597 | |
| City of Chicago, G.O. Project and Rev. Ref. Bonds, Series 2014-A, 5.00% 2022 | |
| 100 | | |
| 106 | |
| City of Chicago, G.O. Project and Rev. Ref. Bonds, Series 2014-A, 5.00% 2035 | |
| 3,140 | | |
| 3,361 | |
| City of Chicago, G.O. Project and Rev. Ref. Bonds, Series 2014-A, 5.25% 2030 | |
| 4,885 | | |
| 5,343 | |
| City of Chicago, G.O. Project and Rev. Ref. Bonds, Series 2017-A, 5.625% 2029 | |
| 6,500 | | |
| 7,699 | |
| City of Chicago, G.O. Project and Rev. Ref. Bonds, Series 2017-A, 6.00% 2038 | |
| 11,170 | | |
| 13,092 | |
| City of Chicago, G.O. Rev. Ref. Bonds, Series 2015-A, 5.375% 2029 | |
| 1,000 | | |
| 1,123 | |
| City of Chicago, G.O. Rev. Ref. Bonds, Series 2015-C, 5.00% 2024 | |
| 3,020 | | |
| 3,296 | |
| City of Chicago, G.O. Rev. Ref. Bonds, Series 2015-C, 5.00% 2027 | |
| 3,105 | | |
| 3,500 | |
| City of Chicago, G.O. Rev. Ref. Bonds, Series 2015-C, 5.00% 2035 | |
| 1,670 | | |
| 1,829 | |
| City of Chicago, G.O. Rev. Ref. Bonds, Series 2015-C, 5.00% 2038 | |
| 3,500 | | |
| 3,805 | |
| City of Chicago, Sales Tax Rev. Ref. Bonds, Series 2002, 5.00% 2032 (preref. 2025) | |
| 145 | | |
| 173 | |
| City of Chicago, School Reform Board of Trustees of the Board of Education, Unlimited Tax G.O. Bonds (Dedicated Tax Rev.), Capital Appreciation Bonds, Series 1998-B-1, National insured, 0% 2019 | |
| 1,205 | | |
| 1,196 | |
| City of Chicago, School Reform Board of Trustees of the Board of Education, Unlimited Tax G.O. Bonds (Dedicated Tax Rev.), Capital Appreciation Bonds, Series 1998-B-1, National insured, 0% 2029 | |
| 2,690 | | |
| 1,965 | |
| City of Chicago, School Reform Board of Trustees of the Board of Education, Unlimited Tax G.O. Bonds (Dedicated Tax Rev.), Capital Appreciation Bonds, Series 1998-B-1, National insured, 0% 2031 | |
| 5,870 | | |
| 3,942 | |
| City of Chicago, School Reform Board of Trustees of the Board of Education, Unlimited Tax G.O. Bonds (Dedicated Tax Rev.), Capital Appreciation Bonds, Series 1999-A, National insured, 0% 2024 | |
| 2,070 | | |
| 1,811 | |
| City of Chicago, School Reform Board of Trustees of the Board of Education, Unlimited Tax G.O. Bonds (Dedicated Tax Rev.), Capital Appreciation Bonds, Series 1999-A, National insured, 0% 2025 | |
| 1,200 | | |
| 1,015 | |
| City of Chicago, School Reform Board of Trustees of the Board of Education, Unlimited Tax G.O. Bonds (Dedicated Tax Rev.), Capital Appreciation Bonds, Series 1999-A, National insured, 0% 2031 | |
| 3,125 | | |
| 2,096 | |
| City of Chicago, School Reform Board of Trustees of the Board of Education, Unlimited Tax G.O. Bonds (Dedicated Tax Rev.), Series 2011-A, 5.00% 2041 | |
| 12,440 | | |
| 12,852 | |
| American Funds Tax-Exempt Funds |
49 |
American High-Income Municipal Bond Fund
| Bonds, notes & other debt instruments (continued) | |
Principal amount
(000) | | |
Value
(000) | |
| Illinois (continued) | |
| | | |
| | |
| City of Chicago, School Reform Board of Trustees of the Board of Education, Unlimited Tax G.O. Bonds (Dedicated Tax Rev.), Series 2012-A, 5.00% 2042 | |
$ | 8,635 | | |
$ | 9,019 | |
| City of Chicago, School Reform Board of Trustees of the Board of Education, Unlimited Tax G.O. Bonds (Dedicated Tax Rev.), Series 2016-A, 7.00% 2044 | |
| 14,980 | | |
| 18,022 | |
| City of Chicago, Transit Auth., Sales Tax Receipts Rev. Bonds, Series 2017, Assured Guaranty Municipal insured, 5.00% 2051 | |
| 21,750 | | |
| 24,256 | |
| City of Chicago, Wastewater Transmission Rev. Bonds (Second Lien), Series 2017-A, 5.00% 2037 | |
| 3,000 | | |
| 3,438 | |
| City of Chicago, Wastewater Transmission Rev. Bonds, Series 2012, 5.00% 2042 | |
| 6,000 | | |
| 6,318 | |
| City of Chicago, Wastewater Transmission Rev. Bonds, Series 2014, 5.00% 2020 | |
| 460 | | |
| 467 | |
| City of Chicago, Wastewater Transmission Rev. Bonds, Series 2014, 5.00% 2024 | |
| 1,000 | | |
| 1,142 | |
| City of Chicago, Wastewater Transmission Rev. Ref. Bonds, Capital Appreciation Bonds, Series 1998-A, National insured, 0% 2026 | |
| 560 | | |
| 481 | |
| City of Chicago, Wastewater Transmission Rev. Ref. Bonds, Capital Appreciation Bonds, Series 1998-A, National insured, 0% 2027 | |
| 5,000 | | |
| 4,158 | |
| City of Chicago, Wastewater Transmission Rev. Ref. Bonds, Series 2008-C, 5.00% 2023 | |
| 1,000 | | |
| 1,114 | |
| City of Chicago, Water Rev. Bonds, Series 2004, 5.00% 2023 | |
| 2,575 | | |
| 2,937 | |
| City of Chicago, Water Rev. Bonds, Series 2004, 5.00% 2024 | |
| 2,000 | | |
| 2,332 | |
| City of Chicago, Water Rev. Bonds, Series 2004, 5.00% 2027 | |
| 1,750 | | |
| 2,086 | |
| City of Chicago, Water Rev. Bonds, Series 2014, 5.00% 2022 | |
| 250 | | |
| 277 | |
| City of Chicago, Water Rev. Bonds, Series 2014, 5.00% 2033 | |
| 6,200 | | |
| 6,981 | |
| City of Chicago, Water Rev. Ref. Bonds (Second Lien), Series 2001, 5.75% 2030 | |
| 3,000 | | |
| 3,772 | |
| City of Chicago, Water Rev. Ref. Bonds, Series 2012, 5.00% 2042 | |
| 4,370 | | |
| 4,681 | |
| City of Chicago, Water Rev. Ref. Bonds, Series 2014, 5.00% 2029 | |
| 1,605 | | |
| 1,821 | |
| City of Chicago, Water Rev. Ref. Bonds, Series 2014, 5.00% 2044 | |
| 500 | | |
| 551 | |
| Fin. Auth., Charter School Rev. Ref. and Improvement Rev. Bonds (Chicago International Charter School Project), Series 2017, 5.00% 2037 | |
| 1,500 | | |
| 1,686 | |
| Fin. Auth., Charter School Rev. Ref. and Improvement Rev. Bonds (Chicago International Charter School Project), Series 2017, 5.00% 2047 | |
| 3,180 | | |
| 3,505 | |
| Fin. Auth., Rev. Bonds (Benedictine University Project), Series 2013-A, 6.25% 2033 | |
| 4,010 | | |
| 4,139 | |
| Fin. Auth., Rev. Bonds (Centegra Health System), Series 2014-A, 5.00% 2022 | |
| 40 | | |
| 45 | |
| Fin. Auth., Rev. Bonds (Centegra Health System), Series 2014-A, 5.00% 2042 | |
| 1,000 | | |
| 1,116 | |
| Fin. Auth., Rev. Bonds (Christian Homes, Inc.), Series 2010, 6.125% 2027 | |
| 645 | | |
| 662 | |
| Fin. Auth., Rev. Bonds (Clean Water Initiative Revolving Fund), Series 2017, 5.00% 2036 | |
| 7,530 | | |
| 9,022 | |
| Fin. Auth., Rev. Bonds (DePaul University), Series 2016, 5.00% 2041 | |
| 1,000 | | |
| 1,164 | |
| Fin. Auth., Rev. Bonds (Edward-Elmhurst Healthcare), Series 2017-A, 5.00% 2032 | |
| 1,285 | | |
| 1,507 | |
| Fin. Auth., Rev. Bonds (Edward-Elmhurst Healthcare), Series 2017-A, 5.00% 2035 | |
| 3,750 | | |
| 4,340 | |
| Fin. Auth., Rev. Bonds (Franciscan Communities, Inc.), Series 2013-A, 5.125% 2043 | |
| 2,405 | | |
| 2,537 | |
| Fin. Auth., Rev. Bonds (Friendship Village Schaumburg), Series 2017, 5.125% 2045 | |
| 7,250 | | |
| 6,995 | |
| Fin. Auth., Rev. Bonds (Hospital Sisters Services, Inc. Obligated Group), Series 2012-C, 5.00% 2020 | |
| 230 | | |
| 239 | |
| Fin. Auth., Rev. Bonds (Lifespace Communities, Inc.), Series 2015-A, 5.00% 2026 | |
| 255 | | |
| 290 | |
| Fin. Auth., Rev. Bonds (Lifespace Communities, Inc.), Series 2015-A, 5.00% 2045 | |
| 3,500 | | |
| 3,800 | |
| Fin. Auth., Rev. Bonds (Mercy Health Corp.), Series 2016, 5.00% 2046 | |
| 17,165 | | |
| 19,276 | |
| Fin. Auth., Rev. Bonds (Northwest Community Hospital), Series 2016-A, 5.00% 2033 | |
| 1,800 | | |
| 2,094 | |
| Fin. Auth., Rev. Bonds (Northwestern Memorial Hospital), Series 2009-A, 5.75% 2030 (preref. 2019) | |
| 4,000 | | |
| 4,007 | |
| Fin. Auth., Rev. Bonds (Northwestern Memorial Hospital), Series 2009-B, 5.75% 2030 (preref. 2019) | |
| 130 | | |
| 130 | |
| Fin. Auth., Rev. Bonds (OSF Healthcare System), Series 2012-A, 5.00% 2028 | |
| 1,500 | | |
| 1,633 | |
| Fin. Auth., Rev. Bonds (OSF Healthcare System), Series 2015-A, 4.125% 2037 | |
| 1,000 | | |
| 1,070 | |
| Fin. Auth., Rev. Bonds (Presbyterian Homes Obligated Group), Series 2016-A, 5.00% 2025 | |
| 1,135 | | |
| 1,338 | |
| Fin. Auth., Rev. Bonds (Presbyterian Homes Obligated Group), Series 2016-A, 5.00% 2026 | |
| 1,000 | | |
| 1,195 | |
| Fin. Auth., Rev. Bonds (Presbyterian Homes Obligated Group), Series 2016-A, 5.00% 2026 | |
| 1,000 | | |
| 1,181 | |
| Fin. Auth., Rev. Bonds (Presbyterian Homes Obligated Group), Series 2016-A, 5.00% 2028 | |
| 2,240 | | |
| 2,652 | |
| Fin. Auth., Rev. Bonds (Presbyterian Homes Obligated Group), Series 2016-A, 5.00% 2029 | |
| 3,090 | | |
| 3,641 | |
| Fin. Auth., Rev. Bonds (Presbyterian Homes Obligated Group), Series 2016-A, 5.00% 2030 | |
| 1,500 | | |
| 1,756 | |
| Fin. Auth., Rev. Bonds (Presbyterian Homes Obligated Group), Series 2016-A, 5.00% 2031 | |
| 2,270 | | |
| 2,637 | |
| Fin. Auth., Rev. Bonds (Presbyterian Homes Obligated Group), Series 2016-B, (1-month USD-LIBOR x 0.70 + 1.35%) 3.031% 2036 (put 2021)3 | |
| 800 | | |
| 802 | |
| Fin. Auth., Rev. Bonds (Presence Health Network), Series 2016-C, 3.75% 2034 | |
| 250 | | |
| 266 | |
| Fin. Auth., Rev. Bonds (Presence Health Network), Series 2016-C, 4.00% 2041 | |
| 1,755 | | |
| 1,910 | |
| Fin. Auth., Rev. Bonds (Presence Health Network), Series 2016-C, 4.00% 2041 (preref. 2027) | |
| 5 | | |
| 6 | |
| Fin. Auth., Rev. Bonds (Presence Health Network), Series 2016-C, 5.00% 2027 | |
| 1,875 | | |
| 2,331 | |
| 50 |
American Funds Tax-Exempt Funds |
American High-Income Municipal Bond Fund
| | |
Principal amount
(000) | | |
Value
(000) | |
| Fin. Auth., Rev. Bonds (Presence Health Network), Series 2016-C, 5.00% 2029 | |
$ | 9,000 | | |
$ | 11,098 | |
| Fin. Auth., Rev. Bonds (Presence Health Network), Series 2016-C, 5.00% 2030 | |
| 1,000 | | |
| 1,221 | |
| Fin. Auth., Rev. Bonds (Presence Health Network), Series 2016-C, 5.00% 2032 | |
| 4,500 | | |
| 5,438 | |
| Fin. Auth., Rev. Bonds (Presence Health Network), Series 2016-C, 5.00% 2034 | |
| 1,265 | | |
| 1,511 | |
| Fin. Auth., Rev. Bonds (Presence Health Network), Series 2016-C, 5.00% 2036 | |
| 3,820 | | |
| 4,517 | |
| Fin. Auth., Rev. Bonds (Presence Health Network), Series 2016-C, 5.00% 2041 | |
| 2,000 | | |
| 2,334 | |
| Fin. Auth., Rev. Bonds (Rehabilitation Institute of Chicago), Series 2013-A, 6.00% 2043 | |
| 2,300 | | |
| 2,594 | |
| Fin. Auth., Rev. Bonds (Rosalind Franklin University Research Building Project), Series 2017-C, 5.00% 2046 | |
| 900 | | |
| 1,010 | |
| Fin. Auth., Rev. Bonds (Rosalind Franklin University Research Building Project), Series 2017-C, 5.00% 2049 | |
| 1,250 | | |
| 1,398 | |
| Fin. Auth., Rev. Bonds (Rush University Medical Center Obligated Group), Series 2015-A, 5.00% 2032 | |
| 1,100 | | |
| 1,262 | |
| Fin. Auth., Rev. Bonds (Rush University Medical Center Obligated Group), Series 2015-A, 5.00% 2038 | |
| 1,500 | | |
| 1,688 | |
| Fin. Auth., Rev. Bonds (Silver Cross Hospital and Medical Centers), Series 2009, 6.875% 2038 (preref. 2019) | |
| 1,500 | | |
| 1,503 | |
| Fin. Auth., Rev. Bonds (Swedish Covenant Hospital), Series 2016-A, 5.00% 2032 | |
| 2,000 | | |
| 2,298 | |
| Fin. Auth., Rev. Bonds (Swedish Covenant Hospital), Series 2016-A, 5.00% 2033 | |
| 2,000 | | |
| 2,292 | |
| Fin. Auth., Rev. Bonds (Swedish Covenant Hospital), Series 2016-A, 5.00% 2035 | |
| 2,000 | | |
| 2,279 | |
| Fin. Auth., Rev. Bonds (Swedish Covenant Hospital), Series 2016-A, 5.00% 2037 | |
| 1,800 | | |
| 2,037 | |
| Fin. Auth., Rev. Bonds (The Cable Foundation), Series 2016-A, 5.00% 2045 | |
| 6,880 | | |
| 7,790 | |
| Fin. Auth., Rev. Bonds (Trinity Health Credit Group), Series 2011-IL, 5.00% 2030 (preref. 2021) | |
| 275 | | |
| 299 | |
| Fin. Auth., Rev. Ref. Bonds (Anne & Robert H. Lurie Children’s Hospital), Series 2017, 5.00% 2034 | |
| 1,000 | | |
| 1,201 | |
| Fin. Auth., Rev. Ref. Bonds (Bradley University Project), Series 2017-C, 5.00% 2032 | |
| 1,250 | | |
| 1,480 | |
| Fin. Auth., Rev. Ref. Bonds (Christian Homes, Inc.), Series 2016, 5.00% 2031 | |
| 1,875 | | |
| 2,031 | |
| Fin. Auth., Rev. Ref. Bonds (Christian Homes, Inc.), Series 2016, 5.00% 2036 | |
| 1,000 | | |
| 1,071 | |
| Fin. Auth., Rev. Ref. Bonds (Northwestern Memorial Hospital), Series 2009-A, 6.00% 2039 (preref. 2019) | |
| 3,500 | | |
| 3,506 | |
| Fin. Auth., Rev. Ref. Bonds (OSF Healthcare System), Series 2010-A, 6.00% 2039 | |
| 940 | | |
| 978 | |
| Fin. Auth., Rev. Ref. Bonds (OSF Healthcare System), Series 2010-A, 6.00% 2039 (preref. 2020) | |
| 5,135 | | |
| 5,328 | |
| Fin. Auth., Rev. Ref. Bonds (OSF Healthcare System), Series 2015-A, 5.00% 2035 | |
| 5,450 | | |
| 6,213 | |
| Fin. Auth., Rev. Ref. Bonds (OSF Healthcare System), Series 2015-A, 5.00% 2045 | |
| 2,000 | | |
| 2,228 | |
| Fin. Auth., Rev. Ref. Bonds (OSF Healthcare System), Series 2018-A, 4.125% 2047 | |
| 2,000 | | |
| 2,151 | |
| Fin. Auth., Rev. Ref. Bonds (Provena Health), Series 2009-A, 7.75% 2034 (preref. 2019) | |
| 9,705 | | |
| 9,728 | |
| Fin. Auth., Rev. Ref. Bonds (Provena Health), Series 2009-A, 7.75% 2034 (preref. 2019) | |
| 125 | | |
| 125 | |
| Fin. Auth., Rev. Ref. Bonds (Provena Health), Series 2010-A, 6.00% 2028 (preref. 2020) | |
| 1,250 | | |
| 1,295 | |
| Fin. Auth., Rev. Ref. Bonds (Silver Cross Hospital and Medical Centers), Series 2015-C, 4.125% 2037 | |
| 8,710 | | |
| 9,078 | |
| Fin. Auth., Rev. Ref. Bonds (Silver Cross Hospital and Medical Centers), Series 2015-C, 5.00% 2035 | |
| 3,950 | | |
| 4,469 | |
| Fin. Auth., Rev. Ref. Bonds (Silver Cross Hospital and Medical Centers), Series 2015-C, 5.00% 2044 | |
| 6,400 | | |
| 7,125 | |
| Fin. Auth., Rev. Ref. Bonds (Southern Illinois Healthcare Enterprises, Inc.), Series 2017-C, 5.00% 2026 | |
| 250 | | |
| 300 | |
| Fin. Auth., Rev. Ref. Bonds (University of Chicago Medical Center), Series 2009-B, 5.00% 2025 | |
| 1,995 | | |
| 2,074 | |
| Fin. Auth., Rev. Ref. Bonds (University of Chicago Medical Center), Series 2009-B, 5.00% 2025 (preref. 2020) | |
| 1,005 | | |
| 1,045 | |
| Fin. Auth., Student Housing and Academic Fac. Rev. Bonds (CHF-Chicago, LLC - University of Illinois at Chicago Project), Series 2017-A, 5.00% 2047 | |
| 2,365 | | |
| 2,641 | |
| Fin. Auth., Student Housing Rev. Bonds (CHF-Cook, LLC - Northeastern Illinois University Project), Series 2015-A, 5.00% 2023 | |
| 775 | | |
| 817 | |
| Fin. Auth., Student Housing Rev. Bonds (CHF-Cook, LLC - Northeastern Illinois University Project), Series 2015-A, 5.00% 2024 | |
| 815 | | |
| 862 | |
| Fin. Auth., Student Housing Rev. Bonds (CHF-Cook, LLC - Northeastern Illinois University Project), Series 2015-A, 5.00% 2025 | |
| 730 | | |
| 774 | |
| Fin. Auth., Student Housing Rev. Bonds (CHF-Cook, LLC - Northeastern Illinois University Project), Series 2015-A, 5.00% 2030 | |
| 2,465 | | |
| 2,550 | |
| American Funds Tax-Exempt Funds |
51 |
American High-Income Municipal Bond Fund
| Bonds, notes & other debt instruments (continued) | |
Principal amount
(000) | | |
Value
(000) | |
| Illinois (continued) | |
| | | |
| | |
| Fin. Auth., Student Housing Rev. Bonds (CHF-Cook, LLC - Northeastern Illinois University Project), Series 2015-A, 5.00% 2035 | |
$ | 700 | | |
$ | 713 | |
| Fin. Auth., Student Housing Rev. Bonds (CHF-Cook, LLC - Northeastern Illinois University Project), Series 2015-A, 5.00% 2047 | |
| 11,500 | | |
| 11,593 | |
| Fin. Auth., Student Housing Rev. Bonds (CHF-DeKalb II, LLC - Northern Illinois University Project), Series 2011, 5.125% 2020 | |
| 4,440 | | |
| 4,506 | |
| Fin. Auth., Student Housing Rev. Bonds (CHF-DeKalb II, LLC - Northern Illinois University Project), Series 2011, 5.75% 2021 | |
| 2,000 | | |
| 2,103 | |
| Fin. Auth., Student Housing Rev. Bonds (CHF-DeKalb II, LLC - Northern Illinois University Project), Series 2011, 6.00% 2024 | |
| 1,000 | | |
| 1,057 | |
| Fin. Auth., Student Housing Rev. Bonds (CHF-DeKalb II, LLC - Northern Illinois University Project), Series 2011, 6.875% 2043 | |
| 19,125 | | |
| 20,334 | |
| Fin. Auth., Student Housing Rev. Bonds (CHF-Normal, LLC - Illinois State University Project), Series 2011, 7.00% 2043 (preref. 2021) | |
| 4,265 | | |
| 4,670 | |
| G.O. Bonds, Series 2012-A, 5.00% 2028 | |
| 1,000 | | |
| 1,051 | |
| G.O. Bonds, Series 2013, 5.00% 2021 | |
| 860 | | |
| 905 | |
| G.O. Bonds, Series 2013, 5.00% 2023 | |
| 685 | | |
| 747 | |
| G.O. Bonds, Series 2013, 5.50% 2026 | |
| 2,000 | | |
| 2,205 | |
| G.O. Bonds, Series 2013, 5.50% 2033 | |
| 3,715 | | |
| 4,054 | |
| G.O. Bonds, Series 2013, 5.50% 2038 | |
| 1,000 | | |
| 1,082 | |
| G.O. Bonds, Series 2014, 5.00% 2022 | |
| 885 | | |
| 942 | |
| G.O. Bonds, Series 2014, 5.00% 2024 | |
| 3,000 | | |
| 3,290 | |
| G.O. Bonds, Series 2014, 5.00% 2026 | |
| 2,025 | | |
| 2,215 | |
| G.O. Bonds, Series 2014, 5.00% 2027 | |
| 2,000 | | |
| 2,249 | |
| G.O. Bonds, Series 2014, 5.00% 2039 | |
| 13,550 | | |
| 14,376 | |
| G.O. Bonds, Series 2014, Assured Guaranty Municipal insured, 5.00% 2039 | |
| 4,100 | | |
| 4,361 | |
| G.O. Bonds, Series 2016, 5.00% 2025 | |
| 1,000 | | |
| 1,116 | |
| G.O. Bonds, Series 2016, 5.00% 2028 | |
| 1,500 | | |
| 1,689 | |
| G.O. Bonds, Series 2016, 5.00% 2033 | |
| 4,000 | | |
| 4,428 | |
| G.O. Bonds, Series 2016, 5.00% 2038 | |
| 1,000 | | |
| 1,092 | |
| G.O. Bonds, Series 2016, Assured Guaranty Municipal insured, 5.00% 2030 | |
| 3,000 | | |
| 3,333 | |
| G.O. Bonds, Series 2016, Assured Guaranty Municipal insured, 5.00% 2041 | |
| 2,125 | | |
| 2,292 | |
| G.O. Bonds, Series 2017-A, 5.00% 2035 | |
| 3,145 | | |
| 3,449 | |
| G.O. Bonds, Series 2017-A, 5.00% 2036 | |
| 3,000 | | |
| 3,279 | |
| G.O. Bonds, Series 2017-B, 5.00% 2019 | |
| 3,550 | | |
| 3,576 | |
| G.O. Bonds, Series 2017-C, 5.00% 2029 | |
| 9,820 | | |
| 11,036 | |
| G.O. Bonds, Series 2017-D, 5.00% 2027 | |
| 21,490 | | |
| 24,426 | |
| G.O. Bonds, Series 2017-D, BAM insured, 5.00% 2021 | |
| 3,335 | | |
| 3,533 | |
| G.O. Bonds, Series 2017-D, BAM insured, 5.00% 2026 | |
| 10,000 | | |
| 11,265 | |
| G.O. Bonds, Series 2017-D, BAM insured, 5.00% 2028 | |
| 18,000 | | |
| 20,347 | |
| G.O. Bonds, Series 2018-A, 5.00% 2020 | |
| 2,650 | | |
| 2,711 | |
| G.O. Bonds, Series 2019-B, 5.00% 2027 | |
| 5,000 | | |
| 5,748 | |
| G.O. Rev. Ref. Bonds, Series 2012, 4.00% 2025 | |
| 405 | | |
| 419 | |
| G.O. Rev. Ref. Bonds, Series 2012, Assured Guaranty Municipal insured, 5.00% 2025 | |
| 4,250 | | |
| 4,541 | |
| G.O. Rev. Ref. Bonds, Series 2016, 5.00% 2026 | |
| 3,000 | | |
| 3,391 | |
| G.O. Rev. Ref. Bonds, Series 2016, 5.00% 2028 | |
| 3,000 | | |
| 3,415 | |
| G.O. Rev. Ref. Bonds, Series 2016, Assured Guaranty Municipal insured, 4.00% 2030 | |
| 750 | | |
| 819 | |
| G.O. Rev. Ref. Bonds, Series 2018-A, 5.00% 2023 | |
| 2,500 | | |
| 2,738 | |
| G.O. Rev. Ref. Bonds, Series 2018-A, 5.00% 2025 | |
| 3,750 | | |
| 4,222 | |
| G.O. Rev. Ref. Bonds, Series 2018-A, 5.00% 2026 | |
| 5,500 | | |
| 6,263 | |
| G.O. Rev. Ref. Bonds, Series 2018-A, 5.00% 2027 | |
| 2,000 | | |
| 2,301 | |
| G.O. Rev. Ref. Bonds, Series 2018-A, 5.00% 2028 | |
| 4,000 | | |
| 4,647 | |
| G.O. Rev. Ref. Bonds, Series 2018-A, 5.00% 2029 | |
| 2,000 | | |
| 2,309 | |
| G.O. Rev. Ref. Bonds, Series 2018-B, 5.00% 2033 | |
| 3,000 | | |
| 3,395 | |
| Metropolitan Pier and Exposition Auth., Dedicated State Tax Rev. Bonds, Capital Appreciation Bonds, Series 1994, BAM insured, 0% 2028 | |
| 3,185 | | |
| 2,564 | |
| Metropolitan Pier and Exposition Auth., Dedicated State Tax Rev. Bonds, Capital Appreciation Bonds, Series 2002-A, National insured, 0% 2030 | |
| 2,435 | | |
| 1,777 | |
| Metropolitan Pier and Exposition Auth., Dedicated State Tax Rev. Bonds, Capital Appreciation Bonds, Series 2002-A, National insured, 0% 2030 (escrowed to maturity) | |
| 130 | | |
| 105 | |
| Metropolitan Pier and Exposition Auth., McCormick Place Expansion Project Bonds, Capital Appreciation Bonds, Series 2002-A, National insured, 0% 2032 | |
| 8,860 | | |
| 5,845 | |
| 52 |
American Funds Tax-Exempt Funds |
American High-Income Municipal Bond Fund
| | |
Principal amount
(000) | | |
Value
(000) | |
| Metropolitan Pier and Exposition Auth., McCormick Place Expansion Project Bonds, Capital Appreciation Bonds, Series 2002-A, National insured, 0% 2033 | |
$ | 10,230 | | |
$ | 6,498 | |
| Metropolitan Pier and Exposition Auth., McCormick Place Expansion Project Bonds, Capital Appreciation Bonds, Series 2002-A, National insured, 0% 2034 | |
| 10,000 | | |
| 6,181 | |
| Metropolitan Pier and Exposition Auth., McCormick Place Expansion Project Bonds, Capital Appreciation Bonds, Series 2002-A, National insured, 0% 2039 | |
| 3,800 | | |
| 1,829 | |
| Metropolitan Pier and Exposition Auth., McCormick Place Expansion Project Bonds, Capital Appreciation Bonds, Series 2012-B, 0% 2050 | |
| 3,630 | | |
| 1,047 | |
| Metropolitan Pier and Exposition Auth., McCormick Place Expansion Project Bonds, Capital Appreciation Bonds, Series 2012-B, 0% 2051 | |
| 13,350 | | |
| 3,653 | |
| Metropolitan Pier and Exposition Auth., McCormick Place Expansion Project Bonds, Series 2012-A, 5.00% 2042 | |
| 1,500 | | |
| 1,579 | |
| Metropolitan Pier and Exposition Auth., McCormick Place Expansion Project Rev. Bonds, Series 2002-A, Assured Guaranty Municipal insured, 5.50% 2023 | |
| 540 | | |
| 589 | |
| Metropolitan Pier and Exposition Auth., McCormick Place Expansion Project Rev. Ref. Bonds, Capital Appreciation Bonds, Series 1996-A, National insured, 0% 2025 | |
| 2,535 | | |
| 2,209 | |
| Metropolitan Pier and Exposition Auth., McCormick Place Expansion Project Rev. Ref. Bonds, Capital Appreciation Bonds, Series 2010-B-1, Assured Guaranty Municipal insured, 0% 2027 | |
| 3,500 | | |
| 2,893 | |
| Metropolitan Pier and Exposition Auth., McCormick Place Expansion Project Rev. Ref. Bonds, Capital Appreciation Bonds, Series 2010-B-1, Assured Guaranty Municipal insured, 0% 2043 | |
| 800 | | |
| 344 | |
| Metropolitan Pier and Exposition Auth., McCormick Place Expansion Project Rev. Ref. Bonds, Capital Appreciation Bonds, Series 2010-B-1, Assured Guaranty Municipal insured, 0% 2044 | |
| 25,395 | | |
| 10,443 | |
| Metropolitan Pier and Exposition Auth., McCormick Place Expansion Project Rev. Ref. Bonds, Capital Appreciation Bonds, Series 2010-B-1, Assured Guaranty Municipal insured, 0% 2046 | |
| 3,300 | | |
| 1,243 | |
| Metropolitan Pier and Exposition Auth., McCormick Place Expansion Project Rev. Ref. Bonds, Capital Appreciation Bonds, Series 2017-A, 0% 2056 | |
| 32,160 | | |
| 6,981 | |
| Metropolitan Pier and Exposition Auth., McCormick Place Expansion Project Rev. Ref. Bonds, Capital Appreciation Bonds, Series 2017-B, 0% 2054 | |
| 27,760 | | |
| 6,663 | |
| Metropolitan Pier and Exposition Auth., McCormick Place Expansion Project Rev. Ref. Bonds, Capital Appreciation Bonds, Series 2017-B, Assured Guaranty Municipal insured, 0% 2056 | |
| 19,175 | | |
| 4,600 | |
| Metropolitan Pier and Exposition Auth., McCormick Place Expansion Project Rev. Ref. Bonds, Series 2010-B-2, 5.00% 2050 | |
| 5,850 | | |
| 5,937 | |
| Metropolitan Pier and Exposition Auth., McCormick Place Expansion Project Rev. Ref. Bonds, Series 2012-B, 5.00% 2028 | |
| 500 | | |
| 536 | |
| Metropolitan Pier and Exposition Auth., McCormick Place Expansion Project Rev. Ref. Bonds, Series 2012-B, 5.00% 2052 | |
| 1,470 | | |
| 1,542 | |
| Metropolitan Pier and Exposition Auth., McCormick Place Expansion Project Rev. Ref. Bonds, Series 2015-B, 5.00% 2035 | |
| 3,000 | | |
| 3,306 | |
| Metropolitan Pier and Exposition Auth., McCormick Place Expansion Project Rev. Ref. Bonds, Series 2015-B, 5.00% 2040 | |
| 4,000 | | |
| 4,364 | |
| Other securities | |
| | | |
| 256,705 | |
| | |
| | | |
| 1,134,482 | |
| | |
| | | |
| | |
| Indiana 1.76% | |
| | | |
| | |
| Fin. Auth., Environmental Rev. Ref. Bonds (Duke Energy Indiana, Inc. Project), Series 2009-B, 6.00% 2039 | |
| 9,000 | | |
| 9,034 | |
| Fin. Auth., Facs. Rev. Ref. Green Bonds (RES Polyflow Project), Series 2019, AMT, 7.00% 20391 | |
| 6,000 | | |
| 6,151 | |
| Fin. Auth., Health System Rev. Bonds (Franciscan Alliance, Inc.), Series 2016-A, 5.00% 2051 | |
| 1,500 | | |
| 1,685 | |
| Fin. Auth., Midwestern Disaster Relief Rev. Bonds (Ohio Valley Electric Corp. Project), Series 2012-A, 5.00% 2032 | |
| 17,560 | | |
| 18,196 | |
| Fin. Auth., Midwestern Disaster Relief Rev. Bonds (Ohio Valley Electric Corp. Project), Series 2012-A, 5.00% 2039 | |
| 10,100 | | |
| 10,467 | |
| Fin. Auth., Private Activity Bonds (Ohio River Bridges East End Crossing Project), Series 2013-A, AMT, 5.00% 2035 | |
| 3,000 | | |
| 3,300 | |
| Fin. Auth., Private Activity Bonds (Ohio River Bridges East End Crossing Project), Series 2013-A, AMT, 5.00% 2044 | |
| 7,225 | | |
| 7,862 | |
| Fin. Auth., Private Activity Bonds (Ohio River Bridges East End Crossing Project), Series 2013-A, AMT, 5.00% 2048 | |
| 3,250 | | |
| 3,528 | |
| American Funds Tax-Exempt Funds |
53 |
American High-Income Municipal Bond Fund
| Bonds, notes & other debt instruments (continued) | |
Principal amount
(000) | | |
Value
(000) | |
| Indiana (continued) | |
| | | |
| | |
| Fin. Auth., Private Activity Bonds (Ohio River Bridges East End Crossing Project), Series 2013-A, AMT, 5.25% 2051 | |
$ | 3,410 | | |
$ | 3,730 | |
| Fin. Auth., Rev. Bonds (BHI Senior Living Obligated Group), Series 2016-A, 5.25% 2046 | |
| 6,750 | | |
| 7,669 | |
| Fin. Auth., Rev. Bonds (BHI Senior Living Obligated Group), Series 2018-A, 5.00% 2033 | |
| 2,410 | | |
| 2,776 | |
| Fin. Auth., Rev. Bonds (BHI Senior Living Obligated Group), Series 2018-A, 5.00% 2038 | |
| 2,395 | | |
| 2,726 | |
| Fin. Auth., Rev. Bonds (BHI Senior Living Obligated Group), Series 2018-A, 5.00% 2043 | |
| 4,000 | | |
| 4,518 | |
| Fin. Auth., Rev. Bonds (BHI Senior Living Obligated Group), Series 2018-A, 5.00% 2048 | |
| 4,500 | | |
| 5,067 | |
| Fin. Auth., Rev. Bonds (Greencroft Obligated Group), Series 2013-A, 6.50% 2033 | |
| 215 | | |
| 239 | |
| Fin. Auth., Rev. Bonds (Greencroft Obligated Group), Series 2013-A, 7.00% 2043 | |
| 3,705 | | |
| 4,146 | |
| Fin. Auth., Rev. Ref. Bonds (Community Foundation of Northwest Indiana Obligated Group), Series 2015, 5.00% 2036 | |
| 3,730 | | |
| 4,256 | |
| Hospital Fin. Auth., Hospital Rev. Ref. Bonds (Indiana University Health Obligated Group), Series 2011-N, 5.00% 2031 (preref. 2021) | |
| 4,000 | | |
| 4,240 | |
| Hospital Fin. Auth., Hospital Rev. Ref. Bonds (The Methodist Hospitals, Inc.), Series 2014-A, 5.00% 2028 | |
| 2,500 | | |
| 2,797 | |
| Other securities | |
| | | |
| 33,855 | |
| | |
| | | |
| 136,242 | |
| | |
| | | |
| | |
| Iowa 1.01% | |
| | | |
| | |
| Student Loan Liquidity Corp., Student Loan Rev. Ref. Bonds, Series 2018-A, AMT, 3.75% 2033 | |
| 23,000 | | |
| 23,894 | |
| Other securities | |
| | | |
| 54,276 | |
| | |
| | | |
| 78,170 | |
| | |
| | | |
| | |
| New Jersey 4.00% | |
| | | |
| | |
| Econ. Dev. Auth., Energy Fac. Rev. Bonds (UMM Energy Partners, LLC Project), Series 2012-A, AMT, 5.00% 2037 | |
| 7,050 | | |
| 7,477 | |
| Econ. Dev. Auth., Energy Fac. Rev. Bonds (UMM Energy Partners, LLC Project), Series 2012-A, AMT, 5.125% 2043 | |
| 750 | | |
| 796 | |
| Econ. Dev. Auth., Private Activity Bonds (Goethals Bridge Replacement Project), Series 2013, AMT, 5.375% 2043 | |
| 7,725 | | |
| 8,644 | |
| Econ. Dev. Auth., Private Activity Bonds (Goethals Bridge Replacement Project), Series 2013, AMT, 5.625% 2052 | |
| 3,940 | | |
| 4,423 | |
| Econ. Dev. Auth., Rev. Bonds (Foundation Academy Charter School Project), Series 2018-A, 5.00% 2050 | |
| 1,100 | | |
| 1,220 | |
| Econ. Dev. Auth., Rev. Bonds (Provident Group - Kean Properties LLC - Kean University Student Housing Project), Series 2017-A, 5.00% 2027 | |
| 1,000 | | |
| 1,154 | |
| Econ. Dev. Auth., Rev. Bonds (Provident Group - Kean Properties LLC - Kean University Student Housing Project), Series 2017-A, 5.00% 2037 | |
| 1,250 | | |
| 1,395 | |
| Econ. Dev. Auth., Rev. Bonds (Provident Group - Kean Properties LLC - Kean University Student Housing Project), Series 2017-A, 5.00% 2047 | |
| 3,500 | | |
| 3,845 | |
| Econ. Dev. Auth., Rev. Bonds (Provident Group - Kean Properties LLC - Kean University Student Housing Project), Series 2017-A, 5.00% 2050 | |
| 1,590 | | |
| 1,743 | |
| Econ. Dev. Auth., Rev. Bonds (Provident Group - Montclair Properties LLC - Montclair State University Student Housing Project), Series 2010-A, 5.875% 2042 (preref. 2020) | |
| 2,500 | | |
| 2,599 | |
| Econ. Dev. Auth., Rev. Ref. Bonds (Cranes Mill Project), Series 2018, 5.00% 2029 | |
| 1,200 | | |
| 1,397 | |
| Econ. Dev. Auth., Rev. Ref. Bonds (Cranes Mill Project), Series 2018, 5.00% 2034 | |
| 2,025 | | |
| 2,310 | |
| Econ. Dev. Auth., Rev. Ref. Bonds (Cranes Mill Project), Series 2018, 5.00% 2039 | |
| 1,685 | | |
| 1,898 | |
| Econ. Dev. Auth., Rev. Ref. Bonds (Cranes Mill Project), Series 2018, 5.00% 2049 | |
| 3,810 | | |
| 4,252 | |
| Econ. Dev. Auth., Rev. Ref. Bonds (Motor Vehicle Surcharges), Series 2017-A, BAM insured, 5.00% 2027 | |
| 3,250 | | |
| 3,974 | |
| Econ. Dev. Auth., Rev. Ref. Bonds (Provident Group - Montclair Properties LLC - Montclair State University Student Housing Project), Series 2017, Assured Guaranty Municipal insured, 5.00% 2037 | |
| 2,750 | | |
| 3,224 | |
| Econ. Dev. Auth., Rev. Ref. Bonds (Provident Group - Rowan Properties LLC - Rowan University Student Housing Project), Series 2015-A, 5.00% 2024 | |
| 2,050 | | |
| 2,267 | |
| Econ. Dev. Auth., Rev. Ref. Bonds (Provident Group - Rowan Properties LLC - Rowan University Student Housing Project), Series 2015-A, 5.00% 2030 | |
| 1,000 | | |
| 1,106 | |
| Econ. Dev. Auth., Rev. Ref. Bonds (Provident Group - Rowan Properties LLC - Rowan University Student Housing Project), Series 2015-A, 5.00% 2035 | |
| 3,750 | | |
| 4,089 | |
| Econ. Dev. Auth., Rev. Ref. Bonds (Provident Group - Rowan Properties LLC - Rowan University Student Housing Project), Series 2015-A, 5.00% 2048 | |
| 2,150 | | |
| 2,306 | |
| Econ. Dev. Auth., School Facs. Construction Bonds, Series 2005-K, AMBAC insured, 5.50% 2019 | |
| 2,075 | | |
| 2,106 | |
| 54 |
American Funds Tax-Exempt Funds |
American High-Income Municipal Bond Fund
| | |
Principal amount
(000) | | |
Value
(000) | |
| Econ. Dev. Auth., School Facs. Construction Bonds, Series 2015-WW, 5.25% 2033 | |
$ | 2,500 | | |
$ | 2,836 | |
| Econ. Dev. Auth., School Facs. Construction Bonds, Series 2016-AAA, 5.50% 2031 | |
| 2,000 | | |
| 2,371 | |
| Econ. Dev. Auth., School Facs. Construction Bonds, Series 2017-DDD, 5.00% 2034 | |
| 1,500 | | |
| 1,722 | |
| Econ. Dev. Auth., School Facs. Construction Bonds, Series 2017-DDD, 5.00% 2035 | |
| 1,275 | | |
| 1,458 | |
| Econ. Dev. Auth., School Facs. Construction Bonds, Series 2018-FFF, 5.00% 2026 | |
| 3,235 | | |
| 3,791 | |
| Econ. Dev. Auth., School Facs. Construction Rev. Bonds, Series 2013-NN, 5.00% 2024 | |
| 2,000 | | |
| 2,219 | |
| Econ. Dev. Auth., School Facs. Construction Rev. Ref. Bonds, Series 2013-I, (SIFMA Municipal Swap Index + 1.60%) 3.00% 20283 | |
| 13,970 | | |
| 14,081 | |
| Econ. Dev. Auth., School Facs. Construction Rev. Ref. Bonds, Series 2015-XX, 5.00% 2021 | |
| 125 | | |
| 133 | |
| Econ. Dev. Auth., School Facs. Construction Rev. Ref. Bonds, Series 2015-XX, 5.00% 2025 | |
| 10,500 | | |
| 12,209 | |
| Econ. Dev. Auth., School Facs. Rev. Bonds (Beloved Community Charter School), Series 2019-A, 4.00% 20291 | |
| 670 | | |
| 705 | |
| Econ. Dev. Auth., School Facs. Rev. Bonds (Beloved Community Charter School), Series 2019-A, 5.00% 20391 | |
| 825 | | |
| 887 | |
| Econ. Dev. Auth., School Facs. Rev. Bonds (Beloved Community Charter School), Series 2019-A, 5.00% 20491 | |
| 930 | | |
| 993 | |
| Econ. Dev. Auth., School Facs. Rev. Bonds (Beloved Community Charter School), Series 2019-A, 5.00% 20541 | |
| 725 | | |
| 768 | |
| Econ. Dev. Auth., Special Fac. Rev. Bonds (Continental Airlines, Inc. Project), Series 1999, AMT, 4.875% 2019 | |
| 6,960 | | |
| 6,984 | |
| Econ. Dev. Auth., Special Fac. Rev. Bonds (Continental Airlines, Inc. Project), Series 1999, AMT, 5.125% 2023 | |
| 3,500 | | |
| 3,796 | |
| Econ. Dev. Auth., Special Fac. Rev. Bonds (Continental Airlines, Inc. Project), Series 1999, AMT, 5.25% 2029 | |
| 16,300 | | |
| 17,900 | |
| Econ. Dev. Auth., Special Fac. Rev. Bonds (Continental Airlines, Inc. Project), Series 2000-B, AMT, 5.625% 2030 | |
| 3,750 | | |
| 4,319 | |
| Econ. Dev. Auth., Special Fac. Rev. Bonds (Continental Airlines, Inc. Project), Series 2003, AMT, 5.50% 2033 | |
| 3,500 | | |
| 3,913 | |
| Econ. Dev. Auth., Special Fac. Rev. Ref. Bonds (Continental Airlines, Inc. Project), Series 2012, AMT, 5.75% 2027 | |
| 4,500 | | |
| 4,990 | |
| Other securities | |
| | | |
| 161,831 | |
| | |
| | | |
| 310,131 | |
| | |
| | | |
| | |
| New York 3.25% | |
| | | |
| | |
| City of Glen Cove, Local Econ. Assistance Corp., Rev. Bonds (Garvies Point Public Improvement Project), Convertible Capital Appreciation Bonds, Series 2016-C, 0% 2055 (5.62% on 1/1/2024)4 | |
| 16,320 | | |
| 15,061 | |
| Transportation Dev. Corp., Special Fac. Rev. Ref. Bonds (American Airlines, Inc. John F. Kennedy International Airport Project), Series 2016, AMT, 5.00% 2019 | |
| 1,000 | | |
| 1,000 | |
| Transportation Dev. Corp., Special Fac. Rev. Ref. Bonds (American Airlines, Inc. John F. Kennedy International Airport Project), Series 2016, AMT, 5.00% 2020 | |
| 15,850 | | |
| 16,343 | |
| Transportation Dev. Corp., Special Fac. Rev. Ref. Bonds (American Airlines, Inc. John F. Kennedy International Airport Project), Series 2016, AMT, 5.00% 2026 | |
| 12,220 | | |
| 12,929 | |
| Transportation Dev. Corp., Special Fac. Rev. Ref. Bonds (American Airlines, Inc. John F. Kennedy International Airport Project), Series 2016, AMT, 5.00% 2031 | |
| 5,500 | | |
| 5,789 | |
| Transportation Dev. Corp., Special Fac. Rev. Ref. Bonds (Terminal One Group Association, LP Project), Series 2015, AMT, 5.00% 2023 | |
| 560 | | |
| 621 | |
| Transportation Dev. Corp., Special Facs. Bonds (LaGuardia Airport Terminal B Redev. Project), Series 2016-A, AMT, 4.00% 2032 | |
| 2,000 | | |
| 2,128 | |
| Transportation Dev. Corp., Special Facs. Bonds (LaGuardia Airport Terminal B Redev. Project), Series 2016-A, AMT, 4.00% 2033 | |
| 4,500 | | |
| 4,778 | |
| Transportation Dev. Corp., Special Facs. Bonds (LaGuardia Airport Terminal B Redev. Project), Series 2016-A, AMT, 5.00% 2041 | |
| 3,250 | | |
| 3,602 | |
| Transportation Dev. Corp., Special Facs. Bonds (LaGuardia Airport Terminal B Redev. Project), Series 2016-A, AMT, 5.00% 2046 | |
| 3,300 | | |
| 3,639 | |
| Transportation Dev. Corp., Special Facs. Bonds (LaGuardia Airport Terminal B Redev. Project), Series 2016-A, AMT, 5.25% 2050 | |
| 16,950 | | |
| 18,841 | |
| Transportation Dev. Corp., Special Facs. Rev. Bonds (Delta Air Lines, Inc. LaGuardia Airport Terminals C & D Redev. Project), Series 2018, AMT 5.00% 2026 | |
| 1,110 | | |
| 1,312 | |
| Transportation Dev. Corp., Special Facs. Rev. Bonds (Delta Air Lines, Inc. LaGuardia Airport Terminals C & D Redev. Project), Series 2018, AMT 5.00% 2029 | |
| 7,000 | | |
| 8,503 | |
| Transportation Dev. Corp., Special Facs. Rev. Bonds (Delta Air Lines, Inc. LaGuardia Airport Terminals C & D Redev. Project), Series 2018, AMT 5.00% 2031 | |
| 10,000 | | |
| 11,996 | |
| American Funds Tax-Exempt Funds |
55 |
American High-Income Municipal Bond Fund
| Bonds, notes &
other debt instruments (continued) | |
Principal amount
(000) | | |
Value
(000) | |
| New York (continued) | |
| | | |
| | |
| Transportation Dev. Corp., Special Facs. Rev. Bonds (Delta Air Lines, Inc. LaGuardia Airport Terminals C & D Redev. Project), Series 2018, AMT, 4.00% 2036 | |
$ | 5,000 | | |
$ | 5,394 | |
| Transportation Dev. Corp., Special Facs. Rev. Bonds (Delta Air Lines, Inc. LaGuardia Airport Terminals C & D Redev. Project), Series 2018, AMT, 5.00% 2030 | |
| 3,500 | | |
| 4,225 | |
| Transportation Dev. Corp., Special Facs. Rev. Bonds (Delta Air Lines, Inc. LaGuardia Airport Terminals C & D Redev. Project), Series 2018, AMT, 5.00% 2032 | |
| 9,000 | | |
| 10,743 | |
| Other securities | |
| | | |
| 124,838 | |
| | |
| | | |
| 251,742 | |
| | |
| | | |
| | |
| Ohio 4.65% | |
| | | |
| | |
| Buckeye Tobacco Settlement Fncg. Auth., Tobacco Settlement Asset-Backed Bonds, Series 2007-A-2, 5.875% 2047 | |
| 50,995 | | |
| 50,166 | |
| Buckeye Tobacco Settlement Fncg. Auth., Tobacco Settlement Asset-Backed Bonds, Series 2007-A-2, 6.50% 2047 | |
| 62,990 | | |
| 63,500 | |
| Buckeye Tobacco Settlement Fncg. Auth., Tobacco Settlement Asset-Backed Bonds, Series 2007-A-3, 6.25% 20374 | |
| 7,875 | | |
| 7,933 | |
| County of Lucas, Hospital Rev. Bonds (Promedica Healthcare Obligated Group), Series 2018-A, 5.25% 2048 | |
| 16,250 | | |
| 19,246 | |
| Private Activity Bonds (Portsmouth Bypass Project), Series 2015, AMT, Assured Guaranty Municipal insured, 5.00% 2053 | |
| 20,455 | | |
| 22,207 | |
| Southeastern Ohio Port Auth., Hospital Facs. Rev. Ref. and Improvement Bonds (Memorial Health System Obligated Group Project), Series 2012, 6.00% 2042 | |
| 14,450 | | |
| 15,491 | |
| Other securities | |
| | | |
| 182,030 | |
| | |
| | | |
| 360,573 | |
| | |
| | | |
| | |
| Oklahoma 0.63% | |
| | | |
| | |
| Trustees of the Tulsa Municipal Airport Trust, American Airlines Inc. Rev. Ref. Bonds, Series 2001-B, AMT, 5.50% 2035 | |
| 15,875 | | |
| 17,316 | |
| Other securities | |
| | | |
| 31,618 | |
| | |
| | | |
| 48,934 | |
| | |
| | | |
| | |
| Pennsylvania 5.56% | |
| | | |
| | |
| Econ. Dev. Fncg. Auth., Exempt Facs. Rev. Ref. Bonds (National Gypsum Co.), Series 2014, AMT, 5.50% 2044 | |
| 4,500 | | |
| 4,786 | |
| Econ. Dev. Fncg. Auth., Exempt Facs. Rev. Ref. Bonds (PPL Energy Supply, LLC Project), Series 2009-C, 5.00% 2037 (put 2020) | |
| 9,775 | | |
| 9,989 | |
| Econ. Dev. Fncg. Auth., Private Activity Rev. Bonds (The Pennsylvania Rapid Bridge Replacement Project), Series 2015, AMT, 5.00% 2029 | |
| 5,000 | | |
| 5,827 | |
| Econ. Dev. Fncg. Auth., Private Activity Rev. Bonds (The Pennsylvania Rapid Bridge Replacement Project), Series 2015, AMT, 5.00% 2034 | |
| 16,300 | | |
| 18,661 | |
| Econ. Dev. Fncg. Auth., Private Activity Rev. Bonds (The Pennsylvania Rapid Bridge Replacement Project), Series 2015, AMT, 5.00% 2038 | |
| 11,690 | | |
| 13,320 | |
| Econ. Dev. Fncg. Auth., Private Activity Rev. Bonds (The Pennsylvania Rapid Bridge Replacement Project), Series 2015, AMT, 5.00% 2042 | |
| 1,000 | | |
| 1,124 | |
| Econ. Dev. Fncg. Auth., Solid Waste Disposal Rev. Bonds (CarbonLite P, LLC Project), Series 2019, AMT, 5.25% 20261 | |
| 2,500 | | |
| 2,588 | |
| Econ. Dev. Fncg. Auth., Solid Waste Disposal Rev. Bonds (CarbonLite P, LLC Project), Series 2019, AMT, 5.75% 20361 | |
| 6,790 | | |
| 7,176 | |
| Econ. Dev. Fncg. Auth., Solid Waste Disposal Rev. Bonds (Waste Management, Inc. Project), Series 2011, AMT, 2.15% 2041 (put 2024) | |
| 3,000 | | |
| 3,060 | |
| Econ. Dev. Fncg. Auth., Solid Waste Disposal Rev. Bonds (Waste Management, Inc. Project), Series 2017-A, AMT, 1.70% 2037 (put 2020) | |
| 4,950 | | |
| 4,960 | |
| Econ. Dev. Fncg. Auth., Solid Waste Disposal Rev. Ref. Bonds (Republic Services, Inc. Project), Series 2019-A, AMT, 1.50% 2034 (put 2019) | |
| 3,600 | | |
| 3,601 | |
| County of Montgomery, Industrial Dev. Auth., Health Systems Rev. Bonds (Albert Einstein Healthcare Network Issue), Series 2015-A, 5.25% 2045 | |
| 14,440 | | |
| 16,115 | |
| Other securities | |
| | | |
| 339,469 | |
| | |
| | | |
| 430,676 | |
| 56 |
American Funds Tax-Exempt Funds |
American High-Income Municipal Bond Fund
| | |
Principal amount
(000) | | |
Value
(000) | |
| Puerto Rico 4.00% | |
| | | |
| | |
| Industrial, Tourist, Educational, Medical and Environmental Control Facs. Fncg. Auth., Higher Education Rev. and Rev. Ref. Bonds (Ana G. Méndez University System Project), Series 2002, 5.375% 2021 | |
$ | 55 | | |
$ | 55 | |
| Industrial, Tourist, Educational, Medical and Environmental Control Facs. Fncg. Auth., Higher Education Rev. and Rev. Ref. Bonds (Ana G. Méndez University System Project), Series 2002, 5.50% 2031 | |
| 6,815 | | |
| 6,817 | |
| Industrial, Tourist, Educational, Medical and Environmental Control Facs. Fncg. Auth., Higher Education Rev. and Rev. Ref. Bonds (Ana G. Méndez University System Project), Series 2006, 5.00% 2021 | |
| 1,125 | | |
| 1,126 | |
| Industrial, Tourist, Educational, Medical and Environmental Control Facs. Fncg. Auth., Higher Education Rev. and Rev. Ref. Bonds (Ana G. Méndez University System Project), Series 2006, 5.00% 2026 | |
| 255 | | |
| 255 | |
| Industrial, Tourist, Educational, Medical and Environmental Control Facs. Fncg. Auth., Higher Education Rev. and Rev. Ref. Bonds (Ana G. Méndez University System Project), Series 2006, 5.00% 2036 | |
| 520 | | |
| 515 | |
| Industrial, Tourist, Educational, Medical and Environmental Control Facs. Fncg. Auth., Higher Education Rev. and Rev. Ref. Bonds (Ana G. Méndez University System Project), Series 2012, 5.00% 2027 | |
| 6,200 | | |
| 6,270 | |
| Industrial, Tourist, Educational, Medical and Environmental Control Facs. Fncg. Auth., Higher Education Rev. and Rev. Ref. Bonds (Ana G. Méndez University System Project), Series 2012, 5.125% 2032 | |
| 3,750 | | |
| 3,764 | |
| Industrial, Tourist, Educational, Medical and Environmental Control Facs. Fncg. Auth., Higher Education Rev. and Rev. Ref. Bonds (Ana G. Méndez University System Project), Series 2012, 5.375% 2042 | |
| 6,455 | | |
| 6,471 | |
| Industrial, Tourist, Educational, Medical and Environmental Control Facs. Fncg. Auth., Higher Education Rev. and Rev. Ref. Bonds (Inter American University of Puerto Rico Project), Series 2004, National insured, 4.25% 2024 | |
| 550 | | |
| 551 | |
| Industrial, Tourist, Educational, Medical and Environmental Control Facs. Fncg. Auth., Higher Education Rev. and Rev. Ref. Bonds (Inter American University of Puerto Rico Project), Series 2012, 5.00% 2019 | |
| 1,500 | | |
| 1,505 | |
| Industrial, Tourist, Educational, Medical and Environmental Control Facs. Fncg. Auth., Higher Education Rev. and Rev. Ref. Bonds (Inter American University of Puerto Rico Project), Series 2012, 5.00% 2020 | |
| 3,485 | | |
| 3,560 | |
| Industrial, Tourist, Educational, Medical and Environmental Control Facs. Fncg. Auth., Higher Education Rev. and Rev. Ref. Bonds (Inter American University of Puerto Rico Project), Series 2012, 5.00% 2021 | |
| 2,420 | | |
| 2,512 | |
| Industrial, Tourist, Educational, Medical and Environmental Control Facs. Fncg. Auth., Higher Education Rev. and Rev. Ref. Bonds (Inter American University of Puerto Rico Project), Series 2012, 5.00% 2022 | |
| 1,000 | | |
| 1,053 | |
| Industrial, Tourist, Educational, Medical and Environmental Control Facs. Fncg. Auth., Higher Education Rev. and Rev. Ref. Bonds (Inter American University of Puerto Rico Project), Series 2012, 5.00% 2031 | |
| 1,700 | | |
| 1,778 | |
| Industrial, Tourist, Educational, Medical and Environmental Control Facs. Fncg. Auth., Higher Education Rev. and Rev. Ref. Bonds (University of the Sacred Heart Project), Series 2012, 4.00% 2023 | |
| 960 | | |
| 926 | |
| Industrial, Tourist, Educational, Medical and Environmental Control Facs. Fncg. Auth., Higher Education Rev. and Rev. Ref. Bonds (University of the Sacred Heart Project), Series 2012, 4.00% 2024 | |
| 300 | | |
| 293 | |
| Industrial, Tourist, Educational, Medical and Environmental Control Facs. Fncg. Auth., Higher Education Rev. and Rev. Ref. Bonds (University of the Sacred Heart Project), Series 2012, 4.00% 2026 | |
| 825 | | |
| 798 | |
| Industrial, Tourist, Educational, Medical and Environmental Control Facs. Fncg. Auth., Higher Education Rev. and Rev. Ref. Bonds (University of the Sacred Heart Project), Series 2012, 4.125% 2027 | |
| 995 | | |
| 976 | |
| Industrial, Tourist, Educational, Medical and Environmental Control Facs. Fncg. Auth., Higher Education Rev. and Rev. Ref. Bonds (University of the Sacred Heart Project), Series 2012, 4.375% 2031 | |
| 1,025 | | |
| 998 | |
| Industrial, Tourist, Educational, Medical and Environmental Control Facs. Fncg. Auth., Higher Education Rev. and Rev. Ref. Bonds (University of the Sacred Heart Project), Series 2012, 5.00% 2020 | |
| 50 | | |
| 50 | |
| Industrial, Tourist, Educational, Medical and Environmental Control Facs. Fncg. Auth., Higher Education Rev. and Rev. Ref. Bonds (University of the Sacred Heart Project), Series 2012, 5.00% 2042 | |
| 1,400 | | |
| 1,373 | |
| American Funds Tax-Exempt Funds |
57 |
American High-Income Municipal Bond Fund
| Bonds, notes & other debt instruments (continued) | |
Principal amount
(000) | | |
Value
(000) | |
| Puerto Rico (continued) | |
| | | |
| | |
| Industrial, Tourist, Educational, Medical and Environmental Control Facs. Fncg. Auth., Higher Education Rev. Bonds (Inter American University of Puerto Rico Project), Series 2004, National insured, 4.50% 2029 | |
$ | 2,230 | | |
$ | 2,233 | |
| Industrial, Tourist, Educational, Medical and Environmental Control Facs. Fncg. Auth., Higher Education Rev. Bonds (Inter American University of Puerto Rico Project), Series 2019, 5.00% 2022 | |
| 1,500 | | |
| 1,579 | |
| Industrial, Tourist, Educational, Medical and Environmental Control Facs. Fncg. Auth., Higher Education Rev. Bonds (Inter American University of Puerto Rico Project), Series 2019, 5.00% 2023 | |
| 1,600 | | |
| 1,709 | |
| Industrial, Tourist, Educational, Medical and Environmental Control Facs. Fncg. Auth., Higher Education Rev. Bonds (Inter American University of Puerto Rico Project), Series 2019, 5.00% 2024 | |
| 1,700 | | |
| 1,839 | |
| Industrial, Tourist, Educational, Medical and Environmental Control Facs. Fncg. Auth., Higher Education Rev. Bonds (Inter American University of Puerto Rico Project), Series 2019, 5.00% 2025 | |
| 1,800 | | |
| 1,961 | |
| Industrial, Tourist, Educational, Medical and Environmental Control Facs. Fncg. Auth., Higher Education Rev. Bonds (Inter American University of Puerto Rico Project), Series 2019, 5.00% 2026 | |
| 1,900 | | |
| 2,083 | |
| Industrial, Tourist, Educational, Medical and Environmental Control Facs. Fncg. Auth., Higher Education Rev. Bonds (Inter American University of Puerto Rico Project), Series 2019, 5.00% 2027 | |
| 1,900 | | |
| 2,096 | |
| Industrial, Tourist, Educational, Medical and Environmental Control Facs. Fncg. Auth., Higher Education Rev. Bonds (Inter American University of Puerto Rico Project), Series 2019, 5.00% 2028 | |
| 2,000 | | |
| 2,220 | |
| Industrial, Tourist, Educational, Medical and Environmental Control Facs. Fncg. Auth., Higher Education Rev. Bonds (Inter American University of Puerto Rico Project), Series 2019, 5.00% 2034 | |
| 2,200 | | |
| 2,379 | |
| Industrial, Tourist, Educational, Medical and Environmental Control Facs. Fncg. Auth., Higher Education Rev. Bonds (Inter American University of Puerto Rico Project), Series 2019, 5.00% 2044 | |
| 2,500 | | |
| 2,616 | |
| Industrial, Tourist, Educational, Medical and Environmental Control Facs. Fncg. Auth., Hospital Rev. and Rev. Ref. Bonds (Hospital Auxilio Mutuo Obligated Group Project), Series 2011-A, 5.00% 2021 | |
| 2,270 | | |
| 2,370 | |
| Industrial, Tourist, Educational, Medical and Environmental Control Facs. Fncg. Auth., Hospital Rev. and Rev. Ref. Bonds (Hospital Auxilio Mutuo Obligated Group Project), Series 2011-A, 6.00% 2033 | |
| 15,180 | | |
| 15,934 | |
| Sales Tax Fncg. Corp., Sales Tax Rev. Bonds, Capital Appreciation Bonds, Series 2007-A, Class 2, AMBAC insured, 0% 20543 | |
| 77,876 | | |
| 14,756 | |
| Sales Tax Fncg. Corp., Sales Tax Rev. Restructured Bonds, Series 2018-A-1, 5.00% 2058 | |
| 36,184 | | |
| 36,273 | |
| Other securities | |
| | | |
| 178,034 | |
| | |
| | | |
| 309,728 | |
| | |
| | | |
| | |
| South Carolina 1.81% | |
| | | |
| | |
| Jobs-Econ. Dev. Auth., Econ. Dev. Rev. Bonds (Custodial Receipts), Series 2018, 5.00% 20361,3 | |
| 3,000 | | |
| 3,347 | |
| Jobs-Econ. Dev. Auth., Econ. Dev. Rev. Bonds (Custodial Receipts), Series 2018, 5.00% 20411,3 | |
| 8,330 | | |
| 9,185 | |
| Jobs-Econ. Dev. Auth., First Mortgage Health Care Facs. Rev. Ref. Bonds (The Lutheran Homes of South Carolina, Inc.), Series 2017, 5.00% 2042 | |
| 1,855 | | |
| 1,984 | |
| Jobs-Econ. Dev. Auth., Health Facs. Rev. Ref. Bonds (Wesley Commons), Series 2016, 5.00% 20361 | |
| 2,000 | | |
| 2,103 | |
| Jobs-Econ. Dev. Auth., Health Facs. Rev. Ref. Bonds (Wesley Commons), Series 2016, 5.00% 20411 | |
| 6,000 | | |
| 6,283 | |
| Jobs-Econ. Dev. Auth., Hospital Rev. Bonds (Prisma Health Obligated Group), Series 2018-A, 5.00% 2048 | |
| 4,500 | | |
| 5,239 | |
| Jobs-Econ. Dev. Auth., Residential Facs. Rev. Bonds (Episcopal Home Still Hopes), Series 2017, 5.00% 2047 | |
| 5,700 | | |
| 6,162 | |
| Jobs-Econ. Dev. Auth., Residential Facs. Rev. Bonds (Episcopal Home Still Hopes), Series 2017, 5.00% 2052 | |
| 5,055 | | |
| 5,451 | |
| Jobs-Econ. Dev. Auth., Residential Facs. Rev. Ref. Bonds (Episcopal Home Still Hopes), Series 2018-A, 5.00% 2031 | |
| 2,040 | | |
| 2,251 | |
| Jobs-Econ. Dev. Auth., Residential Facs. Rev. Ref. Bonds (Episcopal Home Still Hopes), Series 2018-A, 5.00% 2032 | |
| 2,135 | | |
| 2,350 | |
| 58 |
American Funds Tax-Exempt Funds |
American High-Income Municipal Bond Fund
| | |
Principal amount
(000) | | |
Value
(000) | |
| Jobs-Econ. Dev. Auth., Residential Facs. Rev. Ref. Bonds (Episcopal Home Still Hopes), Series 2018-A, 5.00% 2038 | |
$ | 9,035 | | |
$ | 9,837 | |
| Jobs-Econ. Dev. Auth., Residential Facs. Rev. Ref. Bonds (Episcopal Home Still Hopes), Series 2018-A, 5.00% 2048 | |
| 3,500 | | |
| 3,777 | |
| Jobs-Econ. Dev. Auth., Student Housing Rev. Bonds (Coastal Housing Foundation, LLC Project), Series 2009-A, 6.50% 2042 (preref. 2020) | |
| 4,000 | | |
| 4,143 | |
| Other securities | |
| | | |
| 78,513 | |
| | |
| | | |
| 140,625 | |
| | |
| | | |
| | |
| Texas 5.86% | |
| | | |
| | |
| County of Harris, Cultural Education Facs. Fin. Corp., First Mortgage Rev. Bonds (Brazos Presbyterian Homes, Inc. Project), Series 2016, 5.00% 2048 | |
| 21,330 | | |
| 23,138 | |
| City of Houston, Airport System Rev. and Rev. Ref. Bonds, Series 2018-B, 5.00% 2027 | |
| 1,995 | | |
| 2,501 | |
| City of Houston, Airport System Rev. Ref. Bonds, Series 2012-A, AMT, 5.00% 2032 | |
| 1,000 | | |
| 1,090 | |
| City of Houston, Airport System Special Facs. Rev. Bonds (Continental Airlines, Inc. Terminal Improvement Projects), Series 2011, AMT, 6.50% 2030 | |
| 9,300 | | |
| 10,053 | |
| City of Houston, Airport System Special Facs. Rev. Bonds (Continental Airlines, Inc. Terminal Improvement Projects), Series 2011, AMT, 6.625% 2038 | |
| 3,000 | | |
| 3,228 | |
| City of Houston, Airport System Special Facs. Rev. Bonds (United Airlines, Inc. Terminal Improvement Projects), Series 2018-C, AMT, 5.00% 2028 | |
| 15,000 | | |
| 17,971 | |
| City of Houston, Airport System Special Facs. Rev. Ref. Bonds (United Airlines, Inc. Terminal E Project), Series 2014, AMT, 4.50% 2020 | |
| 1,000 | | |
| 1,025 | |
| City of Houston, Airport System Special Facs. Rev. Ref. Bonds (United Airlines, Inc. Terminal E Project), Series 2014, AMT, 4.75% 2024 | |
| 5,500 | | |
| 6,025 | |
| City of Houston, Airport System Special Facs. Rev. Ref. Bonds (United Airlines, Inc. Terminal E Project), Series 2014, AMT, 5.00% 2029 | |
| 6,745 | | |
| 7,555 | |
| City of Houston, Airport System Special Facs. Rev. Ref. Bonds (United Airlines, Inc. Terminal Improvement Projects), Series 2015-B-1, AMT, 5.00% 2030 | |
| 3,000 | | |
| 3,372 | |
| City of Houston, Airport System Special Facs. Rev. Ref. Bonds (United Airlines, Inc. Terminal Improvement Projects), Series 2015-B-2, AMT, 5.00% 2020 | |
| 4,810 | | |
| 4,940 | |
| City of Houston, Airport System Special Facs. Rev. Ref. Bonds (United Airlines, Inc. Terminal Improvement Projects), Series 2015-C, AMT, 5.00% 2020 | |
| 8,485 | | |
| 8,714 | |
| City of Houston, Combined Utility System Rev. Ref. Bonds, Series 2014-C, 5.00% 2025 | |
| 1,670 | | |
| 1,956 | |
| City of Houston, Combined Utility System Rev. Ref. Bonds, Series 2018-C, (1-month USD-LIBOR x 0.70 + 0.36%) 1.946% 2034 (put 2021)3 | |
| 3,500 | | |
| 3,502 | |
| Turnpike Auth., Central Texas Turnpike System, Rev. Bonds, Capital Appreciation Bonds, Series 2002-A, AMBAC insured, 0% 2028 | |
| 17,800 | | |
| 14,645 | |
| Other securities | |
| | | |
| 344,512 | |
| | |
| | | |
| 454,227 | |
| | |
| | | |
| | |
| Utah 0.46% | |
| | | |
| | |
| Hideout Local Dist. No. 1, Special Assessment Bonds, Series 2017, 6.75% 20371 | |
| 27,420 | | |
| 28,083 | |
| Other securities | |
| | | |
| 7,817 | |
| | |
| | | |
| 35,900 | |
| | |
| | | |
| | |
| Virginia 2.31% | |
| | | |
| | |
| City of Newport News, Industrial Dev. Auth., Health Systems Rev. Ref. Bonds (Custodial Receipts), Series 2015, 5.33% 20451 | |
| 27,900 | | |
| 30,374 | |
| Other securities | |
| | | |
| 148,655 | |
| | |
| | | |
| 179,029 | |
| | |
| | | |
| | |
| Wisconsin 2.51% | |
| | | |
| | |
| Public Fin. Auth., Airport Facs. Rev. Ref. Bonds (Transportation Infrastructure Properties, LLC Obligated Group), Series 2012-B, AMT, 5.00% 2022 | |
| 45 | | |
| 48 | |
| Public Fin. Auth., Airport Facs. Rev. Ref. Bonds (Transportation Infrastructure Properties, LLC Obligated Group), Series 2012-B, AMT, 5.00% 2042 | |
| 450 | | |
| 480 | |
| Public Fin. Auth., Charter School Rev. Bonds (American Preparatory Academy - Las Vegas Project), Series 2017-A, 5.375% 20471 | |
| 5,000 | | |
| 5,457 | |
| Public Fin. Auth., Charter School Rev. Bonds (American Preparatory Academy - Las Vegas Project), Series 2017-B, 5.375% 20521 | |
| 2,000 | | |
| 2,176 | |
| Public Fin. Auth., Education Rev. Bonds (North Carolina Leadership Academy), Series 2019-A, 5.00% 20391 | |
| 820 | | |
| 868 | |
| Public Fin. Auth., Education Rev. Bonds (North Carolina Leadership Academy), Series 2019-A, 5.00% 20491 | |
| 520 | | |
| 546 | |
| American Funds Tax-Exempt Funds |
59 |
American High-Income Municipal Bond Fund
| Bonds, notes & other debt instruments (continued) | |
Principal amount
(000) | | |
Value
(000) | |
| Wisconsin (continued) | |
| | | |
| | |
| Public Fin. Auth., Education Rev. Bonds (North Carolina Leadership Academy), Series 2019-A, 5.00% 20541 | |
$ | 1,365 | | |
$ | 1,424 | |
| Public Fin. Auth., Exempt Facs. Rev. Ref. Bonds (Celanese Project), Series 2016-A, AMT, 5.00% 20241 | |
| 1,605 | | |
| 1,778 | |
| Public Fin. Auth., Exempt Facs. Rev. Ref. Bonds (Celanese Project), Series 2016-A, AMT, 5.00% 20251 | |
| 1,000 | | |
| 1,148 | |
| Public Fin. Auth., Exempt Facs. Rev. Ref. Bonds (National Gypsum Co.), Series 2014, AMT, 5.25% 2030 | |
| 3,000 | | |
| 3,302 | |
| Public Fin. Auth., Exempt Facs. Rev. Ref. Bonds (National Gypsum Co.), Series 2016, AMT, 4.00% 2035 | |
| 9,200 | | |
| 9,495 | |
| Public Fin. Auth., Limited Obligation Grant Rev. Bonds (American Dream at Meadowlands Project), Series 2017-A, 6.25% 20271 | |
| 2,000 | | |
| 2,276 | |
| Public Fin. Auth., Limited Obligation Grant Rev. Bonds (American Dream at Meadowlands Project), Series 2017-A, 6.75% 20311 | |
| 2,750 | | |
| 3,249 | |
| Public Fin. Auth., Limited Obligation PILOT Rev. Bonds (American Dream at Meadowlands Project), Series 2017, 7.00% 20501 | |
| 4,000 | | |
| 4,780 | |
| Public Fin. Auth., Retirement Community Rev. Bonds (Evergreens Obligated Group), Series 2019-A, 5.00% 2044 | |
| 1,750 | | |
| 1,994 | |
| Public Fin. Auth., Retirement Community Rev. Bonds (Evergreens Obligated Group), Series 2019-A, 5.00% 2049 | |
| 1,500 | | |
| 1,704 | |
| Public Fin. Auth., Rev. Bonds (Denver International Airport Great Hall Project), Series 2017, AMT, 5.00% 2026 | |
| 1,000 | | |
| 1,184 | |
| Public Fin. Auth., Rev. Bonds (Prime Healthcare Foundation), Series 2018, 5.35% 2045 | |
| 1,000 | | |
| 1,152 | |
| Public Fin. Auth., Rev. Bonds (Retirement Housing Foundation), Series 2017-B, 5.00% 2027 | |
| 2,345 | | |
| 2,750 | |
| Public Fin. Auth., Rev. Bonds (Roseman University of Health Sciences Project), Series 2012, 5.50% 2032 | |
| 500 | | |
| 529 | |
| Public Fin. Auth., Rev. Bonds (Roseman University of Health Sciences Project), Series 2012, 5.75% 2042 | |
| 5,000 | | |
| 5,267 | |
| Public Fin. Auth., Rev. Bonds (Roseman University of Health Sciences Project), Series 2015, 5.75% 2035 | |
| 3,000 | | |
| 3,357 | |
| Public Fin. Auth., Rev. Bonds (Roseman University of Health Sciences Project), Series 2015, 5.875% 2045 | |
| 6,250 | | |
| 6,935 | |
| Public Fin. Auth., Rev. Bonds (Wilson Preparatory Academy), Series 2019-A, 4.125% 20291 | |
| 545 | | |
| 564 | |
| Public Fin. Auth., Rev. Bonds (Wilson Preparatory Academy), Series 2019-A, 5.00% 20391 | |
| 500 | | |
| 521 | |
| Public Fin. Auth., Rev. Bonds (Wilson Preparatory Academy), Series 2019-A, 5.00% 20491 | |
| 1,100 | | |
| 1,137 | |
| Public Fin. Auth., Senior Living Rev. Bonds (Mary’s Woods at Marylhurst Project), Series 2017-A, 5.00% 20321 | |
| 1,280 | | |
| 1,418 | |
| Public Fin. Auth., Senior Living Rev. Bonds (Mary’s Woods at Marylhurst Project), Series 2017-A, 5.25% 20371 | |
| 650 | | |
| 720 | |
| Public Fin. Auth., Senior Living Rev. Bonds (Mary’s Woods at Marylhurst Project), Series 2017-A, 5.25% 20421 | |
| 250 | | |
| 274 | |
| Public Fin. Auth., Senior Living Rev. Bonds (Mary’s Woods at Marylhurst Project), Series 2017-A, 5.25% 20471 | |
| 900 | | |
| 984 | |
| Public Fin. Auth., Senior Living Rev. Bonds (Mary’s Woods at Marylhurst Project), Series 2017-A, 5.25% 20521 | |
| 2,300 | | |
| 2,507 | |
| Public Fin. Auth., Senior Living Rev. Bonds (Rose Villa Project), Series 2014-A, 5.50% 20341 | |
| 1,000 | | |
| 1,071 | |
| Public Fin. Auth., Senior Living Rev. Bonds (Rose Villa Project), Series 2014-A, 5.75% 20441 | |
| 1,800 | | |
| 1,946 | |
| Public Fin. Auth., Solid Waste Disposal Rev. Ref. Bonds (Waste Management, Inc. Project), Series 2016-A-4, AMT, 2.00% 2033 (put 2021) | |
| 1,500 | | |
| 1,512 | |
| Public Fin. Auth., Solid Waste Disposal Rev. Ref. Bonds (Waste Management, Inc. Project), Series 2017-A-3, AMT, 1.95% 2027 (put 2019) | |
| 2,000 | | |
| 2,000 | |
| Public Fin. Auth., Student Housing Rev. Bonds (Beyond Boone, LLC - Appalachian State University Project), Series 2019-A, Assured Guaranty Municipal insured, 5.00% 2054 | |
| 1,700 | | |
| 1,960 | |
| Public Fin. Auth., Student Housing Rev. Bonds (CHF-Cullowhee, LLC - Western Carolina University Project), Series 2015, 5.00% 2035 | |
| 1,000 | | |
| 1,075 | |
| Public Fin. Auth., Student Housing Rev. Bonds (CHF-Cullowhee, LLC - Western Carolina University Project), Series 2015, 5.25% 2047 | |
| 2,000 | | |
| 2,151 | |
| Public Fin. Auth., Student Housing Rev. Bonds (CHF-Cullowhee, LLC - Western Carolina University Project), Series 2015-A, 5.00% 2030 | |
| 2,140 | | |
| 2,327 | |
| Public Fin. Auth., Student Housing Rev. Bonds (CHF-Wilmington, LLC - University of North Carolina Project), Series 2018, Assured Guaranty Municipal insured, 5.00% 2053 | |
| 6,730 | | |
| 7,766 | |
| Public Fin. Auth., Student Housing Rev. Bonds (NC A&T Real Estate Foundation, LLC), Series 2019-A, 5.00% 2034 | |
| 4,135 | | |
| 4,819 | |
| 60 |
American Funds Tax-Exempt Funds |
American High-Income Municipal Bond Fund
| | |
Principal amount
(000) | | |
Value
(000) | |
| Public Fin. Auth., Student Housing Rev. Bonds (NC A&T Real Estate Foundation, LLC), Series 2019-A, 5.00% 2039 | |
$ | 2,045 | | |
$ | 2,344 | |
| Public Fin. Auth., Student Housing Rev. Bonds (NC A&T Real Estate Foundation, LLC), Series 2019-A, 5.00% 2044 | |
| 1,350 | | |
| 1,529 | |
| Public Fin. Auth., Student Housing Rev. Bonds (NC A&T Real Estate Foundation, LLC), Series 2019-A, 5.00% 2049 | |
| 3,625 | | |
| 4,090 | |
| Public Fin. Auth., Tax Increment Fin. Grant Rev. Bonds (Statler Hilton & Dallas Central Library), Capital Appreciation Bonds, Series 2016, 0% 2027 | |
| 15,115 | | |
| 11,116 | |
| Public Fin. Auth., Tax Increment Fin. Grant Rev. Bonds (Statler Hilton & Dallas Central Library), Capital Appreciation Bonds, Series 2016, 0% 2028 | |
| 8,975 | | |
| 6,306 | |
| Public Fin. Auth., Tax Increment Fin. Grant Rev. Bonds (Statler Hilton & Dallas Central Library), Capital Appreciation Bonds, Series 2016, 0% 2029 | |
| 12,855 | | |
| 8,582 | |
| Other securities | |
| | | |
| 64,161 | |
| | |
| | | |
| 194,779 | |
| | |
| | | |
| | |
| Other states & U.S. territories 19.17% | |
| | | |
| | |
| Other securities | |
| | | |
| 1,486,702 | |
| | |
| | | |
| | |
| Total bonds, notes & other debt instruments
(cost: $6,875,834,000) | |
| | | |
| 7,260,182 | |
| | |
| | | |
| | |
| Short-term securities
5.96% | |
| | | |
| | |
| State of Illinois, City of Chicago, Board of Education, Tax Anticipation Notes, Series 2018-E, 2.207% 12/13/20191,3 | |
| 2,500 | | |
| 2,500 | |
| State of Maryland, County of Montgomery, IAM Commercial Paper, Series 2019-A, 1.34% 10/3/2019 | |
| 30,000 | | |
| 30,000 | |
| State of Maryland, County of Montgomery, IAM Commercial Paper, Series 2019-A, 1.38% 8/6/2019 | |
| 1,500 | | |
| 1,500 | |
| State of Maryland, County of Montgomery, IAM Commercial Paper, Series 2019-B, 1.40% 10/9/2019 | |
| 7,500 | | |
| 7,500 | |
| State of Maryland, County of Montgomery, Rev. Bonds (Trinity Health Credit Group), Series 2013, 1.43% 2041 (put 2019)5 | |
| 5,000 | | |
| 5,001 | |
| State of Massachusetts, Health and Educational Facs. Auth., IAM Commercial Paper (Harvard University), Series 2019, 1.30% 10/16/2019 | |
| 15,000 | | |
| 15,000 | |
| State of Mississippi, Business Fin. Corp., Gulf Opportunity Zone Industrial Dev. Rev. Bonds (Chevron U.S.A. Inc. Project), Series 2007-D, 1.48% 20303 | |
| 25,900 | | |
| 25,900 | |
| State of Mississippi, Business Fin. Corp., Gulf Opportunity Zone Industrial Dev. Rev. Bonds (Chevron U.S.A. Inc. Project), Series 2009-D, 1.48% 20303 | |
| 2,300 | | |
| 2,300 | |
| State of Mississippi, Business Fin. Corp., Gulf Opportunity Zone Industrial Dev. Rev. Bonds (Chevron U.S.A. Inc. Project), Series 2010-J, 1.48% 20353 | |
| 12,000 | | |
| 12,000 | |
| State of Mississippi, Business Fin. Corp., Gulf Opportunity Zone Industrial Dev. Rev. Bonds (Chevron U.S.A. Inc. Project), Series 2010-K, 1.52% 20353 | |
| 3,500 | | |
| 3,500 | |
| State of Mississippi, Business Fin. Corp., Gulf Opportunity Zone Industrial Dev. Rev. Bonds (Chevron U.S.A. Inc. Project), Series 2011-F, 1.48% 20353 | |
| 6,900 | | |
| 6,900 | |
| State of Mississippi, Business Fin. Corp., Gulf Opportunity Zone Industrial Dev. Rev. Bonds (Chevron U.S.A. Inc. Project), Series 2011-G, 1.52% 20353 | |
| 14,000 | | |
| 14,000 | |
| State of New York, New York City G.O. Bonds, Fiscal 2006, Series 2006-H-1, 1.48% 20363 | |
| 6,180 | | |
| 6,180 | |
| State of New York, New York City G.O. Bonds, Fiscal 2008, Series 2008-C-4, Assured Guaranty Municipal insured, 1.75% 20273 | |
| 10,700 | | |
| 10,700 | |
| State of New York, New York City G.O. Bonds, Fiscal 2008, Series 2008-L-5, 1.47% 20353 | |
| 5,465 | | |
| 5,465 | |
| State of New York, New York City G.O. Bonds, Fiscal 2013, Series 2013-F-3, 1.47% 20423 | |
| 6,500 | | |
| 6,500 | |
| State of New York, New York City G.O. Bonds, Fiscal 2014, Series 2014-D-3, 1.48% 20383 | |
| 1,000 | | |
| 1,000 | |
| State of New York, New York City G.O. Bonds, Fiscal 2015, Series 2015-F-6, 1.48% 20443 | |
| 1,000 | | |
| 1,000 | |
| State of New York, New York City Municipal Water Fin. Auth., Water and Sewer System Second General Resolution Rev. Bonds, Fiscal 2008, Series 2007-BB-2, 1.47% 20353 | |
| 7,340 | | |
| 7,340 | |
| State of New York, New York City Municipal Water Fin. Auth., Water and Sewer System Second General Resolution Rev. Bonds, Fiscal 2015, Series 2015-BB-1, 1.47% 20493 | |
| 4,475 | | |
| 4,475 | |
| State of New York, New York City Municipal Water Fin. Auth., Water and Sewer System Second General Resolution Rev. Bonds, Fiscal 2016, Series 2016-AA-1, 1.47% 20483 | |
| 7,000 | | |
| 7,000 | |
| State of New York, New York City Transitional Fin. Auth., Future Tax Secured Rev. Ref. Bonds, Fiscal 2015, Series 2015-E-3, 1.48% 20453 | |
| 2,000 | | |
| 2,000 | |
| American Funds Tax-Exempt Funds |
61 |
American High-Income Municipal Bond Fund
| Short-term securities (continued) | |
Principal amount
(000) | | |
Value
(000) | |
| State of New York, New York City Transitional Fin. Auth., Future Tax Secured Rev. Ref. Bonds, Fiscal 2016, Series 2016-E-4, 1.48% 20453 | |
$ | 12,500 | | |
$ | 12,500 | |
| State of New York, New York City Transitional Fin. Auth., Recovery Bonds, Fiscal 2003, Series 2002-1-C, 1.47% 20313 | |
| 1,600 | | |
| 1,600 | |
| State of Pennsylvania, Econ. Dev. Fncg. Auth., Solid Waste Disposal Rev. Bonds (Republic Services, Inc. Project), Series 2014, AMT, 1.60% 2044 (put 2019)5 | |
| 12,300 | | |
| 12,304 | |
| State of Pennsylvania, Econ. Dev. Fncg. Auth., Solid Waste Disposal Rev. Bonds (Waste Management, Inc. Project), Series 2013, AMT, 2.15% 2045 (put 2019)5 | |
| 2,000 | | |
| 2,000 | |
| State of South Carolina, Jobs-Econ. Dev. Auth., Hospital Rev. Bonds (Prisma Health Obligated Group), Series 2018-B, 1.48% 20483 | |
| 15,500 | | |
| 15,500 | |
| State of Texas, City of Houston, Combined Utility System IAM Commercial Paper, Series 2019, 1.27% 9/6/2019 | |
| 10,000 | | |
| 10,000 | |
| State of Texas, City of Houston, Tax and Rev. Anticipation Notes, Series 2019, 5.00% 6/26/2020 | |
| 5,500 | | |
| 5,689 | |
| State of Texas, County of Jefferson, Port Arthur Navigation Dist., Exempt Facs. Rev. Bonds (Emerald Renewable Diesel LLC Project), Series 2018, AMT, 1.90% 2049 (put 2019)1 | |
| 5,000 | | |
| 5,002 | |
| State of Texas, County of Jefferson, Port Arthur Navigation Dist., Pollution Control Rev. Ref. Bonds (Texaco Inc. Project), Series 1994, 1.48% 20243 | |
| 17,400 | | |
| 17,400 | |
| State of Texas, Port Arthur Navigation Dist. Industrial Dev. Corp., Rev. Bonds (Air Products Project), Series 2005, 1.50% 20403 | |
| 500 | | |
| 500 | |
| State of Texas, Tax and Rev. Anticipation Notes, Series 2018, 4.00% 8/29/2019 | |
| 16,965 | | |
| 16,999 | |
| State of Texas, Board of Regents of the University of Texas System, IAM Commercial Paper, Series 2019, 1.32% 10/4/2019 | |
| 8,000 | | |
| 8,000 | |
| State of Texas, Board of Regents of the University of Texas System, IAM Commercial Paper, Series 2019, 1.35% 8/5/2019 | |
| 3,520 | | |
| 3,520 | |
| State of Texas, Board of Regents of the University of Texas System, IAM Commercial Paper, Series 2019, 1.40% 8/8/2019 | |
| 5,000 | | |
| 5,000 | |
| State of Texas, Board of Regents of the University of Texas System, IAM Commercial Paper, Series 2019, 1.50% 11/4/2019 | |
| 5,000 | | |
| 5,000 | |
| State of Wisconsin, Public Fin. Auth., Solid Waste Disposal Rev. Ref. Bonds (Waste Management, Inc. Project), Series 2017-A-1, AMT, 1.95% 2023 (put 2019)5 | |
| 2,000 | | |
| 2,000 | |
| State of Wisconsin, Public Fin. Auth., Solid Waste Disposal Rev. Ref. Bonds (Waste Management, Inc. Project), Series 2017-A-2, AMT, 1.95% 2025 (put 2019)5 | |
| 3,500 | | |
| 3,500 | |
| Other securities | |
| | | |
| 157,274 | |
| | |
| | | |
| | |
| Total short-term securities (cost: $461,498,000) | |
| | | |
| 461,549 | |
| Total investment securities 99.61% (cost: $7,337,332,000) | |
| | | |
| 7,721,731 | |
| Other assets less liabilities 0.39% | |
| | | |
| 30,523 | |
| | |
| | | |
| | |
| Net assets 100.00% | |
| | | |
$ | 7,752,254 | |
This summary investment portfolio is designed to streamline the report
and help investors better focus on the fund’s principal holdings. See the inside back cover for details on how to obtain
a complete schedule of portfolio holdings.
“Other securities” includes all issues that are not disclosed
separately in the summary investment portfolio. “Other securities” includes a security which was valued under fair
value procedures adopted by authority of the board of trustees. The total value of the security which was valued under fair value
procedures was $6,012,000, which represented .08% of the net assets of the fund.
| 62 |
American Funds Tax-Exempt Funds |
American High-Income Municipal Bond Fund
Futures contracts
| Contracts | |
Type | |
Number of
contracts | | |
Expiration | |
Notional
amount
(000) | 6 | |
Value
at
7/31/2019
(000) | 7 |
| Unrealized
(depreciation)
appreciation
at 7/31/2019
(000) | |
| 2 Year U.S. Treasury Note Futures | |
Long | |
| 2,013 | | |
October 2019 | |
$ | 402,600 | | |
$ | 431,600 | |
| |
$ | (621 | ) |
| 5 Year U.S. Treasury Note Futures | |
Long | |
| 1,464 | | |
October 2019 | |
| 146,400 | | |
| 172,100 | |
| |
| 1,516 | |
| 10 Year U.S. Treasury Note Futures | |
Short | |
| 1,166 | | |
September 2019 | |
| (116,600 | ) | |
| (148,574 | ) |
| |
| (431 | ) |
| 30 Year Ultra U.S. Treasury Bond Futures | |
Short | |
| 133 | | |
September 2019 | |
| (13,300 | ) | |
| (23,616 | ) |
| |
| (829 | ) |
| | |
| |
| | | |
| |
| | | |
| | |
| |
$ | (365 | ) |
| 1 |
Acquired in a transaction exempt from registration under Rule 144A of the Securities Act of 1933. May be resold in the U.S. in transactions exempt from registration, normally to qualified institutional buyers. The total value of all such securities, including those in “Other securities,” was $986,843,000, which represented 12.73% of the net assets of the fund. |
| 2 |
Scheduled interest and/or principal payment was not received. |
| 3 |
Coupon rate may change periodically. For short-term securities, the date of the next scheduled coupon rate change is considered to be the maturity date. |
| 4 |
Step bond; coupon rate may change at a later date. |
| 5 |
For short-term securities, the mandatory put date is considered to be the maturity date. |
| 6 |
Notional amount is calculated based on the number of contracts and notional contract size. |
| 7 |
Value is calculated based on the notional amount and current market price. |
Key to abbreviations and symbol
Agcy. = Agency
AMT = Alternative Minimum Tax
Auth. = Authority
Certs. of Part. = Certificates of Participation
Dept. = Department
Dev. = Development
Dist. = District
Econ. = Economic
Fac. = Facility
Facs. = Facilities
Fin. = Finance
Fncg. = Financing
G.O. = General Obligation
LIBOR = London Interbank Offered Rate
LOC = Letter of Credit
Preref. = Prerefunded
Redev. = Redevelopment
Ref. = Refunding
Rev. = Revenue
SIFMA = Securities Industry and Financial Markets Association
USD/$ = U.S. dollars
See notes to financial statements.
| American Funds Tax-Exempt Funds |
63 |
The Tax-Exempt Fund of California
Summary investment portfolio July 31, 2019
| Bonds, notes & other debt instruments 94.34% | |
Principal amount
(000) | | |
Value
(000) | |
| California 92.76% | |
| | | |
| | |
| State issuers 36.35% | |
| | | |
| | |
| Educational Facs. Auth., Rev. Bonds (Art Center College of Design), Series 2018-A, 5.00% 2032 | |
$ | 950 | | |
$ | 1,166 | |
| Educational Facs. Auth., Rev. Bonds (Art Center College of Design), Series 2018-A, 5.00% 2034 | |
| 760 | | |
| 925 | |
| Educational Facs. Auth., Rev. Bonds (Art Center College of Design), Series 2018-A, 5.00% 2035 | |
| 1,300 | | |
| 1,576 | |
| Educational Facs. Auth., Rev. Bonds (Art Center College of Design), Series 2018-A, 5.00% 2036 | |
| 1,000 | | |
| 1,208 | |
| Educational Facs. Auth., Rev. Bonds (Art Center College of Design), Series 2018-A, 5.00% 2037 | |
| 1,265 | | |
| 1,521 | |
| Educational Facs. Auth., Rev. Bonds (Art Center College of Design), Series 2018-A, 5.00% 2038 | |
| 1,140 | | |
| 1,367 | |
| Educational Facs. Auth., Rev. Bonds (Art Center College of Design), Series 2018-A, 5.00% 2044 | |
| 4,000 | | |
| 4,747 | |
| Educational Facs. Auth., Rev. Bonds (Chapman University), Series 2017-B, 4.00% 2047 | |
| 10,575 | | |
| 11,339 | |
| Educational Facs. Auth., Rev. Bonds (Pitzer College), Series 2009, 5.00% 2021 (preref. 2020) | |
| 1,625 | | |
| 1,669 | |
| Educational Facs. Auth., Rev. Bonds (Pitzer College), Series 2009, 6.00% 2040 (preref. 2020) | |
| 1,400 | | |
| 1,447 | |
| Educational Facs. Auth., Rev. Bonds (University of San Francisco), Series 2018-A, 5.00% 2043 | |
| 1,000 | | |
| 1,208 | |
| Educational Facs. Auth., Rev. Bonds (University of San Francisco), Series 2018-A, 5.00% 2053 | |
| 3,985 | | |
| 4,721 | |
| Educational Facs. Auth., Rev. Ref. Bonds (Chapman University), Series 2011, 5.00% 2026 | |
| 3,000 | | |
| 3,193 | |
| Educational Facs. Auth., Rev. Ref. Bonds (Chapman University), Series 2011, 5.00% 2031 | |
| 11,795 | | |
| 12,528 | |
| Educational Facs. Auth., Rev. Ref. Bonds (Chapman University), Series 2015, 5.00% 2032 | |
| 2,500 | | |
| 2,942 | |
| Educational Facs. Auth., Rev. Ref. Bonds (Loyola Marymount University), Capital Appreciation Bonds, Series 2001-A, National insured, 0% 2033 | |
| 2,000 | | |
| 1,358 | |
| Educational Facs. Auth., Rev. Ref. Bonds (Occidental College), Series 2013-A, 5.00% 2029 | |
| 3,265 | | |
| 3,758 | |
| Educational Facs. Auth., Rev. Ref. Bonds (Stanford University), Series 2009-T-5, 5.00% 2023 | |
| 2,000 | | |
| 2,292 | |
| Educational Facs. Auth., Rev. Ref. Bonds (University of Redlands), Series 2014-A, 5.00% 2026 | |
| 1,035 | | |
| 1,227 | |
| Educational Facs. Auth., Rev. Ref. Bonds (University of the Pacific), Series 2015, 5.00% 2030 | |
| 1,000 | | |
| 1,200 | |
| Educational Facs. Auth., Rev. Ref. Bonds (University of the Pacific), Series 2015, 5.00% 2032 | |
| 2,500 | | |
| 2,980 | |
| G.O. Bonds, Series 2009, 6.00% 2039 | |
| 2,000 | | |
| 2,025 | |
| G.O. Bonds, Series 2011, 5.25% 2028 | |
| 2,000 | | |
| 2,170 | |
| G.O. Bonds, Series 2013, (SIFMA Municipal Swap Index + 0.38%) 1.78% 2027 (put 2027)1 | |
| 2,000 | | |
| 2,006 | |
| G.O. Bonds, Series 2013-E, (1-month USD-LIBOR + 0.43%) 1.83% 2029 (put 2023)1 | |
| 1,500 | | |
| 1,507 | |
| G.O. Bonds, Series 2015, 5.25% 2032 | |
| 5,000 | | |
| 6,049 | |
| G.O. Rev. Ref. Bonds, Series 2016, 5.00% 2025 | |
| 7,120 | | |
| 8,736 | |
| G.O. Rev. Ref. Bonds, Series 2019, 5.00% 2026 | |
| 7,500 | | |
| 9,311 | |
| Golden State Tobacco Securitization Corp., Enhanced Tobacco Settlement Asset-Backed Bonds, Capital Appreciation Bonds, Series 2005-A, AMBAC insured, 0% 2027 | |
| 3,460 | | |
| 3,002 | |
| Golden State Tobacco Securitization Corp., Enhanced Tobacco Settlement Asset-Backed Bonds, Capital Appreciation Bonds, Series 2005-A, Assured Guaranty Municipal insured, 0% 2026 | |
| 12,600 | | |
| 11,262 | |
| Golden State Tobacco Securitization Corp., Enhanced Tobacco Settlement Asset-Backed Bonds, Series 2015-A, 5.00% 2032 | |
| 3,250 | | |
| 3,872 | |
| Golden State Tobacco Securitization Corp., Enhanced Tobacco Settlement Asset-Backed Bonds, Series 2015-A, 5.00% 2033 | |
| 1,950 | | |
| 2,299 | |
| Golden State Tobacco Securitization Corp., Enhanced Tobacco Settlement Asset-Backed Bonds, Series 2015-A, 5.00% 2045 | |
| 3,580 | | |
| 4,126 | |
| Golden State Tobacco Securitization Corp., Enhanced Tobacco Settlement Asset-Backed Bonds, Series 2018-A, 5.00% 2022 | |
| 3,640 | | |
| 4,034 | |
| Golden State Tobacco Securitization Corp., Enhanced Tobacco Settlement Asset-Backed Bonds, Series 2018-A-1, 5.00% 2047 | |
| 2,450 | | |
| 2,476 | |
| Golden State Tobacco Securitization Corp., Enhanced Tobacco Settlement Asset-Backed Bonds, Series 2018-A-2, 5.00% 2047 | |
| 4,250 | | |
| 4,295 | |
| Health Facs. Fncg. Auth., Rev. Bonds (Cedars-Sinai Medical Center), Series 2016-A, 5.00% 2036 | |
| 500 | | |
| 601 | |
| Health Facs. Fncg. Auth., Rev. Bonds (Children’s Hospital of Orange County), Series 2011-A, 5.25% 2041 | |
| 2,000 | | |
| 2,171 | |
| Health Facs. Fncg. Auth., Rev. Bonds (El Camino Hospital), Series 2017, 5.00% 2042 | |
| 2,500 | | |
| 2,942 | |
| Health Facs. Fncg. Auth., Rev. Bonds (Episcopal Home), Series 2002-B, 6.00% 2032 (preref. 2020) | |
| 3,600 | | |
| 3,690 | |
| 64 |
American Funds Tax-Exempt Funds |
The Tax-Exempt Fund of California
| | |
Principal amount
(000) | | |
Value
(000) | |
| Health Facs. Fncg. Auth., Rev. Bonds (Kaiser Permanente), Series 2017-A-2, 4.00% 2044 | |
$ | 12,940 | | |
$ | 14,186 | |
| Health Facs. Fncg. Auth., Rev. Bonds (Kaiser Permanente), Series 2017-A-2, 5.00% 2047 | |
| 3,500 | | |
| 5,050 | |
| Health Facs. Fncg. Auth., Rev. Bonds (Lucile Salter Packard Children’s Hospital at Stanford), Series 2014-A, 5.00% 2043 | |
| 1,000 | | |
| 1,127 | |
| Health Facs. Fncg. Auth., Rev. Bonds (Lucile Salter Packard Children’s Hospital at Stanford), Series 2016-B, 5.00% 2055 | |
| 2,000 | | |
| 2,321 | |
| Health Facs. Fncg. Auth., Rev. Bonds (Lucile Salter Packard Children’s Hospital at Stanford), Series 2017-A, 5.00% 2042 | |
| 1,475 | | |
| 1,758 | |
| Health Facs. Fncg. Auth., Rev. Bonds (Lucile Salter Packard Children’s Hospital at Stanford), Series 2017-A, 5.00% 2056 | |
| 2,000 | | |
| 2,367 | |
| Health Facs. Fncg. Auth., Rev. Bonds (Presbyterian Homes and Services, Inc.), Series 2015, 5.00% 2022 | |
| 100 | | |
| 111 | |
| Health Facs. Fncg. Auth., Rev. Bonds (Presbyterian Homes and Services, Inc.), Series 2015, 5.00% 2031 | |
| 400 | | |
| 475 | |
| Health Facs. Fncg. Auth., Rev. Bonds (Presbyterian Homes and Services, Inc.), Series 2015, 5.00% 2039 | |
| 400 | | |
| 464 | |
| Health Facs. Fncg. Auth., Rev. Bonds (Providence St. Joseph Health), Series 2016-A, 4.00% 2034 | |
| 500 | | |
| 554 | |
| Health Facs. Fncg. Auth., Rev. Bonds (Providence St. Joseph Health), Series 2016-A, 4.00% 2036 | |
| 650 | | |
| 716 | |
| Health Facs. Fncg. Auth., Rev. Bonds (Providence St. Joseph Health), Series 2016-B-2, 4.00% 2036 (put 2024) | |
| 2,000 | | |
| 2,269 | |
| Health Facs. Fncg. Auth., Rev. Bonds (Rady Children’s Hospital - San Diego), Series 2011, 5.25% 2041 | |
| 5,000 | | |
| 5,376 | |
| Health Facs. Fncg. Auth., Rev. Bonds (Sutter Health), Series 2011-D, 5.25% 2031 | |
| 2,000 | | |
| 2,162 | |
| Health Facs. Fncg. Auth., Rev. Bonds (Sutter Health), Series 2018-A, 5.00% 2034 | |
| 1,000 | | |
| 1,241 | |
| Health Facs. Fncg. Auth., Rev. Bonds (Sutter Health), Series 2018-A, 5.00% 2035 | |
| 1,500 | | |
| 1,852 | |
| Health Facs. Fncg. Auth., Rev. Bonds (Sutter Health), Series 2018-A, 5.00% 2036 | |
| 2,000 | | |
| 2,461 | |
| Health Facs. Fncg. Auth., Rev. Bonds (Sutter Health), Series 2018-A, 5.00% 2037 | |
| 1,000 | | |
| 1,224 | |
| Health Facs. Fncg. Auth., Rev. Green Bonds (Kaiser Permanente), Series 2017-C, 5.00% 2031 (put 2022) | |
| 1,000 | | |
| 1,127 | |
| Health Facs. Fncg. Auth., Rev. Ref. Bonds (Catholic Healthcare West), Series 2011-A, 5.25% 2041 | |
| 2,000 | | |
| 2,108 | |
| Health Facs. Fncg. Auth., Rev. Ref. Bonds (Cedars-Sinai Medical Center), Series 2015, 5.00% 2030 | |
| 500 | | |
| 606 | |
| Health Facs. Fncg. Auth., Rev. Ref. Bonds (Cedars-Sinai Medical Center), Series 2015, 5.00% 2031 | |
| 1,300 | | |
| 1,569 | |
| Health Facs. Fncg. Auth., Rev. Ref. Bonds (El Camino Hospital), Series 2015-A, 5.00% 2030 | |
| 3,000 | | |
| 3,565 | |
| Health Facs. Fncg. Auth., Rev. Ref. Bonds (El Camino Hospital), Series 2015-A, 5.00% 2040 | |
| 8,700 | | |
| 9,951 | |
| Health Facs. Fncg. Auth., Rev. Ref. Bonds (Memorial Health Services), Series 2012-A, 5.00% 2033 | |
| 1,000 | | |
| 1,111 | |
| Health Facs. Fncg. Auth., Rev. Ref. Bonds (St. Joseph Health System), Series 2013-C, 5.00% 2043 (put 2019) | |
| 2,000 | | |
| 2,016 | |
| Health Facs. Fncg. Auth., Rev. Ref. Bonds (Stanford Health Care), Series 2017-A, 5.00% 2031 | |
| 5,000 | | |
| 6,308 | |
| Health Facs. Fncg. Auth., Rev. Ref. Bonds (Stanford Health Care), Series 2017-A, 5.00% 2034 | |
| 9,000 | | |
| 11,182 | |
| Health Facs. Fncg. Auth., Rev. Ref. Bonds (Stanford Hospital and Clinics), Series 2010-B, 5.25% 2031 (preref. 2020) | |
| 4,475 | | |
| 4,719 | |
| Health Facs. Fncg. Auth., Rev. Ref. Bonds (Sutter Health), Series 2008-A, 5.25% 2022 | |
| 2,000 | | |
| 2,000 | |
| Health Facs. Fncg. Auth., Rev. Ref. Bonds (Sutter Health), Series 2016-A, 5.00% 2033 | |
| 1,000 | | |
| 1,195 | |
| Health Facs. Fncg. Auth., Rev. Ref. Bonds (Sutter Health), Series 2016-A, 5.00% 2034 | |
| 2,000 | | |
| 2,384 | |
| Health Facs. Fncg. Auth., Rev. Ref. Bonds (Sutter Health), Series 2016-A, 5.00% 2035 | |
| 2,000 | | |
| 2,373 | |
| Health Facs. Fncg. Auth., Rev. Ref. Bonds (Sutter Health), Series 2016-B, 4.00% 2038 | |
| 4,165 | | |
| 4,560 | |
| Health Facs. Fncg. Auth., Rev. Ref. Bonds (Sutter Health), Series 2016-B, 5.00% 2035 | |
| 1,000 | | |
| 1,211 | |
| Health Facs. Fncg. Auth., Rev. Ref. Bonds (Sutter Health), Series 2016-B, 5.00% 2046 | |
| 3,000 | | |
| 3,533 | |
| Imperial Irrigation Dist., Electric System Rev. Ref. Bonds, Series 2017, 4.00% 2036 | |
| 6,915 | | |
| 7,779 | |
| Infrastructure and Econ. Dev. Bank, Rev. Bonds (The Colburn School), Series 2015-B, (SIFMA Municipal Swap Index + 1.20%) 2.60% 2037 (put 2022)1 | |
| 8,500 | | |
| 8,652 | |
| Metropolitan Water Dist. of Southern California, Water Rev. Ref. Bonds, Series 2019-A, 5.00% 2025 | |
| 10,000 | | |
| 12,314 | |
| Municipal Fin. Auth., Charter School Rev. Bonds (Bella Mente Montessori Academy), Series 2018-A, ACA insured, 5.00% 20482 | |
| 1,150 | | |
| 1,303 | |
| Municipal Fin. Auth., Educational Rev. Bonds (American Heritage Education Foundation Project), Series 2016-A, 5.00% 2036 | |
| 500 | | |
| 569 | |
| American Funds Tax-Exempt Funds |
65 |
The Tax-Exempt Fund of California
| Bonds, notes & other debt instruments (continued) | |
Principal amount
(000) | | |
Value
(000) | |
| California (continued) | |
| | | |
| | |
| State issuers (continued) | |
| | | |
| | |
| Municipal Fin. Auth., Educational Rev. Bonds (American Heritage Education Foundation Project), Series 2016-A, 5.00% 2046 | |
$ | 2,000 | | |
$ | 2,244 | |
| Municipal Fin. Auth., Insured Senior Living Rev. Ref. Bonds (Pilgrim Place in Claremont), Series 2016-A, 5.00% 2031 | |
| 500 | | |
| 613 | |
| Municipal Fin. Auth., Jurupa Lease Rev. Ref. Bonds (Wineville Unified School Dist.), Series 2015-A, BAM insured, 5.00% 2042 | |
| 4,500 | | |
| 5,181 | |
| Municipal Fin. Auth., Rev. Bonds (Biola University), Series 2013, 5.00% 2042 | |
| 1,000 | | |
| 1,104 | |
| Municipal Fin. Auth., Rev. Bonds (California Baptist University), Series 2015-A, 5.375% 20402 | |
| 2,335 | | |
| 2,685 | |
| Municipal Fin. Auth., Rev. Bonds (California Baptist University), Series 2015-A, 5.50% 20452 | |
| 2,800 | | |
| 3,222 | |
| Municipal Fin. Auth., Rev. Bonds (California Baptist University), Series 2016-A, 4.00% 20212 | |
| 850 | | |
| 870 | |
| Municipal Fin. Auth., Rev. Bonds (California Baptist University), Series 2016-A, 5.00% 20362 | |
| 3,500 | | |
| 4,019 | |
| Municipal Fin. Auth., Rev. Bonds (California Baptist University), Series 2016-A, 5.00% 20462 | |
| 750 | | |
| 846 | |
| Municipal Fin. Auth., Rev. Bonds (California Lutheran University), Series 2018, 5.00% 2027 | |
| 300 | | |
| 372 | |
| Municipal Fin. Auth., Rev. Bonds (California Lutheran University), Series 2018, 5.00% 2028 | |
| 150 | | |
| 190 | |
| Municipal Fin. Auth., Rev. Bonds (California Lutheran University), Series 2018, 5.00% 2029 | |
| 225 | | |
| 282 | |
| Municipal Fin. Auth., Rev. Bonds (California Lutheran University), Series 2018, 5.00% 2030 | |
| 225 | | |
| 280 | |
| Municipal Fin. Auth., Rev. Bonds (California Lutheran University), Series 2018, 5.00% 2031 | |
| 200 | | |
| 247 | |
| Municipal Fin. Auth., Rev. Bonds (California Lutheran University), Series 2018, 5.00% 2032 | |
| 225 | | |
| 276 | |
| Municipal Fin. Auth., Rev. Bonds (California Lutheran University), Series 2018, 5.00% 2033 | |
| 225 | | |
| 275 | |
| Municipal Fin. Auth., Rev. Bonds (Caritas Mobile Home Park), Series 2014-A, 5.25% 2049 | |
| 1,750 | | |
| 1,948 | |
| Municipal Fin. Auth., Rev. Bonds (Channing House Project), Series 2017-A, 5.00% 2033 | |
| 1,000 | | |
| 1,217 | |
| Municipal Fin. Auth., Rev. Bonds (Community Medical Centers), Series 2017-A, 5.00% 2022 | |
| 1,300 | | |
| 1,422 | |
| Municipal Fin. Auth., Rev. Bonds (Community Medical Centers), Series 2017-A, 5.00% 2027 | |
| 690 | | |
| 853 | |
| Municipal Fin. Auth., Rev. Bonds (Emerson College), Series 2017-B, 5.00% 2035 | |
| 1,500 | | |
| 1,796 | |
| Municipal Fin. Auth., Rev. Bonds (Harbor Regional Center Project), Series 2009, 8.00% 2029 (preref. 2019) | |
| 1,500 | | |
| 1,526 | |
| Municipal Fin. Auth., Rev. Bonds (LINXS APM Project), Series 2018-A, AMT, 4.00% 2047 | |
| 3,900 | | |
| 4,159 | |
| Municipal Fin. Auth., Rev. Bonds (LINXS APM Project), Series 2018-A, AMT, 5.00% 2025 | |
| 1,585 | | |
| 1,876 | |
| Municipal Fin. Auth., Rev. Bonds (LINXS APM Project), Series 2018-A, AMT, 5.00% 2031 | |
| 2,695 | | |
| 3,271 | |
| Municipal Fin. Auth., Rev. Bonds (LINXS APM Project), Series 2018-A, AMT, 5.00% 2034 | |
| 1,320 | | |
| 1,585 | |
| Municipal Fin. Auth., Rev. Bonds (LINXS APM Project), Series 2018-A, AMT, 5.00% 2035 | |
| 1,000 | | |
| 1,196 | |
| Municipal Fin. Auth., Rev. Bonds (LINXS APM Project), Series 2018-A, AMT, 5.00% 2043 | |
| 3,000 | | |
| 3,520 | |
| Municipal Fin. Auth., Rev. Bonds (LINXS APM Project), Series 2018-A, AMT, 5.00% 2047 | |
| 8,705 | | |
| 10,169 | |
| Municipal Fin. Auth., Rev. Bonds (Mt. San Antonio Gardens Project), Series 2019, 4.00% 2020 | |
| 260 | | |
| 268 | |
| Municipal Fin. Auth., Rev. Bonds (Pomona College), Series 2017, 4.00% 2048 | |
| 1,550 | | |
| 1,708 | |
| Municipal Fin. Auth., Rev. Bonds (Retirement Housing Foundation), Series 2017-A, 5.00% 2029 | |
| 390 | | |
| 495 | |
| Municipal Fin. Auth., Rev. Bonds (Retirement Housing Foundation), Series 2017-A, 5.00% 2030 | |
| 250 | | |
| 320 | |
| Municipal Fin. Auth., Rev. Bonds (Retirement Housing Foundation), Series 2017-A, 5.00% 2031 | |
| 1,250 | | |
| 1,609 | |
| Municipal Fin. Auth., Rev. Bonds (Retirement Housing Foundation), Series 2017-A, 5.00% 2032 | |
| 925 | | |
| 1,199 | |
| Municipal Fin. Auth., Rev. Bonds (University of La Verne), Series 2010-A, 5.75% 2025 (preref. 2020) | |
| 2,100 | | |
| 2,184 | |
| Municipal Fin. Auth., Rev. Bonds (University of La Verne), Series 2010-A, 6.125% 2030 (preref. 2020) | |
| 1,000 | | |
| 1,043 | |
| Municipal Fin. Auth., Rev. Bonds (University of La Verne), Series 2017-A, 5.00% 2029 | |
| 1,000 | | |
| 1,245 | |
| Municipal Fin. Auth., Rev. Bonds (University of La Verne), Series 2017-A, 5.00% 2030 | |
| 1,500 | | |
| 1,856 | |
| Municipal Fin. Auth., Rev. Bonds (University of La Verne), Series 2017-A, 5.00% 2031 | |
| 650 | | |
| 796 | |
| Municipal Fin. Auth., Rev. Bonds (University of La Verne), Series 2017-A, 5.00% 2032 | |
| 1,000 | | |
| 1,216 | |
| Municipal Fin. Auth., Rev. Bonds (University of La Verne), Series 2017-A, 5.00% 2033 | |
| 1,000 | | |
| 1,210 | |
| Municipal Fin. Auth., Rev. Bonds (University of La Verne), Series 2017-A, 5.00% 2035 | |
| 1,000 | | |
| 1,200 | |
| Municipal Fin. Auth., Rev. Bonds (University of La Verne), Series 2017-A, 5.00% 2036 | |
| 1,150 | | |
| 1,374 | |
| Municipal Fin. Auth., Rev. Bonds (University of La Verne), Series 2017-A, 5.00% 2043 | |
| 4,380 | | |
| 5,151 | |
| Municipal Fin. Auth., Rev. Ref. Bonds (Azusa Pacific University Project), Series 2011-B, 8.00% 2041 (preref. 2021)2 | |
| 4,150 | | |
| 4,630 | |
| Municipal Fin. Auth., Rev. Ref. Bonds (Azusa Pacific University Project), Series 2015-B, 5.00% 2023 | |
| 600 | | |
| 655 | |
| Municipal Fin. Auth., Rev. Ref. Bonds (Azusa Pacific University Project), Series 2015-B, 5.00% 2024 | |
| 600 | | |
| 668 | |
| 66 |
American Funds Tax-Exempt Funds |
The Tax-Exempt Fund of California
| | |
Principal amount
(000) | | |
Value
(000) | |
| Municipal Fin. Auth., Rev. Ref. Bonds (Azusa Pacific University Project), Series 2015-B, 5.00% 2028 | |
$ | 1,135 | | |
$ | 1,269 | |
| Municipal Fin. Auth., Rev. Ref. Bonds (Azusa Pacific University Project), Series 2015-B, 5.00% 2029 | |
| 1,390 | | |
| 1,549 | |
| Municipal Fin. Auth., Rev. Ref. Bonds (Biola University), Series 2017, 5.00% 2030 | |
| 750 | | |
| 914 | |
| Municipal Fin. Auth., Rev. Ref. Bonds (Biola University), Series 2017, 5.00% 2033 | |
| 500 | | |
| 602 | |
| Municipal Fin. Auth., Rev. Ref. Bonds (Biola University), Series 2017, 5.00% 2034 | |
| 440 | | |
| 528 | |
| Municipal Fin. Auth., Rev. Ref. Bonds (Biola University), Series 2017, 5.00% 2039 | |
| 615 | | |
| 727 | |
| Municipal Fin. Auth., Rev. Ref. Bonds (Eisenhower Medical Center), Series 2017-A, 5.00% 2033 | |
| 650 | | |
| 773 | |
| Municipal Fin. Auth., Rev. Ref. Bonds (Eisenhower Medical Center), Series 2017-A, 5.00% 2034 | |
| 2,675 | | |
| 3,168 | |
| Municipal Fin. Auth., Rev. Ref. Bonds (Eisenhower Medical Center), Series 2017-A, 5.00% 2035 | |
| 2,000 | | |
| 2,358 | |
| Municipal Fin. Auth., Rev. Ref. Bonds (Eisenhower Medical Center), Series 2017-A, 5.00% 2036 | |
| 1,000 | | |
| 1,174 | |
| Municipal Fin. Auth., Rev. Ref. Bonds (Eisenhower Medical Center), Series 2017-A, 5.00% 2037 | |
| 1,250 | | |
| 1,460 | |
| Municipal Fin. Auth., Rev. Ref. Bonds (Eisenhower Medical Center), Series 2017-A, 5.00% 2042 | |
| 1,250 | | |
| 1,443 | |
| Municipal Fin. Auth., Rev. Ref. Bonds (Eisenhower Medical Center), Series 2017-A, 5.00% 2047 | |
| 1,000 | | |
| 1,146 | |
| Municipal Fin. Auth., Rev. Ref. Bonds (Eisenhower Medical Center), Series 2017-B, 5.00% 2033 | |
| 1,450 | | |
| 1,725 | |
| Municipal Fin. Auth., Rev. Ref. Bonds (Eisenhower Medical Center), Series 2017-B, 5.00% 2034 | |
| 600 | | |
| 711 | |
| Municipal Fin. Auth., Rev. Ref. Bonds (Eisenhower Medical Center), Series 2017-B, 5.00% 2035 | |
| 625 | | |
| 737 | |
| Municipal Fin. Auth., Rev. Ref. Bonds (Eisenhower Medical Center), Series 2017-B, 5.00% 2036 | |
| 600 | | |
| 704 | |
| Municipal Fin. Auth., Rev. Ref. Bonds (Eisenhower Medical Center), Series 2017-B, 5.00% 2037 | |
| 600 | | |
| 701 | |
| Municipal Fin. Auth., Rev. Ref. Bonds (Eisenhower Medical Center), Series 2017-B, 5.00% 2042 | |
| 1,000 | | |
| 1,154 | |
| Municipal Fin. Auth., Rev. Ref. Bonds (Eisenhower Medical Center), Series 2017-B, 5.00% 2047 | |
| 4,010 | | |
| 4,597 | |
| Municipal Fin. Auth., Rev. Ref. Bonds (Harbor Regional Center Project), Series 2015, 5.00% 2032 | |
| 1,500 | | |
| 1,759 | |
| Municipal Fin. Auth., Rev. Ref. Bonds (Harbor Regional Center Project), Series 2015, 5.00% 2039 | |
| 1,000 | | |
| 1,146 | |
| Municipal Fin. Auth., Rev. Ref. Bonds (HumanGood Obligated Group), Series 2019-A, 4.00% 2031 | |
| 1,000 | | |
| 1,128 | |
| Municipal Fin. Auth., Rev. Ref. Bonds (HumanGood Obligated Group), Series 2019-A, 4.00% 2033 | |
| 1,250 | | |
| 1,396 | |
| Municipal Fin. Auth., Rev. Ref. Bonds (HumanGood Obligated Group), Series 2019-A, 4.00% 2034 | |
| 750 | | |
| 832 | |
| Municipal Fin. Auth., Rev. Ref. Bonds (HumanGood Obligated Group), Series 2019-A, 4.00% 2035 | |
| 1,185 | | |
| 1,308 | |
| Municipal Fin. Auth., Rev. Ref. Bonds (HumanGood Obligated Group), Series 2019-A, 4.00% 2036 | |
| 2,000 | | |
| 2,197 | |
| Municipal Fin. Auth., Rev. Ref. Bonds (HumanGood Obligated Group), Series 2019-A, 4.00% 2037 | |
| 2,850 | | |
| 3,117 | |
| Municipal Fin. Auth., Rev. Ref. Bonds (HumanGood Obligated Group), Series 2019-A, 4.00% 2039 | |
| 2,750 | | |
| 2,995 | |
| Municipal Fin. Auth., Rev. Ref. Bonds (HumanGood Obligated Group), Series 2019-A, 5.00% 2044 | |
| 4,500 | | |
| 5,238 | |
| Municipal Fin. Auth., Rev. Ref. Bonds (Inland Regional Center Project), Series 2015, 5.00% 2032 | |
| 3,000 | | |
| 3,492 | |
| Municipal Fin. Auth., Rev. Ref. Bonds (Inland Regional Center Project), Series 2015, 5.00% 2037 | |
| 4,000 | | |
| 4,581 | |
| Municipal Fin. Auth., Rev. Ref. Bonds (Inland Regional Center Project), Series 2015, 5.00% 2045 | |
| 4,000 | | |
| 4,517 | |
| Municipal Fin. Auth., Rev. Ref. Bonds (University of San Diego), Series 2011-B, 5.00% 2031 | |
| 1,750 | | |
| 1,886 | |
| Municipal Fin. Auth., Rev. Ref. Bonds (University of San Diego), Series 2012-A, 5.00% 2031 | |
| 1,475 | | |
| 1,638 | |
| American Funds Tax-Exempt Funds |
67 |
The Tax-Exempt Fund of California
| Bonds, notes & other debt instruments (continued) | |
Principal amount
(000) | | |
Value
(000) | |
| California (continued) | |
| | | |
| | |
| State issuers (continued) | |
| | | |
| | |
| Municipal Fin. Auth., Rev. Ref. Bonds (University of San Diego), Series 2012-A, 5.00% 2032 | |
$ | 1,000 | | |
$ | 1,109 | |
| Municipal Fin. Auth., Rev. Ref. Bonds (William Jessup University), Series 2019, 5.00% 2039 | |
| 1,000 | | |
| 1,113 | |
| Municipal Fin. Auth., Rev. Ref. Bonds (William Jessup University), Series 2019, 5.00% 2048 | |
| 2,000 | | |
| 2,195 | |
| Municipal Fin. Auth., Solid Waste Disposal Rev. Bonds (Waste Management, Inc. Project), Series 2017-A, AMT, 2.00% 2044 (put 2020) | |
| 4,900 | | |
| 4,939 | |
| Municipal Fin. Auth., Student Housing Rev. Bonds (CHF-Davis I, LLC - West Village Student Housing Project), Series 2018, 5.00% 2040 | |
| 4,610 | | |
| 5,489 | |
| Municipal Fin. Auth., Student Housing Rev. Bonds (CHF-Davis I, LLC - West Village Student Housing Project), Series 2018, 5.00% 2043 | |
| 6,525 | | |
| 7,697 | |
| Municipal Fin. Auth., Student Housing Rev. Bonds (CHF-Riverside I, LLC - UCR Student Housing Project), Series 2018, 5.00% 2043 | |
| 2,000 | | |
| 2,359 | |
| Municipal Fin. Auth., Student Housing Rev. Bonds (CHF-Riverside I, LLC - UCR Student Housing Project), Series 2018, 5.00% 2052 | |
| 7,500 | | |
| 8,783 | |
| Municipal Fin. Auth., Student Housing Rev. Bonds (CHF-Riverside II, LLC - UCR Student Housing Project), Series 2019, 5.00% 2049 | |
| 2,510 | | |
| 2,992 | |
| Municipal Fin. Auth., Student Housing Rev. Bonds (CHF-Riverside II, LLC - UCR Student Housing Project), Series 2019, 5.00% 2052 | |
| 3,500 | | |
| 4,154 | |
| Pollution Control Fncg. Auth., Rev. Bonds (San Jose Water Co. Project), Series 2016, AMT, 4.75% 2046 | |
| 11,475 | | |
| 12,906 | |
| School Fin. Auth., Charter School Rev. Bonds (Classical Academies Project), Series 2013-A-1, 7.375% 2043 (preref. 2022) | |
| 3,465 | | |
| 4,076 | |
| School Fin. Auth., Charter School Rev. Bonds (Classical Academies Project), Series 2017-A, 4.00% 20272 | |
| 750 | | |
| 803 | |
| School Fin. Auth., Charter School Rev. Bonds (Classical Academies Project), Series 2017-A, 5.00% 20322 | |
| 2,500 | | |
| 2,842 | |
| School Fin. Auth., Charter School Rev. Bonds (Classical Academies Project), Series 2017-A, 5.00% 20372 | |
| 1,485 | | |
| 1,663 | |
| School Fin. Auth., Charter School Rev. Bonds (Classical Academies Project), Series 2017-A, 5.00% 20442 | |
| 805 | | |
| 889 | |
| School Fin. Auth., Charter School Rev. Bonds (Downtown College Prep Obligated Group), Series 2016, 4.75% 20362 | |
| 1,365 | | |
| 1,458 | |
| School Fin. Auth., Charter School Rev. Bonds (Equitas Academy Obligated Group), Series 2018-A, 5.00% 20292 | |
| 3,345 | | |
| 3,846 | |
| School Fin. Auth., Charter School Rev. Bonds (Equitas Academy Obligated Group), Series 2018-A, 5.00% 20412 | |
| 3,000 | | |
| 3,323 | |
| School Fin. Auth., Charter School Rev. Bonds (Equitas Academy Obligated Group), Series 2018-A, 5.00% 20482 | |
| 2,795 | | |
| 3,076 | |
| School Fin. Auth., Charter School Rev. Bonds (Larchmont Charter School Project), Series 2018-A, 5.00% 20552 | |
| 1,000 | | |
| 1,067 | |
| School Fin. Auth., Charter School Rev. Bonds (Rocketship Education Obligated Group), Series 2016-A, 5.00% 20362 | |
| 1,000 | | |
| 1,064 | |
| School Fin. Auth., Charter School Rev. Bonds (Rocketship Education Obligated Group), Series 2016-A, 5.00% 20462 | |
| 750 | | |
| 791 | |
| School Fin. Auth., Charter School Rev. Bonds (Rocketship Education Obligated Group), Series 2017-A, 5.00% 20342 | |
| 750 | | |
| 807 | |
| School Fin. Auth., Charter School Rev. Bonds (Rocketship Public Schools Obligated Group), Series 2017-G, 5.00% 20302 | |
| 315 | | |
| 346 | |
| School Fin. Auth., Charter School Rev. Bonds (Rocketship Public Schools Obligated Group), Series 2017-G, 5.00% 20472 | |
| 250 | | |
| 268 | |
| School Fin. Auth., Educational Facs. Rev. Bonds (River Springs Charter School Project), Series 2015-A, 6.375% 20462 | |
| 4,300 | | |
| 5,017 | |
| School Fin. Auth., Educational Facs. Rev. Bonds (River Springs Charter School Project), Series 2017-A, 5.00% 20302 | |
| 1,950 | | |
| 2,217 | |
| School Fin. Auth., Educational Facs. Rev. Bonds (River Springs Charter School Project), Series 2017-A, 5.00% 20372 | |
| 2,105 | | |
| 2,337 | |
| School Fin. Auth., School Fac. Rev. Bonds (KIPP LA Projects), Series 2017-A, 5.00% 20372 | |
| 590 | | |
| 691 | |
| School Fin. Auth., School Fac. Rev. Bonds (KIPP Social), Series 2019-A, 5.00% 20542 | |
| 2,150 | | |
| 2,517 | |
| School Fin. Auth., School Fac. Rev. Ref. Bonds (High Tech High Learning Project), Series 2017-A, 5.00% 20372 | |
| 1,455 | | |
| 1,673 | |
| School Fin. Auth., School Fac. Rev. Ref. Bonds (High Tech High Learning Project), Series 2017-A, 5.00% 20492 | |
| 5,400 | | |
| 6,111 | |
| Statewide Communities Dev. Auth., Health Fac. Rev. Bonds (Los Angeles Jewish Home for the Aging), Series 2008, 5.00% 2028 | |
| 1,500 | | |
| 1,501 | |
| 68 |
American Funds Tax-Exempt Funds |
The Tax-Exempt Fund of California
| | |
Principal amount
(000) | | |
Value
(000) | |
| Statewide Communities Dev. Auth., Health Fac. Rev. Bonds (Los Angeles Jewish Home for the Aging), Series 2008, 5.00% 2037 | |
$ | 2,000 | | |
$ | 2,001 | |
| Statewide Communities Dev. Auth., Health Fac. Rev. Ref. Bonds (Los Angeles Jewish Home for the Aging), Series 2019-A, 4.00% 2024 | |
| 300 | | |
| 344 | |
| Statewide Communities Dev. Auth., Health Fac. Rev. Ref. Bonds (Los Angeles Jewish Home for the Aging), Series 2019-A, 4.00% 2025 | |
| 275 | | |
| 320 | |
| Statewide Communities Dev. Auth., Health Fac. Rev. Ref. Bonds (Los Angeles Jewish Home for the Aging), Series 2019-A, 4.00% 2026 | |
| 370 | | |
| 437 | |
| Statewide Communities Dev. Auth., Health Fac. Rev. Ref. Bonds (Los Angeles Jewish Home for the Aging), Series 2019-A, 5.00% 2034 | |
| 750 | | |
| 957 | |
| Statewide Communities Dev. Auth., Health Fac. Rev. Ref. Bonds (Los Angeles Jewish Home for the Aging), Series 2019-A, 5.00% 2037 | |
| 735 | | |
| 927 | |
| Statewide Communities Dev. Auth., Hospital Rev. Ref. Bonds (Methodist Hospital of Southern California), Series 2018, 5.00% 2030 | |
| 2,585 | | |
| 3,141 | |
| Statewide Communities Dev. Auth., Hospital Rev. Ref. Bonds (Methodist Hospital of Southern California), Series 2018, 5.00% 2032 | |
| 1,165 | | |
| 1,396 | |
| Statewide Communities Dev. Auth., Hospital Rev. Ref. Bonds (Methodist Hospital of Southern California), Series 2018, 5.00% 2038 | |
| 1,000 | | |
| 1,174 | |
| Statewide Communities Dev. Auth., Hospital Rev. Ref. Bonds (Methodist Hospital of Southern California), Series 2018, 5.00% 2043 | |
| 2,000 | | |
| 2,332 | |
| Statewide Communities Dev. Auth., Hospital Rev. Ref. Bonds (Methodist Hospital of Southern California), Series 2018, 5.00% 2048 | |
| 1,500 | | |
| 1,740 | |
| Statewide Communities Dev. Auth., Mortgage Rev. Bonds (Methodist Hospital of Southern California Project), Series 2009, FHA insured, 6.625% 2029 (preref. 2019) | |
| 2,235 | | |
| 2,235 | |
| Statewide Communities Dev. Auth., Multi Family Housing Rev. Bonds (La Mesa Springs Apartments), Series 2019-E, 1.78% 2021 (put 2020) | |
| 7,000 | | |
| 7,060 | |
| Statewide Communities Dev. Auth., Pollution Control Rev. Ref. Bonds (Southern California Edison Co.), Series 2006-A, 1.90% 2028 | |
| 1,250 | | |
| 1,253 | |
| Statewide Communities Dev. Auth., Pollution Control Rev. Ref. Bonds (Southern California Edison Co.), Series 2006-D, 2.625% 2033 (put 2023) | |
| 6,875 | | |
| 7,122 | |
| Statewide Communities Dev. Auth., Pollution Control Rev. Ref. Bonds (Southern California Edison Co.), Series 2010-A, 4.50% 2029 | |
| 2,905 | | |
| 2,996 | |
| Statewide Communities Dev. Auth., Rev. Bonds (Adventist Health System/West), Series 2015-A, 5.00% 2031 | |
| 2,000 | | |
| 2,395 | |
| Statewide Communities Dev. Auth., Rev. Bonds (Adventist Health System/West), Series 2015-A, 5.00% 2032 | |
| 2,115 | | |
| 2,515 | |
| Statewide Communities Dev. Auth., Rev. Bonds (Adventist Health System/West), Series 2015-A, 5.00% 2035 | |
| 3,000 | | |
| 3,524 | |
| Statewide Communities Dev. Auth., Rev. Bonds (Adventist Health System/West), Series 2018-A, 4.00% 2042 | |
| 1,240 | | |
| 1,336 | |
| Statewide Communities Dev. Auth., Rev. Bonds (Adventist Health System/West), Series 2018-A, 5.00% 2032 | |
| 1,000 | | |
| 1,233 | |
| Statewide Communities Dev. Auth., Rev. Bonds (Adventist Health System/West), Series 2018-A, 5.00% 2033 | |
| 1,150 | | |
| 1,411 | |
| Statewide Communities Dev. Auth., Rev. Bonds (Adventist Health System/West), Series 2018-A, 5.00% 2035 | |
| 1,465 | | |
| 1,779 | |
| Statewide Communities Dev. Auth., Rev. Bonds (American Baptist Homes of the West), Series 2010, 6.00% 2029 | |
| 1,125 | | |
| 1,134 | |
| Statewide Communities Dev. Auth., Rev. Bonds (American Baptist Homes of the West), Series 2010, 6.25% 2039 | |
| 5,300 | | |
| 5,342 | |
| Statewide Communities Dev. Auth., Rev. Bonds (American Baptist Homes of the West), Series 2015, 5.00% 2021 | |
| 335 | | |
| 360 | |
| Statewide Communities Dev. Auth., Rev. Bonds (American Baptist Homes of the West), Series 2015, 5.00% 2022 | |
| 250 | | |
| 276 | |
| Statewide Communities Dev. Auth., Rev. Bonds (American Baptist Homes of the West), Series 2015, 5.00% 2045 | |
| 1,700 | | |
| 1,898 | |
| Statewide Communities Dev. Auth., Rev. Bonds (Buck Institute for Research on Aging), Series 2014, Assured Guaranty Municipal insured, 5.00% 2049 | |
| 5,250 | | |
| 5,959 | |
| Statewide Communities Dev. Auth., Rev. Bonds (Covenant Retirement Communities, Inc.), Series 2013-C, 5.625% 2036 | |
| 2,000 | | |
| 2,291 | |
| Statewide Communities Dev. Auth., Rev. Bonds (Front Porch Communities and Services), Series 2017-A, 5.00% 2029 | |
| 405 | | |
| 497 | |
| Statewide Communities Dev. Auth., Rev. Bonds (Front Porch Communities and Services), Series 2017-A, 5.00% 2047 | |
| 1,500 | | |
| 1,742 | |
| American Funds Tax-Exempt Funds |
69 |
The Tax-Exempt Fund of California
| Bonds, notes & other debt instruments (continued) | |
Principal amount
(000) | | |
Value
(000) | |
| California (continued) | |
| | | |
| | |
| State issuers (continued) | |
| | | |
| | |
| Statewide Communities Dev. Auth., Rev. Bonds (Hebrew Home for Aged Disabled), Series 2016, 5.00% 2036 | |
$ | 3,500 | | |
$ | 4,175 | |
| Statewide Communities Dev. Auth., Rev. Bonds (Huntington Memorial Hospital), Series 2014, 5.00% 2044 | |
| 8,500 | | |
| 9,445 | |
| Statewide Communities Dev. Auth., Rev. Bonds (Huntington Memorial Hospital), Series 2018, 4.00% 2048 | |
| 500 | | |
| 531 | |
| Statewide Communities Dev. Auth., Rev. Bonds (John Muir Health), Series 2016-A, 4.00% 2046 | |
| 1,820 | | |
| 1,926 | |
| Statewide Communities Dev. Auth., Rev. Bonds (John Muir Health), Series 2016-A, 4.00% 2051 | |
| 2,750 | | |
| 2,898 | |
| Statewide Communities Dev. Auth., Rev. Bonds (Kaiser Permanente), Series 2012-A, 5.00% 2042 | |
| 6,500 | | |
| 7,097 | |
| Statewide Communities Dev. Auth., Rev. Bonds (Lancer Educational Student Housing Project), Series 2019-A, 5.00% 20342 | |
| 100 | | |
| 118 | |
| Statewide Communities Dev. Auth., Rev. Bonds (Lancer Educational Student Housing Project), Series 2019-A, 5.00% 20392 | |
| 105 | | |
| 121 | |
| Statewide Communities Dev. Auth., Rev. Bonds (Lancer Educational Student Housing Project), Series 2019-A, 5.00% 20512 | |
| 1,440 | | |
| 1,641 | |
| Statewide Communities Dev. Auth., Rev. Bonds (Lancer Plaza Project), Series 2013, 5.625% 2033 | |
| 1,350 | | |
| 1,528 | |
| Statewide Communities Dev. Auth., Rev. Bonds (Lancer Plaza Project), Series 2013, 5.875% 2043 | |
| 935 | | |
| 1,053 | |
| Statewide Communities Dev. Auth., Rev. Bonds (Loma Linda University Medical Center), Series 2014-A, 5.25% 2044 | |
| 4,155 | | |
| 4,601 | |
| Statewide Communities Dev. Auth., Rev. Bonds (Loma Linda University Medical Center), Series 2016-A, 5.25% 20562 | |
| 1,400 | | |
| 1,570 | |
| Statewide Communities Dev. Auth., Rev. Bonds (Loma Linda University Medical Center), Series 2018-A, 5.50% 20582 | |
| 1,000 | | |
| 1,164 | |
| Statewide Communities Dev. Auth., Rev. Bonds (Redlands Community Hospital), Series 2016, 5.00% 2029 | |
| 625 | | |
| 752 | |
| Statewide Communities Dev. Auth., Rev. Bonds (Redlands Community Hospital), Series 2016, 5.00% 2031 | |
| 1,135 | | |
| 1,351 | |
| Statewide Communities Dev. Auth., Rev. Bonds (Redlands Community Hospital), Series 2016, 5.00% 2032 | |
| 1,500 | | |
| 1,781 | |
| Statewide Communities Dev. Auth., Rev. Bonds (Sutter Health), Series 2011-A, 5.25% 2024 (preref. 2020) | |
| 1,000 | | |
| 1,044 | |
| Statewide Communities Dev. Auth., Rev. Bonds (Terraces at San Joaquin Gardens Project), Series 2012-A, 6.00% 2042 | |
| 1,750 | | |
| 1,902 | |
| Statewide Communities Dev. Auth., Rev. Bonds (Terraces at San Joaquin Gardens Project), Series 2012-A, 6.00% 2047 | |
| 2,000 | | |
| 2,170 | |
| Statewide Communities Dev. Auth., Rev. Bonds (Viamonte Senior Living 1 Project), Series 2018-B, 3.00% 2025 | |
| 1,500 | | |
| 1,537 | |
| Statewide Communities Dev. Auth., Rev. Bonds (Viamonte Senior Living 1 Project), Series 2018-B, 3.00% 2026 | |
| 4,000 | | |
| 4,089 | |
| Statewide Communities Dev. Auth., Rev. Ref. Bonds (California Baptist University), Series 2017-A, 5.00% 20322 | |
| 2,025 | | |
| 2,389 | |
| Statewide Communities Dev. Auth., Rev. Ref. Bonds (California Baptist University), Series 2017-A, 5.00% 20412 | |
| 11,920 | | |
| 13,716 | |
| Statewide Communities Dev. Auth., Rev. Ref. Bonds (Cottage Health System Obligated Group), Series 2010, 5.00% 2040 | |
| 2,000 | | |
| 2,075 | |
| Statewide Communities Dev. Auth., Rev. Ref. Bonds (Enloe Medical Center), Series 2015, 5.00% 2031 | |
| 1,000 | | |
| 1,196 | |
| Statewide Communities Dev. Auth., Rev. Ref. Bonds (Enloe Medical Center), Series 2015, 5.00% 2034 | |
| 500 | | |
| 592 | |
| Statewide Communities Dev. Auth., Rev. Ref. Bonds (Enloe Medical Center), Series 2015, 5.00% 2035 | |
| 5,050 | | |
| 5,960 | |
| Statewide Communities Dev. Auth., Rev. Ref. Bonds (Episcopal Communities and Services), Series 2012, 5.00% 2032 | |
| 700 | | |
| 761 | |
| Statewide Communities Dev. Auth., Rev. Ref. Bonds (Episcopal Communities and Services), Series 2012, 5.00% 2047 | |
| 2,100 | | |
| 2,251 | |
| Statewide Communities Dev. Auth., Rev. Ref. Bonds (Huntington Memorial Hospital), Series 2014-B, 5.00% 2031 | |
| 1,750 | | |
| 1,994 | |
| 70 |
American Funds Tax-Exempt Funds |
The Tax-Exempt Fund of California
| | |
Principal amount
(000) | | |
Value
(000) | |
| Statewide Communities Dev. Auth., Rev. Ref. Bonds (Lancer Educational Student Housing Project), Series 2016-A, 4.00% 20262 | |
$ | 3,385 | | |
$ | 3,618 | |
| Statewide Communities Dev. Auth., Rev. Ref. Bonds (Lancer Educational Student Housing Project), Series 2016-A, 5.00% 20362 | |
| 3,500 | | |
| 3,925 | |
| Statewide Communities Dev. Auth., Rev. Ref. Bonds (Lancer Educational Student Housing Project), Series 2016-A, 5.00% 20462 | |
| 2,250 | | |
| 2,486 | |
| Statewide Communities Dev. Auth., Rev. Ref. Bonds (Rady Children’s Hospital), Series 2016-B, 5.00% 2027 | |
| 640 | | |
| 817 | |
| Statewide Communities Dev. Auth., Rev. Ref. Bonds (Trinity Health Credit Group), Series 2011, 5.00% 2041 | |
| 1,500 | | |
| 1,616 | |
| Statewide Communities Dev. Auth., Senior Living Health Fac. Rev. Bonds (Los Angeles Jewish Home for the Aging - Fountainview at Gonda), Series 2014-A, 5.00% 2044 | |
| 1,000 | | |
| 1,122 | |
| Statewide Communities Dev. Auth., Senior Living Rev. Ref. Bonds (Southern California Presbyterian Homes), Series 2009, 7.25% 20412 | |
| 2,000 | | |
| 2,031 | |
| Statewide Communities Dev. Auth., Student Housing Rev. Bonds (Custodial Receipts), Series 2017, 4.305% 2032 | |
| 10,075 | | |
| 11,245 | |
| Statewide Communities Dev. Auth., Student Housing Rev. Ref. Bonds (CHF-Irvine, LLC - University of California, Irvine East Campus Apartments), Series 2016, 5.00% 2029 | |
| 1,000 | | |
| 1,198 | |
| Statewide Communities Dev. Auth., Student Housing Rev. Ref. Bonds (CHF-Irvine, LLC - University of California, Irvine East Campus Apartments), Series 2016, 5.00% 2030 | |
| 1,500 | | |
| 1,788 | |
| Statewide Communities Dev. Auth., Student Housing Rev. Ref. Bonds (CHF-Irvine, LLC - University of California, Irvine East Campus Apartments), Series 2016, 5.00% 2035 | |
| 1,250 | | |
| 1,464 | |
| Statewide Communities Dev. Auth., Student Housing Rev. Ref. Bonds (CHF-Irvine, LLC - University of California, Irvine East Campus Apartments, Phase I), Series 2011, 5.375% 2038 | |
| 1,260 | | |
| 1,348 | |
| Tobacco Securitization Auth. of Southern California, Tobacco Settlement Asset-Backed Rev. Ref. Bonds (San Diego County Tobacco Asset Securitization Corp.), Series 2006-A, 5.125% 2046 | |
| 7,800 | | |
| 7,820 | |
| Regents of the University of California, General Rev. Bonds, Series 2019-BB, 5.00% 2049 | |
| 1,000 | | |
| 1,232 | |
| Regents of the University of California, Limited Project Rev. Bonds, Series 2016-K, 5.00% 2034 | |
| 750 | | |
| 906 | |
| Regents of the University of California, Limited Project Rev. Bonds, Series 2016-K, 5.00% 2035 | |
| 3,750 | | |
| 4,511 | |
| Regents of the University of California, Limited Project Rev. Ref. Bonds, Series 2018-O, 5.00% 2048 | |
| 1,900 | | |
| 2,300 | |
| Regents of the University of California, Medical Center Pooled Rev. Bonds, Series 2016-L, 4.00% 2038 | |
| 1,000 | | |
| 1,099 | |
| Dept. of Veterans Affairs, Veterans G.O. Bonds, Series 2018-CR, 4.00% 2048 | |
| 17,915 | | |
| 19,666 | |
| Dept. of Veterans Affairs, Veterans G.O. Bonds, Series 2019-CS, 4.00% 2049 | |
| 16,000 | | |
| 17,733 | |
| Dept. of Veterans Affairs, Veterans G.O. Rev. Ref. Bonds, Series 2015-CM, AMT, 2.45% 2031 | |
| 3,590 | | |
| 3,596 | |
| Dept. of Veterans Affairs, Veterans G.O. Rev. Ref. Bonds, Series 2016-CN, 3.50% 2045 | |
| 7,360 | | |
| 7,710 | |
| Dept. of Water Resources, Water System Rev. Bonds (Central Valley Project), Series 2016-AW, 4.00% 2035 | |
| 20,840 | | |
| 23,893 | |
| Other securities | |
| | | |
| 129,420 | |
| | |
| | | |
| 936,754 | |
| | |
| | | |
| | |
| City, county & other issuers 56.41% | |
| | | |
| | |
| Assn. of Bay Area Governments, Fin. Auth. for Nonprofit Corps., Rev. Bonds (Casa de las Campanas, Inc.), Series 2010, 6.00% 2037 | |
| 2,200 | | |
| 2,313 | |
| Assn. of Bay Area Governments, Fin. Auth. for Nonprofit Corps., Rev. Bonds (Channing House), Series 2010, 6.00% 2030 (preref. 2020) | |
| 2,000 | | |
| 2,079 | |
| Assn. of Bay Area Governments, Fin. Auth. for Nonprofit Corps., Rev. Bonds (Channing House), Series 2010, 6.125% 2040 (preref. 2020) | |
| 3,000 | | |
| 3,121 | |
| Assn. of Bay Area Governments, Fin. Auth. for Nonprofit Corps., Rev. Ref. Bonds (Episcopal Senior Communities), Series 2011, 6.125% 2041 | |
| 3,000 | | |
| 3,226 | |
| Assn. of Bay Area Governments, Fin. Auth. for Nonprofit Corps., Rev. Ref. Bonds (Episcopal Senior Communities), Series 2012-A, 5.00% 2047 | |
| 4,000 | | |
| 4,256 | |
| Assn. of Bay Area Governments, Fin. Auth. for Nonprofit Corps., Rev. Ref. Bonds (Episcopal Senior Communities), Series 2012-B, 5.00% 2021 | |
| 515 | | |
| 552 | |
| Assn. of Bay Area Governments, Fin. Auth. for Nonprofit Corps., Rev. Ref. Bonds (Episcopal Senior Communities), Series 2012-B, 5.00% 2023 | |
| 80 | | |
| 88 | |
| Assn. of Bay Area Governments, Fin. Auth. for Nonprofit Corps., Rev. Ref. Bonds (Eskaton Properties Inc. Obligated Group), Series 2013, 5.00% 2021 | |
| 1,000 | | |
| 1,080 | |
| American Funds Tax-Exempt Funds |
71 |
The Tax-Exempt Fund of California
| Bonds, notes & other debt instruments (continued) | |
Principal amount
(000) | | |
Value
(000) | |
| California (continued) | |
| | | |
| | |
| City, county & other issuers (continued) | |
| | | |
| | |
| Assn. of Bay Area Governments, Fin. Auth. for Nonprofit Corps., Rev. Ref. Bonds (Sharp HealthCare), Series 2009-B, 6.25% 2039 (preref. 2019) | |
$ | 4,000 | | |
$ | 4,000 | |
| Assn. of Bay Area Governments, Fin. Auth. for Nonprofit Corps., Rev. Ref. Bonds (Sharp HealthCare), Series 2011-A, 6.00% 2030 | |
| 1,000 | | |
| 1,097 | |
| Assn. of Bay Area Governments, Fin. Auth. for Nonprofit Corps., Rev. Ref. Bonds (Sharp HealthCare), Series 2014-A, 5.00% 2043 | |
| 1,000 | | |
| 1,126 | |
| Assn. of Bay Area Governments, Fin. Auth. for Nonprofit Corps., Senior Living Rev. Bonds (Odd Fellows Home of California), Series 2012-A, 5.00% 2032 | |
| 5,000 | | |
| 5,591 | |
| Bay Area Toll Auth., San Francisco Bay Area Toll Bridge Rev. Bonds, Series 2006-C-1, (SIFMA Municipal Swap Index + 0.90%) 2.30% 2045 (put 2023)1 | |
| 1,400 | | |
| 1,420 | |
| Bay Area Toll Auth., San Francisco Bay Area Toll Bridge Rev. Bonds, Series 2008-B-1, (SIFMA Municipal Swap Index + 1.10%) 2.50% 2045 (put 2024)1 | |
| 7,900 | | |
| 8,115 | |
| Bay Area Toll Auth., San Francisco Bay Area Toll Bridge Rev. Bonds, Series 2014-G, (SIFMA Municipal Swap Index + 0.60%) 2.00% 2034 (put 2020)1 | |
| 825 | | |
| 826 | |
| Bay Area Toll Auth., San Francisco Bay Area Toll Bridge Rev. Bonds, Series 2014-H, (SIFMA Municipal Swap Index + 0.70%) 2.10% 2034 (put 2021)1 | |
| 4,000 | | |
| 4,016 | |
| Bay Area Toll Auth., San Francisco Bay Area Toll Bridge Rev. Bonds, Series 2017-D, (3-month USD-LIBOR x 0.70 + 0.55%) 2.182% 2045 (put 2021)1 | |
| 2,100 | | |
| 2,105 | |
| Bay Area Toll Auth., San Francisco Bay Area Toll Bridge Rev. Bonds, Series 2017-F-1, 5.00% 2056 | |
| 3,510 | | |
| 4,160 | |
| Bay Area Toll Auth., San Francisco Bay Area Toll Bridge Rev. Bonds, Series 2019-S-8, 5.00% 2056 | |
| 16,500 | | |
| 20,206 | |
| Bay Area Toll Auth., San Francisco Bay Area Toll Bridge Rev. Bonds, Series 2019-S-H, 5.00% 2044 | |
| 1,000 | | |
| 1,227 | |
| Bay Area Toll Auth., San Francisco Bay Area Toll Bridge Rev. Ref. Bonds, Series 2014-F-1, 5.00% 2054 | |
| 1,475 | | |
| 1,668 | |
| County of Contra Costa, Transportation Auth., Sales Tax Rev. Ref. Bonds, Series 2018-A, (1-month USD-LIBOR x 0.70 + 0.25%) 1.931% 2034 (put 2021)1 | |
| 11,675 | | |
| 11,686 | |
| City of Elk Grove, Fin. Auth., Special Tax Rev. Bonds, Series 2015, BAM insured, 5.00% 2032 | |
| 1,000 | | |
| 1,181 | |
| City of Elk Grove, Fin. Auth., Special Tax Rev. Bonds, Series 2015, BAM insured, 5.00% 2033 | |
| 1,000 | | |
| 1,178 | |
| City of Elk Grove, Fin. Auth., Special Tax Rev. Bonds, Series 2015, BAM insured, 5.00% 2034 | |
| 1,000 | | |
| 1,171 | |
| City of Elk Grove, Fin. Auth., Special Tax Rev. Bonds, Series 2015, BAM insured, 5.00% 2035 | |
| 1,000 | | |
| 1,170 | |
| City of Elk Grove, Fin. Auth., Special Tax Rev. Bonds, Series 2016, 4.00% 2020 | |
| 250 | | |
| 256 | |
| City of Elk Grove, Fin. Auth., Special Tax Rev. Bonds, Series 2016, 4.00% 2032 | |
| 2,500 | | |
| 2,695 | |
| City of Elk Grove, Fin. Auth., Special Tax Rev. Bonds, Series 2016, 5.00% 2041 | |
| 4,680 | | |
| 5,324 | |
| City of Elk Grove, Fin. Auth., Special Tax Rev. Bonds, Series 2016, 5.00% 2046 | |
| 8,065 | | |
| 9,142 | |
| City of Elk Grove, Fin. Auth., Special Tax Rev. Bonds, Series 2018, 5.00% 2033 | |
| 945 | | |
| 1,096 | |
| City of Elk Grove, Fin. Auth., Special Tax Rev. Bonds, Series 2018, 5.00% 2035 | |
| 1,150 | | |
| 1,326 | |
| City of Elk Grove, Fin. Auth., Special Tax Rev. Bonds, Series 2018, 5.00% 2043 | |
| 1,040 | | |
| 1,182 | |
| City of Elk Grove, Fin. Auth., Special Tax Rev. Bonds, Series 2018, 5.00% 2048 | |
| 2,500 | | |
| 2,827 | |
| Hayward Unified School Dist., G.O. Bonds, 2019 Election, Series 2019-A, BAM insured, 5.00% 2044 | |
| 8,000 | | |
| 9,662 | |
| City of Irvine, Community Facs. Dist. No. 2013-3 (Great Park), Improvement Area No. 1, Special Tax Bonds, Series 2014, 5.00% 2044 | |
| 2,705 | | |
| 2,974 | |
| City of Irvine, Community Facs. Dist. No. 2013-3 (Great Park), Improvement Area No. 1, Special Tax Bonds, Series 2014, 5.00% 2049 | |
| 1,000 | | |
| 1,095 | |
| City of Irvine, Community Facs. Dist. No. 2013-3 (Great Park), Improvement Area No. 4, Special Tax Bonds, Series 2016, 4.00% 2028 | |
| 825 | | |
| 897 | |
| City of Irvine, Community Facs. Dist. No. 2013-3 (Great Park), Improvement Area No. 4, Special Tax Bonds, Series 2016, 4.00% 2031 | |
| 400 | | |
| 430 | |
| City of Irvine, Community Facs. Dist. No. 2013-3 (Great Park), Improvement Area No. 4, Special Tax Bonds, Series 2016, 4.00% 2033 | |
| 1,615 | | |
| 1,731 | |
| City of Irvine, Community Facs. Dist. No. 2013-3 (Great Park), Improvement Area No. 8, Special Tax Bonds, Series 2018, 5.00% 2035 | |
| 550 | | |
| 637 | |
| City of Irvine, Community Facs. Dist. No. 2013-3 (Great Park), Improvement Area No. 8, Special Tax Bonds, Series 2018, 5.00% 2037 | |
| 650 | | |
| 750 | |
| City of Irvine, Community Facs. Dist. No. 2013-3 (Great Park), Improvement Area No. 8, Special Tax Bonds, Series 2018, 5.00% 2038 | |
| 1,000 | | |
| 1,151 | |
| City of Irvine, Community Facs. Dist. No. 2013-3 (Great Park), Improvement Area No. 8, Special Tax Bonds, Series 2018, 5.00% 2043 | |
| 2,670 | | |
| 3,054 | |
| City of Irvine, Community Facs. Dist. No. 2013-3 (Great Park), Improvement Area No. 8, Special Tax Bonds, Series 2018, 5.00% 2048 | |
| 5,250 | | |
| 5,981 | |
| 72 |
American Funds Tax-Exempt Funds |
The Tax-Exempt Fund of California
| | |
Principal amount
(000) | | |
Value
(000) | |
| City of Irvine, Community Facs. Dist. No. 2013-3 (Great Park), Improvement Area No. 8, Special Tax Bonds, Series 2018, Assured Guaranty Municipal insured, 5.00% 2051 | |
$ | 1,250 | | |
$ | 1,461 | |
| City of Irvine, Reassessment Dist. No. 12-1, Limited Obligation Improvement Bonds, Series 2012, 4.00% 2020 | |
| 1,000 | | |
| 1,032 | |
| City of Irvine, Reassessment Dist. No. 12-1, Limited Obligation Improvement Bonds, Series 2013, 5.00% 2024 | |
| 825 | | |
| 952 | |
| City of Irvine, Reassessment Dist. No. 12-1, Limited Obligation Improvement Bonds, Series 2013, 5.00% 2025 | |
| 710 | | |
| 816 | |
| City of Irvine, Reassessment Dist. No. 12-1, Limited Obligation Improvement Bonds, Series 2013, 5.00% 2028 | |
| 1,050 | | |
| 1,191 | |
| City of Irvine, Reassessment Dist. No. 12-1, Limited Obligation Improvement Bonds, Series 2015, 5.00% 2024 | |
| 2,250 | | |
| 2,684 | |
| City of Irvine, Reassessment Dist. No. 12-1, Limited Obligation Improvement Bonds, Series 2015, 5.00% 2029 | |
| 2,600 | | |
| 3,006 | |
| City of Irvine, Reassessment Dist. No. 12-1, Limited Obligation Improvement Bonds, Series 2015, 5.00% 2030 | |
| 1,700 | | |
| 1,955 | |
| City of Irvine, Reassessment Dist. No. 12-1, Limited Obligation Improvement Bonds, Series 2015, 5.00% 2031 | |
| 1,500 | | |
| 1,717 | |
| City of Irvine, Reassessment Dist. No. 15-2, Limited Obligation Improvement Bonds, Series 2015, 5.00% 2032 | |
| 800 | | |
| 913 | |
| City of Irvine, Reassessment Dist. No. 15-2, Limited Obligation Improvement Bonds, Series 2015, 5.00% 2042 | |
| 1,000 | | |
| 1,119 | |
| City of Irvine, Reassessment Dist. No. 19-1, Limited Obligation Improvement Bonds, Series 2019, 4.00% 2036 | |
| 1,000 | | |
| 1,148 | |
| City of Irvine, Reassessment Dist. No. 19-1, Limited Obligation Improvement Bonds, Series 2019, 4.00% 2037 | |
| 1,285 | | |
| 1,466 | |
| City of Irvine, Reassessment Dist. No. 19-1, Limited Obligation Improvement Bonds, Series 2019, 5.00% 2026 | |
| 330 | | |
| 412 | |
| City of Irvine, Reassessment Dist. No. 19-1, Limited Obligation Improvement Bonds, Series 2019, 5.00% 2027 | |
| 375 | | |
| 477 | |
| City of Irvine, Reassessment Dist. No. 19-1, Limited Obligation Improvement Bonds, Series 2019, 5.00% 2028 | |
| 525 | | |
| 680 | |
| City of Irvine, Reassessment Dist. No. 19-1, Limited Obligation Improvement Bonds, Series 2019, 5.00% 2029 | |
| 500 | | |
| 657 | |
| City of Irvine, Reassessment Dist. No. 19-1, Limited Obligation Improvement Bonds, Series 2019, 5.00% 2030 | |
| 350 | | |
| 457 | |
| City of Irvine, Reassessment Dist. No. 19-1, Limited Obligation Improvement Bonds, Series 2019, 5.00% 2031 | |
| 330 | | |
| 428 | |
| City of Irvine, Reassessment Dist. No. 19-1, Limited Obligation Improvement Bonds, Series 2019, 5.00% 2032 | |
| 340 | | |
| 437 | |
| City of Irvine, Reassessment Dist. No. 19-1, Limited Obligation Improvement Bonds, Series 2019, 5.00% 2034 | |
| 770 | | |
| 977 | |
| City of Irvine, Reassessment Dist. No. 19-1, Limited Obligation Improvement Bonds, Series 2019, 5.00% 2044 | |
| 1,000 | | |
| 1,228 | |
| City of Los Angeles, Dept. of Airports, Los Angeles International Airport, Rev. Bonds, Series 2010-B, 5.00% 2035 | |
| 1,000 | | |
| 1,031 | |
| City of Los Angeles, Dept. of Airports, Los Angeles International Airport, Rev. Bonds, Series 2015-A, AMT, 5.00% 2027 | |
| 1,250 | | |
| 1,485 | |
| City of Los Angeles, Dept. of Airports, Los Angeles International Airport, Rev. Bonds, Series 2015-A, AMT, 5.00% 2029 | |
| 1,560 | | |
| 1,840 | |
| City of Los Angeles, Dept. of Airports, Los Angeles International Airport, Rev. Bonds, Series 2016-A, AMT, 4.00% 2034 | |
| 1,000 | | |
| 1,118 | |
| City of Los Angeles, Dept. of Airports, Los Angeles International Airport, Rev. Bonds, Series 2016-A, AMT, 5.00% 2035 | |
| 1,000 | | |
| 1,178 | |
| City of Los Angeles, Dept. of Airports, Los Angeles International Airport, Rev. Bonds, Series 2016-A, AMT, 5.00% 2042 | |
| 1,000 | | |
| 1,160 | |
| City of Los Angeles, Dept. of Airports, Los Angeles International Airport, Rev. Bonds, Series 2016-B, AMT, 5.00% 2029 | |
| 1,450 | | |
| 1,750 | |
| City of Los Angeles, Dept. of Airports, Los Angeles International Airport, Rev. Bonds, Series 2016-B, AMT, 5.00% 2031 | |
| 2,395 | | |
| 2,857 | |
| City of Los Angeles, Dept. of Airports, Los Angeles International Airport, Rev. Bonds, Series 2016-B, AMT, 5.00% 2033 | |
| 500 | | |
| 593 | |
| City of Los Angeles, Dept. of Airports, Los Angeles International Airport, Rev. Bonds, Series 2017-A, AMT, 5.00% 2030 | |
| 1,000 | | |
| 1,226 | |
| American Funds Tax-Exempt Funds |
73 |
The Tax-Exempt Fund of California
| Bonds, notes & other debt instruments (continued) | |
Principal amount
(000) | | |
Value
(000) | |
| California (continued) | |
| | | |
| | |
| City, county & other issuers (continued) | |
| | | |
| | |
| City of Los Angeles, Dept. of Airports, Los Angeles International Airport, Rev. Bonds, Series 2017-A, AMT, 5.00% 2032 | |
$ | 1,000 | | |
$ | 1,211 | |
| City of Los Angeles, Dept. of Airports, Los Angeles International Airport, Rev. Bonds, Series 2017-A, AMT, 5.00% 2033 | |
| 1,000 | | |
| 1,208 | |
| City of Los Angeles, Dept. of Airports, Los Angeles International Airport, Rev. Bonds, Series 2017-A, AMT, 5.00% 2034 | |
| 1,250 | | |
| 1,504 | |
| City of Los Angeles, Dept. of Airports, Los Angeles International Airport, Rev. Bonds, Series 2017-A, AMT, 5.00% 2035 | |
| 1,000 | | |
| 1,199 | |
| City of Los Angeles, Dept. of Airports, Los Angeles International Airport, Rev. Bonds, Series 2017-A, AMT, 5.00% 2036 | |
| 1,400 | | |
| 1,674 | |
| City of Los Angeles, Dept. of Airports, Los Angeles International Airport, Rev. Bonds, Series 2017-A, AMT, 5.00% 2037 | |
| 1,260 | | |
| 1,502 | |
| City of Los Angeles, Dept. of Airports, Los Angeles International Airport, Rev. Bonds, Series 2018-A, AMT, 5.00% 2033 | |
| 1,255 | | |
| 1,542 | |
| City of Los Angeles, Dept. of Airports, Los Angeles International Airport, Rev. Bonds, Series 2018-A, AMT, 5.00% 2036 | |
| 1,345 | | |
| 1,634 | |
| City of Los Angeles, Dept. of Airports, Los Angeles International Airport, Rev. Bonds, Series 2018-A, AMT, 5.00% 2037 | |
| 1,450 | | |
| 1,755 | |
| City of Los Angeles, Dept. of Airports, Los Angeles International Airport, Rev. Bonds, Series 2018-A, AMT, 5.00% 2044 | |
| 2,880 | | |
| 3,436 | |
| City of Los Angeles, Dept. of Airports, Los Angeles International Airport, Rev. Bonds, Series 2018-B, AMT, 5.00% 2032 | |
| 5,000 | | |
| 6,176 | |
| City of Los Angeles, Dept. of Airports, Los Angeles International Airport, Rev. Bonds, Series 2018-C, AMT, 5.00% 2032 | |
| 3,450 | | |
| 4,222 | |
| City of Los Angeles, Dept. of Airports, Los Angeles International Airport, Rev. Bonds, Series 2018-D, AMT, 5.00% 2023 | |
| 2,000 | | |
| 2,277 | |
| City of Los Angeles, Dept. of Airports, Los Angeles International Airport, Rev. Bonds, Series 2018-D, AMT, 5.00% 2033 | |
| 5,880 | | |
| 7,361 | |
| City of Los Angeles, Dept. of Airports, Los Angeles International Airport, Rev. Bonds, Series 2019-A, AMT, 5.00% 2031 | |
| 2,345 | | |
| 2,965 | |
| City of Los Angeles, Dept. of Airports, Los Angeles International Airport, Rev. Ref. Bonds, Series 2010-A, 5.00% 2029 | |
| 2,000 | | |
| 2,062 | |
| City of Los Angeles, Dept. of Water and Power, Power System Rev. Bonds, Series 2019-A, 5.00% 2045 | |
| 2,000 | | |
| 2,453 | |
| City of Los Angeles, Dept. of Water and Power, Power System Rev. Bonds, Series 2019-A, 5.00% 2049 | |
| 5,000 | | |
| 6,100 | |
| Los Angeles Unified School Dist., G.O. Bonds (Dedicated Unlimited Ad Valorem Property Tax Bonds), 2005 Election, Series 2018-M-1, 5.25% 2042 | |
| 6,115 | | |
| 7,540 | |
| Oakland Unified School Dist., G.O. Bonds, 2006 Election, Series 2016-A, 5.00% 2026 | |
| 6,250 | | |
| 7,715 | |
| Oakland Unified School Dist., G.O. Bonds, 2012 Election, Series 2013, 6.625% 2038 (preref. 2021) | |
| 1,200 | | |
| 1,335 | |
| Oakland Unified School Dist., G.O. Bonds, 2012 Election, Series 2015-A, 5.00% 2030 | |
| 1,250 | | |
| 1,475 | |
| Oakland Unified School Dist., G.O. Bonds, 2012 Election, Series 2015-A, 5.00% 2031 | |
| 1,500 | | |
| 1,758 | |
| Oakland Unified School Dist., G.O. Bonds, 2012 Election, Series 2015-A, 5.00% 2040 | |
| 5,550 | | |
| 6,333 | |
| Oakland Unified School Dist., G.O. Rev. Ref. Bonds (Measure J), Series 2017-C, 5.00% 2031 | |
| 2,015 | | |
| 2,448 | |
| Oakland Unified School Dist., G.O. Rev. Ref. Bonds (Measure J), Series 2017-C, 5.00% 2035 | |
| 3,245 | | |
| 3,874 | |
| Oakland Unified School Dist., G.O. Rev. Ref. Bonds (Measure J), Series 2017-C, 5.00% 2036 | |
| 2,000 | | |
| 2,381 | |
| Oakland Unified School Dist., G.O. Rev. Ref. Bonds, Series 2015, Assured Guaranty Municipal insured, 5.00% 2024 | |
| 2,225 | | |
| 2,629 | |
| Oakland Unified School Dist., G.O. Rev. Ref. Bonds, Series 2016, 5.00% 2024 | |
| 2,485 | | |
| 2,930 | |
| Oakland Unified School Dist., G.O. Rev. Ref. Bonds, Series 2016, 5.00% 2027 | |
| 2,000 | | |
| 2,433 | |
| Oakland Unified School Dist., G.O. Rev. Ref. Bonds, Series 2016, 5.00% 2031 | |
| 2,145 | | |
| 2,556 | |
| Oakland Unified School Dist., G.O. Rev. Ref. Bonds, Series 2017-A, 5.00% 2022 | |
| 4,025 | | |
| 4,471 | |
| Oakland Unified School Dist., G.O. Rev. Ref. Bonds, Series 2017-A, 5.00% 2025 | |
| 1,800 | | |
| 2,176 | |
| City of Oroville, Hospital Rev. Bonds (Oroville Hospital), Series 2019, 5.25% 2049 | |
| 7,210 | | |
| 8,429 | |
| Palomar Health, G.O. Rev. Ref. Bonds, Series 2016, 5.00% 2025 | |
| 1,000 | | |
| 1,179 | |
| Palomar Health, G.O. Rev. Ref. Bonds, Series 2016, 5.00% 2039 | |
| 1,320 | | |
| 1,495 | |
| Palomar Health, G.O. Rev. Ref. Bonds, Series 2016-A, 5.00% 2034 | |
| 970 | | |
| 1,141 | |
| Palomar Health, G.O. Rev. Ref. Bonds, Series 2016-B, 4.00% 2030 | |
| 1,000 | | |
| 1,123 | |
| Palomar Health, G.O. Rev. Ref. Bonds, Series 2016-B, 4.00% 2031 | |
| 1,000 | | |
| 1,117 | |
| Palomar Health, G.O. Rev. Ref. Bonds, Series 2017, Assured Guaranty Municipal insured, 5.00% 2042 | |
| 3,375 | | |
| 3,800 | |
| Palomar Pomerado Health, Certs. of Part., Series 2009, 6.75% 2039 (preref. 2019) | |
| 3,500 | | |
| 3,549 | |
| 74 |
American Funds Tax-Exempt Funds |
The Tax-Exempt Fund of California
| | |
Principal amount
(000) | | |
Value
(000) | |
| Palomar Pomerado Health, Certs. of Part., Series 2010, 6.00% 2030 (preref. 2020) | |
$ | 1,500 | | |
$ | 1,592 | |
| Palomar Pomerado Health, Certs. of Part., Series 2010, 6.00% 2041 (preref. 2020) | |
| 2,585 | | |
| 2,744 | |
| Palomar Pomerado Health, G.O. Bonds, Capital Appreciation Bonds, 2004 Election, Series 2009-A, Assured Guaranty insured, 0% 2028 | |
| 3,000 | | |
| 2,451 | |
| Palomar Pomerado Health, G.O. Bonds, Capital Appreciation Bonds, 2004 Election, Series 2009-A, Assured Guaranty insured, 0% 2029 | |
| 9,350 | | |
| 7,380 | |
| Palomar Pomerado Health, G.O. Bonds, Capital Appreciation Bonds, 2004 Election, Series 2009-A, Assured Guaranty insured, 0% 2031 | |
| 3,000 | | |
| 2,185 | |
| Peninsula Corridor Joint Powers Board, Farebox Rev. Bonds, Series 2019-A, 5.00% 2049 | |
| 9,035 | | |
| 10,514 | |
| County of Sacramento, Sanitation Dist. Fncg. Auth., Rev. Ref. Bonds (Sacramento Regional County Sanitation Dist.), Series 2007-B, FGIC-National insured, (3-month USD-LIBOR + 0.53%) 2.218% 20351 | |
| 13,500 | | |
| 13,392 | |
| City of San Buenaventura, Rev. Bonds (Community Memorial Health System), Series 2011, 7.50% 2041 | |
| 10,825 | | |
| 12,069 | |
| City and County of San Francisco, Airport Commission, San Francisco International Airport, Second Series Rev. Bonds, Series 2009-A, 4.90% 2029 | |
| 4,560 | | |
| 4,608 | |
| City and County of San Francisco, Airport Commission, San Francisco International Airport, Second Series Rev. Bonds, Series 2016-B, AMT, 5.00% 2046 | |
| 4,000 | | |
| 4,589 | |
| City and County of San Francisco, Airport Commission, San Francisco International Airport, Second Series Rev. Bonds, Series 2019-A, AMT, 5.00% 2049 | |
| 10,000 | | |
| 11,937 | |
| City and County of San Francisco, Airport Commission, San Francisco International Airport, Second Series Rev. Ref. Bonds, Series 2010-F, 5.00% 2040 | |
| 3,000 | | |
| 3,081 | |
| City and County of San Francisco, Airport Commission, San Francisco International Airport, Second Series Rev. Ref. Bonds, Series 2011-F, AMT, 5.00% 2028 | |
| 2,630 | | |
| 2,795 | |
| City and County of San Francisco, Airport Commission, San Francisco International Airport, Second Series Rev. Ref. Bonds, Series 2012-A, AMT, 5.00% 2028 | |
| 1,000 | | |
| 1,098 | |
| City and County of San Francisco, Airport Commission, San Francisco International Airport, Second Series Rev. Ref. Bonds, Series 2012-A, AMT, 5.00% 2030 | |
| 1,000 | | |
| 1,094 | |
| City and County of San Francisco, Airport Commission, San Francisco International Airport, Second Series Rev. Ref. Bonds, Series 2016-A, 5.00% 2029 | |
| 1,375 | | |
| 1,696 | |
| City and County of San Francisco, Airport Commission, San Francisco International Airport, Second Series Rev. Ref. Bonds, Series 2017-A, AMT, 5.00% 2042 | |
| 2,000 | | |
| 2,342 | |
| City and County of San Francisco, Airport Commission, San Francisco International Airport, Second Series Rev. Ref. Bonds, Series 2017-A, AMT, 5.00% 2047 | |
| 3,000 | | |
| 3,490 | |
| City and County of San Francisco, Airport Commission, San Francisco International Airport, Second Series Rev. Ref. Bonds, Series 2017-D, AMT, 5.00% 2027 | |
| 1,000 | | |
| 1,249 | |
| City and County of San Francisco, Airport Commission, San Francisco International Airport, Special Facs. Lease Rev. Bonds (SFO Fuel Company LLC), Series 2019-A, AMT, 5.00% 2027 | |
| 2,000 | | |
| 2,451 | |
| City of San Jose, Airport Rev. Ref. Bonds, Series 2011-A-1, AMT, 5.50% 2030 | |
| 8,000 | | |
| 8,525 | |
| City of San Jose, Airport Rev. Ref. Bonds, Series 2011-A-2, 5.25% 2034 | |
| 4,900 | | |
| 5,203 | |
| City of San Jose, Airport Rev. Ref. Bonds, Series 2017-A, AMT, 5.00% 2020 | |
| 2,080 | | |
| 2,126 | |
| City of San Jose, Airport Rev. Ref. Bonds, Series 2017-A, AMT, 5.00% 2035 | |
| 2,000 | | |
| 2,382 | |
| City of San Jose, Airport Rev. Ref. Bonds, Series 2017-A, AMT, 5.00% 2037 | |
| 1,000 | | |
| 1,184 | |
| City of San Jose, Airport Rev. Ref. Bonds, Series 2017-A, AMT, 5.00% 2041 | |
| 1,500 | | |
| 1,758 | |
| City of San Jose, Airport Rev. Ref. Bonds, Series 2017-A, AMT, 5.00% 2047 | |
| 10,000 | | |
| 11,628 | |
| Stockton Unified School Dist., G.O. Rev. Ref. Bonds, Series 2016, 5.00% 2031 | |
| 7,800 | | |
| 9,346 | |
| City of Whittier, Health Fac. Rev. Bonds (PIH Health), Series 2014, 5.00% 2044 | |
| 10,000 | | |
| 11,071 | |
| Other securities | |
| | | |
| 1,003,183 | |
| | |
| | | |
| 1,453,650 | |
| | |
| | | |
| | |
| Guam 0.34% | |
| | | |
| | |
| Other securities | |
| | | |
| 8,722 | |
| | |
| | | |
| | |
| Puerto Rico 0.50% | |
| | | |
| | |
| Industrial, Tourist, Educational, Medical and Environmental Control Facs. Fncg. Auth., Hospital Rev. and Rev. Ref. Bonds (Hospital Auxilio Mutuo Obligated Group Project), Series 2011-A, 6.00% 2033 | |
| 7,900 | | |
| 8,292 | |
| Other securities | |
| | | |
| 4,552 | |
| | |
| | | |
| 12,844 | |
| American Funds Tax-Exempt Funds |
75 |
The Tax-Exempt Fund of California
| Bonds, notes & other debt instruments (continued) | |
Principal amount
(000) | | |
Value
(000) | |
| United States 0.74% | |
| | | |
| | |
| Freddie Mac, Multi Family Mortgage Bonds, Series 2019-ML-05, Class A-CA, 3.35% 2033 | |
$ | 15,470 | | |
$ | 16,881 | |
| Other securities | |
| | | |
| 2,115 | |
| | |
| | | |
| 18,996 | |
| | |
| | | |
| | |
| Total bonds, notes & other debt instruments
(cost: $2,301,503,000) | |
| | | |
| 2,430,966 | |
| | |
| | | |
| | |
| Short-term securities 6.06% | |
| | | |
| | |
| Fin. Auth., Recovery Zone Fac. Bonds (Chevron U.S.A. Inc. Project), Series 2010-A, 1.44% 20351 | |
| 8,400 | | |
| 8,400 | |
| IAM Commercial Paper, Series 2019, 1.34% 8/6/2019 | |
| 2,000 | | |
| 2,000 | |
| City of Los Angeles, Dept. of Water and Power, Power System Demand Rev. Bonds, Series 2002-A-1, 1.39% 20351 | |
| 13,000 | | |
| 13,000 | |
| City of Los Angeles, Dept. of Water and Power, Power System Demand Rev. Bonds, Series 2002-A-2, 1.39% 20351 | |
| 17,020 | | |
| 17,020 | |
| City of Los Angeles, Dept. of Water and Power, Power System Demand Rev. Bonds, Series 2002-A-3, 1.41% 20351 | |
| 3,000 | | |
| 3,000 | |
| City of Los Angeles, Dept. of Water and Power, Power System Demand Rev. Bonds, Series 2002-A-6, 1.46% 20351 | |
| 4,000 | | |
| 4,000 | |
| County of Los Angeles, IAM Commercial Paper, Series 2019, 1.31% 9/5/2019 | |
| 8,000 | | |
| 8,000 | |
| County of Los Angeles, IAM Commercial Paper, Series 2019, 1.40% 8/22/2019 | |
| 2,200 | | |
| 2,200 | |
| County of Los Angeles, Tax and Rev. Anticipation Notes, Series 2019, 5.00% 6/30/2020 | |
| 18,600 | | |
| 19,268 | |
| Municipal Fin. Auth., Exempt Facs. Rev. Ref. Bonds (ExxonMobil Project), Series 2007, AMT, 1.48% 20291 | |
| 2,100 | | |
| 2,100 | |
| City of San Diego, IAM Commercial Paper, Series 2019, 1.68% 8/6/2019 | |
| 4,915 | | |
| 4,915 | |
| City of San Diego, IAM Commercial Paper, Series 2019, 1.68% 8/6/2019 | |
| 4,000 | | |
| 4,000 | |
| Statewide Communities Dev. Auth., Pollution Control Rev. Ref. Bonds (Chevron U.S.A. Inc. Project), Series 2002, 1.44% 20241 | |
| 11,685 | | |
| 11,685 | |
| University of California, IAM Commercial Paper, Series 2019-A-2, 1.17% 10/8/2019 | |
| 4,000 | | |
| 4,000 | |
| University of California, IAM Commercial Paper, Series 2019-A-2, 1.23% 10/8/2019 | |
| 12,000 | | |
| 12,000 | |
| University of California, IAM Commercial Paper, Series 2019-A-2, 1.40% 10/24/2019 | |
| 2,000 | | |
| 2,000 | |
| University of California, IAM Commercial Paper, Series 2019-A-2, 1.40% 10/25/2019 | |
| 2,250 | | |
| 2,250 | |
| Dept. of Water Resources, IAM Commercial Paper, Series 2019, 1.35% 9/6/2019 | |
| 15,000 | | |
| 15,000 | |
| Other securities | |
| | | |
| 21,476 | |
| | |
| | | |
| | |
| Total short-term securities (cost: $156,251,000) | |
| | | |
| 156,314 | |
| Total investment securities 100.40% (cost: $2,457,754,000) | |
| | | |
| 2,587,280 | |
| Other assets less liabilities (0.40)% | |
| | | |
| (10,399 | ) |
| | |
| | | |
| | |
| Net assets 100.00% | |
| | | |
$ | 2,576,881 | |
This summary investment portfolio is designed to streamline the
report and help investors better focus on the fund’s principal holdings. See the inside back cover for details on how to
obtain a complete schedule of portfolio holdings.
“Other securities” includes all issues that are not
disclosed separately in the summary investment portfolio.
| 76 |
American Funds Tax-Exempt Funds |
The Tax-Exempt Fund of California
Futures contracts
| | |
| |
| |
| |
| | |
| | |
Unrealized | |
| | |
| |
| |
| |
| | |
| | |
(depreciation) | |
| | |
| |
| |
| |
Notional | | |
Value at | | |
appreciation | |
| | |
| |
Number of | |
| |
amount | 3 | |
7/31/2019 | 4 | |
at 7/31/2019 | |
| Contracts | |
Type | |
contracts | |
Expiration | |
(000) | | |
(000) | | |
(000) | |
| 2 Year U.S. Treasury Note Futures | |
Long | |
2,040 | |
October 2019 | |
|
$ | 408,000 | | |
|
$ | 437,389 | | |
|
$ | (1,228 | ) |
| 5 Year U.S. Treasury Note Futures | |
Short | |
569 | |
October 2019 | |
|
| (56,900 | ) | |
|
| (66,889 | ) | |
|
| 59 | |
| 10 Year Ultra U.S. Treasury Note Futures | |
Short | |
100 | |
September 2019 | |
|
| (10,000 | ) | |
|
| (13,784 | ) | |
|
| 3 | |
| | |
| |
| |
| |
|
| | | |
|
| | | |
|
$ | (1,166 | ) |
| 1 |
Coupon rate may change periodically. For short-term securities, the date of the next scheduled coupon rate change is considered to be the maturity date. |
| 2 |
Acquired in a transaction exempt from registration under Rule 144A of the Securities Act of 1933. May be resold in the U.S. in transactions exempt from registration, normally to qualified institutional buyers. The total value of all such securities, including those in “Other securities,” was $97,751,000, which represented 3.79% of the net assets of the fund. |
| 3 |
Notional amount is calculated based on the number of contracts and notional contract size. |
| 4 |
Value is calculated based on the notional amount and current market price. |
Key to abbreviations and symbol
Agcy. = Agency
AMT = Alternative Minimum Tax
Auth. = Authority
Certs. of Part. = Certificates of Participation
Dept. = Department
Dev. = Development
Dist. = District
Econ. = Economic
Fac. = Facility
Facs. = Facilities
Fin. = Finance
Fncg. = Financing
G.O. = General Obligation
LIBOR = London Interbank Offered Rate
LOC = Letter of Credit
Preref. = Prerefunded
Redev. = Redevelopment
Ref. = Refunding
Rev. = Revenue
SIFMA = Securities Industry and Financial Markets Association
USD/$ = U.S. dollars
See notes to financial statements.
| American Funds Tax-Exempt Funds |
77 |
American Funds Tax-Exempt Fund of New York
Summary investment portfolio July 31, 2019
| Bonds, notes & other debt instruments
93.38% | |
Principal amount
(000) | | |
Value
(000) | |
| New York 91.22% | |
| | | |
| | |
| State issuers 46.34% | |
| | | |
| | |
| Convention Center Dev. Corp., Subordinated Lien Rev. Bonds (Hotel Unit Fee Secured), Capital Appreciation Bonds, Series 2016-B, 0% 2048 | |
$ | 3,540 | | |
$ | 1,295 | |
| Dormitory Auth., Lease Rev. Bonds (State University of New York Dormitory Facs.), Series 2010-A, 5.00% 2035 | |
| 1,000 | | |
| 1,033 | |
| Dormitory Auth., Rev. Bonds (Catholic Health System Obligated Group), Series 2019-A, 4.00% 2037 | |
| 1,000 | | |
| 1,102 | |
| Dormitory Auth., Rev. Bonds (Culinary Institute of America), Series 2013, 5.50% 2033 | |
| 500 | | |
| 568 | |
| Dormitory Auth., Rev. Bonds (Fordham University), Series 2011-A, 5.50% 2036 (preref. 2021) | |
| 1,000 | | |
| 1,087 | |
| Dormitory Auth., Rev. Bonds (Fordham University), Series 2017, 4.00% 2034 | |
| 885 | | |
| 994 | |
| Dormitory Auth., Rev. Bonds (Icahn School of Medicine at Mount Sinai), Series 2015-A, 5.00% 2031 | |
| 500 | | |
| 586 | |
| Dormitory Auth., Rev. Bonds (Icahn School of Medicine at Mount Sinai), Series 2015-A, 5.00% 2035 | |
| 1,000 | | |
| 1,157 | |
| Dormitory Auth., Rev. Bonds (Icahn School of Medicine at Mount Sinai), Series 2015-A, 5.00% 2040 | |
| 250 | | |
| 285 | |
| Dormitory Auth., Rev. Bonds (Memorial Sloan-Kettering Cancer Center), Series 2017-1, 5.00% 2027 | |
| 750 | | |
| 962 | |
| Dormitory Auth., Rev. Bonds (Montefiore Obligated Group), Series 2018-A, 5.00% 2031 | |
| 1,000 | | |
| 1,229 | |
| Dormitory Auth., Rev. Bonds (New School), Series 2015-A, 5.00% 2032 | |
| 1,000 | | |
| 1,174 | |
| Dormitory Auth., Rev. Bonds (New School), Series 2016-A, 5.00% 2035 | |
| 500 | | |
| 595 | |
| Dormitory Auth., Rev. Bonds (New York University), Series 2018-A, 5.00% 2032 | |
| 500 | | |
| 637 | |
| Dormitory Auth., Rev. Bonds (New York University), Series 2019-A, 5.00% 2049 | |
| 1,500 | | |
| 1,841 | |
| Dormitory Auth., Rev. Bonds (North Shore-Long Island Jewish Obligated Group), Series 2011-A, 5.00% 2032 (preref. 2021) | |
| 1,500 | | |
| 1,605 | |
| Dormitory Auth., Rev. Bonds (NYU Hospitals Center), Series 2011-A, 6.00% 2040 (preref. 2020) | |
| 1,000 | | |
| 1,045 | |
| Dormitory Auth., Rev. Bonds (NYU Hospitals Center), Series 2014, 5.00% 2022 | |
| 200 | | |
| 222 | |
| Dormitory Auth., Rev. Bonds (NYU Hospitals Center), Series 2014, 5.00% 2034 | |
| 1,000 | | |
| 1,143 | |
| Dormitory Auth., Rev. Bonds (NYU Hospitals Center), Series 2016-A, 5.00% 2033 | |
| 400 | | |
| 475 | |
| Dormitory Auth., Rev. Bonds (Orange Regional Medical Center Obligated Group), Series 2015, 5.00% 20321 | |
| 600 | | |
| 685 | |
| Dormitory Auth., Rev. Bonds (Orange Regional Medical Center Obligated Group), Series 2015, 5.00% 20401 | |
| 1,000 | | |
| 1,119 | |
| Dormitory Auth., Rev. Bonds (Orange Regional Medical Center Obligated Group), Series 2017, 5.00% 20311 | |
| 1,000 | | |
| 1,183 | |
| Dormitory Auth., Rev. Bonds (Orange Regional Medical Center Obligated Group), Series 2017, 5.00% 20351 | |
| 1,000 | | |
| 1,165 | |
| Dormitory Auth., Rev. Bonds (Skidmore College), Series 2011-A, 5.50% 2041 | |
| 1,110 | | |
| 1,193 | |
| Dormitory Auth., Rev. Bonds (State University of New York Dormitory Facs.), Series 2017-A, 5.00% 2030 | |
| 750 | | |
| 935 | |
| Dormitory Auth., Rev. Bonds (State University of New York Dormitory Facs.), Series 2017-A, 5.00% 2032 | |
| 500 | | |
| 617 | |
| Dormitory Auth., Rev. Bonds (Touro College and University System Obligated Group), Series 2014-A, 5.50% 2039 | |
| 1,000 | | |
| 1,122 | |
| Dormitory Auth., Rev. Bonds (Touro College and University System Obligated Group), Series 2017, 5.00% 2038 | |
| 500 | | |
| 573 | |
| Dormitory Auth., Rev. Ref. Bonds (Mount Sinai School of Medicine of New York University), Series 2010-A, 5.00% 2021 | |
| 1,000 | | |
| 1,033 | |
| Dormitory Auth., School Dist. Rev. Bond Fncg. Program Rev. Bonds, Series 2011-A, 5.00% 2024 | |
| 25 | | |
| 27 | |
| Dormitory Auth., School Dist. Rev. Bond Fncg. Program Rev. Bonds, Series 2011-A, 5.00% 2024 (preref. 2021) | |
| 475 | | |
| 516 | |
| Dormitory Auth., School Dist. Rev. Bond Fncg. Program Rev. Bonds, Series 2013-E, Assured Guaranty Municipal insured, 5.00% 2022 | |
| 1,000 | | |
| 1,125 | |
| Dormitory Auth., State Personal Income Tax Rev. Bonds (Education), Series 2014-E, 5.00% 2032 | |
| 750 | | |
| 880 | |
| Dormitory Auth., State Personal Income Tax Rev. Bonds (General Purpose), Series 2015-E, 5.00% 2020 | |
| 35 | | |
| 36 | |
| Dormitory Auth., State Personal Income Tax Rev. Bonds (General Purpose), Series 2017-B, 5.00% 2041 | |
| 750 | | |
| 897 | |
| Dormitory Auth., State Personal Income Tax Rev. Bonds (General Purpose), Series 2017-B, 5.00% 2042 | |
| 1,130 | | |
| 1,350 | |
| 78 |
American Funds Tax-Exempt Funds |
American Funds Tax-Exempt Fund of New York
| | |
Principal amount
(000) | | |
Value
(000) | |
| Dormitory Auth., State Personal Income Tax Rev. Bonds (General Purpose), Series 2018-A, 5.25% 2037 | |
$ | 1,000 | | |
$ | 1,263 | |
| Dormitory Auth., State Personal Income Tax Rev. Bonds (General Purpose), Series 2019-A, 5.00% 2028 | |
| 1,000 | | |
| 1,278 | |
| Dormitory Auth., State Personal Income Tax Rev. Bonds (General Purpose), Series 2019-A, 5.00% 2047 | |
| 1,500 | | |
| 1,822 | |
| Dormitory Auth., State Sales Tax Rev. Bonds, Series 2017-B, 5.00% 2033 | |
| 1,000 | | |
| 1,228 | |
| Dormitory Auth., State Sales Tax Rev. Bonds, Series 2018-A, 5.00% 2036 | |
| 1,000 | | |
| 1,230 | |
| Dormitory Auth., State Sales Tax Rev. Bonds, Series 2018-A, 5.00% 2039 | |
| 1,000 | | |
| 1,215 | |
| Dormitory Auth., State Sales Tax Rev. Bonds, Series 2018-E, 5.00% 2048 | |
| 1,500 | | |
| 1,809 | |
| Environmental Facs. Corp., Rev. Green Bonds (Revolving Funds), Series 2016-B, 4.00% 2036 | |
| 1,950 | | |
| 2,182 | |
| Environmental Facs. Corp., Solid Waste Disposal Rev. Bonds (Casella Waste Systems, Inc. Project), Series 2014-R-2, AMT, 3.125% 2044 (put 2026)1 | |
| 500 | | |
| 503 | |
| Environmental Facs. Corp., Solid Waste Disposal Rev. Bonds (Casella Waste Systems, Inc. Project), Series 2017, AMT, 3.75% 2044 (put 2019)1 | |
| 500 | | |
| 503 | |
| Liberty Dev. Corp., Liberty Rev. Bonds (Goldman Sachs Headquarters Issue), Series 2005, 5.25% 2035 | |
| 1,250 | | |
| 1,678 | |
| Liberty Dev. Corp., Liberty Rev. Ref. Bonds (3 World Trade Center Project), Series 2014, Class 2, 5.15% 20341 | |
| 1,250 | | |
| 1,401 | |
| Liberty Dev. Corp., Liberty Rev. Ref. Bonds (3 World Trade Center Project), Series 2014, Class 2, 5.375% 20401 | |
| 350 | | |
| 393 | |
| Liberty Dev. Corp., Liberty Rev. Ref. Bonds (3 World Trade Center Project), Series 2014, Class 3, 7.25% 20441 | |
| 375 | | |
| 448 | |
| Liberty Dev. Corp., Liberty Rev. Ref. Bonds (4 World Trade Center Project), Series 2011, 5.00% 2031 | |
| 1,500 | | |
| 1,622 | |
| Liberty Dev. Corp., Liberty Rev. Ref. Bonds (Bank of America Tower at One Bryant Park Project), Series 2010, 6.375% 2049 | |
| 1,500 | | |
| 1,533 | |
| Long Island Power Auth., Electric System General Rev. Bonds, Series 2011-A, 5.00% 2038 (preref. 2021) | |
| 500 | | |
| 535 | |
| Long Island Power Auth., Electric System General Rev. Bonds, Series 2015-B, 5.00% 2035 | |
| 1,215 | | |
| 1,425 | |
| Long Island Power Auth., Electric System General Rev. Bonds, Series 2015-B, 5.00% 2038 | |
| 750 | | |
| 873 | |
| Long Island Power Auth., Electric System General Rev. Bonds, Series 2015-C, (1-month USD-LIBOR x 0.70 + 0.75%) 2.431% 2033 (put 2023)2 | |
| 1,500 | | |
| 1,507 | |
| Long Island Power Auth., Electric System General Rev. Bonds, Series 2017, 5.00% 2035 | |
| 1,000 | | |
| 1,221 | |
| Long Island Power Auth., Electric System General Rev. Bonds, Series 2017, 5.00% 2047 | |
| 3,225 | | |
| 3,839 | |
| Long Island Power Auth., Electric System General Rev. Bonds, Series 2018, 5.00% 2036 | |
| 500 | | |
| 618 | |
| Metropolitan Transportation Auth., Dedicated Tax Fund Rev. Ref. Bonds, Series 2002-B-3D, (SIFMA Municipal Swap Index + 1.00%) 2.40% 20202 | |
| 2,000 | | |
| 2,014 | |
| Metropolitan Transportation Auth., Transportation Rev. Bonds, Series 2014-D-1, 5.00% 2039 | |
| 250 | | |
| 285 | |
| Metropolitan Transportation Auth., Transportation Rev. Bonds, Series 2015-A-2, (SIFMA Municipal Swap Index + 0.58%) 1.98% 2039 (put 2020)2 | |
| 500 | | |
| 500 | |
| Metropolitan Transportation Auth., Transportation Rev. Bonds, Series 2015-C-1, 5.00% 2035 | |
| 1,750 | | |
| 2,046 | |
| Metropolitan Transportation Auth., Transportation Rev. Bonds, Series 2015-C-1, 5.25% 2030 | |
| 280 | | |
| 339 | |
| Metropolitan Transportation Auth., Transportation Rev. Green Bonds, Series 2016-A-2, 5.00% 2026 | |
| 560 | | |
| 692 | |
| Metropolitan Transportation Auth., Transportation Rev. Green Bonds, Series 2017-A-1, 5.00% 2027 | |
| 700 | | |
| 882 | |
| Metropolitan Transportation Auth., Transportation Rev. Green Bonds, Series 2017-A-1, 5.25% 2057 | |
| 750 | | |
| 887 | |
| Metropolitan Transportation Auth., Transportation Rev. Ref. Bonds, Series 2002-D-2A, Assured Guaranty Municipal insured, (1-month USD-LIBOR x 0.69 + 0.68%) 2.337% 2032 (put 2021)2 | |
| 600 | | |
| 603 | |
| Metropolitan Transportation Auth., Transportation Rev. Ref. Green Bonds, Capital Appreciation Bonds, Series 2017-C-2, 0% 2029 | |
| 1,500 | | |
| 1,180 | |
| Metropolitan Transportation Auth., Transportation Rev. Ref. Green Bonds, Series 2017-C-1, 4.00% 2034 | |
| 1,000 | | |
| 1,130 | |
| Metropolitan Transportation Auth., Transportation Rev. Ref. Green Bonds, Series 2017-C-1, 5.00% 2026 | |
| 565 | | |
| 699 | |
| Metropolitan Transportation Auth., Transportation Rev. Ref. Green Bonds, Series 2017-C-1, 5.00% 2028 | |
| 750 | | |
| 956 | |
| Mortgage Agcy., Homeowner Mortgage Rev. Bonds, Series 178, 3.50% 2043 | |
| 265 | | |
| 276 | |
| Mortgage Agcy., Homeowner Mortgage Rev. Bonds, Series 191, AMT, 3.50% 2034 | |
| 285 | | |
| 294 | |
| Mortgage Agcy., Homeowner Mortgage Rev. Bonds, Series 194, AMT, 3.50% 2035 | |
| 420 | | |
| 435 | |
| American Funds Tax-Exempt Funds |
79 |
American Funds Tax-Exempt Fund of New York
| Bonds, notes & other debt instruments (continued) | |
Principal amount
(000) | | |
Value
(000) | |
| New York (continued) | |
| | | |
| | |
| State issuers (continued) | |
| | | |
| | |
| Mortgage Agcy., Homeowner Mortgage Rev. Bonds, Series 195, 4.00% 2046 | |
$ | 1,400 | | |
$ | 1,481 | |
| Mortgage Agcy., Homeowner Mortgage Rev. Bonds, Series 197, 3.50% 2044 | |
| 700 | | |
| 735 | |
| Mortgage Agcy., Homeowner Mortgage Rev. Bonds, Series 200, 3.50% 2045 | |
| 255 | | |
| 267 | |
| Mortgage Agcy., Homeowner Mortgage Rev. Bonds, Series 203, 3.50% 2047 | |
| 905 | | |
| 955 | |
| Mortgage Agcy., Homeowner Mortgage Rev. Bonds, Series 206, AMT, 4.00% 2037 | |
| 610 | | |
| 651 | |
| Mortgage Agcy., Homeowner Mortgage Rev. Bonds, Series 213, 4.25% 2047 | |
| 500 | | |
| 548 | |
| Mortgage Agcy., Homeowner Mortgage Rev. Bonds, Series 217, 4.00% 2049 | |
| 1,000 | | |
| 1,097 | |
| Mortgage Agcy., Homeowner Mortgage Rev. Bonds, Series 46, 5.00% 2029 | |
| 20 | | |
| 20 | |
| Mortgage Agcy., Homeowner Mortgage Rev. Bonds, Series 48, 2.625% 2041 | |
| 995 | | |
| 1,011 | |
| Mortgage Agcy., Homeowner Mortgage Rev. Bonds, Series 52, AMT, 3.50% 2030 | |
| 715 | | |
| 744 | |
| Mortgage Agcy., Homeowner Mortgage Rev. Bonds, Series 54, 4.00% 2047 | |
| 1,545 | | |
| 1,648 | |
| Mortgage Agcy., Homeowner Mortgage Rev. Ref. Bonds, Series 45, 4.50% 2029 | |
| 55 | | |
| 56 | |
| Port Auth., Consolidated Bonds, Series 166, 5.00% 2031 | |
| 1,000 | | |
| 1,051 | |
| Port Auth., Consolidated Bonds, Series 205, 5.00% 2047 | |
| 1,000 | | |
| 1,201 | |
| Port Auth., Consolidated Rev. Ref. Bonds, Series 167, AMT, 5.00% 2025 | |
| 1,000 | | |
| 1,058 | |
| Port Auth., Consolidated Rev. Ref. Bonds, Series 172, AMT, 5.00% 2034 | |
| 500 | | |
| 542 | |
| Port Auth., Consolidated Rev. Ref. Bonds, Series 186, AMT, 5.00% 2044 | |
| 500 | | |
| 566 | |
| Port Auth., Special Project Bonds (John F. Kennedy International Air Terminal LLC Project), Series 8, 5.00% 2020 | |
| 680 | | |
| 701 | |
| Power Auth., Rev. Ref. Bonds, Series 2011-A, 5.00% 2038 | |
| 1,500 | | |
| 1,623 | |
| Transportation Dev. Corp., Special Fac. Rev. Ref. Bonds (American Airlines, Inc. John F. Kennedy International Airport Project), Series 2016, AMT, 5.00% 2020 | |
| 1,125 | | |
| 1,160 | |
| Transportation Dev. Corp., Special Fac. Rev. Ref. Bonds (American Airlines, Inc. John F. Kennedy International Airport Project), Series 2016, AMT, 5.00% 2021 | |
| 610 | | |
| 647 | |
| Transportation Dev. Corp., Special Fac. Rev. Ref. Bonds (American Airlines, Inc. John F. Kennedy International Airport Project), Series 2016, AMT, 5.00% 2026 | |
| 500 | | |
| 529 | |
| Transportation Dev. Corp., Special Fac. Rev. Ref. Bonds (American Airlines, Inc. John F. Kennedy International Airport Project), Series 2016, AMT, 5.00% 2031 | |
| 2,500 | | |
| 2,632 | |
| Transportation Dev. Corp., Special Fac. Rev. Ref. Bonds (Terminal One Group Association, LP Project), Series 2015, AMT, 5.00% 2021 | |
| 280 | | |
| 294 | |
| Transportation Dev. Corp., Special Fac. Rev. Ref. Bonds (Terminal One Group Association, LP Project), Series 2015, AMT, 5.00% 2022 | |
| 1,000 | | |
| 1,079 | |
| Transportation Dev. Corp., Special Fac. Rev. Ref. Bonds (Terminal One Group Association, LP Project), Series 2015, AMT, 5.00% 2023 | |
| 500 | | |
| 554 | |
| Transportation Dev. Corp., Special Facs. Bonds (LaGuardia Airport Terminal B Redev. Project), Series 2016-A, AMT, 5.00% 2034 | |
| 500 | | |
| 561 | |
| Transportation Dev. Corp., Special Facs. Bonds (LaGuardia Airport Terminal B Redev. Project), Series 2016-A, AMT, 5.00% 2046 | |
| 1,000 | | |
| 1,103 | |
| Transportation Dev. Corp., Special Facs. Bonds (LaGuardia Airport Terminal B Redev. Project), Series 2016-A, AMT, 5.25% 2050 | |
| 500 | | |
| 556 | |
| Transportation Dev. Corp., Special Facs. Rev. Bonds (Delta Air Lines, Inc. LaGuardia Airport Terminals C & D Redev. Project), Series 2018, AMT, 4.00% 2036 | |
| 500 | | |
| 539 | |
| Transportation Dev. Corp., Special Facs. Rev. Bonds (Delta Air Lines, Inc. LaGuardia Airport Terminals C & D Redev. Project), Series 2018, AMT, 5.00% 2030 | |
| 1,500 | | |
| 1,811 | |
| Transportation Dev. Corp., Special Facs. Rev. Bonds (Delta Air Lines, Inc. LaGuardia Airport Terminals C & D Redev. Project), Series 2018, AMT, 5.00% 2036 | |
| 1,045 | | |
| 1,233 | |
| Urban Dev. Corp., State Personal Income Tax Rev. Bonds (General Purpose), Series 2014-A, 5.00% 2027 | |
| 750 | | |
| 876 | |
| Urban Dev. Corp., State Personal Income Tax Rev. Bonds (General Purpose), Series 2016-A, 5.00% 2026 | |
| 1,500 | | |
| 1,852 | |
| Urban Dev. Corp., State Personal Income Tax Rev. Bonds (General Purpose), Series 2016-A, 5.00% 2032 | |
| 1,000 | | |
| 1,202 | |
| Urban Dev. Corp., State Personal Income Tax Rev. Bonds (General Purpose), Series 2019-A, 5.00% 2036 | |
| 1,500 | | |
| 1,860 | |
| Urban Dev. Corp., State Personal Income Tax Rev. Bonds (General Purpose), Series 2019-A, 5.00% 2042 | |
| 1,345 | | |
| 1,633 | |
| Utility Debt Securitization Auth., Restructuring Bonds, Series 2016-A, 5.00% 2035 | |
| 1,170 | | |
| 1,413 | |
| Utility Debt Securitization Auth., Restructuring Bonds, Series 2017, 5.00% 2040 | |
| 750 | | |
| 916 | |
| Utility Debt Securitization Auth., Restructuring Bonds, Series 2017, 5.00% 2041 | |
| 1,500 | | |
| 1,830 | |
| Other securities | |
| | | |
| 10,338 | |
| | |
| | | |
| 127,408 | |
| 80 |
American Funds Tax-Exempt Funds |
American Funds Tax-Exempt Fund of New York
| | |
Principal amount
(000) | | |
Value
(000) | |
| City, county & other issuers 44.88% | |
| | | |
| | |
| Brooklyn Arena Local Dev. Corp., PILOT Rev. Ref. Bonds (Barclays Center), Series 2016-A, 5.00% 2026 | |
$ | 500 | | |
$ | 600 | |
| Brooklyn Arena Local Dev. Corp., PILOT Rev. Ref. Bonds (Barclays Center), Series 2016-A, 5.00% 2027 | |
| 750 | | |
| 906 | |
| Brooklyn Arena Local Dev. Corp., PILOT Rev. Ref. Bonds (Barclays Center), Series 2016-A, Assured Guaranty Municipal insured, 4.00% 2034 | |
| 240 | | |
| 266 | |
| Brooklyn Arena Local Dev. Corp., PILOT Rev. Ref. Bonds (Barclays Center), Series 2016-A, Assured Guaranty Municipal insured, 5.00% 2030 | |
| 500 | | |
| 594 | |
| Brooklyn Arena Local Dev. Corp., PILOT Rev. Ref. Bonds (Barclays Center), Series 2016-A, Assured Guaranty Municipal insured, 5.00% 2042 | |
| 1,500 | | |
| 1,719 | |
| Buffalo and Erie County Industrial Land Dev. Corp., Rev. Bonds (Buffalo State College Foundation Housing Corp. Project), Series 2011-A, 5.375% 2041 | |
| 1,400 | | |
| 1,488 | |
| Buffalo and Erie County Industrial Land Dev. Corp., Rev. Bonds (Catholic Health System Obligated Group Project), Series 2015, 5.00% 2023 | |
| 1,600 | | |
| 1,819 | |
| Buffalo and Erie County Industrial Land Dev. Corp., Rev. Bonds (Catholic Health System Obligated Group Project), Series 2015, 5.00% 2024 | |
| 275 | | |
| 322 | |
| Buffalo and Erie County Industrial Land Dev. Corp., Rev. Bonds (Catholic Health System Obligated Group Project), Series 2015, 5.00% 2040 | |
| 1,050 | | |
| 1,200 | |
| Buffalo and Erie County Industrial Land Dev. Corp., Rev. Bonds (Catholic Health System Obligated Group Project), Series 2015, 5.25% 2035 | |
| 500 | | |
| 586 | |
| Buffalo and Erie County Industrial Land Dev. Corp., Rev. Bonds (Tapestry Charter School Project), Series 2017-A, 5.00% 2047 | |
| 500 | | |
| 542 | |
| Build NYC Resource Corp., Rev. Bonds (Bronx Charter School for Excellence Project), Series 2013-A, 4.00% 2021 | |
| 525 | | |
| 540 | |
| Build NYC Resource Corp., Rev. Bonds (Bronx Charter School for Excellence Project), Series 2013-A, 4.00% 2022 | |
| 545 | | |
| 569 | |
| Build NYC Resource Corp., Rev. Bonds (Bronx Charter School for Excellence Project), Series 2013-A, 5.50% 2043 | |
| 1,000 | | |
| 1,077 | |
| Build NYC Resource Corp., Rev. Bonds (YMCA of Greater New York Project), Series 2015, 5.00% 2040 | |
| 500 | | |
| 568 | |
| Build NYC Resource Corp., Solid Waste Disposal Rev. Bonds (Pratt Paper (NY), Inc. Project), Series 2014, AMT, 4.50% 20251 | |
| 450 | | |
| 500 | |
| Build NYC Resource Corp., Solid Waste Disposal Rev. Bonds (Pratt Paper (NY), Inc. Project), Series 2014, AMT, 5.00% 20351 | |
| 950 | | |
| 1,042 | |
| Village of Dobbs Ferry, Local Dev. Corp., Rev. Bonds (Mercy College Project), Series 2014, 5.00% 2039 | |
| 1,625 | | |
| 1,833 | |
| County of Dutchess, Local Dev. Corp., Rev. Bonds (Health Quest Systems, Inc. Project), Series 2016-B, 4.00% 2041 | |
| 750 | | |
| 803 | |
| County of Dutchess, Local Dev. Corp., Rev. Ref. Bonds (Health Quest Systems, Inc. Project), Series 2010, 5.75% 2030 | |
| 500 | | |
| 523 | |
| County of Dutchess, Local Dev. Corp., Rev. Ref. Bonds (Health Quest Systems, Inc. Project), Series 2010, 5.75% 2040 | |
| 1,000 | | |
| 1,044 | |
| County of Dutchess, Local Dev. Corp., Rev. Ref. Bonds (Health Quest Systems, Inc. Project), Series 2014-A, 5.00% 2028 | |
| 430 | | |
| 495 | |
| Town of Hempstead, Local Dev. Corp., Rev. Bonds (Hofstra University Project), Series 2011, 5.00% 2027 | |
| 800 | | |
| 855 | |
| Town of Hempstead, Local Dev. Corp., Rev. Bonds (Hofstra University Project), Series 2011, 5.00% 2041 | |
| 800 | | |
| 847 | |
| Town of Hempstead, Local Dev. Corp., Rev. Ref. Bonds (Molloy College Project), Series 2017, 5.00% 2033 | |
| 480 | | |
| 565 | |
| Town of Hempstead, Local Dev. Corp., Rev. Ref. Bonds (Molloy College Project), Series 2017, 5.00% 2034 | |
| 810 | | |
| 951 | |
| Town of Hempstead, Local Dev. Corp., Rev. Ref. Bonds (Molloy College Project), Series 2017, 5.00% 2037 | |
| 630 | | |
| 733 | |
| Hudson Yards Infrastructure Corp., Rev. Bonds, Fiscal 2012, Series 2012-A, 5.25% 2047 | |
| 955 | | |
| 1,008 | |
| Hudson Yards Infrastructure Corp., Rev. Bonds, Fiscal 2012, Series 2012-A, 5.25% 2047 (preref. 2021) | |
| 45 | | |
| 48 | |
| Hudson Yards Infrastructure Corp., Rev. Bonds, Fiscal 2012, Series 2012-A, 5.75% 2047 | |
| 435 | | |
| 464 | |
| Hudson Yards Infrastructure Corp., Rev. Bonds, Fiscal 2012, Series 2012-A, 5.75% 2047 (preref. 2021) | |
| 565 | | |
| 606 | |
| Hudson Yards Infrastructure Corp., Rev. Bonds, Fiscal 2017, Series 2017-A, 5.00% 2033 | |
| 2,700 | | |
| 3,323 | |
| Hudson Yards Infrastructure Corp., Rev. Bonds, Fiscal 2017, Series 2017-A, 5.00% 2035 | |
| 1,000 | | |
| 1,222 | |
| County of Nassau, G.O. Bonds, Series 2014-A, 5.00% 2028 | |
| 1,250 | | |
| 1,445 | |
| County of Nassau, G.O. Bonds, Series 2016-B, 5.00% 2025 | |
| 1,000 | | |
| 1,212 | |
| American Funds Tax-Exempt Funds |
81 |
American Funds Tax-Exempt Fund of New York
| Bonds,
notes & other debt instruments (continued) | |
Principal amount
(000) | | |
Value
(000) | |
| New York (continued) | |
| | | |
| | |
| City, county & other issuers (continued) | |
| | | |
| | |
| County of Nassau, G.O. General Improvement Bonds, Series 2017-A, 5.00% 2030 | |
$ | 1,000 | | |
$ | 1,226 | |
| County of Nassau, G.O. General Improvement Bonds, Series 2018-B, Assured Guaranty Municipal insured, 5.00% 2035 | |
| 750 | | |
| 928 | |
| County of Nassau, G.O. General Improvement Bonds, Series 2019-A, Assured Guaranty Municipal insured, 5.00% 2032 | |
| 750 | | |
| 956 | |
| County of Nassau, G.O. General Improvement Rev. Ref. Bonds, Series 2016-A, 5.00% 2027 | |
| 500 | | |
| 607 | |
| County of Nassau, G.O. General Improvement Rev. Ref. Bonds, Series 2016-A, 5.00% 2030 | |
| 1,795 | | |
| 2,151 | |
| New York City G.O. Bonds, Fiscal 2010, Series 2010-C, 4.00% 2019 | |
| 145 | | |
| 145 | |
| New York City G.O. Bonds, Fiscal 2011, Series 2011-B, 5.00% 2019 | |
| 350 | | |
| 350 | |
| New York City G.O. Bonds, Fiscal 2015, Series 2015-C, 5.00% 2033 | |
| 1,000 | | |
| 1,168 | |
| New York City G.O. Bonds, Fiscal 2016, Series 2016-A, 5.00% 2026 | |
| 1,000 | | |
| 1,213 | |
| New York City G.O. Bonds, Fiscal 2016, Series 2016-C, 5.00% 2031 | |
| 1,000 | | |
| 1,197 | |
| New York City G.O. Bonds, Fiscal 2017, Series 2017-A-1, 5.00% 2034 | |
| 1,000 | | |
| 1,199 | |
| New York City G.O. Bonds, Fiscal 2018, Series 2018-A, 5.00% 2027 | |
| 1,500 | | |
| 1,904 | |
| New York City G.O. Bonds, Fiscal 2018, Series 2018-C, 5.00% 2031 | |
| 1,000 | | |
| 1,252 | |
| New York City G.O. Bonds, Fiscal 2018, Series 2018-C, 5.00% 2032 | |
| 1,720 | | |
| 2,144 | |
| New York City G.O. Bonds, Fiscal 2018, Series 2018-E-1, 5.00% 2037 | |
| 1,150 | | |
| 1,407 | |
| New York City G.O. Bonds, Fiscal 2019, Series 2019-D-1, 5.00% 2037 | |
| 750 | | |
| 929 | |
| New York City Housing Dev. Corp., Multi Family Housing Rev. Bonds (8 Spruce Street), Series 2014-E, 3.50% 2048 | |
| 1,670 | | |
| 1,738 | |
| New York City Housing Dev. Corp., Multi Family Housing Rev. Bonds (8 Spruce Street), Series 2014-F, 4.50% 2048 | |
| 500 | | |
| 530 | |
| New York City Housing Dev. Corp., Multi Family Housing Rev. Bonds (Sustainable Neighborhood Bonds), Series 2018-L-2, 2.75% 2050 (put 2023) | |
| 500 | | |
| 519 | |
| New York City Housing Dev. Corp., Multi Family Housing Rev. Bonds (Sustainable Neighborhood Bonds), Series 2019-E-2, 1.75% 2059 (put 2023) | |
| 1,000 | | |
| 1,007 | |
| New York City Housing Dev. Corp., Multi Family Housing Rev. Bonds (Sustainable Neighborhood Bonds), Series 2015-H, 2.95% 2045 (put 2026) | |
| 750 | | |
| 792 | |
| New York City Housing Dev. Corp., Multi Family Housing Rev. Bonds (Sustainable Neighborhood Bonds), Series 2017-A-1-A, 3.80% 2037 | |
| 885 | | |
| 938 | |
| New York City Housing Dev. Corp., Multi Family Housing Rev. Bonds (Sustainable Neighborhood Bonds), Series 2017-C-2, 1.70% 2021 | |
| 400 | | |
| 401 | |
| New York City Housing Dev. Corp., Multi Family Housing Rev. Bonds (Sustainable Neighborhood Bonds), Series 2017-G-2-A, 2.00% 2057 (put 2021) | |
| 750 | | |
| 756 | |
| New York City Municipal Water Fin. Auth., Water and Sewer System Rev. Bonds, Series 2011-EE, 5.375% 2043 | |
| 590 | | |
| 623 | |
| New York City Municipal Water Fin. Auth., Water and Sewer System Rev. Bonds, Series 2011-EE, 5.375% 2043 (preref. 2020) | |
| 1,150 | | |
| 1,219 | |
| New York City Municipal Water Fin. Auth., Water and Sewer System Second General Resolution Rev. Bonds, Fiscal 2015, Series 2015-EE, 5.00% 2045 | |
| 500 | | |
| 571 | |
| New York City Municipal Water Fin. Auth., Water and Sewer System Second General Resolution Rev. Bonds, Fiscal 2015, Series 2015-HH, 5.00% 2039 | |
| 500 | | |
| 585 | |
| New York City Municipal Water Fin. Auth., Water and Sewer System Second General Resolution Rev. Bonds, Fiscal 2017, Series 2017-DD, 5.00% 2047 | |
| 1,055 | | |
| 1,249 | |
| New York City Municipal Water Fin. Auth., Water and Sewer System Second General Resolution Rev. Bonds, Fiscal 2017, Series 2017-EE, 5.00% 2033 | |
| 750 | | |
| 922 | |
| New York City Municipal Water Fin. Auth., Water and Sewer System Second General Resolution Rev. Bonds, Fiscal 2018, Series 2018-BB-1, 5.00% 2046 | |
| 1,250 | | |
| 1,484 | |
| New York City Municipal Water Fin. Auth., Water and Sewer System Second General Resolution Rev. Bonds, Fiscal 2018, Series 2018-EE, 5.00% 2040 | |
| 2,000 | | |
| 2,417 | |
| New York City Municipal Water Fin. Auth., Water and Sewer System Second General Resolution Rev. Bonds, Fiscal 2019, Series 2019-DD-1, 5.25% 2049 | |
| 1,500 | | |
| 1,846 | |
| New York City Municipal Water Fin. Auth., Water and Sewer System Second General Resolution Rev. Bonds, Fiscal 2019, Series 2019-FF-2, 5.00% 2040 | |
| 1,000 | | |
| 1,239 | |
| New York City Municipal Water Fin. Auth., Water and Sewer System Second General Resolution Rev. Ref. Bonds, Fiscal 2017, Series 2017-EE, 5.00% 2036 | |
| 750 | | |
| 910 | |
| New York City Transitional Fin. Auth., Building Aid Rev. Bonds, Fiscal 2018, Series 2018-S-2, 5.00% 2036 | |
| 590 | | |
| 715 | |
| New York City Transitional Fin. Auth., Building Aid Rev. Bonds, Fiscal 2018, Series 2018-S-4A, 5.00% 2037 | |
| 750 | | |
| 922 | |
| New York City Transitional Fin. Auth., Building Aid Rev. Bonds, Fiscal 2019, Series 2019-S-1, 5.00% 2043 | |
| 1,000 | | |
| 1,213 | |
| 82 |
American Funds Tax-Exempt Funds |
American Funds Tax-Exempt Fund of New York
| | |
Principal amount
(000) | | |
Value
(000) | |
| New York City Transitional Fin. Auth., Building Aid Rev. Bonds, Fiscal 2019, Series 2019-S-3, 5.00% 2036 | |
$ | 1,000 | | |
$ | 1,234 | |
| New York City Transitional Fin. Auth., Future Tax Secured Bonds, Fiscal 2011, Series 2011-C, 5.25% 2025 | |
| 700 | | |
| 736 | |
| New York City Transitional Fin. Auth., Future Tax Secured Bonds, Fiscal 2011, Series 2011-C, 5.25% 2025 (preref. 2020) | |
| 300 | | |
| 316 | |
| New York City Transitional Fin. Auth., Future Tax Secured Bonds, Fiscal 2017, Series 2017-C, 5.00% 2032 | |
| 1,000 | | |
| 1,229 | |
| New York City Transitional Fin. Auth., Future Tax Secured Bonds, Fiscal 2017, Series 2017-E-1, 5.00% 2043 | |
| 1,000 | | |
| 1,184 | |
| New York City Transitional Fin. Auth., Future Tax Secured Bonds, Fiscal 2017, Series 2017-F-1, 5.00% 2039 | |
| 750 | | |
| 899 | |
| New York City Transitional Fin. Auth., Future Tax Secured Bonds, Fiscal 2017, Series 2017-F-1, 5.00% 2042 | |
| 1,000 | | |
| 1,191 | |
| New York City Transitional Fin. Auth., Future Tax Secured Bonds, Fiscal 2018, Series 2018-A-3, 4.00% 2042 | |
| 1,080 | | |
| 1,191 | |
| New York City Transitional Fin. Auth., Future Tax Secured Bonds, Fiscal 2019, Series 2019-A-1, 5.00% 2036 | |
| 2,380 | | |
| 2,945 | |
| New York City Transitional Fin. Auth., Future Tax Secured Bonds, Fiscal 2019, Series 2019-C-1, 5.00% 2034 | |
| 750 | | |
| 948 | |
| New York City Transitional Fin. Auth., Future Tax Secured Rev. Ref. Bonds, Fiscal 2016, Series 2016-C, 5.00% 2026 | |
| 1,000 | | |
| 1,223 | |
| Niagara Frontier Transportation Auth., Airport Rev. Ref. Bonds (Buffalo Niagara International Airport), Series 2014-A, AMT, 5.00% 2027 | |
| 600 | | |
| 686 | |
| Niagara Frontier Transportation Auth., Airport Rev. Ref. Bonds (Buffalo Niagara International Airport), Series 2014-A, AMT, 5.00% 2028 | |
| 500 | | |
| 570 | |
| Niagara Frontier Transportation Auth., Airport Rev. Ref. Bonds (Buffalo Niagara International Airport), Series 2014-A, AMT, 5.00% 2029 | |
| 700 | | |
| 795 | |
| Niagara Frontier Transportation Auth., Airport Rev. Ref. Bonds (Buffalo Niagara International Airport), Series 2019-A, AMT, 5.00% 2031 | |
| 1,000 | | |
| 1,230 | |
| County of Onondaga, Resource Recovery Agcy., Rev. Ref. Bonds, Series 2015-A, AMT, Assured Guaranty Municipal insured, 5.00% 2030 | |
| 1,750 | | |
| 2,016 | |
| Town of Southold, Local Dev. Corp., Rev. Bonds (Peconic Landing at Southold, Inc. Project), Series 2015, 5.00% 2045 | |
| 1,500 | | |
| 1,579 | |
| County of Westchester, Local Dev. Corp., Rev. Bonds (Purchase Housing Corp. II Project), Series 2017, 5.00% 2037 | |
| 1,000 | | |
| 1,168 | |
| County of Westchester, Local Dev. Corp., Rev. Bonds (Purchase Housing Corp. II Project), Series 2017, 5.00% 2047 | |
| 1,000 | | |
| 1,152 | |
| County of Westchester, Local Dev. Corp., Rev. Bonds (Westchester Medical Center Obligated Group Project), Series 2016, 5.00% 2034 | |
| 1,150 | | |
| 1,312 | |
| County of Westchester, Local Dev. Corp., Rev. Bonds (Westchester Medical Center Obligated Group Project), Series 2016, 5.00% 2046 | |
| 1,000 | | |
| 1,117 | |
| County of Westchester, Local Dev. Corp., Rev. Ref. Bonds (Pace University), Series 2014-A, 5.50% 2042 | |
| 450 | | |
| 499 | |
| Other securities | |
| | | |
| 24,497 | |
| | |
| | | |
| 123,404 | |
| | |
| | | |
| | |
| Other U.S. territories 2.16% | |
| | | |
| | |
| Other securities | |
| | | |
| 5,947 | |
| | |
| | | |
| | |
| Total bonds, notes & other debt instruments (cost: $243,770,000) | |
| | | |
| 256,759 | |
| | |
| | | |
| | |
| Short-term
securities 5.59% | |
| | | |
| | |
| Dormitory Auth., IAM Commercial Paper (Columbia University), Series 2019, 1.55% 9/5/2019 | |
| 2,000 | | |
| 2,000 | |
| Metropolitan Transportation Auth., Transportation Rev. Bond Anticipation Notes, Series 2018-A-1, 4.00% 8/15/2019 | |
| 1,500 | | |
| 1,501 | |
| New York City G.O. Bonds, Fiscal 2006, Series 2005-E-2, 1.47% 20342 | |
| 2,000 | | |
| 2,000 | |
| New York City G.O. Bonds, Fiscal 2008, Series 2008-C-4, Assured Guaranty Municipal insured, 1.75% 20272 | |
| 1,000 | | |
| 1,000 | |
| New York City G.O. Bonds, Fiscal 2008, Series 2008-L-5, 1.47% 20352 | |
| 3,500 | | |
| 3,500 | |
| New York City G.O. Bonds, Fiscal 2013, Series 2013-F-3, 1.47% 20422 | |
| 500 | | |
| 500 | |
| American Funds Tax-Exempt Funds |
83 |
American Funds Tax-Exempt Fund of New York
| Short-term securities
(continued) | |
Principal amount
(000) | | |
Value
(000) | |
| New York City Transitional Fin. Auth., Future Tax Secured Rev. Ref. Bonds, Fiscal 2015, Series 2015-E-4, 1.47% 2045 | |
$ | 600 | | |
$ | 600 | |
| New York City Transitional Fin. Auth., Future Tax Secured Rev. Ref. Bonds, Fiscal 2016, Series 2016-E-4, 1.48% 20452 | |
| 125 | | |
| 125 | |
| City of Syracuse, Industrial Dev. Agcy., Civic Fac. Rev. Bonds (Syracuse University Project), Series 2008-A-1, 1.44% 20372 | |
| 900 | | |
| 900 | |
| City of Syracuse, Industrial Dev. Agcy., Civic Fac. Rev. Bonds (Syracuse University Project), Series 2008-A-2, JPMorgan Chase LOC, 1.44% 20372 | |
| 3,250 | | |
| 3,250 | |
| | |
| | | |
| | |
| Total short-term securities
(cost: $15,376,000) | |
| | | |
| 15,376 | |
| Total investment securities 98.97% (cost: $259,146,000) | |
| | | |
| 272,135 | |
| Other assets less liabilities 1.03% | |
| | | |
| 2,819 | |
| |
|
|
|
|
|
|
|
|
| Net assets 100.00% | |
| | | |
$ | 274,954 | |
This summary investment portfolio is designed to streamline the
report and help investors better focus on the fund’s principal holdings. See the inside back cover for details on how to
obtain a complete schedule of portfolio holdings.
“Other securities” includes all issues that are not
disclosed separately in the summary investment portfolio.
| 84 |
American Funds Tax-Exempt Funds |
American Funds Tax-Exempt Fund of New York
Futures contracts
| Contracts | |
Type | |
Number of
contracts | |
Expiration | |
Notional
amount
(000) | 3
|
Value at
7/31/2019
(000) | 4
|
Unrealized
depreciation
at 7/31/2019
(000) |
|
| 5 Year U.S. Treasury Note Futures | |
Long | |
14 | |
October 2019 | |
$ 1,400 | |
$ 1,646 | |
|
$ (2 |
) |
| 10 Year U.S. Treasury Note Futures | |
Long | |
8 | |
September 2019 | |
800 | |
1,019 | |
|
(— |
)5 |
| | |
| |
| |
| |
| |
| |
|
$ (2 |
) |
| 1 |
Acquired in a transaction exempt from registration under Rule 144A of the Securities Act of 1933. May
be resold in the U.S. in transactions exempt from registration, normally to qualified institutional buyers. The total value
of all such securities, including those in “Other securities,” was $10,653,000, which represented 3.87% of the
net assets of the fund. |
| 2 |
Coupon rate may change periodically. For short-term securities, the date of the next scheduled coupon rate change is considered
to be the maturity date. |
| 3 |
Notional amount is calculated based on the number of contracts and notional contract size. |
| 4 |
Value is calculated based on the notional amount and current market price. |
| 5 |
Amount less than one thousand. |
Key to abbreviations and symbol
Agcy. = Agency
AMT = Alternative Minimum Tax
Auth. = Authority
Certs. of Part. = Certificates of Participation
Dept. = Department
Dev. = Development
Dist. = District
Econ. = Economic
Fac. = Facility
Facs. = Facilities
Fin. = Finance
Fncg. = Financing
G.O. = General Obligation
LIBOR = London Interbank Offered Rate
LOC = Letter of Credit
Preref. = Prerefunded
Redev. = Redevelopment
Ref. = Refunding
Rev. = Revenue
SIFMA = Securities Industry and Financial Markets Association
USD/$ = U.S. dollars
| American Funds Tax-Exempt Funds |
85 |
Financial statements
Statements of assets and liabilities
at July 31, 2019
| | |
American Funds
Short-Term
Tax-Exempt Bond Fund | | |
Limited Term
Tax-Exempt Bond
Fund of America | |
| Assets: | |
| | | |
| | |
| Investment securities in unaffiliated issuers, at value | |
$ | 1,136,458 | | |
$ | 4,228,881 | |
| Cash | |
| 560 | | |
| 856 | |
| Cash pledged for futures contracts | |
| 482 | | |
| 1,981 | |
| Receivables for: | |
| | | |
| | |
| Sales of investments | |
| — | | |
| 29,174 | |
| Sales of fund’s shares | |
| 3,128 | | |
| 10,152 | |
| Interest | |
| 9,496 | | |
| 36,458 | |
| Variation margin on futures contracts | |
| 31 | | |
| 109 | |
| | |
| 1,150,155 | | |
| 4,307,611 | |
| | |
| | | |
| | |
| Liabilities: | |
| | | |
| | |
| Payables for: | |
| | | |
| | |
| Purchases of investments | |
| 7,724 | | |
| 46,374 | |
| Repurchases of fund’s shares | |
| 1,348 | | |
| 5,429 | |
| Dividends on fund’s shares | |
| 43 | | |
| 470 | |
| Investment advisory services | |
| 328 | | |
| 802 | |
| Services provided by related parties | |
| 68 | | |
| 672 | |
| Trustees’ deferred compensation | |
| 34 | | |
| 141 | |
| Variation margin on futures contracts | |
| 232 | | |
| 913 | |
| Other | |
| — | * | |
| 2 | |
| | |
| 9,777 | | |
| 54,803 | |
| Net assets at July 31, 2019 | |
$ | 1,140,378 | | |
$ | 4,252,808 | |
| | |
| | | |
| | |
| Net assets consist of: | |
| | | |
| | |
| Capital paid in on shares of beneficial interest | |
$ | 1,130,211 | | |
$ | 4,133,054 | |
| Total distributable earnings | |
| 10,167 | | |
| 119,754 | |
| Net assets at July 31, 2019 | |
$ | 1,140,378 | | |
$ | 4,252,808 | |
| | |
| | | |
| | |
| Investment securities in unaffiliated issuers, at cost | |
$ | 1,123,130 | | |
$ | 4,120,591 | |
| * |
Amount less than one thousand. |
See notes to financial statements.
| 86 |
American Funds Tax-Exempt Funds |
(dollars in thousands)
The Tax-Exempt
Bond Fund
of America | | |
American
High-Income
Municipal Bond Fund | | |
The Tax-Exempt
Fund of
California | | |
American Funds
Tax-Exempt Fund
of New York | |
| | | | |
| | | |
| | | |
| | |
| $ | 21,610,872 | | |
$ | 7,721,731 | | |
$ | 2,587,280 | | |
$ | 272,135 | |
| | 792 | | |
| 661 | | |
| 860 | | |
| 514 | |
| | 5,181 | | |
| 807 | | |
| 822 | | |
| 24 | |
| | | | |
| | | |
| | | |
| | |
| | 17,246 | | |
| 9,668 | | |
| 20,898 | | |
| — | |
| | 41,068 | | |
| 17,527 | | |
| 7,442 | | |
| 101 | |
| | 186,248 | | |
| 69,989 | | |
| 29,237 | | |
| 2,613 | |
| | — | | |
| — | | |
| 36 | | |
| 1 | |
| | 21,861,407 | | |
| 7,820,383 | | |
| 2,646,575 | | |
| 275,388 | |
| | | | |
| | | |
| | | |
| | |
| | 179,255 | | |
| 52,996 | | |
| 65,074 | | |
| — | |
| | 25,208 | | |
| 9,527 | | |
| 2,556 | | |
| 209 | |
| | 2,360 | | |
| 1,589 | | |
| 620 | | |
| 107 | |
| | 3,651 | | |
| 1,752 | | |
| 606 | | |
| 68 | |
| | 1,987 | | |
| 1,414 | | |
| 292 | | |
| 47 | |
| | 694 | | |
| 137 | | |
| 136 | | |
| 2 | |
| | 2,607 | | |
| 712 | | |
| 409 | | |
| 1 | |
| | 8 | | |
| 2 | | |
| 1 | | |
| — | * |
| | 215,770 | | |
| 68,129 | | |
| 69,694 | | |
| 434 | |
| $ | 21,645,637 | | |
$ | 7,752,254 | | |
$ | 2,576,881 | | |
$ | 274,954 | |
| | | | |
| | | |
| | | |
| | |
| $ | 20,649,922 | | |
$ | 7,361,696 | | |
$ | 2,443,914 | | |
$ | 261,856 | |
| | 995,715 | | |
| 390,558 | | |
| 132,967 | | |
| 13,098 | |
| $ | 21,645,637 | | |
$ | 7,752,254 | | |
$ | 2,576,881 | | |
$ | 274,954 | |
| | | | |
| | | |
| | | |
| | |
| $ | 20,617,821 | | |
$ | 7,337,332 | | |
$ | 2,457,754 | | |
$ | 259,146 | |
| American Funds Tax-Exempt Funds |
87 |
Statements of assets and liabilities
at July 31, 2019
| | |
| |
American Funds
Short-Term
Tax-Exempt Bond Fund | | |
Limited Term
Tax-Exempt Bond
Fund of America | |
Shares of beneficial interest issued and outstanding
(no stated par value) — unlimited shares authorized | |
| | | |
| | |
| | |
| |
| | | |
| | |
| Class A: | |
Net assets | |
$ | 767,177 | | |
$ | 3,060,080 | |
| | |
Shares outstanding | |
| 75,266 | | |
| 192,056 | |
| | |
Net asset value per share | |
$ | 10.19 | | |
$ | 15.93 | |
| Class C: | |
Net assets | |
| | | |
$ | 17,561 | |
| | |
Shares outstanding | |
| Not applicable | | |
| 1,102 | |
| | |
Net asset value per share | |
| | | |
$ | 15.93 | |
| Class T: | |
Net assets | |
$ | 10 | | |
$ | 10 | |
| | |
Shares outstanding | |
| 1 | | |
| 1 | |
| | |
Net asset value per share | |
$ | 10.19 | | |
$ | 15.93 | |
| Class F-1: | |
Net assets | |
$ | 6,887 | | |
$ | 60,376 | |
| | |
Shares outstanding | |
| 676 | | |
| 3,789 | |
| | |
Net asset value per share | |
$ | 10.19 | | |
$ | 15.93 | |
| Class F-2: | |
Net assets | |
$ | 182,319 | | |
$ | 500,399 | |
| | |
Shares outstanding | |
| 17,887 | | |
| 31,406 | |
| | |
Net asset value per share | |
$ | 10.19 | | |
$ | 15.93 | |
| Class F-3: | |
Net assets | |
$ | 52,474 | | |
$ | 307,545 | |
| | |
Shares outstanding | |
| 5,148 | | |
| 19,302 | |
| | |
Net asset value per share | |
$ | 10.19 | | |
$ | 15.93 | |
| Class R-6: | |
Net assets | |
$ | 131,511 | | |
$ | 306,837 | |
| | |
Shares outstanding | |
| 12,902 | | |
| 19,258 | |
| | |
Net asset value per share | |
$ | 10.19 | | |
$ | 15.93 | |
See notes to financial statements.
| 88 |
American Funds Tax-Exempt Funds |
(dollars and shares in thousands, except
per-share amounts)
The Tax-Exempt
Bond Fund
of
America | | |
American
High-Income
Municipal
Bond Fund | | |
The Tax-Exempt
Fund of
California | | |
American Funds
Tax-Exempt Fund
of New York | |
| | | | |
| | | |
| | | |
| | |
| $ | 10,867,491 | | |
$ | 4,637,531 | | |
$ | 1,784,052 | | |
$ | 200,120 | |
| | 817,894 | | |
| 283,994 | | |
| 98,689 | | |
| 18,159 | |
| $ | 13.29 | | |
$ | 16.33 | | |
$ | 18.08 | | |
$ | 11.02 | |
| $ | 406,990 | | |
$ | 238,123 | | |
$ | 69,167 | | |
$ | 11,578 | |
| | 30,630 | | |
| 14,582 | | |
| 3,826 | | |
| 1,051 | |
| $ | 13.29 | | |
$ | 16.33 | | |
$ | 18.08 | | |
$ | 11.02 | |
| $ | 10 | | |
$ | 11 | | |
$ | 10 | | |
$ | 10 | |
| | 1 | | |
| 1 | | |
| 1 | | |
| 1 | |
| $ | 13.29 | | |
$ | 16.33 | | |
$ | 18.08 | | |
$ | 11.02 | |
| $ | 337,830 | | |
$ | 180,195 | | |
$ | 71,659 | | |
$ | 1,976 | |
| | 25,425 | | |
| 11,035 | | |
| 3,964 | | |
| 179 | |
| $ | 13.29 | | |
$ | 16.33 | | |
$ | 18.08 | | |
$ | 11.02 | |
| $ | 2,777,595 | | |
$ | 1,113,579 | | |
$ | 411,302 | | |
$ | 28,739 | |
| | 209,044 | | |
| 68,193 | | |
| 22,752 | | |
| 2,608 | |
| $ | 13.29 | | |
$ | 16.33 | | |
$ | 18.08 | | |
$ | 11.02 | |
| $ | 6,570,334 | | |
$ | 896,904 | | |
$ | 240,691 | | |
$ | 32,531 | |
| | 494,487 | | |
| 54,925 | | |
| 13,315 | | |
| 2,952 | |
| $ | 13.29 | | |
$ | 16.33 | | |
$ | 18.08 | | |
$ | 11.02 | |
| $ | 685,387 | | |
$ | 685,911 | | |
| | | |
| | |
| | 51,583 | | |
| 42,004 | | |
| Not
applicable | | |
| Not
applicable | |
| $ | 13.29 | | |
$ | 16.33 | | |
| | | |
| | |
| American Funds Tax-Exempt Funds |
89 |
Statements of operations
for the year
ended July 31, 2019
| | |
American Funds
Short-Term
Tax-Exempt Bond Fund | | |
Limited Term
Tax-Exempt Bond
Fund of America | |
| Investment income: | |
| | | |
| | |
| Income: | |
| | | |
| | |
| Interest | |
$ | 23,285 | | |
$ | 103,880 | |
| | |
| | | |
| | |
| Fees and expenses*: | |
| | | |
| | |
| Investment advisory services | |
| 3,814 | | |
| 9,177 | |
| Distribution services | |
| 1,143 | | |
| 9,093 | |
| Transfer agent services | |
| 383 | | |
| 1,655 | |
| Administrative services | |
| 248 | | |
| 854 | |
| Reports to shareholders | |
| 22 | | |
| 96 | |
| Registration statement and prospectus | |
| 305 | | |
| 477 | |
| Trustees’ compensation | |
| 8 | | |
| 30 | |
| Auditing and legal | |
| 14 | | |
| 19 | |
| Custodian | |
| 4 | | |
| 11 | |
| Federal, state and local taxes | |
| 1 | | |
| 8 | |
| Other | |
| 14 | | |
| 35 | |
| Total fees and expenses | |
| 5,956 | | |
| 21,455 | |
| Transfer agent services reimbursements | |
| — | † | |
| — | † |
| Miscellaneous fee reimbursement | |
| — | | |
| — | |
| Total reimbursements of fees and expenses | |
| — | † | |
| — | † |
| Total fees and expenses after reimbursements | |
| 5,956 | | |
| 21,455 | |
| Net investment income | |
| 17,329 | | |
| 82,425 | |
| | |
| | | |
| | |
| Net realized gain (loss) and unrealized appreciation: | |
| | | |
| | |
| Net realized (loss) gain on: | |
| | | |
| | |
| Investments in unaffiliated issuers | |
| (944 | ) | |
| 8,060 | |
| Futures contracts | |
| 1,006 | | |
| 5,005 | |
| | |
| 62 | | |
| 13,065 | |
| | |
| | | |
| | |
| Net unrealized appreciation (depreciation) on: | |
| | | |
| | |
| Investments in unaffiliated issuers | |
| 18,006 | | |
| 96,147 | |
| Futures contracts | |
| 110 | | |
| (1,885 | ) |
| | |
| 18,116 | | |
| 94,262 | |
| Net realized gain (loss) and unrealized appreciation | |
| 18,178 | | |
| 107,327 | |
| Net increase in net assets resulting from operations | |
$ | 35,507 | | |
$ | 189,752 | |
| * |
Additional information related to class-specific fees and expenses is included in the notes to financial statements. |
| † |
Amount less than one thousand. |
See notes to financial statements.
| 90 |
American Funds Tax-Exempt Funds |
(dollars in thousands)
The Tax-Exempt
Bond Fund
of America | | |
American
High-Income
Municipal Bond Fund | | |
The Tax-Exempt
Fund of
California | | |
American Funds
Tax-Exempt Fund
of New York | |
| | | | |
| | | |
| | | |
| | |
| $ | 661,344 | | |
$ | 300,627 | | |
$ | 80,905 | | |
$ | 8,153 | |
| | | | |
| | | |
| | | |
| | |
| | 40,751 | | |
| 19,255 | | |
| 6,774 | | |
| 805 | |
| | 30,217 | | |
| 15,351 | | |
| 4,996 | | |
| 572 | |
| | 6,801 | | |
| 3,422 | | |
| 776 | | |
| 84 | |
| | 5,785 | | |
| 1,800 | | |
| 519 | | |
| 54 | |
| | 498 | | |
| 204 | | |
| 37 | | |
| 6 | |
| | 1,754 | | |
| 693 | | |
| 136 | | |
| 95 | |
| | 129 | | |
| 52 | | |
| 20 | | |
| 2 | |
| | 34 | | |
| 30 | | |
| 19 | | |
| 15 | |
| | 51 | | |
| 21 | | |
| 7 | | |
| — | † |
| | 802 | | |
| 1,705 | | |
| 162 | | |
| 4 | |
| | 67 | | |
| 166 | | |
| 30 | | |
| 13 | |
| | 86,889 | | |
| 42,699 | | |
| 13,476 | | |
| 1,650 | |
| | 1 | | |
| — | † | |
| — | † | |
| — | † |
| | — | | |
| — | | |
| — | | |
| 7 | |
| | 1 | | |
| — | † | |
| — | † | |
| 7 | |
| | 86,888 | | |
| 42,699 | | |
| 13,476 | | |
| 1,643 | |
| | 574,456 | | |
| 257,928 | | |
| 67,429 | | |
| 6,510 | |
| | | | |
| | | |
| | | |
| | |
| | 628 | | |
| 857 | | |
| 3,883 | | |
| 73 | |
| | 10,675 | | |
| (5,387 | ) | |
| 571 | | |
| — | |
| | 11,303 | | |
| (4,530 | ) | |
| 4,454 | | |
| 73 | |
| | | | |
| | | |
| | | |
| | |
| | 737,486 | | |
| 249,299 | | |
| 83,847 | | |
| 9,699 | |
| | (11,056 | ) | |
| (262 | ) | |
| (1,166 | ) | |
| (2 | ) |
| | 726,430 | | |
| 249,037 | | |
| 82,681 | | |
| 9,697 | |
| | 737,733 | | |
| 244,507 | | |
| 87,135 | | |
| 9,770 | |
| $ | 1,312,189 | | |
$ | 502,435 | | |
$ | 154,564 | | |
$ | 16,280 | |
| American Funds Tax-Exempt Funds |
91 |
Statements of changes in net assets
| | |
American Funds
Short-Term
Tax-Exempt Bond Fund | | |
Limited Term
Tax-Exempt Bond
Fund of America | | |
The Tax-Exempt
Bond Fund
of America | |
| | |
Year ended July 31, | | |
Year ended July 31, | | |
Year ended July 31, | |
| | |
2019 | | |
2018 | | |
2019 | | |
2018 | | |
2019 | | |
2018 | |
| Operations: | |
| | | |
| | | |
| | | |
| | | |
| | | |
| | |
| Net investment income | |
$ | 17,329 | | |
$ | 13,449 | | |
$ | 82,425 | | |
$ | 81,421 | | |
$ | 574,456 | | |
$ | 497,672 | |
| Net realized gain (loss) | |
| 62 | | |
| (1,290 | ) | |
| 13,065 | | |
| 127 | | |
| 11,303 | | |
| 21,037 | |
| Net unrealized appreciation (depreciation) | |
| 18,116 | | |
| (10,029 | ) | |
| 94,262 | | |
| (65,002 | ) | |
| 726,430 | | |
| (262,868 | ) |
| Net increase in net assets resulting from operations | |
| 35,507 | | |
| 2,130 | | |
| 189,752 | | |
| 16,546 | | |
| 1,312,189 | | |
| 255,841 | |
| | |
| | | |
| | | |
| | | |
| | | |
| | | |
| | |
| Distributions paid or accrued to shareholders | |
| (17,259 | ) | |
| (13,421 | ) | |
| (82,197 | ) | |
| (81,415 | ) | |
| (570,280 | ) | |
| (496,829 | ) |
| | |
| | | |
| | | |
| | | |
| | | |
| | | |
| | |
| Net capital share transactions | |
| 143,943 | | |
| (9,712 | ) | |
| 179,942 | | |
| 167,187 | | |
| 1,875,666 | | |
| 4,798,328 | |
| | |
| | | |
| | | |
| | | |
| | | |
| | | |
| | |
| Total increase (decrease) in net assets | |
| 162,191 | | |
| (21,003 | ) | |
| 287,497 | | |
| 102,318 | | |
| 2,617,575 | | |
| 4,557,340 | |
| | |
| | | |
| | | |
| | | |
| | | |
| | | |
| | |
| Net assets: | |
| | | |
| | | |
| | | |
| | | |
| | | |
| | |
| Beginning of year | |
| 978,187 | | |
| 999,190 | | |
| 3,965,311 | | |
| 3,862,993 | | |
| 19,028,062 | | |
| 14,470,722 | |
| End of year | |
$ | 1,140,378 | | |
$ | 978,187 | | |
$ | 4,252,808 | | |
$ | 3,965,311 | | |
$ | 21,645,637 | | |
$ | 19,028,062 | |
See notes to financial statements.
| 92 |
American Funds Tax-Exempt Funds |
American
High-Income
Municipal Bond Fund | | |
The Tax-Exempt
Fund of
California | | |
American Funds
Tax-Exempt Fund
of New York | |
| Year ended July 31, | | |
Year ended July 31, | | |
Year ended July 31, | |
| 2019 | | |
2018 | | |
2019 | | |
2018 | | |
2019 | | |
2018 | |
| | | | |
| | | |
| | | |
| | | |
| | | |
| | |
| $ | 257,928 | | |
$ | 227,543 | | |
$ | 67,429 | | |
$ | 63,832 | | |
$ | 6,510 | | |
$ | 5,760 | |
| | (4,530 | ) | |
| 48,562 | | |
| 4,454 | | |
| 7,138 | | |
| 73 | | |
| 132 | |
| | 249,037 | | |
| (37,622 | ) | |
| 82,681 | | |
| (32,836 | ) | |
| 9,697 | | |
| (4,196 | ) |
| | 502,435 | | |
| 238,483 | | |
| 154,564 | | |
| 38,134 | | |
| 16,280 | | |
| 1,696 | |
| | | | |
| | | |
| | | |
| | | |
| | | |
| | |
| | (253,695 | ) | |
| (224,199 | ) | |
| (66,970 | ) | |
| (63,679 | ) | |
| (6,466 | ) | |
| (5,766 | ) |
| | 1,012,098 | | |
| 963,626 | | |
| 233,925 | | |
| 157,339 | | |
| 26,639 | | |
| 31,122 | |
| | 1,260,838 | | |
| 977,910 | | |
| 321,519 | | |
| 131,794 | | |
| 36,453 | | |
| 27,052 | |
| | | | |
| | | |
| | | |
| | | |
| | | |
| | |
| | 6,491,416 | | |
| 5,513,506 | | |
| 2,255,362 | | |
| 2,123,568 | | |
| 238,501 | | |
| 211,449 | |
| $ | 7,752,254 | | |
$ | 6,491,416 | | |
$ | 2,576,881 | | |
$ | 2,255,362 | | |
$ | 274,954 | | |
$ | 238,501 | |
| American Funds Tax-Exempt Funds |
93 |
Notes to financial statements
1. Organization
American Funds Short-Term Tax-Exempt Bond Fund, Limited Term
Tax-Exempt Bond Fund of America, The Tax-Exempt Bond Fund of America, American High-Income Municipal Bond Fund, The Tax-Exempt
Fund of California, which is presently the only series of The American Funds Tax-Exempt Series II, and American Funds Tax-Exempt
Fund of New York (each a “fund” or collectively, the “funds”), are registered under the Investment Company
Act of 1940 as open-end, diversified management investment companies.
Each fund’s investment objectives are as follows:
American Funds Short-Term Tax-Exempt Bond Fund —
Seeks to provide current income exempt from regular federal income tax, consistent with the maturity and quality standards described
in the prospectus, and to preserve capital.
Limited Term Tax-Exempt Bond Fund of America — Seeks
to provide current income exempt from regular federal income tax, consistent with the maturity and quality standards described
in the prospectus, and to preserve capital.
The Tax-Exempt Bond Fund of America — Seeks to provide
a high level of current income exempt from federal income tax, consistent with the preservation of capital.
American High-Income Municipal Bond Fund — Seeks
to provide a high level of current income exempt from regular federal income tax.
The Tax-Exempt Fund of California — Seeks to provide
a high level of current income exempt from regular federal and California state income taxes. Its secondary objective is preservation
of capital.
American Funds Tax-Exempt Fund of New York — Seeks
to provide a high level of current income exempt from regular federal, New York state and New York City income taxes. Its secondary
objective is preservation of capital.
American Funds Short-Term Tax-Exempt Bond Fund has six share
classes consisting of five retail share classes (Classes A and T, as well as three F share classes, F-1, F-2 and F-3) and one share
class that is only available to the American Funds Portfolio Series (Class R-6). Limited Term Tax-Exempt Bond Fund of America,
The Tax-Exempt Bond Fund of America and American High-Income Municipal Bond Fund each have seven share classes consisting of six
retail share classes (Classes A, C and T, as well as three F share classes, F-1, F-2 and F-3) and one share class that is only
available to the American Funds Portfolio Series (Class R-6). The Tax-Exempt Fund of California and American Funds Tax-Exempt Fund
of New York each have six retail share classes (Classes A, C and T, as well as three F share classes, F-1, F-2 and F-3). Some share
classes are only available to limited categories of investors. The funds’ share classes are described further in the following
table:
| Share
class |
|
Initial sales charge |
|
Contingent deferred sales
charge upon redemption |
|
Conversion feature |
| Class
A |
|
Up to 2.50% for American Funds Short-Term Tax-Exempt Bond Fund and Limited Term Tax-Exempt Bond Fund of America; up to 3.75% for all other funds |
|
None (except 1% for certain redemptions within 18 months of purchase without an initial sales charge) |
|
None |
| Class
C* |
|
None |
|
1% for redemptions within one year of purchase |
|
Class C converts to Class F-1 after 10 years |
| Class
T† |
|
Up to 2.50% |
|
None |
|
None |
| Classes
F-1, F-2 and F-3 |
|
None |
|
None |
|
None |
| Class
R-6 |
|
None |
|
None |
|
None |
| * |
Class C shares are not available for purchase in Limited Term Tax-Exempt Bond Fund of America. |
| † |
Class T shares are not available for purchase. |
Holders of all share classes of each fund have equal pro rata
rights to the assets, dividends and liquidation proceeds of each fund held. Each share class of each fund has identical voting
rights, except for the exclusive right to vote on matters affecting only its class. Share classes have different fees and expenses
(“class-specific fees and expenses”), primarily due to different arrangements for distribution, transfer agent and
administrative services. Differences in class-specific fees and expenses will result in differences in net investment income and,
therefore, the payment of different per-share dividends by each share class of each fund.
| 94 |
American Funds Tax-Exempt Funds |
2. Significant accounting policies
Each fund is an investment company that applies the accounting
and reporting guidance issued in Topic 946 by the U.S. Financial Accounting Standards Board. Each fund’s financial statements
have been prepared to comply with U.S. generally accepted accounting principles (“U.S. GAAP”). These principles require
the funds’ investment adviser to make estimates and assumptions that affect reported amounts and disclosures. Actual results
could differ from those estimates. Subsequent events, if any, have been evaluated through the date of issuance in the preparation
of the financial statements. The funds follow the significant accounting policies described in this section, as well as the valuation
policies described in the next section on valuation.
Security transactions and related investment income —
Security transactions are recorded by the funds as of the date the trades are executed with brokers. Realized gains and losses
from security transactions are determined based on the specific identified cost of the securities. In the event a security is purchased
with a delayed payment date, the funds will segregate liquid assets sufficient to meet their payment obligations. Interest income
is recognized on an accrual basis. Market discounts, premiums and original issue discounts on fixed-income securities are amortized
daily over the expected life of the security.
Class allocations — Income, fees and expenses (other
than class-specific fees and expenses) are allocated daily among the various share classes of each fund based on the relative value
of their settled shares. Realized and unrealized gains and losses are allocated daily among the various share classes of each fund
based on their relative net assets. Class-specific fees and expenses, such as distribution, transfer agent and administrative services,
are charged directly to the respective share class of each fund.
Distributions paid or accrued to shareholders —
Income dividends are declared daily after the determination of each fund’s net investment income and are paid to shareholders
monthly. Capital gain distributions are recorded on each fund’s ex-dividend date.
3. Valuation
Capital Research and Management Company (“CRMC”),
the funds’ investment adviser, values each fund’s investments at fair value as defined by U.S. GAAP. The net asset
value of each share class of each fund is generally determined as of approximately 4:00 p.m. New York time each day the New York
Stock Exchange is open.
Methods and inputs — The funds’ investment
adviser uses the following methods and inputs to establish the fair value of each fund’s assets and liabilities. Use of particular
methods and inputs may vary over time based on availability and relevance as market and economic conditions evolve.
Fixed-income securities, including short-term securities, are
generally valued at prices obtained from one or more pricing vendors. Vendors value such securities based on one or more of the
following inputs: benchmark yields, transactions, bids, offers, quotations from dealers and trading systems, new issues, spreads
and other relationships observed in the markets among comparable securities; and proprietary pricing models such as yield measures
calculated using factors such as cash flows, financial or collateral performance and other reference data. For certain distressed
securities, valuations may include cash flows or liquidation values using a net present value calculation based on inputs that
include, but are not limited to, financial statements and debt contracts.
When the funds’ investment adviser deems it appropriate
to do so (such as when vendor prices are unavailable or not deemed to be representative), fixed-income securities will be valued
in good faith at the mean quoted bid and ask prices that are reasonably and timely available (or bid prices, if ask prices are
not available) or at prices for securities of comparable maturity, quality and type. Some securities may be valued based on their
effective maturity or average life, which may be shorter than the stated maturity.
Exchange-traded futures are generally valued at the official
settlement price of the exchange or market on which such instruments are traded, as of the close of business on the day the futures
are being valued.
| American Funds Tax-Exempt Funds |
95 |
Securities and other assets for which representative market quotations
are not readily available or are considered unreliable by the funds’ investment adviser are fair valued as determined in
good faith under fair valuation guidelines adopted by authority of each fund’s board of trustees as further described. The
investment adviser follows fair valuation guidelines, consistent with U.S. Securities and Exchange Commission rules and guidance,
to consider relevant principles and factors when making fair value determinations. The investment adviser considers relevant indications
of value that are reasonably and timely available to it in determining the fair value to be assigned to a particular security,
such as the type and cost of the security; contractual or legal restrictions on resale of the security; relevant financial or business
developments of the issuer; actively traded similar or related securities; conversion or exchange rights on the security; related
corporate actions; significant events occurring after the close of trading in the security; and changes in overall market conditions.
In addition, the closing prices of equity securities that trade in markets outside U.S. time zones may be adjusted to reflect significant
events that occur after the close of local trading but before the net asset value of each share class of the fund is determined.
Fair valuations and valuations of investments that are not actively trading involve judgment and may differ materially from valuations
that would have been used had greater market activity occurred.
Processes and structure — Each fund’s board
of trustees has delegated authority to the funds’ investment adviser to make fair value determinations, subject to board
oversight. The investment adviser has established a Joint Fair Valuation Committee (the “Fair Valuation Committee”)
to administer, implement and oversee the fair valuation process, and to make fair value decisions. The Fair Valuation Committee
regularly reviews its own fair value decisions, as well as decisions made under its standing instructions to the investment adviser’s
valuation teams. The Fair Valuation Committee reviews changes in fair value measurements from period to period and may, as deemed
appropriate, update the fair valuation guidelines to better reflect the results of back testing and address new or evolving issues.
The Fair Valuation Committee reports any changes to the fair valuation guidelines to the boards of trustees. Each fund’s
board and audit committee also regularly review reports that describe fair value determinations and methods.
The funds’ investment adviser has also established a Fixed-Income
Pricing Review Group to administer and oversee the fixed-income valuation process, including the use of fixed-income pricing vendors.
This group regularly reviews pricing vendor information and market data. Pricing decisions, processes and controls over security
valuation are also subject to additional internal reviews, including an annual control self-evaluation program facilitated by the
investment adviser’s compliance group.
Classifications — The funds’ investment adviser
classifies each fund’s assets and liabilities into three levels based on the inputs used to value the assets or liabilities.
Level 1 values are based on quoted prices in active markets for identical securities. Level 2 values are based on significant observable
market inputs, such as quoted prices for similar securities and quoted prices in inactive markets. Certain securities trading outside
the U.S. may transfer between Level 1 and Level 2 due to valuation adjustments resulting from significant market movements following
the close of local trading. Level 3 values are based on significant unobservable inputs that reflect the investment adviser’s
determination of assumptions that market participants might reasonably use in valuing the securities. The valuation levels are
not necessarily an indication of the risk or liquidity associated with the underlying investment. For example, U.S. government
securities are reflected as Level 2 because the inputs used to determine fair value may not always be quoted prices in an active
market.
| 96 |
American Funds Tax-Exempt Funds |
The following tables present the funds’ valuation levels
as of July 31, 2019 (dollars in thousands):
American Funds Short-Term Tax-Exempt Bond Fund
| | |
Investment securities |
| | |
Level 1 | | |
Level 2 | | |
Level 3 | | |
Total | |
| Assets: | |
| | | |
| | | |
| | | |
| | |
| Bonds, notes & other debt instruments: | |
| | | |
| | | |
| | | |
| | |
| Texas | |
$ | — | | |
$ | 167,204 | | |
$ | — | | |
$ | 167,204 | |
| Illinois | |
| — | | |
| 81,829 | | |
| — | | |
| 81,829 | |
| New York | |
| — | | |
| 79,244 | | |
| — | | |
| 79,244 | |
| Florida | |
| — | | |
| 46,593 | | |
| — | | |
| 46,593 | |
| Pennsylvania | |
| — | | |
| 45,118 | | |
| — | | |
| 45,118 | |
| North Carolina | |
| — | | |
| 44,922 | | |
| — | | |
| 44,922 | |
| California | |
| — | | |
| 38,634 | | |
| — | | |
| 38,634 | |
| Wisconsin | |
| — | | |
| 36,799 | | |
| — | | |
| 36,799 | |
| Ohio | |
| — | | |
| 36,594 | | |
| — | | |
| 36,594 | |
| Washington | |
| — | | |
| 34,098 | | |
| — | | |
| 34,098 | |
| Other | |
| — | | |
| 441,250 | | |
| — | | |
| 441,250 | |
| Short-term securities | |
| — | | |
| 84,173 | | |
| — | | |
| 84,173 | |
| Total | |
$ | — | | |
$ | 1,136,458 | | |
$ | — | | |
$ | 1,136,458 | |
| | |
|
| | |
Other investments* |
| | |
Level 1 | | |
Level 2 | | |
Level 3 | | |
Total | |
| Assets: | |
| | | |
| | | |
| | | |
| | |
| Unrealized appreciation on futures contracts | |
$ | 27 | | |
$ | — | | |
$ | — | | |
$ | 27 | |
| Liabilities: | |
| | | |
| | | |
| | | |
| | |
| Unrealized depreciation on futures contracts | |
| (18 | ) | |
| — | | |
| — | | |
| (18 | ) |
| Total | |
$ | 9 | | |
$ | — | | |
$ | — | | |
$ | 9 | |
Limited Term Tax-Exempt Bond Fund of America
| | |
Investment securities |
| | |
Level 1 | | |
Level 2 | | |
Level 3 | | |
Total | |
| Assets: | |
| | | |
| | | |
| | | |
| | |
| Bonds, notes & other debt instruments: | |
| | | |
| | | |
| | | |
| | |
| Illinois | |
$ | — | | |
$ | 473,256 | | |
$ | — | | |
$ | 473,256 | |
| Texas | |
| — | | |
| 452,089 | | |
| — | | |
| 452,089 | |
| New York | |
| — | | |
| 312,561 | | |
| — | | |
| 312,561 | |
| Pennsylvania | |
| — | | |
| 222,304 | | |
| — | | |
| 222,304 | |
| California | |
| — | | |
| 202,647 | | |
| — | | |
| 202,647 | |
| Florida | |
| — | | |
| 186,993 | | |
| — | | |
| 186,993 | |
| Michigan | |
| — | | |
| 154,948 | | |
| — | | |
| 154,948 | |
| Wisconsin | |
| — | | |
| 145,779 | | |
| — | | |
| 145,779 | |
| Washington | |
| — | | |
| 140,471 | | |
| — | | |
| 140,471 | |
| New Jersey | |
| — | | |
| 127,994 | | |
| — | | |
| 127,994 | |
| Other | |
| — | | |
| 1,516,938 | | |
| — | | |
| 1,516,938 | |
| Short-term securities | |
| — | | |
| 292,901 | | |
| — | | |
| 292,901 | |
| Total | |
$ | — | | |
$ | 4,228,881 | | |
$ | — | | |
$ | 4,228,881 | |
| | |
|
| | |
Other investments* |
| | |
Level 1 | | |
Level 2 | | |
Level 3 | | |
Total | |
| Assets: | |
| | | |
| | | |
| | | |
| | |
| Unrealized appreciation on futures contracts | |
$ | 122 | | |
$ | — | | |
$ | — | | |
$ | 122 | |
| Liabilities: | |
| | | |
| | | |
| | | |
| | |
| Unrealized depreciation on futures contracts | |
| (1,917 | ) | |
| — | | |
| — | | |
| (1,917 | ) |
| Total | |
$ | (1,795 | ) | |
$ | — | | |
$ | — | | |
$ | (1,795 | ) |
See end of tables for footnote.
| American Funds Tax-Exempt Funds |
97 |
The Tax-Exempt Bond Fund of America
| | |
Investment securities |
| | |
Level 1 | | |
Level 2 | | |
Level 3 | | |
Total | |
| Assets: | |
| | | |
| | | |
| | | |
| | |
| Bonds, notes & other debt instruments: | |
| | | |
| | | |
| | | |
| | |
| Illinois | |
$ | — | | |
$ | 2,983,762 | | |
$ | — | | |
$ | 2,983,762 | |
| Texas | |
| — | | |
| 2,239,771 | | |
| — | | |
| 2,239,771 | |
| New York | |
| — | | |
| 1,476,522 | | |
| — | | |
| 1,476,522 | |
| California | |
| — | | |
| 1,457,715 | | |
| — | | |
| 1,457,715 | |
| Florida | |
| — | | |
| 1,384,128 | | |
| 5,935 | | |
| 1,390,063 | |
| Pennsylvania | |
| — | | |
| 1,025,476 | | |
| — | | |
| 1,025,476 | |
| Michigan | |
| — | | |
| 988,535 | | |
| — | | |
| 988,535 | |
| Washington | |
| — | | |
| 575,602 | | |
| — | | |
| 575,602 | |
| Ohio | |
| — | | |
| 532,144 | | |
| — | | |
| 532,144 | |
| Virginia | |
| — | | |
| 523,997 | | |
| — | | |
| 523,997 | |
| Other | |
| — | | |
| 7,073,503 | | |
| — | | |
| 7,073,503 | |
| Short-term securities | |
| — | | |
| 1,343,782 | | |
| — | | |
| 1,343,782 | |
| Total | |
$ | — | | |
$ | 21,604,937 | | |
$ | 5,935 | | |
$ | 21,610,872 | |
| | |
|
| | |
Other investments* |
| | |
Level 1 | | |
Level 2 | | |
Level 3 | | |
Total | |
| Assets: | |
| | | |
| | | |
| | | |
| | |
| Unrealized appreciation on futures contracts | |
$ | 1,295 | | |
$ | — | | |
$ | — | | |
$ | 1,295 | |
| Liabilities: | |
| | | |
| | | |
| | | |
| | |
| Unrealized depreciation on futures contracts | |
| (10,482 | ) | |
| — | | |
| — | | |
| (10,482 | ) |
| Total | |
$ | (9,187 | ) | |
$ | — | | |
$ | — | | |
$ | (9,187 | ) |
American High-Income Municipal Bond Fund
| | |
Investment securities |
| | |
Level 1 | | |
Level 2 | | |
Level 3 | | |
Total | |
| Assets: | |
| | | |
| | | |
| | | |
| | |
| Bonds, notes & other debt instruments: | |
| | | |
| | | |
| | | |
| | |
| Illinois | |
$ | — | | |
$ | 1,134,482 | | |
$ | — | | |
$ | 1,134,482 | |
| Texas | |
| — | | |
| 454,227 | | |
| — | | |
| 454,227 | |
| California | |
| — | | |
| 434,147 | | |
| — | | |
| 434,147 | |
| Pennsylvania | |
| — | | |
| 430,676 | | |
| — | | |
| 430,676 | |
| Colorado | |
| — | | |
| 429,503 | | |
| — | | |
| 429,503 | |
| Florida | |
| — | | |
| 395,276 | | |
| 6,012 | | |
| 401,288 | |
| Ohio | |
| — | | |
| 360,573 | | |
| — | | |
| 360,573 | |
| New Jersey | |
| — | | |
| 310,131 | | |
| — | | |
| 310,131 | |
| Puerto Rico | |
| — | | |
| 309,728 | | |
| — | | |
| 309,728 | |
| New York | |
| — | | |
| 251,742 | | |
| — | | |
| 251,742 | |
| Other | |
| — | | |
| 2,743,685 | | |
| — | | |
| 2,743,685 | |
| Short-term securities | |
| — | | |
| 461,549 | | |
| — | | |
| 461,549 | |
| Total | |
$ | — | | |
$ | 7,715,719 | | |
$ | 6,012 | | |
$ | 7,721,731 | |
| | |
|
| | |
Other investments* |
| | |
Level 1 | | |
Level 2 | | |
Level 3 | | |
Total | |
| Assets: | |
| | | |
| | | |
| | | |
| | |
| Unrealized appreciation on futures contracts | |
$ | 1,516 | | |
$ | — | | |
$ | — | | |
$ | 1,516 | |
| Liabilities: | |
| | | |
| | | |
| | | |
| | |
| Unrealized depreciation on futures contracts | |
| (1,881 | ) | |
| — | | |
| — | | |
| (1,881 | ) |
| Total | |
$ | (365 | ) | |
$ | — | | |
$ | — | | |
$ | (365 | ) |
| 98 |
American Funds Tax-Exempt Funds |
The Tax-Exempt Fund of California
| | |
Investment securities |
| | |
Level 1 | | |
Level 2 | | |
Level 3 | | |
Total | |
| Assets: | |
| | | |
| | | |
| | | |
| | |
| Bonds, notes & other debt instruments: | |
| | | |
| | | |
| | | |
| | |
| State issuers | |
$ | — | | |
$ | 936,754 | | |
$ | — | | |
$ | 936,754 | |
| City, county & other issuers | |
| — | | |
| 1,453,650 | | |
| — | | |
| 1,453,650 | |
| Guam | |
| — | | |
| 8,722 | | |
| — | | |
| 8,722 | |
| Puerto Rico | |
| — | | |
| 12,844 | | |
| — | | |
| 12,844 | |
| United States | |
| — | | |
| 18,996 | | |
| — | | |
| 18,996 | |
| Short-term securities | |
| — | | |
| 156,314 | | |
| — | | |
| 156,314 | |
| Total | |
$ | — | | |
$ | 2,587,280 | | |
$ | — | | |
$ | 2,587,280 | |
| | |
|
| | |
Other investments* |
| | |
Level 1 | | |
Level 2 | | |
Level 3 | | |
Total | |
| Assets: | |
| | | |
| | | |
| | | |
| | |
| Unrealized appreciation on futures contracts | |
$ | 62 | | |
$ | — | | |
$ | — | | |
$ | 62 | |
| Liabilities: | |
| | | |
| | | |
| | | |
| | |
| Unrealized depreciation on futures contracts | |
| (1,228 | ) | |
| — | | |
| — | | |
| (1,228 | ) |
| Total | |
$ | (1,166 | ) | |
$ | — | | |
$ | — | | |
$ | (1,166 | ) |
American Funds Tax-Exempt Fund of New York
| | |
Investment securities |
| | |
Level 1 | | |
Level 2 | | |
Level 3 | | |
Total | |
| Assets: | |
| | | |
| | | |
| | | |
| | |
| Bonds, notes & other debt instruments: | |
| | | |
| | | |
| | | |
| | |
| State issuers | |
$ | — | | |
$ | 127,408 | | |
$ | — | | |
$ | 127,408 | |
| City, county & other issuers | |
| — | | |
| 123,404 | | |
| — | | |
| 123,404 | |
| Other U.S. territories | |
| — | | |
| 5,947 | | |
| — | | |
| 5,947 | |
| Short-term securities | |
| — | | |
| 15,376 | | |
| — | | |
| 15,376 | |
| Total | |
$ | — | | |
$ | 272,135 | | |
$ | — | | |
$ | 272,135 | |
| | |
|
| | |
Other investments* |
| | |
Level 1 | | |
Level 2 | | |
Level 3 | | |
Total | |
| Liabilities: | |
| | | |
| | | |
| | | |
| | |
| Unrealized depreciation on futures contracts | |
$ | (2 | ) | |
$ | — | | |
$ | — | | |
$ | (2 | ) |
| * |
Futures contracts are not included in the investment portfolio. |
| American Funds Tax-Exempt Funds |
99 |
4. Risk factors
Investing in each fund may involve certain risks including, but
not limited to, those described below.
Market conditions — The prices of, and the income
generated by, the securities held by the funds may decline — sometimes rapidly or unpredictably — due to various factors,
including events or conditions affecting the general economy or particular industries; overall market changes; local, regional
or global political, social or economic instability; governmental, governmental agency or central bank responses to economic conditions;
and currency exchange rate, interest rate and commodity price fluctuations.
Issuer risks — The prices of, and the income generated
by, securities held by the funds may decline in response to various factors directly related to the issuers of such securities,
including reduced demand for an issuer’s goods or services, poor management performance, major litigation related to the
issuer, changes in government regulations affecting the issuer or its competitive environment and strategic initiatives such as
mergers, acquisitions or dispositions and the market response to any such initiatives.
Investing in municipal securities — The yield and/or
value of the funds’ investments in municipal securities may be adversely affected by events tied to the municipal securities
markets, which can be very volatile and significantly impacted by unfavorable legislative or political developments and negative
changes in the financial conditions of municipal securities issuers and the economy. To the extent the funds invest in obligations
of a municipal issuer, the volatility, credit quality and performance of the funds may be adversely impacted by local political
and economic conditions of the issuer. For example, a credit rating downgrade, bond default or bankruptcy involving an issuer within
a particular state or territory could affect the market values and marketability of many or all municipal obligations of that state
or territory. Income from municipal securities held by the funds could also be declared taxable because of changes in tax laws
or interpretations by taxing authorities or as a result of noncompliant conduct of a municipal issuer. Additionally, the relative
amount of publicly available information about municipal securities is generally less than that for corporate securities.
Investing in debt instruments — The prices of, and
the income generated by, bonds and other debt securities held by the funds may be affected by changing interest rates and by changes
in the effective maturities and credit ratings of these securities.
Rising interest rates will generally cause the prices of bonds
and other debt securities to fall. A general rise in interest rates may cause investors to sell debt securities on a large scale,
which could also adversely affect the price and liquidity of debt securities and could also result in increased redemptions from
the funds. Falling interest rates may cause an issuer to redeem, call or refinance a debt security before its stated maturity,
which may result in the funds failing to recoup the full amount of its initial investment and having to reinvest the proceeds in
lower yielding securities. Longer maturity debt securities generally have greater sensitivity to changes in interest rates and
may be subject to greater price fluctuations than shorter maturity debt securities.
Bonds and other debt securities are also subject to credit risk,
which is the possibility that the credit strength of an issuer or guarantor will weaken or be perceived to be weaker, and/or an
issuer of a debt security will fail to make timely payments of principal or interest and the security will go into default. A downgrade
or default affecting any of the fund’s securities could cause the value of the fund’s shares to decrease. Lower quality
debt securities generally have higher rates of interest and may be subject to greater price fluctuations than higher quality debt
securities. Credit risk is gauged, in part, by the credit ratings of the debt securities in which the funds invest. However, ratings
are only the opinions of the rating agencies issuing them and are not guarantees as to credit quality or an evaluation of market
risk. The funds’ investment adviser relies on its own credit analysts to research issuers and issues in seeking to assess
credit and default risks.
Liquidity risk — Certain fund holdings may be or
become difficult or impossible to sell, particularly during times of market turmoil. Liquidity may be impacted by the lack of an
active market for a holding, legal or contractual restrictions on resale, or the reduced number and capacity of market participants
to make a market in such holding. Market prices for less liquid or illiquid holdings may be volatile, and reduced liquidity may
have an adverse impact on the market price of such holdings. Additionally, the sale of less liquid or illiquid holdings may involve
substantial delays (including delays in settlement) and additional costs and the fund may be unable to sell such holdings when
necessary to meet its liquidity needs or may be forced to sell at a loss.
Credit and liquidity support — Changes in the credit
quality of banks and financial institutions providing credit and liquidity support features with respect to securities held by
the funds could cause the values of these securities to decline.
| 100 |
American Funds Tax-Exempt Funds |
Investing in lower rated debt instruments — Lower
rated bonds and other lower rated debt securities generally have higher rates of interest and involve greater risk of default or
price declines due to changes in the issuer’s creditworthiness than those of higher quality debt securities. The market prices
of these securities may fluctuate more than the prices of higher quality debt securities and may decline significantly in periods
of general economic difficulty. These risks may be increased with respect to investments in junk bonds.
Investing in similar municipal bonds — Investing
significantly in municipal obligations of multiple issuers in the same state or backed by revenues of similar types of projects
or industries may make the funds more susceptible to certain economic, political or regulatory occurrences. As a result, the potential
for fluctuations in the funds’ share price may increase.
Risks of investing in municipal bonds of issuers within the
state of California — Because The Tax-Exempt Fund of California invests primarily in securities of issuers within the
state of California, the fund is more susceptible to factors adversely affecting issuers of California securities than a comparable
municipal bond mutual fund that does not concentrate its investments in a single state. For example, in the past, California voters
have passed amendments to the state’s constitution and other measures that limit the taxing and spending authority of California
governmental entities, and future voter initiatives may adversely affect California municipal bonds.
Risks of investing in municipal bonds of issuers within the
state of New York — Because American Funds Tax-Exempt Fund of New York invests primarily in securities of issuers within
the state of New York, the fund is more susceptible to factors adversely affecting issuers of New York securities than a comparable
municipal bond mutual fund that does not concentrate its investments in a single state. For example, such factors may include political
policy changes, tax base erosion, state constitutional limits on tax increases, budget deficits and other financial or economic
difficulties, and changes in the credit ratings assigned to New York’s municipal issuers. New York’s economy and finances
may be especially vulnerable to changes in the performance of the financial services sector, which historically has been volatile.
Management — The investment adviser to the funds
actively manages the funds’ investments. Consequently, the funds are subject to the risk that the methods and analyses, including
models, tools and data, employed by the investment adviser in this process may be flawed or incorrect and may not produce the desired
results. This could cause the funds to lose value or their investment results to lag relevant benchmarks or other funds with similar
objectives.
| American Funds Tax-Exempt Funds |
101 |
5. Certain investment techniques
Unfunded commitments — American High-Income Municipal
Bond Fund has participated in transactions that involve unfunded commitments, which may obligate the fund to purchase new or additional
bonds if certain contingencies are met. As of July 31, 2019, the maximum exposure of unfunded bond commitments for American High-Income
Municipal Bond Fund was $2,154,000, which would represent less than .01% of the net assets of the fund should such commitments
become due.
Futures contracts — Each fund has entered into futures
contracts, which provide for the future sale by one party and purchase by another party of a specified amount of a specific financial
instrument for a specified price, date, time and place designated at the time the contract is made. Futures contracts are used
to strategically manage the fund’s interest rate sensitivity by increasing or decreasing the duration of the fund or a portion
of the fund’s portfolio.
Upon entering into futures contracts, and to maintain the fund’s
open positions in futures contracts, each fund is required to deposit with a futures broker, known as a futures commission merchant
(“FCM”), in a segregated account in the name of the FCM an amount of cash, U.S. government securities or other liquid
securities, known as initial margin. The margin required for a particular futures contract is set by the exchange on which the
contract is traded to serve as collateral, and may be significantly modified from time to time by the exchange during the term
of the contract. Securities deposited as initial margin, if any, are disclosed in the investment portfolio and cash deposited as
initial margin, if any, is reflected as cash pledged for futures contracts in the fund’s statement of assets and liabilities.
On a daily basis, each fund pays or receives variation margin
based on the increase or decrease in the value of the futures contracts and records variation margin on futures contracts in the
statement of assets and liabilities. In addition, each fund segregates liquid assets equivalent to each fund’s outstanding
obligations under the contract in excess of the initial margin and variation margin, if any. Futures contracts may involve a risk
of loss in excess of the variation margin shown on each fund’s statement of assets and liabilities. Each fund records realized
gains or losses at the time the futures contract is closed or expires. Net realized gains or losses and net unrealized appreciation
or depreciation from futures contracts are recorded in each fund’s statement of operations.
The following table presents the average month-end notional amount
of futures contracts while held for each fund (dollars in thousands):
| | |
Futures
contracts | |
| American Funds Short-Term Tax-Exempt Bond Fund | |
$ | 155,225 | |
| Limited Term Tax-Exempt Bond Fund of America | |
| 458,050 | |
| The Tax-Exempt Bond Fund of America | |
| 1,729,275 | |
| American High-Income Municipal Bond Fund | |
| 469,625 | |
| The Tax-Exempt Fund of California | |
| 479,460 | |
| American Funds Tax-Exempt Fund of New York | |
| 2,200 | |
The following tables identify the location of and fair value
amounts on the funds’ statements of assets and liabilities and the effect on the funds’ statements of operations resulting
from the funds’ use of futures contracts as of, or for the year ended, July 31, 2019 (dollars in thousands):
American Funds Short-Term Tax-Exempt Bond Fund
| | |
| |
Assets | | |
Liabilities | |
| Contracts | |
Risk type | |
Location on statement of
assets and liabilities | |
Value | | |
Location on statement of
assets and liabilities | |
Value | |
| Futures | |
Interest | |
Unrealized appreciation* | |
$ | 27 | | |
Unrealized depreciation* | |
$ | 18 | |
| | |
| |
| |
| | | |
| |
| | |
| | |
| |
Net realized gain | | |
Net unrealized appreciation | |
| Contracts | |
Risk type | |
Location on statement of
operations | |
Value | | |
Location on statement of
operations | |
Value | |
| Futures | |
Interest | |
Net realized gain on futures contracts | |
$ | 1,006 | | |
Net unrealized appreciation on futures contracts | |
$ | 110 | |
| 102 |
American Funds Tax-Exempt Funds |
Limited Term Tax-Exempt Bond Fund of America
| | |
| |
Assets | | |
Liabilities | |
| Contracts | |
Risk type | |
Location on statement of
assets and liabilities | |
Value | | |
Location on statement of
assets and liabilities | |
Value | |
| Futures | |
Interest | |
Unrealized appreciation* | |
$ | 122 | | |
Unrealized depreciation* | |
$ | 1,917 | |
| | |
| |
| | | |
| |
| |
|
| |
| | |
| |
Net realized gain | | |
Net unrealized depreciation | |
| Contracts | |
Risk type | |
Location on statement of
operations | |
Value | | |
Location on statement of
operations | |
Value | |
| Futures | |
Interest | |
Net realized gain on futures contracts | |
$ | 5,005 | | |
Net unrealized depreciation on futures contracts | |
$ | (1,885 | ) |
| | |
| |
| |
| | | |
| |
| | |
| The Tax-Exempt Bond Fund of America | |
| | |
| |
| |
| | | |
| |
| | |
| | |
| |
Assets | | |
Liabilities | |
| Contracts | |
Risk type | |
Location on statement of
assets and liabilities | |
Value | | |
Location on statement of
assets and liabilities | |
Value | |
| Futures | |
Interest | |
Unrealized appreciation* | |
$ | 1,295 | | |
Unrealized depreciation* | |
$ | 10,482 | |
| | |
| |
| |
| | | |
| |
| | |
| | |
| |
Net realized gain | | |
Net unrealized depreciation | |
| Contracts | |
Risk type | |
Location on statement of
operations | |
Value | | |
Location on statement of
operations | |
Value | |
| Futures | |
Interest | |
Net realized gain on futures contracts | |
$ | 10,675 | | |
Net unrealized depreciation on futures contracts | |
$ | (11,056 | ) |
| | |
| |
| |
| | | |
| |
| | |
| American High-Income Municipal Bond Fund | |
| | |
| | |
| |
| |
| | | |
| |
| | |
| | |
| |
Assets | | |
Liabilities | |
| Contracts | |
Risk type | |
Location on statement of
assets and liabilities | |
Value | | |
Location on statement of
assets and liabilities | |
Value | |
| Futures | |
Interest | |
Unrealized appreciation* | |
$ | 1,516 | | |
Unrealized depreciation* | |
$ | 1,881 | |
| | |
| |
| |
| | | |
| |
| | |
| | |
| |
Net realized loss | | |
Net unrealized depreciation | |
| Contracts | |
Risk type | |
Location on statement of
operations | |
Value | | |
Location on statement of
operations | |
Value | |
| Futures | |
Interest | |
Net realized loss on futures contracts | |
$ | (5,387 | ) | |
Net unrealized depreciation on futures contracts | |
$ | (262 | ) |
| | |
| |
| |
| | | |
| |
| | |
| The Tax-Exempt Fund of California |
| | |
| | |
| |
| |
| | | |
| |
| | |
| | |
| |
Assets | | |
Liabilities | |
| Contracts | |
Risk type | |
Location on statement of
assets and liabilities | |
Value | | |
Location on statement of
assets and liabilities | |
Value | |
| Futures | |
Interest | |
Unrealized appreciation* | |
$ | 62 | | |
Unrealized depreciation* | |
$ | 1,228 | |
| | |
| |
| |
| | | |
| |
| | |
| | |
| |
Net realized gain | | |
Net unrealized depreciation | |
| Contracts | |
Risk type | |
Location on statement of
operations | |
Value | | |
Location on statement of
operations | |
Value | |
| Futures | |
Interest | |
Net realized gain on futures contracts | |
$ | 571 | | |
Net unrealized depreciation on futures contracts | |
$ | (1,166 | ) |
See end of tables for footnote.
| American Funds Tax-Exempt Funds |
103 |
American Funds Tax-Exempt Fund of New York
| | |
| |
Assets |
| |
Liabilities | |
| Contracts | |
Risk type | |
Location on statement of
assets and liabilities | |
Value | | |
Location on statement of
assets and liabilities | |
Value | |
| Futures | |
Interest | |
Unrealized appreciation* | |
$ | — | | |
Unrealized depreciation* | |
$ | 2 | |
| | |
| |
| |
| | | |
| |
| | |
| | |
| |
Net realized gain | | |
Net unrealized depreciation | |
| Contracts | |
Risk type | |
Location on statement of
operations | |
Value | | |
Location on statement of
operations | |
Value | |
| Futures | |
Interest | |
Net realized gain on futures contracts | |
$ | — | | |
Net unrealized depreciation on futures contracts | |
$ | (2 | ) |
| * |
Includes cumulative appreciation/depreciation on futures contracts as reported in the applicable table following each fund’s investment portfolio. Only current day’s variation margin is reported within each fund’s statement of assets and liabilities. |
Collateral — Each fund participates in a collateral
program due to each fund’s use of futures contracts that calls for each fund to either receive or pledge highly liquid assets,
such as cash or U.S. government securities, as collateral for initial and variation margin by contract. The purpose of the collateral
is to cover potential losses that could occur in the event that either party cannot meet its contractual obligation. Non-cash collateral
pledged by each fund, if any, is disclosed in each fund’s investment portfolio, and cash collateral pledged by each fund,
if any, is held in a segregated account with each fund’s custodian, which is reflected as pledged cash in each fund’s
statement of assets and liabilities.
6. Taxation and distributions
Federal income taxation — Each fund complies with
the requirements under Subchapter M of the Internal Revenue Code applicable to mutual funds and intends to distribute substantially
all of its net tax-exempt income and net capital gains each year. Generally, income earned by each fund is exempt from federal
income taxes; however, each fund may earn taxable income from certain investments. The funds are not subject to income taxes to
the extent such taxable income and net capital gains are distributed. To the extent the funds recognize taxable income, the funds
may pay tax on such income in lieu of making distributions; amounts paid are included within federal, state and local taxes on
the funds’ statements of operations.
As of and during the period ended July 31, 2019, none of the
funds had a liability for any unrecognized tax benefits. Each fund recognizes interest and penalties, if any, related to unrecognized
tax benefits as income tax expense in their respective statements of operations. During the period, none of the funds incurred
any significant interest or penalties.
Each fund’s tax returns are not subject to examination
by federal, state and, if applicable, non-U.S. tax authorities after the expiration of each jurisdiction’s statute of limitations,
which is generally three years after the date of filing but can be extended in certain jurisdictions.
Distributions — Distributions paid to shareholders
are based on each fund’s net investment income and net realized gains determined on a tax basis, which may differ from net
investment income and net realized gains for financial reporting purposes. These differences are due primarily to different treatment
for items such as short-term capital gains and losses; capital losses related to sales of certain securities within 30 days of
purchase; deferred expenses; cost of investments sold; net capital losses; amortization of premiums and discounts and income on
certain investments. The fiscal year in which amounts are distributed may differ from the year in which the net investment income
and net realized gains are recorded by the funds for financial reporting purposes.
Under the Regulated Investment Company Modernization Act of 2010
(the “Act”), net capital losses recognized after July 31, 2011, (August 31, 2011, for The Tax-Exempt Bond Fund of America
and The Tax-Exempt Fund of California) may be carried forward indefinitely, and their character is retained as short-term and/or
long-term losses. Previously, net capital losses were carried forward for eight years and treated as short-term losses. As a transition
rule, the Act requires that post-enactment net capital losses be used before pre-enactment net capital losses.
| 104 |
American Funds Tax-Exempt Funds |
Additional tax basis disclosures for each fund as of July 31,
2019, were as follows (dollars in thousands):
| | |
American
Funds
Short-Term
Tax-Exempt
Bond Fund | | |
Limited Term
Tax-Exempt
Bond Fund
of America | | |
The
Tax-Exempt
Bond Fund
of America | | |
American
High-Income
Municipal
Bond Fund | | |
The
Tax-Exempt
Fund of
California | | |
American
Funds
Tax-Exempt
Fund of
New York | |
| Undistributed ordinary income | |
$ | — | | |
$ | 7,876 | | |
$ | — | | |
$ | — | | |
$ | — | | |
$ | — | |
| Undistributed tax-exempt income | |
| 99 | | |
| 574 | | |
| 3,740 | | |
| 2,766 | | |
| 1,048 | | |
| 124 | |
| Undistributed long-term capital gains | |
| — | | |
| 3,228 | | |
| — | | |
| — | | |
| 2,323 | | |
| — | |
| Capital loss carryforward* | |
| (3,213 | ) | |
| — | | |
| (4,085 | ) | |
| (6,497 | ) | |
| — | | |
| (5 | ) |
| Capital loss carryforward utilized | |
| 121 | | |
| 249 | | |
| — | | |
| — | | |
| — | | |
| 74 | |
| Capital loss carryforward expired | |
| — | | |
| — | | |
| — | | |
| 24,408 | | |
| — | | |
| — | |
| Gross unrealized appreciation on investments | |
| 13,706 | | |
| 111,413 | | |
| 1,029,004 | | |
| 430,176 | | |
| 132,093 | | |
| 13,119 | |
| Gross unrealized depreciation on investments | |
| (348 | ) | |
| (2,727 | ) | |
| (25,156 | ) | |
| (29,591 | ) | |
| (1,742 | ) | |
| (32 | ) |
| Net unrealized appreciation on investments | |
| 13,358 | | |
| 108,686 | | |
| 1,003,848 | | |
| 400,585 | | |
| 130,351 | | |
| 13,087 | |
| Cost of investments | |
| 1,123,109 | | |
| 4,118,400 | | |
| 20,597,837 | | |
| 7,320,781 | | |
| 2,455,763 | | |
| 259,046 | |
| Reclassification from (to) total distributable earnings to (from) capital paid in on shares of beneficial interest | |
| 8 | | |
| (3 | ) | |
| 3,044 | | |
| (21,516 | ) | |
| 1,677 | | |
| (2 | ) |
| * |
Capital loss carryforwards will be used to offset any capital gains realized by the funds in future years. The funds will not make distributions from capital gains while a capital loss carryforward remains. |
Distributions paid or accrued from each fund were characterized
as tax-exempt income for tax purposes as follows (dollars in thousands):
American Funds Short-Term Tax-Exempt Bond Fund
| Share class | |
Year ended
July 31, 2019 | | |
Year ended
July 31, 2018 | |
| Class A | |
$ | 11,676 | | |
$ | 10,014 | |
| Class T | |
| — | * | |
| — | * |
| Class F-1 | |
| 90 | | |
| 93 | |
| Class F-2 | |
| 2,521 | | |
| 711 | |
| Class F-3 | |
| 825 | | |
| 716 | |
| Class R-6 | |
| 2,147 | | |
| 1,887 | |
| Total | |
$ | 17,259 | | |
$ | 13,421 | |
Limited Term Tax-Exempt Bond Fund of America
| Share class | |
Year ended
July 31, 2019 | | |
Year ended
July 31, 2018 | |
| Class A | |
$ | 58,861 | | |
$ | 61,392 | |
| Class C | |
| 241 | | |
| 288 | |
| Class T | |
| — | * | |
| — | * |
| Class F-1 | |
| 1,133 | | |
| 1,510 | |
| Class F-2 | |
| 9,544 | | |
| 7,833 | |
| Class F-3 | |
| 5,689 | | |
| 3,549 | |
| Class R-6 | |
| 6,729 | | |
| 6,843 | |
| Total | |
$ | 82,197 | | |
$ | 81,415 | |
See end of tables for footnote.
| American Funds Tax-Exempt Funds |
105 |
| The Tax-Exempt Bond Fund of America | |
| | |
| |
| | |
| | |
| |
| Share class | |
Year ended
July 31, 2019 | | |
Year ended
July 31, 2018 | |
| Class A | |
$ | 285,802 | | |
$ | 290,885 | |
| Class C | |
| 8,239 | | |
| 9,684 | |
| Class T | |
| — | * | |
| — | * |
| Class F-1 | |
| 9,154 | | |
| 12,057 | |
| Class F-2 | |
| 70,312 | | |
| 61,316 | |
| Class F-3 | |
| 178,363 | | |
| 108,231 | |
| Class R-6 | |
| 18,410 | | |
| 14,656 | |
| Total | |
$ | 570,280 | | |
$ | 496,829 | |
| | |
| | | |
| | |
| American High-Income Municipal Bond Fund | |
| | | |
| | |
| | |
| | | |
| | |
| Share class | |
Year ended
July 31, 2019 | | |
Year ended
July 31, 2018 | |
| Class A | |
$ | 151,825 | | |
$ | 141,994 | |
| Class C | |
| 6,528 | | |
| 6,687 | |
| Class T | |
| — | * | |
| — | * |
| Class F-1 | |
| 6,426 | | |
| 7,964 | |
| Class F-2 | |
| 36,440 | | |
| 26,981 | |
| Class F-3 | |
| 28,978 | | |
| 22,072 | |
| Class R-6 | |
| 23,498 | | |
| 18,501 | |
| Total | |
$ | 253,695 | | |
$ | 224,199 | |
| | |
| | | |
| | |
| The Tax-Exempt Fund of California | |
| | | |
| | |
| | |
| | | |
| | |
| Share class | |
Year ended
July 31, 2019 | | |
Year ended
July 31, 2018 | |
| Class A | |
$ | 47,435 | | |
$ | 48,366 | |
| Class C | |
| 1,394 | | |
| 1,638 | |
| Class T | |
| — | * | |
| — | * |
| Class F-1 | |
| 1,952 | | |
| 2,065 | |
| Class F-2 | |
| 10,366 | | |
| 6,945 | |
| Class F-3 | |
| 5,823 | | |
| 4,665 | |
| Total | |
$ | 66,970 | | |
$ | 63,679 | |
| | |
| | | |
| | |
| American Funds Tax-Exempt Fund of New York | |
| | | |
| | |
| | |
| | | |
| | |
| Share class | |
| Year ended
July 31, 2019 | | |
| Year ended
July 31, 2018 | |
| Class A | |
$ | 4,715 | | |
$ | 4,525 | |
| Class C | |
| 201 | | |
| 209 | |
| Class T | |
| — | * | |
| — | * |
| Class F-1 | |
| 50 | | |
| 68 | |
| Class F-2 | |
| 687 | | |
| 374 | |
| Class F-3 | |
| 813 | | |
| 590 | |
| Total | |
$ | 6,466 | | |
$ | 5,766 | |
| * |
Amount less than one thousand. |
| 106 |
American Funds Tax-Exempt Funds |
7. Fees and transactions with related parties
CRMC, the funds’ investment adviser, is the parent company
of American Funds Distributors,® Inc. (“AFD”), the principal underwriter of the funds’ shares,
and American Funds Service Company® (“AFS”), the funds’ transfer agent. CRMC, AFD and AFS are
considered related parties to each fund.
Investment advisory services — Each fund has an
investment advisory and service agreement with CRMC that provides for monthly fees accrued daily. These fees are based on annual
rates that generally decrease as net asset levels increase. On March 4, 2019, the boards of trustees of American Funds Short-Term
Tax-Exempt Bond Fund and American Funds Tax-Exempt Fund of New York approved amended agreements effective May 1, 2019, amending
the annual rates to 0.341% and 0.204%, respectively, of each fund’s daily net assets. The agreement for each fund, except
American Funds Short-Term Tax-Exempt Bond Fund, also provides for monthly fees accrued daily based on a series of decreasing rates
on each fund’s monthly gross income.
The range of rates, net asset levels, gross income levels and
annualized rates of average net assets for each fund are as follows:
| | |
Rates | | |
Net asset level
(in billions) | | |
Rates | | |
Monthly gross income | | |
For the
year ended | |
| Fund | |
Beginning
with | | |
Ending
with | | |
Up to | | |
In excess
of | | |
Beginning
with | | |
Ending
with | | |
Up to | | |
In excess
of | | |
July 31,
2019 | |
| American Funds Short-Term Tax-Exempt Bond
Fund | |
| .341 | % | |
| | | |
| all | | |
| | | |
| | | |
| | | |
| | | |
| | | |
| .352 | % |
| Limited Term Tax-Exempt Bond Fund of America | |
| .300 | | |
| .150 | % | |
$ | .06 | | |
$ | 1.0 | | |
| 3.00 | % | |
| 2.50 | % | |
$ | 3,333,333 | | |
$ | 3,333,333 | | |
| .229 | |
| The Tax-Exempt Bond Fund of America | |
| .300 | | |
| .110 | | |
| .06 | | |
| 21.0 | | |
| 3.00 | | |
| 2.00 | | |
| 3,333,333 | | |
| 8,333,333 | | |
| .207 | |
| American High-Income Municipal Bond Fund | |
| .300 | | |
| .140 | | |
| .06 | | |
| 6.0 | | |
| 3.00 | | |
| 2.50 | | |
| 3,333,333 | | |
| 3,333,333 | | |
| .278 | |
| The Tax-Exempt Fund of California | |
| .300 | | |
| .180 | | |
| .06 | | |
| 1.0 | | |
| 3.00 | | |
| 2.50 | | |
| 3,333,333 | | |
| 3,333,333 | | |
| .290 | |
| American Funds Tax-Exempt
Fund of New York | |
| .204 | | |
| .180 | | |
| 1.5 | | |
| 1.5 | | |
| 3.00 | | |
| 2.50 | | |
| 3,333,333 | | |
| 3,333,333 | | |
| .322 | |
Class-specific fees and expenses — Expenses
that are specific to individual share classes are accrued directly to the respective share class of each fund. The principal
class-specific fees and expenses are described below:
Distribution services — Each fund has plans of distribution
for all share classes, except Class F-2, F-3 and R-6 shares, if applicable. Under the plans, each fund’s board of trustees
approves certain categories of expenses that are used to finance activities primarily intended to sell fund shares and service
existing accounts. The plans provide for payments based on an annualized percentage of average daily net assets. In some cases,
the boards of trustees have limited the amounts that may be paid to less than the maximum allowed by the plans. All share classes
with a plan may use the allotted percentage of average daily net assets to pay service fees, or to compensate AFD for paying service
fees, to firms that have entered into agreements with AFD to provide certain shareholder services. The remaining amounts available
to be paid under each plan are paid to dealers to compensate them for their sales activities.
| | |
American Funds Short-Term
Tax-Exempt Bond Fund | |
Limited Term Tax-Exempt
Bond Fund of America | |
The Tax-Exempt Bond Fund
of America |
|
| Share class | |
Currently
approved limits | | |
Plan limits | | |
Currently
approved limits | | |
Plan limits | | |
Currently
approved limits | | |
Plan limits | |
|
| Class A | |
| 0.15 | % | |
| 0.15 | % | |
| 0.30 | % | |
| 0.30 | % | |
| 0.25 | % | |
| 0.25 | % |
|
| Class C | |
Not applicable | | |
Not applicable | | |
| 1.00 | | |
| 1.00 | | |
| 1.00 | | |
| 1.00 | |
|
| Classes T and F-1 | |
| 0.25 | | |
| 0.50 | | |
| 0.25 | | |
| 0.50 | | |
| 0.25 | | |
| 0.50 | |
|
| | |
| | | |
| | | |
| | | |
| | | |
| | | |
| | |
|
| | |
American High-Income
Municipal Bond Fund | |
The Tax-Exempt Fund
of California | |
American Funds Tax-Exempt
Fund of New York |
|
| Share class | |
Currently
approved limits | | |
Plan limits | | |
Currently
approved limits | | |
Plan limits | | |
Currently
approved limits | | |
Plan limits | |
|
| Class A | |
| 0.30 | % | |
| 0.30 | % | |
| 0.25 | % | |
| 0.25 | % | |
| 0.25 | % | |
| 0.30 | % |
|
| Class C | |
| 1.00 | | |
| 1.00 | | |
| 1.00 | | |
| 1.00 | | |
| 1.00 | | |
| 1.00 | |
|
| Classes T and F-1 | |
| 0.25 | | |
| 0.50 | | |
| 0.25 | | |
| 0.50 | | |
| 0.25 | | |
| 0.50 | |
|
| American Funds Tax-Exempt Funds |
107 |
For Class A shares, distribution-related expenses include the
reimbursement of dealer and wholesaler commissions paid by AFD for certain shares sold without a sales charge. This share class
of each fund reimburses AFD for amounts billed within the prior 15 months but only to the extent that the overall annual expense
limit is not exceeded. As of July 31, 2019, unreimbursed expenses subject to reimbursement for Class A shares of each fund were
as follows (dollars in thousands):
| Fund | |
Class A | |
| American Funds Short-Term Tax-Exempt Bond Fund | |
$ | 1,142 | |
| Limited-Term Tax-Exempt Bond Fund of America | |
| — | |
| The Tax-Exempt Bond Fund of America | |
| 7,545 | |
| American High-Income Municipal Bond Fund | |
| 363 | |
| The Tax-Exempt Fund of California | |
| 1,516 | |
| American Funds Tax-Exempt Fund of New York | |
| 50 | |
Transfer agent services — Each fund has a shareholder
services agreement with AFS under which each fund compensates AFS for providing transfer agent services to each of the funds’
share classes. These services include recordkeeping, shareholder communications and transaction processing. In addition, each fund
reimburses AFS for amounts paid to third parties for performing transfer agent services on behalf of its respective fund shareholders.
Administrative services — Each fund has an administrative
services agreement with CRMC under which each fund compensates CRMC for providing administrative services to each of the funds’
share classes. Administrative services are provided by CRMC to help assist third parties providing non-distribution services to
fund shareholders. These services include providing in depth information on each fund and market developments that impact each
fund’s investments. Administrative services also include, but are not limited to, coordinating, monitoring and overseeing
third parties that provide services to each fund’s shareholders. The agreement provides each fund the ability to charge an
administrative services fee at the annual rate of 0.05% of the daily net assets attributable to each share class of each fund.
Prior to July 1, 2019, Class A shares paid CRMC an administrative services fee at the annual fee of 0.01% of daily net assets and
all other share classes paid a fee at the annual rate of 0.05% of their respective daily net assets. Each fund’s board of
trustees authorized the respective funds to pay CRMC effective July 1, 2019, an administrative services fee at the annual rate
of 0.03% of the daily net assets attributable to each share class of each fund (which could increase as noted above) for CRMC’s
provision of administrative services.
For the year ended July 31, 2019, class-specific expenses under
the agreements for each fund were as follows (dollars in thousands):
American Funds Short-Term Tax-Exempt Bond Fund
| Share class |
|
Distribution
services |
|
Transfer agent
services |
|
Administrative
services |
| Class A |
|
$1,126 |
|
|
$287 |
|
|
$ 88 |
|
| Class T |
|
— |
|
|
— |
* |
|
— |
* |
| Class F-1 |
|
17 |
|
|
9 |
|
|
3 |
|
| Class F-2 |
|
Not applicable |
|
|
86 |
|
|
73 |
|
| Class F-3 |
|
Not applicable |
|
|
1 |
|
|
23 |
|
| Class R-6 |
|
Not applicable |
|
|
— |
* |
|
61 |
|
| Total class-specific expenses |
|
$1,143 |
|
|
$383 |
|
|
$248 |
|
The Tax-Exempt Bond Fund of America
| Share class |
|
Distribution
services |
|
Transfer agent
services |
|
Administrative
services |
| Class A |
|
$25,330 |
|
|
$3,577 |
|
|
$1,196 |
|
| Class C |
|
4,045 |
|
|
145 |
|
|
195 |
|
| Class T |
|
— |
|
|
— |
* |
|
— |
* |
| Class F-1 |
|
842 |
|
|
418 |
|
|
164 |
|
| Class F-2 |
|
Not applicable |
|
|
2,519 |
|
|
1,142 |
|
| Class F-3 |
|
Not applicable |
|
|
142 |
|
|
2,800 |
|
| Class R-6 |
|
Not applicable |
|
|
— |
|
|
288 |
|
| Total class-specific expenses |
|
$30,217 |
|
|
$6,801 |
|
|
$5,785 |
|
Limited Term Tax-Exempt Bond Fund of America
| Share class |
|
Distribution
services |
|
Transfer agent
services |
|
Administrative
services |
| Class A |
|
$8,755 |
|
|
$1,135 |
|
|
$347 |
|
| Class C |
|
191 |
|
|
7 |
|
|
9 |
|
| Class T |
|
— |
|
|
— |
* |
|
— |
* |
| Class F-1 |
|
147 |
|
|
74 |
|
|
29 |
|
| Class F-2 |
|
Not applicable |
|
|
433 |
|
|
209 |
|
| Class F-3 |
|
Not applicable |
|
|
6 |
|
|
119 |
|
| Class R-6 |
|
Not applicable |
|
|
— |
|
|
141 |
|
| Total class-specific expenses |
|
$9,093 |
|
|
$1,655 |
|
|
$854 |
|
American High-Income Municipal Bond Fund
| Share class |
|
Distribution
services |
|
Transfer agent
services |
|
Administrative
services |
| Class A |
|
$12,635 |
|
|
$2,032 |
|
|
$ 499 |
|
| Class C |
|
2,265 |
|
|
111 |
|
|
109 |
|
| Class T |
|
— |
|
|
— |
* |
|
— |
* |
| Class F-1 |
|
451 |
|
|
228 |
|
|
88 |
|
| Class F-2 |
|
Not applicable |
|
|
1,023 |
|
|
460 |
|
| Class F-3 |
|
Not applicable |
|
|
28 |
|
|
356 |
|
| Class R-6 |
|
Not applicable |
|
|
— |
|
|
288 |
|
| Total class-specific expenses |
|
$15,351 |
|
|
$3,422 |
|
|
$1,800 |
|
| 108 |
American Funds Tax-Exempt Funds |
The Tax-Exempt Fund of California
| Share class |
|
Distribution
services |
|
Transfer agent
services |
|
Administrative
services |
| Class A |
|
$4,149 |
|
|
$365 |
|
|
$196 |
|
| Class C |
|
669 |
|
|
15 |
|
|
32 |
|
| Class T |
|
— |
|
|
— |
* |
|
— |
* |
| Class F-1 |
|
178 |
|
|
81 |
|
|
35 |
|
| Class F-2 |
|
Not applicable |
|
|
315 |
|
|
166 |
|
| Class F-3 |
|
Not applicable |
|
|
— |
* |
|
90 |
|
| Total class-specific expenses |
|
$4,996 |
|
|
$776 |
|
|
$519 |
|
American Funds Tax-Exempt Fund of New York
| Share class |
|
Distribution
services |
|
Transfer agent
services |
|
Administrative
services |
| Class A |
|
$457 |
|
|
$57 |
|
|
$22 |
|
| Class C |
|
111 |
|
|
3 |
|
|
5 |
|
| Class T |
|
— |
|
|
— |
* |
|
— |
* |
| Class F-1 |
|
4 |
|
|
2 |
|
|
1 |
|
| Class F-2 |
|
Not applicable |
|
|
22 |
|
|
12 |
|
| Class F-3 |
|
Not applicable |
|
|
— |
* |
|
14 |
|
| Total
class-specific expenses |
|
$572 |
|
|
$84 |
|
|
$54 |
|
| * |
Amount less than one thousand. |
Trustees’ deferred compensation — Trustees
who are unaffiliated with CRMC may elect to defer the cash payment of part or all of their compensation. These deferred amounts,
which remain as liabilities of each fund, are treated as if invested in shares of the funds or other American Funds. These amounts
represent general, unsecured liabilities of each fund and vary according to the total returns of the selected funds. Trustees’
compensation in the funds’ statements of operations reflects the current fees (either paid in cash or deferred) and a net
increase in the value of the following deferred amounts (dollars in thousands):
| Fund | |
Current fees | | Increase in value of
deferred amounts | | |
Total trustees’
compensation | |
| American Funds Short-Term Tax-Exempt Bond Fund | |
$ | 6 | | |
$ | 2 | | |
$ | 8 | |
| Limited Term Tax-Exempt Bond Fund of America | |
| 22 | | |
| 8 | | |
| 30 | |
| The Tax-Exempt Bond Fund of America | |
| 91 | | |
| 38 | | |
| 129 | |
| American High-Income Municipal Bond Fund | |
| 44 | | |
| 8 | | |
| 52 | |
| The Tax-Exempt Fund of California | |
| 12 | | |
| 8 | | |
| 20 | |
| American Funds Tax-Exempt Fund of New York | |
| 2 | | |
| — | * | |
| 2 | |
| * |
Amount less than one thousand. |
Affiliated officers and trustees — Officers and
certain trustees of the funds are or may be considered to be affiliated with CRMC, AFD and AFS. No affiliated officers or trustees
received any compensation directly from the funds.
Security transactions with related funds — Each
fund may purchase securities from, or sell securities to, other CRMC-managed funds (or funds managed by certain affiliates of CRMC)
under procedures adopted by each fund’s board of trustees. The funds involved in such transactions are considered related
by virtue of having a common investment adviser (or affiliated investment advisers), common trustees and/or common officers. When
such transactions occur, each transaction is executed at the current market price of the security and no brokerage commissions
or fees are paid in accordance with Rule 17a-7 of the 1940 Act.
Interfund lending — Pursuant to an exemptive order
issued by the SEC, the funds, along with other CRMC-managed funds (or funds managed by certain affiliates of CRMC), may participate
in an interfund lending program. The program provides an alternate credit facility that permits the funds to lend or borrow cash
for temporary purposes directly to or from one another, subject to the conditions of the exemptive order. None of the funds lent
or borrowed cash during the year ended July 31, 2019.
8. Committed line of credit
American High-Income Municipal Bond Fund participates with other
funds managed by CRMC (or funds managed by certain affiliates of CRMC) in a $1.5 billion credit facility (the “line of credit”)
to be utilized for temporary purposes to support shareholder redemptions. The fund has agreed to pay commitment fees on its pro-rata
portion of the line of credit, which are reflected in other expenses in the fund’s statement of operations. The fund did
not borrow on this line of credit at any time during the year ended July 31, 2019.
| American Funds Tax-Exempt Funds |
109 |
9. Capital share transactions
Capital share transactions in the funds were as follows (dollars
and shares in thousands):
American Funds Short-Term Tax-Exempt Bond Fund
| | |
| | |
| | |
Reinvestments of | | |
| | |
| | |
Net increase | |
| | |
Sales* | | |
distributions | | |
Repurchases* | | |
(decrease) | |
| Share class | |
Amount | | |
Shares | | |
Amount | | |
Shares | | |
Amount | | |
Shares | | |
Amount | | |
Shares | |
| | |
| | |
| | |
| | |
| | |
| |
| Year ended July 31, 2019 | |
| | |
| | |
| | |
| | |
| |
| | |
| | | |
| | | |
| | | |
| | | |
| | | |
| | | |
| | | |
| | |
| Class A | |
$ | 446,679 | | |
| 44,559 | | |
$ | 11,322 | | |
| 1,124 | | |
$ | (454,662 | ) | |
| (45,326 | ) | |
$ | 3,339 | | |
| 357 | |
| Class T | |
| — | | |
| — | | |
| — | | |
| — | | |
| — | | |
| — | | |
| — | | |
| — | |
| Class F-1 | |
| 1,942 | | |
| 194 | | |
| 89 | | |
| 9 | | |
| (2,196 | ) | |
| (219 | ) | |
| (165 | ) | |
| (16 | ) |
| Class F-2 | |
| 183,142 | | |
| 18,317 | | |
| 2,421 | | |
| 240 | | |
| (59,423 | ) | |
| (5,910 | ) | |
| 126,140 | | |
| 12,647 | |
| Class F-3 | |
| 48,796 | | |
| 4,855 | | |
| 787 | | |
| 78 | | |
| (42,824 | ) | |
| (4,276 | ) | |
| 6,759 | | |
| 657 | |
| Class R-6 | |
| 23,958 | | |
| 2,386 | | |
| 2,147 | | |
| 214 | | |
| (18,235 | ) | |
| (1,816 | ) | |
| 7,870 | | |
| 784 | |
| Total net increase (decrease) | |
$ | 704,517 | | |
| 70,311 | | |
$ | 16,766 | | |
| 1,665 | | |
$ | (577,340 | ) | |
| (57,547 | ) | |
$ | 143,943 | | |
| 14,429 | |
| | |
| | | |
| | | |
| | | |
| | | |
| | | |
| | | |
| | | |
| | |
| Year ended July 31, 2018 |
| | | |
| | | |
| | | |
| | | |
| | | |
| | | |
| | |
| | |
| | | |
| | | |
| | | |
| | | |
| | | |
| | | |
| | | |
| | |
| Class A | |
$ | 278,215 | | |
| 27,610 | | |
$ | 9,626 | | |
| 957 | | |
$ | (266,056 | ) | |
| (26,429 | ) | |
$ | 21,785 | | |
| 2,138 | |
| Class T | |
| — | | |
| — | | |
| — | | |
| — | | |
| — | | |
| — | | |
| — | | |
| — | |
| Class F-1 | |
| 2,640 | | |
| 262 | | |
| 92 | | |
| 9 | | |
| (5,104 | ) | |
| (507 | ) | |
| (2,372 | ) | |
| (236 | ) |
| Class F-2 | |
| 32,700 | | |
| 3,244 | | |
| 702 | | |
| 70 | | |
| (26,794 | ) | |
| (2,661 | ) | |
| 6,608 | | |
| 653 | |
| Class F-3 | |
| 47,782 | | |
| 4,729 | | |
| 533 | | |
| 53 | | |
| (80,218 | ) | |
| (7,922 | ) | |
| (31,903 | ) | |
| (3,140 | ) |
| Class R-6 | |
| 16,157 | | |
| 1,599 | | |
| 1,887 | | |
| 187 | | |
| (21,874 | ) | |
| (2,174 | ) | |
| (3,830 | ) | |
| (388 | ) |
| Total net increase (decrease) | |
$ | 377,494 | | |
| 37,444 | | |
$ | 12,840 | | |
| 1,276 | | |
$ | (400,046 | ) | |
| (39,693 | ) | |
$ | (9,712 | ) | |
| (973 | ) |
Limited Term Tax-Exempt Bond Fund of America
| | |
| | |
| | |
Reinvestments of | | |
| | |
| | |
Net (decrease) | |
| | |
Sales* | | |
distributions | | |
Repurchases* | | |
increase | |
| Share class | |
Amount | | |
Shares | | |
Amount | | |
Shares | | |
Amount | | |
Shares | | |
Amount | | |
Shares | |
| | |
| | | |
| | | |
| | | |
| | | |
| | | |
| | | |
| | | |
| | |
| Year ended July 31, 2019 | | | |
| | | |
| | | |
| | | |
| | | |
| | |
| | |
| | | |
| | | |
| | | |
| | | |
| | | |
| | | |
| | | |
| | |
| Class A | |
$ | 817,031 | | |
| 52,517 | | |
$ | 56,604 | | |
| 3,625 | | |
$ | (947,434 | ) | |
| (61,011 | ) | |
$ | (73,799 | ) | |
| (4,869 | ) |
| Class C | |
| 5,804 | | |
| 374 | | |
| 237 | | |
| 15 | | |
| (9,333 | ) | |
| (599 | ) | |
| (3,292 | ) | |
| (210 | ) |
| Class T | |
| — | | |
| — | | |
| — | | |
| — | | |
| — | | |
| — | | |
| — | | |
| — | |
| Class F-1 | |
| 12,716 | | |
| 814 | | |
| 1,084 | | |
| 69 | | |
| (18,544 | ) | |
| (1,193 | ) | |
| (4,744 | ) | |
| (310 | ) |
| Class F-2 | |
| 337,537 | | |
| 21,741 | | |
| 8,588 | | |
| 550 | | |
| (211,713 | ) | |
| (13,615 | ) | |
| 134,412 | | |
| 8,676 | |
| Class F-3 | |
| 224,267 | | |
| 14,414 | | |
| 4,980 | | |
| 318 | | |
| (116,914 | ) | |
| (7,517 | ) | |
| 112,333 | | |
| 7,215 | |
| Class R-6 | |
| 52,433 | | |
| 3,374 | | |
| 6,729 | | |
| 431 | | |
| (44,130 | ) | |
| (2,837 | ) | |
| 15,032 | | |
| 968 | |
| Total net increase (decrease) | |
$ | 1,449,788 | | |
| 93,234 | | |
$ | 78,222 | | |
| 5,008 | | |
$ | (1,348,068 | ) | |
| (86,772 | ) | |
$ | 179,942 | | |
| 11,470 | |
| | |
| | | |
| | | |
| | | |
| | | |
| | | |
| | | |
| | | |
| | |
| Year ended July 31, 2018 | | | |
| | | |
| | | |
| | | |
| | | |
| | |
| | |
| | | |
| | | |
| | | |
| | | |
| | | |
| | | |
| | | |
| | |
| Class A | |
$ | 707,137 | | |
| 45,220 | | |
$ | 58,703 | | |
| 3,763 | | |
$ | (696,821 | ) | |
| (44,622 | ) | |
$ | 69,019 | | |
| 4,361 | |
| Class C | |
| 4,357 | | |
| 279 | | |
| 280 | | |
| 18 | | |
| (9,044 | ) | |
| (579 | ) | |
| (4,407 | ) | |
| (282 | ) |
| Class T | |
| — | | |
| — | | |
| — | | |
| — | | |
| — | | |
| — | | |
| — | | |
| — | |
| Class F-1 | |
| 28,021 | | |
| 1,791 | | |
| 1,451 | | |
| 92 | | |
| (47,647 | ) | |
| (3,055 | ) | |
| (18,175 | ) | |
| (1,172 | ) |
| Class F-2 | |
| 247,425 | | |
| 15,810 | | |
| 6,716 | | |
| 431 | | |
| (203,930 | ) | |
| (13,081 | ) | |
| 50,211 | | |
| 3,160 | |
| Class F-3 | |
| 121,425 | | |
| 7,770 | | |
| 2,877 | | |
| 185 | | |
| (46,337 | ) | |
| (2,972 | ) | |
| 77,965 | | |
| 4,983 | |
| Class R-6 | |
| 38,084 | | |
| 2,428 | | |
| 6,843 | | |
| 439 | | |
| (52,353 | ) | |
| (3,359 | ) | |
| (7,426 | ) | |
| (492 | ) |
| Total net increase (decrease) | |
$ | 1,146,449 | | |
| 73,298 | | |
$ | 76,870 | | |
| 4,928 | | |
$ | (1,056,132 | ) | |
| (67,668 | ) | |
$ | 167,187 | | |
| 10,558 | |
| 110 |
American Funds Tax-Exempt Funds |
The Tax-Exempt Bond Fund of America
| | |
| | |
| | |
Reinvestments of | | |
| | |
| | |
Net increase | |
| | |
Sales* | | |
distributions | | |
Repurchases* | | |
(decrease) | |
| Share class | |
Amount | | |
Shares | | |
Amount | | |
Shares | | |
Amount | | |
Shares | | |
Amount | | |
Shares | |
| |
|
|
|
|
|
|
|
|
|
|
|
|
|
|
|
|
|
|
|
|
|
|
|
|
|
|
|
|
|
|
|
|
| Year ended July 31, 2019 | | | |
| | | |
| | | |
| | | |
| | | |
| | |
| | |
| | | |
| | | |
| | | |
| | | |
| | | |
| | | |
| | | |
| | |
| Class A | |
$ | 1,913,815 | | |
| 148,284 | | |
$ | 270,339 | | |
| 20,936 | | |
$ | (1,793,783 | ) | |
| (140,013 | ) | |
$ | 390,371 | | |
| 29,207 | |
| Class C | |
| 69,698 | | |
| 5,391 | | |
| 7,921 | | |
| 614 | | |
| (116,360 | ) | |
| (9,053 | ) | |
| (38,741 | ) | |
| (3,048 | ) |
| Class T | |
| — | | |
| — | | |
| — | | |
| — | | |
| — | | |
| — | | |
| — | | |
| — | |
| Class F-1 | |
| 66,051 | | |
| 5,127 | | |
| 8,750 | | |
| 678 | | |
| (118,439 | ) | |
| (9,234 | ) | |
| (43,638 | ) | |
| (3,429 | ) |
| Class F-2 | |
| 1,319,680 | | |
| 102,510 | | |
| 66,204 | | |
| 5,123 | | |
| (877,784 | ) | |
| (68,563 | ) | |
| 508,100 | | |
| 39,070 | |
| Class F-3 | |
| 2,078,370 | | |
| 161,360 | | |
| 175,472 | | |
| 13,579 | | |
| (1,306,234 | ) | |
| (101,826 | ) | |
| 947,608 | | |
| 73,113 | |
| Class R-6 | |
| 108,442 | | |
| 8,367 | | |
| 18,410 | | |
| 1,425 | | |
| (14,886 | ) | |
| (1,168 | ) | |
| 111,966 | | |
| 8,624 | |
| Total net increase (decrease) | |
$ | 5,556,056 | | |
| 431,039 | | |
$ | 547,096 | | |
| 42,355 | | |
$ | (4,227,486 | ) | |
| (329,857 | ) | |
$ | 1,875,666 | | |
| 143,537 | |
| |
|
|
|
|
|
|
|
|
|
|
|
|
|
|
|
|
|
|
|
|
|
|
|
|
|
|
|
|
|
|
|
|
| Year ended July 31, 2018 | | | |
| | | |
| | | |
| | | |
| | | |
| | |
| | |
| | | |
| | | |
| | | |
| | | |
| | | |
| | | |
| | | |
| | |
| Class A | |
$ | 1,681,309 | | |
| 130,015 | | |
$ | 272,626 | | |
| 21,145 | | |
$ | (1,405,277 | ) | |
| (108,925 | ) | |
$ | 548,658 | | |
| 42,235 | |
| Class C | |
| 80,078 | | |
| 6,193 | | |
| 9,249 | | |
| 717 | | |
| (125,594 | ) | |
| (9,732 | ) | |
| (36,267 | ) | |
| (2,822 | ) |
| Class T | |
| — | | |
| — | | |
| — | | |
| — | | |
| — | | |
| — | | |
| — | | |
| — | |
| Class F-1 | |
| 104,060 | | |
| 8,060 | | |
| 11,599 | | |
| 899 | | |
| (201,331 | ) | |
| (15,621 | ) | |
| (85,672 | ) | |
| (6,662 | ) |
| Class F-2 | |
| 993,761 | | |
| 77,009 | | |
| 58,043 | | |
| 4,502 | | |
| (756,576 | ) | |
| (58,582 | ) | |
| 295,228 | | |
| 22,929 | |
| Class F-3 | |
| 4,363,042 | | |
| 337,721 | | |
| 106,056 | | |
| 8,255 | | |
| (569,494 | ) | |
| (44,325 | ) | |
| 3,899,604 | | |
| 301,651 | |
| Class R-6 | |
| 183,540 | | |
| 14,204 | | |
| 14,656 | | |
| 1,138 | | |
| (21,419 | ) | |
| (1,668 | ) | |
| 176,777 | | |
| 13,674 | |
| Total net increase (decrease) | |
$ | 7,405,790 | | |
| 573,202 | | |
$ | 472,229 | | |
| 36,656 | | |
$ | (3,079,691 | ) | |
| (238,853 | ) | |
$ | 4,798,328 | | |
| 371,005 | |
American High-Income Municipal Bond Fund
| | |
| | |
| | |
Reinvestments of | | |
| | |
| | |
Net increase | |
| | |
Sales* | | |
distributions | | |
Repurchases* | | |
(decrease) | |
| Share class | |
Amount | | |
Shares | | |
Amount | | |
Shares | | |
Amount | | |
Shares | | |
Amount | | |
Shares | |
| | |
| | | |
| | | |
| | | |
| | | |
| | | |
| | | |
| | | |
| | |
| Year ended July 31, 2019 | | | |
| | | |
| | | |
| | | |
| | | |
| | |
| | |
| | | |
| | | |
| | | |
| | | |
| | | |
| | | |
| | | |
| | |
| Class A | |
$ | 966,900 | | |
| 61,009 | | |
$ | 144,057 | | |
| 9,079 | | |
$ | (684,496 | ) | |
| (43,449 | ) | |
$ | 426,461 | | |
| 26,639 | |
| Class C | |
| 50,981 | | |
| 3,214 | | |
| 6,195 | | |
| 390 | | |
| (53,367 | ) | |
| (3,374 | ) | |
| 3,809 | | |
| 230 | |
| Class T | |
| — | | |
| — | | |
| — | | |
| — | | |
| — | | |
| — | | |
| — | | |
| — | |
| Class F-1 | |
| 48,091 | | |
| 3,037 | | |
| 6,254 | | |
| 395 | | |
| (87,411 | ) | |
| (5,545 | ) | |
| (33,066 | ) | |
| (2,113 | ) |
| Class F-2 | |
| 563,308 | | |
| 35,694 | | |
| 32,471 | | |
| 2,046 | | |
| (317,468 | ) | |
| (20,134 | ) | |
| 278,311 | | |
| 17,606 | |
| Class F-3 | |
| 331,973 | | |
| 20,911 | | |
| 25,362 | | |
| 1,597 | | |
| (134,406 | ) | |
| (8,510 | ) | |
| 222,929 | | |
| 13,998 | |
| Class R-6 | |
| 102,098 | | |
| 6,412 | | |
| 23,498 | | |
| 1,480 | | |
| (11,942 | ) | |
| (764 | ) | |
| 113,654 | | |
| 7,128 | |
| Total net increase (decrease) | |
$ | 2,063,351 | | |
| 130,277 | | |
$ | 237,837 | | |
| 14,987 | | |
$ | (1,289,090 | ) | |
| (81,776 | ) | |
$ | 1,012,098 | | |
| 63,488 | |
| | |
| | | |
| | | |
| | | |
| | | |
| | | |
| | | |
| | | |
| | |
| Year ended July 31, 2018 | | | |
| | | |
| | | |
| | | |
| | | |
| | |
| | |
| | | |
| | | |
| | | |
| | | |
| | | |
| | | |
| | | |
| | |
| Class A | |
$ | 782,611 | | |
| 49,463 | | |
$ | 133,367 | | |
| 8,440 | | |
$ | (508,503 | ) | |
| (32,164 | ) | |
$ | 407,475 | | |
| 25,739 | |
| Class C | |
| 47,927 | | |
| 3,029 | | |
| 6,316 | | |
| 400 | | |
| (57,636 | ) | |
| (3,644 | ) | |
| (3,393 | ) | |
| (215 | ) |
| Class T | |
| — | | |
| — | | |
| — | | |
| — | | |
| — | | |
| — | | |
| — | | |
| — | |
| Class F-1 | |
| 78,860 | | |
| 4,990 | | |
| 7,756 | | |
| 490 | | |
| (113,570 | ) | |
| (7,178 | ) | |
| (26,954 | ) | |
| (1,698 | ) |
| Class F-2 | |
| 441,075 | | |
| 27,866 | | |
| 24,137 | | |
| 1,528 | | |
| (272,343 | ) | |
| (17,228 | ) | |
| 192,869 | | |
| 12,166 | |
| Class F-3 | |
| 288,409 | | |
| 18,214 | | |
| 19,098 | | |
| 1,209 | | |
| (83,527 | ) | |
| (5,278 | ) | |
| 223,980 | | |
| 14,145 | |
| Class R-6 | |
| 172,242 | | |
| 10,880 | | |
| 18,502 | | |
| 1,171 | | |
| (21,095 | ) | |
| (1,341 | ) | |
| 169,649 | | |
| 10,710 | |
| Total net increase (decrease) | |
$ | 1,811,124 | | |
| 114,442 | | |
$ | 209,176 | | |
| 13,238 | | |
$ | (1,056,674 | ) | |
| (66,833 | ) | |
$ | 963,626 | | |
| 60,847 | |
See end of tables for footnote.
| American Funds Tax-Exempt Funds |
111 |
The Tax-Exempt Fund of California
| | |
| | |
| | |
Reinvestments of | | |
| | |
| | |
Net increase | |
| | |
Sales* | | |
distributions | | |
Repurchases* | | |
(decrease) | |
| Share class | |
Amount | | |
Shares | | |
Amount | | |
Shares | | |
Amount | | |
Shares | | |
Amount | | |
Shares | |
| | | | |
| | | |
| | | |
| | | |
| | | |
| | |
| Year ended July 31, 2019 | | | |
| | | |
| | | |
| | | |
| | | |
| | |
| | |
| | | |
| | | |
| | | |
| | | |
| | | |
| | | |
| | | |
| | |
| Class A | |
$ | 354,297 | | |
| 20,195 | | |
$ | 43,242 | | |
| 2,463 | | |
$ | (351,468 | ) | |
| (20,231 | ) | |
$ | 46,071 | | |
| 2,427 | |
| Class C | |
| 11,571 | | |
| 657 | | |
| 1,339 | | |
| 76 | | |
| (17,470 | ) | |
| (1,000 | ) | |
| (4,560 | ) | |
| (267 | ) |
| Class T | |
| — | | |
| — | | |
| — | | |
| — | | |
| — | | |
| — | | |
| — | | |
| — | |
| Class F-1 | |
| 10,762 | | |
| 614 | | |
| 1,815 | | |
| 104 | | |
| (18,340 | ) | |
| (1,050 | ) | |
| (5,763 | ) | |
| (332 | ) |
| Class F-2 | |
| 241,537 | | |
| 13,875 | | |
| 9,002 | | |
| 512 | | |
| (111,887 | ) | |
| (6,404 | ) | |
| 138,652 | | |
| 7,983 | |
| Class F-3 | |
| 105,180 | | |
| 5,967 | | |
| 5,174 | | |
| 294 | | |
| (50,829 | ) | |
| (2,924 | ) | |
| 59,525 | | |
| 3,337 | |
| Total net increase (decrease) | |
$ | 723,347 | | |
| 41,308 | | |
$ | 60,572 | | |
| 3,449 | | |
$ | (549,994 | ) | |
| (31,609 | ) | |
$ | 233,925 | | |
| 13,148 | |
| | |
| | | |
| | | |
| | | |
| | | |
| | | |
| | | |
| | | |
| | |
| Year ended July 31, 2018 | | | |
| | | |
| | | |
| | | |
| | | |
| | |
| | |
| | | |
| | | |
| | | |
| | | |
| | | |
| | | |
| | | |
| | |
| Class A | |
$ | 259,065 | | |
| 14,726 | | |
$ | 43,350 | | |
| 2,472 | | |
$ | (246,151 | ) | |
| (14,019 | ) | |
$ | 56,264 | | |
| 3,179 | |
| Class C | |
| 14,343 | | |
| 815 | | |
| 1,554 | | |
| 89 | | |
| (26,591 | ) | |
| (1,515 | ) | |
| (10,694 | ) | |
| (611 | ) |
| Class T | |
| — | | |
| — | | |
| — | | |
| — | | |
| — | | |
| — | | |
| — | | |
| — | |
| Class F-1 | |
| 27,505 | | |
| 1,567 | | |
| 1,914 | | |
| 109 | | |
| (29,310 | ) | |
| (1,670 | ) | |
| 109 | | |
| 6 | |
| Class F-2 | |
| 112,357 | | |
| 6,393 | | |
| 6,168 | | |
| 352 | | |
| (58,335 | ) | |
| (3,326 | ) | |
| 60,190 | | |
| 3,419 | |
| Class F-3 | |
| 67,902 | | |
| 3,867 | | |
| 3,891 | | |
| 222 | | |
| (20,323 | ) | |
| (1,158 | ) | |
| 51,470 | | |
| 2,931 | |
| Total net increase (decrease) | |
$ | 481,172 | | |
| 27,368 | | |
$ | 56,877 | | |
| 3,244 | | |
$ | (380,710 | ) | |
| (21,688 | ) | |
$ | 157,339 | | |
| 8,924 | |
American Funds Tax-Exempt Fund of New York
| | |
| | |
| | |
Reinvestments of | | |
| | |
| | |
Net increase | |
| | |
Sales* | | |
distributions | | |
Repurchases* | | |
(decrease) | |
| Share class | |
Amount | | |
Shares | | |
Amount | | |
Shares | | |
Amount | | |
Shares | | |
Amount | | |
Shares | |
| | |
| | | |
| | | |
| | | |
| | | |
| | | |
| | | |
| | | |
| | |
| Year ended July 31, 2019 | | | |
| | | |
| | | |
| | | |
| | | |
| | |
| | |
| | | |
| | | |
| | | |
| | | |
| | | |
| | | |
| | | |
| | |
| Class A | |
$ | 43,401 | | |
| 4,058 | | |
$ | 3,742 | | |
| 349 | | |
$ | (36,741 | ) | |
| (3,477 | ) | |
$ | 10,402 | | |
| 930 | |
| Class C | |
| 1,713 | | |
| 160 | | |
| 190 | | |
| 18 | | |
| (2,452 | ) | |
| (231 | ) | |
| (549 | ) | |
| (53 | ) |
| Class T | |
| — | | |
| — | | |
| — | | |
| — | | |
| — | | |
| — | | |
| — | | |
| — | |
| Class F-1 | |
| 409 | | |
| 38 | | |
| 38 | | |
| 4 | | |
| (561 | ) | |
| (53 | ) | |
| (114 | ) | |
| (11 | ) |
| Class F-2 | |
| 21,136 | | |
| 2,004 | | |
| 685 | | |
| 64 | | |
| (10,147 | ) | |
| (952 | ) | |
| 11,674 | | |
| 1,116 | |
| Class F-3 | |
| 16,808 | | |
| 1,584 | | |
| 570 | | |
| 53 | | |
| (12,152 | ) | |
| (1,148 | ) | |
| 5,226 | | |
| 489 | |
| Total net increase (decrease) | |
$ | 83,467 | | |
| 7,844 | | |
$ | 5,225 | | |
| 488 | | |
$ | (62,053 | ) | |
| (5,861 | ) | |
$ | 26,639 | | |
| 2,471 | |
| | |
| | | |
| | | |
| | | |
| | | |
| | | |
| | | |
| | | |
| | |
| Year ended July 31, 2018 | | | |
| | | |
| | | |
| | | |
| | | |
| | |
| | |
| | | |
| | | |
| | | |
| | | |
| | | |
| | | |
| | | |
| | |
| Class A | |
$ | 38,634 | | |
| 3,605 | | |
$ | 3,569 | | |
| 334 | | |
$ | (25,328 | ) | |
| (2,369 | ) | |
$ | 16,875 | | |
| 1,570 | |
| Class C | |
| 2,347 | | |
| 219 | | |
| 196 | | |
| 19 | | |
| (3,139 | ) | |
| (293 | ) | |
| (596 | ) | |
| (55 | ) |
| Class T | |
| — | | |
| — | | |
| — | | |
| — | | |
| — | | |
| — | | |
| — | | |
| — | |
| Class F-1 | |
| 1,142 | | |
| 106 | | |
| 57 | | |
| 5 | | |
| (1,670 | ) | |
| (157 | ) | |
| (471 | ) | |
| (46 | ) |
| Class F-2 | |
| 9,234 | | |
| 861 | | |
| 358 | | |
| 33 | | |
| (4,652 | ) | |
| (435 | ) | |
| 4,940 | | |
| 459 | |
| Class F-3 | |
| 12,329 | | |
| 1,152 | | |
| 433 | | |
| 40 | | |
| (2,388 | ) | |
| (225 | ) | |
| 10,374 | | |
| 967 | |
| Total net increase (decrease) | |
$ | 63,686 | | |
| 5,943 | | |
$ | 4,613 | | |
| 431 | | |
$ | (37,177 | ) | |
| (3,479 | ) | |
$ | 31,122 | | |
| 2,895 | |
| * |
Includes exchanges between share classes of the fund. |
| 112 |
American Funds Tax-Exempt Funds |
10. Investment transactions
Each fund made purchases and sales of investment securities, excluding
short-term securities and U.S. government obligations, if any, during the year ended July 31, 2019, as follows (dollars in thousands):
| Fund | |
Purchases | | |
Sales | |
| American Funds Short-Term Tax-Exempt Bond Fund | |
$ | 644,087 | | |
$ | 492,201 | |
| Limited Term Tax-Exempt Bond Fund of America | |
| 1,681,535 | | |
| 1,544,774 | |
| The Tax-Exempt Bond Fund of America | |
| 5,349,012 | | |
| 3,655,359 | |
| American High-Income Municipal Bond Fund | |
| 2,170,109 | | |
| 1,318,759 | |
| The Tax-Exempt Fund of California | |
| 811,901 | | |
| 595,864 | |
| American Funds Tax-Exempt Fund of New York | |
| 64,754 | | |
| 36,633 | |
11. Ownership concentration
At July 31, 2019, CRMC held aggregate ownership of 13% of the outstanding
shares of American Funds Tax-Exempt Fund of New York. The ownership represents the seed money invested in the fund when it began
operations on November 1, 2010. In addition, American Funds Tax-Exempt Preservation Portfolio held 12% of the outstanding shares
of American Funds Short-Term Tax-Exempt Bond Fund. CRMC is the investment adviser to both of the funds.
| American Funds Tax-Exempt Funds |
113 |
Financial highlights
American Funds Short-Term Tax-Exempt Bond Fund
| | |
| | |
Income from investment
operations1 | | |
| | |
| | |
| | |
| | |
| | |
| |
| Period ended | |
Net
asset
value,
beginning
of period | | |
Net
investment
income | | |
Net
gains
(losses) on
securities
(both
realized and
unrealized) | | |
Total
from
investment
operations | | |
Dividends
(from net
investment
income) | | |
Net
asset
value,
end
of period | | |
Total
return2 | | |
Net
assets,
end of period
(in millions) | | |
Ratio
of
expenses
to average
net assets | | |
Ratio
of
net income
to average
net assets | |
| Class A: | |
| | | |
| | | |
| | | |
| | | |
| | | |
| | | |
| | | |
| | | |
| | | |
| | |
| 7/31/2019 | |
$ | 10.04 | | |
$ | .16 | | |
$ | .15 | | |
$ | .31 | | |
$ | (.16 | ) | |
$ | 10.19 | | |
| 3.09 | % | |
$ | 767 | | |
| .59 | % | |
| 1.56 | % |
| 7/31/2018 | |
| 10.15 | | |
| .13 | | |
| (.11 | ) | |
| .02 | | |
| (.13 | ) | |
| 10.04 | | |
| .24 | | |
| 752 | | |
| .58 | | |
| 1.33 | |
| 7/31/2017 | |
| 10.22 | | |
| .12 | | |
| (.07 | ) | |
| .05 | | |
| (.12 | ) | |
| 10.15 | | |
| .46 | | |
| 739 | | |
| .59 | | |
| 1.15 | |
| 7/31/2016 | |
| 10.17 | | |
| .10 | | |
| .05 | | |
| .15 | | |
| (.10 | ) | |
| 10.22 | | |
| 1.51 | | |
| 688 | | |
| .59 | | |
| 1.02 | |
| 7/31/2015 | |
| 10.25 | | |
| .11 | | |
| (.08 | ) | |
| .03 | | |
| (.11 | ) | |
| 10.17 | | |
| .26 | | |
| 653 | | |
| .58 | | |
| 1.04 | |
| Class T: | |
| | | |
| | | |
| | | |
| | | |
| | | |
| | | |
| | | |
| | | |
| | | |
| | |
| 7/31/2019 | |
| 10.04 | | |
| .17 | | |
| .15 | | |
| .32 | | |
| (.17 | ) | |
| 10.19 | | |
| 3.20 | 3 | |
| — | 4 | |
| .47 | 3 | |
| 1.67 | 3 |
| 7/31/2018 | |
| 10.15 | | |
| .15 | | |
| (.11 | ) | |
| .04 | | |
| (.15 | ) | |
| 10.04 | | |
| .36 | 3 | |
| — | 4 | |
| .47 | 3 | |
| 1.44 | 3 |
| 7/31/20175,6 | |
| 10.11 | | |
| .04 | | |
| .04 | | |
| .08 | | |
| (.04 | ) | |
| 10.15 | | |
| .82 | 3,7 | |
| — | 4 | |
| .15 | 3,7 | |
| .42 | 3,7 |
| Class F-1: | |
| | | |
| | | |
| | | |
| | | |
| | | |
| | | |
| | | |
| | | |
| | | |
| | |
| 7/31/2019 | |
| 10.04 | | |
| .13 | | |
| .15 | | |
| .28 | | |
| (.13 | ) | |
| 10.19 | | |
| 2.85 | | |
| 7 | | |
| .81 | | |
| 1.34 | |
| 7/31/2018 | |
| 10.15 | | |
| .11 | | |
| (.11 | ) | |
| — | 8 | |
| (.11 | ) | |
| 10.04 | | |
| .02 | | |
| 7 | | |
| .80 | | |
| 1.10 | |
| 7/31/2017 | |
| 10.22 | | |
| .09 | | |
| (.07 | ) | |
| .02 | | |
| (.09 | ) | |
| 10.15 | | |
| .23 | | |
| 9 | | |
| .82 | | |
| .92 | |
| 7/31/2016 | |
| 10.17 | | |
| .08 | | |
| .05 | | |
| .13 | | |
| (.08 | ) | |
| 10.22 | | |
| 1.29 | | |
| 13 | | |
| .81 | | |
| .80 | |
| 7/31/2015 | |
| 10.25 | | |
| .08 | | |
| (.08 | ) | |
| — | 8 | |
| (.08 | ) | |
| 10.17 | | |
| .05 | | |
| 9 | | |
| .80 | | |
| .83 | |
| Class F-2: | |
| | | |
| | | |
| | | |
| | | |
| | | |
| | | |
| | | |
| | | |
| | | |
| | |
| 7/31/2019 | |
| 10.04 | | |
| .17 | | |
| .15 | | |
| .32 | | |
| (.17 | ) | |
| 10.19 | | |
| 3.17 | | |
| 182 | | |
| .49 | | |
| 1.67 | |
| 7/31/2018 | |
| 10.15 | | |
| .14 | | |
| (.11 | ) | |
| .03 | | |
| (.14 | ) | |
| 10.04 | | |
| .28 | | |
| 52 | | |
| .54 | | |
| 1.37 | |
| 7/31/2017 | |
| 10.22 | | |
| .12 | | |
| (.07 | ) | |
| .05 | | |
| (.12 | ) | |
| 10.15 | | |
| .49 | | |
| 47 | | |
| .57 | | |
| 1.17 | |
| 7/31/2016 | |
| 10.17 | | |
| .11 | | |
| .05 | | |
| .16 | | |
| (.11 | ) | |
| 10.22 | | |
| 1.55 | | |
| 80 | | |
| .56 | | |
| 1.06 | |
| 7/31/2015 | |
| 10.25 | | |
| .11 | | |
| (.08 | ) | |
| .03 | | |
| (.11 | ) | |
| 10.17 | | |
| .29 | | |
| 64 | | |
| .55 | | |
| 1.08 | |
| 114 |
American Funds Tax-Exempt Funds |
| | |
| | |
Income
from investment operations1 | | |
| | |
| | |
| | |
| | |
| | |
| |
| Period ended | |
Net asset
value,
beginning
of period | | |
Net
investment
income | | |
Net gains
(losses) on
securities
(both
realized and
unrealized) | | |
Total from
investment
operations | | |
Dividends
(from net
investment
income) | | |
Net asset
value,
end
of period | | |
Total
return2 | | |
Net assets,
end of period
(in millions) | | |
Ratio of
expenses
to
average
net assets | | |
Ratio of
net income
to average
net assets | |
| Class F-3: | |
| | | |
| | | |
| | | |
| | | |
| | | |
| | | |
| | | |
| | | |
| | | |
| | |
| 7/31/2019 | |
$ | 10.04 | | |
$ | .17 | | |
$ | .15 | | |
$ | .32 | | |
$ | (.17 | ) | |
$ | 10.19 | | |
| 3.23 | % | |
$ | 52 | | |
| .44 | % | |
| 1.71 | % |
| 7/31/2018 | |
| 10.15 | | |
| .15 | | |
| (.11 | ) | |
| .04 | | |
| (.15 | ) | |
| 10.04 | | |
| .38 | | |
| 45 | | |
| .44 | | |
| 1.45 | |
| 7/31/20175,9 | |
| 10.07 | | |
| .07 | | |
| .08 | | |
| .15 | | |
| (.07 | ) | |
| 10.15 | | |
| 1.49 | 7 | |
| 77 | | |
| .47 | 10 | |
| 1.35 | 10 |
| Class R-6: | |
| | | |
| | | |
| | | |
| | | |
| | | |
| | | |
| | | |
| | | |
| | | |
| | |
| 7/31/2019 | |
| 10.04 | | |
| .17 | | |
| .15 | | |
| .32 | | |
| (.17 | ) | |
| 10.19 | | |
| 3.24 | | |
| 132 | | |
| .43 | | |
| 1.71 | |
| 7/31/2018 | |
| 10.15 | | |
| .15 | | |
| (.11 | ) | |
| .04 | | |
| (.15 | ) | |
| 10.04 | | |
| .38 | | |
| 122 | | |
| .44 | | |
| 1.48 | |
| 7/31/20175,11 | |
| 10.09 | | |
| .05 | | |
| .06 | | |
| .11 | | |
| (.05 | ) | |
| 10.15 | | |
| 1.20 | 7 | |
| 127 | | |
| .17 | 7 | |
| .51 | 7 |
| | |
Year ended July 31, |
| | |
2019 | |
2018 | |
2017 | |
2016 | |
2015 |
| Portfolio turnover rate for all share classes | |
50% | |
34% | |
26% | |
21% | |
38% |
| 1 |
|
Based on average shares outstanding. |
| 2 |
|
Total returns exclude any applicable sales charges, including contingent deferred sales charges. |
| 3 |
|
All or a significant portion of assets in this class consisted of seed capital invested by CRMC and/or its affiliates.
Fees for distribution services are not charged or accrued on these seed capital assets. If such fees were paid by the fund
on seed capital assets, fund expenses would have been higher and net income and total return would have been lower. |
| 4 |
|
Amount less than $1 million. |
| 5 |
|
Based on operations for a period that is less than a full year. |
| 6 |
|
Class T shares began investment operations on April 7, 2017. |
| 7 |
|
Not annualized. |
| 8 |
|
Amount less than $.01. |
| 9 |
|
Class F-3 shares began investment operations on January 27, 2017. |
| 10 |
|
Annualized. |
| 11 |
|
Class R-6 shares began investment operations on March 17, 2017. |
See notes to financial statements.
| American Funds Tax-Exempt Funds |
115 |
Financial highlights (continued)
Limited Term Tax-Exempt Bond Fund of America
| | |
| | |
Income
(loss) from investment operations1 | | |
| | |
| | |
| | |
| | |
| | |
| |
| Period ended | |
Net asset
value,
beginning
of period | | |
Net
investment
income | | |
Net gains
(losses) on
securities
(both
realized and
unrealized) | | |
Total from
investment
operations | | |
Dividends
(from net
investment
income) | | |
Net asset
value,
end
of period | | |
Total
return2 | | |
Net assets,
end of period
(in millions) | | |
Ratio of
expenses
to
average
net assets | | |
Ratio of
net income
to average
net assets | |
| Class A: | |
| | | |
| | | |
| | | |
| | | |
| | | |
| | | |
| | | |
| | | |
| | | |
| | |
| 7/31/2019 | |
$ | 15.52 | | |
$ | .31 | | |
$ | .41 | | |
$ | .72 | | |
$ | (.31 | ) | |
$ | 15.93 | | |
| 4.71 | % | |
$ | 3,060 | | |
| .59 | % | |
| 2.00 | % |
| 7/31/2018 | |
| 15.77 | | |
| .31 | | |
| (.25 | ) | |
| .06 | | |
| (.31 | ) | |
| 15.52 | | |
| .40 | | |
| 3,057 | | |
| .59 | | |
| 2.00 | |
| 7/31/2017 | |
| 16.04 | | |
| .32 | | |
| (.27 | ) | |
| .05 | | |
| (.32 | ) | |
| 15.77 | | |
| .34 | | |
| 3,038 | | |
| .59 | | |
| 2.04 | |
| 7/31/2016 | |
| 15.92 | | |
| .35 | | |
| .12 | | |
| .47 | | |
| (.35 | ) | |
| 16.04 | | |
| 2.97 | | |
| 3,055 | | |
| .59 | | |
| 2.17 | |
| 7/31/2015 | |
| 16.10 | | |
| .38 | | |
| (.18 | ) | |
| .20 | | |
| (.38 | ) | |
| 15.92 | | |
| 1.23 | | |
| 2,670 | | |
| .57 | | |
| 2.36 | |
| Class C: | |
| | | |
| | | |
| | | |
| | | |
| | | |
| | | |
| | | |
| | | |
| | | |
| | |
| 7/31/2019 | |
| 15.52 | | |
| .20 | | |
| .41 | | |
| .61 | | |
| (.20 | ) | |
| 15.93 | | |
| 3.94 | | |
| 18 | | |
| 1.33 | | |
| 1.27 | |
| 7/31/2018 | |
| 15.77 | | |
| .20 | | |
| (.25 | ) | |
| (.05 | ) | |
| (.20 | ) | |
| 15.52 | | |
| (.34 | ) | |
| 20 | | |
| 1.34 | | |
| 1.26 | |
| 7/31/2017 | |
| 16.04 | | |
| .20 | | |
| (.27 | ) | |
| (.07 | ) | |
| (.20 | ) | |
| 15.77 | | |
| (.40 | ) | |
| 25 | | |
| 1.33 | | |
| 1.30 | |
| 7/31/2016 | |
| 15.92 | | |
| .23 | | |
| .12 | | |
| .35 | | |
| (.23 | ) | |
| 16.04 | | |
| 2.20 | | |
| 30 | | |
| 1.33 | | |
| 1.43 | |
| 7/31/2015 | |
| 16.10 | | |
| .26 | | |
| (.18 | ) | |
| .08 | | |
| (.26 | ) | |
| 15.92 | | |
| .47 | | |
| 30 | | |
| 1.33 | | |
| 1.60 | |
| Class T: | |
| | | |
| | | |
| | | |
| | | |
| | | |
| | | |
| | | |
| | | |
| | | |
| | |
| 7/31/2019 | |
| 15.52 | | |
| .35 | | |
| .41 | | |
| .76 | | |
| (.35 | ) | |
| 15.93 | | |
| 4.99 | 3 | |
| — | 4 | |
| .33 | 3 | |
| 2.27 | 3 |
| 7/31/2018 | |
| 15.77 | | |
| .36 | | |
| (.25 | ) | |
| .11 | | |
| (.36 | ) | |
| 15.52 | | |
| .68 | 3 | |
| — | 4 | |
| .33 | 3 | |
| 2.26 | 3 |
| 7/31/20175,6 | |
| 15.68 | | |
| .12 | | |
| .09 | | |
| .21 | | |
| (.12 | ) | |
| 15.77 | | |
| 1.32 | 3,7 | |
| — | 4 | |
| .10 | 3,7 | |
| .74 | 3,7 |
| Class F-1: | |
| | | |
| | | |
| | | |
| | | |
| | | |
| | | |
| | | |
| | | |
| | | |
| | |
| 7/31/2019 | |
| 15.52 | | |
| .30 | | |
| .41 | | |
| .71 | | |
| (.30 | ) | |
| 15.93 | | |
| 4.63 | | |
| 60 | | |
| .67 | | |
| 1.93 | |
| 7/31/2018 | |
| 15.77 | | |
| .30 | | |
| (.25 | ) | |
| .05 | | |
| (.30 | ) | |
| 15.52 | | |
| .33 | | |
| 64 | | |
| .66 | | |
| 1.93 | |
| 7/31/2017 | |
| 16.04 | | |
| .31 | | |
| (.27 | ) | |
| .04 | | |
| (.31 | ) | |
| 15.77 | | |
| .26 | | |
| 83 | | |
| .67 | | |
| 1.96 | |
| 7/31/2016 | |
| 15.92 | | |
| .33 | | |
| .12 | | |
| .45 | | |
| (.33 | ) | |
| 16.04 | | |
| 2.88 | | |
| 90 | | |
| .67 | | |
| 2.09 | |
| 7/31/2015 | |
| 16.10 | | |
| .36 | | |
| (.18 | ) | |
| .18 | | |
| (.36 | ) | |
| 15.92 | | |
| 1.13 | | |
| 84 | | |
| .67 | | |
| 2.27 | |
| 116 |
American Funds Tax-Exempt Funds |
| | |
| | |
Income
(loss) from investment operations1 | | |
| | |
| | |
| | |
| | |
| | |
| |
| Period ended | |
Net asset
value,
beginning
of period | | |
Net
investment
income | | |
Net gains
(losses) on
securities
(both
realized and
unrealized) | | |
Total from
investment
operations | | |
Dividends
(from net
investment
income) | | |
Net asset
value,
end
of period | | |
Total
return2 | | |
Net assets,
end of period
(in millions) | | |
Ratio of
expenses
to
average
net assets | | |
Ratio of
net income
to average
net assets | |
| Class F-2: | |
| | | |
| | | |
| | | |
| | | |
| | | |
| | | |
| | | |
| | | |
| | | |
| | |
| 7/31/2019 | |
$ | 15.52 | | |
$ | .34 | | |
$ | .41 | | |
$ | .75 | | |
$ | (.34 | ) | |
$ | 15.93 | | |
| 4.91 | % | |
$ | 500 | | |
| .39 | % | |
| 2.20 | % |
| 7/31/2018 | |
| 15.77 | | |
| .34 | | |
| (.25 | ) | |
| .09 | | |
| (.34 | ) | |
| 15.52 | | |
| .58 | | |
| 353 | | |
| .41 | | |
| 2.18 | |
| 7/31/2017 | |
| 16.04 | | |
| .35 | | |
| (.27 | ) | |
| .08 | | |
| (.35 | ) | |
| 15.77 | | |
| .51 | | |
| 309 | | |
| .42 | | |
| 2.22 | |
| 7/31/2016 | |
| 15.92 | | |
| .38 | | |
| .12 | | |
| .50 | | |
| (.38 | ) | |
| 16.04 | | |
| 3.15 | | |
| 291 | | |
| .41 | | |
| 2.34 | |
| 7/31/2015 | |
| 16.10 | | |
| .40 | | |
| (.18 | ) | |
| .22 | | |
| (.40 | ) | |
| 15.92 | | |
| 1.39 | | |
| 208 | | |
| .41 | | |
| 2.52 | |
| Class F-3: | |
| | | |
| | | |
| | | |
| | | |
| | | |
| | | |
| | | |
| | | |
| | | |
| | |
| 7/31/2019 | |
| 15.52 | | |
| .36 | | |
| .41 | | |
| .77 | | |
| (.36 | ) | |
| 15.93 | | |
| 5.02 | | |
| 308 | | |
| .30 | | |
| 2.29 | |
| 7/31/2018 | |
| 15.77 | | |
| .36 | | |
| (.25 | ) | |
| .11 | | |
| (.36 | ) | |
| 15.52 | | |
| .70 | | |
| 187 | | |
| .30 | | |
| 2.29 | |
| 7/31/20175,8 | |
| 15.59 | | |
| .19 | | |
| .18 | | |
| .37 | | |
| (.19 | ) | |
| 15.77 | | |
| 2.37 | 7 | |
| 112 | | |
| .30 | 9 | |
| 2.36 | 9 |
| Class R-6: | |
| | | |
| | | |
| | | |
| | | |
| | | |
| | | |
| | | |
| | | |
| | | |
| | |
| 7/31/2019 | |
| 15.52 | | |
| .36 | | |
| .41 | | |
| .77 | | |
| (.36 | ) | |
| 15.93 | | |
| 5.02 | | |
| 307 | | |
| .29 | | |
| 2.30 | |
| 7/31/2018 | |
| 15.77 | | |
| .36 | | |
| (.25 | ) | |
| .11 | | |
| (.36 | ) | |
| 15.52 | | |
| .70 | | |
| 284 | | |
| .30 | | |
| 2.29 | |
| 7/31/2017 | |
| 16.04 | | |
| .37 | | |
| (.27 | ) | |
| .10 | | |
| (.37 | ) | |
| 15.77 | | |
| .63 | | |
| 296 | | |
| .30 | | |
| 2.33 | |
| 7/31/2016 | |
| 15.92 | | |
| .39 | | |
| .12 | | |
| .51 | | |
| (.39 | ) | |
| 16.04 | | |
| 3.26 | | |
| 284 | | |
| .30 | | |
| 2.45 | |
| 7/31/2015 | |
| 16.10 | | |
| .42 | | |
| (.18 | ) | |
| .24 | | |
| (.42 | ) | |
| 15.92 | | |
| 1.50 | | |
| 190 | | |
| .31 | | |
| 2.62 | |
| | |
Year ended July 31, |
| | |
2019 | |
2018 | |
2017 | |
2016 | |
2015 |
| Portfolio turnover rate for all share classes | |
42% | |
28% | |
27% | |
16% | |
19% |
| 1 |
Based on average shares outstanding. |
| 2 |
Total returns exclude any applicable sales charges, including contingent deferred sales charges. |
| 3 |
All or a significant portion of assets in this class consisted of seed capital invested by CRMC and/or its affiliates. Fees for distribution services are not charged or accrued on these seed capital assets. If such fees were paid by the fund on seed capital assets, fund expenses would have been higher and net income and total return would have been lower. |
| 4 |
Amount less than $1 million. |
| 5 |
Based on operations for a period that is less than a full year. |
| 6 |
Class T shares began investment operations on April 7, 2017. |
| 7 |
Not annualized. |
| 8 |
Class F-3 shares began investment operations on January 27, 2017. |
| 9 |
Annualized. |
See notes to financial statements.
| American Funds Tax-Exempt Funds |
117 |
Financial highlights (continued)
The Tax-Exempt Bond Fund of America
| | |
| | |
Income
(loss) from investment operations1 | | |
| | |
| | |
| | |
| | |
| | |
| |
| Period ended | |
Net asset
value,
beginning
of period | | |
Net
investment
income | | |
Net gains
(losses) on
securities
(both
realized and
unrealized) | | |
Total from
investment
operations | | |
Dividends
(from net
investment
income) | | |
Net asset
value,
end
of period | | |
Total
return2 | | |
Net assets,
end of period
(in millions) | | |
Ratio of
expenses
to
average
net assets | | |
Ratio of
net income
to average
net assets | |
| Class A: | |
| | | |
| | | |
| | | |
| | | |
| | | |
| | | |
| | | |
| | | |
| | | |
| | |
| 7/31/2019 | |
$ | 12.81 | | |
$ | .37 | | |
$ | .47 | | |
$ | .84 | | |
$ | (.36 | ) | |
$ | 13.29 | | |
| 6.71 | % | |
$ | 10,868 | | |
| .52 | % | |
| 2.84 | % |
| 7/31/2018 | |
| 12.98 | | |
| .38 | | |
| (.17 | ) | |
| .21 | | |
| (.38 | ) | |
| 12.81 | | |
| 1.60 | | |
| 10,102 | | |
| .53 | | |
| 2.91 | |
| 7/31/2017 | |
| 13.40 | | |
| .40 | | |
| (.42 | ) | |
| (.02 | ) | |
| (.40 | ) | |
| 12.98 | | |
| (.09 | ) | |
| 9,692 | | |
| .53 | | |
| 3.12 | |
| 7/31/2016 | |
| 12.96 | | |
| .41 | | |
| .44 | | |
| .85 | | |
| (.41 | ) | |
| 13.40 | | |
| 6.69 | | |
| 9,510 | | |
| .54 | | |
| 3.15 | |
| 7/31/2015 | |
| 12.92 | | |
| .42 | | |
| .04 | | |
| .46 | | |
| (.42 | ) | |
| 12.96 | | |
| 3.62 | | |
| 7,385 | | |
| .54 | | |
| 3.28 | |
| Class C: | |
| | | |
| | | |
| | | |
| | | |
| | | |
| | | |
| | | |
| | | |
| | | |
| | |
| 7/31/2019 | |
| 12.81 | | |
| .27 | | |
| .47 | | |
| .74 | | |
| (.26 | ) | |
| 13.29 | | |
| 5.88 | | |
| 407 | | |
| 1.31 | | |
| 2.06 | |
| 7/31/2018 | |
| 12.98 | | |
| .27 | | |
| (.17 | ) | |
| .10 | | |
| (.27 | ) | |
| 12.81 | | |
| .80 | | |
| 432 | | |
| 1.32 | | |
| 2.12 | |
| 7/31/2017 | |
| 13.40 | | |
| .30 | | |
| (.42 | ) | |
| (.12 | ) | |
| (.30 | ) | |
| 12.98 | | |
| (.88 | ) | |
| 474 | | |
| 1.32 | | |
| 2.33 | |
| 7/31/2016 | |
| 12.96 | | |
| .31 | | |
| .44 | | |
| .75 | | |
| (.31 | ) | |
| 13.40 | | |
| 5.85 | | |
| 517 | | |
| 1.33 | | |
| 2.35 | |
| 7/31/2015 | |
| 12.92 | | |
| .32 | | |
| .04 | | |
| .36 | | |
| (.32 | ) | |
| 12.96 | | |
| 2.80 | | |
| 349 | | |
| 1.33 | | |
| 2.50 | |
| Class T: | |
| | | |
| | | |
| | | |
| | | |
| | | |
| | | |
| | | |
| | | |
| | | |
| | |
| 7/31/2019 | |
| 12.81 | | |
| .40 | | |
| .47 | | |
| .87 | | |
| (.39 | ) | |
| 13.29 | | |
| 6.93 | 3 | |
| — | 4 | |
| .32 | 3 | |
| 3.05 | 3 |
| 7/31/2018 | |
| 12.98 | | |
| .40 | | |
| (.17 | ) | |
| .23 | | |
| (.40 | ) | |
| 12.81 | | |
| 1.83 | 3 | |
| — | 4 | |
| .32 | 3 | |
| 3.12 | 3 |
| 7/31/20175,6 | |
| 12.85 | | |
| .14 | | |
| .13 | | |
| .27 | | |
| (.14 | ) | |
| 12.98 | | |
| 2.07 | 3,7 | |
| — | 4 | |
| .10 | 3,7 | |
| 1.06 | 3,7 |
| Class F-1: | |
| | | |
| | | |
| | | |
| | | |
| | | |
| | | |
| | | |
| | | |
| | | |
| | |
| 7/31/2019 | |
| 12.81 | | |
| .36 | | |
| .47 | | |
| .83 | | |
| (.35 | ) | |
| 13.29 | | |
| 6.58 | | |
| 338 | | |
| .64 | | |
| 2.72 | |
| 7/31/2018 | |
| 12.98 | | |
| .36 | | |
| (.17 | ) | |
| .19 | | |
| (.36 | ) | |
| 12.81 | | |
| 1.48 | | |
| 370 | | |
| .65 | | |
| 2.80 | |
| 7/31/2017 | |
| 13.40 | | |
| .39 | | |
| (.43 | ) | |
| (.04 | ) | |
| (.38 | ) | |
| 12.98 | | |
| (.22 | ) | |
| 461 | | |
| .66 | | |
| 2.99 | |
| 7/31/2016 | |
| 12.96 | | |
| .39 | | |
| .44 | | |
| .83 | | |
| (.39 | ) | |
| 13.40 | | |
| 6.53 | | |
| 518 | | |
| .67 | | |
| 3.04 | |
| 7/31/2015 | |
| 12.92 | | |
| .41 | | |
| .04 | | |
| .45 | | |
| (.41 | ) | |
| 12.96 | | |
| 3.49 | | |
| 1,474 | | |
| .67 | | |
| 3.16 | |
| 118 |
American Funds Tax-Exempt Funds |
| | |
| | |
Income
(loss) from investment operations1 | | |
| | |
| | |
| | |
| | |
| | |
| |
| Period ended | |
Net asset
value,
beginning
of period | | |
Net
investment
income | | |
Net gains
(losses) on
securities
(both
realized and
unrealized) | | |
Total from
investment
operations | | |
Dividends
(from net
investment
income) | | |
Net asset
value,
end
of period | | |
Total
return2 | | |
Net assets,
end of period
(in millions) | | |
Ratio of
expenses
to
average
net assets | | |
Ratio of
net income
to average
net assets | |
| Class F-2: | |
| | | |
| | | |
| | | |
| | | |
| | | |
| | | |
| | | |
| | | |
| | | |
| | |
| 7/31/2019 | |
$ | 12.81 | | |
$ | .39 | | |
$ | .47 | | |
$ | .86 | | |
$ | (.38 | ) | |
$ | 13.29 | | |
| 6.86 | % | |
$ | 2,778 | | |
| .38 | % | |
| 2.98 | % |
| 7/31/2018 | |
| 12.98 | | |
| .39 | | |
| (.17 | ) | |
| .22 | | |
| (.39 | ) | |
| 12.81 | | |
| 1.74 | | |
| 2,177 | | |
| .39 | | |
| 3.05 | |
| 7/31/2017 | |
| 13.40 | | |
| .42 | | |
| (.42 | ) | |
| — | 8 | |
| (.42 | ) | |
| 12.98 | | |
| .03 | | |
| 1,909 | | |
| .41 | | |
| 3.24 | |
| 7/31/2016 | |
| 12.96 | | |
| .43 | | |
| .44 | | |
| .87 | | |
| (.43 | ) | |
| 13.40 | | |
| 6.84 | | |
| 2,879 | | |
| .40 | | |
| 3.26 | |
| 7/31/2015 | |
| 12.92 | | |
| .44 | | |
| .04 | | |
| .48 | | |
| (.44 | ) | |
| 12.96 | | |
| 3.76 | | |
| 990 | | |
| .41 | | |
| 3.42 | |
| Class F-3: | |
| | | |
| | | |
| | | |
| | | |
| | | |
| | | |
| | | |
| | | |
| | | |
| | |
| 7/31/2019 | |
| 12.81 | | |
| .41 | | |
| .47 | | |
| .88 | | |
| (.40 | ) | |
| 13.29 | | |
| 6.97 | | |
| 6,570 | | |
| .27 | | |
| 3.09 | |
| 7/31/2018 | |
| 12.98 | | |
| .41 | | |
| (.17 | ) | |
| .24 | | |
| (.41 | ) | |
| 12.81 | | |
| 1.84 | | |
| 5,397 | | |
| .28 | | |
| 3.11 | |
| 7/31/20175,9 | |
| 12.75 | | |
| .22 | | |
| .23 | | |
| .45 | | |
| (.22 | ) | |
| 12.98 | | |
| 3.54 | 7 | |
| 1,555 | | |
| .29 | 10 | |
| 3.34 | 10 |
| Class R-6: | |
| | | |
| | | |
| | | |
| | | |
| | | |
| | | |
| | | |
| | | |
| | | |
| | |
| 7/31/2019 | |
| 12.81 | | |
| .41 | | |
| .47 | | |
| .88 | | |
| (.40 | ) | |
| 13.29 | | |
| 6.97 | | |
| 685 | | |
| .27 | | |
| 3.09 | |
| 7/31/2018 | |
| 12.98 | | |
| .41 | | |
| (.17 | ) | |
| .24 | | |
| (.41 | ) | |
| 12.81 | | |
| 1.85 | | |
| 550 | | |
| .28 | | |
| 3.15 | |
| 7/31/2017 | |
| 13.40 | | |
| .44 | | |
| (.43 | ) | |
| .01 | | |
| (.43 | ) | |
| 12.98 | | |
| .15 | | |
| 380 | | |
| .29 | | |
| 3.36 | |
| 7/31/2016 | |
| 12.96 | | |
| .44 | | |
| .44 | | |
| .88 | | |
| (.44 | ) | |
| 13.40 | | |
| 6.95 | | |
| 391 | | |
| .29 | | |
| 3.39 | |
| 7/31/2015 | |
| 12.92 | | |
| .46 | | |
| .04 | | |
| .50 | | |
| (.46 | ) | |
| 12.96 | | |
| 3.86 | | |
| 270 | | |
| .30 | | |
| 3.52 | |
| | |
Year ended July 31, |
| | |
2019 | |
2018 | |
2017 | |
2016 | |
2015 |
| Portfolio turnover rate for all share classes | |
20% | |
17% | |
20% | |
13% | |
14% |
| 1 |
|
Based on average shares outstanding. |
| 2 |
|
Total returns exclude any applicable sales charges, including contingent deferred sales charges. |
| 3 |
|
All or a significant portion of assets in this class consisted of seed capital invested by CRMC and/or its affiliates.
Fees for distribution services are not charged or accrued on these seed capital assets. If such fees were paid by the fund
on seed capital assets, fund expenses would have been higher and net income and total return would have been lower. |
| 4 |
|
Amount less than $1 million. |
| 5 |
|
Based on operations for a period that is less than a full year. |
| 6 |
|
Class T shares began investment operations on April 7, 2017. |
| 7 |
|
Not annualized. |
| 8 |
|
Amount less than $.01. |
| 9 |
|
Class F-3 shares began investment operations on January 27, 2017. |
| 10 |
|
Annualized. |
See notes to financial statements.
| American Funds Tax-Exempt Funds |
119 |
Financial highlights (continued)
American High-Income Municipal Bond Fund
| | |
| | |
Income (loss) from investment
operations1 | | |
| | |
| | |
| | |
| | |
| | |
| |
| Period ended | |
Net asset
value,
beginning
of period | | |
Net
investment
income | | |
Net gains
(losses) on
securities
(both
realized
and
unrealized) | | |
Total from
investment
operations | | |
Dividends
(from net
investment
income) | | |
Net asset
value,
end
of period | | |
Total
return2 | | |
Net assets,
end of period
(in millions) | | |
Ratio of
expenses
to average
net assets | | |
Ratio of
net income
to average
net assets | |
| Class A: | |
| | | |
| | | |
| | | |
| | | |
| | | |
| | | |
| | | |
| | | |
| | | |
| | |
| 7/31/2019 | |
$ | 15.78 | | |
$ | .58 | | |
$ | .54 | | |
$ | 1.12 | | |
$ | (.57 | ) | |
$ | 16.33 | | |
| 7.28 | % | |
$ | 4,637 | | |
| .68 | % | |
| 3.67 | % |
| 7/31/2018 | |
| 15.73 | | |
| .59 | | |
| .04 | | |
| .63 | | |
| (.58 | ) | |
| 15.78 | | |
| 4.05 | | |
| 4,062 | | |
| .68 | | |
| 3.72 | |
| 7/31/2017 | |
| 16.21 | | |
| .60 | | |
| (.49 | ) | |
| .11 | | |
| (.59 | ) | |
| 15.73 | | |
| .76 | | |
| 3,645 | | |
| .67 | | |
| 3.86 | |
| 7/31/2016 | |
| 15.40 | | |
| .63 | | |
| .79 | | |
| 1.42 | | |
| (.61 | ) | |
| 16.21 | | |
| 9.45 | | |
| 3,519 | | |
| .67 | | |
| 4.02 | |
| 7/31/2015 | |
| 15.22 | | |
| .64 | | |
| .17 | | |
| .81 | | |
| (.63 | ) | |
| 15.40 | | |
| 5.34 | | |
| 2,700 | | |
| .68 | | |
| 4.13 | |
| Class C: | |
| | | |
| | | |
| | | |
| | | |
| | | |
| | | |
| | | |
| | | |
| | | |
| | |
| 7/31/2019 | |
| 15.78 | | |
| .47 | | |
| .54 | | |
| 1.01 | | |
| (.46 | ) | |
| 16.33 | | |
| 6.49 | | |
| 238 | | |
| 1.41 | | |
| 2.94 | |
| 7/31/2018 | |
| 15.73 | | |
| .47 | | |
| .04 | | |
| .51 | | |
| (.46 | ) | |
| 15.78 | | |
| 3.29 | | |
| 227 | | |
| 1.43 | | |
| 2.97 | |
| 7/31/2017 | |
| 16.21 | | |
| .48 | | |
| (.49 | ) | |
| (.01 | ) | |
| (.47 | ) | |
| 15.73 | | |
| .00 | | |
| 229 | | |
| 1.43 | | |
| 3.10 | |
| 7/31/2016 | |
| 15.40 | | |
| .52 | | |
| .79 | | |
| 1.31 | | |
| (.50 | ) | |
| 16.21 | | |
| 8.62 | | |
| 247 | | |
| 1.43 | | |
| 3.26 | |
| 7/31/2015 | |
| 15.22 | | |
| .52 | | |
| .17 | | |
| .69 | | |
| (.51 | ) | |
| 15.40 | | |
| 4.55 | | |
| 182 | | |
| 1.44 | | |
| 3.37 | |
| Class T: | |
| | | |
| | | |
| | | |
| | | |
| | | |
| | | |
| | | |
| | | |
| | | |
| | |
| 7/31/2019 | |
| 15.78 | | |
| .62 | | |
| .54 | | |
| 1.16 | | |
| (.61 | ) | |
| 16.33 | | |
| 7.55 | 3 | |
| — | 4 | |
| .42 | 3 | |
| 3.93 | 3 |
| 7/31/2018 | |
| 15.73 | | |
| .63 | | |
| .04 | | |
| .67 | | |
| (.62 | ) | |
| 15.78 | | |
| 4.34 | 3 | |
| — | 4 | |
| .43 | 3 | |
| 3.98 | 3 |
| 7/31/20175,6 | |
| 15.50 | | |
| .20 | | |
| .23 | | |
| .43 | | |
| (.20 | ) | |
| 15.73 | | |
| 2.77 | 3,7 | |
| — | 4 | |
| .12 | 3,7 | |
| 1.28 | 3,7 |
| Class F-1: | |
| | | |
| | | |
| | | |
| | | |
| | | |
| | | |
| | | |
| | | |
| | | |
| | |
| 7/31/2019 | |
| 15.78 | | |
| .57 | | |
| .54 | | |
| 1.11 | | |
| (.56 | ) | |
| 16.33 | | |
| 7.21 | | |
| 180 | | |
| .74 | | |
| 3.61 | |
| 7/31/2018 | |
| 15.73 | | |
| .58 | | |
| .04 | | |
| .62 | | |
| (.57 | ) | |
| 15.78 | | |
| 3.99 | | |
| 208 | | |
| .75 | | |
| 3.65 | |
| 7/31/2017 | |
| 16.21 | | |
| .59 | | |
| (.49 | ) | |
| .10 | | |
| (.58 | ) | |
| 15.73 | | |
| .68 | | |
| 234 | | |
| .75 | | |
| 3.77 | |
| 7/31/2016 | |
| 15.40 | | |
| .62 | | |
| .79 | | |
| 1.41 | | |
| (.60 | ) | |
| 16.21 | | |
| 9.37 | | |
| 282 | | |
| .74 | | |
| 3.95 | |
| 7/31/2015 | |
| 15.22 | | |
| .62 | | |
| .17 | | |
| .79 | | |
| (.61 | ) | |
| 15.40 | | |
| 5.27 | | |
| 207 | | |
| .75 | | |
| 4.06 | |
| 120 |
American Funds Tax-Exempt Funds |
| | |
| | |
Income (loss) from investment
operations1 | | |
| | |
| | |
| | |
| | |
| | |
| |
| Period ended | |
Net asset
value,
beginning
of period | | |
Net
investment
income | | |
Net gains
(losses) on
securities
(both
realized
and
unrealized) | | |
Total from
investment
operations | | |
Dividends
(from net
investment
income) | | |
Net asset
value,
end
of period | | |
Total
return2 | | |
Net assets,
end of period
(in millions) | | |
Ratio of
expenses
to average
net assets | | |
Ratio of
net income
to average
net assets | |
| Class F-2: | |
| | | |
| | | |
| | | |
| | | |
| | | |
| | | |
| | | |
| | | |
| | | |
| | |
| 7/31/2019 | |
$ | 15.78 | | |
$ | .61 | | |
$ | .54 | | |
$ | 1.15 | | |
$ | (.60 | ) | |
$ | 16.33 | | |
| 7.49 | % | |
$ | 1,114 | | |
| .47 | % | |
| 3.87 | % |
| 7/31/2018 | |
| 15.73 | | |
| .62 | | |
| .04 | | |
| .66 | | |
| (.61 | ) | |
| 15.78 | | |
| 4.26 | | |
| 798 | | |
| .49 | | |
| 3.91 | |
| 7/31/2017 | |
| 16.21 | | |
| .63 | | |
| (.49 | ) | |
| .14 | | |
| (.62 | ) | |
| 15.73 | | |
| .93 | | |
| 605 | | |
| .50 | | |
| 4.05 | |
| 7/31/2016 | |
| 15.40 | | |
| .66 | | |
| .79 | | |
| 1.45 | | |
| (.64 | ) | |
| 16.21 | | |
| 9.65 | | |
| 775 | | |
| .48 | | |
| 4.18 | |
| 7/31/2015 | |
| 15.22 | | |
| .66 | | |
| .17 | | |
| .83 | | |
| (.65 | ) | |
| 15.40 | | |
| 5.53 | | |
| 321 | | |
| .49 | | |
| 4.32 | |
| Class F-3: | |
| | | |
| | | |
| | | |
| | | |
| | | |
| | | |
| | | |
| | | |
| | | |
| | |
| 7/31/2019 | |
| 15.78 | | |
| .63 | | |
| .54 | | |
| 1.17 | | |
| (.62 | ) | |
| 16.33 | | |
| 7.60 | | |
| 897 | | |
| .37 | | |
| 3.97 | |
| 7/31/2018 | |
| 15.73 | | |
| .64 | | |
| .04 | | |
| .68 | | |
| (.63 | ) | |
| 15.78 | | |
| 4.37 | | |
| 646 | | |
| .38 | | |
| 4.02 | |
| 7/31/20175,8 | |
| 15.30 | | |
| .32 | | |
| .43 | | |
| .75 | | |
| (.32 | ) | |
| 15.73 | | |
| 4.96 | 7 | |
| 421 | | |
| .37 | 9 | |
| 4.04 | 9 |
| Class R-6: | |
| | | |
| | | |
| | | |
| | | |
| | | |
| | | |
| | | |
| | | |
| | | |
| | |
| 7/31/2019 | |
| 15.78 | | |
| .63 | | |
| .54 | | |
| 1.17 | | |
| (.62 | ) | |
| 16.33 | | |
| 7.61 | | |
| 686 | | |
| .37 | | |
| 3.98 | |
| 7/31/2018 | |
| 15.73 | | |
| .64 | | |
| .04 | | |
| .68 | | |
| (.63 | ) | |
| 15.78 | | |
| 4.37 | | |
| 550 | | |
| .38 | | |
| 4.02 | |
| 7/31/2017 | |
| 16.21 | | |
| .64 | | |
| (.49 | ) | |
| .15 | | |
| (.63 | ) | |
| 15.73 | | |
| 1.05 | | |
| 380 | | |
| .38 | | |
| 4.16 | |
| 7/31/2016 | |
| 15.40 | | |
| .68 | | |
| .79 | | |
| 1.47 | | |
| (.66 | ) | |
| 16.21 | | |
| 9.76 | | |
| 269 | | |
| .38 | | |
| 4.31 | |
| 7/31/2015 | |
| 15.22 | | |
| .68 | | |
| .17 | | |
| .85 | | |
| (.67 | ) | |
| 15.40 | | |
| 5.64 | | |
| 188 | | |
| .39 | | |
| 4.42 | |
| | |
Year ended July 31, |
| | |
2019 | |
2018 | |
2017 | |
2016 | |
2015 |
| Portfolio turnover rate for all share classes | |
20% | |
24% | |
30% | |
21% | |
23% |
| 1 |
Based on average shares outstanding. |
| 2 |
Total returns exclude any applicable sales charges, including contingent deferred sales charges. |
| 3 |
All or a significant portion of assets in this class consisted of seed capital invested by CRMC
and/or its affiliates. Fees for distribution services are not charged or accrued on these seed capital assets. If such fees
were paid by the fund on seed capital assets, fund expenses would have been higher and net income and total return would have
been lower. |
| 4 |
Amount less than $1 million. |
| 5 |
Based on operations for a period that is less than a full year. |
| 6 |
Class T shares began investment operations on April 7, 2017. |
| 7 |
Not annualized. |
| 8 |
Class F-3 shares began investment operations on January 27, 2017. |
| 9 |
Annualized. |
See notes to financial statements.
| American Funds Tax-Exempt Funds |
121 |
Financial highlights (continued)
The Tax-Exempt Fund of California
| | |
| | |
Income (loss) from investment
operations1 | | |
| | |
| | |
| | |
| | |
| | |
| |
| Period ended | |
Net asset
value,
beginning
of period | | |
Net
investment
income | | |
Net gains
(losses) on
securities
(both
realized
and
unrealized) | | |
Total from
investment
operations | | |
Dividends
(from net
investment
income) | | |
Net asset
value,
end
of period | | |
Total
return2 | | |
Net assets,
end of period
(in millions) | | |
Ratio of
expenses
to average
net assets | | |
Ratio of
net income
to average
net assets | |
| Class A: | |
| | | |
| | | |
| | | |
| | | |
| | | |
| | | |
| | | |
| | | |
| | | |
| | |
| 7/31/2019 | |
$ | 17.43 | | |
$ | .50 | | |
$ | .65 | | |
$ | 1.15 | | |
$ | (.50 | ) | |
$ | 18.08 | | |
| 6.73 | % | |
$ | 1,784 | | |
| .59 | % | |
| 2.88 | % |
| 7/31/2018 | |
| 17.63 | | |
| .51 | | |
| (.20 | ) | |
| .31 | | |
| (.51 | ) | |
| 17.43 | | |
| 1.77 | | |
| 1,678 | | |
| .61 | | |
| 2.90 | |
| 7/31/2017 | |
| 18.21 | | |
| .54 | | |
| (.59 | ) | |
| (.05 | ) | |
| (.53 | ) | |
| 17.63 | | |
| (.22 | ) | |
| 1,641 | | |
| .60 | | |
| 3.05 | |
| 7/31/2016 | |
| 17.62 | | |
| .57 | | |
| .58 | | |
| 1.15 | | |
| (.56 | ) | |
| 18.21 | | |
| 6.65 | | |
| 1,678 | | |
| .60 | | |
| 3.17 | |
| 7/31/2015 | |
| 17.52 | | |
| .60 | | |
| .09 | | |
| .69 | | |
| (.59 | ) | |
| 17.62 | | |
| 3.98 | | |
| 1,386 | | |
| .62 | | |
| 3.38 | |
| Class C: | |
| | | |
| | | |
| | | |
| | | |
| | | |
| | | |
| | | |
| | | |
| | | |
| | |
| 7/31/2019 | |
| 17.43 | | |
| .36 | | |
| .65 | | |
| 1.01 | | |
| (.36 | ) | |
| 18.08 | | |
| 5.90 | | |
| 69 | | |
| 1.38 | | |
| 2.10 | |
| 7/31/2018 | |
| 17.63 | | |
| .37 | | |
| (.20 | ) | |
| .17 | | |
| (.37 | ) | |
| 17.43 | | |
| .97 | | |
| 71 | | |
| 1.40 | | |
| 2.11 | |
| 7/31/2017 | |
| 18.21 | | |
| .40 | | |
| (.59 | ) | |
| (.19 | ) | |
| (.39 | ) | |
| 17.63 | | |
| (1.00 | ) | |
| 83 | | |
| 1.39 | | |
| 2.26 | |
| 7/31/2016 | |
| 17.62 | | |
| .43 | | |
| .58 | | |
| 1.01 | | |
| (.42 | ) | |
| 18.21 | | |
| 5.82 | | |
| 97 | | |
| 1.39 | | |
| 2.38 | |
| 7/31/2015 | |
| 17.52 | | |
| .46 | | |
| .09 | | |
| .55 | | |
| (.45 | ) | |
| 17.62 | | |
| 3.16 | | |
| 78 | | |
| 1.40 | | |
| 2.59 | |
| Class T: | |
| | | |
| | | |
| | | |
| | | |
| | | |
| | | |
| | | |
| | | |
| | | |
| | |
| 7/31/2019 | |
| 17.43 | | |
| .54 | | |
| .65 | | |
| 1.19 | | |
| (.54 | ) | |
| 18.08 | | |
| 6.95 | 3 | |
| — | 4 | |
| .39 | 3 | |
| 3.09 | 3 |
| 7/31/2018 | |
| 17.63 | | |
| .54 | | |
| (.20 | ) | |
| .34 | | |
| (.54 | ) | |
| 17.43 | | |
| 1.98 | 3 | |
| — | 4 | |
| .40 | 3 | |
| 3.10 | 3 |
| 7/31/20175,6 | |
| 17.42 | | |
| .18 | | |
| .21 | | |
| .39 | | |
| (.18 | ) | |
| 17.63 | | |
| 2.24 | 3,7 | |
| — | 4 | |
| .12 | 3,7 | |
| 1.02 | 3,7 |
| Class F-1: | |
| | | |
| | | |
| | | |
| | | |
| | | |
| | | |
| | | |
| | | |
| | | |
| | |
| 7/31/2019 | |
| 17.43 | | |
| .48 | | |
| .65 | | |
| 1.13 | | |
| (.48 | ) | |
| 18.08 | | |
| 6.59 | | |
| 72 | | |
| .72 | | |
| 2.76 | |
| 7/31/2018 | |
| 17.63 | | |
| .49 | | |
| (.20 | ) | |
| .29 | | |
| (.49 | ) | |
| 17.43 | | |
| 1.64 | | |
| 75 | | |
| .73 | | |
| 2.77 | |
| 7/31/2017 | |
| 18.21 | | |
| .51 | | |
| (.58 | ) | |
| (.07 | ) | |
| (.51 | ) | |
| 17.63 | | |
| (.35 | ) | |
| 76 | | |
| .73 | | |
| 2.93 | |
| 7/31/2016 | |
| 17.62 | | |
| .55 | | |
| .58 | | |
| 1.13 | | |
| (.54 | ) | |
| 18.21 | | |
| 6.52 | | |
| 83 | | |
| .73 | | |
| 3.04 | |
| 7/31/2015 | |
| 17.52 | | |
| .58 | | |
| .09 | | |
| .67 | | |
| (.57 | ) | |
| 17.62 | | |
| 3.85 | | |
| 63 | | |
| .74 | | |
| 3.26 | |
| 122 |
American Funds Tax-Exempt Funds |
| | |
| | |
Income (loss) from investment operations1 | | |
| | |
| | |
| | |
| | |
| | |
| |
| Period ended | |
Net asset
value,
beginning
of period | | |
Net
investment
income | | |
Net gains
(losses) on
securities
(both
realized and
unrealized) | | |
Total from
investment
operations | | |
Dividends
(from net
investment
income) | | |
Net asset
value,
end
of period | | |
Total
return2 | | |
Net assets,
end of period
(in millions) | | |
Ratio of
expenses
to average
net assets | | |
Ratio of
net income
to average
net assets | |
| Class F-2: | |
| | | |
| | | |
| | | |
| | | |
| | | |
| | | |
| | | |
| | | |
| | | |
| | |
| 7/31/2019 | |
$ | 17.43 | | |
$ | .53 | | |
$ | .65 | | |
$ | 1.18 | | |
$ | (.53 | ) | |
$ | 18.08 | | |
| 6.88 | % | |
$ | 411 | | |
| .45 | % | |
| 3.02 | % |
| 7/31/2018 | |
| 17.63 | | |
| .53 | | |
| (.20 | ) | |
| .33 | | |
| (.53 | ) | |
| 17.43 | | |
| 1.89 | | |
| 257 | | |
| .48 | | |
| 3.03 | |
| 7/31/2017 | |
| 18.21 | | |
| .56 | | |
| (.59 | ) | |
| (.03 | ) | |
| (.55 | ) | |
| 17.63 | | |
| (.09 | ) | |
| 200 | | |
| .48 | | |
| 3.18 | |
| 7/31/2016 | |
| 17.62 | | |
| .60 | | |
| .58 | | |
| 1.18 | | |
| (.59 | ) | |
| 18.21 | | |
| 6.79 | | |
| 213 | | |
| .48 | | |
| 3.29 | |
| 7/31/2015 | |
| 17.52 | | |
| .62 | | |
| .09 | | |
| .71 | | |
| (.61 | ) | |
| 17.62 | | |
| 4.10 | | |
| 134 | | |
| .49 | | |
| 3.51 | |
| Class F-3: | |
| | | |
| | | |
| | | |
| | | |
| | | |
| | | |
| | | |
| | | |
| | | |
| | |
| 7/31/2019 | |
| 17.43 | | |
| .55 | | |
| .64 | | |
| 1.19 | | |
| (.54 | ) | |
| 18.08 | | |
| 6.98 | | |
| 241 | | |
| .36 | | |
| 3.11 | |
| 7/31/2018 | |
| 17.63 | | |
| .55 | | |
| (.20 | ) | |
| .35 | | |
| (.55 | ) | |
| 17.43 | | |
| 2.01 | | |
| 174 | | |
| .37 | | |
| 3.13 | |
| 7/31/20175,8 | |
| 17.27 | | |
| .29 | | |
| .36 | | |
| .65 | | |
| (.29 | ) | |
| 17.63 | | |
| 3.79 | 7 | |
| 124 | | |
| .38 | 9 | |
| 3.25 | 9 |
| | |
Year ended July 31, |
| | |
2019 | |
2018 | |
2017 | |
2016 | |
2015 |
| Portfolio turnover rate for all share classes | |
27% | |
14% | |
21% | |
11% | |
17% |
| 1 |
Based on average shares outstanding. |
| 2 |
Total returns exclude any applicable sales charges, including contingent deferred sales charges. |
| 3 |
All or a significant portion of assets in this class consisted of seed capital invested by CRMC and/or its affiliates.
Fees for distribution services are not charged or accrued on these seed capital assets. If such fees were paid by the fund
on seed capital assets, fund expenses would have been higher and net income and total return would have been lower. |
| 4 |
Amount less than $1 million. |
| 5 |
Based on operations for a period that is less than a full year. |
| 6 |
Class T shares began investment operations on April 7, 2017. |
| 7 |
Not annualized. |
| 8 |
Class F-3 shares began investment operations on January 27, 2017. |
| 9 |
Annualized. |
See notes to financial statements.
| American Funds Tax-Exempt Funds |
123 |
Financial highlights (continued)
American Funds Tax-Exempt Fund of New York
| | |
| | |
Income (loss) from investment
operations1 | | |
| | |
| | |
| | |
| | |
| | |
| | |
| |
| Period ended | |
Net asset
value,
beginning
of year | | |
Net
investment
income | | |
Net gains
(losses)
on
securities
(both
realized and
unrealized) | | |
Total from
investment
operations | | |
Dividends
(from net
investment
income) | | |
Net asset
value,
end
of period | | |
Total
return2,3 | | |
Net assets,
end of
period
(in millions) | | |
Ratio of
expenses
to
average net
assets before
reimbursements | | |
Ratio of
expenses
to
average net
assets after
reimbursements3 | | |
Ratio of
net income
to average
net assets3 | |
| Class A: | |
| | | |
| | | |
| | | |
| | | |
| | | |
| | | |
| | | |
| | | |
| | | |
| | | |
| | |
| 7/31/2019 | |
$ | 10.61 | | |
$ | .28 | | |
$ | .41 | | |
$ | .69 | | |
$ | (.28 | ) | |
$ | 11.02 | | |
| 6.57 | % | |
$ | 200 | | |
| .67 | % | |
| .67 | % | |
| 2.60 | % |
| 7/31/2018 | |
| 10.80 | | |
| .27 | | |
| (.19 | ) | |
| .08 | | |
| (.27 | ) | |
| 10.61 | | |
| .75 | 4 | |
| 183 | | |
| .72 | 4 | |
| .69 | 4 | |
| 2.52 | 4 |
| 7/31/2017 | |
| 11.12 | | |
| .27 | | |
| (.32 | ) | |
| (.05 | ) | |
| (.27 | ) | |
| 10.80 | | |
| (.39 | )4 | |
| 169 | | |
| .74 | 4 | |
| .69 | 4 | |
| 2.55 | 4 |
| 7/31/2016 | |
| 10.66 | | |
| .28 | | |
| .45 | | |
| .73 | | |
| (.27 | ) | |
| 11.12 | | |
| 6.95 | 4 | |
| 161 | | |
| .72 | 4 | |
| .69 | 4 | |
| 2.54 | 4 |
| 7/31/2015 | |
| 10.58 | | |
| .32 | | |
| .07 | | |
| .39 | | |
| (.31 | ) | |
| 10.66 | | |
| 3.65 | 4 | |
| 124 | | |
| .72 | 4 | |
| .67 | 4 | |
| 2.91 | 4 |
| Class C: | |
| | | |
| | | |
| | | |
| | | |
| | | |
| | | |
| | | |
| | | |
| | | |
| | | |
| | |
| 7/31/2019 | |
| 10.61 | | |
| .19 | | |
| .41 | | |
| .60 | | |
| (.19 | ) | |
| 11.02 | | |
| 5.74 | | |
| 12 | | |
| 1.46 | | |
| 1.45 | | |
| 1.81 | |
| 7/31/2018 | |
| 10.80 | | |
| .19 | | |
| (.19 | ) | |
| — | 5 | |
| (.19 | ) | |
| 10.61 | | |
| (.04 | ) | |
| 12 | | |
| 1.52 | | |
| 1.48 | | |
| 1.73 | |
| 7/31/2017 | |
| 11.12 | | |
| .19 | | |
| (.32 | ) | |
| (.13 | ) | |
| (.19 | ) | |
| 10.80 | | |
| (1.17 | ) | |
| 12 | | |
| 1.52 | | |
| 1.48 | | |
| 1.76 | |
| 7/31/2016 | |
| 10.66 | | |
| .20 | | |
| .45 | | |
| .65 | | |
| (.19 | ) | |
| 11.12 | | |
| 6.11 | | |
| 14 | | |
| 1.51 | | |
| 1.48 | | |
| 1.75 | |
| 7/31/2015 | |
| 10.58 | | |
| .23 | | |
| .07 | | |
| .30 | | |
| (.22 | ) | |
| 10.66 | | |
| 2.79 | | |
| 10 | | |
| 1.56 | | |
| 1.50 | | |
| 2.07 | |
| Class T: | |
| | | |
| | | |
| | | |
| | | |
| | | |
| | | |
| | | |
| | | |
| | | |
| | | |
| | |
| 7/31/2019 | |
| 10.61 | | |
| .30 | | |
| .41 | | |
| .71 | | |
| (.30 | ) | |
| 11.02 | | |
| 6.78 | 4 | |
| — | 6 | |
| .47 | 4 | |
| .46 | 4 | |
| 2.79 | 4 |
| 7/31/2018 | |
| 10.80 | | |
| .29 | | |
| (.19 | ) | |
| .10 | | |
| (.29 | ) | |
| 10.61 | | |
| .98 | 4 | |
| — | 6 | |
| .52 | 4 | |
| .48 | 4 | |
| 2.73 | 4 |
| 7/31/20177,8 | |
| 10.68 | | |
| .09 | | |
| .13 | | |
| .22 | | |
| (.10 | ) | |
| 10.80 | | |
| 2.02 | 4,9 | |
| — | 6 | |
| .19 | 4,9 | |
| .15 | 4,9 | |
| .87 | 4,9 |
| Class F-1: | |
| | | |
| | | |
| | | |
| | | |
| | | |
| | | |
| | | |
| | | |
| | | |
| | | |
| | |
| 7/31/2019 | |
| 10.61 | | |
| .27 | | |
| .41 | | |
| .68 | | |
| (.27 | ) | |
| 11.02 | | |
| 6.52 | 4 | |
| 2 | | |
| .72 | 4 | |
| .71 | 4 | |
| 2.55 | 4 |
| 7/31/2018 | |
| 10.80 | | |
| .26 | | |
| (.19 | ) | |
| .07 | | |
| (.26 | ) | |
| 10.61 | | |
| .69 | 4 | |
| 2 | | |
| .79 | 4 | |
| .75 | 4 | |
| 2.45 | 4 |
| 7/31/2017 | |
| 11.12 | | |
| .27 | | |
| (.32 | ) | |
| (.05 | ) | |
| (.27 | ) | |
| 10.80 | | |
| (.38 | )4 | |
| 3 | | |
| .73 | 4 | |
| .68 | 4 | |
| 2.56 | 4 |
| 7/31/2016 | |
| 10.66 | | |
| .29 | | |
| .45 | | |
| .74 | | |
| (.28 | ) | |
| 11.12 | | |
| 7.02 | 4 | |
| 2 | | |
| .65 | 4 | |
| .62 | 4 | |
| 2.61 | 4 |
| 7/31/2015 | |
| 10.58 | | |
| .31 | | |
| .07 | | |
| .38 | | |
| (.30 | ) | |
| 10.66 | | |
| 3.58 | 4 | |
| 2 | | |
| .80 | 4 | |
| .74 | 4 | |
| 2.83 | 4 |
| 124 |
American Funds Tax-Exempt Funds |
| | |
| | |
Income (loss) from investment
operations1 | | |
| | |
| | |
| | |
| | |
| | |
| | |
| |
| Period ended | |
Net asset
value,
beginning
of year | | |
Net
investment
income | | |
Net gains
(losses)
on
securities
(both
realized and
unrealized) | | |
Total from
investment
operations | | |
Dividends
(from net
investment
income) | | |
Net asset
value,
end
of period | | |
Total
return2,3 | | |
Net assets,
end of
period
(in millions) | | |
Ratio of
expenses
to
average net
assets before
reimbursements | | |
Ratio of
expenses
to
average net
assets after
reimbursements3 | | |
Ratio of
net income
to average
net assets3 | |
| Class F-2: | |
| | | |
| | | |
| | | |
| | | |
| | | |
| | | |
| | | |
| | | |
| | | |
| | | |
| | |
| 7/31/2019 | |
$ | 10.61 | | |
$ | .29 | | |
$ | .41 | | |
$ | .70 | | |
$ | (.29 | ) | |
$ | 11.02 | | |
| 6.74 | % | |
$ | 29 | | |
| .51 | % | |
| .51 | % | |
| 2.75 | % |
| 7/31/2018 | |
| 10.80 | | |
| .29 | | |
| (.19 | ) | |
| .10 | | |
| (.29 | ) | |
| 10.61 | | |
| .89 | | |
| 16 | | |
| .59 | | |
| .54 | | |
| 2.67 | |
| 7/31/2017 | |
| 11.12 | | |
| .29 | | |
| (.32 | ) | |
| (.03 | ) | |
| (.29 | ) | |
| 10.80 | | |
| (.26 | ) | |
| 11 | | |
| .58 | | |
| .56 | | |
| 2.68 | |
| 7/31/2016 | |
| 10.66 | | |
| .30 | | |
| .45 | | |
| .75 | | |
| (.29 | ) | |
| 11.12 | | |
| 7.10 | | |
| 31 | | |
| .58 | | |
| .55 | | |
| 2.68 | |
| 7/31/2015 | |
| 10.58 | | |
| .33 | | |
| .07 | | |
| .40 | | |
| (.32 | ) | |
| 10.66 | | |
| 3.77 | | |
| 20 | | |
| .61 | | |
| .56 | | |
| 3.02 | |
| Class F-3: | |
| | | |
| | | |
| | | |
| | | |
| | | |
| | | |
| | | |
| | | |
| | | |
| | | |
| | |
| 7/31/2019 | |
| 10.61 | | |
| .30 | | |
| .41 | | |
| .71 | | |
| (.30 | ) | |
| 11.02 | | |
| 6.83 | | |
| 32 | | |
| .42 | | |
| .42 | | |
| 2.84 | |
| 7/31/2018 | |
| 10.80 | | |
| .30 | | |
| (.19 | ) | |
| .11 | | |
| (.30 | ) | |
| 10.61 | | |
| 1.00 | | |
| 26 | | |
| .48 | | |
| .44 | | |
| 2.78 | |
| 7/31/20177,10 | |
| 10.58 | | |
| .15 | | |
| .22 | | |
| .37 | | |
| (.15 | ) | |
| 10.80 | | |
| 3.54 | 9 | |
| 16 | | |
| .58 | 11 | |
| .45 | 11 | |
| 2.79 | 11 |
| | |
Year ended July 31, |
| | |
2019 | |
2018 | |
2017 | |
2016 | |
2015 |
| Portfolio turnover rate for all share classes | |
16% | |
21% | |
27% | |
14% | |
42% |
| 1 |
|
Based on average shares outstanding. |
| 2 |
|
Total returns exclude any applicable sales charges, including contingent deferred sales charges. |
| 3 |
|
This column reflects the impact, if any, of certain reimbursements from CRMC. During the periods shown, CRMC reimbursed
a portion of miscellaneous fees and expenses. |
| 4 |
|
All or a significant portion of assets in this class consisted of seed capital invested by CRMC and/or its affiliates.
Fees for distribution services are not charged or accrued on these seed capital assets. If such fees were paid by the fund
on seed capital assets, fund expenses would have been higher and net income and total return would have been lower. |
| 5 |
|
Amount less than $.01. |
| 6 |
|
Amount less than $1 million. |
| 7 |
|
Based on operations for a period that is less than a full year. |
| 8 |
|
Class T shares began investment operations on April 7, 2017. |
| 9 |
|
Not annualized. |
| 10 |
|
Class F-3 shares began investment operations on January 27, 2017. |
| 11 |
|
Annualized. |
See notes to financial statements.
| American Funds Tax-Exempt Funds |
125 |
Report of Independent Registered Public Accounting Firm
To the Board of Trustees and Shareholders of American Funds Short-Term
Tax-Exempt Bond Fund, Limited Term Tax-Exempt Bond Fund of America, The Tax-Exempt Bond Fund of America, American High-Income Municipal
Bond Fund and American Funds Tax-Exempt Fund of New York and to the Board of Trustees of The American Funds Tax-Exempt Series II
and Shareholders of The Tax-Exempt Fund of California
Opinions on the Financial Statements
We have audited the accompanying statements of assets and liabilities,
including the summary investment portfolios, of American Funds Short-Term Tax-Exempt Bond Fund, Limited Term Tax-Exempt Bond Fund
of America, The Tax-Exempt Bond Fund of America, American High-Income Municipal Bond Fund, The Tax-Exempt Fund of California and
American Funds Tax-Exempt Fund of New York (the “Funds”) as of July 31, 2019, the related statements of operations for
the year ended July 31, 2019, the statements of changes in net assets for each of the two years in the period ended July 31, 2019,
including the related notes, and the financial highlights for each of the periods indicated therein (collectively referred to as
the “financial statements”). In our opinion, the financial statements present fairly, in all material respects, the
financial position of each of the Funds as of July 31, 2019, the results of each of their operations for the year then ended, the
changes in each of their net assets for each of the two years in the period ended July 31, 2019 and each of the financial highlights
for each of the periods indicated therein in conformity with accounting principles generally accepted in the United States of America.
Basis for Opinions
These financial statements are the responsibility of the Funds’
management. Our responsibility is to express an opinion on the Funds’ financial statements based on our audits. We are a
public accounting firm registered with the Public Company Accounting Oversight Board (United States) (“PCAOB”) and
are required to be independent with respect to the Funds in accordance with the U.S. federal securities laws and the applicable
rules and regulations of the Securities and Exchange Commission and the PCAOB.
We conducted our audits of these financial statements in accordance
with the standards of the PCAOB. Those standards require that we plan and perform the audit to obtain reasonable assurance about
whether the financial statements are free of material misstatement, whether due to error or fraud.
Our audits included performing procedures to assess the risks of
material misstatement of the financial statements, whether due to error or fraud, and performing procedures that respond to those
risks. Such procedures included examining, on a test basis, evidence regarding the amounts and disclosures in the financial statements.
Our audits also included evaluating the accounting principles used and significant estimates made by management, as well as evaluating
the overall presentation of the financial statements. Our procedures included confirmation of securities owned as of July 31, 2019
by correspondence with the custodians and brokers; when replies were not received from brokers, we performed other auditing procedures.
We believe that our audits provide a reasonable basis for our opinions.
/s/ PricewaterhouseCoopers LLP
Los Angeles, California
September 16, 2019
We have served as the auditor of one or more investment companies
in The Capital Group Companies Investment Company Complex since 1934.
American Funds Short-Term Tax-Exempt Bond
Fund
Part C
Other Information
Item 28. Exhibits for Registration Statement (1940 Act No.
811-05750 and 1933 Act. No. 033-26431)
| (a) | Articles of Incorporation – Amended and Restated Agreement and Declaration of
Trust dated 9/13/17 – previously filed (see P/E Amendment No. 56 filed 9/29/17) |
| (b) | By-laws – Amended and Restated By-laws effective 8/29/18 – previously filed (see P/E Amendment No. 58 filed
9/28/18) |
| (c) | Instruments Defining Rights of Security Holders – None |
| (d) | Investment Advisory Contracts – Amended and Restated Investment Advisory and Service
Agreement dated 5/1/19 |
| (e) | Underwriting Contracts – Amended and Restated Principal Underwriting Agreement effective
4/7/17 – previously filed (see P/E Amendment No. 56 filed 9/29/17); Form of Selling Group Agreement – previously filed
(see P/E Amendment No. 56 filed 9/29/17); Form of Bank/Trust Company Selling Group Agreement – previously filed (see P/E
Amendment No. 56 filed 9/29/17); Form of Class F Share Participation Agreement – previously filed (see P/E Amendment No.
56 filed 9/29/17); and Form of Bank/Trust Company Participation Agreement for Class F Shares – previously filed (see P/E
Amendment No. 56 filed 9/29/17) |
| (f) | Bonus or Profit Sharing Contracts - Deferred Compensation Plan effective 3/31/19 |
| (g) | Custodian Agreements – Form of Global Custody Agreement – previously filed (see
P/E Amendment No. 33 filed 8/7/09); and Form of Amendment to Global Custody Agreement effective 7/1/15; previously filed (see P/E
Amendment No. 46 filed 9/30/15) |
| (h-1) | Other Material Contracts – Form of Indemnification Agreement – previously filed
(see P/E Amendment No. 32 filed 6/3/09); Agreement and Plan of Reorganization – previously filed (see P/E Amendment No. 32
filed 6/3/09); and Amended and Restated Administrative Services Agreement effective 1/1/18 – previously filed (see P/E Amendment
No. 58 filed 9/28/18) |
| (h-2) | Amended and Restated Shareholder Services Agreement effective 4/7/17 |
| (i) | Legal Opinion – previously filed (see P/E Amendment No. 33 filed 8/7/09; P/E Amendment
No. 50 filed 12/29/16; P/E Amendment No. 52 filed 3/16/17; and P/E Amendment No. 54 filed 4/6/17) |
| (j) | Other Opinions – Consent of Independent Registered Public Accounting Firm |
| (k) | Omitted Financial Statements - none |
| (l) | Initial Capital Agreements – none |
| (m) | Rule 12b-1 Plan – Forms of Plans of Distribution – previously filed (see P/E
Amendment No. 33 filed 8/7/09); and Plan of Distribution for Class T Shares dated 4/7/17 – previously filed (see P/E Amendment
No. 56 filed 9/29/17) |
| (n) | Rule 18f-3 Plan – Amended and Restated Multiple Class Plan effective 1/1/18 –
previously filed (see P/E Amendment No. 58 filed 9/28/18) |
| (p) | Code of Ethics – Code of Ethics for The Capital Group Companies dated July 2019; and
Code of Ethics for the Registrant |
| Item 29. | Persons Controlled by or Under Common Control with the Fund |
None
The Registrant is a
joint-insured under Investment Advisor/Mutual Fund Errors and Omissions Policies, which insure its officers and trustees against
certain liabilities. However, in no event will Registrant maintain insurance to indemnify any such person for any act for which
Registrant itself is not permitted to indemnify the individual.
Article 8 of the Registrant’s
Declaration of Trust as well as the indemnification agreements that the Registrant has entered into with each of its trustees who
is not an “interested person” of the Registrant (as defined under the Investment Company Act of 1940, as amended),
provide in effect that the Registrant will indemnify its officers and trustees against any liability or expenses actually and reasonably
incurred by such person in any proceeding arising out of or in connection with his or her service to the Registrant, to the fullest
extent permitted by applicable law, subject to certain conditions. In accordance with Section 17(h) and 17(i) of the Investment
Company Act of 1940, as amended, and their respective terms, these provisions do not protect any person against any liability to
the Registrant or its shareholders to which such person would otherwise be subject by reason of willful misfeasance, bad faith,
gross negligence, or reckless disregard of the duties involved in the conduct of his or her office.
Insofar as indemnification
for liability arising under the Securities Act of 1933 may be permitted to trustees, officers and controlling persons of the Registrant
pursuant to the foregoing provisions, or otherwise, the Registrant has been advised that in the opinion of the U.S. Securities
and Exchange Commission such indemnification is against public policy as expressed in the Act and is, therefore, unenforceable.
In the event that a claim for indemnification against such liabilities (other than the payment by the Registrant of expenses incurred
or paid by a trustee, officer or controlling person of the Registrant in the successful defense of any action, suit or proceeding)
is asserted by such trustee, officer or controlling person in connection with the securities being registered, the Registrant will,
unless in the opinion of its counsel the matter has been settled by controlling precedent, submit to a court of appropriate jurisdiction
the question whether such indemnification by it is against public policy as expressed in the Act and will be governed by the final
adjudication of such issue.
Registrant will comply with
the indemnification requirements contained in the Investment Company Act of 1940, as amended, and Release Nos. 7221 (June 9, 1972)
and 11330 (September 4, 1980).
| Item 31. | Business and Other Connections of the Investment Adviser |
None
| Item 32. | Principal Underwriters |
(a) American
Funds Distributors, Inc. is the Principal Underwriter of shares of: AMCAP Fund, American Balanced Fund, American Funds College
Target Date Series, American Funds Corporate Bond Fund, American Funds Developing World Growth and Income Fund, American Funds
Emerging Markets Bond Fund, American Funds Fundamental Investors, American Funds Global Balanced Fund, The American Funds Income
Series, American Funds Inflation Linked Bond Fund, American Funds Mortgage Fund, American Funds Portfolio Series, American Funds
Retirement Income Portfolio Series, American Funds Short-Term Tax-Exempt Bond Fund, American Funds Strategic Bond Fund, American
Funds Target Date Retirement Series, American Funds Tax-Exempt Fund of New York, The American Funds Tax-Exempt Series II, American
Funds U.S. Government Money Market Fund, American High-Income Municipal Bond Fund, American High-Income Trust, American Mutual
Fund, The Bond Fund of America, Capital Group Emerging Markets Total Opportunities Fund, Capital Income Builder, Capital Group
Private Client Services Funds, Capital World Bond Fund, Capital World Growth and Income Fund, Emerging Markets Growth Fund, Inc.,
EuroPacific Growth Fund, The Growth Fund of America, The Income Fund of America, Intermediate Bond Fund of America, International
Growth and Income Fund, The Investment Company of America, Limited Term Tax-Exempt Bond Fund of America, The New Economy Fund,
New Perspective Fund, New World Fund, Inc., Short-Term Bond Fund of America, SMALLCAP World Fund, Inc., The Tax-Exempt Bond Fund
of America and Washington Mutual Investors Fund
(b)
| |
(1)
Name and Principal
Business Address
|
(2)
Positions and Offices
with Underwriter |
(3)
Positions and Offices
with Registrant |
| LAO |
C. Thomas Akin II
|
Regional Vice President |
None |
| LAO |
Christopher S. Anast
|
Senior Vice President, Capital Group Institutional Investment Services Division |
None |
| LAO |
William C. Anderson
|
Director, Senior Vice President and Chief Compliance Officer |
None |
| LAO |
Dion T. Angelopoulos
|
Assistant Vice President |
None |
| LAO |
Luis F. Arocha
|
Regional Vice President |
None |
| LAO |
Keith D. Ashley
|
Regional Vice President |
None |
| LAO |
Curtis A. Baker
|
Senior Vice President, Capital Group Institutional Investment Services Division |
None |
| LAO |
T. Patrick Bardsley
|
Vice President |
None |
| SNO |
Mark C. Barile
|
Assistant Vice President |
None |
| LAO |
Shakeel A. Barkat
|
Senior Vice President |
None |
| LAO |
Antonio M. Bass
|
Regional Vice President |
None |
| LAO |
Brett A. Beach
|
Assistant Vice President |
None |
| LAO |
Katherine A. Beattie
|
Senior Vice President |
None |
| LAO |
Scott G. Beckerman
|
Vice President |
None |
| LAO |
Bethann Beiermeister
|
Regional Vice President |
None |
| LAO |
Clyde O. Bell
|
Assistant Vice President |
None |
| LAO |
Jeb M. Bent
|
Vice President |
None |
| LAO |
Matthew D. Benton
|
Regional Vice President |
None |
| LAO |
Jerry R. Berg
|
Vice President |
None |
| LAO |
Joseph W. Best, Jr.
|
Senior Vice President, Capital Group Institutional Investment Services Division |
None |
| LAO |
Roger J. Bianco, Jr.
|
Senior Vice President |
None |
| LAO |
Ryan M. Bickle
|
Senior Vice President, Capital Group Institutional Investment Services Division |
None |
| LAO |
Peter D. Bjork
|
Regional Vice President |
None |
| LAO |
Marek Blaskovic
|
Vice President |
None |
| LAO |
Matthew C. Bloemer
|
Regional Vice President |
None |
| LAO |
Jeffrey E. Blum
|
Regional Vice President |
None |
| LAO |
Gerard M. Bockstie, Jr.
|
Senior Vice President |
None |
| LAO |
Jon T. Boldt
|
Regional Vice President |
None |
| LAO |
Jill M. Boudreau
|
Senior Vice President, Capital Group Institutional Investment Services Division |
None |
| LAO |
Andre W. Bouvier
|
Senior Vice President, Capital Group Institutional Investment Services Division |
None |
| LAO |
Michael A. Bowman
|
Senior Vice President, Capital Group Institutional Investment Services Division |
None |
| LAO |
Jordan C. Bowers
|
Regional Vice President |
None |
| LAO |
David H. Bradin
|
Vice President |
None |
| LAO |
William P. Brady
|
Senior Vice President |
None |
| LAO |
William G. Bridge
|
Vice President |
None |
| IND |
Robert W. Brinkman
|
Assistant Vice President |
None |
| LAO |
Jeffrey R. Brooks
|
Vice President |
None |
| LAO |
Kevin G. Broulette
|
Vice President, Capital Group Institutional Investment Services Division
|
None |
| LAO |
E. Chapman Brown, Jr.
|
Vice President |
None |
| LAO |
Toni L. Brown
|
Senior Vice President, Capital Group Institutional Investment Services Division |
None |
| IND |
Jennifer A. Bruce
|
Assistant Vice President |
None |
| LAO |
Gary D. Bryce
|
Vice President |
None |
| LAO |
Ronan J. Burke
|
Senior Vice President, Capital Group Institutional Investment Services Division |
None |
| LAO |
Steven Calabria
|
Senior Vice President |
None |
| LAO |
Thomas E. Callahan
|
Senior Vice President |
None |
| LAO |
Matthew S. Cameron
|
Regional Vice President |
None |
| LAO |
Anthony J. Camilleri
|
Vice President |
None |
| LAO |
Kelly V. Campbell
|
Vice President |
None |
| LAO |
Anthon S. Cannon III
|
Vice President |
None |
| LAO |
Kevin J. Carevic
|
Regional Vice President |
None |
| LAO |
Jason S. Carlough
|
Vice President |
None |
| LAO |
Kim R. Carney
|
Senior Vice President |
None |
| LAO |
Damian F. Carroll
|
Senior Vice President |
None |
| LAO |
James D. Carter
|
Senior Vice President |
None |
| LAO |
Stephen L. Caruthers
|
Senior Vice President, Capital Group Institutional Investment Services
Division
|
None |
| SFO |
James G. Carville
|
Senior Vice President, Capital Group Institutional Investment Services
Division
|
None |
| LAO |
Philip L. Casciano
|
Regional Vice President |
None |
| LAO |
Brian C. Casey
|
Senior Vice President |
None |
| LAO |
Christopher M. Cefalo
|
Vice President
|
None |
| LAO |
Joseph M. Cella
|
Regional Vice President |
None |
| LAO |
Kent W. Chan
|
Senior Vice President, Capital Group Institutional Investment Services
Division
|
None |
| LAO |
Thomas M. Charon
|
Senior Vice President |
None |
| LAO |
Ibrahim Chaudry |
Vice President, Capital Group Institutional Investment Services Division
|
None |
| SNO |
Marcus L. Chaves |
Assistant Vice President
|
None |
| LAO |
Daniel A. Chodosch
|
Vice President |
None |
| LAO |
Wellington Choi
|
Senior Vice President, Capital Group Institutional Investment Services Division |
None |
| LAO |
Andrew T. Christos
|
Regional Vice President |
None |
| LAO |
Paul A. Cieslik
|
Senior Vice President |
None |
| IND |
G. Michael Cisternino
|
Vice President |
None |
| LAO |
Andrew R. Claeson
|
Vice President |
None |
| LAO |
Michael J. Clark
|
Regional Vice President |
None |
| IND |
David A. Clase
|
Vice President |
None |
| LAO |
Jamie A. Claypool
|
Regional Vice President |
None |
| LAO |
Kyle R. Coffey
|
Regional Vice President |
None |
| IND |
Timothy J. Colvin
|
Regional Vice President |
None |
| SNO |
Brandon J Cone
|
Assistant Vice President |
None |
| LAO |
Christopher M. Conwell
|
Vice President |
None |
| LAO |
C. Jeffrey Cook
|
Senior Vice President, Capital Group Institutional Investment Services Division |
None |
| LAO |
Greggory J. Cowan
|
Regional Vice President |
None |
| IND |
Sarah D. Crews |
Assistant Vice President
|
None |
| LAO |
Joseph G. Cronin
|
Senior Vice President |
None |
| IND |
Jill R. Cross
|
Vice President |
None |
| LAO |
D. Erick Crowdus
|
Vice President |
None |
| LAO |
Hanh M. Dao
|
Vice President |
None |
| LAO |
Alex L. DaPron
|
Regional Vice President |
None |
| LAO |
William F. Daugherty
|
Senior Vice President |
None |
| SNO |
Bradley C. Davis
|
Assistant Vice President |
None |
| LAO |
Scott T. Davis
|
Vice President |
None |
| LAO |
Shane L. Davis
|
Vice President |
None |
| LAO |
Peter J. Deavan
|
Senior Vice President |
None |
| LAO |
Kristofer J. DeBonville
|
Regional Vice President |
None |
| LAO |
Guy E. Decker
|
Senior Vice President |
None |
| LAO |
Daniel Delianedis
|
Senior Vice President |
None |
| LAO |
Mark A. Dence
|
Senior Vice President |
None |
| SNO |
Brian M. Derrico
|
Vice President |
None |
| LAO |
Stephen Deschenes
|
Senior Vice President |
None |
| LAO |
Alexander J. Diorio
|
Regional Vice President |
None |
| LAO |
Mario P. DiVito
|
Vice President, Capital Group Institutional Investment Services Division |
None |
| LAO |
Joanne H. Dodd
|
Senior Vice President, Capital Group Institutional Investment Services Division |
None |
| LAO |
Kevin F. Dolan
|
Senior Vice President |
None |
| LAO |
John H. Donovan IV
|
Assistant Vice President |
None |
| LAO |
Ronald Q. Dottin
|
Vice President |
|
| LAO |
John J. Doyle
|
Senior Vice President, Capital Group Institutional Investment Services Division |
None |
| LAO |
Ryan T. Doyle
|
Vice President |
None |
| SNO |
Melissa A. Dreyer
|
Assistant Vice President |
None |
| LAO |
Craig Duglin
|
Senior Vice President |
None |
| LAO |
Alan J. Dumas
|
Regional Vice President |
None |
| SNO |
Bryan K. Dunham
|
Assistant Vice President |
None |
| LAO |
Sean P. Durkin
|
Regional Vice President |
None |
| LAO |
John E. Dwyer IV
|
Senior Vice President, Capital Group Institutional Investment Services Division |
None |
| IND |
Karyn B. Dzurisin
|
Vice President |
None |
| LAO |
Kevin C. Easley
|
Senior Vice President |
None |
| LAO |
Damian Eckstein
|
Vice President |
None |
| LAO |
Matthew J. Eisenhardt
|
Senior Vice President |
None |
| LAO |
Timothy L. Ellis
|
Senior Vice President |
None |
| LAO |
John A. Erickson
|
Assistant Vice President |
None |
| LAO |
Riley O. Etheridge, Jr.
|
Senior Vice President |
None |
| LAO |
E. Luke Farrell
|
Senior Vice President, Capital Group Institutional Investment Services Division |
None |
| LAO |
Bryan R. Favilla
|
Regional Vice President |
None |
| LAO |
Joseph M. Fazio
|
Regional Vice President |
None |
| LAO |
Mark A. Ferraro
|
Vice President |
None |
| LAO |
Brandon J. Fetta
|
Assistant Vice President |
None |
| LAO |
Kevin H. Folks
|
Vice President |
None |
| LAO |
David R. Ford
|
Vice President |
None |
| LAO |
William E. Ford
|
Vice President |
None |
| LAO |
Steven M. Fox
|
Vice President |
None |
| LAO |
Daniel Frick
|
Senior Vice President |
None |
| LAO |
Tyler L. Furek
|
Regional Vice President |
None |
| SNO |
Arturo V. Garcia, Jr.
|
Vice President |
None |
| LAO |
J. Gregory Garrett
|
Senior Vice President, Capital Group Institutional Investment Services Division |
None |
| SNO |
Edward S. Garza
|
Regional Vice President |
None |
| LAO |
Brian K. Geiger
|
Vice President |
None |
| LAO |
Leslie B. Geller
|
Vice President |
None |
| LAO |
Jacob M. Gerber
|
Vice President, Capital Group Institutional Investment Services Division |
None |
| LAO |
J. Christopher Gies
|
Senior Vice President |
None |
| LAO |
Pamela A. Gillett
|
Regional Vice President
|
None |
| LAO |
William F. Gilmartin
|
Vice President |
None |
| LAO |
Kathleen D. Golden
|
Regional Vice President |
None |
| SNO |
Craig B. Gray
|
Assistant Vice President |
None |
| LAO |
Robert E. Greeley, Jr.
|
Vice President |
None |
| LAO |
Jameson R. Greenstone
|
Regional Vice President |
None |
| LAO |
Jeffrey J. Greiner
|
Senior Vice President |
None |
| LAO |
Eric M. Grey
|
Senior Vice President |
None |
| LAO |
Karen M. Griffin
|
Assistant Vice President |
None |
| LAO |
E. Renee Grimm
|
Senior Vice President
|
None |
| LAO |
Scott A. Grouten
|
Regional Vice President |
None |
| SNO |
Virginia Guevara
|
Assistant Vice President |
None |
| IRV |
Steven Guida
|
Senior Vice President |
None |
| LAO |
Sam S. Gumma
|
Vice President |
None |
| LAO |
Jan S. Gunderson
|
Senior Vice President |
None |
| SNO |
Lori L. Guy
|
Regional Vice President |
None |
| LAO |
Ralph E. Haberli
|
Senior Vice President; Senior Vice President, Capital Group Institutional
Investment Services Division
|
None |
| LAO |
Paul B. Hammond
|
Senior Vice President |
None |
| LAO |
Philip E. Haning
|
Vice President |
None |
| LAO |
Dale K. Hanks
|
Vice President, Capital Group Institutional Investment Services Division |
None |
| LAO |
David R. Hanna
|
Vice President |
None |
| LAO |
Brandon S. Hansen
|
Regional Vice President |
None |
| LAO |
Julie O. Hansen
|
Vice President |
None |
| LAO |
Kenneth J. Hargreaves
|
Regional Vice President |
None |
| LAO |
John R. Harley
|
Senior Vice President |
None |
| LAO |
Calvin L. Harrelson III
|
Senior Vice President, Capital Group Institutional Investment Services Division |
None |
| LAO |
Robert J. Hartig, Jr.
|
Senior Vice President |
None |
| LAO |
Craig W. Hartigan
|
Senior Vice President |
None |
| LAO |
Alan M. Heaton
|
Vice President |
None |
| LAO |
Clifford W. “Webb” Heidinger
|
Vice President |
None |
| LAO |
Brock A. Hillman
|
Vice President, Capital Group Institutional Investment Services Division
|
None |
| IND |
Kristin S. Himsel |
Regional Vice President
|
None |
| LAO |
Jennifer M. Hoang
|
Vice President |
None |
| LAO |
Jessica K. Hooyenga
|
Regional Vice President |
None |
| LAO |
Heidi B. Horwitz-Marcus
|
Senior Vice President |
None |
| LAO |
David R. Hreha
|
Vice President |
None |
| LAO |
Frederic J. Huber
|
Senior Vice President |
None |
| LAO |
David K. Hummelberg
|
Director, Executive Vice President, Principal Operating Officer and Principal Financial Officer |
None |
| LAO |
Jeffrey K. Hunkins
|
Vice President |
None |
| LAO |
Angelia G. Hunter
|
Senior Vice President |
None |
| LAO |
Christa M. Iacono
|
Assistant Vice President |
None |
| LAO |
Marc G. Ialeggio
|
Senior Vice President |
None |
| IND |
David K. Jacocks
|
Vice President |
None |
| LAO |
Maurice E. Jadah
|
Regional Vice President |
None |
| LAO |
W. Chris Jenkins
|
Senior Vice President |
None |
| LAO |
Daniel J. Jess II
|
Vice President |
None |
| IND |
Jameel S. Jiwani
|
Regional Vice President |
None |
| LAO |
Sarah C. Johnson
|
Vice President |
None |
| LAO |
Brendan M. Jonland
|
Vice President |
None |
| LAO |
Kathryn H. Jordan
|
Regional Vice President |
None |
| LAO |
David G. Jordt
|
Vice President
|
None |
| LAO |
Stephen T. Joyce
|
Senior Vice President, Capital Group Institutional Investment Services Division |
None |
| LAO |
Wassan M. Kasey
|
Vice President |
None |
| LAO |
John P. Keating
|
Senior Vice President |
None |
| LAO |
David B. Keib
|
Vice President |
None |
| LAO |
Brian G. Kelly
|
Senior Vice President |
None |
| LAO |
Christopher J. Kennedy
|
Regional Vice President |
None |
| LAO |
Jason A. Kerr
|
Vice President |
None |
| LAO |
Ryan C. Kidwell
|
Senior Vice President |
None |
| LAO |
Nora A. Kilaghbian
|
Vice President |
None |
| IRV |
Michael C. Kim
|
Vice President |
None |
| LAO |
Charles A. King
|
Senior Vice President, Capital Group Institutional Investment Services Division |
None |
| LAO |
Mark Kistler
|
Senior Vice President |
None |
| LAO |
Stephen J. Knutson
|
Assistant Vice President |
None |
| LAO |
Michael J. Koch
|
Regional Vice President |
None |
| LAO |
James M. Kreider
|
Vice President |
None |
| LAO |
Andrew M. Kruger
|
Regional Vice President |
None |
| SNO |
David D. Kuncho
|
Vice President |
None |
| LAO |
Richard M. Lang
|
Senior Vice President, Capital Group Institutional Investment Services Division |
None |
| LAO |
Christopher F. Lanzafame
|
Senior Vice President |
None |
| LAO |
Andrew P. Laskowski
|
Regional Vice President |
None |
| LAO |
Matthew N. Leeper
|
Vice President |
None |
| LAO |
Clay M. Leveritt
|
Vice President |
None |
| LAO |
Lorin E. Liesy |
Senior Vice President
|
None |
| IND |
Justin L. Linder |
Assistant Vice President
|
None |
| LAO |
Louis K. Linquata
|
Senior Vice President |
None |
| LAO |
Heather M. Lord
|
Senior Vice President |
None |
| LAO |
Peter K. Maddox
|
Regional Vice President |
None |
| LAO |
James M. Maher
|
Vice President |
None |
| LAO |
Brendan T. Mahoney
|
Senior Vice President |
None |
| LAO |
Nathan G. Mains
|
Vice President |
None |
| LAO |
Jeffrey N. Malbasa
|
Regional Vice President |
None |
| LAO |
Usma A. Malik
|
Assistant Vice President |
None |
| LAO |
Brooke M. Marrujo
|
Vice President |
None |
| LAO |
Kristan N. Martin
|
Regional Vice President |
None |
| LAO |
J. T. Masteller
|
Regional Vice President |
None |
| LAO |
Stephen B. May
|
Vice President |
None |
| LAO |
Joseph A. McCreesh, III
|
Senior Vice President |
None |
| LAO |
Ross M. McDonald
|
Senior Vice President |
None |
| LAO |
Timothy W. McHale
|
Secretary |
None |
| LAO |
Max J. McQuiston
|
Vice President |
None |
| LAO |
Scott M. Meade
|
Senior Vice President |
None |
| LAO |
Paulino Medina
|
Regional Vice President |
None |
| LAO |
Christopher J. Meek
|
Regional Vice President |
None |
| LAO |
Britney L. Melvin
|
Vice President |
None |
| LAO |
Simon Mendelson
|
Senior Vice President |
None |
| LAO |
David A. Merrill
|
Assistant Vice President |
None |
| LAO |
Conrad F. Metzger
|
Regional Vice President |
None |
| LAO |
Benjamin J. Miller
|
Regional Vice President |
None |
| LAO |
Jennifer M. Miller
|
Regional Vice President |
None |
| LAO |
Tammy H. Miller |
Assistant Vice President
|
None |
| LAO |
William T. Mills
|
Senior Vice President |
None |
| LAO |
Sean C. Minor
|
Senior Vice President |
None |
| LAO |
Louis W. Minora
|
Regional Vice President |
None |
| LAO |
James R. Mitchell III
|
Senior Vice President |
None |
| LAO |
Charles L. Mitsakos
|
Senior Vice President |
None |
| LAO |
Robert P. Moffett III
|
Vice President |
None |
| IND |
Eric E. Momcilovich
|
Assistant Vice President |
None |
| LAO |
David H. Morrison
|
Vice President |
None |
| LAO |
Andrew J. Moscardini
|
Senior Vice President, Capital Group Institutional Investment Services Division |
None |
| NYO |
Timothy J. Murphy
|
Senior Vice President |
None |
| LAO |
Christina M. Neal
|
Assistant Vice President |
None |
| LAO |
Jon C. Nicolazzo
|
Vice President |
None |
| LAO |
Earnest M. Niemi
|
Senior Vice President |
None |
| LAO |
William E. Noe
|
Senior Vice President |
None |
| LAO |
Jeanell A. Novak
|
Assistant Vice President |
None |
| LAO |
Matthew P. O’Connor
|
Director, Chairman and Chief Executive Officer; Senior Vice President,
Capital Group Institutional Investment Services Division
|
None |
| IND |
Jody L. O’Dell
|
Assistant Vice President |
None |
| LAO |
Jonathan H. O’Flynn
|
Senior Vice President |
None |
| LAO |
Peter A. Olsen
|
Vice President |
None |
| LAO |
Jeffrey A. Olson
|
Vice President |
None |
| LAO |
Thomas A. O’Neil
|
Senior Vice President |
None |
| IRV |
Paula A. Orologas
|
Vice President |
None |
| LAO |
Gregory H. Ortman
|
Vice President, Capital Group Institutional Investment Services Division |
None |
| LAO |
Shawn M. O’Sullivan
|
Senior Vice President |
None |
| IND |
Lance T. Owens
|
Vice President |
None |
| LAO |
Kristina E. Page
|
Vice President |
None |
| LAO |
Rodney Dean Parker II
|
Senior Vice President |
None |
| LAO |
Ingrid S. Parl
|
Regional Vice President |
None |
| LAO |
William D. Parsley
|
Regional Vice President |
None |
| LAO |
Lynn M. Patrick
|
Vice President, Capital Group Institutional Investment Services Division |
None |
| LAO |
Timothy C. Patterson
|
Vice President |
None |
| LAO |
W. Burke Patterson, Jr.
|
Senior Vice President |
None |
| LAO |
Gary A. Peace
|
Senior Vice President |
None |
| LAO |
Robert J. Peche
|
Vice President |
None |
| LAO |
David K. Petzke
|
Senior Vice President |
None |
| LAO |
Harry A. Phinney
|
Vice President, Capital Group Institutional Investment Services Division
|
None |
| LAO |
Adam W. Phillips
|
Vice President |
None |
| LAO |
Joseph M. Piccolo
|
Vice President |
None |
| LAO |
Keith A. Piken
|
Senior Vice President |
None |
| LAO |
Carl S. Platou
|
Senior Vice President |
None |
| LAO |
David T. Polak
|
Senior Vice President, Capital Group Institutional Investment Services Division |
None |
| LAO |
Michael E. Pollgreen
|
Assistant Vice President |
None |
| LAO |
Charles R. Porcher
|
Senior Vice President |
None |
| SNO |
Robert B. Potter III
|
Assistant Vice President |
None |
| LAO |
Darrell W. Pounders
|
Regional Vice President |
None |
| LAO |
Steven J. Quagrello
|
Senior Vice President |
None |
| IND |
Kelly S. Quick
|
Assistant Vice President |
None |
| LAO |
Michael R. Quinn
|
Senior Vice President |
None |
| LAO |
Ryan E. Radtke
|
Regional Vice President |
None |
| LAO |
James R. Raker
|
Senior Vice President, Capital Group Institutional Investment Services Division |
None |
| LAO |
Sunder R. Ramkumar
|
Senior Vice President |
None |
| LAO |
Rachel M. Ramos
|
Assistant Vice President |
None |
| LAO |
Rene M. Reincke
|
Vice President |
None |
| LAO |
Michael D. Reynaert
|
Regional Vice President |
None |
| IND |
Richard Rhymaun |
Vice President
|
None |
| LAO |
Christopher J. Richardson
|
Vice President |
None |
| SNO |
Stephanie A. Robichaud
|
Assistant Vice President |
None |
| LAO |
Jeffrey J. Robinson
|
Vice President |
None |
| LAO |
Matthew M. Robinson
|
Vice President |
None |
| LAO |
Rochelle C. Rodriguez
|
Senior Vice President |
None |
| LAO |
Melissa B. Roe
|
Senior Vice President |
None |
| LAO |
Thomas W. Rose
|
Senior Vice President, Capital Group Institutional Investment Services Division |
None |
| SNO |
Tracy M. Roth
|
Assistant Vice President |
None |
| LAO |
Rome D. Rottura
|
Senior Vice President |
None |
| LAO |
Shane A. Russell
|
Vice President |
None |
| LAO |
William M. Ryan
|
Senior Vice President |
None |
| IND |
Brenda S. Rynski
|
Regional Vice President |
None |
| LAO |
Richard A. Sabec, Jr.
|
Senior Vice President |
None |
| SNO |
Richard R. Salinas
|
Assistant Vice President |
None |
| LAO |
Paul V. Santoro
|
Senior Vice President |
None |
| LAO |
Keith A. Saunders
|
Vice President |
None |
| LAO |
Joe D. Scarpitti
|
Senior Vice President |
None |
| LAO |
Michael A. Schweitzer
|
Senior Vice President |
None |
| LAO |
Domenic A. Sciarra |
Assistant Vice President
|
None |
| LAO |
Mark A. Seaman
|
Senior Vice President, Capital Group Institutional Investment Services Division |
None |
| LAO |
James J. Sewell III
|
Senior Vice President |
None |
| LAO |
Arthur M. Sgroi
|
Senior Vice President |
None |
| LAO |
Nathan W. Simmons
|
Vice President |
None |
| LAO |
Melissa A. Sloane
|
Vice President |
None |
| LAO |
Joshua J. Smith
|
Regional Vice President |
None |
| LAO |
Taylor D. Smith
|
Regional Vice President |
None |
| SNO |
Stacy D. Smolka
|
Senior Vice President |
None |
| LAO |
Stephanie L. Smolka
|
Regional Vice President |
None |
| LAO |
J. Eric Snively
|
Senior Vice President |
None |
| LAO |
John A. Sobotowski
|
Assistant Vice President |
None |
| LAO |
Charles V. Sosa
|
Regional Vice President |
None |
| LAO |
Kristen J. Spazafumo
|
Vice President |
None |
| LAO |
Margaret V. Steinbach
|
Vice President |
None |
| LAO |
Michael P. Stern
|
Senior Vice President |
None |
| LAO |
Andrew J. Strandquist
|
Vice President
|
None |
| LAO |
Allison M. Straub
|
Regional Vice President |
None |
| LAO |
Kevin K. Suen
|
Regional Vice President |
None |
| LAO |
John R. Sulzicki
|
Regional Vice President |
None |
| LAO |
Peter D. Thatch
|
Senior Vice President |
None |
| LAO |
John B. Thomas
|
Vice President |
None |
| LAO |
Cynthia M. Thompson
|
Senior Vice President, Capital Group Institutional Investment Services Division |
None |
| IND |
Scott E. Thompson
|
Assistant Vice President |
None |
| HRO |
Stephen B. Thompson
|
Regional Vice President |
None |
| LAO |
Mark R. Threlfall
|
Vice President |
None |
| LAO |
Ryan D. Tiernan
|
Vice President |
None |
| LAO |
Emily R. Tillman
|
Vice President |
None |
| LAO |
Russell W. Tipper
|
Senior Vice President |
None |
| LAO |
Luke N. Trammell
|
Senior Vice President |
None |
| LAO |
Jordan A. Trevino
|
Vice President |
None |
| LAO |
Michael J. Triessl
|
Director |
None |
| LAO |
Shaun C. Tucker
|
Senior Vice President |
None |
| IND |
Ryan C. Tyson
|
Assistant Vice President |
None |
| LAO |
Jason A. Uberti
|
Vice President |
None |
| LAO |
David E. Unanue
|
Senior Vice President |
None |
| LAO |
John W. Urbanski
|
Regional Vice President |
None |
| LAO |
Idoya Urrutia
|
Vice President |
None |
| LAO |
Scott W. Ursin-Smith
|
Senior Vice President |
None |
| LAO |
Joe M. Valencia
|
Regional Vice President |
None |
| LAO |
Patrick D. Vance
|
Vice President |
None |
| LAO |
Veronica Vasquez |
Assistant Vice President
|
None |
| LAO-W |
Gerrit Veerman III |
Senior Vice President, Capital Group Institutional Investment Services
|
None |
| LAO |
Srinkanth Vemuri
|
Senior Vice President |
None |
| LAO |
Spilios Venetsanopoulos
|
Vice President |
None |
| LAO |
J. David Viale
|
Senior Vice President |
None |
| LAO |
Robert D. Vigneaux III
|
Senior Vice President, Capital Group Institutional Investment Services Division |
None |
| LAO |
Jayakumar Vijayanathan
|
Senior Vice President |
None |
| LAO |
Julie A. Vogel
|
Regional Vice President |
None |
| LAO |
Todd R. Wagner
|
Senior Vice President, Capital Group Institutional Investment Services Division |
None |
| LAO |
Jon N. Wainman
|
Vice President |
None |
| LAO |
Sherrie S. Walling
|
Vice President |
None |
| LAO |
Brian M. Walsh
|
Senior Vice President |
None |
| LAO |
Susan O. Walton
|
Senior Vice President, Capital Group Institutional Investment Services Division |
None |
| SNO |
Chris L. Wammack
|
Vice President |
None |
| LAO |
Matthew W. Ward
|
Regional Vice President |
None |
| LAO |
Thomas E. Warren
|
Senior Vice President |
None |
| LAO |
George J. Wenzel
|
Senior Vice President |
None |
| LAO |
Jason M. Weybrecht
|
Senior Vice President, Capital Group Institutional Investment Services Division |
None |
| LAO |
Adam B. Whitehead
|
Vice President |
None |
| LAO |
N. Dexter Williams
|
Senior Vice President |
None |
| LAO |
Jonathan D. Wilson
|
Regional Vice President |
None |
| LAO |
Steven Wilson
|
Senior Vice President |
None |
| LAO |
Steven C. Wilson
|
Vice President |
None |
| LAO |
Kimberly D. Wood
|
Senior Vice President, Capital Group Institutional Investment Services Division |
None |
| LAO |
Kurt A. Wuestenberg
|
Senior Vice President |
None |
| LAO |
Jonathan A. Young
|
Senior Vice President |
None |
| LAO |
Jason P. Young
|
Senior Vice President |
None |
| LAO |
Raul Zarco, Jr.
|
Vice President, Capital Group Institutional Investment Services Division |
None |
| IND |
Ellen M. Zawacki
|
Vice President |
None |
| LAO |
Connie R. Zeender |
Regional Vice President
|
None |
__________
| DCO |
Business Address, 3000 K Street N.W., Suite 230, Washington, DC 20007-5140 |
| GVO-1 |
Business Address, 3 Place des Bergues, 1201 Geneva, Switzerland |
| HRO |
Business Address, 5300 Robin Hood Road, Norfolk, VA 23513 |
| IND |
Business Address, 12811 North Meridian Street, Carmel, IN 46032 |
| IRV |
Business Address, 6455 Irvine Center Drive, Irvine, CA 92618 |
| LAO |
Business Address, 333 South Hope Street, Los Angeles, CA 90071 |
| LAO-W |
Business Address, 11100 Santa Monica Blvd., 15th Floor, Los Angeles, CA 90025 |
| NYO |
Business Address, 630 Fifth Avenue, 36th Floor, New York, NY 10111 |
| SFO |
Business Address, One Market, Steuart Tower, Suite 2000, San Francisco, CA 94105 |
| SNO |
Business Address, 3500 Wiseman Boulevard, San Antonio, TX 78251 |
(c) None
| Item 33. | Location of Accounts and Records |
Accounts, books and other
records required by Rules 31a-1 and 31a-2 under the Investment Company Act of 1940, as amended, are maintained and kept in the
offices of the Registrant’s investment adviser, Capital Research and Management Company, 333 South Hope Street, Los Angeles,
California 90071, 6455 Irvine Center Drive, Irvine, California 92618, and/or 5300 Robin Hood Road, Norfolk, Virginia 23513.
Registrant’s records
covering shareholder accounts are maintained and kept by its transfer agent, American Funds Service Company, 6455 Irvine Center
Drive, Irvine, California 92618; 12811 North Meridian Street, Carmel, Indiana 46032; 3500 Wiseman Boulevard, San Antonio, Texas
78251; and 5300 Robin Hood Road, Norfolk, Virginia 23513.
Registrant’s records
covering portfolio transactions are maintained and kept by its custodian, JPMorgan Chase Bank, N.A., 270 Park Avenue, New York,
New York 10017-2070.
| Item 34. | Management Services |
None
n/a
SIGNATURES
Pursuant to the requirements
of the Securities Act of 1933 and the Investment Company Act of 1940, the Registrant certifies that it meets all of the requirements
for effectiveness of this Registration Statement under Rule 485(b) under the Securities Act of 1933 and has duly caused this Registration
Statement to be signed on its behalf by the undersigned, duly authorized, in the City of Los Angeles, and State of California,
on the 27th day of September, 2019.
AMERICAN FUNDS
SHORT-TERM TAX-EXEMPT BOND FUND
By /s/ Kristine M. Nishiyama
(Kristine
M. Nishiyama, Executive Vice President)
Pursuant to the requirements
of the Securities Act of 1933, this Registration Statement has been signed below on September 27, 2019, by the following persons
in the capacities indicated.
| |
Signature |
Title |
| (1) |
Principal Executive Officer: |
| |
/s/ Kristine M. Nishiyama |
Executive Vice President |
| |
(Kristine M. Nishiyama) |
| |
| (2) |
Principal Financial Officer and Principal Accounting Officer: |
| |
/s/ Brian C. Janssen |
Treasurer |
| |
(Brian C. Janssen) |
| |
| (3) |
Trustees: |
| |
William H. Baribault* |
Trustee |
| |
James G. Ellis* |
Trustee |
| |
Nariman Farvardin* |
Trustee |
| |
Michael C. Gitlin* |
Trustee |
| |
Mary Davis Holt* |
Trustee |
| |
R. Clark Hooper* |
Trustee |
| |
Merit E. Janow* |
Trustee |
| |
Laurel B. Mitchell* |
Trustee |
| |
Margaret Spellings* |
Chairman of the Board (Independent and Non-Executive) |
| |
Alexandra Trower* |
Trustee |
| |
Karl J. Zeile* |
Trustee |
| |
*By: /s/ Steven I. Koszalka |
|
| |
(Steven I. Koszalka, pursuant to a power of attorney filed herewith) |
|
| |
|
|
|
Counsel represents that
this amendment does not contain disclosures that would make the amendment ineligible for effectiveness under the provisions of
Rule 485(b).
/s/ Jae Won Chung
(Jae Won Chung, Counsel)
POWER OF ATTORNEY
I, William
H. Baribault, the undersigned Board member of the following registered investment companies
(collectively, the “Funds”):
| - | American Balanced Fund (File No. 002-10758, File No. 811-00066) |
| - | American Funds College Target Date Series (File No. 333-180729, File
No. 811-22692) |
| - | American Funds Corporate Bond Fund (File No. 333-183929, File No. 811-22744) |
| - | American Funds Developing World Growth and Income Fund (File No. 333-190913,
File No. 811-22881) |
| - | American Funds Emerging Markets Bond Fund (File No. 333-208636; File
No. 811-23122) |
| - | The American Funds Income Series – U.S. Government Securities
Fund (File No. 002-98199, File No. 811-04318) |
| - | American Funds Inflation Linked Bond Fund (File No. 333-183931, File
No. 811-22746) |
| - | American Funds Insurance Series (File No. 002-86838, File No. 811-03857) |
| - | American Funds Insurance Series |
| - | American Funds Mortgage Fund (File No. 333-168595, File No. 811-22449) |
| - | American Funds Multi-Sector Income Fund (File No. 333-228995, File
No. 811-23409) |
| - | American Funds Portfolio Series (File No. 333-178936, File No. 811-22656) |
| - | American Funds Retirement Income Portfolio Series (File No. 333-203797,
File No. 811-23053) |
| - | American Funds Short-Term Tax-Exempt Bond Fund (File No. 033-26431,
File No. 811-05750) |
| - | American Funds Strategic Bond Fund (File No. 333-207474, File No. 811-23101) |
| - | American Funds Target Date Retirement Series (File No. 333-138648,
File No. 811-21981) |
| - | American Funds Tax-Exempt Fund of New York (File No. 333-168594, File
No. 811-22448) |
| - | The American Funds Tax-Exempt Series II – The Tax-Exempt Fund
of California (File No. 033-06180, File No. 811-04694) |
| - | American Funds U.S. Government Money Market Fund (File No. 333-157162,
File No. 811-22277) |
| - | American High-Income Municipal Bond Fund (File No. 033-80630, File
No. 811-08576) |
| - | American High-Income Trust (File No. 033-17917, File No. 811-05364) |
| - | The Bond Fund of America (File No. 002-50700, File No. 811-02444) |
| - | Capital Group Central Fund Series – Capital Group Central Cash
Fund (File No. 811-23391) |
| - | Capital World Bond Fund (File No. 033-12447, File No. 811-05104) |
| - | The Income Fund of America (File No. 002-33371, File No. 811-01880) |
| - | Intermediate Bond Fund of America (File No. 033-19514, File No. 811-05446) |
| - | International Growth and Income Fund (File No. 333-152323, File No.
811-22215) |
| - | Limited Term Tax-Exempt Bond Fund of America (File No. 033-66214, File
No. 811-07888) |
| - | Short-Term Bond Fund of America (File No. 333-135770, File No.
811-21928) |
| - | The Tax-Exempt Bond Fund of America (File No. 002-49291, File No. 811-02421) |
hereby revoke all previous powers of attorney
I have signed and otherwise act in my name and behalf in matters involving the Funds and do hereby constitute and appoint
|
Jennifer L. Butler
Steven I. Koszalka
Laurie D. Neat
Michael W. Stockton
Courtney R. Taylor
Jane Y. Chung
Susan K. Countess
Julie E. Lawton |
Brian D. Bullard
Brian C. Janssen
Dori Laskin
Hong Le
Gregory F. Niland |
each of them singularly, my true and lawful
attorneys-in-fact, with full power of substitution, and with full power to each of them, to sign for me and in my name in the appropriate
capacities, all Registration Statements of the Funds on Form N-1A, any and all subsequent Amendments, or Post-Effective Amendments
to said Registration Statement on Form N-1A or any successor thereto, and any supplements or other instruments in connection
therewith, and generally to do all such things in my name and behalf in connection therewith as said attorneys-in-fact deem necessary
or appropriate, to comply with the provisions of the Securities Act of 1933 and the Investment Company Act of 1940 as amended,
and all related requirements of the U. S. Securities and Exchange Commission. I hereby ratify and confirm all that said attorneys-in-fact
or their substitutes may do or cause to be done by virtue hereof.
EXECUTED at Los Angeles,
CA, this 4th day of March, 2019.
(City, State)
/s/ William H. Baribault
William
H. Baribault, Board member
POWER OF ATTORNEY
I, James
G. Ellis, the undersigned Board member of the following registered investment companies
(collectively, the “Funds”):
| - | AMCAP Fund (File No. 002-26516, File No. 811-01435) |
| - | American Funds College Target Date Series (File No. 333-180729, File
No. 811-22692) |
| - | American Funds Corporate Bond Fund (File No. 333-183929, File No. 811-22744) |
| - | American Funds Emerging Markets Bond Fund (File No. 333-208636; File
No. 811-23122) |
| - | American Funds Global Balanced Fund (File No. 333-170605, File No.
811-22496) |
| - | The American Funds Income Series – U.S. Government Securities
Fund (File No. 002-98199, File No. 811-04318) |
| - | American Funds Inflation Linked Bond Fund (File No. 333-183931, File
No. 811-22746) |
| - | American Funds Insurance Series (File No. 002-86838, File No. 811-03857) |
| - | American Funds Insurance Series |
| - | American Funds Mortgage Fund (File No. 333-168595, File No. 811-22449)
|
| - | American Funds Multi-Sector Income Fund (File No. 333-228995, File
No. 811-23409) |
| - | American Funds Portfolio Series (File No. 333-178936, File No. 811-22656) |
| - | American Funds Retirement Income Portfolio Series (File No. 333-203797,
File No. 811-23053) |
| - | American Funds Short-Term Tax-Exempt Bond Fund (File No. 033-26431,
File No. 811-05750) |
| - | American Funds Strategic Bond Fund (File No. 333-207474, File No. 811-23101) |
| - | American Funds Target Date Retirement Series (File No. 333-138648,
File No. 811-21981) |
| - | American Funds Tax-Exempt Fund of New York (File No. 333-168594, File
No. 811-22448) |
| - | The American Funds Tax-Exempt Series II – The Tax-Exempt Fund
of California (File No. 033-06180, File No. 811-04694) |
| - | American Funds U.S. Government Money Market Fund (File No. 333-157162,
File No. 811-22277) |
| - | American High-Income Municipal Bond Fund (File No. 033-80630, File
No. 811-08576) |
| - | American High-Income Trust (File No. 033-17917, File No. 811-05364) |
| - | American Mutual Fund (File No. 002-10607, File No. 811-00572) |
| - | The Bond Fund of America (File No. 002-50700, File No. 811-02444) |
| - | Capital Group Central Fund Series – Capital Group Central Cash
Fund (File No. 811-23391) |
| - | Capital Group Emerging Markets Total Opportunities Fund (File No. 333-176635,
File No. 811-22605) |
| - | Capital Group Private Client Services Funds (File No. 333-163115, File
No. 811-22349) |
| - | Capital World Bond Fund (File No. 033-12447, File No. 811-05104) |
| - | Emerging Markets Growth Fund, Inc. (File No. 333-74995, File No. 811-04692) |
| - | Intermediate Bond Fund of America (File No. 033-19514, File No. 811-05446) |
| - | The Investment Company of America (File No. 002-10811, File No. 811-00116) |
| - | Limited Term Tax-Exempt Bond Fund of America (File No. 033-66214, File
No. 811-07888) |
| - | Short-Term Bond Fund of America (File No. 333-135770, File No.
811-21928) |
| - | The Tax-Exempt Bond Fund of America (File No. 002-49291, File No. 811-02421) |
hereby revoke all previous powers of attorney
I have signed and otherwise act in my name and behalf in matters involving the Funds and do hereby constitute and appoint
|
Jennifer L. Butler
Steven I. Koszalka
Laurie D. Neat
Michael W. Stockton
Courtney R. Taylor
Jane Y. Chung
Susan K. Countess
Julie E. Lawton |
Brian D. Bullard
Brian C. Janssen
Dori Laskin
Hong Le
Gregory F. Niland |
each of them singularly, my true and lawful
attorneys-in-fact, with full power of substitution, and with full power to each of them, to sign for me and in my name in the appropriate
capacities, all Registration Statements of the Funds on Form N-1A, any and all subsequent Amendments, or Post-Effective Amendments
to said Registration Statement on Form N-1A or any successor thereto, and any supplements or other instruments in connection
therewith, and generally to do all such things in my name and behalf in connection therewith as said attorneys-in-fact deem necessary
or appropriate, to comply with the provisions of the Securities Act of 1933 and the Investment Company Act of 1940 as amended,
and all related requirements of the U. S. Securities and Exchange Commission. I hereby ratify and confirm all that said attorneys-in-fact
or their substitutes may do or cause to be done by virtue hereof.
EXECUTED at Los Angeles,
CA, this 4th day of March, 2019.
(City, State)
/s/ James G. Ellis
James G. Ellis,
Board member
POWER OF ATTORNEY
I, Nariman
Farvardin, the undersigned Board member of the following registered investment companies
(collectively, the “Funds”):
| - | American Funds College Target Date Series (File No. 333-180729, File
No. 811-22692) |
| - | American Funds Corporate Bond Fund (File No. 333-183929, File No. 811-22744)
|
| - | American Funds Emerging Markets Bond Fund (File No. 333-208636; File
No. 811-23122) |
| - | The American Funds Income Series – U.S. Government Securities
Fund (File No. 002-98199, File No. 811-04318) |
| - | American Funds Inflation Linked Bond Fund (File No. 333-183931, File
No. 811-22746) |
| - | American Funds Insurance Series (File No. 002-86838, File No. 811-03857) |
| - | American Funds Insurance Series |
| - | American Funds Mortgage Fund (File No. 333-168595, File No. 811-22449)
|
| - | American Funds Multi-Sector Income Fund (File No. 333-228995, File
No. 811-23409) |
| - | American Funds Portfolio Series (File No. 333-178936, File No. 811-22656) |
| - | American Funds Retirement Income Portfolio Series (File No. 333-203797,
File No. 811-23053) |
| - | American Funds Short-Term Tax-Exempt Bond Fund (File No. 033-26431,
File No. 811-05750) |
| - | American Funds Strategic Bond Fund (File No. 333-207474, File No. 811-23101) |
| - | American Funds Target Date Retirement Series (File No. 333-138648,
File No. 811-21981) |
| - | American Funds Tax-Exempt Fund of New York (File No. 333-168594, File
No. 811-22448) |
| - | The American Funds Tax-Exempt Series II – The Tax-Exempt Fund
of California (File No. 033-06180, File No. 811-04694) |
| - | American Funds U.S. Government Money Market Fund (File No. 333-157162,
File No. 811-22277) |
| - | American High-Income Municipal Bond Fund (File No. 033-80630, File
No. 811-08576) |
| - | American High-Income Trust (File No. 033-17917, File No. 811-05364) |
| - | The Bond Fund of America (File No. 002-50700, File No. 811-02444) |
| - | Capital Group Central Fund Series – Capital Group Central Cash
Fund (File No. 811-23391) |
| - | Capital World Bond Fund (File No. 033-12447, File No. 811-05104) |
| - | Intermediate Bond Fund of America (File No. 033-19514, File No. 811-05446) |
| - | Limited Term Tax-Exempt Bond Fund of America (File No. 033-66214, File
No. 811-07888) |
| - | Short-Term Bond Fund of America (File No. 333-135770, File No.
811-21928) |
| - | The Tax-Exempt Bond Fund of America (File No. 002-49291, File No. 811-02421) |
| - | Washington Mutual Investors Fund (File No. 002-11051, File No. 811-00604) |
hereby revoke all previous powers of attorney
I have signed and otherwise act in my name and behalf in matters involving the Funds and do hereby constitute and appoint
|
Jennifer L. Butler
Steven I. Koszalka
Laurie D. Neat
Michael W. Stockton
Courtney R. Taylor
Jane Y. Chung
Susan K. Countess
Julie E. Lawton |
Brian D. Bullard
Brian C. Janssen
Dori Laskin
Hong Le
Gregory F. Niland |
each of them singularly, my true and lawful
attorneys-in-fact, with full power of substitution, and with full power to each of them, to sign for me and in my name in the appropriate
capacities, all Registration Statements of the Funds on Form N-1A, any and all subsequent Amendments, or Post-Effective Amendments
to said Registration Statement on Form N-1A or any successor thereto, and any supplements or other instruments in connection
therewith, and generally to do all such things in my name and behalf in connection therewith as said attorneys-in-fact deem necessary
or appropriate, to comply with the provisions of the Securities Act of 1933 and the Investment Company Act of 1940 as amended,
and all related requirements of the U. S. Securities and Exchange Commission. I hereby ratify and confirm all that said attorneys-in-fact
or their substitutes may do or cause to be done by virtue hereof.
EXECUTED at Los Angeles,
CA, this 4th day of March, 2019.
(City, State)
/s/ Nariman Farvardin
Nariman
Farvardin, Board member
POWER OF ATTORNEY
I, Michael
C. Gitlin, the undersigned Board member of the following registered investment companies
(collectively, the “Funds”):
| - | American Funds College Target Date Series (File No. 333-180729, File
No. 811-22692) |
| - | American Funds Corporate Bond Fund (File No. 333-183929, File No. 811-22744)
|
| - | American Funds Emerging Markets Bond Fund (File No. 333-208636; File
No. 811-23122) |
| - | The American Funds Income Series – U.S. Government Securities
Fund (File No. 002-98199, File No. 811-04318) |
| - | American Funds Inflation Linked Bond Fund (File No. 333-183931, File
No. 811-22746) |
| - | American Funds Insurance Series (File No. 002-86838, File No. 811-03857) |
| - | American Funds Insurance Series |
| - | American Funds Mortgage Fund (File No. 333-168595, File No. 811-22449)
|
| - | American Funds Multi-Sector Income Fund (File No. 333-228995, File
No. 811-23409) |
| - | American Funds Portfolio Series (File No. 333-178936, File No. 811-22656) |
| - | American Funds Retirement Income Portfolio Series (File No. 333-203797,
File No. 811-23053) |
| - | American Funds Short-Term Tax-Exempt Bond Fund (File No. 033-26431,
File No. 811-05750) |
| - | American Funds Strategic Bond Fund (File No. 333-207474, File No. 811-23101) |
| - | American Funds Target Date Retirement Series (File No. 333-138648,
File No. 811-21981) |
| - | American Funds Tax-Exempt Fund of New York (File No. 333-168594, File
No. 811-22448) |
| - | The American Funds Tax-Exempt Series II – The Tax-Exempt Fund
of California (File No. 033-06180, File No. 811-04694) |
| - | American Funds U.S. Government Money Market Fund (File No. 333-157162,
File No. 811-22277) |
| - | American High-Income Municipal Bond Fund (File No. 033-80630, File
No. 811-08576) |
| - | American High-Income Trust (File No. 033-17917, File No. 811-05364) |
| - | The Bond Fund of America (File No. 002-50700, File No. 811-02444) |
| - | Capital Group Central Fund Series – Capital Group Central Cash
Fund (File No. 811-23391) |
| - | Capital World Bond Fund (File No. 033-12447, File No. 811-05104) |
| - | Intermediate Bond Fund of America (File No. 033-19514, File No. 811-05446) |
| - | Limited Term Tax-Exempt Bond Fund of America (File No. 033-66214, File
No. 811-07888) |
| - | Short-Term Bond Fund of America (File No. 333-135770, File No.
811-21928) |
| - | The Tax-Exempt Bond Fund of America (File No. 002-49291, File No. 811-02421) |
hereby revoke all previous powers of attorney
I have signed and otherwise act in my name and behalf in matters involving the Funds and do hereby constitute and appoint
|
Jennifer L. Butler
Steven I. Koszalka
Laurie D. Neat
Michael W. Stockton
Courtney R. Taylor
Jane Y. Chung
Susan K. Countess
Julie E. Lawton |
Brian D. Bullard
Brian C. Janssen
Dori Laskin
Hong Le
Gregory F. Niland |
each of them singularly, my true and lawful
attorneys-in-fact, with full power of substitution, and with full power to each of them, to sign for me and in my name in the appropriate
capacities, all Registration Statements of the Funds on Form N-1A, any and all subsequent Amendments, or Post-Effective Amendments
to said Registration Statement on Form N-1A or any successor thereto, and any supplements or other instruments in connection
therewith, and generally to do all such things in my name and behalf in connection therewith as said attorneys-in-fact deem necessary
or appropriate, to comply with the provisions of the Securities Act of 1933 and the Investment Company Act of 1940 as amended,
and all related requirements of the U. S. Securities and Exchange Commission. I hereby ratify and confirm all that said attorneys-in-fact
or their substitutes may do or cause to be done by virtue hereof.
EXECUTED at Los Angeles,
CA, this 4th day of March, 2019.
(City, State)
/s/ Michael C. Gitlin
Michael
C. Gitlin, Board member
POWER OF ATTORNEY
I, Mary
Davis Holt, the undersigned Board member of the following registered investment companies
(collectively, the “Funds”):
| - | American Funds College Target Date Series (File No. 333-180729, File
No. 811-22692) |
| - | American Funds Corporate Bond Fund (File No. 333-183929, File No. 811-22744)
|
| - | American Funds Emerging Markets Bond Fund (File No. 333-208636; File
No. 811-23122) |
| - | The American Funds Income Series – U.S. Government Securities
Fund (File No. 002-98199, File No. 811-04318) |
| - | American Funds Inflation Linked Bond Fund (File No. 333-183931, File
No. 811-22746) |
| - | American Funds Insurance Series (File No. 002-86838, File No. 811-03857) |
| - | American Funds Insurance Series |
| - | American Funds Mortgage Fund (File No. 333-168595, File No. 811-22449)
|
| - | American Funds Multi-Sector Income Fund (File No. 333-228995, File
No. 811-23409) |
| - | American Funds Portfolio Series (File No. 333-178936, File No. 811-22656) |
| - | American Funds Retirement Income Portfolio Series (File No. 333-203797,
File No. 811-23053) |
| - | American Funds Short-Term Tax-Exempt Bond Fund (File No. 033-26431,
File No. 811-05750) |
| - | American Funds Strategic Bond Fund (File No. 333-207474, File No. 811-23101) |
| - | American Funds Target Date Retirement Series (File No. 333-138648,
File No. 811-21981) |
| - | American Funds Tax-Exempt Fund of New York (File No. 333-168594, File
No. 811-22448) |
| - | The American Funds Tax-Exempt Series II – The Tax-Exempt Fund
of California (File No. 033-06180, File No. 811-04694) |
| - | American Funds U.S. Government Money Market Fund (File No. 333-157162,
File No. 811-22277) |
| - | American High-Income Municipal Bond Fund (File No. 033-80630, File
No. 811-08576) |
| - | American High-Income Trust (File No. 033-17917, File No. 811-05364) |
| - | The Bond Fund of America (File No. 002-50700, File No. 811-02444) |
| - | Capital Group Central Fund Series – Capital Group Central Cash
Fund (File No. 811-23391) |
| - | Capital World Bond Fund (File No. 033-12447, File No. 811-05104) |
| - | Intermediate Bond Fund of America (File No. 033-19514, File No. 811-05446) |
| - | Limited Term Tax-Exempt Bond Fund of America (File No. 033-66214, File
No. 811-07888) |
| - | Short-Term Bond Fund of America (File No. 333-135770, File No.
811-21928) |
| - | The Tax-Exempt Bond Fund of America (File No. 002-49291, File No. 811-02421) |
| - | Washington Mutual Investors Fund (File No. 002-11051, File No. 811-00604) |
hereby revoke all previous powers of attorney
I have signed and otherwise act in my name and behalf in matters involving the Funds and do hereby constitute and appoint
|
Jennifer L. Butler
Steven I. Koszalka
Laurie D. Neat
Michael W. Stockton
Courtney R. Taylor
Jane Y. Chung
Susan K. Countess
Julie E. Lawton |
Brian D. Bullard
Brian C. Janssen
Dori Laskin
Hong Le
Gregory F. Niland |
each of them singularly, my true and lawful
attorneys-in-fact, with full power of substitution, and with full power to each of them, to sign for me and in my name in the appropriate
capacities, all Registration Statements of the Funds on Form N-1A, any and all subsequent Amendments, or Post-Effective Amendments
to said Registration Statement on Form N-1A or any successor thereto, and any supplements or other instruments in connection
therewith, and generally to do all such things in my name and behalf in connection therewith as said attorneys-in-fact deem necessary
or appropriate, to comply with the provisions of the Securities Act of 1933 and the Investment Company Act of 1940 as amended,
and all related requirements of the U. S. Securities and Exchange Commission. I hereby ratify and confirm all that said attorneys-in-fact
or their substitutes may do or cause to be done by virtue hereof.
EXECUTED at Los Angeles,
CA, this 4th day of March, 2019.
(City, State)
/s/ Mary Davis Holt
Mary
Davis Holt, Board member
POWER OF ATTORNEY
I, R. Clark
Hooper, the undersigned Board member of the following registered investment companies (collectively,
the “Funds”):
| - | American Funds College Target Date Series (File No. 333-180729, File
No. 811-22692) |
| - | American Funds Corporate Bond Fund (File No. 333-183929, File No. 811-22744)
|
| - | American Funds Emerging Markets Bond Fund (File No. 333-208636; File
No. 811-23122) |
| - | The American Funds Income Series – U.S. Government Securities
Fund (File No. 002-98199, File No. 811-04318) |
| - | American Funds Inflation Linked Bond Fund (File No. 333-183931, File
No. 811-22746) |
| - | American Funds Insurance Series (File No. 002-86838, File No. 811-03857) |
| - | American Funds Insurance Series |
| - | American Funds Mortgage Fund (File No. 333-168595, File No. 811-22449)
|
| - | American Funds Multi-Sector Income Fund (File No. 333-228995, File
No. 811-23409) |
| - | American Funds Portfolio Series (File No. 333-178936, File No. 811-22656) |
| - | American Funds Retirement Income Portfolio Series (File No. 333-203797,
File No. 811-23053) |
| - | American Funds Short-Term Tax-Exempt Bond Fund (File No. 033-26431,
File No. 811-05750) |
| - | American Funds Strategic Bond Fund (File No. 333-207474, File No. 811-23101) |
| - | American Funds Target Date Retirement Series (File No. 333-138648,
File No. 811-21981) |
| - | American Funds Tax-Exempt Fund of New York (File No. 333-168594, File
No. 811-22448) |
| - | The American Funds Tax-Exempt Series II – The Tax-Exempt Fund
of California (File No. 033-06180, File No. 811-04694) |
| - | American Funds U.S. Government Money Market Fund (File No. 333-157162,
File No. 811-22277) |
| - | American High-Income Municipal Bond Fund (File No. 033-80630, File
No. 811-08576) |
| - | American High-Income Trust (File No. 033-17917, File No. 811-05364) |
| - | The Bond Fund of America (File No. 002-50700, File No. 811-02444) |
| - | Capital Group Central Fund Series – Capital Group Central Cash
Fund (File No. 811-23391) |
| - | Capital Income Builder (File No. 033-12967, File No. 811-05085) |
| - | Capital World Bond Fund (File No. 033-12447, File No. 811-05104) |
| - | Capital World Growth and Income Fund (File No. 033-54444, File No.
811-07338) |
| - | Intermediate Bond Fund of America (File No. 033-19514, File No. 811-05446) |
| - | Limited Term Tax-Exempt Bond Fund of America (File No. 033-66214, File
No. 811-07888) |
| - | The New Economy Fund (File No. 002-83848, File No. 811-03735) |
| - | Short-Term Bond Fund of America (File No. 333-135770, File No.
811-21928) |
| - | The Tax-Exempt Bond Fund of America (File No. 002-49291, File No. 811-02421) |
| - | Washington Mutual Investors Fund (File No. 002-11051, File No. 811-00604) |
hereby revoke all previous powers of attorney
I have signed and otherwise act in my name and behalf in matters involving the Funds and do hereby constitute and appoint
|
Jennifer L. Butler
Steven I. Koszalka
Laurie D. Neat
Michael W. Stockton
Courtney R. Taylor
Jane Y. Chung
Susan K. Countess
Julie E. Lawton |
Brian D. Bullard
Brian C. Janssen
Dori Laskin
Hong Le
Gregory F. Niland |
each of them singularly, my true and lawful
attorneys-in-fact, with full power of substitution, and with full power to each of them, to sign for me and in my name in the appropriate
capacities, all Registration Statements of the Funds on Form N-1A, any and all subsequent Amendments, or Post-Effective Amendments
to said Registration Statement on Form N-1A or any successor thereto, and any supplements or other instruments in connection
therewith, and generally to do all such things in my name and behalf in connection therewith as said attorneys-in-fact deem necessary
or appropriate, to comply with the provisions of the Securities Act of 1933 and the Investment Company Act of 1940 as amended,
and all related requirements of the U. S. Securities and Exchange Commission. I hereby ratify and confirm all that said attorneys-in-fact
or their substitutes may do or cause to be done by virtue hereof.
EXECUTED at Los Angeles,
CA, this 4th day of March, 2019.
(City, State)
/s/ R. Clark Hooper
R. Clark
Hooper, Board member
POWER OF ATTORNEY
I, Merit
E. Janow, the undersigned Board member of the following registered investment companies
(collectively, the “Funds”):
| - | American Funds College Target Date Series (File No. 333-180729, File
No. 811-22692) |
| - | American Funds Corporate Bond Fund (File No. 333-183929, File No. 811-22744)
|
| - | American Funds Emerging Markets Bond Fund (File No. 333-208636; File
No. 811-23122) |
| - | The American Funds Income Series – U.S. Government Securities
Fund (File No. 002-98199, File No. 811-04318) |
| - | American Funds Inflation Linked Bond Fund (File No. 333-183931, File
No. 811-22746) |
| - | American Funds Insurance Series (File No. 002-86838, File No. 811-03857) |
| - | American Funds Insurance Series |
| - | American Funds Mortgage Fund (File No. 333-168595, File No. 811-22449)
|
| - | American Funds Multi-Sector Income Fund (File No. 333-228995, File
No. 811-23409) |
| - | American Funds Portfolio Series (File No. 333-178936, File No. 811-22656) |
| - | American Funds Retirement Income Portfolio Series (File No. 333-203797,
File No. 811-23053) |
| - | American Funds Short-Term Tax-Exempt Bond Fund (File No. 033-26431,
File No. 811-05750) |
| - | American Funds Strategic Bond Fund (File No. 333-207474, File No. 811-23101) |
| - | American Funds Target Date Retirement Series (File No. 333-138648,
File No. 811-21981) |
| - | American Funds Tax-Exempt Fund of New York (File No. 333-168594, File
No. 811-22448) |
| - | The American Funds Tax-Exempt Series II – The Tax-Exempt Fund
of California (File No. 033-06180, File No. 811-04694) |
| - | American Funds U.S. Government Money Market Fund (File No. 333-157162,
File No. 811-22277) |
| - | American High-Income Municipal Bond Fund (File No. 033-80630, File
No. 811-08576) |
| - | American High-Income Trust (File No. 033-17917, File No. 811-05364) |
| - | The Bond Fund of America (File No. 002-50700, File No. 811-02444) |
| - | Capital Group Central Fund Series – Capital Group Central Cash
Fund (File No. 811-23391) |
| - | Capital Income Builder (File No. 033-12967, File No. 811-05085) |
| - | Capital World Bond Fund (File No. 033-12447, File No. 811-05104) |
| - | Capital World Growth and Income Fund (File No. 033-54444, File No.
811-07338) |
| - | Intermediate Bond Fund of America (File No. 033-19514, File No. 811-05446) |
| - | Limited Term Tax-Exempt Bond Fund of America (File No. 033-66214, File
No. 811-07888) |
| - | The New Economy Fund (File No. 002-83848, File No. 811-03735) |
| - | Short-Term Bond Fund of America (File No. 333-135770, File No.
811-21928) |
| - | The Tax-Exempt Bond Fund of America (File No. 002-49291, File No. 811-02421) |
hereby revoke all previous powers of attorney
I have signed and otherwise act in my name and behalf in matters involving the Funds and do hereby constitute and appoint
|
Jennifer L. Butler
Steven I. Koszalka
Laurie D. Neat
Michael W. Stockton
Courtney R. Taylor
Jane Y. Chung
Susan K. Countess
Julie E. Lawton |
Brian D. Bullard
Brian C. Janssen
Dori Laskin
Hong Le
Gregory F. Niland |
each of them singularly, my true and lawful
attorneys-in-fact, with full power of substitution, and with full power to each of them, to sign for me and in my name in the appropriate
capacities, all Registration Statements of the Funds on Form N-1A, any and all subsequent Amendments, or Post-Effective Amendments
to said Registration Statement on Form N-1A or any successor thereto, and any supplements or other instruments in connection
therewith, and generally to do all such things in my name and behalf in connection therewith as said attorneys-in-fact deem necessary
or appropriate, to comply with the provisions of the Securities Act of 1933 and the Investment Company Act of 1940 as amended,
and all related requirements of the U. S. Securities and Exchange Commission. I hereby ratify and confirm all that said attorneys-in-fact
or their substitutes may do or cause to be done by virtue hereof.
EXECUTED at Los Angeles,
CA, this 4th day of March, 2019.
(City, State)
/s/ Merit E. Janow
Merit E. Janow,
Board member
POWER OF ATTORNEY
I, Laurel
B. Mitchell, the undersigned Board member of the following registered investment companies
(collectively, the “Funds”):
| - | American Funds College Target Date Series (File No. 333-180729, File
No. 811-22692) |
| - | American Funds Corporate Bond Fund (File No. 333-183929, File No. 811-22744)
|
| - | American Funds Emerging Markets Bond Fund (File No. 333-208636; File
No. 811-23122) |
| - | The American Funds Income Series – U.S. Government Securities
Fund (File No. 002-98199, File No. 811-04318) |
| - | American Funds Inflation Linked Bond Fund (File No. 333-183931, File
No. 811-22746) |
| - | American Funds Insurance Series (File No. 002-86838, File No. 811-03857) |
| - | American Funds Insurance Series |
| - | American Funds Mortgage Fund (File No. 333-168595, File No. 811-22449)
|
| - | American Funds Multi-Sector Income Fund (File No. 333-228995, File
No. 811-23409) |
| - | American Funds Portfolio Series (File No. 333-178936, File No. 811-22656) |
| - | American Funds Retirement Income Portfolio Series (File No. 333-203797,
File No. 811-23053) |
| - | American Funds Short-Term Tax-Exempt Bond Fund (File No. 033-26431,
File No. 811-05750) |
| - | American Funds Strategic Bond Fund (File No. 333-207474, File No. 811-23101) |
| - | American Funds Target Date Retirement Series (File No. 333-138648,
File No. 811-21981) |
| - | American Funds Tax-Exempt Fund of New York (File No. 333-168594, File
No. 811-22448) |
| - | The American Funds Tax-Exempt Series II – The Tax-Exempt Fund
of California (File No. 033-06180, File No. 811-04694) |
| - | American Funds U.S. Government Money Market Fund (File No. 333-157162,
File No. 811-22277) |
| - | American High-Income Municipal Bond Fund (File No. 033-80630, File
No. 811-08576) |
| - | American High-Income Trust (File No. 033-17917, File No. 811-05364) |
| - | The Bond Fund of America (File No. 002-50700, File No. 811-02444) |
| - | Capital Group Central Fund Series – Capital Group Central Cash
Fund (File No. 811-23391) |
| - | Capital World Bond Fund (File No. 033-12447, File No. 811-05104) |
| - | Intermediate Bond Fund of America (File No. 033-19514, File No. 811-05446) |
| - | Limited Term Tax-Exempt Bond Fund of America (File No. 033-66214, File
No. 811-07888) |
| - | Short-Term Bond Fund of America (File No. 333-135770, File No.
811-21928) |
| - | The Tax-Exempt Bond Fund of America (File No. 002-49291, File No. 811-02421) |
| - | Washington Mutual Investors Fund (File No. 002-11051, File No. 811-00604) |
hereby revoke all previous powers of attorney
I have signed and otherwise act in my name and behalf in matters involving the Funds and do hereby constitute and appoint
|
Jennifer L. Butler
Steven I. Koszalka
Laurie D. Neat
Michael W. Stockton
Courtney R. Taylor
Jane Y. Chung
Susan K. Countess
Julie E. Lawton |
Brian D. Bullard
Brian C. Janssen
Dori Laskin
Hong Le
Gregory F. Niland |
each of them singularly, my true and lawful
attorneys-in-fact, with full power of substitution, and with full power to each of them, to sign for me and in my name in the appropriate
capacities, all Registration Statements of the Funds on Form N-1A, any and all subsequent Amendments, or Post-Effective Amendments
to said Registration Statement on Form N-1A or any successor thereto, and any supplements or other instruments in connection
therewith, and generally to do all such things in my name and behalf in connection therewith as said attorneys-in-fact deem necessary
or appropriate, to comply with the provisions of the Securities Act of 1933 and the Investment Company Act of 1940 as amended,
and all related requirements of the U. S. Securities and Exchange Commission. I hereby ratify and confirm all that said attorneys-in-fact
or their substitutes may do or cause to be done by virtue hereof.
EXECUTED at Los Angeles,
CA, this 4th day of March, 2019.
(City, State)
/s/ Laurel B. Mitchell
Laurel
B. Mitchell, Board member
POWER OF ATTORNEY
I, Margaret
Spellings, the undersigned Board member of the following registered investment companies
(collectively, the “Funds”):
| - | American Balanced Fund (File No. 002-10758, File No. 811-00066) |
| - | American Funds College Target Date Series (File No. 333-180729, File
No. 811-22692) |
| - | American Funds Corporate Bond Fund (File No. 333-183929, File No. 811-22744)
|
| - | American Funds Developing World Growth and Income Fund (File No. 333-190913,
File No. 811-22881) |
| - | American Funds Emerging Markets Bond Fund (File No. 333-208636; File
No. 811-23122) |
| - | The American Funds Income Series – U.S. Government Securities
Fund (File No. 002-98199, File No. 811-04318) |
| - | American Funds Inflation Linked Bond Fund (File No. 333-183931, File
No. 811-22746) |
| - | American Funds Insurance Series (File No. 002-86838, File No. 811-03857) |
| - | American Funds Insurance Series |
| - | American Funds Mortgage Fund (File No. 333-168595, File No. 811-22449)
|
| - | American Funds Multi-Sector Income Fund (File No. 333-228995, File
No. 811-23409) |
| - | American Funds Portfolio Series (File No. 333-178936, File No. 811-22656) |
| - | American Funds Retirement Income Portfolio Series (File No. 333-203797,
File No. 811-23053) |
| - | American Funds Short-Term Tax-Exempt Bond Fund (File No. 033-26431,
File No. 811-05750) |
| - | American Funds Strategic Bond Fund (File No. 333-207474, File No. 811-23101) |
| - | American Funds Target Date Retirement Series (File No. 333-138648,
File No. 811-21981) |
| - | American Funds Tax-Exempt Fund of New York (File No. 333-168594, File
No. 811-22448) |
| - | The American Funds Tax-Exempt Series II – The Tax-Exempt Fund
of California (File No. 033-06180, File No. 811-04694) |
| - | American Funds U.S. Government Money Market Fund (File No. 333-157162,
File No. 811-22277) |
| - | American High-Income Municipal Bond Fund (File No. 033-80630, File
No. 811-08576) |
| - | American High-Income Trust (File No. 033-17917, File No. 811-05364) |
| - | The Bond Fund of America (File No. 002-50700, File No. 811-02444) |
| - | Capital Group Central Fund Series – Capital Group Central Cash
Fund (File No. 811-23391) |
| - | Capital World Bond Fund (File No. 033-12447, File No. 811-05104) |
| - | The Income Fund of America (File No. 002-33371, File No. 811-01880) |
| - | Intermediate Bond Fund of America (File No. 033-19514, File No. 811-05446) |
| - | International Growth and Income Fund (File No. 333-152323, File No.
811-22215) |
| - | Limited Term Tax-Exempt Bond Fund of America (File No. 033-66214, File
No. 811-07888) |
| - | Short-Term Bond Fund of America (File No. 333-135770, File No.
811-21928) |
| - | The Tax-Exempt Bond Fund of America (File No. 002-49291, File No. 811-02421) |
| - | Washington Mutual Investors Fund (File No. 002-11051, File No. 811-00604) |
hereby revoke all previous powers of attorney
I have signed and otherwise act in my name and behalf in matters involving the Funds and do hereby constitute and appoint
|
Jennifer L. Butler
Steven I. Koszalka
Laurie D. Neat
Michael W. Stockton
Courtney R. Taylor
Jane Y. Chung
Susan K. Countess
Julie E. Lawton |
Brian D. Bullard
Brian C. Janssen
Dori Laskin
Hong Le
Gregory F. Niland |
each of them singularly, my true and lawful
attorneys-in-fact, with full power of substitution, and with full power to each of them, to sign for me and in my name in the appropriate
capacities, all Registration Statements of the Funds on Form N-1A, any and all subsequent Amendments, or Post-Effective Amendments
to said Registration Statement on Form N-1A or any successor thereto, and any supplements or other instruments in connection
therewith, and generally to do all such things in my name and behalf in connection therewith as said attorneys-in-fact deem necessary
or appropriate, to comply with the provisions of the Securities Act of 1933 and the Investment Company Act of 1940 as amended,
and all related requirements of the U. S. Securities and Exchange Commission. I hereby ratify and confirm all that said attorneys-in-fact
or their substitutes may do or cause to be done by virtue hereof.
EXECUTED at Los Angeles,
CA, this 4th day of March, 2019.
(City, State)
/s/ Margaret Spellings
Margaret
Spellings, Board member
POWER OF ATTORNEY
I, Alexandra
Trower, the undersigned Board member of the following registered investment companies (collectively,
the “Funds”):
| - | American Funds College Target Date Series (File No. 333-180729, File
No. 811-22692) |
| - | American Funds Corporate Bond Fund (File No. 333-183929, File No. 811-22744)
|
| - | American Funds Emerging Markets Bond Fund (File No. 333-208636; File
No. 811-23122) |
| - | The American Funds Income Series – U.S. Government Securities
Fund (File No. 002-98199, File No. 811-04318) |
| - | American Funds Inflation Linked Bond Fund (File No. 333-183931, File
No. 811-22746) |
| - | American Funds Insurance Series (File No. 002-86838, File No. 811-03857) |
| - | American Funds Insurance Series |
| - | American Funds Mortgage Fund (File No. 333-168595, File No. 811-22449)
|
| - | American Funds Multi-Sector Income Fund (File No. 333-228995, File
No. 811-23409) |
| - | American Funds Portfolio Series (File No. 333-178936, File No. 811-22656) |
| - | American Funds Retirement Income Portfolio Series (File No. 333-203797,
File No. 811-23053) |
| - | American Funds Short-Term Tax-Exempt Bond Fund (File No. 033-26431,
File No. 811-05750) |
| - | American Funds Strategic Bond Fund (File No. 333-207474, File No. 811-23101) |
| - | American Funds Target Date Retirement Series (File No. 333-138648,
File No. 811-21981) |
| - | American Funds Tax-Exempt Fund of New York (File No. 333-168594, File
No. 811-22448) |
| - | The American Funds Tax-Exempt Series II – The Tax-Exempt Fund
of California (File No. 033-06180, File No. 811-04694) |
| - | American Funds U.S. Government Money Market Fund (File No. 333-157162,
File No. 811-22277) |
| - | American High-Income Municipal Bond Fund (File No. 033-80630, File
No. 811-08576) |
| - | American High-Income Trust (File No. 033-17917, File No. 811-05364) |
| - | The Bond Fund of America (File No. 002-50700, File No. 811-02444) |
| - | Capital Group Central Fund Series – Capital Group Central Cash
Fund (File No. 811-23391) |
| - | Capital World Bond Fund (File No. 033-12447, File No. 811-05104) |
| - | Intermediate Bond Fund of America (File No. 033-19514, File No. 811-05446) |
| - | Limited Term Tax-Exempt Bond Fund of America (File No. 033-66214, File
No. 811-07888) |
| - | Short-Term Bond Fund of America (File No. 333-135770, File No.
811-21928) |
| - | The Tax-Exempt Bond Fund of America (File No. 002-49291, File No. 811-02421) |
hereby revoke all previous powers of attorney
I have signed and otherwise act in my name and behalf in matters involving the Funds and do hereby constitute and appoint
|
Jennifer L. Butler
Steven I. Koszalka
Laurie D. Neat
Michael W. Stockton
Courtney R. Taylor
Jane Y. Chung
Susan K. Countess
Julie E. Lawton |
Brian D. Bullard
Brian C. Janssen
Dori Laskin
Hong Le
Gregory F. Niland |
each of them singularly, my true and lawful
attorneys-in-fact, with full power of substitution, and with full power to each of them, to sign for me and in my name in the appropriate
capacities, all Registration Statements of the Funds on Form N-1A, any and all subsequent Amendments, or Post-Effective Amendments
to said Registration Statement on Form N-1A or any successor thereto, and any supplements or other instruments in connection
therewith, and generally to do all such things in my name and behalf in connection therewith as said attorneys-in-fact deem necessary
or appropriate, to comply with the provisions of the Securities Act of 1933 and the Investment Company Act of 1940 as amended,
and all related requirements of the U. S. Securities and Exchange Commission. I hereby ratify and confirm all that said attorneys-in-fact
or their substitutes may do or cause to be done by virtue hereof.
EXECUTED at Los Angeles,
CA, this 4th day of March, 2019.
(City, State)
/s Alexandra Trower
Alexandra
Trower, Board member
POWER OF ATTORNEY
I, Karl
J. Zeile, the undersigned Board member of the following registered investment companies
(collectively, the “Funds”):
| - | American Funds Corporate Bond Fund (File No. 333-183929, File No. 811-22744)
|
| - | American Funds Emerging Markets Bond Fund (File No. 333-208636; File
No. 811-23122) |
| - | The American Funds Income Series – U.S. Government Securities
Fund (File No. 002-98199, File No. 811-04318) |
| - | American Funds Inflation Linked Bond Fund (File No. 333-183931, File
No. 811-22746) |
| - | American Funds Mortgage Fund (File No. 333-168595, File No. 811-22449)
|
| - | American Funds Multi-Sector Income Fund (File No. 333-228995, File
No. 811-23409) |
| - | American Funds Short-Term Tax-Exempt Bond Fund (File No. 033-26431,
File No. 811-05750) |
| - | American Funds Strategic Bond Fund (File No. 333-207474, File No. 811-23101) |
| - | American Funds Tax-Exempt Fund of New York (File No. 333-168594, File
No. 811-22448) |
| - | The American Funds Tax-Exempt Series II – The Tax-Exempt Fund
of California (File No. 033-06180, File No. 811-04694) |
| - | American Funds U.S. Government Money Market Fund (File No. 333-157162,
File No. 811-22277) |
| - | American High-Income Municipal Bond Fund (File No. 033-80630, File
No. 811-08576) |
| - | American High-Income Trust (File No. 033-17917, File No. 811-05364) |
| - | The Bond Fund of America (File No. 002-50700, File No. 811-02444) |
| - | Capital Group Central Fund Series – Capital Group Central Cash
Fund (File No. 811-23391) |
| - | Capital World Bond Fund (File No. 033-12447, File No. 811-05104) |
| - | Intermediate Bond Fund of America (File No. 033-19514, File No. 811-05446) |
| - | Limited Term Tax-Exempt Bond Fund of America (File No. 033-66214, File
No. 811-07888) |
| - | Short-Term Bond Fund of America (File No. 333-135770, File No.
811-21928) |
| - | The Tax-Exempt Bond Fund of America (File No. 002-49291, File No. 811-02421) |
hereby revoke all previous powers of attorney
I have signed and otherwise act in my name and behalf in matters involving the Funds and do hereby constitute and appoint
|
Jennifer L. Butler
Steven I. Koszalka
Laurie D. Neat
Michael W. Stockton
Courtney R. Taylor
Jane Y. Chung
Susan K. Countess
Julie E. Lawton |
Brian D. Bullard
Brian C. Janssen
Dori Laskin
Hong Le
Gregory F. Niland |
each of them singularly, my true and lawful
attorneys-in-fact, with full power of substitution, and with full power to each of them, to sign for me and in my name in the appropriate
capacities, all Registration Statements of the Funds on Form N-1A, any and all subsequent Amendments, or Post-Effective Amendments
to said Registration Statement on Form N-1A or any successor thereto, and any supplements or other instruments in connection
therewith, and generally to do all such things in my name and behalf in connection therewith as said attorneys-in-fact deem necessary
or appropriate, to comply with the provisions of the Securities Act of 1933 and the Investment Company Act of 1940 as amended,
and all related requirements of the U. S. Securities and Exchange Commission. I hereby ratify and confirm all that said attorneys-in-fact
or their substitutes may do or cause to be done by virtue hereof.
EXECUTED at Los Angeles,
CA, this 4th day of March, 2019.
(City, State)
/s Karl J. Zeile
Karl J. Zeile,
Board member