| UNDER THE SECURITIES ACT OF 1933 | ☒ |
| Post-Effective Amendment No. | □ |
| Post-Effective Amendment No. 125 | ☒ |
| Amendment No. 126 | ☒ |
| □ | immediately upon filing pursuant to paragraph (b) |
| ☒ | on May 29, 2020, pursuant to paragraph (b) |
| □ | 60 days after filing pursuant to paragraph (a)(1) |
| □ | on (date) pursuant to paragraph (a)(1) |
| □ | 75 days after filing pursuant to paragraph (a)(2) |
| □ | on (date) pursuant to paragraph (a)(2) of rule 485 If appropriate, check the following box: |
| □ | This post-effective amendment designates a new effective date for a previously filed post-effective amendment. |
| See the inside front cover for important information about access to your fund’s annual and semiannual shareholder reports. |
| Investor Shares | Admiral Shares | |
| Sales Charge (Load) Imposed on Purchases | None | None |
| Purchase Fee | None | None |
| Sales Charge (Load) Imposed on Reinvested Dividends | None | None |
| Redemption Fee | None | None |
| Account Service Fee Per Year (for certain fund account balances below $10,000) | $20 | $20 |
| Investor Shares | Admiral Shares | |
| Management Fees | 0.18% | 0.09% |
| 12b-1 Distribution Fee | None | None |
| Other Expenses | 0.02% | 0.01% |
| Total Annual Fund Operating Expenses | 0.20% | 0.10% |
| 1 Year | 3 Years | 5 Years | 10 Years | |
| Investor Shares | $20 | $64 | $113 | $255 |
| Admiral Shares | $10 | $32 | $56 | $128 |
| Total Return | Quarter | |
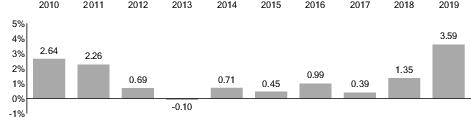
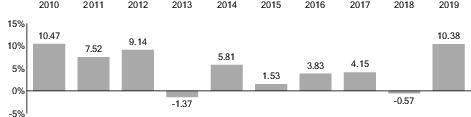
| Highest | 1.51% | June 30, 2019 |
| Lowest | -0.70% | December 31, 2016 |
| 1 Year | 5 Years | 10 Years | |
| Vanguard Short-Term Treasury Fund Investor Shares | |||
| Return Before Taxes | 3.59% | 1.35% | 1.29% |
| Return After Taxes on Distributions | 2.59 | 0.70 | 0.77 |
| Return After Taxes on Distributions and Sale of Fund Shares | 2.12 | 0.75 | 0.79 |
| Vanguard Short-Term Treasury Fund Admiral Shares | |||
| Return Before Taxes | 3.70% | 1.45% | 1.39% |
| Bloomberg Barclays U.S. 1-5 Year Treasury Bond Index (reflects no deduction for fees, expenses, or taxes) | 4.25% | 1.67% | 1.73% |
| Investor Shares | Admiral Shares | |
| Sales Charge (Load) Imposed on Purchases | None | None |
| Purchase Fee | None | None |
| Sales Charge (Load) Imposed on Reinvested Dividends | None | None |
| Redemption Fee | None | None |
| Account Service Fee Per Year (for certain fund account balances below $10,000) | $20 | $20 |
| Investor Shares | Admiral Shares | |
| Management Fees | 0.18% | 0.09% |
| 12b-1 Distribution Fee | None | None |
| Other Expenses | 0.02% | 0.01% |
| Total Annual Fund Operating Expenses | 0.20% | 0.10% |
| 1 Year | 3 Years | 5 Years | 10 Years | |
| Investor Shares | $20 | $64 | $113 | $255 |
| Admiral Shares | $10 | $32 | $56 | $128 |
| Total Return | Quarter | |
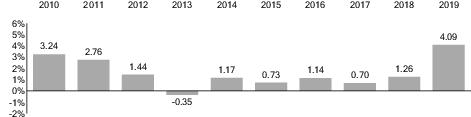
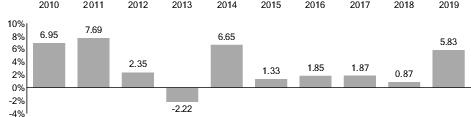
| Highest | 1.74% | June 30, 2010 |
| Lowest | -0.90% | June 30, 2013 |
| 1 Year | 5 Years | 10 Years | |
| Vanguard Short-Term Federal Fund Investor Shares | |||
| Return Before Taxes | 4.09% | 1.58% | 1.61% |
| Return After Taxes on Distributions | 3.11 | 0.89 | 1.00 |
| Return After Taxes on Distributions and Sale of Fund Shares | 2.41 | 0.90 | 1.00 |
| Vanguard Short-Term Federal Fund Admiral Shares | |||
| Return Before Taxes | 4.20% | 1.68% | 1.71% |
| Bloomberg Barclays U.S. 1-5 Year Government Bond Index (reflects no deduction for fees, expenses, or taxes) | 4.23% | 1.67% | 1.71% |
| Investor Shares | Admiral Shares | |
| Sales Charge (Load) Imposed on Purchases | None | None |
| Purchase Fee | None | None |
| Sales Charge (Load) Imposed on Reinvested Dividends | None | None |
| Redemption Fee | None | None |
| Account Service Fee Per Year (for certain fund account balances below $10,000) | $20 | $20 |
| Investor Shares | Admiral Shares | |
| Management Fees | 0.19% | 0.09% |
| 12b-1 Distribution Fee | None | None |
| Other Expenses | 0.01% | 0.01% |
| Total Annual Fund Operating Expenses | 0.20% | 0.10% |
| 1 Year | 3 Years | 5 Years | 10 Years | |
| Investor Shares | $20 | $64 | $113 | $255 |
| Admiral Shares | $10 | $32 | $56 | $128 |
| Total Return | Quarter | |
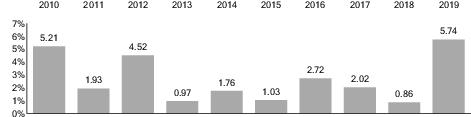
| Highest | 2.15% | September 30, 2010 |
| Lowest | -0.98% | June 30, 2013 |
| 1 Year | 5 Years | 10 Years | |
| Vanguard Short-Term Investment-Grade Fund Investor Shares | |||
| Return Before Taxes | 5.74% | 2.46% | 2.66% |
| Return After Taxes on Distributions | 4.52 | 1.47 | 1.67 |
| Return After Taxes on Distributions and Sale of Fund Shares | 3.38 | 1.44 | 1.64 |
| Vanguard Short-Term Investment-Grade Fund Admiral Shares | |||
| Return Before Taxes | 5.84% | 2.56% | 2.76% |
| Bloomberg Barclays U.S. 1-5 Year Credit Bond Index (reflects no deduction for fees, expenses, or taxes) | 6.58% | 2.71% | 3.07% |
| Investor Shares | Admiral Shares | |
| Sales Charge (Load) Imposed on Purchases | None | None |
| Purchase Fee | None | None |
| Sales Charge (Load) Imposed on Reinvested Dividends | None | None |
| Redemption Fee | None | None |
| Account Service Fee Per Year (for certain fund account balances below $10,000) | $20 | $20 |
| Investor Shares | Admiral Shares | |
| Management Fees | 0.18% | 0.09% |
| 12b-1 Distribution Fee | None | None |
| Other Expenses | 0.02% | 0.01% |
| Total Annual Fund Operating Expenses | 0.20% | 0.10% |
| 1 Year | 3 Years | 5 Years | 10 Years | |
| Investor Shares | $20 | $64 | $113 | $255 |
| Admiral Shares | $10 | $32 | $56 | $128 |
| Total Return | Quarter | |
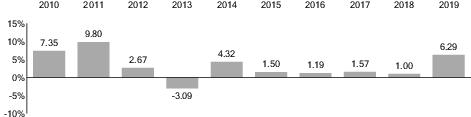
| Highest | 5.71% | September 30, 2011 |
| Lowest | -3.42% | December 31, 2016 |
| 1 Year | 5 Years | 10 Years | |
| Vanguard Intermediate-Term Treasury Fund Investor Shares | |||
| Return Before Taxes | 6.29% | 2.29% | 3.20% |
| Return After Taxes on Distributions | 5.29 | 1.34 | 2.18 |
| Return After Taxes on Distributions and Sale of Fund Shares | 3.71 | 1.35 | 2.14 |
| Vanguard Intermediate-Term Treasury Fund Admiral Shares | |||
| Return Before Taxes | 6.39% | 2.39% | 3.31% |
| Bloomberg Barclays U.S. 5-10 Year Treasury Bond Index (reflects no deduction for fees, expenses, or taxes) | 7.48% | 2.75% | 4.01% |
| Investor Shares | Admiral Shares | |
| Sales Charge (Load) Imposed on Purchases | None | None |
| Purchase Fee | None | None |
| Sales Charge (Load) Imposed on Reinvested Dividends | None | None |
| Redemption Fee | None | None |
| Account Service Fee Per Year (for certain fund account balances below $10,000) | $20 | $20 |
| Investor Shares | Admiral Shares | |
| Management Fees | 0.19% | 0.09% |
| 12b-1 Distribution Fee | None | None |
| Other Expenses | 0.01% | 0.01% |
| Total Annual Fund Operating Expenses | 0.20% | 0.10% |
| 1 Year | 3 Years | 5 Years | 10 Years | |
| Investor Shares | $20 | $64 | $113 | $255 |
| Admiral Shares | $10 | $32 | $56 | $128 |
| Total Return | Quarter | |
| Highest | 4.90% | September 30, 2010 |
| Lowest | -3.28% | June 30, 2013 |
| 1 Year | 5 Years | 10 Years | |
| Vanguard Intermediate-Term Investment-Grade Fund Investor Shares | |||
| Return Before Taxes | 10.38% | 3.80% | 5.01% |
| Return After Taxes on Distributions | 9.00 | 2.40 | 3.35 |
| Return After Taxes on Distributions and Sale of Fund Shares | 6.12 | 2.29 | 3.26 |
| Vanguard Intermediate-Term Investment-Grade Fund Admiral Shares | |||
| Return Before Taxes | 10.49% | 3.90% | 5.11% |
| Bloomberg Barclays U.S. 5-10 Year Credit Bond Index (reflects no deduction for fees, expenses, or taxes) | 13.90% | 4.64% | 5.79% |
| Investor Shares | Admiral Shares | |
| Sales Charge (Load) Imposed on Purchases | None | None |
| Purchase Fee | None | None |
| Sales Charge (Load) Imposed on Reinvested Dividends | None | None |
| Redemption Fee | None | None |
| Account Service Fee Per Year (for certain fund account balances below $10,000) | $20 | $20 |
| Investor Shares | Admiral Shares | |
| Management Fees | 0.20% | 0.10% |
| 12b-1 Distribution Fee | None | None |
| Other Expenses | 0.01% | 0.01% |
| Total Annual Fund Operating Expenses | 0.21% | 0.11% |
| 1 Year | 3 Years | 5 Years | 10 Years | |
| Investor Shares | $22 | $68 | $118 | $268 |
| Admiral Shares | $11 | $35 | $62 | $141 |
| Total Return | Quarter | |
| Highest | 3.43% | June 30, 2010 |
| Lowest | -2.79% | June 30, 2013 |
| 1 Year | 5 Years | 10 Years | |
| Vanguard GNMA Fund Investor Shares | |||
| Return Before Taxes | 5.83% | 2.33% | 3.27% |
| Return After Taxes on Distributions | 4.64 | 1.13 | 1.97 |
| Return After Taxes on Distributions and Sale of Fund Shares | 3.44 | 1.24 | 1.99 |
| Vanguard GNMA Fund Admiral Shares | |||
| Return Before Taxes | 5.93% | 2.44% | 3.37% |
| Bloomberg Barclays U.S. GNMA Bond Index (reflects no deduction for fees, expenses, or taxes) | 5.85% | 2.32% | 3.21% |
| Investor Shares | Admiral Shares | |
| Sales Charge (Load) Imposed on Purchases | None | None |
| Purchase Fee | None | None |
| Sales Charge (Load) Imposed on Reinvested Dividends | None | None |
| Redemption Fee | None | None |
| Account Service Fee Per Year (for certain fund account balances below $10,000) | $20 | $20 |
| Investor Shares | Admiral Shares | |
| Management Fees | 0.18% | 0.09% |
| 12b-1 Distribution Fee | None | None |
| Other Expenses | 0.02% | 0.01% |
| Total Annual Fund Operating Expenses | 0.20% | 0.10% |
| 1 Year | 3 Years | 5 Years | 10 Years | |
| Investor Shares | $20 | $64 | $113 | $255 |
| Admiral Shares | $10 | $32 | $56 | $128 |
| Total Return | Quarter | |
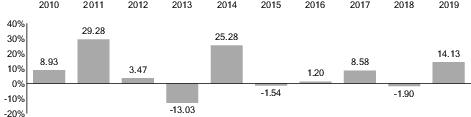
| Highest | 24.73% | September 30, 2011 |
| Lowest | -12.07% | December 31, 2016 |
| 1 Year | 5 Years | 10 Years | |
| Vanguard Long-Term Treasury Fund Investor Shares | |||
| Return Before Taxes | 14.13% | 3.91% | 6.76% |
| Return After Taxes on Distributions | 12.85 | 2.46 | 5.08 |
| Return After Taxes on Distributions and Sale of Fund Shares | 8.39 | 2.40 | 4.73 |
| Vanguard Long-Term Treasury Fund Admiral Shares | |||
| Return Before Taxes | 14.24% | 4.01% | 6.87% |
| Bloomberg Barclays U.S. Long Treasury Bond Index (reflects no deduction for fees, expenses, or taxes) | 14.83% | 4.13% | 7.01% |
| Investor Shares | Admiral Shares | |
| Sales Charge (Load) Imposed on Purchases | None | None |
| Purchase Fee | None | None |
| Sales Charge (Load) Imposed on Reinvested Dividends | None | None |
| Redemption Fee | None | None |
| Account Service Fee Per Year (for certain fund account balances below $10,000) | $20 | $20 |
| Investor Shares | Admiral Shares | |
| Management Fees | 0.20% | 0.11% |
| 12b-1 Distribution Fee | None | None |
| Other Expenses | 0.02% | 0.01% |
| Total Annual Fund Operating Expenses | 0.22% | 0.12% |
| 1 Year | 3 Years | 5 Years | 10 Years | |
| Investor Shares | $23 | $71 | $124 | $280 |
| Admiral Shares | $12 | $39 | $68 | $154 |
| Total Return | Quarter | |
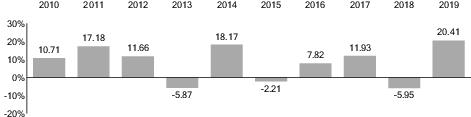
| Highest | 11.05% | September 30, 2011 |
| Lowest | -7.63% | June 30, 2015 |
| 1 Year | 5 Years | 10 Years | |
| Vanguard Long-Term Investment-Grade Fund Investor Shares | |||
| Return Before Taxes | 20.41% | 5.97% | 7.97% |
| Return After Taxes on Distributions | 18.07 | 3.77 | 5.74 |
| Return After Taxes on Distributions and Sale of Fund Shares | 12.15 | 3.65 | 5.36 |
| Vanguard Long-Term Investment-Grade Fund Admiral Shares | |||
| Return Before Taxes | 20.53% | 6.08% | 8.08% |
| Bloomberg Barclays U.S. Long Credit A or Better Bond Index (reflects no deduction for fees, expenses, or taxes) | 20.85% | 5.95% | 7.76% |
| Plain Talk About Costs of Investing |
| Costs are an important consideration in choosing a mutual fund. That is because you, as a shareholder, pay a proportionate share of the costs of operating a fund and any transaction costs incurred when the fund buys or sells securities. These costs can erode a substantial portion of the gross income or the capital appreciation a fund achieves. Even seemingly small differences in expenses can, over time, have a dramatic effect on a fund’s performance. |
| Vanguard Fund | Primary Investments | Expected Dollar-Weighted Average Maturity |
| Short-Term Treasury | U.S. Treasury bonds | 1–4 years |
| Short-Term Federal | U.S. government agency bonds | 1–4 years |
| Short-Term Investment-Grade | Investment-grade bonds | 1–4 years |
| Intermediate-Term Treasury | U.S. Treasury bonds | 5–10 years |
| Intermediate-Term Investment-Grade | Investment-grade bonds | 5–10 years |
| GNMA | GNMA pass-through certificates | Generally 3–10 years |
| Long-Term Treasury | U.S. Treasury bonds | 15–30 years |
| Long-Term Investment-Grade | Investment-grade bonds | Generally 15–30 years |
| Type of Bond (Maturity) | After a 1% Increase | After a 1% Decrease | After a 2% Increase | After a 2% Decrease |
| Short-Term (2.5 years) | $977 | $1,024 | $954 | $1,049 |
| Intermediate-Term (10 years) | 922 | 1,086 | 851 | 1,180 |
| Long-Term (20 years) | 874 | 1,150 | 769 | 1,328 |
| Plain Talk About Bonds and Interest Rates |
| As a rule, when interest rates rise, bond prices fall. The opposite is also true: Bond prices go up when interest rates fall. Why do bond prices and interest rates move in opposite directions? Let’s assume that you hold a bond offering a 4% yield. A year later, interest rates are on the rise and bonds of comparable quality and maturity are offered with a 5% yield. With higher-yielding bonds available, you would have trouble selling your 4% bond for the price you paid—you would probably have to lower your asking price. On the other hand, if interest rates were falling and 3% bonds were being offered, you should be able to sell your 4% bond for more than you paid. |
| How mortgage-backed securities are different: In general, declining interest rates will not lift the prices of mortgage-backed securities—such as those guaranteed by the Government National Mortgage Association—as much as the prices of comparable bonds. Why? Because when interest rates fall, the bond market tends to discount the prices of mortgage-backed securities for prepayment risk—the possibility that homeowners will refinance their mortgages at lower rates and cause the bonds to be paid off prior to maturity. In part to compensate for this prepayment possibility, mortgage-backed securities tend to offer higher yields than other bonds of comparable credit quality and maturity. In contrast, when interest rates rise, prepayments tend to slow down, subjecting mortgage-backed securities to extension risk—the possibility that homeowners will repay their mortgages at slower rates. This will lengthen the duration or average life of mortgage-backed securities held by a fund and delay the fund’s ability to reinvest proceeds at higher interest rates, making the fund more sensitive to changes in interest rates. |
| Plain Talk About Bond Maturities |
| A bond is issued with a specific maturity date—the date when the issuer must pay back the bond’s principal (face value). Bond maturities range from less than 1 year to more than 30 years. Typically, the longer a bond’s maturity, the more price risk you, as a bond investor, will face as interest rates rise—but also the higher the potential yield you could receive. Longer-term bonds are more suitable for investors willing to take a greater risk of price fluctuations to get higher and more stable interest income. Shorter-term bond investors should be willing to accept lower yields and greater income variability in return for less fluctuation in the value of their investment. The stated maturity of a bond may differ from the effective maturity of a bond, which takes into consideration that an action such as a call or refunding may cause bonds to be repaid before their stated maturity dates. |
| Plain Talk About Callable Bonds |
| Although bonds are issued with clearly defined maturities, in some cases the bond issuer has a right to call in (redeem) the bond earlier than its maturity date. When a bond is called, the bondholder must replace it with another bond that may have a lower yield than the original bond. One way for bond investors to protect themselves against call risk is to purchase a bond early in its lifetime, long before its call date. Another way is to buy bonds with lower coupon rates or interest rates, which make them less likely to be called. |
| Plain Talk About Credit Quality |
| A bond’s credit quality rating is an assessment of the issuer’s ability to pay interest on the bond and, ultimately, to repay the principal. The lower the credit quality, the greater the perceived chance that the bond issuer will default, or fail to meet its payment obligations. All things being equal, the lower a bond’s credit quality, the higher its yield should be to compensate investors for assuming additional risk. |
| Vanguard Fund | Issued or Backed by U.S. Gov’t. or its Agencies and Instrumentalities | High or Highest Quality (Non-Gov’t.) | Upper- Medium Quality | Medium Quality | Non- Investment- Grade |
| Short-Term Treasury | 100% | 0% | 0% | 0% | 0% |
| Short-Term Federal | 100% | 0% | 0% | 0% | 0% |
| Short-Term Investment-Grade | —————————At least 80%——————————— | No more than 5% | |||
| Intermediate-Term Treasury | 100% | 0% | 0% | 0% | 0% |
| Intermediate-Term Investment-Grade | —————————At least 80%——————————— | No more than 5% | |||
| GNMA | 100% | 0% | 0% | 0% | 0% |
| Long-Term Treasury | 100% | 0% | 0% | 0% | 0% |
| Long-Term Investment-Grade | —————————At least 65%—————— | No more than 30% | No more than 5% | ||
| Plain Talk About Types of Bonds |
| Bonds are issued (sold) by many sources: Corporations issue corporate bonds; the federal government issues U.S. Treasury bonds; agencies of the federal government issue agency bonds; financial institutions issue asset-backed bonds; and mortgage holders issue “mortgage-backed” pass-through certificates. Each issuer is responsible for paying back the bond’s initial value as well as for making periodic interest payments. Many bonds issued by government agencies and entities are neither guaranteed nor insured by the U.S. government. |
| Short-, Intermediate-, and Long-Term Treasury Funds | Short-Term Federal Fund | Short-, Intermediate-, and Long-Term Investment- Grade Funds | GNMA Fund | |
| Corporate Debt Obligations | • | |||
| U.S. Government & Agency Bonds | • | • | • | • |
| Municipal Bonds | • | |||
| Mortgage-Backed Securities | • | • | • | • |
| Mortgage Dollar Rolls | • | • | • | • |
| Cash Equivalent Investments Including Repurchase Agreements | •1 | •1 | • | •1 |
| Futures, Options, and Other Derivatives | • | • | • | • |
| Asset-Backed Securities | • | • | ||
| International Dollar-Denominated Bonds | • | |||
| Foreign Currency Bonds | • | |||
| Preferred Stocks | • | |||
| Convertible Securities | • | |||
| Collateralized Mortgage Obligations (CMOs) | • | • | • | • |
| Plain Talk About U.S. Government-Sponsored Entities |
| A variety of U.S. government-sponsored entities (GSEs), such as the Federal Home Loan Mortgage Corporation (FHLMC), the Federal National Mortgage Association (FNMA), and the Federal Home Loan Banks (FHLBs), issue debt and mortgage-backed securities. Although GSEs may be chartered or sponsored by acts of Congress, they are not funded by congressional appropriations. In September of 2008, the U.S. Treasury placed FNMA and FHLMC under conservatorship and appointed the Federal Housing Finance Agency (FHFA) to manage their daily operations. In addition, the U.S. Treasury entered into purchase agreements with FNMA and FHLMC to provide them with capital in exchange for senior preferred stock. Generally, a GSE’s securities are neither issued nor guaranteed by the U.S. Treasury and are not backed by the full faith and credit of the U.S. government. In most cases, these securities are supported only by the credit of the GSE, standing alone. In some cases, a GSE’s securities may be supported by the ability of the GSE to borrow from the U.S. Treasury or may be supported by the U.S. government in some other way. Securities issued by the Government National Mortgage Association (GNMA), however, are backed by the full faith and credit of the U.S. government. |
| Plain Talk About Derivatives |
| Derivatives can take many forms. Some forms of derivatives—such as exchange-traded futures and options on securities, commodities, or indexes—have been trading on regulated exchanges for decades. These types of derivatives are standardized contracts that can easily be bought and sold and whose market values are determined and published daily. On the other hand, non-exchange-traded derivatives—such as certain swap agreements—tend to be more specialized or complex and may be more difficult to accurately value. |
| Plain Talk About Vanguard’s Unique Corporate Structure |
| The Vanguard Group is owned jointly by the funds it oversees and thus indirectly by the shareholders in those funds. Most other mutual funds are operated by management companies that are owned by third parties—either public or private stockholders—and not by the funds they serve. |
| Plain Talk About Distributions |
| As a shareholder, you are entitled to your portion of a fund’s income from interest as well as capital gains from the fund’s sale of investments. Income consists of interest the fund earns from its money market and bond investments. Capital gains are realized whenever the fund sells securities for higher prices than it paid for them. These capital gains are either short-term or long-term, depending on whether the fund held the securities for one year or less or for more than one year. |
| Year Ended January 31, | |||||
| For a Share Outstanding Throughout Each Period | 2020 | 2019 | 2018 | 2017 | 2016 |
| Net Asset Value, Beginning of Period | $10.48 | $10.49 | $10.65 | $10.73 | $10.75 |
| Investment Operations | |||||
| Net Investment Income | 0.2451 | 0.2271 | 0.1271 | 0.094 | 0.074 |
| Net Realized and Unrealized Gain (Loss) on Investments | 0.160 | (0.009) | (0.160) | (0.048) | (0.004) |
| Total from Investment Operations | 0.405 | 0.218 | (0.033) | 0.046 | 0.070 |
| Distributions | |||||
| Dividends from Net Investment Income | (0.245) | (0.228) | (0.127) | (0.094) | (0.074) |
| Distributions from Realized Capital Gains | — | — | — | (0.032) | (0.016) |
| Total Distributions | (0.245) | (0.228) | (0.127) | (0.126) | (0.090) |
| Net Asset Value, End of Period | $10.64 | $10.48 | $10.49 | $10.65 | $10.73 |
| Total Return2 | 3.91% | 2.11% | –0.31% | 0.43% | 0.66% |
| Ratios/Supplemental Data | |||||
| Net Assets, End of Period (Millions) | $655 | $671 | $737 | $900 | $1,005 |
| Ratio of Total Expenses to Average Net Assets | 0.20% | 0.20% | 0.20% | 0.20% | 0.20% |
| Ratio of Net Investment Income to Average Net Assets | 2.30% | 2.18% | 1.20% | 0.87% | 0.69% |
| Portfolio Turnover Rate3 | 340% | 282% | 280% | 249% | 211% |
| 1 | Calculated based on average shares outstanding. |
| 2 | Total returns do not include account service fees that may have applied in the periods shown. |
| 3 | Includes 5%, 37%,7%, 3%, and 35% attributable to mortgage-dollar-roll activity. |
| Year Ended January 31, | |||||
| For a Share Outstanding Throughout Each Period | 2020 | 2019 | 2018 | 2017 | 2016 |
| Net Asset Value, Beginning of Period | $10.48 | $10.49 | $10.65 | $10.73 | $10.75 |
| Investment Operations | |||||
| Net Investment Income | 0.2541 | 0.2381 | 0.1381 | 0.105 | 0.085 |
| Net Realized and Unrealized Gain (Loss) on Investments | 0.162 | (0.010) | (0.160) | (0.048) | (0.004) |
| Total from Investment Operations | 0.416 | 0.228 | (0.022) | 0.057 | 0.081 |
| Distributions | |||||
| Dividends from Net Investment Income | (0.256) | (0.238) | (0.138) | (0.105) | (0.085) |
| Distributions from Realized Capital Gains | — | — | — | (0.032) | (0.016) |
| Total Distributions | (0.256) | (0.238) | (0.138) | (0.137) | (0.101) |
| Net Asset Value, End of Period | $10.64 | $10.48 | $10.49 | $10.65 | $10.73 |
| Total Return2 | 4.01% | 2.21% | –0.21% | 0.53% | 0.76% |
| Ratios/Supplemental Data | |||||
| Net Assets, End of Period (Millions) | $8,243 | $7,385 | $7,044 | $6,805 | $6,271 |
| Ratio of Total Expenses to Average Net Assets | 0.10% | 0.10% | 0.10% | 0.10% | 0.10% |
| Ratio of Net Investment Income to Average Net Assets | 2.40% | 2.28% | 1.30% | 0.97% | 0.79% |
| Portfolio Turnover Rate3 | 340% | 282% | 280% | 249% | 211% |
| 1 | Calculated based on average shares outstanding. |
| 2 | Total returns do not include account service fees that may have applied in the periods shown. |
| 3 | Includes 5%, 37%,7%, 3%, and 35% attributable to mortgage-dollar-roll activity. |
| Year Ended January 31, | |||||
| For a Share Outstanding Throughout Each Period | 2020 | 2019 | 2018 | 2017 | 2016 |
| Net Asset Value, Beginning of Period | $10.57 | $10.55 | $10.70 | $10.79 | $10.82 |
| Investment Operations | |||||
| Net Investment Income | 0.2461 | 0.2081 | 0.1421 | 0.116 | 0.095 |
| Net Realized and Unrealized Gain (Loss) on Investments | 0.221 | 0.021 | (0.144) | (0.063) | 0.005 |
| Total from Investment Operations | 0.467 | 0.229 | (0.002) | 0.053 | 0.100 |
| Distributions | |||||
| Dividends from Net Investment Income | (0.247) | (0.209) | (0.142) | (0.116) | (0.095) |
| Distributions from Realized Capital Gains | — | — | (0.006) | (0.027) | (0.035) |
| Total Distributions | (0.247) | (0.209) | (0.148) | (0.143) | (0.130) |
| Net Asset Value, End of Period | $10.79 | $10.57 | $10.55 | $10.70 | $10.79 |
| Total Return2 | 4.46% | 2.20% | –0.02% | 0.49% | 0.93% |
| Ratios/Supplemental Data | |||||
| Net Assets, End of Period (Millions) | $623 | $622 | $719 | $827 | $817 |
| Ratio of Total Expenses to Average Net Assets | 0.20% | 0.20% | 0.20% | 0.20% | 0.20% |
| Ratio of Net Investment Income to Average Net Assets | 2.30% | 1.98% | 1.33% | 1.07% | 0.88% |
| Portfolio Turnover Rate3 | 499% | 327% | 211% | 304% | 314% |
| 1 | Calculated based on average shares outstanding. |
| 2 | Total returns do not include account service fees that may have applied in the periods shown. |
| 3 | Includes 32%, 90%, 30%, 38%, and 75% attributable to mortgage-dollar-roll activity. |
| Year Ended January 31, | |||||
| For a Share Outstanding Throughout Each Period | 2020 | 2019 | 2018 | 2017 | 2016 |
| Net Asset Value, Beginning of Period | $10.57 | $10.55 | $10.70 | $10.79 | $10.82 |
| Investment Operations | |||||
| Net Investment Income | 0.2571 | 0.2191 | 0.1531 | 0.127 | 0.105 |
| Net Realized and Unrealized Gain (Loss) on Investments | 0.220 | 0.020 | (0.144) | (0.063) | 0.005 |
| Total from Investment Operations | 0.477 | 0.239 | 0.009 | 0.064 | 0.110 |
| Distributions | |||||
| Dividends from Net Investment Income | (0.257) | (0.219) | (0.153) | (0.127) | (0.105) |
| Distributions from Realized Capital Gains | — | — | (0.006) | (0.027) | (0.035) |
| Total Distributions | (0.257) | (0.219) | (0.159) | (0.154) | (0.140) |
| Net Asset Value, End of Period | $10.79 | $10.57 | $10.55 | $10.70 | $10.79 |
| Total Return2 | 4.56% | 2.30% | 0.08% | 0.59% | 1.03% |
| Ratios/Supplemental Data | |||||
| Net Assets, End of Period (Millions) | $4,371 | $3,963 | $4,239 | $4,819 | $4,342 |
| Ratio of Total Expenses to Average Net Assets | 0.10% | 0.10% | 0.10% | 0.10% | 0.10% |
| Ratio of Net Investment Income to Average Net Assets | 2.40% | 2.08% | 1.43% | 1.17% | 0.98% |
| Portfolio Turnover Rate3 | 499% | 327% | 211% | 304% | 314% |
| 1 | Calculated based on average shares outstanding. |
| 2 | Total returns do not include account service fees that may have applied in the periods shown. |
| 3 | Includes 32%, 90%, 30%, 38%, and 75% attributable to mortgage-dollar-roll activity. |
| Year Ended January 31, | |||||
| For a Share Outstanding Throughout Each Period | 2020 | 2019 | 2018 | 2017 | 2016 |
| Net Asset Value, Beginning of Period | $10.50 | $10.57 | $10.65 | $10.60 | $10.73 |
| Investment Operations | |||||
| Net Investment Income | 0.2971 | 0.2831 | 0.2241 | 0.213 | 0.204 |
| Net Realized and Unrealized Gain (Loss) on Investments | 0.304 | (0.069) | (0.087) | 0.053 | (0.123) |
| Total from Investment Operations | 0.601 | 0.214 | 0.137 | 0.266 | 0.081 |
| Distributions | |||||
| Dividends from Net Investment Income | (0.301) | (0.284) | (0.215) | (0.205) | (0.209) |
| Distributions from Realized Capital Gains | — | — | (0.002) | (0.011) | (0.002) |
| Total Distributions | (0.301) | (0.284) | (0.217) | (0.216) | (0.211) |
| Net Asset Value, End of Period | $10.80 | $10.50 | $10.57 | $10.65 | $10.60 |
| Total Return2 | 5.79% | 2.07% | 1.29% | 2.52% | 0.77% |
| Ratios/Supplemental Data | |||||
| Net Assets, End of Period (Millions) | $8,179 | $7,846 | $9,333 | $9,558 | $9,840 |
| Ratio of Total Expenses to Average Net Assets | 0.20% | 0.20% | 0.20% | 0.20% | 0.20% |
| Ratio of Net Investment Income to Average Net Assets | 2.78% | 2.71% | 2.11% | 2.00% | 1.91% |
| Portfolio Turnover Rate | 76%3 | 71%3 | 86% | 68% | 75% |
| 1 | Calculated based on average shares outstanding. |
| 2 | Total returns do not include account service fees that may have applied in the periods shown. |
| 3 | Includes 1% and 1% attributable to mortgage-dollar-roll activity. |
| Year Ended January 31, | |||||
| For a Share Outstanding Throughout Each Period | 2020 | 2019 | 2018 | 2017 | 2016 |
| Net Asset Value, Beginning of Period | $10.50 | $10.57 | $10.65 | $10.60 | $10.73 |
| Investment Operations | |||||
| Net Investment Income | 0.3081 | 0.2941 | 0.2361 | 0.224 | 0.215 |
| Net Realized and Unrealized Gain (Loss) on Investments | 0.304 | (0.070) | (0.088) | 0.053 | (0.123) |
| Total from Investment Operations | 0.612 | 0.224 | 0.148 | 0.277 | 0.092 |
| Distributions | |||||
| Dividends from Net Investment Income | (0.312) | (0.294) | (0.226) | (0.216) | (0.220) |
| Distributions from Realized Capital Gains | — | — | (0.002) | (0.011) | (0.002) |
| Total Distributions | (0.312) | (0.294) | (0.228) | (0.227) | (0.222) |
| Net Asset Value, End of Period | $10.80 | $10.50 | $10.57 | $10.65 | $10.60 |
| Total Return2 | 5.90% | 2.17% | 1.39% | 2.62% | 0.87% |
| Ratios/Supplemental Data | |||||
| Net Assets, End of Period (Millions) | $44,211 | $40,218 | $42,156 | $38,564 | $33,857 |
| Ratio of Total Expenses to Average Net Assets | 0.10% | 0.10% | 0.10% | 0.10% | 0.10% |
| Ratio of Net Investment Income to Average Net Assets | 2.88% | 2.81% | 2.21% | 2.10% | 2.01% |
| Portfolio Turnover Rate | 76%3 | 71%3 | 86% | 68% | 75% |
| 1 | Calculated based on average shares outstanding. |
| 2 | Total returns do not include account service fees that may have applied in the periods shown. |
| 3 | Includes 1% and 1% attributable to mortgage-dollar-roll activity. |
| Year Ended January 31, | |||||
| For a Share Outstanding Throughout Each Period | 2020 | 2019 | 2018 | 2017 | 2016 |
| Net Asset Value, Beginning of Period | $10.96 | $10.88 | $11.11 | $11.51 | $11.66 |
| Investment Operations | |||||
| Net Investment Income | 0.2551 | 0.2601 | 0.1981 | 0.177 | 0.188 |
| Net Realized and Unrealized Gain (Loss) on Investments | 0.611 | 0.081 | (0.230) | (0.271) | (0.057) |
| Total from Investment Operations | 0.866 | 0.341 | (0.032) | (0.094) | 0.131 |
| Distributions | |||||
| Dividends from Net Investment Income | (0.256) | (0.261) | (0.198) | (0.177) | (0.188) |
| Distributions from Realized Capital Gains | — | — | — | (0.129) | (0.093) |
| Total Distributions | (0.256) | (0.261) | (0.198) | (0.306) | (0.281) |
| Net Asset Value, End of Period | $11.57 | $10.96 | $10.88 | $11.11 | $11.51 |
| Total Return2 | 7.98% | 3.20% | –0.31% | –0.84% | 1.17% |
| Ratios/Supplemental Data | |||||
| Net Assets, End of Period (Millions) | $917 | $837 | $967 | $1,185 | $1,326 |
| Ratio of Total Expenses to Average Net Assets | 0.20% | 0.20% | 0.20% | 0.20% | 0.20% |
| Ratio of Net Investment Income to Average Net Assets | 2.27% | 2.42% | 1.78% | 1.53% | 1.64% |
| Portfolio Turnover Rate3 | 214% | 231% | 181% | 152% | 142% |
| 1 | Calculated based on average shares outstanding. |
| 2 | Total returns do not include account service fees that may have applied in the periods shown. |
| 3 | Includes 5%, 35%, 6%, 3%, and 34% attributable to mortgage-dollar-roll activity. |
| Year Ended January 31, | |||||
| For a Share Outstanding Throughout Each Period | 2020 | 2019 | 2018 | 2017 | 2016 |
| Net Asset Value, Beginning of Period | $10.96 | $10.88 | $11.11 | $11.51 | $11.66 |
| Investment Operations | |||||
| Net Investment Income | 0.2671 | 0.2721 | 0.2101 | 0.188 | 0.199 |
| Net Realized and Unrealized Gain (Loss) on Investments | 0.610 | 0.080 | (0.230) | (0.271) | (0.057) |
| Total from Investment Operations | 0.877 | 0.352 | (0.020) | (0.083) | 0.142 |
| Distributions | |||||
| Dividends from Net Investment Income | (0.267) | (0.272) | (0.210) | (0.188) | (0.199) |
| Distributions from Realized Capital Gains | — | — | — | (0.129) | (0.093) |
| Total Distributions | (0.267) | (0.272) | (0.210) | (0.317) | (0.292) |
| Net Asset Value, End of Period | $11.57 | $10.96 | $10.88 | $11.11 | $11.51 |
| Total Return2 | 8.09% | 3.30% | –0.21% | –0.74% | 1.27% |
| Ratios/Supplemental Data | |||||
| Net Assets, End of Period (Millions) | $5,452 | $4,976 | $5,100 | $5,190 | $4,849 |
| Ratio of Total Expenses to Average Net Assets | 0.10% | 0.10% | 0.10% | 0.10% | 0.10% |
| Ratio of Net Investment Income to Average Net Assets | 2.37% | 2.52% | 1.88% | 1.63% | 1.74% |
| Portfolio Turnover Rate3 | 214% | 231% | 181% | 152% | 142% |
| 1 | Calculated based on average shares outstanding. |
| 2 | Total returns do not include account service fees that may have applied in the periods shown. |
| 3 | Includes 5%, 35%, 6%, 3%, and 34% attributable to mortgage-dollar-roll activity. |
| Year Ended January 31, | |||||
| For a Share Outstanding Throughout Each Period | 2020 | 2019 | 2018 | 2017 | 2016 |
| Net Asset Value, Beginning of Period | $9.52 | $9.61 | $9.66 | $9.72 | $10.06 |
| Investment Operations | |||||
| Net Investment Income | 0.3001 | 0.3001 | 0.2771 | 0.278 | 0.288 |
| Net Realized and Unrealized Gain (Loss) on Investments | 0.711 | (0.087) | (0.034) | 0.030 | (0.288) |
| Total from Investment Operations | 1.011 | 0.213 | 0.243 | 0.308 | 0.000 |
| Distributions | |||||
| Dividends from Net Investment Income | (0.301) | (0.303) | (0.274) | (0.276) | (0.296) |
| Distributions from Realized Capital Gains | — | — | (0.016) | (0.092) | (0.044) |
| Total Distributions | (0.301) | (0.303) | (0.290) | (0.368) | (0.340) |
| Net Asset Value, End of Period | $10.23 | $9.52 | $9.61 | $9.66 | $9.72 |
| Total Return2 | 10.76% | 2.31% | 2.47% | 3.16% | 0.03% |
| Ratios/Supplemental Data | |||||
| Net Assets, End of Period (Millions) | $2,459 | $2,115 | $2,472 | $2,671 | $2,701 |
| Ratio of Total Expenses to Average Net Assets | 0.20% | 0.20% | 0.20% | 0.20% | 0.20% |
| Ratio of Net Investment Income to Average Net Assets | 3.03% | 3.20% | 2.84% | 2.80% | 2.94% |
| Portfolio Turnover Rate | 114%3 | 73%3 | 63% | 68% | 70% |
| 1 | Calculated based on average shares outstanding. |
| 2 | Total returns do not include account service fees that may have applied in the periods shown. |
| 3 | Includes 1% and 1% attributable to mortgage-dollar-roll activity. |
| Year Ended January 31, | |||||
| For a Share Outstanding Throughout Each Period | 2020 | 2019 | 2018 | 2017 | 2016 |
| Net Asset Value, Beginning of Period | $9.52 | $9.61 | $9.66 | $9.72 | $10.06 |
| Investment Operations | |||||
| Net Investment Income | 0.3091 | 0.3101 | 0.2881 | 0.288 | 0.298 |
| Net Realized and Unrealized Gain (Loss) on Investments | 0.712 | (0.087) | (0.039) | 0.030 | (0.288) |
| Total from Investment Operations | 1.021 | 0.223 | 0.249 | 0.318 | 0.010 |
| Distributions | |||||
| Dividends from Net Investment Income | (0.311) | (0.313) | (0.283) | (0.286) | (0.306) |
| Distributions from Realized Capital Gains | — | — | (0.016) | (0.092) | (0.044) |
| Total Distributions | (0.311) | (0.313) | (0.299) | (0.378) | (0.350) |
| Net Asset Value, End of Period | $10.23 | $9.52 | $9.61 | $9.66 | $9.72 |
| Total Return2 | 10.87% | 2.41% | 2.58% | 3.27% | 0.13% |
| Ratios/Supplemental Data | |||||
| Net Assets, End of Period (Millions) | $31,146 | $27,011 | $27,000 | $25,145 | $18,764 |
| Ratio of Total Expenses to Average Net Assets | 0.10% | 0.10% | 0.10% | 0.10% | 0.10% |
| Ratio of Net Investment Income to Average Net Assets | 3.13% | 3.30% | 2.94% | 2.90% | 3.04% |
| Portfolio Turnover Rate | 114%3 | 73%3 | 63% | 68% | 70% |
| 1 | Calculated based on average shares outstanding. |
| 2 | Total returns do not include account service fees that may have applied in the periods shown. |
| 3 | Includes 1% and 1% attributable to mortgage-dollar-roll activity. |
| Year Ended January 31, | |||||
| For a Share Outstanding Throughout Each Period | 2020 | 2019 | 2018 | 2017 | 2016 |
| Net Asset Value, Beginning of Period | $10.31 | $10.32 | $10.51 | $10.77 | $10.88 |
| Investment Operations | |||||
| Net Investment Income | 0.2851 | 0.2981 | 0.2841 | 0.236 | 0.249 |
| Net Realized and Unrealized Gain (Loss) on Investments | 0.272 | (0.011) | (0.193) | (0.183) | (0.055) |
| Total from Investment Operations | 0.557 | 0.287 | 0.091 | 0.053 | 0.194 |
| Distributions | |||||
| Dividends from Net Investment Income | (0.287) | (0.297) | (0.281) | (0.237) | (0.250) |
| Distributions from Realized Capital Gains | — | — | — | (0.076) | (0.054) |
| Total Distributions | (0.287) | (0.297) | (0.281) | (0.313) | (0.304) |
| Net Asset Value, End of Period | $10.58 | $10.31 | $10.32 | $10.51 | $10.77 |
| Total Return2 | 5.46% | 2.85% | 0.85% | 0.49% | 1.83% |
| Ratios/Supplemental Data | |||||
| Net Assets, End of Period (Millions) | $7,365 | $6,715 | $7,598 | $7,993 | $8,483 |
| Ratio of Total Expenses to Average Net Assets | 0.21% | 0.21% | 0.21% | 0.21% | 0.21% |
| Ratio of Net Investment Income to Average Net Assets | 2.71% | 2.93% | 2.70% | 2.19% | 2.33% |
| Portfolio Turnover Rate3 | 616% | 415% | 620% | 926% | 706% |
| 1 | Calculated based on average shares outstanding. |
| 2 | Total returns do not include account service fees that may have applied in the periods shown. |
| 3 | Includes 198%, 200%, 156%, 300%, and 219% attributable to mortgage-dollar-roll activity. |
| Year Ended January 31, | |||||
| For a Share Outstanding Throughout Each Period | 2020 | 2019 | 2018 | 2017 | 2016 |
| Net Asset Value, Beginning of Period | $10.31 | $10.32 | $10.51 | $10.77 | $10.88 |
| Investment Operations | |||||
| Net Investment Income | 0.2951 | 0.3091 | 0.2941 | 0.247 | 0.260 |
| Net Realized and Unrealized Gain (Loss) on Investments | 0.272 | (0.012) | (0.192) | (0.183) | (0.055) |
| Total from Investment Operations | 0.567 | 0.297 | 0.102 | 0.064 | 0.205 |
| Distributions | |||||
| Dividends from Net Investment Income | (0.297) | (0.307) | (0.292) | (0.248) | (0.261) |
| Distributions from Realized Capital Gains | — | — | — | (0.076) | (0.054) |
| Total Distributions | (0.297) | (0.307) | (0.292) | (0.324) | (0.315) |
| Net Asset Value, End of Period | $10.58 | $10.31 | $10.32 | $10.51 | $10.77 |
| Total Return2 | 5.57% | 2.95% | 0.95% | 0.59% | 1.93% |
| Ratios/Supplemental Data | |||||
| Net Assets, End of Period (Millions) | $17,356 | $14,706 | $16,491 | $17,613 | $17,419 |
| Ratio of Total Expenses to Average Net Assets | 0.11% | 0.11% | 0.11% | 0.11% | 0.11% |
| Ratio of Net Investment Income to Average Net Assets | 2.81% | 3.03% | 2.80% | 2.29% | 2.43% |
| Portfolio Turnover Rate3 | 616% | 415% | 620% | 926% | 706% |
| 1 | Calculated based on average shares outstanding. |
| 2 | Total returns do not include account service fees that may have applied in the periods shown. |
| 3 | Includes 198%, 200%, 156%, 300%, and 219% attributable to mortgage-dollar-roll activity. |
| Year Ended January 31, | |||||
| For a Share Outstanding Throughout Each Period | 2020 | 2019 | 2018 | 2017 | 2016 |
| Net Asset Value, Beginning of Period | $11.86 | $11.96 | $11.79 | $12.80 | $14.19 |
| Investment Operations | |||||
| Net Investment Income | 0.3311 | 0.3341 | 0.3281 | 0.332 | 0.351 |
| Net Realized and Unrealized Gain (Loss) on Investments | 2.226 | (0.100) | 0.170 | (0.725) | (1.070) |
| Total from Investment Operations | 2.557 | 0.234 | 0.498 | (0.393) | (0.719) |
| Distributions | |||||
| Dividends from Net Investment Income | (0.331) | (0.334) | (0.328) | (0.332) | (0.351) |
| Distributions from Realized Capital Gains | (0.036) | — | — | (0.285) | (0.320) |
| Total Distributions | (0.367) | (0.334) | (0.328) | (0.617) | (0.671) |
| Net Asset Value, End of Period | $14.05 | $11.86 | $11.96 | $11.79 | $12.80 |
| Total Return2 | 21.84% | 2.05% | 4.21% | –3.21% | –4.91% |
| Ratios/Supplemental Data | |||||
| Net Assets, End of Period (Millions) | $971 | $794 | $882 | $995 | $1,148 |
| Ratio of Total Expenses to Average Net Assets | 0.20% | 0.20% | 0.20% | 0.20% | 0.20% |
| Ratio of Net Investment Income to Average Net Assets | 2.55% | 2.89% | 2.70% | 2.53% | 2.76% |
| Portfolio Turnover Rate3 | 96%4 | 122% | 103%4 | 94% | 117% |
| 1 | Calculated based on average shares outstanding. |
| 2 | Total returns do not include account service fees that may have applied in the periods shown. |
| 3 | Includes 4%, 34%, 6%, 3%, and 36% attributable to mortgage-dollar-roll activity. |
| 4 | Excludes the value of portfolio securities received or delivered as a result of in-kind purchases or redemptions of the fund’s capital shares. |
| Year Ended January 31, | |||||
| For a Share Outstanding Throughout Each Period | 2020 | 2019 | 2018 | 2017 | 2016 |
| Net Asset Value, Beginning of Period | $11.86 | $11.96 | $11.79 | $12.80 | $14.19 |
| Investment Operations | |||||
| Net Investment Income | 0.3441 | 0.3461 | 0.3401 | 0.345 | 0.363 |
| Net Realized and Unrealized Gain (Loss) on Investments | 2.226 | (0.100) | 0.170 | (0.725) | (1.070) |
| Total from Investment Operations | 2.570 | 0.246 | 0.510 | (0.380) | (0.707) |
| Distributions | |||||
| Dividends from Net Investment Income | (0.344) | (0.346) | (0.340) | (0.345) | (0.363) |
| Distributions from Realized Capital Gains | (0.036) | — | — | (0.285) | (0.320) |
| Total Distributions | (0.380) | (0.346) | (0.340) | (0.630) | (0.683) |
| Net Asset Value, End of Period | $14.05 | $11.86 | $11.96 | $11.79 | $12.80 |
| Total Return2 | 21.96% | 2.16% | 4.32% | –3.12% | –4.81% |
| Ratios/Supplemental Data | |||||
| Net Assets, End of Period (Millions) | $3,071 | $2,532 | $2,588 | $2,509 | $2,400 |
| Ratio of Total Expenses to Average Net Assets | 0.10% | 0.10% | 0.10% | 0.10% | 0.10% |
| Ratio of Net Investment Income to Average Net Assets | 2.65% | 2.99% | 2.80% | 2.63% | 2.86% |
| Portfolio Turnover Rate3 | 96%4 | 122% | 103%4 | 94% | 117% |
| 1 | Calculated based on average shares outstanding. |
| 2 | Total returns do not include account service fees that may have applied in the periods shown. |
| 3 | Includes 4%, 34%, 6%, 3%, and 36% attributable to mortgage-dollar-roll activity. |
| 4 | Excludes the value of portfolio securities received or delivered as a result of in-kind purchases or redemptions of the fund’s capital shares. |
| Year Ended January 31, | |||||
| For a Share Outstanding Throughout Each Period | 2020 | 2019 | 2018 | 2017 | 2016 |
| Net Asset Value, Beginning of Period | $9.79 | $10.40 | $10.06 | $10.00 | $11.34 |
| Investment Operations | |||||
| Net Investment Income | 0.3811 | 0.3971 | 0.4051 | 0.416 | 0.430 |
| Net Realized and Unrealized Gain (Loss) on Investments | 1.854 | (0.560) | 0.520 | 0.260 | (1.148) |
| Total from Investment Operations | 2.235 | (0.163) | 0.925 | 0.676 | (0.718) |
| Distributions | |||||
| Dividends from Net Investment Income | (0.399) | (0.413) | (0.421) | (0.435) | (0.446) |
| Distributions from Realized Capital Gains | (0.146) | (0.034) | (0.164) | (0.181) | (0.176) |
| Total Distributions | (0.545) | (0.447) | (0.585) | (0.616) | (0.622) |
| Net Asset Value, End of Period | $11.48 | $9.79 | $10.40 | $10.06 | $10.00 |
| Total Return2 | 23.31% | –1.45% | 9.28% | 6.71% | –6.33% |
| Ratios/Supplemental Data | |||||
| Net Assets, End of Period (Millions) | $4,942 | $4,098 | $4,570 | $4,069 | $3,860 |
| Ratio of Total Expenses to Average Net Assets | 0.22% | 0.22% | 0.22% | 0.22% | 0.21% |
| Ratio of Net Investment Income to Average Net Assets | 3.57% | 4.08% | 3.87% | 3.92% | 4.18% |
| Portfolio Turnover Rate | 34%3 | 32%3 | 27% | 24% | 35%4 |
| 1 | Calculated based on average shares outstanding. |
| 2 | Total returns do not include account service fees that may have applied in the periods shown. |
| 3 | Includes 1% and less than 1% attributable to mortgage-dollar-roll activity. |
| 4 | Excludes the value of portfolio securities received or delivered as a result of in-kind purchases or redemptions of the fund's capital shares. |
| Year Ended January 31, | |||||
| For a Share Outstanding Throughout Each Period | 2020 | 2019 | 2018 | 2017 | 2016 |
| Net Asset Value, Beginning of Period | $9.79 | $10.40 | $10.06 | $10.00 | $11.34 |
| Investment Operations | |||||
| Net Investment Income | 0.3921 | 0.4071 | 0.4151 | 0.426 | 0.440 |
| Net Realized and Unrealized Gain (Loss) on Investments | 1.853 | (0.560) | 0.520 | 0.260 | (1.148) |
| Total from Investment Operations | 2.245 | (0.153) | 0.935 | 0.686 | (0.708) |
| Distributions | |||||
| Dividends from Net Investment Income | (0.409) | (0.423) | (0.431) | (0.445) | (0.456) |
| Distributions from Realized Capital Gains | (0.146) | (0.034) | (0.164) | (0.181) | (0.176) |
| Total Distributions | (0.555) | (0.457) | (0.595) | (0.626) | (0.632) |
| Net Asset Value, End of Period | $11.48 | $9.79 | $10.40 | $10.06 | $10.00 |
| Total Return2 | 23.43% | –1.35% | 9.39% | 6.82% | –6.23% |
| Ratios/Supplemental Data | |||||
| Net Assets, End of Period (Millions) | $15,335 | $12,820 | $11,925 | $10,336 | $9,946 |
| Ratio of Total Expenses to Average Net Assets | 0.12% | 0.12% | 0.12% | 0.11% | 0.12% |
| Ratio of Net Investment Income to Average Net Assets | 3.67% | 4.18% | 3.97% | 4.03% | 4.27% |
| Portfolio Turnover Rate | 34%3 | 32%3 | 27% | 24% | 35%4 |
| 1 | Calculated based on average shares outstanding. |
| 2 | Total returns do not include account service fees that may have applied in the periods shown. |
| 3 | Includes 1% and less than 1% attributable to mortgage-dollar-roll activity. |
| 4 | Excludes the value of portfolio securities received or delivered as a result of in-kind purchases or redemptions of the fund's capital shares. |
| Web | |
| Vanguard.com | For the most complete source of Vanguard news For fund, account, and service information For most account transactions For literature requests 24 hours a day, 7 days a week |
| Phone | |
| Vanguard Tele-Account® 800-662-6273 | For automated fund and account information Toll-free, 24 hours a day, 7 days a week |
| Investor Information 800-662-7447 (Text telephone for people with hearing impairment at 800-749-7273) | For fund and service information For literature requests |
| Client Services 800-662-2739 (Text telephone for people with hearing impairment at 800-749-7273) | For account information For most account transactions |
| Participant Services 800-523-1188 (Text telephone for people with hearing impairment at 800-749-7273) | For information and services for participants in employer-sponsored plans |
| Institutional Division 888-809-8102 | For information and services for large institutional investors |
| Financial Advisor and Intermediary Sales Support 800-997-2798 | For information and services for financial intermediaries including financial advisors, broker-dealers, trust institutions, and insurance companies |
| Financial Advisory and Intermediary Trading Support 800-669-0498 | For account information and trading support for financial intermediaries including financial advisors, broker-dealers, trust institutions, and insurance companies |
| Inception Date | Newspaper Abbreviation | Vanguard Fund Number | CUSIP Number | |
| Short-Term Treasury Fund | ||||
| Investor Shares | 10/28/1991 | STTsry | 32 | 922031703 |
| Admiral Shares | 2/13/2001 | STsryAdml | 532 | 922031851 |
| Short-Term Federal Fund | ||||
| Investor Shares | 12/31/1987 | STFed | 49 | 922031604 |
| Admiral Shares | 2/12/2001 | STFedAdml | 549 | 922031844 |
| Short-Term Investment-Grade Fund | ||||
| Investor Shares | 10/29/1982 | STIGrade | 39 | 922031406 |
| Admiral Shares | 2/12/2001 | STIGradeAdml | 539 | 922031836 |
| Intermediate-Term Treasury Fund | ||||
| Investor Shares | 10/28/1991 | ITTsry | 35 | 922031802 |
| Admiral Shares | 2/12/2001 | ITsryAdml | 535 | 922031828 |
| Intermediate-Term Investment-Grade Fund | ||||
| Investor Shares | 11/1/1993 | ITIGrade | 71 | 922031885 |
| Admiral Shares | 2/12/2001 | ITIGradeAdml | 571 | 922031810 |
| GNMA Fund | ||||
| Investor Shares | 6/27/1980 | GNMA | 36 | 922031307 |
| Admiral Shares | 2/12/2001 | GNMAAdml | 536 | 922031794 |
| Long-Term Treasury Fund | ||||
| Investor Shares | 5/19/1986 | LTTsry | 83 | 922031505 |
| Admiral Shares | 2/12/2001 | LTsryAdml | 583 | 922031786 |
| Long-Term Investment-Grade Fund | ||||
| Investor Shares | 7/9/1973 | LTIGrade | 28 | 922031109 |
| Admiral Shares | 2/12/2001 | LTIGradeAdml | 568 | 922031778 |
| See the inside front cover for important information about access to your |
| fund’s annual and semiannual shareholder reports. |
| Sales Charge (Load) Imposed on Purchases | None |
| Purchase Fee | None |
| Sales Charge (Load) Imposed on Reinvested Dividends | None |
| Redemption Fee | None |
| Management Fees | 0.08% |
| 12b-1 Distribution Fee | None |
| Other Expenses | 0.00% |
| Total Annual Fund Operating Expenses | 0.08% |
| 1 Year | 3 Years | 5 Years | 10 Years |
| $8 | $26 | $45 | $103 |
| Total Return | Quarter | |
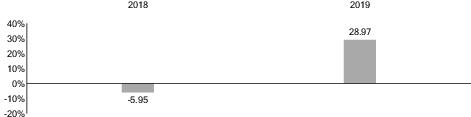
| Highest | 17.29% | March 31, 2019 |
| Lowest | -8.09% | March 31, 2018 |
| 1 Year | Since Inception (Sept. 26, 2017) | |
| Vanguard Real Estate II Index Fund Institutional Plus Shares | ||
| Return Before Taxes | 28.97% | 9.56% |
| Return After Taxes on Distributions | 27.58 | 8.11 |
| Return After Taxes on Distributions and Sale of Fund Shares | 17.13 | 6.69 |
| Comparative Indexes (reflect no deduction for fees, expenses, or taxes) | ||
| MSCI US Investable Market Real Estate 25/50 Index | 29.03% | 10.90% |
| Real Estate Spliced Index | 29.03 | 9.62 |
| MSCI US REIT Index | 25.84 | 9.08 |
| Plain Talk About Fund Expenses |
| All mutual funds have operating expenses. These expenses, which are deducted from a fund’s gross income, are expressed as a percentage of the net assets of the fund. Assuming that operating expenses remain as stated in the Fees and Expenses section, Vanguard Real Estate II Index Fund’s expense ratio would be 0.08%, or $0.80 per $1,000 of average net assets. The average expense ratio for real estate funds in 2019 was 1.19%, or $11.90 per $1,000 of average net assets (derived from data provided by Lipper, a Thomson Reuters Company, which reports on the mutual fund industry). |
| Plain Talk About Costs of Investing |
| Costs are an important consideration in choosing a mutual fund. That is because you, as a shareholder, pay a proportionate share of the costs of operating a fund and any transaction costs incurred when the fund buys or sells securities. These costs can erode a substantial portion of the gross income or the capital appreciation a fund achieves. Even seemingly small differences in expenses can, over time, have a dramatic effect on a fund’s performance. |
| Plain Talk About REITs |
| Rather than directly owning properties—which can be costly and difficult to convert into cash when needed—some investors buy shares in a company that owns and manages real estate. Such a company is known as a real estate investment trust, or REIT. Unlike corporations, REITs do not have to pay income taxes if they meet certain Internal Revenue Code requirements. To qualify, a REIT must distribute at least 90% of its taxable income to its shareholders and receive at least 75% of that income from rents, mortgages, and sales of property. REITs offer investors greater liquidity and diversification than direct ownership of a handful of properties. REITs also offer the potential for higher income than an investment in common stocks would provide. As with any investment in real estate, however, a REIT’s performance depends on several factors, such as the company’s ability to find tenants for its properties, to renew leases, and to finance property purchases and renovations. That said, returns from REITs may not correspond to returns from direct property ownership. |
| Plain Talk About Types of REITs |
| An equity REIT generally owns properties directly. Equity REITs typically generate income from rental and lease payments, and they offer the potential for growth from property appreciation as well as occasional capital gains from the sale of property. A mortgage REIT makes loans to commercial real estate developers. Mortgage REITs earn interest income and are subject to credit risk (i.e., the chance that a developer will fail to repay a loan). A hybrid REIT holds both properties and mortgages. The Fund invests in equity REITs and other real estate-related investments. |
| Fund Allocation by REIT Type | Percentage of Fund |
| Specialized | 33.7% |
| Residential | 15.0 |
| Retail | 11.4 |
| Health Care | 9.8 |
| Office | 9.5 |
| Industrial | 8.6 |
| Diversified | 4.6 |
| Hotel & Resort | 3.7 |
| Real Estate Services | 2.9 |
| Real Estate Development | 0.4 |
| Real Estate Operating Companies | 0.2 |
| Diversified Real Estate Activities | 0.2 |
| Plain Talk About Derivatives |
| Derivatives can take many forms. Some forms of derivatives—such as exchange-traded futures and options on securities, commodities, or indexes—have been trading on regulated exchanges for decades. These types of derivatives are standardized contracts that can easily be bought and sold and whose market values are determined and published daily. On the other hand, non-exchange-traded derivatives—such as certain swap agreements—tend to be more specialized or complex and may be more difficult to accurately value. |
| Plain Talk About Vanguard’s Unique Corporate Structure |
| The Vanguard Group is owned jointly by the funds it oversees and thus indirectly by the shareholders in those funds. Most other mutual funds are operated by management companies that are owned by third parties—either public or private stockholders—and not by the funds they serve. |
| Plain Talk About Distributions |
| As a shareholder, you are entitled to your portion of a fund’s income from interest and dividends as well as capital gains from the fund’s sale of investments. Income consists of both the dividends that the fund earns from any stock holdings and the interest it receives from any money market and bond investments. Capital gains are realized whenever the fund sells securities for higher prices than it paid for them. |
| Plain Talk About Return of Capital |
| The Internal Revenue Code requires a REIT to distribute at least 90% of its taxable income to investors. In many cases, however, because of “noncash” expenses such as property depreciation, an equity REIT’s cash flow will exceed its taxable income. The REIT may distribute this excess cash to investors. Such a distribution is classified as a return of capital. |
| Plain Talk About Buying a Dividend |
| Unless you are a tax-exempt investor or investing through a tax-advantaged account, you should consider avoiding a purchase of fund shares shortly before the fund makes a distribution, because doing so can cost you money in taxes. This is known as “buying a dividend.” For example: On December 15, you invest $5,000, buying 250 shares for $20 each. If the fund pays a distribution of $1 per share on December 16, its share price will drop to $19 (not counting market change). You still have only $5,000 (250 shares x $19 = $4,750 in share value, plus 250 shares x $1 = $250 in distributions), but you owe tax on the $250 distribution you received—even if you reinvest it in more shares. To avoid buying a dividend, check a fund’s distribution schedule before you invest. |
| Year Ended January 31, | Sept. 26, 20171 to Jan. 31, 2018 | ||
| For a Share Outstanding Throughout Each Period | 2020 | 2019 | |
| Net Asset Value, Beginning of Period | $20.10 | $19.17 | $20.00 |
| Investment Operations | |||
| Net Investment Income2 | 0.571 | 0.611 | 0.268 |
| Net Realized and Unrealized Gain (Loss) on Investments | 2.752 | 1.176 | (0.834) |
| Total from Investment Operations | 3.323 | 1.787 | (0.566) |
| Distributions | |||
| Dividends from Net Investment Income | (0.590) | (0.626) | (0.225) |
| Distributions from Realized Capital Gains | — | — | (0.030) |
| Return of Capital | (0.193) | (0.231) | (0.009) |
| Total Distributions | (0.783) | (0.857) | (0.264) |
| Net Asset Value, End of Period | $22.64 | $20.10 | $19.17 |
| Total Return | 16.78% | 9.68% | –2.89% |
| Ratios/Supplemental Data | |||
| Net Assets, End of Period (Millions) | $7,848 | $6,719 | $6,126 |
| Ratio of Total Expenses to Average Net Assets | 0.08% | 0.08% | 0.08%3 |
| Ratio of Net Investment Income to Average Net Assets | 2.63% | 3.22% | 3.84%3 |
| Portfolio Turnover Rate | 3% | 23% | 1% |
| 1 | Inception. |
| 2 | Calculated based on average shares outstanding. |
| 3 | Annualized. |
| Inception Date | Newspaper Abbreviation | Vanguard Fund Number | CUSIP Number | |
| Real Estate II Index Fund | 9/26/2017 | REIIIxInsP | 2023 | 922031695 |
| See the inside front cover for important information about access to your fund’s annual and semiannual shareholder reports. |
| Sales Charge (Load) Imposed on Purchases | None |
| Purchase Fee | None |
| Sales Charge (Load) Imposed on Reinvested Dividends | None |
| Redemption Fee | None |
| Management Fees | 0.20% |
| 12b-1 Distribution Fee | None |
| Other Expenses | 0.01% |
| Total Annual Fund Operating Expenses | 0.21% |
| 1 Year | 3 Years | 5 Years | 10 Years |
| $22 | $68 | $118 | $268 |
| Total Return | Quarter | |
| Highest | 3.43% | June 30, 2010 |
| Lowest | -2.79% | June 30, 2013 |
| 1 Year | 5 Years | 10 Years | |
| Vanguard GNMA Fund Investor Shares | 5.83% | 2.33% | 3.27% |
| Bloomberg Barclays U.S. GNMA Bond Index (reflects no deduction for fees or expenses) | 5.85% | 2.32% | 3.21% |
| Plain Talk About Costs of Investing |
| Costs are an important consideration in choosing a mutual fund. That is because you, as a contract owner, pay a proportionate share of the costs of operating a fund and any transaction costs incurred when the fund buys or sells securities. These costs can erode a substantial portion of the gross income or the capital appreciation a fund achieves. Even seemingly small differences in expenses can, over time, have a dramatic effect on a fund’s performance. |
| Type of Bond (Maturity) | After a 1% Increase | After a 1% Decrease | After a 2% Increase | After a 2% Decrease |
| Short-Term (2.5 years) | $977 | $1,024 | $954 | $1,049 |
| Intermediate-Term (10 years) | 922 | 1,086 | 851 | 1,180 |
| Long-Term (20 years) | 874 | 1,150 | 769 | 1,328 |
| Plain Talk About Bonds and Interest Rates |
| As a rule, when interest rates rise, bond prices fall. The opposite is also true: Bond prices go up when interest rates fall. Why do bond prices and interest rates move in opposite directions? Let’s assume that you hold a bond offering a 4% yield. A year later, interest rates are on the rise and bonds of comparable quality and maturity are offered with a 5% yield. With higher-yielding bonds available, you would have trouble selling your 4% bond for the price you paid—you would probably have to lower your asking price. On the other hand, if interest rates were falling and 3% bonds were being offered, you should be able to sell your 4% bond for more than you paid. |
| How mortgage-backed securities are different: In general, declining interest rates will not lift the prices of mortgage-backed securities—such as those guaranteed by the Government National Mortgage Association—as much as the prices of comparable bonds. Why? Because when interest rates fall, the bond market tends to discount the prices of mortgage-backed securities for prepayment risk—the possibility that homeowners will refinance their mortgages at lower rates and cause the bonds to be paid off prior to maturity. In part to compensate for this prepayment possibility, mortgage-backed securities tend to offer higher yields than other bonds of comparable credit quality and maturity. In contrast, when interest rates rise, prepayments tend to slow down, subjecting mortgage-backed securities to extension risk—the possibility that homeowners will repay their mortgages at slower rates. This will lengthen the duration or average life of mortgage-backed securities held by a fund and delay the fund’s ability to reinvest proceeds at higher interest rates, making the fund more sensitive to changes in interest rates. |
| Plain Talk About Bond Maturities |
| A bond is issued with a specific maturity date—the date when the issuer must pay back the bond’s principal (face value). Bond maturities range from less than 1 year to more than 30 years. Typically, the longer a bond’s maturity, the more price risk you, as a bond investor, will face as interest rates rise—but also the higher the potential yield you could receive. Longer-term bonds are more suitable for investors willing to take a greater risk of price fluctuations to get higher and more stable interest income. Shorter-term bond investors should be willing to accept lower yields and greater income variability in return for less fluctuation in the value of their investment. The stated maturity of a bond may differ from the effective maturity of a bond, which takes into consideration that an action such as a call or refunding may cause bonds to be repaid before their stated maturity dates. |
| Plain Talk About Credit Quality |
| A bond’s credit quality rating is an assessment of the issuer’s ability to pay interest on the bond and, ultimately, to repay the principal. The lower the credit quality, the greater the perceived chance that the bond issuer will default, or fail to meet its payment obligations. All things being equal, the lower a bond’s credit quality, the higher its yield should be to compensate investors for assuming additional risk. |
| Plain Talk About U.S. Government-Sponsored Entities |
| A variety of U.S. government-sponsored entities (GSEs), such as the Federal Home Loan Mortgage Corporation (FHLMC), the Federal National Mortgage Association (FNMA), and the Federal Home Loan Banks (FHLBs), issue debt and mortgage-backed securities. Although GSEs may be chartered or sponsored by acts of Congress, they are not funded by congressional appropriations. In September of 2008, the U.S. Treasury placed FNMA and FHLMC under conservatorship and appointed the Federal Housing Finance Agency (FHFA) to manage their daily operations. In addition, the U.S. Treasury entered into purchase agreements with FNMA and FHLMC to provide them with capital in exchange for senior preferred stock. Generally, a GSE’s securities are neither issued nor guaranteed by the U.S. Treasury and are not backed by the full faith and credit of the U.S. government. In most cases, these securities are supported only by the credit of the GSE, standing alone. In some cases, a GSE’s securities may be supported by the ability of the GSE to borrow from the U.S. Treasury or may be supported by the U.S. government in some other way. Securities issued by the Government National Mortgage Association (GNMA), however, are backed by the full faith and credit of the U.S. government. |
| Plain Talk About Derivatives |
| Derivatives can take many forms. Some forms of derivatives—such as exchange-traded futures and options on securities, commodities, or indexes—have been trading on regulated exchanges for decades. These types of derivatives are standardized contracts that can easily be bought and sold and whose market values are determined and published daily. On the other hand, non-exchange-traded derivatives—such as certain swap agreements—tend to be more specialized or complex and may be more difficult to accurately value. |
| Plain Talk About Vanguard’s Unique Corporate Structure |
| The Vanguard Group is owned jointly by the funds it oversees and thus indirectly by the shareholders in those funds. Most other mutual funds are operated by management companies that are owned by third parties—either public or private stockholders—and not by the funds they serve. |
| Year Ended January 31, | |||||
| For a Share Outstanding Throughout Each Period | 2020 | 2019 | 2018 | 2017 | 2016 |
| Net Asset Value, Beginning of Period | $10.31 | $10.32 | $10.51 | $10.77 | $10.88 |
| Investment Operations | |||||
| Net Investment Income | 0.2851 | 0.2981 | 0.2841 | 0.236 | 0.249 |
| Net Realized and Unrealized Gain (Loss) on Investments | 0.272 | (0.011) | (0.193) | (0.183) | (0.055) |
| Total from Investment Operations | 0.557 | 0.287 | 0.091 | 0.053 | 0.194 |
| Distributions | |||||
| Dividends from Net Investment Income | (0.287) | (0.297) | (0.281) | (0.237) | (0.250) |
| Distributions from Realized Capital Gains | — | — | — | (0.076) | (0.054) |
| Total Distributions | (0.287) | (0.297) | (0.281) | (0.313) | (0.304) |
| Net Asset Value, End of Period | $10.58 | $10.31 | $10.32 | $10.51 | $10.77 |
| Total Return2 | 5.46% | 2.85% | 0.85% | 0.49% | 1.83% |
| Ratios/Supplemental Data | |||||
| Net Assets, End of Period (Millions) | $7,365 | $6,715 | $7,598 | $7,993 | $8,483 |
| Ratio of Total Expenses to Average Net Assets | 0.21% | 0.21% | 0.21% | 0.21% | 0.21% |
| Ratio of Net Investment Income to Average Net Assets | 2.71% | 2.93% | 2.70% | 2.19% | 2.33% |
| Portfolio Turnover Rate3 | 616% | 415% | 620% | 926% | 706% |
| 1 | Calculated based on average shares outstanding. |
| 2 | Total returns do not include account service fees that may have applied in the periods shown. |
| 3 | Includes 198%, 200%, 156%, 300%, and 219% attributable to mortgage-dollar-roll activity. |
| See the inside front cover for important information about access to your fund’s annual and semiannual shareholder reports. |
| Investor Shares | Admiral Shares | |
| Sales Charge (Load) Imposed on Purchases | None | None |
| Purchase Fee | None | None |
| Sales Charge (Load) Imposed on Reinvested Dividends | None | None |
| Redemption Fee | None | None |
| Account Service Fee Per Year (for certain fund account balances below $10,000) | $20 | $20 |
| Investor Shares | Admiral Shares | |
| Management Fees | 0.21% | 0.12% |
| 12b-1 Distribution Fee | None | None |
| Other Expenses | 0.02% | 0.01% |
| Total Annual Fund Operating Expenses | 0.23% | 0.13% |
| 1 Year | 3 Years | 5 Years | 10 Years | |
| Investor Shares | $24 | $74 | $130 | $293 |
| Admiral Shares | $13 | $42 | $73 | $166 |
| Total Return | Quarter | |
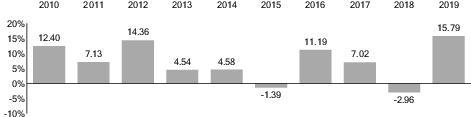
| Highest | 7.56% | March 31, 2019 |
| Lowest | -4.38% | December 31, 2018 |
| 1 Year | 5 Years | 10 Years | |
| Vanguard High-Yield Corporate Fund Investor Shares | |||
| Return Before Taxes | 15.79% | 5.68% | 7.10% |
| Return After Taxes on Distributions | 13.29 | 3.25 | 4.57 |
| Return After Taxes on Distributions and Sale of Fund Shares | 9.28 | 3.23 | 4.41 |
| Vanguard High-Yield Corporate Fund Admiral Shares | |||
| Return Before Taxes | 15.91% | 5.79% | 7.20% |
| Comparative Indexes (reflect no deduction for fees, expenses, or taxes) | |||
| Bloomberg Barclays U.S. Corporate High Yield Bond Index | 14.32% | 6.13% | 7.57% |
| High-Yield Corporate Composite Index | 14.61 | 5.83 | 7.14 |
| Plain Talk About Fund Expenses |
| All mutual funds have operating expenses. These expenses, which are deducted from a fund’s gross income, are expressed as a percentage of the net assets of the fund. Assuming that operating expenses remain as stated in the Fees and Expenses section, Vanguard High-Yield Corporate Fund’s expense ratios would be as follows: for Investor Shares, 0.23%, or $2.30 per $1,000 of average net assets; for Admiral Shares, 0.13%, or $1.30 per $1,000 of average net assets. The average expense ratio for high yield funds in 2019 was 0.99%, or $9.90 per $1,000 of average net assets (derived from data provided by Lipper, a Thomson Reuters Company, which reports on the mutual fund industry). |
| Plain Talk About Costs of Investing |
| Costs are an important consideration in choosing a mutual fund. That is because you, as a shareholder, pay a proportionate share of the costs of operating a fund and any transaction costs incurred when the fund buys or sells securities. These costs can erode a substantial portion of the gross income or the capital appreciation a fund achieves. Even seemingly small differences in expenses can, over time, have a dramatic effect on a fund’s performance. |
| Plain Talk About High-Yield Bonds |
| High-yield bonds, or “junk bonds,” are issued by companies or other entities whose ability to pay interest and principal on the debt in a timely manner is considered questionable. Such bonds are rated “below investment-grade” by independent rating agencies. Because they are riskier than investment-grade bonds, high-yield bonds typically must pay more interest to attract investors. Some high-yield bonds are issued by smaller, less-seasoned companies, while others are issued as part of a corporate restructuring, such as an acquisition, a merger, or a leveraged buyout. Some high-yield bonds were once rated as investment-grade but have been downgraded to junk bond status because of financial difficulties experienced by their issuers. Conversely, an issuer’s improving financial condition may result in an upgrading of its junk bonds to investment-grade status. |
| Type of Bond (Maturity) | After a 1% Increase | After a 1% Decrease | After a 2% Increase | After a 2% Decrease |
| Short-Term (2.5 years) | $977 | $1,024 | $954 | $1,049 |
| Intermediate-Term (10 years) | 922 | 1,086 | 851 | 1,180 |
| Long-Term (20 years) | 874 | 1,150 | 769 | 1,328 |
| Plain Talk About Bonds and Interest Rates |
| As a rule, when interest rates rise, bond prices fall. The opposite is also true: Bond prices go up when interest rates fall. Why do bond prices and interest rates move in opposite directions? Let’s assume that you hold a bond offering a 4% yield. A year later, interest rates are on the rise and bonds of comparable quality and maturity are offered with a 5% yield. With higher-yielding bonds available, you would have trouble selling your 4% bond for the price you paid—you would probably have to lower your asking price. On the other hand, if interest rates were falling and 3% bonds were being offered, you should be able to sell your 4% bond for more than you paid. |
| Plain Talk About Bond Maturities |
| A bond is issued with a specific maturity date—the date when the issuer must pay back the bond’s principal (face value). Bond maturities range from less than 1 year to more than 30 years. Typically, the longer a bond’s maturity, the more price risk you, as a bond investor, will face as interest rates rise—but also the higher the potential yield you could receive. Longer-term bonds are more suitable for investors willing to take a greater risk of price fluctuations to get higher and more stable interest income. Shorter-term bond investors should be willing to accept lower yields and greater income variability in return for less fluctuation in the value of their investment. The stated maturity of a bond may differ from the effective maturity of a bond, which takes into consideration that an action such as a call or refunding may cause bonds to be repaid before their stated maturity dates. |
| Plain Talk About Callable Bonds |
| Although bonds are issued with clearly defined maturities, in some cases the bond issuer has a right to call in (redeem) the bond earlier than its maturity date. When a bond is called, the bondholder must replace it with another bond that may have a lower yield than the original bond. One way for bond investors to protect themselves against call risk is to purchase a bond early in its lifetime, long before its call date. Another way is to buy bonds with lower coupon rates or interest rates, which make them less likely to be called. |
| Plain Talk About Credit Quality |
| A bond’s credit quality rating is an assessment of the issuer’s ability to pay interest on the bond and, ultimately, to repay the principal. The lower the credit quality, the greater the perceived chance that the bond issuer will default, or fail to meet its payment obligations. All things being equal, the lower a bond’s credit quality, the higher its yield should be to compensate investors for assuming additional risk. |
| Credit Quality | Percentage of Fund’s Net Assets |
| U.S. Government | 3.7% |
| Baa | 5.3 |
| Ba | 49.5 |
| B | 32.3 |
| Caa | 4.8 |
| Ca | 0.8 |
| C | 0.6 |
| Not Rated | 0.5 |
| Plain Talk About Derivatives |
| Derivatives can take many forms. Some forms of derivatives—such as exchange-traded futures and options on securities, commodities, or indexes—have been trading on regulated exchanges for decades. These types of derivatives are standardized contracts that can easily be bought and sold and whose market values are determined and published daily. On the other hand, non-exchange-traded derivatives—such as certain swap agreements and foreign currency exchange forward contracts—tend to be more specialized or complex and may be more difficult to accurately value. |
| Plain Talk About Vanguard’s Unique Corporate Structure |
| The Vanguard Group is owned jointly by the funds it oversees and thus indirectly by the shareholders in those funds. Most other mutual funds are operated by management companies that are owned by third parties—either public or private stockholders—and not by the funds they serve. |
| Plain Talk About Distributions |
| As a shareholder, you are entitled to your portion of a fund’s income from interest and dividends as well as capital gains from the fund’s sale of investments. Income consists of both the dividends that the fund earns from any stock holdings and the interest it receives from any money market and bond investments. Capital gains are realized whenever the fund sells securities for higher prices than it paid for them. These capital gains are either short-term or long-term, depending on whether the fund held the securities for one year or less or for more than one year. |
| Year Ended January 31, | |||||
| For a Share Outstanding Throughout Each Period | 2020 | 2019 | 2018 | 2017 | 2016 |
| Net Asset Value, Beginning of Period | $5.67 | $5.91 | $5.86 | $5.46 | $5.98 |
| Investment Operations | |||||
| Net Investment Income | 0.3021 | 0.3171 | 0.3091 | 0.315 | 0.327 |
| Net Realized and Unrealized Gain (Loss) on Investments | 0.278 | (0.230) | 0.048 | 0.404 | (0.495) |
| Total from Investment Operations | 0.580 | 0.087 | 0.357 | 0.719 | (0.168) |
| Distributions | |||||
| Dividends from Net Investment Income | (0.310) | (0.327) | (0.307) | (0.317) | (0.323) |
| Distributions from Realized Capital Gains | — | — | — | (0.002) | (0.029) |
| Total Distributions | (0.310) | (0.327) | (0.307) | (0.319) | (0.352) |
| Net Asset Value, End of Period | $5.94 | $5.67 | $5.91 | $5.86 | $5.46 |
| Total Return2 | 10.45% | 1.61% | 6.19% | 13.43% | –2.99% |
| Ratios/Supplemental Data | |||||
| Net Assets, End of Period (Millions) | $4,102 | $3,557 | $4,146 | $4,064 | $3,604 |
| Ratio of Total Expenses to Average Net Assets | 0.23% | 0.23% | 0.23% | 0.23% | 0.23% |
| Ratio of Net Investment Income to Average Net Assets | 5.16% | 5.55% | 5.20% | 5.48% | 5.61% |
| Portfolio Turnover Rate | 28% | 21% | 27% | 26% | 34% |
| 1 | Calculated based on average shares outstanding. |
| 2 | Total returns do not include account service fees that may have applied in the periods shown. |
| Year Ended January 31, | |||||
| For a Share Outstanding Throughout Each Period | 2020 | 2019 | 2018 | 2017 | 2016 |
| Net Asset Value, Beginning of Period | $5.67 | $5.91 | $5.86 | $5.46 | $5.98 |
| Investment Operations | |||||
| Net Investment Income | 0.3081 | 0.3231 | 0.3141 | 0.320 | 0.333 |
| Net Realized and Unrealized Gain (Loss) on Investments | 0.278 | (0.230) | 0.049 | 0.404 | (0.495) |
| Total from Investment Operations | 0.586 | 0.093 | 0.363 | 0.724 | (0.162) |
| Distributions | |||||
| Dividends from Net Investment Income | (0.316) | (0.333) | (0.313) | (0.322) | (0.329) |
| Distributions from Realized Capital Gains | — | — | — | (0.002) | (0.029) |
| Total Distributions | (0.316) | (0.333) | (0.313) | (0.324) | (0.358) |
| Net Asset Value, End of Period | $5.94 | $5.67 | $5.91 | $5.86 | $5.46 |
| Total Return2 | 10.55% | 1.71% | 6.29% | 13.54% | –2.90% |
| Ratios/Supplemental Data | |||||
| Net Assets, End of Period (Millions) | $22,701 | $19,285 | $20,721 | $17,718 | $13,183 |
| Ratio of Total Expenses to Average Net Assets | 0.13% | 0.13% | 0.13% | 0.13% | 0.13% |
| Ratio of Net Investment Income to Average Net Assets | 5.26% | 5.65% | 5.30% | 5.58% | 5.71% |
| Portfolio Turnover Rate | 28% | 21% | 27% | 26% | 34% |
| 1 | Calculated based on average shares outstanding. |
| 2 | Total returns do not include account service fees that may have applied in the periods shown. |
| Web | |
| Vanguard.com | For the most complete source of Vanguard news For fund, account, and service information For most account transactions For literature requests 24 hours a day, 7 days a week |
| Phone | |
| Vanguard Tele-Account® 800-662-6273 | For automated fund and account information Toll-free, 24 hours a day, 7 days a week |
| Investor Information 800-662-7447 (Text telephone for people with hearing impairment at 800-749-7273) | For fund and service information For literature requests |
| Client Services 800-662-2739 (Text telephone for people with hearing impairment at 800-749-7273) | For account information For most account transactions |
| Participant Services 800-523-1188 (Text telephone for people with hearing impairment at 800-749-7273) | For information and services for participants in employer-sponsored plans |
| Institutional Division 888-809-8102 | For information and services for large institutional investors |
| Financial Advisor and Intermediary Sales Support 800-997-2798 | For information and services for financial intermediaries including financial advisors, broker-dealers, trust institutions, and insurance companies |
| Financial Advisory and Intermediary Trading Support 800-669-0498 | For account information and trading support for financial intermediaries including financial advisors, broker-dealers, trust institutions, and insurance companies |
| Inception Date | Newspaper Abbreviation | Vanguard Fund Number | CUSIP Number | |
| High-Yield Corporate Fund | ||||
| Investor Shares | 12/27/1978 | HYCor | 29 | 922031208 |
| Admiral Shares | 11/12/2001 | HYCorpAdml | 529 | 922031760 |
| See the inside front cover for important information about access to your fund’s annual and semiannual shareholder reports. |
| Sales Charge (Load) Imposed on Purchases | None |
| Purchase Fee | None |
| Sales Charge (Load) Imposed on Reinvested Dividends | None |
| Redemption Fee | None |
| Management Fees | 0.06% |
| 12b-1 Distribution Fee | None |
| Other Expenses | 0.01% |
| Total Annual Fund Operating Expenses | 0.07% |
| 1 Year | 3 Years | 5 Years | 10 Years |
| $7 | $23 | $40 | $90 |
| Total Return | Quarter | |
| Highest | 2.19% | September 30, 2010 |
| Lowest | -0.95% | June 30, 2013 |
| 1 Year | 5 Years | 10 Years | |
| Vanguard Short-Term Investment-Grade Fund Institutional Shares | |||
| Return Before Taxes | 5.87% | 2.59% | 2.80% |
| Return After Taxes on Distributions | 4.60 | 1.55 | 1.75 |
| Return After Taxes on Distributions and Sale of Fund Shares | 3.46 | 1.51 | 1.72 |
| Bloomberg Barclays U.S. 1-5 Year Credit Bond Index (reflects no deduction for fees, expenses, or taxes) | 6.58% | 2.71% | 3.07% |
| Plain Talk About Costs of Investing |
| Costs are an important consideration in choosing a mutual fund. That is because you, as a shareholder, pay a proportionate share of the costs of operating a fund and any transaction costs incurred when the fund buys or sells securities. These costs can erode a substantial portion of the gross income or the capital appreciation a fund achieves. Even seemingly small differences in expenses can, over time, have a dramatic effect on a fund’s performance. |
| Type of Bond (Maturity) | After a 1% Increase | After a 1% Decrease | After a 2% Increase | After a 2% Decrease |
| Short-Term (2.5 years) | $977 | $1,024 | $954 | $1,049 |
| Intermediate-Term (10 years) | 922 | 1,086 | 851 | 1,180 |
| Long-Term (20 years) | 874 | 1,150 | 769 | 1,328 |
| Plain Talk About Bonds and Interest Rates |
| As a rule, when interest rates rise, bond prices fall. The opposite is also true: Bond prices go up when interest rates fall. Why do bond prices and interest rates move in opposite directions? Let’s assume that you hold a bond offering a 4% yield. A year later, interest rates are on the rise and bonds of comparable quality and maturity are offered with a 5% yield. With higher-yielding bonds available, you would have trouble selling your 4% bond for the price you paid—you would probably have to lower your asking price. On the other hand, if interest rates were falling and 3% bonds were being offered, you should be able to sell your 4% bond for more than you paid. |
| Plain Talk About Bond Maturities |
| A bond is issued with a specific maturity date—the date when the issuer must pay back the bond’s principal (face value). Bond maturities range from less than 1 year to more than 30 years. Typically, the longer a bond’s maturity, the more price risk you, as a bond investor, will face as interest rates rise—but also the higher the potential yield you could receive. Longer-term bonds are more suitable for investors willing to take a greater risk of price fluctuations to get higher and more stable interest income. Shorter-term bond investors should be willing to accept lower yields and greater income variability in return for less fluctuation in the value of their investment. The stated maturity of a bond may differ from the effective maturity of a bond, which takes into consideration that an action such as a call or refunding may cause bonds to be repaid before their stated maturity dates. |
| Plain Talk About Callable Bonds |
| Although bonds are issued with clearly defined maturities, in some cases the bond issuer has a right to call in (redeem) the bond earlier than its maturity date. When a bond is called, the bondholder must replace it with another bond that may have a lower yield than the original bond. One way for bond investors to protect themselves against call risk is to purchase a bond early in its lifetime, long before its call date. Another way is to buy bonds with lower coupon rates or interest rates, which make them less likely to be called. |
| Plain Talk About Credit Quality |
| A bond’s credit quality rating is an assessment of the issuer’s ability to pay interest on the bond and, ultimately, to repay the principal. The lower the credit quality, the greater the perceived chance that the bond issuer will default, or fail to meet its payment obligations. All things being equal, the lower a bond’s credit quality, the higher its yield should be to compensate investors for assuming additional risk. |
| Credit Ratings of the Fund’s Investments (Percentage of Fund Assets Under Normal Circumstances) | ||||
| Issued or Backed by U.S. Gov’t. or its Agencies and Instrumentalities | High or Highest Quality (Non-Gov’t.) | Upper Medium Quality | Medium Quality | Non- Investment- Grade |
| ————————————At least 80%————————————— | No more than 5% | |||
| Plain Talk About Types of Bonds |
| Bonds are issued (sold) by many sources: Corporations issue corporate bonds; the federal government issues U.S. Treasury bonds; agencies of the federal government issue agency bonds; financial institutions issue asset-backed bonds; and mortgage holders issue “mortgage-backed” pass-through certificates. Each issuer is responsible for paying back the bond’s initial value as well as for making periodic interest payments. Many bonds issued by government agencies and entities are neither guaranteed nor insured by the U.S. government. |
| Plain Talk About U.S. Government-Sponsored Entities |
| A variety of U.S. government-sponsored entities (GSEs), such as the Federal Home Loan Mortgage Corporation (FHLMC), the Federal National Mortgage Association (FNMA), and the Federal Home Loan Banks (FHLBs), issue debt and mortgage-backed securities. Although GSEs may be chartered or sponsored by acts of Congress, they are not funded by congressional appropriations. In September of 2008, the U.S. Treasury placed FNMA and FHLMC under conservatorship and appointed the Federal Housing Finance Agency (FHFA) to manage their daily operations. In addition, the U.S. Treasury entered into purchase agreements with FNMA and FHLMC to provide them with capital in exchange for senior preferred stock. Generally, a GSE’s securities are neither issued nor guaranteed by the U.S. Treasury and are not backed by the full faith and credit of the U.S. government. In most cases, these securities are supported only by the credit of the GSE, standing alone. In some cases, a GSE’s securities may be supported by the ability of the GSE to borrow from the U.S. Treasury or may be supported by the U.S. government in some other way. Securities issued by the Government National Mortgage Association (GNMA), however, are backed by the full faith and credit of the U.S. government. |
| Plain Talk About Derivatives |
| Derivatives can take many forms. Some forms of derivatives—such as exchange-traded futures and options on securities, commodities, or indexes—have been trading on regulated exchanges for decades. These types of derivatives are standardized contracts that can easily be bought and sold and whose market values are determined and published daily. On the other hand, non-exchange-traded derivatives—such as certain swap agreements—tend to be more specialized or complex and may be more difficult to accurately value. |
| Plain Talk About Vanguard’s Unique Corporate Structure |
| The Vanguard Group is owned jointly by the funds it oversees and thus indirectly by the shareholders in those funds. Most other mutual funds are operated by management companies that are owned by third parties—either public or private stockholders—and not by the funds they serve. |
| Plain Talk About Distributions |
| As a shareholder, you are entitled to your portion of a fund’s income from interest as well as capital gains from the fund’s sale of investments. Income consists of interest the fund earns from its money market and bond investments. Capital gains are realized whenever the fund sells securities for higher prices than it paid for them. These capital gains are either short-term or long-term, depending on whether the fund held the securities for one year or less or for more than one year. |
| Year Ended January 31, | |||||
| For a Share Outstanding Throughout Each Period | 2020 | 2019 | 2018 | 2017 | 2016 |
| Net Asset Value, Beginning of Period | $10.50 | $10.57 | $10.65 | $10.60 | $10.73 |
| Investment Operations | |||||
| Net Investment Income | 0.3111 | 0.2971 | 0.2401 | 0.227 | 0.218 |
| Net Realized and Unrealized Gain (Loss) on Investments | 0.304 | (0.070) | (0.089) | 0.053 | (0.123) |
| Total from Investment Operations | 0.615 | 0.227 | 0.151 | 0.280 | 0.095 |
| Distributions | |||||
| Dividends from Net Investment Income | (0.315) | (0.297) | (0.229) | (0.219) | (0.223) |
| Distributions from Realized Capital Gains | — | — | (0.002) | (0.011) | (0.002) |
| Total Distributions | (0.315) | (0.297) | (0.231) | (0.230) | (0.225) |
| Net Asset Value, End of Period | $10.80 | $10.50 | $10.57 | $10.65 | $10.60 |
| Total Return | 5.93% | 2.20% | 1.42% | 2.65% | 0.90% |
| Ratios/Supplemental Data | |||||
| Net Assets, End of Period (Millions) | $10,830 | $10,100 | $11,566 | $9,949 | $9,205 |
| Ratio of Total Expenses to Average Net Assets | 0.07% | 0.07% | 0.07% | 0.07% | 0.07% |
| Ratio of Net Investment Income to Average Net Assets | 2.91% | 2.84% | 2.24% | 2.13% | 2.04% |
| Portfolio Turnover Rate | 76%2 | 71%2 | 86% | 68% | 75% |
| 1 | Calculated based on average shares outstanding. |
| 2 | Includes 1% and 1% attributable to mortgage-dollar-roll activity. |
| Web | |
| Vanguard.com | For the most complete source of Vanguard news For fund, account, and service information For most account transactions For literature requests 24 hours a day, 7 days a week |
| Phone | |
| Vanguard Tele-Account® 800-662-6273 | For automated fund and account information Toll-free, 24 hours a day, 7 days a week |
| Investor Information 800-662-7447 (Text telephone for people with hearing impairment at 800-749-7273) | For fund and service information For literature requests |
| Client Services 800-662-2739 (Text telephone for people with hearing impairment at 800-749-7273) | For account information For most account transactions |
| Participant Services 800-523-1188 (Text telephone for people with hearing impairment at 800-749-7273) | For information and services for participants in employer-sponsored plans |
| Institutional Division 888-809-8102 | For information and services for large institutional investors |
| Financial Advisor and Intermediary Sales Support 800-997-2798 | For information and services for financial intermediaries including financial advisors, broker-dealers, trust institutions, and insurance companies |
| Financial Advisory and Intermediary Trading Support 800-669-0498 | For account information and trading support for financial intermediaries including financial advisors, broker-dealers, trust institutions, and insurance companies |
| Inception Date | Newspaper Abbreviation | Vanguard Fund Number | CUSIP Number | |
| Short-Term Investment-Grade Fund | ||||
| Institutional Shares | 9/30/1997 (Investor Shares 10/29/1982) | STIGradeInst | 858 | 922031877 |
| See the inside front cover for important information about access to your fund’s annual and semiannual shareholder reports. |
| Investor Shares | Admiral Shares | |
| Sales Charge (Load) Imposed on Purchases | None | None |
| Purchase Fee | None | None |
| Sales Charge (Load) Imposed on Reinvested Dividends | None | None |
| Redemption Fee | None | None |
| Account Service Fee Per Year (for certain fund account balances below $10,000) | $20 | $20 |
| Investor Shares | Admiral Shares | |
| Management Fees | 0.18% | 0.09% |
| 12b-1 Distribution Fee | None | None |
| Other Expenses | 0.02% | 0.01% |
| Total Annual Fund Operating Expenses | 0.20% | 0.10% |
| 1 Year | 3 Years | 5 Years | 10 Years | |
| Investor Shares | $20 | $64 | $113 | $255 |
| Admiral Shares | $10 | $32 | $56 | $128 |
| Total Return | Quarter | |
| Highest | 1.06% | March 31, 2019 |
| Lowest | 0.15% | September 30, 2016 |
| 1 Year | Since Inception (Feb. 24, 2015) | |
| Vanguard Ultra-Short-Term Bond Fund Investor Shares | ||
| Return Before Taxes | 3.34% | 1.64% |
| Return After Taxes on Distributions | 2.25 | 0.98 |
| Return After Taxes on Distributions and Sale of Fund Shares | 1.97 | 0.97 |
| Vanguard Ultra-Short-Term Bond Fund Admiral Shares | ||
| Return Before Taxes | 3.39% | 1.73% |
| Comparative Benchmarks | ||
| Bloomberg Barclays U.S. Treasury Bellwethers: 1 Year Index (reflects no deduction for fees, expenses, or taxes) | 3.01% | 1.37% |
| Bloomberg Barclays U.S. Aggregate Bond Index (reflects no deduction for fees, expenses, or taxes) | 8.72 | 2.90 |
| Ultra-Short Obligations Funds Average (reflects no deduction for taxes) | 3.01 | 1.43 |
| Plain Talk About Fund Expenses |
| All mutual funds have operating expenses. These expenses, which are deducted from a fund’s gross income, are expressed as a percentage of the net assets of the fund. Assuming that operating expenses remain as stated in the Fees and Expenses section, Vanguard Ultra-Short-Term Bond Fund’s expense ratios would be as follows: for Investor Shares, .20%, or $2.00 per $1,000 of average net assets; for Admiral Shares, .10%, or $1.00 per $1,000 of average net assets. The average expense ratio for ultra-short obligations funds in 2019 was 0.46%, or $4.60 per $1,000 of average net assets (derived from data provided by Lipper, a Thomson Reuters Company, which reports on the mutual fund industry). |
| Plain Talk About Costs of Investing |
| Costs are an important consideration in choosing a mutual fund. That is because you, as a shareholder, pay a proportionate share of the costs of operating a fund and any transaction costs incurred when the fund buys or sells securities. These costs can erode a substantial portion of the gross income or the capital appreciation a fund achieves. Even seemingly small differences in expenses can, over time, have a dramatic effect on a fund’s performance. |
| Type of Bond (Maturity) | After a 1% Increase | After a 1% Decrease | After a 2% Increase | After a 2% Decrease |
| Short-Term (2.5 years) | $977 | $1,024 | $954 | $1,049 |
| Intermediate-Term (10 years) | 922 | 1,086 | 851 | 1,180 |
| Long-Term (20 years) | 874 | 1,150 | 769 | 1,328 |
| Plain Talk About Bonds and Interest Rates |
| As a rule, when interest rates rise, bond prices fall. The opposite is also true: Bond prices go up when interest rates fall. Why do bond prices and interest rates move in opposite directions? Let’s assume that you hold a bond offering a 4% yield. A year later, interest rates are on the rise and bonds of comparable quality and maturity are offered with a 5% yield. With higher-yielding bonds available, you would have trouble selling your 4% bond for the price you paid—you would probably have to lower your asking price. On the other hand, if interest rates were falling and 3% bonds were being offered, you should be able to sell your 4% bond for more than you paid. |
| Plain Talk About Bond Maturities |
| A bond is issued with a specific maturity date—the date when the issuer must pay back the bond’s principal (face value). Bond maturities range from less than 1 year to more than 30 years. Typically, the longer a bond’s maturity, the more price risk you, as a bond investor, will face as interest rates rise—but also the higher the potential yield you could receive. Longer-term bonds are more suitable for investors willing to take a greater risk of price fluctuations to get higher and more stable interest income. Shorter-term bond investors should be willing to accept lower yields and greater income variability in return for less fluctuation in the value of their investment. The stated maturity of a bond may differ from the effective maturity of a bond, which takes into consideration that an action such as a call or refunding may cause bonds to be repaid before their stated maturity dates. |
| Plain Talk About Callable Bonds |
| Although bonds are issued with clearly defined maturities, in some cases the bond issuer has a right to call in (redeem) the bond earlier than its maturity date. When a bond is called, the bondholder must replace it with another bond that may have a lower yield than the original bond. One way for bond investors to protect themselves against call risk is to purchase a bond early in its lifetime, long before its call date. Another way is to buy bonds with lower coupon rates or interest rates, which make them less likely to be called. |
| Plain Talk About Credit Quality |
| A bond’s credit quality rating is an assessment of the issuer’s ability to pay interest on the bond and, ultimately, to repay the principal. The lower the credit quality, the greater the perceived chance that the bond issuer will default, or fail to meet its payment obligations. All things being equal, the lower a bond’s credit quality, the higher its yield should be to compensate investors for assuming additional risk. |
| Plain Talk About Types of Bonds |
| Bonds are issued (sold) by many sources: Corporations issue corporate bonds; the federal government issues U.S. Treasury bonds; agencies of the federal government issue agency bonds; financial institutions issue asset-backed bonds; and mortgage holders issue “mortgage-backed” pass-through certificates. Each issuer is responsible for paying back the bond’s initial value as well as for making periodic interest payments. Many bonds issued by government agencies and entities are neither guaranteed nor insured by the U.S. government. |
| Plain Talk About U.S. Government-Sponsored Entities |
| A variety of U.S. government-sponsored entities (GSEs), such as the Federal Home Loan Mortgage Corporation (FHLMC), the Federal National Mortgage Association (FNMA), and the Federal Home Loan Banks (FHLBs), issue debt and mortgage-backed securities. Although GSEs may be chartered or sponsored by acts of Congress, they are not funded by congressional appropriations. In September of 2008, the U.S. Treasury placed FNMA and FHLMC under conservatorship and appointed the Federal Housing Finance Agency (FHFA) to manage their daily operations. In addition, the U.S. Treasury entered into purchase agreements with FNMA and FHLMC to provide them with capital in exchange for senior preferred stock. Generally, a GSE’s securities are neither issued nor guaranteed by the U.S. Treasury and are not backed by the full faith and credit of the U.S. government. In most cases, these securities are supported only by the credit of the GSE, standing alone. In some cases, a GSE’s securities may be supported by the ability of the GSE to borrow from the U.S. Treasury or may be supported by the U.S. government in some other way. Securities issued by the Government National Mortgage Association (GNMA), however, are backed by the full faith and credit of the U.S. government. |
| Plain Talk About Derivatives |
| Derivatives can take many forms. Some forms of derivatives—such as exchange-traded futures and options on securities, commodities, or indexes—have been trading on regulated exchanges for decades. These types of derivatives are standardized contracts that can easily be bought and sold and whose market values are determined and published daily. On the other hand, non-exchange-traded derivatives—such as certain swap agreements and foreign currency exchange forward contracts—tend to be more specialized or complex and may be more difficult to accurately value. |
| Plain Talk About Vanguard’s Unique Corporate Structure |
| The Vanguard Group is owned jointly by the funds it oversees and thus indirectly by the shareholders in those funds. Most other mutual funds are operated by management companies that are owned by third parties—either public or private stockholders—and not by the funds they serve. |
| Plain Talk About Distributions |
| As a shareholder, you are entitled to your portion of a fund’s income from interest and dividends as well as capital gains from the fund’s sale of investments. Income consists of interest the fund earns from its money market and bond investments. Capital gains are realized whenever the fund sells securities for higher prices than it paid for them. These capital gains are either short-term or long-term, depending on whether the fund held the securities for one year or less or for more than one year. |
| Year Ended January 31, | Feb. 10, 20151 to Jan. 31, 2016 | ||||
| For a Share Outstanding Throughout Each Period | 2020 | 2019 | 2018 | 2017 | |
| Net Asset Value, Beginning of Period | $9.98 | $9.97 | $10.00 | $9.99 | $10.00 |
| Investment Operations | |||||
| Net Investment Income | 0.2522 | 0.2272 | 0.1542 | 0.106 | 0.054 |
| Net Realized and Unrealized Gain (Loss) on Investments | 0.065 | 0.003 | (0.037) | 0.006 | (0.010) |
| Total from Investment Operations | 0.317 | 0.230 | 0.117 | 0.112 | 0.044 |
| Distributions | |||||
| Dividends from Net Investment Income | (0.257) | (0.220) | (0.145) | (0.102) | (0.054) |
| Distributions from Realized Capital Gains | — | — | (0.002) | — | — |
| Total Distributions | (0.257) | (0.220) | (0.147) | (0.102) | (0.054) |
| Net Asset Value, End of Period | $10.04 | $9.98 | $9.97 | $10.00 | $9.99 |
| Total Return3 | 3.21% | 2.34% | 1.17% | 1.13% | 0.44% |
| Ratios/Supplemental Data | |||||
| Net Assets, End of Period (Millions) | $471 | $309 | $179 | $131 | $47 |
| Ratio of Total Expenses to Average Net Assets | 0.20% | 0.20% | 0.20% | 0.20% | 0.20%4 |
| Ratio of Net Investment Income to Average Net Assets | 2.53% | 2.28% | 1.54% | 1.11% | 0.66%4 |
| Portfolio Turnover Rate | 70% | 61% | 70% | 81% | 24% |
| 1 | Subscription period for the fund was February 10, 2015, to February 23, 2015, during which time all assets were held in money market instruments. Performance measurement began February 24, 2015, at a net asset value of $10.00. |
| 2 | Calculated based on average shares outstanding. |
| 3 | Total returns do not include account service fees that may have applied in the periods shown. |
| 4 | Annualized. |
| Year Ended January 31, | Feb. 10, 20151 to Jan. 31, 2016 | ||||
| For a Share Outstanding Throughout Each Period | 2020 | 2019 | 2018 | 2017 | |
| Net Asset Value, Beginning of Period | $19.96 | $19.94 | $20.00 | $19.98 | $20.00 |
| Investment Operations | |||||
| Net Investment Income | 0.5272 | 0.4732 | 0.3282 | 0.228 | 0.122 |
| Net Realized and Unrealized Gain (Loss) on Investments | 0.126 | 0.008 | (0.077) | 0.015 | (0.021) |
| Total from Investment Operations | 0.653 | 0.481 | 0.251 | 0.243 | 0.101 |
| Distributions | |||||
| Dividends from Net Investment Income | (0.533) | (0.461) | (0.307) | (0.223) | (0.121) |
| Distributions from Realized Capital Gains | — | — | (0.004) | — | — |
| Total Distributions | (0.533) | (0.461) | (0.311) | (0.223) | (0.121) |
| Net Asset Value, End of Period | $20.08 | $19.96 | $19.94 | $20.00 | $19.98 |
| Total Return3 | 3.31% | 2.44% | 1.26% | 1.22% | 0.51% |
| Ratios/Supplemental Data | |||||
| Net Assets, End of Period (Millions) | $6,443 | $5,244 | $3,474 | $2,024 | $465 |
| Ratio of Total Expenses to Average Net Assets | 0.10% | 0.10% | 0.10% | 0.12% | 0.12%4 |
| Ratio of Net Investment Income to Average Net Assets | 2.63% | 2.38% | 1.64% | 1.19% | 0.74%4 |
| Portfolio Turnover Rate | 70% | 61% | 70% | 81% | 24% |
| 1 | Subscription period for the fund was February 10, 2015, to February 23, 2015, during which time all assets were held in money market instruments. Performance measurement began February 24, 2015, at a net asset value of $20.00. |
| 2 | Calculated based on average shares outstanding. |
| 3 | Total returns do not include account service fees that may have applied in the periods shown. |
| 4 | Annualized. |
| Web | |
| Vanguard.com | For the most complete source of Vanguard news For fund, account, and service information For most account transactions For literature requests 24 hours a day, 7 days a week |
| Phone | |
| Vanguard Tele-Account® 800-662-6273 | For automated fund and account information Toll-free, 24 hours a day, 7 days a week |
| Investor Information 800-662-7447 (Text telephone for people with hearing impairment at 800-749-7273) | For fund and service information For literature requests |
| Client Services 800-662-2739 (Text telephone for people with hearing impairment at 800-749-7273) | For account information For most account transactions |
| Participant Services 800-523-1188 (Text telephone for people with hearing impairment at 800-749-7273) | For information and services for participants in employer-sponsored plans |
| Institutional Division 888-809-8102 | For information and services for large institutional investors |
| Financial Advisor and Intermediary Sales Support 800-997-2798 | For information and services for financial intermediaries including financial advisors, broker-dealers, trust institutions, and insurance companies |
| Financial Advisory and Intermediary Trading Support 800-669-0498 | For account information and trading support for financial intermediaries including financial advisors, broker-dealers, trust institutions, and insurance companies |
| Inception Date | Newspaper Abbreviation | Vanguard Fund Number | CUSIP Number | |
| Ultra-Short-Term Bond Fund | ||||
| Investor Shares | 2/24/2015 | UltSTBdInv | 1492 | 922031729 |
| Admiral Shares | 2/24/2015 | UltSTBdAdm | 592 | 922031711 |
| B-1 | |
| B-4 | |
| B-5 | |
| B-34 | |
| B-34 | |
| B-36 | |
| B-55 | |
| B-62 | |
| B-65 | |
| B-66 | |
| B-66 | |
| B-68 | |
| B-71 |
| Share Classes1 | ||||
| Fund2 | Investor | Admiral | Institutional | Institutional Plus |
| Vanguard Ultra-Short-Term Bond Fund | VUBFX | VUSFX | — | — |
| Vanguard Short-Term Treasury Fund | VFISX | VFIRX | — | — |
| Vanguard Short-Term Federal Fund | VSGBX | VSGDX | — | — |
| Vanguard Short-Term Investment-Grade Fund | VFSTX | VFSUX | VFSIX | — |
| Vanguard Intermediate-Term Treasury Fund | VFITX | VFIUX | — | — |
| Vanguard Intermediate-Term Investment-Grade Fund | VFICX | VFIDX | — | — |
| Vanguard GNMA Fund | VFIIX | VFIJX | — | — |
| Vanguard Long-Term Treasury Fund | VUSTX | VUSUX | — | — |
| Vanguard Long-Term Investment-Grade Fund | VWESX | VWETX | — | — |
| Vanguard High-Yield Corporate Fund | VWEHX | VWEAX | — | — |
| Vanguard Real Estate II Index Fund3 | — | — | — | VRTPX |
| 1 | Individually, a class; collectively, the classes. |
| 2 | Individually, a Fund; collectively, the Funds. |
| 3 | Formerly known as Vanguard REIT II Index Fund. |
| Vanguard Fund | Capital Contribution to Vanguard | Percentage of Fund’s Average Net Assets | Percent of Vanguard Funds’ Contribution |
| Ultra-Short-Term Bond Fund | $296,000 | Less than 0.01% | 0.12% |
| Short-Term Treasury Fund | 388,000 | Less than 0.01 | 0.16 |
| Short-Term Federal Fund | 216,000 | Less than 0.01 | 0.09 |
| Short-Term Investment-Grade Fund | 2,728,000 | Less than 0.01 | 1.09 |
| Intermediate-Term Treasury Fund | 271,000 | Less than 0.01 | 0.11 |
| Intermediate-Term Investment-Grade Fund | 1,433,000 | Less than 0.01 | 0.57 |
| GNMA Fund | 1,073,000 | Less than 0.01 | 0.43 |
| Long-Term Treasury Fund | 164,000 | Less than 0.01 | 0.07 |
| Long-Term Investment-Grade Fund | 849,000 | Less than 0.01 | 0.34 |
| High-Yield Corporate Fund | 1,169,000 | Less than 0.01 | 0.47 |
| Real Estate II Index Fund | 341,000 | Less than 0.01 | 0.14 |
| ■ | Conducting or publishing Vanguard-generated research and analysis concerning the funds, other investments, the financial markets, or the economy. |
| ■ | Providing views, opinions, advice, or commentary concerning the funds, other investments, the financial markets, or the economy. |
| ■ | Providing analytical, statistical, performance, or other information concerning the funds, other investments, the financial markets, or the economy. |
| ■ | Providing administrative services in connection with investments in the funds or other investments, including, but not limited to, shareholder services, recordkeeping services, and educational services. |
| ■ | Providing products or services that assist investors or financial service providers (as defined below) in the investment decision-making process. |
| ■ | Providing promotional discounts, commission-free trading, fee waivers, and other benefits to clients of Vanguard Brokerage Services® who maintain qualifying investments in the funds. |
| Annual Shared Fund Operating Expenses (Shared Expenses Deducted From Fund Assets) | |||
| Vanguard Fund | 2018 | 2019 | 2020 |
| Vanguard GNMA Fund | |||
| Management and Administrative Expenses | 0.11% | 0.12% | 0.12% |
| Marketing and Distribution Expenses | 0.01 | 0.01 | 0.01 |
| Vanguard High-Yield Corporate Fund | |||
| Management and Administrative Expenses | 0.10% | 0.11% | 0.11% |
| Marketing and Distribution Expenses | 0.01 | 0.01 | 0.01 |
| Vanguard Intermediate-Term Investment-Grade Fund | |||
| Management and Administrative Expenses | 0.09% | 0.10% | 0.10% |
| Marketing and Distribution Expenses | 0.01 | 0.01 | 0.01 |
| Vanguard Intermediate-Term Treasury Fund | |||
| Management and Administrative Expenses | 0.10% | 0.10% | 0.10% |
| Marketing and Distribution Expenses | 0.01 | 0.01 | 0.01 |
| Vanguard Long-Term Investment-Grade Fund | |||
| Management and Administrative Expenses | 0.10% | 0.11% | 0.12% |
| Marketing and Distribution Expenses | 0.01 | 0.01 | 0.01 |
| Vanguard Long-Term Treasury Fund | |||
| Management and Administrative Expenses | 0.11% | 0.11% | 0.11% |
| Marketing and Distribution Expenses | 0.01 | 0.01 | 0.01 |
| Vanguard Real Estate II Index Fund | |||
| Management and Administrative Expenses | — | 0.07% | 0.08% |
| Marketing and Distribution Expenses | — | Less than 0.01 | Less than 0.01 |
| Vanguard Short-Term Federal Fund | |||
| Management and Administrative Expenses | 0.10% | 0.10% | 0.10% |
| Marketing and Distribution Expenses | 0.01 | 0.01 | 0.01 |
| Vanguard Short-Term Investment-Grade Fund | |||
| Management and Administrative Expenses | 0.10% | 0.10% | 0.10% |
| Marketing and Distribution Expenses | 0.01 | 0.01 | 0.01 |
| Vanguard Short-Term Treasury Fund | |||
| Management and Administrative Expenses | 0.10% | 0.10% | 0.10% |
| Marketing and Distribution Expenses | 0.01 | 0.01 | 0.01 |
| Vanguard Ultra-Short-Term Bond Fund | |||
| Management and Administrative Expenses | 0.09% | 0.09% | 0.10% |
| Marketing and Distribution Expenses | 0.01 | 0.01 | 0.01 |
| Name, Year of Birth | Position(s) Held With Funds | Vanguard Funds’ Trustee/ Officer Since | Principal Occupation(s) During the Past Five Years, Outside Directorships, and Other Experience | Number of Vanguard Funds Overseen by Trustee/Officer |
| Interested Trustee1 | ||||
| Mortimer J. Buckley (1969) | Chairman of the Board, Chief Executive Officer, and President | January 2018 | Chairman of the board (2019–present) of Vanguard and of each of the investment companies served by Vanguard; chief executive officer (2018– present) of Vanguard; chief executive officer, president, and trustee (2018–present) of each of the investment companies served by Vanguard; president and director (2017–present) of Vanguard; and president (2018–present) of Vanguard Marketing Corporation. Chief investment officer (2013–2017), managing director (2002–2017), head of the Retail Investor Group (2006–2012), and chief information officer (2001–2006) of Vanguard. Chairman of the board (2011–2017) and trustee (2009–2017) of the Children’s Hospital of Philadelphia; and trustee (2018–present) and vice chair (2019–present) of The Shipley School. | 213 |
| 1 Mr. Buckley is considered an “interested person” as defined in the 1940 Act because he is an officer of the Trust. | ||||
| Name, Year of Birth | Position(s) Held With Funds | Vanguard Funds’ Trustee/ Officer Since | Principal Occupation(s) During the Past Five Years, Outside Directorships, and Other Experience | Number of Vanguard Funds Overseen by Trustee/Officer |
| Independent Trustees | ||||
| Emerson U. Fullwood (1948) | Trustee | January 2008 | Executive chief staff and marketing officer for North America and corporate vice president (retired 2008) of Xerox Corporation (document management products and services). Former president of the Worldwide Channels Group, Latin America, and Worldwide Customer Service and executive chief staff officer of Developing Markets of Xerox. Executive in residence and 2009–2010 Distinguished Minett Professor at the Rochester Institute of Technology. Director of SPX FLOW, Inc. (multi-industry manufacturing). Director of the University of Rochester Medical Center, the Monroe Community College Foundation, the United Way of Rochester, North Carolina A&T University, and Roberts Wesleyan College. Trustee of the University of Rochester. | 213 |
| Amy Gutmann (1949) | Trustee | June 2006 | President (2004–present) of the University of Pennsylvania. Christopher H. Browne Distinguished Professor of Political Science, School of Arts and Sciences, and professor of communication, Annenberg School for Communication, with secondary faculty appointments in the Department of Philosophy, School of Arts and Sciences, and at the Graduate School of Education, University of Pennsylvania. | 213 |
| F. Joseph Loughrey (1949) | Trustee | October 2009 | President and chief operating officer (retired 2009) and vice chairman of the board (2008–2009) of Cummins Inc. (industrial machinery). Chairman of the board of Hillenbrand, Inc. (specialized consumer services) and the Lumina Foundation. Director of the V Foundation. Member of the advisory council for the College of Arts and Letters and chair of the advisory board to the Kellogg Institute for International Studies, both at the University of Notre Dame. | 213 |
| Mark Loughridge (1953) | Lead Independent Trustee | March 2012 | Senior vice president and chief financial officer (retired 2013) of IBM (information technology services). Fiduciary member of IBM’s Retirement Plan Committee (2004–2013), senior vice president and general manager (2002–2004) of IBM Global Financing, vice president and controller (1998–2002) of IBM, and a variety of other prior management roles at IBM. Member of the Council on Chicago Booth. | 213 |
| Scott C. Malpass (1962) | Trustee | March 2012 | Chief investment officer (1989–present) and vice president (1996–present) of the University of Notre Dame. Assistant professor of finance at the Mendoza College of Business, University of Notre Dame, and member of the Notre Dame 403(b) Investment Committee. Member of the board of TIFF Advisory Services, Inc. Member of the board of Catholic Investment Services, Inc. (investment advisors) and the board of superintendence of the Institute for the Works of Religion. | 213 |
| Name, Year of Birth | Position(s) Held With Funds | Vanguard Funds’ Trustee/ Officer Since | Principal Occupation(s) During the Past Five Years, Outside Directorships, and Other Experience | Number of Vanguard Funds Overseen by Trustee/Officer |
| Deanna Mulligan (1963) | Trustee | January 2018 | Chief executive officer (2011–present) of The Guardian Life Insurance Company of America. President (2010–2019), chief operating officer (2010–2011), and executive vice president (2008–2010) of Individual Life and Disability of The Guardian Life Insurance Company of America. Member of the board of The Guardian Life Insurance Company of America, the American Council of Life Insurers, and the Economic Club of New York. Trustee of the Partnership for New York City (business leadership), the Chief Executives for Corporate Purpose, the NewYork-Presbyterian Hospital, Catalyst, and the Bruce Museum (arts and science). Member of the Advisory Council for the Stanford Graduate School of Business. | 213 |
| André F. Perold (1952) | Trustee | December 2004 | George Gund Professor of Finance and Banking, Emeritus at the Harvard Business School (retired 2011). Chief investment officer and co-managing partner of HighVista Strategies LLC (private investment firm). Board of Advisors and investment committee member of the Museum of Fine Arts Boston. Board member (2018–present) of RIT Capital Partners (investment firm); investment committee member of Partners Health Care System. | 213 |
| Sarah Bloom Raskin (1961) | Trustee | January 2018 | Deputy secretary (2014–2017) of the United States Department of the Treasury. Governor (2010–2014) of the Federal Reserve Board. Commissioner (2007–2010) of financial regulation for the State of Maryland. Member of the board of directors (2012–2014) of Neighborhood Reinvestment Corporation. Director (2017–present) of i(x) Investments, LLC; director (2017–present) of Reserve Trust. Rubenstein Fellow (2017–present) of Duke University; trustee (2017–present) of Amherst College; and trustee (2019–present) of Folger Shakespeare Library. | 213 |
| Peter F. Volanakis (1955) | Trustee | July 2009 | President and chief operating officer (retired 2010) of Corning Incorporated (communications equipment) and director of Corning Incorporated (2000–2010) and Dow Corning (2001–2010). Director (2012) of SPX Corporation (multi-industry manufacturing). Overseer of the Amos Tuck School of Business Administration, Dartmouth College (2001–2013). Chairman of the board of trustees of Colby-Sawyer College. Member of the board of Hypertherm Inc. (industrial cutting systems, software, and consumables). | 213 |
| Executive Officers | ||||
| John Bendl (1970) | Chief Financial Officer | October 2019 | Principal of Vanguard. Chief financial officer (2019–present) of each of the investment companies served by Vanguard. Chief accounting officer, treasurer, and controller of Vanguard (2017–present). Partner (2003–2016) at KPMG (audit, tax, and advisory services). | 213 |
| Glenn Booraem (1967) | Investment Stewardship Officer | February 2001 | Principal of Vanguard. Investment stewardship officer (2017–present), treasurer (2015–2017), controller (2010–2015), and assistant controller (2001–2010) of each of the investment companies served by Vanguard. | 213 |
| Name, Year of Birth | Position(s) Held With Funds | Vanguard Funds’ Trustee/ Officer Since | Principal Occupation(s) During the Past Five Years, Outside Directorships, and Other Experience | Number of Vanguard Funds Overseen by Trustee/Officer |
| Christine M. Buchanan (1970) | Treasurer | November 2017 | Principal of Vanguard. Treasurer (2017–present) of each of the investment companies served by Vanguard. Partner (2005–2017) at KPMG (audit, tax, and advisory services). | 213 |
| David Cermak (1960) | Finance Director | October 2019 | Principal of Vanguard. Finance director (2019–present) of each of the investment companies served by Vanguard. Managing director and head (2017–present) of Vanguard Investments Singapore. Managing director and head (2017–2019) of Vanguard Investments Hong Kong. Representative director and head (2014–2017) of Vanguard Investments Japan. | 213 |
| Thomas J. Higgins (1957) | Finance Director | July 1998 | Principal of Vanguard. Finance director (2019–present), chief financial officer (2008–2019), and treasurer (1998–2008) of each of the investment companies served by Vanguard. | 213 |
| Peter Mahoney (1974) | Controller | May 2015 | Principal of Vanguard. Controller (2015–present) of each of the investment companies served by Vanguard. Head of International Fund Services (2008– 2014) at Vanguard. | 213 |
| Anne E. Robinson (1970) | Secretary | September 2016 | General counsel (2016–present) of Vanguard. Secretary (2016–present) of Vanguard and of each of the investment companies served by Vanguard. Managing director (2016–present) of Vanguard. Managing director and general counsel of Global Cards and Consumer Services (2014–2016) at Citigroup. Counsel (2003–2014) at American Express. | 213 |
| Michael Rollings (1963) | Finance Director | February 2017 | Finance director (2017–present) and treasurer (2017) of each of the investment companies served by Vanguard. Managing director (2016–present) of Vanguard. Chief financial officer (2016–present) of Vanguard. Director (2016–present) of Vanguard Marketing Corporation. Executive vice president and chief financial officer (2006–2016) of MassMutual Financial Group. | 213 |
| John E. Schadl (1972) | Chief Compliance Officer | March 2019 | Principal of Vanguard. Chief compliance officer (2019–present) of Vanguard and of each of the investment companies served by Vanguard. Assistant vice president (2019–present) of Vanguard Marketing Corporation. | 213 |
| ■ | Audit Committee: This committee oversees the accounting and financial reporting policies, the systems of internal controls, and the independent audits of each fund. The following independent trustees serve as members of the committee: Mr. Loughrey, Mr. Loughridge, Ms. Raskin, and Mr. Volanakis. The committee held six meetings during the Trust’s fiscal year ended January 31, 2020. |
| ■ | Compensation Committee: This committee oversees the compensation programs established by each fund for the benefit of its trustees. All independent trustees serve as members of the committee. The committee held one meeting during the Trust’s fiscal year ended January 31, 2020. |
| ■ | Investment Committees: These committees assist the board in its oversight of investment advisors to the funds and in the review and evaluation of materials relating to the board’s consideration of investment advisory agreements with the funds. Each trustee serves on one of two investment committees. Each investment committee held four meetings during the Trust’s fiscal year ended January 31, 2020. |
| ■ | Nominating Committee: This committee nominates candidates for election to the board of trustees of each fund. The committee also has the authority to recommend the removal of any trustee. All independent trustees serve as members of the committee. The committee held one meeting during the Trust’s fiscal year ended January 31, 2020. |
| ■ | The independent trustees receive an annual fee for their service to the funds, which is subject to reduction based on absences from scheduled board meetings. |
| ■ | The independent trustees are reimbursed for the travel and other expenses that they incur in attending board meetings. |
| ■ | Upon retirement (after attaining age 65 and completing five years of service), the independent trustees who began their service prior to January 1, 2001, receive a retirement benefit under a separate account arrangement. As of January 1, 2001, the opening balance of each eligible trustee’s separate account was generally equal to the net present value of the benefits he or she had accrued under the trustees’ former retirement plan. Each eligible trustee’s separate account will be credited annually with interest at a rate of 7.5% until the trustee receives his or her final distribution. Those independent trustees who began their service on or after January 1, 2001, are not eligible to participate in the plan. |
| Trustee | Aggregate Compensation From the Funds1 | Pension or Retirement Benefits Accrued as Part of the Funds’ Expenses1 | Accrued Annual Retirement Benefit at January 1, 20202 | Total Compensation From All Vanguard Funds Paid to Trustees3 |
| Mortimer J. Buckley | — | — | — | — |
| Emerson U. Fullwood | $15,362 | — | — | $287,500 |
| Amy Gutmann | 15,362 | — | — | 287,500 |
| JoAnn Heffernan Heisen4 | — | $306 | $9,329 | — |
| F. Joseph Loughrey | 16,431 | — | — | 307,500 |
| Mark Loughridge | 19,101 | — | — | 357,500 |
| Scott C. Malpass | 15,362 | — | — | 287,500 |
| Deanna Mulligan | 15,362 | — | — | 287,500 |
| André F. Perold | 15,362 | — | — | 287,500 |
| Sarah Bloom Raskin | 16,431 | — | — | 307,500 |
| Peter F. Volanakis | 16,431 | — | — | 307,500 |
| 1 | The amounts shown in this column are based on the Trust's fiscal year ended January 31, 2020. Each Fund within the Trust is responsible for a proportionate share of these amounts. |
| 2 | Each trustee is eligible to receive retirement benefits only after completing at least 5 years (60 consecutive months) of service as a trustee for the Vanguard funds. The annual retirement benefit will be paid in monthly installments, beginning with the month following the trustee’s retirement from service, and will cease after 10 years of payments (120 monthly installments). Trustees who began their service on or after January 1, 2001, are not eligible to participate in the retirement benefit plan. |
| 3 | The amounts reported in this column reflect the total compensation paid to each trustee for his or her service as trustee of 213 Vanguard funds for the 2019 calendar year. |
| 4 | Ms. Heisen retired from service effective December 31, 2018. |
| Vanguard Fund | Trustee | Dollar Range of Fund Shares Owned by Trustee | Aggregate Dollar Range of Vanguard Fund Shares Owned by Trustee |
| Vanguard GNMA Fund | Mortimer J. Buckley | — | Over $100,000 |
| Emerson U. Fullwood | — | Over $100,000 | |
| Amy Gutmann | — | Over $100,000 | |
| F. Joseph Loughrey | — | Over $100,000 | |
| Mark Loughridge | — | Over $100,000 | |
| Scott C. Malpass | $1 – $10,000 | Over $100,000 | |
| Deanna Mulligan | — | Over $100,000 | |
| André F. Perold | — | Over $100,000 | |
| Sarah Bloom Raskin | — | Over $100,000 | |
| Peter F. Volanakis | — | Over $100,000 | |
| Vanguard Fund | Trustee | Dollar Range of Fund Shares Owned by Trustee | Aggregate Dollar Range of Vanguard Fund Shares Owned by Trustee |
| Vanguard High-Yield Corporate Fund | Mortimer J. Buckley | — | Over $100,000 |
| Emerson U. Fullwood | — | Over $100,000 | |
| Amy Gutmann | — | Over $100,000 | |
| F. Joseph Loughrey | — | Over $100,000 | |
| Mark Loughridge | — | Over $100,000 | |
| Scott C. Malpass | — | Over $100,000 | |
| Deanna Mulligan | — | Over $100,000 | |
| André F. Perold | — | Over $100,000 | |
| Sarah Bloom Raskin | — | Over $100,000 | |
| Peter F. Volanakis | Over $100,000 | Over $100,000 | |
| Vanguard Intermediate-Term Investment-Grade Fund | Mortimer J. Buckley | — | Over $100,000 |
| Emerson U. Fullwood | — | Over $100,000 | |
| Amy Gutmann | — | Over $100,000 | |
| F. Joseph Loughrey | Over $100,000 | Over $100,000 | |
| Mark Loughridge | Over $100,000 | Over $100,000 | |
| Scott C. Malpass | — | Over $100,000 | |
| Deanna Mulligan | — | Over $100,000 | |
| André F. Perold | — | Over $100,000 | |
| Sarah Bloom Raskin | — | Over $100,000 | |
| Peter F. Volanakis | — | Over $100,000 | |
| Vanguard Intermediate-Term Treasury Fund | Mortimer J. Buckley | — | Over $100,000 |
| Emerson U. Fullwood | — | Over $100,000 | |
| Amy Gutmann | — | Over $100,000 | |
| F. Joseph Loughrey | — | Over $100,000 | |
| Mark Loughridge | — | Over $100,000 | |
| Scott C. Malpass | — | Over $100,000 | |
| Deanna Mulligan | — | Over $100,000 | |
| André F. Perold | — | Over $100,000 | |
| Sarah Bloom Raskin | — | Over $100,000 | |
| Peter F. Volanakis | — | Over $100,000 | |
| Vanguard Long-Term Investment-Grade Fund | Mortimer J. Buckley | — | Over $100,000 |
| Emerson U. Fullwood | — | Over $100,000 | |
| Amy Gutmann | — | Over $100,000 | |
| F. Joseph Loughrey | — | Over $100,000 | |
| Mark Loughridge | — | Over $100,000 | |
| Scott C. Malpass | — | Over $100,000 | |
| Deanna Mulligan | — | Over $100,000 | |
| André F. Perold | — | Over $100,000 | |
| Sarah Bloom Raskin | — | Over $100,000 | |
| Peter F. Volanakis | — | Over $100,000 | |
| Vanguard Fund | Trustee | Dollar Range of Fund Shares Owned by Trustee | Aggregate Dollar Range of Vanguard Fund Shares Owned by Trustee |
| Vanguard Long-Term Treasury Fund | Mortimer J. Buckley | — | Over $100,000 |
| Emerson U. Fullwood | — | Over $100,000 | |
| Amy Gutmann | — | Over $100,000 | |
| F. Joseph Loughrey | — | Over $100,000 | |
| Mark Loughridge | — | Over $100,000 | |
| Scott C. Malpass | — | Over $100,000 | |
| Deanna Mulligan | — | Over $100,000 | |
| André F. Perold | — | Over $100,000 | |
| Sarah Bloom Raskin | — | Over $100,000 | |
| Peter F. Volanakis | — | Over $100,000 | |
| Vanguard Real Estate II Index Fund | Mortimer J. Buckley | — | Over $100,000 |
| Emerson U. Fullwood | — | Over $100,000 | |
| Amy Gutmann | — | Over $100,000 | |
| F. Joseph Loughrey | — | Over $100,000 | |
| Mark Loughridge | — | Over $100,000 | |
| Scott C. Malpass | — | Over $100,000 | |
| Deanna Mulligan | — | Over $100,000 | |
| André F. Perold | — | Over $100,000 | |
| Sarah Bloom Raskin | — | Over $100,000 | |
| Peter F. Volanakis | — | Over $100,000 | |
| Vanguard Short-Term Federal Fund | Mortimer J. Buckley | — | Over $100,000 |
| Emerson U. Fullwood | — | Over $100,000 | |
| Amy Gutmann | — | Over $100,000 | |
| F. Joseph Loughrey | — | Over $100,000 | |
| Mark Loughridge | — | Over $100,000 | |
| Scott C. Malpass | — | Over $100,000 | |
| Deanna Mulligan | — | Over $100,000 | |
| André F. Perold | — | Over $100,000 | |
| Sarah Bloom Raskin | — | Over $100,000 | |
| Peter F. Volanakis | — | Over $100,000 | |
| Vanguard Short-Term Investment-Grade Fund | Mortimer J. Buckley | — | Over $100,000 |
| Emerson U. Fullwood | — | Over $100,000 | |
| Amy Gutmann | — | Over $100,000 | |
| F. Joseph Loughrey | — | Over $100,000 | |
| Mark Loughridge | Over $100,000 | Over $100,000 | |
| Scott C. Malpass | — | Over $100,000 | |
| Deanna Mulligan | — | Over $100,000 | |
| André F. Perold | — | Over $100,000 | |
| Sarah Bloom Raskin | — | Over $100,000 | |
| Peter F. Volanakis | — | Over $100,000 | |
| Vanguard Fund | Trustee | Dollar Range of Fund Shares Owned by Trustee | Aggregate Dollar Range of Vanguard Fund Shares Owned by Trustee |
| Vanguard Short-Term Treasury Fund | Mortimer J. Buckley | — | Over $100,000 |
| Emerson U. Fullwood | — | Over $100,000 | |
| Amy Gutmann | — | Over $100,000 | |
| F. Joseph Loughrey | — | Over $100,000 | |
| Mark Loughridge | — | Over $100,000 | |
| Scott C. Malpass | $1 – $10,000 | Over $100,000 | |
| Deanna Mulligan | — | Over $100,000 | |
| André F. Perold | — | Over $100,000 | |
| Sarah Bloom Raskin | — | Over $100,000 | |
| Peter F. Volanakis | — | Over $100,000 | |
| Vanguard Ultra-Short-Term Bond Fund | Mortimer J. Buckley | — | Over $100,000 |
| Emerson U. Fullwood | — | Over $100,000 | |
| Amy Gutmann | — | Over $100,000 | |
| F. Joseph Loughrey | — | Over $100,000 | |
| Mark Loughridge | — | Over $100,000 | |
| Scott C. Malpass | — | Over $100,000 | |
| Deanna Mulligan | Over $100,000 | Over $100,000 | |
| André F. Perold | — | Over $100,000 | |
| Sarah Bloom Raskin | — | Over $100,000 | |
| Peter F. Volanakis | — | Over $100,000 |
| Fund | Share Class | Owner and Address | Percentage of Ownership |
| Vanguard GNMA Fund | Investor Shares | CHARLES SCHWAB & CO INC SAN FRANCISCO, CA | 13.35% |
| VANGUARD STAR FUND VALLEY FORGE, PA | 36.31% | ||
| NATIONAL FINANCIAL SERVICES CORPORATION JERSEY CITY, NJ | 7.61% | ||
| Admiral Shares | CHARLES SCHWAB & CO INC SAN FRANCISCO, CA | 7.12% | |
| NATIONAL FINANCIAL SERVICES CORPORATION JERSEY CITY, NJ | 5.41% | ||
| Vanguard High-Yield Corporate Fund | Investor Shares | CHARLES SCHWAB & CO INC SAN FRANCISCO, CA | 15.34% |
| NATIONAL FINANCIAL SERVICES CORPORATION JERSEY CITY, NJ | 11.47% | ||
| Admiral Shares | CHARLES SCHWAB & CO INC SAN FRANCISCO, CA | 12.63% | |
| NATIONAL FINANCIAL SERVICES CORPORATION JERSEY CITY, NJ | 7.74% |
| Fund | Share Class | Owner and Address | Percentage of Ownership |
| Vanguard Intermediate-Term Investment-Grade Fund | Investor Shares | CHARLES SCHWAB & CO INC SAN FRANCISCO, CA | 15.00% |
| NATIONAL FINANCIAL SERVICES CORPORATION JERSEY CITY, NJ | 11.82% | ||
| Admiral Shares | CHARLES SCHWAB & CO INC SAN FRANCISCO, CA | 8.04% | |
| NATIONAL FINANCIAL SERVICES CORPORATION JERSEY CITY, NJ | 6.14% | ||
| Vanguard Intermediate-Term Treasury Fund | Investor Shares | CHARLES SCHWAB & CO INC SAN FRANCISCO, CA | 9.40% |
| NATIONAL FINANCIAL SERVICES CORPORATION JERSEY CITY, NJ | 8.84% | ||
| Admiral Shares | CHARLES SCHWAB & CO INC SAN FRANCISCO, CA | 5.29% | |
| NATIONAL FINANCIAL SERVICES CORPORATION JERSEY CITY, NJ | 12.50% | ||
| Vanguard Long-Term Investment-Grade Fund | Investor Shares | VANGUARD STAR FUND VALLEY FORGE, PA | 57.58% |
| VARIABLE ANNUITY LIFE INSURANCE COMPANY HOUSTON, TX | 7.61% | ||
| Admiral Shares | NATIONAL FINANCIAL SERVICES CORPORATION JERSEY CITY, NJ | 6.81% | |
| Vanguard Long-Term Treasury Fund | Investor Shares | CHARLES SCHWAB & CO INC SAN FRANCISCO, CA | 5.15% |
| VARIABLE ANNUITY LIFE INSURANCE COMPANY HOUSTON, TX | 22.83% | ||
| Admiral Shares | FIDELITY INVESTMENTS INSTITUTIONAL OPERATIONS CO COVINGTON, KY | 7.84% | |
| NATIONAL FINANCIAL SERVICES CORPORATION JERSEY CITY, NJ | 5.36% | ||
| Vanguard Real Estate II Index Fund | Institutional Plus Shares | VANGUARD REAL ESTATE INDEX FUND VALLEY FORGE, PA | 100% |
| Vanguard Short-Term Federal Fund | Investor Shares | CHARLES SCHWAB & CO INC SAN FRANCISCO, CA | 15.60% |
| NATIONAL FINANCIAL SERVICES CORPORATION JERSEY CITY, NJ | 14.40% | ||
| Admiral Shares | CHARLES SCHWAB & CO INC SAN FRANCISCO, CA | 7.65% | |
| JOHN HANCOCK LIFE INSURANCE CO BOSTON, MA | 6.33% | ||
| NATIONAL FINANCIAL SERVICES CORPORATION JERSEY CITY, NJ | 14.91% |
| Fund | Share Class | Owner and Address | Percentage of Ownership |
| Vanguard Short-Term Investment-Grade Fund | Institutional Shares | CHARLES SCHWAB & CO INC SAN FRANCISCO, CA | 5.53% |
| NATIONAL FINANCIAL SERVICES CORPORATION JERSEY CITY, NJ | 8.89% | ||
| STATE OF UTAH EDUCATIONAL SAVINGS PLAN SALT LAKE, UT | 9.65% | ||
| VCEP SHORT TERM BOND SELECT POOL #879 VALLEY FORGE, PA | 5.05% | ||
| Investor Shares | CHARLES SCHWAB & CO INC SAN FRANCISCO, CA | 13.72% | |
| VANGUARD STAR FUND VALLEY FORGE, PA | 34.57% | ||
| NATIONAL FINANCIAL SERVICES CORPORATION JERSEY CITY, NJ | 9.42% | ||
| Admiral Shares | CHARLES SCHWAB & CO INC SAN FRANCISCO, CA | 15.57% | |
| NATIONAL FINANCIAL SERVICES CORPORATION JERSEY CITY, NJ | 9.46% | ||
| Vanguard Short-Term Treasury Fund | Investor Shares | CHARLES SCHWAB & CO INC SAN FRANCISCO, CA | 20.29% |
| NATIONAL FINANCIAL SERVICES CORPORATION JERSEY CITY, NJ | 8.72% | ||
| Admiral Shares | CHARLES SCHWAB & CO INC SAN FRANCISCO, CA | 10.10% | |
| NATIONAL FINANCIAL SERVICES CORPORATION JERSEY CITY, NJ | 9.91% | ||
| Vanguard Ultra-Short-Term Bond Fund | Investor Shares | CHARLES SCHWAB & CO INC SAN FRANCISCO, CA | 15.67% |
| VANGUARD MANAGED PAYOUT FUND VALLEY FORGE, PA | 8.45% | ||
| NATIONAL FINANCIAL SERVICES CORPORATION JERSEY CITY, NJ | 12.34% | ||
| Admiral Shares | CHARLES SCHWAB & CO INC SAN FRANCISCO, CA | 11.08% | |
| NATIONAL FINANCIAL SERVICES CORPORATION JERSEY CITY, NJ | 12.41% |
| ■ | Wellington Management Company LLP (Wellington Management) provides investment advisory services to Vanguard GNMA Fund, Vanguard High-Yield Corporate Fund, and a portion of Vanguard Long-Term Investment-Grade Fund. |
| ■ | Vanguard provides investment advisory services to Vanguard Ultra-Short-Term Bond Fund, Vanguard Short-Term Treasury Fund, Vanguard Short-Term Federal Fund, Vanguard Short-Term Investment-Grade Fund, Vanguard Intermediate-Term Treasury Fund, Vanguard Intermediate-Term Investment-Grade Fund, Vanguard Long-Term Treasury Fund, Vanguard Real Estate II Index Fund, and a portion of Vanguard Long-Term Investment-Grade Fund. |
| Vanguard Fund | 2018 | 2019 | 2020 |
| GNMA Fund | $2,421,000 | $2,208,000 | $2,265,000 |
| High-Yield Corporate Fund | 7,046,000 | 6,965,000 | $7,379,000 |
| Portfolio Manager | No. of accounts | Total assets | No. of accounts with performance-based fees | Total assets in accounts with performance-based fees | |
| Michael F. Garrett | Registered investment companies1 | 14 | $28B | 1 | $25B |
| Other pooled investment vehicles | 33 | $6.3B | 1 | $49M | |
| Other accounts | 50 | $9.3B | 6 | $1.9B | |
| Joseph F. Marvan | Registered investment companies1 | 18 | $33.6B | 1 | $25B |
| Other pooled investment vehicles | 24 | $6.6B | 0 | $0 | |
| Other accounts | 70 | $35B | 1 | $860M | |
| Brian Conroy | Registered investment companies1 | 10 | $27.7B | 1 | $25B |
| Other pooled investment vehicles | 7 | $4.6B | 0 | $0 | |
| Other accounts | 16 | $7B | 1 | $1.9B | |
| Michael L. Hong | Registered investment companies2 | 12 | $28B | 1 | $27B |
| Other pooled investment vehicles | 8 | $4.4B | 0 | $0 | |
| Other accounts | 29 | $8B | 0 | $0 |
| 1 | Includes Vanguard GNMA Fund which held assets of $25 billion as of January 31, 2020. |
| 2 | Includes Vanguard High-Yield Corporate Fund which held assets of $27 billion as of January 31, 2020. |
| Portfolio Manager | No. of accounts | Total assets | No. of accounts with performance-based fees | Total assets in accounts with performance-based fees | |
| Scott I. St. John | Registered investment companies1 | 17 | $29B | 1 | $20.3B |
| Other pooled investment vehicles | 13 | $4.9B | 0 | $0 | |
| Other accounts | 96 | $47.4B | 4 | $1.5B |
| 1 | Includes Vanguard Long-Term Investment-Grade Fund which held assets of $20.3 billion as of January 31, 2020. |
| Portfolio Manager | No. of accounts | Total assets | No. of accounts with performance-based fees | Total assets in accounts with performance-based fees | |
| Samuel C. Martinez | Registered investment companies1 | 9 | $158B | 0 | $0 |
| Other pooled investment vehicles | 0 | $0 | 0 | $0 | |
| Other accounts | 0 | $0 | 0 | $0 | |
| Daniel Shaykevich | Registered investment companies1 | 10 | $159B | 0 | $0 |
| Other pooled investment vehicles | 0 | $0 | 0 | $0 | |
| Other accounts | 0 | $0 | 0 | $0 | |
| Arvind Narayanan | Registered investment companies1 | 8 | $158B | 0 | $0 |
| Other pooled investment vehicles | 0 | $0 | 0 | $0 | |
| Other accounts | 0 | $0 | 0 | $0 |
| 1 | Includes Vanguard Long-Term Investment-Grade Fund which held assets of $20.3 billion as of January 31, 2020. |
| Vanguard Fund | 2018 | 2019 | 2020 |
| Ultra-Short-Term Bond Fund | $406,000 | $561,000 | $852,000 |
| Short-Term Treasury Fund | 1,039,000 | 881,000 | $1,173,000 |
| Short-Term Federal Fund | 717,000 | 556,000 | $646,000 |
| Short-Term Investment-Grade Fund | 8,276,000 | 6,976,000 | $8,269,000 |
| Intermediate-Term Treasury Fund | 837,000 | 686,000 | $825,000 |
| Intermediate-Term Investment-Grade Fund | 3,813,000 | 3,413,000 | $4,225,000 |
| Long-Term Treasury Fund | 468,000 | 385,000 | $507,000 |
| Real Estate II Index Fund | 123,000 | 1,077,000 | $1,100,000 |
| Portfolio Manager | No. of accounts | Total assets | No. of accounts with performance-based fees | Total assets in accounts with performance-based fees | |
| Gemma Wright-Casparius | Registered investment companies1 | 5 | $72B | 0 | $0 |
| Other pooled investment vehicles | 0 | $0 | 0 | $0 | |
| Other accounts | 0 | $0 | 0 | $0 | |
| Samuel C. Martinez | Registered investment companies2 | 9 | $158B | 0 | $0 |
| Other pooled investment vehicles | 0 | $0 | 0 | $0 | |
| Other accounts | 0 | $0 | 0 | $0 | |
| Daniel Shaykevich | Registered investment companies2 | 10 | $159B | 0 | $0 |
| Other pooled investment vehicles | 0 | $0 | 0 | $0 | |
| Other accounts | 0 | $0 | 0 | $0 | |
| Brian W. Quigley | Registered investment companies3 | 4 | $37B | 0 | $0 |
| Other pooled investment vehicles | 0 | $0 | 0 | $0 | |
| Other accounts | 0 | $0 | 0 | $0 | |
| Walter Nejman | Registered investment companies4 | 50 | $1.9T | 0 | $0 |
| Other pooled investment vehicles | 2 | $2.5B | 0 | $0 | |
| Other accounts | 1 | $1B | 0 | $0 | |
| Gerard C. O’Reilly | Registered investment companies4 | 18 | $1.5T | 0 | $0 |
| Other pooled investment vehicles | 0 | $0 | 0 | $0 | |
| Other accounts | 1 | $464M | 0 | $0 | |
| Arvind Narayanan | Registered investment companies2 | 8 | $158B | 0 | $0 |
| Other pooled investment vehicles | 0 | $0 | 0 | $0 | |
| Other accounts | 0 | $0 | 0 | $0 |
| 1 | Includes Vanguard Short-Term Treasury Fund, Intermediate-Term Treasury Fund, and Long-Term Treasury Fund which held assets of $19.3 billion as of January 31, 2020. |
| 2 | Includes Vanguard Ultra-Short-Term Bond Fund, Short-Term Investment-Grade Fund, and Intermediate-Term Investment-Grade Fund which held assets of $117 billion as of January 31, 2020. |
| 3 | Includes Vanguard Short-Term Federal Fund which held assets of $5 billion as of January 31, 2020. |
| 4 | Includes Vanguard Real Estate II Index Fund which held assets of $7.8 billion as of January 31, 2020. |
| Vanguard Fund | Securities Lending Activities |
| Real Estate II Index Fund | |
| Gross income from securities lending activities | $543,375 |
| Fees paid to securities lending agent from a revenue split | $0 |
| Fees paid for any cash collateral management service (including fees deducted from a pooled cash collateral reinvestment vehicle) that are not included in the revenue split | $772 |
| Administrative fees not included in revenue split | $5,950 |
| Indemnification fee not included in revenue split | $0 |
| Rebate (paid to borrower) | $119,863 |
| Other fees not included in revenue split (specify) | $0 |
| Aggregate fees/compensation for securities lending activities | $126,585 |
| Net income from securities lending activities | $416,790 |
| Vanguard Fund | 2018 | 2019 | 2020 |
| GNMA Fund | $665,000 | $845,000 | $808,000 |
| High-Yield Corporate Fund | — | — | — |
| Intermediate-Term Investment-Grade Fund | 1,303,000 | 1,177,000 | 1,151,000 |
| Intermediate-Term Treasury Fund | 295,000 | 356,000 | 329,000 |
| Long-Term Investment-Grade Fund | 358,000 | 279,000 | 218,000 |
| Long-Term Treasury Fund | 143,000 | 173,000 | 167,000 |
| Real Estate II Index Fund1 | — | 230,000 | 93,000 |
| Short-Term Federal Fund | 386,000 | 327,000 | 396,000 |
| Short-Term Investment-Grade Fund | 2,523,000 | 2,302,000 | 1,562,000 |
| Short-Term Treasury Fund | 452,000 | 490,000 | 426,000 |
| Ultra-Short-Term Bond Fund | 40,000 | 50,000 | 97,000 |
| Vanguard Fund | Regular Broker or Dealer (or Parent) | Aggregate Holdings |
| Vanguard GNMA Fund | Banc of America Securities LLC | $29,000,000 |
| Barclays Capital Inc. | 62,900,000 | |
| Citigroup Global Markets Inc. | 58,600,000 | |
| HSBC Securities (USA) Inc. | 253,800,000 | |
| Societe Generale | 296,500,000 | |
| Wells Fargo Securities, LLC | 98,400,000 | |
| Vanguard High-Yield Corporate Fund | Banc of America Securities LLC | 267,700,000 |
| Barclays Capital Inc. | 45,733,000 | |
| J.P. Morgan Securities Inc. | 186,300,000 | |
| RBC Capital Markets | 242,200,000 | |
| TORONTO DOMINION SECURITIES INC | 282,900,000 | |
| Vanguard Intermediate-Term Investment-Grade Fund | Barclays Capital Inc. | 33,645,000 |
| BNP Paribas Securities Corp. | 92,090,000 | |
| Citigroup Global Markets Inc. | 626,005,000 | |
| Goldman, Sachs & Co. | 315,634,000 | |
| J.P. Morgan Securities Inc. | 778,915,000 | |
| Merrill Lynch, Pierce, Fenner & Smith Inc. | 444,444,000 | |
| Morgan Stanley | 861,980,000 | |
| RBC Capital Markets | 156,996,000 | |
| Wells Fargo Securities, LLC | 785,290,000 | |
| Vanguard Intermediate-Term Treasury Fund | — | — |
| Vanguard Long-Term Investment-Grade Fund | Barclays Capital Inc. | 16,300,000 |
| Citigroup Global Markets Inc. | 385,830,000 | |
| Deutsche Bank Securities Inc. | 3,272,000 | |
| Goldman, Sachs & Co. | 293,150,000 | |
| HSBC Securities (USA) Inc. | 149,737,000 | |
| J.P. Morgan Securities Inc. | 579,791,000 | |
| Merrill Lynch, Pierce, Fenner & Smith Inc. | 449,281,000 | |
| Morgan Stanley | 317,664,000 | |
| RBC Capital Markets | 82,400,000 | |
| Wells Fargo Securities, LLC | 715,652,000 | |
| Vanguard Long-Term Treasury Fund | — | — |
| Vanguard Real Estate II Index Fund | — | — |
| Vanguard Short-Term Federal Fund | — | — |
| Vanguard Short-Term Investment-Grade Fund | Barclays Capital Inc. | 114,327,000 |
| BNP Paribas Securities Corp. | 58,501,000 | |
| Citigroup Global Markets Inc. | 1,080,716,000 | |
| Credit Suisse Securities (USA) LLC | 251,452,000 | |
| Deutsche Bank Securities Inc. | 111,713,000 | |
| Goldman, Sachs & Co. | 908,020,000 | |
| J.P. Morgan Securities Inc. | 1,711,100,000 | |
| Merrill Lynch, Pierce, Fenner & Smith Inc. | 766,838,000 | |
| Morgan Stanley | 1,649,971,000 | |
| Wells Fargo Securities, LLC | 2,269,881,000 | |
| Vanguard Short-Term Treasury Fund | — | — |
| Vanguard Fund | Regular Broker or Dealer (or Parent) | Aggregate Holdings |
| Vanguard Ultra-Short-Term Bond Fund | Citigroup Global Markets Inc. | 20,179,000 |
| Goldman, Sachs & Co. | 65,668,000 | |
| HSBC Securities (USA) Inc. | 54,326,000 | |
| J.P. Morgan Securities Inc. | 23,798,000 | |
| Merrill Lynch, Pierce, Fenner & Smith Inc. | 65,159,000 | |
| Morgan Stanley | 66,013,000 | |
| RBC Capital Markets | 53,963,000 |
| ■ | The subject of the vote and whether, based on our knowledge and experience, we believe the topic is potentially material to the corporate governance and/or long-term performance of the company; |
| ■ | The Vanguard funds' individual and/or aggregate equity investment in a company, and whether we estimate that voting Vanguard funds' shares would affect the shareholder meeting outcome; and |
| ■ | The long-term impact to our fund shareholders, evaluating whether we believe the benefits of voting a company's shares would outweigh the benefits of stock lending revenues in a particular instance. |
| ■ | Generally, issues for which explicit proxy voting guidance is provided in the Guidelines (i.e., “For”, “Against”, “Abstain”) are reviewed by Investment Research and voted in accordance with the Guidelines. |
| ■ | Issues identified as “case-by-case” in the Guidelines are further reviewed by Investment Research. In certain circumstances, further input is needed, so the issues are forwarded to the relevant research analyst and/or portfolio manager(s) for their input. |
| ■ | Absent a material conflict of interest, the portfolio manager has the authority to decide the final vote. Different portfolio managers holding the same securities may arrive at different voting conclusions for their clients' proxies. |
| (a) | Articles of Incorporation, Amended and Restated Agreement and Declaration of Trust, filed with Post-Effective Amendment No. 123, dated May 28, 2019, is hereby incorporated by reference. |
| (b) | By-Laws, Amended and Restated By-Laws, filed with Post-Effective Amendment No. 121, dated May 24, 2018, are hereby incorporated by reference. |
| (c) | Instruments Defining Rights of Security Holders, reference is made to Articles III and V of the Registrant’s Amended and Restated Agreement and Declaration of Trust, refer to Exhibit (a) above. |
| (d) | Investment Advisory Contracts, for Wellington Management Company LLP (with respect to Vanguard GNMA Fund, Vanguard Long-Term Investment-Grade Fund, and Vanguard High-Yield Corporate Fund), filed with Post-Effective Amendment No. 94 dated May 30, 2012, is hereby incorporated by reference. The Vanguard Group, Inc., provides investment advisory services to Vanguard Ultra-Short-Term Bond Fund, Vanguard Short-Term Treasury Fund, Vanguard Short-Term Federal Fund, Vanguard Short-Term Investment-Grade Fund, Vanguard Intermediate-Term Treasury Fund, Vanguard Intermediate-Term Investment-Grade Fund, Vanguard Long-Term Treasury Fund, Vanguard Long-Term Investment-Grade Fund, and Vanguard Real Estate II Index Fund pursuant to the Fifth Amended and Restated Funds’ Service Agreement, refer to Exhibit (h) below. |
| (e) | Underwriting Contracts, not applicable. |
| (f) | Bonus or Profit Sharing Contracts, reference is made to the section entitled “Management of the Funds” in Part B of this Registration Statement. |
| (g) | Custodian Agreements, for Bank of New York Mellon, filed with Post-Effective Amendment No. 123, dated May 28, 2019, is hereby incorporated by reference; for JPMorgan Chase and State Street Bank and Trust Company, are filed herewith. |
| (h) | Other Material Contracts, Fifth Amended and Restated Funds’ Service Agreement, is filed herewith. |
| (i) | Legal Opinion, not applicable. |
| (j) | Other Opinions, Consent of Independent Registered Public Accounting Firm, is filed herewith. |
| (k) | Omitted Financial Statements, not applicable. |
| (l) | Initial Capital Agreements, not applicable. |
| (m) | Rule 12b-1 Plan, not applicable. |
| (n) | Rule 18f-3 Plan, is filed herewith. |
| (o) | Reserved. |
| (p) | Codes of Ethics, for The Vanguard Group, Inc., filed with Post -Effective Amendment No. 123, dated May 28, 2019; and for Wellington Management Company LLP, filed with Post -Effective Amendment No. 121, dated May 24, 2018, are hereby incorporated by reference. |
| (a) | Vanguard Marketing Corporation, a wholly owned subsidiary of The Vanguard Group, Inc., is the principal underwriter of each fund within the Vanguard group of investment companies, a family of over 200 funds. |
| (b) | The principal business address of each named director and officer of Vanguard Marketing Corporation is 100 Vanguard Boulevard, Malvern, PA 19355. |
| Name | Positions and Office with Underwriter | Positions and Office with Funds | ||
| Karin A. Risi | Chairman, Director, Principal, and Chief Executive Officer Designee | None | ||
| Scott A. Conking | Director and Principal | None | ||
| Christopher D. McIsaac | Director and Principal | None | ||
| Thomas M. Rampulla | Director and Principal | None | ||
| Michael Rollings | Director and Principal | Finance Director | ||
| Caroline Cosby | Director, Principal, General Counsel, and Assistant Secretary | None | ||
| Mortimer J. Buckley | President | Chairman of the Board of Trustees, Chief Executive Officer, and President | ||
| John E. Schadl | Assistant Vice President | Chief Compliance Officer | ||
| Beth Morales Singh | Secretary | None | ||
| Angela Gravinese | Chief Compliance Officer | None | ||
| John T. Marcante | Chief Information Officer | None | ||
| Alonzo Ellis | Chief Information Security Officer | None | ||
| Salvatore L. Pantalone | Financial and Operations Principal and Treasurer | None | ||
| Amy M. Laursen | Financial and Operations Principal | None | ||
| Danielle Corey | Annuity and Insurance Officer | None | ||
| Jeff Seglem | Annuity and Insurance Officer | None | ||
| Matthew Benchener | Principal | None |
| Name | Positions and Office with Underwriter | Positions and Office with Funds | ||
| John Bendl | Principal | Chief Financial Officer | ||
| Saundra K. Cusumano | Principal | None | ||
| James M. Delaplane Jr. | Principal | None | ||
| Andrew Kadjeski | Principal | None | ||
| Martha G. King | Principal | None | ||
| Michael V. Lucci | Principal | None | ||
| Brian P. McCarthy | Principal | None | ||
| James M. Norris | Principal | None | ||
| Douglas R. Mento | Principal | None | ||
| David Petty | Principal | None |
| (c) | Not applicable. |
| BY: | /s/ Mortimer J. Buckley* |
| Signature | Title | Date |
| /s/ Mortimer J. Buckley* Mortimer J. Buckley | Chairman and Chief Executive Officer | May 28, 2020 |
| /s/ Emerson U. Fullwood* Emerson U. Fullwood | Trustee | May 28, 2020 |
| /s/ Amy Gutmann* Amy Gutmann | Trustee | May 28, 2020 |
| /s/ Joseph Loughrey* Joseph Loughrey | Trustee | May 28, 2020 |
| /s/ Mark Loughridge* Mark Loughridge | Trustee | May 28, 2020 |
| /s/ Scott C. Malpass* Scott C. Malpass | Trustee | May 28, 2020 |
| /s/ Deanna Mulligan* Deanna Mulligan | Trustee | May 28, 2020 |
| /s/ André F. Perold* André F. Perold | Trustee | May 28, 2020 |
| /s/ Sarah Bloom Raskin* Sarah Bloom Raskin | Trustee | May 28, 2020 |
| /s/ Peter F. Volanakis* Peter F. Volanakis | Trustee | May 28, 2020 |
| /s/ John Bendl* John Bendl | Chief Financial Officer | May 28, 2020 |