|
| |
|
Sales Charge (Load) Imposed on Purchases |
|
|
Purchase Fee |
|
|
Sales Charge (Load) Imposed on Reinvested Dividends |
|
|
Redemption Fee |
|
|
Account Service Fee Per Year
(for certain fund account balances below $10,000) |
$ |
|
| |
|
Management Fees |
|
|
12b-1 Distribution Fee |
|
|
Other Expenses |
|
|
Acquired Fund Fees and Expenses |
|
|
Total Annual Fund Operating Expenses |
|
|
1 Year |
3 Years |
5 Years |
10 Years |
|
$ |
$ |
$ |
$ |
|
|
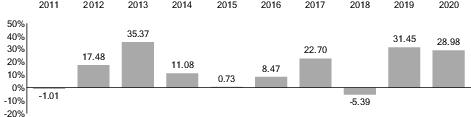
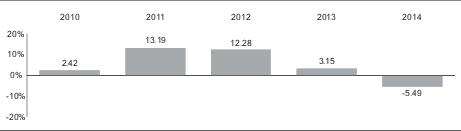
Total Return |
Quarter |
|
|
|
|
|
|
- |
|
|
|
1 Year |
5 Years |
10 Years |
|
Vanguard Diversified Equity Fund Investor Shares |
|
|
|
|
Return Before Taxes |
28.98% |
16.38% |
14.16% |
|
Return After Taxes on Distributions |
27.18 |
14.56 |
12.76 |
|
Return After Taxes on Distributions and Sale of Fund Shares |
18.25 |
12.72 |
11.44 |
|
Comparative Indexes
(reflect no deduction for fees, expenses, or taxes) |
|
|
|
|
MSCI US Broad Market Index |
21.02% |
15.46% |
13.84% |
|
Dow Jones U.S. Total Stock Market Float Adjusted Index |
20.79 |
15.36 |
13.74 |
symbol throughout the prospectus. It is used to mark detailed information about the more significant risks that you would confront as a Fund shareholder. To highlight terms and concepts important to mutual fund investors, we have provided Plain Talk® explanations along the way. Reading the prospectus will help you decide whether the Fund is the right investment for you. We suggest that you keep this prospectus for future reference. |
Plain Talk About Costs of Investing |
|
Costs are an important consideration in choosing a mutual fund. That is
because you, as a shareholder, pay a proportionate share of the costs of
operating a fund and any transaction costs incurred when the fund buys or
sells securities. These costs can erode a substantial portion of the gross
income or the capital appreciation a fund achieves. Even seemingly small
differences in expenses can, over time, have a dramatic effect on a
fund’s performance. |
|
Plain Talk About Growth Funds and Value Funds |
|
Growth investing and value investing are two styles employed by stock-fund
managers. Growth funds generally invest in stocks of companies believed to
have above-average potential for growth in revenue, earnings, cash flow, or
other similar criteria. These stocks typically have low dividend yields, if any,
and above-average prices in relation to measures such as earnings and book
value. Value funds typically invest in stocks whose prices are below average
in relation to those measures; these stocks often have above-average
dividend yields. Value stocks also may remain undervalued by the market for
long periods of time. Growth and value stocks have historically produced
similar long-term returns, though each category has periods when it
outperforms the other. |
|
Plain Talk About Vanguard’s Unique Corporate Structure |
|
The Vanguard Group is owned jointly by the funds it oversees and thus
indirectly by the shareholders in those funds. Most other mutual funds are
operated by management companies that are owned by third parties—either
public or private stockholders—and not by the funds they serve. |
|
Plain Talk About Buying a Dividend |
|
Unless you are a tax-exempt investor or investing through a tax-advantaged
account (such as an IRA or an employer-sponsored retirement or savings
plan), you should consider avoiding a purchase of fund shares shortly before
the fund makes a distribution, because doing so can cost you money in
taxes. This is known as “buying a dividend.” For example: On December 15,
you invest $5,000, buying 250 shares for $20 each. If the fund pays a
distribution of $1 per share on December 16, its share price will drop to $19
(not counting market change). You still have only $5,000 (250 shares x $19 =
$4,750 in share value, plus 250 shares x $1 = $250 in distributions), but you
owe tax on the $250 distribution you received—even if you reinvest it in
more shares. To avoid buying a dividend, check a fund’s distribution schedule
before you invest. |
|
|
Year Ended October 31, | ||||
|
For a Share Outstanding Throughout Each Period |
2020 |
2019 |
2018 |
2017 |
2016 |
|
Net Asset Value, Beginning of Period |
$37.95 |
$35.88 |
$35.57 |
$30.76 |
$33.15 |
|
Investment Operations |
|
|
|
|
|
|
Net Investment Income |
0.4521 |
0.4551 |
0.3951 |
0.4281 |
0.397 |
|
Capital Gain Distributions Received |
1.8661 |
3.0871 |
1.6861 |
1.0641 |
0.860 |
|
Net Realized and Unrealized Gain (Loss) on Investments |
3.447 |
0.575 |
0.206 |
5.627 |
(0.836) |
|
Total from Investment Operations |
5.765 |
4.117 |
2.287 |
7.119 |
0.421 |
|
Distributions |
|
|
|
|
|
|
Dividends from Net Investment Income |
(0.369) |
(0.383) |
(0.358) |
(0.414) |
(0.362) |
|
Distributions from Realized Capital Gains |
(2.366) |
(1.664) |
(1.619) |
(1.895) |
(2.449) |
|
Total Distributions |
(2.735) |
(2.047) |
(1.977) |
(2.309) |
(2.811) |
|
Net Asset Value, End of Period |
$40.98 |
$37.95 |
$35.88 |
$35.57 |
$30.76 |
|
Total Return2 |
15.73% |
12.82% |
6.55% |
24.47% |
1.39% |
|
Ratios/Supplemental Data |
|
|
|
|
|
|
Net Assets, End of Period (Millions) |
$1,919 |
$1,789 |
$1,709 |
$1,439 |
$1,276 |
|
Ratio of Total Expenses to Average Net Assets |
— |
— |
— |
— |
— |
|
Acquired Fund Fees and Expenses |
0.35% |
0.35% |
0.36% |
0.36% |
0.36% |
|
Ratio of Net Investment Income to Average Net Assets |
1.19% |
1.27% |
1.07% |
1.31% |
1.26% |
|
Portfolio Turnover Rate |
14% |
9% |
8% |
5% |
9% |
|
Web |
|
|
Vanguard.com |
For the most complete source of Vanguard news
For fund, account, and service information
For most account transactions
For literature requests
24 hours a day, 7 days a week |
|
Phone | |
|
Vanguard Tele-Account®
800-662-6273 |
For automated fund and account information
Toll-free, 24 hours a day, 7 days a week |
|
Investor Information 800-662-7447
(Text telephone for people with
hearing impairment at 800-749-7273) |
For fund and service information
For literature requests |
|
Client Services 800-662-2739
(Text telephone for people with
hearing impairment at 800-749-7273) |
For account information
For most account transactions |
|
Participant Services 800-523-1188
(Text telephone for people with
hearing impairment at 800-749-7273) |
For information and services for participants in
employer-sponsored plans |
|
Institutional Division
888-809-8102 |
For information and services for large institutional
investors |
|
Financial Advisor and Intermediary
Sales Support 800-997-2798 |
For information and services for financial intermediaries
including financial advisors, broker-dealers, trust
institutions, and insurance companies |
|
Financial Advisory and Intermediary
Trading Support 800-669-0498 |
For account information and trading support for
financial intermediaries including financial advisors,
broker-dealers, trust institutions, and insurance
companies |
|
|
Inception
Date |
Newspaper
Abbreviation |
Vanguard
Fund Number |
CUSIP
Number |
|
Diversified Equity Fund |
6/10/2005 |
DivEqInv |
608 |
921939401 |
|
| |
|
Sales Charge (Load) Imposed on Purchases |
|
|
Purchase Fee |
|
|
Sales Charge (Load) Imposed on Reinvested Dividends |
|
|
Redemption Fee |
|
|
Account Service Fee Per Year
(for certain fund account balances below $10,000) |
$ |
|
| |
|
Management Fees |
|
|
12b-1 Distribution Fee |
|
|
Other Expenses |
|
|
Total Annual Fund Operating Expenses |
|
|
1 Year |
3 Years |
5 Years |
10 Years |
|
$ |
$ |
$ |
$ |
|
|
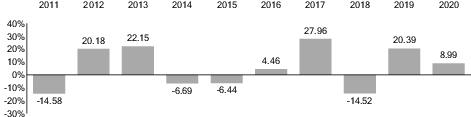
Total Return |
Quarter |
|
|
|
|
|
|
- |
|
|
|
1 Year |
5 Years |
10 Years |
|
Vanguard International Value Fund Investor Shares |
|
|
|
|
Return Before Taxes |
8.99% |
8.43% |
5.08% |
|
Return After Taxes on Distributions |
8.63 |
7.72 |
4.46 |
|
Return After Taxes on Distributions and Sale of Fund Shares |
5.66 |
6.58 |
3.97 |
|
MSCI ACWI ex USA Index
(reflects no deduction for fees or expenses) |
10.65% |
8.93% |
4.92% |
symbol throughout the prospectus. It is used to mark detailed information about the more significant risks that you would confront as a Fund shareholder. To highlight terms and concepts important to mutual fund investors, we have provided Plain Talk® explanations along the way. Reading the prospectus will help you decide whether the Fund is the right investment for you. We suggest that you keep this prospectus for future reference. |
Plain Talk About Fund Expenses |
|
All mutual funds have operating expenses. These expenses, which are
deducted from a fund’s gross income, are expressed as a percentage of the
net assets of the fund. Assuming that operating expenses remain as stated
in the Fees and Expenses section, Vanguard International Value Fund’s
expense ratio would be 0.35%, or $3.50 per $1,000 of average net assets.
The average expense ratio for international funds in 2019 was 1.26%, or
$12.60 per $1,000 of average net assets (derived from data provided by
Lipper, a Thomson Reuters Company, which reports on the mutual
fund industry). |
|
Plain Talk About Costs of Investing |
|
Costs are an important consideration in choosing a mutual fund. That is
because you, as a shareholder, pay a proportionate share of the costs of
operating a fund and any transaction costs incurred when the fund buys or
sells securities. These costs can erode a substantial portion of the gross
income or the capital appreciation a fund achieves. Even seemingly small
differences in expenses can, over time, have a dramatic effect on a
fund’s performance. |
|
Plain Talk About International Investing |
|
U.S. investors who invest in foreign securities will encounter risks not
typically associated with U.S. companies because foreign stock and bond
markets operate differently from the U.S. markets. For instance, foreign
companies and governments may not be subject to the same or similar
accounting, auditing, legal, tax, and financial reporting standards and
practices as U.S. companies and the U.S. government, and their stocks and
bonds may not be as liquid as those of similar U.S. entities. In addition,
foreign stock exchanges, brokers, companies, bond markets, and dealers
may be subject to less government supervision and regulation than their
counterparts in the United States. These factors, among others, could
negatively affect the returns U.S. investors receive from foreign investments. |
|
Plain Talk About Growth Funds and Value Funds |
|
Growth investing and value investing are two styles employed by stock-fund
managers. Growth funds generally invest in stocks of companies believed to
have above-average potential for growth in revenue, earnings, cash flow, or
other similar criteria. These stocks typically have low dividend yields, if any,
and above-average prices in relation to measures such as earnings and book
value. Value funds typically invest in stocks whose prices are below average
in relation to those measures; these stocks often have above-average
dividend yields. Value stocks also may remain undervalued by the market for
long periods of time. Growth and value stocks have historically produced
similar long-term returns, though each category has periods when it
outperforms the other. |
|
Plain Talk About Derivatives |
|
Derivatives can take many forms. Some forms of derivatives—such as
exchange-traded futures and options on securities, commodities, or
indexes—have been trading on regulated exchanges for decades. These
types of derivatives are standardized contracts that can easily be bought and
sold and whose market values are determined and published daily. On the
other hand, non-exchange-traded derivatives—such as certain swap
agreements and foreign currency exchange forward contracts—tend to be
more specialized or complex and may be more difficult to accurately value. |
|
Plain Talk About Vanguard’s Unique Corporate Structure |
|
The Vanguard Group is owned jointly by the funds it oversees and thus
indirectly by the shareholders in those funds. Most other mutual funds are
operated by management companies that are owned by third parties—either
public or private stockholders—and not by the funds they serve. |
|
Plain Talk About Distributions |
|
As a shareholder, you are entitled to your portion of a fund’s income from
interest and dividends as well as capital gains from the fund’s sale of
investments. Income consists of both the dividends that the fund earns from
any stock holdings and the interest it receives from any money market and
bond investments. Capital gains are realized whenever the fund sells
securities for higher prices than it paid for them. These capital gains are
either short-term or long-term, depending on whether the fund held the
securities for one year or less or for more than one year. |
|
Plain Talk About Buying a Dividend |
|
Unless you are a tax-exempt investor or investing through a tax-advantaged
account (such as an IRA or an employer-sponsored retirement or savings
plan), you should consider avoiding a purchase of fund shares shortly before
the fund makes a distribution, because doing so can cost you money in
taxes. This is known as “buying a dividend.” For example: On December 15,
you invest $5,000, buying 250 shares for $20 each. If the fund pays a
distribution of $1 per share on December 16, its share price will drop to $19
(not counting market change). You still have only $5,000 (250 shares x $19 =
$4,750 in share value, plus 250 shares x $1 = $250 in distributions), but you
owe tax on the $250 distribution you received—even if you reinvest it in
more shares. To avoid buying a dividend, check a fund’s distribution schedule
before you invest. |
|
|
Year Ended October 31, | ||||
|
For a Share Outstanding Throughout Each Period |
2020 |
2019 |
2018 |
2017 |
2016 |
|
Net Asset Value, Beginning of Period |
$36.63 |
$35.86 |
$39.26 |
$32.30 |
$33.22 |
|
Investment Operations |
|
|
|
|
|
|
Net Investment Income |
0.6841 |
1.1041 |
0.9501 |
0.7811 |
0.721 |
|
Net Realized and Unrealized Gain (Loss) on
Investments |
(3.723) |
1.669 |
(3.607) |
6.905 |
(0.979) |
|
Total from Investment Operations |
(3.039) |
2.773 |
(2.657) |
7.686 |
(0.258) |
|
Distributions |
|
|
|
|
|
|
Dividends from Net Investment Income |
(1.111) |
(0.943) |
(0.743) |
(0.726) |
(0.662) |
|
Distributions from Realized Capital Gains |
— |
(1.060) |
— |
— |
— |
|
Total Distributions |
(1.111) |
(2.003) |
(0.743) |
(0.726) |
(0.662) |
|
Net Asset Value, End of Period |
$32.48 |
$36.63 |
$35.86 |
$39.26 |
$32.30 |
|
Total Return2 |
–8.69% |
8.48% |
–6.95% |
24.33% |
–0.67% |
|
Ratios/Supplemental Data |
|
|
|
|
|
|
Net Assets, End of Period (Millions) |
$9,408 |
$10,360 |
$9,524 |
$9,964 |
$7,873 |
|
Ratio of Total Expenses to Average Net Assets3 |
0.35% |
0.37% |
0.38% |
0.40% |
0.43% |
|
Ratio of Net Investment Income to Average Net
Assets |
2.05% |
3.15% |
2.41% |
2.21% |
2.29% |
|
Portfolio Turnover Rate |
72% |
38% |
28% |
34% |
30% |
|
Web |
|
|
Vanguard.com |
For the most complete source of Vanguard news
For fund, account, and service information
For most account transactions
For literature requests
24 hours a day, 7 days a week |
|
Phone | |
|
Vanguard Tele-Account®
800-662-6273 |
For automated fund and account information
Toll-free, 24 hours a day, 7 days a week |
|
Investor Information 800-662-7447
(Text telephone for people with
hearing impairment at 800-749-7273) |
For fund and service information
For literature requests |
|
Client Services 800-662-2739
(Text telephone for people with
hearing impairment at 800-749-7273) |
For account information
For most account transactions |
|
Participant Services 800-523-1188
(Text telephone for people with
hearing impairment at 800-749-7273) |
For information and services for participants in
employer-sponsored plans |
|
Institutional Division
888-809-8102 |
For information and services for large institutional
investors |
|
Financial Advisor and Intermediary
Sales Support 800-997-2798 |
For information and services for financial intermediaries
including financial advisors, broker-dealers, trust
institutions, and insurance companies |
|
Financial Advisory and Intermediary
Trading Support 800-669-0498 |
For account information and trading support for
financial intermediaries including financial advisors,
broker-dealers, trust institutions, and insurance
companies |
|
|
Inception Date |
Newspaper
Abbreviation |
Vanguard
Fund Number |
CUSIP
Number |
|
International Value Fund |
5/16/1983 |
IntlVal |
46 |
921939203 |
|
| |
|
Sales Charge (Load) Imposed on Purchases |
|
|
Purchase Fee |
|
|
Sales Charge (Load) Imposed on Reinvested Dividends |
|
|
Redemption Fee |
|
|
Account Service Fee Per Year
(for certain fund account balances below $10,000) |
$ |
|
| |
|
Management Fees |
|
|
12b-1 Distribution Fee |
|
|
Other Expenses |
|
|
Total Annual Fund Operating Expenses |
|
|
1 Year |
3 Years |
5 Years |
10 Years |
|
$ |
$ |
$ |
$ |
|
|
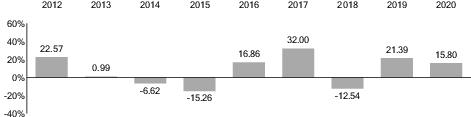
Total Return |
Quarter |
|
|
|
|
|
|
- |
|
|
|
1 Year |
5 Years |
Since
Inception
(Jun. 27,
2011) |
|
Vanguard Emerging Markets Select Stock Fund
Investor Shares |
|
|
|
|
Return Before Taxes |
15.80% |
13.66% |
4.58% |
|
Return After Taxes on Distributions |
15.64 |
13.29 |
4.29 |
|
Return After Taxes on Distributions and Sale of Fund Shares |
9.68 |
10.98 |
3.63 |
|
Comparative Indexes
(reflect no deduction for fees or expenses) |
|
|
|
|
FTSE Emerging Index |
15.17% |
12.40% |
4.03% |
|
MSCI ACWI ex USA Index |
10.65 |
8.93 |
5.22 |
symbol throughout the prospectus. It is used to mark detailed information about the more significant risks that you would confront as a Fund shareholder. To highlight terms and concepts important to mutual fund investors, we have provided Plain Talk® explanations along the way. Reading the prospectus will help you decide whether the Fund is the right investment for you. We suggest that you keep this prospectus for future reference. |
Plain Talk About Fund Expenses |
|
All mutual funds have operating expenses. These expenses, which are
deducted from a fund’s gross income, are expressed as a percentage of the
net assets of the fund. Assuming that operating expenses remain as stated
in the Fees and Expenses section, Vanguard Emerging Markets Select Stock
Fund’s expense ratio would be 0.85%, or $8.50 per $1,000 of average net
assets. The average expense ratio for emerging markets funds in 2019 was
1.34%, or $13.40 per $1,000 of average net assets (derived from data
provided by Lipper, a Thomson Reuters Company, which reports on the
mutual fund industry). |
|
Plain Talk About Costs of Investing |
|
Costs are an important consideration in choosing a mutual fund. That is
because you, as a shareholder, pay a proportionate share of the costs of
operating a fund and any transaction costs incurred when the fund buys or
sells securities. These costs can erode a substantial portion of the gross
income or the capital appreciation a fund achieves. Even seemingly small
differences in expenses can, over time, have a dramatic effect on a
fund’s performance. |
|
Plain Talk About International Investing |
|
U.S. investors who invest in foreign securities will encounter risks not
typically associated with U.S. companies because foreign stock and bond
markets operate differently from the U.S. markets. For instance, foreign
companies and governments may not be subject to the same or similar
accounting, auditing, legal, tax, and financial reporting standards and
practices as U.S. companies and the U.S. government, and their stocks and
bonds may not be as liquid as those of similar U.S. entities. In addition,
foreign stock exchanges, brokers, companies, bond markets, and dealers
may be subject to less government supervision and regulation than their
counterparts in the United States. These factors, among others, could
negatively affect the returns U.S. investors receive from foreign investments. |
|
Plain Talk About Derivatives |
|
Derivatives can take many forms. Some forms of derivatives—such as
exchange-traded futures and options on securities, commodities, or
indexes—have been trading on regulated exchanges for decades. These
types of derivatives are standardized contracts that can easily be bought and
sold and whose market values are determined and published daily. On the
other hand, non-exchange-traded derivatives—such as certain swap
agreements and foreign currency exchange forward contracts—tend to be
more specialized or complex and may be more difficult to accurately value. |
|
Plain Talk About Vanguard’s Unique Corporate Structure |
|
The Vanguard Group is owned jointly by the funds it oversees and thus
indirectly by the shareholders in those funds. Most other mutual funds are
operated by management companies that are owned by third parties—either
public or private stockholders—and not by the funds they serve. |
|
Plain Talk About Distributions |
|
As a shareholder, you are entitled to your portion of a fund’s income from
interest and dividends as well as capital gains from the fund’s sale of
investments. Income consists of both the dividends that the fund earns from
any stock holdings and the interest it receives from any money market and
bond investments. Capital gains are realized whenever the fund sells
securities for higher prices than it paid for them. These capital gains are
either short-term or long-term, depending on whether the fund held the
securities for one year or less or for more than one year. |
|
Plain Talk About Buying a Dividend |
|
Unless you are a tax-exempt investor or investing through a tax-advantaged
account (such as an IRA or an employer-sponsored retirement or savings
plan), you should consider avoiding a purchase of fund shares shortly before
the fund makes a distribution, because doing so can cost you money in
taxes. This is known as “buying a dividend.” For example: On December 15,
you invest $5,000, buying 250 shares for $20 each. If the fund pays a
distribution of $1 per share on December 16, its share price will drop to $19
(not counting market change). You still have only $5,000 (250 shares x $19 =
$4,750 in share value, plus 250 shares x $1 = $250 in distributions), but you
owe tax on the $250 distribution you received—even if you reinvest it in
more shares. To avoid buying a dividend, check a fund’s distribution schedule
before you invest. |
|
|
Year Ended October 31, | ||||
|
For a Share Outstanding Throughout Each Period |
2020 |
2019 |
2018 |
2017 |
2016 |
|
Net Asset Value, Beginning of Period |
$21.87 |
$19.68 |
$22.56 |
$18.27 |
$16.48 |
|
Investment Operations |
|
|
|
|
|
|
Net Investment Income |
0.2981 |
0.4741,2 |
0.4141 |
0.4131 |
0.234 |
|
Net Realized and Unrealized Gain (Loss) on
Investments |
0.483 |
2.208 |
(2.943) |
4.129 |
1.840 |
|
Total from Investment Operations |
0.781 |
2.682 |
(2.529) |
4.542 |
2.074 |
|
Distributions |
|
|
|
|
|
|
Dividends from Net Investment Income |
(0.471) |
(0.492) |
(0.351) |
(0.252) |
(0.284) |
|
Distributions from Realized Capital Gains |
— |
— |
— |
— |
— |
|
Total Distributions |
(0.471) |
(0.492) |
(0.351) |
(0.252) |
(0.284) |
|
Net Asset Value, End of Period |
$22.18 |
$21.87 |
$19.68 |
$22.56 |
$18.27 |
|
Total Return3 |
3.51% |
13.96% |
–11.39% |
25.28% |
12.95% |
|
Ratios/Supplemental Data |
|
|
|
|
|
|
Net Assets, End of Period (Millions) |
$670 |
$702 |
$564 |
$646 |
$339 |
|
Ratio of Total Expenses to Average Net Assets4 |
0.85% |
0.93% |
0.94% |
0.92% |
0.90% |
|
Ratio of Net Investment Income to Average Net
Assets |
1.43% |
2.25%2 |
1.85% |
2.04% |
1.57% |
|
Portfolio Turnover Rate |
52% |
46% |
76% |
44% |
46% |
|
Web |
|
|
Vanguard.com |
For the most complete source of Vanguard news
For fund, account, and service information
For most account transactions
For literature requests
24 hours a day, 7 days a week |
|
Phone | |
|
Vanguard Tele-Account®
800-662-6273 |
For automated fund and account information
Toll-free, 24 hours a day, 7 days a week |
|
Investor Information 800-662-7447
(Text telephone for people with
hearing impairment at 800-749-7273) |
For fund and service information
For literature requests |
|
Client Services 800-662-2739
(Text telephone for people with
hearing impairment at 800-749-7273) |
For account information
For most account transactions |
|
Participant Services 800-523-1188
(Text telephone for people with
hearing impairment at 800-749-7273) |
For information and services for participants in
employer-sponsored plans |
|
Institutional Division
888-809-8102 |
For information and services for large institutional
investors |
|
Financial Advisor and Intermediary
Sales Support 800-997-2798 |
For information and services for financial intermediaries
including financial advisors, broker-dealers, trust
institutions, and insurance companies |
|
Financial Advisory and Intermediary
Trading Support 800-669-0498 |
For account information and trading support for
financial intermediaries including financial advisors,
broker-dealers, trust institutions, and insurance
companies |
|
|
Inception
Date |
Newspaper
Abbreviation |
Vanguard
Fund Number |
CUSIP
Number |
|
Emerging Markets Select
Stock Fund |
6/27/2011 |
EmgMktSelStk |
752 |
921939500 |
|
37 | |
|
37 | |
|
40 | |
|
44 | |
|
44 | |
|
47 | |
|
51 | |
|
52 | |
|
53 | |
|
53 | |
|
54 | |
|
56 |
|
| |
|
Sales Charge (Load) Imposed on Purchases |
|
|
Purchase Fee |
|
|
Sales Charge (Load) Imposed on Reinvested Dividends |
|
|
Redemption Fee |
|
|
Account Service Fee Per Year
(for certain fund account balances below $10,000) |
$ |
|
| ||
|
Management Fees |
|
|
|
12b-1 Distribution Fee |
|
|
|
Other Expenses |
|
|
|
Dividend Expenses on Securities Sold Short |
|
|
|
Borrowing Expenses on Securities Sold Short |
|
|
|
Other Operating Expenses |
|
|
|
Total of Other Expenses |
|
|
|
Acquired Fund Fees and Expenses |
|
|
|
Total Annual Fund Operating Expenses |
|
|
|
1 Year |
3 Years |
5 Years |
10 Years |
|
$ |
$ |
$ |
$ |
|
|
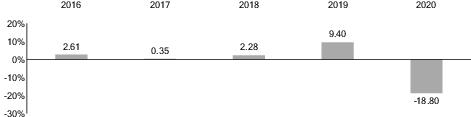
Total Return |
Quarter |
|
|
|
|
|
|
- |
|
|
|
1 Year |
5 Years |
Since
Inception
(Aug. 11,
2015) |
|
Vanguard Alternative Strategies Fund Investor Shares |
|
|
|
|
Return Before Taxes |
–18.80% |
–1.32% |
–0.68% |
|
Return After Taxes on Distributions |
–18.94 |
–2.11 |
–1.46 |
|
Return After Taxes on Distributions and Sale of Fund Shares |
–11.02 |
–1.16 |
–0.68 |
|
Comparative Indexes
(reflect no deduction for fees, expenses, or taxes) |
|
|
|
|
FTSE 3-Month Treasury Bill Index |
0.58% |
1.16% |
1.08% |
|
Spliced Alternative Strategies Index |
0.58 |
4.32 |
4.31 |
symbol throughout the prospectus. It is used to mark detailed information about the more significant risks that you would confront as a Fund shareholder. To highlight terms and concepts important to mutual fund investors, we have provided Plain Talk® explanations along the way. Reading the prospectus will help you decide whether the Fund is the right investment for you. We suggest that you keep this prospectus for future reference. |
Plain Talk About Absolute Return Investing |
|
Conventional approaches to investing money seek to either track or exceed
the performance of a particular asset or sub-asset class. An absolute return
approach to investing, however, seeks capital appreciation over the long term
while exhibiting low correlation with the returns of traditional capital markets.
During periods of falling or rising stock prices, an absolute return investment
may generate returns that are markedly different from the returns of the
stock market, for better or worse. Some absolute return strategies are
designed to take advantage of disparities or inefficiencies in different
markets or to benefit from cyclical relationships or special situations. Certain
absolute return strategies may be designed to systematically capture risk
premiums across the financial markets by offering risk transfer opportunities
to market participants. Other absolute return strategies can be designed to
capture mispricings across asset classes that have historically positive
long-term returns while exhibiting low correlation with stock market returns.
Generally speaking, an absolute return approach to investing places a
premium on manager insight, effective execution, and disciplined risk
controls. Absolute return strategies can use a high degree of implicit or
explicit leverage, which introduces the potential for a substantial loss of
invested capital over short periods of time. |
|
Plain Talk About Costs of Investing |
|
Costs are an important consideration in choosing a mutual fund. That is
because you, as a shareholder, pay a proportionate share of the costs of
operating a fund and any transaction costs incurred when the fund buys or
sells securities. These costs can erode a substantial portion of the gross
income or the capital appreciation a fund achieves. Even seemingly small
differences in expenses can, over time, have a dramatic effect on a
fund’s performance. |
|
Plain Talk About Alternative Strategies Funds |
|
What is an alternative strategies mutual fund? While there is no clear
definition of “alternative” in the mutual fund space, an alternative strategies
mutual fund is generally understood to be a fund whose principal investment
strategy falls into one or more of the three following buckets: (1)
non-traditional asset classes (such as currencies), (2) non-traditional
strategies (such as long/short equity positions), and/or (3) illiquid assets (such
as private debt). These investment strategies generally seek to produce
positive risk-adjusted returns (or alphas) that are not closely correlated to
traditional investments or benchmarks. These investment strategies differ
from those of traditional mutual funds that pursue long-only strategies in
asset classes. It is possible for an alternative strategies mutual fund to
experience considerable losses. |
|
Plain Talk About Bonds and Interest Rates |
|
As a rule, when interest rates rise, bond prices fall. The opposite is also true:
Bond prices go up when interest rates fall. Why do bond prices and interest
rates move in opposite directions? Let’s assume that you hold a bond
offering a 4% yield. A year later, interest rates are on the rise and bonds of
comparable quality and maturity are offered with a 5% yield. With
higher-yielding bonds available, you would have trouble selling your 4% bond
for the price you paid—you would probably have to lower your asking price.
On the other hand, if interest rates were falling and 3% bonds were being
offered, you should be able to sell your 4% bond for more than you paid. |
|
How mortgage-backed securities are different: In general, declining interest
rates will not lift the prices of mortgage-backed securities—such as those
guaranteed by the Government National Mortgage Association—as much as
the prices of comparable bonds. Why? Because when interest rates fall, the
bond market tends to discount the prices of mortgage-backed securities for
prepayment risk—the possibility that homeowners will refinance their
mortgages at lower rates and cause the bonds to be paid off prior to
maturity. In part to compensate for this prepayment possibility,
mortgage-backed securities tend to offer higher yields than other bonds of
comparable credit quality and maturity. In contrast, when interest rates rise,
prepayments tend to slow down, subjecting mortgage-backed securities to
extension risk—the possibility that homeowners will repay their mortgages
at slower rates. This will lengthen the duration or average life of
mortgage-backed securities held by a fund and delay the fund’s ability to
reinvest proceeds at higher interest rates, making the fund more sensitive to
changes in interest rates. |
|
Plain Talk About Bond Maturities |
|
A bond is issued with a specific maturity date—the date when the issuer
must pay back the bond’s principal (face value). Bond maturities range from
less than 1 year to more than 30 years. Typically, the longer a bond’s maturity,
the more price risk you, as a bond investor, will face as interest rates
rise—but also the higher the potential yield you could receive. Longer-term
bonds are more suitable for investors willing to take a greater risk of price
fluctuations to get higher and more stable interest income. Shorter-term
bond investors should be willing to accept lower yields and greater income
variability in return for less fluctuation in the value of their investment. The
stated maturity of a bond may differ from the effective maturity of a bond,
which takes into consideration that an action such as a call or refunding may
cause bonds to be repaid before their stated maturity dates. |
|
Plain Talk About Commodities |
|
Commodities are raw materials used to create the goods that consumers
buy. They include a wide range of physical assets, such as agricultural
products, livestock, precious metals, energy products, and industrial metals.
Commodities can be purchased for immediate delivery (“on the spot”),
delivery within a specific time period in the future under the terms of a
futures contract, or utilizing a swap agreement. An exchange-traded
commodity futures contract provides for the purchase and sale of a specified
type and quantity of a commodity during a stated delivery month. A futures
contract on an index of commodities provides for the payment and receipt of
cash based on the level of the index at settlement or liquidation of the
contract. Unlike equity securities, futures contracts, by their terms, have
stated expirations, and at a specified time prior to expiration, trading in a
futures contract for the current delivery month will cease. As a result, an
investor wishing to maintain exposure to a futures contract on a particular
commodity with the nearest expiration must close out a position in the
expiring contract and establish a new position in the contract for the next
delivery month. This process is referred to as “rolling.” An investor will profit
from rolling a futures contract if the cost for the new contract is lower than
the cost of the expiring contract. Conversely, an investor will lose money by
rolling a futures contract if the cost for the new contract is higher than the
cost of the expiring contract. A commodity swap agreement is an agreement
between two parties, each a counterparty, to exchange payments at
specified dates on the basis of a specified amount with the payments
calculated in reference to a specific commodity asset or index. The payments
will be the net amount to be paid or received under the agreement based on
the relative values of the positions held by each counterparty. The swap
agreement may be privately negotiated and entered into in the
over-the-counter market or may be cleared through a clearinghouse and
traded on an exchange or swap execution facility. |
|
Plain Talk About Derivatives |
|
Generally speaking, a derivative is a financial contract whose value is based
on the value of a financial asset (such as a stock, a bond, or a currency), a
physical asset (such as gold, oil, or wheat), a market index, or a reference
rate. Some forms of derivatives—such as exchange-traded futures and
options on securities, commodities, or indexes—have been trading on
regulated exchanges for decades. These types of derivatives are
standardized contracts that can easily be bought and sold and whose market
values are determined and published daily. On the other hand,
non-exchange-traded derivatives—such as certain swap agreements and
foreign currency exchange forward contracts—tend to be more specialized or
complex and may be less liquid and more difficult to accurately value. |
|
Plain Talk About Equity Short Sales |
|
A short sale of an equity security is the sale of a security that the seller does
not own. In order to deliver the security to the purchaser, the short seller
borrows the security, typically from a broker-dealer or an institutional
investor, for a fee. The short seller later closes out the position by returning
the security to the lender, typically by purchasing the same security on the
open market. A short sale theoretically carries the risk of an unlimited loss,
because the price of the underlying security could increase without limit,
thus increasing the cost of buying that security to cover the short position. In
addition, there can be no assurance that the security needed to cover a short
position will be available for purchase. Also, the purchase of a security to
close out the short position can itself cause the price of the security to rise
further, thereby exacerbating the loss. Short selling is often used to profit
from an expected downward price movement in a security. |
|
Plain Talk About Short Sale Borrowing and Dividend Expenses |
|
The Fund engages in short selling as a principal investment strategy. A short
sale occurs when the Fund sells a stock it does not own and then borrows
the stock from a lender in order to settle the transaction. When the Fund
sells short, it will normally incur two types of expenses—borrowing
expenses and dividend expenses—both of which increase the Fund’s
expense ratio. |
|
In connection with the short sale, the Fund may receive income or be
charged a fee on borrowed stock. This income or fee is calculated on a daily
basis, based upon the market value of the borrowed stock and a variable rate
that is dependent upon the availability of the stock. The net amounts of
income or fees are recorded as “interest income” (for net income received)
or “borrowing expense on securities sold short” (for net fees charged) on the
Fund’s Statement of Operations. |
|
The Fund incurs dividend expenses until the borrowed stock is returned to
the lender. These expenses are paid to the lender of the stock and are based
upon the amount of any dividends declared on the stock. Having sold the
borrowed stock, the Fund does not itself collect the dividends, and thus has
a net expense payable to the lender. This payment is recorded as “dividend
expense on securities sold short” on the Fund’s financial statements. Short
sale dividend expenses generally reduce the market value of the stock by the
amount of the dividend declared, thus increasing the Fund’s unrealized gain
or reducing the Fund’s unrealized loss on the stock sold short. |
|
Plain Talk About Vanguard’s Unique Corporate Structure |
|
The Vanguard Group is owned jointly by the funds it oversees and thus
indirectly by the shareholders in those funds. Most other mutual funds are
operated by management companies that are owned by third parties—either
public or private stockholders—and not by the funds they serve. |
|
Plain Talk About Distributions |
|
As a shareholder, you are entitled to your portion of a fund’s income from
interest, dividends, and other sources as well as capital gains from the fund’s
sale of investments. Income consists of, among other things, the dividends
that the fund earns from any stock holdings and the interest it receives from
any bond investments. Capital gains are realized whenever the fund sells
investments for higher prices than it paid for them. These capital gains are
either short-term or long-term, depending on whether the fund held the
investments for one year or less or for more than one year. |
|
Plain Talk About Buying a Dividend |
|
Unless you are investing through a tax-advantaged account (such as an IRA
or an employer-sponsored retirement or savings plan), you should consider
avoiding a purchase of fund shares shortly before the fund makes a
distribution, because doing so can cost you money in taxes. This is known as
“buying a dividend.” For example: On December 15, you invest $5,000,
buying 250 shares for $20 each. If the fund pays a distribution of $1 per
share on December 16, its share price will drop to $19 (not counting market
change). You still have only $5,000 (250 shares x $19 = $4,750 in share value,
plus 250 shares x $1 = $250 in distributions), but you owe tax on the $250
distribution you received—even if you reinvest it in more shares. To avoid
buying a dividend, check a fund’s distribution schedule before you invest. |
|
|
Year Ended October 31, | ||||
|
For a Share Outstanding Throughout Each Period |
2020 |
2019 |
2018 |
2017 |
2016 |
|
Net Asset Value, Beginning of Period |
$22.23 |
$20.41 |
$20.46 |
$21.28 |
$20.23 |
|
Investment Operations |
|
|
|
|
|
|
Net Investment Income |
0.0231 |
0.2521 |
0.1971 |
0.1531 |
0.106 |
|
Net Realized and Unrealized Gain (Loss) on
Investments |
(3.835) |
1.828 |
(0.143) |
(0.139) |
1.039 |
|
Total from Investment Operations |
(3.812) |
2.080 |
0.054 |
0.014 |
1.145 |
|
Distributions |
|
|
|
|
|
|
Dividends from Net Investment Income |
(0.385) |
(0.260) |
(0.104) |
(0.093) |
(0.095) |
|
Distributions from Realized Capital Gains |
(0.883) |
— |
— |
(0.741) |
— |
|
Total Distributions |
(1.268) |
(0.260) |
(0.104) |
(0.834) |
(0.095) |
|
Net Asset Value, End of Period |
$17.15 |
$22.23 |
$20.41 |
$20.46 |
$21.28 |
|
Total Return2 |
–18.17% |
10.30% |
0.27% |
0.11% |
5.68% |
|
Ratios/Supplemental Data |
|
|
|
|
|
|
Net Assets, End of Period (Millions) |
$306 |
$297 |
$320 |
$292 |
$235 |
|
Ratio of Total Expenses to Average Net Assets |
|
|
|
|
|
|
Based on Total Expenses3 |
0.78% |
0.79%4 |
0.66%4 |
0.79% |
0.71% |
|
Net of Dividend and Borrowing Expense on Securities
Sold Short |
0.34% |
0.38%4 |
0.33%4 |
0.35% |
0.36% |
|
Ratio of Net Investment Income to Average Net
Assets |
0.12% |
1.18% |
0.93% |
0.75% |
0.50% |
|
Portfolio Turnover Rate |
173% |
157% |
131% |
125% |
120% |
|
Web |
|
|
Vanguard.com |
For the most complete source of Vanguard news
For fund, account, and service information
For most account transactions
For literature requests
24 hours a day, 7 days a week |
|
Phone | |
|
Vanguard Tele-Account®
800-662-6273 |
For automated fund and account information
Toll-free, 24 hours a day, 7 days a week |
|
Investor Information 800-662-7447
(Text telephone for people with
hearing impairment at 800-749-7273) |
For fund and service information
For literature requests |
|
Client Services 800-662-2739
(Text telephone for people with
hearing impairment at 800-749-7273) |
For account information
For most account transactions |
|
Participant Services 800-523-1188
(Text telephone for people with
hearing impairment at 800-749-7273) |
For information and services for participants in
employer-sponsored plans |
|
Institutional Division
888-809-8102 |
For information and services for large institutional
investors |
|
Financial Advisor and Intermediary
Sales Support 800-997-2798 |
For information and services for financial intermediaries
including financial advisors, broker-dealers, trust
institutions, and insurance companies |
|
Financial Advisory and Intermediary
Trading Support 800-669-0498 |
For account information and trading support for
financial intermediaries including financial advisors,
broker-dealers, trust institutions, and insurance
companies |
|
|
Inception
Date |
Newspaper
Abbreviation |
Vanguard
Fund Number |
CUSIP
Number |
|
Alternative Strategies Fund |
8/11/2015 |
VanAltStrat |
1298 |
921939609 |
|
|
1 Year |
5 Years |
Since
Inception
(Sep. 10,
2009) |
|
Related Account |
4.69% |
5.76% |
5.28% |
|
Comparative Indexes
(reflect no deduction for fees or expenses) |
|
|
|
|
Citigroup 3-Month U.S.Treasury Bill Index (Daily) |
0.02% |
0.05% |
0.06% |
|
Standard & Poor’s 500 Index |
11.21 |
16.24 |
15.00 |
|
| |
|
Sales Charge (Load) Imposed on Purchases |
|
|
Purchase Fee |
|
|
Sales Charge (Load) Imposed on Reinvested Dividends |
|
|
Redemption Fee |
|
|
Account Service Fee Per Year
(for certain fund account balances below $10,000) |
$ |
|
| |
|
Management Fees |
|
|
12b-1 Distribution Fee |
|
|
Other Expenses |
|
|
Acquired Fund Fees and Expenses |
|
|
Total Annual Fund Operating Expenses |
|
|
1 Year |
3 Years |
5 Years |
10 Years |
|
$ |
$ |
$ |
$ |
|
|
Total Return |
Quarter |
|
|
|
|
|
|
- |
|
|
|
1 Year |
Since
Inception
(Jun. 25,
2019) |
|
Vanguard Commodity Strategy Fund Admiral Shares |
|
|
|
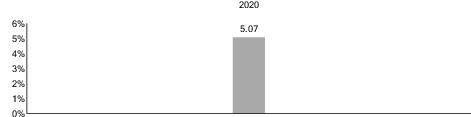
Return Before Taxes |
5.07% |
5.33% |
|
Return After Taxes on Distributions |
4.85 |
5.02 |
|
Return After Taxes on Distributions and Sale of Fund Shares |
3.00 |
3.94 |
|
Bloomberg Commodity Index Total Return
(reflects no deduction for fees, expenses, or taxes) |
–3.12% |
–0.60% |
symbol throughout the prospectus. It is used to mark detailed information about the more significant risks that you would confront as a Fund shareholder. To highlight terms and concepts important to mutual fund investors, we have provided Plain Talk® explanations along the way. Reading the prospectus will help you decide whether the Fund is the right investment for you. We suggest that you keep this prospectus for future reference. |
Plain Talk About Fund Expenses |
|
All mutual funds have operating expenses. These expenses, which are
deducted from a fund’s gross income, are expressed as a percentage of the
net assets of the fund. Assuming that operating expenses remain as stated
in the Fees and Expenses section, Vanguard Commodity Strategy Fund’s
expense ratio would be 0.20%, or $2.00 per $1,000 of average net assets.
The average expense ratio for commodities general funds in 2019 was
1.24%, or $12.40 per $1,000 of average net assets (derived from data
provided by Lipper, a Thomson Reuters Company, which reports on the
mutual fund industry). |
|
Plain Talk About Costs of Investing |
|
Costs are an important consideration in choosing a mutual fund. That is
because you, as a shareholder, pay a proportionate share of the costs of
operating a fund and any transaction costs incurred when the fund buys or
sells securities. These costs can erode a substantial portion of the gross
income or the capital appreciation a fund achieves. Even seemingly small
differences in expenses can, over time, have a dramatic effect on a
fund’s performance. |
|
Plain Talk About Commodities |
|
Commodities are raw materials used to create the goods that consumers
buy. They include a wide range of physical assets, such as agricultural
products, livestock, precious metals, energy products, and industrial metals.
Commodities can be purchased for immediate delivery (“on the spot”),
delivery within a specific time period in the future under the terms of a
futures contract, or utilizing a swap agreement. An exchange-traded
commodity futures contract provides for the purchase and sale of a specified
type and quantity of a commodity during a stated delivery month. A futures
contract on an index of commodities provides for the payment and receipt of
cash based on the level of the index at settlement or liquidation of the
contract. Unlike equity securities, futures contracts, by their terms, have
stated expirations, and at a specified time prior to expiration, trading in a
futures contract for the current delivery month will cease. As a result, an
investor wishing to maintain exposure to a futures contract on a particular
commodity with the nearest expiration must close out a position in the
expiring contract and establish a new position in the contract for the next
delivery month. This process is referred to as “rolling.” An investor will profit
from rolling a futures contract if the cost for the new contract is lower than
the cost of the expiring contract. Conversely, an investor will lose money by
rolling a futures contract if the cost for the new contract is higher than the
cost of the expiring contract. A commodity swap agreement is an agreement
between two parties, each a counterparty, to exchange payments at
specified dates on the basis of a specified amount with the payments
calculated in reference to a specific commodity asset or index. The payments
will be the net amount to be paid or received under the agreement based on
the relative values of the positions held by each counterparty. The swap
agreement may be privately negotiated and entered into in the
over-the-counter market or may be cleared through a clearinghouse and
traded on an exchange or swap execution facility. |
|
Plain Talk About Derivatives |
|
Generally speaking, a derivative is a financial contract whose value is based
on the value of a financial asset (such as a stock, a bond, or a currency), a
physical asset (such as gold, oil, or wheat), a market index, or a reference
rate. Some forms of derivatives—such as exchange-traded futures and
options on securities, commodities, or indexes—have been trading on
regulated exchanges for decades. These types of derivatives are
standardized contracts that can easily be bought and sold and whose market
values are determined and published daily. On the other hand,
non-exchange-traded derivatives—such as certain swap agreements and
foreign currency exchange forward contracts—tend to be more specialized or
complex and may be less liquid and more difficult to accurately value. |
|
Plain Talk About Inflation-Indexed Securities |
|
Unlike a conventional bond, whose issuer makes regular fixed interest
payments and repays the face value of the bond at maturity, an
inflation-indexed security (IIS) provides principal and interest payments that
are adjusted over time to reflect a rise (inflation) or a drop (deflation) in the
general price level for goods and services. This adjustment is a key feature,
given that inflation has typically occurred. However, there have been periods
of deflation, such as in 1954 when the Consumer Price Index (CPI) declined
by 0.7%. (Source: Bureau of Labor Statistics.) Importantly, in the event of
deflation, the U.S. Treasury has guaranteed that it will repay at least the face
value of an IIS issued by the U.S. government. However, if an IIS is
purchased by a fund at a premium, deflation could cause a fund to
experience a loss. |
|
Inflation measurement and adjustment for an IIS have two important
features. There is a two-month lag between the time that inflation occurs in
the economy and when it is factored into IIS valuations. This is due to the
time required to measure and calculate the CPI and for the U.S. Treasury to
adjust the inflation accrual schedules for an IIS. For example, inflation that
occurs in January is calculated and announced during February and affects
IIS valuations throughout the month of March. In addition, the inflation index
used is the nonseasonally adjusted index. It differs from the CPI that is
reported by most news organizations, which is statistically smoothed to
overcome highs and lows observed at different points each year. The use of
the nonseasonally adjusted index can cause a fund’s income level to
fluctuate. |
|
Plain Talk About Inflation-Indexed Securities and Interest Rates |
|
Interest rates on conventional bonds have two primary components: a “real”
yield and an increment that reflects investor expectations of future inflation.
By contrast, interest rates on an IIS are adjusted for inflation and, therefore,
are not affected meaningfully by inflation expectations. This leaves only real
interest rates to influence the price of an IIS. A rise in real interest rates will
cause the price of an IIS to fall, while a decline in real interest rates will
boost the price of an IIS. |
|
Plain Talk About Real Returns |
|
Inflation-indexed securities are designed to provide a “real rate of return”—a
return after adjusting for the impact of inflation. Inflation—a rise in the
general price level—erodes the purchasing power of an investor’s portfolio.
For example, if an investment provides a “nominal” total return of 5% in a
given year and inflation is 2% during that period, the inflation-adjusted, or
real, return is 3%. Investors should be conscious of both the nominal and the
real returns on their investments. Investors in inflation-indexed bond funds
who do not reinvest the portion of the income distribution that comes from
inflation adjustments will not maintain the purchasing power of the
investment over the long term. This is because interest earned depends on
the amount of principal invested, and that principal will not grow with
inflation if the investor does not reinvest the principal adjustment paid out as
part of a fund’s income distributions. |
|
Plain Talk About Credit Quality |
|
A bond’s credit quality rating is an assessment of the issuer’s ability to pay
interest on the bond and, ultimately, to repay the principal. The lower the
credit quality, the greater the perceived chance that the bond issuer will
default, or fail to meet its payment obligations. All things being equal, the
lower a bond’s credit quality, the higher its yield should be to compensate
investors for assuming additional risk. |
|
Plain Talk About Vanguard’s Unique Corporate Structure |
|
The Vanguard Group is owned jointly by the funds it oversees and thus
indirectly by the shareholders in those funds. Most other mutual funds are
operated by management companies that are owned by third parties—either
public or private stockholders—and not by the funds they serve. |
|
Plain Talk About Distributions |
|
As a shareholder, you are entitled to your portion of a fund’s income from
interest as well as capital gains from the fund’s sale of investments. Income
consists of, among other things, interest the fund earns from its fixed
income investments. Capital gains are realized whenever the fund sells
investments for higher prices than it paid for them. These capital gains are
either short-term or long-term, depending on whether the fund held the
investments for one year or less or for more than one year. |
|
Plain Talk About Return of Capital |
|
Return of capital is the portion of a distribution representing the return of
your original investment in a fund. Return of capital reduces your cost basis
in the fund’s shares and is not taxable to you until your cost basis has been
reduced to zero. During periods of deflation, the fund’s inflation-indexed
bonds may experience a downward adjustment in their value. These
downward adjustments can partially or entirely offset, or more than offset,
the income earned on the bonds. Under certain circumstances, these
downward adjustments could require the fund to reclassify a portion of the
income dividends previously distributed to shareholders as return of capital. |
|
Plain Talk About Buying a Dividend |
|
Unless you are a tax-exempt investor or investing through a tax-advantaged
account (such as an IRA or an employer-sponsored retirement or savings
plan), you should consider avoiding a purchase of fund shares shortly before
the fund makes a distribution, because doing so can cost you money in
taxes. This is known as “buying a dividend.” For example: On December 15,
you invest $5,000, buying 250 shares for $20 each. If the fund pays a
distribution of $1 per share on December 16, its share price will drop to $19
(not counting market change). You still have only $5,000 (250 shares x $19 =
$4,750 in share value, plus 250 shares x $1 = $250 in distributions), but you
owe tax on the $250 distribution you received—even if you reinvest it in
more shares. To avoid buying a dividend, check a fund’s distribution schedule
before you invest. |
|
|
Year Ended
October 31, |
June 25, 20191
to October 31, |
|
For a Share Outstanding Throughout Each Period |
2020 |
2019 |
|
Net Asset Value, Beginning of Period |
$24.83 |
$25.00 |
|
Investment Operations |
|
|
|
Net Investment Income2 |
0.265 |
0.143 |
|
Net Realized and Unrealized Gain (Loss) on Investments |
(0.620) |
(0.313) |
|
Total from Investment Operations |
(0.355) |
(0.170) |
|
Distributions |
|
|
|
Dividends from Net Investment Income |
(0.155) |
— |
|
Distributions from Realized Capital Gains |
— |
— |
|
Total Distributions |
(0.155) |
— |
|
Net Asset Value, End of Period |
$24.32 |
$24.83 |
|
Total Return3 |
–1.45% |
–0.68% |
|
Ratios/Supplemental Data |
|
|
|
Net Assets, End of Period (Millions) |
$373 |
$207 |
|
Ratio of Total Expenses to Average Net Assets |
0.20% |
0.20%4 |
|
Ratio of Net Investment Income to Average Net Assets |
1.15% |
1.65%4 |
|
Portfolio Turnover Rate |
38% |
7% |
|
Web |
|
|
Vanguard.com |
For the most complete source of Vanguard news
For fund, account, and service information
For most account transactions
For literature requests
24 hours a day, 7 days a week |
|
Phone | |
|
Vanguard Tele-Account®
800-662-6273 |
For automated fund and account information
Toll-free, 24 hours a day, 7 days a week |
|
Investor Information 800-662-7447
(Text telephone for people with
hearing impairment at 800-749-7273) |
For fund and service information
For literature requests |
|
Client Services 800-662-2739
(Text telephone for people with
hearing impairment at 800-749-7273) |
For account information
For most account transactions |
|
Participant Services 800-523-1188
(Text telephone for people with
hearing impairment at 800-749-7273) |
For information and services for participants in
employer-sponsored plans |
|
Institutional Division
888-809-8102 |
For information and services for large institutional
investors |
|
Financial Advisor and Intermediary
Sales Support 800-997-2798 |
For information and services for financial intermediaries
including financial advisors, broker-dealers, trust
institutions, and insurance companies |
|
Financial Advisory and Intermediary
Trading Support 800-669-0498 |
For account information and trading support for
financial intermediaries including financial advisors,
broker-dealers, trust institutions, and insurance
companies |
|
|
Inception
Date |
Newspaper
Abbreviation |
Vanguard
Fund Number |
CUSIP
Number |
|
Commodity Strategy Fund |
|
|
|
|
|
Admiral Shares |
6/25/2019 |
VgComSgyAdm |
517 |
921939708 |
|
B-1 | |
|
B-4 | |
|
B-5 | |
|
B-27 | |
|
B-28 | |
|
B-29 | |
|
B-44 | |
|
B-59 | |
|
B-61 | |
|
B-61 | |
|
B-62 | |
|
B-64 | |
|
B-67 |
|
|
Share Classes1 | |
|
Vanguard Fund2 |
Investor |
|
|
Vanguard Diversified Equity Fund |
VDEQX |
|
|
Vanguard International Value Fund |
VTRIX |
|
|
Vanguard Emerging Markets Select Stock Fund |
VMMSX |
|
|
Vanguard Alternative Strategies Fund |
VASFX |
|
|
Vanguard Commodity Strategy Fund |
— |
|
|
Vanguard Fund |
Capital
Contribution
to Vanguard |
Percentage of
Fund’s Average
Net Assets |
Percent of
Vanguard Funds’
Contribution |
|
Vanguard International Value Fund |
$ 399,000 |
Less than 0.01% |
0.16% |
|
Vanguard Emerging Markets Select Stock Fund |
28,000 |
Less than 0.01 |
0.01 |
|
Vanguard Alternative Strategies Fund |
12,000 |
Less than 0.01 |
0.00 |
|
Vanguard Commodity Strategy Fund |
16,000 |
Less than 0.01 |
0.01 |
|
Annual Shared Fund Operating Expenses
(Shared Expenses Deducted From Fund Assets) | |||
|
Vanguard Fund |
2018 |
2019 |
2020 |
|
Vanguard Alternative Strategies Fund |
|
|
|
|
Management and Administrative Expenses |
0.26% |
0.29% |
0.29% |
|
Marketing and Distribution Expenses |
0.01 |
0.01 |
0.01 |
|
Vanguard Commodity Strategy Fund |
|
|
|
|
Management and Administrative Expenses |
— |
0.06% |
0.17% |
|
Marketing and Distribution Expenses |
— |
Less than 0.01 |
0.01 |
|
Vanguard Emerging Markets Select Stock Fund |
|
|
|
|
Management and Administrative Expenses |
0.28% |
0.29% |
0.31% |
|
Marketing and Distribution Expenses |
0.02 |
0.01 |
0.01 |
|
Annual Shared Fund Operating Expenses
(Shared Expenses Deducted From Fund Assets) | |||
|
Vanguard Fund |
2018 |
2019 |
2020 |
|
Vanguard International Value Fund |
|
|
|
|
Management and Administrative Expenses |
0.20% |
0.19% |
0.19% |
|
Marketing and Distribution Expenses |
0.01 |
0.01 |
0.01 |
|
Name, Year of Birth |
Position(s)
Held With
Funds |
Vanguard
Funds’ Trustee/
Officer Since |
Principal Occupation(s)
During the Past Five Years,
Outside Directorships,
and Other Experience |
Number of
Vanguard Funds
Overseen by
Trustee/Officer |
|
Interested Trustee1 |
|
|
|
|
|
Mortimer J. Buckley
(1969) |
Chairman of the
Board, Chief
Executive
Officer, and
President |
January 2018 |
Chairman of the board (2019–present) of Vanguard and
of each of the investment companies served by
Vanguard; chief executive officer (2018–present) of
Vanguard; chief executive officer, president, and
trustee (2018–present) of each of the investment
companies served by Vanguard; president and director
(2017–present) of Vanguard; and president
(2018–present) of Vanguard Marketing Corporation.
Chief investment officer (2013–2017), managing
director (2002–2017), head of the Retail Investor Group
(2006–2012), and chief information officer (2001–2006)
of Vanguard. Chairman of the board (2011–2017) and
trustee (2009–2017) of the Children’s Hospital of
Philadelphia; and trustee (2018–present) and vice chair
(2019–present) of The Shipley School. |
211 |
|
1 Mr. Buckley is considered an “interested person” as defined in the 1940 Act because he is an officer of the Trust. | ||||
|
Independent Trustees |
|
|
|
|
|
Emerson U. Fullwood
(1948) |
Trustee |
January 2008 |
Executive chief staff and marketing officer for North
America and corporate vice president (retired 2008) of
Xerox Corporation (document management products
and services). Former president of the Worldwide
Channels Group, Latin America, and Worldwide
Customer Service and executive chief staff officer of
Developing Markets of Xerox. Executive in residence
and 2009–2010 Distinguished Minett Professor at the
Rochester Institute of Technology. Director of SPX
FLOW, Inc. (multi-industry manufacturing). Director of
the University of Rochester Medical Center, the
Monroe Community College Foundation, the United
Way of Rochester, North Carolina A&T University, and
Roberts Wesleyan College. Trustee of the University of
Rochester. |
211 |
|
Amy Gutmann
(1949) |
Trustee |
June 2006 |
President (2004–present) of the University of
Pennsylvania. Christopher H. Browne Distinguished
Professor of Political Science, School of Arts and
Sciences, and professor of communication, Annenberg
School for Communication, with secondary faculty
appointments in the Department of Philosophy, School
of Arts and Sciences, and at the Graduate School of
Education, University of Pennsylvania. |
211 |
|
F. Joseph Loughrey
(1949) |
Trustee |
October 2009 |
President and chief operating officer (retired 2009) and
vice chairman of the board (2008–2009) of Cummins
Inc. (industrial machinery). Chairman of the board of
Hillenbrand, Inc. (specialized consumer services).
Director of the V Foundation. Member of the advisory
council for the College of Arts and Letters and chair of
the advisory board to the Kellogg Institute for
International Studies, both at the University of Notre
Dame. Chairman of the board of Saint Anselm College. |
211 |
|
Mark Loughridge
(1953) |
Lead
Independent
Trustee |
March 2012 |
Senior vice president and chief financial officer (retired
2013) of IBM (information technology services).
Fiduciary member of IBM’s Retirement Plan
Committee (2004–2013), senior vice president and
general manager (2002–2004) of IBM Global Financing,
vice president and controller (1998–2002) of IBM, and
a variety of other prior management roles at IBM.
Member of the Council on Chicago Booth. |
211 |
|
Name, Year of Birth |
Position(s)
Held With
Funds |
Vanguard
Funds’ Trustee/
Officer Since |
Principal Occupation(s)
During the Past Five Years,
Outside Directorships,
and Other Experience |
Number of
Vanguard Funds
Overseen by
Trustee/Officer |
|
Scott C. Malpass
(1962) |
Trustee |
March 2012 |
Chief investment officer and vice president of the
University of Notre Dame (retired June 2020).
Assistant professor of finance at the Mendoza College
of Business, University of Notre Dame (retired June
2020), and member of the Notre Dame 403(b)
Investment Committee. Member of the board of
Catholic Investment Services, Inc. (investment
advisors) and the board of superintendence of the
Institute for the Works of Religion. |
211 |
|
Deanna Mulligan
(1963) |
Trustee |
January 2018 |
Board chair (2020), chief executive officer (2011–2020),
and president (2010–2019) of The Guardian Life
Insurance Company of America. Chief operating officer
(2010–2011) and executive vice president (2008–2010)
of Individual Life and Disability of The Guardian Life
Insurance Company of America. Member of the board
of the Economic Club of New York. Trustee of the
Partnership for New York City (business leadership),
the Chief Executives for Corporate Purpose, the New
York-Presbyterian Hospital, and the Bruce Museum
(arts and science). Member of the Advisory Council for
the Stanford Graduate School of Business. |
211 |
|
André F. Perold
(1952) |
Trustee |
December 2004 |
George Gund Professor of Finance and Banking,
Emeritus at the Harvard Business School (retired
2011). Chief investment officer and co-managing
partner of HighVista Strategies LLC (private
investment firm). Board member (2018–present) of RIT
Capital Partners (investment firm); investment
committee member of Partners Health Care System. |
211 |
|
Sarah Bloom Raskin
(1961) |
Trustee |
January 2018 |
Deputy secretary (2014–2017) of the United States
Department of the Treasury. Governor (2010–2014) of
the Federal Reserve Board. Commissioner
(2007–2010) of financial regulation for the State of
Maryland. Director (2017–present) of i(x) Investments,
LLC. Rubenstein Fellow (2017–2020) of Duke
University; trustee (2017–present) of Amherst College;
and member of Amherst College Investment
Committee (2019–present). |
211 |
|
Peter F. Volanakis
(1955) |
Trustee |
July 2009 |
President and chief operating officer (retired 2010) of
Corning Incorporated (communications equipment)
and director of Corning Incorporated (2000–2010) and
Dow Corning (2001–2010). Director (2012) of SPX
Corporation (multi-industry manufacturing). Overseer
of the Amos Tuck School of Business Administration,
Dartmouth College (2001–2013). Chairman of the
board of trustees of Colby-Sawyer College. Member of
the BMW Group Mobility Council. |
211 |
|
Executive Officers |
|
|
|
|
|
John Bendl
(1970) |
Chief Financial
Officer |
October 2019 |
Principal of Vanguard. Chief financial officer
(2019–present) of each of the investment companies
served by Vanguard. Chief accounting officer, treasurer,
and controller of Vanguard (2017–present). Partner
(2003–2016) at KPMG (audit, tax, and advisory
services). |
211 |
|
Christine M. Buchanan
(1970) |
Treasurer |
November 2017 |
Principal of Vanguard. Treasurer (2017–present) of each
of the investment companies served by Vanguard.
Partner (2005–2017) at KPMG (audit, tax, and advisory
services). |
211 |
|
Name, Year of Birth |
Position(s)
Held With
Funds |
Vanguard
Funds’ Trustee/
Officer Since |
Principal Occupation(s)
During the Past Five Years,
Outside Directorships,
and Other Experience |
Number of
Vanguard Funds
Overseen by
Trustee/Officer |
|
David Cermak
(1960) |
Finance Director |
October 2019 |
Principal of Vanguard. Finance director (2019–present)
of each of the investment companies served by
Vanguard. Managing director and head (2017–present)
of Vanguard Investments Singapore. Managing director
and head (2017–2019) of Vanguard Investments Hong
Kong. Representative director and head (2014–2017)
of Vanguard Investments Japan. |
211 |
|
John Galloway
(1973) |
Investment
Stewardship
Officer |
September 2020 |
Principal of Vanguard. Investment stewardship officer
(September 2020–present) of each of the investment
companies served by Vanguard. Head of Investor
Advocacy (February 2020–present) and head of
Marketing Strategy and Planning (2017–2020) at
Vanguard. Deputy Assistant to the President of the
United States (2015). |
211 |
|
Peter Mahoney
(1974) |
Controller |
May 2015 |
Principal of Vanguard. Controller (2015–present) of
each of the investment companies served by
Vanguard. Head of International Fund Services (2008–
2014) at Vanguard. |
211 |
|
Anne E. Robinson
(1970) |
Secretary |
September 2016 |
General counsel (2016–present) of Vanguard.
Secretary (2016–present) of Vanguard and of each of
the investment companies served by Vanguard.
Managing director (2016–present) of Vanguard.
Managing director and general counsel of Global Cards
and Consumer Services (2014–2016) at Citigroup.
Counsel (2003–2014) at American Express. |
211 |
|
Michael Rollings
(1963) |
Finance Director |
February 2017 |
Finance director (2017–present) and treasurer (2017)
of each of the investment companies served by
Vanguard. Managing director (2016–present) of
Vanguard. Chief financial officer (2016–present) of
Vanguard. Director (2016–present) of Vanguard
Marketing Corporation. Executive vice president and
chief financial officer (2006–2016) of MassMutual
Financial Group. |
211 |
|
John E. Schadl
(1972) |
Chief
Compliance
Officer |
March 2019 |
Principal of Vanguard. Chief compliance officer
(2019–present) of Vanguard and of each of the
investment companies served by Vanguard. Assistant
vice president (2019–present) of Vanguard Marketing
Corporation. |
211 |
|
Trustee |
Aggregate
Compensation From
the Funds1 |
Pension or Retirement
Benefits Accrued as Part of
the Funds’ Expenses1 |
Accrued Annual
Retirement Benefit at
January 1, 20212 |
Total Compensation
From All Vanguard
Funds Paid to Trustees3 |
|
Mortimer J. Buckley |
— |
— |
— |
— |
|
Emerson U. Fullwood |
$ 1,976 |
— |
— |
$ 287,500 |
|
Amy Gutmann |
1,976 |
— |
— |
287,500 |
|
F. Joseph Loughrey |
2,113 |
— |
— |
307,500 |
|
Mark Loughridge |
2,456 |
— |
— |
357,500 |
|
Trustee |
Aggregate
Compensation From
the Funds1 |
Pension or Retirement
Benefits Accrued as Part of
the Funds’ Expenses1 |
Accrued Annual
Retirement Benefit at
January 1, 20212 |
Total Compensation
From All Vanguard
Funds Paid to Trustees3 |
|
Scott C. Malpass |
1,976 |
— |
— |
287,500 |
|
Deanna Mulligan |
1,976 |
— |
— |
287,500 |
|
André F. Perold |
1,976 |
— |
— |
287,500 |
|
Sarah Bloom Raskin |
2,113 |
— |
— |
307,500 |
|
Peter F. Volanakis |
2,113 |
— |
— |
307,500 |
|
Vanguard Fund |
Trustee |
Dollar Range of
Fund Shares
Owned by Trustee |
Aggregate Dollar Range
of Vanguard Fund Shares
Owned by Trustee |
|
Vanguard Alternative Strategies Fund |
Mortimer J. Buckley |
— |
Over $100,000 |
|
|
Emerson U. Fullwood |
— |
Over $100,000 |
|
|
Amy Gutmann |
— |
Over $100,000 |
|
|
F. Joseph Loughrey |
— |
Over $100,000 |
|
|
Mark Loughridge |
— |
Over $100,000 |
|
|
Scott C. Malpass |
— |
Over $100,000 |
|
|
Deanna Mulligan |
— |
Over $100,000 |
|
|
André F. Perold |
— |
Over $100,000 |
|
|
Sarah Bloom Raskin |
— |
Over $100,000 |
|
|
Peter F. Volanakis |
— |
Over $100,000 |
|
|
|
|
|
|
Vanguard Commodity Strategy Fund |
Mortimer J. Buckley |
— |
Over $100,000 |
|
|
Emerson U. Fullwood |
— |
Over $100,000 |
|
|
Amy Gutmann |
— |
Over $100,000 |
|
|
F. Joseph Loughrey |
— |
Over $100,000 |
|
|
Mark Loughridge |
— |
Over $100,000 |
|
|
Scott C. Malpass |
— |
Over $100,000 |
|
|
Deanna Mulligan |
— |
Over $100,000 |
|
|
André F. Perold |
— |
Over $100,000 |
|
|
Sarah Bloom Raskin |
— |
Over $100,000 |
|
|
Peter F. Volanakis |
— |
Over $100,000 |
|
|
|
|
|
|
Vanguard Fund |
Trustee |
Dollar Range of
Fund Shares
Owned by Trustee |
Aggregate Dollar Range
of Vanguard Fund Shares
Owned by Trustee |
|
Vanguard Diversified Equity Fund |
Mortimer J. Buckley |
— |
Over $100,000 |
|
|
Emerson U. Fullwood |
— |
Over $100,000 |
|
|
Amy Gutmann |
— |
Over $100,000 |
|
|
F. Joseph Loughrey |
— |
Over $100,000 |
|
|
Mark Loughridge |
— |
Over $100,000 |
|
|
Scott C. Malpass |
— |
Over $100,000 |
|
|
Deanna Mulligan |
— |
Over $100,000 |
|
|
André F. Perold |
— |
Over $100,000 |
|
|
Sarah Bloom Raskin |
— |
Over $100,000 |
|
|
Peter F. Volanakis |
Over $100,000 |
Over $100,000 |
|
|
|
|
|
|
Vanguard Emerging Markets Select Stock Fund |
Mortimer J. Buckley |
Over $100,000 |
Over $100,000 |
|
|
Emerson U. Fullwood |
— |
Over $100,000 |
|
|
Amy Gutmann |
— |
Over $100,000 |
|
|
F. Joseph Loughrey |
— |
Over $100,000 |
|
|
Mark Loughridge |
— |
Over $100,000 |
|
|
Scott C. Malpass |
— |
Over $100,000 |
|
|
Deanna Mulligan |
— |
Over $100,000 |
|
|
André F. Perold |
— |
Over $100,000 |
|
|
Sarah Bloom Raskin |
— |
Over $100,000 |
|
|
Peter F. Volanakis |
— |
Over $100,000 |
|
|
|
|
|
|
Vanguard International Value Fund |
Mortimer J. Buckley |
— |
Over $100,000 |
|
|
Emerson U. Fullwood |
— |
Over $100,000 |
|
|
Amy Gutmann |
— |
Over $100,000 |
|
|
F. Joseph Loughrey |
— |
Over $100,000 |
|
|
Mark Loughridge |
— |
Over $100,000 |
|
|
Scott C. Malpass |
— |
Over $100,000 |
|
|
Deanna Mulligan |
— |
Over $100,000 |
|
|
André F. Perold |
— |
Over $100,000 |
|
|
Sarah Bloom Raskin |
— |
Over $100,000 |
|
|
Peter F. Volanakis |
— |
Over $100,000 |
|
Vanguard Fund |
Share Class |
Owner and Address |
Percentage
of Ownership |
|
Vanguard Alternative Strategies Fund |
Investor Shares |
VANGUARD MANAGED ALLOCATION
FUND VALLEY FORGE, PA |
76.56% |
|
|
|
NATIONWIDE TRUST COMPANY FSB
C/O IPO PORTFOLIO ACCOUNTING
COLUMBUS, OH |
5.03% |
|
Vanguard Commodity Strategy Fund |
Admiral Shares |
CHARLES SCHWAB & CO INC SAN
FRANCISCO, CA |
19.09% |
|
|
|
VANGUARD MANAGED ALLOCATION
FUND VALLEY FORGE, PA |
15.02% |
|
|
|
SEI PRIVATE TRUST COMPANY OAKS,
PA |
5.73% |
|
|
|
NATIONAL FINANCIAL SERVICES
CORPORATION JERSEY CITY, NJ |
12.29% |
|
Vanguard Fund |
Share Class |
Owner and Address |
Percentage
of Ownership |
|
Vanguard Diversified Equity Fund |
Investor Shares |
FIDELITY INVESTMENTS
INSTITUTIONAL OPERATIONS CO INC
COVINGTON, KY |
9.61% |
|
Vanguard Emerging Markets Select Stock Fund |
Investor Shares |
CHARLES SCHWAB & CO INC SAN
FRANCISCO, CA |
12.84% |
|
Vanguard International Value Fund |
Investor Shares |
CHARLES SCHWAB & CO INC SAN
FRANCISCO, CA |
8.32% |
|
|
|
VANGUARD STAR FUND VALLEY
FORGE, PA |
20.31% |
|
Vanguard Fund |
Owner |
Percentage
of Ownership |
|
Vanguard Alternative Strategies Fund |
VANGUARD MANAGED ALLOCATION FUND VALLEY
FORGE, PA |
76.56% |
|
Portfolio Manager |
|
No. of
accounts |
Total assets |
No. of accounts with
performance-based
fees |
Total assets in
accounts with
performance-based
fees |
|
William Coleman |
Registered investment companies1 |
54 |
$ 949B |
0 |
$ 0 |
|
|
Other pooled investment vehicles |
1 |
$ 8.1B |
0 |
$ 0 |
|
|
Other accounts |
0 |
$ 0 |
0 |
$ 0 |
|
Walter Nejman |
Registered investment companies1 |
50 |
$ 1.9T |
0 |
$ 0 |
|
|
Other pooled investment vehicles |
2 |
$ 4B |
0 |
$ 0 |
|
|
Other accounts |
1 |
$ 1B |
0 |
$ 0 |
|
Anatoly Shtekman |
Registered investment companies2,3 |
3 |
$ 1.9B |
0 |
$ 0 |
|
|
Other pooled investment vehicles |
0 |
$ 0 |
0 |
$ 0 |
|
|
Other accounts |
0 |
$ 0 |
0 |
$ 0 |
|
Fei Xu |
Registered investment companies2,3 |
3 |
$ 1.9B |
0 |
$ 0 |
|
|
Other pooled investment vehicles |
0 |
$ 0 |
0 |
$ 0 |
|
|
Other accounts |
0 |
$ 0 |
0 |
$ 0 |
|
Joshua C. Barrickman |
Registered investment companies3 |
23 |
$ 959B |
0 |
$ 0 |
|
|
Other pooled investment vehicles |
0 |
$ 0 |
0 |
$ 0 |
|
|
Other accounts |
0 |
$ 0 |
0 |
$ 0 |
|
Portfolio Manager |
|
No. of
accounts |
Total assets |
No. of accounts with
performance-based
fees |
Total assets in
accounts with
performance-based
fees |
|
A. Rama Krishna |
Registered investment companies1 |
1 |
$ 9.4B |
1 |
$ 9.4B |
|
|
Other pooled investment vehicles |
7 |
$ 340M |
3 |
$ 314.5M |
|
|
Other accounts |
36 |
$ 2.8B |
2 |
$ 754.6M |
|
Steven Morrow |
Registered investment companies1 |
1 |
$ 9.4B |
1 |
$ 9.4B |
|
|
Other pooled investment vehicles |
4 |
$ 11.7M |
2 |
$ 10.3M |
|
|
Other accounts |
22 |
$ 639.3M |
0 |
$ 0 |
|
Portfolio Manager |
|
No. of
accounts |
Total assets |
No. of accounts with
performance-based
fees |
Total assets in
accounts with
performance-based
fees |
|
Michael A. Bennett |
Registered investment companies1 |
15 |
$ 19.2B |
2 |
$ 13.2B |
|
|
Other pooled investment vehicles |
11 |
$ 4.3B |
0 |
$ 0 |
|
|
Other accounts |
180 |
$ 23.5B |
3 |
$ 251.1M |
|
Michael G. Fry |
Registered investment companies1 |
11 |
$ 13.9B |
2 |
$ 13.2B |
|
|
Other pooled investment vehicles |
6 |
$ 1.5B |
0 |
$ 0 |
|
|
Other accounts |
144 |
$ 15.5B |
3 |
$ 251.1M |
|
Portfolio Manager |
|
No. of
accounts |
Total assets |
No. of accounts with
performance-based
fees |
Total assets in
accounts with
performance-based
fees |
|
Arjun Kumar |
Registered investment companies1 |
1 |
$ 9.4B |
1 |
$ 9.4B |
|
|
Other pooled investment vehicles |
14 |
$ 8.2B |
0 |
$ 0 |
|
|
Other accounts |
11 |
$ 6.9B |
0 |
$ 0 |
|
Shirley Woo |
Registered investment companies1 |
1 |
$ 9.4B |
1 |
$ 9.4B |
|
|
Other pooled investment vehicles |
14 |
$ 8.2B |
0 |
$ 0 |
|
|
Other accounts |
11 |
$ 6.9B |
0 |
$ 0 |
|
Portfolio Manager |
|
No. of
accounts |
Total assets |
No. of accounts with
performance-based
fees |
Total assets in
accounts with
performance-based
fees |
|
Andrew Stobart |
Registered investment companies1 |
7 |
$ 13B |
1 |
$ 670.3M |
|
|
Other pooled investment vehicles |
4 |
$ 2.5B |
1 |
$ 71M |
|
|
Other accounts |
48 |
$ 22.7B |
5 |
$ 2.6B |
|
Mike Gush |
Registered investment companies1 |
3 |
$ 5.6B |
1 |
$ 670.3M |
|
|
Other pooled investment vehicles |
8 |
$ 4B |
1 |
$ 71M |
|
|
Other accounts |
18 |
$ 8.4B |
1 |
$ 684M |
|
Ewan Markson-Brown |
Registered investment companies1 |
2 |
$ 5.6B |
1 |
$ 670.3M |
|
|
Other pooled investment vehicles |
6 |
$ 4.9B |
1 |
$ 71M |
|
|
Other accounts |
12 |
$ 7.3B |
0 |
$ 0 |
|
Portfolio Manager |
|
No. of
accounts |
Total assets |
No. of accounts with
performance-based
fees |
Total assets in
accounts with
performance-based
fees |
|
Frank J. Carroll III |
Registered investment companies1 |
5 |
$ 1.1B |
1 |
$ 670.3M |
|
|
Other pooled investment vehicles |
2 |
$ 2B |
0 |
$ 0 |
|
|
Other accounts |
5 |
$ 1.1B |
0 |
$ 0 |
|
Portfolio Manager |
|
No. of
accounts |
Total assets |
No. of accounts with
performance-based
fees |
Total assets in
accounts with
performance-based
fees |
|
Caroline Cai |
Registered investment companies1 |
9 |
$ 3.1B |
1 |
$ 670.3M |
|
|
Other pooled investment vehicles |
47 |
$ 9.1B |
3 |
$ 366M |
|
|
Other accounts |
51 |
$ 9.8B |
2 |
$ 202M |
|
Allison Fisch |
Registered investment companies1 |
10 |
$ 3.1B |
1 |
$ 670.3M |
|
|
Other pooled investment vehicles |
26 |
$ 2.9B |
1 |
$ 23M |
|
|
Other accounts |
26 |
$ 5.3B |
0 |
$ 0 |
|
John P. Goetz |
Registered investment companies1 |
9 |
$ 3.1B |
1 |
$ 670.3M |
|
|
Other pooled investment vehicles |
47 |
$ 9.1B |
3 |
$ 366M |
|
|
Other accounts |
51 |
$ 10B |
2 |
$ 202M |
|
Rakesh Bordia |
Registered investment companies1 |
3 |
$ 1.1B |
1 |
$ 670.3M |
|
|
Other pooled investment vehicles |
11 |
$ 1.5B |
0 |
$ 0 |
|
|
Other accounts |
17 |
$ 3B |
0 |
$ 0 |
|
Portfolio Manager |
|
No. of
accounts |
Total assets |
No. of accounts with
performance-based
fees |
Total assets in
accounts with
performance-based
fees |
|
Mary Pryshlak |
Registered investment companies1 |
12 |
$ 8.8B |
2 |
$ 1.3B |
|
|
Other pooled investment vehicles |
50 |
$ 18.7B |
9 |
$ 6.1B |
|
|
Other accounts |
90 |
$ 33B |
14 |
$ 5.9B |
|
Vanguard Fund |
Securities Lending Activities |
|
Vanguard Emerging Markets Select Stock Fund |
|
|
Gross income from securities lending activities |
$115,814 |
|
Fees paid to securities lending agent from a revenue split |
$0 |
|
Fees paid for any cash collateral management service (including fees deducted from a pooled cash
collateral reinvestment vehicle) that are not included in the revenue split |
$114 |
|
Administrative fees not included in revenue split |
$1,382 |
|
Indemnification fee not included in revenue split |
$0 |
|
Rebate (paid to borrower) |
$5,549 |
|
Other fees not included in revenue split (specify) |
$0 |
|
Aggregate fees/compensation for securities lending activities |
$7,045 |
|
Net income from securities lending activities |
$108,769 |
|
Vanguard International Value Fund |
|
|
Gross income from securities lending activities |
$2,436,639 |
|
Fees paid to securities lending agent from a revenue split |
$115,178 |
|
Fees paid for any cash collateral management service (including fees deducted from a pooled cash
collateral reinvestment vehicle) that are not included in the revenue split |
$4,737 |
|
Administrative fees not included in revenue split |
$349 |
|
Indemnification fee not included in revenue split |
$0 |
|
Rebate (paid to borrower) |
$481,043 |
|
Other fees not included in revenue split (specify) |
$0 |
|
Aggregate fees/compensation for securities lending activities |
$601,307 |
|
Net income from securities lending activities |
$1,835,332 |
|
Vanguard Fund |
2018 |
2019 |
2020 |
|
Vanguard Alternative Strategies Fund1 |
$ 208,000 |
$ 201,000 |
$ 457,000 |
|
Vanguard Commodity Strategy Fund |
$ — |
— |
— |
|
Vanguard Diversified Equity Fund |
— |
— |
— |
|
Vanguard Emerging Markets Select Stock Fund |
905,000 |
672,000 |
733,000 |
|
Vanguard International Value Fund2 |
4,133,000 |
4,200,000 |
6,287,000 |
|
Vanguard Fund |
Regular Broker or Dealer (or Parent) |
Aggregate Holdings |
|
Vanguard Alternative Strategies Fund |
Fidelity Capital Markets |
$ 283,000 |
|
|
Morgan Stanley |
— |
|
Vanguard Commodity Strategy Fund |
— |
— |
|
Vanguard Emerging Markets Select Stock Fund |
— |
— |
|
Vanguard Fund |
Regular Broker or Dealer (or Parent) |
Aggregate Holdings |
|
Vanguard International Value Fund |
UBS Securities LLC |
24,602,000 |
|
(a) |
Articles of Incorporation, Amended and Restated Agreement and Declaration of Trust, filed with Post-Effective
Amendment No. 87, dated June 25, 2019, is hereby incorporated by reference. |
|
(b) |
By-Laws, Amended and Restated By-Laws, are filed herewith. |
|
(c) |
Instruments Defining Rights of Security Holders, reference is made to Articles III and V of the Registrant’s
Amended and Restated Agreement and Declaration of Trust, refer to Exhibit (a) above. |
|
(d) |
Investment Advisory Contracts, for
Lazard Asset Management LLC, filed with Post-Effective Amendment No. 44
dated July 27, 2006, is hereby incorporated by reference; for
ARGA Investment Management, LP, filed with
Post-Effective Amendment No. 62 dated August 2, 2012, is hereby incorporated by reference. For
Pzena Investment
Management, LLC, and
Wellington Management Company, LLP, filed with Post-Effective Amendment No. 69 dated
February 26, 2014, are hereby incorporated by reference. For
Oaktree Capital Management, L.P., filed Post-Effective
Amendment No. 91 dated November 1, 2019, is hereby incorporated by reference. For
Baillie Gifford Overseas Ltd.
and
Sprucegrove Investment Management Ltd., are filed herewith. The Vanguard Group, Inc. provides investment
advisory services to Vanguard Alternative Strategies Fund, Vanguard Commodity Strategy Fund, and Vanguard
Diversified Equity Fund pursuant to the Amended and Restated Funds’ Service Agreement, refer to Exhibit (h)
below. |
|
(e) |
Underwriting Contracts, not applicable. |
|
(f) |
Bonus or Profit Sharing Contracts, reference is made to the section entitled “Management of the Funds” in Part B
of this Registration Statement. |
|
(g) |
Custodian Agreements, for
State Street Bank and Trust Company and
JPMorgan Chase Bank, are filed herewith. |
|
(h) |
Other Material Contracts,
Fifth Amended and Restated Funds’ Service Agreement, filed with Post-Effective
Amendment No. 93 dated February 27, 2020, is hereby incorporated by reference. |
|
(i) |
Legal Opinion, not applicable. |
|
(j) |
|
|
(k) |
Omitted Financial Statements, not applicable. |
|
(l) |
Initial Capital Agreements, not applicable. |
|
(m) |
Rule 12b-1 Plan, not applicable. |
|
(n) |
|
|
(o) |
Reserved. |
|
(p) |
Codes of Ethics, for
ARGA Investment Management, LP,
Baillie Gifford Overseas Ltd.,
Lazard Asset Management,
LLC,
Pzena Investment Management, LLC,
Sprucegrove Investment Management Ltd.,
Wellington Management
Company, LLP, and
The Vanguard Group, Inc., are filed herewith. For
Oaktree Capital Management, L.P., filed with
Post-Effective Amendment No. 93 dated February 27, 2020, is hereby incorporated by reference. |
|
(a) |
Vanguard Marketing Corporation, a wholly owned subsidiary of The Vanguard Group, Inc., is the principal underwriter
of each fund within the Vanguard group of investment companies, a family of over 200 funds. |
|
(b) |
The principal business address of each named director and officer of Vanguard Marketing Corporation is 100
Vanguard Boulevard, Malvern, PA 19355. |
|
Name |
Positions and Office with Underwriter |
Positions and Office with Funds |
|
Matthew Benchener |
Chairman, Director, Principal, and Chief
Executive Officer Designee |
None |
|
Karin A. Risi |
Director and Principal |
None |
|
Scott A. Conking |
Director and Principal |
None |
|
Thomas M. Rampulla |
Director and Principal |
None |
|
Michael Rollings |
Director and Principal |
Finance Director |
|
Caroline Cosby |
Director, Principal, General Counsel, and
Assistant Secretary |
None |
|
Matthew C. Brancato |
Director and Principal |
None |
|
Mortimer J. Buckley |
President |
Chairman of the Board of Trustees, Chief
Executive Officer, and President |
|
John E. Schadl |
Assistant Vice President |
Chief Compliance Officer |
|
Beth Morales Singh |
Secretary |
None |
|
Erica Green |
Chief Compliance Officer |
None |
|
John T. Marcante |
Chief Information Officer |
None |
|
Alonzo Ellis |
Chief Information Security Officer |
None |
|
Salvatore L. Pantalone |
Financial and Operations Principal and
Treasurer |
None |
|
Celeste Hagerty |
Financial and Operations Principal |
None |
|
Danielle Corey |
Annuity and Insurance Officer |
None |
|
Jeff Seglem |
Annuity and Insurance Officer |
None |
|
John Bendl |
Principal |
Chief Financial Officer |
|
Barbara Bock |
Principal |
None |
|
Saundra K. Cusumano |
Principal |
None |
|
James M. Delaplane Jr. |
Principal |
None |
|
Andrew Kadjeski |
Principal |
None |
|
Michael V. Lucci |
Principal |
None |
|
Brian P. McCarthy |
Principal |
None |
|
Matthew P. McCarthy |
Principal |
None |
|
Douglas R. Mento |
Principal |
None |
|
Jim O’Rourke |
Principal |
None |
|
David Petty |
Principal |
None |
|
Monica Verma |
Principal |
None |
|
(c) |
Not applicable. |
|
Signature |
Title |
Date |
|
/s/ Mortimer J. Buckley*
Mortimer J. Buckley |
Chairman and Chief Executive Officer |
February 25, 2021 |
|
/s/ Emerson U. Fullwood*
Emerson U. Fullwood |
Trustee |
February 25, 2021 |
|
/s/ Amy Gutmann*
Amy Gutmann |
Trustee |
February 25, 2021 |
|
/s/ Joseph Loughrey*
Joseph Loughrey |
Trustee |
February 25, 2021 |
|
/s/ Mark Loughridge*
Mark Loughridge |
Trustee |
February 25, 2021 |
|
/s/ Scott C. Malpass*
Scott C. Malpass |
Trustee |
February 25, 2021 |
|
/s/ Deanna Mulligan*
Deanna Mulligan |
Trustee |
February 25, 2021 |
|
/s/ André F. Perold*
André F. Perold |
Trustee |
February 25, 2021 |
|
/s/ Sarah Bloom Raskin*
Sarah Bloom Raskin |
Trustee |
February 25, 2021 |
|
/s/ Peter F. Volanakis*
Peter F. Volanakis |
Trustee |
February 25, 2021 |
|
/s/ John Bendl*
John Bendl |
Chief Financial Officer |
February 25, 2021 |