FORM 6-K
SECURITIES AND EXCHANGE COMMISSION
Washington, D.C. 20549
Report of Foreign Issuer
Pursuant to Rule 13a-16 or 15d-16
of the Securities Exchange Act of 1934
For the month of February, 2022
Commission File Number: 001-12518
Banco Santander, S.A.
(Exact name of registrant as specified in its charter)
Ciudad Grupo Santander
28660 Boadilla del Monte (Madrid) Spain
(Address of principal executive office)
Indicate by check mark whether the registrant files or will file annual reports under cover of Form 20-F or Form 40-F:
Form 20-F ☒ Form 40-F ☐
Indicate by check mark if the registrant is submitting the Form 6-K in paper as permitted by Regulation S-T Rule 101(b)(1):
Yes ☐ No ☒
Indicate by check mark if the registrant is submitting the Form 6-K in paper as permitted by Regulation S-T Rule 101(b)(7):
Yes ☐ No ☒
Banco Santander, S.A.
TABLE OF CONTENTS
Pillar 3 - Disclosure Report
2021 - strengthening our capital strategy
| | | | | | | | | | | | | | | | | |
Introduction (Ch. 1) | | Capital (Ch. 2) |
| | | | | |
| Santander | | | Capital |
| Santander Pillar 3 Report overview | | | Capital function |
| Regulatory framework | | | Capital management and adequacy. Solvency ratios |
| Scope of consolidation | | | Pillar 1 - Regulatory Capital |
| | | | Pillar 2 - Economic Capital |
| | | | Capital planning and stress tests |
| | | | TLAC & MREL |
| | | | Lines of defence |
| | | | Corporate Special Situations and Resolution Framework |
| | | | | |
| | | | | |
Risks (Ch. 3, 4, 5, 6, 7, 8, 9 and 10) | | Santander (Ch. 11 and 12) |
| | | | |
| Global risk vision | | | Remuneration policies |
| Credit Risk | | | Appendices |
| Counterparty Credit Risk | | | | |
| Credit Risk - Securitisations | | Other appendices available on the Santander website. |
| Market Risk | |
| Operational Risk | | | Access 2021 Pillar 3 Disclosures Report available on the Santander Group website |
| ESG Risk | |
| Other Risks | |
| | | | | |
| | | | | |


| | | | | | | | | | | | | | | | | | | | | | | | | | | | | | | | | | | | | | |
| | |
| Introduction |
|
| |
| 1.1. Santander | |
| 1.2. Santander Pillar 3 report overview | |
| 1.2.1. Background information on Santander | |
| 1.2.2. Governance: approval and publication | |
| 1.2.3. Transparency enhancements | |
| 1.2.4. Disclosure criteria used in this report | |
| 1.3. Regulatory framework | |
| 1.3.1. Prudential framework 2021: Capital Adequacy and Resolution key points | |
| 1.3.2. Regulatory response to impacts of covid-19 | |
| 1.3.3. Other regulations: Sustainability | |
| 1.3.4. Other regulations: Digital | |
| 1.3.5. Other regulations: AML/FT | |
| 1.4. Scope of consolidation | |
| 1.4.1. Differences between the consolidation method for accounting purposes and the consolidation method for regulatory capital calculation purposes | |
| 1.4.2. Substantial amendments due to a change in perimeter and corporate transactions | |
| |
| |
| |
| |
| |
| |
| |
| |
| |
| |
| |
| | |
INTRODUCTION 2021 Pillar 3 Disclosures Report |
1.Introduction
1.1. Santander
Everything we do must be Simple, Personal & Fair
Santander is one of the largest banks in the eurozone. As of December 2021, we had EUR 1,595,835 million in assets and EUR 1,153,656 million in total funds. Our market capitalization reached EUR 50,990 million.
Santander has a very clear aim to be the best open financial service platform, by acting responsibly and earning the lasting loyalty of our people, customers, shareholders and communities. Our purpose is to help people and businesses prosper.
| | | | | | | | | | | | | | | | | | | | | | | | | | | | | | | | | | | |
| CUSTOMER FOCUS | | | | OUR SCALE | | | | DIVERSIFICATION |
Customers worldwide
153 mn +5 mn in 2021 | | | | Top 3 in 10 of our markets  1 1 | | | |
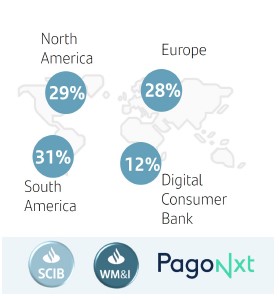
Geographic and business A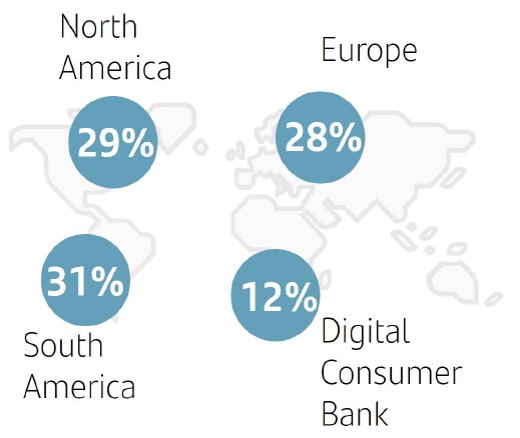 |
A. 2021 underlying attributable profit by region. Operating areas excluding Corporate Centre.
We have laid the foundations to deliver great value and service for our customers, while increasing profits, improving profitability, and strengthening our capital base
| | | | | | | | | | | | | | | | | |
| Customer focus | | | | |
| | | | | |
| Deepening the relationships with our customers through a simpler value proposition, superior customer experience and our digital proposition | | → We have increased our number of customers over the last seven years, and notably in 2021, with balanced growth by region and business. → Our aim is to further enhance our customers' experience and satisfaction. → We also help a new generation of customers with new ways to interact with their finances, which is reflected in an increase digitalization (54% digital sales / total sales in 2021). |
|
|
| | | | | |
| Our scale | | | | |
| | | | | |
| Local scale and global reach | | → Regional and global scale based on three geographic regions, where we maintain a leadership position in our core markets. → Worldwide reach through our global businesses and PagoNxt, enabling greater collaboration across the Group to generate higher revenue and efficiencies. |
|
|
| | | | | |
| Diversification | | | | |
| | | | | |
| Our geographic and business diversification make us more resilient under adverse circumstances | | → We have a diversified geographical footprint which is well balanced between emerging and developed markets. → Business diversification between customers segments (individuals, SMEs, mid-market companies and large corporates). → This diversification remains a source of great strength and earnings stability. |
|
|
1 Market share in lending as of Sep-21 including only privately-owned banks. UK benchmark only covers the mortgage market (source: central banks). Digital Consumer Bank (DCB) refers to auto financing market shares in the majority of our Europe footprint (source: information from local auto associations and market intelligence reported by SCF units).
| | | | | | | | | | | |
9 | | 2021 Pillar 3 Disclosures Report | |
| | |
INTRODUCTION 2021 Pillar 3 Disclosures Report |
Strong operating performance in 2021: EUR 8.7 bn of underlying profit
| | | | | | | | | | | | | | |
2021 (vs. 2020) |
GROWTH | | PROFITABILITY | | STRENGTH |
| Total customers | | RoTE B | | FL CET1 C |
153 mn (+5mn) | | 12.7% (+529bps) | | 12.0% (+7bps) |
Total revenue A | | Efficiency ratio | | Cost of credit D |
EUR 46.4 bn (+7%) | | 46.2% (-86bps) | | 0.8% (-51bps) |
| | | | |
2021 Shareholder value creation: +11%E |
A. Changes in constant euros. In euros: +4%.
B. Underlying RoTE. Statutory RoTE: 12%.
C. Including acquisition of SC USA minority interest which closed on 31 January 2022 and the announced acquisition of Amherst Pierpont which is subject to completion, regulatory approval and other conditions.
D. Provisions to cover losses due to impairment of loans in the last 12 months / average customer loans and advances of the last 12 months.
E. TNAV per share + cash DPS of EUR 7.6 cents paid in calendar year 2021.
We are creating value for our shareholders by focusing on delivering profitable growth in a responsible way
In 2021, we continued to deliver on our ESG commitments, supporting our customers´ green transition and financially empowering more people
| | | | | | | | | | | | | | |
Supporting the green transition | | Building a more inclusive society | | With a talented and diverse team |
| EUR 61 bn | | 7.5 mn | | 6 |
Green finance since 2019 A | | People financially empowered since 2019 | | Geographies where we are Top 10 company to work for |
| >200% | | >EUR 500 mn | | 26% |
YoY green finance in retail B | | Credit allocated to microfinance in 2021 | | Women in senior leadership positions |
| EUR 27 bn | | 1.4 mn | | ESG |
AuM in Sustainable funds C | | Microentrepreneurs supported since 2019 | | Metrics included in executives´incentives |
| #1 | | 8 | | #1 |
Financial advisor in Project Finance renewables D | | Countries with microfinance initiatives underway | | Bank in Bloomberg Gender Equality Index |
Note: non-audited data.
A. Only Santander Corporate Investment Bank (SCIB) global business.
B. All segments excluding SCIB and WM&I (Well Management and Investment).
C. AuMs classified as Article 8 and 9 funds (SFDR) from SAM, plus third-party funds and other ESG products according to EU taxonomy from Private Banking. We apply equivalent ESG criteria to SAM´s funds in Latin America.
D. Banco Santander, SA emerged as the top financial advisor for renewable energy project financing in 2021, with a total deal credit of USD 10.3 billion and a market share of 28%, according to Bloomberg NEF´s H2 2021 Clean Energy League Tables.
| | |
INTRODUCTION 2021 Pillar 3 Disclosures Report |
Santander operated in 2021 amid an environment characterised by:
| | | | | | | | | | | | | | |
| 1 | Fiscal and monetary policies implemented to counter the adverse effects of the covid-19 pandemic. |
|
|
| | | | |
| 2 | The ongoing recovery from the pandemic, which has been inconsistent across countries and sectors. |
|
|
| | | | |
| 3 | New covid-19 variants and significant outbreaks. |
|
|
| | | | |
| 4 | An upturn in inflation in the second half of the year, which reached a three-decade high in mature markets. |
|
|
Inflationary pressures have intensified as a result of a number of factors, including the renewed demand for consumer goods; labour shortages; tensions in the supply chains of microchips and other key items; transportation issues; and increases in energy, certain raw materials and food prices.
Under these circumstances, withdrawal of the expansionary fiscal and monetary policies implemented in response to the covid-19 pandemic began, especially in the last quarter of 2021, particularly in countries that experienced the heaviest pressure on prices.
| | |
| Capital management and solvency ratios |
Grupo Santander’s capital management aims to guarantee solvency and maximize profitability, while complying with internal objectives and regulatory requirements.
It is a key strategic tool for local and corporate decision making, enabling us to set a common framework of actions, criteria, policies, functions, metrics and processes.
Our active capital management applies strategies on efficient capital allocation to business lines, and considers securitizations, asset sales and issuances of capital instruments (capital hybrids and subordinated debt).
Our economic capital model aims to ensure our capital allocation is right for the risks inherent in our operations and risk appetite to optimize economic value added for our group and business units.
To optimize economic value added, we measure the real economic capital an activity requires and its return, and select those activities that maximize returns. We do this under both expected as well as unlikely but plausible economic scenarios, and with the solvency level decided by the Group.
| | | | | | | | | | | |
11 | | 2021 Pillar 3 Disclosures Report | |
| | |
INTRODUCTION 2021 Pillar 3 Disclosures Report |
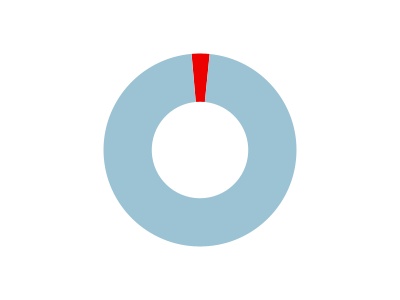
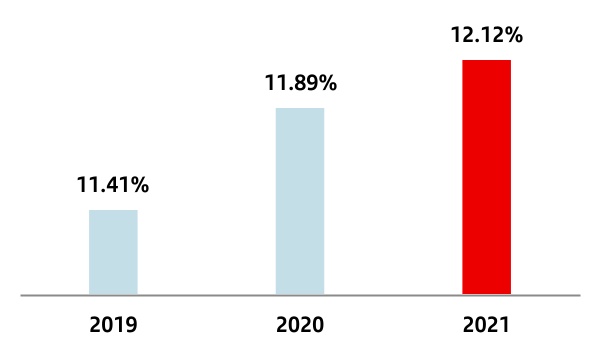
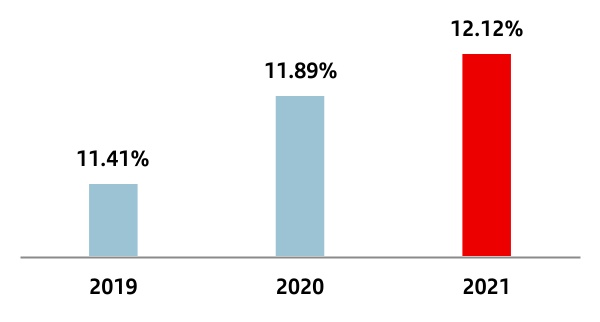
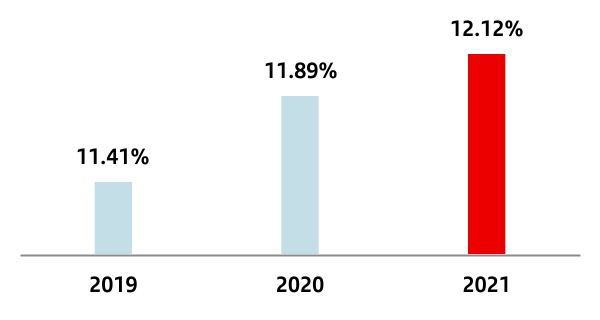
The fully-loaded CET1 ratio stood at 12.12%,
keeping our target between 11% and 12%
| | | | | | | | | | | | | | |
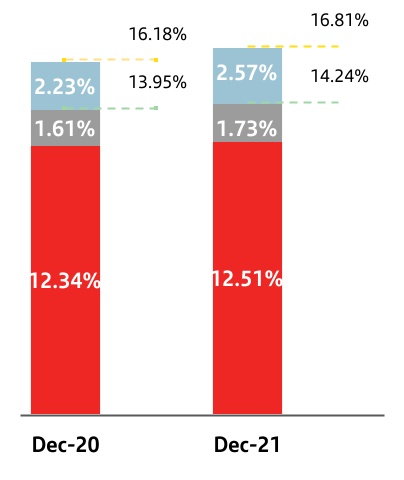
| Regulatory CET1 ratio (Phased-in)2 | |
| | | | |
| 11.65 | % | 12.34 | % | 12.51 | % | |
| | | | | | | | | | | | | | |
| Main capital figures and capital adequacy ratios. |
| EUR million |
| Fully-loaded | Phased-in2 |
| 2021 | 2020 | 2021 | 2020 |
| Common Equity (CET1) | 70,208 | 69,399 | 72,402 | 69,399 |
| Tier 1 | 79,939 | 75,510 | 82,452 | 78,501 |
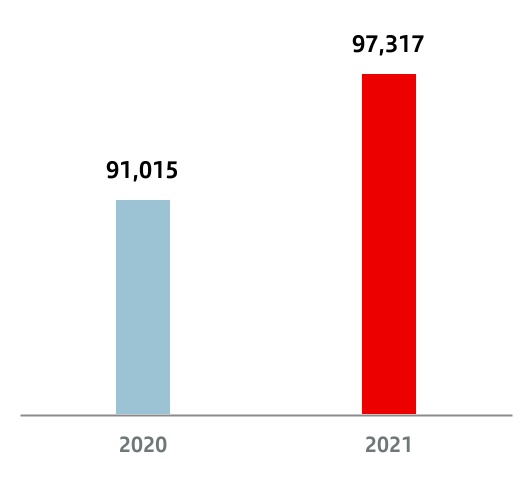
| Total capital | 95,078 | 88,368 | 97,317 | 91,015 |
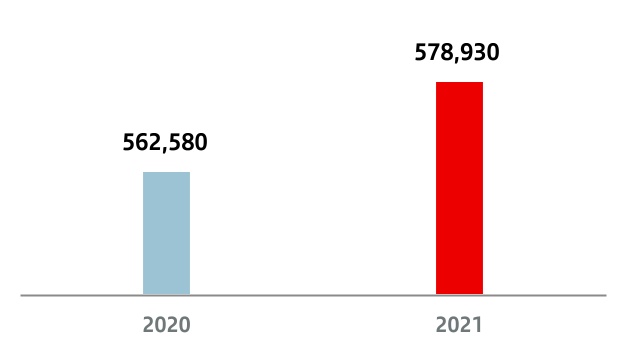
| Risk weighted assets | 579,478 | 561,850 | 578,930 | 562,580 |
| CET1 Ratio | 12.12 | % | 11.89 | % | 12.51 | % | 12.34 | % |
| Tier 1 Ratio | 13.79 | % | 13.44 | % | 14.24 | % | 13.95 | % |
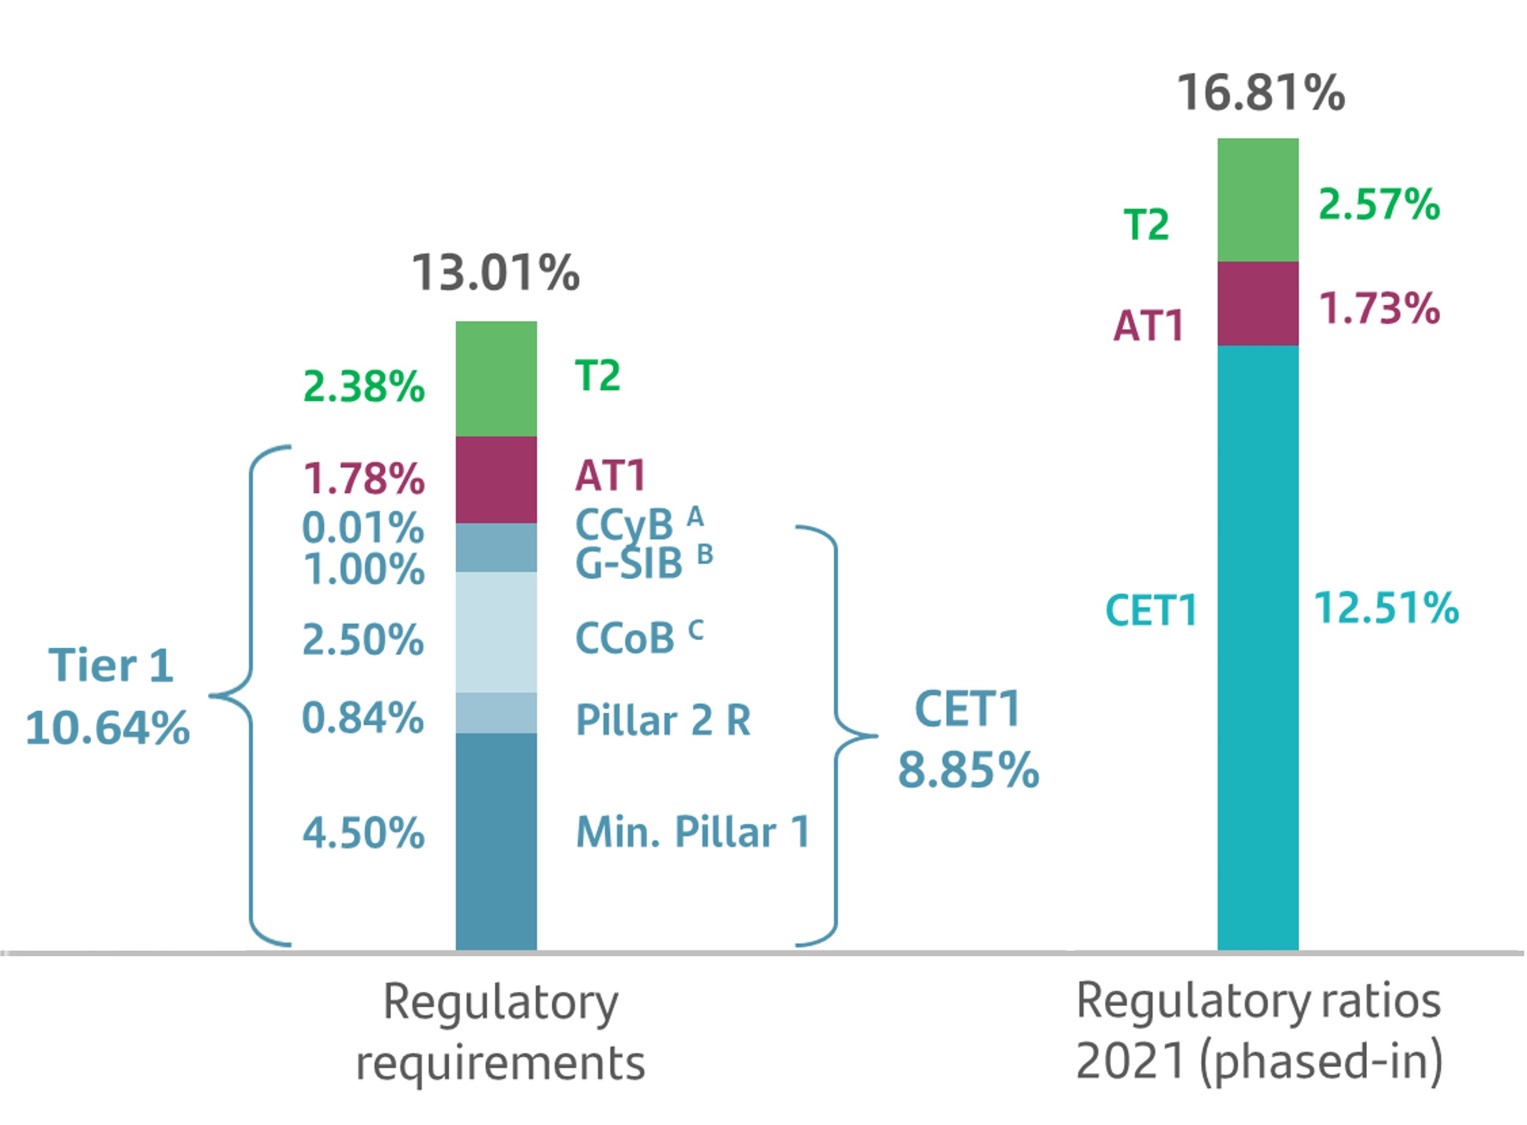
| Total capital ratio | 16.41 | % | 15.73 | % | 16.81 | % | 16.18 | % |
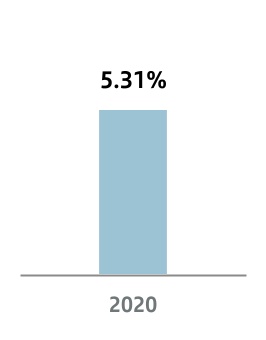
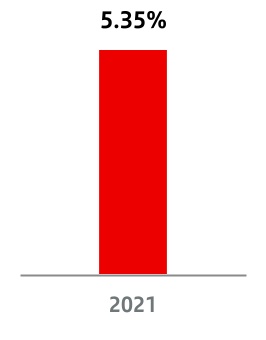
| Leverage Ratio | 5.21 | % | 5.31 | % | 5.37 | % | 5.33 | % |
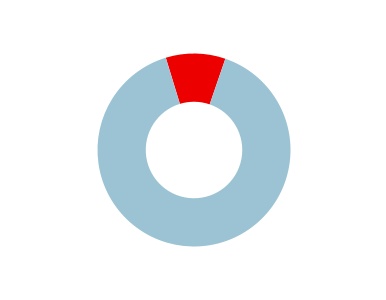
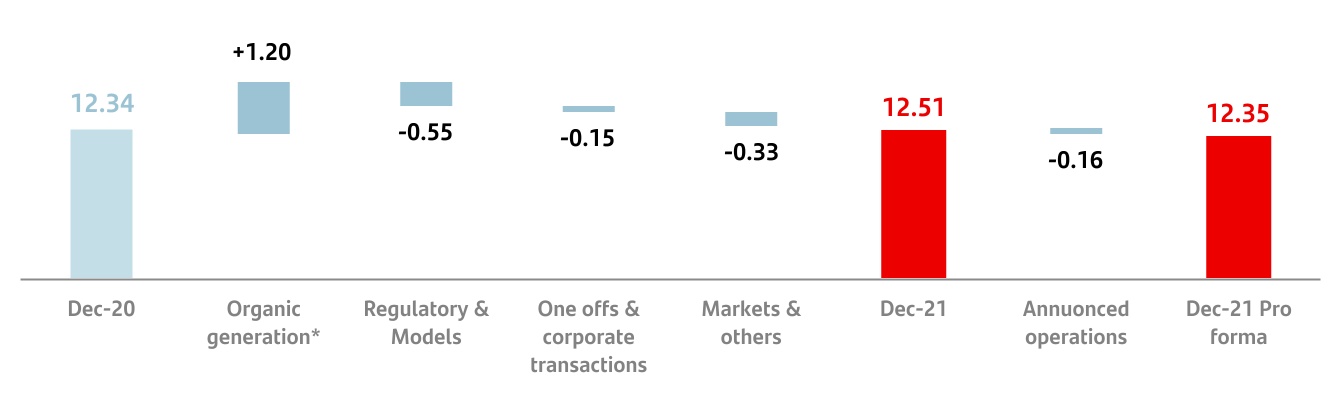
Strong organic generation driven by profit and RWA management
in fully-loaded CET1 ratio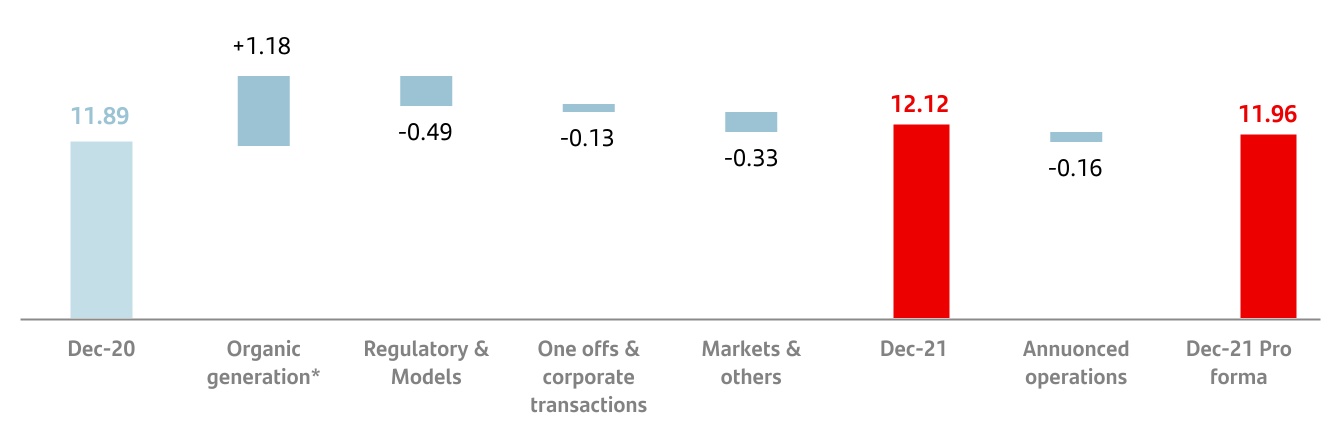
*Includes Accrued shareholders remuneration
If we do not apply the transitory IFRS 9 provisions, nor the subsequent amendments introduced by Regulation 2020/873 of the European Union, which has a 39 basis point impact, the fully-loaded CET1 ratio was 12.12%.
Of note in the year was organic generation of 118 basis points, supported by the results obtained in the year and management of risk-weighted assets. This figure includes a negative impact of 45 basis points related to shareholder remuneration. This strong generation was partially offset by regulatory and model impacts, the negative market impacts on available for sale (HTC&S) portfolios and non-recurring impacts (acquisition of minority interest in Mexico and restructuring costs).
If we include the acquisition of SC USA minority interests, which closed on 31 January 2022, and the announced acquisition of Amherst Pierpont, which is pending to completion, the CET1 ratio would be an estimated 16 basis points lower, bringing it to 11.96%.
The fully-loaded leverage ratio stood at 5.21%.
2 The phased-in ratios include the transitory treatment of IFRS 9, calculated in accordance with article 473 bis of the Regulation on Capital Requirements (CRR) and subsequent amendments introduced by Regulation 2020/873 of the European Union. Additionally, the Tier 1 and total phased-in capital ratios include the transitory treatment according to chapter 2, title 1, part 10 of the aforementioned CRR.
| | |
INTRODUCTION 2021 Pillar 3 Disclosures Report |
| | |
| Main risks capital requirements |
Solid risk culture, robust governance and advanced
risk management processes
| | | | | | | | | | | | | | |
| Credit risk3 | | Market risk | | Operational risk |
| 40,233 | | 1,378 | | 4,703 |
Million euros | | Million euros | | Million euros |
The credit risk management process involves identification, assessment, control and decision-making in relation to the credit risk incurred in the group's operations. It incorporates operational, customer and portfolio factors, together with a comprehensive view of the credit risk cycle. The Business and Risk areas are involved in the process, along with senior management. Santander's profile is mainly retail, with an adequate diversification of credit risk between mature and emerging markets. The Group includes counterparty credit risk in its credit risk framework. Additionally, for management purposes, it also has a specific counterparty credit risk model, policy and procedures. | | The measurement, control and monitoring perimeter of the Market Risk area includes all transactions where risk arises due to changes in market factors. This risk arises from changes in risk factors (interest rate, exchange rate, equities, credit spreads, commodity prices and the volatility of each of these) which may impact earnings or capital, and from the liquidity risk of the products and markets in which Santander operates.
At the end of December 2021, Santander had authorisation to use the internal market risk model for calculating regulatory capital in the trading books of the Spain, Chile and Mexico units. From October 2021, the market risk capital of the internal model for Spain and Santander London Branch (SLB) will be reported in a single entity, following regulatory approval of the diversification between the two units. The Group aims to gradually extend this approval to the rest of the units with significant market positions. | | The Group controls and manages operational risk by focusing on identifying, assessing, mitigating and reporting sources of operational risk, whether or not they have materialised, ensuring that risk management priorities are properly established. Santander expressly recognises that while a certain volume of operational losses can be expected, severe unexpected losses resulting from failures in business controls are unacceptable.
The group applied new developments and enhancements to the operational risk management model in 2021 in the risk assessment and control tools, operational risk appetite, business continuity plans and the analysis and integration of new risks (such as transformation risk or climate risk) into the non-financial risk monitoring and control model. |
3 It includes counterparty credit risk and securitisations without 1250% deduction.
| | | | | | | | | | | |
13 | | 2021 Pillar 3 Disclosures Report | |
| | |
INTRODUCTION 2021 Pillar 3 Disclosures Report |
1.2. Santander Pillar 3 report overview
1.2.1. Background information on Santander
Banco Santander, S.A. is a private-law entity subject to the rules and regulations applicable to banks operating in Spain. In addition to its direct operations, Banco Santander is the head of a group of subsidiaries engaged in a range of business activities that comprise Santander. The Capital Requirements Regulation (CRR) and its modifications (hereinafter referred to as CRR), Capital Requirements Directive (CRD) and its modifications, and its transposition through Banco de España Circular 2/2016, on supervision and capital adequacy, are applicable at a consolidated level to the whole of the Group.
Santander is one of the banks that have not required state aid in any of the countries in which they operate.
See Appendix II, CRR Mapping, for all aspects for which disclosure is required under Part Eight of the CRR, as amended but that are not applicable to Santander. These are reported as “N/A” (not applicable).
At 31 December 2021, none of the financial institutions consolidated in the Group had less than the minimum capital required under applicable regulations.
Under Article 7 and 9 of the CRR, the subsidiaries Santander Leasing S.A. EFC and Santander Factoring y Confirming S.A. EFC are exempt from the minimum capital requirements, the limit on large exposures and the internal corporate governance obligations at 31 December 2021. None of the exemptions under applicable regulations have been used for any other Santander subsidiaries.
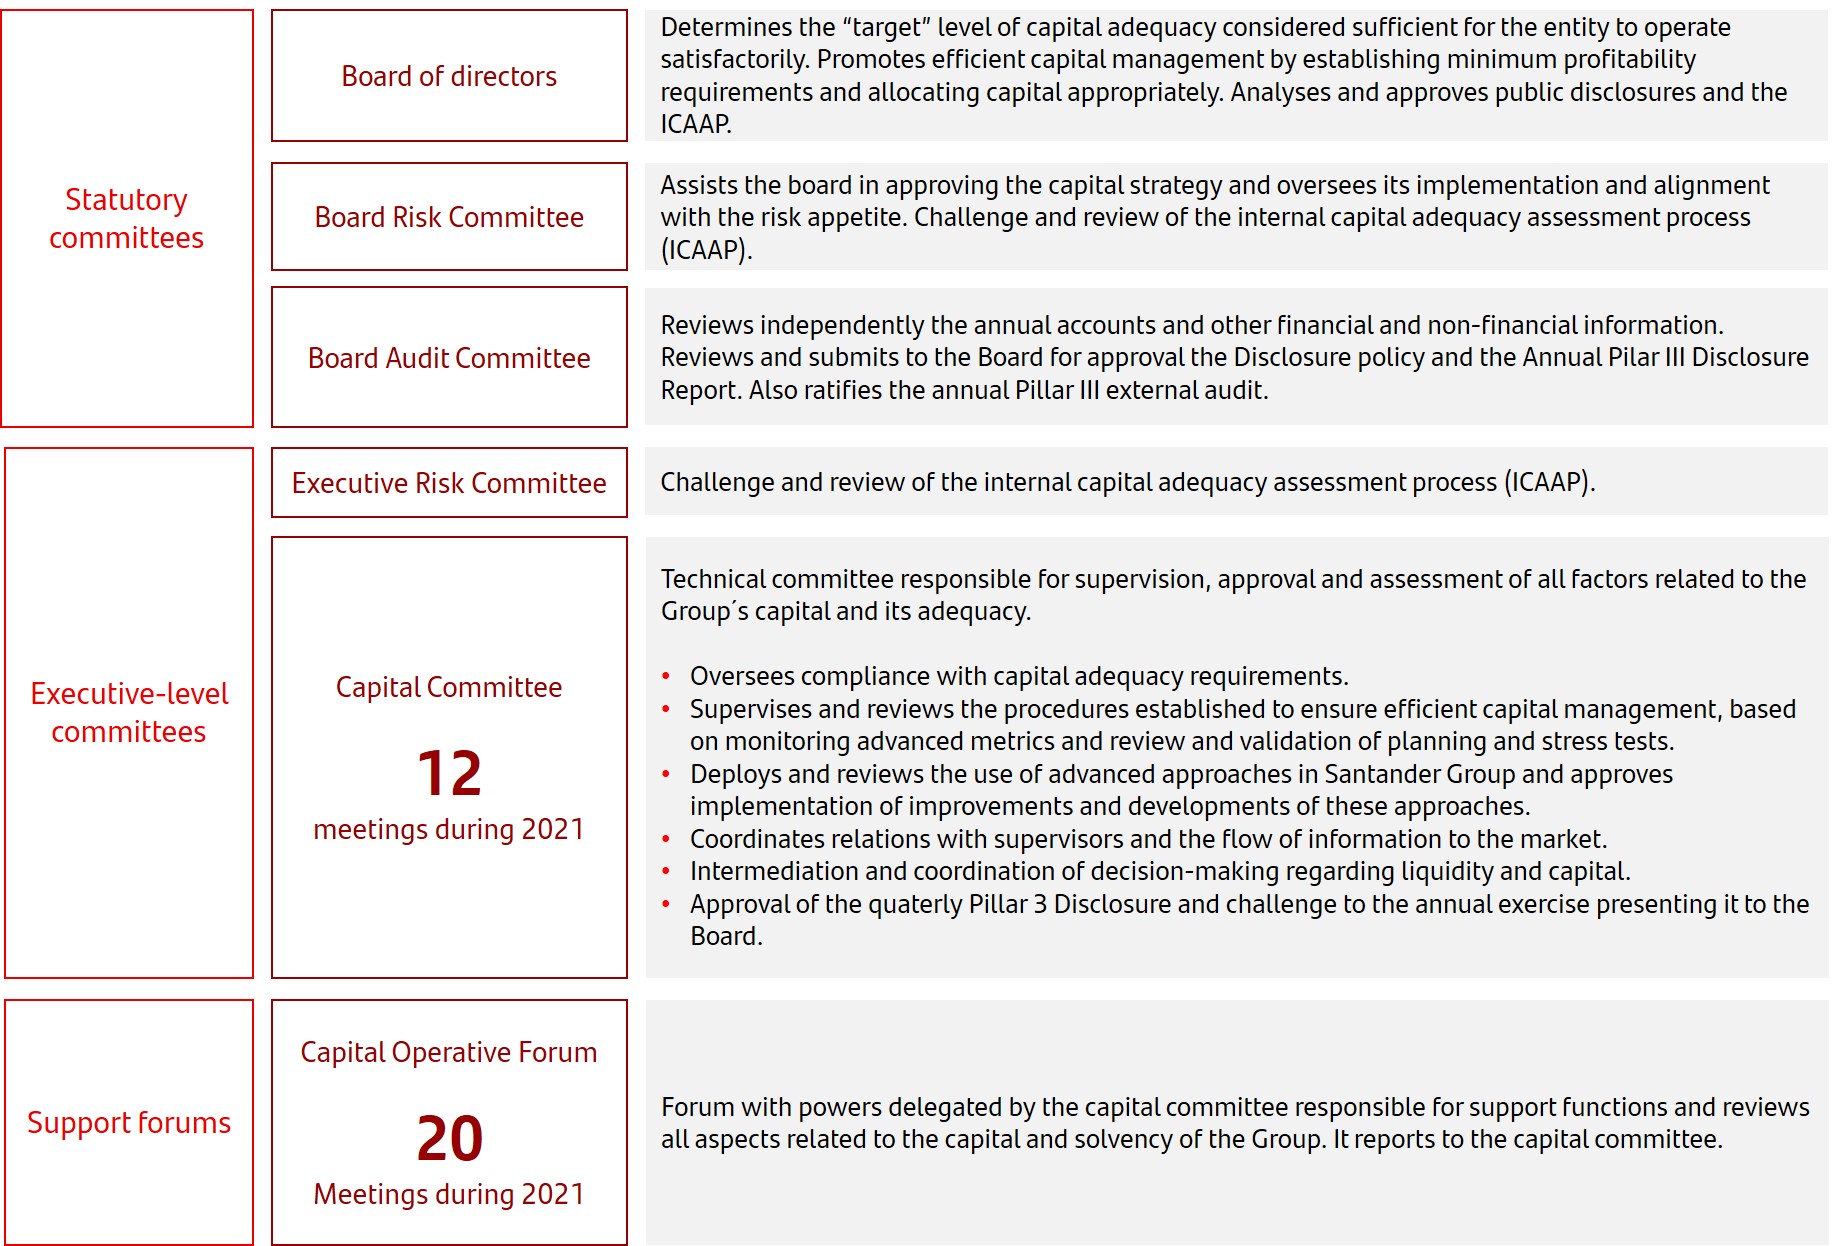
1.2.2. Governance: approval and publication
Santander Group has a formal policy on the disclosure of information of prudential relevance with the aim of defining the criteria for regulating the preparation process, minimum requirements to be included, frequency and associated governance in accordance with the provisions set forth in Directive 2013/36/EU, Regulation (EU) no. 2019/876 of 20 May 2019 (the EU Regulation or CRR2) amending Regulation (EU) no. 575/2013, as well as the law on supervision and capital requirements (10/2014) of the Bank of Spain.
This policy has been prepared in compliance with the criteria established in the European Banking Authority: Guidelines on Materiality, Proprietary, Confidentiality and Frequency of the Information in accordance with Article 432, sections 1 and 2 and Article 433 of Regulation (EU) 575/2013.
Pursuant to this policy, the Prudential Relevance Report corresponding to the financial year 2021 is published after its approval by the Board of Directors. Prior to its approval by the Board of Directors held on 24 February 2022, the report was reviewed by the Capital Committee held on 18 February 2022 and the Audit Committee during its session on the 21 February 2022.
Furthermore, since March 2015, a quarterly report is published which includes a set of information complying with the internal policy and criteria established in the European Banking Authority guidelines.
The information contained in this report has been subject to review by the External Auditor (PwC) which has not declared any incident in its report in relation to the reasonableness of the information detailed and the compliance with the information requirements established in the European Capital Directive and Regulation.
Certification by governing bodies
The board of directors of Santander certifies that the publication of the Pillar 3 disclosures report is compliant with the guidelines in Part Eight of Regulation (EU) 575/2013 and consistent with the “Pillar 3 Disclosures Policy” adopted by the board of directors.
No exceptions have been applied for the publication of information considered proprietary or confidential.
The Pillar 3 disclosures report relies on a range of processes relating to the internal control framework, with duties and responsibilities having been defined for review and certification of the information in the report at several levels of the organisation.
Further information on Santander´s internal control model (ICM) can be found in section VIII of the chapter on Corporate governance of the 2021 Annual report.
| | | | | |
| Access 2021 Annual Report available on the Santander Group website |
In addition, an ex-ante review is performed by external audit, the conclusions of which are presented to the audit committee and form part of the work plans of the recurring internal audit reviews.
The Pillar 3 disclosures report is available in the Shareholders and Investors section of the Santander website (www.santander.com), under "Financial and economic information".
| | | | | |
| Access 2021 Pillar 3 Disclosures Report available on the Santander Group website |
Disclosures by Santander subsidiaries
In addition to the information contained in this report, Santander subsidiaries that are considered to have significant
| | |
INTRODUCTION 2021 Pillar 3 Disclosures Report |
importance for their local market (under article 13 of the CRR, Application of disclosure requirements on a consolidated basis) publish information at the individual level on their websites, in relation to own funds, capital requirements, capital buffers, credit risk adjustments, remuneration policy and the application of credit risk mitigation techniques.
Santander subsidiaries in Argentina, Mexico, the United States, Santander Consumer Nordics, Santander Consumer Germany, Portugal, Chile, Poland, the United Kingdom and Uruguay publish their Pillar 3 reports in accordance with local regulations.
1.2.3. Transparency enhancements
The Group has noted the recommendation issued by international bodies with the aim of improving the transparency of the information published each year in the Pillar 3 disclosures report.
Santander takes into account all reporting requirements regarding market transparency published by the EBA, the BCBS and the Commission. Appendices I and II contain details on the various relevant documents.
Appendix I shows compliance with the different ITS in force in relation to disclosure, and Appendix II lists the location of the information disclosed in accordance with the relevant articles of Part Eight of the Regulation.
Some of the main transparency enhancements include the following:
Some of the main transparency enhancements include the following:
•In June 2021, phased to December 2021, the implementing technical standard (ITS) for the disclosure of Part VIII of Regulation No 575/2013 (CRR) came into force to standardise Pillar 3 disclosures. This disclosure increases our semi-annual disclosure by 30% and our annual disclosure by 10% and provides a uniform definition of the relationship between reporting and disclosure (mapping tool) for 60% of it.
•The implementing technical standard on the disclosure and reporting of the minimum requirement for own funds and eligible liabilities (MREL) and the total loss absorbing capacity (TLAC) also came into force in June 2021.
| | | | | |
| ¤ | For more information, see section 2.7. |
•As a result of the global health crisis, the EBA published a guide to the impact of covid-19 entitled "EBA GLs on reporting and disclosure of exposures subject to measures applied in response to the covid-19 crisis", which specifies that three quantitative templates with information on the scope of the moratoria must be published every six months. Given the ongoing covid-19 pandemic and the uncertainty over its future development, the EBA confirmed in January 2022 the continued application of this reporting and disclosure requirements until further notice.
| | | | | |
| ¤ | For more information, see section 4.10. |
•The EBA also published another ITS on Pillar 3 disclosure on interest rate risk arising from the non-trading book activities (IRRBB).
| | | | | |
| ¤ | For more information, see section 7.4.1. |
See Appendix I Transparency Enhancements and Appendix II CRR Mapping for further information on improvements in transparency.
| | | | | |
| ¤ | For more information, see Appendix I. |
| | | | | |
| ¤ | For more information, see Appendix II. |
In the Financial and economic information / Pillar 3 section of the Group's website, we also publish all the tables shown in this document in editable format for easier processing, as well as the appendices.
| | | | | |
| Access 2021 Pillar 3 Disclosures Report available on the Santander Group website |
Best practise aspiration
Grupo Santander strives to be a best practise example of disclosure, having already excelled in the last EBA assessments in the areas of liquidity, prudent valuation, improvements to general sections, presentation of information and other aspects of navigability.
1.2.4. Disclosure criteria used in this report
This report has been prepared in accordance with current European regulations on capital requirements (CRR).
The ratios presented in this report have been calculated using the transitional CRR and IFRS 9 implementation schedules.
Details of the types of information where there are differences between the regulatory information shown in this report and the information in the annual report and accounting information are as follows.
•The credit risk exposure measurements used for calculating regulatory capital requirements include:
◦Not only current exposures but also potential future risk exposures arising from future commitments (contingent liabilities and commitments) and changes in market risk factors (derivative instruments).
◦The mitigating factors for these exposures (netting agreements and collateral agreements for derivative exposures, and collateral and personal guarantees for on-balance-sheet exposures).
•The criteria used in classifying non-performing exposures in portfolios subject to advanced models for calculating regulatory capital are more conservative than those used
| | | | | | | | | | | |
15 | | 2021 Pillar 3 Disclosures Report | |
| | |
INTRODUCTION 2021 Pillar 3 Disclosures Report |
for preparing the disaggregated information provided in the annual report.
1.3. Regulatory framework
1.3.1. Prudential framework 2021: Capital Adequacy and Resolution key points
Credit institutions must meet a number of minimum capital and liquidity requirements. These minimum requirements are governed by the European Capital Requirements Regulation, better known as CRR, and the Capital Requirements Directive, CRD. In June 2019, these regulations were significantly amended.
The applicable regulations are now CRRII and CRDV.
As the Directives need to be transposed into the legal systems of the different Member States in order to be applicable, in the case of Spain, Royal Legislative Decree 7/2021 and Royal Decree 970/2021 were published for this purpose in 2021.
In June 2019, CRRII introduced the minimum TLAC (Total Loss Absorbing Capacity) requirement, which only applies to global systemically important banks (G-SIBs). This requirement introduces two metrics: i) a minimum requirement for own funds and eligible liabilities as a percentage of the Total Risk Exposure Amount (TREA) set at 16% during the transition period and 18% from 1 January 2022 after the end of the transition period; and ii) a metric to set a minimum requirement for own funds and eligible liabilities in terms of a percentage of the Basel III tier 1 leverage ratio exposure measure of 6% during the transition period and 6.75% from 1 January 2022 after the end of the transition period.
This year saw the implementation of the EBA Guidelines on the New Definition of Default, which were prepared in accordance with CRR II, on 1 January 2021. The changes to CRRII that are applicable from June 2021 include the introduction of a minimum leverage ratio of 3%, the new standardised EAD calculation for counterparty risk, known as SA-CCR, the long-term liquidity ratio (NSFR), the new limits for large exposures and the requirement to report under the standardised approach for market risk.
CRDV introduces important modifications such as Pillar 2G regulation (guidance, Pillar 2 requirements orientation).
On 27 October 2021, the European Commission published the draft review of European banking legislation: CRR III and CRD VI.
This review completes the implementation of the Basel III reform, which was agreed at the end of 2017 and aims to reduce the variability of risk-weighted assets and improve comparability between banks.
The banking package consists of the following elements: 1) Implementation of the final Basel III reforms, 2) Contribution to sustainability and green transition and 3) Stronger supervision: ensuring sound management of EU banks and better protection of financial stability.
The first part is reflected in the Commission's proposal to amend the text of the CRR. This proposal contains changes concerning, among other things, key risk factors, standardised credit risk, internal models, the output floor and operational risk.
The second part, relating to the contribution to sustainability and green transition, is reflected in the fact that the legislative proposals continue to incorporate ESG (environmental, social and governance) factors into the various areas of prudential regulation: governance, supervision, risk management, reporting obligations to competent authorities and disclosure requirements, among other topics.
Finally, the third part, which refers to stronger supervision and protection of financial stability, is expressed in a series of provisions concerning: fit-and-proper requirements, the extension of the scope by revising certain definitions that would cover groups managed by fintechs, and the establishment of third-country branches in the EU in order to achieve greater harmonisation of rules and better supervision of this type of entity.
In general, the Commission proposes to start applying the new rules from 1.1.2025, but the amendments to the regulation that concern resolution issues could come into force in the first months of 2022.
With regard to the resolution rules, institutions must have an adequate funding structure to ensure that, in the event of financial distress, the institution has sufficient liabilities to absorb losses in order to recover its position or be resolved, while ensuring the protection of depositors and financial stability.
The directive that governs the resolution framework mentioned above is the Bank Recovery and Resolution Directive (BRRD). Like the CRR and the CRD, the BRRD was amended in June 2019, so BRRDII refers to all of these amendments. The transposition of this directive into the Spanish legal system took place in 2021 through a Royal Decree.
BRRDII has introduced important changes to the Minimum Requirement for Own Funds and Eligible Liabilities (MREL). For example, the TLAC requirement is now considered a Pillar 1 resolution requirement for G-SIBs. For large banks (defined as banks with total assets of more than €100 billion) or banks deemed systemically important by the resolution authority, BRRDII sets a minimum subordination requirement of 13.5% of risk-weighted assets or 5% of the leverage ratio, whichever is higher. For all other institutions, the subordination requirement is set by the resolution authority on a case-by-case basis.
Finally, Deposit Guarantee Schemes (DGS) are regulated by Directive 2014/49 or DSGD, which has not undergone any significant changes since its publication in 2014. It aims to harmonise the deposit guarantee schemes of the Member States, thus ensuring stability and balance in the different countries. It creates an appropriate framework for depositors to have better access to DGSs than was the case before the publication of this Directive through clear coverage, shorter repayment periods, better information and robust funding requirements. This Directive is transposed into Spanish law by Law 11/2015, Royal Decree 1012/2015 and Royal Decree 1041/2021.
| | |
INTRODUCTION 2021 Pillar 3 Disclosures Report |
1.3.2. Regulatory response to impacts of covid-19
The severe economic disruption caused by the covid-19 pandemic during 2020, which continued throughout 2021, has brought home the importance of the financing role banks will play in contributing to the recovery. Competent authorities (national, European and international) have acted by relaxing liquidity, capital and operational requirements so that banks could continue to provide funding to the economy, while ensuring they continue to act prudently.
As part of the European Central Bank's actions, several recommendations have been issued asking European banks to refrain from paying dividends and buying back shares to compensate shareholders.
The first recommendation to refrain from paying dividends was issued in March 2020 and was successively extended until 30 September 2021, when the ECB decided to lift it.
Throughout 2020, national governments took measures to counter the economic and social impact of the pandemic, particularly through legislative repayment moratoria to contain non-performing loans and help people cope with their liquidity needs. For its part, the European Banking Authority (EBA) has adopted a number of guidelines during 2020, including the guidelines on legislative and non-legislative moratoria implemented to respond to the covid-19 crisis on 2 April 2020. These guidelines clarify how the requirements of the public and private moratoria granted are to be met in order to avoid unjustified mass categorisation of these exposures as restructured or doubtful. While these guidelines were originally intended to apply to moratoria granted before 30 June 2020, the EBA decided on 2 December 2020 to reactivate the application of these guidelines for moratoria requested before 31 March 2021 and for a period not exceeding 9 months.
Another measure adopted in 2020 to provide flexibility in meeting the requirements was the approval and entry into force of the CRR "Quick Fix" amending CRR II (urgent and extraordinary amendments to bring about a more flexible regulatory framework in response to covid-19). The Quick Fix introduces a number of new features, including the extension of the transitional period granted before the pandemic for the entry into force of IFRS 9, due to the sudden and significant increase in expected credit loss provisions to be recognised. The implementation of certain provisions of CRR II has also been delayed, such as those relating to the leverage ratio buffer (postponed until 1 January 2023); the possibility of excluding exposures to central banks from the calculation of the leverage ratio, which should have been applied from June 2021 on, has been brought forward. Other provisions beneficial to institutions have also been brought forward. These include the support factors for SMEs and infrastructure, and the new treatment for software (applicable from the day following the publication date of the Delegated Regulation that implements it).
1.3.3. Other regulations: Sustainability
Since the publication of the European Commission's Action Plan underpinning the EU's 2030 climate and sustainable development goals and agenda, steady progress has been made in the development of sustainable finance.
2021 saw further implementation of the Taxonomy Regulation (2020/852), which sets harmonised criteria for classifying an economic activity as environmentally
sustainable. As part of its task to develop the six environmental objectives, the European Commission published the final selection criteria for identifying sustainable activities that contribute to the climate change mitigation and adaptation objectives, which were finally adopted in December 2021. The remaining four objectives – sustainability and protection of water and marine resources, transition to a circular economy, pollution prevention and control, and protection and restoration of biodiversity and ecosystems – will be further implemented during 2022. In addition, the Commission has begun to work on a possible extension of the taxonomy to also classify activities in transition that do not yet meet the criteria of the taxonomy, as well as those with harmful environmental impacts and those with social objectives. This work will continue in 2022.
The final version of the Delegated Act on Article 8 of the Taxonomy Regulation on disclosure requirements for financial and non-financial undertakings was published in July. It sets out a series of indicators that companies subject to the Non-Financial Reporting Directive (NFDR) must publish in relation to the taxonomy.
The most relevant indicator for banks is the Green Asset Ratio. The Green Asset Ratio is the percentage of its exposures that are consistent with the environmentally sustainable activities identified and specified in the relevant Delegated Regulations underlying the Taxonomy Regulation. The final text was adopted in December 2021.
The European Central Bank published its guide on supervisory expectations for climate and environmental risks in November 2020, which was integrated into the supervisory dialogue during the 2021 financial year. The European Central Bank also announced that it will conduct a climate stress test in the first half of 2022, the methodology for which was published at the end of October this year.
Finally, in July, the EBA published its report on the management and monitoring of ESG risks for banks and investment firms. This report will form the basis for the development of guidelines for the ESG risk management of institutions and the supervision of ESG risks by competent authorities in the EU. The EBA guidelines are expected to be published in June 2022.
In 2022, the EBA is expected to publish the technical implementation details for the integration of ESG risks in the Pillar 3 report. Institutions must implement these developments from 2023, for the 2022 financial year.
1.3.4. Other regulations: Digital
Due to the digitalisation of the financial industry and the resulting transformation of the sector, regulators and supervisors need to update both the regulatory framework and their approach to reflect the new realities and business models that are emerging as a result of this new digital world.
In their efforts to maintain financial stability, financial regulators and Supervisors proceed in three main ways:
•by adapting or creating new rules that take into account new realities and new uses of already identified technologies or new relationships that emerge between participants in the financial system and technology companies;
| | | | | | | | | | | |
17 | | 2021 Pillar 3 Disclosures Report | |
| | |
INTRODUCTION 2021 Pillar 3 Disclosures Report |
•by broadening the scope of the already existing regulatory framework to ensure regulation that applies consistently to all those engaged in the same activity (in line with the principle of "same activity, same risks, same rules");
•and finally, by adapting the supervisory approach to the new risks that emerge in a constantly evolving digital environment.
In 2021, there have been other regulatory initiatives at both international and European levels that address new realities or the use of technology in the financial industry. These include in particular in Europe (currently under discussion):
•The proposed Digital Operational Resilience Act (DORA), which aims to manage the risks generated by IT-related service providers in their interactions with financial sector participants. An important part of this proposal is that providers deemed to be critical will be subject to direct supervision by banking supervisors.
•The proposed Digital Markets Act (DMA) regulation aims to regulate competition in digital markets and proposes to impose certain "ex ante" obligations on those digital platforms that can be considered "gatekeepers".
•The proposal for a European regulation on Artificial Intelligence, which regulates the use of this technology for both public and private entities. The proposal focuses on applications that are considered high-risk, including the customers' creditworthiness assessment and human resources management.
•The proposed Regulation on Markets in Crypto-Assets (MiCA), which regulates and establishes a regulatory framework for service providers (e.g. issuers, exchanges, wallets, etc.) of crypto-assets, which are not considered financial instruments. Among other things, the proposal regulates crypto-assets used for payments and establishes a stricter framework for crypto-assets that are "significant" in terms of their degree of proliferation.
•The proposed revision of the EIDAs (Regulation on Electronic Identification, Authentication and Trust Services), which proposes a new framework for a European digital identity available to citizens and businesses through digital wallets. The new framework will enable the electronic exchange of documents and proof of identity across Europe, as well as access to public services, applications requiring a high level of security, such as banking services, and digital platforms.
In the area of payment services, the authorities are focusing on further development so that the benefits of innovation and the opportunities created by digitalisation can be exploited. The aim is to create a payment system that is more accessible, faster, offers cross-border solutions and preserves consumer protection at all times.
There is still a debate on whether and under what conditions it makes sense to issue a Digital Euro (there has been a lot of discussion about possible design options this year). The same sorts of debates are also taking place in many other jurisdictions across the world.
1.3.5. Other regulations: Anti-money laundering and countering the financing of terrorism (AML/FT)
In July 2021, the European Commission published a proposal for an Anti-Money Laundering and Countering the Financing of Terrorism (AML/FT) regulatory package that aims to strengthen existing EU rules, improve the detection of suspicious transactions and activities, and close loopholes in the current regulatory framework. It consists of four legislative proposals:
1.Regulation establishing a new European AML/FT Authority that will coordinate national AML/FT authorities and directly supervise certain financial sector institutions. The Authority is expected to become operational in 2024 and to start its supervisory activities in 2026.
2.AML/FT Regulation. Parts of the current Directive will be transferred to this Regulation, which will be directly applicable in all Member States without the need for local transposition. This will harmonise EU requirements in areas such as customer due diligence, among others. Expected to be implemented by the end of 2025.
3.Sixth AML/FT Directive, which will repeal the current Directive. It contains provisions that must be transposed into national law, in particular on national supervisory authorities and Financial Intelligence Units (FIUs).
4.Recast of the Regulation on Transfers of Funds, with a particular focus on the tracking of transfers of crypto-assets. This revision introduces new requirements in relation to Virtual Asset Service Providers (VASPs) by requiring these actors to collect and make available data on the originators and beneficiaries of the transfers of virtual or crypto assets they operate.
The European Parliament and the Council are now debating this package, and the legislative procedure is estimated to take about two years.
1.4. Scope of consolidation
This section covers the qualitative requirements LIA - Explanations of differences between accounting and regulatory exposure amounts and LIB - Other qualitative information on the scope of application.
The Group companies included in the scope of consolidation for calculating the capital adequacy ratio under the CRR are the same as those included in the scope of consolidation for accounting purposes under Banco de España Circular 2/2018.
1.4.1. Differences between the accounting consolidation method and the consolidation method for calculating regulatory capital
In application of Part I (General Provisions) of the CRR, some Santander companies are consolidated using a different methods for accounting consolidation.
For the purposes of calculating the capital adequacy ratio based on the nature of their business activities, the Group companies included in the prudential scope of consolidation are consolidated using the full consolidation method, with the exception of jointly controlled entities, which use proportionate consolidation. All companies that cannot be
| | |
INTRODUCTION 2021 Pillar 3 Disclosures Report |
consolidated based on their business activities are accounted for using the equity method and so are treated as equity exposures.
The basis of the information used for accounting purposes differs from that used for calculating regulatory capital requirements. Risk exposure measurements may differ depending on the purpose for which they are calculated, such as financial reporting, regulatory capital reporting and management information. The exposure data included in the quantitative disclosures in this document are used for calculating regulatory capital or leverage ratio.
The companies for which different consolidation methods are used, depending on the regulations applied (table LI3), are listed in Appendix V of the 2021 Pillar 3 Report file available on the Santander website.
| | | | | |
| Access 2021 Pillar 3 Disclosures Report available on the Santander Group website |
| | | | | | | | | | | |
19 | | 2021 Pillar 3 Disclosures Report | |
| | |
INTRODUCTION 2021 Pillar 3 Disclosures Report |
The following table shows the relationship between the categories in the financial statements and the risk categories in accordance with prudential requirements.
| | | | | | | | | | | | | | | | | | | | | | | |
| Table 1.LI1 - Differences between accounting and regulatory scopes of consolidation and mapping of financial statement categories with regulatory risk categories |
|
| EUR million | | | | | | | |
| | | | | | 2021 |
| Carrying values as reported in published financial statements | Carrying values under scope of regulatory consolidation | Carrying values of items: |
| Subject to credit risk framework | Subject to the CCR framework | Subject to securitisation framework | Subject to market risk framework | Not subject to capital requirements or subject to deduction from capital |
| Assets | | | | | | | |
| Cash and cash balances at central banks | 210,689 | 211,095 | 211,095 | — | — | — | — |
| Financial assets held for trading | 116,953 | 116,923 | — | 71,264 | 73 | 116,850 | — |
| Non-trading financial assets mandatorily measured at fair value through profit or loss | 5,536 | 3,483 | 752 | — | 760 | 1,971 | — |
| Financial assets not held for trading valued mandatorily at fair value through profit or loss | 15,957 | 13,790 | — | 5,489 | — | 13,790 | — |
| Financial assets designated at fair value through profit or loss | 108,038 | 95,246 | 80,803 | — | 14,443 | — | — |
| Financial assets at amortised cost | 1,037,898 | 1,042,227 | 1,005,832 | 32,637 | 3,677 | — | 82 |
| Derivatives - Hedge accounting | 4,761 | 4,770 | — | 4,770 | — | — | — |
| Fair value changes of the hedged items in portfolio hedge of interest rate risk | 410 | 410 | — | — | — | — | 410 |
| Investments in subsidiaries, joint ventures and associates | 7,525 | 8,492 | — | — | — | — | 8,492 |
| Reinsurance assets | 283 | — | — | — | — | — | — |
| Tangible assets | 33,321 | 31,073 | 31,073 | — | — | — | — |
| Intangible assets | 16,584 | 16,819 | 1,766 | — | — | — | 15,052 |
| Tax assets | 25,196 | 25,210 | 23,954 | — | — | — | 1,256 |
| Other assets | 8,597 | 8,842 | 6,870 | — | — | — | 1,972 |
| Non-current assets and disposal groups classified as held for sale | 4,089 | 4,305 | 4,305 | — | — | — | — |
| Total assets | 1,595,837 | 1,582,685 | 1,366,450 | 114,161 | 18,953 | 132,610 | 27,264 |
| Liabilities | | | | | | | |
| Financial liabilities held for trading | (79,469) | (79,508) | — | (67,272) | — | (79,508) | — |
| Financial liabilities designated at fair value through profit or loss | (32,733) | (15,305) | — | (390) | — | (15,305) | — |
| Financial liabilities measured at amortised cost | (1,349,169) | (1,354,296) | — | — | — | — | (1,354,296) |
| Derivatives - Hedge accounting | (5,463) | (5,457) | — | (5,457) | — | — | — |
| Fair value changes of the hedged items in portfolio hedge of interest rate risk | (248) | (248) | — | — | — | — | — |
| Liabilities under insurance contracts | (770) | — | — | — | — | — | — |
| Provisions | (9,583) | (9,595) | (733) | — | — | — | (8,862) |
| Tax liabilities | (8,649) | (8,576) | — | — | — | — | (8,576) |
| Other liabilities | (12,700) | (12,669) | — | — | — | — | (12,669) |
| Total liabilities | (1,498,784) | (1,485,654) | (733) | (73,119) | — | (94,813) | (1,384,403) |
| | |
INTRODUCTION 2021 Pillar 3 Disclosures Report |
The difference in total assets between the public and the reserved scopes is not material and corresponds to the exclusion of financial institutions and the inclusion of jointly controlled and intra group entities.
In addition, the sum of the carrying amounts of certain items is greater than the carrying amounts under the scope of prudential consolidation, as the financial assets held for trading and the financial assets at fair value through profit or loss are subject to the capital requirements of more than one risk category under the regulatory scope.
The main differences between the carrying amounts in the financial statements and the exposures for prudential purposes are shown below:
| | | | | | | | | | | | | | | | | |
| Table 2.LI2 - Main sources of differences between regulatory exposure amounts and carrying values in financial statements |
|
| EUR million | | | | | |
| | | | 2021 |
| Total | Items subject to: |
| Credit risk framework | CCR framework | Securitisation framework | Market risk framework |
| Asset carrying value amount under scope of regulatory consolidation (as per template EU LI1) | 1,632,174 | 1,366,450 | 114,161 | 18,953 | 132,610 |
| Liabilities carrying value amount under regulatory scope of consolidation (as per template EU LI1) | (168,665) | (733) | (73,119) | — | (94,813) |
| Total net amount under regulatory scope of consolidation | 1,463,509 | 1,365,717 | 41,042 | 18,953 | 37,797 |
| Off-balance sheet amounts | 331,030 | 331,030 | — | — | — |
| Regulatory Add-on | 31,975 | — | 31,975 | — | — |
| Differences in valuations | — | — | — | — | — |
| Differences due to different netting rules, other than those already included in row 2 | (42,626) | — | (4,828) | — | (37,797) |
| Non-eligibility of the balances corresponding to accounting hedges (derivatives) | (4,770) | — | (4,770) | — | — |
| Securitisations with risk transfer | 28,321 | 32,874 | — | (4,553) | — |
| Other | (17,006) | (50,745) | — | 33,739 | — |
| Differences due to consideration of provisions | (14,601) | (14,389) | — | (212) | — |
| Differences due to CRMs | (32,629) | (16,442) | (15,592) | (595) | — |
| Differences due to CCFs | (235,233) | (235,233) | — | — | — |
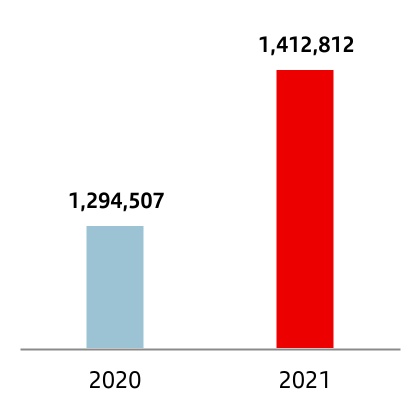
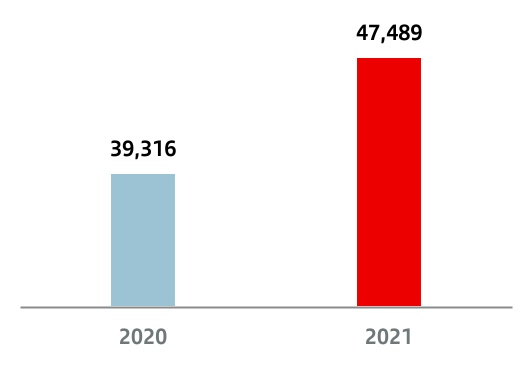
| Exposure amounts considered for regulatory purposes (EAD) | 1,508,128 | 1,412,812 | 47,827 | 47,489 | — |
This table shows a breakdown of the differences between the amounts of exposures for prudential purposes and the carrying amounts according to various parameters
The main causes in this case, result from the amount of off-balance sheet items +EUR 331.030 billion) and the application of CCFs (-EUR 235.233 billion). The regulatory add-on (+EUR 31.975 billion and the differences resulting from the various offsetting rules (-EUR 42.626 billion).
The reconciliation of the public and non-public balance sheets (table CC2) is shown in Appendix VI, which is available on the Santander website.
| | | | | |
| Access 2021 Pillar 3 Disclosures Report available on the Santander Group website |
1.4.2. Substantial amendments due to a change in the perimeter and corporate transactions
For more information on the main acquisitions and disposals of holdings in other companies and other major corporate transactions by Santander last year, refer to section 3 of the Notes to the consolidated financial statements in the Audit Report section of the 2021 Annual Report.
| | | | | |
| Access 2021 Annual Report available on the Santander Group website |
| | | | | | | | | | | |
21 | | 2021 Pillar 3 Disclosures Report | |
| | |
INTRODUCTION 2021 Pillar 3 Disclosures Report |
| | | | | | | | | | | | | | | | | | | | | | | | | | | | | | | | | | | | | | |
| | |
| Capital |
|
|
| |
| 2.1. Capital | |
| 2.2. Capital function | |
| 2.2.1. Organisation | |
| 2.2.2. Capital governance | |
| 2.3. Capital management and adequacy. Solvency ratios | |
| 2.3.1. Profitability | |
| 2.3.2. Pricing | |
| 2.3.3. Other activities in capital management | |
| 2.4. Pillar 1 - Regulatory capital | |
| 2.4.1. Eligible capital | |
| 2.4.2. Capital requirements | |
| 2.4.2.1. Plan to deploy advanced internal models and supervisory approval | |
| 2.4.3. Capital buffers and capital requirements | |
| 2.4.4. Leverage ratio | |
| 2.5. Economic capital and RoRAC - Pillar II | |
| 2.6. Capital planning and stress tests | |
| 2.7. Total Loss-Absorbing Capacity (TLAC) and Minimum Requirement for own funds and Eligible Liabilities (MREL) | |
| 2.8. Lines of defence | |
| 2.8.1. Second line of defense | |
| 2.8.2. Internal Audit | |
| 2.9. Corporate Special Situations and Resolution Framework, crisis management, Recovery and Resolution Planningk | |
| |
| |
| |
| | |
CAPITAL 2021 Pillar 3 Disclosures Report |
2. Capital
| | | | | | | | | | | | | | |
| Regulatory CET1 ratio (Phased-in)4 | |
| | | | |
| 11.65 | % | 12.34 | % | 12.51 | % | |
Focus ahead will remain on disciplined capital allocation and shareholder
remuneration while we maintain our fully-loaded CET1 target
between 11% and 12%.
At December 31, 2021, the fully-loaded CET1 ratio (without applying the IFRS 9 or CRR transitional arrangements) stood at 12.12% and the phased-in CET1 ratio was 12.51%. Only applying the IFRS 9 transitional arrangements (CRR fully-loaded), the ratio remains at 12.51%. The following table shows shows the impact of the CRR transitional arrangements under a IFRS 9 phased-in scenario:
| | | | | | | | | | | | | | | | | | | | | | | | | | | | | | | | | | | |
| Table 3.Main capital figures and capital adequacy ratios (Phased-in IFRS 9). | | |
| EUR million | | |
| Fully-loaded CRR | | Phased-in CRR |
| Dec'21 | Sep'21 | Jun'21 | Mar'21 | Dec'20 | | Dec'21 | Sep'21 | Jun'21 | Mar'21 | Dec'20 |
| Common Equity (CET1) | 72,402 | 70,787 | 70,864 | 69,627 | 69,399 | | 72,402 | 70,787 | 70,864 | 69,627 | 69,399 |
| Tier 1 | 82,133 | 80,585 | 79,661 | 78,417 | 78,126 | | 82,452 | 80,897 | 79,973 | 78,731 | 78,501 |
| Total capital | 97,013 | 93,240 | 92,270 | 91,466 | 90,933 | | 97,317 | 93,537 | 92,539 | 91,550 | 91,015 |
| Risk weighted assets | 578,930 | 577,209 | 584,999 | 567,797 | 562,580 | | 578,930 | 577,209 | 584,999 | 567,797 | 562,580 |
| CET1 Ratio | 12.51 | % | 12.26 | % | 12.11 | % | 12.26 | % | 12.34 | % | | 12.51 | % | 12.26 | % | 12.11 | % | 12.26 | % | 12.34 | % |
| Tier 1 Ratio | 14.19 | % | 13.96 | % | 13.62 | % | 13.81 | % | 13.89 | % | | 14.24 | % | 14.02 | % | 13.67 | % | 13.87 | % | 13.95 | % |
| Total capital ratio | 16.76 | % | 16.15 | % | 15.77 | % | 16.11 | % | 16.16 | % | | 16.81 | % | 16.20 | % | 15.82 | % | 16.12 | % | 16.18 | % |
| Leverage Ratio | 5.35 | % | 5.29 | % | 5.25 | % | 5.06 | % | 5.31 | % | | 5.37 | % | 5.31 | % | 5.27 | % | 5.08 | % | 5.33 | % |
| | | | | | | | | | | |
| 2020 and 2021 figures are calculated applying the transitional arrangements of IFRS 9 unless specified otherwise (Phased-in IFRS 9). | | |
| In March and June 2021 a pay-out of 50% was applied, from September onwards 20% cash was applied depending on the dividend in cash and the first authorized repurchase. | | |
2.1. Capital
Capital management and control at the Group is a fully transversal process that seeks to guarantee the bank's capital adequacy, while complying with regulatory requirements and maximising profitability.
It is determined by the strategic objectives and risk appetite set by the board of directors. To achieve this, the following
policies have been established that shape the approach that the Group applies to capital management:
•Establish adequate capital planning, so as to meet current needs and provide the necessary resources to meet the needs of the business plans, regulatory requirements and the associated risks in the short and medium term, while maintaining the risk profile approved by the board.
4 The phased-in ratios include the transitory treatment of IFRS 9, calculated in accordance with article 473 bis of the Regulation on Capital Requirements (CRR) and subsequent amendments introduced by Regulation 2020/873 of the European Union. Additionally, the Tier 1 and total phased-in capital ratios include the transitory treatment according to chapter 2, title 1, part 10 of the aforementioned CRR.
| | | | | | | | | | | |
25 | | 2021 Pillar 3 Disclosures Report | |
| | |
CAPITAL 2021 Pillar 3 Disclosures Report |
•Ensure that Santander and its companies have adequate capital to cover needs resulting from increased risks due to deteriorating macroeconomic conditions under stress scenarios.
•Optimise capital use through its appropriate allocation among the businesses, based on the relative return on regulatory and economic capital and taking risk appetite, growth and strategic objectives into account.
Santander maintains a very comfortable capital adequacy position, well above the levels required by applicable regulations and by the European Central Bank.
IFRS 9 became effective on 1 January 2018, implying changes in accounting that affect capital ratios. Santander decided to apply the transitional arrangements, which means a seven-year transitional period.
Had the IFRS9 or CRR transitional arrangements not been applied, the total impact on the fully-loaded CET1 ratio at December would have been -39bps.
Phased-in CET1 stood at 12.51% in December, increasing by 17 bps during the year.
For further detail see the comparison of institutions’ own funds and capital and leverage ratios with and without the application of transitional arrangements for IFRS 9 or analogous ECLs (IFRS 9-FL), Appendix VIII (NIIF9).
| | | | | |
| Access 2021 Pillar 3 Disclosures Report available on the Santander Group website |
For further information on capital key metrics see Appendix VII (KM1 requirement).
| | | | | |
| Access 2021 Pillar 3 Disclosures Report available on the Santander Group website |
| | | | | | | | |
| Changes in main Capital ratios (Phased-in IFRS9) | |
| |
| | | | | |
|
| n | T2 |
| n | AT1 |
| n | CET1 |
| n | Tier 1 |
| n | Total capital ratio |
| |
| |
| |
| |
| | |
| 2021 CET1 evolution (Phased-in IFRS9) |
% |
*Includes Accrued shareholders remuneration
| | | | | | | | | | | |
26 | | 2021 Pillar 3 Disclosures Report | |
| | |
CAPITAL 2021 Pillar 3 Disclosures Report |
There was 120 basis points of organic capital growth in the year (including the negative impact from shareholder remuneration), supported by the results obtained in the year and the management of risk weighted assets. This figure includes a negative impact of 45 basis points related to shareholder remuneration. This strong generation was partially offset by regulatory and model impacts, the negative market impacts on available for sale portfolios and non-recurring impacts (acquisition of minority interest in Mexico and restructuring costs).
If we include the acquisition of SC USA minority interests, which closed on 31 January 2022, and the announced acquisition of Amherst Pierpont, which is pending to completion, the CET1 ratio would be 12.35% (instead of 12.51%).
The phased-in leverage ratio was 5.37%.
| | | | | |
| ¤ | For more information, see section 2.4.3. |
2.2. Capital function
The core principles establish the basic guidelines governing the actions of Santander entities in capital management, monitoring and control processes.
2.2.1. Organisation
The organisational structure has been defined with the aim of guaranteeing compliance with the core principles in relation to capital and ensuring that the relationship between the subsidiaries and the corporate centre is maintained. This function allows twin objectives to be met: comply with the subsidiary’s financial autonomy while at the same time retaining coordinated monitoring at group level.
2.2.2. Capital governance
Santander has developed a structure of agile and efficient governing bodies, ensuring the Capital function operates properly when it comes to both decision-making and supervision and control. This ensures the involvement of all the areas concerned and the necessary involvement of senior management.
The Group's characteristic subsidiary-based structure has a strong capital governance where there are various committees that have responsibilities at regional level and also for coordination at group level. The local committees must report to the corporate committees in due time and proper form on any relevant aspects of their activity that may affect capital, to ensure proper coordination between the subsidiaries and the corporate centre.
| | | | | | | | | | | |
27 | | 2021 Pillar 3 Disclosures Report | |
| | |
CAPITAL 2021 Pillar 3 Disclosures Report |
2.2.3. Capital targets
Focus ahead will remain on disciplined capital allocation and shareholder remuneration while we maintain our fully-loaded CET1 target between 11%-12%.
| | | | | | | | | | | | | | |
| Regulatory CET1 ratio (Phased-in) | |
| | | | |
| 11.65 | % | 12.34 | % | 12.51 | % | |
The continuous improvement in the capital ratios reflects our profitable growth strategy and a culture of active capital management at all levels of the organization.
In order to have a more global vision and simplify our structure, we created a new team, ‘Capital and Profitability Management’, in charge of our capital analysis, adequacy and management, coordination with subsidiaries in all matters related to capital and monitoring and measuring returns.
All the countries and business units have drawn up individual capital plans focused on achieving a business that maximizes the return on equity.
Santander gives a significant weight to capital and incentives. Certain aspects relating to capital management and returns are taken into account when setting the variable remuneration payable to members of senior management:
•The relevant metrics include our CET1 ratio, the county units' capital contributions to the Group ratio, the return on tangible equity (RoTE) and profit after tax.
•The qualitative aspects considered include the proper management of regulatory changes affecting capital, effective management of capital relating to business decisions, sustainable capital generation over time and effective capital allocation.
Action plans
In addition, we have developed a three-year action plan for the continuous improvement of infrastructures, processes and methodologies that support all aspects related to capital,
with the aim of further enhancing active capital management, responding more quickly to the numerous and increasing regulatory requirements and efficiently carrying out all associated activities.
We continue to improve our processes and controls associated with capital data quality. Additionally, we continuously develop risk management initiatives at both the consolidated and local levels to strengthen and fine-tune different activities.
2.3. Capital management and adequacy. Solvency ratios
The aim of capital management and adequacy at the Group is to guarantee solvency and maximise its profitability, while complying with internal capital targets and regulatory requirements.
Capital management is a key strategic tool for decision-making at both the local and corporate levels.
At the Group there is a common framework of action, criteria, policies, functions, metrics and processes for capital management.
The Group's most notable capital management activities are:
•Establishing capital adequacy and capital contribution targets aligned with minimum regulatory requirements and internal policies, to guarantee robust capital levels consistent with our risk profile and efficient use of capital to maximise shareholder value.
•Developing a capital plan to meet those objectives consistently with the strategic plan. Capital planning is an essential part of executing the three-year strategic plan.
•Assessing capital adequacy to ensure that the capital plan is also consistent with our risk profile and risk appetite framework in stress scenarios.
•Developing the annual capital budget as part of the group's budgeting process.
•Monitoring and controlling the group's and countries' budget execution and drawing up action plans to correct any deviations from the budget.
•Integrating capital metrics into business management to ensure consistency with group objectives.
•Preparing internal capital reports, and reports for the supervisory authorities and the market.
•Planning and managing other loss absorbing instruments (MREL and TLAC).
The Group's capital function is carried out on three levels:
| | | | | | | | | | | |
28 | | 2021 Pillar 3 Disclosures Report | |
| | |
CAPITAL 2021 Pillar 3 Disclosures Report |
| | | | | | | | | | | | | | |
| → | Regulatory capital |
| The first step in managing regulatory capital is to analyse the capital base, the capital adequacy ratios under the current regulatory criteria and the scenarios used in capital planning in order to make the capital structure as efficient as possible, both in terms of cost and compliance with regulatory requirements. Active capital management includes strategies for capital allocation and its efficient usage, together with securitisations, asset sales and issuances of equity instruments (hybrid equity instruments and subordinated debt). |
|
| | | | |
| → | Economic capital |
| The objective of the economic capital model is to ensure that we adequately allocate our capital to cover all the risks to which we are exposed as a result of our activity and risk appetite. It also aims to optimise value creation in the Group and all of the business units. |
|
|
| | | | |
| → | Profitability and pricing |
| Creating value and maximizing profitability is one of Santander's main objectives, carefully selecting the most appropriate markets and portfolios based on profitability, taking into account risk. Profitability and pricing are therefore integral parts of the key capital model processes. |
|
| | | | |
Disciplined capital allocation, prioritizing organic growth and shareholder remuneration, always present in our capital management.
2.3.1. Profitability
One of the main priorities in the Group is capital management, ensuring a profitable capital adequacy in all our activities.
Our strategy includes allocating capital in those markets and portfolios showing the best capital returns, ensuring a strong value creation for shareholders in a sustainable manner.
Identifying and managing underperforming businesses is part of this process, where we hope to optimize Group's capital, targeting customers, portfolios and markets with an interesting capital return, being dynamic, monitoring it actively.
We must encourage the Group's business development within capital and profitability targets through adequate and efficient capital allocation. Our strength is our business model, diversified in businesses and geographically, with solid results, based on risk-adjusted profitability, metrics such as RoTE, RoRWA and RoRAC are part of our admission and monitoring policies.
The combination with a correct pricing adjusted to the risk taken with maintaining a medium-low risk profile is the key to success, having in every moment (including stress scenarios) the needed capital to undertake our corporate strategy.
| | | | | | | | | | | |
29 | | 2021 Pillar 3 Disclosures Report | |
| | |
CAPITAL 2021 Pillar 3 Disclosures Report |
Disciplined capital allocation
A disciplined execution of our capital allocation strategy...
leads to growth, profitability and strength.
| | | | | | | | | | | | | | | | | | | | |
| | | | | | |
| | | | | | |
| — | | — | | — | |
| GROWTH | | PROFITABILITY | | BALANCE SHEET STRENGTH | |
| | | | | | |
| Focused on business that generate high RoTE and high capital generation, along with meaningful potential for growth. | | Focused on maintaining high and sustainable levels through scale in the markets in which we operate, leading to efficiency, and allowing us to provide value to our customers and high returns to our shareholders. | | After years of regulatory capital accumulation, we are focused on maintaining capital levels around 11%-12% on a fully-loaded basis. | |
| | | | | | |
| | | ESG embedded in everything we do | | | |
| | | | | |
Santander's core objectives include creating value and maximising profitability. Therefore, pricing and profitability are among the capital model's key processes.
Pricing is an objective process for determining the right price based on the characteristics of the transaction, product, borrower, segment and market. The process must make sure the price is not below a minimum threshold for, at least, covering funding, operating, credit and capital costs, plus a margin that factors in the sensitivity of demand to price and value generation. Therefore, the pricing process should aim to maximise profitability by creating value on every transaction, customer and/or portfolio and ensuring that minimum return on capital targets are achieved.
The main components and responsibilities of the pricing process are:
| | | | | | | | | | | |
30 | | 2021 Pillar 3 Disclosures Report | |
| | |
CAPITAL 2021 Pillar 3 Disclosures Report |
| | | | | | | | | | | | | | |
| A | | B | | C |
| | | | |
Determining the minimum price | | Integrating pricing into the approval process | | Monitoring of prices and profitability |
| | | | |
The finance function sets the criteria for establishing cost of capital and determining minimum profitability thresholds, ensuring that at least capital, funding, operating and credit costs are covered. The financial management function sets the criteria for establishing cost of funding and the management control function allocates operating costs and passes on financing costs to the businesses. The risk function sets the criteria for measuring expected loss and estimates the parameters used to calculate it. | | The business function is ultimately responsible for the transaction approval process, while the risk function is involved in authorising transactions based on each committee's rules and regulations and the governance of authority, and incorporates profitability metrics and minimum thresholds into the approval process. | | The financial and risk functions are the main functions charged with monitoring trends in profitability using appropriate risk-adjusted profitability metrics and presenting them to the relevant governing bodies. Together with the financial function, the risk function is also responsible for duly recording, controlling and monitoring transactions approved under the defined minimum threshold. The management control function monitors the degree of compliance with the budgeted profitability of each portfolio. |
The capital committee tracks return on capital metrics, the ALCO monitors the status of origination, and the executive risk committee (ERC) ensures that all transactions and customers/portfolios have the appropriate risk profile and create value in line with the agreed-upon return on capital targets. The ERC must also approve the internal models plan and approve the Group's main models, while the model approval forum (MAF) reviews and authorises the models used in the Group's capital management.
To execute this process correctly, Santander has a granular approval process for the SCIB and corporates segments with tools for calculating regulatory and economic return on capital (RoRWA and RoRAC) and determining the appropriate price. For retail segments, granular approval processes using risk-adjusted approval tools are already in place in many cases or are currently being developed. The approval and pricing processes consider the unit's minimum profitability threshold for creating value above cost of capital. Cost of capital is reviewed at least annually and approved by the capital committee. Implementation of a common granular tool for monitoring return on capital among units is now in the advanced stage. Once implemented, it will make it easier to assess profitability, determine whether pricing is commensurate with the level of risk considering the main related costs, and help recommend possible action plans.
Approval tools are used to identify and justify any new loans granted at a price below the minimum threshold. Monitoring tools are used to identify transactions whose profitability is below cost of capital and destroys value, and those for which it must apply measures to raise profitability and deliver on targets. The approval and profitability monitoring processes both have robust approval and review governance for ensuring that the minimum threshold is integrated correctly. An appropriate escalation process is in place for authorising transactions and those approved below the minimum threshold are monitored closely.
In 2022-2023, we will continue with our three-year strategy on resources allocation efficiently, competing where we can achieve the best returns.
With all this, Santander is in an optimal position to ensure appropriate pricing and maximise profitability. It also complies with regulatory requirements, especially the EBA guidelines on loan origination and monitoring published in May 2020 and effective from June 2021, which set out
supervisory expectations regarding the need for risk-based pricing of loans, covering the main costs and ensuring that institutions apply an overall framework in their pricing. These EBA guidelines state that, in pricing, institutions should consider the relevant costs (mainly cost of capital, credit risk costs, cost of funding, and operating and administrative costs), that risk-adjusted indicators should be used as performance measures (e.g. EVA, RoRWA, RoRAC, RoTA), that ex ante transaction tools and regular ex post monitoring should be implemented, and that all material transactions below costs should be reported and properly justified.
The guidelines note that pricing frameworks should be well documented and supported by appropriate governance structures that are responsible for the maintenance of the overall pricing framework and for individual pricing decisions when relevant. In December 2020, the capital committee approved a corporate pricing policy, which sets out the general criteria and describes the main stages for pricing. It also outlines the core components, focusing on the minimum threshold, the need to integrate pricing in approval using ex ante tools and the relevance of defining robust governance and monitoring of recurring profitability. All Group units transposed this corporate policy in 2021, after validation by the corporate teams, to ensure uniformity in interpretation and local implementation. Meanwhile, the risk function drew up and approved three pricing procedures in 2021
•SCIB
•Corporates
•Pooled or personalised treatment
These procedures implement the processes described in the corporate pricing policy, further specifying and allocating the required roles and responsibilities, and governance. These pricing procedures are now being transposed by the units and will also be subject to prior validation by the corporate teams.
2.3.3. Other activities in capital management
Details of the most significant actions undertaken over the year are set out below:
Issues of hybrid capital and other loss absorbing instruments
In 2021, Banco Santander, S.A. issued EUR 4,464 million in hybrid instruments. This comprised EUR 1,852 million in T2 subordinated debt and EUR 2,612 million in contingently convertible preferred shares (CoCos). Part of these CoCos
| | | | | | | | | | | |
31 | | 2021 Pillar 3 Disclosures Report | |
| | |
CAPITAL 2021 Pillar 3 Disclosures Report |
were intended to replace the early amortization of a EUR 1,500 million issuance called in September 2021.
Banco Santander, S.A. also issued EUR 7,934 million in senior non-preferred debt.
For further details on main features of regulatory own funds instruments and eligible liabilities instruments (table CCA), see Appendix IX available on the Group's website.
| | | | | |
| Access 2021 Pillar 3 Disclosures Report available on the Santander Group website |
Dividend policy
On 28 September 2021, the board announced its 2021 shareholder remuneration policy to pay out an interim distribution of approximately 40% of the Group's underlying profit (half through a cash dividend and half through a shares buyback).
•Interim remuneration. Accordingly, it authorized the payment of an interim dividend of EUR 4.85 cents per share (i.e. 20% of the Group's underlying profit for H1'21), in cash and charged against 2021 profits; it was paid on 2 November 2021. The board also voted to launch the First Buyback Programme worth EUR 841 million (20% of the
Group's underlying profit for H1'21) once the ECB approved it on 28 September 2021. The number of shares acquired (259,930,273 shares) makes up approximately 1.499% of our share capital.
•Final remuneration. The board of directors voted to submit a resolution at the 2022 AGM for the approval of a complementary cash dividend of EUR 5.15 cents per share (gross), equalling an approximate total of EUR 865 million; and a Second Buyback Programme for EUR 865 million, to be approved by the ECB.
Finally,in some geographies where the ECB is not home supervisor, local regulators have recommended limiting dividend payments in 2021. Santander México followed the CNBV's recommendation and distributed only 25% of annual profits, and the subsidiary in Poland distributed 30% because of restrictions imposed by the KNF due to mortgages in foreign currency. The other subsidiaries were able to distribute their dividends without any constraints.
Described at greater length in the "Corporate governance" chapter, "Dividends" section.
| | | | | |
| Access 2021 Annual Report available on the Santander Group website |
| | | | | | | | | | | |
| The updated remuneration policy reflects our confidence that investing in our shares at this valuation offers an attractive |
|
|
opportunity to generate value for our shareholders. This reflects the very strong performance we have seen in our businesses during 2021. | |
|
|
|
Ana Botín
Executive Chairman Banco Santander | |
2.4. Pillar 1 - Regulatory capital
The current regulatory framework for calculating capital is based on three pillars:
•Pillar 1 sets the minimum capital requirements for credit risk, market risk and operational risk, allowing internal ratings and models to be used. The aim is to make regulatory requirements more sensitive to the risks actually incurred by financial institutions in their business activities.
•Pillar 2 establishes a system of supervisory review, aimed at improving banks' internal risk management and capital adequacy assessment in line with their risk profile.
•Pillar 3 is intended to enhance market discipline by developing a set of disclosure requirements that enable market agents to appraise key information relating to the application of Basel II: capital, risk exposures, risk assessment processes and, by extension, the bank's capital adequacy.
| | | | | | | | | | | |
32 | | 2021 Pillar 3 Disclosures Report | |
| | |
CAPITAL 2021 Pillar 3 Disclosures Report |
2.4.1. Eligible capital
Equity at 31 December 2021 stood at €97,053 million, up €5,731 million from the year before.
The reconciliation between equity and capital eligible as Tier 1 is set out below:
| | | | | | | | |
| Table 4.Reconciliation of accounting capital with regulatory capital |
| EUR million | | |
| 2021 | 2020 |
| Subscribed capital | 8,670 | | 8,670 | |
| Share premium account | 47,979 | | 52,013 | |
| Reserves | 56,606 | | 62,777 | |
| Treasury shares | (894) | | (69) | |
| Attributable profit | 8,124 | | (8,771) | |
| Approved dividend | (836) | | — | |
| Shareholders' equity on public balance sheet | 119,649 | | 114,620 | |
| Valuation adjustments | (32,719) | | (33,144) | |
| Non-controlling interests | 10,123 | | 9,846 | |
| Total equity on public balance sheet | 97,053 | | 91,322 | |
| Goodwill and intangible assets | (16,132) | | (15,711) | |
| Eligible preference shares and participating securities | 10,050 | | 9,102 | |
| Accrued dividend | (895) | | (478) | |
| Other adjustments | (7,624) | | (5,734) | |
| Tier 1 (Phased-in) | 82,452 | | 78,501 | |
| | |
| CRR Phased-in, IFRS 9 Phased-in. | | |
The following table provides a breakdown of the Group’s eligible capital and a comparison with the previous year:
| | | | | | | | |
| Table 5.Eligible capital |
| EUR million | | |
| 2021 | 2020 |
| Eligible capital |
| Common Equity Tier 1 (CET1) | 72,402 | 69,399 |
| Capital | 8,670 | 8,670 |
| (-) Treasury shares and own shares financed | (966) | (126) |
| Share premium | 47,979 | 52,013 |
| Reserves | 58,157 | 64,766 |
| Other retained earnings | (34,784) | (34,937) |
| Minority interests | 6,736 | 6,669 |
| Attributable profit net of dividends | 6,394 | (9,249) |
| Deductions | (19,784) | (18,407) |
| Goodwill and intangible assets | (16,064) | (15,711) |
| Others | (3,720) | (2,696) |
| Aditional Tier 1 (AT1) | 10,050 | 9,102 |
| Eligible instruments AT1 | 10,102 | 8,854 |
| T1 excesses - subsidiaries | (52) | 248 |
| Residual value of intangibles | — | — |
| Deductions | — | — |
| Tier 2 (T2) | 14,865 | 12,514 |
| Eligible instruments T2 | 15,424 | 13,351 |
| Gen. funds and surplus loan loss prov. IRB | 75 | — |
| T2 excesses - subsidiaries | (634) | (837) |
| Others | — | — |
| Total eligible capital | 97,317 | 91,015 |
| | |
| CRR Phased-in, IFRS 9 Phased-in. | | |
Common equity Tier 1 capital (CET1) comprises the elements of Tier 1 capital (after applying prudential filters) and CET1 deductions after applying the threshold exemptions specified in the CRR.
| | | | | | | | | | | |
33 | | 2021 Pillar 3 Disclosures Report | |
| | |
CAPITAL 2021 Pillar 3 Disclosures Report |
CET1 consists of:
•Subscribed share capital, which stood at €8,670 million in December 2021.
•Other tier 1 capital items: (i) paid-up share premiums; (ii) effective and disclosed reserves generated against profits and amounts that are not taken to the income statement but are recorded under “Other reserves” (any item); (iii) other retained earnings, including certain valuation adjustments, primarily for exchange differences and for hedges of net investments in foreign operations.
•The paid-up portion of any non-controlling interests arising from the issue of ordinary shares by consolidated subsidiaries, subject to the limits set in the CRR.
•The Group's attributable net of dividends, which was €6,394 million in December 2021.
•The prudential filters exclude any positive or negative valuation adjustments from cash flow hedges. They also exclude gains or losses on liabilities and derivative liabilities measured at fair value resulting from changes in the institution’s own credit quality. The prudential filters include the additional valuation adjustments applied pursuant to article 34 of the CRR.
•Deductions from CET1 items mainly include: treasury shares; current-year losses; goodwill and other intangible assets recognised in the balance sheet; deferred tax assets that rely on future earnings (subject to the limits set in the CRR); the valuation adjustments due to prudent valuation requirements; and defined benefit pension fund assets shown on the balance sheet.
In addition to the movements in net book equity, for changes in regulatory capital, the undistributed dividend for 2021 was considered to be €895 million, so the net attributable profit net of dividends calculated is €6,394 million.
| | | | | |
| Table 6.Regulatory capital. Changes |
| EUR million | |
| 2021 |
| Common Equity Tier 1 (CET1) | |
| Starting figure (31/12/2020) | 69,399 |
| Shares issued during the year and share premium account | (4,034) |
| Treasury shares and own shares financed | (840) |
| Reserves | 2,640 |
| Attributable profit net of dividends | 6,394 |
| Other retained earnings | 152 |
| Minority interests | 67 |
| Decrease/(increase) in goodwill and other intangibles | (353) |
| Other deductions | (1,023) |
| Ending figure (31/12/2021) | 72,402 |
| |
| Additional Tier 1 (AT1) | |
| Starting figure (31/12/2020) | 9,102 |
| Eligible instruments AT1 | 1,248 |
| T1 excesses - subsidiaries | (299) |
| Residual value of intangibles | — |
| Deductions | — |
| Ending figure (31/12/2021) | 10,050 |
| |
| Tier 2 (T2) | |
| Starting figure (31/12/2020) | 12,514 |
| Eligible instruments T2 | 2,073 |
| Gen. funds and surplus loan loss prov. IRB | 75 |
| T2 excesses - subsidiaries | 203 |
| Deductions | — |
| Ending figure (31/12/2021) | 14,865 |
| Deductions from total capital | — |
| Final figure for total capital (31/12/2021) | 97,317 |
| |
| CRR Phased-in, IFRS 9 Phased-in. | |
| | | | | |
| Eligible capital over time |
| | | | | | | | | | | |
34 | | 2021 Pillar 3 Disclosures Report | |
| | |
CAPITAL 2021 Pillar 3 Disclosures Report |
Tier 1 capital comprises CET1 capital plus Additional Tier 1 capital (AT1) including preferred securities issued by Santander.
Tier 2 capital comprises Tier 1 capital plus Tier 2 capital (T2) and includes, among other items, equity instruments and subordinated loans where the conditions laid down in the CRR are met.
This regulation provides for a phase-in period that will give institutions time to adapt to the new requirements in the European Union. This phase-in applies to the Group under Regulation (EU) 2016/445 of the European Central Bank on the exercise of options and national discretions, published on 14 March 2016.
The movement of issued shares and issue premiums is mainly due to the agreement approved at the General Shareholders' Meeting to allocate part of the results obtained during the 2021 financial year to the share premium reserve account, involving losses of €3,557 million.
Similarly, the change included in deductions and prudential filters was increased as a result of an increase in the assets of defined benefit pension funds and of the modifications introduced by Regulation 2019/630 of the European Parliament and of the Council that modifies the Capital Requirements Regulation (CRR).
The increase in Tier 1 capital is mainly explained by the issues made in the period. Banco Santander, S.A. launched a preference issue for €1,750 million and $1,000 million applicable to Tier 1 capital.
The increase in Tier 2 capital is mainly due to the recognition of subordinated debt issues by Banco Santander, S.A. amounting to £850 million and $1,000 million.
For further detail on regulatory own funds (Table CC1) see Appendix X.
| | | | | |
| Access 2021 Pillar 3 Disclosures Report available on the Santander Group website |
2.4.2. Capital requirements
Capital requirements have barely changed from 2020, maintaining a Pillar I risk distribution similar to that of the prior year: credit risk 87%, market risk 3% and operational risk 10%.
The risk weighted assets for credit risk increased by 2.91% up to 578,930. This is due to the fact that credit risk increases 7,644 million euros impacted by the New default definition, counterparty credit risk increases mainly due to SA-CCR, 5,435 million euros, operational risk increases 2,921 million euros, compensated partially by a decrease of 759 million euros in market risk.
| | | | | | | | | | | |
| Distribution of capital requirements by risk type and geography |
| 2021 |
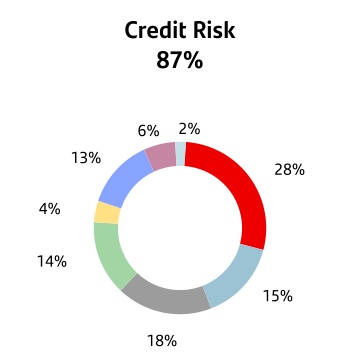
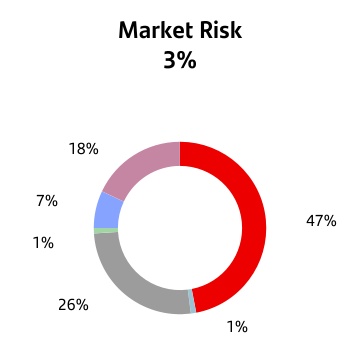
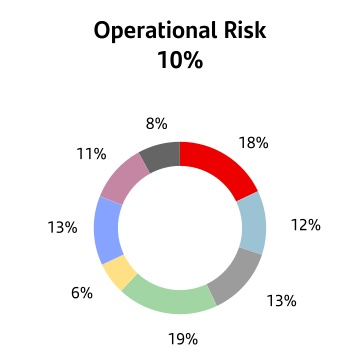
| | | | | |
| n | Spain |
| n | UK |
| n | Rest of Europe |
| n | USA |
| n | Rest of North America |
| n | Brazil |
| n | Rest of South America |
| n | Others |
| | | | | | | | |
| 40,2335 | 1,378 | 4,703 |
Million euros | Million euros | Million euros |
5 It includes counterparty credit risk and securitisations without 1250% deduction.
| | | | | | | | | | | |
35 | | 2021 Pillar 3 Disclosures Report | |
| | |
CAPITAL 2021 Pillar 3 Disclosures Report |
Below is a general evolution of RWAs by risk, and then also by geography:
| | | | | | | | | | | | | | | | | | | | |
| Table 7.OV1 - Overview of risk weighted exposure amounts | | |
| EUR million | | | | | | |
| RWA | Minimum Capital Requirements | | |
| Dec'21 | Sep'21 | Dec'20 | Dec'21 | | |
| Credit risk (excluding CCR)* | 477,977 | 479,618 | 470,333 | 38,238 | | Chapter 4. Credit Risk
|
| Of which, standardised approach (SA) | 262,869 | 267,589 | 259,362 | 21,029 | |
| Of which, the foundation IRB (FIRB) approach | 9,483 | 7,799 | 8,841 | 759 | |
| Of which, slotting approach** | 14,672 | 14,621 | 14,529 | 1,174 | |
| Of which, equities under the simple risk weighted approach | 2,219 | 2,282 | 2,750 | 178 | |
| Of which, the advanced IRB (AIRB) approach | 173,956 | 170,622 | 168,096 | 13,916 | |
| Counterparty credit risk - CCR | 15,674 | 14,798 | 10,239 | 1,254 | | Chapter 5. Counterparty Credit Risk |
| Of which, the standardised approach*** | 13,639 | 12,867 | 9,278 | 1,091 | |
| Of which, internal model method (IMM) | — | — | — | — | |
| Of which, exposures to a CCP | 268 | 270 | 241 | 21 | |
| Of which, credit valuation adjustment - CVA | 1,767 | 1,662 | 720 | 141 | |
| Of which, other CCR | — | — | — | — | |
| Settlement risk | 1 | 1 | | — | | |
| Securitisation exposures in the banking book (after the cap) | 11,151 | 9,182 | 9,751 | 892 | | Chapter 6. Credit Risk - Securitisations |
| Of which, SEC-IRBA approach | 5,226 | 4,180 | 4,731 | 418 | |
| Of which, SEC-ERBA approach | 1,366 | 1,283 | 1,607 | 109 | |
| Of which, SEC-SA approach**** | 2,676 | 2,344 | 1,821 | 214 | |
| Of which, 1250%/ deduction | 1,883 | 1,374 | 1,592 | 151 | |
| Position, foreign exchange and commodities risks (Market risk) | 17,224 | 19,088 | 17,983 | 1,378 | | Chapter 7. Market Risk |
| Of which, standardised approach | 6,844 | 6,388 | 5,047 | 547 | |
| Of which, IMA | 10,380 | 12,700 | 12,936 | 830 | |
| Large exposures | — | — | | — | | |
| Operational risk | 58,786 | 55,896 | 55,865 | 4,703 | | Chapter 8. Operational Risk |
| Of which, basic indicator approach | — | — | — | — | |
| Of which, standardised approach | 58,786 | 55,896 | 55,865 | 4,703 | |
| Of which advanced measurement approach | — | — | — | — | |
| Amounts below the thresholds for deduction (subject to 250% risk weight) | 21,032 | 24,295 | 22,382 | 1,683 | | |
| Total***** | 578,930 | 578,583 | 562,580 | 46,314 | | |
| | | | | | |
| CRR Phased-in, IFRS9 Phased-in. |
| *It includes equities under the PD/LGD approach. |
| ** Correction from the mapping to {C 08.01, r0020, c0260, s0010} + {C 08.01, r0030, c0260, s0010}. |
| ***Correction from the mapping to {C 34.02, r0030, c0200, s0002} - RWEA pertaining to exposures to CCPs that are not QCCPs . |
| ****Correction from the mapping to the one appearing in tables SEC3+SEC4. |
| ***** Correction from the mapping, 1250% deductions are not included in the total. |
At 31 December 2021, the Group had no additional capital requirements arising from the floors set by Regulation (EU) No 575/2013 of the European Parliament and of the Council of 26 June 2013 on prudential requirements for credit institutions and investment firms, in Part Ten, Title 1.
| | | | | | | | | | | |
36 | | 2021 Pillar 3 Disclosures Report | |
| | |
CAPITAL 2021 Pillar 3 Disclosures Report |
| | | | | | | | | | | | | | | | | | | | | | | | | | | | | |
| Table 8.Capital requirements by geographical region | |
| EUR million | | | | | | | | 2021 |
| | | | | | | | | |
| Total | Europe | Of which, Spain | Of which, UK | North America | Of which, US | South America | Of which, Brazil | Other |
| Credit risk (excluding CCR) | 38,238 | 22,926 | 9,688 | 5,824 | 6,831 | 5,205 | 7,592 | 5,103 | 888 |
| Of which, internal rating-based (IRB) approach* | 16,684 | 13,090 | 5,789 | 4,320 | 1,320 | 540 | 1,530 | 1,241 | 745 |
| Central governments and Central Banks | — | — | — | — | — | — | — | — | — |
| Institutions | 776 | 454 | 92 | 95 | 138 | 67 | 54 | 11 | 131 |
| Corporates | 9,428 | 6,392 | 3,586 | 1,306 | 1,175 | 470 | 1,472 | 1,229 | 389 |
| of which, Specialised Lending | 1,345 | 1,029 | 362 | 426 | 205 | 56 | 62 | — | 49 |
| of which, SMEs | 1,593 | 1,427 | 1,226 | 55 | 108 | 1 | 57 | 54 | 1 |
| Retail - Secured by real estate SME | 232 | 231 | 222 | 1 | 1 | 1 | — | — | 1 |
| Retail - Secured by real estate non-SME | 3,650 | 3,636 | 884 | 2,515 | 3 | 2 | 2 | — | 8 |
| Retail - Qualifying revolving | 373 | 372 | 98 | 216 | — | — | — | — | — |
| Retail - Other SME | 578 | 564 | 388 | — | — | — | 1 | — | 14 |
| Retail - Other non-SME | 1,562 | 1,356 | 435 | 187 | 2 | — | 1 | — | 203 |
| Other non-credit-obligation assets | 85 | 85 | 85 | — | — | — | — | — | — |
| Of which, standardised approach (SA) | 21,032 | 9,193 | 3,208 | 1,530 | 5,548 | 4,667 | 6,146 | 3,918 | 144 |
| Central governments or central banks | 2,073 | 1,058 | 903 | 24 | 160 | — | 846 | 776 | 9 |
| Regional governments or local authorities | 25 | 8 | 4 | — | — | — | 16 | 13 | — |
| Public sector entities | 29 | 4 | — | — | 15 | 15 | 10 | — | — |
| Multilateral Development Banks | — | — | — | — | — | — | — | — | — |
| International Organisations | — | — | — | — | — | — | — | — | — |
| Institutions | 367 | 113 | 59 | 17 | 123 | 114 | 126 | 103 | 6 |
| Corporates | 3,450 | 1,760 | 329 | 491 | 692 | 674 | 975 | 399 | 23 |
| Retail | 7,868 | 2,973 | 324 | 516 | 2,631 | 2,280 | 2,167 | 1,714 | 96 |
| Secured by mortgages on immovable property | 2,614 | 860 | 180 | 54 | 792 | 586 | 962 | 279 | 1 |
| Exposures in default | 957 | 370 | 156 | 76 | 281 | 241 | 304 | 196 | 3 |
| Items associated with particular high risk | 111 | 13 | 2 | 2 | 10 | 10 | 88 | 16 | — |
| Covered bonds | 13 | 13 | — | 12 | — | — | — | — | — |
| Claims on institutions and corporates with a short-term credit assessment | 20 | 8 | 1 | — | 6 | — | — | — | 5 |
| Collective investments undertakings (CIU) | 17 | 17 | 6 | — | — | — | — | — | — |
| Equity under risk weighted | 12 | 5 | — | — | — | — | 7 | — | — |
| Other items | 3,475 | 1,992 | 1,245 | 337 | 838 | 746 | 644 | 421 | 1 |
| Of which, Equity IRB | 1,358 | 1,358 | 1,358 | — | — | — | — | — | — |
| Simple method | 178 | 178 | 178 | — | — | — | — | — | — |
| Under the PD/LGD method | 428 | 428 | 428 | — | — | — | — | — | — |
| Equity exposures under risk weighted | 753 | 753 | 753 | — | — | — | — | — | — |
| Counterparty credit risk | 1,254 | 959 | 701 | 125 | 114 | 67 | 177 | 127 | 4 |
| Of which, standardised approach | 1,091 | 832 | 670 | 78 | 104 | 60 | 153 | 111 | 2 |
| Of which, internal model method (IMM) | — | — | — | — | — | — | — | — | — |
| Of which, CCPs | 21 | 14 | 1 | 8 | 1 | 1 | 6 | 6 | — |
| Of which, CVA | 141 | 113 | 31 | 38 | 9 | 5 | 17 | 9 | 2 |
| Settlement risk | — | — | — | — | — | — | — | — | — |
| Securitisations exposures in banking book (after cap)** | 741 | 383 | 114 | 131 | 345 | 310 | 11 | 11 | 2 |
| Market risk | 1,378 | 1,027 | 653 | 14 | 11 | 11 | 340 | 96 | — |
| Of which, the standardised approach | 547 | 433 | 60 | 14 | 11 | 11 | 103 | 96 | — |
| Of which, internal model method (IMM) | 830 | 594 | 594 | — | — | — | 237 | — | — |
| Operational risk | 4,703 | 2,001 | 834 | 546 | 1,170 | 879 | 1,149 | 622 | 383 |
| Of which, basic indicator approach | — | — | — | — | — | — | — | — | — |
| Of which, standardised approach | 4,703 | 2,001 | 834 | 546 | 1,170 | 879 | 1,149 | 622 | 383 |
| Of which, advanced measurement approach | — | — | — | — | — | — | — | — | — |
| Amounts below the thresholds for deduction (subject to 250% risk weight) | 1,683 | 907 | 765 | 24 | 102 | — | 673 | 656 | — |
| Total*** | 46,314 | 27,296 | 11,991 | 6,641 | 8,471 | 6,472 | 9,270 | 5,960 | 1,277 |
| | | | | | | | | |
| *Including counterparty credit risk. | | | | | | | | | |
| **It does not include 1250% deductions. | | | | | | | | | |
| *** Total does not include amounts below the thresholds for deductions (subject to 250% risk weight). | | | |
| | | | | | | | | | | |
37 | | 2021 Pillar 3 Disclosures Report | |
| | |
CAPITAL 2021 Pillar 3 Disclosures Report |
2.4.2.1. Plan to deploy advanced internal models and supervisory approval
This section covers the letter (a) of the qualitative requirement CRE - Qualitative disclosure requirements related to IRB approach.
Santander remains committed to adopting the Basel II advanced internal ratings-based (AIRB) approach for its banks, increasing the amount of exposure managed using internal models. This approach will be applied progressively over the coming years. The commitment to the supervisory authority means adapting the advanced approaches in the Group's core markets.
This objective of covering IRB models in the group should be seen in the context of the current supervisory focus on the
robustness and adequacy of existing models, as well as the simplification strategy recently agreed with ECB.
Santander has supervisory approval to use advanced approaches for calculating regulatory capital for credit risk for the parent and its main subsidiaries in Spain, the United Kingdom and Portugal, and for some portfolios in Germany, Mexico, Brazil, Chile, Nordic countries (Sweden, Finland and Norway), France and the United States.
The following table shows the geographical scope of the internal models for credit risk (AIRB or FIRB) in the various portfolios:
| | | | | | | | |
| List of authorised IRB models by legal entity |
| | |
| Country | Legal Entity | IRB portfolio (AIRB or FIRB) |
| UK | Santander UK PLC | Institutions, Corporates, Corporates SMEs, Corporates Project Finance, Mortgages, Qualifying Revolving, Other Retail. |
| Abbey National Treasury Services | Institutions, Corporates, Corporates SMEs, Corporates Project Finance. |
| Abbey Covered Bonds LLP | Institutions |
| Spain | Banco Santander, S.A. | Institutions, Corporates, Corporates SMEs, Corporates Project Finance, Mortgages, Qualifying Revolving, Retail SMEs, Other Retail |
| Santander Factoring y Confirming S.A. | Institutions, Corporates, Corporates SMEs, Corporates Project Finance, Mortgages, Retail SMEs, Other Retail |
| Santander Lease, S.A. E.F.C. | Institutions, Corporates Corporates SMEs, Mortgages, Retail SMEs, Other Retail |
| Santander Consumer EFC, S.A. | Corporates, Corporates SMEs, Qualifying Revolving, Other Retail. |
| Santander Consumer Finance, S.A. | Corporates, Corporates SMEs, Qualifying Revolving, Other Retail. |
| Portugal | Banco Santander Totta | Institutions, Corporates, Corporates SMEs, Corporates Project Finance, Mortgages, Qualifying Revolving, Retail SMEs, Other Retail. |
| Brazil | Banco Santander Brazil | Corporates |
| Santander Brasil EFC | Corporates |
| Germany | Santander Consumer Bank AG | Corporates, Corporates SMEs, Mortgages, Revolving and Other Retail |
| Mexico | Banco Santander México | Institutions, Corporates, Corporates SMEs, Corporates Project Finance |
| USA | Santander Bank, National Association | Corporates |
| France | Société Financiére de Banque - SOFIB | Corporates, Corporates SMEs, Retail SMEs, Other Retail |
| Nordics | Santander Consumer Bank A.S. | Other Retail |
| Santander Consumer Finance OY | Other Retail |
| Chile | Banco Santander - Chile | Institutions and Corporates |
For further information on the scope of the use of IRB and SA approaches (Table CR6-A) see Appendix XI. | | | | | |
| Access 2021 Pillar 3 Disclosures Report available on the Santander Group website |
| | | | | | | | | | | |
38 | | 2021 Pillar 3 Disclosures Report | |
| | |
CAPITAL 2021 Pillar 3 Disclosures Report |
The following table shows the geographical scope of portfolios using the internal models approach (IMA) for market risk:
| | | | | | | | |
| List of authorised IMA models by legal entity |
| | |
Country | Legal entity | IMA portfolio (product) |
| Spain | Banco Santander, S.A. | Trading book |
| Santander London Branch | Trading book |
| Chile | Banco Santander - Chile | Trading book |
| Santander Agent de Valores Limited | Trading book |
| Santander Investment Chile Limited | Trading book |
| Santander Corridors de Bolsa Limited | Trading book |
| Mexico | Banco Santander México | Trading book |
| Casa de Bolsa Santander, S.A. de C.V. | Trading book |
| | | | | |
| ¤ | For further information on the market risk, see chapter 7. |
The Group currently uses the standardised approach for calculating regulatory capital for operational risk, as provided for in the CRR. In 2017, the European Central Bank granted authorisation for the Alternative Standardised Approach to be used to calculate consolidated capital requirements at Banco Santander México, following the approval granted in 2016 for Brazil.
| | | | | |
| ¤ | For further information on the Operational Risk, see chapter 8. |
Supervisory validation process
As established by the European Parliament, the first key element of Banking Union is the Single Supervisory Mechanism (SSM). Under this mechanism, direct banking supervision falls to the European Central Bank. This ensures that the largest European banks are independently supervised by just one entity and are subject to a common set of standards. Eurozone states are required to participate. Participation is voluntary for non-eurozone EU Member States.
The second key element is the Single Resolution Mechanism (SRM), which is responsible for preparing for the worst-case scenario, i.e. bank failure. The objective is to ensure that such situations can be resolved in an orderly fashion and at the minimum cost to taxpayers. The focus on shielding taxpayers from the costs of future bank resolutions led to a change in the underlying regulations, namely the Bank Recovery and Resolution Directive (BRRD), so that the bank's shareholders and creditors will bear the brunt of the resolution costs. Under certain circumstances, banks may also obtain supplementary financing from the recently-created Single Resolution Fund (SRF), which is financed by the banking sector. The SRF is expected to meet its target funding level by 2023.
The SSM and the SRM are both operational: the SSM became effective on 4 November 2014
The SRM started developing resolution plans for banks in January 2015 and is fully operational since January 2016, with a full range of resolution tools.
| | | | | | | | | | | |
39 | | 2021 Pillar 3 Disclosures Report | |
| | |
CAPITAL 2021 Pillar 3 Disclosures Report |
The European Central Bank has gradually been deploying its new structure and functions, developing into the single European supervisor. The European Banking Authority (EBA) will continue to actively collaborate in adapting regulations. Each body's responsibilities are as follows:
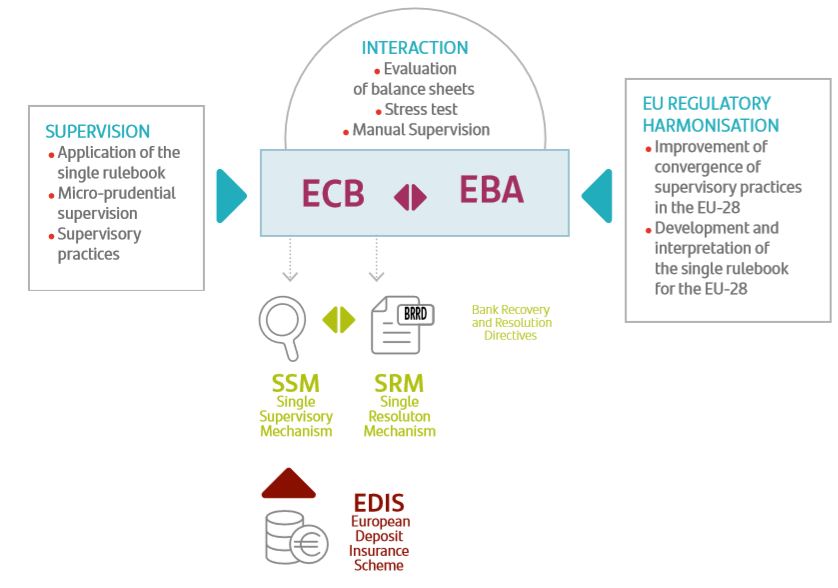
The governance process of the European supervisor follows the following steps:
•The Joint Supervisory Team (JST), consisting of a mixed team of experts, analyses the entity's situation and releases a technical report to the ECB's Supervisory Board.
•The Supervisory Board then submits its preliminary decisions to the Governing Council.
•The Governing Council then issues a final decision authorising or rejecting the use of internal models.
The supervisory authority uses the documentation provided by the entity as the basis for its assessment of whether the minimum requirements for using advanced models to calculate regulatory capital have been met. This information must be sufficiently thorough and detailed to provide a third party with a clear idea of the entity's rating systems, methodologies, technological infrastructure, capital calculation process and internal governance, and to be able to replicate the outputs of the model. The unit itself is responsible for preparing this documentation, which forms part of the formal application required for the validation process established by the supervisors of entities seeking to implement advanced models to calculate regulatory capital.
A preparatory "pre-application" phase has been introduced as part of the supervisory approval process for major changes to advanced models for calculating regulatory capital. This involves the entity providing the supervisory authority with the necessary documentation beforehand, so that the supervisory authority can assess whether the minimum requirements have been met to continue the formal approval process. If the European Central Bank considers the entity to be initially ready, the application is sent and the supervisory authority begins a formal review process of the regulatory models.
The approval of changes in the Group's models sometimes involves supervisory authorities from various jurisdictions, often subject to different legislation, criteria and implementation calendars. This often hinders and slows joint decisions on the approval of internal models on the basis of consolidation and may affect authorisations at the local level.
Targeted Review of Internal Models
The on-site performance of the TRIM (Targeted Review of Internal Models) was completed in 2019. Banco Santander has reviewed several portfolios through on-site inspections
| | | | | | | | | | | |
40 | | 2021 Pillar 3 Disclosures Report | |
| | |
CAPITAL 2021 Pillar 3 Disclosures Report |
this year. From April 2018 to April 2021, the final decision letters (including findings, commitments and limitations) of the inspections carried out have been received, coinciding in April 2021 with the publication of the final horizontal results of the whole TRIM.
Banco Santander launched two strategic programmes in 2018, which are currently underway to improve the quality of the internal models IRB 2.0 (internal credit risk models) and MRAP – Market Risk Advanced Platform – (internal market risk models), to meet the expectations and requirements of regulators (including the entry into force of the EBA repair programme in January 2022) and to address the weaknesses identified in TRIM and IMIs (Internal Model Inspections).
In addition, in order to intensify the development of high-quality models, in 2020 the organisation was reinforced thanks to the creation of the Global Models and Data Unit, aiming to execute modelling in a better, more efficient way, while leveraging the synergies that come from combining modelling and data. We have also strengthened the role of the Single Validation Office, a team tasked with improving consistency and coordination of all model validation activities.
2.4.3. Capital buffers and eligible capital requirements
The Group must always comply with the combined capital buffer requirement, which is defined as the total CET1 capital necessary to meet the following obligations:
•Capital conservation buffer (CCoB): mandatory for all entities from 1 January 2016. The recharge for banks is 2.5%.
•Buffers for systemically important banks (G-SIB and D-SIB): applicable from 1 January 2016. There are two types, each with their own methodologies, which classify financial institutions into buckets. These buckets determine their systemic risk (either global or domestic) and the recharge percentage applicable. Where an institution is subject to both recharges at the same consolidation level, the higher of the two shall apply. The two types are:
◦G-SIB (global systemically important banks) buffer: common methodology following the Basel framework. Applicable at the consolidated level. CRDV added an additional methodology that considers the eurozone as a single jurisdiction, allowing the competent authority to classify a G-SIB in a lower bucket, reducing the applicable G-SIB buffer accordingly.
◦D-SIB (domestic systemically important banks) buffer: common methodology following EBA guidelines. This is applied at the consolidated, sub-consolidated or individual level.
•Systemic risk buffer (SyRB): competent national authorities may require this buffer to mitigate macro prudential or systemic risks that are not covered by the countercyclical buffer or the systemically important financial institutions buffer and that could trigger a disturbance in the financial system with serious consequences for both it and the real economy. Its application by the authorities is discretionary, and it may be required for all institutions or for one or more subsets of institutions, for all exposures or for a subset of
exposures (domestic, third countries, mortgage sector, etc.).
•Countercyclical capital buffer (CCyB): this is applied when the national authorities consider that lending is growing excessively in a jurisdiction, with the aim of containing it. This buffer is calculated specifically for each institution or group and consists of the weighted average of the countercyclical buffer rates applied in regions in which the bank's significant exposures are located. It is also applicable from 1 January 2016.
The table below summarises the required regulatory rates based on the capital buffers to be applied and Banco Santander's position in 2022:
| | | | | | | | | | | | | | |
Application | | Buffers (% RWAs) | | 2022 |
| All entities | | Conservation (CCoB) | | 2.5 | % |
| Designated entities | | G-SIB entities (1%-3.5%) (1) | | 100% of the buffer |
| D-SIB entities (2) | | 100% of the buffer |
| At the discretion of competent national authority | | Systemic risk (SRB) | | 0%-5% |
| Countercyclical (CCyB) (3) | | 0% - 2.5% |
| Consolidated combined buffer | | CCoB+CCyB+SyRB +Max (G-SIB, D-SIB)(4) |
(1) Banco de España requires a 1% buffer from Santander for 2022(2) This requirement is 1% for Santander.
(3) % countercyclical buffer applicable at 1 January 2022 according to data from the European Systemic Risk Board (ESRB):
a.Exposures to customers resident in Bulgaria: 0.5%
b.Exposures to customers resident in the Czech Republic: 0.5%
c.Exposures to customers resident in Norway: 1%
d.Exposures to customers resident in Luxembourg: 0.5%
e.Exposures to customers resident in Slovakia: 1%
4) The highest of the three buffers applies if the SyRB buffer covers all exposures. Otherwise, the higher of G-SIB and D-SIB plus the SyRB buffer applies. With the transposition of the CRDV, the SyRB will be additional to the others.
The geographic breakdown of significant lending exposures for calculating the countercyclical capital buffer (table CCyB1) and the amount of institution-specific countercyclical capital buffer (table CCyB2) are available in Appendix XII and Appendix XIII respectively on Santander's website.
| | | | | |
| Access 2021 Pillar 3 Disclosures Report available on the Santander Group website |
| | | | | | | | | | | |
41 | | 2021 Pillar 3 Disclosures Report | |
| | |
CAPITAL 2021 Pillar 3 Disclosures Report |
Eligible capital requirements
The capital decision resulting from the Supervisory Review and Evaluation Process (SREP) under the European Central Bank’s (ECB) Single Supervisory Mechanism comprises a Pillar 2 Requirement (Pillar 2R) and Pillar 2 Guidance (Pillar 2G). Pillar 2R is binding and failure to comply may have direct consequences for banks. Pillar 2G is not directly binding. Failure to comply has no bearing on the maximum distributable amount (MDA) threshold. However, the ECB expects compliance with Pillar 2G at all times. If a bank is not compliant with Pillar 2G, the ECB will carefully consider the reasons and circumstances and may define additional supervisory control measures.
At 1 January 2022, at consolidated level, Santander must maintain a minimum CET1 ratio of 8.85% (i.e. 4.50% of the Pillar 1 requirement, 0.84% of the Pillar 2R requirement, 2.50% of the capital conservation buffer requirement, 1.00% of the G-SIB requirement and 0.01% of the countercyclical capital buffer requirement).
Santander must also maintain a minimum Tier 1 capital ratio of 10.64% and a minimum total capital ratio of 13.01%.
In 2021, the capital adequacy target set was achieved. Santander's fully loaded CET1 ratio stood at 12.51% at the close of the year, demonstrating its organic capacity to generate capital.
| | | | | |
| Regulatory Capital vs Regulatory requirement (Phased-in IFRS9) |
A. Countercyclical buffer.
B. Global systemically important banks (G-SIB) buffer.
C. Capital conservation buffer.
| | | | | | | | | | | |
42 | | 2021 Pillar 3 Disclosures Report | |
| | |
CAPITAL 2021 Pillar 3 Disclosures Report |
Global systemically important institutions
The Group is one of 30 entities designated as global systemically important banks (G-SIB) in 2021.
Systemically important banks may pose a risk to financial stability.
The insolvency of a systemically important bank, or even an expectation that it might become insolvent, could generate negative effects for the financial system and even the real economy that are difficult to predict.
This situation warrants special prudential treatment. This has led to the introduction of specific capital buffer requirements for both global (G-SIB) and domestic (D-SIB) systemically important banks.
This designation requires Santander to meet additional requirements mainly relating to the following:
•Its capital buffer (Santander is in the group of banks with the lowest capital buffer, 1%)
•TLAC (total loss-absorbing capacity) requirements
•The requirement to publish relevant information more often than other banks
•Stricter regulatory requirements for internal control bodies
•Special supervision
•Requirements to submit special reports to supervisory authorities
The BCBS and the Financial Stability Board jointly decide which banks qualify as being global systemically important, using a method based on five indicators: size, cross-jurisdiction activity, interconnectedness with other financial institutions, substitutability of financial services/infrastructure and complexity. Each of these categories has an equal weighting of 20%.
This methodology has been changed and will come into effect from January 2022. The main changes in the methodology are: inclusion of a trading volume indicator, modifying the weighting of the remaining indicators in the substitutability category, and inclusion of insurance companies in the reporting scope. A new measurement for cross-jurisdictional indicators will also be included, which will consider the EU as one jurisdiction, possibly reducing the indicator by +/-10 bp.
The information needed to evaluate the indicators is requested yearly from banks with leverage exposure exceeding €200 billion, or from any other banks at the supervisor's discretion: 76 banks were considered in December 2020. These institutions are then required to publish the information before 30 April of the following year.
The information is used to produce a global indicator. The score obtained by each bank determines the size of the capital buffer required of it, which is based on a set of buckets defined by the regulators (CET1 surcharge ranging from 1% to 3.5%).
In November 2021, the Financial Stability Board (FSB) published its list of global systemically important banks based on the December 2020 data. This will be fully applicable in 2023. Meeting these requirements makes the Group a more robust bank than its domestic rivals. Santander is currently subject to a systemic capital surcharge of 1%, which will become fully effective in 2022.
| | | | | |
| For more details regarding Quantitative Indicators, access file “G-SIBs indicators quantitative”, under section Shareholders and Investors/Other presentations (April month) on the Santander Group website. |
| | | | | | | | |
| Indicators for global systemically important institutions |
| | |
| Category | Individual indicator | Supervisor jurisdiction |
| Size | Exposure used for the leverage ratio calculation | An indicator of the weight of the bank in the financial system |
| Cross-jurisdictional activity | Cross-jurisdictional assets | Snapshot of a bank’s global footprint |
| Cross-jurisdictional liabilities |
| Interconnectedness | Intra-financial system assets | Measures a bank’s interconnectedness with other financial institutions |
| Intra-financial system liabilities |
| Securities outstanding |
| Substitutability/financial infrastructure | Assets under custody | Measures whether the bank’s activity can be replaced with other banks |
| Payments activity |
| Transactions subscribed in debt and equity markets |
| Complexity | Notional amount of over-the-counter (OTC) derivatives | Measures the complexity of a financial entity |
| Level 3 assets |
| Held for trading and available-for-sale securities |
| | | | | | | | | | | |
43 | | 2021 Pillar 3 Disclosures Report | |
| | |
CAPITAL 2021 Pillar 3 Disclosures Report |
| | | | | |
| Global systemically important institutions |
| |
Capital buffer | Entity |
| 5 (3.50%) | (Empty) |
| 4 (2.50%) | JP Morgan Chase |
| 3 (2.00%) | BNP Paribas
Citigroup
HSBC |
| 2 (1.50%) | Bank of America
Bank of China
Barclays
China Construction Bank
Deutsche Bank
Goldman Sachs
Industrial and Commercial Bank of China Limited
Mitsubishi UFJ FG |
| 1 (1,00%) | Agricultural Bank of China Bank of New York Mellon Credit Suisse Group BPCE Group Crédit Agricole ING Bank Mizuho FG Morgan Stanley Royal Bank of Canada Santander Société Générale Standard Chartered State Street Sumitomo Mitsui FG Toronto Dominion UBS Uni credit Group Wells Fargo |
Domestic Systemically Important Institutions
When identifying domestic systemically important banks (D-SIBs), Banco de España, using the methodology established in rule 14 of Circular 2/2016, applies a mix of guidelines based on size, importance, complexity (cross-jurisdiction activity) and the degree of interconnectedness between the institutions and the financial system. Banco de España conducts an annual review of this classification. The following institutions are included on its 2021 list:
| | | | | | | | |
| Systemical buffer (2022) |
Domestic Systemically Important Institutions |
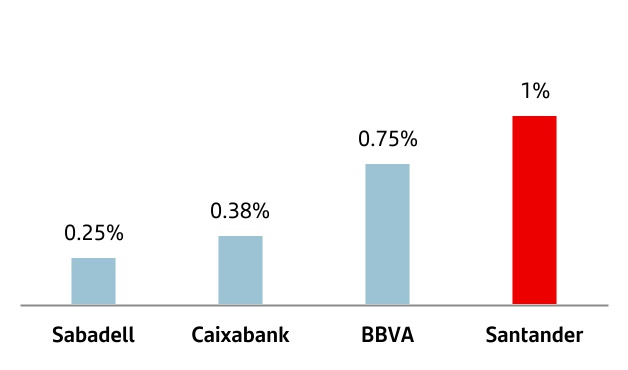
The Group is on the lists of both global and domestic systemically important banks. Banco de España requires the higher of the two buffers to be applied, under rule 23 of Circular 2/2016. As both buffers are the same for Banco Santander, the applicable surcharge in 2022 will be 1%.
2.4.4. Leverage ratio
This section covers the qualitative requirement LRA - Free format text boxes for disclosure on qualitative items.
Basel III established the leverage ratio as a non-risk-sensitive measure to limit excessive growth of the balance sheet relative to available capital.
The ratio is calculated as the ratio of Tier 1 divided by the leverage exposure. This exposure is calculated as the sum of the following components:
•Asset value, without derivatives and without elements considered as deductions in Tier 1 (for example, the loan balance is included but not goodwill), also excluding the exposures referred to in section 1 of article 429.a of the standard.
•Off-balance-sheet accounts (mainly: guarantees, undrawn credit limits, letters of credit) weighted by the conversion factors of the standardised approach to credit risk.
•Inclusion of the net value of derivatives (gains and losses against a single counterparty are netted, minus collateral – provided certain criteria are met) plus a surcharge for potential future exposure.
•A surcharge for the potential risk of financing securities transactions.
•Lastly, a surcharge is included for risk relating to unhedged credit derivatives (CDS).
The following tables illustrate the ratios published by Santander since December 2020. These show that Banco Santander's ratio is stable with an upward trend.
| | | | | |
Leverage ratio (CRR Fully loaded , IFRS 9 Phased-in) |
| | | | | |
Leverage ratio (CRR Phased-in, IFRS 9 Phased-in) |
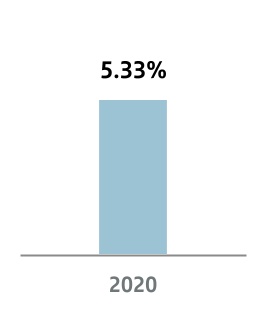
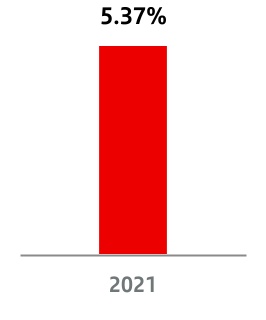 2021 and 2020 data has been calculated under application of CRR and IFRS 9 transitional arrangements
| | | | | | | | | | | |
44 | | 2021 Pillar 3 Disclosures Report | |
| | |
CAPITAL 2021 Pillar 3 Disclosures Report |
With the publication of CRR II, the definitive calibration of the leverage ratio was set at 3% for all institutions, with G-SIBs being subject to an additional surcharge of 50% of the ratio of the buffer applicable to the global systemically important institution (G-SII). Adjustments to its calculation are also included, chief among which are the exclusion of certain exposures from the measure of total exposure: public loans, transfer loans and officially supported export credits.
Banks implemented this final definition of the leverage ratio in June 2021, although the new ratio calibration (the additional surcharge for G-SIBs) will begin to apply from January 2023.
The Group's leverage ratio at 31 December 2021 was as follows:
| | | | | | | | |
| Table 9.Leverage ratio |
| EUR million | | |
| 2021 |
| Fully-loaded CRR | Phased-in CRR |
| Tier 1 | 82,133 | 82,452 |
| Exposure | 1,536,516 | 1,536,516 |
| Leverage Ratio | 5.35 | % | 5.37 | % |
The following table gives a breakdown of the ratio calculation:
| | | | | | | | | | | | | | | | | |
| Table 10.Leverage ratio details | | | |
| EUR million |
| 2021 |
| Item | Amounts Consol.
Balance Sheet | To be
eliminated | To be
included | Leverage
exposure | Comment |
| Derivatives | 59,072 | 59,072 | 28,025 | 28,025 | Substitution of carrying amount by EAD net of collateral |
| Securities financing transactions | 58,697 | — | 1,780 | 60,478 | A buffer is added for these transactions |
| Assets deducted in Tier 1 | 17,409 | 17,409 | — | — | Deletion to avoid duplication |
| DTAs | 1,045 | 1,045 | — | — | Carrying amount of the balance sheet asset adjusted for changes in DTAs, as a result of the recognition of lower reserve account provisions, due to the application of IFRS 9 transitional arrangements. |
| Rest of Assets | 1,446,462 | 111,393 | — | 1,335,070 | Fully included |
| Total Assets | 1,582,685 | 188,919 | 29,805 | 1,423,572 | |
| Total Off-Balance-Sheet items | 349,913 | 236,969 | — | 112,944 | Balances are weighted according to their risk |
| Total Exposure (denominator) | | | | 1,536,516 | |
| Tier 1 (numerator) | | | | 82,452 | |
| Leverage ratio | 1,393,767 | | | 5.37 | % | Minimum recommended 3% |
The leverage ratio is calculated by Santander every month and reported to the capital committee and other governing bodies, thus ensuring adequate monitoring of the risk of excessive leverage at its most restrictive measurement: fully loaded.
The leverage ratio is a primary metric in Santander's Risk Appetite Framework, as part of its commitment to preserving robust capital adequacy ratios. It is regularly monitored to ensure that the ratio comfortably exceeds the minimum regulatory requirements. The bank's Risk Appetite Framework includes a "stressed" leverage ratio as an additional metric, to manage the risk of excessive leverage in a forward-looking way, identifying how it will perform in a crisis scenario.
Within this framework, the group has established the necessary limits and alerts to ensure that leverage is kept at tolerable risk levels, consistent with sustainable growth in the group's balance sheet and well above the minimum levels that could be considered to be a risk. Any significant changes in any of the main drivers of this indicator are therefore analysed and reported to senior management.
Additional quantitative indicators are monitored as part of the group's active management of leverage risk, to complement
the management and monitoring of the risk of excessive leverage, so as to understand the maturities, types of charges and movements of collateralised assets. These metrics include asset encumbrance and the Net Stable Funding Ratio (NSFR).
| | | | | |
| ¤ | For more information, see section 10.1.2. |
As part of its capital planning, the group estimates the leverage ratio over a three-year horizon under a range of macroeconomic scenarios, including recession.
Despite the covid-19 crisis, which has necessitated higher levels of liquidity for our customers, at no point did the leverage ratio rise above the limits established in the Risk Appetite Framework over the course of the year.
| | | | | | | | | | | |
45 | | 2021 Pillar 3 Disclosures Report | |
| | |
CAPITAL 2021 Pillar 3 Disclosures Report |
For further information on the leverage ratio, see tables LR1(LRSum)-summary reconciliation of accounting assets and leverage ratio exposures, LR2(LRCom)-leverage ratio common disclosure and LR3 (LRSpl)- split-up of on balance sheet exposures (excluding derivatives, SFTs and exempted exposures) in Appendix XIV, Appendix XV and Appendix XVI respectively, which are available on Santander's website.
| | | | | |
| Access 2021 Pillar 3 Disclosures Report available on the Santander Group website |
2.5. Economic capital and RoRAC – Pillar II
Economic capital is the capital required to cover risks from our activity with a certain level of solvency. We measure it through an internal model.
Economic capital is an essential tool for internal management and the development of our strategy, assessing solvency and managing portfolio and business risk. It is also a key player in the supervisory review and evaluation process (SREP) as well as in the internal capital adequacy assessment process (ICAAP).
Our economic capital model measurements cover all significant risks incurred in our activity.
Our economic capital model measurements cover all significant risks incurred in our activity (concentration risk, structural interest rate risk, business risk, pensions risk, deferred tax assets (DTAs), goodwill and others that are beyond the scope of regulatory Pillar 1).
It also considers diversification, which is key to determining and understanding our risk profile and solvency in view of our multinational operations and businesses.
Having a balanced geographic and business diversification makes us more resilient, more predictable and less volatile.
A. 2021 underlying attributable profit by region. Operating areas excluding Corporate Centre.
For more information on economic capital, including RoRAC, value creation and capital planning, see Capital management section of the Economic and financial report of the 2021 Annual report. This section covers the Disclosure OVC 'ICAAP information' implementing technical standards (ITS).
| | | | | |
| Access 2021 Annual Report available on the Santander Group website |
2.6. Capital planning and stress tests
This section covers the qualitative requirement OVC - ICAAP information.
Internal capital stress and planning aims to ensure sufficient current and future capital, even in unlikely-but-plausible economic scenarios.
We estimate results in various business environments (including severe recessions as well as expected macroeconomic environments), based on our initial situation (financial statements, capital base, risk parameters and regulatory and economic ratios) to determine our solvency ratios, usually for a three-year period.
In addition to internal projections and stress tests, the Group participates in regulatory stress tests (e.g. EBA stress tests), which are conducted at regular intervals and the results of which are published.
For more information on capital planning and stress tests, see section 3.5 of the Economic and financial report of the 2021 annual report.
| | | | | |
| Access 2021 Annual Report available on the Santander Group website |
| | | | | | | | | | | |
46 | | 2021 Pillar 3 Disclosures Report | |
| | |
CAPITAL 2021 Pillar 3 Disclosures Report |
2.7. Total Loss-Absorbing Capacity (TLAC) and Minimum Requirement for own funds and Eligible Liabilities (MREL)
Information on TLAC and MREL can be found in chapter 3.5. of the Economic and financial report of the 2021 Annual Report.
| | | | | |
| Access 2021 Annual Report available on the Santander Group website |
TLAC information is published separately on Santander's website, in the section "Information on TLAC", which can be found between the link "Prudential Relevance Report (Pillar III)" and the link "Information for other regulators".
| | | | | |
| Access the file TLAC Disclosure available on the Santander Group website |
For further details, see the Fixed income presentation available on the Santander's website.
| | | | | |
| Access the file Fixed Income Presentations available on the Santander Group website |
2.8. Lines of defence
In this section, the provisions of letters (b), (c) and (d) of the CRE - Qualitative disclosure requirements related to IRB approach requirement -Institution risk management approach, are complied with.
Our model of three lines of defence effectively manages and controls risks:
•First line: formed by the business units that take or originate exposure to risk, it recognizes, measures, controls, monitors and reports on risks according to internal risk management regulation. Risk origination must be consistent with the approved risk appetite and related limits.
•Second line: formed by the risk and compliance and conduct functions, it independently oversees and challenges the first line’s risk management. Its duties include ensuring that risks are managed according to the risk appetite defined by senior management and strengthening our risk culture throughout Grupo Santander.
•Third line: the internal audit function, which is independent to ensure the board of directors and senior managers with high quality and efficient internal controls, governance and risk management systems, helping to safeguard our value, solvency and reputation.
The Risk, Compliance & Conduct and Internal Audit functions are separate and independent.
Each has direct access to the board of directors and its committees.
2.8.1. Second line of defence
For more information on the second line of defence see chapter 10. 'Other risks'.
| | | | | |
| ¤ | For further information on second line of defence, see chapters 3,4,5,6,7,8,9 and 10. |
2.8.2. Internal Audit
Internal Audit applies the definition of internal audit by the Institute of Internal Auditors. Internal Audit is a permanent function and is independent of all other functions and units. Its mission is to provide the board of directors and senior management with independent assurance with regard to the quality and efficacy of the systems and internal control, risk (current and emerging) management and governance processes, helping to safeguard the organisation's value, capital adequacy and reputation. Internal Audit evaluates:
i.the efficacy and efficiency of the processes and systems referred to above;
ii.compliance with applicable legislation and the requirements of supervisory bodies;
iii.the reliability and integrity of financial and operating information;
iv.and the integrity of capital.
The scope of Internal Audit's work encompasses:
i.all group entities over which the group exercises effective control;
ii.separate asset pools (for example, investment funds) managed by the entities mentioned in the previous section;
iii.all entities (or separate asset pools) not included in the previous points for which there is an agreement for the group to provide internal audit functions.
Internal Audit is guided by the following principles in this work: (i) Independence, objectivity and impartiality, (ii) Integrity, ethical behaviour and confidentiality of the information handled and its findings, (iii) Competence and professional qualifications of the auditors, (iv) Quality of the work, (v) Value creation, (vi) Adequate collaboration with other control functions in the group and with the external auditors and other assurance providers working within the organisation, (vii) A smooth relationship with the supervisory bodies and (viii) Compliance with international standards for the function.
Internal Audit is the third line of defence, acting independently from the others. Internal Audit organises its
| | | | | | | | | | | |
47 | | 2021 Pillar 3 Disclosures Report | |
| | |
CAPITAL 2021 Pillar 3 Disclosures Report |
activities with the flexibility necessary to adapt to the group's current structure and circumstances and to achieve its objectives with maximum effectiveness and efficiency.
Internal Audit's authority comes directly from the board of directors. Internal Audit reports to the audit committee and complies with the information requirements it receives from the committee in the discharge of its duties. However, as an independent unit, it reports regularly to the board of directors, at least twice a year, and, when it deems it necessary, it has direct access to the board.
The Group chief audit executive is responsible for submitting a corporate framework for Internal Audit to the board of directors for approval and subsequent implementation. This corporate framework sets out the global function and the way in which it is to be performed, as well as any changes that arise from its regular reviews.
Internal Audit prepares a plan based on an assessment of the risks to which the group is exposed, and submits it to the audit committee. It is then submitted to the board of directors, which approves it. In terms of solvency, this plan is defined in accordance with the cycle of capital audits, taking into account the results of engagements in previous years and other criteria, such as the rate of implementation of recommendations issued, the results of regulatory inspections, requests made by supervisory authorities and changes in mandatory regulations.
The Internal Audit functions uses this cycle to issue a full opinion on the capital function in the Group, assessing the capital governance framework and the key capital processes defined in the period established and executed by teams specialised in capital. It also performs other tasks focusing on
transversal issues with significant impact on the Group's solvency, such as analysis of credit portfolios and accounting provisions, and risk management processes.
Internal Audit also includes Recovery and Resolution work in its review plan as part of the specific audit cycle, covering key aspects of crisis management and resolution.
In accordance with the "ECB Guide to Internal Models" of October 2019, a risk assessment exercise is performed on the models used to calculate capital. This focuses on the aspects in each geography that present the greatest risks in the following major lines of action:
i.Reviewing compliance with the Group's internal governance model and supervisory requirements for the approval and maintenance of advanced models.
ii.Managing models and their adequacy and integration.
iii.Analysing the accuracy of risk measurement. Checking, through analysis and tests on the consistency and integrity of the Basel databases, that the methodology used in constructing the risk parameter models is consistent with their intended uses and complies with corporate standards and regulatory requirements, and verifying the replication of the calculations.
iv.Reviewing the regulatory capital calculation and reporting process.
v.Analysing the technical aspects and applications of the technological environment.
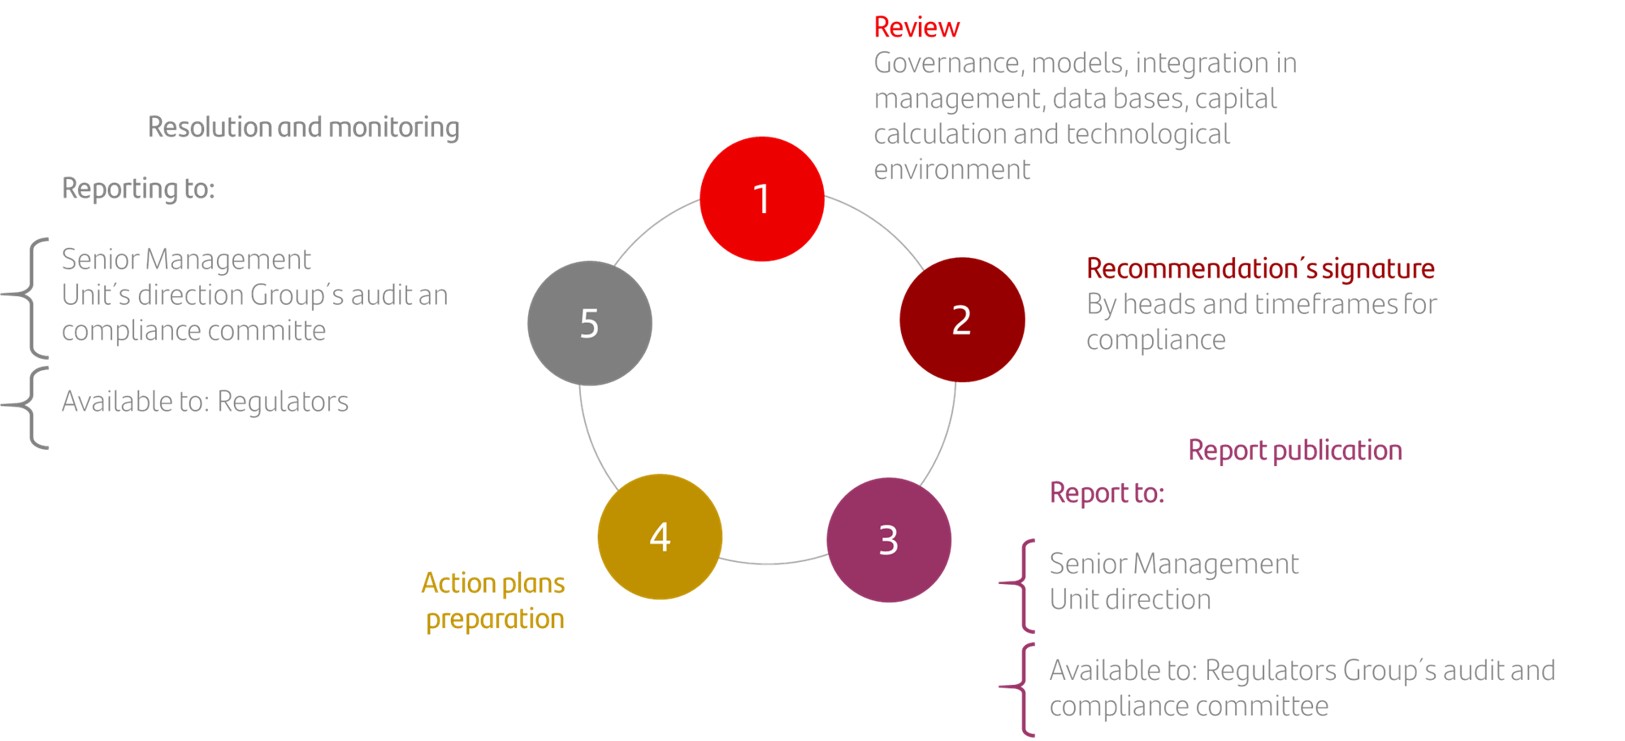
| | | | | | | | | | | |
48 | | 2021 Pillar 3 Disclosures Report | |
| | |
CAPITAL 2021 Pillar 3 Disclosures Report |
2.9. Corporate Special Situations and Resolution Framework, crisis management, Recovery and Resolution Planning
For details on the main developments by the Group in crisis management, specifically in relation to viability and resolution plans, and the special situations management framework, see section 3.6 of the Economic and financial report of the 2021 annual report.
| | | | | |
| Access 2021 Annual Report available on the Santander Group website |
| | | | | | | | | | | |
49 | | 2021 Pillar 3 Disclosures Report | |
| | |
CAPITAL 2021 Pillar 3 Disclosures Report |
| | | | | | | | | | | |
50 | | 2021 Pillar 3 Disclosures Report | |
| | | | | | | | | | | | | | | | | | | | | | | | | | | | | | | | | | | | | | |
| | |
| Global risk view | |
|
|
| |
| 3.1. Risk management and control model | |
| 3.1.1. Risk principles and culture | |
| 3.1.2. Risk factors | |
| 3.1.3. Risk management processes and tools | |
| 3.2. Governance | |
| 3.2.1. Board of directors | |
| 3.2.1.1. Diversity | |
| 3.2.1.2. Board committees | |
| 3.2.3. Risk and Compliance committees structure | |
| |
| |
| |
| |
| |
| |
| |
| |
| |
| |
| |
| |
| |
| |
| |
| |
| |
| |
| | |
GLOBAL RISK VISION 2021 Pillar 3 Disclosures Report |
3. Global risk view
3.1. Risk management and control model
This section covers the qualitative requirements OVA - Institution risk management approach and OVB - Disclosure on governance arrangements.
Our risk management and control model is underpinned by common principles, a strong risk culture, a solid governance structure and advanced risk management processes and tools.
3.1.1. Risk principles and culture
Our risk principles below are compulsory. They comply with regulatory requirements and are inspired by best market practices:
1. All employees are risk managers who must understand the risks associated with their functions and not assume risks with an impact that exceeds the Group’s risk appetite or is unknown.
2. Involvement of senior managers, with consistent risk management and control through their conduct, actions and communications, as well as oversight of our risk culture and make sure we maintain our risk profile within the defined risk appetite.
3. Independent risk management and control functions, according to our three lines of defence model, described in detail under section 2.8. 'Lines of defence'.
| | | | | |
| ¤ | For further information on the lines of defense, see section 2.8. |
4. A forward-looking, comprehensive approach to risk management and control for all businesses and risk types.
5. Complete and timely information to identify, assess, manage and disclose risks to the appropriate level.
Grupo Santander’s holistic control structure stands on these principles and includes strategic tools and processes set out in the risk appetite statement, such as annual planning and budget planning, scenario analysis, the risk reporting structure and risk identification and assessment.
Risk culture - Risk Pro
Santander has a strong risk culture called Risk Pro (or I AM RISK in the UK and the US), based on the principle that all employees are risk managers. Risk Pro is a pillar of 'The Santander Way' group culture and considers all risks to promote socially responsible management and long-term sustainability.
For more details on risk culture and the code of conduct , see the section 'Risk pro: our risk culture' in the Responsible Banking chapter of the 2021 annual report.
| | | | | |
| Access 2021 Annual Report available on the Santander Group website |
3.1.2. Risk factors
Grupo risks categorization ensures effective risk management, control and reporting. Our risk framework distinguishes these key risk types:
| | | | | | | | |
| 1 | Credit risk relates to financial loss arising from the default or credit quality deterioration of a customer or counterparty, to which Santander has directly financed or assumed a contractual obligation. |
| 2 | Market risk results of loss and detriment to profits or capital stemming from movements in interest rates, exchange rates, stock and commodity prices and its potential impact on capital requirements. |
| 3 | Liquidity risk occurs if liquid financial resources are insufficient or too costly to obtain in order to meet liabilities when they fall due. |
| 4 | Structural risk relates risk that market movements or balance sheet behaviour will change the value or profit generation of assets or liabilities in the banking book. It covers insurance and pension risks as well as the risk that Santander will not have sufficient capital (in terms of quantity or quality) to meet internal business targets, regulatory requirements or market expectations. |
| 5 | Operational risk is the possibility of losses due to shortcomings and failures relating to processes, employees and internal systems, even as a result of external events. It includes legal, regulatory compliance and conduct risks. |
| 6 | Financial crime risk is the risk of loss due to criminal or illegal activity involving Santander’s resources, products and services. Such activity includes money laundering, terrorism financing, violation of international sanctions, corruption, bribery and tax evasion. |
| 7 | Model risk involves potential losses due to inaccurate forecasting or from a model being implemented or misused models that can result in poor decision-making. |
| 8 | Reputational risk is the risk of current or potential negative economic impact due to damage to the bank’s reputation among employees, customers, shareholders, investors and broader society. |
| 9 | Strategic risk relates to losses due to strategic decisions or their poor implementation that affect our core stakeholders’ medium-to-long-term interests or to an inability to adapt to a changing environment. |
Environmental and climate-related risk drivers are considered as factors that could impact the existing risks in the medium-to-longterm.
| | | | | | | | | | | |
53 | | 2021 Pillar 3 Disclosures Report | |
| | |
GLOBAL RISK VISION 2021 Pillar 3 Disclosures Report |
These elements include, on the one hand, those derived from the physical effects of climate change, generated by one-off events as well as by chronic changes in the environment and, on the other hand, those derived from the process of transition to a development model with lower emissions, including legislative, technological or behaviour of economic agents changes.
3.1.3. Risk management processes and tools
Grupo Santander has the following processes and tools to carry out an effective risk management :
A. Risk appetite and structure of limits
Risk appetite is the volume and type of risks we deem prudent for our business strategy, even in unforeseen circumstances. It considers adverse scenarios that could have a negative impact on capital, liquidity and profitability. The board sets the Group's risk appetite statement (RAS) every year. Our subsidiaries' boards also set their own risk appetites annually. Each of those risk appetites translates into risk management limits and policies based on risk type, portfolio and segment.
For more details on risk appetite fundamentals and risk appetite principles see the section 2.4. 'Risk management processes and tools' in the Risk management and compliance chapter of the 2021 annual report.
| | | | | |
| Access 2021 Annual Report available on the Santander Group website |
Limits structure, monitoring and control
Our risk appetite is expressed in qualitative terms and limits structured on these five core elements.
| | | | | |
| 1 | Earnings volatility Maximum loss Santander can tolerate in an acute-but plausible stress scenario. |
| 2 | Solvency • Minimum capital position Santander can tolerate in a stress scenario. • Maximum leverage Grupo Santander can tolerate in a stress scenario. |
| 3 | Liquidity • Minimum structural liquidity position. • Minimum liquidity horizon Santander can tolerate in peak stress scenarios. • Minimum liquidity coverage position. |
| | | | | |
| 4 | Concentration • Concentration in single names, industries and portfolios. • Concentration in non-investment-grade counterparties. • Concentration in large exposures. |
| 5 | Non-financial risks • Maximum operational risk losses. • Maximum risk profile. • Non-financial risk indicators: ◦ Financial crime compliance (FCC) ◦ Cyber and security risk ◦ Model risk ◦ Reputational risk |
While risk appetite limits are regularly monitored, specialized control functions report on risk profile and compliance with limits to the board and its committees every month. The link between risk appetite limits and the limits used to manage business units and portfolios is key to making risk appetite an effective tool for managing risks.
B. Risk profile assessment
Identification and assessment are central to the management and reporting of Grupo Santander’s risk. To assess the Group's risk profile systematically, we use a single, robust methodology that allows us to analyse the various risk types described in our risk framework (outlined under Section 2.2 “Risk factors"). In addition, it classifies them by different levels and unit according to a points system with four categories (“low”, “medium-low”, “medium-high” and “high”).
The RPA methodology is based on the main principles of the identification and risk assessment model, such as: self-assessment and exercise suitability; efficiency; and holistic, in-depth risk analysis (with common approaches and alignment for decision-making). The three lines of defence take part in assessment, strengthening our risk culture by reviewing how risks change and pinpointing areas for improvement.
For more details on risk appetite see the section 2.4. 'Risk management processes and tools' in the Risk management and compliance chapter of the 2021 annual report.
| | | | | |
| Access 2021 Annual Report available on the Santander Group website |
Acquisitions and disposals
Following is a summary of the main acquisitions and disposals of ownership interests in the share capital of other entities and other significant corporate transactions performed in the last three years or pending to be completed:
i.Purchase by SHUSA for shares of Santander Consumer USA.
ii.Acquisition of Amherst Pierpont, a U.S. fixed-income broker dealer.
iii.Tender offer for shares of Banco Santander México, S.A., Institución de Banca Múltiple, Grupo Financiero Santander México.
| | |
GLOBAL RISK VISION 2021 Pillar 3 Disclosures Report |
iv.Agreement for the acquisition of a significant stake in Ebury Partners Limited.
v.Reorganization of the banking insurance business, asset management and pension plans in Spain.
vi.Agreement with Crédit Agricole S.A. on the depositary and custody business.
vii.Offer to acquire shares of Banco Santander Mexico, S.A., Institución de Banca Multiple, Grupo Financiero Santander México.
For more information on Acquisitions and disposals, see 'Notes to the consolidated annual accounts' Chapter of the 2021 Annual Report.
| | | | | |
| Access 2021 Annual Report available on the Santander Group website |
3.2. Governance
This section covers the qualitative requirements OVA - Institution risk management approach and OVB - Disclosure on governance arrangements.
The board is the highest decision-making body and focuses on supervision.
3.2.1. Board of directors
Size
At 31 December 2021, the board of directors was made up of the 15 members whose profile and background are described in section 4.1 'Our directors'. The Bylaws allow it to have between 12 and 17 members.
Composition by type of director
The composition of the board of directors is balanced between executive and non-executive directors, most of whom are independent. Each director’s status has been verified by the nomination committee and submitted to the board.
For more details on the actual knowledge, skills and experience of the members of the board of directors, as well as on the appointment, renewal and succession of directors, see section 4. 'Board of Directors' of the Corporate Governance chapter of the 2021 annual report.
| | | | | |
| Access 2021 Annual Report available on the Santander Group website |
3.2.1.1. Diversity
A diverse board of directors is essential to its effectiveness.
The combination of skills and experiences creates an environment with varied points of view that improves the quality of decision-making. Thus, we seek to achieve a sound balance of technical skills, expertise and points of view.
Our policy on the selection, suitability assessment and succession of directors helps make our board more diverse from different perspectives, for instance, in terms of gender, age, geographical provenance, experience and knowledge. It was amended in July 2018 in line with European legislation on the disclosure of non-financial and diversity information and the European Banking Authority (EBA) and the European Securities and Markets Authority (ESMA) joint guidelines on suitability assessments of board members and key functions holders. In 2019, the new gender equality target of 40%-60% representation of either gender in the board was included. The policy was later amended in April 2020, at the time of the general review of the succession process for directors and other executive positions, and in December 2020, after the CNMV amended the Spanish Corporate Governance Code in June 2020 to include age diversity as a factor to take into account. Banco Santander applies this policy to select candidates for any vacancy on the board.
Our selection policy aims to diversify the board of directors in different terms. In particular:
•Country of origin or international education
•Gender equality
•Age
•Education and career
•Race, disability and/or ethnicity
For more details on the skills and diversity matrix and on diversity in Santander see section 4 of the Corporate Governance chapter of the 2021 annual report.
| | | | | |
| Access 2021 Annual Report available on the Santander Group website |
| | | | | | | | | | | |
55 | | 2021 Pillar 3 Disclosures Report | |
| | |
GLOBAL RISK VISION 2021 Pillar 3 Disclosures Report |
3.2.1.2. Board committees
The board made the following changes to the composition of its committees to further enhance their operations and support in their areas of expertise, according to best international practice and internal regulation:
•Nomination committee: Gina Díez Barroso joined the committee on 22 December 2021, raising the number of committee members from three to four.
•Risk supervision, regulation and compliance committee: Belén Romana García was appointed chair of the committee on 1 April 2021, replacing Álvaro Cardoso de Souza, who stepped down on the same date and was replaced by Pamela Walkden on 1 May 2021.
3.2.2. Risk and Compliance committees structure
The board of directors is ultimately responsible for risk and compliance management and control.
It revises and approves the bank's risk frameworks and appetite, while promoting a strong risk culture across the Group. The board relies on its risk supervision, regulation and compliance committee for risk control and on the Group’s executive committee for risk approval.
For more details on Board committees see section 4 of the Corporate Governance chapter and section 2.3. of the Risk management and compliance chapter of the 2021 annual report.
| | | | | |
| Access 2021 Annual Report available on the Santander Group website |
| | | | | | | | | | | | | | | | | | | | | | | | | | | | | | | | | | | | | | |
| | |
| Credit risk | |
|
| |
| 4.1. General aspects | |
| 4.2. Capital requirements for credit risk | |
| 4.2.1. Internal ratings-based (IRB) approach | |
| 4.2.2. Equity investments and capital instruments not included in the trading book | |
| 4.2.3. Standardised approach | |
| 4.3. Distribution of exposures | |
| 4.4. Internal rating systems | |
| 4.5. Rating assignment process and parameter estimation | |
| 4.6. Uses of internal parameter estimates | |
| 4.7. Credit risk mitigation techniques | |
| 4.7.1. Recognition of credit risk mitigation | |
| 4.8. Impairment losses: influencing factors and comparative analysis | |
| 4.9. Backtesting of IRB parameters | |
| 4.9.1. PD backtest | |
| 4.9.2. EAD backtest | |
| 4.9.3. Backtest of expected loss | |
| 4.10. Covid-19 | |
| |
| |
| |
| |
| |
| |
| |
| |
| |
| | |
CREDIT RISK 2021 Pillar 3 Disclosures Report |
4. Credit risk
| | | | | |
| RWA by geography |
| Includes Counterparty Credit risk |
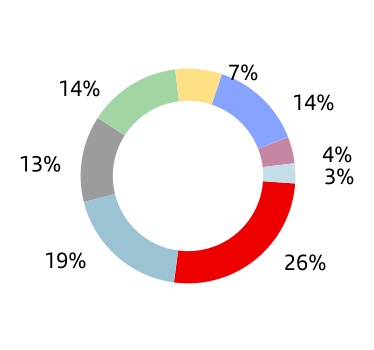
| | | | | |
| n | Spain |
| n | Rest of Europe |
| n | Brazil |
| n | UK |
| n | Rest of South America |
| n | USA |
| n | Rest of North America |
| n | Others |
| | | | | | | | | | | | | | |
| Main figures |
Million euros | | | |
| | EAD | | RWA |
| 2021 | 2020 | 2021 | 2020 |
| Credit risk | 1,412,812 | 1,294,507 | 477,977 | 470,333 |
| of which, with standard method (SA) | 773,896 | 697,219 | 262,869 | 259,362 |
| | | | |
| Of which, the foundation IRB (FIRB) approach | 13,413 | 12,239 | 9,483 | 8,841 |
| Of which, Slotting | 21,102 | 20,485 | 14,672 | 14,529 |
| Of which, equities under the simple risk weighted approach | 1,165 | 1,428 | 2,219 | 2,750 |
| Of which, the advanced IRB (AIRB) approach | 595,486 | 554,438 | 173,956 | 168,096 |
It does not include securitisations or counterparty risk.
| | | | | | | | |
| EAD Variation | | RWA Variation |
Million euros | Million euros |
| | | | | | | | | | | |
59 | | 2021 Pillar 3 Disclosures Report | |
| | |
CREDIT RISK 2021 Pillar 3 Disclosures Report |
4.1. General aspects
This section covers the CRA - General qualitative information about credit risk. It also complies with (d), (e), (f) and (g) of the OVA Requirement - Institution risk management approach.
The credit risk management process involves identification, assessment, control and decision-making in relation to the credit risk incurred in the group's operations.
It incorporates operational, customer and portfolio factors, together with a comprehensive view of the credit risk cycle. The Business and Risk areas are involved in the process, along with senior management.
The Group's profile is mainly retail, with an adequate diversification of credit risk between mature and emerging markets.
4.2. Capital requirements for credit risk
4.2.1. Internal ratings-based approach (IRB)
The following table shows the main changes in capital requirements for credit risk under the IRB approach in the year:
| | | | | | | | |
| Table 11.Credit risk capital requirements movements |
| EUR million |
| RWAs | Capital requeriments |
| Starting amount (31/12/2020) | 487,745 | 39,020 |
| Asset size | (15,078) | (1,206) |
| Model updates | 4,407 | 353 |
| Regulatory | 14,058 | 1,125 |
| Acquisitions and disposals | (1,729) | (138) |
| Foreign exchange movements | 11,482 | 919 |
| Other | — | — |
| Ending amount (31/12/2021) | 500,884 | 40,071 |
| | |
| It includes capital requirements of equity, securitisations and counterparty credit risk (Does not include CVA and CPP) |
Credit risk RWAs increased EUR 13,079 million in 2021, largely driven by exchange rate movements (+EUR 11,482 million), mainly due to the USD's and GBP's appreciation. Regulatory changes (methodology and policy) related to the implementation of the New Default Definition and changes in the calculation of counterparty credit risk exposure (SA-CCR) were also significant in the year. In models, changes arose from TRIM (Targeted Review of Internal Models) in Low Default Portfolios. In terms of asset size, of note was the impact from securitizations the Group carried out in the year.
The following table shows the main variations in IRB credit risk RWAs in the last quarter:
| | | | | |
| Table 12.CR8 - RWEA flow statements of credit risk exposures under the IRB approach |
| EUR million |
| 2021 |
| RWA |
| RWA as Sep'21 | 202,213 |
| Asset size | (6,754) |
| Asset quality | — |
| Model updates | — |
| Methodology and policy | 8,421 |
| Acquisitions and disposals | — |
| Foreign exchange movements | 1,796 |
| Other | — |
| RWA as Dec'21 | 205,676 |
| |
| It includes capital requirements of equity. |
| Fully-loaded CRR, Phased-in IFRS 9. |
Credit risk assets under the IRB approach increased by €3.46 billion in the fourth quarter, driven by the regulatory impact of the new default definition, which was offset partially by asset securitisations in Santander Spain and Santander Consumer Finance.
The tables in this section show, for each business segment and credit rating (internal and Standard & Poor’s), the value of exposures, credit risk parameters and capital under the IRB approach, distinguishing between foundation IRB (FIRB) and advanced IRB (AIRB).
| | |
CREDIT RISK 2021 Pillar 3 Disclosures Report |
| | | | | | | | | | | | | | | | | | | | | | | | | | | | | | | | | | | | | | |
| Table 13.Credit risk exposures by exposure class and PD range |
| AIRB | | | | | | | | | | | | |
| | | | | | | | | | | | |
| EUR million | | | | | | | | | | | | 2021 |
| Exposure class | Original on-balance-sheet gross exposures | Off-balance-sheet exposures pre-CCF | Average CCF | EAD post CRM and post CCF | Average PD | Number of obligors | Average LGD | Average maturity | RWA | RW | EL | Value adjustments and provisions |
| Institutions | 27,665 | 14,255 | 29.52 | % | 31,443 | 0.21 | % | 2,724 | 40.47 | % | 1.00 | 6,655 | 21 | % | 20 | (35) |
| Corporates - Other | 125,483 | 109,745 | 35.74 | % | 140,832 | 3.15 | % | 38,442 | 43.14 | % | 2.00 | 68,918 | 49 | % | 2,070 | (2,564) |
| Corporates - SMEs | 36,401 | 8,881 | 30.35 | % | 29,942 | 13.94 | % | 92,812 | 42.72 | % | 2.00 | 18,474 | 62 | % | 1,724 | (2,210) |
| Retail - Mortgages SMEs | 14,123 | 133 | 61.84 | % | 14,285 | 17.90 | % | 195,220 | 20.85 | % | — | 2,903 | 20 | % | 746 | (889) |
| Retail - Mortgages no SMEs | 292,304 | 19,682 | 70.15 | % | 306,592 | 4.40 | % | 2,390,581 | 10.01 | % | — | 45,619 | 15 | % | 1,685 | (1,390) |
| Qualifying Revolving | 3,136 | 20,775 | 60.53 | % | 15,756 | 3.59 | % | 20,609,718 | 59.07 | % | — | 4,659 | 30 | % | 354 | (271) |
| Retail - Other non SMEs | 38,834 | 1,849 | 68.62 | % | 39,778 | 5.34 | % | 4,679,691 | 45.94 | % | — | 19,514 | 49 | % | 1,201 | (1,143) |
| Retail - SMEs | 24,416 | 5,162 | 49.49 | % | 16,857 | 9.06 | % | 1,645,983 | 49.69 | % | — | 7,213 | 43 | % | 1,003 | (980) |
| Total | 562,363 | 180,483 | 42.34 | % | 595,486 | 4.86 | % | 29,655,171 | 26.18 | % | 1.00 | 173,956 | 29 | % | 8,804 | (9,483) |
| | | | | | | | | | | | | | | | | | | | | | | | | | | | | | | | | | | | | | |
| Table 13.Credit risk exposures by exposure class and PD range |
| FIRB | | | | | | | | | | | | |
| | | | | | | | | | | | |
| Million euros | | | | | | | | | | | | 2021 |
| Exposure class | Original on-balance-sheet gross exposures | Off-balance-sheet exposures pre-CCF | Average CCF | EAD post CRM and post CCF | Average PD | Number of obligors | Average LGD | Average maturity | RWA | RW | EL | Value adjustments and provisions |
| Institutions | 1,197 | 1,914 | 10.79 | % | 1,294 | 0.09 | % | 302 | 44.93 | % | 1.00 | 291 | 22 | % | 1 | (1) |
| Corporates - Other | 8,903 | 3,283 | 31.14 | % | 9,745 | 5.17 | % | 5,394 | 44.54 | % | 3.00 | 7,108 | 73 | % | 225 | (130) |
| Corporates - SMEs | 1,257 | 270 | 21.96 | % | 1,317 | 14.09 | % | 1,759 | 42.73 | % | 3.00 | 1,027 | 78 | % | 82 | (113) |
| Total | 11,358 | 5,467 | 23.56 | % | 12,355 | 5.59 | % | 7,455 | 44.38 | % | 2.41 | 8,426 | 68 | % | 307 | (244) |
| | | | | | | | | | | | |
| | | | | | | | | | | |
61 | | 2021 Pillar 3 Disclosures Report | |
| | |
CREDIT RISK 2021 Pillar 3 Disclosures Report |
The following chart depicts exposures using the IRB approach approved up to December 2021 (excluding Equities and Specialised Lending), based on the internal credit quality associated with its external rating.
| | | | | | | | | | | | | | |
| EAD-weighted average PD | | EAD-weighted average LGD |
| % | | | % | |
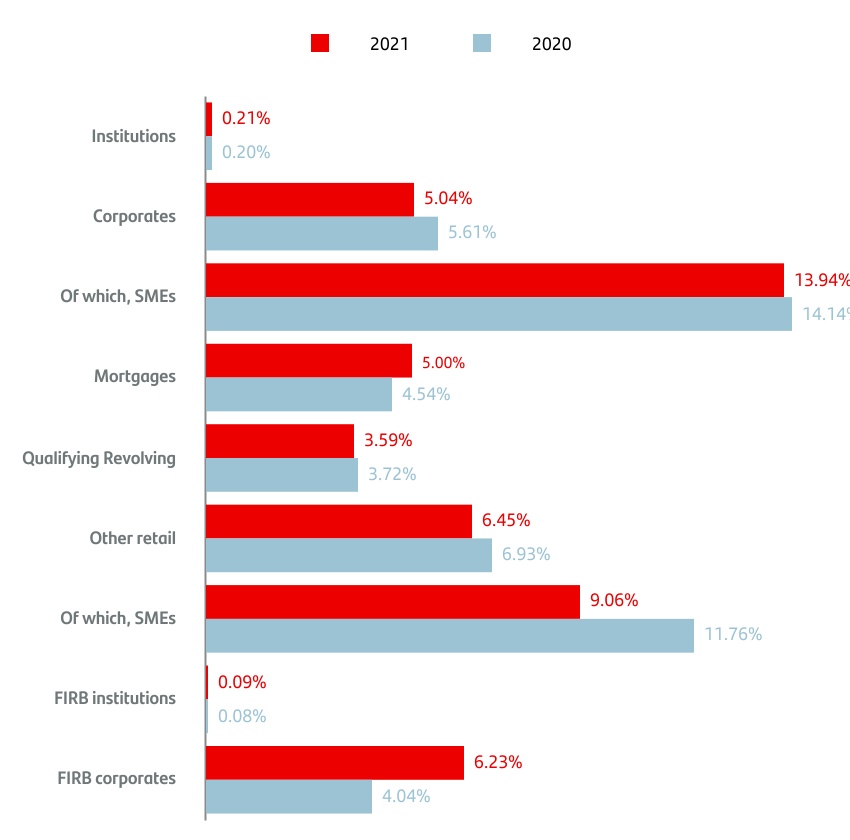
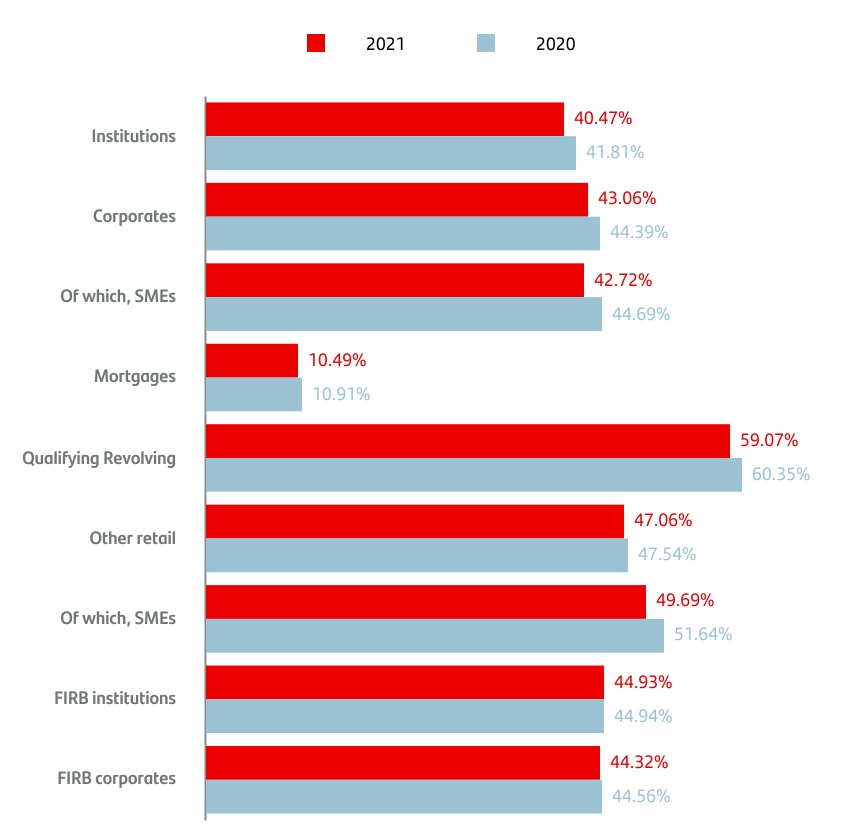
| | |
CREDIT RISK 2021 Pillar 3 Disclosures Report |
| | | | | | | | | | | | | | |
| Exposure | | RWA/EAD |
| Million euros | | | % | |
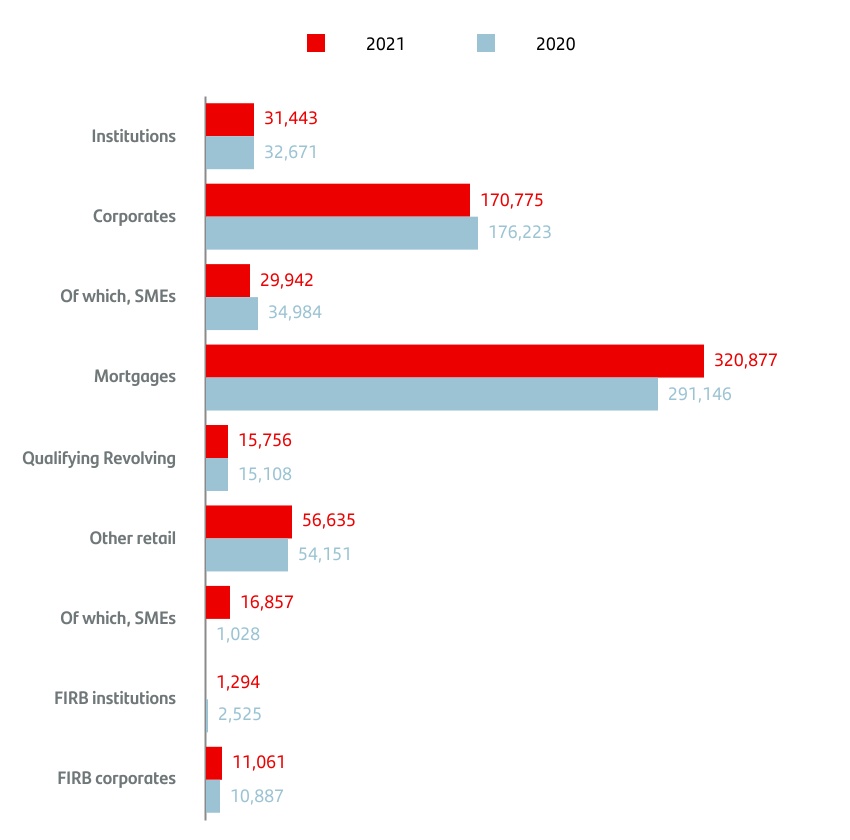
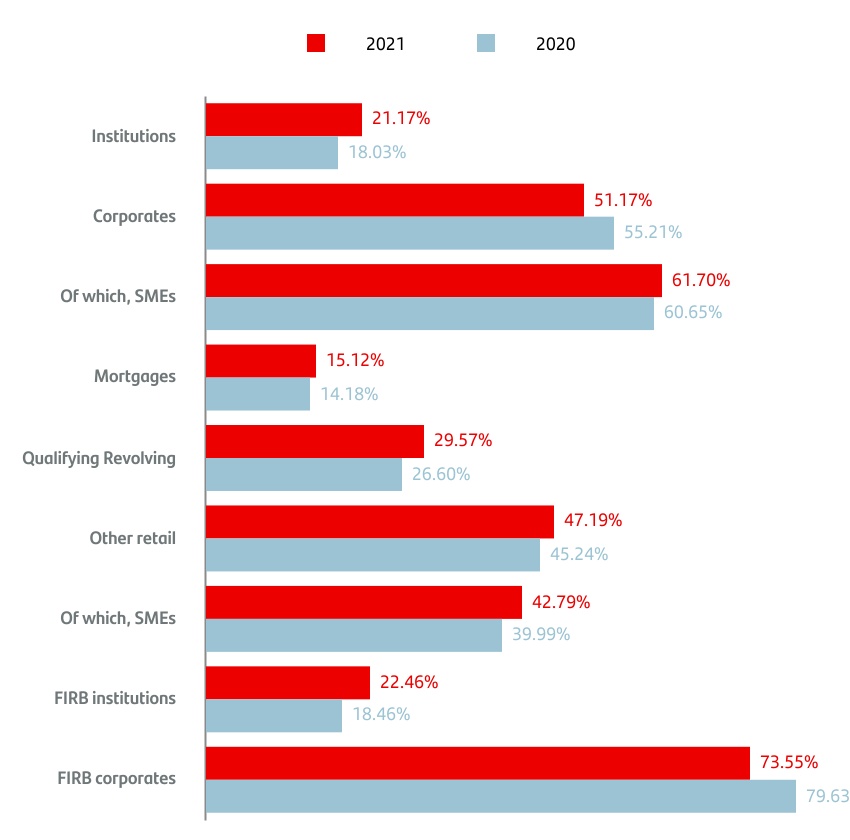
| | | | | | | | | | | |
63 | | 2021 Pillar 3 Disclosures Report | |
| | |
CREDIT RISK 2021 Pillar 3 Disclosures Report |
| | | | | | | | | | | | | | | | | | | | | | | | | | | | | | | | | | | | | | |
| Table 14.CR6 - AIRB approach - Credit risk exposures by exposure class and PD range |
| EUR million |
| | | | | | | | | | | 2021 |
| PD scale | Original on-balance-sheet gross exposures | Off-balance-sheet exposures pre-CCF | Average CCF | EAD post CRM and post CCF | Average PD | Number of obligors | Average LGD | Average maturity | RWA | RW | EL | Value adjustments and provisions |
| Institutions |
| 0.00 < 0.15 | 15,899 | 8,956 | 30.41 | % | 22,796 | 0.06 | % | 912 | 41.91 | % | 1 | 3,051 | 13 | % | 5 | (18) |
| 0.00 to < 0.10 | 12,185 | 8,527 | 30.33 | % | 21,965 | 0.05 | % | 771 | 41.80 | % | 1 | 2,791 | 13 | % | 5 | (16) |
| 0.10 to < 0.15 | 3,714 | 428 | 31.86 | % | 831 | 0.13 | % | 141 | 44.99 | % | 1 | 260 | 31 | % | — | (2) |
| 0.15 < 0.25 | 4,648 | 2,636 | 29.97 | % | 4,208 | 0.16 | % | 478 | 41.03 | % | 1 | 1,241 | 29 | % | 3 | (4) |
| 0.25 < 0.50 | 2,781 | 1,038 | 29.84 | % | 1,783 | 0.32 | % | 188 | 42.17 | % | 1 | 814 | 46 | % | 2 | (2) |
| 0.50 < 0.75 | 1,199 | 1,164 | 24.89 | % | 774 | 0.66 | % | 248 | 42.21 | % | 2 | 637 | 82 | % | 2 | (2) |
| 0.75 < 2.50 | 2,801 | 351 | 17.08 | % | 1,606 | 1.10 | % | 788 | 18.10 | % | 4 | 696 | 43 | % | 3 | (2) |
| 0.75 to < 1.75 | 2,799 | 326 | 16.70 | % | 1,598 | 1.10 | % | 771 | 18.07 | % | 4 | 690 | 43 | % | 3 | (2) |
| 1.75 to < 2.50 | 2 | 24 | 22.13 | % | 8 | 2.43 | % | 17 | 23.59 | % | 1 | 5 | 66 | % | — | — |
| 2.50 < 10.00 | 292 | 46 | 77.89 | % | 267 | 3.15 | % | 59 | 27.00 | % | 3 | 214 | 80 | % | 2 | (3) |
| 2.50 to <5 | 222 | 33 | 97.13 | % | 245 | 2.89 | % | 23 | 25.68 | % | 3 | 180 | 73 | % | 2 | (1) |
| 5 to <10 | 70 | 14 | 32.10 | % | 22 | 6.04 | % | 36 | 41.73 | % | 2 | 34 | 156 | % | 1 | (1) |
| 10.00 < 100.00 | 35 | — | 23.85 | % | — | 28.04 | % | 13 | 47.54 | % | 1 | 0 | 264 | % | — | — |
| 10 to < 20 | — | — | — | % | — | — | % | — | — | % | — | 0 | — | % | — | — |
| 20 to < 30 | 28 | — | — | % | — | 28.04 | % | 2 | 47.54 | % | 1 | 0 | 264 | % | — | — |
| 30 to < 100 | 7 | — | 23.85 | % | — | — | % | 11 | — | % | — | 0 | — | % | — | — |
| 100.00 (Default) | 9 | 64 | — | % | 9 | 100.00 | % | 38 | 26.65 | % | 2 | 3 | 28 | % | 2 | (5) |
| Subtotal (exposure class) | 27,665 | 14,255 | 29.52 | % | 31,443 | 0.21 | % | 2,724 | 40.47 | % | 1 | 6,655 | 21 | % | 20 | (35) |
| Total (all exposures classes AIRB) | 562,363 | 180,483 | 42.34 | % | 595,486 | 4.86 | % | 29,655,171 | 26.18 | % | 1 | 173,956 | 29 | % | 8,804 | (9,483) |
| | | | | | | | | | | | |
| | |
CREDIT RISK 2021 Pillar 3 Disclosures Report |
| | | | | | | | | | | | | | | | | | | | | | | | | | | | | | | | | | | | | | |
| Table 14.CR6 - AIRB approach - Credit risk exposures by exposure class and PD range |
| EUR million |
| | | | | | | | | | | 2021 |
| PD scale | Original on-balance-sheet gross exposures | Off-balance-sheet exposures pre-CCF | Average CCF | EAD post CRM and post CCF | Average PD | Number of obligors | Average LGD | Average maturity | RWA | RW | EL | Value adjustments and provisions |
| Corporates - Other |
| 0.00 < 0.15 | 37,211 | 55,211 | 43.95 | % | 60,042 | 0.08 | % | 2,116 | 43.05 | % | 2 | 14,353 | 24 | % | 22 | (63) |
| 0.00 to < 0.10 | 23,198 | 37,907 | 51.15 | % | 41,915 | 0.06 | % | 1,167 | 42.44 | % | 2 | 8,395 | 20 | % | 10 | (52) |
| 0.10 to < 0.15 | 14,013 | 17,303 | 28.17 | % | 18,127 | 0.15 | % | 949 | 44.45 | % | 2 | 5,958 | 33 | % | 12 | (11) |
| 0.15 < 0.25 | 15,155 | 15,359 | 21.62 | % | 16,227 | 0.24 | % | 2,133 | 42.50 | % | 1 | 6,552 | 40 | % | 17 | (91) |
| 0.25 < 0.50 | 19,021 | 14,041 | 28.66 | % | 21,964 | 0.37 | % | 5,160 | 42.68 | % | 2 | 11,705 | 53 | % | 34 | (236) |
| 0.50 < 0.75 | 23,889 | 11,823 | 29.65 | % | 18,749 | 0.60 | % | 8,130 | 44.71 | % | 2 | 13,522 | 72 | % | 50 | (86) |
| 0.75 < 2.50 | 17,983 | 7,651 | 30.26 | % | 14,657 | 1.42 | % | 11,784 | 42.40 | % | 2 | 14,224 | 97 | % | 89 | (233) |
| 0.75 to < 1.75 | 11,837 | 5,034 | 26.71 | % | 9,219 | 1.15 | % | 6,978 | 41.14 | % | 2 | 8,095 | 88 | % | 44 | (76) |
| 1.75 to < 2.50 | 6,146 | 2,616 | 37.09 | % | 5,438 | 1.89 | % | 4,806 | 44.54 | % | 2 | 6,129 | 113 | % | 45 | (157) |
| 2.50 < 10.00 | 6,231 | 3,632 | 27.83 | % | 4,963 | 4.08 | % | 5,982 | 40.85 | % | 2 | 6,424 | 129 | % | 83 | (217) |
| 2.50 to <5 | 4,808 | 2,773 | 27.33 | % | 3,972 | 3.40 | % | 4,798 | 40.49 | % | 2 | 4,797 | 121 | % | 54 | (143) |
| 5 to <10 | 1,423 | 858 | 29.45 | % | 991 | 6.80 | % | 1,184 | 42.28 | % | 2 | 1,627 | 164 | % | 28 | (74) |
| 10.00 < 100.00 | 2,430 | 809 | 63.80 | % | 611 | 21.06 | % | 1,211 | 43.38 | % | 2 | 1,455 | 238 | % | 56 | (114) |
| 10 to < 20 | 394 | 205 | 49.18 | % | 302 | 13.71 | % | 596 | 42.47 | % | 2 | 652 | 216 | % | 18 | (75) |
| 20 to < 30 | 1,938 | 563 | 71.70 | % | 239 | 23.90 | % | 443 | 44.51 | % | 2 | 630 | 264 | % | 25 | (11) |
| 30 to < 100 | 98 | 41 | 28.52 | % | 71 | 42.89 | % | 172 | 43.49 | % | 2 | 173 | 245 | % | 13 | (28) |
| 100.00 (Default) | 3,563 | 1,220 | 21.62 | % | 3,618 | 100.00 | % | 1,926 | 48.23 | % | 2 | 684 | 19 | % | 1,720 | (1,523) |
| Subtotal (exposure class) | 125,483 | 109,745 | 35.74 | % | 140,832 | 3.15 | % | 38,442 | 43.14 | % | 2 | 68,918 | 49 | % | 2,070 | (2,564) |
| Total (all exposures classes AIRB) | 562,363 | 180,483 | 42.34 | % | 595,486 | 4.86 | % | 29,655,171 | 26.18 | % | 1 | 173,956 | 29 | % | 8,804 | (9,483) |
|
| | | | | | | | | | | |
65 | | 2021 Pillar 3 Disclosures Report | |
| | |
CREDIT RISK 2021 Pillar 3 Disclosures Report |
| | | | | | | | | | | | | | | | | | | | | | | | | | | | | | | | | | | | | | |
| Table 14.CR6 - AIRB approach - Credit risk exposures by exposure class and PD range |
| EUR million |
| | | | | | | | | | | 2021 |
| PD scale | Original on-balance-sheet gross exposures | Off-balance-sheet exposures pre-CCF | Average CCF | EAD post CRM and post CCF | Average PD | Number of obligors | Average LGD | Average maturity | RWA | RW | EL | Value adjustments and provisions |
| Corporates - SMEs |
| 0.00 < 0.15 | 39 | 33 | 15.20 | % | 51 | 0.09 | % | 637 | 39.89 | % | 2 | 7 | 14 | % | — | — |
| 0.00 to < 0.10 | 20 | 30 | 13.37 | % | 30 | 0.08 | % | 367 | 45.19 | % | 1 | 4 | 13 | % | — | — |
| 0.10 to < 0.15 | 19 | 3 | 34.84 | % | 20 | 0.11 | % | 270 | 31.93 | % | 3 | 3 | 16 | % | — | — |
| 0.15 < 0.25 | 303 | 170 | 25.36 | % | 208 | 0.21 | % | 1,557 | 36.06 | % | 2 | 47 | 23 | % | — | (1) |
| 0.25 < 0.50 | 3,873 | 1,348 | 31.63 | % | 3,489 | 0.35 | % | 9,031 | 45.48 | % | 2 | 1,461 | 42 | % | 5 | (13) |
| 0.50 < 0.75 | 5,518 | 1,280 | 37.68 | % | 5,244 | 0.62 | % | 11,704 | 45.56 | % | 2 | 2,806 | 54 | % | 14 | (12) |
| 0.75 < 2.50 | 12,778 | 3,335 | 31.76 | % | 9,834 | 1.50 | % | 34,202 | 41.91 | % | 2 | 6,369 | 65 | % | 61 | (71) |
| 0.75 to < 1.75 | 8,789 | 2,320 | 28.12 | % | 6,786 | 1.25 | % | 20,998 | 41.42 | % | 2 | 4,153 | 61 | % | 35 | (22) |
| 1.75 to < 2.50 | 3,989 | 1,016 | 40.06 | % | 3,048 | 2.06 | % | 13,204 | 43.00 | % | 2 | 2,217 | 73 | % | 27 | (50) |
| 2.50 < 10.00 | 9,221 | 2,424 | 25.16 | % | 6,883 | 4.66 | % | 25,740 | 41.01 | % | 2 | 6,056 | 88 | % | 130 | (113) |
| 2.50 to <5 | 5,328 | 1,587 | 24.78 | % | 3,976 | 3.32 | % | 14,961 | 41.29 | % | 2 | 3,184 | 80 | % | 53 | (52) |
| 5 to <10 | 3,894 | 837 | 25.90 | % | 2,907 | 6.50 | % | 10,779 | 40.62 | % | 2 | 2,872 | 99 | % | 77 | (61) |
| 10.00 < 100.00 | 861 | 138 | 27.22 | % | 708 | 19.08 | % | 3,492 | 39.99 | % | 3 | 976 | 138 | % | 52 | (40) |
| 10 to < 20 | 610 | 84 | 31.87 | % | 523 | 13.42 | % | 2,445 | 41.43 | % | 2 | 710 | 136 | % | 29 | (24) |
| 20 to < 30 | 86 | 14 | 32.56 | % | 78 | 25.62 | % | 622 | 35.93 | % | 3 | 112 | 143 | % | 7 | (5) |
| 30 to < 100 | 166 | 40 | 15.46 | % | 107 | 41.94 | % | 425 | 35.90 | % | 4 | 154 | 145 | % | 16 | (12) |
| 100.00 (Default) | 3,807 | 154 | 20.86 | % | 3,525 | 100.00 | % | 6,449 | 42.36 | % | 3 | 750 | 21 | % | 1,461 | (1,960) |
| Subtotal (exposure class) | 36,401 | 8,881 | 30.35 | % | 29,942 | 13.94 | % | 92,812 | 42.72 | % | 2 | 18,474 | 62 | % | 1,724 | (2,210) |
| Total (all exposures classes AIRB) | 562,363 | 180,483 | 42.34 | % | 595,486 | 4.86 | % | 29,655,171 | 26.18 | % | 1 | 173,956 | 29 | % | 8,804 | (9,483) |
| | | | | | | | | | | | |
| | |
CREDIT RISK 2021 Pillar 3 Disclosures Report |
| | | | | | | | | | | | | | | | | | | | | | | | | | | | | | | | | | | | | | |
| Table 15.CR6 - AIRB approach Retail - Credit risk exposures by exposure class and PD range |
| EUR million |
| | | | | | | | | | | 2021 |
| PD scale | Original on-balance-sheet gross exposures | Off-balance-sheet exposures pre-CCF | Average CCF | EAD post CRM and post CCF | Average PD | Number of obligors | Average LGD | Average maturity | RWA | RW | EL | Value adjustments and provisions |
| Retail - Mortgages SMEs |
| 0.00 < 0.15 | 3,747 | 27 | 98.59 | % | 3,772 | 0.07 | % | 61,905 | 13.87 | % | — | 79 | 2 | % | — | (5) |
| 0.00 to < 0.10 | 3,001 | 16 | 100.00 | % | 3,017 | 0.05 | % | 52,433 | 11.00 | % | — | 39 | 1 | % | — | (4) |
| 0.10 to < 0.15 | 746 | 11 | 96.46 | % | 756 | 0.11 | % | 9,472 | 25.32 | % | — | 40 | 5 | % | — | (1) |
| 0.15 < 0.25 | 1,469 | 7 | 94.45 | % | 1,475 | 0.19 | % | 21,320 | 15.69 | % | — | 73 | 5 | % | — | (2) |
| 0.25 < 0.50 | 1,895 | 14 | 77.95 | % | 1,912 | 0.39 | % | 24,468 | 21.26 | % | — | 214 | 11 | % | 2 | (4) |
| 0.50 < 0.75 | 690 | 17 | 40.36 | % | 723 | 0.64 | % | 10,432 | 15.99 | % | — | 92 | 13 | % | 1 | (2) |
| 0.75 < 2.50 | 2,528 | 33 | 52.15 | % | 2,600 | 1.34 | % | 29,449 | 22.26 | % | — | 712 | 27 | % | 7 | (10) |
| 0.75 to < 1.75 | 2,003 | 29 | 49.95 | % | 2,057 | 1.13 | % | 22,623 | 22.85 | % | — | 529 | 26 | % | 5 | (4) |
| 1.75 to < 2.50 | 525 | 5 | 66.18 | % | 543 | 2.15 | % | 6,826 | 20.02 | % | — | 183 | 34 | % | 2 | (5) |
| 2.50 < 10.00 | 859 | 18 | 63.08 | % | 864 | 4.69 | % | 9,742 | 28.24 | % | — | 607 | 70 | % | 11 | (11) |
| 2.50 to <5 | 575 | 14 | 68.54 | % | 578 | 3.49 | % | 6,479 | 28.64 | % | — | 364 | 63 | % | 5 | (5) |
| 5 to <10 | 284 | 4 | 42.85 | % | 285 | 7.12 | % | 3,263 | 27.42 | % | — | 243 | 85 | % | 5 | (6) |
| 10.00 < 100.00 | 626 | 3 | 49.15 | % | 629 | 24.50 | % | 8,460 | 20.08 | % | — | 550 | 87 | % | 30 | (22) |
| 10 to < 20 | 326 | 1 | 56.02 | % | 329 | 14.56 | % | 4,416 | 19.44 | % | — | 267 | 81 | % | 9 | (7) |
| 20 to < 30 | 71 | — | 20.58 | % | 71 | 24.56 | % | 736 | 23.00 | % | — | 77 | 108 | % | 4 | (3) |
| 30 to < 100 | 229 | 2 | 50.16 | % | 229 | 38.75 | % | 3,308 | 20.09 | % | — | 206 | 90 | % | 18 | (12) |
| 100.00 (Default) | 2,310 | 14 | 8.35 | % | 2,310 | 100.00 | % | 29,444 | 32.56 | % | — | 577 | 25 | % | 695 | (834) |
| Subtotal (exposure class) | 14,123 | 133 | 61.84 | % | 14,285 | 17.90 | % | 195,220 | 20.85 | % | — | 2,903 | 20 | % | 746 | (889) |
| Total (all exposures classes AIRB) | 562,363 | 180,483 | 42.34 | % | 595,486 | 4.86 | % | 29,655,171 | 26.18 | % | 1 | 173,956 | 29 | % | 8,804 | (9,483) |
|
| | | | | | | | | | | |
67 | | 2021 Pillar 3 Disclosures Report | |
| | |
CREDIT RISK 2021 Pillar 3 Disclosures Report |
| | | | | | | | | | | | | | | | | | | | | | | | | | | | | | | | | | | | | | |
| Table 15.CR6 - AIRB approach Retail - Credit risk exposures by exposure class and PD range |
| EUR million |
| | | | | | | | | | | 2021 |
| PD scale | Original on-balance-sheet gross exposures | Off-balance-sheet exposures pre-CCF | Average CCF | EAD post CRM and post CCF | Average PD | Number of obligors | Average LGD | Average maturity | RWA | RW | EL | Value adjustments and provisions |
| Retail - Mortgages no SMEs |
| 0.00 < 0.15 | 32,390 | 438 | 100.00 | % | 32,828 | 0.07 | % | 508,589 | 14.25 | % | — | 935 | 3 | % | 3 | (15) |
| 0.00 to < 0.10 | 27,817 | 258 | 100.00 | % | 28,075 | 0.06 | % | 443,714 | 13.05 | % | — | 629 | 2 | % | 2 | (10) |
| 0.10 to < 0.15 | 4,573 | 180 | 100.00 | % | 4,753 | 0.13 | % | 64,875 | 21.29 | % | — | 306 | 6 | % | 1 | (5) |
| 0.15 < 0.25 | 24,758 | 4,446 | 77.96 | % | 28,233 | 0.21 | % | 230,203 | 15.91 | % | — | 2,019 | 7 | % | 9 | (15) |
| 0.25 < 0.50 | 21,148 | 6,340 | 75.72 | % | 25,979 | 0.34 | % | 223,872 | 10.09 | % | — | 1,682 | 6 | % | 9 | (18) |
| 0.50 < 0.75 | 19,141 | 2,509 | 73.18 | % | 20,991 | 0.62 | % | 167,799 | 10.52 | % | — | 2,036 | 10 | % | 12 | (10) |
| 0.75 < 2.50 | 119,967 | 5,207 | 55.86 | % | 123,128 | 1.48 | % | 754,193 | 7.76 | % | — | 15,964 | 13 | % | 127 | (74) |
| 0.75 to < 1.75 | 79,567 | 4,193 | 55.79 | % | 82,025 | 1.20 | % | 513,674 | 8.17 | % | — | 9,895 | 12 | % | 73 | (38) |
| 1.75 to < 2.50 | 40,400 | 1,013 | 56.13 | % | 41,103 | 2.04 | % | 240,519 | 6.96 | % | — | 6,069 | 15 | % | 54 | (35) |
| 2.50 < 10.00 | 58,366 | 510 | 54.41 | % | 58,796 | 4.48 | % | 346,625 | 8.31 | % | — | 16,092 | 27 | % | 210 | (105) |
| 2.50 to <5 | 40,188 | 459 | 53.44 | % | 40,549 | 3.44 | % | 233,647 | 7.48 | % | — | 8,644 | 21 | % | 96 | (51) |
| 5 to <10 | 18,179 | 50 | 63.29 | % | 18,247 | 6.80 | % | 112,978 | 10.15 | % | — | 7,448 | 41 | % | 114 | (53) |
| 10.00 < 100.00 | 10,494 | 202 | 39.48 | % | 10,597 | 25.52 | % | 95,123 | 9.64 | % | — | 5,609 | 53 | % | 229 | (131) |
| 10 to < 20 | 6,189 | 33 | 46.61 | % | 6,220 | 15.01 | % | 44,384 | 9.95 | % | — | 3,377 | 54 | % | 83 | (43) |
| 20 to < 30 | 1,370 | 7 | 32.74 | % | 1,375 | 24.48 | % | 15,035 | 10.78 | % | — | 909 | 66 | % | 34 | (23) |
| 30 to < 100 | 2,934 | 163 | 38.34 | % | 3,002 | 47.77 | % | 35,704 | 8.47 | % | — | 1,324 | 44 | % | 112 | (64) |
| 100.00 (Default) | 6,041 | 30 | 0.05 | % | 6,041 | 100.00 | % | 64,177 | 20.29 | % | — | 1,282 | 21 | % | 1,086 | (1,023) |
| Subtotal (exposure class) | 292,304 | 19,682 | 70.15 | % | 306,592 | 4.40 | % | 2,390,581 | 10.01 | % | — | 45,619 | 15 | % | 1,685 | (1,390) |
| Total (all exposures classes AIRB) | 562,363 | 180,483 | 42.34 | % | 595,486 | 4.86 | % | 29,655,171 | 26.18 | % | 1 | 173,956 | 29 | % | 8,804 | (9,483) |
| | | | | | | | | | | | |
| | |
CREDIT RISK 2021 Pillar 3 Disclosures Report |
| | | | | | | | | | | | | | | | | | | | | | | | | | | | | | | | | | | | | | |
| Table 15.CR6 - AIRB approach Retail - Credit risk exposures by exposure class and PD range |
| EUR million |
| | | | | | | | | | | 2021 |
| PD scale | Original on-balance-sheet gross exposures | Off-balance-sheet exposures pre-CCF | Average CCF | EAD post CRM and post CCF | Average PD | Number of obligors | Average LGD | Average maturity | RWA | RW | EL | Value adjustments and provisions |
| Qualifying Revolving |
| 0.00 < 0.15 | 458 | 5,428 | 54.84 | % | 3,435 | 0.08 | % | 3,039,850 | 58.48 | % | — | 106 | 3 | % | 2 | (3) |
| 0.00 to < 0.10 | 24 | 2,959 | 73.95 | % | 2,213 | 0.05 | % | 1,649,013 | 58.69 | % | — | 48 | 2 | % | 1 | (2) |
| 0.10 to < 0.15 | 434 | 2,469 | 31.93 | % | 1,222 | 0.13 | % | 1,390,837 | 58.11 | % | — | 57 | 5 | % | 1 | (1) |
| 0.15 < 0.25 | 149 | 1,870 | 40.50 | % | 906 | 0.19 | % | 1,459,244 | 59.58 | % | — | 56 | 6 | % | 1 | (1) |
| 0.25 < 0.50 | 82 | 6,649 | 69.60 | % | 4,710 | 0.31 | % | 7,137,486 | 62.03 | % | — | 527 | 11 | % | 9 | (4) |
| 0.50 < 0.75 | 134 | 835 | 48.58 | % | 541 | 0.57 | % | 559,424 | 46.80 | % | — | 69 | 13 | % | 1 | (1) |
| 0.75 < 2.50 | 741 | 4,039 | 60.56 | % | 3,193 | 1.38 | % | 4,476,332 | 55.73 | % | — | 977 | 31 | % | 24 | (11) |
| 0.75 to < 1.75 | 398 | 3,222 | 62.26 | % | 2,406 | 1.15 | % | 3,241,438 | 56.11 | % | — | 657 | 27 | % | 15 | (6) |
| 1.75 to < 2.50 | 343 | 817 | 53.88 | % | 787 | 2.09 | % | 1,234,894 | 54.56 | % | — | 319 | 41 | % | 9 | (5) |
| 2.50 < 10.00 | 920 | 1,511 | 70.35 | % | 1,992 | 5.03 | % | 2,767,391 | 60.24 | % | — | 1,646 | 83 | % | 60 | (27) |
| 2.50 to <5 | 477 | 929 | 70.51 | % | 1,135 | 3.56 | % | 1,593,430 | 60.55 | % | — | 765 | 67 | % | 24 | (10) |
| 5 to <10 | 443 | 582 | 70.09 | % | 857 | 6.98 | % | 1,173,961 | 59.82 | % | — | 881 | 103 | % | 36 | (17) |
| 10.00 < 100.00 | 466 | 381 | 72.31 | % | 770 | 24.54 | % | 1,001,322 | 59.19 | % | — | 1,251 | 163 | % | 109 | (86) |
| 10 to < 20 | 241 | 220 | 79.08 | % | 422 | 12.99 | % | 564,353 | 60.17 | % | — | 628 | 149 | % | 33 | (50) |
| 20 to < 30 | 104 | 90 | 78.05 | % | 184 | 23.51 | % | 261,001 | 59.94 | % | — | 359 | 196 | % | 26 | (13) |
| 30 to < 100 | 122 | 71 | 43.96 | % | 164 | 55.40 | % | 175,968 | 55.85 | % | — | 263 | 161 | % | 51 | (23) |
| 100.00 (Default) | 187 | 62 | 36.21 | % | 210 | 100.00 | % | 168,669 | 71.29 | % | — | 27 | 13 | % | 147 | (138) |
| Subtotal (exposure class) | 3,136 | 20,775 | 60.53 | % | 15,756 | 3.59 | % | 20,609,718 | 59.07 | % | — | 4,659 | 30 | % | 354 | (271) |
| Total (all exposures classes AIRB) | 562,363 | 180,483 | 42.34 | % | 595,486 | 4.86 | % | 29,655,171 | 26.18 | % | 1 | 173,956 | 29 | % | 8,804 | (9,483) |
|
| | | | | | | | | | | |
69 | | 2021 Pillar 3 Disclosures Report | |
| | |
CREDIT RISK 2021 Pillar 3 Disclosures Report |
| | | | | | | | | | | | | | | | | | | | | | | | | | | | | | | | | | | | | | |
| Table 15.CR6 - AIRB approach Retail - Credit risk exposures by exposure class and PD range |
| EUR million |
| | | | | | | | | | | 2021 |
| PD scale | Original on-balance-sheet gross exposures | Off-balance-sheet exposures pre-CCF | Average CCF | EAD post CRM and post CCF | Average PD | Number of obligors | Average LGD | Average maturity | RWA | RW | EL | Value adjustments and provisions |
| Retail - Other non SMEs |
| 0.00 < 0.15 | 1,110 | 44 | 55.59 | % | 1,135 | 0.09 | % | 138,940 | 39.02 | % | — | 109 | 10 | % | — | (2) |
| 0.00 to < 0.10 | 1,068 | 43 | 56.24 | % | 1,092 | 0.08 | % | 135,120 | 38.94 | % | — | 103 | 9 | % | — | (1) |
| 0.10 to < 0.15 | 42 | 2 | 38.54 | % | 43 | 0.14 | % | 3,820 | 41.14 | % | — | 6 | 14 | % | — | (1) |
| 0.15 < 0.25 | 3,331 | 479 | 53.01 | % | 3,585 | 0.20 | % | 600,429 | 37.82 | % | — | 604 | 17 | % | 3 | (5) |
| 0.25 < 0.50 | 5,614 | 397 | 91.55 | % | 5,896 | 0.36 | % | 690,168 | 47.82 | % | — | 1,862 | 32 | % | 11 | (19) |
| 0.50 < 0.75 | 3,585 | 70 | 83.75 | % | 3,643 | 0.58 | % | 434,390 | 38.55 | % | — | 1,191 | 33 | % | 8 | (12) |
| 0.75 < 2.50 | 15,363 | 551 | 75.27 | % | 15,661 | 1.25 | % | 1,556,445 | 46.08 | % | — | 8,222 | 53 | % | 88 | (103) |
| 0.75 to < 1.75 | 12,381 | 319 | 88.84 | % | 12,627 | 1.04 | % | 1,224,343 | 46.92 | % | — | 6,397 | 51 | % | 61 | (68) |
| 1.75 to < 2.50 | 2,982 | 232 | 56.67 | % | 3,034 | 2.11 | % | 332,102 | 42.58 | % | — | 1,825 | 60 | % | 27 | (35) |
| 2.50 < 10.00 | 7,006 | 270 | 47.96 | % | 7,050 | 4.23 | % | 751,180 | 49.55 | % | — | 5,394 | 77 | % | 143 | (106) |
| 2.50 to <5 | 5,250 | 183 | 42.69 | % | 5,262 | 3.31 | % | 570,244 | 51.19 | % | — | 4,068 | 77 | % | 89 | (63) |
| 5 to <10 | 1,756 | 87 | 59.05 | % | 1,788 | 6.97 | % | 180,936 | 44.72 | % | — | 1,326 | 74 | % | 54 | (43) |
| 10.00 < 100.00 | 1,696 | 32 | 73.19 | % | 1,690 | 27.17 | % | 281,356 | 46.43 | % | — | 1,798 | 106 | % | 217 | (165) |
| 10 to < 20 | 912 | 17 | 82.56 | % | 908 | 14.76 | % | 116,820 | 48.58 | % | — | 919 | 101 | % | 65 | (28) |
| 20 to < 30 | 319 | 7 | 59.72 | % | 318 | 26.47 | % | 73,516 | 37.19 | % | — | 315 | 99 | % | 32 | (64) |
| 30 to < 100 | 465 | 7 | 64.73 | % | 463 | 52.00 | % | 91,020 | 48.54 | % | — | 563 | 122 | % | 121 | (73) |
| 100.00 (Default) | 1,129 | 7 | 18.86 | % | 1,120 | 100.00 | % | 226,783 | 67.69 | % | — | 336 | 30 | % | 732 | (732) |
| Subtotal (exposure class) | 38,834 | 1,849 | 68.62 | % | 39,778 | 5.34 | % | 4,679,691 | 45.94 | % | — | 19,514 | 49 | % | 1,201 | (1,143) |
| Total (all exposures classes AIRB) | 562,363 | 180,483 | 42.34 | % | 595,486 | 4.86 | % | 29,655,171 | 26.18 | % | 1 | 173,956 | 29 | % | 8,804 | (9,483) |
| | | | | | | | | | | | |
| | |
CREDIT RISK 2021 Pillar 3 Disclosures Report |
| | | | | | | | | | | | | | | | | | | | | | | | | | | | | | | | | | | | | | |
| Table 15.CR6 - AIRB approach Retail - Credit risk exposures by exposure class and PD range |
| EUR million |
| | | | | | | | | | | 2021 |
| PD scale | Original on-balance-sheet gross exposures | Off-balance-sheet exposures pre-CCF | Average CCF | EAD post CRM and post CCF | Average PD | Number of obligors | Average LGD | Average maturity | RWA | RW | EL | Value adjustments and provisions |
| Retail - SMEs |
| 0.00 < 0.15 | 207 | 250 | 49.92 | % | 327 | 0.08 | % | 89,327 | 46.16 | % | — | 25 | 8 | % | — | (1) |
| 0.00 to < 0.10 | 190 | 147 | 55.73 | % | 269 | 0.07 | % | 70,632 | 45.40 | % | — | 18 | 7 | % | — | — |
| 0.10 to < 0.15 | 17 | 103 | 41.61 | % | 58 | 0.13 | % | 18,695 | 49.67 | % | — | 7 | 12 | % | — | — |
| 0.15 < 0.25 | 2,333 | 349 | 58.56 | % | 1,681 | 0.20 | % | 175,673 | 46.30 | % | — | 259 | 15 | % | 2 | (3) |
| 0.25 < 0.50 | 1,413 | 904 | 61.45 | % | 1,295 | 0.38 | % | 145,514 | 45.08 | % | — | 301 | 23 | % | 2 | (5) |
| 0.50 < 0.75 | 4,708 | 941 | 48.33 | % | 2,679 | 0.63 | % | 201,706 | 50.93 | % | — | 980 | 37 | % | 9 | (8) |
| 0.75 < 2.50 | 7,895 | 1,783 | 44.13 | % | 5,529 | 1.43 | % | 504,237 | 48.08 | % | — | 2,802 | 51 | % | 38 | (42) |
| 0.75 to < 1.75 | 5,455 | 1,374 | 44.85 | % | 3,974 | 1.20 | % | 322,978 | 48.55 | % | — | 2,020 | 51 | % | 23 | (19) |
| 1.75 to < 2.50 | 2,440 | 409 | 41.70 | % | 1,555 | 2.01 | % | 181,259 | 46.90 | % | — | 782 | 50 | % | 15 | (23) |
| 2.50 < 10.00 | 5,258 | 708 | 50.79 | % | 3,514 | 4.20 | % | 302,000 | 48.03 | % | — | 2,007 | 57 | % | 71 | (50) |
| 2.50 to <5 | 3,750 | 518 | 53.09 | % | 2,604 | 3.37 | % | 227,562 | 46.85 | % | — | 1,414 | 54 | % | 41 | (30) |
| 5 to <10 | 1,508 | 190 | 44.51 | % | 910 | 6.56 | % | 74,438 | 51.39 | % | — | 593 | 65 | % | 30 | (21) |
| 10.00 < 100.00 | 1,120 | 128 | 37.04 | % | 746 | 25.39 | % | 115,402 | 46.50 | % | — | 623 | 84 | % | 88 | (57) |
| 10 to < 20 | 610 | 72 | 37.62 | % | 382 | 13.77 | % | 53,006 | 47.13 | % | — | 284 | 74 | % | 25 | (13) |
| 20 to < 30 | 210 | 28 | 42.72 | % | 143 | 25.60 | % | 30,636 | 43.56 | % | — | 126 | 88 | % | 16 | (10) |
| 30 to < 100 | 300 | 28 | 29.86 | % | 221 | 45.34 | % | 31,760 | 47.30 | % | — | 214 | 97 | % | 48 | (34) |
| 100.00 (Default) | 1,482 | 99 | 21.78 | % | 1,085 | 100.00 | % | 112,124 | 74.25 | % | — | 215 | 20 | % | 794 | (813) |
| Subtotal (exposure class) | 24,416 | 5,162 | 49.49 | % | 16,857 | 9.06 | % | 1,645,983 | 49.69 | % | — | 7,213 | 43 | % | 1,003 | (980) |
| Total (all exposures classes AIRB) | 562,363 | 180,483 | 42.34 | % | 595,486 | 4.86 | % | 29,655,171 | 26.18 | % | 1 | 173,956 | 29 | % | 8,804 | (9,483) |
| | | | | | | | | | | |
71 | | 2021 Pillar 3 Disclosures Report | |
| | |
CREDIT RISK 2021 Pillar 3 Disclosures Report |
| | | | | | | | | | | | | | | | | | | | | | | | | | | | | | | | | | | | | | |
| Table 16.CR6 - FIRB approach - Credit risk exposures by exposure class and PD range |
| EUR million |
| | | | | | | | | | | 2021 |
| PD scale | Original on-balance-sheet gross exposures | Off-balance-sheet exposures pre-CCF | Average CCF | EAD post CRM and post CCF | Average PD | Number of obligors | Average LGD | Average maturity | RWA | RW | EL | Value adjustments and provisions |
| Institutions |
| 0.00 < 0.15 | 813 | 1,415 | 11.97 | % | 983 | 0.04 | % | 194 | 44.98 | % | — | 89 | 9 | % | — | — |
| 0.00 to < 0.10 | 802 | 1,190 | 11.31 | % | 937 | 0.04 | % | 161 | 44.98 | % | — | 72 | 8 | % | — | — |
| 0.10 to < 0.15 | 12 | 225 | 15.45 | % | 46 | 0.13 | % | 33 | 45.00 | % | 1 | 17 | 36 | % | — | — |
| 0.15 < 0.25 | 193 | 202 | 4.59 | % | 202 | 0.16 | % | 32 | 44.68 | % | 2 | 112 | 56 | % | — | — |
| 0.25 < 0.50 | 175 | 171 | 12.50 | % | 86 | 0.32 | % | 43 | 44.90 | % | 2 | 65 | 75 | % | — | — |
| 0.50 < 0.75 | 15 | 41 | 15.02 | % | 21 | 0.66 | % | 25 | 45.00 | % | 3 | 23 | 108 | % | — | — |
| 0.75 < 2.50 | 1 | 85 | 0.42 | % | 1 | 1.31 | % | 8 | 45.00 | % | 2 | 1 | 129 | % | — | — |
| 0.75 to < 1.75 | 1 | 85 | 0.42 | % | 1 | 1.31 | % | 8 | 45.00 | % | 2 | 1 | 129 | % | — | — |
| 1.75 to < 2.50 | — | — | — | % | — | — | % | — | — | % | — | — | — | % | — | — |
| 2.50 < 10.00 | — | — | — | % | — | — | % | — | — | % | — | — | — | % | — | — |
| 2.50 to <5 | — | — | — | % | — | — | % | — | — | % | — | — | — | % | — | — |
| 5 to <10 | — | — | — | % | — | — | % | — | — | % | — | — | — | % | — | — |
| 10.00 < 100.00 | — | — | — | % | — | — | % | — | — | % | — | — | — | % | — | — |
| 10 to < 20 | — | — | — | % | — | — | % | — | — | % | — | — | — | % | — | — |
| 20 to < 30 | — | — | — | % | — | — | % | — | — | % | — | — | — | % | — | — |
| 30 to < 100 | — | — | — | % | — | — | % | — | — | % | — | — | — | % | — | — |
| 100.00 (Default) | — | — | — | % | — | — | % | — | — | % | — | — | — | % | — | — |
| Subtotal (exposure class) | 1,197 | 1,914 | 10.79 | % | 1,294 | 0.09 | % | 302 | 44.93 | % | 1 | 291 | 22 | % | 1 | (1) |
| Total (all exposures classes FIRB) | 11,358 | 5,467 | 23.56 | % | 12,355 | 5.59 | % | 7,455 | 44.38 | % | 2 | 8,426 | 68 | % | 307 | (244) |
| | | | | | | | | | | | |
| | |
CREDIT RISK 2021 Pillar 3 Disclosures Report |
| | | | | | | | | | | | | | | | | | | | | | | | | | | | | | | | | | | | | | |
| Table 16.CR6 - FIRB approach - Credit risk exposures by exposure class and PD range |
| EUR million |
| | | | | | | | | | | 2021 |
| PD scale | Original on-balance-sheet gross exposures | Off-balance-sheet exposures pre-CCF | Average CCF | EAD post CRM and post CCF | Average PD | Number of obligors | Average LGD | Average maturity | RWA | RW | EL | Value adjustments and provisions |
| Corporates - Other |
| 0.00 < 0.15 | 2,216 | 1,192 | 43.22 | % | 3,181 | 0.11 | % | 59 | 45.00 | % | 2 | 1,069 | 34 | % | 2 | (2) |
| 0.00 to < 0.10 | 1,072 | 518 | 52.34 | % | 1,569 | 0.07 | % | 21 | 45.00 | % | 2 | 432 | 28 | % | 1 | (1) |
| 0.10 to < 0.15 | 1,144 | 675 | 36.22 | % | 1,612 | 0.15 | % | 38 | 45.00 | % | 2 | 637 | 40 | % | 1 | (1) |
| 0.15 < 0.25 | 442 | 465 | 59.57 | % | 568 | 0.24 | % | 41 | 45.00 | % | 2 | 308 | 54 | % | 1 | — |
| 0.25 < 0.50 | 1,230 | 170 | 43.52 | % | 1,224 | 0.31 | % | 1,280 | 45.00 | % | 3 | 745 | 61 | % | 2 | (6) |
| 0.50 < 0.75 | 1,188 | 381 | 6.51 | % | 992 | 0.57 | % | 275 | 44.83 | % | 3 | 764 | 77 | % | 3 | (4) |
| 0.75 < 2.50 | 2,133 | 750 | 9.31 | % | 2,035 | 1.28 | % | 1,573 | 44.43 | % | 3 | 2,148 | 106 | % | 12 | (10) |
| 0.75 to < 1.75 | 1,697 | 125 | 23.48 | % | 1,559 | 1.07 | % | 1,351 | 45.00 | % | 3 | 1,600 | 103 | % | 8 | (9) |
| 1.75 to < 2.50 | 436 | 625 | 6.46 | % | 476 | 1.98 | % | 222 | 42.54 | % | 2 | 548 | 115 | % | 4 | (2) |
| 2.50 < 10.00 | 1,162 | 219 | 17.04 | % | 1,189 | 3.95 | % | 1,540 | 42.39 | % | 3 | 1,677 | 141 | % | 20 | (12) |
| 2.50 to <5 | 1,041 | 185 | 19.09 | % | 1,069 | 3.56 | % | 1,330 | 42.25 | % | 3 | 1,463 | 137 | % | 16 | (11) |
| 5 to <10 | 121 | 34 | 6.00 | % | 120 | 7.44 | % | 210 | 43.71 | % | 3 | 214 | 178 | % | 4 | (1) |
| 10.00 < 100.00 | 162 | 48 | 9.26 | % | 167 | 16.53 | % | 477 | 44.55 | % | 3 | 398 | 239 | % | 12 | (1) |
| 10 to < 20 | 153 | 27 | 12.17 | % | 156 | 15.55 | % | 408 | 44.61 | % | 3 | 372 | 238 | % | 11 | (1) |
| 20 to < 30 | 6 | 1 | 75.00 | % | 6 | 23.35 | % | 28 | 45.00 | % | 3 | 16 | 259 | % | 1 | — |
| 30 to < 100 | 3 | 20 | 3.11 | % | 4 | 43.85 | % | 41 | 41.67 | % | 3 | 9 | 232 | % | 1 | — |
| 100.00 (Default) | 370 | 56 | 33.97 | % | 389 | 100.00 | % | 149 | 44.97 | % | 3 | — | — | % | 175 | (94) |
| Subtotal (exposure class) | 8,903 | 3,283 | 31.14 | % | 9,745 | 5.17 | % | 5,394 | 44.54 | % | 3 | 7,108 | 73 | % | 225 | (130) |
| Total (all exposures classes FIRB) | 11,358 | 5,467 | 23.56 | % | 12,355 | 5.59 | % | 7,455 | 44.38 | % | 2 | 8,426 | 68 | % | 307 | (244) |
|
| | | | | | | | | | | |
73 | | 2021 Pillar 3 Disclosures Report | |
| | |
CREDIT RISK 2021 Pillar 3 Disclosures Report |
| | | | | | | | | | | | | | | | | | | | | | | | | | | | | | | | | | | | | | |
| Table 16.CR6 - FIRB approach - Credit risk exposures by exposure class and PD range |
| EUR million |
| | | | | | | | | | | 2021 |
| PD scale | Original on-balance-sheet gross exposures | Off-balance-sheet exposures pre-CCF | Average CCF | EAD post CRM and post CCF | Average PD | Number of obligors | Average LGD | Average maturity | RWA | RW | EL | Value adjustments and provisions |
| Corporates - SMEs |
| 0.00 < 0.15 | — | — | — | % | — | — | % | — | — | % | — | 0 | — | % | — | — |
| 0.00 to < 0.10 | — | — | — | % | — | — | % | — | — | % | — | 0 | — | % | — | — |
| 0.10 to < 0.15 | — | — | — | % | — | — | % | — | — | % | — | 0 | — | % | — | — |
| 0.15 < 0.25 | — | — | — | % | — | — | % | — | — | % | — | 0 | — | % | — | — |
| 0.25 < 0.50 | 165 | 7 | 75.00 | % | 170 | 0.30 | % | 179 | 45.00 | % | 3 | 70 | 41 | % | — | — |
| 0.50 < 0.75 | 26 | — | 23.84 | % | 26 | 0.53 | % | 13 | 45.00 | % | 3 | 14 | 54 | % | — | (1) |
| 0.75 < 2.50 | 332 | 113 | 21.27 | % | 356 | 1.49 | % | 438 | 42.27 | % | 3 | 249 | 70 | % | 2 | (15) |
| 0.75 to < 1.75 | 181 | 55 | 34.16 | % | 200 | 0.96 | % | 324 | 45.00 | % | 3 | 134 | 67 | % | 1 | (1) |
| 1.75 to < 2.50 | 151 | 58 | 9.04 | % | 156 | 2.16 | % | 114 | 38.78 | % | 3 | 115 | 74 | % | 1 | (13) |
| 2.50 < 10.00 | 485 | 114 | 20.50 | % | 509 | 4.47 | % | 777 | 41.85 | % | 3 | 499 | 98 | % | 9 | (39) |
| 2.50 to <5 | 422 | 99 | 21.80 | % | 444 | 3.98 | % | 691 | 41.87 | % | 3 | 421 | 95 | % | 7 | (31) |
| 5 to <10 | 63 | 15 | 12.16 | % | 65 | 7.82 | % | 86 | 41.77 | % | 3 | 78 | 119 | % | 2 | (9) |
| 10.00 < 100.00 | 118 | 30 | 15.71 | % | 122 | 19.53 | % | 261 | 41.71 | % | 3 | 195 | 159 | % | 10 | (8) |
| 10 to < 20 | 105 | 29 | 14.45 | % | 109 | 16.98 | % | 199 | 41.41 | % | 3 | 174 | 159 | % | 8 | (7) |
| 20 to < 30 | 5 | — | 75.00 | % | 5 | 23.35 | % | 54 | 45.00 | % | 3 | 8 | 161 | % | 1 | — |
| 30 to < 100 | 8 | — | 97.03 | % | 8 | 50.47 | % | 8 | 43.69 | % | 3 | 13 | 160 | % | 2 | (2) |
| 100.00 (Default) | 131 | 7 | 31.57 | % | 133 | 100.00 | % | 91 | 44.92 | % | 3 | 0 | — | % | 60 | (49) |
| Subtotal (exposure class) | 1,257 | 270 | 21.96 | % | 1,317 | 14.09 | % | 1,759 | 42.73 | % | 3 | 1,027 | 78 | % | 82 | (113) |
| Total (all exposures classes FIRB) | 11,358 | 5,467 | 23.56 | % | 12,355 | 5.59 | % | 7,455 | 44.38 | % | 2 | 8,426 | 68 | % | 307 | (244) |
| | |
CREDIT RISK 2021 Pillar 3 Disclosures Report |
The distribution of exposures and average parameters by segments and geographies in IRBs without default, equities or specialized financing is shown below:
| | | | | | | | | | | | | | | | | | | | | | | | | | |
| Table 17.Exposures and parameters by segment and geography |
| EUR million | | | | | | | | |
| | | | | | | 2021 |
| Central governments and central banks | Institutions | Corporates | Retail Mortgages | Retail SME | Retail Other | Retail Qualifying Revolving | Total |
| Santander Group | | | | | | | | |
| EAD | 0 | 47,052 | 186,775 | 312,526 | 13,169 | 41,294 | 15,546 | 616,361 |
| Average LGD in % | — | % | 41.78 | % | 42.25 | % | 9.17 | % | 48.34 | % | 44.12 | % | 58.75 | % | 26.11 | % |
| Average PD in % | — | % | 0.16 | % | 1.40 | % | 2.47 | % | 3.04 | % | 2.54 | % | 2.28 | % | 1.98 | % |
| Spain | | | | | | | | |
| EAD | 0 | 42,993 | 144,428 | 312,526 | 13,161 | 41,294 | 15,546 | 569,948 |
| Average LGD in % | — | % | 42.60 | % | 42.05 | % | 9.17 | % | 48.34 | % | 44.12 | % | 58.75 | % | 24.82 | % |
| Average PD in % | — | % | 0.11 | % | 0.92 | % | 2.47 | % | 3.04 | % | 2.54 | % | 2.28 | % | 1.91 | % |
| North America | | | | | | | | |
| EAD | 0 | 2,795 | 14,672 | 0 | 0 | 0 | 0 | 17,467 |
| Average LGD in % | — | % | 27.83 | % | 42.05 | % | — | % | — | % | — | % | — | % | 39.78 | % |
| Average PD in % | — | % | 0.84 | % | 9.20 | % | — | % | — | % | — | % | — | % | 7.86 | % |
| Latam | | | | | | | | |
| EAD | 0 | 1,264 | 27,674 | 0 | 8 | 0 | 0 | 28,946 |
| Average LGD in % | — | % | 44.93 | % | 43.35 | % | — | % | 45.71 | % | — | % | — | % | 43.42 | % |
| Average PD in % | — | % | 0.12 | % | 0.91 | % | — | % | 0.58 | % | — | % | — | % | 0.88 | % |
| | | | | | | | |
| EAD and parameters without default. |
| EAD does not include neither equities nor specialised lending. |
| North America includes the United States and Mexico. | | | | | | |
The following tables show the specialized financing exposures:
| | | | | | | | | | | | | | | | | | | | | | | |
| Table 18.CR10.1 - Specialised lending and equity exposures under the simple riskweighted approach. Project financing |
| EUR million |
| | | | | | 2021 |
| Specialised lending : Project finance (Slotting approach) |
| Regulatory Categories | Remaining maturity | On-balance-sheet amount | Off-balance-sheet amount | RW | EAD | RWA | Expected loss |
| Category 1 | < 2.5 years | 1,022 | 627 | 50 | % | 1,205 | 537 | 0 |
| >= 2.5 years | 3,320 | 630 | 70 | % | 3,515 | 1,999 | 14 |
| Category 2 | < 2.5 years | 3,886 | 1,520 | 70 | % | 4,304 | 2,651 | 17 |
| >= 2.5 years | 7,709 | 2,702 | 90 | % | 8,397 | 6,067 | 67 |
| Category 3 | < 2.5 years | 186 | 8 | 115 | % | 188 | 186 | 5 |
| >= 2.5 years | 681 | 19 | 115 | % | 686 | 651 | 19 |
| Category 4 | < 2.5 years | 81 | 7 | 250 | % | 83 | 202 | 7 |
| >= 2.5 years | 156 | 29 | 250 | % | 167 | 389 | 13 |
| Category 5 | < 2.5 years | 81 | 7 | — | % | 84 | 0 | 42 |
| >= 2.5 years | 481 | 6 | — | % | 485 | 0 | 242 |
| Total | < 2.5 years | 5,256 | 2,169 | | 5,864 | 3,576 | 71 |
| >= 2.5 years | 12,348 | 3,385 | | 13,251 | 9,106 | 356 |
| | | | | | | | | | | |
75 | | 2021 Pillar 3 Disclosures Report | |
| | |
CREDIT RISK 2021 Pillar 3 Disclosures Report |
| | | | | | | | | | | | | | | | | | | | | | | |
| Table 19.CR10.2 - Specialised lending and equity exposures under the simple riskweighted approach. Income-earning real estate and highly volatile commercial real estate |
| EUR million |
| | | | | | 2021 |
| Specialised lending:Income-producing real estate and high volatility commercial real estate (Slotting approach) |
| Regulatory Categories | Remaining maturity | On-balance-sheet amount | Off-balance-sheet amount | RW | EAD | RWA | Expected loss |
| Category 1 | < 2.5 years | — | — | 50 | % | — | — | — |
| >= 2.5 years | — | — | 70 | % | — | — | — |
| Category 2 | < 2.5 years | 1,728 | 562 | 70 | % | 1,858 | 1,178 | 7 |
| >= 2.5 years | 1,797 | 264 | 90 | % | 1,857 | 1,515 | 15 |
| Category 3 | < 2.5 years | 254 | 3 | 115 | % | 254 | 256 | 7 |
| >= 2.5 years | 548 | 20 | 115 | % | 551 | 560 | 15 |
| Category 4 | < 2.5 years | 2 | — | 250 | % | 2 | 6 | — |
| >= 2.5 years | — | — | 250 | % | — | — | — |
| Category 5 | < 2.5 years | 3 | — | — | % | 3 | — | 2 |
| >= 2.5 years | 34 | — | — | % | 34 | — | 17 |
| Total | < 2.5 years | 1,988 | 564 | | 2,118 | 1,440 | 16 |
| >= 2.5 years | 2,379 | 284 | | 2,443 | 2,075 | 47 |
| | | | | | | | | | | | | | | | | | | | | | | |
| Table 20.CR10.3 - Specialised lending and equity exposures under the simple riskweighted approach. Financing of assets |
| EUR million |
| | | | | | 2021 |
| Specialised lending : Project finance (Slotting approach) |
| Regulatory Categories | Remaining maturity | On-balance-sheet amount | Off-balance-sheet amount | RW | EAD | RWA | Expected loss |
| Category 1 | < 2.5 years | — | — | 50 | % | — | — | — |
| >= 2.5 years | — | 52 | 70 | % | 52 | 36 | — |
| Category 2 | < 2.5 years | 52 | 10 | 70 | % | 53 | 36 | — |
| >= 2.5 years | 253 | 205 | 90 | % | 389 | 346 | 3 |
| Category 3 | < 2.5 years | 44 | — | 115 | % | 44 | 48 | 1 |
| >= 2.5 years | 126 | — | 115 | % | 126 | 129 | 4 |
| Category 4 | < 2.5 years | — | — | 250 | % | — | — | — |
| >= 2.5 years | — | — | 250 | % | — | — | — |
| Category 5 | < 2.5 years | — | — | — | % | — | — | — |
| >= 2.5 years | — | — | — | % | — | — | — |
| Total | < 2.5 years | 96 | 10 | | 97 | 84 | 1 |
| >= 2.5 years | 379 | 257 | | 566 | 510 | 7 |
| | | | | | | | | | | | | | | | | | | | | | | |
| Table 21.CR10.4 - Specialised lending and equity exposures under the simple riskweighted approach. Financing of raw materials |
| EUR million |
| | | | | | 2021 |
| Commodities finance slotting approach |
| Regulatory Categories | Remaining maturity | On-balance-sheet amount | Off-balance-sheet amount | RW | EAD | RWA | Expected loss |
| Category 1 | < 2.5 years | — | — | 50 | % | — | — | — |
| >= 2.5 years | — | — | 70 | % | — | — | — |
| Category 2 | < 2.5 years | — | — | 70 | % | — | — | — |
| >= 2.5 years | 18 | — | 90 | % | 18 | 16 | — |
| Category 3 | < 2.5 years | — | — | 115 | % | — | — | — |
| >= 2.5 years | — | — | 115 | % | — | — | — |
| Category 4 | < 2.5 years | — | — | 250 | % | — | — | — |
| >= 2.5 years | — | — | 250 | % | — | — | — |
| Category 5 | < 2.5 years | — | — | — | % | — | — | — |
| >= 2.5 years | — | — | — | % | — | — | — |
| Total | < 2.5 years | — | — | | — | — | — |
| >= 2.5 years | 18 | — | | 18 | 16 | — |
| | |
CREDIT RISK 2021 Pillar 3 Disclosures Report |
4.2.2. Equity investments and equity instruments not included in the held-for-trading book
This section provides definitions of investments in associates, equity instruments classified as other financial assets at fair value through other comprehensive income, and financial assets with mandatory classification at fair value through profit or loss. It also defines the accounting policies and measurement methods applied. Information is also provided on the amounts of those equity instruments not included in the held-for-trading portfolio.
Investments in associates are those stakes affording the Group significant influence, but not control or joint control. This capacity is usually observed with 20% or more of the voting power at the investee.
Equity instruments not held for trading issued by entities other than subsidiaries, jointly controlled entities and
associates are required to be classified at fair value through profit or loss, unless the entity opts to classify them as financial assets at fair value through other comprehensive income, irrevocably, on initial recognition.
Investments in associates are recognised at cost and the Group periodically tests for their impairment.
Equity instruments classified as other financial assets at fair value through other comprehensive income are recognised and measured at fair value with a corresponding entry in equity, under valuation adjustments, irrevocably. Instruments classified as financial assets with mandatory recognition at fair value through profit or loss are recognised and measured at fair value with a corresponding entry in profit or loss.
| | | | | | | | | | | | | | | | | | | | |
| Table 22.CR10.5 - Equity exposures under the simple risk-weighted approach |
| EUR million | | | | | | |
| | | | 2021 |
| Categories | On-balance sheet exposure | Off-balance sheet exposure | Risk weight | Exposure value | Risk weighted exposure amount | Expected loss amount |
| Private equity exposures | 1,159 | — | 190 | % | 1,159 | 2,202 | 9 |
| Exchange-traded equity exposures | 6 | — | 290 | % | 6 | 17 | — |
| Other equity exposures | — | — | 370 | % | — | — | — |
| Total | 1,165 | — | | 1,165 | 2,219 | 9 |
Equity exposures under the simple risk-weighted approach represent in Santander 1,165 million euros in exposure with a risk weighted exposure amount of 2,219 million.
| | | | | | | | | | | |
| Table 23.Equity instruments through other comprehensive income |
|
| EUR million | | | |
| | | 2021 |
| Carrying value | Fair value | Valuation adjustment |
| Quoted | 1,521 | 1,521 | 471 |
| Unquoted | 933 | 933 | (587) |
| Total | 2,454 | 2,454 | (116) |
| | | | | |
| Table 24.Equity instruments mandatory at fair value through profit and loss |
|
| EUR million | |
| 2021 |
| Fair Value |
| Quoted | 55 |
| Investment funds | 331 |
| Unquoted | 1,584 |
| Total | 1,971 |
Refer to the Auditor's Report and Financial Statements in the annual report for further information on the portfolio of equity instruments classified as financial assets at fair value through other comprehensive income and with mandatory classification at fair value through profit or loss.
| | | | | |
| Access 2021 Annual Report available on the Santander Group website |
| | | | | | | | | | | |
77 | | 2021 Pillar 3 Disclosures Report | |
| | |
CREDIT RISK 2021 Pillar 3 Disclosures Report |
| | | | | |
| Table 25.Equity instruments through other comprehensive income. Consolidated gross valuation adjustments |
|
| EUR million | 2021 |
| Fair Value |
|
| Prior-year balance | (272) |
| Revaluation gains and losses | 156 |
| Current-year balance | (116) |
Refer to the Auditor's Report and Financial Statements in the annual report for further information on the portfolio of equity instruments classified as other financial assets at fair value through other comprehensive income.
| | | | | |
| Access 2021 Annual Report available on the Santander Group website |
With respect to holdings accounted for using the equity method at year-end 2021, the amounts for associates and jointly controlled entities were €5,824 million and €546 million, respectively.
There are also investments in group entities totalling €2,123 million, which are accounted for using the full consolidation method in the public perimeter.
The group tests these investments for impairment on a regular basis. No evidence of significant impairment was found in 2021.
4.2.3. Standardised approach
For the calculation of regulatory capital under the standardised approach, Santander uses the external rating agencies designated as eligible by the ECB (European Central Bank). The agencies used for the capital calculation at 31 December 2021 are Fitch, Moody's, DBRS, Standard & Poor's, Japan Credit Rating Agency and HR Ratings de México.
For the central government and central banks category, if the requirements of article 137 of the CRR are met, the Group uses the OECD's Country Risk Classification of the Participants to the Arrangement on Officially Supported Export Credits.
Different risk weights are applied to credit exposures depending on the rating assigned by the credit rating agencies (e.g. Fitch, Moody's and Standard & Poor's for the segments approved under Part III, Title II, Chapter II of the CRR) or the minimum export insurance premium rating (e.g. OECD for the central government and central bank segment, as explained above). Japan Credit Rating Agency and HR Ratings de México are used for credit exposures in the Sovereign segment.
The assignment of weights according to credit ratings complies with the regulatory requirements, aligning the alphanumeric scale of each agency used with the credit quality steps set down in Chapter II, Section II of the CRR, as follows:
| | | | | | | | | | | | | | | | | | | | |
Credit quality step | S&P | Moody's | Fitch | DBRS | Japan Credit Rating Agency | HR Ratings Mexico |
| 1 | AAA a AA | Aaa a Aa | AAA a AA | AAA a AA | AAA a AA | HR AAA a HR AA |
| 2 | A | A | A | A | A | HR A |
| 3 | BBB | Baa | BBB | BBB | BBB | HR BBB |
| 4 | BB | Ba | BB | BB | BB | HR BB |
| 5 | B | B | B | B | B | HR B |
| 6 | CCC to lower | CCC to lower | CCC to lower | CCC to lower | CCC to lower | HR CCC to lower |
| | | | | | | | | | | | | | | | | | | | |
Credit quality step | Central governments and central banks | Public sector entities | Institutions ≤ 3 months rated | Institutions > 3 months rated | Institutions not rated | Corporates |
| 1 | 0% | 20% | 20% | 20% | 20% | 20% |
| 2 | 20% | 50% | 20% | 50% | 50% | 50% |
| 3 | 50% | 100% | 20% | 50% | 100% | 100% |
| 4 | 100% | 100% | 50% | 100% | 100% | 100% |
| 5 | 100% | 100% | 50% | 100% | 100% | 150% |
| 6 | 150% | 150% | 150% | 150% | 150% | 150% |
| | |
CREDIT RISK 2021 Pillar 3 Disclosures Report |
Santander does not currently have a process in place for assigning the credit ratings of publicly issued securities to comparable assets that are not included in the trading portfolio.
In accordance with article 150 of the CRR, Santander always uses the standardised approach for sovereign exposures denominated and funded in the Member State’s local currency, applying a 0% risk weighting.
The tables below show the net exposure value after impairment loss allowances after risk mitigation, by segment and credit quality grade.
Guarantees are applied by reallocating exposures to the corresponding asset categories and risk weightings.
When credit institutions use some of their qualifying financial collateral as a credit risk mitigation technique, the valuation of this collateral for the calculation of risk-weighted exposure amounts can either follow the financial collateral simple method under Article 222 of the CRR or the financial collateral comprehensive method under Article 223.
| | | | | | | | | | | | | | | | | | | | | | | | | | |
| Table 26.CR4 - standardised approach - Credit risk exposure and CRM effects |
| EUR million |
| | | | | 2021 |
| Exposures before CCF and CRM | | Exposures post CCF and CRM | | RWAs and RW |
| Exposure classes | On-balance-sheet amount | Off-balance-sheet amount | | On-balance-sheet amount | Off-balance-sheet amount | | RWAs | RW |
| Central governments or central banks | 328,544 | 1,114 | | 370,750 | 3,943 | | 25,913 | — |
| Regional governments or local authorities | 2,829 | 650 | | 10,802 | 494 | | 312 | — |
| Public sector entities | 4,883 | 693 | | 5,009 | 290 | | 357 | — |
| Multilateral Development Banks | 1,970 | 3 | | 4,451 | 1 | | — | — |
| International Organisations | 63 | — | | 63 | — | | — | — |
| Institutions | 16,711 | 2,610 | | 15,277 | 466 | | 4,565 | — |
| Corporates | 52,913 | 31,528 | | 42,674 | 4,201 | | 43,128 | 1 |
| Retail | 148,484 | 72,322 | | 135,969 | 1,810 | | 98,353 | 1 |
| Secured by mortgages on immovable property | 88,461 | 9,589 | | 86,578 | 383 | | 32,678 | — |
| Exposures in default | 10,404 | 492 | | 10,268 | 223 | | 11,968 | 1 |
| Items associated with particularly high risk | 945 | 251 | | 921 | 2 | | 1,384 | 1 |
| Covered bonds | 1,567 | — | | 1,567 | — | | 157 | — |
| Claims on institutions and corporates with a short-term credit assessment | 335 | 44 | | 338 | — | | 253 | 1 |
| Collective investments undertakings (CIU) | 180 | — | | 180 | — | | 218 | 1 |
| Equity | 148 | — | | 148 | — | | 148 | 1 |
| Other items | 72,484 | 18,746 | | 73,306 | 3,783 | | 43,435 | 1 |
| TOTAL | 730,924 | 138,042 | | 758,299 | 15,597 | | 262,869 | — |
| | | | | | | | |
| Securitisations not included. | | | | | | | | |
| CRR Fully-loaded, Phased-in IFRS 9. | | | | | | | | |
| | | | | | | | | | | |
79 | | 2021 Pillar 3 Disclosures Report | |
| | |
CREDIT RISK 2021 Pillar 3 Disclosures Report |
| | | | | | | | | | | | | | | | | | | | | | | | | | | | | | | | | | | | | | | | | | | | | | | | | | | | | |
| Table 27.CR5 - standardised approach | |
|
| EUR million | | | | | | | | | | | | | | | | | |
| | | | | | | | | | | | | | | | | 2021 |
| Risk Weight | Total | Of which unrated |
| 0% | 2% | 4% | 10% | 20% | 35% | 50% | 70% | 75% | 100% | 150% | 250% | 370% | 1250% | Otros |
| Central governments or central banks | 353,358 | — | — | — | 1,403 | — | 2,575 | — | — | 12,678 | 28 | 4,650 | — | — | — | 374,692 | 369,412 |
| Regional government or local authorities | 10,641 | — | — | — | 400 | — | 44 | — | — | 210 | — | — | — | — | — | 11,296 | 11,097 |
| Public sector entities | 4,184 | — | — | — | 908 | — | 64 | — | — | 143 | — | — | — | — | — | 5,299 | 4,199 |
| Multilateral development banks | 4,452 | — | — | — | — | — | — | — | — | — | — | — | — | — | — | 4,452 | 4,452 |
| International organisations | 63 | — | — | — | — | — | — | — | — | — | — | — | — | — | — | 63 | 63 |
| Institutions | — | — | — | — | 13,686 | — | 465 | — | — | 1,569 | 22 | — | — | — | — | 15,743 | 6,455 |
| Corporates | — | — | — | — | 1,247 | — | 174 | — | — | 44,927 | 528 | — | — | — | — | 46,876 | 45,799 |
| Retail | — | — | — | — | — | 1,392 | — | — | 136,387 | — | — | — | — | — | — | 137,779 | 137,779 |
| Secured by mortgages on immovable property | — | — | — | — | — | 69,332 | 12,726 | — | 2,334 | 2,562 | 7 | — | — | — | — | 86,961 | 86,955 |
| Exposures in default | — | — | — | — | — | — | — | — | — | 7,535 | 2,955 | — | — | — | — | 10,490 | 10,490 |
| Exposures associated with particularly high risk | — | — | — | — | — | — | — | — | — | — | 923 | — | — | — | — | 923 | 923 |
| Covered bonds | — | — | — | 1,567 | — | — | — | — | — | — | — | — | — | — | — | 1,567 | — |
| Institutions and corporates with a short-term credit assessment | — | — | — | — | 8 | — | 202 | — | — | 80 | 47 | — | — | — | — | 338 | 5 |
| Collective investment undertakings | — | — | — | — | — | — | — | — | — | — | — | — | — | — | 180 | 180 | 180 |
| Equity | — | — | — | — | — | — | — | — | — | 148 | — | — | — | — | — | 148 | 148 |
| Other items | 22,103 | 260 | — | — | 13,890 | — | 16 | — | 703 | 40,117 | — | — | — | — | — | 77,089 | 77,085 |
| Total | 394,802 | 260 | — | 1,567 | 31,542 | 70,725 | 16,268 | — | 139,424 | 109,969 | 4,510 | 4,650 | — | — | 180 | 773,896 | 755,042 |
| | | | | | | | | | | | | | | | | |
| Securitisations not included. Including counterparty credit risk | |
| | |
CREDIT RISK 2021 Pillar 3 Disclosures Report |
4.3. Distribution of exposures
The tables below give a breakdown of the exposures to credit and dilution risk of the Group:
•Exposure category
•Business sector
•Geographical area
•Residual maturity
Information is also presented on non-performing exposures, impairment loss allowances, and provisions for contingent liabilities and commitments.
The amounts shown in the tables in this section include the amounts for counterparty and credit risk excluding securitisations.
The following two tables show all exposures by industry and geography:
| | |
| Exposures by geographical area |
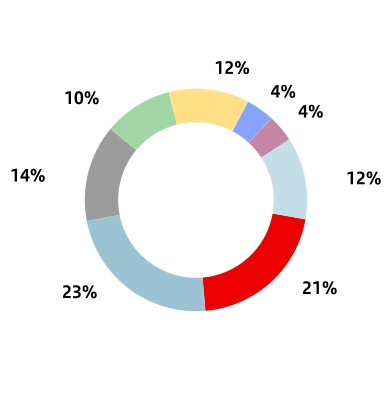
| | | | | |
| n | Spain |
| n | UK |
| n | Rest of Europe |
| n | Brazil |
| n | USA |
| n | Rest of South America |
| n | Rest of North America |
| n | Others |
| | | | | | | | | | | |
81 | | 2021 Pillar 3 Disclosures Report | |
| | |
CREDIT RISK 2021 Pillar 3 Disclosures Report |
The following two tables show all exposures by industry and geographical area:
| | | | | | | | | | | | | | | | | | | | |
| Table 28.CQ5 - Credit quality of loans and advances by industry |
|
| EUR million |
| 2021 |
| Gross carrying amount | | | Accumulated impairment | Accumulated negative changes in fair value due to credit risk on non-performing exposures |
| | of which: non-performing | of which: loans and advances subject to impairment |
| of which: defaulted |
| Agriculture, forestry and fishing | 7,983 | | 493 | | 488 | | 7,895 | | (298) | | — | |
| Mining and quarrying | 6,536 | | 210 | | 210 | | 6,473 | | (107) | | — | |
| Manufacturing | 52,162 | | 2,228 | | 2,216 | | 51,453 | | (1,488) | | — | |
| Electricity, gas, steam and air conditioning supply | 14,687 | | 415 | | 409 | | 14,687 | | (162) | | — | |
| Water supply | 1,613 | | 38 | | 38 | | 1,571 | | (29) | | — | |
| Construction | 18,750 | | 1,625 | | 1,597 | | 18,719 | | (835) | | — | |
| Wholesale and retail trade | 65,802 | | 3,029 | | 2,945 | | 65,463 | | (1,910) | | — | |
| Transport and storage | 19,759 | | 920 | | 914 | | 19,542 | | (507) | | — | |
| Accommodation and food service activities | 13,622 | | 2,014 | | 1,959 | | 13,410 | | (729) | | — | |
| Information and communication | 14,634 | | 384 | | 375 | | 14,604 | | (213) | | — | |
| Real estate activities | 41,022 | | 1,385 | | 1,383 | | 40,342 | | (679) | | — | |
| Financial and insurance actvities | — | | — | | — | | — | | — | | — | |
| Professional, scientific and technical activities | 16,999 | | 700 | | 692 | | 16,618 | | (851) | | — | |
| Administrative and support service activities | 13,418 | | 552 | | 518 | | 13,277 | | (400) | | — | |
| Public administration and defense, compulsory social security | 1,958 | | — | | — | | 1,881 | | (1) | | — | |
| Education | 1,995 | | 78 | | 74 | | 1,963 | | (53) | | — | |
| Human health services and social work activities | 5,296 | | 221 | | 220 | | 5,222 | | (135) | | — | |
| Arts, entertainment and recreation | 1,601 | | 167 | | 163 | | 1,582 | | (80) | | — | |
| Other services | 20,976 | | 460 | | 397 | | 20,780 | | (348) | | (7) | |
| Total | 318,813 | | 14,919 | | 14,598 | | 315,482 | | (8,825) | | (7) | |
| | |
CREDIT RISK 2021 Pillar 3 Disclosures Report |
| | | | | | | | | | | | | | | | | | | | | | | |
| Table 29.CQ4 - Quality of non-performing exposures by geography |
|
| EUR million |
| 2021 |
| Gross carrying/Nominal amount | | | Accumulated impairment | Provisions on off-balance sheet commitments and financial guarantee given | Accumulated negative changes in fair value due to credit risk on non-performing exposures |
| | of which: non-performing | of which: subject to impairment |
| of which: defaulted |
| On balance sheet exposures | 1,174,096 | | 38,012 | | 36,754 | | 1,161,226 | | (23,508) | | | (20) | |
| GB | 292,782 | | 4,433 | | 4,406 | | 292,026 | | (1,048) | | | — | |
| ES | 228,356 | | 14,878 | | 14,751 | | 222,079 | | (7,237) | | | (7) | |
| BR | 121,516 | | 5,109 | | 4,507 | | 121,291 | | (4,665) | | | — | |
| US | 131,158 | | 4,060 | | 3,855 | | 130,980 | | (3,896) | | | — | |
| MX | 50,336 | | 1,431 | | 1,308 | | 50,124 | | (902) | | | — | |
| CL | 50,034 | | 1,891 | | 1,889 | | 50,033 | | (1,089) | | | — | |
| PL | 50,030 | | 1,623 | | 1,610 | | 49,953 | | (1,270) | | | (13) | |
| PT | 46,539 | | 1,303 | | 1,303 | | 46,608 | | (1,011) | | | — | |
| DE | 45,806 | | 680 | | 676 | | 45,659 | | (540) | | | — | |
| FR | 23,056 | | 392 | | 338 | | 21,660 | | (275) | | | — | |
| Other countries | 134,483 | | 2,212 | | 2,111 | | 130,813 | | (1,575) | | | — | |
| Off balance sheet exposures | 350,259 | | 2,402 | | 2,323 | | | | 732 | | |
| ES | 84,093 | | 987 | | 968 | | | | 160 | | |
| GB | 63,772 | | 151 | | 151 | | | | 51 | | |
| US | 47,975 | | 173 | | 167 | | | | 67 | | |
| BR | 31,977 | | 423 | | 396 | | | | 211 | | |
| FR | 17,274 | | 4 | | 4 | | | | 10 | | |
| DE | 14,087 | | 45 | | 45 | | | | 19 | | |
| CL | 12,314 | | 24 | | 24 | | | | 42 | | |
| PL | 10,494 | | 25 | | 14 | | | | 13 | | |
| MX | 10,919 | | 31 | | 31 | | | | 48 | | |
| PT | 9,005 | | 198 | | 198 | | | | 55 | | |
| Other countries | 48,349 | | 341 | | 325 | | | | 56 | | |
| Total | 1,524,355 | | 40,414 | | 39,077 | | 1,161,226 | | (23,508) | | 732 | | (20) | |
| | | | | | | | | | | |
83 | | 2021 Pillar 3 Disclosures Report | |
| | |
CREDIT RISK 2021 Pillar 3 Disclosures Report |
| | | | | | | | | | | | | | | | | | | | | | | | | | |
| Table 30.CQ1 - Credit quality of forborne exposures |
| EUR million |
| 2021 |
| Gross carrying amount/nominal amount of exposures with forbearance measures | Accumulated impairment, accumulated negative changes in fair value due to credit risk and provisions | Collateral received and financial guarantees received on forborne exposures |
| Performing forborne | Non-performing forborne | On performing forborne exposures | On non-performing forborne exposures | | Of which collateral and financial guarantees received on non-performing exposures with forbearance measures |
| | Of which defaulted | Of which impaired |
| Cash balances at central banks and other demand deposits | — | | — | | — | | — | | — | | — | | — | | — | |
| Loans and advances | 19,946 | | 17,158 | | 16,940 | | 16,154 | | (1,616) | | (6,613) | | 22,400 | | 8,347 | |
| Central banks | — | | — | | — | | — | | — | | — | | — | | — | |
| General governments | 18 | | 6 | | 6 | | 6 | | — | | (4) | | 2 | | 2 | |
| Credit institutions | — | | — | | — | | — | | — | | — | | — | | — | |
| Other financial corporations | 172 | | 110 | | 110 | | 110 | | (2) | | (23) | | 199 | | 73 | |
| Non-financial corporations | 9,929 | | 8,705 | | 8,633 | | 8,549 | | (392) | | (3,408) | | 11,466 | | 3,901 | |
| Households | 9,827 | | 8,337 | | 8,191 | | 7,489 | | (1,222) | | (3,178) | | 10,733 | | 4,371 | |
| Debt Securities | 68 | | 217 | | 216 | | 206 | | (5) | | (144) | | 58 | | 58 | |
| Loan commitments given | 1,124 | | 10 | | 9 | | 7 | | 2 | | 2 | | — | | — | |
| Total | 21,138 | | 17,385 | | 17,165 | | 16,367 | | (1,619) | | (6,755) | | 22,458 | | 8,405 | |
| | |
CREDIT RISK 2021 Pillar 3 Disclosures Report |
The following table breaks down performing and non-performing exposures according to the number of days past due:
| | | | | | | | | | | | | | | | | | | | | | | | | | | | | | | | | | | | | | | | | |
| Table 31.CQ3 - Credit quality of performing and non-performing exposures by past due days |
| EUR million | | | | | | | | | | | | 2021 |
| Gross carrying amount/nominal amount |
| Performing exposures | | Non-performing exposures |
| Not past due or past due ≤ 30 days | Past due > 30 days ≤ 90 days | | | Unlikely to pay that are not past due or are past due ≤ 90 days | Past due
> 90 days
≤ 180 days
| Past due
> 180 days
≤ 1 year
| Past due
> 1 year ≤ 2 years
| Past due
> 2 years ≤ 5 years
| Past due
> 5 years ≤ 7 years
| Past due > 7 years | Of which defaulted |
| Cash balances at central banks and other demand deposits | 202,953 | 202,953 | — | | — | — | — | — | — | — | — | — | — |
| Loans and advances | 1,014,387 | 1,009,642 | 4,745 | | 37,663 | 20,700 | 3,694 | 3,194 | 3,011 | 3,468 | 1,267 | 2,329 | 36,417 |
| Central banks | 15,679 | 15,679 | — | | — | — | — | — | — | — | — | — | — |
| General governments | 24,347 | 24,342 | 5 | | 46 | 26 | 4 | 2 | 1 | 4 | 3 | 6 | 41 |
| Credit institutions | 41,641 | 41,641 | — | | 1 | 1 | — | — | — | — | — | — | 1 |
| Other financial corporations | 69,707 | 69,705 | 2 | | 260 | 222 | 2 | 3 | 4 | 16 | 1 | 12 | 255 |
| Non-financial corporations | 303,894 | 303,306 | 588 | | 14,919 | 8,295 | 1,038 | 936 | 806 | 1,934 | 589 | 1,321 | 14,598 |
| Of which SMEs | 118,854 | 118,418 | 436 | | 9,162 | 4,329 | 834 | 688 | 609 | 1,273 | 465 | 964 | 9,058 |
| Households | 559,119 | 554,969 | 4,150 | | 22,437 | 12,156 | 2,650 | 2,253 | 2,200 | 1,514 | 674 | 990 | 21,522 |
| Debt securities | 121,697 | 121,692 | 5 | | 349 | 341 | — | — | 8 | — | — | — | 335 |
| Central banks | 7,551 | 7,551 | — | | — | — | — | — | — | — | — | — | — |
| General governments | 80,253 | 80,253 | — | | — | — | — | — | — | — | — | — | — |
| Credit institutions | 9,145 | 9,145 | — | | — | — | — | — | — | — | — | — | — |
| Other financial corporations | 15,075 | 15,072 | 3 | | 13 | 13 | — | — | — | — | — | — | 13 |
| Non-financial corporations | 9,673 | 9,671 | 2 | | 336 | 328 | — | — | 8 | — | — | — | 322 |
| Off-balance-sheet exposures | 347,857 | | | | 2,402 | | | | | | | | 2,325 |
| Central banks | — | | | | — | | | | | | | | — |
| General governments | 3,457 | | | | 6 | | | | | | | | 6 |
| Credit institutions | 30,764 | | | | 9 | | | | | | | | 6 |
| Other financial corporations | 27,485 | | | | 283 | | | | | | | | 283 |
| Non-financial corporations | 173,742 | | | | 1,905 | | | | | | | | 1,842 |
| Households | 112,409 | | | | 199 | | | | | | | | 188 |
| Total | 1,686,894 | 1,334,287 | 4,750 | | 40,414 | 21,041 | 3,694 | 3,194 | 3,019 | 3,468 | 1,267 | 2,329 | 39,077 |
| | | | | | | | | | | |
85 | | 2021 Pillar 3 Disclosures Report | |
| | |
CREDIT RISK 2021 Pillar 3 Disclosures Report |
The following table displays performing and non-performing exposures including provisions by stage: | | | | | | | | | | | | | | | | | | | | | | | | | | | | | | | | | | | | | | | | | | | | | | | | | | | | | | | | | | | | | | |
| Table 32.CR1 - Performing and non-performing exposures and related provisions |
| EUR million | 2021 |
| Gross carrying amount/nominal amount | | Accumulated impairment, accumulated negative changes in fair value due to credit risk and provisions | | Accumulated partial write-off | | Collateral and financial guarantees received |
| Performing exposures | | Non-performing exposures | | Performing exposures - accumulated impairment and provisions | | Non-performing exposures - accumulated impairment, accumulated negative changes in fair value due to credit risk and provisions | | | On performing exposures | On non-performing exposures |
| Of which, stage 1 | Of which, stage 2 | | | Of which, stage 2 | Of which, stage 3 | | | Of which, stage 1 | Of which, stage 2 | | | Of which, stage 2 | Of which, stage 3 | |
| Cash balances at central banks and other demand deposits | 202,953 | 202,875 | 78 | | — | — | — | | — | — | — | | — | — | — | | — | | — | — |
| Loans and advances | 1,014,387 | 934,678 | 65,365 | | 37,663 | 3,604 | 31,767 | | (8,697) | (4,166) | (4,531) | | (14,609) | (725) | (13,233) | | (388) | | 685,665 | 16,771 |
| Central banks | 15,679 | 15,679 | — | | — | — | — | | — | — | — | | — | — | — | | — | | 2,359 | — |
| General governments | 24,347 | 21,860 | 259 | | 46 | — | 38 | | (17) | (14) | (3) | | (14) | — | (13) | | — | | 2,727 | — |
| Credit institutions | 41,641 | 38,489 | — | | 1 | — | 1 | | (8) | (8) | — | | — | — | — | | — | | 8,627 | — |
| Other financial corporations | 69,707 | 63,629 | 633 | | 260 | — | 250 | | (104) | (56) | (48) | | (74) | — | (66) | | — | | 38,357 | 167 |
| Non-financial corporations | 303,894 | 270,410 | 30,151 | | 14,919 | 708 | 13,094 | | (2,485) | (1,084) | (1,401) | | (6,347) | (103) | (5,835) | | (290) | | 182,675 | 6,233 |
| Of which SMEs | 118,854 | 102,773 | 14,949 | | 9,162 | 369 | 8,311 | | (1,166) | (482) | (684) | | (4,010) | (78) | (3,687) | | (122) | | 83,406 | 4,176 |
| Households | 559,119 | 524,611 | 34,322 | | 22,437 | 2,896 | 18,384 | | (6,083) | (3,004) | (3,079) | | (8,174) | (622) | (7,319) | | (98) | | 450,920 | 10,371 |
| Debt securities | 121,697 | 120,626 | 128 | | 349 | — | 277 | | (34) | (26) | (8) | | (188) | — | (182) | | — | | 560 | 58 |
| Central banks | 7,551 | 7,551 | — | | — | — | — | | (1) | (1) | — | | — | — | — | | — | | — | — |
| General governments | 80,253 | 80,252 | 1 | | — | — | — | | (3) | (3) | — | | — | — | — | | — | | 273 | — |
| Credit institutions | 9,145 | 9,145 | — | | — | — | — | | (1) | (1) | — | | — | — | — | | — | | — | — |
| Other financial corporations | 15,075 | 14,413 | 1 | | 13 | — | — | | (3) | (3) | — | | — | — | — | | — | | — | — |
| Non-financial corporations | 9,673 | 9,265 | 126 | | 336 | — | 277 | | (26) | (18) | (8) | | (188) | — | (182) | | — | | 287 | 58 |
| Off-balance-sheet exposures | 347,857 | 338,487 | 9,367 | | 2,402 | 393 | 1,566 | | 513 | 368 | 145 | | 219 | 54 | 159 | | — | | 6,208 | 253 |
| Central banks | — | — | — | | — | — | — | | — | — | — | | — | — | — | | — | | — | — |
| General governments | 3,457 | 3,436 | 21 | | 6 | — | 6 | | — | — | — | | — | — | — | | — | | 9 | — |
| Credit institutions | 30,764 | 30,762 | 2 | | 9 | — | 6 | | 6 | 6 | — | | 1 | — | 1 | | — | | 199 | — |
| Other financial corporations | 27,485 | 26,899 | 587 | | 283 | 1 | 217 | | 18 | 8 | 10 | | — | — | — | | — | | 126 | 1 |
| Non-financial corporations | 173,742 | 166,351 | 7,389 | | 1,905 | 389 | 1,178 | | 236 | 131 | 105 | | 197 | 54 | 138 | | — | | 5,371 | 248 |
| Households | 112,409 | 111,039 | 1,368 | | 199 | 3 | 159 | | 253 | 223 | 30 | | 21 | — | 20 | | — | | 503 | 4 |
| Total | 1,686,894 | 1,596,666 | 74,938 | | 40,414 | 3,997 | 33,610 | | (8,218) | (3,824) | (4,394) | | (14,578) | (671) | (13,256) | | (388) | | 692,433 | 17,082 |
| | |
CREDIT RISK 2021 Pillar 3 Disclosures Report |
Requirements CQ2, CQ6, CQ8 and CR2A of the EBA Disclosure ITS are not published because our NPL ratio does not exceed 5%.
The following table shows the collateral obtained through repossession and foreclosure processes:
| | | | | | | | |
| Table 33.CQ7 - Collateral obtained by taking possession and execution processes |
| EUR million | 2021 |
| Collateral obtained by taking possession |
| Value at initial recognition | Accumulated negative changes |
| Property, plant and equipment (PP&E) | — | — |
| Other than PP&E | 7,387 | 3,101 |
| Residential immovable property | 1,193 | 386 |
| Commercial Immovable property | 5,913 | 2,677 |
| Movable property (auto, shipping, etc.) | 265 | 38 |
| Equity and debt instruments | 16 | — |
| Other | — | — |
| Total | 7,387 | 3,101 |
The following table shows the stock of loans classified as non-performing between the close of the previous year and the end of current year.
| | | | | |
| Table 34.CR2 - Changes in the stock of non-performing loans and advances |
|
| EUR million | |
| 2021 |
| Gross carrying amount |
| Opening balance | 31,565 |
| Inflows to non-performing portfolios | 19,929 |
| Outflows from non-performing portfolios | (4,783) |
| Outflows due to write-offs | (9,048) |
| Outflow due to other situations | — |
| Closing balance | 37,663 |
| |
| Figures are referred to inflows to net new non-performing portfolios. Mapping has been corrected to F18.01 & F12 | |
| | | | | | | | | | | | | | | | | | | | |
| Table 35.CR1-A: Maturity of exposures |
| EUR million |
| 2021 |
| Net exposure value |
| On demand | <= 1 year | r > 1 year <= 5 years | > 5 years | No stated maturity | Total |
| Loans and advances | 35,062 | 282,182 | 275,475 | 436,022 | — | 1,028,741 |
| Debt securities | — | 37,328 | 49,530 | 34,722 | — | 121,580 |
| Total | 35,062 | 319,510 | 325,005 | 470,744 | — | 1,150,321 |
| | | | | | | | | | | |
87 | | 2021 Pillar 3 Disclosures Report | |
| | |
CREDIT RISK 2021 Pillar 3 Disclosures Report |
4.4. Internal rating systems
Santander has been using its own internal rating and scoring models to measure the credit quality of customers and transactions since 1993.
Each rating or score indicates a probability of default, measured on the basis of the bank’s historical default experience (except in the case of low default portfolios).
More than 400 internal rating models are used in the Group’s credit approval and risk monitoring process.
The global rating tools are those used for SCIB segments: corporates, financial institutions and specialised funding, which are managed centrally in Santander, in terms of both allocating the rating and risk monitoring. The rating these tools assign to each customer is obtained using a model which relies on an analyst’s opinion, supported by a quantitative or automatic module based on balance sheet ratios or macroeconomic variables. This quantitative module is created by applying a structured technique for dealing with complex decisions based on two-by-two comparisons to evaluate priorities. Starting from an expert selection of variables/ratios to be considered in the model, this method yields the relative weight of each variable in the overall model. The analyst takes this information as a reference but revises and adjusts it to obtain the final rating, which is therefore heavily based on expert judgement. Occasionally, ratings are also adjusted when the company belongs to a group from which it receives explicit support, as in the case of Corporate SCIB.
The parent of Santander has established a single methodology for constructing a rating in each country for the Corporates and Institutions segment (including the SMEs with the highest turnover). The aim is to include all available information (internal behaviour, external sources, etc.) in a structured way and to (statistically) weight the objective (automatic) assessment and the subjective (expert) assessment according to the client's characteristics. The analyst may or may not modify the resulting score by a limited number of rating points.
Customer ratings are reviewed regularly to take account of new information that becomes available. Ratings are reviewed more frequently when certain automatic alerts are triggered and for customers placed on special watch. The rating tools are also reviewed, to refine the ratings they generate.
For the Retail segment (individuals and SMEs), Santander has scoring tools that automatically assign a score to transactions submitted for approval.
These credit approval systems are supplemented by behavioural rating models, which provide greater predictability of the assumed risk. These are used not only when accepting new risks but also when monitoring and setting limits.
For each of the Group's portfolios, PD models are developed where the rating and/or scoring models are an essential input. In the case of SCIB portfolios, the aforementioned models establish the following list of internal ratings and probability of default:
| | | | | | | | | | | | | | | | | | | | | | | |
| Mapping of internal ratings and PD |
| Corporate | | | Banks | | | Financial institutions non banks |
| Rating | PD | | Rating | PD | | Rating | PD |
| 9.3 | | 0.009 | % | | 9.3 | 0.012 | % | | 9.3 | 0.001 | % |
| 9.2 | | 0.010 | % | | 9.2 | 0.013 | % | | 9.2 | 0.002 | % |
| 9.0 | | 0.012 | % | | 9.0 | 0.016 | % | | 9.0 | 0.002 | % |
| 8.5 | | 0.020 | % | | 8.5 | 0.024 | % | | 8.5 | 0.005 | % |
| 8.0 | | 0.032 | % | | 8.0 | 0.037 | % | | 8.0 | 0.010 | % |
| 7.5 | | 0.053 | % | | 7.5 | 0.056 | % | | 7.5 | 0.021 | % |
| 7.0 | | 0.087 | % | | 7.0 | 0.085 | % | | 7.0 | 0.044 | % |
| 6.5 | | 0.144 | % | | 6.5 | 0.129 | % | | 6.5 | 0.093 | % |
| 6.0 | | 0.237 | % | | 6.0 | 0.196 | % | | 6.0 | 0.194 | % |
| 5.5 | | 0.389 | % | | 5.5 | 0.299 | % | | 5.5 | 0.406 | % |
| 5.0 | | 0.640 | % | | 5.0 | 0.454 | % | | 5.0 | 0.850 | % |
| 4.5 | | 1.050 | % | | 4.5 | 0.690 | % | | 4.5 | 1.779 | % |
| 4.0 | | 1.718 | % | | 4.0 | 1.047 | % | | 4.0 | 3.721 | % |
| 3.5 | | 2.800 | % | | 3.5 | 1.586 | % | | 3.5 | 7.785 | % |
| 3.0 | | 4.531 | % | | 3.0 | 2.397 | % | | 3.0 | 16.285 | % |
| 2.5 | | 7.252 | % | | 2.5 | 3.605 | % | | 2.5 | 34.068 | % |
| 2.0 | | 11.412 | % | | 2.0 | 5.390 | % | | 2.0 | 45.000 | % |
| 1.5 | | 17.507 | % | | 1.5 | 7.985 | % | | 1.5 | 45.000 | % |
| 1.0 | | 25.907 | % | | 1.0 | 11.676 | % | | 1.0 | 45.000 | % |
These PDs are applied uniformly across the whole Santander, consistently with the global management of the portfolios. As we can see, the PD assigned to any given internal rating is not exactly the same in every portfolio. Regulatory requirements require differentiated calibration.
4.5. Rating assignment process and parameter estimation
Measuring the credit risk of a transaction involves calculating both the expected and the unexpected loss on the transaction. Unexpected loss is the basis for the calculation of both regulatory and economic capital. It refers to a very high, though improbable, level of loss that is not considered a recurring cost and must be absorbed by capital. Measuring risk involves two separate steps: estimating the risk and then assigning the credit risk parameters: PD, LGD and EAD.
PD (probability of default) estimates the likelihood that a customer or a contract will default within 12 months. PD used for regulatory capital is long run, or TTC (through-the-cycle) PD, which is not linked to a specific point in the cycle.
The default event being modelled is based on the definition in article 178 of the European Central Bank Solvency Regulation6, which considers default to be defined for a
6 Regulation (EU) No 575/2013 of the European Parliament and Council of 26 June 2013 on prudential requirements for credit institutions and investment firms.
| | |
CREDIT RISK 2021 Pillar 3 Disclosures Report |
customer/contract when at least one of the following circumstances arises:
•The entity considers there is reasonable doubt about the obligor meeting their credit obligations in full.
•The customer/contract is past due by more than 90 days on any material credit obligation.
Recently, the definition of default has also been adopted in accordance with the “Guidelines on the application of the definition of default” and the materiality thresholds set by the competent authorities.
The event to be modelled in corporate portfolios is customer default, whereas PD is estimated at the contract level in retail portfolios.
Calculations of PD are based on the entity’s own internal experience, i.e. on past observations of defaults by rating level or scoring.
LGD (loss given default) is the mathematical expectation of the percentage loss in the event of a default event. LGD is calculated using internal data on the income and expenses incurred by the institution during the recovery process once the default event has arisen, discounted to the start date of the default.
LGD calculated to determine regulatory capital is “downturn” LGD, i.e. considered for a worst-case scenario in the economic cycle.
In addition to the estimation of downturn LGD, a specific loss estimate is made for operations in default. This is determined using LGD and ELBE (expected loss best estimate) parameters. ELBE attempts to provide the best estimate of economic loss at a particular time based mainly on the time during which the operation has been in default, with due regard to the prevailing economic situation, while LGD for transactions in default is increased by any further unexpected losses that may be reported during the recovery period.
Finally, EAD (exposure at default) is calculated. This is defined as the value of the debt at the time of default. For lending products or any product with no off-balance-sheet amount, EAD equals the balance of the transaction plus any interest accrued but not yet payable. For products providing facilities it is necessary to estimate any future drawings that will be made between the present time and any possible future default event. The CCF (credit conversion factor) is calculated for this reason, to show the percentage of the balance not currently utilised (off-balance-sheet amount) that would be utilised at the time of default.
Past information on portfolios is essential for estimating regulatory parameters, as established in EU regulations (Regulation No 575/2013). The minimum data periods to be used in estimates are between five and seven years, depending on the parameter and the portfolio, although the period used in the estimate can be longer, depending on the historical information available. The Bank has an internal data model containing historical information on portfolios, which is subject to review by the internal supervisory divisions (Validation and Audit) and by the supervisory authorities.
The methodology used to estimate the credit risk parameters will be updated under the new regulatory guidelines, mainly established in the “Guidelines on PD estimation, LGD estimation and the treatment of defaulted assets", to
incorporate the requirements and interpretations deriving from these regulatory provisions.
For regulatory purposes, observations of frequency of default and associated losses must be averaged out over an entire economic cycle, in the case of PD, or represent a downturn situation in the case of LGD or EAD, or represent the current economic cycle in the case of ELBE for non-performing transactions.
For this reason, recent observations are not directly comparable with the regulatory parameters and backtesting exercises should be treated with due caution, placing them in the context of the current economic environment. As explained in section 3.10, recent observed default frequencies (ODFs) are below the regulatory PDs in geographies with economic growth rates above the average for the cycle. Conversely, in regions where economic growth is below average, the ODFs may exceed the regulatory PDs.
The risk parameters must be estimated separately for each entity, country and segment, and must be reviewed at least once a year.
The parameters are then assigned to the transactions recorded on each unit’s balance sheet, so as to calculate the expected losses and capital requirements associated with the unit’s exposure.
In certain portfolios there is so little default experience that alternative approaches to parameter estimation must be adopted. These are known as low default portfolios.
Low default portfolio: corporates; banks; non-bank financial institutions and central governments.
Estimates of PD and LGD in low default portfolios rely chiefly on studies performed by external rating agencies, which reflect the pooled experience of the large numbers of entities and countries rated by the agencies. These databases contain in-depth historical information to help identify complete economic cycles and analyse downturn situations.
The definition of default employed by the agencies is compared in detail with the regulatory requirements. Even though this does not produce a perfect match, there are sufficient points in common to enable this approach to be used.
For PD, the agencies do not directly report long run (through the cycle, TTC) estimates, but rather the annual observed default frequency. The observations are averaged out over an economic cycle by external rating levels to obtain the long run (TTC) PD. This long run PD is assigned to all counterparties with external ratings, which later helps to calibrate the internal rating. Therefore, the PD will not depend on the counterparty’s external rating, but on its internal rating, and may also be applied to customers with no external rating.
The parameters estimated for global portfolios are the same for all the Group units. Thus, a financial institution with a rating of 8.5 will have the same PD, regardless of the unit in which the exposure is recognised.
| | | | | | | | | | | |
89 | | 2021 Pillar 3 Disclosures Report | |
| | |
CREDIT RISK 2021 Pillar 3 Disclosures Report |
Corporates (including SMEs, specialised lending and receivables)
The estimation is based on the entity’s own internal experience for portfolios of customers that have an account manager assigned to them with sufficient experience of internal defaults. The PD is calculated for customers by observing new NPLs in the portfolio and relating these to the ratings assigned to the customers concerned. To this end, long-run observed default frequencies (LR ODFs) are calculated for a rating or group of ratings and are adjusted to the average PD observed for each portfolio over a complete economic cycle.
Corporates portfolios have specific rating systems in each the Group unit, requiring specific PD calibrations in each case.
In Corporates portfolios, LGD is calculated on the basis of observed recoveries of defaulted transactions. This calculation takes into account not only the cash inflows and outflows associated with the recovery process but also the timing of these flows, so as to calculate their present value, and direct and indirect recovery costs. For regulatory use, LGD estimates must be associated with a period of economic crisis or downturn. The existence of major variables (known as “drivers”) is modelled to explain the emergence of various LGDs for different groups of transactions. The main drivers used are the age of the transactions, the existence or absence of guarantees, the type of guarantee, the Loan to Value, etc. Statistical significance and business relevance are required for these explanatory variables. Estimated ELBE and LGD are also calculated for operations in default.
Finally, EAD is estimated by comparing the percentage use of off-balance sheet operations at the time of default and in normal circumstances, to estimate the extent to which customers make more use of their credit facilities as they approach default. To estimate the CCF, information on past defaults is gathered from databases and balances (on and off the balance sheet) are compared between the time of default and earlier times when the downturn in the customer’s credit quality had yet to be observed.
Retail
In portfolios where customers do not have an account manager assigned to them but are treated on a pooled or standardised basis, PDs are estimated based on the entity’s internal experience, although the unit of information for assigning PD is the transaction, not the customer.
PDs are calculated by observing new NPLs and relating each new NPL to the score assigned to the transaction at the time of approval or, for transactions beyond a certain age, to the customer's rating. As with the corporates portfolios, LGD is calculated on the basis of an observed recovery process, adjusted to downturn conditions. Estimated ELBE and LGD are also calculated for transactions in default. The EAD estimation is also similar to that for corporates.
For further details, see Appendix XVII, which contains several tables summarising the parameter models used in the geographies, complying with the requirement (e) of CRE in relation to the article 452 (f) of the CRR.
| | | | | |
| Access 2021 Pillar 3 Disclosures Report available on the Santander Group website |
4.6. Uses of internal parameter estimates
One major application of the PD, LGD and EAD credit risk parameters is to determine minimum capital requirements within the CRR framework.
The CRR states that these parameters and their associated metrics, including expected and unexpected loss, are to be used not only for regulatory purposes but also for internal credit risk management.
The Group has adapted its projection methodology to IFRS 9, resulting in an impact on the estimation of expected loss and the other relevant credit risk metrics arising from the parameters obtained, thus making full use of the risk parameters (PD, LGD and EAD) in its management through the calculation of provisions and allowances.
The internal credit risk parameter estimates are also used in a variety of management tools, including pre-classifications, economic capital allocation, the RoRAC (return on risk-adjusted capital) calculation, RoRWA (return on risk-eeighted assets), stress testing and scenario analyses, the results of which are reported to senior management through various internal committees.
The pre-classification tool is used to assign limits to customers based on their risk characteristics. For the Corporate Investment Banking (SCIB) segment, limits are established for capital at risk (CaR) and nominal CAP.7 Limits for financial institutions are managed using credit risk equivalent (CRE) models.
Through the calculation and allocation of economic capital, all the various types of risks arising from the lending business are integrated in a single measurement, combining measurement of credit risk with that of other risks, including market, operational, business and on-balance-sheet interest rate risk. The economic capital allocation at the business unit level provides a view of the distribution of risk by business activity and geographical area, taking the benefits of diversification into account. By relating economic capital to financial results, it is possible to calculate the risk-adjusted return (RoRAC), which can be compared to the cost of capital to determine how each unit is contributing to value creation in the Group.
The use of economic capital figures in determining management compensation and setting capital and RoRAC-related targets for the business units further reinforces the integration of economic capital in management.
7 Maximum nominal amount of a risk transaction, excluding market transactions and with maximum terms according to the type of transaction
| | |
CREDIT RISK 2021 Pillar 3 Disclosures Report |
In scenario analyses, the credit risk parameters (including provisions under IFRS 9) are related to macroeconomic variables, such as the unemployment rate, GDP growth and interest rates, using statistical models. This allows credit risk to be quantified under different macroeconomic scenarios, and in particular, to assess potential risk levels in stress situations.
For further details on IFRS 9, see the Risk management and control chapter (section 3.4) of the 2020 annual report.
| | | | | |
| Access 2021 Annual Report available on the Santander Group website |
4.7. Credit risk mitigation techniques
Santander applies various credit risk mitigation techniques based on customer and product type, among other factors.
Some are inherent to specific operations (such as real estate collateral) while others apply to a series of transactions (such as netting or collateral).
Second and subsequent mortgages
As a general rule, and from a risk acceptance perspective, lending criteria are linked to the borrower's capacity to fulfil all of their financial obligations in due time and proper form, although this is no impediment to seeking the highest level of collateral or personal guarantees.
Payment capacity is assessed on the basis of the funds or net cash flows from their businesses or usual sources of income, without depending on guarantors or assets delivered as collateral. These must always be taken into account when considering approval of the transaction as a second and exceptional method of recovery when the first method has failed. As a general rule, security is defined as a reinforcement that is added to a credit operation for the purpose of mitigating any loss arising from default on the payment obligation.
Effective guarantees, for these purposes, are collateral and personal guarantees whose validity is demonstrated as mitigating the credit risk and whose valuation is compliant with the internal policies and procedures in place. The analysis of the effectiveness of the guarantee must consider, among other things, the time necessary for the execution of the security and the capacity to make the guarantees effective.
For the calculation of regulatory capital, only those that meet the requirements described both in the CRR and in the EBA's guide on credit risk reduction are taken into consideration.
Implementation of mitigation techniques follows the minimum requirements established in the guarantee management policy: legal certainty (possibility of legally requiring the settlement of guarantees at all times); the lack of a substantial positive correlation between the counterparty
and the value of the collateral; the correct documentation of all guarantees; the availability of the documented methodologies used for each mitigation technique; and appropriate monitoring, traceability and regular monitoring of the items or assets used for the guarantee.The mitigation techniques can be grouped into the following categories:
Personal guarantees
This type of guarantee grants the creditor a personal right or entitlement affecting the equity of the guarantor. Examples include bonds, guarantees and stand-by letters of credit. Only personal guarantees provided by persons who meet the minimum requirements established by the supervisory authority can be recognised in capital calculations.
Hedging through credit derivatives
Credit derivatives are financial instruments that are mainly used to hedge credit risk. By buying protection from a third party, Banco Santander transfers the risk of the issuer of the underlying instrument. Credit derivatives are over-the-counter (OTC) instruments that are traded on non-organised markets. Hedging with credit derivatives is contracted with leading financial institutions, mainly using credit default swaps.
The distribution of personal guarantees and credit derivatives for the corporates, banks, non-financial institutions and sovereigns segments by rating grade is shown below, in compliance with one of the transparency recommendations originally issued by the Basel Committee:
| | | | | | | | | | | |
91 | | 2021 Pillar 3 Disclosures Report | |
| | |
CREDIT RISK 2021 Pillar 3 Disclosures Report |
| | | | | | | | |
| Table 36.Guarantees by external rating |
| EUR million | | |
| | 2021 |
| Corporates |
| External Rating | Exposures in default | Exposures not in default |
| AAA/AA | — | 270 |
| A | — | 8,176 |
| BBB | — | 16,695 |
| BB | 10 | 3,313 |
| B | 2 | 1,108 |
| Rest | 34 | 417 |
| Unrated | — | — |
| Total | 46 | 29,979 |
| | |
| Banks |
| External Rating | Exposures in default | Exposures not in default |
| AAA/AA | 0 | 2,479 |
| A | 0 | 4,347 |
| BBB | 0 | 1,458 |
| BB | 0 | — |
| B | 0 | — |
| Rest | 0 | — |
| Unrated | 0 | — |
| Total | 0 | 8,284 |
| | |
| Other financial institutions |
| External Rating | Exposures in default | Exposures not in default |
| AAA/AA | 0 | 307 |
| A | 0 | 6,112 |
| BBB | 0 | 1,740 |
| BB | 0 | 6 |
| B | 0 | — |
| Rest | 0 | — |
| Unrated | 0 | — |
| Total | 0 | 8,165 |
| | |
| Sovereign |
| External Rating | Exposures in default | Exposures not in default |
| AAA/AA | 0 | 13,223 |
| A | 0 | 30,942 |
| BBB | 0 | 4,033 |
| BB | 0 | 6 |
| B | 0 | 8 |
| Rest | 0 | — |
| Unrated | 0 | — |
| Total | 0 | 48,212 |
Collateral
This is collateral pledged on assets (movable or immovable) or rights that are specific and determinate. These are rights that secure performance of the main obligation for the creditor via the attachment of an asset. As a result of this attachment, in the event of default on the secured obligation, the creditor may realise the economic value of the asset through a regulated procedure and collect the proceeds; preference over other creditors may be upheld in this collection method. Collateral may also be classified as follows:
•Real estate guarantees implemented as first charge real estate mortgages. The property can be buildings and parts of finished buildings (homes, offices, commercial premises,
multi-purpose buildings, non multi-purpose buildings and hotels), urban land and land for urban development, and other property (buildings under construction, developments in progress, etc.).
•Pledges on financial instruments (cash deposits, debt instruments).
A very important example of financial collateral is that which is used for the purpose (as with the netting technique) of reducing counterparty credit risk. Collateral consists of instruments with certain economic value and high liquidity that are deposited/transferred by one party in favour of another to guarantee or reduce any counterparty credit risk arising from portfolios of risk-bearing transactions between the two. Transactions backed by collateral are marked to market periodically (usually daily) and the parameters defined in the collateral agreement are applied, obtaining an amount of collateral (usually cash or securities) to be called from, or returned to, the counterparty.
Netting
The concept of netting involves offsetting gains and losses on multiple transactions of the same type under the umbrella of a master agreement such as an ISDA or similar (CSA, OSLA, ISMA, GMRA, etc.).
Market gains and losses on derivative transactions between Santander and a counterparty are offset against one another, so that if the counterparty defaults, it owes (or Santander owes, if the net amount is negative) a single net amount, rather than a large number of positive and negative amounts relating to the individual transactions entered into with that counterparty.
An important feature of a master netting agreement is that it entails a single legal obligation, encompassing all the transactions covered by the agreement. This is what makes it possible to offset the risks of all the transactions covered by the agreement with a counterparty.
There are two methodologies for the measurement of exposure: a mark-to-market (MtM) methodology, involving replacement cost in the case of derivatives, plus an add-on for potential future exposure; and a methodology including calculation of exposure using Monte Carlo simulation, which is used in certain regions and for some products. We also calculate capital at risk or unexpected loss, i.e. the loss in economic capital once expected loss is subtracted, net of guarantees and recoveries.
Exposures are recalculated at market close, adjusting all transactions to their new time horizon. Potential future exposure is adjusted and mitigation measures (netting, collateral, etc.) are applied, so that exposures can be checked on a daily basis against the limits approved by senior management. Risk control is performed through an integrated system in real time, enabling the exposure limit available with any counterparty to be known at any time.
4.7.1. Recognition of credit risk mitigation
Credit risk mitigation techniques affect the value of the risk parameters used to determine capital when calculating regulatory capital. Identifying and valuing the security associated with the contracts is essential here and a distinction is drawn between the types of security: collateral and personal guarantees. This mitigation process is performed whenever the validity of the guarantee has been
| | |
CREDIT RISK 2021 Pillar 3 Disclosures Report |
checked and it is believed they may be enforced. The mitigation process is described in the following section.
Firstly, in portfolios where PD is assigned at customer level, personal guarantees are assessed. Personal guarantees affect the final PD value by effectively replacing the counterparty’s PD in the transaction with the guarantor’s PD. Here, we compare the Risk Weight (RW) of the transaction obtained by applying the customer’s PD with the RW of the transaction calculated by employing the guarantor’s PD. The final PD is the one that generates the lowest RW value.
Secondly, the existence of any associated collateral is verified for all transaction types (retail and non-retail). Under the IRB
approach, the existence of collateral impacts the final value of the LGD used to calculate capital. The process also factors in potentially significant factors such as product type and transaction balance. In the case of mortgage guarantees, the LGD of the transaction will be based on the LTV (Loan To Value).
The tables below show the original exposure covered by type of guarantee and by exposure category. Only in cases where the guarantee could have been used to mitigate the capital requirements:
| | | | | | | | | | | | | | | | | | | | |
| Table 37.CR3 - CRM techniques overview: Disclosure of the use of credit risk mitigation techniques |
| EUR million | | | | | | |
| | | | | | 2021 |
| Unsecured carrying amount | | Secured carrying amount |
| | | Of which secured by collateral | Of which secured by financial guarantees |
| | | Of which secured by credit derivatives |
| Loans and advances | 552,565 | | 702,437 | 612,273 | 90,164 | 2,915 |
| Debt securities | 121,428 | | 618 | 58 | 560 | — |
| Total | 673,993 | | 703,055 | 612,331 | 90,724 | 2,915 |
| Of which non-performing exposures | 21,182 | | 16,830 | 14,647 | 2,183 | — |
| Of which defaulted* | 17,438 | | 7,515 | 7,301 | 213 | — |
| | | | | | |
| *Defaulted information net of provisions |
| | | | | | | | | | | | | | |
| Table 38.IRB approach. Credit risk mitigation techniques: credit derivatives and personal guarantees |
|
| EUR million | | | | |
| 2021 | 2020 |
| Original hedged exposure by collateral type and exposure category | Financial guarantees | Personal guarantees | Financial Guarantees | Personal guarantees |
| IRB Approach | | | | |
| Central administrations and banks | — | — | — | 2,426 |
| Institutions | 144 | 12,985 | 144 | 12,984 |
| Corporates | 1,637 | 52,537 | 1,707 | 46,386 |
| Retail | — | 11,732 | — | 8,188 |
| Total | 1,781 | 77,253 | 1,852 | 69,984 |
| | | | | | | | | | | |
93 | | 2021 Pillar 3 Disclosures Report | |
| | |
CREDIT RISK 2021 Pillar 3 Disclosures Report |
The following table shows the impact of the credit derivatives used as credit mitigation techniques in RWAs.
| | | | | | | | |
| Table 39.CR7 - IRB approach - Effect on the RWEAs of credit derivatives used as CRM techniques |
|
| EUR million | | |
| | 2021 |
| Pre-credit derivatives RWAs | Actual RWAs |
| Exposures under FIRB | 23,098 | 23,098 |
| Central governments and central banks | — | — |
| Institutions | 291 | 291 |
| Corporates | 22,807 | 22,807 |
| of which Corporates - SMEs | 1,027 | 1,027 |
| of which Corporates - Specialised lending | 14,672 | 14,672 |
| Exposures under AIRB | 174,436 | 173,956 |
| Central governments and central banks | — | — |
| Institutions | 7,136 | 6,655 |
| Corporates | 87,392 | 87,392 |
| of Corporates - which SMEs | 18,474 | 18,474 |
| of which Corporates - Specialised lending | — | — |
| Retail | 79,908 | 79,908 |
| of which Retail - SMEs - Secured by immovable property collateral | 2,903 | 2,903 |
| of which Retail - non-SMEs - Secured by immovable property collateral | 45,619 | 45,619 |
| of which Retail - Qualifying revolving | 4,659 | 4,659 |
| of which Retail - SMEs - Other | 7,213 | 7,213 |
| of which Retail - Non-SMEs- Other | 19,514 | 19,514 |
| Total | 197,534 | 197,054 |
| | |
| Does not include CCPs | | |
The table shows an impact of credit derivatives on AIRB Institutions of 480 million euros.
| | |
CREDIT RISK 2021 Pillar 3 Disclosures Report |
| | | | | | | | | | | | | | | | | | | | | | | | | | | | | | | | | | | | | | | | | | | | | | | | | | | | | |
| Table 40.CR7-A - IRB approach - Disclosure of the extent of the use of CRM techniques |
|
| EUR million | | | | | | | | | | | | | | | | | |
| 2021 |
| | | Credit risk Mitigation techniques | | Credit risk Mitigation methods in the calculation of RWEAs |
| | | Funded credit Protection (FCP) | | Unfunded credit Protection (UFCP) | | RWEA without substitution effects
(reduction effects only)
| RWEA with substitution effects
(both reduction and sustitution effects)
|
| A-IRB | Total exposures
| | Part of exposures covered by Financial Collaterals (%) | Part of exposures covered by Other eligible collaterals (%) | Part of exposures covered by Other funded credit protection (%) | | Part of exposures covered by Guarantees (%) | Part of exposures covered by Credit Derivatives (%) | |
| | Part of exposures covered by Immovable property Collaterals (%) | Part of exposures covered by Receivables (%) | Part of exposures covered by Other physical collateral (%) | | Part of exposures covered by Cash on deposit (%) | Part of exposures covered by Life insurance policies (%) | Part of exposures covered by Instruments held by a third party (%) | | |
| Central governments and central banks | — | | — | % | — | % | — | % | — | % | — | % | — | % | — | % | — | % | — | % | | — | % | — | % | | — | — |
| Institutions | 31,443 | | 1.96 | % | 0.07 | % | 0.02 | % | — | % | 0.05 | % | — | % | — | % | — | % | — | % | | — | % | — | % | | 8,279 | 6,655 |
| Corporates | 170,775 | | 4.28 | % | 7.02 | % | 6.16 | % | 0.05 | % | 0.81 | % | 0.04 | % | 0.04 | % | — | % | — | % | | — | % | — | % | | 94,183 | 87,392 |
| Of which Corporates - SMEs | 29,942 | | 3.28 | % | 2.34 | % | 0.01 | % | — | % | 2.33 | % | — | % | — | % | — | % | — | % | | — | % | — | % | | 19,023 | 18,474 |
| Of which Corporates - Specialised lending | — | | — | % | — | % | — | % | — | % | — | % | — | % | — | % | — | % | — | % | | — | % | — | % | | — | — |
| Of which Corporates - Other | 140,832 | | 4.50 | % | 8.01 | % | 7.47 | % | 0.06 | % | 0.49 | % | 0.05 | % | 0.05 | % | — | % | — | % | | — | % | — | % | | 75,160 | 68,918 |
| Retail | 393,268 | | 0.49 | % | 83.13 | % | 80.28 | % | — | % | 2.85 | % | 0.01 | % | — | % | 0.01 | % | — | % | | — | % | — | % | | 79,231 | 79,908 |
| Of which Retail - Immovable property SMEs | 14,285 | | 0.19 | % | 92.69 | % | 92.69 | % | — | % | — | % | — | % | — | % | — | % | — | % | | — | % | — | % | | 2,851 | 2,903 |
| Of which Retail - Immovable property non-SMEs | 306,592 | | 0.02 | % | 99.32 | % | 98.66 | % | — | % | 0.66 | % | — | % | — | % | — | % | — | % | | — | % | — | % | | 45,609 | 45,619 |
| Of which Retail - Qualifying revolving | 15,756 | | — | % | — | % | — | % | — | % | — | % | — | % | — | % | — | % | — | % | | — | % | — | % | | 4,996 | 4,659 |
| Of which Retail - Other SMEs | 16,857 | | 1.65 | % | 9.34 | % | — | % | — | % | 9.34 | % | 0.01 | % | — | % | 0.01 | % | — | % | | — | % | — | % | | 6,187 | 7,213 |
| Of which Retail - Other non-SMEs | 39,778 | | 3.91 | % | 19.09 | % | — | % | — | % | 19.09 | % | 0.05 | % | — | % | 0.05 | % | — | % | | — | % | — | % | | 19,587 | 19,514 |
| Total | 595,486 | | 1.66 | % | 56.92 | % | 54.79 | % | 0.01 | % | 2.12 | % | 0.02 | % | 0.01 | % | — | % | — | % | | — | % | — | % | | 181,693 | 173,956 |
| | | | | | | | | | | |
95 | | 2021 Pillar 3 Disclosures Report | |
| | |
CREDIT RISK 2021 Pillar 3 Disclosures Report |
| | | | | | | | | | | | | | | | | | | | | | | | | | | | | | | | | | | | | | | | | | | | | | | | | | | | | |
| EUR million | | | | | | | | | | | | | | | | | |
| 2021 |
| | | Credit risk Mitigation techniques | | Credit risk Mitigation methods in the calculation of RWEAs |
| | | Funded credit Protection (FCP) | | Unfunded credit Protection (UFCP) | | RWEA without substitution effects
(reduction effects only)
| RWEA with substitution effects
(both reduction and sustitution effects)
|
| F-IRB | Total exposures
| | Part of exposures covered by Financial Collaterals (%) | Part of exposures covered by Other eligible collaterals (%) | Part of exposures covered by Other funded credit protection (%) | | Part of exposures covered by Guarantees (%) | Part of exposures covered by Credit Derivatives (%) | |
| | Part of exposures covered by Immovable property Collaterals (%) | Part of exposures covered by Receivables (%) | Part of exposures covered by Other physical collateral (%) | | Part of exposures covered by Cash on deposit (%) | Part of exposures covered by Life insurance policies (%) | Part of exposures covered by Instruments held by a third party (%) | | |
| Central governments and central banks | 0 | | — | % | — | % | — | % | — | % | — | % | — | % | — | % | — | % | — | % | | — | % | — | % | | 0 | 0 |
| Institutions | 0 | | 0.11 | % | 0.19 | % | 0.18 | % | — | % | — | % | — | % | — | % | — | % | — | % | | (8.54) | % | — | % | | 0 | 0 |
| Corporates | 0 | | 0.12 | % | 1.86 | % | 1.70 | % | 0.07 | % | 0.10 | % | — | % | — | % | — | % | — | % | | (2.23) | % | — | % | | 0 | 0 |
| Of which Corporates - SMEs | 0 | | 0.12 | % | 22.64 | % | 22.50 | % | — | % | 0.14 | % | — | % | — | % | — | % | — | % | | — | % | — | % | | 0 | 0 |
| Of which Corporates - Specialised lending | 0 | | — | % | — | % | — | % | — | % | — | % | — | % | — | % | — | % | — | % | | — | % | — | % | | 0 | 0 |
| Of which Corporates - Other | 0 | | 0.39 | % | 3.09 | % | 2.56 | % | 0.22 | % | 0.31 | % | — | % | — | % | — | % | — | % | | (7.35) | % | — | % | | 0 | 0 |
| Total | 33,457 | | 0.12 | % | 1.80 | % | 1.64 | % | 0.06 | % | 0.10 | % | — | % | — | % | — | % | — | % | | (2.47) | % | — | % | | 25,611 | 23,098 |
| | | | | | | | | | | | | | | | | |
| Fully-loaded CRR, Phased-in IFRS 9 |
| | |
CREDIT RISK 2021 Pillar 3 Disclosures Report |
4.8. Asset impairment losses: influencing factors and comparative analysis
In addition to the advanced models described (which are detailed in the economic capital section), other metrics are used to help ensure prudent and effective credit risk management based on an assessment of losses on the portfolios.
Credit risk is monitored continuously and comprehensively, to ensure the early identification of incidents involving risk that could affect customers' credit ratings. This monitoring is carried out through the periodic review of all customers, the allocation of a monitoring score, the establishment of pre-defined actions associated with each category and the implementation of specific measures (predefined or ad-hoc) to correct potential deviations that could have negative impact on the entity.
The analysis of credit risk involves continuous and systematic comparison to budgets, limits and standards, assessing the effects of future external events and strategic decisions, to establish measures that ensure the risk profile and volume are within the established parameters and aligned with the appetite established by the group.
The main metric used to measure and control the credit risk at the Group is the cost of credit. This ratio quantifies loan-loss provisions arising from credit risk over a defined period of time for a given loan portfolio. As such, it acts as an indicator of the group's credit quality.
The loan-loss provisions are calculated under the IFRS 9 standards.
The basic structure for the impairment recognition phases is as follows, from lower to higher credit quality impairment (phases 1 to 3):
•Phase 1: expected credit losses over the next twelve months
•Phase 2: expected credit losses over the life of the instrument
•Phase 3: recognised credit losses over the life of the instrument
A significant increase in credit risk determines the transition from the first phase to the second phase.
For further details on the key credit risk figures, see the Risk management and control chapter of the 2021 annual report.
| | | | | |
| Access 2021 Annual Report available on the Santander Group website |
4.9. Backtesting of IRB parameters
4.9.1. Backtesting of PD
The aim of the backtesting of PD is to assess the suitability of regulatory PDs by comparing them with the Observed Default Frequencies (ODFs) during the most recent period.
This comparison applies the quantitative study required by the European Banking Authority (EBA) in its Guidelines on disclosure requirements under part eight of the capital requirements regulation (EU) No 575/2013, of August 2017.
This proposes disclosure of information on backtesting of PD in accordance with Template 24: – IRB approach – Backtesting of PD per exposure class.
Detailed information on backtesting of PD, reported in table CR9, can be found in Appendix XV. A summary of the conclusions from the results obtained can be found below.
1.There is no major difference between the average exposure weighted PD and the simple average in each band, indicating that exposure is fairly uniformly distributed among the various transactions. This result is quite typical of retail portfolios, but not so clear in the case of corporate portfolios, where certain individuals may have significant exposures that can lead to greater variation between both parameters. However, as may be observed in the results shown in the Appendix, there are no significant differences in the corporate portfolios either.
2.Regulatory PDs are similar to the actual default rates observed, although the following material facts should be noted
◦In general, regulatory PDs are higher than actual default rates, both in the last year and from a historical perspective. This situation is generally reflected by: 1) the conservative approach adopted in the estimation of the parameters and 2) the gradually improving prospect, though interrupted in the last two years, of a better economic situation once the recession that began in 2008 was overcome. These factors tend to reduce the frequencies of default observed. The exceptions to this situation are rare and are generally due to idiosyncratic features of the portfolios that have nothing to do with the economic situation, such as the process of integrating acquired entities.
◦The good performance of mortgage portfolios is especially noteworthy, where the differences between the PD of the model and the delinquency levels are more noticeable.
◦In the case of the portfolios of large corporates and Financial Institutions, to which section (f) of article 180(1) of the CRR is being applied to estimate the PD, it can be seen that the low number of defaults leads to inconsistencies in some intervals and makes comparability with the average PD per debtor difficult. There may also be substantial differences if the PD is weighted by exposure. The good predictive capacity of the rating system used can be seen in the average historical default rate.
| | | | | | | | | | | |
97 | | 2021 Pillar 3 Disclosures Report | |
| | |
CREDIT RISK 2021 Pillar 3 Disclosures Report |
For further details on PD backtesting (tables CR9 and CR9.1), see Appendix XVIII and Appendix XIX respectively, which are available on the Santander's website.
| | | | | |
| Access 2021 Pillar 3 Disclosures Report available on the Santander Group website |
4.9.2. Backtesting of EAD
In order to compare the suitability of the estimated credit conversion factors (CCFs), the estimated parameters are compared with the actual CCFs in the most recent period. Given the downturn nature of the regulatory parameter, the estimated conversion factors are expected to exceed those observed. For this reason, the comparison must be placed in the context of the economic circumstances in which the contrast is made, although EAD is not a parameter that is particularly sensitive to the economic cycle.
Additionally, calculations of the so-called “coverage ratios” are performed, where the assigned EAD is compared with the default balance or observed EAD. Values above 100% are indicative of a suitable degree of conservatism.
4.9.3. Backtesting of expected loss
As for the rest of the parameters, the LGD estimates are compared with the LGD realised in the most recent period. Given the downturn nature of the regulatory parameter, the estimated LGDs are expected to exceed those observed. For this reason, the comparison must be placed in the context of the economic circumstances in which the contrast is made, particularly taking into account the typical sensitivity to the cycle of the parameter, especially in portfolios where the collateral is sensitive to the economic cycle.
4.10. Covid-19
The European Union reacted to the negative economic impact of the crisis caused by covid-19 by implementing a series of measures to support the real economy of the financial sector. As part of these measures, Member States implemented a series of legislative moratoria on loan repayments, to mitigate the operational and liquidity challenges faced by borrowers. During 2020, the EBA published Guidelines 2020/02 on legislative and non-legislative moratoria on loan repayments applied in the light of the covid-19 crisis, which defined the scope, nature and criteria for granting moratoria.
In order to monitor the moratoria and additional support measures granted and to provide consistent public disclosures, the EBA published Guidelines 2020/07 on reporting and disclosure of exposures subject to measures applied in response to the covid-19 crisis.
In accordance with the requirements of Annex 3 of the EBA Guidelines 2020/07 referred to above, the required quantitative templates are as follows:
| | |
CREDIT RISK 2021 Pillar 3 Disclosures Report |
The first template shows a generic summary of the loans and advances for which moratoria are possible.
| | | | | | | | | | | | | | | | | | | | | | | | | | | | | | | | | | | | | | | | | | | | | | | | | | |
| Table 41.Information on loans and advances subject to legislative and non-legislative moratoria |
| EUR Thousands | | | | | | | | | | | | | | | |
| | 2021 |
| | Gross carrying amount | Accumulated impairment, accumulated negative changes in fair value due to credit risk | Gross carrying amount |
| | | Performing | Non performing | | Performing | Non performing | Inflows to non-performing exposures* |
| | | | Of which: exposures with forberance measures | Of which: Instruments with significant increase in credit risk since initial recognition but not credit-impaired (Stage 2) | | Of which: exposures with forberance measures | Of which:
Unlikely to pay that are not past-due or past-due <= 90 days | | | Of which: exposures with forberance measures | Of which: Instruments with significant increase in credit risk since initial recognition but not credit-impaired (Stage 2) | | Of which: exposures with forberance measures | Of which:
Unlikely to pay that are not past-due or past-due <= 90 days |
| Loans and advances subject to moratorium | 166 | 158 | 2 | 24 | 8 | 2 | 6 | (5) | (2) | — | (1) | (3) | — | (2) | 2 |
| of which: Households | 72 | 69 | 2 | 5 | 3 | — | 2 | (1) | — | — | — | (1) | — | — | — |
| of which: Collateralised by residential immovable property | 10 | 8 | 1 | 3 | 2 | — | 2 | (1) | — | — | — | — | — | — | — |
| of which: Non-financial corporations | 94 | 89 | 1 | 19 | 5 | 2 | 4 | (4) | (2) | — | (1) | (2) | — | (1) | 2 |
| of which: Small and Medium-sized Enterprises | 74 | 71 | 1 | 14 | 4 | 2 | 4 | (2) | (1) | — | (1) | (1) | — | (1) | 1 |
| of which: Collateralised by commercial immovable property | 25 | 22 | 1 | 10 | 3 | 2 | 3 | (1) | — | — | — | (1) | — | (1) | — |
| | | | | | | | | | | | | | | | |
| Following indications from the Competent supervisory authority, information in this table is related to outstanding moratoria. |
| * Inflows to non-performing exposures are biannual. |
| | | | | | | | | | | |
99 | | 2021 Pillar 3 Disclosures Report | |
| | |
CREDIT RISK 2021 Pillar 3 Disclosures Report |
The next template shows the volume of loans and advances subject to legislative and non-legislative moratoria divided by their residual maturity.
| | | | | | | | | | | | | | | | | | | | | | | | | | | | | | | | |
| Table 42.Breakdown of loans and advances subject to legislative and non-legislative moratoria by residual maturity of moratoria |
| EUR Thousands | | | | | | | | | | |
| | | | | | | | 2021 |
| | Number of obligors | Gross carrying amount |
| Of which: legislative moratoria | Of which: expired | Residual maturity of moratoria |
| <= 3 months | > 3 months
<= 6 meses | > 6 months
<= 9 months | > 9 months
<= 12 months | > 1 year |
|
|
| Loans and advances for which moratorium was offered | 3,234,082 | 109,007 | | | | | | | |
| Loans and advances subject to moratorium | 2,731,503 | 93,122 | 61,961 | 92,956 | 96 | 28 | 21 | 17 | 4 |
| of which: Households | | 77,862 | 55,240 | 77,790 | 29 | 19 | 7 | 15 | 1 |
| of which: Collateralised by residential immovable property | | 65,162 | 52,849 | 65,152 | 8 | 1 | 1 | — | — |
| of which: Non-financial corporations | | 15,260 | 6,720 | 15,165 | 67 | 9 | 14 | 2 | 3 |
| of which: Small and Medium-sized Enterprises | | 6,315 | 4,023 | 6,241 | 59 | 3 | 9 | — | 2 |
| of which: Collateralised by commercial immovable property | | 3,695 | 1,751 | 3,670 | 13 | 3 | 9 | — | — |
The last template displays information on newly originated loans and advances provided under newly applicable public guarantee schemes introduced in response to covid-19.
| | | | | | | | | | | | | | | | | |
| Table 43.Information on newly originated loans and advances provided under newly applicable public guarantee schemes introduced in response to covid-19 crisis |
| EUR Thousands | | | | |
| | 2021 |
| | Gross carrying amount | Maximum amount of the guarantee that can be considered | Gross carrying amount |
| | | of which: forborne | Public guarantees received | Inflows to non-performing exposures* |
| Newly originated loans and advances subject to public guarantee schemes | 39,879 | 5,005 | 32,126 | 621 |
| of which: Households | 1,696 | | | 53 |
| of which: Collateralised by residencial immovable property | 2 | | | — |
| of which: Non-financial corporations | 38,181 | 4,694 | 30,760 | 568 |
| of which: Small and Medium-sized Enterprises | 27,080 | | | 348 |
| of which: Collateralised by commercial immovable property | 189 | | | 13 |
| | | | | |
| * Inflows to non-performing exposures are biannual. | | | |
| | | | | | | | | | | | | | | | | | | | | | | | | | | | | | | | | | | | | | |
| | |
| Counterparty credit risk |
|
|
| |
| 5.1. Counterparty credit risk definition and framework | |
| 5.2. Collateral agreements and guarantees | |
| 5.3. Wrong-way risk | |
| 5.4. Credit Rating Downgrade | |
| 5.5. Credit Value Adjustment (CVA) | |
| 5.6. Central counterparties | |
| 5.7. Credit counterparty credit risk indicators | |
| |
| |
| |
| |
| |
| |
| |
| |
| |
| |
| |
| |
| | |
COUNTERPARTY CREDIT RISK 2021 Pillar 3 Disclosures Report |
5. Counterparty credit risk
| | | | | | | | | | | | | | | | | |
| Main figures | | | | | |
EUR million | | | | | |
| EAD | | RWA |
| 2021 | 2020 | | 2021 | 2020 |
| Counterparty credit risk* | 47,827 | 37,612 | | 15,674 | 10,239 |
| Of which the standardised approach | 40,805 | 24,311 | | 13,639 | 9,278 |
| Of which internal model method (IMM) | — | — | | — | — |
| Of which exposures to a CCPs* | 7,023 | 13,301 | | 268 | 241 |
| Of which credit valuation adjustment - CVA | 9,168 | 7,715 | | 1,767 | 720 |
| Of which other CCR | — | — | | — | — |
| | | | | |
| *Does not include CCPs exposures corresponding to pre-funded default fund contributions and unfunded default fund contributions. |
| | | | | | | | |
| EAD variation | | RWA variation |
EUR million | | EUR million |
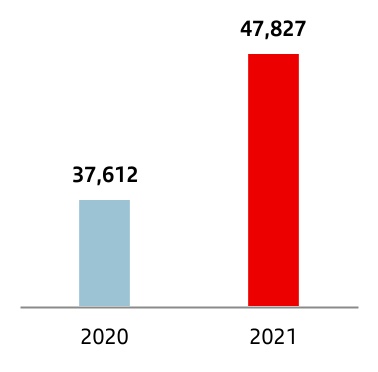
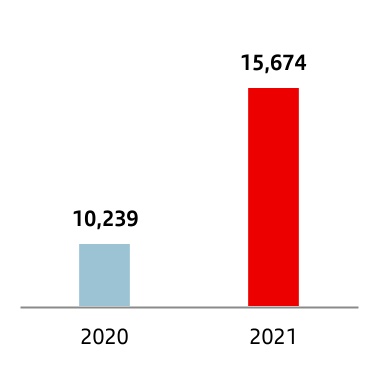
| | | | | | | | |
| Note: Does not include CCPs or CVA. | | Note: Does not include CCPs or CVA. |
5.1 Counterparty credit risk definition and framework
This section covers the qualitative requirement CCRA - Qualitative disclosure related to CCR. It also complies with (d), (e), (f) and (g) of the OVA Requirement - Institution risk management approach.
Chapter 6 of the CRR (Regulation (EU) No 575/2013) describes counterparty credit risk as the risk a counterparty to a transaction could default before the final settlement of the transaction's cash flows. It includes the following transaction types: derivative instruments, repurchase agreements, securities or commodities lending, long settlement transactions and lending transactions with margin replacement.
Santander includes counterparty credit risk in its Credit Risk Framework.
For management purposes, it also has a specific counterparty credit risk model, policy and procedures.
This risk is controlled using an integrated system that provides real-time information so that exposures can be checked on a daily basis against the limits approved by senior management for any counterparty, product or maturity, in any the Group unit.
Specific counterparty credit risk limits are included in the overall credit risk limits and counterparty credit risk is independently monitored and controlled. These limits are set and reviewed in accordance with the appetite set by the board. The definition of limits and appetite metrics are reviewed and updated every year.
| | | | | | | | | | | |
103 | | 2021 Pillar 3 Disclosures Report | |
| | |
COUNTERPARTY CREDIT RISK 2021 Pillar 3 Disclosures Report |
There are two methodologies for the measurement of credit risk equivalent (CRE): a mark-to-market (MtM, replacement cost in the case of derivatives) methodology with an add-on for potential future exposure; and a methodology including calculation of exposure using Monte Carlo simulation, which is used in certain geographies and for some products.
In addition, quarterly stress tests are conducted for credit risk equivalent and the results are reported to senior management.
Credit risk equivalent is used to calculate capital at risk or unexpected loss, i.e. the loss in economic capital once expected loss is subtracted, net of guarantees and recoveries.
Every quarter, the risk teams report to senior management on the main risk metrics (exposure, MtM, notional amounts) of the group's Counterparty Credit Risk portfolio broken down by geography and segment.
5.2. Collateral agreements and guarantees
A policy is applied to regulate eligibility criteria for eligible collaterals and applicable haircuts complying with the Variation and Initial Margin regulatory requirements . The policy applies to derivatives, repo and securities lending transactions.
Transactions subject to collateral agreements are valued daily and on that valuation, the parameters agreed in the collateral agreement are applied, giving an amount of collateral to be called from, or returned to, the counterparty.
The counterparty that receives the margin call checks the valuation, at which point discrepancies may arise.
A monitoring committee (discrepancies committee) meets weekly to analyse transactions in which significant discrepancies have been detected, and manages them with Risk teams to ensure they are valued correctly.
5.3. Wrong-way risk
Wrong-way risk exists when the potential exposure of a transaction with a counterparty is highly and positively (adversely) correlated with the credit rating of the counterparty, i.e. if the counterparty's credit rating deteriorates, potential exposure increases.
The criterion used by the Group for calculating the credit exposure of derivatives with specific wrong way risk (WWR) is
very conservative, as exposure to derivatives with WWR resembles exposure to basic financing. In very specific exceptions, a decision may be taken to calculate the stressed credit exposure for the derivative, to provide incentives for short-term transactions with customers with good ratings and liquid underlyings with collateralisation mechanisms in the derivatives.
Santander has defined criteria to identify transactions subject to specific wrong way risk on the basis of the legal connection between the counterparty and the issuer of the underlying instrument. Additionally, a method for measuring general wrong way risk has also been defined.
Where most collateral is in cash, there is practically no risk of adverse effects arising from specific correlations between the collateral and the collateral provider. Any adverse effects arising from correlations in non-cash collateral are immaterial since issuances from the same counterparty and its subsidiaries are excluded from collateral eligibility policies.
5.4. Credit rating downgrade
It is estimated that if our credit rating was downgraded and it was required to post additional collateral, the impact of collateral would be relatively limited. This is because the Group's credit rating affects only a small percentage of its current collateral agreements. In the event of a hypothetical one-notch downgrade in the group's credit rating, it is estimated that the resulting impact of the collateral it would have to post would be €95 million.
5.5. Credit value adjustment (CVA)
The team responsible for managing counterparty credit risk in each geography charges the corresponding treasury desk a credit premium at the start of each transaction, in exchange for assuming the credit risk involved.
The team can then cover the CVA sensitivities through a combination of credit derivatives, interest rate derivatives, currency derivatives and other instruments.
CVA regulatory capital is also calculated. The purpose of this charge is to improve the resilience of banks to potential losses of market value associated with a reduction in the solvency of counterparties in derivatives transactions that are not settled through clearing houses.
The following table shows the credit valuation adjustment (CVA) for the counterparty credit risk.
| | | | | | | | |
| Table 44.CCR2 - Transactions subject to own funds requirements for CVA risk |
| | |
| EUR million |
| | 2021 |
| Exposure value | RWA |
| Total transactions subject to the Advanced method | — | — |
| (i) VaR component (including the 3× multiplier) | — | — |
| (ii) stressed VaR component (including the 3× multiplier) | — | — |
| Transactions subject to the Standardised method | 9,168 | 1,767 |
| Transactions subject to the Alternative approach (Based on the Original Exposure Method) | — | — |
| Total transactions subject to own funds requirements for CVA risk | 9,168 | 1,767 |
| | |
| Figures applying 1 year floor. | | |
| | |
COUNTERPARTY CREDIT RISK 2021 Pillar 3 Disclosures Report |
5.6. Central counterparties
The clearing of transactions through central counterparties is a common market practice for Santander. As a member of the clearing houses with which it operates, the bank contributes to their risk management framework through payments into the default fund, in addition to daily margin calls.
The risk associated with this type of counterparty is managed through the credit risk framework.
The following tables show central counterparty (CCP) exposure following risk mitigation techniques.
| | | | | | | | |
| Table 45.CCR8 - Exposures to CCPs |
| EUR million |
| | 2021 |
| EAD (post CRM) | RWA |
| Exposures to QCCPs (total) | | 268 |
| Exposures for trades at QCCPs (excluding initial margin and default fund contributions); of which | 7,023 | 140 |
| (i) OTC derivatives | 4,849 | 97 |
| (ii) Exchange-traded derivatives | 580 | 12 |
| (iii) Securities financing transactions | 1,594 | 32 |
| (iv) Netting sets where cross-product netting has been approved | — | — |
| Segregated initial margin | — | |
| Non-segregated initial margin | — | — |
| Pre-funded default fund contributions | 953 | 128 |
| Unfunded default fund contributions | 1,984 | — |
| Exposures to non-QCCPs (total) | | — |
| Exposures for trades at CCPs non-qualified (excluding initial margin and fund contributions); of which | — | — |
| (i) OTC derivatives | — | — |
| (ii) Exchange-traded derivatives | — | — |
| (iii) Securities financing transactions | — | — |
| (iv) Netting sets where cross-product netting has been approved | — | — |
| Segregated initial margin | — | |
| Non-segregated initial margin | — | — |
| Pre-funded default fund contributions | — | — |
| Unfunded default fund contributions | — | — |
| | | | | | | | | | | |
105 | | 2021 Pillar 3 Disclosures Report | |
| | |
COUNTERPARTY CREDIT RISK 2021 Pillar 3 Disclosures Report |
5.7. Credit counterparty credit risk indicators
The following table shows a breakdown of derivatives exposure by the type of product, category, geographical area and rating of the counterparty:
| | | | | | | | |
| Derivatives exposure by product | | Derivatives exposure by category |
| % | | % |
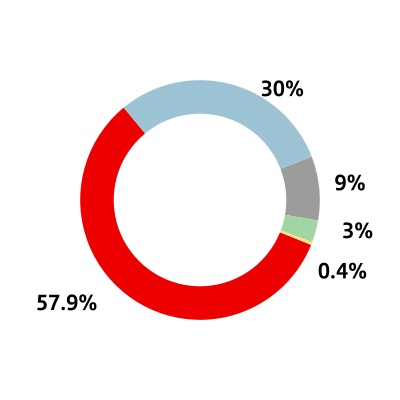
| | | | | |
| n | Interest rate |
| n | Exchange rate |
| n | Equity |
| n | Raw materials |
| n | Credit |
| |
| |
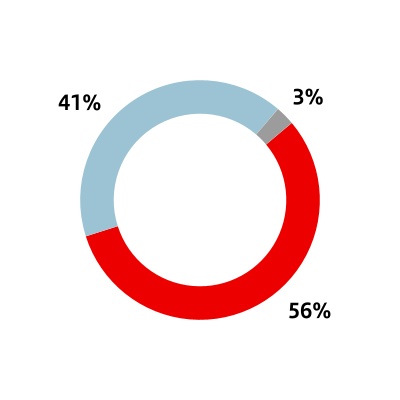
| | | | | |
| n | Corporates |
| n | Institutions |
| n | Sovereign |
| |
| | | | | | | | |
| Derivatives exposure by geography | | Derivatives exposure by rating |
| % | | % |
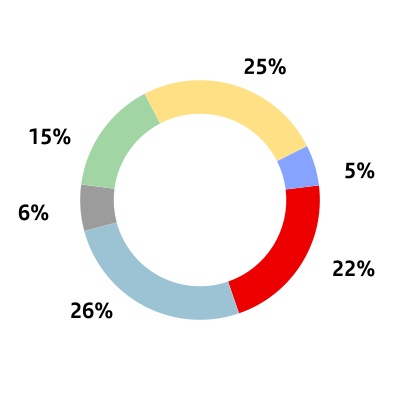
| | | | | |
| n | UK |
| n | Rest of Europe |
| n | USA |
| n | Spain |
| n | Latam |
| n | Others |
| |
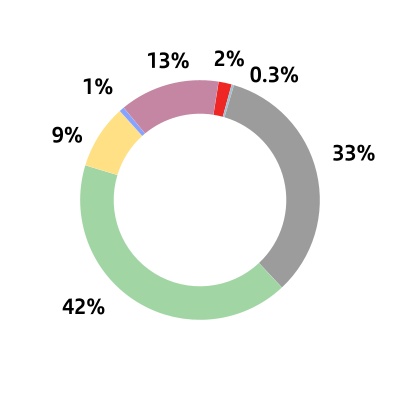
In 2021, exposure to counterparty credit risk from derivative transactions was concentrated in counterparties with high credit quality, so that around 35.3% of the exposure was with counterparties rated A or higher. The distribution by type of counterparty was 41% Institutions and 56% Corporates.
As regards geographic distribution, 22% of the exposure was accounted for by UK counterparties (mainly Santander UK's operations) with the remainder being accounted for by Spain (15%), the rest of Europe (26%), Latin America (25%), the United States (6%) and the rest of the world (5%).
| | |
COUNTERPARTY CREDIT RISK 2021 Pillar 3 Disclosures Report |
The following table shows exposure to counterparty credit risk depending on the calculation methodology used.
| | | | | | | | | | | | | | | | | | | | | | | | | | |
| Table 46.CCR1 - Analysis of CCR exposure by approach |
| EUR million |
| 2021 |
| Replacement cost (RC) | Potential future exposure (PFE) | EEPE | Alpha used for computing regulatory exposure value | Exposure value pre-CRM | Exposure value-post CRM | Exposure Value | RWEA |
| EU - Original Exposure Method (for derivatives) | — | — | | 1.4 | — | — | — | — |
| EU - Simplified SA-CCR (for derivatives) | — | — | | 1.4 | — | — | — | — |
| SA-CCR (for derivatives) | 10,234 | 10,946 | | 1.4 | 53,464 | 27,996 | 27,812 | 11,275 |
| IMM (for derivatives and SFTs) | | | — | 1.4 | — | — | — | — |
| Of which securities financing transactions netting sets | | | — | | — | — | — | — |
| Of which derivatives and long settlement transactions netting sets | | | — | | — | — | — | — |
| Of which from contractual cross-product netting sets | | | — | | — | — | — | — |
| Financial collateral simple method (for SFTs) | | | | | — | — | — | — |
| Financial collateral comprehensive method (for SFTs) | | | | | 124,458 | 12,992 | 12,992 | 2,364 |
| VaR for SFTs | | | | | — | — | — | — |
| Total | | | | | 177,922 | 40,988 | 40,805 | 13,639 |
| | | | | | | | |
| It does not include CCPs | | | | | | | | |
Since June 2021, when the new European Capital Requirement Regulation (CRR) came into force, the Group has implemented the standard SA-CCR methodology for calculating the regulatory exposure of the derivatives portfolio.
The following table details the breakdown of counterparty credit risk exposures calculated using the standardised approach, by portfolio (counterparty type) and risk weighting (degree of risk resulting from the standardised approach):
| | | | | | | | | | | | | | | | | | | | | | | | | | | | | | | | | | | | | | |
| Table 47.CCR3 - Standardised approach - CCR exposures by regulatory exposure class and risk weights |
| EUR million |
| 2021 |
| Risk Weight |
| 0 | % | 2 | % | 4 | % | 10 | % | 20 | % | 50 | % | 70 | % | 75 | % | 100 | % | 150 | % | Others | Total |
| Central governments or central banks | 5,233 | — | — | — | 130 | 2 | — | — | — | — | — | 5,365 |
| Regional government or local authorities | 631 | — | — | — | — | — | — | — | — | — | — | 631 |
| Public sector entities | 188 | — | — | — | — | — | — | — | — | — | — | 189 |
| Multilateral development banks | 144 | — | — | — | — | — | — | — | — | — | — | 144 |
| International organisations | 23 | — | — | — | — | — | — | — | — | — | — | 23 |
| Institutions | — | 7,023 | — | — | 886 | 517 | — | — | 64 | 41 | — | 8,531 |
| Corporates | 12 | — | — | — | 7 | 29 | — | — | 2,546 | 47 | — | 2,641 |
| Retail | — | — | — | — | — | — | — | 42 | — | — | — | 42 |
| Institutions and corporates with a short-term credit assessment | — | — | — | — | — | 7 | — | — | — | — | — | 7 |
| Other items | — | — | — | — | — | 4 | — | — | 16 | — | — | 20 |
| Total | 6,231 | 7,023 | — | — | 1,023 | 559 | — | 42 | 2,626 | 89 | — | 17,593 |
| | | | | | | | | | | |
107 | | 2021 Pillar 3 Disclosures Report | |
| | |
COUNTERPARTY CREDIT RISK 2021 Pillar 3 Disclosures Report |
The following table shows a breakdown of counterparty credit risk exposure by portfolio and PD scale (excluding CCPs and specialised lending).
| | | | | | | | | | | | | | | | | | | | | | | |
| Table 48.CCR4 - AIRB approach - CCR exposures by exposure class and PD scale |
| EUR million | |
| 2021 |
| PD scale | Exposure value | Exposure weighted average PD (%) | Number of obligors | Exposure weighted average LGD (%) | Exposure weighted average maturity (years) | RWEA | Density of risk weighted exposure amount |
| | | | | | | |
| Institutions |
| 0.00 < 0.15 | 11,529 | 0.07 | % | 922 | 44.35 | % | 0.28 | 1,688 | 14.64 | % |
| 0.15 < 0.25 | 985 | 0.19 | % | 121 | 44.49 | % | 0.22 | 304 | 30.89 | % |
| 0.25 < 0.50 | 505 | 0.33 | % | 93 | 43.94 | % | 0.07 | 198 | 39.30 | % |
| 0.50 < 0.75 | 124 | 0.66 | % | 105 | 41.67 | % | 0.39 | 67 | 53.68 | % |
| 0.75 < 2.50 | 206 | 1.07 | % | 38 | 46.04 | % | 3.17 | 249 | 120.70 | % |
| 2.50 < 10.00 | 3 | 3.42 | % | 2 | 44.42 | % | 1.26 | 4 | 122.02 | % |
| 10.00 < 100.00 | 0 | — | % | 0 | — | % | 0.00 | — | — | % |
| 100.00 (Default) | 3 | 100.00 | % | 4 | 91.64 | % | 0.86 | — | 1.88 | % |
| Sub-total | 13,355 | 0.14 | % | 1,285 | 44.35 | % | 0.31 | 2,510 | 18.79 | % |
| | | | | | |
| Corporates |
| 0.00 < 0.15 | 8,414 | 0.10 | % | 357 | 44.63 | % | 2.32 | 2,405 | 28.58 | % |
| 0.15 < 0.25 | 1,567 | 0.24 | % | 231 | 44.92 | % | 2.01 | 749 | 47.77 | % |
| 0.25 < 0.50 | 829 | 0.37 | % | 706 | 33.73 | % | 2.00 | 602 | 72.63 | % |
| 0.50 < 0.75 | 835 | 0.63 | % | 906 | 34.82 | % | 2.45 | 748 | 89.63 | % |
| 0.75 < 2.50 | 389 | 1.43 | % | 2,477 | 23.32 | % | 3.21 | 429 | 110.16 | % |
| 2.50 < 10.00 | 281 | 4.74 | % | 2,092 | 25.13 | % | 2.93 | 372 | 132.25 | % |
| 10.00 < 100.00 | 43 | 20.50 | % | 137 | 24.76 | % | 3.10 | 87 | 202.81 | % |
| 100.00 (Default) | 12 | 100.00 | % | 454 | 10.08 | % | 2.62 | — | 0.57 | % |
| Sub-total | 12,370 | 0.48 | % | 7,360 | 42.06 | % | 2.31 | 5,392 | 43.59 | % |
| | | | | | | |
| Retail |
| 0.00 < 0.15 | — | — | % | 0 | — | % | 0.00 | — | — | % |
| 0.15 < 0.25 | — | — | % | 0 | — | % | 0.00 | — | — | % |
| 0.25 < 0.50 | — | 0.40 | % | 145 | — | % | 1.00 | — | 85.99 | % |
| 0.50 < 0.75 | 2 | 0.64 | % | 447 | — | % | 2.15 | 2 | 85.99 | % |
| 0.75 < 2.50 | 2 | 1.73 | % | 1,014 | 6.90 | % | 3.36 | 2 | 68.89 | % |
| 2.50 < 10.00 | 1 | 3.99 | % | 804 | 0.03 | % | 2.61 | 1 | 85.96 | % |
| 10.00 < 100.00 | 28 | 11.68 | % | 15,398 | 38.36 | % | 2.28 | 18 | 65.41 | % |
| 100.00 (Default) | 2 | 100.00 | % | 1,239 | 30.70 | % | 2.52 | 1 | 46.81 | % |
| Sub-total | 35 | 14.20 | % | 19,047 | 32.46 | % | 2.36 | 23 | 66.62 | % |
| | |
COUNTERPARTY CREDIT RISK 2021 Pillar 3 Disclosures Report |
| | | | | | | | | | | | | | | | | | | | | | | |
| Table 49.CCR4 - FIRB approach - CCR exposures by exposure class and PD scale |
| EUR million | |
| 2021 |
| PD scale | Exposure value | Exposure weighted average PD (%) | Number of obligors | Exposure weighted average LGD (%) | Exposure weighted average maturity (years) | RWEA | Density of risk weighted exposure amount |
| Sub-total | | | | | | | |
| | | | | | | |
| Institutions |
| 0.00 < 0.15 | 738 | 0.06 | % | 73 | 45.00 | % | 1.13 | 127 | 17.17 | % |
| 0.15 < 0.25 | 84 | 0.19 | % | 23 | 45.00 | % | 0.20 | 25 | 30.32 | % |
| 0.25 < 0.50 | 132 | 0.32 | % | 26 | 45.00 | % | 1.28 | 80 | 60.35 | % |
| 0.50 < 0.75 | 18 | 0.66 | % | 12 | 45.00 | % | 1.82 | 16 | 93.58 | % |
| 0.75 < 2.50 | 1 | 1.38 | % | 1 | 45.00 | % | 0.20 | 1 | 77.84 | % |
| 2.50 < 10.00 | 0 | — | % | 0 | — | % | 0.00 | 0 | — | % |
| 10.00 < 100.00 | 0 | — | % | 0 | — | % | 0.00 | 0 | — | % |
| 100.00 (Default) | 0 | — | % | 0 | — | % | 0.00 | 0 | — | % |
| Sub-total | 972 | 0.12 | % | 135 | 45.00 | % | 1.08 | 249 | 25.59 | % |
| | | | | | |
| Corporates |
| 0.00 < 0.15 | 62 | 0.11 | % | 20 | 45.00 | % | 1.92 | 19 | 30.36 | % |
| 0.15 < 0.25 | 155 | 0.24 | % | 9 | 45.00 | % | 2.37 | 85 | 55.20 | % |
| 0.25 < 0.50 | 11 | 0.40 | % | 8 | 45.00 | % | 2.50 | 8 | 72.88 | % |
| 0.50 < 0.75 | 13 | 0.65 | % | 53 | 45.00 | % | 1.06 | 9 | 70.80 | % |
| 0.75 < 2.50 | 5 | 1.65 | % | 5 | 45.00 | % | 2.46 | 6 | 125.78 | % |
| 2.50 < 10.00 | 0 | 2.85 | % | 1 | 45.00 | % | 2.50 | 0 | 147.68 | % |
| 10.00 < 100.00 | 0 | — | % | 0 | — | % | 0.00 | 0 | — | % |
| 100.00 (Default) | 2 | 100.00 | % | 2 | 45.00 | % | 2.50 | 0 | — | % |
| Sub-total | 248 | 1.23 | % | 98 | 45.00 | % | 2.20 | 128 | 51.56 | % |
The following table shows a summary of the effects of netting agreements and collateral for exposure to counterparty credit risk, in addition to the type of collateral exchanges in derivatives transactions and securities financing transactions (SFTs).
| | | | | | | | | | | | | | | | | | | | | | | | | | |
| Table 50.CCR5 - Composition of collateral for CCR exposures |
| EUR million | | |
| 2021 |
| Collateral used in derivative transactions | Collateral used in SFTs |
| Fair value of collateral received | Fair value of posted collateral | Fair value of collateral received | Fair value of posted collateral |
| Segregated | Unsegregated | Segregated | Unsegregated | Segregated | Unsegregated | Segregated | Unsegregated |
| Cash - domestic currency | 40 | 5,517 | 26 | 6,754 | — | 39,825 | — | 48,228 |
| Cash - other currencies | 1 | 4,323 | 7 | 4,626 | — | 11,086 | 530 | 9,361 |
| Domestic sovereign debt | 1,701 | 1,002 | 1,342 | 1,326 | 85 | 58,084 | 5,948 | 48,678 |
| Other sovereign debt | 2,030 | 133 | 2,128 | 75 | 428 | 21,174 | 1,855 | 15,954 |
| Government agency debt | 2 | 24 | 14 | — | — | 100 | 18 | 381 |
| Corporate bonds | 79 | 53 | 72 | 70 | 811 | 11,024 | 2,347 | 12,736 |
| Shares | 948 | 25 | 914 | — | 6,250 | 5,305 | 11,700 | 1,046 |
| Other collateral | — | — | — | — | — | 984 | — | 602 |
| Total | 4,802 | 11,077 | 4,504 | 12,850 | 7,575 | 147,582 | 22,398 | 136,986 |
| | |
COUNTERPARTY CREDIT RISK 2021 Pillar 3 Disclosures Report |
| | | | | | | | |
| Table 51.CCR6 - Credit derivatives exposures |
| EUR million |
| | 2021 |
| Credit derivatives hedges |
| Protection bought | Protection sold |
| Notionals | — | — |
| Single-name credit default swaps | 7,935 | 3,082 |
| Index credit default swaps | 4,676 | 737 |
| Total return swaps | — | — |
| Credit options | — | — |
| Other credit derivatives | — | — |
| Total notionals | 12,612 | 3,820 |
| Fair values | — | — |
| Positive fair value (asset) | 13 | 124 |
| Negative fair value (liability) | (227) | (11) |
| | |
| Bought credit derivatives do include loan coverage | | |
Table CCR7- Statement of flows of risk-weighted amounts of counterparty exposures subject to IMM is not included as Santander does not have an internal model to calculate counterparty risk EAD.
For more information, see the 'Risk management and control' chapter of the 2021 Annual Report.
| | | | | |
| Access 2021 Annual Report available on the Santander Group website |
| | | | | | | | | | | | | | | | | | | | | | | | | | | | | | | | | | | | | | |
| | | | | | | | | | | | |
| Credit risk - Securitisations | |
|
|
| |
| 6.1. Theoretical considerations on securitisation | |
| 6.2. Securitisation accounting policies | |
| 6.3. Management of the securitisation activity at Santander | |
| 6.3.1. Santander securitisation objectives and management | |
| 6.3.2. Santander securitisation functions | |
| 6.3.3. Risk inherent to the securitisation activity at Santander | |
| 6.3.4. Santander securitisation activity | |
| 6.4. Capital requirements - Securitisations | |
| |
| |
| |
| |
| |
| |
| |
| |
| |
| |
| |
| |
| | |
CREDIT RISK - SECURITISATIONS 2021 Pillar 3 Disclosures Report |
6. Credit risk - Securitisations
| | | | | | | | | | | | | | | | | |
| Main figures |
Million euros | | | | | |
| | EAD | | | RWA* |
| 2021 | 2020 | | 2021 | 2020 |
| Securitisation exposures in banking book | 47,489 | | 39,316 | | | 9,269 | | 8,159 | |
| | | | | |
| *It does not include 1250% deductions. | | | |
| | |
| EAD variation |
Million euros |
| | |
| RWA variation |
Million euros |
6.1. Theoretical considerations on securitisation
At the Group, securitisation is treated as stipulated in chapter 5 of the CRR. The assessment of the characteristics to determine whether or not securitisation exists, and consequently whether the transaction has to be processed under the conditions described in this section, is based on the legal format and economic basis of the transaction.
Pursuant to the CRR, the following concepts shall be interpreted using these regulatory definitions:
Securitisation: a financial transaction or scheme whereby the credit risk associated with an exposure or pool of exposures is divided into tranches, with both of the following characteristics:
a. Payments for the transaction or scheme are dependent upon the performance of the exposure or pool of exposures.
b. The subordination of the tranches determines the distribution of losses during the ongoing life of the transaction or scheme.
Securitisation position: exposures arising from securitisations. For these purposes, the providers of credit risk
hedges for specific securitisation positions are considered to hold positions in the securitisation.
Tranche: a contractually established segment of the credit risk associated with an exposure or pool of exposures, where a position in the segment entails a risk of credit loss greater or less than a position of the same amount in each of the other segments, without taking account of credit protection provided by third parties directly to the holders of positions in the segment or any of the other segments. In this respect, the whole securitisation position either forms part of a tranche or is a tranche in itself. The following terms can also be used:
First-loss tranche: the most subordinated tranche of a securitisation, which is the first tranche to bear losses on the securitised exposures and therefore provides protection for the second-loss tranche and, where applicable, the senior tranches.
Mezzanine tranche: a securitisation position that is subordinated to the senior securitisation position, senior to the first-loss tranche and subject to a risk weight of less than 1 250% and more than 25%.
Senior tranche: all tranches other than the first loss or mezzanine tranches. Within the senior tranche, the super senior tranche is the top tranche in the priority of payments, without taking into account for these purposes of any
| | | | | | | | | | | |
113 | | 2021 Pillar 3 Disclosures Report | |
| | |
CREDIT RISK - SECURITISATIONS 2021 Pillar 3 Disclosures Report |
amounts owed under interest rate or currency derivatives, brokerage charges or similar payments.
Traditional securitisations: a securitisation in which the economic interest in the securitised exposures is transferred by the transfer of ownership of those exposures from the originator to an SSPE (securitisation special purpose entity) or by sub-participation of an SSPE, where the securities issued do not represent payment obligations of the originator.
Synthetic securitisation: a securitisation where the transfer of risk is achieved by the use of credit derivatives or guarantees, and the exposures being securitised remain exposures of the originator institution.
Resecuritisation: securitisation where the risk associated with an underlying pool of exposures is divided into tranches and at least one of the underlying exposures is a securitisation position.
Asset-backed commercial paper (ABCP) programme: a securitisation programme in which the securities issued predominantly take the form of commercial paper with an original maturity of one year or less.
Investment entity: any institution or subject, other than the originator or sponsor institution, holding a securitisation position.
Originator institution: is an institution that:
a. itself or through related entities was, directly or indirectly, involved in the original agreement that created the obligations or potential obligations of the debtor or potential debtor giving rise to the exposure being securitised; or
b. purchases a third party's exposures for its own account and then securitises them.
Sponsor institution: an institution other than the originator that establishes and manages an asset-backed commercial paper programme, or other securitisation scheme, that purchases exposures from third-party entities and to which liquidity or credit facilities or other credit enhancements are generally granted.
6.2. Securitisation accounting policies
This section covers letter (g) of the qualitative requirement SECA - Qualitative disclosure requirements related to securitisation exposures.
The rule for derecognising securitised assets is that set by IFRS 9 Financial Instruments for the derecognition of financial assets in accounts (section 3.2.). The accounting treatment of transfers of financial assets depends on the form and extent to which the cash flows, risks and rewards are transferred to third parties, along with the control of the assets transferred:
1.Where substantially all the risks and rewards are transferred to third parties, e.g. in asset securitisations in which the transferor neither retains subordinated debt nor grants any credit enhancement to the new holders, the transferred financial assets are derecognised. Any right or obligation retained or created in the transfer is recognised. The difference between the carrying amount recorded prior to the transfer and the fair value of the retained rights or obligations is recognised in income for the year.
2.Where substantially all the risks and rewards associated with the transferred financial asset are retained (as in securitisations in which subordinated debt or some other type of credit enhancements are retained that absorb substantially all of the expected credit losses for the transferred asset or the probable variation of its future net cash flows), the transferred financial asset is not derecognised and continues to be measured using the same criteria as before the transfer. The following are also recognised for accounting purposes:
a.An associated financial liability, which is recognised for an amount equal to the consideration received and is subsequently measured at amortised cost, unless it meets the requirements for classification at fair value through profit or loss.
b.The income from the financial asset that has been transferred but not derecognised and any expense incurred on the new financial liability are presented on the income statement without netting.
3.The following distinction is made when substantially all the risks and rewards associated with the transferred financial asset are neither transferred nor retained, e.g. in securitisations in which the transferor takes on subordinated debt or some other type of credit enhancement for a portion of the transferred asset and thus significantly, but not substantially, reduces its exposure to variations in the present value of future net cash flows:
a.Where the transferor does not retain control of the transferred financial asset: the transferred financial asset is derecognised and any right or obligation retained or created in the transfer is recognised.
b.Where the transferor retains control of the transferred financial asset: it continues to recognise the transferred financial asset on its balance sheet for an amount equal to its exposure to possible changes in value and recognises a financial liability associated with the transferred financial asset. The net amount of the transferred asset and the associated liability is:
•The amortised cost of the rights and obligations retained, if the transferred asset is measured at amortised cost, or
•The fair value of the rights and obligations retained, if the transferred asset is measured at fair value.
Accordingly, financial assets are only derecognised when any of the following circumstances occur:
•The rights to the future cash flows they generate have been extinguished.
•The risks and benefits have been substantially transferred to third parties.
•If not all risks and benefits are retained or transferred, when control has been transferred.
There have been no changes with respect to the previous year in the methods, assumptions and key data used to assess the securitised exposures or re-securitisation exposures (i.e. securitisations in which at least one of the underlying exposures is a securitisation exposure)
There is no specific accounting treatment for synthetic securitisations or assets awaiting securitisation.
| | |
CREDIT RISK - SECURITISATIONS 2021 Pillar 3 Disclosures Report |
6.3. Management of the securitisation activity at Santander
This section covers the qualitative requirement SECA - Qualitative disclosure requirements related to securitisation exposures. Letters (d), (e), (f) e (i) are not applicable to Santander. Also the provisions of letters (d), (e), (f) and (g) of the OVA requirement -Institution risk management approach, are complied with.
6.3.1. Santander securitisation objectives and management
Santander pursues various objectives through its securitisation activity:
•Management and diversification of credit risk: the group aims to reduce credit risk concentrations that arise naturally from its commercial activity through securitisation transactions and the subsequent sale of the bonds in the market. The effective transfer of risks achieved through these transactions enables the group to optimise its credit risk exposure and contributes to value creation by reducing Banco Santander's need to retain own funds.
•Obtaining liquidity: securitisation enables Santander to mobilise its balance sheet by transforming illiquid assets into liquid assets and obtain wholesale funding by selling the transformed assets or using them as collateral. Retained securitisation positions can also be used as collateral for ECB and Bank of England funding.
•Diversifying funding sources: the liquidity obtained from securitisation allows the Group to diversify its funding sources, in terms of maturity and product type.
•Optimisation of capital consumption: in 2021, 13 new securitisations were originated, all involving significant risk transfer.
The Financial Management division draws up the issuances and securitisations plan for each Santander subsidiary/global business annually, on the basis of the liquidity plan and considering certain prudential limits on raising short-term market funding.
Santander has a robust governance process for its securitisations originated with the release of capital, in which transactions are assessed from a risk, capital and regulatory perspective.
The group's management also approves securitisations under different scenarios (including stress scenarios)
6.3.2. Santander securitisation functions
Santander's role in the securitisation process is mainly that of originator of the underlying assets being securitised. Nevertheless, in addition to originating the underlying payments, the Group also plays a role in servicing the loans and granting subordinated loans. It also acts as a
counterparty, when needed, in the interest rate swap agreement for the SSPE that acquires the loans.
Santander also acts as an investor, acquiring positions in SSPEs originated by non-group entities and/or retaining a portion of the positions originated by Banco Santander.
The Group is the sponsor of a securitisation whose underlying consists of loans granted by various financial institutions to SSPEs of mortgage-backed bonds to cover the reserve fund.
Santander also structures and places its own securitisations, as it does for third parties, and leads and promotes new structures in various jurisdictions for both funding and risk transfer purposes. This activity is situated in the context of a revival of securitisation as a tool for channelling credit to the real economy, with a special focus on SMEs.
| | | | | | | | | | | |
115 | | 2021 Pillar 3 Disclosures Report | |
| | |
CREDIT RISK - SECURITISATIONS 2021 Pillar 3 Disclosures Report |
The following table gives a breakdown of the securitisation positions purchased or retained by securitised asset class and the Bank’s role in the securitisation at 31 December 2021:
| | | | | | | | | | | | | | | | | | | | | | | | | | | | | | | | | | | | | | | | | |
| Table 52.Securitisation positions purchased and retained with risk transfer by exposure type in the banking book |
| EUR million |
| 2021 | | 2020 |
| Exposure | RWA | | EAD | RWA |
| Originator | Investor | Sponsor | Originator | Investor | Sponsor | | Originator | Investor | Sponsor | Originator | Investor | Sponsor |
| Traditional securitisations | 631 | 14,552 | — | 139 | 2,944 | — | | 1,392 | 11,071 | — | 454 | 2,154 | — |
| Residential mortgages | — | 3,567 | — | — | 713 | — | | 6 | 1,670 | — | 1 | 371 | — |
| Commercial mortgages | — | — | — | — | — | — | | — | — | — | — | — | — |
| Credit cards | — | 120 | — | — | 41 | — | | — | 105 | — | — | 39 | — |
| Leasing | — | 158 | — | — | 104 | — | | — | 297 | — | — | 145 | — |
| Loans to corporates or to SMEs treated as corporates | — | 4,077 | — | — | 947 | — | | — | 2 | — | — | — | — |
| Consumer loans | 629 | 3,807 | — | 139 | 701 | — | | 1,386 | 4,032 | — | 453 | 687 | — |
| Receivables | — | 1,270 | — | — | 190 | — | | — | — | — | — | — | — |
| Securitisation positions | — | — | — | — | — | — | | — | — | — | — | — | — |
| Others | 2 | 1,554 | — | — | 247 | — | | — | 4,966 | — | — | 913 | — |
| Resecuritisations | — | — | — | — | — | — | | — | — | — | — | — | — |
| Securitisation positions | — | — | — | — | — | — | | — | — | — | — | — | — |
| Synthetic securitisations | 32,307 | — | — | 6,186 | — | — | | 26,647 | 205 | — | 5,300 | 251 | — |
| Loans to corporates or to SMEs treated as corporates | — | — | — | — | — | — | | 7,606 | 102 | — | 954 | 143 | — |
| Consumer loans | 3,192 | — | — | 477 | — | — | | 4,190 | — | — | 651 | — | — |
| Receivables | — | — | — | — | — | — | | — | — | — | — | — | — |
| Residential mortgages | — | — | — | — | — | — | | — | — | — | — | — | — |
| Commercial mortgages | 19,491 | — | — | 4,261 | — | — | | — | — | — | — | — | — |
| Credit cards | 4,085 | — | — | 732 | — | — | | — | — | — | — | — | — |
| Leasing | — | — | — | — | — | — | | — | — | — | — | — | — |
| Others | 5,539 | — | — | 715 | — | — | | 14,852 | 102 | — | 3,695 | 107 | — |
| Total | 32,937 | 14,552 | — | 6,325 | 2,944 | — | | 28,040 | 11,276 | — | 5,754 | 2,405 | — |
The following diagram depicts the distribution of the Group’s exposure by activity at 31 December 2021:
| | |
CREDIT RISK - SECURITISATIONS 2021 Pillar 3 Disclosures Report |
| | | | | | | | |
| Distribution of the group’s securitisation function (EAD) |
| | |
| Overview | Originator Activity | Investor Activity |
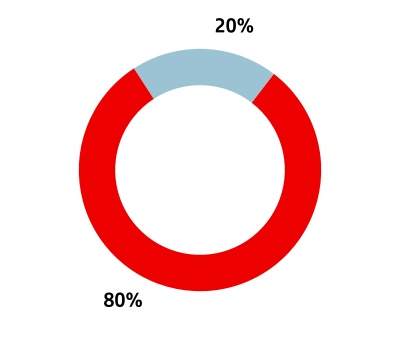
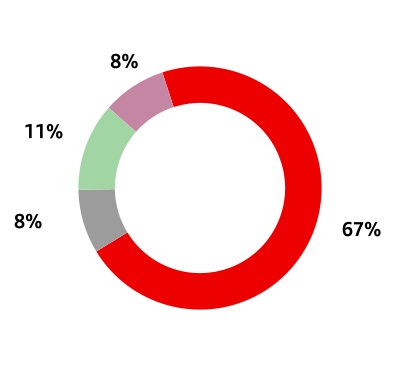
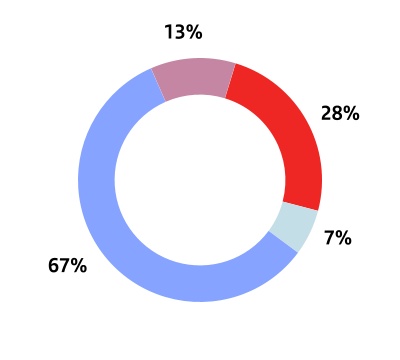
| | | | | | | | | | | | | | | | | | | | | | | | | | | | | | | | | | | | | | |
| n | Originator | | n | Spain | n | Italy | | n | USA | n | Germany |
| n | Investor | | n | Germany | n | USA | | n | UK | n | Spain |
| | | | n | Portugal | n | Others | | n | France | n | Others |
| | | | n | UK | | | | n | Italy | | |
The information on the securitisation positions of the investment and trading portfolio of Santander is included.
As indicated in the graph, originator activity accounts for more than 80% of Santander securitisation activity, while investment activity accounts for 20%.
67% of the volume of securitisations originated by Santander is concentrated in Spain.
On the investment side, 67% of acquisitions of investment positions are concentrated in Spain and the United States 28%, as shown in the graph on the right.
6.3.3. Risk inherent to the securitisation activity at Santander
Securitisation offers advantages in terms of lower funding costs and better risk management. However, it exposes investors to certain inherent risks. Santander is not exposed to any additional risk by acting as the originator or sole investor in a securitisation. In fact, doing so reduces liquidity risk by transforming illiquid assets (the loans originated) into liquid assets (securitisation bonds).
Acting as the originator and as one of the investors in the issue, subjects the Group to the following risks:
•Credit risk: the risk that borrowers will fail to meet their contractual obligations in due time and proper form, with the consequent impairment of the underlying assets backing the securitisation positions. Credit risk is assessed by external credit rating agencies, which assign ratings to the securitisation positions. At the Group, the maximum exposure in the banking book is limited by rating (AAA, AA, A, BBB) and by type of underlying. In addition, the group continuously monitors published data on default of the underlying, the credit quality of the originator and mandatory minimum ratios and ratings in the structure, as well as data on granularity, geographical distribution and type of underlying.
•Prepayment risk: the risk of early repayment of some or all of the assets underlying the securitisation, so that the securitisation positions mature before the contractual maturity date of the underlying assets. Calculations of the
average life, return and duration of securitisation positions is subject, among other things, to assumptions about the rate at which the underlying assets will be prepaid, which may vary. This risk is practically non-existent at Santander as the contractual maturity of the securities issued is usually longer than that of any underlying.
•Basis risk: this risk arises when there is a mismatch between the interest rates or maturities of the securitised assets and those of the securitisation positions. At Santander this risk is usually hedged with swaps.
•Exchange rate risk: this exists in securitisations where the securitised assets and the securitisation positions are denominated in different currencies. At the Group, the risk arising from the currency mismatch between the underlying and the issue is usually hedged in the structure through a swap (excluding synthetic securitisations). The P&L risk assumed in non-euro bonds is managed by the Active Credit Portfolio Management (ACPM) area.
•Liquidity risk: this risk is diminished through the securitisation process, whereby naturally illiquid assets are transformed into debt securities that can be traded on organised financial markets. In some securitisations, however, such as those which issue commercial paper, liquidity risk is still significant and is manifested in the need to cover potential timing mismatches between interest payments on the underlying assets and payments of interest on the securities. At Santander, this risk tends to be very small and is mitigated by liquidity facilities included in the structure (excluding synthetic securitisations). The liquidity risk associated with investing in bond positions is managed by establishing maximum holding periods.
•Counterparty risk: in synthetic securitisations, there is no portfolio sale to a Special Purpose Vehicle (SPV). Banco Santander buys financial guarantees from an SPV (which then issues a Credit Link Note (CLN)) or the end investor to transfer risk. The financial guarantees received can be funded or unfunded. In the latter case, Banco Santander
| | | | | | | | | | | |
117 | | 2021 Pillar 3 Disclosures Report | |
| | |
CREDIT RISK - SECURITISATIONS 2021 Pillar 3 Disclosures Report |
has to reclaim the losses from the investor, which generates counterparty risk.
Santander conducts annual reviews on the securitisations originated with the release of capital, assessing various parameters from a risks and capital perspective. These reviews are submitted to the relevant management bodies.
6.3.4. Santander securitisation activity
In 2021, Santander Group originated fourteen securitizations in order to obtain SRT and Full Deduction risk transfer.
Santander also originates and holds positions in traditional securitisation funds whose underlying portfolios mainly comprise consumer and corporate loans.
In the context of securitisation efficiency, it seeks the STS label for most of its operations (both its synthetic and traditional securitisations). Different entities structure in different ways (sale of the mezzanine tranche, the first-loss tranche or sale of all tranches), whether or not the STS label is achieved. The group has established a governance structure to ensure STS requirements are complied with.
The Group is also the originator of 34 synthetic securitisation funds, 8 of which were originated in 2021. The underlying assets of those originated this year are loans to SMEs, project finance loans and auto loans.
Santander is awarded a rating by one or more of the following external rating agencies for each of these traditional structures, regardless of the underlying product: Standard & Poors, Moody's, Fitch, DBRS, Arc, Scope and KROLL. The group obtains ratings from at least two of these agencies when a traditional securitisation is placed on the market.
For two of the synthetic securitisations, two external ratings have been requested.
With regard to investment activity, Santander holds positions in securitisation funds originated by entities outside the Group whose underlying assets mainly comprise receivables, credit cards, and corporate, SME and mortgage loans. As Santander limits its maximum exposure by rating (AAA, AA, A, BBB), it does not usually employ hedging techniques to mitigate the risk.
Monitoring process for changes in associated risk:
•Securitisation positions originated: periodic monitoring is the responsibility of the different securitisation fund managers (trustees/management companies) that prepare regular reports containing an update of the rating performance of the bonds' underlying portfolios.
•Securitisation positions invested in: published NPL metrics (90+, default, recoveries) and prepayments are monitored regularly using specialised software, which also checks whether the established rating-based limits are being met.
The processes mentioned above serve to monitor changes in credit and market risk for securitisation exposures.
The performance of the underlying assets particularly affects the duration of the tranches. It is unlikely that this will affect the principal bearing in mind the high levels of subordination and continuous monitoring.
The following tables show the distribution, by type of underlying asset, of the securitisation positions issued and repurchased by the Group as an originator, investor and sponsor at 31 December 2020, in both the banking book and trading book.
The following table shows the exposure of all securitisations in the banking book, distinguishing between wholesale and retail underlyings:
| | |
CREDIT RISK - SECURITISATIONS 2021 Pillar 3 Disclosures Report |
| | | | | | | | | | | | | | | | | | | | | | | | | | | | | | | | | | | | | | | | | | | | | | | | | | | | | |
| Table 53.SEC1 - Securitisation exposures in the non-trading book |
| EUR million | | | | | | | | | |
| | | | | 2021 |
| Bank acting as originator | | Bank acting as sponsor | | Bank acting as investor |
| Traditional | Synthetic | Sub-total | | Traditional | Synthetic | Sub-total | | Traditional | Synthetic | Sub-total |
| STS | Non-STS | | of which SRT | | STS | Non-STS | | STS | Non-STS |
| | of which SRT | | of which SRT | | |
| Total exposures | 1,319 | 23 | 23,609 | 608 | 35,297 | 32,307 | 60,225 | | — | — | — | — | | 322 | 14,230 | — | 14,552 |
| Retail (total) | 1,319 | 23 | 23,468 | 608 | 8,256 | 8,256 | 33,043 | | — | — | — | — | | 216 | 7,901 | — | 8,117 |
| Residential mortgages | — | — | 6,723 | — | — | — | 6,723 | | — | — | — | — | | 114 | 3,452 | — | 3,567 |
| Credit card | — | — | — | — | — | — | — | | — | — | — | — | | — | 120 | — | 120 |
| Other retail exposures | 1,319 | 23 | 16,745 | 608 | 8,256 | 8,256 | 26,320 | | — | — | — | — | | 102 | 4,330 | — | 4,431 |
| Resecuritisation | — | — | — | — | — | — | — | | — | — | — | — | | — | — | — | — |
| Wholesales (total) | — | — | 141 | — | 27,041 | 24,050 | 27,182 | | — | — | — | — | | 106 | 6,329 | — | 6,434 |
| Loans to corporates | — | — | — | — | 19,491 | 19,491 | 19,491 | | — | — | — | — | | 56 | 4,021 | — | 4,077 |
| Commercial mortgage | — | — | — | — | 3,192 | 3,192 | 3,192 | | — | — | — | — | | — | — | — | — |
| Finance leases and receivables | — | — | — | — | — | — | — | | — | — | — | — | | 50 | 1,377 | — | 1,427 |
| Other wholesale exposures | — | — | 141 | — | 4,358 | 1,368 | 4,499 | | — | — | — | — | | — | 930 | — | 930 |
| Resecuritisation | — | — | — | — | — | — | — | | — | — | — | — | | — | — | — | — |
| | | | | | | | | | | | | | | | | |
| Note: The securitisation portfolio has been considered as a whole (positions bought and retained) |
| | | | | | | | | | | | | | | | | | | | | | | | | | | | | | | | | | | | | | |
| Table 54.SEC2 - Securitisation exposures in the trading book |
| EUR million |
| | 2021 |
| Bank acting as originator | Bank acting as sponsor | Bank acting as investor |
| Traditional | Synthetic | Subtotal | Traditional | Synthetic | Subtotal | Traditional | Synthetic | Subtotal |
| STS | Non-STS | STS | Non-STS | STS | Non-STS |
| Total | — | — | — | — | — | — | — | — | 38 | 95 | — | 133 |
| Retail (total) | — | — | — | — | — | — | — | — | 38 | 95 | — | 133 |
| Residential mortgages | — | — | — | — | — | — | — | — | 1 | 72 | — | 73 |
| Credit card | — | — | — | — | — | — | — | — | — | — | — | — |
| Other retail exposures | — | — | — | — | — | — | — | — | 36 | 24 | — | 60 |
| Resecuritisation | — | — | — | — | — | — | — | — | — | — | — | — |
| Wholesales (total) | — | — | — | — | — | — | — | — | — | — | — | — |
| Loans to corporates | — | — | — | — | — | — | — | — | — | — | — | — |
| Commercial mortgage | — | — | — | — | — | — | — | — | — | — | — | — |
| Finance leases and receivables | — | — | — | — | — | — | — | — | — | — | — | — |
| Other wholesale exposures | — | — | — | — | — | — | — | — | — | — | — | — |
| Resecuritisation | — | — | — | — | — | — | — | — | — | — | — | — |
| | | | | | | | | | | |
119 | | 2021 Pillar 3 Disclosures Report | |
| | |
CREDIT RISK - SECURITISATIONS 2021 Pillar 3 Disclosures Report |
Finally, in its role as originator and investment entity for securitisations, Santander complies with the requirements relating to the retention of economic interest and requirements established in procedure and control policies for all securitisation funds issued since 1 January 2011. We have to distinguish between the requirements for originators and for investment positions:
Securitisations originated:
•Santander always retains a minimum of 5% of the net economic interest.
•Santander makes available to investors all the information needed to ensure the risks of the investment are fully known before purchase and to enable regular monitoring of the performance of the investment. This information includes details of the risk criteria applied to the securitised exposures, which in all cases are the same as for the non-securitised exposures in the originator's balance sheet.
Investment positions in securitisations:
•The Group performs due diligence to ensure that the investment risks are understood before purchase and to be able to monitor the performance of the investment on a regular basis.
•The Group verifies that the originators of the securitisations in which it invests retain a 5% net economic interest.
6.4. Capital requirements - Securitisations
Santander calculates regulatory capital under the securitisation approach for positions held in originated securitisations only if the regulatory conditions established in the CRR for significant risk transfer are met. Otherwise, capital is calculated for the securitised exposures as if they had never been securitised. Capital is also calculated for investment positions in securitisation funds originated by third parties.
Regulation (EU) 2017/2401 on securitisations entered into force on 1 January 2019.
This new framework modifies the calculation methods for capital requirements. Firstly, with the aim of ruling out any form of automatic recourse to external ratings, the entity must use its own calculation of regulatory capital requirements so long as it is authorised to apply the internal ratings-based approach for securitisations (SEC-IRBA). Entities that cannot use the SEC-IRBA must apply the standardised approach (SEC-SA) to securitisations. The SEC-SA must be based on a formula which takes as its input data the capital requirements calculated under the standardised approach for credit risk. When neither of these two approaches are available, the entities must adopt the external ratings-based approach for securitisations (SEC-ERBA). In accordance with SEC-ERBA, capital requirements must be assigned to securitisation tranches on the basis of their external rating.
Capital requirements for securitisation positions are calculated by applying the appropriate risk weight to the exposure value of each position, depending on the approach used by the entity to calculate the risk-weighted exposure amounts of the securitised portfolio.
For new securitisations generated in 2020, capital requirements are calculated using the new approaches under the new Regulation (EU) 2017/2401 on securitisations.
In November 2020, the BCBS published a technical amendment establishing prudential treatment for securitisations of non-performing loans. In 2021, this technical amendment was transposed into an EU regulation as part of the 'quick fix' for securitisations implemented through two EU regulations, as explained below.
In April 2021, the 'quick fix' for securitisations was published, which in turn consists of two regulations. Regulation (EU) 2021/557 amending Regulation (EU) 2017/2402 (Securitisation Regulation) laying down a general framework for securitisation and creating a specific framework for simple, transparent and standardised securitisation (STS) to help the recovery from the covid-19 crisis. The covid-19 crisis may increase the amount of non-performing exposures, making management of these exposures by institutions even more important. One way for institutions to do this is to trade their non-performing exposures in the market through securitisation. Moreover, in the current context, it is crucial that risks are shifted away from the systemically important parts of the financial system and that lenders strengthen their capital position. Synthetic securitisation is one way to achieve this, as is, for example, raising new equity. In addition to establishing a framework for securitisations of non-performing exposures, this regulation also aims to extend the benefits of STS securitisation to synthetic securitisations.
Regulation 2021/558 amending Regulation 575/2013 (CRR) to specify the capital requirements applicable to the changes introduced by Regulation 2021/557, such as securitisations of NPLs, senior tranches of STS synthetic securitisations, etc.
Below we show positions in securitisations with risk transfer and in investment and sponsoring positions on the banking book, based on the approach used to calculate regulatory capital:
| | |
CREDIT RISK - SECURITISATIONS 2021 Pillar 3 Disclosures Report |
| | | | | | | | | | | | | | | | | | | | | | | | | | | | | | | | |
| Table 55.Breakdown of repurchased positions in SSPEs with risk transfer, distributed by function and approach used |
| EUR million |
| 2021 | 2020 |
| On-balance
sheet amount
exposures | Off-balance
sheet amount
exposures | EAD | EAD after
capital
reductions | RWA* | On-balance
sheet amount
exposures | Off-balance
sheet amount
exposures | EAD | EAD after
capital
reductions | RWA* |
| Originator - standardised approach | — | — | — | — | — | — | — | — | — | — |
| Originator - SEC standardised approach | 3,779 | — | 3,768 | 3,745 | 570 | 3,496 | — | 2,699 | 2,699 | 393 |
| Originator - SEC ERB approach | 1,479 | 1 | 1,469 | 1,429 | 583 | 1,516 | — | 1,063 | 1,038 | 630 |
| Originator - RB approach | — | — | — | — | — | — | — | — | — | — |
| Originator - SF approach | — | — | — | — | — | — | — | — | — | — |
| Originator - IRB approach | 27,784 | 15 | 27,683 | 27,617 | 5,226 | 28,921 | 43 | 24,248 | 24,182 | 4,731 |
| Originator - 1250% | 667 | 14 | 17 | — | — | 5,804 | — | 30 | — | — |
| Total originator | 33,709 | 30 | 32,937 | 32,791 | 6,379 | 39,738 | 43 | 28,040 | 27,919 | 5,754 |
| Investor - standardised approach | — | — | — | — | — | — | — | — | — | — |
| Investor - SEC standardised approach | 12,406 | 173 | 12,573 | 12,570 | 2,126 | 8,820 | — | 8,820 | 8,814 | 1,428 |
| Investor - SEC ERB approach | 1,916 | 62 | 1,977 | 1,977 | 818 | 2,455 | — | 2,455 | 2,455 | 977 |
| Investor - RB approach | — | — | — | — | — | — | — | — | — | — |
| Investor - SF approach | — | — | — | — | — | — | — | — | — | — |
| Investor - IRB approach | — | — | — | — | — | — | — | — | — | — |
| Investor - 1250% | 1 | — | 1 | — | — | — | — | — | — | — |
| Total investor | 14,322 | 235 | 14,552 | 14,548 | 2,944 | 11,276 | — | 11,276 | 11,269 | 2,405 |
| Sponsor - standardised approach | — | — | — | — | — | — | — | — | — | — |
| Sponsor - SEC standardised approach | — | — | — | — | — | — | — | — | — | — |
| Sponsor - SEC ERB approach | — | — | — | — | — | — | — | — | — | — |
| Sponsor - RB approach | — | — | — | — | — | — | — | — | — | — |
| Sponsor - SF approach | — | — | — | — | — | — | — | — | — | — |
| Sponsor - IRB approach | — | — | — | — | — | — | — | — | — | — |
| Sponsor - 1250% | — | — | — | — | — | — | — | — | — | — |
| Total sponsor | — | — | — | — | — | — | — | — | — | — |
| Total | 48,031 | 265 | 47,489 | 47,338 | 9,322 | 51,013 | 43 | 39,316 | 39,188 | 8,159 |
| Of which: traditional securitisations | 15,607 | 265 | 15,182 | 15,159 | 3,115 | 19,510 | 43 | 12,463 | 12,438 | 2,608 |
| Of which: synthetic securitisations | 32,424 | — | 32,307 | 32,180 | 6,207 | 31,503 | — | 26,852 | 26,751 | 5,551 |
| | | | | | | | | | |
| On and off-balance sheet totals before provisions and after outflows to other regulatory reports. |
| EAD IRB (RBA & SFA): exposures net of collateral, before provisions and deductions and after outflows to other regulatory reports. | |
| EAD STD: exposures net of collateral, before deductions and after provisions and outflows to other regulatory reports. | | |
| RWA IRB (RBA & SFA): after provisions, deductions and outflows to other regulatory reports and before application of the limit. |
| RWA STD: after provisions, deductions and outflows to other regulatory reports and before application of the limit. | | | |
*RWA before CAP. | | | | | | | | | | |
It should be noted that for all securitisations which qualify for a weight of 1250%, the entity deducts this exposure from equity.
As shown in table 55, exposure has increased by 20.8%, due to the increase in exposures in securitisations originated by the Group. This year, 14 new securitisations with significant
risk transfer were originated, with the main goal of optimising capital consumption.
Securitisation positions in the trading portfolio are eliminated from the regulatory capital calculation based on an internal market risk model and are included in the calculation of capital for specific risk, in accordance with article 335 of the
| | | | | | | | | | | |
121 | | 2021 Pillar 3 Disclosures Report | |
| | |
CREDIT RISK - SECURITISATIONS 2021 Pillar 3 Disclosures Report |
CRR. The correlation trading portfolio is also included among these positions. This book consists of securitisation positions and nth-to-default derivatives that meet all the criteria in article 338.1 of the CRR. Therefore, none of these positions are considered in the VaR spread and IRC calculation, although they are included in the interest rate VaR calculation (general risk). For these positions, capital is calculated as if they were securitisation positions in the banking book, so that capital requirements are calculated taking into account the new approaches considered in the new Regulation (EU) 2017/2401 on securitisations.
Finally, Regulation (EU) 2017/2402 on securitisations came into force from 1 January 2019. This regulation changes the prudential requirements for credit institutions and investment firms, establishing new treatment for securitisation positions.
One of the most significant changes is that positions in preferential securitisation tranches may not consume more capital than the loan portfolio. It also provides for a more favourable treatment for senior tranches of STS (simple, transparent and standardised) securitisations which was updated on 31 March 2021 Regulation (EU) 2021/558 amending Regulation (EU) No 575/2013 as regards adjustments to the securitisation framework to support the economic recovery in response to the covid-19 crisis.
A breakdown of all securitisations in the banking book is provided below, together with the corresponding capital consumption arranged by RW (risk weighting) interval and the calculation method employed when the Group acts as originator or sponsor.
| | | | | | | | | | | | | | | | | | | | | | | | | | | | | | | | |
| Table 56.SEC3 - Securitisation exposures in the non-trading book and associated regulatory capital requirements - institution acting as originator or as sponsor |
| EUR million |
| 2021 |
| Exposure values (by RW bands/deductions) | | Exposure values (by regulatory approach) |
| <= 20% | > 20% to 50% | > 50% to 100% | > 100% to 1250% | 1250% RW/ deductions | | SEC-IRBA | SEC-ERBA
(including IAA) | SEC-SA | 1250%/ deductions |
| Total exposure | 19,882 | 12,133 | 767 | 8 | 147 | | 27,617 | 1,429 | 3,745 | 147 |
| Traditional securitisation | 172 | 306 | 133 | — | 20 | | 477 | 134 | — | 20 |
| Securitisation | 172 | 306 | 133 | — | 20 | | 477 | 134 | — | 20 |
| Retail underlying | 172 | 306 | 133 | — | 20 | | 477 | 134 | — | 20 |
| Of which STS | 15 | 1 | — | — | 7 | | 15 | 1 | — | 7 |
| Wholesale | — | — | — | — | — | | — | — | — | — |
| Of which STS | — | — | — | — | — | | — | — | — | — |
| Re-securitisation | — | — | — | — | — | | — | — | — | — |
| Synthetic securitisation | 19,710 | 11,827 | 634 | 8 | 127 | | 27,139 | 1,295 | 3,745 | 127 |
| Securitisation | 19,710 | 11,827 | 634 | 8 | 127 | | 27,139 | 1,295 | 3,745 | 127 |
| Of which, retail underlying | 7,037 | 1,134 | — | 8 | 77 | | 4,116 | 997 | 3,066 | 77 |
| Of which, wholesale underlying | 12,673 | 10,693 | 634 | — | 50 | | 23,023 | 298 | 679 | 50 |
| Of which, resecuritisation | — | — | — | — | — | | — | — | — | — |
| | | | | | | | | | | | | | | | | | | | | | | | | | | | | |
| EUR million | |
| 2021 |
| RWEA (by regulatory approach)* | | RWEA (by regulatory approach) |
| SEC-IRBA | SEC-ERBA
(including IAA) | SEC-SA | 1250%/ deductions | | SEC-IRBA | SEC-ERBA
(including IAA) | SEC-SA | 1250%/ deductions |
| Total exposure | 5,226 | 583 | 570 | — | | 418 | 44 | 44 | — |
| Traditional securitisation | 103 | 68 | — | — | | 8 | 3 | — | — |
| Securitisation | 103 | 68 | — | — | | 8 | 3 | — | — |
| Retail underlying | 103 | 68 | — | — | | 8 | 3 | — | — |
| Of which STS | 2 | — | — | — | | — | — | — | — |
| Wholesale | — | — | — | — | | — | — | — | — |
| Of which STS | — | — | — | — | | — | — | — | — |
| Re-securitisation | — | — | — | — | | — | — | — | — |
| Synthetic securitisation | 5,122 | 515 | 570 | — | | 410 | 41 | 44 | — |
| Securitisation | 5,122 | 515 | 570 | — | | 410 | 41 | 44 | — |
| Of which, retail underlying | 565 | 230 | 465 | — | | 45 | 18 | 36 | — |
| Of which, wholesale underlying | 4,557 | 284 | 105 | — | | 365 | 23 | 8 | — |
| Of which, resecuritisation | — | — | — | — | | — | — | — | — |
| | | | | | | | | |
| *RWA do not include tranches that have a risk weight of 1250% due to they are deducted from Common Equity Tier 1. |
| CRR Fully-loaded, IFRS 9 Phased-in. | | | | | | | | | |
| Following Mapping tool defined by the EBA, RWAs are before CAP adjustment, capital requirements after. |
| | |
CREDIT RISK - SECURITISATIONS 2021 Pillar 3 Disclosures Report |
The following table shows the aggregate value of securitisation positions purchased and retained in the trading portfolio.
| | | | | | | | | | | | | | | | | | | | |
| Table 57.Aggregate amount of securitisation positions purchased and retained. Trading book |
| EUR million | | | | | | |
| 2021 |
| Investor positions | Originator positions | Sponsor positions |
| ABS PORTFOLIO | Mark to market | RWA | Mark to market | RWA | Mark to market | RWA |
| SEC - ERBA approach | | | | | | |
| 10 -12% | 25 | 2 | — | — | — | — |
| 12-20% | 57 | 8 | — | — | — | — |
| 20-40% | 3 | 1 | — | — | — | — |
| 40-100% | — | — | — | — | — | — |
| 1,250% | — | — | — | — | — | — |
| ABS PORTFOLIO | | | | | | |
| 10 -12% | 1 | — | — | — | — | — |
| 12-20% | 47 | 7 | — | — | — | — |
| 20-40% | — | — | — | — | — | — |
| 40-100% | — | — | — | — | — | — |
| 1,250% | — | — | — | — | — | — |
| Total ABS Portfolio | 133 | 19 | — | — | — | — |
| | | | | | |
| CORRELATION PORTFOLIO | | | | | | |
| SEC - ERBA approach | | | | | | |
| 40-75 % | | | | | | |
| 100% | | | | | | |
| 250% | | | | | | |
| Supervisory formula method | | | | | | |
| FS | | | | | | |
| Total correlation portfolio | — | — | — | — | — | — |
| Total | 133 | 19 | 0 | 0 | 0 | 0 |
| | | | | | |
| The table does not include the RWA of short position correlation, since it does not consume capital. | | | |
| | | | | | | | | | | | | | | | | | | | | | | | | | | | | | | | |
| Table 58.SEC4 - Securitisation exposures in the non-trading book and associated regulatory capital requirements - institution acting as investor |
| EUR million |
| 2021 |
| Exposure values (by RW bands/deductions) | | Exposure values (by regulatory approach) |
| <= 20% | > 20% to 50% | > 50% to 100% | > 100% to 1250% | 1250% | | SEC-IRBA | SEC-ERBA
(including IAA) | SEC-SA | 1250% |
| Total exposure | 11,319 | 2,766 | 251 | 212 | 4 | | — | 1,977 | 12,570 | 4 |
| Traditional securitisation | 11,319 | 2,766 | 251 | 212 | 4 | | — | 1,977 | 12,570 | 4 |
| Securitisation | 11,319 | 2,766 | 251 | 212 | 4 | | — | 1,977 | 12,570 | 4 |
| Retail underlying | 7,526 | 368 | 116 | 104 | 4 | | — | 1,357 | 6,756 | 4 |
| Of which STS | 216 | — | — | — | — | | — | 13 | 203 | — |
| Wholesale | 3,793 | 2,398 | 135 | 108 | — | | — | 620 | 5,814 | — |
| Of which STS | 106 | — | — | — | — | | — | — | 106 | — |
| Re-securitisation | — | — | — | — | — | | — | — | — | — |
| Synthetic securitisation | — | — | — | — | — | | — | — | — | — |
| Securitisation | — | — | — | — | — | | — | — | — | — |
| Of which, retail underlying | — | — | — | — | — | | — | — | — | — |
| Of which, wholesale underlying | — | — | — | — | — | | — | — | — | — |
| Of which, resecuritisation | — | — | — | — | — | | — | — | — | — |
| | | | | | | | | | | |
123 | | 2021 Pillar 3 Disclosures Report | |
| | |
CREDIT RISK - SECURITISATIONS 2021 Pillar 3 Disclosures Report |
| | | | | | | | | | | | | | | | | | | | | | | | | | | | | |
| EUR million | | | | | | | | | |
| 2021 |
| RWEA (by regulatory approach) | | RWEA (by regulatory approach) |
| SEC-IRBA | SEC-ERBA
(including IAA) | SEC-SA | 1250% | | SEC-IRBA | SEC-ERBA
(including IAA) | SEC-SA | 1250% |
| Total exposure | — | 818 | 2,126 | — | | — | 65 | 170 | — |
| Traditional securitisation | — | 818 | 2,126 | — | | — | 65 | 170 | — |
| Securitisation | — | 818 | 2,126 | — | | — | 65 | 170 | — |
| Retail underlying | — | 481 | 1,068 | — | | — | 38 | 85 | — |
| Of which STS | — | 1 | 20 | — | | — | — | 2 | — |
| Wholesale | — | 337 | 1,057 | — | | — | 27 | 85 | — |
| Of which STS | — | — | 12 | — | | — | — | 1 | — |
| Re-securitisation | — | — | — | — | | — | — | — | — |
| Synthetic securitisation | — | — | — | — | | — | — | — | — |
| Securitisation | — | — | — | — | | — | — | — | — |
| Of which, retail underlying | — | — | — | — | | — | — | — | — |
| Of which, wholesale underlying | — | — | — | — | | — | — | — | — |
| Of which, resecuritisation | — | — | — | — | | — | — | — | — |
| | | | | | | | | |
| CRR Fully-loaded, IFRS 9 Phased-in. | | | | | | | | | |
Santander, as an originator institution, retains positions in the funds with risk transfers issued by group entities. Santander also acquires positions in SSPEs originated by non-group entities.
The increase in originator positions by the Group is due to the origination of 14 new securitisations in 2021.
The following table shows the current situation of the underlying portfolio for originated securitisations with risk transfer and the changes compared to 2020.
| | | | | | | | | | | | | | | | | | | | | | | | | | |
| Table 59.Securitisation structures with risk transfer |
| EUR million | | | | | | | | |
| 2021 | 2020 |
| Traditional SPVs | Outstanding balance | Of which, in default | Value adjustments in the period | RWA | Outstanding balance | Of which, in default | Value adjustments in the period | RWA |
| Residential mortgages | 3,566 | 7 | 73 | 713 | 411 | 83 | — | 1 |
| Commercial mortgages | — | — | — | — | — | — | — | — |
| Loans to corporates or to SMEs treated as corporates | 3,967 | — | 2 | 930 | — | — | — | — |
| Consumer loans | 11,659 | 123 | 192 | 1,018 | 7,577 | 131 | 66 | 453 |
| Others | 5,974 | 55 | 94 | 454 | — | — | — | — |
| Resecuritisations | | | | | | | | |
| Securitisation positions | | | | | | | | |
| Total traditional SPVs | 25,166 | 185 | 361 | 3,115 | 7,988 | 214 | 66 | 454 |
| Synthetic securitisation SPVs | | | | | | | | |
| Residential mortgages | 1,623 | 37 | 4 | 191 | — | — | — | — |
| Commercial mortgages | 1,775 | 7 | 13 | 477 | — | — | — | — |
| Loans to corporates or to SMEs treated as corporates | 19,588 | 195 | 39 | 4,267 | 8,539 | 71 | 39 | 954 |
| Consumer loans | 6,466 | 61 | 51 | 841 | 5,159 | 45 | 56 | 651 |
| Others | 4,708 | 88 | 95 | 431 | 16,042 | 176 | 15 | 3,695 |
| Total synthetic securitisation SPVs | 34,160 | 388 | 202 | 6,207 | 29,740 | 291 | 110 | 5,300 |
| Total | 59,326 | 573 | 563 | 9,322 | 37,728 | 505 | 176 | 5,754 |
| | | | | | | | |
| The value adjustments in the period include the value adjustments by asset and provision (generic and specific) deterioration. |
| | |
CREDIT RISK - SECURITISATIONS 2021 Pillar 3 Disclosures Report |
As shown in table 59, during 2021, the outstanding balance of originated securitisations increased due mainly to the increase in securitisations in loans to corporates, SMEs and consumer loans.
In securitisation funds without risk transfer, the Group retains the majority of it positions in the originated securitisation funds, as they do not meet the regulatory conditions for significant risk transfer. For these funds, capital is calculated for the securitised exposures as if the exposures had not been securitised.
The underlying assets securitised in the funds originated by Santander continue to mainly consist of residential mortgages and consumer loans.
| | | | | | | | | | | |
| Table 60.SEC5 - Exposures securitised by the institution - Exposures in default and specific credit risk adjustments |
| EUR million | | | 2021 |
| Exposures securitised by the institution - Institution acts as originator or as sponsor |
| Total outstanding nominal amount | Total amount of specific credit risk adjustments made during the period |
| | Of which exposures in default |
| Total exposures | 140,524 | 2,767 | 1,399 |
| Retail (total) | 110,631 | 1,843 | 1,219 |
| residential mortgage | 23,905 | 202 | 80 |
| credit card | — | — | — |
| other retail exposures | 86,726 | 1,641 | 1,140 |
| re-securitisation | — | — | — |
| Wholesale (total) | 29,893 | 924 | 180 |
| loans to corporates | 20,597 | 233 | 65 |
| commercial mortgage | 3,667 | 14 | 5 |
| lease and receivables | 410 | 1 | — |
| other wholesale | 5,218 | 675 | 110 |
| re-securitisation | — | — | — |
| | | |
| CRR Fully-loaded, IFRS 9 Phased-in. | | | |
| | | | | | | | | | | |
125 | | 2021 Pillar 3 Disclosures Report | |
| | |
CREDIT RISK - SECURITISATIONS 2021 Pillar 3 Disclosures Report |
lkjuhy
| | | | | | | | | | | | | | | | | | | | | | | | | | | | | | | | | | | | | | |
| | |
| Market risk |
|
| |
| 7.1. Activities subject to market risk | |
| 7.2. Capital requirements for market risk | |
| 7.2.1. Internal initiatives on methods for calculating market risk | |
| 7.3. Trading activity | |
7.3.1. Value at Risk | |
7.3.2. Stressed VaR | |
7.3.3. Incremental Risk Charge | |
7.3.4. Stress testing | |
| |
| 7.3.6. Internal validation of the models | |
| 7.4. Structural balance sheet risks | |
| 7.4.1. Main interest rate risk in the banking book (IRRBB) metrics | |
| |
| |
| |
| |
| |
| |
| |
| |
| | |
MARKET RISK 2021 Pillar 3 Disclosures Report |
| | | | | | | | | | | |
| Main figures |
Million euros | | | |
| RWA | | RWA |
| 2021 | | 2020 |
| Market risk | 17,224 | | 17,983 |
| Of which, standardised approach | 6,844 | | 5,047 |
| Of which, IMA | 10,380 | | 12,936 |
| | | | | | | | |
| RWA by calculation approach | | RWA by geography |
| % | | % |
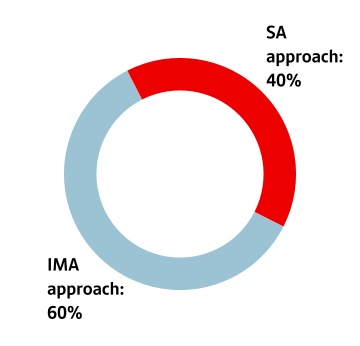

| | | | | |
| n | Spain |
| n | Brasil |
| n | Rest of South America |
| n | North America |
| n | Others |
| |
| |
7.1. Activities subject to market risk
This section covers the qualitative requirement MRA - Qualitative disclosure requirements related to market risk and MRB - Qualitative disclosure requirements for institutions using the internal Market Risk Models.
Also the provisions of letters (d), (e), (f) and (g) of the OVA requirement -Institution risk management approach, are complied with.
The measurement, control and monitoring perimeter of the Market Risk area includes all transactions where risk arises due to changes in market factors. This risk arises from changes in risk factors (interest rate, exchange rate, equities, credit spreads, commodity prices and the volatility of each of these) which may impact earnings or capital, and from the
liquidity risk of the products and markets in which Santander operates.
The activities are segmented according to the purpose of the risk, as follows:
a.Trading: the trading book includes all financial instruments that a bank holds for short-term resale in order to profit from short-term price movements, to make arbitrage profits or to hedge risks arising from the positions or instruments in this portfolio. This includes the provision of financial services in the markets to customers where the bank is the counterparty, as well as proprietary trading and positioning primarily in fixed income, equities, currencies and commodities.
| | | | | | | | | | | |
129 | | 2021 Pillar 3 Disclosures Report | |
| | |
MARKET RISK 2021 Pillar 3 Disclosures Report |
See section 4.1, Introduction, of the the Group annual report, for further information about the different risks of this activity.
| | | | | |
| Access 2021 Annual Report available on the Santander Group website |
b.Structural risks: these are composed of the market risks inherent to the balance sheet, excluding the trading book. Namely:
•Structural interest rate risk: this risk arises from timing mismatches in maturities and repricing of all balance sheet assets and liabilities.
•Structural foreign exchange risk (hedging of results): foreign currency risk arising from the currency in which investments in consolidated and non-consolidated companies are made (structural exchange rate). This category also includes the positions taken to hedge the foreign currency risk on future results generated in currencies other than the euro (hedging of results).
•Structural equity risk: this includes equity investments in non-consolidated financial and non-financial companies, and the available-for-sale portfolios of equity positions.
7.2. Capital requirements for market risk
This section provides more detailed information on changes in capital requirements for market risk through both internal and standardised models. The Group's consumption of regulatory capital for market risk at the end of December 2021 breaks down as follows.
| | | | | | | | |
| Table 61.Regulatory capital requirements for market risk |
| EUR million | | |
| 2021 | 2020 |
| Position risk - Trading book* - Standardised approach | 162 | 174 |
| Commodity Risk - Standardised approach | 37 | 28 |
| Specific risk in the correlation trading risk portfolio | — | — |
| Currency risk - standardised approach | 349 | 202 |
| Position and currency risk - Tradingbook - Internal models | 830 | 1,035 |
| Spain & SLB | 594 | 727 |
| Chile | 148 | 108 |
| Mexico | 89 | 199 |
| Total | 1,378 | 1,439 |
| | |
| *Includes structural equity considered as business. |
Santander has an internal market risk model in Spain, Chile and Mexico.
At the end of December 2021, Santander had authorisation to use the internal market risk model for calculating regulatory capital in the trading books of the Spain, Chile and Mexico units. From October 2021, the market risk capital of the internal model for Spain and SLB will be reported in a single entity, following regulatory approval of the diversification between the two units. Santander aims to gradually extend this approval to the rest of the units with significant market positions. The other geographic units calculate capital consumption by market risk through the standardised approach. This calculation methodology is also used by entities that have approved internal models for only some of their portfolios. The standardised approach is applied to portfolios for which the internal model is not approved.
Consolidated regulatory capital under the internal market risk model for Santander is computed as the sum of the regulatory capital of the units that have the necessary approval from the European Central Bank. This is a conservative criterion when consolidating the Group's capital, as it takes no account of the capital savings arising from the geographic diversification effect.
The regulatory capital of the trading activity for the perimeter concerned is calculated with advanced approaches, using VaR, Stressed VaR and IRC (incremental risk charge) as the core metrics, in line with the new bank capital requirements under the Basel Accords and, specifically, the CRR.
The capital resulting from the VaR and SVaR metrics is adjusted through a Kr coefficient, derived from the number of backtesting overshootings existing for each unit in its local internal model.
In 2021, we continued to add new not-in-model risks to the calculation of capital by market risk, for those risk factors not included in the current regulatory capital metrics (VaR, SVaR, etc.).
| | |
MARKET RISK 2021 Pillar 3 Disclosures Report |
A breakdown of capital requirements in the units that use the internal model is shown below, by geography and component, at year-end:
| | | | | | | | | | | | | | | | | | | | |
| Table 62.Capital requirements for market risk. Internal model |
| EUR million | | | | | | |
| 2021 |
| CR (VaR) | CR (SVaR) | IRC | Risk Not in VaR | Add-On | Total |
| Spain & SLB | 155 | | 356 | | 18 | | 64 | | — | | 594 | |
| Chile | 36 | | 82 | | 8 | | 22 | | — | | 148 | |
| México | 26 | | 61 | | 2 | | — | | — | | 89 | |
| Total | 218 | | 499 | | 28 | | 86 | | — | | 830 | |
Below is a breakdown of capital requirements and RWAs for market risk and calculation component with internal model approval at 2021 year-end:
| | | | | | | | |
| Table 63.MR2-A - Market risk under the internal Model Approach (IMA) |
| EUR million | | |
| | 2021 |
| RWA | Capital requirements |
| VaR (higher of values a and b) | 2,719 | | 218 | |
| (a) Previous day’s VaR (Article 365(1) of the CRR (VaRt-1)) | 1,166 | | 93 | |
| (b) Average of the daily VaR (Article 365(1)) of the CRR on each of the preceding 60 business days (VaRavg) x multiplication factor (mc) in accordance with Article 366 of the CRR | 2,719 | | 218 | |
| SVaR (higher of values a and b) | 6,236 | | 499 | |
| (a) Latest SVaR (Article 365(2) of the CRR (SVaRt-1)) | 2,076 | | 166 | |
| (b) Average of the SVaR (Article 365(2) of the CRR) during the preceding 60 business days (SVaRavg) x multiplication factor (ms) (Article 366 of the CRR) | 6,236 | | 499 | |
| IRC (higher of values a and b) | 352 | | 28 | |
| (a) Most recent IRC value (incremental default and migration risks calculated in accordance with Article 370 and Article 371 of the CRR) | 251 | | 20 | |
| (b) Average of the IRC number over the preceding 12 weeks | 352 | | 28 | |
| Comprehensive risk measure (higher of values a, b and c) | — | | — | |
| (a) Most recent risk number for the correlation trading portfolio (Article 377 of the CRR) | — | | — | |
| (b) Average of the risk number for the correlation trading portfolio over the preceding 12 weeks | — | | — | |
| (c) 8% of the own funds requirement in the standardised approach on the most recent risk number for the correlation trading portfolio (Article 338(4) of the CRR) | — | | — | |
| Other* | 1,073 | | 86 | |
| Total | 10,380 | | 830 | |
| | |
| * Other includes Risks not in Model not included in Var or Svar. | | |
| | | | | | | | | | | |
131 | | 2021 Pillar 3 Disclosures Report | |
| | |
MARKET RISK 2021 Pillar 3 Disclosures Report |
| | | | | | | | | | | | | | | | | | | | | | | |
| Table 64.MR2-B - RWA flow statements of market risk exposures under the IMA |
| EUR million | | |
| | | | | | | 2021 |
| VaR | SVaR | IRC | Comprehensive risk measure | Other* | Total RWAs | Total capital requirements |
| RWA Sep'21 | 2,767 | | 5,672 | | 2,616 | | — | | 1,645 | | 12,700 | | 1,016 | |
| Regulatory adjustment | 1,996 | | 4,005 | | 2,239 | | — | | — | | 8,240 | | 659 | |
| RWAs at the previous quarter-end (end of the day) | 771 | | 1,667 | | 377 | | — | | 1,645 | | 4,460 | | 357 | |
| Movement in risk levels | 220 | | 723 | | (2,264) | | — | | (572) | | (1,893) | | (151) | |
| Model updates/changes | — | | — | | — | | — | | — | | — | | — | |
| Methodology and policy | — | | — | | — | | — | | — | | — | | — | |
| Acquisitions and disposals | — | | — | | — | | — | | — | | — | | — | |
| Foreign exchange movements | (267) | | (159) | | — | | — | | — | | (427) | | (34) | |
| Other | — | | — | | — | | — | | — | | — | | — | |
| RWAs at the end of the reporting period (end of the day) | 1,166 | | 2,076 | | 251 | | — | | 1,073 | | 4,566 | | 365 | |
| Regulatory adjustment | 1,553 | | 4,160 | | 102 | | — | | — | | 5,814 | | 465 | |
| RWA Dec'21 | 2,719 | | 6,236 | | 352 | | — | | 1,073 | | 10,380 | | 830 | |
| | | | | | | |
| * Other includes Risks not in Model not included in Var or Svar. |
ESP & SLB
◦Entry into force of the diversification of Spain and SLB in October 2021, leading to a significant reduction in capital consumption.
◦RNIV: Increase due to higher impact of RNIM Z spread, whose severity increases in December and pushes up the quarterly average.
◦VaR / SVaR: significant increase in SVaR, as a result of the increase in position on EURO zone repo curves,
MEXICO
◦IRC: decrease, due to reduction in exposure to foreign currency government bonds and change in 12-week average IRC calculation window.
◦VaR / SVaR: The increase was due to the upward movement in interest rates as a result of inflation uncertainty and changes in MXN bank and sovereign sensitivity.
CHILE
◦VaR / SVaR: increase mainly due to increased risks in CLP, CLF and CLD.
◦RNIV: significant relative increase due to the higher impact on PnL resulting from considering scenarios with higher impact on RNIM in the current position.
| | | | | |
| Table 65.MR1 - Market risk under the standardised approach |
| EUR million | |
| 2021 |
| RWEAs |
| Outright products | |
| Interest rate risk (general and specific) | 1,705 |
| Equity risk (general and specific) | 244 |
| Foreign exchange risk | 4,209 |
| Commodity risk | 465 |
| Options | — |
| Simplified approach | — |
| Delta-plus method | 202 |
| Scenario approach | — |
| Securitisation (specific risk) | 19 |
| Total | 6,844 |
| | |
MARKET RISK 2021 Pillar 3 Disclosures Report |
Below is a breakdown of capital requirements and RWAs for market risk with standardised model approval from 2020 to 2021.
| | | | | | | | |
| Table 66.Capital requirements for market risk. Standardised approach |
| EUR million | | |
| 2021 |
| Capital | RWAs |
| Starting figure (31 Dec. 2020) | 404 | 5,047 |
| Changes in business | 143 | 1,797 |
| Ending figure (31 Dec. 2021) | 547 | 6,844 |
Prudent Valuation Adjustments (PVA)
There is also a breakdown in Appendix XX of the constituent elements of Banco Santander's PVA for all assets measured at fair value (marked to market or marked to model) for which PVAs are required.
After the significant increase in prudential valuation adjustments in 2020 due to the impact of the pandemic, financial markets have returned to normal and are now at pre covid-19 levels. The level of these adjustments has remained stable in all quarters of the year.
For further details on prudent valuation adjustments (table PV1) , see Appendix XX available on the Santander's website.
| | | | | |
| Access 2021 Pillar 3 Disclosures Report available on the Santander Group website |
7.2.1. Internal initiatives on methods for calculating market risk
Santander is making further progress with its new global Market Risk Advanced Platform (MRAP) initiative. This adapts, transforms and strengthens our current market risk calculation, in line with the new requirements of the regulatory framework for market risk published by Basel (FRTB), and adapts the internal risk models to the latest TRIM (Targeted Review of Internal Models) guidelines and to the supervisor's expectations.
This programme adopts a multidisciplinary and multi-geographical approach, with the participation of all our entities that carry on activities exposed to market risk and all relevant stakeholders, including Market Risk, Technology, Front Office, and Regulatory Affairs and Compliance.
The MRAP programme introduces significant improvements in terms of functional and IT architecture and operating models, leading to a change in the culture established in the group and the generation of synergies among all initiatives and resources.
As part of this programme, a good deal of work was carried out in 2019 and 2020 to improve and adapt the IRC model to take account of the findings previously raised by the supervisory authority. Finally, in 2021, following the improvements and developments developed for this purpose, the ECB approved the new model for calculating capital requirements for market risk.
As a result of the IBOR reform, the bank has started the transition programme to new valuation curves during 2019, as opposed to the IBOR reference curves it has been using.
See section 4.1, Introduction – IBOR reform, of the Santander Annual Report, for further information about the IBOR initiative.
| | | | | |
| Access 2021 Annual Report available on the Santander Group website |
7.3. Trading activity
The goal of daily market risk function monitoring is to ensure that market risk positions remain within approved limits and to assess performance and significant deviations in risk metrics.
Trading activity at Santander is monitored by the local market risk units, under the principle of independence of business units, monitoring market risk positions on a daily basis and analysing the value of a set of metrics identified and approved by the group, the changes in them, any material changes that may occur and compliance with the approved limits on these metrics.
Regular reports are prepared and distributed on the basis of this analysis. These reports ensure the appropriate monitoring of market risk activities within the group, and are distributed to senior management and other internal and external stakeholders, so that market risk activities may be properly monitored.
The corporate Market Risk functions also monitor positions daily, both locally at the level of the individual unit and globally, through exhaustive checking of changes in the portfolios to detect any incidents and correct them immediately.
The local Market Risk functions are also responsible for the daily calculation and analysis of the results of the trading books. Preparing and analysing a daily income statement is an
excellent risk indicator, helping us identify the impact of changes in financial variables on the portfolios.
The main market risk metrics are:
•VaR and Stressed VaR
•Equivalent and/or nominal positions
•Sensitivities of the various market risk factors to underlying factors (delta, vega, gamma and theta)
•Delivery risk for short positions in securities (fixed income and equities)
•The volume of effective and relative losses resulting from the monitoring of results during a period:
◦Loss trigger
| | | | | | | | | | | |
133 | | 2021 Pillar 3 Disclosures Report | |
| | |
MARKET RISK 2021 Pillar 3 Disclosures Report |
◦Stop loss
•Credit metrics:
a.Total exposure and exposure by sector/geography/rating
b.Jump to default by issuer, product, currency and seniority
c.Sensitivity to credit risk
•Volume of origination transactions
•P&L of each desk and/or portfolio
These metrics are used to establish limits and sub-limits, in order to provide a sufficiently granular limit structure to enable effective control of the various types of market risk factors to which the group's portfolios are exposed in its trading activities.
The establishment of market risk limits for trading is a dynamic process that responds to the level of risk appetite established by the group. This process is part of an annual limits plan defined by the group's senior management, involving all of the group's subsidiaries.
For more information on the process of setting limits please refer to the sections 2.4 Management processes and tools and 4.2. Market risk management, of the Santander Annual Report.
| | | | | |
| Access 2021 Annual Report available on the Santander Group website |
Scenario analysis is also performed as a risk management tool, to control the potential impact of extreme or unexpected movements in market risk factors on trading books. These scenarios can replicate past events (historical scenarios), identify plausible alternatives that do not correspond to past events (hypothetical scenarios) or look for market movements that cause a particular impact on results (reverse scenarios).7.3.1. Value at Risk
Santander's VaR calculation methodology consists of historical simulation at a 99% confidence level, with a one-day horizon for internal risk management and a ten-day horizon when calculating own funds for market risk.
Statistical adjustments are applied in VaR to enable swift and efficient incorporation of the most recent events affecting the levels of risk assumed. Currently, all units use historical simulation with full revaluation, except for Market Risk Spain, which, while using this methodology for certain portfolios, applies historical simulation using a Taylor series approximation for the bulk of its portfolios.
The group uses a two-year window, or 520 daily readings, backwards in time from the VaR calculation reference date. Two figures are calculated every day: one applying an exponential decay factor that accords less weight to the
observations furthest away in time and another with the same weight for all observations. The reported VaR is the higher of these two figures. Simultaneously, the value at earnings (VaE) is calculated, which measures the maximum potential gain at a certain level of confidence and time horizon, applying the same methodology as for VaR.
VaR by historical simulation has many advantages as a risk metric: it sums up the market risk of the portfolio in a single number and is based on observed market movements without the need for assumptions about functional forms or correlations between market factors.
In relation to the VaR, the Expected Shortfall (ES) is also calculated by estimating the expected value of the potential loss when this is greater than the level set by the VaR.
Unlike VaR, ES has the advantage of being better at capturing the risk of large losses with low probability (tail risk) and of being a sub-additive metric. The BCBS considers that a 97.5% confidence interval delivers a similar level of risk to VaR at a 99% confidence interval. ES is calculated by applying uniform weightings to all observations
During the year, the strategy for Santander trading activity was to remain focused on customer business, minimising any exposure to directional risk as much as possible and maintaining geographic and risk factor diversification. This is reflected in the VaR of SCIB's trading book.
Despite continued market volatility, particularly in interest rates and exchange rates, VaR remained below trend for most of the past three years, with the exception of a spike in September when volatility increased in the face of a possible slowdown in economic growth, mainly due to supply chain disruptions and higher energy prices. It ended September at €14.9 million.
See section 5.3. Key market risk metrics – VaR analysis, for further information about changes in VaR, and its breakdown by risk factor and business unit.
Santander also continues to have very limited exposure to complex structured instruments or vehicles, reflecting a risk culture in which prudent risk management is one of the key features. At the end of September 2021, the group had the following exposures in this regard:
•Hedge funds: exposure was €56 million, all of which was indirect, acting as a counterparty in derivative transactions. We analyse risk with this type of counterparty on a case-by-case basis, establishing percentages of collateralisation on the basis of the features and assets of each fund.
•Monolines: no exposure at the end of September 2021.
The group's policy for approving new transactions related to these products remains very prudent and conservative, and is subject to strict supervision by the group's senior management.
The bank's derivatives activity is mainly focused on the sale of investment products and on hedging risks for our customers. Risk management is focused on ensuring that net open risk is as low as possible.
These transactions include options on equities, fixed income and exchange rates. The units where this activity mainly takes place are: Spain, Brazil, the UK and Mexico.
In comparison with other similar financial groups, the Group's trading risk profile can be classified as low. Dynamic
| | |
MARKET RISK 2021 Pillar 3 Disclosures Report |
management of risk enables Santander to adopt changes in strategy to unlock opportunities in an uncertain environment.
For more information, see the Risk Management chapter (section 4) of the 2020 annual report.
| | | | | |
| Access 2021 Annual Report available on the Santander Group website |
| | | | | | | | | | | |
135 | | 2021 Pillar 3 Disclosures Report | |
| | |
MARKET RISK 2021 Pillar 3 Disclosures Report |
At year-end 2021, VaR by geography was as follows:
| | | | | | | | | | | | | | |
| Table 67.MR3 - IMA values for trading portfolios |
| EUR million |
| Total | 2021 | 2020 | Variation |
| Var (10 days - 99%) |
| 1 | Maximum | 108 | 213 | (49 | %) |
| 2 | Average | 43 | 71 | (40 | %) |
| 3 | Minimum | 25 | 34 | (25 | %) |
| 4 | End of period | 50 | 50 | — | % |
| Stressed VaR (10 days - 99%) |
| 5 | Maximum | 160 | 209 | (23 | %) |
| 6 | Average | 105 | 144 | (27 | %) |
| 7 | Minimum | 71 | 95 | (25 | %) |
| 8 | End of period | 123 | 104 | 18 | % |
| Incremental Risk Charge (99.9%) |
| 9 | Maximum | 184 | 215 | (15 | %) |
| 10 | Average | 106 | 116 | (9 | %) |
| 11 | Minimum | 17 | 58 | (72 | %) |
| 12 | End of period | 20 | 103 | (81 | %) |
| Comprehensive risk measure (99.9%) |
| 13 | Maximum | 0 | — | 0 | % |
| 14 | Average | 0 | — | 0 | % |
| 15 | Minimum | 0 | — | 0 | % |
| 16 | End of period | 0 | — | 0 | % |
| | | | |
| Figures do not include Risks not in model |
| | | | | | | | | | | | | | |
| Spain | 2021 | 2020 | Variation |
| Var (10 days - 99%) |
| 1 | Maximum | 72 | 132 | (45 | %) |
| 2 | Average | 29 | 39 | (25 | %) |
| 3 | Minimum | 19 | 21 | (6 | %) |
| 4 | End of period | 32 | 34 | (4 | %) |
| Stressed VaR (10 days - 99%) |
| 5 | Maximum | 110 | 129 | (14 | %) |
| 6 | Average | 79 | 93 | (15 | %) |
| 7 | Minimum | 57 | 72 | (21 | %) |
| 8 | End of period | 87 | 80 | 8 | % |
| Incremental Risk Charge (99.9%) |
| 9 | Maximum | 161 | 184 | (12 | %) |
| 10 | Average | 96 | 110 | (13 | %) |
| 11 | Minimum | 15 | 58 | (75 | %) |
| 12 | End of period | 16 | 100 | (84 | %) |
| Comprehensive risk measure (99.9%) |
| 13 | Maximum | 0 | — | 0 | % |
| 14 | Average | 0 | — | 0 | % |
| 15 | Minimum | 0 | — | 0 | % |
| 16 | End of period | 0 | — | 0 | % |
| | | | |
| Figures do not include Risks not in model |
| | | | | | | | | | | | | | |
| Chile | 2021 | 2020 | Variation |
| Var (10 days - 99%) |
| 1 | Maximum | 13 | 36 | (65 | %) |
| 2 | Average | 7 | 11 | (41 | %) |
| 3 | Minimum | 3 | 5 | (38 | %) |
| 4 | End of period | 12 | 7 | 79 | % |
| Stressed VaR (10 days - 99%) |
| 5 | Maximum | 28 | 38 | (28 | %) |
| 6 | Average | 13 | 25 | (46 | %) |
| 7 | Minimum | 8 | 10 | (19 | %) |
| 8 | End of period | 23 | 11 | 111 | % |
| Incremental Risk Charge (99.9%) |
| 9 | Maximum | 16 | 10 | 52 | % |
| 10 | Average | 7 | 3 | 113 | % |
| 11 | Minimum | 1 | — | 609 | % |
| 12 | End of period | 3 | 1 | 137 | % |
| Comprehensive risk measure (99.9%) |
| 13 | Maximum | 0 | — | 0 | % |
| 14 | Average | 0 | — | 0 | % |
| 15 | Minimum | 0 | — | 0 | % |
| 16 | End of period | 0 | — | 0 | % |
| | | | |
| Figures do not include Risks not in model |
| | | | | | | | | | | | | | |
| Mexico | 2021 | 2020 | Variation |
| Var (10 days - 99%) |
| 1 | Maximum | 23 | 45 | (49 | %) |
| 2 | Average | 7 | 21 | (68 | %) |
| 3 | Minimum | 3 | 8 | (62 | %) |
| 4 | End of period | 6 | 10 | (40 | %) |
| Stressed VaR (10 days - 99%) |
| 5 | Maximum | 22 | 42 | (47 | %) |
| 6 | Average | 12 | 26 | (53 | %) |
| 7 | Minimum | 6 | 13 | (54 | %) |
| 8 | End of period | 13 | 13 | 4 | % |
| Incremental Risk Charge (99.9%) |
| 9 | Maximum | 7 | 21 | (66 | %) |
| 10 | Average | 2 | 3 | (26 | %) |
| 11 | Minimum | 1 | — | 121 | % |
| 12 | End of period | 1 | 2 | (61 | %) |
| Comprehensive risk measure (99.9%) |
| 13 | Maximum | 0 | — | 0 | % |
| 14 | Average | 0 | — | 0 | % |
| 15 | Minimum | 0 | — | 0 | % |
| 16 | End of period | 0 | — | 0 | % |
| | | | |
| Figures do not include Risks not in model |
| | |
MARKET RISK 2021 Pillar 3 Disclosures Report |
7.3.2. Stressed VaR
In addition to standard VaR, Stressed VaR is also calculated daily for the main portfolios. The methodology for calculating Stressed VaR is the same as that used to calculate VaR, apart from two differences:
•Historical window for observing factors: in the stressed VaR calculation a window of 260 data readings is used, instead of the 520 used for computing the ordinary VaR measurement.
•Unlike the method used for the ordinary VaR calculation: stressed VaR is not obtained as the higher of the uniformly weighted percentile and the exponentially weighted percentile; instead, the uniformly weighted percentile is used directly.
All other aspects of the methodology and inputs for calculating the stressed VaR are the same as for the VaR.
The Market Risk functions periodically define the window used to calculate SVaR (the observation period), using the most severe at any given time, depending on the positions in the portfolio. The scope considered comprises the Treasuries for which approval has been obtained for the use of the internal model at 31 December 2021: Spain, Chile and Mexico.
The windows currently used to calculate Stressed VaR are:
| | | | | |
| Stress window |
| Period |
| Spain & SLB | 05/08/2011 – 08/08/2012 |
| Chile | 19/06/2008 – 03/07/2009 |
| Mexico | 12/09/2008 – 25/09/2008 |
The Market Risk functions review these stress windows every quarter. The SVaR figures are also checked daily, comparing them to the VaR figures. If this analysis reveals that the current window used to calculate daily VaR covers a period with greater volatility than the window used to calculate SVaR, the stress window is reviewed on an extraordinary basis.
7.3.3. Incremental risk charge
Following the recommendations of the Basel Committee on Banking Supervision and applicable regulations, an additional metric is calculated in relation to the credit risk inherent to the trading portfolios: the incremental risk charge (IRC).
The IRC is intended to measure both rating migration risk and any incremental default risk that is not captured by VaR, through changes in the corresponding credit spreads. The IRC metric is calculated for public and private fixed-income bonds, bond derivatives and credit derivatives in the trading portfolio.
The method used to calculate the IRC, which is essentially similar to that applied to the credit risk of non-trading portfolio exposures, is based on the Merton structural model, which dictates that the default event occurs when the assets of a company fall below a certain level of its debts. This internally developed model comprises direct measurements on the distribution queues of losses caused by the different credit events it provides for, i.e. default risk and migration of credit quality subject to a confidence interval of 99.9% and a capital horizon of one year for all positions. The assumed liquidity horizon coincides with the one-year capital horizon
and the simulation methodology uses the Montecarlo approach.
Work has been ongoing in 2019 and 2020 to develop a new IRC model to respond to the shortcomings and findings raised by the regulator in the recent IMI. In this way, the new IRC model incorporates several improvements in basic aspects of the model, such as the methodology used and the technological architecture that supports it. Operational improvements have also been made to the control model and processes.
In short, a more robust model has been developed and implemented, which has resulted in regulatory approval for Spain, including SLB, and the subsequent elimination of the multiplier that was previously imposed for this geography, following IMI 4313 carried out during 2020.
The improvements made to the model may be summarised as follows:
•A new asset value model was implemented that takes into account a multivariate t-student distribution that better captures tail risks.
•A multi-factor model has been implemented (two systemic factors: sector and region).
•The model parameter calibration uses real market data.
•Additional products not previously listed have been included.
•A Constant Level of Position is used without ageing of the positions.
•The methodology for determining the P&L in the event of a rating migration was improved to better capture potential maturity mismatches.
•The LGDs used to obtain JTD are more granular.
•The technology architecture is more robust (implemented in a big data environment: SUPRA Data Lake) and has a higher computational efficiency.
•An operating model has been developed and implemented to ensure a robust, traceable and constantly monitored recurring calculation process from both a technical (administrators) and functional perspective. In addition, the tasks of each team involved and the various dependencies between them were described in detail.
As approval of the new model was only granted for Spain, the geographies of Chile and Mexico will continue to calculate their regulatory capital for market risk using the previous IRC model.
7.3.4. Analysis of scenarios and stress testing
The risk measures described above are based on assumptions that underpin day-to-day risk management and decision-making, including normal market conditions, continuous pricing and adequate liquidity, although they do not fully predict extreme movements or unforeseen market turbulence.
Stress testing is an important risk management tool that identifies unexpected outcomes related to a wide range of risks, telling us how much capital would be needed to absorb losses if these unexpected events were to occur.
| | | | | | | | | | | |
137 | | 2021 Pillar 3 Disclosures Report | |
| | |
MARKET RISK 2021 Pillar 3 Disclosures Report |
Stress tests play a particularly important role in: estimating future risk; overcoming the inherent constraints of models and the use of historical data; the communication of internal and external risks; supporting liquidity and capital plans; reporting the establishment of risk tolerance levels; and designing risk mitigation and contingency plans for stressed conditions.
The group's stress test programme includes the following scenarios:
•Historical scenarios: these study how the portfolio reacts under crisis conditions or significant market events that occurred in the past which affect portfolio positions, estimating maximum losses under the assumption that such events will recur.
•Subprime crisis: based on events that occurred in the period between September 2007 and December 2008, triggered by the subprime mortgage crisis in the USA. Considering two different time horizons (one day and ten days), it identifies the most severe changes in market variables for each risk factor
•Covid-19 crisis: this reflects the dramatic changes in financial markets as a result of the covid-19 pandemic during the first two quarters of 2020. It is based on the application of historical market movements during the most severe ten-day period in terms of results, for most of the positions in the trading portfolios of the group's units
•Hypothetical scenarios: built using movements for market variables that are not necessarily connected to historical events, with a forward-looking (ex-ante) view, as opposed to a backward-looking (ex-post) view of historical scenarios.
•Abrupt crisis: a hypothetical scenario based on abrupt changes in market risk factors: rise in yield curves and credit spreads, appreciation of the USD, sharp fall in stock market indices and dividends, increased volatility in all risk factors, rises in commodity prices and default of the main positions in the portfolio.
•Worst case: this combines movements in risk factors and their respective historical volatilities, assuming a variation in the value of market factors of +/-3 and +/-6 standard deviations per day. Its output is the sum of the worst results by risk factor, regardless of their historical correlations.
•EBA adverse scenario: based on the adverse macroeconomic scenario to be applied to market risk factors, as proposed by the EBA for the "EU-wide stress test 2020" exercise
•Forward-looking scenario: a plausible scenario defined by the Market Risk functions, based on the portfolio positions
and their expert judgement regarding short-term changes in market variables that can have a negative impact on such positions.
•Reverse stress test scenarios: analysis of scenarios that could undermine the institution's viability, identifying the potential vulnerabilities of the business, along with hidden risks and interactions between risk factors. They start from a known stress result (such as non-compliance with certain ratios relating to capital, liquidity or capital adequacy) and from there they identify the extreme scenarios in which movements in market variables could cause events that might compromise the viability of the business.
Other scenarios:
•IRC scenarios: designed to stress the default risk and rating migration risk of credit positions in the trading portfolio, with a view to identifying credit events that could impact regulatory capital and measure how reasonable the assumptions of the IRC model are.
•Use of proxies scenarios: defined to analyse what impact incorrect estimates of proxies could have on determining the time horizons used to calculate VaR.
•Liquidity and concentration stress scenario: designed to estimate the potential impact of a reduction in market liquidity or an excessive concentration of portfolio positions that could affect their exit price.
The Market Risk functions regularly calculate and analyse all these scenarios. A consolidated stress test report is prepared every month, based on the results of each of the scenarios and for all the group's units with trading activities. There are also alerts on the stress results which, when exceeded, trigger communication and joint analysis by Risk and Business functions.
The table below shows the results as at 31 December 2021, broken down by risk factor (interest rate, equities, foreign currency, credit spread, commodities and the volatility for each), in a scenario in which volatility equivalent to six standard deviations in a normal distribution is applied, regardless of the historical correlation between them.
The scenario is defined by taking the change that produces the highest potential loss in the global portfolio for each risk factor, discarding the most improbable combinations in economic and financial terms.
The result of the analysis shows that the economic impact that Santander would suffer in its trading portfolios, in terms of mark to market, assuming that the stress movements defined in the worst-case scenario materialised in the market, would be €74 million.
| | |
MARKET RISK 2021 Pillar 3 Disclosures Report |
| | | | | | | | | | | | | | | | | | | | | | | | | | | | | | | | | | | | | | | | | |
| Table 68.Stress scenario: Maximum volatility (worst case) |
| EUR million |
| 2021 | | 2020 |
| Interest rate | Equities | Foreign currency | Credit spread | Commodities | Total | | Interest rate | Equities | Foreign currency | Credit spread | Commodities | Total |
| Total Trading | (23) | (18) | (13) | (21) | — | (74) | | (41) | (25) | (7) | (5) | — | (78) |
| Europe | (15) | (15) | (5) | (21) | — | (56) | | (21) | (25) | (3) | (5) | — | (53) |
| South America | (3) | (3) | (6) | — | — | (12) | | (18) | (1) | (3) | — | — | (22) |
| USA | (4) | — | (2) | — | — | (7) | | (2) | — | (1) | — | — | (3) |
| Global Activities | — | — | — | — | — | — | | — | — | — | — | — | — |
| Asia | — | — | — | — | — | — | | — | — | — | — | — | — |
7.3.5. Backtesting (MR4)
The backtesting exercise consists of comparing the VaR forecasts, given a certain confidence level and time horizon, with the actual losses incurred over a time horizon equal to the VaR time horizon.
The general aim of backtesting is to verify the accuracy of the Value at Risk (VaR) calculation model. In other words, whether to accept or reject the model used to estimate the maximum loss on a portfolio with a given level of confidence, over a certain period of time.
Backtesting is analysed at local level by the local market risk control units. The market risk consolidation unit is responsible for backtest reporting at consolidated level. It is important to note that the backtesting methodology is applied identically to all the sub-portfolios covered by the internal market risk model. The analysis of regulatory backtesting is conducted daily, at portfolio and sub-portfolio level.
Four types of backtesting are defined, depending on the kind of P&L used:
•Economic P&L (dirty P&L): refers to the daily P&L calculated on the basis of mark-to-market or mark-to-model securities (depending on the instruments) of the books and records of Banco Santander at the end of the day. It is calculated using Front Office systems (data on positions, pricing models, valuation methods, price parameters and end-of-day market data)
•Actual P&L (dirty P&L without mark-ups): refers to the daily P&L calculated by comparing the portfolio's closing value and its actual value at the end of the following day, including losses and gains derived from intraday activities, excluding fees, commission and net interest income. Santander, as considered acceptable in paragraph 63 of the TRIM guidance ("ECB Guide to Internal Models", Oct 2019), has established that net interest income is equal to zero in the trading portfolio. The "actual P&L" includes all time effects (theta). This P&L is used for the regulatory backtesting in accordance with article 366 (3) of the CRR, in order to compute the number of overshootings. The additional aspects included in the TRIM guidance are also considered.
•Hypothetical P&L (clean P&L due to subtractions): this refers to the daily P&L calculated by comparing the portfolio's closing value and its actual value at the end of the following day, assuming unchanged positions. In this case, time effects are not considered, to be consistent with the VaR. Similarly, the additional aspects included in
the TRIM guidance are also considered. Specifically, any valuation adjustment made in actual P&L that is not included in VaR is also not included in hypothetical P&L. Hypothetical P&L is obtained from the Front Office platforms by the Market Risk function, without considering intraday results or changes in portfolio positions. This P&L, like actual P&L, is used for the regulatory backtesting in accordance with article 366 (3) of the CRR, in order to calculate the number of overshootings.
•Risk-theoretical P&L (clean P&L due to change of factors): this hypothetical P&L is similar to the previous measure but is calculated using the Market Risk calculation engine (AIRE), without considering intraday results, changes in portfolio positions or time effects (theta). This P&L is exclusively used to verify the quality of the internal VaR model.
Of these four backtesting methods, only the backtesting on actual P&L (dirty P&L without mark-ups) and the hypothetical P&L (clean P&L due to subtractions) are used to measure and report the accuracy of the model, for regulatory purposes.
In order to calibrate and control the effectiveness of the internal market risk measurement and management systems, Santander regularly performed the required benchmark tests and analyses throughout 2021, with the conclusion that the model was reliable.
Number of overshootings
Overshooting occurs whenever the losses or gains observed in a day exceed the VaR estimate. The number (or percentage) of overshootings recorded is one of the most intuitive indicators of a model's accuracy.
When the P&L exceeds the previous day's VaR it is considered to be an overshooting (or exception). The number (or percentage) of overshootings recorded is one of the most intuitive indicators of the models accuracy. A regulatory coefficient "K" is calculated on the basis of the number of overshootings in the regulatory backtesting. This affects the calculation of regulatory capital in accordance with the following table:
| | | | | | | | | | | |
139 | | 2021 Pillar 3 Disclosures Report | |
| | |
MARKET RISK 2021 Pillar 3 Disclosures Report |
| | | | | | | | | | | |
| Backtesting overshootings | KR value |
| 0 | — |
| 1 | — |
| 2 | — |
| 3 | — |
| 4 | — |
| 5 | 0.40 |
| 6 | 0.50 |
| 7 | 0.65 |
| 8 | 0.75 |
| 9 | 0.85 |
| 10 | 1.00 |
The confidence level for the VaR calculation is a measure of the number of overshootings expected to occur in a given time window. For example, if the daily VaR is calculated with a confidence level of 99%, the percentiles of interest are the 1st and the 99th percentiles of the P&L distribution, so we should expect 2% of overshootings during the days studied (1% due to excess profits and 1% due to excess losses).
If there are significantly more, or fewer, overshootings, this might be a sign of problems in the VaR model employed. The observed P&L and estimated VaR data can be used to construct a hypothesis test to check the validity of the VaR/P&L relationship.
Time between overshootings
The confidence level for the VaR calculation is also an indicative measure of the number of days that can be expected to elapse between two successive overshootings. For instance, if the daily VaR is calculated at 99% confidence (1st and 99th percentiles), we may expect an average time of approximately 50 days between overshootings.
Similarly to the frequency of overshootings, hypothesis-testing can be done based on the time between overshootings, as a means of validating the VaR model.
Distance between overshootings
Whereas VaR predicts the risk that is assumed with a certain probability, average overshooting (expected shortfall) is a predictor, for that probability, of the average loss once VaR is exceeded. This study should be included when analysing the backtesting report, to obtain the size of the potential losses that exceed the VaR level.
Daily VaR/P&L relationship
To validate the VaR model, it is not enough to analyse the number and type of overshootings that occur in a time window. Other indicators must be observed to ensure the model's consistency. One such indicator is the daily VaR/P&L relationship. This relationship is defined as:
•The P&L figure, as a percentage of VaR, on all the days on which there are no overshootings (losses or gains).
•Calculation of its arithmetic mean.
The percentage should be close to a value determined by the VaR confidence level, because the higher the chosen confidence level, the higher the VaR estimate (and the smaller the P&L results as a percentage of that estimate).
If the percentage observed is much higher than expected, the risk is being underestimated and the model should be reviewed. Conversely, if the percentage is significantly smaller, then the risk is being overestimated and the VaR model should be adjusted. The latter outcome may, however, be desirable if the aim is to maintain conservative risk estimates.
The following diagram shows the annual backtest (MR4) at the end of December 2021 for each unit with internal model approval (see Appendix XXI).
| | | | | |
| Access 2021 Pillar 3 Disclosures Report available on the Santander Group website |
The following table includes backtesting overshootings for units with approved internal models that account for over 3% of total RWAs for market risk. The number of overshootings at 31 December 2021 for the units with internal model approval are shown below. | | | | | | | | |
| Table 69.Exceptions at units with internal model |
|
| | 2021 |
| Exceptions | Model Status |
| Spain & SLB | — | OK |
| Chile | 1 | OK |
| Mexico | 3 | OK |
During 2021, there have been no overshootings in Spain.
Overshootings in Mexico are due to the increase in the TIIE Swap curve, with abrupt movements in the Mexican peso exchange rate, this currency appreciating in 2021 against the dollar.
Chile's overshooting is due to the decline in the long-term CLF swap curve along with the rise in the CLP/USD basis swap curve combined with unfavourable movements in the USD/CLP exchange rate.
The fair value of a financial instrument is calculated using quoted market prices or appropriate valuation models, duly validated and approved. This may cause a degree of uncertainty in the valuation of less liquid financial instruments, which are not traded on a regular basis or which use valuation models. These uncertainty factors are incorporated into the fair value of positions through valuation adjustments.
Valuation adjustments are designed to ensure the fair valuation of positions, by including variables in the market value that are not considered in the valuation models or for which there is sufficient uncertainty to significantly affect the valuation.
The valuation adjustment categories used at the Group include:
•Market liquidity valuation adjustments (close out cost): adjustments arising from the use of average prices when valuing portfolio positions, where accounting rules require valuation based on the exit price.
•Valuation adjustments are included due to the existence of spreads between buy and sell prices.
| | |
MARKET RISK 2021 Pillar 3 Disclosures Report |
•These adjustments are calculated taking into account the spread between market buy and sell prices and are estimated independently for each risk factor, distinguishing between: interest rate curves, prices, dividends, volatilities and correlation.
•Valuation adjustments due to uncertainty in market prices (market price uncertainty): these are warranted because of considerable uncertainty in the market data used for the calculation of fair value, distinguishing between:
◦Observable market data
◦Unobservable market data
•Valuation adjustments due to model risk: these are warranted when there is a high degree of uncertainty in the valuation models or in the parameters used by these models. This uncertainty may be caused by: adding certain assumptions that may be erroneous, models whose results cannot be calibrated because there are no alternatives or because of dependence on parameters that are subject to possible estimation errors.
•Other valuation adjustments: adjustments for limitations in valuation systems, for exotic items not captured in the payoffs configured in the systems, uncertainty in the financing/investment costs used in estimating the exit price, profit reserves for specific or one-off transactions (generally associated with the first-day profit or loss of instruments classified as Level 3 in the fair value hierarchy) and credit risk adjustments (CVA/DVA).
7.3.6. Internal validation of the models
Market, counterparty and other non-financial risk models
In 2021, in accordance with the model risk policies, the Internal Validation team performed independent review exercises for the main models used in the group's various geographies. The areas covered are counterparty risk (maximum and expected exposures, CVA/DVA), issuer risk (incremental risk charge), valuation (interest rates, FX, equity, credit and commodities), valuation adjustments (AVA, FVA), market risk (VaR/SVaR), structural interest rate and liquidity risk (prepayments, accounts with no specified maturity, mortgages, calculation of EVE/NIM) and other non-financial risks (operational risk, macroeconomic scenarios).
During these exercises, recommendations were issued aimed at improving the models and correcting their weaknesses. The resolution of the recommendations addressed was certified and an independent opinion was issued on the changes made to the models, in accordance with the policy on material changes.
The group also continued to monitor on a quarterly basis the VaR & SVaR models used to calculate regulatory capital for market risk, based on key indicators of the quality of the models, in order to proactively and independently monitor the operation of these models.
7.4. Structural balance sheet risks
This section covers the requirement IRRBBA - RIIBB qualitative information.
Structural risk is inherent in banking business and arises as a result of changes in a number of factors, including market or balance sheet behaviour variables, that affect the profit or loss or economic value of balance sheet items (banking book). This risk includes both the potential losses from price changes for assets recognised at fair value, and economic losses arising from management of assets and liabilities carried at amortised cost in the banking book positions.
Within structural risk, interest rate risk in the banking book (IRRBB) is considered the main source of balance sheet risk. There are four sources of IRRBB: repricing risk (or mismatch risk), curve risk, basis risk and optionality risk (automatic and behavioural).
The management and control of IRRBB in Santander aims to ensure the stability and recurrence of net interest margin and of the economic value, maintaining at all times levels of risk below those permitted by the risk appetite approved by the board of directors. These activities are based on the following principles, which take into account internal policy, regulatory and market best practice requirements:
•Independence of risk management and control functions following the group's established lines of defence model.
•Involvement of senior management
•Holistic approach to risk: IRRBB control and monitoring must take into account all sources of risk and the fact that risks can originate due to factors connected with subsidiaries or for reasons not connected with them, so that local IRRBB risk events can have an impact on the group. Furthermore, the approach should be forward-looking and analyse trends over different time periods and under different scenarios.
•Robust systems and quality internal data
•Use of methodologies and models which are standardised and documented
•Establishment and adaptability of limits
For more information, see the Risk management and control chapter (section 4.1) of the 2021 annual report.
| | | | | |
| Access 2021 Annual Report available on the Santander Group website |
The financial area of each group subsidiary manages interest rate risk originated by retail and commercial banking and is responsible for management of the structural risk generated by interest rate fluctuations. Mitigation strategies are used to manage the IRRBB risk profile by using interest rate instruments such as fixed income bond portfolios (usually government bonds) or derivative instruments with high credit
| | | | | | | | | | | |
141 | | 2021 Pillar 3 Disclosures Report | |
| | |
MARKET RISK 2021 Pillar 3 Disclosures Report |
quality, high liquidity and low capital consumption that complement the natural hedges provided by the balance sheet itself. They are always carried out taking into account the market environment.
For more information, see the Risk management and control chapter (section 4.5) of the 2021 annual report.
| | | | | |
| Access 2021 Annual Report available on the Santander Group website |
7.4.1. Main interest rate risk in the banking book (IRRBB) metrics
The management, measurement and control of IRRBB risk and metrics is performed independently in each subsidiary. The set of metrics used in the group is homogeneous to ensure consistent measurement. However, the range of specific metrics implemented in each subsidiary depends on the dimensions and risk factors identified as relevant by each subsidiary in its IRRBB self-assessment, based on the individual features and nature of its business, its balance sheet structure and the complexity of the markets in which it operates.
IRRBB metrics are calculated under various scenarios and provide a static and/or dynamic overview of balance sheet exposure and net interest margin in response to adverse interest rate movements and/or on the main behavioural parameters and assumptions under which optionality is modelled. The main metrics are as follows:
a.Repricing gap: it measures the difference between the volume of sensitive assets and liabilities, on and off the balance sheet, that re-price (i.e. that mature or are subject to rate revisions) at certain times.
b.Economic value and its sensitivity: economic value of the equity (EVE) is the difference between the present value of assets less the present value of liabilities of the banking book, excluding own equity and other instruments that do not generate interest. The present value is calculated by discounting projected cash flows of assets and liabilities with the appropriate discount curve. EVE sensitivity is calculated as the difference between the EVE in a selected interest rates scenario and the EVE calculated in the baseline scenario. Therefore, EVE can have as many sensitivities as scenarios considered. This metric enables the identification of long-term risk, and so supplements net interest margin.
c.Net interest margin and its sensitivity: net interest margin is calculated as the difference between the interest income as percentage of assets and the interest cost of the liabilities of the banking book in a determined time horizon (typically from one to three years, the group's standard being one year). Its sensitivity reflects the impact of changes in interest rates on net interest income in the given time horizon. Net interest margin sensitivity is calculated as the difference between the net interest margin in a selected scenario and the net interest margin in the baseline scenario. Therefore, the net interest margin can have as many sensitivities as scenarios considered. This
metric enables the identification of short-term risk, and supplements economic value of equity (EVE) sensitivity.
d.Earnings measures: measures the change in expected future returns within a certain time horizon (three months) as a result of movements in interest rates and credit spreads as risk factors. This ratio takes into account both the impact of net interest income and the instruments whose value could be affected by changes in interest rates and which can be sold in the short term (mainly the instruments assigned to the HTCS (Held to Collect and Sale) model and reported in the fair value measurement category OCI (Fair Value Through Other Comprehensive Income)).
e.Economic P&L of the ALCO portfolio: to estimate losses from price changes of assets recognised at fair value, economic P&L is calculated under stress for fixed-income instruments managed by the ALCO (ALCO portfolios). The impact this market stress could have on the portfolio is then measured. A change in the value of this portfolio would reduce the group's equity and, therefore, have a negative effect on its capital ratio. The stress has a statistical component, as it is calibrated according to past performances observed in the market, and a forward-looking component, as it also uses stress scenarios generated by the group based on macro-economic analysis.
f.Value at risk (VaR and EaR) for the purpose of calculating economic capital: the economic capital model by IRRBB in the group is based on a value-at-risk model that assesses the potential impact of movements in market variables, interest rates and credit spreads (the latter limited to the FV positions managed by ALCO) on both the economic value of equity and earnings. VaR and EaR represent the maximum amount of estimated losses on the economic value of equity and earnings calculated over a two-year period, which are expected to be exceeded only in a percentage of cases (confidence level 0.05%) and over a time horizon that varies for each subsidiary depending on its balance sheet structure.
System for controlling limits
The measurement, analysis and control of IRRBB metrics guarantees that the level of risk is aligned with the group's policies, approved management limits and risk appetite.
As a general rule, metrics are measured and controlled on a monthly basis, using the previous month's closing data.
IRRBB limits are set independently for each subsidiary in accordance with the individualised management and control per subsidiary. The main limits set in all subsidiaries are:
•Net interest margin sensitivity limit at one year
•Market value of equity sensitivity limit
•Limit of the market value of ALCO portfolios used for on-balance-sheet interest rate management that could have an impact on equity due to their accounting classification (fair value through equity)
The limits are reviewed regularly and have flexible modification mechanisms that can adapt to extreme or
| | |
MARKET RISK 2021 Pillar 3 Disclosures Report |
unfavourable market situations, but also to market opportunities.
If one of these limits or their sub-limits is exceeded (by currency or IRRBB risk type), the heads of risk management must explain the reasons and facilitate a corrective action plan.
IRRBB information is reported to the group's senior management on a subsidiary-by-subsidiary basis, but collectively. In this way, the group's management can assess and control the risk profile in the subsidiaries, while at the same time obtaining a comprehensive overview of the risk so that it can be analysed and controlled from a global perspective.
The internal metrics used in the group to monitor IRRBB, based on the direct application of shocks to interest rate curves, are economic value and net interest margin sensitivities. The most commonly used interest rate scenarios are:
a.Parallels of + / -100bp and + /- 25bp, depending on the volatility of the group's various currencies.
b.The six regulatory scenarios (parallel and non-parallel) defined by the EBA8 for the EVE sensitivity calculation.
In addition, each subsidiary of the group uses a variety of scenarios sufficient to ensure appropriate measurement and control of its IRRBB profile. The use of these scenarios plays an important role in providing supplementary future risk estimates. These scenarios are set on an annual basis and the range is also based on the IRRBB self-assessment performed by each entity in the group. They can be of different types, e.g. historical, forward-looking, probabilistic or based on expert assessments.
Santander measures structural risks using models to support decision-making processes, obtain predictive information and generate metrics that are better adapted to the reality of each subsidiary and its balance sheet structure. These models must be consistent with the methodological standards defined in the group. Wherever possible, the group tries to align all methods and models used for the calculation of regulatory and internal metrics, and currently there are no relevant differences.
The general IRRBB management strategies are transactions with fixed-income instruments or derivatives. If hedging is through fixed income instruments, they are generally recorded at fair value through equity and to a lesser extent at amortised cost. If hedging is through derivatives, the group's general policy to reduce asymmetries in accounting treatment is to enter into fair value or cash flow hedges depending on the exposure of the underlying.
Fair value hedges hedge portfolio risks (fixed rate) and are therefore exposed to changes in the fair value of the portfolios due to changes in interest rates.
The cash flow hedges hedge the exposure of foreign flows subject to changes in interest rates. The purpose of these hedges is to actively manage the interest rate risk of floating rate volumes by entering into interest rate derivatives where the bank swaps floating rate flows for fixed rate flows.
Both types of hedging are carried out in the group. The financial management divisions of the individual subsidiaries
are responsible for designing and implementing operations according to their balance sheet structure, risk exposure and markets. These hedges are made through mainly interest rate swaps.
Financial derivatives that do not qualify for hedge accounting are treated for accounting purposes as trading derivatives.
For further details, see the Hedging transactions chapter (chapter 4.5) of the 2021 annual report.
| | | | | |
| Access 2021 Annual Report available on the Santander Group website |
Methodologies
Three main elements are necessary to calculate IRRBB metrics in Santander:
•Yield curves for capitalisation and discounting
•Behavioural models that enable the cash flows of certain instruments to be determined
•Assumptions about future changes in the entity's balance sheet and its various items
Of these three elements, the behavioural element is the main one subject to modelling.
The group develops methodological standards that establish best practises and criteria to be followed for the successful development and implementation of IRRBB models. Models may be based on quantitative approaches and methods using statistical or other mathematical techniques, or on assumptions and hypotheses assessed by experts. All models are managed within the framework of the Model Risk framework, which defines the principles and processes (including planning, development, validation, etc.) required to ensure adequate control of the models used in the group.
The main models used in the management and control of IRRBB are described below, by product type:
a. Treatment of non-maturity deposits (NMD)
Accounts with no contractual maturity are subject to two types of optionality, the customer's option to withdraw their money without prior notice and/or the bank's option to review the interest paid. The NMD corporate model models the product as a synthetic bond, with callable nominal and a periodic coupon. The callable nominal is determined by the stable balance and the estimated run-off for these flows. The coupon can be fixed, floating or subject to an elasticity with respect to market rates or a more complex function depending on different variables.
The model is based on the following sub-models and variables:
•Beta model: this sub-model defines the relationship between benchmark interest rates in the market and the remuneration paid to customers. The model can use a single beta or multi betas for the same account.
8 EBA/GL/2018/02
| | | | | | | | | | | |
143 | | 2021 Pillar 3 Disclosures Report | |
| | |
MARKET RISK 2021 Pillar 3 Disclosures Report |
•Attrition model: is determined by two sub-models: one calculates the unstable/stable balance, while the other determines the run-off of the stable balance up to the maximum maturity considered. For the unstable balance an outflow is assumed in the first temporary bucket, typically one day.
•Stable and unstable balance: a statistical model is used to estimate the stable balance based on the historical distribution of aggregated balances at the segment level and the observed outflows in relation to the trend of the series. The stable balance is determined on the basis of a certain confidence level, which is usually above 95%.
•Run-off model: this sub-model attempts to estimate customer behaviour on the basis of historical harvest data (development of accounts created at the same point in time). The estimate can be made using a statistical model that depends on several variables (interest rates, spread with other products, macro variables) or it can be calculated using an optimisation process that assumes a certain function, e.g. assuming an exponential function and calibrating the decay rate9.
The average repricing term is not a parameter used directly in the NMD corporate model, but duration is. However, following regulatory criteria, the group ensures that the average repricing term of NMDs for each currency does not exceed the thresholds set out in the EBA guidelines. This is calculated using the average maturity of the expected cash flows of the entire NMD balance (stable and unstable) adjusted by the betas of the model. For segments with fixed coupons or a beta of zero, the average maturity of the repricing dates matches the average maturity of the cash flows, and as the unstable balance (repricing balance) or betas increase, the gap between them opens (causing the average repricing maturity to decrease).
This model requires a variety of inputs, which are as follows:
◦Parameters inherent to the product.
◦Customer and/or bank behavioural parameters (in this case, analysis of historical data is combined with expert judgement on the business).
◦Market data.
◦Historical data for the portfolio.
b. Treatment of non-maturing assets (NMA)
The model used on the asset side for products such as credit cards can be modelled in a similar way to the NMD model, sharing some of the same methodology and assumptions. The difference between the two models is that for assets without a fixed maturity, the fixed credit limit, which serves as a ceiling for future drawdowns, must be taken into account.
c. Treatment of prepayment of certain assets.
The prepayment option is defined as the possibility offered to customers to repay their loans before the contractual maturity date, without this involving a significant additional cost for them. Prepayment can be total or partial. Prepayment mainly affects fixed-rate products, such as fixed-rate mortgages in markets where the yield curves for these loans are at low levels and there is an incentive for customers to
prepay when the market interest rate is below the product's reference interest rate. However, prepayment does not only depend on the level of interest rates. It also depends on other more complex factors resulting from macroeconomic and cultural situations in the market. This means that the normal techniques used to value options cannot be applied directly, and they must be combined with empirical statistical models that aim to capture customer behaviour. Some of the factors conditioning this behaviour are:
•Interest rate: the differential between the fixed rate of the product (e.g. a mortgage) and the market rate at which it could be refinanced, net of cancellation and opening costs.
•Seasoning: the trend whereby prepayment is low at the beginning of the instrument lifecycle (signature of the agreement) and then increases, stabilising with the passage of time.
•Seasonality: redemptions and early cancellations tend to take place at specific dates.
•Burnout: a decreasing trend in the speed of prepayment as the instrument's maturity approaches. This includes:
1. Age, which defines low rates of prepayment.
2. Cash pooling, which defines loans that have already survived various waves of interest rate reductions as being more stable. In other words, when a loan portfolio has been through one or more cycles of rate cuts and, thus, high levels of prepayment, the surviving loans have a significantly lower prepayment probability.
3.Other: such as geographic mobility, demographic, social and disposable income factors.
However, prepayment can also occur with variable rate products, and variable rate mortgages are also modelled in the group. In these cases, prepayment is usually due to factors other than the level of interest rates and the impact in terms of IRRBB risk is lower due to having variable repricing.
The prepayments model assumes that these balances naturally decline as customers gradually repay. Prepayment parameters can be constant values or a function dependent on several variables. The model creates a function that produces a fall in flows until the maturity for the transaction.
The use of additional behavioural models in the group (e.g. early termination of time deposits or pipelines) depends on the structure and complexity of each subsidiary's balance sheet. The rationale for these models is based on those described above.
d. Treatment of NPE10
The group includes and models NPEs in the IRRBB measurement. The definition of the parameters used in the model (e.g. estimated recovery period) is based on expert judgement and/or credit risk model parameters (probability of default and loss given default).
9 An exponential function implies assuming higher outflows in the short/medium term followed by long-term stability; i.e. the empirically observed behaviour of most units with positive interest rates.
10 Non Performing Exposures
| | |
MARKET RISK 2021 Pillar 3 Disclosures Report |
For further details, see the Hedging transactions chapter (chapter 4.1) of the 2021 annual report.
| | | | | |
| Access 2021 Annual Report available on the Santander Group website |
The following tables show changes in the bank's economic value of equity (EVE) and net interest margin (NIM) for every prescribed interest rate scenario and for every currency:
The following tables show the bank’s changes in the Economic Value of Equity (EVE) and Net Interest Income (NII) for every interest rate prescribed scenario and for every currency.
| | | | | | | | | | | | | | | | | |
| Table 70.IRRBB1 - Interest rate risks of non-trading book activities |
| EUR million |
| 2021 |
| Total | Changes of the economic value of equity | Changes of the net interest income |
| Supervisory shock scenarios | Current period | Last period | Current period | requirement | Last period |
| Parallel up | 953.85 | 1,243.39 | 2,092.10 | — | 1,716.08 |
| Parallel down | (5,948.13) | (1,866.72) | (1,742.55) | — | (739.90) |
| Steepener | 1,730.54 | 2,726.09 | | — | |
| Flattener | (3,727.52) | (4,731.49) | | — | |
| Short rates up | (2,136.59) | (2,893.76) | | — | |
| Short rates down | (624.62) | (463.02) | | — | |
| | | | | | | | | | | | | | | | | |
| EUR | Changes of the economic value of equity | Changes of the net interest income |
| Supervisory shock scenarios | Current period | Last period | Current period | requirement | Last period |
| Parallel up | 7,086.86 | 7,660.14 | 1,066.00 | — | 1,195.05 |
| Parallel down | (3,326.57) | (1,477.36) | (430.33) | — | (439.29) |
| Steepener | 1,528.95 | 2,696.20 | | — | |
| Flattener | 0.69 | (594.16) | | — | |
| Short rates up | 2,558.03 | 1,465.54 | | — | |
| Short rates down | (1,819.43) | (1,426.72) | | — | |
| | | | | | | | | | | | | | | | | |
| USD | Changes of the economic value of equity | Changes of the net interest income |
| Supervisory shock scenarios | Current period | Last period | Current period | requirement | Last period |
| Parallel up | (74.54) | (600.18) | 637.80 | — | 192.46 |
| Parallel down | (2,449.97) | (448.73) | (413.73) | — | 84.68 |
| Steepener | 103.66 | 541.20 | | — | |
| Flattener | (813.32) | (986.91) | | — | |
| Short rates up | (240.06) | (746.21) | | — | |
| Short rates down | (247.46) | 187.76 | | — | |
| | | | | | | | | | | | | | | | | |
| GBP | Changes of the economic value of equity | Changes of the net interest income |
| Supervisory shock scenarios | Current period | Last period | Current period | requirement | Last period |
| Parallel up | 443.04 | 1,618.83 | 804.67 | — | 598.91 |
| Parallel down | (1,563.63) | (859.55) | (1,171.01) | — | (424.60) |
| Steepener | 1,096.67 | 1,547.08 | | — | |
| Flattener | (1,492.25) | (1,701.86) | | — | |
| Short rates up | (825.40) | (407.25) | | — | |
| Short rates down | 324.99 | (210.59) | | — | |
| | | | | | | | | | | | | | | | | |
| BRL | Changes of the economic value of equity | Changes of the net interest income |
| Supervisory shock scenarios | Current period | Last period | Current period | requirement | Last period |
| Parallel up | (1,404.82) | (1,095.86) | (176.75) | — | (131.69) |
| Parallel down | 1,542.24 | 861.79 | 176.75 | — | 131.69 |
| Steepener | 343.77 | 751.57 | | — | |
| Flattener | (636.73) | (1,006.50) | | — | |
| Short rates up | (1,074.04) | (1,250.17) | | — | |
| Short rates down | 1,199.76 | 1,192.32 | | — | |
| | | | | | | | | | | |
145 | | 2021 Pillar 3 Disclosures Report | |
| | |
MARKET RISK 2021 Pillar 3 Disclosures Report |
The published sensitivity to economic value in the EUIRRBB1 table follows all methodologies and criteria defined within the group and is adjusted (if necessary) by the principles set out in the EBA guidelines.
The published sensitivity to net interest margin is calculated for an interest rate shock of +/-200 basis points in all currencies and following all methodologies and principles defined for internal metrics.
The average and maximum repricing maturity of NMDs in the group is calculated by each subsidiary based on its historical data and statistical techniques. The data for the group are:
| | | | | | | | | | | | | | | | | | | | |
| | Average reprincing maturity | | Longest repricing maturity |
| | Total volume | Core Volume | | Total Volume | Core volume |
| Retail | | 2.50 | 3.40 | | 20.00 | 20.00 |
| Non-financial Wholesale | | 2.60 | 3.80 | | 20.00 | 20.00 |
| | | | | | | | | | | | | | | | | | | | | | | | | | | | | | | | | | | | | | |
| | |
| Operational risk |
|
|
| |
| 8.1. Definition and objectives | |
| 8.2. Capital requirements for Operational Risk | |
| |
| |
| |
| |
| |
| |
| |
| |
| |
| |
| |
| |
| |
| |
| |
| |
| |
| |
| |
| |
| |
| | |
OPERATIONAL RISK 2021 Pillar 3 Disclosures Report |
8. Operational risk
| | | | | | | | |
| Main figures | | |
Million euros | | |
| RWA | RWA |
| 2021 | 2020 |
| Operational risk | 58,786 | 55,865 |
| Of which, standardised approach | 49,645 | 45,707 |
| Of which, alternative standardised approach | 9,141 | 10,158 |
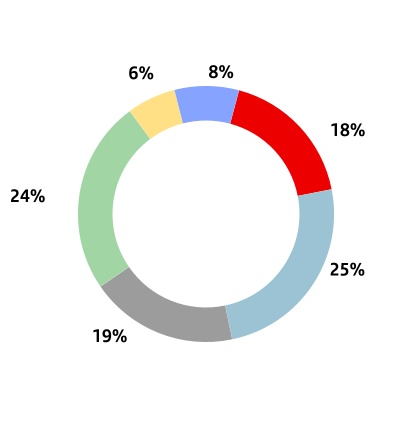
| | | | | |
| n | Spain |
| n | Rest of Europe |
| n | USA |
| n | South America |
| n | North America |
| n | Others |
| |
| | |
| RWA variation |
Million euros |
8.1. Definition and objectives
This section covers the letter (a) of the qualitative requirement ORA - Qualitative information on operational risk . Also the provisions of letters (d), (e), (f) and (g) of the OVA requirement -Institution risk management approach, are complied with.
Paragraphs (c) and (d) of the qualitative requirement ORA are not applicable as Banco Santander does not use the AMA approach to calculate minimum capital requirements.
Santander operational risk management and control model is based on a continual process of identifying, evaluating and mitigating sources of risk, regardless of whether they have materialized or not, ensuring that risk management priorities are established appropriately. Santander expressly
recognises that while a certain volume of operational losses can be expected, severe unexpected losses resulting from failures in business controls are unacceptable.
The group applied new developments and enhancements to the operational risk management model in 2021 in the risk assessment and control tools, operational risk appetite, business continuity plans and the analysis and integration of new risks (such as transformation risk or climate risk) into the non-financial risk monitoring and control model.
In terms of key risks, the business opportunities arising from digital transformation bring with them a host of new risks, such as technology risks, cyber risks and increasing dependence on suppliers,which increases potential exposure to events that could affect the delivery of services to our customers. The group has taken numerous initiatives to mitigate these risks and adapt to changes in the regulatory framework, the focus being on strengthening its ability to recover from disruptive events affecting its core operations.
| | | | | | | | | | | |
149 | | 2021 Pillar 3 Disclosures Report | |
| | |
OPERATIONAL RISK 2021 Pillar 3 Disclosures Report |
For more information, see the Risk management and control chapter (section 6) of the 2021 annual report.
| | | | | |
| Access 2021 Annual Report available on the Santander Group website |
Operational risk reporting should cover the following objectives:
a.Provide the heads of business units and support functions with the data they need to manage their risks and meet their objectives and strategies.
b.Provide senior management with the information it needs to establish, review and, where appropriate, modify business strategies and risk profiles.
c.Provide the operational risk function with the information necessary to efficiently discharge its duties.
d.Comply with the information requests of supervisory and regulatory bodies.
The business and support functions of all group entities are responsible for identifying, assessing and communicating their operational risks and are supported by the Operational Risk Coordinator function. The Operational Risk function in each Group unit collects information from all business and support functions and reports on it in established local forums.
Subsequently, the corporate Operational Risk function consolidates the information available from each unit in order to provide a comprehensive and complete overview of the group's operational risk profile. Such information shall be communicated to senior management in accordance with the governance framework described in the Corporate governance chapter of the 2021 annual report.
At the group level, the process of consolidating and reporting operational risk information is divided into the following phases:
a.Reception of information: the local operational risk functions submit various types of information to the corporate operational risk function with the frequency that is specified in the related procedures and guidelines. Although information can be sent via various channels, the Heracles corporate tool is the primary tool for collecting and recording information.
b.Consolidation and processing of the information: once all the required information has been received and/or extracted, the corporate operational risk function conducts a qualitative analysis, checking the suitability and consistency of the data and the main deviations.
c.Use of information: the consolidated information is used for reporting to external parties as well as to the group's senior management. The reports' content is updated and developed in response to the needs of the governing bodies.
Heracles is the Golden Source of the operational risk data of the Group. One of its main components is the database of events and losses for this risk, which is used in internal and
regulatory reporting and in the calculation of economic capital. In addition, Heracles contains all the necessary tools for operational risk analysis and management: controls, risks, metrics, scenarios and mitigation measures. Its functionality integrates all these programmes through the use of common taxonomies applied in the different control communities and common methodologies for assessing risks and the effectiveness of controls. Heracles is also the tool used to perform certifications related to various regulations such as SOX, Volcker and FATCA.
Risk mitigation is one of the core elements of the operational risk framework and consists of continuous monitoring of risks exposure to identify unmanaged risks, implement control procedures, provide training and reduce the occurrence of events and losses. This information is shared on a regular basis with the governing bodies in order to ensure proper monitoring and control.
For Santander, insurance is also a key element in operational risk management.The Own Insurance function is responsible for the use of risk transfer formulas to optimize and safeguard the bank´s financial results. The group constantly monitors the appropriate implementation of policies and procedures for managing insurable risks, in collaboration with the relevant group areas that contribute to their correct execution in the various units.
For further information on the specific management of the principal operational risks, as well as global insurance programs, please refer to the Risk management and control chapter (section 6) of the 2021 annual report.
| | | | | |
| Access 2021 Annual Report available on the Santander Group website |
The Group operational risk management and control model is based on a continual process of identifying, evaluating and mitigating sources of risk, regardless of whether they have materialized or not, ensuring that risk management priorities are established appropriately.
The following are the key operational risk management and control processes:
a.Strategic planning and estimation of OR losses: covers the activities necessary to define the Group's objective operational risk profile, including setting the risk appetite, estimating losses annually and reviewing the management perimeter.
b.Identification and assessment of operational risk: aims to identify the risks and factors that may cause OR in the organisation and assess their potential impact quantitatively or qualitatively. The first lines of defence, which include all organisational units of the group, are responsible for identifying and assessing the operational risks in their activities.
c.Continuous monitoring of the OR profile: this process aims to regularly analyze available information on the nature and extent of the risks incurred in the development of the group's activities through an adequate alerts system, based on available tools such as indicators and escalation processes.
| | |
OPERATIONAL RISK 2021 Pillar 3 Disclosures Report |
d.Identify risk mitigation and risk transfer measures: once the OR assessment has been carried out, it is important to identify risk mitigation measures to prevent risks from occurring and, if necessary, to take corrective measures to minimise the economic impact of the risks that have occurred. The identification and implementation of such risk mitigating measures is an ongoing process and particularly important for adequate risk management.
e.Information: information includes obtaining, disseminating and making available the information necessary for decision-making to the relevant persons. The information processes are carried out in accordance with the standards and criteria established in each case. See the OVA and OVB tables for more information about this process.
The group has defined an organisational model with three lines of defence for the structure and organisation of operational risk management in order to meet regulatory requirements and in line with best practises in the banking sector:
a.The first line of defence includes all business units and support functions. The first line of defence is responsible for the OR generated in its area. Its main function within the OR management and control model is to identify, assess, monitor, mitigate and communicate the risks.
b.The second line of defence comprises the operational risk control function within the Risk division. Its main responsibilities include: designing, maintaining and evolving the OR management and control model, fostering the development of a risk culture throughout the group, encouraging business units and support functions to monitor and effectively manage identified risks, and ensuring that the management bodies receive adequate information on all relevant risks for decision-making.
c.At Santander, Internal Audit is the independent body that performs the functions of the third line of defence. Its functions include: verifying that the risks associated with the group's activities are adequately covered; monitoring the compliance, effectiveness and efficiency of the internal control systems of OR; assessing the state of implementation of the OR management and control model in the group; and making recommendations for continuous improvement to all functions involved in OR management.
For more information on risk governance structure, please refer to the Corporate governance chapter of the 2021 annual report.
| | | | | |
| Access 2021 Annual Report available on the Santander Group website |
For more information on risk measurement and control tools and reporting of operational risk, please refer to the EU OVA table of this document, and the Risk management and control chapter (section 6) of the 2021 annual report.
| | | | | |
| Access 2021 Annual Report available on the Santander Group website |
8.2. Capital requirements for Operational Risk
This section covers the letter (b) of the qualitative requirement ORA - Qualitative information on operational risk .
Santander uses the standardised approach to calculate the capital requirements for operational risk, as established in the CRR.
The resolution was taken by the board of directors on 22 June 2007 and reported to Banco de España's general supervisory department by the second vice chairman and chief executive officer on 29 June 2007.
Under the standardised approach, capital requirements are calculated on the basis of relevant income, which is defined as the sum of the following components of the income statement:
•Interest and similar income
•Interest expense and similar charges
•Income from equity instruments
•Fee and commission income
•Fee and commission expense
•Trading gains (net)
•Exchange differences (net)
•Other operating income
The CRR also defines the following segmentation of business lines for this method:
a.Corporate finance
b.Trading and sales
c.Retail brokerage
d.Commercial banking
e.Retail banking
f.Payment and settlement
g.Agency services
h.Asset management
| | | | | | | | | | | |
151 | | 2021 Pillar 3 Disclosures Report | |
| | |
OPERATIONAL RISK 2021 Pillar 3 Disclosures Report |
Relevant income
Under the standardised approach, capital requirements are calculated as the simple average over the last three years of the aggregation, for each year, of the greater of zero or the sum of relevant income across each of the business lines, multiplied by the weight assigned to each business line.
The mathematical expression of these requirements is as follows:
Where:
RI1-8 = Relevant income of each business line, with the appropriate sign, in accordance with the CRR.
ß1-8 = Weight applicable to each business line, in accordance with the CRR.
The Financial Accounting and Control division is responsible for obtaining data on relevant income, allocating it to the various business lines and calculating the capital requirements.
Santander obtains the figure for relevant income from the consolidated management information by business line. This information is generated from accounting information.
Consolidated management information is published quarterly in aggregate form and is the basis on which the budgetary compliance of the businesses is measured. This is prepared by the Management Control area, which regulates the business lines of all the group's units based on corporate criteria, which all units must apply when drawing up their management information.
Main segments
This primary level of segmentation, which is based on the group's management structure, comprises five reportable segments: four operating areas plus the corporate centre. The operating areas are:
Europe: includes all business conducted in the region except that included in Digital Consumer Bank, including Spain, the UK, Portugal and Poland.
North America: includes all the business activities carried out in Mexico and the US, which includes the holding company
(SHUSA) and the businesses of Santander Bank, Santander Consumer USA, the specialised unit of Banco Santander International, Santander Investment Securities (SIS), and the New York branch.
South America: mainly includes all the financial activities performed by the group through its banks and subsidiary banks in the region.
Digital Consumer Bank: includes Santander Consumer Finance, which covers all the consumer business in Europe, Openbank and ODS (Open Digital Services).
In addition to these operating units described, the group continues to maintain the corporate centre, which includes the centralised management businesses relating to financial holdings, financial management of the structural exchange rate position, carried out within the scope of the group's assets and liabilities committee, and management of liquidity and own funds through issuances.
As the group's holding entity, the corporate centre manages all capital and reserves and allocations of capital and liquidity with the rest of businesses. It also incorporates amortisation of goodwill but not the costs related to the group's central services (charged to the areas), except for corporate and institutional expenses related to the group's functioning.
The following chart shows the distribution of capital by business line at 31 December 2021
| | | | | |
| Capital distribution by business line |
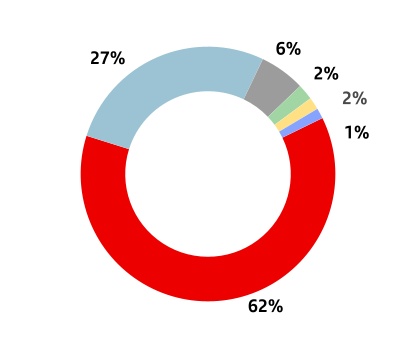
| | | | | |
| n | Retail Banking |
| n | Commercial Banking |
| n | Trading and sales |
| n | Payment and settlement |
| n | Asset management |
| n | Corporate Finance |
Changes in capital requirements and RWAs for operational risk from 2020 to 2021 are shown below:
| | | | | | | | |
| Table 71.Changes in capital requirements for operation risk |
|
| EUR million | | |
| | |
| 2021 |
| Capital | RWAs |
| Starting figure (31/12/2020) | 4,469 | 55,865 |
| Perimeter | (51) | (637) |
| Exchange rate effect | 82 | 1,021 |
| Change in business | 203 | 2,537 |
| Ending figure (31/12/2021) | 4,703 | 58,786 |
| | |
OPERATIONAL RISK 2021 Pillar 3 Disclosures Report |
The standardised approach imposes higher capital requirements for financial institutions operating in jurisdictions with high net interest income, which are often associated with a high risk premium but not necessarily greater operational risk. To avoid this undesired effect, EU legislation (Regulation 575/2013/EU) provides for the use of the alternative standardised approach by businesses that meet certain conditions, subject to the supervisor's approval. This approach uses a standardised indicator calculated by multiplying certain balances by 3.5%, thereby providing an average which is more in line with the unit's operational risk.
On 3 February 2016, the European Central Bank issued authorisation for the alternative standardised approach to be used to calculate consolidated capital requirements for operational risk at Banco Santander Brasil, S.A.
The European Central Bank also issued authorisation for the alternative standardised approach to be used to calculate consolidated capital requirements for operational risk at Banco Santander México S.A., on 12 July 2017.
| | | | | | | | | | | | | | | | | |
| Table 72.OR1 - Operational risk own funds requirements and risk-weighted exposure amounts |
| EUR million | | | | | |
| | | | | |
| | | | 2021 |
| Relevant indicator | Own funds requirements | Risk weighted exposure amount |
| Year-3 | Year-2 | Last year | | |
| Banking activities subject to basic indicator approach (BIA) | — | — | — | — | — |
| Banking activities subject to standardised (TSA) / alternative standardised (ASA) approaches | 33,861 | 35,649 | 38,064 | 4,703 | 58,786 |
| Subject to TSA: | 29,075 | 30,005 | 32,528 | | |
| Subject to ASA: | 4,787 | 5,644 | 5,537 | | |
| Banking activities subject to advanced measurement approaches AMA | — | — | — | — | — |
| | | | | | | | | | | |
153 | | 2021 Pillar 3 Disclosures Report | |
| | |
OPERATIONAL RISK 2021 Pillar 3 Disclosures Report |
| | | | | | | | | | | | | | | | | | | | | | | | | | | | | | | | | | | | | | |
| | |
| ESG risks |
|
| |
| 9.1. Building a more responsible bank by embedding ESG | |
| 9.2. Climate change and environmental risk | |
| |
| |
| |
| |
| |
| |
| |
| |
| |
| |
| |
| |
| |
| |
| |
| | |
ESG RISK 2021 Pillar 3 Disclosures Report |
9. ESG risk
9.1. Building a more responsible bank by embedding ESG
Our ESG strategy
| | | | | | | | |
| E | | Deliver our net zero carbon ambition by 2050, by setting decarbonization targets, elping our customers transition, and remaining carbon neutral in our own operations |
| | |
| | |
| S | | Support inclusive growth through financial empowerment; support for education, nterprise and employment, and building a diverse, talented workforce. |
| | |
| | |
| G | | Embed behaviours, processes, policies and governance to ensure we are acting esponsibly, listening to our stakeholders, and treating all our stakeholders in a Simple, Personal and Fair way – all based on solid governance and prudent risk management |
ESG priorities
Our materiality assessment identified 15 ESG topics we should focus on to develop our ESG agenda. Embedding ESG in risk management is one of the top five more relevant topics, categorized as a crucial topic for Banco Santander.
We will ensure our risk Management framework incorporates customer and operations’ environmental (e.g. climate) and social (e.g. human rights) risks and outlining them in policies and procedures.
Governance
Our principles, frameworks and policies ensure we behave responsibly in all we do.
Our Environmental, social and climate change risk management policy sets out the standards for investing in, and providing financial products and services to, companies and customers in the oil and gas, power generation and transmission, mining and metals, and soft commodities industries.
For further information on our ESG strategy and our performance in 2021, see the 'Responsible banking' chapter in the 2021 Annual Report available on the Group website.
| | | | | |
| Access 2021 Annual Report available on the Santander Group website |
9.2.Climate change and environmental risk
Climate-related and environmental risk management is key to fulfilling our objectives and the commitments in our climate strategy sustainably. Santander takes aiding customers’ and households’ transition to a low-carbon economy seriously, offering financial products and services to environmentally and socially responsible businesses in keeping with our sustainability commitments and the objectives of the Paris Agreement. For more details, see the Responsible banking chapter.
Santander has an environmental, social and climate change risk policy (available on its corporate website). It dictates the standards for measuring, monitoring and managing risks from oil and gas, power generation, mining and metals, soft commodities and other sectors that require in-depth analysis because of their potential impact on the environment and society. It is consistent, and must be applied, with the Group's policies on sustainability and human rights.
The Risk and Responsible banking functions oversee the annual revision of the policy alongside other business areas to make sure it will conform to international practices and standards and to the Group's sustainability strategy.
Climate-related and environmental risk management is a priority of the Risk function.
Identification
Two core processes help Santander spot climate-related risks: top and emerging risk identification and regular risk profile assessment — RPA. Here is how they form part of climate-related risk management.
In identifying emerging and top risks, we pinpoint and measure our most significant internal and external threats to profitability, capital adequacy and strategy. Since 2018, our four top risk event categories have included a climate and environment subcategory. Our analysis covers qualitative as well as quantitative factors (which we’ve been developing further as more data and new methodologies become available).
As the Group makes progress on its climate-related commitment, it shows us how the importance of climate-related and environmental risks and the mounting pressures from regulators, supervisors and broader society have grown in recent years.
Findings from emerging and top risk identification fuel our internal capital and liquidity adequacy assessment processes (ICAAP and ILAAP). For instance, our 2021 ICAAP included an idiosyncratic event to show climate change's potential impact on measurement.
The risk profile assessment (RPA) is the second topic of this section. Santander regularly conducts an RPA that covers all
| | | | | | | | | | | |
157 | | 2021 Pillar 3 Disclosures Report | |
| | |
ESG RISK 2021 Pillar 3 Disclosures Report |
risk types and reveals any threat to its business plan. In 2021, we added a special module on climate-related risk control to measure the Corporate Centre and the other subsidiaries'’ progress. The questionnaire covers strategic planning, implementation, control and monitoring, and governance. Its findings enable us to find gaps and areas for improvement. The questionnaire will continue to change throughout 2022.
Planning
Strategic planning includes annual budgeting, the three-year financial plan (including risk in executing the Group's strategy, internal and external influence, inability to respond to a changing business environment) and the Group's long-term strategic plan (including risk from its own design).
Those core strategic processes enable the Group to plan for risks from the transition to a low-carbon economy and the physical impact of climate change, and introduce them into short-, medium- and long-term strategy, making it easier to spot threats and changing conditions that could influence our ability to deliver objectives. In qualitative and group-wide terms, plans cover priorities and projects for the coming years; in quantitative terms, they include a financial plan for the period that is consistent with the Group's risk appetite.
Assessment
To determine the most significant climate-related and environmentally material loan portfolios, Santander runs a quarterly materiality assessment. It proves fundamental to making decisions about selected industries, customers and regions and to establishing our strategic priorities. It covers climate-related and environmental risks over many time horizons so our management processes (e.g. risk appetite, top risk identification, credit limits and stress testing) can address them.
Our risk taxonomy and heatmaps are the basis for categorizing portfolios by industry and region according to their potential exposure to physical or transition-based climate-related and environmental risk. Santander’s materiality assessment follows the guidelines of the Task Force on Climate-related Financial Disclosures (TCFD) and the United Nations Environmental Programme Finance Initiative (UNEP-FI).Because the taxonomy of industries and sub-industries is based on the EU’s NACE codes, it enables us to consistently compile exposure data that serve as a starting point (along with the heatmap for physical and transition-based risks) for quantitative and qualitative measurements of the most material climate change-related risks.
It covers practically our entire balance sheet. It also analyses residual value, strategic risk, market risk and liquidity risk in depth. In 2021, we continued making progress with our climate-related risk materiality assessment by raising the level of granularity and including other businesses (namely Santander Consumer Finance and Private Banking). The graph below shows the Group's last materiality assessment at the end of Q3’21.
SCIB : REC (on and off balance sheet lending + guarantees + derivatives PFE), Other segments : Drawn amount
Other Sectors= SCIB and Corporate NACES outside of risk taxonomy perimeter //
Individuals and SCF: Cards and Other Consumer
Other segments include Individuals, SCF, Corporates and Institutions.
TR: Transition Risk. PR: Physical Risk
Monitoring
Santander uses risk appetite, scenario analyses and other tools to monitor climate-related and environmental risk. Here we delve deeper into each one.
Risk appetite sets the volume and type of risks we deem prudent for our business strategy. Along with implementing policies, it is a key tool to monitor climate-related risk, our objectives and our commitments, and to mitigate the risk of failing to meet them.
Climate-related matters have been expressly part of our risk appetite since 2019. The board of directors approved a qualitative risk appetite statement on climate. It linked climate change management to our industry-related policies, which prohibit or place restrictions on financing operations with an environmental or social impact in the energy, mining and metals, and soft commodities industries. We review those policies every year to make sure our standards remain consistent with our strategy and best practice.
In line with our ambition and commitment to financing the transition to a low-carbon economy, in November 2020 the Group updated our risk appetite consistently with our support for the Paris Agreement while our industry-based policies were combined into our environmental, social and climate change policy.
In February 2021, the Group made its first decarbonization commitments as part of its goal to reach net zero emissions by 2050. They included commitments on the thermal carbon industry. Accordingly, by 2030 we will end financial services to electricity generating customers if 10% of their revenues rely on thermal coal; and eliminate our exposure to coal mining worldwide.
| | |
ESG RISK 2021 Pillar 3 Disclosures Report |
We continue to enhance our risk appetite statement to complement the Group’s strategy with available methodologies and data. To start setting climate-related risk appetite metrics, we determine industry targets according to our strategy and follow this conceptual process:
1.Design options: metrics, data availability and frequency
2.Calibration and definition of limits thresholds
3.Policy and procedure analysis
4.Approval government
5.Monitoring
According to our first decarbonization commitments, our current qualitative risk appetite statement added a specific quantitative metric the board had approved in November 2021 in accordance with established governance procedures.
The metric puts limits and thresholds on counterparties from the thermal carbon industry that our commitments concern. It also gives a path to those limits that is conducive to fulfilling the target by 2030. The process involves permanent contact with affected customers to share Santander’s strategy and to understand and assess their transition planning.
Santander will also continue to set alignment targets for industries with a material impact on climate as part of the Net Zero Banking Alliance initiative. The Group's risk appetite will gradually introduce metrics and limits for each one of those industries (subject to established governance procedures).
As mentioned earlier, scenario analyses are a management tool to monitor climate-related and environmental risk. Analysis techniques are useful for the Group's internal management and for handling regulatory and supervisory stress testing. We use scenarios determined by the network for greening the financial system (NGFS) and others designed by our Research department to analyse the impact on climate under various circumstances.
In 2022, Santander will undergo the Single Supervisory Mechanism’s (SSM) climate and environmental risk stress test. It will have three modules: a qualitative questionnaire; climate risk metrics; and bottom-up stress test projections. Although it may be qualitatively introduced into the Supervisory review and evaluation process (SREP), it is an overall learning exercise without direct quantitative implications about capital. To carry it out, the Group will use a combination of internally developed items and an external provider’s platform and databases to quantify the financial impact of each counterparty’s physical and transition-based risks. According to the graph below, the platform has seven modules and is based on the United Nations Environmental Programme Finance Initiative's (UNEP FI) methodology and other external information. The exercises we conduct entail both a bottom-up analysis of the customer and a top-down analysis of portfolios by industry and geography.
Furthermore, Santander UK took part in the Bank of England’s Climate Biennial Exploratory Scenario (CBES) in 2021. The CBES marks the first time Santander UK conducted an analysis of climate scenarios in what became a learning exercise. That enables us to measure the dimension of our portfolios’ climate change-related risks and understand the challenges involved.
The CBES required three scenario models exploring many combinations of physical and transition-based risks over 30
years. It also required closer contact with customers to better understand their plans to adapt to climate change and reflect them in final risk models. Focus was on credit risk and, in particular, on detailed analyses of risks to large corporates.
In response to the CBES, Santander UK set out its target operating model, created internal climate-related risk models, engaged with providers specializing in climate modelling, obtained internal and market data to include them within models, and involved hundreds of employees and customers. Its CBES exercise followed a sound governance and control framework. We expect the Bank of England will publish its findings in May 2022.
Mitigation
In mitigation, we updated our environmental, social and climate change policy, which sets out our public commitments and aims to support our strategy for sensitive, special-attention and prohibited industries. Our loan approval policies follow the EBA's guidelines on loan origination and monitoring.
Our internal taxonomy is also considered a mitigating instrument since it helps us inform our customers of the need to have credible plans in place to cease carbon-based activities in the coming years and ensure an orderly transition. The sustainable finance classification system (SFCS) is our internal guide to identify sustainable activities and ensures a blanket approach to monitoring operations, supporting the development of solutions for customers and mitigating the risk of greenwashing. It is also key to designing our sustainable financing proposition and supplements our Global sustainable bond framework and Green finance commitment.
Furthermore, for credit approvals, the first line of defence runs due diligence with several special questionnaires. If the process reveals a reputational issue, it will be escalated to the Reputational risk team as a preventative measure. All project finance transactions with SCIB must be analysed according to the Equator Principles (for more details about Santander’s commitment to the Equator Principles, see section ‘Environmental and social risk analysis’ in the Responsible banking chapter).
For 2022, we have planned several measures to continue including climate and environmental variables in credit approvals:
•Credit committees: Subsidiary committees will inquire about environmental, social and climate change factors.
•Customer ratings: They aim to ensure all SCIB corporate ratings include environmental, social and climate change factors. We will broaden the scope to retail banking (corporates). Environmental, social and climate change analysis is gradually being introduced into pricing based on companies’ ratings. However, pricing for green mortgages and other special products already provides discounts under certain conditions.
•Collateral: Collateral valuation includes energy certificates.
A corporate multidisciplinary working group is analysing and monitoring the most significant claims and disputes, including those related to climate change management that could have an impact on Santander’s reputation. Its work includes mitigation plans and escalations according to the established governance.
| | | | | | | | | | | |
159 | | 2021 Pillar 3 Disclosures Report | |
| | |
ESG RISK 2021 Pillar 3 Disclosures Report |
Santander takes part in international regulatory and supervisory forums and working groups to assess climate risks and opportunities, while anticipating and mitigating potential risks to the Group.
Lastly, the Risk function increased the number and capabilities of its resources to manage and monitor climate and environmental risk, for which specialist training proved fundamental. Furthermore, we will gradually give most employees general training in 2022 to raise their awareness. Our Risk pro culture will be essential. In 2022, we also hope to progress our policy on incentives/remuneration tied to climate-related risk management and control.
Reporting
Santander continues to make progress on internal and external disclosures to ensure communications to stakeholders on climate and environmental risk progress are transparent and accurate according to the law and supervisors’ expectations.
Our external reports such as the 2021 Climate finance report (that explains Santander’s position and strategy on climate change) and this Annual report highlight the progress we made climate and environmental risk. We are also working on areas that are closely related to external disclosures such as the green asset ratio (GAR), transparency requirements of the sustainable finance disclosure regulation (SFRD) and climate disclosure requirements under Pillar III. Because of the increasing interest in, and scrutiny of, climate and environmental risk, information on climate-related and environmental risk is becoming more important to the Group’s senior managers.
For more information, refer to the Climate change risk report or the Risks and compliance chapter of the 2021 Annual Report.
| | | | | |
| Access 2021 Annual Report available on the Santander Group website |
For further detail see the TCFD chapter and the Climate Finance Report.
| | | | | |
| Access the Climate Finance Report available on the Santander Group website |
| | | | | | | | | | | | | | | | | | | | | | | | | | | | | | | | | | | | | | |
|
|
|
|
|
|
|
|
|
|
|
|
|
|
|
|
| | | | | | | | | | | | |
| Other risks | | | | | | | | | | |
| | | | | | | | | |
| | | | | | | | | |
| | | | | | | | | | | | |
| 10.1. Liquidity and funding risk | | | | | | | | | | | |
10.1.1. Liquidity Coverage Ratio (LCR) | | | | | | | | | | | |
10.1.2. Net Stable Funding Ratio (NSFR) | | | | | | | | | | | |
10.1.3. Asset Encumbrance | | | | | | | | | | | |
| 10.2. Compliance and conduct risk | | | | | | | | | | | |
| 10.3. Model risk | | | | | | | | | | | |
| 10.3.1. Introduction | | | | | | | | | | | |
| 10.3.2. Model Risk Management | | | | | | | | | | | |
| 10.3.3. Key metrics | | | | | | | | | | | |
| 10.4. Capital risk | | | | | | | | | | | |
| | |
OTHER RISKS 2021 Pillar 3 Disclosures Report |
10. Other risks
| | | | | | | | |
| Main figures | | |
| EUR million | | |
| 2021 | 2020 |
| Liquidity Coverage Ratio | | |
| Total high-quality liquid assets (HQLA) (Weighted value - average) | 281,783 | | 250,857 | |
| Cash outflows - Total weighted value | 224,876 | | 204,842 | |
| Cash inflows - Total weighted value | 54,114 | | 49,980 | |
| Total net cash outflows (adjusted value) | 170,762 | | 154,862 | |
| Liquidity coverage ratio (%)11 | 165% | 162% |
| Net Stable Funding Ratio | | |
| Total available stable funding | 1,123,411 | | 1,029,104 | |
| Total required stable funding | 891,442 | | 854,193 | |
| NSFR ratio (%) | 126% | 120% |
10.1. Liquidity and funding
risk
This section covers the qualitative requirements LIQA - Liquidity risk management and LIQB - Qualitative information on LCR, which complements template EU LIQ1. Also the provisions of letters (d), (e), (f) and (g) of the OVA requirement -Institution risk management approach, are complied with.
Liquidity risk entails the potential losses that may be incurred by an entity as a result of its inability to secure funding on the market and/or the higher borrowing costs of new sources of finance.
The aim of liquidity risk management is to guarantee that funds are available at the right time and cost to enable the entity to meet its obligations and carry out its operations.
Risk profile:
•Management of liquidity and funding is an essential component of business strategy.
•The liquidity and funding model is decentralised and based on autonomous subsidiaries responsible for covering their own liquidity needs.
•Needs arising from business activity in the medium/long term must be funded by medium-term and long-term instruments.
•A large proportion of customer deposits, from an essentially retail banking balance sheet.
•Diversification of sources of wholesale funding in terms of instruments/investors, markets/currencies and maturities.
•Limited recourse to short-term wholesale funding.
•Availability of sufficient liquidity reserves, including a discount capacity with central banks to be used in adverse situations.
The requirements of the EU LIQA table are addressed in the Economic and financial report (section 3.4) chapter of the 2021 annual report.
| | | | | |
| Access 2021 Annual Report available on the Santander Group website |
10.1.1. Liquidity Coverage Ratio (LCR)
Description of the degree of centralisation of liquidity management and interaction among the Group’s units:
The group has adopted a decentralised financing model through a structure of autonomous subsidiaries that are self-sufficient when it comes to liquidity.
Each subsidiary is responsible for covering the liquidity needs arising from its current and future business, either through deposits secured from its customers in its area of influence or through recourse to the wholesale markets in which it operates, within a management and supervision framework coordinated at group level. Therefore, each subsidiary manages and monitors its own LCR ratio, ensuring that it remains at all times within the limits specifically established for that subsidiary.
This funding model has proven itself to be highly effective during times of high market stress, since it effectively prevents problems at one area from impacting the borrowing
11 LCR calculation is performed following EBA’s ITS Disclosure, being the year’s average
| | | | | | | | | | | |
163 | | 2021 Pillar 3 Disclosures Report | |
| | |
OTHER RISKS 2021 Pillar 3 Disclosures Report |
capacity of other areas and, therefore, of the group as a whole, which can happen with centralised funding models.
The breakdown of the LCR ratio is essentially the sum of the individual ratios at each group unit, stripping out any one-off intra-group transactions.
For more information, see the LIQ1 table in Appendix XXII available on the Group's website.
| | | | | |
| Access 2021 Pillar 3 Disclosures Report available on the Santander Group website |
Explanation of the main drivers and inputs that contribute to the LCR
The Group's consolidated ratio is largely shaped by the individual ratios of its three main units: Santander Parent, Santander UK and Santander Brazil. These units acquire most of their funding from retail deposits, which are much more stable liabilities that generate fewer potential outflows from the LCR ratio. Most cash outflows from the LCR ratio stem from wholesale funding, which is considerably more unstable, although the group typically minimises and diversifies the maturities. The group's stock of liquid assets is very high quality. On average, approximately 96% of the assets that form part of the LCR numerator are Level 1. This is because the units' asset portfolios mainly comprise the public debt of the countries in which the group operates or countries with good credit ratings.
The value of the group's consolidated ratio in December was 163%, above the internal and regulatory requirement. The group's LCR trend remains stable with a modest reduction during 2021 driven by optimisation initiatives carried out mainly by the parent company.
Composition of the liquidity buffer
The group's liquidity buffer consists mainly of Level 1 assets: cash and sovereign debt, with a broad level of diversification across issuers. In addition to the regulatory liquidity buffer, the group has an internal buffer that monitors the positions of other non-pledged liquid assets that can be immediately used as collateral for additional funding.
Concentration of funding and liquidity sources
The group seeks to diversify its sources of wholesale financing, in terms of instruments, investors, markets, currencies and maturities, to ensure sound liquidity management. The group's model relies on its presence in major markets, affording it a large degree of diversification. Since most group units are commercially-oriented, they obtain a large part of their funding from deposits secured from retail customers, which are inherently more stable than wholesale funding sources.
In view of the above, there is no material risk in the concentration of funding. However, the group has a number of additional metrics in place to identify and monitor those counterparties whose funding is significant and whose withdrawal could trigger liquidity issues. During 2021, the group's concentration risk levels were within management
limits, ensuring the diversity of wholesale funding at unit level.
Derivative exposures and potential collateral calls
Most derivatives transactions involving group entities are subject to collateral contracts covering the market value of the transactions. Liquidity risk relates to the impact of adverse market scenarios leading to changes in the market values of derivatives, which generate additional liquidity needs due to the requirement to post collateral. Group units include liquidity risk in their LCR ratios using the historical look-back approach, in which the most significant net change in 30 days over the preceding 24 months is calculated and then added as additional liquidity needs.
Currency mismatches in the LCR
The Group prepares its consolidated LCR ratio for each of its identified significant currencies, which reflect the geographies in which the group's units operate: euro (EUR), US dollar (USD), pound sterling (GBP), Brazilian real (BRL), Mexican peso (MXN) and Chilean peso (CLP). Each of the entities draws up its own LCR ratio in its significant currency. Units present a consistent position between the liquidity buffer and net outflows. Latin American countries have significant buffer positions in USD, so as to optimise the position and ensure high convertibility. The positions of foreign currencies are closely tracked, e.g. by conducting currency stress scenarios.
Other items in the LCR calculation not captured in the LCR disclosure template that the institution considers relevant for its liquidity profile
Contingent lines, which are the last driver of the group's LCR, exhibit a stable performance over time. During the covid-19 crisis the position was monitored on a daily basis, with limited impact on liquidity. This monitoring remains in place and has been included in the indicators for regular liquidity monitoring.
For further details, see the Economic and financial report chapter and the Risk management and control chapter in the 2021 annual report.
| | | | | |
| Access 2021 Annual Report available on the Santander Group website |
10.1.2. Net Stable Funding Ratio (NSFR)
NSFR or the net stable funding ratio is a regulatory metric which represents required stable funding against available stable funding. This metric requires banks to maintain a solid balance sheet in which assets and off-balance sheet activities are funded with stable liabilities. Grupo Santander monitors this metric on a monthly basis, which is a higher requirement than the regulatory one.
We benefit from a high weight of customer deposits, which are more stable, from permanent liquidity needs deriving from commercial activity funded by medium- and long-term instruments and limited recourse to short-term funding. Taken together, this has enabled us to maintain a balanced liquidity structure, reflected in NSFR ratios higher than 100%,
| | |
OTHER RISKS 2021 Pillar 3 Disclosures Report |
both at Group and at the level of our subsidiaries at end December 2021.
For more information, see the LIQ2 table in Appendix XXIII available on the Santander's website.
| | | | | |
| Access 2021 Pillar 3 Disclosures Report available on the Santander Group website |
10.1.3. Asset Encumbrance
This section covers the qualitative requirements AE4 - Accompanying narrative information.
Following the guidelines laid down by the European Banking Authority (EBA), the concept of asset encumbrance includes both on-balance-sheet assets pledged as collateral in
transactions to obtain liquidity and off-balance-sheet assets that have been received and re-used for similar purposes, in addition to other assets associated with liabilities other than for funding reasons.
Disclosures on the Group required by Commission Delegated Regulation (EU) 2017/2295.
The scope used for the disclosures in this report is the same as the liquidity management scope on a consolidated basis, as regulated in CRR II 876/2019, which amends regulation 575/2013.
The value of the exposure shown in the tables below was calculated as the median of the values disclosed in the regulatory information for the four quarters of the year, in line with European Banking Authority guidelines.
As we can see from table AE1, the vast majority of unencumbered assets are loans that could be pledged as collateral.
| | | | | | | | | | | | | | | | | | | | | | | | | | |
| Table 73.AE1 - Encumbered and unencumbered assets | |
| EUR million | | | | | | | 2021 |
| | | | | | | | |
| Carrying amount of encumbered assets | Fair value of encumbered assets | Carrying amount of unencumbered assets | Fair value of unencumbered assets |
| | of which notionally eligible EHQLA and HQLA | | of which notionally eligible EHQLA and HQLA | | of which EHQLA and HQLA | | of which EHQLA and HQLA |
| Assets of the reporting institution | 348,902 | | 47,156 | | | | 1,214,397 | | 248,451 | | | |
| Equity instruments | 6,680 | | 4,912 | | 6,679.633 | | 4,911.7855 | | 11,646 | | 5,801 | | 11,645.5855 | | 5,800.7785 | |
| Debt securities | 61,839 | | 40,732 | | 61,926 | | 40,885 | | 88,826 | | 61,245 | | 88,584 | | 59,945 | |
| of which: covered bonds | 1,618 | | 1,597 | | 1,639 | | 1,618 | | 1,707 | | 1,600 | | 1,680 | | 1,617 | |
| of which: securitisations | 6,053 | | 4,358 | | 5,934 | | 4,327 | | 5,059 | | 3,134 | | 5,042 | | 3,073 | |
| of which: issued by general governments | 50,564 | | 34,037 | | 50,643 | | 34,122 | | 55,156 | | 51,392 | | 55,695 | | 50,281 | |
| of which: issued by financial corporations | 9,528 | | 5,533 | | 9,535 | | 5,564 | | 17,453 | | 8,203 | | 17,264 | | 8,191 | |
| of which: issued by non-financial corporations | 1,233 | | 428 | | 1,287 | | 452 | | 9,371 | | 116 | | 9,307 | | 126 | |
| Other assets | 276,594 | | 1,176 | | | | 1,113,925 | | 170,580 | | | |
| | | | | | | | | | | |
165 | | 2021 Pillar 3 Disclosures Report | |
| | |
OTHER RISKS 2021 Pillar 3 Disclosures Report |
| | | | | | | | | | | | | | |
| Table 74.AE2 - Collateral received and own debt securities issued | |
| EUR million | | | 2021 |
| | | | |
| Fair value of encumbered collateral received or own debt securities issued | Unencumbered |
| Fair value of collateral received or own debt securities issued available for encumbrance |
| | of which notionally eligible EHQLA and HQLA | | of which EHQLA and HQLA |
| Collateral received by the reporting institution | 88,022 | 77,708 | 37,391 | 31,853 |
| Loans on demand | — | — | — | — |
| Equity instruments | 4,046 | 3,225 | 6,875 | 4,980 |
| Debt securities | 83,566 | 73,956 | 29,669 | 26,118 |
| of which: covered bonds | 682 | 681 | 714 | 687 |
| of which: securitisations | 3,246 | 2,360 | 2,575 | 1,526 |
| of which: issued by general governments | 71,826 | 66,120 | 22,971 | 22,636 |
| of which: issued by financial corporations | 9,137 | 6,314 | 4,227 | 2,257 |
| of which: issued by non-financial corporations | 513 | 247 | 200 | 46 |
| Loans and advances other than loans on demand | 914 | 914 | 4 | — |
| Other collateral received | — | — | 5 | — |
| Own debt securities issued other than own covered bonds or securitisations | 14 | — | 865 | — |
| Own covered bonds and asset-backed securities issued and not yet pledged | | | — | — |
| TOTAL ASSETS, COLLATERAL RECEIVED AND OWN DEBT SECURITIES ISSUED | — | — | | |
Where our own covered bonds and asset-backed securities are retained and used, the pledged asset is included in table 73 under loans and the related liability in table 75.
The main sources and types of encumbrances and the level of over-collateralisation are set out in the following table:
| | | | | | | | |
| Table 75.AE3 - Sources of encumbrance |
| EUR million | | 2021 |
| | |
| Matching liabilities, contingent liabilities or securities lent | Assets, collateral received and own
debt securities issued other than covered bonds and securitisations encumbered |
|
| Carrying amount of selected financial liabilities | 297,778 | 413,735 |
The table below shows the amount of own covered bonds and asset-backed securities retained and not used as collateral and the value of the related underlying assets
| | | | | | | | |
| Table 76.Own covered bonds and asset-backed securities issued |
| EUR million | | 2021 |
| | |
| Non-encumbered |
| Carrying amount of the underlying pool of assets | Fair value of debt securities issued available for encumbrance |
| Own covered bonds and asset-backed securities issued | 10,426 | 7,153 |
| Retained covered bonds issued | 4,351 | 3,470 |
| Retained asset-backed securities issued | 6,136 | 3,620 |
| | |
OTHER RISKS 2021 Pillar 3 Disclosures Report |
The contribution to the group's level of asset encumbrance on a consolidated basis by the various units is uneven across geographies. The assets of the Santander Consumer USA (United States) and Santander Consumer Finance (Eurozone) units are relatively more encumbered, due to the high weight of the consumer business. In the other units operating in the Eurozone and the United Kingdom, where covered bonds and securitisations are highly developed, the level of asset encumbrance is similar and close to the group average. Asset encumbrance is also significant in Mexico, which is very active in asset repurchase agreements. The South American and Poland units have a relatively low level of asset encumbrance. Moreover, intra-group asset encumbrance is not material.
In each unit, the encumbered assets are denominated in the same currency as the encumbrance, normally the unit's functional currency.
The qualitative and quantitative information provided in addition to tables EU-AE1, EU-AE2 and EU-AE3 is introduced to meet the requirements of table EU-AE4.
For further details on unencumbered assets (article 443 of the CRR), see the Economic and financial report chapter (Liquidity and funding management section) of the 2021 annual report.
| | | | | |
| Access 2021 Annual Report available on the Santander Group website |
10.2. Compliance and conduct risk
Under the current configuration of the three lines of defence, Compliance and Conduct is a second line of defence which conducts independent control of risks, reporting organisationally to the Group chief risk officer (CRO). It reports directly and regularly to the board of directors and its committees, through the Group chief compliance officer (GCCO).
The Compliance and Conduct function covers all matters related to regulatory compliance, financial crime compliance (FCC), product governance and consumer protection, and reputational risk.
The main responsibility for Compliance and Conduct risks lies with the first lines of defence, which directly manage these risks. The Compliance and Conduct function is responsible for monitoring and overseeing these risks and assessing the impact on our risk appetite and risk profile.
The Compliance function fosters adherence by Santander to rules, supervisory requirements and principles, ethical values and values of good conduct by setting standards and control mechanisms, discussing, advising and reporting in the interests of employees, customers, shareholders and society in general.
The Group's risk appetite in this area essentially takes the form of a declaration of zero appetite or of very low appetite for risks according to their type, with the clear objective of minimising any economic, regulatory or reputational impact
on the Group. To ensure this, Compliance and Conduct Risk performs consistent management of this area, using a common methodology and taxonomy, which is fully aligned with the Risk function's principles, and establishes a series of compliance and conduct risk indicators, assessment matrices and qualitative statements.
In 2021, as in previous years, the annual process of preparing the risk appetite was completed towards the end of the year, with the aim of verifying that the current model is appropriate for measuring the function's risk appetite and aligned with the group's risk appetite.
The composition of the indicators has been reviewed and some of their corporate thresholds have been adjusted, to provide a more accurate view and to ensure proper alignment with the function's strategy and risk tolerance. These adjustments were approved by the relevant committees and passed on to the units concerned.
For further details on Compliance and Conduct risk, see the Risk management chapter (section 8) on the 2021 annual report.
| | | | | |
| Access 2021 Annual Report available on the Santander Group website |
10.3. Model risk
10.3.1. Introduction
A model is defined as a system, approach or quantitative method that applies theories, techniques and statistical, economic, financial and mathematical assumptions to transform data into quantitative estimates. They are simplified representations of real-world relationships between characteristics, values and observed facts, which Santander uses to focus on specific variables.
We use models mainly for approval processes (scoring/rating), capital calculation, behaviour, provisioning, market and operational risk, compliance and liquidity.
The use of models entails model risk, which consists of the potential adverse consequences of decisions arising from incorrect, inadequate or improperly used models.
Model risk originates from:
•The model itself, due to the use of incorrect or incomplete data, or due to the modelling method used to develop the model.
•Improper use or implementation of the model.
Model risk may result in financial loss, inappropriate commercial or strategic decisions, or damage to the group's operations.
Santander has defined, managed and controlled model risk for a number of years. The model risk function has been consolidated across the group, including management both in the corporate centre and in the main subsidiaries.
| | | | | | | | | | | |
167 | | 2021 Pillar 3 Disclosures Report | |
| | |
OTHER RISKS 2021 Pillar 3 Disclosures Report |
To ensure adequate model risk management, we use a set of policies and procedures which establish the principles, responsibilities and processes to follow during models' life cycle detailing aspects related to organisation, governance, management and validation. Internal Audit regularly conducts an independent review of the model risk function, including specific model validation work, to ensure compliance with established internal policies and procedures and regulatory requirements.
Supervision and control of model risk is proportional to the importance of each model. Tiering is the main attribute used to synthesise the level of importance of non-regulatory models and it determines the intensity of risk management. The regulatory models, given their particular relevance for the group, will follow the highest standards of control and management.
Our Model Risk Management 2.0 (MRM 2.0) multi-year strategic plan was implemented to enhance our model risk management and ensure compliance with regulatory standards (ECB Guideline on internal models, 2018). The MRM 2.0 project will come to an end at the end of 2021, having launched a number of initiatives to strengthen the model risk function. In 2021, the project included several initiatives focused on the following topics:
•Simplified processes: we have taken a number of measures aimed at simplifying existing processes following a risk-based approach, so that we can focus more on the activities that are most important to the group, including the management of regulatory models.
•Regulatory models (IRB and IMA): in order to meet the requirements of the supervisory authority and to adapt the models to the new EBA guidelines, we have reduced the mapping of the regulatory credit risk (IRB) model portfolios.
•Validation: we have further strengthened the role of the Single Validation Office, a team tasked with ensuring consistency and coordination of model validation activities across the group.
•Model risk facilitators: we have continued to improve our infrastructure and tools and have helped to expand the culture of modelling in the group. We can support our decisions with real-time data thanks to the high level of digitalisation.
In addition to MRM 2.0, which focuses on model management, we have two specific projects underway related to our regulatory credit and market risk models: IRB 2.0 (internal credit risk models) and MRAP – Market Risk Advanced Platform – (internal market risk models). Both projects aim to monitor the actions of TRIM (Targeted Review of Internal Models) and IMIs (Internal Model Inspections) and ensure compliance with the new regulatory requirements.
We are committed to further improving our regulatory models (IRB and IMA) to meet ECB requirements. Our main priority for the coming year will focus on the implementation of the EBA repair programme. We have submitted numerous model changes to ECB during 2021, which will require formal approval before implementation. This approval will come after a thorough evaluation by the regulator, which will include the full participation of the model risk function.
10.3.2. Model Risk Management
Model risk management and control are structured processes which are regarded as the model lifecycle. The various phases in the model lifecycle at Santander are as follows:
1. Identification
The identified models must be included in the scope of control of model risk.
A complete inventory of all models in use is essential to ensure proper management of this risk.
We keep a centralised inventory, based on a uniform taxonomy for all models used in the business units. The inventory contains all relevant information of each model, which allows for proper monitoring according to their relevance and the tiering criteria.
2. Planning
This is an annual internal exercise approved by the subsidiary governing bodies and validated by the global team. A strategic action plan is created for the models that fall within the management scope of the model risk function. This phase identifies the need for models to be developed, reviewed and implemented during the year.
In the case of regulatory models, planning is a crucial task because in some cases, when a substantial or ex ante change is triggered, the approval of the regulator is required before implementation. Hence, these changes must be planned in advance and planning must be strictly adhered to in order to obtain the relevant approval in a timely manner without affecting the business.
3. Development
This is the model building stage, based on econometrics and carried out by methodologists.
Models are developed according to the needs of each unit, as specified in the annual model plan.
| | |
OTHER RISKS 2021 Pillar 3 Disclosures Report |
The development of the models must adhere to the group's common methodological standards established by the global team to ensure their quality and consistency. The Global Data and Modelling Unit, created in 2020, aims to execute modelling in a better, more efficient and centralised way, while leveraging the synergies that come from combining modelling and data. This unit brings together world-class data and modelling capabilities in one centre of excellence to support the entire group in developing the most robust models.
4. Internal validation
Independent validation of models is not only a regulatory requirement but is also a key part of our management and control of model risk.
The group has therefore set up a specialised unit that is fully independent of both developers and users. This unit issues expert opinions on the fitness for purpose of internal models. These validation opinions are expressed through a rating which summarises the associated model risk. The intensity and frequency of validation tasks are well defined and follow a risk-based approach.
The scope of the validation covers theory, methodology and technological systems, and also extends to the quality of the data used, to ensure their effectiveness. It also includes a detailed analysis of the performance of the model and other aspects of risk management (including controls, reporting, use, senior management's involvement, etc.).
During the MRM 2.0 project, the Validation function was significantly strengthened, particularly with regard to the overall framework that governs validation activities: guidelines, tests and thresholds for reviewing risk parameters. Furthermore, the Validation function's independence was increased through better issuance, tracking, and escalation of issued suggestions.
One of the most important tasks related to internal validation is the consistency analysis carried out by the validators, which checks the recommendations made, their severity and the rating given. In this way, it serves as an important point of control for the consistency, homogeneity and comparability of the validation work. The validation work is not complete until this consistency phase has been passed.
The Single Validation Office plays a key role.
The Single Validation Office ensures consistency of validations across the group's models, promoting a consistent view of validation tasks and findings.
5. Approval
Before being deployed and used, each model must be submitted for approval to the corresponding governing bodies. To this end, a governance cycle has been established for our model inventory, depending on the relevance of the models.
The group ensures a robust approval process.
This way we can guarantee that the limitations and weaknesses of the models are widely known and an
appropriate senior management challenge process is in place for the most important models .
6. Implementation and use
In this phase, the newly developed models are integrated into the IT systems. This is another possible source of model risk. It is therefore essential that tests are conducted by technical units and the model owners to certify that it has been implemented in accordance with the methodological definition and to check that it works as expected.
7. Monitoring and control
Models have to be reviewed regularly to ensure they are working correctly and that they are suitable for their purpose. Otherwise, they must be adapted or redesigned.
Model risk control teams also have to ensure that the model risk is managed in accordance with the principles and rules set out in the general model risk framework and related internal regulations.
In addition, control teams must promote senior management's involvement in model risk. To this end, there is a forward-looking reporting agenda in which relevant topics (key model risk metrics, monitoring of compliance with the model plan, recommendations from the regulator, internal audit and internal validation teams, etc.) are regularly reviewed and escalated as appropriate, with a particular focus on regulatory models.
10.3.3. Key metrics
The risk level of a model is reflected in the rating assigned to it. This is usually generated by independent validation of the model.
The risk appetite at the group and local levels establishes various thresholds based on the average rating of the models. Changes in the distribution of the ratings is also monitored, focusing on the models with the lowest ratings depending on their relevance for the group.
The model risk appetite metrics therefore focus on the quality of the models, based on internal validation ratings. Appetite levels differ depending on the relevance of the models and are most demanding for the most relevant models, which are the regulatory models.
The metrics are monitored on a monthly basis and action plans must be prepared if there are any deviations from established levels. Monitoring of recommendations and the inclusion of the impact on metrics in the planning process are natural management processes to align the quality of the models with the risk appetite path in the event of deviation.
| | | | | | | | | | | |
169 | | 2021 Pillar 3 Disclosures Report | |
| | |
OTHER RISKS 2021 Pillar 3 Disclosures Report |
10.4. Capital risk
The Group takes into account, in the context of structural risk, the risk of maintaining an insufficient quantity or quality of capital to meet internal business objectives, regulatory requirements or market expectations.
The Capital Risk function, as part of the second line of defence, monitors and oversees the capital activities carried out by the first line
Through a range of processes such as capital planning and adequacy and the resulting implementation and monitoring of the budget, along with continuous measurement of capital and reporting and disclosure of information on capital, as shown below:
This control and oversight is carried out independently, mainly through the following processes:
•Supervision of capital planning and adequacy to ensure that capital levels fit with our risk profile and are adequate and consistent with the group's strategy.
•Ongoing supervision of the measurement of the group's regulatory capital by identifying the key metrics for the calculation, setting tolerance levels and reviewing significant variations and the consistency of the calculations, including individual transactions that impact capital. The performance of capital initiatives is also reviewed and challenged, in line with the risk appetite and planning.
•Monitoring the effective risk transfer of those securitisations that allow for the release of risk-weighted assets according to the applicable regulatory criteria.
The function aims to provide complete and regular monitoring and control of capital risk by verifying that capital coverage and adequacy reflect the Group's risk profile.
For further details on capital risk, see the Risk management chapter (section 5) on the 2021 annual report.
| | | | | |
| Access 2021 Annual Report available on the Santander Group website |
| | | | | | | | | | | | | | | | | | | | | | | | | | | | | | | | | | | | | | |
|
|
|
|
|
|
|
|
|
|
|
|
|
|
|
|
| | | | | | | | | | | | |
| Remuneration policies | | | | | | | |
| | | | | | |
| | | | | | |
| | | | | | | | | | | | |
| 11.1. Relevant information contained in other documents | | | | | | | | | | | | |
| 11.2. Remuneration policy applicable to categories of staff that may have a material impact on the risk profile of Santander | | | | | | | | | | | | |
| 11.3. Main characteristics of the criteria for identifying categories of staff that may have a material impact on the risk profile of Santander | | | | | | | | | | | | |
| 11.4. Specific features of the remuneration policy applicable to Identified Staff members | | | | | | | | | | | | |
| 11.5. Application of the remuneration policy for the Identified Staff in 2021 | | | | | | | | | | | | |
| 11.6. Total remuneration of the Identified Staff in 2021 | | | | | | | | | | | | |
| 11.7. Remuneration policy for 2022 and following years | | | | | | | | | | | | |
| | | | | | | | | | | | |
| | |
REMUNERATION POLICIES 2021 Pillar 3 Disclosures Report |
11. Remuneration policies
11.1.Relevant information contained in other documents
This section covers the qualitative requirement REMA - Remuneration policy.
The corporate governance chapter in the 2021 annual report, which was published together with the call to the 2022 General Shareholders’ Meeting, describes:
•The functions of the remuneration committee regarding the remuneration of directors, members of senior management and other executives whose work could have a material impact on the Group’s risk profile.
•The composition of the remuneration committee, directors’ attendance at meetings, the involvement of board members on other committees, the approximate time dedicated to each task and how the committee operates.
•The principles of the remuneration policy of directors, in their capacity as such or for their performance of executive duties, and the corporate governance principles regulating remuneration.
•The 2021 remuneration policy for directors and senior management, focusing especially on variable remuneration and how it was applied in the year.
The board of directors is responsible for approving the remuneration of directors and senior management, as well as the core payment terms of other executives and employees who, while not belonging to senior management, take on risks, carry out control functions (i.e. Internal Audit, Risk Management and Compliance) or receive total remuneration that places them in the same remuneration bracket as senior management, and employees who take on risk and whose professional activities may have a material impact on the Group’s risk profile. All of these, together with the senior management and the Company’s board of directors, are known as "identified staff" or Material Risk Takers).
The corporate governance chapter of the annual report also includes the following Pillar 3 disclosures:
•The decision-making process for setting the remuneration policy of directors, senior management and the core elements of the remuneration of identified staff.
•The basic features of the remuneration components.
•Information on the criteria applied for assessing the metrics that determine the variable remuneration of directors and senior management and their adjustment according to risk, as well as the results of the metrics for directors.
•The deferral policy and other conditions linked to the payment of variable remuneration, including the application of malus and clawback provisions.
11.2. Remuneration policy applicable to categories of staff that may have a material impact on the risk profile of Santander
Santander has specific guidelines in its remuneration policy for those professionals qualified internally as identified staff or material risk takers. These guidelines contain:
•The principles and criteria that determine which people have a material impact on the Group’s risk profile, based on Commission Delegated Regulation (EU) 2021/923 of 25 March 2021 as explained in the section below.
•The specifics that modify the general remuneration policy for its application to this group, taking into account all applicable rules and European Banking Authority (EBA) guidelines, are described below.
•The mandate to apply the Group’s remuneration policy, as adapted in each case so as to comply with local regulatory requirements and recommendations issued by supervisory bodies.
The remuneration of identified staff in 2021 is in line with the criteria in the Group’s remuneration policy, which is reviewed annually to ensure that it is aligned with the long-term interests of shareholders, the Group’s strategic targets and regulatory requirements.
The subsidiaries formally adhere to the Group's corporate remuneration policy, which implies the alignment of their practices with the principles it contains.
| | | | | | | | | | | |
173 | | 2021 Pillar 3 Disclosures Report | |
| | |
REMUNERATION POLICIES 2021 Pillar 3 Disclosures Report |
11.3. Main characteristics of the criteria for identifying categories of staff that may have a material impact on the risk profile of Santander
The Identified Staff have been defined according to the provisions of Law 10/2014, of 26 June, on the restructuring, supervision and capital adequacy of credit institutions, (Law 10/2014 or LOSS), transposing into Spanish law the text of Directive 2013/36/EU of the European Parliament and Council of 26 June 2013, on access to the activity of credit institutions and the prudential supervision of credit institutions and investment firms (Directive CRD IV) and its successor, CRD V, is transposed through Royal Decree-Law 7/2021, of 27 April.
In accordance with the CRD V, people who may have a material impact on the Bank’s risk profile are deemed to include senior management, employees who assume risks, employees who exercise control functions and all employees who receive total remuneration that includes them in the same remuneration bracket as senior management and employees who assume risks. In addition to the previous definition, European legislation, through the publication of Commission Delegated Regulation (EU) No. 2021/923, of 25 March 2021, supplementing CRD V with regard to the regulatory technical standards (RTS) on appropriate qualitative and quantitative criteria for identifying categories of staff whose professional activities have a material impact on an institution’s risk profile “Delegated Regulation 2021/923”), establishes a closed list of specific criteria that entities must consider in the identification process.
Santander implements the quantitative and qualitative criteria in the regulation to determine the members of identified staff and has further supplemented these criteria with additional internal criteria. The following persons generally qualify as identified staff based on these criteria:
•Based on qualitative criteria, staff members who work at a material business unit, such as:
◦Members of the management body and senior management
◦Members of staff with managerial responsibilities with regard to the entity's control functions or significant business units;
◦Those responsible for legal affairs, sound accounting policies and procedures, finance, including taxation and budgeting, conducting economic analysis, anti-money laundering and counter-terrorism financing, human resources, developing and implementing remuneration policy, information technology, information security, management of outsourcing arrangements for essential or important functions
◦Members of senior risk committees and executives with powers to initiate, approve or veto significant credit and market risk proposals.
◦Traders authorised to take substantial positions in market risk.
◦Members of the new products committee.
•By quantitative criteria:
◦Staff who have received significant remuneration in the previous financial year
◦Managers receiving total remuneration of over €750 thousand in 2020.
◦Managers of companies with more than 1,000 employees whose remuneration is in the 0.3% highest in their country.
•By internal criteria:
◦Executives with a given level of credit or market risk responsibility at certain non-material units.
◦Heads of business units with a banking licence.
◦Managers of the managers identified by any of the qualitative criteria.
Additional criteria have also been defined to identify and classify the units to which the above criteria are applied. These criteria are based on simple and widely recognised parameters, such as capital and gross income, and reflect the relative importance of each identified unit with an impact on the Group's risk profile.
Current legislation, best practices and market trends are taken into account when defining the proportionality standards. These apply to both the relative importance of the units and the degrees of responsibility of the positions occupied by the individuals, to facilitate implementation.
According to these criteria, the identified staff comprised 1,018 executives across Santander at year-end 2021, accounting for approximately 0.52% of total staff.
11.4. Specific features of the remuneration policy applicable to the identified staff
In general:
•Fixed remuneration must represent a significant proportion of total compensation.
•Variable remuneration for the year shall not exceed 100% of the fixed remuneration, in any event, of the members of the independent control functions, and generally for other employees that are part of the identified staff, unless the General Shareholders’ Meeting has authorised a higher percentage for these, which may not exceed 200%. In this respect, the General Shareholders' Meeting, held on 26 March 2021, authorised the increase up to 200% of the maximum percentage permitted, for a maximum of 1,002 members of the identified staff in 2021 and up to 50 additional beneficiaries, up to a maximum of 1,052 people in total.
Variable remuneration typically comprises:
•An incentive to be received partly in cash and partly in shares or other eligible financial instruments. Payment of this incentive is deferred for a period of three to five years (up to seven years in the United Kingdom) and from the current tax year onwards, four or five years.
| | |
REMUNERATION POLICIES 2021 Pillar 3 Disclosures Report |
•Performance measurement elements in line with the strategy and long-term interests of shareholders. These elements, take into consideration quantitative and qualitative criteria that reflect the entity’s results, return, capital performance, conduct in respect of customers and quality of the services provided thereto, risk management and compliance with legislation.
•Malus and clawback clauses, which are triggered in situations in which there is poor financial performance by the Bank as a whole, specific divisions or areas, or the exposure generated by the staff, attributable to the management of the person(s) in charge, based on the presence of, at least, some of the following factors:
(i) Significant failures in risk management by the Bank, a business or a risk control unit.
(ii) Increases in capital requirements in the Bank or one of its business units that were not planned at the time that exposure was generated.
(iii) Regulatory penalties or legal convictions for events that might be attributable to the unit or staff responsible for them. Failure to comply with the Bank’s internal codes of conduct.
(iv) Improper conduct, whether individual or collective. Negative effects deriving from the marketing of unsuitable products and the liability of persons or bodies making such decisions will be considered especially significant.
•Ban on hedging deferred or retained shares or instruments and on transferring these in the twelve months following their delivery.
For control functions, the total remuneration package must be competitive within the market to attract sufficiently qualified and experienced employees. The individual objectives of these positions must be pegged to the performance of the control function rather than business results. Performance of
the control function must be assessed by staff members who are independent of the business units being supervised.
11.5. Application of the remuneration policy for the identified staff in 2021
The remuneration policy and the essential remuneration conditions of individuals belonging to the identified staff have been approved by Banco Santander’s board of directors at the proposal of the remuneration committee. The human resources function and the risk and compliance functions in each Santander company have duly confirmed that this policy and the remuneration practices comply with applicable law and regulations.
This is confirmed by the third independent report issued in application of article 33.2 of Act 10/2014 of 26 June on the ordering, supervision and solvency of credit institutions. The risk supervision, regulation and compliance committee supervises the remuneration policy and remuneration schemes with the greatest impact to ensure that they are suitably aligned with risk management.
The essential elements with regard to variable remuneration include:
•The metrics used to determine the variable remuneration of senior management and other top executives, which have also been used to determine the variable remuneration of other members of the identified staff. These metrics are described in section 6.3.B ii) of the corporate governance chapter of the 2021 Annual Report.
•Deferral percentages and periods for the identified staff based on their category:
| | | | | | | | | | | |
| Percentage for
immediate payment | Deferred
percentage | Deferred
period (*) |
| Executive directors and members of the material risk takers group with total variable remuneration of ≥ EUR 2.7 million | 40% | 60% | 5 years |
| Senior management and country heads that represent at least 1% of Santander’s economic capital and other members of the identified staff with total target variable remuneration of ≥ EUR 1.7 million and< EUR 2.7 million | 50% | 50% | 5 years |
| Other members belonging to the material risk takers | 60% | 40% | 3 years |
* Up to 7 years in certain jurisdictions.
Note: Variable reference remuneration for standard compliance (100% of objectives).
•Pegging a part of the deferred amounts to fulfilment of multi-year objectives for executive directors, senior management and other executives based on their category. These metrics are described in section 6.3.B (iv) of the corporate governance chapter of the 2021 Annual Report.
•The suitability of financial instruments used for the portion of deferred remuneration in financial instruments: use of shares in Banco Santander S.A. or in any of its listed subsidiaries (such as Brazil, Mexico and Santander Consumer USA), the latter with delisting processes in
2021) or equivalent instruments (Chile and Poland); and the ratio between these instruments.
•Defining the events that might trigger the application of malus and clawback provisions on the variable remuneration accruing in 2021. These events are described in the previous section and apply to all the identified staff.
•No discount is applied to deferred variable remuneration when calculating the ratio of variable to fixed components.
| | | | | | | | | | | |
175 | | 2021 Pillar 3 Disclosures Report | |
| | |
REMUNERATION POLICIES 2021 Pillar 3 Disclosures Report |
In addition to the general scheme of variable remuneration metrics, the corporate and investment banking business (Santander Corporate & Investment Banking, SCIB) follows a model that is widely applied across all geographies where the business carries out its activities. The model provides remuneration for achieving results using a partial pay-out system, pegging variable remuneration to the division’s ordinary net profit, including provisions and other assimilated costs, and the budget objectives, with additional impact from the Group's results, ensuring alignment with it. The model includes the same categories of metrics – including capital, risks and customers – as used for senior management, although they may be adapted for the needs and requirements of the individual business.
For further details, see the corporate governance chapter of the 2021 Annual Report.
| | | | | |
| Access 2021 Annual Report available on the Santander Group website |
11.6. Total remuneration of the identified staff in 2021
The following table shows the total remuneration of the identified staff in 2021:
| | | | | | | | | | | | | | | | | |
| Table 77.REM1 - Remuneration awarded for the financial year |
| EUR Thousands | | | |
| 2021 |
| MB Supervisory function | MB Management function | Other senior management | Other identified staff |
| Fixed remuneration | Number of identified staff | 12 | 3 | 15 | 988 |
| Total fixed remuneration | 4,009 | 10,350 | 29,006 | 333,595 |
| Of which: cash-based | 4,009 | 7,120 | 22,072 | 267,597 |
| Of which: shares or equivalent ownership interests | — | — | — | — |
| Of which: share-linked instruments or equivalent non-cash instruments | — | — | — | — |
| Of which: other instruments | — | — | — | — |
| Of which: other forms | — | 3,230 | 6,934 | 65,997 |
| Variable remuneration | Number of identified staff | 12 | 3 | 15 | 988 |
| Total variable remuneration | — | 14,300 | 32,881 | 346,682 |
| Of which: cash-based | — | 7,150 | 16,440 | 173,319 |
| Of which: deferred | — | 3,957 | 7,785 | 70,712 |
| Of which: shares or equivalent ownership interests | — | 7,150 | 16,440 | 171,717 |
| Of which: deferred | — | 3,957 | 7,785 | 73,192 |
| Of which: share-linked instruments or equivalent non-cash instruments | — | — | — | 1,647 |
| Of which: deferred | — | — | — | 1,647 |
| Of which: other instruments | — | — | — | — |
| Of which: deferred | — | — | — | — |
| Of which: other forms | — | — | — | — |
| Of which: deferred | — | — | — | — |
| Total remuneration | 4,009 | 24,650 | 61,887 | 680,277 |
| | |
REMUNERATION POLICIES 2021 Pillar 3 Disclosures Report |
The Investment Banking area includes members of identified staff who belong to businesses related to corporate and investment banking (Santander Corporate & Investment Banking).
The Retail and Commercial Banking area covers all customer banking businesses, including all the people who provide support in the geographies, whether they are local senior executives or other categories.
The breakdown of total remuneration by area of activity is as follows:
| | | | | | | | | | | | | | | | | | | | | | | | | | | | | | | | |
| Table 78.REM5 - Information on remuneration of staff whose professional activities have a material impact on institutions’ risk profile (identified staff) |
| EUR Thousands | 2021 |
| | | | | | | | | |
| Management body remuneration | Business areas | |
| MB Supervisory function | MB Management function | Total MB | Investment banking | Retail banking | Asset management | Corporate functions | Independent internal control functions | All other | Total |
| Total number of identified staff | | | | | | | | | | 1,018 |
| Of which: members of the MB | 12 | 3 | 15 | | | | | | | |
| Of which: other senior management | | | | 1 | 1 | 1 | 9 | 3 | — | |
| Of which: other identified staff | | | | 84 | 615 | 19 | 48 | 222 | — | |
| Total remuneration of identified staff | 4,009 | 24,650 | 28,659 | 100,937 | 422,156 | 20,154 | 92,754 | 106,163 | — | |
| Of which: variable remuneration | — | 14,300 | 14,300 | 62,008 | 215,901 | 9,723 | 47,623 | 44,308 | — | |
| Of which: fixed remuneration | 4,009 | 10,350 | 14,359 | 38,929 | 206,255 | 10,430 | 45,131 | 61,855 | — | |
| | | | | | | | | | | |
177 | | 2021 Pillar 3 Disclosures Report | |
| | |
REMUNERATION POLICIES 2021 Pillar 3 Disclosures Report |
| | | | | | | | | | | | | | |
| Table 79.REM2 - Special payments to staff whose professional activities have a material impact on institutions’ risk profile (identified staff) |
| 2021 |
| | | | |
| MB Supervisory function | MB Management function | Other senior management | Other identified staff |
| Guaranteed variable remuneration awards | | | | |
| Guaranteed variable remuneration awards - Number of identified staff | — | — | — | 18 |
| Guaranteed variable remuneration awards -Total amount | — | — | — | 8,356 |
| Of which guaranteed variable remuneration awards paid during the financial year, that are not taken into account in the bonus cap | — | — | — | 3,898 |
| Severance payments awarded in previous periods, that have been paid out during the financial year | | | | |
| Severance payments awarded in previous periods, that have been paid out during the financial year - Number of identified staff | — | — | — | 19 |
| Severance payments awarded in previous periods, that have been paid out during the financial year - Total amount | — | — | — | 3,415 |
| Severance payments awarded during the financial year | | | | |
| Severance payments awarded during the financial year - Number of identified staff | — | — | — | 38 |
| Severance payments awarded during the financial year - Total amount | — | — | — | 36,697 |
| Of which paid during the financial year | — | — | — | 36,697 |
| Of which deferred | — | — | — | 1 |
| Of which severance payments paid during the financial year, that are not taken into account in the bonus cap | — | — | — | 36,695 |
| Of which highest payment that has been awarded to a single person | — | — | — | 11,248 |
The total amount of severance payments and other benefits associated with contract termination, including pre-retirement payments, awarded during the year to members of the identified staff amounted to €37 million (of which €13 correspond to three members of senior management who held the position at some point in 2021, as a result of non-competition agreements) for a total of 38 people with average seniority of 16 years. Out of that total, 15 people received an amount corresponding to more than two annual fixed remuneration payments, with a total vested value of severance payments of €26 million. The maximum amount of a single award was €11 million.
The area of independent control functions includes risk management, internal audit and compliance functions.
Corporate functions cover people belonging to the identified staff of corporate support areas (such as Human Resources, Technology and Operations, Intervention and management control, as well as other functions related to the control of regulatory capital, Communication, Executive Secretary, Strategy, Financial Planning, etc.).
The sum of variable components in 2021 for each member of the identified staff did not exceed the limit established in each case for 2021, which was either 100% or 200%, as authorised by the General Shareholders’ Meeting. Specifically, the ratio of variable components of remuneration to fixed components for all the identified staff was 120% and the limits prescribed for each component were duly observed in all cases.
| | |
REMUNERATION POLICIES 2021 Pillar 3 Disclosures Report |
| | | | | | | | | | | | | | | | | | | | | | | | | | |
| Table 80.REM3 - Deferred remuneration |
| EUR Thousands | | 2021 |
| Deferred and retained remuneration | Total amount of deferred remuneration awarded for previous performance periods |
Of which due to vest in the financial year |
Of which vesting in subsequent financial years | Amount of performance adjustment made in the financial year to deferred remuneration that was due to vest in the financial year | Amount of performance adjustment made in the financial year to deferred remuneration that was due to vest in future performance years | Total amount of adjustment during the financial year due to ex post implicit adjustments (i.e.changes of value of deferred remuneration due to the changes of prices of instruments) | Total amount of deferred remuneration awarded before the financial year actually paid out in the financial year | Total of amount of deferred remuneration awarded for previous performance period that has vested but is subject to retention periods |
| MB Supervisory function | — | — | — | — | — | — | — | — |
| Cash-based | — | — | — | — | — | — | — | — |
| Shares or equivalent ownership interests | — | — | — | — | — | — | — | — |
| Share-linked instruments or equivalent non-cash instruments | — | — | — | — | — | — | — | — |
| Other instruments | — | — | — | — | — | — | — | — |
| Other forms | — | — | — | — | — | — | — | — |
| MB Management function | 18,739 | 9,457 | 9,282 | 2,817 | — | 1,409 | 6,202 | 3,101 |
| Cash-based | 9,369 | 4,729 | 4,641 | 1,408 | — | — | 3,101 | — |
| Shares or equivalent ownership interests | 9,369 | 4,729 | 4,641 | 1,408 | — | 1,409 | 3,101 | 3,101 |
| Share-linked instruments or equivalent non-cash instruments | — | — | — | — | — | — | — | — |
| Other instruments | — | — | — | — | — | — | — | — |
| Other forms | — | — | — | — | — | — | — | — |
| Other senior management | 47,361 | 26,161 | 21,200 | 4,274 | — | 3,405 | 17,522 | 8,761 |
| Cash-based | 23,030 | 13,080 | 9,950 | 2,137 | — | — | 8,761 | — |
| Shares or equivalent ownership interests | 23,030 | 13,080 | 9,950 | 2,137 | — | 3,405 | 8,761 | 8,761 |
| Share-linked instruments or equivalent non-cash instruments | 1,300 | — | 1,300 | — | — | — | — | — |
| Other instruments | — | — | — | — | — | — | — | — |
| Other forms | — | — | — | — | — | — | — | — |
| Other identified staff | 221,585 | 138,985 | 82,601 | 11,636 | — | 18,479 | 184,963 | 92,481 |
| Cash-based | 102,658 | 69,492 | 33,166 | 5,818 | — | — | 92,481 | — |
| Shares or equivalent ownership interests | 102,658 | 69,492 | 33,166 | 5,818 | — | 18,479 | 92,481 | 92,481 |
| Share-linked instruments or equivalent non-cash instruments | 16,269 | — | 16,269 | — | — | — | — | — |
| Other instruments | — | — | — | — | — | — | — | — |
| Other forms | — | — | — | — | — | — | — | — |
| Total amount | 287,685 | 174,602 | 113,083 | 18,727 | — | 23,293 | 208,687 | 104,344 |
| | | | | | | | | | | |
179 | | 2021 Pillar 3 Disclosures Report | |
| | |
REMUNERATION POLICIES 2021 Pillar 3 Disclosures Report |
The breakdown of the remuneration by salary band of the members of the identified staff in the whole of Santander is shown below:
| | | | | |
| Table 81.REM4 - Remuneration of 1 million EUR or more per year |
| 2021 |
| EUR | Identified staff that are high earners as set out in Article 450(i) CRR |
| 1 000 000 to below 1 500 000 | 99 |
| 1 500 000 to below 2 000 000 | 42 |
| 2 000 000 to below 2 500 000 | 22 |
| 2 500 000 to below 3 000 000 | 8 |
| 3 000 000 to below 3 500 000 | 4 |
| 3 500 000 to below 4 000 000 | 10 |
| 4 000 000 to below 4 500 000 | 3 |
| 4 500 000 to below 5 000 000 | 1 |
| 5 000 000 to below 6 000 000 | 6 |
| 6 000 000 to below 7 000 000 | 2 |
| 7 000 000 to below 8 000 000 | 2 |
| 8 000 000 to below 9 000 000 | — |
| 9 000 000 to below 10 000 000 | — |
| 10 000 000 to below 11 000 000 | 2 |
| 11 000 000 to below 12 000 000 | — |
| 12 000 000 to below 13 000 000 | — |
| 13 000 000 to below 14 000 000 | 1 |
| Total | 202 |
11.7. Remuneration policy for 2022 and following years
The 2022 remuneration policy for directors is described in section 6.4 of the corporate governance chapter of the Annual Report. The main principles of the policy, along with the fixed and variable remuneration components and the variable remuneration policy for members of the identified staff, will comply with the rules and procedures for executive directors set out in the report referred to above. In particular, as regards the variable remuneration policy:
The existence of a single incentive, which will be determined by a set of quantitative and qualitative metrics.
Short-term metrics, which include customer, profitability, capital and risk elements.
Long-term metrics for senior managers: return on tangible equity (RoTE), relative performance of Banco Santander's total shareholder return (TSR) in relation to the weighted TSR of a reference group and metrics linked to environmental, social and corporate governance (ESG) criteria: percentage of women in managerial positions, financially empowered people, green financing, establishment of decarbonisation goals by sectors in line with the commitment of the net-zero banking alliance and fulfilment of the decarbonisation goal for the electricity generation sector.
Part payment in cash, in shares, share options or other instruments.
Continued-employment, malus and clawback provisions.
Other conditions, such as the ban on hedging and transferring shares in the twelve months following their delivery (three years in the case of executive directors).
In 2022 the board of directors of Banco Santander, S.A. will approve the fourth cycle of the incentive for digital transformation. The 2022 digital incentive will be structured into two blocks: (i) the first applies to a total of up to 250 the Group employees whose activity is essential for the growth and digital transformation of the Group, including certain members of the Identified Staff (not including directors of Banco Santander). This incentive is instrumented in 50% Banco Santander shares and 50% in options on Banco Santander shares, and its accrual is subject to the ability to achieve the key objectives for 2022 in the digital transformation process; (ii) and the second, which is applicable to a total of up to 50 Santander employees, whose activity is essential for the success of PagoNxt, but who are not employees of said company (including certain members of the Identified Staff, not including directors of Banco Santander). This incentive is instrumented in 80% PagoNxt shares and 20% in PagoNxt units.
Delivery is conditional on the beneficiary remaining in the Group's employment, and is subject to the deferral rules and other regulatory restrictions, such as malus and clawback provisions.
For further details, see the corporate governance chapter of the 2021 Annual Report.
| | | | | |
| Access 2021 Annual Report available on the Santander Group website |
| | |
REMUNERATION POLICIES 2021 Pillar 3 Disclosures Report |
Deferral periods for members of the identified staff are as follows:
| | | | | | | | | | | | | | | | | | | | | | | |
| Deferral of the identified collective |
| 2022 | | 2021 |
| Percentage paid immediately | Deferred percentage | Deferred periods’ (*) | | Percentage paid immediately | Deferred percentage | Deferred periods’ (*) |
| Executive directors and members of the material risk takers of the group with total target variable remuneration of ≥ EUR 2.7 million (**) | 40 | % | 60 | % | 5 years | | 40 | % | 60 | % | 5 years |
| Senior management and country heads that represent at least 1% of Santander Group’s economic capital and other members of the identified staff with total target variable remuneration of ≥ EUR 1.7 million and< EUR 2.7 million €. (**) | 50 | % | 50 | % | 5 years | | 50 | % | 50 | % | 5 years |
| Other members belonging to the material risk takers | 60 | % | 40 | % | 4 years | | 60 | % | 40 | % | 3 years |
* Up to 7 years in certain jurisdictions.
** Variable remuneration not denominated in Euros is calculated using the average closing exchange rates in the fifteen trading sessions immediately prior to the Friday, exclusive, of the week before the date on which the board of directors agrees the variable remuneration of the Bank’s executive directors.
| | | | | | | | | | | |
181 | | 2021 Pillar 3 Disclosures Report | |
| | |
REMUNERATION POLICIES 2021 Pillar 3 Disclosures Report |

| | | | | | | | | | | | | | | | | | | | |
| | |
| |
| |
| |
| |
| |
| |
| |
| |
| |
| |
| |
| |
| |
| |
| Appendices | | | | |
| | | |
| | | |
| I. Transparency enhancements | | | XII. | CCyB1 - Geographical distribution of credit exposures relevant for the calculation of the countercyclical buffer |
| II. CRR Mapping | | | XIII. | CCyB2 - Amount of institution-specific countercyclical capital buffer |
| III. List of tables | | | XIV. | LR1 - LRSum: Summary reconciliation of accounting assets and leverage ratio exposures |
| IV. Glossary | | | XV. | LR2 - LRCom: Leverage ratio common disclosure |
| | | | XVI. | LR3 - LRSpl: Split-up of on balance sheet exposures (excluding derivatives, SFTs and exempted exposures) |
| Appendices available in the Santander website | | XVII. | IRB parameter models by region |
| | | | | | |
| V. | LI3 - Outline of the differences in the scopes of consolidation (entity by entity) | | XVIII. | CR9 - Back-testing of PD per exposure class (fixed PD scale) |
| VI. | CC2 - reconciliation of regulatory own funds to balance sheet in the audited financial statements | | XIX. | CR9.1 - Back-testing of PD per exposure class (only for PD estimates according to point (f) of Article 180(1) CRR) |
| VII. | KM1 - Overview of risk weighted exposure amounts | | XX. | PV1 - Prudent valuation adjustments (PVA) |
| VIII. | IFRS 9-FL Template: Comparison of institutions’ own funds and capital and leverage ratios with and without the application of transitional arrangements for IFRS 9 or analogous ECLs | | XXI. | MR4 - Comparison of VaR estimates with gains/losses |
| IX. | CCA - Main features of regulatory own funds instruments and eligible liabilities instruments | | XXII. | LIQ1 - Quantitative information of LCR |
| X. | CC1 - Composition of regulatory own funds | | XXIII. | LIQ2 - Net Stable Funding Ratio |
| XI. | CR6 - A - Scope of the use of IRB and SA approaches | | | | |
| | | | | |
| Access 2021 Pillar 3 Disclosures Report available on the Santander Group website |
| | |
APPENDICES 2021 Pillar 3 Disclosures Report |
Appendix I - Transparency enhancements | | | | | | | | |
| IMPLEMENTING TECHNICAL STANDARDS ON PUBLIC DISCLOSURES BY INSTITUTIONS UNDER PART EIGHT OF REGULATION (EU) NO 575/2013 |
Requirement | 2021 Pillar 3 Location |
| Annex I. Disclosure of key metrics and overview of risk-weighted exposure amounts |
| Annex II. Disclosure of key metrics and overview of risk-weighted exposure amounts (instructions) |
| OV1 | Overview of risk weighted exposure amounts | Table 7 |
| KM1 | Overview of risk weighted exposure amounts | Appendix VII |
| INS1 | Insurance participations | N/A12 |
| OVC | ICAAP information | Section 2.6 |
| Annex III. Disclosure of risk management policies and objectives |
| Annex IV. Disclosure of risk management policies and objectives (instructions) |
| OVA | Institution risk management approach | Section 3.1 |
| OVB | Disclosure on governance arrangements | Section 3.2 |
| Annex V. Disclosure of the scope of application |
| Annex VI. Disclosure of the scope of application (instructions) |
| LI1 | Differences between accounting and regulatory scopes of consolidation and mapping of financial statement categories with regulatory risk categories | Table 1 |
| LI2 | Main sources of differences between regulatory exposure amounts and carrying values in financial statements | Table 2 |
| LI3 | Outline of the differences in the scopes of consolidation (entity by entity) | Appendix V |
| LIA | Explanations of differences between accounting and regulatory exposure amounts | Section 1.4.1 |
| LIB | Other qualitative information on the scope of application | Section 1.4.1 |
| PV1 | Prudent valuation adjustments (PVA) | Appendix XX |
| Annex VII. Disclosure of own funds |
| Annex VIII. Disclosure of own funds (instructions) |
| CC1 | Composition of regulatory own funds | Appendix X |
| CC2 | Reconciliation of regulatory own funds to balance sheet in the audited financial statements | Appendix VI |
| CCA | Main features of regulatory own funds instruments and eligible liabilities instruments | Appendix IX |
| Annex IX. Disclosure of countercyclical capital buffers |
| Annex X. Disclosure of countercyclical capital buffers (instructions) |
| CCyB1 | Geographical distribution of credit exposures relevant for the calculation of the countercyclical buffer | Appendix XII |
| CCyB2 | Amount of institution-specific countercyclical capital buffer | Appendix XIII |
| Annex XI. Disclosure of the leverage ratio |
| Annex XII. Disclosure of the leverage ratio (instructions) |
| LR1 | LRSum: Summary reconciliation of accounting assets and leverage ratio exposures | Appendix XIV |
| LR2 | LRCom: Leverage ratio common disclosure | Appendix XV |
| LR3 | LRSpl: Split-up of on balance sheet exposures (excluding derivatives, SFTs and exempted exposures) | Appendix XVI |
| LRA | Free format text boxes for disclosure on qualitative items | Section 2.4.4 |
| Annex XIII. Disclosure of liquidity requirements |
| Annex XIV. Disclosure of liquidity requirements (instructions) |
| LIQA | Liquidity risk management | Section 10.1 |
| LIQ1 | Quantitative information of LCR | Appendix XXII |
| LIQB | Qualitative information on LCR, which complements template EU LIQ1 | Section 10.1 |
| LIQ2 | Net Stable Funding Ratio | Appendix XXIII |
| Annex XV. Disclosure of credit risk quality |
| Annex XVI. Disclosure of credit risk quality (instructions) |
| CRA | General qualitative information about credit risk | Section 4.1 |
| CRB | Additional disclosure related to the credit quality of assets | Section 4.3 |
| CR1 | Performing and non-performing exposures and related provisions | Table 32 |
| CR1-A | Maturity of exposures | Table 35 |
| CR2 | Changes in the stock of non-performing loans and advances | Table 34 |
12 The exemption under Article 48 of the CRR is not used, so table INS1 on non-deducted holdings in insurance companies does not need to be published.
| | |
APPENDICES 2021 Pillar 3 Disclosures Report |
| | | | | | | | |
| CR2-A | Changes in the stock of non-performing loans and advances and related net accumulated recoveries | N/A13 |
| CQ1 | Credit quality of forborne exposures | Table 30 |
| CQ2 | Quality of forbearance | N/A14 |
| CQ3 | Credit quality of performing and non-performing exposures by past due days | Table 31 |
| CQ4 | Quality of non-performing exposures by geography | Table 29 |
| CQ5 | Credit quality of loans and advances by industry | Table 28 |
| CQ6 | Collateral valuation - loans and advances | N/A15 |
| CQ7 | Collateral obtained by taking possession and execution processes | Table 33 |
| CQ8 | Collateral obtained by taking possession and execution processes – vintage breakdown | N/A16 |
| Annex XVII. Disclosure of the use of credit risk mitigation techniques |
| Annex XVIII. Disclosure of the use of credit risk mitigation techniques (instructions) |
| CRC | Qualitative disclosure requirements related to CRM techniques | Section 4.7 |
| CR3 | CRM techniques overview: Disclosure of the use of credit risk mitigation techniques | Table 37 |
| Annex XIX. Disclosure of the use of standardised approach |
| Annex XX. Disclosure of the use of standardised approach (instructions) |
| CRD | Qualitative disclosure requirements related to standardised model | Section 4.2.3 |
| CR4 | Standardised approach – Credit risk exposure and CRM effects | Table 26 |
| CR5 | Standardised approach | Table 27 |
| Annex XXI. Disclosure of the use of the IRB approach to credit risk |
| Annexo XXII. Disclosure of the use of the IRB approach to credit risk (instructions) |
| CRE | Qualitative disclosure requirements related to IRB approach | Section 2.4.2.1 Section 2.8 Appendix XVII |
| CR6 | IRB approach – Credit risk exposures by exposure class and PD range | Table 14, Table 15, Table 16 |
| CR6-A | Scope of the use of IRB and SA approaches | Appendix XI |
| CR7 | IRB approach – Effect on the RWEAs of credit derivatives used as CRM techniques | Table 39 |
| CR7-A | IRB approach – Disclosure of the extent of the use of CRM techniques | Table 40 |
| CR8 | RWEA flow statements of credit risk exposures under the IRB approach | Table 12 |
| CR9 | IRB approach – Back-testing of PD per exposure class (fixed PD scale) | Appendix XVIII |
| CR9.1 | IRB approach – Back-testing of PD per exposure class (only for PD estimates according to point (f) of Article 180(1) CRR) | Appendix XIX |
| Annex XXIII. Disclosure of specialised lending |
| Annex XXIV. Disclosure of specialised lending (instructions) |
| CR10 | Specialised lending and equity exposures under the simple riskweighted approach | Table 18, Table 19, Table 20, Table 21, Table 22 |
| Annex XXV. Disclosure of exposures to counterparty credit risk |
| Annex XXVI. Disclosure of exposures to counterparty credit risk (instructions) |
| CCRA | Qualitative disclosure related to CCR | Section 5.1 |
| CCR1 | Analysis of CCR exposure by approach | Table 46 |
| CCR2 | Transactions subject to own funds requirements for CVA risk | Table 44 |
| CCR3 | Standardised approach – CCR exposures by regulatory exposure class and risk weights | Table 47 |
| CCR4 | IRB approach – CCR exposures by exposure class and PD scale | Table 48, Table 49 |
| CCR5 | Composition of collateral for CCR exposures | Table 50 |
| CCR6 | Credit derivatives exposures | Table 51 |
| CCR7 | RWEA flow statements of CCR exposures under the IMM | N/A17 |
| CCR8 | Exposures to CCPs | Table 45 |
| Annex XXVII. Disclosure of exposures to securitisation positions |
| Annex XXVIII. Disclosure of exposures to securitisation positions (instructions) |
| SECA | Qualitative disclosure requirements related to securitisation exposures | Section 6.3 |
| SEC1 | Securitisation exposures in the non-trading book | Table 53 |
| SEC2 | Securitisation exposures in the trading book | Table 54 |
13 Requirement CR2A of the EBA Disclosure ITS are not published because our NPL ratio does not exceed 5%
14 Requirement CQ2 of the EBA Disclosure ITS are not published because our NPL ratio does not exceed 5%.
15 Requirement CQ6 of the EBA Disclosure ITS are not published because our NPL ratio does not exceed 5%.
16 Requirement CQ8 of the EBA Disclosure ITS are not published because our NPL ratio does not exceed 5%.
17 Statement of flows of risk-weighted amounts of counterparty exposures subject to IMM is not included as Santander does not have an internal model to calculate counterparty risk EAD.
| | | | | | | | | | | |
186 | | 2021 Pillar 3 Disclosures Report | |
| | |
APPENDICES 2021 Pillar 3 Disclosures Report |
| | | | | | | | |
| SEC3 | Securitisation exposures in the non-trading book and associated regulatory capital requirements - institution acting as originator or as sponsor | Table 56 |
| SEC4 | Securitisation exposures in the non-trading book and associated regulatory capital requirements - institution acting as investor | Table 58 |
| SEC5 | Exposures securitised by the institution - Exposures in default and specific credit risk adjustments | Table 60 |
| Annex XXIX. Disclosure of the use of standardised approach and internal model for market risk |
| Annex XXX. Disclosure of the use of standardised approach and internal model for market risk (instructions) |
| MRA | Qualitative disclosure requirements related to market risk | Section 7.1 |
| MR1 | EU MR1 - Market risk under the standardised approach | Table 65 |
| MRB | Qualitative disclosure requirements for institutions using the internal Market Risk Models | Section 7.1 |
| MR2-A | Market risk under the internal Model Approach (IMA) | Table 63 |
| MR2-B | RWA flow statements of market risk exposures under the IMA | Table 64 |
| MR3 | IMA values for trading portfolios | Table 67 |
| MR4 | Comparison of VaR estimates with gains/losses | Appendix XXI |
| Annex XXXI. Disclosure of operational risk |
| Annex XXXII. Disclosure of operational risk (instructions) |
| ORA | Qualitative information on operational risk | Section 8 |
| OR1 | Operational risk own funds requirements and risk-weighted exposure amounts | Table 72 |
| Annex XXXIII. Disclosure of remuneration policy |
| Annex XXXIV. Disclosure of remuneration policy (instructions) |
| REMA | Remuneration policy | Section 11.1 |
| REM1 | Remuneration awarded for the financial year | Table 77 |
| REM2 | Special payments to staff whose professional activities have a material impact on institutions’ risk profile (identified staff) | Table 79 |
| REM3 | Deferred remuneration | Table 80 |
| REM4 | Remuneration of 1 million EUR or more per year | Table 81 |
| REM5 | Information on remuneration of staff whose professional activities have a material impact on institutions’ risk profile (identified staff) | Table 78 |
| Annex XXXV. Disclosure of encumbered and unencumbered assets |
| Annex XXXVI. Disclosure of encumbered and unencumbered assets (instructions) |
| AE1 | Encumbered and unencumbered assets | Table 73 |
| AE2 | Collateral received and own debt securities issued | Table 74 |
| AE3 | Sources of encumbrance | Table 75 |
| AE4 | Accompanying narrative information | Section 10.1.2 |
| | | | | | | | |
| IMPLEMENTING TECHNICAL STANDARDS ON DISCLOSURE OF INFORMATION ON EXPOSURES TO INTEREST RATE RISK ON POSITIONS NOT HELD IN THE TRADING BOOK |
Table | Table Title | 2021 Pillar 3 Location |
| IRRBB1 | Interest rate risks of non-trading book activities | Table 70 |
| IRRBBA | IRRBB qualitative information | Section 7.4.1 |
| | | | | | | | |
| GUIDELINES ON UNIFORM DISCLOSURES UNDER ARTICLE 473A OF REGULATION (EU) NO 575/2013 AS REGARDS THE TRANSITIONAL PERIOD FOR MITIGATING THE IMPACT OF THE INTRODUCTION OF IFRS 9 ON OWN FUNDS - EBA/GL/2018/01 |
Table | Table title | 2021 Pillar 3 Location |
| IFRS 9-FL Template | Comparison of equity, capital ratios and leverage of entities with or with out the application of the transitional arrangements of IFRS 9 or analog ECL | Appendix VIII |
| | | | | | | | |
GUIDELINES ON COVID -19 MEASURES REPORTING AND DISCLOSURE - EBA/GL/2018/10 |
Table | Table title | 2021 Pillar 3 Location |
| Template 1 | Information on loans and advances subject to legislative and non-legislative moratoria | Table 41 |
| Template 2 | Breakdown of loans and advances subject to legislative and non-legislative moratoria by residual maturity of moratoria | Table 42 |
| Template 3 | Information on newly originated loans and advances provided under newly applicable public guarantee schemes introduced in response to covid-19 crisis | Table 43 |
| | |
APPENDICES 2021 Pillar 3 Disclosures Report |
| | | | | | | | |
| IMPLEMENTING TECHNICAL STANDARDS ON DISCLOSURE AND REPORTING OF MREL AND TLAC |
Table | Table title | 2021 Pillar 3 Location |
| KM2 | Key metrics – MREL and, where applicable, G-SII requirement for own
funds and eligible liabilities | |
| TLAC1 | Composition – MREL and, where applicable, the G-SII requirement
for own funds and eligible liabilities | |
| TLAC3 | Creditor ranking – resolution entity | |
| | | | | | | | | | | |
188 | | 2021 Pillar 3 Disclosures Report | |
| | |
APPENDICES 2021 Pillar 3 Disclosures Report |
Appendix II -CRR Mapping
The following table links the CRR’s articles on divulging information (Part 8) to the various sections of the document that provide the information required. The ‘Location’ column specifies the section of Pillar 3 or other public document in which the information is dealt with, in whole or in part. This information may be distributed throughout the document on a piecemeal basis.
| | | | | | | | | | | | | | |
Article | Brief Description | 2021 P3DR Location | Tables | 2021 Annual Report Location |
| 431. Scope of disclosures requirements |
| 431.1 | Requirement to publish Pillar 3 disclosures. | Pillar 3 Disclosures Report (Santander corporate website) | | |
| 431.2 | Permission granted by the competent authorities under Part Three for the instruments and methodologies referred to in Title III shall be subject to the public disclosure by institutions of the information laid down therein. | Section 2.4.2.1. | | |
| 431.3 | Institution must have a policy covering the frequency of disclosures, their verification, comprehensiveness and appropriateness, as well as policies for assuring the overall comprehension of their risk profile by market participants. | Section 1.2.2 | | |
| 431.4 | All quantitative disclosures shall be accompanied by a qualitative narrative and any other supplementary
information that may be necessary | | | |
| 431.5 | Explanation of SMEs ratings decision upon request. | Section 4.4. | | |
| | | | |
| 432. Non-material, proprietary or confidential information |
| 432.1 | Institutions may omit information that is not material if certain conditions are respected. | Sections 1.2.1. and 1.2.2. | | |
| 432.2 | Institutions may omit information that is proprietary or confidential if certain conditions are respected. | Section 1.2.2. | | |
| 432.3 | Where 432.2 applies this must be stated in the disclosures, and more general information must be disclosed. | Section 1.2.2. | | |
| | | | |
| 433. Frequency of disclosure |
| 433 | Institutions shall publish the disclosures required under Titles II and III in the manner set out in Articles 433a, 433b and 433c. | Section 1.2.2. | | |
| | | | |
| 433a. Disclosures by large institutions |
| 433a | Large institutions shall disclose the information outlined below with the following frequency: | Section 1.2.2. | | |
| | | | |
| 433b. Disclosures by small and non-complex institutions |
| 433b | Small and non-complex institutions shall disclose the information outlined below with the following frequency | N/A | | |
| | | | |
| 433c. Disclosures by other institutions |
| 433c | Institutions that are not subject to Article 433a or 433b shall disclose the information outlined below with the following frequency | N/A | | |
| | | | |
| 434. Means of disclosure |
| 434.1 | Institutions shall disclose all the information required under Titles II and III in electronic format and in a single medium or location. | Section 1.2.1. | | |
| 434.2 | Disclosures made under other requirements (e.g. accounting, listing) can be used to satisfy Pillar 3 requirements, if appropriate. | Section 1.2.1. | | |
| | | | |
| 434a. Uniform disclosure formats |
| | |
APPENDICES 2021 Pillar 3 Disclosures Report |
| | | | | | | | | | | | | | |
Article | Brief Description | 2021 P3DR Location | Tables | 2021 Annual Report Location |
| 434a | EBA shall develop draft implementing technical standards specifying uniform disclosure formats, and associated instructions in accordance with which the disclosures required under Titles II and III shall be made. | N/A | | |
| | | | |
| 435. Risk management objectives and policies |
| 435.1 | Disclose information for each separate category of risk: | | | |
| 435.1.a | The strategies and processes to manage risks. | Chapters 3 to 10 | | Risk Management Chapter (Section 2) |
| 435.1.b | Structure and organization of the risk management function. | Chapters 3 to 10 | | Risk Management Chapter (Section 2) |
| 435.1.c | Risk reporting and measurement systems. | Chapters 3 to 10 | | Risk Management Chapter (Section 2) |
| 435.1.d | Hedging and mitigating risk - policies, strategies and processes. | Chapters 3 to 10 | | Risk Management Chapter (Section 3.2.) (Section 3.5) (Sections 4 - 9) |
| 435.1.e | A declaration of adequacy of risk management arrangements approved by the Board. | Section 3.1.3 | | Risk Management Chapter (Section 2) |
| 435.1.f | Inclusion of a concise risk statement approved by the Board. | Sections 1.4.2 and 3.1.3 | | Risk Management Chapter (Section 2) |
| 435.2 | Information on governance arrangements, including information on Board composition and recruitment, and risk committees. | | | |
| 435.2.a | Number of directorships held by Board members. | Section 3.2.1 | | Corporate Governance Chapter |
| 435.2.b | Recruitment policy for the selection of Board members, their actual knowledge, skills and expertise. | Section 3.2 | | Corporate Governance Chapter |
| 435.2.c | Policy on diversity of Board membership, objectives, and achievement status. | Section 3.2.3 | | Corporate Governance Chapter |
| 435.2.d | Existence of a dedicated risk committee, and number of meetings during the year. | Section 2.2.2 | | Corporate Governance Chapter
Risk Management Chapter |
| 435.2.e | Description of the information flow on risk to the Board. | Section 2.2.2 | | Corporate Governance Chapter
Risk Management Chapter |
| | | | |
| 436. Scope of application of the requirements |
| 436 | Institutions shall disclose the following information regarding the scope of application of the requirements of this Regulation in accordance with Directive 2013/36/EU: | | | |
| 436.a | Name of institution to which the requirements of this Regulation applies. | Section 1.2.1. | | |
| 436.b | Difference in the basis of consolidation for accounting and prudential purposes, briefly describing entities that are:
(i) fully consolidated
(ii) proportionally consolidated
(iii) deducted from own funds
(iv) neither consolidated nor deducted | Section 1.4.1 | Table 1 (LI1)
Table 2 (LI2)
Appendix V (LI3) | |
| 436.c | a breakdown of assets and liabilities of the consolidated financial statements prepared in accordance with the requirements on regulatory consolidation pursuant to Sections 2 and 3 of Title II of Part One | Section 1.2.4 | Table 1 (LI1) | |
| 436.d | a reconciliation identifying the main sources of differences between the carrying value amounts in the financial statements under the regulatory scope of consolidation as defined in Sections 2 and 3 of Title II of Part One | Section 1.4.1 | Table 1 (LI1)
Table 2 (LI2)
| |
| 436.e | a breakdown of the amounts of the constituent elements of an institution's prudent valuation adjustment, by type of risks, and the total of constituent elements separately for the trading
book and non-trading book positions; | | Appendix XX (PV1) | |
| 436.f | Impediments to transfer of own funds between parent and subsidiaries. | Sections 1.3.1 and 2.3.3 | | |
| 436.g | Capital shortfalls in any subsidiaries outside the scope of consolidation. | Section 1.2.1. | | |
| | | | | | | | | | | |
190 | | 2021 Pillar 3 Disclosures Report | |
| | |
APPENDICES 2021 Pillar 3 Disclosures Report |
| | | | | | | | | | | | | | |
Article | Brief Description | 2021 P3DR Location | Tables | 2021 Annual Report Location |
| 436.h | The circumstance of making use of articles on derogations from:
a) Prudential requirements
b) Liquidity requirements for individual subsidiaries/entities. | Section 1.2.1. | | |
| | | | |
| 437. Disclosure of own funds |
| 437.1 | Institutions shall disclose the following information regarding their own funds: | | | |
| 437.1.a | A full reconciliation of Common Equity Tier 1 items, Additional Tier 1 items, Tier 2 items and filters and deductions applied pursuant to Articles 32 to 35, 36, 56, 66 and 79 to own funds of the institution and the balance sheet in the audited financial statements of the institution. | | Tables 4 y 5
Appendix VI (CC2) Appendix X (CC1) Appendix IX (CCA) | |
| 437.1.b | Description of the main features of the Common Equity Tier 1 and Additional Tier 1 instruments and Tier 2 instruments issued by the institution. | Section 2.4.1. | Appendix IX (CCA) Appendix X (CC1) | |
| 437.1.c | Dull terms and conditions of all Common Equity Tier 1, Additional Tier 1 and Tier 2 instruments. | Section 2.4.1. | Appendix IX (CCA) Appendix X (CC1) | |
| 437.1.d | Disclosure of the nature and amounts of the following: | Sections 2.2. and 2.3 | Appendix X (CC1) | |
| 437.1.d.i | Each prudential filter applied pursuant to Articles 32 to 35; | Sections 2.2. and 2.3 | Appendix X (CC1) | |
| 437.1.d.ii | Each deduction made pursuant to Articles 36, 56 and 66; | Sections 2.2. and 2.3 | Appendix X (CC1) | |
| 437.1.d.iii | Items not deducted in accordance with Articles 47, 51, 56, 66 and 79. | Sections 2.2. and 2.3 | Appendix X (CC1) | |
| 437.1.e | Description of all restrictions applied to the calculation of own funds in accordance with this Regulation and the instruments, prudential filters and deductions to which those restrictions apply. | Section 2.4.1. | Appendix X (CC1) | |
| 437.1.f | Explanation of the calculation basis of the disclosed capital ratios estimated using elements of own funds determined, on a basis other than that laid down in this Regulation. | N/A | | |
| | | | |
| 437a. Disclosure of own funds and eligible liabilities |
| 437a | Institutions that are subject to Article 92a or 92b shall disclose the following information regarding their own funds and eligible liabilities: (a) the composition of their own funds and eligible liabilities, their maturity and their main features; (b) the ranking of eligible liabilities in the creditor hierarchy; (c) the total amount of each issuance of eligible liabilities instruments referred to in Article 72b; (d) the total amount of excluded liabilities referred to in Article 72a(2). | Sections 1.2.3 and 1.3 | | |
| | | | |
| 438. Capital requirements |
| 438 | Institutions shall disclose the following information regarding their compliance with Article 92 of this Regulation
and with the requirements laid down in Article 73 and in point (a) of Article 104(1) of Directive 2013/36/EU: | | | |
| 438.a | a summary of their approach to assessing the adequacy of their internal capital to support current and future activities; | Section 2.4 | | Economic and Financial Report Chapter (Section 3.5) |
| 438.b | the amount of the additional own funds requirements | Sections 2.4.1, 2.4.3 and 2.5 | Appendix VII (KM1) | |
| 438.c | upon demand from the relevant competent authority, the result of the institution's internal capital adequacy assessment process; | Section 2.4 | | Economic and Financial Report Chapter (Section 3.5) |
| 438.d | the total risk-weighted exposure amount and the corresponding total own funds requirement determined in accordance with Article 92, to be broken down by the different risk categories set out in Part Three and, where applicable, an explanation of the effect on the calculation of own funds and risk-weighted exposure amounts that results from applying capital floors and not deducting items from own funds;
| Section 2.4.2 | Table 7 (OV1) | |
| | |
APPENDICES 2021 Pillar 3 Disclosures Report |
| | | | | | | | | | | | | | |
Article | Brief Description | 2021 P3DR Location | Tables | 2021 Annual Report Location |
| 438.e | The on- and off-balance-sheet exposures, the risk-weighted exposure amounts | Section 2.4.2 | Tables 18 - 21 (CR10) | |
| 438.f | The exposure value and the risk-weighted exposure amount of own funds instruments held in any insurance undertaking, reinsurance undertaking or insurance holding company that the institutions do not deduct from their own funds
| N/A | | |
| 438.g | The supplementary own funds requirement and the capital adequacy ratio of the financial conglomerate
| N/A | | |
| 438.h | The variations in the risk-weighted exposure amounts of the current disclosure period compared to the immediately preceding disclosure period that result from the use of internal models, including an outline of the key drivers explaining those variations. | | Table 12 (CR8)
Table 64 (MR2-B) | |
| | | | |
| 439. Exposure to counterparty credit risk |
| 439 | Institutions shall disclose the following information regarding the institution's exposure to counterparty credit risk as referred to in Part Three, Title II, Chapter 6: | | | |
| 439.a | Description of process to assign internal capital and credit limits to CCR exposures. | Sections 5, 5.1 and 5.6 | Table 45 (CCR8) | |
| 439.b | Discussion of policies for securing collateral and establishing credit reserves. | Section 5.2 | Table 50 (CCR5) | |
| 439.c | Discussion of management of wrong-way risk exposures. | Section 5.3 | | |
| 439.d | Disclosure of collateral to be provided (outflows) in the event of a ratings downgrade. | Section 5.4 | | |
| 439.e | The amount of segregated and unsegregated collateral received and posted per type of collateral, | | Table 50 (CCR5) | |
| 439.f | For derivative transactions, the exposure values before and after the effect of the credit risk mitigation | | Table 46 (CCR1) | |
| 439.g | For securities financing transactions, the exposure values before and after the effect of the credit risk
mitigation | | Table 46 (CCR1) | |
| 439.h | The exposure values after credit risk mitigation effects and the associated risk exposures for credit valuation
adjustment capital charge | Section 5.5 | Table 44 (CCR2) | |
| 439.i | The exposure value to central counterparties and the associated risk exposures | Section 5.6 | Table 45 (CCR8) | |
| 439.j | The notional amounts and fair value of credit derivative transactions; | | Table 51 (CCR6) | |
| 439.k | The estimate of alpha where the institution has received the permission of the competent authorities to use its
own estimate of alpha | | Table 46 (CCR1) | |
| 439.l | Separately, the disclosures included in point (e) of Article 444 and point (g) of Article 452; | | Table 46 (CCR1)
Table 47 (CCR3)
Tables 48 and 49 (CCR4)
Table 50 (CCR5)
Table 51 (CCR6) | |
| 439.m | For institutions using the methods set out in Sections 4 to 5 of Chapter 6 of Title II Part Three, the size of their on- and off-balance-sheet derivative business | | Table 46 (CCR1) | |
| | | | |
| 440. Capital buffers |
| | | | | | | | | | | |
192 | | 2021 Pillar 3 Disclosures Report | |
| | |
APPENDICES 2021 Pillar 3 Disclosures Report |
| | | | | | | | | | | | | | |
Article | Brief Description | 2021 P3DR Location | Tables | 2021 Annual Report Location |
| 440 | Disclosure of the following information in relation to its compliance with the requirement for a countercyclical capital buffer referred to in Title VII, Chapter 4 of Directive
2013/36/EU: | | | |
| 440.a | Geographical distribution of credit exposures relevant for the calculation of countercyclical capital buffer. | Section 2.2.3. | Appendix XII (CCyB1) | |
| 440.b | Amount of the specific countercyclical capital buffer. | Section 2.2.3. | Appendix XIII (CCyB2) | |
| | | | |
| 441. Indicators of global systemic importance |
| 441 | Disclosure of the indicators of global systemic importance. | Section 2.4.3. | | |
| | | | |
| 442. Credit risk adjustments |
| 442 | Institutions shall disclose the following information regarding the institution's exposure to credit risk and dilution risk: | | | |
| 442.a | The scope and definitions that they use for accounting purposes of ‘past due’ and ‘impaired’ and the differences, if any, between the definitions of ‘past due’ and ‘default’ for accounting and regulatory purposes; | Section 4.5. | | Risk Management Chapter (Section 3.3.) |
| 442.b | A description of the approaches and methods adopted for determining specific and general credit risk adjustments; | | Table 60 (SEC1) | Risk Management Chapter (Section 3.3.) |
| 442.c | Information on the amount and quality of performing, non-performing and forborne exposures for loans, debt securities and off-balance-sheet exposures, including their related accumulated impairment, provisions and negative fair value changes due to credit risk and amounts of collateral and financial guarantees received; | | Table 28 (CQ5)
Table 29 (CQ4)
Table 30 (CQ1)
Table 32 (CR1)
Table 33 (CQ7) | |
| 442.d | An ageing analysis of accounting past due exposures;
| | Table 31 (CQ3) | Risk Management Chapter (Section 3.3.) |
| 442.e | The gross carrying amounts of both defaulted and non-defaulted exposures, the accumulated specific and general credit risk adjustments, the accumulated write-offs taken against those exposures and the net carrying amounts and their distribution by geographical area and industry type and for loans, debt securities and off balance-sheet exposures; | | Table 32 (CR1)
Table28 (CQ5)
Table 29 (CQ4) | Risk Management Chapter (Section 3.3.) |
| 442.f | Any changes in the gross amount of defaulted on- and off-balance-sheet exposures, including, as a minimum, information on the opening and closing balances of those exposures, the gross amount of any of those exposures reverted to non-defaulted status or subject to a write-off;
| | Table 34 (CR2) | Risk Management Chapter (Section 3.3.) |
| 442.g. | The breakdown of loans and debt securities by residual maturity | | Table 35 (CR1-A) | |
| | | | |
| 443. Unencumbered assets |
| 443 | Institutions shall disclose information concerning their encumbered and unencumbered assets. For those purposes, institutions shall use the carrying amount per exposure class broken down by asset quality and the total amount of the carrying amount that is encumbered and unencumbered. | Section 10.1.3. | Table 73 (AE1)
Table 74 (AE2)
Table 75 (AE3) | Economic and Financial Report Chapter (Section 3) |
| | | | |
| 444. Use of ECAIs |
| 444 | For institutions calculating the risk-weighted exposure amounts in accordance with Part Three, Title II, Chapter 2, the following information shall be disclosed for each of the exposure classes specified in Article 112: | | | |
| 444.a | Names of the ECAIs used in the calculation of Standardised approach risk-weighted assets and reasons for any changes. | Section 4.2.3. | | |
| 444.b | Exposure classes associated with each ECAI. | Section 4.2.3. | | |
| 444.c | Description of the process used to transfer credit assessments to non-trading book items. | Section 4.2.3. | | |
| 444.d | Mapping of external rating to credit quality steps (CQS). | Section 4.2.3. | | |
| | |
APPENDICES 2021 Pillar 3 Disclosures Report |
| | | | | | | | | | | | | | |
Article | Brief Description | 2021 P3DR Location | Tables | 2021 Annual Report Location |
| 444.e | Exposure value pre and post-credit risk mitigation, by CQS. | | Table 26 (CR4)
Table 27(CR5)
Table 47(CCR3) | |
| | | | |
| 445. Exposure to market risk |
| 445 | Disclosure of position risk, large exposures exceeding limits, FX, settlement and commodities risk. | Section 7.2. | Table 65 (MR1) | |
| | | | |
| 446. Operational risk |
| 446 | Institutions shall disclose the following information about their operational risk management: | | | |
| 446.a | The approaches for the assessment of own funds requirements for operation risk that the institution qualifies for; | Section 8.2 | Table 72 (OR1) | |
| 446.b | A discussion of the relevant internal and external factors being considered in the institution's advanced measurement approach; | Section 8.2 | Table 72 (OR1) | |
| 446.c | In the case of partial use, the scope and coverage of the different methodologies used. | Section 8.2 | Table 72 (OR1) | |
| | | | |
| 447. Exposures in equities not included in the trading book |
| 447 | Institutions shall disclose the following key metrics in a tabular format: | | | |
| 447.a | The composition of their own funds and their own funds requirements as calculated in accordance with Article 92; | | Appendix VII ( KM1) | |
| 447.b | The total risk exposure amount as calculated in accordance with Article 92(3); | | Appendix VII ( KM1) | |
| 447.c | Where applicable, the amount and composition of additional own funds which the institutions are required to hold | | Appendix VII ( KM1) | |
| 447.d | Their combined buffer requirement which the institutions are required to hold | | Appendix VII ( KM1) | |
| 447.e | Their leverage ratio and the total exposure measure as calculated in accordance with Article 429 | | Appendix VII ( KM1) | |
| 447.f | Information in relation to their liquidity coverage ratio | | Appendix VII ( KM1) | |
| 447.g | Information in relation to their net stable funding requirement | | Appendix VII ( KM1) | |
| 447.h | Their own funds and eligible liabilities ratios and their components, numerator and denominator | | | |
| | | | |
| 448. Exposure to interest rate risk on positions not included in the trading book |
| 448.1 | As from 28 June 2021, institutions shall disclose the following quantitative and qualitative information on the risks arising from potential changes in interest rates that affect both the economic value of equity and the net interest income of their non-trading book activities | | | |
| 448.1.a | The changes in the economic value of equity calculated under the six supervisory shock scenarios for the current and previous disclosure periods;
| Sections 7.4 and 7.4.1 | Table 70 (IRRBB1) | Risk Management Chapter (Section 4.4.) |
| 448.1.b | The changes in the net interest income calculated under the two supervisory shock scenarios for the current and previous disclosure periods; | Sections 7.4 and 7.4.1 | Table 70 (IRRBB1) | Risk Management Chapter (Section 4.4.) |
| 448.1.c | A description of key modelling and parametric assumptions used to calculate changes in the economic value of equity and in
the net interest income | Sections 7.4 and 7.4.1 | Table 70 (IRRBB1) | |
| 448.1.d | An explanation of the significance of the risk measures disclosed under points (a) and (b) of this paragraph and of any significant variations of those risk measures since the previous disclosure reference date; | Sections 7.4 and 7.4.1 | Table 70 (IRRBB1) | |
| 448.1.e | The description of how institutions define, measure, mitigate and control the interest rate risk of their nontrading book activities for the purposes of the competent authorities' review | Sections 7.4 and 7.4.1 | Table 70 (IRRBB1) | |
| 448.1.f | The description of the overall risk management and mitigation strategies for those risks; | Sections 7.4 and 7.4.1 | Table 70 (IRRBB1) | |
| 448.1.g | Average and longest repricing maturity assigned to non-maturity deposits. | Sections 7.4 and 7.4.1 | Table 70 (IRRBB1) | |
| | | | | | | | | | | |
194 | | 2021 Pillar 3 Disclosures Report | |
| | |
APPENDICES 2021 Pillar 3 Disclosures Report |
| | | | | | | | | | | | | | |
Article | Brief Description | 2021 P3DR Location | Tables | 2021 Annual Report Location |
| 448.2 | By way of derogation from paragraph 1 of this Article, the requirements set out in points (c) and (e)(i) to (e) (iv) of paragraph 1 of this Article shall not apply to institutions that use the standardised methodology or the simplified standardised methodology referred to in Article 84(1) of Directive 2013/36/EU. | Sections 7.4 and 7.4.1 | Table 70 (IRRBB1) | |
| | | | |
| 449. Exposure to securitisation positions |
| 449 | Institutions calculating risk-weighted exposure amounts in accordance with Chapter 5 of Title II of Part Three or own funds requirements in accordance with Article 337 or 338 shall disclose the following information separately for their trading book and non-trading book activities: | | | |
| 449.a | A description of their securitisation and re-securitisation activities, including their risk management and investment objectives in connection with those activities | Sections 6.3.1, 6.3.2 and 6.4 | | |
| 449.b | The type of risks they are exposed to in their securitisation and re-securitisation activities by level of seniority of the relevant securitisation positions | Sections 6.3.3 and 6.3.4 | | |
| 449.c | Their approaches for calculating the risk-weighted exposure amounts that they apply to their securitisation
activities | Section 6.4 | Table 55
Table 56 (SEC3) | |
| 449.d | A list of SSPEs falling into any of the following categories, with a description of their types of exposures to those SSPEs, including derivative contracts. | N/A | | |
| 449.e | A list of any legal entities in relation to which the institutions have disclosed that they have provided support | N/A | | |
| 449.f | A list of legal entities affiliated with the institutions and that invest in securitisations originated by the institutions or in securitisation positions issued by SSPEs sponsored by the institutions; | N/A | | |
| 449.g | A summary of their accounting policies for securitisation activity, including where relevant a distinction between securitisation and re-securitisation positions; | Section 6.2 | | |
| 449.h | The names of the ECAIs used for securitisations and the types of exposure for which each agency is used; | Section 6.3.4 | | |
| 449.i | A description of the Internal Assessment Approach as set out in Chapter 5 of Title II of Part Three, | N/A | | |
| 449.j | Separately for the trading book and the non-trading book, the carrying amount of securitisation exposures, | | Table 53 (SEC1)
Table 54 (SEC2) | |
| 449.k | For the non-trading book activities, the following information: | | Table 56 (SEC3)
Table 58 (SEC4) | |
| 449.k.i | The aggregate amount of securitisation positions where institutions act as originator or sponsor and the associated risk-weighted assets and capital requirements by regulatory approaches | | Table 56 (SEC3)
Table 58 (SEC4) | |
| 449.k.ii | The aggregate amount of securitisation positions where institutions act as investor and the associated risk weighted assets and capital requirements by regulatory approaches | | Table 56 (SEC3)
Table 58 (SEC4) | |
| 449.l | For exposures securitised by the institution, the amount of exposures in default and the amount of the specific credit risk adjustments made by the institution during the current period, both broken down by exposure type. | | Table 60 (SEC5) | |
| | | | |
| 449a. Disclosure of environmental, social and governance risks (ESG risks) |
| 449a | From 28 June 2022, large institutions which have issued securities that are admitted to trading on a regulated market of any Member State, as defined in point (21) of Article 4(1) of Directive 2014/65/EU, shall disclose information on ESG risks, including physical risks and transition risks, as defined in the report referred to in Article 98(8) of Directive 2013/36/EU. | Chapter 9 | | |
| | | | |
| 450. Remuneration policy |
| 450 | Remuneration disclosures (Material Risk Takers): | Chapter 11 | Table 77 (REM1)
Table 79 (REM2)
Table 80 (REM3)
Table 81 (REM4)
Table 78 (REM5) | Corporate Governance Chapter |
| | | | |
| | |
APPENDICES 2021 Pillar 3 Disclosures Report |
| | | | | | | | | | | | | | |
Article | Brief Description | 2021 P3DR Location | Tables | 2021 Annual Report Location |
| 451. Leverage |
| 451.1 | Institutions that are subject to Part Seven shall disclose the following information regarding their leverage ratio. | | | |
| 451.1.a | The leverage ratio and how the institutions apply Article 499(2);
| | Appendix XV (LR2) | |
| 451.1.b | A breakdown of the total exposure measure referred to in Article 429(4), as well as a reconciliation of the total exposure measure with the relevant information disclosed in published financial statements; | | Appendix XIV (LR1)
Appendix XV (LR2) Appendix XVI (LR3) | |
| 451.1.c | Where applicable, the amount of exposures and the adjusted leverage ratio
| | Appendix XV (LR2) | |
| 451.1.d | A description of the processes used to manage the risk of excessive leverage;
| Section 2.4.4. | Table 10 | |
| 451.1.e | A description of the factors that had an impact on the leverage ratio during the period to which the disclosed leverage ratio refers. | Section 2.4.4. | Table 10 | |
| 451.2 | Public development credit institutions as defined in Article 429a(2) shall disclose the leverage ratio without the adjustment to the total exposure measure determined in accordance with point (d) of the first subparagraph of Article 429a(1). | | Appendix XV (LR2) | |
| 451.3 | Large institutions shall disclose the leverage ratio and the breakdown of the total exposure measure. | | Appendix XV (LR2) | |
| | | | |
| 451a. Use of the IRB Approach to credit risk |
| 451a.1 | Institutions that are subject to Part Six shall disclose information on their liquidity coverage ratio, net stable funding ratio and liquidity risk management in accordance with this Article. | Sections 10.1.1 and 10.1.2 | | |
| 451a.2 | Institutions shall disclose the following information in relation to their liquidity coverage ratio as calculated in accordance with the delegated act referred to in Article 460(1) | Section 10.1.1 | Appendix XXII (LIQ1) | |
| 451a.3 | Institutions shall disclose the following information in relation to their net stable funding ratio as calculated in accordance with Title IV of Part Six | | Appendix XXIII (LIQ2) | |
| 451a.4 | Institutions shall disclose the arrangements, systems, processes and strategies put in place to identify, measure, manage and monitor their liquidity risk in accordance with Article 86 of Directive 2013/36/EU. | Section 10.1 | | Risk Management Chapter (Section 3.4.) |
| | | | |
| 452. Use of the IRB Approach to credit risk |
| 452 | Institutions calculating the risk-weighted exposure amounts under the IRB Approach shall disclose the following information: | | | |
| 452.a | Permission for use of the IRB approach from the competent authority. | Section 2.4.2.1. | | |
| 452.b | For each exposure class referred to in Article 147, the percentage of the total exposure value of each exposure class subject to the Standardised Approach or to the IRB Approach, as well as the part of each exposure class subject to a roll-out plan. | | Appendix XI (CR6-A) | |
| 452.c | The control mechanisms for rating systems at the different stages of model development, controls and changes, which shall include information on: | Sections 2.8 and 4.5 | | |
| 452.c.i | The relationship between the risk management function and the internal audit function; | Sections 2.8 and 4.5 | | |
| 452.c.ii | The rating system review; | Sections 2.8 and 4.5 | | |
| 452.c.iii | The procedure to ensure the independence of the function in charge of reviewing the models from the functions responsible for the development of the models; | Sections 2.8 and 4.5 | | |
| 452.c.iv | The procedure to ensure the accountability of the functions in charge of developing and reviewing the models; | Sections 2.8 and 4.5 | | |
| 452.d | The role of the functions involved in the development, approval and subsequent changes of the credit risk models; | Sections 2.8.2 and 10.3 | | |
| | | | | | | | | | | |
196 | | 2021 Pillar 3 Disclosures Report | |
| | |
APPENDICES 2021 Pillar 3 Disclosures Report |
| | | | | | | | | | | | | | |
Article | Brief Description | 2021 P3DR Location | Tables | 2021 Annual Report Location |
| 452.e | The scope and main content of the reporting related to credit risk models; | | Appendix XVII (CRE) | |
| 452.f | A description of the internal ratings process by exposure class, including the number of key models used with respect to each portfolio and a brief discussion of the main differences between the models within the same portfolio, covering: | | Appendix XVII (CRE) | |
| 452.f.i | The definitions, methods and data for estimation and validation of PD | | Appendix XVII (CRE) | |
| 452.f.ii | Were applicable, the definitions, methods and data for estimation and validation of LGD | | Appendix XVII (CRE) | |
| 452.f.iii | Where applicable, the definitions, methods and data for estimation and validation of conversion factors | | Appendix XVII (CRE) | |
| 452.g | As applicable, the following information in relation to each exposure class referred to in Article 147: | | Tables 14 - 16 (CR6)
Table 26 (CR4) | |
| 452.g.i | Their gross on-balance-sheet exposure;
| | Tables 14 - 16 (CR6)
Table 26 (CR4) | |
| 452.g.ii | Their off-balance-sheet exposure values prior to the relevant conversion factor; | | Tables 14 - 16 (CR6)
Table 26 (CR4) | |
| 452.g.iii | Their exposure after applying the relevant conversion factor and credit risk mitigation; | | Tables 14 - 16 (CR6)
Table 26 (CR4) | |
| 452.g.iv | Any model, parameter or input relevant for the understanding of the risk weighting and the resulting risk exposure amounts disclosed across a sufficient number of obligor grades (including default) to allow for a meaningful differentiation of credit risk; | | Tables 14 - 16 (CR6)
Table 26 (CR4) | |
| 452.g.v | Separately for those exposure classes in relation to which institutions have received permission to use own LGDs and conversion factors for the calculation of risk-weighted exposure amounts, and for exposures for which the institutions do not use such estimates, the values referred to in points (i) to (iv) subject to that permission; | | Tables 14 - 16 (CR6)
Table 26 (CR4) | |
| 452.h | Institutions' estimates of PDs against the actual default rate for each exposure class over a longer period | | Appendix XVIII (CR9) | |
| | | | |
| 453. Use of credit risk mitigation techniques |
| 453 | Institutions applying credit risk mitigation techniques shall disclose the following information: | | | |
| 453.a | Use of on and off-balance sheet netting. | Sections 4.7 and 5.7 | Table 37 (CR3)
Table 38
Table 39 (CR7)
Table 40 (CR7-A)
Table 50 (CCR5) | Risk Management Chapter (Section 3.2.) |
| 453.b | How collateral valuation is managed. | Section 4.7 | | Risk Management Chapter (Section 3.2.) |
| 453.c | Description of types of collateral used by the institution. | Section 4.7 | | Risk Management Chapter (Section 3.2.) |
| 453.d | Main types of guarantor and credit derivative counterparty, creditworthiness. | Sections 4.7 and 4.7.1 | Table 37 (CR3)
Table 38
Table 39 (CR7)
Table 40 (CR7-A) | Risk Management Chapter (Section 3.2.) |
| 453.e | Market or credit risk concentrations within risk mitigation exposures. | Section 4.7 | Table 36 | |
| 453.f | For institutions calculating risk-weighted exposure amounts under the Standardised Approach or the IRB Approach, the total exposure value not covered by any eligible credit protection and the total exposure value covered by eligible credit protection after applying volatility adjustments | | Table 37 (CR3) | |
| | |
APPENDICES 2021 Pillar 3 Disclosures Report |
| | | | | | | | | | | | | | |
Article | Brief Description | 2021 P3DR Location | Tables | 2021 Annual Report Location |
| 453.g | The corresponding conversion factor and the credit risk mitigation associated with the exposure and the incidence of credit risk mitigation techniques with and without substitution effect; | | Table 26 (CR4)
Table 39 (CR7-A) | |
| 453.h | For institutions calculating risk-weighted exposure amounts under the Standardised Approach, the on- and off-balance-sheet exposure value by exposure class before and after the application of conversion factors and any associated credit risk mitigation; | | Table 26 (CR4) | |
| 453.i | for institutions calculating risk-weighted exposure amounts under the Standardised Approach, the riskweighted exposure amount and the ratio between that risk-weighted exposure amount and the exposure value after applying the corresponding conversion factor and the credit risk mitigation associated with the
exposure | | Table 26 (CR4) | |
| 453.j | For institutions calculating risk-weighted exposure amounts under the IRB Approach, the risk-weighted exposure amount before and after recognition of the credit risk mitigation impact of credit derivatives | | Table 39 (CR7) | |
| | | | |
| 454. Use of the Advanced Measurement Approaches to operational risk |
| 454 | Description of the use of insurance or other risk transfer mechanisms to mitigate operational risk. | N/A | | |
| | | | |
| 455. Use of Internal Market Risk Models |
| 455 | Institutions calculating their capital requirements in accordance with Article 363 shall disclose the following information: | | | |
| 455.a | For each sub-portfolio covered: | | | |
| 455.a.i | Disclosure of the characteristics of the market risk models used; | Sections 7.2, 7.3.1, 7.3.2 and 7.3.3 | | |
| 455.a.ii | Disclosure of the methodologies used to measure incremental default and migration risk; | | | |
| 455.a.iii | Descriptions of stress tests applied to the portfolios; | Sections 7.3.4 and 7.3.5 | | |
| 455.a.iv | Methodology for back-testing and validating the models. | Section 7.3.6 | | |
| 455.b | Scope of permission for use of the models. | Section 7.2 | | |
| 455.c | Policies and processes to determine trading book classification, and to comply with prudential valuation requirements. | Sections 7.3.1, 7.3.2 and 7.3.3 | | |
| 455.d.(i-iii) | High/Low/Mean values over the year of VaR, SVaR and incremental risk charge. | Section 7.3.1 | Table 67 (MR3) | |
| 455.e | The elements of the own fund calculation. | Sections 2.4.2 and 7.2 | Table 7 (OV1)
Table 63 (MR2-A) | |
| 455.f | Weighted average liquidity horizons for each sub-portfolio covered by internal models. | Section 7.3.3 | | |
| 455.g | Comparison of end-of-day value-at-risk (VaR) measures compared with one-day changes in the portfolio's value. | Section 7.3.5 | Appendix XXI (MR4) | |
| | | | | | | | | | | |
198 | | 2021 Pillar 3 Disclosures Report | |
| | |
APPENDICES 2021 Pillar 3 Disclosures Report |
Appendix III - List of tables
| | | | | |
| Click on the page number corresponding to each table to access it. |
| | | | | | | | | | | |
Num. | Regulatory requirement | Name | Page |
| CHAPTER 1. INTRODUCTION |
| Table 1 | LI1 | Differences between accounting and regulatory scopes of consolidation and mapping of financial statement categories with regulatory risk categories | |
| Table 2 | LI2 | Main sources of differences between regulatory exposure amounts and carrying values in financial statements | |
| CHAPTER 2. CAPITAL |
| Table 3 | | Main capital figures and capital adequacy ratios. | |
| Table 4 | | Reconciliation of accounting capital with regulatory capital | |
| Table 5 | | Eligible capital | |
| Table 6 | | Regulatory capital. Changes | |
| Table 7 | OV1 | Overview of risk weighted exposure amounts | |
| Table 8 | | Capital requirements by geographical region | |
| Table 9 | | Leverage ratio | |
| Table 10 | | Leverage ratio details | |
| CHAPTER 3. CREDIT RISK |
| Table 11 | | Credit risk capital requirements movements | |
| Table 12 | CR8 | RWEA flow statements of credit risk exposures under the IRB approach | |
| Table 13 | | Credit risk exposures by exposure class and PD range (CR6) | |
| Table 14 | CR6 | AIRB approach. Wholesale credit risk exposures by exposure class and PD range | |
| Table 15 | CR6 | CR6 - AIRB approach Retail- Credit risk exposures by exposure class and PD range | |
| Table 16 | CR6 | CR6 - FIRB approach - Credit risk exposures by exposure class and PD range | |
| Table 17 | | Exposures and parameters by segment and geography* | |
| Table 18 | CR10 | Specialised lending exposures under the simple riskweighted approach. Project finance Slotting approach (CR10.1) | |
| Table 19 | CR10 | Specialised lending exposures under the simple riskweighted approach. Income-producing real estate and high volatility commercial real estate (Slotting approach) (CR10.2) | |
| Table 20 | CR10 | Specialised lending exposures under the simple riskweighted approach. Object finance, slotting approach (CR10.3) | |
| Table 21 | CR10 | Specialised lending exposures under the simple riskweighted approach. Commodities finance (Slotting approach)(CR10.4) | |
| Table 22 | CR10 | Equity exposures under the simple risk-weighted approach (CR10.5) | |
| Table 23 | | Equity instruments through other comprehensive income | |
| Table 24 | | Equity instruments mandatory at fair value through profit and loss | |
| Table 25 | | Equity instruments through other comprehensive income. Consolidated gross valuation adjustments | |
| Table 26 | CR4 | Standardised approach – Credit risk exposure and CRM effects | |
| Table 27 | CR5 | Standardised approach | |
| Table 28 | CQ5 | Credit quality of loans and advances by industry | |
| Table 29 | CQ4 | Quality of non-performing exposures by geography | |
| Table 30 | CQ1 | Credit quality of forborne exposures | |
| Table 31 | CQ3 | Credit quality of performing and non-performing exposures by past due days | |
| Table 32 | CR1 | Performing and non-performing exposures and related provisions | |
| Table 33 | CQ7 | Collateral obtained by taking possession and execution processes | |
| Table 34 | CR2 | Changes in the stock of non-performing loans and advances | |
| Table 35 | CR1-A | Maturity of exposures | |
| Table 36 | | Guarantees by external rating | |
| Table 37 | CR3 | CRM techniques overview: Disclosure of the use of credit risk mitigation techniques | |
| Table 38 | | IRB approach. Credit risk mitigation techniques: credit derivatives and personal guarantees | |
| Table 39 | CR7 | IRB approach – Effect on the RWEAs of credit derivatives used as CRM techniques | |
| Table 40 | CR7-A | IRB approach – Disclosure of the extent of the use of CRM techniques | |
| | |
APPENDICES 2021 Pillar 3 Disclosures Report |
| | | | | | | | | | | |
| Table 41 | | Information on loans and advances subject to legislative and non-legislative moratoria | |
| Table 42 | | Breakdown of loans and advances subject to legislative and non-legislative moratoria by residual maturity of moratoria | |
| Table 43 | | Information on newly originated loans and advances provided under newly applicable public guarantee schemes introduced in response to covid-19 crisis | |
| CHAPTER 4. COUNTERPARTY CREDIT RISK |
| Table 44 | CCR2 | Transactions subject to own funds requirements for CVA risk | |
| Table 45 | CCR8 | Exposures to CCPs | |
| Table 46 | CCR1 | Analysis of CCR exposure by approach | |
| Table 47 | CCR3 | Standardised approach – CCR exposures by regulatory exposure class and risk weights | |
| Table 48 | CCR4 | AIRB approach – CCR exposures by exposure class and PD scale | |
| Table 49 | CCR4 | FIRB approach - CCR exposures by exposure class and PD scale | |
| Table 50 | CCR5 | Composition of collateral for CCR exposures | |
| Table 51 | CCR6 | Credit derivatives exposures | |
| CHAPTER 5. SECURITISATIONS |
| Table 52 | | Securitisation positions purchased and retained with risk transfer by exposure type in the banking book | |
| Table 53 | SEC1 | Securitisation exposures in the non-trading book | |
| Table 54 | SEC2 | Securitisation exposures in the trading book | |
| Table 55 | | Breakdown of repurchased positions in SSPEs with risk transfer, distributed by function and approach used | |
| Table 56 | SEC3 | Securitisation exposures in the non-trading book and associated regulatory capital requirements - institution acting as originator or as sponsor | |
| Table 57 | | Aggregate amount of securitisation positions purchased and retained. Trading book | |
| Table 58 | SEC4 | Securitisation exposures in the non-trading book and associated regulatory capital requirements - institution acting as investor | |
| Table 59 | | Securitisation structures with risk transfer | |
| Table 60 | SEC5 | Exposures securitised by the institution - Exposures in default and specific credit risk adjustments | |
| CHAPTER 6. MARKET RISK |
| Table 61 | | Regulatory capital requirements for market risk | |
| Table 62 | | Capital requirements for market risk. Internal model | |
| Table 63 | MR2-A | Market risk under the internal Model Approach (IMA) | |
| Table 64 | MR2-B | RWA flow statements of market risk exposures under the IMA | |
| Table 65 | MR1 | Market risk under the standardised approach | |
| Table 66 | | Capital requirements for market risk. Standardised approach | |
| Table 67 | MR3 | IMA values for trading portfolios | |
| Table 68 | | Stress scenario: Maximum volatility (worst case) | |
| Table 69 | | Exceptions at units with internal model | |
| Table 70 | IRRBB1 | Interest rate risks of non-trading book activities | |
| CHAPTER 7. OPERATIONAL RISK |
| Table 71 | | Changes in capital requirements for operation risk | |
| Table 72 | OR1 | Operational risk own funds requirements and risk-weighted exposure amounts | |
| CHAPTER X. LIQUIDITY AND FUNDING RISK |
| Table 73 | AE1 | Encumbered and unencumbered assets | |
| Table 74 | AE2 | Collateral received and own debt securities issued | |
| Table 75 | AE3 | Sources of encumbrance | |
| Table 76 | | Own covered bonds and asset-backed securities issued | |
| CHAPTER 9. REMUNERATION POLICIES |
| Table 77 | REM1 | Remuneration awarded for the financial year | |
| Table 78 | REM5 | Information on remuneration of staff whose professional activities have a material impact on institutions’ risk profile (identified staff) | |
| Table 79 | REM2 | Special payments to staff whose professional activities have a material impact on institutions’ risk profile (identified staff) | |
| Table 80 | REM3 | Deferred remuneration | |
| Table 81 | REM4 | Remuneration of 1 million EUR or more per year | |
| | | | | | | | | | | |
200 | | 2021 Pillar 3 Disclosures Report | |
| | |
APPENDICES 2021 Pillar 3 Disclosures Report |
Appendix IV -Glossary
Advanced IRB approach: all the credit risk parameters are estimated internally by the entity, including the CCFs for calculating the EAD.
ALM (Asset liability management): a series of techniques and procedures to ensure correct decision-making on investments and funding at the entity, taking into consideration the interrelation between the various on- balance-sheet and off-balance-sheet items.
AMA (Advanced Measurement Approach): an operational risk measurement technique set forth in Basel capital adequacy norms, based on an internal modelling methodology.
AQR (Asset Quality Review): asset quality review exercise performed by the European Central Bank.
Asset securitisation: a financial mechanism that consists of converting certain assets into fixed-income securities that can be traded on a secondary securities market.
AT1 (Additional Tier 1): capital which consists primarily of hybrid instruments.
Backtesting: the use of historical data to monitor the performance of the risk models.
Basel III: a set of amendments to the Basel II regulations published in December 2010, scheduled to take effect in January 2013 and to be gradually implemented until January 2019.
Basic IRB approach: all the risk parameters are determined by the regulator except for the probability of default, which is estimated internally by the bank. The CCFs required to calculate EAD are determined by the regulator.
BCBS: Basel Committee on Banking Supervision.
BIS: Bank for International Settlements.
BRRD (Bank Recovery and Resolution Directive): approved in 2014, the BRRD establishes the framework for the recovery and resolution of banks with the objective of minimising the costs for taxpayers.
CBE 2/2016: Banco de España Circular of 2 February 2016 on the supervision and solvency of credit institutions, which completes the adaptation to Spanish law of Directive 2013/36/EU and Regulation (EU) No 575/2013. The new Circular repeals Banco de España Circular 3/2008 to credit institutions on the determination and control of minimum own funds (except the parts referred to in Circular 5/2008 regarding the regime established therein) and section 11 of Banco de España Circular 2/2014.
CBE 3/2008: Banco de España Circular of 22 May 2008 on the calculation and control of minimum capital requirements.
CBE 4/2004: Banco de España Circular of 22 December 2004 on public and confidential financial reporting standards and model financial statement forms.
CBE 9/2010: Banco de España Circular of 22 December 2010 amending Circular 3/2008.
CCAR (Comprehensive Capital Analysis Review): a framework introduced by the Federal Reserve to review the
capital planning and adaptation processes of the main US financial institutions.
CCF (Credit conversion factor): a conversion factor used for converting off-balance-sheet credit risk balances into credit exposure equivalents. Under the AIRB approach Santander applies the CCFs in order to calculate the EAD value of the items representing contingent liabilities and commitments.
CCoB (Conservation Buffer): a capital buffer equal to 2.5% of risk-weighted assets (and comprised fully of high-quality liquid assets) to absorb losses generated from the business.
CCP (Central Counterparty Clearing House): entity defined in article 2.1 of Regulation (EU) no. 648/2012.
CCyB (Counter Cyclical Buffer): a buffer whose objective is to mitigate or prevent cyclical risks arising from excessive credit growth at aggregate level. Accordingly, the CCB is designed to build up capital buffers during expansionary phases with a dual objective: to enhance the solvency of the banking system and to stabilise the credit cycle.
CET1 (Common Equity Tier 1): the highest quality capital of a bank.
CoCos (Contingent Convertible Bonds): debt securities that are convertible into capital if a specified event occurs.
Common equity: a capital measure that considers, among other components, ordinary shares, the share premium and retained profits. It does not include preference shares.
Concentration risk: the risk of loss due to large exposures to a small number of debtors to which the entity has lent money.
Confidence level: in the context of value at risk (VaR) and economic capital, this is the level of probability that the actual loss will not exceed the potential loss estimated by value at risk or economic capital.
Cost of capital: The minimum return required by investors (shareholders) as compensation for the opportunity cost and risk assumed when investing their capital in the entity. It represents a “cut-off rate” or “minimum return” to be achieved, enabling analysis of the activity of business units and evaluation of their efficiency
Counterparty credit risk: the risk that a counterparty will default on a derivatives contract before its maturity. The risk could arise from derivatives transactions in the trading portfolio or the banking portfolio and, as with other credit exposures, it is subject to a credit limit.
Credit default swap: a derivatives contract that transfers the credit risk of a financial instrument from the buyer (who receives the credit protection) to the seller (who guarantees the solvency of the instrument).
Credit risk: the risk that customers are unable to meet their contractual payment obligations. Credit risk includes default, country and settlement risk.
Credit risk mitigation: a technique for reducing the credit risk of a transaction by applying coverage such as personal guarantees or collateral.
CRM (Comprehensive Risk Measure): the estimate of risk in the correlation trading portfolio.
CRR (Capital Requirements Regulation) and CRD IV (Capital Requirements Directive): directive and regulation transposing the Basel II framework into European Union law.
| | |
APPENDICES 2021 Pillar 3 Disclosures Report |
CSP: Commercial strategic plan.
CVA (Credit Valuation Adjustment): the difference between the value of the risk-free portfolio and the true portfolio value, taking into account counterparty credit risk.
DEBA: European Banking Authority. Created in 2010, it entered into operation in 2011. The EBA acts as a coordinator between the national entities responsible for safeguarding values such as the stability of the financial system, transparency of markets and financial products, and the protection of bank customers and investors.
Default risk: the risk that counterparties will not meet their contractual payment obligations.
Derivatives: financial instruments that derive their value from one or more underlying assets, e.g. bonds or currencies.
DLGD (Downturn LGD): the LGD estimated in adverse economic conditions.
DTA: deferred tax assets.
D-SIIs: Domestic Systemically Important Institutions.
EAD (Exposure at Default): the amount that the entity could lose in the event of counterparty default.
ECAI: External Credit Assessment Institution, such as Moody’s Investors Service, Standard & Poor’s Ratings Group and Fitch Group.
ECB Governing Council: the main decision-making body of the ECB, consisting of all members of the Executive Board and the governors of the national central banks of the Euro area countries.
ECB Supervisory Board: the body which undertakes the planning and execution of the ECB’s supervisory tasks, carrying out preparatory work and making proposals for decisions for approval by the ECB Governing Board.
Economic capital: the figure that demonstrates to a high degree of certainty the quantity of capital resources that Santander needs at a given point in time to absorb unexpected losses arising from its current exposure.
EDTF (Enhanced Disclosure Task Force): task force that issues recommendations to enhance the transparency of financial institution disclosures to the market.
EL (Expected loss): a regulatory calculation of the average amount expected to be lost on an exposure, using a 12-month time horizon. EL is calculated by multiplying probability of default (a percentage) by exposure at default (an amount) and LGD (a percentage).
EPS (earnings per share): an indicator used to measure a company’s profitability over a specified period of time. EPS is calculated by dividing the company’s profit for the period by the number of shares comprising its share capital.
ESG (Environmental, Social and Governance): is an evaluation of a firm's collective conscientiousness for social and environmental factors. It is typically a score that is compiled from data collected surrounding specific metrics related to intangible assets within the enterprise. It can be considered a form of corporate social credit score.
ESRB (European Systemic Risk Board): the body that has been charged with macroprudential supervision of the financial system in the European Union in order to contribute
to preventing or mitigating to systemic risks to financial stability.
Exposure: the gross amount that the entity could lose if the counterparty is unable to meet its contractual payment obligations, without taking into consideration any guarantees, credit enhancements or credit risk mitigation transactions.
FSB (Financial Stability Board): international institution that monitors and makes recommendations on the global el financial system.
Fully-Loaded: denotes full compliance with Basel III solvency requirements (which become mandatory in 2019).
GHOS (Group of Governors and Heads of Supervision): supervisory body of the Basel Committee.
Global rating tools: these assign a rating to each customer using a quantitative or automatic module.
G-SIB (Global Systemically Important Bank) or SIFI (Systemically Important Financial Institution): financial institutions which, because of their size, complexity and systemic interconnectedness, if allowed to fail could cause major disruptions to the financial system and economic activity.
HQLA: High Quality Liquid Assets.
HVCRE: High Volatility Commercial Real Estate.
ICAAP: internal capital adequacy assessment process.
IFRS: International Financial Reporting Standards.
ILAAP (Internal Liquidity Adequacy Assessment Process): process for the identification, measurement, management and control of liquidity implemented by the entity in compliance with article 86 of Directive 2013/36/EU.
Implicit LGD: this is used to back-test the regulatory LGD estimates. It is based on taking NPLMV as proxy for the Observed Loss, and then dividing the Observed Loss by the PD gives an implicit or observed LGD that can be compared to the regulatory LGD.
Interest rate risk: exposure of the bank’s financial position to adverse movements in interest rates. Acceptance of this risk is a normal part of the banking business and can be a source of significant returns and creation of shareholder value.
Internal ratings-based approach (IRB): an approach based on internal ratings for the calculation of risk-weighted exposures.
Internal validation: a pre-requisite for the supervisory validation process. A sufficiently independent specialised unit of the entity obtains an expert opinion on the adequacy of the internal models for the relevant internal and regulatory purposes, and issues a conclusion on their usefulness and effectiveness.
IRC (Incremental Risk Charge): an estimate of the credit risk associated with unsecuritised positions in the trading book.
IRP: This report, titled Pillar III Disclosures in the English version. (the acronym is for the Spanish Informe de Relevancia Prudencial).
IRRBB: Interest Rate Risk in the Banking Book.
ISDA (International Swaps and Derivatives Association): OTC derivative transactions between financial institutions are
| | | | | | | | | | | |
202 | | 2021 Pillar 3 Disclosures Report | |
| | |
APPENDICES 2021 Pillar 3 Disclosures Report |
usually carried out under a master agreement established by this organisation which details the definitions and general terms and conditions of the contract.
ITS: Implementing Technical Standards.
JST (Joint Supervisory Team): one of the main forms of cooperation between the ECB and the national supervisors.
LCR (Liquidity Coverage Ratio): a ratio that ensures that a bank has an adequate stock of unencumbered high quality liquid assets that can be converted, easily and immediately, into cash in private markets, to meet its liquidity needs for a 30 calendar day liquidity stress scenario.
LDP: low-default portfolio.
Leverage Ratio: a complementary (non-risk based) regulatory capital measure that attempts to guarantee banks’ financial resilience. The ratio is calculated by dividing eligible Tier 1 capital by exposure.
LGD (Loss Given Default): the portion of EAD not recovered at the end of the loan recovery process. It is equal to 1 minus the recovery rate (i.e.: LGD = 1 - recovery rate). The definition of loss used to estimate LGD must be a definition of economic loss, not an accounting loss.
Liquidity risk: the risk that Santander might be unable to meet all its payment obligations when they fall due or might only be able to meet them at an excessive cost.
LTV (Loan to value): amount of credit extended / value of guarantees and collateral.
Mark-to-market approach: in regulatory terms, an approach for calculating the value of the credit risk exposure of counterparty derivatives (present market value plus a margin, i.e. the amount that takes into consideration the potential future increase in market value).
Market risk: the risk arising from uncertainty regarding changes in market prices and rates (including interest rates, share prices, exchange rates and commodity prices), the correlations between them and their levels of volatility.
MDA: Maximum Distributable Amount.
Model validation: the process of assessing the effectiveness of a credit risk model using a pre-defined set of criteria, such as the model’s discriminatory power, the appropriateness of the inputs and expert opinions.
MPE (Multiple Point of Entry): a resolution approach based on multiple points of entry.
MREL (Minimum Requirement of Eligible Liabilities): the final loss absorption requirement established in European legislation for institutions based on an assessment of their resolution plans.
Netting: a bank’s ability to reduce its credit risk exposure by setting off the value of its rights against its obligations with the same counterparty.
Non-standardised customers: customers who have been assigned a risk analyst due to the risk assumed. This category includes wholesale banking customers, financial institutions and certain enterprises in retail banking.
NSFR (Net Stable Funding Ratio): a ratio designed to ensure a bank has a balanced balance sheet structure, in which stable funding requirements are funded by stable liabilities.
Operational risk: the risk of incurring losses with regard to employees, contractual specifications and documentation, technology, infrastructure failures and disasters, projects, external influences and customer relations. This definition includes legal and regulatory risk but does not include business and reputational risk.
Over-the-counter (OTC): off-exchange, that is, trading done between two parties (in derivatives, for example) without the supervision of an organised exchange.
Phased-in: refers to compliance with current solvency requirements bearing in mind the transitional period for Basel III implementation.
Pillar 1 – Minimum Capital Requirements: the part of the New Basel Capital Accord that establishes the minimum regulatory capital requirements for credit, market and operational risk.
Pillar 2 - Supervisory Review Process: an internal capital adequacy assessment process reviewed by the supervisor with possible additional capital requirements for risk that are not included in Pillar I and the use of more sophisticated methodologies than Pillar I.
Pillar 3 - Market Discipline: this pillar is designed to complete the minimum capital requirements and the supervisory review process and, accordingly, enhance market discipline through the regulation of public disclosure by the entities.
Point-in-time (PIT) PD: the probability of default at a particular point in time or in particular state of the economic cycle.
Probability of default (PD): this represents the likelihood that a customer or a transaction will fall into default. It is the probability that an event (the default) will occur within a given time horizon.
QIS (Quantitative Impact Study): ad-hoc requests by the EBA for studies analysing and calibrating the impact of new changes in regulation.
Qualifying central counterparty (QCCP): a central counterparty that has either been authorised under article 14 of Regulation (EU) no. 648/2012, or been recognised under article 25 of said Regulation.
Rating: the result of the objective assessment of the counterparties’ future economic situation based on current characteristics and assumptions. The methodology for assigning the ratings depends largely on the type of customer and the available data. A wide range of methodologies for assessing credit risk is applied, such as expert systems and econometric methods.
RDL: Royal Decree Law.
Regulatory Capital
Capital requirements: the minimum amount of capital the regulatory authority requires the entity to hold to safeguard its capital adequacy, based on the amount of credit, market and operational risk.
Eligible capital: the volume of capital the regulatory authority considers eligible to meet capital requirements. The main components of eligible capital are accounting capital and reserves.
| | |
APPENDICES 2021 Pillar 3 Disclosures Report |
Risk appetite: the amount and type of risks considered reasonable to assume in the execution of its business strategy, so that Santander can maintain its ordinary activity in the event of unexpected circumstances. Severe scenarios are taken into account that could have a negative impact on the levels of capital, liquidity, profitability and/or the share price.
Risk limits: approval tools for certain risk types and levels.
Risk-weighted assets (RWA): calculated by assigning a level of risk, expressed as a percentage (risk weighting), to an exposure in accordance with the relevant rules under the standardised approach or the IRB approach.
RoRAC: Return on Risk Adjusted Capital.
RoRWA: Return on Risk-Weighted Assets.
ROTA (Return On Total Assets): ratio between net income and total average assets, or the amount of financial and operational income a company receives in a financial year as compared to the average of that company's total assets. The ratio is considered to be an indicator of how effectively a company is using its assets to generate earnings
RTS: Regulatory Technical Standards.
RWA density: ratio that compares institutions’ total weighted assets and their total balance sheet, and can be interpreted as an average relative risk measure -according to regulatory criteria- of a bank’s overall operations.
SFT (Securities Financing Transactions): any transaction where securities are used to borrow cash, or vice versa. They mostly include repurchase agreements (repos), securities lending activities and sell/buy-back transactions.
Slotting Criteria: an approach used for calculating risk weights for specialised lending exposures, which consists of mapping the internal ratings to five supervisory categories, each with its own specific risk weight.
Special-purpose vehicle (SPV): a company created for the sole purpose of acquiring certain assets or derivative exposures and of issuing liabilities that are associated solely with these assets or exposures.
SRB (Single Resolution Board): the single resolution authority, which is the second pillar of the Banking Union after the Single Supervisory Mechanism.
SRB: Systemic Risk Buffer.
SREP (Supervisory Review and Evaluation Process): a review of the systems, strategies, processes and mechanisms applied by credit institutions and of their risks.
SRF: Single Resolution Fund.
SRM: Single Resolution Mechanism.
SSM (Single Supervisory System): the system of banking supervision in Europe. It comprises the ECB and the competent supervisory authorities of the participating EU countries.
Standardised approach: an approach for calculating credit risk capital requirements under Pillar I of Basel II. Under this approach, the risk weightings used in the capital calculation are determined by the regulator.
Standardised customers: customers which have not been expressly assigned a risk analyst. This category generally
includes individuals, individual entrepreneurs and retail banking enterprises not classified as non-standardised customers.
Stress testing: used to describe various techniques for measuring the potential vulnerability to exceptional but plausible events.
Stressed VaR: measures the level of risk in stressed historical or simulated market situations.
Synthetic securitisation: transactions that involve a basket of credit swap agreements and bonds serving as collateral. They are called synthetic as rather than containing physical bonds, they carry credit derivatives, also known as synthetic contracts.
Through-the-cycle (TTC) PD: probability of default adjusted to a full economic cycle. It may be taken as a long-term average of the point-in-time PD.
Tier 1: core capital less hybrid instruments.
Tier 2: supplementary capital instruments, mainly subordinated debt and general loan loss allowances, which contribute to the robustness of financial institutions.
TLAC (Total Loss Absorbency Capacity): an additional requirement to the minimum capital requirements set out in the Basel III framework for the absorption of total losses and effecting a recapitalisation that minimises any impact on financial stability, ensures the continuity of critical functions and avoids exposing taxpayers to losses. This requirement is applicable to all G-SIBs.
TLTRO: Targeted Longer-Term Refinancing Operations.
TRIM: Targeted Review of Internal Models.
TSR (Total Shareholder Return): relative performance of total shareholder returns. An indicator of the returns obtained by owners of a company over a period of one year on capital provided to the company.
Unexpected loss: unexpected losses (not covered by allowances) must be covered by capital.
VaR (Value at Risk): estimate of the potential losses that could arise in risk positions as a result of movements in market risk factors within a given time horizon and for a specific confidence level.
Value creation: Any profit generated above the cost of economic capital. Santander creates value when risk-adjusted returns (measured by RoRAC) exceed its cost of capital, and destroys value when the reverse occurs. It measures the risk-adjusted return in absolute terms (monetary units), supplementing the RoRAC result.
| | | | | | | | | | | |
204 | | 2021 Pillar 3 Disclosures Report | |
SIGNATURE
Pursuant to the requirements of the Securities Exchange Act of 1934, the registrant has duly caused this report to be signed on its behalf by the undersigned, thereunto duly authorized.
| | | | | | | | |
| | |
| Banco Santander, S.A. |
| |
| |
| Date: 28 February 2022 | By: | /s/ José García Cantera |
| Name: | José García Cantera |
| Title: | Chief Financial Officer |