FORM 6-K
SECURITIES AND EXCHANGE COMMISSION
Washington, D.C. 20549
Report of Foreign Issuer
Pursuant to Rule 13a-16 or 15d-16
of the Securities Exchange Act of 1934
For the month of July, 2022
Commission File Number: 001-12518
Banco Santander, S.A.
(Exact name of registrant as specified in its charter)
Ciudad Grupo Santander
28660 Boadilla del Monte (Madrid) Spain
(Address of principal executive office)
Indicate by check mark whether the registrant files or will file annual reports under cover of Form 20-F or Form 40-F:
Form 20-F ☒ Form 40-F ☐
Indicate by check mark if the registrant is submitting the Form 6-K in paper as permitted by Regulation S-T Rule 101(b)(1):
Yes ☐ No ☒
Indicate by check mark if the registrant is submitting the Form 6-K in paper as permitted by Regulation S-T Rule 101(b)(7):
Yes ☐ No ☒
BANCO SANTANDER, S.A.
________________________
TABLE OF CONTENTS
| | | | | |
|
|
| |
Part 1. Interim consolidated directors’ report | |
Part 2. Interim consolidated financial statements | |
Interim Consolidated Directors' Report
Index
| | | | | |
| |
| BUSINESS MODEL | |
| |
| |
| |
| |
| |
| |
| |
| |
| |
| |
| |
| |
| |
| |
| |
| |
| |
| |
| |
| Other disclosures required by the Bank of Spain | |
This report was approved by the board of directors on 27 July 2022, following a favourable report from the audit committee. Important information regarding this report can be found on pages 89 and 90.
Key consolidated data
| | | | | | | | | | | | | | | | | | | | | | | |
| BALANCE SHEET (EUR million) | Jun-22 | Mar-22 | % | Jun-22 | Jun-21 | % | Dec-21 |
| Total assets | 1,722,840 | | 1,666,012 | | 3.4 | | 1,722,840 | | 1,568,636 | | 9.8 | | 1,595,835 | |
| Loans and advances to customers | 1,037,721 | | 1,011,497 | | 2.6 | | 1,037,721 | | 954,518 | | 8.7 | | 972,682 | |
| Customer deposits | 973,787 | | 957,820 | | 1.7 | | 973,787 | | 894,127 | | 8.9 | | 918,344 | |
| Total funds | 1,204,407 | | 1,196,544 | | 0.7 | | 1,204,407 | | 1,121,969 | | 7.3 | | 1,153,656 | |
| Total equity | 97,462 | | 99,378 | | (1.9) | | 97,462 | | 95,745 | | 1.8 | | 97,053 | |
| Note: Total funds includes customer deposits, mutual funds, pension funds and managed portfolios |
| | | | | | | | | | | | | | | | | | | | | | | |
| INCOME STATEMENT (EUR million) | Q2'22 | Q1'22 | % | H1'22 | H1'21 | % | 2021 |
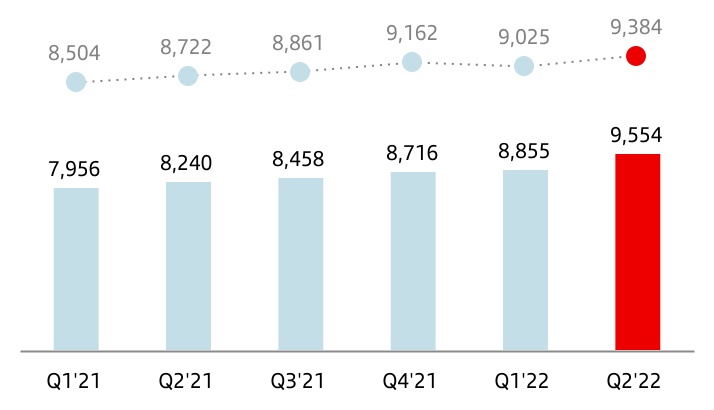
| Net interest income | 9,554 | | 8,855 | | 7.9 | | 18,409 | | 16,196 | | 13.7 | | 33,370 | |
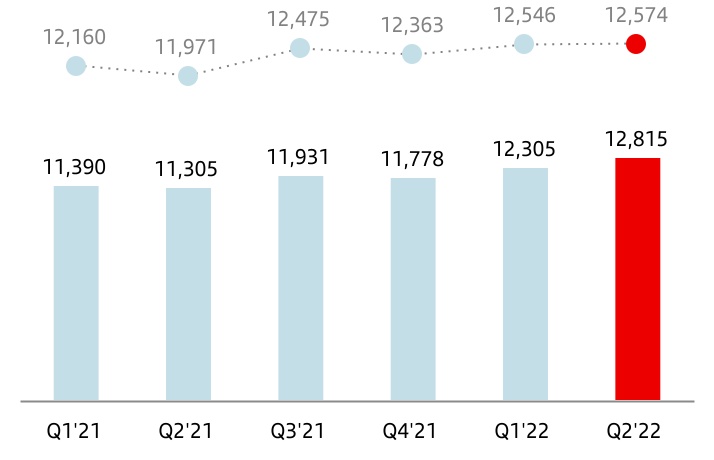
| Total income | 12,815 | | 12,305 | | 4.1 | | 25,120 | | 22,695 | | 10.7 | | 46,404 | |
| | | | | | | |
| Net operating income | 6,915 | | 6,770 | | 2.1 | | 13,685 | | 12,318 | | 11.1 | | 24,989 | |
| | | | | | | |
| Profit before tax | 3,744 | | 4,171 | | (10.2) | | 7,915 | | 6,914 | | 14.5 | | 14,547 | |
| Profit attributable to the parent | 2,351 | | 2,543 | | (7.6) | | 4,894 | | 3,675 | | 33.2 | | 8,124 | |
| Changes in constant euros: | | | | | | | |
| Q2'22 / Q1'22: NII: +4.0%; Total income: +0.2%; Net operating income: -2.6%; Profit before tax: -14.4%; Attributable profit: -11.9% |
| H1'22 / H1'21: NII: +6.9%; Total income: +4.1%; Net operating income: +3.1%; Profit before taxes: +4.4%; Attributable profit: +20.8% |
| | | | | | | | | | | | | | | | | | | | | | | |
| EPS, PROFITABILITY AND EFFICIENCY (%) | Q2'22 | Q1'22 | % | H1'22 | H1'21 | % | 2021 |
| EPS (euros) | 0.131 | | 0.141 | | (7.2) | | 0.272 | | 0.197 | | 38.1 | | 0.438 | |
| RoE | 10.44 | | 11.49 | | | 10.98 | | 9.53 | | | 9.66 | |
| RoTE | 13.10 | | 14.21 | | | 13.69 | | 11.82 | | | 11.96 | |
| RoA | 0.63 | | 0.71 | | | 0.66 | | 0.61 | | | 0.62 | |
| RoRWA | 1.76 | | 1.95 | | | 1.86 | | 1.66 | | | 1.69 | |
| Efficiency ratio | 46.0 | | 45.0 | | | 45.5 | | 45.7 | | | 46.2 | |
| | | | | | | | | | | | | | | | | | | | | | | |
UNDERLYING INCOME STATEMENT (1) (EUR million) | Q2'22 | Q1'22 | % | H1'22 | H1'21 | % | 2021 |
| Net interest income | 9,554 | | 8,855 | | 7.9 | | 18,409 | | 16,196 | | 13.7 | | 33,370 | |
| Total income | 12,815 | | 12,305 | | 4.1 | | 25,120 | | 22,695 | | 10.7 | | 46,404 | |
| | | | | | | |
| Net operating income | 6,915 | | 6,770 | | 2.1 | | 13,685 | | 12,318 | | 11.1 | | 24,989 | |
| | | | | | | |
| Profit before tax | 3,744 | | 4,171 | | (10.2) | | 7,915 | | 7,628 | | 3.8 | | 15,260 | |
| Profit attributable to the parent | 2,351 | | 2,543 | | (7.6) | | 4,894 | | 4,205 | | 16.4 | | 8,654 | |
| Changes in constant euros: | | | | | |
| Q2'22 / Q1'22: NII: +4.0%; Total income: +0.2%; Net operating income: -2.6%; Profit before tax: -14.4%; Attributable profit: -11.9% |
| H1'22 / H1'21: NII: +6.9%; Total income: +4.1%; Net operating income: +3.1%; Profit before tax: -4.8%; Attributable profit: +6.7% |
| | | | | | | | | | | | | | | | | | | | | | | |
UNDERLYING EPS AND PROFITABILITY (1) (%) | Q2'22 | Q1'22 | % | H1'22 | H1'21 | % | 2021 |
| Underlying EPS (euros) | 0.131 | | 0.141 | | (7.2) | | 0.272 | | 0.227 | | 19.5 | | 0.468 | |
| Underlying RoE | 10.44 | | 11.49 | | | 10.98 | | 10.17 | | | 10.29 | |
| Underlying RoTE | 13.10 | | 14.21 | | | 13.69 | | 12.62 | | | 12.73 | |
| Underlying RoA | 0.63 | | 0.71 | | | 0.66 | | 0.65 | | | 0.65 | |
| Underlying RoRWA | 1.76 | | 1.95 | | | 1.86 | | 1.75 | | | 1.78 | |
| | | | | | | | | | | | | | | | | | | | | | | |
| SOLVENCY (%) | Jun-22 | Mar-22 | | Jun-22 | Jun-21 | | Dec-21 |
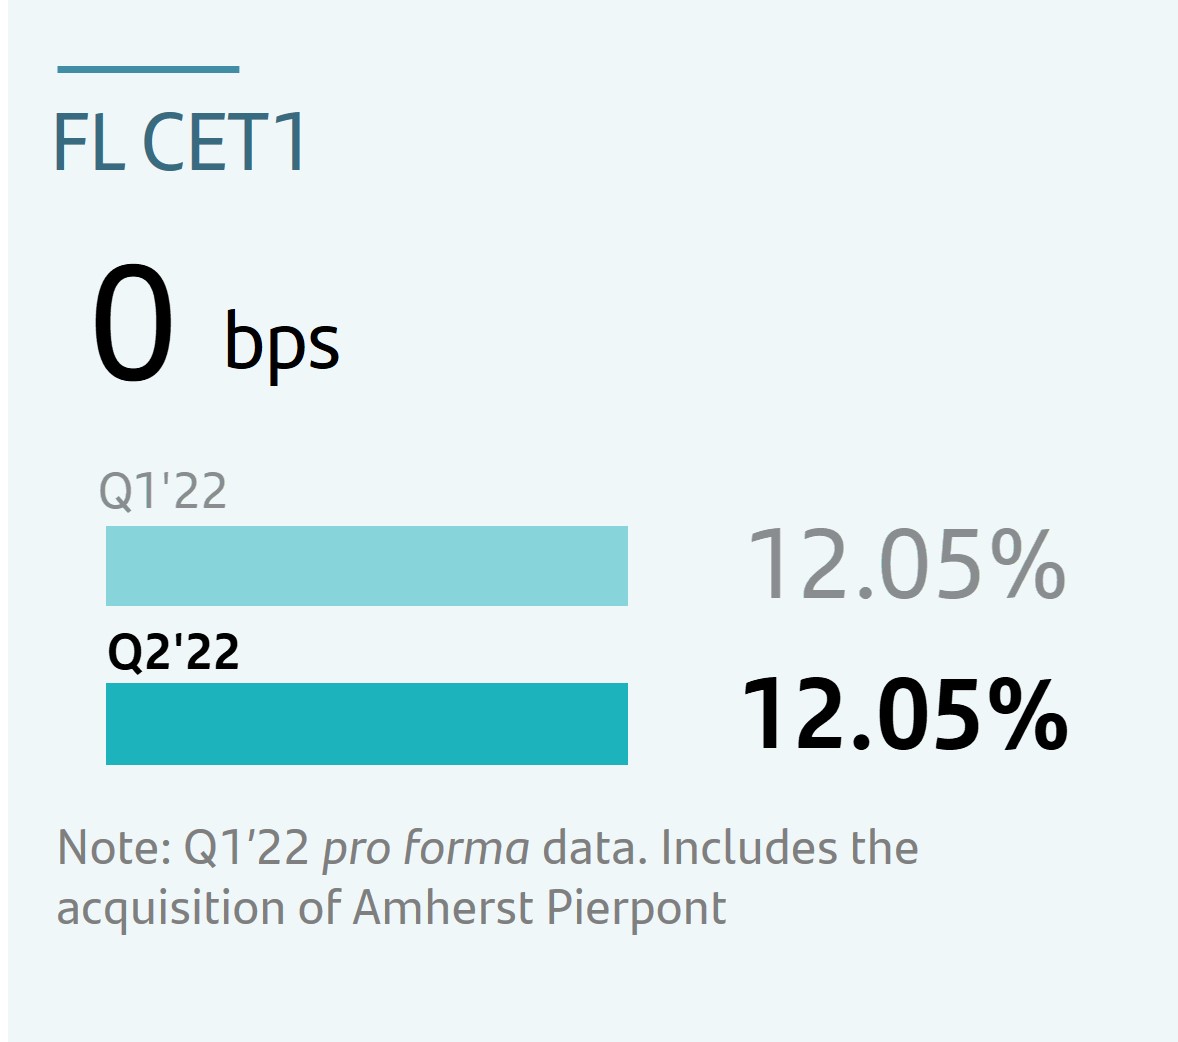
| Fully-loaded CET1 ratio | 12.05 | | 12.12 | | | 12.05 | | 11.70 | | | 12.12 | |
| Fully-loaded total capital ratio | 15.95 | | 16.15 | | | 15.95 | | 15.42 | | | 16.41 | |
| | | | | | | |
| | | | | | | |
| | | | | | | | | | | | | | | | | | | | | | | |
| CREDIT QUALITY (%) | Q2'22 | Q1'22 | | H1'22 | H1'21 | | 2021 |
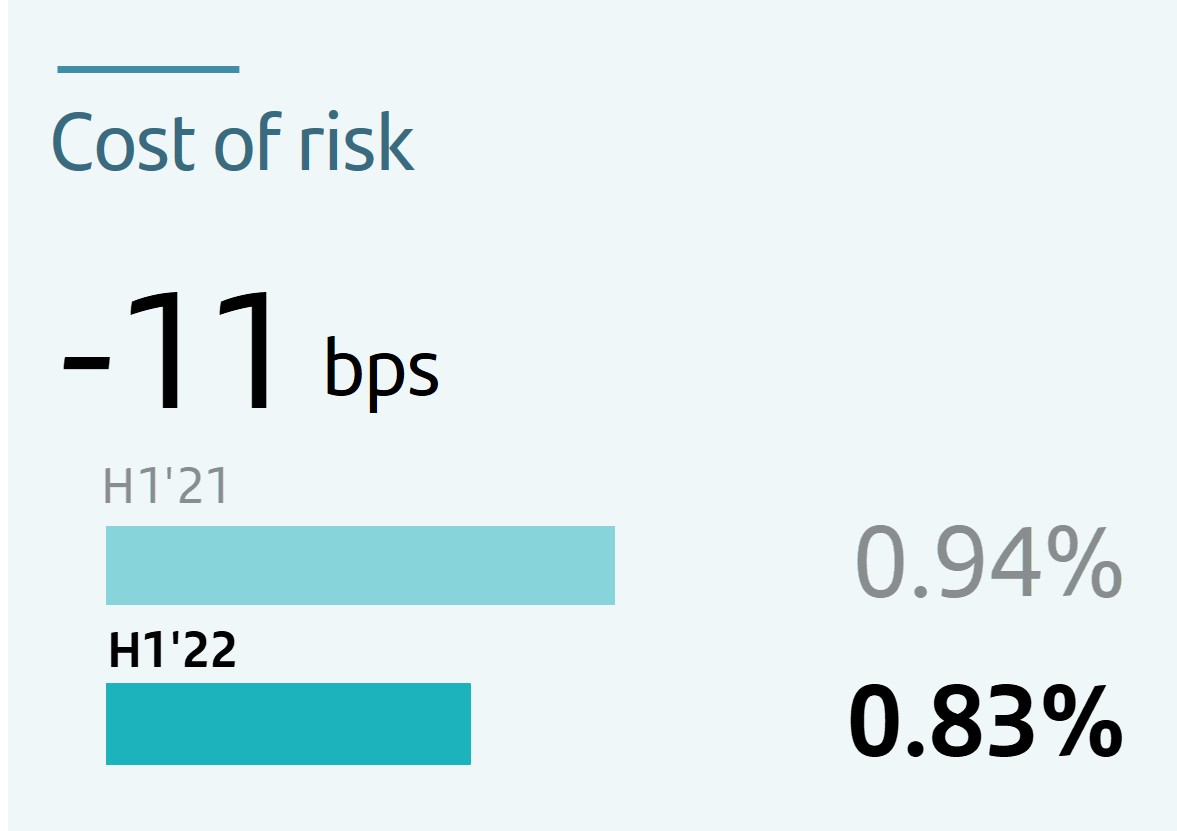
Cost of credit (2) | 0.83 | | 0.77 | | | 0.83 | | 0.94 | | | 0.77 | |
| NPL ratio | 3.05 | | 3.26 | | | 3.05 | | 3.22 | | | 3.16 | |
| Total coverage ratio | 71 | | 69 | | | 71 | | 73 | | | 71 | |
| | | | | | | | | | | | | | | | | | | | | | | |
| MARKET CAPITALIZATION AND SHARES | Jun-22 | Mar-22 | % | Jun-22 | Jun-21 | % | Dec-21 |
| Shares (millions) | 16,794 | | 17,341 | | (3.2) | | 16,794 | | 17,341 | | (3.2) | | 17,341 | |
| Share price (euros) | 2.688 | | 3.100 | | (13.3) | | 2.688 | | 3.220 | | (16.5) | | 2.941 | |
| Market capitalization (EUR million) | 45,143 | | 53,756 | | (16.0) | | 45,143 | | 55,828 | | (19.1) | | 50,990 | |
| Tangible book value per share (euros) | 4.24 | | 4.29 | | | 4.24 | | 3.98 | | | 4.12 | |
| Price / Tangible book value per share (X) | 0.63 | | 0.72 | | | 0.63 | | 0.81 | | | 0.71 | |
| | | | | | | |
| | | | | | | | | | | | | | | | | | | | | | | |
| CUSTOMERS (thousands) | Q2'22 | Q1'22 | % | H1'22 | H1'21 | % | 2021 |
| Total customers | 156,896 | | 154,762 | | 1.4 | | 156,896 | | 149,497 | | 4.9 | 152,943 | |
| Loyal customers | 26,494 | | 25,978 | | 2.0 | | 26,494 | | 24,196 | | 9.5 | 25,548 | |
| Loyal retail customers | 24,361 | | 23,799 | | 2.4 | | 24,361 | | 22,076 | | 10.4 | 23,359 | |
| Loyal SME & corporate customers | 2,133 | | 2,179 | | (2.1) | | 2,133 | | 2,121 | | 0.6 | 2,189 | |
| Digital customers | 49,870 | | 49,158 | | 1.4 | | 49,870 | | 45,444 | | 9.7 | 47,489 | |
| Digital sales / Total sales (%) | 55 | | 56 | | | 56 | | 52 | | | 54 | |
| | | | | | | | | | | | | | | | | | | | | | | |
| OTHER DATA | Jun-22 | Mar-22 | % | Jun-22 | Jun-21 | % | Dec-21 |
| Number of shareholders | 3,985,638 | | 3,975,210 | | 0.3 | | 3,985,638 | | 3,879,232 | | 2.7 | | 3,936,922 | |
| Number of employees | 200,651 | | 200,294 | | 0.2 | | 200,651 | | 192,843 | | 4.0 | | 199,177 | |
| Number of branches | 9,193 | | 9,248 | | (0.6) | | 9,193 | | 9,423 | | (2.4) | | 9,229 | |
| | |
(1) In addition to financial information prepared in accordance with International Financial Reporting Standards (IFRS) and derived from our consolidated financial statements, this report contains certain financial measures that constitute alternative performance measures (APMs) as defined in the Guidelines on Alternative Performance Measures issued by the European Securities and Markets Authority (ESMA) on 5 October 2015, and other non-IFRS measures, including the figures related to “underlying” results, which do not include the items recorded in the separate line of “net capital gains and provisions”, above the line of profit attributable to the parent. Further details are provided in the “Alternative performance measures” section of the appendix to this report.
For further details on the APMs and non-IFRS measures used, including its definition or a reconciliation between any applicable management indicators and the financial data presented in the annual consolidated financial statements prepared under IFRS, please see our 2021 Annual Financial Report, published in the CNMV on 25 February 2022, our 20-F report for the year ending 31 December 2021 filed with the SEC in the United States on 1 March 2022, as updated by the Form 6-K filed with the SEC on 8 April 2022 in order to reflect our new organizational and reporting structure, as well as the “Alternative performance measures” section of the appendix to this report.
|
|
|
| (2) Allowances for loan-loss provisions over the last 12 months / Average loans and advances to customers over the last 12 months. |
| | | | | | | | | | | | | | | | | | | | | | | | | | |
Business model | | Group financial information | | Financial information by segments | | Responsible banking
Corporate governance
Santander share | | Appendix |
| | | | | | | | |
Our business model is based on three pillars
| | | | | | | | | | | | | | | | | | | | | | | |
| 01. Customer focus | | | 02. Our scale | | | 03. Diversification |
Deepening the relationships
with our customers | | |
Local scale and global reach | | |
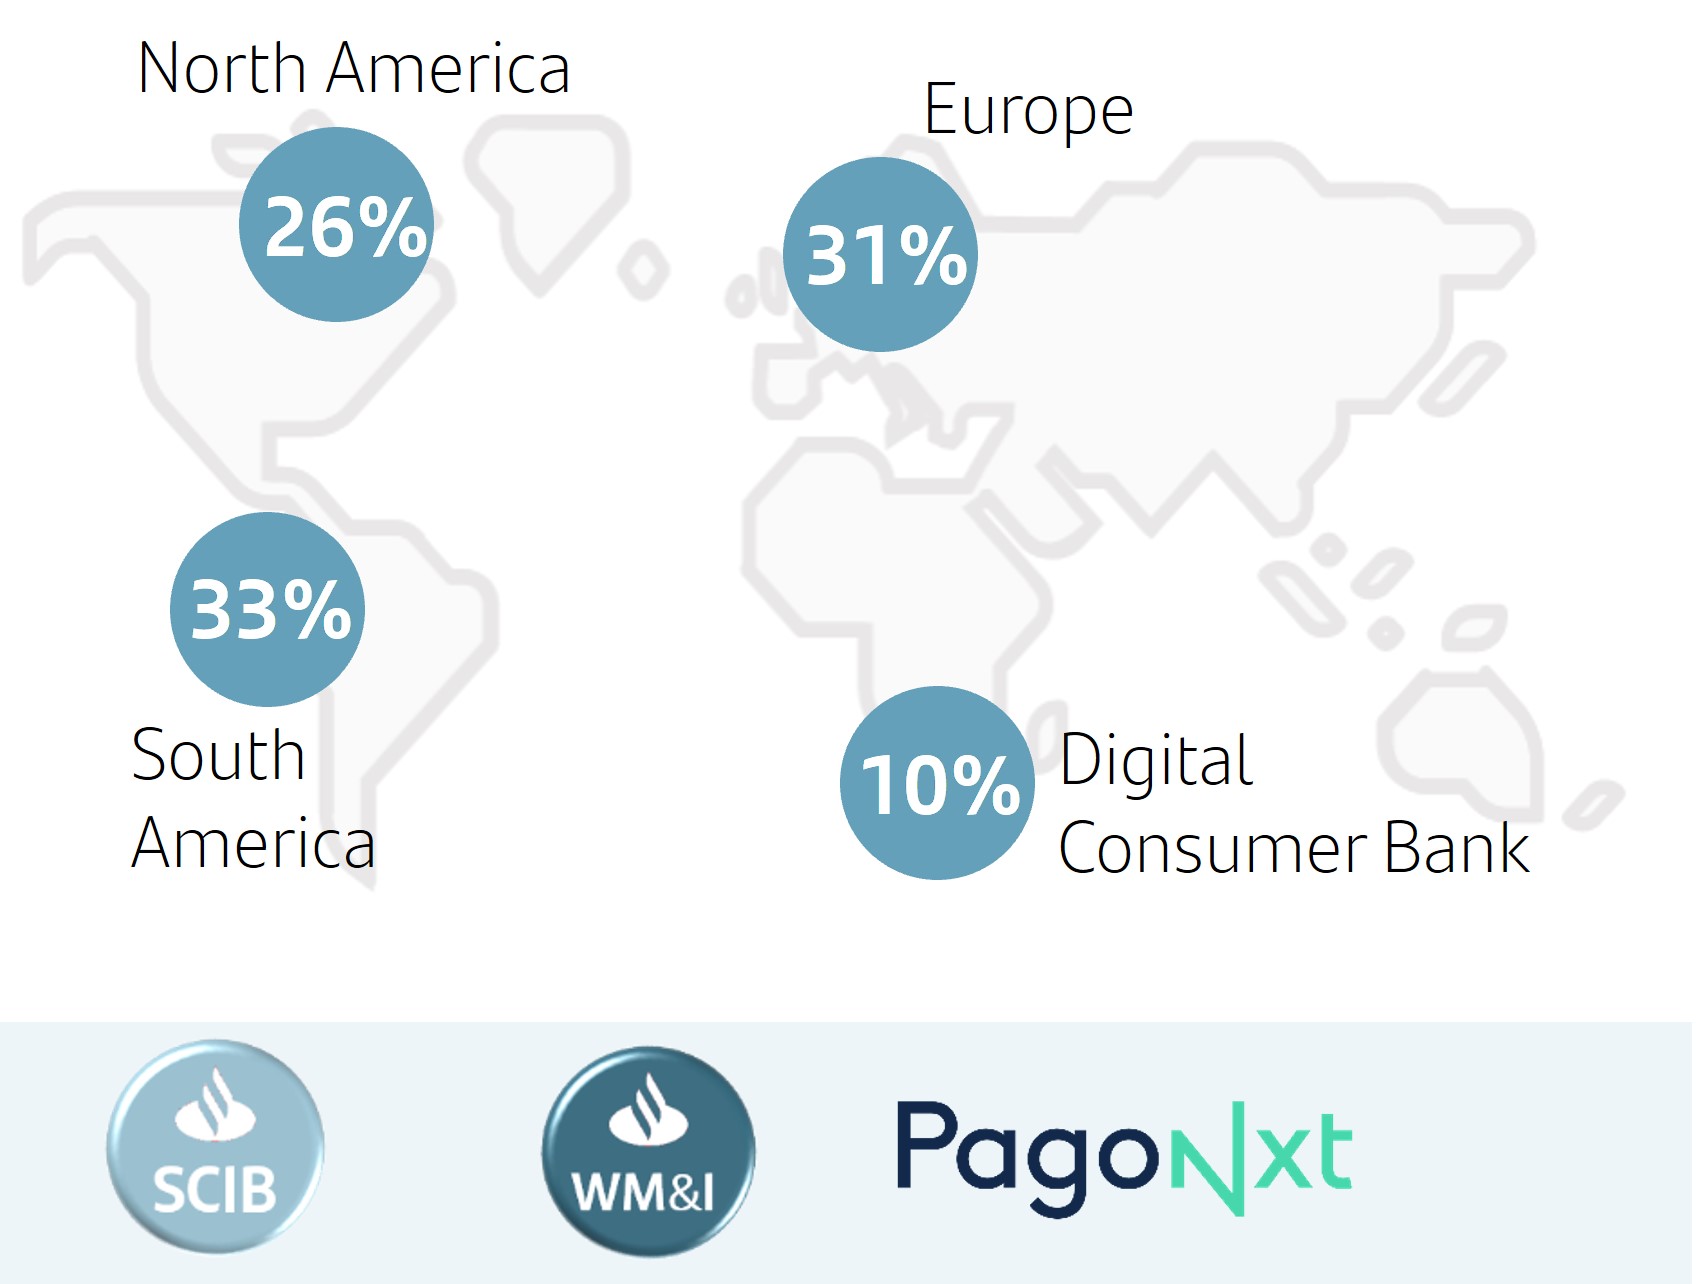
Geographic and business diversification |
| | | | | | | |
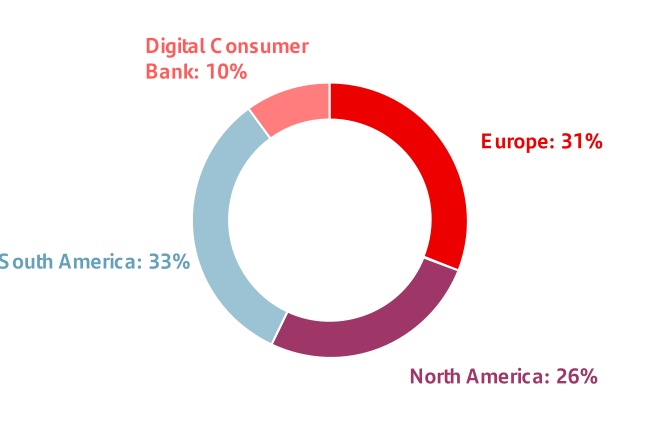
| Top 3 NPS1 in 6 out of 9 markets | | | Top 3 in lending2 in 10 of our markets | | | Balanced profit distribution3 |
| | | | |
| | | | | | |
| 157 mn total customers | | | | | |
| | | |
| | | | | | | |
| 1. NPS – internal benchmark of individual customers' satisfaction audited by Stiga / Deloitte in H1'22. | | | 2. Market share in lending as of March 2022 including only privately-owned banks. UK benchmark refers to the mortgage market. Digital Consumer Bank (DCB) refers to auto in Europe. | | | 3. H1'22 underlying attributable profit by region. Operating areas excluding Corporate Centre. |
| Our business model remains a source of great strength and resilience |
Our corporate culture
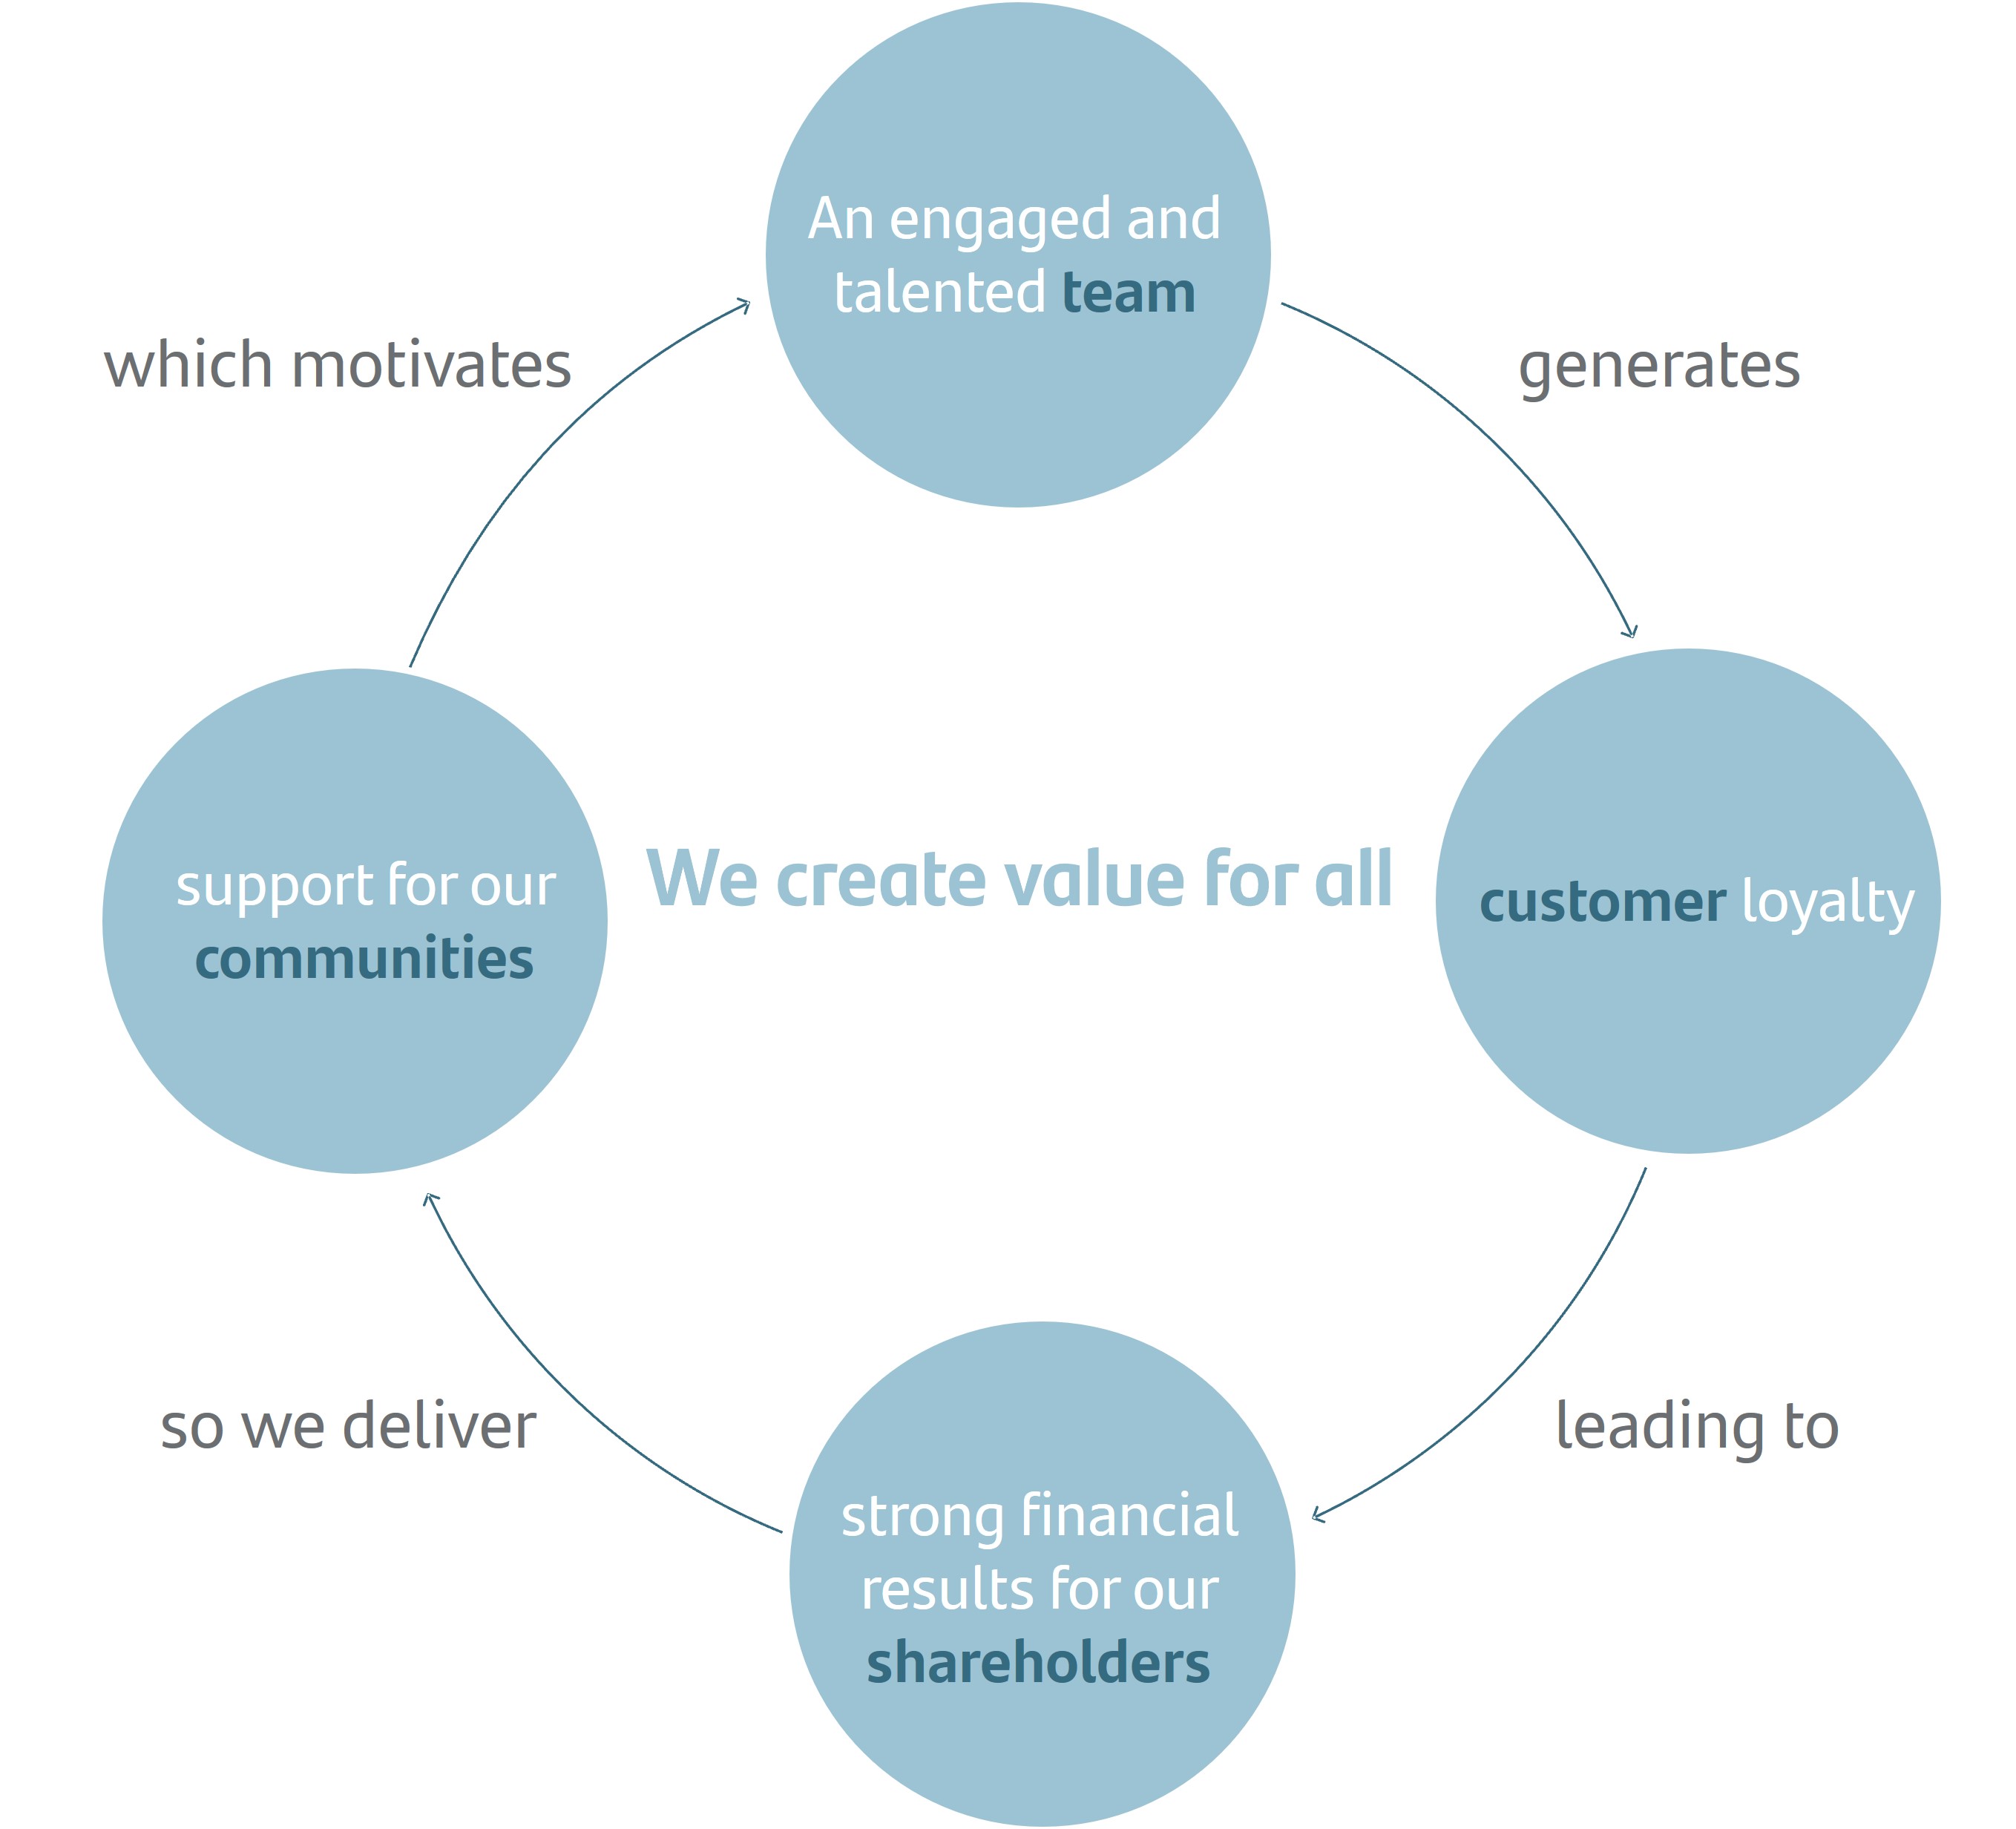
The Santander Way remains unchanged to continue to deliver for all our stakeholders
| | | | | | | | | | | |
| Our purpose To help people and businesses prosper. | | |
| | |
| Our aim To be the best open financial services platform, by acting responsibly and earning the lasting loyalty of our people, customers, shareholders and communities. | |
| | |
| Our how Everything we do should be Simple, Personal and Fair. | |
| | |
| | | | | | | | | | | |
| | u | In Q2'22, attributable profit amounted to EUR 2,351 million. The quarter-on-quarter comparison was affected by regulatory charges (Single Resolution Fund and, in Poland, Institutional Protection Scheme - IPS -). Excluding the regulatory charges, profit was 5% higher compared to the previous quarter (+1% in constant euros). |
| | |
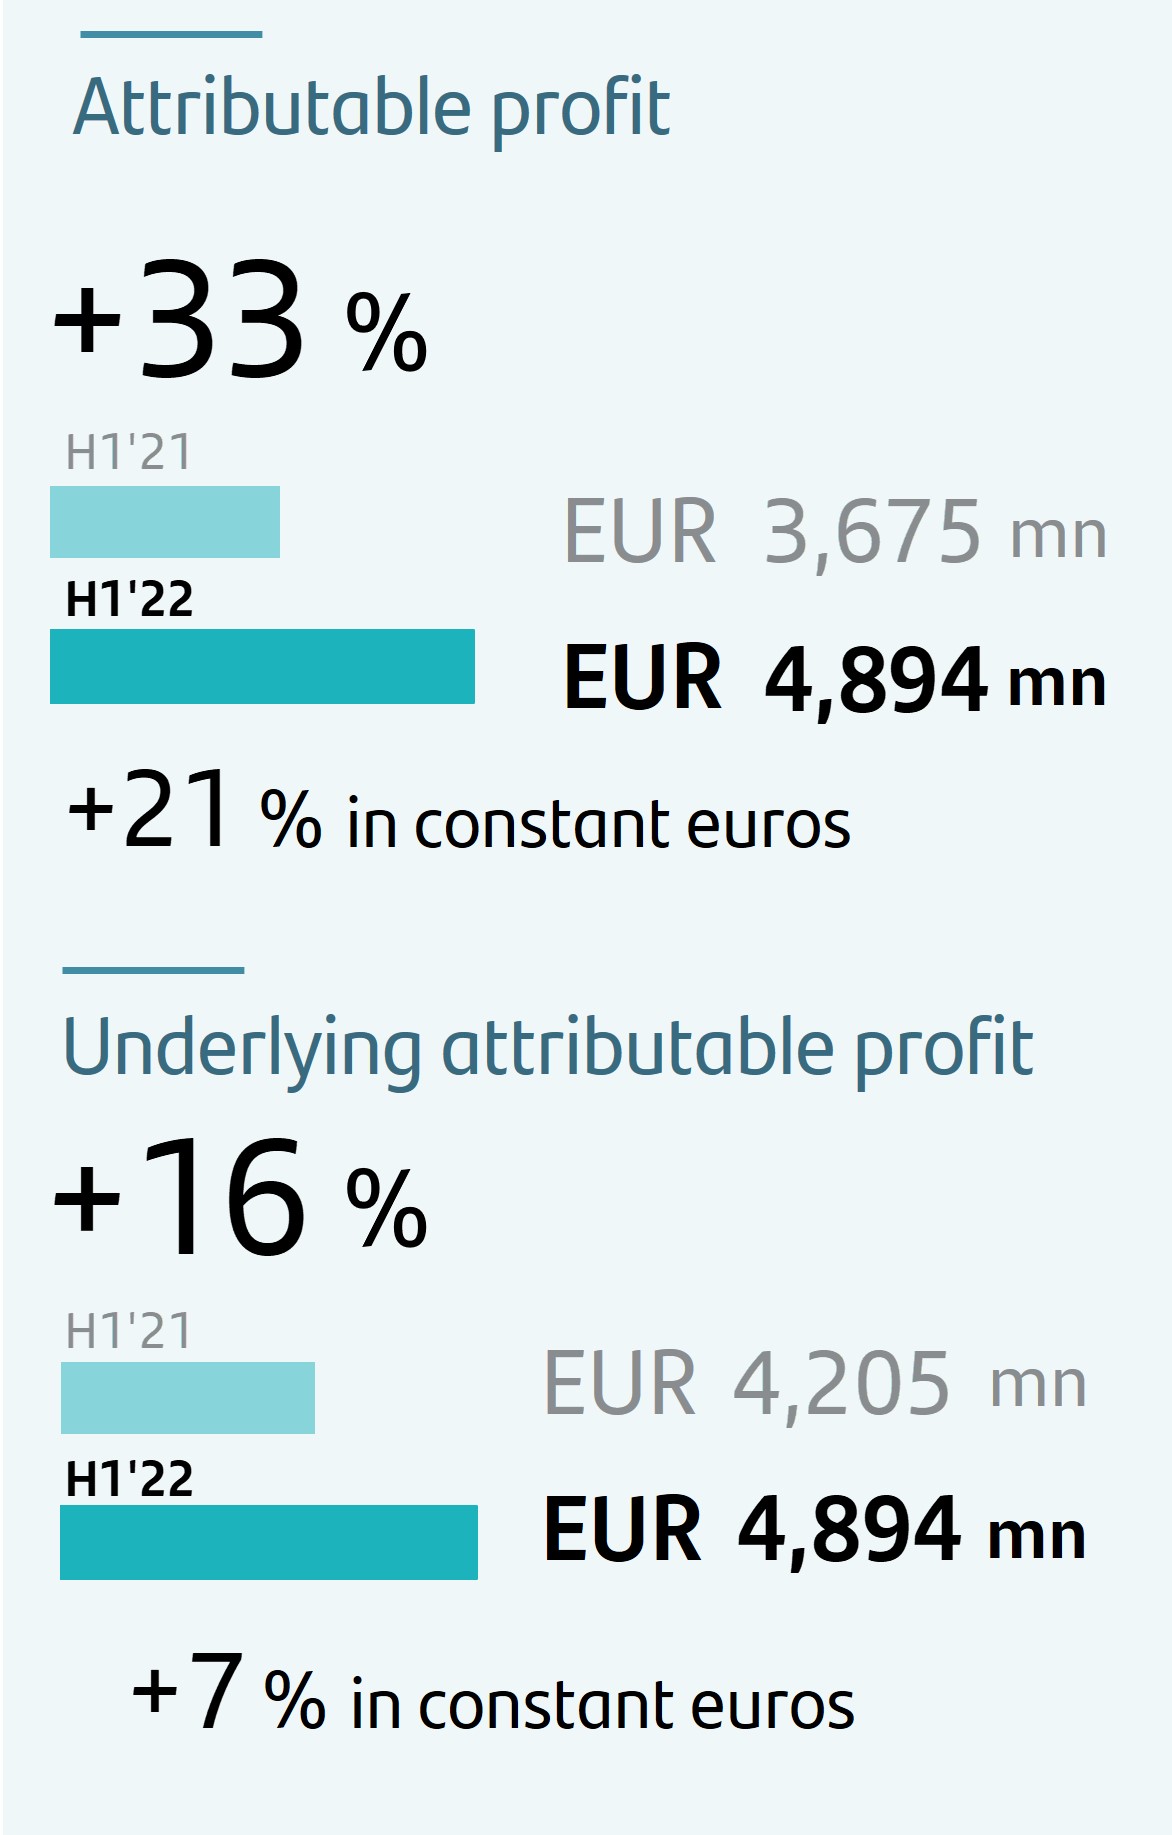
| u | In the first half of 2022, attributable profit rose to EUR 4,894 million, 33% more than in the first six months of 2021 (+21% in constant euros), when we recorded EUR 530 million of net charges for restructuring costs. Underlying profit also amounted to EUR 4,894 million, 16% higher (+7% in constant euros) versus the first half of 2021 (before restructuring costs). |
| | |
| u | Our geographic and business diversification to some extent protects us from adverse circumstances and enables us to resiliently face the indirect impacts arising from the Russia-Ukraine conflict. Santander's presence in and exposure to Russia and Ukraine is negligible. |
| | |
| u | In 2022, although it is difficult to make projections in the current environment, our strategy and business model are a clear competitive advantage. Under the main scenario we are considering, we believe we will meet the Group targets for the year announced at the Group's 2021 earnings presentation. |
| | | |
| | | |
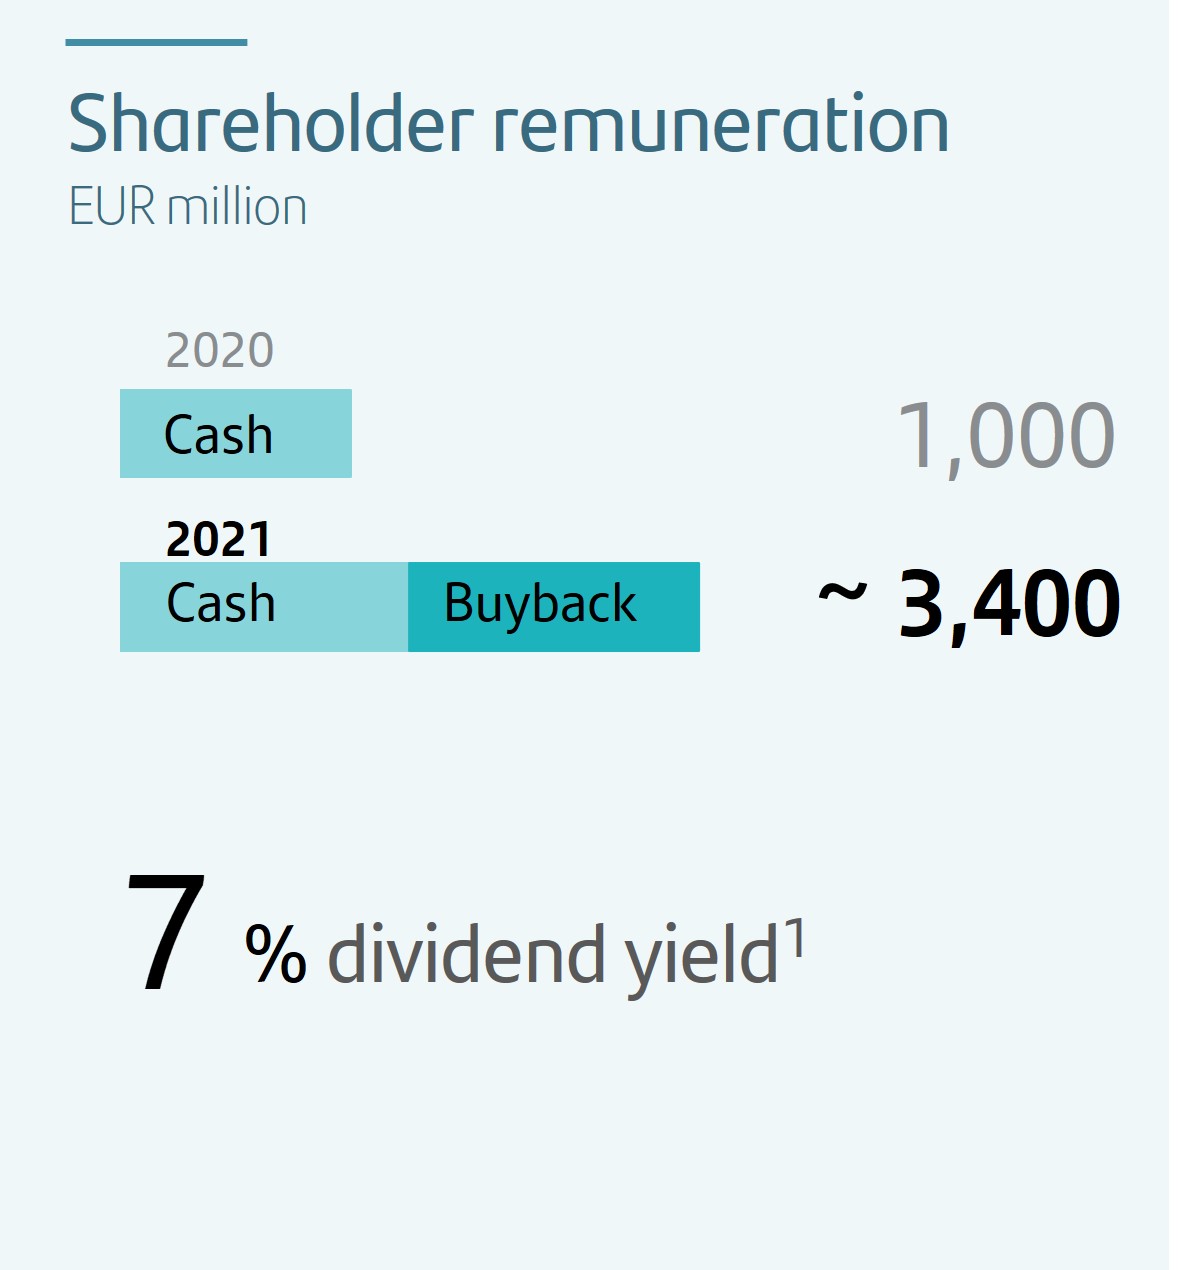
| | u | In applying the shareholder remuneration policy for 2021, the bank paid a second interim cash dividend of EUR 5.15 cents per share in May 2022 against 2021 results. In addition, a second share buyback programme was implemented for a total amount of EUR 865 million, in which 286,309,445 own shares were acquired, equivalent to 1.7% of the bank's share capital, whose redemption was executed by the board of directors on 28 June 2022. As a result, the total amount allocated to shareholders was around EUR 3.4 billion, equivalent to approximately 40% of the Group's underlying attributable profit in 2021. |
| | |
| u | The board approved a payout for 2022 of approximately 40% of underlying attributable profit, which will include both the cash dividend and the share buybacks, which are each expected to account for 50% of the payout2. |
|
| | | |
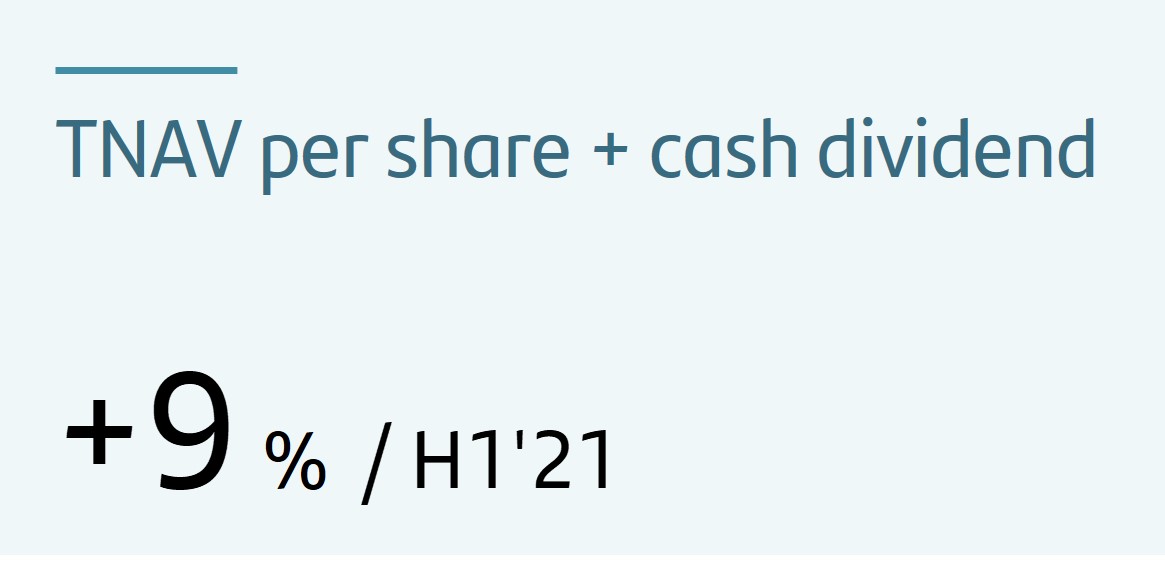
| | u | TNAV per share was EUR 4.24, +9% year-on-year including the cash dividend per share paid in November 2021 and May 2022. In the quarter, TNAV per share plus dividend remained largely unchanged. |
| | | |
| | | |
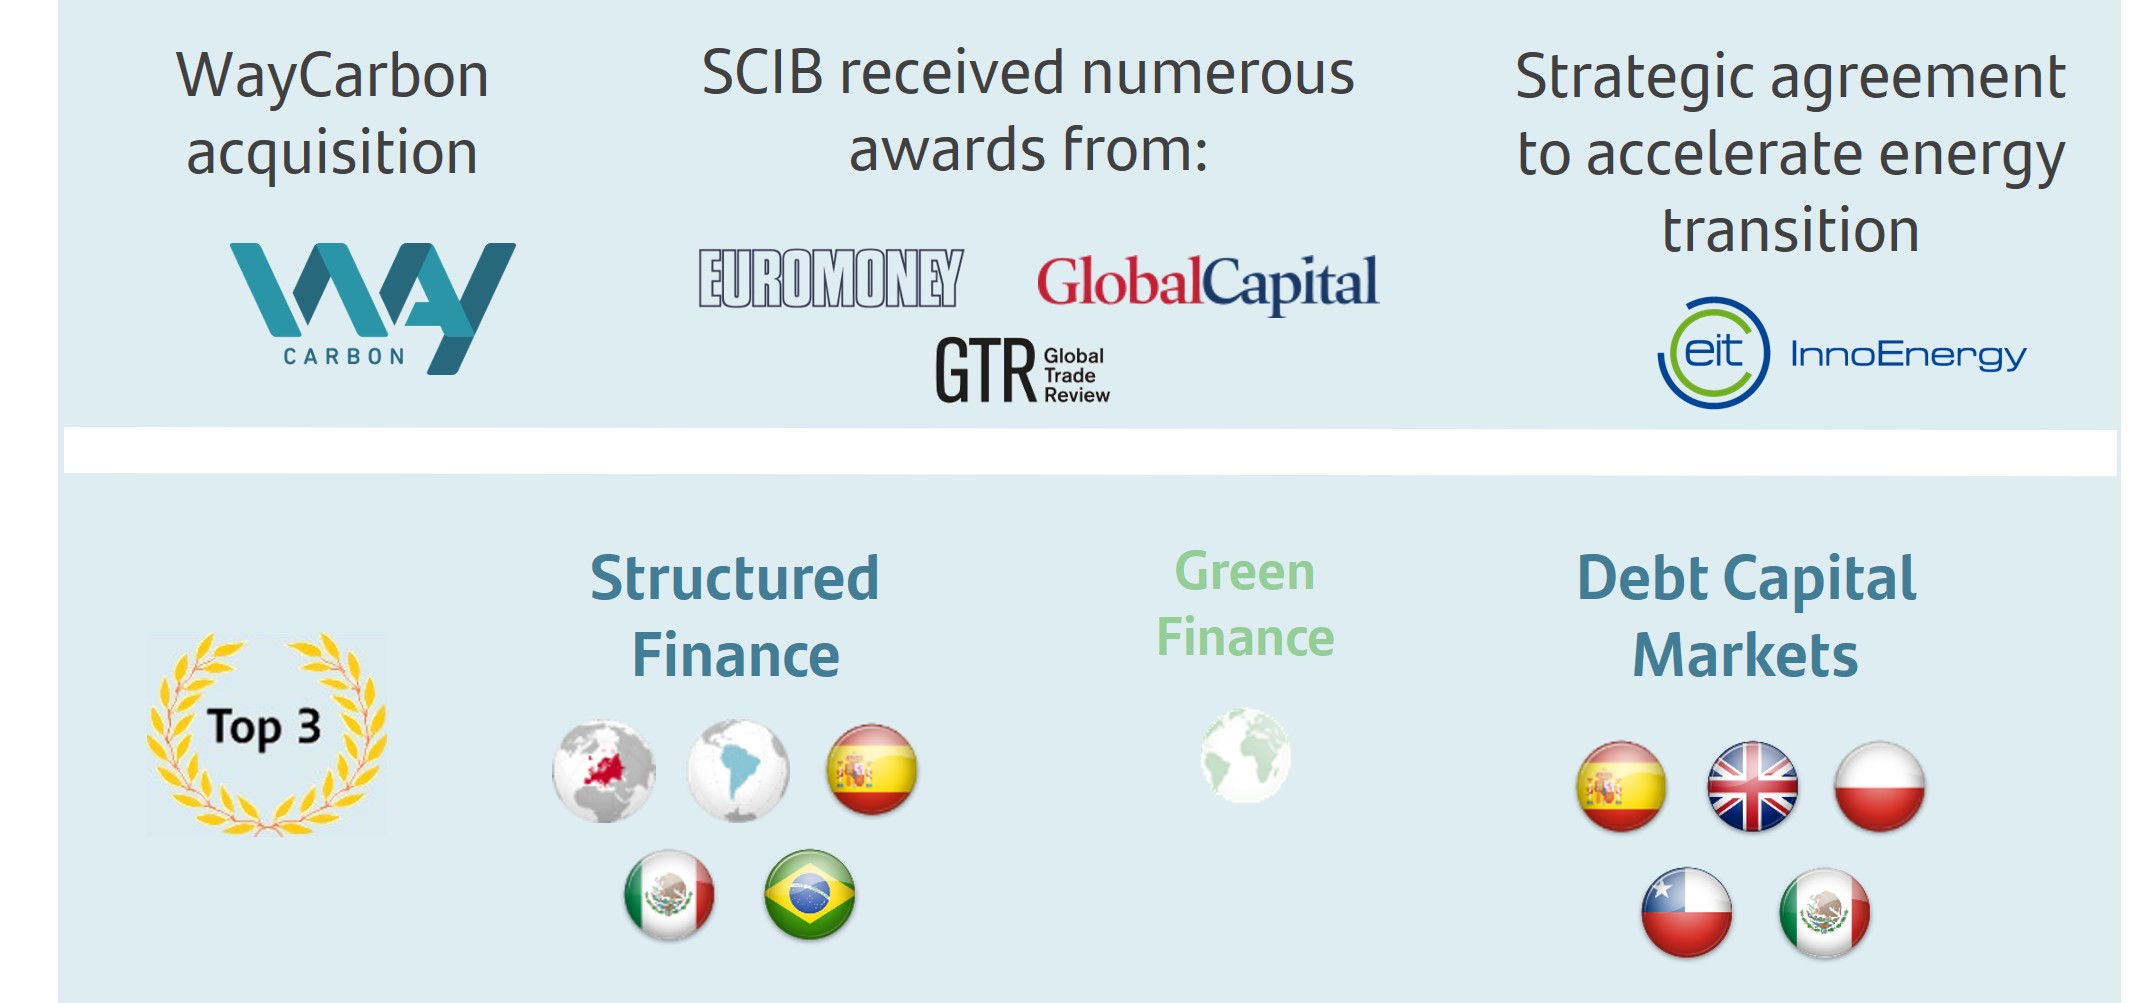
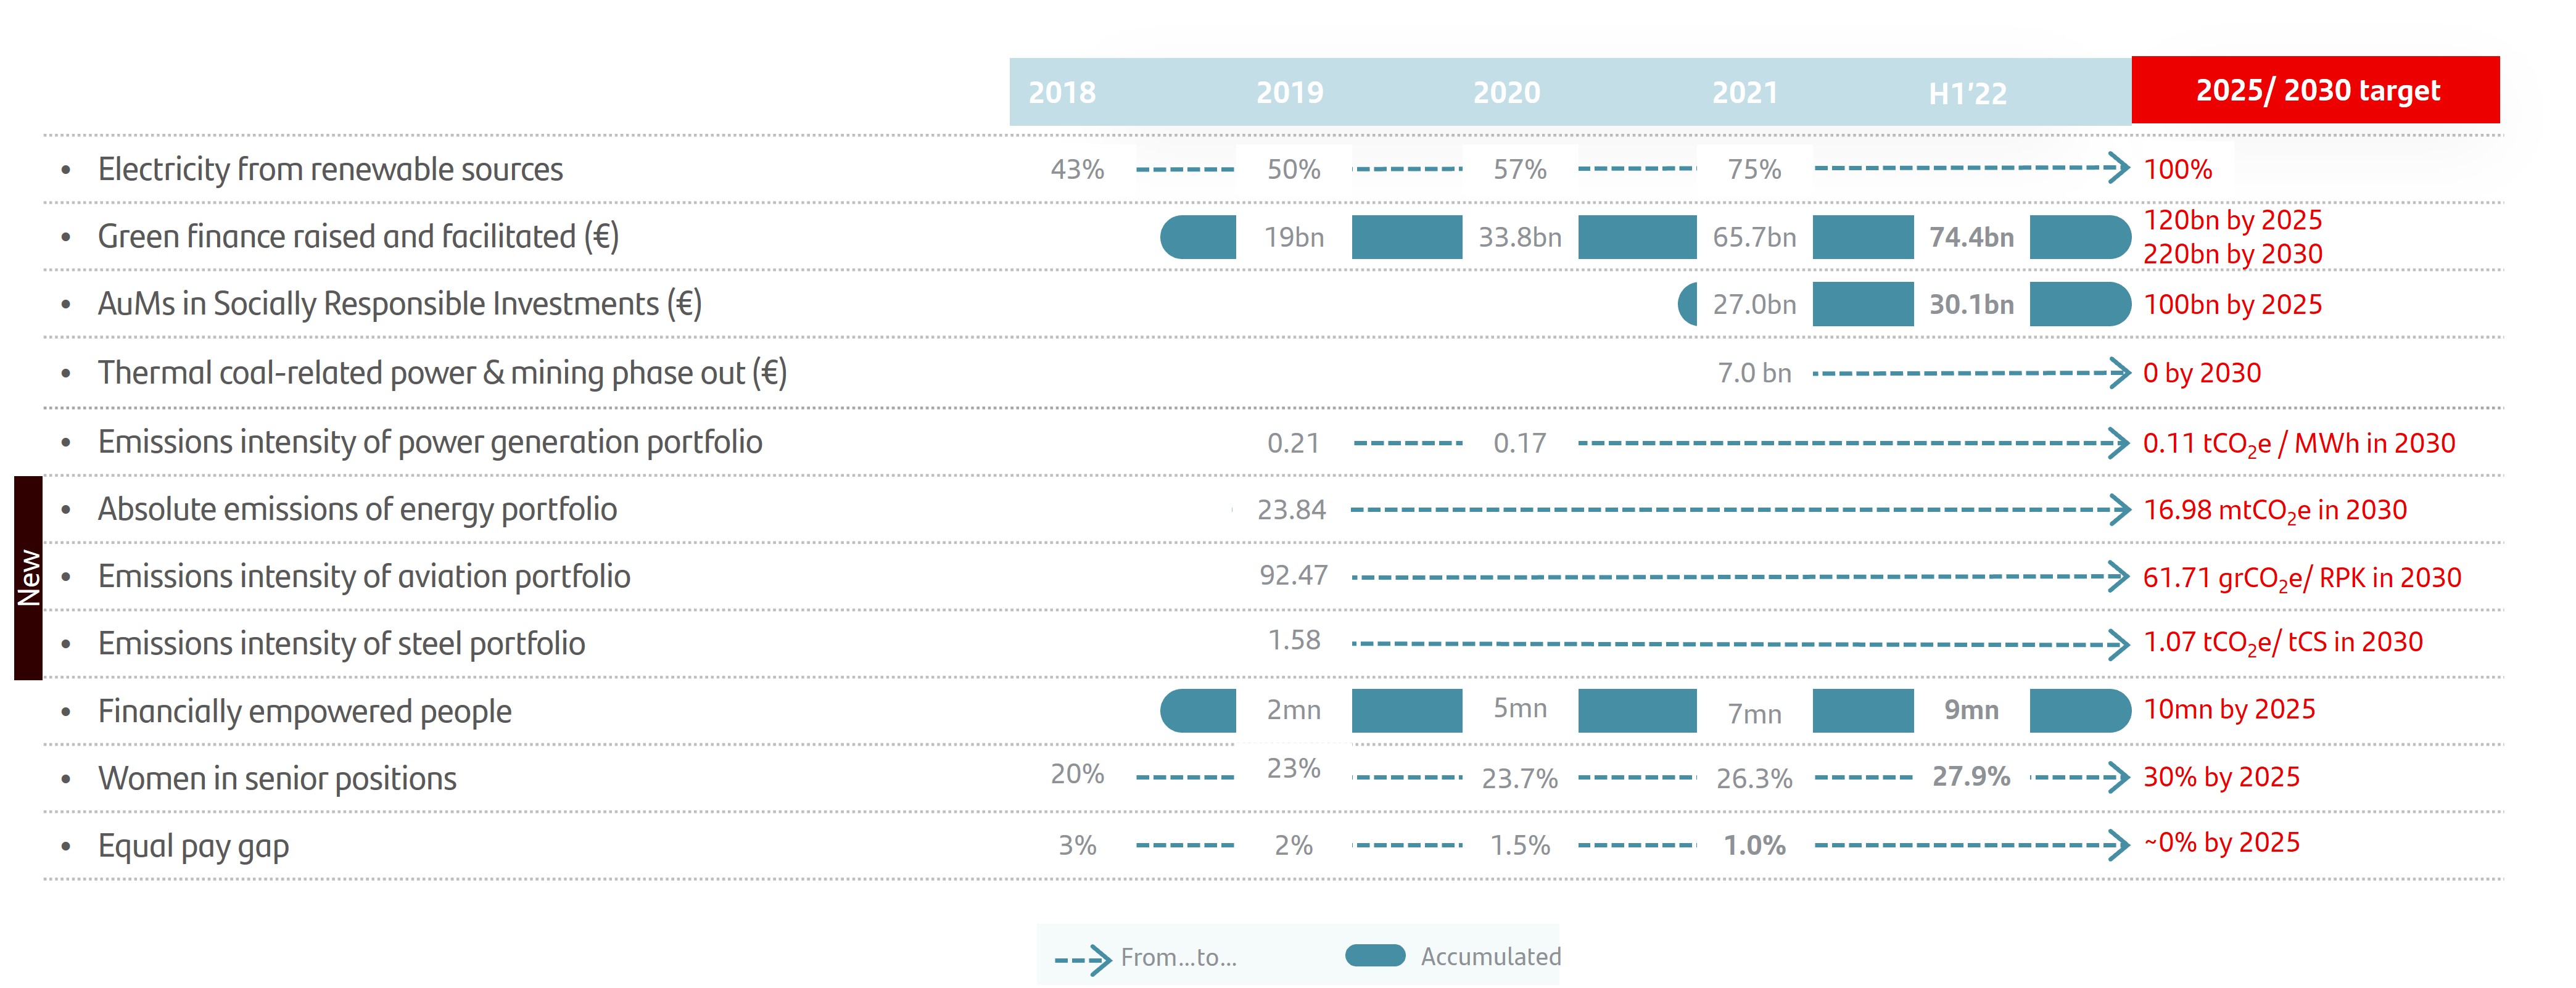
| | u | Santander is the leader in renewable energy financing and mobilized close to EUR 74.4 billion between 2019 and the end of H1'22. The Group's target is to mobilize EUR 220 billion in green finance by 2030. |
| | |
| u | We have set three new decarbonization targets for 2030 (measured in emission reductions vs. 2019) in the energy (-29%), aviation (-33%) and steel (-32%) sectors. |
| | |
| u | In the first half, we granted EUR 426 million in loans through our microfinance programmes in 8 countries. |
| | |
| u | We were named Best Global Bank for Financial Inclusion by Euromoney, highlighting our programmes in South America and Mexico, and Best Bank for Corporate Responsibility in Central and Eastern Europe for our support to refugees from the Russia-Ukraine conflict. |
(1) As % of H1'22 average share price.
(2) Implementation of the shareholder remuneration policy is subject to future corporate and regulatory decisions and approvals.
| | | | | | | | | | | |
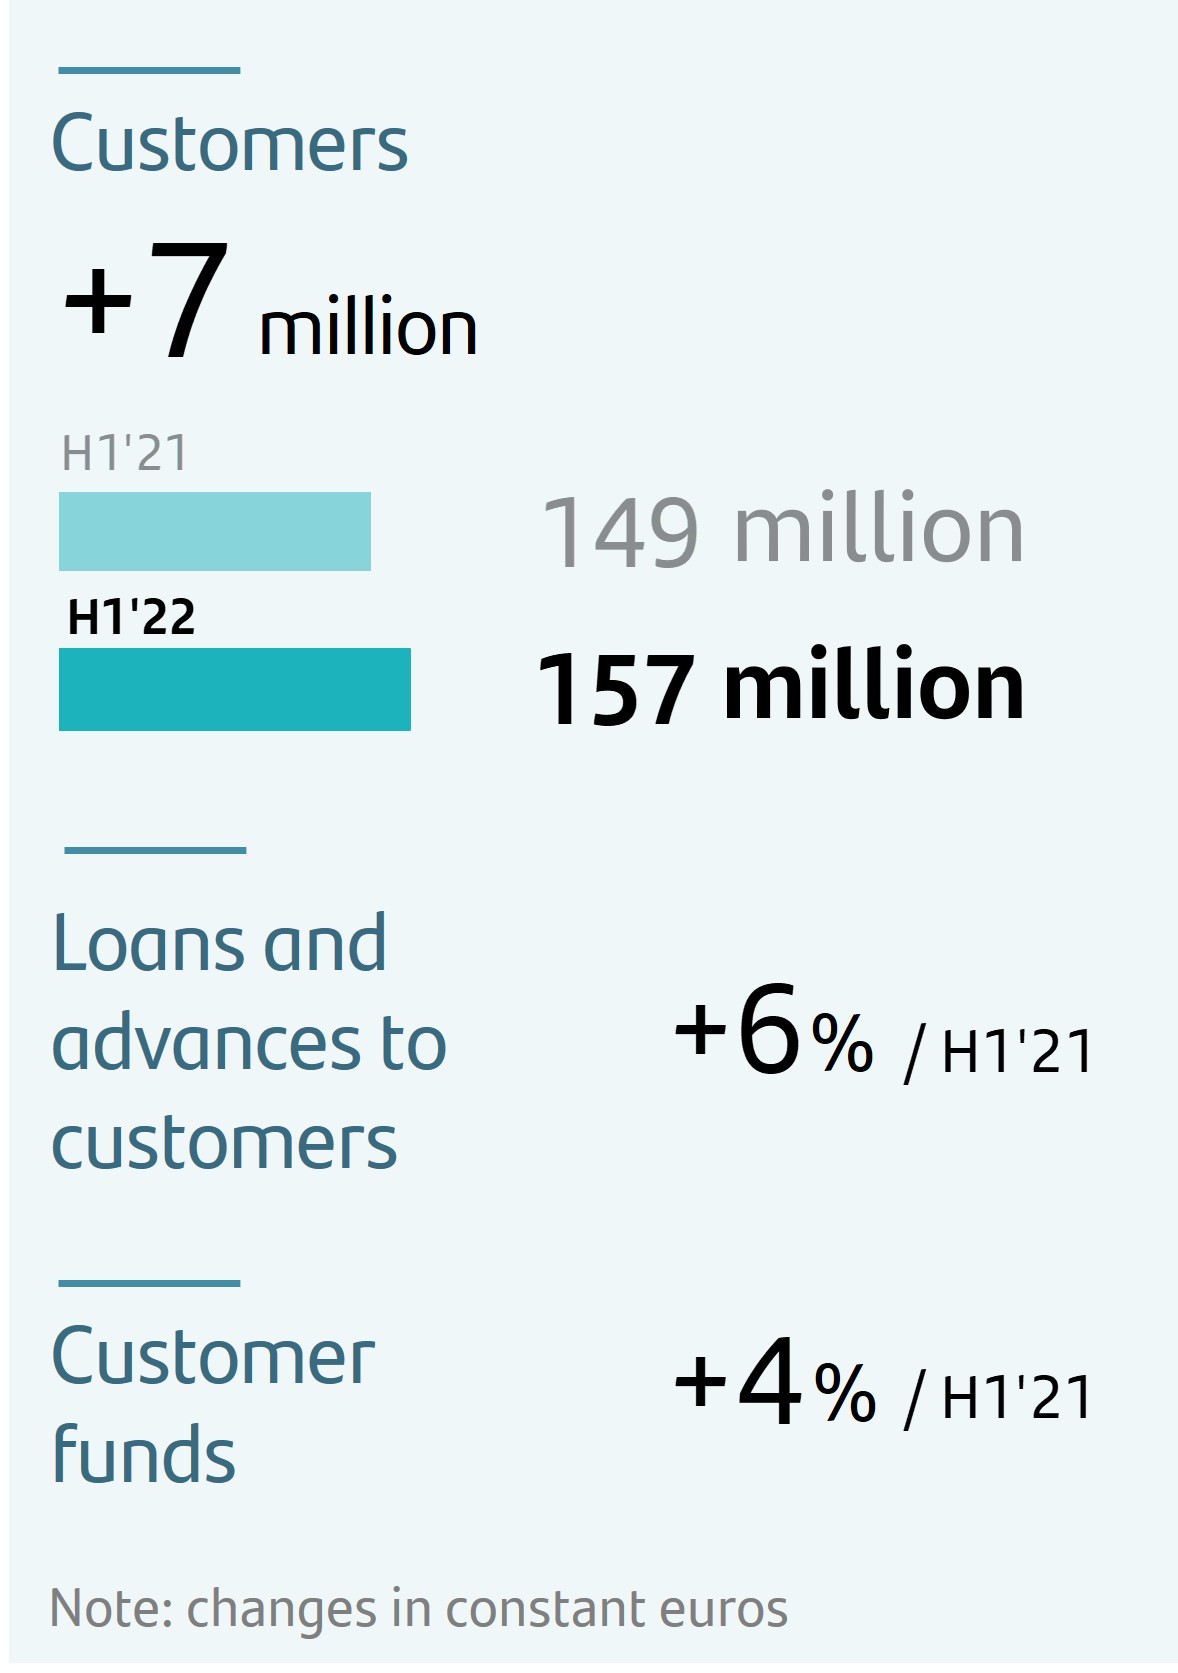
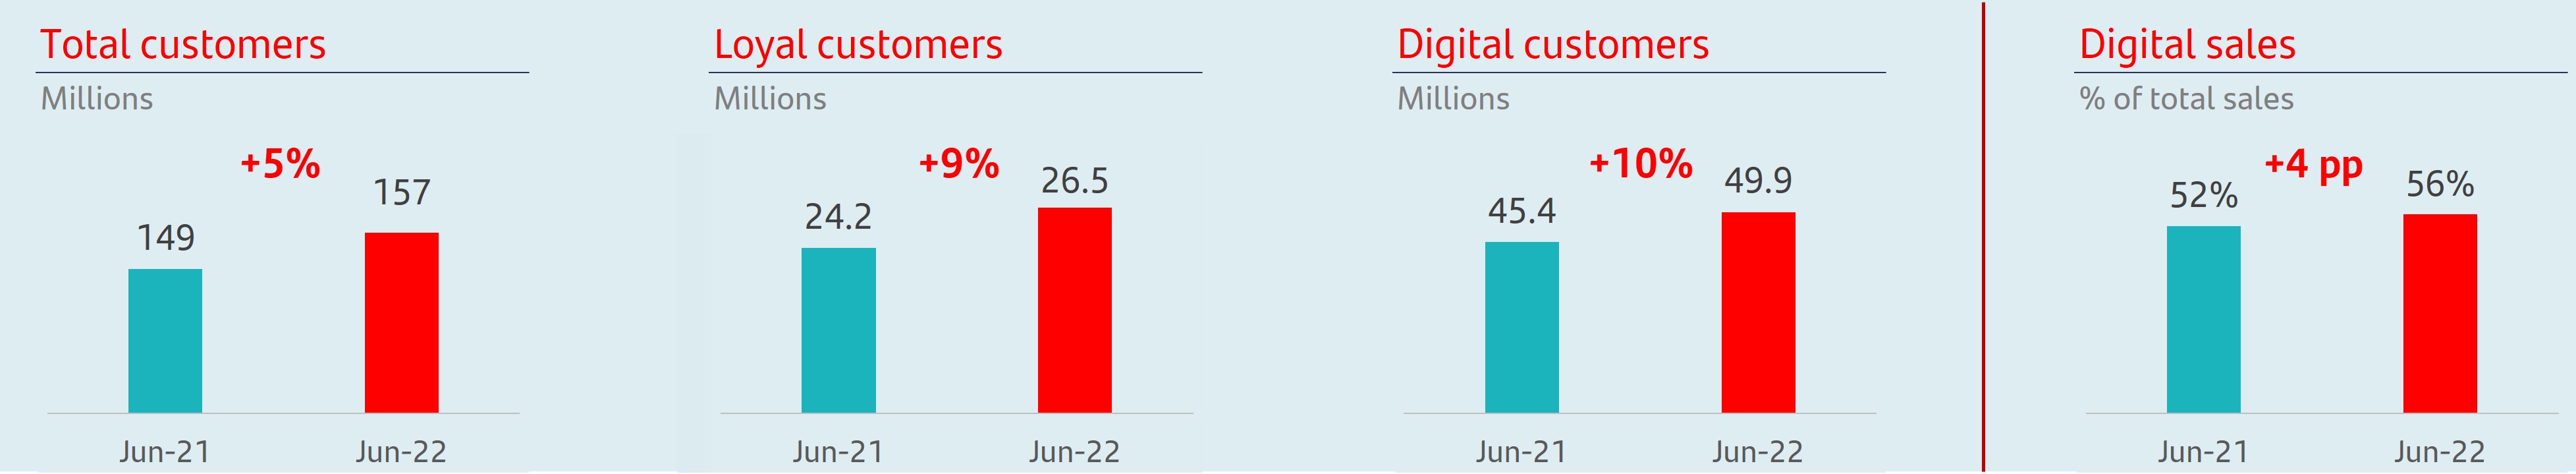
| | u | Total customers amounted to 157 million, +7.4 million compared to June 2021. Loyal customers reached 26.5 million, 9% higher year-on-year. |
| | |
| u | Digital adoption continued to be key, as we now have more than 50 million digital customers, an increase of 4 million since June 2021. In H1'22, 56% of sales were made through digital channels (52% in H1'21). |
| | |
| u | Business volumes continued to grow in a context of uncertainty. In this environment, loans and advances to customers rose 3% in the quarter and +9% year-on-year. Customer deposits rose 2% in the quarter and +9% year-on-year. Excluding the exchange rate impact, gross loans and advances to customers excluding reverse repos were 2% higher compared to Q1'22 and +6% versus H1'21. Customer funds excluding repos increased 1% in the quarter and 4% year-on-year. |
| | |
| u | Greater activity, together with higher interest rates and margin management, was reflected in the 14% rise in net interest income and a 13% increase in net fee income in euros (both grew +7% in constant euros). |
| | | | | | | | | | | |
| | u | The increase in profit, underpinned by the positive performance across regions, Digital Consumer Bank (DCB) and the global businesses, was reflected in higher profitability. |
| | |
| u | Sustained earnings per share growth, which rose 38% year-on-year to EUR 27.2 cents in H1'22 (+19% compared to H1'21 underlying EPS). |
| | |
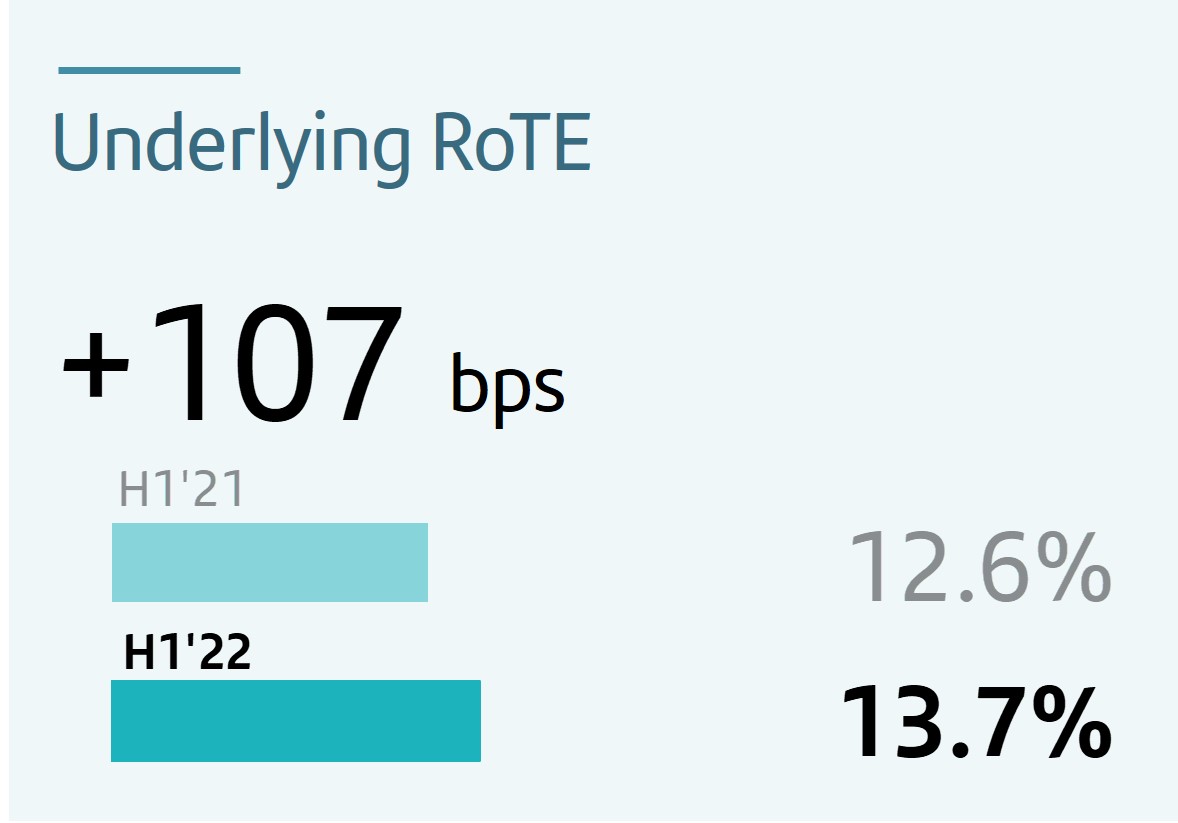
| u | RoTE of 13.7%, RoRWA was 1.86%, both clearly exceeding H1'21 and FY'21 figures. |
| | | | | | | | | | | |
| | u | Regarding credit quality, the cost of risk stood at 0.83% (0.94% in June 2021). |
| u | The NPL ratio was 3.05%, 21 bps lower quarter-on-quarter and -17 bps year-on-year, mainly driven by the positive performance in Europe (favoured by portfolio sales in Spain) and somewhat offset by the increases in South America. |
| u | Total loan-loss reserves reached EUR 24,195 million, with a coverage of 71% (+2 pp vs. Q1'22). |
| | | |
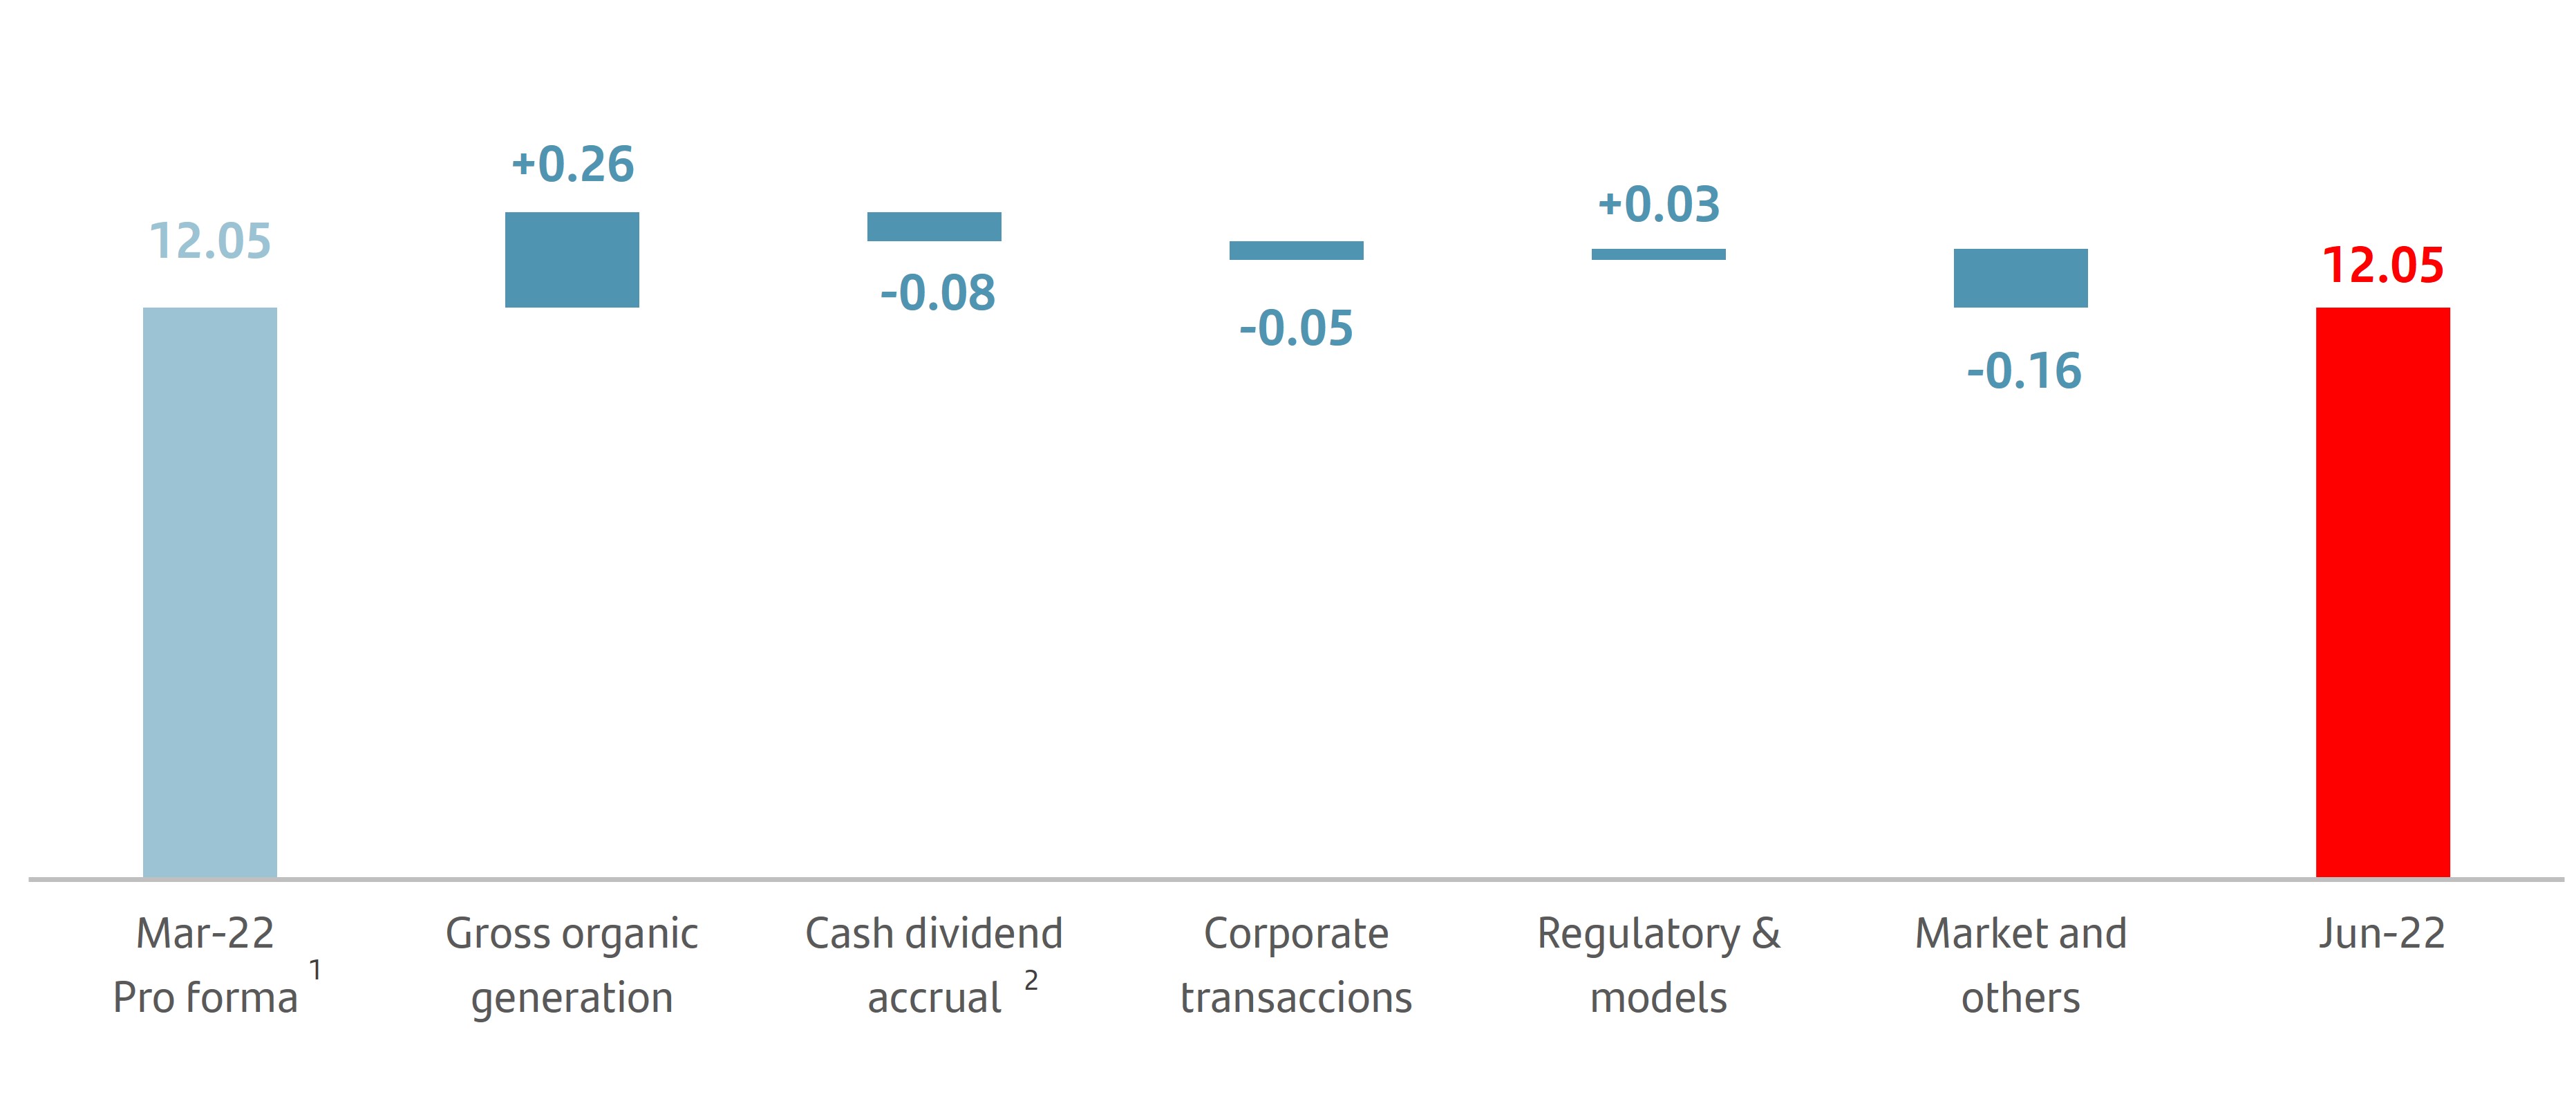
| | u | The fully-loaded CET1 ratio was 12.05%. In the quarter, net organic generation of 18 bps, resulting from gross organic generation of 26 bps from Q2'22 profit and an 8 bp charge for a future dividend payment. In addition, negative impacts from market performance and corporate transactions, and positive impacts from models. |
| | | | | | | | | | | | | | | | | | | | | | | | | | |
| Grupo Santander. Summarized income statement |
| EUR million | | | | | | | | |
| | | Change | | | Change |
| Q2'22 | Q1'22 | % | % excl. FX | H1'22 | H1'21 | % | % excl. FX |
| Net interest income | 9,554 | | 8,855 | | 7.9 | | 4.0 | | 18,409 | | 16,196 | | 13.7 | | 6.9 | |
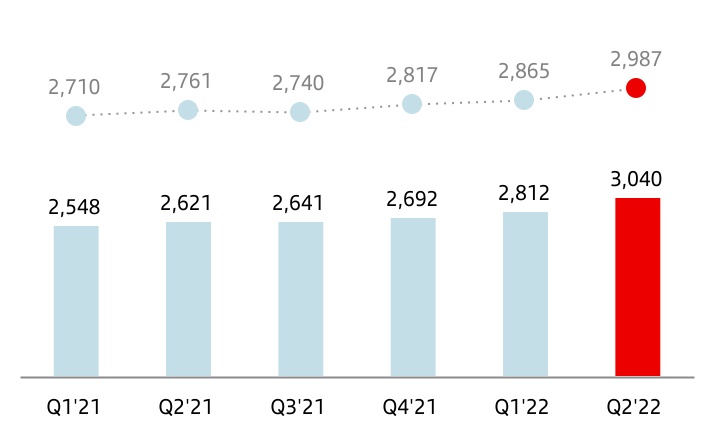
| Net fee income (commission income minus commission expense) | 3,040 | | 2,812 | | 8.1 | | 4.2 | | 5,852 | | 5,169 | | 13.2 | | 7.0 | |
| Gains or losses on financial assets and liabilities and exchange differences (net) | 356 | | 387 | | (8.0) | | (11.0) | | 743 | | 894 | | (16.9) | | (20.7) | |
| Dividend income | 267 | | 68 | | 292.6 | | 288.2 | | 335 | | 309 | | 8.4 | | 8.1 | |
| Share of results of entities accounted for using the equity method | 179 | | 133 | | 34.6 | | 30.8 | | 312 | | 163 | | 91.4 | | 80.8 | |
| Other operating income / expenses | (581) | | 50 | | — | | — | | (531) | | (36) | | — | | — | |
| Total income | 12,815 | | 12,305 | | 4.1 | | 0.2 | | 25,120 | | 22,695 | | 10.7 | | 4.1 | |
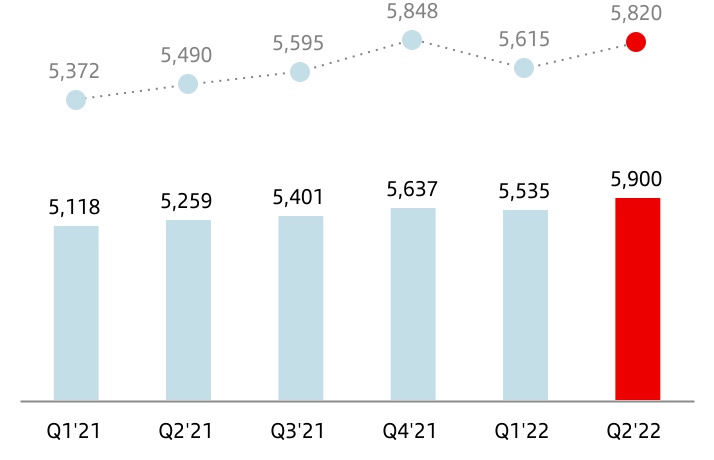
| Operating expenses | (5,900) | | (5,535) | | 6.6 | | 3.6 | | (11,435) | | (10,377) | | 10.2 | | 5.3 | |
| Administrative expenses | (5,162) | | (4,831) | | 6.9 | | 3.9 | | (9,993) | | (8,996) | | 11.1 | | 6.1 | |
| Staff costs | (3,085) | | (2,863) | | 7.8 | | 4.9 | | (5,948) | | (5,438) | | 9.4 | | 4.8 | |
| Other general administrative expenses | (2,077) | | (1,968) | | 5.5 | | 2.3 | | (4,045) | | (3,558) | | 13.7 | | 8.0 | |
| Depreciation and amortization | (738) | | (704) | | 4.8 | | 2.2 | | (1,442) | | (1,381) | | 4.4 | | 0.2 | |
| Provisions or reversal of provisions | (480) | | (455) | | 5.5 | | 3.9 | | (935) | | (1,490) | | (37.2) | | (38.2) | |
| Impairment or reversal of impairment of financial assets not measured at fair value through profit or loss (net) | (2,640) | | (2,123) | | 24.4 | | 17.9 | | (4,763) | | (3,804) | | 25.2 | | 17.2 | |
| | | | | | | | |
| Impairment on other assets (net) | (26) | | (35) | | (25.7) | | (28.2) | | (61) | | (130) | | (53.1) | | (54.5) | |
| Gains or losses on non-financial assets and investments, net | (6) | | 2 | | — | | — | | (4) | | 52 | | — | | — | |
| Negative goodwill recognized in results | — | | — | | — | | — | | — | | — | | — | | — | |
| Gains or losses on non-current assets held for sale not classified as discontinued operations | (19) | | 12 | | — | | — | | (7) | | (32) | | (78.1) | | (78.1) | |
| Profit or loss before tax from continuing operations | 3,744 | | 4,171 | | (10.2) | | (14.4) | | 7,915 | | 6,914 | | 14.5 | | 4.4 | |
| Tax expense or income from continuing operations | (1,072) | | (1,302) | | (17.7) | | (21.9) | | (2,374) | | (2,474) | | (4.0) | | (12.8) | |
| Profit from the period from continuing operations | 2,672 | | 2,869 | | (6.9) | | (11.0) | | 5,541 | | 4,440 | | 24.8 | | 14.0 | |
| Profit or loss after tax from discontinued operations | — | | — | | — | | — | | — | | — | | — | | — | |
| Profit for the period | 2,672 | | 2,869 | | (6.9) | | (11.0) | | 5,541 | | 4,440 | | 24.8 | | 14.0 | |
| Profit attributable to non-controlling interests | (321) | | (326) | | (1.5) | | (4.0) | | (647) | | (765) | | (15.4) | | (20.3) | |
| Profit attributable to the parent | 2,351 | | 2,543 | | (7.6) | | (11.9) | | 4,894 | | 3,675 | | 33.2 | | 20.8 | |
| | | | | | | | |
| EPS (euros) | 0.131 | | 0.141 | | (7.2) | | | 0.272 | | 0.197 | | 38.1 | | |
| Diluted EPS (euros) | 0.130 | | 0.140 | | (7.2) | | | 0.271 | | 0.196 | | 38.1 | | |
| | | | | | | | |
| Memorandum items: | | | | | | | | |
| Average total assets | 1,707,903 | | 1,624,930 | | 5.1 | | | 1,666,474 | | 1,539,167 | | 8.3 | | |
| Average stockholders' equity | 90,035 | | 88,532 | | 1.7 | | | 89,125 | | 82,669 | | 7.8 | | |
| | | | | | | | | | | | | | | | | | | | | | | | | | | | | | | | | | | | | | | | | | | | | | | | | | | | | | | | | | | | | | | | | | | | | | | | | | | | | | | | | | | | | | | | | | | | | | | |
| | | | | Executive summary | | | | | | | | | | | | | | | | | | | | | | | | |
| | | | | | | | | | | | | | | | | | | | | | | | | | | | | | | |
| | | | | Profit (H1'22 vs H1'21). In constant euros | | | | | | Performance (H1'22 vs H1'21). In constant euros | | |
| | | | | | | | | | | |
| | Strong profit growth underpinned by our geographic and business diversification | | | | | Profit growth driven by higher revenue, cost control and lower minority interest and tax burden | | |
| | Attributable profit | | | | | Total income | Costs | Provisions | | |
| | EUR 4,894 mn | | +21% vs H1'21 | | | | | +4.1% | +5.3% | +18.1% | | |
| | | +7% vs H1'21 underlying att. profit | | | | | | |
| | | | | | | | | | | | | | | | | |
| | | | | | | | | | | | | | | | | | | | | | | | | | | |
| | | | | | | | | | | | | | | | | | | | | | | | | | | | | | |
| | | | | Efficiency | | | | | | | | | | | Profitability | | |
| | | | | | | | | | | | | | | | |
| | The Group's efficiency ratio improved compared to FY'21, mainly driven by Europe | | | | | Strong improvement in our profitability ratios | | |
| | Group | | Europe | | | | | RoTE | RoRWA | | |
| | 45.5% | | 48.5% | | | | | 13.7% | 1.86% | | |
| | -0.7 pp vs 2021 | | -3.7 pp vs 2021 | | | | | +1.9 pp | +1.1 pp | 1 | +0.2 pp | +0.1 pp | 2 | | |
| | | | | | | | | | | | | | | | | | Changes vs H1'21 | 1.vs underlying RoTE | | 2. vs und. RoRWA | |
| | | | | | | | | | | | | | | | | | | | | | | | | | | | | | | |
è Results performance compared to H1'21
The Group presents, both at the total level and for each of the business units, the changes in euros produced in the income statement, as well as variations excluding the exchange rate effect (FX), on the understanding that the latter provide a better analysis of the Group’s management of the country units. For the Group as a whole, exchange rates had a positive impact of 7 pp in revenue and 5 pp in costs.
u Total income
Total income of EUR 25,120 million in the first half of 2022, up 11% year-on-year. Excluding the exchange rate impact, total income increased 4%. Net interest income and net fee income accounted for 97% of total income. By line:
•Net interest income amounted to EUR 18,409 million, 14% higher compared to the first half of 2021. Stripping out the exchange rate impact, growth was 7%, mainly due to the increase in activity, greater volumes and higher interest rates.
By country, and at constant exchange rates, increases were recorded in the UK (+13%), Poland (+92%), Brazil (+2%), Mexico (+9%), Chile (+7%) and Argentina (+93%).
| | | | | |
| Net interest income |
| EUR million |
| constant euros |
On the other hand, the US remained unchanged, mainly due to the Bluestem portfolio disposal in 2021 (excluding this impact, net interest income would have increased 2%). Declines in Spain (-6%, due to lower ALCO volumes and some change of mix towards mortgages) and Portugal (-8%, due to ALCO portfolio sales in H1'21).
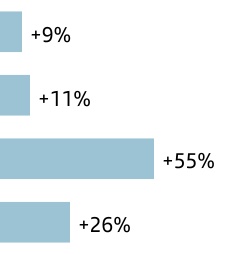
•Net fee income rose 13% year-on-year to EUR 5,852 million. Excluding the exchange rate impact, net fee income was 7% higher, driven by higher volumes and improved activity, with significant increases in high value-added products and services.
Card and point of sale turnover increased 20% and 30%, respectively, and card transactions were 18% higher. Transactional fees rose 9%.
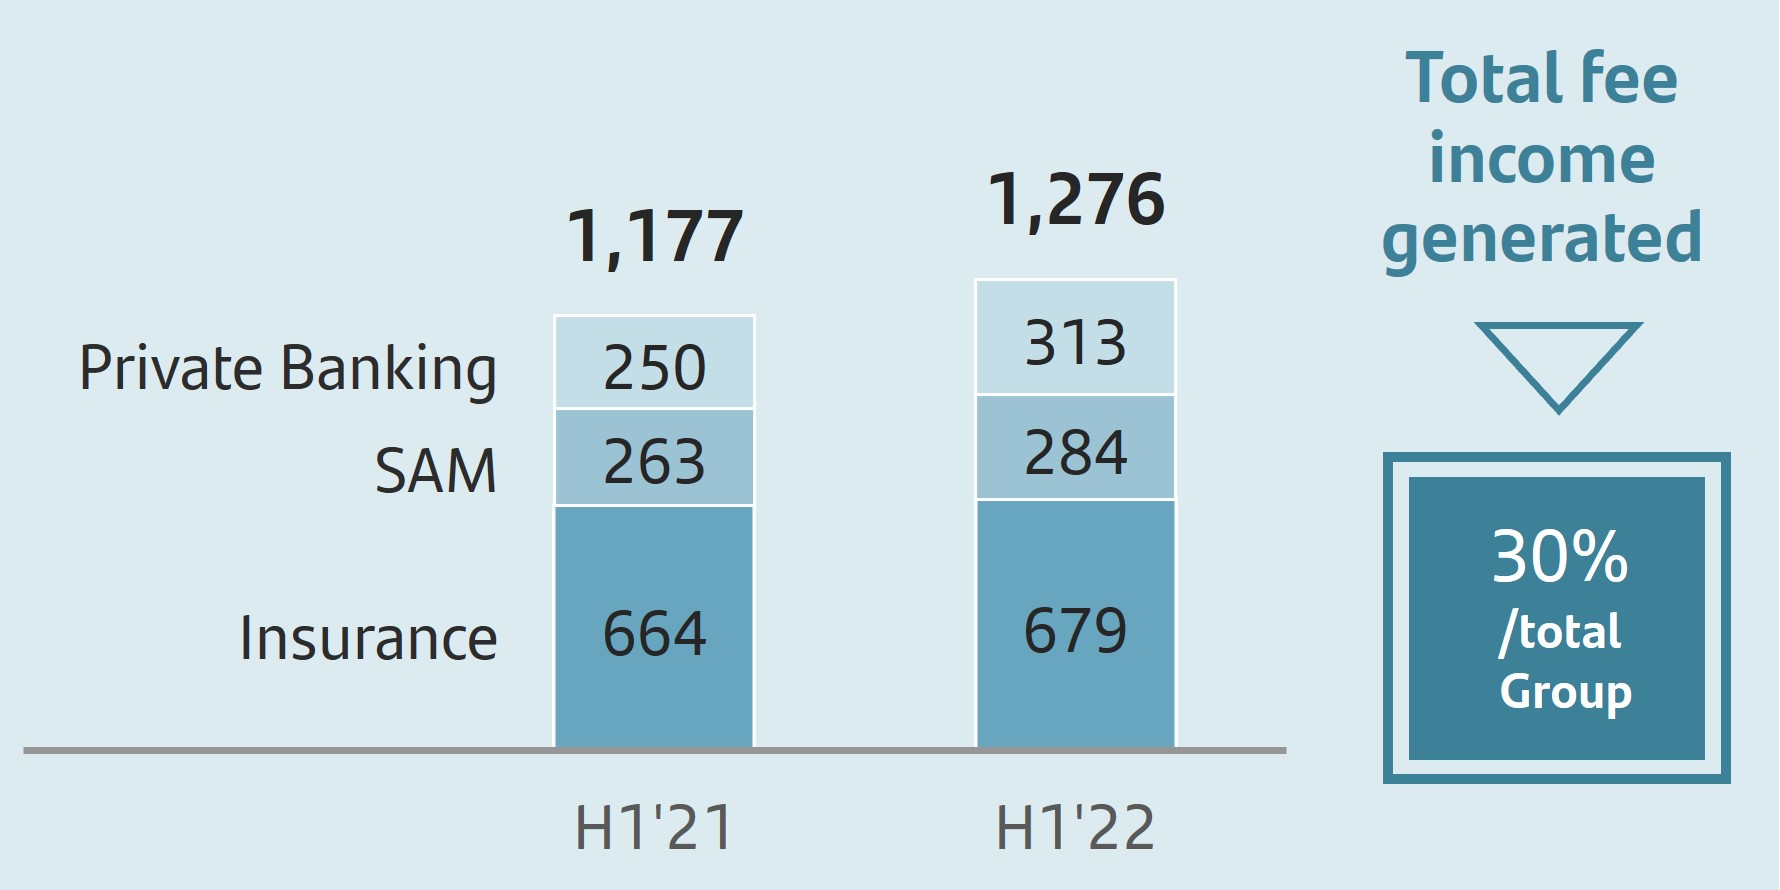
In Wealth Management & Insurance (WM&I), net fee income from mutual funds and pensions grew 5% and insurance premiums rose 17%.
| | | | | |
| Net fee income |
| EUR million |
| constant euros |
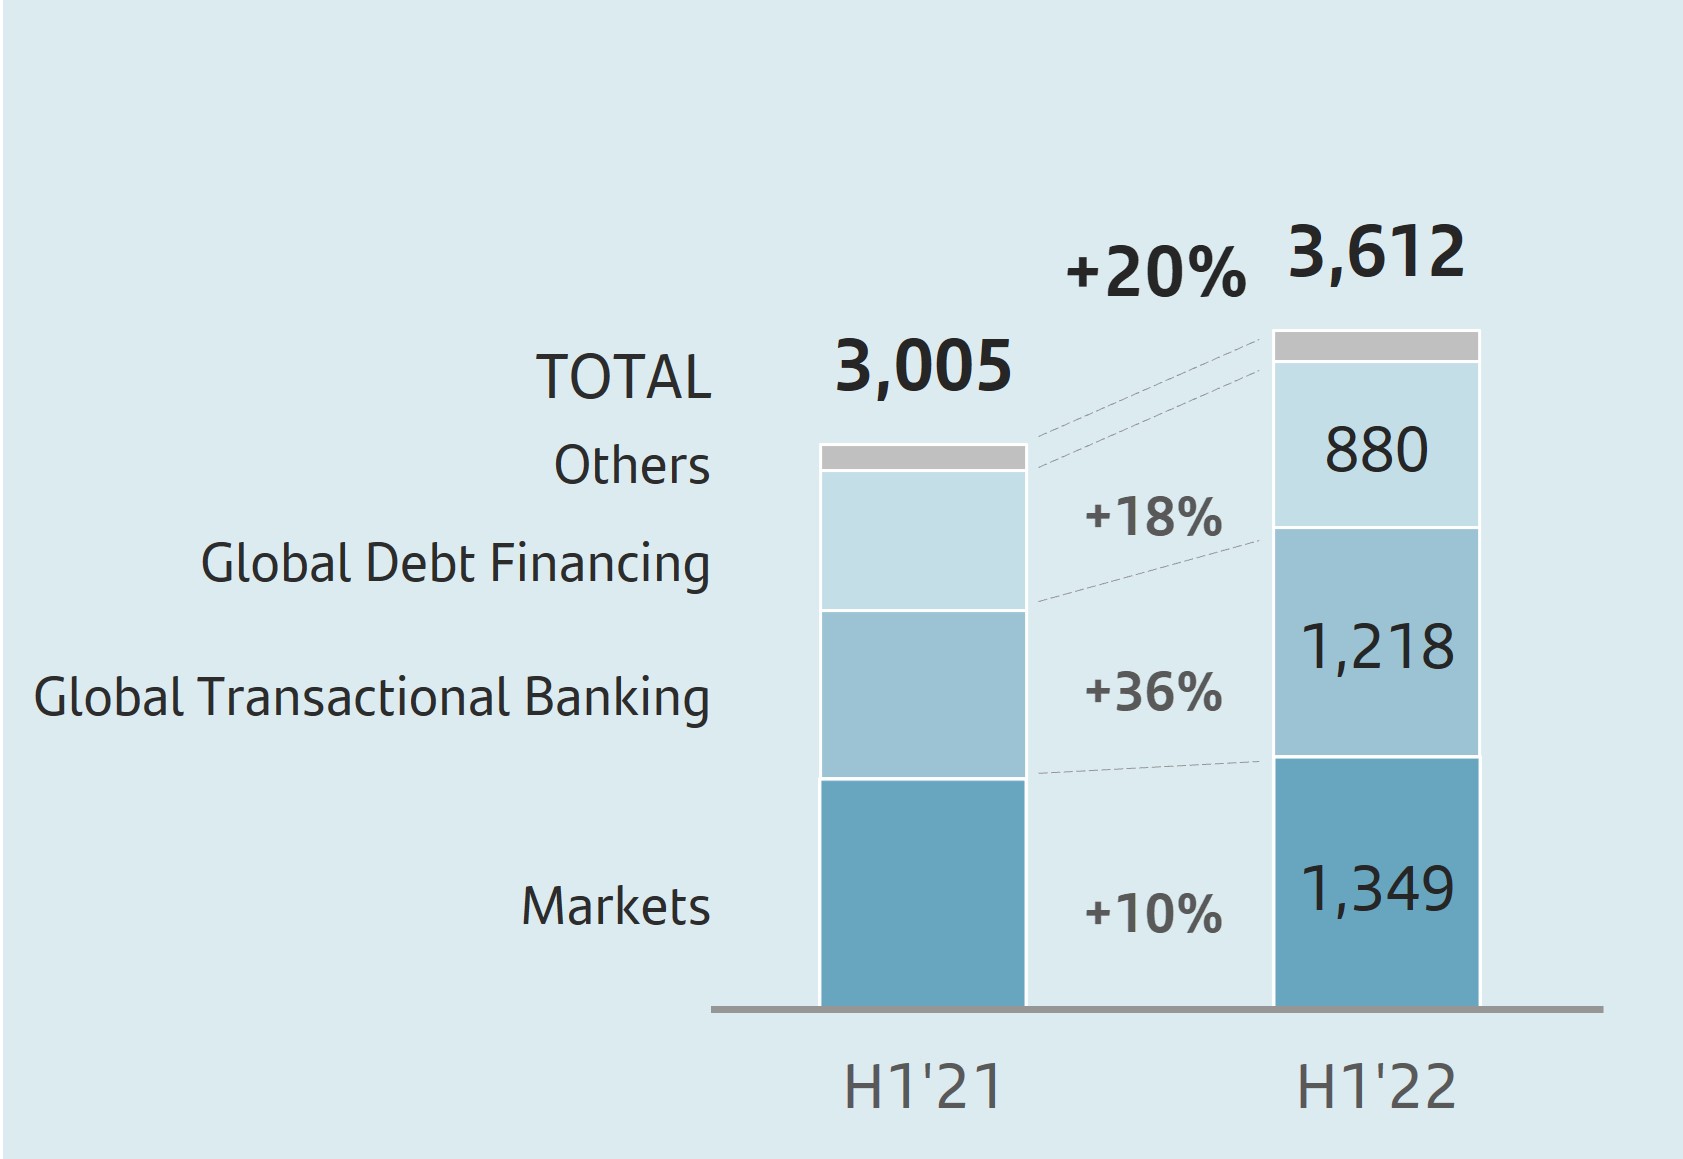
In Santander Corporate & Investment Banking (SCIB), net fee income increased 10%, underscored by double-digit growth in the core businesses. Together, both businesses accounted for close to 50% of the Group’s total fee income (SCIB: 18%; WM&I: 30%).
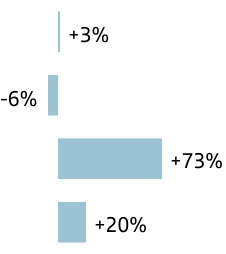
By region, net fee income Europe was up 7%, supported by growth in all countries except the UK, mainly due to the transfer of its SCIB business. 1% decrease in North America, affected by the Bluestem portfolio disposal. Excluding it, fee income would have increased 4% in the region (the US would have fallen mainly due to lower fee income in SCIB). 16% increase in Mexico driven by fee income from insurance, cards and account management. +10% in South America driven by greater transactionality, with growth in all countries and +7% at Digital Consumer Bank driven by the rise in new lending.
•Gains on financial transactions, accounted for 3% of total income and were 17% lower year-on-year at EUR 743 million (-21% excluding the exchange rate impact), weighed down by the falls in Spain and Portugal, due to ALCO portfolio sales recorded in 2021, and the Corporate Centre, affected by the negative impact of FX hedging, offset by the positive impact of exchange rates in the countries' results.
•Dividend income was EUR 335 million in H1'22, increasing 8% in euros and constant euros.
•The results of entities accounted for using the equity method rose to EUR 312 million, due to the greater contribution from Group entities in Spain and Brazil.
•Other operating income recorded a loss of EUR 531 million compared to -EUR 36 million in H1'21, mainly due to the lower leasing income (approximately EUR 240 million less year-on-year), higher contribution to the SRF, higher provisions for the contribution to the BFG in Poland, where we also recorded an EUR 88 million contribution for the creation of an Institutional Protection Scheme along with several Polish local entities to strengthen the liquidity and solvency of the members of this newly established company, and impact of high inflation in Argentina.
| | | | | |
| Total income |
| EUR million |
| constant euros |
u Costs
Operating costs amounted to EUR 11,435 million, 10% higher than H1'21 (+5% excluding the exchange rate impact), due to the sharp increase in inflation. In real terms (excluding the rise in average inflation), costs fell 4% in constant euros.
Our disciplined cost management enabled us to maintain one of the best efficiency ratios in the sector, which stood at 45.5% in H1'22, improving 0.2 pp versus June 2021 and -0.7 pp versus FY'21, mainly driven by Europe.
Our transformation plan continued to progress across countries towards a more integrated and digital operating model. This allows us to increase efficiencies and productivity with better business dynamics and improved customer service and satisfaction. The year-on-year cost trends in constant euros were as follows:
•In Europe, costs were down 1%, -7% in real terms, on the back of our transformation process and operating improvement. In real terms, falls across in the region: -11% in Spain, -5% in the UK, -17% Portugal and -1% Poland. The region's efficiency ratio improved to 48.5%, an improvement of 3.9 pp versus H1'21.
•In North America, costs increased 5%. In real terms, they dropped 3%. They remained stable in the US (-8% in real terms) while Mexico recorded an increase due to investments in digitalization and insourcing of employees. The efficiency ratio stood at 46.6% (+3.4 pp vs H1'21).
•In South America, the rise in costs (+16%) was significantly distorted by soaring average inflation in the region (17%) which was reflected in salary agreements (salary increase in Brazil in September 2021) and greater overall expenses. In real terms, costs in Brazil remained stable, in Chile they fell 2% and rose 3% in Argentina. The efficiency ratio was 35.3% (+0.8 pp vs H1'21).
•Costs at Digital Consumer Bank increased 2% affected by inflation, strategic investments and perimeter effects (Allane, TIMFin and Greece). In real terms, costs fell 3%. The efficiency ratio stood at 48.5% (-0.3 pp vs H1'21).
| | | | | |
| Operating expenses |
| EUR million |
| constant euros |
u Provisions or reversal of provisions
Provisions (net of provisions reversals) amounted to EUR 935 million (EUR 1,490 million in H1'21). This item includes the charges for restructuring costs recorded in 2021 (EUR 530 million net of tax).
u Impairment or reversal of impairment of financial assets not measured at fair value through profit or loss (net)
Impairment or reversal of impairment on financial assets not measured at fair value through profit or loss (net) amounted to EUR 4,763 million, 25% higher than in the same period of 2021 (+17% in constant euros). This comparison was affected by the releases recorded in the UK and the US in Q2'21, the EUR 184 million charge for CHF mortgages recorded in Poland and DCB this year and the rise in Brazil, driven by individual volumes.
u Impairment on other assets (net)
The impairment on other assets (net) stood at EUR 61 million, down from EUR 130 million in H1'21.
u Gains or losses on non-financial assets and investments (net)
-EUR 4 million was recorded in this line in H1'22 (EUR 52 million in H1'21).
| | | | | |
| Net loan-loss provisions |
| EUR million |
| constant euros |
u Negative goodwill recognized in results
No negative goodwill was recorded in H1'22 or H1'21.
u Gains or losses on non-current assets held for sale not classified as discontinued operations
This item, which mainly includes impairment of foreclosed assets recorded and the sale of properties acquired upon foreclosure, totalled -EUR 7 million in H1'22, compared to -EUR 32 million in H1'21.
u Profit before tax
Profit before tax was EUR 7,915 million in H1'22, 14% higher year-on-year (+4% in constant euros).
u Income tax
Total corporate income tax was EUR 2,374 million (EUR 2,474 million in H1'21).
u Attributable profit to non-controlling interests
Attributable profit to non-controlling interests amounted to EUR 647 million, down 15% year-on-year (-20% excluding the exchange rate impact), mainly due to the buyback of minority interests of SC USA in the US.
u Attributable profit to the parent
Attributable profit to the parent amounted to EUR 4,894 million in H1'22, compared to EUR 3,675 million in the same period of 2021. This represents a 33% increase in euros and +21% in constant euros, receiving an uplift from higher revenue, lower minority interests and no results outside the ordinary course of our business.
RoTE stood at 13.69% (11.82% in H1'21), RoRWA at 1.86% (1.66% in H1'21) and earnings per share stood at EUR 0.272 (EUR 0.197 in H1'21).
u Underlying profit attributable to the parent
Profit attributable to the parent recorded in H1'22 was not affected by the recording of results that are outside the ordinary course of our business. As such, attributable profit and underlying profit attributable to the parent in H1'22 amounted to EUR 4,894 million.
In H1'21, profit attributable to the parent was affected by restructuring costs, mainly in the UK and Portugal. Excluding these charges from the line where they were recorded, and including them separately in the net capital gains and provisions line, adjusted profit or underlying profit attributable to the parent in H1'21 stood at EUR 4,205 million.
As a result, profit in H1'22 was 16% higher in euros and +7% in constant euros compared to the adjusted profit or underlying in the same period of 2021.
The Group’s cost of risk (considering the last 12 months) stood at 0.83%, slightly higher than FY'21 (0.77%) when we recorded releases mainly in the second and fourth quarters.
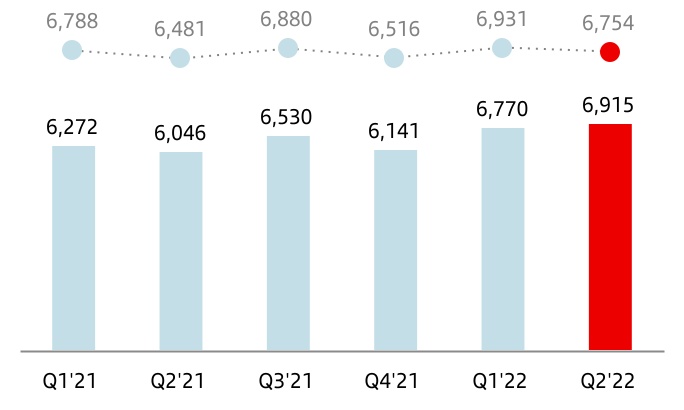
Before recording loan-loss provisions, Grupo Santander's underlying net operating income (total income less operating expenses) was EUR 13,685 million, 11% higher year-on-year in euros, +3% excluding the FX impact. This is the highest net operating income ever recorded in a first half of a year. The performance in constant euros is detailed below.
By line:
•Total income increased mainly due to net interest income (+7%) and net fee income (+7%), which maintained a positive quarterly growth trend given the greater commercial activity.
•Costs were up driven by soaring inflation.
By region:
•In Europe, net operating income increased 17% underscored by higher total income and lower costs.
•In North America, net operating income fell 9%, -6% excluding the impact from the sale of the Bluestem portfolio, dampened by lower fee income and leasing in the US. Growth in Mexico was 9%.
•In South America, net operating income growth was 7% with rises of 2% in Brazil, 17% in Chile and 88% in Argentina.
•In Digital Consumer Bank, net operating income increased 3%.
In H1'22, Grupo Santander’s underlying RoTE was 13.69% (12.62% in H1'21), underlying RoRWA was 1.86% (1.75% in H1'21) and underlying earnings per share was EUR 0.272 (EUR 0.227 in H1'21).
| | | | | | | | | | | | | | | | | | | | | | | | | | |
| Summarized underlying income statement |
| EUR million | | | Change | | | Change |
| Q2'22 | Q1'22 | % | % excl. FX | H1'22 | H1'21 | % | % excl. FX |
| Net interest income | 9,554 | | 8,855 | | 7.9 | 4.0 | 18,409 | | 16,196 | | 13.7 | 6.9 |
| Net fee income | 3,040 | | 2,812 | | 8.1 | 4.2 | 5,852 | | 5,169 | | 13.2 | 7.0 |
Gains (losses) on financial transactions (1) | 356 | | 387 | | (8.0) | (11.0) | 743 | | 894 | | (16.9) | (20.7) |
| Other operating income | (135) | | 251 | | — | — | 116 | | 436 | | (73.4) | (76.7) |
| Total income | 12,815 | | 12,305 | | 4.1 | 0.2 | 25,120 | | 22,695 | | 10.7 | 4.1 |
| Administrative expenses and amortizations | (5,900) | | (5,535) | | 6.6 | 3.6 | (11,435) | | (10,377) | | 10.2 | 5.3 |
| Net operating income | 6,915 | | 6,770 | | 2.1 | (2.6) | 13,685 | | 12,318 | | 11.1 | 3.1 |
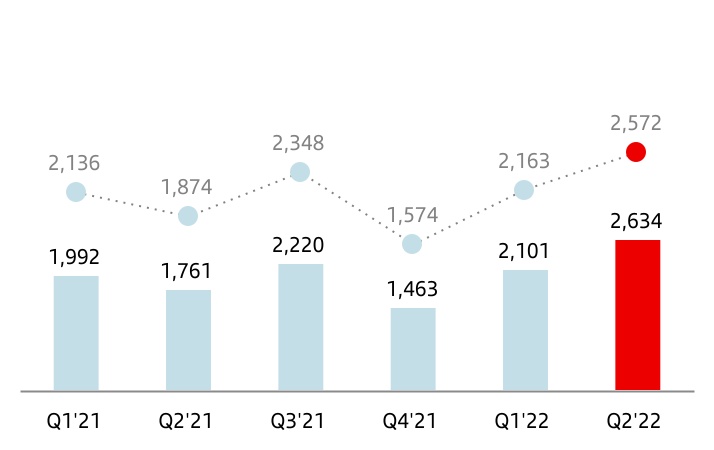
| Net loan-loss provisions | (2,634) | | (2,101) | | 25.4 | 18.9 | (4,735) | | (3,753) | | 26.2 | 18.1 |
| Other gains (losses) and provisions | (537) | | (498) | | 7.8 | 5.7 | (1,035) | | (937) | | 10.5 | 9.1 |
| Profit before tax | 3,744 | | 4,171 | | (10.2) | (14.4) | 7,915 | | 7,628 | | 3.8 | (4.8) |
| Tax on profit | (1,072) | | (1,302) | | (17.7) | (21.9) | (2,374) | | (2,658) | | (10.7) | (18.4) |
| Profit from continuing operations | 2,672 | | 2,869 | | (6.9) | (11.0) | 5,541 | | 4,970 | | 11.5 | 2.6 |
| Net profit from discontinued operations | — | | — | | — | | — | | — | | — | | — | | — | |
| Consolidated profit | 2,672 | | 2,869 | | (6.9) | (11.0) | 5,541 | | 4,970 | | 11.5 | 2.6 |
| Non-controlling interests | (321) | | (326) | | (1.5) | (4.0) | (647) | | (765) | | (15.4) | (20.3) |
| Net capital gains and provisions | — | | — | | — | — | — | | (530) | | (100.0) | (100.0) |
| Profit attributable to the parent | 2,351 | | 2,543 | | (7.6) | (11.9) | 4,894 | | 3,675 | | 33.2 | 20.8 |
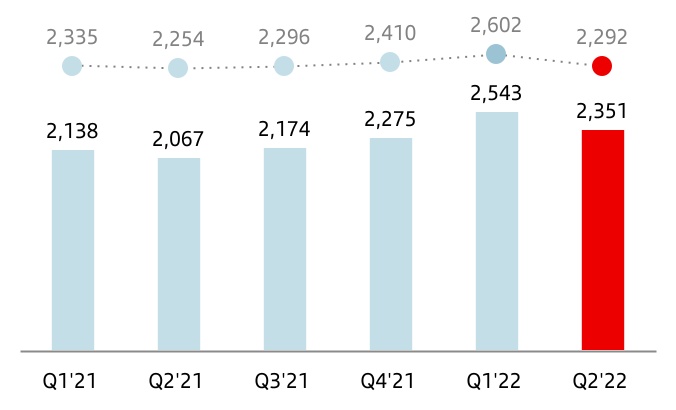
Underlying profit attributable to the parent (2) | 2,351 | | 2,543 | | (7.6) | (11.9) | 4,894 | | 4,205 | | 16.4 | 6.7 |
| | | | | | | | |
(1) Includes exchange differences.
(2) Excludes net capital gains and provisions.
è Results performance compared to the previous quarter
Underlying profit attributable to the parent and profit attributable to the parent recorded the same amount, both in Q2'22 and Q1'22, as profit was not affected by results outside the ordinary course of our business in either period.
As a result, profit in the second quarter amounted to EUR 2,351 million, an 8% decrease in euros and -12% in constant euros.
This performance was driven by the contribution to the SRF, which is usually recorded in the second quarter, in Spain, Portugal, Digital Consumer Bank and the Corporate Centre and the EUR 88 million contribution to the IPS in Poland, as previously explained.
Excluding these impacts, underlying attributable profit was 5% higher. Excluding the exchange rate impact, it rose 1%, as follows:
•Total income remained broadly in line with the previous quarter (+0.2%) due to the aforementioned contributions. Excluding these contributions, total income increased 4%.
| | | | | |
| Net operating income |
| EUR million |
| constant euros |
Net interest income was up 4% supported by higher interest rates and volumes. By region, of note was the 6% rise in Europe, driven by Poland and the UK. In North America, net interest income growth was 4%, with a positive performance both in the US and Mexico, and South America also rose 4% backed by Chile and Argentina, which offset the fall in Brazil.
Net fee income rose 4% with positive performance across regions and Digital Consumer Bank.
Gains on financial transactions dropped 11%, partly due to FX hedging.
•Costs rose 4% affected by the overall increase in inflation.
•Net loan-loss provisions increased 19% mainly due to Poland (CHF mortgages) and Brazil, driven by individual volumes.
| | | | | |
| Underlying profit attributable to the parent* |
| EUR million |
| constant euros |
(*) Excluding net capital gains and provisions.
| | | | | | | | | | | | | | | | | | | | | | | | | | |
Business model | |
| |
| | | |
|
| | Balance sheet | | | | | | |
| | | | | | | | | | | | | | | | | |
| Grupo Santander. Condensed balance sheet |
| EUR million | | | | | |
| | | Change | |
| Assets | Jun-22 | Jun-21 | Absolute | % | Dec-21 |
| Cash, cash balances at central banks and other demand deposits | 211,276 | | 183,091 | | 28,185 | | 15.4 | | 210,689 | |
| Financial assets held for trading | 163,235 | | 102,792 | | 60,443 | | 58.8 | | 116,953 | |
| Debt securities | 41,668 | | 34,114 | | 7,554 | | 22.1 | | 26,750 | |
| Equity instruments | 10,686 | | 13,545 | | (2,859) | | (21.1) | | 15,077 | |
| Loans and advances to customers | 15,090 | | 265 | | 14,825 | | — | | 6,829 | |
| Loans and advances to central banks and credit institutions | 27,076 | | — | | 27,076 | | — | | 14,005 | |
| Derivatives | 68,715 | | 54,868 | | 13,847 | | 25.2 | | 54,292 | |
| Financial assets designated at fair value through profit or loss | 16,870 | | 61,324 | | (44,454) | | (72.5) | | 21,493 | |
| Loans and advances to customers | 7,755 | | 25,353 | | (17,598) | | (69.4) | | 10,826 | |
| Loans and advances to central banks and credit institutions | 1,396 | | 28,791 | | (27,395) | | (95.2) | | 3,152 | |
| Other (debt securities an equity instruments) | 7,719 | | 7,180 | | 539 | | 7.5 | | 7,515 | |
| Financial assets at fair value through other comprehensive income | 91,998 | | 114,505 | | (22,507) | | (19.7) | | 108,038 | |
| Debt securities | 82,664 | | 103,549 | | (20,885) | | (20.2) | | 97,922 | |
| Equity instruments | 2,131 | | 2,751 | | (620) | | (22.5) | | 2,453 | |
| Loans and advances to customers | 7,203 | | 8,205 | | (1,002) | | (12.2) | | 7,663 | |
| Loans and advances to central banks and credit institutions | — | | — | | — | | — | | — | |
| Financial assets measured at amortized cost | 1,129,690 | | 1,003,417 | | 126,273 | | 12.6 | | 1,037,898 | |
| Debt securities | 57,520 | | 29,038 | | 28,482 | | 98.1 | | 35,708 | |
| Loans and advances to customers | 1,007,673 | | 920,695 | | 86,978 | | 9.4 | | 947,364 | |
| Loans and advances to central banks and credit institutions | 64,497 | | 53,684 | | 10,813 | | 20.1 | | 54,826 | |
| Investments in subsidiaries, joint ventures and associates | 7,665 | | 7,562 | | 103 | | 1.4 | | 7,525 | |
| Tangible assets | 34,640 | | 32,678 | | 1,962 | | 6.0 | | 33,321 | |
| Intangible assets | 18,349 | | 16,454 | | 1,895 | | 11.5 | | 16,584 | |
| Goodwill | 13,877 | | 12,854 | | 1,023 | | 8.0 | | 12,713 | |
| Other intangible assets | 4,472 | | 3,600 | | 872 | | 24.2 | | 3,871 | |
| Other assets | 49,117 | | 46,813 | | 2,304 | | 4.9 | | 43,334 | |
| Total assets | 1,722,840 | | 1,568,636 | | 154,204 | | 9.8 | | 1,595,835 | |
| | | | | |
| Liabilities and shareholders' equity | | | | | |
| Financial liabilities held for trading | 114,406 | | 68,982 | | 45,424 | | 65.8 | | 79,469 | |
| Customer deposits | 13,799 | | — | | 13,799 | | — | | 6,141 | |
| Debt securities issued | — | | — | | — | | — | | — | |
| Deposits by central banks and credit institutions | 14,860 | | — | | 14,860 | | — | | 7,526 | |
| Derivatives | 67,152 | | 52,440 | | 14,712 | | 28.1 | | 53,566 | |
| Other | 18,595 | | 16,542 | | 2,053 | | 12.4 | | 12,236 | |
| Financial liabilities designated at fair value through profit or loss | 40,823 | | 54,131 | | (13,308) | | (24.6) | | 32,733 | |
| Customer deposits | 31,463 | | 38,005 | | (6,542) | | (17.2) | | 25,608 | |
| Debt securities issued | 5,597 | | 5,491 | | 106 | | 1.9 | | 5,454 | |
| Deposits by central banks and credit institutions | 3,763 | | 10,635 | | (6,872) | | (64.6) | | 1,671 | |
| Other | — | | — | | — | | — | | — | |
| Financial liabilities measured at amortized cost | 1,427,721 | | 1,310,433 | | 117,288 | | 9.0 | | 1,349,169 | |
| Customer deposits | 928,525 | | 856,122 | | 72,403 | | 8.5 | | 886,595 | |
| Debt securities issued | 255,049 | | 237,739 | | 17,310 | | 7.3 | | 240,709 | |
| Deposits by central banks and credit institutions | 203,511 | | 182,770 | | 20,741 | | 11.3 | | 191,992 | |
| Other | 40,636 | | 33,802 | | 6,834 | | 20.2 | | 29,873 | |
| Liabilities under insurance contracts | 858 | | 1,014 | | (156) | | (15.4) | | 770 | |
| Provisions | 8,590 | | 10,400 | | (1,810) | | (17.4) | | 9,583 | |
| Other liabilities | 32,980 | | 27,931 | | 5,049 | | 18.1 | | 27,058 | |
| Total liabilities | 1,625,378 | | 1,472,891 | | 152,487 | | 10.4 | | 1,498,782 | |
| Shareholders' equity | 122,037 | | 117,552 | | 4,485 | | 3.8 | | 119,649 | |
| Capital stock | 8,397 | | 8,670 | | (273) | | (3.1) | | 8,670 | |
| Reserves (including treasury stock) | 108,746 | | 105,207 | | 3,539 | | 3.4 | | 103,691 | |
| Profit attributable to the Group | 4,894 | | 3,675 | | 1,219 | | 33.2 | | 8,124 | |
| Less: dividends | — | | — | | — | | — | | (836) | |
| Other comprehensive income | (32,526) | | (32,181) | | (345) | | 1.1 | | (32,719) | |
| Minority interests | 7,951 | | 10,374 | | (2,423) | | (23.4) | | 10,123 | |
| Total equity | 97,462 | | 95,745 | | 1,717 | | 1.8 | | 97,053 | |
| Total liabilities and equity | 1,722,840 | | 1,568,636 | | 154,204 | | 9.8 | | 1,595,835 | |
| | | | | | | | | | | | | | | | | | | | | | | | | | |
Business model | |
| |
| | | |
|
| | Balance sheet | | | | | | |
| | | | | | | | |
| GRUPO SANTANDER BALANCE SHEET |
|
| | | | | | | | | | | | | | | | | | | | | | | | | | | | | | | | | | | | | | | | | | | | | | | | | | | | | | | | | | | | | | | | | | | | | | | | | | | | | | | | |
| | | | | Executive summary 1 | | | | | | | | | | | | | | | | | | | | |
| | | | | | | | | | | | | | | | | | | | | | | | |
| | | | | Loans and advances to customers (excl. reverse repos) | | | | | | | Customer funds (deposits excl. repos + mutual funds) | | |
| | | | | | | | | | | | |
| | | | | | | | | | | | |
| | Loans and advances to customers maintained a positive growth trend, increasing both QoQ and YoY | | | | | Customer funds maintained its growth trend, mainly backed by customer deposits | | |
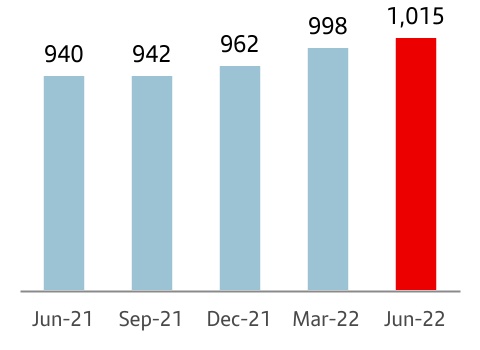
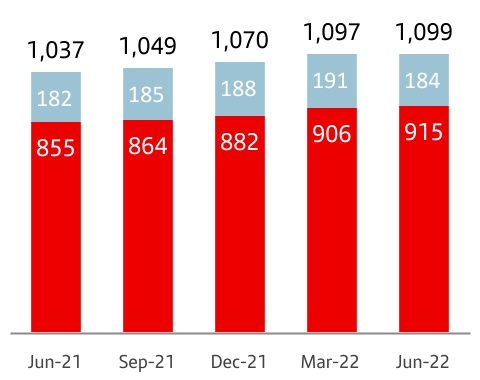
| | 1,015 | +2% QoQ | +6% YoY | | | | | 1,099 | +1% QoQ | +4% YoY | | |
| | EUR billion | | | | | EUR billion | | |
| | | | | | | | | | | | | | | | | | | | | | | | | | |
| | | | | è By segment (YoY changes): | | | | | | | | | | | | è By product (YoY changes): | | | | | | | |
| | | | | | | | | | | | | | | | | | | | | | |
| | | | | | | | | | | | | | | | | | | | | | |
| | | | | | | | | | | | | | | | | | | | | | |
| | Growth backed by individuals and large corporates | | | | Demand deposits accounted for 65% of customer funds and mutual funds were impacted by market performance | | |
| | | | | | |
| | Individuals | SMEs and corporates | CIB | | | | Demand | Time | Mutual funds | | |
| | +7% | 0% | +13% | | | | +3% | +13% | -2% | | |
| | | | | | | | | | | | |
| | | | | (1) Changes in constant euros | | | | | | | | | | | | | | | |
| | | | | | | | | | | | | | | | | | | | | | | | | | |
è Loans and advances to customers
Loans and advances to customers stood at EUR 1,037,721 million in June 2022, 3% higher quarter-on-quarter and +9% year-on-year.
For the purpose of analysing traditional commercial banking loans, the Group uses gross loans and advances to customers excluding reverse repos, which exceeded EUR 1 trillion (EUR 1,015,434 million). In addition, in order to facilitate the analysis of the Group's management, the comments below do not include the exchange rate impact.
In the quarter, gross loans and advances to customers, excluding reverse repos, rose 2%, with increases in all markets, as follows:
•In Europe, loans grew 2%. They rose 2% in Spain, the UK and Poland while in Portugal loans were 1% higher.
•In North America, growth in Mexico was 2% and 1% in the US. In the region as a whole, loans rose 1%.
•In South America, loans increased 5%, with Brazil increasing 3%, Chile +5%, Argentina +17% and Uruguay +6%.
•In Digital Consumer Bank (DCB) growth was 3%, with growth in Openbank of 14%.
| | | | | |
| Gross loans and advances to customers (excl. reverse repos) |
| EUR billion |
(*) In constant EUR: +6%
Compared to June 2021, gross loans and advances to customers (excluding reverse repos and the FX impact) grew 6%, with broad-based growth across countries, as follows:
•In Europe, growth was 5%. Poland rose 8% driven by corporates and institutions and CIB, Spain +7% due to individuals, private banking and institutions, the UK grew 4% backed by mortgages and Portugal increased 2% also driven by mortgages.
•+7% in North America as the US grew 5% propelled by auto financing, SCIB and WM, while Mexico was up 11% with rises in most segments, except SMEs.
•Growth in South America was 12%, with Argentina increasing 55% driven by auto, SMEs and corporates, Chile +11% backed by individuals, Brazil rose 9% owing to individuals and SMEs, and Uruguay recorded a 14% increase.
•Digital Consumer Bank increased 4%, receiving an uplift from new lending, which rose 10% year-on-year, and increased in most countries. Openbank increased 52%.
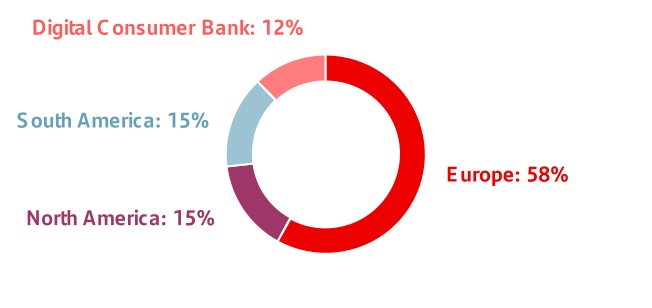
As of June 2022, gross loans and advances to customers excluding reverse repos maintained a balanced structure: individuals (61%), SMEs and corporates (25%) and SCIB (14%).
| | |
| Gross loans and advances to customers (excl. reverse repos) |
| % operating areas. June 2022 |
| | | | | | | | | | | | | | | | | | | | | | | | | | |
Business model | |
| |
| | | |
|
| | Balance sheet | | | | | | |
è Customer funds
Customer deposits amounted to EUR 973,787 million in June 2022, increasing 2% quarter-on-quarter and 9% year-on-year.
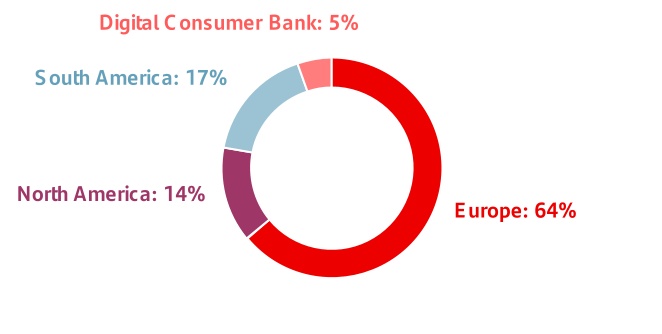
The Group uses customer funds (customer deposits excluding repos, plus mutual funds) for the purpose of analysing traditional retail banking funds, which amounted to EUR 1,098,708 million in June 2022. Just as for loans and advances to customers, the comments below do not include the exchange rate impact.
•In the second quarter, customer funds grew 1%, as follows:
–By product, customer deposits excluding repos rose 1% while mutual funds decreased 3%.
–By primary segment, customer funds rose in South America (+3%) and DCB (+2%), had no material change in Europe and declined in North America (-2%). By country, customer funds increased 18% in Argentina and 3% in Brazil, but declined 3% both in Poland and the US. The other countries remained stable.
•Compared to June 2021, customer funds were up 4%, excluding the exchange rate impact:
–By product, deposits excluding repos rose 5%. Demand deposits grew 3% (with rises Europe and South America and falls in North America) and time deposits were 13% higher driven by all three regions, notably North America. Mutual funds dropped 2% with widespread falls across most countries due to the impact from markets and the rising interest rate environment.
–By region, customer funds increased 4% in Europe, with rises in Spain (+9%), Portugal (+5%) and Poland (+1%), while the UK decreased 3%. 3% rise in North America (the US: +3%; Mexico: +3%) and +5% South America in (Brazil: +3%; Chile: -6%; Argentina: +73%; Uruguay: +18%).
–7% rise in DCB, where Openbank increased 14%.
With this performance, the weight of demand deposits as a percentage of total customer funds was 65%, time deposits accounted for 18% of the total and mutual funds 17%.
| | |
| Customer funds |
| EUR billion |
| | | | | | | | |
| | |
| +6 | % | * | |
| | |
| +1 | % | | |
| | |
| +7 | % | | |
| | |
| | |
•Total |
•Mutual funds |
•Deposits exc. repos |
| | |
| Jun-22 / Jun-21 |
| | |
(*) In constant EUR: +4%
In addition to capturing customer deposits, the Group, for strategic reasons, maintains a selective policy of issuing securities in the international fixed income markets and strives to adapt the frequency and volume of its market operations to the structural liquidity needs of each unit, as well as to the receptiveness of each market.
In the first half of 2022, the Group issued:
•Medium- and long-term covered bonds amounting to EUR 5,158 million and EUR 12,421 million of senior debt placed in the market.
•There were EUR 5,592 million of securitizations placed in the market. Additionally, we extended the maturity of an additional EUR 160 million.
•In order to strengthen the Group’s situation, issuances to meet the TLAC requirement amounted to EUR 5,091 million (EUR 4,974 million of senior non-preferred debt and EUR 117 million of subordinated debt).
•Maturities of medium- and long-term debt of EUR 17,243 million.
The net loan-to-deposit ratio was 107%, the same as in June 2021. The ratio of deposits plus medium- and long-term funding to the Group’s loans was 116%, underscoring the comfortable funding structure.
The Group's access to wholesale funding markets as well as the cost of issuances depends, in part, on the ratings of the rating agencies.
The ratings of Banco Santander, S.A. by the main rating agencies were: Fitch A- senior non-preferred debt, A senior long-term and F2/F1 senior short-term;, Moody's A2 long-term and P-1 short-term; and DBRS A High and R-1 Medium short-term. In December, Standard & Poor's (S&P) raised its long-term rating to A+ (from A) and maintained its short-term rating at A-1. Moody's, DBRS and Fitch maintained their stable outlooks. In March, S&P upgraded it to stable as a result of the sovereign's outlook upgrade.
Sometimes the methodology applied by the agencies limits a bank's rating to the sovereign rating of the country where it is headquartered. Banco Santander, S.A. is still rated above the sovereign debt rating of the Kingdom of Spain by Moody’s, DBRS and S&P and at the same level by Fitch, which demonstrates our financial strength and diversification.
| | |
| Customer funds |
| % operating areas. June 2022 |
| | | | | | | | | | | | | | | | | | | | | | | | | | | | | | | | | | | | | | | | | | | | | | | | | | | | | | | | | | | | | | | | | | | | | | | | | | | | | | | | | | | | | | | | | | | | | | | | | | |
| | | | | Executive summary | | | | | | | | | | | | | | | | | | | | | | | | | |
| | | | | | | | | | | | | | | | | | | | | | | | | | | | | |
| | | | | | | | | | | | | | | | | | | | | | | | | | | | | | | | |
| | | | | Fully-loaded capital ratio | | | | | | | | Fully-loaded CET1 ratio | | | | | | | | | |
| | | | | | | | | | | | | | | | | | | | |
| | Fully-loaded CET1 ratio over 12% at the end of June 2022 | | | | | We continued to generate capital organically in the quarter, backed by profit and RWA management | | |
| | | | | | | | | | Gross organic generation | +26 bps | | | |
| | | | | | | | | Cash dividend accrual2 | -8 bps | | | |
| | | | | | | | | | | | | | |
| | | | | | | | | | | | | | | | | | | | | |
| | | | | | | | | TNAV per share | | | | | | | | | |
| | | | | | | | | | | | | | | | | |
| | | | | | TNAV per share was EUR 4.24, in line with the previous quarter and 9% higher year-on-year including cash dividends | | |
| | | | | | | |
| | | | | | | | | | | | | | | | | | | | | | | | | | | | | | | | |
| | | | | | | | | | | | | | | | | | | | | | | | | | | | | | | | |
| | | | | | | | | | | | | | | | | | | | | | | | | | | | | | | | |
At the end of June 2022, the total phased-in capital ratio (applying the IFRS 9 transitional arrangements) stood at 16.18% and the phased-in CET1 ratio at 12.25%. We comfortably meet the levels required by the European Central Bank on a consolidated basis (13.01% for the total capital ratio and 8.85% for the CET1 ratio). This results in a distance to the maximum distributable amount (MDA) of 307 bps and a CET1 management buffer of 340 bps.
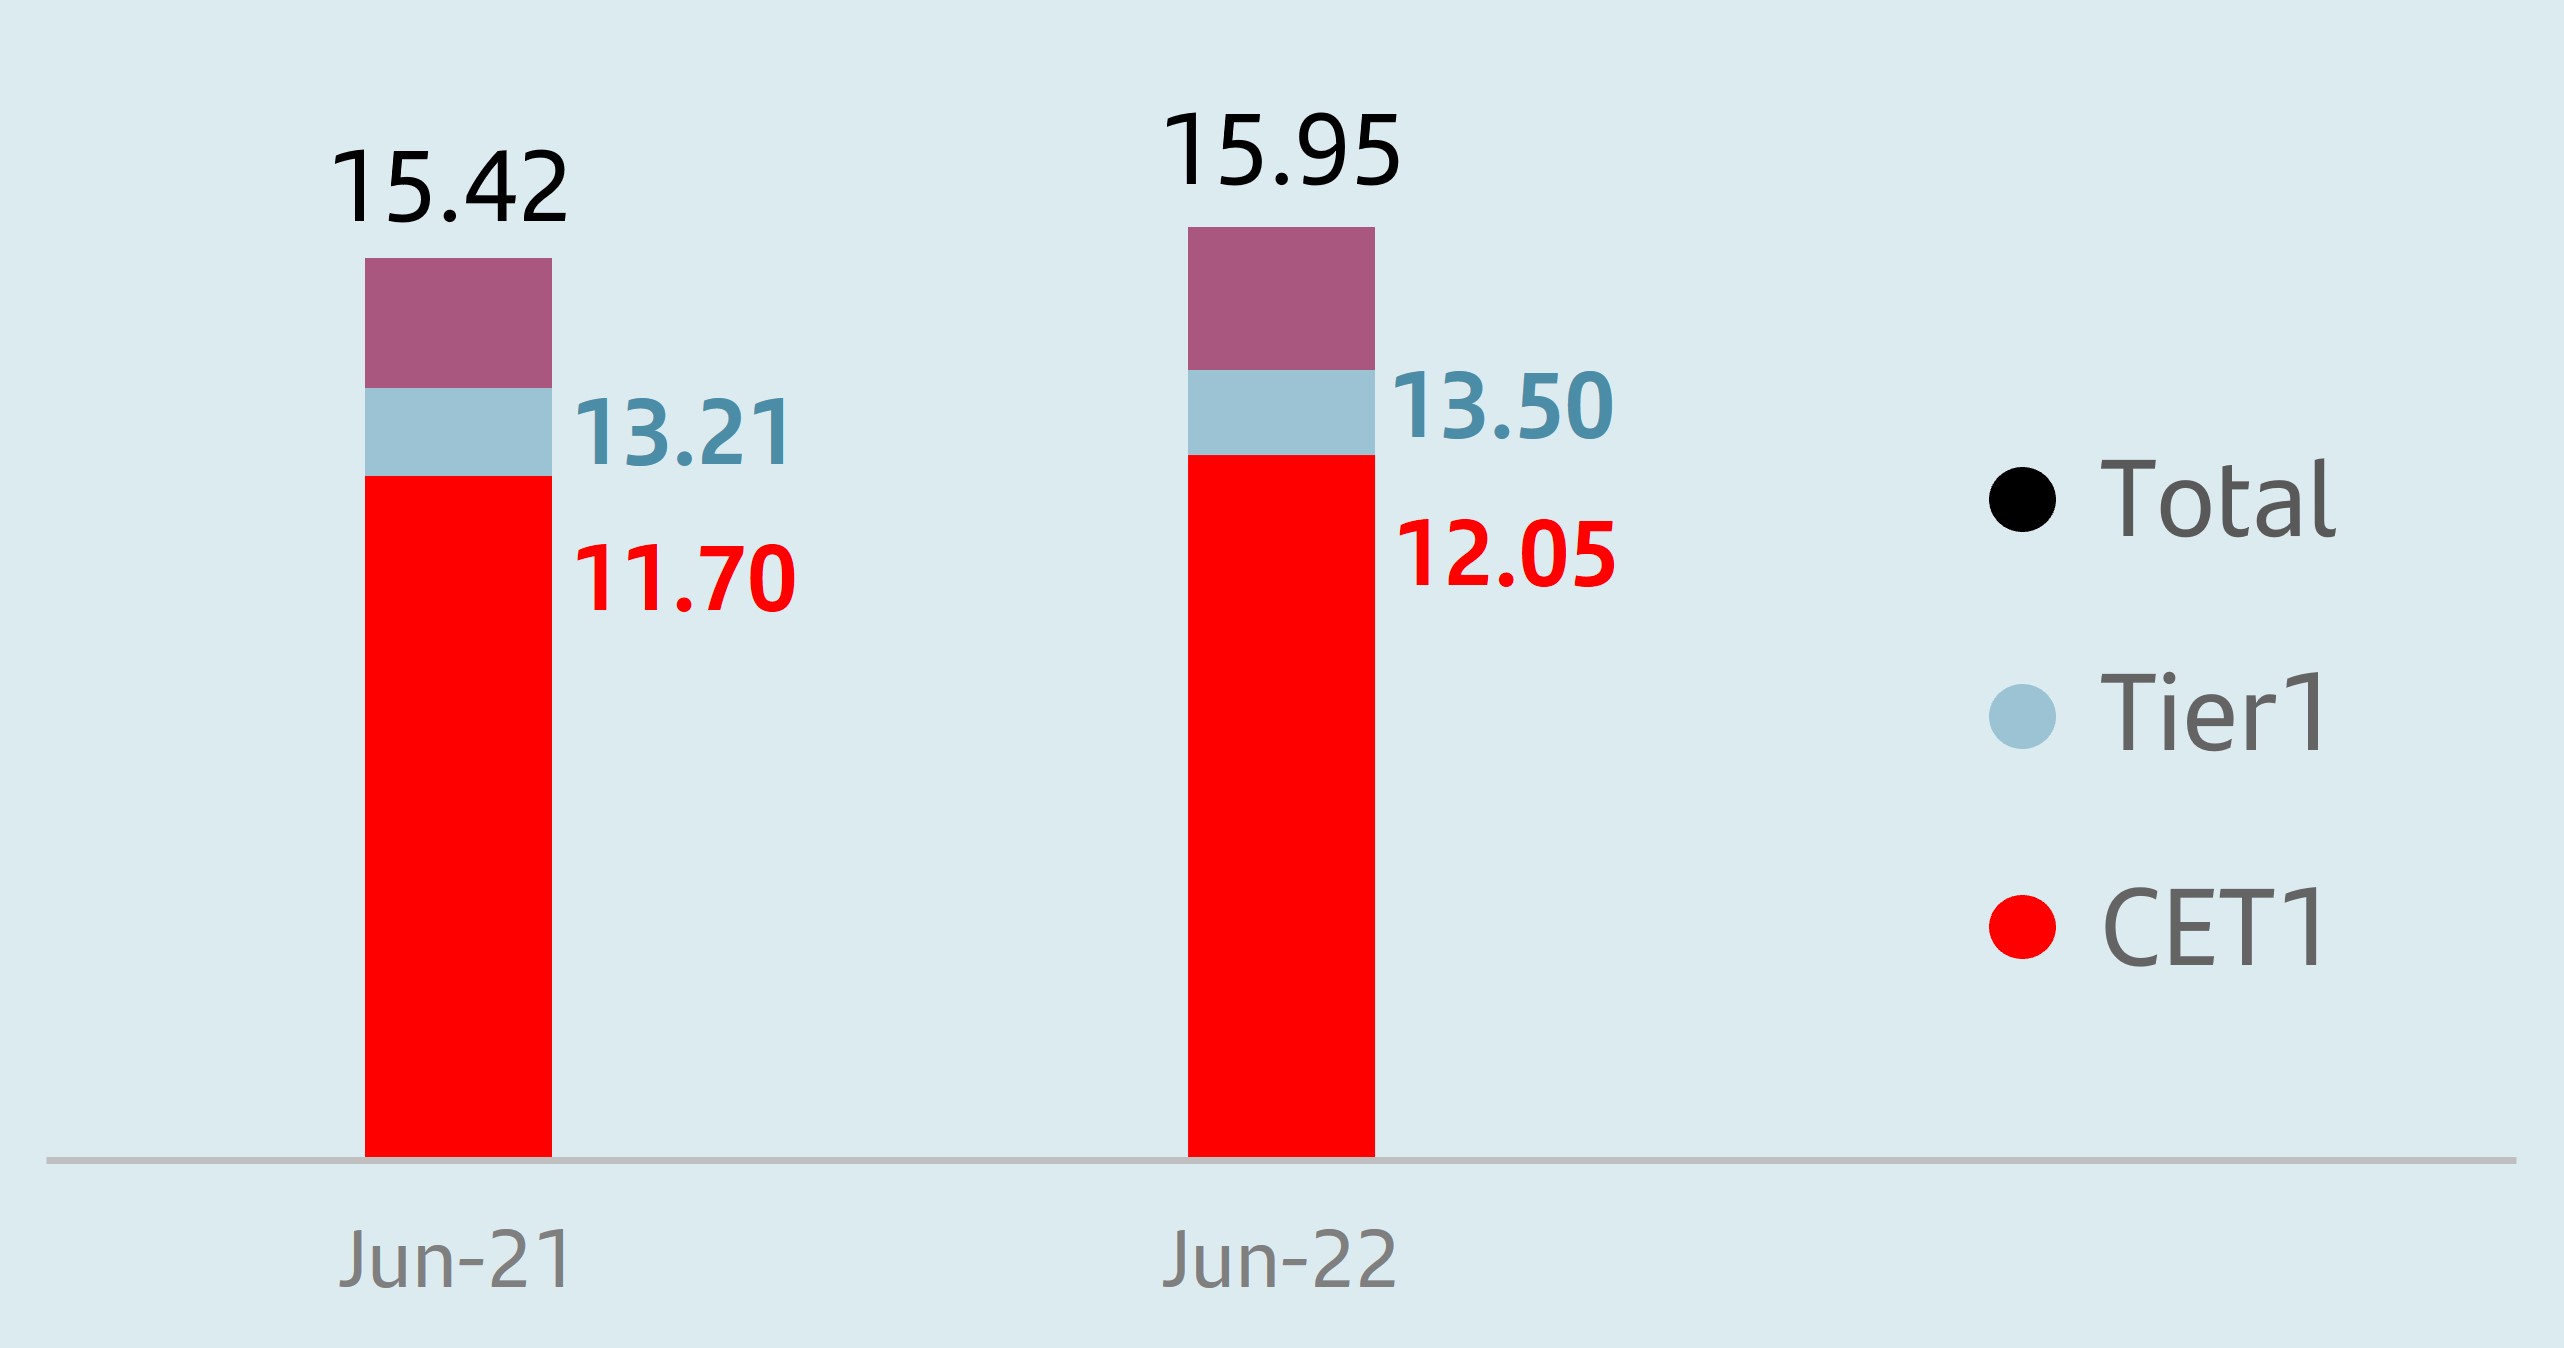
The total fully-loaded capital ratio stood at 15.95% and the fully-loaded CET1 ratio at 12.05%.
We maintained strong net organic generation in the quarter, 18 bps, resulting from gross organic generation of 26 bps (from Q2'22 earnings and RWA management), and the -8 bps accrual for the future cash dividend payment, corresponding to 20% of Q2'22 profit.
Additionally, in the quarter there was a 5 bp reduction stemming from corporate transactions (mainly due to the increase in Ebury's stake), a 16 bp negative impact from markets (of which -13 bps from portfolio valuations) and a 3 bp positive impact from models and others.
The fully-loaded leverage ratio stood at 4.67%, and the phased-in at 4.73%, following the end of the temporary measures approved during the pandemic which permitted the exclusion of reserves with Eurosystem central banks.
Lastly, the TNAV per share ended June 2022 at EUR 4.24, in line with March 2022 including the EUR 5.15 cents cash dividend paid in May. Compared to the same period last year, TNAV per share increased 9%, including the previously mentioned dividend, and EUR 4.85 cents cash dividend paid in November 2021.
| | | | | | | | |
| Eligible capital. June 2022 |
| EUR million | | |
| Fully-loaded | Phased-in* |
| CET1 | 72,964 | | 74,091 | |
| Basic capital | 81,758 | | 82,885 | |
| Eligible capital | 96,585 | | 97,850 | |
| Risk-weighted assets | 605,405 | | 604,777 | |
| | |
| CET1 capital ratio | 12.05 | | 12.25 | |
| Tier 1 capital ratio | 13.50 | | 13.71 | |
| Total capital ratio | 15.95 | | 16.18 | |
| | |
| Fully-loaded CET1 ratio performance |
| % |
(1) Data published in Q1'22, which included the acquisition of Amherst Pierpont (completed in April 2022).
(2) Cash dividend accrual corresponding to 20% of Q2'22 profit. The implementation of the shareholder remuneration policy is subject to future corporate and regulatory decisions and approvals.
(*) The phased-in ratio includes the transitory treatment of IFRS 9, calculated in accordance with article 473 bis of the Capital Requirements Regulation (CRR2) and subsequent modifications introduced by Regulation 2020/873 of the European Union. Total phased-in capital ratios include the transitory treatment according to chapter 4, title 1, part 10 of the CRR2.
| | | | | | | | | | | | | | | | | | | | | | | | | | | | | | | | | | | | | | | | | | | | | | | | | | | | | |
| | | | Executive summary | | | | | | | | |
| | |
| | | | | | | | | | | | | | |
| | | | | | | | | | | | | | | | | |
| | | Credit risk | | Market risk | | |
| | | | | | | |
| | | Credit quality indicators remain at contained levels even in the current environment. | | Despite the uncertainty caused by the Russia-Ukraine conflict, our risk profile remained stable with a slight increase in VaR levels | | |
| | | Cost of risk2 | NPL ratio | Coverage ratio | | Q2'22 | Average
VaR | EUR 13.5 million | | |
| | | 0.83% | 3.05% | 71% | | | |
| | | +6 bps vs Q1'22 | -21 bps vs Q1'22 | +2 pp vs Q1'22 | | | |
| | | | | | | | | | | | | | | | | |
| | | | | | | | | | | | | | | | | |
| | | Structural and liquidity risk | | Operational risk | | |
| | | | | | | | | |
| | | Robust and diversified liquidity buffer, with ratios well above regulatory requirements | | Losses, by Basel categories, remained in line with the previous quarter | | |
| | | Liquidity Coverage Ratio (LCR) | | | |
| | | 165% +8 pp vs Q1'22 | | | |
| | | | | | | | | | | | | | | | | |
| | | | | | | | | | | | | | | | | |
u Russia-Ukraine conflict monitoring
As mentioned in the previous quarter, Santander's direct exposure to Russia and Ukraine is immaterial.
Nevertheless, we are continuously monitoring the geopolitical events with special focus on key indicators, as well as on the most affected customers due to the increased inflation (energy, oil and commodities prices) as a consequence of the Russia-Ukraine conflict.
The Compliance teams continue to review the correct application of the sanctions established by the international community and are carrying out assessments and analyses to provide senior management with the necessary data.
u Credit risk management
Total risk: our exposure increased to EUR 1,121,726 million, +3% vs Q1'22 and +7% year-on-year in constant euros, despite the economic slowdown caused by the rise in interest rates to reduce inflation, the disruption of global production chains as a result of covid-19 outbreaks in Asia and the impact on energy and food prices from the Russia-Ukraine conflict.
Credit impaired loans: EUR 34,259 million, 3% lower in constant compared to the previous quarter, due to portfolio sales, mainly in Spain, together with proactive risk management.
NPL ratio: 3.05%, a 21 bp decrease quarter-on-quarter and -17 bps year-on-year, explained by the positive performance in Europe and North America (-37 bps and -12 bps vs Q1’22, respectively) somewhat mitigated by the rise in South America.
Loan-loss provisions amounted to EUR 4,735 million, an 18% increase compared to the previous year in constant euros, which led to a cost of risk of 0.83% (+6 bps in the quarter), currently with no signs of deterioration despite the current inflationary scenario.
This loan-loss provisions performance, together with the aforementioned portfolio sales, brought the total loan-loss reserves to EUR 24,195 million, a 2% decrease compared to Q1’22 in constant euros.
Total coverage of credit impaired loans stood at 71% (+2 pp compared to the previous quarter). Moreover, to fully understand this value, it should be noted that a significant part of our portfolios in Spain and the UK has real estate collateral, which requires lower coverage levels.
| | | | | | | | | | | | | | | | | | | | | | | | | | | | | | | | | | | | |
| Key metrics performance by geographic area | | | | | | | |
| | | | | | | | | | | | |
| | | | | | | | |
| | | | | | | | | | | | |
| | Loan-loss provisions1 | | Cost of risk (%)2 | | NPL ratio (%) | | Total coverage ratio (%) |
| | H1'22 | Chg (%)
/ H1'21 | | H1'22 | Chg (bps)
/ H1'21 | | H1'22 | Chg (bps)
/ H1'21 | | H1'22 | Chg (pp)
/ Q1'21 |
| Europe | 1,146 | | (4.3) | | | 0.37 | | (12) | | | 2.63 | | (67) | | | 50.2 | | 1.8 | |
| | | | | | | | | | | | |
| | | | | | | | | | | | |
| | | | | | | | | | | | |
| | | | | | | | | | | | |
| | | | | | | | | | | | |
| North America | 962 | | 48.8 | | | 1.09 | | (59) | | | 2.71 | | 43 | | | 111.4 | | (40.9) | |
| | | | | | | | | | | | |
| | | | | | | | | | | | |
| | | | | | | | | | | | |
| South America | 2,333 | | 37.8 | | | 2.97 | | 46 | | | 5.39 | | 102 | | | 86.9 | | (11.2) | |
| | | | | | | | | | | | |
| | | | | | | | | | | | |
| | | | | | | | | | | | |
| | | | | | | | | | | | |
| Digital Consumer Bank | 287 | | (7.0) | | | 0.44 | | (20) | | | 2.22 | | 5 | | | 97.4 | | (14.4) | |
| | | | | | | | | | | | |
| TOTAL GROUP | 4,735 | | 18.1 | | | 0.83 | | (11) | | | 3.05 | | (17) | | | 70.6 | | (2.2) | |
| | | | | | | | | | | | |
| (1) EUR million and % change in constant euros. |
| (2) Allowances for loan-loss provisions over the last 12 months / Average loans and advances to customers over the last 12 months. |
| |
Regarding the measures implemented to mitigate the impact of the pandemic, all moratoria programmes granted by the Group had fully expired by the end of the second quarter, with a better-than-expected performance. As for government liquidity programmes, we are closely monitoring their performance as grace periods come to an end. This type of programme was mostly granted in Spain, where 87% have now expired and credit quality is in line with expectations, with no concerning signs of deterioration.
IFRS 9 stages evolution: the distribution of the portfolio remained stable in the quarter.
| | | | | | | | | | | | | | | | | | | | | | | |
| Coverage ratio by stage | |
| EUR billion |
| Exposure1 | | Coverage |
| Jun-22 | Mar-22 | Jun-21 | | Jun-22 | Mar-22 | Jun-21 |
| Stage 1 | 998 | 967 | 904 | | 0.5 | % | 0.5 | % | 0.5 | % |
| Stage 2 | 66 | 68 | 70 | | 8.5 | % | 8.0 | % | 8.2 | % |
| Stage 3 | 34 | 36 | 33 | | 40.1 | % | 41.0 | % | 42.2 | % |
(1) Exposure subject to impairment. Additionally, in June 2022 there is EUR 23 billion in loans and advances to customers not subject to impairment recorded at mark to market with changes through P&L (EUR 22 billion in March 2022 and EUR 26 billion in June 2021).
Stage 1: financial instruments for which no significant increase in credit risk is identified since its initial recognition.
Stage 2: if there has been a significant increase in credit risk since the date of initial recognition but the impairment event has not materialized, the financial instrument is classified in Stage 2.
Stage 3: a financial instrument is catalogued in this stage when it shows effective signs of impairment as a result of one or more events that have already occurred resulting in a loss.
| | | | | | | | | | | |
| Credit impaired loans and loan-loss allowances |
| EUR million | | |
| | Change (%) |
| Q2'22 | QoQ | YoY |
| Balance at beginning of period | 35,670 | | 7.3 | | 9.8 | |
| Net additions | 2,115 | | (44.0) | | (17.4) | |
| Increase in scope of consolidation | — | | — | | — | |
| Exchange rate differences and other | (247) | | — | | — | |
| Write-offs | (3,279) | | 36.5 | | 54.7 | |
| Balance at period-end | 34,259 | | (4.0) | | 3.0 | |
| | | |
| Loan-loss allowances | 24,195 | | (2.4) | | (0.2) | |
| For impaired assets | 13,739 | | (6.0) | | (2.1) | |
| For other assets | 10,456 | | 2.8 | | 2.4 | |
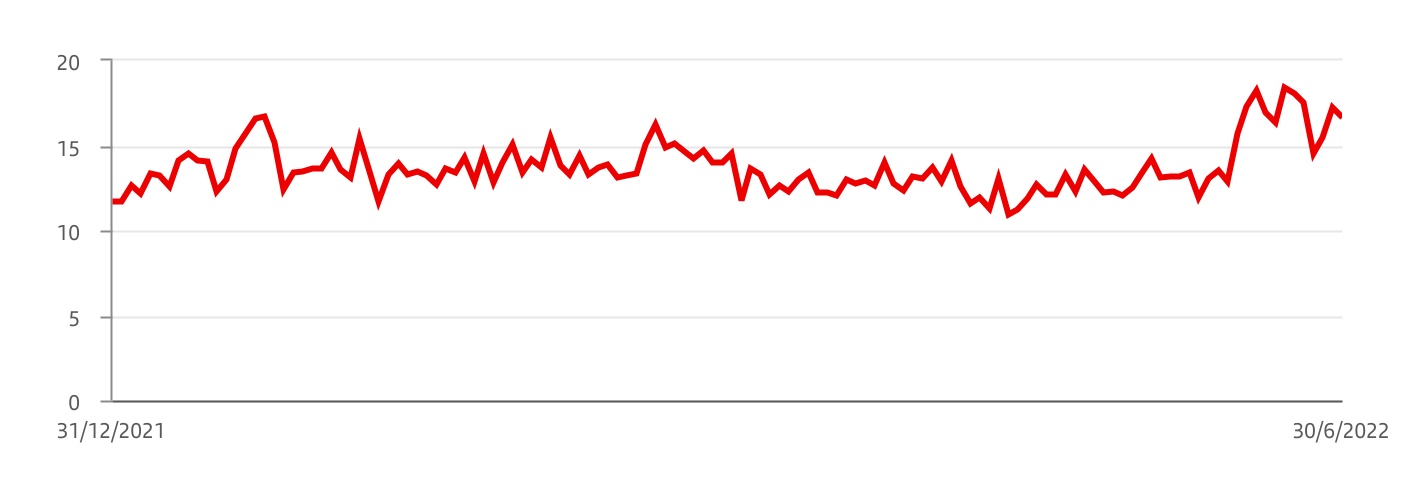
u Market risk
The risk associated with global corporate banking trading activity is mainly interest rate driven, focused on servicing our customers' needs and measured in daily VaR terms at 99%.
In the second quarter of 2022, the VaR fluctuated around an average value of EUR 13.5 million, reflecting our low market risk profile in an environment of high uncertainty caused by a new covid-19 outbreak in Asia, pressure from high global inflation and the Russia-Ukraine conflict. VaR rebounded slightly at the end of the period driven by increased volatility mainly due to the recent actions taken by central banks, who accelerated their policies to combat inflation. The quarter’s closing VaR was EUR 17 million. These figures remain low compared to the size of the Group’s balance sheet and activity.
| | | | | | | | | | | | | | |
Trading portfolios.(1) VaR by geographic region |
| EUR million | | | | |
| 2022 | | 2021 |
| Second quarter | Average | Latest | | Average |
| | | | |
| Total | 13.5 | | 16.6 | | | 9.1 | |
| Europe | 10.2 | | 13.3 | | | 7.9 | |
| North America | 2.0 | | 2.1 | | | 2.4 | |
| South America | 7.8 | | 10.7 | | | 6.0 | |
1. Activity performance in Santander Corporate & Investment Banking markets.
| | | | | | | | | | | | | | |
Trading portfolios.(1) VaR by market factor |
| EUR million | | | | |
| Second quarter 2022 | Min. | Avg. | Max. | Last |
| VaR total | 10.9 | | 13.5 | | 18.4 | | 16.6 | |
| Diversification effect | (8.8) | | (14.1) | | (28.0) | | (18.8) | |
| Interest rate VaR | 9.0 | | 11.6 | | 17.9 | | 16.6 | |
| Equity VaR | 3.2 | | 4.2 | | 5.6 | | 3.4 | |
| FX VaR | 2.7 | | 5.2 | | 10.3 | | 5.3 | |
| Credit spreads VaR | 3.8 | | 5.1 | | 8.5 | | 6.1 | |
| Commodities VaR | 1.0 | | 1.5 | | 4.0 | | 4.0 | |
1.Activity performance in Santander Corporate & Investment Banking markets.
Note: In the North America, South America and Asia portfolios, VaR corresponding to the credit spreads factor other than sovereign risk is not relevant and is included in the interest rate factor.
| | |
Trading portfolios1. VaR performance
|
| EUR million |
| | | | | | | | | | | | | | |
(1) Corporate & Investment Banking performance in financial markets |
u Structural and liquidity risk
Structural exchange rate risk: mainly driven by transactions in foreign currencies related to permanent financial investments, their results and related hedges. Our dynamic management of this risk seeks to limit the impact of foreign exchange rate movements on the Group's core capital ratio. In the quarter, hedging of currencies impacting this ratio remained close to 100%.
Structural interest rate risk: uncertainty over the Russia-Ukraine conflict continued to put pressure on commodity prices, reflected in persistent high levels of inflation. The Central Banks latest actions suggest a faster upward adjustment in interest rates than initially expected, causing higher market volatility. In this context, our structural debt portfolios were negatively impacted, although risk remained at comfortable levels.
Liquidity risk: the Group maintained a comfortable liquidity risk position, supported by a robust and diversified liquidity buffer, with ratios well above regulatory limits.
u Operational risk
In general, our operational risk profile remained stable in the second quarter of 2022, after a moderate increase in the first quarter. The following aspects were closely monitored during this period:
•The Russia-Ukraine conflict and the compliance with international financial measures and sanctions are still a priority.
•IT risks, mainly related to transformation plans due to business strategy and regulatory changes, proactive management of obsolete technology and IT services provided by third parties, in order to ensure availability for services and operations.
•Regulatory compliance, due to increasing regulatory requirements (such as ESG, operational resilience, data management regulations, among others) across the Group.
•Cyber threats across the financial industry, also focused on alerts derived from the Russia-Ukraine conflict, strengthening the bank's monitoring and control environment mechanisms.
•Third party risk exposure, maintaining a close oversight on critical providers, focusing on their control environment including business continuity capabilities, supply chains, cyber risk management and compliance with service level agreements.
•New types of fraud, mainly in online banking transactions (e.g. customer fraud) and in the loan admission processes (e.g. identity theft).
•Emerging risks derived from our transformation initiatives, consumer protection in different markets and climate risk.
Regarding the second quarter performance, losses (by Basel categories) remained in line with the previous quarter.
Grupo Santander conducted its business in the second quarter of 2022 in an environment marked by market volatility, uncertainty stemming from the Russia-Ukraine conflict and the increase in inflation related to higher commodity prices, in particular energy and food. Other factors, such as China's zero-covid strategy and its impact on global production chains, have also exacerbated these issues and together have fuelled speculation of a potential future weakening of the global economy. Against this backdrop, central banks in industrialized countries moved ahead with monetary policy normalization, while policies in Latin America continued to tighten.
| | | | | | | | | | | |
| Country | GDP Change1 | Economic performance |
| Eurozone | +5.4% | GDP in Q2'22 is expected to slow down due to the effect of the Russia-Ukraine conflict on business confidence, the persistence of supply issues and the rise in inflation. However, the labour market remained dynamic (unemployment rate of 6.6% in May, the lowest since the introduction of the euro). The rise in inflation concerned the ECB, who raised interest rate by 50 bps in July. |
| Spain | +6.3% | In Q2'22, the dynamism of the labour market remained, boosted by the end of covid-19-related restrictions. All this despite the uncertainty stemming from the Russia-Ukraine conflict and the tightening of financing conditions. Inflation continued to rise to 10.2% in June. |
| United Kingdom | +8.7% | Economic growth started to slow down in February due to higher energy and production costs, which had an impact on inflation (9.4% in June), in turn affecting households. Employment remained strong in an environment of tight labour supply (unemployment rate at 3.8%). To tackle high inflation, the BoE raised interest rates to 1.25% in June. |
| Portugal | +11.9% | The economy continued to expand, albeit at a slower pace, backed by both consumption and tourism. Despite rising inflation (8.7% in June) damaging purchasing power, the labour market remained robust (unemployment rate at 5.9%) and contributed to economic growth. Positive economic performance is having a favourable impact on public accounts (deficit reduction between January-April). |
| Poland | +8.5% | Economic growth is losing momentum in Q2'22 due to the consequences of the Russia-Ukraine conflict. Government measures to support households in the face of sharp price increases (CPI of 15.5% in June) and supply cuts, as well as the strong labour market (unemployment rate at 3%) should enable economic growth to slow down gradually. The official interest rate was raised to 6.5% to tame inflation. |
| United States | +3.5% | Inflation reached 9.1% in June. Core inflation stood at 5.9% and forecasts suggest it has not yet peaked. Employment grew at a healthy pace and unemployment stood at low levels (3.5%). The Fed accelerated rate hikes (to 1.5-1.75% in June) and expects further rapid raises this year, increasing fears of recession. |
| Mexico | +1.8% | The recovery of GDP growth that began in early 2022 continued in Q2'22 supported by industry and services. However, greater global uncertainty and heightened inflation (8% in June) could result in a slowdown. The central bank reaffirmed its commitment to price stability and accelerated the process of interest rate hikes (125 bps in Q2'22 to 7.75%) and maintained a restrictive policy. |
| Brazil | +1.7% | After a positive first quarter, economic growth remained dynamic in Q2'22, with expansion in services and manufacturing and a strong labour market. Inflation started to moderate slightly in May, but remained high (11.9% in June) and the central bank raised the official rate by 150 bps in Q2'22 to 13.25% and announced at least one more hike. |
| Chile | +7.2% | GDP growth weakened in 2022 following the strong growth recorded in 2021, as the effects of fiscal and monetary impulses of the previous year faded. Soaring inflation (12.5% in June) prompted the central bank to move ahead with monetary tightening, raising the official rate by 350 bps in Q2'22 and 75 bps in July to 9.75%. |
| Argentina | +6.0% | In the first technical review of the agreement with the IMF, Argentina met the established targets, allowing the refinancing of debt maturities with the organization. The economy showed some volatility, although economic slowdown prevailed in the last few months. Inflation remained high (5.5% monthly in Q2'22) and the central bank continued to raise the official rate (750 bps in Q2'22 to 52%). |
(1) Year-on-year change for Q1'22.
We base segment reporting on financial information presented to the chief operating decision maker, which excludes certain statutory results items that distort year-on-year comparisons and are not considered for management reporting. This financial information (underlying basis) is computed by adjusting reported results for the effects of certain gains and losses (e.g. capital gains, write-downs, impairment of goodwill, etc.). These gains and losses are items that management and investors ordinarily identify and consider separately to better understand the underlying trends in the business.
Santander has aligned the information in this chapter with the underlying information used internally for management reporting and with that presented in the Group's other public documents.
Santander's executive committee has been selected to be its chief operating decision maker. The Group's operating segments reflect its organizational and managerial structures. The executive committee reviews internal reporting based on these segments to assess performance and allocate resources.
The segments are split by geographic area in which profits are earned and type of business. We prepare the information by aggregating the figures for Santander’s various geographic areas and business units, relating it to both the accounting data of the business units integrated in each segment and that provided by management information systems. The same general principles as those used in the Group are applied.
With the aim of increasing transparency and improving capital allocation to continue enhancing our profitability, on 4 April 2022, we announced that, starting and effective with the financial information for the first quarter of 2022, inclusive, we would carry out the following modifications to our reporting:
a. Main changes in the composition of Grupo Santander's segments announced in April 2022
The main changes, which have been applied to management information for all periods included in the consolidated financial statements, are the following:
1.Reallocation of certain financial costs from the Corporate Centre to the country units:
•Further clarity in the MREL/TLAC regulation makes it possible to better allocate the cost of eligible debt issuances to the country units.
•Other financial costs, primarily associated with the cost of funding the excess capital held by the country units above the Group's CET1 ratio, have been reassigned accordingly.
2.Downsizing of Other Europe.
•The Corporate & Investment Banking branches of Banco Santander, S.A. in Europe and other business lines previously reported under 'Other Europe' have been now integrated into the Spain unit to reflect how the business will be managed and supervised, in line with other regions.
The Group recast the corresponding information of earlier periods considering the changes included in this section to facilitate a homogeneous comparison.
In addition to these changes, we completed the usual annual adjustment of the perimeter of the Global Customer Relationship Model between Retail Banking and Santander Corporate & Investment Banking and between Retail Banking and Wealth Management & Insurance.
The above-mentioned changes have no impact on the Group’s reported consolidated financial figures.
b. Current composition of Grupo Santander segments
Primary segments
This primary level of segmentation, which is based on the Group’s management structure, comprises five reportable segments: four operating areas plus the Corporate Centre. The operating areas are:
Europe: comprises all business activity carried out in the region, except that included in Digital Consumer Bank. Detailed financial information is provided on Spain, the UK, Portugal and Poland.
North America: comprises all the business activities carried out in Mexico and the US, which includes the holding company (SHUSA) and the businesses of Santander Bank, Santander Consumer USA (SC USA), the specialized business unit Banco Santander International, Santander Investment Securities (SIS) and Santander's New York branch.
South America: includes all the financial activities carried out by Grupo Santander through its banks and subsidiary banks in the region. Detailed information is provided on Brazil, Chile, Argentina, Uruguay, Peru and Colombia.
Digital Consumer Bank: includes Santander Consumer Finance, which incorporates the entire consumer finance business in Europe, Openbank and ODS.
Secondary segments
At this secondary level, Grupo Santander is structured into Retail Banking, Santander Corporate & Investment Banking (SCIB), Wealth Management & Insurance (WM&I) and PagoNxt.
Retail Banking: this covers all customer banking businesses, including consumer finance, except those of corporate banking which are managed through Santander Corporate & Investment Banking, asset management, private banking and insurance, which are managed by Wealth Management & Insurance. The results of the hedging positions in each country are also included, conducted within the sphere of their respective assets and liabilities committees.
Santander Corporate & Investment Banking: this business reflects revenue from global corporate banking, investment banking and markets worldwide including treasuries managed globally (always after the appropriate distribution with Retail Banking customers), as well as equity business.
Wealth Management & Insurance: includes the asset management business (Santander Asset Management), the corporate unit of Private Banking and International Private Banking in Miami and Switzerland (Santander Private Banking) and the insurance business (Santander Insurance).
PagoNxt: this includes digital payment solutions, providing global technology solutions for our banks and new customers in the open market. It is structured in four businesses: Merchant, International Trade, Payments and Consumer.
In addition to these operating units, both primary and secondary segments, the Group continues to maintain the area of Corporate Centre, that includes the centralized activities relating to equity stakes in financial companies, financial management of the structural exchange rate position, assumed within the sphere of the Group’s assets and liabilities committee, as well as management of liquidity and of shareholders’ equity via issuances, adapting this management to the changes described above.
As the Group’s holding entity, this area manages all capital and reserves and allocations of capital and liquidity with the rest of businesses. It also incorporates goodwill impairment but not the costs related to the Group’s central services (charged to the areas), except for corporate and institutional expenses related to the Group’s functioning.
| | |
The businesses included in each of the primary segments in this report and the accounting principles under which their results are presented here may differ from the businesses included and accounting principles applied in the financial information separately prepared and disclosed by our subsidiaries (some of which are publicly listed) which in name or geographical description may seem to correspond to the business areas covered in this report. Accordingly, the results of operations and trends shown for our business areas in this document may differ materially from those of such subsidiaries. The results of our business areas presented below are provided on the basis of underlying results only and generally including the impact of foreign exchange rate fluctuations. However, for a better understanding of the changes in the performance of our business areas, we also provide and discuss the year-on-year changes to our results excluding such exchange rate impacts. On the other hand, certain figures contained in this report, including financial information, have been subject to rounding to enhance their presentation. Accordingly, in certain instances, the sum of the numbers in a column or a row in tables contained in this report may not conform exactly to the total figure given for that column or row. |
| | | | | | | | | | | | | | | | | | | | |
| January-June 2022 |
| Main items of the underlying income statement |
| EUR million | | | | | | |
| Primary segments | Net interest
income | Net fee
income | Total
income | Net operating
income | Profit
before tax | Underlying profit attributable to
the parent |
| Europe | 5,820 | | 2,316 | | 8,581 | | 4,417 | | 2,693 | | 1,839 | |
| Spain | 2,015 | | 1,475 | | 3,937 | | 1,994 | | 904 | | 652 | |
| United Kingdom | 2,418 | | 202 | | 2,633 | | 1,285 | | 995 | | 736 | |
| Portugal | 340 | | 245 | | 613 | | 363 | | 327 | | 225 | |
| Poland | 894 | | 268 | | 1,090 | | 751 | | 444 | | 207 | |
| Other | 152 | | 126 | | 307 | | 25 | | 23 | | 18 | |
| North America | 4,483 | | 937 | | 5,780 | | 3,088 | | 2,061 | | 1,578 | |
| US | 2,877 | | 394 | | 3,665 | | 1,984 | | 1,378 | | 1,090 | |
| Mexico | 1,606 | | 529 | | 2,096 | | 1,166 | | 747 | | 546 | |
| Other | 0 | | 14 | | 19 | | (62) | | (64) | | (58) | |
| South America | 6,427 | | 2,175 | | 8,933 | | 5,780 | | 3,165 | | 1,946 | |
| Brazil | 4,421 | | 1,600 | | 6,393 | | 4,442 | | 2,270 | | 1,365 | |
| Chile | 1,038 | | 222 | | 1,357 | | 868 | | 646 | | 391 | |
| Argentina | 732 | | 264 | | 821 | | 345 | | 168 | | 145 | |
| Other | 236 | | 90 | | 362 | | 126 | | 82 | | 44 | |
| Digital Consumer Bank | 2,032 | | 425 | | 2,573 | | 1,325 | | 1,010 | | 572 | |
| Corporate Centre | (353) | | (1) | | (747) | | (926) | | (1,014) | | (1,040) | |
| TOTAL GROUP | 18,409 | | 5,852 | | 25,120 | | 13,685 | | 7,915 | | 4,894 | |
| | | | | | |
| Secondary segments | | | | | | |
| Retail Banking | 16,714 | | 3,791 | | 20,635 | | 11,610 | | 5,997 | | 3,991 | |
| Corporate & Investment Banking | 1,714 | | 1,027 | | 3,612 | | 2,324 | | 2,291 | | 1,531 | |
| Wealth Management & Insurance | 329 | | 655 | | 1,222 | | 726 | | 705 | | 515 | |
| PagoNxt | 5 | | 379 | | 398 | | (50) | | (64) | | (104) | |
| Corporate Centre | (353) | | (1) | | (747) | | (926) | | (1,014) | | (1,040) | |
| TOTAL GROUP | 18,409 | | 5,852 | | 25,120 | | 13,685 | | 7,915 | | 4,894 | |
| | |
Underlying attributable profit to the parent distribution* |
| January - June 2022 |
(*) As a % of operating areas. Excluding the Corporate Centre.
| | |
| Underlying attributable profit to the parent. H1'22 |
| EUR million. % change YoY in constant euros |
| | | | | | | | |
| Europe | | |
| |
| |
| |
| | |
North
America | | |
| |
| | |
South
America | | |
| |
| |
| | |
| Digital Consumer Bank | | DCB |
| | |
| Global businesses | | |
| |
|
| | |
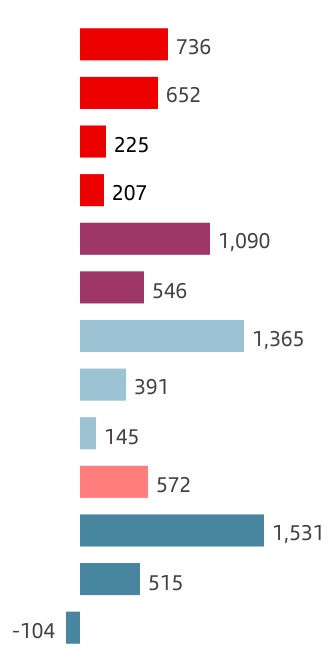
| | |
| +6 | % |
| +86 | % |
| -2 | % |
| +381 | % |
|
| -21 | % |
| +32 | % |
|
| -1 | % |
| +27 | % |
| +58 | % |
|
| +16 | % |
|
| +28 | % |
| +15 | % |
| -16 | % |
|
| | | | | | | | | | | | | | | | | | | | |
| January-June 2021 |
| Main items of the underlying income statement |
| EUR million | | | | | | |
| Primary segments | Net interest
income | Net fee
income | Total
income | Net operating
income | Profit
before tax | Underlying profit attributable to
the parent |
| Europe | 5,207 | | 2,157 | | 7,903 | | 3,760 | | 1,963 | | 1,312 | |
| Spain | 2,139 | | 1,378 | | 3,901 | | 1,874 | | 512 | | 351 | |
| United Kingdom | 2,076 | | 238 | | 2,298 | | 999 | | 973 | | 677 | |
| Portugal | 370 | | 210 | | 715 | | 427 | | 333 | | 229 | |
| Poland | 475 | | 253 | | 759 | | 438 | | 127 | | 44 | |
| Other | 147 | | 79 | | 229 | | 23 | | 18 | | 11 | |
| North America | 3,949 | | 861 | | 5,421 | | 3,079 | | 2,478 | | 1,581 | |
| US | 2,610 | | 432 | | 3,684 | | 2,152 | | 1,996 | | 1,253 | |
| Mexico | 1,339 | | 414 | | 1,730 | | 978 | | 535 | | 378 | |
| Other | 0 | | 14 | | 7 | | (52) | | (53) | | (50) | |
| South America | 5,326 | | 1,770 | | 7,303 | | 4,785 | | 3,105 | | 1,639 | |
| Brazil | 3,696 | | 1,330 | | 5,199 | | 3,697 | | 2,350 | | 1,178 | |
| Chile | 1,008 | | 190 | | 1,251 | | 770 | | 591 | | 321 | |
| Argentina | 437 | | 161 | | 561 | | 212 | | 98 | | 106 | |
| Other | 185 | | 88 | | 292 | | 107 | | 66 | | 35 | |
| Digital Consumer Bank | 2,010 | | 395 | | 2,486 | | 1,272 | | 888 | | 485 | |
| Corporate Centre | (297) | | (13) | | (418) | | (577) | | (806) | | (812) | |
| TOTAL GROUP | 16,196 | | 5,169 | | 22,695 | | 12,318 | | 7,628 | | 4,205 | |
| | | | | | |
| Secondary segments | | | | | | |
| Retail Banking | 14,859 | | 3,489 | | 18,995 | | 10,629 | | 6,270 | | 3,576 | |
| Corporate & Investment Banking | 1,407 | | 889 | | 2,869 | | 1,764 | | 1,688 | | 1,140 | |
| Wealth Management & Insurance | 228 | | 596 | | 1,063 | | 615 | | 598 | | 432 | |
| PagoNxt | (2) | | 209 | | 189 | | (108) | | (118) | | (127) | |
| Corporate Centre | (297) | | (13) | | (418) | | (577) | | (806) | | (812) | |
| TOTAL GROUP | 16,196 | | 5,169 | | 22,695 | | 12,318 | | 7,628 | | 4,205 | |
| | | | | | | | | | | | | | | | | | | | | | | | | | |
Business model | |
| |
| | | |
|
| | | | Primary segments | | | | |
| | | | | | | | |
| EUROPE | Underlying attributable profit |
| EUR 1,839 mn |
Executive summary → We continue to accelerate our business transformation in One Santander in Europe, in order to achieve superior growth and a more efficient operating model. This should allow us to further improve profitability and increase RoTE in the coming years. → Overall growth in volumes quarter-on-quarter and in the last 12 months, when loans and deposits both grew 5% in constant euros. → Higher revenue, continued efficiency improvement and better cost of risk, led to an underlying attributable profit of EUR 1,839 million, up 40% year-on-year in euros and +38% excluding the exchange rate impact. |
Strategy
Our goal with One Santander in Europe is to create a better bank where customers and our people feel a deep connection and that delivers sustainable value for our shareholders having a positive impact in society. In order to achieve our goals of growing our customer base and loyalty while delivering a more efficient and profitable business model, we are making progress in the business transformation through our action plan, defined around three main blocks:
•Grow our business by better serving our customers through regional simplification and an improved value proposition.
•Redefining customer interaction by enhancing our digital capabilities to offer comprehensive experiences (such as OneApp).
•Create a common operating model that embeds technology into our business, leveraging our scale in the region.
Key developments by country in the quarter:
•Spain: sustained customer base growth with strong commercial activity based on offering the best customer experience through all channels with a simple and innovative value proposition. We focused on product simplification and process automatization to reduce the cost to serve while accelerating the transition to an agile organization.
•United Kingdom: we continue to focus on growing the mortgage business. Our transformation programme continues to deliver efficiency improvements through the simplification and digitalization of key processes.
•Portugal: the digital and commercial transformation plans implemented in 2021 enabled us to continue executing our strategy to increase our customer base, by leveraging service quality. Customer revenue improved and costs decreased while maintaining an adequate risk management.
| | | | | | | | | | | | | | | | | | | | | | | | | | | | | | | | | |
| Loyal customers | | | | Spain | | UK | | Portugal | | Poland |
| | | | | | | | | | |
| Thousands | | 10,536 | | 2,880 | | 4,464 | | 883 | | 2,307 |
| YoY change | | +4% | | +4% | | +2% | | +6% | | +7% |
| | | | | | | | | | | |
| Digital customers | | | | Spain | | UK | | Portugal | | Poland |
| | | | | | | | | | |
| Thousands | | 16,816 | | 5,697 | | 6,765 | | 1,019 | | 3,170 |
| YoY change | | +7% | | +7% | | +6% | | +4% | | +11% |
| | | | | | | | | | | | | | | | | | | | | | | | | | |
Business model | |
| |
| | | |
|
| | | | Primary segments | | | | |
•Poland: we remained focused on providing the best customer and employee experience, simplifying our products and internal processes through digitalization, while developing platforms to accelerate our progress towards our responsible banking commitments.
To deliver on our targets to tackle climate change, we developed a new governance structure, identifying five key verticals for which we have appointed business leaders in each country: green buildings, clean mobility, renewable energy, agro and circular economy. With this specialization, we strive to create business opportunities to help our customers through joint projects with other relevant players. In Spain, we are already developing a green commercial proposition based on retrofitting, that goes from awareness to turnkey products.
Business performance
We developed our activities in H1'22 amid a complex and uncertain macro environment marked by the continuation of the Russia-Ukraine conflict. This led to higher inflation and, therefore, lower growth forecasts, interest rates hikes in some countries, changes in expectations for eurozone interest rates, and higher market volatility.
Loans and advances to customers grew 4% year-on-year. In gross terms, excluding the exchange rate impact and reverse repurchase agreements, growth was 5%, primarily driven by the mortgage business (mainly in the UK and Spain, but also by the positive trends in Portugal) and cards (primarily in the UK and Portugal). Loans to corporates and SMEs slowed down due to previous government support programmes and a lower demand in previous months.
Customer deposits rose 4%. Excluding the exchange rate impact and repurchase agreements, customer deposits increased 5%, with positive trends in all countries except in the UK, where rising interest rates led to an increase in price competition to capture funds, especially in the retail segment. Mutual funds decreased due to the rising interest rate environment, mainly in Poland.
| | | | | | | | | | | | | | | | | | | | | | | | | | | | | | | | | | | | | | |
| Europe. Business performance |
| June 2022. EUR billion and YoY % change in constant euros | |
| | | | | | | | | | | | |
| | 589 | | +5% | | | | | | 705 | | +4% | |
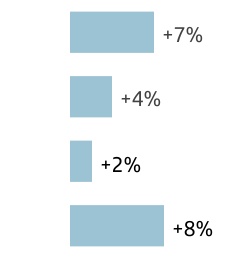 aaaaa
aaaaa 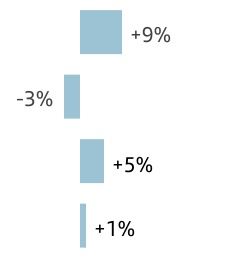
| | | | | | | | | | | | | | | | | | | | | | | | | | | | | | | | | | | | | | |
| Gross loans and advances to customers excl. reverse repos | | Customer deposits excl.
repos + mutual funds |
Results
Underlying attributable profit in the first half of 2022 was EUR 1,839 million, 40% higher than in the same period of 2021. Excluding the exchange rate impact, profit rose 38%, with the following detail:
•Total income was up 8%, driven by net interest income performance in the UK and Poland, benefitting from higher volumes and interest rate hikes in recent quarters. Net fee income increased in Spain, Poland and Portugal, partially offsetting lower non-recurring results due to ALCO portfolio sales recorded in 2021.
•Our transformation plans enabled us to lower costs by 1% in a high-inflation environment. In real terms, costs fell 7%.
•Loan-loss provisions decreased 4% year-on-year, even with the new provisions related to the CHF portfolio in Poland. Excluding this impact, loan-loss provisions dropped 13%, primarily driven by Spain.
By country:
•Spain: underlying attributable profit recovered driven by strong net fee income growth, higher productivity and a sharp LLP reduction, which drove the six-month annualized cost of risk down to 0.61%.
•United Kingdom: underlying attributable profit increased, reflecting margin management after recent interest rate hikes and boosted by the mortgage business. The cost of risk remained low due to proper credit risk management.
•Portugal: underlying attributable profit fell slightly, mainly due to 2021 non-recurring results from ALCO portfolio sales. Continued positive performance in net fee income propelled by transactional and insurance businesses, while costs and provisions continued downward.
•Poland: underlying attributable profit increased five fold on the back of sharp NII growth. Costs rose reflecting inflationary pressures, while loan-loss provisions increased mainly due to higher provisioning required for the CHF mortgage portfolio.
In the quarter, underlying attributable profit decreased 19% primarily driven by higher regulatory charges: SRF in Spain and Portugal and Institutional Protection Scheme (IPS) in Poland.
| | | | | | | | | | | | | | | | | | | | | | | | |
| Europe. Underlying income statement |
| EUR million and % change |
| | | | | | | | |
| | | | | | | | |
| | | / | Q1'22 | | | / | H1'21 |
| | Q2'22 | % | excl. FX | | H1'22 | % | excl. FX |
| | | | | | | | |
| Revenue | 4,276 | | -1 | 0 | | 8,581 | | +9 | +8 |
| Expenses | -2,104 | | +2 | +2 | | -4,164 | | 0 | -1 |
| Net operating income | 2,172 | | -3 | -3 | | 4,417 | | +17 | +17 |
| LLPs | -631 | | +23 | +23 | | -1,146 | | -5 | -4 |
| PBT | 1,199 | | -20 | -19 | | 2,693 | | +37 | +35 |
| Underlying attrib. profit | 821 | | -19 | -19 | | 1,839 | | +40 | +38 |
| | | | | | | | | | | | | | | | | | | | | | | | | | |
Business model | |
| |
| | | |
|
| | | | Primary segments | | | | |
| | | | | | | | |
| Spain | Underlying attributable profit |
| EUR 652 mn |
Commercial activity and business performance
The quarter was marked by rising inflation, downward growth revisions and market instability. Against this backdrop, we consolidated the growth trend in customers.
In individuals, we maintained positive dynamics both in mortgage and consumer lending, increasing new lending volumes in the quarter. In addition, the insurance protection business continued to grow at double-digit rates year-on-year.
In corporates, we improved on Q1 figures, with quarter-on-quarter growth in factoring (+23%), confirming (+9%) and trade discount (+6%). The trend in long-term funding remained positive (+9%).
Transactional products maintained their year-on-year growth path, also improving our market shares in terms of volumes and number of customers in PoS.
As a result, loans and advances to customers grew 10% year-on-year (+7% in gross terms, excluding reverse repurchase agreements and the exchange rate impact), mainly backed by individuals, private banking and institutions. In the quarter, lending volumes rose 2%.
Customer funds increased 9% versus H1'21, notably deposits (+12% excluding repos) driven both by demand deposits (+9%) and time deposits (+27%). Market volatility continued to impact mutual fund assets under management, but assets under management remained virtually stable compared to June 2021.
Results
Underlying attributable profit in the first half of 2022 amounted to EUR 652 million, 86% higher year-on-year. By line:
•Total income rose 1% year-on-year, backed by net fee income (+7%), compensating the fall in net interest income due to the lower contribution from the ALCO portfolio and the change of mix towards mortgages.
•The cost base continued to fall (-4%) despite soaring inflation and the expansion of the wholesale business, which reflects the progress in the transformation of the operating model.
•The NPL ratio improved further (3.83%; -133 bps year-on-year, partially driven by NPL sales), enabling us to continue reducing LLPs (-26%) and driving the six month annualized cost of credit to 0.61%.
Compared to the first quarter, underlying attributable profit declined 21%, impacted by the contribution to the Single Resolution Fund.
| | | | | | | | | | | | | | | | | | |
| Spain. Underlying income statement |
| EUR million and % change |
| | | | | | |
| | | | | | |
| | Q2'22 | / Q1'22 | | H1'22 | / H1'21 |
| | | | | | |
| Revenue | 1,916 | | -5 | | 3,937 | | +1 |
| Expenses | -971 | | 0 | | -1,943 | | -4 |
| Net operating income | 945 | | -10 | | 1,994 | | +6 |
| LLPs | -416 | | +6 | | -807 | | -26 |
| PBT | 385 | | -26 | | 904 | | +77 |
| Underlying attrib. profit | 287 | | -21 | | 652 | | +86 |
Detailed financial information on page 57 | | | | | | | | |
| United Kingdom | Underlying attributable profit |
| EUR 736 mn |
Commercial activity and business performance
In the first half of 2022, we delivered a positive performance amid a challenging backdrop of rising inflation and interest rates.
We continued to adapt our operating model to meet the changing needs of our customers and increased remote banking capabilities. Our customers further utilized digital channels for banking services, with 70% of refinanced mortgage loans processed online, 90% of new current accounts opened through digital channels and digital transactions up 12% year-on-year.
In June 2022, we increased the rate on our 1|2|3 Current Account by 25 bps to 0.75% and our eSaver accounts by 50 bps. Santander UK remains the only bank in the UK to offer customers both cashback on household bills and interest on current account balances.
Loans and advances to customers decreased by 1% year-on-year. In gross terms and excluding reverse repos and the exchange rate impact, growth was 4%, supported by an increase of GBP 7.1 billion in net mortgage lending (GBP 18.9 billion in gross new lending) in a strong housing market.
Customer deposits declined by 6%. Excluding repos and the exchange rate impact, customer deposits contracted 3% primarily due to the CIB business transfer. This performance also reflected reductions in retail liability balances, as customers return to more normal spending patterns following the covid-19 pandemic.
Results
Underlying attributable profit in the first half of 2022 increased 9% year-on-year to EUR 736 million, +6% excluding the exchange rate impact, as follows:
•Total income was up 11% driven by strong NII growth (+13%) benefitting from higher interest rates and a resilient mortgage market. This performance was partially offset by lower fee income due to the transfer of the CIB business.
•Operating expenses grew slightly due to technology investments and inflationary pressures. In real terms, costs were down 5% as we continue to see savings from our transformation programme. The efficiency ratio improved 5.3 pp to 51.2%.
•Loan-loss provisions rose to EUR 125 million (EUR 70 million release in H1'21), reflecting the impact of a downturn in the economic forecast and increased affordability in our retail portfolios. However, cost of risk remained very low.
In the quarter, underlying attributable profit decreased 3% in constant euros as higher revenue and efficiency improvement was offset by higher provisions.
| | | | | | | | | | | | | | | | | | | | | | | | |
| United Kingdom. Underlying income statement |
| EUR million and % change |
| | | | | | | | |
| | | | | | | | |
| | | / | Q1'22 | | | / | H1'21 |
| | Q2'22 | % | excl. FX | | H1'22 | % | excl. FX |
| | | | | | | | |
| Revenue | 1,342 | | +4 | +5 | | 2,633 | | +15 | +11 |
| Expenses | -677 | | +1 | +2 | | -1,348 | | +4 | +1 |
| Net operating income | 666 | | +7 | +9 | | 1,285 | | +29 | +25 |
| LLPs | -74 | | +45 | +46 | | -125 | | — | — |
| PBT | 492 | | -2 | -1 | | 995 | | +2 | -1 |
| Underlying attrib. profit | 361 | | -4 | -3 | | 736 | | +9 | +6 |
Detailed financial information on page 58
| | | | | | | | | | | | | | | | | | | | | | | | | | |
Business model | |
| |
| | | |
|
| | | | Primary segments | | | | |
| | | | | | | | |
| Portugal | Underlying attributable profit |
| EUR 225 mn |
Commercial activity and business performance
Activity and business volumes continued to rise as a result of our strategy of selective growth, customer loyalty and improved service quality. As a result, we further increased the number of loyal (+6%) and digital (+4%) customers.
New mortgage lending maintained its momentum, with market shares over 20% and stock figures at record highs. As a result, loans and advances to customers increased 2% (as well as in gross terms and excluding reverse repos). On the other hand, good portfolio management reduced the NPL ratio 37 bps to 3.33%.
Customer funds were up 5%. Customer deposits increased 6%, as well as excluding repos, boosted by demand deposits (+10%), while mutual funds dropped 4%, reflecting the challenging market environment.
Results
Underlying attributable profit in the first half of 2022 was 2% lower year-on-year at EUR 225 million, dampened by lower gains on financial transactions (-71%), which included ALCO capital gains recorded in 2021:
•Customer revenue grew 1% driven by the positive trend in net fee income (+17%), which mitigated weak NII performance, dampened by still low interest rates and reduced ALCO portfolio volumes.
•Costs continued on their downward trend (-13%), benefiting from the business and digital transformation and enabled the efficiency ratio to stand below 41%.
•Loan-loss provisions plummeted by 84%, driving the cost of risk to virtually 0%.
Compared to the previous quarter, profit was 48% lower, mainly due to the contribution to the SRF and to the banking sector, as net interest income and net fee income increased slightly, costs remained flat and loan-loss provisions decreased.
| | | | | | | | | | | | | | | | | | |
| Portugal. Underlying income statement |
| EUR million and % change |
| | | | | | |
| | | | | | |
| | Q2'22 | / Q1'22 | | H1'22 | / H1'21 |
| | | | | | |
| Revenue | 281 | | -16 | | 613 | | -14 |
| Expenses | -125 | | 0 | | -251 | | -13 |
| Net operating income | 155 | | -25 | | 363 | | -15 |
| LLPs | -3 | | -62 | | -11 | | -84 |
| PBT | 112 | | -48 | | 327 | | -2 |
| Underlying attrib. profit | 77 | | -48 | | 225 | | -2 |
| | | | | | | | |
| Poland | Underlying attributable profit |
| EUR 207 mn |
Commercial activity and business performance
In H1'22 we remained focused on providing the best customer and employee experience. To this end, we further simplified our products and internal processes through digitalization, while developing platforms to accelerate our progress towards our responsible banking commitments. We also implemented several initiatives to strongly support Ukrainians.
In retail banking, we maximized the number of self-service products and increased digital sales and customer acquisition through digital channels. Regarding the bancassurance business, of note was the integration of Allianz, renaming our joint venture Santander Allianz.
In corporates, we enhanced the iBiznes24 digital platform in the quarter by extending its capabilities with Trade Finance products. In the wholesale platform, we facilitated operations of up to PLN 5 million, including multi-currency functionalities and streamlined operations with leasing products.
As a result, loans and advances to customers rose 5% year-on-year. Gross loans and advances to customers, excluding reverse repos and the exchange rate impact, increased 8% on the back of corporates and institutions and CIB, where we maintained our leadership position, mainly in the green transition sphere.
Customer deposits were 2% higher. Excluding repos and the exchange rate impact, they were up 6% strongly driven by time deposits (+89%), which benefited from interest rates hikes in recent quarters. Customer funds excluding repos rose 1% in constant euros.
Results
In the first half of 2022, a near five-fold increase in underlying attributable profit to EUR 207 million. By line and in constant euros:
•Total income was 47% higher year-on-year driven by a strong net interest income performance, which virtually doubled year-on-year following higher interest rates and greater volumes.
•Operating costs were 8% up, impacted by inflationary pressures, but decreased 1% in real terms.
•Loan-loss provisions were affected by CHF mortgage-related charges (previously reported in other gains (losses) and provisions). Excluding this impact, LLPs remained flat. The NPL ratio stood at 3.45%.
The quarter-on-quarter comparison showed a similar performance, with revenue growth (+14%) driven by net interest income.
| | | | | | | | | | | | | | | | | | | | | | | | |
| Poland. Underlying income statement |
| EUR million and % change |
| | | | | | | | |
| | | | | | | | |
| | | / | Q1'22 | | | / | H1'21 |
| | Q2'22 | % | excl. FX | | H1'22 | % | excl. FX |
| | | | | | | | |
| Revenue | 579 | | +13 | +14 | | 1,090 | | +44 | +47 |
| Expenses | -173 | | +4 | +5 | | -339 | | +5 | +8 |
| Net operating income | 406 | | +18 | +19 | | 751 | | +71 | +75 |
| LLPs | -138 | | +117 | +118 | | -202 | | +78 | +82 |
| PBT | 208 | | -12 | -11 | | 444 | | +250 | +258 |
| Underlying attrib. profit | 95 | | -15 | -15 | | 207 | | +371 | +381 |
| | | | | | | | | | | | | | | | | | | | | | | | | | |
Business model | |
| |
| | | |
|
| | | | Primary segments | | | | |
| | | | | | | | |
| NORTH AMERICA | Underlying attributable profit |
| EUR 1,578 mn |
Executive summary → In North America, we continue leveraging our own local individual strengths and capabilities in Mexico and the US while capitalizing on Group’s scale and connectivity.
→ In volumes, loans and advances to customers increased 7% in constant euros driven by growth in most segments in Mexico and in auto, Wealth Management and CIB in the US. Customer funds rose 3% in constant euros boosted by higher retail and corporate deposits in the US, and deposits and mutual funds in Mexico.
→ Underlying attributable profit remained broadly stable year-on-year in euros. In constant euros, profit was down 10% impacted by LLP normalization and lower lease income in the US, primarily due to an increase in the share of lease-end vehicles repurchased at dealerships. Strong profit increase in Mexico. |
Strategy
In line with our strategy to deploy capital towards our businesses where we can grow profitably, during the first half of the year:
•After receiving Federal Reserve approval on 31 January 2022, SHUSA completed the acquisition of the remaining shares of common stock of Santander Consumer USA (SC USA).
•Santander US discontinued mortgage and home equity originations to focus efforts on products, services and digital capabilities that have greater potential for growth.
In terms of our regional strategy, synergies across countries leverage our joint initiatives, including:
•Further development and strengthening of the USMX trade corridor: SCIB and Commercial Banking continue to deepen relationships with existing customers, which was reflected in revenue growth, adding more than 180 new large clients to the Group in the last 4 years.
•Boost customer attraction and retention through loyalty strategies, while broadening our tailored products and services proposition for a more straightforward customer experience. We are taking advantage of successful proven businesses and improved interactions to drive customer loyalty, NPS and CX.
•Create synergies and reduce duplications in our business model, by leveraging our regional capabilities and sharing best practices to optimize expenses and improve profitability.
•Strengthen One Santander in North America, by unifying a common and regional approach by promoting a strong level of
collaboration between both countries and the Group, to forge future growth within the region.
•In line with our global responsible banking agenda and public commitments, we are focusing on expanding and implementing sustainable finance opportunities within our businesses. Our regional operations are carbon neutral and we continue to contribute on building a more inclusive society, with more than 670,000 financially empowered people in the region during H1'22.
In addition, in terms of their local priorities:
United States
Santander US has refocused its business model towards a simpler, more integrated structure around four segments that benefit from the Group’s connectivity or have a distinct competitive advantage: Consumer, Commercial, CIB and Wealth Management:
•After the acquisition of the remaining minority stake in SC USA, the amendment extension of the Stellantis agreement through 2025, the expansion of our partnership with AutoFi Inc., the new preferred finance partnership with Mitsubishi Motors North America (MMNA) and the increased ability to benefit from deposit funding, Santander US is well positioned to grow its Auto business profitably.
•Within our CIB business, Santander US closed its acquisition of APS, which will transform CIB’s asset structuring and distribution capabilities, enhancing our fixed income markets business and creating self-clearing capabilities.
| | | | | | | | | | | | | | | | | | | | | |
| Loyal customers | | | | United States | | Mexico |
| | | | | | |
| Thousands | | 4,477 | | 364 | | 4,113 |
| YoY change | | +8% | | -5% | | +10% |
| | | | | | | |
| Digital customers | | | | United States | | Mexico |
| | | | | | |
| Thousands | | 6,959 | | 1,031 | | 5,762 |
| YoY change | | +9% | | +1% | | +12% |
| | | | | | | | | | | | | | | | | | | | | | | | | | |
Business model | |
| |
| | | |
|
| | | | Primary segments | | | | |
• Top 10 CRE and Multifamily lender, funded by commercial deposits and serving leading US developers and investors.
• Leading brand in Latin American High Net Worth leveraging connectivity with Group.
Santander US announced a multi-year programme to accelerate its new consumer banking digital transformation strategy, leveraging Santander’s global technology assets and expertise to expand our digital capabilities, increase efficiency and enhance the experience for customers across the United States.
During the quarter, Santander US resumed its capital distributions with a USD 1.5 billion dividend. In June, the Federal Reserve Board released the results of its Supervisory Stress Test. With minimum capital ratios ranked in the top quartile among participating banks, the results indicate that Santander US can remain well capitalized during times of severe market stress.
Mexico
We continue to focus on multi-channel innovation, promoting digital channels and strengthening our value proposition:
•We are strengthening synergies between lines of business, highlighting projects to increase profitability through attracting new payroll and portability, commercial alliances and customer referrals.
•We maintained the momentum of the LikeU credit card, our flagship product, reaching more than 635,000 cards issued since its launch 10 months ago. We continued to drive ongoing improvement in acceptance and security processes to provide a better experience for our customers and reduce fraud.
•Santander Personal is our digital and personalized channel for high-income customers, which has a module in Supermóvil through which customers receive investment advice and can take out products in an agile and secure way.
•We launched a tailored proposition, Hipoteca Integral, to serve the mixed-income population (fixed and variable), recognizing the total income of families, with the backing of the housing credit insurance of Sociedad Hipotecaria Federal. We also improved the conditions of our land acquisition offering, for high-potential and loyal customers.
•In auto, we increased financing of pre-owned vehicles, improving the mix (90% new cars and 10% pre-owned vs 97% and 3%, respectively, in 2020), to adapt to the current market situation and increase profitability.
| | | | | | | | | | | | | | | | | | | | | | | | | | | | | | | | | | | | | | |
Business performance. June 2022 |
| EUR billion and YoY % change in constant euros | |
| | | | | | | | | | | | |
| | 152 | | +7% | | | | | 151 | | +3% | |
| | | | | | | | | | | | | | | | | | | | | | | | | | | | | | | | | | | | | | |
| Gross loans and advances to customers excl. reverse repos | | Customer deposits excl.
repos + mutual funds |
In addition, we implemented cost of risk models by product line to improve the quality of the portfolio. In Plan Piso, we financed more than 120 dealers, mostly new customers.
•In SMEs, we made further progress with our customer attraction strategy through commercial agreements in strategic sectors and we continued to attract digital customers through our alliance with CONTPAQi. In the acquiring business, we continue to promote our main products (G-Mini, G-Advance, G-Smart and G-Store) by offering competitive rates and commissions.
Business performance
Loans and advances grew 30% year-on-year. In gross terms, excluding reverse repos and the exchange rate impact, they were up 7% boosted by growth in individuals and commercial loans in Mexico (except SMEs) and a positive performance in auto, CIB and WM in the US.
Customer deposits rose 34% year-on-year. Excluding repos and the exchange rate impact, customer deposits increased 4% mainly driven by positive dynamics in individual deposits in Mexico and the continued strong performance across most US businesses in a highly competitive market.
Results
During the first six months of 2022, underlying attributable profit amounted to EUR 1,578 million, broadly stable in euros year-on-year. In constant euros, profit dropped 10% (-8% excluding the Bluestem portfolio divestiture). By line:
•Total income reduced 3% (-1% ex. divestiture), mainly affected by other operating income (-55%) primarily due to an increase in the share of lease-end vehicles repurchased at dealerships in the US. Net interest income increased 3% (+4% like-for-like) and net fee income fell 1% (+4% like-for-like), dampened by lower fees from the US's SafetyNet programme, which offset the strong performance in insurance, credit cards and account management in Mexico.
•Costs rose 5% primarily due to higher-than-expected inflation. However, strict cost control remains in both countries to absorb this impact.
•Loan-loss provisions increased 49%, mainly from the cost of risk normalization in the US, countered by the decrease in Mexico due to the positive performance in cards, SME and CIB portfolios.
In the quarter, underlying attributable profit fell 10% in constant euros due to lower lease income and higher costs. Net interest income and net fee income showed signs of recovery.
| | | | | | | | | | | | | | | | | | | | | | | | |
| North America. Underlying income statement |
| EUR million and % change |
| | | | | | | | |
| | | | | | | | |
| | | / | Q1'22 | | | / | H1'21 |
| | Q2'22 | % | excl. FX | | H1'22 | % | excl. FX |
| | | | | | | | |
| Revenue | 2,986 | | +7 | +1 | | 5,780 | | +7 | -3 |
| Expenses | -1,432 | | +14 | +7 | | -2,692 | | +15 | +5 |
| Net operating income | 1,554 | | +1 | -5 | | 3,088 | | 0 | -9 |
| LLPs | -524 | | +19 | +13 | | -962 | | +64 | +49 |
| PBT | 1,011 | | -4 | -10 | | 2,061 | | -17 | -25 |
| Underlying attrib. profit | 772 | | -4 | -10 | | 1,578 | | 0 | -10 |
Detailed financial information on page 62
| | | | | | | | | | | | | | | | | | | | | | | | | | |
Business model | |
| |
| | | |
|
| | | | Primary segments | | | | |
| | | | | | | | |
| United States | Underlying attributable profit |
| EUR 1,090 mn |
Commercial activity and business performance
Following record profits during H1'21, Santander US again exhibited a strong performance in H1'22, supported by the progress of our strategic initiatives. The foundational work conducted over recent years, the resilience and higher integration of our core business lines together with the strength of our balance sheet allows Santander US to perform in line with its financial goals despite more challenging market conditions.
The stock of loans and advances to customers grew 33% year-on-year. In gross terms, excluding reverse repos and the exchange rate impact, loans grew 5% led by growth in CIB, Consumer Auto and Wealth Management. Auto originations decreased 17% as stronger volumes in Core Non-Prime were offset by lower originations in Prime and Lease. Used car prices remain near all-time highs as new vehicle production continues to be impacted by global supply chain issues.
Customer deposits grew 43% year-on-year. After strong growth throughout 2021, customer deposits increased 5% excluding repos and the exchange rate impact, while maintaining deposit costs relatively stable despite the significantly higher rate environment.
Results
Underlying attributable profit in the first half of 2022 was EUR 1,090 million, 13% lower in euros year-on-year. When measured in constant euros, profit was down 21% (19% lower adjusted for the Bluestem portfolio divestiture). By line:
•Total income decreased 10% (-7% ex-divestiture). Despite rate benefits and strong deposit pricing behaviour, net interest income fell due to the Bluestem portfolio sale (+2% excluding this impact) and auto loan pricing competition pressure. Net fee income also declined, driven by the Bluestem portfolio sale, lower capital markets fees and initiatives to lower consumer fees (SafetyNet). Other income was affected by reduced leasing income.
•Operating expenses were stable despite the inflationary pricing pressure on personnel costs. In real terms, costs decreased 8%.
•On the back of exceptionally low figures in H1'21, cost of risk remained at historically low levels, although loan-loss provisions increased 245% as we evaluate the impact of more adverse macroeconomic outlook on our customers.
Despite NII growth (+3%), underlying attributable profit was 18% lower quarter-on-quarter in constant euros, due to lower lease income, decreased capital markets activity and greater costs due to APS, while credit continues to perform well.
| | | | | | | | | | | | | | | | | | | | | | | | |
| United States. Underlying income statement |
| EUR million and % change |
| | | | | | | | |
| | | | | | | | |
| | | / | Q1'22 | | | / | H1'21 |
| | Q2'22 | % | excl. FX | | H1'22 | % | excl. FX |
| | | | | | | | |
| Revenue | 1,854 | | +2 | -3 | | 3,665 | | -1 | -10 |
| Expenses | -883 | | +11 | +5 | | -1,682 | | +10 | 0 |
| Net operating income | 970 | | -4 | -9 | | 1,984 | | -8 | -16 |
| LLPs | -338 | | +32 | +26 | | -594 | | +280 | +245 |
| PBT | 640 | | -13 | -18 | | 1,378 | | -31 | -37 |
| Underlying attrib. profit | 507 | | -13 | -18 | | 1,090 | | -13 | -21 |
| | | | | | | | |
| Mexico | Underlying attributable profit |
| EUR 546 mn |
Commercial activity and business performance
In Mexico, we have gained market share in individual loans for 26 months running, and in total loans for six straight months. The positive performance in individual loans was driven by the mortgage and auto strategies that continued to bear fruit.
We are one of the largest mortgage originators in the country, with an innovative product range and an offering for each customer profile, such as Hipoteca Plus, Hipoteca Free and Hipoteca Integral. In auto, we further consolidated our position, becoming the third largest player in the market with a 14% market share. In addition, consumer credit showed a significant recovery in recent months.
The stock of loans and advances to customers grew 20% year-on-year. In gross terms, excluding reverse repos and the exchange rate impact, it was up 11%, supported by individual loans (mortgages: +12%, consumer: +12% and cards: +15%) and corporate loans (+16% in CIB and +8% in companies and institutions, which offset the 3% decline in SMEs).
Customer deposits grew 15% year-on-year. Excluding reverse repos and the exchange rate impact, customer deposits increased 2% boosted by time deposits and mutual funds were 6% higher.
Results
Underlying attributable profit in the first half of 2022 of EUR 546 million, 45% higher in euros year-on-year. In constant euros, growth of 32%. By line:
•Total income rose 10%. Net interest income increased 9% supported by higher volumes and the rise in interest rates. Positive net fee income performance (+16%) mainly from credit cards, insurance and account management. Gains on financial transactions dropped due to gains on ALCO portfolio sales recorded in 2021 and a weak first half of the year in markets.
•Operating expenses increased 13%, affected by investments in digitalization and insourcing of employees.
•Loan-loss provisions dropped 23% due to the positive portfolio performance.
Compared to the previous quarter, underlying attributable profit increased 11% in constant euros driven by the upturn in net interest income (+5%), higher net fee income (+7%) and lower provisions (-7%).
| | | | | | | | | | | | | | | | | | | | | | | | |
| Mexico. Underlying income statement |
| EUR million and % change | | |
| | | | | | | | |
| | | | | | | | |
| | | / | Q1'22 | | | / | H1'21 |
| | Q2'22 | % | excl. FX | | H1'22 | % | excl. FX |
| | | | | | | | |
| Revenue | 1,115 | | +14 | +6 | | 2,096 | | +21 | +10 |
| Expenses | -498 | | +15 | +7 | | -930 | | +24 | +13 |
| Net operating income | 617 | | +12 | +4 | | 1,166 | | +19 | +9 |
| LLPs | -184 | | +1 | -7 | | -367 | | -15 | -23 |
| PBT | 407 | | +20 | +11 | | 747 | | +40 | +27 |
| Underlying attrib. profit | 297 | | +19 | +11 | | 546 | | +45 | +32 |
Detailed financial information on page 64
| | | | | | | | | | | | | | | | | | | | | | | | | | |
Business model | |
| |
| | | |
|
| | | | Primary segments | | | | |
| | | | | | | | |
| SOUTH AMERICA | Underlying attributable profit |
| EUR 1,946 mn |
Executive summary → We continued with our strategy to strengthen connectivity and share best practices across countries, capturing new business opportunities. → We remain focused on delivering profitable growth, increasing loyalty and customer attraction, as well as controlling risks and costs through the strength of our model. → Quarter-on-quarter and year-on-year growth in both gross loans and advances to customers and customer deposits, while we continue to expand ESG initiatives in the region. → Underlying attributable profit increased 19% year-on-year (+7% in constant euros) backed by positive revenue performance and a lower tax burden. |
Strategy
South America continued to be a region with great growth potential and opportunities for banking penetration and progress in financial inclusion. In this environment, we remained focused on growing the number of customers and enhancing digitalization, consolidating new technologies and innovative solutions.
We maintained our strategy of capturing synergies across business units:
•In consumer finance, we remained focused on exchanging positive experiences across countries such as the management platform for new and used vehicle financing and the consolidation of Cockpit in Chile, Argentina and Peru. Santander Chile, through Santander Consumer Finance, recorded a positive performance both in loans and results. In Uruguay, auto financing increased 38% year-on-year and in Perú, the financial entity specialized in auto loans continued to expand, reaching a 31.7% market share in new lending in June.
•In payment methods, we remained focused on e-commerce strategies and on the business of instant domestic and international transfers. Getnet, a successful model developed in Brazil, is delivering very positive results in other countries: in Chile, Getnet has more than 111,000 PoS terminals and in Argentina we remained the second largest company in payments processing. In Uruguay, we launched the digital onboarding for current accounts and credit cards.
•We continued to make headway in the development of joint initiatives between SCIB and corporates to deepen relationships with multinational clients, boosting loyalty and customer acquisition in all countries, especially in Chile and Argentina.
•We continued to promote inclusive and sustainable businesses, such as Prospera, our micro-credit programme, which was launched in Chile in the first quarter and continues to be implemented in Brazil (776,000 active customers), Uruguay (10,000 entrepreneurs), Colombia (present in 332 municipalities) and Peru (45,000 customers). In addition, we further developed our ESG initiatives. In Chile, we introduced the Eco card, a new range of sustainable cards made with recycled PVC, and, in Brazil, we began to replace plastic cards with environmentally friendly models. In Argentina, we made headway in new partnerships to promote sustainable activities.
The main initiatives by country were:
•Brazil: we continued to grow our customer base and increase loyalty. Our aim is to become the best consumer company in the country, build the best platform for corporates and consolidate our position in investments. In addition, we remained the only global bank in the wholesale segment with leadership in FX, Infrastructure, Equities, Agribusiness and Cash Management.
| | | | | | | | | | | | | | | | | | | | | | | | | | | | | | | | | |
| Loyal customers | | | | Brazil | | Chile | | Argentina | | Other South America |
| | | | | | | | | | |
| Thousands | | 11,147 | | 8,534 | | 816 | | 1,632 | | 166 |
| YoY change | | +16% | | +19% | | +5% | | +4% | | +16% |
| | | | | | | | | | | |
| Digital customers | | | | Brazil | | Chile | | Argentina | | Other South America |
| | | | | | | | | | |
| Thousands | | 25,269 | | 19,847 | | 1,963 | | 2,850 | | 609 |
| YoY change | | +11% | | +14% | | +5% | | +5% | | -4% |
| | | | | | | | | | | | | | | | | | | | | | | | | | |
Business model | |
| |
| | | |
|
| | | | Primary segments | | | | |
To this end, we continue to boost our multi-channel strategy: in physical channels, where we serve over 15 million visits per month, of note was our Bank to Go model, which streamlines and tailors customer service. Regarding digital channels, we reached 537 million accesses per month and almost 4 million contracts monthly. In the remote channels, sales increased substantially and in the external channels, focused on geographic expansion, we produced BRL 1.3 billion per month in contracts.
•Chile: we remained focused on digital banking and enhancing customer service. We continued to promote Santander Life and Superdigital, which already have one million and 334,000 customers, respectively. Positive performance in Santander Consumer Finance, which accounted for 45% of new lending. In ESG, in order to boost banking and help micro-entrepreneurs with their business performance, we launched a current account integrated with Getnet and the Cuenta Life for SMEs.
•Argentina: we remained focused on optimizing and improving customer service, developing our open financial services platform, strengthening Getnet's value proposition, which exceeded 85,000 PoS, and MODO, a systemic solution that promotes digital payments and financial inclusion. In addition, we boosted consumer and auto lending and signed new commercial alliances in the quarter.
•Uruguay: we remained the country's leading privately-owned bank. Our offering and alliances with dealers enabled us to become the market leader in auto finance, with a 30% market share. Soy Santander, a fully-digital loyalty proposition for individuals, increased transactions by 15% year-on-year. In ESG, the carbon neutral credit for vehicle purchases reached 3,260 customers.
•Peru: our strategy focuses on supporting global companies and the corporate segment, boosting growth through joint initiatives between SCIB and corporates, combining tailored and value-added products. We made progress in digitalization, through our Office Banking and Nexus platforms, digital onboarding of customers and the use of data intelligence for internal controls. This was reflected in the significant increase in the number of customers and loyalty.
| | | | | | | | | | | | | | | | | | | | | | | | | | | | | | | | | | | | | | |
| South America. Business performance |
| June 2022. EUR billion and YoY % change in constant euros | |
| | | | | | | | | | | | |
| | 148 | | +12% | | | | | 182 | | +5% | |
| | | | | | | | | | | | | | | | | | | | | | | | | | | | | | | | | | | | | | |
| Gross loans and advances to customers excl. reverse repos | | Customer deposits excl.
repos + mutual funds |
•Colombia: we continue to offer sustainable and inclusive financial solutions. In SCIB, we continued to participate in important operations for the country's development and launched joint initiatives with Corporate. Regarding consumer finance, we continued to consolidate our position in the new and used vehicle markets, with a 66% increase in our portfolio year-on-year. In ESG, we continued to promote Prospera and increased the number of credit lines granted to entrepreneurs, 30% of which went to the agricultural segment and 54% to female entrepreneurs.
Business performance
Loans and advances to customers rose 13% year-on-year. Gross loans and advances to customers (excluding reverse repos and exchange rates) increased 12% year-on-year, with rises in all country units.
Customer deposits were 8% higher year-on-year. Excluding the exchange rate impact and reverse repos, customer deposits rose 5%, with increases in all units except Chile and Peru. Mutual funds were 4% higher excluding the exchange rate impact.
Results
Underlying attributable profit in the first six months of 2022 amounted to EUR 1,946 million, up 19% year-on-year. Excluding the exchange rate impact, it was 7% higher, as follows:
•In total income, of note was the performance in net interest income and net fee income (+9% and +10%, respectively) and the 48% rise in gains on financial transactions (Brazil, Chile and Argentina).
•Costs were 16% higher, heavily affected by inflation. In real terms, they decreased 1%, reflecting management efforts.
•Loan-loss provisions increased 38% mainly due to the rises recorded in the main countries. The cost of risk stood at 2.97%.
By country, of note was the strong profit growth recorded in all markets except Brazil, where it was slightly lower as the positive performance in revenue could not offset higher costs and provisions.
Compared to the first quarter of 2022, underlying attributable profit was up 8% in constant euros, benefitting from the increase in the main revenue lines and a lower tax burden.
| | | | | | | | | | | | | | | | | | | | | | | | |
| South America. Underlying income statement |
| EUR million and % change |
| | | | | | | | |
| | | | | | | | |
| | | / | Q1'22 | | | / | H1'21 |
| | Q2'22 | % | excl. FX | | H1'22 | % | excl. FX |
| | | | | | | | |
| Revenue | 4,738 | | +13 | +5 | | 8,933 | | +22 | +10 |
| Expenses | -1,669 | | +12 | +6 | | -3,153 | | +25 | +16 |
| Net operating income | 3,069 | | +13 | +4 | | 5,780 | | +21 | +7 |
| LLPs | -1,335 | | +34 | +23 | | -2,333 | | +56 | +38 |
| PBT | 1,604 | | +3 | -5 | | 3,165 | | +2 | -9 |
| Underlying attrib. profit | 1,046 | | +16 | +8 | | 1,946 | | +19 | +7 |
| | | | | | | | | | | | | | | | | | | | | | | | | | |
Business model | |
| |
| | | |
|
| | | | Primary segments | | | | |
| | | | | | | | |
| Brazil | Underlying attributable profit |
| EUR 1,365 mn |
Commercial activity and business performance
In Brazil, we remained focused on customer experience and satisfaction throughout the cycle, with simple and tailored solutions for each profile. As a result, we continued to expand commercial activity. In cards, turnover grew 17% year-on-year. In home equity, we are the leading private company with a 20% market share. In agribusiness, the portfolio increased 33% year-on-year. In auto, we remained the leader in individuals with a 23% market share. Additionally, we launched Green Building, which offers business financing for environmentally certified constructions.
In ESG, we continue to promote social and financial inclusion: Prospera Microfinance reached a portfolio of BRL 2.2 billion and we committed to use 100% renewable energy in our facilities by 2025.
As a result, we were named one of the Best Consumer Companies in the country by Consumidor Moderno magazine and as the Best of ESG 2022 in the financial services category by Exame magazine.
Loans and advances to customers rose 16% year-on-year. Gross loans and advances to customers excluding reverse repos and the exchange rate impact, grew 9% driven by the double-digit increase in individuals and SMEs, broadly absorbing a weaker performance in corporates and CIB.
Customer deposits surged 13%. Excluding the exchange rate impact and repos, they rose 4% year-on-year drien by time deposits (+7%), more than offsetting the fall in demand deposits (-3%).
Results
In the first half of 2022, underlying attributable profit amounted to EUR 1,365 million, +16% year-on-year. Excluding the exchange rate impact, profit dropped 1%, as follows:
•Total income rose 5% due to higher customer revenue (+2% due to higher average volumes and management of spreads, partially offset by initial negative sensitivity to interest rate increases) and higher gains on financial transactions.
•Costs rose 11%, strongly impacted by inflation, and were reflected in higher personnel expenses (salary increase approved in September 2021) and administrative costs. However, in real terms, costs remained flat and the efficiency ratio around 30%, one of the best globally.
•Net loan-loss provisions increased 41% due to the change of mix, with a greater weight of loans to individuals, which grew at double digit rates. The cost of risk was 4.26% (+74 bps compared to June 2021) and the NPL ratio was 6.34%.
Compared to the first quarter, profit was 6% higher in constant euros, driven by gains on financial transactions, fee income and a lower tax burden.
| | | | | | | | | | | | | | | | | | | | | | | | |
| Brazil. Underlying income statement |
| EUR million and % change |
| | | | | | | | |
| | | | | | | | |
| | | / | Q1'22 | | | / | H1'21 |
| | Q2'22 | % | excl. FX | | H1'22 | % | excl. FX |
| | | | | | | | |
| Revenue | 3,374 | | +12 | 0 | | 6,393 | | +23 | +5 |
| Expenses | -1,022 | | +10 | -2 | | -1,951 | | +30 | +11 |
| Net operating income | 2,352 | | +13 | +1 | | 4,442 | | +20 | +2 |
| LLPs | -1,163 | | +37 | +24 | | -2,015 | | +65 | +41 |
| PBT | 1,146 | | +2 | -9 | | 2,270 | | -3 | -18 |
| Underlying attrib. profit | 737 | | +18 | +6 | | 1,365 | | +16 | -1 |
Detailed financial information on page 67 | | | | | | | | |
| Chile | Underlying attributable profit |
| EUR 391 mn |
Commercial activity and business performance
We remained focused on improving customer satisfaction through the transformation of our commercial network and our digital banking proposition, expanding Santander Life and Superdigital. Getnet is firmly established in the country and has installed 111,000 PoS terminals, with a 20% market share.
At the beginning of the year, we launched the Santander Life SME account and Prospera, transactional products integrated with Getnet, which are aimed at boosting banking penetration and helping micro-entrepreneurs to improve their businesses. As a result, we exceeded 4 million customers in the country and remained first in service quality in terms of NPS.
In volumes, loans and advances to customers decreased 2% year-on-year. Gross loans and advances to customers excluding reverse repurchase agreements and at constant exchange rates, were 11% higher, mainly driven by individuals (+11% boosted by the impact that charges in the UF had on mortgages and growth in cards), corporates and institutions (+12%) and CIB (+61%).
Customer deposits dropped 16%. Excluding the exchange rate impact and repurchase agreements, customer deposits decreased 7% as customers are normalizing their liquidity levels, following strong growth in 2021, due to the withdrawal of pension funds and state aids during the pandemic.
Results
Underlying attributable profit in the first half of 2022 amounted to EUR 391 million, 22% higher year-on-year. In constant euros, profit grew 27%, as follows:
•Total income rose 13% driven by the increase in net interest income (positive impact from the UF portfolio and greater volumes), the double-digit rise in net fee income (greater customer base and transactionality) and gains on financial transactions (+48% driven by business with customers).
•Costs rose 6%, below inflation (8%), which enabled net operating income to increase 17% and the efficiency ratio to improve to 36.0% (-2.4 pp year-on-year).
•Loan-loss provisions were 17% higher, the NPL ratio remained virtually stable and the cost of risk fell to 0.89%. NPL indicators remain better than pre-pandemic levels, although they are expected to normalize.
In the second quarter, profit rose 8% in constant euros boosted by the growth in net interest income, following the rise in inflation, and a lower tax burden.
| | | | | | | | | | | | | | | | | | | | | | | | |
| Chile. Underlying income statement |
| EUR million and % change |
| | | | | | | | |
| | | | | | | | |
| | | / | Q1'22 | | | / | H1'21 |
| | Q2'22 | % | excl. FX | | H1'22 | % | excl. FX |
| | | | | | | | |
| Revenue | 707 | | +9 | +8 | | 1,357 | | +8 | +13 |
| Expenses | -255 | | +9 | +8 | | -489 | | +2 | +6 |
| Net operating income | 452 | | +9 | +8 | | 868 | | +13 | +17 |
| LLPs | -110 | | +16 | +16 | | -205 | | +13 | +17 |
| PBT | 323 | | 0 | -1 | | 646 | | +9 | +14 |
| Underlying attrib. profit | 204 | | +9 | +8 | | 391 | | +22 | +27 |
Detailed financial information on page 68
| | | | | | | | | | | | | | | | | | | | | | | | | | |
Business model | |
| |
| | | |
|
| | | | Primary segments | | | | |
| | | | | | | | |
| Argentina | Underlying attributable profit |
| EUR 145 mn |
Commercial activity and business performance
Santander Argentina remained centred on improving customer service through innovation and process digitalization. The number of loyal customers increased and our app was the best rated among banking app. We continue to build our open financial services platform, strengthening the value proposition of Getnet, Santander Consumer, Superdigital and MODO.
In addition, we signed new alliances in the quarter, for example with Gentos, to boost the livestock business through a sustainable approach; the commercial alliance with Acindar Pymes, which will provide better access to financing for initiatives related to renewable energy; and the SuperClub+ programme, which provides benefits for Aerolíneas Argentinas' tourism products.
Loans and advances to customers were up 37% year-on-year. In gross terms, excluding reverse repos and the exchange rate impact, loans and advances to customers rose 55% year-on-year, driven by auto loans, SMEs and corporates.
Customer deposits increased 45% with respect June 2021. Excluding repos and the exchange rate impact, customer deposits rose 67% with growth in demand (+65%) and time (+71%) deposits, and mutual funds were 94% higher. As a result, customer funds increased 73% in constant euros.
These high growth rates, as in the case of results, are impacted by high inflation in the country.
Results
Underlying attributable profit in the first half of 2022 was EUR 145 million, 37% higher compared to the first half of 2021. At constant exchange rates, profit was 58% higher. By line:
•Total income grew 69%, underpinned by net interest income (+93%), net fee income (+88%, mainly driven by transactional fees and mutual funds) and gains on financial transactions (+102%). This performance clearly outstripped inflation.
•Costs rose 57%, in line with inflation and at a much slower pace than revenue. This drove a 4.2 pp improvement in the efficiency ratio, which improved to 58.0% and net operating income rose 88%.
•Loan-loss provisions increased due to extraordinarily low levels in the first six months of 2021 (following large pandemic-related provisioning in 2020). The cost of risk stood at 3.07%, lower than in June 21 and in line with December 2021.
In the second quarter, profit surged 60% in constant euros, mainly due to customer revenue.
| | | | | | | | | | | | | | | | | | | | | | | | |
| Argentina. Underlying income statement |
| EUR million and % change |
| | | | | | | | |
| | | | | | | | |
| | | / | Q1'22 | | | / | H1'21 |
| | Q2'22 | % | excl. FX | | H1'22 | % | excl. FX |
| | | | | | | | |
| Revenue | 458 | | +26 | +40 | | 821 | | +46 | +69 |
| Expenses | -260 | | +20 | +34 | | -477 | | +36 | +57 |
| Net operating income | 198 | | +34 | +49 | | 345 | | +63 | +88 |
| LLPs | -33 | | -15 | -4 | | -72 | | +48 | +71 |
| PBT | 97 | | +38 | +52 | | 168 | | +72 | +98 |
| Underlying attrib. profit | 86 | | +45 | +60 | | 145 | | +37 | +58 |
Uruguay
Gross loans and advances to customers, excluding reverse repurchase agreements and the exchange rate impact were up 14% year-on-year. Customer deposits excluding repos and exchange rates rose 2%, spurred by time deposits (+31%).
Underlying attributable profit in the first six months of EUR 60 million, up 18% year-on-year and +3% in constant euros, as follows:
•Total income up 8% boosted by net interest income following interest rate hikes and higher inflation and gains on financial transactions.
•Costs remained virtually flat (+0.5%). As a result, the efficiency ratio stood at 45.0% (-3.1 pp year-on-year).
•Loan-loss provisions rose, normalizing following the low levels recorded in 2021. The cost of risk remained low (1.34%) and the NPL ratio fell to 2.72%.
Compared to the previous quarter, underlying attributable profit declined 5% in constant euros due to LLP normalization, partly mitigated by higher gains on financial transactions and lower costs.
Peru
Gross loans and advances to customers excluding reverse repos and the exchange rate impact rose 22% year-on-year and customer deposits (excluding repos and at constant exchange rates) were 2% lower dampened by time deposits (-5%), as demand deposits were 5% higher.
In the first half of 2022, underlying attributable profit amounted to EUR 33 million, 29% higher year-on-year. Excluding the exchange rate impact, growth was 18%, as follows:
•Total income rose 14%, mainly led by net interest income (+33%). Costs rose 49%, mainly driven by inflation and the launch of new businesses.
•Loan-loss provisions dropped 44% and the cost of risk remained very low (0.31%).
Colombia
Gross loans and advances to customers (excluding reverse repos and the exchange rate impact) were 61% higher year-on-year. Customer deposits (excluding repos and exchange rates) rose 57% due to demand deposits (+125%).
In the first half of 2022, underlying attributable profit of EUR 13 million, 11% higher year-on-year. At constant exchange rates, profit was 9% higher, due to:
•Total income growth of 29% (driven by net interest income and gains on financial transactions) and a 60% rise in costs.
•Loan-loss provisions dropped 37% and the cost of risk improved 50 bps year-on-year to 0.22%.
| | | | | | | | | | | | | | | | | | | | | | | | |
| Other South America. Underlying income statement |
| EUR million and % change |
| | | | |
| | Net operating income | | Underlying attrib. profit |
| | | | | | | | |
| | | | | | | | |
| | | / | H1'21 | | | / | H1'21 |
| | H1'22 | % | excl. FX | | H1'22 | % | excl. FX |
| | | | | | | | |
| Uruguay | 110 | | +31 | +14 | | 60 | | +18 | +3 |
| Peru | 56 | | +8 | -1 | | 33 | | +29 | +18 |
| Colombia | 25 | | +5 | +3 | | 13 | | +11 | +9 |
| | | | | | | | | | | | | | | | | | | | | | | | | | |
Business model | |
| |
| | | |
|
| | | | Primary segments | | | | |
| | | | | | | | |
| DCB | DIGITAL CONSUMER BANK | Underlying attributable profit |
| EUR 572 mn |
Executive summary → Continuing to reinforce auto leadership via new strategic alliances, leasing and subscription. In H1, we signed the binding agreement with Stellantis, continued BNPL deployment and new leasing contracts showed double-digit growth. → New lending +10% year-on-year in constant euros. In auto, global production issues dampened the new auto market. In this context, we gained market share in new and used cars in most markets. Strong year-on-year increase in consumer new lending. → Underlying attributable profit amounted to EUR 572 million, improving 18% year-on-year in euros. In constant euros, +16% due to net fee income (+7% year-on-year) and cost of risk improvement. RoRWA remained high, c.2%. |
Strategy
Digital Consumer Bank (DCB) is the leading consumer finance bank in Europe, created through the combination of Santander Consumer Finance's (SCF) scale and leadership in consumer finance in Europe, and Openbank’s retail banking and digital capabilities.
SCF is Europe's consumer finance leader, present in 18 countries (16 in Europe including the recent launch in Greece, China and Canada) and works through more than 130,000 associated points of sale (mainly auto dealers and retail merchants). In addition, it is developing pan-European initiatives to boost Direct business across its footprint.
Openbank is the largest 100% digital bank in Europe. It offers current accounts, cards, loans, mortgages, a state-of-the-art robo-advisor service and open platform brokerage services. Openbank is currently active in Spain, the Netherlands, Germany and Portugal, and we are working on its expansion across Europe and the Americas.
DCB's aim is to generate synergies for both businesses:
•SCF is dedicated to helping our customers and partners (OEMs, car dealers and retailers) to enhance their sales capacity by financing their products and developing advanced technologies to give them a competitive edge. SCF is the top mobility financer and provider in Europe.
| | | | | |
| Digital Consumer Bank. Loan distribution |
| June 2022 |
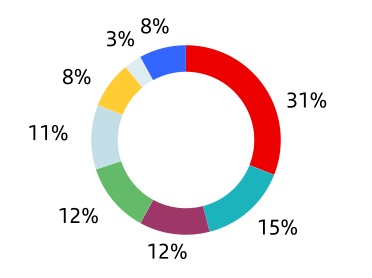
| | | | | | | | |
| | Germany |
| | |
| | Nordics |
| | |
| | France |
| | |
| | Spain |
| | |
| | The UK |
| | |
| | Italy |
| | |
| | Poland |
| | |
| | Others |
| | |
•Openbank will continue to focus on customer loyalty and engagement targets by applying Openbank's IT and business philosophy, while ensuring an unbeatable time to market.
Our main priorities for 2022 are to:
•Secure leadership in global digital consumer lending focusing on growth and transformation within three dimensions:
–Auto: strengthen our auto financing leadership position, gain market share, reinforce the leasing business and develop subscription services. SCF is focusing on providing its partners advanced digital financing capabilities to support their sales growth strategy and the best customer experience. We had a EUR 93 billion loan book at the end of June.
–Consumer Non-Auto: gain market share in consumer lending and develop buy now, pay later (BNPL) 2.0 to strengthen our top 3 position in Europe. We had a loan book of EUR 20 billion as of 30 June. In Retail, the aim is to continue improving digital capabilities to increase loyalty among our 3.8 million customers (Openbank and SC Germany Retail), boosting digital banking activity.
–Simplification and efficiency from self-contained banks to European hubs (Western Hub, Nordics, Germany) through: legal structure simplification, shared services and IT commonality, and capital and liquidity optimization.
•Increase profit leveraging strategic operations initiated in 2021, e.g. Stellantis (Auto), leasing and subscription launch and BNPL development (Non-Auto).
•Launch of tech transformation projects to seize on the fast-growing transition to online, support digital customer base expansion and provide our partners with digital tools to achieve a single European digital connection (via auto marketplaces). All this while maintaining high profitability and one of the best efficiency ratios in the sector.
| | | | | | | | | | | | | | | | | | | | | | | | | | |
Business model | |
| |
| | | |
|
| | | | Primary segments | | | | |
To contribute to the transition to a greener economy, we continue to develop new business solutions and partnerships. In 2021, we financed >140,000 fully-electric vehicles and >23,000 solar panels. In H1'22, in the context of a shrinking new car market, we financed 71,000 fully-electric vehicles (+72% year-on-year) and solar panel financing grew 69% year-on-year. Electric chargers and green heating systems financing is also booming.
We are actively partnering several European, American, Japanese and Chinese OEMs with strong electric product portfolios to develop joint solutions within our footprint to capture growth in a market that is evolving towards reduced emissions.
Business performance
New lending increased 10% year-on-year in H1'22, despite impacts from the covid-19 Omicron wave, the microchip crisis and global supply chain disruptions from the Russia-Ukraine conflict.
In this environment, we further increased market share in new and used cars and most countries. New car registrations in Europe fell 14% in H1 while our new car volumes were up 2%. Regarding used vehicles, new lending rose 19% compared to a 10% fall in the European market.
In Auto, "tactical" leasing solutions, together with a commercial focus, generated a 16% increase in new contracts year-on-year. We also started to develop our proprietary digital leasing platform for Europe (gradual rollout expected to start before year end) with the ambition of disrupting the market.
SCF's new subscription service Wabi is live in Spain, Norway and Germany and will expand to other countries in the coming years. In June, SCF launched Ulity, its new, white-label platform for developing vehicle subscription-based solutions for companies.
In H1, we expanded our partnership with Stellantis in a transaction expected to complete in H1'23 (following the required authorizations). We also entered into a long-term global partnership with Piaggio Group, Europe's leader in scooters.
In Non-Auto, Zinia, our new buy now, pay later initiative is already achieving outstanding results in Germany, with more than 3 million contracts since its launch and more than 33 thousand merchants connected. The focus for 2022 is the full roll out of the new tech stack and to the Netherlands and Spain.
| | | | | | | | | | | | | | | | | | | | | | | | | | | | | | | | |
| Activity |
| June 2022. EUR billion and % change in constant euros | |
| | | | | | | | | | |
| | | +3% | | | | | | | |
| | | QoQ | | | | | | +2% | |
| | | | | | | | | QoQ | |
| 119 | | | | | | | | | |
| | | +4% | | | | 60 | | +7% | |
| | | YoY | | | | | | YoY | |
| | | | | | | | | | |
| Gross loans and advances to customers excl. reverse repos | | Customer deposits excl. repos + mutual funds |
The TIMFin joint venture in 2021 represented a strategic alliance with the leading Italian Telco, a new vertical for DCB. The company has >1 million contracts since launch as well as >5,700 active points of sale.
The stock of loans and advances to customers increased 4% year-on-year. In gross terms, excluding reverse repos and the exchange rate impact, it also increased 4% to EUR 119 billion.
These good results have been achieved in an unstable environment where higher fuel prices and inflation are generating uncertainty and reducing our customers' disposable income. We will keep a prudent market approach and remain vigilant so to react quickly to any specific event affecting our activity.
Results
Underlying attributable profit in the first half was EUR 572 million, 18% higher in euros year-on-year (RoRWA c.2%). In constant euros growth of 16% year-on-year, by line:
•Total income rose 3% mainly driven by growth in net fee income (+7%) due to increased volumes and leasing activity. Net interest income increased 1%.
•Costs grew 2% affected by inflation, strategic investments to boost future income and lower running costs, and perimeter effects (Allane, TIMFin and Greece). In real terms, costs fell 3%. The efficiency ratio stood at 48.5% (34 bp improvement on H1'21).
•Loan-loss provisions fell 7% driven by the maintained good credit quality performance. Cost of risk fell a further 20 bps to 0.44%.
•By country, the largest contribution to underlying attributable profit came from Germany (EUR 183 million), the UK (EUR 126 million), the Nordic countries (EUR 126 million), France (EUR 87 million) and Spain (EUR 76 million).
Compared to the previous quarter, underlying attributable profit increased 3% despite the SRF charge in the quarter (+18% excluding it) due to strength in net fee income, lower costs and decreases in provisions (even with a EUR 23 million CHF mortgage-related charge).
| | | | | | | | | | | | | | | | | | | | | | | | |
| Digital Consumer Bank. Underlying income statement |
| EUR million and % change |
| | | | | | | | |
| | | | | | | | |
| | | / | Q1'22 | | | / | H1'21 |
| | Q2'22 | % | excl. FX | | H1'22 | % | excl. FX |
| | | | | | | | |
| Revenue | 1,261 | | -4 | -4 | | 2,573 | | +3 | +3 |
| Expenses | -603 | | -6 | -6 | | -1,248 | | +3 | +2 |
| Net operating income | 658 | | -1 | -1 | | 1,325 | | +4 | +3 |
| LLPs | -139 | | -6 | -6 | | -287 | | -7 | -7 |
| PBT | 508 | | +1 | +2 | | 1,010 | | +14 | +13 |
| Underlying attrib. profit | 290 | | +3 | +3 | | 572 | | +18 | +16 |
| | | | | | | | | | | | | | | | | | | | | | | | | | |
Business model | |
| |
| | | |
|
| | | | Primary segments | | | | |
| | | | | | | | |
| Corporate Centre | Underlying attributable profit |
| -EUR 1,040 mn |
Executive summary → In the current environment, the Corporate Centre continued with its role supporting the Group. → The Corporate Centre’s objective is to monitor the Group's strategy and aid the operating units by contributing value and carrying out the corporate function of oversight and control. It also carries out functions related to financial and capital management. → Underlying attributable loss increased 28% compared to the first half of 2021, mainly due to the fall in gains on financial transactions due to exchange rate differences from the hedging of results and costs from the higher liquidity buffer, partially offset by lower provision charges. |
The Corporate Centre contributes value to the Group in various ways:
•Making the Group’s governance more solid, through global control frameworks and supervision.
•Fostering the exchange of best practices in cost management, which enables us to be one of the most efficient banks in the sector.
•Contributing to the launch of projects that will be developed by our global businesses aimed at leveraging our worldwide presence to generate economies of scale.
It also coordinates the relationship with European regulators and supervisors and develops functions related to financial and capital management, as follows:
•Financial Management functions:
–Structural management of liquidity risk associated with funding the Group’s recurring activity and stakes of a financial nature.
–This activity is carried out by the different funding sources (issuances and other), always maintaining an adequate profile in volumes, maturities and costs. The price of these operations with other Group units is the market rate that includes all liquidity concepts (which the Group supports by immobilizing funds during the term of the operation) and regulatory requirements (TLAC/MREL).
–Interest rate risk is also actively managed in order to dampen the impact of interest rate changes on net interest income, conducted via high credit quality, very liquid and low capital consumption derivatives.
–Strategic management of the exposure to exchange rates in equity and dynamic in the countervalue of the units’ annual results in euros. Net investments in equity are currently covered by EUR 20,336 million (mainly Brazil, the UK, Mexico, Chile, the US, Poland and Norway) with different instruments (spot, fx, forwards).
•Management of total capital and reserves: efficient capital allocation to each of the units in order to maximize shareholder return.
Results
In the first half of 2022, underlying attributable loss of EUR 1,040 million, 28% higher than in H1'21 (-EUR 812 million), as follows:
•Net interest income decreased due to the higher liquidity buffer.
•Lower gains on financial transactions (EUR 276 million less than in H1'21), due to negative foreign currency hedging results (-EUR 300 million), that partly offset the positive performance of exchange rates in the countries' results.
•This was largely offset by the sharp decrease in provisions compared to the same period of the previous year.
| | | | | | | | | | | | | | | | | | | | | | | | |
| Corporate Centre. Underlying income statement |
| EUR million |
| | | | | | | | |
| | Q2'22 | Q1'22 | Chg. | | H1'22 | H1'21 | Chg. |
| | | | | | | | |
| Total income | -446 | | -301 | | +48% | | -747 | | -418 | | +79% |
| Net operating income | -538 | | -388 | | +39% | | -926 | | -577 | | +60% |
| PBT | -577 | | -437 | | +32% | | -1,014 | | -806 | | +26% |
| Underlying attrib. profit | -577 | | -462 | | +25% | | -1,040 | | -812 | | +28% |
Detailed financial information on page 72
| | | | | | | | | | | | | | | | | | | | | | | | | | |
Business model | | | | | | | | |
| | | | Secondary segments | | | | |
| | | | | | | | |
| Retail Banking | Underlying attributable profit |
| EUR 3,991 mn |
| | | | | | | | | | | | | | | | | | | | | | | | | | | | | | | | | | | | | | | | | | | | | | | | | | | | | |
| | | | Executive summary | | | | | | | | | | | | |
| | | | | | | | | | | | | | | |
| | | | | | | | | | | | | | | | | |
| | | Results. (H1'21 vs. H1'22). % change in constant euros | | Business performance. EUR bn. % change in constant euros | | |
| | | Profit increased driven by total income, a slight efficiency improvement and lower minority interests and tax burden | | Continued growth in asset and liability volumes at a mid-single digit | | |
| | | Total income | Costs | Provisions | | Loans and advances to customers | Customer funds | | |
| | | +2% | +3% | +26% | | 842 | +5% YoY | 804 | | +3% YoY | | |
| | | | | |
| | | | | | | | | | | | | | | | | |
| | | Customers | | | | |
| | | | |
| | | |
| | | |
| | | | | | | | | | | | | | | | | |
| | | | | | | | | | | | | | | | | |
Commercial activity
We continued to accelerate the implementation and development of our digital transformation, focusing on our multi-channel strategy and the digitalization of processes and businesses. Our aim is to ensure personalized support tailored to the needs of each customer, which also adresses one of our main priorities: the continuous improvement our customer service.
In addition, we rolled out several commercial initiatives, with tailored products and services for each segment, as explained in the comments regarding the regions and countries:
•In individuals, mortgages continued to grow in the majority of our markets, with positive trends in Spain, the UK and Portugal, where new mortgage lending reached record highs. We also introduced new products such as Hipoteca Integral in Mexico, which considers a family’s total income, gives a previously excluded segment of the population the opportunity to access mortgages.
We are also digitalizing the processes for granting consumer loans in most countries.
•In auto finance, we made headway in new alliances and partnerships and renewing existing ones, both in Europe and the US.
•Regarding corporates, we continued to offer differentiated products and services for SMEs, companies and SCIB, while launching joint initiatives between them to deepen relationships with multinational clients. For example, we launched Green Building in Brazil, which offers business financing for environmentally certified construction projects for SMEs and wholesale banking.
These initiatives allowed us to reach 157 million customers across the Group. The number of loyal customers increased 9% year-on-year to 26.5 million, digital customers rose 10% year-on-year to 49.9 million and digital sales accounted for 56% of total sales.
Results
Underlying attributable profit in the first half of 2022 was EUR 3,991 million, 12% higher year-on-year. Excluding the exchange rate impact, it was 3% higher, as follows:
•Total income grew 2% driven by higher net interest income (+6%) and net fee income (+3%) which offset lower gains on financial transactions.
•Costs increased 3%, affected by inflation. Net operating income grew 1% and efficiency stood at 43.7%.
•Loan-loss provisions rose 26%, mainly driven by the increases in North and South America.
•Lower tax burden and lower impacts from minority interests.
| | | | | | | | | | | | | | | | | | | | | | | | |
| Retail Banking. Underlying income statement |
| EUR million and % change |
| | | | | | | | |
| | | | | | | | |
| | | / | Q1'22 | | | / | H1'21 |
| | Q2'22 | % | excl. FX | | H1'22 | % | excl. FX |
| | | | | | | | |
| Revenue | 10,541 | | +4 | +1 | | 20,635 | | +9 | +2 |
| Expenses | -4,626 | | +5 | +2 | | -9,025 | | +8 | +3 |
| Net operating income | 5,915 | | +4 | -1 | | 11,610 | | +9 | +1 |
| LLPs | -2,621 | | +24 | +18 | | -4,732 | | +35 | +26 |
| PBT | 2,838 | | -10 | -14 | | 5,997 | | -4 | -12 |
| Underlying attrib. profit | 1,936 | | -6 | -10 | | 3,991 | | +12 | +3 |
| | | | | | | | | | | | | | | | | | | | | | | | | | |
Business model | | | | | | | | |
| | | | Secondary segments | | | | |
| | | | | | | | |
| Santander Corporate & Investment Banking | Underlying attributable profit |
| EUR 1,531 mn |
| | | | | | | | | | | | | | | | | | | | | | | | | | | | | | | | | | | | | | | | | | | | | | | | | | | | | | | | | | | | | | |
| | | | Executive summary | | | | | | | | | | | | | | |
| | | | | | | | | | | | | | | | | |
| | | | | | | | | | | | | | | | | | | | |
| | | Results. (H1'22 vs. H1'21). % change in constant euros | | Our aim and strategic priorities | | |
| | | | | | | | | | | | | | | | | | | | |
| | Total income | Underlying att. profit | | | | |
| | +20% | +28% | | | |
| | Efficiency ratio | RoTE | | | |
| | 35.7% | 24.3% | | | |
| | | | | | | | | | | | | | | | | | | | |
| | | Revenue growth by business and region* | | Other highlights in the quarter | | |
| | | | | | | | | | | | | | | | | | | | |
| | | | | | | | |
| | | +11% | | | |
| | | +31% | | | |
| | | +29% | | | |
| | | | * Constant EUR million | | | | | | | |
| | | | | | | | | | | | | | | | | | | | |
Strategy
In a challenging macroeconomic environment due to geopolitical uncertainty arising from the Russia-Ukraine conflict, our priority has been to support our clients in these difficult times, while ensuring compliance with international restrictions and sanctions.
In this context, SCIB continued to make headway in the execution of its strategy to transform the business and become our clients' strategic advisor of choice, via specialized high value-added products and services; focusing on ESG and the digital transformation.
Our goal with this transformation is to become one of the leading investment banks in Europe. To this end, SCIB is strengthening its client advisory services through a pan-European platform, consolidating its leadership in Latin America in most countries and products, and continues to accelerate growth in the US, focusing on the integration of broker-dealer Amherst Pierpont Securities (APS) as a first step towards achieving its growth ambitions.
To accelerate the execution of our strategy within the sustainability sphere, in April 2022 , Banco Santander completed its plan to acquire 80% of WayCarbon Soluções Ambientais e Projetos de Carbono (‘WayCarbon’), a leading Brazil-based ESG consultancy firm that provides three core services: ESG consultancy; ESG strategy management software; and carbon credit trading.
This alliance further strengthens our commitment to the energy transition and our leadership in sustainable projects and renewable energy financing. In addition, we will expand our product portfolio in voluntary carbon markets, reforestation and conservation programmes, among others.
In ESG, of note in the quarter was Santander's role as financial advisor and intermediary for SCR Sibelco N.V. ("Sibelco") in the acquisition of 93.8% of Krynicki Recykling S.A.'s share capital, a Polish glass recycling company, for approximately PLN 375 million. This transaction will allow Sibelco to strengthen its market position in the glass recycling sector in Poland and the European Economic Community.
In Debt Capital Markets (DCM), SCIB acted as structurer for State Grid International Development and CFE (large Chinese and Mexican utilities) in their first green and sustainability bond issuances, respectively. In addition, SCIB structured a sustainable financing framework for Hexagon, a UK housing association. This structure enabled the client to issue a sustainability instrument, with an offering that will enable this not-for-profit organization to deliver on its commitment to provide safe, warm and energy-efficient homes for its residents.
Global Transaction Banking (GTB) closed the first sustainability-linked transaction to finance the acquisition of aircraft and several financings for the supply of components for the manufacture of electric vehicles and the construction of renewable energy plants. In addition, regarding supply chain disruptions, GTB continued to support our clients by providing new products to facilitate access to supplies and inventory management.
Of note in the Digital Solutions Group (DSG) was its activity in M&A in the digital environment and advising Telepass on the acquisition of Eurotoll.
| | | | | | | | | | | | | | | | | | | | | | | | | | |
Business model | | | | | | | | |
| | | | Secondary segments | | | | |
Results
Underlying attributable profit in the first half of 2022 amounted to EUR 1,531 million (26% of the Group's total operating areas), 34% higher than in H1'21, becoming one of the best in SCIB's history, backed by double-digit growth across core businesses, notably GTB and GDF. In constant euros, profit was 28% higher, by line:
Revenue performance by business was as follows:
•Markets: 10% increase vs H1'21. Macroeconomic uncertainty led to risk reductions, where different assets suffered losses. The only gains were recorded in FX portfolios, due to increased volatility in currencies and commodities.
By region, in Markets Europe & Asia, this uncertainty resulted in lower sales activity with clients. On the other hand, good management of the Market Making teams allowed us to protect the value of our trading books.
In Latin America, we recorded excellent results despite the slowdown in activity compared to the first quarter of 2022. Positive contribution from virtually all countries with strong, double-digit increases, except Peru and Uruguay.
•GDF (Global Debt Financing): in a geopolitical environment of rising inflation and volatility, total income was 18% higher compared to H1'21. Despite government bond market volumes falling by more than 25% globally and in Europe, SCIB gained market share, and ranked in Europe's top 5 for corporate clients and financial institutions.
Regarding Structured Finance, we continue to lead League Tables globally, participating in relevant transactions in the renewable energy sector, within our ESG strategy, such as Origis Energy Debt Raise or Great Pathfinder.
•GTB (Global Transactional Banking): revenue grew 36% year-on-year. Cash Management continued the trend set in the first quarter, with significant growth both in terms of transactionality and revenue from liabilities, favoured by the rise in interest rates in Latin America. Trade & Working Capital Solutions continued to support its clients through new solutions that facilitate access to supplies, inventory management and working capital optimization.
This strong performance allowed us to receive awards from experts, being named: Best Supply Chain Finance Bank Global and Best Trade Finance Bank in Latin America by Global Trade Review; Best Supply Chain Finance Provider of the Year by BCR; and Best Trade Financier in Latin America by Trade Finance Global.
Export Finance is the leader in ESG financing. Of note was Santander's role as Green Loan Coordinator, Underwriter and Mandated Lead Arranger in a EUR 1 billion green facility with Iberdrola, 95% guaranteed by a European ECA, being Iberdrola's largest ECA-backed green loan in the last 20 years.
•CF (Corporate Finance): strong performance in Mergers and Acquisitions (M&A), 31% increase in total income in the first half of 2021, although partially offset by the slowdown in Equity Capital Markets due to stagnation in the global equity placement markets.
In the Telecommunications, Media & Technology (TMT) industry, there continues to be a strong appetite for investment, where Santander remains very active. Of note were two M&A transactions for a total amount of over EUR 3 billion.
In Energy, Santander maintained its leadership position as financial advisor in the renewable energy market. It is worth highlighting the advisory services provided to Q-Energy in the sale of a EUR 1 billion asset portfolio.
In CRH (Consumer Retail Healthcare), Santander continued to strengthen its Consumer and Retail franchise. Also noteworthy was the sale of 75% of HFEB to the Canadian pension fund PSP.
In Infrastructures, despite the current challenging environment, Santander continued to be a key player in the sector. Of note was its advising role to the consortium between Globalvia and Kinetic in the acquisition of Go-Ahead, a listed UK transport company. The transaction, worth over EUR 1.2 billion, is Santander's first takeover bid as advisor in the UK.
Operating expenses increased 12% year-on-year due to investments in products and franchises under development. However, at 35.7%, efficiency remained at lower levels than the previous year and well below the sector.
Sharp improvement in loan-loss provisions compared to the first half of 2021, which was still heavily affected by the macroeconomic deterioration caused by the covid-19 pandemic.
Compared to the previous quarter, underlying attributable profit increased 2% but fell slightly in constant euros (-1%), dampened by higher costs and the contribution to the SRF.
| | | | | | | | | | | | | | | | | | | | | | | | |
| SCIB. Underlying income statement |
| EUR million and % change |
| | | | | | | | |
| | | | | | | | |
| | | / | Q1'22 | | | / | H1'21 |
| | Q2'22 | % | excl. FX | | H1'22 | % | excl. FX |
| | | | | | | | |
| Revenue | 1,849 | | +5 | +1 | | 3,612 | | +26 | +20 |
| Expenses | -673 | | +9 | +7 | | -1,289 | | +17 | +12 |
| Net operating income | 1,176 | | +2 | -1 | | 2,324 | | +32 | +25 |
| LLPs | 10 | | -25 | -27 | | 23 | | — | — |
| PBT | 1,149 | | +1 | -3 | | 2,291 | | +36 | +28 |
| Underlying attrib. profit | 772 | | +2 | -1 | | 1,531 | | +34 | +28 |
| | | | | | | | | | | | | | | | | | | | | | | | | | |
Business model | | | | | | | | |
| | | | Secondary segments | | | | |
| | | | | | | | |
| Wealth Management & Insurance | Underlying attributable profit |
| EUR 515 mn |
| | | | | | | | | | | | | | | | | | | | | | | | | | | | | | | | | | | | | | | | | | | | | | | | | | | | | | | | | | | | | | | | | | | | | | | | | | | | | | | | | | | | | | |
| | | | Executive summary | | | | | | | | | | | | | | | | | | | | | |
| | | | | | | | | | | | | | | | | | | | | | | | |
| | | | | | | | | | | | | | | | | | | | | | | | | | | | |
| | | Results (H1'22 vs. H1'21). % change in constant euros | | Growth drivers H1'22 | | |
| | Total fee income generated1 | Total contribution to profit1 | Assets under management
(AuMs) | RoTE | | | | | | |
| | | Net new money | AuMs | Gross written premiums | | |
| | | | |
| | +6% | +15% | -4% | 57.1% | | EUR 5.8 bn | EUR 189 bn | +17% | | |
| | | (2.3% of total CAL) | (-4% vs June 21) | vs June 21 | | |
| | | | |
| | | Total contribution to profit by business | | Other highlights in the period | | |
| | | | Constant EUR million (incl. fee income ceded to the Group) | | Private Banking | | SAM | | Insurance | | | |
| | | | | | | |
| | | | | Customer growth +5% vs June 21 | SRI* EUR 14.5 bn | Fee income1 EUR 795 mn +6% vs. H1'21 | | |
| | | | | (Total WM&I:
EUR 30.1 bn) | | |
| | | | | | | |
| | | | | | |
| | | | | (1) Excluding insurance one-offs in 2021 | | * Sustainable Responsible Investment | | |
| | | | | | | | | | | | | | | | | | | | | | | | | | | | |
Commercial activity
We maintain our objective to become the best responsible Wealth & Protection Manager in Europe and Latin America, being one of the Group's growth drivers:
•In Private Baking, despite market volatility and inflationary pressures, we continued to leverage our scale to enable clients to benefit from our global platform and to foster collaboration across markets and segments, with collaboration volumes increasing 22% to EUR 9.6 billion. We are the leader in the large flow of investment from Latin America to Spain and the United States.
| | | | | | | | | | | | | | | | | | | | |
| Collaboration volumes |
| Constant EUR billion | | |
| | |
| 10 | | | | | |
| | | | | |
| 〉 | | +22% | | |
| | vs. H1'21 | | |
| | | | | |
| | | | | |
We continue to renew our value proposition, widening our product range according to market trends, with a particular focus on alternative products, collateralized lending, investment banking and ESG. We also continued to grow our discretionary advisory service, to offer our clients value-added solutions tailored to their specific investment needs and risk profiles, which account for 11.6% of total assets under management, 0.4% more than the same period last year.
Our range of alternative products exceeded EUR 2.59 billion (EUR 1.67 billion in H1'21) in both Santander Asset Management (SAM) and third-party funds. In the first six months, we launched several funds, such as Laurion, Blackrock, Compass, Ameris, Sancus and Qualitas.
Our real estate investment service, where we are capturing a large part of the existing flow between Latin America and Europe and the United States, reached a total volume of EUR 109 million through transactions in the period.
Our Sustainable Responsible Investment (SRI) products amounted to EUR 18.3 billion, (classified according to Article 8 or 9 under the SFDR or similar criteria applicable in Latin America).
•In Santander Asset Management, market volatility affected overall asset valuations and investment flows. We continued to improve and complete our local and global product proposition. We made further headway in our ESG strategy, offering 35 products globally, and assets under management (including sustainability strategies) of around EUR 14.5 billion. The range of alternative products aimed primarily at our institutional clients and Family Offices is becoming increasingly robust, with 5 funds already launched with EUR 689 million of AuMs and EUR 307 million already invested.
Regarding our operational and technological transformation, we launched the new Santander Activa management service in Spain in June, a fully digital (available on the web and app) automated portfolio management service (robo-advisor), that offers a quick and simple take-out process.
•In Insurance, we maintained a healthy growth rate in premiums, mainly in the protection business. The credit-related business was slightly affected by the macroeconomic environment, especially in Brazil and Chile.
| | | | | | | | | | | | | | | | | | | | | | | | | | |
Business model | | | | | | | | |
| | | | Secondary segments | | | | |
Protection insurance sales were particularly strong in Europe. The new savings value proposition developed in Spain was particularly successful, completing the range of unit linked products.
In the Americas, we continued to consolidate the improvements to our value proposition, with healthy dynamics in the distribution mix through channels and in non-credit related insurance sales. It is worth highlighting helpS, our new, fully-digital assistance proposal in Brazil that enables us to access new customer segments.
The motor vehicle insurance business was 8% higher. The Autocompara platform, which operates in Argentina, Brazil, Chile, Mexico and Uruguay, reached 1.6 million active policies (+4% year-on-year). Regarding our digital strategy, we continued to increase the number of insurance policies distributed through our digital channels at double-digit rates, which now account for 20% of the total sales volumes (+21% year-on-year).
Business performance
Total assets under management amounted to EUR 395 billion, 4% lower year-on-year, dampened by markets since early 2022, especially in Europe.
| | | | | | | | | | | | | | | | | | | | |
| Business performance: SAM and Private Banking |
| Constant EUR billion |
| | |
|
| Total assets under management |
| Funds and investment* |
| - SAM |
| - Private Banking |
| Custody of customer funds |
| Customer deposits |
| Customer loans |
|
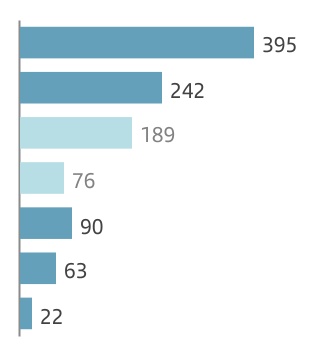
| | | | | |
| / Mar-22 | / Jun-21 |
| |
| -1 | % | -4 | % |
| -2 | % | -3 | % |
| -3 | % | -4 | % |
| -5 | % | -5 | % |
| -2 | % | -12 | % |
| +3 | % | +11 | % |
| +3 | % | +13 | % |
| |
Note: Total assets marketed and/or managed in 2022 and 2021.
(*) Total adjusted private banking customer funds managed by SAM.
•In Private Banking, the volume of customer assets and liabilities reached EUR 251.4 billion, 3% lower than in June 2021, affected by custody valuations. Net new money amounted to EUR 5.8 billion (2.3% of total volume). Net profit in H1'22 was EUR 313 million, up 25% compared to H1'21, primarily backed by growth in total income. Private Banking customers increased 5% to 115,000 clients.
•In SAM, total assets under management decreased 4% compared to June 2021 to EUR 189 billion. Net sales recorded outflows of EUR 1.747 billion (0.9% of the total). Total contribution to the Group's profit (including ceded fee income) was EUR 284 million, 8% higher year-on-year.
•In Insurance, the volume of gross written premiums in H1'22 amounted to EUR 5.5 billion (+17% year-on-year), with protection premiums growing 9% despite lower lending demand in Latin America. Total fee income rose 2% (+6% excluding the impact from insurance portfolio buybacks in 2021) and fee income from protection insurance was 5% higher. Total contribution to profit stood at EUR 679 million, +2% year-on-year (+13% excluding insurance earn-out one-offs and insurance portfolio buybacks in 2021).
Results
Underlying attributable profit was EUR 515 million in the first half of 2022, up 15% year-on-year in constant euros (+29% excluding insurance one-offs in 2021), as follows:
•Total income increased 10% due to higher revenue as a result of improved margins and net fee income, and the increase in the insurance protection business, especially non-credit related (+18% excluding the impact of insurance one-offs in 2021). Total fee income generated amounted to EUR 1,785 million (+4% year-on-year; +6% excluding insurance one-offs in 2021) and represented 30% of the Group's total.
| | | | | | | | | | | | | | | | | | | | | | | | | | | | | | | | |
| Total fee income generated |
| Constant EUR million | | |
| | |
| 1,785 | | | | | | | | | |
| | | | | | | | | |
| 〉 | | +4% | | | | 30% | | |
| | vs. H1'21 | | | | / total Group | | |
| | | | | | | | | |
| | | | | | | | | |
•Operating expenses were 5% higher year-on-year, due to the investments carried out together with higher costs related to increased commercial activity and the perimeter of several operations, such as the acquisition of Crédit Agricole's business in Miami in 2021.
•As a result, net operating income rose 14%.
The total contribution to the Group (including net profit and total fees generated net of tax) was EUR 1,276 million in H1'22, 8% higher than in the same period of 2021 (+15% excluding insurance one-offs in 2021).
Compared to the previous quarter, underlying attributable profit increased 7% primarily due to the positive performance in total income and cost stability.
| | | | | | | | | | | | | | |
| Total contribution to profit |
| EUR million and % change in constant euros |
| Q2'22 | | H1'22 |
| | | | |
| 662 | | | 1,276 |
| +8 | % | / Q1'22 | | +8 | % | / H1'21 |
| | | | | | | | | | | | | | | | | | | | | | | | |
| WM&I. Underlying income statement |
| EUR million and % change |
| | | | | | | | |
| | | | | | | | |
| | | / | Q1'22 | | | / | H1'21 |
| | Q2'22 | % | excl. FX | | H1'22 | % | excl. FX |
| | | | | | | | |
| Revenue | 635 | | +8 | +5 | | 1,222 | | +15 | +10 |
| Expenses | -252 | | +3 | 0 | | -496 | | +10 | +5 |
| Net operating income | 384 | | +12 | +9 | | 726 | | +18 | +14 |
| LLPs | -9 | | — | — | | -8 | | -15 | -14 |
| PBT | 367 | | +9 | +6 | | 705 | | +18 | +14 |
| Underlying attrib. profit | 270 | | +10 | +7 | | 515 | | +19 | +15 |
| | | | | | | | | | | | | | | | | | | | | | | | | | |
Business model | | | | | | | | |
| | | | Secondary segments | | | | |
| | | | | | | | |
| | Underlying attributable profit |
| -EUR 104 mn |
| | | | | | | | | | | | | | | | | | | | | | | | | | | | | | | | | | | | | | | | | | | | | | | | | | | | | | | | | | | | | | | | | | | | | | | | | | | | | | | | |
| | | | Executive summary | | | | | | | | | | | | | | | | | | | | | |
| | | | | | | | | | | | | | | | | | | | | | | | |
| | | | | | | | | | | | | | | | | | | | | | | | | | |
| | | Revenue performance | | Our business | | | | | |
| | | | | | |
| | Solid revenue growth* | | Merchants | International Trade | Payments | Consumers | | |
| | | +87%H1'22 vs. H1'21 | | Global payments solutions for all merchant segments | International trading solutions for business | Wholesale account-to-account payment solutions | Financial marketplace for the underbanked | | |
| | | | |
| | | | | | | | | | | | | | | | | | | | | | | | | | |
| | | Our main strategic priorities | | Main growth drivers | | | | | |
| | | | | | |
| | •Scaling up our global technology platform | | Merchants Total Payments Volume* | Active merchants | International Trade
active customers | | |
| | •Accelerating our commercial growth | | | |
| | •Pursuing the open market opportunity | | +35% H1'22 vs H1'21 | +5% Jun-22 vs Jun-21 | >25k | | |
| | (*) Constant EUR million | | | | |
| | | | | | | | | | | | | | | | | | | | | | | | | | |
.
Strategy
PagoNxt aims to achieve a global leadership position in payments through our distinctive, holistic and customer-centric value proposition. We are one-of-a-kind paytech business providing customers with a one-stop shop for innovative payments and integrated value-added solutions.
We address several high-growth and strategic business segments, namely:
•Merchants: providing global and integrated acquiring, processing and value-added solutions for physical and e-commerce merchants of all sizes.
•International Trade: delivering specialized cross-border trading solutions – payments, FX, cash management, trade finance – for business customers, in a large and global addressable market yet to be fully digitalized.
•Payments: providing wholesale account-to-account payments processing and instant connectivity to schemes in multiple geographies through a highly-scalable model.
•Consumer: providing a financial marketplace for the economic inclusion of the underbanked and low-income population, with a focus on Latin America.
PagoNxt's technology platform and specialist teams serve the payments needs of Grupo Santander and additionally cater for open market opportunities beyond Santander's business.
PagoNxt's strategy is anchored on the following key levers:
•Scaling up our global, cloud-native, data-driven, secure and efficient platform. We operate a connected, real-time, flexible and highly scalable technology platform that is fully cloud and API-based to ensure access to PagoNxt's latest features through a single integration. We process and generate insights to help our customers and their businesses leverage the full power of data and make data-driven decisions.
•Accelerating commercial growth by continuing to strengthen our commerce and international trade ecosystem, our offerings and our distribution through Santander's commercial muscle.
•Decisively pursuing the open market opportunity through direct commercialization and distribution partnerships, increasing our market penetration in Europe, North America and South America and extending our footprint in additional strategic regions.
| | | | | | | | | | | | | | | | | | | | | | | | | | |
Business model | | | | | | | | |
| | | | Secondary segments | | | | |
Business performance
In the first half of the year, PagoNxt had several important achievements, effectively responding to the current market challenges:
•Getnet continued its growth, reaching 1.27 million active merchants (+5% vs. Jun-21) and EUR 74.6 billion in Total Payments Volume (TPV), 35% higher compared to the first half of 2021.
–TPV in Getnet Brazil grew 23% in H1 boosted by our e-commerce proposition, which has become one of our main growth drivers, positioning us as one of the main players in the industry. Our growth strategy is also centred on leveraging our relationship with Santander Brasil, pursuing opportunities through all sales channels (digital, call centre, branches, Prospera). Additionally, we are boosting our independent channel through partnerships, direct sales (owned and third parties, including franchises) and digital sales. Our ambition is to be the one-stop-shop platform for solutions for SMEs and long-tail customers. In Q2, PagoNxt announced its plan to acquire the minority interests in Getnet Brazil.
–Getnet Europe, our pan-European acquirer, grew significantly in H1. TPV increased 53% and active merchants rose 15% year-on-year, mainly driven by our exposure to high-growth verticals in Spain. In addition, we continue to develop our open market strategy in the region, with an initial focus on developing solutions for highly specialized industries, such as airlines and mobility. Through our activity with European merchants, our presence in the region now includes nine countries.
–Getnet Mexico continued to fuel growth, with TPV increasing by 38% in H1 year-on-year. This rise was driven by the progressive recovery across key sectors and by the development of the open market distribution channel through partnerships with financial institutions, independent software vendors (ISVs) and payment ecosystems.
•Our One Trade platform continued to develop new and innovative solutions to become the core provider of international capabilities to Grupo Santander. In the last quarter, the platform expanded its reach, implementing new cross-border payments capabilities for Santander España and new Trading FX capabilities for Santander Chile.
•More broadly in Grupo Santander payments, PagoNxt is accelerating its roadmap to become the wholesale payments provider of Santander, centralizing all types of non-card payments.
•In the quarter, Ebury extended its B2B cross-border trade presence and portfolio in the open market, acquiring the Brazilian fintech, Bexs.
•On the consumer side, our Superdigital business recorded 637 thousand active users in Brazil, Argentina and Uruguay in Q2. The global platform will shortly be launched in Colombia, Peru and Mexico.
| | | | | | | | | | | | | | | | | | | | | | | | | | | | | | | | | | | | | | | | | | | | |
| Merchant Acquiring |
| Active merchants | | Total Payments Volume |
| Millions | | Constant EUR billion |
| | | | | | | | | | | | | | |
| | | | | 1.27 | | | | | | | | | |
| 1.21 | | +5% | | | | | | | | +35% | | 74.6 | |
| | | | | | | | | | | | |
| | | | | | | | | 55.1 | | | | | |
| | | | | | | | | | | | | | |
| | | | | | | | | | | | | | |
| | | | | | | | | | | | | | |
| Jun-21 | | Jun-22 | | H1'21 | | H1'22 |
Results
In the first half of 2022, underlying attributable loss decreased year-on-year to -EUR 104 million, compared to -EUR 123 million in the first half of 2021.
Total income was EUR 398 million, an 87% increase in constant euros compared to the first half of 2021, backed by the overall increase in business activity and volumes across regions, especially in our Merchant and Trade businesses (Getnet, Ebury).
This revenue growth keeps PagoNxt on track to achieve its 50% revenue growth target for 2022.
| | | | | | | | | | | | | | | | | | | | |
| PagoNxt. Revenue performance |
| Constant EUR million and % change in constant euros |
| | | | | | |
| | | | | 398 | | |
| | | +87% | | | |
| 213 | | | | |
| | | | | | |
| | | | | | |
| | | | | | |
| | | | | | |
| H1'21 | | H1'22 |
In the period, PagoNxt has continued its investment phase to develop and implement its global technology.
Compared to the previous quarter, underlying attributable profit was similar and stood at -EUR 50 million.
| | | | | | | | | | | | | | | | | | | | | | | | |
| PagoNxt. Underlying income statement |
| EUR million and % change |
| | | | | | | | |
| | | | | | | | |
| | | / | Q1'22 | | | / | H1'21 |
| | Q2'22 | % | excl. FX | | H1'22 | % | excl. FX |
| | | | | | | | |
| Revenue | 236 | | +46 | +35 | | 398 | | +110 | +87 |
| Expenses | -258 | | +36 | +31 | | -447 | | +50 | +43 |
| Net operating income | -22 | | -22 | 0 | | -50 | | -54 | -50 |
| LLPs | -9 | | +222 | +199 | | -11 | | +142 | +107 |
| PBT | -33 | | +5 | +25 | | -64 | | -46 | -42 |
| Underlying attrib. profit | -50 | | -8 | -3 | | -104 | | -18 | -16 |
| | | | | |
| Responsible Banking targets |
| |
This quarter we set three new decarbonization targets and continued to make progress on the other medium-term commitments:
More information available on our corporate website.
Note: H1'22 data provisional and not audited
☑ We announced three new decarbonization targets for 2030 (measured in emissions reductions vs 2019) in the following sectors: energy1 (-29%), aviation (-33%) and steel (-32%).
☑ We appointed a new Head of Green Finance to drive the transition to a greener economy for our customers.
☑ Euromoney named us Best Global Bank for Financial Inclusion, highlighting our programmes in South America and Mexico, and Best Bank for Corporate Responsibility in Central and Eastern Europe for our support to refugees from Russia-Ukraine conflict.
Of note among the implemented initiatives were:
♣ In line with our commitment to grant EUR 120 billion in green finance by 2025 and EUR 220 billion by 2030, we mobilized EUR 8.7 billion in green finance in the first half of 2022, reaching EUR 74.4 billion since 2019.
♣ The volume of AuMs in socially responsible investments amounted to EUR 30.1 billion.
♣ We continued to support our wholesale customers, through:
•The EUR 1 billion green export loan with Iberdrola. The funds will mainly finance the purchase of turbines for wind farms in Europe.
•Participation in the issuance of green bonds for the ICO and the Junta de Andalucía, for EUR 500 million each.
•New partnerships: SCIB and EIT InnoEnergy will work together to foster innovation in the development of sustainable energy solutions. Agreement with EcoVadis to incorporate ESG metrics in the bank's global confirming programmes.
(1) Energy refers to Oil & Gas. Further detail on our Climate Finance Report 2021 - June 2022.
♣ New features and products for our customers:
•In Spain, we added a carbon footprint calculator on our app and website that considers the customer's entire transaction, allows them to offset their own footprint and gives eco-advice for its reduction. We also offer a "turnkey" service that includes everything from the online simulation of the home renovation to the management of European aid and the energy efficiency loan.
•In the UK, we introduced the Green Mortgages Hub platform to inform and promote energy efficiency in our customers' homes.
•In Brazil, we designed a Sustainable Business Plan for financing real estate projects that includes environmental certifications and the ability to significantly reduce waste and water and energy consumption.
t We continue to strengthen our financial inclusion and empowerment proposition:
•We have financially empowered more than 9 million people since 2019, making headway towards our 10 million target in 2025, mainly driven by the expansion of our financial education programmes in the UK (The Numbers Game) and Poland (Finansiaki), as well as Tuiio, our financing programme in Mexico.
•We have granted over EUR 426 million in loans through our microfinance programmes in 8 countries.
•In Mexico, we launched Hipoteca Integral, backed by Sociedad Hipotecaria Federal (SHF, the federal mortgage company), enabling access to mortgages to eight million families that do not have stable incomes.
•In Portugal, we made headway in our proposal for senior customers by opening a call centre intended for 70+ customers to improve the experience of this segment.
•In the US, we extended our partnership with Operation HOPE, an NGO specialized in financial education and inclusion, to continue supporting people from all walks of life.
t We promote a diverse and inclusive workplace: Santander's headquarters hosted the EMEA Women in Payments Symposium. The event, sponsored by Santander Women's Network, brought together female professionals in the payments industry, in order to boost professional development and gender equality.
t We support the communities where we operate:
•Santander Universities, opened new calls for scholarship applications (7,900 spots) related to sustainability and the development of key skills for the labour market, together with Harvard Business Publishing, LSE and Cambridge Judge School.
•We continue to support Ukraine through Poland's recent partnership with the United Nations High Commissioner for Refugees, enabling rapid and safe arrival to the country.
v We introduced new mandatory ESG training for all employees. In addition, jointly with the International Association for Sustainable Economy, we provide employees with an internal and an external certification. The latter is aimed at those employees who are involved in the Responsible Banking agenda.
v We published annual sustainability reports in Mexico, Portugal and Brazil.
☑ IR Magazine gave Santander awards for Best Annual Report and Best ESG Materiality Reporting.
☑ In Brazil, Exame magazine named us Best ESG in the financial institutions category.
☑ In Spain, we received the IMEF - MEF 2022 Gender Equality Award and we entered the Best LinkedIn Companies 2022 ranking.
☑ In Poland, we were awarded with the gold leaf in the CSR Leaves awards, as well as being named, together with the Santander Fundakja foundation, in the Responsible Business in Poland best practice report.
☑ We ranked among the top 10 companies to work for in Uruguay by Great Place to Work for companies with over 150 employees.
| | | | | |
A responsible bank has a solid governance model with well-defined functions, it manages risks and opportunities prudently and defines its long-term strategy looking out for the interests of all its stakeholders and society in general | |
àChanges in the board of directors
On 17 June, it was announced that, following a favourable report from the nomination committee and after a rigorous succession process, the bank's board of directors had proposed, the currently CEO of Santander México and regional head of North America, Mr Hector Grisi, as Group CEO and member of the board effective 1 January 2023, subject to the corresponding approvals. Mr Grisi’s appointment will take place once regulatory approvals have been obtained. Mr Grisi will succeed Mr José Antonio Álvarez, who, after the transition period, will remain on the board of directors as non-executive vice chair.
On 21 April, once the corresponding regulatory approval was obtained, Mr Germán de la Fuente joined the board of directors as an independent director, filling the vacancy of Mr Álvaro Cardoso de Souza.
Mr R. Martín Chávez resigned, for personal reasons, as an independent director of Banco Santander effective on 1 July, thereby stepping down from the committees he had been assigned. Mr Chávez remains a director of PagoNxt.
àChanges in the composition of the board committees
Ms Ana Botín has been appointed as chair of the innovation and technology committee, replacing Mr R. Martín Chávez, effective on 18 April 2022.
Mr Germán de la Fuente joined the audit committee on 21 April 2022.
àShare capital. Amendment of Article 5 of the Bylaws
On 1 April, the board of directors reduced the bank's share capital in the amount of EUR 129,965,136.50 by cancelling 259,930,273 of its own shares acquired in the buy-back programme carried out between October and November 2021 within the framework of the shareholder remuneration against 2021 results. The reduction was approved by the general shareholders' meeting on 1 April 2022 and was registered in the Commercial Registry of Cantabria on 25 April 2022.
Likewise, on 28 June 2022, a second share capital reduction in the amount of EUR 143,154,722.50 was executed by the board, as a result the cancellation of 286,309,445 of its own shares acquired in the buy-back programme carried out between March and May 2022 within the framework of the shareholder remuneration against 2021 results. The reduction was approved by the general shareholders' meeting on 1 April 2022, which delegated to the board the power to set its terms in all matters not specified and was registered in the Commercial Registry of Cantabria on 1 July 2022.
Following the aforementioned reductions, the bank's share capital has been set at EUR 8,397,200,792, represented by 16,794,401,584 shares with a nominal value of EUR 0.50 for each share, belonging to the same class and with the same rights.
àOther amendments of the Bylaws
On 26 May, once the ECB provided authorization for the amendments to the Bylaws approved at the ordinary general shareholders' meeting on 1 April 2022 (Articles 6, 12, 16, 19, 26, 29, 45, 48, 52, 58, 59, 59 bis of the Bylaws and the introduction of a new Article 64 bis), they were registered in the Commercial Registry of Cantabria. Their purpose is to:
•conform them to the amendments introduced in the Spanish Companies Act and introduce certain technical clarifications regarding to the right to know the identity of the ultimate beneficiary of the shares and the time at which newly-issued shares are transferable, the directors' remuneration, capital reductions, convertible securities and the powers of the audit committee with respect to the directors’ report and related party transactions;
•clarify that the board can establish direct reporting lines from other executives to the board itself or to its committees;
•allow the board of directors to appoint more than one vice secretary and reflect this possibility in the regulation of the presiding committee of the general shareholders’ meeting;
•provide for the ability of directors to attend the meetings remotely if there are justified grounds as determined by the board or the chair of the meeting; and
•include a technical clarification regarding the distribution of dividends other than in cash or own funds instruments of the Bank, in accordance with the criteria of the European Banking Authority.
àAmendment of the Rules and Regulations of the General Shareholders’ Meeting
Likewise, on 26 May 2022, the amendments to the Rules and regulations of the general shareholders’ meeting approved at the general meeting on 1 April 2022 (Articles 6, 13, 17 and 19, the elimination of the Additional Provision and the introduction of a new Article 15 bis) were registered in the Commercial Registry of Cantabria and submitted to the National Securities Market Commission. The amendments were introduced to conform the regulatory text to the amendments to the Bylaws approved by the general shareholders’ meeting and to the amendments implemented to the Spanish Companies Act regarding attendance at the general meeting remotely, as well as to modify the minimum time that may be allocated to the shareholders presentations at the general meeting.
àAmendment of the Rules and Regulations of the Board of Directors
On 13 June 2022, the amendments to the Rules and regulations of the board of directors (Articles 3, 8, 13, 17, 19, 27 and 33) were registered in the Commercial Registry of Cantabria and submitted to the National Securities Market Commission. The amendments were introduced to conform to the amended Bylaws, as approved by the general shareholders’ meeting, to clarify the term of office of directors appointed by co-option and to strengthen coordination between the audit committee and the responsible banking, sustainability and culture committee.
In application of the shareholder remuneration policy for 2021, the bank paid a second cash dividend of EUR 5.15 cents per share against 2021 results. In addition, as detailed in the Corporate Governance chapter, a second share buyback programme was implemented for a total amount of EUR 865 million, equivalent to 1.7% of the bank's share capital, whose redemption was executed by the board of directors on 28 June 2022.
As a result, total shareholder remuneration totalled around EUR 3.4 billion, equivalent to a share of approximately 40% of 2021 underlying attributable profit.
à Share price performance
Santander's shares are listed in 5 markets, in Spain, Mexico, Poland, the US (as an ADR) and the UK (as a CDI).
The OECD has identified several factors that are contributing to the downturn of the global economy, including heightened inflation that is in turn reducing disposable income and lowering consumption, economic uncertainty that deters business investment and threatens to curb supply in the coming years, China's zero-covid-19 policy that is disrupting global supply chains and the Russia-Ukraine conflict that is negatively affecting the distribution of basic food and energy commodities.
The decisions taken by central banks to combat soaring inflation, including interest rate hikes in the US, the UK and Latin America, as well as the increasingly accelerated reduction of the asset purchase programme by the European Central Bank (ECB) have had a negative impact on our share price performance.
In recent weeks, concerns about inflation and a potential recession forced the main central banks to act more aggressively. Therefore, the Fed raised interest rates by another 75 basis points, compared with the expected 50 bp increase, and the ECB raised interest rate by 50 bps in July. Moreover, the ECB announced its new tool to tackle the so-called financial fragmentation,which arises from the increase in the risk premiums of South-European countries; the Transmission Protection Instrument (TPI).
The impact of these measures is leading to a depreciation trend in currency exchange rates against the dollar, which is now close to parity with the euro.
In this environment, the Santander share price ended the first six months with an 8.6% decrease versus December 2021, a better performance than that of the main comparable indices, primarily due to its very limited exposure to Russia and Ukraine, geographic diversification, good Q1'22 results and a positive performance of Latin American currencies.
The main global equity markets ended the first half with declines. The banking sector recorded an overall worse performance, affected by the different exposures to Russia. The DJ Stoxx Banks fell 13.9% and the MSCI World Banks 17.4%, compared to the 7.1% Ibex 35 decrease and the 9.7% DJ Stoxx 50 decline.
| | | | | | | | | | | | | | |
| Share price |
| | |
| | |
START 31/12/2021 | | END 30/06/2022 |
| €2.941 | | €2.688 |
| | | | |
| | |
Maximum 10/02/2022 | | Minimum 07/03/2022 |
| €3.482 | | €2.490 |
| | |
| Comparative share performance |
|
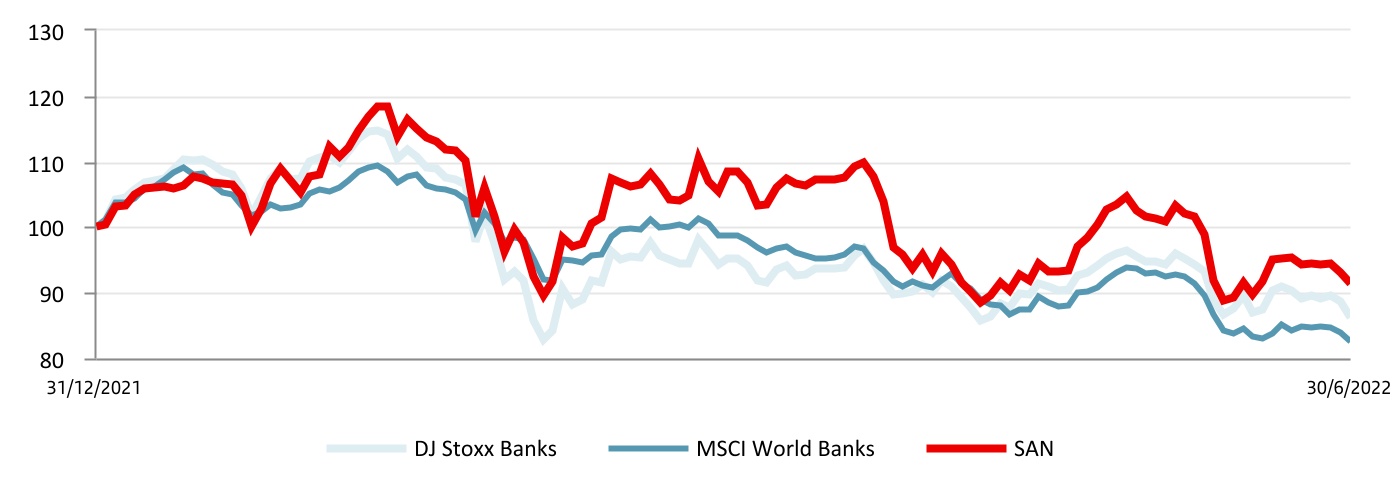
àMarket capitalization and trading
As at 30 June 2022, Santander was the second largest bank in the Eurozone by market capitalization and the 37th in the world among financial entities (EUR 45,143 million).
The share’s weighting in the DJ Stoxx Banks index was 6.8% and 12.4% in the DJ Euro Stoxx Banks. In the domestic market, its weight in the Ibex 35 as at end-June was 10.6%.
A total of 8,157 million shares were traded in the period for an effective value of EUR 24,486 million and a liquidity ratio of 47%.
The daily trading volume was 64.2 million shares with an effective value of EUR 193 million.
àShareholder base
The total number of Santander shareholders at 30 June 2022 was 3,985,638, of which 3,453,534 were European (75.10% of the capital stock) and 520,769 from the Americas (23.84% of the capital stock).
Excluding the board, which holds 1.10% of the Bank’s capital stock, retail shareholders account for 42.59% and institutional shareholders account for 56.31%.
| | | | | | | | |
| Share capital distribution by geographic area |
| June 2022 |
| The Americas | Europe | Other |
| 23.84% | 75.10% | 1.06% |
|
| | | | | | | | |
| 2nd | Bank in the Eurozone by market capitalization |
EUR 45,143 million |
| | | | | |
| The Santander share |
| June 2022 | |
| |
| Shares and trading data | |
| Shares (number) | 16,794,401,584 | |
| Average daily turnover (number of shares) | 64,228,243 | |
| Share liquidity (%) | 47 |
| (Number of shares traded during the year / number of shares) |
| |
| Stock market indicators |
| Price / Tangible book value (X) | 0.63 |
| |
| Free float (%) | 99.98 |
| | | | | |
| Share capital distribution by type of shareholder |
| June 2022 |
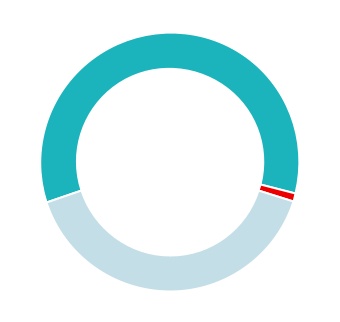
| | | |
| Institutions |
| 56.31% |
| |
| Board * |
| 1.10% |
| |
| Retail |
| 42.59% |
| |
(*) Shares owned or represented by directors.
2022 A P P E N D I X
| | | | | | | | | | | | | | | | | | | | | | | | | | |
| |
| |
| | | |
|
| | | | | | | | Group financial information |
| | | | | | | | | | | | | | | | | | | | |
| Net fee income. Consolidated |
| EUR million | | | | | | |
| Q2'22 | Q1'22 | Change (%) | H1'22 | H1'21 | Change (%) |
| Fees from services | 1,772 | | 1,597 | | 11.0 | 3,369 | | 2,843 | | 18.5 |
| Wealth management and marketing of customer funds | 1,004 | | 923 | | 8.8 | 1,927 | | 1,783 | | 8.1 |
| Securities and custody | 264 | | 292 | | (9.6) | 556 | | 543 | | 2.4 |
| Net fee income | 3,040 | | 2,812 | | 8.1 | 5,852 | | 5,169 | | 13.2 |
| | | | | | | | | | | | | | | | | | | | |
| Underlying operating expenses. Consolidated |
| EUR million | | | | | | |
| Q2'22 | Q1'22 | Change (%) | H1'22 | H1'21 | Change (%) |
| Staff costs | 3,085 | | 2,863 | | 7.8 | 5,948 | | 5,438 | | 9.4 |
| Other general administrative expenses | 2,077 | | 1,968 | | 5.5 | 4,045 | | 3,558 | | 13.7 |
| Information technology | 596 | | 565 | | 5.5 | 1,161 | | 1,048 | | 10.8 |
| Communications | 108 | | 100 | | 8.0 | 208 | | 199 | | 4.5 |
| Advertising | 144 | | 121 | | 19.0 | 265 | | 233 | | 13.7 |
| Buildings and premises | 192 | | 167 | | 15.0 | 359 | | 332 | | 8.1 |
| Printed and office material | 24 | | 23 | | 4.3 | 47 | | 42 | | 11.9 |
| Taxes (other than tax on profits) | 139 | | 141 | | (1.4) | 280 | | 264 | | 6.1 |
| Other expenses | 874 | | 851 | | 2.7 | 1,725 | | 1,440 | | 19.8 |
| Administrative expenses | 5,162 | | 4,831 | | 6.9 | 9,993 | | 8,996 | | 11.1 |
| Depreciation and amortization | 738 | | 704 | | 4.8 | 1,442 | | 1,381 | | 4.4 |
| Operating expenses | 5,900 | | 5,535 | | 6.6 | 11,435 | | 10,377 | | 10.2 |
| | | | | | | | | | | | | | | | | | | | | | | |
| Operating means. Consolidated | |
| Employees1 | | Branches2 |
| Jun-22 | Jun-21 | Change | | Jun-22 | Jun-21 | Change |
| Europe | 63,579 | | 66,398 | | (2,819) | | | 3,178 | | 3,401 | | (223) | |
| Spain | 26,272 | | 26,152 | | 120 | | | 1,921 | | 1,951 | | (30) | |
| United Kingdom | 20,320 | | 22,451 | | (2,131) | | | 450 | | 553 | | (103) | |
| Portugal | 4,977 | | 6,049 | | (1,072) | | | 386 | | 418 | | (32) | |
| Poland | 10,468 | | 10,443 | | 25 | | | 413 | | 471 | | (58) | |
| Other | 1,542 | | 1,303 | | 239 | | | 8 | | 8 | | — | |
| North America | 43,779 | | 41,670 | | 2,109 | | | 1,859 | | 1,920 | | (61) | |
| US | 14,943 | | 15,610 | | (667) | | | 486 | | 544 | | (58) | |
| Mexico | 28,236 | | 25,543 | | 2,693 | | | 1,373 | | 1,376 | | (3) | |
| Other | 600 | | 517 | | 83 | | | — | | — | | — | |
| South America | 75,588 | | 67,198 | | 8,390 | | | 3,786 | | 3,788 | | (2) | |
| Brazil | 53,743 | | 45,115 | | 8,628 | | | 2,936 | | 2,940 | | (4) | |
| Chile | 9,921 | | 10,628 | | (707) | | | 306 | | 332 | | (26) | |
| Argentina | 8,514 | | 8,814 | | (300) | | | 407 | | 408 | | (1) | |
| Other | 3,410 | | 2,641 | | 769 | | | 137 | | 108 | | 29 | |
| Digital Consumer Bank | 15,894 | | 15,834 | | 60 | | | 370 | | 314 | | 56 | |
| Corporate Centre | 1,811 | | 1,743 | | 68 | | | | | |
| Total Group | 200,651 | | 192,843 | | 7,808 | | | 9,193 | | 9,423 | | (230) | |
(1) UK and Poland figures have been changed to headcount to align with the other units.
(2) Branch data for Brazil has been adjusted to the show number of physical branches rather than operating units.
| | | | | | | | | | | | | | | | | | | | |
| Underlying net loan-loss provisions. Consolidated |
| EUR million | | | | | | |
| Q2'22 | Q1'22 | Change (%) | H1'22 | H1'21 | Change (%) |
| | | | | | |
| Non-performing loans | 2,988 | | 2,409 | | 24.0 | 5,397 | | 4,353 | | 24.0 |
| Country-risk | — | | 1 | | (100.0) | | 1 | | (1) | | — | |
| Recovery of written-off assets | (354) | | (309) | | 14.6 | (663) | | (599) | | 10.7 |
| | | | | | |
| Net loan-loss provisions | 2,634 | | 2,101 | | 25.4 | 4,735 | | 3,753 | | 26.2 |
| | | | | | | | | | | | | | | | | | | | | | | | | | |
| |
| |
| | | |
|
| | | | | | | | Group financial information |
| | | | | | | | | | | | | | | | | |
| Loans and advances to customers. Consolidated |
| EUR million | | | | | |
| | | Change | |
| Jun-22 | Jun-21 | Absolute | % | Dec-21 |
| Commercial bills | 57,171 | | 42,529 | | 14,642 | | 34.4 | 49,603 | |
| Secured loans | 563,525 | | 522,412 | | 41,113 | | 7.9 | 542,404 | |
| Other term loans | 288,070 | | 275,974 | | 12,096 | | 4.4 | 269,526 | |
| Finance leases | 39,139 | | 38,054 | | 1,085 | | 2.9 | 38,503 | |
| Receivable on demand | 13,244 | | 9,995 | | 3,249 | | 32.5 | 10,304 | |
| Credit cards receivable | 21,884 | | 18,459 | | 3,425 | | 18.6 | 20,397 | |
| Impaired assets | 32,402 | | 32,136 | | 266 | | 0.8 | 31,645 | |
| Gross loans and advances to customers (excl. reverse repos) | 1,015,435 | | 939,559 | | 75,876 | | 8.1 | 962,382 | |
| Reverse repos | 45,738 | | 38,536 | | 7,202 | | 18.7 | 33,264 | |
| Gross loans and advances to customers | 1,061,173 | | 978,095 | | 83,078 | | 8.5 | 995,646 | |
| Loan-loss allowances | 23,452 | | 23,577 | | (125) | | (0.5) | 22,964 | |
| Loans and advances to customers | 1,037,721 | | 954,518 | | 83,203 | | 8.7 | 972,682 | |
| | | | | | | | | | | | | | | | | |
| Total funds. Consolidated |
| EUR million | | | | | |
| | | Change | |
| Jun-22 | Jun-21 | Absolute | % | Dec-21 |
| Demand deposits | 717,516 | | 685,086 | | 32,430 | | 4.7 | 717,728 | |
| Time deposits | 197,420 | | 169,491 | | 27,929 | | 16.5 | 164,259 | |
| Mutual funds | 183,773 | | 182,491 | | 1,282 | | 0.7 | 188,096 | |
| Customer funds | 1,098,709 | | 1,037,068 | | 61,641 | | 5.9 | 1,070,083 | |
| Pension funds | 14,250 | | 15,858 | | (1,608) | | (10.1) | 16,078 | |
| Managed portfolios | 32,597 | | 29,493 | | 3,104 | | 10.5 | 31,138 | |
| Repos | 58,851 | | 39,550 | | 19,301 | | 48.8 | 36,357 | |
| Total funds | 1,204,407 | | 1,121,969 | | 82,438 | | 7.3 | 1,153,656 | |
| | | | | | | | | | | | | | | | | |
Eligible capital (phased-in) 1. Consolidated |
| EUR million | | | | | |
| | | Change | |
| Jun-22 | Jun-21 | Absolute | % | Dec-21 |
| Capital stock and reserves | 117,619 | | 115,678 | | 1,941 | | 1.7 | 114,806 | |
| Attributable profit | 4,894 | | 3,675 | | 1,219 | | 33.2 | 8,124 | |
| Dividends | (979) | | (2,102) | | 1,124 | | (53.4) | (1,731) | |
| Other retained earnings | (32,506) | | (34,048) | | 1,542 | | (4.5) | (34,395) | |
| Minority interests | 6,971 | | 6,347 | | 625 | | 9.8 | 6,736 | |
| Goodwill and intangible assets | (17,084) | | (15,823) | | (1,261) | | 8.0 | (16,064) | |
| Other deductions | (4,825) | | (2,862) | | (1,962) | | 68.6 | (5,076) | |
| Core CET1 | 74,091 | | 70,864 | | 3,227 | | 4.6 | 72,402 | |
| Preferred shares and other eligible tier 1 | 8,794 | | 9,109 | | (315) | | (3.5) | 10,050 | |
| Tier 1 | 82,885 | | 79,973 | | 2,913 | | 3.6 | 82,452 | |
| Generic funds and eligible tier 2 instruments | 14,965 | | 12,567 | | 2,398 | | 19.1 | 14,865 | |
| Eligible capital | 97,850 | | 92,539 | | 5,311 | | 5.7 | 97,317 | |
| Risk-weighted assets | 604,777 | | 584,999 | | 19,778 | | 3.4 | 578,930 | |
| | | | | |
| CET1 capital ratio | 12.25 | 12.11 | 0.14 | | 12.51 |
| Tier 1 capital ratio | 13.71 | 13.67 | 0.03 | | 14.24 |
| Total capital ratio | 16.18 | 15.82 | 0.36 | | 16.81 |
(1) The phased-in ratio includes the transitory treatment of IFRS 9, calculated in accordance with article 473 bis of the Regulation on Capital Requirements (CRR) and subsequent amendments introduced by Regulation 2020/873 of the European Union. Total phased-in capital ratios include the transitory treatment according to chapter 4, title 1, part 10 of the CRR2.
| | | | | | | | | | | | | | | | | | | | | | | | | | |
| |
| |
| | | |
|
| | | | | | | | Financial information by segment |
| | | | | | | | | | | | | | | | | | | | | | | |
| EUROPE | |
| EUR million | | | | | | |
| | / | Q1'22 | | | / | H1'21 |
| Underlying income statement | Q2'22 | % | % excl. FX | | H1'22 | % | % excl. FX |
| Net interest income | 2,981 | | 5.0 | | 5.6 | | | 5,820 | | 11.8 | | 10.5 | |
| Net fee income | 1,162 | | 0.7 | | 0.7 | | | 2,316 | | 7.3 | | 7.0 | |
Gains (losses) on financial transactions (1) | 170 | | (14.6) | | (14.8) | | | 370 | | (21.1) | | (21.5) | |
| Other operating income | (37) | | — | | — | | | 76 | | 8.6 | | 9.5 | |
| Total income | 4,276 | | (0.7) | | (0.3) | | | 8,581 | | 8.6 | | 7.7 | |
| Administrative expenses and amortizations | (2,104) | | 2.1 | | 2.5 | | | (4,164) | | 0.5 | | (0.5) | |
| Net operating income | 2,172 | | (3.2) | | (2.8) | | | 4,417 | | 17.5 | | 16.7 | |
| Net loan-loss provisions | (631) | | 22.6 | | 22.9 | | | (1,146) | | (4.6) | | (4.3) | |
| Other gains (losses) and provisions | (342) | | 45.2 | | 45.8 | | | (578) | | (2.8) | | (2.6) | |
| Profit before tax | 1,199 | | (19.8) | | (19.4) | | | 2,693 | | 37.2 | | 35.0 | |
| Tax on profit | (331) | | (21.5) | | (21.1) | | | (753) | | 19.3 | | 17.7 | |
| Profit from continuing operations | 867 | | (19.1) | | (18.7) | | | 1,940 | | 45.7 | | 43.2 | |
| Net profit from discontinued operations | — | | — | | — | | | — | | — | | — | |
| Consolidated profit | 867 | | (19.1) | | (18.7) | | | 1,940 | | 45.7 | | 43.2 | |
| Non-controlling interests | (47) | | (15.1) | | (14.5) | | | (102) | | 401.7 | | 412.6 | |
| Underlying profit attributable to the parent | 821 | | (19.4) | | (18.9) | | | 1,839 | | 40.2 | | 37.7 | |
| | | | | | | |
| Balance sheet | | | | | | | |
| Loans and advances to customers | 609,342 | | 1.1 | | 1.8 | | | 609,342 | | 4.2 | | 4.2 | |
| Cash, central banks and credit institutions | 234,343 | | 4.0 | | 4.5 | | | 234,343 | | 16.7 | | 16.4 | |
| Debt instruments | 66,134 | | (2.2) | | (1.9) | | | 66,134 | | (14.6) | | (14.0) | |
| Other financial assets | 47,046 | | 5.5 | | 5.4 | | | 47,046 | | (4.8) | | (4.9) | |
| Other asset accounts | 29,091 | | (1.1) | | (0.9) | | | 29,091 | | (10.9) | | (11.1) | |
| Total assets | 985,956 | | 1.7 | | 2.3 | | | 985,956 | | 4.3 | | 4.3 | |
| Customer deposits | 626,163 | | 0.4 | | 1.1 | | | 626,163 | | 4.5 | | 4.7 | |
| Central banks and credit institutions | 173,956 | | 4.4 | | 4.5 | | | 173,956 | | 12.7 | | 11.3 | |
| Marketable debt securities | 72,129 | | 2.4 | | 3.5 | | | 72,129 | | (8.7) | | (8.5) | |
| Other financial liabilities | 58,095 | | 16.0 | | 16.0 | | | 58,095 | | 5.9 | | 5.7 | |
| Other liabilities accounts | 11,151 | | 0.2 | | 0.6 | | | 11,151 | | (6.8) | | (6.4) | |
| Total liabilities | 941,494 | | 2.1 | | 2.7 | | | 941,494 | | 4.7 | | 4.6 | |
| Total equity | 44,462 | | (6.8) | | (6.3) | | | 44,462 | | (2.2) | | (2.1) | |
| | | | | | | |
| Memorandum items: | | | | | | | |
Gross loans and advances to customers (2) | 589,371 | | 0.9 | | 1.5 | | | 589,371 | | 4.8 | | 4.8 | |
| Customer funds | 705,411 | | (0.1) | | 0.5 | | | 705,411 | | 3.5 | | 3.8 | |
Customer deposits (3) | 608,753 | | 0.7 | | 1.4 | | | 608,753 | | 5.2 | | 5.4 | |
| Mutual funds | 96,658 | | (5.2) | | (5.0) | | | 96,658 | | (5.9) | | (5.7) | |
| | | | | | | |
| Ratios (%), operating means and customers | | | | | | | |
| Underlying RoTE | 7.86 | | (1.81) | | | | 8.80 | | 2.13 | | |
| Efficiency ratio | 49.2 | | 1.3 | | | | 48.5 | | (3.9) | | |
| NPL ratio | 2.63 | | (0.37) | | | | 2.63 | | (0.67) | | |
| Total coverage ratio | 50.19 | | 1.1 | | | | 50.2 | | 1.8 | | |
| Number of employees | 63,579 | | 0.9 | | | | 63,579 | | (4.2) | | |
| Number of branches | 3,178 | | (1.2) | | | | 3,178 | | (6.6) | | |
| Number of loyal customers (thousands) | 10,536 | | 1.9 | | | | 10,536 | | 3.9 | | |
| Number of digital customers (thousands) | 16,816 | | 1.4 | | | | 16,816 | | 7.1 | | |
(1) Includes exchange differences.
(2) Excluding reverse repos.
(3) Excluding repos.
| | | | | | | | | | | | | | | | | | | | | | | | | | |
| |
| |
| | | |
|
| | | | | | | | Financial information by segment |
| | | | | | | | | | | | | | | | | |
| Spain | | | | | |
| EUR million | | | | |
| | / Q1'22 | | | / H1'21 |
| Underlying income statement | Q2'22 | % | | H1'22 | % |
| Net interest income | 1,017 | | 2.0 | | | 2,015 | | (5.8) | |
| Net fee income | 730 | | (2.1) | | | 1,475 | | 7.1 | |
Gains (losses) on financial transactions (1) | 84 | | (35.2) | | | 215 | | (20.7) | |
| Other operating income | 84 | | (43.1) | | | 232 | | 104.5 | |
| Total income | 1,916 | | (5.2) | | | 3,937 | | 0.9 | |
| Administrative expenses and amortizations | (971) | | (0.1) | | | (1,943) | | (4.1) | |
| Net operating income | 945 | | (9.9) | | | 1,994 | | 6.4 | |
| Net loan-loss provisions | (416) | | 6.3 | | | (807) | | (25.6) | |
| Other gains (losses) and provisions | (144) | | 4.0 | | | (283) | | 1.7 | |
| Profit before tax | 385 | | (25.9) | | | 904 | | 76.7 | |
| Tax on profit | (98) | | (36.6) | | | (252) | | 56.0 | |
| Profit from continuing operations | 287 | | (21.4) | | | 652 | | 86.2 | |
| Net profit from discontinued operations | — | | — | | | — | | — | |
| Consolidated profit | 287 | | (21.4) | | | 652 | | 86.2 | |
| Non-controlling interests | — | | (87.8) | | | — | | (80.9) | |
| Underlying profit attributable to the parent | 287 | | (21.4) | | | 652 | | 86.1 | |
| | | | | |
| Balance sheet | | | | | |
| Loans and advances to customers | 266,419 | | 3.8 | | | 266,419 | | 9.6 | |
| Cash, central banks and credit institutions | 148,909 | | 6.5 | | | 148,909 | | 22.7 | |
| Debt instruments | 31,648 | | 0.7 | | | 31,648 | | (18.4) | |
| Other financial assets | 42,115 | | 3.1 | | | 42,115 | | (8.3) | |
| Other asset accounts | 18,545 | | 0.0 | | | 18,545 | | (5.7) | |
| Total assets | 507,636 | | 4.2 | | | 507,636 | | 8.3 | |
| Customer deposits | 311,889 | | 3.6 | | | 311,889 | | 13.3 | |
| Central banks and credit institutions | 92,908 | | 4.9 | | | 92,908 | | 3.0 | |
| Marketable debt securities | 25,533 | | (2.3) | | | 25,533 | | (13.6) | |
| Other financial liabilities | 51,315 | | 16.3 | | | 51,315 | | 2.9 | |
| Other liabilities accounts | 5,974 | | (0.5) | | | 5,974 | | 21.2 | |
| Total liabilities | 487,620 | | 4.6 | | | 487,620 | | 8.4 | |
| Total equity | 20,017 | | (6.0) | | | 20,017 | | 5.0 | |
| | | | | |
| Memorandum items: | | | | | |
Gross loans and advances to customers (2) | 253,429 | | 2.3 | | | 253,429 | | 7.0 | |
| Customer funds | 376,818 | | 1.8 | | | 376,818 | | 8.5 | |
Customer deposits (3) | 302,690 | | 3.2 | | | 302,690 | | 11.7 | |
| Mutual funds | 74,128 | | (3.5) | | | 74,128 | | (2.7) | |
| | | | | |
| Ratios (%), operating means and customers | | | | | |
| Underlying RoTE | 5.77 | | (1.60) | | | 6.62 | | 2.70 | |
| Efficiency ratio | 50.7 | | 2.6 | | | 49.4 | | (2.6) | |
| NPL ratio | 3.83 | | (0.64) | | | 3.83 | | (1.33) | |
| Total coverage ratio | 49.4 | | (1.0) | | | 49.4 | | 3.7 | |
| Number of employees | 26,272 | | 0.7 | | | 26,272 | | 0.5 | |
| Number of branches | 1,921 | | (1.5) | | | 1,921 | | (1.5) | |
| Number of loyal customers (thousands) | 2,880 | | 3.7 | | | 2,880 | | 4.4 | |
| Number of digital customers (thousands) | 5,697 | | 3.3 | | | 5,697 | | 7.4 | |
(1) Includes exchange differences.
(2) Excluding reverse repos.
(3) Excluding repos.
| | | | | | | | | | | | | | | | | | | | | | | | | | |
| |
| |
| | | |
|
| | | | | | | | Financial information by segment |
| | | | | | | | | | | | | | | | | | | | | | | |
| United Kingdom | |
| EUR million | | | | | | |
| | / | Q1'22 | | | / | H1'21 |
| Underlying income statement | Q2'22 | % | % excl. FX | | H1'22 | % | % excl. FX |
| Net interest income | 1,227 | | 2.9 | | 4.3 | | | 2,418 | | 16.5 | | 13.1 | |
| Net fee income | 110 | | 19.1 | | 20.6 | | | 202 | | (15.0) | | (17.5) | |
Gains (losses) on financial transactions (1) | 6 | | 10.9 | | 12.3 | | | 12 | | — | | — | |
| Other operating income | — | | — | | — | | | 1 | | 19.6 | | 16.1 | |
| Total income | 1,342 | | 4.0 | | 5.4 | | | 2,633 | | 14.6 | | 11.2 | |
| Administrative expenses and amortizations | (677) | | 0.8 | | 2.1 | | | (1,348) | | 3.8 | | 0.7 | |
| Net operating income | 666 | | 7.4 | | 8.9 | | | 1,285 | | 28.7 | | 24.9 | |
| Net loan-loss provisions | (74) | | 44.7 | | 46.4 | | | (125) | | — | | — | |
| Other gains (losses) and provisions | (99) | | 50.8 | | 52.5 | | | (165) | | 76.5 | | 71.3 | |
| Profit before tax | 492 | | (2.0) | | (0.7) | | | 995 | | 2.2 | | (0.8) | |
| Tax on profit | (132) | | 3.5 | | 4.9 | | | (259) | | (12.7) | | (15.3) | |
| Profit from continuing operations | 361 | | (3.9) | | (2.6) | | | 736 | | 8.8 | | 5.6 | |
| Net profit from discontinued operations | — | | — | | — | | | — | | — | | — | |
| Consolidated profit | 361 | | (3.9) | | (2.6) | | | 736 | | 8.8 | | 5.6 | |
| Non-controlling interests | — | | — | | — | | | — | | — | | — | |
| Underlying profit attributable to the parent | 361 | | (3.9) | | (2.6) | | | 736 | | 8.8 | | 5.6 | |
| | | | | | | |
| Balance sheet | | | | | | | |
| Loans and advances to customers | 259,566 | | (1.1) | | 0.7 | | | 259,566 | | (0.6) | | (0.4) | |
| Cash, central banks and credit institutions | 65,291 | | (4.6) | | (2.8) | | | 65,291 | | 4.0 | | 4.2 | |
| Debt instruments | 6,178 | | (6.5) | | (4.9) | | | 6,178 | | (25.5) | | (25.4) | |
| Other financial assets | 575 | | 29.8 | | 32.1 | | | 575 | | (37.0) | | (36.9) | |
| Other asset accounts | 5,269 | | (6.7) | | (5.0) | | | 5,269 | | (29.9) | | (29.8) | |
| Total assets | 336,878 | | (2.0) | | (0.2) | | | 336,878 | | (1.1) | | (0.9) | |
| Customer deposits | 229,033 | | (3.4) | | (1.6) | | | 229,033 | | (6.0) | | (5.8) | |
| Central banks and credit institutions | 45,991 | | 2.0 | | 3.8 | | | 45,991 | | 50.2 | | 50.5 | |
| Marketable debt securities | 43,115 | | 5.9 | | 7.8 | | | 43,115 | | (3.1) | | (3.0) | |
| Other financial liabilities | 3,013 | | (6.4) | | (4.7) | | | 3,013 | | 12.0 | | 12.2 | |
| Other liabilities accounts | 1,911 | | (4.3) | | (2.6) | | | 1,911 | | (48.3) | | (48.2) | |
| Total liabilities | 323,063 | | (1.5) | | 0.3 | | | 323,063 | | (0.6) | | (0.5) | |
| Total equity | 13,815 | | (11.3) | | (9.7) | | | 13,815 | | (10.8) | | (10.6) | |
| | | | | | | |
| Memorandum items: | | | | | | | |
Gross loans and advances to customers (2) | 250,841 | | (0.3) | | 1.5 | | | 250,841 | | 3.4 | | 3.6 | |
| Customer funds | 228,556 | | (2.4) | | (0.7) | | | 228,556 | | (3.1) | | (2.9) | |
Customer deposits (3) | 220,998 | | (2.1) | | (0.3) | | | 220,998 | | (2.7) | | (2.6) | |
| Mutual funds | 7,557 | | (11.4) | | (9.8) | | | 7,557 | | (12.0) | | (11.9) | |
| | | | | | | |
| Ratios (%), operating means and customers | | | | | | | |
| Underlying RoTE | 10.66 | | (0.21) | | | | 10.78 | | 0.38 | | |
| Efficiency ratio | 50.4 | | (1.6) | | | | 51.2 | | (5.3) | | |
| NPL ratio | 1.17 | | (0.26) | | | | 1.17 | | (0.13) | | |
| Total coverage ratio | 32.9 | | 6.8 | | | | 32.9 | | (4.4) | | |
| Number of employees | 20,320 | | 0.4 | | | | 20,320 | | (9.5) | | |
| Number of branches | 450 | | — | | | | 450 | | (18.6) | | |
| Number of loyal customers (thousands) | 4,464 | | 0.9 | | | | 4,464 | | 1.9 | | |
| Number of digital customers (thousands) | 6,765 | | 0.3 | | | | 6,765 | | 5.8 | | |
(1) Includes exchange differences.
(2) Excluding reverse repos.
(3) Excluding repos.
| | | | | | | | | | | | | | | | | | | | | | | | | | |
| |
| |
| | | |
|
| | | | | | | | Financial information by segment |
| | | | | | | | | | | | | | | | | |
| Portugal | | | | | |
| EUR million | | | | |
| | / Q1'22 | | | / H1'21 |
| Underlying income statement | Q2'22 | % | | H1'22 | % |
| Net interest income | 171 | | 0.5 | | | 340 | | (8.0) | |
| Net fee income | 123 | | 0.6 | | | 245 | | 16.8 | |
Gains (losses) on financial transactions (1) | 14 | | (52.0) | | | 44 | | (71.4) | |
| Other operating income | (27) | | — | | | (16) | | (6.9) | |
| Total income | 281 | | (15.6) | | | 613 | | (14.3) | |
| Administrative expenses and amortizations | (125) | | (0.1) | | | (251) | | (13.3) | |
| Net operating income | 155 | | (25.1) | | | 363 | | (15.0) | |
| Net loan-loss provisions | (3) | | (61.8) | | | (11) | | (84.4) | |
| Other gains (losses) and provisions | (40) | | — | | | (24) | | 1.0 | |
| Profit before tax | 112 | | (47.7) | | | 327 | | (1.7) | |
| Tax on profit | (35) | | (47.7) | | | (101) | | (2.0) | |
| Profit from continuing operations | 78 | | (47.7) | | | 226 | | (1.5) | |
| Net profit from discontinued operations | — | | — | | | — | | — | |
| Consolidated profit | 78 | | (47.7) | | | 226 | | (1.5) | |
| Non-controlling interests | — | | (18.5) | | | (1) | | 59.2 | |
| Underlying profit attributable to the parent | 77 | | (47.8) | | | 225 | | (1.6) | |
| | | | | |
| Balance sheet | | | | | |
| Loans and advances to customers | 39,565 | | 1.1 | | | 39,565 | | 2.0 | |
| Cash, central banks and credit institutions | 11,725 | | 16.9 | | | 11,725 | | 34.4 | |
| Debt instruments | 7,986 | | (6.5) | | | 7,986 | | (11.5) | |
| Other financial assets | 1,391 | | (3.0) | | | 1,391 | | (4.3) | |
| Other asset accounts | 1,406 | | 12.3 | | | 1,406 | | 1.7 | |
| Total assets | 62,072 | | 2.8 | | | 62,072 | | 4.6 | |
| Customer deposits | 43,769 | | 1.7 | | | 43,769 | | 5.6 | |
| Central banks and credit institutions | 10,169 | | 10.1 | | | 10,169 | | 7.0 | |
| Marketable debt securities | 2,699 | | 3.0 | | | 2,699 | | 8.7 | |
| Other financial liabilities | 285 | | 12.0 | | | 285 | | 30.5 | |
| Other liabilities accounts | 1,327 | | (7.2) | | | 1,327 | | (21.6) | |
| Total liabilities | 58,249 | | 3.0 | | | 58,249 | | 5.2 | |
| Total equity | 3,823 | | 0.5 | | | 3,823 | | (5.0) | |
| | | | | |
| Memorandum items: | | | | | |
Gross loans and advances to customers (2) | 40,564 | | 1.1 | | | 40,564 | | 1.8 | |
| Customer funds | 47,550 | | 0.9 | | | 47,550 | | 4.8 | |
Customer deposits (3) | 43,769 | | 1.7 | | | 43,769 | | 5.6 | |
| Mutual funds | 3,781 | | (7.7) | | | 3,781 | | (4.0) | |
| | | | | |
| Ratios (%), operating means and customers | | | | | |
| Underlying RoTE | 8.32 | | (6.67) | | | 11.73 | | 0.29 | |
| Efficiency ratio | 44.6 | | 7.0 | | | 40.9 | | 0.5 | |
| NPL ratio | 3.33 | | (0.09) | | | 3.33 | | (0.37) | |
| Total coverage ratio | 74.3 | | 1.4 | | | 74.3 | | 1.3 | |
| Number of employees | 4,977 | | (0.6) | | | 4,977 | | (17.7) | |
| Number of branches | 386 | | (0.8) | | | 386 | | (7.7) | |
| Number of loyal customers (thousands) | 883 | | 1.9 | | | 883 | | 5.9 | |
| Number of digital customers (thousands) | 1,019 | | — | | | 1,019 | | 3.9 | |
(1) Includes exchange differences.
(2) Excluding reverse repos.
(3) Excluding repos.
| | | | | | | | | | | | | | | | | | | | | | | | | | |
| |
| |
| | | |
|
| | | | | | | | Financial information by segment |
| | | | | | | | | | | | | | | | | | | | | | | |
| Poland | |
| EUR million | | | | | | |
| | / | Q1'22 | | | / | H1'21 |
| Underlying income statement | Q2'22 | % | % excl. FX | | H1'22 | % | % excl. FX |
| Net interest income | 486 | | 19.4 | | 20.2 | | | 894 | | 88.1 | | 92.2 | |
| Net fee income | 130 | | (5.7) | | (5.1) | | | 268 | | 5.8 | | 8.1 | |
Gains (losses) on financial transactions (1) | 44 | | 238.9 | | 240.3 | | | 57 | | 38.7 | | 41.7 | |
| Other operating income | (81) | | 70.6 | | 71.5 | | | (129) | | — | | — | |
| Total income | 579 | | 13.5 | | 14.2 | | | 1,090 | | 43.6 | | 46.7 | |
| Administrative expenses and amortizations | (173) | | 4.4 | | 5.0 | | | (339) | | 5.5 | | 7.8 | |
| Net operating income | 406 | | 17.8 | | 18.6 | | | 751 | | 71.5 | | 75.2 | |
| Net loan-loss provisions | (138) | | 117.4 | | 118.4 | | | (202) | | 78.0 | | 81.8 | |
| Other gains (losses) and provisions | (60) | | 31.6 | | 32.4 | | | (106) | | (46.6) | | (45.5) | |
| Profit before tax | 208 | | (11.7) | | (11.1) | | | 444 | | 250.4 | | 257.9 | |
| Tax on profit | (66) | | (4.1) | | (3.5) | | | (135) | | 116.5 | | 121.1 | |
| Profit from continuing operations | 142 | | (14.8) | | (14.2) | | | 309 | | 379.5 | | 389.8 | |
| Net profit from discontinued operations | — | | — | | — | | | — | | — | | — | |
| Consolidated profit | 142 | | (14.8) | | (14.2) | | | 309 | | 379.5 | | 389.8 | |
| Non-controlling interests | (47) | | (14.0) | | (13.4) | | | (102) | | 398.5 | | 409.2 | |
| Underlying profit attributable to the parent | 95 | | (15.2) | | (14.6) | | | 207 | | 370.7 | | 380.8 | |
| | | | | | | |
| Balance sheet | | | | | | | |
| Loans and advances to customers | 30,245 | | 0.9 | | 2.2 | | | 30,245 | | 4.7 | | 8.9 | |
| Cash, central banks and credit institutions | 3,779 | | 0.2 | | 1.5 | | | 3,779 | | 100.1 | | 108.2 | |
| Debt instruments | 13,011 | | (8.6) | | (7.4) | | | 13,011 | | (14.2) | | (10.8) | |
| Other financial assets | 841 | | 20.3 | | 21.8 | | | 841 | | 8.1 | | 12.5 | |
| Other asset accounts | 1,714 | | 7.6 | | 8.9 | | | 1,714 | | 33.2 | | 38.6 | |
| Total assets | 49,591 | | (1.3) | | (0.1) | | | 49,591 | | 3.3 | | 7.5 | |
| Customer deposits | 36,558 | | (3.6) | | (2.4) | | | 36,558 | | 1.5 | | 5.6 | |
| Central banks and credit institutions | 4,644 | | 10.0 | | 11.4 | | | 4,644 | | 103.1 | | 111.4 | |
| Marketable debt securities | 782 | | (15.4) | | (14.3) | | | 782 | | (68.3) | | (67.0) | |
| Other financial liabilities | 1,160 | | 10.6 | | 11.9 | | | 1,160 | | 37.4 | | 42.9 | |
| Other liabilities accounts | 1,609 | | 27.8 | | 29.4 | | | 1,609 | | 29.7 | | 35.0 | |
| Total liabilities | 44,753 | | (1.4) | | (0.1) | | | 44,753 | | 4.4 | | 8.7 | |
| Total equity | 4,838 | | (1.1) | | 0.1 | | | 4,838 | | (6.4) | | (2.6) | |
| | | | | | | |
| Memorandum items: | | | | | | | |
Gross loans and advances to customers (2) | 30,972 | | 0.4 | | 1.7 | | | 30,972 | | 3.6 | | 7.8 | |
| Customer funds | 39,684 | | (4.3) | | (3.1) | | | 39,684 | | (2.6) | | 1.3 | |
Customer deposits (3) | 36,556 | | (3.6) | | (2.4) | | | 36,556 | | 1.5 | | 5.6 | |
| Mutual funds | 3,128 | | (11.7) | | (10.6) | | | 3,128 | | (34.1) | | (31.5) | |
| | | | | | | |
| Ratios (%), operating means and customers | | | | | | | |
| Underlying RoTE | 12.38 | | (2.59) | | | | 13.70 | | 10.99 | | |
| Efficiency ratio | 29.9 | | (2.6) | | | | 31.1 | | (11.2) | | |
| NPL ratio | 3.45 | | (0.04) | | | | 3.45 | | (1.13) | | |
| Total coverage ratio | 76.0 | | (2.5) | | | | 76.0 | | 3.6 | | |
| Number of employees | 10,468 | | 1.5 | | | | 10,468 | | 0.2 | | |
| Number of branches | 413 | | (1.7) | | | | 413 | | (12.3) | | |
| Number of loyal customers (thousands) | 2,307 | | 1.6 | | | | 2,307 | | 6.5 | | |
| Number of digital customers (thousands) | 3,170 | | 1.3 | | | | 3,170 | | 11.2 | | |
(1) Includes exchange differences.
(2) Excluding reverse repos.
(3) Excluding repos.
| | | | | | | | | | | | | | | | | | | | | | | | | | |
| |
| |
| | | |
|
| | | | | | | | Financial information by segment |
| | | | | | | | | | | | | | | | | | | | | | | |
| Other Europe | |
| EUR million | | | | | | | |
| | / | Q1'22 | | | / | H1'21 |
| Underlying income statement | Q2'22 | % | % excl. FX | | H1'22 | % | % excl. FX |
| Net interest income | 80 | | 10.3 | | 7.6 | | | 152 | | 3.5 | | (0.5) | |
| Net fee income | 69 | | 23.1 | | 19.7 | | | 126 | | 58.2 | | 47.0 | |
Gains (losses) on financial transactions (1) | 21 | | 2.2 | | (1.6) | | | 42 | | 107.6 | | 77.7 | |
| Other operating income | (12) | | — | | — | | | (12) | | (29.0) | | (32.2) | |
| Total income | 158 | | 5.9 | | 2.9 | | | 307 | | 34.0 | | 26.0 | |
| Administrative expenses and amortizations | (158) | | 26.2 | | 23.7 | | | (282) | | 36.9 | | 30.8 | |
| Net operating income | 1 | | (97.9) | | — | | | 25 | | 8.6 | | (11.2) | |
| Net loan-loss provisions | (1) | | (53.7) | | (51.0) | | | (2) | | (52.5) | | (54.8) | |
| Other gains (losses) and provisions | 1 | | — | | — | | | — | | (85.2) | | (85.3) | |
| Profit before tax | 1 | | (95.8) | | (99.5) | | | 23 | | 26.9 | | (0.3) | |
| Tax on profit | (1) | | (80.1) | | (84.4) | | | (6) | | (14.2) | | (27.7) | |
| Profit from continuing operations | — | | — | | — | | | 17 | | 52.6 | | 15.0 | |
| Net profit from discontinued operations | — | | — | | — | | | — | | — | | — | |
| Consolidated profit | — | | — | | — | | | 17 | | 52.6 | | 15.0 | |
| Non-controlling interests | 1 | | 614.0 | | 614.0 | | | 1 | | 199.4 | | 197.7 | |
| Underlying profit attributable to the parent | 1 | | (96.2) | | (99.8) | | | 18 | | 56.2 | | 18.4 | |
| | | | | | | |
| Balance sheet | | | | | | | |
| Loans and advances to customers | 13,547 | | (4.5) | | (9.9) | | | 13,547 | | 5.0 | | (6.9) | |
| Cash, central banks and credit institutions | 4,640 | | 36.2 | | 29.4 | | | 4,640 | | (23.1) | | (32.0) | |
| Debt instruments | 7,310 | | 7.1 | | 6.3 | | | 7,310 | | 18.2 | | 16.8 | |
| Other financial assets | 2,125 | | 83.7 | | 73.1 | | | 2,125 | | 572.7 | | 379.6 | |
| Other asset accounts | 2,157 | | (9.7) | | (12.0) | | | 2,157 | | (22.7) | | (26.3) | |
| Total assets | 29,779 | | 6.5 | | 2.1 | | | 29,779 | | 5.5 | | (3.9) | |
| Customer deposits | 4,914 | | 9.5 | | 3.6 | | | 4,914 | | 54.3 | | 38.4 | |
| Central banks and credit institutions | 20,244 | | 4.0 | | — | | | 20,244 | | (6.7) | | (14.9) | |
| Marketable debt securities | — | | — | | — | | | — | | — | | 975.0 | |
| Other financial liabilities | 2,322 | | 61.1 | | 53.1 | | | 2,322 | | 90.7 | | 72.5 | |
| Other liabilities accounts | 330 | | (25.2) | | (25.4) | | | 330 | | (19.1) | | (19.6) | |
| Total liabilities | 27,809 | | 7.6 | | 3.2 | | | 27,809 | | 4.9 | | (4.4) | |
| Total equity | 1,970 | | (7.7) | | (11.8) | | | 1,970 | | 14.6 | | 3.1 | |
| | | | | | | |
| Memorandum items: | | | | | | | |
Gross loans and advances to customers (2) | 13,565 | | (4.5) | | (9.8) | | | 13,565 | | 5.0 | | (6.9) | |
| Customer funds | 12,803 | | (3.7) | | (5.5) | | | 12,803 | | 5.1 | | 2.1 | |
Customer deposits (3) | 4,740 | | 10.0 | | 3.9 | | | 4,740 | | 57.5 | | 40.4 | |
| Mutual funds | 8,063 | | (10.2) | | (10.2) | | | 8,063 | | (12.1) | | (12.1) | |
| | | | | | | |
| Resources | | | | | | | |
| Number of employees | 1,542 | | 11.3 | | | | 1,542 | | 18.3 | | |
(1) Includes exchange differences.
(2) Excluding reverse repos.
(3) Excluding repos.
| | | | | | | | | | | | | | | | | | | | | | | | | | |
| |
| |
| | | |
|
| | | | | | | | Financial information by segment |
| | | | | | | | | | | | | | | | | | | | | | | |
| NORTH AMERICA | |
| EUR million | | | | | | |
| | / | Q1'22 | | | / | H1'21 |
| Underlying income statement | Q2'22 | % | % excl. FX | | H1'22 | % | % excl. FX |
| Net interest income | 2,352 | | 10.3 | | 4.0 | | | 4,483 | | 13.5 | | 3.1 | |
| Net fee income | 494 | | 11.6 | | 4.7 | | | 937 | | 8.8 | | (1.0) | |
Gains (losses) on financial transactions (1) | 39 | | (51.2) | | (55.3) | | | 120 | | (7.4) | | (15.9) | |
| Other operating income | 101 | | (27.7) | | (31.9) | | | 240 | | (50.1) | | (54.9) | |
| Total income | 2,986 | | 6.9 | | 0.6 | | | 5,780 | | 6.6 | | (3.2) | |
| Administrative expenses and amortizations | (1,432) | | 13.7 | | 7.4 | | | (2,692) | | 14.9 | | 4.6 | |
| Net operating income | 1,554 | | 1.2 | | (5.0) | | | 3,088 | | 0.3 | | (9.1) | |
| Net loan-loss provisions | (524) | | 19.3 | | 12.5 | | | (962) | | 63.6 | | 48.8 | |
| Other gains (losses) and provisions | (19) | | (57.4) | | (62.0) | | | (65) | | 442.9 | | 396.7 | |
| Profit before tax | 1,011 | | (3.8) | | (9.8) | | | 2,061 | | (16.9) | | (24.7) | |
| Tax on profit | (229) | | (2.9) | | (8.9) | | | (464) | | (22.8) | | (30.0) | |
| Profit from continuing operations | 782 | | (4.0) | | (10.0) | | | 1,596 | | (15.0) | | (23.0) | |
| Net profit from discontinued operations | — | | — | | — | | | — | | — | | — | |
| Consolidated profit | 782 | | (4.0) | | (10.0) | | | 1,596 | | (15.0) | | (23.0) | |
| Non-controlling interests | (10) | | 17.7 | | 9.5 | | | (18) | | (93.8) | | (94.4) | |
| Underlying profit attributable to the parent | 772 | | (4.3) | | (10.2) | | | 1,578 | | (0.2) | | (9.7) | |
| | | | | | | |
| Balance sheet | | | | | | | |
| Loans and advances to customers | 163,729 | | 12.3 | | 5.9 | | | 163,729 | | 29.6 | | 14.6 | |
| Cash, central banks and credit institutions | 35,174 | | (4.4) | | (9.8) | | | 35,174 | | (5.1) | | (16.0) | |
| Debt instruments | 45,137 | | 15.1 | | 8.9 | | | 45,137 | | 27.1 | | 12.8 | |
| Other financial assets | 13,945 | | 23.1 | | 16.5 | | | 13,945 | | 28.4 | | 14.2 | |
| Other asset accounts | 23,878 | | 8.4 | | 2.2 | | | 23,878 | | 14.0 | | 0.8 | |
| Total assets | 281,862 | | 10.4 | | 4.2 | | | 281,862 | | 22.1 | | 8.1 | |
| Customer deposits | 154,450 | | 10.7 | | 4.4 | | | 154,450 | | 34.2 | | 18.7 | |
| Central banks and credit institutions | 31,023 | | 9.8 | | 3.9 | | | 31,023 | | 1.1 | | (10.4) | |
| Marketable debt securities | 40,708 | | 6.3 | | 0.2 | | | 40,708 | | 6.3 | | (6.1) | |
| Other financial liabilities | 20,813 | | 38.0 | | 30.8 | | | 20,813 | | 46.5 | | 30.4 | |
| Other liabilities accounts | 6,764 | | 5.2 | | (0.7) | | | 6,764 | | 12.5 | | (0.4) | |
| Total liabilities | 253,758 | | 11.5 | | 5.2 | | | 253,758 | | 24.2 | | 9.9 | |
| Total equity | 28,104 | | 1.8 | | (3.9) | | | 28,104 | | 6.2 | | (5.9) | |
| | | | | | | |
| Memorandum items: | | | | | | | |
Gross loans and advances to customers (2) | 151,578 | | 7.2 | | 1.1 | | | 151,578 | | 20.6 | | 6.7 | |
| Customer funds | 151,098 | | 3.6 | | (2.2) | | | 151,098 | | 16.2 | | 2.8 | |
Customer deposits (3) | 123,599 | | 3.5 | | (2.3) | | | 123,599 | | 17.5 | | 4.0 | |
| Mutual funds | 27,498 | | 3.9 | | (1.7) | | | 27,498 | | 10.4 | | (2.1) | |
| | | | | | | |
| Ratios (%), operating means and customers | | | | | | | |
| Underlying RoTE | 11.79 | | (0.72) | | | | 12.17 | | (2.08) | | |
| Efficiency ratio | 48.0 | | 2.9 | | | | 46.6 | | 3.4 | | |
| NPL ratio | 2.71 | | (0.12) | | | | 2.71 | | 0.43 | | |
| Total coverage ratio | 111.4 | | 0.9 | | | | 111.4 | | (40.9) | | |
| Number of employees | 43,779 | | (0.2) | | | | 43,779 | | 5.1 | | |
| Number of branches | 1,859 | | — | | | | 1,859 | | (3.2) | | |
| Number of loyal customers (thousands) | 4,477 | | 2.6 | | | | 4,477 | | 8.3 | | |
| Number of digital customers (thousands) | 6,959 | | 1.0 | | | | 6,959 | | 9.4 | | |
(1) Includes exchange differences.
(2) Excluding reverse repos.
(3) Excluding repos.
| | | | | | | | | | | | | | | | | | | | | | | | | | |
| |
| |
| | | |
|
| | | | | | | | Financial information by segment |
| | | | | | | | | | | | | | | | | | | | | | | |
| United States | |
| EUR million | | | | | | |
| | / | Q1'22 | | | / | H1'21 |
| Underlying income statement | Q2'22 | % | % excl. FX | | H1'22 | % | % excl. FX |
| Net interest income | 1,499 | | 8.8 | | 3.3 | | | 2,877 | | 10.2 | | (0.1) | |
| Net fee income | 198 | | 0.5 | | (4.8) | | | 394 | | (8.8) | | (17.3) | |
Gains (losses) on financial transactions (1) | 31 | | (53.7) | | (57.5) | | | 98 | | 9.2 | | (1.0) | |
| Other operating income | 126 | | (25.3) | | (29.9) | | | 296 | | (46.4) | | (51.4) | |
| Total income | 1,854 | | 2.4 | | (3.0) | | | 3,665 | | (0.5) | | (9.8) | |
| Administrative expenses and amortizations | (883) | | 10.7 | | 5.2 | | | (1,682) | | 9.8 | | (0.5) | |
| Net operating income | 970 | | (4.2) | | (9.4) | | | 1,984 | | (7.8) | | (16.5) | |
| Net loan-loss provisions | (338) | | 32.2 | | 26.0 | | | (594) | | 280.2 | | 244.6 | |
| Other gains (losses) and provisions | 7 | | — | | — | | | (12) | | — | | — | |
| Profit before tax | 640 | | (13.3) | | (18.2) | | | 1,378 | | (31.0) | | (37.4) | |
| Tax on profit | (133) | | (14.2) | | (19.1) | | | (288) | | (39.7) | | (45.4) | |
| Profit from continuing operations | 507 | | (13.1) | | (18.0) | | | 1,090 | | (28.2) | | (34.9) | |
| Net profit from discontinued operations | — | | — | | — | | | — | | — | | — | |
| Consolidated profit | 507 | | (13.1) | | (18.0) | | | 1,090 | | (28.2) | | (34.9) | |
| Non-controlling interests | — | | — | | — | | | — | | (100.0) | | (100.0) | |
| Underlying profit attributable to the parent | 507 | | (13.1) | | (18.0) | | | 1,090 | | (13.0) | | (21.2) | |
| | | | | | | |
| Balance sheet | | | | | | | |
| Loans and advances to customers | 124,681 | | 14.1 | | 7.3 | | | 124,681 | | 33.0 | | 17.2 | |
| Cash, central banks and credit institutions | 21,368 | | (9.0) | | (14.4) | | | 21,368 | | (16.0) | | (26.0) | |
| Debt instruments | 22,276 | | 32.4 | | 24.5 | | | 22,276 | | 39.9 | | 23.2 | |
| Other financial assets | 5,859 | | 22.3 | | 15.0 | | | 5,859 | | 63.8 | | 44.3 | |
| Other asset accounts | 19,455 | | 8.2 | | 1.7 | | | 19,455 | | 12.7 | | (0.7) | |
| Total assets | 193,639 | | 12.3 | | 5.6 | | | 193,639 | | 24.2 | | 9.4 | |
| Customer deposits | 113,256 | | 13.6 | | 6.8 | | | 113,256 | | 42.7 | | 25.7 | |
| Central banks and credit institutions | 14,682 | | 18.1 | | 11.0 | | | 14,682 | | (15.6) | | (25.7) | |
| Marketable debt securities | 32,489 | | 3.7 | | (2.5) | | | 32,489 | | 1.1 | | (10.9) | |
| Other financial liabilities | 8,620 | | 73.1 | | 62.8 | | | 8,620 | | 121.1 | | 94.8 | |
| Other liabilities accounts | 4,450 | | 1.9 | | (4.2) | | | 4,450 | | 14.7 | | 1.0 | |
| Total liabilities | 173,497 | | 13.6 | | 6.8 | | | 173,497 | | 26.9 | | 11.8 | |
| Total equity | 20,142 | | 2.9 | | (3.3) | | | 20,142 | | 4.7 | | (7.8) | |
| | | | | | | |
| Memorandum items: | | | | | | | |
Gross loans and advances to customers (2) | 111,590 | | 7.2 | 0.8 | | 111,590 | | 19.3 | 5.1 |
| Customer funds | 101,521 | | 3.0 | (3.1) | | 101,521 | | 16.4 | 2.5 |
Customer deposits (3) | 88,015 | | 3.6 | (2.6) | | 88,015 | | 18.8 | 4.7 |
| Mutual funds | 13,506 | | (0.7) | (6.6) | | 13,506 | | 2.7 | (9.5) |
| | | | | | | |
| Ratios (%), operating means and customers | | | | | | | |
| Underlying RoTE | 10.49 | | (1.95) | | | | 11.50 | | (3.95) | | |
| Efficiency ratio | 47.7 | | 3.6 | | | | 45.9 | | 4.3 | | |
| NPL ratio | 2.64 | | (0.11) | | | | 2.64 | | 0.64 | | |
| Total coverage ratio | 121.0 | | (1.2) | | | | 121.0 | | (64.7) | | |
| Number of employees | 14,943 | | (3.9) | | | | 14,943 | | (4.3) | | |
| Number of branches | 486 | | (0.4) | | | | 486 | | (10.7) | | |
| Number of loyal customers (thousands) | 364 | | 0.8 | | | | 364 | | (4.9) | | |
| Number of digital customers (thousands) | 1,031 | | (1.2) | | | | 1,031 | | 0.6 | | |
(1) Includes exchange differences.
(2) Excluding reverse repos.
(3) Excluding repos.
| | | | | | | | | | | | | | | | | | | | | | | | | | |
| |
| |
| | | |
|
| | | | | | | | Financial information by segment |
| | | | | | | | | | | | | | | | | | | | | | | |
| Mexico | |
| EUR million | | | | | | |
| | / | Q1'22 | | | / | H1'21 |
| Underlying income statement | Q2'22 | % | % excl. FX | | H1'22 | % | % excl. FX |
| Net interest income | 853 | | 13.3 | | 5.3 | | | 1,606 | | 20.0 | | 9.3 | |
| Net fee income | 283 | | 15.5 | | 7.4 | | | 529 | | 27.6 | | 16.2 | |
Gains (losses) on financial transactions (1) | 9 | | (32.1) | | (38.4) | | | 22 | | (45.8) | | (50.7) | |
| Other operating income | (30) | | 3.1 | | (4.5) | | | (60) | | (4.3) | | (12.8) | |
| Total income | 1,115 | | 13.6 | | 5.6 | | | 2,096 | | 21.2 | | 10.3 | |
| Administrative expenses and amortizations | (498) | | 15.2 | | 7.1 | | | (930) | | 23.7 | | 12.6 | |
| Net operating income | 617 | | 12.3 | | 4.4 | | | 1,166 | | 19.2 | | 8.6 | |
| Net loan-loss provisions | (184) | | 0.5 | | (7.0) | | | (367) | | (15.0) | | (22.6) | |
| Other gains (losses) and provisions | (26) | | (0.2) | | (7.6) | | | (53) | | 361.0 | | 319.8 | |
| Profit before tax | 407 | | 19.6 | | 11.4 | | | 747 | | 39.6 | | 27.1 | |
| Tax on profit | (99) | | 19.9 | | 11.6 | | | (182) | | 43.5 | | 30.7 | |
| Profit from continuing operations | 308 | | 19.5 | | 11.3 | | | 565 | | 38.4 | | 26.0 | |
| Net profit from discontinued operations | — | | — | | — | | | — | | — | | — | |
| Consolidated profit | 308 | | 19.5 | | 11.3 | | | 565 | | 38.4 | | 26.0 | |
| Non-controlling interests | (11) | | 24.9 | | 16.5 | | | (19) | | (37.0) | | (42.6) | |
| Underlying profit attributable to the parent | 297 | | 19.3 | | 11.1 | | | 546 | | 44.5 | | 31.6 | |
| | | | | | | |
| Balance sheet | | | | | | | |
| Loans and advances to customers | 39,007 | | 6.8 | | 1.5 | | | 39,007 | | 19.6 | | 6.8 | |
| Cash, central banks and credit institutions | 13,499 | | 2.7 | | (2.3) | | | 13,499 | | 18.2 | | 5.6 | |
| Debt instruments | 22,860 | | 2.1 | | (2.9) | | | 22,860 | | 16.7 | | 4.3 | |
| Other financial assets | 7,915 | | 21.1 | | 15.1 | | | 7,915 | | 8.6 | | (2.9) | |
| Other asset accounts | 4,179 | | 10.6 | | 5.2 | | | 4,179 | | 21.9 | | 8.9 | |
| Total assets | 87,459 | | 6.2 | | 1.0 | | | 87,459 | | 17.6 | | 5.1 | |
| Customer deposits | 41,011 | | 2.9 | | (2.2) | | | 41,011 | | 14.8 | | 2.6 | |
| Central banks and credit institutions | 16,211 | | 2.8 | | (2.2) | | | 16,211 | | 22.2 | | 9.2 | |
| Marketable debt securities | 8,219 | | 17.9 | | 12.2 | | | 8,219 | | 33.3 | | 19.1 | |
| Other financial liabilities | 12,026 | | 19.5 | | 13.6 | | | 12,026 | | 17.2 | | 4.7 | |
| Other liabilities accounts | 2,262 | | 10.7 | | 5.3 | | | 2,262 | | 7.2 | | (4.3) | |
| Total liabilities | 79,729 | | 6.7 | | 1.5 | | | 79,729 | | 18.1 | | 5.5 | |
| Total equity | 7,730 | | 0.7 | | (4.2) | | | 7,730 | | 13.3 | | 1.2 | |
| | | | | | | |
| Memorandum items: | | | | | | | |
Gross loans and advances to customers (2) | 39,943 | | 7.2 | | 2.0 | | | 39,943 | | 24.4 | | 11.2 | |
| Customer funds | 49,393 | | 4.4 | | (0.7) | | | 49,393 | | 15.2 | | 2.9 | |
Customer deposits (3) | 35,401 | | 2.8 | | (2.2) | | | 35,401 | | 13.8 | | 1.7 | |
| Mutual funds | 13,992 | | 8.8 | | 3.5 | | | 13,992 | | 18.9 | | 6.2 | |
| | | | | | | |
| Ratios (%), operating means and customers | | | | | | | |
| Underlying RoTE | 16.83 | | 2.12 | | | | 15.81 | | 2.79 | | |
| Efficiency ratio | 44.6 | | 0.6 | | | | 44.4 | | 0.9 | | |
| NPL ratio | 2.95 | | (0.14) | | | | 2.95 | | (0.15) | | |
| Total coverage ratio | 84.1 | | 4.6 | | | | 84.1 | | (6.5) | | |
| Number of employees | 28,236 | | 1.6 | | | | 28,236 | | 10.5 | | |
| Number of branches | 1,373 | | 0.1 | | | | 1,373 | | (0.2) | | |
| Number of loyal customers (thousands) | 4,113 | | 2.8 | | | | 4,113 | | 9.7 | | |
| Number of digital customers (thousands) | 5,762 | | 1.7 | | | | 5,762 | | 11.6 | | |
(1) Includes exchange differences.
(2) Excluding reverse repos.
(3) Excluding repos.
| | | | | | | | | | | | | | | | | | | | | | | | | | |
| |
| |
| | | |
|
| | | | | | | | Financial information by segment |
| | | | | | | | | | | | | | | | | | | | | | | |
| Other North America | |
| EUR million | | | | | | | |
| | / | Q1'22 | | | / | H1'21 |
| Underlying income statement | Q2'22 | % | % excl. FX | | H1'22 | % | % excl. FX |
| Net interest income | — | | — | | — | | | — | | 32.6 | | 32.6 | |
| Net fee income | 13 | | — | | — | | | 14 | | (1.9) | | (1.9) | |
Gains (losses) on financial transactions (1) | — | | — | | — | | | 1 | | 165.7 | | 165.7 | |
| Other operating income | 5 | | — | | — | | | 4 | | — | | — | |
| Total income | 17 | | 897.3 | | 897.3 | | | 19 | | 157.9 | | 157.9 | |
| Administrative expenses and amortizations | (51) | | 73.1 | | 73.0 | | | (81) | | 36.3 | | 36.3 | |
| Net operating income | (34) | | 21.6 | | 21.5 | | | (62) | | 18.9 | | 18.9 | |
| Net loan-loss provisions | (1) | | — | | — | | | (1) | | — | | — | |
| Other gains (losses) and provisions | — | | 899.8 | | 899.8 | | | (1) | | (15.9) | | (15.9) | |
| Profit before tax | (36) | | 28.5 | | 28.4 | | | (64) | | 21.2 | | 21.2 | |
| Tax on profit | 3 | | 66.0 | | 65.1 | | | 5 | | 84.4 | | 84.4 | |
| Profit from continuing operations | (33) | | 25.8 | | 25.7 | | | (59) | | 17.8 | | 17.8 | |
| Net profit from discontinued operations | — | | — | | — | | | — | | — | | — | |
| Consolidated profit | (33) | | 25.8 | | 25.7 | | | (59) | | 17.8 | | 17.8 | |
| Non-controlling interests | 1 | | 614.0 | | 614.0 | | | 1 | | 216.7 | | 216.7 | |
| Underlying profit attributable to the parent | (32) | | 23.5 | | 23.4 | | | (58) | | 16.8 | | 16.8 | |
| | | | | | | |
| Balance sheet | | | | | | | |
| Loans and advances to customers | 41 | | 526.5 | | 526.5 | | | 41 | | 129.2 | | 129.2 | |
| Cash, central banks and credit institutions | 308 | | 61.3 | | 61.3 | | | 308 | | 43.9 | | 43.9 | |
| Debt instruments | — | | — | | — | | | — | | — | | — | |
| Other financial assets | 171 | | — | | — | | | 171 | | — | | — | |
| Other asset accounts | 243 | | (8.8) | | (8.8) | | | 243 | | (8.4) | | (8.4) | |
| Total assets | 764 | | 64.4 | | 64.4 | | | 764 | | 53.1 | | 53.1 | |
| Customer deposits | 184 | | — | | — | | | 184 | | — | | — | |
| Central banks and credit institutions | 130 | | 144.5 | | 144.4 | | | 130 | | 706.9 | | 706.9 | |
| Marketable debt securities | — | | — | | — | | | — | | — | | — | |
| Other financial liabilities | 167 | | 424.0 | | 424.0 | | | 167 | | 260.5 | | 260.5 | |
| Other liabilities accounts | 51 | | 164.0 | | 164.0 | | | 51 | | 126.9 | | 126.9 | |
| Total liabilities | 532 | | 357.9 | | 357.8 | | | 532 | | 457.5 | | 457.5 | |
| Total equity | 232 | | (33.4) | | (33.4) | | | 232 | | (42.5) | | (42.5) | |
| | | | | | | |
| Memorandum items: | | | | | | | |
Gross loans and advances to customers (2) | 45 | | 556.9 | | 556.9 | | | 45 | | 141.2 | | 141.2 | |
| Customer funds | 184 | | — | | — | | | 184 | | — | | — | |
Customer deposits (3) | 184 | | — | | — | | | 184 | | — | | — | |
| Mutual funds | — | | — | | — | | | — | | — | | — | |
| | | | | | | |
| Resources | | | | | | | |
| Number of employees | 600 | | 11.9 | | | | 600 | | 16.1 | | |
(1) Includes exchange differences.
(2) Excluding reverse repos.
(3) Excluding repos.
| | | | | | | | | | | | | | | | | | | | | | | | | | |
| |
| |
| | | |
|
| | | | | | | | Financial information by segment |
| | | | | | | | | | | | | | | | | | | | | | | |
| SOUTH AMERICA | |
| EUR million | | | | | | |
| | / | Q1'22 | | | / | H1'21 |
| Underlying income statement | Q2'22 | % | % excl. FX | | H1'22 | % | % excl. FX |
| Net interest income | 3,390 | | 11.6 | | 4.0 | | | 6,427 | | 20.7 | | 9.2 | |
| Net fee income | 1,162 | | 14.8 | | 6.9 | | | 2,175 | | 22.9 | | 10.0 | |
Gains (losses) on financial transactions (1) | 380 | | 68.6 | | 64.9 | | | 606 | | 58.2 | | 48.0 | |
| Other operating income | (195) | | 142.6 | | 183.4 | | | (275) | | 56.9 | | 64.8 | |
| Total income | 4,738 | | 12.9 | | 4.9 | | | 8,933 | | 22.3 | | 10.2 | |
| Administrative expenses and amortizations | (1,669) | | 12.5 | | 6.1 | | | (3,153) | | 25.2 | | 15.7 | |
| Net operating income | 3,069 | | 13.2 | | 4.3 | | | 5,780 | | 20.8 | | 7.4 | |
| Net loan-loss provisions | (1,335) | | 33.6 | | 22.9 | | | (2,333) | | 56.4 | | 37.8 | |
| Other gains (losses) and provisions | (130) | | (13.8) | | (19.2) | | | (281) | | 49.7 | | 40.0 | |
| Profit before tax | 1,604 | | 2.7 | | (5.4) | | | 3,165 | | 1.9 | | (9.3) | |
| Tax on profit | (389) | | (23.6) | | (31.8) | | | (897) | | (24.7) | | (34.6) | |
| Profit from continuing operations | 1,215 | | 15.5 | | 7.5 | | | 2,268 | | 18.5 | | 7.1 | |
| Net profit from discontinued operations | — | | — | | — | | | — | | — | | — | |
| Consolidated profit | 1,215 | | 15.5 | | 7.5 | | | 2,268 | | 18.5 | | 7.1 | |
| Non-controlling interests | (169) | | 10.6 | | 4.6 | | | (322) | | 17.2 | | 10.6 | |
| Underlying profit attributable to the parent | 1,046 | | 16.3 | | 7.9 | | | 1,946 | | 18.7 | | 6.6 | |
| | | | | | | |
| Balance sheet | | | | | | | |
| Loans and advances to customers | 140,767 | | (0.9) | | 4.6 | | | 140,767 | | 12.8 | | 11.0 | |
| Cash, central banks and credit institutions | 51,061 | | 2.3 | | 6.7 | | | 51,061 | | 1.2 | | (1.7) | |
| Debt instruments | 59,378 | | (1.5) | | 3.2 | | | 59,378 | | 18.9 | | 13.7 | |
| Other financial assets | 24,049 | | 25.6 | | 36.0 | | | 24,049 | | 93.1 | | 96.8 | |
| Other asset accounts | 18,746 | | 3.0 | | 7.9 | | | 18,746 | | 15.4 | | 11.3 | |
| Total assets | 294,001 | | 1.5 | | 6.9 | | | 294,001 | | 15.8 | | 13.1 | |
| Customer deposits | 134,690 | | (1.3) | | 3.6 | | | 134,690 | | 8.2 | | 5.7 | |
| Central banks and credit institutions | 47,517 | | 4.5 | | 10.1 | | | 47,517 | | 6.2 | | 3.2 | |
| Marketable debt securities | 32,457 | | 1.5 | | 7.5 | | | 32,457 | | 41.3 | | 40.6 | |
| Other financial liabilities | 45,501 | | 9.7 | | 16.2 | | | 45,501 | | 43.4 | | 39.7 | |
| Other liabilities accounts | 10,819 | | 3.2 | | 9.4 | | | 10,819 | | 18.3 | | 13.8 | |
| Total liabilities | 270,984 | | 1.9 | | 7.3 | | | 270,984 | | 16.3 | | 13.6 | |
| Total equity | 23,017 | | (2.8) | | 2.2 | | | 23,017 | | 10.7 | | 7.5 | |
| | | | | | | |
| Memorandum items: | | | | | | | |
Gross loans and advances to customers (2) | 147,965 | | (0.7) | | 4.8 | | | 147,965 | | 13.8 | | 11.9 | |
| Customer funds | 181,506 | | (1.5) | | 3.4 | | | 181,506 | | 7.8 | | 5.1 | |
Customer deposits (3) | 124,100 | | — | | 5.0 | | | 124,100 | | 7.4 | | 5.4 | |
| Mutual funds | 57,407 | | (4.5) | | (0.1) | | | 57,407 | | 8.8 | | 4.5 | |
| | | | | | | |
| Ratios (%), operating means and customers | | | | | | | |
| Underlying RoTE | 21.43 | | 1.60 | | | | 20.80 | | 0.57 | | |
| Efficiency ratio | 35.2 | | (0.2) | | | | 35.3 | | 0.8 | | |
| NPL ratio | 5.39 | | 0.33 | | | | 5.39 | | 1.02 | | |
| Total coverage ratio | 86.9 | | (5.3) | | | | 86.9 | | (11.2) | | |
| Number of employees | 75,588 | | (0.3) | | | | 75,588 | | 12.5 | | |
| Number of branches | 3,786 | | (0.4) | | | | 3,786 | | (0.1) | | |
| Number of loyal customers (thousands) | 11,147 | | 1.7 | | | | 11,147 | | 15.7 | | |
| Number of digital customers (thousands) | 25,269 | | 1.5 | | | | 25,269 | | 11.4 | | |
(1) Includes exchange differences.
(2) Excluding reverse repos.
(3) Excluding repos.
| | | | | | | | | | | | | | | | | | | | | | | | | | |
| |
| |
| | | |
|
| | | | | | | | Financial information by segment |
| | | | | | | | | | | | | | | | | | | | | | | |
| Brazil | |
| EUR million | | | | | | |
| | / | Q1'22 | | | / | H1'21 |
| Underlying income statement | Q2'22 | % | % excl. FX | | H1'22 | % | % excl. FX |
| Net interest income | 2,279 | | 6.4 | | (4.9) | | | 4,421 | | 19.6 | | 2.1 | |
| Net fee income | 857 | | 15.4 | | 3.7 | | | 1,600 | | 20.3 | | 2.6 | |
Gains (losses) on financial transactions (1) | 245 | | 171.6 | | 151.3 | | | 335 | | 63.3 | | 39.3 | |
| Other operating income | (7) | | — | | — | | | 36 | | — | | — | |
| Total income | 3,374 | | 11.8 | | 0.2 | | | 6,393 | | 23.0 | | 4.9 | |
| Administrative expenses and amortizations | (1,022) | | 9.9 | | (1.6) | | | (1,951) | | 29.9 | | 10.8 | |
| Net operating income | 2,352 | | 12.6 | | 1.0 | | | 4,442 | | 20.1 | | 2.5 | |
| Net loan-loss provisions | (1,163) | | 36.6 | | 23.6 | | | (2,015) | | 64.8 | | 40.6 | |
| Other gains (losses) and provisions | (43) | | (62.2) | | (69.8) | | | (157) | | 26.4 | | 7.8 | |
| Profit before tax | 1,146 | | 2.0 | | (9.0) | | | 2,270 | | (3.4) | | (17.6) | |
| Tax on profit | (327) | | (22.6) | | (32.3) | | | (751) | | (28.1) | | (38.7) | |
| Profit from continuing operations | 819 | | 16.9 | | 5.1 | | | 1,519 | | 16.3 | | (0.8) | |
| Net profit from discontinued operations | — | | — | | — | | | — | | — | | — | |
| Consolidated profit | 819 | | 16.9 | | 5.1 | | | 1,519 | | 16.3 | | (0.8) | |
| Non-controlling interests | (81) | | 11.4 | | (0.2) | | | (154) | | 20.4 | | 2.7 | |
| Underlying profit attributable to the parent | 737 | | 17.5 | | 5.7 | | | 1,365 | | 15.9 | | (1.1) | |
| | | | | | | |
| Balance sheet | | | | | | | |
| Loans and advances to customers | 85,642 | | (0.6) | | 3.0 | | | 85,642 | | 16.2 | | 7.1 | |
| Cash, central banks and credit institutions | 37,700 | | 4.6 | | 8.4 | | | 37,700 | | 15.5 | | 6.4 | |
| Debt instruments | 41,215 | | (6.7) | | (3.3) | | | 41,215 | | 9.4 | | 0.8 | |
| Other financial assets | 8,344 | | 3.5 | | 7.3 | | | 8,344 | | 40.0 | | 29.0 | |
| Other asset accounts | 13,387 | | 2.3 | | 6.0 | | | 13,387 | | 14.1 | | 5.2 | |
| Total assets | 186,289 | | (0.7) | | 2.9 | | | 186,289 | | 15.2 | | 6.2 | |
| Customer deposits | 86,561 | | (1.0) | | 2.6 | | | 86,561 | | 13.0 | | 4.1 | |
| Central banks and credit institutions | 27,661 | | (2.6) | | 1.0 | | | 27,661 | | (4.1) | | (11.6) | |
| Marketable debt securities | 22,359 | | 1.6 | | 5.3 | | | 22,359 | | 64.9 | | 51.9 | |
| Other financial liabilities | 28,255 | | (0.8) | | 2.8 | | | 28,255 | | 25.9 | | 16.0 | |
| Other liabilities accounts | 6,084 | | 4.6 | | 8.5 | | | 6,084 | | (8.4) | | (15.6) | |
| Total liabilities | 170,920 | | (0.7) | | 2.9 | | | 170,920 | | 15.4 | | 6.3 | |
| Total equity | 15,369 | | (0.4) | | 3.3 | | | 15,369 | | 13.1 | | 4.2 | |
| | | | | | | |
| Memorandum items: | | | | | | | |
Gross loans and advances to customers (2) | 91,266 | | (0.2) | | 3.5 | | | 91,266 | | 18.0 | | 8.7 | |
| Customer funds | 121,810 | | (0.6) | | 3.0 | | | 121,810 | | 11.4 | | 2.7 | |
Customer deposits (3) | 76,693 | | 1.9 | | 5.6 | | | 76,693 | | 13.2 | | 4.3 | |
| Mutual funds | 45,118 | | (4.5) | | (1.0) | | | 45,118 | | 8.6 | | — | |
| | | | | | | |
| Ratios (%), operating means and customers | | | | | | | |
| Underlying RoTE | 21.93 | | 0.95 | | | | 21.46 | | (0.61) | | |
| Efficiency ratio | 30.3 | | (0.5) | | | | 30.5 | | 1.6 | | |
| NPL ratio | 6.34 | | 0.66 | | | | 6.34 | | 1.79 | | |
| Total coverage ratio | 92.3 | | (8.8) | | | | 92.3 | | (20.0) | | |
| Number of employees | 53,743 | | (0.2) | | | | 53,743 | | 19.1 | | |
| Number of branches | 2,936 | | (0.7) | | | | 2,936 | | (0.1) | | |
| Number of loyal customers (thousands) | 8,534 | | 2.4 | | | | 8,534 | | 19.4 | | |
| Number of digital customers (thousands) | 19,847 | | 1.1 | | | | 19,847 | | 13.6 | | |
(1) Includes exchange differences.
(2) Excluding reverse repos.
(3) Excluding repos.
| | | | | | | | | | | | | | | | | | | | | | | | | | |
| |
| |
| | | |
|
| | | | | | | | Financial information by segment |
| | | | | | | | | | | | | | | | | | | | | | | |
| Chile | |
| EUR million | | | | | | |
| | / | Q1'22 | | | / | H1'21 |
| Underlying income statement | Q2'22 | % | % excl. FX | | H1'22 | % | % excl. FX |
| Net interest income | 554 | | 14.8 | | 14.0 | | | 1,038 | | 3.0 | | 7.0 | |
| Net fee income | 110 | | (2.1) | | (2.8) | | | 222 | | 16.4 | | 21.0 | |
Gains (losses) on financial transactions (1) | 49 | | (23.8) | | (24.4) | | | 114 | | 41.9 | | 47.6 | |
| Other operating income | (7) | | (33.2) | | (33.8) | | | (17) | | (40.4) | | (38.0) | |
| Total income | 707 | | 8.7 | | 8.0 | | | 1,357 | | 8.5 | | 12.8 | |
| Administrative expenses and amortizations | (255) | | 8.8 | | 8.1 | | | (489) | | 1.7 | | 5.7 | |
| Net operating income | 452 | | 8.7 | | 8.0 | | | 868 | | 12.7 | | 17.2 | |
| Net loan-loss provisions | (110) | | 16.4 | | 15.6 | | | (205) | | 12.8 | | 17.3 | |
| Other gains (losses) and provisions | (19) | | — | | — | | | (17) | | — | | — | |
| Profit before tax | 323 | | 0.2 | | (0.5) | | | 646 | | 9.2 | | 13.5 | |
| Tax on profit | (31) | | (43.9) | | (44.5) | | | (86) | | (31.0) | | (28.3) | |
| Profit from continuing operations | 292 | | 9.3 | | 8.5 | | | 560 | | 19.9 | | 24.6 | |
| Net profit from discontinued operations | — | | — | | — | | | — | | — | | — | |
| Consolidated profit | 292 | | 9.3 | | 8.5 | | | 560 | | 19.9 | | 24.6 | |
| Non-controlling interests | (88) | | 10.8 | | 10.1 | | | (168) | | 15.0 | | 19.6 | |
| Underlying profit attributable to the parent | 204 | | 8.6 | | 7.9 | | | 391 | | 22.1 | | 26.9 | |
| | | | | | | |
| Balance sheet | | | | | | | |
| Loans and advances to customers | 39,247 | | (6.4) | | 4.9 | | | 39,247 | | (1.7) | | 11.6 | |
| Cash, central banks and credit institutions | 7,310 | | (6.6) | | 4.6 | | | 7,310 | | (37.8) | | (29.4) | |
| Debt instruments | 10,829 | | 7.9 | | 21.0 | | | 10,829 | | 30.2 | | 47.8 | |
| Other financial assets | 15,450 | | 40.8 | | 57.8 | | | 15,450 | | 145.5 | | 178.6 | |
| Other asset accounts | 3,401 | | 9.6 | | 22.8 | | | 3,401 | | 18.0 | | 33.8 | |
| Total assets | 76,237 | | 3.2 | | 15.6 | | | 76,237 | | 10.2 | | 25.1 | |
| Customer deposits | 28,014 | | (10.7) | | — | | | 28,014 | | (15.9) | | (4.6) | |
| Central banks and credit institutions | 14,432 | | 18.5 | | 32.8 | | | 14,432 | | 23.7 | | 40.4 | |
| Marketable debt securities | 9,445 | | (0.4) | | 11.6 | | | 9,445 | | 4.0 | | 18.0 | |
| Other financial liabilities | 15,991 | | 34.2 | | 50.4 | | | 15,991 | | 87.8 | | 113.2 | |
| Other liabilities accounts | 3,865 | | 7.4 | | 20.3 | | | 3,865 | | 106.6 | | 134.5 | |
| Total liabilities | 71,746 | | 4.7 | | 17.3 | | | 71,746 | | 11.3 | | 26.3 | |
| Total equity | 4,491 | | (15.6) | | (5.5) | | | 4,491 | | (4.7) | | 8.1 | |
| | | | | | | |
| Memorandum items: | | | | | | | |
Gross loans and advances to customers (2) | 40,389 | | (6.4) | | 4.9 | | | 40,389 | | (1.8) | | 11.4 | |
| Customer funds | 34,989 | | (11.3) | | (0.6) | | | 34,989 | | (17.3) | | (6.2) | |
Customer deposits (3) | 27,292 | | (12.4) | | (1.9) | | | 27,292 | | (18.0) | | (6.9) | |
| Mutual funds | 7,697 | | (7.1) | | 4.0 | | | 7,697 | | (14.8) | | (3.3) | |
| | | | | | | |
| Ratios (%), operating means and customers | | | | | | | |
| Underlying RoTE | 23.94 | | 2.58 | | | | 22.74 | | 4.14 | | |
| Efficiency ratio | 36.1 | | — | | | | 36.0 | | (2.4) | | |
| NPL ratio | 4.70 | | (0.01) | | | | 4.70 | | 0.13 | | |
| Total coverage ratio | 60.4 | | (0.4) | | | | 60.4 | | (3.5) | | |
| Number of employees | 9,921 | | (3.1) | | | | 9,921 | | (6.7) | | |
| Number of branches | 306 | | (2.5) | | | | 306 | | (7.8) | | |
| Number of loyal customers (thousands) | 816 | | (1.8) | | | | 816 | | 5.0 | | |
| Number of digital customers (thousands) | 1,963 | | (1.7) | | | | 1,963 | | 5.1 | | |
(1) Includes exchange differences.
(2) Excluding reverse repos.
(3) Excluding repos.
| | | | | | | | | | | | | | | | | | | | | | | | | | |
| |
| |
| | | |
|
| | | | | | | | Financial information by segment |
| | | | | | | | | | | | | | | | | | | | | | | |
| Argentina | |
| EUR million | | | | | | |
| | / | Q1'22 | | | / | H1'21 |
| Underlying income statement | Q2'22 | % | % excl. FX | | H1'22 | % | % excl. FX |
| Net interest income | 432 | | 44.1 | | 58.9 | | | 732 | | 67.4 | | 92.9 | |
| Net fee income | 143 | | 18.6 | | 31.9 | | | 264 | | 63.4 | | 88.3 | |
Gains (losses) on financial transactions (1) | 63 | | 20.5 | | 33.9 | | | 115 | | 75.2 | | 101.8 | |
| Other operating income | (180) | | 65.4 | | 81.6 | | | (289) | | 180.3 | | 223.0 | |
| Total income | 458 | | 25.8 | | 39.6 | | | 821 | | 46.4 | | 68.7 | |
| Administrative expenses and amortizations | (260) | | 20.1 | | 33.5 | | | (477) | | 36.5 | | 57.3 | |
| Net operating income | 198 | | 34.3 | | 48.6 | | | 345 | | 62.9 | | 87.7 | |
| Net loan-loss provisions | (33) | | (15.2) | | (4.0) | | | (72) | | 48.0 | | 70.6 | |
| Other gains (losses) and provisions | (67) | | 78.4 | | 95.4 | | | (105) | | 61.0 | | 85.5 | |
| Profit before tax | 97 | | 38.0 | | 52.5 | | | 168 | | 71.5 | | 97.7 | |
| Tax on profit | (11) | | 1.9 | | 14.2 | | | (22) | | — | | — | |
| Profit from continuing operations | 86 | | 44.6 | | 59.5 | | | 146 | | 36.6 | | 57.4 | |
| Net profit from discontinued operations | — | | — | | — | | | — | | — | | — | |
| Consolidated profit | 86 | | 44.6 | | 59.5 | | | 146 | | 36.6 | | 57.4 | |
| Non-controlling interests | — | | (8.7) | | 3.0 | | | — | | (42.1) | | (33.3) | |
| Underlying profit attributable to the parent | 86 | | 44.8 | | 59.7 | | | 145 | | 37.2 | | 58.0 | |
| | | | | | | |
| Balance sheet | | | | | | | |
| Loans and advances to customers | 6,098 | | 11.3 | | 18.0 | | | 6,098 | | 36.8 | | 57.6 | |
| Cash, central banks and credit institutions | 3,615 | | 30.1 | | 38.0 | | | 3,615 | | 12.7 | | 29.9 | |
| Debt instruments | 4,511 | | 4.6 | | 11.0 | | | 4,511 | | 106.2 | | 137.6 | |
| Other financial assets | 35 | | 15.6 | | 22.6 | | | 35 | | (54.9) | | (48.0) | |
| Other asset accounts | 1,062 | | 2.0 | | 8.2 | | | 1,062 | | 27.2 | | 46.5 | |
| Total assets | 15,320 | | 12.3 | | 19.1 | | | 15,320 | | 42.3 | | 64.0 | |
| Customer deposits | 11,279 | | 14.0 | | 21.0 | | | 11,279 | | 44.8 | | 66.9 | |
| Central banks and credit institutions | 719 | | 37.4 | | 45.8 | | | 719 | | (13.0) | | 0.3 | |
| Marketable debt securities | 156 | | (14.0) | | (8.8) | | | 156 | | 146.3 | | 183.8 | |
| Other financial liabilities | 956 | | 3.2 | | 9.5 | | | 956 | | 41.7 | | 63.2 | |
| Other liabilities accounts | 400 | | (31.7) | | (27.5) | | | 400 | | 27.5 | | 46.9 | |
| Total liabilities | 13,510 | | 11.6 | | 18.4 | | | 13,510 | | 39.8 | | 61.1 | |
| Total equity | 1,810 | | 17.9 | | 25.1 | | | 1,810 | | 64.5 | | 89.5 | |
| | | | | | | |
| Memorandum items: | | | | | | | |
Gross loans and advances to customers (2) | 6,336 | | 10.3 | | 17.0 | | | 6,336 | | 34.4 | | 54.9 | |
| Customer funds | 14,822 | | 10.9 | | 17.7 | | | 14,822 | | 49.8 | | 72.6 | |
Customer deposits (3) | 11,279 | | 14.0 | | 21.0 | | | 11,279 | | 44.8 | | 66.9 | |
| Mutual funds | 3,543 | | 2.1 | | 8.3 | | | 3,543 | | 67.9 | | 93.5 | |
| | | | | | | |
| Ratios (%), operating means and customers | | | | | | | |
| Underlying RoTE | 23.13 | | 4.80 | | | | 20.93 | | (2.67) | | |
| Efficiency ratio | 56.8 | | (2.7) | | | | 58.0 | | (4.2) | | |
| NPL ratio | 2.48 | | (0.73) | | | | 2.48 | | (0.86) | | |
| Total coverage ratio | 171.1 | | 9.4 | | | | 171.1 | | 3.5 | | |
| Number of employees | 8,514 | | (0.4) | | | | 8,514 | | (3.4) | | |
| Number of branches | 407 | | — | | | | 407 | | (0.2) | | |
| Number of loyal customers (thousands) | 1,632 | | 1.2 | | | | 1,632 | | 4.0 | | |
| Number of digital customers (thousands) | 2,850 | | 7.4 | | | | 2,850 | | 4.9 | | |
(1) Includes exchange differences.
(2) Excluding reverse repos.
(3) Excluding repos.
| | | | | | | | | | | | | | | | | | | | | | | | | | |
| |
| |
| | | |
|
| | | | | | | | Financial information by segment |
| | | | | | | | | | | | | | | | | | | | | | | |
| Other South America | |
| EUR million | | | | | | | |
| | / | Q1'22 | | | / | H1'21 |
| Underlying income statement | Q2'22 | % | % excl. FX | | H1'22 | % | % excl. FX |
| Net interest income | 125 | | 12.2 | | 2.3 | | | 236 | | 27.4 | | 14.3 | |
| Net fee income | 52 | | 38.8 | | 27.8 | | | 90 | | 2.9 | | (5.7) | |
Gains (losses) on financial transactions (1) | 23 | | 25.0 | | 16.6 | | | 41 | | 31.4 | | 21.1 | |
| Other operating income | (1) | | (81.4) | | (85.2) | | | (6) | | (52.7) | | (55.2) | |
| Total income | 199 | | 22.6 | | 12.3 | | | 362 | | 23.7 | | 11.8 | |
| Administrative expenses and amortizations | (132) | | 27.4 | | 19.8 | | | (236) | | 27.3 | | 18.5 | |
| Net operating income | 67 | | 14.0 | | (0.5) | | | 126 | | 17.5 | | 1.0 | |
| Net loan-loss provisions | (28) | | 113.4 | | 97.4 | | | (41) | | 5.5 | | (4.2) | |
| Other gains (losses) and provisions | (1) | | 59.9 | | 44.4 | | | (2) | | 30.8 | | 17.6 | |
| Profit before tax | 37 | | (16.2) | | (29.6) | | | 82 | | 24.3 | | 3.4 | |
| Tax on profit | (19) | | (0.9) | | (10.2) | | | (39) | | 23.1 | | 11.2 | |
| Profit from continuing operations | 18 | | (28.1) | | (44.0) | | | 43 | | 25.4 | | (2.8) | |
| Net profit from discontinued operations | — | | — | | — | | | — | | — | | — | |
| Consolidated profit | 18 | | (28.1) | | (44.0) | | | 43 | | 25.4 | | (2.8) | |
| Non-controlling interests | 1 | | 553.5 | | 550.5 | | | 1 | | 171.3 | | 167.1 | |
| Underlying profit attributable to the parent | 19 | | (25.4) | | (41.5) | | | 44 | | 26.7 | | (1.6) | |
| | | | | | | |
| Balance sheet | | | | | | | |
| Loans and advances to customers | 9,780 | | 15.7 | | 11.2 | | | 9,780 | | 45.5 | | 26.0 | |
| Cash, central banks and credit institutions | 2,436 | | (25.5) | | (30.1) | | | 2,436 | | (14.6) | | (28.4) | |
| Debt instruments | 2,823 | | 58.4 | | 48.4 | | | 2,823 | | 58.5 | | 33.6 | |
| Other financial assets | 220 | | 186.6 | | 180.5 | | | 220 | | 72.6 | | 58.4 | |
| Other asset accounts | 895 | | (6.9) | | (9.4) | | | 895 | | 12.3 | | 5.7 | |
| Total assets | 16,154 | | 11.0 | | 5.9 | | | 16,154 | | 31.6 | | 13.3 | |
| Customer deposits | 8,836 | | 13.1 | | 5.5 | | | 8,836 | | 30.2 | | 8.0 | |
| Central banks and credit institutions | 4,706 | | 7.0 | | 6.5 | | | 4,706 | | 37.6 | | 26.1 | |
| Marketable debt securities | 497 | | 65.1 | | 53.0 | | | 497 | | 90.4 | | 57.7 | |
| Other financial liabilities | 299 | | 81.7 | | 75.8 | | | 299 | | 174.2 | | 151.1 | |
| Other liabilities accounts | 470 | | (3.1) | | (8.3) | | | 470 | | 46.1 | | 24.9 | |
| Total liabilities | 14,807 | | 12.5 | | 7.3 | | | 14,807 | | 35.9 | | 16.4 | |
| Total equity | 1,347 | | (2.8) | | (7.0) | | | 1,347 | | (2.4) | | (12.3) | |
| | | | | | | |
| Memorandum items: | | | | | | | |
Gross loans and advances to customers (2) | 9,973 | | 15.7 | | 11.1 | | | 9,973 | | 45.1 | | 25.6 | |
| Customer funds | 9,885 | | 10.9 | | 3.1 | | | 9,885 | | 44.7 | | 20.0 | |
Customer deposits (3) | 8,836 | | 13.1 | | 5.5 | | | 8,836 | | 30.2 | | 8.0 | |
| Mutual funds | 1,049 | | (4.8) | | (13.3) | | | 1,049 | | — | | — | |
| | | | | | | |
| Resources | | | | | | | |
| Number of employees | 3,410 | | 8.8 | | | | 3,410 | | 29.1 | | |
(1) Includes exchange differences.
(2) Excluding reverse repos.
(3) Excluding repos.
| | | | | | | | | | | | | | | | | | | | | | | | | | |
| |
| |
| | | |
|
| | | | | | | | Financial information by segment |
| | | | | | | | | | | | | | | | | | | | | | | |
| DIGITAL CONSUMER BANK | |
| EUR million | | | | | | |
| | / | Q1'22 | | | / | H1'21 |
| Underlying income statement | Q2'22 | % | % excl. FX | | H1'22 | % | % excl. FX |
| Net interest income | 1,012 | | (0.7) | | (0.5) | | | 2,032 | | 1.1 | | 0.6 | |
| Net fee income | 219 | | 6.1 | | 6.2 | | | 425 | | 7.5 | | 7.5 | |
Gains (losses) on financial transactions (1) | 18 | | — | | — | | | 18 | | 96.8 | | 96.0 | |
| Other operating income | 12 | | (86.1) | | (85.9) | | | 98 | | 37.6 | | 31.7 | |
| Total income | 1,261 | | (3.9) | | (3.6) | | | 2,573 | | 3.5 | | 3.0 | |
| Administrative expenses and amortizations | (603) | | (6.5) | | (6.3) | | | (1,248) | | 2.8 | | 2.5 | |
| Net operating income | 658 | | (1.3) | | (1.1) | | | 1,325 | | 4.2 | | 3.4 | |
| Net loan-loss provisions | (139) | | (5.9) | | (5.8) | | | (287) | | (6.8) | | (7.0) | |
| Other gains (losses) and provisions | (11) | | (36.3) | | (36.1) | | | (28) | | (62.9) | | (62.6) | |
| Profit before tax | 508 | | 1.3 | | 1.5 | | | 1,010 | | 13.7 | | 12.5 | |
| Tax on profit | (122) | | 10.8 | | 11.0 | | | (233) | | 1.6 | | 1.2 | |
| Profit from continuing operations | 385 | | (1.4) | | (1.2) | | | 777 | | 17.9 | | 16.5 | |
| Net profit from discontinued operations | — | | — | | — | | | — | | — | | — | |
| Consolidated profit | 385 | | (1.4) | | (1.2) | | | 777 | | 17.9 | | 16.5 | |
| Non-controlling interests | (96) | | (12.5) | | (12.3) | | | (205) | | 18.1 | | 17.8 | |
| Underlying profit attributable to the parent | 290 | | 2.8 | | 3.2 | | | 572 | | 17.9 | | 16.0 | |
| | | | | | | |
| Balance sheet | | | | | | | |
| Loans and advances to customers | 116,796 | | 2.3 | | 3.2 | | | 116,796 | | 3.6 | | 3.9 | |
| Cash, central banks and credit institutions | 14,484 | | (17.8) | | (17.1) | | | 14,484 | | (16.0) | | (15.8) | |
| Debt instruments | 7,830 | | 48.0 | | 49.0 | | | 7,830 | | 36.5 | | 37.2 | |
| Other financial assets | 134 | | 34.3 | | 35.0 | | | 134 | | 223.5 | | 224.3 | |
| Other asset accounts | 7,627 | | 4.0 | | 4.5 | | | 7,627 | | 17.7 | | 17.6 | |
| Total assets | 146,871 | | 1.6 | | 2.5 | | | 146,871 | | 3.3 | | 3.5 | |
| Customer deposits | 57,556 | | 1.1 | | 2.0 | | | 57,556 | | 6.5 | | 6.8 | |
| Central banks and credit institutions | 39,369 | | 6.7 | | 7.8 | | | 39,369 | | 6.8 | | 6.9 | |
| Marketable debt securities | 31,043 | | (3.0) | | (2.2) | | | 31,043 | | (8.0) | | (7.8) | |
| Other financial liabilities | 1,687 | | 9.8 | | 10.5 | | | 1,687 | | 16.0 | | 16.3 | |
| Other liabilities accounts | 4,632 | | 3.6 | | 4.2 | | | 4,632 | | 10.1 | | 10.3 | |
| Total liabilities | 134,286 | | 1.9 | | 2.7 | | | 134,286 | | 3.1 | | 3.3 | |
| Total equity | 12,584 | | (1.1) | | 0.3 | | | 12,584 | | 5.4 | | 5.9 | |
| | | | | | | |
| Memorandum items: | | | | | | | |
Gross loans and advances to customers (2) | 119,348 | | 2.2 | | 3.2 | | | 119,348 | | 3.3 | | 3.6 | |
| Customer funds | 59,765 | | 0.8 | | 1.6 | | | 59,765 | | 6.4 | | 6.7 | |
Customer deposits (3) | 57,556 | | 1.1 | | 2.0 | | | 57,556 | | 6.5 | | 6.8 | |
| Mutual funds | 2,209 | | (7.3) | | (7.3) | | | 2,209 | | 2.8 | | 2.8 | |
| | | | | | | |
| Ratios (%), operating means and customers | | | | | | | |
| Underlying RoTE | 11.39 | | (1.21) | | | | 11.99 | | 1.65 | | |
| Efficiency ratio | 47.8 | | (1.4) | | | | 48.5 | | (0.3) | | |
| NPL ratio | 2.22 | | (0.04) | | | | 2.22 | | 0.05 | | |
| Total coverage ratio | 97.4 | | (1.9) | | | | 97.4 | | (14.4) | | |
| Number of employees | 15,894 | | 0.2 | | | | 15,894 | | 0.4 | | |
| Number of branches | 370 | | (0.3) | | | | 370 | | 17.8 | | |
| Number of total customers (thousands) | 19,388 | | 1.1 | | | | 19,388 | | (0.2) | | |
| | | | | | | |
| | | | | | | |
(1) Includes exchange differences.
(2) Excluding reverse repos.
(3) Excluding repos.
| | | | | | | | | | | | | | | | | | | | | | | | | | |
| |
| |
| | | |
|
| | | | | | | | Financial information by segment |
| | | | | | | | | | | | | | | | | | | | | | | |
| CORPORATE CENTRE | |
| EUR million | | | | | | |
| Underlying income statement | Q2'22 | Q1'22 | % | | H1'22 | H1'21 | % |
| Net interest income | (181) | | (172) | | 5.0 | | | (353) | | (297) | | 18.9 | |
| Net fee income | 2 | | (3) | | — | | | (1) | | (13) | | (92.8) | |
Gains (losses) on financial transactions (1) | (253) | | (119) | | 113.0 | | | (371) | | (96) | | 288.4 | |
| Other operating income | (15) | | (7) | | 108.9 | | | (22) | | (12) | | 82.6 | |
| Total income | (446) | | (301) | | 48.1 | | | (747) | | (418) | | 78.8 | |
| Administrative expenses and amortizations | (92) | | (87) | | 6.0 | | | (179) | | (160) | | 12.3 | |
| Net operating income | (538) | | (388) | | 38.7 | | | (926) | | (577) | | 60.4 | |
| Net loan-loss provisions | (4) | | (1) | | 268.2 | | | (5) | | (163) | | (96.7) | |
| Other gains (losses) and provisions | (34) | | (48) | | (28.2) | | | (82) | | (66) | | 25.0 | |
| Profit before tax | (577) | | (437) | | 32.0 | | | (1,014) | | (806) | | 25.8 | |
| Tax on profit | (1) | | (25) | | (96.7) | | | (26) | | (5) | | 434.9 | |
| Profit from continuing operations | (577) | | (462) | | 24.9 | | | (1,040) | | (811) | | 28.2 | |
| Net profit from discontinued operations | — | | — | | — | | | — | | — | | — | |
| Consolidated profit | (577) | | (462) | | 24.9 | | | (1,040) | | (811) | | 28.2 | |
| Non-controlling interests | — | | — | | — | | | — | | (1) | | (98.6) | |
| Underlying profit attributable to the parent | (577) | | (462) | | 25.0 | | | (1,040) | | (812) | | 28.1 | |
| | | | | | | |
| Balance sheet | | | | | | | |
| Loans and advances to customers | 7,087 | | 6,901 | | 2.7 | | | 7,087 | | 5,832 | | 21.5 | |
| Cash, central banks and credit institutions | 108,644 | | 87,582 | | 24.0 | | | 108,644 | | 71,908 | | 51.1 | |
| Debt instruments | 6,928 | | 5,000 | | 38.6 | | | 6,928 | | 1,605 | | 331.7 | |
| Other financial assets | 522 | | 2,261 | | (76.9) | | | 522 | | 2,016 | | (74.1) | |
| Other asset accounts | 129,429 | | 132,306 | | (2.2) | | | 129,429 | | 118,374 | | 9.3 | |
| Total assets | 252,610 | | 234,051 | | 7.9 | | | 252,610 | | 199,736 | | 26.5 | |
| Customer deposits | 928 | | 1,193 | | (22.2) | | | 928 | | 1,017 | | (8.8) | |
| Central banks and credit institutions | 69,730 | | 57,936 | | 20.4 | | | 69,730 | | 38,664 | | 80.3 | |
| Marketable debt securities | 84,309 | | 75,134 | | 12.2 | | | 84,309 | | 69,217 | | 21.8 | |
| Other financial liabilities | 287 | | 947 | | (69.7) | | | 287 | | 534 | | (46.3) | |
| Other liabilities accounts | 9,063 | | 8,162 | | 11.0 | | | 9,063 | | 8,009 | | 13.2 | |
| Total liabilities | 164,317 | | 143,371 | | 14.6 | | | 164,317 | | 117,441 | | 39.9 | |
| Total equity | 88,292 | | 90,679 | | (2.6) | | | 88,292 | | 82,295 | | 7.3 | |
| | | | | | | |
| Memorandum items: | | | | | | | |
Gross loans and advances to customers (2) | 7,172 | | 6,962 | | 3.0 | | | 7,172 | | 6,138 | | 16.9 | |
| Customer funds | 928 | | 1,193 | | (22.2) | | | 928 | | 1,021 | | (9.2) | |
Customer deposits (3) | 928 | | 1,193 | | (22.2) | | | 928 | | 1,017 | | (8.8) | |
| Mutual funds | — | | — | | — | | | — | | 4 | | (100.0) | |
| | | | | | | |
| Resources | | | | | | | |
| Number of employees | 1,811 | | 1,747 | | 3.7 | | | 1,811 | | 1,743 | | 3.9 | |
(1) Includes exchange differences.
(2) Excluding reverse repos.
(3) Excluding repos.
| | | | | | | | | | | | | | | | | | | | | | | | | | |
| |
| |
| | | |
|
| | | | | | | | Financial information by segment |
| | | | | | | | | | | | | | | | | | | | | | | |
| RETAIL BANKING | |
| EUR million | | | | | | |
| | / | Q1'22 | | | / | H1'21 |
| Underlying income statement | Q2'22 | % | % excl. FX | | H1'22 | % | % excl. FX |
| Net interest income | 8,620 | | 6.5 | | 2.6 | | | 16,714 | | 12.5 | | 5.7 | |
| Net fee income | 1,975 | | 8.8 | | 4.9 | | | 3,791 | | 8.7 | | 2.6 | |
Gains (losses) on financial transactions (1) | 153 | | 189.2 | | 210.0 | | | 206 | | (46.5) | | (48.2) | |
| Other operating income | (208) | | — | | — | | | (76) | | — | | — | |
| Total income | 10,541 | | 4.4 | | 0.5 | | | 20,635 | | 8.6 | | 2.0 | |
| Administrative expenses and amortizations | (4,626) | | 5.1 | | 2.2 | | | (9,025) | | 7.9 | | 2.9 | |
| Net operating income | 5,915 | | 3.9 | | (0.8) | | | 11,610 | | 9.2 | | 1.3 | |
| Net loan-loss provisions | (2,621) | | 24.2 | | 17.8 | | | (4,732) | | 34.9 | | 25.8 | |
| Other gains (losses) and provisions | (456) | | 7.2 | | 4.8 | | | (881) | | 3.4 | | 1.2 | |
| Profit before tax | 2,838 | | (10.2) | | (14.0) | | | 5,997 | | (4.4) | | (12.2) | |
| Tax on profit | (650) | | (23.3) | | (27.6) | | | (1,499) | | (26.0) | | (32.8) | |
| Profit from continuing operations | 2,188 | | (5.3) | | (9.0) | | | 4,499 | | 5.9 | | (2.1) | |
| Net profit from discontinued operations | — | | — | | — | | | — | | — | | — | |
| Consolidated profit | 2,188 | | (5.3) | | (9.0) | | | 4,499 | | 5.9 | | (2.1) | |
| Non-controlling interests | (251) | | (1.6) | | (3.9) | | | (507) | | (24.3) | | (28.6) | |
| Underlying profit attributable to the parent | 1,936 | | (5.8) | | (9.7) | | | 3,991 | | 11.6 | | 2.7 | |
(1) Includes exchange differences.
| | | | | | | | | | | | | | | | | | | | | | | |
| CORPORATE & INVESTMENT BANKING | |
| EUR million | | | | | | |
| | / | Q1'22 | | | / | H1'21 |
| Underlying income statement | Q2'22 | % | % excl. FX | | H1'22 | % | % excl. FX |
| Net interest income | 928 | | 18.1 | | 14.5 | | | 1,714 | | 21.8 | | 16.4 | |
| Net fee income | 506 | | (3.0) | | (5.9) | | | 1,027 | | 15.5 | | 9.9 | |
Gains (losses) on financial transactions (1) | 429 | | 1.5 | | (2.3) | | | 851 | | 55.9 | | 48.4 | |
| Other operating income | (13) | | — | | — | | | 20 | | (25.8) | | (19.8) | |
| Total income | 1,849 | | 4.9 | | 1.4 | | | 3,612 | | 25.9 | | 20.2 | |
| Administrative expenses and amortizations | (673) | | 9.5 | | 6.5 | | | (1,289) | | 16.6 | | 11.9 | |
| Net operating income | 1,176 | | 2.5 | | (1.3) | | | 2,324 | | 31.7 | | 25.4 | |
| Net loan-loss provisions | 10 | | (25.3) | | (26.8) | | | 23 | | — | | — | |
| Other gains (losses) and provisions | (36) | | 93.1 | | 89.4 | | | (55) | | 630.1 | | — | |
| Profit before tax | 1,149 | | 0.7 | | (3.1) | | | 2,291 | | 35.7 | | 28.5 | |
| Tax on profit | (325) | | (1.1) | | (6.1) | | | (654) | | 37.6 | | 27.9 | |
| Profit from continuing operations | 824 | | 1.4 | | (1.8) | | | 1,637 | | 35.0 | | 28.7 | |
| Net profit from discontinued operations | — | | — | | — | | | — | | — | | — | |
| Consolidated profit | 824 | | 1.4 | | (1.8) | | | 1,637 | | 35.0 | | 28.7 | |
| Non-controlling interests | (52) | | (2.6) | | (6.9) | | | (106) | | 45.7 | | 34.2 | |
| Underlying profit attributable to the parent | 772 | | 1.7 | | (1.4) | | | 1,531 | | 34.3 | | 28.4 | |
(1) Includes exchange differences.
| | | | | | | | | | | | | | | | | | | | | | | | | | |
| |
| |
| | | |
|
| | | | | | | | Financial information by segment |
| | | | | | | | | | | | | | | | | | | | | | | |
| WEALTH MANAGEMENT & INSURANCE | |
| EUR million | | | | | | |
| | / | Q1'22 | | | / | H1'21 |
| Underlying income statement | Q2'22 | % | % excl. FX | | H1'22 | % | % excl. FX |
| Net interest income | 184 | | 26.4 | | 23.8 | | | 329 | | 44.3 | | 39.0 | |
| Net fee income | 334 | | 4.0 | | 1.6 | | | 655 | | 9.9 | | 5.2 | |
Gains (losses) on financial transactions (1) | 29 | | (4.0) | | (5.9) | | | 58 | | (1.7) | | (4.7) | |
| Other operating income | 89 | | (1.7) | | (6.4) | | | 179 | | (0.5) | | (3.3) | |
| Total income | 635 | | 8.3 | | 5.4 | | | 1,222 | | 14.9 | | 10.5 | |
| Administrative expenses and amortizations | (252) | | 3.1 | | 0.2 | | | (496) | | 10.5 | | 5.5 | |
| Net operating income | 384 | | 12.0 | | 9.2 | | | 726 | | 18.1 | | 14.2 | |
| Net loan-loss provisions | (9) | | — | | — | | | (8) | | (14.5) | | (13.8) | |
| Other gains (losses) and provisions | (8) | | 66.6 | | 64.2 | | | (13) | | 103.9 | | 106.2 | |
| Profit before tax | 367 | | 8.5 | | 5.7 | | | 705 | | 17.7 | | 13.7 | |
| Tax on profit | (81) | | 3.4 | | 1.3 | | | (159) | | 9.9 | | 6.7 | |
| Profit from continuing operations | 286 | | 10.1 | | 7.0 | | | 546 | | 20.2 | | 15.9 | |
| Net profit from discontinued operations | — | | — | | — | | | — | | — | | — | |
| Consolidated profit | 286 | | 10.1 | | 7.0 | | | 546 | | 20.2 | | 15.9 | |
| Non-controlling interests | (16) | | 6.1 | | 2.4 | | | (30) | | 41.2 | | 35.7 | |
| Underlying profit attributable to the parent | 270 | | 10.3 | | 7.3 | | | 515 | | 19.2 | | 14.9 | |
(1) Includes exchange differences.
| | | | | | | | | | | | | | | | | | | | | | | |
| PAGONXT | |
| EUR million | | | | | | |
| | / | Q1'22 | | | / | H1'21 |
| Underlying income statement | Q2'22 | % | % excl. FX | | H1'22 | % | % excl. FX |
| Net interest income | 3 | | 85.6 | 72.1 | | 5 | | — | — |
| Net fee income | 222 | | 41.2 | 30.9 | | 379 | | 82.0 | 63.3 |
Gains (losses) on financial transactions (1) | (2) | | — | — | | (1) | | — | — |
| Other operating income | 13 | | 501.1 | | 446.2 | | | 15 | | — | | — | |
| Total income | 236 | | 45.6 | 35.0 | | 398 | | 110.1 | 86.8 |
| Administrative expenses and amortizations | (258) | | 35.6 | 30.5 | | (447) | | 50.2 | 42.9 |
| Net operating income | (22) | | (22.2) | (0.3) | | (50) | | (54.3) | (50.5) |
| Net loan-loss provisions | (9) | | 222.5 | | 198.9 | | | (11) | | 142.2 | | 107.2 | |
| Other gains (losses) and provisions | (3) | | 171.4 | | 153.4 | | | (4) | | (28.6) | | (31.6) | |
| Profit before tax | (33) | | 4.6 | 24.8 | | (64) | | (45.5) | (41.8) |
| Tax on profit | (15) | | (28.7) | (39.3) | | (36) | | 278.7 | 180.4 |
| Profit from continuing operations | (48) | | (8.8) | (3.4) | | (101) | | (21.2) | (18.6) |
| Net profit from discontinued operations | — | | — | | — | | | — | | — | | — | |
| Consolidated profit | (48) | | (8.8) | (3.4) | | (101) | | (21.2) | (18.6) |
| Non-controlling interests | (2) | | 44.2 | 24.9 | | (3) | | — | — |
| Underlying profit attributable to the parent | (50) | | (7.6) | (2.7) | | (104) | | (18.5) | (15.8) |
(1) Includes exchange differences.
| | | | | | | | | | | | | | | | | | | | | | | | | | |
| |
| |
| | | |
|
| | | | | | | | Alternative performance measures |
| | | | | | | | |
| ALTERNATIVE PERFORMANCE MEASURES (APMs) |
|
In addition to the financial information prepared under IFRS, this consolidated directors’ report contains financial measures that constitute alternative performance measures (‘APMs’) to comply with the guidelines on alternative performance measures issued by the European Securities and Markets Authority on 5 October 2015 and non-IFRS measures.
The financial measures contained in this consolidated directors’ report that qualify as APMs and non-IFRS measures have been calculated using the financial information from Santander but are not defined or detailed in the applicable financial information framework or under IFRS and have neither been audited nor reviewed by our auditors.
We use these APMs and non-IFRS measures when planning, monitoring and evaluating our performance. We consider these APMs and non-IFRS financial measures to be useful metrics for management and investors to facilitate operating performance comparisons from period to period. While we believe that these APMs and non-IFRS financial measures are useful in evaluating our business, this information should be considered as supplemental in nature and is not meant as a substitute of IFRS measures. In addition, the way in which Santander defines and calculates these
APMs and non-IFRS measures may differ from the calculations and by other companies with similar measures and, therefore, may not be comparable.
The APMs and non-IFRS measures we use in this document can be categorised as follows:
Underlying results
In addition to IFRS results measures, we present some results measures which are non-IFRS measures and which we refer to as underlying measures. These underlying measures allow in our view a better year-on-year comparability as they exclude items outside the ordinary performance of our business which are grouped in the non-IFRS line net capital gains and provisions and are further detailed on page 12 of this report.
In addition, in the section "Financial information by segments", relative to the primary and secondary segments, results are presented on an underlying basis in accordance with IFRS 8, and reconciled on an aggregate basis to our IFRS consolidated results to the consolidated financial statements, which are set out below.
| | | | | | | | | | | |
| Reconciliation of underlying results to statutory results |
| EUR million | | | |
| January-June 2022 |
| Underlying results | Adjustments | Statutory results |
| Net interest income | 18,409 | | — | | 18,409 | |
| Net fee income | 5,852 | | — | | 5,852 | |
Gains (losses) on financial transactions (1) | 743 | | — | | 743 | |
| Other operating income | 116 | | — | | 116 | |
| Total income | 25,120 | | — | | 25,120 | |
| Administrative expenses and amortizations | (11,435) | | — | | (11,435) | |
| Net operating income | 13,685 | | — | | 13,685 | |
| Net loan-loss provisions | (4,735) | | — | | (4,735) | |
| Other gains (losses) and provisions | (1,035) | | — | | (1,035) | |
| Profit before tax | 7,915 | | — | | 7,915 | |
| Tax on profit | (2,374) | | — | | (2,374) | |
| Profit from continuing operations | 5,541 | | — | | 5,541 | |
| Net profit from discontinued operations | — | | — | | — | |
| Consolidated profit | 5,541 | | — | | 5,541 | |
| Non-controlling interests | (647) | | — | | (647) | |
| Profit attributable to the parent | 4,894 | | — | | 4,894 | |
(1) Includes exchange differences.
| | | | | | | | | | | | | | | | | | | | | | | | | | |
| |
| |
| | | |
|
| | | | | | | | Alternative performance measures |
| | | | | | | | | | | |
| Reconciliation of underlying results to statutory results |
| EUR million | | | |
| January-June 2021 |
| Underlying results | Adjustments | Statutory results |
| Net interest income | 16,196 | | — | | 16,196 | |
| Net fee income | 5,169 | | — | | 5,169 | |
Gains (losses) on financial transactions (1) | 894 | | — | | 894 | |
| Other operating income | 436 | | — | | 436 | |
| Total income | 22,695 | | — | | 22,695 | |
| Administrative expenses and amortizations | (10,377) | | — | | (10,377) | |
| Net operating income | 12,318 | | — | | 12,318 | |
| Net loan-loss provisions | (3,753) | | — | | (3,753) | |
| Other gains (losses) and provisions | (937) | | (714) | | (1,651) | |
| Profit before tax | 7,628 | | (714) | | 6,914 | |
| Tax on profit | (2,658) | | 184 | | (2,474) | |
| Profit from continuing operations | 4,970 | | (530) | | 4,440 | |
| Net profit from discontinued operations | — | | — | | — | |
| Consolidated profit | 4,970 | | (530) | | 4,440 | |
| Non-controlling interests | (765) | | — | | (765) | |
| Profit attributable to the parent | 4,205 | | (530) | | 3,675 | |
(1) Includes exchange differences.
Explanation of adjustments:
Restructuring costs for a net impact of -EUR 530 million, mainly in the UK and Portugal.
| | | | | | | | | | | | | | | | | | | | | | | | | | |
| |
| |
| | | |
|
| | | | | | | | Alternative performance measures |
Profitability and efficiency ratios
The purpose of the profitability and efficiency ratios is to measure the ratio of profit to capital, to tangible capital, to assets and to risk weighted assets, while the efficiency ratio measures how much general administrative expenses (personnel and other) and amortization costs are needed to generate revenue.
Additionally, the goodwill adjustments have been removed from the RoTE numerator as, since they are not considered in the denominator, we believe this calculation is more correct.
| | | | | | | | | | | | | | |
| Ratio | | Formula | | Relevance of the metric |
| RoE | | Attributable profit to the parent | | This ratio measures the return that shareholders obtain on the funds invested in the Bank and as such measures the company's ability to pay shareholders. |
| (Return on equity) | | Average stockholders’ equity 1 (excl. minority interests) | |
| Underlying RoE | | Underlying attributable profit to the parent | | This ratio measures the return that shareholders obtain on the funds invested in the Bank excluding items outside the ordinary performance of our business. |
| | Average stockholders’ equity 1 (excl. minority interests) | |
| RoTE | | Attributable profit to the parent2 | | This indicator is used to evaluate the profitability of the company as a percentage of its tangible equity. It's measured as the return that shareholders receive as a percentage of the funds invested in the entity less intangible assets. |
| (Return on tangible equity) | | Average stockholders' equity 1 (excl. minority interests) - intangible assets | |
| Underlying RoTE | | Underlying attributable profit to the parent | | This indicator measures the profitability of the tangible equity of a company arising from ordinary activities, i.e. excluding items outside the ordinary performance of our business. |
| | Average stockholders' equity 1 (excl. minority interests) - intangible assets | |
| RoA | | Consolidated profit | | This metric measures the profitability of a company as a percentage of its total assets. It is an indicator that reflects the efficiency of the company's total funds in generating profit. |
| (Return on assets) | | Average total assets | |
| Underlying RoA | | Underlying consolidated profit | | This metric measures the profitability of a company as a percentage of its total assets, excluding non-recurring results. It is an indicator that reflects the efficiency of the company's total funds in generating underlying profit. |
| | Average total assets | |
| RoRWA | | Consolidated profit | | The return adjusted for risk is a derivative of the RoA metric. The difference is that RoRWA measures profit in relation to the bank's risk-weighted assets. |
| (Return on risk weighted assets) | | Average risk-weighted assets | |
| Underlying RoRWA | | Underlying consolidated profit | | This relates the consolidated profit (excluding items outside the ordinary performance of our business) to the bank's risk-weighted assets. |
| | Average risk-weighted assets | |
| Efficiency ratio | | Operating expenses 3 | | One of the most commonly used indicators when comparing productivity of different financial entities. It measures the amount of funds used to generate the bank's total income. |
| | Total income | |
1. Stockholders’ equity = Capital and Reserves + Accumulated other comprehensive income + Attributable profit to the parent + Dividends.
2. Excluding the adjustment to the valuation of goodwill.
3. Operating expenses = Administrative expenses + amortizations.
| | | | | | | | | | | | | | | | | | | | | | | | | | |
| |
| |
| | | |
|
| | | | | | | | Alternative performance measures |
| | | | | | | | | | | | | | |
Profitability and efficiency (1) (2) (3) (4) | Q2'22 | Q1'22 | H1'22 | H1'21 |
| RoE | 10.44 | % | 11.49 | % | 10.98 | % | 9.53 | % |
| Attributable profit to the parent | 9,404 | 10,173 | 9,789 | 7,880 |
| Average stockholders' equity (excluding minority interests) | 90,035 | 88,532 | 89,125 | 82,669 |
| | | | |
| Underlying RoE | 10.44 | % | 11.49 | % | 10.98 | % | 10.17 | % |
| Attributable profit to the parent | 9,404 | 10,173 | 9,789 | 7,880 |
| (-) Net capital gains and provisions | — | — | — | -530 |
| Underlying attributable profit to the parent | 9,404 | 10,173 | 9,789 | 8,410 |
| Average stockholders' equity (excluding minority interests) | 90,035 | 88,532 | 89,125 | 82,669 |
| | | | |
| RoTE | 13.10 | % | 14.21 | % | 13.69 | % | 11.82 | % |
| Attributable profit to the parent | 9,404 | 10,173 | 9,789 | 7,880 |
| (+) Goodwill impairment | — | — | — | — |
| Attributable profit to the parent (excluding goodwill impairment) | 9,404 | 10,173 | 9,789 | 7,880 |
| Average stockholders' equity (excluding minority interests) | 90,035 | 88,532 | 89,125 | 82,669 |
| (-) Average intangible assets | 18,255 | 16,959 | 17,630 | 16,015 |
| Average stockholders' equity (excl. minority interests) - intangible assets | 71,780 | 71,573 | 71,495 | 66,654 |
| | | | |
| Underlying RoTE | 13.10 | % | 14.21 | % | 13.69 | % | 12.62 | % |
| Attributable profit to the parent | 9,404 | 10,173 | 9,789 | 7,880 |
| (-) Net capital gains and provisions | — | — | — | -530 |
| Underlying attributable profit to the parent | 9,404 | 10,173 | 9,789 | 8,410 |
| Average stockholders' equity (excl. minority interests) - intangible assets | 71,780 | 71,573 | 71,495 | 66,654 |
| | | | |
| RoA | 0.63 | % | 0.71 | % | 0.66 | % | 0.61 | % |
| Consolidated profit | 10,688 | 11,476 | 11,082 | 9,410 |
| Average total assets | 1,707,903 | 1,624,930 | 1,666,474 | 1,539,167 |
| | | | |
| Underlying RoA | 0.63 | % | 0.71 | % | 0.66 | % | 0.65 | % |
| Consolidated profit | 10,688 | 11,476 | 11,082 | 9,410 |
| (-) Net capital gains and provisions | — | — | — | -530 |
| Underlying consolidated profit | 10,688 | 11,476 | 11,082 | 9,940 |
| Average total assets | 1,707,903 | 1,624,930 | 1,666,474 | 1,539,167 |
| | | | |
| RoRWA | 1.76 | % | 1.95 | % | 1.86 | % | 1.66 | % |
| Consolidated profit | 10,688 | 11,476 | 11,082 | 9,410 |
| Average risk weighted-assets | 606,154 | 588,776 | 597,276 | 567,231 |
| | | | |
| Underlying RoRWA | 1.76 | % | 1.95 | % | 1.86 | % | 1.75 | % |
| Consolidated profit | 10,688 | 11,476 | 11,082 | 9,410 |
| (-) Net capital gains and provisions | — | — | — | -530 |
| Underlying consolidated profit | 10,688 | 11,476 | 11,082 | 9,940 |
| Average risk-weighted assets | 606,154 | 588,776 | 597,276 | 567,231 |
| | | | |
| Efficiency ratio | 46.0 | % | 45.0 | % | 45.5 | % | 45.7 | % |
| Underlying operating expenses | 5,900 | 5,535 | 11,435 | 10,377 |
| Operating expenses | 5,900 | 5,535 | 11,435 | 10,377 |
| Net capital gains and provisions impact in operating expenses | — | — | — | — |
| Underlying total income | 12,815 | 12,305 | 25,120 | 22,695 |
| Total income | 12,815 | 12,305 | 25,120 | 22,695 |
| Net capital gains and provisions impact on total income | — | — | — | — |
| (1) Averages included in the RoE, RoTE, RoA and RoRWA denominators are calculated using 4 months' worth of data in the case of quarterly figures (from March to June in Q2 and December to March in Q1) and 7 months in the case of annual figures (from December to June). |
| (2) For periods less than one year, and if there are results in the net capital gains and provisions line, the profit used to calculate RoE and RoTE is the annualized underlying attributable profit to which said results are added without annualizing. |
| (3) For periods less than one year, and if there are results in the net capital gains and provisions line, the profit used to calculate RoA and RoRWA is the annualized underlying consolidated profit, to which said results are added without annualizing. |
| (4) The risk weighted assets included in the denominator of the RoRWA metric are calculated in line with the criteria laid out in the CRR (Capital Requirements Regulation). |
| | | | | | | | | | | | | | | | | | | | | | | | | | |
| |
| |
| | | |
|
| | | | | | | | Alternative performance measures |
| | | | | | | | | | | | | | | | | | | | |
| Efficiency ratio | | | | | |
| H1'22 | H1'21 |
| % | Total income | Operating expenses | % | Total income | Operating expenses |
| Europe | 48.5 | | 8,581 | | 4,164 | | 52.4 | | 7,903 | | 4,143 | |
| Spain | 49.4 | | 3,937 | | 1,943 | | 52.0 | | 3,901 | | 2,027 | |
| United Kingdom | 51.2 | | 2,633 | | 1,348 | | 56.5 | | 2,298 | | 1,299 | |
| Portugal | 40.9 | | 613 | | 251 | | 40.4 | | 715 | | 289 | |
| Poland | 31.1 | | 1,090 | | 339 | | 42.3 | | 759 | | 321 | |
| North America | 46.6 | | 5,780 | | 2,692 | | 43.2 | | 5,421 | | 2,343 | |
| US | 45.9 | | 3,665 | | 1,682 | | 41.6 | | 3,684 | | 1,531 | |
| Mexico | 44.4 | | 2,096 | | 930 | | 43.5 | | 1,730 | | 752 | |
| South America | 35.3 | | 8,933 | | 3,153 | | 34.5 | | 7,303 | | 2,518 | |
| Brazil | 30.5 | | 6,393 | | 1,951 | | 28.9 | | 5,199 | | 1,502 | |
| Chile | 36.0 | | 1,357 | | 489 | | 38.5 | | 1,251 | | 481 | |
| Argentina | 58.0 | | 821 | | 477 | | 62.3 | | 561 | | 349 | |
| Digital Consumer Bank | 48.5 | | 2,573 | | 1,248 | | 48.8 | | 2,486 | | 1,214 | |
| | | | | | | | | | | | | | | | | | | | |
| Underlying RoTE | | | | | |
| H1'22 | H1'21 |
| % | Underlying profit attributable to the parent | Average stockholders' equity (excl. minority interests) - intangible assets | % | Underlying profit attributable to the parent | Average stockholders' equity (excl. minority interests) - intangible assets |
| Europe | 8.80 | | 3,677 | | 41,777 | | 6.68 | | 2,623 | | 39,298 | |
| Spain | 6.62 | | 1,305 | | 19,711 | | 3.91 | | 701 | | 17,912 | |
| United Kingdom | 10.78 | | 1,472 | | 13,649 | | 10.40 | | 1,353 | | 13,011 | |
| Portugal | 11.73 | | 451 | | 3,842 | | 11.44 | | 458 | | 4,004 | |
| Poland | 13.70 | | 415 | | 3,027 | | 2.71 | | 88 | | 3,253 | |
| North America | 12.17 | | 3,156 | | 25,935 | | 14.25 | | 3,162 | | 22,199 | |
| US | 11.50 | | 2,180 | | 18,952 | | 15.46 | | 2,506 | | 16,216 | |
| Mexico | 15.81 | | 1,092 | | 6,904 | | 13.02 | | 755 | | 5,803 | |
| South America | 20.80 | | 3,891 | | 18,712 | | 20.22 | | 3,278 | | 16,210 | |
| Brazil | 21.46 | | 2,730 | | 12,719 | | 22.07 | | 2,355 | | 10,669 | |
| Chile | 22.74 | | 783 | | 3,443 | | 18.60 | | 641 | | 3,447 | |
| Argentina | 20.93 | | 291 | | 1,389 | | 23.60 | | 212 | | 898 | |
| Digital Consumer Bank | 11.99 | | 1,144 | | 9,538 | | 10.34 | | 970 | | 9,381 | |
| | | | | | | | | | | | | | | | | | | | | | | | | | |
| |
| |
| | | |
|
| | | | | | | | Alternative performance measures |
Credit risk indicators
The credit risk indicators measure the quality of the credit portfolio and the percentage of non-performing loans covered by provisions.
| | | | | | | | | | | | | | |
| Ratio | | Formula | | Relevance of the metric |
NPL ratio (Non-performing loans) | | Credit impaired loans and advances to customers, customer guarantees and customer commitments granted | | The NPL ratio is an important variable regarding financial institutions' activity since it gives an indication of the level of risk the entities are exposed to. It calculates risks that are, in accounting terms, declared to be credit impaired as a percentage of the total outstanding amount of customer credit and contingent liabilities. |
| | Total Risk 1 | |
| | | | |
| Total coverage ratio | | Total allowances to cover impairment losses on loans and advances to customers, customer guarantees and customer commitments granted | | The total coverage ratio is a fundamental metric in the financial sector. It reflects the level of provisions as a percentage of the credit impaired assets. Therefore it is a good indicator of the entity's solvency against client defaults both present and future. |
| | Credit impaired loans and advances to customers, customer guarantees and customer commitments granted | |
| | | | |
| Cost of risk | | Allowances for loan-loss provisions over the last 12 months | | This ratio quantifies loan-loss provisions arising from credit risk over a defined period of time for a given loan portfolio. As such, it acts as an indicator of credit quality. |
| | Average loans and advances to customers over the last 12 months | |
(1) Total risk = Total loans and advances and guarantees to customers (including credit impaired assets) + contingent liabilities granted that are credit impaired
| | | | | | | | | | | | | | |
| Credit risk (I) | Jun-22 | Mar-22 | Jun-22 | Jun-21 |
| NPL ratio | 3.05 | % | 3.26 | % | 3.05 | % | 3.22 | % |
| Credit impaired loans and advances to customers, customer guarantees and customer commitments granted | 34,259 | 35,670 | 34,259 | 33,266 |
| Gross loans and advances to customers registered under the headings “financial assets measured at amortized cost” and "financial assets designated at fair value through profit or loss" classified in stage 3 (OCI), excluding POCI (Purchased or Originated Credit Impaired) that is currently impaired | 32,100 | 33,447 | 32,100 | 31,705 |
| POCI exposure (Purchased or Originated Credit Impaired) that is currently impaired | 303 | 334 | 303 | 431 |
| Customer guarantees and customer commitments granted classified in stage 3 | 1,846 | 1,879 | 1,846 | 1,122 |
| Doubtful exposure of loans and advances to customers at fair value through profit or loss | 10 | 10 | 10 | 8 |
| Total risk | 1,121,726 | 1,093,023 | 1,121,726 | 1,032,084 |
| Impaired and non-impaired gross loans and advances to customers | 1,061,172 | 1,035,523 | 1,061,172 | 978,096 |
| Impaired and non-impaired customer guarantees and customer commitments granted | 60,554 | 57,500 | 60,554 | 53,988 |
| | | | |
| | | | | | | | | | | | | | | | | | | | | | | | | | |
| |
| |
| | | |
|
| | | | | | | | Alternative performance measures |
| | | | | | | | | | | | | | |
| Credit risk (II) | Jun-22 | Mar-22 | Jun-22 | Jun-21 |
| Total coverage ratio | 71 | % | 69 | % | 71 | % | 73 | % |
| Total allowances to cover impairment losses on loans and advances to customers, customer guarantees and customer commitments granted | 24,195 | 24,778 | 24,195 | 24,239 |
| Total allowances to cover impairment losses on loans and advances to customers measured at amortized cost and designated at fair value through OCI | 23,452 | 24,025 | 23,452 | 23,577 |
| Total allowances to cover impairment losses on customer guarantees and customer commitments granted | 743 | 753 | 743 | 662 |
| Credit impaired loans and advances to customers, customer guarantees and customer commitments granted | 34,259 | 35,670 | 34,259 | 33,266 |
| Gross loans and advances to customers registered under the headings “financial assets measured at amortized cost” and "financial assets designated at fair value through profit or loss" classified in stage 3 (OCI), excluding POCI (Purchased or Originated Credit Impaired) that is currently impaired | 32,100 | 33,447 | 32,100 | 31,705 |
| POCI exposure (Purchased or Originated Credit Impaired) that is currently impaired | 303 | 334 | 303 | 431 |
| Customer guarantees and customer commitments granted classified in stage 3 | 1,846 | 1,879 | 1,846 | 1,122 |
| Doubtful exposure of loans and advances to customers at fair value through profit or loss | 10 | 10 | 10 | 8 |
| | | | |
| Cost of risk | 0.83 | % | 0.77 | % | 0.83 | % | 0.94 | % |
| Underlying allowances for loan-loss provisions over the last 12 months | 8,417 | 7,545 | 8,417 | 8,899 |
| | | | |
| | | | |
| Average loans and advances to customers over the last 12 months | 1,010,282 | 985,401 | 1,010,282 | 948,351 |
| | | | | | | | | | | | | | | | | | | | |
| NPL ratio | | | | | |
| H1'22 | H1'21 |
| % | Credit impaired loans and advances to customers, customer guarantees and customer commitments granted | Total risk | % | Credit impaired loans and advances to customers, customer guarantees and customer commitments granted | Total risk |
| Europe | 2.63 | 17,264 | | 656,029 | | 3.30 | 20,804 | | 629,681 | |
| Spain | 3.83 | 11,565 | | 301,693 | | 5.16 | 14,344 | | 277,793 | |
| United Kingdom | 1.17 | 3,046 | | 261,116 | | 1.30 | 3,424 | | 263,318 | |
| Portugal | 3.33 | 1,410 | | 42,310 | | 3.71 | 1,539 | | 41,517 | |
| Poland | 3.45 | 1,162 | | 33,640 | | 4.58 | 1,496 | | 32,675 | |
| North America | 2.71 | 4,811 | | 177,452 | | 2.28 | 3,149 | | 137,802 | |
| US | 2.64 | 3,551 | | 134,761 | | 2.00 | 2,043 | | 102,175 | |
| Mexico | 2.95 | 1,260 | | 42,646 | | 3.10 | 1,106 | | 35,627 | |
| South America | 5.39 | 8,720 | | 161,884 | | 4.36 | 6,215 | | 142,500 | |
| Brazil | 6.34 | 6,364 | | 100,389 | | 4.55 | 3,920 | | 86,157 | |
| Chile | 4.70 | 2,032 | | 43,271 | | 4.57 | 1,985 | | 43,472 | |
| Argentina | 2.48 | 159 | | 6,422 | | 3.34 | 158 | | 4,728 | |
| Digital Consumer Bank | 2.22 | 2,664 | | 119,753 | | 2.18 | 2,521 | | 115,838 | |
| | | | | | | | | | | | | | | | | | | | | | | | | | |
| |
| |
| | | |
|
| | | | | | | | Alternative performance measures |
| | | | | | | | | | | | | | | | | | | | |
| Total coverage ratio | | | | | |
| H1'22 | H1'21 |
| % | Total allowances to cover impairment losses on loans and advances to customers, customer guarantees and customer commitments granted | Credit impaired loans and advances to customers, customer guarantees and customer commitments granted | % | Total allowances to cover impairment losses on loans and advances to customers, customer guarantees and customer commitments granted | Credit impaired loans and advances to customers, customer guarantees and customer commitments granted |
| Europe | 50.2 | 8,665 | | 17,264 | | 48.4 | 10,061 | | 20,804 | |
| Spain | 49.4 | 5,713 | | 11,565 | | 45.7 | 6,559 | | 14,344 | |
| United Kingdom | 32.9 | 1,004 | | 3,046 | | 37.4 | 1,280 | | 3,424 | |
| Portugal | 74.3 | 1,047 | | 1,410 | | 73.0 | 1,123 | | 1,539 | |
| Poland | 76.0 | 883 | | 1,162 | | 72.4 | 1,084 | | 1,496 | |
| North America | 111.4 | 5,362 | | 4,811 | | 152.3 | 4,796 | | 3,149 | |
| US | 121.0 | 4,298 | | 3,551 | | 185.7 | 3,794 | | 2,043 | |
| Mexico | 84.1 | 1,060 | | 1,260 | | 90.6 | 1,002 | | 1,106 | |
| South America | 86.9 | 7,580 | | 8,720 | | 98.1 | 6,098 | | 6,215 | |
| Brazil | 92.3 | 5,876 | | 6,364 | | 112.3 | 4,403 | | 3,920 | |
| Chile | 60.4 | 1,227 | | 2,032 | | 63.9 | 1,268 | | 1,985 | |
| Argentina | 171.1 | 272 | | 159 | | 167.6 | 265 | | 158 | |
| Digital Consumer Bank | 97.4 | 2,596 | | 2,664 | | 111.9 | 2,820 | | 2,521 | |
| | | | | | | | | | | | | | | | | | | | |
| Cost of risk | | | | | |
| H1'22 | H1'21 |
| % | Underlying allowances for loan-loss provisions over the last 12 months | Average loans and advances to customers over the last 12 months | % | Underlying allowances for loan-loss provisions over the last 12 months | Average loans and advances to customers over the last 12 months |
| Europe | 0.37 | 2,237 | | 604,293 | | 0.49 | 2,865 | | 581,334 | |
| Spain | 0.79 | 2,043 | | 259,039 | | 0.91 | 2,246 | | 247,145 | |
| United Kingdom | -0.02 | -52 | | 249,120 | | 0.09 | 208 | | 243,289 | |
| Portugal | -0.05 | -21 | | 40,194 | | 0.41 | 158 | | 39,035 | |
| Poland | 0.95 | 288 | | 30,398 | | 0.88 | 259 | | 29,529 | |
| North America | 1.09 | 1,584 | | 145,667 | | 1.67 | 2,136 | | 127,577 | |
| US | 0.78 | 856 | | 110,316 | | 1.34 | 1,289 | | 96,047 | |
| Mexico | 2.05 | 726 | | 35,430 | | 2.74 | 847 | | 30,929 | |
| South America | 2.97 | 4,092 | | 137,575 | | 2.51 | 2,981 | | 118,697 | |
| Brazil | 4.26 | 3,507 | | 82,420 | | 3.51 | 2,331 | | 66,377 | |
| Chile | 0.89 | 364 | | 41,056 | | 1.07 | 430 | | 40,092 | |
| Argentina | 3.07 | 164 | | 5,324 | | 3.94 | 142 | | 3,614 | |
| Digital Consumer Bank | 0.44 | 506 | | 116,090 | | 0.64 | 735 | | 114,798 | |
| | | | | | | | | | | | | | | | | | | | | | | | | | |
| |
| |
| | | |
|
| | | | | | | | Alternative performance measures |
Other indicators
The market capitalization indicator provides information on the volume of tangible equity per share. The loan-to-deposit ratio (LTD) identifies the relationship between net customer loans and advances and customer deposits, assessing the proportion of loans and advances granted by the Group that are funded by customer deposits.
The Group also uses gross customer loan magnitudes excluding reverse repurchase agreements (repos) and customer deposits excluding repos. In order to analyse the evolution of the traditional commercial banking business of granting loans and capturing deposits, repos and reverse repos are excluded, as they are mainly treasury business products and highly volatile.
| | | | | | | | | | | | | | |
| Ratio | | Formula | | Relevance of the metric |
| TNAV per share | | Tangible book value 1 | | This is a very commonly used ratio used to measure the company's accounting value per share having deducted the intangible assets. It is useful in evaluating the amount each shareholder would receive if the company were to enter into liquidation and had to sell all the company's tangible assets. |
| (Tangible equity net asset value per share) | | Number of shares excluding treasury stock | |
| | | | |
| Price / tangible book value per share (X) | | Share price | | This is one of the most commonly used ratios by market participants for the valuation of listed companies both in absolute terms and relative to other entities. This ratio measures the relationship between the price paid for a company and its accounting equity value. |
| | TNAV per share | |
| | | | |
| LTD ratio | | Net loans and advances to customers | | This is an indicator of the bank's liquidity. It measures the total (net) loans and advances to customers as a percentage of customer deposits. |
| (Loan-to-deposit) | | Customer deposits | |
| | | | |
| Loans and advances (excl. reverse repos) | | Gross loans and advances to customers excluding reverse repos | | In order to aid analysis of the commercial banking activity, reverse repos are excluded as they are highly volatile treasury products. |
| | | | |
| Deposits (excl. repos) | | Customer deposits excluding repos | | In order to aid analysis of the commercial banking activity, repos are excluded as they are highly volatile treasury products. |
| | | | |
| PAT + After tax fees paid to SAN (in Wealth Management & Insurance) | | Net profit + fees paid from Santander Asset Management and Santander Insurance to Santander, net of taxes, excluding Private Banking customers | | Metric to assess Wealth Management & Insurance's total contribution to Grupo Santander profit. |
(1) Tangible book value = Stockholders' equity - intangible assets
| | | | | | | | | | | | | | |
| Others | Jun-22 | Mar-22 | Jun-22 | Jun-21 |
| TNAV (tangible book value) per share | 4.24 | 4.29 | 4.24 | 3.98 |
| Tangible book value | 71,162 | 72,940 | 71,162 | 68,917 |
| Number of shares excl. treasury stock (million) | 16,791 | 17,008 | 16,791 | 17,306 |
| | | | |
| Price / Tangible book value per share (X) | 0.63 | 0.72 | 0.63 | 0.81 |
| Share price (euros) | 2.688 | 3.100 | 2.688 | 3.220 |
| TNAV (tangible book value) per share | 4.24 | 4.29 | 4.24 | 3.98 |
| | | | |
| Loan-to-deposit ratio | 107 | % | 106 | % | 107 | % | 107 | % |
| Net loans and advances to customers | 1,037,721 | 1,011,497 | 1,037,721 | 954,518 |
| Customer deposits | 973,787 | 957,820 | 973,787 | 894,127 |
| | | | |
| Q2'22 | Q1'22 | H1'22 | H1'21 |
| PAT + After tax fees paid to SAN (in WM&I) (Constant EUR million) | 662 | 614 | 1,276 | 1,177 |
| Profit after tax | 282 | 264 | 546 | 471 |
| Net fee income net of tax | 380 | 350 | 730 | 706 |
| | | | | | | | | | | | | | | | | | | | | | | | | | |
| |
| |
| | | |
|
| | | | | | | | Alternative performance measures |
Local currency measures
We make use of certain financial measures in local currency to help in the assessment of our ongoing operating performance. These non-IFRS financial measures include the results of operations of our subsidiary banks located outside the Eurozone, excluding the impact of foreign exchange. Because changes in foreign currency exchange rates do not have an operating impact on the results, we believe that evaluating their performance on a local currency basis provides an additional and meaningful assessment of performance to both management and the company’s investors.
The Group presents, at both the Group level as well as the business unit level, the real changes in the income statement as well as the changes excluding the exchange rate effect, as it considers the latter facilitates analysis, since it enables businesses movements to be identified without taking into account the impact of converting each local currency into euros.
Said variations, excluding the impact of exchange rate movements, are calculated by converting P&L lines for the different business units comprising the Group into our presentation currency, the euro, applying the average exchange rate for the first half of 2022 to all periods contemplated in the analysis.
The Group presents, at both the Group level as well as the business unit level, the changes in euros in the balance sheet as well as the changes excluding the exchange rate effect for loans and advances to customers excluding reverse repos and customer funds (which comprise deposits and mutual funds) excluding repos. As with the income statement, the reason is to facilitate analysis by isolating the changes in the balance sheet that are not caused by converting each local currency into euros.
These changes excluding the impact of exchange rate movements are calculated by converting loans and advances to customers excluding reverse repos and customer funds excluding repos, into our presentation currency, the euro, applying the closing exchange rate on the last working day of June 2022 to all periods contemplated in the analysis.
The average and period-end exchange rates for the main currencies in which the Group operates are set out in the table below.
| | | | | | | | | | | | | | | | | | | | |
| Exchange rates: 1 euro / currency parity | | | | |
| | | | | | |
| Average (income statement) | | Period-end (balance sheet) |
| H1'22 | H1'21 | | Jun-22 | Mar-22 | Jun-21 |
| US dollar | 1.092 | | 1.205 | | | 1.045 | | 1.111 | | 1.186 | |
| Pound sterling | 0.842 | | 0.868 | | | 0.860 | | 0.845 | | 0.858 | |
| Brazilian real | 5.527 | | 6.480 | | | 5.473 | | 5.280 | | 5.941 | |
| Mexican peso | 22.142 | | 24.316 | | | 21.073 | | 22.157 | | 23.587 | |
| Chilean peso | 902.582 | | 868.037 | | | 979.495 | | 874.158 | | 863.161 | |
| Argentine peso | 122.552 | | 110.020 | | | 130.825 | | 123.315 | | 113.539 | |
| Polish zloty | 4.634 | | 4.537 | | | 4.702 | | 4.644 | | 4.519 | |
| | | | | | | | | | | | | | | | | | | | | | | | | | |
| |
| |
| | | |
|
| | | | | | | | Condensed consolidated financial statements |
| | | | | | | | |
| INTERIM CONDENSED CONSOLIDATED FINANCIAL STATEMENTS |
|
•CONSOLIDATED BALANCE SHEET
•CONSOLIDATED INCOME STATEMENT
NOTE: The following financial information for the first six months of 2022 and 2021 (attached herewith) corresponds to the condensed consolidated financial statements prepared in accordance with the International Financial Reporting Standards.
| | | | | | | | | | | | |
| Interim condensed consolidated balance sheet |
| EUR million | | | | |
| | | | |
| ASSETS | Jun-22 | Dec-21 | Jun-21 | |
| Cash, cash balances at central banks and other deposits on demand | 211,276 | | 210,689 | | 183,091 | | |
| Financial assets held for trading | 163,235 | | 116,953 | | 102,792 | | |
| Non-trading financial assets mandatorily at fair value through profit or loss | 5,845 | | 5,536 | | 4,838 | | |
| Financial assets designated at fair value through profit or loss | 11,025 | | 15,957 | | 56,486 | | |
| Financial assets at fair value through other comprehensive income | 91,998 | | 108,038 | | 114,505 | | |
| Financial assets at amortized cost | 1,129,690 | | 1,037,898 | | 1,003,417 | | |
| Hedging derivatives | 6,735 | | 4,761 | | 5,430 | | |
| Changes in the fair value of hedged items in portfolio hedges of interest risk | (1,769) | | 410 | | 1,434 | | |
| Investments | 7,665 | | 7,525 | | 7,562 | | |
| Joint ventures entities | 1,971 | | 1,692 | | 1,620 | | |
| Associated entities | 5,694 | | 5,833 | | 5,942 | | |
| Assets under insurance or reinsurance contracts | 310 | | 283 | | 276 | | |
| Tangible assets | 34,640 | | 33,321 | | 32,678 | | |
| Property, plant and equipment | 33,621 | | 32,342 | | 31,712 | | |
| For own-use | 13,513 | | 13,259 | | 12,921 | | |
| Leased out under an operating lease | 20,108 | | 19,083 | | 18,791 | | |
| Investment property | 1,019 | | 979 | | 966 | | |
| Of which : Leased out under an operating lease | 838 | | 839 | | 863 | | |
| Intangible assets | 18,349 | | 16,584 | | 16,454 | | |
| Goodwill | 13,877 | | 12,713 | | 12,854 | | |
| Other intangible assets | 4,472 | | 3,871 | | 3,600 | | |
| Tax assets | 29,025 | | 25,196 | | 24,707 | | |
| Current tax assets | 8,293 | | 5,756 | | 4,956 | | |
| Deferred tax assets | 20,732 | | 19,440 | | 19,751 | | |
| Other assets | 10,981 | | 8,595 | | 9,889 | | |
| Insurance contracts linked to pensions | 128 | | 149 | | 162 | | |
| Inventories | 7 | | 6 | | 5 | | |
| Other | 10,846 | | 8,440 | | 9,722 | | |
| Non-current assets held for sale | 3,835 | | 4,089 | | 5,077 | | |
| TOTAL ASSETS | 1,722,840 | | 1,595,835 | | 1,568,636 | | |
| | | | |
| | | | | | | | | | | | | | | | | | | | | | | | | | |
| |
| |
| | | |
|
| | | | | | | | Condensed consolidated financial statements |
| | | | | | | | | | | | |
| Interim condensed consolidated balance sheet | | |
| EUR million | | | | |
| | | | |
| LIABILITIES | Jun-22 | Dec-21 | Jun-21 | |
| Financial liabilities held for trading | 114,406 | | 79,469 | | 68,982 | | |
| Financial liabilities designated at fair value through profit or loss | 40,823 | | 32,733 | | 54,131 | | |
| Financial liabilities at amortized cost | 1,427,721 | | 1,349,169 | | 1,310,433 | | |
| Hedging derivatives | 9,269 | | 5,463 | | 6,573 | | |
| Changes in the fair value of hedged items in portfolio hedges of interest rate risk | (94) | | 248 | | 427 | | |
| Liabilities under insurance or reinsurance contracts | 858 | | 770 | | 1,014 | | |
| Provisions | 8,590 | | 9,583 | | 10,400 | | |
| Pensions and other post-retirement obligations | 2,525 | | 3,185 | | 3,454 | | |
| Other long term employee benefits | 1,071 | | 1,242 | | 1,407 | | |
| Taxes and other legal contingencies | 2,242 | | 1,996 | | 2,169 | | |
| Contingent liabilities and commitments | 743 | | 733 | | 661 | | |
| Other provisions | 2,009 | | 2,427 | | 2,709 | | |
| Tax liabilities | 10,085 | | 8,649 | | 9,154 | | |
| Current tax liabilities | 2,853 | | 2,187 | | 2,711 | | |
| Deferred tax liabilities | 7,232 | | 6,462 | | 6,443 | | |
| Other liabilities | 13,720 | | 12,698 | | 11,777 | | |
| Liabilities associated with non-current assets held for sale | — | | — | | — | | |
| TOTAL LIABILITIES | 1,625,378 | | 1,498,782 | | 1,472,891 | | |
| | | | |
| EQUITY | | | | |
| Shareholders' equity | 122,037 | | 119,649 | | 117,552 | | |
| Capital | 8,397 | | 8,670 | | 8,670 | | |
| Called up paid capital | 8,397 | | 8,670 | | 8,670 | | |
| Unpaid capital which has been called up | — | | — | | — | | |
| Share premium | 46,273 | | 47,979 | | 47,979 | | |
| Equity instruments issued other than capital | 672 | | 658 | | 641 | | |
| Equity component of the compound financial instrument | — | | — | | — | | |
| Other equity instruments issued | 672 | | 658 | | 641 | | |
| Other equity | 151 | | 152 | | 165 | | |
| Accumulated retained earnings | 66,698 | | 60,273 | | 60,280 | | |
| Revaluation reserves | — | | — | | — | | |
| Other reserves | (5,038) | | (4,477) | | (3,762) | | |
| (-) Own shares | (10) | | (894) | | (96) | | |
| Profit attributable to shareholders of the parent | 4,894 | | 8,124 | | 3,675 | | |
| (-) Interim dividends | — | | (836) | | — | | |
| Other comprehensive income (loss) | (32,526) | | (32,719) | | (32,181) | | |
| Items not reclassified to profit or loss | (3,809) | | (4,241) | | (4,962) | | |
| Items that may be reclassified to profit or loss | (28,717) | | (28,478) | | (27,219) | | |
| Non-controlling interest | 7,951 | | 10,123 | | 10,374 | | |
| Other comprehensive income | (2,090) | | (2,104) | | (1,817) | | |
| Other items | 10,041 | | 12,227 | | 12,191 | | |
| TOTAL EQUITY | 97,462 | | 97,053 | | 95,745 | | |
| TOTAL LIABILITIES AND EQUITY | 1,722,840 | | 1,595,835 | | 1,568,636 | | |
| | | | |
| MEMORANDUM ITEMS: OFF BALANCE SHEET AMOUNTS | | | | |
| Loan commitments granted | 275,865 | | 262,737 | | 247,154 | | |
| Financial guarantees granted | 12,881 | | 10,758 | | 12,121 | | |
| Other commitments granted | 91,195 | | 75,733 | | 81,277 | | |
| | | | | | | | | | | | | | | | | | | | | | | | | | |
| |
| |
| | | |
|
| | | | | | | | Condensed consolidated financial statements |
| | | | | | | | |
| Interim condensed consolidated income statement |
| EUR million | | |
| | |
| H1'22 | H1'21 |
| Interest income | 30,869 | | 21,933 | |
| Financial assets at fair value through other comprehensive income | 2,211 | | 1,292 | |
| Financial assets at amortized cost | 26,073 | | 19,149 | |
| Other interest income | 2,585 | | 1,492 | |
| Interest expense | (12,460) | | (5,737) | |
| Interest income/ (charges) | 18,409 | | 16,196 | |
| Dividend income | 335 | | 309 | |
| Income from companies accounted for using the equity method | 312 | | 163 | |
| Commission income | 7,792 | | 6,676 | |
| Commission expense | (1,940) | | (1,507) | |
| Gain or losses on financial assets and liabilities not measured at fair value through profit or loss, net | 233 | | 344 | |
| Financial assets at amortized cost | 28 | | 77 | |
| Other financial assets and liabilities | 205 | | 267 | |
| Gain or losses on financial assets and liabilities held for trading, net | 718 | | 347 | |
| Reclassification of financial assets at fair value through other comprehensive income | — | | — | |
| Reclassification of financial assets from amortized cost | — | | — | |
| Other gains (losses) | 718 | | 347 | |
Gains or losses on non-trading financial assets and liabilities mandatorily at fair value
through profit or loss | (15) | | 10 | |
| Reclassification of financial assets at fair value through other comprehensive income | — | | — | |
| Reclassification of financial assets from amortized cost | — | | — | |
| Other gains (losses) | (15) | | 10 | |
| Gain or losses on financial assets and liabilities measured at fair value through profit or loss, net | 756 | | 221 | |
| Gain or losses from hedge accounting, net | 128 | | 57 | |
| Exchange differences, net | (1,077) | | (85) | |
| Other operating income | 819 | | 1,167 | |
| Other operating expenses | (1,461) | | (1,289) | |
| Income from assets under insurance and reinsurance contracts | 1,349 | | 769 | |
| Expenses from liabilities under insurance and reinsurance contracts | (1,238) | | (683) | |
| Total income | 25,120 | | 22,695 | |
| Administrative expenses | (9,993) | | (8,996) | |
| Staff costs | (5,948) | | (5,438) | |
| Other general and administrative expenses | (4,045) | | (3,558) | |
| Depreciation and amortization | (1,442) | | (1,381) | |
| Provisions or reversal of provisions, net | (935) | | (1,490) | |
Impairment or reversal of impairment of financial assets not measured at fair value
through profit or loss and net gains and losses from changes | (4,763) | | (3,804) | |
| Financial assets at fair value through other comprehensive income | (1) | | (19) | |
| Financial assets at amortized cost | (4,762) | | (3,785) | |
| Impairment of investments in subsidiaries, joint ventures and associates, net | — | | — | |
| Impairment on non-financial assets, net | (61) | | (130) | |
| Tangible assets | (24) | | (125) | |
| Intangible assets | (29) | | (3) | |
| Others | (8) | | (2) | |
| Gain or losses on non-financial assets and investments, net | (4) | | 52 | |
| Negative goodwill recognized in results | — | | — | |
| Gains or losses on non-current assets held for sale not classified as discontinued operations | (7) | | (32) | |
| Operating profit/(loss) before tax | 7,915 | | 6,914 | |
| Tax expense or income from continuing operations | (2,374) | | (2,474) | |
| Profit/(loss) for the period from continuing operations | 5,541 | | 4,440 | |
| Profit/( loss) after tax from discontinued operations | — | | — | |
| Profit/(loss) for the period | 5,541 | | 4,440 | |
| Profit attributable to non-controlling interests | 647 | | 765 | |
| Profit/(loss) attributable to the parent | 4,894 | | 3,675 | |
| | |
| Earnings/(losses) per share | | |
| Basic | 0.27 | | 0.20 | |
| Diluted | 0.27 | | 0.20 | |
•Active customer: Those customers who comply with the minimum balance, income and/or transactionality requirements as defined according to the business area
•ADR: American Depositary Receipt
•ALCO: Assets and Liabilities Committee
•APIs: Application Programming Interface
•APM: Alternative Performance Measures
•AuMs: Assets under management
•bn: Billion
•bps: basis points
•CAL: consumer, assets and liabilities
•CDI: CREST Depository Interest
•CET1: Core equity tier 1
•CIB: Corporate & Investment Banking
•CNMV: Spanish National Securities Market Commission (Comisión Nacional del Mercado de Valores)
•DCB: Digital Consumer Bank
•DGF: Deposit guarantee fund
•Digital customers: Every consumer of a commercial bank’s services who has logged on to their personal online banking and/or mobile banking in the last 30 days
•EBA: European Banking Authority
•ECB: European Central Bank
•EPS: Earnings per share
•ESG: Environmental, Social and Governance
•ESMA: European Securities and Markets Authority
•Fed: Federal Reserve
•Financially empowered people: People (unbanked, underbanked or financially vulnerable), who are given access to the financial system, receive tailored finance and increase their knowledge and resilience through financial education.
•FX: Foreign Exchange
•GDP: Gross Domestic Product
•ICO: Insitituto de Crédito Oficial (Official Credit Institution)
•IFRS 9: International Financial Reporting Standard 9, regarding financial instruments
•IMF: International Monetary Fund
•IPO: Initial Public Offering
•LCR: Liquidity Coverage Ratio
•LLPs: Loan-loss provisions
•Loyal customers: Active customers who receive most of their financial services from the Group according to the commercial segment that they belong to. Various engaged customer levels have been defined taking profitability into account.
•MDA: Maximum Distribution Amount
•mn: Million
•NII: Net Interest Income
•NPLs: Non-performing loans
•NPS: Net Promoter Score
•PBT: Profit before tax
•POS: Point of Sale
•pp: percentage points
•PPI: Payment protection insurance
•QoQ: Quarter-on- quarter
•Repos: Repurchase agreements
•RoA: Return on assets
•RoE: Return on equity
•RoRWA: Return on risk weighted assets
•RoTE: Return on tangible equity
•RWAs: Risk weighted assets
•SAM: Santander Asset Management
•SBNA: Santander Bank N.A.
•SCF: Santander Consumer Finance
•SCIB: Santander Corporate & Investment Banking
•SC USA: Santander Consumer USA
•SEC: Securities and Exchanges Commission
•SH USA: Santander Holdings USA, Inc.
•SMEs: Small and medium enterprises
•SRF: Single resolution fund
•TLAC: The total loss-absorption capacity requirement which is required to be met under the CRD V package
•TLTRO: Targeted longer-term refinancing operations
•TNAV: Tangible net asset value
•VaR: Value at Risk
•WM&I: Wealth Management & Insurance
•YoY: Year-on- year
Non-IFRS and alternative performance measures
This report contains, in addition to the financial information prepared in accordance with International Financial Reporting Standards (“IFRS”) and derived from our financial statements, alternative performance measures (“APMs”) as defined in the Guidelines on Alternative Performance Measures issued by the European Securities and Markets Authority (ESMA) on 5 October 2015 (ESMA/2015/1415en) and other non-IFRS measures (“Non-IFRS Measures”). These financial measures that qualify as APMs and non-IFRS measures have been calculated with information from Santander Group; however those financial measures are not defined or detailed in the applicable financial reporting framework nor have been audited or reviewed by our auditors. We use these APMs and non-IFRS measures when planning, monitoring and evaluating our performance. We consider these APMs and non-IFRS measures to be useful metrics for our management and investors to compare operating performance between accounting periods, as these measures exclude items outside the ordinary course performance of our business, which are grouped in the “management adjustment” line and are further detailed in Section 3.2 of the Economic and Financial Review in our Directors’ Report included in our Annual Report on Form 20-F for the year ended 31 December 2021. Nonetheless, these APMs and non-IFRS measures should be considered supplemental information to, and are not meant to substitute IFRS measures. Furthermore, companies in our industry and others may calculate or use APMs and non-IFRS measures differently, thus making them less useful for comparison purposes. For further details on APMs and Non-IFRS Measures, including its definition or a reconciliation between any applicable management indicators and the financial data presented in the consolidated financial statements prepared under IFRS, please see the 2021 Annual Report on Form 20-F filed with the U.S. Securities and Exchange Commission (the “SEC”) on 1 March 2022, as updated by the Form 6-K filed with the SEC on 8 April 2022 in order to reflect our new organizational and reporting structure, as well as the section “Alternative performance measures” of the annex to this Banco Santander, S.A. (“Santander”) Q2 2022 Financial Report, published as Inside Information on 28 July 2022. These documents are available on Santander’s website (www.santander.com). Underlying measures, which are included in this report, are non-IFRS measures.
The businesses included in each of our geographic segments and the accounting principles under which their results are presented here may differ from the included businesses and local applicable accounting principles of our public subsidiaries in such geographies. Accordingly, the results of operations and trends shown for our geographic segments may differ materially from those of such subsidiaries.
Forward-looking statements
Banco Santander, S.A. (“Santander”) advises that this report contains “forward-looking statements” as per the meaning of the U.S. Private Securities Litigation Reform Act of 1995. These statements may be identified by words like “expect”, “project”, “anticipate”, “should”, “intend”, “probability”, “risk”, “VaR”, “RoRAC”, “RoRWA”, “TNAV”, “target”, “goal”, “objective”, “estimate”, “future” and similar expressions. Found throughout this report, they include (but are not limited to) statements on our future business development, economic performance and shareholder remuneration policy. However, a number of risks, uncertainties and other important factors may cause actual developments and results to differ materially from our expectations. The following important factors, in addition to others discussed elsewhere in this report, could affect our future results and could cause materially different outcomes from those anticipated in forward-looking statements: (1) general economic or industry conditions of areas where we have significant operations or investments (such as a worse economic environment; higher volatility in the capital markets; inflation or deflation; changes in demographics, consumer spending, investment or saving habits; and the effects of the war in Ukraine or the COVID-19 pandemic in the global economy); (2) exposure to various market risks (particularly interest rate risk, foreign exchange rate risk, equity price risk and risks associated with the replacement of benchmark indices); (3) potential losses from early repayments on our loan and investment portfolio, declines in value of collateral securing our loan portfolio, and counterparty risk; (4) political stability in Spain, the United Kingdom, other European countries, Latin America and the US (5) changes in legislation, regulations, taxes, including regulatory capital and liquidity requirements, especially in view of the UK exit of the European Union and increased regulation in response to financial crises; (6) our ability to integrate successfully our acquisitions and related challenges that result from the inherent diversion of management’s focus and resources from other strategic opportunities and operational matters; and (7) changes in our access to liquidity and funding on acceptable terms, in particular if resulting from credit spreads shifts or downgrade in credit ratings for the entire Group or significant subsidiaries.
Numerous factors could affect our future results and could cause those results deviating from those anticipated in the forward-looking statements. Other unknown or unpredictable factors could cause actual results to differ materially from those in the forward-looking statements.
Forward-looking statements speak only as of the date of this report and are informed by the knowledge, information and views available on such date. Santander is not required to update or revise any forward-looking statements, regardless of new information, future events or otherwise.
No offer
The information contained in this report is subject to, and must be read in conjunction with, all other publicly available information, including, where relevant any fuller disclosure document published by Santander. Any person at any time acquiring securities must do so only on the basis of such person’s own judgment as to the merits or the suitability of the securities for its purpose and only on such information as is contained in such public information having taken all such professional or other advice as it considers necessary or appropriate in the circumstances and not in reliance on the information contained in this report. No investment activity should be undertaken on the basis of the information contained in this report. In making this report available Santander gives no advice and makes no recommendation to buy, sell or otherwise deal in shares in Santander or in any other securities or investments whatsoever.
Neither this report nor any of the information contained therein constitutes an offer to sell or the solicitation of an offer to buy any securities. No offering of securities shall be made in the United States except pursuant to registration under the U.S. Securities Act of 1933, as amended, or an exemption therefrom. Nothing contained in this report is intended to constitute an invitation or inducement to engage in investment activity for the purposes of the prohibition on financial promotion in the U.K. Financial Services and Markets Act 2000.
Historical performance is not indicative of future results
Statements about historical performance or accretion must not be construed to indicate that future performance, share price or results (including earnings per share) in any future period will necessarily match or exceed those of any prior period. Nothing in this report should be taken as a profit forecast.
Third Party Information
In particular, regarding the data provided by third parties, neither Santander, nor any of its administrators, directors or employees, either explicitly or implicitly, guarantees that these contents are exact, accurate, comprehensive or complete, nor are they obliged to keep them updated, nor to correct them in the case that any deficiency, error or omission were to be detected. Moreover, in reproducing these contents in by any means, Santander may introduce any changes it deems suitable, may omit partially or completely any of the elements of this document, and in case of any deviation between such a version and this one, Santander assumes no liability for any discrepancy.
| | |
This document is a translation of a document originally issued in Spanish. Should there be any discrepancies between the English and the Spanish versions, only the original Spanish version should be binding. |
| | | | | | | | | | | | | | | | | | | | | | | | | | |
| |
| |
| | | |
|
| | | | | | | | Main risks and uncertainties |
MAIN RISKS AND UNCERTAINTIES
At the date of preparation of this management report, Grupo Santander considers that the following important factors, in addition to others discussed elsewhere in this report, could affect the Group, its activity, the sector in which it operates or the environment in which it conducts its business, its results, its financial, economic or equity position, or its ability to meet its requirements:
1.General economic or industrial conditions in areas where we have significant operations or investments, such as a worse economic environment; higher volatility in capital markets; inflation, deflation or stagflation; changes in demographics, consumer spending, investment or savings habits; the war in Ukraine which is causing the global economy to deteriorate as a result of international tensions and confrontation; and accelerating protectionism and nationalism in politics globally. In particular, the bank's NPLs may increase as a result of these factors.
2.Exposure to various market risks, particularly interest rate risk, foreign exchange risk, equity price risk and risks associated with the replacement of benchmark indices.
3.Potential losses from early amortization of our loan and investment portfolio, declines in value of collateral securing our loan portfolio, and counterparty risk.
4.Changes in legislation, regulations, taxes, including modifications to capital and liquidity requirements, including those stemming from the UK's exit from the European Union and increased regulation in response to financial crises.
5.Changes in our access to liquidity and funding on acceptable terms, including when resulting from credit spread shifts or credit rating downgrade for the entire Group or significant subsidiaries.
Of note in the Group's main business areas:
Europe: the ongoing conflict in Ukraine and the Russian threat to cut off gas supplies are driving up energy and commodity prices, increasing inflation and reducing GDP growth, causing a slowdown in the post-pandemic economic recovery, especially in southern European countries. Furthermore, we should add the risk in these countries (Greece, Italy, Spain and Portugal) of a rise in risk premiums against benchmark sovereign bonds, such as Germany's, which could lead to financial fragmentation. To deal with both inflation and rising risk premiums, the European Central Bank is taking an increasingly active stance, announcing interest rate hikes and working on the creation of a new tool to prevent such fragmentation.
North America: in the US, soaring inflation and the sharp rise in wages is prompting the Fed to increase interest rates very rapidly this year. Rising prices are also a concern in Mexico, where the central bank is raising the official rate after both headline and core inflation forecasts were revised upwards for 2022.
South America: economic growth is expected to be lower than initially forecasted. Rising commodity prices, which should benefit exporting regions such as South America, are not being fully reflected in growth (largely due to higher energy prices or inputs such as fertilizers). To combat inflation, central banks are tightening monetary policies by increasing interest rates, which is causing the appreciation of their currencies.
Digital Consumer Bank: of concern is the microchip crisis and global supply chain disruptions stemming from the war in Ukraine and China's zero covid-19 policy, which directly impacts auto supply. This, combined with rising fuel prices and inflation, is causing greater uncertainty and reducing customers' disposable income. Households are using debt as a cushion against price rises. The more persistent the inflationary pressures and the higher the rate hikes, the less sustainable the increase in indebtedness and the resilience of consumption will be.
These are not the only risks that the bank may face. Other unknown risks or those not considered relevant at this time, may materialize in the future.
Our geographic and business diversification protects us to some extent from adverse circumstances and enables us to resiliently face them. Although it is difficult to make estimations in the current environment, our strategy and business model are a clear competitive advantage.
| | | | | | | | | | | | | | | | | | | | | | | | | | |
| |
| |
| | | |
|
| | | | | | | | Other disclosures required by the Bank of Spain |
OTHER DISCLOSURES REQUIRED BY THE BANK OF SPAIN
Financing for real estate construction and development
Policies and strategies to manage risks of financing for real estate construction
The policies for managing this portfolio, which are regularly reviewed and approved by the Group's senior management, are currently focused on reducing and consolidating exposure, while also staying attuned to new, viable business opportunities.
In order to manage this credit exposure, the Santander Group creates specialised teams that work not only in the risk areas, but also as a support for the entire life cycle of the operations: commercial management, legal treatment, potential recovery, etc.
Proactive management of these risks has allowed the Group to significantly reduce its exposure, ensuring a granular, regionally-diversified portfolio in which financing for second homes represents a very small portion overall. Mortgage loans for undeveloped land account for only a reduced portion of total land mortgage exposure, as the bulk of these loans relate to developed or developable land.
Exposure to financing of completed residences has been significantly reduced through a number of actions. In tandem with existing specialised sales channels, the Group carried out campaigns supported by specific management teams. In the case of the Santander network, these teams were directly guided by the recovery area. By directly managing loans to property developers and buyers and applying buyer reduction criteria, the Bank was able to subrogate outstanding loans. Subrogating the sale price and adapting financing conditions to borrowers' needs made it possible to diversify risk to a business segment whose NPL ratio is markedly lower.
Loan approval processes are managed by specialised teams working in direct coordination with sales teams, under clearly-defined policies and criteria:
- Property developers must have a strong creditworthiness profile and demonstrable market experience.
- Strict criteria are applied for transaction parameters: financing for the cost of construction only, high percentage of accredited sales, financing for primary residences, etc.
- Support is given for financing state-sponsored housing, with high percentages of accredited sales.
- Land financing is restricted to the level needed to re-establish proper coverage for existing financing or to increase collateral.
In addition to ongoing control by the Group's risk monitoring teams, a technical unit is specialised in monitoring and controlling this portfolio in respect of progress of works, compliance with work schedules and control of sales, as well as validation and control of payments made upon work certified. To that end, Santander uses specific tools created for this purpose. All mortgage distributions, drawdowns for any reason, modification of grace periods, etc., are authorised centrally.
In the event projects in the construction phase present any type of difficulty, the Group guarantees completion of the work in order to ensure that it has finished buildings that can be sold in the market. Individual analyses are carried out for each project and the most efficient measures are adopted for each specific case (supplier payment structures that ensure completion of the works, specific drawdown calendars, etc.).
In those cases that could potentially warrant a possible restructuring of the exposure, this restructuring is analysed collaboratively between the risks area and the recovery business area. The analysis is performed before any default occurs, in order to ensure that the payment structure of each project allows for its successful completion. These operations are authorised centrally by expert teams, applying strict criteria in line with the Group's prudent risk management principles. Possible losses are recognised as soon as they are identified, classifying the positions as needed and making any provisions required before any default occurs, in line with Bank of Spain regulations.
On-balance sheet real estate assets are managed through specialised property sales companies (Altamira Santander Real Estate, S.A. and Promodomus Desarrollo de Activos, S.L.), supported by the commercial network structure. Sales are made at low prices, in response to market conditions.
| | | | | | | | | | | | | | | | | | | | | | | | | | |
| |
| |
| | | |
|
| | | | | | | | Other disclosures required by the Bank of Spain |
Foreclosed assets (Spain)
The sale and foreclosure of real estate assets is one of the mechanisms adopted in Spain in order to efficiently manage the portfolio.
The Group views acquisitions as a more effective tool for resolving defaulted loans than recurring to legal enforcement proceedings, given the following factors:
- Immediate availability of assets after an acquisition, compared to lengthy legal proceedings
- Cost savings
- Enhanced viability of companies, as acquisition provides them with an injection of liquidity
- Reduction in the possible loss of value of loans to these customers
- Reduction in exposure and expected loss
Disclosures required under Bank of Spain Circular 7/2010 on certain aspects of the mortgage market
a) Assets
As required under Bank of Spain Circular 7/2010 and Circular 5/2011 of November 30 on certain aspects of the mortgage market, details are provided below of the nominal value of all mortgage loans and credits and of those that are eligible, pursuant to Royal Decree 716/2009 regulating the Spanish mortgage market, for calculating the limit for issuing mortgage covered bonds, mortgage loans and credits covering the issue of mortgage bonds, loans that have been monetised through mortgage participations or mortgage transfer certificates and uncommitted transactions corresponding to Banco Santander, S.A and Santander Consumer, S.A.
At 30 June 2022, the breakdown of mortgage loans, based on their eligibility in respect of mortgage market calculations, is as follows:
| | | | | |
| |
| Million euros |
| Nominal value |
| 30-06-2022 |
| |
| Total mortgage loans and credits (*) | 96,215 |
| |
| Mortgage participations issued | 1566 |
| Of which: On-balance sheet loans | — | |
| |
| Mortgage transfer certificates issued | 12,426 |
| Of which: On-balance sheet loans | 10,612 |
| |
| Mortgage loans and credits securing financing received | — | |
| |
| Mortgage loans and credits backing the issue of mortgage bonds and mortgage covered bonds (**) | 82,223 |
| i) Ineligible mortgage loans and credits (***) | 15,432 |
–That meet the eligibility requirements except for the limit established in article 5.1 of RD 716/2009 | 9,166 |
–Others | 6,266 |
| ii) Eligible mortgage loans and credits (****) | 66,791 |
–Amounts not included in calculation (*****) | — | |
–Amounts included in calculation | 66,791 |
| a) Mortgage loans and credits covering issues of mortgage bonds | — | |
| b) Mortgage loans and credits covering issues of mortgage covered bonds | 66,791 |
(*) Including those acquired through mortgage participations and mortgage transfer certificates, even when derecognised from the balance sheet.
(**) Total loans less mortgage participations issued, mortgage transfer certificates issued and mortgage loans securing financing received.
(***) As the requirements of article 3 of Royal Decree 716/2009 are not meet.
(****) As per article 3 of Royal Decree 716/2009, without deducting the limits for calculation pursuant to article 12 of Royal Decree 716/2009.
(*****) In line with the criteria set out under article 12 of Royal Decree 716/2009.
| | | | | | | | | | | | | | | | | | | | | | | | | | |
| |
| |
| | | |
|
| | | | | | | | Other disclosures required by the Bank of Spain |
The nominal value of outstanding mortgage loans and credits and the nominal value of eligible loans and credits pursuant to Royal Decree 716/2009, without taking into account the calculation limits established in article 12 thereof and broken down by origin, currency, payment status, average residual maturity, interest rate, holder and type of collateral are as follows:
| | | | | | | | |
| Million euros |
| 30-06-2022 |
| Mortgage loans and
credits backing the
issue of mortgage
bonds and mortgage
covered bonds | Of which: Eligible
loans (*) |
| Origin | | |
| Originated by the Bank | 81,589 | | 66,172 | |
| Derived from subrogations | 634 | | 619 | |
| Other | — | | — | |
| 82,223 | | 66,791 | |
| Currency | | |
| Euros | 81,564 | | 66,791 | |
| Other currencies | 659 | | — | |
| 82,223 | | 66,791 | |
| Payment status | | |
| Performing | 76,870 | | 65,334 | |
| Other status | 5,353 | | 1,457 | |
| 82,223 | | 66,791 | |
| Residual maturity | | |
| Up to 10 years | 23,318 | | 15,212 | |
| 10 to 20 years | 30,104 | | 26,347 | |
| 20 to 30 years | 28,102 | | 24,983 | |
| Over 30 years | 699 | | 249 | |
| 82,223 | | 66,791 | |
| Interest rate | | |
| Fixed interest | 25,305 | | 22,571 | |
| Variable interest | 56,918 | | 44,220 | |
| Mixed interest | — | | — | |
| 82,223 | | 66,791 | |
| Holder | | |
| Legal entities and individual business owners | 22,009 | | 12,392 | |
| Of which: Real estate developers | 2,346 | | 564 | |
| Other individuals and non-profit institutions serving households | 60,214 | | 54,399 | |
| 82,223 | | 66,791 | |
| Type of collateral | | |
| Finished buildings – residential | 65,042 | | 57,251 | |
| Of which: State-sponsored housing | 7,707 | | 6,691 | |
| Finished buildings – commercial | 5,156 | | 3,366 | |
| Finished buildings – other | 8,590 | | 5,012 | |
| Buildings under construction – residential | 1,040 | | — | |
| Of which: State-sponsored housing | 22 | | — | |
| Buildings under construction – commercial | 59 | | — | |
| Buildings under construction – other | 36 | | 5 | |
| Land – certified for development | 1,229 | | 510 | |
| Land – other | 1,071 | | 647 | |
| 82,223 | | 66,791 | |
(*) As per article 3 of Royal Decree 716/2009, without deducting the limits for calculation established in article 12 of Royal Decree 716/2009.
| | | | | | | | | | | | | | | | | | | | | | | | | | |
| |
| |
| | | |
|
| | | | | | | | Other disclosures required by the Bank of Spain |
The nominal value of mortgage loans and credits eligible pursuant to Royal Decree 716/2009, without taking into account the calculation limits established in article 12 thereof and broken down by the percentage loan-to-value (LTV) are as follows:
| | | | | | | | | | | | | | | | | |
| 30-06-2022 |
| LTV (million euros) |
| <=40% | >40%, <= 60% | >60%, <= 80% | >80% | Total |
| Mortgage loans and credits eligible for issuing mortgage bonds and mortgage covered bonds (*) | 26,420 | 24,616 | 15,755 | — | 66,791 |
| Residential | 20,655 | 20,841 | 15,755 | — | 57,251 |
| Other | 5,765 | 3,775 | — | | 9,540 |
(*) As per article 3 of Royal Decree 716/2009, without deducting the limits for calculation established in article 12 of Royal Decree 716/2009.
Changes in the nominal value of mortgage loans and credits, both eligible and ineligible pursuant to Royal Decree 716/2009, are as follows:
| | | | | | | | |
| Million euros |
| Eligible mortgage loans and credits (*) | Ineligible mortgage loans and credits (**) |
| Balance at 31 December 2021 | 64,896 | | 18,192 | |
| Derecognitions during the period | 4,973 | 5,120 |
| Repaid upon maturity | 80 | 313 |
| Repaid early | 1,731 | 561 |
| Subrogated by other entities | — | | — | |
| Other | 3,162 | 4,246 |
| Additions during the period | 6,868 | 2,360 |
| Originated by the Bank | 6,237 | 1,512 |
| Subrogated from other entities | 0 | 1 |
| Other | 631 | 847 |
| Balance at 30 June 2022 | 66,791 | | 15,432 | |
(*) As per article 3 of Royal Decree 716/2009, without deducting the limits for calculation pursuant to article 12 of Royal Decree 716/2009.
(**) As the requirements of article 3 of Royal Decree 716/2009 are not meet.
The breakdown of available balances of mortgage loans and credits backing the issue of mortgage bonds and mortgage covered bonds is as follows:
| | | | | |
| |
| Million euros |
| Nominal value (*) |
| 30-06-2022 |
| Potentially eligible (**) | 779 |
| Ineligible | 1,722 |
(*) Amounts committed less amounts drawn down, including those amounts only delivered to developers upon sale of the property.
(**) Pursuant to article 3 of Royal Decree 716/2009.
| | | | | | | | | | | | | | | | | | | | | | | | | | |
| |
| |
| | | |
|
| | | | | | | | Other disclosures required by the Bank of Spain |
b) Liabilities
The Bank has not issued any mortgage bonds. The aggregate nominal value of outstanding mortgage covered bonds issued by the Bank, pursuant to Royal Decree 716/2009 and broken down by residual maturity, is as follows:
| | | | | | | | | | | | | | | | | |
| 30-06-2022 |
| Million euros | Less | | | | |
| than 3 | 3 to 5 | 5 to 10 | Over 10 | Total |
| years | years | years | years | |
| Issued through public offerings: | 8,925 | 9,000 | 30,597 | 2,657 | 51,179 |
| Marketable mortgage covered bonds (1) | 8,925 | 9,000 | 30,597 | 2,657 | 51,179 |
| EIB covered bonds | — | — | — | — | — |
| Multi-seller bonds | 300 | — | — | — | 300 |
| Other issue | — | — | — | — | — |
| Marketable mortgage covered bonds | — | — | — | — | — |
| (-) Issues not recognised under liabilities | — | — | — | — | 31,037 | |
| Total issued through public offerings and placed in the market | — | | — | | — | | — | | 20,142 | |
(1) Recognised under "Financial liabilities at amortised cost - Marketable debt securities", for a cash value of EUR 20,255 million, after deducting unrecognised issues.
At the subject date, the Bank's overcollateralisation stood at 161% (based on all mortgage covered bonds, EUR 51,179 million), compared to the nominal value of the mortgage loan and credit portfolio pending repayment in accordance with Royal Decree 716/2009 (EUR 82,223 million).
None of the mortgage covered bonds issued by the Bank have replacement assets.
The aggregate nominal value of outstanding mortgage transfer certificates issued by the Bank at 30 June 2022, based on residual maturity, is as follows:
| | | | | | | | | | | | | | | | | |
| Million euros |
30-06-2022 | Less than 3 years | 3 to 5 years | 5 to 10 years | Over 10 years | Total |
| Mortgage transfer certificates | — | | — | | — | | 10,612 | | 10,612 | |
| Issued through public offerings | — | | — | | — | | — | | — | |
The members of the Board of Directors hereby state that the Bank has implemented policies and procedures to expressly address all activities carried out in respect of the mortgage market issues it performs and to ensure rigorous compliance with mortgage market regulations applicable to these activities as per Royal Decree 716/2009 of April 24, implementing certain aspects of Mortgage Market Law 2/1981 of March 25, and therefore, of Bank of Spain Circular 7/2010 of November 30, along with other regulations governing the mortgage and financial system. In addition, the financial management area defines the Bank's funding strategy.
The risk policies applied to mortgage market transactions foresee maximum loan-to-value limits. In addition, specific policies are in place for each mortgage product, which at times apply even more restrictive limits.
The general policies defined in that respect require that a repayment capacity analysis be carried out for each potential customer. This analysis determines whether the customer's income is sufficient to allow it to settle each repayment required. In addition, the analysis determines whether the customer's income can be considered stable over the entire lifetime of the transaction in question. The indicator used to measure repayment capacity (housing affordability index) of each customer primarily looks at the ratio of the potential debt to the borrowers' income, taking into account both monthly repayments on the requested transaction as well as for other debts held, in comparison with monthly salary income and any other duly-justified income.
In ascertaining the customer's information and creditworthiness, the Bank applies specialised documentary verification tools and procedures (see Note 49 to the Bank's financial statements for the year ended 31 December 2021).
| | | | | | | | | | | | | | | | | | | | | | | | | | |
| |
| |
| | | |
|
| | | | | | | | Other disclosures required by the Bank of Spain |
Under the Bank's procedures, an individual appraisal must be carried out by an independent appraisal company for each mortgage loan originated in the mortgage market.
Although under article 5 of Mortgage Market Law 41/2007 any Bank of Spain-certified appraisal company may issue valid valuation reports, under this same article, the Bank of Spain sets out a series of verifications, selecting, among these entities, a smaller group with which it signs collaboration agreements, applying special conditions and automated control mechanisms. The Bank's internal regulations further specify, in detail, each internally-certified appraisal company, along with the pertinent certification requirements and procedures and the specific review controls established. This regulation also governs the functioning of an appraisal committee comprising several Bank areas that engage with these appraisal companies. The purpose of this committee is to regulate and adapt internal rules, as well as these companies' procedures, to the market and business situation.
In this way, the appraisal companies that wish to work with the Bank must have a relevant activity in the mortgage market and in the region in question, pass certain filters in respect of independence criteria, technical capacity and creditworthiness (to ensure their business continuity) and, lastly, successfully complete a series of tests prior to definitive certification.
Moreover, in accordance with the Bank's internal regulations, any appraisal submitted by a potential customer is reviewed, regardless of the issuing company, in order to formally verify that all requirements, procedures and methods employed are suitable for the asset valued, based on prevailing regulations, and that the values reported are in line with market conditions.
Disclosures required under Bank of Spain Circular 6/2012 on sector and geographic concentration of risk
Concentration of risk
The breakdown at 30 June 2022 of the concentration of the Group's risk, by activity and geographic location of counterparties, is as follows:
| | | | | | | | | | | | | | | | | |
| | | | | |
| Million euros | 30-06-2022 |
| Total | Spain | Rest of the European Union | America | Rest of the world |
| Central banks and Credit institutions | 360,880 | 100,275 | 64,237 | 98,931 | 97,437 |
| Public sector | 164,835 | 34,281 | 33,221 | 89,052 | 8,281 |
| Of which: | | | | | |
| Central government | 137,942 | 22,059 | 30,262 | 77,746 | 7875 |
| Other central government | 26,893 | 12,222 | 2,959 | 11,306 | 406 |
| Other financial institutions (financial business activity) | 151,027 | 14,610 | 46,622 | 51,486 | 38,309 |
| Non-financial companies and individual entrepreneurs (non-financial business activity) (broken down by purpose) | 439,287 | 118,863 | 90,732 | 162,044 | 67,648 |
| Of which: | | | | | |
| Construction and property development | 22,155 | 3,399 | 3,352 | 7,448 | 7,956 |
| Civil engineering construction | 5,724 | 2,633 | 1,403 | 1,514 | 174 |
| Large companies | 269,640 | 56,442 | 52,387 | 111,151 | 49660 |
| SMEs and individual entrepreneurs | 141,768 | 56,389 | 33,590 | 41,931 | 9,858 |
| Households – other (broken down by purpose) | 568,429 | 92,636 | 97,223 | 137,622 | 240,948 |
| Of which: | | | | | |
| Residential | 363,462 | 65,580 | 36,213 | 44,169 | 217,500 |
| Consumer loans | 181,472 | 16,806 | 58,611 | 87,073 | 18,982 |
| Other purposes | 23,495 | 10,250 | 2,399 | 6,380 | 4,466 |
| Total | 1,684,458 | | 360,665 | | 332,035 | | 539,135 | | 452,623 | |
(*) For the purpose of this table, the definition of risk includes the following public balance sheet items: loans and advances to credit institutions, deposits at central banks, loans and advances to customers, debt securities, capital instruments, trading derivatives, hedging derivatives, equity investments and guarantees extended.
| | | | | | | | | | | | | | | | | | | | | | | | | | |
| |
| |
| | | |
|
| | | | | | | | Other disclosures required by the Bank of Spain |
| | | | | | | | | | | | | | | | | | | | | | | | | | | | | |
| Million euros (*) |
| | | Secured loans |
| | | Net exposure | Loan-to-value (a) |
| Total | Unsecured loans | Of which: Mortgage collateral | Of which: Other collateral | Less than or equal to 40% | Greater than 40% and less than or equal to 60% | Greater than 60% and less than or equal to 80% | Greater than 80% and less than or equal to 100% | Greater than 100% |
| Public sector | 23,645 | 22,402 | 163 | 1,080 | 72 | 78 | 15 | 1,070 | 8 |
| Other financial institutions (financial business activity) | 87,208 | 30,336 | 4,285 | 52,587 | 3,741 | 2,315 | 1,092 | 48,674 | 1,050 |
| Non-financial corporations and individual entrepreneurs (non-financial business activity) (broken down by purpose) | 341,858 | 196,914 | 68,340 | 76,604 | 24,940 | 22,228 | 17,715 | 59,904 | 20,157 |
| Of which: | | | | | | | | | |
| Construction and property development | 19,767 | 1,903 | 16,860 | 1,004 | 6,448 | 5,631 | 2,048 | 2,199 | 1,538 |
| Civil engineering construction | 3,468 | 2,353 | 88 | 1,027 | 60 | 108 | 27 | 849 | 71 |
| Large companies | 188,215 | 128,838 | 20,058 | 39,319 | 7,794 | 5,022 | 5,216 | 32,930 | 8,415 |
| SMEs and individual entrepreneurs | 130,408 | 63,820 | 31,334 | 35,254 | 10,638 | 11,467 | 10,424 | 23,926 | 10,133 |
| Households – other (broken down by purpose) | 563,783 | 104,816 | 370,598 | 88,369 | 104,242 | 123,951 | 138,559 | 56,119 | 36,096 |
| Of which: | | | | | | | | | |
| Residential | 363,266 | 1,726 | 360,793 | 747 | 96,674 | 116,762 | 122,686 | 22,355 | 3,063 |
| Consumer loans | 178,320 | 97,961 | 1,388 | 78,971 | 3,301 | 4,536 | 12,659 | 27,825 | 32,038 |
| Other purposes | 22,197 | 5,129 | 8,417 | 8,651 | 4,267 | 2,653 | 3,214 | 5,939 | 995 |
| Total | 1,016,494 | 354,468 | 443,386 | 218,640 | 132,995 | 148,572 | 157,381 | 165,767 | 57,311 |
| Memorandum item | | | | | | | | | |
| Refinanced and restructured transactions | 27,852 | 12,729 | 9,837 | 5,286 | 3,823 | 2,094 | 4,297 | 2,939 | 1,970 |
(*) In addition, the Group has granted customer prepayments amounting to EUR 21,227 million; therefore, the total amount of credits and customer prepayments amounts to EUR 1,037,721 million.
(**) Includes fair value impairment and losses net balance due to credit risk.
| | | | | |
| INTERIM CONDENSED CONSOLIDATED FINANCIAL STATEMENTS |
| |
Banco Santander, S.A.
and companies composing
Santander Group
Interim Condensed Consolidated
Financial Statements for the six-month
period ended 30 June 2022
Translation of interim condensed consolidated financial statements originally issued in Spanish and prepared in accordance with the regulatory financial reporting framework
applicable to the Group in Spain (see Notes 1 and 17). In the event of a discrepancy, the Spanish-language version prevails.
The interim consolidated financial statements included herein have not been audited in accordance with Public Company Accounting Oversight Board (PCAOB) standards of the United States.
Translation of interim condensed consolidated financial statements originally issued in Spanish and prepared in accordance with the regulatory financial reporting framework applicable to the Group in Spain
(see Notes 1 and 17). In the event of a discrepancy, the Spanish-language version prevails.
GRUPO SANTANDER
CONDENSED CONSOLIDATED BALANCE SHEETS AS AT 30 JUNE 2022 AND 31 DECEMBER 2021
(EUR million)
| | | | | | | | | | | |
| | | |
| ASSETS | Note | 30-06-2022 | 31-12-2021 (*) |
| CASH, CASH BALANCES AT CENTRAL BANKS AND OTHER DEPOSITS ON DEMAND | | 211,276 | | 210,689 | |
| | | |
| FINANCIAL ASSETS HELD FOR TRADING | 5 | 163,235 | | 116,953 | |
| NON-TRADING FINANCIAL ASSETS MANDATORILY AT FAIR VALUE THROUGH PROFIT OR LOSS | 5 | 5,845 | | 5,536 | |
| FINANCIAL ASSETS DESIGNATED AT FAIR VALUE THROUGH PROFIT OR LOSS | 5 | 11,025 | | 15,957 | |
| FINANCIAL ASSETS AT FAIR VALUE THROUGH OTHER COMPREHENSIVE INCOME | 5 | 91,998 | | 108,038 | |
| FINANCIAL ASSETS AT AMORTISED COST | 5 | 1,129,690 | | 1,037,898 | |
| HEDGING DERIVATIVES | | 6,735 | | 4,761 | |
| | | |
| CHANGES IN THE FAIR VALUE OF HEDGED ITEMS IN PORTFOLIO HEDGES OF INTEREST RISK | | (1,769) | | 410 | |
| | | |
| INVESTMENTS | | 7,665 | | 7,525 | |
| Joint venture entities | | 1,971 | | 1,692 | |
| Associated entities | | 5,694 | | 5,833 | |
| | | |
| ASSETS UNDER INSURANCE OR REINSURANCE CONTRACTS | | 310 | | 283 | |
| | | |
| TANGIBLE ASSETS | 7 | 34,640 | | 33,321 | |
| Property, plant and equipment | | 33,621 | | 32,342 | |
| For own-use | | 13,513 | | 13,259 | |
| Leased out under an operating lease | | 20,108 | | 19,083 | |
| Investment properties | | 1,019 | | 979 | |
| Of which : Leased out under an operating lease | | 838 | | 839 | |
| INTANGIBLE ASSETS | | 18,349 | | 16,584 | |
| Goodwill | 8 | 13,877 | | 12,713 | |
| Other intangible assets | | 4,472 | | 3,871 | |
| | | |
| TAX ASSETS | | 29,025 | | 25,196 | |
| Current tax assets | | 8,293 | | 5,756 | |
| Deferred tax assets | | 20,732 | | 19,440 | |
| | | |
| OTHER ASSETS | | 10,981 | | 8,595 | |
| Insurance contracts linked to pensions | | 128 | | 149 | |
| Inventories | | 7 | | 6 | |
| Other | | 10,846 | | 8,440 | |
| | | |
| NON-CURRENT ASSETS HELD FOR SALE | 6 | 3,835 | | 4,089 | |
| TOTAL ASSETS | | 1,722,840 | | 1,595,835 | |
(*)Presented for comparison purposes only (see Note 1.e).
The accompanying explanatory Notes 1 to 17 are an integral part of the condensed consolidated balance sheet as at 30 June 2022.
Translation of interim condensed consolidated financial statements originally issued in Spanish and prepared in accordance with the regulatory financial reporting framework applicable to the Group in Spain
(see Notes 1 and 17). In the event of a discrepancy, the Spanish-language version prevails.
GRUPO SANTANDER
CONDENSED CONSOLIDATED BALANCE SHEETS AS AT 30 JUNE 2022 AND 31 DECEMBER 2021
(EUR million)
| | | | | | | | | | | |
| | | |
| LIABILITIES | Note | 30-06-2022 | 31-12-2021 (*) |
| | | |
| FINANCIAL LIABILITIES HELD FOR TRADING | 9 | 114,406 | | 79,469 | |
| | | |
| FINANCIAL LIABILITIES DESIGNATED AT FAIR VALUE THROUGH PROFIT OR LOSS | 9 | 40,823 | | 32,733 | |
| FINANCIAL LIABILITIES AT AMORTISED COST | 9 | 1,427,721 | | 1,349,169 | |
| HEDGING DERIVATIVES | | 9,269 | | 5,463 | |
| | | |
| CHANGES IN THE FAIR VALUE OF HEDGED ITEMS IN PORTFOLIO HEDGES OF INTEREST RATE RISK | | (94) | | 248 | |
| | | |
| LIABILITIES UNDER INSURANCE OR REINSURANCE CONTRACTS | | 858 | | 770 | |
| | | |
| PROVISIONS | | 8,590 | | 9,583 | |
| Pension and other post-retirement obligations | 10 | 2,525 | | 3,185 | |
| Other long term employee benefits | 10 | 1,071 | | 1,242 | |
| Taxes and other legal contingencies | 10 | 2,242 | | 1,996 | |
| Contingent liabilities and commitments | 14 | 743 | | 733 | |
| Other provisions | 10 | 2,009 | | 2,427 | |
| TAX LIABILITIES | | 10,085 | | 8,649 | |
| Current tax liabilities | | 2,853 | | 2,187 | |
| Deferred tax liabilities | | 7,232 | | 6,462 | |
| | | |
| OTHER LIABILITIES | | 13,720 | | 12,698 | |
| | | |
| LIABILITIES ASSOCIATED WITH NON-CURRENT ASSETS HELD FOR SALE | | — | | — | |
| TOTAL LIABILITIES | | 1,625,378 | | 1,498,782 | |
| | | |
| SHAREHOLDERS´ EQUITY | | 122,037 | | 119,649 | |
| | | |
| CAPITAL | 11 | 8,397 | | 8,670 | |
| Called up paid capital | | 8,397 | | 8,670 | |
| Unpaid capital which has been called up | | — | | — | |
| SHARE PREMIUM | | 46,273 | | 47,979 | |
| EQUITY INSTRUMENTS ISSUED OTHER THAN CAPITAL | | 672 | | 658 | |
| Equity component of the compound financial instrument | | — | | — | |
| Other equity instruments issued | | 672 | | 658 | |
| OTHER EQUITY | | 151 | | 152 | |
| ACCUMULATED RETAINED EARNINGS | | 66,698 | | 60,273 | |
| REVALUATION RESERVES | | — | | — | |
| OTHER RESERVES | | (5,038) | | (4,477) | |
| (-) OWN SHARES | | (10) | | (894) | |
| PROFIT ATTRIBUTABLE TO SHAREHOLDERS OF THE PARENT | 3 | 4,894 | | 8,124 | |
| (-) INTERIM DIVIDENDS | | — | | (836) | |
| | | |
| OTHER COMPREHENSIVE INCOME (LOSS) | 11 | (32,526) | | (32,719) | |
| | | |
| ITEMS NOT RECLASSIFIED TO PROFIT OR LOSS | | (3,809) | | (4,241) | |
| | | |
| ITEMS THAT MAY BE RECLASSIFIED TO PROFIT OR LOSS | | (28,717) | | (28,478) | |
| | | |
| NON-CONTROLLING INTEREST | | 7,951 | | 10,123 | |
| Other comprehensive income | | (2,090) | | (2,104) | |
| Other items | | 10,041 | | 12,227 | |
| TOTAL EQUITY | | 97,462 | | 97,053 | |
| TOTAL LIABILITIES AND EQUITY | | 1,722,840 | | 1,595,835 | |
| MEMORANDUM ITEMS: OFF BALANCE SHEET AMOUNTS | 14 | | |
| Loan commitments granted | | 275,865 | | 262,737 | |
| Financial guarantees granted | | 12,881 | | 10,758 | |
| Other commitments granted | | 91,195 | | 75,733 | |
(*)Presented for comparison purposes only (see Note 1.e).
The accompanying explanatory Notes 1 to 17 are an integral part of the condensed consolidated balance sheet as at 30 June 2022.
Translation of interim condensed consolidated financial statements originally issued in Spanish and prepared in accordance with the regulatory financial reporting framework applicable to the Group in Spain
(see Notes 1 and 17). In the event of a discrepancy, the Spanish-language version prevails.
GRUPO SANTANDER
CONDENSED CONSOLIDATED INCOME STATEMENTS
FOR THE FIRST SIX MONTHS ENDED 30 JUNE 2022 AND 2021
(EUR million)
| | | | | | | | | | | |
| | | |
| | Debit (Credit) |
| Note | 01-01-2022 to 30-06-2022 | 01-01-2021 to 30-06-2021 (*) |
| Interest income | | 30,869 | | 21,933 | |
| Financial assets at fair value through other comprehensive income | | 2,211 | | 1,292 | |
| Financial assets at amortised cost | | 26,073 | | 19,149 | |
| Other interest income | | 2,585 | | 1,492 | |
| Interest expense | | (12,460) | | (5,737) | |
| Interest income/ (charges) | | 18,409 | | 16,196 | |
| Dividend income | | 335 | | 309 | |
| Income from companies accounted for using the equity method | | 312 | | 163 | |
| Commission income | | 7,792 | | 6,676 | |
| Commission expense | | (1,940) | | (1,507) | |
| Gain or losses on financial assets and liabilities not measured at fair value through profit or loss, net | | 233 | | 344 | |
| Financial assets at amortised cost | | 28 | | 77 | |
| Other financial assets and liabilities | | 205 | | 267 | |
| Gain or losses on financial assets and liabilities held for trading, net | | 718 | | 347 | |
| Reclassification of financial assets at fair value through other comprehensive income | | — | | — | |
| Reclassification of financial assets at amortized cost | | — | | — | |
| Other gains (losses) | | 718 | | 347 | |
Gains or losses on non-trading financial assets and liabilities mandatorily at fair value
through profit or loss | | (15) | | 10 | |
| Reclassification of financial assets at fair value through other comprehensive income | | — | | — | |
| Reclassification of financial assets at amortized cost | | — | | — | |
| Other gains (losses) | | (15) | | 10 | |
| Gain or losses on financial assets and liabilities measured at fair value through profit or loss, net | | 756 | | 221 | |
| Gain or losses from hedge accounting, net | | 128 | | 57 | |
| Exchange differences, net | | (1,077) | | (85) | |
| Other operating income | | 819 | | 1,167 | |
| Other operating expenses | | (1,461) | | (1,289) | |
| Income from assets under insurance and reinsurance contracts | | 1,349 | | 769 | |
| Expenses from liabilities under insurance and reinsurance contracts | | (1,238) | | (683) | |
| Total income | | 25,120 | | 22,695 | |
| Administrative expenses | | (9,993) | | (8,996) | |
| Staff costs | | (5,948) | | (5,438) | |
| Other general and administrative expenses | | (4,045) | | (3,558) | |
| Depreciation and amortisation cost | | (1,442) | | (1,381) | |
| Provisions or reversal of provisions, net | | (935) | | (1,490) | |
Impairment or reversal of impairment of financial assets not measured at fair value
through profit or loss and net gains and losses from changes | | (4,763) | | (3,804) | |
| Financial assets at fair value through other comprehensive income | | (1) | | (19) | |
| Financial assets at amortised cost | 5 | (4,762) | | (3,785) | |
| Impairment of investments in subsidiaries, joint ventures and associates, net | | — | | — | |
| Impairment on non-financial assets, net | | (61) | | (130) | |
| Tangible assets | | (24) | | (125) | |
| Intangible assets | | (29) | | (3) | |
| Others | | (8) | | (2) | |
| Gain or losses on non financial assets and investments, net | | (4) | | 52 | |
| Negative goodwill recognised in results | | — | | — | |
| Gains or losses on non-current assets held for sale not classified as discontinued operations | 6 | (7) | | (32) | |
| Operating profit/(loss) before tax | | 7,915 | | 6,914 | |
| Tax expense or income from continuing operations | | (2,374) | | (2,474) | |
| Profit/(loss) for the period from continuing operations | | 5,541 | | 4,440 | |
| Profit/( loss) after tax from discontinued operations | | — | | — | |
| Profit/(loss) for the period | | 5,541 | | 4,440 | |
| Profit attributable to non-controlling interests | | 647 | | 765 | |
| Profit/(loss) attributable to the parent | | 4,894 | | 3,675 | |
| Earnings/(losses) per share | 3 | | |
| Basic | | 0.27 | | 0.20 | |
| Diluted | | 0.27 | | 0.20 | |
(*)Presented for comparison purposes only (see Note 1.e).
The accompanying explanatory Notes 1 to 17 are an integral part of the condensed consolidated income statement
for the first six months ended 30 June 2022.
Translation of interim condensed consolidated financial statements originally issued in Spanish and prepared in accordance with the regulatory financial reporting framework applicable to the Group in Spain
(see Notes 1 and 17). In the event of a discrepancy, the Spanish-language version prevails.
GRUPO SANTANDER
CONDENSED CONSOLIDATED STATEMENTS OF RECOGNISED INCOME AND EXPENSE
FOR THE FIRST SIX MONTHS ENDED 30 JUNE 2022 AND 2021
(EUR million)
| | | | | | | | | | | |
| Note | 01-01-2022 to 30-06-2022 | 01-01-2021 to 30-06-2021 (*) |
| CONSOLIDATED PROFIT/(LOSS) FOR THE PERIOD | | 5,541 | | 4,440 | |
| OTHER RECOGNISED INCOME AND EXPENSE | | 214 | | 946 | |
| Items that will not be reclassified to profit or loss | 11 | 433 | | 390 | |
| Actuarial gains and losses on defined benefit pension plans | | 843 | | 885 | |
| Non-current assets held for sale | | — | | — | |
Other recognised income and expense of investments in
subsidiaries, joint ventures and associates | | (1) | | (8) | |
| Changes in the fair value of equity instruments measured at fair value through other comprehensive income | | (334) | | (68) | |
| Gains or losses resulting from the accounting for hedges of equity instruments measured at fair value through other comprehensive income, net | | — | | — | |
| Changes in the fair value of equity instruments measured at fair value through other comprehensive income (hedged item) | | 37 | | 54 | |
| Changes in the fair value of equity instruments measured at fair value through other comprehensive income (hedging instrument) | | (37) | | (54) | |
| Changes in the fair value of financial liabilities at fair value through profit or loss attributable to changes in credit risk | | 123 | | (129) | |
| Income tax relating to items that will not be reclassified | | (198) | | (290) | |
| Items that may be reclassified to profit or loss | 11 | (219) | | 556 | |
| Hedges of net investments in foreign operations (effective portion) | 11 | (1,693) | | (1,001) | |
| Revaluation gains (losses) | | (1,693) | | (1,001) | |
| Amounts transferred to income statement | | — | | — | |
| Other reclassifications | | — | | — | |
| Exchange differences | 11 | 4,462 | | 3,036 | |
| Revaluation gains (losses) | | 4,462 | | 3,036 | |
| Amounts transferred to income statement | | — | | — | |
| Other reclassifications | | — | | — | |
| Cash flow hedges (effective portion) | | (2,604) | | (230) | |
| Revaluation gains (losses) | | (942) | | (651) | |
| Amounts transferred to income statement | | (1,662) | | 421 | |
| Transferred to initial carrying amount of hedged items | | — | | — | |
| Other reclassifications | | — | | — | |
| Hedging instruments (items not designated) | | — | | — | |
| Revaluation gains (losses) | | — | | — | |
| Amounts transferred to income statement | | — | | — | |
| Other reclassifications | | — | | — | |
| Debt instruments at fair value with changes in other comprehensive income | | (1,804) | | (1,914) | |
| Revaluation gains (losses) | | (2,411) | | (1,637) | |
| Amounts transferred to income statement | | (190) | | (277) | |
| Other reclassifications | | 797 | | — | |
| Non-current assets held for sale | | — | | — | |
| Revaluation gains (losses) | | — | | — | |
| Amounts transferred to income statement | | — | | — | |
| Other reclassifications | | — | | — | |
| Share of other recognised income and expense of investments | | 139 | | 49 | |
| Income tax relating to items that may be reclassified to profit or loss | | 1,281 | | 616 | |
| Total recognised income and expenses for the year | | 5,755 | | 5,386 | |
| Attributable to non-controlling interests | | 664 | | 748 | |
| Attributable to the parent | | 5,091 | | 4,638 | |
(*)Presented for comparison purposes only (see Note 1.e).
The accompanying explanatory Notes 1 to 17 are an integral part of the condensed consolidated statement of recognised income and expense for the first six months ended 30 June 2022.
Translation of interim condensed consolidated financial statements originally issued in Spanish and prepared in accordance with the regulatory financial reporting framework applicable to the Group in Spain (see Notes 1 and 17). In the event of a discrepancy, the Spanish-language version prevails.
GRUPO SANTANDER
CONDENSED CONSOLIDATED STATEMENTS OF CHANGES IN TOTAL EQUITY
FOR THE FIRST SIX MONTHS ENDED 30 JUNE 2022 AND 2021
(EUR million)
| | | | | | | | | | | | | | | | | | | | | | | | | | | | | | | | | | | | | | | | | | | | |
| Capital | Share premium | Equity instruments issued (not capital) | Other equity instruments | Accumulated retained earnings | Revaluation reserves | Other reserves | (-) Own shares | Profit Attributable to shareholders of the parent | (-) Interim dividends | Other comprehensive income | Non-Controlling interest | Total |
| Other comprehensive income | Other items |
| Balance as at 31-12-2021 (*) | 8,670 | | 47,979 | | 658 | | 152 | | 60,273 | | — | | (4,477) | | (894) | | 8,124 | | (836) | | (32,719) | | (2,104) | | 12,227 | | 97,053 | |
| Adjustments due to errors | — | | — | | — | | — | | — | | — | | — | | — | | — | | — | | — | | — | | — | | — | |
Adjustments due to changes in
accounting policies | — | | — | | — | | — | | — | | — | | — | | — | | — | | — | | — | | — | | — | | — | |
| Opening balance as at 01-01-2022 (*) | 8,670 | | 47,979 | | 658 | | 152 | | 60,273 | | — | | (4,477) | | (894) | | 8,124 | | (836) | | (32,719) | | (2,104) | | 12,227 | | 97,053 | |
| Total recognised income and expense | — | | — | | — | | — | | — | | — | | — | | — | | 4,894 | | — | | 197 | | 17 | | 647 | | 5,755 | |
| Other changes in equity | (273) | | (1,706) | | 14 | | (1) | | 6,425 | | — | | (561) | | 884 | | (8,124) | | 836 | | (4) | | (3) | | (2,833) | | (5,346) | |
| Issuance of ordinary shares | — | | — | | — | | — | | — | | — | | — | | — | | — | | — | | — | | — | | — | | — | |
| Issuance of preferred shares | — | | — | | — | | — | | — | | — | | — | | — | | — | | — | | — | | — | | — | | — | |
| Issuance of other financial instruments | — | | — | | — | | — | | — | | — | | — | | — | | — | | — | | — | | — | | — | | — | |
| Maturity of other financial instruments | — | | — | | — | | — | | — | | — | | — | | — | | — | | — | | — | | — | | — | | — | |
| Conversion of financial liabilities into equity | — | | — | | — | | — | | — | | — | | — | | — | | — | | — | | — | | — | | — | | — | |
| Capital reduction | (273) | | (1,706) | | — | | — | | — | | — | | 273 | | 1,706 | | — | | — | | — | | — | | — | | — | |
| Dividends | — | | — | | — | | — | | (869) | | — | | — | | — | | — | | — | | — | | — | | (367) | | (1,236) | |
| Purchase of equity instruments | — | | — | | — | | — | | — | | — | | — | | (1,173) | | — | | — | | — | | — | | — | | (1,173) | |
| Disposal of equity instruments | — | | — | | — | | — | | — | | — | | 6 | | 351 | | — | | — | | — | | — | | — | | 357 | |
| Transfer from equity to liabilities | — | | — | | — | | — | | — | | — | | — | | — | | — | | — | | — | | — | | — | | — | |
| Transfer from liabilities to equity | — | | — | | — | | — | | — | | — | | — | | — | | — | | — | | — | | — | | — | | — | |
| Transfers between equity items | — | | — | | — | | — | | 7,294 | | — | | (1) | | — | | (8,124) | | 836 | | (4) | | (3) | | 3 | | 1 | |
Increases (decreases) due to
business combinations | — | | — | | — | | — | | — | | — | | — | | — | | — | | — | | — | | — | | 31 | | 31 | |
| Share-based payment | — | | — | | — | | (42) | | — | | — | | — | | — | | — | | — | | — | | — | | — | | (42) | |
| Others increases or (-) decreases of the equity | — | | — | | 14 | | 41 | | — | | — | | (839) | | — | | — | | — | | — | | — | | (2,500) | | (3,284) | |
| Balance as at 30-06-2022 | 8,397 | | 46,273 | | 672 | | 151 | | 66,698 | | — | | (5,038) | | (10) | | 4,894 | | — | | (32,526) | | (2,090) | | 10,041 | | 97,462 | |
(*)Presented for comparison purposes only (see Note 1.e).
The accompanying explanatory Notes 1 to 17 are an integral part of the condensed consolidated statement of changes in total equity
for the first six months ended 30 June 2022.
Translation of interim condensed consolidated financial statements originally issued in Spanish and prepared in accordance with the regulatory financial reporting framework applicable to the Group in Spain (see Notes 1 and 17). In the event of a discrepancy, the Spanish-language version prevails.
GRUPO SANTANDER
CONDENSED CONSOLIDATED STATEMENTS OF CHANGES IN TOTAL EQUITY
FOR THE FIRST SIX MONTHS ENDED 30 JUNE 2022 AND 2021
(EUR million)
| | | | | | | | | | | | | | | | | | | | | | | | | | | | | | | | | | | | | | | | | | | | |
| Capital | Share premium | Equity instruments issued (not capital) | Other equity instruments | Accumulated retained earnings | Revaluation reserves | Other reserves | (-) Own shares | Profit Attributable to shareholders of the parent | (-) Interim dividends | Other comprehensive income | Non-Controlling interest | Total |
| Other comprehensive income | Other items |
| Balance as at 31-12-2020 (*) | 8,670 | | 52,013 | | 627 | | 163 | | 65,583 | | — | | (3,596) | | (69) | | (8,771) | | — | | (33,144) | | (1,800) | | 11,646 | | 91,322 | |
| Adjustments due to errors | — | | — | | — | | — | | — | | — | | — | | — | | — | | — | | — | | — | | — | | — | |
Adjustments due to changes in
accounting policies | — | | — | | — | | — | | — | | — | | — | | — | | — | | — | | — | | — | | — | | — | |
| Opening balance as at 01-01-2021 (*) | 8,670 | | 52,013 | | 627 | | 163 | | 65,583 | | — | | (3,596) | | (69) | | (8,771) | | — | | (33,144) | | (1,800) | | 11,646 | | 91,322 | |
| Total recognised income and expense | — | | — | | — | | — | | — | | — | | — | | | 3,675 | | — | | 963 | | (17) | | 765 | | 5,386 | |
| Other changes in equity | — | | (4,034) | | 14 | | 2 | | (5,303) | | — | | (166) | | (27) | | 8,771 | | — | | — | | — | | (220) | | (963) | |
| Issuance of ordinary shares | — | | — | | — | | — | | | — | | — | | — | | — | | — | | — | | — | | 17 | | 17 | |
| Issuance of preferred shares | — | | — | | — | | — | | — | | — | | — | | — | | — | | — | | — | | — | | — | | — | |
| Issuance of other financial instruments | — | | — | | — | | — | | — | | — | | — | | — | | — | | — | | — | | — | | — | | — | |
| Maturity of other financial instruments | — | | — | | — | | — | | — | | — | | — | | — | | — | | — | | — | | — | | — | | — | |
| Conversion of financial liabilities into equity | — | | — | | — | | — | | — | | — | | — | | — | | — | | — | | — | | — | | — | | — | |
| Capital reduction | — | | — | | — | | — | | — | | — | | — | | — | | — | | — | | — | | — | | — | | — | |
| Dividends | — | | (477) | | — | | — | | — | | — | | — | | — | | — | | — | | — | | — | | (347) | | (824) | |
| Purchase of equity instruments | — | | — | | — | | — | | — | | — | | — | | (404) | | — | | — | | — | | — | | — | | (404) | |
| Disposal of equity instruments | — | | — | | — | | — | | — | | — | | 7 | | 377 | | — | | — | | — | | — | | — | | 384 | |
| Transfer from equity to liabilities | — | | — | | — | | — | | — | | — | | — | | — | | — | | — | | — | | — | | — | | — | |
| Transfer from liabilities to equity | — | | — | | — | | — | | — | | — | | — | | — | | — | | — | | — | | — | | — | | — | |
| Transfers between equity items | — | | (3,557) | | — | | — | | (5,303) | | — | | 89 | | — | | 8,771 | | — | | — | | — | | — | | — | |
Increases (decreases) due to
business combinations | — | | — | | — | | — | | — | | — | | — | | — | | — | | — | | — | | — | | — | | — | |
| Share-based payment | — | | — | | — | | (48) | | | — | | — | | — | | — | | — | | — | | — | | — | | (48) | |
| Others increases or (-) decreases of the equity | — | | — | | 14 | | 50 | | — | | — | | (262) | | — | | — | | — | | — | | — | | 110 | | (88) | |
| Balance as at 30-06-2021 (*) | 8,670 | | 47,979 | | 641 | | 165 | | 60,280 | | — | | (3,762) | | (96) | | 3,675 | | — | | (32,181) | | (1,817) | | 12,191 | | 95,745 | |
(*)Presented for comparison purposes only (see Note 1.e).
The accompanying explanatory Notes 1 to 17 are an integral part of the condensed consolidated statement of changes in total equity
for the first six months ended 30 June 2022.
Translation of interim condensed consolidated financial statements originally issued in Spanish and prepared in accordance with the regulatory financial reporting framework applicable to the Group in Spain
(see Notes 1 and 17). In the event of a discrepancy, the Spanish-language version prevails.
GRUPO SANTANDER
CONDENSED CONSOLIDATED STATEMENTS OF CASH FLOWS
FOR THE FIRST SIX MONTHS ENDED 30 JUNE 2022 AND 2021
(EUR million)
| | | | | | | | | | | |
| | | |
| Note | 30-06-2022 | 30-06-2021 (*) |
| A. CASH FLOWS FROM OPERATING ACTIVITIES | | 7,386 | | 28,045 | |
| Profit/(loss) for the period | | 5,541 | | 4,440 | |
| Adjustments made to obtain the cash flows from operating activities | | 11,307 | | 11,142 | |
| Depreciation and amortisation cost | | 1,442 | | 1,381 | |
| Other adjustments | | 9,865 | | 9,761 | |
| Net increase/(decrease) in operating assets | | 90,128 | | 9,091 | |
| Financial assets held-for-trading | | 36,879 | | (13,569) | |
| Non-trading financial assets mandatorily at fair value through profit or loss | | 226 | | 280 | |
| Financial assets at fair value through profit or loss | | (5,133) | | 7,447 | |
| Financial assets at fair value through other comprehensive income | | (15,752) | | (6,313) | |
| Financial assets at amortised cost | | 65,608 | | 26,923 | |
| Other operating assets | | 8,300 | | (5,677) | |
| Net increase/(decrease) in operating liabilities | | 83,182 | | 22,830 | |
| Financial liabilities held-for-trading | | 29,376 | | (13,014) | |
| Financial liabilities designated at fair value through profit or loss | | 9,520 | | 6,467 | |
| Financial liabilities at amortised cost | | 41,445 | | 33,692 | |
| Other operating liabilities | | 2,841 | | (4,315) | |
| Income tax recovered/(paid) | | (2,516) | | (1,276) | |
| B. CASH FLOWS FROM INVESTING ACTIVITIES | | (1,652) | | (1,678) | |
| Payments | | 6,016 | | 4,022 | |
| Tangible assets | 7 | 4,387 | | 3,363 | |
| Intangible assets | | 676 | | 593 | |
| Investments | | 109 | | 11 | |
| Subsidiaries and other business units | 2 | 844 | | 55 | |
| Non-current assets held for sale and associated liabilities | | — | | — | |
| Other payments related to investing activities | | — | | — | |
| Proceeds | | 4,364 | | 2,344 | |
| Tangible assets | 7 | 2,961 | | 1,673 | |
| Intangible assets | | — | | — | |
| Investments | | 138 | | 286 | |
| Subsidiaries and other business units | | 729 | | — | |
| Non-current assets held for sale and associated liabilities | 6 | 536 | | 385 | |
| Other proceeds related to investing activities | | — | | — | |
| C. CASH FLOW FROM FINANCING ACTIVITIES | | (7,123) | | (286) | |
| Payments | | 7,604 | | 2,277 | |
| Dividends | 3 | 869 | | 477 | |
| Subordinated liabilities | | 1,693 | | 645 | |
| Redemption of own equity instruments | | — | | — | |
| Acquisition of own equity instruments | | 1,173 | | 404 | |
| Other payments related to financing activities | | 3,869 | | 751 | |
| Proceeds | | 481 | | 1,991 | |
| Subordinated liabilities | | 113 | | 1,586 | |
| Issuance of own equity instruments | 11 | — | | — | |
| Disposal of own equity instruments | | 360 | | 387 | |
| Other proceeds related to financing activities | | 8 | | 18 | |
| D. EFFECT OF FOREIGN EXCHANGE RATE DIFFERENCES | | 1,976 | | 3,171 | |
| E. NET INCREASE/(DECREASE) IN CASH AND CASH EQUIVALENTS | | 587 | | 29,252 | |
| F. CASH AND CASH EQUIVALENTS AT BEGINNING OF PERIOD | | 210,689 | | 153,839 | |
| G. CASH AND CASH EQUIVALENTS AT END OF PERIOD | | 211,276 | | 183,091 | |
| COMPONENTS OF CASH AND CASH EQUIVALENTS AT END OF PERIOD | | | |
| Cash | | 8,568 | | 6,929 | |
| Cash equivalents at central banks | | 191,065 | | 160,991 | |
| Other financial assets | | 11,643 | | 15,171 | |
| Less: Bank overdrafts refundable on demand | | — | | — | |
| TOTAL CASH AND CASH EQUIVALENTS AT END OF PERIOD | | 211,276 | | 183,091 | |
| In which: restricted cash | | — | | — | |
(*)Presented for comparison purposes only (see Note 1.e).
The accompanying explanatory Notes 1 to 17 are an integral part of the condensed consolidated statement of recognised income and expense for the first six months ended 30 June 2022.
Banco Santander, S.A. and Companies composing Grupo Santander
Explanatory notes to the interim condensed consolidated financial statements for the first six months ended 30 June 2022.
1. Introduction, basis of presentation of the interim condensed consolidated financial statements and other information
a) Introduction
Banco Santander, S.A. ('the parent' or 'Banco Santander') is a private-law entity subject to the rules and regulations applicable to banks operating in Spain. The Bylaws and other public information of the Bank can be consulted at its registered office at Paseo de Pereda 9-12, Santander.
In addition to the operations carried on directly by it, Banco Santander is the head of a group of subsidiaries that engage in various business activities and which compose, together with it, Grupo Santander ('Santander' or 'The Group').
Grupo Santander's interim condensed consolidated financial statements ('interim financial statements') for the six-month period ended 30 June 2022 were authorised and approved by Grupo Santander's directors at the board of directors meeting held on 27 July 2022. Grupo Santander's consolidated annual accounts for year 2021 were approved by shareholders at Banco Santander annual general meeting on 1 April 2022.
b) Basis of presentation of the interim financial statements
Under Regulation (EC) n.º 1606/2002 of the European Parliament and of the Council of 19 July 2002 all companies governed by the law of an EU Member State and whose securities are admitted to trading on a regulated market of any Member State must prepare their consolidated financial statements for the years beginning on or after 1 January, 2005 in conformity with the International Financial Reporting Standards ('IFRS') previously adopted by the European Union ('EU-IFRS'). In order to adapt the accounting system of Spanish credit institutions with the principles and criteria established by the IFRS adopted by the European Union ('EU-IFRS'), the Bank of Spain published circular 4/2017, dated 27 November 2017, and subsequent changes, on Public and Confidential Financial Reporting Standards and Financial Statement Formats.
The consolidated annual accounts for 2021 were authorised at the board of directors meeting on 24 February 2022 in compliance with International Financial Reporting Standards as adopted by the European Union, taking into account Bank of Spain Circular 4/2017, and subsequent modifications, using the basis of consolidation, accounting policies and measurement bases described in Note 2 to the aforementioned consolidated annual accounts and, accordingly, they presented fairly Grupo Santander’s consolidated equity and consolidated financial position at 31 December 2021 and the consolidated results of its operations, and the consolidated cash flows in 2021. The aforementioned consolidated annual accounts, which are included in Grupo Santander’s Form 6-K filed with the U.S. Securities and Exchange Commission on 8 April 2022, and these interim financial statements are also in compliance with International Financial Reporting Standards as issued by the International Accounting Standards Board ('IFRS-IASB', and together with EU-IFRS, 'IFRS').
These interim financial statements were prepared and are presented in accordance with International Accounting Standard (IAS 34), Interim Financial Reporting, for the preparation of interim financial statements in accordance with the provisions of article 12 of Royal Decree 1362 /2007 and taking into account the requirements of Circular 3/2018, of 28 June, of the Spanish National Securities Market Commission ('CNMV'). The aforementioned interim financial statements will be included in the half-year financial report for the first six months of 2022 to be presented by the Group in accordance with the Circular 3/2018.
In accordance with IAS 34, the interim financial statements are intended only to provide an update on the content of the latest consolidated annual accounts authorised for issue, focusing on new activities, events and circumstances occurring during the first six months, and does not duplicate information previously reported in the latest consolidated annual accounts. Consequently, these interim financial statements do not include all the information that would be required for a complete set of consolidated annual accounts prepared in accordance with IFRS and, accordingly, for a proper comprehension of the information included in these interim financial statements, they should be read together with Grupo Santander’s consolidated annual accounts for the year ended 31 December 2021.
Grupo Santander policies include presenting the interim financial statements for its use in the different markets using the Euro as its presentation currency. The amounts held in other currencies and the balances of entities whose functional currency is not the Euro, have been translated to the presentation currency in accordance with the criteria indicated in Note 2.a to the consolidated annual accounts for 2021. As indicated in that Note, for practical reasons, the balance sheet amount has been converted to the closing exchange rate, the equity to the historical type, and the income and expenses have been converted by applying the average exchange rate of the period; the application of such exchange rate or that corresponding to the date of each transaction does not lead to significant differences in the interim financial statements of Grupo Santander.
The accounting policies and methods used in preparing these interim financial statements are the same as those applied in the consolidated annual accounts for 2021 taking into account the standards and interpretations with effective application date during the first six months of 2022, which are detailed below:
–Amendment to IFRS 3 Business Combinations: to update the references to the Conceptual Framework for Financial Reporting and add an exception for the recognition of liabilities and contingent liabilities within the scope of IAS 37 Provisions, Contingent Liabilities and Contingent Assets and IFRIC 21 Levies. The amendments also confirm that an acquirer should not recognize contingent assets acquired in a business combination. Applicable from 1 January 2022.
–Amendment to IAS 16 Property, Plant and Equipment: prevents an entity from deducting from the cost of an item of property, plant and equipment any revenue from the sale of finished goods while the entity is preparing the item for its intended use. It is also clear that an entity is "testing whether the asset is functioning properly" when evaluating the technical and physical performance of the asset. The financial performance of the asset should not be taken into account for this evaluation. Additionally, entities should disclose separately the amounts of income and expenses related to finished goods that are not the product of the entity's ordinary activities. Applicable from 1 January 2022.
–Amendment to IAS 37 Provisions, Contingent Liabilities and Contingent Assets: clarifies that the direct costs of fulfilling a contract include both the incremental costs of fulfilling the contract and an allocation of other costs directly related to fulfilling contracts. Before recognising a separate provision for an onerous contract, the entity recognises any impairment loss that has occurred on assets used in fulfilling the contract. Applicable from 1 January 2022.
–Amendment to IFRS Cycle (2018-2020): introduces minor amendments, applicable from 1 January 2022, to the following standards:
•IFRS 9 Financial Instruments: clarifies which rates must be included in the 10% test for derecognition of financial liabilities.
•IFRS 16 Leases: amendment to remove possible confusion regarding the treatment of leasing incentives in the application of IFRS 16 Leases.
•IFRS 1, in relation to the first-time adoption of International Financial Reporting Standards, allows entities that have measured their assets and liabilities at the carrying amounts recorded in their parent's books to also measure any cumulative translation differences using the amounts reported by the parent. This amendment also applies to associates and joint ventures that have adopted the same exemption from IFRS 1.
The aforementioned amendments to accounting standards have not had a significant effect on Grupo Santander’s financial statements.
All accounting policies and measurement bases with a material effect on the interim financial statements for 30 June 2022 were applied in their preparation.
By the time of the preparation and authorisation of these interim financial statements, there were no standards to be adopted by the European Union for the current year whose effective date of implementation by the IASB is after 1 January 2022.
c) Use of critical estimates
The consolidated results and the determination of the consolidated equity are sensitive to the accounting principles and policies, valuation criteria and estimates used by the directors of Banco Santander in preparing the interim financial statements. The main accounting principles, policies, and valuation criteria are indicated in note 2 of the consolidated annual accounts of the year 2021, except for those indicated in these interim financial statements due to the rules that have come into effect during the first six months of the year 2022.
The interim financial statements contain estimates made by the senior management of Banco Santander and of the consolidated entities in order to quantify certain of the assets, liabilities, income, expenses and obligations reported in the consolidated entities. These estimates, which were made on the basis of the best information available, relate mainly to the following:
1.The income tax expense, which, in accordance with IAS 34, is recognised in interim periods based on the best estimate of the weighted average tax rate expected by Grupo Santander for the full financial year;
2.The impairment losses on certain assets – Financial assets at fair value through other comprehensive income, financial assets at amortised cost, non-current assets held for sale, investments in subsidiaries, joint ventures and associates, tangible assets and intangible assets;
3.The assumptions used in the calculation of the post-employment benefit liabilities and commitments and other obligations;
4.The useful life of the tangible and intangible assets;
5.The measurement of goodwill impairment arising on consolidation;
6.The calculation of provisions and the consideration of contingent liabilities;
7.The fair value of certain unquoted assets and liabilities;
8.The recoverability of deferred tax assets; and
9.The fair value of the identifiable assets acquired and the liabilities assumed in business combinations in accordance with IFRS 3.
To update the above estimates, the Group's management has considered the situation of the war in Ukraine. The Group has no presence in Russia or Ukraine and its direct exposure to Russian and Ukrainian markets and assets are not material. The extent to which the conflict could ultimately impact the Group's results will depend on future developments, including subsequent sanctions that could eventually affect negatively to some Groups’ customers (those more closely related to Russia or Ukraine). Group's management has assessed the uncertainties caused by the current situation (high inflation, rise in interest rates, supply chain disruptions in more sensitive sectors, etc.) taking into account the best information available in order to anticipate the impact on the most relevant portfolios.
Furthermore, Grupo Santander reinforced the monitoring of all risks, with special attention to Poland (due to its geographical situation). Overall, the most significant impacts have been in higher commodity prices, particularly energy, and lower household disposable income due to inflationary pressures. The main actions being taken by Santander have been:
•Identification of potentially affected customers, specially by the increase in energy and oil prices, leveraging on risk playbooks
•Cyber teams prepared for a possible contingency, as cyber threats have increased due to the conflict.
•Sensitivity analysis to assess potential impacts and define action plans if needed.
•Continuous revision, by the Compliance teams, of the correct application of the sanctions established by the international community.
•Activation of the Special Situation Committee to oversee the potential effects of the conflict.
In addition, the Group's Management has taken into account the current situation as a result of covid-19, which significantly affected the economic activity worldwide and, as a result, the Group's operations and financial results.
In order to minimize the medium- and long-term economic impacts of the efforts made to contain the covid-19 pandemic, in 2020 and 2021, governments and economic and regulatory authorities of the main countries, in which the Group operates, launched a set of fiscal and monetary policy measures and other initiatives to mitigate the impact of the pandemic on the economy and to support companies and people. Likewise, Grupo Santander implemented a set of customer relief measures in full compliance with regulatory and supervisory recommendations. Santander continued to support its customers in the first six months of 2022, fostering their economic resilience in all the Group's geographies.
In relation to the relief measures to tackle the pandemic effects, the Group’s total moratoria programmes granted have fully expired at the end of first half performing better than expected. Regarding government liquidity programmes, the Group is closely monitoring their performance as the grace periods established are reaching their end. Spain concentrates most of these types of programmes, with 87% of the grace periods expired and credit quality in line with expectations, with no concerning signs of deterioration.
Lastly, the Group has partially and voluntarily aligned during the first half of 2022 the accounting definition of stage 3, as well as for the calculation of impairment provision models, to the New Definition of Default, incorporating the criteria defined by the EBA in its implementation guide of the definition of default, capturing the economic deterioration of the operations (days in default - on a daily basis – and materiality thresholds - minimum amount in arrears). The alignment of criteria has been done taking into account the criteria of IFRS 9 as well as the accounting principles of unbiased presentation of financial information. There has been an increase in the default rate at around 19 basis points, with no material impact on the provision figures for credit risk.
During the first six months ended 30 June 2022, there have been no additional significant changes in the estimates made at the end of 2021, other than those indicated in these interim financial statements.
d) Contingent assets and liabilities
Note 2.o to Grupo Santander's consolidated annual accounts for the year ended 31 December 2021 includes information on the contingent assets and liabilities at that date. There were no significant changes in Grupo Santander's contingent assets and liabilities from 31 December 2021 to the date of formal preparation of these interim financial statements.
e) Comparative information
The information for the year 2021 contained in these interim financial statements is only presented for comparison purposes with the information relating to the first six months ended 30 June 2022.
The comparative information in Note 8 as of 31 December 2021 has been restated in accordance with the reallocation of the total amount of goodwill described in said note.
In addition, the information in Note 12 regarding the Group´ segments information corresponding to the six months period ended 30 June 2021 has been restated in accordance with the Group's new organizational structure, as required by IFRS 8.
Additionally, the information in Note 15 for June 2021 has been restated in accordance with the Group's standardization criteria.
In order to interpret the changes in the balances with respect to 31 December 2021, it is necessary to take into consideration the exchange rate effect arising from the volume of foreign currency balances held by the Group in view of its geographic diversity (Note 50.b to the consolidated annual accounts for the year ended 31 December 2021) and the impact of the appreciation/depreciation of the various currencies against the euro in the first six months of 2022: Mexican peso (9.87%), US dollar (8.40%), Brazilian real (15.47%), Argentine peso (-11.10%), Pound sterling (-2.30%), Chilean peso (-1.53%) and Polish zloty (-2.22%); as well as the evolution of the average exchange rates between comparable periods: Mexican peso (9.82%), US dollar (10.32%), Brazilian real (17.23%), Pound sterling (3.01%), Chilean peso (-3.83%) and Polish zloty (-2.11%).
f) Seasonality of the Grupo Santander’s transactions
The business activities carried on by Grupo Santander entities, and their transactions are not cyclical or seasonal in nature. Therefore, no specific disclosures are included in these explanatory notes to the interim financial statements for the first six months ended 30 June 2022.
g) Materiality
In determining the note disclosures to be made on the various items in the interim financial statements or other matters, Grupo Santander, in accordance with IAS 34, took into account their materiality in relation to the interim financial statements for the first six months ended 30 June 2022.
h) Events after the reporting period
On 12 July 2022 the Spanish government announced its plans to impose new taxes on banks and energy companies. Particularly, regarding the new levy to Spanish banks, the only information available at the date of these interim financial statements is that this new tax would apply temporarily to domestic activities in 2022 and 2023. The proposal is subject to parliamentary approval and needs development to calculate the potential impact on profits.
On 14 July 2022 the President of Poland signed a "Payment Holidays Act" on crowdfunding for businesses and support for borrowers. The impact of payment holidays solutions introduced in the execution of this act that will be accounted for in the third quarter is estimated at approximately PLN 1,400 million (EUR 300 million) in the gross financial results (assuming that 50% of eligible customers will avail of this solution). This impact will depend, among others, on the number of customers who will benefit from the solution, the number of instalments suspended by each of these customers and the moment they start to benefit from the "payment holidays".
2. Santander Group
Appendices I, II and III to the consolidated annual accounts for the year ended 31 December 2021 provide relevant information on Grupo Santander companies at that date and on the companies accounted for under the equity method.
Also, Note 3 to the aforementioned consolidated annual accounts includes a description of the most significant acquisitions and disposals of companies performed by Grupo Santander in 2021, 2020 and 2019.
The most significant transactions carried out during the first six months of 2022 or pending execution at 30 June 2022 are described below:
Purchase by SHUSA for shares of Santander Consumer USA
In August 2021 Santander Holdings USA, Inc. ('SHUSA') and Santander Consumer USA Holdings Inc. ('SC') entered into a definitive agreement pursuant to which SHUSA acquired all outstanding shares of common stock of SC not already owned by SHUSA via an all-cash tender offer (the 'Tender Offer') for USD 41.50 per SC common share (the 'Offer Price'), followed by a second-step consisting of a merge (together with the Offer, the 'Transaction') in which a wholly owned subsidiary of SHUSA was merged with and into SC, with SC surviving as a wholly owned subsidiary of SHUSA, and all outstanding shares of common stock of SC not tendered in the Tender Offer were converted into the right to receive the Offer Price in cash. The Offer Price represented a 14% premium to the closing price of SC common stock of USD 36.43 as of 1 July 2021, the last day prior to the announcement of SHUSA’s initial offer to acquire the remaining outstanding shares of SC’s common stock.
On 31 January 2022, after completion of the customary closing conditions, the Transaction was performed and SHUSA increased its share up to the 100% of SC's common stock. The transaction has meant a disbursement of USD 2,510 million (around EUR 2,239 million) for the Group, with a decrease of reserves of EUR 487 million and a decrease of EUR 1,752 million of minority interests.
Acquisition of Amherst Pierpont, a U.S. fixed-income broker dealer
On 15 July 2021, Santander Holdings USA, Inc. reached an agreement to acquire Amherst Pierpont Securities, a market-leading independent fixed-income and structured products broker dealer, through the acquisition of its parent holding company, Pierpont Capital Holdings LLC, for a total consideration of approximately USD 450 million (around EUR 405 million). The operation has been closed on 11 April 2022 once the pertinent regulatory approvals have been obtained. Immediately after the acquisition, SHUSA has lent financing to the company for an amount of USD 163 million (approximately EUR 147 million), which the company will use to cancel debt with third parties. Amherst Pierpont will become part of Santander Corporate & Investment Banking (Santander CIB) Global business line.
The business combination has meant the recognition of a goodwill of EUR 158 million and EUR 24 million of intangible assets (mainly relationships with customers) identified in the purchase price allocation, without other relevant value adjustments to net assets of the business.
The amount contributed by this business to the group net attributable profit since the date of acquisition is not material. Similarly, the result that this business would have brought to the group if the transaction had been carried out on January 1, 2022 is also immaterial.
3. Shareholder remuneration system and earnings per share
a) Shareholder remuneration system
The cash remuneration paid by Banco Santander to its shareholders in the first six months of 2022 and 2021 was as follows:
| | | | | | | | | | | | | | | | | | | | |
| 30-06-2022 | 30-06-2021 |
| % of par value | Euros per share | Amount (EUR million) | % of par value | Euros per share | Amount (EUR million) |
| Ordinary shares | 10.30 | % | 0.0515 | | 869 | | 5.50 | % | 0.0275 | | 477 | |
| Other shares (without vote, redeemable, etc.) | — | | — | | — | | — | | — | | — | |
| Total remuneration paid | 10.30 | % | 0.0515 | | 869 | 5.50 | % | 0.0275 | | 477 | |
| Dividend paid out of profit | 10.30 | % | 0.0515 | | 869 | | — | | — | | — | |
| Dividend paid with a charge to reserves or share premium | — | | — | | — | | 5.50 | % | 0.0275 | | 477 | |
| Dividend in kind | — | | — | | — | | — | | — | | — | |
| Flexible payment | — | | — | | — | | — | | — | | — | |
Pursuant to the resolution of the general shareholders' meeting held on 1 April 2022, on 2 May 2022 the Bank paid a complementary cash dividend of EUR 5.15 cents per share charged to the results of the 2021 financial year for an amount of EUR 869 million (see Statement of Changes in total Equity).
Likewise, the general shareholders´ meeting approved to implement a share buyback program agreed by the board of directors for a maximum amount of EUR 865 million, for which Banco Santander received authorization from the European Central Bank, which has ended on 18 May 2022.
In May 2021, the Bank paid a dividend of EUR 2.75 cents in cash per share against the 2020 financial year, charged to the share premium of an amount of EUR 477 million (see Statement of Changes in total Equity and Note 11), this being the maximum amount allowed by the recommendation of the European Central Bank of 15 December 2020. This payment has been made in execution of the premium distribution agreement approved at the General Meeting of Shareholders of the Bank held on 27 October 2020.
b) Earnings per share from continuing and discontinued operations
i. Basic earnings per share
Basic earnings per share for the period are calculated by dividing the net profit attributable to Grupo Santander for the first six months adjusted by the after-tax amount relating to the remuneration of contingently convertible preference shares recognised in equity by the weighted average number of ordinary shares outstanding during the period, excluding the average number of treasury shares held in the period.
Accordingly:
| | | | | | | | |
| 30-06-2022 | 30-06-2021 |
| Profit attributable to the Parent (EUR million) | 4,894 | | 3,675 | |
| Remuneration of contingently convertible preferred securities (CCPS) (EUR million) | (292) | | (271) | |
| 4,602 | | 3,404 | |
| Of which: | | |
| Profit or Loss from discontinued operations (non controlling interest net) (EUR million) | — | | — | |
| Profit or Loss from continuing operations (CCPS net) (EUR million) | 4,602 | | 3,404 | |
| Weighted average number of shares outstanding | 16,947,764,566 | | 17,309,951,841 | |
| Basic earnings per share (euros) | 0.27 | | 0.20 | |
| Of which: from discontinued operations (euros) | — | | — | |
| from continuing operations (euros) | 0.27 | | 0.20 | |
ii. Diluted earnings per share
Diluted earnings per share for the period are calculated by dividing the net profit attributable to Grupo Santander for the first six months adjusted by the after-tax amount relating to the remuneration of contingently convertible preference shares recognised in equity and of perpetual liabilities contingently amortisable in their case by the weighted average number of ordinary shares outstanding during the period, excluding the average number of treasury shares and adjusted for all the dilutive effects inherent to potential ordinary shares (share options, warrants and convertible debt instruments).
Accordingly, diluted earnings per share were determined as follows:
| | | | | | | | |
| 30-06-2022 | 30-06-2021 |
| Profit attributable to the Parent (EUR million) | 4,894 | 3,675 | |
| Remuneration of contingently convertible preferred securities (CCPS) (EUR million) | (292) | | (271) | |
| 4,602 | | 3,404 | |
| Of which: | | |
| Profit or Loss from discontinued operations (non controlling interest net) (EUR million) | — | | — | |
| Profit or Loss from continuing operations (CCPS net) (EUR million) | 4,602 | | 3,404 | |
| Weighted average number of shares outstanding | 16,947,764,566 | | 17,309,951,841 | |
| Dilutive effect of options/receipt of shares | 48,431,475 | | 48,815,931 | |
| Adjusted number of shares | 16,996,196,041 | | 17,358,767,772 | |
| Diluted earnings per share (euros) | 0.27 | | 0.20 | |
| Of which: from discontinued operations (euros) | — | | — | |
| from continuing operations (euros) | 0.27 | 0.20 | |
4. Remuneration and other benefits paid to Banco Santander’s directors and senior managers
Note 5 to Grupo Santander’s consolidated annual accounts for the year ended 31 December 2021 details the remuneration and other benefits to members of Banco Santander’s Board of Directors and senior management in 2021.
Following is a summary of the most significant data on the remunerations and benefits for the first six months ended 30 June 2022 and 2021:
Remuneration of members of the board of directors (1)
| | | | | | | | |
| EUR thousand |
| 30-06-2022 | 30-06-2021 |
| Members of the board of directors: (2) | | |
| Remuneration concept | | |
| Fixed salary remuneration of executive directors | 2,859 | 3,234 |
| Variable salary remuneration of executive directors | — | | — | |
| Directors fees | 525 | 590 |
| Bylaw-stipulated emoluments (annual emolument) | 1,890 | 1,857 |
| Other (except insurance premiums) | 1,317 | 1,236 |
| Sub-total | 6,591 | 6,917 |
| Transactions with shares and/or other financial instruments | — | | — | |
| 6,591 | 6,917 |
(1)The Notes to the consolidated annual accounts for 2022 will contain detailed and complete information on the remuneration paid to all the directors, including executive directors.
(2)Mr. Germán de la Fuente was designated member of the board on 1 April 2022.
Mr. Álvaro Cardoso de Souza stepped down as member of the board on 1 April 2022.
Other benefits of members of the board of directors
| | | | | | | | |
| EUR thousand |
| 30-06-2022 | 30-06-2021 |
| Members of the board of directors | | |
| Other benefits | | |
| Advances | — | | — | |
| Loans granted | 133 | | 73 | |
| Pension funds and plans: Endowments and/or contributions (1) | 946 | | 912 | |
| Pension funds and plans: Accumulated rights (2) | 64,895 | | 68,317 | |
| Life insurance premiums | 769 | | 677 | |
| Guarantees provided for directors | — | | — | |
(1) These correspond to the endowments and/or contributions made during first six months of 2022 and 2021 in respect of retirement pensions and complementary benefits for widowhood, orphanhood and permanent disability.
(2) Corresponds to the rights accrued by the directors in matters of pensions. Additionally, former members of the board had at 30 June 2022 and 30 June 2021 rights accrued for this concept for EUR 48,388 thousand and EUR 50,107 thousand, respectively.
Remuneration of senior management (1)(2)
The table below includes the corresponding amounts related to remunerations of senior management at 30 June 2022 and 2021, excluding the executive directors:
| | | | | | | | |
| EUR thousand |
| 30-06-2022 | 30-06-2021 |
| Senior management (1) | | |
| Total remuneration of senior management (2) | 13,978 | | 14,014 | |
(3)None of the senior managers have ceased in their functions during the first six months of 2022. Remunerations received by members of the senior management who ceased in their functions by 30 June 2021, amounted to EUR 2,690 thousand.
(2) The number of members of Banco Santander's senior management, excluding executive directors, is 15 as at 30 June 2022 (16 persons at 30 June 2021 ).
The variable annual remuneration (or bonuses) received for fiscal year 2021, both for directors and the rest of senior management, were included in the information on remuneration included in the annual report for that year. Similarly, the variable remuneration attributable to the 2022 results, which will be submitted for approval by the Board of Directors at the appropriate time, will be included in the financial statements for the current year.
Funds and pension plans of senior management
| | | | | | | | |
| EUR thousand |
| 30-06-2022 | 30-06-2021 |
| Senior management (1) | | |
| Pension funds: Endowments and / or contributions (2) | 2,808 | | 2,917 | |
| Pension funds: Accumulated rights (3) | 56,222 | | 57,372 | |
(1)None of the senior managers have ceased in their functions during the first six months of 2022. Remunerations received as endowments and/or contributions to pension funds by members of the senior management who ceased in their functions by 30 June 2021 amounted to EUR 195 thousand.
(2)Corresponds to the allocations and/or contributions made during the first six months of 2022 and 2021 as retirement pensions.
(3)Corresponds to the rights accrued by members of senior management in the area of pensions. In addition, former members of senior management had at 30 June 2022 and 30 June 2021 rights accumulated for this same concept for EUR 113,060 thousand and EUR 132,597 thousand, respectively.
5. Financial assets
a) Breakdown
The detail, by nature and category for measurement purposes, of Grupo Santander's financial assets, other than the balances relating to Cash, cash balances at central banks and other deposits on demand and Hedging derivatives, at 30 June 2022 and 31 December 2021 is as follows, presented by the nature and categories for valuation purposes:
| | | | | | | | | | | | | | | | | |
| EUR million |
| 30-06-2022 |
| Financial
assets held
for trading | Non-trading
financial
assets
mandatorily
at fair value
through
profit or loss | Financial
assets
designated
at fair value
through
profit or loss | Financial
assets at fair
value through
other
comprehensive
income | Financial
assets at
amortised
cost |
| Derivatives | 68,715 | | | | | |
| Equity instruments | 10,686 | | 4,165 | | | 2,131 | | |
| Debt instruments | 41,668 | | 1,025 | | 2,529 | | 82,664 | | 57,520 | |
| Loans and advances | 42,166 | | 655 | | 8,496 | | 7,203 | | 1,072,170 | |
| Central Banks | 8,439 | | — | | — | | — | | 15,760 | |
| Credit institutions | 18,637 | | — | | 1,396 | | — | | 48,737 | |
| Customers | 15,090 | | 655 | | 7,100 | | 7,203 | | 1,007,673 | |
| Total | 163,235 | | 5,845 | | 11,025 | | 91,998 | | 1,129,690 | |
| | | | | | | | | | | | | | | | | |
| EUR million |
| 31-12-2021 |
| Financial
assets held
for trading | Non-trading
financial
assets
mandatorily
at fair value
through
profit or loss | Financial
assets
designated
at fair value
through
profit or loss | Financial
assets at fair
value through
other
comprehensive
income | Financial
assets at
amortised
cost |
| Derivatives | 54,292 | | | | | |
| Equity instruments | 15,077 | | 4,042 | | | 2,453 | | |
| Debt instruments | 26,750 | | 957 | | 2,516 | | 97,922 | | 35,708 | |
| Loans and advances | 20,834 | | 537 | | 13,441 | | 7,663 | | 1,002,190 | |
| Central Banks | 3,608 | | — | | — | | — | | 15,657 | |
| Credit institutions | 10,397 | | — | | 3,152 | | — | | 39,169 | |
| Customers | 6,829 | | 537 | | 10,289 | | 7,663 | | 947,364 | |
| Total | 116,953 | | 5,536 | | 15,957 | | 108,038 | | 1,037,898 | |
Following is the gross exposure of financial assets subject to impairment stages at 30 June 2022 and 31 December 2021:
| | | | | | | | | | | | | | | | | | | | | | | | | | |
| EUR million |
| 30-06-2022 | 31-12-2021 |
| Gross amount | Gross amount |
| Stage 1 | Stage 2 | Stage 3 | Total | Stage 1 | Stage 2 | Stage 3 | Total |
| Financial assets at fair value through other comprehensive income | 89,724 | | 89 | | 76 | | 89,889 | | 105,458 | | 72 | | 77 | | 105,607 | |
| Debt instruments | 82,667 | | 1 | | 6 | | 82,674 | | 97,924 | | 2 | | 6 | | 97,932 | |
| Loans and advances | 7,057 | | 88 | | 70 | | 7,215 | | 7,534 | | 70 | | 71 | | 7,675 | |
| Central Banks | — | | — | | — | | — | | — | | — | | — | | — | |
| Credit institutions | — | | — | | — | | — | | — | | — | | — | | — | |
| Customers | 7,057 | | 88 | | 70 | | 7,215 | | 7,534 | | 70 | | 71 | | 7,675 | |
| Financial assets at amortised cost | 1,056,866 | | 63,717 | | 32,423 | | 1,153,006 | | 961,511 | | 67,640 | | 31,491 | | 1,060,642 | |
| Debt instruments | 57,194 | | 157 | | 393 | | 57,744 | | 35,513 | | 126 | | 274 | | 35,913 | |
| Loans and advances | 999,672 | | 63,560 | | 32,030 | | 1,095,262 | | 925,998 | | 67,514 | | 31,217 | | 1,024,729 | |
| Central Banks | 15,760 | | — | | — | | 15,760 | | 15,657 | | — | | — | | 15,657 | |
| Credit institutions | 48,746 | | — | | 1 | | 48,747 | | 39,175 | | — | | 1 | | 39,176 | |
| Customers | 935,166 | | 63,560 | | 32,029 | | 1,030,755 | | 871,166 | | 67,514 | | 31,216 | | 969,896 | |
| Total | 1,146,590 | | 63,806 | | 32,499 | | 1,242,895 | | 1,066,969 | | 67,712 | | 31,568 | | 1,166,249 | |
On 30 June 2022, Grupo Santander has EUR 358 million (EUR 420 million on 31 December 2021) of exposure in impaired assets purchased with impairment, of which EUR 303 million still show signs of impairment, which mainly correspond to the business combinations carried out by Grupo Santander.
b) Impairment allowances of financial assets at amortised cost portfolio
The following is the movement that has taken place, during the first six months ended 30 June 2022 and 2021, in the balance of provisions that cover losses due to impairment of assets which comprise the heading balance of the financial assets at amortised cost:
| | | | | | | | |
| EUR million |
| 30-06-2022 | 30-06-2021 |
| Balance as at beginning of period | 23,164 | | 23,849 | |
| | |
| Impairment losses charged to income for the period | 5,255 | | 4,384 | |
| Of which: | | |
| Impairment losses charged to income | 9,720 | | 9,778 | |
| Impairment losses reversed with a credit to income | (4,465) | | (5,394) | |
| Write-off of impaired balances against recorded impairment allowance | (5,682) | | (4,353) | |
| Exchange differences and other | 937 | | (57) | |
| | |
| Balance as at end of period | 23,674 | | 23,823 | |
| | |
| Of which, relating to: | | |
| Impaired assets | 13,707 | | 14,101 | |
| Other assets | 9,967 | | 9,722 | |
| | |
| Of which: | | |
| Individually calculated | 2,719 | | 3,077 | |
| Collectively calculated | 20,955 | | 20,746 | |
Following is the movement of the loan loss provision broken down by impairment stage of loans and advances to customers recognised under 'Financial assets at amortised cost' as at 30 June 2022 and 30 June 2021:
| | | | | | | | | | | | | | |
| EUR million |
| 30-06-2022 |
| Stage 1 | Stage 2 | Stage 3 | Total |
| Impairment allowance as at beginning of period | 4,182 | | 5,224 | | 13,546 | | 22,952 | |
| Transfers between stages | (455) | | 381 | | 2,618 | | 2,544 | |
| Variation due to credit risk | 473 | | (447) | | 2,695 | | 2,721 | |
| Write-offs | — | | — | | (5,682) | | (5,682) | |
| Exchange differences and other | 249 | | 324 | | 332 | | 905 | |
| Carrying amount at end of period | 4,449 | | 5,482 | | 13,509 | | 23,440 | |
| | | | | | | | | | | | | | |
| EUR million |
| 30-06-2021 |
| Stage 1 | Stage 2 | Stage 3 | Total |
| Impairment allowance as at beginning of period | 4,252 | | 5,672 | | 13,647 | | 23,571 | |
| Transfers between stages | (474) | | 747 | | 2,273 | | 2,546 | |
| Variation due to credit risk | 473 | | (904) | | 2,269 | | 1,838 | |
| Write-offs | — | | — | | (4,353) | | (4,353) | |
| Exchange differences and other | (104) | | 33 | | (2) | | (73) | |
| Carrying amount at end of period | 4,147 | | 5,548 | | 13,834 | | 23,529 | |
Previously written-off assets recovered during the first six months of 2022 and 2021 amount to EUR 662 million and to EUR 599 million, respectively. In addition, during the first six months of 2022 EUR 169 million were recognized for losses in the income statement due to renegotiation or contractual modifications (no amount being recognized in the first six months of 2021). Considering these amounts, the recorded impairment of financial assets at amortised cost is EUR 4,762 million and EUR 3,785 million during the first six months of 2022 and 2021, respectively.
c) Impaired assets of financial assets at amortised cost portfolio
The movement during the first six months ended 30 June 2022 and 2021, in the balance of financial assets classified at amortised cost and considered impaired by reason for the credit risk is as follows:
| | | | | | | | | | |
| EUR million | | |
| 30-06-2022 | 30-06-2021 | | |
| Balance as at beginning of period | 31,848 | | 31,168 | | | |
| Net additions | 5,710 | | 4,842 | | | |
| Written-off assets | (5,682) | | (4,353) | | | |
| Exchange differences and other | 850 | | 819 | | | |
| Balance at end of period | 32,726 | | 32,476 | | | |
This amount, after deducting the related allowances, represents Grupo Santander's best estimate of the discounted value of the flows that are expected to be recovered from the impaired assets.
d) Guarantees received
Following is the breakdown of the value of the guarantees received to ensure the collection of the financial assets that comprise the heading of financial assets at amortized cost, distinguishing between real guarantees and other guarantees as of 30 June 2022 and 31 December 2021:
| | | | | | | | |
| EUR million |
| 30-06-2022 | 31-12-2021 |
| Real guarantees value | 625,070 | | 595,038 | |
| Of which: Impaired | 11,411 | | 11,371 | |
| Other guarantees value | 96,091 | | 87,791 | |
| Of which: Impaired | 1,957 | | 1,873 | |
| Total value of the guarantees received | 721,161 | | 682,829 | |
e) Fair value of financial assets not measured at fair value
Following is a comparison of the carrying amounts of Grupo Santander’s financial assets measured at other than fair value and their respective fair values at 30 June 2022 and 31 December 2021:
| | | | | | | | | | | | | | |
| EUR million |
| 30-06-2022 | 31-12-2021 |
| Carrying amount | Fair value | Carrying amount | Fair value |
| Loans and advances | 1,072,170 | | 1,065,917 | | 1,002,190 | | 1,006,711 | |
| Debt instruments | 57,520 | | 55,111 | | 35,708 | | 35,378 | |
| ASSETS | 1,129,690 | | 1,121,028 | | 1,037,898 | | 1,042,089 | |
The main valuation methods and inputs used in the estimation of the fair value of the financial assets of the previous table are detailed in Note 50.c of the consolidated annual accounts for the year 2021.
6. Non-current assets held for sale
The detail, by nature, of Grupo Santander’s non-current assets held for sale at 30 June 2022 and 31 December 2021 is as follows presented by nature:
| | | | | | | | |
| EUR million |
| 30-06-2022 | 31-12-2021 |
| Tangible assets | 3,835 | 4,089 |
| Of which: | | |
| Foreclosed assets | 3,472 | 3,651 |
| Of which: Property assets in Spain | 2,898 | 3,120 |
| Other tangible assets held for sale | 363 | 438 |
| 3,835 | 4,089 |
On 30 June 2022, the allowance recognised for the non-current tangible assets held for sale represented 48.45% (48.25% at 31 December 2021). The charges recorded in the first six months of 2022 and 2021 amounted to EUR 100 million and EUR 84 million, respectively, and the recoveries undergone during those periods amount to EUR 33 million and EUR 17 million, respectively.
7. Tangible assets
a) Changes in the period
In the first six months of 2022 and 2021, tangible assets (rights of use are not included) were acquired for EUR 4,387 million and EUR 3,363 million, respectively.
Likewise, in the first six months of 2022 and 2021 tangible asset items were disposed of with a carrying amount of EUR 2,965 million and EUR 1,621 million, generating a net loss of EUR 4 million during the first half of 2022 (net profit of EUR 52 million in the first half of 2021).
b) Property, plant and equipment purchase commitments
At 30 June 2022 and 2021, Grupo Santander did not have any significant commitments to purchase property, plant and equipment items.
c) Leasing rights
As of 30 June 2022, Grupo Santander has tangible assets under lease for the amount of EUR 2,703 million (EUR 2,625 million at 31 December 2021).
8. Intangible assets
The detail of Intangible Assets - Goodwill at 30 June 2022 and 31 December 2021, based on the cash-generating units giving rise thereto, is as follows:
| | | | | | | | |
| EUR million |
| 30-06-2022 | 31-12-2021 |
| Banco Santander (Brazil) | 3,416 | | 2,930 | |
| SAM Investment Holdings Limited | 1,444 | | 1,444 | |
| Santander Consumer Germany | 1,304 | | 1,304 | |
| Santander Bank Polska | 1,071 | | 1,095 | |
| Santander Consumer USA | 1,062 | | 979 | |
| Santander Portugal | 1,040 | | 1,040 | |
| Santander España | 998 | | 998 | |
| Santander Bank, National Association | 697 | | 643 | |
| Santander UK | 618 | | 633 | |
| Banco Santander - Chile | 508 | | 516 | |
| Grupo Financiero Santander (Mexico) | 463 | | 422 | |
| Getnet Brazil | 330 | | 287 | |
| Ebury | 308 | | — | |
| Santander Consumer Nordics | 218 | | 224 | |
| Other entities | 400 | | 198 | |
| Total Goodwill | 13,877 | | 12,713 | |
During the first half of 2022, the Group has reallocated the goodwill initially assigned to certain cash-generating units (CGUs), being the main modification the one made in the Banco Santander (Brazil) CGU, after the spin-off of Getnet Brasil and subsequent contribution of the Group's stake in this company to PagoNxt, SL. This reassignment has been made based on the relative values of the split units, none of them presenting evidence of impairment prior to the reassignment. The consolidated figures were not modified by this fact.
In addition, during the first six months of 2022 there has been an increase in goodwill of EUR 1,164 million, of which EUR 643 million correspond to exchange differences and the rest to business combinations. Exchange differences (see Note 11), in accordance with current regulations, have been recorded with a credit to the heading Other comprehensive income - Items that can be reclassified in results- Foreign currency translation of equity through the Statement of recognized income and expenses consolidated summary. As for the main business combinations of the period, the Group completed the acquisition of Amherst Pierpont Securities in April (see Note 2). Additionally, in the same month, it took control of Ebury after disbursing USD 173 million (EUR 206 million) to thus reach a 66.5% participation in its capital.
Note 17 of the consolidated annual accounts for the year ended 31 December 2021 includes detailed information on the procedures followed by Grupo Santander to analyse the potential impairment of the goodwill recognised with the respect to its recoverable amount and to recognise the related impairment losses, where appropriate.
The accounting standard (IAS 36) requires that a cash‑generating unit to which goodwill has been allocated is tested for impairment annually, and whenever there is an indication that the unit may be impaired.
Accordingly, based on the analysis performed of the available information on the performance of the various cash-generating units which might evidence the existence of indicators of impairment, Grupo Santander's directors concluded that in the first six months of 2022 there were no impairment losses which required recognition (see Note 1.c).
9. Financial liabilities
a) Breakdown
The following is a breakdown of Grupo Santander's financial liabilities, other than the balances corresponding to the Derivatives - hedge accounting heading, as of 30 June 2022 and 31 December 2021, presented by nature and categories for valuation purposes:
| | | | | | | | | | | | | | | | | | | | |
| EUR million |
| 30-06-2022 | 31-12-2021 |
| Financial
liabilities
held for
trading | Financial
liabilities
designated at
fair value through
profit or loss | Financial
liabilities at
amortised cost | Financial
liabilities
held for
trading | Financial
liabilities
designated at
fair value through
profit or loss | Financial
liabilities at
amortised cost |
| Derivatives | 67,152 | | | | 53,566 | | | |
| Short Positions | 18,595 | | | | 12,236 | | | |
| Deposits | 28,659 | | 35,226 | | 1,132,036 | | 13,667 | | 27,279 | | 1,078,587 | |
| Central banks | 3,249 | | 1,909 | | 140,872 | | 1,038 | | 607 | | 139,757 | |
| Credit institutions | 11,611 | | 1,854 | | 62,639 | | 6,488 | | 1,064 | | 52,235 | |
| Customer | 13,799 | | 31,463 | | 928,525 | | 6,141 | | 25,608 | | 886,595 | |
| Debt instruments | — | | 5,597 | | 255,049 | | — | | 5,454 | | 240,709 | |
| Other financial liabilities | — | | — | | 40,636 | | — | | — | | 29,873 | |
| Total | 114,406 | | 40,823 | | 1,427,721 | | 79,469 | | 32,733 | | 1,349,169 | |
b) Information on issues, repurchases or redemptions of debt instruments issued
The detail of the balance of debt instruments issued according to their nature is:
| | | | | | | | |
| EUR million |
| 30-06-2022 | 31-12-2021 |
| Bonds and debentures outstanding | 204,623 | | 194,362 | |
| Subordinated | 25,833 | | 25,938 | |
| Promissory notes and other securities | 30,190 | | 25,863 | |
| Total debt instruments issued | 260,646 | | 246,163 | |
The detail, at 30 June 2022 and 2021, of the outstanding balance of the debt instruments, excluding promissory notes, which at these dates had been issued by Banco Santander or any other Group entity is disclosed below. Also included is the detail of the changes in this balance in the first six months of 2022 and 2021:
| | | | | | | | | | | | | | | | | | | | |
| EUR million |
| 30-06-2022 |
| Opening
balance at
01-01-22 | Perimeter | Issuances or placements | Repurchases or
redemptions | Exchange
rate and other
adjustments | Closing
balance at
30-06-22 |
| Bonds and debentures outstanding | 194,362 | | — | | 33,800 | | (27,376) | | 3,837 | | 204,623 | |
| Subordinated | 25,938 | | — | | 113 | | (853) | | 635 | | 25,833 | |
| Bonds and debentures outstanding and subordinated liabilities issued | 220,300 | | — | | 33,913 | | (28,229) | | 4,472 | | 230,456 | |
| | | | | | | | | | | | | | | | | | | | |
| EUR million |
| 30-06-2021 |
| Opening
balance at
01-01-21 | Perimeter | Issuances or placements | Repurchases or
redemptions | Exchange
rate and other
adjustments | Closing
balance at
30-06-21 |
| Bonds and debentures outstanding | 191,577 | | — | | 33,415 | | (32,496) | | 2,364 | | 194,860 | |
| Subordinated | 21,686 | | — | | 1,578 | | — | | 119 | | 23,383 | |
| Bonds and debentures outstanding and subordinated liabilities issued | 213,263 | | — | | 34,993 | | (32,496) | | 2,483 | | 218,243 | |
At 25 April 2022, Banco Santander, S.A. proceeded to prepay all the Tier 1 Contingently Convertible Preferred Securities with ISIN code XS1602466424 and common code 160246642 in circulation, for a total nominal amount of 750 million euros and which were traded on the Irish Stock Market 'Global Exchange Market' (the 'PPCC').
At 12 May 2021, Banco Santander placed the issue contingently convertible preference shares into newly issued ordinary shares of the Bank, previously announced, for a total nominal amount of EUR 1,578 million, issued in a US Dollar Series of USD 1,000 million (EUR 828 million at the exchange rate on the day of the issue) and a Euro Series of EUR 750 million.
The issuance was carried out at par and the remuneration of PPCC, whose payment is subject to certain conditions and is also discretionary, was fixed (i) for the Dollar Series at 4.750% per annum for the first six years, revised every five years thereafter by applying a margin of 375.3 basis points over the 5-year UST rate and (ii) for the Euro Series at 4.125% per annum for the first seven years, revised every five years thereafter by applying a margin of 431.1 basis points over the applicable 5-year Euro mid-swap.
c) Other issues guaranteed by Grupo Santander
At 30 June 2022 and 2021, there were no debt instruments issued by associates or non-Group third parties (unrelated) that had been guaranteed by Banco Santander or any other Group entity.
d) Fair value of financial liabilities not measured at fair value
Following is a comparison between the value by which Grupo Santander’s financial liabilities are recorded that are measured using criteria other than fair value and their corresponding fair value at 30 June 2022 and 31 December 2021:
| | | | | | | | | | | | | | |
| EUR million |
| 30-06-2022 | 31-12-2021 |
| Carrying amount | Fair value | Carrying amount | Fair value |
| Deposits | 1,132,036 | | 1,129,103 | | 1,078,587 | | 1,076,876 | |
| Debt instruments | 255,049 | | 248,583 | | 240,709 | | 246,697 | |
| Liabilities | 1,387,085 | | 1,377,686 | | 1,319,296 | | 1,323,573 | |
Additionally, other financial liabilities are accounted for EUR 40,636 million and EUR 29,873 million as of 30 June 2022 and 31 December 2021, respectively.
The main valuation methods and inputs used in the estimation of the fair value of the financial liabilities in the previous table are detailed in Note 50.c of the consolidated annual accounts for 2021, other than those mentioned in these interim financial statements.
10. Provisions
a) Provisions for Pensions and other post-retirements obligations and Other long term employee benefits
The variation experienced by the balance of the Pensions and other post-retirements obligations and other long-term employee benefits from 31 December 2021 to 30 June 2022, is mainly due to lower net actuarial losses as a result of changes in actuarial assumptions (see Note 11.d).
b) Provisions for taxes and other legal contingencies and Other provisions
Set forth below is the detail, by type of provision, of the balances at 30 June 2022 and at 31 December 2021 of Provisions for taxes and other legal contingencies and Other provisions. The types of provision were determined by grouping together items of a similar nature:
| | | | | | | | |
| EUR million |
| 30-06-2022 | 31-12-2021 |
| Provisions for taxes | 678 | | 564 | |
| Provisions for employment-related proceedings (Brazil) | 381 | | 328 | |
| Provisions for other legal proceedings | 1,183 | | 1,104 | |
| Provision for customer remediation | 351 | | 745 | |
| Regulatory framework-related provisions | 18 | | 36 | |
| Provision for restructuring | 683 | | 749 | |
| Other | 957 | | 897 | |
| 4,251 | | 4,423 | |
Relevant information is set forth below in relation to each type of provision shown in the preceding table:
The provisions for taxes include provisions for tax-related proceedings.
The provisions for employment-related proceedings (Brazil) relate to claims filed by trade unions, associations, the prosecutor’s office and ex-employees claiming employment rights to which, in their view, they are entitled, particularly the payment of overtime and other employment rights, including litigation concerning retirement benefits. The number and nature of these proceedings, which are common for banks in Brazil, justify the classification of these provisions in a separate category or as a separate type from the rest. The Group calculates the provisions associated with these claims in accordance with past experience of payments made in relation to claims for similar items. When claims do not fall within these categories, a case-by-case assessment is performed and the amount of the provision is calculated in accordance with the status of each proceeding and the risk assessment carried out by the legal advisers.
The provisions for other legal proceedings include provisions for court, arbitration or administrative proceedings (other than those included in other categories or types of provisions disclosed separately) brought against Santander Group companies.
The provisions for customer remediation include mainly the estimated cost of payments to remedy errors relating to the sale of certain products in the UK, as well as the estimated amount related to the floor clauses of Banco Popular Español, S.A.U. To calculate the provision for customer remediation, the best estimate of the provision made by management is used, which is based on the estimated number of claims to be received and, of these, the number that will be accepted, as well as the estimated average payment per case.
The regulatory framework-related provisions include Bank Levy in the UK and in Poland the provision related to the Banking Tax.
The provisions for restructuring include only the costs arising from restructuring processes carried out by the various Group companies.
Lastly, the 'Other' heading contains very atomized and individually insignificant provisions, such as the provisions to cover the operational risk.
Qualitative information on the main litigation is provided in Note 10.c.
The Group's general policy is to record provisions for tax and legal proceedings in which the Group assesses the chances of loss to be probable and the Group does not record provisions when the chances of loss are possible or remote. Grupo Santander determines the amounts to be provided for as its best estimate of the expenditure required to settle the corresponding claim based, among other factors, on a case-by-case analysis of the facts and the legal opinion of internal and external counsel or by considering the historical average amount of the loss incurred in claims of the same nature. The definitive date of the outflow of resources embodying economic benefits for the Group depends on each obligation. In certain cases, the obligations do not have a fixed settlement term and, in others, they depend on legal proceedings in progress.
The changes in provisions arising from civil contingencies and legal nature are disclosed in this note.
The main changes in provisions in the first six months of 2022 are as follows:
With respect to provisions for labor and other legal proceedings, in Brazil, provisions of EUR 109 million and EUR 66 million were recorded, making payments of EUR 107 million and EUR 90 million, respectively.
With respect to provisions for customer compensation, and based on the best information available, the gross amount of mortgage loans denominated and indexed to foreign currencies in Poland has been adjusted, in accordance with IFRS 9, by the new estimated cash flows, as described in Note 10 c.
On the regulatory framework side, in Poland, EUR 76 million were recorded and paid in the period of six months of 2022 under the said regulatory framework.
c) Litigation and other matters
i. Tax-related litigation
At 30 June 2022 the main tax-related proceedings concerning the Group were as follows:
•Legal actions filed by Banco Santander (Brasil) S.A. and other Group entities to avoid the application of Law 9.718/98, which modifies the basis to calculate PIS and COFINS social contribution, extending it to all the entities income, and not only to the income from the provision of services. In relation of Banco Santander (Brasil) S.A. process, in May 2015 the Federal Supreme Court (FSC) admitted the extraordinary appeal filed by the Federal Union regarding PIS, and dismissed the extraordinary appeal lodged by the Brazilian Public Prosecutor's Office regarding COFINS contribution, confirming the decision of Federal Regional Court favourable to Banco Santander (Brasil) S.A. of August 2007. The appeals filed by the other entities before the Federal Supreme Court, both for PIS and COFINS, are still pending. These claims are fully provisioned.
•Banco Santander (Brasil) S.A. and other Group companies in Brazil have appealed against the assessments issued by the Brazilian tax authorities questioning the deduction of loan losses in their income tax returns (IRPJ and CSLL) in relation to different administrative processes of various years on the ground that the requirements under the applicable legislation were not met. The appeals are pending decision in CARF. No provision was recognised in connection with the amount considered to be a contingent liability.
•Banco Santander (Brasil) S.A. and other Group companies in Brazil are involved in administrative and legal proceedings against several municipalities that demand payment of the Service Tax on certain items of income from transactions not classified as provisions of services. There are several cases in different judicial instances. A provision was recognised in connection with the amount of the estimated loss.
•Banco Santander (Brasil) S.A. and other Group companies in Brazil are involved in administrative and legal proceedings against the tax authorities in connection with the taxation for social security purposes of certain items which are not considered to be employee remuneration. There are several cases in different judicial instances. A provision was recognised in connection with the amount of the estimated loss.
•In May 2003 the Brazilian tax authorities issued separate infringement notices against Santander Distribuidora de Títulos e Valores Mobiliarios, Ltda. (DTVM, actually Santander Brasil Tecnología S.A.) and Banco Santander (Brasil) S.A. in relation to the Provisional Tax on Financial Movements (CPMF) of the years 2000 to 2002. The administrative discussion ended unfavourably for both companies, and on July 3, 2015, filed a lawsuit requesting the cancellation of both tax assessments. The lawsuit was judged unfavourably in first instance. Therefore, both plaintiffs appealed to the court of second instance. On December 2020, the appeal was decided unfavourably. Against the judgment, the bank filed a motion for clarification which has not been accepted. Currently it is appealed to higher courts. There is a provision recognized for the estimated loss.
•In December 2010 the Brazilian tax authorities issued an infringement notice against Santander Seguros S.A. (Brazil), currently Zurich Santander Brasil Seguros e Previdência S.A., as the successor by merger to ABN AMRO Brasil dois Participações S.A., in relation to income tax (IRPJ and CSLL) for 2005, questioning the tax treatment applied to a sale of shares of Real Seguros, S.A. The administrative discussion ended unfavourably, and the CARF decision has been appealed at the Federal Justice. As the former parent of Santander Seguros S.A. (Brasil), Banco Santander (Brasil) S.A. is liable in the event of any adverse outcome of this proceeding. No provision was recognised in connection with this proceeding as it is considered to be a contingent liability.
•In November 2014 the Brazilian tax authorities issued an infringement notice against Banco Santander (Brasil) S.A. in relation to corporate income tax (IRPJ and CSLL) for 2009 questioning the tax-deductibility of the amortisation of the goodwill of Banco ABN AMRO Real S.A. performed prior to the absorption of this bank by Banco Santander (Brasil) S.A., but accepting the amortisation performed after the merger. Actually it is appealed before the Higher Chamber of CARF. No provision was recognised in connection with this proceeding as it was considered to be a contingent liability.
•Banco Santander (Brasil) S.A. has also appealed against infringement notices issued by the tax authorities questioning the tax deductibility of the amortisation of the goodwill arising on the acquisition of Banco Comercial e de Investimento Sudameris S.A from years 2007 to 2012. No provision was recognised in connection with this matter as it was considered to be a contingent liability.
•Banco Santander (Brasil) S.A. and other companies of the Group in Brazil are undergoing administrative and judicial procedures against Brazilian tax authorities for not admitting tax compensation with credits derived from other tax concepts, not having registered a provision for the amount considered to be a contingent liability.
•Banco Santander (Brasil) S.A. is involved in appeals in relation to infringement notices initiated by tax authorities regarding the offsetting of tax losses in the CSLL (‘Social Contribution on Net Income’) of year 2009. The appeal is pending decision in CARF. No provision was recognised in connection with this matter as it is considered to be a contingent liability.
•Brazilian tax authorities have issued infringement notices against Getnet Adquirência e Serviços para Meios de Pagamento S.A and Banco Santander (Brasil) S.A. as jointly liable in relation to corporate income tax (IRPJ and CSLL) for 2014 to 2018 questioning the tax-deductibility of the amortization of the goodwill from the acquisition of Getnet Tecnologia Proces S.A., considering that the company would not have complied with the legal requirements for such amortization. A defense against the tax assessment notices were submitted, and the appeal is pending decision in CARF. No provision was recognized as it is considered to be a contingent liability.
The total amount for the aforementioned Brazil lawsuits that are fully provisioned is EUR 1,024 million, and for lawsuits that qualify as contingent liabilities is EUR 4,530 million.
•Banco Santander appealed before European Courts the Decisions 2011/5/CE of 28 October 2009 (First Decision), and 2011/282/UE of 12 January 2011 (Second Decision) of the European Commission, ruling that the deduction of the financial goodwill regulated pursuant to Article 12.5 of the Corporate Income Tax Law constituted illegal State aid. On October 2021 the Court of Justice has definitively confirmed these Decisions. The dismissal of the appeal, that only affects these two decisions, has no effect on equity.
At the date of approval of these interim financial statements certain other less significant tax-related proceedings are also in progress.
ii. Non-tax-related proceedings
At 30 June 2022 the main non-tax-related proceedings concerning the Group were as follows:
•Payment Protection Insurance (PPI): In recent years Santander UK plc has processed customer claims associated with the sale of payment protection insurance (“PPI”), derived from the Financial Conduct Authority guidelines. As of 30 June 2022 there is no provision related to those claims as the deadline for presenting them has already expired. However, customers can still commence in-court litigation for the mis-sale of PPI and a provision for the best estimate of any obligation to pay compensation in respect of current and future claims is recognized for this purpose.
In addition, there is a legal dispute regarding allocation of liability for pre-2005 PPI policies underwritten by two entities (“Axa France”) that Axa Group acquired from Genworth Financial International Holdings, Inc. in September 2015. The dispute involves Santander Cards UK Limited (formerly known as GE Capital Bank Limited which was acquired by Banco Santander, S.A. from GE Capital group in 2008) which was the distributor of the policies in dispute and Santander Insurance Services UK Limited (the Santander Entities).
In July 2017, the Santander Entities notified Axa France that they did not accept liability for losses on PPI policies relating to the referred period. Santander UK plc entered in a Complaints Handling Agreement –that included a standstill agreement- agreeing to handle complaints on Axa France, whilst Axa France accepted paying redress assessed to be due to relevant policyholders on a without prejudice basis.
After the termination of the Complaints Handling Agreement, on 30 December 2020 Axa France provided written notice to the Santander Entities to terminate the standstill agreement. On 5 March 2021, the Santander Entities were served with a Claim Form and Brief Details of Claim by Axa France, claiming that the Santander Entities are liable to reimburse Axa France for pre-2005 PPI mis-selling losses, currently estimated at GBP 636 million (EUR 739 million). On 22 March 2021, the Santander Entities acknowledged service of the claim and notified the court of their intention to defend the claim in full and issued an application for Axa Frances’s claim to be struck out/summarily dismissed, which was heard by the Commercial Court on 22 and 23 February 2022 with judgement reserved. Judgment was handed down by the Commercial Court on 12 July 2022. The Commercial Court upheld a significant part of the Santander Entities’ strike-out plead. Both parties can seek permission to appeal this decision. In any event, notwithstanding any appeal, there are still ongoing factual issues to be resolved during the trial, which may have legal consequences including in relation to liability. These issues create uncertainties which mean that it is difficult to reliably predict the outcome or the timing of the resolution of the matter. The provision includes our best estimate of the Santander Entities’ liability for this matter.
•Delforca: dispute arising from equity swaps entered into by Gaesco (now Delforca 2008, S.A.) on shares of Inmobiliaria Colonial, S.A. Banco Santander, S.A. is claiming to Delforca before the Court of Barcelona in charge of the bankruptcy proceedings, a total of EUR 66 million from the liquidation resulting from the early termination of financial transactions due to Delforca's non-payment of the equity swaps. In the same bankruptcy proceedings, Delforca and Mobiliaria Monesa have in turn claimed the Bank to repay EUR 57 million, which the Bank received for the enforcement of the agreed guarantee, as a result of the aforementioned liquidation. On 16 September 2021 the Commercial Court Number 10 of Barcelona has ordered Delforca to pay the Bank EUR 66 million plus EUR 11 million in interest and has dismissed the claims filed by Delforca. This decision has been appealed by Delforca, Mobiliaria Monesa and the bankruptcy administrator. The appeal which the Bank has already opposed to will be resolved by the Provincial Court of Barcelona.
Separately, Mobiliaria Monesa, S.A. (parent of Delforca) filed in 2009 a civil procedure with the Courts of Santander against the Bank claiming damages that have not been specified to date. The procedure is suspended.
•Former employees of Banco do Estado de São Paulo S.A., Santander Banespa, Cia. de Arrendamiento Mercantil: claim initiated in 1998 by the association of retired Banespa employees (AFABESP) requesting the payment of a half-yearly bonus contemplated in the by-laws of Banespa in the event that Banespa obtained a profit and that the distribution of this profit were approved by the Board of Directors. The bonus was not paid in 1994 and 1995 since Banespa had not made a profit during those years. Partial payments were made from 1996 to 2000, as approved by the Board of Directors. The relevant clause was eliminated in 2001. The Tribunal Regional do Trabalho (“Regional Labour Court”) and the High Employment Court (“TST”) ordered Santander Brazil, as successor to Banespa, to pay this half-yearly bonus for the period from 1996 to the present. On 20 March 2019, the Supreme Federal Court (“STF”) rejected the extraordinary appeal filed by Santander Brazil.
Santander Bank Brazil filed a rescissory action before the TST to nullify the decisions of the main proceedings. The rescissory action was dismissed and a motion for clarification was filed, due to the absence of an explicit argument to deny the rescissory action filed by Santander Brazil. After the decision of the motion for clarification, Santander Brazil filed an extraordinary appeal in the rescissory action in February 2021, which was denied in an interlocutory decision in June 2021 by the TST. As Santander Brazil understands there is a conflict between the TST decision and the doctrine set by the STF, Santander Brazil has appealed this decision. This appeal is pending.
In August 2021, a first instance court has ruled that the enforcement of the TST decision shall be carried out individually, at the jurisdiction pertaining to each person. AFABESP appealed this decision. In December 2021, the Regional Labor Court denied the appeal filled by AFABESP. This decision has not been appealed by AFABESP, and therefore it has become final.
Santander Brazil external advisers have classified the risk as probable. The recorded provisions are considered sufficient to cover the risks associated with the legal claims that are being substantiated as of 30 June 2022.
•'Planos Económicos': Like the rest of the banking system in Brazil, Santander Brazil has been the target of customer complaints and collective civil suits stemming mainly from legislative changes and its application to bank deposits ('economic plans'). At the end of 2017, an agreement between regulatory entities and the Brazilian Federation of Banks (“Febraban”) with the purpose of closing the lawsuits was reached and was approved by the Supremo Tribunal Federal. Discussions focused on specifying the amount to be paid to each affected client according to the balance in their notebook at the time of the Plan. Finally, the total value of the payments will depend on the number of adhesions there may be and the number of savers who have demonstrated the existence of the account and its balance on the date the indexes were changed. In November 2018, the STF ordered the suspension of all economic plan proceedings for two years from May 2018. On 29 May 2020, the STF approved the extension of the agreement for 5 additional years starting from 3 June 2020. Condition for this extension was to include in the agreement actions related to the “Collor I Plan”. The provision recorded for the economic plan proceedings amounts to EUR 262 million at 30 June 2022.
•Floor clauses: as a consequence of the acquisition of Banco Popular Español, S.A., the Group has been exposed to a material number of transactions with floor clauses. The so-called "floor clauses" are those under which the borrower accepts a minimum interest rate to be paid to the lender, regardless of the applicable reference interest rate. Banco Popular Español, S.A. included "floor clauses" in certain asset-side transactions with customers. In relation to this type of clauses, and after several rulings made by the Court of Justice of the European Union and the Spanish Supreme Court, and the extrajudicial process established by the Spanish Royal Decree-Law 1/2017, of 20 January, Banco Popular Español, S.A. made provisions that were updated in order to cover the effect of the potential return of the excess interest charged for the application of the floor clauses between the contract date of the corresponding mortgage loans and May 2013. At 30 June 2022, after having processed most of the customer requests, the potential residual loss associated with ongoing court proceedings is estimated at EUR 44 million, amount which is fully covered by provisions.
•Banco Popular´s acquisition: After the declaration of the resolution of Banco Popular Español, S.A. (“Banco Popular”), some investors filed claims against the EU’s Single Resolution Board decision, and the FROB's resolution executed in accordance to the aforementioned decision. Likewise, numerous appeals were filed against Banco Santander, S.A. alleging that the information provided by Banco Popular was erroneous and requesting from Banco Santander, S.A. the restitution of the price paid for the acquisition of the investment instruments or, where appropriate, the corresponding compensation.
In relation to these appeals, on the one hand, the General Court of the European Union (“GCUE”) selected 5 appeals from among all those filed before the European courts by various investors against the European institutions and processed them as pilot cases. On 1 June 2022, the GCUE has rendered five judgements in which it has completely dismissed the appeals, (i) supporting the legality of the resolution framework applied to Banco Popular, (ii) confirming the legality of the action of the European institutions in the resolution of Banco Popular and (iii) rejecting, in particular, all the allegations that there were irregularities in the sale process of Banco Popular to Banco Santander, S.A. These judgements can be appealed before the Court of Justice of the European Union ('CJEU').
On the other hand, in relation to the lawsuits initiated by investors directly against Banco Santander, S.A. derived from the acquisition of Banco Popular, on 2 September 2020, the Provincial Court of La Coruña submitted a preliminary ruling to the CJEU in which it asked for the correct interpretation of the Article 60, section 2 of Directive 2014/59/EU of the European Parliament and of the Council, of May 15, 2014, establishing a framework for the restructuring and resolution of credit institutions and investment services companies. Said article establishes that, in the cases of redemption of capital instruments in a bank resolution, no liability will subsist in relation to the amount of the instrument that has been redeemed. On 5 May 2022, the CJEU has rendered its judgement confirming that Directive 2014/59/EU of the European Parliament and of the Council does not allow that, after the total redemption of the shares of the share capital of a credit institution or an investment services company subject to a resolution procedure, the shareholders who have acquired shares within the framework of a public subscription offer issued by said company before the start of such a resolution procedure, exercise against that entity or against its successor, an action for liability for the information contained in the prospectus, under Directive 2003/71/EC of the European Parliament and of the Council, or an action for annulment of the subscription contract for those shares, which, taking into account its retroactive effects, gives rise to the restitution of the equivalent value of said shares, plus the interest accrued from the date of execution of said contract.
Separately, the Central Court of Instruction 4 is currently conducting preliminary proceedings 42/2017, in which, amongst other things, is being investigated the following: (i) the accuracy of the prospectus for the capital increase with subscription rights carried out by Banco Popular in 2016; and (ii) the alleged manipulation of the share price of Banco Popular until the resolution of the bank, in June 2017. During the course of the proceedings, on 30 April 2019, the Spanish National Court, ruled in favour of Banco Santander, S.A. declaring that Banco Santander, S.A. cannot inherit Banco Popular’s potential criminal liability. This ruling was appealed before the Supreme Court, which rejected it. In these proceedings, Banco Santander, S.A. could potentially be subsidiarily liable for the civil consequences. Recently, and in view of the CJEU ruling of 5 May 2022, the Bank has requested confirmation of the exclusion of its subsidiary civil liability status in this criminal proceeding. On 26 July 2022, the Court has rejected this request stating that it is a matter to be determined at a later procedural time. This decision is subject to appeal.
The estimated cost of any compensation to shareholders and bondholders of Banco Popular recognized in the 2017 accounts amounted to EUR 680 million, of which EUR 535 million were applied to the commercial loyalty program. The CJEU judgement of 5 May represents a very significant reduction in the risk associated with these claims.
•German shares investigation: The Cologne Public Prosecution Office is conducting an investigation against the Bank, and other group entities based in the UK - Santander UK plc, Santander Financial Services Plc and Cater Allen International Limited -, in relation to a particular type of tax dividend linked transactions known as cum-ex transactions.
The Group is cooperating with the German authorities. According to the state of the investigations, the result and the effects for the Group, which may potentially include the imposition of material financial penalties, cannot be anticipated. For this reason, the Bank has not recognized any provisions in relation to the potential imposition of financial penalties.
•Banco Santander, S.A. has been sued in a legal proceeding in which the plaintiff alleges that a contract was concluded whereby he would be entrusted with the functions of CEO of the Bank. In the complaint, the claimant mainly requests a declaratory ruling that affirms the validity and conclusion of such contract and its enforcement together with the payment of certain amounts. If the main request is not granted, the claimant sought a compensation for a total amount of approximately EUR 112 million or, an alternative relief for other minor amounts. Banco Santander, S.A. answered to the complaint stating that the conditions to which the appointment was subject to were not met and that the contract required by law was not concluded. On 17 May 2021, the plaintiff reduced his claims for compensation to EUR 61.9 million.
On 9 December 2021, the Court has rendered its decision ordering the Bank to compensate the plaintiff in the amount of EUR 67.8 million. On 13 January 2022, the Court has corrected and supplemented its judgment, reducing the total amount to EUR 51.4 million and establishing that part of this amount (EUR 18.6 million) would have to be paid in shares of Banco Santander, S.A. and subject to the application of the same terms provided in the applicable Santander executives’ remuneration program (deferred and linked to Santander’s performance metrics). On 14 February 2022, the Bank filed an appeal against the judgment before the Provincial Court of Madrid, which was formally objected by the plaintiff on 7 March 2022. The decision is pending.
In parallel, the plaintiff lodged a request for provisional partial enforcement of the judgment of first instance. An order was issued for execution and the Bank deposited the entire amount within the voluntary compliance period. If the appeal filed by the Bank succeeds, the amount would be returned with the applicable interest.
The provisions recorded are considered to be sufficient to cover the risks deriving from this claim.
•Universalpay Entidad de Pago, S.L. has filed a lawsuit against Banco Santander, S.A. for breach of the marketing alliance agreement (“MAA”) and claim payment (EUR 1,050 million). The claim is being processed in the Court of First Instance no. 81 of Madrid. The MAA was originally entered into by Banco Popular Español, S.A. and its purpose is the rendering of acquiring services (point of sale payment terminals) for businesses in the Spanish market. The lawsuit is mainly based on the potential breach of clause 6 of the MAA, which establishes certain obligations of exclusivity, non-competition and customer referral.
The Bank answered the complaint on May 2021 and the pretrial hearing took place on 11 March 2022. The hearing of the case will take place on 10 and 11 November 2022. At the current stage of the proceeding, there are still factual issues pending resolution, which may have legal consequences and affect any potential liability. This uncertainty makes it impossible to reliably predict the resolution of the issue, the timing or the significance of the potential economic impact.
•CHF Polish Mortgage Loans. On 3 October 2019, the Court of Justice of the European Union (“CJEU”) rendered its decision in relation to a judicial proceeding against an unrelated bank in Poland considering that certain contractual clauses in CHF-indexed loan agreements were abusive. The CJEU has left to Polish courts the decision on whether the whole contract can be maintained once the abusive terms have been removed, which should in turn decide whether the effects of the annulment of the contract are prejudicial to the consumer. In case of maintenance of the contract, the court may only integrate the contract with subsidiary provisions of national law and decide, in accordance with those provisions, on the applicable rate.
In 2021, the Supreme Court was expected to take a position regarding the key issues in disputes concerning loans based on foreign currency, clarifying the discrepancies and unifying case law. The Supreme Court met several times, with the last session taking place on 2 September 2021. However, the resolution was not adopted and instead, the Supreme Court referred questions to the CJEU on constitutional issues of the Polish judiciary system. No new date for consideration of the issue has been set and no comprehensive decision by the Supreme Court of the issue is expected in the near future. In the absence of a comprehensive position of the Supreme Court, it is difficult to expect a full unification of judicial decisions, and decisions of the Supreme Court and CJEU issued on particular issues may be important for shaping further case law on CHF matters.
At the date of these interim financial statements, there is no uniform ruling practice and – in the opinion of Santander Bank Polska and Santander Consumer Bank Poland - it is not possible to predict the Supreme Court’s and CJEU decisions on individual cases. Santander Bank Polska and Santander Consumer Bank Poland regularly monitor court rulings on foreign currency loans to verify changes in case law practice.
As of 30 June 2022, Santander Bank Polska and Santander Consumer Bank Poland maintain a portfolio of mortgages denominated in or indexed to CHF for an approximate gross amount of PLN 9,119.9 million (EUR 1,940 million). As of 1 January 2022, in accordance with IFRS 9 and based on the new best available information, the gross carrying amount of mortgage loans denominated and indexed in foreign currencies is reduced by the amount in which the estimated cash flows are not expected to cover the gross amount of loans, including as a result of legal controversies relating to these loans. In the absence of exposure or insufficient gross exposure, a provision according to IAS 37 is recorded. Total value of adjustment to gross carrying amount in accordance with IFRS9 as well as provisions recorded under IAS37, amount to PLN 2,964.5 million (EUR 630.5 million) of which PLN 2,651.1 million (EUR 563.9 million) corresponds to adjustment to gross carrying amount under IFRS 9 and PLN 313.3 million (EUR 66.6 million) to provisions recognized in accordance with IAS 37. During the period, the adjustment against gross value under IFRS 9 amounted to PLN 738.4 million (EUR 159.3 million), additional provisions to the provisions accounted for under IAS 37 amounted to PLN 126.3 million (EUR 27.3 million), and other costs associated with the dispute amounting to PLN 82.7 million (EUR 17.8 million).
This provision represents the best estimate as at 30 June 2022 given the difficulty to predict the financial impact, as it is for national courts to decide the relevant issues and the process of analyzing and deciding on the KNF proposal described below has not yet been completed. Santander Bank Polska and Santander Consumer Bank Poland will continue to monitor and assess appropriateness of those provisions.
In December 2020, the Chairman of the Polish Financial Supervision Authority (“KNF”) presented a proposal for voluntary settlements between banks and borrowers under which CHF loans would be retrospectively settled as PLN loans bearing an interest rate based on WIBOR plus margin. The Bank has been testing such settlements in relation to different customer groups in parallel with own settlement solutions. The tests will need to be continued due to lingering legal uncertainty and unstable economic environment caused by interest rate hikes. The results of the current tests have been incorporated into the present provision calculation model.
While the above referred events could lead to significant changes in the level of expected provisions, in the opinion of Santander Bank Polska and Santander Consumer Bank Poland, it is not possible to reliably estimate the value of their impact on their financial position at 30 June 2022.
•Banco Santander Mexico. Dispute regarding an inheritance trust constituted in 1994 by Mr. Roberto Garza Sada in Banca Serfin (currently Santander Mexico) in favor of his four children in which he affected shares of Alfa, S.A.B. de C.V.
(respectively, "Alfa" and the "Trust"). During 1999, Mr. Roberto Garza Sada instructed Santander México in its capacity as trustee to transfer 36,700,000 shares from the Trust's assets to his children and himself. These instructions were ratified in 2004 by Mr. Roberto Garza Sada before a Notary Public.
Mr. Roberto Garza Sada, passed away on 14 August 2010 and subsequently, in 2012, his daughters filed a complaint against Santander Mexico alleging it had been negligent in its trustee role. The lawsuit was dismissed at first instance in April 2017 and on appeal in 2018. In May 2018, the plaintiffs filed an appeal (recurso de amparo) before the First Collegiate Court of the Fourth Circuit based in Nuevo León, which ruled in favor of the plaintiffs on 7 May 2021, annulling the 2018 appeal judgment and condemning Santander Mexico to the petitions claimed, consisting of the recovery of the amount of 36,700,000 Alfa shares, together with dividends, interest and damages. On 7 June 2021, Santander México filed an appeal for constitutional review against the decision of the Collegiate Court before the Supreme Court of Justice of the Nation, considering that this court was not empowered to resolve substantive issues that had not been raised by the parties, lack of procedural standing, and the absence of a decision imposing the plaintiffs to pay costs. This appeal was rejected by the President of the Supreme Court of Justice of the Nation on 1 October 2021 on the grounds that the matter, although it refers to constitutional matters, is not of exceptional interest.
On 6 October 2021, Santander México filed an appeal against this decision before the Supreme Court itself, which was rejected in limine by the President of the Court by order dated 11 October 2021, considering that against the dismissal of the appeal for constitutional review, there is no possible appeal pursuant to the Constitutional Reform of March 2021. Against this decision, on 8 December 2021, a new appeal was filed for this matter to be reviewed by the First Chamber of the Supreme Court of Justice of the Nation, considering that the failure to accept the appeal constitutes a retroactive application of the law, and that this violates the transitory fifth article of the reform of the “Ley de Amparo” published on 7 June 2021. This appeal has not been admitted by the Chairman of the Supreme Court of Justice of the Nation on 3 January 2022 (and notified on 17 February 2022).
In compliance with the aforementioned ruling of 7 May 2021, the Seventh Civil Chamber of the Superior Court of Justice of Nuevo León has issued a judgement imposing Santander Mexico to pay the benefits claimed by the plaintiffs. As a result of this judgement, Santander Mexico has filed a new appeal (recurso de amparo) before the First Collegiate Court of the Fourth Circuit based in Nuevo León and has requested that it be resolved by the Supreme Court of Justice of the Nation. As of 30 June 2022 a decision on such appeal is pending. In addition, on 29 June 2022, Santander Mexico has, within the framework of this recurso de amparo, requested the First Collegiate Court in Civil Matters of the Fourth Circuit of Nuevo León, the recusal of two of the three Magistrates who rendered judgement against Santander Mexico.
Santander México estimates that the actions taken should prevail and reverse the decision against it. The impact of a potential unfavorable resolution for Santander México will be determined in a subsequent proceeding and will also depend on the additional actions that Santander México may take in its defense, so it is not possible to determine it at this time. At the current stage of the proceedings, the provisions recorded are considered to be sufficient to cover the risks deriving from this claim.
•URO Property Holdings SOCIMI SA: on 16 February 2022, legal proceedings were commenced in the Commercial Court of London against Uro Property Holdings SOCIMI SA (“Uro”), a subsidiary of Banco Santander, S.A., by BNP Paribas Trust Corporation UK Limited (“BNP”) in its capacity as trustee on behalf of certain bondholders and beneficiaries of security rights. The litigation concerns certain terms of a financing granted to Uro which was supported by a bond issue in 2015 with BNP acting as trustee on behalf of the bondholders and security right beneficiaries. The litigation seeks a declaration by the Court that Uro must pay an additional premium above the nominal value of the financing repayment as a consequence of Uro having lost its status as SOCIMI (Sociedad Anónima Cotizada de Inversión Inmobiliaria), such loss causing the prepayment of the bond issue and, in the opinion of the claimant BNP, also the obligation to pay the additional premium by Uro. Uro denies being liable to pay that additional premium and filed its defense statement. It is estimated that the maximum loss associated with this possible contingency, amounts to approximately EUR 250 million. Trial hearing has not been scheduled yet.
Banco Santander, S.A. and the other Group companies are subject to claims and, therefore, are party to certain legal proceedings incidental to the normal course of their business including those in connection with lending activities, relationships with employees and other commercial or tax matters additional to those referred to here.
With the information available to it, the Group considers that, at 30 June 2022, it had reliably estimated the obligations associated with each proceeding and had recognized, where necessary, sufficient provisions to cover reasonably any liabilities that may arise as a result of these tax and legal risks. Those cases in which provisions have been registered but are not disclosed are justified on the basis that it would be prejudicial to the proper defense of the Group. Subject to the qualifications made, the Group believes that any liability arising from such claims and proceedings will not have, overall, a material adverse effect on the Group’s business, financial position, or results of operations.
11. Equity
In the first six month periods ended 30 June 2022 and 2021 there were no quantitative or qualitative changes in Grupo Santander's equity other than those indicated in the condensed consolidated statements of changes in total equity.
a) Capital
Banco Santander's share capital at 30 June 2022 and 31 December 2021 consisted of EUR 8,397 and EUR 8,670 million, respectively, represented by 16,794,401,584 and 17,340,641,302 shares of EUR 0.50 of nominal value each, respectively, and all of them of a unique class and series.
On 1 April 2022, there was a capital reduction amounting to EUR 129,965,136.50 through the redemption of 259,930,273 shares, corresponding to the share buyback program carried out in 2021.
Likewise, on 28 June 2022, Banco Santander has decreased its capital by an amount of EUR 143,154,722.50 through the redemption of 286,309,445 shares, corresponding to the share buyback program carried out during the first half of 2022.
Both operations have not entailed the return of contributions to the shareholders as Banco Santander was the owner of the redeemed shares.
b) Share premium
Includes the amount paid by the bank's shareholders in capital issues in excess of par value.
As a result of the capital reductions described in Note 11.a, the issue premium has been reduced during the first half of 2022 by an amount of EUR 1,433 million, corresponding to the difference between the purchase value of the redeemed shares (EUR 1,706 million) and the par value of said shares (EUR 273 million). Likewise, in accordance with the applicable legislation, a reserve has been provided for amortized capital charged to the issue premium for an amount equal to the nominal value of said amortized shares (EUR 273 million).
The decrease produced in 2021 for an amount of EUR 4,034 million has been the consequence of applying the result obtained by Banco Santander during the financial year 2020, consisting of losses of EUR 3,557 million and the charge of the dividend for the fiscal year 2020 for an amount of EUR 477 million, as reflected in the interim consolidated statement of changes in total equity.
c) Breakdown of other comprehensive income - Items not reclassified to profit or loss and Items that may be reclassified to profit or loss
| | | | | | | | |
| EUR million |
| 30-06-2022 | 31-12-2021 |
| Other comprehensive income accumulated | (32,526) | | (32,719) | |
| Items not reclassified to profit or loss | (3,809) | | (4,241) | |
| Actuarial gains or losses on defined benefit pension plans | (3,284) | | (3,986) | |
| Non-current assets held for sale | — | | — | |
| Share in other income and expenses recognised in investments, joint ventures and associates | (9) | | (8) | |
| Other valuation adjustments | — | | — | |
| Changes in the fair value of equity instruments measured at fair value with changes in other comprehensive income | (512) | | (157) | |
Inefficacy of fair value hedges of equity instruments measured at fair value with changes
in other comprehensive income | — | | — | |
Changes in the fair value of equity instruments measured at fair value with changes
in other comprehensive income (hedged item) | 312 | | 275 | |
Changes in the fair value of equity instruments measured at fair value with changes
in other comprehensive income (hedging instrument) | (312) | | (275) | |
Changes in the fair value of financial liabilities measured at fair value through profit or loss
attributable to changes in credit risk | (4) | | (90) | |
| Items that may be reclassified to profit or loss | (28,717) | | (28,478) | |
| Hedge of net investments in foreign operations (effective portion) | (5,976) | | (4,283) | |
| Exchange differences | (19,524) | | (23,887) | |
| Hedging derivatives (effective portion) | (2,054) | | (276) | |
| Changes in the fair value of debt instruments measured at fair value with changes in other comprehensive income | (834) | | 436 | |
| Hedging instruments (items not designated) | — | | — | |
| Non-current assets held for sale | — | | — | |
| Share in other income and expenses recognised in investments, joint ventures and associates | (329) | | (468) | |
d) Other comprehensive income - Items not reclassified to profit or loss - Actuarial gains or losses on defined benefit pension plans
The changes in the balance of Other comprehensive income - Items not reclassified to profit or loss - Actuarial gains or losses on defined benefit pension plans include the actuarial gains or losses generated in the period and the return on plan assets, excluding amounts included in net interest on the net defined benefit liability (asset), less the administrative expenses and taxes inherent to the plan, and any change in the effect of the asset ceiling. Its variation is shown in the condensed consolidated statement of recognised income and expense.
During the first six months of 2022, the amount of actuarial losses (net of actuarial gains) has decreased by EUR 843 million. The main impacts are:
•Decrease of EUR 386 million in the cumulative actuarial losses relating to the Group´s businesses in the UK, mainly due to the evolution experienced by the discount rate (increase from 1.90% to 3.84%), partly compensated by the movement of assets.
•Decrease of EUR 229 million in the accumulates actuarial losses relating to the Group´s entities in Spain, mainly due to the discount rate variation (increase from 0.90% to 3.10%).
•Decrease of EUR 161 million in the cumulative actuarial losses relating to the Group's businesses in Germany, due to the discount rate variation (increase from 1.45% to 3.55%).
•Decrease of EUR 110 million in the cumulative actuarial losses relating to the Group's businesses in Portugal, due to the discount rate variation (increase from 1.10% to 2.60%).
•Decrease of EUR 46 million in accumulated actuarial losses corresponding to the Group’s business in Brazil, mainly due to the increase in the discount rate (increase from 8.39% to 9.12% for pension plans), partly compensated by the movement of assets.
The other modification in accumulated actuarial profit or losses is an increase of EUR 89 million as a result of the evolution of exchange rates, mainly the appreciation of the Brazilian real.
e) Other comprehensive income - Items not reclassified to profit or loss – Changes in the fair value of equity instruments measured at fair value with changes in other comprehensive income
Includes the net amount of unrealised fair value changes in equity instruments at fair value with changes in other comprehensive income.
Below is a breakdown of the composition of the balance as of 30 June 2022 and 31 December 2021 under 'Other comprehensive income - Items not reclassified to profit or loss - Changes in the fair value of equity instruments measured at fair value with changes in other comprehensive income' depending on the geographical origin of the issuer:
| | | | | | | | | | | | | | | | | | | | | | | | | | |
| EUR million |
| 30-06-2022 | 31-12-2021 |
| Revaluation gains | Revaluation losses | Net revaluation gains/(losses) | Fair value | Revaluation gains | Revaluation losses | Net revaluation gains/(losses) | Fair value |
| Equity instruments | | | | | | | | |
| Domestic | | | | | | | | |
| Spain | 25 | | (916) | | (891) | | 504 | | 25 | | (663) | | (638) | | 759 | |
| International | | | | | | | | |
| Rest of Europe | 82 | | (59) | | 23 | | 220 | | 39 | | (58) | | (19) | | 170 | |
| United States | 17 | | (5) | | 12 | | 36 | | 13 | | (4) | | 9 | | 31 | |
| Latin America and rest | 346 | | (2) | | 344 | | 1,371 | | 496 | | (5) | | 491 | | 1,493 | |
| 470 | | (982) | | (512) | | 2,131 | | 573 | | (730) | | (157) | | 2,453 | |
| Of which: | | | | | | | | |
| Listed | 346 | | (46) | | 300 | | 1,391 | | 500 | | (44) | | 456 | | 1,521 | |
| Unlisted | 124 | | (936) | | (812) | | 740 | | 73 | | (686) | | (613) | | 932 | |
f) Other comprehensive income - Items that may be reclassified to profit or loss – Hedges of net investments in foreign operations (effective portion) and exchange differences
Other comprehensive income - Items that may be reclassified to profit or loss - Hedges of net investments in foreign operations (effective portion) includes the net amount of the changes in value of hedging instruments in hedges of net investments in foreign operations, in respect of the portion of these changes considered to be effective hedges.
Other comprehensive income - Items that may be reclassified to profit or loss - Exchange differences includes the net amount of exchange differences arising on non-monetary items whose fair value is adjusted against equity and the differences arising on the translation to euros of the balances of the consolidated entities whose functional currency is not the euro.
The net variation of both headings recognised during the first six months of 2022 in the interim condensed consolidated statement of recognised income and expenses, reflects the impact of the evolution of the currencies during the year, reflecting mainly the strong appreciation of the Brazilian real, US dollar and Mexican peso, and in the negative side the impact of the depreciation of the Pound sterling (see Note 1.e). Of this variation, a capital gain of EUR 643 million corresponds to the valuation at the closing exchange rate of goodwill for the first six months of 2022 (see Note 8).
g) Other comprehensive income – Items that may be reclassified to profit or loss – Changes in the fair value of debt instruments measured at fair value through other comprehensive income
Includes the net amount of unrealised fair value changes in debt instruments at fair value through other comprehensive income.
Below is a breakdown of the composition of the balance as of 30 June 2022 and 31 December 2021 under Other comprehensive income - Items that may be reclassified to profit or loss - Changes in the fair value of debt instruments measured at fair value through other comprehensive income depending on the type of instrument and the geographical origin of the issuer:
| | | | | | | | | | | | | | | | | | | | | | | | | | |
| EUR million |
| 30-06-2022 | 31-12-2021 |
| Revaluation gains | Revaluation losses | Net revaluation gains/(losses) | Fair value | Revaluation gains | Revaluation losses | Net revaluation gains/(losses) | Fair value |
| Debt instruments | | | | | | | | |
Government and central banks
debt instruments
| | | | | | | | |
| Spain | 99 | | — | | 99 | | 8,927 | | 271 | | — | | 271 | | 12,917 | |
| Rest of Europe | 345 | | (220) | | 125 | | 16,671 | | 544 | | (118) | | 426 | | 20,397 | |
| Latin America and rest of the world | 157 | | (844) | | (687) | | 45,506 | | 334 | | (438) | | (104) | | 49,847 | |
| Private-sector debt instruments | 28 | | (399) | | (371) | | 18,763 | | 80 | | (237) | | (157) | | 22,424 | |
| 629 | | (1,463) | | (834) | | 89,867 | | 1,229 | | (793) | | 436 | | 105,585 | |
In the first half of 2022 management has changed the business models due to the cease of significant activities related to the commercialization of a certain type of current accounts in Poland, the origination of mortgages and home equity loans in the US and the cease of significant activities of foreign branches in Brazil. Due to this fact Debt securities were transferred from the 'Financial asset at fair value through other comprehensive income' to the ‘Financial asset at amortised cost', being the value of these assets at the date of the transfer EUR 6,427 million.
The business models are subject to change as the requirements of IFRS 9 are met. Moreover, as established in IFRS 9, the aforementioned transfer was made prospectively. The financial asset is reclassified at its fair value at the reclassification date, and the cumulative gain or loss previously recognized in other comprehensive income is removed from equity. As a result, the financial asset is measured at the reclassification date as if it had always been measured at amortized cost and the cumulative gain or loss previously recognized in 'Other comprehensive income' (see condensed consolidated statements of recognised income and expense) is adjusted against the fair value of the financial asset at the reclassification date.
12. Segment information (Primary segment)
Grupo Santander has aligned the information in this note with the underlying information used internally for management reporting and with that presented in Grupo Santander's other public documents.
Grupo Santander's executive committee has been selected to be its chief operating decision maker. Grupo Santander's operating segments reflect its organizational and managerial structures. The executive committee reviews internal reporting based on these segments to assess performance and allocate resources.
The segments are split by geographic area in which profits are earned and type of business. We prepare the information by aggregating the figures for Santander’s various geographic areas and business units, relating it to both the accounting data of the units integrated in each segment and that provided by management information systems. The same general principles as those used in Grupo Santander are applied.
On 4 April 2022, Grupo Santander announced that, starting and effective with the financial information for the first quarter of 2022, it will carry out changes in the reportable segments to reflect the new reporting structure.
The main changes, which have been applied to management information for all periods included in the interim financial statements, relate to the allocation of certain financial costs of the Corporate Centre as follows:
•Further clarity in the minimum requirement for own funds and eligible liabilities (MREL) and total loss absorbing capacity (TLAC) regulation makes it possible to allocate the cost of eligible debt issuances to the corresponding units from the Corporate Centre.
•Other financial costs, primarily associated with the cost of funding the excess capital held by the units above the Group's CET1 ratio have been reassigned from the Corporate Centre to the corresponding units.
Following is the breakdown of revenue that is deemed to be recognised under Dividend income, Commission income, Gain or losses on financial assets and liabilities not measured at fair value through profit or loss, net, Gain or losses on financial assets and liabilities held for trading, net, Gain or losses on non-trading financial assets and liabilities mandatorily at fair value through profit or loss, Gain or losses on financial assets and liabilities measured at fair value through profit or loss, net, Gain or losses from hedge accounting, net, Other operating income and Income from assets under insurance and reinsurance contracts in the accompanying consolidated income statements for the first six months ended 30 June 2022 and 2021.
In addition to these operating units, which report by geographic area and businesses, Grupo Santander continues to maintain the area of Corporate Centre, that includes the centralized activities relating to equity stakes in financial companies, financial management of the structural exchange rate position, assumed within the sphere of Grupo Santander's assets and liabilities committee, as well as management of liquidity and of shareholders' equity via issuances.
This financial information ('underlying basis') is computed by adjusting reported results for the effects of certain gains and losses (e.g.: capital gains, write-downs, etc.). These gains and losses are items that management and investors ordinarily identify and consider separately to understand better the underlying trends in the business.
Following is the reconciliation between the adjusted profit and the statutory profit corresponding to the first six months ended 30 June 2022 and 2021:
| | | | | | | | | | | | | | | | | | | | |
| EUR million |
| Revenue from ordinary activities | Profit before taxes | Profit |
| Segment | 30-06-2022 | 30-06-2021 | 30-06-2022 | 30-06-2021 | 30-06-2022 | 30-06-2021 |
| Europe | 13,649 | | 10,862 | | 2,693 | | 1,963 | | 1,839 | | 1,312 | |
| North America | 8,154 | | 7,315 | | 2,061 | | 2,478 | | 1,578 | | 1,581 | |
| South America | 17,613 | | 10,580 | | 3,165 | | 3,105 | | 1,946 | | 1,639 | |
| Digital Consumer Bank | 3,395 | | 3,245 | | 1,010 | | 888 | | 572 | | 485 | |
| Corporate Centre | 173 | | (169) | | (1,014) | | (805) | | (1,041) | | (812) | |
| Underlying Profit | 42,984 | | 31,833 | | 7,915 | | 7,629 | | 4,894 | | 4,205 | |
| Adjustments | — | | — | | — | | (715) | | — | | (530) | |
| Statutory Profit | 42,984 | | 31,833 | | 7,915 | | 6,914 | | 4,894 | | 3,675 | |
Explanation of adjustments:
In the first six months of 2021, the impact of restructuring costs of EUR -530 million was mainly in the United Kingdom and Portugal.
113. Related parties
The parties related to Grupo Santander are deemed to include, in addition to its subsidiaries, associates and joint ventures, Banco Santander’s key management personnel (the members of its board of directors and the executive vice presidents, together with their close family members) and the entities over which the key management personnel may exercise significant influence or control.
Following is a detail of the transactions performed by Grupo Santander with its related parties in the first six months of 2022 and 2021, distinguishing between significant shareholders, members of Banco Santander’s board of directors, Banco Santander’s executive vice presidents, Grupo Santander entities and other related parties. Related party transactions were made on terms equivalent to those that prevail in arm’s-length transactions or, when this was not the case, the related compensation in kind was recognised:
| | | | | | | | | | | | | | | | | |
| EUR million |
| 30-06-2022 |
| Expenses and income | Significant shareholders | Directors and executives | Group companies or entities | Other related parties | Total |
| Expenses | | | | | |
| Finance costs | — | | — | | 16 | | — | | 16 | |
| Leases | — | | — | | — | | — | | — | |
| Services received | — | | — | | — | | — | | — | |
| Purchases of stocks | — | | — | | — | | — | | — | |
| Other expenses | — | | — | | 197 | | — | | 197 | |
| — | | — | | 213 | | — | | 213 | |
| Income | | | | | |
| Finance income | — | | — | | 71 | | — | | 71 | |
| Dividends received | — | | — | | — | | — | | — | |
| Services rendered | — | | — | | — | | — | | — | |
| Sale of stocks | — | | — | | — | | — | | — | |
| Other income | — | | — | | 683 | | 1 | | 684 | |
| — | | — | | 754 | | 1 | | 755 | |
| | | | | | | | | | | | | | | | | |
| EUR million |
| 30-06-2022 |
| Other transactions | Significant shareholders | Directors and executives | Group companies or entities | Other related parties | Total |
| Financing agreements: loans and capital contributions (lender) | — | | — | | 715 | | 26 | | 741 | |
| Financing agreements: loans and capital contributions (borrower) | — | | 9 | | 362 | | 40 | | 411 | |
| Guarantees provided | — | | — | | — | | — | | — | |
| Guarantees received | — | | — | | — | | — | | — | |
| Commitments acquired | — | | — | | (12) | | (2) | | (14) | |
| Dividends and other distributed profit | — | | 1 | | — | | 9 | | 10 | |
| Other transactions | — | | — | | (106) | | — | | (106) | |
| | | | | | | | | | | | | | | | | |
| EUR million |
| 30-06-2022 |
| Balance closing period | Significant shareholders | Directors and executives | Group companies or entities | Other related parties | Total |
| Debt balances: | | | | | |
| Customers and commercial debtors | — | | — | | — | | — | | — | |
| Loans and credits granted | — | | 13 | | 9,156 | | 410 | | 9,579 | |
| Other collection rights | — | | — | | 885 | | — | | 885 | |
| — | | 13 | | 10,041 | | 410 | | 10,464 | |
| Credit balances: | | | | | |
| Suppliers and creditors granted | — | | — | | — | | — | | — | |
| Loans and credits received | — | | 28 | | 3,692 | | 238 | | 3,958 | |
| Other payment obligations | — | | — | | 264 | | — | | 264 | |
| — | | 28 | | 3,956 | | 238 | | 4,222 | |
| | | | | | | | | | | | | | | | | |
| EUR million |
| 30-06-2021 |
| Expenses and income | Significant shareholders | Directors and executives | Group companies or entities | Other related parties | Total |
| Expenses | | | | | |
| Finance costs | — | | — | | 4 | | — | | 4 | |
| Leases | — | | — | | — | | — | | — | |
| Services received | — | | — | | — | | — | | — | |
| Purchases of stocks | — | | — | | — | | — | | — | |
| Other expenses | — | | — | | 44 | | — | | 44 | |
| — | | — | | 48 | | — | | 48 | |
| Income | | | | | |
| Finance income | — | | — | | 44 | | 1 | | 45 | |
| Dividends received | — | | — | | — | | — | | — | |
| Services rendered | — | | — | | — | | — | | — | |
| Sale of stocks | — | | — | | — | | — | | — | |
| Other income | — | | — | | 613 | | — | | 613 | |
| — | | — | | 657 | | 1 | | 658 | |
| | | | | | | | | | | | | | | | | |
| EUR million |
| 30-06-2021 |
| Other transactions | Significant shareholders | Directors and executives | Group companies or entities | Other related parties | Total |
| Financing agreements: loans and capital contributions (lender) | — | | (1) | | 492 | | (32) | | 459 | |
| Financing agreements: loans and capital contributions (borrower) | — | | 3 | | (503) | | 81 | | (419) | |
| Guarantees provided | — | | — | | — | | — | | — | |
| Guarantees received | — | | — | | — | | — | | — | |
| Commitments acquired | — | | — | | (38) | | 6 | | (32) | |
| Dividends and other distributed profit | — | | 1 | | — | | 5 | | 6 | |
| Other transactions | — | | — | | (7) | | — | | (7) | |
| | | | | | | | | | | | | | | | | |
| EUR million |
| 31-12-2021 |
| Balance closing period | Significant shareholders | Directors and executives | Group companies or entities | Other related parties | Total |
| Debt balances: | | | | | |
| Customers and commercial debtors | — | | — | | — | | — | | — | |
| Loans and credits granted | — | | 14 | | 8,585 | | 384 | | 8,983 | |
| Other collection rights | — | | — | | 801 | | — | | 801 | |
| — | | 14 | | 9,386 | | 384 | | 9,784 | |
| Credit balances: | | | | | |
| Suppliers and creditors granted | — | | — | | — | | — | | — | |
| Loans and credits received | — | | 19 | | 3,331 | | 197 | | 3,547 | |
| Other payment obligations | — | | — | | 74 | | — | | 74 | |
| — | | 19 | | 3,405 | | 197 | | 3,621 | |
14. Off-balance-sheet exposures
The off-balance-sheet exposures related to balances representing loans commitments, financial guarantees and other commitments granted (recoverables and non recoverables).
Financial guarantees granted include financial guarantees contracts such as financial bank guarantees, credit derivatives, and risks arising from derivatives granted to third parties; non-financial guarantees include other guarantees and irrevocable documentary credits.
Loan and other commitments granted include all off-balance-sheet exposures, which are not classified as guarantees provided, including loans commitment granted.
| | | | | | | | |
| EUR million |
| 30-06-2022 | 31-12-2021 |
| Loan commitments granted | 275,865 | | 262,737 | |
| Of which impaired | 657 | | 615 | |
| Financial guarantees granted | 12,881 | | 10,758 | |
| Of which impaired | 513 | | 188 | |
| Bank sureties | 12,836 | | 10,715 | |
| Credit derivatives sold | 45 | | 43 | |
| Other commitments granted | 91,195 | | 75,733 | |
| Of which impaired | 681 | | 781 | |
| Other granted guarantees | 44,016 | | 40,158 | |
| Other | 47,179 | | 35,575 | |
The breakdown of the off-balance sheet exposure and impairment on 30 June 2022 and 31 December 2021 by impairment stages is EUR 370,571 million and EUR 337,113 million of exposure and EUR 378 million and EUR 372 million of impairment in stage 1, EUR 7,519 million and EUR 10,531 million of exposure and EUR 142 million and EUR 200 million of impairment in stage 2, and EUR 1,851 million and EUR 1,584 million of exposure and EUR 223 million and EUR 161 million of impairment in stage 3, respectively.
15. Average headcount and number of branches
The average number of employees at Banco Santander and Grupo Santander, by gender, in the first six months ended 30 June 2022 and 2021 is as follows:
| | | | | | | | | | | | | | |
| Average headcount | | | | |
| Bank | Group |
| 30-06-2022 | 30-06-2021 | 30-06-2022 | 30-06-2021 |
| Men | 11,867 | | 13,371 | | 90,747 | | 88,204 | |
| Women | 11,355 | | 12,367 | | 109,055 | | 104,432 | |
| 23,222 | | 25,738 | | 199,802 | | 192,636 | |
The number of branches at 30 June 2022 and 31 December 2021 is as follow:
| | | | | | | | |
| Number of branches | | |
| Group |
| 30-06-2022 | 31-12-2021 |
| Spain | 1,974 | | 1,998 | |
| Group | 7,219 | | 7,231 | |
| 9,193 | | 9,229 | |
16. Other disclosures
a) Valuation techniques for financial assets and liabilities
The following table shows a summary of the fair values, at 30 June 2022 and 31 December 2021, of the financial assets and liabilities indicated below, classified on the basis of the various measurement methods used by Grupo Santander to determine their fair value:
| | | | | | | | | | | | | | | | | | | | |
| EUR million |
| 30-06-2022 | 31-12-2021 |
| Published price quotations in active markets (Level 1) | Internal models (Levels 2 and 3) | Total | Published price quotations in active markets (Level 1) | Internal models (Levels 2 and 3) | Total |
| Financial assets held for trading | 45,464 | | 117,771 | | 163,235 | | 39,678 | | 77,275 | | 116,953 | |
| Non-trading financial assets mandatorily at fair value through profit or loss | 2,333 | | 3,512 | | 5,845 | | 2,398 | | 3,138 | | 5,536 | |
| Financial assets at fair value through profit and loss | 1,957 | | 9,068 | | 11,025 | | 2,113 | | 13,844 | | 15,957 | |
| Financial assets at fair value through other comprehensive income | 70,150 | | 21,848 | | 91,998 | | 77,749 | | 30,289 | | 108,038 | |
| Hedging derivatives (assets) | — | | 6,735 | | 6,735 | | — | | 4,761 | | 4,761 | |
| Financial liabilities held for trading | 14,377 | | 100,029 | | 114,406 | | 10,379 | | 69,090 | | 79,469 | |
| Financial liabilities designated at fair value through profit or loss | 3,329 | | 37,494 | | 40,823 | | 3,620 | | 29,113 | | 32,733 | |
| Hedging derivatives (liabilities) | — | | 9,269 | | 9,269 | | — | | 5,463 | | 5,463 | |
| Liabilities under insurance contracts | — | | 858 | | 858 | | — | | 770 | | 770 | |
The financial instruments at fair value determined on the basis of published price quotations in active markets (level 1) include government debt securities, private-sector debt securities, derivatives traded in organised markets, securitised assets, shares, short positions and fixed-income securities issued.
In cases where price quotations cannot be observed, management makes its best estimate of the price that the market would set, using its own internal models. In most cases, these internal models use data based on observable market parameters as significant inputs (level 2) and, in cases, they use significant inputs not observable in market data (level 3). In order to make these estimates, various techniques are employed, including the extrapolation of observable market data. The best evidence of the fair value of a financial instrument on initial recognition is the transaction price, unless the fair value of the instrument can be obtained from other market transactions performed with the same or similar instruments or can be measured by using a valuation technique in which the variables used include only observable market data, mainly interest rates.
During the first six months of 2022 and 2021, Grupo Santander did not make any material transfers of financial instruments between measurement levels other than the transfers included in level 3 table.
Grupo Santander has developed a formal process for the systematic valuation and management of financial instruments, which has been implemented worldwide across all the Group’s units. The governance scheme for this process distributes responsibilities between two independent divisions: Treasury (development, marketing and daily management of financial products and market data) and Risk (on a periodic basis, validation of pricing models and market data, computation of risk metrics, new transaction approval policies, management of market risk and implementation of fair value adjustment policies).
The approval of new products follows a sequence of steps (request, development, validation, integration in corporate systems and quality assurance) before the product is brought into production. This process ensures that pricing systems have been properly reviewed and are stable before they are used.
The most important products and families of derivatives, and the related valuation techniques and inputs, by asset class, are detailed in the consolidated annual accounts as at 31 December 2021.
As of 30 June 2022, the CVA (Credit Valuation Adjustment) accounted for was EUR 308 million (an increase of 30% compared to 31 December 2021) and adjustments of DVA (Debt Valuation Adjustment) was EUR 280 million (an increase of 73% compared to 31 December 2021). The increase is mainly due to movements in the credit markets, whose spread levels have doubled compared to those at the end of the year. These increases have been partially offset by reductions in exposures due to the increase in the medium and long-term yield curves.
Set forth below are the financial instruments at fair value whose measurement was based on internal models (levels 2 and 3) at 30 June 2022 and 31 December 2021:
| | | | | | | | | | | | | | | | | | | | |
| | | | | | |
| EUR million | EUR million | | |
| Fair values calculated using internal models at 30-06-2022 (*) | Fair values calculated using internal models at 31-12-2021 (*) | | |
| Level 2 | Level 3 | Level 2 | Level 3 | Valuation techniques | Main inputs |
| ASSETS | 151,273 | | 7,661 | | 121,640 | | 7,667 | | | |
| Financial assets held for trading | 117,254 | | 517 | | 76,738 | | 537 | | | |
| Central banks (**) | 8,438 | | — | | 3,608 | | — | | Present value method | Yield curves, FX market prices |
| Credit institutions (**) | 18,637 | | — | | 10,397 | | — | | Present value method | Yield curves, FX market prices |
| Customers (**) | 15,090 | | — | | 6,829 | | — | | Present value method | Yield curves, FX market prices |
| Debt instruments and equity instruments | 7,045 | | 29 | | 2,312 | | 24 | | Present value method | Yield curves, FX market prices |
| Derivatives | 68,044 | | 488 | | 53,592 | | 513 | | | |
| Swaps | 52,450 | | 216 | | 43,700 | | 224 | | Present value method, Gaussian Copula | Yield curves, FX market prices, HPI, Basis, Liquidity |
| Exchange rate options | 1,161 | | 13 | | 539 | | 12 | | Black-Scholes Model | Yield curves, Volatility surfaces, FX market prices, Liquidity |
| Interest rate options | 2,270 | | 83 | | 2,112 | | 182 | | Black's Model, multifactorial advanced models interest rate | Yield curves, Volatility surfaces, FX market prices, Liquidity |
| Interest rate futures | 1,090 | | — | | 409 | | — | | Present value method | Yield curves, FX market prices |
| Index and securities options | 448 | | 2 | | 439 | | 41 | | Black’s Model, multifactorial advanced models interest rate | Yield curves, Volatility surfaces, FX & EQ market prices, Dividends, Liquidity |
| Other | 10,625 | | 174 | | 6,393 | | 54 | | Present value method, Advanced stochastic volatility models and other | Yield curves, Volatility surfaces, FX and EQ market prices, Dividends, Liquidity, Dividends, Correlation, HPI, Credit, Others |
| Hedging derivatives | 6,735 | | — | | 4,761 | | — | | | |
| Swaps | 5,880 | | — | | 4,202 | | — | | Present value method | Yield curves, FX market prices, Basis |
| Interest rate options | 5 | | — | | 9 | | — | | Black-Scholes Model | Yield curves, FX market prices, Volatility surfaces |
| Other | 850 | | — | | 548 | | — | | Present value method, Advanced stochastic volatility models and others | Yield curves, Volatility surfaces, FX market prices, Credit, Liquidity, Others |
| Non-trading financial assets mandatorily at fair value through profit or loss | 1,567 | | 1,945 | | 1,273 | | 1,865 | | | |
| Equity instruments | 554 | | 1,315 | | 415 | | 1,231 | | Present value method | Market price, Yield curves, Dividends and Others |
| Debt instruments | 677 | | 311 | | 589 | | 366 | | Present value method | Yield curves |
| Loans and receivables | 336 | | 319 | | 269 | | 268 | | Present value method, swap asset model & CDS | Yield curves and Credit curves |
| Financial assets designated at fair value through profit or loss | 8,574 | | 494 | | 13,426 | | 418 | | | |
| Credit institutions | 1,396 | | — | | 3,152 | | — | | Present value method | Yield curves, FX market prices |
| Customers (***) | 7,087 | | 13 | | 10,270 | | 18 | | Present value method | Yield curves, FX market prices, HPI |
| Debt instruments | 91 | | 481 | | 4 | | 400 | | Present value method | Yield curves, FX market prices |
| Financial assets at fair value through other comprehensive income | 17,143 | | 4,705 | | 25,442 | | 4,847 | | | |
| Equity instruments | 7 | | 700 | | 74 | | 821 | | Present value method | Market price, Yield curves, Dividends and Others |
| Debt instruments | 13,720 | | 217 | | 21,585 | | 146 | | Present value method | Yield curves, FX market prices |
| Loans and receivables | 3,416 | | 3,788 | | 3,783 | | 3,880 | | Present value method | Yield curves, FX market prices and Credit curves |
| LIABILITIES | 147,020 | | 630 | | 103,807 | | 629 | | | |
| Financial liabilities held for trading | 99,818 | | 211 | | 68,930 | | 160 | | | |
| Central banks (**) | 3,250 | | — | | 1,038 | | — | | Present value method | FX market prices, Yield curves |
| Credit institutions (**) | 11,611 | | — | | 6,488 | | — | | Present value method | FX market prices, Yield curves |
| Customers | 13,799 | | — | | 6,141 | | — | | Present value method | FX market prices, Yield curves |
| Derivatives | 66,598 | | 211 | | 53,234 | | 160 | | | |
| Swaps | 52,500 | | 121 | | 42,438 | | 44 | | Present value method, Gaussian Copula | Yield curves, FX market prices, Basis, Liquidity, HPI |
| Exchange rate options | 1,076 | | — | | 2,720 | | 26 | | Black Model, multifactorial advanced models interest rate | Yield curves, Volatility surfaces, FX market prices, Liquidity |
| Interest rate options | 2,564 | | 32 | | 446 | | 67 | | Black-Scholes Model | Yield curves, Volatility surfaces, FX market prices, Liquidity |
| Index and securities options | 656 | | — | | 658 | | 7 | | Black-Scholes Model | Yield curves, FX market prices, Liquidity |
| Interest rate and equity futures | 10 | | — | | 184 | | — | | Present value method | Yield curves, Volatility surfaces, FX & EQ market prices, Dividends, Correlation, Liquidity, HPI |
| Other | 9,792 | | 58 | | 6,788 | | 16 | | Present value method, Advanced stochastic volatility models and others | Yield curves, Volatility surfaces, FX & EQ market prices, Dividends, Correlation, HPI, Credit, Others |
| Short positions | 4,560 | | — | | 2,029 | | — | | Present value method | Yield curves ,FX & EQ market prices, Equity |
| Hedging derivatives | 9,269 | | — | | 5,463 | | — | | | |
| Swaps | 6,809 | | — | | 4,149 | | — | | Present value method | Yield curves ,FX market prices, Basis |
| Other | 2,460 | | — | | 1,314 | | — | | Present value method, Advanced stochastic volatility models and others | Yield curves , Volatility surfaces, FX market prices, Credit, Liquidity, Other |
| Financial liabilities designated at fair value through profit or loss | 37,075 | | 419 | | 28,644 | | 469 | | Present value method | Yield curves, FX market prices |
| Liabilities under insurance contracts | 858 | | — | | 770 | | — | | Present Value Method with actuarial techniques | Mortality tables and interest rate curves |
(*) The internal models of level 2 implement figures based on the parameters observed in the market, while level 3 internal models uses significant inputs that are not observable in market data.
(**) Includes mainly short-term loans/deposits and repurchase/reverse repurchase agreements with corporate customers (mainly brokerage and investment companies).
(***) Includes mainly structured loans to corporate clients.
Level 3 financial instruments
Set forth below are the Group’s main financial instruments measured using unobservable market data as significant inputs of the internal models (level 3):
•HTC&S (Hold to collect and sale) syndicated loans classified in the fair value category with changes in other comprehensive income, where the cost of liquidity is not directly observable in the market, as well as the prepayment option in favour of the borrower.
•Illiquid equity in non-trading portfolios, classified at fair value through profit or loss and at fair value through equity.
•Instruments in Santander UK’s portfolio (loans, debt instruments and derivatives) linked to the House Price Index (HPI). Even if the valuation techniques used for these instruments may be the same as those used to value similar products (present value in the case of loans and debt instruments, and the Black-Scholes model for derivatives), the main factors used in the valuation of these instruments are the HPI spot rate, the growth and volatility thereof, and the mortality rates, which are not always observable in the market and, accordingly, these instruments are considered illiquid.
•Callable interest rate derivatives (Bermudan-style options) where the main unobservable input is mean reversion of interest rates.
•Trading derivatives on interest rates, taking as an underlying asset titling and with the amortization rate (CPR, Conditional prepayment rate) as unobservable main entry.
•Derivatives from trading on inflation in Spain, where volatility is not observable in the market.
•Equity volatility derivatives, specifically indices and equities, where volatility is not observable in the long term.
•Derivatives on long-term interest rate and FX in some units (mainly South America) where for certain underlyings it is not possible to demonstrate observability to these terms.
•Debt instruments referenced to certain illiquid interest rates, for which there is no reasonable market observability.
The measurements obtained using the internal models might have been different if other methods or assumptions had been used with respect to interest rate risk, to credit risk, market risk and foreign currency risk spreads, or to their related correlations and volatilities. Nevertheless, the Bank’s directors consider that the fair value of the financial assets and liabilities recognised in the interim condensed consolidated balance sheet and the gains and losses arising from these financial instruments are reasonable.
The net amount recorded in the results of the first six months of 2022 arising from models whose significant inputs are unobservable market data (level 3) amounted to EUR 19 million profit (EUR 11 million loss in the first six months of 2021).
The table below shows the effect, at 30 June 2022 and 31 December 2021, on the fair value of the main financial instruments classified as Level 3 of a reasonable change in the assumptions used in the valuation. This effect was determined by applying the probable valuation ranges of the main unobservable inputs detailed in the following table:
| | | | | | | | | | | | | | | | | | | | |
| 2022 | | | | | |
| Portfolio/Instrument | Valuation technique | Main unobservable inputs | Range 1 | Weighted average | Impacts (EUR million) |
| (Level 3) | Unfavourable scenario | Favourable scenario |
| Financial assets held for trading | | | | | | |
| Derivatives | | | | | | |
| CCS | Discounted Cash Flows | Interest rate | (0.7)% - 0.7% | 0.73% | (0.09) | 0.09 |
| CCS | Forward estimation | Interest rate | (4)pb - 4pb | 4.00% | (0.14) | 0.11 |
| EQ Options | EQ option pricing model | Volatility | 0% - 90% | 61.30% | (0.24) | 0.50 |
| EQ Options | Local volatility | Volatility | 10% - 90% | 40.00% | (3.53) | 3.53 |
| FRAs | Asset Swap model | Interest rate | 0% - 4% | 1.81% | (0.77) | 0.64 |
| FX Options | FX option pricing model | Volatility | 0% - 50% | 31.37% | (0.23) | 0.39 |
| Inflation Derivatives | Asset Swap model | Inflation Swap Rate | (50)% - 50% | 50.00% | (0.43) | 0.22 |
| Inflation Derivatives | Volatility option model | Volatility | 0% - 40% | 14.04% | (0.35) | 0.19 |
| IR Futures | Asset Swap model | Interest rate | 0% - 15% | 6.02% | (0.84) | 0.57 |
| IR Options | IR option pricing model | Volatility | 0% - 60% | 35.82% | (0.15) | 0.22 |
| IRS | Asset Swap model | Interest rate | (5.9)% - 12.7% | 10.27% | (0.06) | 0.11 |
| IRS | Discounted Cash Flows | Credit spread | 154.5% - 632.3% | 156.06% | (3.82) | 2.49 |
| IRS | Discounted Cash Flows | Swap Rate | 9% - 9.4% | 9.28% | 0.00 | 0.00 |
| IRS | Forward estimation | Interest rate | (8.95) TIIE 91pb - 15.18 TIIE 91pb | n.a. | (0.03) | 0.03 |
| IRS | Forward estimation | Prepayment rate | 6% - 12% | n.a. | 0.00 | 0.00 |
| IRS | Others | Others | 0.05% | n.a. | (5.27) | 3.17 |
| IRS | Prepayment modelling | Prepayment rate | 2.5% - 6.2% | 4.25% | (0.08) | 0.07 |
| Others | Forward estimation | Price | 0% - 2% | 0.62% | (0.56) | 0.25 |
| Property derivatives | Option pricing model | Growth rate | 0% - 5% | 2.50% | (8.15) | 8.15 |
| Securitisation Swap | Discounted Cash Flows | Constant prepayment rates | 90% - 10% | (40.00)% | (0.11) | 0.11 |
| Swaptions | IR option pricing model | Volatility | 0% - 40% | 27.32% | (0.10) | 0.21 |
| Debt securities | | | | | | |
| Corporate debt | Price based | Market price | 6.4% - 8.6% | 1.12% | 0.00 | 0.00 |
| Financial assets designated at fair value through profit or loss | | | | | | |
| Loans and advances to customers | | | | | | |
| Loans | Discounted Cash Flows | Credit spreads | 0.1% - 0.7% | 0.31% | (0.31) | 0.31 |
| Mortgage portfolio | Black Scholes Model | Growth rate | 0% - 5% | 2.50% | (1.16) | 1.16 |
| Debt securities | | | | | | |
| Corporate debt | Discounted Cash Flows | Credit spread | 0% - 20% | 10.07% | (1.13) | 1.15 |
| Government debt | Discounted Cash Flows | Discount curve | 0% - 10% | 4.92% | (8.84) | 8.55 |
| Other debt securities | Others | Inflation Swap Rate | 0% - 10% | 4.74% | (4.51) | 4.06 |
| | | | | | | | | | | | | | | | | | | | |
| 2022 | | | | | | |
| Portfolio/Instrument | Valuation technique | Main unobservable inputs | Range | Weighted average | Impacts (EUR million) |
| (Level 3) | Unfavourable scenario | Favourable scenario |
| Financial assets not held for trading compulsorily valued at fair value through profit or loss | | | | | | |
| Debt securities | | | | | | |
| Corporate debt | Discounted Cash Flows | Margin of a reference portfolio | (1)pb - 1pb | 0.01% | (0.33) | 0.33 |
| Property securities | Probability weighting | Growth rate | 0% - 5% | 2.50% | (0.93) | 0.93 |
| Equity instruments | | | | | | |
| Equities | Price Based | Price | 90% - 110% | 10.00% | (131.54) | 131.54 |
| Financial assets at fair value with changes in other comprehensive income | | | | | | |
| Loans and advances to customers | | | | | | |
| Loans | Discounted Cash Flows | Credit spread | n.a. | n.a. | (47.19) | 0.00 |
| Loans | Discounted Cash Flows | Interest rate curve | (0.1)% - 0.1% | 0.08% | (0.13) | 0.13 |
| Loans | Discounted Cash Flows | Margin of a reference portfolio | (1)% - 1% | 1.00% | (12.00) | 12.01 |
| Loans | Forward estimation | Credit spread | 130pb - 450pb | (130.00)% | (3.74) | 0.00 |
| Debt securities | | | | | | |
| Government debt | Discounted Cash Flows | Interest rate | (0.7)% - 0.7% | 0.68% | (0.62) | 0.62 |
| Equity instruments | | | | | | |
| Equities | Price Based | Price | 90% - 110% | 100.00% | (70.05) | 70.05 |
| Financial liabilities held for trading | | | | | | |
| Derivatives | | | | | | |
| Cap&Floor | Volatility option model | Volatility | 10% - 90% | 26.18% | (0.25) | 0.14 |
| Financial liabilities designated at fair value through profit or loss | | | | | | |
| Loans and advances to customers | | | | | | |
| Repos / Reverse repos | Repodeal model | Long-term repo spread | n.a. | n.a. | (0.25) | 0.00 |
| | | | | | | | | | | | | | | | | | | | |
| 2021 | | | | | |
| Portfolio/Instrument | Valuation technique | Main unobservable inputs | Range | Weighted average | Impacts (EUR million) |
| (Level 3) | Unfavourable scenario | Favourable scenario |
| Financial assets held for trading | | | | | | |
| Derivatives | | | | | | |
| Cap&Floor | Volatility option model | Volatility | 10% - 90% | 36.30% | (0.50) | 0.43 |
| CCS | Discounted Cash Flows | Interest rate | (0.7)%- 0.7% | 0.73% | (0.11) | 0.11 |
| CCS | Forward estimation | Interest rate | 4bp (4)bp | (0.09)% | (0.03) | 0.03 |
Convertibility curve- inputs:
NDFs Offshore | Forward estimation | Price | 0% - 2% | 0.61% | (0.65) | 0.28 |
| EQ Options | EQ option pricing model | Volatility | 0% - 90% | 61.20% | (0.24) | 0.52 |
| EQ Options | Local volatility | Volatility | 10% - 90% | 40.00% | (6.82) | 6.82 |
| FRAs | Asset Swap model | Interest rate | 0% - 4% | 1.78% | (0.91) | 0.73 |
| FX Options | FX option pricing model | Volatility | 0% - 50% | 32.14% | (0.28) | 0.50 |
| Inflation Derivatives | Asset Swap model | Inflation Swap Rate | (50)% - 50% | 50.00% | (0.56) | 0.28 |
| Inflation Derivatives | Volatility option model | Volatility | 0% - 40% | 13.29% | (0.47) | 0.24 |
| IR Futures | Asset Swap model | Interest rate | 0% - 15% | 5.91% | (1.09) | 0.71 |
| IR Options | IR option pricing model | Volatility | 0% - 60% | 36.28% | (0.20) | 0.31 |
| IRS | Asset Swap model | Interest rate | (6)% - 12.8% | 10.36% | (0.07) | 0.13 |
| IRS | Discounted Cash Flows | Credit spread | 103.1bp - 375.6bp | 71.91% | (7.21) | 4.16 |
| IRS | Discounted Cash Flows | Inflation Swap Rate | (0.8)% - 6.5% | 1.81% | (0.04) | 0.01 |
| IRS | Discounted Cash Flows | Swap Rate | 7.7% - 8.2% | (2.87)% | (0.23) | 0.10 |
| IRS | Forward estimation | Interest rate | TIIE91 (8.98)bps - TIIE91 +11.12bps | n.a. | (0.27) | 0.17 |
| IRS | Forward estimation | Prepayment rate | 6% - 12% | n.a. | — | — |
| IRS | Others | Others | (0.05)% | n.a. | (1.49) | — |
| IRS | Prepayment modelling | Prepayment rate | 2.5% - 6.2% | 0.44% | (0.09) | 0.05 |
| Property derivatives | Option pricing model | Growth rate | 0% - 5% | 2.50% | (2.62) | 2.62 |
| Swaptions | IR option pricing model | Volatility | 0% - 40% | 26.67% | (0.13) | 0.27 |
| Debt securities | | | | | | |
| Corporate debt | Price based | Market price | 85% - 115% | 15.00% | — | — |
| Financial assets designated at fair value through profit or loss | | | | | | |
| Loans and advances to customers | | | | | | |
| Loans | Discounted Cash Flows | Credit spreads | 0.1% - 1.4% | 0.66% | (0.26) | 0.26 |
| Mortgage | Black Scholes model | Growth rate | 0% - 5% | 2.50% | (1.90) | 1.90 |
| Debt securities | | | | | | |
| Corporate debt | Discounted Cash Flows | Credit spread | 0% - 20% | 9.88% | (1.23) | 1.20 |
| Government debt | Discounted Cash Flows | Discount curve | 0% - 10% | 8.33% | (4.14) | 20.69 |
| Other debt securities | Others | Inflation Swap Rate | 0% - 10% | 4.74% | (5.47) | 4.92 |
| | | | | | | | | | | | | | | | | | | | | | | |
| 2021 | | | | | | | |
| Portfolio/Instrument | Valuation technique | Main unobservable inputs | Range | Weighted average | Impacts (EUR million) | |
| (Level 3) | Unfavourable scenario | Favourable scenario | |
| Financial assets not held for trading compulsorily valued at fair value through profit or loss | | | | | | | |
| Debt securities | | | | | | | |
| Corporate debt | Discounted Cash Flows | Margin of a reference portfolio | (1)bp - 1bp | 0.01% | (0.6) | 0.6 | |
| Property securities | Probability weighting | Growth rate | 0% - 5% | 2.50% | (1.2) | 1.2 | |
| Equity instruments | | | | | | | |
| Equities | Price Based | Price | 90% - 110% | 10.00% | (123.1) | 123.1 | |
| Financial assets at fair value with changes in other comprehensive income | | | | | | | |
| Loans and advances to customers | | | | | | | |
| Loans | Discounted Cash Flows | Credit spread | n.a. | n.a. | (0.4) | — | |
| Loans | Discounted Cash Flows | Interest rate curve | (0.1)% - 0.1% | 0.12% | (0.1) | 0.1 | |
| Loans | Discounted Cash Flows | Margin of a reference portfolio | (1)bp - 1bp | 1.00% | (13.1) | 13.0 | |
| Loans | Forward estimation | Credit spread | 77bp - 242bp | n.a. | — | — | |
| Debt securities | | | | | | | |
| Government debt | Discounted Cash Flows | Interest rate | 0.6% - 0.8% | 0.09% | — | — | |
| Equity instruments | | | | | | | |
| Equities | Price Based | Price | 90% - 110% | 10.00% | (82.1) | 82.1 | |
| Financial liabilities held for trading | | | | | | | |
| Derivatives | | | | | | | |
| Cap&Floor | Volatility option model | Volatility | 10% - 90% | 36.30% | (0.5) | 0.4 | |
| Financial liabilities designated at fair value through profit or loss | | | | | | | |
| Loans and advances to customers | | | | | | | |
| Repos / Reverse repos | Asset Swap model | Long-term repo spread | n.a. | n.a. | (0.4) | — | |
Lastly, the changes in the financial instruments classified as level 3 in the first six months of 2022 and 2021 were as follows:
| | | | | | | | | | | | | | | | | | | | | | | | | | |
| 01-01-2022 | Changes | 30-06-2022 |
| EUR million | Fair value calculated using internal models (Level 3) | Purchases/Settlements | Sales/Amortisation | Changes in fair value recognized in profit or loss | Changes in fair value recognised in equity | Level reclassifications | Other | Fair value calculated using internal models (Level 3) |
| Financial assets held for trading | 537 | | 29 | | (9) | | (52) | | — | | (2) | | 14 | | 517 | |
| Debt instruments | 22 | | — | | — | | 1 | | — | | — | | 5 | | 28 | |
| Equity instruments | 2 | | — | | — | | (1) | | — | | — | | — | | 1 | |
| Trading derivatives | 513 | | 29 | | (9) | | (52) | | — | | (2) | | 9 | | 488 | |
| Swaps | 224 | | — | | — | | 5 | | — | | — | | (13) | | 216 | |
| Exchange rate options | 12 | | — | | (9) | | 11 | | — | | — | | (1) | | 13 | |
| Interest rate options | 182 | | — | | — | | (98) | | — | | (1) | | — | | 83 | |
| Index and securities options | 41 | | — | | — | | 1 | | — | | — | | (40) | | 2 | |
| Other | 54 | | 29 | | — | | 29 | | — | | (1) | | 63 | | 174 | |
| Trading financial assets at fair value through profit or loss | 418 | | — | | (3) | | 4 | | — | | — | | 75 | | 494 | |
| Credit institutions | — | | — | | — | | — | | — | | — | | — | | — | |
| Loans and advances to customers | 18 | | — | | (3) | | (2) | | — | | — | | — | | 13 | |
| Debt instruments | 400 | | — | | — | | 6 | | — | | — | | 75 | | 481 | |
| Non-trading financial assets mandatorily at fair value through profit or loss | 1,865 | | 112 | | (218) | | 110 | | — | | (29) | | 105 | | 1,945 | |
| Loans and advances to customers | 268 | | 20 | | (67) | | 40 | | — | | — | | 58 | | 319 | |
| Debt instruments | 366 | | — | | (25) | | (3) | | — | | (29) | | 2 | | 311 | |
| Equity instruments | 1,231 | | 92 | | (126) | | 73 | | — | | — | | 45 | | 1,315 | |
| Financial assets at fair value through other comprehensive income | 4,847 | | 4,962 | | (5,187) | | — | | (191) | | 205 | | 69 | | 4,705 | |
| Loans and advances to customers | 3,880 | | 4,960 | | (5,177) | | — | | (17) | | 137 | | 5 | | 3,788 | |
| Debt instruments | 146 | | — | | (1) | | — | | 9 | | — | | 63 | | 217 | |
| Equity instruments | 821 | | 2 | | (9) | | — | | (183) | | 68 | | 1 | | 700 | |
| TOTAL ASSETS | 7,667 | | 5,103 | | (5,417) | | 62 | | (191) | | 174 | | 263 | | 7,661 | |
| Financial liabilities held for trading | 160 | | 84 | | (61) | | 42 | | — | | (14) | | — | | 211 | |
| Trading derivatives | 160 | | 84 | | (61) | | 42 | | — | | (14) | | — | | 211 | |
| Swaps | 44 | | 15 | | (5) | | 80 | | — | | — | | (13) | | 121 | |
| Exchange rate options | 7 | | 6 | | (14) | | 1 | | — | | — | | — | | — | |
| Interest rate options | 26 | | 42 | | (20) | | (16) | | — | | — | | — | | 32 | |
| Index and securities options | 67 | | — | | (2) | | — | | — | | — | | (65) | | — | |
| Interest rate and equity futures | — | | — | | — | | — | | — | | — | | — | | — | |
| Others | 16 | | 21 | | (20) | | (23) | | — | | (14) | | 78 | | 58 | |
| Financial liabilities designated at fair value through profit or loss | 469 | | — | | (99) | | 1 | | — | | — | | 48 | | 419 | |
| TOTAL LIABILITIES | 629 | | 84 | | (160) | | 43 | | — | | (14) | | 48 | | 630 | |
| | | | | | | | | | | | | | | | | | | | | | | | | | |
| 01-01-2021 | Changes | 30-06-2021 |
| EUR million | Fair value calculated using internal models (Level 3) | Purchases/Settlements | Sales/Amortisation | Changes in fair value recognized in profit or loss | Changes in fair value recognised in equity | Level reclassifications | Other | Fair value calculated using internal models (Level 3) |
| Financial assets held for trading | 740 | | 67 | | (91) | | (51) | | — | | (59) | | 5 | | 611 | |
| Debt instruments | 7 | | 17 | | (2) | | (3) | | — | | — | | — | | 19 | |
| Equity instruments | 3 | | — | | (1) | | 1 | | — | | — | | — | | 3 | |
| Trading derivatives | 730 | | 50 | | (88) | | (49) | | — | | (59) | | 5 | | 589 | |
| Swaps | 272 | | 5 | | (12) | | (29) | | — | | (1) | | (2) | | 233 | |
| Exchange rate options | 22 | | 14 | | (27) | | 24 | | — | | — | | — | | 33 | |
| Interest rate options | 241 | | 7 | | (39) | | (24) | | — | | — | | — | | 185 | |
| Index and securities options | 94 | | 11 | | (4) | | 20 | | — | | (59) | | 4 | | 66 | |
| Other | 101 | | 13 | | (6) | | (40) | | — | | 1 | | 3 | | 72 | |
| Trading financial assets at fair value through profit or loss | 649 | | 53 | | (127) | | 35 | | — | | (163) | | 31 | | 478 | |
| Credit institutions | 163 | | — | | — | | — | | — | | (163) | | — | | — | |
| Loans and advances to customers | 19 | | — | | (2) | | — | | — | | — | | — | | 17 | |
| Debt instruments | 467 | | 53 | | (125) | | 35 | | — | | — | | 31 | | 461 | |
| Non-trading financial assets mandatorily at fair value through profit or loss | 934 | | 97 | | (114) | | 7 | | — | | 515 | | 30 | | 1,469 | |
| Loans and advances to customers | 295 | | 56 | | (71) | | (18) | | — | | — | | 4 | | 266 | |
| Debt instruments | 134 | | — | | (11) | | 6 | | — | | 12 | | 9 | | 150 | |
| Equity instruments | 505 | | 41 | | (32) | | 19 | | — | | 503 | | 17 | | 1,053 | |
| Financial assets at fair value through other comprehensive income | 6,220 | | 2,941 | | (2,825) | | — | | (127) | | (260) | | 27 | | 5,976 | |
| Loans and advances to customers | 4,792 | | 2,865 | | (2,782) | | — | | (18) | | (192) | | 3 | | 4,668 | |
| Debt instruments | 206 | | 74 | | (25) | | — | | 40 | | (68) | | 17 | | 244 | |
| Equity instruments | 1,222 | | 2 | | (18) | | — | | (149) | | — | | 7 | | 1,064 | |
| TOTAL ASSETS | 8,543 | | 3,158 | | (3,157) | | (9) | | (127) | | 33 | | 93 | | 8,534 | |
| Financial liabilities held for trading | 295 | | 27 | | (27) | | (23) | | — | | (25) | | 9 | | 256 | |
| Trading derivatives | 295 | | 27 | | (27) | | (23) | | — | | (25) | | 9 | | 256 | |
| Swaps | 81 | | 3 | | (3) | | (19) | | — | | (4) | | (1) | | 57 | |
| Exchange rate options | 1 | | — | | — | | 21 | | — | | — | | 1 | | 23 | |
| Interest rate options | 49 | | 6 | | (13) | | (6) | | — | | — | | — | | 36 | |
| Index and securities options | 97 | | 16 | | (4) | | 34 | | — | | (21) | | 10 | | 132 | |
| Interest rate and equity futures | 2 | | — | | (2) | | — | | — | | — | | — | | — | |
| Others | 65 | | 2 | | (5) | | (53) | | — | | — | | (1) | | 8 | |
| Financial liabilities designated at fair value through profit or loss | 610 | | — | | — | | 25 | | — | | (289) | | 21 | | 367 | |
| TOTAL LIABILITIES | 905 | | 27 | | (27) | | 2 | | — | | (314) | | 30 | | 623 | |
b) Refinancing and restructured transactions
The following terms are used with the meanings specified below:
•Refinancing transaction: transaction that is granted or used, for reasons relating to current or foreseeable financial difficulties of the borrower, to repay one or more of the transactions granted to it, or through which the payments on such transactions are brought fully or partially up to date, in order to enable the borrowers of the cancelled or refinanced transactions to repay their debt (principal and interest) because they are unable, or might foreseeably become unable, to comply with the conditions thereof in due time and form.
•Restructured transaction: transaction with respect to which, for economic or legal reasons relating to current or foreseeable financial difficulties of the borrower, the financial terms and conditions are modified in order to facilitate the payment of the debt (principal and interest) because the borrower is unable, or might foreseeably become unable, to comply with the aforementioned terms and conditions in due time and form, even if such modification is envisaged in the agreement.
For maximum guarantees amount, we will consider as follows:
•Real guarantees: the appraisal amount or valuation amount of the real guarantees received; for each transaction it cannot be higher than the covered amount of exposure.
| | | | | | | | | | | | | | | | | | | | | | | | | | | | | | | | | | | | | | | | | | | | |
| 30-06-2022 |
| Total | Of which: impaired |
| Without real guarantee | With real guarantee | | Without real guarantee | With real guarantee | |
| | | | | Maximum amount of the actual collateral that can be considered | | | | | | Maximum amount of the actual collateral that can be considered | |
| Amounts in million euros, except number of transactions in units | Number of transactions | Gross amount | Number of operations | Gross amount | Mortgage guarantee | Other guarantees | Impairment of accumulated value or accumulated losses in fair value due to credit risk | Number of transactions | Gross amount | Number of operations | Gross amount | Mortgage guarantee | Other guarantees | Impairment of accumulated value or accumulated losses in fair value due to credit risk |
| Credit entities | 22,432 | 25 | — | — | — | — | 11 | 13,582 | 16 | — | — | — | — | 11 |
| Public sector | 30 | 32 | 20 | 6 | 2 | — | 5 | 11 | 3 | 16 | 5 | 2 | — | 5 |
| Other financial institutions and: individual shareholder | 1,109 | 120 | 662 | 294 | 107 | 82 | 52 | 508 | 31 | 383 | 118 | 24 | 3 | 49 |
| Non financial institutions and individual shareholder | 286,155 | 11,178 | 54,277 | 9,183 | 5,066 | 2,001 | 4,157 | 138,159 | 3,983 | 35,913 | 4,963 | 2,843 | 692 | 3,611 |
| Of which: Financing for constructions and property development | 12,637 | 118 | 1,619 | 535 | 384 | 58 | 197 | 6,829 | 68 | 1,011 | 286 | 171 | 39 | 166 |
| Other warehouses | 5,174,350 | 5,657 | 502,492 | 9,915 | 5,262 | 3,818 | 4,333 | 2,771,672 | 2,507 | 216,415 | 3,659 | 2,008 | 986 | 2,780 |
| Total | 5,484,076 | 17,012 | 557,451 | 19,398 | 10,437 | 5,901 | 8,558 | 2,923,932 | 6,540 | 252,727 | 8,745 | 4,877 | 1,681 | 6,456 |
| Financing classified as non-current assets and disposable groups of items that have been classified as held for sale | — | — | — | — | — | — | — | — | — | — | — | — | — | — |
| | | | | | | | | | | | | | | | | | | | | | | | | | | | | | | | | | | | | | | | | | | | |
| 31-12-2021 |
| Total | Of which: impared |
| Without real guarantee | With real guarantee | | Without real guarantee | With real guarantee | |
| | | | | Maximum amount of the actual collateral that can be considered | | | | | | Maximum amount of the actual collateral that can be considered | |
| Amounts in million euros, except number of transactions in units | Number of transactions | Gross amount | Number of operations | Gross amount | Mortgage guarantee | Other guarantees | Impairment of accumulated value or accumulated losses in fair value due to credit risk | Number of transactions | Gross amount | Number of operations | Gross amount | Mortgage guarantee | Other guarantees | Impairment of accumulated value or accumulated losses in fair value due to credit risk |
| Credit entities | — | — | — | — | — | — | — | — | — | — | — | — | — | — |
| Public sector | 32 | 18 | 15 | 7 | 2 | — | 4 | 7 | 1 | 14 | 5 | 2 | — | 4 |
| Other financial institutions and: individual shareholder | 1,002 | 93 | 720 | 200 | 102 | 79 | 30 | 421 | 51 | 528 | 67 | 54 | 7 | 27 |
| Non financial institutions and individual shareholder | 248,375 | 11,548 | 47,865 | 8,915 | 5,517 | 1,206 | 4,367 | 116,009 | 4,377 | 32,263 | 5,261 | 3,308 | 424 | 3,891 |
| Of which: Financing for constructions and property development | 8,576 | 113 | 1,321 | 550 | 390 | 40 | 176 | 4,638 | 63 | 849 | 301 | 172 | 34 | 148 |
| Other warehouses | 3,650,507 | 4,491 | 451,930 | 10,771 | 6,063 | 3,615 | 3,860 | 1,839,629 | 1,879 | 162,177 | 3,898 | 2,641 | 434 | 2,382 |
| Total | 3,899,916 | 16,150 | 500,530 | 19,893 | 11,684 | 4,900 | 8,261 | 1,956,066 | 6,308 | 194,982 | 9,231 | 6,005 | 865 | 6,304 |
| Financing classified as non-current assets and disposable groups of items that have been classified as held for sale | — | — | — | — | — | — | — | — | — | — | — | — | — | — |
c) Real estate business – Spain
i) Portfolio of home purchase loans to families
Home purchase loans granted to families in Spain on 30 June 2022 amounted to EUR 63,914 million (EUR 62,324 million at 31 December 2021). Of which mortgage guarantees are 99.49%.
| | | | | | | | | | | | | | |
| Million euros | | |
| 30-06-2022 | 31-12-2021 |
| Gross Amount | Of which: impaired | Gross Amount | Of which: impaired |
| Home purchase loans to families | 63,914 | | 1,248 | | 62,324 | | 1,860 | |
| - Without mortgage guarantee | 328 | | 48 | | 419 | | 115 | |
| - With mortgage guarantee | 63,586 | | 1,200 | | 61,905 | | 1,745 | |
The risk profile of the home purchase mortgage loan portfolio in Spain remained at a medium-low level, with limited prospects of additional impairment:
•Principal is repaid on all mortgages from the start.
•Early repayment is common so the average life of the transaction is well below that of the contract.
•High quality of collateral concentrated almost exclusively in financing the first home.
•Average affordability rate at the end of June stood at 26%.
•92.05% of the portfolio has a LTV below 80%, calculated as total risk/latest available house appraisal.
| | | | | | | | | | | | | | | | | | | | |
| 30-06-2022 |
| Gross amount in books on the amount of the last appraisal (loan to value) |
| Million euros | Less than or equal to 40% | More than 40% or less than 60% | More than 60% and less than 80% | More than 80% and less or equal to 100% | More than 100% | Total |
| Gross amount | 17,941 | | 20,851 | | 19,740 | | 3,515 | | 1,539 | | 63,586 | |
| Of which: impaired | 152 | | 196 | | 247 | | 215 | | 390 | | 1,200 | |
| | | | | | | | | | | | | | | | | | | | |
| 31-12-2021 |
| Gross amount in books on the amount of the last appraisal (loan to value) |
| Million euros | Less than or equal to 40% | More than 40% or less than 60% | More than 60% and less than 80% | More than 80% and less or equal to 100% | More than 100% | Total |
| Gross amount | 16,479 | | 19,391 | | 19,479 | | 4,376 | | 2,180 | | 61,905 | |
| Of which: impaired | 187 | | 240 | | 349 | | 313 | | 656 | | 1,745 | |
ii) Financing construction and property development
At 30 June 2022 and 31 December 2021 the financing amount related to construction and real estate business in Spain amounted to EUR 2,272 million and EUR 2,572 million net of allowances, respectively.
| | | | | | | | | | | |
| 30-06-2022 |
| Million euros | Gross amount | Excess of gross exposure over maximum recoverable amount of effective collateral | Specific allowance |
| Financing for construction and property development recognised by the Group's credit institutions (including land) (business in Spain) | 2,318 | | 239 | | 46 | |
| Of which: impaired | 102 | | 21 | | 36 | |
| Memorandum items: Written-off assets | 566 | | | |
| | | | | | | | | | | |
| 31-12-2021 |
| Million euros | Gross amount | Excess of gross exposure over maximum recoverable amount of effective collateral | Specific allowance |
| Financing for construction and property development recognised by the Group's credit institutions (including land) (business in Spain) | 2,625 | | 380 | | 53 | |
| Of which: impaired | 133 | | 22 | | 40 | |
| Memorandum items: Written-off assets | 650 | | | |
| | | | | | | | |
| | |
| 30-06-2022 | 31-12-2021 |
| Million euros | Carrying amount |
| Memorandum items: | | |
| Total loans and advances to customers excluding the public sector (business in Spain) (book value) | 250,099 | | 239,328 | |
| Total consolidated assets (Total business) (book value) | 1,722,840 | | 1,595,835 | |
| Impairment losses and provision for exposure classified as normal (business in Spain) | 1,474 | | 1,472 | |
At the end 30 June 2022 and 31 December 2021 the concentration of this portfolio was as follows:
| | | | | | | | |
| Loans: gross amount |
| Million euros | 30-06-2022 | 31-12-2021 |
| 1. Without mortgage guarantee | 45 | | 180 | |
| 2. With mortgage guarantee | 2,273 | | 2,445 | |
| 2.1 Completed buildings | 1,181 | | 1,412 | |
| 2.1.1 Residential | 729 | | 876 | |
| 2.1.2 Other | 452 | | 536 | |
| 2.2 Buildings and other constructions under construction | 1,006 | | 969 | |
| 2.2.1 Residential | 955 | | 907 | |
| 2.2.2 Other | 51 | | 62 | |
| 2.3 Land | 86 | | 64 | |
| 2.3.1 Developed consolidated land | 72 | | 46 | |
| 2.3.2 Other land | 14 | | 18 | |
| Total | 2,318 | | 2,625 | |
d) Foreclosed real estate assets
The following table shows the breakdown at 30 June 2022 and 31 December 2021 of the foreclosed assets for the Spanish business:
| | | | | | | | | | | | | | |
| 30-06-2022 |
| Million euros | Gross carrying amount | Valuation Adjustments | Of which: Impairment losses since time of the foreclosure | Carrying amount |
| Property assets arising from financing provided to construction and property development companies | 5,960 | | 3,213 | | 2,347 | | 2,747 | |
| Of which: | | | | |
| Completed Buildings | 1,649 | | 716 | | 570 | | 933 | |
| Residential | 374 | | 146 | | 114 | | 228 | |
| Other | 1,275 | | 570 | | 456 | | 705 | |
| Buildings under construction | 120 | | 61 | | 46 | | 59 | |
| Residential | 56 | | 25 | | 17 | | 31 | |
| Other | 64 | | 36 | | 29 | | 28 | |
| Land | 4,191 | | 2,436 | | 1,731 | | 1,755 | |
| Developed Land | 1,350 | | 716 | | 428 | | 634 | |
| Other land | 2,841 | | 1,720 | | 1,303 | | 1,121 | |
| Property assets from home purchase mortgage loans to households | 733 | | 268 | | 178 | | 465 | |
| Other foreclosed property assets | 191 | | 79 | | 59 | | 112 | |
| Total property assets | 6,884 | | 3,560 | | 2,584 | | 3,324 | |
| | | | | | | | | | | | | | |
| 31-12-2021 |
| Million euros | Gross carrying amount | Valuation Adjustments | Of which: Impairment losses since time of the foreclosure | Carrying amount |
| Property assets arising from financing provided to construction and property development companies | 6,313 | | 3,376 | | 2,455 | | 2,937 | |
| Of which: | | | | |
| Completed Buildings | 1,900 | | 799 | | 627 | | 1,101 | |
| Residential | 470 | | 181 | | 143 | | 289 | |
| Other | 1,430 | | 618 | | 484 | | 812 | |
| Buildings under construction | 112 | | 57 | | 42 | | 55 | |
| Residential | 56 | | 26 | | 17 | | 30 | |
| Other | 56 | | 31 | | 25 | | 25 | |
| Land | 4,301 | | 2,520 | | 1,786 | | 1,781 | |
| Developed Land | 1,506 | | 805 | | 496 | | 701 | |
| Other land | 2,795 | | 1,715 | | 1,290 | | 1,080 | |
| Property assets from home purchase mortgage loans to households | 838 | | 310 | | 211 | | 528 | |
| Other foreclosed property assets | 213 | | 87 | | 63 | | 126 | |
| Total property assets | 7,364 | | 3,773 | | 2,729 | | 3,591 | |
Additionally, Grupo Santander has participation in entities holding real estate assets foreclosed or received in payment of debts for an amount of EUR 448 million, mainly in Project Quasar Investments 2017, S.L. (EUR 405 million), and capital instruments foreclosed or received in payment of debts for an amount of EUR 16 million.
e) Solvency information
The Group commands a solvency position above the levels required by regulators and by the European Central bank. At 30 June 2022, at a consolidated level, the Group must maintain a minimum capital ratio of 8.85% of CET1 fully loaded (4.5% being the requirement for Pillar I, 0.84% being the requirement for Pillar II, 2.5% being the requirement for capital conservation buffer, 1% being the requirement for G-SIB and 0.01% being the requirement for anti-cyclical capital buffer). Santander Group must also maintain a minimum capital ratio of 10.64% of Tier 1 fully loaded and a minimum total ratio of 13.01% fully loaded.
At 30 June 2022, the Group has a capital ratio regulatory CET1 of 12.25% and a total ratio of 16.18%, the CET1 capital ratio without applying the transitory provision of IFRS 9 is 12.05%.
Capital ratio
| | | | | | | | |
| | |
| 30-06-2022 | 31-12-2021 |
| Capital coefficients | | |
| Level 1 ordinary eligible capital (EUR million) | 74,091 | | 72,402 | |
| Level 1 additional eligible capital (EUR million) | 8,794 | | 10,050 | |
| Level 2 eligible capital (EUR million) | 14,965 | | 14,865 | |
| Risk-weighted assets (EUR million) | 604,777 | | 578,930 | |
| Level 1 ordinary capital coefficient (CET 1) | 12.25 | % | 12.51 | % |
| Level 1 additional capital coefficient (AT1) | 1.46 | % | 1.73 | % |
| Level 1 capital coefficient (TIER1) | 13.71 | % | 14.24 | % |
| Level 2 capital coefficient (TIER 2) | 2.47 | % | 2.57 | % |
| Total capital coefficient | 16.18 | % | 16.81 | % |
Leverage
| | | | | | | | |
| 30-06-2022 | 31-12-2021 |
| Leverage | | |
| Tier 1 capital (EUR million) | 82,885 | | 82,452 | |
| Exposure (EIR million) | 1,751,029 | | 1,536,516 | |
| Leverage ratio | 4.73 | % | 5.37 | % |
17. Explanation added for translation to English
These interim condensed consolidated financial statements are presented on the basis of the regulatory financial reporting framework applicable to Grupo Santander in Spain (see Note 1.b).
SIGNATURE
Pursuant to the requirements of the Securities Exchange Act of 1934, the registrant has duly caused this report to be signed on its behalf by the undersigned, thereunto duly authorized.
| | | | | | | | |
| | |
| Banco Santander, S.A. |
| |
| |
| Date: 29 July 2022 | By: | /s/ José García Cantera |
| Name: | José García Cantera |
| Title: | Chief Financial Officer |