UNITED STATES
SECURITIES AND EXCHANGE COMMISSION
Washington, D.C. 20549
______________________________
FORM
______________________________
CERTIFIED SHAREHOLDER REPORT OF REGISTERED
MANAGEMENT INVESTMENT COMPANIES
Investment Company Act file number 811-21593
______________________________
KAYNE ANDERSON ENERGY INFRASTRUCTURE FUND, INC.
(Exact name of registrant as specified in charter)
______________________________
|
811 Main Street, 14th Floor, Houston, Texas |
77002 |
|
(Address of principal executive offices) |
(Zip code) |
|
Michael J. O’Neil |
|
(Name and address of agent for service) |
Registrant’s telephone number, including area code: (713) 493-2020
Date of fiscal year end: November 30, 2022
Date of reporting period: November 30, 2022
Form N-CSR is to be used by management investment companies to file reports with the Commission not later than 10 days after the transmission to stockholders of any report that is required to be transmitted to stockholders under Rule 30e-1 under the Investment Company Act of 1940 (17 CFR 270.30e-1). The Commission may use the information provided on Form N-CSR in its regulatory, disclosure review, inspection, and policymaking roles.
A registrant is required to disclose the information specified by Form N-CSR, and the Commission will make this information public. A registrant is not required to respond to the collection of information contained in Form N-CSR unless the Form displays a currently valid Office of Management and Budget (“OMB”) control number. Please direct comments concerning the accuracy of the information collection burden estimate and any suggestions for reducing the burden to Secretary, Securities and Exchange Commission, 450 Fifth Street, NW, Washington, DC 20549-0609. The OMB has reviewed this collection of information under the clearance requirements of 44 U.S.C. § 3507.
Item 1. Reports to Stockholders.
The report of Kayne Anderson Energy Infrastructure Fund, Inc. (the “Registrant”) to stockholders for the fiscal year ended November 30, 2022 is attached below.
CONTENTS
|
Page |
||
|
Disclosure Pursuant to Rule 8b-16 under the Investment Company Act of 1940, as amended |
1 |
|
|
2 |
||
|
8 |
||
|
9 |
||
|
14 |
||
|
18 |
||
|
19 |
||
|
Statement of Changes in Net Assets Applicable to Common Stockholders |
20 |
|
|
21 |
||
|
22 |
||
|
26 |
||
|
48 |
||
|
49 |
||
|
50 |
||
|
78 |
||
|
83 |
||
|
86 |
||
|
87 |
CAUTIONARY NOTE REGARDING FORWARD-LOOKING STATEMENTS: This report of Kayne Anderson Energy Infrastructure Fund, Inc. (the “Company”) contains “forward-looking statements” as defined under the U.S. federal securities laws. Generally, the words “believe,” “expect,” “intend,” “estimate,” “anticipate,” “project,” “will” and similar expressions identify forward-looking statements, which generally are not historical in nature. Forward-looking statements are subject to certain risks and uncertainties that could cause actual results to materially differ from the Company’s historical experience and its present expectations or projections indicated in any forward-looking statements. These risks include, but are not limited to, changes in economic and political conditions; regulatory and legal changes; energy infrastructure company industry risk; leverage risk; valuation risk; interest rate risk; tax risk; and other risks discussed in the Company’s filings with the Securities and Exchange Commission (“SEC”). You should not place undue reliance on forward-looking statements, which speak only as of the date they are made. The Company undertakes no obligation to update or revise any forward-looking statements made herein. There is no assurance that the Company’s investment objectives will be attained.
All investments in securities involve risks, including the possible loss of principal. The value of an investment in the Company could be volatile, and you could suffer losses of some or a substantial portion of the amount invested. The Company’s concentration of investments in energy infrastructure companies subjects it to the risks of midstream, renewable infrastructure and utility entities and the energy sector, including the risks of declines in energy and commodity prices, decreases in energy demand, adverse weather conditions, natural or other disasters, changes in government regulation, and changes in tax laws. Leverage creates risks that may adversely affect return, including the likelihood of greater volatility of net asset value and market price of common shares and fluctuations in distribution rates, which increases a stockholder’s risk of loss.
Performance data quoted in this report represent past performance and are for the stated time period only. Past performance is not a guarantee of future results. Current performance may be lower or higher than that shown based on market fluctuations from the end of the reported period.
KAYNE ANDERSON ENERGY INFRASTRUCTURE FUND, INC.
ADOPTION OF AN OPTIONAL DELIVERY METHOD FOR SHAREHOLDER REPORTS
Rule 8b-16 Disclosure
Rule 8b-16 under the Investment Company Act of 1940, as amended, requires that we disclose certain information to stockholders in our annual report. That disclosure is included in this report as follows: (1) information about our dividend investment plan is included on pages 83-85, (2) information about our investment objectives and policies is included on page 50, and (3) information regarding the principal risk factors associated with investment in the Company is included on pages 51-77. During the fiscal year ended November 30, 2022, there were no changes to our charter or by-laws that were not approved by stockholders that delay or prevent a change of control, nor were there changes to persons who are primarily responsible for the day-to-day management of the Company’s investment portfolio.
1
December 21, 2022
Dear Fellow Stockholders:
We hope that you and your families are well and enjoying the holiday season.
While quite a bit has changed in the world of investments since KYN went public in 2004, the Company’s core mission of providing a high after-tax return with an emphasis on making quarterly cash distributions to shareholders remains unchanged. Further, KYN was designed to provide investors an efficient means of investing in the energy infrastructure asset class — a vital part of the global economy — and the Company remains true to that mission today. Energy infrastructure is the backbone of the global energy sector, and the vast network of infrastructure assets owned by the Company’s portfolio investments are critical enablers of society’s modern way of life.
This year’s annual letter is designed to provide a concise summary of KYN’s performance, portfolio, and outlook. As discussed in this letter, we are excited about the Company’s prospects. While we readily acknowledge that the near-term economic outlook is uncertain, we believe the long-term benefits for KYN’s portfolio companies outweigh any short-term headwinds.
KYN generated very strong returns over the last 12 months — energy infrastructure companies performed well, with stock price returns far in excess of the S&P 500 index. Active portfolio management played a role in KYN’s excellent year, as performance benefited from our decision to “overweight” the midstream subsector vs. renewable infrastructure and utilities.(1) Active management of the Company’s balance sheet also influenced performance. In the face of heightened volatility in financial markets and rising interest rates, we reduced leverage during fiscal 2022. We made this decision to enable the Company to better navigate “choppy” market conditions, which seem to be the one constant in the financial markets these days. Higher marginal borrowing costs also played a role in this decision. While KYN’s returns would have been slightly higher had we not reduced leverage, we believe lower leverage levels are in the long-term best interest of the Company’s stockholders.
The parallel themes of energy security and energy transition — trends that have shaped our investment process for several years — are now recognized globally by policy makers, consumers, and the media. Throughout 2022, topics such as liquified natural gas (“LNG”) exports to Europe, the Strategic Petroleum Reserve, and investment tax credits frequented the front pages of mainstream news sources across the globe. While this renewed interest in the energy markets is partially attributable to market disruptions resulting from the war in Ukraine, it is our view that energy literacy among global citizens and policymakers will result in pragmatic energy policies over the longer term. A key global challenge today is the acute need for more energy, and North American energy infrastructure is the critical link in providing low-cost, abundant, and secure sources of energy to global markets.
____________
Endnotes can be found on page 7.
2
KAYNE ANDERSON ENERGY INFRASTRUCTURE FUND, INC.
LETTER TO STOCKHOLDERS
Why Invest in KYN?
We routinely try to put ourselves “in the shoes” of our investors and ask: What is KYN’s value proposition for investors? In our opinion, KYN — with its flexible investment mandate, permanent capital base, and expertise providing capital solutions to both public and private companies — is a very attractive vehicle for investors seeking diversified exposure to the North American energy infrastructure sector in an income-producing vehicle. We believe the sector’s investment thesis is compelling for several reasons:
• Access to affordable and reliable energy is critical to the global economy, as evidenced by international developments throughout 2022. Energy infrastructure plays a vital role in facilitating this access by connecting producers and end users;
• European nations’ pursuit of reliable, alternative sources of energy, including natural gas produced in the United States, has created a new frontier of commercial opportunities for North American energy infrastructure companies;
• Policy developments supporting the energy transition — namely, the Inflation Reduction Act in the U.S. — create decades-long visibility on cash flows and an attractive runway for long-term growth;
• Global demand for energy is expected to steadily increase over the next several decades — driven primarily by growth in developing economies; and
• Energy infrastructure companies have stable cash flows, operate businesses with increasingly high barriers to entry, and, in many cases, have contractual protections to offset higher levels of inflation.
In short, KYN provides investors exposure to the durable megatrends of global decarbonization and energy security in a diversified fund. The Company provides this exposure to investors in a very easy-to-own structure — daily liquidity via the NYSE listing, an attractive quarterly distribution, and the tax simplicity of a single Form 1099. Importantly, the Company’s portfolio has evolved over the last 18 years in concert with the domestic energy sector’s transition. Today, KYN is much more than “a way to invest in MLPs,” and the Company’s portfolio is, in our opinion, a more comprehensive and better way to invest in the North American energy infrastructure sector.
Performance and Distributions
KYN generated a total Net Asset Return of 30.5% in fiscal 2022.(2) We were pleased with this performance on the heels of a 41.0% return in fiscal 2021. KYN outperformed its benchmark by 820 basis points in fiscal 2022.(3) As you can see in the table below, midstream companies were the best performing energy infrastructure subsector for the second consecutive year. Renewable infrastructure companies performed the weakest during fiscal 2022, with higher interest rates (and inflation), supply chain pressure, and concerns about the outlook for European and Asian economies weighing on equity price performance.
|
Comparison of Returns in Fiscal 2022 |
|||||||||
|
KYN Net Asset Return(2) |
30.5 |
% |
|||||||
|
KYN Benchmark(4) |
22.3 |
% |
|||||||
|
Midstream(5) |
30.8 |
% |
|||||||
|
Renewable Infrastructure(6) |
-13.0 |
% |
|||||||
|
U.S. Utilities(7) |
11.8 |
% |
|||||||
____________
Endnotes can be found on page 7.
3
KAYNE ANDERSON ENERGY INFRASTRUCTURE FUND, INC.
LETTER TO STOCKHOLDERS
KYN’s Market Return, which is based on stock price performance rather than Net Asset Value, was 27.2% for fiscal 2022.(8) This trailed our Net Asset Return as our stock price traded at a 15.0% discount to NAV at fiscal year-end compared to a 12.8% discount at the beginning of the year.
We are disappointed in KYN’s current discount to NAV, and we continue to assess options to narrow this discount. Narrowing this discount can — in the short term — be an elusive goal. We will not hesitate to consider actions that we expect to have a sustained impact, but we do not anticipate utilizing strategies that are unlikely to result in a lasting solution. While we will carefully consider all actions suggested by our stockholders, our decisions will be guided by what we believe is in the best interests of all of our investors. To that end, one of our most important long-term goals is to provide investors with an attractive distribution because we continue to believe that consistent performance, along with a substantial return of cash to shareholders through quarterly distributions, will be rewarded over time in the form of a narrowing discount.
KYN’s current quarterly distribution rate is 20¢ per share, a level that we believe is sustainable based on our current outlook. Our goal is to steadily increase KYN’s distribution over time, as supported by the Company’s operating results.
In determining KYN’s distribution, the Company’s board of directors considers both the income we receive from our investments as well as capital appreciation in the portfolio. We take a long-term view when making this determination and are not overly influenced by fluctuations in quarterly operating results. We expect that the returns generated by our portfolio companies over the next few years will accrue to the Company in a balanced combination of income and capital appreciation.
Portfolio Positioning and Outlook
In many ways, fiscal 2022 ushered in a “long forgotten” era for financial markets. Inflation rose to levels not seen since the early 1980s and remains stubbornly high. The Federal Reserve has engaged in a very aggressive tightening cycle, and short-term interest rates rose to levels not seen in decades. As investors digested the potential for a global recession, SPACs and NFTs ceded market share to “old economy” stocks like Exxon Mobil and Berkshire Hathaway. Unsettled capital markets and heightened geopolitical risk drove a flight to investments with defensive attributes, and KYN’s portfolio investments have benefited from this trend.
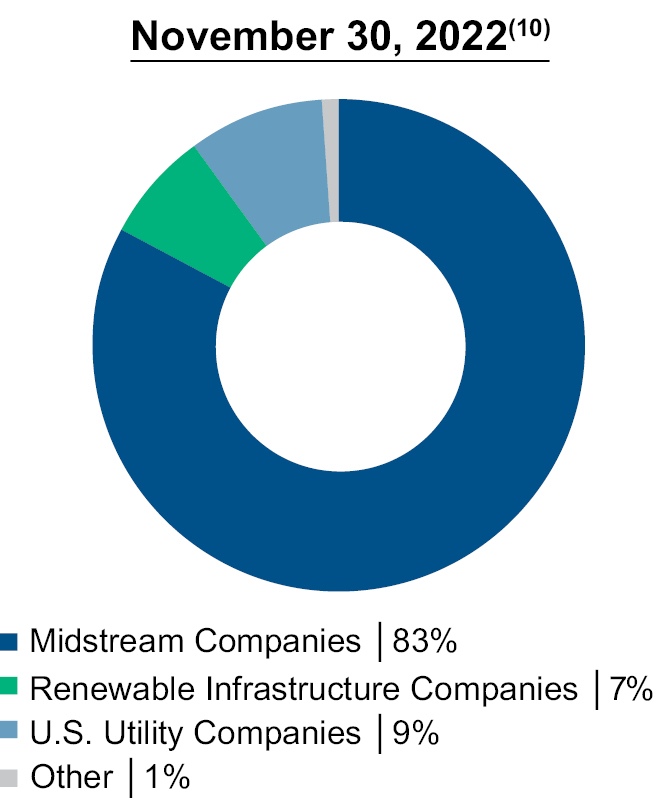
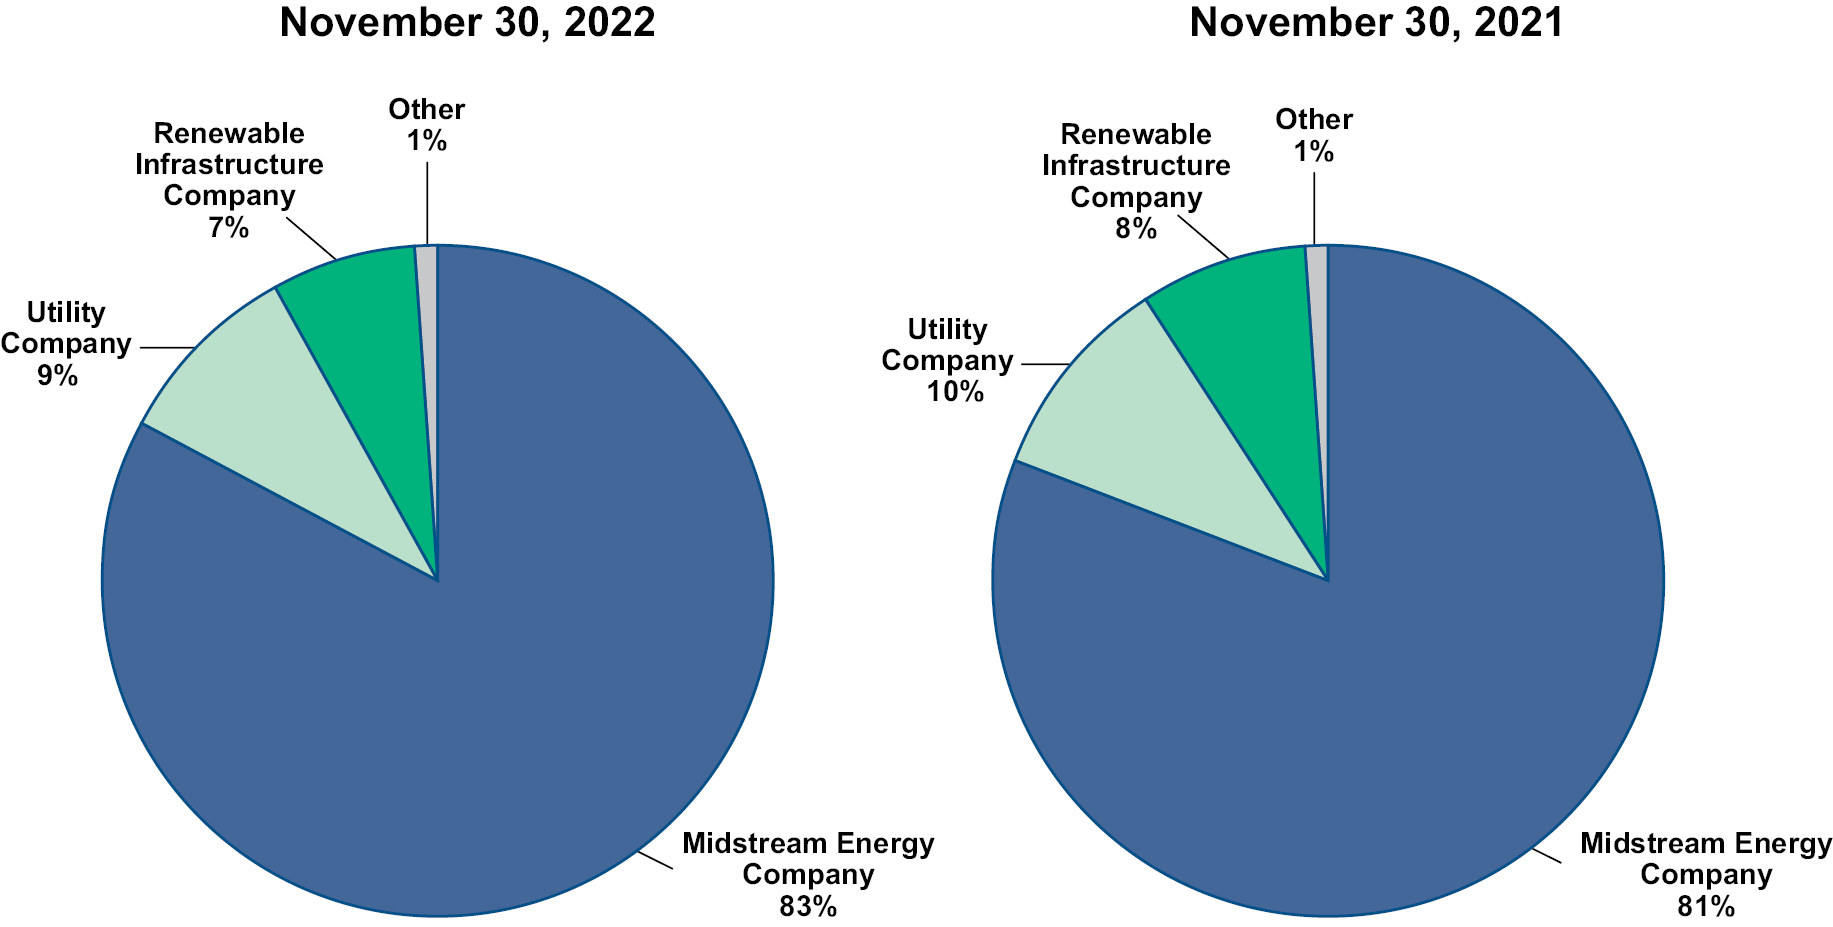
KYN’s portfolio consists of a diversified mix of North American-focused energy infrastructure investments. Throughout 2020 and 2021, we meaningfully increased the Company’s holdings of U.S. utilities and renewable infrastructure companies to capitalize on the accelerating transition to lower carbon fuels. We paused that shift during fiscal 2022 because we believed midstream companies offered a better near-term value proposition. While utilities and renewable infrastructure companies will play an essential role in KYN’s portfolio over the coming years, we will continue to tactically position the portfolio in the short term for the most attractive risk-adjusted returns. The pie chart below summarizes KYN’s allocations to the three energy infrastructure subsectors at the end of fiscal 2022. The Company’s Benchmark for fiscal 2023 has similar subsector allocations as were used in fiscal 2022.(9) Importantly, this benchmark should be seen as a directional target for subsector allocations over the intermediate term — we do not believe rigid portfolio allocation guidelines are in stockholders’ best interests.
____________
Endnotes can be found on page 7.
4
KAYNE ANDERSON ENERGY INFRASTRUCTURE FUND, INC.
LETTER TO STOCKHOLDERS
As we contemplate the outlook for the next few years, we believe the energy infrastructure sector is positioned for success — business fundamentals for the companies in our portfolio are excellent, corporate governance is greatly improved, and balance sheets are as healthy as any time in the past decade. Furthermore, the defensive attributes of these businesses compare favorably in the current economic environment. Importantly, fundamentals in the broader energy markets remain constructive. Global energy demand is poised to exceed pre-COVID levels and is set to grow consistently over the next decade. North American energy companies remain steadfastly committed to generating free cash flow, returning capital to shareholders, and growing production at a responsible pace. Collective adherence to this “new” business model bodes well for the stability of the North American energy infrastructure sector over the next decade.
Additionally, we are witnessing a permanent, seismic shift in the nature of global energy supply and demand: an understanding that not all molecules and electrons are created equal. The megatrends of decarbonization and energy security have collided to create a durable, global “bid” on low carbon, responsibly produced, secure sources of energy; in our opinion, this bodes very well for KYN’s portfolio investments. We expect North American energy infrastructure to remain the enabling network of choice for heating homes and powering economies all over the world in 2023 and beyond.
Higher interest rates are naturally a headwind for companies with deep project backlogs (including certain companies in KYN’s portfolio), but this is a manageable situation in our view. At the Company level, KYN’s balance sheet is well-positioned for the current interest rate environment. Our decision to primarily utilize fixed-rate leverage (as opposed to floating-rate leverage) should benefit the Company over the next few years, and interest expense during fiscal 2023 will not be nearly as high as it would have otherwise been. We have always believed this was the prudent way to operate the business. Further, KYN’s leverage levels are conservative, and we have ample downside cushion to dampen the impact of any potential market dislocations.(11)
____________
Endnotes can be found on page 7.
5
KAYNE ANDERSON ENERGY INFRASTRUCTURE FUND, INC.
LETTER TO STOCKHOLDERS
Over a longer horizon, domestic legislation like the Inflation Reduction Act and the European Commission’s REPowerEU plan — replete with tax credit extensions, regional incentives, and other policy support mechanisms — create an extremely attractive commercial backdrop for new renewable infrastructure and other energy transition related investments. Commercial traction in emerging energy subsectors continues to accelerate, and we believe energy infrastructure companies are just beginning to capitalize on the global decarbonization megatrend.
The energy infrastructure industry today — in its themes, corporate structure, and even its jargon — is fundamentally different than a decade ago. Our diverse team of industry experts embraces this evolution and is well-positioned to capitalize on opportunities emerging from this new landscape. We do this with decades of experience and a deep appreciation for, and understanding of, business cycles and the dangers of chasing investment fads.
We appreciate the trust you have placed in us, and we take this responsibility very seriously. We are very optimistic about the Company’s prospects moving forward and look forward to executing on our investment objective of achieving high after-tax total returns. Please do not hesitate to contact us with any questions or comments.
Sincerely,

James C. Baker, Jr.
Chairman of the Board
President and Chief Executive Officer
____________
Endnotes can be found on page 7.
6
KAYNE ANDERSON ENERGY INFRASTRUCTURE FUND, INC.
LETTER TO STOCKHOLDERS
____________
(1) Whenever we reference “midstream companies”, the “midstream sector” or the “midstream industry” it includes both traditional midstream companies and natural gas & LNG infrastructure companies. Traditional midstream companies are defined as midstream companies that own and/or operate midstream assets related to crude oil, refined products, natural gas liquids or water. Natural gas & LNG infrastructure companies are defined as midstream companies that primarily own and/or operate midstream assets related to natural gas or liquefied natural gas. “Overweight” relative to KYN’s Benchmark detailed in footnote 4.
(2) Net Asset Return is defined as the change in net asset value per share plus cash distributions paid during the period (assuming reinvestment through our dividend reinvestment plan).
(3) Based on the difference between the Company’s Net Asset Return and the total return of KYN’s Benchmark.
(4) KYN’s Benchmark is a composite of energy infrastructure companies. For fiscal 2022, this composite is comprised of a 75% weighting to the midstream sector, a 15% weighting to the renewable infrastructure sector, and a 10% weighting to the U.S. utility sector. The subsector allocations for this composite were established by Kayne Anderson at the beginning of fiscal 2022 based on the estimated target subsector allocations of the Company’s assets over the intermediate term. KYN’s portfolio holdings and/or subsector allocations may change at any time. Returns for each period are total returns (assuming reinvestment of dividends).
(5) The benchmark for the midstream sector is the Alerian Midstream Energy Index (AMNA).
(6) The benchmark for the renewable infrastructure sector is a composite total return of 41 domestic and international renewable infrastructure and utility companies (calculated on a market-cap weighted basis with individual constituents capped at a 10% weighting).
(7) The benchmark for the U.S. utility sector is the Utilities Select Sector SPDR Fund (XLU), which is an exchange-traded fund (“ETF”) linked to the Utilities Select Sector Index (IXU), a subset of the S&P 500.
(8) Market Return is defined as the change in share price plus cash distributions paid during the period (assuming reinvestment through our dividend reinvestment program).
(9) For fiscal 2023, KYN’s Benchmark is a composite that is comprised of a 75% weighting to the midstream sector, a 12.5% weighting to the renewable infrastructure sector, and a 12.5% weighting to the U.S. utility sector. The subsector allocations for this composite were established by Kayne Anderson based on the estimated target subsector allocations of the Company’s assets over the intermediate term. KYN’s portfolio holdings and/or sector allocations may change at any time.
(10) “Midstream companies” include traditional midstream and natural gas / LNG companies.
(11) Downside cushion reflects the decrease in total asset value that could be sustained while maintaining compliance with 1940 Act leverage levels and KYN’s financial covenants.
7
Portfolio of Long-Term Investments by Category
Top 10 Holdings by Issuer(1)
|
Percent of Long-Term |
||||||||
|
Holding |
Category |
2022 |
2021 |
|||||
|
1. |
Energy Transfer LP |
Midstream Energy Company |
10.6% |
7.8% |
||||
|
2. |
MPLX LP(2) |
Midstream Energy Company |
10.2 |
12.9 |
||||
|
3. |
Enterprise Products Partners L.P.(2) |
Midstream Energy Company |
10.0 |
10.5 |
||||
|
4. |
Targa Resources Corp. |
Midstream Energy Company |
8.0 |
7.4 |
||||
|
5. |
The Williams Companies, Inc. |
Midstream Energy Company |
7.3 |
6.4 |
||||
|
6. |
Plains All American Pipeline, L.P.(3) |
Midstream Energy Company |
7.0 |
5.2 |
||||
|
7. |
Cheniere Energy, Inc. |
Midstream Energy Company |
6.7 |
3.2 |
||||
|
8. |
Western Midstream Partners, LP |
Midstream Energy Company |
5.0 |
4.5 |
||||
|
9. |
DT Midstream, Inc. |
Midstream Energy Company |
2.8 |
2.1 |
||||
|
10. |
ONEOK, Inc. |
Midstream Energy Company |
2.7 |
4.0 |
||||
(1) Includes ownership of equity and debt investments.
(2) Includes ownership of common and preferred units.
(3) Includes ownership of Plains All American Pipeline, L.P. (“PAA”) and Plains AAP, L.P. (“PAGP-AAP”).
8
Company Overview
Kayne Anderson Energy Infrastructure Fund, Inc. (the “Company” or “KYN”) is a non-diversified, closed-end fund that commenced operations in September 2004. Our investment objective is to provide a high after-tax total return with an emphasis on making cash distributions to stockholders. We intend to achieve our investment objective by investing at least 80% of our total assets in the securities of Energy Infrastructure Companies. Please refer to the Glossary of Key Terms for the meaning of capitalized terms not otherwise defined herein.
As of November 30, 2022, we had total assets of $2.0 billion, net assets applicable to our common stockholders of $1.4 billion (net asset value of $10.64 per share), and 136.1 million shares of common stock outstanding.
Results of Operations — For the Three Months Ended November 30, 2022
Investment Income. Investment income totaled $15.0 million for the quarter. We received $27.9 million of dividends and distributions, of which $11.7 million was treated as return of capital and $1.4 million was treated as distributions in excess of cost basis. Interest income was $0.2 million.
Operating Expenses. Operating expenses totaled $12.5 million, including $6.9 million of investment management fees, $3.8 million of interest expense, $1.1 million of preferred stock distributions and $0.7 million of other operating expenses.
Net Investment Income. Our net investment income totaled $2.6 million and included a current tax expense of less than $0.1 million and a deferred tax benefit of $0.1 million.
Net Realized Gains. We had net realized gains from our investments of $10.2 million, consisting of realized gains from long term investments of $10.6 million, $0.4 million of net realized gains from option activity, a current income tax expense of $2.4 million and a deferred tax benefit of $1.6 million.
Net Change in Unrealized Gains. We had a net increase in our unrealized gains of $16.0 million. The net change consisted of a $14.9 million increase in unrealized gains on investments, $0.2 million of unrealized losses from option activity and a deferred tax benefit of $1.3 million.
Net Increase in Net Assets Resulting from Operations. As a result of the above, we had a net increase in net assets resulting from operations of $28.8 million.
Results of Operations — For the Fiscal Year Ended November 30, 2022
Investment Income. Investment income totaled $57.0 million for the fiscal year. We received $109.8 million of dividends and distributions, of which $48.7 million was treated as return of capital and $4.5 million was treated as distributions in excess of cost basis. Return of capital and distributions in excess of cost basis decreased by $9.1 million and $0.2 million, respectively, during the year due to 2021 tax reporting information that we received in fiscal 2022. Interest income was $0.4 million.
Operating Expenses. Operating expenses totaled $46.1 million, including $26.7 million of net investment management fees, $12.7 million of interest expense, $3.9 million of preferred stock distributions and $2.8 million of other operating expenses.
Net Investment Income. Our net investment income totaled $9.7 million and included a current tax expense of $1.0 million and a deferred tax expense of $0.2 million.
9
KAYNE ANDERSON ENERGY INFRASTRUCTURE FUND, INC.
MANAGEMENT DISCUSSION
(UNAUDITED)
Net Realized Gains. We had net realized gains from our investments of $83.1 million, consisting of realized gains from long term investments of $103.9 million, $0.6 million of realized gains from option activity, $0.1 million of realized losses on foreign currency transactions, a current tax expense of $17.2 million and a deferred tax expense of $4.1 million.
Net Change in Unrealized Gains. We had a net increase in unrealized gains of $230.5 million. The net change consisted of a $289.7 million increase in our unrealized gains on investments and a deferred tax expense of $59.2 million.
Net Increase in Net Assets Resulting from Operations. As a result of the above, we had a net increase in net assets resulting from operations of $323.3 million.
Management Discussion of Fund Performance
See Letter to Stockholders for a more fulsome discussion of the Company’s performance during the fiscal year ended November 30, 2022.
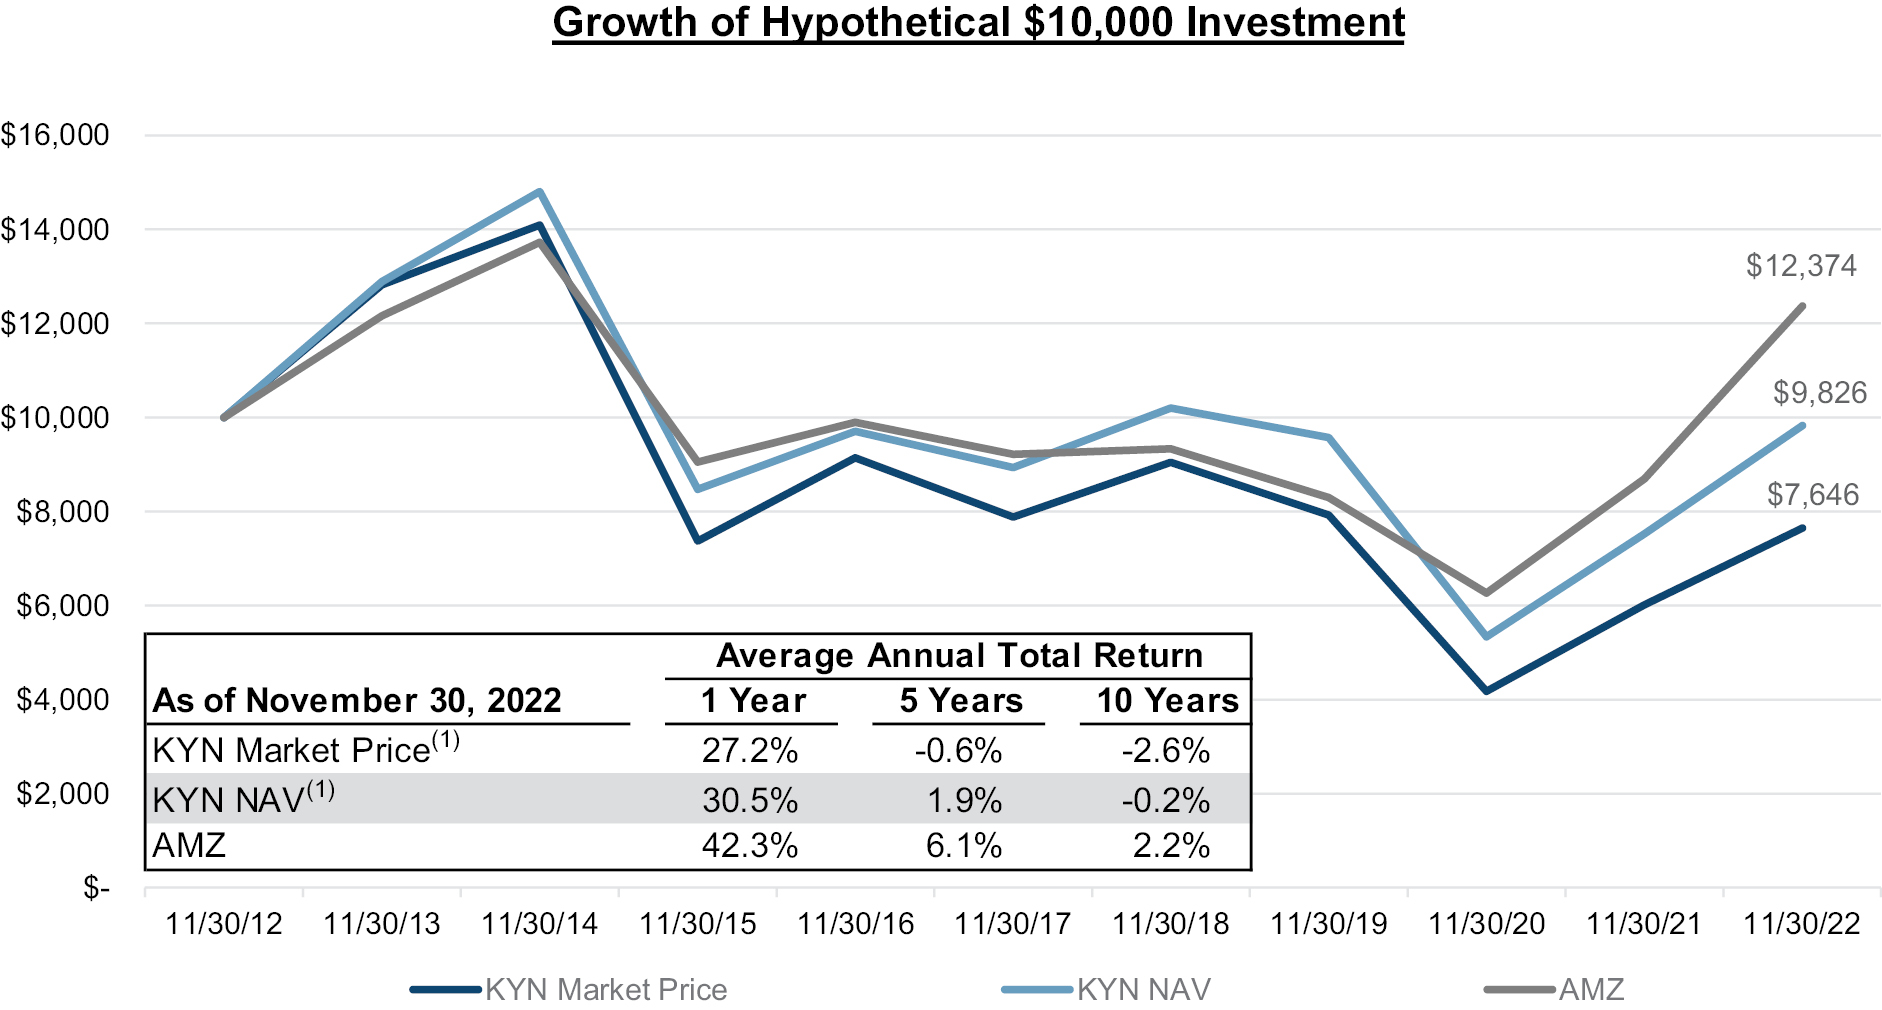
The below graph illustrates the hypothetical growth of $10,000 based upon the total return performance of the Company’s common share price (“KYN Market Price”) and net asset value per share price (“KYN NAV”) for the 10-year period ended November 30, 2022 as compared to the total return of the Alerian MLP Index (“AMZ”).
____________
(1) KYN Market Price and NAV return assume that distributions have been reinvested at actual prices pursuant to the Company’s dividend reinvestment plan. Return reflects the deduction of management fees and expenses but does not reflect transaction fees or broker commissions.
10
KAYNE ANDERSON ENERGY INFRASTRUCTURE FUND, INC.
MANAGEMENT DISCUSSION
(UNAUDITED)
The table and graph do not reflect any deduction for taxes that a shareholder may pay on distributions or the disposition of Company shares. Index performance is shown for illustrative purposes only and does not reflect any fees, expenses or sales charges. It is not possible to invest directly in an index.
Performance data quoted represents past performance and is no guarantee of future results. Current performance may be lower or higher than that shown based on market fluctuations from the end of the reported period.
The AMZ is an index of energy infrastructure Master Limited Partnerships (MLPs). The AMZ is a capped, float-adjusted, capitalization-weighted index, whose constituents earn the majority of their cash flow from midstream activities involving energy commodities.
Distributions to Common Stockholders
On December 14, 2022, KYN declared a quarterly distribution of $0.20 per common share for the fourth quarter, which was paid on January 11, 2023. Payment of future distributions is subject to Board of Directors approval, as well as meeting the covenants on our debt agreements and terms of our preferred stock.
The Board of Directors considers several items in setting our distributions to common stockholders including net distributable income (as defined below), realized and unrealized gains and expected returns for portfolio investments. For instance, we expect earnings growth and/or excess free cash flows generated by our holdings will enhance shareholder value and, in turn, result in appreciation in our portfolio investments. Taking this into consideration when setting our distribution gives us an effective way to pass along these benefits to our stockholders.
Net Distributable Income (“NDI”) is the amount of income received by us from our portfolio investments less operating expenses, subject to certain adjustments as described below. NDI is not a financial measure under the accounting principles generally accepted in the United States of America (“GAAP”). Refer to the Reconciliation of NDI to GAAP section below for a reconciliation of this measure to our results reported under GAAP.
For the purposes of calculating NDI, income from portfolio investments includes (a) cash dividends and distributions, (b) paid-in-kind dividends received (i.e., stock dividends), (c) interest income from debt securities and (d) net premiums received from the sale of covered calls.
For the purposes of calculating NDI, operating expenses include (a) investment management fees paid to our investment adviser, (b) other expenses (mostly comprised of fees paid to other service providers), (c) interest expense and preferred stock distributions and (d) current and deferred income tax expense/benefit on net investment income/loss.
11
KAYNE ANDERSON ENERGY INFRASTRUCTURE FUND, INC.
MANAGEMENT DISCUSSION
(UNAUDITED)
Net Distributable Income (NDI)
(amounts in millions, except for per share amounts)
|
Three Months |
Fiscal Year |
|||||||
|
Distributions and Other Income from Investments |
|
|
|
|
||||
|
Dividends and Distributions |
$ |
27.9 |
|
$ |
109.8 |
|
||
|
Interest Income and Other Income |
|
0.1 |
|
|
0.4 |
|
||
|
Net Premiums Received from Call Options Written |
|
0.1 |
|
|
0.6 |
|
||
|
Total Distributions and Other Income from Investments |
$ |
28.1 |
|
$ |
110.8 |
|
||
|
Expenses |
|
|
|
|
||||
|
Net Investment Management Fee |
|
(6.9 |
) |
|
(26.7 |
) |
||
|
Other Expenses |
|
(0.7 |
) |
|
(2.7 |
) |
||
|
Interest Expense |
|
(3.8 |
) |
|
(12.7 |
) |
||
|
Preferred Stock Distributions |
|
(1.1 |
) |
|
(3.9 |
) |
||
|
Income Tax Benefit (Expense), net |
|
0.1 |
|
|
(1.2 |
) |
||
|
Net Distributable Income (NDI) |
$ |
15.7 |
|
$ |
63.6 |
|
||
|
Weighted Shares Outstanding |
|
136.1 |
|
|
133.7 |
|
||
|
NDI per Weighted Share Outstanding |
$ |
0.116 |
|
$ |
0.476 |
|
||
Reconciliation of NDI to GAAP
The difference between distributions and other income from investments in the NDI calculation and total investment income as reported in our Statement of Operations is reconciled as follows:
• A significant portion of the cash distributions received from our investments is characterized as return of capital. For GAAP purposes, return of capital distributions are excluded from investment income, whereas the NDI calculation includes the return of capital portion of such distributions.
• GAAP recognizes distributions received from our investments that exceed the cost basis of our securities to be realized gains and are therefore excluded from investment income, whereas the NDI calculation includes these distributions.
• We may sell covered call option contracts to generate income or to reduce our ownership of certain securities that we hold. In some cases, we are able to repurchase these call option contracts at a price less than the call premium that we received, thereby generating a profit. The premium we receive from selling call options, less (i) the premium that we pay to repurchase such call option contracts and (ii) the amount by which the market price of an underlying security is above the strike price at the time a new call option is written (if any), is included in NDI. For GAAP purposes, premiums received from call option contracts sold are not included in investment income. See Note 2 — Significant Accounting Policies for the GAAP treatment of option contracts.
Liquidity and Capital Resources
At November 30, 2022, we had total leverage outstanding of $423 million, which represented 21% of total assets. Total leverage was comprised of $261 million of senior unsecured notes (“Notes”), $50 million outstanding under our unsecured term loan (the “Term Loan”) and $112 million of mandatory redeemable preferred stock (“MRP Shares”). At such date we had $2 million of cash and cash equivalents.
12
KAYNE ANDERSON ENERGY INFRASTRUCTURE FUND, INC.
MANAGEMENT DISCUSSION
(UNAUDITED)
As of January 20, 2023, we had $29 million of borrowings outstanding under our unsecured revolving credit facility (the “Credit Facility”), $50 million outstanding under our Term Loan and $2 million of cash.
Our Credit Facility has a total commitment of $200 million and matures on February 24, 2023. The interest rate on borrowings under the Credit Facility may vary between the secured overnight financing rate (“SOFR”) plus 1.40% and SOFR plus 2.25%, depending on our asset coverage ratios. We pay a fee of 0.20% per annum on any unused amounts of the Credit Facility. As of November 30, 2022, we did not have any borrowings under the Credit Facility.
Our $50 million Term Loan has a three-year term, maturing August 6, 2024. The interest rate on $25 million of the Term Loan is fixed at a rate of 1.735% and the interest rate on the remaining $25 million is LIBOR plus 1.30%. Amounts repaid under the Term Loan cannot be reborrowed.
As of November 30, 2022, we had $261 million of Notes outstanding that mature between 2023 and 2034 and we had $112 million of MRP Shares outstanding that are subject to mandatory redemption between 2027 and 2032. We expect to have sufficient borrowing capacity on our Credit Facility to refinance the $32 million of Notes that mature in fiscal 2023.
At November 30, 2022, our asset coverage ratios under the Investment Company Act of 1940, as amended (“1940 Act”), were 602% for debt and 443% for total leverage (debt plus preferred stock). We target asset coverage ratios that give us the ability to withstand declines in the market value of the securities we hold before breaching the financial covenants in our leverage. At this time, we target asset coverage ratios that provide at least 40% of cushion relative to our financial covenants (i.e., market values could decline by approximately this amount before our asset coverage ratios would be equal to our financial covenants). Our leverage targets are dependent on market conditions as well as certain other factors and may vary from time to time.
As of November 30, 2022, our total leverage consisted 82% of fixed rate obligations and 18% of floating rate obligations. At such date, the weighted average interest/dividend rate on our total leverage was 4.01%.
13
KAYNE ANDERSON ENERGY INFRASTRUCTURE FUND, INC.
SCHEDULE OF INVESTMENTS
November 30, 2022
(amounts in 000’s, except number of option contracts)
|
Description |
No. of |
Value |
|||
|
Long-Term Investments — 137.5% |
|
||||
|
Equity Investments(1) — 136.9% |
|
||||
|
Midstream Energy Company(2) — 114.6% |
|
||||
|
Aris Water Solutions, Inc. |
478 |
$ |
7,567 |
||
|
Cheniere Energy, Inc. |
756 |
|
132,642 |
||
|
Cheniere Energy Partners, L.P. |
300 |
|
18,647 |
||
|
DCP Midstream, LP |
161 |
|
6,334 |
||
|
DT Midstream, Inc. |
919 |
|
55,425 |
||
|
Enbridge Inc.(3) |
862 |
|
35,608 |
||
|
Energy Transfer LP |
16,788 |
|
210,517 |
||
|
Enterprise Products Partners L.P. |
7,087 |
|
175,817 |
||
|
Enterprise Products Partners L.P. — Convertible Preferred |
23 |
|
22,387 |
||
|
Kinder Morgan, Inc. |
1,480 |
|
28,288 |
||
|
Kinetik Holdings Inc. |
546 |
|
18,567 |
||
|
Magellan Midstream Partners, L.P. |
896 |
|
47,199 |
||
|
MPLX LP |
3,714 |
|
126,248 |
||
|
MPLX LP — Convertible Preferred Units(4)(5)(7) |
2,255 |
|
76,661 |
||
|
ONEOK, Inc. |
807 |
|
53,976 |
||
|
Pembina Pipeline Corporation(3) |
789 |
|
28,764 |
||
|
Plains All American Pipeline, L.P. |
9,518 |
|
118,217 |
||
|
Plains GP Holdings, L.P. — Plains AAP, L.P.(5)(8) |
1,622 |
|
21,463 |
||
|
Streamline Innovations Holdings, Inc. — Series C Preferred Shares(4)(5)(9)(10)(11) |
4,125 |
|
19,594 |
||
|
Targa Resources Corp.(12) |
2,132 |
|
158,608 |
||
|
TC Energy Corporation(3) |
1,177 |
|
52,362 |
||
|
The Williams Companies, Inc. |
4,145 |
|
143,843 |
||
|
Western Midstream Partners, LP |
3,570 |
|
99,892 |
||
|
|
1,658,626 |
||||
|
Utility Company(2) — 12.2% |
|
||||
|
American Electric Power Company, Inc. |
79 |
|
7,599 |
||
|
Dominion Energy, Inc. |
486 |
|
29,718 |
||
|
Duke Energy Corporation |
206 |
|
20,566 |
||
|
Evergy, Inc. |
121 |
|
7,176 |
||
|
Eversource Energy |
132 |
|
10,904 |
||
|
NextEra Energy, Inc. |
262 |
|
22,225 |
||
|
Sempra Energy |
259 |
|
42,977 |
||
|
TransAlta Corporation(3) |
1,016 |
|
9,416 |
||
|
Xcel Energy Inc. |
374 |
|
26,241 |
||
|
|
176,822 |
||||
See accompanying notes to financial statements.
14
KAYNE ANDERSON ENERGY INFRASTRUCTURE FUND, INC.
SCHEDULE OF INVESTMENTS
November 30, 2022
(amounts in 000’s, except number of option contracts)
|
Description |
No. of |
Value |
|||
|
Renewable Infrastructure Company(2) — 8.9% |
|
||||
|
Atlantica Sustainable Infrastructure plc(3) |
979 |
$ |
27,301 |
||
|
Brookfield Renewable Partners L.P.(3) |
625 |
|
17,689 |
||
|
Clearway Energy, Inc. — Class A |
111 |
|
3,665 |
||
|
Clearway Energy, Inc. — Class C |
403 |
|
14,265 |
||
|
Enviva Inc. |
248 |
|
14,063 |
||
|
Innergex Renewable Energy Inc.(3) |
735 |
|
9,126 |
||
|
NextEra Energy Partners, LP |
401 |
|
32,269 |
||
|
Northland Power Inc.(3) |
377 |
|
10,581 |
||
|
|
128,959 |
||||
|
Energy Company(2) —1.2% |
|
||||
|
Phillips 66 |
167 |
|
18,068 |
||
|
Total Equity Investments (Cost — $1,806,580) |
|
1,982,475 |
|||
|
Interest |
Maturity |
Principal |
||||||||
|
Debt Investments — 0.6% |
|
|
||||||||
|
Midstream Energy Company(2) — 0.6% |
|
|
||||||||
|
Energy Transfer LP |
5.30 |
% |
4/15/47 |
$ |
750 |
633 |
||||
|
EQM Midstream Partners, LP |
7.50 |
|
6/1/30 |
|
667 |
661 |
||||
|
EQM Midstream Partners, LP |
6.50 |
|
7/15/48 |
|
6,000 |
4,652 |
||||
|
Kinder Morgan, Inc. |
5.55 |
|
6/1/45 |
|
750 |
696 |
||||
|
Plains All American Pipeline, L.P. |
4.90 |
|
2/15/45 |
|
750 |
588 |
||||
|
The Williams Companies, Inc. |
5.10 |
|
9/15/45 |
|
750 |
666 |
||||
|
Total Debt Investments (Cost — $9,253) |
7,896 |
|||||||||
|
Total Long-Term Investments (Cost — $1,815,833) |
1,990,371 |
|||||||||
|
No. of |
||||
|
Short-Term Investment — Money Market Fund — 0.1% |
||||
|
JPMorgan 100% U.S. Treasury Securities Money Market Fund — |
||||
|
Total Investments — 137.6% (Cost — $1,817,610) |
1,777 |
1,777 |
||
|
1,992,148 |
|
Liabilities |
Strike |
Expiration |
No. of |
Notional |
|||||||||
|
Call Option Contracts Written(11) |
|
|
|
||||||||||
|
Midstream Energy Company(2) |
|
|
|
||||||||||
|
Targa Resources Corp. |
$ |
85.00 |
1/20/23 |
6 |
$ |
45 |
— |
|
|||||
|
Targa Resources Corp. |
|
82.50 |
1/20/23 |
375 |
|
2,790 |
(45 |
) |
|||||
|
Total Call Option Contracts Written (Premiums Received — $44) |
(45 |
) |
|||||||||||
See accompanying notes to financial statements.
15
KAYNE ANDERSON ENERGY INFRASTRUCTURE FUND, INC.
SCHEDULE OF INVESTMENTS
November 30, 2022
(amounts in 000’s, except number of option contracts)
|
Description |
Value |
|||||
|
Debt |
$ |
(310,789 |
) |
|||
|
Mandatory Redeemable Preferred Stock at Liquidation Value |
|
(111,603 |
) |
|||
|
Current Income Tax Receivable, net |
|
7,790 |
|
|||
|
Deferred Income Tax Liability, net |
|
(123,746 |
) |
|||
|
Other Liabilities in Excess of Other Assets |
|
(5,733 |
) |
|||
|
Net Assets Applicable to Common Stockholders |
$ |
1,448,022 |
|
|||
____________
(1) Unless otherwise noted, equity investments are common units/common shares.
(2) Refer to Glossary of Key Terms for definitions of Energy Company, Midstream Energy Company, Renewable Infrastructure Company and Utility Company.
(3) Foreign security.
(4) Fair valued on a recurring basis using significant unobservable inputs (Level 3). See Notes 2 and 3 in Notes to Financial Statements.
(5) The Company’s ability to sell this security is subject to certain legal or contractual restrictions. As of November 30, 2022, the aggregate value of restricted securities held by the Company was $140,105 (7.0% of total assets), which included $21,463 of Level 2 securities and $118,642 of Level 3 securities. See Note 7 — Restricted Securities.
(6) Enterprise Products Partners L.P. (“EPD”) Series A Cumulative Convertible Preferred Units (“EPD Convertible Preferred Units”) are senior to the common units in terms of liquidation preference and priority of distributions, and pay a distribution of 7.25% per annum. The EPD Convertible Preferred Units are convertible into EPD common units at any time after September 29, 2025 at the liquidation preference amount divided by 92.5% of the 5-day volume weighted average price of EPD’s common units at such time.
(7) MPLX LP (“MPLX”) Series A Convertible Preferred Units (“MPLX Convertible Preferred Units”) are convertible on a one-for-one basis into common units of MPLX and are senior to the common units in terms of liquidation preference and priority of distributions. For the quarter ended November 30, 2022, the Company received a distribution of $0.775 per MPLX Convertible Preferred Unit.
(8) The Company’s ownership of Plains AAP, L.P. (“PAGP-AAP”) is exchangeable on a one-for-one basis into either Plains GP Holdings, L.P. (“PAGP”) shares or Plains All American Pipeline, L.P. (“PAA”) units at the Company’s option. The Company values its PAGP-AAP investment on an “as exchanged” basis based on the higher public market value of either PAGP or PAA. As of November 30, 2022, the Company’s PAGP-AAP investment is valued at PAGP’s closing price. See Note 7 — Restricted Securities.
(9) The Company believes that it is an affiliate of Streamline Innovations Holdings, Inc. (“Streamline”). See Note 5 — Agreements and Affiliations.
(10) Streamline is a privately-held company. Streamline Series C Preferred Shares are convertible into common equity at any time at the Company’s option and are senior to common equity and Series A and Series B preferred shares in terms of liquidation preference and priority of distributions. Streamline Series C Preferred Shares are entitled to receive a quarterly dividend beginning March 31, 2025, at an annual rate of 12.0%, which rate shall increase 2.0% each year thereafter to a maximum rate of 18.0%. Streamline Series C Preferred Shares are redeemable by Streamline at any time after March 31, 2025, at a price sufficient for the Company to achieve a 20.0% internal rate of return on its investment.
(11) Security is non-income producing.
(12) Security or a portion thereof is segregated as collateral on option contracts written.
See accompanying notes to financial statements.
16
KAYNE ANDERSON ENERGY INFRASTRUCTURE FUND, INC.
SCHEDULE OF INVESTMENTS
November 30, 2022
(amounts in 000’s, except number of option contracts)
(13) The rate indicated is the yield as of November 30, 2022.
(14) The notional amount of call option contracts written is the product of (a) the number of contracts written, (b) 100 (each contract entitles the option holder to 100 units/shares) and (c) the market price of the underlying security as of November 30, 2022.
At November 30, 2022, the Company’s geographic allocation was as follows:
|
Geographic Location |
% of Long-Term |
|
|
United States |
90.4% |
|
|
Canada |
8.2% |
|
|
Europe/U.K. |
1.4% |
See accompanying notes to financial statements.
17
KAYNE ANDERSON ENERGY INFRASTRUCTURE FUND, INC.
STATEMENT OF ASSETS AND LIABILITIES
NOVEMBER 30, 2022
(amounts in 000’s, except share and per share amounts)
| ASSETS |
|
| ||
| Investments at fair value: |
|
| ||
| Non-affiliated (Cost — $1,795,188) | $ | 1,970,777 |
| |
| Affiliated (Cost — $20,645) |
| 19,594 |
| |
| Short-term investments (Cost — $1,777) |
| 1,777 |
| |
| Cash |
| 505 |
| |
| Deposits with brokers |
| 251 |
| |
| Receivable for securities sold |
| 1,149 |
| |
| Dividends, distributions and interest receivable (Cost — $2,273) |
| 2,263 |
| |
| Current income tax receivable, net |
| 7,790 |
| |
| Deferred credit facility offering costs and other assets |
| 551 |
| |
| Total Assets |
| 2,004,657 |
| |
|
|
| |||
| LIABILITIES |
|
| ||
| Payable for securities purchased |
| 15 |
| |
| Investment management fee payable |
| 6,926 |
| |
| Accrued directors’ fees |
| 199 |
| |
| Accrued expenses and other liabilities |
| 6,141 |
| |
| Call option contracts written (Premiums received — $44) |
| 45 |
| |
| Deferred income tax liability, net |
| 123,746 |
| |
| Term loan |
| 50,000 |
| |
| Unamortized term loan issuance costs |
| (93 | ) | |
| Notes |
| 260,789 |
| |
| Unamortized notes issuance costs |
| (1,350 | ) | |
| Mandatory redeemable preferred stock, $25.00 liquidation value per share (4,464,117 shares issued and outstanding) |
| 111,603 |
| |
| Unamortized mandatory redeemable preferred stock issuance costs |
| (1,386 | ) | |
| Total Liabilities |
| 556,635 |
| |
| NET ASSETS APPLICABLE TO COMMON STOCKHOLDERS | $ | 1,448,022 |
| |
| NET ASSETS APPLICABLE TO COMMON STOCKHOLDERS CONSIST OF |
|
| ||
| | $ | 136 |
| |
| Paid-in capital |
| 1,903,057 |
| |
| Total distributable earnings (loss) |
| (455,171 | ) | |
| NET ASSETS APPLICABLE TO COMMON STOCKHOLDERS | $ | 1,448,022 |
| |
| NET ASSET VALUE PER COMMON SHARE | $ | 10.64 |
|
See accompanying notes to financial statements.
18
KAYNE ANDERSON ENERGY INFRASTRUCTURE FUND, INC.
STATEMENT OF OPERATIONS
FOR THE FISCAL YEAR ENDED NOVEMBER 30, 2022
(amounts in 000’s)
|
INVESTMENT INCOME |
|
|
||
|
Income |
|
|
||
|
Dividends and distributions: |
|
|
||
|
Non-affiliated investments |
$ |
109,837 |
|
|
|
Money market mutual funds |
|
21 |
|
|
|
Total dividends and distributions (after foreign taxes withheld of $1,326) |
|
109,858 |
|
|
|
Return of capital |
|
(48,711 |
) |
|
|
Distributions in excess of cost basis |
|
(4,514 |
) |
|
|
Net dividends and distributions |
|
56,633 |
|
|
|
Interest income |
|
|
||
|
Non-affiliated investments |
|
366 |
|
|
|
Total Investment Income |
|
56,999 |
|
|
|
Expenses |
|
|
||
|
Investment management fees |
|
26,709 |
|
|
|
Directors’ fees |
|
709 |
|
|
|
Administration fees |
|
625 |
|
|
|
Professional fees |
|
569 |
|
|
|
Insurance |
|
221 |
|
|
|
Reports to stockholders |
|
207 |
|
|
|
Stock exchange listing fees |
|
122 |
|
|
|
Custodian fees |
|
99 |
|
|
|
Other expenses |
|
220 |
|
|
|
Total Expenses — before interest expense, preferred distributions and taxes |
|
29,481 |
|
|
|
Interest expense including amortization of offering costs |
|
12,695 |
|
|
|
Distributions on mandatory redeemable preferred stock including amortization of offering costs |
|
3,925 |
|
|
|
Total Expenses — before taxes |
|
46,101 |
|
|
|
Net Investment Income — Before Taxes |
|
10,898 |
|
|
|
Current income tax expense |
|
(967 |
) |
|
|
Deferred income tax expense |
|
(231 |
) |
|
|
Net Investment Income |
|
9,700 |
|
|
|
REALIZED AND UNREALIZED GAINS (LOSSES) |
|
|
||
|
Net Realized Gains (Losses) |
|
|
||
|
Investments — non-affiliated |
|
103.884 |
|
|
|
Foreign currency transactions |
|
(143 |
) |
|
|
Securities sold short |
|
84 |
|
|
|
Options |
|
597 |
|
|
|
Current income tax expense |
|
(17,223 |
) |
|
|
Deferred income tax expense |
|
(4,118 |
) |
|
|
Net Realized Gains |
|
83,081 |
|
|
|
Net Change in Unrealized Gains (Losses) |
|
|
||
|
Investments — non-affiliated |
|
290,841 |
|
|
|
Investments — affiliated |
|
(1,052 |
) |
|
|
Foreign currency translations |
|
(3 |
) |
|
|
Options |
|
(1 |
) |
|
|
Deferred income tax expense |
|
(59,223 |
) |
|
|
Net Change in Unrealized Gains |
|
230,562 |
|
|
|
Net Realized and Unrealized Gains |
|
313,643 |
|
|
|
NET INCREASE IN NET ASSETS APPLICABLE TO COMMON STOCKHOLDERS RESULTING FROM OPERATIONS |
$ |
323,343 |
|
See accompanying notes to financial statements.
19
KAYNE ANDERSON ENERGY INFRASTRUCTURE FUND, INC.
STATEMENT OF CHANGES IN NET ASSETS APPLICABLE TO COMMON STOCKHOLDERS
(amounts in 000’s, except share amounts)
|
For the Fiscal Year Ended |
||||||||
|
2022 |
2021 |
|||||||
|
OPERATIONS |
|
|
|
|
||||
|
Net investment income (loss), net of tax(1) |
$ |
9,700 |
|
$ |
(9,857 |
) |
||
|
Net realized gains, net of tax |
|
83,081 |
|
|
142,221 |
|
||
|
Net change in unrealized gains, net of tax |
|
230,562 |
|
|
203,391 |
|
||
|
Net Increase in Net Assets Resulting from Operations |
|
323,343 |
|
|
335,755 |
|
||
|
DIVIDENDS AND DISTRIBUTIONS TO COMMON STOCKHOLDERS(1)(2) |
|
|
|
|
||||
|
Dividends |
|
(103,807 |
) |
|
— |
|
||
|
Distributions — return of capital |
|
— |
|
|
(82,190 |
) |
||
|
Dividends and Distributions to Common Stockholders |
|
(103,807 |
) |
|
(82,190 |
) |
||
|
CAPITAL STOCK TRANSACTIONS |
|
|
|
|
||||
|
Issuance of 9,683,976 shares of common stock in connection with the merger of Fiduciary/Claymore Energy Infrastructure Fund |
|
102,007 |
|
|
— |
|
||
|
Total Increase in Net Assets Applicable to Common Stockholders |
|
321,543 |
|
|
253,565 |
|
||
|
NET ASSETS APPLICABLE TO COMMON STOCKHOLDERS |
|
|
|
|
||||
|
Beginning of year |
|
1,126,479 |
|
|
872,914 |
|
||
|
End of year |
$ |
1,448,022 |
|
$ |
1,126,479 |
|
||
____________
(1) Distributions on the Company’s mandatory redeemable preferred stock (“MRP Shares”) are treated as an operating expense under GAAP and are included in the calculation of net investment income (loss). See Note 2 — Significant Accounting Policies.
(2) Distributions paid to common stockholders for the fiscal years ended November 30, 2022 and 2021 were characterized as either dividends (eligible to be treated as qualified dividend income) or distributions (return of capital). This characterization is based on the Company’s earnings and profits.
See accompanying notes to financial statements.
20
KAYNE ANDERSON ENERGY INFRASTRUCTURE FUND, INC.
STATEMENT OF CASH FLOWS
FOR THE FISCAL YEAR ENDED NOVEMBER 30, 2022
(amounts in 000’s)
|
CASH FLOWS FROM OPERATING ACTIVITIES |
|
|
||
|
Net increase in net assets resulting from operations |
$ |
323,343 |
|
|
|
Adjustments to reconcile net increase in net assets resulting from operations to net cash provided by operating activities: |
|
|
||
|
Return of capital distributions |
|
48,711 |
|
|
|
Distributions in excess of cost basis |
|
4,514 |
|
|
|
Net realized gains (excluding securities sold short and foreign currency transactions) |
|
(104,481 |
) |
|
|
Net realized gains on securities sold short |
|
(84 |
) |
|
|
Net change in unrealized gains (excluding foreign currency translations) |
|
(289,788 |
) |
|
|
Accretion of bond discounts, net |
|
(4 |
) |
|
|
Purchase of long-term investments |
|
(537,999 |
) |
|
|
Proceeds from sale of long-term investments |
|
603,254 |
|
|
|
Purchases of securities to cover securities sold short |
|
(41,056 |
) |
|
|
Proceeds from securities sold short |
|
41,140 |
|
|
|
Purchase of short-term investments, net |
|
(1,777 |
) |
|
|
Amortization of deferred debt offering costs |
|
1,269 |
|
|
|
Amortization of mandatory redeemable preferred stock offering costs |
|
217 |
|
|
|
Decrease in deposits with brokers |
|
40 |
|
|
|
Increase in receivable for securities sold |
|
(1,149 |
) |
|
|
Increase in dividends, distributions and interest receivable |
|
(583 |
) |
|
|
Decrease in current income tax receivable |
|
9,729 |
|
|
|
Decrease in other assets |
|
45 |
|
|
|
Decrease in payable for securities purchased |
|
(5 |
) |
|
|
Increase in investment management fee payable |
|
1,478 |
|
|
|
Increase in accrued directors’ fees |
|
61 |
|
|
|
Increase in premiums received on call option contracts written |
|
44 |
|
|
|
Increase in accrued expenses and other liabilities |
|
1,720 |
|
|
|
Increase in deferred income tax liability |
|
63,573 |
|
|
|
Net Cash Provided by Operating Activities |
|
122,212 |
|
|
|
CASH FLOWS FROM FINANCING ACTIVITIES |
|
|
||
|
Decrease in borrowings under credit facility |
|
(63,000 |
) |
|
|
Costs associated with renewal of credit facility |
|
(895 |
) |
|
|
Repayment of borrowings acquired in merger |
|
(15,042 |
) |
|
|
Proceeds from offering of notes |
|
90,000 |
|
|
|
Redemption of notes |
|
(38,897 |
) |
|
|
Costs associated with offering of notes |
|
(788 |
) |
|
|
Proceeds from offering of mandatory redeemable preferred stock |
|
20,000 |
|
|
|
Redemption of mandatory redeemable preferred stock |
|
(10,067 |
) |
|
|
Costs associated with offering of mandatory redeemable preferred stock |
|
(364 |
) |
|
|
Cash distributions paid to common stockholders |
|
(103,807 |
) |
|
|
Net Cash Used in Financing Activities |
|
(122,860 |
) |
|
|
NET CHANGE IN CASH |
|
(648 |
) |
|
|
CASH — BEGINNING OF YEAR |
|
1,153 |
|
|
|
CASH — END OF YEAR |
$ |
505 |
|
____________
Supplemental disclosure of cash flow information:
Non-cash financing activities not included herein consisted of the issuance of $102,007 of common shares in connection with the merger of Fiduciary/Claymore Energy Infrastructure Fund (see Note 1 — Organization).
During the fiscal year ended November 30, 2022, interest paid related to debt obligations were $9,859 and income tax paid was $8,461 (net of refunds received).
See accompanying notes to financial statements.
21
KAYNE ANDERSON ENERGY INFRASTRUCTURE FUND, INC.
FINANCIAL HIGHLIGHTS
(amounts in 000’s, except share and per share amounts)
| For the Fiscal Year Ended November 30, | ||||||||||||
| 2022 | 2021 | 2020 | ||||||||||
| Per Share of Common Stock(1) |
|
|
|
|
|
| ||||||
| Net asset value, beginning of period | $ | 8.91 |
| $ | 6.90 |
| $ | 13.89 |
| |||
| Net investment income (loss)(2) |
| 0.07 |
|
| (0.08 | ) |
| (0.34 | ) | |||
| Net realized and unrealized gain (loss) |
| 2.44 |
|
| 2.74 |
|
| (5.87 | ) | |||
| Total income (loss) from operations |
| 2.51 |
|
| 2.66 |
|
| (6.21 | ) | |||
| Common dividends(3) |
| (0.78 | ) |
| — |
|
| — |
| |||
| Common distributions — return of capital(3) |
| — |
|
| (0.65 | ) |
| (0.78 | ) | |||
| Total dividends and distributions — common |
| (0.78 | ) |
| (0.65 | ) |
| (0.78 | ) | |||
| Offering expenses associated with the issuance of common stock |
| — |
|
| — |
|
| — |
| |||
| Effect of issuance of common stock |
| — |
|
| — |
|
| — |
| |||
| Effect of shares issued in reinvestment of dividends and |
| — |
|
| — |
|
| — |
| |||
| Total capital stock transactions |
| — |
|
| — |
|
| — |
| |||
| Net asset value, end of period | $ | |
| $ | 8.91 |
| $ | 6.90 |
| |||
| Market value per share of common stock, end of period | $ | |
| $ | 7.77 |
| $ | 5.89 |
| |||
| Total investment return based on common stock market value(4) |
| 27.2 | % |
| 44.0 | % |
| (47.3 | )% | |||
| Total investment return based on net asset value(5) |
| 30.5 | % |
| 41.0 | % |
| (44.3 | )% | |||
| Supplemental Data and Ratios(6) |
|
|
|
|
|
| ||||||
| Net assets applicable to common stockholders, end of period | $ | 1,448,022 |
| $ | 1,126,479 |
| $ | 872,914 |
| |||
| Ratio of expenses to average net assets |
|
|
|
|
|
| ||||||
| Management fees (net of fee waiver) |
| 2.0 | % |
| 1.8 | % |
| 2.3 | % | |||
| Other expenses |
| 0.2 |
|
| 0.3 |
|
| 0.3 |
| |||
| Subtotal |
| 2.2 |
|
| 2.1 |
|
| 2.6 |
| |||
| Interest expense and distributions on mandatory redeemable preferred stock(2) |
| 1.2 |
|
| 1.3 |
|
| 3.6 |
| |||
| Income tax expense(7) |
| 6.1 |
|
| 5.1 |
|
| — |
| |||
| Total expenses |
| 9.5 | % |
| 8.5 | % |
| 6.2 | % | |||
| Ratio of net investment income (loss) to average net assets(2) |
| 0.7 | % |
| (0.9 | )% |
| (4.0 | )% | |||
| Net increase (decrease) in net assets to common stockholders resulting from operations to average net assets |
| 24.1 | % |
| 31.4 | % |
| (73.8 | )% | |||
| Portfolio turnover rate |
| 28.2 | % |
| 50.8 | % |
| 22.3 | % | |||
| Average net assets | $ | 1,344,102 |
| $ | 1,068,396 |
| $ | 1,063,404 |
| |||
| Notes outstanding, end of period(8) | $ | 260,789 |
| $ | 209,686 |
| $ | 173,260 |
| |||
| Borrowings under credit facilities, end of period(8) | $ | — |
| $ | 63,000 |
| $ | 62,000 |
| |||
| Term loan outstanding, end of period(8) | $ | 50,000 |
| $ | 50,000 |
| $ | — |
| |||
| Mandatory redeemable preferred stock, end of period(8) | $ | 111,603 |
| $ | 101,670 |
| $ | 136,633 |
| |||
| Average shares of common stock outstanding |
| 133,664,106 |
|
| 126,447,554 |
|
| 126,420,698 |
| |||
| Asset coverage of total debt(9) |
| 601.8 | % |
| 480.6 | % |
| 529.1 | % | |||
| Asset coverage of total leverage (debt and |
| 442.8 | % |
| 365.5 | % |
| 334.7 | % | |||
| Average amount of borrowings per share of common stock during the period(1) | $ | 2.79 |
| $ | 2.43 |
| $ | 2.88 |
| |||
See accompanying notes to financial statements.
22
KAYNE ANDERSON ENERGY INFRASTRUCTURE FUND, INC.
FINANCIAL HIGHLIGHTS
(amounts in 000’s, except share and per share amounts)
|
For the Fiscal Year Ended November 30, |
||||||||||||||||
|
2019 |
2018 |
2017 |
2016 |
|||||||||||||
|
Per Share of Common Stock(1) |
|
|
|
|
|
|
|
|
||||||||
|
Net asset value, beginning of period |
$ |
16.37 |
|
$ |
15.90 |
|
$ |
19.18 |
|
$ |
19.20 |
|
||||
|
Net investment income (loss)(2) |
|
(0.26 |
) |
|
(0.45 |
) |
|
(0.45 |
) |
|
(0.61 |
) |
||||
|
Net realized and unrealized gain (loss) |
|
(0.75 |
) |
|
2.74 |
|
|
(0.92 |
) |
|
2.80 |
|
||||
|
Total income (loss) from operations |
|
(1.01 |
) |
|
2.29 |
|
|
(1.37 |
) |
|
2.19 |
|
||||
|
Common dividends(3) |
|
— |
|
|
(1.80 |
) |
|
(0.53 |
) |
|
— |
|
||||
|
Common distributions — return of capital(3) |
|
(1.47 |
) |
|
— |
|
|
(1.37 |
) |
|
(2.20 |
) |
||||
|
Total dividends and distributions — |
|
(1.47 |
) |
|
(1.80 |
) |
|
(1.90 |
) |
|
(2.20 |
) |
||||
|
Offering expenses associated with the issuance of common stock |
|
— |
|
|
(0.01 |
)(11) |
|
— |
|
|
— |
|
||||
|
Effect of issuance of common stock |
|
— |
|
|
— |
|
|
— |
|
|
— |
|
||||
|
Effect of shares issued in reinvestment of dividends and distributions |
|
— |
|
|
(0.01 |
) |
|
(0.01 |
) |
|
(0.01 |
) |
||||
|
Total capital stock transactions |
|
— |
|
|
(0.02 |
) |
|
(0.01 |
) |
|
(0.01 |
) |
||||
|
Net asset value, end of period |
$ |
13.89 |
|
$ |
16.37 |
|
$ |
15.90 |
|
$ |
19.18 |
|
||||
|
Market value per share of common stock, end of period |
$ |
12.55 |
|
$ |
15.85 |
|
$ |
15.32 |
|
$ |
19.72 |
|
||||
|
Total investment return based on common stock market value(4) |
|
(12.4 |
)% |
|
14.8 |
% |
|
(13.8 |
)% |
|
24.1 |
% |
||||
|
Total investment return based on net asset value(5) |
|
(6.1 |
)% |
|
14.2 |
% |
|
(8.0 |
)% |
|
14.6 |
% |
||||
|
Supplemental Data and Ratios(6) |
|
|
|
|
|
|
|
|
||||||||
|
Net assets applicable to common stockholders, end of period |
$ |
1,755,216 |
|
$ |
2,066,269 |
|
$ |
1,826,173 |
|
$ |
2,180,781 |
|
||||
|
Ratio of expenses to average net assets |
|
|
|
|
|
|
|
|
||||||||
|
Management fees (net of fee waiver) |
|
2.3 |
% |
|
2.3 |
% |
|
2.5 |
% |
|
2.5 |
% |
||||
|
Other expenses |
|
0.1 |
|
|
0.2 |
|
|
0.1 |
|
|
0.2 |
|
||||
|
Subtotal |
|
2.4 |
|
|
2.5 |
|
|
2.6 |
|
|
2.7 |
|
||||
|
Interest expense and distributions on mandatory redeemable preferred stock(2) |
|
2.1 |
|
|
1.9 |
|
|
2.0 |
|
|
2.8 |
|
||||
|
Income tax expense(7) |
|
— |
|
|
— |
|
|
— |
|
|
7.9 |
|
||||
|
Total expenses |
|
4.5 |
% |
|
4.4 |
% |
|
4.6 |
% |
|
13.4 |
% |
||||
|
Ratio of net investment income (loss) to average net assets(2) |
|
(1.6 |
)% |
|
(2.5 |
)% |
|
(2.4 |
)% |
|
(3.4 |
)% |
||||
|
Net increase (decrease) in net assets to common stockholders resulting from operations to average net assets |
|
(6.3 |
)% |
|
10.8 |
% |
|
(7.5 |
)% |
|
12.5 |
% |
||||
|
Portfolio turnover rate |
|
22.0 |
% |
|
25.8 |
% |
|
17.6 |
% |
|
14.5 |
% |
||||
|
Average net assets |
$ |
2,032,591 |
|
$ |
2,127,407 |
|
$ |
2,128,965 |
|
$ |
2,031,206 |
|
||||
|
Notes outstanding, end of period(8) |
$ |
596,000 |
|
$ |
716,000 |
|
$ |
747,000 |
|
$ |
767,000 |
|
||||
|
Borrowings under credit facilities, end of period(8) |
$ |
35,000 |
|
$ |
39,000 |
|
$ |
— |
|
$ |
43,000 |
|
||||
|
Term loan outstanding, end of period(8) |
$ |
60,000 |
|
$ |
60,000 |
|
$ |
— |
|
$ |
— |
|
||||
|
Mandatory redeemable preferred stock, end of period(8) |
$ |
317,000 |
|
$ |
317,000 |
|
$ |
292,000 |
|
$ |
300,000 |
|
||||
|
Average shares of common stock outstanding |
|
126,326,087 |
|
|
118,725,060 |
|
|
114,292,056 |
|
|
112,967,480 |
|
||||
|
Asset coverage of total debt(9) |
|
399.9 |
% |
|
392.4 |
% |
|
383.6 |
% |
|
406.3 |
% |
||||
|
Asset coverage of total leverage (debt and preferred stock)(10) |
|
274.1 |
% |
|
282.5 |
% |
|
275.8 |
% |
|
296.5 |
% |
||||
|
Average amount of borrowings per share of common stock during the period(1) |
$ |
6.09 |
|
$ |
6.52 |
|
$ |
7.03 |
|
$ |
7.06 |
|
||||
See accompanying notes to financial statements.
23
KAYNE ANDERSON ENERGY INFRASTRUCTURE FUND, INC.
FINANCIAL HIGHLIGHTS
(amounts in 000’s, except share and per share amounts)
|
For the Fiscal Year Ended November 30, |
||||||||||||
|
2015 |
2014 |
2013 |
||||||||||
|
Per Share of Common Stock(1) |
|
|
|
|
|
|
||||||
|
Net asset value, beginning of period |
$ |
36.71 |
|
$ |
34.30 |
|
$ |
28.51 |
|
|||
|
Net investment income (loss)(2) |
|
(0.53 |
) |
|
(0.76 |
) |
|
(0.73 |
) |
|||
|
Net realized and unrealized gain (loss) |
|
(14.39 |
) |
|
5.64 |
|
|
8.72 |
|
|||
|
Total income (loss) from operations |
|
(14.92 |
) |
|
4.88 |
|
|
7.99 |
|
|||
|
Common dividends(3) |
|
(2.15 |
) |
|
(2.28 |
) |
|
(1.54 |
) |
|||
|
Common distributions — return of capital(3) |
|
(0.48 |
) |
|
(0.25 |
) |
|
(0.75 |
) |
|||
|
Total dividends and distributions — common |
|
(2.63 |
) |
|
(2.53 |
) |
|
(2.29 |
) |
|||
|
Offering expenses associated with the issuance of common stock |
|
— |
|
|
— |
|
|
— |
|
|||
|
Effect of issuance of common stock |
|
0.03 |
|
|
0.06 |
|
|
0.09 |
|
|||
|
Effect of shares issued in reinvestment of dividends and distributions |
|
0.01 |
|
|
— |
|
|
— |
|
|||
|
Total capital stock transactions |
|
0.04 |
|
|
0.06 |
|
|
0.09 |
|
|||
|
Net asset value, end of period |
$ |
19.20 |
|
$ |
36.71 |
|
$ |
34.30 |
|
|||
|
Market value per share of common stock, end of period |
$ |
18.23 |
|
$ |
38.14 |
|
$ |
37.23 |
|
|||
|
Total investment return based on common stock market value(4) |
|
(47.7 |
)% |
|
9.9 |
% |
|
28.2 |
% |
|||
|
Total investment return based on net asset value(5) |
|
(42.8 |
)% |
|
14.8 |
% |
|
29.0 |
% |
|||
|
Supplemental Data and Ratios(6) |
|
|
|
|
|
|
||||||
|
Net assets applicable to common stockholders, end of period |
$ |
2,141,602 |
|
$ |
4,026,822 |
|
$ |
3,443,916 |
|
|||
|
Ratio of expenses to average net assets |
|
|
|
|
|
|
||||||
|
Management fees (net of fee waiver) |
|
2.6 |
% |
|
2.4 |
% |
|
2.4 |
% |
|||
|
Other expenses |
|
0.1 |
|
|
0.1 |
|
|
0.1 |
|
|||
|
Subtotal |
|
2.7 |
|
|
2.5 |
|
|
2.5 |
|
|||
|
Interest expense and distributions on mandatory redeemable preferred stock(2) |
|
2.4 |
|
|
1.8 |
|
|
2.1 |
|
|||
|
Income tax expense(7) |
|
— |
|
|
8.3 |
|
|
14.4 |
|
|||
|
Total expenses |
|
5.1 |
% |
|
12.6 |
% |
|
19.0 |
% |
|||
|
Ratio of net investment income (loss) to average net assets(2) |
|
(1.8 |
)% |
|
(2.0 |
)% |
|
(2.3 |
)% |
|||
|
Net increase (decrease) in net assets to common stockholders resulting from operations to average net assets |
|
(51.7 |
)% |
|
13.2 |
% |
|
24.3 |
% |
|||
|
Portfolio turnover rate |
|
17.1 |
% |
|
17.6 |
% |
|
21.2 |
% |
|||
|
Average net assets |
$ |
3,195,445 |
|
$ |
3,967,458 |
|
$ |
3,027,563 |
|
|||
|
Notes outstanding, end of period(8) |
$ |
1,031,000 |
|
$ |
1,435,000 |
|
$ |
1,175,000 |
|
|||
|
Borrowings under credit facilities, end of period(8) |
$ |
— |
|
$ |
51,000 |
|
$ |
69,000 |
|
|||
|
Term loan outstanding, end of period(8) |
$ |
— |
|
$ |
— |
|
$ |
— |
|
|||
|
Mandatory redeemable preferred stock, end of period(8) |
$ |
464,000 |
|
$ |
524,000 |
|
$ |
449,000 |
|
|||
|
Average shares of common stock outstanding |
|
110,809,350 |
|
|
107,305,514 |
|
|
94,658,194 |
|
|||
|
Asset coverage of total debt(9) |
|
352.7 |
% |
|
406.2 |
% |
|
412.9 |
% |
|||
|
Asset coverage of total leverage (debt and preferred stock)(10) |
|
243.3 |
% |
|
300.3 |
% |
|
303.4 |
% |
|||
|
Average amount of borrowings per share of common stock during the period(1) |
$ |
11.95 |
|
$ |
13.23 |
|
$ |
11.70 |
|
|||
See accompanying notes to financial statements.
24
KAYNE ANDERSON ENERGY INFRASTRUCTURE FUND, INC.
FINANCIAL HIGHLIGHTS
(amounts in 000’s, except share and per share amounts)
_______
(1) Based on average shares of common stock outstanding.
(2) Distributions on the Company’s MRP Shares are treated as an operating expense under GAAP and are included in the calculation of net investment income (loss). See Note 2 — Significant Accounting Policies.
(3) The information presented for each period is a characterization of the total distributions paid to common stockholders as either a dividend (eligible to be treated as qualified dividend income) or a distribution (return of capital) and is based on the Company’s earnings and profits.
(4) Total investment return based on market value is calculated assuming a purchase of common stock at the market price on the first day and a sale at the current market price on the last day of the period reported. The calculation also assumes reinvestment of distributions at actual prices pursuant to the Company’s dividend reinvestment plan.
(5) Total investment return based on net asset value is calculated assuming a purchase of common stock at the net asset value on the first day and a sale at the net asset value on the last day of the period reported. The calculation also assumes reinvestment of distributions at actual prices pursuant to the Company’s dividend reinvestment plan.
(6) Unless otherwise noted, ratios are annualized.
(7) For the fiscal years ended November 30, 2020, 2019, 2018, 2017 and 2015, the Company reported an income tax benefit of $190,326 (17.9% of average net assets), $43,357 (2.1% of average net assets), $175,827 (8.3% of average net assets), $86,746 (4.1% of average net assets) and $980,647 (30.7% of average net assets), respectively. The income tax expense is assumed to be 0% because the Company reported a net deferred income tax benefit during the period.
(8) Principal/liquidation value.
(9) Calculated pursuant to section 18(a)(1)(A) of the 1940 Act. Represents the value of total assets less all liabilities not represented by Notes (principal value), or any other senior securities representing indebtedness and MRP Shares (liquidation value) divided by the aggregate amount of Notes and any other senior securities representing indebtedness. Under the 1940 Act, the Company may not declare or make any distribution on its common stock nor can it incur additional indebtedness if, at the time of such declaration or incurrence, its asset coverage with respect to senior securities representing indebtedness would be less than 300%.
(10) Calculated pursuant to section 18(a)(2)(A) of the 1940 Act. Represents the value of total assets less all liabilities not represented by Notes (principal value), any other senior securities representing indebtedness and MRP Shares (liquidation value) divided by the aggregate amount of Notes, any other senior securities representing indebtedness and MRP Shares. Under the 1940 Act, the Company may not declare or make any distribution on its common stock nor can it issue additional preferred stock if at the time of such declaration or issuance, its asset coverage with respect to all senior securities would be less than 200%. In addition to the limitations under the 1940 Act, the Company, under the terms of its MRP Shares, would not be able to declare or pay any distributions on its common stock if such declaration would cause its asset coverage with respect to all senior securities to be less than 225%.
(11) Represents offering costs incurred in connection with the merger of Kayne Anderson Energy Development Company.
See accompanying notes to financial statements.
25
KAYNE ANDERSON ENERGY INFRASTRUCTURE FUND, INC.
NOTES TO FINANCIAL STATEMENTS
(amounts in 000’s, except number of option contracts, share and per share amounts)
1. Organization
Kayne Anderson Energy Infrastructure Fund, Inc. (the “Company” or “KYN”) was organized as a Maryland corporation on June 4, 2004, and is a non-diversified, closed-end management investment company registered under the Investment Company Act of 1940, as amended (the “1940 Act”). The Company’s investment objective is to obtain a high after-tax total return with an emphasis on making cash distributions to shareholders. The Company intends to achieve this objective by investing at least 80% of its total assets in the securities of Energy Infrastructure Companies. The Company commenced operations on September 28, 2004. The Company’s shares of common stock are listed on the New York Stock Exchange, Inc. (“NYSE”) under the symbol “KYN.” For more information about the Company’s investment objective, policies and principal risks, see Investment Objective, Policies and Risks.
On March 4, 2022, the Company completed its merger with Fiduciary/Claymore Energy Infrastructure Fund (“FMO”). Pursuant to the terms of the merger agreement approved by FMO shareholders, FMO was merged with and into KYN, and FMO shareholders received newly issued shares of KYN common stock in exchange for their shares of FMO, the aggregate net asset value of which equaled the aggregate net asset value of FMO common shares, as determined at the close of business on March 4, 2022. A total of 9,683,976 shares of KYN common stock were issued as a result of the merger. The merger qualified as a tax-free reorganization under Section 368(a) of the Internal Revenue Code. Immediately following the merger, KYN’s combined net assets were $1,433,834 and the Company had 136,131,530 shares of common stock outstanding.
The Company’s results of operations for the fiscal year ended November 30, 2022, are not directly comparable to prior periods as these results include income and earnings associated with assets acquired in connection with the merger (included as of the date such merger was completed). Assuming the merger had been completed on December 1, 2021, the beginning of the annual reporting period for the Company, the pro forma results in the Statement of Operations for the fiscal year ended November 30, 2022, would be as follows:
|
Pro Forma |
|||
|
Net investment income, net of tax |
$ |
9,185 |
|
|
Net realized gains, net of tax |
|
83,600 |
|
|
Net change in unrealized gains (losses), net of tax |
|
251,112 |
|
|
Net increase (decrease) in net assets resulting from operations |
$ |
343,897 |
|
Because the combined entity has been managed as a single integrated entity since the merger was completed, it is not practicable to separate the amounts of income and earnings of FMO that have been included in the Company’s Statement of Operations since the merger.
2. Significant Accounting Policies
The following is a summary of the significant accounting policies that the Company uses to prepare its financial statements in accordance with accounting principles generally accepted in the United States of America (“GAAP”). The Company is an investment company and follows accounting and reporting guidance of the Financial Accounting Standards Board (FASB) Accounting Standards Codification (ASC) Topic 946 — “Financial Services — Investment Companies.”
26
KAYNE ANDERSON ENERGY INFRASTRUCTURE FUND, INC.
NOTES TO FINANCIAL STATEMENTS
(amounts in 000’s, except number of option contracts, share and per share amounts)
A. Use of Estimates — The preparation of financial statements in conformity with GAAP requires management to make estimates and assumptions that affect the reported amount of assets and liabilities and disclosure of contingent assets and liabilities as of the date of the financial statements and the reported amounts of income and expenses during the period. Actual results could differ materially from those estimates.
B. Cash and Cash Equivalents — Cash and cash equivalents include short-term, liquid investments with an original maturity of three months or less and include money market fund accounts.
C. Calculation of Net Asset Value — The Company determines its net asset value on a daily basis and reports its net asset value on its website. Net asset value is computed by dividing the value of the Company’s assets (including accrued interest and distributions and current and deferred income tax assets), less all of its liabilities (including accrued expenses, distributions payable, current and deferred accrued income taxes, and any borrowings) and the liquidation value of any outstanding preferred stock, by the total number of common shares outstanding.
D. Investment Valuation — In December 2020, the SEC adopted Rule 2a-5 under the 1940 Act, establishing requirements to determine fair value in good faith for purposes of the 1940 Act. Pursuant to Rule 2a-5 and effective September 1, 2022, the Board of Directors designated KA Fund Advisors, LLC (“KAFA“), the Company’s investment adviser, as the “Valuation Designee” to perform fair value determinations of the Company’s portfolio holdings, subject to oversight by and periodic reporting to the Board. The Valuation Designee determines the fair value of the Company’s portfolio holdings in accordance with the Company’s valuation program, as adopted by the Board. KAFA’s internal valuation process did not change as a result of Rule 2a-5, and it continues to receive a valuation report from a third-party firm for fair valued (Level 3) securities.
Readily marketable portfolio securities listed on any exchange (including a foreign exchange) other than the NASDAQ Stock Market, Inc. (“NASDAQ”) are valued, except as indicated below, at the last sale price on the business day as of which such value is being determined. If there has been no sale on such day, the securities are valued at the mean of the most recent bid and ask prices on such day. Securities admitted to trade on the NASDAQ are valued at the NASDAQ official closing price. Portfolio securities traded on more than one securities exchange are valued at the last sale price on the business day as of which such value is being determined at the close of the exchange representing the principal market for such securities. The value of foreign securities traded outside of the Americas may be adjusted to reflect events occurring after a foreign exchange closes that may affect the value of the foreign security. In such cases, these foreign securities are valued by an independent pricing service and are categorized as Level 2 securities for purposes of the fair value hierarchy. See Note 3 — Fair Value.
Equity securities traded in the over-the-counter market, but excluding securities admitted to trading on the NASDAQ, are valued at the closing bid prices. Debt securities that are considered bonds are valued by using the bid price provided by an independent pricing service or, if such prices are not available or in the judgment of KAFA such prices are stale or do not represent fair value, by an independent broker. For debt securities that are considered bank loans, the fair market value is determined by using the bid price provided by the agent or syndicate bank or principal market maker. When price quotes for securities are not available, or such prices are stale or do not represent fair value in the judgment of KAFA, fair market value will be determined using the Company’s valuation process for securities that are privately issued or otherwise restricted as to resale.
27
KAYNE ANDERSON ENERGY INFRASTRUCTURE FUND, INC.
NOTES TO FINANCIAL STATEMENTS
(amounts in 000’s, except number of option contracts, share and per share amounts)
Exchange-traded options and futures contracts are valued at the last sales price at the close of trading in the market where such contracts are principally traded or, if there was no sale on the applicable exchange on such day, at the mean between the quoted bid and ask price as of the close of such exchange.
The Company may hold securities that are privately issued or otherwise restricted as to resale. For these securities, as well as any security for which (a) reliable market quotations are not available in the judgment of KAFA, or (b) the independent pricing service or independent broker does not provide prices or provides a price that in the judgment of KAFA is stale or does not represent fair value, each shall be valued in a manner that most fairly reflects fair value of the security on the valuation date.
For the fiscal year ended November 30, 2022, unless otherwise determined by the Valuation Designee, the following valuation process was used for such securities:
• Valuation Designee. The applicable investments are valued monthly by KAFA with new investments valued at the time such investment was made. The applicable investments are valued by senior professionals of KAFA who comprise KAFA’s Valuation Committee. KAFA will specify the titles of the persons responsible for determining the fair value of Company investments, including by specifying the particular functions for which they are responsible, and will reasonably segregate fair value determinations from the portfolio management of the Company such that the portfolio manager(s) may not determine, or effectively determine by exerting substantial influence on, the fair values ascribed to portfolio investments.
• Valuation Firm. Quarterly, a third-party valuation firm engaged by KAFA reviews the valuation methodologies and calculations employed for these securities, unless the aggregate fair value of such security is less than 0.1% of the Company’s total assets.
At November 30, 2022, the Company held 8.2% of its net assets applicable to common stockholders (5.9% of total assets) in securities that were fair valued pursuant to these procedures (Level 3 securities). The aggregate fair value of these securities at November 30, 2022, was $118,642. See Note 3 — Fair Value and Note 7 — Restricted Securities.
E. Security Transactions — Security transactions are accounted for on the date these securities are purchased or sold (trade date). Realized gains and losses are calculated using the specific identification cost basis method for GAAP purposes. For tax purposes, the Company utilizes the average cost method to compute the adjusted tax cost basis of its MLP securities.
F. Return of Capital Estimates — Dividends and distributions received from the Company’s investments generally are comprised of income and return of capital. At the time such dividends and distributions are received, the Company estimates the amount of such payments that is considered investment income and the amount that is considered a return of capital. The Company estimates the return of capital portion of dividends and distributions received from investments based on historical information available and other information provided by certain investments. Return of capital estimates are adjusted to actual in the subsequent fiscal year when final tax reporting information related to the Company’s investments is received.
The return of capital portion of the distributions is a reduction to investment income that results in an equivalent reduction in the cost basis of the associated investments and increases net realized gains (losses) and net change in unrealized gains (losses). If the distributions received by the Company exceed its cost basis (i.e., its cost basis has been reduced to zero), the distributions are treated as realized gains.
28
KAYNE ANDERSON ENERGY INFRASTRUCTURE FUND, INC.
NOTES TO FINANCIAL STATEMENTS
(amounts in 000’s, except number of option contracts, share and per share amounts)
The Company includes all distributions received on its Statement of Operations and reduces its investment income by (i) the estimated return of capital and (ii) the distributions in excess of cost basis, if any. Distributions received that were in excess of cost basis were treated as realized gains.
In accordance with GAAP, the return of capital cost basis reductions for the Company’s investments are limited to the total amount of the cash distributions received from such investments.
The following table sets forth the Company’s estimated return of capital portion of the dividends and distributions received from its investments that were not treated as distributions in excess of cost basis.
|
For the |
||||
|
Dividends and distributions (before foreign taxes withheld of $1,326, and excluding distributions in excess of cost basis) |
$ |
106,670 |
|
|
|
Dividends and distributions — % return of capital |
|
46 |
% |
|
|
Return of capital — attributable to net realized gains (losses) |
$ |
6,734 |
|
|
|
Return of capital — attributable to net change in unrealized gains (losses) |
|
41,977 |
|
|
|
Total return of capital |
$ |
48,711 |
|
|
For the fiscal year ended November 30, 2022, the Company estimated the return of capital portion of dividends and distributions received to be $57,797 (54%). During the fiscal year ended November 30, 2022, the Company decreased its return of capital estimate for the year by $9,086 due to 2021 tax reporting information received by the Company in fiscal 2022. As a result, the return of capital percentage for the fiscal year ended November 30, 2022 was 46%. In addition, for the fiscal year ended November 30, 2022, the Company estimated the cash distributions received that were in excess of cost basis to be $4,712. Distributions in excess of cost basis for the fiscal year ended November 30, 2022, decreased by $198 due to 2021 tax reporting information received by the Company in fiscal 2022.
G. Investment Income — The Company records dividends and distributions on the ex-dividend date. Interest income is recognized on the accrual basis, including amortization of premiums and accretion of discounts. When investing in securities with paid-in-kind interest, the Company will accrue interest income during the life of the security even though it will not be receiving cash as the interest is accrued. To the extent that interest income to be received is not expected to be realized, a reserve against income is established.
The Company may receive paid-in-kind and non-cash dividends and distributions in the form of additional units or shares from its investments. For paid-in-kind dividends, the additional units are not reflected in investment income during the period received, but are recorded as unrealized gains upon receipt. Non-cash distributions are reflected in investment income because the Company has the option to receive its distributions in cash or in additional units of the security. During the fiscal year ended November 30, 2022, the Company did not receive any paid-in-kind dividends or non-cash distributions.
H. Distributions to Stockholders — Distributions to common stockholders are recorded on the ex-dividend date. Distributions to holders of MRP Shares are accrued on a daily basis. As required by the Distinguishing Liabilities from Equity topic of the FASB Accounting Standards Codification (ASC 480), the Company includes the accrued distributions on its MRP Shares as an operating expense due to the fixed term of this obligation. For tax purposes, payments made to the holders of the Company’s MRP Shares are treated as dividends or distributions.
29
KAYNE ANDERSON ENERGY INFRASTRUCTURE FUND, INC.
NOTES TO FINANCIAL STATEMENTS
(amounts in 000’s, except number of option contracts, share and per share amounts)
The characterization of the distributions paid to holders of MRP Shares and common stock as either a dividend (eligible to be treated as qualified dividend income) or a distribution (return of capital) is determined after the end of the fiscal year based on the Company’s actual earnings and profits and may differ substantially from preliminary estimates.
I. Partnership Accounting Policy — The Company records its pro-rata share of the income (loss), to the extent of distributions it has received, allocated from the underlying partnerships and adjusts the cost basis of the underlying partnerships accordingly. These amounts are included in the Company’s Statement of Operations.
J. Taxes — The Company, as a corporation, is obligated to pay federal and state income tax on its taxable income. The Company invests in MLPs, which generally are treated as partnerships for federal income tax purposes. As a limited partner in the MLPs, the Company includes its allocable share of the MLP’s taxable income or loss in computing its own taxable income. Deferred income taxes reflect (i) taxes on unrealized gains (losses), which are attributable to the difference between fair value and tax cost basis, (ii) the net tax effects of temporary differences between the carrying amounts of assets and liabilities for financial reporting purposes and the amounts used for income tax purposes and (iii) the net tax benefit of accumulated net operating and capital losses.
To the extent the Company has a deferred tax asset, consideration is given as to whether or not a valuation allowance is required. The need to establish a valuation allowance for deferred tax assets is assessed periodically by the Company based on the Income Tax Topic of the FASB Accounting Standards Codification (ASC 740), that it is more likely than not that some portion or all of the deferred tax asset will not be realized. In the assessment for a valuation allowance, consideration is given to all positive and negative evidence related to the realization of the deferred tax asset. This assessment considers, among other matters, the nature, frequency and severity of current and cumulative losses, forecasts of future profitability (which are highly dependent on future cash distributions from the Company’s holdings), the duration of statutory carryforward periods and the associated risk that certain loss carryforwards may expire unused.
The Company may rely to some extent on information provided by portfolio investments, which may not necessarily be timely, to estimate taxable income allocable to the units/shares of such companies held in the portfolio and to estimate the associated current and/or deferred tax liability. Such estimates are made in good faith. From time to time, as new information becomes available, the Company modifies its estimates or assumptions regarding the deferred tax liability. See Note 6 — Income Taxes.
The Company may be subject to withholding taxes on foreign-sourced income and accrues such taxes when the related income is earned.
The Company utilizes the average cost method to compute the adjusted tax cost basis of its MLP securities.
The Company’s policy is to classify interest and penalties associated with underpayment of federal and state income taxes, if any, as income tax expense on its Statement of Operations. Tax years subsequent to fiscal year 2017 remain open and subject to examination by the federal and state tax authorities. The Internal Revenue Service (“IRS”) has opened an examination of fiscal years 2017 through 2020. The IRS audit is currently open though the Company does not believe there will be any material adjustment to the amount of tax owed as a result of this audit.
K. Derivative Financial Instruments — The Company may utilize derivative financial instruments in its operations and will do so in conformity with Rule 18f-4 under the 1940 Act.
30
KAYNE ANDERSON ENERGY INFRASTRUCTURE FUND, INC.
NOTES TO FINANCIAL STATEMENTS
(amounts in 000’s, except number of option contracts, share and per share amounts)
Interest rate swap contracts. The Company may use hedging techniques such as interest rate swaps to mitigate potential interest rate risk on a portion of the Company’s leverage. Such interest rate swaps would principally be used to protect the Company against higher costs on its leverage resulting from increases in interest rates. The Company does not hedge any interest rate risk associated with portfolio holdings. Interest rate transactions the Company may use for hedging purposes may expose it to certain risks that differ from the risks associated with its portfolio holdings. A decline in interest rates may result in a decline in the value of the swap contracts, which, everything else being held constant, would result in a decline in the net assets of the Company. In addition, if the counterparty to an interest rate swap defaults, the Company would not be able to use the anticipated net receipts under the interest rate swap to offset its cost of financial leverage.
Interest rate swap contracts are recorded at fair value with changes in value during the reporting period, and amounts accrued under the agreements, included as unrealized gains or losses in the Statement of Operations. Monthly cash settlements under the terms of the interest rate swap agreements or termination payments are recorded as realized gains or losses in the Statement of Operations. The Company generally values its interest rate swap contracts based on dealer quotations, if available, or by discounting the future cash flows from the stated terms of the interest rate swap agreement by using interest rates currently available in the market. See Note 8 — Derivative Financial Instruments.
Option contracts. The Company is also exposed to financial market risks including changes in the valuations of its investment portfolio. The Company may purchase or write (sell) call options. A call option on a security is a contract that gives the holder of the option, in return for a premium, the right to buy from the writer of the option the security underlying the option at a specified exercise price at any time during the term of the option.
The Company would realize a gain on a purchased call option if, during the option period, the value of such securities exceeded the sum of the exercise price, the premium paid and transaction costs; otherwise the Company would realize either no gain or a loss on the purchased call option. The Company may also purchase put option contracts. If a purchased put option is exercised, the premium paid increases the cost basis of the securities sold by the Company.
The Company may also write (sell) call options with the purpose of generating realized gains or reducing its ownership of certain securities. If the Company writes a call option on a security, the Company has the obligation upon exercise of the option to deliver the underlying security upon payment of the exercise price. The Company will only write call options on securities that the Company holds in its portfolio (i.e., covered calls).
When the Company writes a call option, an amount equal to the premium received by the Company is recorded as a liability and is subsequently adjusted to the current fair value of the option written. Premiums received from writing options that expire unexercised are treated by the Company on the expiration date as realized gains from investments. If the Company repurchases a written call option prior to its exercise, the difference between the premium received and the amount paid to repurchase the option is treated as a realized gain or loss. If a call option is exercised, the premium is added to the proceeds from the sale of the underlying security in determining whether the Company has realized a gain or loss. The Company, as the writer of an option, bears the market risk of an unfavorable change in the price of the security underlying the written option. See Note 8 — Derivative Financial Instruments.
31
KAYNE ANDERSON ENERGY INFRASTRUCTURE FUND, INC.
NOTES TO FINANCIAL STATEMENTS
(amounts in 000’s, except number of option contracts, share and per share amounts)
L. Short Sales — A short sale is a transaction in which the Company sells securities it does not own (but has borrowed) in anticipation of or to hedge against a decline in the market price of the securities. To complete a short sale, the Company may arrange through a broker to borrow the securities to be delivered to the buyer. The proceeds received by the Company for the short sale are retained by the broker until the Company replaces the borrowed securities. In borrowing the securities to be delivered to the buyer, the Company becomes obligated to replace the securities borrowed at their market price at the time of replacement, whatever the price may be.
The Company’s short sales, if any, are fully collateralized. The Company is required to maintain assets consisting of cash or liquid securities equal in amount to the liability created by the short sale. These assets are adjusted daily to reflect changes in the value of the securities sold short. The Company is liable for any interest, dividends or distributions paid on securities sold short.
The Company may also sell short “against the box” (i.e., the Company enters into a short sale as described above while holding an offsetting long position in the security which it sold short). If the Company enters into a short sale “against the box,” the Company would segregate an equivalent amount of securities owned as collateral while the short sale is outstanding.
M. Foreign Currency Translations — The books and records of the Company are maintained in U.S. dollars. Foreign currency amounts are translated into U.S. dollars on the following basis: (i) market value of investment securities, assets and liabilities at the rate of exchange as of the valuation date; and (ii) purchases and sales of investment securities, income and expenses at the relevant rates of exchange prevailing on the respective dates of such transactions.
The Company does not isolate that portion of gains and losses on investments in equity and debt securities which is due to changes in the foreign exchange rates from that which is due to changes in market prices of equity and debt securities. Accordingly, realized and unrealized foreign currency gains and losses with respect to such securities are included in the reported net realized and unrealized gains and losses on investment transactions balances.
Net realized foreign exchange gains or losses represent gains and losses from transactions in foreign currencies and foreign currency contracts, foreign exchange gains or losses realized between the trade date and settlement date on security transactions, and the difference between the amounts of interest and dividends recorded on the Company’s books and the U.S. dollar equivalent of such amounts on the payment date.
Net unrealized foreign exchange gains or losses represent the difference between the cost of assets and liabilities (other than investments) recorded on the Company’s books from the value of the assets and liabilities (other than investments) on the valuation date.
N. Indemnifications — Under the Company’s organizational documents, its officers and directors are indemnified against certain liabilities arising out of the performance of their duties to the Company. In addition, in the normal course of business, the Company enters into contracts that provide general indemnification to other parties. The Company’s maximum exposure under these arrangements is unknown, as this would involve future claims that may be made against the Company that have not yet occurred, and may not occur. However, the Company has not had prior claims or losses pursuant to these contracts and expects the risk of loss to be remote.
32
KAYNE ANDERSON ENERGY INFRASTRUCTURE FUND, INC.
NOTES TO FINANCIAL STATEMENTS
(amounts in 000’s, except number of option contracts, share and per share amounts)
O. Offering and Debt Issuance Costs — Offering costs incurred by the Company related to the issuance of its common stock reduce additional paid-in capital when the stock is issued. Costs incurred by the Company related to the issuance of its debt (credit facility, term loan or notes) or its preferred stock are capitalized and amortized over the period the debt or preferred stock is outstanding.
The Company has classified the costs incurred to issue its term loan, notes and preferred stock as a deduction from the carrying value on the Statement of Assets and Liabilities. For the purpose of calculating the Company’s asset coverage ratios pursuant to the 1940 Act, deferred issuance costs are not deducted from the carrying value of debt or preferred stock.
3. Fair Value
The Fair Value Measurement Topic of the FASB Accounting Standards Codification (ASC 820) defines fair value as the price at which an orderly transaction to sell an asset or to transfer a liability would take place between market participants under current market conditions at the measurement date. As required by ASC 820, the Company has performed an analysis of all assets and liabilities (other than deferred taxes) measured at fair value to determine the significance and character of all inputs to their fair value determination. Inputs are the assumptions, along with considerations of risk, that a market participant would use to value an asset or a liability. In general, observable inputs are based on market data that is readily available, regularly distributed and verifiable that the Company obtains from independent, third-party sources. Unobservable inputs are developed by the Company based on its own assumptions of how market participants would value an asset or a liability.
The fair value hierarchy prioritizes the inputs to valuation techniques used to measure fair value into the following three broad categories.
• Level 1 — Valuations based on quoted unadjusted prices for identical instruments in active markets traded on a national exchange to which the Company has access at the date of measurement.
• Level 2 — Valuations based on quoted prices for similar instruments in active markets; quoted prices for identical or similar instruments in markets that are not active; and model-derived valuations in which all significant inputs and significant value drivers are observable in active markets. Level 2 inputs are those in markets for which there are few transactions, the prices are not current, little public information exists or instances where prices vary substantially over time or among brokered market makers.
• Level 3 — Model derived valuations in which one or more significant inputs or significant value drivers are unobservable. Unobservable inputs are those inputs that reflect the Company’s own assumptions that market participants would use to price the asset or liability based on the best available information.
33
KAYNE ANDERSON ENERGY INFRASTRUCTURE FUND, INC.
NOTES TO FINANCIAL STATEMENTS
(amounts in 000’s, except number of option contracts, share and per share amounts)
The following table presents the Company’s assets and liabilities measured at fair value on a recurring basis at November 30, 2022, and the Company presents these assets and liabilities by security type and description on its Schedule of Investments. Note that the valuation levels below are not necessarily an indication of the risk or liquidity associated with the underlying investment.
|
Total |
Quoted Prices in |
Prices with Other |
Unobservable |
||||||||||
|
Assets at Fair Value |
|
|
|
|
|
||||||||
|
Equity investments |
$ |
1,982,475 |
$ |
1,842,370 |
$ |
21,463 |
(1) |
$ |
118,642 |
||||
|
Debt investments |
|
7,896 |
|
— |
|
7,896 |
|
|
— |
||||
|
Short-term investments |
|
1,777 |
|
1,777 |
|
— |
|
|
— |
||||
|
Total assets at fair value |
$ |
1,992,148 |
$ |
1,844,147 |
$ |
29,359 |
|
$ |
118,642 |
||||
|
Liabilities at Fair Value |
|
|
|
|
|
||||||||
|
Call options written |
$ |
45 |
$ |
— |
$ |
45 |
|
$ |
— |
||||
____________
(1) As of November 30, 2022, this amount represents the value of the Company’s investment in Plains AAP, L.P. (“PAGP-AAP”).
As of November 30, 2022, the Company had Notes outstanding with an aggregate principal amount of $260,789 and 4,464,117 of MRP Shares outstanding with a total liquidation value of $111,603. See Note 11 — Notes and Note 12 — Preferred Stock.
All of the Notes and MRP Shares were issued in private placements to institutional investors and are not listed on any exchange or automated quotation system. As such, the Company categorizes all of the Notes ($260,789 aggregate principal amount) and all of the MRP Shares ($111,603 aggregate liquidation value) as Level 3 and determines the fair value of these instruments based on estimated market yields and credit spreads for comparable instruments with similar maturity, terms and structure.
The Company records these Notes and MRP Shares on its Statement of Assets and Liabilities at principal amount or liquidation value. As of November 30, 2022, the estimated fair values of these leverage instruments are as follows.
|
Instrument |
Principal Amount/ |
Fair Value |
||||
|
Notes (Series FF, GG, KK, NN through SS) |
$ |
260,789 |
$ |
253,800 |
||
|
MRP Shares (Series R, S and T) |
$ |
111,603 |
$ |
99,400 |
||
34
KAYNE ANDERSON ENERGY INFRASTRUCTURE FUND, INC.
NOTES TO FINANCIAL STATEMENTS
(amounts in 000’s, except number of option contracts, share and per share amounts)
The following table presents the Company’s assets measured at fair value on a recurring basis using significant unobservable inputs (Level 3) for the fiscal year ended November 30, 2022.
|
Equity |
||||
|
Balance — November 30, 2021 |
$ |
106,563 |
|
|
|
Purchases |
|
20,645 |
|
|
|
Sales |
|
— |
|
|
|
Transfers out to Level 1 and 2 |
|
— |
|
|
|
Realized gains (losses) |
|
— |
|
|
|
Change in unrealized gains (losses), net |
|
(8,566 |
) |
|
|
Balance — November 30, 2022 |
$ |
118,642 |
|
|
|
|
|
|||
|
Net change in unrealized gain (loss) of investments still held at November 30, 2022 |
$ |
(8,566 |
) |
|
The purchase of $20,645 relates to the Company’s investment in Streamline Innovations Holdings, Inc. (“Streamline”) Series C Preferred Shares, that was made in the third quarter of fiscal 2022.
The $8,566 of unrealized losses relates to investments that were held during the period. The Company includes these unrealized gains and losses on the Statement of Operations — Net Change in Unrealized Gains (Losses).
Valuation Techniques and Unobservable Inputs
The Company owns cumulative convertible preferred units of Enterprise Products Partners L.P. (“EPD”). The convertible preferred units will be convertible by the holders into common units at any time after September 29, 2025 at a conversion rate calculated as the Liquidation Preference divided by 92.5% of the 5-day volume weighted average price of EPD’s common units at the time of conversion. The convertible preferred units are redeemable at any time by EPD, at Redemption Prices ranging from 100% to 110% of Liquidation Preference based on the date of redemption. The convertible preferred units are senior to the underlying common units in terms of liquidation preference and priority of distributions. KAFA, as the Company’s Valuation Designee, has determined that it is appropriate to value these convertible preferred units using a discounted cash flow analysis under two different scenarios and calculate a probability weighted valuation based on these scenarios. Under the first scenario, the valuation assumes that the Company holds the security until the fifth anniversary of the original issuance date (September 30, 2025) and assigns a 95% probability to this outcome. Under the second scenario, the valuation assumes the security is redeemed by EPD upon the next step-down in Redemption Price (September 30, 2024) and assigns a 5% probability to this outcome. To determine the appropriate discount rate for this analysis, the Company estimates the credit spread for the convertible preferred units, which is based on (a) the credit spread of EPD’s unsecured notes with a focus on its notes maturing February 2026 and (b) the credit spread of publicly traded preferred securities of similar investment grade issuers in the energy industry over their publicly traded notes. The Company’s ability to sell the preferred units prior to redemption is subject to certain restrictions. As such, the Company applies a 5% illiquidity discount to be amortized over an assumed five-year holding period to September 30, 2025. If the resulting valuation implies a price higher than the current redemption price, the valuation is limited to the current redemption price plus unpaid distributions.
The Company owns convertible preferred units of MPLX LP (“MPLX”). The convertible preferred units are convertible on a one-for-one basis into common units at the Company’s option and are senior to the underlying common units in terms of liquidation preference and priority of distributions. KAFA has determined that it is appropriate to value this convertible preferred units using a two-step process.
35
KAYNE ANDERSON ENERGY INFRASTRUCTURE FUND, INC.
NOTES TO FINANCIAL STATEMENTS
(amounts in 000’s, except number of option contracts, share and per share amounts)
The first step in this valuation process is to use a convertible pricing model to value the security. The convertible pricing model takes into account the attributes of the convertible preferred units, including the preferred dividend, conversion ratio and call features, to determine the estimated value of such units. In using this model, the Company estimates (i) the credit spread for the convertible preferred units, which is based on (a) the credit spread of the partnership’s unsecured notes, (b) the credit spread of the partnership’s publicly traded preferred securities to their unsecured notes, and (c) the credit spreads of similar publicly traded preferred securities over bonds with similar maturities, and (ii) the expected volatility for the underlying common units. The second step in this valuation process is to assess the additional yield that a buyer of this security would require to hold this security (relative to the yield implied by the convertible pricing model) due to the illiquid nature of the security. The range of additional yield required is informed by publicly reported trades in the security, if any, as well as the judgment of KAFA.
In addition to the above, KAFA reviews the model derived valuation as compared to any reported trades in the security. For the MPLX convertible preferred, KAFA has observed certain trades in which the value of the MPLX convertible preferred was sold for less than the model derived valuation. As such, in KAFA’s judgment, the MPLX convertible preferred was valued based on the as-converted public market price of the underlying common units as of November 30, 2022.
The Company’s Streamline Series C Preferred Shares are convertible into common equity at any time at the Company’s option and are senior to common equity and Series A and Series B preferred shares in terms of liquidation preference and priority of distributions. Streamline Series C Preferred Shares are entitled to receive a quarterly dividend beginning in March 31, 2025, at an annual rate of 12.0%, which rate shall increase 2.0% each year thereafter to a maximum rate of 18.0%. Streamline Series C Preferred Shares are redeemable by Streamline at any time after March 31, 2025, at a price sufficient for the Company to achieve a 20.0% internal rate of return on its investment.
As part of the process to determine this investment’s fair value, KAFA utilizes three valuation methodologies to determine the estimated value of the Series C Preferred Shares assuming such shares have been converted into common equity. Two of the methodologies use multiples analysis based on forecasted EBITDA and the third is based on a discounted cash flow model. A range of per share values is derived from these three methodologies. An illiquidity discount is then applied to this range of values and a per share value within the resulting range is selected as the fair value.
Due to the inherent uncertainty of determining the fair value of investments that do not have a readily available market value, the fair value of the Company’s investments may fluctuate from period to period. Additionally, the fair value of the Company’s investments may differ from the values that would have been used had a ready market existed for such investments and may differ materially from the values that the Company may ultimately realize.
36
KAYNE ANDERSON ENERGY INFRASTRUCTURE FUND, INC.
NOTES TO FINANCIAL STATEMENTS
(amounts in 000’s, except number of option contracts, share and per share amounts)
The following table summarizes the significant unobservable inputs that the Company used to value its portfolio investments categorized as Level 3 as of November 30, 2022:
Quantitative Table for Valuation Techniques
|
|
|
|
|
Range |
Average |
||||||||
|
Low |
High |
||||||||||||
|
EPD Convertible |
$ |
22,387 |
- Discounted cash flow analysis |
- Discount rate - Illiquidity discount |
6.7% |
7.8% |
7.3% |
||||||
|
MPLX Convertible |
|
76,661 |
- Convertible pricing model |
- Credit spread - Volatility - Yield spread |
4.0% |
4.5% |
4.3% |
||||||
|
Streamline Series C |
|
19,594 |
- EV/EBITDA multiples |
- 2023 EV/EBITDA multiples |
7.3x |
8.3x |
7.8x |
||||||
|
|
- 2024 EV/EBITDA multiples |
6.5x |
7.5x |
7.0x |
|||||||||
|
|
|
- Discounted cash flow analysis |
- Discount rate - Illiquidity discount |
25% |
25% |
25% |
|||||||
|
Total |
$ |
118,642 |
|||||||||||
4. Risk Considerations
The Company’s investments are concentrated in the energy sector. A downturn in one or more industries within the energy sector, material declines in energy-related commodity prices, adverse political, legislative or regulatory developments or environmental, catastrophic or other events could have a larger impact on the Company than on an investment company that does not concentrate in the energy sector. The performance of companies in the energy sector may lag the performance of other sectors or the broader market as a whole. The Company also invests in securities of foreign issuers, predominantly those located in Canada and, to a lesser extent, Europe. The value of those investments will fluctuate with market conditions, currency exchange rates and the economic and political climates of the foreign countries in which the issuers operate or are domiciled. Additionally, to the extent that the Company invests a relatively high percentage of its assets in the securities of a limited number of issuers, the Company may be more susceptible than a more widely diversified investment company to any single economic, political or regulatory occurrence.
At November 30, 2022, the Company had the following investment concentrations:
|
Category |
Percent of |
|
|
Energy Companies |
100.0% |
|
|
Equity securities |
99.6% |
|
|
Energy Infrastructure Companies |
99.1% |
|
|
Largest single issuer |
10.6% |
|
|
Restricted securities |
7.0% |
|
|
Debt securities |
0.4% |
For more information about the principal risks of investing in the Company, see Investment Objective, Policies and Risks.
37
KAYNE ANDERSON ENERGY INFRASTRUCTURE FUND, INC.
NOTES TO FINANCIAL STATEMENTS
(amounts in 000’s, except number of option contracts, share and per share amounts)
5. Agreements and Affiliations
A. Administration Agreement — On February 1, 2022, the Company entered into an amended administration and accounting agreement with Ultimus Fund Solutions, LLC (“Ultimus”). Pursuant to the agreement, Ultimus will continue to provide certain administrative and accounting services for the Company. The agreement has an initial term of three years and automatic one-year renewals unless earlier terminated by either party as provided under the terms of the agreement.
B. Investment Management Agreement — The Company has entered into an investment management agreement with KA Fund Advisors, LLC (“KAFA”) under which KAFA, subject to the overall supervision of the Company’s Board of Directors, manages the day-to-day operations of, and provides investment advisory services to, the Company. For providing these services, KAFA receives an investment management fee from the Company.
KAFA has also entered into a fee waiver agreement with the Company that provides for a management fee of 1.375% on average total assets up to $4,000,000; 1.25% on average total assets between $4,000,000 and $6,000,000; 1.125% on average total assets between $6,000,000 and $8,000,000; and 1.0% on average total assets over $8,000,000. These tiered fee waivers will result in a reduction to the effective management fee rate payable to KAFA as the Company’s assets under management increase. Any amount waived by KAFA pursuant to the fee waiver agreement may not be recouped.
The investment management and fee waiver agreements have a current term through April 30, 2023 and may be renewed annually thereafter upon approval of KAFA and the Company’s Board of Directors (including a majority of the Company’s directors who are not “interested persons” of the Company, as such term is defined in the 1940 Act). For the fiscal year ended November 30, 2022, the Company paid management fees at an annual rate of 1.375% of the Company’s average quarterly total assets (as defined in the investment management agreement).
For purposes of calculating the management fee the average total assets for each quarterly period are determined by averaging the total assets at the last day of that quarter with the total assets at the last day of the prior quarter. The Company’s total assets are equal to the Company’s gross asset value (which includes assets attributable to the Company’s use of preferred stock, commercial paper or notes and other borrowings and excludes any net deferred tax asset), minus the sum of the Company’s accrued and unpaid dividends and distributions on any outstanding common stock and accrued and unpaid dividends and distributions on any outstanding preferred stock and accrued liabilities (other than liabilities associated with borrowing or leverage by the Company and any accrued taxes, including, a deferred tax liability). Liabilities associated with borrowing or leverage by the Company include the principal amount of any borrowings, commercial paper or notes issued by the Company, the liquidation preference of any outstanding preferred stock, and other liabilities from other forms of borrowing or leverage such as short positions and put or call options held or written by the Company.
C. Portfolio Companies — From time to time, the Company may “control” or may be an “affiliate” of one or more of its portfolio companies, as each of these terms is defined in the 1940 Act. In general, under the 1940 Act, the Company would be presumed to “control” a portfolio company if the Company and its affiliates owned 25% or more of its outstanding voting securities and would be an “affiliate” of a portfolio company if the Company and its affiliates owned 5% or more of its outstanding voting securities. The 1940 Act contains prohibitions and restrictions relating to transactions between investment companies
38
KAYNE ANDERSON ENERGY INFRASTRUCTURE FUND, INC.
NOTES TO FINANCIAL STATEMENTS
(amounts in 000’s, except number of option contracts, share and per share amounts)
and their affiliates (including the Company’s investment adviser), principal underwriters and affiliates of those affiliates or underwriters.
The Company believes that there are several factors that determine whether or not a security should be considered a “voting security” in complex structures such as limited partnerships of the kind in which the Company invests. The Company also notes that the Securities and Exchange Commission (the “SEC”) staff has issued guidance on the circumstances under which it would consider a limited partnership interest to constitute a voting security. Under most partnership agreements, the management of the partnership is vested in the general partner, and the limited partners, individually or collectively, have no rights to manage or influence management of the partnership through such activities as participating in the selection of the managers or the board of the limited partnership or the general partner. As a result, the Company believes that many of the limited partnership interests in which it invests should not be considered voting securities. However, it is possible that the SEC staff may consider the limited partner interests the Company holds in certain limited partnerships to be voting securities. If such a determination were made, the Company may be regarded as a person affiliated with and controlling the issuer(s) of those securities for purposes of Section 17 of the 1940 Act.
In making such a determination as to whether to treat any class of limited partnership interests the Company holds as a voting security, the Company considers, among other factors, whether or not the holders of such limited partnership interests have the right to elect the board of directors of the limited partnership or the general partner. If the holders of such limited partnership interests do not have the right to elect the board of directors, the Company generally has not treated such security as a voting security. In other circumstances, based on the facts and circumstances of those partnership agreements, including the right to elect the directors of the general partner, the Company has treated those securities as voting securities. If the Company does not consider the security to be a voting security, it will not consider such partnership to be an “affiliate” unless the Company and its affiliates own more than 25% of the outstanding securities of such partnership. Additionally, certain partnership agreements give common unitholders the right to elect the partnership’s board of directors, but limit the amount of voting securities any limited partner can hold to no more than 4.9% of the partnership’s outstanding voting securities (i.e., any amounts held in excess of such limit by a limited partner do not have voting rights). In such instances, the Company does not consider itself to be an affiliate if it owns more than 5% of such partnership’s common units.
There is no assurance that the SEC staff will not consider that other limited partnership securities that the Company owns and does not treat as voting securities are, in fact, voting securities for the purposes of Section 17 of the 1940 Act. If such determination were made, the Company will be required to abide by the restrictions on “control” or “affiliate” transactions as proscribed in the 1940 Act. The Company or any portfolio company that it controls, and its affiliates, may from time to time engage in certain of such joint transactions, purchases, sales and loans in reliance upon and in compliance with the conditions of certain exemptive rules promulgated by the SEC. The Company cannot make assurances, however, that it would be able to satisfy the conditions of these rules with respect to any particular eligible transaction, or even if the Company were allowed to engage in such a transaction, that the terms would be more or as favorable to the Company or any company that it controls as those that could be obtained in an arm’s length transaction. As a result of these prohibitions, restrictions may be imposed on the size of positions that may be taken for the Company or on the type of investments that it could make.
Streamline Innovations Holdings, Inc. — Pursuant to the terms of the Streamline Series C Preferred Shares, Kayne Anderson has the right to designate one director of Streamline for so long as Kayne Anderson and its affiliates continue to beneficially own at least 50% of the Streamline Series
39
KAYNE ANDERSON ENERGY INFRASTRUCTURE FUND, INC.
NOTES TO FINANCIAL STATEMENTS
(amounts in 000’s, except number of option contracts, share and per share amounts)
C Preferred Shares. Ron M. Logan is a Senior Managing Director of Kayne Anderson and serves as the Kayne Anderson appointed director of Streamline. The Company believes that it is an affiliate of Streamline under the 1940 Act by virtue of the Company’s and other affiliated Kayne Anderson funds’ ownership interest in Streamline and Kayne Anderson’s director designation right.
The following table summarizes the Company’s investments in affiliates as of and for the fiscal year ended November 30, 2022:
|
Investment(1) |
No. of |
|
Dividends/Distributions |
Net Realized |
Net Change in |
|||||||||
|
Streamline Innovations Holdings, Inc. |
4,125 |
$ |
19,594 |
$ |
— |
$ |
— |
$ |
(1,052) |
|||||
____________
(1) See Schedule of Investments for investment classifications.
(2) During the fiscal year ended November 30, 2022, the Company purchased 4,125 Streamline Series C Preferred Shares. During the fiscal year ended November 30, 2022, there were no sales of any affiliates.
6. Income Taxes
The Company’s taxes include current and deferred income taxes. Current income taxes reflect the estimated income tax liability or asset of the Company as of a measurement date. Deferred income taxes reflect (i) taxes on net unrealized gains (losses), which are attributable to the difference between fair market value and tax cost basis, (ii) the net tax effects of temporary differences between the carrying amounts of assets and liabilities for financial reporting purposes and the amounts used for income tax purposes and (iii) the net tax benefit of accumulated net operating losses and capital losses, if any.
As of November 30, 2022, the components of the Company’s deferred tax assets and liabilities are as follows:
|
Current tax receivable, net |
$ |
7,790 |
|
|
|
|
|
|||
|
Deferred tax assets: |
|
|
||
|
Capital loss carryforward — Federal |
$ |
41,337 |
|
|
|
Capital loss carryforward — State |
|
2,645 |
|
|
|
Net operating loss carryforward — Federal |
|
1,364 |
|
|
|
Net operating loss carryforward — State |
|
124 |
|
|
|
|
|
|||
|
Deferred tax liabilities: |
|
|
||
|
Net unrealized gains on investment securities |
|
(169,216 |
) |
|
|
Total deferred income tax asset (liability), net |
$ |
(123,746 |
) |
During the fiscal year ended November 30, 2022, the Company made $8,461 of tax payments (net of $7,059 of tax refunds received primarily related to federal and state capital loss carryback claims).
40
KAYNE ANDERSON ENERGY INFRASTRUCTURE FUND, INC.
NOTES TO FINANCIAL STATEMENTS
(amounts in 000’s, except number of option contracts, share and per share amounts)
As of November 30, 2022, the Company had a net current income tax receivable of $7,790, which was comprised of a net state tax asset of $1,858 and a net federal tax asset of $5,932.
As of November 30, 2022, the Company had capital loss carryforwards of $199,441 (federal and state deferred tax asset of $41,337 and $2,645, respectively). Realization of capital loss carryforwards is dependent on generating sufficient capital gains prior to their expiration. The majority of these capital loss carryforwards will expire if not used by fiscal 2025.
As of November 30, 2022, the Company had a federal net operating loss carryforward $6,497 (subject to Section 382 limitation described below; federal deferred tax asset of $1,364). This net operating loss can be carried forward indefinitely.
On March 4, 2022, the Company completed its merger with FMO. The merger qualified as a tax-free reorganization under Section 368(a) of the Internal Revenue Code. As of the merger date, the Company acquired all of the tax attributes of FMO. Regulations under Section 382 of the Internal Revenue Code limit the use of tax attributes subsequent to ownership changes until FMO’s net operating loss and capital loss carryforwards are utilized or expire unused. The annual Section 382 limitation was calculated as of the merger date to be $1,663 and this amount is pro-rated for the year in which the merger is completed.
As of the merger date, FMO had $76,808 of unrealized built-in gains for tax purposes. In addition to the Section 382 limitation, the Company will be able to utilize FMO’s capital loss carryforwards up to the amount of built-in gains that are realized (prior to the statutory expiration of the capital loss carryforward period).
As of the merger date, FMO had established a valuation allowance on the amount of capital losses that exceeded its net unrealized built-in gain as of the same date. As a result of the limitations on these losses post-merger, the Company has written off the deferred tax asset (and removed the valuation allowance) associated with the losses that exceeded (1) the built-in gains as of the merger date and (2) the portion of losses that will become available through the annual Section 382 limitation (prior to the statutory expiration of the capital loss carryforward period). Post-merger, $84,693 of capital losses and $6,497 of net operating losses will be available to the Company subject to the limitations described above.
The Company periodically reviews the recoverability of its deferred tax assets based on the weight of available evidence. When assessing the recoverability of its deferred tax assets, significant weight is given to the effects of potential future realized and unrealized gains on investments and the period over which these deferred tax assets can be realized.
Based on the Company’s assessment at November 30, 2022, it has determined that it is more likely than not that its deferred tax assets would be realized through future taxable income of the appropriate character. Accordingly, there is no valuation allowance related to the Company’s deferred tax assets.
The Company will continue to review and assess the need for a valuation allowance in the future. Significant variability in the fair value of its portfolio of investments may change the Company’s assessment regarding the recoverability of its deferred tax assets. If a further valuation allowance is required to reduce any deferred tax asset in the future, or if a change in a valuation allowance is necessary, it could have a material impact on the Company’s net asset value and results of operations in the period of adjustment.
41
KAYNE ANDERSON ENERGY INFRASTRUCTURE FUND, INC.
NOTES TO FINANCIAL STATEMENTS
(amounts in 000’s, except number of option contracts, share and per share amounts)
Total income taxes were different from the amount computed by applying the federal statutory income tax rate of 21% to the net investment income and realized and unrealized gains (losses) on investments before taxes as follows:
|
For the |
||||
|
Computed federal income tax expense at 21% |
$ |
85,072 |
|
|
|
State income tax expense, net of federal tax |
|
4,477 |
|
|
|
Income tax benefit of capital losses and net operating losses acquired in merger |
|
(4,506 |
) |
|
|
Foreign tax credit |
|
(1,326 |
) |
|
|
dividend received deduction, non-deductible distributions on MRP Shares and other, net |
|
(1,176 |
) |
|
|
Effect of change in state tax rate (0.35% decrease)(1) |
|
(779 |
) |
|
|
Total income tax expense |
$ |
81,762 |
|
|
____________
(1) During the fourth quarter of fiscal 2022, the Company changed its state tax rate from 1.39% to 1.04% (net of federal benefit) based upon updated state apportionment information.
As a limited partner of MLPs, the Company includes its allocable share of such MLP’s income or loss in computing its own taxable income or loss. Additionally, for income tax purposes, the Company reduces the cost basis of its MLP investments by the cash distributions received, and increases or decreases the cost basis of its MLP investments by its allocable share of the MLP’s income or loss. During the fiscal year ended November 30, 2022, the Company increased its tax cost basis by approximately $13,358 due to 2021 net allocated income from its MLP investments.
The Company utilizes the average cost method to compute the adjusted tax cost basis of its MLP securities.
At November 30, 2022, the cost basis of investments for federal income tax purposes was $1,224,332, and the premiums received on outstanding option contracts written were $44. The cost basis for federal income tax purposes is $593,278 lower than the cost basis for GAAP reporting purposes primarily due to the additional basis adjustments attributable to the Company’s share of the allocated losses from its MLP investments. At November 30, 2022, gross unrealized appreciation and depreciation of investments and options, if any, for federal income tax purposes were as follows:
|
Gross unrealized appreciation of investments (including options, if any) |
$ |
796,483 |
|
|
|
Gross unrealized depreciation of investments (including options, if any) |
|
(28,667 |
) |
|
|
Net unrealized appreciation of investments before foreign currency related translations |
|
767,816 |
|
|
|
Unrealized depreciation on foreign currency related translations |
|
(14 |
) |
|
|
Net unrealized appreciation of investments |
$ |
767,802 |
|
Distributions in the amount of $3,708 paid to holders of MRP Shares and $103,807 paid to common stockholders for the fiscal year ended November 30, 2022, were characterized as dividends (eligible to be treated as qualified dividend income). Distributions in the amount of $4,087 paid to holders of MRP Shares and $82,190 paid to common stockholders for the fiscal year ended November 30, 2021, were characterized as distributions (return of capital). These characterizations are based on the Company’s earnings and profits.
42
KAYNE ANDERSON ENERGY INFRASTRUCTURE FUND, INC.
NOTES TO FINANCIAL STATEMENTS
(amounts in 000’s, except number of option contracts, share and per share amounts)
7. Restricted Securities
From time to time, the Company’s ability to sell certain of its investments is subject to certain legal or contractual restrictions. For instance, private investments that are not registered under the Securities Act of 1933, as amended (the “Securities Act”), cannot be offered for public sale in a non-exempt transaction without first being registered. In other cases, certain of the Company’s investments have restrictions such as lock-up agreements that preclude the Company from offering these securities for public sale.
At November 30, 2022, the Company held the following restricted investments:
|
Investment |
Acquisition |
Type of |
Number of |
Cost |
Fair |
Fair Value |
Percent |
Percent |
|||||||||||||
|
Level 2 Investments |
|
|
|
|
|
||||||||||||||||
|
Plains GP Holdings, L.P. — Plains AAP, L.P.(1) |
(2) |
(3) |
1,622 |
$ |
1,487 |
$ |
21,463 |
$ |
13.23 |
1.5 |
% |
1.1 |
% |
||||||||
|
|
|
|
|
|
|||||||||||||||||
|
Level 3 Investments(4) |
|
|
|
|
|
||||||||||||||||
|
Enterprise Products Partners L.P. Convertible Preferred Units |
(2) |
(5) |
23 |
$ |
23,496 |
$ |
22,387 |
$ |
982.96 |
1.5 |
% |
1.1 |
% |
||||||||
|
MPLX LP |
5/13/16 |
(5) |
2,255 |
|
72,217 |
|
76,661 |
|
33.99 |
5.3 |
|
3.8 |
|
||||||||
|
Streamline Innovations Holdings, Inc. Series C Preferred Shares |
(2) |
(6) |
4,125 |
|
20,645 |
|
19,594 |
|
4.75 |
1.4 |
|
1.0 |
|
||||||||
|
Total |
$ |
116,358 |
$ |
118,642 |
|
8.2 |
% |
5.9 |
% |
||||||||||||
|
Total of all restricted securities |
$ |
117,845 |
$ |
140,105 |
|
9.7 |
% |
7.0 |
% |
||||||||||||
____________
(1) The Company values its investment in Plains AAP, L.P. (“PAGP-AAP”) on an “as exchanged” basis based on the higher public market value of either Plains GP Holdings, L.P. (“PAGP”) or Plains All American Pipeline, L.P. (“PAA”). As of November 30, 2022, the Company’s PAGP-AAP investment is valued at PAGP’s closing price. See Note 3 — Fair Value.
(2) Security was acquired at various dates in current and/or prior fiscal years.
(3) The Company’s investment in PAGP-AAP is exchangeable on a one-for-one basis into either PAGP shares or PAA units at the Company’s option. Upon exchange, the PAGP shares or the PAA units will be freely tradable.
(4) Securities are valued using inputs reflecting the Company’s own assumptions as more fully described in Note 2 — Significant Accounting Policies and Note 3 — Fair Value.
(5) Unregistered or restricted security of a publicly-traded company.
(6) Unregistered or restricted security of a private company.
8. Derivative Financial Instruments
As required by the Derivatives and Hedging Topic of the FASB Accounting Standards Codification (ASC 815), the following are the derivative instruments and hedging activities of the Company. See Note 2 — Significant Accounting Policies.
Option Contracts — Based on the notional amount, the Company has written a monthly average of $5,936 of call options during the fiscal year ended November 30, 2022.
43
KAYNE ANDERSON ENERGY INFRASTRUCTURE FUND, INC.
NOTES TO FINANCIAL STATEMENTS
(amounts in 000’s, except number of option contracts, share and per share amounts)
Interest Rate Swap Contracts — As of November 30, 2022, the Company did not have any interest rate swap contracts outstanding.
The following table sets forth the fair value of the Company’s derivative instruments on the Statement of Assets and Liabilities:
|
Derivatives Not Accounted for |
Statement of |
Fair Value |
|||
|
Call options written |
Call option contracts written |
$ |
(45) |
||
The following table sets forth the effect of the Company’s derivative instruments on the Statement of Operations:
|
For the Fiscal Year Ended |
||||||||
|
Derivatives Not Accounted for |
Location of |
Net Realized |
Change in |
|||||
|
Call options written |
Options |
$ |
597 |
$ |
(1) |
|||
|
Securities sold short |
Securities sold short |
|
84 |
|
— |
|||
|
$ |
681 |
$ |
(1) |
|||||
9. Investment Transactions
For the fiscal year ended November 30, 2022, the Company purchased and sold securities in the amounts of $537,999 and $603,254 (excluding short-term investments and securities sold short, if any).
10. Credit Facility and Term Loan
As of November 30, 2022, the Company had a $200,000 unsecured revolving credit facility (the “Credit Facility”) that matures on February 24, 2023. The interest rate on outstanding borrowings under the Credit Facility may vary between the secured overnight financing rate (“SOFR”) plus 1.40% and SOFR plus 2.25%, depending on the Company’s asset coverage ratios. The Company pays a fee of 0.20% per annum on any unused amounts of the Credit Facility.
For the fiscal year ended November 30, 2022, the average amount of borrowings outstanding under the Credit Facility was $83,542 with a weighted average interest rate of 2.24%. As of November 30, 2022, the Company did not have any borrowings outstanding under the Credit Facility.
As of November 30, 2022, the Company had a $50,000 unsecured term loan (the “Term Loan”) that matures on August 6, 2024. The interest rate on $25,000 of the Term Loan is fixed at a rate of 1.735% and the interest rate on the remaining $25,000 is LIBOR plus 1.30%. Amounts repaid under the Term Loan cannot be reborrowed.
44
KAYNE ANDERSON ENERGY INFRASTRUCTURE FUND, INC.
NOTES TO FINANCIAL STATEMENTS
(amounts in 000’s, except number of option contracts, share and per share amounts)
As of November 30, 2022, $50,000 was borrowed under the Term Loan at a weighted average interest rate of 3.46%. As of November 30, 2022, the Company had $93 of unamortized Term Loan issuance costs.
As of November 30, 2022, the Company was in compliance with all financial and operational covenants required by the Credit Facility and Term Loan. See Financial Highlights for the Company’s asset coverage ratios under the 1940 Act.
11. Notes
At November 30, 2022, the Company had $260,789 aggregate principal amount of Notes outstanding. During the fiscal year ended November 30, 2022, the Company issued $90,000 of Notes and redeemed $38,897 of Notes.
The table below sets forth a summary of the issuances, redemptions, and the key terms of each series of Notes outstanding at November 30, 2022.
Series | Principal | Principal | Principal | Principal | Unamortized | Estimated | Fixed/Floating | Maturity | |||||||||||||||
CC | $ | 11,575 | $ | — | $ | (11,575 | ) | $ | — | $ | — | $ | — | 3.95% | 5/3/22 | ||||||||
FF |
| 16,571 |
| — |
| — |
|
| 16,571 |
| 9 |
| 16,700 | 3.57% | 4/16/23 | ||||||||
GG |
| 21,419 |
| — |
| — |
|
| 21,419 |
| 52 |
| 20,900 | 3.67% | 4/16/25 | ||||||||
KK |
| 32,247 |
| — |
| — |
|
| 32,247 |
| 67 |
| 31,900 | 3.93% | 7/30/24 | ||||||||
MM |
| 27,322 |
| — |
| (27,322 | ) |
| — |
| — |
| — | 3.26% | 10/29/22 | ||||||||
NN |
| 15,774 |
| — |
| — |
|
| 15,774 |
| 21 |
| 15,700 | 3.37% | 10/29/23 | ||||||||
OO |
| 14,778 |
| — |
| — |
|
| 14,778 |
| 34 |
| 14,400 | 3.46% | 10/29/24 | ||||||||
PP |
| 50,000 |
| — |
| — |
|
| 50,000 |
| 304 |
| 51,200 | 3-month LIBOR + 125 bps | 6/19/26 | ||||||||
| 20,000 |
| — |
| — |
|
| 20,000 |
| 109 |
| 18,500 | 1.81% | 6/19/25 | |||||||||
RR |
| — |
| 45,000 |
| — |
|
| 45,000 |
| 363 |
| 42,400 | 4.57% | 5/18/32 | ||||||||
SS |
| — |
| 45,000 |
| — |
|
| 45,000 |
| 391 |
| 42,100 | 4.67% | 8/2/34 | ||||||||
$ | 209,686 | $ | 90,000 | $ | (38,897 | ) | $ | 260,789 | $ | 1,350 | $ | ||||||||||||
Holders of the fixed rate Notes are entitled to receive cash interest payments semi-annually (on June 19 and December 19) at the fixed rate. Holders of the floating rate Notes are entitled to receive cash interest payments quarterly (on March 19, June 19, September 19 and December 19) at the floating rate. As of November 30, 2022, the weighted average interest rate on the outstanding Notes was 4.06%.
As of November 30, 2022, each series of Notes was rated “AAA” by Kroll Bond Rating Agency (“KBRA”). In the event the credit rating on any series of Notes falls below “A-”, the interest rate on such series will increase by 1% during the period of time such series is rated below “A-”. The Company is required to maintain a current rating from one rating agency with respect to each series of Notes and is prohibited from having any rating of less than investment grade (“BBB-”) with respect to each series of Notes.
The Notes were issued in private placement offerings to institutional investors and are not listed on any exchange or automated quotation system. The Notes contain various covenants related to other indebtedness, liens and limits on the Company’s overall leverage. Under the 1940 Act and the terms of the Notes, the Company may not declare dividends or make other distributions on shares of its common stock or make purchases of such shares if, at any time of the declaration, distribution or purchase, asset coverage with respect to senior securities representing indebtedness (including the Notes) would be less than 300%.
45
KAYNE ANDERSON ENERGY INFRASTRUCTURE FUND, INC.
NOTES TO FINANCIAL STATEMENTS
(amounts in 000’s, except number of option contracts, share and per share amounts)
The Notes are redeemable in certain circumstances at the option of the Company. The Notes are also subject to a mandatory redemption to the extent needed to satisfy certain requirements if the Company fails to meet an asset coverage ratio required by law and is not able to cure the coverage deficiency by the applicable deadline.
The Notes are unsecured obligations of the Company and, upon liquidation, dissolution or winding up of the Company, will rank: (1) senior to all of the Company’s outstanding preferred shares; (2) senior to all of the Company’s outstanding common shares; (3) on parity with any unsecured creditors of the Company and any unsecured senior securities representing indebtedness of the Company; and (4) junior to any secured creditors of the Company.
At November 30, 2022, the Company was in compliance with all covenants under the Notes agreements.
12. Preferred Stock
At November 30, 2022, the Company had 4,464,117 shares of MRP Shares outstanding, with a total liquidation value of $111,603 ($25.00 per share). During the fiscal year ended November 30, 2022, the Company issued $20,000 of MRP Shares and redeemed $10,067 of MRP Shares.
The table below sets forth a summary of the issuances and redemptions and key terms of each series of MRP Shares outstanding at November 30, 2022.
|
Series |
Liquidation |
Liquidation |
Liquidation |
Liquidation |
Unamortized |
Estimated |
Rate |
Mandatory |
|||||||||||||||
|
P |
$ |
10,067 |
$ |
— |
$ |
(10,067 |
) |
$ |
— |
$ |
— |
$ |
— |
3.86% |
10/29/22 |
||||||||
|
R |
|
41,828 |
|
— |
|
— |
|
|
41,828 |
|
366 |
|
37,900 |
3.38% |
2/11/27 |
||||||||
|
S |
|
49,775 |
|
— |
|
— |
|
|
49,775 |
|
667 |
|
43,000 |
3.60% |
2/11/30 |
||||||||
|
T |
|
— |
|
20,000 |
|
— |
|
|
20,000 |
|
353 |
|
18,500 |
5.07% |
8/2/32 |
||||||||
|
$ |
101,670 |
$ |
20,000 |
$ |
(10,067 |
) |
$ |
111,603 |
$ |
1,386 |
|
99,400 |
|||||||||||
Holders of the MRP Shares are entitled to receive cumulative cash dividend payments on the first business day following each quarterly period (February 28, May 31, August 31 and November 30).
As of November 30, 2022, each series of MRP Shares was rated “A+” by KBRA. The dividend rate on the Company’s MRP Shares will increase if the credit rating is downgraded below “A” (as determined by the lowest credit rating assigned). Further, the annual dividend rate for all series of MRP Shares will increase by 4.0% if no ratings are maintained, and the annual dividend rate will increase by 5.0% if the Company fails to make a dividend or certain other payments.
The MRP Shares rank senior to all of the Company’s outstanding common shares and on parity with any other preferred stock. The MRP Shares are redeemable in certain circumstances at the option of the Company and are also subject to a mandatory redemption if the Company fails to meet a total leverage (debt and preferred stock) asset coverage ratio of 225%.
Under the terms of the MRP Shares, the Company may not declare dividends or pay other distributions on shares of its common stock or make purchases of such shares if, at any time of the declaration, distribution or purchase, asset coverage with respect to total leverage would be less than 225%.
The holders of the MRP Shares have one vote per share and will vote together with the holders of common stock as a single class except on matters affecting only the holders of MRP Shares or the holders of common stock. The holders of the MRP Shares, voting separately as a single class, have the right to elect at least two directors of the Company.
46
KAYNE ANDERSON ENERGY INFRASTRUCTURE FUND, INC.
NOTES TO FINANCIAL STATEMENTS
(amounts in 000’s, except number of option contracts, share and per share amounts)
At November 30, 2022, the Company was in compliance with the asset coverage requirement of its MRP Shares.
13. Common Stock
At November 30, 2022, the Company had 195,535,883 shares of
|
Shares outstanding at November 30, 2021 |
126,447,554 |
|
|
Shares issued in connection with merger (see Note 1) |
9,683,976 |
|
|
Shares outstanding at November 30, 2022 |
136,131,530 |
During the fiscal year ended November 30, 2021, there were no common stock transactions.
14. Subsequent Events
On December 14, 2022, the Company declared a quarterly distribution of $0.20 per common share for the fourth quarter. The total distribution of $27,226 was paid January 11, 2023. Of this total, pursuant to the Company’s dividend reinvestment plan, $3,065 was reinvested into the Company through open market purchases of common stock.
The Company has performed an evaluation of subsequent events through the date the financial statements were issued and has determined that no additional items require recognition or disclosure.
47
This glossary contains definitions of certain key terms, as they are used in our investment policies and as described in this report. These definitions may not correspond to standard sector definitions.
“Energy Assets” means Energy Infrastructure Assets and other assets that are used in the energy sector, including assets used in exploring, developing, producing, generating, transporting, transmitting, storing, gathering, processing, fractionating, refining, distributing, mining or marketing of natural gas, natural gas liquids, crude oil, refined products, coal, electricity or water.
“Energy Companies” means companies that own and/or operate Energy Assets or provide energy- related services. For purposes of this definition, this includes companies that (i) derive at least 50% of their revenues or operating income from operating Energy Assets or providing services for the operation of such assets or (ii) have Energy Assets that represent the majority of their assets.
“Energy Infrastructure Assets” means (a) Midstream Assets, (b) Renewable Infrastructure Assets and (c) Utility Assets.
“Energy Infrastructure Companies” consists of (a) Midstream Energy Companies, (b) Renewable Infrastructure Companies and (c) Utility Companies.
“Master Limited Partnerships” or “MLPs” means limited partnerships and limited liability companies that are publicly traded and are treated as partnerships for federal income tax purposes.
“Midstream Assets” means assets used in energy logistics, including, but not limited to, assets used in transporting, storing, gathering, processing, fractionating, distributing, or marketing of natural gas, natural gas liquids, crude oil, refined products or water produced in conjunction with such activities.
“Midstream Energy Companies” means companies that primarily own and operate Midstream Assets. Such companies may be structured as Master Limited Partnerships or taxed as corporations. For purposes of this definition, this includes companies that (i) derive at least 50% of their revenue or operating income from operating Midstream Assets or providing services for the operation of such assets or (ii) have Midstream Assets that represent the majority of their assets.
“Renewable Infrastructure Assets” means assets used in the generation, production, distribution, transportation, transmission, storage and marketing of energy including, but not limited to, electricity or steam from renewable sources such as solar, wind, flowing water (hydroelectric power), geothermal, biomass and hydrogen.
“Renewable Infrastructure Companies” means companies that own and/or operate Renewable Infrastructure Assets. For purposes of this definition, this includes companies that (i) derive at least 50% of their revenues or operating income from operating Renewable Infrastructure Assets or providing services for the operation of such assets or (ii) have Renewable Infrastructure Assets that represent the majority of their assets.
“Utility Assets” means assets, other than Renewable Infrastructure Assets, that are used in the generation, production, distribution, transportation, transmission, storage and marketing of energy, including, but not limited to, electricity, natural gas and steam.
“Utility Companies” means companies that own and/or operate Utility Assets. For purposes of this definition, this includes companies that (i) derive at least 50% of their revenues or operating income from operating Utility Assets or providing services for the operation of such assets or (ii) have Utility Assets that represent the majority of their assets.
48
To the Board of Directors and Stockholders of Kayne Anderson Energy Infrastructure Fund, Inc.
Opinion on the Financial Statements
We have audited the accompanying statement of assets and liabilities, including the schedule of investments, of Kayne Anderson Energy Infrastructure Fund, Inc. (the “Company”) as of November 30, 2022, the related statements of operations and cash flows for the year ended November 30, 2022, the statement of changes in net assets applicable to common stockholders for each of the two years in the period ended November 30, 2022, including the related notes, and the financial highlights for each of the ten years in the period ended November 30, 2022 (collectively referred to as the “financial statements”). In our opinion, the financial statements present fairly, in all material respects, the financial position of the Company as of November 30, 2022, the results of its operations and its cash flows for the year then ended, the changes in its net assets for each of the two years in the period ended November 30, 2022 and the financial highlights for each of the ten years in the period ended November 30, 2022 in conformity with accounting principles generally accepted in the United States of America.
Basis for Opinion
These financial statements are the responsibility of the Company’s management. Our responsibility is to express an opinion on the Company’s financial statements based on our audits. We are a public accounting firm registered with the Public Company Accounting Oversight Board (United States) (PCAOB) and are required to be independent with respect to the Company in accordance with the U.S. federal securities laws and the applicable rules and regulations of the Securities and Exchange Commission and the PCAOB.
We conducted our audits of these financial statements in accordance with the standards of the PCAOB. Those standards require that we plan and perform the audit to obtain reasonable assurance about whether the financial statements are free of material misstatement, whether due to error or fraud.
Our audits included performing procedures to assess the risks of material misstatement of the financial statements, whether due to error or fraud, and performing procedures that respond to those risks. Such procedures included examining, on a test basis, evidence regarding the amounts and disclosures in the financial statements. Our audits also included evaluating the accounting principles used and significant estimates made by management, as well as evaluating the overall presentation of the financial statements. Our procedures included confirmation of securities owned as of November 30, 2022 by correspondence with the custodian, issuer, transfer agent and brokers. We believe that our audits provide a reasonable basis for our opinion.
/s/ PricewaterhouseCoopers LLP
Los Angeles, CA
January 26, 2023
We have served as the auditor of one or more investment companies in the Kayne Anderson Funds Family since 2004.
49
Investment Objective and Policies
References to “we” “us” “our” or “the Company” in this section are references to KYN. See Glossary of Key Terms for definitions of capitalized terms.
Our investment objective is to provide a high after-tax total return with an emphasis on making cash distributions to stockholders. Our investment objective is considered a fundamental policy and therefore may not be changed without the approval of the holders of a “majority of the outstanding” voting securities, as such term is defined under the 1940 Act. When used with respect to our voting securities, a “majority of the outstanding” voting securities means (i) 67% or more of the shares present at a meeting, if the holders of more than 50% of the shares are present or represented by proxy, or (ii) more than 50% of the shares, whichever is less. There can be no assurance that we will achieve our investment objective.
Our non-fundamental investment policies may be changed by the Board of Directors without the approval of the holders of a “majority of the outstanding” voting securities, provided that the holders of such voting securities receive at least 60 days’ prior written notice of any change. The following are our non-fundamental investment policies, under normal market conditions:
• We intend to invest at least 80% of total assets in public and private securities of Energy Infrastructure Companies.
• We intend to invest at least 50% of our total assets in publicly traded securities of Energy Infrastructure Companies.
• Under normal market conditions, we may invest up to 50% of our total assets in unregistered or otherwise restricted securities. The types of unregistered or otherwise restricted securities that we may purchase include common equity, preferred equity, convertible equity and other securities of other public and private companies.
• We may invest up to 15% of our total assets in any single issuer.
• We may invest up to 20% of our total assets in debt securities, including below investment grade debt securities rated, at the time of investment, at least B3 by Moody’s, B- by Standard & Poor’s or Fitch, comparably rated by another rating agency or, if unrated, determined by KAFA to be of comparable quality. In addition, up to one-quarter of our permitted investments in debt securities (or up to 5% of our total assets) may be invested in unrated debt securities or debt securities that are rated less than B3/B- of public or private companies.
• We may, but are not required to, use derivative investments and engage in short sales to hedge against interest rate and market risks.
• Under normal market conditions, our policy is to utilize our debt securities, revolving credit facility and other borrowings, and our preferred stock (collectively, “Leverage Instruments”) in an amount that represents approximately 25% to 30% of our total assets (our “target leverage levels”), including proceeds from such Leverage Instruments. However, we reserve the right at any time, based on market conditions, (i) to reduce our target leverage levels or (ii) to use Leverage Instruments to the extent permitted by the 1940 Act.
Unless otherwise stated, all investment restrictions apply at the time of purchase and we will not be required to reduce a position due solely to market value fluctuations.
50
KAYNE ANDERSON ENERGY INFRASTRUCTURE FUND, INC.
INVESTMENT OBJECTIVE, POLICIES AND RISKS
(UNAUDITED)
Principal Risks
As with all closed-end funds, it is possible to lose money on an investment in the Company. An investment in the Company is not a deposit of any bank and is not guaranteed, endorsed or insured by any financial institution, government authority or the Federal Deposit Insurance Corporation (FDIC). Each risk summarized below is considered a “principal risk” of investing in the Company, regardless of the order in which it appears.
Investment and Market Risk
An investment in our common stock is subject to investment risk, including the possible loss of the entire amount that you invest. Your investment in our common stock represents an indirect investment in Energy Infrastructure Companies and other securities owned by us, which will generally be traded on a national securities exchange or in the over-the-counter markets. An investment in our common stock is not intended to constitute a complete investment program and should not be viewed as such. The value of these publicly traded securities, like other market investments, may move up or down, sometimes rapidly and unpredictably. The value of the securities in which we invest may affect the value of our common stock. Your common stock at any point in time may be worth less than your original investment, even after taking into account the reinvestment of our distributions. We are primarily a long-term investment vehicle and should not be used for short-term trading.
Energy Infrastructure Company Risk
Our concentration in the energy infrastructure sector may present more risk than if we were broadly diversified over multiple sectors of the economy. Energy Infrastructure Companies, including Midstream Energy Companies, Renewable Infrastructure Companies and Utility Companies, are subject to risks specific to the energy and energy-related industries. See the Glossary of Key Terms for descriptions of these capitalized terms.
Energy Sector Risk
The revenues of Energy Infrastructure Companies, including many Midstream Energy Companies and Utilities, are often dependent upon the volumes of oil, natural gas, refined products, natural gas liquids or water produced by Energy Companies and/or consumed by customers of these commodities, and could be adversely affected by reductions in the supply of, or demand for, such energy commodities. The adverse impact of these events could lead to a material reduction in the earnings of Energy Infrastructure Companies and a substantial reduction (or elimination) of distributions paid to equity holders, and could result in a decline in (i) the equity values of the affected Energy Infrastructure Companies and/or (ii) our net distributable income. The volume of energy commodities produced and the volume of energy commodities available for transportation, storage, processing or distribution could be negatively affected by a variety of factors, including, among others, depletion of resources, depressed commodity prices, access to capital for companies engaged in the energy industry, catastrophic or extreme weather events, labor relations, increased environmental or other governmental regulation (including policies designed to reduce carbon emissions and/or address climate change), limitations on leasing of additional federal lands or the issuance of permits for oil and gas drilling, equipment malfunctions and maintenance difficulties, volumes of imports or exports, international politics, policies of the Organization of the Petroleum Exporting Countries (“OPEC”), and increased competition from alternative energy sources. A decline in demand for energy commodities could result from factors such as adverse economic conditions, increased taxation,
51
KAYNE ANDERSON ENERGY INFRASTRUCTURE FUND, INC.
INVESTMENT OBJECTIVE, POLICIES AND RISKS
(UNAUDITED)
increased environmental or other governmental regulation (including policies designed to reduce carbon emissions and/or address climate change), catastrophic events, extreme weather events, pandemics, increased fuel economy, increased energy conservation or use of alternative energy sources, legislation intended to promote the use of alternative energy sources, or increased commodity prices.
Power Sector Risk
The revenues of Energy Infrastructure Companies, including many Utility Companies and Renewable Infrastructure Companies, are often dependent upon the availability of electric power and/or the consumption of electric power and could be adversely affected by reductions in the supply of, or demand for, such power. The adverse impact of these events could lead to a material reduction in the earnings of Energy Infrastructure Companies and a substantial reduction (or elimination) of dividends paid to equity holders, and could result in a decline in (i) the equity values of the affected Energy Infrastructure Companies and/or (ii) our net distributable income. The production or availability of electric power could be negatively affected by a variety of factors, including depressed power prices, high prices for commodities used in the generation of power, lower than expected wind, solar or hydro power resources, catastrophic or extreme weather events, labor relations, increased environmental or other governmental regulation (including policies designed to reduce carbon emissions and/or address climate change), equipment malfunctions, transmission grid disruptions and maintenance difficulties. A decline in demand for power could result from factors such as increased power prices, adverse economic conditions, increased taxation, increased governmental regulation, catastrophic events, extreme weather events, equipment malfunctions, transmission grid disruptions and maintenance difficulties.
Commodity Pricing Risk
The operations and financial performance of Energy Infrastructure Companies may be directly affected by energy commodity or power prices, especially those companies that (i) produce energy commodities or power, (ii) consume energy commodities or power in their operations, or (iii) receive payments for services that are based on energy commodity or power prices. Such impact may be a result of changes in the price for such commodity or a result of changes in the price of one commodity relative to the price of another commodity (for example, the price of natural gas relative to the price of natural gas liquids). Commodity prices can fluctuate for many different reasons, including changes in market and economic conditions, the impact of weather on demand, levels of domestic and international production, policies implemented by producer groups such as OPEC, energy conservation, domestic and foreign governmental regulation and taxation, acts of terrorism or war and the availability of local, intrastate and interstate transportation systems. Volatility of commodity prices may also make it more difficult for Energy Infrastructure Companies to raise capital to the extent the market perceives that their performance may be directly or indirectly tied to commodity prices, and such difficulty raising capital could adversely impact the financial condition of these companies and their ability to maintain or grow cash distributions or dividends to their equity holders. In addition to the volatility of commodity prices, extremely high commodity prices may drive further energy conservation efforts or incentivize substitution in favor of other energy sources, which may adversely affect the performance of Energy Infrastructure Companies.
52
KAYNE ANDERSON ENERGY INFRASTRUCTURE FUND, INC.
INVESTMENT OBJECTIVE, POLICIES AND RISKS
(UNAUDITED)
Regulatory Risk
Energy Infrastructure Companies are subject to significant national, state and local government regulation in virtually every aspect of their operations, including (i) how facilities are constructed, maintained and operated, (ii) how services are provided, (iii) environmental and safety controls, and, in some cases, the prices they may charge for the products and services they provide. Such regulation can change rapidly or over time in both scope and intensity and may vary significantly across countries, states, and local jurisdictions. Various governmental authorities have the power to enforce compliance with these regulations and the permits issued under them. Working with national, state, and local governments to plan, site, and install energy infrastructure in compliance with such regulations can be complex, time-consuming, and costly. Violations of such regulations may subject companies to administrative, civil and criminal penalties, including civil fines, injunctions or both. Stricter laws, regulations or enforcement policies could be enacted in the future which would likely increase compliance costs and may adversely affect the financial performance of Energy Infrastructure Companies. Additionally, government authorities, such as the Federal Energy Regulatory Commission (“FERC”) and state authorities regulate the rates charged for services of many Energy Infrastructure Companies. Those authorities can change the regulations and, as a result, materially reduce the rates charged for these services, which may adversely affect the financial performance of Energy Infrastructure Companies.
Emissions of greenhouse gases, including gases associated with the production and use of hydrocarbons such as carbon dioxide, methane and nitrous oxide among others contribute to a warming of the earth’s atmosphere and other adverse environmental effects, commonly referred to as “climate change.” To protect against climate change, most of the worlds’ governments, including the federal government of the United States and many states, are committed to taking action to substantially reduce emissions of greenhouse gases. The adoption and implementation of federal, state or local limits on greenhouse gas emissions from Energy Infrastructure Companies could result in significant costs to reduce emissions of greenhouse gases associated with their operations or could adversely affect the supply of, or demand for, power, crude oil, natural gas, natural gas liquids or other hydrocarbon products, which in turn could reduce production of those commodities. As a result, greenhouse gas emissions legislation or regulation could have a material adverse impact on the financial performance of Energy Infrastructure Companies.
There is an inherent risk that Energy Infrastructure Companies may incur material environmental costs and liabilities due to the nature of their businesses and the substances they handle. For example, an accidental release from a pipeline could subject the owner of such pipeline to substantial liabilities for environmental cleanup and restoration costs, claims made by neighboring landowners and other third parties for personal injury and property damage, and fines or penalties for related violations of environmental laws or regulations. Energy Infrastructure Companies can be liable for hazardous substance releases under certain environmental statutes, including the Resource Conservation and Recovery Act, the Comprehensive Environmental Response, Compensation, and Liability Act, the federal Oil Pollution Act and analogous state laws and regulations. These laws impose strict, joint and several liability for costs required to clean up and restore sites where Energy Infrastructure Companies have released hazardous substances. Moreover, the possibility exists that stricter laws, regulations or enforcement policies could significantly increase the compliance costs of Energy Infrastructure Companies. Similarly, the implementation of more stringent environmental requirements could significantly increase the cost for any remediation that may become necessary. Energy Infrastructure Companies may not be able to recover these costs from insurance or recover these costs in the rates they charge customers.
53
KAYNE ANDERSON ENERGY INFRASTRUCTURE FUND, INC.
INVESTMENT OBJECTIVE, POLICIES AND RISKS
(UNAUDITED)
Catastrophic Event Risk
Energy Infrastructure Companies are subject to many dangers inherent in the production, exploration, management, transportation, processing and distribution of natural gas, natural gas liquids, crude oil, refined products, water or power. These dangers include leaks, fires, explosions, train wrecks, damage to facilities and equipment resulting from natural disasters — including floods, freezes and hurricanes — inadvertent damage to facilities and equipment and terrorist acts, including cyber- attacks. The U.S. government has issued warnings that energy assets, specifically domestic energy infrastructure such as pipelines or power transmission grids may be targeted in future terrorist attacks.
These dangers give rise to risks of substantial losses as a result of loss or destruction of reserves; damage to or destruction of property, facilities and equipment; pollution and environmental damage; and personal injury or loss of life. Any occurrence of such catastrophic events could bring about a limitation, suspension or discontinuation of the operations of certain assets owned by such Energy Infrastructure Company.
Midstream Energy Companies Risk
Midstream Energy Companies are a subset of Energy Infrastructure Companies and, as such, are subject to the risks described above under Energy Infrastructure Company Risks.
Regulatory Risk
In the last several years, several pipeline projects have experienced significant delays related to difficulties in obtaining the necessary permits to proceed with construction (or some phase of construction). These delays have raised concerns about the ability of Midstream Energy Companies to place such projects in service and their ability to get the necessary financing to complete such projects. Furthermore, it has become much more common for opponents of energy infrastructure development to utilize the courts, media campaigns and political activism to attempt to stop, or delay as much as possible, these projects. Significant delays could result in a material increase in the cost of developing these projects and could result in Midstream Energy Companies developing such projects failing to generate the expected return on investment or, if the project does not go forward, realizing a financial loss, either of which would adversely affect the results of operations and financial performance of the affected Energy Infrastructure Companies.
Natural gas transmission pipeline systems, crude oil transportation pipeline systems, refined products transportation pipeline systems, and certain classes of storage facilities and related assets owned by Energy Infrastructure Companies are subject to regulation by the FERC. The regulators have authority to regulate natural gas pipeline transmission, crude oil pipeline transportation services, and refined products pipeline transportation services including the rates charged for the services, terms and conditions of service, certification and construction of new facilities, the extension or abandonment of services and facilities, the maintenance of accounts and records, the acquisition and disposition of facilities, the initiation and discontinuation of services, and various other matters. Action by the FERC could adversely affect the ability of Energy Infrastructure Companies to establish or charge rates that would cover future increases in their costs, such as additional costs related to environmental matters including any climate change regulation, or even to continue to collect rates that cover current costs, including a reasonable rate of return. It could also become more common for regulatory agencies (such as FERC) to include the impact of carbon emissions from energy infrastructure assets as a consideration in granting permits for the construction or operation of such assets. This could result in costly delays in obtaining permits, requirements to spend additional capital to limit carbon emissions or denial of required permits to operate existing or proposed energy infrastructure assets. Any such change could have an adverse impact on the financial condition, results of operations, or cash flows of Energy Infrastructure Companies.
54
KAYNE ANDERSON ENERGY INFRASTRUCTURE FUND, INC.
INVESTMENT OBJECTIVE, POLICIES AND RISKS
(UNAUDITED)
Over the past several years, governmental agencies have imposed more stringent protections governing hydraulic fracturing and the disposal of wastewater associated with hydraulic fracturing processes that are critical to the recovery of economic amounts of oil, natural gas and natural gas liquids by Energy Companies. Wastewater is a byproduct of hydraulic fracturing and production and, to the extent it is not recycled, must be disposed. Scientific research links the disposal of wastewater to increased earthquake activity in certain oil and natural gas producing regions, and legislation and regulations have been proposed in states like Oklahoma and Colorado to limit or prohibit further underground wastewater disposal in seismically sensitive regions. While we are not able to predict the likelihood that similar regulations will be adopted in other regions, additional restrictions on hydraulic fracturing, wastewater disposal or any other activity necessary for the production of oil, natural gas or natural gas liquids could result in a reduction in production of those commodities. Midstream Energy Companies have spent (and continue to spend) significant amounts of capital building pipelines, processing, treating and storage assets to facilitate the development of oil and gas reserves and such reductions in production could have an adverse impact on the financial performance of Midstream Energy Companies.
Upstream Exploration and Production Risk
Energy reserves naturally deplete as they are produced over time, and to maintain or grow their revenues, companies engaged in the production of natural gas, natural gas liquids, crude oil and other energy commodities need to maintain or expand their reserves through exploration of new sources of supply, through the development of existing sources or through acquisitions. Energy Companies may be unsuccessful adding reserves and/or maintaining production levels for several reasons, including the lack of sufficient cash flow to fund re-investment due to a material decline in commodity prices, an inability to raise capital on favorable terms or an unwillingness to reinvest cash flow in the development (or acquisition) of new reserves. The failure to cost-effectively acquire additional reserves sufficient to replace the natural decline in production may cause the production of natural gas, natural gas liquids, crude oil and other energy commodities to decline. During recent industry downturns, including the 2020 downturn resulting from COVID-19’s severe negative impact on global demand, many Energy Companies significantly reduced capital expenditures, leading to declines in U.S. production of natural gas and crude oil. Many Energy Companies were forced to monetize reserves or acreage to manage their balance sheets and maintain adequate liquidity levels. Some Energy Companies were forced to file for bankruptcy in an effort to restructure their balance sheets. These actions have had a negative impact on the operating results and financial performance for some Midstream Energy Companies engaged in the transportation, storage, distribution and processing of production from such Energy Companies.
Energy Companies engaged in the production of natural gas, natural gas liquids and crude oil estimate the quantities of their reserves. If reserve estimates prove to be inaccurate, these companies’ reserves may be overstated, and no commercially productive amounts of such energy commodities may be discovered. Furthermore, drilling or other exploration activities, may be curtailed, delayed, or cancelled as a result of low commodity prices, unexpected conditions or miscalculations, title problems, pressure or irregularities in formations, equipment failures or accidents, adverse weather conditions, compliance with environmental and other governmental requirements and cost of, or shortages or delays in the availability of, drilling rigs and other exploration equipment. In addition, there are many operational risks and hazards associated with the development of the underlying properties, including natural disasters, blowouts, explosions, fires, leakage of such energy commodities, mechanical failures, cratering, and pollution. Midstream Energy Companies invest significant capital in assets to provide transportation, processing, treating, storage, and other services to facilitate production of these energy commodities and would be adversely impacted in the event reserves were significantly underestimated or were unable to be economically produced.
55
KAYNE ANDERSON ENERGY INFRASTRUCTURE FUND, INC.
INVESTMENT OBJECTIVE, POLICIES AND RISKS
(UNAUDITED)
Affiliated Party Risk
Certain Midstream Energy Companies are dependent on their affiliates for a majority of their revenues. In some cases, those same affiliates are the majority owners and/or have effective control of the Midstream Energy Companies. Any failure by a Midstream Energy Company’s affiliates to satisfy their payments or obligations would impact the Midstream Energy Company’s revenues and cash flows and ability to make interest payments and distributions or dividends to their equity holders. Controlling affiliates of Midstream Energy Companies may also enter into M&A transactions or attempt to effect changes in commercial contracts that could be adverse to the Midstream Energy Company.
Contract Renegotiation/Rejection Risk
Midstream Energy Companies that operate midstream assets are also subject to the credit risk of their customers. For example, many Energy Companies that explore for and produce oil, natural gas and natural gas liquids filed for bankruptcy during the last downturn. During the bankruptcy process, the debtor Energy Company may be able to reject a contract that it has with a Midstream Energy Company that provides services for the debtor, which could include gathering, processing, treating, transportation or storage services. If a contract is successfully rejected during bankruptcy, the affected Midstream Energy Company will have an unsecured claim for damages but will likely only recover a portion of its claim for damages and may not recover anything at all. A debtor Energy Company may also threaten to reject a contract in an effort to force a renegotiation of the agreement on terms less favorable to its counterparty, the Midstream Energy Company. For these reasons, a Midstream Energy Company that provides services to an Energy Company that is in financial distress could experience a material adverse impact to its financial performance and results of operations.
Utility Companies Risk
Utility Companies are a subset of Energy Infrastructure Companies and, as such, are subject to the risks described above under Energy Infrastructure Company Risk.
Other risks inherent in the utilities sector include a variety of factors that may adversely affect the business or operations of Utility Companies, including: high interest costs associated with capital construction and improvement programs; difficulty in raising adequate capital on reasonable terms in periods of high inflation and unsettled capital markets; governmental regulation of rates that the company can charge to customers; costs associated with compliance with, and adjusting to changes to, environmental and other regulations; the difficulty in obtaining an adequate return on invested capital or in financing large construction projects; effects of economic slowdowns and surplus capacity; increased competition from other providers of utilities services; costs associated with the reduced availability of certain types of fuel, occasionally reduced availability and high costs of natural gas for resale, and the effects of energy conservation policies.
Some Utility Companies also face risks associated with the effects of a national energy policy and lengthy delays, and greatly increased costs and other problems, associated with the design, construction, licensing, regulation and operation of nuclear facilities for power generation, including, among other considerations: the problems associated with the use of radioactive materials and the disposal of radioactive wastes; technological innovations that may render existing plants, equipment or products obsolete; difficulty in obtaining regulatory approval of new technologies; lack of compatibility of telecommunications equipment; potential impacts of terrorist activities on the utilities industry and its
56
KAYNE ANDERSON ENERGY INFRASTRUCTURE FUND, INC.
INVESTMENT OBJECTIVE, POLICIES AND RISKS
(UNAUDITED)
customers; and the impact of natural or man-made disasters. Utility Companies may also be subject to regulation by various governmental authorities and may be affected by the imposition of special tariffs and changes in tax laws, regulatory policies and accounting standards.
Deregulation is subjecting Utility Companies to greater competition and may adversely affect profitability. As deregulation allows utilities to diversify outside of their original geographic regions and their traditional lines of business, Utility Companies may engage in riskier ventures. There is no assurance that regulatory authorities will, in the future, grant rate increases, or that such increases will be adequate to permit the payment of dividends on stocks issued by a Utility Company.
In many regions, including the United States, the Utility Industry is experiencing increasing competitive pressures, primarily in wholesale markets, as a result of consumer demand, technological advances, greater availability of natural gas with respect to electric utility companies and other factors. For example, FERC has implemented regulatory changes to increase access to the nationwide transmission grid by utility and non-utility purchasers and sellers of electricity. A number of countries, including the United States, are considering or have implemented methods to introduce and promote retail competition. Changes in regulation may result in consolidation among domestic utilities and the disaggregation of many vertically integrated utilities into separate generation, transmission and distribution businesses. As a result, additional significant competitors could become active in certain parts of the utility industry.
Renewable Infrastructure Companies Risk
Renewable Infrastructure Companies are a subset of Energy Infrastructure Companies and, as such, are subject to the risks described above under Energy Infrastructure Company Risk. In addition, the future growth of Renewable Infrastructure Companies may be dependent upon on government policies that support renewable power generation and enhance the economic viability of owning renewable electric generation assets. Such policies can include renewable portfolio standard programs, which mandate that a specified percentage of electricity sales come from eligible sources of renewable energy, accelerated cost-recovery systems of depreciation, tax credits and production credits.
The electric power produced, and revenues generated by a renewable energy generation facility, including solar electric or wind energy, is highly dependent on suitable weather conditions. These assets may not be able to operate in extreme weather conditions, such as during a severe freeze. Furthermore, components used in the generation of renewable energy could be damaged by severe weather, such as hailstorms, tornadoes or hurricanes. In addition, replacement and spare parts for key components may be difficult or costly to acquire or may be unavailable. Unfavorable weather and atmospheric conditions could impair the effectiveness of assets or reduce their output beneath their rated capacity or require shutdown of key equipment, impeding operation of renewable assets. Actual climatic conditions at a facility site, particularly wind conditions, may not conform to the historical findings and, therefore, renewable energy facilities may not meet anticipated production levels or the rated capacity of the generation assets, which could adversely affect the business, financial condition and results of operations and cash flows of the Renewable Infrastructure Companies involved in the renewable energy industry.
A portion of revenues from investments in Renewable Infrastructure Assets will be tied, either directly or indirectly, to the wholesale market price for electricity in the markets served. Wholesale market electricity prices are impacted by a number of factors including: the price of fuel (for example, natural gas) that is used to generate electric power; the cost of and management of generation and the amount of excess generating capacity relative to load in a particular market; and conditions (such as extremely hot or cold weather) that impact electrical system demand. Owners of Renewable Infrastructure Assets may attempt to secure fixed prices for their power production through the use of financial hedges; but may not be able to deliver power to collect such fixed price, rendering those hedges ineffective or creating economic
57
KAYNE ANDERSON ENERGY INFRASTRUCTURE FUND, INC.
INVESTMENT OBJECTIVE, POLICIES AND RISKS
(UNAUDITED)
losses for Renewable Infrastructure Assets. In addition, there is uncertainty surrounding the trend in electricity demand growth. This volatility and uncertainty in power markets could have a material adverse effect on the assets, liabilities, financial condition, results of operations and cash flow of the companies in which we invest.
Decreases in Subsidies and Changes in Regulations Risk
Poor economic conditions could have an effect on government budgets and threaten the continuation of government subsidies such as regulated revenues, cash grants, U.S. federal income and state tax benefits or state renewables portfolio standards that benefit Renewable Infrastructure Companies. Such conditions may also lead to adverse changes in laws or regulations. The reduction or elimination of renewable generation targets, tariffs, subsidies or tax incentives or adverse changes in law could have a material adverse effect on the profitability of some existing projects. The availability and continuation of public policy support mechanisms will drive a significant part of the economics and viability of clean energy investments, and the curtailment or termination of such subsidies and incentives could adversely affect the feasibility and profitability of Renewable Infrastructure Assets and the growth plan of Renewable Infrastructure Companies. In addition, if the various domestic and international regulations that provide incentives for renewable energy change or expire in a manner that adversely impacts the market for Renewable Infrastructure Companies, the competitiveness of renewable energy generally and the economic value of new projects undertaken by Renewable Infrastructure Companies could be impacted.
Renewable Infrastructure Companies also rely in part on environmental and other regulations of industrial and local government activities, including regulations granting subsidies or mandating reductions in carbon or other greenhouse gas emissions and minimum biofuel content in fuel or use of energy from renewable sources. If the businesses to which such regulations relate were deregulated or if such subsidies or regulations were changed or weakened, the profitability of Renewable Infrastructure Companies could suffer.
Hydrology, Solar and Wind Changes Risk
The revenues and cash flows generated by Renewable Infrastructure Assets are often correlated to the amount of electric power generated, which for some assets is dependent upon available water flows, solar conditions, wind conditions and weather conditions generally. Hydrology, solar, wind and weather conditions have natural variations from season to season and from year to year and may also change permanently because of climate change or other factors, and these changes could impact the profitability of Renewable Infrastructure Assets. A natural disaster could also impact water flows within the watersheds the Renewable Infrastructure Companies in which we invest operate. Wind energy is highly dependent on weather conditions and, in particular, on wind conditions.
Operational Disruption Risk
Renewable Infrastructure Companies are exposed to risks in connection with disruptions of their operations, or to the operations of third parties on which they depend, which may be caused by technical breakdowns at power generation assets, resulting from aged or defective facility components, insufficient maintenance, failed repairs, power outages, adverse weather conditions, natural disasters, labor disputes, ill-intentioned acts or other accidents or incidents. These disruptions could result in shutdowns, delays or long-term decommissioning in production or distribution of energy. This may materially and adversely affect operations or financial condition and cause harm to the reputation of companies in which we invest.
58
KAYNE ANDERSON ENERGY INFRASTRUCTURE FUND, INC.
INVESTMENT OBJECTIVE, POLICIES AND RISKS
(UNAUDITED)
Construction Risk
Renewable Infrastructure Companies may invest in projects that are subject to construction risk and construction delays. The ability of these projects to generate revenues will often depend upon their successful completion of the construction and operation of generating assets. Any shortage, delay or component price change from the suppliers of equipment associated with renewable energy projects could result in construction or installation delays. There have been periods of industry-wide shortage of key components, including solar panels and wind turbines. Delays in construction may also occur as a result of inclement weather, labor disruptions, technical complications or other reasons, and any resulting cost over-runs could negatively impact the income and market values of Renewable Infrastructure Companies.
In addition, tariffs on imports to the United States could affect operating or construction costs for a number of companies in which we invest. The cost of new solar power generation projects could be more challenging as a result of increases in the cost of solar panels or tariffs on imported solar panels imposed by the U.S. government on imported solar cells and modules manufactured in China. If project developers purchase solar panels containing cells manufactured in China, the purchase price for renewable energy equipment and facilities may reflect the tariff penalties mentioned above.
Renewable Infrastructure Technology Risk
Technology related to the production of renewable power and conventional power generation is continually advancing, resulting in a gradual decline in the cost of producing electricity. Renewable Infrastructure Companies may invest in and use newly developed, less proven, technologies in their development projects or in maintaining or enhancing their existing assets. There is no guarantee that such new technologies will perform as anticipated. The failure of a new technology to perform as anticipated may materially and adversely affect the profitability of a particular development project.
Increasing Competition/Market Change Risks
A significant portion of the electric power generation and transmission capacity sold by Renewable Infrastructure Assets is sold under long-term agreements with public utilities, industrial or commercial end-users or governmental entities. If, for any reason, any of the purchasers of power or transmission capacity under these agreements are unable or unwilling to fulfill their related contractual obligations or if they otherwise terminate such agreements prior to the expiration thereof, the business and financial condition of Renewable Infrastructure Companies could be materially and adversely affected. The power generation industry is characterized by intense competition, which may impact the ability of Renewable Infrastructure Companies to replace an expiring or terminated agreement with an agreement on equivalent terms and conditions, including at prices that permit operation of the related facility on a profitable basis, and as a result the affected facility may temporarily or permanently cease operations.
Changes in Tariffs Risk
The revenue that Renewable Infrastructure Assets generate from contracted concessions is often dependent on regulated tariffs or other long-term fixed rate arrangements. Under such concession agreements, a tariff structure is established, and Renewable Infrastructure Companies have limited or no possibility to independently raise tariffs beyond the established rates and indexation or adjustment mechanisms. Similarly, under a long-term power purchase agreement, Renewable Infrastructure Companies may be required to deliver power at a fixed rate for the contract period, with limited escalation
59
KAYNE ANDERSON ENERGY INFRASTRUCTURE FUND, INC.
INVESTMENT OBJECTIVE, POLICIES AND RISKS
(UNAUDITED)
rights. In addition, Renewable Infrastructure Companies may be unable to adjust tariffs or rates as a result of fluctuations in prices of raw materials, exchange rates, labor and subcontractor costs during the operating phase of these projects. Moreover, in some cases, if Renewable Infrastructure Assets fail to comply with certain pre-established conditions, the government or customer, as applicable, may reduce the tariffs or rates payable. In addition, during the life of a concession, the relevant government authority may unilaterally impose additional restrictions on tariff rates, subject to the regulatory frameworks applicable in each jurisdiction.
Risks of Investing in MLP Units
In addition to the risks summarized herein, an investment in MLP units involves certain risks, which differ from an investment in the securities of a corporation. Limited partners of MLPs, unlike investors in the securities of a corporation, have limited voting rights on matters affecting the partnership and generally have no rights to elect the directors of the general partner. In addition, conflicts of interest exist between limited partners and the general partner and the general partner does not generally have any duty to the limited partners beyond a “good faith” standard.
Tax Risks of Investing in Equity Securities of MLPs
Our ability to meet our investment objective will depend, in part, on the level of taxable income and distributions and dividends we receive from the MLP securities in which we invest, a factor over which we have no control. The benefit we derive from our investment in MLPs is largely dependent on the MLPs being treated as partnerships and not as corporations for federal income tax purposes. As a partnership, an MLP has no tax liability at the entity level. If, as a result of a change in the tax code or a change in an MLP’s business, an MLP were treated as a corporation for federal income tax purposes, such MLP would be obligated to pay federal income tax on its income at the corporate tax rate. Upon the sale of an equity security in an MLP, we generally will be liable for any previously deferred taxes. In addition, the sale of an equity security in an MLP involves certain tax depreciation recapture relating to the MLP’s underlying assets. Such depreciation recapture is treated as ordinary income for tax purposes, and such ordinary income may result even if the sale of the MLP equity security is at a loss or exceeds the gain if sold at a gain. MLPs generally provide the relevant tax information for these calculations on a delayed basis, usually during the calendar year following the sale, so final determination of any resulting recapture income may be similarly delayed. If the recapture exceeds operating losses, we could recognize taxable income and have an income tax liability. No assurance can be given that such taxes will not exceed the Company’s deferred tax assumptions for purposes of computing the Company’s net asset value per share, which would result in an immediate reduction of the Company’s net asset value per share. If an MLP were classified as a corporation for federal income tax purposes, the amount of cash available for distribution by the MLP would likely be reduced and distributions received by us that are treated as dividend income or capital gain would be taxed under federal income tax laws applicable to corporate distributions, which would reduce our net distributable income. In addition, as U.S presidential and legislative priorities change and develop, energy-related tax provisions may be enacted, some of which may not be favorable to MLPs or corporations investing in them and may increase the amount of taxes we ultimately bear. There can be no assurance how any such provisions could affect our net distributable income or our business generally.
60
KAYNE ANDERSON ENERGY INFRASTRUCTURE FUND, INC.
INVESTMENT OBJECTIVE, POLICIES AND RISKS
(UNAUDITED)
Non-Diversification Risk
We are a non-diversified, closed-end investment company under the 1940 Act and will not be treated as a regulated investment company under the Internal Revenue Code of 1986, as amended, or the Code. Accordingly, there are no regulatory requirements under the 1940 Act or the Code on the minimum number or size of securities we hold. As we may invest up to 15% of our total assets in any single issuer, a decline in value of the securities of such an issuer could significantly impact the value of our portfolio.
Dependence on Limited Number of Customers and Suppliers
Certain Energy Infrastructure Companies in which we may invest depend upon a limited number of customers for a majority of their revenue. Similarly, certain Energy Infrastructure Companies in which we may invest depend upon a limited number of suppliers of goods or services to continue their operations. The recent COVID-19 related downturn in the energy industry put significant pressure on a number of these customers and suppliers and caused many companies operating in the energy industry to file for bankruptcy. Other public health emergencies or widespread market disruptions in the future could have similar effects. Any loss of any such customers or suppliers, including through bankruptcy, could materially adversely affect such Energy Infrastructure Companies’ results of operation and cash flow, and their ability to make distributions or dividends to equity holders could therefore be materially adversely affected.
Capital Markets Risk
Financial markets are volatile, and Energy Infrastructure Companies may not be able to obtain new debt or equity financing on attractive terms or at all. For example, the downturn in commodity prices and economic activity associated with the COVID-19 pandemic negatively impacted the ability of Energy Companies to raise capital, and equity capital in particular, at attractive levels. Downgrades of the debt of Energy Infrastructure Companies by rating agencies during times of distress could exacerbate this challenge. In addition, downgrades of the credit ratings of Energy Infrastructure Companies by ratings agencies may increase the cost of borrowing under the terms of an Energy Infrastructure Company’s credit facility, and a downgrade from investment grade to below investment may cause an Energy Infrastructure Company to be required to post collateral (or additional collateral) by its contractual counterparties, which could reduce the amount of liquidity available to such Energy Infrastructure Company and increase its need for additional funding sources. If funding is not available when needed, or is available only on unfavorable terms, Energy Infrastructure Companies may have to reduce their distributions or dividends to manage their funding needs and may not be able to meet their obligations as they come due. Moreover, without adequate funding, many Energy Infrastructure Companies may be unable to execute their growth strategies, complete future acquisitions, take advantage of other business opportunities or respond to competitive pressures, any of which could have a material adverse effect on their revenues and results of operations.
Political Instability Risk
The Energy Infrastructure Companies in which we may invest are subject to disruption as a result of terrorist activities (including cyber-attacks), war, and other geopolitical events. The U.S. government has issued warnings that energy assets, specifically those related to pipeline and other energy infrastructure, production facilities and transmission and distribution facilities, may be targeted in future terrorist attacks. Internal unrest, acts of violence or strained relations between a government and energy companies or other governments may affect the operations and profitability of Energy Infrastructure Companies in which we invest. Political instability in other parts of the world may also cause volatility and disruptions in the market for the securities of Energy Infrastructure Companies, even those that operate solely in North America.
61
KAYNE ANDERSON ENERGY INFRASTRUCTURE FUND, INC.
INVESTMENT OBJECTIVE, POLICIES AND RISKS
(UNAUDITED)
Weather Risks
Weather conditions and the seasonality of weather patterns play a role in the cash flows of certain Energy Infrastructure Companies. Although most Energy Infrastructure Companies can reasonably predict seasonal weather demand based on normal weather patterns, extreme weather conditions (for instance hurricanes, wildfires and extreme winter storms) demonstrate that no amount of preparation can protect an Energy Infrastructure Company from the unpredictability of the weather. The damage done by extreme weather also may serve to increase insurance premiums for energy assets owned by Energy Infrastructure Companies, could significantly increase the volatility in the supply of energy- related commodities and could adversely affect such companies’ financial condition and ability to pay distributions or dividends to equity holders.
Concentration Risk
Our investments are concentrated in the energy infrastructure sector. The focus of our portfolio on the energy infrastructure sector may present more risks than if our portfolio were broadly diversified over numerous sectors of the economy. A downturn in the energy infrastructure sector, or more generally in the energy industry, would have a larger impact on us than on an investment company that does not concentrate in the energy infrastructure sector. The performance of securities in the energy infrastructure sector may lag the performance of other industries or the broader market as a whole. To the extent that we invest a relatively high percentage of our assets in the obligations of a limited number of issuers, we may be more susceptible than a more widely diversified investment company to any single economic, political or regulatory occurrence.
Interest Rate Risk
Valuations of securities in which we invest are based on numerous factors, including sector and business fundamentals, management expertise, and expectations of future operating results. Most of the securities in which we invest pay quarterly distributions or dividends to investors and are viewed by investors as yield-based investments. As a result, yields for these securities are also susceptible, in the short-term, to fluctuations in interest rates and the equity prices of such securities may decline when interest rates rise. Because we invest in equity securities of Energy Infrastructure Companies, our net asset value and the asset coverage ratios on our senior securities may decline if interest rates rise.
Inflation/Deflation Risk
Inflation risk is the risk that the value of assets or income from investment will be worth less in the future as inflation decreases the value of money. As inflation increases, the real value of our common stock and distributions that we pay declines. In addition, during any periods of rising inflation, the dividend rates or borrowing costs associated with our use of leverage would likely increase. Deflation risk is the risk that prices throughout the economy decline over time — the opposite of inflation. Deflation may have an adverse effect on the creditworthiness of issuers and may make issuer defaults more likely, which may result in a decline in the value of our portfolio.
In an effort to control inflation, the Federal Open Market Committee (“FOMC”), the committee within the Federal Reserve (“Fed”) that sets domestic monetary policy, raised the target range for the federal funds rate seven times in calendar year 2022 to a current range of 4.25% to 4.50%. The Fed has signaled that further increases could happen in 2023. Rising rates generally have a negative impact on income-oriented investments such as those in which we invest and could be adversely impacted by these actions. There is no assurance that the action being taken by the Fed will improve the outlook for long-term inflation or
62
KAYNE ANDERSON ENERGY INFRASTRUCTURE FUND, INC.
INVESTMENT OBJECTIVE, POLICIES AND RISKS
(UNAUDITED)
whether they might result in a recession. A recession could lead to declined employment, global demand destruction and/or business failures, which may result in a decline in the value of our portfolio. In addition, increased interest rates could increase our cost of borrowing and reduce the return on leverage to common shareholders.
Risk of Conflicting Transactions by the Investment Adviser
Kayne Anderson manages portfolios of other investment companies and client accounts that invest in similar or the same securities as the Company. It is possible that Kayne Anderson would effect a purchase of a security for us when another investment company or client account is selling that same security, or vice versa. Kayne Anderson will use reasonable efforts to avoid adverse impacts on the Company’s transactions as a result of those other transactions, but there can be no assurances that adverse impacts will be avoided.
Equity Securities Risk
The vast majority of our assets are invested in equity securities of Energy Infrastructure Companies. Such securities are subject to general movements in the stock market and a significant drop in the stock market may depress the price of securities to which we have exposure. Equity securities prices fluctuate for several reasons, including changes in the financial condition of a particular issuer, investors’ perceptions of Energy Infrastructure Companies, investors’ perceptions of the energy industry, the general condition of the relevant stock market, or when political or economic events affecting the issuers occur. In addition, Energy Infrastructure Company equity securities held by the Company may decline in price if the issuer fails to make anticipated distributions or dividend payments (or reduces the amount of such payments) because, among other reasons, the issuer experiences a decline in its financial condition. In general, the equity securities of MLPs that are publicly traded partnerships tend to be less liquid than the equity securities of corporations, which means that we could have difficulty selling such securities at the time and price we would like.
Small Capitalization Risk
Certain of the Energy Infrastructure Companies in which we invest may have comparatively smaller capitalizations than other companies whose securities are included in major benchmarked indices. Investing in the securities of smaller Energy Infrastructure Companies presents some unique investment risks. These Energy Infrastructure Companies may have limited product lines and markets, as well as shorter operating histories, less experienced management and more limited financial resources than larger Energy Infrastructure Companies and may be more vulnerable to adverse general market or economic developments. Stocks of smaller Energy Infrastructure Companies may be less liquid than those of larger Energy Infrastructure Companies and may experience greater price fluctuations than larger Energy Infrastructure Companies. In addition, small-cap securities may not be widely followed by the investment community, which may result in reduced demand. This means that we could have greater difficulty selling such securities at the time and price that we would like.
Debt Securities Risks
Debt securities in which we invest are subject to many of the risks described elsewhere in this section. In addition, they are subject to credit risk and other risks, depending on the quality and other terms of the debt security.
63
KAYNE ANDERSON ENERGY INFRASTRUCTURE FUND, INC.
INVESTMENT OBJECTIVE, POLICIES AND RISKS
(UNAUDITED)
Credit Risk
An issuer of a debt security may be unable to make interest payments and repay principal. We could lose money if the issuer of a debt obligation is, or is perceived to be, unable or unwilling to make timely principal and/or interest payments, or to otherwise honor its obligations. The downgrade in the credit rating of a security by rating agencies may further decrease its value. Additionally, we may purchase a debt security that has payment-in-kind interest, which represents contractual interest added to the principal balance and due at the maturity date of the debt security in which we invest. It is possible that by effectively increasing the principal balance payable or deferring cash payment of such interest until maturity, the use of payment-in-kind features will increase the risk that such amounts will become uncollectible when due and payable.
Below Investment Grade and Unrated Debt Securities Risk
Below investment grade debt securities (commonly referred to as “junk bonds” or “high yield bonds”) are rated Ba1 or less by Moody’s, BB+ or less by Fitch or Standard & Poor’s, or comparably rated by another rating agency. Below investment grade and unrated debt securities generally pay a premium above the yields of U.S. government securities or debt securities of investment grade issuers because they are subject to greater risks than these securities. These risks, which reflect their speculative character, include the following: greater yield and price volatility; greater credit risk and risk of default; potentially greater sensitivity to general economic or industry conditions; potential lack of attractive resale opportunities (illiquidity); and additional expenses to seek recovery from issuers who default. In addition, the prices of these below investment grade and other unrated debt securities in which we may invest are more sensitive to negative developments, such as a decline in the issuer’s revenues or profitability or a general economic downturn, than are the prices of higher grade securities. Below investment grade and unrated debt securities tend to be less liquid than investment grade securities, and the market for below investment grade and unrated debt securities could contract further under adverse market or economic conditions. In such a scenario, it may be more difficult for us to sell these securities in a timely manner or for as high a price as could be realized if such securities were more widely traded.
Prepayment Risk
Certain debt instruments, particularly below investment grade securities, may contain call or redemption provisions which would allow the issuer thereof to prepay principal prior to the debt instrument’s stated maturity. This is known as prepayment risk. Prepayment risk is greater during a falling interest rate environment as issuers can reduce their cost of capital by refinancing higher yielding debt instruments with lower yielding debt instruments. An issuer may also elect to refinance its debt instruments with lower yielding debt instruments if the credit standing of the issuer improves. To the extent debt securities in our portfolio are called or redeemed, we may be forced to reinvest in lower yielding securities.
Interest Rate Risk for Debt and Equity Securities
Debt securities, and equity securities that pay dividends and distributions, have the potential to decline in value, sometimes dramatically, when interest rates rise or are expected to rise. In general, the values or prices of debt securities vary inversely with interest rates. The change in a debt security’s price depends on several factors, including its maturity. Generally, debt securities with longer maturities are subject to greater price volatility from changes in interest rates. Adjustable rate instruments also react to interest rate changes in a similar manner although generally to a lesser degree (depending, however, on the characteristics of the reset terms).
64
KAYNE ANDERSON ENERGY INFRASTRUCTURE FUND, INC.
INVESTMENT OBJECTIVE, POLICIES AND RISKS
(UNAUDITED)
LIBOR Risk
The United Kingdom’s Financial Conduct Authority, which regulates LIBOR, has ceased making LIBOR available as a reference rate over a phase-out period that began on December 31, 2021. Alternative reference rates have been established or are in development in most major currencies, including with regards to the Secured Overnight Financing Rate (“SOFR”), which is intended to replace U.S. dollar LIBOR. Although the transition process away from LIBOR has become increasingly well-defined, there remains uncertainty regarding the impact of the transition to a new reference rate. At this time, it is not possible to predict the full impact of the elimination of LIBOR and the establishment of an alternative reference rate on the Company or its investments.
Risks Associated with Investing in Initial Public Offerings (“IPOs”)
Securities purchased in IPOs are often subject to the general risks associated with investments in companies with small market capitalizations and, at times, are magnified. Securities issued in IPOs have no trading history, and information about the companies may be available for very limited periods. In addition, the prices of securities sold in an IPO may be highly volatile. At any particular time, or from time to time, we may not be able to invest in IPOs, or to invest to the extent desired, because, for example, only a small portion (if any) of the securities being offered in an IPO may be available to us. In addition, under certain market conditions, a relatively small number of companies may issue securities in IPOs. Our investment performance during periods when we are unable to invest significantly or at all in IPOs may be lower than during periods when we are able to do so. IPO securities may be volatile, and we cannot predict whether investments in IPOs will be successful. As we grow in size, the positive effect of IPO investments on the Company may decrease.
Risks Associated with a Private Investment in a Public Entity (“PIPE”) Transaction
PIPE investors purchase securities directly from a publicly traded company in a private placement transaction, typically at a discount to the market price of the company’s common stock. Because the sale of the securities is not registered under the Securities Act of 1933, as amended (the “Securities Act”), the securities are “restricted” and cannot be immediately resold by the investors into the public markets. Until we can sell such securities into the public markets, our holdings will be less liquid, and any sales will need to be made pursuant to an exemption under the Securities Act. We may purchase equity securities in a PIPE transaction that are structured as convertible preferred equity (that may also pay distributions in kind). At the time a convertible preferred equity investment becomes convertible into common equity, the common equity may be worth less than the conversion price, which would make it uneconomic to convert into common equity and, as a result, significantly reduce the liquidity of the investment.
Privately Held Company Risk
65
KAYNE ANDERSON ENERGY INFRASTRUCTURE FUND, INC.
INVESTMENT OBJECTIVE, POLICIES AND RISKS
(UNAUDITED)
Liquidity Risk
Securities with limited trading volumes may display volatile or erratic price movements. Kayne Anderson is one of the largest investors in Energy Infrastructure Companies. Thus, it may be more difficult for us to buy and sell significant amounts of such securities without an unfavorable impact on prevailing market prices. Larger purchases or sales of these securities by us in a short period of time may cause abnormal movements in the market price of these securities. As a result, these securities may be difficult to dispose of at a fair price at the times when we believe it is desirable to do so. Investment of our capital in securities that are less actively traded or over time experience decreased trading volume may restrict our ability to take advantage of other market opportunities.
We also invest in unregistered or otherwise restricted securities. The term “restricted securities” refers to securities that are unregistered or are held by control persons of the issuer and securities that are subject to contractual restrictions on their resale. Unregistered securities are securities that cannot be sold publicly in the United States without registration under the Securities Act, unless an exemption from such registration is available. Restricted securities may be more difficult to value, and we may have difficulty disposing of such assets either in a timely manner or for a reasonable price. In order to dispose of an unregistered security, we, where we have contractual rights to do so, may have to cause such security to be registered. A considerable period may elapse between the time the decision is made to sell the security and the time the security is registered so that we could sell it. Contractual restrictions on the resale of securities vary in length and scope and are generally the result of a negotiation between the issuer and acquiror of the securities. We would, in either case, bear the risks of any downward price fluctuation during that period. The difficulties and delays associated with selling restricted securities could result in our inability to realize a favorable price upon disposition of such securities, and at times might make disposition of such securities impossible.
Our investments in restricted securities may include investments in private companies. Such securities are not registered under the Securities Act until the company becomes a public company. Accordingly, in addition to the risks described above, our ability to dispose of such securities on favorable terms would be limited until the portfolio company becomes a public company.
Portfolio Turnover Risk
Portfolio turnover may vary greatly from year to year. Portfolio turnover rate is not considered a limiting factor in KAFA’s execution of investment decisions. A higher portfolio turnover rate results in correspondingly greater brokerage commissions and other transactional expenses, including taxes related to realized gains, that are borne by us. It could also result in an acceleration of realized gains on portfolio securities held by us (and payment of cash taxes on such realized gains).
Derivatives Risk
We may purchase and sell derivative investments such as exchange-listed and over-the-counter put and call options on securities, equity, fixed income, interest rate and currency indices, and other financial instruments, enter into total return swaps and various interest rate transactions such as swaps. We also may purchase derivative investments that combine features of these instruments. The use of derivatives has risks, including the imperfect correlation between the value of such instruments and the underlying assets, the possible default of the other party to the transaction or illiquidity of the derivative investments. Furthermore, the ability to successfully use these techniques depends on our ability to predict pertinent market movements, which cannot be assured. Thus, the use of derivatives may result in losses greater than if they had not been used, may require us to sell or purchase portfolio securities at inopportune times or for prices other than current market values, may limit the amount of appreciation we can realize
66
KAYNE ANDERSON ENERGY INFRASTRUCTURE FUND, INC.
INVESTMENT OBJECTIVE, POLICIES AND RISKS
(UNAUDITED)
on an investment or may cause us to hold a security that we might otherwise sell. Additionally, amounts paid by us as premiums and cash or other assets held in margin accounts with respect to derivative transactions are not otherwise available to us for investment purposes.
We have written covered calls in the past and may do so in the future. As the writer of a covered call option, during the option’s life we give up the opportunity to profit from increases in the market value of the security covering the call option above the sum of the premium and the strike price of the call, but we retain the risk of loss should the price of the underlying security decline. The writer of an option has no control over the time when it may be required to fulfill its obligation as a writer of the option. Once an option writer has received an exercise notice, it cannot effect a closing purchase transaction in order to terminate its obligation under the option and must deliver the underlying security at the exercise price. There can be no assurance that a liquid market will exist when we seek to close out an option position. If trading were suspended in an option purchased by us, we would not be able to close out the option. If we were unable to close out a covered call option that we had written on a security, we would not be able to sell the underlying security unless the option expired without exercise.
Depending on whether we would be entitled to receive net payments from the counterparty on an interest rate swap, which in turn would depend on the general state of short-term interest rates at that point in time, a default by a counterparty could negatively impact the performance of our common stock. In addition, at the time an interest rate transaction reaches its scheduled termination date, there is a risk that we would not be able to obtain a replacement transaction or that the terms of the replacement would not be as favorable as on the expiring transaction. If this occurs, it could have a negative impact on the performance of our common stock. If we fail to maintain any required asset coverage ratios in connection with any use by us of our debt securities, revolving credit facility and other borrowings (collectively, our “Borrowings”) and our preferred stock (together with our Borrowings, “Leverage Instruments”), we may be required to redeem or prepay some or all of the Leverage Instruments. Such redemption or prepayment would likely result in our seeking to terminate early all or a portion of any swap or cap transactions. Early termination of a swap could result in a termination payment by or to us.
Short Sales Risk
Short selling involves selling securities which may or may not be owned and borrowing the same securities for delivery to the purchaser, with an obligation to replace the borrowed securities at a later date. Short selling allows the short seller to profit from declines in market prices to the extent such declines exceed the transaction costs and the costs of borrowing the securities. A short sale creates the risk of an unlimited loss, in that the price of the underlying security could theoretically increase without limit, thus increasing the cost of buying those securities to cover the short position. There can be no assurance that the securities necessary to cover a short position will be available for purchase. Purchasing securities to close out the short position can itself cause the price of the securities to rise further, thereby exacerbating the loss.
Our obligation to replace a borrowed security is secured by collateral deposited with the broker-dealer, usually cash, U.S. government securities or other liquid securities similar to those borrowed. We also are required to segregate similar collateral to the extent, if any, necessary so that the value of both collateral amounts in the aggregate is at all times equal to at least 100% of the current market value of the security sold short. Depending on arrangements made with the broker-dealer from which we borrowed the security regarding payment over of any payments received by us on such security, we may not receive any payments (including interest) on the collateral deposited with such broker-dealer.
67
KAYNE ANDERSON ENERGY INFRASTRUCTURE FUND, INC.
INVESTMENT OBJECTIVE, POLICIES AND RISKS
(UNAUDITED)
Public Health Emergency Risk
Pandemics and other local, national, and international public health emergencies, including outbreaks of infectious diseases such as SARS, H1N1/09 Flu, the Avian Flu, Ebola and the novel coronavirus (“COVID-19”) pandemic, can result in market volatility and disruption, and any similar future emergencies may materially and adversely impact economic production and activity in ways that cannot be predicted, all of which could result in substantial investment losses. Most recently, COVID-19 has caused a worldwide public health emergency, significantly diminished and disrupted global economic production and activity of all kinds, and contributed to both volatility and a severe decline in financial markets.
The full extent of the impact of COVID-19 (and of the resulting precipitous decline and disruption in economic and commercial activity across many of the world’s economies) on global economic conditions, and on the operations, financial condition, and performance of any particular market, industry or business, is impossible to predict, and additional economic disruptions and market volatility may occur as new variants appear and spread. Ongoing and potential additional materially adverse effects, including further global, regional and local economic downturns (including recessions) of indeterminate duration and severity, are possible.
The ongoing COVID-19 crisis and any other public health emergency could have a significant adverse impact on our investments and result in significant investment losses. Of particular relevance to an investment in KYN, volatility in the energy markets, including decreases in demand for (and prices of) energy-related commodities as a result of the impact of COVID-19 on global economic activity, has significantly affected the performance of the energy sector, as well as the performance of Energy Infrastructure Companies in which we invest. Other public health emergencies in the future could have similar impacts.
General Market Conditions Risk
Global economic, political and market conditions, including uncertainty about the financial stability of the United States, could have a significant adverse effect on our business, financial condition and results of operations. The current worldwide financial markets situation, as well as various social and political tensions in the United States and around the world (including wars and other forms of conflict, terrorist acts, security operations and catastrophic events such as fires, floods, earthquakes, tornadoes, hurricanes and global health epidemics), may contribute to increased market volatility, may have long term effects on the United States and worldwide financial markets, and may cause economic uncertainties or deterioration in the United States and worldwide.
In addition, the continuing conflict between Russia and Ukraine, and resulting market volatility, could adversely affect our business, financial condition or results of operations. In response to the conflict between Russia and Ukraine, the U.S. and other countries have imposed sanctions or other restrictive actions against Russia. The ongoing conflict and the rapidly evolving measures in response could be expected to have a negative impact on the economy and business activity globally and could have a material adverse effect on our portfolio companies and our business, financial condition, cash flows and results of operations. The severity and duration of the conflict and its impact on global economic and market conditions are impossible to predict. In addition, sanctions could also result in Russia taking counter measures or retaliatory actions which could adversely impact our business or the business of our portfolio companies, including, but not limited to, cyberattacks targeting companies, individuals or other infrastructure upon which our business and the business of our portfolio companies rely.
68
KAYNE ANDERSON ENERGY INFRASTRUCTURE FUND, INC.
INVESTMENT OBJECTIVE, POLICIES AND RISKS
(UNAUDITED)
Risks Related to Our Business and Structure
Use of Leverage
We currently utilize Leverage Instruments and intend to continue to do so. Under normal market conditions, our policy is to utilize Leverage Instruments in an amount that represents approximately 25% – 30% of our total assets, including proceeds from such Leverage Instruments. Notwithstanding this policy, based on market conditions at such time, we may use Leverage Instruments in amounts greater than our policy (to the extent permitted by the 1940 Act) or less than our policy. Leverage Instruments have seniority in liquidation and distribution rights over our common stock.
If we are unable to renew or refinance our credit facility prior to maturity or if we are unable to refinance our Notes or MRP Shares as they mature, we may be forced to sell securities in our portfolio to repay debt or MRP Shares as they mature. If we are required to sell portfolio securities to repay outstanding debt or MRP Shares as they mature or to maintain asset coverage ratios, such sales may be at prices lower than what we would otherwise realize if we were not required to sell such securities at such time.
Additionally, we may be unable to refinance our debt or MRP Shares or sell a sufficient amount of portfolio securities to repay debt or MRP Shares as they mature or to maintain asset coverage ratios, which could cause an event of default on our debt securities or MRP Shares.
Leverage Instruments constitute a substantial lien and burden by reason of their prior claim against our income and against our net assets in liquidation. The rights of lenders to receive payments of interest on and repayments of principal of any Borrowings are senior to the rights of holders of common stock and preferred stock, with respect to the payment of distributions or upon liquidation. We may not be permitted to declare dividends and distributions with respect to common stock or preferred stock or purchase common stock or preferred stock unless at such time, we meet certain asset coverage requirements and no event of default exists under any Borrowing. In addition, we may not be permitted to pay distributions on common stock unless all dividends on the preferred stock and/or accrued interest on Borrowings have been paid, or set aside for payment.
In an event of default under any Borrowing, the lenders have the right to cause a liquidation of collateral (i.e., sell portfolio securities and other of our assets) and, if any such default is not cured, the lenders may be able to control the liquidation as well. If an event of default occurs or in an effort to avoid an event of default, we may be forced to sell securities at inopportune times and, as a result, receive lower prices for such security sales. We may also incur prepayment penalties on Notes and MRP Shares that are redeemed prior to their stated maturity dates or mandatory redemption dates.
Certain types of leverage, including the Notes and MRP Shares, subject us to certain affirmative covenants relating to asset coverage and our portfolio composition. In a declining market, we may need to sell securities in our portfolio to maintain asset coverage ratios, which would impact the distributions to us, and as a result, our cash available for distribution to common stockholders. By utilizing Notes and MRP Shares, we may be forced to sell securities at an inopportune time in the future to maintain asset coverage ratios and may be forced to pay additional prepayment penalties on our Notes and MRP Shares. Our Notes and MRP Shares also may impose special restrictions on our use of various investment techniques or strategies or in our ability to pay distributions on common stock and preferred stock in certain instances. In addition, we are subject to certain negative covenants relating to transactions with affiliates, mergers and consolidation, among others. We are also subject to certain restrictions on investments imposed by guidelines of one or more rating agencies, which issue ratings for Leverage Instruments issued by
69
KAYNE ANDERSON ENERGY INFRASTRUCTURE FUND, INC.
INVESTMENT OBJECTIVE, POLICIES AND RISKS
(UNAUDITED)
us. These guidelines may impose asset coverage or portfolio composition requirements that are more stringent than those imposed by the 1940 Act. Kayne Anderson does not believe that these covenants or guidelines will impede it from managing our portfolio in accordance with our investment objective and policies.
Interest Rate Hedging Risk
We may hedge against interest rate risk resulting from our leveraged capital structure. We do not intend to hedge interest rate risk of our portfolio holdings. Interest rate transactions that we may use for hedging purposes will expose us to certain risks that differ from the risks associated with our portfolio holdings. There are economic costs of hedging reflected in the price of interest rate swaps and similar techniques, the cost of which can be significant. In addition, our success in using hedging instruments is subject to KAFA’s ability to correctly predict changes in the relationships of such hedging instruments to our leverage risk, and there can be no assurance that KAFA’s judgment in this respect will be accurate. To the extent there is a decline in interest rates, the value of interest rate swaps could decline, and result in a decline in the net asset value of our common stock (and asset coverage ratios for our senior securities). In addition, if the counterparty to an interest rate swap or cap defaults, we would not be able to use the anticipated net receipts under the interest rate swap to offset our cost of financial leverage.
Foreign Investing Risk
We invest in securities of foreign issuers, predominantly those located in Canada and, to a lesser extent, Europe. Canada is a significant exporter of natural resources, such as oil, natural gas and agricultural products. As a result, the Canadian economy is susceptible to adverse changes in certain commodities markets. It is also heavily dependent on trading with key partners, including the United States, Mexico, and China. Any reduction in trading with these key partners may adversely affect the Canadian economy. Canada’s dependency on the economy of the United States, in particular, makes Canada’s economy vulnerable to political and regulatory changes affecting the United States economy.
The European financial markets have continued to experience volatility because of concerns about economic downturns and about high and rising government debt levels of several countries in the European Union (“EU”) and Europe generally. These events have adversely affected the exchange rate of the Euro and the European securities markets, and may spread to other countries in Europe, including countries that do not use the Euro. These events may affect the value and liquidity of certain of our investments. Responses to the financial problems by EU governments, central banks and others, including austerity measures and reforms, may not work, may result in social unrest and may limit future growth and economic recovery or have other unintended consequences. Further defaults or restructurings by governments and others of their debt could have additional adverse effects on economies, financial markets and asset valuations around the world.
The United Kingdom (“U.K.”) left the EU on January 31, 2020, in a process now commonly referred to as “Brexit.” Investments in European issuers face risks associated with the potential uncertainty and consequences following Brexit, including with respect to volatility in exchange rates and interest rates. Brexit could adversely affect European or worldwide political, regulatory, economic or market conditions and could contribute to instability in global political institutions, regulatory agencies and financial markets. Brexit has also led to legal uncertainty and could lead to politically divergent national laws and regulations as a new relationship between the U.K. and EU is defined and the U.K. determines which EU laws to replace or replicate. Any of these effects of Brexit could adversely affect any of the companies to which we have exposure and any other assets in which we invest. The political, economic and legal consequences of Brexit are not yet fully known.
70
KAYNE ANDERSON ENERGY INFRASTRUCTURE FUND, INC.
INVESTMENT OBJECTIVE, POLICIES AND RISKS
(UNAUDITED)
Secessionist movements, such as the Catalan movement in Spain and the independence movement in Scotland, as well as governmental or other responses to such movements, may also create instability and uncertainty in the region. In addition, the national politics of countries in the EU have been unpredictable and subject to influence by disruptive political groups and ideologies. The governments of EU countries may be subject to change and such countries may experience social and political unrest. Unanticipated or sudden political or social developments may result in sudden and significant investment losses. The occurrence of terrorist incidents throughout Europe could also impact financial markets. The impact of these events is not clear but could be significant and far-reaching and could adversely affect the value and liquidity of our investments.
Investments in some foreign securities may involve greater risks than investing in U.S. securities. As compared to U.S. companies, foreign issuers generally disclose less financial and other information publicly and are subject to less stringent and less uniform accounting, auditing and financial reporting standards. Foreign countries typically impose less thorough regulations on brokers, dealers, stock exchanges, corporate insiders and listed companies than does the U.S., and foreign securities markets may be less liquid and more volatile than U.S. markets. Investments in foreign securities generally involve higher costs than investments in U.S. securities, including higher transaction and custody costs as well as additional taxes imposed by foreign governments. In addition, securities trading practices abroad may offer less protection to investors. Political or social instability, civil unrest, acts of terrorism, regional economic volatility, and the imposition of sanctions, confiscations, trade restrictions (including tariffs) and other government restrictions by the United States and/or other governments are other potential risks that could impact an investment in a foreign security. Settlement of transactions in some foreign markets may be delayed or may be less frequent than in the U.S., which could affect the liquidity of our portfolio.
Foreign Currency Risk
Because we invest in foreign (non-U.S.) currencies or in foreign securities that are denominated, trade and/or receive revenues in foreign (non-U.S.) currencies, we are subject to the risk that those foreign currencies may decline in value relative to the U.S. dollar. In the case of currency hedging positions, we are subject to the risk that the U.S. dollar may decline in value relative to the currency being hedged. Currency exchange rates may fluctuate significantly and unpredictably. As a result, our investments in foreign currencies, in foreign securities that are denominated, trade, and/or receive revenues in foreign currencies, or in derivatives that provide exposure to foreign currencies may reduce our returns.
Tax Risks
In addition to other risk considerations, an investment in our common stock will involve certain tax risks, including, but not limited to, the risks summarized below. The federal, state, local and foreign tax consequences of an investment in and holding of our common stock will depend on the facts of each investor’s situation. Investors are encouraged to consult their own tax advisers regarding the specific tax consequences that may affect them.
Taxability of Distributions Received
We cannot assure you what percentage of the distributions paid on our common stock, if any, will be treated as tax-advantaged qualified dividend income or return of capital or what the tax rates on various types of income or gain will be in future years. New legislation could negatively impact the amount and tax characterization of distributions received by our common stockholders. Under current law, qualified dividend income received by individual stockholders is taxed at a maximum federal tax rate of 20% for
71
KAYNE ANDERSON ENERGY INFRASTRUCTURE FUND, INC.
INVESTMENT OBJECTIVE, POLICIES AND RISKS
(UNAUDITED)
individuals, provided a holding period requirement and certain other requirements are met. In addition, currently a 3.8% federal tax on net investment income (the “Tax Surcharge”) generally applies to dividend income and net capital gains for taxpayers whose adjusted gross income exceeds $200,000 for single filers or $250,000 for married joint filers.
Tax Risks of Investing in our Securities
A reduction in the return of capital portion of the distributions that we receive from our portfolio investments or an increase in our earnings and profits and portfolio turnover may reduce that portion of our distribution treated as a tax-deferred return of capital and increase that portion treated as a dividend, resulting in lower after-tax distributions to our common and preferred stockholders.
Other Tax Risks
As a limited partner in the MLPs in which we invest, we will be allocated our distributive share of income, gains, losses, deductions and credits from those MLPs. Historically, a significant portion of income from such MLPs has been offset by tax deductions. We will incur a current tax liability on our distributive share of an MLP’s income and gains that is not offset by tax deductions, losses and credits, or our capital or net operating loss carryforwards or other applicable deductions, if any. The percentage of an MLP’s income and gains which is offset by tax deductions, losses and credits will fluctuate over time for various reasons. A significant slowdown in acquisition activity or capital spending by MLPs held in our portfolio could result in a reduction in the depreciation deduction passed through to us, which may, in turn, result in increased current tax liability to us. In addition, changes to the tax code that impact the amount of income, gain, deduction or loss that is passed through to us from the MLP securities in which we invest (for example through changes to the deductibility of interest expense or changes to how capital expenditures are depreciated) may also result in an increased current tax liability to us. For example, the 2017 Tax Cuts and Jobs Act imposed certain limitations on the deductibility of interest expense that could result in less deduction being passed through to us as the owner of an MLP that is impacted by such limitations. We will accrue deferred income taxes for any future tax liability associated with that portion of MLP distributions considered to be a tax-deferred return of capital as well as capital appreciation of our investments. Upon the sale of an MLP security, we may be required to pay previously deferred taxes. A portion of the gain upon disposition of MLP units attributable to Internal Revenue Code Section 751 assets, including depreciation recapture, would be recognized as ordinary income. Ordinary income attributable to Section 751 assets may exceed the net taxable gain realized upon sale and may be recognized even if there is a net taxable loss upon disposition. We could therefore recognize both ordinary income and a capital loss upon disposition of MLP units.
We rely to some extent on information provided by the MLPs, which may not necessarily be timely, to estimate taxable income allocable to the MLP units held in the portfolio and to estimate the associated current or deferred taxes. Such estimates are made in good faith. From time to time, as new information becomes available, we modify our estimates or assumptions regarding our deferred taxes.
The 2017 Tax Cuts and Jobs Act also imposed limitations on the deductibility of net interest expense and limitations on the usage of net operating loss carryforwards (and elimination of carrybacks). These limitations may impact certain deductions to taxable income and may result in an increased current tax liability to us. To the extent certain deductions are limited in any given year, we may not be able to utilize such deductions in future periods if we do not have sufficient taxable income.
72
KAYNE ANDERSON ENERGY INFRASTRUCTURE FUND, INC.
INVESTMENT OBJECTIVE, POLICIES AND RISKS
(UNAUDITED)
Deferred Tax Risks of Investing in our Securities
The Tax Cuts and Jobs Act reduced the federal corporate tax rate from 35% to 21%. Because our deferred tax liability is based primarily on the federal corporate tax rate, the enactment of the bill significantly reduced our deferred tax liability and increased our net asset value. If the federal income tax rate were to increase in the future, as has been proposed by the Biden administration, our deferred tax liability would increase resulting in a corresponding decrease to our net asset value.
The Company periodically reviews the recoverability of its deferred tax assets based on the weight of available evidence. When assessing the recoverability of its deferred tax assets, significant weight is given to the effects of potential future realized and unrealized gains on investments and the period over which these deferred tax assets can be realized. The Company will continue to review and assess the need for a valuation allowance in the future. Significant variability in the fair value of its portfolio of investments may change the Company’s assessment regarding the recoverability of its deferred tax assets. If a valuation allowance is required to reduce any deferred tax asset in the future, or if a change in a valuation allowance is necessary, it could have a material impact on the Company’s net asset value and results of operations in the period of adjustment.
Management Risk; Dependence on Key Personnel of Kayne Anderson
Our portfolio is subject to management risk because it is actively managed. KAFA applies investment techniques and risk analyses in making investment decisions for us, but there can be no guarantee that they will produce the desired results.
We depend upon Kayne Anderson’s key personnel for our future success and upon their access to certain individuals and investments in the energy sector. In particular, we depend on the diligence, skill and network of business contacts of our portfolio managers, who evaluate, negotiate, structure, close and monitor our investments. These individuals manage a number of investment vehicles on behalf of Kayne Anderson and, as a result, do not devote all of their time to managing us, which could negatively impact our performance. Furthermore, these individuals do not have long-term employment contracts with Kayne Anderson, although they do have equity interests and other financial incentives to remain with Kayne Anderson. We also depend on the senior management of Kayne Anderson. The departure of any of our portfolio managers or the senior management of Kayne Anderson could have a material adverse effect on our ability to achieve our investment objective. In addition, we can offer no assurance that KAFA will remain our investment adviser or that we will continue to have access to Kayne Anderson’s industry contacts and deal flow.
Cybersecurity Risk
The information and technology systems relied upon by KYN, KAFA and our service providers (including, but not limited to, fund accountants, custodians, transfer agents, administrators, distributors and other financial intermediaries) and/or the issuers of securities in which we invest may be vulnerable to damage or interruption from computer viruses, network failures, computer and telecommunication failures, infiltration by unauthorized persons, security breaches, usage errors, power outages and catastrophic events such as fires, tornadoes, floods, hurricanes and earthquakes. Although KAFA has implemented measures to manage risks relating to these types of events, if these systems are compromised, become inoperable for extended periods of time or cease to function properly, significant investment may be required to fix or replace them. The failure of these systems and/or of disaster recovery plans could cause significant interruptions in the operations of KYN, KAFA, our service providers and/or issuers
73
KAYNE ANDERSON ENERGY INFRASTRUCTURE FUND, INC.
INVESTMENT OBJECTIVE, POLICIES AND RISKS
(UNAUDITED)
of securities in which we invest and may result in a failure to maintain the security, confidentiality or privacy of sensitive data, including personal information relating to investors (and the beneficial owners of investors). Such a failure could also harm the reputation of KYN, KAFA, our service providers and/or issuers of securities in which we invest, subject these entities and their respective affiliates to legal claims or otherwise affect their business and financial performance. There is also a risk that cybersecurity breaches may not be detected, and KYN and its stockholders could be negatively impacted as a result.
Conflicts of Interest of Kayne Anderson
Conflicts of interest may arise because Kayne Anderson and its affiliates generally carry on substantial investment activities for other clients in which the Company will have no interest. Kayne Anderson or its affiliates may have financial incentives to favor certain of such accounts over us. Any of their proprietary accounts and other customer accounts may compete with us for specific trades. Kayne Anderson or its affiliates may buy or sell securities for us which differ from securities bought or sold for other accounts and customers, even though their investment objectives and policies may be similar to ours. Situations may occur when we could be disadvantaged because of the investment activities conducted by Kayne Anderson or its affiliates for their other accounts. Such situations may be based on, among other things, legal or internal restrictions on the combined size of positions that may be taken for us and the other accounts, thereby limiting the size of our position, or the difficulty of liquidating an investment for us and the other accounts where the market cannot absorb the sale of the combined position.
Our investment opportunities may be limited by affiliations of Kayne Anderson or its affiliates with Energy Infrastructure Companies. In addition, to the extent that Kayne Anderson sources and structures private investments in Energy Infrastructure Companies, certain employees of Kayne Anderson may become aware of actions planned by Energy Infrastructure Companies, such as acquisitions, that may not be announced to the public. It is possible that we could be precluded from investing in an Energy Infrastructure Company about which Kayne Anderson has material non-public information; however, it is Kayne Anderson’s intention to ensure that any material non-public information available to certain Kayne Anderson employees not be shared with those employees responsible for the purchase and sale of publicly traded Energy Infrastructure Company securities.
KAFA also manages Kayne Anderson NextGen Energy & Infrastructure, Inc., a closed-end investment company listed on the NYSE under the ticker “KMF”, and Kayne Anderson Renewable Infrastructure Fund, an open-end investment company.
In addition to closed-end and open-end investment companies, KAFA and KACALP manage several private investment funds and separately managed accounts (collectively, “Affiliated Funds”). Some of the Affiliated Funds have investment objectives that are similar to or overlap with ours. Further, Kayne Anderson may at some time in the future, manage other investment funds with the same investment objective as ours or that otherwise create potential conflicts of interest with us.
Investment decisions for us are made independently from those of Kayne Anderson’s other clients; however, from time to time, the same investment decision may be made for more than one fund or account. When two or more clients advised by Kayne Anderson or its affiliates seek to purchase or sell the same publicly traded securities, the securities actually purchased or sold are allocated among the clients on a good faith equitable basis by Kayne Anderson in its discretion in accordance with the clients’ various investment objectives and procedures adopted by Kayne Anderson and approved by our Board of Directors. In some cases, this system may adversely affect the price or size of the position we may
74
KAYNE ANDERSON ENERGY INFRASTRUCTURE FUND, INC.
INVESTMENT OBJECTIVE, POLICIES AND RISKS
(UNAUDITED)
obtain. In other cases, however, our ability to participate in volume transactions may produce better execution for us.
We and our affiliates, including Affiliated Funds, may be precluded from co-investing in private placements of securities, including in any portfolio companies that we control. Except as permitted by law, Kayne Anderson will not co-invest its other clients’ assets in the private transactions in which we invest. Kayne Anderson will allocate private investment opportunities among its clients, including us, based on allocation policies that take into account several suitability factors, including the size of the investment opportunity, the amount each client has available for investment and the client’s investment objectives. These allocation policies may result in the allocation of investment opportunities to an Affiliated Fund rather than to us. The policies contemplate that Kayne Anderson will exercise discretion, based on several factors relevant to the determination, in allocating the entirety, or a portion, of such investment opportunities to an Affiliated Fund, in priority to other prospectively interested advisory clients, including us. In this regard, when applied to specified investment opportunities that would normally be suitable for us, the allocation policies may result in certain Affiliated Funds having greater priority than us to participate in such opportunities depending on the totality of the considerations, including, among other things, our available capital for investment, our existing holdings, applicable tax and diversification standards to which we may then be subject and the ability to efficiently liquidate a portion of our existing portfolio in a timely and prudent fashion in the time period required to fund the transaction.
The investment management fee paid to KAFA is based on the value of our assets, as periodically determined. A significant percentage of our assets may be illiquid securities acquired in private transactions for which market quotations will not be readily available. Although we have adopted valuation procedures designed to determine valuations of illiquid securities in a manner that reflects their fair value, there typically is a range of prices that may be established for each individual security. Pursuant to Rule 2a-5, our Board of Directors has designated KAFA as our “Valuation Designee”. As the Valuation Designee, KAFA performs fair value determinations of our portfolio holdings, subject to oversight by and periodic reporting to the Board. KAFA determines the fair value of our portfolio holdings in accordance with our valuation program, as adopted by the Board. As a part of this process, KAFA receives a valuation report from a third-party firm for fair valued (Level 3) securities.
Risk of Owning Securities of Affiliates
From time to time, we may “control” or may be an “affiliate” of one or more of our portfolio companies, as each of these terms is defined in the 1940 Act. In general, under the 1940 Act, we would be presumed to “control” a portfolio company if we and our affiliates owned 25% or more of its outstanding voting securities and would be an “affiliate” of a portfolio company if we and our affiliates owned 5% or more of its outstanding voting securities. The 1940 Act contains prohibitions and restrictions relating to transactions between investment companies and their affiliates (including our investment adviser), principal underwriters and affiliates of those affiliates or underwriters. See Note 5 — Agreements and Affiliations in our financial statements for more information regarding risks associated with affiliates.
Valuation Risk
Market prices may not be readily available for certain of our investments in restricted or unregistered investments in public companies or investments in private companies. The value of such investments will ordinarily be determined based on fair valuations determined by KAFA as our Valuation Designee. Restrictions on resale or the absence of a liquid secondary market may adversely affect our ability to determine our net asset value. The sale price of securities that are not readily marketable may be lower
75
KAYNE ANDERSON ENERGY INFRASTRUCTURE FUND, INC.
INVESTMENT OBJECTIVE, POLICIES AND RISKS
(UNAUDITED)
or higher than our most recent determination of their fair value. Additionally, the value of these securities typically requires more reliance on the judgment of KAFA than that required for securities for which there is an active trading market. Due to the difficulty in valuing these securities and the absence of an active trading market for these investments, we may not be able to realize these securities’ true value or may have to delay their sale in order to do so.
Anti-Takeover Provisions
Our Charter, Bylaws and the Maryland General Corporation Law include provisions that could limit the ability of other entities or persons to acquire control of us, to convert us to open-end status, or to change the composition of our Board of Directors. We also have adopted other measures that may make it difficult for a third party to obtain control of us, including provisions of our Charter classifying our Board of Directors in three classes serving staggered three-year terms; provisions authorizing our Board of Directors to classify or reclassify shares of our stock in one or more classes or series, to cause the issuance of additional shares of our stock, and allowing a majority of our entire Board of Directors to amend our Charter, without stockholder approval, to increase or decrease the number of shares of stock that we have the authority to issue; and provisions in our Bylaws electing to be subject to the anti-takeover measures provided by the Maryland Control Share Acquisition Act. These provisions, as well as other provisions of our Charter and Bylaws, could have the effect of discouraging, delaying, deferring or preventing a transaction or a change in control that might otherwise be in the best interests of our stockholders. As a result, these provisions may deprive our common stockholders of opportunities to sell their common stock at a premium over the then current market price of our common stock.
Additional Risks Related to Our Common Stock
Market Discount from Net Asset Value Risk
Our common stock has traded both at a premium and at a discount to our net asset value. Shares of closed-end investment companies frequently trade at a discount to their net asset value. This characteristic is a risk separate and distinct from the risk that our net asset value could decrease as a result of our investment activities. Although the value of our net assets is generally considered by market participants in determining whether to purchase or sell shares, whether investors will realize gains or losses upon the sale of our common stock depends upon whether the market price of our common stock at the time of sale is above or below the investor’s purchase price for our common stock. Because the market price of our common stock is affected by factors such as net asset value, distribution levels (which are dependent, in part, on expenses), supply of and demand for our common stock, stability of distributions, trading volume, general market and economic conditions, and other factors beyond our control, we cannot predict whether our common stock will trade at, below or above net asset value.
Leverage Risk to Common Stockholders
The issuance of Leverage Instruments represents the leveraging of our common stock. Leverage is a technique that could adversely affect our common stockholders. Unless the income and capital appreciation, if any, on securities acquired with the proceeds from Leverage Instruments exceed the costs of the leverage, the use of leverage could cause us to lose money. When leverage is used, the net asset value and market value of our common stock will be more volatile. There is no assurance that our use of leverage will be successful.
76
KAYNE ANDERSON ENERGY INFRASTRUCTURE FUND, INC.
INVESTMENT OBJECTIVE, POLICIES AND RISKS
(UNAUDITED)
Our common stockholders bear the costs of leverage through higher operating expenses. Our common stockholders also bear management fees, whereas holders of notes or preferred stock do not bear management fees. Because management fees are based on our total assets, our use of leverage increases the effective management fee borne by our common stockholders. In addition, the issuance of additional senior securities by us would result in offering expenses and other costs, which would ultimately be borne by our common stockholders. Fluctuations in interest rates could increase our interest or dividend payments on Leverage Instruments and could reduce cash available for distributions on common stock. Certain Leverage Instruments are subject to covenants regarding asset coverage, portfolio composition and other matters, which may affect our ability to pay distributions to our common stockholders in certain instances. We may also be required to pledge our assets to the lenders in connection with certain other types of borrowing.
Leverage involves other risks and special considerations for common stockholders including: the likelihood of greater volatility of net asset value and market price of our common stock than a comparable portfolio without leverage; the risk of fluctuations in dividend rates or interest rates on Leverage Instruments; that the dividends or interest paid on Leverage Instruments may reduce the returns to our common stockholders or result in fluctuations in the distributions paid on our common stock; the effect of leverage in a declining market, which is likely to cause a greater decline in the net asset value of our common stock than if we were not leveraged, which may result in a greater decline in the market price of our common stock; and when we use financial leverage, the investment management fee payable to Kayne Anderson may be higher than if we did not use leverage.
While we may from time to time consider reducing leverage in response to actual or anticipated changes in interest rates or actual or anticipated changes in investment values in an effort to mitigate the increased volatility of current income and net asset value associated with leverage, there can be no assurance that we will actually reduce leverage in the future or that any reduction, if undertaken, will benefit our common stockholders. Changes in the future direction of interest rates or changes in investment values are difficult to predict accurately. If we were to reduce leverage based on a prediction about future changes to interest rates (or future changes in investment values), and that prediction turned out to be incorrect, the reduction in leverage would likely result in a reduction in income and/or total returns to common stockholders relative to the circumstance if we had not reduced leverage. We may decide that this risk outweighs the likelihood of achieving the desired reduction to volatility in income and the price of our common stock if the prediction were to turn out to be correct, and determine not to reduce leverage as described above.
Finally, the 1940 Act provides certain rights and protections for preferred stockholders which may adversely affect the interests of our common stockholders.
77
KAYNE ANDERSON ENERGY INFRASTRUCTURE FUND, INC.
INFORMATION CONCERNING DIRECTORS AND CORPORATE OFFICERS
(UNAUDITED)
|
Independent Directors(1) |
||||||||
|
Name(2) |
Position(s) |
Principal Occupations |
Other Directorships Held by |
|||||
|
William R. Cordes |
Director. 3-year term (until the 2023 Annual Meeting of Stockholders)/served since August 2018. Member of Audit Committee (Chair) and Valuation Committee. |
Retired from Northern Border Pipeline Company in March 2007 after serving as President from October 2000 to March 2007. Chief Executive Officer of Northern Border Partners, L.P. from October 2000 to April 2006. President of Northern Natural Gas Company from 1993 to 2000. President of Transwestern Pipeline Company from 1996 to 2000. |
Current: • Kayne Anderson NextGen Energy & Infrastructure, Inc. (“KMF”) Prior: • Kayne Anderson Energy Development Company (“KED”) • Boardwalk Pipeline Partners, LP • Northern Border Partners, L.P. |
|||||
|
Anne K. Costin |
Director. 3-year term (until the 2025 Annual Meeting of Stockholders)/served since inception. Member of Valuation Committee (Chair) and Audit Committee. |
Professor at the Amsterdam Institute of Finance from 2007 through 2013. Adjunct Professor in the Finance and Economics Department of Columbia University Graduate School of Business in New York from 2004 through 2007. As of March 1, 2005, Ms. Costin retired after a 28-year career at Citigroup. During the seven years prior to her retirement, Ms. Costin was Managing Director and Global Deputy Head of the Project & Structured Trade Finance product group within Citigroup’s Investment Banking Division. |
Current: • KMF • Music Guild Orchestra Prior: • Kayne Anderson Energy Total Return Fund, Inc. (“KYE”) • Our Community LA (not-for-profit organization) |
|||||
|
Barry R. Pearl |
Director. 3-year term (until the 2023 Annual Meeting of Stockholders)/served since August 2018. Member of Audit Committee and Nominating, Corporate Governance and Compensation Committee. |
Management consultant to Northstar Midstream, a private developer and operator of petroleum infrastructure assets from March 2016 to July 2018, Executive Vice President of Kealine, LLC, (and its affiliate WesPac Midstream LLC an energy infrastructure developer), from February 2007 to March 2016. Provided management consulting services from January 2006 to February 2007. President of Texas Eastern Products Pipeline Company, LLC (“TEPPCO”), (the general partner of TEPPCO Partners, L.P.,) from February 2001 to December 2005. Chief Executive Officer and director of TEPPCO from May 2002 to December 2005; and Chief Operating Officer from February 2001 to May 2002. |
Current: • KMF • Magellan Midstream Partners, L.P. Prior: • KED • Peregrine Midstream Partners LLC • Seaspan Corporation • Targa Resources Partners LP • TEPPCO Partners, L.P. |
|||||
78
KAYNE ANDERSON ENERGY INFRASTRUCTURE FUND, INC.
INFORMATION CONCERNING DIRECTORS AND CORPORATE OFFICERS
(UNAUDITED)
|
Independent Directors(1) |
||||||||
|
Name(2) |
Position(s) |
Principal Occupations |
Other Directorships Held by |
|||||
|
Albert L. Richey (born 1949) |
Director. 3-year term (until the 2025 Annual Meeting of Stockholders)/served since August 2018. Member of Audit Committee and Valuation Committee. |
Retired from Anadarko Petroleum Corporation in August 2016 after serving as Senior Vice President Finance and Treasurer from January 2013 to August 2016; Vice President Special Projects from January 2009 to December 2012; Vice President Corporate Development from 2006 to December 2008; Vice President and Treasurer from 1995 to 2005 and Treasurer from 1987 to 1995. |
Current: • KMF Prior: • KED • Boys & Girls Clubs of Houston (not-for-profit organization) • Boy Scouts of America |
|||||
|
William H. Shea, Jr. (born 1954) |
Lead Director. 3-year term (until the 2024 Annual Meeting of Stockholders)/served since March 2008. Member of Nominating, Corporate Governance and Compensation Committee (Chair). |
Chief Executive Officer of Jefferson Energy Companies from January 2020 to June 2021. Chief Executive Officer of Mainline Energy Partners, LLC from July 2016 to September 2019. Chief Executive Officer and President of Niska Gas Storage Partners LLC from May 2014 to July 2016. Chief Executive Officer of the general partner of PVR Partners, L.P. (PVR) from March 2010 to March 2014. Chief Executive Officer and President of the general partner of Penn Virginia GP Holdings, L.P. (PVG), from March 2010 to March 2011. Private investor from June 2007 to March 2010. From September 2000 to June 2007, President, Chief Executive Officer and Director (Chairman from May 2004 to June 2007) of Buckeye Partners L.P. (BPL). From May 2004 to June 2007, President, Chief Executive Officer and Chairman of Buckeye GP Holdings L.P. (BGH) and its predecessors. |
Current: • KMF Prior: • KYE • BGH • BPL • Gibson Energy ULC • Mainline Energy Partners, LLC • Niska Gas Storage Partners LLC • PVG • PVR • Penn Virginia Corporation • USA Compression Partners, LP |
|||||
|
Carita S. Walker (1971) |
Director. 3-year term (until the 2023 Annual Meeting of Stockholders)/served since June 2022. Member of Nominating, Corporate Governance and Compensation Committee. |
Chief Legal Officer at Shell Recharge Solutions — a Shell company since June 2020. Senior Legal Counsel with Qatar Shell Service Company from June 2016 to June 2020. |
Current: • KMF • Xavier University of Louisiana (not-for-profit organization) • Environmental Law Institute (not-for-profit organization) Prior: • Houston Wilderness • Oakland Black Chamber of Commerce |
|||||
79
KAYNE ANDERSON ENERGY INFRASTRUCTURE FUND, INC.
INFORMATION CONCERNING DIRECTORS AND CORPORATE OFFICERS
(UNAUDITED)
|
Independent Directors(1) |
||||||||
|
Name(2) |
Position(s) |
Principal Occupations |
Other Directorships Held by |
|||||
|
Caroline A. Winn (1963) |
Director. 3-year term (until the 2025 Annual Meeting of Stockholders)/served since April 2022. Member of the Audit Committee. |
Chief Executive Officer of San Diego Gas & Electric (SDG&E), one of Sempra’s regulated California utilities, since August 2020. Chief Operating Officer of SDG&E from 2017 to 2020. |
Current: • KMF • SDG&E • Monarch School • Father Joe’s Villages • Scripps Institution of Oceanography Prior: • Western Energy Institute |
|||||
|
Interested Directors and Non-Director Officers |
||||||
|
Name(2) |
Position(s) |
Principal Occupations |
Other Directorships Held by |
|||
|
James C. Baker, Jr.(4) |
Chairman of the Board of Directors since June 2020, Director, President and Chief Executive Officer. 3-year term (until the 2024 Annual Meeting of Stockholders). Member of Valuation Committee. Elected annually as an officer/served since June 2005. |
Partner and Senior Managing Director of Kayne Anderson since February 2008. Co-Managing Partner of KAFA since June 2019. Senior Managing Director of KAFA from February 2008 to June 2019. Chief Executive Officer of KMF since June 2019. President of KMF since June 2016. Executive Vice President of KMF from August 2010 to June 2016. President of Kayne Anderson BDC, Inc. (“KABDC”) since February 2021. Chief Executive Officer of KABDC since June 2021. President and Chief Executive Officer of Kayne DL 2021, Inc. (“KDL”) since December 2021. |
Current: • KMF • KACALP • Expression Therapeutics Prior: • KED • K-Sea Transportation Partners L.P. • Petris Technology, Inc. • ProPetro Services, Inc. |
|||
|
J.C. Frey |
Executive Vice President. Elected annually as an officer/served since inception. |
Managing Partner of Kayne Anderson since 2004 and Co-Managing Partner of KAFA since 2006. Executive Vice President of KMF since August 2010. Assistant Secretary and Assistant Treasurer of KMF from August 2010 to January 2019. |
None |
|||
80
KAYNE ANDERSON ENERGY INFRASTRUCTURE FUND, INC.
INFORMATION CONCERNING DIRECTORS AND CORPORATE OFFICERS
(UNAUDITED)
|
Interested Directors and Non-Director Officers |
||||||
|
Name(2) |
Position(s) |
Principal Occupations |
Other Directorships Held by |
|||
|
Terry A. Hart |
Chief Operating Officer and Assistant Secretary since April 2022. Elected annually as an officer/served since 2005. |
Senior Managing Director of Kayne Anderson since January 2020. Managing Director of Kayne Anderson from December 2005 to January 2020 and Chief Financial Officer of KAFA since 2006. Chief Operating Officer of KMF since April 2022. Chief Financial Officer and Treasurer of KMF from August 2010 to March 2022. Assistant Secretary of KMF since January 2019. Chief Financial Officer and Treasurer of KABDC since February 2021. Chief Financial Officer and Treasurer of KDL since December 2021. Chief Financial Officer of Kayne Anderson Acquisition Corp. from December 2016 to November 2018. |
Current: • The Source for Women Prior: • KED |
|||
|
A. Colby Parker |
Chief Financial Officer and Treasurer since April 2022. Elected annually as an officer/served since January 2019. |
Chief Financial Officer and Treasurer of KMF since April 2022. Vice President of KMF from June 2020 to March 2022. Assistant Treasurer of KMF from January 2019 to March 2022. Controller of Kayne Anderson since July 2015. |
None |
|||
|
Michael J. O’Neil |
Secretary and Chief Compliance Officer. Elected annually as an officer/served as Secretary since 2021 and as Chief Compliance Officer since December 2013. |
Secretary of KYN since 2021. Chief Compliance Officer of Kayne Anderson since March 2012 and of KYN since December 2013 and of KA Associates, Inc. (broker-dealer) since January 2013. Chief Compliance Officer of KABDC since February 2021. Secretary of KABDC since June 2021. Chief Compliance Officer and Secretary of KDL since December 2021. A compliance officer at BlackRock Inc. from January 2008 to February 2012. |
Current: • Worcester Academy |
|||
|
Ron M. Logan, Jr. (born 1960) |
Senior Vice President. Elected annually as an officer/served since September 2012. |
Senior Managing Director of Kayne Anderson since February 2014. Managing Director of Kayne Anderson from September 2006 to February 2014. Senior Vice President of KMF since June 2012. |
Current: • Streamline Innovations Holdings, Inc. Prior: • VantaCore Partners LP |
|||
|
Adriana I. Jimenez (born 1976) |
Vice President. Elected annually as an officer/served since December 2021. |
Vice President of KMF since December 2021. Controller of Kayne Anderson since 2011. |
None |
|||
____________
(1) The Company is managed by KA Fund Advisors, LLC (“KAFA”), an affiliate of Kayne Anderson Capital Advisors, L.P. (“KACALP” and, together with its affiliates, “Kayne Anderson”). The 1940 Act requires the term “Fund Complex” to be defined to include registered investment companies advised by Kayne Anderson, and includes the Company and KMF. Each Independent Director oversees two registered investment companies in the Fund Complex, the Company and KMF, as noted above.
81
KAYNE ANDERSON ENERGY INFRASTRUCTURE FUND, INC.
INFORMATION CONCERNING DIRECTORS AND CORPORATE OFFICERS
(UNAUDITED)
(2) The address of each director and corporate officer is c/o KA Fund Advisors, LLC, 811 Main Street, 14th Floor, Houston, Texas, 77002.
(3) In August 2018, Kayne Anderson Energy Total Return Fund, Inc. (“KYE”) merged into Kayne Anderson NextGen Energy & Infrastructure, Inc. (“KMF”) and Kayne Anderson Energy Development Company (“KED”) merged into Kayne Anderson Energy Infrastructure Fund, Inc. (“KYN”), respectively. The table presents principal occupations for each interested director and non-director officer of KYN and KMF and does not set forth the principal occupations, if any, for KYE and KED.
(4) James C. Baker, Jr. is an “interested person” of the Company as defined in the 1940 Act by virtue of his employment relationship with Kayne Anderson.
Additional information regarding the Company’s directors is contained in the Company’s Statement of Additional Information, the most recent version of which can be found on the Company’s website at www.kaynefunds.com or is available without charge, upon request, by calling (877) 657-3863.
82
The Company has adopted a Dividend Reinvestment Plan (the “Plan”), as further described below. A stockholder is automatically enrolled in the Plan unless that stockholder specifically elects to receive cash distributions, as further described below. The automatic reinvestment of dividends and distributions will not relieve participants of any federal, state or local income tax that may be payable (or required to be withheld) on such dividends even though no cash is received by participants. There are no brokerage charges with respect to shares issued directly by the Company as a result of dividends or distributions payable either in shares or in cash. However, each participant will pay a pro rata share of brokerage commissions incurred with respect to the Plan Agent’s open-market purchases in connection with the reinvestment of dividends or distributions.
An investor that holds common stock of the Company with a brokerage firm that does not participate in the Plan will not be able to participate in the Plan. In addition, an investor that participates in the Plan through a brokerage account may not be able to transfer common stock of the Company to another brokerage firm and continue to participate in the Plan.
The following are the terms of the Company’s Dividend Reinvestment Plan:
Kayne Anderson Energy Infrastructure Fund, Inc., a Maryland corporation (the “Company”), has adopted the following plan (the “Plan”) with respect to distributions declared by its Board of Directors (the “Board”) on shares of its Common Stock:
1. Unless a stockholder specifically elects to receive cash as set forth below, all distributions hereafter declared by the Board shall be payable in shares of the Common Stock of the Company, and no action shall be required on such stockholder’s part to receive a distribution in stock.
2. Such distributions shall be payable on such date or dates as may be fixed from time to time by the Board to stockholders of record at the close of business on the record date(s) established by the Board for the distribution involved.
3. The Company may use newly-issued shares of its Common Stock or purchase shares in the open market in connection with the implementation of the plan. The number of shares to be issued to a stockholder shall be based on share price equal to 95% of the closing price of the Company’s Common Stock one day prior to the dividend payment date.
4. The Board may, in its sole discretion, instruct the Company to purchase shares of its Common Stock in the open market in connection with the implementation of the Plan as follows: If the Company’s Common Stock is trading below net asset value at the time of valuation, upon notice from the Company, the Plan Administrator (as defined below) will receive the dividend or distribution in cash and will purchase Common Stock in the open market, on the New York Stock Exchange or elsewhere, for the Participants’ accounts, except that the Plan Administrator will endeavor to terminate purchases in the open market and cause the Company to issue the remaining shares if, following the commencement of the purchases, the market value of the shares, including brokerage commissions, exceeds the net asset value at the time of valuation. These remaining shares will be issued by the Company at a price equal to the greater of (i) the net asset value at the time of valuation or (ii) 95% of the then current market price.
5. In a case where the Plan Administrator has terminated open market purchases and caused the issuance of remaining shares by the Company, the number of shares received by the participant in respect of the cash dividend or distribution will be based on the weighted average of prices paid for shares purchased in the open market, including brokerage commissions, and the price at which the Company issues the remaining shares. To the extent that the Plan Administrator is unable to terminate purchases in the open market before the Plan Administrator has completed its purchases,
83
KAYNE ANDERSON ENERGY INFRASTRUCTURE FUND, INC.
DIVIDEND REINVESTMENT PLAN
(UNAUDITED)
or remaining shares cannot be issued by the Company because the Company declared a dividend or distribution payable only in cash, and the market price exceeds the net asset value of the shares, the average share purchase price paid by the Plan Administrator may exceed the net asset value of the shares, resulting in the acquisition of fewer shares than if the dividend or distribution had been paid in shares issued by the Company.
6. A stockholder may, however, elect to receive his or its distributions in cash. To exercise this option, such stockholder shall notify American Stock Transfer & Trust Company, the plan administrator and the Company’s transfer agent and registrar (collectively the “Plan Administrator”), in writing so that such notice is received by the Plan Administrator no later than the record date fixed by the Board for the distribution involved.
7. The Plan Administrator will set up an account for shares acquired pursuant to the Plan for each stockholder who has not so elected to receive dividends and distributions in cash (each, a “Participant”). The Plan Administrator may hold each Participant’s shares, together with the shares of other Participants, in non-certificated form in the Plan Administrator’s name or that of its nominee. Upon request by a Participant, received no later than three (3) days prior to the payable date, the Plan Administrator will, instead of crediting shares to and/or carrying shares in a Participant’s account, issue, without charge to the Participant, a certificate registered in the Participant’s name for the number of whole shares payable to the Participant and a check for any fractional share less a broker commission on the sale of such fractional shares. If a request to terminate a Participant’s participation in the Plan is received less than three (3) days before the payable date, dividends and distributions for that payable date will be reinvested. However, subsequent dividends and distributions will be paid to the Participant in cash.
8. The Plan Administrator will confirm to each Participant each acquisition made pursuant to the Plan as soon as practicable but not later than ten (10) business days after the date thereof. Although each Participant may from time to time have an undivided fractional interest (computed to three decimal places) in a share of Common Stock of the Company, no certificates for a fractional share will be issued. However, dividends and distributions on fractional shares will be credited to each Participant’s account. In the event of termination of a Participant’s account under the Plan, the Plan Administrator will adjust for any such undivided fractional interest in cash at the market value of the Company’s shares at the time of termination.
9. The Plan Administrator will forward to each Participant any Company related proxy solicitation materials and each Company report or other communication to stockholders, and will vote any shares held by it under the Plan in accordance with the instructions set forth on proxies returned by Participants to the Company.
10. In the event that the Company makes available to its stockholders rights to purchase additional shares or other securities, the shares held by the Plan Administrator for each Participant under the Plan will be added to any other shares held by the Participant in certificated form in calculating the number of rights to be issued to the Participant.
11. The Plan Administrator’s service fee, if any, and expenses for administering the Plan will be paid for by the Company.
12. Each Participant may terminate his or its account under the Plan by so notifying the Plan Administrator via the Plan Administrator’s website at www.amstock.com, by filling out the transaction request form located at the bottom of the Participant’s Statement and sending it to American Stock Transfer and Trust Company, P.O. Box 922, Wall Street Station, New York, NY 10269-0560 or by
84
KAYNE ANDERSON ENERGY INFRASTRUCTURE FUND, INC.
DIVIDEND REINVESTMENT PLAN
(UNAUDITED)
calling the Plan Administrator at (888) 888-0317. Such termination will be effective immediately. The Plan may be terminated by the Company upon notice in writing mailed to each Participant at least 30 days prior to any record date for the payment of any dividend or distribution by the Company. Upon any termination, the Plan Administrator will cause a certificate or certificates to be issued for the full shares held for the Participant under the Plan and a cash adjustment for any fractional share to be delivered to the Participant without charge to the Participant. If a Participant elects by his or its written notice to the Plan Administrator in advance of termination to have the Plan Administrator sell part or all of his or its shares and remit the proceeds to the Participant, the Plan Administrator is authorized to deduct a $15.00 transaction fee plus a $0.10 per share brokerage commission from the proceeds.
13. These terms and conditions may be amended or supplemented by the Company at any time but, except when necessary or appropriate to comply with applicable law or the rules or policies of the Securities and Exchange Commission or any other regulatory authority, only by mailing to each Participant appropriate written notice at least 30 days prior to the effective date thereof. The amendment or supplement shall be deemed to be accepted by each Participant unless, prior to the effective date thereof, the Plan Administrator receives written notice of the termination of his or its account under the Plan. Any such amendment may include an appointment by the Plan Administrator in its place and stead of a successor agent under these terms and conditions, with full power and authority to perform all or any of the acts to be performed by the Plan Administrator under these terms and conditions. Upon any such appointment of any agent for the purpose of receiving dividends and distributions, the Company will be authorized to pay to such successor agent, for each Participant’s account, all dividends and distributions payable on shares of the Company held in the Participant’s name or under the Plan for retention or application by such successor agent as provided in these terms and conditions.
14. The Plan Administrator will at all times act in good faith and use its best efforts within reasonable limits to ensure its full and timely performance of all services to be performed by it under this Plan and to comply with applicable law, but assumes no responsibility and shall not be liable for loss or damage due to errors unless such error is caused by the Plan Administrator’s negligence, bad faith, or willful misconduct or that of its employees or agents.
15. These terms and conditions shall be governed by the laws of the State of Maryland.
Adopted: September 27, 2004
Amended: December 13, 2005
Amended: March 12, 2009
85
ANNUAL CERTIFICATION
The Company’s Chief Executive Officer has filed an annual certification with the NYSE that, as of the date of the certification, he was unaware of any violation by the Company of the NYSE’s corporate governance listing standards.
PROXY VOTING AND PORTFOLIO HOLDINGS INFORMATION
The policies and procedures that the Company uses to determine how to vote proxies relating to its portfolio securities are available:
• without charge, upon request, by calling (877) 657-3863;
• on the Company’s website, www.kaynefunds.com; and
• on the SEC’s website, www.sec.gov.
Information regarding how the Company voted proxies relating to portfolio securities during the most recent 12-month period ended June 30 is available without charge, upon request, by calling (877) 657-3863, and on the SEC’s website at www.sec.gov (see Form N-PX).
The Company files a complete schedule of its portfolio holdings for the first and third quarters of each of its fiscal years with the SEC on Form N-PORT and Form N-30B-2. The Company’s Form N-PORT and Form N-30B-2 are available on the SEC’s website at www.sec.gov. The Company also makes its quarterly reports available on its website at www.kaynefunds.com.
REPURCHASE DISCLOSURE
Notice is hereby given in accordance with Section 23(c) of the 1940 Act, that the Company may from time to time purchase shares of its common and preferred stock and its Notes in the open market or in privately negotiated transactions.
86
This Privacy Notice (“Notice”) provides information about the data that is collected, processed, used, transmitted and stored by KA Fund Advisors, LLC and its affiliates (collectively “we,” “Kayne Anderson” or the “Firm”), and Kayne Anderson’s commitment to appropriately using and protecting the data collected.
Generally speaking, Kayne Anderson collects data about you from the following sources:
• Information we receive about you on applications or other forms;
• Information you provide to us orally; and
• Information about your transactions with us, our affiliates or others.
When you use our services, you acknowledge that you have read and understand the contents of this Notice.
Defining Personal Information
Various laws and regulations use different terms and definitions for information about individuals that is personal and should be protected. Some laws and regulations consider only very limited types of information to be protected and private. Others include much broader categories.
At Kayne Anderson, we have chosen to adopt the broader approach to what information must be protected and kept private. In this notice, “Personal Information” (or “PI”) refers to data that could be used, alone or in combination with other data, to identify you as an individual. It can include name, physical address, email address, IP address, date of birth, social security number, passwords, financial information, and more.
What Personal Information Do We Collect?
Kayne Anderson does not collect more information than is needed to conduct its business and satisfy any associated regulatory requirements. The following are examples of the types of personal information that we may collect:
• Name, address, phone number and email address;
• Age, date of birth, occupation and marital status;
• Personal identifier, depending on your country of residence, such as your Social Security Number; and
• Financial information, including account balances and assets, and, in certain jurisdictions, representations required under applicable law or regulation concerning your financial resources.
How Do We Collect Information?
When Kayne collects data from you directly, we will provide Kayne Anderson’s contact information and Kayne Anderson’s purpose for collecting and processing the data.
Do We Need Consent to Collect Your Data?
By providing your data, you consent to its collection, processing, use, transfer and storage. Your consent can be withdrawn at any time by providing adequate notice (see below) to Kayne Anderson. However, withdrawing your consent may impact your ability to invest in our funds.
87
KAYNE ANDERSON ENERGY INFRASTRUCTURE FUND, INC.
PRIVACY POLICY NOTICE
(UNAUDITED)
How Do We Use Personal Information?
We use your personal information for a variety of business purposes, including but not limited to, the following:
• For our everyday business purposes to administer, facilitate and manage your relationship and/or account(s) with Kayne Anderson.
• To contact you or your designated representative(s) in connection with your relationship and/or account;
• To monitor and audit compliance with our internal policies and procedures; and
• To comply with and enforce applicable legal and regulatory requirements.
If your relationship with Kayne Anderson ends, we will continue to treat your personal information, to the extent we retain it, as described in this Notice.
With Whom Do We Share Personal Information?
Privacy is an integral part of the Firm. We do not disclose your personal information to third parties, except as described in this Notice, and never for compensation. Additionally, we will not share your personal information with third parties without your specific consent or unless Kayne Anderson is required or permitted to by law (such as Regulation S-P) and/or government authorities.
Third parties that we share personal information with are required to maintain the confidentiality of such information and are prohibited from using your personal information for purposes other than those that were specified upon receipt of your data. We enter into contractual agreements with all nonaffiliated third parties that prohibit such third parties from disclosing or using the information other than to carry out the purposes for which we disclose the information.
We will not sell your personal information. If we share your personal information with third parties performing services for us, or acting on our behalf, we will not allow them to use your information for other purposes, and we will contractually require them to protect your information.
What Security Measures Do We Have?
Kayne Anderson restricts access to personal information about you to those employees who need to know that information to provide financial products or services to you. Kayne Anderson has physical, electronic and administrative safeguards in place to help protect data from loss, misuse, unauthorized access, disclosure, alteration, and destruction. This includes a dedicated group of information security personnel that design, implement and monitor our information security program.
Please contact us for a copy of Kayne Anderson’s policies for more information on the Firm’s information security practices and procedures.
How Long Do We Retain Personal Information?
We will retain your personal information for the period necessary to fulfill our services and the purposes outlined in this Notice unless a longer retention period is required by law.
88
KAYNE ANDERSON ENERGY INFRASTRUCTURE FUND, INC.
PRIVACY POLICY NOTICE
(UNAUDITED)
How Can You Manage Your Personal Information?
If you would like to request, delete, or update the personal information that you provided us, or exercise any of your data protection rights you may contact us using the contact information below. For your protection, we will need to verify your identity prior to complying with your request. Kayne Anderson does not charge for this service.
Kayne Anderson will make a good faith effort to process your request without undue delay and within the timeframe provided by applicable law. You are also entitled to have Kayne Anderson modify or delete any information that you believe is incorrect or out of date. Kayne Anderson reserves the right to limit or deny access to personal information where providing such information would be unreasonably burdensome or expensive or as otherwise permissible under relevant laws. If Kayne Anderson determines that access cannot be provided in any particular instance, Kayne Anderson will provide the individual requesting access with an explanation of why it has made that determination and a contact point for any further inquiries.
What Rights Do California Clients Have?
Under the California Consumer Privacy Act (CCPA), clients domiciled in California have certain rights with respect to their personal information. In particular, you may have the right to:
• Request that we disclose, free of charge, the categories and specifics of the PI we collect about you as a California resident (and/or, if applicable, sell or otherwise disclose to a third party for business purposes). Currently, however, Kayne Anderson does not sell personal information.
• Choose to opt-out of the sale of personal information. Currently, however, Kayne Anderson does not sell personal information.
• Request that we delete the PI we have collected. Following our verification of the request, we will comply with the request and delete any or all of the PI in our possession that we collected from you and/or any or all such PI in the possession of our service providers, unless otherwise restricted by law or regulation. However, withdrawing your consent for us to collect, process, use, transfer and store your data may impact your ability to invest in our funds.
Non-Discrimination for Exercising Your CCPA Right
We follow the requirements of California Civil Code §1798.125, and will not discriminate against any consumer who exercises the rights under the CCPA. However, withdrawing your consent for us to collect, process, use, transfer and store your data may impact your ability to invest in our funds.
Contact Us
If you have questions, concerns, or suggestions related to our Notice or our privacy practices, contact the Investor Relations Team or Kayne’s Chief Compliance Officer, Michael O’Neil, at:
KA Fund Advisors, LLC
811 Main Street, 14th Floor
Houston, TX 77002
Website: https://www.kaynefunds.com/
Email Address: CEF@kaynecapital.com
Toll Free Phone Number: 877-657-3863
89
KAYNE ANDERSON ENERGY INFRASTRUCTURE FUND, INC.
PRIVACY POLICY NOTICE
(UNAUDITED)
Changes to this Privacy Notice
We reserve the right to update this Notice at any time to reflect changes in our policies concerning the collection and use of personal information.
This Privacy Notice was last revised on January 16, 2020.
90
Directors and Corporate Officers
|
James C. Baker, Jr. |
Chairman of the Board of Directors, |
|
|
William H. Shea, Jr. |
Lead Independent Director |
|
|
William R. Cordes |
Director |
|
|
Anne K. Costin |
Director |
|
|
Barry R. Pearl |
Director |
|
|
Albert L. Richey |
Director |
|
|
Carita S. Walker |
Director |
|
|
Caroline A. Winn |
Director |
|
|
Terry A. Hart |
Chief Operating Officer and Assistant Secretary |
|
|
A. Colby Parker |
Chief Financial Officer and Treasurer |
|
|
Michael J. O’Neil |
Chief Compliance Officer and Secretary |
|
|
J.C. Frey |
Executive Vice President |
|
|
Ron M. Logan, Jr. |
Senior Vice President |
|
|
Adriana I. Jimenez |
Vice President |
|
|
Investment Adviser |
Administrator |
|
|
1800 Avenue of the Stars, Third Floor |
Stock Transfer Agent and Registrar |
|
|
Custodian |
Independent Registered Public Accounting Firm |
|
|
Legal Counsel |
Please visit us on the web at www.kaynefunds.com or call us toll-free at 1-877-657-3863.
![]()
This report, including the financial statements herein, is made available to stockholders of the Company for their information. It is not a prospectus, circular or representation intended for use in the purchase or sale of shares of the Company or of any securities mentioned in this report.
Item 2. Code of Ethics.
(a) As of the end of the period covered by this report, the Registrant has adopted a code of ethics (the “Code”) that applies to the Registrant’s principal executive officer, principal financial officer, principal accounting officer or controller, or persons performing similar functions.
(d) During the period covered by this report, no waiver, including implicit waiver, was granted from, any provision of the Registrant’s code of ethics that applies to the Registrant’s principal executive officer, principal financial officer, principal accounting officer or controller, or persons performing similar functions.
(f)(1) Pursuant to Item 12(a)(1), the Registrant is attaching as an exhibit (EX-99.CODE ETH) a copy of its code of ethics that applies to its principal executive officer, principal financial officer, principal accounting officer or controller, or persons performing similar functions.
Item 3. Audit Committee Financial Expert.
(a)(1) The Registrant’s board of directors has determined that the Registrant has five audit committee financial experts serving on its Audit Committee.
(a)(2) The audit committee financial experts are William R. Cordes, Anne K. Costin, Barry R. Pearl, Albert L. Richey and Caroline A. Winn. Messrs. Cordes, Pearl and Richey and Mses. Costin and Winn are “independent” for purposes of this Item.
Item 4. Principal Accountant Fees and Services.
(a) through (d) The information in the table below is provided for professional services rendered to the Registrant by its independent registered public accounting firm, PricewaterhouseCoopers LLP, during the Registrant’s (i) fiscal year ended November 30, 2022, and (ii) fiscal year ended November 30, 2021.
|
2022 |
2021 |
|||||
|
Audit Fees |
$ |
203,000 |
$ |
170,000 |
||
|
Audit-Related Fees |
|
10,000 |
|
6,000 |
||
|
Tax Fees |
|
180,000 |
|
243,000 |
||
|
All Other Fees |
|
— |
|
— |
||
|
Total |
$ |
393,000 |
$ |
419,000 |
||
With respect to the table above, “Audit Fees” are the aggregate fees billed for professional services for the audit of the Registrant’s annual financial statements and services provided in connection with statutory and regulatory filings or engagements. “Audit-Related Fees” are the aggregate fees billed for assurance and related services reasonably related to the performance of the audit of the Registrant’s financial statements and are not reported under “Audit Fees.” “Tax Fees” are the aggregate fees billed for professional services for tax compliance, tax advice and tax planning.
(e)(1) Audit Committee Pre-Approval Policies and Procedures.
(i) Before the auditor is engaged by the Registrant to render audit, audit related or permissible non-audit services to the Registrant or (ii) with respect to non-audit services to be provided by the auditor to the Registrant’s investment adviser or any entity in the Registrant’s investment company complex, if the nature of the services provided relate directly to the operations or financial reporting of the Registrant, either: (a) the Audit Committee shall pre-approve such engagement; or (b) such engagement shall be entered into pursuant to pre-approval policies and procedures established by the Audit Committee. Any such policies and procedures must be detailed as to the particular service and not involve any delegation of the Audit Committee’s responsibilities to the Registrant’s investment adviser. The Audit Committee may delegate to one or more of its members the authority to grant pre-approvals. The pre-approval policies and procedures shall include the requirement that the decisions of any member to whom authority is delegated under this provision be presented to the full Audit Committee at its next scheduled meeting. Under certain limited circumstances, pre-approvals are not required if certain de minimis thresholds are not exceeded, as such thresholds are set forth by the Audit Committee and in accordance with applicable Securities and Exchange Commission rules and regulations.
(e)(2) None of the services provided to the Registrant described in paragraphs (b) through (d) of this Item 4 were pre-approved by the Audit Committee pursuant to paragraph (c)(7)(i)(C) of Rule 2-01 of regulation S-X.
(f) No disclosures are required by this Item 4(f).
(g) The aggregate non-audit fees billed by PricewaterhouseCoopers LLP for services rendered to the Registrant for the fiscal years ended November 30, 2022 and 2021 were $180,000 and $243,000, respectively. The aggregate non-audit fees billed by PricewaterhouseCoopers LLP totaled $4,783,000 and $4,781,000 for services rendered to the Registrant’s investment adviser and any entity controlling, controlled by, or under common control with the adviser that provides ongoing services to the Registrant for the fiscal years ended November 30, 2022 and 2021, respectively.
(h) The Registrant’s Audit Committee has considered the provision of non-audit services that were rendered to the Registrant’s investment adviser and any entity controlling, controlled by, or under common control with the investment adviser that provides ongoing services to the Registrant that were not pre-approved pursuant to paragraph (c)(7)(ii) of Rule 2-01 of Regulation S-X and has determined that the provision of such non-audit services is compatible with maintaining the Registrant’s principal accountant’s independence.
(i) Not applicable.
(j) Not applicable.
Item 5. Audit Committee of Listed Registrants.
The Registrant has a separately-designated standing audit committee established in accordance with Section 3(a)(58)(A) of the Securities and Exchange Act of 1934, as amended (the “Exchange Act”). William R. Cordes (Chair), Anne K. Costin, Barry R. Pearl, Albert L. Richey and Caroline A. Winn, are the members of the Registrant’s Audit Committee.
Item 6. Investments.
(a) Please see the Schedule of Investments contained in the KYN Annual Report for the fiscal year ended November 30, 2022 included under Item 1 of this Form N-CSR.
(b) Not applicable.
Item 7. Disclosure of Proxy Voting Policies and Procedures for Closed-End Management Investment Companies.
The Registrant has delegated the voting of proxies relating to its voting securities to its investment adviser, KA Fund Advisors, LLC (the “Adviser”). The respective proxy voting policies and procedures of the Registrant and the Adviser are attached as Exhibit 99.VOTEREG and Exhibit 99.VOTEADV hereto.
Item 8. Portfolio Managers of Closed-End Management Investment Companies.
(a)(1) As of the date of filing of this report, the following individuals (the “Portfolio Managers”) are primarily responsible for the day-to-day management of the Registrant’s portfolio:
James C. Baker, Jr. has served as the Registrant’s Chief Executive Officer since June 2019 and Director, President and co-portfolio manager of the Registrant and Kayne Anderson NextGen Energy & Infrastructure, Inc. (“KMF”) since November 2017. Mr. Baker has served as Senior Managing Director of Kayne Anderson Capital Advisors, L.P. (“KACALP” and the Adviser together with KACALP, “Kayne Anderson”) since February 2008; President of the Registrant and KMF since June 2016; and Executive Vice President of the Registrant from June 2008 to June 2016 and of KMF from August 2010 to June 2016. Mr. Baker has served as President of Kayne Anderson BDC, Inc. (“KABDC”) since February 2021; Chief Executive Officer of KABDC since June 2021; and President and Chief Executive Officer of Kayne DL 2021, Inc. (“KDL”) since December 2021. Prior to joining Kayne Anderson in 2004, Mr. Baker was Director in Planning and Analysis at El Paso Corporation from April 2004 to December 2004. Prior to that, he was a Director in the energy investment banking group at UBS Securities LLC. At
2
UBS, he focused on securities underwriting and mergers and acquisitions in the energy industry. Prior to joining UBS in 2000, Mr. Baker was an Associate in the energy investment banking group at PaineWebber Incorporated. He earned a BBA degree in Finance from the University of Texas at Austin in 1995 and an MBA degree in Finance from Southern Methodist University in 1997.
J.C. Frey is the Registrant’s Executive Vice President (since June 2008) and co-portfolio manager (since June 2004), and was the Registrant’s Assistant Secretary and Assistant Treasurer from June 2004 to January 2019. Mr. Frey has served as a Managing Partner of KACALP since 2004 and Co-Managing Partner of the Adviser since 2006. He has served as Executive Vice President and co-portfolio manager of KMF since November 2010, and Assistant Secretary and Assistant Treasurer of KMF from November 2010 to January 2019. Mr. Frey began investing in MLPs on behalf of Kayne Anderson in 1998 and has served as portfolio manager of Kayne Anderson’s MLP funds since their inception in 2000. Prior to joining Kayne Anderson in 1997, Mr. Frey was a CPA and audit manager in KPMG Peat Marwick’s financial services group, specializing in banking and finance clients and loan securitizations. Mr. Frey graduated from Loyola Marymount University with a BS degree in Accounting in 1990. In 1991, he received a Master’s degree in Taxation from the University of Southern California.
(a)(2)(i) and (ii) Other Accounts Managed by Portfolio Managers:
The following table reflects information regarding accounts for which the Portfolio Managers have day-to-day management responsibilities (other than the Registrant). Accounts are grouped into three categories: (i) registered investment companies, (ii) other pooled investment vehicles, and (iii) other accounts, and include accounts that pay advisory fees based on account performance shown in the separate table below under (a)(2)(iii). Information is shown as of November 30, 2022. Asset amounts are approximate and have been rounded.
|
Registered |
Other Pooled |
Other Accounts |
|||||||||||||
|
Portfolio Manager |
Number of |
Total Assets |
Number of |
Total Assets |
Number of |
Total Assets |
|||||||||
|
James C. Baker, Jr. |
1 |
$ |
585 |
— |
$ |
— |
— |
$ |
— |
||||||
|
J.C. Frey |
3 |
$ |
850 |
9 |
$ |
1,099 |
6 |
$ |
259 |
||||||
(a)(2)(iii) Other Accounts that Pay Performance-Based Advisory Fees Managed by Portfolio Managers:
The following table reflects information regarding accounts for which the Portfolio Managers have day-to-day management responsibilities (other than the Registrant) and with respect to which the advisory fee is based on the performance of the account. Information is shown as of November 30, 2022. Asset amounts are approximate and have been rounded.
|
Registered |
Other Pooled |
Other Accounts |
||||||||||||
|
Portfolio Manager |
Number of |
Total Assets in the Accounts ($ in millions) |
Number of |
Total Assets in the Accounts ($ in millions) |
Number of |
Total Assets in the Accounts ($ in millions) |
||||||||
|
James C. Baker, Jr. |
— |
— |
— |
$ |
— |
— |
$ |
— |
||||||
|
J.C. Frey |
— |
— |
5 |
$ |
550 |
2 |
$ |
88 |
||||||
(a)(2)(iv) Potential Material Conflicts of Interest:
Some of the other accounts managed by Messrs. Baker and Frey have investment strategies that are similar to those of the Registrant. However, Kayne Anderson manages potential conflicts of interest by allocating investment opportunities in accordance with its written allocation policies and procedures.
3
(a)(3) Compensation of Each Portfolio Manager:
As of November 30, 2022, Messrs. Baker and Frey are compensated by Kayne Anderson through partnership distributions from Kayne Anderson, based on the amount of assets they manage, and they receive a portion of the advisory fees applicable to those accounts (including the Registrant), which, with respect to certain accounts (not including the Registrant), as noted above, are based in part on the performance of those accounts.
Additional benefits received by Messrs. Baker and Frey are normal and customary benefits generally available to all salaried employees.
(a)(4) As of November 30, 2022, the end of the Registrant’s most recently completed fiscal year, the dollar range of equity securities beneficially owned by each Portfolio Manager in the Registrant is shown below:
James C. Baker, Jr.: over $1,000,000
J.C. Frey: over $1,000,000
(b) Not applicable.
Item 9. Purchases of Equity Securities by Closed-End Management Investment Company and Affiliated Purchasers.
REGISTRANT PURCHASES OF EQUITY SECURITIES
|
Period |
(a) |
(b) |
(c) |
(d) |
|||||
|
December 1-31, 2021 |
— |
$ |
— |
— |
Not applicable. |
||||
|
January 1-31, 2022 |
269,415 |
$ |
8.42 |
— |
Not applicable. |
||||
|
February 1-28, 2022 |
— |
$ |
— |
— |
Not applicable. |
||||
|
March 1-31, 2022 |
— |
$ |
— |
— |
Not applicable. |
||||
|
April 1-30, 2022 |
372,567 |
$ |
9.27 |
— |
Not applicable. |
||||
|
May 1-31, 2022 |
— |
$ |
— |
— |
Not applicable. |
||||
|
June 1-30, 2022 |
— |
$ |
— |
— |
Not applicable. |
||||
|
July 1-31, 2022 |
351,910 |
$ |
8.36 |
— |
Not applicable. |
||||
|
August 1-31, 2022 |
— |
$ |
— |
— |
Not applicable. |
||||
|
September 1-30, 2022 |
— |
$ |
— |
— |
Not applicable. |
||||
|
October 1-31, 2022 |
365,020 |
$ |
8.43 |
— |
Not applicable. |
||||
|
November 1-30, 2022 |
— |
$ |
— |
— |
Not applicable. |
||||
|
Total |
1,358,912 |
$ |
8.64 |
— |
— |
||||
____________
(1) Specified shares were purchased in the open market pursuant to the terms of the Registrant’s Automatic Dividend Reinvestment Plan, adopted September 27, 2004, and last amended March 12, 2009.
Item 10. Submission of Matters to a Vote of Security Holders.
None.
4
Item 11. Controls and Procedures.
(a) The Registrant’s principal executive officer and principal financial officer have evaluated the Registrant’s disclosure controls and procedures (as defined in Rule 30a-3(c) under the Investment Company Act of 1940, as amended (the “1940 Act”)), as of a date within 90 days of the filing of this report and have concluded that the Registrant’s disclosure controls and procedures are effective, as of such date, based on the evaluation of these controls and procedures required by Rule 30a-3(b) under the 1940 Act and
Rule 13a-15(b) or 15d-15(b) under the Exchange Act.
(b) There have been no changes in the Registrant’s internal control over financial reporting (as defined in Rule 30a-3(d) under the 1940 Act) that occurred during the period covered by this report that have materially affected, or are reasonably likely to materially affect, the Registrant’s internal control over financial reporting.
Item 12. Disclosure of Securities Lending Activities for Closed-End Management Investment Companies.
The Registrant did not participate in securities lending activities during the fiscal year ended November 30, 2022.
Item 13. Exhibits.
(a)(1) Code of Ethics attached hereto as EX-99.CODE ETH.
(99) Proxy Voting Policies of the Registrant attached hereto as EX-99.VOTEREG.
(99) Proxy Voting Policies of the Adviser attached hereto as EX-99.VOTEADV.
5
SIGNATURES
Pursuant to the requirements of the Securities Exchange Act of 1934 and the Investment Company Act of 1940, the Registrant has duly caused this report to be signed on its behalf by the undersigned, thereunto duly authorized.
|
KAYNE ANDERSON ENERGY INFRASTRUCTURE FUND, INC. |
||||
|
Date: January 26, 2023 |
By: |
/s/ James C. Baker, Jr. |
||
|
James C. Baker, Jr. |
||||
|
Chairman of the Board of Directors, |
||||
Pursuant to the requirements of the Securities Exchange Act of 1934 and the Investment Company Act of 1940, this report has been signed below by the following persons on behalf of the Registrant and in the capacities and on the dates indicated.
|
Date: January 26, 2023 |
By: |
/s/ James C. Baker, Jr. |
||
|
James C. Baker, Jr. |
||||
|
Chairman of the Board of Directors, |
||||
|
Date: January 26, 2023 |
By: |
/s/ A. Colby Parker |
||
|
A. Colby Parker |
||||
|
Chief Financial Officer and Treasurer |
Exhibit Index
(a)(1) Code of Ethics attached hereto as EX-99.CODE ETH.
(99) Proxy Voting Policies of the Registrant attached hereto as EX-99.VOTEREG.
(99) Proxy Voting Policies of the Adviser attached hereto as EX-99.VOTEADV.