
Exhibit 99.2
ANNUAL SUPPLEMENTAL DATA
|
As of December 31, 2022

TABLE OF CONTENTS
|
PAGE REFERENCE |
Financial Summary |
|
4 |
|
5 |
|
5 |
|
6 |
|
7 |
|
7 |
|
8 |
|
9 |
|
11 |
|
11 |
|
12 |
|
Transaction Summary |
|
13 |
|
13 |
|
Property Portfolio |
|
14 |
|
15 |
|
15 |
|
16 |
|
17 |
|
18 |
|
18 |
|
19 |
|
19 |
|
20 |
2
Statements in this press release that are not strictly historical are “forward-looking” statements. These statements generally are characterized by the use of terms such as "believe," "expect," "intend," "may," "estimated," or other similar words or expressions. Forward-looking statements involve known and unknown risks, which may cause the company’s actual future results to differ materially from expected results. These risks include, among others, general economic conditions, including inflation, local real estate conditions, changes in interest rates, increases in operating costs, the preferences and financial condition of the company's tenants, the availability of capital, risks related to the company's status as a REIT and the potential impacts of COVID-19, or any epidemic or pandemic on the company's business operations, financial results and financial position and on the world economy. Additional information concerning these and other factors that could cause actual results to differ materially from these forward-looking statements is contained from time to time in the company’s Securities and Exchange Commission (the “Commission”) filings, including, but not limited to, the company’s Annual Report on Form 10-K for the year ended December 31, 2022.
Copies of each filing may be obtained from the company or the Commission. Such forward-looking statements should be regarded solely as reflections of the company’s current operating plans and estimates. Actual operating results may differ materially from what is expressed or forecast in this press release. National Retail Properties, Inc. undertakes no obligation to publicly release the results of any revisions to these forward-looking statements that may be made to reflect events or circumstances after the date these statements were made.
3
INCOME STATEMENT SUMMARY |
(in thousands, except per share data)
(unaudited)
|
|
Quarter Ended |
|
|
Year Ended |
|
|
||||||||||
|
|
December 31, |
|
|
December 31, |
|
|
||||||||||
|
|
2022 |
|
|
2021 |
|
|
2022 |
|
|
2021 |
|
|
||||
Revenues: |
|
|
|
|
|
|
|
|
|
|
|
|
|
||||
Rental income |
|
$ |
198,217 |
|
|
$ |
186,633 |
|
|
$ |
771,618 |
|
|
$ |
723,859 |
|
|
Interest and other income from real estate transactions |
|
|
303 |
|
|
|
628 |
|
|
|
1,435 |
|
|
|
2,548 |
|
|
|
|
|
198,520 |
|
|
|
187,261 |
|
|
|
773,053 |
|
|
|
726,407 |
|
|
Operating expenses: |
|
|
|
|
|
|
|
|
|
|
|
|
|
||||
General and administrative |
|
|
10,788 |
|
|
|
9,947 |
|
|
|
41,695 |
|
|
|
44,640 |
|
|
Real estate |
|
|
7,035 |
|
|
|
7,520 |
|
|
|
26,281 |
|
|
|
28,385 |
|
|
Depreciation and amortization |
|
|
57,322 |
|
|
|
53,389 |
|
|
|
223,834 |
|
|
|
205,220 |
|
|
Leasing transaction costs |
|
|
61 |
|
|
|
57 |
|
|
|
320 |
|
|
|
203 |
|
|
Impairment losses – real estate, net of recoveries |
|
|
1,088 |
|
|
|
7,310 |
|
|
|
8,309 |
|
|
|
21,957 |
|
|
Executive retirement costs |
|
|
715 |
|
|
|
— |
|
|
|
7,520 |
|
|
|
— |
|
|
|
|
|
77,009 |
|
|
|
78,223 |
|
|
|
307,959 |
|
|
|
300,405 |
|
|
Gain on disposition of real estate |
|
|
6,787 |
|
|
|
5,159 |
|
|
|
17,443 |
|
|
|
23,094 |
|
|
Earnings from operations |
|
|
128,298 |
|
|
|
114,197 |
|
|
|
482,537 |
|
|
|
449,096 |
|
|
Other expenses (revenues): |
|
|
|
|
|
|
|
|
|
|
|
|
|
||||
Interest and other income |
|
|
(29 |
) |
|
|
(57 |
) |
|
|
(149 |
) |
|
|
(216 |
) |
|
Interest expense |
|
|
37,665 |
|
|
|
36,684 |
|
|
|
148,065 |
|
|
|
137,874 |
|
(1) |
Loss on early extinguishment of debt |
|
|
— |
|
|
|
— |
|
|
|
— |
|
|
|
21,328 |
|
|
|
|
|
37,636 |
|
|
|
36,627 |
|
|
|
147,916 |
|
|
|
158,986 |
|
|
Net earnings |
|
|
90,662 |
|
|
|
77,570 |
|
|
|
334,621 |
|
|
|
290,110 |
|
|
Loss attributable to noncontrolling interests |
|
|
— |
|
|
|
— |
|
|
|
5 |
|
|
|
3 |
|
|
Net earnings attributable to NNN |
|
|
90,662 |
|
|
|
77,570 |
|
|
|
334,626 |
|
|
|
290,113 |
|
|
Series F preferred stock dividends |
|
|
— |
|
|
|
(1,544 |
) |
|
|
— |
|
|
|
(14,999 |
) |
|
Excess of redemption value over carrying value of |
|
|
— |
|
|
|
(10,897 |
) |
|
|
— |
|
|
|
(10,897 |
) |
|
Net earnings available to common stockholders |
|
$ |
90,662 |
|
|
$ |
65,129 |
|
|
$ |
334,626 |
|
|
$ |
264,217 |
|
|
|
|
|
|
|
|
|
|
|
|
|
|
|
|
||||
Weighted average common shares outstanding: |
|
|
|
|
|
|
|
|
|
|
|
|
|
||||
Basic |
|
|
178,779 |
|
|
|
174,750 |
|
|
|
176,404 |
|
|
|
174,711 |
|
|
Diluted |
|
|
179,472 |
|
|
|
174,868 |
|
|
|
177,068 |
|
|
|
174,819 |
|
|
|
|
|
|
|
|
|
|
|
|
|
|
|
|
||||
Net earnings per share available to common stockholders: |
|
|
|
|
|
|
|
|
|
|
|
|
|
||||
Basic |
|
$ |
0.51 |
|
|
$ |
0.37 |
|
|
$ |
1.89 |
|
|
$ |
1.51 |
|
|
Diluted |
|
$ |
0.50 |
|
|
$ |
0.37 |
|
|
$ |
1.89 |
|
|
$ |
1.51 |
|
|
(1) |
Includes $2,078 in connection with the redemption of 3.30% senior unsecured notes due 2023 for the year ended December 31, 2021. |
4
FUNDS FROM OPERATIONS (FFO)(1) |
(in thousands, except per share data)
(unaudited)
|
|
Quarter Ended |
|
|
Year Ended |
|
|
||||||||||
|
|
December 31, |
|
|
December 31, |
|
|
||||||||||
|
|
2022 |
|
|
2021 |
|
|
2022 |
|
|
2021 |
|
|
||||
Net earnings available to common stockholders |
|
$ |
90,662 |
|
|
$ |
65,129 |
|
|
$ |
334,626 |
|
|
$ |
264,217 |
|
|
Real estate depreciation and amortization |
|
|
57,215 |
|
|
|
53,249 |
|
|
|
223,392 |
|
|
|
204,753 |
|
|
Gain on disposition of real estate |
|
|
(6,787 |
) |
|
|
(5,159 |
) |
|
|
(17,443 |
) |
|
|
(23,094 |
) |
|
Impairment losses – depreciable real estate, net of |
|
|
1,088 |
|
|
|
7,310 |
|
|
|
8,309 |
|
|
|
21,957 |
|
|
Total FFO adjustments |
|
|
51,516 |
|
|
|
55,400 |
|
|
|
214,258 |
|
|
|
203,616 |
|
|
FFO available to common stockholders |
|
$ |
142,178 |
|
|
$ |
120,529 |
|
|
$ |
548,884 |
|
|
$ |
467,833 |
|
|
|
|
|
|
|
|
|
|
|
|
|
|
|
|
||||
FFO per common share: |
|
|
|
|
|
|
|
|
|
|
|
|
|
||||
Basic |
|
$ |
0.80 |
|
|
$ |
0.69 |
|
|
$ |
3.11 |
|
|
$ |
2.68 |
|
|
Diluted |
|
$ |
0.79 |
|
|
$ |
0.69 |
|
|
$ |
3.10 |
|
|
$ |
2.68 |
|
|
(1) |
FFO is a non-GAAP financial measure. Please reference the Earnings Release for the quarter and year ended December 31, 2022 for the company's definition and explanation of how the company utilizes this metric. |
CORE FUNDS FROM OPERATIONS (Core FFO)(1) |
(in thousands, except per share data)
(unaudited)
|
|
Quarter Ended |
|
|
Year Ended |
|
|
||||||||||
|
|
December 31, |
|
|
December 31, |
|
|
||||||||||
|
|
2022 |
|
|
2021 |
|
|
2022 |
|
|
2021 |
|
|
||||
Net earnings available to common stockholders |
|
$ |
90,662 |
|
|
$ |
65,129 |
|
|
$ |
334,626 |
|
|
$ |
264,217 |
|
|
Total FFO adjustments |
|
|
51,516 |
|
|
|
55,400 |
|
|
|
214,258 |
|
|
|
203,616 |
|
|
FFO available to common stockholders |
|
|
142,178 |
|
|
|
120,529 |
|
|
|
548,884 |
|
|
|
467,833 |
|
|
|
|
|
|
|
|
|
|
|
|
|
|
|
|
||||
Executive retirement costs |
|
|
715 |
|
|
|
— |
|
|
|
7,520 |
|
|
|
— |
|
|
Loss on early extinguishment of debt |
|
|
— |
|
|
|
— |
|
|
|
— |
|
|
|
21,328 |
|
|
Excess of redemption value over carrying value of |
|
|
— |
|
|
|
10,897 |
|
|
|
— |
|
|
|
10,897 |
|
|
Total Core FFO adjustments |
|
|
715 |
|
|
|
10,897 |
|
|
|
7,520 |
|
|
|
32,225 |
|
|
Core FFO available to common stockholders |
|
$ |
142,893 |
|
|
$ |
131,426 |
|
|
$ |
556,404 |
|
|
$ |
500,058 |
|
|
|
|
|
|
|
|
|
|
|
|
|
|
|
|
||||
Core FFO per common share: |
|
|
|
|
|
|
|
|
|
|
|
|
|
||||
Basic |
|
$ |
0.80 |
|
|
$ |
0.75 |
|
|
$ |
3.15 |
|
|
$ |
2.86 |
|
|
Diluted |
|
$ |
0.80 |
|
|
$ |
0.75 |
|
|
$ |
3.14 |
|
|
$ |
2.86 |
|
|
(1) |
Core FFO is a non-GAAP financial measure. Please reference the Earnings Release for the quarter and year ended December 31, 2022 for the company's definition and explanation of how the company utilizes this metric. |
5
ADJUSTED FUNDS FROM OPERATIONS (AFFO)(1) |
(in thousands, except per share data)
(unaudited)
|
|
Quarter Ended |
|
|
Year Ended |
|
|
||||||||||
|
|
December 31, |
|
|
December 31, |
|
|
||||||||||
|
|
2022 |
|
|
2021 |
|
|
2022 |
|
|
2021 |
|
|
||||
Net earnings available to common stockholders |
|
$ |
90,662 |
|
|
$ |
65,129 |
|
|
$ |
334,626 |
|
|
$ |
264,217 |
|
|
Total FFO adjustments |
|
|
51,516 |
|
|
|
55,400 |
|
|
|
214,258 |
|
|
|
203,616 |
|
|
Total Core FFO adjustments |
|
|
715 |
|
|
|
10,897 |
|
|
|
7,520 |
|
|
|
32,225 |
|
|
Core FFO available to common stockholders |
|
|
142,893 |
|
|
|
131,426 |
|
|
|
556,404 |
|
|
|
500,058 |
|
|
|
|
|
|
|
|
|
|
|
|
|
|
|
|
||||
Straight-line accrued rent, net of reserves |
|
|
261 |
|
|
|
2,046 |
|
|
|
3,559 |
|
|
|
21,137 |
|
|
Net capital lease rent adjustment |
|
|
78 |
|
|
|
79 |
|
|
|
302 |
|
|
|
340 |
|
|
Below-market rent amortization |
|
|
(100 |
) |
|
|
(280 |
) |
|
|
(510 |
) |
|
|
(710 |
) |
|
Stock based compensation expense |
|
|
2,344 |
|
|
|
1,975 |
|
|
|
10,078 |
|
|
|
14,295 |
|
|
Capitalized interest expense |
|
|
(334 |
) |
|
|
(114 |
) |
|
|
(881 |
) |
|
|
(328 |
) |
|
Total AFFO adjustments |
|
|
2,249 |
|
|
|
3,706 |
|
|
|
12,548 |
|
|
|
34,734 |
|
|
AFFO available to common stockholders |
|
$ |
145,142 |
|
(2) |
$ |
135,132 |
|
(3) |
$ |
568,952 |
|
(2) |
$ |
534,792 |
|
(3) |
|
|
|
|
|
|
|
|
|
|
|
|
|
|
||||
AFFO per common share: |
|
|
|
|
|
|
|
|
|
|
|
|
|
||||
Basic |
|
$ |
0.81 |
|
(2) |
$ |
0.77 |
|
(3) |
$ |
3.23 |
|
(2) |
$ |
3.06 |
|
(3) |
Diluted |
|
$ |
0.81 |
|
(2) |
$ |
0.77 |
|
(3) |
$ |
3.21 |
|
(2) |
$ |
3.06 |
|
(3) |
(1) |
AFFO is a non-GAAP financial measure. Please reference the Earnings Release for the quarter and year ended December 31, 2022 for the company's definition and explanation of how the company utilizes this metric. |
(2) |
Amounts include $681 and $5,391 of net straight-line accrued rent from net rent deferral repayments from the COVID-19 rent deferral lease amendments for the quarter and year ended December 31, 2022, respectively. Excluding such, AFFO per common share would have been $0.80 and $3.18 for the quarter and year ended December 31, 2022, respectively. |
(3) |
Amounts include $2,949 and $24,945 of net straight-line accrued rent from net rent deferral repayments from the COVID-19 rent deferral lease amendments for the quarter and year ended December 31, 2021, respectively. Excluding such, AFFO per common share results would have been $0.76 and $2.92 for the quarter and year ended December 31, 2021, respectively. |
6
OTHER INFORMATION |
(in thousands)
(unaudited)
|
|
Quarter Ended |
|
|
Year Ended |
|
||||||||||
|
|
December 31, |
|
|
December 31, |
|
||||||||||
|
|
2022 |
|
|
2021 |
|
|
2022 |
|
|
2021 |
|
||||
Rental income from operating leases(1) |
|
$ |
192,738 |
|
|
$ |
181,078 |
|
|
$ |
751,680 |
|
|
$ |
703,865 |
|
Earned income from direct financing leases(1) |
|
$ |
146 |
|
|
$ |
154 |
|
|
$ |
595 |
|
|
$ |
623 |
|
Percentage rent(1) |
|
$ |
310 |
|
|
$ |
176 |
|
|
$ |
1,541 |
|
|
$ |
706 |
|
|
|
|
|
|
|
|
|
|
|
|
|
|
||||
Real estate expense reimbursement from tenants(1) |
|
$ |
5,023 |
|
|
$ |
5,225 |
|
|
$ |
17,802 |
|
|
$ |
18,665 |
|
Real estate expenses |
|
|
(7,035 |
) |
|
|
(7,520 |
) |
|
|
(26,281 |
) |
|
|
(28,385 |
) |
Real estate expenses, net of tenant reimbursements |
|
$ |
(2,012 |
) |
|
$ |
(2,295 |
) |
|
$ |
(8,479 |
) |
|
$ |
(9,720 |
) |
|
|
|
|
|
|
|
|
|
|
|
|
|
||||
Amortization of debt costs |
|
$ |
1,200 |
|
|
$ |
1,164 |
|
|
$ |
4,734 |
|
|
$ |
5,186 |
|
Scheduled debt principal amortization (excluding maturities) |
|
$ |
170 |
|
|
$ |
161 |
|
|
$ |
664 |
|
|
$ |
630 |
|
Non-real estate depreciation expense |
|
$ |
109 |
|
|
$ |
116 |
|
|
$ |
454 |
|
|
$ |
451 |
|
(1) |
For the quarter and year ended December 31, 2022, the aggregate of such amounts is $198,217 and $771,618, respectively, classified as rental income on the income statement summary. For the quarter and year ended December 31, 2021, the aggregate of such amounts is $186,633 and $723,859, respectively. |
EBITDA(1) |
Earnings before Interest, Taxes, Depreciation and Amortization for Real Estate:
(in thousands)
(unaudited)
|
|
Quarter Ended December 31, |
|
|
Year Ended December 31, |
|
||||||||||
|
|
2022 |
|
|
2021 |
|
|
2022 |
|
|
2021 |
|
||||
Net earnings attributable to NNN |
|
$ |
90,662 |
|
|
$ |
77,570 |
|
|
$ |
334,626 |
|
|
$ |
290,113 |
|
Interest expense |
|
|
37,665 |
|
|
|
36,684 |
|
|
|
148,065 |
|
|
|
137,874 |
|
Depreciation and amortization |
|
|
57,322 |
|
|
|
53,389 |
|
|
|
223,834 |
|
|
|
205,220 |
|
Gain on disposition of real estate |
|
|
(6,787 |
) |
|
|
(5,159 |
) |
|
|
(17,443 |
) |
|
|
(23,094 |
) |
Impairment losses – real estate, net of recoveries |
|
|
1,088 |
|
|
|
7,310 |
|
|
|
8,309 |
|
|
|
21,957 |
|
Loss attributable to noncontrolling interests |
|
|
— |
|
|
|
— |
|
|
|
(5 |
) |
|
|
(3 |
) |
EBITDA |
|
$ |
179,950 |
|
|
$ |
169,794 |
|
|
$ |
697,386 |
|
|
$ |
632,067 |
|
(1) |
EBITDA is non-GAAP financial measure. Please reference the Earnings Release for the quarter and ended December 31, 2022 for the company's definition and explanation of how the company utilizes this metric. |
7
BALANCE SHEET |
(in thousands)
(unaudited)
|
|
December 31, |
|
|
December 31, |
|
||
Assets: |
|
|
|
|
|
|
||
Real estate portfolio, net of accumulated depreciation and amortization |
|
$ |
8,020,814 |
|
|
$ |
7,449,846 |
|
Cash and cash equivalents |
|
|
2,505 |
|
|
|
171,322 |
|
Restricted cash and cash equivalents |
|
|
4,273 |
|
|
|
— |
|
Receivables, net of allowance of $708 and $782, respectively |
|
|
3,612 |
|
|
|
3,154 |
|
Accrued rental income, net of allowance of $3,836 and $4,587, respectively |
|
|
27,795 |
|
|
|
31,942 |
|
Debt costs, net of accumulated amortization of $21,663 and $19,377, respectively |
|
|
5,352 |
|
|
|
7,443 |
|
Other assets |
|
|
81,694 |
|
|
|
87,347 |
|
Total assets |
|
$ |
8,146,045 |
|
|
$ |
7,751,054 |
|
|
|
|
|
|
|
|
||
Liabilities: |
|
|
|
|
|
|
||
Line of credit payable |
|
$ |
166,200 |
|
|
$ |
— |
|
Mortgages payable, including unamortized premium and net of unamortized debt costs |
|
|
9,964 |
|
|
|
10,697 |
|
Notes payable, net of unamortized discount and unamortized debt costs |
|
|
3,739,890 |
|
|
|
3,735,769 |
|
Accrued interest payable |
|
|
23,826 |
|
|
|
23,923 |
|
Other liabilities |
|
|
82,663 |
|
|
|
79,002 |
|
Total liabilities |
|
|
4,022,543 |
|
|
|
3,849,391 |
|
|
|
|
|
|
|
|
||
Stockholders’ equity of NNN |
|
|
4,123,502 |
|
|
|
3,901,662 |
|
Noncontrolling interests |
|
|
— |
|
|
|
1 |
|
Total equity |
|
|
4,123,502 |
|
|
|
3,901,663 |
|
|
|
|
|
|
|
|
||
Total liabilities and equity |
|
$ |
8,146,045 |
|
|
$ |
7,751,054 |
|
|
|
|
|
|
|
|
||
Common shares outstanding |
|
|
181,425 |
|
|
|
175,636 |
|
|
|
|
|
|
|
|
||
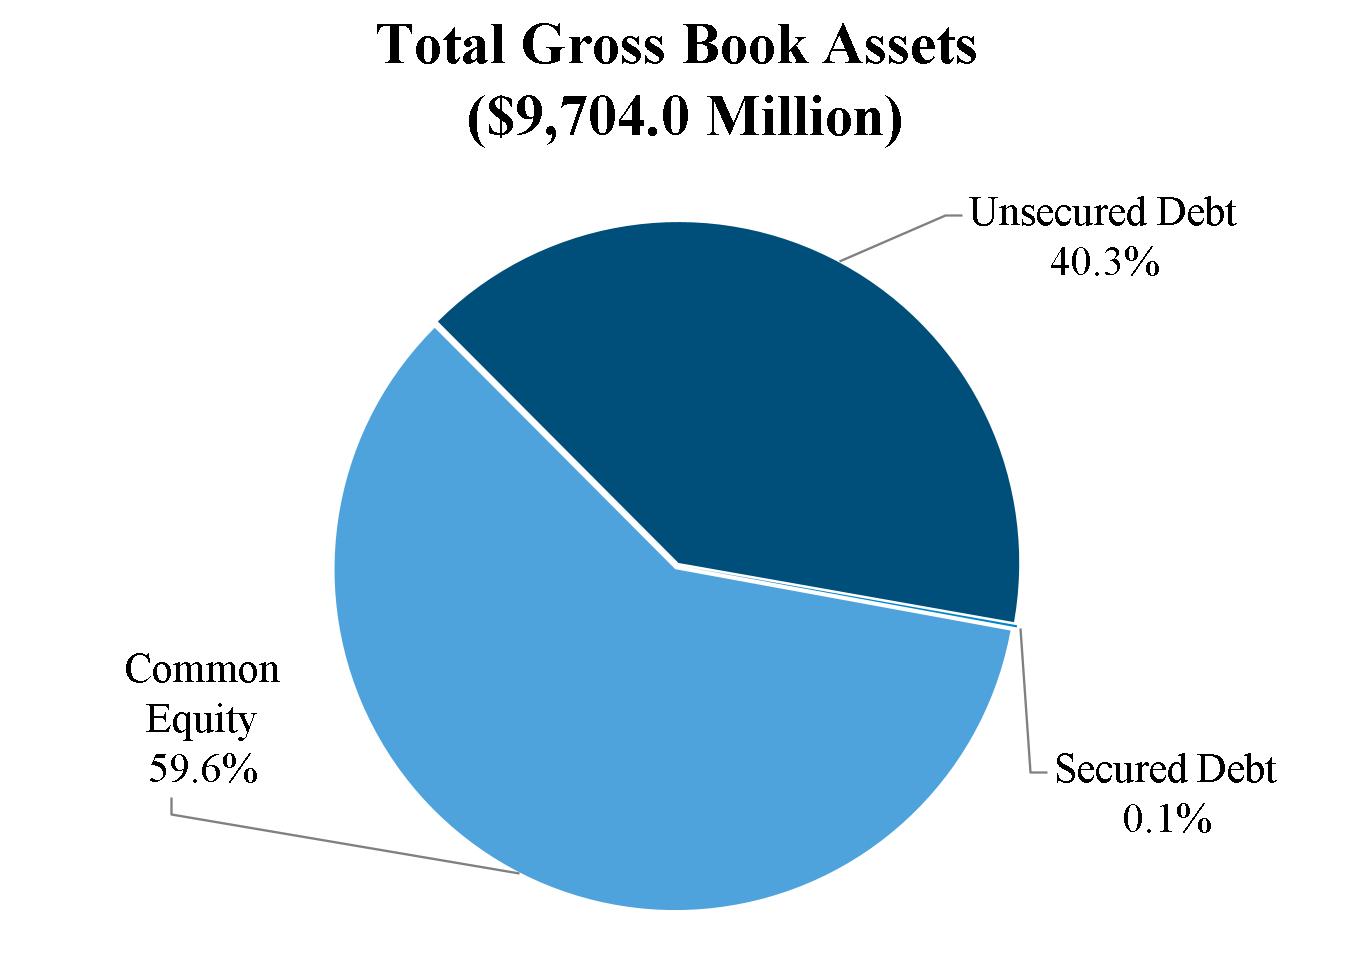
Gross leasable area, Property Portfolio (square feet) |
|
|
35,010 |
|
|
|
32,753 |
|
8
DEBT SUMMARY |
As of December 31, 2022 (dollars in thousands):
(unaudited)
Unsecured Debt |
|
Principal |
|
|
Principal, |
|
|
Stated |
|
|
Effective |
|
|
Maturity |
||||
Line of credit payable |
|
$ |
166,200 |
|
|
$ |
166,200 |
|
|
SOFR + 87.5bps |
|
|
|
5.175 |
% |
|
June 2025 |
|
|
|
|
|
|
|
|
|
|
|
|
|
|
|
|
||||
Unsecured notes payable: |
|
|
|
|
|
|
|
|
|
|
|
|
|
|
||||
2024 |
|
|
350,000 |
|
|
|
349,880 |
|
|
|
3.900 |
% |
|
|
3.924 |
% |
|
June 2024 |
2025 |
|
|
400,000 |
|
|
|
399,684 |
|
|
|
4.000 |
% |
|
|
4.029 |
% |
|
November 2025 |
2026 |
|
|
350,000 |
|
|
|
348,301 |
|
|
|
3.600 |
% |
|
|
3.733 |
% |
|
December 2026 |
2027 |
|
|
400,000 |
|
|
|
399,155 |
|
|
|
3.500 |
% |
|
|
3.548 |
% |
|
October 2027 |
2028 |
|
|
400,000 |
|
|
|
398,210 |
|
|
|
4.300 |
% |
|
|
4.388 |
% |
|
October 2028 |
2030 |
|
|
400,000 |
|
|
|
399,039 |
|
|
|
2.500 |
% |
|
|
2.536 |
% |
|
April 2030 |
2048 |
|
|
300,000 |
|
|
|
296,057 |
|
|
|
4.800 |
% |
|
|
4.890 |
% |
|
October 2048 |
2050 |
|
|
300,000 |
|
|
|
294,289 |
|
|
|
3.100 |
% |
|
|
3.205 |
% |
|
April 2050 |
2051 |
|
|
450,000 |
|
|
|
441,884 |
|
|
|
3.500 |
% |
|
|
3.602 |
% |
|
April 2051 |
2052 |
|
|
450,000 |
|
|
|
439,843 |
|
|
|
3.000 |
% |
|
|
3.118 |
% |
|
April 2052 |
Total |
|
|
3,800,000 |
|
|
|
3,766,342 |
|
|
|
|
|
|
|
|
|
||
|
|
|
|
|
|
|
|
|
|
|
|
|
|
|
||||
Total unsecured debt(1) |
|
$ |
3,966,200 |
|
|
$ |
3,932,542 |
|
|
|
|
|
|
|
|
|
||
|
|
|
|
|
|
|
|
|
|
|
|
|
|
|
||||
Debt costs |
|
|
|
|
$ |
(38,145 |
) |
|
|
|
|
|
|
|
|
|||
Accumulated amortization |
|
|
|
11,693 |
|
|
|
|
|
|
|
|
|
|||||
Debt costs, net of accumulated amortization |
|
|
|
(26,452 |
) |
|
|
|
|
|
|
|
|
|||||
Notes payable, net of unamortized discount and |
|
|
$ |
3,739,890 |
|
|
|
|
|
|
|
|
|
|||||
(1) Unsecured notes payable have a weighted average interest rate of 3.7% and a weighted average maturity of 13.7 years.
9
DEBT SUMMARY (continued) |
As of December 31, 2022 (in thousands):DEBT S SMMARY
Mortgages Payable |
|
Principal |
|
|
Interest |
|
|
Maturity |
||
Mortgage(1) |
|
$ |
9,969 |
|
|
|
5.230 |
% |
|
July 2023 |
|
|
|
|
|
|
|
|
|
||
Debt costs |
|
|
(147 |
) |
|
|
|
|
|
|
Accumulated amortization |
|
|
142 |
|
|
|
|
|
|
|
Debt costs, net of accumulated amortization |
|
|
(5 |
) |
|
|
|
|
|
|
Mortgages payable, including unamortized |
|
$ |
9,964 |
|
|
|
|
|
|
|
(1) Includes unamortized premium.
10
CREDIT METRICS (1) |
Ratings: Moody's Baa1; S&P BBB+
|
|
2018 |
|
|
2019 |
|
|
2020 |
|
|
2021 |
|
|
2022 |
|
|||||
Debt / Total assets (gross book) |
|
|
34.6 |
% |
|
|
35.3 |
% |
|
|
34.4 |
% |
|
|
39.9 |
% |
|
|
40.4 |
% |
Debt + preferred / Total assets (gross book) |
|
|
42.6 |
% |
|
|
39.3 |
% |
|
|
38.4 |
% |
|
|
39.9 |
% |
|
|
40.4 |
% |
Debt / EBITDA (last quarter annualized) |
|
|
4.7 |
|
|
|
4.8 |
|
|
|
5.0 |
|
|
|
5.2 |
|
|
|
5.4 |
|
Debt + preferred / EBITDA (last quarter annualized) |
|
|
5.8 |
|
|
|
5.3 |
|
|
|
5.6 |
|
|
|
5.2 |
|
|
|
5.4 |
|
EBITDA / Interest expense (cash) |
|
|
4.8 |
|
|
|
5.0 |
|
|
|
4.6 |
|
|
|
4.7 |
|
|
|
4.7 |
|
EBITDA / Fixed charges (cash) |
|
|
3.7 |
|
|
|
4.0 |
|
|
|
4.0 |
|
|
|
4.3 |
|
|
|
4.7 |
|
(1) Debt amounts used in calculations are net of cash balances.
CREDIT FACILITY AND NOTES COVENANTS |
The following is a summary of key financial covenants for the company's unsecured credit facility and notes, as defined and calculated per the terms of the facility's credit agreement and the notes' governing documents, respectively, which are included in the company's filings with the Commission. These calculations, which are not based on U.S. GAAP measurements, are presented to investors to show that as of December 31, 2022, the company believes it is in compliance with the covenants.
Unsecured Credit Facility Key Covenants |
|
Required |
|
December 31, 2022 |
Maximum leverage ratio |
|
< 0.60 |
|
0.36 |
Minimum fixed charge coverage ratio |
|
> 1.50 |
|
4.76 |
Maximum secured indebtedness ratio |
|
< 0.40 |
|
0.001 |
Unencumbered asset value ratio |
|
> 1.67 |
|
2.81 |
Unencumbered interest ratio |
|
> 1.75 |
|
4.82 |
|
|
|
|
|
Unsecured Notes Key Covenants |
|
Required |
|
December 31, 2022 |
Limitation on incurrence of total debt |
|
≤ 60% |
|
40.0% |
Limitation on incurrence of secured debt |
|
≤ 40% |
|
0.1% |
Debt service coverage ratio |
|
≥ 1.50 |
|
4.68 |
Maintenance of total unencumbered assets |
|
≥ 150% |
|
250% |
11
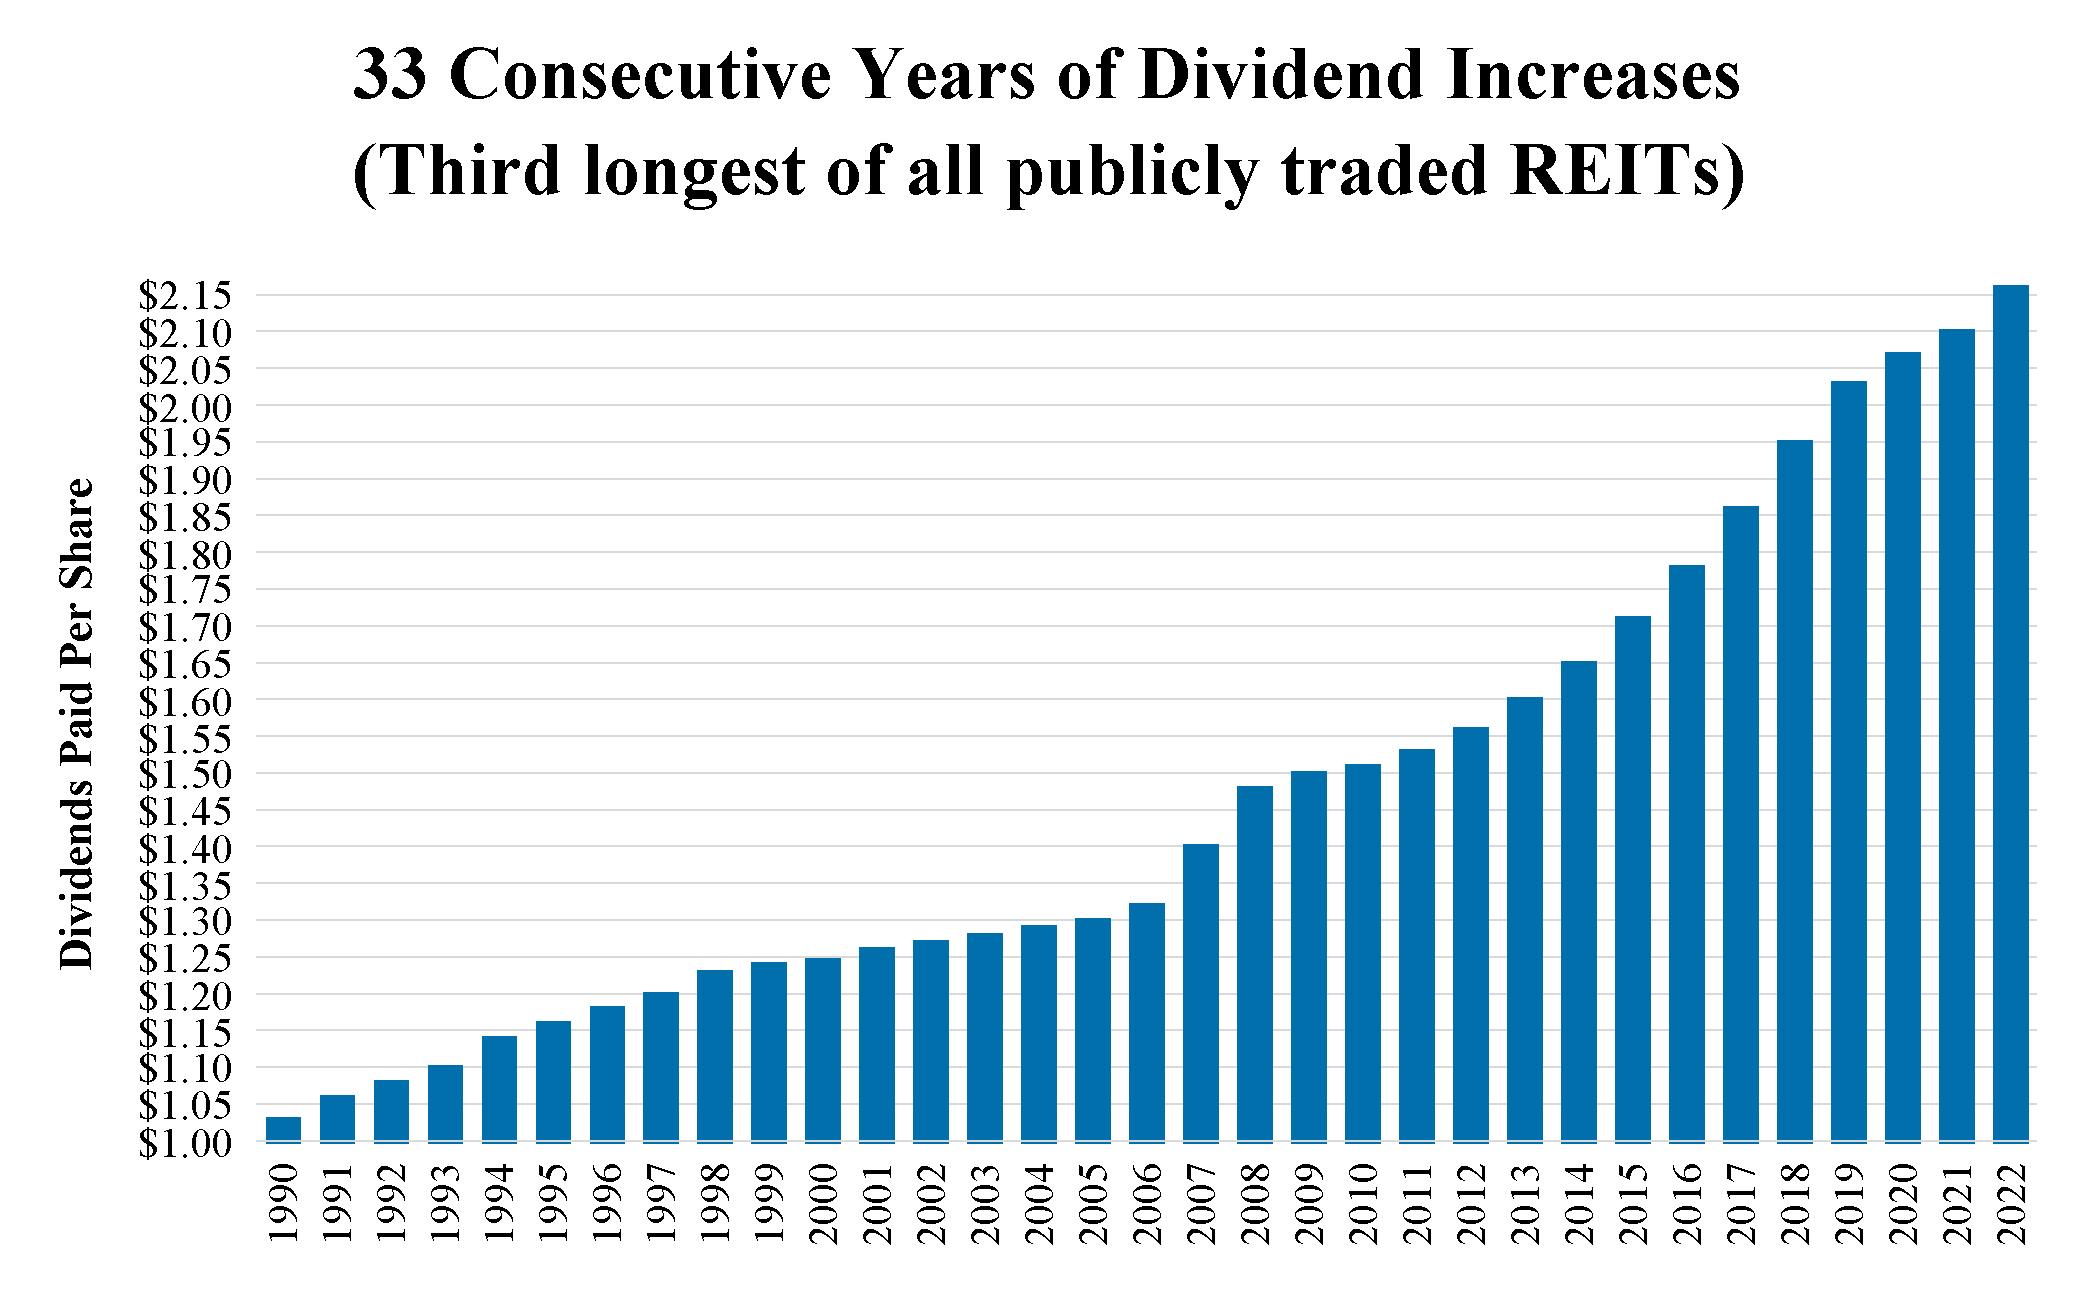
LONG-TERM DIVIDEND HISTORY |
12
PROPERTY ACQUISITIONS |
(dollars in thousands)
|
|
Year Ended December 31, |
|
|||||
|
|
2022 |
|
|
2021 |
|
||
Total dollars invested(1) |
|
$ |
847,747 |
|
|
$ |
555,415 |
|
Number of Properties |
|
|
223 |
|
|
|
156 |
|
Gross leasable area (square feet)(2) |
|
|
2,629,000 |
|
|
|
1,341,000 |
|
Cap rate (3) |
|
|
6.4 |
% |
|
|
6.5 |
% |
Weighted average lease term greater than 15 years on acquisitions for December 31, 2022 and 2021. |
|
(1) |
Includes dollars invested in projects under construction or tenant improvements for each respective year. |
(2) |
Includes additional square footage from completed construction on existing Properties. |
(3) |
The cap rate is a weighted average, calculated as the intial cash annual base rent divided by the total purchase price of the Properties. |
PROPERTY DISPOSITIONS |
(dollars in thousands)
|
|
Year Ended December 31, |
|
|||||||||||||||||||||
|
|
2022 |
|
|
2021 |
|
||||||||||||||||||
|
|
Occupied |
|
|
Vacant |
|
|
Total |
|
|
Occupied |
|
|
Vacant |
|
|
Total |
|
||||||
Number of properties |
|
|
17 |
|
|
|
16 |
|
|
|
33 |
|
|
|
34 |
|
|
|
40 |
|
|
|
74 |
|
Gross leasable area (square feet) |
|
|
138,000 |
|
|
|
173,000 |
|
|
|
311,000 |
|
|
|
429,000 |
|
|
|
586,000 |
|
|
|
1,015,000 |
|
Acquisition costs |
|
$ |
39,446 |
|
|
$ |
38,282 |
|
|
$ |
77,728 |
|
|
$ |
93,172 |
|
|
$ |
91,947 |
|
|
$ |
185,119 |
|
Net book value |
|
$ |
25,515 |
|
|
$ |
22,258 |
|
|
$ |
47,773 |
|
|
$ |
61,489 |
|
|
$ |
40,061 |
|
|
$ |
101,550 |
|
Net sale proceeds |
|
$ |
41,190 |
|
|
$ |
24,026 |
|
|
$ |
65,216 |
|
|
$ |
78,018 |
|
|
$ |
44,000 |
|
|
$ |
122,018 |
|
Cap rate(1) |
|
|
5.9 |
% |
|
|
— |
|
|
|
5.9 |
% |
|
|
7.4 |
% |
|
|
— |
|
|
|
7.4 |
% |
(1) |
The cap rate is a weighted average, calculated as the cash annual base rent divided by the total sales price of the properties. |
13
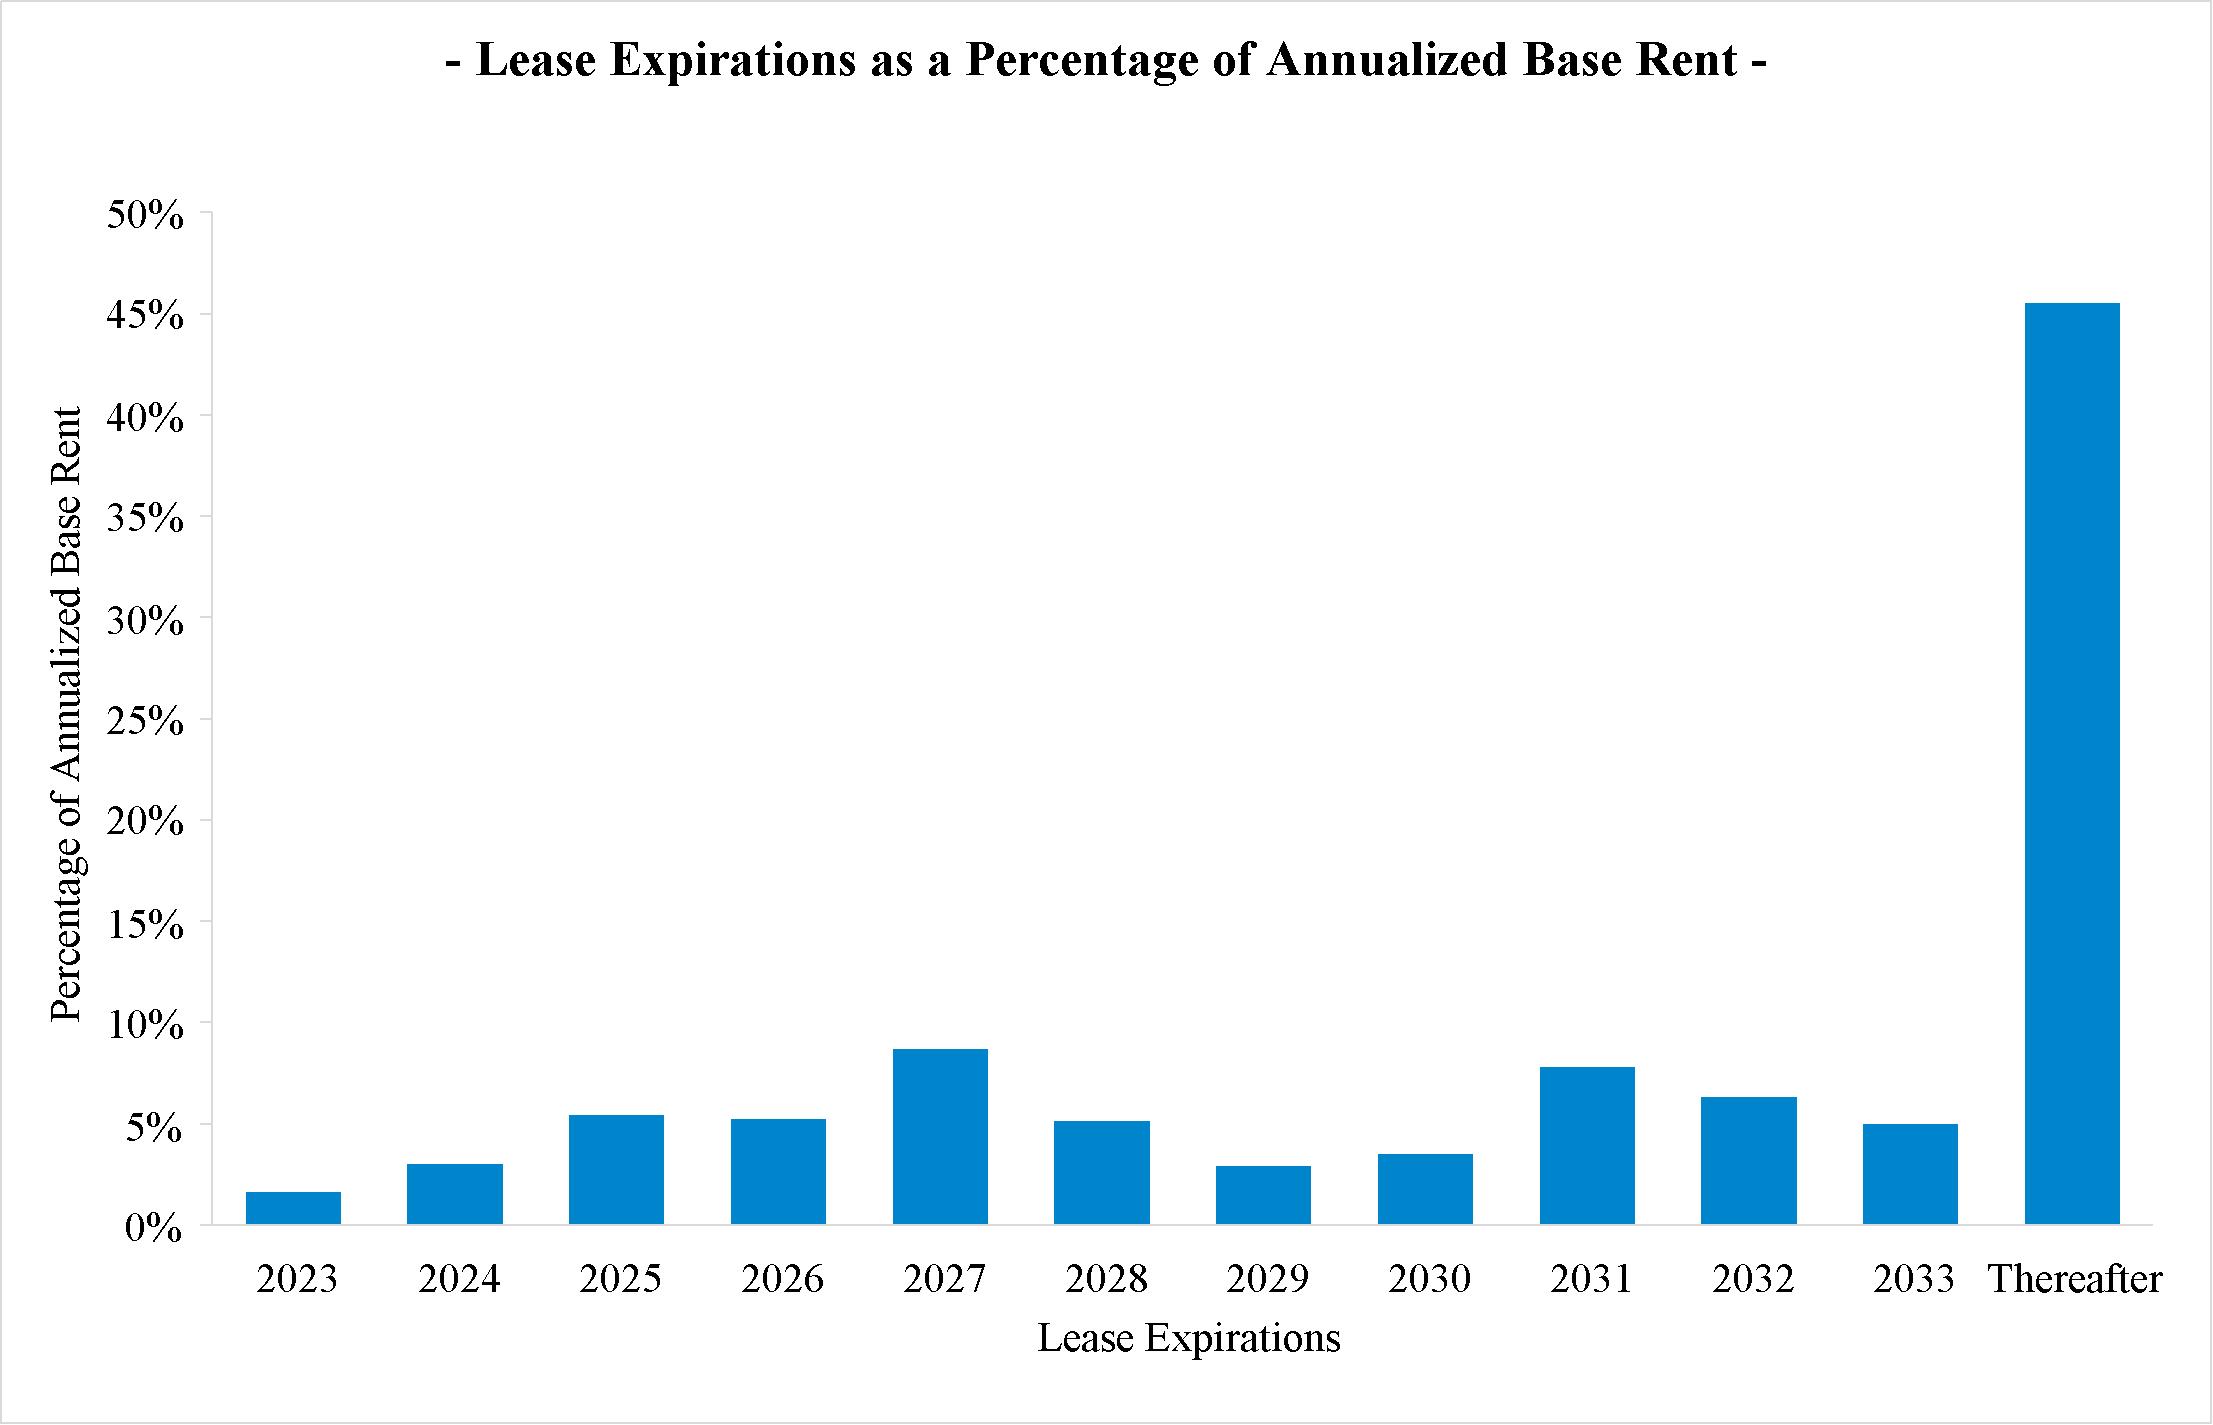
LEASE EXPIRATIONS(1) |
|
|
% of |
|
# of |
|
|
Gross Leasable |
|
|
|
|
% of |
|
# of |
|
|
Gross Leasable |
|
||||
2023 |
|
1.6% |
|
|
83 |
|
|
|
889,000 |
|
|
2029 |
|
2.9% |
|
|
82 |
|
|
|
1,032,000 |
|
2024 |
|
3.0% |
|
|
90 |
|
|
|
1,439,000 |
|
|
2030 |
|
3.5% |
|
|
107 |
|
|
|
1,207,000 |
|
2025 |
|
5.4% |
|
|
187 |
|
|
|
1,986,000 |
|
|
2031 |
|
7.8% |
|
|
186 |
|
|
|
2,704,000 |
|
2026 |
|
5.2% |
|
|
219 |
|
|
|
2,162,000 |
|
|
2032 |
|
6.3% |
|
|
221 |
|
|
|
2,358,000 |
|
2027 |
|
8.7% |
|
|
240 |
|
|
|
3,637,000 |
|
|
2033 |
|
5.0% |
|
|
139 |
|
|
|
1,390,000 |
|
2028 |
|
5.1% |
|
|
179 |
|
|
|
1,753,000 |
|
|
Thereafter |
|
45.5% |
|
|
1,655 |
|
|
|
14,272,000 |
|
(1) |
As of December 31, 2022, the weighted average remaining lease term is 10.4 years. |
(2) |
Based on the annual base rent of $771,984,000, which is the annualized base rent for all leases in place as of December 31, 2022. |
(3) |
Square feet. |
14
TOP 20 LINES OF TRADE |
|
|
|
|
As of December 31, 2022 |
|
|
As of December 31, 2021 |
|
||||||
|
|
Lines of Trade |
|
% of Total(1) |
|
# of Properties |
|
|
% of Total(2) |
|
# of Properties |
|
||
1. |
|
Convenience stores |
|
16.5% |
|
|
650 |
|
|
17.9% |
|
|
654 |
|
2. |
|
Automotive service |
|
13.7% |
|
|
528 |
|
|
12.3% |
|
|
449 |
|
3. |
|
Restaurants – full service |
|
9.1% |
|
|
420 |
|
|
9.8% |
|
|
421 |
|
4. |
|
Restaurants – limited service |
|
8.9% |
|
|
611 |
|
|
9.4% |
|
|
603 |
|
5. |
|
Family entertainment centers |
|
5.9% |
|
|
88 |
|
|
5.9% |
|
|
91 |
|
6. |
|
Health and fitness |
|
4.9% |
|
|
34 |
|
|
5.2% |
|
|
33 |
|
7. |
|
Theaters |
|
4.3% |
|
|
33 |
|
|
4.5% |
|
|
33 |
|
8. |
|
Recreational vehicle dealers, parts and accessories |
|
4.1% |
|
|
52 |
|
|
3.9% |
|
|
47 |
|
9. |
|
Equipment rental |
|
3.1% |
|
|
100 |
|
|
3.2% |
|
|
95 |
|
10. |
|
Automotive parts |
|
2.6% |
|
|
152 |
|
|
3.0% |
|
|
155 |
|
11. |
|
Wholesale clubs |
|
2.6% |
|
|
13 |
|
|
2.5% |
|
|
12 |
|
12. |
|
Drug stores |
|
2.6% |
|
|
67 |
|
|
1.3% |
|
|
32 |
|
13. |
|
Home improvement |
|
2.3% |
|
|
50 |
|
|
2.5% |
|
|
50 |
|
14. |
|
Furniture |
|
2.3% |
|
|
80 |
|
|
1.7% |
|
|
45 |
|
15. |
|
Medical service providers |
|
1.9% |
|
|
84 |
|
|
2.0% |
|
|
83 |
|
16. |
|
General merchandise |
|
1.6% |
|
|
74 |
|
|
1.7% |
|
|
73 |
|
17. |
|
Consumer electronics |
|
1.4% |
|
|
17 |
|
|
1.5% |
|
|
17 |
|
18. |
|
Home furnishings |
|
1.4% |
|
|
16 |
|
|
1.5% |
|
|
15 |
|
19. |
|
Travel plazas |
|
1.4% |
|
|
24 |
|
|
1.5% |
|
|
25 |
|
20. |
|
Automobile auctions, wholesale |
|
1.3% |
|
|
15 |
|
|
1.3% |
|
|
14 |
|
|
|
Other |
|
8.1% |
|
|
303 |
|
|
7.4% |
|
|
276 |
|
|
|
Total |
|
100.0% |
|
|
3,411 |
|
|
100.0% |
|
|
3,223 |
|
(1) |
Based on the annual base rent of $771,984,000, which is the annualized base rent for all leases in place as of December 31, 2022. |
(2) |
Based on the annual base rent of $713,169,000, which is the annualized base rent for all leases in place as of December 31, 2021. |
TOP 10 STATES |
|
|
State |
|
% of Total(1) |
|
|
|
State |
|
% of Total(1) |
1. |
|
Texas |
|
17.1% |
|
6. |
|
North Carolina |
|
4.0% |
2. |
|
Florida |
|
8.8% |
|
7. |
|
Indiana |
|
3.8% |
3. |
|
Illinois |
|
5.3% |
|
8. |
|
Tennessee |
|
3.8% |
4. |
|
Ohio |
|
5.2% |
|
9. |
|
Virginia |
|
3.6% |
5. |
|
Georgia |
|
4.6% |
|
10. |
|
California |
|
3.5% |
(1) |
Based on the annual base rent of $771,984,000, which is the annualized base rent for all leases in place as of December 31, 2022. |
15
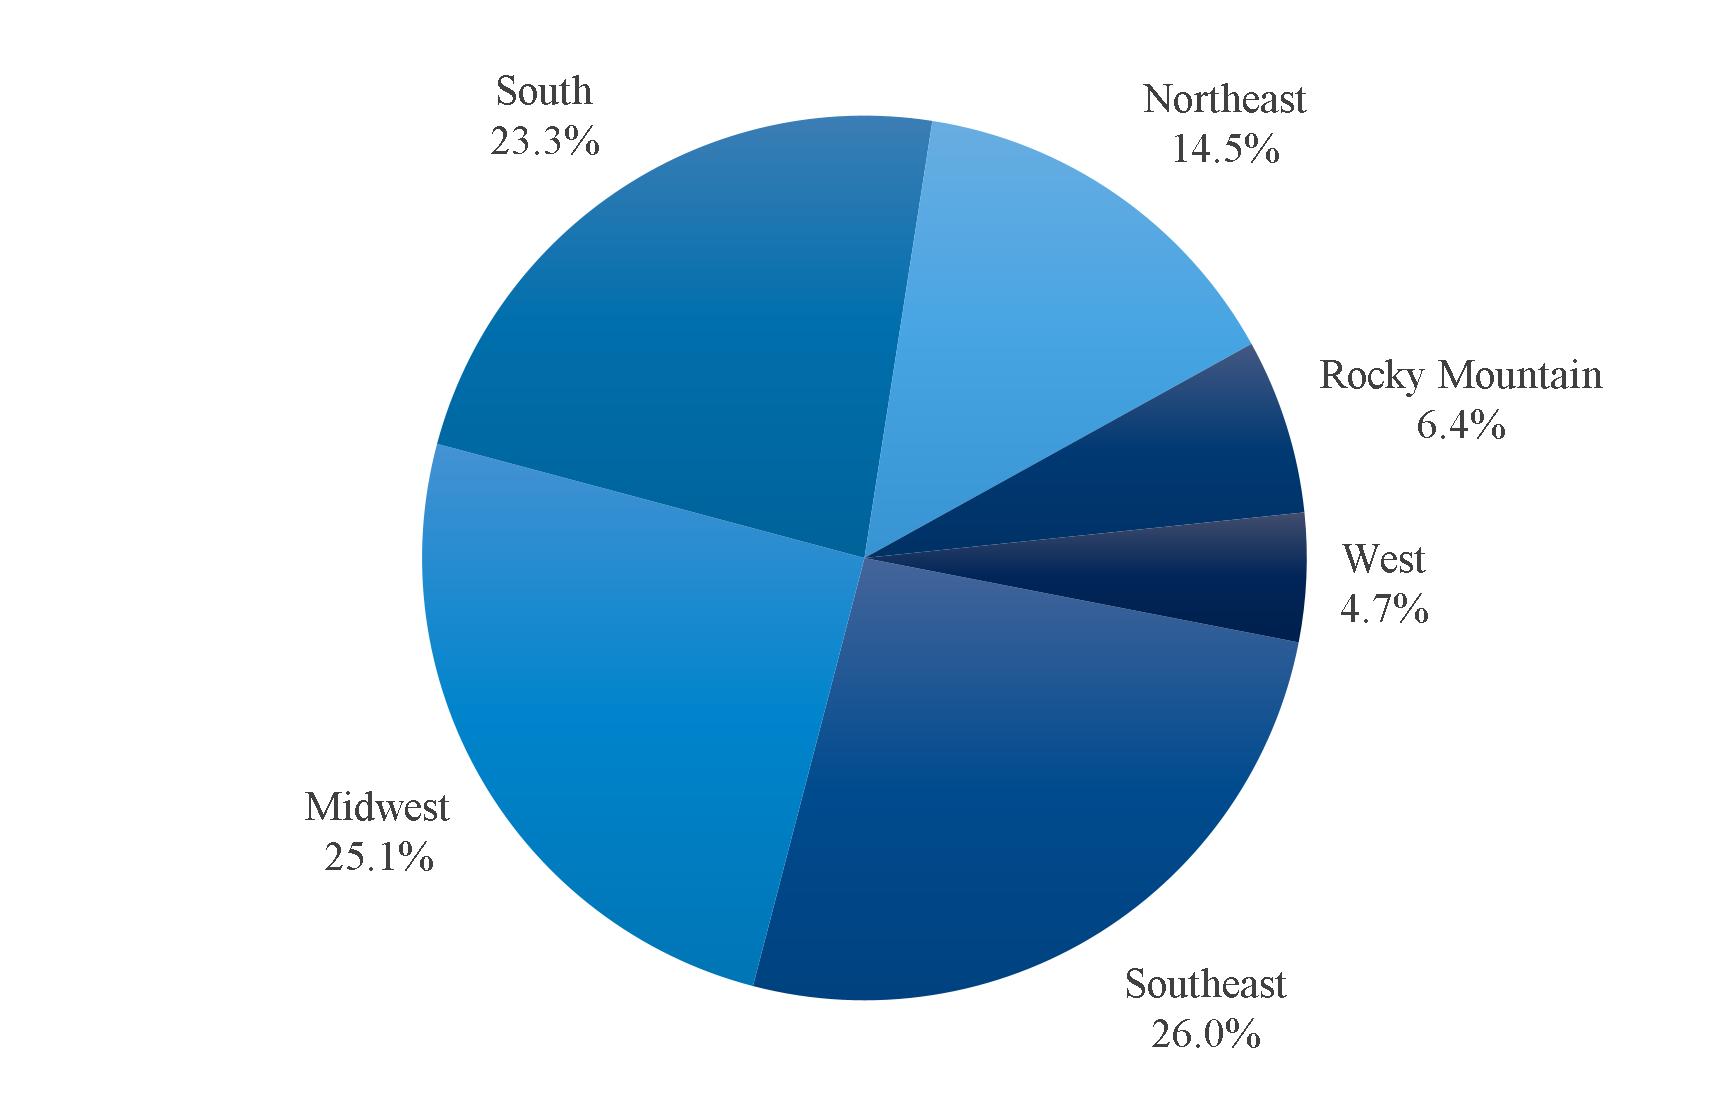
PORTFOLIO BY REGION |
As a percentage of annual base rent - December 31, 2022
|
Based on the annual base rent of $771,984,000, which is the annualized base rent for all leases in place as of December 31, 2022. |
16
TOP TENANTS |
Creditworthy Retailers
|
|
Tenant |
|
# of |
|
% of |
1. |
|
7-Eleven |
|
138 |
|
4.7% |
2. |
|
Mister Car Wash |
|
121 |
|
4.4% |
3. |
|
Camping World |
|
47 |
|
3.9% |
4. |
|
LA Fitness |
|
30 |
|
3.4% |
5. |
|
GPM Investments (Convenience Stores) |
|
152 |
|
3.1% |
6. |
|
Dave & Buster's |
|
28 |
|
2.9% |
7. |
|
Flynn Restaurant Group (Taco Bell/Arby's) |
|
204 |
|
2.9% |
8. |
|
AMC Theatres |
|
20 |
|
2.8% |
9. |
|
BJ's Wholesale Club |
|
13 |
|
2.6% |
10. |
|
Mavis Tire Express Services |
|
134 |
|
2.1% |
11. |
|
Sunoco |
|
59 |
|
2.1% |
12. |
|
Walgreens |
|
49 |
|
2.0% |
13. |
|
Chuck E. Cheese's |
|
53 |
|
1.9% |
14. |
|
United Rentals |
|
52 |
|
1.8% |
15. |
|
Couche Tard (Pantry) |
|
71 |
|
1.7% |
16. |
|
Frisch's Restaurants |
|
69 |
|
1.7% |
17. |
|
Fikes (Convenience Stores) |
|
59 |
|
1.6% |
18. |
|
Life Time Fitness |
|
3 |
|
1.4% |
19. |
|
Best Buy |
|
16 |
|
1.4% |
20. |
|
Bob Evans |
|
106 |
|
1.4% |
(1) |
Based on the annual base rent of $771,984,000, which is the annualized base rent for all leases in place as of December 31, 2022. |
17
SAME STORE RENTAL INCOME |
(dollars in thousands)
Same Store Rental Income – Properties (Cash Basis) (1) |
|
|
|
|
Number of properties |
|
|
3,026 |
|
Year ended December 31, 2022 (2) |
|
$ |
676,882 |
|
Year ended December 31, 2021 (2) |
|
$ |
666,538 |
|
Change (in dollars) |
|
$ |
10,344 |
|
Change (percent) |
|
|
1.6 |
% |
(1) |
Includes all properties owned for current and prior year period excluding any properties under development or re-development. |
(2) |
Excludes the impact of the rent deferral lease amendments (Reference page 20 of this Annual Supplemental Data). |
LEASING DATA |
(dollars in thousands)
Year Ended December 31, 2022 |
|
Renewals With |
|
|
Vacancy Re-Lease To New Tenant |
|
|
Releasing |
|
|
|||
Number of leases |
|
|
91 |
|
|
|
32 |
|
|
|
123 |
|
|
Prior cash rents |
|
$ |
21,378 |
|
|
$ |
5,514 |
|
|
$ |
26,892 |
|
|
New cash rents |
|
$ |
17,571 |
|
|
$ |
4,671 |
|
|
$ |
22,242 |
|
(2) |
Recovery rate |
|
|
82.2 |
% |
|
|
84.7 |
% |
|
|
82.7 |
% |
|
|
|
|
|
|
|
|
|
|
|
|
|||
Tenant improvements |
|
$ |
5,897 |
|
|
$ |
2,781 |
|
|
$ |
8,678 |
|
|
(1) |
Long-term renewal rate for the period of 2010 through 2022 was 83.1%. |
(2) |
Represents 2.9% of total annualized base rent as of December 31, 2022. |
18
OTHER PROPERTY PORTFOLIO DATA |
As of December 31, 2022
Tenant Financials
|
|
# of |
|
|
% of Annual |
|
||
Property Level Financial Information |
|
|
2,865 |
|
|
|
80 |
% |
Tenant Corporate Financials |
|
|
2,661 |
|
|
|
78 |
% |
Rent Increases |
|
% of Annual Base Rent (1) |
||||||
|
|
Annual |
|
Five Year |
|
Other |
|
Total |
CPI |
|
35% |
|
57% |
|
1% |
|
93% |
Fixed |
|
2% |
|
— |
|
1% |
|
3% |
No increases |
|
— |
|
— |
|
4% |
|
4% |
|
|
37% |
|
57% |
|
6% |
|
100% |
Lease Structure - as a percentage of the Company's annual base rent(1)
(1) |
Based on the annual base rent of $771,984,000, which is the annualized base rent for all leases in place as of December 31, 2022. |
EARNINGS GUIDANCE |
Guidance is based on current plans and assumptions and subject to risks and uncertainties more fully described in this press release and the company's reports filed with the Commission. |
|
|
2023 Guidance |
Net earnings per common share excluding any gains on disposition |
|
$1.87 - $1.93 per share |
Real estate depreciation and amortization per share |
|
$1.27 per share |
Core FFO per share |
|
$3.14 - $3.20 per share |
AFFO per share |
|
$3.19 - $3.25 per share |
General and administrative expenses |
|
$43 - $45 Million |
Real estate expenses, net of tenant reimbursements |
|
$8 - $10 Million |
Acquisition volume |
|
$500 - $600 Million |
Disposition volume |
|
$100 - $120 Million |
19
COVID-19 METRICS |
The following table outlines the rent deferred and corresponding scheduled repayment by quarter of the rent deferral lease amendments executed as of December 31, 2022 (dollars in thousands):
|
|
|
Deferred |
|
|
|
Scheduled Repayment |
|
||||||||||||||||||||||||||||||
|
|
|
Accrual |
|
|
Cash |
|
|
Total |
|
|
% of |
|
|
|
Accrual |
|
|
Cash |
|
|
Total |
|
|
% of |
|
|
Cumulative |
|
|||||||||
2020 |
|
|
$ |
33,594 |
|
|
$ |
18,425 |
|
|
$ |
52,019 |
|
|
|
91.7 |
% |
|
|
$ |
3,239 |
|
|
$ |
20 |
|
|
$ |
3,259 |
|
|
|
5.7 |
% |
|
|
5.7 |
% |
|
|
|
|
|
|
|
|
|
|
|
|
|
|
|
|
|
|
|
|
|
|
|
|
|
|
|
|
|
|
|||||||||
2021 |
|
|
|
990 |
|
|
|
3,768 |
|
|
|
4,758 |
|
|
|
8.3 |
% |
|
|
|
25,935 |
|
|
|
5,841 |
|
|
|
31,776 |
|
|
|
56.0 |
% |
|
|
61.7 |
% |
|
|
|
|
|
|
|
|
|
|
|
|
|
|
|
|
|
|
|
|
|
|
|
|
|
|
|
|
|
|
|||||||||
2022 |
Q1 |
|
|
— |
|
|
|
— |
|
|
|
— |
|
|
|
— |
|
|
|
|
1,780 |
|
|
|
2,283 |
|
|
|
4,063 |
|
|
|
7.2 |
% |
|
|
68.9 |
% |
|
Q2 |
|
|
— |
|
|
|
— |
|
|
|
— |
|
|
|
— |
|
|
|
|
1,729 |
|
|
|
2,284 |
|
|
|
4,013 |
|
|
|
7.1 |
% |
|
|
76.0 |
% |
|
Q3 |
|
|
— |
|
|
|
— |
|
|
|
— |
|
|
|
— |
|
|
|
|
1,201 |
|
|
|
2,284 |
|
|
|
3,485 |
|
|
|
6.1 |
% |
|
|
82.1 |
% |
|
Q4 |
|
|
— |
|
|
|
— |
|
|
|
— |
|
|
|
— |
|
|
|
|
681 |
|
|
|
2,284 |
|
|
|
2,965 |
|
|
|
5.2 |
% |
|
|
87.3 |
% |
|
|
|
|
— |
|
|
|
— |
|
|
|
— |
|
|
|
— |
|
|
|
|
5,391 |
|
|
|
9,135 |
|
|
|
14,526 |
|
|
|
25.6 |
% |
|
|
87.3 |
% |
|
|
|
|
|
|
|
|
|
|
|
|
|
|
|
|
|
|
|
|
|
|
|
|
|
|
|
|
|
|
|||||||||
2023 |
Q1 |
|
|
— |
|
|
|
— |
|
|
|
— |
|
|
|
— |
|
|
|
|
9 |
|
|
|
1,704 |
|
|
|
1,713 |
|
|
|
3.0 |
% |
|
|
90.3 |
% |
|
Q2 |
|
|
— |
|
|
|
— |
|
|
|
— |
|
|
|
— |
|
|
|
|
10 |
|
|
|
543 |
|
|
|
553 |
|
|
|
1.0 |
% |
|
|
91.3 |
% |
|
Q3 |
|
|
— |
|
|
|
— |
|
|
|
— |
|
|
|
— |
|
|
|
|
— |
|
|
|
543 |
|
|
|
543 |
|
|
|
0.9 |
% |
|
|
92.2 |
% |
|
Q4 |
|
|
— |
|
|
|
— |
|
|
|
— |
|
|
|
— |
|
|
|
|
— |
|
|
|
544 |
|
|
|
544 |
|
|
|
1.0 |
% |
|
|
93.2 |
% |
|
|
|
|
— |
|
|
|
— |
|
|
|
— |
|
|
|
— |
|
|
|
|
19 |
|
|
|
3,334 |
|
|
|
3,353 |
|
|
|
5.9 |
% |
|
|
93.2 |
% |
|
|
|
|
|
|
|
|
|
|
|
|
|
|
|
|
|
|
|
|
|
|
|
|
|
|
|
|
|
|
|||||||||
2024 |
|
|
|
— |
|
|
|
— |
|
|
|
— |
|
|
|
— |
|
|
|
|
— |
|
|
|
1,932 |
|
|
|
1,932 |
|
|
|
3.4 |
% |
|
|
96.6 |
% |
|
|
|
|
|
|
|
|
|
|
|
|
|
|
|
|
|
|
|
|
|
|
|
|
|
|
|
|
|
|
|||||||||
2025 |
|
|
|
— |
|
|
|
— |
|
|
|
— |
|
|
|
— |
|
|
|
|
— |
|
|
|
1,931 |
|
|
|
1,931 |
|
|
|
3.4 |
% |
|
|
100.0 |
% |
|
|
|
|
|
|
|
|
|
|
|
|
|
|
|
|
|
|
|
|
|
|
|
|
|
|
|
|
|
|
|||||||||
|
|
|
$ |
34,584 |
|
|
$ |
22,193 |
|
|
$ |
56,777 |
|
|
|
100 |
% |
|
|
$ |
34,584 |
|
|
$ |
22,193 |
|
|
$ |
56,777 |
|
|
|
100 |
% |
|
|
|
|
20