PAY VERSUS PERFORMANCE
In accordance with rules adopted by the Securities and Exchange Commission pursuant to the Dodd-Frank Wall Street Reform and Consumer Protection Act of 2010, we provide the following disclosure regarding executive compensation for our principal executive officer (“PEO”) and Non-PEO NEOs and Company performance for the fiscal years listed below. Our Compensation Committee did not consider the pay versus performance disclosure below in making its pay decisions for any of the years shown. Please refer to the Compensation Discussion and Analysis for the complete discussion as to how pay was determined.
| Year |
Summary Compensation Table (“SCT”) Total for Childers (PEO) (1) ($) |
Compensation Actually Paid to Childers (PEO) (1,2,3) ($) |
Average SCT Total for Non-PEO NEOs (1) ($) |
Average Compensation Actually Paid to Non-PEO NEOs (1,2,3) ($) |
Value of Initial Fixed $100 Investment Based On: (4) |
Net |
Adjusted EBITDA(5) ($MM) |
|
|
TSR ($) |
Peer ($) |
|||||||
| 2022 | 7,192,632 | 7,318,092 | 1,951,033 | 1,976,804 | 112 | 129 | 44 | 363 |
| 2021 | 6,609,272 | 3,716,961 | 1,708,806 | 1,212,821 | 87 | 106 | 28 | 326 |
| 2020 | 6,123,248 | 6,701,111 | 1,466,445 | 1,427,338 | 94 | 77 | (68) | 415 |
| (1) | Mr. Childers was our PEO for each year presented. The individuals comprising the Non-PEO NEOs for each year presented are: Ms. Hildebrandt and Messrs. Aron, Ingersoll and Thode. |
| (2) | The amounts shown for Compensation Actually Paid have been calculated in accordance with Item 402(v) of Regulation S-K and do not reflect compensation actually earned, realized, or received by the Company’s NEOs. These amounts reflect the SCT Total with certain adjustments as described in footnote 3 below. |
| (3) | “Compensation Actually Paid” reflects the exclusions and inclusions of certain amounts for the PEO and the Non-PEO NEOs as set forth below. Equity values are calculated in accordance with FASB ASC Topic 718. Amounts under Exclusion of Stock Awards are the totals from the Stock Awards column set forth in the SCT. |
PEO – Mr. Childers
| Year | SCT Total for PEO ($) |
Exclusion of ($) |
Inclusion of Equity ($) |
Compensation ($) |
| 2022 | 7,192,632 | (4,879,884) | 5,005,344 | 7,318,092 |
| 2021 | 6,609,272 | (4,375,869) | 1,483,558 | 3,716,961 |
| 2020 | 6,123,248 | (4,245,524) | 4,823,387 | 6,701,111 |
NON-PEO NEOs – Ms. Hildebrandt and Messrs. Aron, Ingersoll and Thode
| Year | Average Summary SCT ($) |
Average Exclusion of |
Average Inclusion ($) |
Average Compensation ($) |
| 2022 | 1,951,033 | (1,003,068) | 1,028,839 | 1,976,804 |
| 2021 | 1,708,806 | (840,462) | 344,477 | 1,212,821 |
| 2020 | 1,466,445 | (769,493) | 730,386 | 1,427,338 |
The amounts in Inclusion of Equity Values in the tables above are derived from the amounts set forth in the following tables:
PEO – Mr. Childers
| Year |
Year-End Fair Value (“FV”) of Equity Awards Granted During Year That Remained Unvested as of Last Day of Year ($) |
Change in FV From Last Day of Prior Year to Last Day of Year of Unvested Equity Awards ($) |
Change in FV From Last Day of Prior Year to Vesting Date of Unvested Equity Awards that Vested During Year ($) |
Value of Dividends Paid on Equity Awards Not Otherwise Included ($) |
Total Inclusion of Equity Values ($) |
| 2022 | 4,861,691 | (818,579) | 451,332 | 510,900 | 5,005,344 |
| 2021 | 2,958,118 | (1,910,090) | (160,663) | 596,192 | 1,483,558 |
| 2020 | 5,563,896 | (558,310) | (874,186) | 691,987 | 4,823,387 |
NON-PEO NEOs – Ms. Hildebrandt and Messrs. Aron, Ingersoll and Thode
|
Year |
Average Year-End FV of Equity Awards Granted During Year That Remained Unvested as of Last Day of Year ($) |
Average Change in FV from Last Day of Prior Year to Last Day of Year of Unvested Equity Awards ($) |
Average Change in FV from Last Day of Prior Year to Vesting Date of Unvested Equity Awards that Vested During Year ($) |
Average Value of Dividends Paid on Equity Awards Not Otherwise Included ($) |
Total Average Inclusion of Equity Values ($) |
|||||
| 2022 | 999,328 | (149,194) | 78,509 | 100,196 | 1,028,839 | |||||
| 2021 | 568,159 | (323,536) | (1,545) | 101,400 | 344,477 | |||||
| 2020 | 796,610 | (65,803) | (87,950) | 87,529 | 730,386 | |||||
For the equity values included in the above tables, the valuation assumptions used to calculate fair values did not materially differ from those disclosed at the time of the grant.
| (4) | The Peer Group TSR shown in this table utilizes the Alerian Midstream Energy Total Return (AMNAX) Index, which we also utilize in the stock performance graph required by Item 201(e) of Regulation S-K included in our Annual Report for the year ended December 31, 2022. The comparison assumes $100 was invested for the period starting December 31, 2019, through the end of the listed year in the Company and the AMNAX Index. Historical stock price performance is not necessarily indicative of future stock performance. |
| (5) | We determined Adjusted EBITDA to be the most important financial performance measure used to link Company performance to Compensation Actually Paid to our PEO and other NEOs in 2022. Adjusted EBITDA is a Non-GAAP measure, and is defined in the Compensation Discussion and Analysis under “Annual Performance-Based Incentive Compensation.” This performance measure may not have been the most important financial performance measure for years 2021 and 2020 and we may determine a different financial performance measure to be the most important measure in future years. |
| (1) | Mr. Childers was our PEO for each year presented. The individuals comprising the Non-PEO NEOs for each year presented are: Ms. Hildebrandt and Messrs. Aron, Ingersoll and Thode. |
| (4) | The Peer Group TSR shown in this table utilizes the Alerian Midstream Energy Total Return (AMNAX) Index, which we also utilize in the stock performance graph required by Item 201(e) of Regulation S-K included in our Annual Report for the year ended December 31, 2022. The comparison assumes $100 was invested for the period starting December 31, 2019, through the end of the listed year in the Company and the AMNAX Index. Historical stock price performance is not necessarily indicative of future stock performance. |
| (3) | “Compensation Actually Paid” reflects the exclusions and inclusions of certain amounts for the PEO and the Non-PEO NEOs as set forth below. Equity values are calculated in accordance with FASB ASC Topic 718. Amounts under Exclusion of Stock Awards are the totals from the Stock Awards column set forth in the SCT. |
PEO – Mr. Childers
| Year | SCT Total for PEO ($) |
Exclusion of ($) |
Inclusion of Equity ($) |
Compensation ($) |
| 2022 | 7,192,632 | (4,879,884) | 5,005,344 | 7,318,092 |
| 2021 | 6,609,272 | (4,375,869) | 1,483,558 | 3,716,961 |
| 2020 | 6,123,248 | (4,245,524) | 4,823,387 | 6,701,111 |
The amounts in Inclusion of Equity Values in the tables above are derived from the amounts set forth in the following tables:
PEO – Mr. Childers
| Year |
Year-End Fair Value (“FV”) of Equity Awards Granted During Year That Remained Unvested as of Last Day of Year ($) |
Change in FV From Last Day of Prior Year to Last Day of Year of Unvested Equity Awards ($) |
Change in FV From Last Day of Prior Year to Vesting Date of Unvested Equity Awards that Vested During Year ($) |
Value of Dividends Paid on Equity Awards Not Otherwise Included ($) |
Total Inclusion of Equity Values ($) |
| 2022 | 4,861,691 | (818,579) | 451,332 | 510,900 | 5,005,344 |
| 2021 | 2,958,118 | (1,910,090) | (160,663) | 596,192 | 1,483,558 |
| 2020 | 5,563,896 | (558,310) | (874,186) | 691,987 | 4,823,387 |
| (3) | “Compensation Actually Paid” reflects the exclusions and inclusions of certain amounts for the PEO and the Non-PEO NEOs as set forth below. Equity values are calculated in accordance with FASB ASC Topic 718. Amounts under Exclusion of Stock Awards are the totals from the Stock Awards column set forth in the SCT. |
NON-PEO NEOs – Ms. Hildebrandt and Messrs. Aron, Ingersoll and Thode
| Year | Average Summary SCT ($) |
Average Exclusion of |
Average Inclusion ($) |
Average Compensation ($) |
| 2022 | 1,951,033 | (1,003,068) | 1,028,839 | 1,976,804 |
| 2021 | 1,708,806 | (840,462) | 344,477 | 1,212,821 |
| 2020 | 1,466,445 | (769,493) | 730,386 | 1,427,338 |
The amounts in Inclusion of Equity Values in the tables above are derived from the amounts set forth in the following tables:
NON-PEO NEOs – Ms. Hildebrandt and Messrs. Aron, Ingersoll and Thode
|
Year |
Average Year-End FV of Equity Awards Granted During Year That Remained Unvested as of Last Day of Year ($) |
Average Change in FV from Last Day of Prior Year to Last Day of Year of Unvested Equity Awards ($) |
Average Change in FV from Last Day of Prior Year to Vesting Date of Unvested Equity Awards that Vested During Year ($) |
Average Value of Dividends Paid on Equity Awards Not Otherwise Included ($) |
Total Average Inclusion of Equity Values ($) |
|||||
| 2022 | 999,328 | (149,194) | 78,509 | 100,196 | 1,028,839 | |||||
| 2021 | 568,159 | (323,536) | (1,545) | 101,400 | 344,477 | |||||
| 2020 | 796,610 | (65,803) | (87,950) | 87,529 | 730,386 | |||||
Description of Relationship Between PEO and Other NEO Compensation Actually Paid and Company TSR
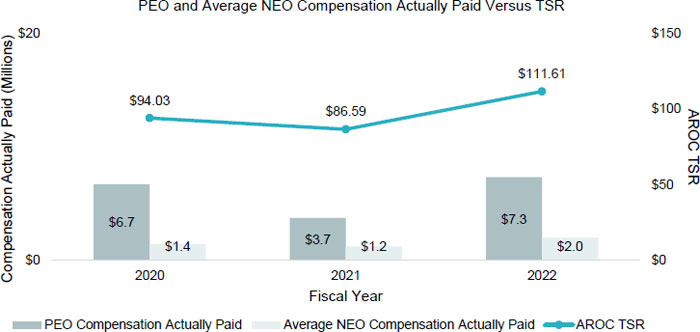
As demonstrated by the following chart, the amount of Compensation Actually Paid to our PEO and the average of Compensation Actually Paid to our other NEOs is aligned with the Company’s cumulative TSR over the three years presented in the chart. The alignment of Compensation Actually Paid with the Company’s TSR over the period is because a significant portion of the Compensation Actually Paid to our PEO and other NEOs is comprised of equity awards. As described in more detail in the section “Executive Compensation – Compensation Discussion and Analysis”, for the 2022 year for example, approximately 70% and 55% of the value of total compensation awarded to our PEO and other NEOs, respectively, was comprised of equity awards, including restricted stock awards and performance units.
Description of Relationship Between PEO and Other NEO Compensation Actually Paid and Net Income
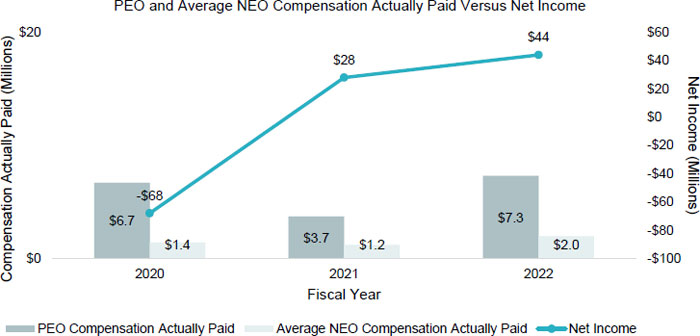
The following chart sets forth the relationship between Compensation Actually Paid to our PEO, the average of Compensation Actually Paid to our other NEOs, and our net income during the three most recently completed fiscal years. While the Company does not use net income as a performance measure in its overall executive compensation program, the measure of net income is generally correlated with the measure of Adjusted EBITDA, which the Company does use when setting goals in the Company’s annual incentive program and CAD and Leverage Performance Units. As described in more detail in the section “Executive Compensation – Compensation Discussion and Analysis”, for the 2022 year, approximately 16% and 20%, respectively, of the value of total compensation awarded to our PEO and our other NEOs, respectively, consisted of amounts under the Company’s short-term incentive program.
Description of Relationship Between PEO and NEO Compensation Actually Paid and Adjusted EBITDA
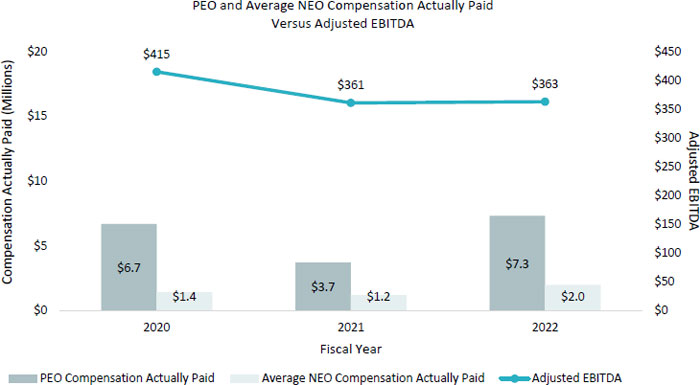
The following chart demonstrates the general alignment between Compensation Actually Paid to our PEO, the average of Compensation Actually Paid to our other NEOs, and our Adjusted EBITDA during the three most recently completed fiscal years. As noted above, Adjusted EBITDA is a non-GAAP measure. While the Company uses numerous financial and non-financial performance measures for the purpose of evaluating performance for the Company’s compensation programs, the Company has determined that Adjusted EBITDA is the financial performance measure that, in the Company’s assessment, represents the most important performance measure (that is not otherwise required to be disclosed in the table) used by the Company to link compensation actually paid to the company’s NEOs, for the most recently completed fiscal year, to Company performance. The Company utilizes Adjusted EBITDA when setting goals in the Company’s short-term incentive program, as well as serving as a component for setting goals for a portion of the Performance Units that are awarded to the NEOs.
Description of Relationship Between Company TSR and Peer Group TSR
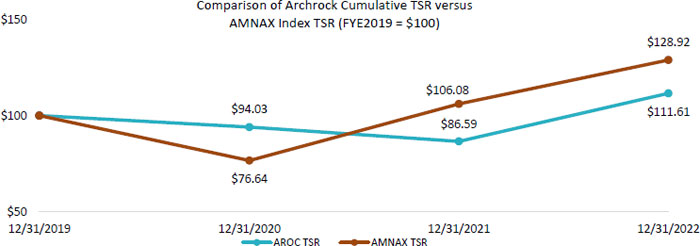
The following chart compares our cumulative TSR over the three most recently completed fiscal years to that of the AMNAX Index over the same period.
Important Financial Performance Measures
As described in greater detail in “Executive Compensation – Compensation Discussion and Analysis”, the Company’s executive compensation program reflects a variable pay-for-performance philosophy. As described in more detail in the section “Executive Compensation – Compensation Discussion and Analysis”, the portion of variable compensation out of total compensation awarded during 2022 was 86% for our PEO and an average of 75% for our other NEOs. The Company considers the following financial performance measures to have been the most important in linking Compensation Actually Paid to our PEO and other NEOs for 2022 to Company performance. The measures in this table are not ranked.
|
Adjusted EBITDA Cash Available for Dividend Leverage |
| (5) | We determined Adjusted EBITDA to be the most important financial performance measure used to link Company performance to Compensation Actually Paid to our PEO and other NEOs in 2022. Adjusted EBITDA is a Non-GAAP measure, and is defined in the Compensation Discussion and Analysis under “Annual Performance-Based Incentive Compensation.” This performance measure may not have been the most important financial performance measure for years 2021 and 2020 and we may determine a different financial performance measure to be the most important measure in future years. |