Pay vs Performance Disclosure
Dec. 31, 2022
USD ($)
Dec. 31, 2021
USD ($)
Dec. 31, 2020
USD ($)
Dec. 31, 2022
Pay Versus Performance Table for Fiscal Year 2022
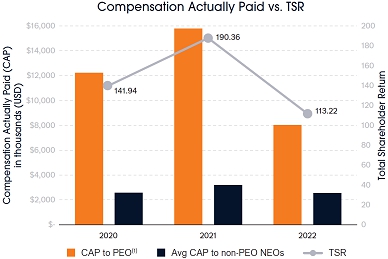
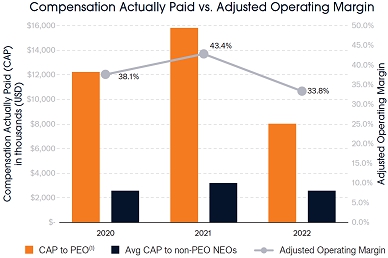
The Pay Versus Performance Table below discloses the relationship between the compensation actually paid to the executive officers and the Company’s financial performance during the years ended December 31, 2020, 2021, and 2022. The compensation information presented in this table is different from compensation information presented in the Summary Compensation Table above. The differences can largely be attributed to variation in the treatment of stock awards in each of these tables.
| ■ | The compensation presented in the “2022 Compensation for the CEO and Other NEOs” section of the CD&A illustrates compensation paid or granted to NEOs based on their performance during the 2022 performance period as determined by the scorecard approach. The stock awards shown as “JHG Restricted Stock” in these tables include the portion of 2022 total variable compensation that will be deferred into JHG RSUs when it is granted in March 2023. |
| ■ | In accordance with SEC rules, the Stock Awards column in the Summary Compensation Table includes the aggregate grant date fair values of the RSUs granted during 2022, even though the number of RSUs granted was determined based on the 2021 performance of the executive officers. |
| ■ | The Pay Versus Performance Table below differs from both the information presented in the CD&A and in the Summary Compensation Table, because it calculates actual compensation based on different methodologies, including the value of outstanding unvested stock awards as of December 31, 2022. |
| Average SCT | Average Compensation | Value of Initial Fixed $100 Investment Based On: | ||||||||||||||||||||||||||||||||||||||
| Year | Summary Compensation Table Total for Ali Dibadj ($) | Summary Compensation Table Total for Richard Weil ($) | Compensation Actually Paid to Ali Dibadj ($)(1) | Compensation Actually Paid to Richard Weil ($)(1) | Total for Non-PEO Named Executive Officers ($)(2) | Actually Paid to Non-PEO Named Executive Officers ($) | Total Shareholder Return ($) | Peer Group Total Shareholder Return ($)(3) | Net Income (millions) ($) | Adjusted Operating Margin (%)(4)(5) | ||||||||||||||||||||||||||||||
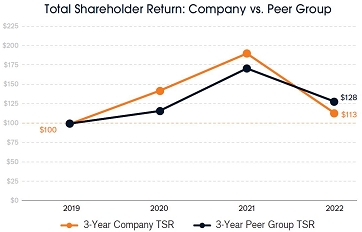
| 2022 | 7,947,815 | 4,515,893 | 8,027,246 | (2,057,211 | ) | 3,259,428 | 2,559,255 | 113.22 | 128.15 | 372.4 | 33.8 | |||||||||||||||||||||||||||||
| 2021 | — | 9,317,046 | — | 15,802,892 | 2,613,369 | 3,185,241 | 190.36 | 171.06 | 620.0 | 43.4 | ||||||||||||||||||||||||||||||
| 2020 | — | 8,388,794 | — | 12,221,851 | 2,046,390 | 2,565,353 | 141.94 | 115.88 | 130.3 | 38.1 | ||||||||||||||||||||||||||||||
| (1) | The amounts in the following table represent each of the amounts deducted and added to the equity award values for our Principal Executive Officer (“PEO”), which in our case is the CEO, for the applicable year for purposes of computing the “compensation actually paid” (“CAP”) amounts appearing in these columns of the Pay Versus Performance Table: |
| Year | PEO Name | Grant Date Fair Value of Equity Awards Granted During Applicable Year ($)(i) | Year-End Fair Value of Equity Awards Granted During Applicable Year ($) | Change in Fair Value as of Year-End of Any Prior Year Awards that Remain Unvested as of Year-End ($) | Fair Value of Awards Granted and Vested in the Applicable Year ($) | Change in Fair Value as of the Vesting Date of Any Prior Year Awards that Vested During Applicable Year ($) | Dollar Value of Any Dividends or Other Earnings Paid on Stock Awards Prior to the Vesting Date ($)(ii) | Total Equity Value Adjustments Reflected in Compensation Actually Paid ($)(iii) | ||||||||||||||||||||||
| 2022 | Ali Dibadj | (5,000,022 | ) | 4,916,409 | — | — | — | 163,044 | 79,431 | |||||||||||||||||||||
| 2022 | Richard Weil | (1,000,027 | ) | 697,321 | (2,409,840 | ) | — | (3,895,246 | ) | 34,688 | (6,573,104 | ) | ||||||||||||||||||
| 2021 | Richard Weil | (1,950,007 | ) | 3,607,008 | 4,928,291 | — | (101,092 | ) | 1,646 | 6,485,846 | ||||||||||||||||||||
| 2020 | Richard Weil | (1,856,267 | ) | 3,151,292 | 2,504,043 | — | 3,233 | 30,756 | 3,833,057 | |||||||||||||||||||||
| (i) | Represents the deduction of amounts reported in the Stock Awards column of the Summary Compensation Table. | |
| (ii) | Represents dividends paid or accrued on stock awards in 2022 prior to the vesting date(s) that are not otherwise reflected in the Compensation Actually Paid to the applicable PEO. | |
| (iii) | Represents the total adjustments to the Summary Compensation Table in respect of equity awards for the applicable year, as reflected in Compensation Actually Paid. |
| (2) | The amounts in the following table represent each of the amounts deducted and added to the equity award values for the non-PEO NEOs for the applicable year for purposes of computing the “compensation actually paid” amounts appearing in the Pay Versus Performance Table: |
| Year | NEO Names | Grant Date Fair Value of Equity Awards Granted During Applicable Year ($) | Year-End Fair Value of Equity Awards Granted During Applicable Year ($) | Change in Fair Value as of Year-End of Any Prior Year Awards that Remain Unvested as of Year-End ($) | Fair Value of Awards Granted and Vested in the Applicable Year ($) | Change in Fair Value as of the Vesting Date of Any Prior Year Awards that Vested During Applicable Year ($) | Dollar Value of Any Dividends or Other Earnings Paid on Stock Awards Prior to the Vesting Date ($)(i) | Total Equity Value Adjustments Reflected in Compensation Actually Paid ($)(ii) | ||||||||||||||||||||||
| 2022(iii) | 2022 AVERAGE | (1,875,254 | ) | 1,320,305 | (377,728 | ) | 474,002 | (340,406 | ) | 98,908 | (700,173 | ) | ||||||||||||||||||
| 2021(iv) | 2021 AVERAGE | (547,511 | ) | 781,573 | 284,199 | — | (11,677 | ) | 65,288 | 571,872 | ||||||||||||||||||||
| 2020(v) | 2020 AVERAGE | (444,495 | ) | 692,739 | 249,241 | — | (32,744 | ) | 54,222 | 518,963 | ||||||||||||||||||||
| (i) | Represents dividends paid or accrued on stock awards in 2022 prior to the vesting date(s) that are not otherwise reflected in the Compensation Actually Paid to the non-PEO NEOs. | |
| (ii) | Represents the total adjustments to the Average Summary Compensation Table Total in respect of equity awards for the applicable year, as reflected in Compensation Actually Paid. | |
| (iii) | 2022 NEOs include: Mr. Thompson, Mses. Cain, Fogo, Rosenberg, and Krueger. Mr. Thompson served as our Interim Chief Executive Officer from April 1, 2022, until Mr. Dibadj’s appointment on June 21, 2022. In connection with Mr. Thompson’s interim role, he continued to receive the same salary he received in 2022 for his role as Chief Financial Officer. Accordingly, Mr. Thompson’s 2022 compensation has been included in the average compensation column for our non-PEO NEOs. | |
| (iv) | 2021 NEOs include: Mr. Thompson, Mses. Cain, Fogo, and Rosenberg. | |
| (v) | 2020 NEOs include: Mr. Thompson, Mses. Cain, Fogo, and Rosenberg. |
| (3) | The companies included in the peer group total shareholder return calculations are the publicly traded companies included in the S&P U.S. BMI Asset Management & Custody Banks Index used by the Company for purposes of disclosing our cumulative total shareholder return in our Annual Report on Form 10-K for the fiscal year ended December 31, 2022. The S&P US BMI Asset Management & Custody Banks Index is a market-value weighted index of 40 asset management companies. |
| (4) | In addition to financial results reported in accordance with GAAP, we report certain financial measures on a non-GAAP basis. These measures are not in accordance with, or a substitute for, GAAP, and our financial measures may differ from the non-GAAP financial measures used by other companies. For additional information, see Annex A, “Reconciliation of Non-GAAP Financial Measures”. |
| (5) | Adjusted operating margin is adjusted operating income divided by adjusted revenue for 2022. This measure has been designated as the “Company-Selected Measure” for 2022, in accordance with SEC rules, and represents the most important financial performance measure (that is not otherwise required to be disclosed in the table) used by the Company to link compensation actually paid to our NEOs in 2022. |
| (1) | The amounts in the following table represent each of the amounts deducted and added to the equity award values for our Principal Executive Officer (“PEO”), which in our case is the CEO, for the applicable year for purposes of computing the “compensation actually paid” (“CAP”) amounts appearing in these columns of the Pay Versus Performance Table: |
| Year | PEO Name | Grant Date Fair Value of Equity Awards Granted During Applicable Year ($)(i) | Year-End Fair Value of Equity Awards Granted During Applicable Year ($) | Change in Fair Value as of Year-End of Any Prior Year Awards that Remain Unvested as of Year-End ($) | Fair Value of Awards Granted and Vested in the Applicable Year ($) | Change in Fair Value as of the Vesting Date of Any Prior Year Awards that Vested During Applicable Year ($) | Dollar Value of Any Dividends or Other Earnings Paid on Stock Awards Prior to the Vesting Date ($)(ii) | Total Equity Value Adjustments Reflected in Compensation Actually Paid ($)(iii) | ||||||||||||||||||||||
| 2022 | Ali Dibadj | (5,000,022 | ) | 4,916,409 | — | — | — | 163,044 | 79,431 | |||||||||||||||||||||
| 2022 | Richard Weil | (1,000,027 | ) | 697,321 | (2,409,840 | ) | — | (3,895,246 | ) | 34,688 | (6,573,104 | ) | ||||||||||||||||||
| 2021 | Richard Weil | (1,950,007 | ) | 3,607,008 | 4,928,291 | — | (101,092 | ) | 1,646 | 6,485,846 | ||||||||||||||||||||
| 2020 | Richard Weil | (1,856,267 | ) | 3,151,292 | 2,504,043 | — | 3,233 | 30,756 | 3,833,057 | |||||||||||||||||||||
| (2) | The amounts in the following table represent each of the amounts deducted and added to the equity award values for the non-PEO NEOs for the applicable year for purposes of computing the “compensation actually paid” amounts appearing in the Pay Versus Performance Table: |
| Year | NEO Names | Grant Date Fair Value of Equity Awards Granted During Applicable Year ($) | Year-End Fair Value of Equity Awards Granted During Applicable Year ($) | Change in Fair Value as of Year-End of Any Prior Year Awards that Remain Unvested as of Year-End ($) | Fair Value of Awards Granted and Vested in the Applicable Year ($) | Change in Fair Value as of the Vesting Date of Any Prior Year Awards that Vested During Applicable Year ($) | Dollar Value of Any Dividends or Other Earnings Paid on Stock Awards Prior to the Vesting Date ($)(i) | Total Equity Value Adjustments Reflected in Compensation Actually Paid ($)(ii) | ||||||||||||||||||||||
| 2022(iii) | 2022 AVERAGE | (1,875,254 | ) | 1,320,305 | (377,728 | ) | 474,002 | (340,406 | ) | 98,908 | (700,173 | ) | ||||||||||||||||||
| 2021(iv) | 2021 AVERAGE | (547,511 | ) | 781,573 | 284,199 | — | (11,677 | ) | 65,288 | 571,872 | ||||||||||||||||||||
| 2020(v) | 2020 AVERAGE | (444,495 | ) | 692,739 | 249,241 | — | (32,744 | ) | 54,222 | 518,963 | ||||||||||||||||||||
| (i) | Represents dividends paid or accrued on stock awards in 2022 prior to the vesting date(s) that are not otherwise reflected in the Compensation Actually Paid to the non-PEO NEOs. | |
| (ii) | Represents the total adjustments to the Average Summary Compensation Table Total in respect of equity awards for the applicable year, as reflected in Compensation Actually Paid. | |
| (iii) | 2022 NEOs include: Mr. Thompson, Mses. Cain, Fogo, Rosenberg, and Krueger. Mr. Thompson served as our Interim Chief Executive Officer from April 1, 2022, until Mr. Dibadj’s appointment on June 21, 2022. In connection with Mr. Thompson’s interim role, he continued to receive the same salary he received in 2022 for his role as Chief Financial Officer. Accordingly, Mr. Thompson’s 2022 compensation has been included in the average compensation column for our non-PEO NEOs. | |
| (iv) | 2021 NEOs include: Mr. Thompson, Mses. Cain, Fogo, and Rosenberg. | |
| (v) | 2020 NEOs include: Mr. Thompson, Mses. Cain, Fogo, and Rosenberg. |
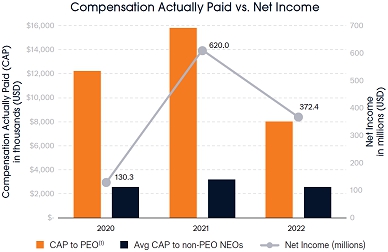
| Note: | The SEC requires companies to compare compensation actually paid to our NEOs (including the PEO) and net income, however, we do not rely on net income in the determination of NEO compensation. |
| (1) | The “CAP to PEO” amount for 2022 represents compensation paid to Ali Dibadj. “CAP to PEO” amounts for 2021 and 2020 represents compensation paid to Richard Weil. |
| Most Important Performance Measures |
| Adjusted Operating Margin |
| Annual Net New Revenue |
| Total Shareholder Return |
| % Assets Outperforming Benchmarks |
| [1] |
|
||||||||||||||||||||||||||||||||||||||||||||||||||||||||||||||||||||||||||||||||||||||||||||||||||||||||||||||||||||||||||||||||||||||||||||||||||||||||||||||
| [2] |
|
||||||||||||||||||||||||||||||||||||||||||||||||||||||||||||||||||||||||||||||||||||||||||||||||||||||||||||||||||||||||||||||||||||||||||||||||||||||||||||||
| [3] | (3)The companies included in the peer group total shareholder return calculations are the publicly traded companies included in the S&P U.S. BMI Asset Management & Custody Banks Index used by the Company for purposes of disclosing our cumulative total shareholder return in our Annual Report on Form 10-K for the fiscal year ended December 31, 2022. The S&P US BMI Asset Management & Custody Banks Index is a market-value weighted index of 40 asset management companies. | ||||||||||||||||||||||||||||||||||||||||||||||||||||||||||||||||||||||||||||||||||||||||||||||||||||||||||||||||||||||||||||||||||||||||||||||||||||||||||||||
| [4] | (4)In addition to financial results reported in accordance with GAAP, we report certain financial measures on a non-GAAP basis. These measures are not in accordance with, or a substitute for, GAAP, and our financial measures may differ from the non-GAAP financial measures used by other companies. For additional information, see Annex A, “Reconciliation of Non-GAAP Financial Measures”. | ||||||||||||||||||||||||||||||||||||||||||||||||||||||||||||||||||||||||||||||||||||||||||||||||||||||||||||||||||||||||||||||||||||||||||||||||||||||||||||||
| [5] | (5)Adjusted operating margin is adjusted operating income divided by adjusted revenue for 2022. This measure has been designated as the “Company-Selected Measure” for 2022, in accordance with SEC rules, and represents the most important financial performance measure (that is not otherwise required to be disclosed in the table) used by the Company to link compensation actually paid to our NEOs in 2022. | ||||||||||||||||||||||||||||||||||||||||||||||||||||||||||||||||||||||||||||||||||||||||||||||||||||||||||||||||||||||||||||||||||||||||||||||||||||||||||||||
| [6] | (i)Represents the deduction of amounts reported in the Stock Awards column of the Summary Compensation Table. | ||||||||||||||||||||||||||||||||||||||||||||||||||||||||||||||||||||||||||||||||||||||||||||||||||||||||||||||||||||||||||||||||||||||||||||||||||||||||||||||
| [7] | (ii)Represents dividends paid or accrued on stock awards in 2022 prior to the vesting date(s) that are not otherwise reflected in the Compensation Actually Paid to the applicable PEO. | ||||||||||||||||||||||||||||||||||||||||||||||||||||||||||||||||||||||||||||||||||||||||||||||||||||||||||||||||||||||||||||||||||||||||||||||||||||||||||||||
| [8] | (iii)Represents the total adjustments to the Summary Compensation Table in respect of equity awards for the applicable year, as reflected in Compensation Actually Paid. | ||||||||||||||||||||||||||||||||||||||||||||||||||||||||||||||||||||||||||||||||||||||||||||||||||||||||||||||||||||||||||||||||||||||||||||||||||||||||||||||
| [9] | (iii)2022 NEOs include: Mr. Thompson, Mses. Cain, Fogo, Rosenberg, and Krueger. Mr. Thompson served as our Interim Chief Executive Officer from April 1, 2022, until Mr. Dibadj’s appointment on June 21, 2022. In connection with Mr. Thompson’s interim role, he continued to receive the same salary he received in 2022 for his role as Chief Financial Officer. Accordingly, Mr. Thompson’s 2022 compensation has been included in the average compensation column for our non-PEO NEOs. | ||||||||||||||||||||||||||||||||||||||||||||||||||||||||||||||||||||||||||||||||||||||||||||||||||||||||||||||||||||||||||||||||||||||||||||||||||||||||||||||
| [10] | (iv)2021 NEOs include: Mr. Thompson, Mses. Cain, Fogo, and Rosenberg. | ||||||||||||||||||||||||||||||||||||||||||||||||||||||||||||||||||||||||||||||||||||||||||||||||||||||||||||||||||||||||||||||||||||||||||||||||||||||||||||||
| [11] | (v)2020 NEOs include: Mr. Thompson, Mses. Cain, Fogo, and Rosenberg. | ||||||||||||||||||||||||||||||||||||||||||||||||||||||||||||||||||||||||||||||||||||||||||||||||||||||||||||||||||||||||||||||||||||||||||||||||||||||||||||||
| [12] | (i)Represents dividends paid or accrued on stock awards in 2022 prior to the vesting date(s) that are not otherwise reflected in the Compensation Actually Paid to the non-PEO NEOs | ||||||||||||||||||||||||||||||||||||||||||||||||||||||||||||||||||||||||||||||||||||||||||||||||||||||||||||||||||||||||||||||||||||||||||||||||||||||||||||||