item in Millions
Value ($) of Initial Fixed $100 | ||||||||||||||||||||
SCT ($) for | CAP ($) to | SCT ($) for | CAP ($) to | Average | Average | Investment Based On: | Adjusted | |||||||||||||
Fiscal |
| Mr. Makuen | Mr. Makuen |
| Mr. Sachse | Mr. Sachse | SCT ($) | CAP ($) | Citi Trends | Peer Group | Net Income | EBIT | ||||||||
Year | (PEO 1) | (PEO 1) | (PEO 2) | (PEO 2) | for NEOs | to NEOs | TSR | TSR | ($M) | ($M) | ||||||||||
(a) |
| (b)1 | (c)2 | (d)1 | (e)2 | (f)3 | (g)2 | (h)4 | (i)4 | (j) | (k)5 | |||||||||
2022 |
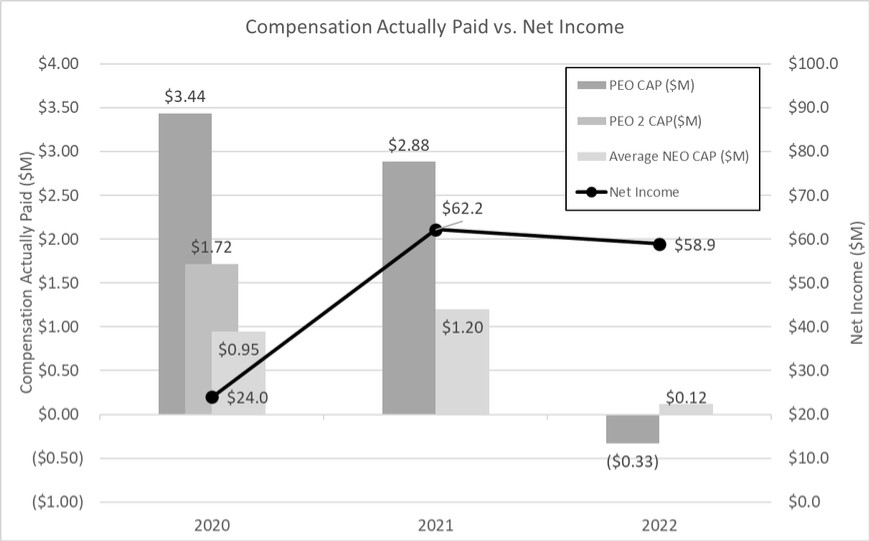
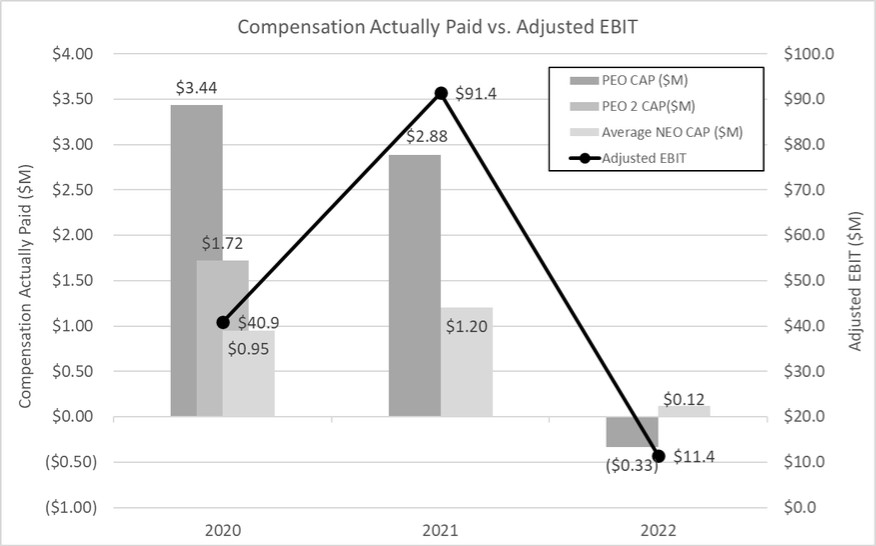
| 1,730,016 | (331,897) | — | — | 483,470 | 122,735 | 135.73 | 135.59 | 58.9 | 11.4 | |||||||||
2021 |
| 2,979,581 | 2,882,746 | — | — | 1,140,197 | 1,200,526 | 210.06 | 142.18 | 62.2 | 91.4 | |||||||||
2020 | 2,995,723 | 3,438,476 | 682,576 | 1,719,020 | 693,908 | 949,579 | 254.38 | 140.92 | 24.0 | 40.9 | ||||||||||
(1) | The dollar amounts reported in columns (b) and (d) are the amounts of total compensation reported for Mr. Makuen (Chief Executive Officer and Principal Executive Officer since March 9th, 2020) and Mr. Sachse (Interim Chief Executive Officer until March 9th, 2020) for each corresponding year in the “Total” column of the Summary Compensation Table. Refer to our Summary Compensation Table on page 32. |
(2) | The dollar amounts reported in column (c), (e) and (g) represent the amount of “compensation actually paid,” as computed in accordance with SEC rules. “Compensation actually paid” does not necessarily represent cash and/or equity value transferred to the applicable NEO without restriction, but rather is a value calculated under applicable SEC rules. We do not have a defined benefit plan so no adjustment for pension benefits is included in the table below. Similarly, no adjustment is made for dividends as dividends are factored into the fair value of the award. The following table details these adjustments: |
All table values in $ | Grant Date | Year End | Change in | Change in | Change in | Total | |||||||||||||
|
| Value of | Value of | Value of | Value of | Value of | Equity | ||||||||||||
Fiscal | Executives | SCT | New Awards | New Awards | Prior Awards | Vested Awards | Forfeited Awards | CAP | CAP | ||||||||||
Year |
| (a) | (b) | (i) | (ii) | (iii) | (iv) | (c)=(i)+(ii)+(iii)+(iv) | (d)=(a)+(b)+(c) | ||||||||||
2022 |
| PEO 1 | 1,730,016 | 1,015,002 | 196,574 | (324,732) | (51,798) | (866,955) | (1,046,911) | (331,897) | |||||||||
| Others | 483,470 | 176,668 | 94,824 | (45,312) | (60,821) | (172,758) | (184,067) | 122,735 | ||||||||||
2021 |
| PEO 1 | 2,979,581 | 924,752 | 350,522 | 301,204 | 176,191 | — | 827,917 | 2,882,746 | |||||||||
| Others | 1,140,197 | 245,399 | 108,289 | (19,168) | 216,608 | — | 305,728 | 1,200,526 | ||||||||||
2020 | PEO 1 | 2,995,723 | 877,513 | 1,320,266 | — | — | — | 1,320,266 | 3,438,476 | ||||||||||
PEO 2 | 682,576 | 335,157 | 1,103,045 | 199,851 | 68,704 | — | 1,371,601 | 1,719,020 | |||||||||||
| Others | 693,908 | 245,819 | 386,341 | 159,463 | (24,576) | (19,738) | 501,491 | 949,579 | ||||||||||
(a)The dollar amounts reported in the Summary Compensation Table for the applicable year.
(b) | The grant date fair value of equity awards represents the total of the amounts reported in the “Stock Awards” column in the Summary Compensation Table for the applicable year. |
(c)The recalculated value of equity awards for each applicable year includes the addition (or subtraction, as applicable) of the following:
(i) | the year-end fair value of any equity awards granted in the applicable year that are outstanding and unvested as of the end of the year; |
(ii) | the amount of change as of the end of the applicable year (from the end of the prior fiscal year) in fair value of any awards granted in prior years that are outstanding and unvested as of the end of the applicable year; |
(iii) | for awards that vest in applicable year, the change in the fair value as of the vesting date from the beginning of the applicable year. |
(iv) | for awards that failed to meet vesting conditions in the applicable year, the fair value from the end of prior fiscal year. |
The valuation assumptions and processes used to recalculate fair values did not materially differ from those disclosed at the time of grant, except for PSU awards whose year-end and vesting date values are adjusted by the probability of achievement as of each such date.
(d) | “Compensation actually paid” does not necessarily represent cash and/or equity value transferred to the applicable NEO without restriction, but rather is a value calculated under applicable SEC rules. |
(3) | The dollar amounts reported in column (f) are the average amounts of total compensation reported for the other Named Executive Officers for each corresponding year in the “Total” column of the Summary Compensation Table. Refer to our Summary Compensation Table on page 32. For each of 2020, 2021 and 2022, the other NEOs were: |
2022 |
| 2021 | 2020 | |||
Heather Plutino |
| Pamela J. Edwards | Pamela J. Edwards | |||
Pamela J. Edwards | Lisa A. Powell | Stuart C. Clifford | ||||
Lisa A. Powell |
| Ivy D. Council | Jason Moschner | |||
Ivy D. Council |
| James A. Dunn | Lisa A. Powell | |||
Charles J. Hynes |
| Ivy D. Council | ||||
Jason Moschner | Christina K. Short |
(4) | TSR is determined based on the value of an initial fixed investment of $100. The TSR peer group consists of the Dow Jones US Specialty Retailers Index. |
(5) | Our Company Selected Measure is Adjusted EBIT, consistent with our Short- and Long-Term Incentive Programs. For more details, refer to our Compensation Discussion and Analysis, beginning on page 24. |
Value ($) of Initial Fixed $100 | ||||||||||||||||||||
SCT ($) for | CAP ($) to | SCT ($) for | CAP ($) to | Average | Average | Investment Based On: | Adjusted | |||||||||||||
Fiscal |
| Mr. Makuen | Mr. Makuen |
| Mr. Sachse | Mr. Sachse | SCT ($) | CAP ($) | Citi Trends | Peer Group | Net Income | EBIT | ||||||||
Year | (PEO 1) | (PEO 1) | (PEO 2) | (PEO 2) | for NEOs | to NEOs | TSR | TSR | ($M) | ($M) | ||||||||||
(a) |
| (b)1 | (c)2 | (d)1 | (e)2 | (f)3 | (g)2 | (h)4 | (i)4 | (j) | (k)5 | |||||||||
2022 |
| 1,730,016 | (331,897) | — | — | 483,470 | 122,735 | 135.73 | 135.59 | 58.9 | 11.4 | |||||||||
2021 |
| 2,979,581 | 2,882,746 | — | — | 1,140,197 | 1,200,526 | 210.06 | 142.18 | 62.2 | 91.4 | |||||||||
2020 | 2,995,723 | 3,438,476 | 682,576 | 1,719,020 | 693,908 | 949,579 | 254.38 | 140.92 | 24.0 | 40.9 | ||||||||||
(1) | The dollar amounts reported in columns (b) and (d) are the amounts of total compensation reported for Mr. Makuen (Chief Executive Officer and Principal Executive Officer since March 9th, 2020) and Mr. Sachse (Interim Chief Executive Officer until March 9th, 2020) for each corresponding year in the “Total” column of the Summary Compensation Table. Refer to our Summary Compensation Table on page 32. |
(3) | The dollar amounts reported in column (f) are the average amounts of total compensation reported for the other Named Executive Officers for each corresponding year in the “Total” column of the Summary Compensation Table. Refer to our Summary Compensation Table on page 32. For each of 2020, 2021 and 2022, the other NEOs were: |
2022 |
| 2021 | 2020 | |||
Heather Plutino |
| Pamela J. Edwards | Pamela J. Edwards | |||
Pamela J. Edwards | Lisa A. Powell | Stuart C. Clifford | ||||
Lisa A. Powell |
| Ivy D. Council | Jason Moschner | |||
Ivy D. Council |
| James A. Dunn | Lisa A. Powell | |||
Charles J. Hynes |
| Ivy D. Council | ||||
Jason Moschner | Christina K. Short |
(4) | TSR is determined based on the value of an initial fixed investment of $100. The TSR peer group consists of the Dow Jones US Specialty Retailers Index. |
(2) | The dollar amounts reported in column (c), (e) and (g) represent the amount of “compensation actually paid,” as computed in accordance with SEC rules. “Compensation actually paid” does not necessarily represent cash and/or equity value transferred to the applicable NEO without restriction, but rather is a value calculated under applicable SEC rules. We do not have a defined benefit plan so no adjustment for pension benefits is included in the table below. Similarly, no adjustment is made for dividends as dividends are factored into the fair value of the award. The following table details these adjustments: |
All table values in $ | Grant Date | Year End | Change in | Change in | Change in | Total | |||||||||||||
|
| Value of | Value of | Value of | Value of | Value of | Equity | ||||||||||||
Fiscal | Executives | SCT | New Awards | New Awards | Prior Awards | Vested Awards | Forfeited Awards | CAP | CAP | ||||||||||
Year |
| (a) | (b) | (i) | (ii) | (iii) | (iv) | (c)=(i)+(ii)+(iii)+(iv) | (d)=(a)+(b)+(c) | ||||||||||
2022 |
| PEO 1 | 1,730,016 | 1,015,002 | 196,574 | (324,732) | (51,798) | (866,955) | (1,046,911) | (331,897) | |||||||||
| Others | 483,470 | 176,668 | 94,824 | (45,312) | (60,821) | (172,758) | (184,067) | 122,735 | ||||||||||
2021 |
| PEO 1 | 2,979,581 | 924,752 | 350,522 | 301,204 | 176,191 | — | 827,917 | 2,882,746 | |||||||||
| Others | 1,140,197 | 245,399 | 108,289 | (19,168) | 216,608 | — | 305,728 | 1,200,526 | ||||||||||
2020 | PEO 1 | 2,995,723 | 877,513 | 1,320,266 | — | — | — | 1,320,266 | 3,438,476 | ||||||||||
PEO 2 | 682,576 | 335,157 | 1,103,045 | 199,851 | 68,704 | — | 1,371,601 | 1,719,020 | |||||||||||
| Others | 693,908 | 245,819 | 386,341 | 159,463 | (24,576) | (19,738) | 501,491 | 949,579 | ||||||||||
(a)The dollar amounts reported in the Summary Compensation Table for the applicable year.
(b) | The grant date fair value of equity awards represents the total of the amounts reported in the “Stock Awards” column in the Summary Compensation Table for the applicable year. |
(c)The recalculated value of equity awards for each applicable year includes the addition (or subtraction, as applicable) of the following:
(i) | the year-end fair value of any equity awards granted in the applicable year that are outstanding and unvested as of the end of the year; |
(ii) | the amount of change as of the end of the applicable year (from the end of the prior fiscal year) in fair value of any awards granted in prior years that are outstanding and unvested as of the end of the applicable year; |
(iii) | for awards that vest in applicable year, the change in the fair value as of the vesting date from the beginning of the applicable year. |
(iv) | for awards that failed to meet vesting conditions in the applicable year, the fair value from the end of prior fiscal year. |
The valuation assumptions and processes used to recalculate fair values did not materially differ from those disclosed at the time of grant, except for PSU awards whose year-end and vesting date values are adjusted by the probability of achievement as of each such date.
(d) | “Compensation actually paid” does not necessarily represent cash and/or equity value transferred to the applicable NEO without restriction, but rather is a value calculated under applicable SEC rules. |
(2) | The dollar amounts reported in column (c), (e) and (g) represent the amount of “compensation actually paid,” as computed in accordance with SEC rules. “Compensation actually paid” does not necessarily represent cash and/or equity value transferred to the applicable NEO without restriction, but rather is a value calculated under applicable SEC rules. We do not have a defined benefit plan so no adjustment for pension benefits is included in the table below. Similarly, no adjustment is made for dividends as dividends are factored into the fair value of the award. The following table details these adjustments: |
All table values in $ | Grant Date | Year End | Change in | Change in | Change in | Total | |||||||||||||
|
| Value of | Value of | Value of | Value of | Value of | Equity | ||||||||||||
Fiscal | Executives | SCT | New Awards | New Awards | Prior Awards | Vested Awards | Forfeited Awards | CAP | CAP | ||||||||||
Year |
| (a) | (b) | (i) | (ii) | (iii) | (iv) | (c)=(i)+(ii)+(iii)+(iv) | (d)=(a)+(b)+(c) | ||||||||||
2022 |
| PEO 1 | 1,730,016 | 1,015,002 | 196,574 | (324,732) | (51,798) | (866,955) | (1,046,911) | (331,897) | |||||||||
| Others | 483,470 | 176,668 | 94,824 | (45,312) | (60,821) | (172,758) | (184,067) | 122,735 | ||||||||||
2021 |
| PEO 1 | 2,979,581 | 924,752 | 350,522 | 301,204 | 176,191 | — | 827,917 | 2,882,746 | |||||||||
| Others | 1,140,197 | 245,399 | 108,289 | (19,168) | 216,608 | — | 305,728 | 1,200,526 | ||||||||||
2020 | PEO 1 | 2,995,723 | 877,513 | 1,320,266 | — | — | — | 1,320,266 | 3,438,476 | ||||||||||
PEO 2 | 682,576 | 335,157 | 1,103,045 | 199,851 | 68,704 | — | 1,371,601 | 1,719,020 | |||||||||||
| Others | 693,908 | 245,819 | 386,341 | 159,463 | (24,576) | (19,738) | 501,491 | 949,579 | ||||||||||
(a)The dollar amounts reported in the Summary Compensation Table for the applicable year.
(b) | The grant date fair value of equity awards represents the total of the amounts reported in the “Stock Awards” column in the Summary Compensation Table for the applicable year. |
(c)The recalculated value of equity awards for each applicable year includes the addition (or subtraction, as applicable) of the following:
(i) | the year-end fair value of any equity awards granted in the applicable year that are outstanding and unvested as of the end of the year; |
(ii) | the amount of change as of the end of the applicable year (from the end of the prior fiscal year) in fair value of any awards granted in prior years that are outstanding and unvested as of the end of the applicable year; |
(iii) | for awards that vest in applicable year, the change in the fair value as of the vesting date from the beginning of the applicable year. |
(iv) | for awards that failed to meet vesting conditions in the applicable year, the fair value from the end of prior fiscal year. |
The valuation assumptions and processes used to recalculate fair values did not materially differ from those disclosed at the time of grant, except for PSU awards whose year-end and vesting date values are adjusted by the probability of achievement as of each such date.
(d) | “Compensation actually paid” does not necessarily represent cash and/or equity value transferred to the applicable NEO without restriction, but rather is a value calculated under applicable SEC rules. |

2022 Performance Measures
As required by SEC rules, the performance measure identified as the most important for NEOs’ 2022 compensation decisions are listed in the table to the right. Adjusted EBIT is the only metric used in determining compensation. | Most Important Performance Measure |
Adjusted EBIT |
(5) | Our Company Selected Measure is Adjusted EBIT, consistent with our Short- and Long-Term Incentive Programs. For more details, refer to our Compensation Discussion and Analysis, beginning on page 24. |