
UNITED STATES
SECURITIES AND EXCHANGE COMMISSION
WASHINGTON, D.C. 20549
FORM N-CSR
CERTIFIED SHAREHOLDER REPORT OF REGISTERED
MANAGEMENT INVESTMENT COMPANIES
Investment Company Act file number: 811-07732
ALLIANCEBERNSTEIN GLOBAL HIGH INCOME FUND, INC.
(Exact name of registrant as specified in charter)
1345 Avenue of the Americas,
New York, New York 10105
(Address of principal executive offices) (Zip code)
Joseph J. Mantineo
AllianceBernstein L.P.
1345 Avenue of the Americas
New York, New York 10105
(Name and address of agent for service)
Registrant’s telephone number, including area code: (800) 221-5672
Date of fiscal year end: March 31, 2023
Date of reporting period: March 31, 2023
ITEM 1. REPORTS TO STOCKHOLDERS.
MAR 03.31.23
ANNUAL REPORT
ALLIANCEBERNSTEIN
GLOBAL HIGH INCOME FUND
(NYSE: AWF)

| Investment Products Offered | • Are Not FDIC Insured • May Lose Value • Are Not Bank Guaranteed | |
You may obtain a description of the Fund’s proxy voting policies and procedures, and information regarding how the Fund voted proxies relating to portfolio securities during the most recent 12-month period ended June 30, without charge. Simply visit AB’s website at www.abfunds.com, or go to the Securities and Exchange Commission’s (the “Commission”) website at www.sec.gov, or call AB at (800) 227 4618.
The Fund files its complete schedule of portfolio holdings with the Commission for the first and third quarters of each fiscal year as an exhibit to its reports on Form N-PORT. The Fund’s Form N-PORT reports are available on the Commission’s website at www.sec.gov. AB publishes full portfolio holdings for the Fund monthly at www.abfunds.com.
AllianceBernstein Investments, Inc. (ABI) is the distributor of the AB family of mutual funds. ABI is a member of FINRA and is an affiliate of AllianceBernstein L.P., the Adviser of the funds.
The [A/B] logo is a registered service mark of AllianceBernstein and AllianceBernstein® is a registered service mark used by permission of the owner, AllianceBernstein L.P.
| FROM THE PRESIDENT |

|
Dear Shareholder,
We’re pleased to provide this report for AllianceBernstein Global High Income Fund, Inc. (the “Fund”). Please review the discussion of Fund performance, the market conditions during the reporting period and the Fund’s investment strategy.
At AB, we’re striving to help our clients achieve better outcomes by:
| + | Fostering diverse perspectives that give us a distinctive approach to navigating global capital markets |
| + | Applying differentiated investment insights through a connected global research network |
| + | Embracing innovation to design better ways to invest and leading-edge mutual-fund solutions |
Whether you’re an individual investor or a multibillion-dollar institution, we’re putting our knowledge and experience to work for you every day.
For more information about AB’s comprehensive range of products and shareholder resources, please log on to www.abfunds.com.
Thank you for your investment in AB mutual funds—and for placing your trust in our firm.
Sincerely,

Onur Erzan
President and Chief Executive Officer, AB Mutual Funds
| abfunds.com | ALLIANCEBERNSTEIN GLOBAL HIGH INCOME FUND | 1 | |
ANNUAL REPORT
May 8, 2023
This report provides management’s discussion of fund performance for AllianceBernstein Global High Income Fund, Inc. for the annual reporting period ended March 31, 2023. The Fund is a closed-end fund and its shares of common stock trade on the New York Stock Exchange.
The Fund seeks high current income and, secondarily, capital appreciation.
RETURNS AS OF MARCH 31, 2023 (unaudited)
| 6 Months | 12 Months | |||||||
| ALLIANCEBERNSTEIN GLOBAL HIGH INCOME FUND (NAV)1 | 9.43% | -4.09% | ||||||
| Primary Benchmark: Bloomberg Global High Yield Index (USD hedged) |
9.45% | -3.45% | ||||||
| Blended Benchmark: 33% JPM GBI-EM / 33% JPM EMBI Global / 33% Bloomberg US Corporate HY 2% Issuer Capped Index |
8.78% | -3.93% | ||||||
| 1 | The returns shown are based on net asset values calculated for shareholder transactions and may differ from the returns shown in the Financial Highlights, which reflect adjustments made to the net asset values in accordance with accounting principles generally accepted in the United States of America. |
The Fund’s market price per share on March 31, 2023, was $9.72. The Fund’s NAV per share on March 31, 2023, was $10.56. For additional financial highlights, please see pages 117-118.
INVESTMENT RESULTS
The table above shows the Fund’s performance compared with its primary benchmark, the Bloomberg Global High Yield Index (USD hedged), as well as its blended benchmark for the six- and 12-month periods ended March 31, 2023. The blended benchmark is composed of equal weightings of the JPMorgan Government Bond Index-Emerging Markets (“JPM GBI-EM”) (local currency-denominated), the JPMorgan Emerging Markets Bond Index Global (“JPM EMBI Global”) and the Bloomberg US Corporate High Yield (“HY”) 2% Issuer Capped Index.
During the 12-month period, the Fund underperformed its primary and blended benchmarks. Security selection was the main detractor, relative to the primary benchmark, due to selections within US and eurozone high-yield corporate bonds, along with emerging-market sovereign and corporate bonds, which were partially offset by gains from selection within commercial mortgage-backed securities (“CMBS”) and US investment-grade corporate bonds. Yield-curve positioning was the largest contributor. Sector allocation also contributed, mostly from off-benchmark exposure to agency risk-sharing transactions and emerging-market sovereign bonds that added more to performance than losses from off-benchmark exposure to bank loans and emerging-market corporate
| 2 | ALLIANCEBERNSTEIN GLOBAL HIGH INCOME FUND |
abfunds.com | |
bonds. An underweight to the eurozone contributed from a country perspective. Currency decisions were a minor contributor, from a short in the euro.
Over the six-month period, the Fund underperformed its primary benchmark and outperformed its blended benchmark. Security selection detracted from performance, mainly from selections within US high-yield corporate bonds and CMBS that were partially offset by gains from selection within eurozone high-yield corporates and emerging-market corporate bonds. Sector allocation was the largest contributor to performance, mostly from the utilization of credit default swaps in the eurozone, off-benchmark exposure to collateralized loan obligations and an overweight to US high-yield corporate bonds. Losses from underweights to emerging-market sovereign and corporate bonds, and off-benchmark exposure to CMBS, US Treasuries, bank loans and US investment-grade corporate bonds partially offset gains. Yield-curve positioning added to performance, mostly from an overweight on the six-month part of the curve in the US, offset by a loss on the two-year part of the US curve from an underweight. An underweight to the eurozone contributed at the country level. A currency long position in the euro was a minor contributor to performance.
During both periods, the Fund used interest rate swaps and futures to manage and hedge duration risk and/or to take active yield-curve positioning. Currency forwards were used to hedge foreign currency exposure and/or to take active currency risk. Interest rate swaptions were used to take active yield-curve positioning. Credit default swaps were used to effectively obtain high-yield credit/sector exposure. Total return swaps were used to take active credit risk. During the 12-month period, written options were used to generate income.
During the 12-month period, the utilization of leverage on behalf of the Fund detracted from performance, relative to the benchmark. As the benchmark generated negative returns in excess of the Fund’s borrowing rates, the utilization of leverage detracted from the Fund’s absolute returns. During the six-month period, the utilization of leverage on behalf of the Fund contributed to outperformance, relative to the benchmark. As the benchmark generated positive returns in excess of the Fund’s borrowing rates, the utilization of leverage contributed to the Fund’s absolute returns.
MARKET REVIEW AND INVESTMENT STRATEGY
During the 12-month period ended March 31, 2023, fixed-income government bond market yields rose sharply, and bond prices fell in all major developed markets, except in Japan and Australia, as most central banks raised interest rates significantly to combat persistent inflation. Developed-market top-line inflation peaked in October, causing bond markets to rally until February, when investors realized that sticky core inflation would be
| abfunds.com | ALLIANCEBERNSTEIN GLOBAL HIGH INCOME FUND | 3 | |
more difficult to contain. Stress in the global banking sector led treasury markets to rally on growth concerns. Global investment-grade corporate bonds, which typically have longer maturities and are more sensitive to changes in yields than high-yield corporates, underperformed global treasuries—trailing US Treasury bonds in the US, while outperforming eurozone treasuries in the euro bloc. Developed-market high-yield corporate bonds also fell, but they significantly outperformed global treasuries, and outperformed respective treasury markets in the US and eurozone. Emerging-market hard-currency sovereign bonds trailed global developed-market treasuries as the US dollar rose against most developed- and emerging-market currencies. Emerging-market hard-currency corporate bonds outperformed developed-market treasuries by a wide margin, with high yield posting a small positive return. Emerging-market local-currency bonds also outperformed developed-market treasuries and led risk assets. Brent crude oil prices fell significantly on reduced demand and economic growth concerns.
The Fund’s Investment Management Team (the “Team”) seeks to generate high current income and, secondarily, capital appreciation. The Fund is a globally diversified portfolio that takes full advantage of the Team’s best research ideas by pursuing high-income opportunities across all fixed-income sectors. The Fund invests primarily (and without limit) in corporate debt securities from US and non-US issuers, as well as government bonds from both developing and developed countries, including the US. Under normal market conditions, the Fund invests substantially in lower-rated bonds, but may also invest in investment-grade and unrated debt securities.
INVESTMENT POLICIES
The Fund invests without limit in securities denominated in non-US currencies as well as those denominated in the US dollar. The Fund may also invest, without limit, in sovereign debt securities issued by emerging and developed nations and in debt securities of US and non-US corporate issuers. For more information regarding the Fund’s risks, please see “Disclosures and Risks” on pages 5-8 and “Note E—Risks Involved in Investing in the Fund” of the Notes to Financial Statements on pages 110-114.
| 4 | ALLIANCEBERNSTEIN GLOBAL HIGH INCOME FUND |
abfunds.com | |
AllianceBernstein Global High Income Fund Shareholder Information
Weekly comparative net asset value (“NAV”) and market price information about the Fund is published each Saturday in Barron’s and in other newspapers in a table called “Closed-End Funds.” Daily NAV and market price information, and additional information regarding the Fund, is available at www.abfunds.com and www.nyse.com. For additional shareholder information regarding this Fund, please see pages 122-123.
Benchmark Disclosure
All indices are unmanaged and do not reflect fees and expenses associated with the active management of a fund portfolio. The Bloomberg Global High Yield Index (USD hedged) represents non-investment grade fixed-income securities of companies in the US, and developed and emerging markets, hedged to the US dollar. The JPM® GBI-EM represents the performance of local currency government bonds issued by emerging markets. The JPM EMBI Global (market-capitalization weighted) represents the performance of US dollar-denominated Brady bonds, Eurobonds and trade loans issued by sovereign and quasi-sovereign entities. The Bloomberg US Corporate HY 2% Issuer Capped Index is the 2% Issuer Capped component of the US Corporate High Yield Index, which represents the performance of fixed-income securities having a maximum quality rating of Ba1, a minimum amount outstanding of $150 million and at least one year to maturity. An investor cannot invest directly in an index, and its results are not indicative of the performance of any specific investment, including the Fund.
A Word About Risk
Market Risk: The market value of a security may move up or down, sometimes rapidly and unpredictably. These fluctuations may cause a security to be worth less than the price originally paid for it, or less than it was worth at an earlier time. Market risk may affect a single issuer, industry, sector of the economy or the market as a whole. Global economies and financial markets are increasingly interconnected, which increases the probabilities that conditions in one country or region might adversely impact issuers in a different country or region. Conditions affecting the general economy, including political, social, or economic instability at the local, regional, or global level may also affect the market value of a security. Health crises, such as pandemic and epidemic diseases, as well as other incidents that interrupt the expected course of events, such as natural disasters, including fires, earthquakes and flooding, war or civil disturbance, acts of terrorism, power outages and other unforeseeable and external events, and the public response to or fear of such diseases or events, have had, and may in the future have, an adverse effect on the
| abfunds.com | ALLIANCEBERNSTEIN GLOBAL HIGH INCOME FUND | 5 | |
DISCLOSURES AND RISKS (continued)
Fund’s investments and net asset value and can lead to increased market volatility. For example, the diseases or events themselves or any preventative or protective actions that governments may take in respect of such diseases or events may result in periods of business disruption, inability to obtain raw materials, supplies and component parts, and reduced or disrupted operations for the Fund’s portfolio companies. The occurrence and pendency of such diseases or events could adversely affect the economies and financial markets either in specific countries or worldwide.
Interest-Rate Risk: Changes in interest rates will affect the value of investments in fixed-income securities. When interest rates rise, the value of existing investments in fixed-income securities tends to fall and this decrease in value may not be offset by higher income from new investments. Interest-rate risk is generally greater for fixed-income securities with longer maturities or durations. The Fund may be subject to a greater risk of rising interest rates than would normally be the case due to the recent end of a period of historically low rates and the effect of potential central bank monetary policy, and government fiscal policy, initiatives and resulting market reactions to those initiatives.
Credit Risk: An issuer or guarantor of a fixed-income security, or the counterparty to a derivatives or other contract, may be unable or unwilling to make timely payments of interest or principal, or to otherwise honor its obligations. The issuer or guarantor may default, causing a loss of the full principal amount of a security and accrued interest. The degree of risk for a particular security may be reflected in its credit rating. There is the possibility that the credit rating of a fixed-income security may be downgraded after purchase, which may adversely affect the value of the security.
Below Investment-Grade Securities Risk: Investments in fixed-income securities with lower ratings (commonly known as “junk bonds”) are subject to a higher probability that an issuer will default or fail to meet its payment obligations. These securities may be subject to greater price volatility due to such factors as specific corporate developments and negative perceptions of the junk bond market generally and may be more difficult to trade than other types of securities.
Duration Risk: Duration is a measure that relates the expected price volatility of a fixed-income security to changes in interest rates. The duration of a fixed-income security may be shorter than or equal to full maturity of a fixed-income security. Fixed-income securities with longer durations have more risk and will decrease in price as interest rates rise.
| 6 | ALLIANCEBERNSTEIN GLOBAL HIGH INCOME FUND |
abfunds.com | |
DISCLOSURES AND RISKS (continued)
Inflation Risk: This is the risk that the value of assets or income from investments will be less in the future as inflation decreases the value of money. As inflation increases, the value of the Fund’s assets can decline as can the value of the Fund’s distributions. This risk is significantly greater for fixed-income securities with longer maturities.
Foreign (Non-US) Risk: Investments in securities of non-US issuers may involve more risk than those of US issuers. These securities may fluctuate more widely in price and may be more difficult to trade due to adverse market, economic, political, regulatory or other factors.
Emerging-Market Risk: Investments in emerging-market countries may have more risk because the markets are less developed and less liquid and are subject to increased economic, political, regulatory or other uncertainties.
Currency Risk: Fluctuations in currency exchange rates may negatively affect the value of the Fund’s investments or reduce its returns.
Leverage Risk: As a result of the Fund’s use of leveraging techniques, its NAV may be more volatile because leverage tends to exaggerate the effect of changes in interest rates and any increase or decrease in the value of the Fund’s investments.
Derivatives Risk: Investments in derivatives may be difficult to price or unwind and leveraged so that small changes may produce disproportionate losses for the Fund. A short position in a derivative instrument involves the risk of a theoretically unlimited increase in the value of the underlying asset, which could cause the Fund to suffer a potentially unlimited loss. Derivatives, especially over-the-counter derivatives, are also subject to counterparty risk, which is the risk that the counterparty (the party on the other side of the transaction) on a derivative transaction will be unable or unwilling to honor its contractual obligations to the Fund.
Illiquid Investments Risk: Illiquid investments risk exists when certain investments are or become difficult to purchase or sell. Difficulty in selling such investments may result in sales at disadvantageous prices affecting the value of your investment in the Fund. Causes of illiquid investments risk may include low trading volumes, large positions and heavy redemptions of Fund shares. Illiquid investments risk may be higher in a rising interest rate environment, when the value and liquidity of fixed-income securities generally decline.
Management Risk: The Fund is subject to management risk because it is an actively managed investment fund. The Adviser will apply its investment techniques and risk analyses in making investment decisions, but there is
| abfunds.com | ALLIANCEBERNSTEIN GLOBAL HIGH INCOME FUND | 7 | |
DISCLOSURES AND RISKS (continued)
no guarantee that its techniques will produce the intended results. Some of these techniques may incorporate, or rely upon, quantitative models, but there is no guarantee that these models will generate accurate forecasts, reduce risk or otherwise perform as expected.
Mortgage-Related and/or Other Asset-Backed Securities Risk: The Fund may invest in mortgage-backed and/or other asset-backed securities, including securities backed by mortgages and assets with an international or emerging-markets origination and securities backed by non-performing loans at the time of investment. Investments in mortgage-related and other asset-backed securities are subject to certain additional risks. The value of these securities may be particularly sensitive to changes in interest rates. These risks include “extension risk”, which is the risk that, in periods of rising interest rates, issuers may delay the payment of principal, and “prepayment risk”, which is the risk that, in periods of falling interest rates, issuers may pay principal sooner than expected, exposing the Fund to a lower rate of return upon reinvestment of principal. Mortgage-backed securities offered by nongovernmental issuers and other asset-backed securities may be subject to other risks, such as higher rates of default in the mortgages or assets backing the securities or risks associated with the nature and servicing of mortgages or assets backing the securities.
As with all investments, you may lose money by investing in the Fund.
An Important Note About Historical Performance
The performance shown in this report represents past performance and does not guarantee future results. Current performance may be lower or higher than the performance information shown. All fees and expenses related to the operation of the Fund have been deducted. Performance assumes reinvestment of distributions and does not account for taxes. Historical performance does not reflect the deduction of taxes that a shareholder would pay on fund distributions or the sale of fund shares and assumes the reinvestment of dividends and capital gains distributions at prices obtained pursuant to the Fund’s dividend reinvestment plan.
| 8 | ALLIANCEBERNSTEIN GLOBAL HIGH INCOME FUND |
abfunds.com | |
HISTORICAL PERFORMANCE
GROWTH OF A $10,000 INVESTMENT IN THE FUND (unaudited)
3/31/2013 TO 3/31/2023
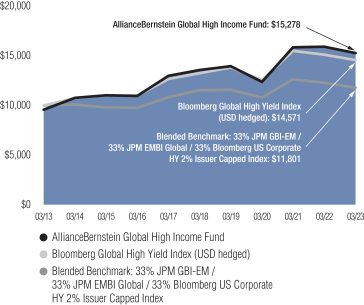
This chart illustrates the total value of an assumed $10,000 investment in AllianceBernstein Global High Income Fund based on market prices (from 3/31/2013 to 3/31/2023) as compared with the performance of the Fund’s benchmarks. The chart assumes the reinvestment of dividends and capital gains distributions at prices obtained pursuant to the Fund’s dividend reinvestment plan.
| abfunds.com | ALLIANCEBERNSTEIN GLOBAL HIGH INCOME FUND | 9 | |
HISTORICAL PERFORMANCE (continued)
AVERAGE ANNUAL RETURNS AS OF MARCH 31, 2023 (unaudited)
| NAV Returns |
Market Price |
|||||||
| 1 Year | -4.09% | -5.00% | ||||||
| 5 Years | 2.41% | 3.41% | ||||||
| 10 Years | 4.33% | 3.06% | ||||||
AVERAGE ANNUAL RETURNS
AS OF THE MOST RECENT CALENDAR QUARTER-END
MARCH 31, 2023 (unaudited)
| NAV Returns |
Market Price |
|||||||
| 1 Year | -4.09% | -5.00% | ||||||
| 5 Years | 2.41% | 3.41% | ||||||
| 10 Years | 4.33% | 3.06% | ||||||
Performance assumes the reinvestment of dividends and capital gains distributions at prices obtained pursuant to the Fund’s dividend reinvestment plan.
| 10 | ALLIANCEBERNSTEIN GLOBAL HIGH INCOME FUND |
abfunds.com | |
PORTFOLIO SUMMARY
March 31, 2023 (unaudited)
PORTFOLIO STATISTICS
Net Assets ($mil): $910.9

| 1 | The Fund’s security type breakdown is expressed as a percentage of total investments and may vary over time. The Fund also enters into derivative transactions, which may be used for hedging or investment purposes (see “Portfolio of Investments” section of the report for additional details). “Other” security type weightings represent 0.2% or less in the following: Governments–Sovereign Bonds, Inflation-Linked Securities, Preferred Stocks and Rights. |
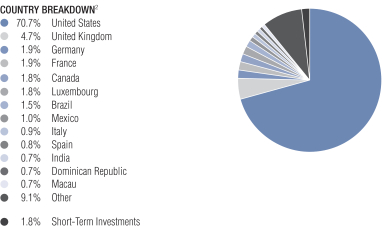
| 2 | The Fund’s country breakdown is expressed as a percentage of total investments and may vary over time. The Fund also enters into derivative transactions, which may be used for hedging or other investment purposes (see “Portfolio of Investments” section of the report for additional details). “Other” country weightings represent 0.6% or less in the following: Angola, Argentina, Australia, Belgium, Cayman Islands, Chile, China, Colombia, Czech Republic, Ecuador, Egypt, El Salvador, Finland, Gabon, Ghana, Guatemala, Hong Kong, Indonesia, Ireland, Israel, Jamaica, Japan, Jersey (Channel Islands), Kazakhstan, Kuwait, Morocco, Netherlands, Nigeria, Norway, Panama, Peru, Slovenia, South Africa, South Korea, Sweden, Switzerland, Trinidad & Tobago, Turkey, Ukraine, Venezuela and Zambia. |
| abfunds.com | ALLIANCEBERNSTEIN GLOBAL HIGH INCOME FUND | 11 | |
PORTFOLIO OF INVESTMENTS
March 31, 2023
| Principal Amount (000) |
U.S. $ Value | |||||||||||
|
|
||||||||||||
| CORPORATES - NON-INVESTMENT GRADE – 55.3% |
||||||||||||
| Industrial – 48.9% |
||||||||||||
| Basic – 3.1% |
||||||||||||
| Advanced Drainage Systems, Inc.
|
U.S.$ | 140 | $ | 133,279 | ||||||||
| 6.375%, 06/15/2030(a) |
27 | 26,585 | ||||||||||
| Arconic Corp. |
83 | 81,833 | ||||||||||
| ASP Unifrax Holdings, Inc.
|
851 | 680,172 | ||||||||||
| 7.50%, 09/30/2029(a) |
1,244 | 843,751 | ||||||||||
| Baffinland Iron Mines Corp./Baffinland Iron Mines LP |
215 | 205,330 | ||||||||||
| Berry Global, Inc.
|
166 | 163,475 | ||||||||||
| Big River Steel LLC/BRS Finance Corp. |
171 | 171,130 | ||||||||||
| Cerdia Finanz GmbH
|
419 | 384,377 | ||||||||||
| Chemours Co. (The) |
13 | 12,049 | ||||||||||
| 5.75%, 11/15/2028(a) |
232 | 208,428 | ||||||||||
| Cleveland-Cliffs, Inc.
|
107 | 108,863 | ||||||||||
| Commercial Metals Co. |
80 | 71,057 | ||||||||||
| 4.375%, 03/15/2032 |
80 | 69,364 | ||||||||||
| Constellium SE |
EUR | 1,109 | 974,527 | |||||||||
| Crown Americas LLC/Crown Americas Capital Corp. VI |
U.S.$ | 439 | 429,711 | |||||||||
| CVR Partners LP/CVR Nitrogen Finance Corp. |
370 | 328,219 | ||||||||||
| Domtar Corp. |
140 | 124,642 | ||||||||||
| Element Solutions, Inc.
|
1,279 | 1,121,166 | ||||||||||
| ERP Iron Ore, LLC
|
240 | 160,109 | ||||||||||
| FMG Resources (August 2006) Pty Ltd. |
2,191 | 1,892,327 | ||||||||||
| 4.50%, 09/15/2027(a) |
877 | 824,389 | ||||||||||
| 5.875%, 04/15/2030(a) |
76 | 72,840 | ||||||||||
| 6.125%, 04/15/2032(a) |
2,563 | 2,457,822 | ||||||||||
| 12 | ALLIANCEBERNSTEIN GLOBAL HIGH INCOME FUND |
abfunds.com | |
PORTFOLIO OF INVESTMENTS (continued)
| Principal Amount (000) |
U.S. $ Value | |||||||||
|
|
||||||||||
| Glatfelter Corp.
|
U.S.$ | 77 | $ | 51,339 | ||||||
| Graham Packaging Co., Inc.
|
420 | 364,915 | ||||||||
| Graphic Packaging International LLC
|
1,661 | 1,450,851 | ||||||||
| Hecla Mining Co. |
282 | 284,700 | ||||||||
| Hudbay Minerals, Inc.
|
215 | 199,995 | ||||||||
| 6.125%, 04/01/2029(a) |
174 | 164,461 | ||||||||
| INEOS Quattro Finance 1 PLC
|
EUR | 101 | 94,949 | |||||||
| INEOS Quattro Finance 2 PLC
|
U.S.$ | 426 | 389,670 | |||||||
| Ingevity Corp. |
643 | 555,753 | ||||||||
| Intelligent Packaging Holdco Issuer LP |
611 | 439,916 | ||||||||
| Intelligent Packaging Ltd. Finco, Inc./Intelligent Packaging Ltd.
Co-Issuer LLC |
603 | 518,460 | ||||||||
| Kaiser Aluminum Corp.
|
47 | 38,616 | ||||||||
| Kobe US Midco 2, Inc. |
1,300 | 949,251 | ||||||||
| LABL, Inc. |
222 | 214,240 | ||||||||
| Magnetation LLC/Mag Finance Corp.
|
2,857 | – 0 | – | |||||||
| Mercer International, Inc. |
969 | 830,043 | ||||||||
| Methanex Corp. |
16 | 14,955 | ||||||||
| Mineral Resources Ltd.
|
192 | 195,401 | ||||||||
| 8.125%, 05/01/2027(a) |
158 | 159,087 | ||||||||
| 8.50%, 05/01/2030(a) |
53 | 52,976 | ||||||||
| Novelis Corp. |
61 | 55,710 | ||||||||
| 3.875%, 08/15/2031(a) |
19 | 15,993 | ||||||||
| 4.75%, 01/30/2030(a) |
135 | 124,085 | ||||||||
| Olympus Water US Holding Corp.
|
237 | 193,795 | ||||||||
| 7.125%, 10/01/2027(a) |
755 | 708,325 | ||||||||
| abfunds.com | ALLIANCEBERNSTEIN GLOBAL HIGH INCOME FUND | 13 | |
PORTFOLIO OF INVESTMENTS (continued)
| Principal Amount (000) |
U.S. $ Value | |||||||||||
|
|
||||||||||||
| Rain CII Carbon LLC/CII Carbon Corp. |
U.S.$ | 224 | $ | 214,788 | ||||||||
| Roller Bearing Co. of America, Inc. |
143 | 127,609 | ||||||||||
| SCIH Salt Holdings, Inc.
|
68 | 60,525 | ||||||||||
| SCIL IV LLC/SCIL USA Holdings LLC
|
EUR | 320 | 319,663 | |||||||||
| 5.375%, 11/01/2026(a) |
U.S.$ | 1,039 | 955,271 | |||||||||
| Sealed Air Corp. |
192 | 179,210 | ||||||||||
| 6.875%, 07/15/2033(a) |
726 | 739,126 | ||||||||||
| Sealed Air Corp./Sealed Air Corp. US |
546 | 552,492 | ||||||||||
| SPCM SA |
655 | 575,431 | ||||||||||
| 3.375%, 03/15/2030(a) |
951 | 787,353 | ||||||||||
| SunCoke Energy, Inc.
|
145 | 127,168 | ||||||||||
| Trinseo Materials Operating SCA/Trinseo Materials Finance, Inc. |
256 | 207,054 | ||||||||||
| Tronox, Inc. |
98 | 82,048 | ||||||||||
| United States Steel Corp. |
37 | 35,735 | ||||||||||
| 6.875%, 03/01/2029 |
110 | 109,994 | ||||||||||
| Vibrantz Technologies, Inc.
|
3,258 | 2,496,594 | ||||||||||
| WR Grace Holdings LLC
|
1,174 | 1,131,239 | ||||||||||
| 5.625%, 08/15/2029(a) |
61 | 51,750 | ||||||||||
|
|
|
|||||||||||
| 28,365,981 | ||||||||||||
|
|
|
|||||||||||
| Capital Goods – 3.6% |
||||||||||||
| ARD Finance SA |
EUR | 3,069 | 2,485,547 | |||||||||
| Ardagh Metal Packaging Finance USA LLC/Ardagh Metal Packaging Finance PLC |
U.S.$ | 985 | 772,279 | |||||||||
| 6.00%, 06/15/2027(a) |
684 | 676,237 | ||||||||||
| Ardagh Packaging Finance PLC/Ardagh Holdings USA, Inc. |
2,663 | 2,480,276 | ||||||||||
| 5.25%, 08/15/2027(a) |
235 | 184,288 | ||||||||||
| Artera Services LLC
|
133 | 114,558 | ||||||||||
| 14 | ALLIANCEBERNSTEIN GLOBAL HIGH INCOME FUND |
abfunds.com | |
PORTFOLIO OF INVESTMENTS (continued)
| Principal Amount (000) |
U.S. $ Value | |||||||||
|
|
||||||||||
| Ball Corp. |
U.S.$ | 103 | $ | 102,847 | ||||||
| 6.875%, 03/15/2028 |
159 | 164,544 | ||||||||
| Bombardier, Inc.
|
77 | 75,017 | ||||||||
| 7.125%, 06/15/2026(a) |
217 | 218,641 | ||||||||
| 7.50%, 02/01/2029(a) |
74 | 75,607 | ||||||||
| 7.875%, 04/15/2027(a) |
1,814 | 1,839,364 | ||||||||
| Camelot Return Merger Sub, Inc.
|
196 | 181,408 | ||||||||
| Clean Harbors, Inc.
|
69 | 66,959 | ||||||||
| 6.375%, 02/01/2031(a) |
11 | 11,224 | ||||||||
| Covanta Holding Corp.
|
66 | 58,314 | ||||||||
| Crown Americas LLC |
411 | 397,746 | ||||||||
| Eco Material Technologies, Inc.
|
2,614 | 2,488,533 | ||||||||
| Energizer Holdings, Inc.
|
348 | 315,181 | ||||||||
| EnerSys |
935 | 866,776 | ||||||||
| F-Brasile SpA/F-Brasile US
LLC |
957 | 793,848 | ||||||||
| GrafTech Finance, Inc.
|
65 | 54,839 | ||||||||
| Griffon Corp. |
603 | 558,856 | ||||||||
| Harsco Corp. |
1,384 | 1,083,913 | ||||||||
| JELD-WEN, Inc. |
128 | 119,416 | ||||||||
| Koppers, Inc. |
118 | 117,969 | ||||||||
| Madison IAQ LLC
|
359 | 275,880 | ||||||||
| Masonite International Corp.
|
166 | 158,530 | ||||||||
| MIWD Holdco II LLC/MIWD Finance Corp. |
84 | 70,864 | ||||||||
| Moog, Inc. |
171 | 160,428 | ||||||||
| Mueller Water Products, Inc.
|
291 | 261,762 | ||||||||
| abfunds.com | ALLIANCEBERNSTEIN GLOBAL HIGH INCOME FUND | 15 | |
PORTFOLIO OF INVESTMENTS (continued)
| Principal Amount (000) |
U.S. $ Value | |||||||||
|
|
||||||||||
| New Enterprise Stone & Lime Co., Inc. |
U.S.$ | 13 | $ | 11,571 | ||||||
| Oscar AcquisitionCo LLC/Oscar Finance, Inc. |
63 | 54,823 | ||||||||
| Owens-Brockway Glass Container, Inc. |
165 | 165,139 | ||||||||
| Renk AG/Frankfurt am Main
|
EUR | 1,560 | 1,653,144 | |||||||
| Rolls-Royce PLC
|
U.S.$ | 918 | 867,472 | |||||||
| Silgan Holdings, Inc. |
213 | 200,531 | ||||||||
| Smyrna Ready Mix Concrete LLC
|
53 | 49,724 | ||||||||
| Spirit AeroSystems, Inc. |
23 | 19,490 | ||||||||
| Stericycle, Inc.
|
764 | 673,669 | ||||||||
| Summit Materials LLC/Summit Materials Finance Corp. |
164 | 155,623 | ||||||||
| Terex Corp. |
86 | 79,927 | ||||||||
| Titan Holdings II BV
|
EUR | 649 | 541,568 | |||||||
| TK Elevator Holdco GmbH
|
U.S.$ | 465 | 403,816 | |||||||
| TK Elevator Midco GmbH
|
EUR | 885 | 869,118 | |||||||
| TK Elevator US Newco, Inc.
|
U.S.$ | 525 | 495,385 | |||||||
| TransDigm, Inc. |
491 | 436,161 | ||||||||
| 4.875%, 05/01/2029 |
2,049 | 1,813,685 | ||||||||
| 5.50%, 11/15/2027 |
175 | 165,030 | ||||||||
| 6.25%, 03/15/2026(a) |
332 | 332,261 | ||||||||
| 6.375%, 06/15/2026 |
165 | 162,186 | ||||||||
| 6.75%, 08/15/2028(a) |
2,508 | 2,533,070 | ||||||||
| Triumph Group, Inc. |
428 | 392,386 | ||||||||
| 9.00%, 03/15/2028(a) |
2,516 | 2,519,254 | ||||||||
| Trivium Packaging Finance BV
|
EUR | 100 | 100,090 | |||||||
| Tutor Perini Corp.
|
U.S.$ | 90 | 63,497 | |||||||
| 16 | ALLIANCEBERNSTEIN GLOBAL HIGH INCOME FUND |
abfunds.com | |
PORTFOLIO OF INVESTMENTS (continued)
| Principal Amount (000) |
U.S. $ Value | |||||||||||
|
|
||||||||||||
| Waste Pro USA, Inc.
|
U.S.$ | 41 | $ | 37,721 | ||||||||
| WESCO Distribution, Inc.
|
20 | 20,336 | ||||||||||
| 7.25%, 06/15/2028(a) |
308 | 316,517 | ||||||||||
|
|
|
|||||||||||
| 32,364,845 | ||||||||||||
|
|
|
|||||||||||
| Communications - Media – 7.4% |
||||||||||||
| Advantage Sales & Marketing, Inc. |
393 | 298,172 | ||||||||||
| Allen Media LLC/Allen Media Co-Issuer, Inc.
|
42 | 22,997 | ||||||||||
| Altice Financing SA
|
1,456 | 1,173,134 | ||||||||||
| 5.75%, 08/15/2029(a) |
5,165 | 4,118,618 | ||||||||||
| AMC Networks, Inc. |
1,098 | 672,888 | ||||||||||
| 4.75%, 08/01/2025 |
914 | 807,069 | ||||||||||
| Arches Buyer, Inc.
|
605 | 501,314 | ||||||||||
| Banijay Entertainment SASU
|
EUR | 210 | 221,399 | |||||||||
| 5.375%, 03/01/2025(a) |
U.S.$ | 2,324 | 2,260,831 | |||||||||
| CCO Holdings LLC/CCO Holdings Capital Corp. |
163 | 126,256 | ||||||||||
| 4.50%, 08/15/2030(a) |
4,665 | 3,932,180 | ||||||||||
| 4.50%, 06/01/2033(a) |
2,998 | 2,390,728 | ||||||||||
| 4.75%, 02/01/2032(a) |
6,963 | 5,860,096 | ||||||||||
| 5.125%, 05/01/2027(a) |
327 | 308,867 | ||||||||||
| 6.375%, 09/01/2029(a) |
1,760 | 1,680,522 | ||||||||||
| 7.375%, 03/01/2031(a) |
2,762 | 2,722,304 | ||||||||||
| Clear Channel Outdoor Holdings, Inc. |
512 | 459,371 | ||||||||||
| CMG Media Corp.
|
158 | 119,496 | ||||||||||
| CSC Holdings LLC
|
981 | 702,515 | ||||||||||
| 4.625%, 12/01/2030(a) |
1,461 | 718,995 | ||||||||||
| 5.375%, 02/01/2028(a) |
1,278 | 1,049,584 | ||||||||||
| 5.75%, 01/15/2030(a) |
6,396 | 3,234,736 | ||||||||||
| 7.50%, 04/01/2028(a) |
1,150 | 732,460 | ||||||||||
| Deluxe Corp. |
17 | 12,409 | ||||||||||
| Diamond Sports Group LLC/Diamond Sports Finance Co. |
299 | 16,176 | ||||||||||
| abfunds.com | ALLIANCEBERNSTEIN GLOBAL HIGH INCOME FUND | 17 | |
PORTFOLIO OF INVESTMENTS (continued)
| Principal Amount (000) |
U.S. $ Value | |||||||||
|
|
||||||||||
| DISH DBS Corp. |
U.S.$ | 2,995 | $ | 1,580,405 | ||||||
| 5.25%, 12/01/2026(a) |
2,798 | 2,235,418 | ||||||||
| 5.75%, 12/01/2028(a) |
2,596 | 1,938,284 | ||||||||
| 5.875%, 11/15/2024 |
1,821 | 1,624,699 | ||||||||
| 7.375%, 07/01/2028 |
115 | 65,547 | ||||||||
| 7.75%, 07/01/2026 |
727 | 479,822 | ||||||||
| DISH Network Corp.
|
72 | 69,232 | ||||||||
| Gray Escrow II, Inc.
|
1,381 | 905,913 | ||||||||
| iHeartCommunications, Inc.
|
60 | 47,826 | ||||||||
| 5.25%, 08/15/2027(a) |
1,499 | 1,225,003 | ||||||||
| 8.375%, 05/01/2027 |
178 | 129,298 | ||||||||
| LCPR Senior Secured Financing DAC
|
2,910 | 2,459,861 | ||||||||
| 6.75%, 10/15/2027(a) |
200 | 184,032 | ||||||||
| Liberty Interactive LLC
|
870 | 134,438 | ||||||||
| McGraw-Hill Education, Inc.
|
1,123 | 977,010 | ||||||||
| National CineMedia LLC
|
623 | 192,995 | ||||||||
| Nexstar Media Inc.
|
172 | 152,910 | ||||||||
| Outfront Media Capital LLC/Outfront Media Capital Corp. |
391 | 324,148 | ||||||||
| 5.00%, 08/15/2027(a) |
113 | 102,899 | ||||||||
| Radiate Holdco LLC/Radiate Finance, Inc. |
1,331 | 1,040,699 | ||||||||
| 6.50%, 09/15/2028(a) |
124 | 51,130 | ||||||||
| Scripps Escrow II, Inc.
|
26 | 20,332 | ||||||||
| Sinclair Television Group, Inc.
|
1,613 | 1,302,205 | ||||||||
| 5.50%, 03/01/2030(a)(i) |
944 | 750,672 | ||||||||
| Sirius XM Radio, Inc.
|
6,132 | 5,270,947 | ||||||||
| 4.125%, 07/01/2030(a) |
204 | 166,761 | ||||||||
| 5.00%, 08/01/2027(a) |
982 | 912,735 | ||||||||
| 5.50%, 07/01/2029(a) |
186 | 169,122 | ||||||||
| Stagwell Global LLC
|
67 | 58,801 | ||||||||
| Summer BC Holdco B SARL
|
EUR | 1,395 | 1,318,197 | |||||||
| 18 | ALLIANCEBERNSTEIN GLOBAL HIGH INCOME FUND |
abfunds.com | |
PORTFOLIO OF INVESTMENTS (continued)
| Principal Amount (000) |
U.S. $ Value | |||||||||||
|
|
||||||||||||
| Summer BidCo BV |
EUR | 877 | $ | 735,053 | ||||||||
| TEGNA, Inc. |
U.S.$ | 333 | 288,035 | |||||||||
| Townsquare Media, Inc.
|
113 | 106,410 | ||||||||||
| Univision Communications, Inc.
|
1,593 | 1,513,347 | ||||||||||
| 7.375%, 06/30/2030(a) |
1,186 | 1,118,940 | ||||||||||
| Urban One, Inc.
|
2,221 | 2,015,773 | ||||||||||
| VZ Vendor Financing II BV
|
EUR | 885 | 764,201 | |||||||||
| Ziggo Bond Co. BV
|
U.S.$ | 1,124 | 903,845 | |||||||||
|
|
|
|||||||||||
| 67,480,062 | ||||||||||||
|
|
|
|||||||||||
| Communications - Telecommunications – 2.9% |
||||||||||||
| Altice France SA/France
|
EUR | 885 | 749,401 | |||||||||
| 5.125%, 07/15/2029(a) |
U.S.$ | 6,254 | 4,713,356 | |||||||||
| 5.50%, 10/15/2029(a) |
431 | 330,270 | ||||||||||
| 8.125%, 02/01/2027(a) |
224 | 205,827 | ||||||||||
| British Telecommunications PLC
|
214 | 185,866 | ||||||||||
| Connect Finco SARL/Connect US Finco LLC |
2,440 | 2,290,550 | ||||||||||
| Consolidated Communications, Inc.
|
795 | 540,116 | ||||||||||
| 6.50%, 10/01/2028(a) |
2,067 | 1,506,880 | ||||||||||
| Embarq Corp. |
2,128 | 891,989 | ||||||||||
| Frontier Communications Holdings LLC |
132 | 100,567 | ||||||||||
| 6.75%, 05/01/2029(a) |
524 | 415,270 | ||||||||||
| 8.625%, 03/15/2031(a) |
73 | 71,472 | ||||||||||
| 8.75%, 05/15/2030(a) |
893 | 888,993 | ||||||||||
| Hughes Satellite Systems Corp. |
465 | 439,181 | ||||||||||
| Iliad Holding SASU
|
719 | 687,691 | ||||||||||
| Intelsat Jackson Holdings SA
|
1,675 | – 0 | – | |||||||||
| Level 3 Financing, Inc.
|
64 | 35,324 | ||||||||||
| 3.75%, 07/15/2029(a) |
1,018 | 543,478 | ||||||||||
| abfunds.com | ALLIANCEBERNSTEIN GLOBAL HIGH INCOME FUND | 19 | |
PORTFOLIO OF INVESTMENTS (continued)
| Principal Amount (000) |
U.S. $ Value | |||||||||||
|
|
||||||||||||
| 4.25%, 07/01/2028(a) |
U.S.$ | 791 | $ | 445,749 | ||||||||
| 4.625%, 09/15/2027(a) |
1,691 | 1,015,801 | ||||||||||
| Lorca Telecom Bondco SA
|
EUR | 952 | 948,969 | |||||||||
| Lumen Technologies, Inc. |
U.S.$ | 73 | 27,919 | |||||||||
| Series U |
68 | 25,876 | ||||||||||
| Telecom Italia Capital SA |
50 | 42,711 | ||||||||||
| 7.20%, 07/18/2036 |
451 | 409,025 | ||||||||||
| 7.721%, 06/04/2038 |
1,596 | 1,480,143 | ||||||||||
| Telecom Italia SpA/Milano
|
403 | 394,844 | ||||||||||
| Telesat Canada/Telesat LLC
|
14 | 7,343 | ||||||||||
| 6.50%, 10/15/2027(a) |
132 | 39,898 | ||||||||||
| United Group BV
|
EUR | 237 | 183,228 | |||||||||
| 4.625%, 08/15/2028(a) |
481 | 384,880 | ||||||||||
| 7.357% (EURIBOR 3 Month + 4.88%), 02/01/2029(j) |
896 | 811,698 | ||||||||||
| Vmed O2 UK Financing I PLC
|
U.S.$ | 530 | 439,842 | |||||||||
| 4.75%, 07/15/2031(a) |
3,880 | 3,307,086 | ||||||||||
| Vodafone Group PLC |
208 | 162,240 | ||||||||||
| 5.125%, 06/04/2081 |
48 | 33,600 | ||||||||||
| Windstream Escrow LLC/Windstream Escrow Finance Corp. |
235 | 189,803 | ||||||||||
| Zayo Group Holdings, Inc.
|
1,515 | 1,149,111 | ||||||||||
| 6.125%, 03/01/2028(a) |
128 | 77,609 | ||||||||||
|
|
|
|||||||||||
| 26,173,606 | ||||||||||||
|
|
|
|||||||||||
| Consumer Cyclical - Automotive – 4.0% |
||||||||||||
| Adient Global Holdings Ltd.
|
400 | 385,318 | ||||||||||
| Allison Transmission, Inc.
|
213 | 181,495 | ||||||||||
| 5.875%, 06/01/2029(a) |
1,163 | 1,132,434 | ||||||||||
| American Axle & Manufacturing, Inc. |
220 | 186,075 | ||||||||||
| Aston Martin Capital Holdings Ltd. |
1,028 | 1,099,052 | ||||||||||
| 20 | ALLIANCEBERNSTEIN GLOBAL HIGH INCOME FUND |
abfunds.com | |
PORTFOLIO OF INVESTMENTS (continued)
| Principal Amount (000) |
U.S. $ Value | |||||||||
|
|
||||||||||
| Clarios Global LP/Clarios US Finance Co. |
EUR | 210 | $ | 216,904 | ||||||
| Dana Financing Luxembourg SARL
|
U.S.$ | 109 | 107,701 | |||||||
| Dana, Inc. |
760 | 619,835 | ||||||||
| 5.375%, 11/15/2027 |
109 | 103,021 | ||||||||
| 5.625%, 06/15/2028 |
182 | 170,918 | ||||||||
| Dealer Tire LLC/DT Issuer LLC
|
1,116 | 1,002,947 | ||||||||
| Exide Technologies |
2,940 | – 0 | – | |||||||
| (First Lien) |
1,207 | – 0 | – | |||||||
| Ford Motor Co. |
3,020 | 2,364,403 | ||||||||
| 4.75%, 01/15/2043 |
107 | 81,455 | ||||||||
| 5.291%, 12/08/2046 |
249 | 201,996 | ||||||||
| 6.10%, 08/19/2032 |
4,663 | 4,504,965 | ||||||||
| Ford Motor Credit Co. LLC |
793 | 705,863 | ||||||||
| 3.664%, 09/08/2024 |
200 | 192,565 | ||||||||
| 4.271%, 01/09/2027 |
220 | 204,951 | ||||||||
| 4.95%, 05/28/2027 |
1,160 | 1,106,379 | ||||||||
| 7.35%, 11/04/2027 |
4,412 | 4,551,223 | ||||||||
| Series G |
200 | 189,727 | ||||||||
| Goodyear Tire & Rubber Co. (The) |
49 | 43,088 | ||||||||
| IHO Verwaltungs GmbH |
EUR | 284 | 306,951 | |||||||
| 3.75% (3.75% Cash or 4.50% PIK), 09/15/2026(a)(f) |
885 | 862,858 | ||||||||
| 3.875% (3.875% Cash or 4.625% PIK), 05/15/2027(a)(f) |
338 | 322,112 | ||||||||
| 4.75% (4.75% Cash or 5.50% PIK), 09/15/2026(a)(f) |
U.S.$ | 433 | 386,428 | |||||||
| 6.00% (6.00% Cash or 6.75% PIK), 05/15/2027(a)(f) |
1,984 | 1,823,562 | ||||||||
| 8.75% (8.75% Cash or 9.50% PIK), 05/15/2028(a)(f) |
EUR | 306 | 339,438 | |||||||
| Jaguar Land Rover Automotive PLC
|
U.S.$ | 1,490 | 1,168,278 | |||||||
| 5.875%, 01/15/2028(a) |
1,295 | 1,091,733 | ||||||||
| 7.75%, 10/15/2025(a) |
1,417 | 1,374,421 | ||||||||
| abfunds.com | ALLIANCEBERNSTEIN GLOBAL HIGH INCOME FUND | 21 | |
PORTFOLIO OF INVESTMENTS (continued)
| Principal Amount (000) |
U.S. $ Value | |||||||||||
|
|
||||||||||||
| JB Poindexter & Co., Inc.
|
U.S.$ | 146 | $ | 136,901 | ||||||||
| Mclaren Finance PLC
|
1,973 | 1,612,429 | ||||||||||
| PM General Purchaser LLC
|
1,339 | 1,229,722 | ||||||||||
| Real Hero Merger Sub 2, Inc.
|
1,777 | 1,318,005 | ||||||||||
| Titan International, Inc. |
1,465 | 1,319,856 | ||||||||||
| ZF Europe Finance BV
|
EUR | 200 | 197,138 | |||||||||
| ZF Finance GmbH |
200 | 186,728 | ||||||||||
| 2.75%, 05/25/2027(a) |
900 | 868,736 | ||||||||||
| ZF North America Capital, Inc.
|
U.S.$ | 2,528 | 2,484,957 | |||||||||
|
|
|
|||||||||||
| 36,382,568 | ||||||||||||
|
|
|
|||||||||||
| Consumer Cyclical - Entertainment – 2.9% |
||||||||||||
| AMC Entertainment Holdings, Inc.
|
142 | 98,140 | ||||||||||
| Carnival Corp. |
1,739 | 1,492,279 | ||||||||||
| 5.75%, 03/01/2027(a) |
1,336 | 1,092,180 | ||||||||||
| 6.00%, 05/01/2029(a) |
43 | 34,185 | ||||||||||
| 7.625%, 03/01/2026(a) |
EUR | 311 | 300,128 | |||||||||
| 7.625%, 03/01/2026(a) |
U.S.$ | 246 | 224,475 | |||||||||
| 9.875%, 08/01/2027(a) |
437 | 448,917 | ||||||||||
| 10.125%, 02/01/2026(a) |
EUR | 310 | 353,127 | |||||||||
| 10.50%, 06/01/2030(a) |
U.S.$ | 212 | 203,520 | |||||||||
| Carnival Holdings Bermuda Ltd.
|
3,714 | 3,993,623 | ||||||||||
| Carnival PLC |
EUR | 202 | 111,371 | |||||||||
| Cedar Fair LP/Canada’s Wonderland Co./Magnum Management Corp./Millennium Op |
U.S.$ | 2,191 | 2,189,234 | |||||||||
| Cinemark USA, Inc.
|
521 | 452,179 | ||||||||||
| Lindblad Expeditions LLC
|
365 | 353,487 | ||||||||||
| Motion Bondco DAC
|
EUR | 670 | 641,078 | |||||||||
| NCL Corp., Ltd.
|
U.S.$ | 2,072 | 1,763,376 | |||||||||
| 22 | ALLIANCEBERNSTEIN GLOBAL HIGH INCOME FUND |
abfunds.com | |
PORTFOLIO OF INVESTMENTS (continued)
| Principal Amount (000) |
U.S. $ Value | |||||||||||
|
|
||||||||||||
| 7.75%, 02/15/2029(a) |
U.S.$ | 93 | $ | 79,900 | ||||||||
| 8.375%, 02/01/2028(a) |
637 | 639,600 | ||||||||||
| NCL Finance Ltd.
|
39 | 31,639 | ||||||||||
| Royal Caribbean Cruises Ltd.
|
1,159 | 1,030,061 | ||||||||||
| 5.50%, 08/31/2026(a) |
1,118 | 1,045,945 | ||||||||||
| 5.50%, 04/01/2028(a) |
4,222 | 3,716,415 | ||||||||||
| 11.50%, 06/01/2025(a) |
1,409 | 1,502,403 | ||||||||||
| 11.625%, 08/15/2027(a) |
74 | 79,318 | ||||||||||
| Viking Cruises Ltd.
|
1,558 | 1,341,860 | ||||||||||
| 7.00%, 02/15/2029(a) |
1,837 | 1,575,601 | ||||||||||
| 13.00%, 05/15/2025(a) |
65 | 68,675 | ||||||||||
| VOC Escrow Ltd. |
1,822 | 1,614,751 | ||||||||||
|
|
|
|||||||||||
| 26,477,467 | ||||||||||||
|
|
|
|||||||||||
| Consumer Cyclical - Other – 3.4% |
||||||||||||
| Adams Homes, Inc.
|
598 | 531,169 | ||||||||||
| Affinity Gaming
|
199 | 177,819 | ||||||||||
| Allwyn Entertainment Financing UK PLC |
EUR | 650 | 697,090 | |||||||||
| Beazer Homes USA, Inc. |
U.S.$ | 355 | 349,675 | |||||||||
| Brookfield Residential Properties, Inc./Brookfield Residential US LLC |
1,097 | 827,338 | ||||||||||
| 5.00%, 06/15/2029(a) |
167 | 127,751 | ||||||||||
| 6.25%, 09/15/2027(a) |
1,233 | 1,093,658 | ||||||||||
| Builders FirstSource, Inc.
|
244 | 210,958 | ||||||||||
| 6.375%, 06/15/2032(a) |
1,070 | 1,074,084 | ||||||||||
| Caesars Entertainment, Inc.
|
897 | 897,281 | ||||||||||
| 7.00%, 02/15/2030(a) |
1,275 | 1,297,064 | ||||||||||
| Castle UK Finco PLC |
GBP | 679 | 663,301 | |||||||||
| 7.904% (EURIBOR 3 Month + 5.25%), 05/15/2028(j) |
EUR | 514 | 463,930 | |||||||||
| Century Communities, Inc.
|
U.S.$ | 75 | 64,277 | |||||||||
| Churchill Downs, Inc.
|
520 | 486,910 | ||||||||||
| 5.50%, 04/01/2027(a) |
169 | 165,436 | ||||||||||
| abfunds.com | ALLIANCEBERNSTEIN GLOBAL HIGH INCOME FUND | 23 | |
PORTFOLIO OF INVESTMENTS (continued)
| Principal Amount (000) |
U.S. $ Value | |||||||||
|
|
||||||||||
| CP Atlas Buyer, Inc.
|
U.S.$ | 126 | $ | 93,484 | ||||||
| Everi Holdings, Inc.
|
240 | 215,208 | ||||||||
| Five Point Operating Co. LP/Five Point Capital Corp. |
1,969 | 1,765,922 | ||||||||
| Forestar Group, Inc.
|
385 | 349,139 | ||||||||
| Hilton Domestic Operating Co., Inc. |
1,728 | 1,456,778 | ||||||||
| 3.75%, 05/01/2029(a) |
62 | 55,489 | ||||||||
| 4.00%, 05/01/2031(a) |
54 | 47,279 | ||||||||
| 5.375%, 05/01/2025(a) |
229 | 228,497 | ||||||||
| 5.75%, 05/01/2028(a) |
450 | 449,707 | ||||||||
| Hilton Grand Vacations Borrower Escrow LLC/Hilton Grand Vacations Borrower Esc |
597 | 510,066 | ||||||||
| 5.00%, 06/01/2029(a) |
1,598 | 1,417,503 | ||||||||
| Installed Building Products, Inc.
|
291 | 269,350 | ||||||||
| Jacobs Entertainment, Inc.
|
131 | 114,452 | ||||||||
| Marriott Ownership Resorts, Inc.
|
255 | 217,089 | ||||||||
| Mattamy Group Corp.
|
170 | 149,925 | ||||||||
| 5.25%, 12/15/2027(a) |
178 | 167,488 | ||||||||
| MGM Resorts International |
1,047 | 976,300 | ||||||||
| 5.50%, 04/15/2027 |
1,163 | 1,126,921 | ||||||||
| 5.75%, 06/15/2025 |
30 | 29,939 | ||||||||
| Mohegan Tribal Gaming Authority
|
223 | 204,045 | ||||||||
| New Home Co., Inc. (The)
|
211 | 195,203 | ||||||||
| Premier Entertainment Sub LLC/Premier Entertainment Finance Corp. |
69 | 51,046 | ||||||||
| 5.875%, 09/01/2031(a) |
39 | 28,025 | ||||||||
| Scientific Games Holdings LP/Scientific Games US FinCo, Inc. |
112 | 99,495 | ||||||||
| Scientific Games International, Inc. |
135 | 138,178 | ||||||||
| Shea Homes LP/Shea Homes Funding Corp. |
549 | 490,647 | ||||||||
| 4.75%, 04/01/2029 |
911 | 796,348 | ||||||||
| 24 | ALLIANCEBERNSTEIN GLOBAL HIGH INCOME FUND |
abfunds.com | |
PORTFOLIO OF INVESTMENTS (continued)
| Principal Amount (000) |
U.S. $ Value | |||||||||||
|
|
||||||||||||
| Standard Industries, Inc./NJ
|
U.S.$ | 929 | $ | 806,606 | ||||||||
| 4.75%, 01/15/2028(a) |
163 | 152,168 | ||||||||||
| Sugarhouse HSP Gaming Prop Mezz LP/Sugarhouse HSP Gaming Finance Corp. |
1,785 | 1,696,294 | ||||||||||
| Taylor Morrison Communities, Inc.
|
292 | 286,874 | ||||||||||
| Thor Industries, Inc.
|
230 | 190,002 | ||||||||||
| TopBuild Corp. |
69 | 58,516 | ||||||||||
| Travel + Leisure Co.
|
976 | 850,400 | ||||||||||
| 4.625%, 03/01/2030(a) |
2,415 | 2,078,237 | ||||||||||
| 6.00%, 04/01/2027 |
112 | 110,976 | ||||||||||
| 6.625%, 07/31/2026(a) |
637 | 639,527 | ||||||||||
| Universal Entertainment Corp.
|
410 | 381,833 | ||||||||||
| Wyndham Hotels & Resorts, Inc. |
727 | 670,009 | ||||||||||
| Wynn Las Vegas LLC/Wynn Las Vegas Capital Corp. |
781 | 738,045 | ||||||||||
| Wynn Resorts Finance LLC/Wynn Resorts Capital Corp. |
1,988 | 1,804,303 | ||||||||||
|
|
|
|||||||||||
| 31,235,054 | ||||||||||||
|
|
|
|||||||||||
| Consumer Cyclical - Restaurants – 0.5% |
||||||||||||
| 1011778 BC ULC/New Red Finance, Inc. |
1,524 | 1,417,939 | ||||||||||
| 4.375%, 01/15/2028(a) |
315 | 290,706 | ||||||||||
| CEC Entertainment LLC
|
210 | 199,389 | ||||||||||
| KFC Holding Co./Pizza Hut Holdings LLC/Taco Bell of America LLC |
168 | 164,629 | ||||||||||
| Stonegate Pub Co. Financing 2019 PLC |
GBP | 192 | 217,780 | |||||||||
| 8.25%, 07/31/2025(a) |
1,245 | 1,431,353 | ||||||||||
| Yum! Brands, Inc. |
U.S.$ | 49 | 42,981 | |||||||||
| 4.625%, 01/31/2032 |
1,114 | 1,035,116 | ||||||||||
| 4.75%, 01/15/2030(a) |
85 | 81,211 | ||||||||||
|
|
|
|||||||||||
| 4,881,104 | ||||||||||||
|
|
|
|||||||||||
| abfunds.com | ALLIANCEBERNSTEIN GLOBAL HIGH INCOME FUND | 25 | |
PORTFOLIO OF INVESTMENTS (continued)
| Principal Amount (000) |
U.S. $ Value | |||||||||||
|
|
||||||||||||
| Consumer Cyclical - Retailers – 2.5% |
||||||||||||
| Arko Corp. |
U.S.$ | 1,035 | $ | 864,592 | ||||||||
| Asbury Automotive Group, Inc.
|
852 | 762,333 | ||||||||||
| 5.00%, 02/15/2032(a) |
826 | 724,071 | ||||||||||
| At Home Group, Inc.
|
63 | 36,045 | ||||||||||
| Bath & Body Works, Inc.
|
1,916 | 1,866,639 | ||||||||||
| 6.75%, 07/01/2036 |
299 | 267,020 | ||||||||||
| 6.875%, 11/01/2035 |
587 | 530,880 | ||||||||||
| 7.50%, 06/15/2029 |
107 | 109,153 | ||||||||||
| 7.60%, 07/15/2037 |
261 | 226,368 | ||||||||||
| 9.375%, 07/01/2025(a) |
41 | 43,997 | ||||||||||
| BCPE Ulysses Intermediate, Inc. |
518 | 405,728 | ||||||||||
| Bed Bath & Beyond, Inc. |
58 | 3,108 | ||||||||||
| Carvana Co. |
415 | 185,620 | ||||||||||
| 5.875%, 10/01/2028(a) |
1,298 | 572,418 | ||||||||||
| eG Global Finance PLC
|
428 | 402,575 | ||||||||||
| 8.50%, 10/30/2025(a) |
408 | 378,973 | ||||||||||
| Foundation Building Materials, Inc.
|
246 | 195,584 | ||||||||||
| Gap, Inc. (The)
|
56 | 38,003 | ||||||||||
| Group 1 Automotive, Inc.
|
276 | 242,833 | ||||||||||
| Guitar Center, Inc.
|
145 | 127,201 | ||||||||||
| Kontoor Brands, Inc.
|
894 | 763,788 | ||||||||||
| LBM Acquisition LLC
|
81 | 62,261 | ||||||||||
| LCM Investments Holdings II LLC
|
52 | 43,469 | ||||||||||
| Levi Strauss & Co.
|
746 | 636,498 | ||||||||||
| Lithia Motors, Inc.
|
65 | 56,207 | ||||||||||
| 4.375%, 01/15/2031(a) |
60 | 51,737 | ||||||||||
| 26 | ALLIANCEBERNSTEIN GLOBAL HIGH INCOME FUND |
abfunds.com | |
PORTFOLIO OF INVESTMENTS (continued)
| Principal Amount (000) |
U.S. $ Value | |||||||||||
|
|
||||||||||||
| LSF9 Atlantis Holdings LLC/Victra Finance Corp. |
U.S.$ | 154 | $ | 140,154 | ||||||||
| Michaels Cos, Inc. (The)
|
1,475 | 1,229,006 | ||||||||||
| 7.875%, 05/01/2029(a) |
1,378 | 964,282 | ||||||||||
| Murphy Oil USA, Inc.
|
246 | 207,315 | ||||||||||
| 4.75%, 09/15/2029 |
201 | 185,531 | ||||||||||
| 5.625%, 05/01/2027 |
69 | 66,927 | ||||||||||
| NMG Holding Co., Inc./Neiman Marcus Group LLC |
1,720 | 1,614,838 | ||||||||||
| Nordstrom, Inc. |
159 | 113,517 | ||||||||||
| 4.375%, 04/01/2030 |
47 | 36,059 | ||||||||||
| 5.00%, 01/15/2044 |
4 | 2,515 | ||||||||||
| Penske Automotive Group, Inc. |
1,029 | 887,726 | ||||||||||
| QVC, Inc. |
5 | 2,025 | ||||||||||
| 4.75%, 02/15/2027 |
213 | 89,393 | ||||||||||
| 4.85%, 04/01/2024 |
133 | 106,425 | ||||||||||
| Rite Aid Corp. |
992 | 593,524 | ||||||||||
| Sonic Automotive, Inc.
|
1,864 | 1,581,396 | ||||||||||
| 4.875%, 11/15/2031(a) |
221 | 180,926 | ||||||||||
| Specialty Building Products Holdings LLC/SBP Finance Corp. |
508 | 466,961 | ||||||||||
| Staples, Inc. |
2,323 | 2,035,037 | ||||||||||
| 10.75%, 04/15/2027(a) |
1,271 | 921,702 | ||||||||||
| TPro Acquisition Corp.
|
1,062 | 1,062,570 | ||||||||||
| Victoria’s Secret & Co. |
58 | 46,934 | ||||||||||
| White Cap Buyer LLC
|
226 | 196,357 | ||||||||||
| White Cap Parent LLC |
329 | 300,316 | ||||||||||
|
|
|
|||||||||||
| 22,628,537 | ||||||||||||
|
|
|
|||||||||||
| Consumer Non-Cyclical – 7.2% |
||||||||||||
| AdaptHealth LLC
|
288 | 263,759 | ||||||||||
| abfunds.com | ALLIANCEBERNSTEIN GLOBAL HIGH INCOME FUND | 27 | |
PORTFOLIO OF INVESTMENTS (continued)
| Principal Amount (000) |
U.S. $ Value | |||||||||
|
|
||||||||||
| AHP Health Partners, Inc.
|
U.S.$ | 988 | $ | 830,003 | ||||||
| Albertsons Cos., Inc./Safeway, Inc./New Albertsons LP/Albertsons LLC |
615 | 594,426 | ||||||||
| 4.875%, 02/15/2030(a) |
200 | 186,687 | ||||||||
| 6.50%, 02/15/2028(a) |
2,469 | 2,489,223 | ||||||||
| B&G Foods, Inc. |
193 | 179,577 | ||||||||
| Bausch Health Americas, Inc.
|
543 | 246,447 | ||||||||
| Bausch Health Cos., Inc.
|
2,835 | 1,684,730 | ||||||||
| 5.00%, 02/15/2029(a) |
1,338 | 520,917 | ||||||||
| 5.25%, 01/30/2030(a) |
8 | 2,978 | ||||||||
| 5.50%, 11/01/2025(a) |
196 | 163,472 | ||||||||
| 6.125%, 02/01/2027(a) |
303 | 196,319 | ||||||||
| 6.25%, 02/15/2029(a) |
911 | 362,211 | ||||||||
| 7.00%, 01/15/2028(a) |
204 | 81,920 | ||||||||
| 7.25%, 05/30/2029(a) |
254 | 97,893 | ||||||||
| 11.00%, 09/30/2028(a) |
236 | 173,569 | ||||||||
| Cab Selas |
EUR | 1,880 | 1,672,351 | |||||||
| CD&R Smokey Buyer, Inc.
|
U.S.$ | 203 | 174,143 | |||||||
| Cheplapharm Arzneimittel GmbH
|
436 | 388,419 | ||||||||
| CHS/Community Health Systems, Inc.
|
493 | 364,607 | ||||||||
| 5.25%, 05/15/2030(a) |
66 | 51,435 | ||||||||
| 5.625%, 03/15/2027(a) |
416 | 360,926 | ||||||||
| 6.125%, 04/01/2030(a) |
3,702 | 2,230,486 | ||||||||
| 6.875%, 04/01/2028(a)(i) |
577 | 357,724 | ||||||||
| 6.875%, 04/15/2029(a) |
1,537 | 951,080 | ||||||||
| 8.00%, 03/15/2026(a) |
807 | 780,281 | ||||||||
| Coty, Inc. |
133 | 128,828 | ||||||||
| DaVita, Inc. |
687 | 541,328 | ||||||||
| 4.625%, 06/01/2030(a) |
3,556 | 3,034,337 | ||||||||
| Edgewell Personal Care Co.
|
164 | 145,137 | ||||||||
| 5.50%, 06/01/2028(a) |
81 | 77,563 | ||||||||
| Elanco Animal Health, Inc. |
1,416 | 1,336,442 | ||||||||
| Embecta Corp. |
2,581 | 2,222,002 | ||||||||
| 28 | ALLIANCEBERNSTEIN GLOBAL HIGH INCOME FUND |
abfunds.com | |
PORTFOLIO OF INVESTMENTS (continued)
| Principal Amount (000) |
U.S. $ Value | |||||||||
|
|
||||||||||
| Emergent BioSolutions, Inc.
|
U.S.$ | 1,516 | $ | 736,212 | ||||||
| Garden Spinco Corp.
|
883 | 954,841 | ||||||||
| Global Medical Response, Inc.
|
431 | 318,012 | ||||||||
| Grifols Escrow Issuer SA
|
EUR | 2,222 | 1,878,790 | |||||||
| Gruenenthal GmbH
|
885 | 901,183 | ||||||||
| 4.125%, 05/15/2028(a) |
1,141 | 1,122,954 | ||||||||
| Herbalife Nutrition Ltd./HLF Financing, Inc. |
U.S.$ | 59 | 55,165 | |||||||
| Hologic, Inc. |
246 | 218,963 | ||||||||
| IQVIA, Inc. |
EUR | 862 | 796,017 | |||||||
| Jazz Securities DAC
|
U.S.$ | 954 | 875,237 | |||||||
| Kronos Acquisition Holdings, Inc./KIK Custom Products, Inc. |
1,951 | 1,698,204 | ||||||||
| Lamb Weston Holdings, Inc.
|
1,209 | 1,106,791 | ||||||||
| 4.875%, 05/15/2028(a) |
204 | 198,496 | ||||||||
| Legacy LifePoint Health LLC
|
2,831 | 2,316,402 | ||||||||
| 6.75%, 04/15/2025(a) |
89 | 84,385 | ||||||||
| LifePoint Health, Inc.
|
41 | 25,066 | ||||||||
| Mallinckrodt International Finance SA/Mallinckrodt CB LLC |
109 | 63,421 | ||||||||
| 11.50%, 12/15/2028(a) |
201 | 164,457 | ||||||||
| Medline Borrower LP
|
1,738 | 1,507,973 | ||||||||
| 5.25%, 10/01/2029(a) |
3,373 | 2,926,386 | ||||||||
| Newell Brands, Inc. |
687 | 661,409 | ||||||||
| 4.875%, 06/01/2025 |
170 | 166,469 | ||||||||
| 5.875%, 04/01/2036 |
88 | 77,955 | ||||||||
| 6.00%, 04/01/2046 |
41 | 33,572 | ||||||||
| 6.375%, 09/15/2027 |
1,500 | 1,513,676 | ||||||||
| 6.625%, 09/15/2029 |
1,500 | 1,511,863 | ||||||||
| Organon & Co./Organon Foreign Debt Co-Issuer BV
|
EUR | 885 | 844,609 | |||||||
| abfunds.com | ALLIANCEBERNSTEIN GLOBAL HIGH INCOME FUND | 29 | |
PORTFOLIO OF INVESTMENTS (continued)
| Principal Amount (000) |
U.S. $ Value | |||||||||
|
|
||||||||||
| 4.125%, 04/30/2028(a) |
U.S.$ | 1,837 | $ | 1,690,695 | ||||||
| 5.125%, 04/30/2031(a) |
420 | 372,819 | ||||||||
| Oriflame Investment Holding PLC
|
347 | 207,459 | ||||||||
| Owens & Minor, Inc.
|
47 | 37,304 | ||||||||
| 6.625%, 04/01/2030(a) |
19 | 16,313 | ||||||||
| Performance Food Group, Inc.
|
187 | 168,911 | ||||||||
| 5.50%, 10/15/2027(a) |
190 | 185,756 | ||||||||
| Perrigo Finance Unlimited Co. |
691 | 619,563 | ||||||||
| Post Holdings, Inc.
|
1,564 | 1,376,383 | ||||||||
| 4.625%, 04/15/2030(a) |
870 | 779,891 | ||||||||
| 5.50%, 12/15/2029(a) |
529 | 500,813 | ||||||||
| Prime Healthcare Services, Inc.
|
225 | 199,907 | ||||||||
| Primo Water Holdings, Inc.
|
1,227 | 1,077,699 | ||||||||
| Radiology Partners, Inc.
|
1,599 | 883,611 | ||||||||
| RegionalCare Hospital Partners Holdings, Inc./LifePoint Health, Inc. |
990 | 800,233 | ||||||||
| RP Escrow Issuer LLC
|
638 | 483,351 | ||||||||
| Simmons Foods Inc/Simmons Prepared Foods Inc/Simmons Pet Food Inc/Simmons Feed |
10 | 8,124 | ||||||||
| Spectrum Brands, Inc.
|
2,079 | 1,720,319 | ||||||||
| 4.00%, 10/01/2026(a) |
EUR | 530 | 537,320 | |||||||
| Tenet Healthcare Corp. |
U.S.$ | 2,307 | 2,071,123 | |||||||
| 6.125%, 10/01/2028 |
872 | 831,403 | ||||||||
| 6.125%, 06/15/2030(a) |
1,017 | 1,004,628 | ||||||||
| Triton Water Holdings, Inc.
|
884 | 696,694 | ||||||||
| United Natural Foods, Inc.
|
187 | 173,533 | ||||||||
| US Acute Care Solutions LLC
|
3,003 | 2,676,705 | ||||||||
| US Renal Care, Inc.
|
616 | 164,568 | ||||||||
| 30 | ALLIANCEBERNSTEIN GLOBAL HIGH INCOME FUND |
abfunds.com | |
PORTFOLIO OF INVESTMENTS (continued)
| Principal Amount (000) |
U.S. $ Value | |||||||||||
|
|
||||||||||||
| Vector Group Ltd.
|
U.S.$ | 188 | $ | 167,237 | ||||||||
| 10.50%, 11/01/2026(a) |
188 | 189,120 | ||||||||||
| Vista Outdoor, Inc.
|
202 | 162,904 | ||||||||||
|
|
|
|||||||||||
| 65,454,114 | ||||||||||||
|
|
|
|||||||||||
| Energy – 4.0% |
||||||||||||
| Aethon United BR LP/Aethon United Finance Corp. |
68 | 66,694 | ||||||||||
| Ascent Resources Utica Holdings LLC/ARU Finance Corp. |
18 | 17,394 | ||||||||||
| Berry Petroleum Co. LLC
|
245 | 229,482 | ||||||||||
| Blue Racer Midstream LLC/Blue Racer Finance Corp. |
421 | 417,852 | ||||||||||
| Buckeye Partners LP |
6 | 5,429 | ||||||||||
| 4.125%, 03/01/2025(a) |
171 | 162,744 | ||||||||||
| 4.125%, 12/01/2027 |
214 | 189,888 | ||||||||||
| 4.50%, 03/01/2028(a) |
17 | 15,336 | ||||||||||
| Callon Petroleum Co. |
301 | 299,748 | ||||||||||
| Calumet Specialty Products Partners LP/Calumet Finance Corp. |
33 | 33,956 | ||||||||||
| CGG SA |
422 | 356,988 | ||||||||||
| Chesapeake Energy Corp.
|
135 | 128,479 | ||||||||||
| 6.75%, 04/15/2029(a) |
158 | 156,729 | ||||||||||
| Citgo Holding, Inc.
|
478 | 479,107 | ||||||||||
| CITGO Petroleum Corp.
|
471 | 461,788 | ||||||||||
| 7.00%, 06/15/2025(a) |
1,781 | 1,761,312 | ||||||||||
| Civitas Resources, Inc.
|
682 | 643,357 | ||||||||||
| CNX Resources Corp.
|
423 | 397,515 | ||||||||||
| 7.375%, 01/15/2031(a) |
72 | 70,915 | ||||||||||
| Comstock Resources, Inc.
|
30 | 25,868 | ||||||||||
| 6.75%, 03/01/2029(a) |
294 | 267,674 | ||||||||||
| abfunds.com | ALLIANCEBERNSTEIN GLOBAL HIGH INCOME FUND | 31 | |
PORTFOLIO OF INVESTMENTS (continued)
| Principal Amount (000) |
U.S. $ Value | |||||||||
|
|
||||||||||
| Crescent Energy Finance LLC
|
U.S.$ | 1,005 | $ | 944,724 | ||||||
| Crestwood Midstream Partners LP/Crestwood Midstream Finance Corp. |
182 | 175,415 | ||||||||
| 6.00%, 02/01/2029(a) |
54 | 51,286 | ||||||||
| 8.00%, 04/01/2029(a) |
101 | 102,958 | ||||||||
| CVR Energy, Inc.
|
223 | 215,127 | ||||||||
| Earthstone Energy Holdings LLC
|
151 | 148,134 | ||||||||
| Encino Acquisition Partners Holdings LLC |
1,352 | 1,181,992 | ||||||||
| Enerflex Ltd. |
174 | 169,236 | ||||||||
| EnLink Midstream Partners LP |
2,734 | 2,318,888 | ||||||||
| EQM Midstream Partners LP
|
811 | 689,560 | ||||||||
| 4.75%, 01/15/2031(a) |
859 | 713,296 | ||||||||
| 6.50%, 07/15/2048 |
137 | 105,645 | ||||||||
| FTAI Infra Escrow Holdings LLC
|
157 | 155,781 | ||||||||
| Genesis Energy LP/Genesis Energy Finance Corp. |
92 | 87,864 | ||||||||
| 6.50%, 10/01/2025 |
411 | 399,295 | ||||||||
| 7.75%, 02/01/2028 |
440 | 431,272 | ||||||||
| 8.00%, 01/15/2027 |
738 | 728,218 | ||||||||
| 8.875%, 04/15/2030 |
74 | 75,240 | ||||||||
| Global Partners LP/GLP Finance Corp. |
439 | 405,283 | ||||||||
| 7.00%, 08/01/2027 |
403 | 387,356 | ||||||||
| Gulfport Energy Corp.
|
589 | 371 | ||||||||
| 6.375%, 05/15/2025(c) |
1,547 | 975 | ||||||||
| 6.375%, 01/15/2026(c) |
1,710 | 1,077 | ||||||||
| 6.625%, 05/01/2023(c) |
161 | 101 | ||||||||
| 8.00%, 05/17/2026(a) |
610 | 603,871 | ||||||||
| Harbour Energy PLC
|
200 | 177,667 | ||||||||
| Harvest Midstream I LP
|
69 | 68,797 | ||||||||
| Hess Midstream Operations LP
|
481 | 475,555 | ||||||||
| 32 | ALLIANCEBERNSTEIN GLOBAL HIGH INCOME FUND |
abfunds.com | |
PORTFOLIO OF INVESTMENTS (continued)
| Principal Amount (000) |
U.S. $ Value | |||||||||
|
|
||||||||||
| Hilcorp Energy I LP/Hilcorp Finance Co. |
U.S.$ | 233 | $ | 216,773 | ||||||
| 6.00%, 02/01/2031(a) |
340 | 314,262 | ||||||||
| 6.25%, 04/15/2032(a) |
96 | 88,755 | ||||||||
| Ithaca Energy North Sea PLC
|
1,188 | 1,137,105 | ||||||||
| ITT Holdings LLC
|
2,299 | 1,939,185 | ||||||||
| KLX Energy Services Holdings, Inc.
|
64 | 60,160 | ||||||||
| MEG Energy Corp.
|
231 | 222,572 | ||||||||
| Moss Creek Resources Holdings, Inc.
|
713 | 661,396 | ||||||||
| 10.50%, 05/15/2027(a) |
202 | 192,225 | ||||||||
| Murphy Oil Corp. |
211 | 206,348 | ||||||||
| Nabors Industries Ltd.
|
403 | 384,279 | ||||||||
| 7.50%, 01/15/2028(a) |
2,085 | 1,915,563 | ||||||||
| Nabors Industries, Inc.
|
319 | 312,381 | ||||||||
| New Fortress Energy, Inc.
|
1,126 | 1,083,052 | ||||||||
| NGL Energy Operating LLC/NGL Energy Finance Corp. |
1,614 | 1,557,965 | ||||||||
| Northern Oil and Gas, Inc.
|
97 | 96,064 | ||||||||
| NuStar Logistics LP |
144 | 140,678 | ||||||||
| 6.375%, 10/01/2030 |
278 | 266,644 | ||||||||
| Parkland Corp. |
220 | 195,517 | ||||||||
| 4.625%, 05/01/2030(a) |
220 | 195,474 | ||||||||
| 5.875%, 07/15/2027(a) |
90 | 87,290 | ||||||||
| PBF Holding Co. LLC/PBF Finance Corp. |
216 | 207,686 | ||||||||
| 7.25%, 06/15/2025 |
212 | 211,140 | ||||||||
| PDC Energy, Inc. |
1,575 | 1,533,184 | ||||||||
| 6.125%, 09/15/2024 |
593 | 590,740 | ||||||||
| Permian Resources Operating LLC
|
42 | 39,779 | ||||||||
| Petrofac Ltd. |
200 | 149,284 | ||||||||
| abfunds.com | ALLIANCEBERNSTEIN GLOBAL HIGH INCOME FUND | 33 | |
PORTFOLIO OF INVESTMENTS (continued)
| Principal Amount (000) |
U.S. $ Value | |||||||||||
|
|
||||||||||||
| Rockies Express Pipeline LLC
|
U.S.$ | 174 | $ | 163,551 | ||||||||
| 6.875%, 04/15/2040(a) |
77 | 64,662 | ||||||||||
| SM Energy Co. |
26 | 25,466 | ||||||||||
| Southwestern Energy Co. |
187 | 176,512 | ||||||||||
| 8.375%, 09/15/2028 |
120 | 126,175 | ||||||||||
| Strathcona Resources Ltd.
|
227 | 180,018 | ||||||||||
| Summit Midstream Holdings LLC/Summit Midstream Finance Corp. |
1,086 | 1,043,204 | ||||||||||
| Sunnova Energy Corp.
|
503 | 426,591 | ||||||||||
| Sunoco LP/Sunoco Finance Corp. |
114 | 104,456 | ||||||||||
| 5.875%, 03/15/2028 |
774 | 755,078 | ||||||||||
| 6.00%, 04/15/2027 |
192 | 190,268 | ||||||||||
| Tallgrass Energy Partners LP/Tallgrass Energy Finance Corp. |
9 | 8,560 | ||||||||||
| 6.00%, 12/31/2030(a) |
160 | 142,891 | ||||||||||
| 6.00%, 09/01/2031(a) |
151 | 133,635 | ||||||||||
| Topaz Solar Farms LLC
|
143 | 135,792 | ||||||||||
| Transocean Poseidon Ltd.
|
18 | 17,489 | ||||||||||
| Transocean, Inc.
|
82 | 83,640 | ||||||||||
| 11.50%, 01/30/2027(a) |
211 | 218,123 | ||||||||||
| USA Compression Partners LP/USA Compression Finance Corp. |
225 | 215,061 | ||||||||||
| Venture Global Calcasieu Pass LLC
|
890 | 781,525 | ||||||||||
| Weatherford International Ltd.
|
175 | 177,224 | ||||||||||
| 11.00%, 12/01/2024(a) |
9 | 9,243 | ||||||||||
|
|
|
|||||||||||
| 36,187,904 | ||||||||||||
|
|
|
|||||||||||
| Other Industrial – 0.2% |
||||||||||||
| AECOM |
221 | 216,764 | ||||||||||
| American Builders & Contractors Supply Co., Inc. |
100 | 91,339 | ||||||||||
| 34 | ALLIANCEBERNSTEIN GLOBAL HIGH INCOME FUND |
abfunds.com | |
PORTFOLIO OF INVESTMENTS (continued)
| Principal Amount (000) |
U.S. $ Value | |||||||||||
|
|
||||||||||||
| Grand Canyon University |
U.S.$ | 207 | $ | 195,553 | ||||||||
| Ritchie Bros Holdings, Inc.
|
768 | 790,823 | ||||||||||
| 7.75%, 03/15/2031(a) |
703 | 736,649 | ||||||||||
|
|
|
|||||||||||
| 2,031,128 | ||||||||||||
|
|
|
|||||||||||
| Services – 3.5% |
||||||||||||
| ADT Security Corp. (The) |
11 | 10,958 | ||||||||||
| 4.875%, 07/15/2032(a) |
1,097 | 958,806 | ||||||||||
| Allied Universal Holdco LLC/Allied Universal Finance Corp. |
327 | 243,764 | ||||||||||
| 6.625%, 07/15/2026(a) |
312 | 299,655 | ||||||||||
| 9.75%, 07/15/2027(a) |
1,363 | 1,212,121 | ||||||||||
| Allied Universal Holdco LLC/Allied Universal Finance Corp./Atlas Luxco 4 SARL |
EUR | 255 | 226,775 | |||||||||
| 4.625%, 06/01/2028(a) |
U.S.$ | 1,727 | 1,450,099 | |||||||||
| 4.875%, 06/01/2028(a) |
GBP | 1,010 | 1,019,873 | |||||||||
| AMN Healthcare, Inc.
|
U.S.$ | 205 | 190,902 | |||||||||
| ANGI Group LLC |
2,420 | 1,893,326 | ||||||||||
| Aptim Corp. |
627 | 429,495 | ||||||||||
| APX Group, Inc. |
1,504 | 1,347,476 | ||||||||||
| 6.75%, 02/15/2027(a) |
676 | 672,245 | ||||||||||
| Aramark Services, Inc.
|
1,064 | 1,006,777 | ||||||||||
| Block, Inc. |
463 | 422,245 | ||||||||||
| 3.50%, 06/01/2031 |
1,474 | 1,209,531 | ||||||||||
| Brink’s Co. (The)
|
176 | 166,205 | ||||||||||
| Cars.com, Inc. |
830 | 784,635 | ||||||||||
| CoreLogic, Inc. |
119 | 92,212 | ||||||||||
| Garda World Security Corp.
|
102 | 92,553 | ||||||||||
| 6.00%, 06/01/2029(a) |
99 | 78,705 | ||||||||||
| 7.75%, 02/15/2028(a) |
1,355 | 1,335,643 | ||||||||||
| 9.50%, 11/01/2027(a) |
479 | 455,403 | ||||||||||
| abfunds.com | ALLIANCEBERNSTEIN GLOBAL HIGH INCOME FUND | 35 | |
PORTFOLIO OF INVESTMENTS (continued)
| Principal Amount (000) |
U.S. $ Value | |||||||||
|
|
||||||||||
| Gartner, Inc. |
U.S.$ | 237 | $ | 211,695 | ||||||
| 4.50%, 07/01/2028(a) |
210 | 199,311 | ||||||||
| GrubHub Holdings, Inc.
|
234 | 176,241 | ||||||||
| IHS Markit Ltd. |
202 | 200,788 | ||||||||
| 4.75%, 08/01/2028 |
104 | 102,427 | ||||||||
| ION Trading Technologies SARL
|
1,067 | 854,558 | ||||||||
| Korn Ferry |
402 | 379,890 | ||||||||
| Millennium Escrow Corp.
|
1,828 | 1,187,064 | ||||||||
| Monitronics International, Inc.
|
958 | – 0 | – | |||||||
| MPH Acquisition Holdings
LLC |
1,922 | 1,548,460 | ||||||||
| 5.75%, 11/01/2028(a)(i) |
3,593 | 2,588,739 | ||||||||
| Neptune Bidco US, Inc.
|
2,157 | 1,999,062 | ||||||||
| Photo Holdings Merger Sub, Inc.
|
64 | 28,110 | ||||||||
| Prime Security Services Borrower LLC/Prime Finance, Inc. |
618 | 554,035 | ||||||||
| 5.25%, 04/15/2024(a) |
25 | 24,798 | ||||||||
| 6.25%, 01/15/2028(a) |
1,619 | 1,520,153 | ||||||||
| Q-Park Holding I BV |
EUR | 184 | 183,477 | |||||||
| 2.00%, 03/01/2027(a) |
579 | 521,798 | ||||||||
| Rakuten Group, Inc.
|
U.S.$ | 200 | 191,649 | |||||||
| Sabre GLBL, Inc.
|
378 | 355,918 | ||||||||
| 11.25%, 12/15/2027(a) |
2,483 | 2,308,057 | ||||||||
| Service Corp. International/US |
259 | 220,807 | ||||||||
| 4.00%, 05/15/2031 |
166 | 145,973 | ||||||||
| Sotheby’s/Bidfair Holdings, Inc. |
205 | 169,576 | ||||||||
| TriNet Group, Inc.
|
238 | 204,375 | ||||||||
| Verscend Escrow Corp.
|
551 | 551,555 | ||||||||
| 36 | ALLIANCEBERNSTEIN GLOBAL HIGH INCOME FUND |
abfunds.com | |
PORTFOLIO OF INVESTMENTS (continued)
| Principal Amount (000) |
U.S. $ Value | |||||||||||
|
|
||||||||||||
| ZipRecruiter, Inc.
|
U.S.$ | 25 | $ | 21,476 | ||||||||
|
|
|
|||||||||||
| 32,049,396 | ||||||||||||
|
|
|
|||||||||||
| Technology – 2.3% |
||||||||||||
| Ahead DB Holdings LLC
|
725 | 607,030 | ||||||||||
| Amkor Technology, Inc.
|
128 | 128,192 | ||||||||||
| AthenaHealth Group, Inc.
|
1,754 | 1,422,153 | ||||||||||
| Cablevision Lightpath LLC
|
1,060 | 731,228 | ||||||||||
| Central Parent, Inc./CDK Global, Inc. |
164 | 161,185 | ||||||||||
| Cloud Software Group Holdings, Inc.
|
216 | 188,602 | ||||||||||
| CommScope Technologies LLC
|
255 | 186,275 | ||||||||||
| CommScope, Inc. |
637 | 530,774 | ||||||||||
| 6.00%, 03/01/2026(a) |
276 | 266,076 | ||||||||||
| 8.25%, 03/01/2027(a) |
86 | 70,453 | ||||||||||
| Consensus Cloud Solutions, Inc.
|
51 | 42,533 | ||||||||||
| CWT Travel Group, Inc.
|
131 | 102,184 | ||||||||||
| Diebold Nixdorf, Inc.
|
51 | 26,237 | ||||||||||
| Entegris Escrow Corp.
|
1,146 | 1,110,520 | ||||||||||
| Fair Isaac Corp.
|
228 | 211,538 | ||||||||||
| Gen Digital, Inc.
|
1,271 | 1,278,201 | ||||||||||
| 7.125%, 09/30/2030(a) |
771 | 767,197 | ||||||||||
| GoTo Group, Inc.
|
1,677 | 864,759 | ||||||||||
| Imola Merger Corp.
|
968 | 865,495 | ||||||||||
| MicroStrategy, Inc.
|
40 | 35,516 | ||||||||||
| NCR Corp. |
1,001 | 868,104 | ||||||||||
| 5.75%, 09/01/2027(a) |
89 | 87,374 | ||||||||||
| ON Semiconductor Corp.
|
231 | 209,811 | ||||||||||
| abfunds.com | ALLIANCEBERNSTEIN GLOBAL HIGH INCOME FUND | 37 | |
PORTFOLIO OF INVESTMENTS (continued)
| Principal Amount (000) |
U.S. $ Value | |||||||||||
|
|
||||||||||||
| Open Text Corp.
|
U.S.$ | 64 | $ | 57,148 | ||||||||
| Playtech PLC |
EUR | 101 | 105,173 | |||||||||
| Playtika Holding Corp.
|
U.S.$ | 1,104 | 925,529 | |||||||||
| Presidio Holdings, Inc.
|
98 | 93,699 | ||||||||||
| 8.25%, 02/01/2028(a) |
1,588 | 1,510,963 | ||||||||||
| PTC, Inc. |
98 | 94,493 | ||||||||||
| Rackspace Technology Global, Inc.
|
3,885 | 2,016,969 | ||||||||||
| 5.375%, 12/01/2028(a) |
82 | 30,719 | ||||||||||
| Science Applications International Corp. |
105 | 98,193 | ||||||||||
| Seagate HDD Cayman |
45 | 33,567 | ||||||||||
| 4.091%, 06/01/2029 |
1,214 | 1,084,847 | ||||||||||
| 4.125%, 01/15/2031 |
38 | 32,003 | ||||||||||
| 5.75%, 12/01/2034 |
194 | 176,968 | ||||||||||
| Sensata Technologies BV
|
219 | 217,359 | ||||||||||
| 5.625%, 11/01/2024(a) |
53 | 52,902 | ||||||||||
| 5.875%, 09/01/2030(a) |
200 | 196,832 | ||||||||||
| Sensata Technologies, Inc.
|
474 | 414,488 | ||||||||||
| Vericast Corp. |
130 | 137,343 | ||||||||||
| Veritas US, Inc./Veritas Bermuda Ltd. |
2,757 | 2,079,498 | ||||||||||
| Viasat, Inc. |
161 | 152,718 | ||||||||||
| Virtusa Corp. |
717 | 567,691 | ||||||||||
| Xerox Corp. |
42 | 30,542 | ||||||||||
| Xerox Holdings Corp.
|
248 | 214,595 | ||||||||||
|
|
|
|||||||||||
| 21,085,676 | ||||||||||||
|
|
|
|||||||||||
| Transportation - Airlines – 0.6% |
||||||||||||
| Allegiant Travel Co.
|
127 | 125,275 | ||||||||||
| American Airlines Pass Through Trust |
257 | 222,515 | ||||||||||
| 38 | ALLIANCEBERNSTEIN GLOBAL HIGH INCOME FUND |
abfunds.com | |
PORTFOLIO OF INVESTMENTS (continued)
| Principal Amount (000) |
U.S. $ Value | |||||||||||
|
|
||||||||||||
| American Airlines, Inc.
|
U.S.$ | 113 | $ | 123,448 | ||||||||
| American Airlines, Inc./AAdvantage Loyalty IP Ltd. |
1,007 | 992,286 | ||||||||||
| 5.75%, 04/20/2029(a) |
1,242 | 1,191,818 | ||||||||||
| Hawaiian Brand Intellectual Property Ltd./HawaiianMiles Loyalty Ltd. |
1,242 | 1,179,855 | ||||||||||
| Spirit Loyalty Cayman Ltd./Spirit IP Cayman Ltd. |
1,590 | 1,600,217 | ||||||||||
|
|
|
|||||||||||
| 5,435,414 | ||||||||||||
|
|
|
|||||||||||
| Transportation - Railroads – 0.0% |
||||||||||||
| Watco Cos. LLC/Watco Finance Corp.
|
12 | 11,305 | ||||||||||
|
|
|
|||||||||||
| Transportation - Services – 0.8% |
||||||||||||
| Albion Financing 1 SARL/Aggreko Holdings, Inc. |
EUR | 625 | 614,509 | |||||||||
| 6.125%, 10/15/2026(a) |
U.S.$ | 657 | 589,365 | |||||||||
| Avis Budget Car Rental LLC/Avis Budget Finance, Inc. |
660 | 600,374 | ||||||||||
| 5.75%, 07/15/2027(a) |
1,031 | 986,914 | ||||||||||
| BCP V Modular Services Finance II PLC |
EUR | 132 | 121,732 | |||||||||
| BCP V Modular Services Finance PLC |
1,214 | 1,047,540 | ||||||||||
| Hertz Corp. (The)
|
U.S.$ | 1,307 | 1,174,381 | |||||||||
| 5.00%, 12/01/2029(a) |
752 | 622,422 | ||||||||||
| Loxam SAS |
EUR | 301 | 297,194 | |||||||||
| 4.50%, 02/15/2027 |
629 | 640,901 | ||||||||||
| PROG Holdings, Inc.
|
U.S.$ | 19 | 16,278 | |||||||||
| United Rentals North America, Inc. |
178 | 157,045 | ||||||||||
| 4.00%, 07/15/2030 |
206 | 185,208 | ||||||||||
| 4.875%, 01/15/2028 |
93 | 88,930 | ||||||||||
| 5.50%, 05/15/2027 |
200 | 198,208 | ||||||||||
| Williams Scotsman International, Inc. |
132 | 121,107 | ||||||||||
| 6.125%, 06/15/2025(a) |
88 | 87,463 | ||||||||||
|
|
|
|||||||||||
| 7,549,571 | ||||||||||||
|
|
|
|||||||||||
| 445,793,732 | ||||||||||||
|
|
|
|||||||||||
| abfunds.com | ALLIANCEBERNSTEIN GLOBAL HIGH INCOME FUND | 39 | |
PORTFOLIO OF INVESTMENTS (continued)
| Principal Amount (000) |
U.S. $ Value | |||||||||||
|
|
||||||||||||
| Financial Institutions – 5.4% |
||||||||||||
| Banking – 0.6% |
||||||||||||
| Ally Financial, Inc. |
U.S.$ | 2,950 | $ | 2,093,210 | ||||||||
| Series C |
256 | 170,752 | ||||||||||
| Bread Financial Holdings, Inc.
|
1,253 | 1,124,236 | ||||||||||
| 7.00%, 01/15/2026(a) |
600 | 530,562 | ||||||||||
| CaixaBank SA
|
EUR | 1,000 | 955,956 | |||||||||
| Freedom Mortgage Corp.
|
U.S.$ | 35 | 28,459 | |||||||||
| 8.125%, 11/15/2024(a) |
56 | 53,912 | ||||||||||
| 8.25%, 04/15/2025(a) |
222 | 205,058 | ||||||||||
| Intesa Sanpaolo SpA
|
200 | 143,392 | ||||||||||
|
|
|
|||||||||||
| 5,305,537 | ||||||||||||
|
|
|
|||||||||||
| Brokerage – 0.8% |
||||||||||||
| Advisor Group Holdings, Inc.
|
1,425 | 1,446,356 | ||||||||||
| AG Issuer LLC |
406 | 367,250 | ||||||||||
| AG TTMT Escrow Issuer LLC
|
787 | 791,914 | ||||||||||
| Hightower Holding LLC
|
2,936 | 2,487,198 | ||||||||||
| NFP Corp. |
14 | 12,622 | ||||||||||
| 6.875%, 08/15/2028(a) |
1,494 | 1,283,243 | ||||||||||
| 7.50%, 10/01/2030(a) |
1,323 | 1,277,995 | ||||||||||
|
|
|
|||||||||||
| 7,666,578 | ||||||||||||
|
|
|
|||||||||||
| Finance – 1.9% |
||||||||||||
| Aircastle Ltd.
|
1,374 | 1,016,299 | ||||||||||
| Castlelake Aviation Finance DAC
|
1,036 | 920,867 | ||||||||||
| CNG Holdings, Inc.
|
861 | 718,540 | ||||||||||
| Compass Group Diversified Holdings LLC |
1,277 | 1,129,662 | ||||||||||
| Curo Group Holdings Corp.
|
3,717 | 1,480,855 | ||||||||||
| Enova International, Inc.
|
343 | 337,887 | ||||||||||
| 8.50%, 09/15/2025(a) |
1,996 | 1,891,720 | ||||||||||
| 40 | ALLIANCEBERNSTEIN GLOBAL HIGH INCOME FUND |
abfunds.com | |
PORTFOLIO OF INVESTMENTS (continued)
| Principal Amount (000) |
U.S. $ Value | |||||||||||
|
|
||||||||||||
| Home Point Capital, Inc.
|
U.S.$ | 25 | $ | 18,799 | ||||||||
| Icahn Enterprises LP/Icahn Enterprises Finance Corp. |
125 | 107,482 | ||||||||||
| 6.25%, 05/15/2026 |
116 | 114,119 | ||||||||||
| Jefferies Finance LLC/JFIN Co-Issuer Corp.
|
2,234 | 1,891,727 | ||||||||||
| LD Holdings Group LLC
|
85 | 54,197 | ||||||||||
| Lincoln Financing SARL
|
EUR | 194 | 208,011 | |||||||||
| Midcap Financial Issuer Trust
|
U.S.$ | 216 | 164,807 | |||||||||
| Nationstar Mortgage Holdings, Inc.
|
63 | 48,428 | ||||||||||
| 6.00%, 01/15/2027(a) |
176 | 159,991 | ||||||||||
| Navient Corp. |
1,706 | 1,435,574 | ||||||||||
| 5.00%, 03/15/2027 |
792 | 701,055 | ||||||||||
| 5.50%, 03/15/2029 |
79 | 66,716 | ||||||||||
| 5.625%, 08/01/2033 |
40 | 29,689 | ||||||||||
| 5.875%, 10/25/2024 |
164 | 159,672 | ||||||||||
| 6.75%, 06/25/2025 |
954 | 934,888 | ||||||||||
| 6.75%, 06/15/2026 |
835 | 812,838 | ||||||||||
| OneMain Finance Corp. |
174 | 146,182 | ||||||||||
| 5.375%, 11/15/2029 |
124 | 104,294 | ||||||||||
| 6.875%, 03/15/2025 |
153 | 148,321 | ||||||||||
| PennyMac Financial Services, Inc.
|
205 | 191,429 | ||||||||||
| 5.75%, 09/15/2031(a) |
67 | 53,991 | ||||||||||
| Rocket Mortgage LLC/Rocket Mortgage Co-Issuer, Inc.
|
225 | 193,270 | ||||||||||
| SLM Corp. |
188 | 160,828 | ||||||||||
| Springleaf Finance Corp. |
180 | 172,951 | ||||||||||
| Synchrony Financial |
1,439 | 1,259,358 | ||||||||||
| VistaJet Malta Finance PLC/XO Management Holding, Inc. |
15 | 13,369 | ||||||||||
| 7.875%, 05/01/2027(a) |
185 | 178,338 | ||||||||||
|
|
|
|||||||||||
| 17,026,154 | ||||||||||||
|
|
|
|||||||||||
| abfunds.com | ALLIANCEBERNSTEIN GLOBAL HIGH INCOME FUND | 41 | |
PORTFOLIO OF INVESTMENTS (continued)
| Principal Amount (000) |
U.S. $ Value | |||||||||||
|
|
||||||||||||
| Insurance – 0.3% |
||||||||||||
| Acrisure LLC/Acrisure Finance, Inc.
|
U.S.$ | 94 | $ | 80,207 | ||||||||
| 10.125%, 08/01/2026(a) |
559 | 558,583 | ||||||||||
| Ardonagh Midco 2 PLC |
1,926 | 1,757,290 | ||||||||||
| HUB International Ltd.
|
292 | 287,651 | ||||||||||
| Molina Healthcare, Inc.
|
206 | 174,935 | ||||||||||
| 4.375%, 06/15/2028(a) |
222 | 206,484 | ||||||||||
|
|
|
|||||||||||
| 3,065,150 | ||||||||||||
|
|
|
|||||||||||
| Other Finance – 0.7% |
||||||||||||
| ADLER Group SA |
EUR | 200 | 84,281 | |||||||||
| Altice France Holding SA
|
U.S.$ | 448 | 338,753 | |||||||||
| Armor Holdco, Inc.
|
1,967 | 1,596,725 | ||||||||||
| Coinbase Global, Inc.
|
852 | 525,106 | ||||||||||
| 3.625%, 10/01/2031(a) |
818 | 459,710 | ||||||||||
| Intrum AB |
EUR | 360 | 303,701 | |||||||||
| 3.125%, 07/15/2024(a) |
255 | 264,243 | ||||||||||
| 3.50%, 07/15/2026(a) |
705 | 638,027 | ||||||||||
| 4.875%, 08/15/2025 |
683 | 683,008 | ||||||||||
| Motion Finco SARL
|
885 | 971,158 | ||||||||||
|
|
|
|||||||||||
| 5,864,712 | ||||||||||||
|
|
|
|||||||||||
| REITs – 1.1% |
||||||||||||
| Aedas Homes Opco SLU |
1,580 | 1,500,395 | ||||||||||
| Apollo Commercial Real Estate Finance, Inc. |
U.S.$ | 35 | 24,611 | |||||||||
| Brookfield Property REIT, Inc./BPR Cumulus LLC/BPR Nimbus LLC/GGSI Sellco LL |
2,519 | 2,022,066 | ||||||||||
| 5.75%, 05/15/2026(a) |
350 | 312,847 | ||||||||||
| Diversified Healthcare Trust |
23 | 15,522 | ||||||||||
| Howard Hughes Corp. (The)
|
128 | 108,311 | ||||||||||
| Hunt Cos., Inc. |
32 | 25,215 | ||||||||||
| 42 | ALLIANCEBERNSTEIN GLOBAL HIGH INCOME FUND |
abfunds.com | |
PORTFOLIO OF INVESTMENTS (continued)
| Principal Amount (000) |
U.S. $ Value | |||||||||||
|
|
||||||||||||
| Iron Mountain, Inc.
|
U.S.$ | 53 | $ | 45,530 | ||||||||
| 4.875%, 09/15/2029(a) |
161 | 144,900 | ||||||||||
| 5.25%, 03/15/2028(a) |
1,576 | 1,499,830 | ||||||||||
| 5.625%, 07/15/2032(a) |
169 | 153,707 | ||||||||||
| Kennedy-Wilson, Inc. |
17 | 13,513 | ||||||||||
| Ladder Capital Finance Holdings LLLP/Ladder Capital Finance Corp. |
99 | 71,470 | ||||||||||
| MPT Operating Partnership LP/MPT Finance Corp. |
413 | 339,611 | ||||||||||
| Necessity Retail REIT, Inc. (The)/American Finance Operating Partner LP |
27 | 19,934 | ||||||||||
| Neinor Homes SA |
EUR | 786 | 784,736 | |||||||||
| Office Properties Income Trust |
U.S.$ | 863 | 479,088 | |||||||||
| Realogy Group LLC/Realogy Co-Issuer Corp. 5.75%, 01/15/2029(a) |
156 | 116,697 | ||||||||||
| RHP Hotel Properties LP/RHP Finance Corp. |
14 | 12,654 | ||||||||||
| Rithm Capital Corp.
|
115 | 102,635 | ||||||||||
| Service Properties Trust |
167 | 140,637 | ||||||||||
| 4.95%, 10/01/2029 |
85 | 64,177 | ||||||||||
| Uniti Group LP/Uniti Group Finance, Inc./CSL Capital LLC |
267 | 206,450 | ||||||||||
| 10.50%, 02/15/2028(a) |
43 | 41,705 | ||||||||||
| Via Celere Desarrollos Inmobiliarios SA |
EUR | 771 | 752,860 | |||||||||
| Vivion Investments SARL
|
1,000 | 793,582 | ||||||||||
| 3.50%, 11/01/2025(a) |
400 | 286,308 | ||||||||||
|
|
|
|||||||||||
| 10,078,991 | ||||||||||||
|
|
|
|||||||||||
| 49,007,122 | ||||||||||||
|
|
|
|||||||||||
| Utility – 1.0% |
||||||||||||
| Electric – 0.7% |
||||||||||||
| Algonquin Power & Utilities Corp. |
U.S.$ | 172 | 137,669 | |||||||||
| Calpine Corp. |
72 | 61,148 | ||||||||||
| 5.125%, 03/15/2028(a) |
362 | 331,533 | ||||||||||
| abfunds.com | ALLIANCEBERNSTEIN GLOBAL HIGH INCOME FUND | 43 | |
PORTFOLIO OF INVESTMENTS (continued)
| Principal Amount (000) |
U.S. $ Value | |||||||||||
|
|
||||||||||||
| ContourGlobal Power Holdings SA
|
EUR | 167 | $ | 143,939 | ||||||||
| NextEra Energy Operating Partners LP |
U.S.$ | 180 | 168,185 | |||||||||
| 4.50%, 09/15/2027(a) |
108 | 102,961 | ||||||||||
| NRG Energy, Inc.
|
158 | 131,371 | ||||||||||
| 3.875%, 02/15/2032(a) |
2,090 | 1,673,214 | ||||||||||
| 5.25%, 06/15/2029(a) |
225 | 207,696 | ||||||||||
| 5.75%, 01/15/2028 |
207 | 203,215 | ||||||||||
| 6.625%, 01/15/2027 |
7 | 7,009 | ||||||||||
| 10.25%, 03/15/2028(a)(k) |
842 | 802,440 | ||||||||||
| PG&E Corp. |
209 | 197,393 | ||||||||||
| 5.25%, 07/01/2030 |
38 | 35,212 | ||||||||||
| Vistra Corp. |
835 | 737,639 | ||||||||||
| 8.00%, 10/15/2026(a)(k) |
1,003 | 939,380 | ||||||||||
| Vistra Operations Co. LLC
|
207 | 184,307 | ||||||||||
| 5.625%, 02/15/2027(a) |
163 | 158,800 | ||||||||||
|
|
|
|||||||||||
| 6,223,111 | ||||||||||||
|
|
|
|||||||||||
| Natural Gas – 0.2% |
||||||||||||
| AmeriGas Partners LP/AmeriGas Finance Corp. |
106 | 102,227 | ||||||||||
| 5.75%, 05/20/2027 |
230 | 215,949 | ||||||||||
| 5.875%, 08/20/2026 |
334 | 319,038 | ||||||||||
| UGI International LLC
|
EUR | 1,169 | 988,515 | |||||||||
|
|
|
|||||||||||
| 1,625,729 | ||||||||||||
|
|
|
|||||||||||
| Other Utility – 0.1% |
||||||||||||
| Solaris Midstream Holdings LLC
|
U.S.$ | 1,376 | 1,322,081 | |||||||||
|
|
|
|||||||||||
| 9,170,921 | ||||||||||||
|
|
|
|||||||||||
| Total Corporates – Non-Investment Grade |
503,971,775 | |||||||||||
|
|
|
|||||||||||
| CORPORATES - INVESTMENT GRADE – 14.5% |
||||||||||||
| Financial Institutions – 7.5% |
||||||||||||
| Banking – 5.1% |
||||||||||||
| AIB Group PLC |
1,640 | 1,676,421 | ||||||||||
| 44 | ALLIANCEBERNSTEIN GLOBAL HIGH INCOME FUND |
abfunds.com | |
PORTFOLIO OF INVESTMENTS (continued)
| Principal Amount (000) |
U.S. $ Value | |||||||||
|
|
||||||||||
| Ally Financial, Inc. |
U.S.$ | 22 | $ | 20,680 | ||||||
| 6.70%, 02/14/2033 |
755 | 667,800 | ||||||||
| 8.00%, 11/01/2031 |
548 | 573,045 | ||||||||
| Banco Santander SA |
200 | 155,219 | ||||||||
| 5.179%, 11/19/2025 |
400 | 391,299 | ||||||||
| Bank of America Corp. |
1,199 | 1,170,898 | ||||||||
| Bank of Ireland Group PLC
|
655 | 650,899 | ||||||||
| Barclays PLC |
998 | 849,794 | ||||||||
| 7.125%, 06/15/2025(k) |
GBP | 404 | 435,748 | |||||||
| 7.385%, 11/02/2028 |
U.S.$ | 1,696 | 1,791,143 | |||||||
| 8.00%, 03/15/2029(k) |
361 | 309,314 | ||||||||
| BNP Paribas SA
|
1,350 | 1,000,308 | ||||||||
| 7.375%, 08/19/2025(a)(k) |
208 | 195,854 | ||||||||
| 7.75%, 08/16/2029(a)(k) |
539 | 512,288 | ||||||||
| Citigroup, Inc. |
1,107 | 1,101,034 | ||||||||
| Series W |
413 | 361,891 | ||||||||
| Credit Agricole SA
|
1,461 | 1,417,170 | ||||||||
| 8.125%, 03/23/2172(k) |
448 | 432,847 | ||||||||
| Credit Suisse Group AG
|
1,018 | 811,713 | ||||||||
| 6.373%, 07/15/2026(a) |
712 | 692,551 | ||||||||
| Deutsche Bank AG/New York NY |
150 | 139,819 | ||||||||
| 6.72%, 01/18/2029 |
1,317 | 1,310,648 | ||||||||
| 7.079%, 02/10/2034 |
1,185 | 1,093,202 | ||||||||
| Discover Financial Services |
286 | 295,179 | ||||||||
| Dresdner Funding Trust I
|
108 | 110,328 | ||||||||
| Goldman Sachs Group, Inc. (The) |
213 | 182,554 | ||||||||
| Series P |
782 | 746,924 | ||||||||
| HSBC Holdings PLC
|
EUR | 1,595 | 1,392,408 | |||||||
| abfunds.com | ALLIANCEBERNSTEIN GLOBAL HIGH INCOME FUND | 45 | |
PORTFOLIO OF INVESTMENTS (continued)
| Principal Amount (000) |
U.S. $ Value | |||||||||||
|
|
||||||||||||
| 4.762%, 03/29/2033 |
U.S.$ | 901 | $ | 811,371 | ||||||||
| 6.00%, 09/29/2023(a)(k) |
EUR | 1,819 | 1,923,539 | |||||||||
| 8.00%, 03/07/2028(k) |
U.S.$ | 1,024 | 1,014,553 | |||||||||
| 8.113%, 11/03/2033 |
200 | 221,498 | ||||||||||
| Intesa Sanpaolo SpA
|
753 | 720,704 | ||||||||||
| 5.71%, 01/15/2026(a) |
1,650 | 1,547,896 | ||||||||||
| 7.00%, 11/21/2025(a) |
355 | 360,300 | ||||||||||
| JPMorgan Chase & Co. |
210 | 208,797 | ||||||||||
| KBC Group NV |
414 | 415,371 | ||||||||||
| Lloyds Banking Group PLC
|
528 | 486,375 | ||||||||||
| 7.953%, 11/15/2033 |
854 | 940,333 | ||||||||||
| 8.00%, 09/27/2029(k) |
1,205 | 1,088,568 | ||||||||||
| NatWest Group PLC |
304 | 313,150 | ||||||||||
| 7.472%, 11/10/2026 |
800 | 835,105 | ||||||||||
| Nordea Bank Abp
|
3,065 | 2,834,519 | ||||||||||
| Santander Holdings USA, Inc. |
2,272 | 2,270,579 | ||||||||||
| Santander UK Group Holdings PLC |
3,782 | 3,822,177 | ||||||||||
| Standard Chartered PLC
|
232 | 232,000 | ||||||||||
| 7.776%, 11/16/2025(a) |
1,355 | 1,384,567 | ||||||||||
| State Street Corp. |
178 | 176,875 | ||||||||||
| Swedbank AB |
1,000 | 950,747 | ||||||||||
| Synchrony Bank |
727 | 668,099 | ||||||||||
| Truist Financial Corp. |
165 | 133,143 | ||||||||||
| 5.122%, 01/26/2034 |
448 | 436,401 | ||||||||||
| UBS Group AG |
620 | 583,536 | ||||||||||
| UniCredit SpA |
915 | 798,004 | ||||||||||
| 5.861%, 06/19/2032(a) |
246 | 217,282 | ||||||||||
| 7.296%, 04/02/2034(a) |
200 | 186,963 | ||||||||||
| US Bancorp |
523 | 507,029 | ||||||||||
|
|
|
|||||||||||
| 46,578,459 | ||||||||||||
|
|
|
|||||||||||
| 46 | ALLIANCEBERNSTEIN GLOBAL HIGH INCOME FUND |
abfunds.com | |
PORTFOLIO OF INVESTMENTS (continued)
| Principal Amount (000) |
U.S. $ Value | |||||||||||
|
|
||||||||||||
| Brokerage – 0.1% |
||||||||||||
| Charles Schwab Corp. (The) |
U.S.$ | 1,251 | $ | 1,028,234 | ||||||||
|
|
|
|||||||||||
| Finance – 1.1% |
||||||||||||
| AerCap Ireland Capital DAC/AerCap Global Aviation Trust |
913 | 753,329 | ||||||||||
| Air Lease Corp. |
1,229 | 1,017,430 | ||||||||||
| Aircastle Ltd. |
33 | 31,226 | ||||||||||
| 5.25%, 08/11/2025(a) |
2,239 | 2,187,590 | ||||||||||
| Aviation Capital Group LLC
|
844 | 730,488 | ||||||||||
| 3.50%, 11/01/2027(a) |
295 | 263,097 | ||||||||||
| 4.125%, 08/01/2025(a) |
395 | 375,707 | ||||||||||
| 4.875%, 10/01/2025(a) |
319 | 307,595 | ||||||||||
| Enact Holdings, Inc.
|
215 | 209,590 | ||||||||||
| Huarong Finance 2017 Co., Ltd.
|
200 | 160,350 | ||||||||||
| Huarong Finance 2019 Co., Ltd.
|
343 | 317,875 | ||||||||||
| Huarong Finance II Co., Ltd.
|
200 | 168,500 | ||||||||||
| 4.875%, 11/22/2026(a) |
430 | 355,099 | ||||||||||
| 5.50%, 01/16/2025(a) |
1,082 | 992,938 | ||||||||||
| ILFC E-Capital Trust II |
2,000 | 1,322,325 | ||||||||||
| United Wholesale Mortgage LLC
|
179 | 169,518 | ||||||||||
| 5.50%, 04/15/2029(a) |
145 | 121,547 | ||||||||||
| 5.75%, 06/15/2027(a) |
15 | 13,519 | ||||||||||
|
|
|
|||||||||||
| 9,497,723 | ||||||||||||
|
|
|
|||||||||||
| Insurance – 1.1% |
||||||||||||
| Allstate Corp. (The) |
1,657 | 1,563,711 | ||||||||||
| Enstar Finance LLC |
216 | 154,211 | ||||||||||
| Global Atlantic Fin Co.
|
62 | 49,940 | ||||||||||
| Liberty Mutual Group, Inc.
|
43 | 33,633 | ||||||||||
| abfunds.com | ALLIANCEBERNSTEIN GLOBAL HIGH INCOME FUND | 47 | |
PORTFOLIO OF INVESTMENTS (continued)
| Principal Amount (000) |
U.S. $ Value | |||||||||||
|
|
||||||||||||
| 4.30%, 02/01/2061(a) |
U.S.$ | 54 | $ | 31,998 | ||||||||
| 7.80%, 03/15/2037(a) |
2,187 | 2,292,912 | ||||||||||
| MetLife, Inc. |
2,350 | 3,017,975 | ||||||||||
| MGIC Investment Corp. |
189 | 179,558 | ||||||||||
| Prudential Financial, Inc. |
340 | 322,954 | ||||||||||
| 5.625%, 06/15/2043 |
1,082 | 1,064,275 | ||||||||||
| Transatlantic Holdings, Inc. |
1,261 | 1,606,824 | ||||||||||
|
|
|
|||||||||||
| 10,317,991 | ||||||||||||
|
|
|
|||||||||||
| REITs – 0.1% |
||||||||||||
| Global Net Lease, Inc./Global Net Lease Operating Partnership LP |
135 | 106,685 | ||||||||||
| Trust Fibra Uno
|
405 | 340,276 | ||||||||||
| VICI Properties LP/VICI Note Co., Inc. |
767 | 754,343 | ||||||||||
|
|
|
|||||||||||
| 1,201,304 | ||||||||||||
|
|
|
|||||||||||
| 68,623,711 | ||||||||||||
|
|
|
|||||||||||
| Industrial – 6.8% |
||||||||||||
| Basic – 0.9% |
||||||||||||
| ArcelorMittal SA |
362 | 364,406 | ||||||||||
| Arconic Corp. |
903 | 902,843 | ||||||||||
| Braskem Netherlands Finance BV
|
1,515 | 1,277,902 | ||||||||||
| Celanese US Holdings LLC |
626 | 626,294 | ||||||||||
| 6.05%, 03/15/2025 |
626 | 629,622 | ||||||||||
| Freeport Indonesia PT
|
281 | 273,501 | ||||||||||
| Freeport-McMoRan, Inc. |
694 | 649,489 | ||||||||||
| Georgia-Pacific LLC |
1 | 1,260 | ||||||||||
| Industrias Penoles SAB de CV
|
386 | 342,647 | ||||||||||
| INEOS Finance PLC
|
EUR | 351 | 356,534 | |||||||||
| MEGlobal Canada ULC
|
U.S.$ | 343 | 348,960 | |||||||||
| 48 | ALLIANCEBERNSTEIN GLOBAL HIGH INCOME FUND |
abfunds.com | |
PORTFOLIO OF INVESTMENTS (continued)
| Principal Amount (000) |
U.S. $ Value | |||||||||||
|
|
||||||||||||
| Nexa Resources SA
|
U.S.$ | 773 | $ | 751,404 | ||||||||
| Olin Corp. |
198 | 185,757 | ||||||||||
| 5.625%, 08/01/2029 |
735 | 719,967 | ||||||||||
| Smurfit Kappa Treasury Funding DAC |
238 | 250,672 | ||||||||||
| Suzano Austria GmbH |
262 | 226,381 | ||||||||||
| 5.00%, 01/15/2030 |
218 | 207,482 | ||||||||||
| Series DM3N |
331 | 269,765 | ||||||||||
|
|
|
|||||||||||
| 8,384,886 | ||||||||||||
|
|
|
|||||||||||
| Capital Goods – 0.3% |
||||||||||||
| General Electric Co. |
1,681 | 1,678,094 | ||||||||||
| Howmet Aerospace, Inc. |
198 | 175,255 | ||||||||||
| 5.90%, 02/01/2027 |
119 | 121,340 | ||||||||||
| 5.95%, 02/01/2037 |
89 | 89,714 | ||||||||||
| 6.875%, 05/01/2025 |
187 | 194,208 | ||||||||||
| Regal Rexnord Corp.
|
235 | 236,083 | ||||||||||
| 6.40%, 04/15/2033(a) |
277 | 277,463 | ||||||||||
| Weir Group PLC (The)
|
200 | 178,351 | ||||||||||
|
|
|
|||||||||||
| 2,950,508 | ||||||||||||
|
|
|
|||||||||||
| Communications - Media – 0.6% |
||||||||||||
| Directv Financing LLC/Directv Financing Co-Obligor,
Inc. |
2,295 | 2,078,736 | ||||||||||
| Discovery Communications LLC |
179 | 166,447 | ||||||||||
| Netflix, Inc. |
247 | 248,252 | ||||||||||
| Paramount Global |
245 | 183,751 | ||||||||||
| Prosus NV |
331 | 215,316 | ||||||||||
| Telecomunicaciones Digitales SA
|
505 | 413,595 | ||||||||||
| Warnermedia Holdings, Inc.
|
745 | 701,849 | ||||||||||
| 4.279%, 03/15/2032(a) |
1,034 | 922,617 | ||||||||||
| abfunds.com | ALLIANCEBERNSTEIN GLOBAL HIGH INCOME FUND | 49 | |
PORTFOLIO OF INVESTMENTS (continued)
| Principal Amount (000) |
U.S. $ Value | |||||||||||
|
|
||||||||||||
| Weibo Corp. |
U.S.$ | 513 | $ | 415,626 | ||||||||
|
|
|
|||||||||||
| 5,346,189 | ||||||||||||
|
|
|
|||||||||||
| Communications - Telecommunications – 0.1% |
||||||||||||
| Sprint Capital Corp. |
666 | 810,553 | ||||||||||
| Sprint LLC |
186 | 196,711 | ||||||||||
|
|
|
|||||||||||
| 1,007,264 | ||||||||||||
|
|
|
|||||||||||
| Consumer Cyclical - Automotive – 0.7% |
||||||||||||
| General Motors Co. |
19 | 15,939 | ||||||||||
| General Motors Financial Co., Inc. |
30 | 30,380 | ||||||||||
| Harley-Davidson Financial Services, Inc. |
3,503 | 3,549,008 | ||||||||||
| Lear Corp. |
3 | 2,646 | ||||||||||
| 4.25%, 05/15/2029 |
17 | 16,093 | ||||||||||
| Nissan Motor Acceptance Co. LLC
|
83 | 71,789 | ||||||||||
| 2.45%, 09/15/2028(a) |
575 | 466,071 | ||||||||||
| 2.75%, 03/09/2028(a) |
1,112 | 939,432 | ||||||||||
| Nissan Motor Co., Ltd.
|
1,084 | 1,010,122 | ||||||||||
| 4.81%, 09/17/2030(a) |
233 | 209,243 | ||||||||||
|
|
|
|||||||||||
| 6,310,723 | ||||||||||||
|
|
|
|||||||||||
| Consumer Cyclical - Entertainment – 0.2% |
||||||||||||
| Mattel, Inc. |
1,152 | 1,078,289 | ||||||||||
| 3.75%, 04/01/2029(a) |
383 | 344,174 | ||||||||||
| 5.875%, 12/15/2027(a) |
578 | 575,087 | ||||||||||
|
|
|
|||||||||||
| 1,997,550 | ||||||||||||
|
|
|
|||||||||||
| Consumer Cyclical - Other – 1.0% |
||||||||||||
| Genting New York LLC/GENNY Capital, Inc. |
239 | 214,962 | ||||||||||
| International Game Technology PLC
|
EUR | 214 | 223,824 | |||||||||
| 4.125%, 04/15/2026(a) |
U.S.$ | 1,552 | 1,474,827 | |||||||||
| 5.25%, 01/15/2029(a) |
216 | 207,117 | ||||||||||
| 6.25%, 01/15/2027(a) |
402 | 404,493 | ||||||||||
| Las Vegas Sands Corp. |
210 | 199,157 | ||||||||||
| 3.20%, 08/08/2024 |
144 | 139,226 | ||||||||||
| 3.50%, 08/18/2026 |
293 | 273,094 | ||||||||||
| 50 | ALLIANCEBERNSTEIN GLOBAL HIGH INCOME FUND |
abfunds.com | |
PORTFOLIO OF INVESTMENTS (continued)
| Principal Amount (000) |
U.S. $ Value | |||||||||||
|
|
||||||||||||
| MDC Holdings, Inc. |
U.S.$ | 1,881 | $ | 1,633,223 | ||||||||
| Owens Corning |
777 | 867,297 | ||||||||||
| Resorts World Las Vegas LLC/RWLV Capital, Inc. |
1,200 | 919,259 | ||||||||||
| 4.625%, 04/06/2031(a) |
1,100 | 809,245 | ||||||||||
| Sands China Ltd. |
235 | 202,100 | ||||||||||
| 3.75%, 08/08/2031 |
285 | 229,871 | ||||||||||
| 4.30%, 01/08/2026 |
200 | 187,250 | ||||||||||
| 4.875%, 06/18/2030 |
935 | 833,991 | ||||||||||
|
|
|
|||||||||||
| 8,818,936 | ||||||||||||
|
|
|
|||||||||||
| Consumer Cyclical - Retailers – 0.2% |
||||||||||||
| Macy’s Retail Holdings LLC
|
552 | 510,132 | ||||||||||
| 5.875%, 03/15/2030(a) |
1,064 | 941,677 | ||||||||||
| 6.125%, 03/15/2032(a) |
688 | 605,240 | ||||||||||
|
|
|
|||||||||||
| 2,057,049 | ||||||||||||
|
|
|
|||||||||||
| Consumer Non-Cyclical – 0.4% |
||||||||||||
| BAT Capital Corp. |
665 | 737,514 | ||||||||||
| Charles River Laboratories International, Inc. |
770 | 684,981 | ||||||||||
| 4.00%, 03/15/2031(a) |
991 | 870,118 | ||||||||||
| Pilgrim’s Pride Corp. |
1,249 | 1,003,257 | ||||||||||
|
|
|
|||||||||||
| 3,295,870 | ||||||||||||
|
|
|
|||||||||||
| Energy – 1.5% |
||||||||||||
| Antero Resources Corp.
|
24 | 24,551 | ||||||||||
| Apache Corp. |
46 | 34,661 | ||||||||||
| 5.10%, 09/01/2040 |
59 | 49,991 | ||||||||||
| 6.00%, 01/15/2037 |
214 | 198,725 | ||||||||||
| Cenovus Energy, Inc. |
30 | 32,020 | ||||||||||
| Cheniere Energy Partners LP |
603 | 562,536 | ||||||||||
| Continental Resources, Inc./OK
|
970 | 930,889 | ||||||||||
| Ecopetrol SA |
588 | 449,614 | ||||||||||
| 5.875%, 11/02/2051 |
118 | 78,618 | ||||||||||
| 6.875%, 04/29/2030 |
1,035 | 947,066 | ||||||||||
| 8.875%, 01/13/2033 |
531 | 535,646 | ||||||||||
| abfunds.com | ALLIANCEBERNSTEIN GLOBAL HIGH INCOME FUND | 51 | |
PORTFOLIO OF INVESTMENTS (continued)
| Principal Amount (000) |
U.S. $ Value | |||||||||||
|
|
||||||||||||
| Energy Transfer LP |
U.S.$ | 32 | $ | 30,721 | ||||||||
| 4.40%, 03/15/2027 |
1,466 | 1,425,538 | ||||||||||
| 4.75%, 01/15/2026 |
25 | 24,711 | ||||||||||
| EnLink Midstream LLC
|
213 | 209,257 | ||||||||||
| 6.50%, 09/01/2030(a) |
129 | 130,439 | ||||||||||
| EnLink Midstream Partners LP |
159 | 154,106 | ||||||||||
| 5.05%, 04/01/2045 |
807 | 620,931 | ||||||||||
| 5.45%, 06/01/2047 |
116 | 92,523 | ||||||||||
| 5.60%, 04/01/2044 |
104 | 84,931 | ||||||||||
| EQT Corp. |
291 | 273,402 | ||||||||||
| Hunt Oil Co. of Peru LLC Sucursal Del Peru |
177 | 165,878 | ||||||||||
| Occidental Petroleum Corp. |
81 | 64,474 | ||||||||||
| 5.50%, 12/01/2025 |
158 | 158,788 | ||||||||||
| 5.875%, 09/01/2025 |
21 | 21,213 | ||||||||||
| 6.125%, 01/01/2031 |
166 | 172,274 | ||||||||||
| 6.20%, 03/15/2040 |
69 | 69,376 | ||||||||||
| 6.45%, 09/15/2036 |
160 | 168,309 | ||||||||||
| 6.625%, 09/01/2030 |
166 | 174,748 | ||||||||||
| 7.50%, 05/01/2031 |
187 | 206,360 | ||||||||||
| Oleoducto Central SA
|
424 | 364,587 | ||||||||||
| Tengizchevroil Finance Co. International Ltd. |
1,212 | 905,970 | ||||||||||
| Var Energi ASA |
894 | 936,959 | ||||||||||
| 8.00%, 11/15/2032(a) |
1,300 | 1,387,638 | ||||||||||
| Western Midstream Operating LP |
199 | 190,262 | ||||||||||
| 3.95%, 06/01/2025 |
225 | 215,735 | ||||||||||
| 4.30%, 02/01/2030 |
801 | 728,560 | ||||||||||
| 4.50%, 03/01/2028 |
216 | 204,327 | ||||||||||
| 4.75%, 08/15/2028 |
503 | 479,047 | ||||||||||
| 5.45%, 04/01/2044 |
193 | 168,461 | ||||||||||
| 5.50%, 02/01/2050 |
96 | 81,540 | ||||||||||
|
|
|
|||||||||||
| 13,755,382 | ||||||||||||
|
|
|
|||||||||||
| Other Industrial – 0.0% |
||||||||||||
| Fluor Corp. |
227 | 208,078 | ||||||||||
|
|
|
|||||||||||
| 52 | ALLIANCEBERNSTEIN GLOBAL HIGH INCOME FUND |
abfunds.com | |
PORTFOLIO OF INVESTMENTS (continued)
| Principal Amount (000) |
U.S. $ Value | |||||||||||
|
|
||||||||||||
| Services – 0.1% |
||||||||||||
| Elis SA |
EUR | 300 | $ | 287,889 | ||||||||
| Expedia Group, Inc.
|
U.S.$ | 176 | 178,358 | |||||||||
| Verisk Analytics, Inc. |
5 | 4,880 | ||||||||||
|
|
|
|||||||||||
| 471,127 | ||||||||||||
|
|
|
|||||||||||
| Technology – 0.4% |
||||||||||||
| Broadcom, Inc. |
211 | 197,583 | ||||||||||
| Dell International LLC/EMC Corp. |
130 | 158,159 | ||||||||||
| HP, Inc. |
1,353 | 1,340,562 | ||||||||||
| Lenovo Group Ltd.
|
289 | 242,182 | ||||||||||
| 5.831%, 01/27/2028(a) |
597 | 600,445 | ||||||||||
| SK Hynix, Inc. |
301 | 304,130 | ||||||||||
| 6.375%, 01/17/2028(a) |
301 | 302,129 | ||||||||||
| 6.50%, 01/17/2033(a) |
258 | 253,614 | ||||||||||
| Western Digital Corp. |
59 | 48,036 | ||||||||||
| 3.10%, 02/01/2032 |
130 | 98,181 | ||||||||||
|
|
|
|||||||||||
| 3,545,021 | ||||||||||||
|
|
|
|||||||||||
| Transportation - Airlines – 0.3% |
||||||||||||
| Delta Air Lines, Inc./SkyMiles IP Ltd. |
716 | 687,360 | ||||||||||
| Mileage Plus Holdings LLC/Mileage Plus Intellectual Property Assets Ltd. |
2,112 | 2,106,527 | ||||||||||
|
|
|
|||||||||||
| 2,793,887 | ||||||||||||
|
|
|
|||||||||||
| Transportation - Railroads – 0.1% |
||||||||||||
| Lima Metro Line 2 Finance Ltd.
|
401 | 351,054 | ||||||||||
|
|
|
|||||||||||
| Transportation - Services – 0.0% |
||||||||||||
| AerCap Global Aviation Trust
|
235 | 221,443 | ||||||||||
| United Rentals North America, Inc. |
46 | 43,100 | ||||||||||
|
|
|
|||||||||||
| 264,543 | ||||||||||||
|
|
|
|||||||||||
| 61,558,067 | ||||||||||||
|
|
|
|||||||||||
| abfunds.com | ALLIANCEBERNSTEIN GLOBAL HIGH INCOME FUND | 53 | |
PORTFOLIO OF INVESTMENTS (continued)
| Principal Amount (000) |
U.S. $ Value | |||||||||||
|
|
||||||||||||
| Utility – 0.2% |
||||||||||||
| Electric – 0.2% |
||||||||||||
| Cometa Energia SA de CV
|
U.S.$ | 471 | $ | 445,367 | ||||||||
| Enel Finance International NV
|
1,190 | 1,316,440 | ||||||||||
| FirstEnergy Corp. |
146 | 139,889 | ||||||||||
| Series C |
51 | 35,523 | ||||||||||
| 5.10%, 07/15/2047 |
7 | 6,286 | ||||||||||
| NRG Energy, Inc.
|
323 | 334,602 | ||||||||||
|
|
|
|||||||||||
| 2,278,107 | ||||||||||||
|
|
|
|||||||||||
| Total Corporates – Investment Grade |
132,459,885 | |||||||||||
|
|
|
|||||||||||
| EMERGING MARKETS - CORPORATE BONDS – 5.1% |
||||||||||||
| Industrial – 4.8% |
||||||||||||
| Basic – 1.3% |
||||||||||||
| Braskem Idesa SAPI
|
652 | 485,740 | ||||||||||
| 7.45%, 11/15/2029(a) |
1,010 | 802,950 | ||||||||||
| Cia de Minas Buenaventura SAA
|
1,072 | 919,441 | ||||||||||
| Consolidated Energy Finance SA
|
196 | 168,561 | ||||||||||
| CSN Inova Ventures
|
2,644 | 2,462,886 | ||||||||||
| Eldorado Gold Corp.
|
986 | 914,515 | ||||||||||
| First Quantum Minerals Ltd.
|
1,215 | 1,175,512 | ||||||||||
| 7.50%, 04/01/2025(a) |
261 | 259,318 | ||||||||||
| Indika Energy Capital IV Pte Ltd.
|
1,431 | 1,409,249 | ||||||||||
| JSW Steel Ltd. |
409 | 351,740 | ||||||||||
| 5.05%, 04/05/2032(a) |
658 | 535,892 | ||||||||||
| OCP SA |
403 | 331,468 | ||||||||||
| Stillwater Mining Co.
|
319 | 284,708 | ||||||||||
| 4.50%, 11/16/2029(a) |
309 | 253,341 | ||||||||||
| 54 | ALLIANCEBERNSTEIN GLOBAL HIGH INCOME FUND |
abfunds.com | |
PORTFOLIO OF INVESTMENTS (continued)
| Principal Amount (000) |
U.S. $ Value | |||||||||||
|
|
||||||||||||
| Vedanta Resources Finance II PLC
|
U.S.$ | 1,319 | $ | 1,056,272 | ||||||||
| Volcan Cia Minera SAA
|
345 | 285,013 | ||||||||||
|
|
|
|||||||||||
| 11,696,606 | ||||||||||||
|
|
|
|||||||||||
| Capital Goods – 0.3% |
||||||||||||
| Cemex SAB de CV
|
505 | 450,056 | ||||||||||
| 7.375%, 06/05/2027(a) |
424 | 435,660 | ||||||||||
| Embraer Netherlands Finance BV |
918 | 884,263 | ||||||||||
| 6.95%, 01/17/2028(a) |
724 | 727,530 | ||||||||||
| IHS Holding Ltd.
|
402 | 336,374 | ||||||||||
| 6.25%, 11/29/2028(a) |
383 | 305,634 | ||||||||||
| Odebrecht Holdco Finance Ltd. |
2,661 | 6,653 | ||||||||||
|
|
|
|||||||||||
| 3,146,170 | ||||||||||||
|
|
|
|||||||||||
| Communications - Media – 0.1% |
||||||||||||
| Globo Comunicacao e Participacoes SA |
1,130 | 893,971 | ||||||||||
|
|
|
|||||||||||
| Communications - Telecommunications – 0.1% |
||||||||||||
| CT Trust |
230 | 191,544 | ||||||||||
| Digicel Group Holdings Ltd.
|
98 | 11,258 | ||||||||||
| Digicel International Finance Ltd./Digicel international Holdings Ltd. |
657 | 597,648 | ||||||||||
|
|
|
|||||||||||
| 800,450 | ||||||||||||
|
|
|
|||||||||||
| Consumer Cyclical - Other – 1.1% |
||||||||||||
| Allwyn International AS
|
EUR | 170 | 167,311 | |||||||||
| Melco Resorts Finance Ltd.
|
U.S.$ | 1,603 | 1,310,452 | |||||||||
| 5.625%, 07/17/2027(a) |
965 | 838,344 | ||||||||||
| 5.75%, 07/21/2028(a) |
1,255 | 1,061,730 | ||||||||||
| MGM China Holdings Ltd.
|
1,322 | 1,177,519 | ||||||||||
| 5.25%, 06/18/2025(a) |
222 | 210,040 | ||||||||||
| 5.375%, 05/15/2024(a) |
398 | 388,498 | ||||||||||
| 5.875%, 05/15/2026(a) |
414 | 389,626 | ||||||||||
| Studio City Co., Ltd.
|
289 | 271,660 | ||||||||||
| abfunds.com | ALLIANCEBERNSTEIN GLOBAL HIGH INCOME FUND | 55 | |
PORTFOLIO OF INVESTMENTS (continued)
| Principal Amount (000) |
U.S. $ Value | |||||||||||
|
|
||||||||||||
| Studio City Finance Ltd.
|
U.S.$ | 609 | $ | 462,840 | ||||||||
| 6.00%, 07/15/2025(a) |
648 | 595,876 | ||||||||||
| 6.50%, 01/15/2028(a) |
438 | 366,277 | ||||||||||
| Wynn Macau Ltd.
|
286 | 275,361 | ||||||||||
| 5.125%, 12/15/2029(a) |
241 | 194,005 | ||||||||||
| 5.50%, 01/15/2026(a) |
934 | 859,280 | ||||||||||
| 5.50%, 10/01/2027(a) |
947 | 823,890 | ||||||||||
| 5.625%, 08/26/2028(a) |
717 | 609,450 | ||||||||||
|
|
|
|||||||||||
| 10,002,159 | ||||||||||||
|
|
|
|||||||||||
| Consumer Cyclical - Retailers – 0.0% |
||||||||||||
| K201640219 South Africa Ltd. |
ZAR | 66 | – 0 | – | ||||||||
|
|
|
|||||||||||
| Consumer Non-Cyclical – 1.0% |
||||||||||||
| BBFI Liquidating Trust |
U.S.$ | 780 | 340,947 | |||||||||
| BRF SA |
455 | 374,465 | ||||||||||
| Central American Bottling Corp./CBC Bottling Holdco SL/Beliv Holdco SL |
377 | 348,263 | ||||||||||
| MARB BondCo PLC |
2,318 | 1,755,537 | ||||||||||
| Natura & Co. Luxembourg Holdings SARL |
228 | 197,790 | ||||||||||
| Natura Cosmeticos SA
|
1,373 | 1,112,988 | ||||||||||
| Rede D’or Finance SARL
|
223 | 182,364 | ||||||||||
| 4.95%, 01/17/2028(a) |
735 | 658,523 | ||||||||||
| Teva Pharmaceutical Finance Netherlands II BV |
EUR | 446 | 436,467 | |||||||||
| 4.375%, 05/09/2030 |
1,000 | 913,895 | ||||||||||
| Teva Pharmaceutical Finance Netherlands III BV |
U.S.$ | 517 | 480,810 | |||||||||
| 5.125%, 05/09/2029(i) |
517 | 473,313 | ||||||||||
| 7.875%, 09/15/2029 |
506 | 528,590 | ||||||||||
| 8.125%, 09/15/2031 |
506 | 529,490 | ||||||||||
| Tonon Luxembourg SA
|
621 | 62 | ||||||||||
| Ulker Biskuvi Sanayi AS
|
327 | 284,506 | ||||||||||
| 56 | ALLIANCEBERNSTEIN GLOBAL HIGH INCOME FUND |
abfunds.com | |
PORTFOLIO OF INVESTMENTS (continued)
| Principal Amount (000) |
U.S. $ Value | |||||||||||
|
|
||||||||||||
| Virgolino de Oliveira Finance SA
|
U.S.$ | 4,090 | $ | 410 | ||||||||
| 10.875%, 01/13/2020(b)(c)(d)(e)(g) |
480 | 48 | ||||||||||
| 11.75%, 02/09/2022(b)(c)(d)(e)(g) |
1,620 | 162 | ||||||||||
|
|
|
|||||||||||
| 8,618,630 | ||||||||||||
|
|
|
|||||||||||
| Energy – 0.7% |
||||||||||||
| Acu Petroleo Luxembourg SARL
|
546 | 481,118 | ||||||||||
| Cosan SA |
461 | 415,707 | ||||||||||
| Gran Tierra Energy, Inc.
|
732 | 571,020 | ||||||||||
| Greenko Wind Projects Mauritius Ltd. |
957 | 905,442 | ||||||||||
| Kosmos Energy Ltd.
|
545 | 443,494 | ||||||||||
| 7.75%, 05/01/2027(a) |
200 | 167,500 | ||||||||||
| Leviathan Bond Ltd.
|
190 | 188,729 | ||||||||||
| 6.50%, 06/30/2027(a) |
1,197 | 1,140,531 | ||||||||||
| MV24 Capital BV
|
475 | 433,051 | ||||||||||
| Peru LNG SRL |
909 | 719,985 | ||||||||||
| ReNew Power Pvt Ltd.
|
202 | 188,087 | ||||||||||
| SEPLAT Energy PLC
|
581 | 452,199 | ||||||||||
| SierraCol Energy Andina LLC
|
558 | 430,462 | ||||||||||
|
|
|
|||||||||||
| 6,537,325 | ||||||||||||
|
|
|
|||||||||||
| Services – 0.0% |
||||||||||||
| Bidvest Group UK PLC (The)
|
454 | 408,969 | ||||||||||
|
|
|
|||||||||||
| Technology – 0.2% |
||||||||||||
| CA Magnum Holdings
|
2,039 | 1,799,418 | ||||||||||
|
|
|
|||||||||||
| Transportation - Services – 0.0% |
||||||||||||
| JSW Infrastructure Ltd.
|
204 | 171,768 | ||||||||||
|
|
|
|||||||||||
| 44,075,466 | ||||||||||||
|
|
|
|||||||||||
| abfunds.com | ALLIANCEBERNSTEIN GLOBAL HIGH INCOME FUND | 57 | |
PORTFOLIO OF INVESTMENTS (continued)
| Principal Amount (000) |
U.S. $ Value | |||||||||||
|
|
||||||||||||
| Utility – 0.3% |
||||||||||||
| Electric – 0.3% |
||||||||||||
| Adani Green Energy Ltd.
|
U.S.$ | 495 | $ | 424,555 | ||||||||
| AES Andes SA |
495 | 465,300 | ||||||||||
| India Clean Energy Holdings
|
511 | 410,972 | ||||||||||
| Investment Energy Resources Ltd.
|
403 | 370,710 | ||||||||||
| JSW Hydro Energy Ltd.
|
482 | 396,953 | ||||||||||
| Star Energy Geothermal Wayang Windu Ltd. |
186 | 180,718 | ||||||||||
| Terraform Global Operating LP
|
118 | 112,236 | ||||||||||
|
|
|
|||||||||||
| 2,361,444 | ||||||||||||
|
|
|
|||||||||||
| Financial Institutions – 0.0% |
||||||||||||
| Finance – 0.0% |
||||||||||||
| Global Aircraft Leasing Co., Ltd. |
188 | 170,091 | ||||||||||
|
|
|
|||||||||||
| Other Finance – 0.0% |
||||||||||||
| OEC Finance Ltd.
|
201 | 5,624 | ||||||||||
| 5.25%, 12/27/2033(a)(f) |
646 | 20,012 | ||||||||||
| 7.125%, 12/26/2046(a)(f) |
1,764 | 56,456 | ||||||||||
|
|
|
|||||||||||
| 82,092 | ||||||||||||
|
|
|
|||||||||||
| REITs – 0.0% |
||||||||||||
| China Aoyuan Group Ltd.
|
247 | 22,230 | ||||||||||
| 5.88%, 03/01/2027(a)(c)(l) |
306 | 27,540 | ||||||||||
| Times China Holdings Ltd.
|
320 | 46,560 | ||||||||||
| 6.20%, 03/22/2026(a)(c)(l) |
200 | 29,413 | ||||||||||
| 6.75%, 07/08/2025(a)(c)(l) |
313 | 46,950 | ||||||||||
| Yango Justice International Ltd.
|
414 | 8,280 | ||||||||||
|
|
|
|||||||||||
| 180,973 | ||||||||||||
|
|
|
|||||||||||
| 433,156 | ||||||||||||
|
|
|
|||||||||||
| Total Emerging Markets – Corporate Bonds |
46,870,066 | |||||||||||
|
|
|
|||||||||||
| 58 | ALLIANCEBERNSTEIN GLOBAL HIGH INCOME FUND |
abfunds.com | |
PORTFOLIO OF INVESTMENTS (continued)
| Principal Amount (000) |
U.S. $ Value | |||||||||||
|
|
||||||||||||
| COLLATERALIZED LOAN OBLIGATIONS – 4.7% |
||||||||||||
| CLO - Floating Rate – 4.7% |
||||||||||||
| AMMC CLO 25 Ltd. |
U.S.$ | 5,000 | $ | 4,544,685 | ||||||||
| Ares XXXIV CLO Ltd. |
2,358 | 2,204,090 | ||||||||||
| Balboa Bay Loan Funding Ltd. |
3,100 | 2,847,570 | ||||||||||
| Series 2021-2A, Class E |
1,000 | 866,137 | ||||||||||
| Series 2022-1A, Class E |
3,700 | 3,441,499 | ||||||||||
| Ballyrock CLO 15 Ltd. |
250 | 223,251 | ||||||||||
| Crown Point CLO 11 Ltd. |
2,000 | 1,800,970 | ||||||||||
| Dryden 49 Senior Loan Fund |
417 | 346,432 | ||||||||||
| Dryden 57 CLO Ltd. |
275 | 219,722 | ||||||||||
| Dryden 78 CLO Ltd. |
3,000 | 2,824,428 | ||||||||||
| Series 2020-78A, Class D |
1,329 | 1,228,808 | ||||||||||
| Dryden 98 CLO Ltd. |
541 | 482,947 | ||||||||||
| abfunds.com | ALLIANCEBERNSTEIN GLOBAL HIGH INCOME FUND | 59 | |
PORTFOLIO OF INVESTMENTS (continued)
| Principal Amount (000) |
U.S. $ Value | |||||||||
|
|
||||||||||
| Elevation CLO Ltd. |
U.S.$ | 648 | $ | 595,801 | ||||||
| Series 2020-11A, Class D1 |
1,006 | 884,307 | ||||||||
| Elmwood CLO IX Ltd. |
250 | 226,522 | ||||||||
| Elmwood CLO VII Ltd. |
402 | 384,056 | ||||||||
| Elmwood CLO VIII Ltd. |
350 | 319,082 | ||||||||
| Elmwood CLO XII Ltd. |
650 | 595,468 | ||||||||
| Flatiron CLO 21 Ltd. |
400 | 355,775 | ||||||||
| Galaxy 30 CLO Ltd. |
2,000 | 1,830,866 | ||||||||
| Madison Park Funding LI Ltd. |
250 | 215,030 | ||||||||
| OCP CLO Ltd. |
250 | 223,553 | ||||||||
| Octagon Investment Partners 29 Ltd. |
1,701 | 1,546,538 | ||||||||
| OZLM XXII Ltd. |
349 | 255,765 | ||||||||
| 60 | ALLIANCEBERNSTEIN GLOBAL HIGH INCOME FUND |
abfunds.com | |
PORTFOLIO OF INVESTMENTS (continued)
| Principal Amount (000) |
U.S. $ Value | |||||||||
|
|
||||||||||
| Palmer Square CLO Ltd. |
U.S.$ | 1,202 | $ | 1,068,063 | ||||||
| Series 2021-3A, Class E |
4,100 | 3,666,007 | ||||||||
| Rad CLO 4 Ltd. |
585 | 536,037 | ||||||||
| Rad CLO 10 Ltd. |
750 | 667,037 | ||||||||
| Rad CLO 11 Ltd. |
355 | 319,381 | ||||||||
| Regatta XIX Funding Ltd. |
349 | 318,310 | ||||||||
| Regatta XXIV Funding Ltd. |
3,600 | 3,306,751 | ||||||||
| Rockford Tower CLO Ltd. |
250 | 196,417 | ||||||||
| Series 2021-2A, Class E |
250 | 210,383 | ||||||||
| Series 2021-3A, Class E |
1,062 | 848,195 | ||||||||
| Sixth Street CLO XVIII Ltd. |
1,238 | 1,143,315 | ||||||||
| Sixth Street CLO XX Ltd. |
679 | 615,960 | ||||||||
| abfunds.com | ALLIANCEBERNSTEIN GLOBAL HIGH INCOME FUND | 61 | |
PORTFOLIO OF INVESTMENTS (continued)
| Principal Amount (000) |
U.S. $ Value | |||||||||||
|
|
||||||||||||
| Trimaran Cavu Ltd. |
U.S.$ | 485 | $ | 416,046 | ||||||||
| Voya CLO Ltd. |
1,050 | 921,498 | ||||||||||
|
|
|
|||||||||||
| Total Collateralized Loan Obligations |
42,696,702 | |||||||||||
|
|
|
|||||||||||
| COLLATERALIZED MORTGAGE OBLIGATIONS – 4.6% |
||||||||||||
| Risk Share Floating Rate – 3.6% |
||||||||||||
| Bellemeade Re Ltd. |
1,520 | 1,514,174 | ||||||||||
| Series 2019-4A, Class M2 |
475 | 472,810 | ||||||||||
| Eagle Re Ltd. |
2,764 | 2,774,147 | ||||||||||
| Federal Home Loan Mortgage Corp. Structured Agency Credit Risk Debt Notes |
743 | 753,924 | ||||||||||
| Series 2014-DN3, Class M3 |
37 | 37,738 | ||||||||||
| Series 2014-HQ2, Class M3 |
1,390 | 1,417,152 | ||||||||||
| Series 2015-DNA1, Class B |
593 | 618,107 | ||||||||||
| Series 2015-DNA2, Class B |
1,341 | 1,359,835 | ||||||||||
| Series 2015-DNA3, Class B |
1,015 | 1,058,507 | ||||||||||
| 62 | ALLIANCEBERNSTEIN GLOBAL HIGH INCOME FUND |
abfunds.com | |
PORTFOLIO OF INVESTMENTS (continued)
| Principal Amount (000) |
U.S. $ Value | |||||||||
|
|
||||||||||
| Series 2015-HQA1, Class B |
U.S.$ | 1,001 | $ | 1,012,304 | ||||||
| Series 2016-DNA2, Class B |
853 | 909,035 | ||||||||
| Series 2016-DNA3, Class B |
2,745 | 2,992,386 | ||||||||
| Series 2016-DNA4, Class B |
392 | 396,366 | ||||||||
| Series 2016-HQA2, Class B |
421 | 460,660 | ||||||||
| Series 2017-DNA3, Class B1 |
323 | 336,613 | ||||||||
| Series 2020-HQA2, Class M2 |
39 | 40,165 | ||||||||
| Federal National Mortgage Association Connecticut Avenue Securities |
659 | 673,780 | ||||||||
| Series 2014-C04, Class 1M2 |
948 | 987,646 | ||||||||
| Series 2015-C02, Class 1M2 |
141 | 146,129 | ||||||||
| Series 2015-C03, Class 1M2 |
422 | 441,673 | ||||||||
| Series 2015-C04, Class 1M2 |
1,021 | 1,089,717 | ||||||||
| Series 2015-C04, Class 2M2 |
299 | 311,184 | ||||||||
| Series 2016-C01, Class 1B |
674 | 752,321 | ||||||||
| Series 2016-C01, Class 1M2 |
834 | 890,049 | ||||||||
| abfunds.com | ALLIANCEBERNSTEIN GLOBAL HIGH INCOME FUND | 63 | |
PORTFOLIO OF INVESTMENTS (continued)
| Principal Amount (000) |
U.S. $ Value | |||||||||
|
|
||||||||||
| Series 2016-C01, Class 2M2 |
U.S.$ | 158 | $ | 167,503 | ||||||
| Series 2016-C02, Class 1B |
446 | 498,849 | ||||||||
| Series 2016-C02, Class 1M2 |
437 | 459,467 | ||||||||
| Series 2016-C03, Class 1B |
371 | 411,829 | ||||||||
| Series 2016-C03, Class 2B |
630 | 711,415 | ||||||||
| Series 2016-C04, Class 1B |
1,476 | 1,583,087 | ||||||||
| Series 2016-C05, Class 2B |
1,816 | 1,951,808 | ||||||||
| Series 2016-C06, Class 1B |
1,276 | 1,334,905 | ||||||||
| Series 2016-C07, Class 2B |
1,556 | 1,610,580 | ||||||||
| Series 2017-C03, Class 1B1 |
142 | 151,170 | ||||||||
| Series 2017-C05, Class 1B1 |
319 | 328,067 | ||||||||
| Series 2018-C01, Class 1B1 |
847 | 872,698 | ||||||||
| JPMorgan Madison Avenue Securities Trust |
400 | 389,664 | ||||||||
| Traingle Re Ltd. |
186 | 186,916 | ||||||||
| 64 | ALLIANCEBERNSTEIN GLOBAL HIGH INCOME FUND |
abfunds.com | |
PORTFOLIO OF INVESTMENTS (continued)
| Principal Amount (000) |
U.S. $ Value | |||||||||||
|
|
||||||||||||
| Wells Fargo Credit Risk Transfer Securities Trust |
U.S.$ | 133 | $ | 126,178 | ||||||||
|
|
|
|||||||||||
| 32,230,558 | ||||||||||||
|
|
|
|||||||||||
| Non-Agency Fixed Rate – 0.4% |
||||||||||||
| Alternative Loan Trust |
499 | 281,184 | ||||||||||
| Series 2006-42, Class 1A6 |
457 | 274,036 | ||||||||||
| Series 2006-HY12, Class A5 |
508 | 459,510 | ||||||||||
| Series 2006-J1, Class 1A10 |
563 | 405,549 | ||||||||||
| Series 2006-J5, Class 1A1 |
507 | 290,549 | ||||||||||
| Bear Stearns ARM Trust |
76 | 65,945 | ||||||||||
| Series 2007-4, Class 22A1 |
310 | 271,775 | ||||||||||
| ChaseFlex Trust |
401 | 154,705 | ||||||||||
| CHL Mortgage Pass-Through Trust |
90 | 76,270 | ||||||||||
| Citigroup Mortgage Loan Trust |
46 | 39,182 | ||||||||||
| CitiMortgage Alternative Loan Trust |
441 | 398,851 | ||||||||||
| CSMC Mortgage-Backed Trust |
191 | 81,152 | ||||||||||
| Residential Accredit Loans, Inc. Trust |
191 | 166,454 | ||||||||||
| Residential Asset Securitization Trust |
126 | 66,745 | ||||||||||
| abfunds.com | ALLIANCEBERNSTEIN GLOBAL HIGH INCOME FUND | 65 | |
PORTFOLIO OF INVESTMENTS (continued)
| Principal Amount (000) |
U.S. $ Value | |||||||||||
|
|
||||||||||||
| Washington Mutual Mortgage Pass-Through Certificates Trust |
U.S.$ | 1,229 | $ | 349,166 | ||||||||
| Wells Fargo Mortgage Backed Securities Trust |
309 | 264,372 | ||||||||||
|
|
|
|||||||||||
| 3,645,445 | ||||||||||||
|
|
|
|||||||||||
| Non-Agency Floating Rate – 0.3% |
||||||||||||
| Alternative Loan Trust |
1,961 | 696,165 | ||||||||||
| CHL Mortgage Pass-Through Trust |
286 | 115,524 | ||||||||||
| First Horizon Alternative Mortgage Securities Trust |
71 | 7,765 | ||||||||||
| Series 2007-FA2, Class 1A10 |
209 | 54,151 | ||||||||||
| Lehman XS Trust |
117 | 11,508 | ||||||||||
| Residential Accredit Loans, Inc. Trust |
1,798 | 190,597 | ||||||||||
| Wachovia Mortgage Loan Trust |
5,152 | 1,940,137 | ||||||||||
|
|
|
|||||||||||
| 3,015,847 | ||||||||||||
|
|
|
|||||||||||
| Agency Fixed Rate – 0.3% |
||||||||||||
| Federal Home Loan Mortgage Corp. |
4,336 | 925,332 | ||||||||||
| 66 | ALLIANCEBERNSTEIN GLOBAL HIGH INCOME FUND |
abfunds.com | |
PORTFOLIO OF INVESTMENTS (continued)
| Principal Amount (000) |
U.S. $ Value | |||||||||||
|
|
||||||||||||
| Federal Home Loan Mortgage Corp. |
U.S.$ | 9,524 | $ | 1,926,107 | ||||||||
|
|
|
|||||||||||
| 2,851,439 | ||||||||||||
|
|
|
|||||||||||
| Total Collateralized Mortgage Obligations |
41,743,289 | |||||||||||
|
|
|
|||||||||||
| BANK LOANS – 4.3% |
||||||||||||
| Industrial – 3.9% |
||||||||||||
| Capital Goods – 0.4% |
||||||||||||
| ACProducts Holdings, Inc. |
1,942 | 1,536,518 | ||||||||||
| Apex Tool Group, LLC |
1,726 | 1,512,258 | ||||||||||
| Chariot Buyer, LLC |
158 | 151,562 | ||||||||||
| TransDigm, Inc. |
293 | 292,290 | ||||||||||
|
|
|
|||||||||||
| 3,492,628 | ||||||||||||
|
|
|
|||||||||||
| Communications - Media – 0.2% |
||||||||||||
| Advantage Sales & Marketing, Inc. |
1,711 | 1,462,584 | ||||||||||
| Clear Channel Outdoor Holdings, Inc. |
313 | 291,187 | ||||||||||
| iHeartCommunications, Inc. (fka Clear Channel Communications, Inc.) |
355 | 313,532 | ||||||||||
|
|
|
|||||||||||
| 2,067,303 | ||||||||||||
|
|
|
|||||||||||
| Communications - Telecommunications – 0.7% |
||||||||||||
| Crown Subsea Communications Holding, Inc. 9.530% (SOFR 1 Month + 4.75%), 04/27/2027(o) |
1,515 | 1,489,977 | ||||||||||
| DIRECTV Financing, LLC |
606 | 581,486 | ||||||||||
| abfunds.com | ALLIANCEBERNSTEIN GLOBAL HIGH INCOME FUND | 67 | |
PORTFOLIO OF INVESTMENTS (continued)
| Principal Amount (000) |
U.S. $ Value | |||||||||||
|
|
||||||||||||
| Proofpoint, Inc. |
U.S.$ | 2,480 | $ | 2,333,258 | ||||||||
| Zacapa SARL |
2,126 | 2,071,291 | ||||||||||
|
|
|
|||||||||||
| 6,476,012 | ||||||||||||
|
|
|
|||||||||||
| Consumer Cyclical - Automotive – 0.0% |
||||||||||||
| Clarios Global LP |
431 | 427,823 | ||||||||||
|
|
|
|||||||||||
| Consumer Cyclical - Other – 0.0% |
||||||||||||
| Caesars Entertainment, Inc. |
400 | 397,444 | ||||||||||
|
|
|
|||||||||||
| Consumer Cyclical - Restaurants – 0.0% |
||||||||||||
| IRB Holding Corp. |
95 | 92,611 | ||||||||||
| 7.718% (SOFR 1 Month + 3.00%), 12/15/2027(o) |
65 | 64,060 | ||||||||||
|
|
|
|||||||||||
| 156,671 | ||||||||||||
|
|
|
|||||||||||
| Consumer Cyclical - Retailers – 0.1% |
||||||||||||
| Great Outdoors Group, LLC |
476 | 468,788 | ||||||||||
| Restoration Hardware, Inc. |
836 | 634,574 | ||||||||||
|
|
|
|||||||||||
| 1,103,362 | ||||||||||||
|
|
|
|||||||||||
| Consumer Non-Cyclical – 0.8% |
||||||||||||
| Gainwell Acquisition Corp. |
1,212 | 1,154,525 | ||||||||||
| Kronos Acquisition Holdings, Inc. |
774 | 740,479 | ||||||||||
| LifePoint Health, Inc. (fka Regionalcare Hospital Partners Holdings, Inc.) |
793 | 753,622 | ||||||||||
| Mallinckrodt International Finance S.A. |
847 | 609,102 | ||||||||||
| 68 | ALLIANCEBERNSTEIN GLOBAL HIGH INCOME FUND |
abfunds.com | |
PORTFOLIO OF INVESTMENTS (continued)
| Principal Amount (000) |
U.S. $ Value | |||||||||||
|
|
||||||||||||
| PetSmart, LLC |
U.S.$ | 2,197 | $ | 2,178,253 | ||||||||
| US Radiology Specialists, Inc. (US Outpatient Imaging Services, Inc.) |
1,945 | 1,818,329 | ||||||||||
|
|
|
|||||||||||
| 7,254,310 | ||||||||||||
|
|
|
|||||||||||
| Energy – 0.5% |
||||||||||||
| GIP II Blue Holding, L.P. |
2,838 | 2,808,651 | ||||||||||
| Parkway Generation, LLC |
1,405 | 1,354,195 | ||||||||||
|
|
|
|||||||||||
| 4,162,846 | ||||||||||||
|
|
|
|||||||||||
| Other Industrial – 0.3% |
||||||||||||
| American Tire Distributors, Inc. |
2,093 | 1,822,020 | ||||||||||
| Dealer Tire Financial, LLC |
291 | 288,658 | ||||||||||
| FCG Acquisitions, Inc. |
640 | 599,469 | ||||||||||
| Rockwood Service Corporation |
84 | 83,038 | ||||||||||
|
|
|
|||||||||||
| 2,793,185 | ||||||||||||
|
|
|
|||||||||||
| Services – 0.1% |
||||||||||||
| Verscend Holding Corp. |
742 | 740,432 | ||||||||||
|
|
|
|||||||||||
| Technology – 0.8% |
||||||||||||
| Amentum Government Services Holdings, LLC |
311 | 304,976 | ||||||||||
| Ascend Learning, LLC |
840 | 720,997 | ||||||||||
| Banff Guarantor, Inc. |
690 | 661,972 | ||||||||||
| abfunds.com | ALLIANCEBERNSTEIN GLOBAL HIGH INCOME FUND | 69 | |
PORTFOLIO OF INVESTMENTS (continued)
| Principal Amount (000) |
U.S. $ Value | |||||||||||
|
|
||||||||||||
| Boxer Parent Company, Inc. |
U.S.$ | 1,480 | $ | 1,458,890 | ||||||||
| Endurance International Group Holdings, Inc. |
1,959 | 1,826,636 | ||||||||||
| FINThrive Software Intermediate Holdings, Inc. |
660 | 400,402 | ||||||||||
| Loyalty Ventures, Inc. |
1,610 | 146,254 | ||||||||||
| Peraton Corp. |
616 | 606,774 | ||||||||||
| Presidio Holdings, Inc. |
373 | 369,153 | ||||||||||
| 8.407% (SOFR 1 Month + 3.50%), |
15 | 14,396 | ||||||||||
| Veritas US, Inc. |
574 | 434,307 | ||||||||||
|
|
|
|||||||||||
| 6,944,757 | ||||||||||||
|
|
|
|||||||||||
| 36,016,773 | ||||||||||||
|
|
|
|||||||||||
| Financial Institutions – 0.2% |
| |||||||||||
| Finance – 0.0% |
| |||||||||||
| Orbit Private Holdings I Ltd. |
238 | 236,111 | ||||||||||
|
|
|
|||||||||||
| Insurance – 0.2% |
| |||||||||||
| Asurion, LLC |
1,660 | 1,534,986 | ||||||||||
|
|
|
|||||||||||
| 1,771,097 | ||||||||||||
|
|
|
|||||||||||
| Utility – 0.2% |
| |||||||||||
| Electric – 0.2% |
| |||||||||||
| Granite Generation LLC |
1,781 | 1,671,741 | ||||||||||
|
|
|
|||||||||||
| Total Bank Loans |
39,459,611 | |||||||||||
|
|
|
|||||||||||
| 70 | ALLIANCEBERNSTEIN GLOBAL HIGH INCOME FUND |
abfunds.com | |
PORTFOLIO OF INVESTMENTS (continued)
| Principal Amount (000) |
U.S. $ Value | |||||||||||
|
|
||||||||||||
| GOVERNMENTS - TREASURIES – 2.6% |
| |||||||||||
| United States – 2.6% |
| |||||||||||
| U.S. Treasury Bonds
|
U.S.$ | 2,154 | $ | 1,822,149 | ||||||||
| 5.00%, 05/15/2037(p) |
1,824 | 2,122,680 | ||||||||||
| 5.25%, 02/15/2029(q) |
320 | 345,100 | ||||||||||
| 6.125%, 11/15/2027(r) |
1,000 | 1,102,500 | ||||||||||
| U.S. Treasury Notes
|
12,811 | 12,126,128 | ||||||||||
| 2.875%, 08/15/2028(i)(q) |
6,366 | 6,127,468 | ||||||||||
|
|
|
|||||||||||
| Total Governments – Treasuries |
23,646,025 | |||||||||||
|
|
|
|||||||||||
| EMERGING MARKETS - SOVEREIGNS – 2.4% |
| |||||||||||
| Angola – 0.3% |
| |||||||||||
| Angolan Government International Bond |
835 | 718,100 | ||||||||||
| 8.25%, 05/09/2028(a) |
200 | 177,750 | ||||||||||
| 9.50%, 11/12/2025(a) |
2,118 | 2,094,173 | ||||||||||
|
|
|
|||||||||||
| 2,990,023 | ||||||||||||
|
|
|
|||||||||||
| Argentina – 0.2% |
| |||||||||||
| Argentine Republic Government International Bond |
952 | 273,629 | ||||||||||
| 1.00%, 07/09/2029 |
1,099 | 302,748 | ||||||||||
| 1.50%, 07/09/2035 |
1,034 | 266,273 | ||||||||||
| 3.50%, 07/09/2041 |
562 | 156,655 | ||||||||||
| 3.875%, 01/09/2038 |
1,323 | 408,726 | ||||||||||
|
|
|
|||||||||||
| 1,408,031 | ||||||||||||
|
|
|
|||||||||||
| Dominican Republic – 0.7% |
| |||||||||||
| Dominican Republic International Bond |
5,719 | 5,957,768 | ||||||||||
|
|
|
|||||||||||
| Ecuador – 0.1% |
| |||||||||||
| Ecuador Government International Bond |
864 | 258,255 | ||||||||||
| 2.50%, 07/31/2035(a) |
1,011 | 334,324 | ||||||||||
| 5.50%, 07/31/2030(a) |
979 | 453,093 | ||||||||||
|
|
|
|||||||||||
| 1,045,672 | ||||||||||||
|
|
|
|||||||||||
| Egypt – 0.2% |
| |||||||||||
| Egypt Government International Bond
|
862 | 499,314 | ||||||||||
| 8.70%, 03/01/2049(a) |
611 | 355,067 | ||||||||||
| 8.875%, 05/29/2050(a) |
1,096 | 641,365 | ||||||||||
|
|
|
|||||||||||
| 1,495,746 | ||||||||||||
|
|
|
|||||||||||
| abfunds.com | ALLIANCEBERNSTEIN GLOBAL HIGH INCOME FUND | 71 | |
PORTFOLIO OF INVESTMENTS (continued)
| Principal Amount (000) |
U.S. $ Value | |||||||||||
|
|
||||||||||||
| El Salvador – 0.1% |
| |||||||||||
| El Salvador Government International Bond |
U.S.$ | 577 | $ | 259,650 | ||||||||
| 7.625%, 09/21/2034(a) |
762 | 356,235 | ||||||||||
| 7.625%, 02/01/2041(a) |
1,024 | 471,040 | ||||||||||
| 9.50%, 07/15/2052(a) |
520 | 265,200 | ||||||||||
|
|
|
|||||||||||
| 1,352,125 | ||||||||||||
|
|
|
|||||||||||
| Gabon – 0.2% |
| |||||||||||
| Gabon Government International Bond |
2,609 | 1,984,960 | ||||||||||
|
|
|
|||||||||||
| Nigeria – 0.4% |
| |||||||||||
| Nigeria Government International Bond |
2,789 | 2,168,447 | ||||||||||
| 7.143%, 02/23/2030(a) |
1,718 | 1,305,680 | ||||||||||
|
|
|
|||||||||||
| 3,474,127 | ||||||||||||
|
|
|
|||||||||||
| Ukraine – 0.1% |
| |||||||||||
| Ukraine Government International Bond |
1,886 | 322,152 | ||||||||||
| 7.375%, 09/25/2034(a) |
1,164 | 199,044 | ||||||||||
| 7.75%, 09/01/2025(a) |
3,507 | 697,674 | ||||||||||
|
|
|
|||||||||||
| 1,218,870 | ||||||||||||
|
|
|
|||||||||||
| Venezuela – 0.1% |
| |||||||||||
| Venezuela Government International Bond |
7,978 | 861,624 | ||||||||||
| 9.25%, 05/07/2028(a)(c)(l) |
300 | 32,400 | ||||||||||
|
|
|
|||||||||||
| 894,024 | ||||||||||||
|
|
|
|||||||||||
| Total Emerging Markets – Sovereigns |
21,821,346 | |||||||||||
|
|
|
|||||||||||
| QUASI-SOVEREIGNS – 0.9% |
| |||||||||||
| Quasi-Sovereign Bonds – 0.9% |
| |||||||||||
| Kazakhstan – 0.1% |
| |||||||||||
| KazMunayGas National Co. JSC
|
1,383 | 1,228,415 | ||||||||||
|
|
|
|||||||||||
| Mexico – 0.6% |
| |||||||||||
| Comision Federal de Electricidad
|
650 | 578,012 | ||||||||||
| Petroleos Mexicanos |
3,604 | 2,742,284 | ||||||||||
| 6.49%, 01/23/2027 |
463 | 420,173 | ||||||||||
| 6.75%, 09/21/2047 |
2,113 | 1,365,526 | ||||||||||
| 6.95%, 01/28/2060 |
579 | 371,356 | ||||||||||
|
|
|
|||||||||||
| 5,477,351 | ||||||||||||
|
|
|
|||||||||||
| 72 | ALLIANCEBERNSTEIN GLOBAL HIGH INCOME FUND |
abfunds.com | |
PORTFOLIO OF INVESTMENTS (continued)
| Principal Amount (000) |
U.S. $ Value | |||||||||||
|
|
||||||||||||
| Panama – 0.0% |
| |||||||||||
| Aeropuerto Internacional de Tocumen SA |
U.S.$ | 249 | $ | 197,924 | ||||||||
| 5.125%, 08/11/2061(a) |
236 | 181,838 | ||||||||||
|
|
|
|||||||||||
| 379,762 | ||||||||||||
|
|
|
|||||||||||
| South Africa – 0.2% |
||||||||||||
| Eskom Holdings SOC Ltd.
|
237 | 231,712 | ||||||||||
| Transnet SOC Ltd.
|
1,300 | 1,290,250 | ||||||||||
|
|
|
|||||||||||
| 1,521,962 | ||||||||||||
|
|
|
|||||||||||
| Total Quasi-Sovereigns |
8,607,490 | |||||||||||
|
|
|
|||||||||||
| Shares | ||||||||||||
| COMMON STOCKS – 0.7% |
||||||||||||
| Consumer Staples – 0.2% |
||||||||||||
| Household Products – 0.2% |
||||||||||||
| Southeastern Grocers, Inc.(b)(c)(e) |
105,865 | 2,381,963 | ||||||||||
|
|
|
|||||||||||
| Energy – 0.2% |
||||||||||||
| Energy Equipment & Services – 0.0% |
||||||||||||
| BIS Industries Holdings Ltd.(b)(c)(e) |
838,296 | 1 | ||||||||||
| CHC Group LLC(b)(c) |
21,009 | 31 | ||||||||||
| Diamond Offshore Drilling, Inc.(c) |
23,444 | 282,266 | ||||||||||
|
|
|
|||||||||||
| 282,298 | ||||||||||||
|
|
|
|||||||||||
| Oil, Gas & Consumable Fuels – 0.2% |
||||||||||||
| Berry Corp. |
37,000 | 290,450 | ||||||||||
| Civitas Resources, Inc. |
3,393 | 231,877 | ||||||||||
| Denbury, Inc.(c) |
6,529 | 572,136 | ||||||||||
| Golden Energy Offshore Services AS(c) |
916,212 | 96,003 | ||||||||||
| SandRidge Energy, Inc.(c) |
243 | 3,502 | ||||||||||
|
|
|
|||||||||||
| 1,193,968 | ||||||||||||
|
|
|
|||||||||||
| 1,476,266 | ||||||||||||
|
|
|
|||||||||||
| Consumer Discretionary – 0.1% |
||||||||||||
| Broadline Retail – 0.1% |
||||||||||||
| ATD New Holdings, Inc.(b)(c) |
20,185 | 1,105,129 | ||||||||||
| K201640219 South Africa Ltd. A Shares(b)(c)(e) |
12,695,187 | 12 | ||||||||||
| K201640219 South Africa Ltd. B Shares(b)(c)(e) |
2,009,762 | 2 | ||||||||||
|
|
|
|||||||||||
| 1,105,143 | ||||||||||||
|
|
|
|||||||||||
| Diversified Consumer Services – 0.0% |
||||||||||||
| AG Tracker(b)(c)(e) |
78,082 | – 0 | – | |||||||||
| abfunds.com | ALLIANCEBERNSTEIN GLOBAL HIGH INCOME FUND | 73 | |
PORTFOLIO OF INVESTMENTS (continued)
| Shares |
U.S. $ Value | |||||||||||
|
|
||||||||||||
| Monitronics International, Inc.(c) |
17,878 | $ | 894 | |||||||||
|
|
|
|||||||||||
| 894 | ||||||||||||
|
|
|
|||||||||||
| Hotels, Restaurants & Leisure – 0.0% |
||||||||||||
| Caesars Entertainment, Inc.(c) |
1,674 | 81,708 | ||||||||||
|
|
|
|||||||||||
| Leisure Products – 0.0% |
||||||||||||
| New Cotai LLC/New Cotai Capital Corp.(b)(c)(e) |
3 | – 0 | – | |||||||||
|
|
|
|||||||||||
| 1,187,745 | ||||||||||||
|
|
|
|||||||||||
| Financials – 0.1% |
| |||||||||||
| Financial Services – 0.0% |
| |||||||||||
| Paysafe Ltd.(c) |
10,709 | 184,944 | ||||||||||
|
|
|
|||||||||||
| Insurance – 0.1% |
| |||||||||||
| Mt Logan Re Ltd. (Special Investment)(b)(c)(e) |
541 | 472,836 | ||||||||||
|
|
|
|||||||||||
| 657,780 | ||||||||||||
|
|
|
|||||||||||
| Communication Services – 0.1% |
| |||||||||||
| Diversified Telecommunication Services – 0.1% |
| |||||||||||
| Intelsat SA(b)(c) |
15,662 | 377,454 | ||||||||||
|
|
|
|||||||||||
| Media – 0.0% |
| |||||||||||
| iHeartMedia, Inc. – Class A(c) |
25,545 | 99,626 | ||||||||||
|
|
|
|||||||||||
| 477,080 | ||||||||||||
|
|
|
|||||||||||
| Industrials – 0.0% |
| |||||||||||
| Electrical Equipment – 0.0% |
| |||||||||||
| Exide Corp.(b)(c)(e) |
643 | 273,275 | ||||||||||
|
|
|
|||||||||||
| Health Care – 0.0% |
| |||||||||||
| Pharmaceuticals – 0.0% |
| |||||||||||
| Mallinckrodt PLC(c) |
3,821 | 27,856 | ||||||||||
|
|
|
|||||||||||
| Information Technology – 0.0% |
| |||||||||||
| IT Services – 0.0% |
| |||||||||||
| GOLO Mobile, Inc.(b)(c)(e) |
38,543 | – 0 | – | |||||||||
|
|
|
|||||||||||
| Total Common Stocks |
6,481,965 | |||||||||||
|
|
|
|||||||||||
| 74 | ALLIANCEBERNSTEIN GLOBAL HIGH INCOME FUND |
abfunds.com | |
PORTFOLIO OF INVESTMENTS (continued)
| Principal Amount (000) |
U.S. $ Value | |||||||||||
|
|
||||||||||||
| COMMERCIAL MORTGAGE-BACKED SECURITIES – 0.6% |
||||||||||||
| Non-Agency Fixed Rate CMBS – 0.6% |
| |||||||||||
| Citigroup Commercial Mortgage Trust |
U.S.$ | 902 | $ | 802,195 | ||||||||
| Commercial Mortgage Trust |
182 | 36,184 | ||||||||||
| Series 2012-CR3, Class XA |
619 | 6 | ||||||||||
| Series 2013-LC6, Class D |
2,233 | 2,098,802 | ||||||||||
| Series 2014-CR15, Class XA |
1,187 | 3,956 | ||||||||||
| Series 2014-CR20, Class XA |
7,966 | 83,307 | ||||||||||
| WF-RBS Commercial Mortgage Trust |
1,022 | 878,654 | ||||||||||
| Series 2012-C10, Class XA |
141 | 2 | ||||||||||
| Series 2014-C25, Class D |
1,807 | 1,461,307 | ||||||||||
|
|
|
|||||||||||
| 5,364,413 | ||||||||||||
|
|
|
|||||||||||
| Non-Agency Floating Rate CMBS – 0.0% |
||||||||||||
| Morgan Stanley Capital I Trust |
301 | 251,837 | ||||||||||
|
|
|
|||||||||||
| Total Commercial Mortgage-Backed Securities |
5,616,250 | |||||||||||
|
|
|
|||||||||||
| LOCAL GOVERNMENTS - US MUNICIPAL BONDS – 0.5% |
||||||||||||
| United States – 0.5% |
||||||||||||
| State of California |
750 | 987,340 | ||||||||||
| State of Illinois |
1,778 | 1,951,879 | ||||||||||
| abfunds.com | ALLIANCEBERNSTEIN GLOBAL HIGH INCOME FUND | 75 | |
PORTFOLIO OF INVESTMENTS (continued)
| Principal Amount (000) |
U.S. $ Value | |||||||||||
|
|
||||||||||||
| Wisconsin Public Finance Authority |
U.S.$ | 1,435 | $ | 1,306,110 | ||||||||
|
|
|
|||||||||||
| Total Local Governments – US Municipal Bonds |
4,245,329 | |||||||||||
|
|
|
|||||||||||
| ASSET-BACKED SECURITIES – 0.2% |
||||||||||||
| Other ABS - Fixed Rate – 0.1% |
||||||||||||
| Consumer Loan Underlying Bond Certificate Issuer Trust I |
5 | 4,895 | ||||||||||
| Series 2019-24, Class PT |
37 | 36,159 | ||||||||||
| Series 2019-36, Class PT |
73 | 71,035 | ||||||||||
| Series 2019-43, Class PT |
0 | ** | 319 | |||||||||
| Consumer Loan Underlying Bond Club Certificate Issuer Trust I |
2 | 1,949 | ||||||||||
| Series 2018-12, Class PT |
5 | 4,479 | ||||||||||
| Consumer Loan Underlying Bond Credit Trust |
1 | 535 | ||||||||||
| Pagaya AI Debt Trust |
897 | 902,298 | ||||||||||
|
|
|
|||||||||||
| 1,021,669 | ||||||||||||
|
|
|
|||||||||||
| Autos - Fixed Rate – 0.1% |
||||||||||||
| Flagship Credit Auto Trust |
770 | 715,712 | ||||||||||
|
|
|
|||||||||||
| Total Asset-Backed Securities |
1,737,381 | |||||||||||
|
|
|
|||||||||||
| 76 | ALLIANCEBERNSTEIN GLOBAL HIGH INCOME FUND |
abfunds.com | |
PORTFOLIO OF INVESTMENTS (continued)
| Shares |
U.S. $ Value | |||||||||||
|
|
||||||||||||
| PREFERRED STOCKS – 0.2% |
||||||||||||
| Industrial – 0.2% |
||||||||||||
| Energy – 0.1% |
||||||||||||
| Gulfport Energy Corp. |
142 | $ | 766,800 | |||||||||
|
|
|
|||||||||||
| Industrial Conglomerates – 0.1% |
||||||||||||
| WESCO International, Inc. |
35,175 | 953,594 | ||||||||||
|
|
|
|||||||||||
| Total Preferred Stocks |
1,720,394 | |||||||||||
|
|
|
|||||||||||
| INFLATION-LINKED SECURITIES – 0.2% |
||||||||||||
| Colombia – 0.2% |
||||||||||||
| Fideicomiso PA Concesion Ruta al Mar |
COP | 1,437,090 | 191,446 | |||||||||
| Fideicomiso PA Costera
|
1,230,800 | 245,790 | ||||||||||
| Fideicomiso PA Pacifico Tres
|
6,642,880 | 1,258,824 | ||||||||||
|
|
|
|||||||||||
| Total Inflation-Linked Securities |
1,696,060 | |||||||||||
|
|
|
|||||||||||
| GOVERNMENTS - SOVEREIGN BONDS – 0.1% |
||||||||||||
| Colombia – 0.1% |
||||||||||||
| Colombia Government International Bond |
U.S.$ | 1,058 | 653,844 | |||||||||
|
|
|
|||||||||||
| Netherlands – 0.0% |
||||||||||||
| SNS Bank NV |
EUR | 620 | – 0 | – | ||||||||
|
|
|
|||||||||||
| Total Governments – Sovereign Bonds |
653,844 | |||||||||||
|
|
|
|||||||||||
| RIGHTS – 0.0% |
| |||||||||||
| Intelsat Jackson Holdings SA, expiring 12/31/2049(b)(c)(e) |
3,280 | – 0 | – | |||||||||
| Vistra Energy Corp., expiring 12/31/2049(b)(c) |
10,721 | 12,597 | ||||||||||
|
|
|
|||||||||||
| Total Rights |
12,597 | |||||||||||
|
|
|
|||||||||||
| abfunds.com | ALLIANCEBERNSTEIN GLOBAL HIGH INCOME FUND | 77 | |
PORTFOLIO OF INVESTMENTS (continued)
| Shares |
U.S. $ Value | |||||||||||
|
|
||||||||||||
| SHORT-TERM INVESTMENTS – 1.8% |
||||||||||||
| Investment Companies – 1.1% |
||||||||||||
| AB Fixed Income Shares, Inc. – Government Money Market Portfolio – Class AB, 4.75%(s)(t)(u) |
10,074,438 | $ | 10,074,438 | |||||||||
|
|
|
|||||||||||
| Principal Amount (000) |
||||||||||||
| U.S. Treasury Bills – 0.4% |
||||||||||||
| U.S. Treasury Bill |
U.S.$ | 3,383 | 3,304,173 | |||||||||
|
|
|
|||||||||||
| Time Deposits – 0.3% |
||||||||||||
| BBH, Grand Cayman |
ZAR | 0 | ** | 3 | ||||||||
| Citibank, London |
EUR | 55 | 59,181 | |||||||||
| Citibank, New York |
U.S.$ | 2,562 | 2,561,663 | |||||||||
|
|
|
|||||||||||
| Total Time Deposits |
2,620,847 | |||||||||||
|
|
|
|||||||||||
| Total Short-Term Investments |
15,999,458 | |||||||||||
|
|
|
|||||||||||
| Total Investments – 98.7% |
899,439,467 | |||||||||||
| Other assets less liabilities – 1.3% |
11,509,467 | |||||||||||
|
|
|
|||||||||||
| Net Assets – 100.0% |
$ | 910,948,934 | ||||||||||
|
|
|
|||||||||||
FUTURES (see Note C)
| Description | Number of Contracts |
Expiration Month |
Current Notional |
Value and Unrealized Appreciation (Depreciation) |
||||||||||||
| Purchased Contracts |
||||||||||||||||
| U.S. 10 Yr Ultra Futures |
103 | June 2023 | $ | 12,477,484 | $ | 414,070 | ||||||||||
| U.S. Long Bond (CBT) Futures |
51 | June 2023 | 6,688,969 | 248,445 | ||||||||||||
| U.S. T-Note 5 Yr (CBT) Futures |
702 | June 2023 | 76,874,485 | 1,514,547 | ||||||||||||
| U.S. T-Note 10 Yr (CBT) Futures |
82 | June 2023 | 9,423,594 | 270,156 | ||||||||||||
|
|
|
|||||||||||||||
| $ | 2,447,218 | |||||||||||||||
|
|
|
|||||||||||||||
| 78 | ALLIANCEBERNSTEIN GLOBAL HIGH INCOME FUND |
abfunds.com | |
PORTFOLIO OF INVESTMENTS (continued)
FORWARD CURRENCY EXCHANGE CONTRACTS (see Note C)
| Counterparty | Contracts to Deliver (000) |
In Exchange For (000) |
Settlement Date |
Unrealized Appreciation (Depreciation) |
||||||||||||||||||||
| Australia and New Zealand Banking Group Ltd. |
USD | 1,291 | EUR | 1,219 | 05/11/2023 | $ | 34,232 | |||||||||||||||||
| Bank of America, NA |
USD | 8 | CNH | 52 | 04/20/2023 | 93 | ||||||||||||||||||
| Bank of America, NA |
KRW | 34,617 | USD | 28 | 04/26/2023 | 1,099 | ||||||||||||||||||
| Bank of America, NA |
USD | 27 | KRW | 34,639 | 04/26/2023 | (667 | ) | |||||||||||||||||
| Bank of America, NA |
EUR | 975 | USD | 1,064 | 05/11/2023 | 3,991 | ||||||||||||||||||
| Bank of America, NA |
EUR | 63,981 | USD | 68,100 | 05/11/2023 | (1,433,892 | ) | |||||||||||||||||
| Bank of America, NA |
CLP | 9,292 | USD | 12 | 05/17/2023 | 47 | ||||||||||||||||||
| Bank of America, NA |
CLP | 11,040 | USD | 14 | 05/17/2023 | (72 | ) | |||||||||||||||||
| Bank of America, NA |
USD | 82 | CLP | 66,619 | 05/17/2023 | 1,566 | ||||||||||||||||||
| Bank of America, NA |
GBP | 3,041 | USD | 3,727 | 05/24/2023 | (27,951 | ) | |||||||||||||||||
| Bank of America, NA |
USD | 41 | TWD | 1,234 | 06/15/2023 | (47 | ) | |||||||||||||||||
| Bank of America, NA |
INR | 2,028 | USD | 25 | 06/22/2023 | (76 | ) | |||||||||||||||||
| Bank of America, NA |
USD | 16 | INR | 1,333 | 06/22/2023 | (13 | ) | |||||||||||||||||
| Barclays Bank PLC |
KRW | 95,894 | USD | 76 | 04/26/2023 | 2,447 | ||||||||||||||||||
| Barclays Bank PLC |
KRW | 39,956 | USD | 30 | 04/26/2023 | (186 | ) | |||||||||||||||||
| Barclays Bank PLC |
CLP | 7,577 | USD | 9 | 05/17/2023 | (336 | ) | |||||||||||||||||
| BNP Paribas SA |
USD | 69 | KRW | 88,243 | 04/26/2023 | (1,820 | ) | |||||||||||||||||
| BNP Paribas SA |
USD | 1,007 | EUR | 945 | 05/11/2023 | 19,164 | ||||||||||||||||||
| BNP Paribas SA |
TWD | 279 | USD | 9 | 06/15/2023 | 94 | ||||||||||||||||||
| BNP Paribas SA |
USD | 45 | TWD | 1,373 | 06/15/2023 | (33 | ) | |||||||||||||||||
| BNP Paribas SA |
USD | 13 | INR | 1,060 | 06/22/2023 | 2 | ||||||||||||||||||
| Brown Brothers Harriman & Co. |
AUD | 233 | USD | 163 | 04/13/2023 | 7,308 | ||||||||||||||||||
| Brown Brothers Harriman & Co. |
AUD | 55 | USD | 36 | 04/13/2023 | (72 | ) | |||||||||||||||||
| Brown Brothers Harriman & Co. |
USD | 62 | AUD | 94 | 04/13/2023 | 388 | ||||||||||||||||||
| Brown Brothers Harriman & Co. |
USD | 132 | AUD | 193 | 04/13/2023 | (3,513 | ) | |||||||||||||||||
| Brown Brothers Harriman & Co. |
CNH | 297 | USD | 43 | 04/20/2023 | 69 | ||||||||||||||||||
| Brown Brothers Harriman & Co. |
CNH | 551 | USD | 80 | 04/20/2023 | (427 | ) | |||||||||||||||||
| Brown Brothers Harriman & Co. |
NZD | 53 | USD | 34 | 04/20/2023 | 805 | ||||||||||||||||||
| Brown Brothers Harriman & Co. |
NZD | 106 | USD | 66 | 04/20/2023 | (261 | ) | |||||||||||||||||
| Brown Brothers Harriman & Co. |
USD | 96 | CNH | 662 | 04/20/2023 | 434 | ||||||||||||||||||
| Brown Brothers Harriman & Co. |
USD | 91 | CNH | 623 | 04/20/2023 | (268 | ) | |||||||||||||||||
| Brown Brothers Harriman & Co. |
USD | 51 | NZD | 83 | 04/20/2023 | 597 | ||||||||||||||||||
| Brown Brothers Harriman & Co. |
USD | 38 | NZD | 60 | 04/20/2023 | (448 | ) | |||||||||||||||||
| Brown Brothers Harriman & Co. |
USD | 233 | ZAR | 4,249 | 04/20/2023 | 5,386 | ||||||||||||||||||
| Brown Brothers Harriman & Co. |
ZAR | 4,514 | USD | 246 | 04/20/2023 | (7,226 | ) | |||||||||||||||||
| Brown Brothers Harriman & Co. |
NOK | 337 | USD | 33 | 04/21/2023 | 633 | ||||||||||||||||||
| Brown Brothers Harriman & Co. |
SEK | 801 | USD | 78 | 04/21/2023 | 411 | ||||||||||||||||||
| Brown Brothers Harriman & Co. |
SEK | 520 | USD | 50 | 04/21/2023 | (302 | ) | |||||||||||||||||
| Brown Brothers Harriman & Co. |
USD | 131 | NOK | 1,321 | 04/21/2023 | (5,028 | ) | |||||||||||||||||
| Brown Brothers Harriman & Co. |
USD | 108 | SEK | 1,131 | 04/21/2023 | 532 | ||||||||||||||||||
| Brown Brothers Harriman & Co. |
USD | 14 | SEK | 147 | 04/21/2023 | (128 | ) | |||||||||||||||||
| Brown Brothers Harriman & Co. |
PLN | 227 | USD | 53 | 04/27/2023 | 280 | ||||||||||||||||||
| Brown Brothers Harriman & Co. |
PLN | 1,501 | USD | 339 | 04/27/2023 | (8,173 | ) | |||||||||||||||||
| Brown Brothers Harriman & Co. |
USD | 288 | PLN | 1,271 | 04/27/2023 | 5,781 | ||||||||||||||||||
| Brown Brothers Harriman & Co. |
USD | 12 | PLN | 54 | 04/27/2023 | (37 | ) | |||||||||||||||||
| Brown Brothers Harriman & Co. |
JPY | 11,190 | USD | 85 | 04/28/2023 | 650 | ||||||||||||||||||
| Brown Brothers Harriman & Co. |
JPY | 8,292 | USD | 62 | 04/28/2023 | (811 | ) | |||||||||||||||||
| Brown Brothers Harriman & Co. |
USD | 25 | JPY | 3,410 | 04/28/2023 | 353 | ||||||||||||||||||
| Brown Brothers Harriman & Co. |
USD | 46 | JPY | 5,934 | 04/28/2023 | (688 | ) | |||||||||||||||||
| Brown Brothers Harriman & Co. |
EUR | 100 | USD | 109 | 05/11/2023 | 683 | ||||||||||||||||||
| Brown Brothers Harriman & Co. |
EUR | 336 | USD | 362 | 05/11/2023 | (2,951 | ) | |||||||||||||||||
| Brown Brothers Harriman & Co. |
USD | 4,279 | EUR | 3,983 | 05/11/2023 | 49,663 | ||||||||||||||||||
| Brown Brothers Harriman & Co. |
SGD | 119 | USD | 89 | 05/15/2023 | (941 | ) | |||||||||||||||||
| abfunds.com | ALLIANCEBERNSTEIN GLOBAL HIGH INCOME FUND | 79 | |
PORTFOLIO OF INVESTMENTS (continued)
| Counterparty | Contracts to Deliver (000) |
In Exchange For (000) |
Settlement Date |
Unrealized Appreciation (Depreciation) |
||||||||||||||||||||
| Brown Brothers Harriman & Co. |
USD | 152 | SGD | 204 | 05/15/2023 | $ | 1,373 | |||||||||||||||||
| Brown Brothers Harriman & Co. |
USD | 29 | SGD | 38 | 05/15/2023 | (82 | ) | |||||||||||||||||
| Brown Brothers Harriman & Co. |
CHF | 90 | USD | 97 | 05/24/2023 | (1,991 | ) | |||||||||||||||||
| Brown Brothers Harriman & Co. |
USD | 48 | GBP | 39 | 05/24/2023 | 257 | ||||||||||||||||||
| Brown Brothers Harriman & Co. |
MXN | 2,398 | USD | 127 | 05/25/2023 | (4,845 | ) | |||||||||||||||||
| Brown Brothers Harriman & Co. |
USD | 132 | MXN | 2,470 | 05/25/2023 | 4,157 | ||||||||||||||||||
| Brown Brothers Harriman & Co. |
USD | 92 | CAD | 125 | 06/09/2023 | 723 | ||||||||||||||||||
| Citibank, NA |
BRL | 513 | USD | 101 | 04/04/2023 | (238 | ) | |||||||||||||||||
| Citibank, NA |
USD | 99 | BRL | 513 | 04/04/2023 | 2,120 | ||||||||||||||||||
| Citibank, NA |
KRW | 60,454 | USD | 49 | 04/26/2023 | 2,809 | ||||||||||||||||||
| Citibank, NA |
BRL | 513 | USD | 99 | 05/03/2023 | (2,061 | ) | |||||||||||||||||
| Citibank, NA |
EUR | 1,700 | USD | 1,819 | 05/11/2023 | (28,436 | ) | |||||||||||||||||
| Citibank, NA |
USD | 2,821 | EUR | 2,616 | 05/11/2023 | 22,167 | ||||||||||||||||||
| Citibank, NA |
TWD | 270 | USD | 9 | 06/15/2023 | 3 | ||||||||||||||||||
| Citibank, NA |
USD | 7 | INR | 545 | 06/22/2023 | 10 | ||||||||||||||||||
| Goldman Sachs Bank USA |
BRL | 152 | USD | 30 | 04/04/2023 | (535 | ) | |||||||||||||||||
| Goldman Sachs Bank USA |
USD | 30 | BRL | 152 | 04/04/2023 | 500 | ||||||||||||||||||
| Goldman Sachs Bank USA |
USD | 16 | CLP | 13,128 | 05/17/2023 | 326 | ||||||||||||||||||
| HSBC Bank USA |
EUR | 1,595 | USD | 1,726 | 05/11/2023 | (7,264 | ) | |||||||||||||||||
| HSBC Bank USA |
TWD | 638 | USD | 21 | 06/15/2023 | (55 | ) | |||||||||||||||||
| HSBC Bank USA |
INR | 1,666 | USD | 20 | 06/22/2023 | (32 | ) | |||||||||||||||||
| JPMorgan Chase Bank, NA |
IDR | 13,160 | USD | 1 | 04/13/2023 | (2 | ) | |||||||||||||||||
| JPMorgan Chase Bank, NA |
KRW | 15,526 | USD | 12 | 04/26/2023 | 375 | ||||||||||||||||||
| JPMorgan Chase Bank, NA |
USD | 9,670 | EUR | 9,058 | 05/11/2023 | 173,871 | ||||||||||||||||||
| JPMorgan Chase Bank, NA |
USD | 31 | INR | 2,562 | 06/22/2023 | 19 | ||||||||||||||||||
| JPMorgan Chase Bank, NA |
USD | 1 | IDR | 13,160 | 07/12/2023 | 1 | ||||||||||||||||||
| Morgan Stanley Capital Services LLC |
BRL | 511 | USD | 99 | 04/04/2023 | (1,880 | ) | |||||||||||||||||
| Morgan Stanley Capital Services LLC |
USD | 101 | BRL | 511 | 04/04/2023 | 237 | ||||||||||||||||||
| Morgan Stanley Capital Services LLC |
USD | 1 | IDR | 13,160 | 04/13/2023 | 21 | ||||||||||||||||||
| Morgan Stanley Capital Services LLC |
KRW | 94,831 | USD | 73 | 04/26/2023 | 514 | ||||||||||||||||||
| Morgan Stanley Capital Services LLC |
KRW | 16,027 | USD | 12 | 04/26/2023 | (117 | ) | |||||||||||||||||
| Morgan Stanley Capital Services LLC |
USD | 109 | KRW | 137,022 | 04/26/2023 | (4,449 | ) | |||||||||||||||||
| Morgan Stanley Capital Services LLC |
USD | 4,122 | EUR | 3,856 | 05/11/2023 | 68,834 | ||||||||||||||||||
| Morgan Stanley Capital Services LLC |
CLP | 29,344 | USD | 36 | 05/17/2023 | (334 | ) | |||||||||||||||||
| Morgan Stanley Capital Services LLC |
COP | 13,572,390 | USD | 2,808 | 05/17/2023 | (80,174 | ) | |||||||||||||||||
| Morgan Stanley Capital Services LLC |
USD | 1 | COP | 2,987 | 05/17/2023 | 18 | ||||||||||||||||||
| Morgan Stanley Capital Services LLC |
USD | 1,165 | CAD | 1,589 | 06/09/2023 | 12,291 | ||||||||||||||||||
| Morgan Stanley Capital Services LLC |
TWD | 1,189 | USD | 39 | 06/15/2023 | 210 | ||||||||||||||||||
| Morgan Stanley Capital Services LLC |
INR | 3,812 | USD | 46 | 06/22/2023 | (182 | ) | |||||||||||||||||
| Morgan Stanley Capital Services LLC |
USD | 10 | INR | 868 | 06/22/2023 | 30 | ||||||||||||||||||
| 80 | ALLIANCEBERNSTEIN GLOBAL HIGH INCOME FUND |
abfunds.com | |
PORTFOLIO OF INVESTMENTS (continued)
| Counterparty | Contracts to Deliver (000) |
In Exchange For (000) |
Settlement Date |
Unrealized Appreciation (Depreciation) |
||||||||||||||||||||
| Royal Bank of Scotland PLC |
KRW | 12,724 | USD | 10 | 04/26/2023 | $ | (64 | ) | ||||||||||||||||
| Royal Bank of Scotland PLC |
USD | 57 | KRW | 72,835 | 04/26/2023 | (774 | ) | |||||||||||||||||
| Royal Bank of Scotland PLC |
USD | 2,115 | EUR | 1,966 | 05/11/2023 | 22,030 | ||||||||||||||||||
| Royal Bank of Scotland PLC |
TWD | 551 | USD | 18 | 06/15/2023 | (88 | ) | |||||||||||||||||
| Royal Bank of Scotland PLC |
USD | 30 | TWD | 906 | 06/15/2023 | 166 | ||||||||||||||||||
| Royal Bank of Scotland PLC |
USD | 17 | TWD | 525 | 06/15/2023 | (26 | ) | |||||||||||||||||
| Royal Bank of Scotland PLC |
INR | 1,824 | USD | 22 | 06/22/2023 | (185 | ) | |||||||||||||||||
| Standard Chartered Bank |
CLP | 20,220 | USD | 24 | 05/17/2023 | (1,036 | ) | |||||||||||||||||
| Standard Chartered Bank |
TWD | 652 | USD | 22 | 06/15/2023 | 4 | ||||||||||||||||||
| UBS AG |
KRW | 32,464 | USD | 26 | 04/26/2023 | 982 | ||||||||||||||||||
| UBS AG |
KRW | 11,414 | USD | 9 | 04/26/2023 | (76 | ) | |||||||||||||||||
| UBS AG |
USD | 56 | KRW | 72,425 | 04/26/2023 | (109 | ) | |||||||||||||||||
| UBS AG |
USD | 937 | EUR | 882 | 05/11/2023 | 21,295 | ||||||||||||||||||
| UBS AG |
USD | 20 | TWD | 600 | 06/15/2023 | 156 | ||||||||||||||||||
| UBS AG |
USD | 39 | TWD | 1,183 | 06/15/2023 | (248 | ) | |||||||||||||||||
|
|
|
|||||||||||||||||||||||
| $ | (1,159,443 | ) | ||||||||||||||||||||||
|
|
|
|||||||||||||||||||||||
CENTRALLY CLEARED CREDIT DEFAULT SWAPS (see Note C)
| Description | Fixed Rate (Pay) Receive |
Payment Frequency |
Implied Credit Spread at March 31, 2023 |
Notional Amount (000) |
Market Value |
Upfront Premiums Paid (Received) |
Unrealized Appreciation (Depreciation) |
|||||||||||||||||||||
| Sale Contracts |
| |||||||||||||||||||||||||||
| Brazilian Government International Bond, 4.250%, 01/07/2025, 06/20/2028* |
1.00 | % | Quarterly | 2.27 | % | USD | 320 | $ | (18,344 | ) | $ | (24,176 | ) | $ | 5,832 | |||||||||||||
| CDX-NAHY Series 40, 5 Year Index, 06/20/2028* |
5.00 | Quarterly | 4.63 | USD | 145,918 | 2,430,475 | 1,194,947 | 1,235,528 | ||||||||||||||||||||
| iTraxx Europe Crossover Series 39, 5 Year Index, 06/20/2028* |
5.00 | Quarterly | 4.36 | EUR | 36,820 | 1,105,151 | 192,222 | 912,929 | ||||||||||||||||||||
| South Africa Government International Bond, 5.875%, 09/16/2025, 06/20/2028* |
1.00 | Quarterly | 2.74 | USD | 2,380 | (184,256 | ) | (196,848 | ) | 12,592 | ||||||||||||||||||
|
|
|
|
|
|
|
|||||||||||||||||||||||
| $ | 3,333,026 | $ | 1,166,145 | $ | 2,166,881 | |||||||||||||||||||||||
|
|
|
|
|
|
|
|||||||||||||||||||||||
| * | Termination date |
| abfunds.com | ALLIANCEBERNSTEIN GLOBAL HIGH INCOME FUND | 81 | |
PORTFOLIO OF INVESTMENTS (continued)
CREDIT DEFAULT SWAPS (see Note C)
| Swap Counterparty & Referenced Obligation |
Fixed Rate (Pay) Receive |
Payment Frequency |
Implied Credit Spread at March 31, 2023 |
Notional |
Market Value |
Upfront Premiums Paid (Received) |
Unrealized Appreciation (Depreciation) |
|||||||||||||||||||||||||
| Sale Contracts |
| |||||||||||||||||||||||||||||||
| Citigroup Global Markets, Inc. |
||||||||||||||||||||||||||||||||
| CDX-CMBX.NA.BBB- |
3.00 | % | Monthly | 7.50 | % | USD | 260 | $ | (55,137 | ) | $ | (27,019 | ) | $ | (28,118 | ) | ||||||||||||||||
| Deutsche Bank AG |
| |||||||||||||||||||||||||||||||
| CDX-CMBX.NA.BBB- |
3.00 | Monthly | 7.50 | USD | 148 | (31,334 | ) | (15,170 | ) | (16,164 | ) | |||||||||||||||||||||
| CDX-CMBX.NA.BBB- Series
6, |
3.00 | Monthly | 7.50 | USD | 209 | (44,224 | ) | (22,601 | ) | (21,623 | ) | |||||||||||||||||||||
| Goldman Sachs International |
||||||||||||||||||||||||||||||||
| Avis Budget Car Rental LLC, 5.250%, 03/15/2025, 12/20/2023* |
5.00 | Quarterly | 0.85 | USD | 270 | 8,428 | 2,513 | 5,915 | ||||||||||||||||||||||||
| Avis Budget Car Rental LLC, 5.250%, 03/15/2025, 12/20/2023* |
5.00 | Quarterly | 0.85 | USD | 300 | 9,364 | 4,370 | 4,994 | ||||||||||||||||||||||||
| CDX-CMBX.NA.BBB- Series
6, |
3.00 | Monthly | 7.50 | USD | 76 | (16,153 | ) | (7,606 | ) | (8,547 | ) | |||||||||||||||||||||
| CDX-CMBX.NA.BBB- Series
6, |
3.00 | Monthly | 7.50 | USD | 103 | (21,869 | ) | (8,544 | ) | (13,325 | ) | |||||||||||||||||||||
| CDX-CMBX.NA.BBB- Series
6, |
3.00 | Monthly | 7.50 | USD | 206 | (43,738 | ) | (18,834 | ) | (24,904 | ) | |||||||||||||||||||||
| CDX-CMBX.NA.BBB- Series
6, |
3.00 | Monthly | 7.50 | USD | 206 | (43,738 | ) | (17,405 | ) | (26,333 | ) | |||||||||||||||||||||
| CDX-CMBX.NA.BBB- Series
6, |
3.00 | Monthly | 7.50 | USD | 213 | (45,075 | ) | (16,592 | ) | (28,483 | ) | |||||||||||||||||||||
| CDX-CMBX.NA.BBB- Series
6, |
3.00 | Monthly | 7.50 | USD | 304 | (64,367 | ) | (30,088 | ) | (34,279 | ) | |||||||||||||||||||||
| CDX-CMBX.NA.BBB- Series
6, |
3.00 | Monthly | 7.50 | USD | 412 | (87,355 | ) | (41,115 | ) | (46,240 | ) | |||||||||||||||||||||
| CDX-CMBX.NA.BBB- Series
6, |
3.00 | Monthly | 7.50 | USD | 596 | (126,427 | ) | (59,494 | ) | (66,933 | ) | |||||||||||||||||||||
| CDX-CMBX.NA.BBB- Series
6, |
3.00 | Monthly | 7.50 | USD | 1,236 | (262,188 | ) | (98,775 | ) | (163,413 | ) | |||||||||||||||||||||
| JPMorgan Securities, LLC |
| |||||||||||||||||||||||||||||||
| CDX-CMBX.NA.BBB- Series
6, |
3.00 | Monthly | 7.50 | USD | 3,666 | (777,573 | ) | (408,277 | ) | (369,296 | ) | |||||||||||||||||||||
| CDX-CMBX.NA.BBB- Series
6, |
3.00 | Monthly | 7.50 | USD | 6,874 | (1,457,949 | ) | (730,143 | ) | (727,806 | ) | |||||||||||||||||||||
| Morgan Stanley Capital Services LLC |
||||||||||||||||||||||||||||||||
| CDX-CMBX.NA.BBB- Series
6, |
3.00 | Monthly | 7.50 | USD | 681 | (144,280 | ) | (66,102 | ) | (78,178 | ) | |||||||||||||||||||||
| 82 | ALLIANCEBERNSTEIN GLOBAL HIGH INCOME FUND |
abfunds.com | |
PORTFOLIO OF INVESTMENTS (continued)
| Swap Counterparty & Referenced Obligation |
Fixed Rate (Pay) Receive |
Payment Frequency |
Implied Credit Spread at March 31, 2023 |
Notional |
Market Value |
Upfront Premiums Paid (Received) |
Unrealized Appreciation (Depreciation) |
|||||||||||||||||||||||||
| CDX-CMBX.NA.BBB- Series 6, 05/11/2063* |
3.00 | % | Monthly | 7.50 | % | USD | 729 | $ | (154,482 | ) | $ | (73,703 | ) | $ | (80,779 | ) | ||||||||||||||||
| CDX-CMBX.NA.BBB- Series 6, 05/11/2063* |
3.00 | Monthly | 7.50 | USD | 1,913 | (405,796 | ) | (19,586 | ) | (386,210 | ) | |||||||||||||||||||||
|
|
|
|
|
|
|
|||||||||||||||||||||||||||
| $ | (3,763,893 | ) | $ | (1,654,171 | ) | $ | (2,109,722 | ) | ||||||||||||||||||||||||
|
|
|
|
|
|
|
|||||||||||||||||||||||||||
| * | Termination date |
TOTAL RETURN SWAPS (see Note C)
| Counterparty & Referenced Obligation |
Rate Paid/ Received |
Payment Frequency |
Current Notional (000) |
Maturity Date |
Unrealized Appreciation (Depreciation) |
|||||||||||||||
| Receive Total Return on Reference Obligation |
| |||||||||||||||||||
| Goldman Sachs International Markit iBoxx EUR Contingent Convertible Liquid Developed Market AT1 |
EURIBOR | Maturity | EUR 8,911 | 09/20/2023 | $ | (29,258 | ) | |||||||||||||
REVERSE REPURCHASE AGREEMENTS (see Note C)
| Broker | Currency | Principal (000) |
Interest Rate |
Maturity | U.S. $ Value at March 31, 2023 |
|||||||||||||||
| Barclays Capital, Inc. |
USD | 2,295 | (2.00 | )%* | 04/04/2023 | $ | 2,290,155 | |||||||||||||
| Barclays Capital, Inc. |
USD | 610 | 1.50 | % | 04/04/2023 | 609,957 | ||||||||||||||
| Barclays Capital, Inc.† |
USD | 468 | (1.00 | )%* | — | 467,378 | ||||||||||||||
| Barclays Capital, Inc.† |
USD | 375 | (9.00 | )%* | — | 371,185 | ||||||||||||||
| HSBC Securities† |
USD | 3,374 | 4.97 | % | — | 3,401,062 | ||||||||||||||
| RBC Capital Markets† |
USD | 1,121 | 1.25 | % | — | 1,121,873 | ||||||||||||||
|
|
|
|||||||||||||||||||
| $ | 8,261,610 | |||||||||||||||||||
|
|
|
|||||||||||||||||||
| † | The reverse repurchase agreement matures on demand. Interest rate resets daily and the rate shown is the rate in effect on March 31, 2023. |
| * | Interest payment due from counterparty. |
The type of underlying collateral and the remaining maturity of open reverse repurchase agreements on statements of assets and liabilities is as follows:
| Overnight and Continuous |
Up to 30 Days | 31-90 Days | Greater than 90 Days |
Total | ||||||||||||||||
| Corporates – Non-Investment Grade |
$ | 1,493,058 | $ | 2,900,112 | $ | – 0 | – | $ | – 0 | – | $ | 4,393,170 | ||||||||
| Emerging Markets – Corporate Bonds |
467,378 | – 0 | – | – 0 | – | – 0 | – | 467,378 | ||||||||||||
| Governments – Treasuries |
3,401,062 | – 0 | – | – 0 | – | – 0 | – | 3,401,062 | ||||||||||||
|
|
|
|
|
|
|
|
|
|
|
|||||||||||
| Total |
$ | 5,361,498 | $ | 2,900,112 | $ | – 0 | – | $ | – 0 | – | $ | 8,261,610 | ||||||||
|
|
|
|
|
|
|
|
|
|
|
|||||||||||
| ** | Principal amount less than 500. |
| abfunds.com | ALLIANCEBERNSTEIN GLOBAL HIGH INCOME FUND | 83 | |
PORTFOLIO OF INVESTMENTS (continued)
| (a) | Security is exempt from registration under Rule 144A or Regulation S of the Securities Act of 1933. These securities are considered restricted, but liquid and may be resold in transactions exempt from registration. At March 31, 2023, the aggregate market value of these securities amounted to $613,617,158 or 67.3% of net assets. |
| (b) | Security in which significant unobservable inputs (Level 3) were used in determining fair value. |
| (c) | Non-income producing security. |
| (d) | Defaulted matured security. |
| (e) | Fair valued by the Adviser. |
| (f) | Pay-In-Kind Payments (PIK). The issuer may pay cash interest and/or interest in additional debt securities. Rates shown are the rates in effect at March 31, 2023. |
| (g) | Security is exempt from registration under Rule 144A or Regulation S of the Securities Act of 1933. These securities, which represent 0.27% of net assets as of March 31, 2023, are considered illiquid and restricted. Additional information regarding such securities follows: |
| 144A/Restricted & Illiquid Securities |
Acquisition Date |
Cost | Market Value |
Percentage of Net Assets |
||||||||||||
| BBFI Liquidating Trust |
|
01/18/2013 - 05/09/2017 |
|
$ | 666,094 | $ | 340,947 | 0.04 | % | |||||||
| Consumer Loan Underlying Bond Certificate Issuer Trust I
Series 2019-43, Class PT |
|
04/25/2018 - 06/01/2020 |
|
347 | 319 | 0.00 | % | |||||||||
| Consumer Loan Underlying Bond Certificate Issuer Trust I
Series 2019-24, Class PT |
06/27/2019 | 36,458 | 36,159 | 0.00 | % | |||||||||||
| Consumer Loan Underlying Bond Certificate Issuer Trust I Series
2019-36, Class PT |
09/04/2019 | 72,718 | 71,035 | 0.01 | % | |||||||||||
| Consumer Loan Underlying Bond Certificate Issuer Trust I Series
2018-7, Class PT |
10/09/2019 | 5,264 | 4,895 | 0.00 | % | |||||||||||
| Consumer Loan Underlying Bond Club Certificate Issuer Trust I |
|
03/27/2018 - 05/11/2018 |
|
2,049 | 1,949 | 0.00 | % | |||||||||
| Consumer Loan Underlying Bond Club Certificate Issuer Trust I |
06/26/2018 | 4,703 | 4,479 | 0.00 | % | |||||||||||
| Consumer Loan Underlying Bond Credit Trust |
03/07/2018 | 577 | 535 | 0.00 | % | |||||||||||
| 84 | ALLIANCEBERNSTEIN GLOBAL HIGH INCOME FUND |
abfunds.com | |
PORTFOLIO OF INVESTMENTS (continued)
| 144A/Restricted & Illiquid Securities |
Acquisition Date |
Cost | Market Value |
Percentage of Net Assets |
||||||||||||
| Digicel Group Holdings Ltd. |
|
11/28/2016 - 10/01/2021 |
|
$ | 152,928 | $ | 11,258 | 0.00 | % | |||||||
| Exide Technologies |
10/29/2020 | – 0 | – | – 0 | – | 0.00 | % | |||||||||
| Exide Technologies |
10/29/2020 | – 0 | – | – 0 | – | 0.00 | % | |||||||||
| Fideicomiso PA Concesion Ruta al Mar |
12/14/2017 | 476,718 | 191,446 | 0.02 | % | |||||||||||
| Fideicomiso PA Pacifico Tres 7.00%, 01/15/2035 |
03/04/2016 | 1,972,582 | 1,258,824 | 0.14 | % | |||||||||||
| JPMorgan Madison Avenue Securities Trust |
09/18/2015 | 399,520 | 389,664 | 0.04 | % | |||||||||||
| Magnetation LLC/Mag Finance Corp. |
|
05/05/2013 - 02/19/2015 |
|
2,295,760 | – 0 | – | 0.00 | % | ||||||||
| Odebrecht Holdco Finance Ltd. |
01/22/2021 | 655,050 | 6,653 | 0.00 | % | |||||||||||
| Terraform Global Operating LP |
02/08/2018 | 118,000 | 112,236 | 0.01 | % | |||||||||||
| Tonon Luxembourg SA |
|
05/03/2019 - 10/31/2021 |
|
1,209,003 | 62 | 0.00 | % | |||||||||
| Virgolino de Oliveira Finance SA |
|
01/23/2014 - 01/27/2014 |
|
2,401,854 | 410 | 0.00 | % | |||||||||
| Virgolino de Oliveira Finance SA |
01/29/2014 | 477,418 | 48 | 0.00 | % | |||||||||||
| Virgolino de Oliveira Finance SA |
02/26/2018 | 838,866 | 162 | 0.00 | % | |||||||||||
| Wells Fargo Credit Risk Transfer Securities Trust |
06/26/2018 | 132,923 | 126,178 | 0.01 | % | |||||||||||
| (h) | Convertible security. |
| (i) | Position, or a portion thereof, has been segregated to collateralize reverse repurchase agreements. |
| (j) | Floating Rate Security. Stated interest/floor/ceiling rate was in effect at March 31, 2023. |
| (k) | Securities are perpetual and, thus, do not have a predetermined maturity date. The date shown, if applicable, reflects the next call date. |
| (l) | Defaulted. |
| (m) | Inverse interest only security. |
| abfunds.com | ALLIANCEBERNSTEIN GLOBAL HIGH INCOME FUND | 85 | |
PORTFOLIO OF INVESTMENTS (continued)
| (n) | IO – Interest Only. |
| (o) | The stated coupon rate represents the greater of the LIBOR or an alternate base rate such as the SOFR or the LIBOR/SOFR floor rate plus a spread at March 31, 2023. |
| (p) | Position, or a portion thereof, has been segregated to collateralize margin requirements for open futures contracts. |
| (q) | Position, or a portion thereof, has been segregated to collateralize OTC derivatives outstanding. |
| (r) | Position, or a portion thereof, has been segregated to collateralize margin requirements for open centrally cleared swaps. |
| (s) | To obtain a copy of the fund’s shareholder report, please go to the Securities and Exchange Commission’s website at www.sec.gov, or call AB at (800) 227-4618. |
| (t) | The rate shown represents the 7-day yield as of period end. |
| (u) | Affiliated investments. |
| Currency Abbreviations:
AUD – Australian Dollar BRL – Brazilian Real CAD – Canadian Dollar CHF – Swiss Franc CLP – Chilean Peso CNH – Chinese Yuan Renminbi (Offshore) COP – Colombian Peso EUR – Euro GBP – Great British Pound IDR – Indonesian Rupiah INR – Indian Rupee |
JPY – Japanese Yen KRW – South Korean Won MXN – Mexican Peso NOK – Norwegian Krone NZD – New Zealand Dollar PLN – Polish Zloty SEK – Swedish Krona SGD – Singapore Dollar TWD – New Taiwan Dollar USD – United States Dollar ZAR – South African Rand |
Glossary:
ABS – Asset-Backed Securities
CBT – Chicago Board of Trade
CDX-CMBX.NA – North American Commercial Mortgage-Backed Index
CDX-NAHY – North American High Yield Credit Default Swap Index
CLO – Collateralized Loan Obligations
CMBS – Commercial Mortgage-Backed Securities
EURIBOR – Euro Interbank Offered Rate
LIBOR – London Interbank Offered Rate
REIT – Real Estate Investment Trust
REMICs – Real Estate Mortgage Investment Conduits
SOFR – Secured Overnight Financing Rate
See notes to financial statements.
| 86 | ALLIANCEBERNSTEIN GLOBAL HIGH INCOME FUND |
abfunds.com | |
STATEMENT OF ASSETS & LIABILITIES
March 31, 2023
| Assets | ||||
| Investments in securities, at value |
$ | 889,365,029 | ||
| Affiliated issuers (cost $10,074,438) |
10,074,438 | |||
| Cash collateral due from broker |
11,254,416 | |||
| Foreign currencies, at value (cost $442,351) |
109,390 | |||
| Unaffiliated interest receivable |
14,880,760 | |||
| Receivable for investment securities sold |
2,619,809 | |||
| Receivable for variation margin on centrally cleared swaps |
1,022,966 | |||
| Unrealized appreciation on forward currency exchange contracts |
472,207 | |||
| Receivable for variation margin on futures |
294,562 | |||
| Affiliated dividends receivable |
30,685 | |||
| Market value of credit default swaps (net premiums paid $6,883) |
17,792 | |||
| Receivable for terminated credit default swaps |
5,780 | |||
|
|
|
|||
| Total assets |
930,147,834 | |||
|
|
|
|||
| Liabilities | ||||
| Due to Custodian |
118,610 | |||
| Payable for reverse repurchase agreements |
8,261,610 | |||
| Market value of credit default swaps (net premiums received $1,661,054) |
3,781,685 | |||
| Payable for investment securities purchased and foreign currency transactions |
3,488,584 | |||
| Unrealized depreciation on forward currency exchange contracts |
1,631,650 | |||
| Advisory fee payable |
781,787 | |||
| Payable for capital gains taxes |
433,291 | |||
| Unrealized depreciation on total return swaps |
29,258 | |||
| Administrative fee payable |
26,032 | |||
| Payable for newly entered credit default swaps |
11,785 | |||
| Accrued expenses |
634,608 | |||
|
|
|
|||
| Total liabilities |
19,198,900 | |||
|
|
|
|||
| Net Assets |
$ | 910,948,934 | ||
|
|
|
|||
| Composition of Net Assets | ||||
| Capital stock, at par |
$ | 862,297 | ||
| Additional paid-in capital |
1,154,458,535 | |||
| Accumulated loss |
(244,371,898 | ) | ||
|
|
|
|||
| $ | 910,948,934 | |||
|
|
|
|||
| Net Asset Value Per Share—100 million shares of capital stock authorized, $0.01 par value (based on 86,229,677 shares outstanding) |
$ | 10.56 | ||
|
|
|
See notes to financial statements.
| abfunds.com | ALLIANCEBERNSTEIN GLOBAL HIGH INCOME FUND | 87 | |
STATEMENT OF OPERATIONS
Year Ended March 31, 2023
| Investment Income | ||||||||
| Interest |
$ | 67,880,521 | ||||||
| Dividends |
||||||||
| Unaffiliated issuers |
1,048,956 | |||||||
| Affiliated issuers |
222,659 | $ | 69,152,136 | |||||
|
|
|
|||||||
| Expenses | ||||||||
| Advisory fee (see Note B) |
8,369,868 | |||||||
| Transfer agency |
34,545 | |||||||
| Custody and accounting |
369,463 | |||||||
| Audit and tax |
192,377 | |||||||
| Printing |
184,380 | |||||||
| Administrative |
102,079 | |||||||
| Registration fees |
83,720 | |||||||
| Legal |
53,956 | |||||||
| Directors’ fees |
29,586 | |||||||
| Miscellaneous |
71,723 | |||||||
|
|
|
|||||||
| Total expenses before interest expense |
9,491,697 | |||||||
| Interest expense |
234,381 | |||||||
|
|
|
|||||||
| Total expenses |
9,726,078 | |||||||
| Less: expenses waived and reimbursed by the Adviser (see Note B) |
(8,726 | ) | ||||||
|
|
|
|||||||
| Net expenses |
9,717,352 | |||||||
|
|
|
|||||||
| Net investment income |
59,434,784 | |||||||
|
|
|
|||||||
| Realized and Unrealized Gain (Loss) on Investment and Foreign Currency Transactions | ||||||||
| Net realized gain (loss) on: |
||||||||
| Investment transactions(a) |
(44,080,764 | ) | ||||||
| Forward currency exchange contracts |
3,916,836 | |||||||
| Futures |
(13,011,001 | ) | ||||||
| Written Options |
217 | |||||||
| Swaps |
(6,486,778 | ) | ||||||
| Written Swaptions |
605,979 | |||||||
| Foreign currency transactions |
(590,675 | ) | ||||||
| Net change in unrealized appreciation (depreciation) on: |
||||||||
| Investments(b) |
(62,721,743 | ) | ||||||
| Forward currency exchange contracts |
(2,755,607 | ) | ||||||
| Futures |
4,010,851 | |||||||
| Written Options |
(7 | ) | ||||||
| Swaps |
12,192,037 | |||||||
| Written Swaptions |
3,666 | |||||||
| Foreign currency denominated assets and liabilities |
(53,565 | ) | ||||||
|
|
|
|||||||
| Net loss on investment and foreign currency transactions |
(108,970,554 | ) | ||||||
|
|
|
|||||||
| Net Decrease in Net Assets from Operations |
$ | (49,535,770 | ) | |||||
|
|
|
| (a) | Net of foreign realized capital gains taxes of $3,578. |
| (b) | Net of decrease in accrued foreign capital gains taxes on unrealized gains of $23,959. |
See notes to financial statements.
| 88 | ALLIANCEBERNSTEIN GLOBAL HIGH INCOME FUND |
abfunds.com | |
STATEMENT OF CHANGES IN NET ASSETS
| Year Ended March 31, 2023 |
Year Ended March 31, 2022 |
|||||||
| Increase (Decrease) in Net Assets from Operations | ||||||||
| Net investment income |
$ | 59,434,784 | $ | 52,550,075 | ||||
| Net realized gain (loss) on investment and foreign currency transactions |
(59,646,186 | ) | 26,881,172 | |||||
| Net change in unrealized appreciation (depreciation) on investments and foreign currency denominated assets and liabilities |
(49,324,368 | ) | (77,241,510 | ) | ||||
|
|
|
|
|
|||||
| Net increase (decrease) in net assets from operations |
(49,535,770 | ) | 2,189,737 | |||||
| Distributions to Shareholders |
(76,201,166 | ) | (67,035,667 | ) | ||||
| Return of Capital |
– 0 | – | (740,859 | ) | ||||
|
|
|
|
|
|||||
| Total decrease |
(125,736,936 | ) | (65,586,789 | ) | ||||
| Net Assets | ||||||||
| Beginning of period |
1,036,685,870 | 1,102,272,659 | ||||||
|
|
|
|
|
|||||
| End of period |
$ | 910,948,934 | $ | 1,036,685,870 | ||||
|
|
|
|
|
|||||
See notes to financial statements.
| abfunds.com | ALLIANCEBERNSTEIN GLOBAL HIGH INCOME FUND | 89 | |
NOTES TO FINANCIAL STATEMENTS
March 31, 2023
NOTE A
Significant Accounting Policies
AllianceBernstein Global High Income Fund, Inc. (the “Fund”) is incorporated under the laws of the State of Maryland and is registered under the Investment Company Act of 1940, as amended, as a diversified, closed-end management investment company. The financial statements have been prepared in conformity with U.S. generally accepted accounting principles (“U.S. GAAP”), which require management to make certain estimates and assumptions that affect the reported amounts of assets and liabilities in the financial statements and amounts of income and expenses during the reporting period. Actual results could differ from those estimates. The Fund is an investment company under U.S. GAAP and follows the accounting and reporting guidance applicable to investment companies. The following is a summary of significant accounting policies followed by the Fund.
1. Security Valuation
Portfolio securities are valued at market value determined on the basis of market quotations or, if market quotations are not readily available or are unreliable, at “fair value” as determined in accordance with procedures approved by and under the oversight of the Fund’s Board of Directors (the “Board”). Pursuant to these procedures, AllianceBernstein L.P. (the “Adviser”) serves as the Fund’s valuation designee pursuant to Rule 2a-5 of the 1940 Act. In this capacity, the Adviser is responsible, among other things, for making all fair value determinations relating to the Fund’s portfolio investments, subject to the Board’s oversight.
In general, the market values of securities which are readily available and deemed reliable are determined as follows: securities listed on a national securities exchange (other than securities listed on the NASDAQ Stock Market, Inc. (“NASDAQ”)) or on a foreign securities exchange are valued at the last sale price at the close of the exchange or foreign securities exchange. If there has been no sale on such day, the securities are valued at the last traded price from the previous day. Securities listed on more than one exchange are valued by reference to the principal exchange on which the securities are traded; securities listed only on NASDAQ are valued in accordance with the NASDAQ Official Closing Price; listed or over the counter (“OTC”) market put or call options are valued at the mid level between the current bid and ask prices. If either a current bid or current ask price is unavailable, the Adviser will have discretion to determine the best valuation (e.g., last trade price in the case of listed options); open futures are valued using the closing settlement price or, in the absence of such a price, the most recent quoted bid price. If there are no quotations available for the day of valuation, the last available closing settlement price is used; U.S. Government securities and any other debt instruments
| 90 | ALLIANCEBERNSTEIN GLOBAL HIGH INCOME FUND |
abfunds.com | |
NOTES TO FINANCIAL STATEMENTS (continued)
having 60 days or less remaining until maturity are generally valued at market by an independent pricing vendor, if a market price is available. If a market price is not available, the securities are valued at amortized cost. This methodology is commonly used for short term securities that have an original maturity of 60 days or less, as well as short term securities that had an original term to maturity that exceeded 60 days. In instances when amortized cost is utilized, the Valuation Committee (the “Committee”) must reasonably conclude that the utilization of amortized cost is approximately the same as the fair value of the security. Factors the Committee will consider include, but are not limited to, an impairment of the creditworthiness of the issuer or material changes in interest rates. Fixed-income securities, including mortgage-backed and asset-backed securities, may be valued on the basis of prices provided by a pricing service or at a price obtained from one or more of the major broker-dealers. In cases where broker-dealer quotes are obtained, the Adviser may establish procedures whereby changes in market yields or spreads are used to adjust, on a daily basis, a recently obtained quoted price on a security. Swaps and other derivatives are valued daily, primarily using independent pricing services, independent pricing models using market inputs, as well as third party broker-dealers or counterparties. Open-end mutual funds are valued at the closing net asset value per share, while exchange traded funds are valued at the closing market price per share.
Securities for which market quotations are not readily available (including restricted securities) or are deemed unreliable are valued at fair value as deemed appropriate by the Adviser. Factors considered in making this determination may include, but are not limited to, information obtained by contacting the issuer, analysts, analysis of the issuer’s financial statements or other available documents. In addition, the Fund may use fair value pricing for securities primarily traded in non-U.S. markets because most foreign markets close well before the Fund values its securities at 4:00 p.m., Eastern Time. The earlier close of these foreign markets gives rise to the possibility that significant events, including broad market moves, may have occurred in the interim and may materially affect the value of those securities. To account for this, the Fund generally values many of its foreign equity securities using fair value prices based on third party vendor modeling tools to the extent available.
2. Fair Value Measurements
In accordance with U.S. GAAP regarding fair value measurements, fair value is defined as the price that the Fund would receive to sell an asset or pay to transfer a liability in an orderly transaction between market participants at the measurement date. U.S. GAAP establishes a framework for measuring fair value, and a three-level hierarchy for fair value measurements based upon the transparency of inputs to the valuation of an asset or
| abfunds.com | ALLIANCEBERNSTEIN GLOBAL HIGH INCOME FUND | 91 | |
NOTES TO FINANCIAL STATEMENTS (continued)
liability (including those valued based on their market values as described in Note A.1 above). Inputs may be observable or unobservable and refer broadly to the assumptions that market participants would use in pricing the asset or liability. Observable inputs reflect the assumptions market participants would use in pricing the asset or liability based on market data obtained from sources independent of the Fund. Unobservable inputs reflect the Fund’s own assumptions about the assumptions that market participants would use in pricing the asset or liability based on the best information available in the circumstances. Each investment is assigned a level based upon the observability of the inputs which are significant to the overall valuation. The three-tier hierarchy of inputs is summarized below.
| • | Level 1—quoted prices in active markets for identical investments |
| • | Level 2—other significant observable inputs (including quoted prices for similar investments, interest rates, prepayment speeds, credit risk, etc.) |
| • | Level 3—significant unobservable inputs (including the Fund’s own assumptions in determining the fair value of investments) |
The fair value of debt instruments, such as bonds, and over-the-counter derivatives is generally based on market price quotations, recently executed market transactions (where observable) or industry recognized modeling techniques and are generally classified as Level 2. Pricing vendor inputs to Level 2 valuations may include quoted prices for similar investments in active markets, interest rate curves, coupon rates, currency rates, yield curves, option adjusted spreads, default rates, credit spreads and other unique security features in order to estimate the relevant cash flows which are then discounted to calculate fair values. If these inputs are unobservable and significant to the fair value, these investments will be classified as Level 3.
Where readily available market prices or relevant bid prices are not available for certain equity investments, such investments may be valued based on similar publicly traded investments, movements in relevant indices since last available prices or based upon underlying company fundamentals and comparable company data (such as multiples to earnings or other multiples to equity). Where an investment is valued using an observable input, such as another publicly traded security, the investment will be classified as Level 2. If management determines that an adjustment is appropriate based on restrictions on resale, illiquidity or uncertainty, and such adjustment is a significant component of the valuation, the investment will be classified as Level 3. An investment will also be classified as Level 3 where management uses company fundamentals and other significant inputs to determine the valuation.
| 92 | ALLIANCEBERNSTEIN GLOBAL HIGH INCOME FUND |
abfunds.com | |
NOTES TO FINANCIAL STATEMENTS (continued)
Options are valued using market-based inputs to models, broker or dealer quotations, or alternative pricing sources with reasonable levels of price transparency, where such inputs and models are available. Alternatively, the values may be obtained through unobservable management determined inputs and/or management’s proprietary models. Where models are used, the selection of a particular model to value an option depends upon the contractual terms of, and specific risks inherent in, the option as well as the availability of pricing information in the market. Valuation models require a variety of inputs, including contractual terms, market prices, measures of volatility and correlations of such inputs. Exchange traded options generally will be classified as Level 2. For options that do not trade on an exchange but trade in liquid markets, inputs can generally be verified and model selection does not involve significant management judgment. Options are classified within Level 2 on the fair value hierarchy when all of the significant inputs can be corroborated to market evidence. Otherwise such instruments are classified as Level 3.
Valuations of mortgage-backed or other asset-backed securities, by pricing vendors, are based on both proprietary and industry recognized models and discounted cash flow techniques. Significant inputs to the valuation of these instruments are value of the collateral, the rates and timing of delinquencies, the rates and timing of prepayments, and default and loss expectations, which are driven in part by housing prices for residential mortgages. Significant inputs are determined based on relative value analyses, which incorporate comparisons to instruments with similar collateral and risk profiles, including relevant indices. Mortgage and asset-backed securities for which management has collected current observable data through pricing services are generally categorized within Level 2. Those investments for which current observable data has not been provided are classified as Level 3.
Bank loan prices are provided by third party pricing services and consist of a composite of the quotes received by the vendor into a consensus price. Certain bank loans are classified as Level 3, as a significant input used in the fair value measurement of these instruments is the market quotes that are received by the vendor and these inputs are not observable.
Other fixed income investments, including non-U.S. government and corporate debt, are generally valued using quoted market prices, if available, which are typically impacted by current interest rates, maturity dates and any perceived credit risk of the issuer. Additionally, in the absence of quoted market prices, these inputs are used by pricing vendors to derive a valuation based upon industry or proprietary models which incorporate issuer specific data with relevant yield/spread comparisons with more widely quoted bonds with similar key characteristics. Those investments
| abfunds.com | ALLIANCEBERNSTEIN GLOBAL HIGH INCOME FUND | 93 | |
NOTES TO FINANCIAL STATEMENTS (continued)
for which there are observable inputs are classified as Level 2. Where the inputs are not observable, the investments are classified as Level 3.
The following table summarizes the valuation of the Fund’s investments by the above fair value hierarchy levels as of March 31, 2023:
| Investments in |
Level 1 | Level 2 | Level 3 | Total | ||||||||||||
| Assets: |
||||||||||||||||
| Corporates – Non-Investment Grade |
$ | – 0 | – | $ | 503,811,666 | $ | 160,109 | # | $ | 503,971,775 | ||||||
| Corporates – Investment Grade |
– 0 | – | 132,459,885 | – 0 | – | 132,459,885 | ||||||||||
| Emerging Markets – Corporate Bonds |
– 0 | – | 46,528,499 | 341,567 | # | 46,870,066 | ||||||||||
| Collateralized Loan Obligations |
– 0 | – | 42,696,702 | – 0 | – | 42,696,702 | ||||||||||
| Collateralized Mortgage Obligations |
– 0 | – | 41,743,289 | – 0 | – | 41,743,289 | ||||||||||
| Bank Loans |
– 0 | – | 37,091,888 | 2,367,723 | 39,459,611 | |||||||||||
| Governments – Treasuries |
– 0 | – | 23,646,025 | – 0 | – | 23,646,025 | ||||||||||
| Emerging Markets – Sovereigns |
– 0 | – | 21,821,346 | – 0 | – | 21,821,346 | ||||||||||
| Quasi-Sovereigns |
– 0 | – | 8,607,490 | – 0 | – | 8,607,490 | ||||||||||
| Common Stocks |
1,775,259 | 96,003 | 4,610,703 | # | 6,481,965 | |||||||||||
| Commercial Mortgage-Backed Securities |
– 0 | – | 5,616,250 | – 0 | – | 5,616,250 | ||||||||||
| Local Governments – US Municipal Bonds |
– 0 | – | 4,245,329 | – 0 | – | 4,245,329 | ||||||||||
| Asset-Backed Securities |
– 0 | – | 1,737,381 | – 0 | – | 1,737,381 | ||||||||||
| Preferred Stocks |
953,594 | – 0 | – | 766,800 | 1,720,394 | |||||||||||
| Inflation-Linked Securities |
– 0 | – | 1,696,060 | – 0 | – | 1,696,060 | ||||||||||
| Governments – Sovereign Bonds |
– 0 | – | 653,844 | 0 | # | 653,844 | ||||||||||
| Rights |
– 0 | – | – 0 | – | 12,597 | # | 12,597 | |||||||||
| Short-Term Investments: |
||||||||||||||||
| Investment Companies |
10,074,438 | – 0 | – | – 0 | – | 10,074,438 | ||||||||||
| U.S. Treasury Bills |
– 0 | – | 3,304,173 | – 0 | – | 3,304,173 | ||||||||||
| Time Deposits |
– 0 | – | 2,620,847 | – 0 | – | 2,620,847 | ||||||||||
|
|
|
|
|
|
|
|
|
|||||||||
| Total Investments in Securities |
12,803,291 | 878,376,677 | 8,259,499 | 899,439,467 | ||||||||||||
| Other Financial Instruments*: |
||||||||||||||||
| Assets |
||||||||||||||||
| Futures |
2,447,218 | – 0 | – | – 0 | – | 2,447,218 | † | |||||||||
| Forward Currency Exchange Contracts |
– 0 | – | 472,207 | – 0 | – | 472,207 | ||||||||||
| Centrally Cleared Credit Default Swaps |
– 0 | – | 3,535,626 | – 0 | – | 3,535,626 | † | |||||||||
| Credit Default Swaps |
– 0 | – | 17,792 | – 0 | – | 17,792 | ||||||||||
| 94 | ALLIANCEBERNSTEIN GLOBAL HIGH INCOME FUND |
abfunds.com | |
NOTES TO FINANCIAL STATEMENTS (continued)
| Investments in |
Level 1 | Level 2 | Level 3 | Total | ||||||||||||
| Liabilities |
||||||||||||||||
| Forward Currency Exchange Contracts |
$ | – 0 | – | $ | (1,631,650 | ) | $ | – 0 | – | $ | (1,631,650 | ) | ||||
| Centrally Cleared Credit Default Swaps |
– 0 | – | (202,600 | ) | – 0 | – | (202,600 | )† | ||||||||
| Credit Default Swaps |
– 0 | – | (3,781,685 | ) | – 0 | – | (3,781,685 | ) | ||||||||
| Total Return Swaps |
– 0 | – | (29,258 | ) | – 0 | – | (29,258 | ) | ||||||||
| Reverse Repurchase Agreements |
(8,261,610 | ) | – 0 | – | – 0 | – | (8,261,610 | ) | ||||||||
|
|
|
|
|
|
|
|
|
|||||||||
| Total |
$ | 6,988,899 | $ | 876,757,109 | $ | 8,259,499 | $ | 892,005,507 | ||||||||
|
|
|
|
|
|
|
|
|
|||||||||
| # | The Fund held securities with zero market value at period end. |
| * | Other financial instruments are derivative instruments, such as futures, forwards and swaps, which are valued at the unrealized appreciation (depreciation) on the instrument. Other financial instruments may also include swaps with upfront premiums, written options and written swaptions which are valued at market value. |
| † | Only variation margin receivable (payable) at period end is reported within the statement of assets and liabilities. This amount reflects cumulative unrealized appreciation (depreciation) on futures and centrally cleared swaps as reported in the portfolio of investments. Where applicable, centrally cleared swaps with upfront premiums are presented here at market value. |
3. Currency Translation
Assets and liabilities denominated in foreign currencies and commitments under forward currency exchange contracts are translated into U.S. dollars at the mean of the quoted bid and ask prices of such currencies against the U.S. dollar. Purchases and sales of portfolio securities are translated into U.S. dollars at the rates of exchange prevailing when such securities were acquired or sold. Income and expenses are translated into U.S. dollars at the rates of exchange prevailing when accrued.
Net realized gain or loss on foreign currency transactions represents foreign exchange gains and losses from sales and maturities of foreign fixed income investments, holding of foreign currencies, currency gains or losses realized between the trade and settlement dates on foreign investment transactions, and the difference between the amounts of dividends, interest and foreign withholding taxes recorded on the Fund’s books and the U.S. dollar equivalent amounts actually received or paid. Net unrealized currency gains and losses from valuing foreign currency denominated assets and liabilities at period end exchange rates are reflected as a component of net unrealized appreciation or depreciation of foreign currency denominated assets and liabilities.
4. Taxes
It is the Fund’s policy to meet the requirements of the Internal Revenue Code applicable to regulated investment companies and to distribute all of its investment company taxable income and net realized gains, if any, to shareholders. Therefore, no provisions for federal income or excise taxes
| abfunds.com | ALLIANCEBERNSTEIN GLOBAL HIGH INCOME FUND | 95 | |
NOTES TO FINANCIAL STATEMENTS (continued)
are required. The Fund may be subject to taxes imposed by countries in which it invests. Such taxes are generally based on income and/or capital gains earned or repatriated. Taxes are accrued and applied to net investment income, net realized gains and net unrealized appreciation/depreciation as such income and/or gains are earned.
In accordance with U.S. GAAP requirements regarding accounting for uncertainties in income taxes, management has analyzed the Fund’s tax positions taken or expected to be taken on federal and state income tax returns for all open tax years (the current and the prior three tax years) and has concluded that no provision for income tax is required in the Fund’s financial statements.
5. Investment Income and Investment Transactions
Dividend income is recorded on the ex-dividend date or as soon as the Fund is informed of the dividend. Interest income is accrued daily. Investment transactions are accounted for on the date the securities are purchased or sold. Investment gains or losses are determined on the identified cost basis. Non-cash dividends, if any, are recorded on the ex-dividend date at the fair value of the securities received. The Fund amortizes premiums and accretes discounts as adjustments to interest income. The Fund accounts for distributions received from REIT investments or from regulated investment companies as dividend income, realized gain, or return of capital based on information provided by the REIT or the investment company.
6. Dividends and Distributions
Dividends and distributions to shareholders, if any, are recorded on the ex-dividend date. Income dividends and capital gains distributions are determined in accordance with federal tax regulations and may differ from those determined in accordance with U.S. GAAP. To the extent these differences are permanent, such amounts are reclassified within the capital accounts based on their federal tax basis treatment; temporary differences do not require such reclassification.
NOTE B
Advisory Fee and Other Transactions with Affiliates
Under the terms of the investment advisory agreement, the Fund pays the Adviser an advisory fee at an annual rate of .90% of the Fund’s average weekly net assets. Such fee is accrued daily and paid monthly.
Pursuant to the administration agreement, the Fund may reimburse the Adviser for certain legal and accounting services provided to the Fund by the Adviser, provided, however, that the reimbursement may not exceed .15% annualized of average weekly net assets. For the year ended March 31, 2023, the reimbursement for such services amounted to $102,079.
| 96 | ALLIANCEBERNSTEIN GLOBAL HIGH INCOME FUND |
abfunds.com | |
NOTES TO FINANCIAL STATEMENTS (continued)
Under the terms of a Shareholder Inquiry Agency Agreement with AllianceBernstein Investor Services, Inc. (“ABIS”), a wholly owned subsidiary of the Adviser, the Fund reimburses ABIS for costs relating to servicing phone inquiries on behalf of the Fund. During the year ended March 31, 2023, there was no such reimbursement paid to ABIS.
The Fund may invest in AB Government Money Market Portfolio (the “Government Money Market Portfolio”) which has a contractual annual advisory fee rate of .20% of the portfolio’s average daily net assets and bears its own expenses. The Adviser has contractually agreed to waive .10% of the advisory fee of Government Money Market Portfolio (resulting in a net advisory fee of .10%) until August 31, 2023. In connection with the investment by the Fund in Government Money Market Portfolio, the Adviser has contractually agreed to waive its advisory fee from the Fund in an amount equal to the Fund’s pro rata share of the effective advisory fee of Government Money Market Portfolio, as borne indirectly by the Fund as an acquired fund fee and expense. For the year ended March 31, 2023, such waiver amounted to $8,726.
A summary of the Fund’s transactions in AB mutual funds for the year ended March 31, 2023 is as follows:
| Fund |
Market Value 3/31/22 (000) |
Purchases at Cost (000) |
Sales Proceeds (000) |
Market Value 3/31/23 (000) |
Dividend Income (000) |
|||||||||||||||
| Government Money Market Portfolio |
$ | 7,990 | $ | 303,321 | $ | 301,237 | $ | 10,074 | $ | 223 | ||||||||||
NOTE C
Investment Transactions
Purchases and sales of investment securities (excluding short-term investments) for the year ended March 31, 2023, were as follows:
| Purchases | Sales | |||||||
| Investment securities (excluding U.S. government securities) |
$ | 348,139,548 | $ | 376,226,564 | ||||
| U.S. government securities |
24,129,264 | 30,448,576 | ||||||
The cost of investments for federal income tax purposes, gross unrealized appreciation and unrealized depreciation are as follows:
| Cost |
$ | 1,025,086,703 | ||
|
|
|
|||
| Gross unrealized appreciation |
$ | 19,299,836 | ||
| Gross unrealized depreciation |
(142,297,711 | ) | ||
|
|
|
|||
| Net unrealized depreciation |
$ | (122,997,875 | ) | |
|
|
|
| abfunds.com | ALLIANCEBERNSTEIN GLOBAL HIGH INCOME FUND | 97 | |
NOTES TO FINANCIAL STATEMENTS (continued)
1. Derivative Financial Instruments
The Fund may use derivatives in an effort to earn income and enhance returns, to replace more traditional direct investments, to obtain exposure to otherwise inaccessible markets (collectively, “investment purposes”), or to hedge or adjust the risk profile of its portfolio. The principal types of derivatives utilized by the Fund, as well as the methods in which they may be used are:
| • | Forward Currency Exchange Contracts |
The Fund may enter into forward currency exchange contracts in order to hedge its exposure to changes in foreign currency exchange rates on its foreign portfolio holdings, to hedge certain firm purchase and sale commitments denominated in foreign currencies and for non-hedging purposes as a means of making direct investments in foreign currencies, as described below under “Currency Transactions”.
A forward currency exchange contract is a commitment to purchase or sell a foreign currency at a future date at a negotiated forward rate. The gain or loss arising from the difference between the original contract and the closing of such contract would be included in net realized gain or loss on forward currency exchange contracts. Fluctuations in the value of open forward currency exchange contracts are recorded for financial reporting purposes as unrealized appreciation and/or depreciation by the Fund. Risks may arise from the potential inability of a counterparty to meet the terms of a contract and from unanticipated movements in the value of a foreign currency relative to the U.S. dollar.
During the year ended March 31, 2023, the Fund held forward currency exchange contracts for hedging purposes.
| • | Futures |
The Fund may buy or sell futures for investment purposes or for the purpose of hedging its portfolio against adverse effects of potential movements in the market. The Fund bears the market risk that arises from changes in the value of these instruments and the imperfect correlation between movements in the price of the futures and movements in the price of the assets, reference rates or indices which they are designed to track. Among other things, the Fund may purchase or sell futures for foreign currencies or options thereon for non-hedging purposes as a means of making direct investment in foreign currencies, as described below under “Currency Transactions”.
At the time the Fund enters into futures, the Fund deposits and maintains as collateral an initial margin with the broker, as required by the exchange on which the transaction is effected. Such amount is shown as cash collateral due from broker on the statement of assets
| 98 | ALLIANCEBERNSTEIN GLOBAL HIGH INCOME FUND |
abfunds.com | |
NOTES TO FINANCIAL STATEMENTS (continued)
and liabilities. Pursuant to the contract, the Fund agrees to receive from or pay to the broker an amount of cash equal to the daily fluctuation in the value of the contract. Such receipts or payments are known as variation margin and are recorded by the Fund as unrealized gains or losses. Risks may arise from the potential inability of a counterparty to meet the terms of the contract. The credit/ counterparty risk for exchange-traded futures is generally less than privately negotiated futures, since the clearinghouse, which is the issuer or counterparty to each exchange-traded future, has robust risk mitigation standards, including the requirement to provide initial and variation margin. When the contract is closed, the Fund records a realized gain or loss equal to the difference between the value of the contract at the time it was opened and the time it was closed.
Use of long futures subjects the Fund to risk of loss in excess of the amounts shown on the statement of assets and liabilities, up to the notional value of the futures. Use of short futures subjects the Fund to unlimited risk of loss. Under some circumstances, futures exchanges may establish daily limits on the amount that the price of futures can vary from the previous day’s settlement price, which could effectively prevent liquidation of unfavorable positions.
During the year ended March 31, 2023, the Fund held futures for hedging and non-hedging purposes.
| • | Option Transactions |
For hedging and investment purposes, the Fund may purchase and write (sell) put and call options on U.S. and foreign securities, including government securities, and foreign currencies that are traded on U.S. and foreign securities exchanges and over-the-counter markets. Among other things, the Fund may use options transactions for non-hedging purposes as a means of making direct investments in foreign currencies, as described below under “Currency Transactions” and may use options strategies involving the purchase and/or writing of various combinations of call and/or put options, for hedging and investment purposes.
The risk associated with purchasing an option is that the Fund pays a premium whether or not the option is exercised. Additionally, the Fund bears the risk of loss of the premium and change in market value should the counterparty not perform under the contract. If a put or call purchased option by the Fund were permitted to expire without being sold or exercised, its premium would represent a loss to the Fund. Put and call purchased options are accounted for in the same manner as portfolio securities. The cost of securities acquired through the
| abfunds.com | ALLIANCEBERNSTEIN GLOBAL HIGH INCOME FUND | 99 | |
NOTES TO FINANCIAL STATEMENTS (continued)
exercise of call options is increased by premiums paid. The proceeds from securities sold through the exercise of put options are decreased by the premiums paid.
When the Fund writes an option, the premium received by the Fund is recorded as a liability and is subsequently adjusted to the current market value of the written option. The Fund’s maximum payment for written put options equates to the number of shares multiplied by the strike price. In certain circumstances maximum payout amounts may be partially offset by recovery values of the respective referenced assets and upfront premium received upon entering into the contract. Premiums received from written options which expire unexercised are recorded by the Fund on the expiration date as realized gains from written options. The difference between the premium received and the amount paid on effecting a closing purchase transaction, including brokerage commissions, is also treated as a realized gain, or if the premium received is less than the amount paid for the closing purchase transaction, as a realized loss. If a call option is exercised, the premium received is added to the proceeds from the sale of the underlying security or currency in determining whether the Fund has realized a gain or loss. If a put option is exercised, the premium received reduces the cost basis of the security or currency purchased by the Fund. In writing an option, the Fund bears the market risk of an unfavorable change in the price of the security or currency underlying the written option. Exercise of a written option by the Fund could result in the Fund selling or buying a security or currency at a price different from the current market value.
The Fund may also invest in options on swap agreements, also called “swaptions”. A swaption is an option that gives the buyer the right, but not the obligation, to enter into a swap on a future date in exchange for paying a market-based “premium”. A receiver swaption gives the owner the right to receive the total return of a specified asset, reference rate, or index. A payer swaption gives the owner the right to pay the total return of a specified asset, reference rate, or index. Swaptions also include options that allow an existing swap to be terminated or extended by one of the counterparties. The Fund’s maximum payment for written put swaptions equates to the notional amount of the underlying swap. In certain circumstances maximum payout amounts may be partially offset by recovery values of the respective referenced assets and upfront premium received upon entering into the contract.
During the year ended March 31, 2023, the Fund held written options for non-hedging purposes.
| 100 | ALLIANCEBERNSTEIN GLOBAL HIGH INCOME FUND |
abfunds.com | |
NOTES TO FINANCIAL STATEMENTS (continued)
During the year ended March 31, 2023, the Fund held written swaptions for non-hedging purposes.
| • | Swaps |
The Fund may enter into swaps to hedge its exposure to interest rates, credit risk or currencies. The Fund may also enter into swaps for non-hedging purposes as a means of gaining market exposures including by making direct investments in foreign currencies, as described below under “Currency Transactions” or in order to take a “long” or “short” position with respect to an underlying referenced asset described below under “Total Return Swaps”. A swap is an agreement that obligates two parties to exchange a series of cash flows at specified intervals based upon or calculated by reference to changes in specified prices or rates for a specified amount of an underlying asset. The payment flows are usually netted against each other, with the difference being paid by one party to the other. In addition, collateral may be pledged or received by the Fund in accordance with the terms of the respective swaps to provide value and recourse to the Fund or its counterparties in the event of default, bankruptcy or insolvency by one of the parties to the swap.
Risks may arise as a result of the failure of the counterparty to the swap to comply with the terms of the swap. The loss incurred by the failure of a counterparty is generally limited to the net interim payment to be received by the Fund, and/or the termination value at the end of the contract. Therefore, the Fund considers the creditworthiness of each counterparty to a swap in evaluating potential counterparty risk. This risk is mitigated by having a netting arrangement between the Fund and the counterparty and by the posting of collateral by the counterparty to the Fund to cover the Fund’s exposure to the counterparty. Additionally, risks may arise from unanticipated movements in interest rates or in the value of the underlying securities. The Fund accrues for the interim payments on swaps on a daily basis, with the net amount recorded within unrealized appreciation/depreciation of swaps on the statement of assets and liabilities, where applicable. Once the interim payments are settled in cash, the net amount is recorded as realized gain/(loss) on swaps on the statement of operations, in addition to any realized gain/(loss) recorded upon the termination of swaps. Upfront premiums paid or received for swaps are recognized as cost or proceeds on the statement of assets and liabilities and are amortized on a straight line basis over the life of the contract. Amortized upfront premiums are included in net realized gain/(loss) from swaps on the statement of operations. Fluctuations in the value of swaps are recorded as a component of net change in unrealized appreciation/depreciation of swaps on the statement of operations.
| abfunds.com | ALLIANCEBERNSTEIN GLOBAL HIGH INCOME FUND | 101 | |
NOTES TO FINANCIAL STATEMENTS (continued)
Certain standardized swaps, including certain interest rate swaps and credit default swaps, are (or soon will be) subject to mandatory central clearing. Cleared swaps are transacted through futures commission merchants (“FCMs”) that are members of central clearinghouses, with the clearinghouse serving as central counterparty, similar to transactions in futures contracts. Centralized clearing will be required for additional categories of swaps on a phased-in basis based on requirements published by the Securities and Exchange Commission and Commodity Futures Trading Commission.
At the time the Fund enters into a centrally cleared swap, the Fund deposits and maintains as collateral an initial margin with the broker, as required by the clearinghouse on which the transaction is effected. Such amount is shown as cash collateral due from broker on the statement of assets and liabilities. Pursuant to the contract, the Fund agrees to receive from or pay to the broker an amount of cash equal to the daily fluctuation in the value of the contract. Such receipts or payments are known as variation margin and are recorded by the Fund as unrealized gains or losses. Risks may arise from the potential inability of a counterparty to meet the terms of the contract. The credit/counterparty risk for centrally cleared swaps is generally less than non-centrally cleared swaps, since the clearinghouse, which is the issuer or counterparty to each centrally cleared swap, has robust risk mitigation standards, including the requirement to provide initial and variation margin. When the contract is closed, the Fund records a realized gain or loss equal to the difference between the value of the contract at the time it was opened and the time it was closed.
Interest Rate Swaps:
The Fund is subject to interest rate risk exposure in the normal course of pursuing its investment objectives. Because the Fund holds fixed rate bonds, the value of these bonds may decrease if interest rates rise. To help hedge against this risk and to maintain its ability to generate income at prevailing market rates, the Fund may enter into interest rate swaps. Interest rate swaps are agreements between two parties to exchange cash flows based on a notional amount. The Fund may elect to pay a fixed rate and receive a floating rate, or, receive a fixed rate and pay a floating rate on a notional amount.
In addition, the Fund may also enter into interest rate swap transactions to preserve a return or spread on a particular investment or portion of its portfolio, or protecting against an increase in the price of securities the Fund anticipates purchasing at a later date. Interest rate swaps involve the exchange by the Fund with another party of their respective commitments to pay or receive interest (e.g., an
| 102 | ALLIANCEBERNSTEIN GLOBAL HIGH INCOME FUND |
abfunds.com | |
NOTES TO FINANCIAL STATEMENTS (continued)
exchange of floating rate payments for fixed rate payments) computed based on a contractually-based principal (or “notional”) amount. Interest rate swaps are entered into on a net basis (i.e., the two payment streams are netted out, with the Fund receiving or paying, as the case may be, only the net amount of the two payments).
During the year ended March 31, 2023, the Fund held interest rate swaps for hedging and non-hedging purposes.
Credit Default Swaps:
The Fund may enter into credit default swaps, including to manage its exposure to the market or certain sectors of the market, to reduce its risk exposure to defaults by corporate and sovereign issuers held by the Fund, or to create exposure to corporate or sovereign issuers to which it is not otherwise exposed. The Fund may purchase credit protection (“Buy Contract”) or provide credit protection (“Sale Contract”) on the referenced obligation of the credit default swap. During the term of the swap, the Fund receives/(pays) fixed payments from/(to) the respective counterparty, calculated at the agreed upon rate applied to the notional amount. If the Fund is a buyer/(seller) of protection and a credit event occurs, as defined under the terms of the swap, the Fund will either (i) receive from the seller/(pay to the buyer) of protection an amount equal to the notional amount of the swap (the “Maximum Payout Amount”) and deliver/(take delivery of) the referenced obligation or (ii) receive/(pay) a net settlement amount in the form of cash or securities equal to the notional amount of the swap less the recovery value of the referenced obligation. In certain circumstances Maximum Payout Amounts may be partially offset by recovery values of the respective referenced obligations, upfront premium received upon entering into the agreement, or net amounts received from settlement of buy protection credit default swaps entered into by the Fund for the same referenced obligation with the same counterparty.
Credit default swaps may involve greater risks than if the Fund had invested in the referenced obligation directly. Credit default swaps are subject to general market risk, liquidity risk, counterparty risk and credit risk. If the Fund is a buyer of protection and no credit event occurs, it will lose the payments it made to its counterparty. If the Fund is a seller of protection and a credit event occurs, the value of the referenced obligation received by the Fund coupled with the periodic payments previously received may be less than the Maximum Payout Amount it pays to the buyer, resulting in a net loss to the Fund.
| abfunds.com | ALLIANCEBERNSTEIN GLOBAL HIGH INCOME FUND | 103 | |
NOTES TO FINANCIAL STATEMENTS (continued)
Implied credit spreads over U.S. Treasuries of comparable maturity utilized in determining the market value of credit default swaps on issuers as of period end are disclosed in the portfolio of investments. The implied spreads serve as an indicator of the current status of the payment/performance risk and typically reflect the likelihood of default by the issuer of the referenced obligation. The implied credit spread of a particular reference obligation also reflects the cost of buying/selling protection and may reflect upfront payments required to be made to enter into the agreement. Widening credit spreads typically represent a deterioration of the referenced obligation’s credit soundness and greater likelihood of default or other credit event occurring as defined under the terms of the agreement. A credit spread identified as “Defaulted” indicates a credit event has occurred for the referenced obligation.
During the year ended March 31, 2023, the Fund held credit default swaps for non-hedging purposes.
Total Return Swaps:
The Fund may enter into total return swaps in order to take a “long” or “short” position with respect to an underlying referenced asset. The Fund is subject to market price volatility of the underlying referenced asset. A total return swap involves commitments to pay interest in exchange for a market linked return based on a notional amount. To the extent that the total return of the security, group of securities or index underlying the transaction exceeds or falls short of the offsetting interest obligation, the Fund will receive a payment from or make a payment to the counterparty.
During the year ended March 31, 2023, the Fund held total return swaps for non-hedging purposes.
The Fund typically enters into International Swaps and Derivatives Association, Inc. Master Agreements (“ISDA Master Agreement”) with its OTC derivative contract counterparties in order to, among other things, reduce its credit risk to OTC counterparties. ISDA Master Agreements include provisions for general obligations, representations, collateral and events of default or termination. Under an ISDA Master Agreement, the Fund typically may offset with the OTC counterparty certain derivative financial instruments’ payables and/or receivables with collateral held and/or posted and create one single net payment (close-out netting) in the event of default or termination. In the event of a default by an OTC counterparty, the return of collateral with market value in excess of the Fund’s net liability, held by the defaulting party, may be delayed or denied.
| 104 | ALLIANCEBERNSTEIN GLOBAL HIGH INCOME FUND |
abfunds.com | |
NOTES TO FINANCIAL STATEMENTS (continued)
The Fund’s ISDA Master Agreements may contain provisions for early termination of OTC derivative transactions in the event the net assets of the Fund decline below specific levels (“net asset contingent features”). If these levels are triggered, the Fund’s OTC counterparty has the right to terminate such transaction and require the Fund to pay or receive a settlement amount in connection with the terminated transaction. If OTC derivatives were held at period end, please refer to netting arrangements by the OTC counterparty tables below for additional details.
During the year ended March 31, 2023, the Fund had entered into the following derivatives:
| Asset Derivatives |
Liability Derivatives |
|||||||||||
| Derivative Type |
Statement of |
Fair Value | Statement of |
Fair Value | ||||||||
| Interest rate contracts |
Receivable for |
$ |
2,447,218 |
* |
||||||||
| Foreign currency contracts |
Unrealized |
|
472,207 |
|
Unrealized |
$ |
1,631,650 |
| ||||
| Credit contracts |
Market value of credit default swaps |
17,792 | Market value of credit default swaps |
3,781,685 | ||||||||
| Credit contracts |
Receivable for variation margin on centrally cleared swaps |
2,166,881 | * | |||||||||
| Credit contracts |
Unrealized depreciation on total return swaps |
29,258 | ||||||||||
|
|
|
|
|
|||||||||
| Total |
$ | 5,104,098 | $ | 5,442,593 | ||||||||
|
|
|
|
|
|||||||||
| * | Only variation margin receivable (payable) at period end is reported within the statement of assets and liabilities. This amount reflects cumulative unrealized appreciation (depreciation) on futures and centrally cleared swaps as reported in the portfolio of investments. |
| abfunds.com | ALLIANCEBERNSTEIN GLOBAL HIGH INCOME FUND | 105 | |
NOTES TO FINANCIAL STATEMENTS (continued)
| Derivative Type |
Location of Gain |
Realized Gain or (Loss) on Derivatives |
Change in Unrealized Appreciation or (Depreciation) |
|||||||
| Interest rate contracts |
Net realized gain/(loss) on swaps; Net change in unrealized appreciation (depreciation) on swaps | $ | 11,604 | $ | (2,785 | ) | ||||
| Interest rate contracts |
Net realized gain/(loss) on futures; Net change in unrealized appreciation (depreciation) on futures | (13,011,001 | ) | 4,010,851 | ||||||
| Interest rate contracts |
Net realized gain/(loss) on written swaptions; Net change in unrealized appreciation (depreciation) on written swaptions | (88,111 | ) | 3,666 | ||||||
| Foreign currency contracts |
Net realized gain/(loss) on forward currency exchange contracts; Net change in unrealized appreciation (depreciation) on forward currency exchange contracts |
3,916,836 | (2,755,607 | ) | ||||||
| Foreign currency contracts |
Net realized gain/(loss) on written options; Net change in unrealized appreciation (depreciation) on written options | 217 | (7 | ) | ||||||
| Credit contracts |
Net realized gain/(loss) on swaps; Net change in unrealized appreciation (depreciation) on swaps | (6,498,382 | ) | 12,194,822 | ||||||
| Credit contracts |
Net realized gain/(loss) on written swaptions; Net change in unrealized appreciation (depreciation) on written swaptions | 694,090 | – 0 | – | ||||||
|
|
|
|
|
|||||||
| Total |
$ | (14,974,747 | ) | $ | 13,450,940 | |||||
|
|
|
|
|
|||||||
| 106 | ALLIANCEBERNSTEIN GLOBAL HIGH INCOME FUND |
abfunds.com | |
NOTES TO FINANCIAL STATEMENTS (continued)
The following table represents the average monthly volume of the Fund’s derivative transactions during the year ended March 31, 2023:
| Centrally Cleared Credit Default Swaps: |
||||
| Average notional amount of sale contracts |
$ | 189,790,686 | ||
| Centrally Cleared Interest Rate Swaps |
||||
| Average notional amount |
$ | 99,727 | (a) | |
| Credit Default Swaps: |
||||
| Average notional amount of sale contracts |
$ | 55,437,414 | ||
| Forward Currency Exchange Contracts: |
||||
| Average principal amount of buy contracts |
$ | 10,065,047 | ||
| Average principal amount of sale contracts |
$ | 71,138,394 | ||
| Futures: |
||||
| Average notional amount of buy contracts |
$ | 117,978,556 | ||
| Average notional amount of sale contracts |
$ | 18,933,852 | (b) | |
| Total Return Swaps: |
||||
| Average notional amount |
$ | 10,485,383 | ||
| Written Options: |
||||
| Average notional amount |
$ | 100,393 | (b) | |
| Written Swaptions: |
||||
| Average notional amount |
$ | 17,656,125 | (c) |
| (a) | Positions were open for ten months during the reporting period. |
| (b) | Positions were open for less than one month during the reporting period. |
| (c) | Positions were open for seven months during the reporting period. |
For financial reporting purposes, the Fund does not offset derivative assets and derivative liabilities that are subject to netting arrangements in the statement of assets and liabilities.
All OTC derivatives held at period end were subject to netting arrangements. The following table presents the Fund’s derivative assets and liabilities by OTC counterparty net of amounts available for offset under ISDA Master Agreements (“MA”) and net of the related collateral received/pledged by the Fund as of March 31, 2023. Exchange-traded derivatives and centrally cleared swaps are not subject to netting arrangements and as such are excluded from the tables.
| abfunds.com | ALLIANCEBERNSTEIN GLOBAL HIGH INCOME FUND | 107 | |
NOTES TO FINANCIAL STATEMENTS (continued)
| Counterparty |
Derivative Assets Subject to a MA |
Derivatives Available for Offset |
Cash Collateral Received* |
Security Collateral Received* |
Net Amount of Derivative Assets |
|||||||||||||||
| Australia and New Zealand Banking Group Ltd. |
$ | 34,232 | $ | – 0 | – | $ | – 0 | – | $ | – 0 | – | $ | 34,232 | |||||||
| Bank of America, NA |
6,796 | (6,796 | ) | – 0 | – | – 0 | – | – 0 | – | |||||||||||
| Barclays Bank PLC |
2,447 | (522 | ) | – 0 | – | – 0 | – | 1,925 | ||||||||||||
| BNP Paribas SA |
19,260 | (1,853 | ) | – 0 | – | – 0 | – | 17,407 | ||||||||||||
| Brown Brothers Harriman & Co. |
80,483 | (38,192 | ) | – 0 | – | – 0 | – | 42,291 | ||||||||||||
| Citibank, NA/Citigroup Global Markets, |
27,109 | (27,109 | ) | – 0 | – | – 0 | – | – 0 | – | |||||||||||
| Goldman Sachs Bank USA/Goldman |
18,618 | (18,618 | ) | – 0 | – | – 0 | – | – 0 | – | |||||||||||
| JPMorgan Chase Bank, NA/JPMorgan Securities, LLC |
174,266 | (174,266 | ) | – 0 | – | – 0 | – | – 0 | – | |||||||||||
| Morgan Stanley Capital Services |
82,155 | (82,155 | ) | – 0 | – | – 0 | – | – 0 | – | |||||||||||
| Royal Bank of |
22,196 | (1,137 | ) | – 0 | – | – 0 | – | 21,059 | ||||||||||||
| Standard Chartered |
4 | (4 | ) | – 0 | – | – 0 | – | – 0 | – | |||||||||||
| UBS AG |
22,433 | (433 | ) | – 0 | – | – 0 | – | 22,000 | ||||||||||||
|
|
|
|
|
|
|
|
|
|
|
|||||||||||
| Total |
$ | 489,999 | $ | (351,085 | ) | $ | – 0 | – | $ | – 0 | – | $ | 138,914 | ^ | ||||||
|
|
|
|
|
|
|
|
|
|
|
|||||||||||
| Counterparty |
Derivative Liabilities Subject to a MA |
Derivatives Available for Offset |
Cash Collateral Pledged* |
Security Collateral Pledged* |
Net Amount of Derivative Liabilities |
|||||||||||||||
| Bank of America, NA |
$ | 1,462,718 | $ | (6,796 | ) | $ | – 0 | – | $ | – 0 | – | $ | 1,455,922 | |||||||
| Barclays Bank PLC |
522 | (522 | ) | – 0 | – | – 0 | – | – 0 | – | |||||||||||
| BNP Paribas SA |
1,853 | (1,853 | ) | – 0 | – | – 0 | – | – 0 | – | |||||||||||
| Brown Brothers Harriman & Co. |
38,192 | (38,192 | ) | – 0 | – | – 0 | – | – 0 | – | |||||||||||
| Citibank, NA/Citigroup Global Markets, Inc. |
85,872 | (27,109 | ) | – 0 | – | (58,763 | ) | – 0 | – | |||||||||||
| Deutsche Bank AG |
75,558 | – 0 | – | – 0 | – | – 0 | – | 75,558 | ||||||||||||
| Goldman Sachs Bank USA/Goldman Sachs International |
740,703 | (18,618 | ) | (722,085 | ) | – 0 | – | – 0 | – | |||||||||||
| HSBC Bank USA |
7,351 | – 0 | – | – 0 | – | – 0 | – | 7,351 | ||||||||||||
| JPMorgan Chase Bank, NA/JPMorgan Securities, LLC |
2,235,524 | (174,266 | ) | (255,000 | ) | (1,806,258 | ) | – 0 | – | |||||||||||
| Morgan Stanley Capital Services LLC |
791,694 | (82,155 | ) | (120,000 | ) | (589,539 | ) | – 0 | – | |||||||||||
| Royal Bank of Scotland PLC |
1,137 | (1,137 | ) | – 0 | – | – 0 | – | – 0 | – | |||||||||||
| Standard Chartered Bank |
1,036 | (4 | ) | – 0 | – | – 0 | – | 1,032 | ||||||||||||
| UBS AG |
433 | (433 | ) | – 0 | – | – 0 | – | – 0 | – | |||||||||||
|
|
|
|
|
|
|
|
|
|
|
|||||||||||
| Total |
$ | 5,442,593 | $ | (351,085 | ) | $ | (1,097,085 | ) | $ | (2,454,560 | ) | $ | 1,539,863 | ^ | ||||||
|
|
|
|
|
|
|
|
|
|
|
|||||||||||
| 108 | ALLIANCEBERNSTEIN GLOBAL HIGH INCOME FUND |
abfunds.com | |
NOTES TO FINANCIAL STATEMENTS (continued)
| * | The actual collateral received/pledged may be more than the amount reported due to overcollateralization. |
| ^ | Net amount represents the net receivable (payable) that would be due from/to the counterparty in the event of default or termination. The net amount from OTC financial derivative instruments can only be netted across transactions governed under the same master agreement with the same counterparty. |
| See Note C.3 for additional disclosure of netting arrangements regarding reverse repurchase agreements. |
2. Currency Transactions
The Fund may invest in non-U.S. Dollar-denominated securities on a currency hedged or unhedged basis. The Fund may seek investment opportunities by taking long or short positions in currencies through the use of currency-related derivatives, including forward currency exchange contracts, futures and options on futures, swaps, and other options. The Fund may enter into transactions for investment opportunities when it anticipates that a foreign currency will appreciate or depreciate in value but securities denominated in that currency are not held by the Fund and do not present attractive investment opportunities. Such transactions may also be used when the Adviser believes that it may be more efficient than a direct investment in a foreign currency-denominated security. The Fund may also conduct currency exchange contracts on a spot basis (i.e., for cash at the spot rate prevailing in the currency exchange market for buying or selling currencies).
3. Reverse Repurchase Agreements
The Fund may enter into reverse repurchase transactions (“RVP”) in accordance with the terms of a Master Repurchase Agreement (“MRA”), under which the Fund sells securities and agrees to repurchase them at a mutually agreed upon date and price. At the time the Fund enters into a reverse repurchase agreement, it will establish a segregated account with the custodian containing liquid assets having a value comparable to the repurchase price. Under the MRA and other Master Agreements, the Fund is permitted to offset payables and/or receivables with collateral held and/or posted to the counterparty and create one single net payment due to or from the Fund in the event of a default. In the event of a default by a MRA counterparty, the Fund may be considered an unsecured creditor with respect to any excess collateral (collateral with a market value in excess of the repurchase price) held by and/or posted to the counterparty, and as such the return of such excess collateral may be delayed or denied. For the year ended March 31, 2023, the average amount of reverse repurchase agreements outstanding was $12,717,851 and the daily weighted average interest rate was 1.26%. At March 31, 2023, the Fund had reverse repurchase agreements outstanding in the amount of $8,261,610 as reported in the statement of assets and liabilities.
| abfunds.com | ALLIANCEBERNSTEIN GLOBAL HIGH INCOME FUND | 109 | |
NOTES TO FINANCIAL STATEMENTS (continued)
The following table presents the Fund’s RVP liabilities by counterparty net of the related collateral pledged by the Fund as of March 31, 2023:
| Counterparty |
RVP Liabilities Subject to a MRA |
Securities Collateral Pledged†* |
Net Amount of RVP Liabilities |
|||||||||
| Barclays Capital, Inc |
$ | 3,738,675 | $ | (3,738,675 | ) | $ | – 0 | – | ||||
| HSBC Securities |
3,401,062 | (3,342,616 | ) | 58,446 | ||||||||
| RBC Capital Markets |
1,121,873 | (1,121,873 | ) | – 0 | – | |||||||
|
|
|
|
|
|
|
|||||||
| $ | 8,261,610 | $ | (8,203,164 | ) | $ | 58,446 | ||||||
|
|
|
|
|
|
|
|||||||
| † | Including accrued interest. |
| * | The actual collateral pledged may be more than the amount reported due to overcollateralization. |
NOTE D
Capital Stock
During the year ended March 31, 2023 and the year ended March 31, 2022, the Fund issued no shares in connection with the Fund’s dividend reinvestment plan.
Risks Involved in Investing in the Fund
Market Risk—The market value of a security may move up or down, sometimes rapidly and unpredictably. These fluctuations may cause a security to be worth less than the price originally paid for it, or less than it was worth at an earlier time. Market risk may affect a single issuer, industry, sector of the economy or the market as a whole. Global economies and financial markets are increasingly interconnected, which increases the probabilities that conditions in one country or region might adversely impact issuers in a different country or region. Conditions affecting the general economy, including political, social, or economic instability at the local, regional, or global level may also affect the market value of a security. Health crises, such as pandemic and epidemic diseases, as well as other incidents that interrupt the expected course of events, such as natural disasters, including fires, earthquakes and flooding, war or civil disturbance, acts of terrorism, power outages and other unforeseeable and external events, and the public response to or fear of such diseases or events, have had, and may in the future have, an adverse effect on the Fund’s investments and net asset value and can lead to increased market volatility. For example, the diseases or events themselves or any preventative or protective actions that governments may take in respect of such diseases or events may result in periods of business disruption, inability to obtain raw materials, supplies and component parts, and reduced or disrupted operations for the Fund’s portfolio companies. The occurrence and pendency of such diseases or events could adversely affect the economies and financial markets either in specific countries or worldwide.
| 110 | ALLIANCEBERNSTEIN GLOBAL HIGH INCOME FUND |
abfunds.com | |
NOTES TO FINANCIAL STATEMENTS (continued)
Interest-Rate Risk—Changes in interest rates will affect the value of investments in fixed-income securities. When interest rates rise, the value of existing investments in fixed-income securities tends to fall and this decrease in value may not be offset by higher income from new investments. Interest-rate risk is generally greater for fixed-income securities with longer maturities or durations. The Fund may be subject to a greater risk of rising interest rates than would normally be the case due to the end of a recent period of historically low rates and the effect of potential central bank monetary policy, and government fiscal policy, initiatives and resulting market reactions to those initiatives.
Credit Risk—An issuer or guarantor of a fixed-income security, or the counterparty to a derivatives or other contract, may be unable or unwilling to make timely payments of interest or principal, or to otherwise honor its obligations. The issuer or guarantor may default, causing a loss of the full principal amount of a security and accrued interest. The degree of risk for a particular security may be reflected in its credit rating. There is the possibility that the credit rating of a fixed-income security may be downgraded after purchase, which may adversely affect the value of the security.
Below Investment-Grade Securities Risk—Investments in fixed-income securities with lower ratings (commonly known as “junk bonds”) are subject to a higher probability that an issuer will default or fail to meet its payment obligations. These securities may be subject to greater price volatility due to such factors as specific corporate developments and negative perceptions of the junk bond market generally and may be more difficult to trade than other types of securities.
Duration Risk—Duration is a measure that relates the expected price volatility of a fixed-income security to changes in interest rates. The duration of a fixed-income security may be shorter than or equal to full maturity of a fixed-income security. Fixed-income securities with longer durations have more risk and will decrease in price as interest rates rise.
Inflation Risk—This is the risk that the value of assets or income from investments will be less in the future as inflation decreases the value of money. As inflation increases, the value of the Fund’s assets can decline as can the value of the Fund’s distributions. This risk is significantly greater for fixed-income securities with longer maturities.
Foreign (Non-US) Risk—Investments in securities of non-US issuers may involve more risk than those of US issuers. These securities may fluctuate more widely in price and may be more difficult to trade due to adverse market, economic, political, regulatory or other factors.
| abfunds.com | ALLIANCEBERNSTEIN GLOBAL HIGH INCOME FUND | 111 | |
NOTES TO FINANCIAL STATEMENTS (continued)
Emerging-Market Risk—Investments in emerging-market countries may have more risk because the markets are less developed and less liquid and are subject to increased economic, political, regulatory or other uncertainties.
Currency Risk—Fluctuations in currency exchange rates may negatively affect the value of the Fund’s investments or reduce its returns.
Leverage Risk—As a result of the Fund’s use of leveraging techniques, its NAV may be more volatile because leverage tends to exaggerate the effect of changes in interest rates and any increase or decrease in the value of the Fund’s investments.
Derivatives Risk—Investments in derivatives may be difficult to price or unwind and leveraged so that small changes may produce disproportionate losses for the Fund. A short position in a derivative instrument involves the risk of a theoretically unlimited increase in the value of the underlying instrument, which could cause the Fund to suffer a (potentially unlimited) loss. Derivatives, especially over-the-counter derivatives, are also subject to counterparty risk, which is the risk that the counterparty (the party on the other side of the transaction) on a derivative transaction will be unable or unwilling to honor its contractual obligations to the Fund.
Illiquid Investments Risk—Illiquid investments risk exists when certain investments become difficult to purchase or sell. Difficulty in selling such investments may result in sales at disadvantageous prices affecting the value of your investment in the Fund. Causes of illiquid investments risk may include low trading volumes, large positions and heavy redemptions of Fund shares. Illiquid investments risk may be higher in a rising interest rate environment, when the value and liquidity of fixed-income securities generally decline.
Mortgage-Related and/or Other Asset-Backed Securities Risk—The Fund may invest in mortgage-backed and/or other asset-backed securities, including securities backed by mortgages and assets with an international or emerging-markets origination and securities backed by non-performing loans at the time of investment. Investments in mortgage-related and other asset-backed securities are subject to certain additional risks. The value of these securities may be particularly sensitive to changes in interest rates. These risks include “extension risk”, which is the risk that, in periods of rising interest rates, issuers may delay the payment of principal, and “prepayment risk”, which is the risk that, in periods of falling interest rates, issuers may pay principal sooner than expected, exposing the Fund to a lower rate of return upon reinvestment of principal. Mortgage-backed securities offered by nongovernmental issuers and other asset-backed securities may be subject to other risks, such as higher rates of
| 112 | ALLIANCEBERNSTEIN GLOBAL HIGH INCOME FUND |
abfunds.com | |
NOTES TO FINANCIAL STATEMENTS (continued)
default in the mortgages or assets backing the securities or risks associated with the nature and servicing of mortgages or assets backing the securities.
LIBOR Transition and Associated Risk—The Fund may be exposed to debt securities, derivatives or other financial instruments that utilize the London Interbank Offered Rate, or “LIBOR,” as a “benchmark” or “reference rate” for various interest rate calculations. In 2017, the United Kingdom Financial Conduct Authority (“FCA”), which regulates LIBOR, announced a desire to phase out the use of LIBOR by the end of 2021. As announced by the FCA and LIBOR’s administrator, ICE Benchmark Administration, most LIBOR settings (which reflect LIBOR rates quoted in different currencies over various time periods) have not been published since the end of 2021, but the most widely used U.S. Dollar LIBOR settings are expected to continue to be published until June 30, 2023. However, banks were strongly encouraged to cease entering into agreements with counterparties referencing LIBOR by the end of 2021. It is possible that a subset of LIBOR settings will be published after these dates on a “synthetic” basis, but any such publications would be considered non-representative of the underlying market. Since 2018 the Federal Reserve Bank of New York has published the Secured Overnight Financing Rate (referred to as SOFR), which is intended to replace U.S. Dollar LIBOR. SOFR is a broad measure of the cost of borrowing cash overnight collateralized by U.S. Treasury securities in the repurchase agreement (repo) market and has been used increasingly on a voluntary basis in new instruments and transactions. In addition, on March 15, 2022, the Adjustable Interest Rate Act was signed into law. This law provides a statutory fallback mechanism to replace LIBOR with a benchmark rate that is selected by the Federal Reserve Board and based on SOFR for certain contracts that reference LIBOR without adequate fallback provisions. On December 16, 2022, the Federal Reserve Board adopted regulations implementing the law by identifying benchmark rates based on SOFR that will replace LIBOR in different categories of financial contracts after June 30, 2023. The regulations include provisions that (i) provide a safe harbor for selection or use of a replacement benchmark rate selected by the Federal Reserve Board; (ii) clarify who may choose the replacement benchmark rate selected by the Federal Reserve Board; and (iii) ensure that contracts adopting a replacement benchmark rate selected by the Federal Reserve Board will not be interrupted or terminated following the replacement of LIBOR.
The elimination of LIBOR or changes to other reference rates or any other changes or reforms to the determination or supervision of reference rates could have an adverse impact on the market for, or value of, any securities or payments linked to those reference rates, which may adversely affect
| abfunds.com | ALLIANCEBERNSTEIN GLOBAL HIGH INCOME FUND | 113 | |
NOTES TO FINANCIAL STATEMENTS (continued)
the Fund’s performance and/or NAV. Uncertainty and risk also remain regarding the willingness and ability of issuers and lenders to include revised provisions in new and existing contracts or instruments. Consequently, the transition from LIBOR to other reference rates may lead to increased volatility and illiquidity in markets that are tied to LIBOR, fluctuations in values of LIBOR-related investments or investments in issuers that utilize LIBOR, increased difficulty in borrowing or refinancing and diminished effectiveness of hedging strategies, potentially adversely affecting the Fund’s performance. Furthermore, the risks associated with the expected discontinuation of LIBOR and transition may be exacerbated if the work necessary to effect an orderly transition to an alternative reference rate is not completed in a timely manner. Neither the effect of the LIBOR transition process nor its ultimate success can yet be known.
Indemnification Risk—In the ordinary course of business, the Fund enters into contracts that contain a variety of indemnifications. The Fund’s maximum exposure under these arrangements is unknown. However, the Fund has not had prior claims or losses pursuant to these indemnification provisions and expects the risk of loss thereunder to be remote. Therefore, the Fund has not accrued any liability in connection with these indemnification provisions.
Management Risk—The Fund is subject to management risk because it is an actively-managed investment fund. The Adviser will apply its investment techniques and risk analyses in making investment decisions, but there is no guarantee that its techniques will produce the intended results. Some of these techniques may incorporate, or rely upon, quantitative models, but there is no guarantee that these models will generate accurate forecasts, reduce risk or otherwise perform as expected.
NOTE F
Distributions to Shareholders
The tax character of distributions paid during the fiscal years ended March 31, 2023 and March 31, 2022 were as follows:
| 2023 | 2022 | |||||||
| Distributions paid from: |
||||||||
| Ordinary income |
$ | 76,201,166 | $ | 67,035,667 | ||||
|
|
|
|
|
|||||
| Total taxable distributions paid |
$ | 76,201,166 | $ | 67,035,667 | ||||
| Return of Capital |
– 0 | – | 740,859 | |||||
|
|
|
|
|
|||||
| Total distributions paid |
$ | 76,201,166 | $ | 67,776,526 | ||||
|
|
|
|
|
|||||
| 114 | ALLIANCEBERNSTEIN GLOBAL HIGH INCOME FUND |
abfunds.com | |
NOTES TO FINANCIAL STATEMENTS (continued)
As of March 31, 2023, the components of accumulated earnings (deficit) on a tax basis were as follows:
| Accumulated capital losses |
$ | (105,586,035 | )(a) | |
| Other losses |
(3,106,003 | )(b) | ||
| Unrealized appreciation (depreciation) |
(126,210,243 | )(c) | ||
|
|
|
|||
| Total accumulated earnings (deficit) |
$ | (234,902,281 | )(d) | |
|
|
|
| (a) | As of March 31, 2023, the Fund had a net capital loss carryforward of $105,586,035. |
| (b) | As of March 31, 2023, the Fund had a qualified late-year ordinary loss deferral of $3,106,003. |
| (c) | The differences between book-basis and tax-basis unrealized appreciation (depreciation) are attributable primarily to the recognition for tax purposes of unrealized gains/losses on certain derivative instruments, the tax treatment of passive foreign investment companies (PFICs), the tax treatment of hyper-inflationary currency contracts, the tax treatment of swaps, the tax deferral of losses on wash sales, the tax treatment of partnership investments, and the tax treatment of callable bonds. |
| (d) | The differences between book-basis and tax-basis components of accumulated earnings (deficit) are attributable primarily to the accrual of foreign capital gains tax and the tax treatment of defaulted securities. |
For tax purposes, net realized capital losses may be carried over to offset future capital gains, if any. Funds are permitted to carry forward capital losses for an indefinite period, and such losses will retain their character as either short-term or long-term capital losses. As of March 31, 2023, the Fund had a net short-term capital loss carryforward of $29,826,191 and a net long-term capital loss carryforward of $75,759,844, which may be carried forward for an indefinite period.
During the current fiscal year, permanent differences primarily due to prior year post-financial statement adjustments resulted in a net decrease in accumulated loss and a net decrease in additional paid-in capital. These reclassifications had no effect on net assets.
NOTE G
Recent Accounting Pronouncements
In December 2022, the Financial Accounting Standards Board issued an Accounting Standards Update, ASU 2022-06, “Reference Rate Reform (Topic 848) – Deferral of the Sunset Date of Topic 848”. ASU 2022-06 is an amendment to ASU 2020-04, which provided optional guidance to ease the potential accounting burden due to the discontinuation of the LIBOR and other interbank-offered based reference rates and which was effective as of March 12, 2020 through December 31, 2022. ASU 2022-06 extends the effective period through December 31, 2024. Management is currently evaluating the impact, if any, of applying ASU 2022-06.
| abfunds.com | ALLIANCEBERNSTEIN GLOBAL HIGH INCOME FUND | 115 | |
NOTES TO FINANCIAL STATEMENTS (continued)
NOTE H
Subsequent Events
Management has evaluated subsequent events for possible recognition or disclosure in the financial statements through the date the financial statements are issued. Management has determined that there are no material events that would require disclosure in the Fund’s financial statements through this date.
| 116 | ALLIANCEBERNSTEIN GLOBAL HIGH INCOME FUND |
abfunds.com | |
Selected Data For A Share of Capital Stock Outstanding Throughout Each Period
| Year Ended March 31, | ||||||||||||||||||||
| 2023 | 2022 | 2021 | 2020 | 2019 | ||||||||||||||||
|
|
|
|||||||||||||||||||
| Net asset value, beginning of period |
$ 12.02 | $ 12.78 | $ 10.74 | $ 12.95 | $ 13.56 | |||||||||||||||
|
|
|
|||||||||||||||||||
| Income From Investment Operations |
||||||||||||||||||||
| Net investment income(a) |
.69 | .61 | .59 | .67 | .75 | |||||||||||||||
| Net realized and unrealized gain (loss) on investment and foreign currency transactions |
(1.27 | ) | (.58 | ) | 2.24 | (2.09 | ) | (.52 | ) | |||||||||||
| Contributions from Affiliates |
– 0 | – | – 0 | – | .00 | (b) | .00 | (b) | .00 | (b) | ||||||||||
|
|
|
|||||||||||||||||||
| Net increase (decrease) in net asset value from operations |
(.58 | ) | .03 | 2.83 | (1.42 | ) | .23 | |||||||||||||
|
|
|
|||||||||||||||||||
| Less: Dividends and Distributions |
||||||||||||||||||||
| Dividends from net investment income |
(.88 | ) | (.78 | ) | (.69 | ) | (.75 | ) | (.75 | ) | ||||||||||
| Return of capital |
– 0 | – | (.01 | ) | (.10 | ) | (.04 | ) | (.09 | ) | ||||||||||
|
|
|
|||||||||||||||||||
| Total dividends and distributions |
(.88 | ) | (.79 | ) | (.79 | ) | (.79 | ) | (.84 | ) | ||||||||||
|
|
|
|||||||||||||||||||
| Net asset value, end of period |
$ 10.56 | $ 12.02 | $ 12.78 | $ 10.74 | $ 12.95 | |||||||||||||||
|
|
|
|||||||||||||||||||
| Market value, end of period |
$ 9.72 | $ 11.18 | $ 11.85 | $ 9.26 | $ 11.59 | |||||||||||||||
|
|
|
|||||||||||||||||||
| (Discount), end of period |
(7.95 | )% | (6.99 | )% | (7.28 | )% | (13.78 | )% | (10.50 | )% | ||||||||||
| Total Return |
||||||||||||||||||||
| Total investment return based on:(c) |
||||||||||||||||||||
| Market value |
(5.00 | )% | .79 | % | 37.57 | % | (14.43 | )% | 4.91 | % | ||||||||||
| Net asset value |
(4.01 | )%^ | .48 | %^ | 27.92 | % | (11.18 | )% | 2.78 | % | ||||||||||
| Ratios/Supplemental Data |
||||||||||||||||||||
| Net assets, end of period (000’s omitted) |
$910,949 | $1,036,686 | $1,102,273 | $926,184 | $1,116,970 | |||||||||||||||
| Ratio to average net assets of: |
||||||||||||||||||||
| Expenses, net of waivers/reimbursements(d)(e)† |
1.04 | % | 1.00 | % | 1.02 | % | 1.00 | % | 1.04 | % | ||||||||||
| Expenses, before waivers/reimbursements(d)(e)† |
1.04 | % | 1.00 | % | 1.02 | % | 1.01 | % | 1.05 | % | ||||||||||
| Net investment income |
6.39 | % | 4.77 | % | 4.88 | % | 5.16 | % | 5.72 | % | ||||||||||
| Portfolio turnover rate |
40 | % | 40 | % | 51 | % | 32 | % | 40 | % | ||||||||||
|
† Expense ratios exclude the estimated acquired fund fees of affiliated/unaffiliated underlying |
| |||||||||||||||||||
| portfolios |
.00 | % | .00 | % | .00 | % | .01 | % | .01 | % | ||||||||||
See footnote summary on page 118.
| abfunds.com | ALLIANCEBERNSTEIN GLOBAL HIGH INCOME FUND | 117 | |
FINANCIAL HIGHLIGHTS (continued)
Selected Data For A Share of Capital Stock Outstanding Throughout Each Period
| (a) | Based on average shares outstanding. |
| (b) | Amount is less than $0.005. |
| (c) | Total investment return is calculated assuming a purchase of common stock on the opening of the first day and a sale on the closing of the last day of each period reported. Dividends and distributions, if any, are assumed, for purposes of this calculation, to be reinvested at prices obtained under the Fund’s Dividend Reinvestment Plan. Generally, Total investment return based on net asset value will be higher than total investment return based on market value to the net asset value from the beginning to the end of such periods. Conversely, total investment return based on net asset value will be lower than total investment return based on market value in periods where there is a decrease in the discount or an increase in the premium of the market value to the net asset value from the beginning to the end of such periods. Total investment return calculated for a period of less than one year is not annualized. |
| (d) | The expense ratios presented below exclude interest expense: |
| Year Ended March 31, | ||||||||||||||||||||
| 2023 | 2022 | 2021 | 2020 | 2019 | ||||||||||||||||
| Net of waivers/reimbursements |
1.02 | % | .99 | % | 1.02 | % | .99 | % | .99 | % | ||||||||||
| Before waivers/reimbursements |
1.02 | % | .99 | % | 1.02 | % | 1.00 | % | 1.00 | % | ||||||||||
| (e) | In connection with the Fund’s investments in affiliated underlying portfolios, the Fund incurs no direct expenses but bears proportionate shares of the acquired fund fees and expenses (i.e. operating, administrative and investment advisory fees) of the affiliated underlying portfolios. The Adviser has contractually agreed to waive its fees from the Fund in an amount equal to the Fund’s pro rata share of certain acquired fund fees and expenses, and for the years ended March 31, 2020 and March 31, 2019, such waiver amounted to 0.01% and 0.01%, respectively. |
| ^ | The net asset value and total return include adjustments in accordance with accounting principles generally accepted in the United States of America for financial reporting purposes. As such, the net asset value and total return for shareholder transactions may differ from financial statements. |
See notes to financial statements.
| 118 | ALLIANCEBERNSTEIN GLOBAL HIGH INCOME FUND |
abfunds.com | |
REPORT OF INDEPENDENT REGISTERED
PUBLIC ACCOUNTING FIRM
To the Board of Directors and Shareholders of
AllianceBernstein Global High Income Fund, Inc.
Opinion on the Financial Statements
We have audited the accompanying statement of assets and liabilities of AllianceBernstein Global High Income Fund, Inc. (the “Fund”), including the portfolio of investments, as of March 31, 2023, and the related statement of operations for the year then ended, the statements of changes in net assets for each of the two years in the period then ended, the financial highlights for each of the five years in the period then ended and the related notes (collectively referred to as the “financial statements”). In our opinion, the financial statements present fairly, in all material respects, the financial position of the Fund at March 31, 2023, the results of its operations for the year then ended, the changes in its net assets for each of the two years in the period then ended and its financial highlights for each of the five years in the period then ended, in conformity with U.S. generally accepted accounting principles.
Basis for Opinion
These financial statements are the responsibility of the Fund’s management. Our responsibility is to express an opinion on the Fund’s financial statements based on our audits. We are a public accounting firm registered with the Public Company Accounting Oversight Board (United States) (“PCAOB”) and are required to be independent with respect to the Fund in accordance with the U.S. federal securities laws and the applicable rules and regulations of the Securities and Exchange Commission and the PCAOB.
We conducted our audits in accordance with the standards of the PCAOB. Those standards require that we plan and perform the audit to obtain reasonable assurance about whether the financial statements are free of material misstatement, whether due to error or fraud. The Fund is not required to have, nor were we engaged to perform, an audit of the Fund’s internal control over financial reporting. As part of our audits we are required to obtain an understanding of internal control over financial reporting but not for the purpose of expressing an opinion on the effectiveness of the Fund’s internal control over financial reporting. Accordingly, we express no such opinion.
Our audits included performing procedures to assess the risks of material misstatement of the financial statements, whether due to error or fraud, and performing procedures that respond to those risks. Such procedures included examining, on a test basis, evidence regarding the amounts and disclosures in the financial statements. Our procedures included
| abfunds.com | ALLIANCEBERNSTEIN GLOBAL HIGH INCOME FUND | 119 | |
REPORT OF INDEPENDENT REGISTERED
PUBLIC ACCOUNTING FIRM (continued)
confirmation of securities owned as of March 31, 2023, by correspondence with the custodian, brokers and others; when replies were not received from brokers or others, we performed other auditing procedures. Our audits also included evaluating the accounting principles used and significant estimates made by management, as well as evaluating the overall presentation of the financial statements. We believe that our audits provide a reasonable basis for our opinion.

We have served as the auditor of one or more of the AB investment companies since 1968.
New York, New York
May 26, 2023
| 120 | ALLIANCEBERNSTEIN GLOBAL HIGH INCOME FUND |
abfunds.com | |
2023 FEDERAL TAX INFORMATION
(unaudited)
For Federal income tax purposes, the following information is furnished with respect to the distributions paid by the Fund during the taxable year ended March 31, 2023. For individual shareholders, the Fund designates 1.22% of dividends paid as qualified dividend income. For corporate shareholders, 1.22% of dividends paid qualify for the dividends received deduction.
For foreign shareholders, 50.88% of ordinary dividends paid may be considered to be qualifying to be taxed as interest-related dividends.
Shareholders should not use the above information to prepare their income tax returns. The information necessary to complete your income tax returns will be included with your Form 1099-DIV which will be sent to you separately in January 2024.
| abfunds.com | ALLIANCEBERNSTEIN GLOBAL HIGH INCOME FUND | 121 | |
(unaudited)
AllianceBernstein Global High Income Fund
Shareholders whose shares are registered in their own names will automatically be participants in the Dividend Reinvestment Plan (the “Plan”), pursuant to which distributions to shareholders will be paid in or reinvested in additional shares of the Fund, unless they elect to receive cash. Computershare Trust Company N.A. (the “Agent”) will act as agent for participants under the Plan. Shareholders whose shares are held in the name of a broker or nominee should contact such broker or nominee to determine whether or how they may participate in the Plan.
If the Board declares a distribution payable either in shares or in cash, as holders of the Common Stock may have elected, non-participants in the Plan will receive cash and participants in the Plan will receive the equivalent in shares of Common Stock of the Fund valued as follows:
| (i) | If the shares of Common Stock are trading at net asset value or at a premium above net asset value at the time of valuation, the Fund will issue new shares at the greater of net asset value or 95% of the then current market price. |
| (ii) | If the shares of Common Stock are trading at a discount from net asset value at the time of valuation, the Agent will receive the distribution in cash and apply it to the purchase of the Fund’s shares of Common Stock in the open market on the New York Stock Exchange or elsewhere, for the participants’ accounts. Such purchases will be made on or shortly after the payment date for such distribution and in no event more than 30 days after such date except where temporary curtailment or suspension of purchase is necessary to comply with Federal securities laws. If, before the Agent has completed its purchases, the market price exceeds the net asset value of a share of Common Stock, the average purchase price per share paid by the Agent may exceed the net asset value of the Fund’s shares of Common Stock, resulting in the acquisition of fewer shares than if the distribution had been paid in shares issued by the Fund. |
The Agent will maintain all shareholders’ accounts in the Plan and furnish written confirmation of all transactions in the account, including information needed by shareholders for tax records. Shares in the account of each Plan participant will be held by the Agent in non-certificate form in the name of the participant, and each shareholder’s proxy will include those shares purchased or received pursuant to the Plan.
There will be no charges with respect to shares issued directly by the Fund to satisfy the dividend reinvestment requirements. However, each participant
| 122 | ALLIANCEBERNSTEIN GLOBAL HIGH INCOME FUND |
abfunds.com | |
ADDITIONAL INFORMATION (continued)
will pay a pro rata share of brokerage commissions incurred with respect to the Agent’s open market purchases of shares.
The automatic reinvestment of distributions will not relieve participants of any income taxes that may be payable (or required to be withheld) on distributions.
Experience under the Plan may indicate that changes are desirable. Accordingly, the Fund reserves the right to amend or terminate the Plan as applied to any voluntary cash payments made and any dividend or distribution paid subsequent to written notice of the change sent to participants in the Plan at least 90 days before the record date for such dividend or distribution. The Plan may also be amended or terminated by the Agent on at least 90 days written notice to participants in the Plan. All correspondence concerning the Plan should be directed to the Agent at Computershare Trust Company N.A., P.O. Box 30170 College Point, TX 77842-3170.
| abfunds.com | ALLIANCEBERNSTEIN GLOBAL HIGH INCOME FUND | 123 | |
BOARD OF DIRECTORS
| Garry L. Moody(1), Jorge A. Bermudez(1) Michael J. Downey(1) Onur Erzan, President and Chief Executive Officer |
Nancy P. Jacklin(1) Jeanette W. Loeb(1) Carol C. McMullen(1) Marshall C. Turner, Jr.(1) |
OFFICERS
| Christian DiClementi(2), Vice President Gershon M. Distenfeld(2), Vice President Fahd Malik(2), Vice President Matthew S. Sheridan(2), Vice President William Smith(2), Vice President |
Nancy E. Hay, Secretary Michael B. Reyes, Senior Vice President Joseph J. Mantineo, Treasurer and Chief Financial Officer Stephen M. Woetzel, Controller Jennifer Friedland, Chief Compliance Officer |
| Administrator AllianceBernstein, L.P. 501 Commerce Street Nashville, TN 37203
Custodian and Accounting Agent Brown Brothers Harriman & Co. 50 Post Office Square Boston, MA 02110
Dividend Paying Agent, Transfer Agent and Registrar Computershare Trust Company, N.A. P.O. Box 505000 Louisville, KY 40233 |
Independent Registered Public Accounting Firm Ernst & Young LLP One Manhattan West New York, NY 10001
Legal Counsel Seward & Kissel LLP One Battery Park Plaza New York, NY 10004 |
| 1 | Member of the Audit Committee, the Governance and Nominating Committee and the Independent Directors Committee. |
| 2 | The day-to-day management of, and investment decisions for, the Fund’s portfolio are made by the Adviser’s Global High Income Investment Team. While all members of the team work jointly to determine the majority of the investment strategy including stock selection for the Fund, Messrs. DiClementi, Distenfeld, Malik, Sheridan and Smith, members of the Global High Income Investment Team, are primarily responsible for the day-to-day management of the Fund’s portfolio. |
| Notice is hereby given in accordance with Section 23(c) of the Investment Company Act of 1940 that the Fund may purchase from time to time at market prices shares of its Common Stock in the open market. |
| This report, including the financial statements herein, is transmitted to the shareholders of AllianceBernstein Global High Income Fund for their information. The financial information included herein is taken from the records of the Fund. This is not a prospectus, circular or representation intended for use in the purchase of shares of the Fund or any securities mentioned in this report. |
| Annual Certifications—As required, on April 19, 2023, the Fund submitted to the New York Stock Exchange (“NYSE”) the annual certification of the Fund’s Chief Executive Officer certifying that he is not aware of any violation of the NYSE’s Corporate Governance listing standards. The Fund also has included the certifications of the Fund’s Chief Executive Officer and Chief Financial Officer required by Section 302 of the Sarbanes-Oxley Act of 2002 as exhibits to the Fund’s Form N-CSR filed with the Securities and Exchange Commission for the reporting period. |
| 124 | ALLIANCEBERNSTEIN GLOBAL HIGH INCOME FUND |
abfunds.com | |
MANAGEMENT OF THE FUND
Board of Directors Information
The business and affairs of the Fund are managed under the direction of the Board of Directors. Certain information concerning the Fund’s Directors is set forth below.
| NAME, ADDRESS* AND AGE (YEAR FIRST ELECTED**) |
PRINCIPAL OCCUPATION(S) DURING PAST FIVE YEARS AND OTHER RELEVANT QUALIFICATIONS*** |
PORTFOLIOS IN AB FUND COMPLEX OVERSEEN BY DIRECTOR |
OTHER PUBLIC COMPANY DIRECTORSHIPS CURRENTLY HELD BY DIRECTOR | |||||
| INTERESTED DIRECTOR | ||||||||
| Onur Erzan# 47 (2021) |
Senior Vice President of AllianceBernstein L.P. (the “Adviser”), Head of Global Client Group and Head of Private Wealth. He oversees AB’s entire private wealth management business and third-party institutional and retail franchise, where he is responsible for all client services, sales and marketing, as well as product strategy, management and development worldwide. Director, President and Chief Executive Officer of the AB Mutual Funds as of April 1, 2021. He is also a member of the Equitable Holdings Management Committee. Prior to joining the firm in January 2021, he spent over 19 years with McKinsey (management consulting firm), most recently as a senior partner and co-leader of its Wealth & Asset Management practice. In addition, he co-led McKinsey’s Banking & Securities Solutions (a portfolio of data, analytics and digital assets and capabilities) globally. |
76 | None | |||||
| abfunds.com | ALLIANCEBERNSTEIN GLOBAL HIGH INCOME FUND | 125 | |
MANAGEMENT OF THE FUND (continued)
| NAME, ADDRESS* AND AGE (YEAR FIRST ELECTED**) |
PRINCIPAL OCCUPATION(S) DURING PAST FIVE YEARS AND OTHER RELEVANT QUALIFICATIONS*** |
PORTFOLIOS IN AB FUND COMPLEX OVERSEEN BY DIRECTOR |
OTHER PUBLIC COMPANY DIRECTORSHIPS CURRENTLY HELD BY DIRECTOR | |||||
| DISINTERESTED DIRECTORS | ||||||||
| Garry L. Moody,## Chairman of the Board 71 (2008) |
Private Investor since prior to 2018. Formerly, Partner, Deloitte & Touche LLP (1995-2008) where he held a number of senior positions, including Vice Chairman, and U.S. and Global Investment Management Practice Managing Partner; President, Fidelity Accounting and Custody Services Company (1993-1995), where he was responsible for accounting, pricing, custody and reporting for the Fidelity mutual funds; and Partner, Ernst & Young LLP (1975-1993), where he served as the National Director of Mutual Fund Tax Services and Managing Partner of its Chicago Office Tax department. He is a member of the Investment Company Institute’s Board of Governors and the Independent Directors Council’s Governing Council, where he serves as Chairman of the Governance Committee. He is Chairman of the AB Funds and Chairman of the Independent Directors Committees since January 2023; he has served as a director or trustee since 2008, and served as Chairman of the Audit Committee of such Funds from 2008 to February 2023. |
76 | None | |||||
| 126 | ALLIANCEBERNSTEIN GLOBAL HIGH INCOME FUND |
abfunds.com | |
MANAGEMENT OF THE FUND (continued)
| NAME, ADDRESS* AND AGE (YEAR FIRST ELECTED**) |
PRINCIPAL OCCUPATION(S) DURING PAST FIVE YEARS AND OTHER RELEVANT QUALIFICATIONS*** |
PORTFOLIOS IN AB FUND COMPLEX OVERSEEN BY DIRECTOR |
OTHER PUBLIC COMPANY DIRECTORSHIPS CURRENTLY HELD BY DIRECTOR | |||||
| DISINTERESTED DIRECTORS (continued) |
||||||||
| Jorge A. Bermudez,## |
Private Investor since prior to 2018. Formerly, Chief Risk Officer of Citigroup, Inc., a global financial services company, from November 2007 to March 2008, Chief Executive Officer of Citigroup’s Commercial Business Group in North America and Citibank Texas from 2005 to 2007, and a variety of other executive and leadership roles at various businesses within Citigroup prior to then; Chairman (2018) of the Texas A&M Foundation Board of Trustees (Trustee since 2013) and Chairman of the Smart Grid Center Board at Texas A&M University since 2012; director of, among others, Citibank N.A. from 2005 to 2008, the Federal Reserve Bank of Dallas, Houston Branch from 2009 to 2011, the Federal Reserve Bank of Dallas from 2011 to 2017, and the Electric Reliability Council of Texas from 2010 to 2016; and Chair of the Audit Committee of the Board of Directors of Moody’s Corporation since December 2022. He has served as director or trustee of the AB Funds since January 2020. | 76 | Moody’s Corporation since April 2011 | |||||
| Michael J. Downey,## 79 (2005) |
Private Investor since prior to 2018. Formerly, Chairman of The Asia Pacific Fund, Inc. (registered investment company) since prior to 2018 until January 2019. From 1987 until 1993, Chairman and CEO of Prudential Mutual Fund Management, director of the Prudential mutual funds, and member of the Executive Committee of Prudential Securities, Inc. He has served as a director or trustee of the AB Funds since 2005. | 76 | None | |||||
| abfunds.com | ALLIANCEBERNSTEIN GLOBAL HIGH INCOME FUND | 127 | |
MANAGEMENT OF THE FUND (continued)
| NAME, ADDRESS* AND AGE (YEAR FIRST ELECTED**) |
PRINCIPAL OCCUPATION(S) DURING PAST FIVE YEARS AND OTHER RELEVANT QUALIFICATIONS*** |
PORTFOLIOS IN AB FUND COMPLEX OVERSEEN BY DIRECTOR |
OTHER PUBLIC COMPANY DIRECTORSHIPS CURRENTLY HELD BY DIRECTOR | |||||
| DISINTERESTED DIRECTORS (continued) |
||||||||
| Nancy P. Jacklin,## 75 (2006) |
Private Investor since prior to 2018. Professorial Lecturer at the Johns Hopkins School of Advanced International Studies (2008-2015). U.S. Executive Director of the International Monetary Fund (which is responsible for ensuring the stability of the international monetary system), (December 2002-May 2006); Partner, Clifford Chance (1992-2002); Sector Counsel, International Banking and Finance, and Associate General Counsel, Citicorp (1985-1992); Assistant General Counsel (International), Federal Reserve Board of Governors (1982-1985); and Attorney Advisor, U.S. Department of the Treasury (1973-1982). Member of the Bar of the District of Columbia and of New York; and member of the Council on Foreign Relations. She has served as a director or trustee of the AB Funds since 2006 and has been Chair of the Governance and Nominating Committees of the AB Funds since August 2014. | 76 | None | |||||
| Jeanette W. Loeb,## 70 (2020) |
Chief Executive Officer of PetCareRx (e-commerce pet pharmacy) from 2002 to 2011 and 2015 to present. Director of New York City Center since 2005. She was a director of AB Multi-Manager Alternative Fund (fund of hedge funds) from 2012 to 2018. Formerly, affiliated with Goldman Sachs Group, Inc. (financial services) from 1977 to 1994, including as a partner thereof from 1986 to 1994. She has served as a Director of the AB Funds since April 2020. | 76 | Apollo Investment Corp. (business development company) since August 2011 | |||||
| 128 | ALLIANCEBERNSTEIN GLOBAL HIGH INCOME FUND |
abfunds.com | |
MANAGEMENT OF THE FUND (continued)
| NAME, ADDRESS* AND AGE (YEAR FIRST ELECTED**) |
PRINCIPAL OCCUPATION(S) DURING PAST FIVE YEARS AND OTHER RELEVANT QUALIFICATIONS*** |
PORTFOLIOS IN AB FUND COMPLEX OVERSEEN BY DIRECTOR |
OTHER PUBLIC COMPANY DIRECTORSHIPS CURRENTLY HELD BY DIRECTOR | |||||
| DISINTERESTED DIRECTORS (continued) |
||||||||
| Carol C. McMullen,## 67 (2016) |
Managing Director of Slalom Consulting (consulting) since 2014, private investor and a member of the Advisory Board of Butcher Box (since 2018). Formerly, member, Partners Healthcare Investment Committee (2010-2019); Director of Norfolk & Dedham Group (mutual property and casualty insurance) from 2011 until November 2016; Director of Partners Community Physicians Organization (healthcare) from 2014 until December 2016; and Managing Director of The Crossland Group (consulting) from 2012 until 2013. She has held a number of senior positions in the asset and wealth management industries, including at Eastern Bank (where her roles included President of Eastern Wealth Management), Thomson Financial (Global Head of Sales for Investment Management), and Putnam Investments (where her roles included Chief Investment Officer, Core and Growth and Head of Global Investment Research). She has served on a number of private company and non-profit boards, and as a director or trustee of the AB Funds since June 2016 and serves as Chair of the Audit Committees of such Funds since February 2023. | 76 | None | |||||
| abfunds.com | ALLIANCEBERNSTEIN GLOBAL HIGH INCOME FUND | 129 | |
MANAGEMENT OF THE FUND (continued)
| NAME, ADDRESS* AND AGE (YEAR FIRST ELECTED**) |
PRINCIPAL OCCUPATION(S) DURING PAST FIVE YEARS AND OTHER RELEVANT QUALIFICATIONS*** |
PORTFOLIOS IN AB FUND COMPLEX OVERSEEN BY DIRECTOR |
OTHER PUBLIC COMPANY DIRECTORSHIPS CURRENTLY HELD BY DIRECTOR | |||||
| DISINTERESTED DIRECTORS (continued) |
||||||||
| Marshall C. Turner, Jr.,## 81 (2005) |
Private Investor since prior to 2018. Former Chairman and CEO of Dupont Photomasks, Inc. (semi-conductor manufacturing equipment). He was a Director of Xilinx, Inc. (programmable logic semi-conductors and adaptable, intelligent computing) from 2007 through August 2020, and is a former director of 33 other companies and organizations. He has extensive operating leadership and venture capital investing experience, including five interim or full-time CEO roles, and prior service as general partner of institutional venture capital partnerships. He also has extensive non-profit board leadership experience, and currently serves on the board of the George Lucas Educational Foundation. He has served as a director of one AB Fund since 1992, and director or trustee of all AB Funds since 2005. He has served as both Chairman of the AB Funds and Chairman of the Independent Directors Committees from 2014 through December 2022. |
76 | None | |||||
| * | The address for each of the Fund’s disinterested Directors is c/o AllianceBernstein L.P., Attention: Legal and Compliance Department—Mutual Fund Legal, 1345 Avenue of the Americas, New York, NY 10105. |
| ** | There is no stated term of office for the Fund’s Directors. |
| *** | The information above includes each Director’s principal occupation during the last five years and other information relating to the experience, attributes and skills relevant to each Director’s qualifications to serve as a Director, which lead to the conclusion that each Director should serve as a Director for the Fund. |
| # | Mr. Erzan is an “interested person” of the Fund, as defined in the 1940 Act, due to his position as a Senior Vice President of the Adviser. |
| ## | Member of the Audit Committee, the Governance and Nominating Committee and the Independent Directors Committee. |
| 130 | ALLIANCEBERNSTEIN GLOBAL HIGH INCOME FUND |
abfunds.com | |
MANAGEMENT OF THE FUND (continued)
Officer Information
Certain information concerning the Fund’s Officers is listed below.
| NAME, ADDRESS* AND AGE |
POSITION(S) HELD WITH FUND |
PRINCIPAL OCCUPATION DURING PAST FIVE YEARS | ||
| Onur Erzan, 47 |
President and Chief Executive Officer | See biography above. | ||
| Gershon M. Distenfeld, 47 |
Vice President | Senior Vice President of the Adviser**, with which he has been associated since prior to 2018. He is also co-Head of Fixed-Income. | ||
| Christian DiClementi, 41 |
Vice President | Senior Vice President of the Adviser**, with which he has been associated since prior to 2018. | ||
| Matthew Sheridan, 47 |
Vice President | Senior Vice President of the Adviser**, with which he has been associated since prior to 2018. He is also Director – US Multi-Sector Fixed Income. | ||
| Fahd Malik, 38 |
Vice President | Senior Vice President of the Adviser**, with which he has been associated since prior to 2018. | ||
| William Smith, 36 |
Vice President | Senior Vice President of the Adviser**, with which he associated since prior to 2018. He is also Director of US High Yield Credit. | ||
| Nancy E. Hay, 50 |
Secretary | Vice President and Counsel of the Adviser**, with which she has been associated since prior to 2018 and Assistant Secretary of ABI**. | ||
| Michael B. Reyes, 46 |
Senior Vice President | Vice President of the Adviser**, with which he has been associated since prior to 2018. | ||
| Joseph J. Mantineo, 64 |
Treasurer and Chief Financial Officer | Senior Vice President of AllianceBernstein Investor Services, Inc. (“ABIS”)**, with which he has been associated since prior to 2018. | ||
| Stephen M. Woetzel, 51 |
Controller | Senior Vice President of ABIS**, with which he has been associated since prior to 2018. | ||
| Jennifer Friedland, 48 |
Chief Compliance Officer | Vice President of the Adviser since 2020 and Mutual Fund Chief Compliance Officer (of all Funds since January 2023 and of the ETF Funds since 2022). Before joining the Adviser in 2020, she was Chief Compliance Officer at WestEnd Advisors, LLC from prior to 2018 until 2019. |
| * | The address for each of the Fund’s Officers is 1345 Avenue of the Americas, New York, NY 10105. |
| ** | The Adviser, ABI and ABIS are affiliates of the Fund. |
| abfunds.com | ALLIANCEBERNSTEIN GLOBAL HIGH INCOME FUND | 131 | |
Information Regarding the Review and Approval of the Fund’s Advisory and Administration Agreements
The disinterested directors (the “directors”) of AllianceBernstein Global High Income Fund, Inc. (the “Fund”) unanimously approved the continuance of the Fund’s Advisory Agreement with the Adviser and the continuance of the Fund’s Administration Agreement with the Adviser (in such capacity, the “Administrator”) at a meeting held in-person on November 1-3, 2022 (the “Meeting”).
Prior to approval of the continuance of the Advisory Agreement and the Administration Agreement, the directors had requested from the Adviser, and received and evaluated, extensive materials. They reviewed the proposed continuance of the Advisory Agreement and Administration Agreement with the Adviser and with experienced counsel who are independent of the Adviser, who advised on the relevant legal standards. The directors also reviewed additional materials, including comparative analytical data prepared by the Senior Vice President of the Fund. The directors also discussed the proposed continuance in private sessions with counsel.
The directors considered their knowledge of the nature and quality of the services provided by the Adviser to the Fund gained from their experience as directors or trustees of most of the registered investment companies advised by the Adviser, their overall confidence in the Adviser’s integrity and competence they have gained from that experience, the Adviser’s initiative in identifying and raising potential issues with the directors and its responsiveness, frankness and attention to concerns raised by the directors in the past, including the Adviser’s willingness to consider and implement organizational and operational changes designed to improve investment results and the services provided to the AB Funds. The directors noted that they have four regular meetings each year, at each of which they review extensive materials and information from the Adviser, including information on the investment performance of the Fund and the money market fund advised by the Adviser in which the Fund invests a portion of its assets.
The directors also considered all factors they believed relevant, including the specific matters discussed below. During the course of their deliberations, the directors evaluated, among other things, the reasonableness of the advisory fee. The directors did not identify any particular information that was all-important or controlling, and different directors may have attributed different weights to the various factors. The directors determined that the selection of the Adviser to manage the Fund and the Administrator to provide administrative services to the Fund and the overall arrangements (i) between the Fund and the Adviser, as provided in the Advisory Agreement, including the advisory fee and (ii) between the Fund and the Administrator, as provided in the Administration Agreement, including the administration fee, were fair and reasonable in light of the services performed, expenses incurred and such other matters as the directors
| 132 | ALLIANCEBERNSTEIN GLOBAL HIGH INCOME FUND |
abfunds.com | |
considered relevant in the exercise of their business judgment. The material factors and conclusions that formed the basis for the directors’ determinations included the following:
Nature, Extent and Quality of Services Provided
The directors considered the scope and quality of services provided by the Adviser under the Advisory Agreement and by the Administrator under the Administration Agreement, including the quality of the investment research capabilities of the Adviser and the other resources it has dedicated to performing services for the Fund and the resources the Administrator has devoted to providing services to the Fund. The directors noted that the Adviser from time to time reviews the Fund’s investment strategies and from time to time proposes changes intended to improve the Fund’s relative or absolute performance for the directors’ consideration. They also noted the professional experience and qualifications of the Fund’s portfolio management team and other senior personnel of the Adviser. The directors noted that the Adviser receives reimbursements for certain clerical, accounting, administrative and other services provided to the Fund by the Adviser pursuant to the Administration Agreement. The directors noted that the methodology used to determine the reimbursement amounts had been reviewed by an independent consultant at the request of the directors. The quality of administrative and other services, including the Adviser’s role in coordinating the activities of the Fund’s other service providers, also was considered. The directors concluded that, overall, they were satisfied with the nature, extent and quality of services provided to the Fund under the Advisory Agreement and the Administration Agreement.
Costs of Services Provided and Profitability
The directors reviewed a schedule of the revenues and expenses and related notes indicating the profitability of the Fund to the Adviser (including in its capacity as Administrator) for calendar years 2020 and 2021 that had been prepared with an expense allocation methodology arrived at in consultation with an independent consultant at the request of the directors. The directors noted the assumptions and methods of allocation used by the Adviser in preparing fund-specific profitability data and understood that there are a number of potentially acceptable allocation methodologies for information of this type. The directors noted that the profitability information reflected all revenues and expenses of the Adviser’s relationship with the Fund, including those relating to its subsidiary that provides shareholder services to the Fund. The directors recognized that it is difficult to make comparisons of the profitability of the Advisory Agreement with the profitability of fund advisory contracts for unaffiliated funds because comparative information is not generally publicly available and is affected by numerous factors. The directors focused on the profitability of the Adviser’s relationship with the Fund before taxes. The directors concluded that the Adviser’s level of profitability from its relationship with the Fund was not unreasonable.
| abfunds.com | ALLIANCEBERNSTEIN GLOBAL HIGH INCOME FUND | 133 | |
Fall-Out Benefits
The directors considered the other benefits to the Adviser and its affiliates from their relationships with the Fund and the money market fund advised by the Adviser in which the Fund invests, including, but not limited to, benefits relating to shareholder servicing fees paid by the Fund to a wholly owned subsidiary of the Adviser. The directors recognized that the Adviser’s profitability would be somewhat lower without these benefits. The directors understood that the Adviser also might derive reputational and other benefits from its association with the Fund.
Investment Results
In addition to the information reviewed by the directors in connection with the Meeting, the directors receive detailed performance information for the Fund at each regular Board meeting during the year.
At the Meeting, the directors reviewed performance information prepared by an independent service provider (the “15(c) service provider”), showing the Fund’s performance against a group of similar funds (“peer group”) and a larger group of similar funds (“peer universe”), each selected by the 15(c) service provider, and information prepared by the Adviser showing the Fund’s performance against a broad-based securities market index, in each case for the 1-, 3-, 5- and 10-year periods ended July 31, 2022. Based on their review, the directors concluded that the Fund’s investment performance was acceptable.
Advisory Fees and Other Expenses
The directors considered the management fee rate payable by the Fund (the combined advisory fee payable to the Adviser and administration fee payable to the Administrator) and information prepared by the 15(c) service provider concerning advisory fee rates payable by other funds in the same category as the Fund. They compared the combined advisory and administration fees payable by the Fund to the advisory fees of other funds where there is no separate administrator. The directors recognized that it is difficult to make comparisons of advisory fees because there are variations in the services that are included in the fees payable by other funds. The directors compared the Fund’s contractual total management fee rate (the combined advisory fee payable to the Adviser plus the administration fee payable to the Administrator) with a peer group median. The directors noted that the total management fee rate was expressed as a percentage of net assets and would have been lower if expressed as a percentage of average total assets (i.e., net assets plus assets supported by leverage).
The directors also compared the Fund’s contractual advisory fee rate with the fee rate charged by the Adviser for advising an open-end high income fund that also invested globally, and noted historical differences in their fee structures.
| 134 | ALLIANCEBERNSTEIN GLOBAL HIGH INCOME FUND |
abfunds.com | |
The Adviser informed the directors that there were no institutional products managed by the Adviser that utilize investment strategies similar to those of the Fund.
In connection with their review of the Fund’s advisory fee, the directors also considered the total expense ratio of the Fund in comparison to a peer group selected by the 15(c) service provider. The expense ratio of the Fund was based on the Fund’s latest fiscal year. The directors noted that it was likely that the expense ratios of some of the other funds in the Fund’s category were lowered by waivers or reimbursements by those funds’ investment advisers, which in some cases might be voluntary or temporary. The directors view expense ratio information as relevant to their evaluation of the Adviser’s services because the Adviser is responsible for coordinating services provided to the Fund by others. Based on their review, the directors concluded that the Fund’s expense ratio was acceptable.
Economies of Scale
The advisory fee schedule for the Fund does not contain breakpoints that reduce the fee rates on assets above specified levels. The directors considered that the Fund is a closed-end fixed-income fund and was not expected to have meaningful asset growth (absent a rights offering or an acquisition). In such circumstances, the directors did not view the potential for realization of economies of scale as the Fund’s assets grow to be a material factor in their deliberations. They noted that, if the Fund’s net assets were to increase materially, they would review whether potential economies of scale were being realized.
| abfunds.com | ALLIANCEBERNSTEIN GLOBAL HIGH INCOME FUND | 135 | |
INFORMATION REGARDING INVESTMENT OBJECTIVE,
INVESTMENT POLICIES AND PRINCIPAL RISKS
Recent Changes to Investment Objective, Investment Policies and Principal Risks
The following is a summary of certain material changes to the Fund’s investment objective, investment policies and principal risks during the most recent fiscal year. This information may not reflect all of the changes that have occurred since you purchased shares of the Fund.
None.
Investment Objective
The Fund’s primary investment objective is to seek high current income. Its secondary investment objective is capital appreciation.
The investment objective is fundamental and may not be changed without the approval of a “majority of the outstanding voting securities” of the Fund, as defined in the Investment Company Act of 1940.
Investment Policies
The Fund is permitted to invest without limit in debt securities, including Sovereign Debt Obligations (defined as U.S. Dollar-denominated debt securities issued or guaranteed by foreign governments, including participations in loans between foreign governments and financial institutions and interests in entities organized and operated for the purpose of restructuring the investment characteristics of instruments issued or guaranteed by foreign governments) and corporate debt, denominated in non-U.S. currencies as well as in the U.S. Dollar. In addition, the Fund may invest without limit in emerging and developed markets and in debt securities of U.S. and non-U.S. corporate issuers.
The Fund will not invest 25% or more of its total assets in the Sovereign Debt Obligations of any one country other than the U.S.
Substantially all of the Fund’s investments will be in high yield, high risk debt securities that are low-rated (i.e., below investment-grade) or unrated and in both cases that are considered to be predominantly speculative as regards the issuer’s capacity to pay interest and repay principal.
Principal Investment Risks
See the earlier description of the Fund’s risks under “Disclosures and Risks.”
Fundamental Investment Restrictions
The Fund has adopted the following investment restrictions, which may not be changed without the approval of the holders of a “majority of the Fund’s
| 136 | ALLIANCEBERNSTEIN GLOBAL HIGH INCOME FUND |
abfunds.com | |
INFORMATION REGARDING INVESTMENT OBJECTIVE,
INVESTMENT POLICIES AND PRINCIPAL RISKS (continued)
outstanding voting securities.” A “majority of the Fund’s outstanding voting securities” means the lesser of (i) 67% of the shares of the Fund represented at a meeting at which more than 50% of the outstanding shares are present in person or represented by proxy, or (ii) more than 50% of the outstanding shares. The percentage limitations set forth below apply only at the time an investment is made or other relevant action is taken by the Fund.
| 1. | The Fund will not make loans except through (a) the purchase of debt obligations in accordance with its investment objective and policies; (b) the lending of portfolio securities; or (c) the use of repurchase agreements; |
| 2. | The Fund will not invest 25% or more of its total assets in securities of issuers conducting their principal business activities in the same industry, except that this restriction does not apply to U.S. Government Securities; |
| 3. | The Fund will not borrow money, except the Fund may borrow (a) from a bank or other entity in a privately arranged transaction and issue commercial paper, bonds, debentures or notes, in series or otherwise, with such interest rates, conversion rights and other terms and provisions as are determined by the Fund’s Board, if after such borrowing or issuance there is asset coverage of at least 300% as defined in the Investment Company Act of 1940 Act, as amended, and (b) for temporary purposes in an amount not exceeding 5% of the value of the total assets of the Fund; |
| 4. | The Fund will not pledge, hypothecate, mortgage or otherwise encumber its assets, except to secure permitted borrowings; |
| 5. | The Fund will not invest in companies for the purpose of exercising control; |
| 6. | The Fund will not make short sales of securities or maintain a short position, unless at all times when a short position is open it owns an equal amount of such securities or securities convertible into or exchangeable for, without payment of any further consideration, securities of the same issue as, and equal in amount to, the securities sold short (“short sales against the box”), and unless not more than 10% of the Fund’s net assets (taken at market value) is held as collateral for such sales at any one time (it is the Fund’s present intention to make such sales only for the purpose of deferring realization of gain or loss for federal income tax purposes); |
| 7. | The Fund will not (a) purchase or sell real estate, except that it may purchase and sell securities of companies which deal in real |
| abfunds.com | ALLIANCEBERNSTEIN GLOBAL HIGH INCOME FUND | 137 | |
INFORMATION REGARDING INVESTMENT OBJECTIVE,
INVESTMENT POLICIES AND PRINCIPAL RISKS (continued)
| estate or interests therein and securities that are secured by real estate, provided such securities are Sovereign Debt Obligations; (b) purchase or sell commodities or commodity contracts; (c) invest in interests in oil, gas, or other mineral exploration or development programs; and (d) purchase securities on margin, except for such short-term credits as may be necessary for the clearance of transactions; |
| 8. | The Fund will not own more than 3% of the total outstanding voting stock of any investment company and not more than 5% of the value of the Fund’s total assets may be invested in the securities of any investment company; and |
| 9. | The Fund will not act as an underwriter of securities, except that the Fund may acquire restricted securities under circumstances in which, if such securities were sold, the Fund might be deemed to be an underwriter for purposes of the Securities Act of 1933. |
| 138 | ALLIANCEBERNSTEIN GLOBAL HIGH INCOME FUND |
abfunds.com | |
This page is not part of the Shareholder Report or the Financial Statements.
AB FAMILY OF FUNDS
US EQUITY
CORE
Core Opportunities Fund
Select US Equity Portfolio
Sustainable US Thematic Portfolio
GROWTH
Concentrated Growth Fund
Discovery Growth Fund
Growth Fund
Large Cap Growth Fund
Small Cap Growth Portfolio
VALUE
Discovery Value Fund
Equity Income Fund
Relative Value Fund
Small Cap Value Portfolio
Value Fund
INTERNATIONAL/ GLOBAL EQUITY
CORE
Global Core Equity Portfolio
International Strategic Core Portfolio
Sustainable Global Thematic Fund
Sustainable International Thematic Fund
Tax-Managed Wealth Appreciation Strategy
Wealth Appreciation Strategy
GROWTH
Concentrated International Growth Portfolio
VALUE
All China Equity Portfolio
International Value Fund
FIXED INCOME
MUNICIPAL
High Income Municipal Portfolio
Intermediate California Municipal Portfolio
Intermediate Diversified Municipal Portfolio
Intermediate New York Municipal Portfolio
Municipal Bond Inflation Strategy
Tax-Aware Fixed Income Opportunities Portfolio
National Portfolio
Arizona Portfolio
California Portfolio
Massachusetts Portfolio
Minnesota Portfolio
New Jersey Portfolio
New York Portfolio
Ohio Portfolio
Pennsylvania Portfolio
Virginia Portfolio
TAXABLE
Bond Inflation Strategy
Global Bond Fund
High Income Fund
Income Fund
Intermediate Duration Portfolio
Limited Duration High Income Portfolio
Short Duration Income Portfolio
Short Duration Portfolio
Sustainable Thematic Credit Portfolio
Total Return Bond Portfolio
ALTERNATIVES
All Market Real Return Portfolio
Global Real Estate Investment Fund
Select US Long/Short Portfolio
MULTI-ASSET
All Market Total Return Portfolio
Emerging Markets Multi-Asset Portfolio
Global Risk Allocation Fund
Sustainable Thematic Balanced Portfolio
CLOSED-END FUNDS
AllianceBernstein Global High Income Fund
AllianceBernstein National Municipal Income Fund
EXCHANGE-TRADED FUNDS
Disruptors ETF
High Yield ETF
Tax-Aware Short Duration Municipal ETF
Ultra Short Income ETF
US High Dividend ETF
US Low Volatility Equity ETF
We also offer Government Money Market Portfolio, which serves as the money market fund exchange vehicle for the AB mutual funds. You could lose money by investing in the Fund. Although the Fund seeks to preserve the value of your investment at $1.00 per share, it cannot guarantee it will do so. The Fund may impose a fee upon sale of your shares or may temporarily suspend your ability to sell shares if the Fund’s liquidity falls below required minimums because of market conditions or other factors. An investment in the Fund is not insured or guaranteed by the Federal Deposit Insurance Corporation or any other government agency. The Fund’s sponsor has no legal obligation to provide financial support to the Fund, and you should not expect that the sponsor will provide financial support to the Fund at any time.
Investors should consider the investment objectives, risks, charges and expenses of the Fund carefully before investing. For copies of our prospectus or summary prospectus, which contain this and other information, visit us online at www.abfunds.com or contact your AB representative. Please read the prospectus and/or summary prospectus carefully before investing.
| abfunds.com | ALLIANCEBERNSTEIN GLOBAL HIGH INCOME FUND | 139 | |
NOTES
| 140 | ALLIANCEBERNSTEIN GLOBAL HIGH INCOME FUND |
abfunds.com | |
Privacy Notice
AllianceBernstein and its affiliates (collectively referred to as “AllianceBernstein”, “we”, “our”, and similar pronouns) understand the importance of maintaining the confidentiality and security of our clients’ nonpublic personal information. Nonpublic personal information is personally identifiable financial information about our clients who are natural persons. To provide financial products and services to our clients, we collect nonpublic personal information from a variety of sources, including: (1) information we receive from clients, such as through applications or other forms, which can include a client’s name, address, phone number, social security number, assets, income and other household information, (2) information about client transactions with us, our affiliates and non-affiliated third parties, which can include account balances and transactions history, and (3) information from visitors to our websites provided through online forms, site visitorship data and online information-collecting devices known as “cookies.”
We may disclose all of the nonpublic personal information that we collect about our current and former clients, as described above, to non-affiliated third parties to manage our business and as otherwise required or permitted by law, including those that perform transaction processing or servicing functions, marketing services providers that provide marketing services on our behalf pursuant to a joint marketing agreement, and professional services firms that provide knowledge-based services such as accountants, consultants, lawyers and auditors to help manage client accounts. We require all the third-party providers to adhere to our privacy policy or a functional equivalent.
We may also disclose the nonpublic personal information that we collect about current and former clients, as described above, to our affiliated investment, brokerage, service and insurance companies for the purpose of marketing their products or services to clients under circumstances that are permitted by law, such as if our affiliate has its own relationship with you. We have policies and procedures to ensure that certain conditions are met before an AllianceBernstein affiliated company may use information obtained from another affiliate to solicit clients for marketing purposes.
We will also use nonpublic personal information about our clients for our own internal analysis, analytics, research and development, and to improve and add to our client offerings.
We have policies and procedures designed to safeguard the confidentiality and security of nonpublic personal information about our clients that include restricting access to nonpublic personal information to personnel that have been screened and undergone security and privacy training; to personnel who need it to perform their work functions such as our operations, customer service, account management, finance, quality, vendor management and compliance teams as required to provide services, communicate with you and fulfill our legal obligations.
We employ reasonably designed physical, electronic and procedural safeguards to secure and protect client nonpublic personal information.
If you are in the European Economic Area (“EEA”) or Switzerland, we will comply with applicable legal requirements providing adequate protection for the transfer of personal information to recipients in countries outside of the EEA and Switzerland.
For more information, our Privacy Policy statement can be viewed here: https://www.alliancebernstein.com/abcom/Privacy_Terms/PrivacyPolicy.htm.
ALLIANCEBERNSTEIN GLOBAL HIGH INCOME FUND
1345 Avenue of the Americas
New York, NY 10105
800 221 5672
GHI-0151-0323

ITEM 2. CODE OF ETHICS.
(a) The registrant has adopted a code of ethics that applies to its principal executive officer, principal financial officer and principal accounting officer. A copy of the registrant’s code of ethics is filed herewith as Exhibit 12(a)(1).
(b) During the period covered by this report, no material amendments were made to the provisions of the code of ethics adopted in 2(a) above.
(c) During the period covered by this report, no implicit or explicit waivers to the provisions of the code of ethics adopted in 2(a) above were granted.
ITEM 3. AUDIT COMMITTEE FINANCIAL EXPERT.
The registrant’s Board of Directors has determined that independent directors Garry L. Moody, Marshall C. Turner, Jr. and Jorge A. Bermudez qualify as audit committee financial experts.
ITEM 4. PRINCIPAL ACCOUNTANT FEES AND SERVICES.
(a) - (c) The following table sets forth the aggregate fees billed by the independent auditor Ernst & Young LLP, for the Fund’s last two fiscal years for professional services rendered for: (i) the audit of the Fund’s annual financial statements included in the Fund’s annual report to stockholders; (ii) assurance and related services that are reasonably related to the performance of the audit of the Fund’s financial statements and are not reported under (i), which include advice and education related to accounting and auditing issues and quarterly press release review (for those Funds that issue quarterly press releases), and preferred stock maintenance testing (for those Funds that issue preferred stock); and (iii) tax compliance, tax advice and tax return preparation.
| Audit Fees | Audit-Related Fees |
Tax Fees | ||||||||||||||
| AB Global High Income Fund |
2022 | $ | 154,767 | $ | 10,000 | $ | 23,907 | |||||||||
| 2023 | $ | 162,505 | $ | 6,000 | $ | 15,869 | ||||||||||
(d) Not applicable.
(e) (1) Beginning with audit and non-audit service contracts entered into on or after May 6, 2003, the Fund’s Audit Committee policies and procedures require the pre-approval of all audit and non-audit services provided to the Fund by the Fund’s independent registered public accounting firm. The Fund’s Audit Committee policies and procedures also require pre-approval of all audit and non-audit services provided to the Adviser and Service Affiliates to the extent that these services are directly related to the operations or financial reporting of the Fund.
(e) (2) 100% of the amounts for Audit-Related Fees and Tax Fees in the table under Item 4 (b) and (c) are for services pre-approved by the Fund’s Audit Committee. No amounts are reported for Item 4 (d).
(f) Not applicable.
(g) The following table sets forth the aggregate non-audit services provided to the Fund, the Fund’s Adviser and entities that control, are controlled by or under common control with the Adviser that provide ongoing services to the Fund:
| All Fees for Non-Audit Services Provided to the Portfolio, the Adviser and Service Affiliates |
Total Amount of Foregoing Column Pre- approved by the Audit Committee (Portion Comprised of Audit Related Fees) (Portion Comprised of Tax Fees) |
|||||||||||
| AB Global High Income Fund |
2022 | $ | 1,163,132 | $ | 33,907 | |||||||
| $ | (10,000 | ) | ||||||||||
| $ | (23,907 | ) | ||||||||||
| 2023 | $ | 2,006,552 | $ | 21,869 | ||||||||
| $ | (6,000 | ) | ||||||||||
| $ | (15,869 | ) | ||||||||||
(h) The Audit Committee of the Fund has considered whether the provision of any non-audit services not pre-approved by the Audit Committee provided by the Fund’s independent registered public accounting firm to the Adviser and Service Affiliates is compatible with maintaining the auditor’s independence.
ITEM 5. AUDIT COMMITTEE OF LISTED REGISTRANTS.
The registrant has a separately designated standing audit committee established in accordance with Section 3(a)(58)(A) of the Securities Exchange Act of 1934. The audit committee members are as follows:
| Jorge A. Bermudez | Garry L. Moody | |||
| Michael J. Downey | Marshall C. Turner, Jr. | |||
| Nancy P. Jacklin | Jeanette Loeb | |||
| Carol C. McMullen |
ITEM 6. INVESTMENTS.
Please see Schedule of Investments contained in the Report to Shareholders included under Item 1 of this Form N-CSR.
ITEM 7. DISCLOSURE OF PROXY VOTING POLICIES AND PROCEDURES FOR CLOSED-END MANAGEMENT INVESTMENT COMPANIES.
Statement of Policies and Procedures for
Proxy Voting
| 1. | INTRODUCTION |
AllianceBernstein L.P.’s (“AB,” “we,” “us,” “our” and similar terms) mission is to work in our clients’ best interests to deliver better investment outcomes through differentiated research insights and innovative portfolio solutions. As a fiduciary and investment adviser, we place the interests of our clients first and treat all our clients fairly and equitably, and we have an obligation to responsibly allocate, manage and oversee their investments to seek sustainable, long-term shareholder value.
AB has authority to vote proxies relating to securities in certain client portfolios and, accordingly, AB’s fiduciary obligations extend to AB’s exercise of such proxy voting authority for each client AB has agreed to exercise that duty. AB’s general policy is to vote proxy proposals, amendments, consents or resolutions relating to client securities, including interests in private investment funds, if any (collectively, “proxies”), in a manner that serves the best interests of each respective client as determined by AB in its discretion, after consideration of the relevant clients’ investment strategies, and in accordance with this Proxy Voting and Governance Policy (“Proxy Voting and Governance Policy” or “Policy”) and the operative agreements governing the relationship with each respective client (“Governing Agreements”). This Policy outlines our principles for proxy voting, includes a wide range of issues that often appear on voting ballots, and applies to all of AB’s internally managed assets, globally. It is intended for use by those involved in the proxy voting decision-making process and those responsible for the administration of proxy voting (“members of Responsibility team”), in order to ensure that this Policy and its procedures are implemented consistently.
To be effective stewards of our client’s investments and maximize shareholder value, we need to vote proxies on behalf of our clients responsibly. This Policy forms part of a suite of policies and frameworks beginning with AB’s Stewardship Statement that outline our approach to Responsibility, stewardship, engagement, climate change, human rights, global slavery and human trafficking, and controversial investments. Proxy voting is an integral part of this process, enabling us to support strong corporate governance structures, shareholder rights, transparency and disclosure, and encourage corporate action on material environmental, social and governance (“ESG”) and climate issues.
This Policy is overseen by the Proxy Voting and Governance Committee (“Proxy Voting and Governance Committee” or “Committee”), which provides oversight and includes senior representatives from Equities, Fixed Income, Responsibility, Legal and Operations. It is the responsibility of the Committee to evaluate and maintain proxy voting procedures and guidelines, to evaluate proposals and issues not covered by these guidelines, to consider changes in the Policy, and to review the Policy no less frequently than annually. In addition, the Committee meets at least three times a year and as necessary to address special situations.
| 2. | RESEARCH UNDERPINS DECISION MAKING |
As a research-driven firm, we approach our proxy voting responsibilities with the same commitment to rigorous research and engagement that we apply to all of our investment activities. The different investment philosophies utilized by our investment teams may occasionally result in different conclusions being drawn regarding certain proposals. In turn, our votes on some proposals may vary by issuer, while maintaining the goal of maximizing the value of the securities in client portfolios.
We sometimes manage accounts where proxy voting is directed by clients or newly acquired subsidiary companies. In these cases, voting decisions may deviate from this Policy. Where we have agreed to vote proxies on behalf of our clients, we have an obligation to vote proxies in a timely manner and we apply the principles in this Policy to our proxy decisions. To the extent there are any inconsistencies between this Policy and a client’s Governing Agreements, the Governing Agreements shall supersede this Policy.
RESEARCH SERVICES
We subscribe to the corporate governance and proxy research services of vendors such as Institutional Shareholder Services Inc. (“ISS”) and Glass Lewis at different levels. This research includes proxy voting recommendations distributed by ISS and Glass Lewis. All our investment professionals can access these materials via the members of the Responsibility team and/or the Committee.
ENGAGEMENT
In evaluating proxy issues and determining our votes, we welcome and seek perspectives of various parties. Internally, members of Responsibility team may consult the Committee, Chief Investment Officers, Portfolio Managers, and/or Research Analysts across our equities platforms, and Portfolio Managers who manage accounts in which a stock is held. Externally, we may engage with companies in advance of their Annual General Meeting, and throughout the year. We believe engagement provides the opportunity to share our philosophy, our corporate governance values, and more importantly, affect positive change that we believe will drive shareholder value. Also, these meetings often are joint efforts between the investment professionals, who are best positioned to comment on company-specific details, and members of Responsibility team, who offer a more holistic view of ESG and climate practices and relevant trends. In addition, we engage with shareholder proposal proponents and other stakeholders to understand different viewpoints and objectives.
| 3. | PROXY VOTING GUIDELINES |
Our proxy voting guidelines are both principles-based and rules-based. We adhere to a core set of principles that are described in this Policy. We assess each proxy proposal in light of these principles. Our proxy voting “litmus test” will always be guided by what we view as most likely to maximize long-term shareholder value. We believe that authority and accountability for setting and executing corporate policies, goals and compensation generally should rest with a company’s board of directors and senior management. In return, we support strong investor rights that allow shareholders to hold directors and management accountable if they fail to act in the best interests of shareholders.
With this as a backdrop, our proxy voting guidelines pertaining to specific issues are set forth below. We generally vote proposals in accordance with these guidelines but, consistent with our “principles-based” approach to proxy voting, we may deviate from these guidelines if we believe that deviating from our stated Policy is necessary to help maximize long-term shareholder value) or as otherwise warranted by the specific facts and circumstances of an investment. In addition,
these guidelines are not intended to address all issues that may appear on all proxy ballots. We will evaluate on a case-by-case basis any proposal not specifically addressed by these guidelines, whether submitted by management or shareholders, always keeping in mind our fiduciary duty to make voting decisions that, by maximizing long-term shareholder value, are in our clients’ best interests.
SHAREHOLDER PROPOSAL ASSESSMENT FRAMEWORK
AB’s commitment to maximize the long-term value of clients’ portfolios drives how we analyze shareholder proposals. Rather than opting to automatically support all shareholder proposals that mention an ESG or climate issue, we evaluate whether or not each shareholder proposal promotes genuine improvement in the way a company addresses an ESG or climate issue, thereby enhancing shareholder value for our clients in managing a more comprehensive set of risks and opportunities for the company’s business. The evaluation of a proposal that addresses an ESG or climate issue will consider (among other things) the following core factors, as necessary:
| • | Materiality of the mentioned ESG or climate issue for the company’s business |
| • | The company’s current practice, policy and framework |
| • | Prescriptiveness of the proposal – does the shareholder demand unreasonably restrict management from conducting its business? |
| • | Context of the shareholder proposal – is the proponent tied to any particular interest group(s)? Does the proposal aim to promote the interest of the shareholders or group that they are associated with? |
| • | How does the proposal add value for the shareholders? |
We believe ESG and climate considerations are important elements that help improve the accuracy of our valuation of companies. We think it is in our clients’ best interests to incorporate a more comprehensive set of risks and opportunities, such as ESG and climate issues, from a long-term shareholder value perspective.
| 3.1 | BOARD AND DIRECTOR PROPOSALS |
| 1. Board Oversight and Director Accountability on Material Environmental and Social Topics Impacting Shareholder Value: Climate Risk Management and Human Rights Oversight |
CASE-BY-CASE |
AB believes that board oversight and director accountability are critical elements of corporate governance. Companies demonstrate effective governance through proactive monitoring of material risks and opportunities, including ESG related risks and opportunities. In evaluating investee companies’ adaptiveness to evolving climate risks and human rights oversight, AB engages its significant holdings on climate strategy through a firmwide campaign. Based on each company’s response, AB will hold respective directors accountable as defined by the committee charter of the company.
| 2. Establish New Board Committees and Elect Board Members with Specific Expertise (SHP) |
CASE-BY-CASE |
We believe that establishing committees should be the prerogative of a well-functioning board of directors. However, we may support shareholder proposals to establish additional board committees to address specific shareholder issues, including ESG and climate issues. In some cases, oversight for material ESG issues can be managed effectively by existing committees of the board of directors, depending on the expertise of the directors assigned to such committees. We consider on a case-by-case basis proposals that require the addition of a board member with a specific area of expertise.
| 3. Changes in Board Structure and Amending the Articles of Incorporation |
FOR |
Companies may propose various provisions with respect to the structure of the board of directors, including changing the manner in which board vacancies are filled, directors are nominated and the number of directors. Such proposals may require amending the charter or by-laws or may otherwise require shareholder approval. When these proposals are not controversial or meant as an anti-takeover device, which is generally the case, we vote in their favor. However, if we believe a proposal is intended as an anti-takeover device and diminishes shareholder rights, we generally vote against.
We may vote against directors for amending by-laws without seeking shareholder approval and/or restricting or diminishing shareholder rights.
| 4. Classified Boards |
AGAINST |
A classified board typically is divided into three separate classes. Each class holds office for a term of two or three years. Only a portion of the board can be elected or replaced each year. Because this type of proposal has fundamental anti- takeover implications, we generally oppose the adoption of classified boards unless there is a justifiable financial reason or an adequate sunset provision. We may also vote against directors that fail to implement shareholder approved proposals to declassify boards that we previously supported.
| 5. Director Liability and Indemnification |
CASE-BY-CASE |
Some companies argue that increased indemnification and decreased liability for directors are important to ensure the continued availability of competent directors. However, others argue that the risk of such personal liability minimizes the propensity for corruption and recklessness.
We generally support indemnification provisions that are consistent with the local jurisdiction in which the company has been formed. We vote in favor of proposals adopting indemnification for directors with respect to acts conducted in the normal course of business. We also vote in favor of proposals that expand coverage for directors and officers where, despite an unsuccessful legal defense, we believe the director or officer acted in good faith and in the best interests of the company. We oppose proposals to indemnify directors for gross negligence.
| 6. Disclose CEO Succession Plan (SHP) |
FOR |
Proposals like these are often suggested by shareholders of companies with long-tenured CEOs and/or high employee turnover rates. Even though some markets might not require the disclosure of a CEO succession plan, we do think it is good business practice and will support these proposals.
| 7. Election of Directors |
FOR |
The election of directors is an important vote. We expect directors to represent shareholder interests at the company and maximize shareholder value. We generally vote in favor of the management-proposed slate of directors while considering a number of factors, including local market best practice. We believe companies should have a majority of independent directors and independent key committees. However, we will incorporate local market regulation and corporate governance codes into our decision making. We may support requirements that surpass market regulation and corporate governance codes implemented in a local market if we believe heightened requirements may improve corporate governance practices. We will generally regard a director as independent if the director satisfies the criteria for independence either (i) espoused by the primary exchange on which the company’s shares are traded, or (ii) set forth in the code we determine to be best practice in the country where the subject company is domiciled. We may also take into account affiliations, related-party transactions and prior service to the company. We consider the election of directors who are “bundled” on a single slate to be a poor governance practice and vote on a case-by-case basis considering the amount of information available and an assessment of the group’s qualifications.
In addition:
We believe that directors have a duty to respond to shareholder actions that have received significant shareholder support. We may vote against directors (or withhold votes for directors if plurality voting applies) who fail to act on key issues. We oppose directors who fail to attend at least 75% of board meetings within a given year without a reasonable excuse.
We may abstain or vote against (depending on a company’s history of disclosure in this regard) directors of issuers where there is insufficient information about the nominees disclosed in the proxy statement.
We may vote against directors for poor compensation, audit or governance practices, including the lack of a formal key committee.
We may vote against directors for unilateral bylaw amendments that diminish shareholder rights.
We also may consider engaging company management (by phone, in writing and in person), until any issues have been satisfactorily resolved.
| a. Controlled Company Exemption |
CASE-BY-CASE |
In certain markets, a different standard for director independence may be applicable for controlled companies, which are companies where more than 50% of the voting power is held by an individual, group or another company, or as otherwise defined by local market standards. We may take these local standards into consideration when determining the appropriate level of independence required for the board and key committees.
Exchanges in certain jurisdictions do not have a controlled company exemption (or something similar). In such a jurisdiction, if a company has a majority shareholder or group of related majority shareholders with a majority economic interest, we generally will not oppose that company’s directors simply because the board does not include a majority of independent members, although we may take local standards into consideration when determining the appropriate level of independence required for the board and key committees. We will, however, consider these directors in a negative light if the company has a history of violating the rights of minority shareholders.
| b. Voting for Director Nominees in a Contested Election |
CASE-BY-CASE |
Votes in a contested election of directors are evaluated on a case-by-case basis with the goal of maximizing shareholder value.
| 8. | Board Capacity |
We believe that incorporating an assessment of each director’s capacity into consideration for a director election is essential to promote meaningful board oversight of the management. Director effectiveness aside, a social externality arises when the practice of directors serving on many public company boards becomes widespread, as this limits the opportunities for other board candidates, particularly diverse candidates. AB currently votes against the appointment of directors who occupy, or would occupy following the vote: four (4) or more outside public company board seats for non-CEOs, three (3) or more outside public company board seats for the sitting CEO of the company in question and two (2) or more outside public company board seats for sitting CEOs of companies other than the company under consideration. We may also exercise flexibility on occasions where the “over-boarded” director nominee’s presence on the board is critical, based on company specific contexts in absence of any notable accountability concerns.
| 9. | Board Diversity |
Diversity is an important element of assessing the board’s quality, as it promotes wider range of perspectives to be considered for companies to both strategize and mitigate risks. In line with this view, several European countries legally require a quota of female directors. Other European countries have a comply-or-explain policy. In the US, California requires corporations headquartered in the State of California to have at least one female director on board.
We believe that boards should develop, as part of their refreshment process, a framework for identifying diverse candidates for all open board positions. We believe diversity is broader than gender and should also take into consideration factors such as business experience, ethnicity, tenure and nationality. As such, we generally vote in favor of proposals that encourage the adoption of a diverse search policy, so-called “Rooney Rules”, assuring that each director search includes at least one woman, and in the US, at least one underrepresented person of color, in the slate of nominees. Our views on board diversity translate to the following two voting approaches:
| a. | Gender Diversity: AB will generally vote against the nominating/governance committee chair, or a relevant incumbent member in case of classified boards, when the board has no female members. In Japan, we will vote against the top management. This approach applies globally. |
| b. | Ethnic and Racial Diversity: AB will escalate the topic of board level ethnic/racial diversity and engage with its significant holdings that lack a minority ethnic/racial representation on the board through 2021. Based on the outcome of such engagements, AB will begin voting against the nominating/governance committee chair or a relevant incumbent member for classified boards of companies that lack minority ethnic/racial representation on their board in 2022. |
| 10. Independent Lead Director (SHP) |
FOR |
We support shareholder proposals that request a company to amend its by-laws to establish an independent lead director if the position of chairman is non-independent. We view the existence of a strong independent lead director, whose role is robust and includes clearly defined duties and responsibilities, such as the authority to call meetings and approve agendas, as a good example of the sufficient counter-balancing governance. If a company has such an independent lead director in place, we will generally oppose a proposal to require an independent board chairman, barring any additional board leadership concerns.
| 11. Limit Term of Directorship (SHP) |
CASE-BY-CASE |
These proposals seek to limit the term during which a director may serve on a board to a set number of years.
Accounting for local market practice, we generally consider a number of factors, such as overall level of board independence, director qualifications, tenure, board diversity and board effectiveness in representing our interests as shareholders, in assessing whether limiting directorship terms is in shareholders’ best interests. Accordingly, we evaluate these items case-by-case.
| 12. Majority Independent1 Directors (SHP) |
FOR |
Each company’s board of directors has a duty to act in the best interest of the company’s shareholders at all times. We believe that these interests are best served by having directors who bring objectivity to the company and are free from potential conflicts of interests. Accordingly, we support proposals seeking a majority of independent directors on the board while taking into consideration local market regulation and corporate governance codes.
| 13. Majority of Independent Directors on Key Committees (SHP) |
FOR |
In order to ensure that those who evaluate management’s performance, recruit directors and set management’s compensation are free from conflicts of interests, we believe that the audit2, nominating/governance, and compensation committees should be composed of a majority of independent directors, considering the local market regulation and corporate governance codes as well as controlled company status.
| 14. Majority Votes for Directors (SHP) |
FOR |
We believe that good corporate governance requires shareholders to have a meaningful voice in the affairs of the company. This objective is strengthened if directors are elected by a majority of votes cast at an annual meeting rather than by the plurality method commonly used. With plurality voting a director could be elected by a single affirmative vote even if the rest of the votes were withheld.
We further believe that majority voting provisions will lead to greater director accountability. Therefore, we support shareholder proposals that companies amend their by-laws to provide that director nominees be elected by an affirmative vote of a majority of the votes cast, provided the proposal includes a carve-out to provide for plurality voting in contested elections where the number of nominees exceeds the number of directors to be elected.
| 15. Removal of Directors Without Cause (SHP) |
FOR |
Company by-laws sometimes define cause very narrowly, including only conditions of criminal indictment, final adverse adjudication that fiduciary duties were breached or incapacitation, while also providing shareholders with the right to remove directors only upon “cause”.
We believe that the circumstances under which shareholders have the right to remove directors should not be limited to those traditionally defined by companies as “cause”. We also believe that shareholders should have the right to conduct a vote to remove directors who fail to perform in a manner consistent with their fiduciary duties or representative of shareholders’ best interests. And, while we would prefer shareholder proposals that seek to broaden the definition of “cause” to include situations like these, we generally support proposals that would provide shareholders with the right to remove directors without cause.
| 1 | For purposes of this Policy, generally, we will consider a director independent if the director satisfies the independence definition set forth in the listing standards of the exchange on which the common stock is listed. However, we may deem local independence classification criteria insufficient. |
| 2 | Pursuant to the SEC rules, adopted pursuant to the Sarbanes-Oxley Act of 2002, as of October 31, 2004, each U.S. listed issuer must have a fully independent audit committee. |
| 16. Require Independent Board Chairman (SHP) |
CASE-BY-CASE |
We believe there can be benefits to an executive chairman and to having the positions of chairman and CEO combined as well as split. When the chair is non-independent, the company must have sufficient counter-balancing governance in place, generally through a strong independent lead director. Also, for companies with smaller market capitalizations, separate chairman and CEO positions may not be practical.
| 3.2 | COMPENSATION PROPOSALS |
| 17. Pro Rata Vesting of Equity Compensation Awards-Change in Control (SHP) |
CASE-BY-CASE |
We examine proposals on the treatment of equity awards in the event of a change in control on a case-by-case basis. If a change in control is accompanied by termination of employment, often referred to as a double-trigger, we generally support accelerated vesting of equity awards. If, however, there is no termination agreement in connection with a change in control, often referred to as a single-trigger, we generally prefer pro rata vesting of outstanding equity awards.
| 18. Adopt Policies to Prohibit any Death Benefits to Senior Executives (SHP) |
AGAINST |
We view these bundled proposals as too restrictive and conclude that blanket restrictions on any and all such benefits, including the payment of life insurance premiums for senior executives, could put a company at a competitive disadvantage.
| 19. Advisory Vote to Ratify Directors’ Compensation (SHP) |
FOR |
Similar to advisory votes on executive compensation, shareholders may request a non-binding advisory vote to approve compensation given to board members. We generally support this item
| 20. Amend Executive Compensation Plan Tied to Performance (Bonus Banking) (SHP) |
AGAINST |
These proposals seek to force a company to amend executive compensation plans such that compensation awards tied to performance are deferred for shareholder specified and extended periods of time. As a result, awards may be adjusted downward if performance goals achieved during the vesting period are not sustained during the added deferral period.
We believe that most companies have adequate vesting schedules and clawbacks in place. Under such circumstances, we will oppose these proposals. However, if a company does not have what we believe to be adequate vesting and/or clawback requirements, we decide these proposals on a case-by-case basis.
| 21. Approve Remuneration for Directors and Auditors |
CASE-BY-CASE |
We will vote on a case-by-case basis where we are asked to approve remuneration for directors or auditors. We will generally oppose performance-based remuneration for non-executive directors as this may compromise independent oversight. In addition, where disclosure relating to the details of such remuneration is inadequate or provided without sufficient time for us to consider our vote, we may abstain or vote against, depending on the adequacy of the company’s prior disclosures in this regard and the local market practice.
| 22. Approve Retirement Bonuses for Directors (Japan and South Korea) |
CASE-BY-CASE |
Retirement bonuses are customary in Japan and South Korea. Companies seek approval to give the board authority to grant retirement bonuses for directors and/or auditors and to leave the exact amount of bonuses to the board’s discretion. We will analyze such proposals on a case-by-case basis, considering management’s commitment to maximizing long- term shareholder value. However, when the details of the retirement bonus are inadequate or undisclosed, we may abstain or vote against.
| 23. Approve Special Payments to Continuing Directors and Auditors (Japan) |
CASE-BY-CASE |
In conjunction with the abolition of a company’s retirement allowance system, we will generally support special payment allowances for continuing directors and auditors if there is no evidence of their independence becoming impaired. However, when the details of the special payments are inadequate or undisclosed, we may abstain or vote against.
| 24. Disclose Executive and Director Pay (SHP) |
CASE-BY-CASE |
The United States Securities and Exchange Commission (“SEC”) has adopted rules requiring increased and/or enhanced compensation-related and corporate governance-related disclosure in proxy statements and Forms 10-K. Similar steps have
been taken by regulators in foreign jurisdictions. We believe the rules enacted by the SEC and various foreign regulators generally ensure more complete and transparent disclosure. Therefore, while we will consider them on a case-by-case basis (analyzing whether there are any relevant disclosure concerns), we generally vote against shareholder proposals seeking additional disclosure of executive and director compensation, including proposals that seek to specify the measurement of performance-based compensation, if the company is subject to SEC rules or similar rules espoused by a regulator in a foreign jurisdiction. Similarly, we generally support proposals seeking additional disclosure of executive and director compensation if the company is not subject to any such rules.
| 25. Executive and Employee Compensation Plans, Policies and Reports |
CASE-BY-CASE |
Compensation plans usually are complex and are a major corporate expense, so we evaluate them carefully and on a case-by-case basis. In all cases, however, we assess each proposed Compensation Plan within the framework of four guiding principles, each of which ensures a company’s Compensation Plan helps to align the long-term interests of management with shareholders:
Valid measures of business performance tied to the firm’s strategy and shareholder value creation, which are clearly articulated and incorporate appropriate time periods, should be utilized;
Compensation costs should be managed in the same way as any other expense;
Compensation should reflect management’s handling, or failure to handle, any recent social, environmental, governance, ethical or legal issue that had a significant adverse financial or reputational effect on the company and;
In granting compensatory awards, management should exhibit a history of integrity and decision-making based on logic and well thought out processes.
We may oppose plans which include, and directors who establish, compensation plan provisions deemed to be poor practice such as automatic acceleration of equity, or single-triggered, in the event of a change in control. Although votes on compensation plans are by nature only broad indications of shareholder views, they do lead to more compensation-related dialogue between management and shareholders and help ensure that management and shareholders meet their common objective: maximizing shareholder value.
In markets where votes on compensation plans are not required for all companies, we will support shareholder proposals asking the board to adopt such a vote on an advisory basis.
Where disclosure relating to the details of Compensation Plans is inadequate or provided without sufficient time for us to consider our vote, we may abstain or vote against, depending on the adequacy of the company’s prior disclosures in this regard. Where appropriate, we may raise the issue with the company directly or take other steps.
| 26. Limit Executive Pay (SHP) |
CASE-BY-CASE |
We believe that management and directors, within reason, should be given latitude in determining the mix and types of awards offered to executive officers. We vote against shareholder proposals seeking to limit executive pay if we deem them too restrictive. Depending on our analysis of the specific circumstances, we are generally against requiring a company to adopt a policy prohibiting tax gross up payments to senior executives.
| 27. Mandatory Holding Periods (SHP) |
AGAINST |
We generally vote against shareholder proposals asking companies to require a company’s executives to hold stock for a specified period of time after acquiring that stock by exercising company-issued stock options (i.e., precluding “cashless” option exercises), unless we believe implementing a mandatory holding period is necessary to help resolve underlying problems at a company that have hurt, and may continue to hurt, shareholder value. We are generally in favor of reasonable stock ownership guidelines for executives.
| 28. Performance-Based Stock Option Plans (SHP) |
CASE-BY-CASE |
These shareholder proposals require a company to adopt a policy that all or a portion of future stock options granted to executives be performance-based. Performance-based options usually take the form of indexed options (where the option sale price is linked to the company’s stock performance versus an industry index), premium priced options (where the strike price is significantly above the market price at the time of the grant) or performance vesting options (where options vest when the company’s stock price exceeds a specific target). Proponents argue that performance-based options provide an incentive for executives to outperform the market as a whole and prevent management from being rewarded for average performance. We believe that management, within reason, should be given latitude in determining the mix and types of awards it offers. However, we recognize the benefit of linking a portion of executive compensation to certain types of performance
benchmarks. While we will not support proposals that require all options to be performance-based, we will generally support proposals that require a portion of options granted to senior executives be performance-based. However, because performance-based options can also result in unfavorable tax treatment and the company may already have in place an option plan that sufficiently ties executive stock option plans to the company’s performance, we will consider such proposals on a case-by-case basis.
| 29. Prohibit Relocation Benefits to Senior Executives (SHP) |
AGAINST |
We do not consider such perquisites to be problematic pay practices as long as they are properly disclosed. Therefore we will vote against shareholder proposals asking to prohibit relocation benefits.
| 30. Recovery of Performance-Based Compensation (SHP) |
FOR |
We generally support shareholder proposals requiring the board to seek recovery of performance-based compensation awards to senior management and directors in the event of a fraud or other reasons that resulted in the detriment to shareholder value and/or company reputation due to gross ethical lapses. In deciding how to vote, we consider the adequacy of the existing company clawback policy, if any.
| 31. Submit Golden Parachutes/Severance Plans to a Shareholder Vote (SHP) |
FOR |
Golden Parachutes assure key officers of a company lucrative compensation packages if the company is acquired and/or if the new owners terminate such officers. We recognize that offering generous compensation packages that are triggered by a change in control may help attract qualified officers. However, such compensation packages cannot be so excessive that they are unfair to shareholders or make the company unattractive to potential bidders, thereby serving as a constructive anti-takeover mechanism. Accordingly, we support proposals to submit severance plans (including supplemental retirement plans), to a shareholder vote, and we review proposals to ratify or redeem such plans retrospectively on a case-by-case basis.
| 32. Submit Golden Parachutes/Severance Plans to a Shareholder Vote Prior to Their Being Negotiated by Management (SHP) |
CASE-BY-CASE |
We believe that in order to attract qualified employees, companies must be free to negotiate compensation packages without shareholder interference. However, shareholders must be given an opportunity to analyze a compensation plan’s final, material terms in order to ensure it is within acceptable limits. Accordingly, we evaluate proposals that require submitting severance plans and/or employment contracts for a shareholder vote prior to being negotiated by management on a case-by-case basis.
| 33. Submit Survivor Benefit Compensation Plan to Shareholder Vote (SHP) |
FOR |
Survivor benefit compensation plans, or “golden coffins”, can require a company to make substantial payments or awards to a senior executive’s beneficiaries following the death of the senior executive. The compensation can take the form of unearned salary or bonuses, accelerated vesting or the continuation in force of unvested equity grants, perquisites and other payments or awards. This compensation would not include compensation that the senior executive chooses to defer during his or her lifetime.
We recognize that offering generous compensation packages that are triggered by the passing of senior executives may help attract qualified officers. However, such compensation packages cannot be so excessive that they are unfair to shareholders or make the company unattractive to potential bidders, thereby serving as a constructive anti-takeover mechanism.
| 3.3 | CAPITAL CHANGES AND ANTI-TAKEOVER PROPOSALS |
| 34. Amend Exclusive Forum Bylaw (SHP) |
AGAINST |
We will generally oppose proposals that ask the board to repeal the company’s exclusive forum bylaw. Such bylaws require certain legal action against the company to take place in the state of the company’s incorporation. The courts within the state of incorporation are considered best suited to interpret that state’s laws.
| 35. Amend Net Operating Loss (“NOL”) |
FOR |
Rights Plans NOL Rights Plans are established to protect a company’s net operating loss carry forwards and tax credits, which can be used to offset future income. We believe this is a reasonable strategy for a company to employ. Accordingly, we will vote in favor of NOL Rights Plans unless we believe the terms of the NOL Rights Plan may provide for a long-term anti- takeover device.
| 36. Authorize Share Repurchase |
FOR |
We generally support share repurchase proposals that are part of a well-articulated and well-conceived capital strategy. We assess proposals to give the board unlimited authorization to repurchase shares on a case-by-case basis.
Furthermore, we would generally support the use of derivative instruments (e.g., put options and call options) as part of a share repurchase plan absent a compelling reason to the contrary. Also, absent a specific concern at the company, we will generally support a repurchase plan that could be continued during a takeover period.
| 37. Blank Check Preferred Stock |
AGAINST |
Blank check preferred stock proposals authorize the issuance of certain preferred stock at some future point in time and allow the board to establish voting, dividend, conversion and other rights at the time of issuance. While blank check preferred stock can provide a corporation with the flexibility needed to meet changing financial conditions, it also may be used as the vehicle for implementing a “poison pill” defense or some other entrenchment device.
We are concerned that, once this stock has been authorized, shareholders have no further power to determine how or when it will be allocated. Accordingly, we generally oppose this type of proposal.
| 38. Corporate Restructurings, Merger Proposals and Spin-Offs |
CASE-BY-CASE |
Proposals requesting shareholder approval of corporate restructurings, merger proposals and spin-offs are determined on a case-by-case basis. In evaluating these proposals and determining our votes, we are singularly focused on meeting our goal of maximizing long-term shareholder value.
| 39. Elimination of Preemptive Rights |
CASE-BY-CASE |
Preemptive rights allow the shareholders of the company to buy newly issued shares before they are offered to the public in order to maintain their percentage ownership. We believe that, because preemptive rights are an important shareholder right, careful scrutiny must be given to management’s attempts to eliminate them. However, because preemptive rights can be prohibitively expensive to widely held companies, the benefit of such rights will be weighed against the economic effect of maintaining them.
| 40. Expensing Stock Options (SHP) |
FOR |
US generally accepted accounting principles require companies to expense stock options, as do the accounting rules in many other jurisdictions (including those jurisdictions that have adopted IFRS — international financial reporting standards). If a company is domiciled in a jurisdiction where the accounting rules do not already require the expensing of stock options, we will support shareholder proposals requiring this practice and disclosing information about it.
| 41. Fair Price Provisions |
CASE-BY-CASE |
A fair price provision in the company’s charter or by laws is designed to ensure that each shareholder’s securities will be purchased at the same price if the corporation is acquired under a plan not agreed to by the board. In most instances, the provision requires that any tender offer made by a third party must be made to all shareholders at the same price.
Fair pricing provisions attempt to prevent the “two-tiered front-loaded offer” where the acquirer of a company initially offers a premium for a sufficient percentage of shares of the company to gain control and subsequently makes an offer for the remaining shares at a much lower price. The remaining shareholders have no choice but to accept the offer. The two -tiered approach is coercive as it compels a shareholder to sell his or her shares immediately in order to receive the higher price per share. This type of tactic has caused many states to adopt fair price provision statutes to restrict this practice.
We consider fair price provisions on a case-by-case basis. We oppose any provision where there is evidence that management intends to use the provision as an anti-takeover device as well as any provision where the shareholder vote requirement is greater than a majority of disinterested shares (i.e., shares beneficially owned by individuals other than the acquiring party).
| 42. Increase Authorized Common Stock |
CASE-BY-CASE |
In general we regard increases in authorized common stock as serving a legitimate corporate purpose when used to: implement a stock split, aid in a recapitalization or acquisition, raise needed capital for the firm, or provide for employee savings plans, stock option plans or executive compensation plans. That said, we may oppose a particular proposed increase if we consider the authorization likely to lower the share price (this would happen, for example, if the firm were proposing to use the proceeds to overpay for an acquisition, to invest in a project unlikely to earn the firm’s cost of capital, or to compensate employees well above market rates). We oppose increases in authorized common stock where there is evidence that the shares are to be used to implement a “poison pill” or another form of anti-takeover device, or if the issuance of new shares would, in our judgment, excessively dilute the value of the outstanding shares upon issuance. In addition, a satisfactory explanation of a company’s intentions—going beyond the standard “general corporate purposes”— must be disclosed in the proxy statement for proposals requesting an increase of greater than 100% of the shares outstanding. We view the use of derivatives, particularly warrants, as legitimate capital-raising instruments and apply these same principles to
their use as we do to the authorization of common stock. Under certain circumstances where we believe it is important for shareholders to have an opportunity to maintain their proportional ownership, we may oppose proposals requesting shareholders approve the issuance of additional shares if those shares do not include preemptive rights.
In Hong Kong, it is common for companies to request board authority to issue new shares up to 20% of outstanding share capital. The authority typically lapses after one year. We may vote against plans that do not prohibit issuing shares at a discount, taking into account whether a company has a history of doing so.
| 43. Issuance of Equity Without Preemptive Rights |
FOR |
We are generally in favor of issuances of equity without preemptive rights of up to 30% of a company’s outstanding shares unless there is concern that the issuance will be used in a manner that could hurt shareholder value (e.g., issuing the equity at a discount from the current market price or using the equity to help create a “poison pill” mechanism).
| 44. Multi Class Equity Structure |
AGAINST |
The one share, one vote principle — stating that voting power should be proportional to an investor’s economic ownership — is generally preferred in order to hold the board accountable to shareholders. AB’s general expectation of companies with multi class equity structures is to attach safeguards for minority shareholders when appropriate and in a cost-effective manner, which may include measures such as sunset provisions or requiring periodic shareholder reauthorizations. We expect boards to routinely review existing multi-class vote structures and share their current view.
With that backdrop, we acknowledge that multi-class structures may be beneficial for a period of time, allowing management to focus on longer-term value creation which benefits all shareholders. Accordingly, AB recommends companies that had an initial public offering (IPO) in the past two (2) years to institute a time-based sunset to be triggered seven (7) years from the year of the IPO. In 2021, we will engage with companies in our significant holdings universe that fall under this category. We may vote against the relevant board member of companies that remain unresponsive starting 2022 AGM, unless there is a valid case to apply an exemption.
For companies that instituted a multi-class share structure unrelated to an IPO event or had an IPO two (2) or more years ago, sunset should be seven (7) years from the year when the issuer implemented the multi-class structure. If the structure was adopted greater than seven (7) years ago, we will expect the issuer to consider the shortest sunset plan that makes sense based on the issuer’s context. In 2021, we will engage with our portfolio companies in scope. We may vote against the respective board member if we don’t see any progress starting 2022 AGM, unless there is a valid case to apply an exemption.
| 45. Net Long Position Requirement |
FOR |
We support proposals that require the ownership level needed to call a special meeting to be based on the net long position of a shareholder or shareholder group. This standard ensures that a significant economic interest accompanies the voting power.
| 46. Reincorporation |
CASE-BY-CASE |
There are many valid business reasons a corporation may choose to reincorporate in another jurisdiction. We perform a case-by-case review of such proposals, taking into consideration management’s stated reasons for the proposed move.
Careful scrutiny also will be given to proposals that seek approval to reincorporate in countries that serve as tax havens. When evaluating such proposals, we consider factors such as the location of the company’s business, the statutory protections available in the country to enforce shareholder rights and the tax consequences of the reincorporation to shareholders.
| 47. Reincorporation to Another Jurisdiction to Permit Majority Voting or Other Changes in Corporate Governance (SHP) |
CASE-BY-CASE |
If a shareholder proposes that a company move to a jurisdiction where majority voting (among other shareholder-friendly conditions) is permitted, we will generally oppose the move notwithstanding the fact that we favor majority voting for directors. Our rationale is that the legal costs, taxes, other expenses and other factors, such as business disruption, in almost all cases would be material and outweigh the benefit of majority voting. If, however, we should find that these costs are not material and/or do not outweigh the benefit of majority voting, we may vote in favor of this kind of proposal. We will evaluate similarly proposals that would require reincorporation in another state to accomplish other changes in corporate governance.
| 48. Stock Splits |
FOR |
Stock splits are intended to increase the liquidity of a company’s common stock by lowering the price, thereby making the stock seem more attractive to small investors. We generally vote in favor of stock split proposals.
| 49. Submit Company’s Shareholder Rights Plan to Shareholder Vote (SHP) |
FOR |
Most shareholder rights plans (also known as “poison pills”) permit the shareholders of a target company involved in a hostile takeover to acquire shares of the target company, the acquiring company, or both, at a substantial discount once a “triggering event” occurs. A triggering event is usually a hostile tender offer or the acquisition by an outside party of a certain percentage of the target company’s stock. Because most plans exclude the hostile bidder from the purchase, the effect in most instances is to dilute the equity interest and the voting rights of the potential acquirer once the plan is triggered. A shareholder rights plan is designed to discourage potential acquirers from acquiring shares to make a bid for the issuer. We believe that measures that impede takeovers or entrench management not only infringe on the rights of shareholders but also may have a detrimental effect on the value of the company.
We support shareholder proposals that seek to require the company to submit a shareholder rights plan to a shareholder vote. We evaluate on a case-by-case basis proposals to implement or eliminate a shareholder rights plan.
| 50. Transferrable Stock Options |
CASE-BY-CASE |
In cases where a compensation plan includes a transferable stock option program, we will consider the plan on a case-by- case basis.
These programs allow stock options to be transferred to third parties in exchange for cash or stock. In effect, management becomes insulated from the downside risk of holding a stock option, while the ordinary shareholder remains exposed to downside risk. This insulation may unacceptably remove management’s exposure to downside risk, which significantly misaligns management and shareholder interests. Accordingly, we generally vote against these programs if the transfer can be executed without shareholder approval, is available to executive officers or non-employee directors, or we consider the available disclosure relating to the mechanics and structure of the program to be insufficient to determine the costs, benefits and key terms of the program.
| 3.4 | AUDITOR PROPOSALS |
| 51. Appointment of Auditors |
FOR |
We believe that the company is in the best position to choose its accounting firm, and we generally support management’s recommendation.
We recognize that there may be inherent conflicts when a company’s independent auditors perform substantial non-audit related services for the company. Therefore, in reviewing a proposed auditor, we will consider the amount of fees paid for non-audit related services performed compared to the total audit fees paid by the company to the auditing firm, and whether there are any other reasons for us to question the independence or performance of the firm’s auditor such as, for example, tenure. We generally will deem as excessive the non-audit fees paid by a company to its auditor if those fees account for 50% or more of total fees paid. In the UK market, which utilizes a different calculation, we adhere to a non- audit fee cap of 100% of audit fees. Under these circumstances, we generally vote against the auditor and the directors, in particular the members of the company’s audit committee. In addition, we generally vote against authorizing the audit committee to set the remuneration of such auditors. We exclude from this analysis non-audit fees related to IPOs, bankruptcy emergence, and spin-offs and other extraordinary events. We may vote against or abstain due to a lack of disclosure of the name of the auditor while taking into account local market practice.
| 52. Approval of Financial Statements |
FOR |
In some markets, companies are required to submit their financial statements for shareholder approval. This is generally a routine item and, as such, we will vote for the approval of financial statements unless there are appropriate reasons to vote otherwise. We may vote against if the information is not available in advance of the meeting.
| 53. Approval of Internal Statutory Auditors |
FOR |
Some markets (e.g., Japan) require the annual election of internal statutory auditors. Internal statutory auditors have a number of duties, including supervising management, ensuring compliance with the articles of association and reporting to a company’s board on certain financial issues. In most cases, the election of internal statutory auditors is a routine item and we will support management’s nominee provided that the nominee meets the regulatory requirements for serving as internal statutory auditors. However, we may vote against nominees who are designated independent statutory auditors who serve as executives of a subsidiary or affiliate of the issuer or if there are other reasons to question the independence of the nominees.
| 54. Limitation of Liability of External Statutory Auditors (Japan) |
CASE-BY-CASE |
In Japan, companies may limit the liability of external statutory auditors in the event of a shareholder lawsuit through any of three mechanisms: (i) submitting the proposed limits to shareholder vote; (ii) setting limits by modifying the company’s articles of incorporation; and (iii) setting limits in contracts with outside directors, outside statutory auditors and external audit firms (requires a modification to the company’s articles of incorporation). A vote by 3% or more of shareholders can nullify a limit set through the second mechanism. The third mechanism has historically been the most prevalent.
We review proposals to set limits on auditor liability on a case-by-case basis, considering whether such a provision is necessary to secure appointment and whether it helps to maximize long-term shareholder value.
| 55. Separating Auditors and Consultants (SHP) |
CASE-BY-CASE |
We believe that a company serves its shareholders’ interests by avoiding potential conflicts of interest that might interfere with an auditor’s independent judgment. SEC rules adopted as a result of the Sarbanes-Oxley Act of 2002 attempted to address these concerns by prohibiting certain services by a company’s independent auditors and requiring additional disclosure of other non-audit related services.
We evaluate on a case-by-case basis proposals that go beyond the SEC rules or other local market standards by prohibiting auditors from performing other non-audit services or calling for the board to adopt a policy to ensure auditor independence.
We take into consideration the policies and procedures the company already has in place to ensure auditor independence and non-audit fees as a percentage of total fees paid to the auditor are not excessive.
| 3.5 | SHAREHOLDER ACCESS AND VOTING PROPOSALS |
| 56. A Shareholder’s Right to Call Special Meetings (SHP) |
FOR |
Most state corporation statutes (though not Delaware, where many US issuers are domiciled) allow shareholders to call a special meeting when they want to take action on certain matters that arise between regularly scheduled annual meetings. This right may apply only if a shareholder, or a group of shareholders, owns a specified percentage as defined by the relevant company bylaws.
We recognize the importance of the right of shareholders to remove poorly performing directors, respond to takeover offers and take other actions without having to wait for the next annual meeting. However, we also believe it is important to protect companies and shareholders from nuisance proposals. We further believe that striking a balance between these competing interests will maximize shareholder value. We believe that encouraging active share ownership among shareholders generally is beneficial to shareholders and helps maximize shareholder value. Accordingly, we will generally support a proposal to establish shareholders’ right to call a special meeting unless we see a potential abuse of the right based on the company’s current share ownership structure.
| 57. Adopt Cumulative Voting (SHP) |
CASE-BY-CASE |
Cumulative voting is a method of electing directors that enables each shareholder to multiply the number of his or her shares by the number of directors being considered. A shareholder may then cast the total votes for any one director or a selected group of directors. For example, a holder of 10 shares normally casts 10 votes for each of 12 nominees to the board thus giving the shareholder 120 (10 × 12) votes. Under cumulative voting, the shareholder may cast all 120 votes for a single nominee, 60 for two, 40 for three, or any other combination that the shareholder may choose.
We believe that encouraging activism among shareholders generally is beneficial to shareholders and helps maximize shareholder value. Cumulative voting supports the interests of minority shareholders in contested elections by enabling them to concentrate their votes and dramatically increase their chances of electing a dissident director to a board.
Accordingly, we generally will support shareholder proposals to restore or provide for cumulative voting and we generally will oppose management proposals to eliminate cumulative voting. However, we may oppose cumulative voting if a company has in place both proxy access, which allows shareholders to nominate directors to the company’s ballot, and majority voting (with a carve-out for plurality voting in situations where there are more nominees than seats), which requires each director to receive the affirmative vote of a majority of votes cast and, we believe, leads to greater director accountability to shareholders.
Also, we support cumulative voting at controlled companies regardless of any other shareholder protections that may be in place.
| 58. Adopt Cumulative Voting in Dual Shareholder Class Structures (SHP) |
FOR |
In dual class structures (such as A and B shares) where the shareholders with a majority economic interest have a minority voting interest, we generally vote in favor of cumulative voting for those shareholders.
| 59. Early Disclosure of Voting Results (SHP) |
AGAINST |
These proposals seek to require a company to disclose votes sooner than is required by the local market. In the US, the SEC requires disclosure in the first periodic report filed after the company’s annual meeting which we believe is reasonable. We do not support requests that require disclosure earlier than the time required by the local regulator.
| 60. Limiting a Shareholder’s Right to Call Special Meetings |
AGAINST |
Companies contend that limitations on shareholders’ rights to call special meetings are needed to prevent minority shareholders from taking control of the company’s agenda. However, such limits also have anti-takeover implications because they prevent a shareholder or a group of shareholders who have acquired a significant stake in the company from forcing management to address urgent issues, such as the potential sale of the company. Because most states prohibit shareholders from abusing this right, we see no justifiable reason for management to eliminate this fundamental shareholder right. Accordingly, we generally will vote against such proposals.
In addition, if the board of directors, without shareholder consent, raises the ownership threshold a shareholder must reach before the shareholder can call a special meeting, we will vote against those directors.
| 61. Permit a Shareholder’s Right to Act by Written Consent (SHP) |
CASE-BY-CASE |
Action by written consent enables a large shareholder or group of shareholders to initiate votes on corporate matters prior to the annual meeting. We believe this is a fundamental shareholder right and, accordingly, will generally support shareholder proposals seeking to restore this right. However, in cases where a company has a majority shareholder or group of related majority shareholders with majority economic interest, we will oppose proposals seeking to restore this right as there is a potential risk of abuse by the majority shareholder or group of majority shareholders. We may also vote against the proposal if the company provides shareholders a right to call special meetings with an ownership threshold of 15% or below in absence of material restrictions, as we believe that shareholder access rights should be considered from a holistic view rather than promoting all possible access rights that may impede one another in contrast to long-term shareholder value.
| 62. Proxy Access for Annual Meetings (SHP) (Management) |
FOR |
These proposals allow “qualified shareholders” to nominate directors. We generally vote in favor of management and shareholder proposals for proxy access that employ guidelines reflecting the SEC framework for proxy access (adopted by the SEC in 2010, but vacated by the US District of Columbia Circuit Court of Appeals in 2011), which would have allowed a single shareholder, or group of shareholders, who hold at least 3% of the voting power for at least three years continuously to nominate up to 25% of the current board seats, or two directors, for inclusion in the subject company’s annual proxy statement alongside management nominees.
We may vote against proposals that use requirements that are stricter than the SEC’s framework including implementation restrictions and against individual board members, or entire boards, who exclude from their ballot properly submitted shareholder proxy access proposals or compete against shareholder proxy access proposals with stricter management proposals on the same ballot We will generally vote in favor of proposals that seek to amend an existing right to more closely align with the SEC framework.
We will evaluate on a case-by-case basis proposals with less stringent requirements than the vacated SEC framework.
From time to time we may receive requests to join with other shareholders to support a shareholder action. We may, for example, receive requests to join a voting block for purposes of influencing management. If the third parties requesting our participation are not affiliated with us and have no business relationships with us, we will consider the request on a case-by-case basis. However, where the requesting party has a business relationship with us (e.g., the requesting party is a client or a significant service provider), agreeing to such a request may pose a potential conflict of interest. As a fiduciary we have an obligation to vote proxies in the best interest of our clients (without regard to our own interests in generating and maintaining business with our other clients) and given our desire to avoid even the appearance of a conflict, we will generally decline such a request.
| 63. Reduce Meeting Notification from 21 Days to 14 Days (UK) |
FOR |
Companies in the United Kingdom may, with shareholder approval, reduce the notice period for extraordinary general meetings from 21 days to 14 days.
A reduced notice period expedites the process of obtaining shareholder approval of additional financing needs and other important matters. Accordingly, we support these proposals.
| 64. Shareholder Proponent Engagement Process (SHP) |
FOR |
We believe that proper corporate governance requires that proposals receiving support from a majority of shareholders be considered and implemented by the company. Accordingly, we support establishing an engagement process between shareholders and management to ensure proponents of majority-supported proposals, have an established means of communicating with management.
| 65. Supermajority Vote Requirements |
AGAINST |
A supermajority vote requirement is a charter or by-law requirement that, when implemented, raises the percentage (higher than the customary simple majority) of shareholder votes needed to approve certain proposals, such as mergers, changes of control, or proposals to amend or repeal a portion of the Articles of Incorporation.
In most instances, we oppose these proposals and support shareholder proposals that seek to reinstate the simple majority vote requirement. However, we may support supermajority vote requirements at controlled companies as a protection to minority shareholders from unilateral action of the controlling shareholder.
| 66. Authorize Virtual-Only Shareholder Meetings |
CASE-BY-CASE |
COVID-19 has called for a need to authorize companies in holding virtual-only shareholder meetings. While recognizing technology has enabled shareholders to remain connected with the board and management, AB acknowledges that virtual only shareholder meetings have resulted in certain companies abusing their authority by limiting shareholders from raising questions and demanding onerous requirements to be able to read their questions during the meeting. Because such practice vary by company and jurisdiction with different safeguard provisions, we will consider—among other things—a company’s disclosure on elements such as those below when voting on management or shareholder proposals for authorizing the company to hold virtual-only shareholder meetings:
| • | Explanation for eliminating the in-person meeting; |
| • | Clear description of which shareholders are qualified to participate in virtual-only shareholder meetings and how attendees can join the meeting; |
| • | How to submit and ask questions; |
| • | How the company plans to mimic a real-time in-person question and answer session; and |
| • | List of questions received from shareholders in their entirety, both prior to and during the meeting, as well as associated responses from the company |
| 3.6 | ENVIRONMENTAL, SOCIAL AND DISCLOSURE PROPOSALS |
| 67. Animal Welfare (SHP) |
CASE-BY-CASE |
These proposals may include reporting requests or policy adoption on items such as pig gestation crates and animal welfare in the supply chain. For proposals requesting companies to adopt a policy, we will carefully consider existing policies and the company’s incorporation of national standards and best practices. In addition, we will evaluate the potential enactment of new regulations, as well as any investment risk related to the specific issue.
We generally support shareholder proposals calling for reports and disclosure while taking into account existing policies and procedures of the company and whether the proposed information is of added benefit to shareholders.
| 68. Climate Change (SHP) |
FOR |
Proposals addressing climate change concerns are plentiful and their scope varies. Climate change increasingly receives investor attention as a potentially critical and material risk to the sustainability of a wide range of business-specific activities. These proposals may include emissions standards or reduction targets, quantitative goals, and impact assessments. We generally support these proposals, while taking into account the materiality of the issue and whether the proposed information is of added benefit to shareholders.
For proposals requesting companies to adopt a policy, we will carefully consider existing policies and the company’s incorporation of national standards and best practices. In addition, we will evaluate the potential enactment of new regulations, as well as any investment risk related to the specific issue.
We generally support shareholder proposals calling for reports and disclosure, while taking into account existing policies and procedures of the company and whether the proposal is of added benefit to shareholders.
| 69. Charitable Contributions (SHP) (Management) |
CASE-BY-CASE |
Proposals relating to charitable contributions may be sponsored by either management or shareholders.
Management proposals may ask to approve the amount for charitable contributions.
We generally support shareholder proposals calling for reports and disclosure while taking into account existing policies and procedures of the company and whether the proposed information is of added benefit to shareholders.
| 70. Environmental Proposals (SHP) |
CASE-BY-CASE |
These proposals can include reporting and policy adoption requests in a wide variety of areas, including, but not limited to, (nuclear) waste, deforestation, packaging and recycling, renewable energy, toxic material, palm oil and water.
For proposals requesting companies to adopt a policy, we will carefully consider existing policies and the company’s incorporation of national standards and best practices. In addition, we will evaluate the potential enactment of new regulations, as well as any investment risk related to the specific issue.
We generally support shareholder proposals calling for reports and disclosure while taking into account existing policies and procedures of the company and whether the proposed information is of added benefit to shareholders.
| 71. Genetically Altered or Engineered Food and Pesticides (SHP) |
CASE-BY-CASE |
These proposals may include reporting requests on pesticides monitoring/use and Genetically Modified Organism (GMO) as well as GMO labeling.
For proposals requesting companies to adopt a policy, we will carefully consider existing policies and the company’s incorporation of national standards and best practices. In addition, we will evaluate the potential enactment of new regulations, as well as any investment risk related to the specific issue.
We generally support shareholder proposals calling for reports and disclosure while taking into account existing policies and procedures of the company and whether the proposed information is of added benefit to shareholders.
| 72. Health Proposals (SHP) |
CASE-BY-CASE |
These proposals may include reports on pharmaceutical pricing, antibiotic use in the meat supply, and tobacco products. We generally support shareholder proposals calling for reports and disclosure while taking into account the current reporting policies of the company and whether the proposed information is of added benefit to shareholders.
For proposals requesting companies to adopt a policy, we will carefully consider existing policies and the company’s incorporation of national standards and best practices. In addition, we will evaluate the potential enactment of new regulations, as well as any investment risk related to the specific issue. We generally support shareholder proposals calling for reports and disclosure while taking into account existing policies and procedures of the company and whether the proposal is of added benefit to shareholders.
| 73. Human Rights Policies and Reports (SHP) |
CASE-BY-CASE |
These proposals may include reporting requests on human rights risk assessments, humanitarian engagement and mediation policies, working conditions, adopting policies on supply chain worker fees and expanding existing policies in these areas. We recognize that many companies have complex supply chains which have led to increased awareness of supply chain issues as an investment risk.
For proposals requesting companies to adopt a policy, we will carefully consider existing policies and the company’s incorporation of national standards and best practices. In addition, we will evaluate the potential enactment of new regulations, as well as any investment risk related to the specific issue.
We generally support shareholder proposals calling for reports and disclosure while taking into account existing policies and procedures of the company and whether the proposed information is of added benefit to shareholders.
| 74. Include Sustainability as a Performance Measure (SHP) |
CASE-BY-CASE |
We believe management and directors should be given latitude in determining appropriate performance measurements. While doing so, consideration should be given to how long-term sustainability issues might affect future company performance. Therefore, we will evaluate on a case-by-case basis proposals requesting companies to consider incorporating specific, measurable, practical goals consisting of sustainability principles and environmental impacts as metrics for incentive compensation and how they are linked with our objectives as long-term shareholders.
| 75. Lobbying and Political Spending (SHP)
|
FOR |
We generally vote in favor of proposals requesting increased disclosure of political contributions and lobbying expenses, including those paid to trade organizations and political action committees, whether at the federal, state, or local level.
These proposals may increase transparency.
| 76. Other Business |
AGAINST |
In certain jurisdictions, these proposals allow management to act on issues that shareholders may raise at the annual meeting. Because it is impossible to know what issues may be raised, we will vote against these proposals.
| 77. Reimbursement of Shareholder Expenses (SHP) |
AGAINST |
These shareholder proposals would require companies to reimburse the expenses of shareholders who submit proposals that receive a majority of votes cast or the cost of proxy contest expenses. We generally vote against these proposals, unless reimbursement occurs only in cases where management fails to implement a majority passed shareholder proposal, in which case we may vote in favor.
| 78. Sustainability Report (SHP) |
FOR |
We generally support shareholder proposals calling for reports and disclosure related to sustainability while taking into account existing policies and procedures of the company and whether the proposed information is of added benefit to shareholders.
| 79. Workplace: Diversity (SHP) |
FOR |
We generally support shareholder proposals calling for reports and disclosure surrounding workplace diversity while taking into account existing policies and procedures of the company and whether the proposed information is of added benefit to shareholders.
We generally support proposals requiring a company to amend its Equal Employment Opportunity policies to prohibit workplace discrimination based on sexual orientation and gender identity.
| 80. Workplace: Gender Pay Equity (SHP) |
FOR |
A report on pay disparity between genders typically compares the difference between male and female median earnings expressed as a percentage of male earnings and may include, (i) statistics and rationale explanation pertaining to changes in the size of the gap, (ii) recommended actions, and (iii) information on whether greater oversight is needed over certain aspects of the company’s compensation policies. In the U.S., we are generally supportive of proposals to require companies to make similar assessments and disclosure related to the pay disparity between different gender and ethnic/racial groups. Shareholder requests to place a limit on a global median ethnic/racial pay gap will be assessed based on the cultural and the legal context of markets to which the company is exposed.
The SEC requires US issuers with fiscal years ending on or after January 1, 2017, to contrast CEO pay with median employee pay. This requirement, however, does not specifically address gender pay equity issues in such pay disparity reports. Accordingly, we will generally support proposals requiring gender pay metrics, taking into account the specific metrics and scope of the information requested and whether the SEC’s requirement renders the proposal unnecessary.
| 4. | CONFLICTS OF INTEREST |
| 4.1 | INTRODUCTION |
As a fiduciary, we always must act in our clients’ best interests. We strive to avoid even the appearance of a conflict that may compromise the trust our clients have placed in us, and we insist on strict adherence to fiduciary standards and compliance with all applicable federal and state securities laws. We have adopted a comprehensive Code of Business Conduct and Ethics (“Code”) to help us meet these obligations. As part of this responsibility and as expressed throughout the Code, we place the interests of our clients first and attempt to avoid any perceived or actual conflicts of interest.
AB recognizes that potentially material conflicts of interest arise when we engage with a company or vote a proxy solicited by an issuer that sponsors a retirement plan we manage (or administer), that distributes AB-sponsored mutual funds, or with which AB or one or more of our employees have another business or personal relationship , and that such conflicts could affect how we vote on the issuer’s proxy. Similarly, potentially material conflicts of interest arise when engaging with and deciding how to vote on a proposal sponsored or supported by a shareholder group that is a client. In order to address any perceived or actual conflict of interest, the procedures set forth below in sections 4.2 through 4.8 have been established for use when we encounter a potential conflict to ensure that our engagement activities and voting decisions are in our clients’ best interest consistent with our fiduciary duties and seek to maximize shareholder value.
| 4.2 | ADHERENCE TO STATED PROXY VOTING POLICIES |
Votes generally are cast in accordance with this Policy3. In situations where our Policy involves a case-by-case assessment, the following sections provide criteria that will guide our decision. In situations where our Policy on a particular issue involves a case-by-case assessment and the vote cannot be clearly decided by an application of our stated Policy, a member of the Committee or his/her designee will make the voting decision in accordance with the basic principle of our Policy to vote proxies with the intention of maximizing the value of the securities in our client accounts. In these situations, the voting rationale must be documented either on the voting platform of our proxy services vendor, by retaining relevant emails or another appropriate method. Where appropriate, the views of investment professionals are considered. All votes cast contrary to our stated voting Policy on specific issues must be documented. If a proxy vote involves a potential conflict of interest, the voting decision will be determined in accordance with the processes outlined in section 4.5 of the Policy. On an annual basis, the Committee will receive and review a report of all such votes so as to confirm adherence with the Policy.
| 4.3 | DISCLOSURE OF CONFLICTS |
When considering a proxy proposal, members of the Committee or investment professionals involved in the decision- making process must disclose to the Committee any potential conflict (including personal relationships) of which they are aware and any substantive contact that they have had with any interested outside party (including the issuer or shareholder group sponsoring a proposal) regarding the proposal. Any previously unknown conflict will be recorded on the Potential Conflicts List (discussed below). If a member of the Committee has a material conflict of interest, he or she generally must recuse himself or herself from the decision-making process.
| 4.4 | POTENTIAL CONFLICTS LIST |
No less frequently than annually, a list of companies and organizations whose engagement and proxies may pose potential conflicts of interest is compiled by the Legal and Compliance Department (the “Potential Conflicts List”). The Potential Conflicts List generally includes:
| • | Publicly-traded clients of AB; |
| • | Publicly-traded companies that distribute AB mutual funds; |
| • | Bernstein private clients who are directors, officers, or 10% shareholders of publicly traded companies; |
| • | Publicly-traded companies that are sell-side clients of our affiliated broker-dealer, SCB&Co.; |
| • | Companies where an employee of AB or Equitable Holdings, Inc., the parent company of AB, has identified an interest; |
| • | Publicly-traded affiliated companies; |
| • | Clients who sponsor, publicly support or have material interest in a proposal upon which we will be eligible to vote; |
| • | Publicly-traded companies targeted by the AFL-CIO for engagement and voting; and |
| • | Any other company subject to a material conflict of which a Committee member becomes aware4. |
| 3 | From time to time a client may request that we vote their proxies consistent with AFL-CIO guidelines or the policy of the National Association of Pension Funds. In those situations, AB reserves the right to depart from those policies if we believe it to be in the client’s best interests. |
| 4 | The Committee must notify the Legal and Compliance Department promptly of any previously unknown conflict. |
We determine our votes for all meetings of companies that may present a conflict by applying the processes described in Section 4.5 below. We document all instances when the Conflicts Officer determines our vote.
| 4.5 | DETERMINE EXISTENCE OF CONFLICT OF INTEREST |
When we encounter a potential conflict of interest, we review our proposed vote using the following analysis to ensure our voting decision is in the best interest of our clients:
| • | If our proposed vote is explicitly addressed by and consistent with the Policy, no further review is necessary. |
| • | If our proposed vote is contrary to the Policy (i.e., requires a case-by-case assessment or is not covered by the Policy), the vote will be presented to the Conflicts Officer. The Conflicts Officer’s review will be documented using a Proxy Voting Conflict of Interest Form (a copy of which is attached hereto). The Conflicts Officer will determine whether the proposed vote is reasonable. If the Conflicts Officer cannot determine that the proposed vote is reasonable, the Conflicts Officer may instruct AB to refer the votes back to the client(s) or take other actions as the Conflicts Officer deems appropriate in light of the facts and circumstances of the particular potential conflict. The Conflicts Officer may take or recommend that AB take the following steps: |
| • | Recuse or “wall-off” certain personnel from the proxy voting process; |
| • | Confirm whether AB’s proposed vote is consistent with the voting recommendations of our proxy research services vendor; or |
| • | Take other actions as the Conflicts Officer deems appropriate. |
| 4.6 | REVIEW OF THIRD PARTY PROXY SERVICE VENDORS |
AB engages one or more Proxy Service Vendors to provide voting recommendations and voting execution services. From time to time, AB will evaluate each Proxy Service Vendor’s services to assess that they are consistent with this Policy and the best interest of our clients. This evaluation may include: (i) a review of pre-populated votes on the Proxy Service Vendor’s electronic voting platform before such votes are cast, and (ii) a review of policies that address the consideration of additional information that becomes available regarding a proposal before the vote is cast. AB will also periodically review whether Proxy Service Vendors have the capacity and competency to adequately analyze proxy issues and provide the necessary services to AB. AB will consider, among other things, the adequacy and quality of the Proxy Service Vendor’s staffing, personnel and/or technology, as well as whether the Proxy Service Vendor has adequate disclosures regarding its methodologies in formulating voting recommendations. If applicable, we will also review whether any potential factual errors, incompleteness or methodological weaknesses materially affected the Proxy Service Vendor’s services and the effectiveness of the Proxy Service Vendor’s procedures for obtaining current and accurate information relevant to matters included in its research.
The Committee also takes reasonable steps to review the Proxy Service Vendor’s policies and procedures addressing conflicts of interest and verify that the Proxy Service Vendor(s) to which we have a full- level subscription is, in fact, independent based on all of the relevant facts and circumstances. This includes reviewing each Proxy Service Vendor’s conflict management procedures on an annual basis. When reviewing these conflict management procedures, we will consider, among other things, (i) whether the Proxy Service Vendor has adequate policies and procedures to identify, disclose, and address actual and potential conflicts of interest; and (ii) whether the Proxy Service Vendor provides adequate disclosure of actual and potential conflicts of interest with respect to the services provided to AB by the Proxy Service Vendor and (iii) whether the Proxy Service Vendor’s policies and procedures utilize technology in delivering conflicts disclosure; and (iv) can offer research in an impartial manner and in the best interests of our clients.
| 4.7 | CONFIDENTIAL VOTING |
It is AB’s policy to support confidentiality before the actual vote has been cast. Employees are prohibited from revealing how we intend to vote except to (i) members of the Committee; (ii) Portfolio Managers who hold the security in their managed accounts; (iii) the Research Analyst(s) who cover(s) the security; (iv) clients, upon request, for the securities held in their portfolios; (v) clients who do not hold the security or for whom AB does not have proxy voting authority, but who provide AB with a signed a Non-Disclosure Agreement; or (vi) declare our stance on an ESG related shareholder proposal(s) that is (are) deemed material for the issuer’s business for generating long-term value in our clients’ best interests. Once the votes have been cast for our mutual fund clients, they are made public in accordance with mutual fund proxy vote disclosures required by the SEC, and we generally post all votes to our public website one business day after the meeting date.
We may participate in proxy surveys conducted by shareholder groups or consultants so long as such participation does not compromise our confidential voting policy. Specifically, prior to our required SEC disclosures each year, we may respond to surveys asking about our proxy voting policies, but not any specific votes. After our mutual fund proxy vote disclosures required by the SEC each year have been made public and/or votes have been posted to our public website, we may respond to surveys that cover specific votes in addition to our voting policies.
On occasion, clients for whom we do not have proxy voting authority may ask us how AB’s Policy would be implemented. A member of the Committee or one or more members of Responsibility team may provide the results of a potential implementation of the AB policy to the client’s account subject to an understanding with the client that the implementation shall remain confidential.
Any substantive contact regarding proxy issues from the issuer, the issuer’s agent or a shareholder group sponsoring a proposal must be reported to the Committee if such contact was material to a decision to vote contrary to this Policy. Routine administrative inquiries from proxy solicitors need not be reported.
| 4.8 | A NOTE REGARDING AB’S STRUCTURE |
AB and AllianceBernstein Holding L.P. (“AB Holding”) are Delaware limited partnerships. As limited partnerships, neither company is required to produce an annual proxy statement or hold an annual shareholder meeting. In addition, the general partner of AB and AB Holding, AllianceBernstein Corporation is an indirect wholly owned subsidiary of Equitable Holdings, Inc.
As a result, most of the positions we express in this Proxy Voting Policy are inapplicable to our business. For example, although units in AB Holding are publicly traded on the New York Stock Exchange (“NYSE”), the NYSE Listed Company Manual exempts limited partnerships and controlled companies from compliance with various listing requirements, including the requirement that our board have a majority of independent directors.
| 5. | VOTING TRANSPARENCY |
We publish our voting records on our website one business day after the shareholder meeting date for each issuer company. Many clients have requested that we provide them with periodic reports on how we voted their proxies. Clients may obtain information about how we voted proxies on their behalf by contacting their Advisor.
| 6. | RECORDKEEPING |
All of the records referenced below will be kept in an easily accessible place for at least the length of time required by local regulation and custom, and, if such local regulation requires that records are kept for less than six (6) years from the end of the fiscal year during which the last entry was made on such record, we will follow the US rule of six (6) or more years. If the local regulation requires that records are kept for more than six (6) or more years, we will comply with the local regulation.9 We maintain the vast majority of these records electronically.
| 6.1 | PROXY VOTING AND GOVERNANCE POLICY |
The Policy shall be maintained in the Legal and Compliance Department and posted on our company intranet and on the AB website.
| 6.2 | PROXY STATEMENTS RECEIVED REGARDING CLIENT SECURITIES |
For US Securities5, AB relies on the SEC to maintain copies of each proxy statement we receive regarding client securities. For Non-US Securities, we rely on ISS, our proxy voting agent, to retain such proxy statements.
| 6.3 | RECORDS OF VOTES CAST ON BEHALF OF CLIENTS |
Records of votes cast by AB are retained electronically by our proxy research service vendor.
| 6.4 | RECORDS OF CLIENTS REQUESTS FOR PROXY VOTING INFORMATION |
Copies of written requests from clients for information on how AB voted their proxies shall be maintained by the Legal and Compliance Department. Responses to written and oral requests for information on how we voted clients’ proxies will be kept in the Client Group.
| 6.5 | DOCUMENTS PREPARED BY AB THAT ARE MATERIAL TO VOTING DECISIONS |
The Committee is responsible for maintaining documents prepared by the Committee or any AB employee that were material to a voting decision. Therefore, where an investment professional’s opinion is essential to the voting decision, the recommendation from investment professionals must be made in writing to a member of Responsibility team.
| 5 | US securities are defined as securities of issuers required to make reports pursuant to §12 of the Securities Exchange Act of 1934, as amended. Non-US securities are defined as all other securities. |
| 7. | PROXY VOTING PROCEDURES |
| 7.1 | VOTE ADMINISTRATION |
In an effort to increase the efficiency of voting proxies, AB currently uses ISS to act as its voting agent for our clients’ holdings globally.
Issuers initially send proxy information to the custodians of our client accounts. We instruct these custodian banks to direct proxy related materials to ISS’s offices. ISS provides us with research related to each resolution and pre-populates certain ballots based on the guidelines contained in this Policy. Members of Responsibility team review the ballots via ISS’s web platform, ProxyExchange, and complete the ballots for any proposals where our Policy involves a case-by-case assessment. In addition, all AB’s proxy votes are double-checked by an offshore compliance team to verify that they are being voted in-line with our Policy. Using ProxyExchange, the members of Responsibility team submit our voting decision. ISS then returns the proxy ballot forms to the designated returnee for tabulation.
If necessary, any paper ballots we receive will be voted online using ProxyVote or via mail or fax.
| 7.2 | SHARE BLOCKING AND ABSTAINING FROM VOTING CLIENT SECURITIES |
Proxy voting in certain countries requires “share blocking.” Shareholders wishing to vote their proxies must deposit their shares shortly before the date of the meeting (usually one week) with a designated depositary. During this blocking period, shares that will be voted at the meeting cannot be sold until the meeting has taken place and the shares are returned to the clients’ custodian banks. We may determine that the value of exercising the vote is outweighed by the detriment of not being able to sell the shares during this period. In cases where we want to retain the ability to trade shares, we may determine to not vote those shares.
We seek to vote all proxies for securities held in client accounts for which we have proxy voting authority. However, in some markets administrative issues beyond our control may sometimes prevent us from voting such proxies. For example, we may receive meeting notices after the cut-off date for voting or without enough time to fully consider the proxy. Similarly, proxy materials for some issuers may not contain disclosure sufficient to arrive at a voting decision, in which cases we may abstain from voting. Some markets outside the US require periodic renewals of powers of attorney that local agents must have from our clients prior to implementing our voting instructions.
AB will abstain from voting (which generally requires submission of a proxy voting card) or affirmatively decide not to vote if AB determines that abstaining or not voting would be in the applicable client’s best interest. In making such a determination, AB will consider various factors, including, but not limited to: (i) the costs associated with exercising the proxy (e.g., translation or travel costs); (ii) any legal restrictions on trading resulting from the exercise of a proxy (e.g., share-blocking jurisdictions); (iii) whether AB’s clients have sold the underlying securities since the record date for the proxy; and (iv) whether casting a vote would not reasonably be expected to have a material effect on the value of the client’s investment.
| 7.3 | LOANED SECURITIES |
Many of our clients have entered into securities lending arrangements with agent lenders to generate additional revenue. We will not be able to vote securities that are on loan under these types of arrangements. However, under rare circumstances, for voting issues that may have a significant impact on the investment, we may request that clients or custodians recall securities that are on loan if we determine that the benefit of voting outweighs the costs and lost revenue to the client or fund and the administrative burden of retrieving the securities. For the SRI labeled Thematic funds, we recall U.S. securities on loan to vote proxies and have discontinued lending for non-U.S. securities.
If you have questions or desire additional information about this Policy, please contact ProxyTeam@alliancebernstein.com.
PROXY VOTING GUIDELINE SUMMARY
| Shareholder Proposal |
For |
Against |
Case-by- Case | |||||
| Board and Director Proposals | ||||||||
| Board Diversity | + | |||||||
| + | Establish New Board Committees and Elect Board Members with Specific Expertise | + | ||||||
| Changes in Board Structure and Amending the Articles of Incorporation | + | |||||||
| Classified Boards | + | |||||||
| Director Liability and Indemnification | + | |||||||
| + | Disclose CEO Succession Plan | + | ||||||
| Election of Directors | + | |||||||
| Controlled Company Exemption | + | |||||||
| Voting for Director Nominees in a Contested Election | + | |||||||
| + | Independent Lead Director | + | ||||||
| + | Limit Term of Directorship | + | ||||||
| + | Majority of Independent Directors | + | ||||||
| + | Majority of Independent Directors on Key Committees | + | ||||||
| + | Majority Votes for Directors | + | ||||||
| + | Removal of Directors Without Cause | + | ||||||
| + | Require Independent Board Chairman | + | ||||||
| + | Require Two Candidates for Each Board Seat | + | ||||||
| Compensation Proposals | ||||||||
| + | Elimination of Single Trigger Change-in-Control Agreements | + | ||||||
| + | Pro Rata Vesting of Equity Compensation Awards-Change of Control | + | ||||||
| + | Adopt Policies to Prohibit any Death Benefits to Senior Executives | + | ||||||
| + | Advisory Vote to Ratify Directors’ Compensation | + | ||||||
| + | Amend Executive Compensation Plan Tied to Performance (Bonus Banking) | + | ||||||
| Approve Remuneration for Directors and Auditors | + | |||||||
| Approve Remuneration Reports | + | |||||||
| Approve Retirement Bonuses for Directors (Japan and South Korea) | + | |||||||
| Approve Special Payments to Continuing Directors and Auditors (Japan) | + | |||||||
| + | Disclose Executive and Director Pay | + | ||||||
| + | Exclude Pension Income from Performance-Based Compensation | + | ||||||
| Executive and Employee Compensation Plans | + | |||||||
| + | Limit Dividend Payments to Executives | + | ||||||
| + | Limit Executive Pay | + | ||||||
| Shareholder Proposal |
For |
Against |
Case-by- Case | |||||
| + | Mandatory Holding Periods | + | ||||||
| + | Performance-Based Stock Option Plans | + | ||||||
| + | Prohibit Relocation Benefits to Senior Executives | + | ||||||
| + | Recovery of Performance-Based Compensation | + | ||||||
| + | Submit Golden Parachutes/Severance Plans to a Shareholder Vote | + | ||||||
| + | Submit Golden Parachutes/Severance Plans to a Shareholder Vote prior to their being Negotiated by Management | + | ||||||
| + | Submit Survivor Benefit Compensation Plans to a Shareholder Vote | + | ||||||
| Capital Changes and Anti-Take Over Proposals | ||||||||
| + | Amend Exclusive Forum Bylaw | + | ||||||
| Amend Net Operating Loss (“NOL”) Rights Plans | + | |||||||
| Authorize Share Repurchase | + | |||||||
| Blank Check Preferred Stock | + | |||||||
| Corporate Restructurings, Merger Proposals and Spin-Offs | + | |||||||
| Elimination of Preemptive Rights | + | |||||||
| + | Expensing Stock Options | + | ||||||
| Fair Price Provisions | + | |||||||
| Increase Authorized Common Stock | + | |||||||
| Issuance of Equity without Preemptive Rights | + | |||||||
| Issuance of Stock with Unequal Voting Rights | + | |||||||
| Net Long Position Requirement | + | |||||||
| Reincorporation | + | |||||||
| + | Reincorporation to Another jurisdiction to Permit Majority Voting or Other Changes in Corporate Governance | + | ||||||
| Stock Splits | + | |||||||
| + | Submit Company’s Shareholder Rights Plan to a Shareholder Vote | + | ||||||
| Transferrable Stock Options | + | |||||||
| Auditor Proposals | ||||||||
| Appointment of Auditors | + | |||||||
| Approval of Financial Statements | + | |||||||
| Approval of Internal Statutory Auditors | + | |||||||
| + | Limit Compensation Consultant Services | + | ||||||
| Limitation of Liability of External Statutory Auditors (Japan) | + | |||||||
| + | Separating Auditors and Consultants | + | ||||||
| Shareholder Access & Voting Proposals | ||||||||
| + | A Shareholder’s Right to Call Special Meetings | + | ||||||
| + | Adopt Cumulative Voting | + | ||||||
| + | Adopt Cumulative Voting in Dual Shareholder Class Structures | + | ||||||
| + | Early Disclosure of Voting Results | + | ||||||
| Shareholder Proposal |
For |
Against |
Case-by- Case | |||||
| + | Implement Confidential Voting | + | ||||||
| Limiting a Shareholder’s Right to Call Special Meetings | + | |||||||
| + | Permit a Shareholder’s Right to Act by Written Consent | + | ||||||
| + | Proxy Access for Annual Meetings | + | ||||||
| Reduce Meeting Notification from 21 Days to 14 Days (UK) | + | |||||||
| + | Rotation of Locale for Annual Meeting | + | ||||||
| + | Shareholder Proponent Engagement Process | + | ||||||
| Supermajority Vote Requirements | + | |||||||
| Environmental & Social, Disclosure Proposals | ||||||||
| + | Animal Welfare | + | ||||||
| + | Climate Change | + | ||||||
| + | Carbon Accounting | + | ||||||
| + | Carbon Risk | + | ||||||
| + | Charitable Contributions | + | ||||||
| + | Environmental Proposals | + | ||||||
| + | Genetically Altered or Engineered Food and Pesticides | + | ||||||
| + | Health Proposals | + | ||||||
| + | Pharmaceutical Pricing (US) | + | ||||||
| + | Human Rights Policies and Reports | + | ||||||
| + | Include Sustainability as a Performance Measure (SHP) | + | ||||||
| + | Lobbying and Political Spending | + | ||||||
| + | Other Business | + | ||||||
| + | Reimbursement of Shareholder Expenses | + | ||||||
| + | Sustainability Report | + | ||||||
| + | Workplace: Diversity | + | ||||||
| + | Workplace: Pay Disparity | + | ||||||
PROXY VOTING CONFLICT OF INTEREST FORM
| Name of Security | Date of Shareholder Meeting | |||||
| Short Description of the conflict (client, mutual fund distributor, etc.): |
| 1. | Is our proposed vote on all issues explicitly addressed by, and consistent with our stated proxy voting policy? |
|
|
☐ Yes ☐ No |
If yes, stop here and sign below as no further review is necessary.
| 2. | Is our proposed vote on consistent with our client’s recommended vote? |
|
|
☐ Yes ☐ No |
Leave blank if not applicable; if yes, continue to question 3; if no, provide a memo reflecting the guidelines provided below.
| 3. | Is our proposed vote consistent with the views of Institutional Shareholder Services? ☐ Yes ☐ No |
Leave blank if not applicable.
Please attach a memo containing the following information and documentation supporting the proxy voting decision:
| • | A list of the issue(s) where our proposed vote is contrary to our stated Policy (director election, cumulative voting, compensation) |
| • | A description of any substantive contact with any interested outside party and a proxy voting and governance committee or an AB investment professional that was material to our voting decision. Please include date, attendees, titles, organization they represent and topics discussed. If there was no such contact, please note as such. |
| • | If the Independent Compliance Officer has NOT determined that the proposed vote is reasonable, please explain and indicate what action has been, or will be taken. |
| AB Conflicts Officer Approval (if necessary. Email approval is acceptable.): | Prepared By: | |||||||
| I hereby confirm that the proxy voting decision referenced on this form is reasonable. | ||||||||
| Print Name: | ||||||||
| AB Conflicts Officer | Date: | |||||||
| Date: | ||||||||
Please return this completed form and all supporting documentation to the Conflicts Officer in the Legal and Compliance Department and keep a copy for your records.
ITEM 8. PORTFOLIO MANAGERS OF CLOSED-END MANAGEMENT INVESTMENT COMPANIES.
(a) (1) The management of, and investment decisions for, the Fund’s portfolio are made by the Global Fixed Income: Emerging Markets Investment Team.
The following table lists the five members of the team with the most significant responsibility for the day-to-day management of the Fund’s portfolio, the length of time that each person has been involved in the management of the Fund, and each person’s principal occupation during the past five years:
| Employee; Year; Title |
Principal Occupation During the Past Five (5) Years | |
| Gershon Distenfeld; since prior to 2013; Vice President of the Adviser | Senior Vice President of the Adviser* with which he has been associated since prior to 2013. | |
| Matthew S. Sheridan; since prior to 2013; Vice President of the Adviser | Senior Vice President of the Adviser* with which he has been associated since prior to 2013. | |
| * | The Adviser, ABI and ABIS are affiliates of the Fund. |
(a) (2) The following tables provide information regarding registered investment companies other than the Fund, other pooled investment vehicles and other accounts over which the Fund’s portfolio managers also have day-to-day management responsibilities. The tables provide the numbers of such accounts, the total assets in such accounts and the number of accounts and total assets whose fees are based on performance. The information is provided as of the Fund’s fiscal year ended March 31, 2023.
| REGISTERED INVESTMENT COMPANIES (excluding the Fund) | ||||||||||||
| Portfolio Manager |
Total Number of Registered Investment Companies Managed |
Total Assets of Registered Investment Companies Managed |
Number of Registered Investment Companies Managed with Performance- based Fees |
Total Assets of Registered Investment Companies Managed with Performance-based Fees | ||||||||
| Gershon Distenfeld |
6 | $ | 6,660,000,000 | None | None | |||||||
| Matthew S. Sheridan |
17 | $ | 13,479,000,000 | None | None | |||||||
| POOLED INVESTMENT VEHICLES | ||||||||||||
| Portfolio Manager |
Total Number of Pooled Investment Vehicles Managed |
Total Assets of Pooled Investment Vehicles Managed |
Number of Pooled Investment Vehicles Managed with Performance-based Fees |
Total Assets of Pooled Investment Vehicles Managed with Performance- based Fees | ||||||||
| Gershon Distenfeld |
75 | $ | 37,052,000,000 | None | None | |||||||
| Matthew S. Sheridan |
102 | $ | 36,259,000,000 | None | None | |||||||
| OTHER ACCOUNTS | ||||||||||||
| Portfolio Manager |
Total Number of Other Accounts Managed |
Total Assets of Other Accounts Managed |
Number of Other Accounts Managed with Performance- based Fees |
Total Assets of Other Accounts with Performance- based Fees | ||||||||
| Gershon Distenfeld |
30 | $ | 2,689,000,000 | None | None | |||||||
| Matthew S. Sheridan |
30 | $ | 10,540,000,000 | None | None | |||||||
Investment Professional Conflict of Interest Disclosure
As an investment adviser and fiduciary, the Adviser owes its clients and shareholders an undivided duty of loyalty. The Adviser recognizes that conflicts of interest are inherent in its business and accordingly has developed policies and procedures (including oversight monitoring) reasonably designed to detect, manage and mitigate the effects of actual or potential conflicts of interest in the area of employee personal trading, managing multiple accounts for multiple clients, including AB Mutual Funds, and allocating investment opportunities. Investment professionals, including portfolio managers and research analysts, are subject to the above-mentioned policies and oversight monitoring to ensure that all clients are treated equitably. The Adviser places the interests of its clients first and expects all of its employees to meet their fiduciary duties.
Employee Personal Trading. The Adviser has adopted a Code of Business
Conduct and Ethics that is designed to detect and prevent conflicts of interest when investment professionals and other personnel of the Adviser own, buy or sell securities which may be owned by, or bought or sold for, clients. Personal securities transactions by an employee may raise a potential conflict of interest when an employee owns or trades in a security that is owned or considered for purchase or sale by a client, or recommended for purchase or sale by an employee to a client. Subject to the reporting requirements and other limitations of its Code of Business Conduct and Ethics, the Adviser permits its employees to engage in personal securities transactions, and also allows them to acquire investments in certain funds managed by the Adviser. The Adviser’s Code of Business Conduct and Ethics requires disclosure of all personal accounts and maintenance of brokerage accounts with designated broker-dealers approved by the Adviser. The Code of Business Conduct and Ethics also requires preclearance of all securities transactions (except transactions in U.S. Treasuries and open-end mutual funds other than funds advised by the Adviser) and imposes a 60-day holding period for securities purchased by employees to discourage short-term trading.
Managing Multiple Accounts for Multiple Clients
The Adviser has compliance policies and oversight monitoring in place to address conflicts of interest relating to the management of multiple accounts for multiple clients. Conflicts of interest may arise when an investment professional has responsibilities for the investments of more than one account because the investment professional may be unable to devote equal time and attention to each 90 account. The investment professional or investment professional teams for each client may have responsibilities for managing all or a portion of the investments of multiple accounts with a common investment strategy, including other registered investment companies, unregistered investment vehicles, such as hedge funds, pension plans, separate accounts, collective trusts and charitable foundations. Among other things, the Adviser’s policies and procedures provide for the prompt dissemination to investment professionals of initial or changed investment recommendations by analysts so that investment professionals are better able to develop investment strategies for all accounts they manage. In addition, investment decisions by investment professionals are reviewed for the purpose of maintaining uniformity among similar accounts and ensuring that accounts are treated equitably. Investment professional compensation reflects a broad contribution in multiple dimensions to long-term investment success for clients of the Adviser and is generally not tied specifically to the performance of any particular client’s account, nor is it generally tied directly to the level or change in level of assets under management.
Allocating Investment Opportunities and Order Aggregation
The investment professionals at the Adviser routinely are required to select and allocate investment opportunities among accounts. The Adviser has adopted policies and procedures intended to address conflicts of interest relating to the allocation of investment opportunities. These policies and procedures are designed to ensure that information relevant to investment decisions is disseminated promptly within its portfolio management teams and investment opportunities are allocated equitably among different clients. The policies and procedures require, among other things, objective allocation for limited investment opportunities (e.g., on a rotational basis), and documentation and review of justifications for any decisions to make investments only for select accounts or in a manner disproportionate to the size of the account. Portfolio holdings, position sizes, and industry and sector exposures tend to be similar across similar accounts, which minimizes the potential for conflicts of interest relating to the allocation
of investment opportunities. Nevertheless, access to portfolio funds or other investment opportunities may be allocated differently among accounts due to the particular characteristics of an account, such as size of the account, cash position, tax status, risk tolerance and investment restrictions or for other reasons.
Generally, all orders in the same security are aggregated in each trading system by the Adviser to facilitate best execution and to reduce overall trading costs. Executions for aggregated orders with the same executing broker are combined to determine one average price. The shares are then allocated to participating accounts using automated algorithms designed to achieve a fair, equitable and objective distribution of the shares over time. When the liquidity in a market is not sufficient to fill all client orders, the Adviser may give priority to certain orders over others. This prioritization is based on objective factors driving the order. Under such circumstances, the Adviser aggregates orders by these factors and subjects each aggregated order to the trade allocation algorithms discussed above. The factors used, in order of priority, are (1) correction of guideline breaches; (2) avoidance of guideline breaches; (3) investing significant new funding and completing tax strategy implementations; (4) investing in services that focus on specific financial instruments or market sectors, (5) avoidance of tracking error on the service/product level; and (6) portfolio rebalancing and optimization. Separate orders with the same priority may be traded using a rotational process that is fair and objective.
The Adviser may not require orders in the same security from different managers to be aggregated where one manager’s investment strategy requires rapid trade execution, provided the Adviser believes that disaggregation will not materially impact other client orders. Certain other clients of the Adviser have investment objectives and policies similar to those of a Fund. The Adviser may, from time to time, make recommendations that result in the purchase or sale of a particular security by its other clients simultaneously with a purchase or sale thereof by one or more Funds. If transactions on behalf of more than one client during the same period increase the demand for securities being purchased or the supply of securities being sold, there may be an adverse effect on price or the quantity of securities available at a particular price. It is the policy of the Adviser to allocate advisory recommendations and the placing of orders in a manner that is deemed equitable by the Adviser to the accounts involved, including the Funds. When two or more of the clients of the Adviser (including a Fund) are purchasing or selling the same security on a given day through the same broker or dealer, such transactions may be averaged as to price.
The Adviser’s procedures are also designed to address potential conflicts of interest that may arise when the Adviser has a particular financial incentive, such as a performance-based management fee, relating to an account. The Adviser is conscious of these potential conflicts. When the Adviser is providing fiduciary services, the goal of the Adviser’s policies and procedures is to act in good faith and to treat all client accounts in a fair and equitable manner over time, regardless of their strategy, fee arrangements or the influence of their owners or beneficiaries.
Portfolio Manager Compensation
The Adviser’s compensation program for portfolio managers is designed to align with clients’ interests, emphasizing each portfolio manager’s ability to generate long-term investment success for the Adviser’s clients, including the Funds. The Adviser also strives to ensure that compensation is competitive and effective in attracting and retaining the highest caliber employees.
Portfolio managers receive a base salary, incentive compensation and contributions to AllianceBernstein’s 401(k) plan. Part of the annual incentive compensation is generally paid in the form of a cash bonus, and part through an award under the firm’s Incentive Compensation Award Plan (ICAP). The ICAP awards vest over a four-year period. Deferred awards are paid in the form of restricted grants of the firm’s Master Limited Partnership Units, and award recipients have the ability to receive a portion of their awards in deferred cash. The amount of contributions to the 401(k) plan is determined at the sole discretion of the Adviser. On an annual basis, the Adviser endeavors to combine all of the foregoing elements into a total compensation package that considers industry compensation trends and is designed to retain its best talent.
The incentive portion of total compensation is determined by quantitative and qualitative factors. Quantitative factors, which are weighted more heavily, are driven by investment performance. Qualitative factors are driven by contributions to the investment process and client success.
The quantitative component includes measures of absolute, relative and riskadjusted investment performance. Relative and risk-adjusted returns are determined based on the benchmark in the Fund’s prospectus and versus peers over one-, three- and five-year calendar periods, with more weight given to longer-time periods. Peer groups are chosen by Chief Investment Officers, who consult with the product management team to identify products most similar to our investment style and most relevant within the asset class. Portfolio managers of the Funds do not receive any direct compensation based upon the investment returns of any individual client account, and compensation is not tied directly to the level or change in level of assets under management.
Among the qualitative components considered, the most important include thought leadership, collaboration with other investment colleagues, contributions to risk-adjusted returns of other portfolios in the firm, efforts in mentoring and building a strong talent pool and being a good corporate citizen. Other factors can play a role in determining portfolio managers’ compensation, such as the complexity of investment strategies managed, volume of assets managed and experience.
The Adviser emphasizes four behavioral competencies—relentlessness, ingenuity, team orientation and accountability—that support its mission to be the most trusted advisor to its clients. Assessments of investment professionals are formalized in a year-end review process that includes 360-degree feedback from other professionals from across the investment teams and the Adviser.
Asset-Based and Performance-Based Compensation:
With respect to the Select US Equity and Select US Long/Short, Mr. Feuerman and members of the investment team he leads (the “Investment Team”) were hired by the Adviser in 2011. At that time, the Adviser entered into an employment agreement with Mr. Feuerman under which a
compensation pool for Mr. Feuerman and members of the Investment Team was created based on specified percentages of the fees (both asset-based and performance-based fees) received by the Adviser from the accounts managed by the Investment Team. Performance fees are not assessed on the Fund or the assets of the Fund. In general, a larger percentage of the fees received by the Adviser is allocated to the compensation pool with respect to assets that were managed by Mr. Feuerman at his prior employer and that followed Mr. Feuerman to the Adviser than with respect to assets, such as the Fund, that were obtained or created after Mr. Feuerman joined the Adviser. The compensation pool is allocated among the members of the Investment Team based on the recommendations of Mr. Feuerman subject to approval by the Adviser’s Compensation Committee. This compensation represents a portion of the overall compensation received by members of the Investment Team.
(a) (4) The dollar range of the Fund’s equity securities owned directly or beneficially by the Fund’s portfolio managers as of the Fund’s fiscal year ended March 31, 2023 is set forth below:
| DOLLAR RANGE OF EQUITY SECURITIES IN THE FUND | ||
| Gershon Distenfeld |
None | |
| Matthew S. Sheridan |
None |
ITEM 9. PURCHASES OF EQUITY SECURITIES BY CLOSED-END MANAGEMENT INVESTMENT COMPANY AND AFFILIATED PURCHASERS.
There have been no purchases of equity securities by the Fund or by affiliated parties for the reporting period.
ITEM 10. SUBMISSION OF MATTERS TO A VOTE OF SECURITY HOLDERS.
There have been no material changes to the procedures by which shareholders may recommend nominees to the Fund’s Board of Directors since the Fund last provided disclosure in response to this item.
ITEM 11. CONTROLS AND PROCEDURES.
(a) The registrant’s principal executive officer and principal financial officer have concluded that the registrant’s disclosure controls and procedures (as defined in Rule 30a-2(c) under the
Investment Company Act of 1940, as amended) are effective at the reasonable assurance level based on their evaluation of these controls and procedures as of a date within 90 days of the filing date of this document.
(b) There were no changes in the registrant’s internal controls over financial reporting that occurred during the period covered by this report that has materially affected, or is reasonably likely to materially affect, the registrant’s internal control over financial reporting.
ITEM 12. DISCLOSURE OF SECURITIES LENDING ACTIVITIES FOR CLOSED-END MANAGEMENT INVESTMENT COMPANIES.
The registrant did not engage in securities lending during its most recent fiscal year.
ITEM 13. EXHIBITS.
The following exhibits are attached to this Form N-CSR:
SIGNATURES
Pursuant to the requirements of the Securities Exchange Act of 1934 and the Investment Company Act of 1940, the registrant has duly caused this report to be signed on its behalf by the undersigned, thereunto duly authorized.
(Registrant): AllianceBernstein Global High Income Fund, Inc.
| By: | /s/ Onur Erzan | |
| Onur Erzan | ||
| President |
Date: May 30, 2023
Pursuant to the requirements of the Securities Exchange Act of 1934 and the Investment Company Act of 1940, this report has been signed below by the following persons on behalf of the registrant and in the capacities and on the dates indicated.
| By: | /s/ Onur Erzan | |
| Onur Erzan | ||
| President |
Date: May 30, 2023
| By: | /s/ Joseph J. Mantineo | |
| Joseph J. Mantineo | ||
| Treasurer and Chief Financial Officer |
Date: May 30, 2023