UNITED STATES
SECURITIES AND EXCHANGE COMMISSION
Washington, D.C. 20549
SECURITIES AND EXCHANGE COMMISSION
Washington, D.C. 20549
FORM N-CSR
CERTIFIED SHAREHOLDER REPORT OF REGISTERED
MANAGEMENT INVESTMENT COMPANIES
Investment Company Act file number 811-23084
Series Portfolios Trust
(Exact name of registrant as specified in charter)
(Exact name of registrant as specified in charter)
615 East Michigan Street
Milwaukee, WI 53202
(Address of principal executive offices) (Zip code)
(Address of principal executive offices) (Zip code)
Ryan Roell, President
Series Portfolios Trust
c/o U.S. Bancorp Fund Services, LLC
777 East Wisconsin Ave, 6th Fl
Milwaukee, WI 53202
(Name and address of agent for service)
(Name and address of agent for service)
(414) 516-1709
Registrant's telephone number, including area code
Date of fiscal year end: June 30, 2023
Date of reporting period: June 30, 2023
Item 1. Reports to Stockholders.
|
(a)
|
|
|
|
 |
HW Opportunities MP Fund
Annual Report
JUNE 30, 2023
|
|
|
|
|
|
HW OPPORTUNITIES MP FUND
Dear Shareholder:
The following investment review and shareholder report relates to the activities of the HW Opportunities MP Fund for the twelve months ended June 30, 2023.
Overview
In the twelve-month period ended June 30, 2023, the S&P 500® Index returned +19.6%. The catalyst for the market’s
performance this year appears to be the decrease in rates of inflation. The U.S. Consumer Price Index has fallen from its 9.1% peak in mid-2022 to 4.0% and is expected to decline further. Lower inflation and lower interest rates are generally good
for equities. This seems to have trumped concerns about an economic slowdown. Bloomberg publishes a Recession Probability Forecast, which surveys a group of economists on what they think the chances of a recession are in the next 12 months. The U.S.
version of this index currently stands at 65%. However, equity markets fell in 2022 more than they have risen in 2023. Also, not all recessions/slowdowns are created equally. Balance sheets of consumers and companies are generally healthy, unlike
2007/2008. Fewer excesses in the financial system are likely to limit the severity of a recession if one occurs.
Our equity portfolios generally trade at considerable discounts to their respective benchmarks. Importantly, however, we do not blindly invest in companies/industries with the lowest price multiples. We
invest in those that trade at the largest discounts to intrinsic value, and that intrinsic value is highly dependent on a company’s risk profile—lower risk companies have higher intrinsic values all else equal and should command higher fair value
multiples.
HW Opportunities MP Fund
The Fund had a total return of 27.92% for the year ended June 30, 2023, compared to the Russell 3000® Value Index return
of 11.22%.
Positive security selection in financials, communication services, and health care were the largest positive contributors to relative performance during the period. The overweight exposure to energy and
industrials, along with the underweight exposure to health care also helped. Stock selection in information technology hurt relative performance. The largest positive contributors to relative performance in the period were General Electric,
Rothschild & Co., Stagwell, Accor and First Republic Bank; the largest detractors were Ericsson, Redbubble, Popular, F5, and International Distributions Services.
Sincerely,
 |
 |
|
George Davis
|
David Green
|
|
Fund Manager
|
Fund Manager
|
1
HW OPPORTUNITIES MP FUND
Fund Information
FUND RISKS
Mutual fund investing involves risk; loss of principal is possible. The Fund is non-diversified and may invest in foreign securities, high yield securities (junk
bonds), and derivatives. Value investing style may over time go in and out of favor and the Fund may be negatively impacted. Please read the Fund prospectus for a full list of Fund risks.
MARKET INDEXES
S&P 500® Index, a capital weighted, unmanaged index, represents the aggregate market value of the common equity of
500 stocks primarily traded on the New York Stock Exchange.
Russell 3000® Value Index measures the performance of those Russell 3000® companies with lower price-to-book ratios and lower forecasted growth values.
US Consumer Price Index is a measure of the average change over time in the prices paid by urban consumers for a market basket of consumer goods and services.
DISCLOSURE
Past performance does not guarantee future results. Short term performance in particular is not a good indication of the Fund’s future performance and an
investment should not be made based solely on returns.
The shareholder letter reflects opinions of the Fund manager as of June 30, 2023. It is subject to change and any forecasts made cannot be guaranteed. The Fund might not continue to
hold any securities mentioned and has no obligation to disclose purchases or sales in these securities. Please refer to the Schedule of Investments in this report for a complete list of Fund holdings for June 30, 2023.
Indexes do not incur expenses or sales loads and are not available for investment.
2
HW OPPORTUNITIES MP FUND
Value of $10,000 Investment (Unaudited)
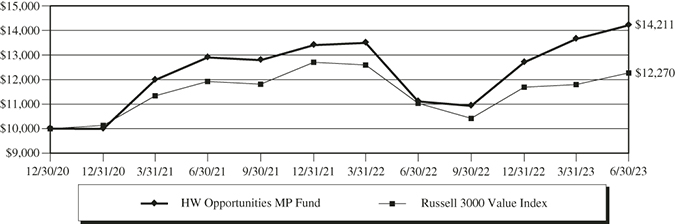
The chart assumes an initial investment of $10,000. Performance reflects waivers of fees and operating expenses in effect. In the absence of such waivers, total return would be reduced. Past performance
is not predictive of future performance. Investment return and principal value will fluctuate, so that your shares, when redeemed, may be worth more or less than their original cost. Performance assumes the reinvestment of capital gains and income
distributions. The performance does not reflect the deduction of taxes that a shareholder would pay on Fund distributions or the redemption of Fund shares.
Rates of Return (%) – As of June 30, 2023
|
One Year
|
Since Inception(1)
|
||
|
HW Opportunities MP Fund
|
27.92%
|
15.08%
|
|
|
Russell 3000 Value Total Return(2)
|
11.22%
|
8.52%
|
|
(1)
|
December 30, 2020.
|
|
(2)
|
The Russell 3000 Value Total Return Index measures the performance of those Russell 3,000 companies with lower price-to-book ratios and lower forecasted growth values.
|
The performance data quoted represents past performance and does not guarantee future results. Current performance may be lower or higher. Investment return and principal value of
the fund will fluctuate, and shares may be worth more or less than their original cost when redeemed. For performance current to most recent month end, please call 1-888-458-1963. Gross expense ratio as of the current prospectus dated 10/31/22 is
1.36%.
3
HW OPPORTUNITIES MP FUND
Schedule of Investments
June 30, 2023
|
Percent of
|
|||
| Geographic Breakdown (% of net assets) |
Largest Equity Holdings
|
Net Assets
|
|
 |
Stagwell, Inc.
|
9.28%
|
|
|
Telefonaktiebolaget LM Ericsson
|
6.96%
|
||
|
U-Haul Holding Co.
|
6.84%
|
||
|
ManpowerGroup, Inc.
|
6.07%
|
||
|
Evercore, Inc.
|
5.10%
|
||
|
Alphabet, Inc., Class A
|
4.59%
|
||
|
NOV, Inc.
|
4.00%
|
||
|
International Distributions Services plc
|
3.85%
|
||
|
Popular, Inc.
|
3.80%
|
||
|
Comcast Corp., Class A
|
3.80%
|
|
Shares
|
||||||||
|
Held
|
Value
|
|||||||
|
COMMON STOCKS – 96.18%
|
||||||||
|
COMMUNICATION SERVICES – 20.28%
|
||||||||
|
Interactive Media & Services – 4.59%
|
||||||||
|
Alphabet, Inc., Class A (a)
|
17,680
|
$
|
2,116,296
|
|||||
|
Media – 15.69%
|
||||||||
|
Comcast Corp., Class A
|
42,100
|
1,749,255
|
||||||
|
News Corp., Class A
|
53,389
|
1,041,086
|
||||||
|
Paramount Global, Class B
|
10,100
|
160,691
|
||||||
|
Stagwell, Inc. (a)
|
593,080
|
4,276,106
|
||||||
|
7,227,138
|
||||||||
|
TOTAL COMMUNICATION SERVICES
|
9,343,434
|
|||||||
|
CONSUMER DISCRETIONARY – 2.72%
|
||||||||
|
Automobiles – 1.10%
|
||||||||
|
General Motors Co.
|
13,110
|
505,522
|
||||||
|
Broadline Retail – 0.47%
|
||||||||
|
Redbubble Ltd. (a)(b)
|
884,900
|
218,800
|
||||||
|
Hotels, Restaurants & Leisure – 1.15%
|
||||||||
|
Accor SA (b)
|
14,200
|
528,403
|
||||||
|
TOTAL CONSUMER DISCRETIONARY
|
1,252,725
|
|||||||
The accompanying notes are an integral part of these financial statements.
4
HW OPPORTUNITIES MP FUND
Schedule of Investments – Continued
June 30, 2023
|
Shares
|
||||||||
|
Held
|
Value
|
|||||||
|
COMMON STOCKS – 96.18% (Continued)
|
||||||||
|
CONSUMER STAPLES – 0.55%
|
||||||||
|
Tobacco – 0.55%
|
||||||||
|
Philip Morris International, Inc.
|
2,600
|
$
|
253,812
|
|||||
|
TOTAL CONSUMER STAPLES
|
253,812
|
|||||||
|
ENERGY – 14.31%
|
||||||||
|
Energy Equipment & Services – 4.00%
|
||||||||
|
NOV, Inc.
|
114,800
|
1,841,392
|
||||||
|
Oil, Gas & Consumable Fuels – 10.31%
|
||||||||
|
APA Corp.
|
31,500
|
1,076,355
|
||||||
|
Berry Corp.
|
227,100
|
1,562,448
|
||||||
|
Kosmos Energy Ltd. (a)
|
219,100
|
1,312,409
|
||||||
|
Shell plc – ADR (b)
|
13,248
|
799,914
|
||||||
|
4,751,126
|
||||||||
|
TOTAL ENERGY
|
6,592,518
|
|||||||
|
FINANCIALS – 17.60%
|
||||||||
|
Banks – 7.05%
|
||||||||
|
Citigroup, Inc.
|
12,200
|
561,688
|
||||||
|
Citizens Financial Group, Inc.
|
13,830
|
360,686
|
||||||
|
Popular, Inc. (b)
|
28,920
|
1,750,238
|
||||||
|
Wells Fargo & Co.
|
13,480
|
575,326
|
||||||
|
3,247,938
|
||||||||
|
Capital Markets – 5.81%
|
||||||||
|
The Bank of New York Mellon Corp.
|
7,400
|
329,448
|
||||||
|
Evercore, Inc., Class A
|
19,000
|
2,348,210
|
||||||
|
2,677,658
|
||||||||
|
Consumer Finance – 3.08%
|
||||||||
|
SLM Corp.
|
86,808
|
1,416,707
|
||||||
|
Financial Services – 0.39%
|
||||||||
|
Euronet Worldwide, Inc. (a)
|
1,550
|
181,924
|
||||||
|
Insurance – 1.27%
|
||||||||
|
Global Indemnity Group LLC, Class A
|
17,354
|
582,921
|
||||||
|
TOTAL FINANCIALS
|
8,107,148
|
|||||||
The accompanying notes are an integral part of these financial statements.
5
HW OPPORTUNITIES MP FUND
Schedule of Investments – Continued
June 30, 2023
|
Shares
|
||||||||
|
Held
|
Value
|
|||||||
|
COMMON STOCKS – 96.18% (Continued)
|
||||||||
|
HEALTH CARE – 4.48%
|
||||||||
|
Health Care Equipment & Supplies – 1.87%
|
||||||||
|
Medtronic plc (b)
|
9,800
|
$
|
863,380
|
|||||
|
Health Care Providers & Services – 2.61%
|
||||||||
|
Elevance Health, Inc.
|
2,700
|
1,199,583
|
||||||
|
TOTAL HEALTH CARE
|
2,062,963
|
|||||||
|
INDUSTRIALS – 22.73%
|
||||||||
|
Aerospace & Defense – 2.37%
|
||||||||
|
Babcock International Group plc (a)(b)
|
303,270
|
1,089,385
|
||||||
|
Air Freight & Logistics – 3.85%
|
||||||||
|
International Distributions Services plc (b)
|
631,450
|
1,774,986
|
||||||
|
Ground Transportation – 6.84%
|
||||||||
|
U-Haul Holding Co.
|
62,150
|
3,149,141
|
||||||
|
Professional Services – 9.67%
|
||||||||
|
Hudson Global, Inc. (a)
|
2,250
|
50,063
|
||||||
|
Korn Ferry
|
32,500
|
1,610,050
|
||||||
|
ManpowerGroup, Inc.
|
35,200
|
2,794,880
|
||||||
|
4,454,993
|
||||||||
|
TOTAL INDUSTRIALS
|
10,468,505
|
|||||||
|
INFORMATION TECHNOLOGY – 12.58%
|
||||||||
|
Communications Equipment – 9.71%
|
||||||||
|
F5, Inc. (a)
|
8,657
|
1,266,173
|
||||||
|
Telefonaktiebolaget LM Ericsson – ADR (b)
|
588,100
|
3,205,145
|
||||||
|
4,471,318
|
||||||||
|
Electronic Equipment, Instruments & Components – 2.03%
|
||||||||
|
Arrow Electronics, Inc. (a)
|
6,550
|
938,157
|
||||||
|
Semiconductors & Semiconductor Equipment – 0.41%
|
||||||||
|
Micron Technology, Inc.
|
3,000
|
189,330
|
||||||
The accompanying notes are an integral part of these financial statements.
6
HW OPPORTUNITIES MP FUND
Schedule of Investments – Continued
June 30, 2023
|
Shares
|
||||||||
|
Held
|
Value
|
|||||||
|
COMMON STOCKS – 96.18% (Continued)
|
||||||||
|
INFORMATION TECHNOLOGY – 12.58% (Continued)
|
||||||||
|
Software – 0.43%
|
||||||||
|
Microsoft Corp.
|
180
|
$
|
61,297
|
|||||
|
Workday, Inc., Class A (a)
|
600
|
135,534
|
||||||
|
196,831
|
||||||||
|
TOTAL INFORMATION TECHNOLOGY
|
5,795,636
|
|||||||
|
MATERIALS – 0.93%
|
||||||||
|
Chemicals – 0.93%
|
||||||||
|
Olin Corp.
|
8,300
|
426,537
|
||||||
|
TOTAL MATERIALS
|
426,537
|
|||||||
|
Total Common Stocks (Cost $43,965,588)
|
44,303,278
|
|||||||
|
PREFERRED STOCKS – 0.94%
|
||||||||
|
FINANCIALS – 0.94%
|
||||||||
|
Thrifts & Mortgage Finance – 0.94%
|
||||||||
|
Federal Home Loan Mortgage Corp., Series Z (a)
|
187,700
|
431,710
|
||||||
|
8.375%, Perpetual
|
||||||||
|
TOTAL FINANCIALS
|
431,710
|
|||||||
|
Total Preferred Stocks (Cost $440,844)
|
431,710
|
|||||||
|
Notional
|
||||||||||||
|
Contracts (c)
|
Amount
|
|||||||||||
|
PURCHASED OPTIONS – 1.85%
|
||||||||||||
|
Purchased Put Options – 1.85%
|
||||||||||||
|
Alteryx, Inc.
|
||||||||||||
|
Expiration: January 2025, Exercise Price: $40.00
|
300
|
$
|
1,362,000
|
256,500
|
||||||||
|
S&P 500 Index
|
||||||||||||
|
Expiration: December 2023, Exercise Price: $4,000.00
|
70
|
31,152,660
|
341,600
|
|||||||||
|
Tesla, Inc.
|
||||||||||||
|
Expiration: June 2024, Exercise Price: $333.33
|
28
|
732,956
|
256,480
|
|||||||||
|
Total Purchased Options (Cost $1,212,360)
|
854,580
|
|||||||||||
|
Total Long-Term Investments (Cost $45,618,792)
|
45,589,568
|
|||||||||||
The accompanying notes are an integral part of these financial statements.
7
HW OPPORTUNITIES MP FUND
Schedule of Investments – Continued
June 30, 2023
|
Shares
|
||||||||
|
Held
|
Value
|
|||||||
|
SHORT-TERM INVESTMENTS – 1.21%
|
||||||||
|
MONEY MARKET FUND – 1.21%
|
||||||||
|
First American Government Obligations Fund, Class X, 5.01% (d)
|
556,168
|
$
|
556,168
|
|||||
|
Total Short-Term Investments (Cost $556,168)
|
556,168
|
|||||||
|
Total Investments – 100.18% (Cost $46,174,960)
|
46,145,736
|
|||||||
|
Liabilities in Excess of Other Assets – (0.18)%
|
(84,437
|
)
|
||||||
|
Net Assets – 100.00%
|
$
|
46,061,299
|
||||||
|
(a)
|
Non-income producing security.
|
|
(b)
|
Foreign security.
|
|
(c)
|
100 shares per contract.
|
|
(d)
|
The rate quoted is the annualized seven-day effective yield as of June 30, 2023.
|
ADR – American Depositary Receipt
The Global Industry Classification Standard (GICS®) was developed by and/or is the exclusive property of MSCI, Inc. and
Standard & Poor Financial Services LLC (“S&P”). GICS is a service mark of MSCI and S&P and has been licensed for use by U.S. Bancorp Fund Services, LLC, doing business as U.S. Bank Global Fund Services (“Fund Services”).
The accompanying notes are an integral part of these financial statements.
8
HW OPPORTUNITIES MP FUND
Statement of Assets and Liabilities
June 30, 2023
|
ASSETS:
|
||||
|
Long-term investments, at value (Cost $45,618,792 )
|
$
|
45,589,568
|
||
|
Short-term investments (Cost $556,168 )
|
556,168
|
|||
|
Dividends and interest receivable
|
47,605
|
|||
|
Receivable from Adviser
|
33,530
|
|||
|
Collateral for options
|
5,744
|
|||
|
Prepaid expenses and other receivables
|
18,938
|
|||
|
Total assets
|
$
|
46,251,553
|
||
|
LIABILITIES:
|
||||
|
Payable for investments purchased
|
119,961
|
|||
|
Payable for fund administration and fund accounting fees
|
18,850
|
|||
|
Payable for Fund shares sold
|
11,192
|
|||
|
Payable for transfer agent fees and expenses
|
6,762
|
|||
|
Payable for compliance fees
|
2,855
|
|||
|
Payable for custodian fees
|
2,612
|
|||
|
Accrued expenses and other liabilities
|
28,022
|
|||
|
Total liabilities
|
190,254
|
|||
|
NET ASSETS
|
$
|
46,061,299
|
||
|
NET ASSETS CONSIST OF:
|
||||
|
Paid-in capital
|
45,005,813
|
|||
|
Total distributable earnings
|
1,055,486
|
|||
|
Net Assets
|
$
|
46,061,299
|
||
|
CALCULATION OF NET ASSET VALUE PER SHARE
|
||||
|
Net assets
|
$
|
46,061,299
|
||
|
Shares issued and outstanding(1)
|
3,349,362
|
|||
|
Net asset value, offering and redemption price per share
|
$
|
13.75
|
||
|
(1)
|
Unlimited shares authorized without par value.
|
The accompanying notes are an integral part of these financial statements.
9
HW OPPORTUNITIES MP FUND
Statement of Operations
For the Year Ended June 30, 2023
|
INVESTMENT INCOME:
|
||||
|
Dividend Income (net of foreign withholding taxes of $15,728)
|
$
|
812,328
|
||
|
Interest Income
|
41,800
|
|||
|
Total Income
|
854,128
|
|||
|
EXPENSES:
|
||||
|
Fund administration and fund accounting fees (See Note 3)
|
110,124
|
|||
|
Transfer agent fees and expenses (See Note 3)
|
38,431
|
|||
|
Legal fees
|
29,702
|
|||
|
Federal and state registration fees
|
24,888
|
|||
|
Audit fees
|
19,999
|
|||
|
Compliance fees (See Note 3)
|
16,516
|
|||
|
Custodian fees (See Note 3)
|
16,512
|
|||
|
Trustees’ fees (See Note 3)
|
14,051
|
|||
|
Reports to shareholders
|
4,140
|
|||
|
Other expenses
|
13,213
|
|||
|
Total expenses
|
287,576
|
|||
|
Less: Expense reimbursement by Advisor (See Note 3)
|
(287,576
|
)
|
||
|
Net expenses
|
—
|
|||
|
NET INVESTMENT INCOME
|
854,128
|
|||
|
REALIZED AND CHANGE IN UNREALIZED GAIN (LOSS) ON INVESTMENTS:
|
||||
|
Net realized gain (loss) on:
|
||||
|
Investments
|
1,260,419
|
|||
|
Foreign currency transactions
|
(25,853
|
)
|
||
|
Net realized gain
|
1,234,566
|
|||
|
Net change in unrealized appreciation on:
|
||||
|
Investments
|
4,508,875
|
|||
|
Foreign currency transactions
|
501
|
|||
|
Net change in unrealized appreciation
|
4,509,376
|
|||
|
Net realized and change in unrealized gain on investments
|
5,743,942
|
|||
|
NET INCREASE IN NET ASSETS RESULTING FROM OPERATIONS
|
$
|
6,598,070
|
||
The accompanying notes are an integral part of these financial statements.
10
HW OPPORTUNITIES MP FUND
Statements of Changes in Net Assets
|
Year Ended
|
Year Ended
|
|||||||
|
June 30, 2023
|
June 30, 2022
|
|||||||
|
OPERATIONS:
|
||||||||
|
Net investment income
|
$
|
854,128
|
$
|
328,611
|
||||
|
Net realized gain (loss) on investments, futures contracts,
|
||||||||
|
and foreign currency transactions
|
1,234,566
|
(336,323
|
)
|
|||||
|
Change in unrealized appreciation (depreciation) on investments
|
||||||||
|
and foreign currency translation
|
4,509,376
|
(4,616,129
|
)
|
|||||
|
Net increase (decrease) in net assets resulting from operations
|
6,598,070
|
(4,623,841
|
)
|
|||||
|
DISTRIBUTION TO SHAREHOLDERS
|
||||||||
|
Total distributions to shareholders
|
(742,705
|
)
|
(306,787
|
)
|
||||
|
CAPITAL SHARE TRANSACTIONS:
|
||||||||
|
Net increase in net assets resulting
|
||||||||
|
from capital share transactions(1)
|
10,763,374
|
33,742,439
|
||||||
|
NET INCREASE IN NET ASSETS
|
16,618,739
|
28,811,811
|
||||||
|
NET ASSETS:
|
||||||||
|
Beginning of year
|
29,442,560
|
630,749
|
||||||
|
End of year
|
$
|
46,061,299
|
$
|
29,442,560
|
||||
|
(1)
|
A summary of capital share transactions is as follows:
|
|
SHARE TRANSACTIONS:
|
||||||||||||||||
|
For the Year Ended
June 30, 2023
|
For the Year Ended
June 30, 2022
|
|||||||||||||||
|
Shares
|
Amount
|
Shares
|
Amount
|
|||||||||||||
|
Issued
|
2,346,014
|
$
|
30,160,367
|
3,401,226
|
$
|
43,205,417
|
||||||||||
|
Issued to holders in
|
||||||||||||||||
|
reinvestment of dividends
|
—
|
—
|
652
|
8,567
|
||||||||||||
|
Redeemed
|
(1,684,810
|
)
|
(19,396,993
|
)
|
(762,623
|
)
|
(9,471,545
|
)
|
||||||||
|
Net increase in shares outstanding
|
661,204
|
$
|
10,763,374
|
2,639,255
|
$
|
33,742,439
|
||||||||||
The accompanying notes are an integral part of these financial statements.
11
HW OPPORTUNITIES MP FUND
Financial Highlights
|
|
||||||||||||
|
For the period
|
||||||||||||
|
|
Year Ended
|
Year Ended
|
Inception through
|
|||||||||
|
June 30, 2023
|
June 30, 2022
|
June 30, 2021(1)
|
||||||||||
|
PER SHARE DATA:
|
||||||||||||
|
Net asset value, beginning of period
|
$
|
10.95
|
$
|
12.90
|
$
|
10.00
|
||||||
|
INVESTMENT OPERATIONS:
|
||||||||||||
|
Net investment income(2)
|
0.28
|
0.20
|
0.12
|
|||||||||
|
Net realized and unrealized
|
||||||||||||
|
gain (loss) on investments
|
2.75
|
(1.96
|
)
|
2.78
|
||||||||
|
Total from investment operations
|
3.03
|
(1.76
|
)
|
2.90
|
||||||||
|
LESS DISTRIBUTIONS FROM:
|
||||||||||||
|
Net investment income
|
(0.13
|
)
|
(0.09
|
)
|
—
|
|||||||
|
Net realized gains
|
(0.10
|
)
|
(0.10
|
)
|
—
|
|||||||
|
Total distributions
|
(0.23
|
)
|
(0.19
|
)
|
—
|
|||||||
|
Net asset value, end of period
|
$
|
13.75
|
$
|
10.95
|
$
|
12.90
|
||||||
|
TOTAL RETURN(3)
|
27.92
|
%
|
-13.88
|
%
|
29.00
|
%
|
||||||
|
SUPPLEMENTAL DATA AND RATIOS:
|
||||||||||||
|
Net assets, end of period (in thousands)
|
$
|
46,061
|
$
|
29,443
|
$
|
631
|
||||||
|
Ratio of gross expenses to average net assets:
|
||||||||||||
|
Before expense reimbursement(4)
|
0.74
|
%
|
1.36
|
%
|
45.41
|
%
|
||||||
|
After expense reimbursement(4)
|
0.00
|
%
|
0.00
|
%
|
0.00
|
%
|
||||||
|
Ratio of net investment income to average net assets
|
2.21
|
%
|
1.59
|
%
|
2.02
|
%
|
||||||
|
Portfolio turnover rate(3)(5)
|
140
|
%
|
96
|
%
|
57
|
%
|
||||||
|
(1)
|
Inception date of the Fund was December 30, 2020.
|
|
(2)
|
Calculated based on average shares outstanding during the period.
|
|
(3)
|
Not annualized for periods less than one year.
|
|
(4)
|
Annualized for periods less than one year.
|
|
(5)
|
The portfolio turnover disclosed is for the Fund as a whole. The numerator for the portfolio turnover rate includes the lesser of purchases or sales (excluding short-term investments). The
denominator includes the average fair value of long positions throughout the period.
|
The accompanying notes are an integral part of these financial statements.
12
HW OPPORTUNITIES MP FUND
Notes to the Financial Statements
June 30, 2023
1. ORGANIZATION
Series Portfolios Trust (the “Trust”) was organized as a Delaware statutory trust under a Declaration of Trust dated July 27, 2015. The Trust is registered under the Investment Company Act of 1940, as
amended (the “1940 Act”), as an open-end management investment company. The HW Opportunities MP Fund (the “Fund”) is a non-diversified series with its own investment objectives and policies within the Trust. The Fund’s investment adviser, Hotchkis
& Wiley Capital Management LLC (the “Adviser”), is responsible for investment advisory services, day-to-day management of the Fund’s assets, as well as compliance, sales, marketing and operation services to the Fund. The primary investment
objective of the Fund is to provide capital appreciation.
The Fund commenced operations on December 30, 2020. The Fund is an investment company and accordingly follows the investment company accounting and reporting guidance of the Financial Accounting
Standards Board (“FASB”) Accounting Standards Codification (the “Codification”) Topic 946 Financial Services — Investment Companies. The Fund does not hold itself out as related to any other series of the Trust for purposes of investment and investor
services, nor does it share the same investment adviser with any other series of the Trust.
Shareholders should be aware that the Fund pays no fees under its management and advisory agreements to the Fund’s adviser. However, Fund shares are only offered to participants in separately managed
account programs who pay fees to program sponsors for the costs and expenses of the programs, including fees for investment advice, custody and portfolio execution. When a program participant, alone or with his or her program sponsor, elects to
allocate assets to an investment strategy managed or advised by the Fund’s adviser, the adviser typically receives a fee from the program sponsor for providing such management or advisory services to the managed account, including with respect to
assets that may be invested in the Fund. In certain cases, a program participant will pay a fee for investment advice directly to the adviser in its capacity as manager to the participant’s managed account.
The Fund may issue an unlimited number of shares of beneficial interest, with no par value. All shares of the Fund have equal rights and privileges except with respect to distribution fees and voting
rights on matters affecting a single share class.
2. SIGNIFICANT ACCOUNTING POLICIES
The following is a summary of significant accounting policies consistently followed by the Fund in the preparation of its financial statements. These policies are in conformity with generally accepted
accounting principles in the United States of America (“GAAP”).
A. Investment Valuation – The following is a summary of the Fund’s pricing procedures. It is intended to be a general discussion and may not necessarily
reflect all the pricing procedures followed by the Fund. Equity securities, including common stocks, preferred stocks, and real estate investment trusts (“REITS”) that are traded on a national securities exchange, except those listed on the Nasdaq
Global Market®, Nasdaq Global Select Market® and the Nasdaq Capital Market® exchanges (collectively “Nasdaq”), are valued at the last reported sale price on that exchange on which the security is principally traded. Securities traded on Nasdaq
will be valued at the Nasdaq Official Closing Price (“NOCP”). If, on a particular day, an exchange traded or Nasdaq security does not trade, then the mean between the most recent quoted bid and asked prices will be used. All equity securities that
are not traded on a listed exchange are valued at the last sale price in the over-the-counter (“OTC”) market. If a non-exchanged traded equity security does not trade on a particular day, then the mean between the last quoted closing bid and asked
price will be used. To the extent these securities are actively traded and valuation adjustments are not applied, they are categorized in Level 1 of the fair value hierarchy.
13
HW OPPORTUNITIES MP FUND
Notes to the Financial Statements – Continued
June 30, 2023
Fixed income securities, including short-term debt instruments having a maturity less than 60 days, are valued at the evaluated mean price supplied by an approved independent third-party pricing service
(“Pricing Service”). These securities are categorized in Level 2 of the fair value hierarchy.
In the case of foreign securities, the occurrence of events after the close of foreign markets, but prior to the time the Fund’s NAV is calculated will result in an adjustment to the trading prices of
foreign securities when foreign markets open on the following business day. The Fund will value foreign securities at fair value, taking into account such events in calculating the NAV. In such cases, use of fair valuation can reduce an investor’s
ability to seek profit by estimating the Fund’s NAV in advance of the time the NAV is calculated. These securities are categorized in Level 2 of the fair value hierarchy.
Exchange traded funds and closed-end funds are valued at the last reported sale price on the exchange on which the security is principally traded. If, on a particular day, an exchange-traded fund does
not trade, then the mean between the most recent quoted bid and asked prices will be used. To the extent these securities are actively traded and valuation adjustments are not applied, they are categorized in Level 1 of the fair value hierarchy.
Investments in registered open-end investment companies (including money market funds), other than exchange- traded funds, are typically valued at their reported NAV per share. To the extent these
securities are valued at their NAV per share, they are categorized in Level 1 of the fair value hierarchy.
Forward currency contracts maturing in two or fewer days are valued at the spot rate. Forward currency contracts maturing in three days or more are valued at the midpoint prices calculated by U.S.
Bancorp Fund Services, LLC, doing business as U.S. Bank Global Fund Services (“Fund Services” or the “Administrator”) using an “interpolation” methodology that incorporates foreign-exchange prices obtained from an approved pricing service for
standard forward-settlement periods, such as one month, three months, six months and one year. These securities are categorized in Level 2 of the fair value hierarchy.
Futures contracts are valued at the settlement price on the exchange on which they are principally traded. The settlement price is the average of the prices at which a futures contract trades
immediately before the close of trading for the day. Equity swap contract prices are determined by using the same methods used to price the underlying security. Option securities that are traded on a national securities exchange are valued at the
last reported sale price on the exchange on which the security is principally traded. If, on a particular day, the option does not trade, then the mean between the most recent quoted bid and asked prices will be used. These securities are categorized
in Level 1 or Level 2 of the fair value hierarchy.
The Board of Trustees (the “Board”) has adopted a pricing and valuation policy for use by the Fund and its Valuation Designee (as defined below) in calculating the Fund’s NAV. Pursuant to Rule 2a-5
under the 1940 Act, the Fund has designated the Adviser as its “Valuation Designee” to perform all of the fair value determinations as well as to perform all of the responsibilities that may be performed by the Valuation Designee in accordance with
Rule 2a-5. The Valuation Designee is authorized to make all necessary determinations of the fair values of the portfolio securities and other assets for which market quotations are not readily available or if it is deemed that the prices obtained
from brokers and dealers or independent pricing services are unreliable.
14
HW OPPORTUNITIES MP FUND
Notes to the Financial Statements – Continued
June 30, 2023
The Fund has adopted authoritative fair value accounting standards which establish an authoritative definition of fair value and set out a hierarchy for measuring fair value. These standards require
additional disclosures about the various inputs and valuation techniques used to develop the measurements of fair value, a discussion in changes in valuation techniques and related inputs during the period and expanded disclosure of valuation levels
for major security types. These inputs are summarized in the three broad levels listed below:
|
Level 1 –
|
Unadjusted quoted prices in active markets for identical assets or liabilities that the Fund has the ability to access.
|
|
Level 2 –
|
Observable inputs other than quoted prices included in Level 1 that are observable for the asset or liability, either directly or indirectly. These inputs may include quoted prices for the
identical instrument on an inactive market, prices for similar instruments, interest rates, prepayment speeds, credit risk, yield curves, default rates and similar data.
|
|
Level 3 –
|
Unobservable inputs for the asset or liability, to the extent relevant observable inputs are not available, representing the Fund’s own assumptions about the assumptions a market participant
would use in valuing the asset or liability, and would be based on the best information available.
|
The inputs or methodology used for valuing securities are not an indication of the risk associated with investing in those securities.
The following is a summary of the inputs used to value the Fund’s securities by level within the fair value hierarchy as of June 30, 2023:
|
Investments at Fair Value(1)
|
Level 1
|
Level 2
|
Level 3
|
Total
|
||||||||||||
|
Assets
|
||||||||||||||||
|
Common Stocks
|
$
|
40,691,704
|
$
|
3,611,574
|
$
|
—
|
$
|
44,303,278
|
||||||||
|
Preferred Stock
|
431,710
|
—
|
—
|
431,710
|
||||||||||||
|
Purchased Options
|
341,600
|
512,980
|
—
|
854,580
|
||||||||||||
|
Short-Term Investments
|
556,168
|
—
|
—
|
556,168
|
||||||||||||
|
$
|
42,021,182
|
$
|
4,124,554
|
$
|
—
|
$
|
46,145,736
|
|||||||||
|
(1)
|
Please refer to the Schedule of Investments to view securities segregated by sector and industry type.
|
During the year ended June 30, 2023, the Fund did not hold any Level 3 securities, nor were there any transfers into or out of Level 3.
B. Foreign Securities and Currency Translation – Investment securities and other assets and liabilities denominated in foreign currencies are translated into
U.S. dollar amounts at the date of valuation. Purchases and sales of investment securities and income and expense items denominated in foreign currencies are translated into U.S. dollar amounts on the respective dates of such transactions. The Fund
does not isolate the portion of the results of operations from changes in foreign exchange rates on investments from the fluctuations arising from changes in market prices of securities held. Reported net realized foreign exchange gains or losses
arise from sales of foreign currencies, currency gains or losses realized between the trade and settlement dates on securities transactions, and the difference between the amounts of dividends, interest, and foreign withholding taxes recorded on the
Fund’s books and the U.S. dollar equivalent of the amounts actually received or paid. Net unrealized foreign exchange gains and losses arise from changes in the fair values of assets and liabilities, other than investments in securities at fiscal
year- end, resulting from changes in exchange rates.
15
HW OPPORTUNITIES MP FUND
Notes to the Financial Statements – Continued
June 30, 2023
Investments in foreign securities entail certain risks. There may be a possibility of nationalization or expropriation of assets, confiscatory taxation, political or financial instability, and
diplomatic developments that could affect the value of the Fund’s investments in certain foreign countries. Since foreign securities normally are denominated and traded in foreign currencies, the value of the Fund’s assets may be affected favorably
or unfavorably by currency exchange rates, currency exchange control regulations, foreign withholding taxes, and restrictions or prohibitions on the repatriation of foreign currencies. There may be less information publicly available about a foreign
issuer than about a U.S. issuer, and foreign issuers are not generally subject to accounting, auditing, and financial reporting standards and practices comparable to those in the United States. The securities of some foreign issuers are less liquid
and at times more volatile than securities of comparable U.S. issuers.
C. Futures Contracts – The Fund may enter into futures contracts traded on domestic and international exchanges, including stock index and fixed income
futures contracts. The Fund may enter into futures contracts for hedging purposes, volatility management purposes, or otherwise to gain or reduce long or short exposure to one or more asset classes. Upon entering into a contract, the Fund deposits
and maintains as collateral such initial margin as required by the exchange on which the transaction is affected. Pursuant to the contract, the Fund agrees to receive from or pay to the broker an amount of cash equal to the daily fluctuation in value
of the contract). Such receipts or payments are known as variation margin and are recorded by the Fund as unrealized gains and losses. When the contract is closed, the Fund records a realized gain or loss equal to the difference between the value of
the contract at the time it was opened and the value at the time it was closed. The risks inherent in the use of futures contracts include adverse changes in the value of such instruments. Refer to Note 2 A. for a pricing description. Refer to Note 2
L. for further derivative disclosures, and Note 2 J. for further counterparty risk disclosure.
D. Options on Securities on Securities Indexes – The Fund may purchase put options on securities or security indexes to protect holdings in an underlying or
related security against a substantial decline in market value or for speculative purposes. The Fund may also purchase call options on securities and security indexes. The Fund may sell put or call options it has previously purchased, which could
result in a net gain or loss depending on whether the amount realized on the sale is more or less than the premium and other transaction costs paid on the put or call option which is sold. The Fund may write a call or put option only if the option
is “covered” by the Fund holding a position in the underlying securities or by other means which would permit immediate satisfaction of the Fund’s obligation as writer of the option. Prior to exercise or expiration, an option may be closed out by an
offsetting purchase or sale of an option of the same series. Refer to Note 2 A. for a pricing description. Refer to Note 2 L. for further derivative disclosures, and Note 2 J. for further counterparty risk disclosure.
E. Cash and Cash Equivalents – The Fund considers highly liquid short-term fixed income investments purchased with an original maturity of less than three
months to be cash equivalents. Cash equivalents are included in short- term investments on the Schedule of Investments as well as in investments on the Statement of Assets and Liabilities.
F. Guarantees and Indemnifications – In the normal course of business, the Fund enters into contracts with service providers that contain general
indemnification clauses. The Fund’s maximum exposure under these arrangements is unknown, as this would involve future claims that may be made against the Fund that have not yet occurred.
G. Security Transactions, Income and Expenses – The Fund follows industry practice and records security transactions on the trade date. Realized gains and
losses on sales of securities are calculated on the basis of identified cost. Dividend income and expense is recorded on the ex-dividend date and interest income and expense is recorded on an accrual basis. Withholding taxes on foreign dividends have
been provided for in accordance with the Fund’s
16
HW OPPORTUNITIES MP FUND
Notes to the Financial Statements – Continued
June 30, 2023
understanding of the applicable country’s tax rules and regulations. Discounts and premiums on securities purchased are amortized over the expected life of the respective securities. Interest income is
accounted for on the accrual basis and includes amortization of premiums and accretion of discounts on the effective interest method.
H. Allocation of Trust Expenses – Trust Expenses associated with a specific fund in the Trust are charged to that fund. Common Trust expenses are typically
allocated evenly between the funds of the Trust, or by other equitable means.
I. Share Valuation – The NAV per share of the Fund is calculated by dividing the sum of the value of the securities held by the Fund, plus cash and other
assets, minus all liabilities (including estimated accrued expenses) by the total number of shares outstanding for the Fund, rounded to the nearest cent. The Fund’s shares will not be priced on days which the New York Stock Exchange (“NYSE”) is
closed for trading.
J. Counterparty Risk – The Fund helps manage counterparty credit risk by entering into agreements only with counterparties the Adviser believes have the
financial resources to honor its obligations. The Adviser considers the credit worthiness of each counterparty to a contract in evaluating potential credit risk. The counterparty risk for forward currency exchange contracts to the Fund includes the
amount of any net unrealized appreciation on the contract. The counterparty risk for equity swaps contracts to the Fund includes the risk of loss of the full amount of any net unrealized appreciation on the contract, along with dividends receivable
on long equity contracts and interest receivable on short equity contracts. Written and purchased options and futures contracts sold on an exchange do not expose the Fund to counterparty risk; the exchange’s clearinghouse guarantees the options and
futures against counterparty nonperformance. Over-the-counter options counterparty risk includes the risk of loss of the full amount of any net unrealized appreciation.
K. Use of Estimates – The preparation of financial statements in conformity with GAAP requires management to make estimates and assumptions that affect the reported amounts of assets and liabilities
and disclosure of contingent assets and liabilities at the date of the financial statements and the reported amounts of revenues and expenses during the reporting period. Actual results could differ from those estimates.
L. Derivatives – The Fund may utilize derivative instruments such as options, swaps, futures, forward currency exchange contracts and other instruments with similar characteristics to the extent that
they are consistent with the Fund’s respective investment objectives and limitations. The use of these instruments may involve additional investment risks, including the possibility of illiquid markets or imperfect correlation between the value of
the instruments and the underlying securities. Derivatives also may create leverage which will amplify the effect of their performance on the Fund and may produce significant losses.
The Fund has adopted authoritative standards regarding disclosure about derivatives and hedging activities and how they affect the Fund’s Statement of Assets and Liabilities and Statement of Operations.
For the year ended June 30, 2023, the Fund’s average derivative volume is described below:
|
Monthly Average
|
Monthly Average
|
||
|
Quantity
|
Notional Value
|
||
|
Purchased Option Contracts
|
260
|
$3,586,499
|
17
HW OPPORTUNITIES MP FUND
Notes to the Financial Statements – Continued
June 30, 2023
Statement of Assets & Liabilities
The effect of derivative instruments on the Statement of Assets and Liabilities as of June 30, 2023.
|
Fair Value
|
|||||
|
Statement of Assets and Liabilities Location
|
Assets
|
Liabilities
|
|||
|
Purchased Option Contracts
|
|||||
|
Equity
|
Investments, at value
|
$854,580
|
$ —
|
||
|
Total Fair Values of Derivative Instruments
|
$854,580
|
$ —
|
|||
Statement of Operations
The effect of derivative instruments on the Statements of Operations for the year ended June 30, 2023:
|
Net Realized Gain (Loss) on Derivatives
|
||||||||
|
Purchased Option
|
||||||||
|
Derivatives
|
Contracts*
|
Total
|
||||||
|
Equity Contracts
|
$
|
532,093
|
$
|
532,093
|
||||
|
Total
|
$
|
532,093
|
$
|
532,093
|
||||
|
Net Change in Unrealized
Appreciation (Depreciation) on Derivatives
|
||||||||
|
Purchased Option
|
||||||||
|
Derivatives
|
Contracts**
|
Total
|
||||||
|
Equity Contracts
|
$
|
(350,397
|
)
|
$
|
(350,397
|
)
|
||
|
Total
|
$
|
(350,397
|
)
|
$
|
(350,397
|
)
|
||
|
*
|
The amounts disclosed are included in the realized gain (loss) on investments.
|
|
**
|
The amounts disclosed are included in the change in unrealized appreciation (depreciation) on investments.
|
M. Statement of Cash Flows – Pursuant to the Cash Flows Topic of the Codification, the Fund qualifies for an exemption from the requirement to provide a
statement of cash flows and has elected not to provide a statement of cash flows.
3. RELATED PARTY TRANSACTIONS
The Trust has an agreement with the Adviser to furnish investment advisory services to the Fund. Pursuant to an Investment Advisory Agreement between the Trust and the Adviser, the Adviser does not
charge a management fee for advisory services to the Fund. However, the Fund is an integral part of separately managed account programs, and the Adviser and its affiliates will be compensated directly or indirectly by separately managed account
program sponsors or program participants for managed account advisory services.
The Fund’s Adviser has contractually agreed in an Operating Expenses Limitation Agreement to reduce its management fees and/or absorb expenses of the Fund to ensure that total annual operating expenses
after fee waiver and/or expense reimbursement (excluding any acquired fund fees and expenses, front-end or contingent deferred loads, dividends and interest on short positions, taxes, leverage interest, brokerage fees (including commissions,
18
HW OPPORTUNITIES MP FUND
Notes to the Financial Statements – Continued
June 30, 2023
mark-ups and mark-downs), annual account fees for margin accounts, expenses incurred in connection with any merger or reorganization and extraordinary expenses such as litigation) do not exceed 0.00% of
the Fund’s average daily net assets. All fees waived during the year were contractual and not subject to recoupment by the Advisor. The Operating Expense Limitation Agreement is intended to be continual in nature and cannot be terminated within one
year after the effective date of the Fund’s prospectus and subject thereafter to termination at any time upon 60 days written notice and approval by the Board or the Adviser.
Fund Services acts as the Fund’s Administrator, transfer agent, and fund accountant. U.S. Bank N.A. (the “Custodian”) serves as the custodian to the Fund. The Custodian is an affiliate of the
Administrator. The Administrator performs various administrative and accounting services for the Fund. The Administrator prepares various federal and state regulatory filings, reports and returns for the Fund; prepares reports and materials to be
supplied to the Trustees; monitors the activities of the Fund’s custodian; coordinates the payment of the Fund’s expenses and reviews the Fund’s expense accruals. The officers of the Trust, including the Chief Compliance Officer, are employees of the
Administrator. A trustee of the Trust is an officer of the Administrator. As compensation for its services, the Administrator is entitled to a monthly fee at an annual rate based upon the average daily net assets of the Fund, subject to annual
minimums. Fees paid by the Fund for administration and accounting, transfer agency, custody and compliance services for the year ended June 30, 2023, are disclosed in the Statement of Operations.
Quasar Distributors, LLC is the Fund’s distributor (the “Distributor”). The Distributor is not affiliated with the Adviser, Fund Services, or its affiliated companies.
4. TAX FOOTNOTE
Federal Income Taxes – The Fund intends to comply with the requirements of Subchapter M of the Internal Revenue Code of 1986, as amended, necessary to qualify as
a regulated investment company and distributes substantially all net taxable investment income and net realized gains to shareholders in a manner which results in no tax cost to the Fund. Therefore, no federal income or excise tax provision is
required. As of and during the year ended June 30, 2023, the Fund did not have any tax positions that did not meet the “more-likely-than-not” threshold of being sustained by the applicable tax authority and did not have liabilities for any
unrecognized tax benefits. The Fund recognizes interest and penalties, if any, related to unrecognized tax benefits on uncertain tax positions as income tax expense in the Statement of Operations. There were none for the current year. The Fund is
subject to examination by taxing authorities for the tax period since the commencement of operations. As of June 30, 2023, the components of distributable earnings on a tax basis were:
|
Tax cost of investments*
|
$
|
47,762,078
|
|||
|
Gross unrealized appreciation
|
$
|
3,001,242
|
|||
|
Gross unrealized depreciation
|
(5,173,533
|
)
|
|||
|
Net unrealized depreciation
|
(2,172,291
|
)
|
|||
|
Undistributed ordinary income
|
3,227,930
|
||||
|
Undistributed long-term capital gain
|
—
|
||||
|
Other accumulated gain
|
(153
|
)
|
|||
|
Total distributable earnings
|
$
|
1,055,486
|
|
*
|
Represents cost for federal income tax purposes and differs from the cost for financial reporting purposes due to wash sales.
|
19
HW OPPORTUNITIES MP FUND
Notes to the Financial Statements – Continued
June 30, 2023
As of June 30, 2023, the Fund did not have any capital loss carryovers. A regulated investment company may elect for any taxable year to treat any portion of any qualified late year loss as arising on
the first day of the next taxable year. Qualified late year losses are certain capital, and ordinary losses which occur during the portion of the Fund’s taxable period subsequent to October 31 and December 31, respectively. For the taxable period
ended June 30, 2023, the Fund does not plan to defer any qualified late year losses.
Distributions to Shareholders – The Fund distributes substantially all net investment income, if any, and net realized capital gains, if any, annually.
Distributions to shareholders are recorded on the ex-dividend date. The treatment for financial reporting purposes of distributions made to shareholders during the period from net investment income or net realized capital gains may differ from their
treatment for federal income tax purposes. These differences are caused primarily by differences in the timing of the recognition of certain components of income, expense or realized capital gain for federal income tax purposes. Where such
differences are permanent in nature, GAAP requires that they be reclassified in the components of the net assets based on their ultimate characterization for federal income tax purposes. For the year ended June 30, 2023, no such reclassifications
were made between distributable earnings and paid-in capital.
The tax character of distributions paid for the year ended June 30, 2023 were as follows:
|
Ordinary Income*
|
Long-Term Capital Gain
|
Total
|
||||
|
$683,472
|
$59,233
|
$742,705
|
The tax character of distributions paid for the year ended June 30, 2022 were as follows:
|
Ordinary Income*
|
Long-Term Capital Gain
|
Total
|
||||
|
$303,736
|
$3,051
|
$306,787
|
|
*
|
For federal income tax purposes, distributions of short-term capital gains are treated as ordinary income distributions.
|
5. INVESTMENT TRANSACTIONS
The aggregate purchases and sales, excluding short-term investments, by the Fund for the year ended June 30, 2023, were as follows:
|
Purchases
|
Sales
|
|||||||
|
U.S. Government
|
$
|
—
|
$
|
—
|
||||
|
Other
|
63,563,455
|
52,400,378
|
||||||
6. BENEFICIAL OWNERSHIP
The beneficial ownership, either directly or indirectly, of more than 25% of the voting securities of a fund creates a presumption of control of the fund, under Section 2(a)(9) of the Investment Company
Act of 1940. As of June 30, 2023, Merrill Lynch Pierce Fenner & Smith for the benefit of their customers own 98.7% of the outstanding shares of the Fund.
20
HW OPPORTUNITIES MP FUND
Notes to the Financial Statements – Continued
June 30, 2023
7. OTHER REGULATORY MATTERS
In October 2022, the Securities and Exchange Commission (the “SEC”) adopted a final rule relating to Tailored Shareholder Reports for Mutual Funds and Exchange-Traded Funds; Fee Information in
Investment Company Advertisements. The rule and form amendments will, among other things, require the Fund to transmit concise and visually engaging shareholder reports that highlight key information. The amendments will require that funds tag
information in a structured data format and that certain more in-depth information be made available online and available for delivery free of charge to investors on request. The amendments became effective January 24, 2023. There is an 18-month
transition period after the effective date of the amendment.
8. SUBSEQUENT EVENTS
Management has evaluated events and transactions for potential recognition or disclosure through the date the financial statements were issued and there were no additional subsequent events to report
that would have a material impact on the Fund’s financial statements and notes to the financial statements.
21
HW OPPORTUNITIES MP FUND
Report of Independent Registered Public Accounting Firm
To the Shareholders of HW Opportunities MP Fund and
Board of Trustees of Series Portfolios Trust
Opinion on the Financial Statements
We have audited the accompanying statement of assets and liabilities, including the schedule of investments, of HW Opportunities MP Fund (the “Fund”), a series of Series Portfolios Trust, as of June 30,
2023, the related statement of operations for the year then ended, the statements of changes in net assets for each of the two years in the period then ended, the related notes, and the financial highlights for each of the three periods in the period
then ended (collectively referred to as the “financial statements”). In our opinion, the financial statements present fairly, in all material respects, the financial position of the Fund as of June 30, 2023, the results of its operations for the year
then ended, the changes in net assets for each of the two years in the period then ended, and the financial highlights for each of the three periods in the period then ended, in conformity with accounting principles generally accepted in the United
States of America.
Basis for Opinion
These financial statements are the responsibility of the Fund’s management. Our responsibility is to express an opinion on the Fund’s financial statements based on our audits. We are a public accounting
firm registered with the Public Company Accounting Oversight Board (United States) (“PCAOB”) and are required to be independent with respect to the Fund in accordance with the U.S. federal securities laws and the applicable rules and regulations of
the Securities and Exchange Commission and the PCAOB.
We conducted our audits in accordance with the standards of the PCAOB. Those standards require that we plan and perform the audit to obtain reasonable assurance about whether the financial statements
are free of material misstatement whether due to error or fraud.
Our audits included performing procedures to assess the risks of material misstatement of the financial statements, whether due to error or fraud, and performing procedures that respond to those risks.
Such procedures included examining, on a test basis, evidence regarding the amounts and disclosures in the financial statements. Our procedures included confirmation of securities owned as of June 30, 2023, by correspondence with the custodian and
brokers; when replies were not received from brokers, we performed other auditing procedures. Our audits also included evaluating the accounting principles used and significant estimates made by management, as well as evaluating the overall
presentation of the financial statements. We believe that our audits provide a reasonable basis for our opinion.
We have served as the Fund’s auditor since 2020.

COHEN & COMPANY, LTD.
Milwaukee, Wisconsin
August 25, 2023
22
HW OPPORTUNITIES MP FUND
Expense Example
June 30, 2023
As a shareholder of the Fund, you incur two types of costs: (1) transaction costs, and (2) ongoing costs, including management fees and other Fund specific expenses. The expense example is intended to
help the shareholder understand ongoing costs (in dollars) of investing in the Fund and to compare these costs with the ongoing costs of investing in other mutual funds. The example is based on an investment of $1,000 invested at the beginning of the
period and held for the most recent six-month period.
The Actual Expenses comparison provides information about actual account values and actual expenses. A shareholder may use the information in this line, together with the amount invested, to estimate
the expenses paid over the period. A shareholder may divide his/her account value by $1,000 (e.g., an $8,600 account value divided by $1,000 = 8.6), then multiply the result by the number in the first line under the heading entitled “Expenses Paid
During Period” to estimate the expenses paid on his/her account during this period.
The Hypothetical Example for Comparison Purposes provides information about hypothetical account values and hypothetical expenses based on each Fund’s actual expense ratio and an assumed rate of return
of 5% per year before expenses, which is not the Fund’s actual return. The hypothetical account values and expenses may not be used to estimate the actual ending account balance or expenses paid for the period. A shareholder may use this information
to compare the ongoing costs of investing in the Fund and other funds. To do so, a shareholder would compare this 5% hypothetical example with the 5% hypothetical examples that appear in the shareholder reports of other funds.
The expenses shown in the table are meant to highlight your ongoing costs only and do not reflect any transactional costs, such as sales charges (loads), redemptions fees or exchange fees. Therefore,
the Hypothetical Example for Comparisons Purposes is useful in comparing ongoing costs only, and will not help to determine the relevant total costs of owning different funds. In addition, if these transactional costs were included, shareholder costs
would have been higher.
|
Annualized Net
|
Beginning
|
Ending
|
Expenses Paid
|
||||
|
Expense Ratio
|
Account Value
|
Account Value
|
During Period(1)
|
||||
|
(6/30/2023)
|
(1/1/2023)
|
(6/30/2023)
|
(1/1/2023 to 06/30/2023)
|
||||
|
Actual(2)
|
0.00%
|
$1,000.00
|
$1,118.80
|
$0.00
|
|||
|
Hypothetical
|
|||||||
|
(5% annual return before expenses)
|
0.00%
|
$1,000.00
|
$1,024.79
|
$0.00
|
|
(1)
|
Expense are equal to the Fund’s annualized expense ratio for the period multiplied by the average account value over the period, multiplied by 181/365 to reflect its inception period.
|
|
(2)
|
Based on the actual returns for the period from January 1, 2023 through June 30, 2023, of 11.88%.
|
23
HW OPPORTUNITIES MP FUND
Additional Information (Unaudited)
June 30, 2023
TRUSTEES AND EXECUTIVE OFFICERS
|
Number of
|
|||||||||
|
Portfolios
|
|||||||||
|
in Fund
|
Other
|
||||||||
|
Positions
|
Term of Office
|
Complex(2)
|
Directorships
|
||||||
|
Name and
|
with
|
and Length of
|
Principal Occupations
|
Overseen
|
Held During
|
||||
|
Year of Birth
|
the Trust
|
Time Served
|
During Past Five Years
|
by Trustees
|
Past Five Years
|
||||
|
Independent Trustees of the Trust(1)
|
|||||||||
|
Koji Felton
|
Trustee
|
Indefinite
|
Retired
|
1
|
Independent
|
||||
|
(born 1961)
|
Term;
|
Trustee, Listed
|
|||||||
|
Since
|
Funds Trust
|
||||||||
|
September
|
(52 portfolios)
|
||||||||
|
2015.
|
(Since 2019).
|
||||||||
|
Debra McGinty-Poteet
|
Trustee
|
Indefinite
|
Retired.
|
1
|
Independent
|
||||
|
(born 1956)
|
Term;
|
Trustee, F/m
|
|||||||
|
Since
|
Funds Trust
|
||||||||
|
September
|
(4 portfolios)
|
||||||||
|
2015.
|
(Since May
|
||||||||
|
2015).
|
|||||||||
|
Daniel B. Willey
|
Trustee
|
Indefinite
|
Retired. Chief Compliance
|
1
|
None
|
||||
|
(born 1955)
|
Term;
|
Officer, United Nations
|
|||||||
|
Since
|
Joint Staff Pension Fund
|
||||||||
|
September
|
(2009 – 2017).
|
||||||||
|
2015.
|
|||||||||
|
Interested Trustee
|
|||||||||
|
Elaine E. Richards(3)
|
Chair,
|
Indefinite
|
Senior Vice President,
|
1
|
None
|
||||
|
(born 1968)
|
Trustee
|
Term;
|
U.S. Bank Global Fund
|
||||||
|
Since
|
Services (since 2007).
|
||||||||
|
July
|
|||||||||
|
2021.
|
24
HW OPPORTUNITIES MP FUND
Additional Information (Unaudited) – Continued
June 30, 2023
|
Number of
|
|||||||||
|
Portfolios
|
|||||||||
|
in Fund
|
Other
|
||||||||
|
Positions
|
Term of Office
|
Complex(2)
|
Directorships
|
||||||
|
Name and
|
with
|
and Length of
|
Principal Occupations
|
Overseen
|
Held During
|
||||
|
Year of Birth
|
the Trust
|
Time Served
|
During Past Five Years
|
by Trustees
|
Past Five Years
|
||||
|
Officers of the Trust
|
|||||||||
|
Ryan L. Roell
|
President
|
Indefinite
|
Vice President,
|
Not
|
Not
|
||||
|
(born 1973)
|
and Principal
|
Term; Since
|
U.S. Bank Global Fund
|
Applicable
|
Applicable
|
||||
|
Executive
|
July 2019.
|
Services (since 2005).
|
|||||||
|
Officer
|
|||||||||
|
Cullen O. Small
|
Vice
|
Indefinite
|
Vice President,
|
Not
|
Not
|
||||
|
(born 1987)
|
President,
|
Term; Since
|
U.S. Bank Global Fund
|
Applicable
|
Applicable
|
||||
|
Treasurer
|
January 2019.
|
Services (since 2010).
|
|||||||
|
and Principal
|
|||||||||
|
Financial
|
|||||||||
|
Officer
|
|||||||||
|
Donna Barrette
|
Vice
|
Indefinite
|
Senior Vice President and
|
Not
|
Not
|
||||
|
(born 1966)
|
President,
|
Term; Since
|
Compliance Officer, U.S.
|
Applicable
|
Applicable
|
||||
|
Chief
|
November 2019.
|
Bank Global Fund
|
|||||||
|
Compliance
|
Services (since 2004).
|
||||||||
|
Officer and
|
|||||||||
|
Anti-Money
|
|||||||||
|
Laundering
|
|||||||||
|
Officer
|
|||||||||
|
Adam W. Smith
|
Secretary
|
Indefinite
|
Vice President, U.S. Bank
|
Not
|
Not
|
||||
|
(born 1981)
|
Term; Since
|
Global Fund Services
|
Applicable
|
Applicable
|
|||||
|
June 2019.
|
(since 2012).
|
||||||||
|
Richard E. Grange
|
Assistant
|
Indefinite
|
Officer, U.S. Bank
|
Not
|
Not
|
||||
|
(born 1982)
|
Treasurer
|
Term; Since
|
Global Fund Services
|
Applicable
|
Applicable
|
||||
|
October 2022.
|
(since 2015).
|
|
(1)
|
The Trustees of the Trust who are not “interested persons” of the Trust as defined by the 1940 Act (“Independent Trustees”).
|
|
(2)
|
As of the date of June 30, 2023, the Trust was comprised of 17 portfolios (including the Fund) managed by unaffiliated investment advisors. The term “Fund Complex” applies only to the Fund. The
Fund does not hold itself out as related to any other series within the Trust for investment purposes, nor does it share the same investment adviser with any other series within the Trust.
|
|
(3)
|
Ms. Richards, as a result of her employment with U.S. Bank Global Fund Services, which acts as transfer agent, administrator, and fund accountant to the Trust, is considered to be an “interested
person” of the Trust, as defined by the 1940 Act.
|
25
HW OPPORTUNITIES MP FUND
Additional Information (Unaudited) – Continued
June 30, 2023
AVAILABILITY OF FUND PORTFOLIO INFORMATION
The Fund files complete schedules of portfolio holdings with the SEC for the first and third quarters of each fiscal year on Part F of Form N-PORT, which is available on the SEC’s website at
www.sec.gov. The Fund’s Part F of Form N-PORT may be reviewed and copied at the SEC’s Public Reference Room in Washington, D.C. For information on the Public Reference Room call 1-800-SEC-0330. In addition, the Fund’s Part F of Form N-PORT is
available without charge upon request by calling 1-888-458-1963.
AVAILABILITY OF PROXY VOTING INFORMATION
A description of the Fund’s Proxy Voting Policies and Procedures is available without charge, upon request, by calling 1-888-458-1963. Information regarding how the Fund voted proxies relating to
portfolio securities during the most recent period ended June 30, is available (1) without charge, upon request, by calling 1-888-458-1963, or (2) on the SEC’s website at www.sec.gov.
QUALIFIED DIVIDEND INCOME/DIVIDENDS RECEIVED DEDUCTION
For the fiscal year ended June 30, 2023, certain dividends paid by the Fund may be reported as qualified dividend income (“QDI”) and may be eligible for taxation at capital gains rates. The percentage
of dividends declared from ordinary income designated as qualified dividend income was 41.17%.
For corporate shareholders, the percent of ordinary income distributions qualifying for the corporate dividends received deduction for the period ended June 30, 2023 was 17.14%.
The percentage of taxable ordinary income distributions that are designated as short-term capital gain distributions under Internal Revenue section 871 (k)(2)(c) was 38.76%.
26
HW OPPORTUNITIES MP FUND
Privacy Notice (Unaudited)
The Fund collects non-public information about you from the following sources:
|
•
|
Information we receive about you on applications or other forms;
|
|
|
•
|
Information you give us orally; and/or
|
|
|
•
|
Information about your transactions with us or others
|
We do not disclose any non-public personal information about our customers or former customers without the customer’s authorization, except as permitted by law. We may share information with affiliated
and unaffiliated third parties with whom we have contracts for servicing the Fund. We will provide unaffiliated third parties with only the information necessary to carry out their assigned responsibilities. We maintain physical, electronic and
procedural safeguards to guard your personal information and require third parties to treat your personal information with the same high degree of confidentiality.
In the event that you hold shares of the Fund through a financial intermediary, including, but not limited to, a broker- dealer, bank, or trust company, the privacy policy of your financial intermediary
would govern how your non-public personal information would be shared with unaffiliated third parties.
27
(This Page Intentionally Left Blank.)
INVESTMENT ADVISER
Hotchkis & Wiley Capital Management, LLC
601 South Figueroa Street, 39th Floor
Los Angeles, CA 90017
DISTRIBUTOR
Quasar Distributors, LLC
111 East Kilbourn Avenue, Suite 2200
Milwaukee, WI 53202
CUSTODIAN
U.S. Bank N.A.
1555 North Rivercenter Drive, Suite 302
Milwaukee, WI 53212
ADMINISTRATOR, FUND ACCOUNTANT
AND TRANSFER AGENT
U.S. Bancorp Fund Services, LLC
615 East Michigan Street
Milwaukee, WI 53202
INDEPENDENT REGISTERED PUBLIC ACCOUNTING FIRM
Cohen & Company, Ltd.
342 North Water Street, Suite 830
Milwaukee, WI 53202
LEGAL COUNSEL
Goodwin Procter LLP
1900 N Street NW
Washington, DC 20036
This report is for the information of shareholders of the HW Opportunities MP Fund, but may also be used as sales literature when preceded or accompanied by a current prospectus, which gives details
about charges, expenses, investment objectives and operating policies of the Fund.