Putnam Massachusetts Tax Exempt Income Fund seeks as high a level of current income exempt from federal income tax and Massachusetts personal income tax as we believe is consistent with preservation of capital.
The following tables describe the fees and expenses you may pay if you buy, hold and sell shares of the fund. You may pay other fees, such as brokerage commissions and other fees to financial intermediaries, which are not reflected in the tables and examples below. You may qualify for sales charge discounts if you and your family invest, or agree to invest in the future, at least $50,000 in Putnam funds. More information about these and other discounts is available from your financial professional and in How do I buy fund shares? beginning on page 38 of the fund’s prospectus, in the Appendix to the fund’s prospectus, and in How to buy shares beginning on page II-1 of the fund’s statement of additional information (SAI).
Shareholder Fees - Putnam Massachusetts Tax Exempt Income Fund |
Class A C000017120 |
Class B C000017121 |
Class C C000017118 |
Class R6 C000202927 |
Class Y C000060571 |
|||
|---|---|---|---|---|---|---|---|---|
| Maximum Sales Charge Imposed on Purchases (as a percentage of Offering Price) | 4.00% | none | none | none | none | |||
| Maximum Deferred Sales Charge (as a percentage) | 1.00% | [1] | 5.00% | [2] | 1.00% | [3] | none | none |
| [1] | Applies only to certain redemptions of shares bought with no initial sales charge. |
| [2] | This charge is phased out over six years. |
| [3] | This charge is eliminated after one year. |
Annual Fund Operating Expenses - Putnam Massachusetts Tax Exempt Income Fund |
Class A C000017120 |
Class B C000017121 |
Class C C000017118 |
Class R6 C000202927 |
Class Y C000060571 |
|---|---|---|---|---|---|
| Management Fees (as a percentage of Assets) | 0.43% | 0.43% | 0.43% | 0.43% | 0.43% |
| Distribution and Service (12b-1) Fees | 0.25% | 0.85% | 1.00% | none | none |
| Other Expenses (as a percentage of Assets): | 0.14% | 0.14% | 0.14% | 0.13% | 0.14% |
| Expenses (as a percentage of Assets) | 0.82% | 1.42% | 1.57% | 0.56% | 0.57% |
The following hypothetical example is intended to help you compare the cost of investing in the fund with the cost of investing in other funds. It assumes that you invest $10,000 in the fund for the time periods indicated and then, except as indicated, redeem all your shares at the end of those periods. It assumes a 5% return on your investment each year and that the fund’s operating expenses remain the same. Your actual costs may be higher or lower.
Expense Example - Putnam Massachusetts Tax Exempt Income Fund - USD ($) |
Expense Example, with Redemption, 1 Year |
Expense Example, with Redemption, 3 Years |
Expense Example, with Redemption, 5 Years |
Expense Example, with Redemption, 10 Years |
Expense Example, No Redemption, 1 Year |
Expense Example, No Redemption, 3 Years |
Expense Example, No Redemption, 5 Years |
Expense Example, No Redemption, 10 Years |
|---|---|---|---|---|---|---|---|---|
| Class A C000017120 | 480 | 651 | 837 | 1,373 | ||||
| Class B C000017121 | 645 | 749 | 976 | 1,539 | 145 | 449 | 776 | 1,539 |
| Class C C000017118 | 260 | 496 | 855 | 1,666 | 160 | 496 | 855 | 1,666 |
| Class R6 C000202927 | 57 | 179 | 313 | 701 | ||||
| Class Y C000060571 | 58 | 183 | 318 | 714 |
The fund pays transaction-related costs, such as commissions, when it buys and sells securities (or “turns over” its portfolio). A higher turnover rate may indicate higher transaction costs and may result in higher taxes when the fund’s shares are held in a taxable account. These costs, which are not reflected in annual fund operating expenses or the above example, affect fund performance. The fund’s turnover rate in the most recent fiscal year was 21%.
Investments
We invest mainly in bonds that pay interest that is exempt from federal income tax and Massachusetts personal income tax (but that may be subject to federal alternative minimum tax (AMT)), are investment-grade in quality, and have intermediate- to long-term maturities (i.e., three years or longer). Under normal circumstances, we invest at least 80% of the fund’s net assets in tax-exempt investments. Tax-exempt investments are issued by or for states, territories or possessions of the United States or by their political subdivisions, agencies, authorities or other government entities, and the income from these investments is exempt from both federal and Massachusetts personal income tax. This investment policy cannot be changed without the approval of the fund’s shareholders. We may consider, among other factors, credit, interest rate and prepayment risks, as well as general market conditions, when deciding whether to buy or sell investments.
It is important to understand that you can lose money by investing in the fund.
The value of investments in the fund’s portfolio may fall or fail to rise over extended periods of time for a variety of reasons, including general economic, political or financial market conditions, investor sentiment and market perceptions, government actions, geopolitical events or changes, outbreaks of infectious illnesses or other widespread public health issues, and factors related to a specific issuer, geography, industry or sector. These and other factors may lead to increased volatility and reduced liquidity in the fund’s portfolio holdings, may negatively impact the fund’s performance, and may exacerbate other risks to which the fund is subject.
The risks associated with bond investments include interest rate risk, which is the risk that the value of the fund’s investments is likely to fall if interest rates rise. Bond investments also are subject to credit risk, which is the risk that the issuers of the fund’s investments may default on payment of interest or principal. Bond investments may be more susceptible to downgrades or defaults during economic downturns or other periods of economic stress. Interest rate risk is generally greater for longer-term bonds, and credit risk is generally greater for below-investment-grade bonds, which can be more sensitive to changes in markets, credit conditions, and interest rates, and may be considered speculative. Since the fund invests in tax-exempt bonds, which, to be treated as tax-exempt under the Internal Revenue Code, may be issued only by limited types of issuers for limited types of projects, the fund’s investments may be focused in certain market segments. Consequently, the fund may be more vulnerable to fluctuations in the values of the securities it holds than a fund that invests more broadly. The fund’s performance will be closely tied to the economic and political conditions in Massachusetts, and can be more volatile than the performance of a more geographically diversified fund. To the extent the fund invests in securities of issuers located outside of Massachusetts, the fund may also be exposed to the risks affecting other states. Interest the fund receives might be taxable.
There is no guarantee that the investment techniques, analyses, or judgments that we apply in making investment decisions for the fund will produce the intended outcome or that the investments we select for the fund will perform as well as other securities that were not selected for the fund. We, or the fund’s other service providers, may experience disruptions or operating errors that could negatively impact the fund.
The fund may not achieve its goal, and it is not intended to be a complete investment program. An investment in the fund is not insured or guaranteed by the Federal Deposit Insurance Corporation or any other government agency.
The performance information below gives some indication of the risks associated with an investment in the fund by showing the fund’s performance year to year and over time. The bar chart does not reflect the impact of sales charges. If it did, performance would be lower. Please remember that past performance is not necessarily an indication of future results. Monthly performance figures for the fund are available at putnam.com.
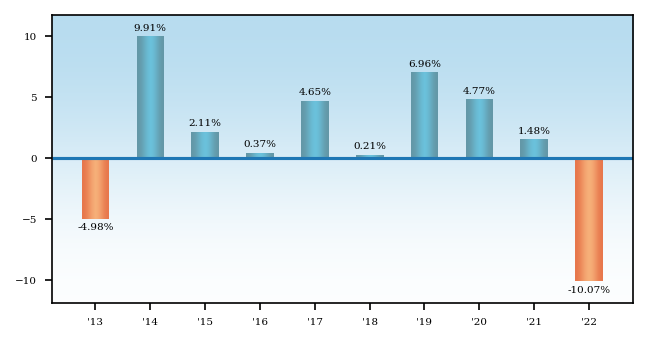
Average Annual Total Returns - Putnam Massachusetts Tax Exempt Income Fund |
1 Year |
5 Years |
10 Years |
|
|---|---|---|---|---|
| Class A C000017120 | (13.67%) | (0.33%) | 0.98% | |
| Class A C000017120 | After Taxes on Distributions | (13.67%) | (0.34%) | 0.95% | |
| Class A C000017120 | After Taxes on Distributions and Sales | (7.28%) | 0.30% | 1.35% | |
| Class B C000017121 | (14.94%) | (0.49%) | 0.89% | |
| Class C C000017118 | (11.61%) | (0.27%) | 0.76% | |
| Class R6 C000202927 | [1] | (9.82%) | 0.74% | 1.63% |
| Class Y C000060571 | (9.80%) | 0.73% | 1.62% | |
| Bloomberg Municipal Bond Index (no deduction for fees, expenses or taxes) | (8.53%) | 1.25% | 2.13% | |
| [1] | Performance for class R6 shares prior to their inception (5/22/18) is derived from the historical performance of class Y shares and has not been adjusted for the lower investor servicing fees applicable to class R6 shares; had it, returns would have been higher. |
| All Bloomberg indices are provided by Bloomberg Index Services Limited. |
| BLOOMBERG® is a trademark and service mark of Bloomberg Finance L.P. and its affiliates (collectively “Bloomberg”). Bloomberg or Bloomberg’s licensors, own all proprietary rights in the Bloomberg Indices. Neither Bloomberg nor Bloomberg’s licensors approve or endorse this material, or guarantee the accuracy or completeness of any information herein, or make any warranty, express or implied, as to the results to be obtained therefrom, and to the maximum extent allowed by law, neither shall have any liability or responsibility for injury or damages arising in connection therewith. |
| After-tax returns reflect the historical highest individual federal marginal income tax rates and do not reflect state and local taxes. Actual after-tax returns depend on an investor’s tax situation and may differ from those shown. After-tax returns are shown for class A shares only and will vary for other classes. These after-tax returns do not apply if you hold your fund shares through a 401(k) plan, an IRA, or another tax-advantaged arrangement. |
| Class B and C share performance reflects conversion to class A shares after eight years. |
Putnam Minnesota Tax Exempt Income Fund seeks as high a level of current income exempt from federal income tax and Minnesota personal income tax as we believe is consistent with preservation of capital.
The following tables describe the fees and expenses you may pay if you buy, hold and sell shares of the fund. You may pay other fees, such as brokerage commissions and other fees to financial intermediaries, which are not reflected in the tables and examples below. You may qualify for sales charge discounts if you and your family invest, or agree to invest in the future, at least $50,000 in Putnam funds. More information about these and other discounts is available from your financial professional and in How do I buy fund shares? beginning on page 38 of the fund’s prospectus, in the Appendix to the fund’s prospectus, and in How to buy shares beginning on page II-1 of the fund’s statement of additional information (SAI).
Shareholder Fees - Putnam Minnesota Tax Exempt Income Fund |
Class A C000017144 |
Class B C000017145 |
Class C C000039836 |
Class R6 C000202929 |
Class Y C000060573 |
|||
|---|---|---|---|---|---|---|---|---|
| Maximum Sales Charge Imposed on Purchases (as a percentage of Offering Price) | 4.00% | none | none | none | none | |||
| Maximum Deferred Sales Charge (as a percentage) | 1.00% | [1] | 5.00% | [2] | 1.00% | [3] | none | none |
| [1] | Applies only to certain redemptions of shares bought with no initial sales charge. |
| [2] | This charge is phased out over six years. |
| [3] | This charge is eliminated after one year. |
Annual Fund Operating Expenses - Putnam Minnesota Tax Exempt Income Fund |
Class A C000017144 |
Class B C000017145 |
Class C C000039836 |
Class R6 C000202929 |
Class Y C000060573 |
|---|---|---|---|---|---|
| Management Fees (as a percentage of Assets) | 0.43% | 0.43% | 0.43% | 0.43% | 0.43% |
| Distribution and Service (12b-1) Fees | 0.25% | 0.85% | 1.00% | none | none |
| Other Expenses (as a percentage of Assets): | 0.22% | 0.22% | 0.22% | 0.17% | 0.22% |
| Expenses (as a percentage of Assets) | 0.90% | 1.50% | 1.65% | 0.60% | 0.65% |
The following hypothetical example is intended to help you compare the cost of investing in the fund with the cost of investing in other funds. It assumes that you invest $10,000 in the fund for the time periods indicated and then, except as indicated, redeem all your shares at the end of those periods. It assumes a 5% return on your investment each year and that the fund’s operating expenses remain the same. Your actual costs may be higher or lower.
Expense Example - Putnam Minnesota Tax Exempt Income Fund - USD ($) |
Expense Example, with Redemption, 1 Year |
Expense Example, with Redemption, 3 Years |
Expense Example, with Redemption, 5 Years |
Expense Example, with Redemption, 10 Years |
Expense Example, No Redemption, 1 Year |
Expense Example, No Redemption, 3 Years |
Expense Example, No Redemption, 5 Years |
Expense Example, No Redemption, 10 Years |
|---|---|---|---|---|---|---|---|---|
| Class A C000017144 | 488 | 676 | 879 | 1,464 | ||||
| Class B C000017145 | 653 | 774 | 1,018 | 1,628 | 153 | 474 | 818 | 1,628 |
| Class C C000039836 | 268 | 520 | 897 | 1,754 | 168 | 520 | 897 | 1,754 |
| Class R6 C000202929 | 61 | 192 | 335 | 750 | ||||
| Class Y C000060573 | 66 | 208 | 362 | 810 |
The fund pays transaction-related costs, such as commissions, when it buys and sells securities (or “turns over” its portfolio). A higher turnover rate may indicate higher transaction costs and may result in higher taxes when the fund’s shares are held in a taxable account. These costs, which are not reflected in annual fund operating expenses or the above example, affect fund performance. The fund’s turnover rate in the most recent fiscal year was 16%.
Investments
We invest mainly in bonds that pay interest that is exempt from federal income tax and Minnesota personal income tax (but that may be subject to federal alternative minimum tax (AMT)), are investment-grade in quality, and have intermediate- to long-term maturities (i.e., three years or longer). Under normal circumstances, we invest at least 80% of the fund’s net assets in tax-exempt investments. Tax-exempt investments are issued by or for states, territories or possessions of the United States or by their political subdivisions, agencies, authorities or other government entities, and the income from these investments is exempt from both federal and Minnesota personal income tax. This investment policy cannot be changed without the approval of the fund’s shareholders. We may consider, among other factors, credit, interest rate and prepayment risks, as well as general market conditions, when deciding whether to buy or sell investments.
It is important to understand that you can lose money by investing in the fund.
The value of investments in the fund’s portfolio may fall or fail to rise over extended periods of time for a variety of reasons, including general economic, political or financial market conditions, investor sentiment and market perceptions, government actions, geopolitical events or changes, outbreaks of infectious illnesses or other widespread public health issues, and factors related to a specific issuer, geography, industry or sector. These and other factors may lead to increased volatility and reduced liquidity in the fund’s portfolio holdings, may negatively impact the fund’s performance, and may exacerbate other risks to which the fund is subject.
The risks associated with bond investments include interest rate risk, which is the risk that the value of the fund’s investments is likely to fall if interest rates rise. Bond investments also are subject to credit risk, which is the risk that the issuers of the fund’s investments may default on payment of interest or principal. Bond investments may be more susceptible to downgrades or defaults during economic downturns or other periods of economic stress. Interest rate risk is generally greater for longer-term bonds, and credit risk is generally greater for below-investment-grade bonds, which can be more sensitive to changes in markets, credit conditions, and interest rates, and may be considered speculative. Since the fund invests in tax-exempt bonds, which, to be treated as tax-exempt under the Internal Revenue Code, may be issued only by limited types of issuers for limited types of projects, the fund’s investments may be focused in certain market segments. Consequently, the fund may be more vulnerable to fluctuations in the values of the securities it holds than a fund that invests more broadly. The fund’s performance will be closely tied to the economic and political conditions in Minnesota, and can be more volatile than the performance of a more geographically diversified fund. To the extent the fund invests in securities of issuers located outside of Minnesota, the fund may also be exposed to the risks affecting other states. Interest the fund receives might be taxable.
There is no guarantee that the investment techniques, analyses, or judgments that we apply in making investment decisions for the fund will produce the intended outcome or that the investments we select for the fund will perform as well as other securities that were not selected for the fund. We, or the fund’s other service providers, may experience disruptions or operating errors that could negatively impact the fund.
The fund may not achieve its goal, and it is not intended to be a complete investment program. An investment in the fund is not insured or guaranteed by the Federal Deposit Insurance Corporation or any other government agency.
The performance information below gives some indication of the risks associated with an investment in the fund by showing the fund’s performance year to year and over time. The bar chart does not reflect the impact of sales charges. If it did, performance would be lower. Please remember that past performance is not necessarily an indication of future results. Monthly performance figures for the fund are available at putnam.com.
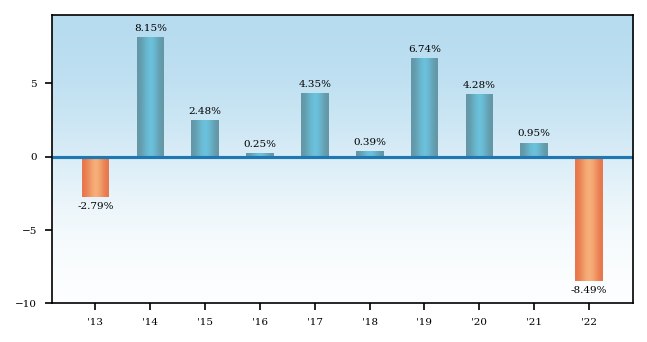
Average Annual Total Returns - Putnam Minnesota Tax Exempt Income Fund |
1 Year |
5 Years |
10 Years |
|
|---|---|---|---|---|
| Class A C000017144 | (12.15%) | (0.18%) | 1.11% | |
| Class A C000017144 | After Taxes on Distributions | (12.15%) | (0.24%) | 1.06% | |
| Class A C000017144 | After Taxes on Distributions and Sales | (6.45%) | 0.34% | 1.42% | |
| Class B C000017145 | (13.47%) | (0.33%) | 1.03% | |
| Class C C000039836 | (10.01%) | (0.11%) | 0.89% | |
| Class R6 C000202929 | [1] | (8.22%) | 0.90% | 1.79% |
| Class Y C000060573 | (8.14%) | 0.88% | 1.77% | |
| Bloomberg Municipal Bond Index (no deduction for fees, expenses or taxes) | (8.53%) | 1.25% | 2.13% | |
| [1] | Performance for class R6 shares prior to their inception (5/22/18) is derived from the historical performance of class Y shares and has not been adjusted for the lower investor servicing fees applicable to class R6 shares; had it, returns would have been higher. |
| All Bloomberg indices are provided by Bloomberg Index Services Limited. |
| BLOOMBERG® is a trademark and service mark of Bloomberg Finance L.P. and its affiliates (collectively “Bloomberg”). Bloomberg or Bloomberg’s licensors, own all proprietary rights in the Bloomberg Indices. Neither Bloomberg nor Bloomberg’s licensors approve or endorse this material, or guarantee the accuracy or completeness of any information herein, or make any warranty, express or implied, as to the results to be obtained therefrom, and to the maximum extent allowed by law, neither shall have any liability or responsibility for injury or damages arising in connection therewith. |
| After-tax returns reflect the historical highest individual federal marginal income tax rates and do not reflect state and local taxes. Actual after-tax returns depend on an investor’s tax situation and may differ from those shown. After-tax returns are shown for class A shares only and will vary for other classes. These after-tax returns do not apply if you hold your fund shares through a 401(k) plan, an IRA, or another tax-advantaged arrangement. |
| Class B and C share performance reflects conversion to class A shares after eight years. |
Putnam New Jersey Tax Exempt Income Fund seeks as high a level of current income exempt from federal income tax and New Jersey personal income tax as we believe is consistent with preservation of capital.
The following tables describe the fees and expenses you may pay if you buy, hold and sell shares of the fund. You may pay other fees, such as brokerage commissions and other fees to financial intermediaries, which are not reflected in the tables and examples below. You may qualify for sales charge discounts if you and your family invest, or agree to invest in the future, at least $50,000 in Putnam funds. More information about these and other discounts is available from your financial professional and in How do I buy fund shares? beginning on page 38 of the fund’s prospectus, in the Appendix to the fund’s prospectus, and in How to buy shares beginning on page II-1 of the fund’s statement of additional information (SAI).
Shareholder Fees - Putnam New Jersey Tax Exempt Income Fund |
Class A C000017198 |
Class B C000017199 |
Class C C000039838 |
Class R6 C000202931 |
Class Y C000060575 |
|||
|---|---|---|---|---|---|---|---|---|
| Maximum Sales Charge Imposed on Purchases (as a percentage of Offering Price) | 4.00% | none | none | none | none | |||
| Maximum Deferred Sales Charge (as a percentage) | 1.00% | [1] | 5.00% | [2] | 1.00% | [3] | none | none |
| [1] | Applies only to certain redemptions of shares bought with no initial sales charge. |
| [2] | This charge is phased out over six years. |
| [3] | This charge is eliminated after one year. |
Annual Fund Operating Expenses - Putnam New Jersey Tax Exempt Income Fund |
Class A C000017198 |
Class B C000017199 |
Class C C000039838 |
Class R6 C000202931 |
Class Y C000060575 |
|---|---|---|---|---|---|
| Management Fees (as a percentage of Assets) | 0.43% | 0.43% | 0.43% | 0.43% | 0.43% |
| Distribution and Service (12b-1) Fees | 0.25% | 0.85% | 1.00% | none | none |
| Other Expenses (as a percentage of Assets): | 0.18% | 0.18% | 0.18% | 0.16% | 0.18% |
| Expenses (as a percentage of Assets) | 0.86% | 1.46% | 1.61% | 0.59% | 0.61% |
The following hypothetical example is intended to help you compare the cost of investing in the fund with the cost of investing in other funds. It assumes that you invest $10,000 in the fund for the time periods indicated and then, except as indicated, redeem all your shares at the end of those periods. It assumes a 5% return on your investment each year and that the fund’s operating expenses remain the same. Your actual costs may be higher or lower.
Expense Example - Putnam New Jersey Tax Exempt Income Fund - USD ($) |
Expense Example, with Redemption, 1 Year |
Expense Example, with Redemption, 3 Years |
Expense Example, with Redemption, 5 Years |
Expense Example, with Redemption, 10 Years |
Expense Example, No Redemption, 1 Year |
Expense Example, No Redemption, 3 Years |
Expense Example, No Redemption, 5 Years |
Expense Example, No Redemption, 10 Years |
|---|---|---|---|---|---|---|---|---|
| Class A C000017198 | 484 | 663 | 858 | 1,418 | ||||
| Class B C000017199 | 649 | 762 | 997 | 1,584 | 149 | 462 | 797 | 1,584 |
| Class C C000039838 | 264 | 508 | 876 | 1,710 | 164 | 508 | 876 | 1,710 |
| Class R6 C000202931 | 60 | 189 | 329 | 738 | ||||
| Class Y C000060575 | 62 | 195 | 340 | 762 |
The fund pays transaction-related costs, such as commissions, when it buys and sells securities (or “turns over” its portfolio). A higher turnover rate may indicate higher transaction costs and may result in higher taxes when the fund’s shares are held in a taxable account. These costs, which are not reflected in annual fund operating expenses or the above example, affect fund performance. The fund’s turnover rate in the most recent fiscal year was 18%.
Investments
We invest mainly in bonds that pay interest that is exempt from federal income tax and New Jersey personal income tax (but that may be subject to federal alternative minimum tax (AMT)), are investment-grade in quality, and have intermediate- to long-term maturities (i.e., three years or longer). Under normal circumstances, we invest at least 80% of the fund’s net assets in tax-exempt investments. Tax-exempt investments are issued by or for states, territories or possessions of the United States or by their political subdivisions, agencies, authorities or other government entities, and the income from these investments is exempt from both federal and New Jersey personal income tax. This investment policy cannot be changed without the approval of the fund’s shareholders. We may consider, among other factors, credit, interest rate and prepayment risks, as well as general market conditions, when deciding whether to buy or sell investments.
It is important to understand that you can lose money by investing in the fund.
The value of investments in the fund’s portfolio may fall or fail to rise over extended periods of time for a variety of reasons, including general economic, political or financial market conditions, investor sentiment and market perceptions, government actions, geopolitical events or changes, outbreaks of infectious illnesses or other widespread public health issues, and factors related to a specific issuer, geography, industry or sector. These and other factors may lead to increased volatility and reduced liquidity in the fund’s portfolio holdings, may negatively impact the fund’s performance, and may exacerbate other risks to which the fund is subject.
The risks associated with bond investments include interest rate risk, which is the risk that the value of the fund’s investments is likely to fall if interest rates rise. Bond investments also are subject to credit risk, which is the risk that the issuers of the fund’s investments may default on payment of interest or principal. Bond investments may be more susceptible to downgrades or defaults during economic downturns or other periods of economic stress. Interest rate risk is generally greater for longer-term bonds, and credit risk is generally greater for below-investment-grade bonds, which can be more sensitive to changes in markets, credit conditions, and interest rates, and may be considered speculative. Since the fund invests in tax-exempt bonds, which, to be treated as tax-exempt under the Internal Revenue Code, may be issued only by limited types of issuers for limited types of projects, the fund’s investments may be focused in certain market segments. Consequently, the fund may be more vulnerable to fluctuations in the values of the securities it holds than a fund that invests more broadly. The fund’s performance will be closely tied to the economic and political conditions in New Jersey, and can be more volatile than the performance of a more geographically diversified fund. To the extent the fund invests in securities of issuers located outside of New Jersey, the fund may also be exposed to the risks affecting other states. Interest the fund receives might be taxable.
There is no guarantee that the investment techniques, analyses, or judgments that we apply in making investment decisions for the fund will produce the intended outcome or that the investments we select for the fund will perform as well as other securities that were not selected for the fund. We, or the fund’s other service providers, may experience disruptions or operating errors that could negatively impact the fund.
The fund may not achieve its goal, and it is not intended to be a complete investment program. An investment in the fund is not insured or guaranteed by the Federal Deposit Insurance Corporation or any other government agency.
The performance information below gives some indication of the risks associated with an investment in the fund by showing the fund’s performance year to year and over time. The bar chart does not reflect the impact of sales charges. If it did, performance would be lower. Please remember that past performance is not necessarily an indication of future results. Monthly performance figures for the fund are available at putnam.com.
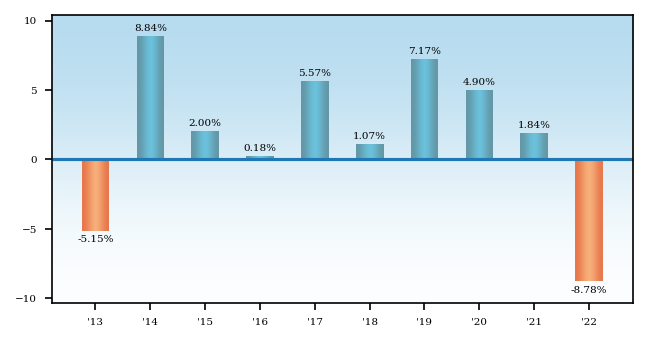
Average Annual Total Returns - Putnam New Jersey Tax Exempt Income Fund |
1 Year |
5 Years |
10 Years |
|
|---|---|---|---|---|
| Class A C000017198 | (12.43%) | 0.26% | 1.22% | |
| Class A C000017198 | After Taxes on Distributions | (12.43%) | 0.24% | 1.19% | |
| Class A C000017198 | After Taxes on Distributions and Sales | (6.37%) | 0.84% | 1.60% | |
| Class B C000017199 | (13.80%) | 0.10% | 1.13% | |
| Class C C000039838 | (10.35%) | 0.32% | 1.00% | |
| Class R6 C000202931 | [1] | (8.51%) | 1.35% | 1.88% |
| Class Y C000060575 | (8.53%) | 1.33% | 1.88% | |
| Bloomberg Municipal Bond Index (no deduction for fees, expenses or taxes) | (8.53%) | 1.25% | 2.13% | |
| [1] | Performance for class R6 shares prior to their inception (5/22/18) is derived from the historical performance of class Y shares and has not been adjusted for the lower investor servicing fees applicable to class R6 shares; had it, returns would have been higher. |
| All Bloomberg indices are provided by Bloomberg Index Services Limited. |
| BLOOMBERG® is a trademark and service mark of Bloomberg Finance L.P. and its affiliates (collectively “Bloomberg”). Bloomberg or Bloomberg’s licensors, own all proprietary rights in the Bloomberg Indices. Neither Bloomberg nor Bloomberg’s licensors approve or endorse this material, or guarantee the accuracy or completeness of any information herein, or make any warranty, express or implied, as to the results to be obtained therefrom, and to the maximum extent allowed by law, neither shall have any liability or responsibility for injury or damages arising in connection therewith. |
| After-tax returns reflect the historical highest individual federal marginal income tax rates and do not reflect state and local taxes. Actual after-tax returns depend on an investor’s tax situation and may differ from those shown. After-tax returns are shown for class A shares only and will vary for other classes. These after-tax returns do not apply if you hold your fund shares through a 401(k) plan, an IRA, or another tax-advantaged arrangement. |
| Class B and C share performance reflects conversion to class A shares after eight years. |
Putnam Ohio Tax Exempt Income Fund seeks as high a level of current income exempt from federal income tax and Ohio personal income tax as we believe is consistent with preservation of capital.
The following tables describe the fees and expenses you may pay if you buy, hold and sell shares of the fund. You may pay other fees, such as brokerage commissions and other fees to financial intermediaries, which are not reflected in the tables and examples below. You may qualify for sales charge discounts if you and your family invest, or agree to invest in the future, at least $50,000 in Putnam funds. More information about these and other discounts is available from your financial professional and in How do I buy fund shares? beginning on page 38 of the fund’s prospectus, in the Appendix to the fund’s prospectus, and in How to buy shares beginning on page II-1 of the fund’s statement of additional information (SAI).
Shareholder Fees - Putnam Ohio Tax Exempt Income Fund |
Class A C000017547 |
Class B C000017548 |
Class C C000039840 |
Class R6 C000202934 |
Class Y C000060574 |
|||
|---|---|---|---|---|---|---|---|---|
| Maximum Sales Charge Imposed on Purchases (as a percentage of Offering Price) | 4.00% | none | none | none | none | |||
| Maximum Deferred Sales Charge (as a percentage) | 1.00% | [1] | 5.00% | [2] | 1.00% | [3] | none | none |
| [1] | Applies only to certain redemptions of shares bought with no initial sales charge. |
| [2] | This charge is phased out over six years. |
| [3] | This charge is eliminated after one year. |
Annual Fund Operating Expenses - Putnam Ohio Tax Exempt Income Fund |
Class A C000017547 |
Class B C000017548 |
Class C C000039840 |
Class R6 C000202934 |
Class Y C000060574 |
|---|---|---|---|---|---|
| Management Fees (as a percentage of Assets) | 0.43% | 0.43% | 0.43% | 0.43% | 0.43% |
| Distribution and Service (12b-1) Fees | 0.25% | 0.85% | 1.00% | none | none |
| Other Expenses (as a percentage of Assets): | 0.23% | 0.23% | 0.23% | 0.19% | 0.23% |
| Expenses (as a percentage of Assets) | 0.91% | 1.51% | 1.66% | 0.62% | 0.66% |
The following hypothetical example is intended to help you compare the cost of investing in the fund with the cost of investing in other funds. It assumes that you invest $10,000 in the fund for the time periods indicated and then, except as indicated, redeem all your shares at the end of those periods. It assumes a 5% return on your investment each year and that the fund’s operating expenses remain the same. Your actual costs may be higher or lower.
Expense Example - Putnam Ohio Tax Exempt Income Fund - USD ($) |
Expense Example, with Redemption, 1 Year |
Expense Example, with Redemption, 3 Years |
Expense Example, with Redemption, 5 Years |
Expense Example, with Redemption, 10 Years |
Expense Example, No Redemption, 1 Year |
Expense Example, No Redemption, 3 Years |
Expense Example, No Redemption, 5 Years |
Expense Example, No Redemption, 10 Years |
|---|---|---|---|---|---|---|---|---|
| Class A C000017547 | 489 | 679 | 884 | 1,475 | ||||
| Class B C000017548 | 654 | 777 | 1,024 | 1,640 | 154 | 477 | 824 | 1,640 |
| Class C C000039840 | 269 | 523 | 902 | 1,766 | 169 | 523 | 902 | 1,766 |
| Class R6 C000202934 | 63 | 199 | 346 | 774 | ||||
| Class Y C000060574 | 67 | 211 | 368 | 822 |
The fund pays transaction-related costs, such as commissions, when it buys and sells securities (or “turns over” its portfolio). A higher turnover rate may indicate higher transaction costs and may result in higher taxes when the fund’s shares are held in a taxable account. These costs, which are not reflected in annual fund operating expenses or the above example, affect fund performance. The fund’s turnover rate in the most recent fiscal year was 23%.
Investments
We invest mainly in bonds that pay interest that is exempt from federal income tax and Ohio personal income tax (but that may be subject to federal alternative minimum tax (AMT)), are investment-grade in quality, and have intermediate- to long-term maturities (i.e., three years or longer). Under normal circumstances, we invest at least 80% of the fund’s net assets in tax-exempt investments. Tax-exempt investments are issued by or for states, territories or possessions of the United States or by their political subdivisions, agencies, authorities or other government entities, and the income from these investments is exempt from both federal and Ohio personal income tax. This investment policy cannot be changed without the approval of the fund’s shareholders. We may consider, among other factors, credit, interest rate and prepayment risks, as well as general market conditions, when deciding whether to buy or sell investments.
It is important to understand that you can lose money by investing in the fund.
The value of investments in the fund’s portfolio may fall or fail to rise over extended periods of time for a variety of reasons, including general economic, political or financial market conditions, investor sentiment and market perceptions, government actions, geopolitical events or changes, outbreaks of infectious illnesses or other widespread public health issues, and factors related to a specific issuer, geography, industry or sector. These and other factors may lead to increased volatility and reduced liquidity in the fund’s portfolio holdings, may negatively impact the fund’s performance, and may exacerbate other risks to which the fund is subject.
The risks associated with bond investments include interest rate risk, which is the risk that the value of the fund’s investments is likely to fall if interest rates rise. Bond investments also are subject to credit risk, which is the risk that the issuers of the fund’s investments may default on payment of interest or principal. Bond investments may be more susceptible to downgrades or defaults during economic downturns or other periods of economic stress. Interest rate risk is generally greater for longer-term bonds, and credit risk is generally greater for below-investment-grade bonds, which can be more sensitive to changes in markets, credit conditions, and interest rates, and may be considered speculative. Since the fund invests in tax-exempt bonds, which, to be treated as tax-exempt under the Internal Revenue Code, may be issued only by limited types of issuers for limited types of projects, the fund’s investments may be focused in certain market segments. Consequently, the fund may be more vulnerable to fluctuations in the values of the securities it holds than a fund that invests more broadly. The fund’s performance will be closely tied to the economic and political conditions in Ohio, and can be more volatile than the performance of a more geographically diversified fund. To the extent the fund invests in securities of issuers located outside of Ohio, the fund may also be exposed to the risks affecting other states. Interest the fund receives might be taxable.
There is no guarantee that the investment techniques, analyses, or judgments that we apply in making investment decisions for the fund will produce the intended outcome or that the investments we select for the fund will perform as well as other securities that were not selected for the fund. We, or the fund’s other service providers, may experience disruptions or operating errors that could negatively impact the fund.
The fund may not achieve its goal, and it is not intended to be a complete investment program. An investment in the fund is not insured or guaranteed by the Federal Deposit Insurance Corporation or any other government agency.
The performance information below gives some indication of the risks associated with an investment in the fund by showing the fund’s performance year to year and over time. The bar chart does not reflect the impact of sales charges. If it did, performance would be lower. Please remember that past performance is not necessarily an indication of future results. Monthly performance figures for the fund are available at putnam.com.
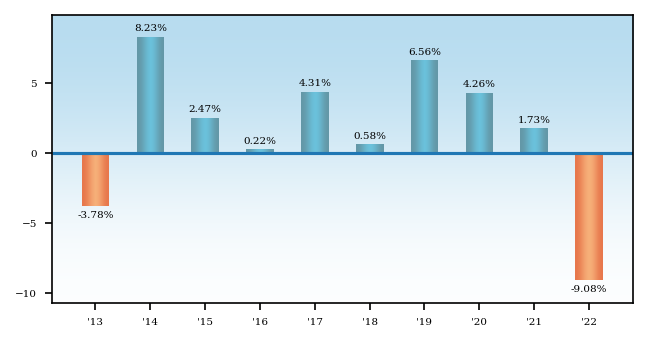
Average Annual Total Returns - Putnam Ohio Tax Exempt Income Fund |
1 Year |
5 Years |
10 Years |
|
|---|---|---|---|---|
| Class A C000017547 | (12.71%) | (0.15%) | 1.02% | |
| Class A C000017547 | After Taxes on Distributions | (12.73%) | (0.21%) | 0.99% | |
| Class A C000017547 | After Taxes on Distributions and Sales | (6.70%) | 0.44% | 1.40% | |
| Class B C000017548 | (13.99%) | (0.29%) | 0.92% | |
| Class C C000039840 | (10.66%) | (0.10%) | 0.81% | |
| Class R6 C000202934 | [1] | (8.80%) | 0.95% | 1.70% |
| Class Y C000060574 | (8.84%) | 0.90% | 1.68% | |
| Bloomberg Municipal Bond Index (no deduction for fees, expenses or taxes) | (8.53%) | 1.25% | 2.13% | |
| [1] | Performance for class R6 shares prior to their inception (5/22/18) is derived from the historical performance of class Y shares and has not been adjusted for the lower investor servicing fees applicable to class R6 shares; had it, returns would have been higher. |
| All Bloomberg indices are provided by Bloomberg Index Services Limited. |
| BLOOMBERG® is a trademark and service mark of Bloomberg Finance L.P. and its affiliates (collectively “Bloomberg”). Bloomberg or Bloomberg’s licensors, own all proprietary rights in the Bloomberg Indices. Neither Bloomberg nor Bloomberg’s licensors approve or endorse this material, or guarantee the accuracy or completeness of any information herein, or make any warranty, express or implied, as to the results to be obtained therefrom, and to the maximum extent allowed by law, neither shall have any liability or responsibility for injury or damages arising in connection therewith. |
| After-tax returns reflect the historical highest individual federal marginal income tax rates and do not reflect state and local taxes. Actual after-tax returns depend on an investor’s tax situation and may differ from those shown. After-tax returns are shown for class A shares only and will vary for other classes. These after-tax returns do not apply if you hold your fund shares through a 401(k) plan, an IRA, or another tax-advantaged arrangement. |
| Class B and C share performance reflects conversion to class A shares after eight years. |
Putnam Pennsylvania Tax Exempt Income Fund seeks as high a level of current income exempt from federal income tax and Pennsylvania personal income tax as we believe is consistent with preservation of capital.
The following tables describe the fees and expenses you may pay if you buy, hold and sell shares of the fund. You may pay other fees, such as brokerage commissions and other fees to financial intermediaries, which are not reflected in the tables and examples below. You may qualify for sales charge discounts if you and your family invest, or agree to invest in the future, at least $50,000 in Putnam funds. More information about these and other discounts is available from your financial professional and in How do I buy fund shares? beginning on page 38 of the fund’s prospectus, in the Appendix to the fund’s prospectus, and in How to buy shares beginning on page II-1 of the fund’s statement of additional information (SAI).
Shareholder Fees - Putnam Pennsylvania Tax Exempt Income Fund |
Class A C000017915 |
Class B C000017916 |
Class C C000039842 |
Class R6 C000202936 |
Class Y C000060576 |
|||
|---|---|---|---|---|---|---|---|---|
| Maximum Sales Charge Imposed on Purchases (as a percentage of Offering Price) | 4.00% | none | none | none | none | |||
| Maximum Deferred Sales Charge (as a percentage) | 1.00% | [1] | 5.00% | [2] | 1.00% | [3] | none | none |
| [1] | Applies only to certain redemptions of shares bought with no initial sales charge. |
| [2] | This charge is phased out over six years. |
| [3] | This charge is eliminated after one year. |
Annual Fund Operating Expenses - Putnam Pennsylvania Tax Exempt Income Fund |
Class A C000017915 |
Class B C000017916 |
Class C C000039842 |
Class R6 C000202936 |
Class Y C000060576 |
|---|---|---|---|---|---|
| Management Fees (as a percentage of Assets) | 0.43% | 0.43% | 0.43% | 0.43% | 0.43% |
| Distribution and Service (12b-1) Fees | 0.25% | 0.85% | 1.00% | none | none |
| Other Expenses (as a percentage of Assets): | 0.19% | 0.19% | 0.19% | 0.16% | 0.19% |
| Expenses (as a percentage of Assets) | 0.87% | 1.47% | 1.62% | 0.59% | 0.62% |
The following hypothetical example is intended to help you compare the cost of investing in the fund with the cost of investing in other funds. It assumes that you invest $10,000 in the fund for the time periods indicated and then, except as indicated, redeem all your shares at the end of those periods. It assumes a 5% return on your investment each year and that the fund’s operating expenses remain the same. Your actual costs may be higher or lower.
Expense Example - Putnam Pennsylvania Tax Exempt Income Fund - USD ($) |
Expense Example, with Redemption, 1 Year |
Expense Example, with Redemption, 3 Years |
Expense Example, with Redemption, 5 Years |
Expense Example, with Redemption, 10 Years |
Expense Example, No Redemption, 1 Year |
Expense Example, No Redemption, 3 Years |
Expense Example, No Redemption, 5 Years |
Expense Example, No Redemption, 10 Years |
|---|---|---|---|---|---|---|---|---|
| Class A C000017915 | 485 | 666 | 863 | 1,430 | ||||
| Class B C000017916 | 650 | 765 | 1,003 | 1,595 | 150 | 465 | 803 | 1,595 |
| Class C C000039842 | 265 | 511 | 881 | 1,721 | 165 | 511 | 881 | 1,721 |
| Class R6 C000202936 | 60 | 189 | 329 | 738 | ||||
| Class Y C000060576 | 63 | 199 | 346 | 774 |
The fund pays transaction-related costs, such as commissions, when it buys and sells securities (or “turns over” its portfolio). A higher turnover rate may indicate higher transaction costs and may result in higher taxes when the fund’s shares are held in a taxable account. These costs, which are not reflected in annual fund operating expenses or the above example, affect fund performance. The fund’s turnover rate in the most recent fiscal year was 19%.
Investments
We invest mainly in bonds that pay interest that is exempt from federal income tax and Pennsylvania personal income tax (but that may be subject to federal alternative minimum tax (AMT)), are investment-grade in quality, and have intermediate- to long-term maturities (i.e., three years or longer). Under normal circumstances, we invest at least 80% of the fund’s net assets in tax-exempt investments. Tax-exempt investments are issued by or for states, territories or possessions of the United States or by their political subdivisions, agencies, authorities or other government entities, and the income from these investments is exempt from both federal and Pennsylvania personal income tax. This investment policy cannot be changed without the approval of the fund’s shareholders. We may consider, among other factors, credit, interest rate and prepayment risks, as well as general market conditions, when deciding whether to buy or sell investments.
It is important to understand that you can lose money by investing in the fund.
The value of investments in the fund’s portfolio may fall or fail to rise over extended periods of time for a variety of reasons, including general economic, political or financial market conditions, investor sentiment and market perceptions, government actions, geopolitical events or changes, outbreaks of infectious illnesses or other widespread public health issues, and factors related to a specific issuer, geography, industry or sector. These and other factors may lead to increased volatility and reduced liquidity in the fund’s portfolio holdings, may negatively impact the fund’s performance, and may exacerbate other risks to which the fund is subject.
The risks associated with bond investments include interest rate risk, which is the risk that the value of the fund’s investments is likely to fall if interest rates rise. Bond investments also are subject to credit risk, which is the risk that the issuers of the fund’s investments may default on payment of interest or principal. Bond investments may be more susceptible to downgrades or defaults during economic downturns or other periods of economic stress. Interest rate risk is generally greater for longer-term bonds, and credit risk is generally greater for below-investment-grade bonds, which can be more sensitive to changes in markets, credit conditions, and interest rates, and may be considered speculative. Since the fund invests in tax-exempt bonds, which, to be treated as tax-exempt under the Internal Revenue Code, may be issued only by limited types of issuers for limited types of projects, the fund’s investments may be focused in certain market segments. Consequently, the fund may be more vulnerable to fluctuations in the values of the securities it holds than a fund that invests more broadly. The fund’s performance will be closely tied to the economic and political conditions in Pennsylvania, and can be more volatile than the performance of a more geographically diversified fund. To the extent the fund invests in securities of issuers located outside of Pennsylvania, the fund may also be exposed to the risks affecting other states. Interest the fund receives might be taxable.
There is no guarantee that the investment techniques, analyses, or judgments that we apply in making investment decisions for the fund will produce the intended outcome or that the investments we select for the fund will perform as well as other securities that were not selected for the fund. We, or the fund’s other service providers, may experience disruptions or operating errors that could negatively impact the fund.
The fund may not achieve its goal, and it is not intended to be a complete investment program. An investment in the fund is not insured or guaranteed by the Federal Deposit Insurance Corporation or any other government agency.
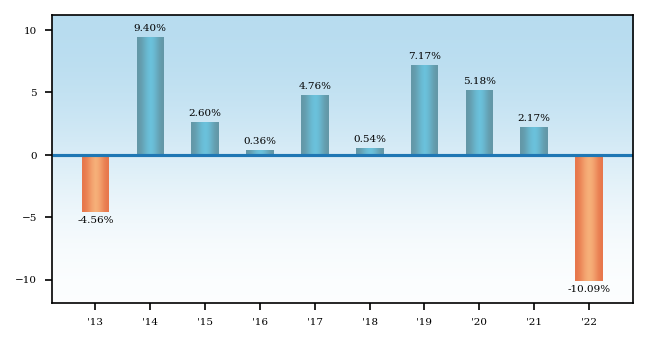
The performance information below gives some indication of the risks associated with an investment in the fund by showing the fund’s performance year to year and over time. The bar chart does not reflect the impact of sales charges. If it did, performance would be lower. Please remember that past performance is not necessarily an indication of future results. Monthly performance figures for the fund are available at putnam.com.
Average Annual Total Returns - Putnam Pennsylvania Tax Exempt Income Fund |
1 Year |
5 Years |
10 Years |
|
|---|---|---|---|---|
| Class A C000017915 | (13.68%) | (0.01%) | 1.19% | |
| Class A C000017915 | After Taxes on Distributions | (13.69%) | (0.02%) | 1.18% | |
| Class A C000017915 | After Taxes on Distributions and Sales | (7.25%) | 0.57% | 1.56% | |
| Class B C000017916 | (14.96%) | (0.16%) | 1.08% | |
| Class C C000039842 | (11.56%) | 0.06% | 0.97% | |
| Class R6 C000202936 | [1] | (9.73%) | 1.10% | 1.87% |
| Class Y C000060576 | (9.85%) | 1.05% | 1.84% | |
| Bloomberg Municipal Bond Index (no deduction for fees, expenses or taxes) | (8.53%) | 1.25% | 2.13% | |
| [1] | Performance for class R6 shares prior to their inception (5/22/18) is derived from the historical performance of class Y shares and has not been adjusted for the lower investor servicing fees applicable to class R6 shares; had it, returns would have been higher. |
| All Bloomberg indices are provided by Bloomberg Index Services Limited. |
| BLOOMBERG® is a trademark and service mark of Bloomberg Finance L.P. and its affiliates (collectively “Bloomberg”). Bloomberg or Bloomberg’s licensors, own all proprietary rights in the Bloomberg Indices. Neither Bloomberg nor Bloomberg’s licensors approve or endorse this material, or guarantee the accuracy or completeness of any information herein, or make any warranty, express or implied, as to the results to be obtained therefrom, and to the maximum extent allowed by law, neither shall have any liability or responsibility for injury or damages arising in connection therewith. |
| After-tax returns reflect the historical highest individual federal marginal income tax rates and do not reflect state and local taxes. Actual after-tax returns depend on an investor’s tax situation and may differ from those shown. After-tax returns are shown for class A shares only and will vary for other classes. These after-tax returns do not apply if you hold your fund shares through a 401(k) plan, an IRA, or another tax-advantaged arrangement. |
| Class B and C share performance reflects conversion to class A shares after eight years. |