Pay vs Performance Disclosure - USD ($)
Jun. 30, 2023
Jun. 30, 2022
Jun. 30, 2021
PAY VERSUS PERFORMANCE
As required by the SEC’s new pay versus performance (“) disclosure rules as set forth in Item 402(v) of Regulation ) which requires us to make various adjustments to amounts reported in the Summary Compensation Table (). Due to the valuation component of CAP, the dollar amounts do not reflect the actual amounts of compensation earned or paid during the year.
PvP
”S-K,
we are providing the following information regarding the relationship between executive compensation and our financial performance for each of the last three completed fiscal years. Under the PvP rules, the SEC has developed a new definition of NEO pay, referred to as “Compensation Actually Paid” (“
CAP
”“
SCT
”As a general matter, our Board of Directors does not use CAP as a basis for making compensation decisions. We structure our executive compensation program to focus on stockholders’ interests by incentivizing strategic and sustainable long-term performance. We believe our executive compensation program strikes an appropriate balance between using responsible, measured pay practices and effectively incentivizing our NEOs to dedicate themselves fully to value creation for our stockholders. Under our executive compensation program, we align pay and performance by making a significant portion of our NEO compensation contingent on achieving specific and challenging annual and long-term performance goals and increasing stockholder value. Importantly, because of the fluctuations in CAP reported for our NEOs may not correlate with our performance against our goals and the related compensation decisions made by our Board.
SEC-mandated
formula for calculating CAP, year-to-year
For further information concerning our philosophy and how we align executive compensation with our performance, refer to “
pay-for-performance
Section 3 — Elements of Our Executive Compensation Programs
” beginning on page 41.
The PvP table below provides compensation values reported in our current and prior SCTs, as well as the CAP amounts required in this section for the fiscal years ending 2021, 2022 and 2023. Note that for our NEOs other than our CEO, compensation is reported as an average. Adjustments made to CEO and
non-CEO
NEO compensation to determine CAP from the SCT amounts are described in the sections that follow the table. Year |
SCT Total for Susan DeVore ($) (1) |
Compensation Actually Paid to Susan DeVore ($) (1) |
SCT Total for Michael Alkire ($) (2) |
Compensation Actually Paid to Michael Alkire ($) (2) |
Average SCT Total for Non-CEO NEOs ($) (3) |
Average Compensation Actually Paid to Non-CEO NEOs ($) (3) |
Value of Initial Fixed $100 Investment Based On: |
Net Income (Loss) MM ($) (5) |
Adjusted EPS ($) (6) | |||||||||||||||||||||||||||||||||||||||||
Total Shareholder Return ($) (4) |
Peer Group Total Shareholder Return ($) (4) | |||||||||||||||||||||||||||||||||||||||||||||||||
(a) |
(b) |
(c) |
(d) |
(e) |
(f) |
(g) |
(h) |
(i) |
(j) |
(k) | ||||||||||||||||||||||||||||||||||||||||
2023 |
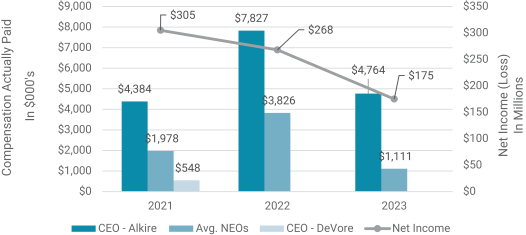
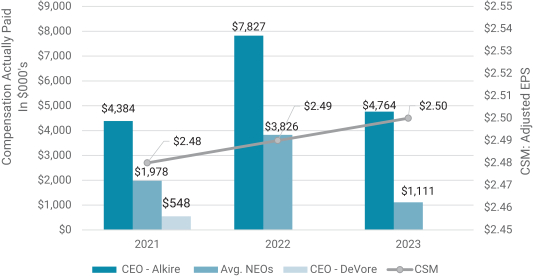
— | — | 7,799,802 | 4,764,095 | 2,320,296 | 1,110,952 | 87 | 159 | 175 | 2.50 | ||||||||||||||||||||||||||||||||||||||||
2022 |
— | — | 7,857,901 | 7,827,172 | 3,785,718 | 3,825,786 | 109 | 176 | 268 | 2.49 | ||||||||||||||||||||||||||||||||||||||||
2021 |
8,874,885 | 547,577 | 5,723,086 | 4,384,217 | 2,387,947 | 1,978,360 | 104 | 181 | 305 | 2.48 | ||||||||||||||||||||||||||||||||||||||||
| (1) | Susan DeVore served as CEO until May 1, 2021. |
| (2) | Michael Alkire served as CEO in 2021 (since May 1, 2021), 2022, and 2023. |
| (3) | Non-CEO NEOs for 2021-2023 were Leigh Anderson, David Hargraves, David Klatsky, and Craig McKasson. |
| (4) | Total Shareholder Return ( “ TSR ”10-K. |
| (5) | Net Income (Loss) reflected represents GAAP Net Earnings (Loss) as reported in our Annual Reports on Form 10-K for the relevant years. |
| (6) | Under the PvP rules, we are required to identify a “Company-Selected Measure” ( “ CSM ”Appendix A for the definition of this non-GAAP financial measure). |
Ms. DeVore (CEO) Compensation
To determine the CAP amount in column (c) in the PvP table, the following amounts were deducted from and added to (as applicable) Ms. DeVore’s total compensation as reported in the SCT, in accordance with Item 402(v) of Regulation
S-K.
Year |
SCT Total for Susan DeVore ($) |
SCT Reported Equity Award Value for Susan DeVore ($) |
Equity Award Adjustments for Susan DeVore ($) (1) |
Compensation Actually Paid to Susan DeVore ($) | ||||||||||||||||
2023 |
— | — | — | — | ||||||||||||||||
2022 |
— | — | — | — | ||||||||||||||||
2021 |
8,874,885 | (5,383,970 | ) | (2,943,338 | ) | 547,577 | ||||||||||||||
| (1) | Represents the year-over-year change in the fair value of equity awards to Ms. DeVore as summarized below: |
Year |
Year End Fair Value of Unvested Equity Awards Granted in the Year ($) |
Year over Year Change in Fair Value of Outstanding Unvested Equity Awards Granted in Prior Years ($) |
Fair Value as of Vesting Date of Equity Awards Granted and Vested in the Year ($) |
Year over Year Change in Fair Value of Equity Awards Granted in Prior Years that Vested in the Year ($) |
Fair Value at the End of the Prior Year of Equity Awards that Failed to Meet Vesting Conditions in the Year ($) |
Value of Dividends or other Earnings Paid on Equity Awards not Otherwise Reflected in Fair Value or Total Compensation ($) |
Total Equity Award Adjustments ($) | ||||||||||||||||||||||||||||
2023 |
— | — | — | — | — | — | — | ||||||||||||||||||||||||||||
2022 |
— | — | — | — | — | — | — | ||||||||||||||||||||||||||||
2021 |
— | 1,060,221 | — | 131,670 | (4,135,229 | ) | — | (2,943,338 | ) | ||||||||||||||||||||||||||
In the table above, the equity values are computed in accordance with the methodologies used for financial reporting purposes, reflecting updated economic assumptions as of the valuation dates. Dividends and other earnings are included as other income in the SCT, and therefore not reflected in the table above.
Mr. Alkire (CEO) Compensation
To determine the CAP amounts in column (e) in the PvP table, the following amounts were deducted from and added to (as applicable) Mr. Alkire’s total compensation as reported in the SCT, in accordance with Item 402(v) of Regulation
S-K.
Year |
SCT Total for Michael Alkire ($) |
SCT Reported Equity Award Value for Michael Alkire ($) |
Equity Award Adjustments for Michael Alkire ($) (1) |
Compensation Actually Paid to Michael Alkire ($) | ||||||||||||||||
2023 |
7,799,802 | (5,267,551 | ) | 2,231,844 | 4,764,095 | |||||||||||||||
2022 |
7,857,901 | (4,987,520 | ) | 4,956,791 | 7,827,172 | |||||||||||||||
2021 |
5,723,086 | (2,812,860 | ) | 1,473,991 | 4,384,217 | |||||||||||||||
| (1) | Represents the year-over-year change in the fair value of equity awards to Mr. Alkire as summarized below: |
PAY VERSUS PERFORMANCE |
Year |
Year End Fair Value of Unvested Equity Awards Granted in the Year ($) |
Year over Year Change in Fair Value of Outstanding Unvested Equity Awards Granted in Prior Years ($) |
Fair Value as of Vesting Date of Equity Awards Granted and Vested in the Year ($) |
Year over Year Change in Fair Value of Equity Awards Granted in Prior Years that Vested in the Year ($) |
Fair Value at the End of the Prior Year of Equity Awards that Failed to Meet Vesting Conditions in the Year ($) |
Value of Dividends or other Earnings Paid on Equity Awards not Otherwise Reflected in Fair Value or Total Compensation ($) |
Total Equity Award Adjustments ($) | ||||||||||||||||||||||||||||
2023 |
3,780,042 | (1,241,171 | ) | — | (307,027 | ) | — | — | 2,231,844 | ||||||||||||||||||||||||||
2022 |
4,583,763 | 244,482 | — | 128,546 | — | — | 4,956,791 | ||||||||||||||||||||||||||||
2021 |
1,452,639 | 4,500 | — | 16,852 | — | — | 1,473,991 | ||||||||||||||||||||||||||||
In the table above, the equity values are computed in accordance with the methodologies used for fin
anc
ial reporting purposes, reflecting updated economic assumptions as of the valuation dates. Dividends and other earnings are included as other income in the SCT, and therefore not reflected in the table above. Average
Non-CEO
NEO Compensation To determine the CAP amounts in column (g) in the PvP table, the following amounts were deducted from and added to (as applicable) our
Non-CEO
NEO average total compensation as reported in the SCT, in accordance with Item 402(v) of Regulation S-K.
Year |
Average SCT Total for Non-CEO NEOs ($) |
Average SCT Reported Equity Award Value for Non-CEO NEOs ($) |
Average Equity Award Adjustments for Non-CEO NEOs($) (1) |
Average Compensation Actually Paid to Non-CEO NEOs ($) | ||||||||||||||||
2023 |
2,320,296 | (1,314,173 | ) | 104,829 | 1,110,952 | |||||||||||||||
2022 |
3,785,718 | (2,651,154 | ) | 2,691,223 | 3,825,786 | |||||||||||||||
2021 |
2,387,947 | (1,196,670 | ) | 787,083 | 1,978,360 | |||||||||||||||
| (1) | Represents the average of the year-over-year change in the fair value of equity awards to our Non-CEO NEOs as summarized below: |
Year |
Year End Fair Value of Unvested Equity Awards Granted in the Year ($) |
Year over Year Change in Fair Value of Outstanding Unvested Equity Awards Granted in Prior Years ($) |
Fair Value as of Vesting Date of Equity Awards Granted and Vested in the Year ($) |
Year over Year Change in Fair Value of Equity Awards Granted in Prior Years that Vested in the Year ($) |
Fair Value at the End of the Prior Year of Equity Awards that Failed to Meet Vesting Conditions in the Year ($) |
Value of Dividends or other Earnings Paid on Equity Awards not Otherwise Reflected in Fair Value or Total Compensation ($) |
Total Equity Award Adjustments ($) | ||||||||||||||||||||||||||||
2023 |
943,063 | (676,245 | ) | — | (161,989 | ) | — | — | 104,829 | ||||||||||||||||||||||||||
2022 |
2,473,995 | 133,850 | — | 83,378 | — | — | 2,691,223 | ||||||||||||||||||||||||||||
2021 |
779,640 | 186 | — | 7,257 | — | — | 787,083 | ||||||||||||||||||||||||||||
In the table above, the equity values are computed in accordance with the methodologies used for financial reporting purposes, reflecting updated economic assumptions as of the valuation dates. Dividends and other earnings are included as other income in the SCT, and therefore not reflected in the table above.
| (3) | Non-CEO NEOs for 2021-2023 were Leigh Anderson, David Hargraves, David Klatsky, and Craig McKasson. |
| (4) | Total Shareholder Return ( “ TSR ”10-K. |
Ms. DeVore (CEO) Compensation
To determine the CAP amount in column (c) in the PvP table, the following amounts were deducted from and added to (as applicable) Ms. DeVore’s total compensation as reported in the SCT, in accordance with Item 402(v) of Regulation
S-K.
Year |
SCT Total for Susan DeVore ($) |
SCT Reported Equity Award Value for Susan DeVore ($) |
Equity Award Adjustments for Susan DeVore ($) (1) |
Compensation Actually Paid to Susan DeVore ($) | ||||||||||||||||
2023 |
— | — | — | — | ||||||||||||||||
2022 |
— | — | — | — | ||||||||||||||||
2021 |
8,874,885 | (5,383,970 | ) | (2,943,338 | ) | 547,577 | ||||||||||||||
| (1) | Represents the year-over-year change in the fair value of equity awards to Ms. DeVore as summarized below: |
Year |
Year End Fair Value of Unvested Equity Awards Granted in the Year ($) |
Year over Year Change in Fair Value of Outstanding Unvested Equity Awards Granted in Prior Years ($) |
Fair Value as of Vesting Date of Equity Awards Granted and Vested in the Year ($) |
Year over Year Change in Fair Value of Equity Awards Granted in Prior Years that Vested in the Year ($) |
Fair Value at the End of the Prior Year of Equity Awards that Failed to Meet Vesting Conditions in the Year ($) |
Value of Dividends or other Earnings Paid on Equity Awards not Otherwise Reflected in Fair Value or Total Compensation ($) |
Total Equity Award Adjustments ($) | ||||||||||||||||||||||||||||
2023 |
— | — | — | — | — | — | — | ||||||||||||||||||||||||||||
2022 |
— | — | — | — | — | — | — | ||||||||||||||||||||||||||||
2021 |
— | 1,060,221 | — | 131,670 | (4,135,229 | ) | — | (2,943,338 | ) | ||||||||||||||||||||||||||
In the table above, the equity values are computed in accordance with the methodologies used for financial reporting purposes, reflecting updated economic assumptions as of the valuation dates. Dividends and other earnings are included as other income in the SCT, and therefore not reflected in the table above.
Mr. Alkire (CEO) Compensation
To determine the CAP amounts in column (e) in the PvP table, the following amounts were deducted from and added to (as applicable) Mr. Alkire’s total compensation as reported in the SCT, in accordance with Item 402(v) of Regulation
S-K.
Year |
SCT Total for Michael Alkire ($) |
SCT Reported Equity Award Value for Michael Alkire ($) |
Equity Award Adjustments for Michael Alkire ($) (1) |
Compensation Actually Paid to Michael Alkire ($) | ||||||||||||||||
2023 |
7,799,802 | (5,267,551 | ) | 2,231,844 | 4,764,095 | |||||||||||||||
2022 |
7,857,901 | (4,987,520 | ) | 4,956,791 | 7,827,172 | |||||||||||||||
2021 |
5,723,086 | (2,812,860 | ) | 1,473,991 | 4,384,217 | |||||||||||||||
| (1) | Represents the year-over-year change in the fair value of equity awards to Mr. Alkire as summarized below: |
PAY VERSUS PERFORMANCE |
Year |
Year End Fair Value of Unvested Equity Awards Granted in the Year ($) |
Year over Year Change in Fair Value of Outstanding Unvested Equity Awards Granted in Prior Years ($) |
Fair Value as of Vesting Date of Equity Awards Granted and Vested in the Year ($) |
Year over Year Change in Fair Value of Equity Awards Granted in Prior Years that Vested in the Year ($) |
Fair Value at the End of the Prior Year of Equity Awards that Failed to Meet Vesting Conditions in the Year ($) |
Value of Dividends or other Earnings Paid on Equity Awards not Otherwise Reflected in Fair Value or Total Compensation ($) |
Total Equity Award Adjustments ($) | ||||||||||||||||||||||||||||
2023 |
3,780,042 | (1,241,171 | ) | — | (307,027 | ) | — | — | 2,231,844 | ||||||||||||||||||||||||||
2022 |
4,583,763 | 244,482 | — | 128,546 | — | — | 4,956,791 | ||||||||||||||||||||||||||||
2021 |
1,452,639 | 4,500 | — | 16,852 | — | — | 1,473,991 | ||||||||||||||||||||||||||||
In the table above, the equity values are computed in accordance with the methodologies used for fin
anc
ial reporting purposes, reflecting updated economic assumptions as of the valuation dates. Dividends and other earnings are included as other income in the SCT, and therefore not reflected in the table above. Average
Non-CEO
NEO Compensation To determine the CAP amounts in column (g) in the PvP table, the following amounts were deducted from and added to (as applicable) our
Non-CEO
NEO average total compensation as reported in the SCT, in accordance with Item 402(v) of Regulation S-K.
Year |
Average SCT Total for Non-CEO NEOs ($) |
Average SCT Reported Equity Award Value for Non-CEO NEOs ($) |
Average Equity Award Adjustments for Non-CEO NEOs($) (1) |
Average Compensation Actually Paid to Non-CEO NEOs ($) | ||||||||||||||||
2023 |
2,320,296 | (1,314,173 | ) | 104,829 | 1,110,952 | |||||||||||||||
2022 |
3,785,718 | (2,651,154 | ) | 2,691,223 | 3,825,786 | |||||||||||||||
2021 |
2,387,947 | (1,196,670 | ) | 787,083 | 1,978,360 | |||||||||||||||
| (1) | Represents the average of the year-over-year change in the fair value of equity awards to our Non-CEO NEOs as summarized below: |
Year |
Year End Fair Value of Unvested Equity Awards Granted in the Year ($) |
Year over Year Change in Fair Value of Outstanding Unvested Equity Awards Granted in Prior Years ($) |
Fair Value as of Vesting Date of Equity Awards Granted and Vested in the Year ($) |
Year over Year Change in Fair Value of Equity Awards Granted in Prior Years that Vested in the Year ($) |
Fair Value at the End of the Prior Year of Equity Awards that Failed to Meet Vesting Conditions in the Year ($) |
Value of Dividends or other Earnings Paid on Equity Awards not Otherwise Reflected in Fair Value or Total Compensation ($) |
Total Equity Award Adjustments ($) | ||||||||||||||||||||||||||||
2023 |
943,063 | (676,245 | ) | — | (161,989 | ) | — | — | 104,829 | ||||||||||||||||||||||||||
2022 |
2,473,995 | 133,850 | — | 83,378 | — | — | 2,691,223 | ||||||||||||||||||||||||||||
2021 |
779,640 | 186 | — | 7,257 | — | — | 787,083 | ||||||||||||||||||||||||||||
In the table above, the equity values are computed in accordance with the methodologies used for financial reporting purposes, reflecting updated economic assumptions as of the valuation dates. Dividends and other earnings are included as other income in the SCT, and therefore not reflected in the table above.
CAP vs. Premier
3-year
Cumulative TSR vs. Peer 3-year
Cumulative TSR 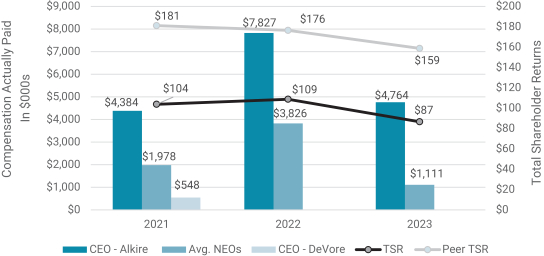
CAP vs. Net Income (Loss)
CAP vs. Adjusted EPS
CAP vs. Premier
3-year
Cumulative TSR vs. Peer 3-year
Cumulative TSR Most Important Financial Performance Measures
As described above and in greater detail in the Compensation Discussion and Analysis section of this proxy statement, our executive compensation program reflects a philosophy. Our compensation program incorporates goals that link pay and performance in alignment with our business strategies and the long-term interests of stockholders. In accordance with the PvP rules, we have listed below the most important financial performance measures (listed alphabetically) we used to link fiscal year 2023 NEO pay to performance.
pay-for-performance
Performance Measures |
||
Combined Net Revenue |
||
Adjusted EBITDA* |
||
Adjusted EPS * |
||
| * | Adjusted EBITDA and Adjusted EPS are non-GAAP financial measures. See Appendix A for the definitions of these measures. |
| (6) | Under the PvP rules, we are required to identify a “Company-Selected Measure” ( “ CSM ”Appendix A for the definition of this non-GAAP financial measure). |