Depending on the proximity to its target date, the fund will seek to achieve the following objectives to varying degrees: growth, income and preservation of capital. The target date is meant to roughly correspond to the year in which the fund beneficiary will start to withdraw funds to meet higher education expenses. The fund will increasingly emphasize income and preservation of capital by investing a greater portion of its assets in fixed income, equity-income and balanced funds as it approaches and passes its target date. In this way, the fund seeks to achieve an appropriate balance of total return and stability during different time periods.
This table describes the fees and expenses that you may pay if you buy, hold and sell shares of the fund. You may pay other fees, such as brokerage commissions and other fees to financial intermediaries, which are not reflected in the tables and examples below. For example, in addition to the fees and expenses described below, you may also be required to pay brokerage commissions on purchases and sales of Class 529-F-2 or 529-F-3 shares of the fund. You may qualify for a Class 529-A sales charge discount if you and your family invest, or agree to invest in the future, at least $100,000 in American Funds. More information about these and other discounts is available from your financial professional, in the “Sales charge reductions and waivers” sections on page 82 of the prospectus and on page 85 of the fund’s statement of additional information, and in the sales charge waiver appendix to the prospectus.
Shareholder Fees - American Funds College 2036 Fund |
Class 529-A |
Class 529-C |
Class 529-E |
Class 529-T |
Class 529-F-1 |
Class 529-F-2 |
Class 529-F-3 |
|
|---|---|---|---|---|---|---|---|---|
| Maximum sales charge (load) imposed on purchases (as a percentage of offering price) | 3.50% | none | none | 2.50% | none | none | none | |
| Maximum deferred sales charge (load) (as a percentage of the amount redeemed) | 1.00% | [1] | 1.00% | none | none | none | none | none |
| Maximum sales charge (load) imposed on reinvested dividends | none | none | none | none | none | none | none | |
| Redemption or exchange fees | none | none | none | none | none | none | none | |
| [1] | A contingent deferred sales charge of 1.00% applies on certain redemptions made within 18 months following purchases of $1 million or more made without an initial sales charge. Contingent deferred sales charge is calculated based on the lesser of the offering price and market value of shares being sold. |
Annual Fund Operating Expenses - American Funds College 2036 Fund |
Class 529-A |
Class 529-C |
Class 529-E |
Class 529-T |
Class 529-F-1 |
Class 529-F-2 |
Class 529-F-3 |
|
|---|---|---|---|---|---|---|---|---|
| Management fees | none | none | none | none | none | none | none | |
| Distribution and/or service (12b-1) fees | 0.25% | 1.00% | 0.50% | 0.25% | 0.25% | none | none | |
| Other expenses | 0.19% | 0.19% | 0.15% | 0.19% | [1] | 0.21% | 0.14% | 0.07% |
| Acquired (underlying) fund fees and expenses | 0.35% | 0.35% | 0.35% | 0.35% | 0.35% | 0.35% | 0.35% | |
| Total annual fund operating expenses | 0.79% | 1.54% | 1.00% | 0.79% | 0.81% | 0.49% | 0.42% | |
| [1] | Restated to reflect current fees. |
This example is intended to help you compare the cost of investing in the fund with the cost of investing in other mutual funds.
The example assumes that you invest $10,000 in the fund for the time periods indicated and then redeem or hold all of your shares at the end of those periods. The example also assumes that your investment has a 5% return each year and that the fund’s operating expenses remain the same. You may be required to pay brokerage commissions on your purchases and sales of Class 529-F-2 or 529-F-3 shares of the fund, which are not reflected in the example.
Expense Example - American Funds College 2036 Fund - USD ($) |
Class 529-A |
Class 529-C |
Class 529-E |
Class 529-T |
Class 529-F-1 |
Class 529-F-2 |
Class 529-F-3 |
|---|---|---|---|---|---|---|---|
| 1 year | $ 428 | $ 257 | $ 102 | $ 329 | $ 83 | $ 50 | $ 43 |
| 3 years | 593 | 486 | 318 | 496 | 259 | 157 | 135 |
| 5 years | 773 | 839 | 552 | 678 | 450 | 274 | 235 |
| 10 years | $ 1,294 | $ 1,360 | $ 1,225 | $ 1,203 | $ 1,002 | $ 616 | $ 530 |
Expense Example No Redemption |
American Funds College 2036 Fund
Class 529-C
USD ($)
|
|---|---|
| 1 year | $ 157 |
| 3 years | 486 |
| 5 years | 839 |
| 10 years | $ 1,360 |
The fund may pay transaction costs, such as commissions, when it buys and sells securities (or “turns over” its portfolio). A higher portfolio turnover rate may indicate higher transaction costs and may result in higher taxes when fund shares are held in a taxable account. These costs, which are not reflected in annual fund operating expenses or in the example, affect the fund’s investment results. During the most recent fiscal year, the fund’s portfolio turnover rate was 19% of the average value of its portfolio.
The fund will attempt to achieve its investment objectives by investing in a mix of American Funds in different combinations and weightings. The underlying American Funds represent a variety of fund categories, including growth funds, growth-and-income funds, equity-income funds, balanced funds and fixed income funds. The fund categories represent differing investment objectives and strategies. For example, growth funds seek long-term growth primarily through investing in both U.S. stocks and stocks of issuers domiciled outside the United States. Growth-and-income funds seek long-term growth and income primarily through investments in stocks. Equity-income and balanced funds generally strive for income and growth through stocks and/or fixed income investments, while fixed income funds seek current income through investments in bonds or in other fixed income instruments.
The fund is designed for investors who plan to start withdrawing funds to meet higher education expenses in, or close to, the fund’s target date – that is, the year designated in the fund’s name. However, investors may purchase shares of the fund throughout the life of the fund, including after the target date.
The fund’s investment adviser periodically reviews the investment strategies and asset mix of the underlying funds and may, from time to time, rebalance or modify the asset mix of the funds and change the underlying fund investments. The investment adviser may also determine not to change the underlying fund allocations, particularly in response to short-term market movements, if in its opinion the combination of underlying funds is appropriate to meet the fund’s investment objective.
The following glide path chart illustrates the investment approach of the fund by showing how its investment in the various fund categories will change over time. The glide path represents the shifting of asset classes over time and shows how the fund’s asset mix becomes relatively more conservative as time elapses. The fund’s asset allocation strategy promotes asset accumulation prior to college enrollment through equity exposure. As it approaches the target date, the fund will seek dividend income to help dampen risk while maintaining equity exposure, and will invest in fixed income securities to help provide current income, capital preservation and inflation protection. Upon reaching its target date, the fund will be principally invested in fixed income funds and may merge into the Enrollment Fund, which will also be principally invested in fixed income funds. The allocations shown reflect the target allocations as of January 1, 2024.
Investment approach
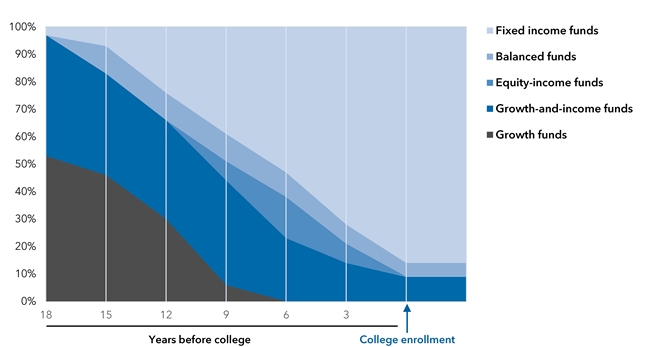
The investment adviser anticipates that the fund will invest its assets within a range that deviates no more than 10% above or below the investment approach set forth above. For example, a 20% target allocation to growth funds is not expected to be greater than 30% or less than 10%. The investment adviser will monitor the fund on an ongoing basis and may make modifications to either the investment approach or the underlying fund allocations that the investment adviser believes could benefit shareholders.
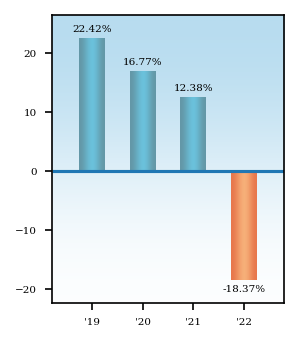
The following bar chart shows how the fund’s investment results have varied from year to year, and the following table shows how the fund’s average annual total returns for various periods compare with a broad measure of securities market results and other applicable measures of market results. This information provides some indication of the risks of investing in the fund. Past investment results (before and after taxes) are not predictive of future investment results. Prior to October 30, 2020, certain fees, such as 12b-1 fees, were not charged on Class 529-F-1 shares. If these expenses had been deducted, results would have been lower. Updated information on the fund’s investment results can be obtained by visiting capitalgroup.com.
The following bar chart shows how the fund’s investment results have varied from year to year, and the following table shows how the fund’s average annual total returns for various periods compare with a broad measure of securities market results and other applicable measures of market results.
Highest/Lowest quarterly results during this period were:
Highest 15.72% (quarter ended June 30, 2020)
Lowest -15.55% (quarter ended March 31, 2020)
The fund's total return for the nine months ended September 30, 2023, was 7.21%.
Average Annual Returns - American Funds College 2036 Fund |
Average Annual Returns, 1 Year |
Average Annual Returns, Since Inception |
Average Annual Returns, Inception Date |
|---|---|---|---|
| Class 529-A | (21.20%) | 3.46% | Feb. 09, 2018 |
| Class 529-C | (19.79%) | 3.48% | Feb. 09, 2018 |
| Class 529-E | (18.56%) | 4.02% | Feb. 09, 2018 |
| Class 529-F-1 | (18.13%) | 4.50% | Feb. 09, 2018 |
| Class 529-F-2 | (18.12%) | 2.54% | Oct. 30, 2020 |
| Class 529-F-3 | (18.06%) | 2.63% | Oct. 30, 2020 |
| After Taxes on Distributions | Class 529-A | (22.21%) | 2.22% | |
| After Taxes on Distributions and Sale of Fund Shares | Class 529-A | (12.13%) | 2.49% | |
| S&P 500 Index (reflects no deductions for sales charges, account fees, expenses or U.S. federal income taxes) | (18.11%) | 10.06% | Feb. 09, 2018 |
| Bloomberg U.S. Aggregate Index (reflects no deductions for sales charges, account fees, expenses or U.S. federal income taxes) | (13.01%) | 0.42% | Feb. 09, 2018 |