
Fourth Quarter & Full Year 2023 Earnings Review February 22, 2024 ™
Disclosures 2 Forward-Looking Statements This communication contains forward-looking statements within the meaning of the Private Securities Litigation Reform Act of 1995, including, among others, statements regarding our goals, plans and projections with respect to our operations, financial position and business strategy. Such forward-looking statements generally can be identified by the use of forward-looking terminology such as "may," "will," "expect," "intend," "could," "estimate," "predict," "continue," “maintain,” "should," "anticipate," "believe," or “confident,” or the negative thereof or variations thereon or similar terminology. Such forward-looking statements are based on particular assumptions that our management has made in light of its experience and its perception of expected future developments and other factors that it believes are appropriate under the circumstances, and are subject to various risks and uncertainties. Factors that could cause or contribute to material and adverse differences between actual and anticipated results include, but are not limited to, (1) the general strength of the economy and other economic conditions affecting consumer preferences and spending, including the availability of credit to the Company's target consumers and to other consumers, impacts from continued inflation, central bank monetary policy initiatives to address inflation concerns and a possible recession or slowdown in economic growth, and (2) the other risks detailed from time to time in the reports filed by us with the Securities and Exchange Commission, including our Annual Report on Form 10-K for the year ended December 31, 2022, and upcoming Annual Report on Form 10-K for the year ended December 31, 2023, as well as subsequent reports on Form 10-Q or Form 8-K. You are cautioned not to place undue reliance on forward-looking statements, which speak only as of the date of this communication. Except as required by law, we are not obligated to, and do not undertake to, publicly release any revisions to these forward-looking statements to reflect any events or circumstances after the date hereof or to reflect the occurrence of unanticipated events. Use of Non-GAAP Financial Measures This communication contains certain financial information determined by methods other than in accordance with U.S. Generally Accepted Accounting Principles (GAAP), including (1) Non-GAAP diluted earnings per share (net earnings or loss, as adjusted for special items (as defined below), net of taxes, divided by the number of shares of our common stock on a fully diluted basis), (2) Adjusted EBITDA (net earnings before interest, taxes, stock-based compensation, depreciation and amortization, as adjusted for special items) on a consolidated and segment basis, (3) Free Cash Flow (net cash provided by operating activities less capital expenditures), and (4) Adjusted EBITDA margin on a consolidated and segment basis. “Special items” refers to certain gains and charges we view as extraordinary, unusual, non-recurring in nature or which we believe do not reflect our core business activities. For the periods presented herein, these special items are described in the quantitative reconciliation tables included in the appendix of this presentation. Because of the inherent uncertainty related to the special items, management does not believe it is able to provide a meaningful forecast of the comparable GAAP measures or reconciliation to any forecasted GAAP measure without unreasonable effort. These non-GAAP measures are additional tools intended to assist our management in comparing our performance on a more consistent basis for purposes of business decision-making by removing the impact of certain items management believes do not directly reflect our core operations. These measures are intended to assist management in evaluating operating performance and liquidity, comparing performance and liquidity across periods, planning and forecasting future business operations, helping determine levels of operating and capital investments and identifying and assessing additional trends potentially impacting our company that may not be shown solely by comparisons of GAAP measures. Consolidated Adjusted EBITDA is also used as part of our incentive compensation program for our executive officers and others. We believe these non-GAAP financial measures also provide supplemental information that is useful to investors, analysts and other external users of our consolidated financial statements in understanding our financial results and evaluating our performance and liquidity from period to period. However, non-GAAP financial measures have inherent limitations and are not substitutes for or superior to GAAP financial measures, and they should be read together with our consolidated financial statements prepared in accordance with GAAP. Further, because non-GAAP financial measures are not standardized, it may not be possible to compare such measures to the non-GAAP financial measures presented by other companies, even if they have the same or similar names. Note that all sources in this presentation are from Company reports and Company estimates unless otherwise noted.
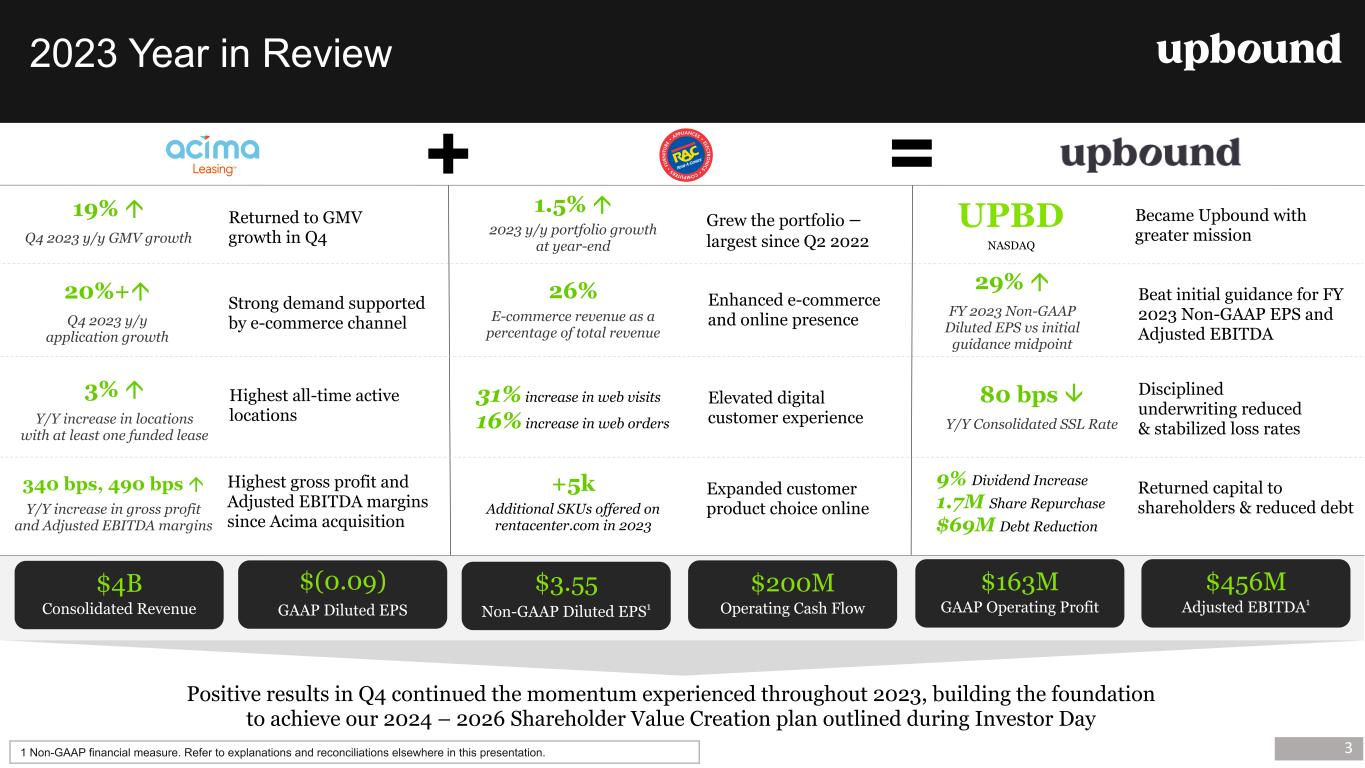
2023 Year in Review 3 Positive results in Q4 continued the momentum experienced throughout 2023, building the foundation to achieve our 2024 – 2026 Shareholder Value Creation plan outlined during Investor Day Expanded customer product choice online Returned to GMV growth in Q4 Became Upbound with greater mission +5k Additional SKUs offered on rentacenter.com in 2023 UPBD NASDAQ $4B Consolidated Revenue $3.55 Non-GAAP Diluted EPS1 $200M Operating Cash Flow $163M GAAP Operating Profit $(0.09) GAAP Diluted EPS Highest all-time active locations 3% á Y/Y increase in locations with at least one funded lease Highest gross profit and Adjusted EBITDA margins since Acima acquisition 340 bps, 490 bps á Y/Y increase in gross profit and Adjusted EBITDA margins Grew the portfolio – largest since Q2 2022 1.5% á 2023 y/y portfolio growth at year-end Returned capital to shareholders & reduced debt 9% Dividend Increase 1.7M Share Repurchase $69M Debt Reduction Beat initial guidance for FY 2023 Non-GAAP EPS and Adjusted EBITDA Disciplined underwriting reduced & stabilized loss rates 80 bps â Y/Y Consolidated SSL Rate 29% á FY 2023 Non-GAAP Diluted EPS vs initial guidance midpoint + = 19% á Q4 2023 y/y GMV growth $456M Adjusted EBITDA1 Enhanced e-commerce and online presence 26% E-commerce revenue as a percentage of total revenue Elevated digital customer experience 31% increase in web visits 16% increase in web orders 1 Non-GAAP financial measure. Refer to explanations and reconciliations elsewhere in this presentation. Strong demand supported by e-commerce channel 20%+á Q4 2023 y/y application growth
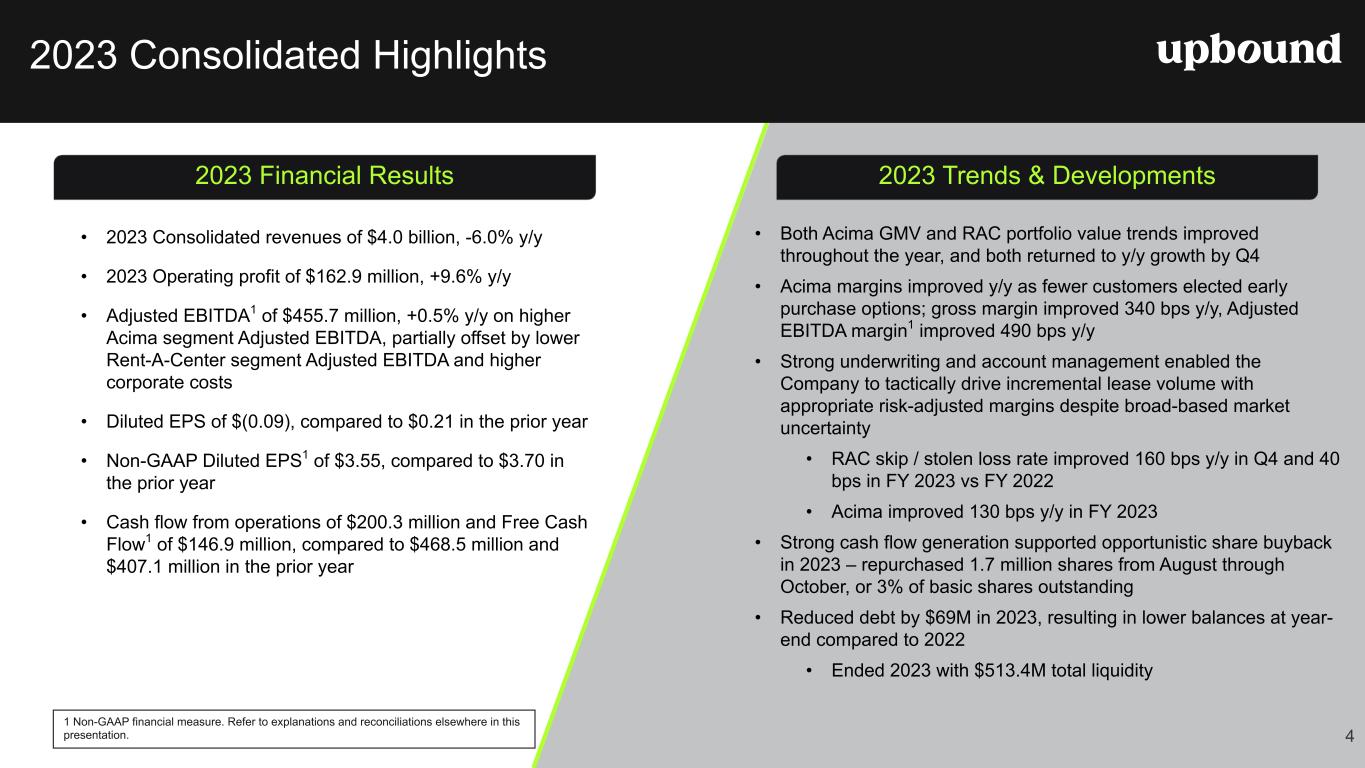
2023 Consolidated Highlights 2023 Financial Results • 2023 Consolidated revenues of $4.0 billion, -6.0% y/y • 2023 Operating profit of $162.9 million, +9.6% y/y • Adjusted EBITDA1 of $455.7 million, +0.5% y/y on higher Acima segment Adjusted EBITDA, partially offset by lower Rent-A-Center segment Adjusted EBITDA and higher corporate costs • Diluted EPS of $(0.09), compared to $0.21 in the prior year • Non-GAAP Diluted EPS1 of $3.55, compared to $3.70 in the prior year • Cash flow from operations of $200.3 million and Free Cash Flow1 of $146.9 million, compared to $468.5 million and $407.1 million in the prior year 2023 Trends & Developments • Both Acima GMV and RAC portfolio value trends improved throughout the year, and both returned to y/y growth by Q4 • Acima margins improved y/y as fewer customers elected early purchase options; gross margin improved 340 bps y/y, Adjusted EBITDA margin1 improved 490 bps y/y • Strong underwriting and account management enabled the Company to tactically drive incremental lease volume with appropriate risk-adjusted margins despite broad-based market uncertainty • RAC skip / stolen loss rate improved 160 bps y/y in Q4 and 40 bps in FY 2023 vs FY 2022 • Acima improved 130 bps y/y in FY 2023 • Strong cash flow generation supported opportunistic share buyback in 2023 – repurchased 1.7 million shares from August through October, or 3% of basic shares outstanding • Reduced debt by $69M in 2023, resulting in lower balances at year- end compared to 2022 • Ended 2023 with $513.4M total liquidity 1 Non-GAAP financial measure. Refer to explanations and reconciliations elsewhere in this presentation. 4
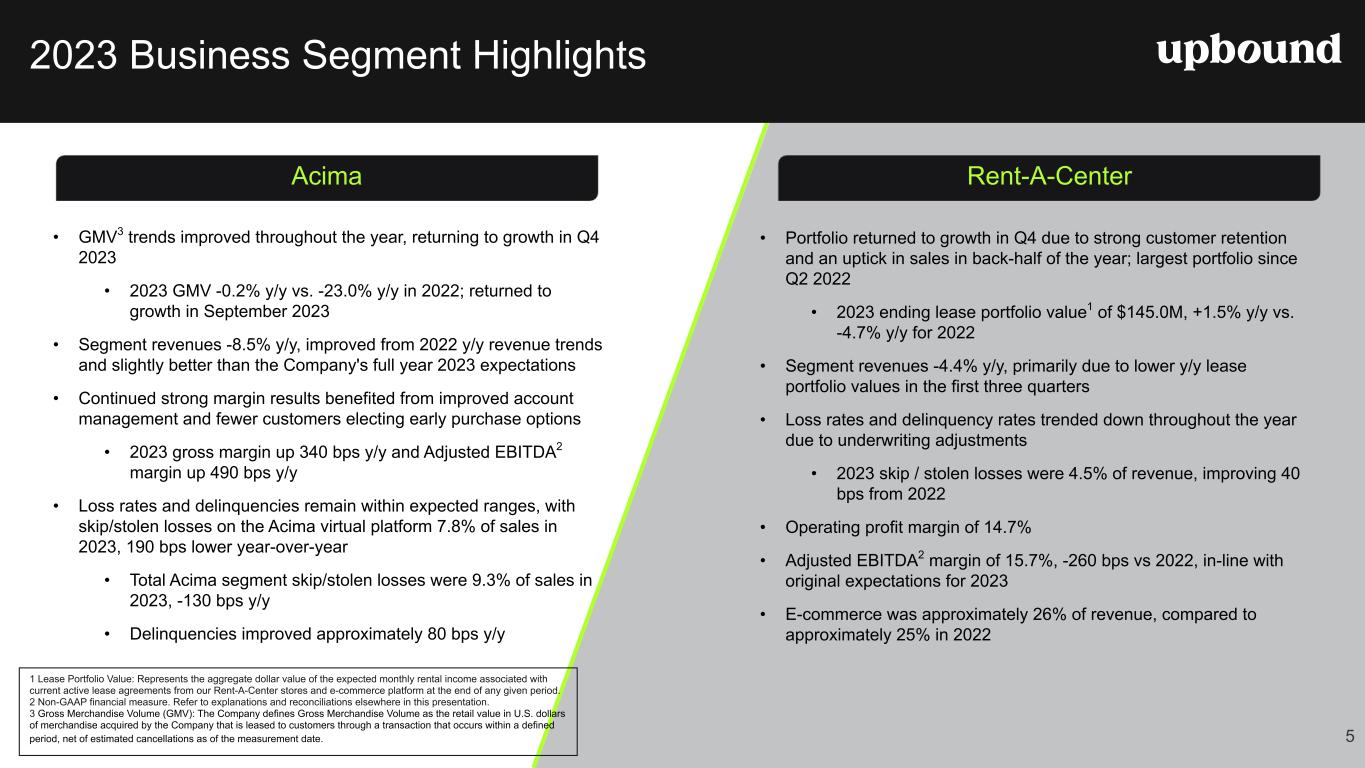
2023 Business Segment Highlights Rent-A-CenterAcima • Portfolio returned to growth in Q4 due to strong customer retention and an uptick in sales in back-half of the year; largest portfolio since Q2 2022 • 2023 ending lease portfolio value1 of $145.0M, +1.5% y/y vs. -4.7% y/y for 2022 • Segment revenues -4.4% y/y, primarily due to lower y/y lease portfolio values in the first three quarters • Loss rates and delinquency rates trended down throughout the year due to underwriting adjustments • 2023 skip / stolen losses were 4.5% of revenue, improving 40 bps from 2022 • Operating profit margin of 14.7% • Adjusted EBITDA2 margin of 15.7%, -260 bps vs 2022, in-line with original expectations for 2023 • E-commerce was approximately 26% of revenue, compared to approximately 25% in 2022 • GMV3 trends improved throughout the year, returning to growth in Q4 2023 • 2023 GMV -0.2% y/y vs. -23.0% y/y in 2022; returned to growth in September 2023 • Segment revenues -8.5% y/y, improved from 2022 y/y revenue trends and slightly better than the Company's full year 2023 expectations • Continued strong margin results benefited from improved account management and fewer customers electing early purchase options • 2023 gross margin up 340 bps y/y and Adjusted EBITDA2 margin up 490 bps y/y • Loss rates and delinquencies remain within expected ranges, with skip/stolen losses on the Acima virtual platform 7.8% of sales in 2023, 190 bps lower year-over-year • Total Acima segment skip/stolen losses were 9.3% of sales in 2023, -130 bps y/y • Delinquencies improved approximately 80 bps y/y 1 Lease Portfolio Value: Represents the aggregate dollar value of the expected monthly rental income associated with current active lease agreements from our Rent-A-Center stores and e-commerce platform at the end of any given period. 2 Non-GAAP financial measure. Refer to explanations and reconciliations elsewhere in this presentation. 3 Gross Merchandise Volume (GMV): The Company defines Gross Merchandise Volume as the retail value in U.S. dollars of merchandise acquired by the Company that is leased to customers through a transaction that occurs within a defined period, net of estimated cancellations as of the measurement date. 5
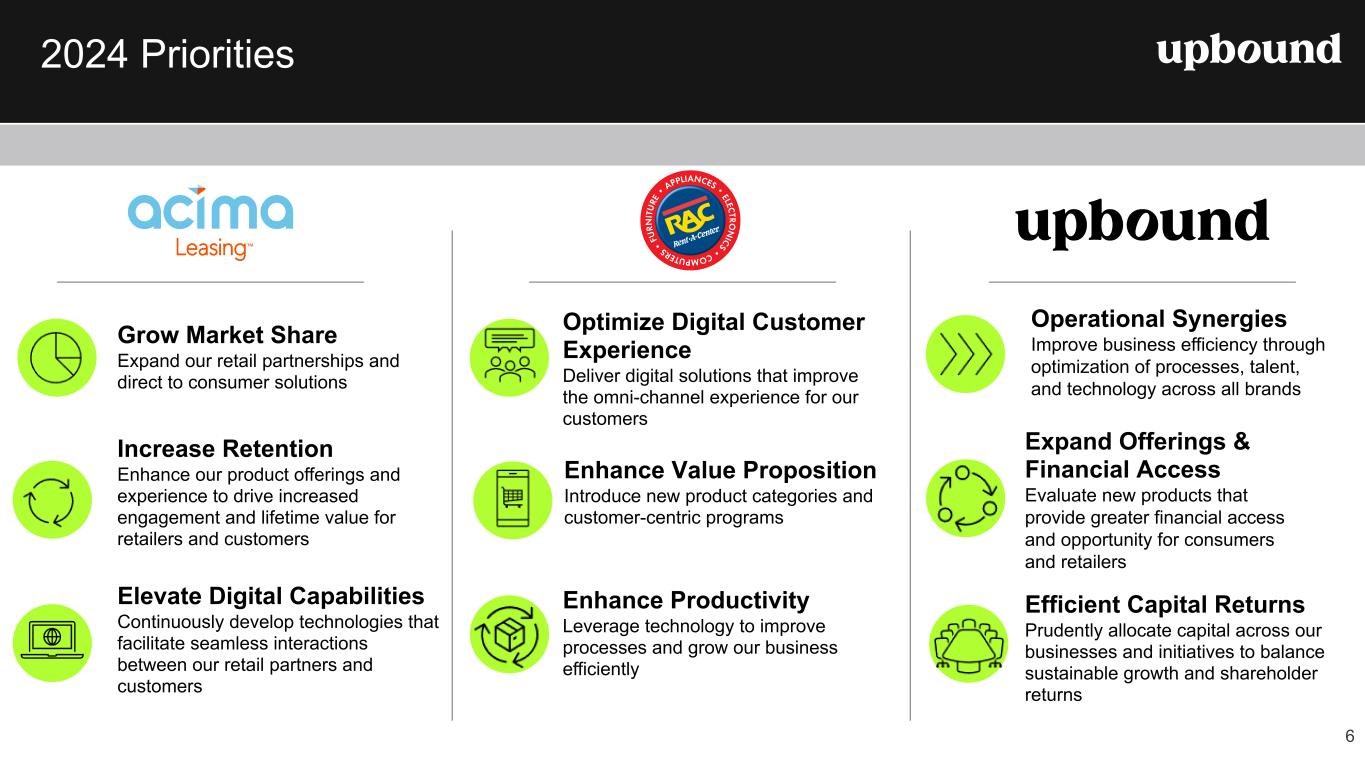
2024 Priorities 6 Grow Market Share Expand our retail partnerships and direct to consumer solutions Increase Retention Enhance our product offerings and experience to drive increased engagement and lifetime value for retailers and customers Elevate Digital Capabilities Continuously develop technologies that facilitate seamless interactions between our retail partners and customers Operational Synergies Improve business efficiency through optimization of processes, talent, and technology across all brands Enhance Value Proposition Introduce new product categories and customer-centric programs Enhance Productivity Leverage technology to improve processes and grow our business efficiently Optimize Digital Customer Experience Deliver digital solutions that improve the omni-channel experience for our customers Expand Offerings & Financial Access Evaluate new products that provide greater financial access and opportunity for consumers and retailers Efficient Capital Returns Prudently allocate capital across our businesses and initiatives to balance sustainable growth and shareholder returns
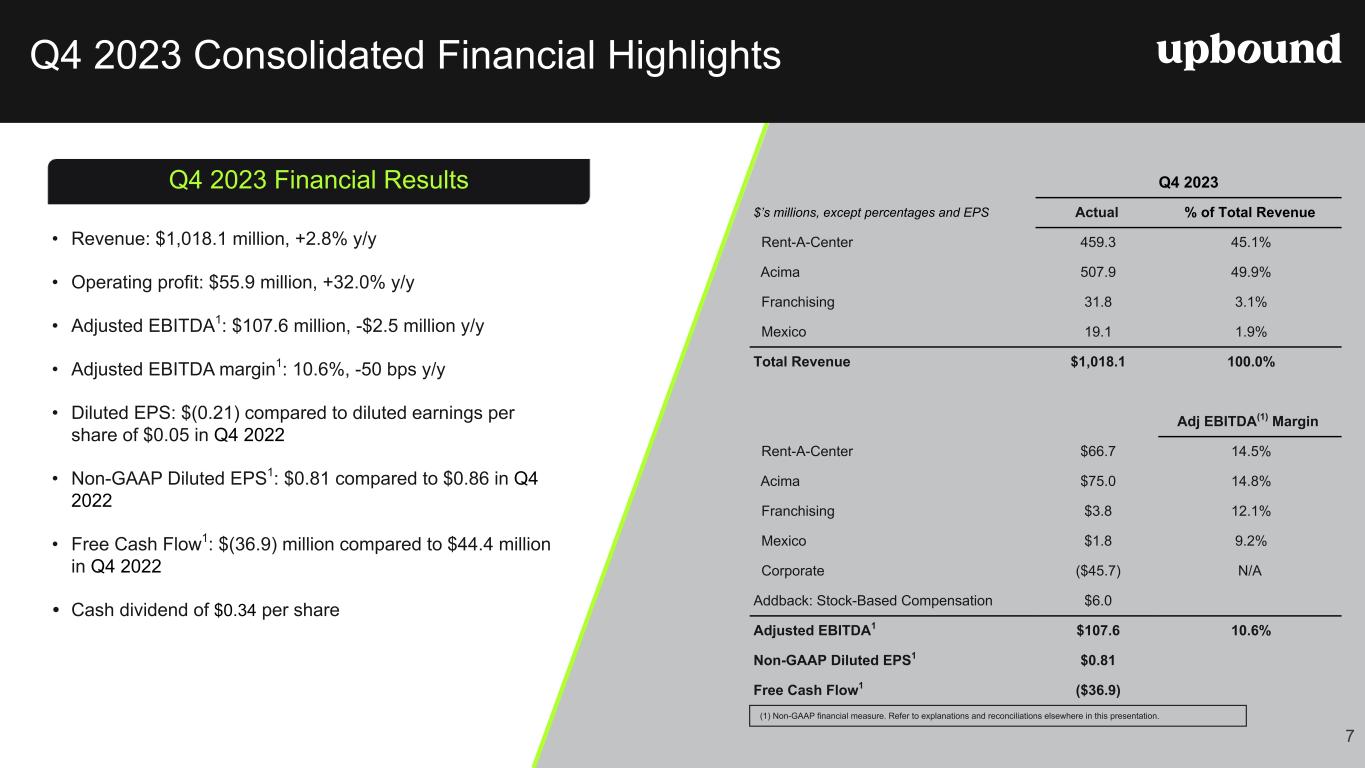
Q4 2023 Consolidated Financial Highlights Q4 2023 $’s millions, except percentages and EPS Actual % of Total Revenue Rent-A-Center 459.3 45.1% Acima 507.9 49.9% Franchising 31.8 3.1% Mexico 19.1 1.9% Total Revenue $1,018.1 100.0% Adj EBITDA(1) Margin Rent-A-Center $66.7 14.5% Acima $75.0 14.8% Franchising $3.8 12.1% Mexico $1.8 9.2% Corporate ($45.7) N/A Addback: Stock-Based Compensation $6.0 Adjusted EBITDA1 $107.6 10.6% Non-GAAP Diluted EPS1 $0.81 Free Cash Flow1 ($36.9) Q4 2023 Financial Results • Revenue: $1,018.1 million, +2.8% y/y • Operating profit: $55.9 million, +32.0% y/y • Adjusted EBITDA1: $107.6 million, -$2.5 million y/y • Adjusted EBITDA margin1: 10.6%, -50 bps y/y • Diluted EPS: $(0.21) compared to diluted earnings per share of $0.05 in Q4 2022 • Non-GAAP Diluted EPS1: $0.81 compared to $0.86 in Q4 2022 • Free Cash Flow1: $(36.9) million compared to $44.4 million in Q4 2022 • Cash dividend of $0.34 per share (1) Non-GAAP financial measure. Refer to explanations and reconciliations elsewhere in this presentation. 7
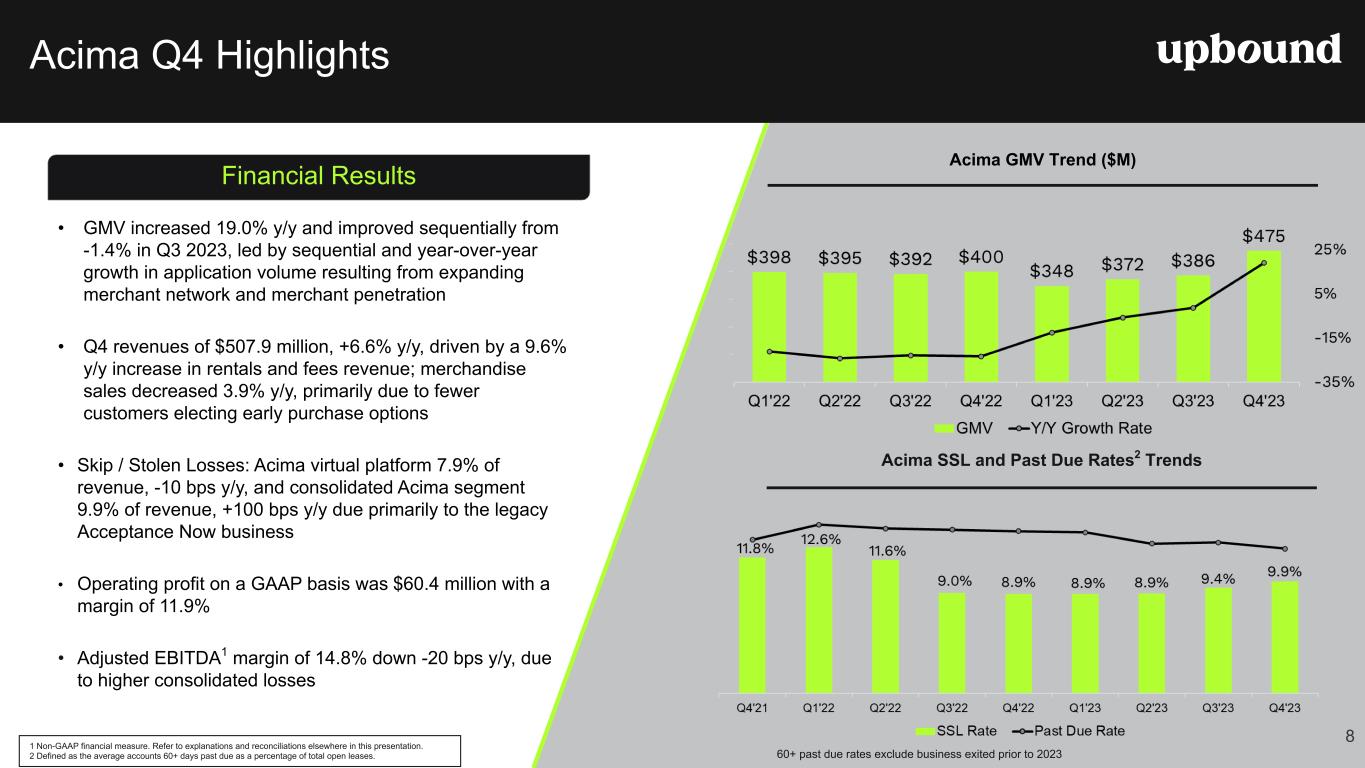
Acima GMV Trend ($M) Acima SSL and Past Due Rates2 Trends Acima Q4 Highlights Financial Results • GMV increased 19.0% y/y and improved sequentially from -1.4% in Q3 2023, led by sequential and year-over-year growth in application volume resulting from expanding merchant network and merchant penetration • Q4 revenues of $507.9 million, +6.6% y/y, driven by a 9.6% y/y increase in rentals and fees revenue; merchandise sales decreased 3.9% y/y, primarily due to fewer customers electing early purchase options • Skip / Stolen Losses: Acima virtual platform 7.9% of revenue, -10 bps y/y, and consolidated Acima segment 9.9% of revenue, +100 bps y/y due primarily to the legacy Acceptance Now business • Operating profit on a GAAP basis was $60.4 million with a margin of 11.9% • Adjusted EBITDA1 margin of 14.8% down -20 bps y/y, due to higher consolidated losses 1 Non-GAAP financial measure. Refer to explanations and reconciliations elsewhere in this presentation. 2 Defined as the average accounts 60+ days past due as a percentage of total open leases. 8 60+ past due rates exclude business exited prior to 2023
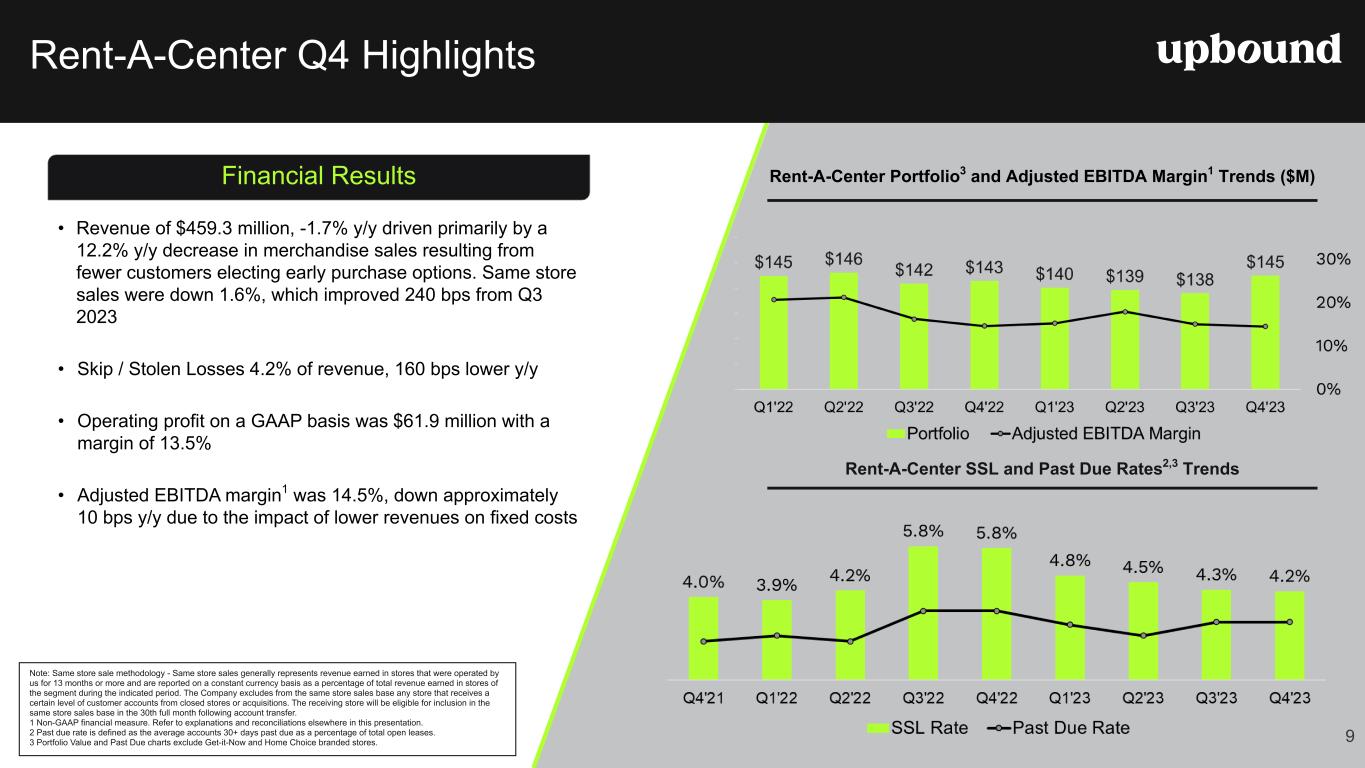
Rent-A-Center Portfolio3 and Adjusted EBITDA Margin1 Trends ($M) Rent-A-Center SSL and Past Due Rates2,3 Trends Rent-A-Center Q4 Highlights Financial Results • Revenue of $459.3 million, -1.7% y/y driven primarily by a 12.2% y/y decrease in merchandise sales resulting from fewer customers electing early purchase options. Same store sales were down 1.6%, which improved 240 bps from Q3 2023 • Skip / Stolen Losses 4.2% of revenue, 160 bps lower y/y • Operating profit on a GAAP basis was $61.9 million with a margin of 13.5% • Adjusted EBITDA margin1 was 14.5%, down approximately 10 bps y/y due to the impact of lower revenues on fixed costs Note: Same store sale methodology - Same store sales generally represents revenue earned in stores that were operated by us for 13 months or more and are reported on a constant currency basis as a percentage of total revenue earned in stores of the segment during the indicated period. The Company excludes from the same store sales base any store that receives a certain level of customer accounts from closed stores or acquisitions. The receiving store will be eligible for inclusion in the same store sales base in the 30th full month following account transfer. 1 Non-GAAP financial measure. Refer to explanations and reconciliations elsewhere in this presentation. 2 Past due rate is defined as the average accounts 30+ days past due as a percentage of total open leases. 3 Portfolio Value and Past Due charts exclude Get-it-Now and Home Choice branded stores. 9
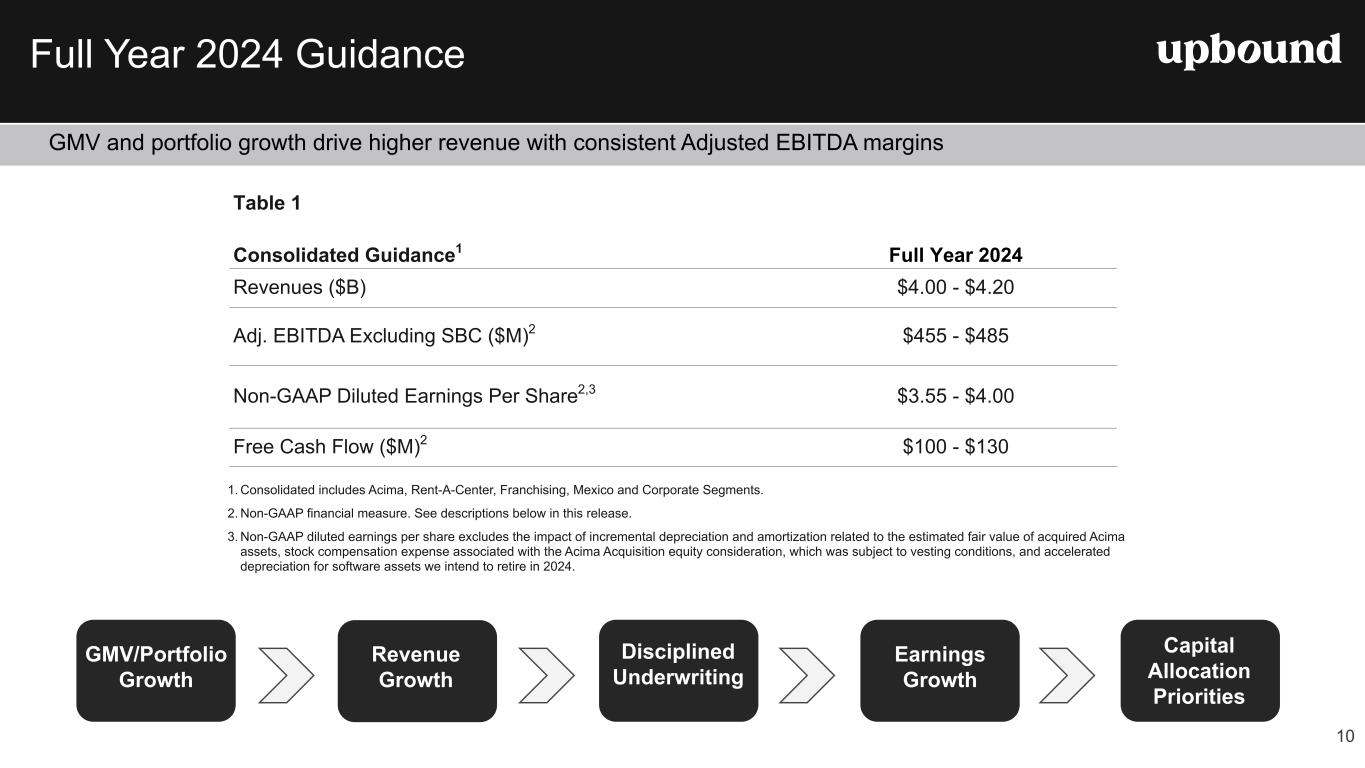
Full Year 2024 Guidance 10 GMV and portfolio growth drive higher revenue with consistent Adjusted EBITDA margins 1. Consolidated includes Acima, Rent-A-Center, Franchising, Mexico and Corporate Segments. 2. Non-GAAP financial measure. See descriptions below in this release. 3. Non-GAAP diluted earnings per share excludes the impact of incremental depreciation and amortization related to the estimated fair value of acquired Acima assets, stock compensation expense associated with the Acima Acquisition equity consideration, which was subject to vesting conditions, and accelerated depreciation for software assets we intend to retire in 2024. Table 1 Full Year 2024Consolidated Guidance1 Revenues ($B) $4.00 - $4.20 Adj. EBITDA Excluding SBC ($M)2 $455 - $485 Non-GAAP Diluted Earnings Per Share2,3 $3.55 - $4.00 Free Cash Flow ($M)2 $100 - $130 GMV/Portfolio Growth Revenue Growth Disciplined Underwriting Earnings Growth Capital Allocation Priorities
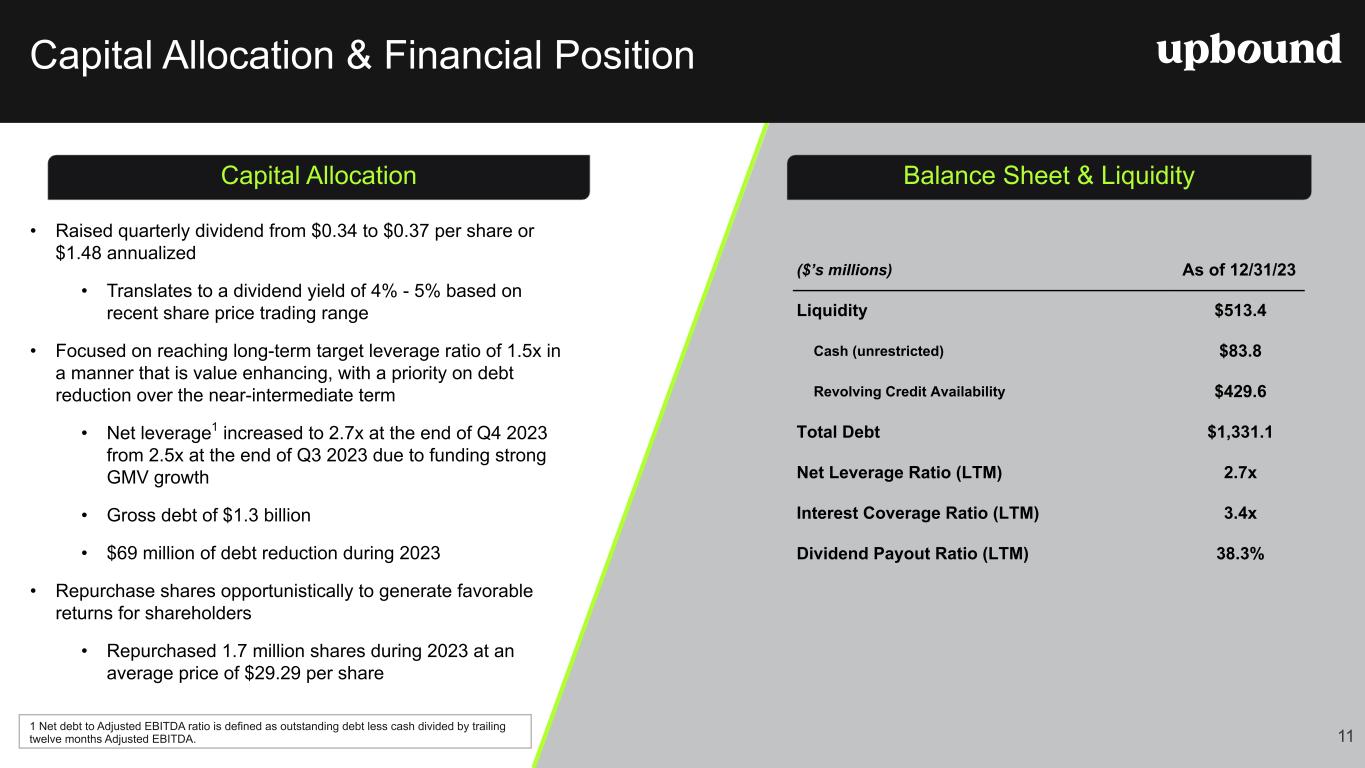
Capital Allocation & Financial Position Capital Allocation • Raised quarterly dividend from $0.34 to $0.37 per share or $1.48 annualized • Translates to a dividend yield of 4% - 5% based on recent share price trading range • Focused on reaching long-term target leverage ratio of 1.5x in a manner that is value enhancing, with a priority on debt reduction over the near-intermediate term • Net leverage1 increased to 2.7x at the end of Q4 2023 from 2.5x at the end of Q3 2023 due to funding strong GMV growth • Gross debt of $1.3 billion • $69 million of debt reduction during 2023 • Repurchase shares opportunistically to generate favorable returns for shareholders • Repurchased 1.7 million shares during 2023 at an average price of $29.29 per share Balance Sheet & Liquidity ($’s millions) As of 12/31/23 Liquidity $513.4 Cash (unrestricted) $83.8 Revolving Credit Availability $429.6 Total Debt $1,331.1 Net Leverage Ratio (LTM) 2.7x Interest Coverage Ratio (LTM) 3.4x Dividend Payout Ratio (LTM) 38.3% 11 1 Net debt to Adjusted EBITDA ratio is defined as outstanding debt less cash divided by trailing twelve months Adjusted EBITDA.
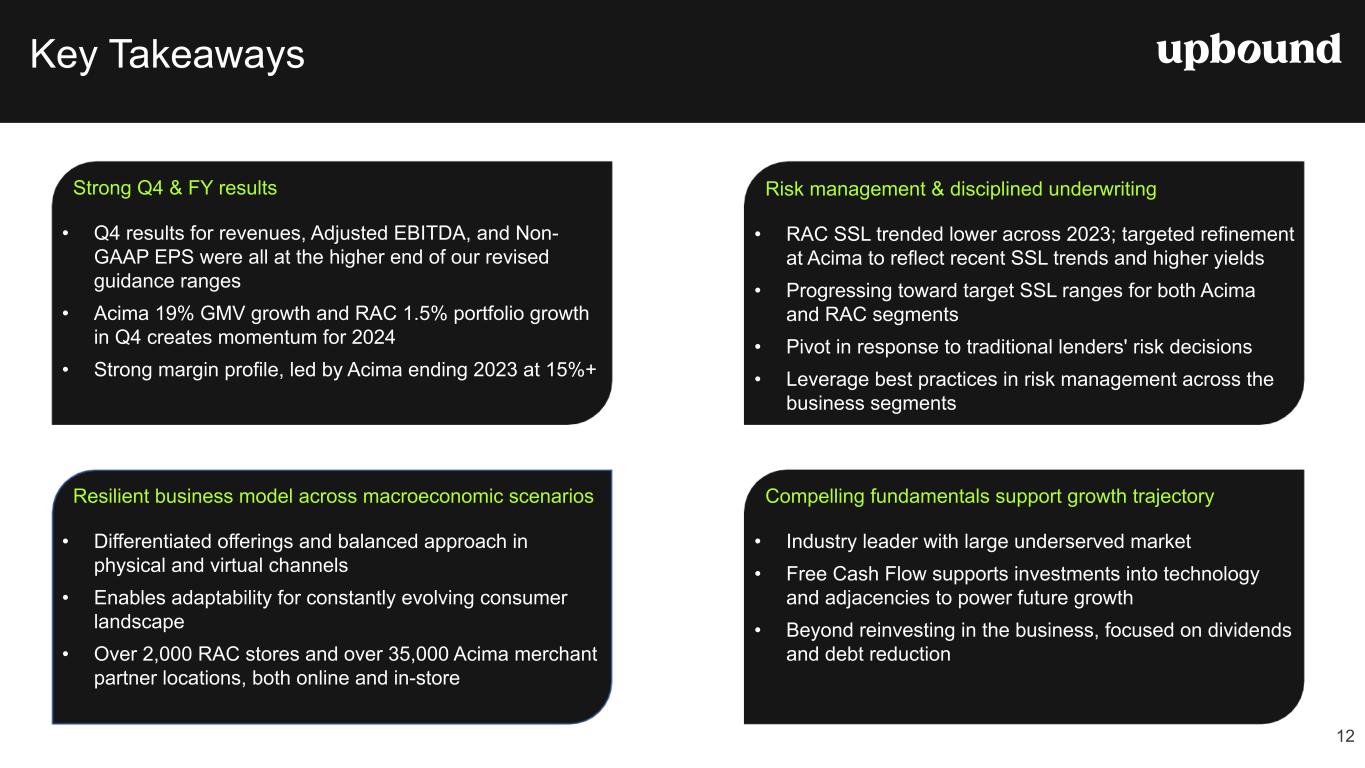
Key Takeaways 12 Resilient business model across macroeconomic scenarios • Differentiated offerings and balanced approach in physical and virtual channels • Enables adaptability for constantly evolving consumer landscape • Over 2,000 RAC stores and over 35,000 Acima merchant partner locations, both online and in-store Strong Q4 & FY results • Q4 results for revenues, Adjusted EBITDA, and Non- GAAP EPS were all at the higher end of our revised guidance ranges • Acima 19% GMV growth and RAC 1.5% portfolio growth in Q4 creates momentum for 2024 • Strong margin profile, led by Acima ending 2023 at 15%+ Compelling fundamentals support growth trajectory • Industry leader with large underserved market • Free Cash Flow supports investments into technology and adjacencies to power future growth • Beyond reinvesting in the business, focused on dividends and debt reduction Risk management & disciplined underwriting • RAC SSL trended lower across 2023; targeted refinement at Acima to reflect recent SSL trends and higher yields • Progressing toward target SSL ranges for both Acima and RAC segments • Pivot in response to traditional lenders' risk decisions • Leverage best practices in risk management across the business segments

Appendix
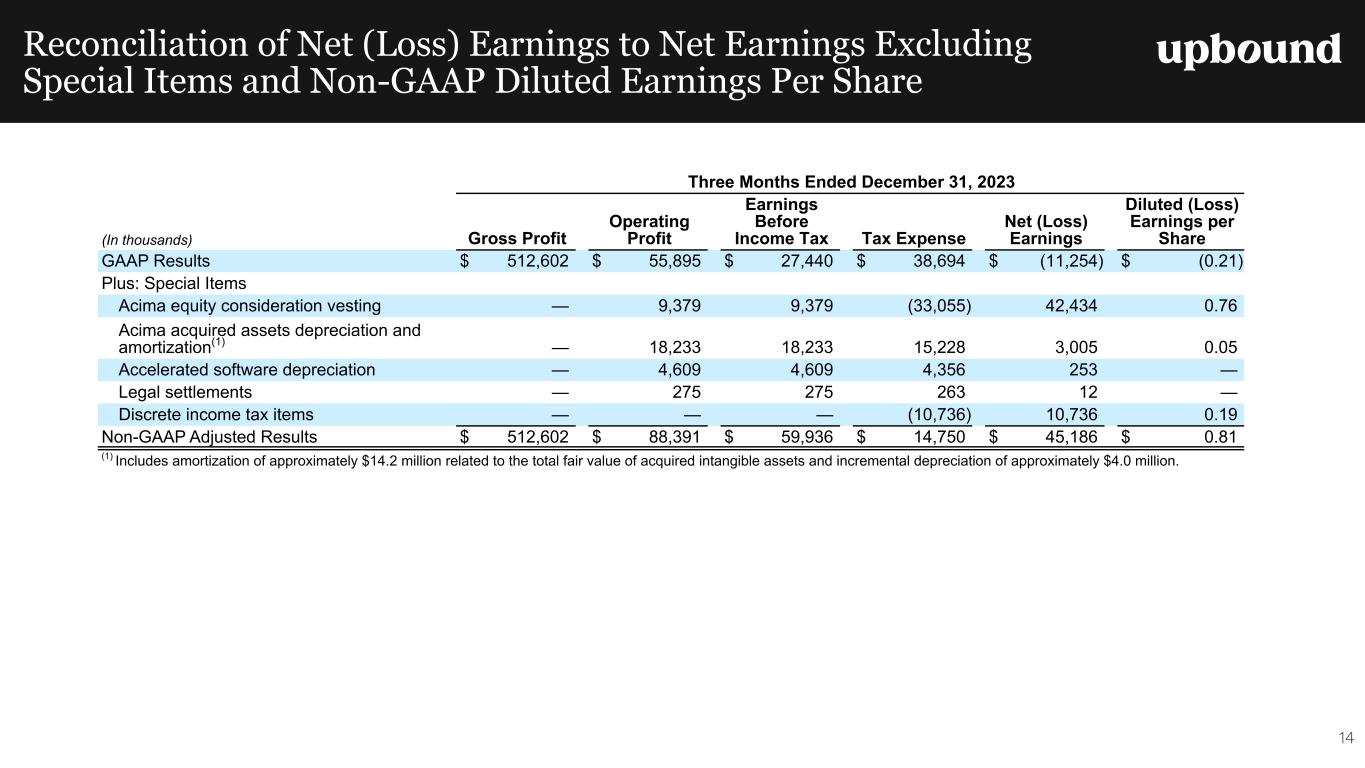
Reconciliation of Net (Loss) Earnings to Net Earnings Excluding Special Items and Non-GAAP Diluted Earnings Per Share 14 Three Months Ended December 31, 2023 (In thousands) Gross Profit Operating Profit Earnings Before Income Tax Tax Expense Net (Loss) Earnings Diluted (Loss) Earnings per Share GAAP Results $ 512,602 $ 55,895 $ 27,440 $ 38,694 $ (11,254) $ (0.21) Plus: Special Items Acima equity consideration vesting — 9,379 9,379 (33,055) 42,434 0.76 Acima acquired assets depreciation and amortization(1) — 18,233 18,233 15,228 3,005 0.05 Accelerated software depreciation — 4,609 4,609 4,356 253 — Legal settlements — 275 275 263 12 — Discrete income tax items — — — (10,736) 10,736 0.19 Non-GAAP Adjusted Results $ 512,602 $ 88,391 $ 59,936 $ 14,750 $ 45,186 $ 0.81 (1) Includes amortization of approximately $14.2 million related to the total fair value of acquired intangible assets and incremental depreciation of approximately $4.0 million.
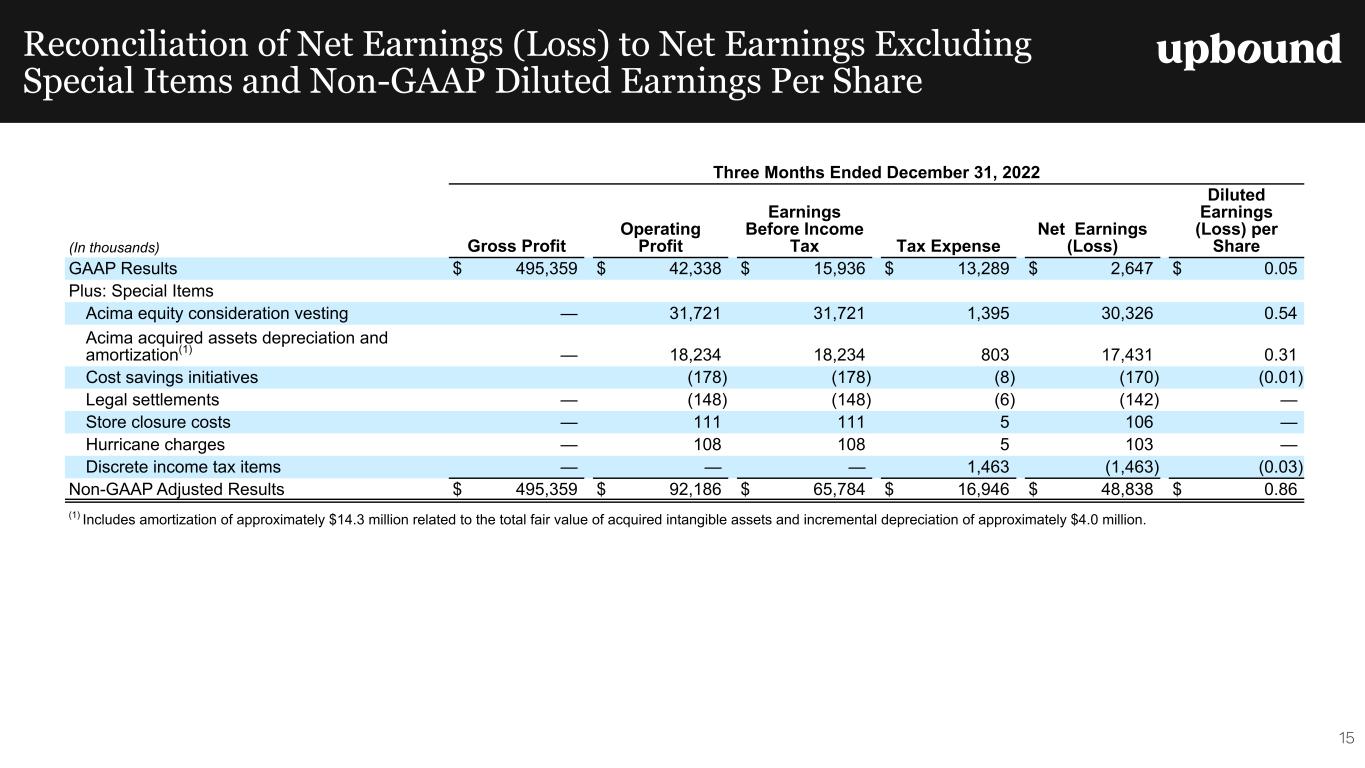
Reconciliation of Net Earnings (Loss) to Net Earnings Excluding Special Items and Non-GAAP Diluted Earnings Per Share Three Months Ended December 31, 2022 (In thousands) Gross Profit Operating Profit Earnings Before Income Tax Tax Expense Net Earnings (Loss) Diluted Earnings (Loss) per Share GAAP Results $ 495,359 $ 42,338 $ 15,936 $ 13,289 $ 2,647 $ 0.05 Plus: Special Items Acima equity consideration vesting — 31,721 31,721 1,395 30,326 0.54 Acima acquired assets depreciation and amortization(1) — 18,234 18,234 803 17,431 0.31 Cost savings initiatives (178) (178) (8) (170) (0.01) Legal settlements — (148) (148) (6) (142) — Store closure costs — 111 111 5 106 — Hurricane charges — 108 108 5 103 — Discrete income tax items — — — 1,463 (1,463) (0.03) Non-GAAP Adjusted Results $ 495,359 $ 92,186 $ 65,784 $ 16,946 $ 48,838 $ 0.86 (1) Includes amortization of approximately $14.3 million related to the total fair value of acquired intangible assets and incremental depreciation of approximately $4.0 million. 15
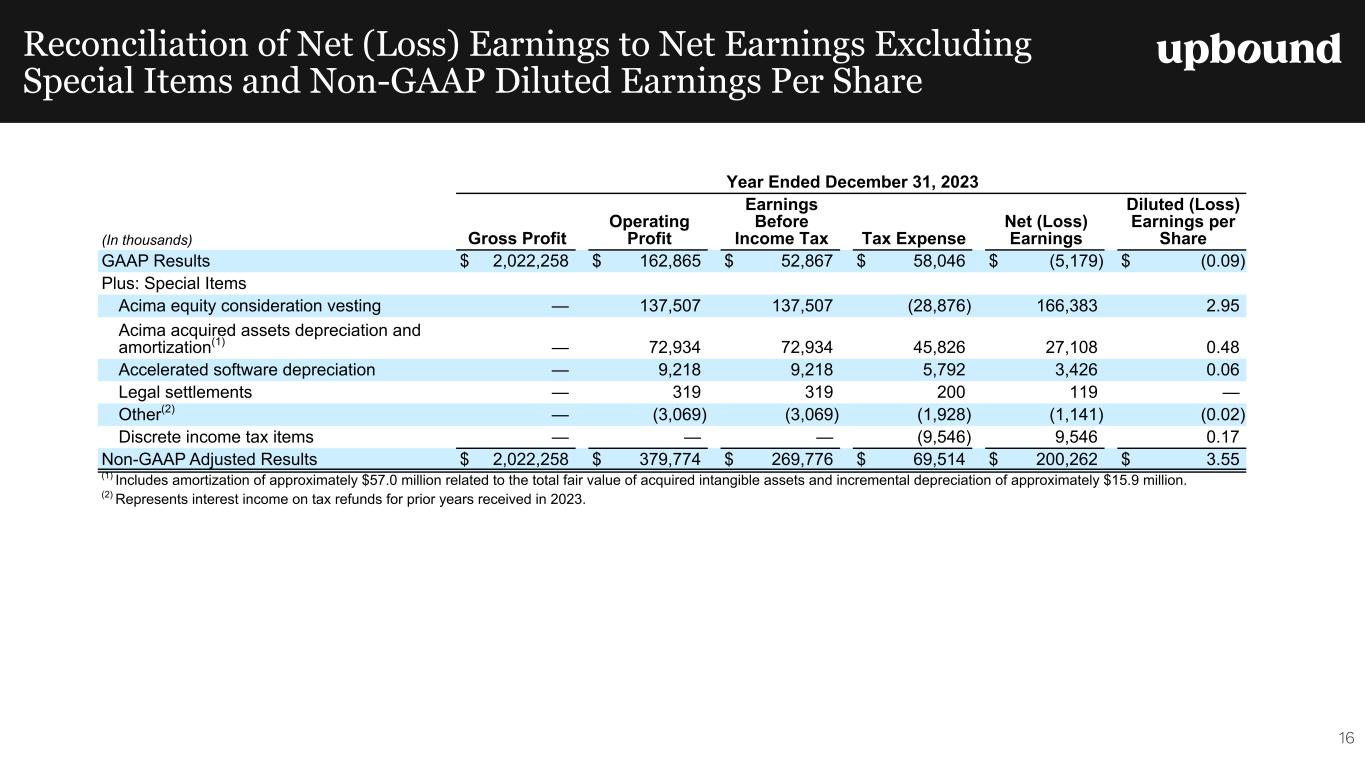
Reconciliation of Net (Loss) Earnings to Net Earnings Excluding Special Items and Non-GAAP Diluted Earnings Per Share 16 Year Ended December 31, 2023 (In thousands) Gross Profit Operating Profit Earnings Before Income Tax Tax Expense Net (Loss) Earnings Diluted (Loss) Earnings per Share GAAP Results $ 2,022,258 $ 162,865 $ 52,867 $ 58,046 $ (5,179) $ (0.09) Plus: Special Items Acima equity consideration vesting — 137,507 137,507 (28,876) 166,383 2.95 Acima acquired assets depreciation and amortization(1) — 72,934 72,934 45,826 27,108 0.48 Accelerated software depreciation — 9,218 9,218 5,792 3,426 0.06 Legal settlements — 319 319 200 119 — Other(2) — (3,069) (3,069) (1,928) (1,141) (0.02) Discrete income tax items — — — (9,546) 9,546 0.17 Non-GAAP Adjusted Results $ 2,022,258 $ 379,774 $ 269,776 $ 69,514 $ 200,262 $ 3.55 (1) Includes amortization of approximately $57.0 million related to the total fair value of acquired intangible assets and incremental depreciation of approximately $15.9 million. (2) Represents interest income on tax refunds for prior years received in 2023.
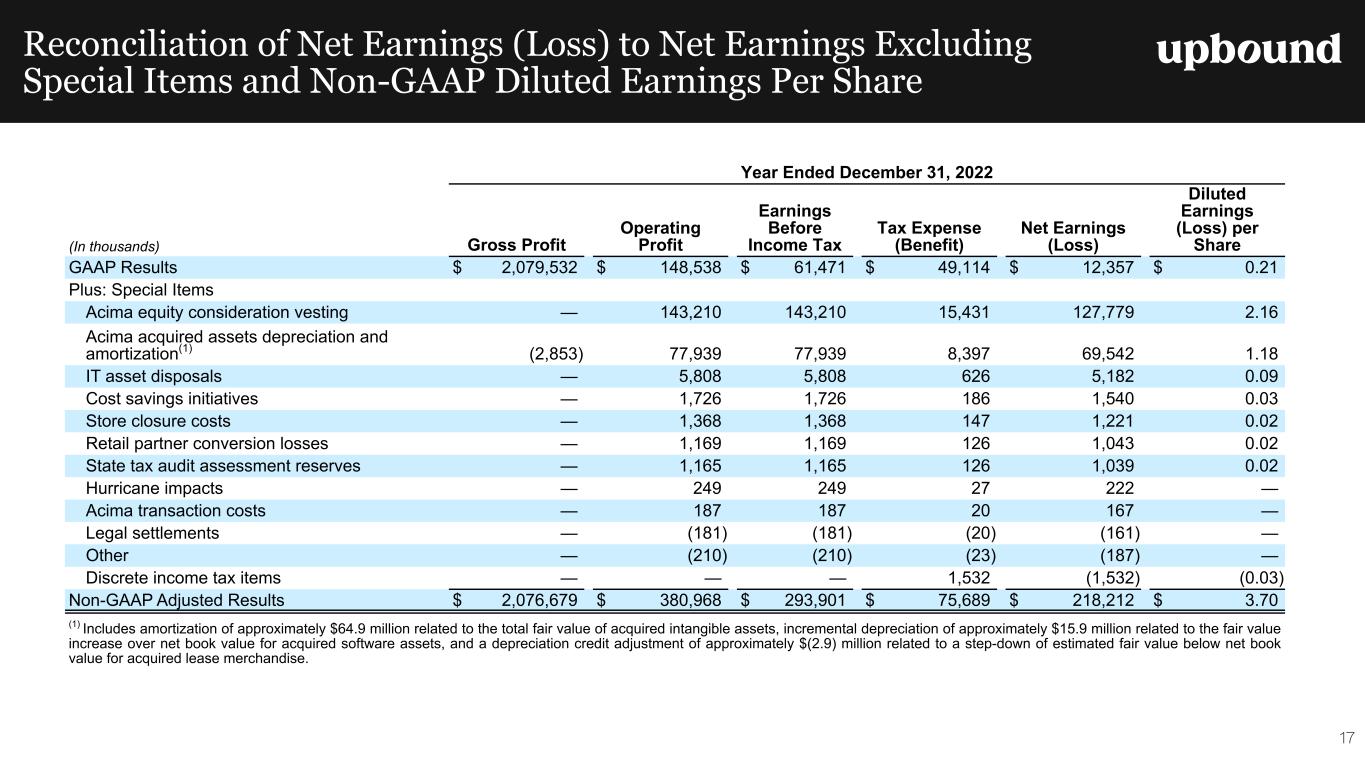
Reconciliation of Net Earnings (Loss) to Net Earnings Excluding Special Items and Non-GAAP Diluted Earnings Per Share Year Ended December 31, 2022 (In thousands) Gross Profit Operating Profit Earnings Before Income Tax Tax Expense (Benefit) Net Earnings (Loss) Diluted Earnings (Loss) per Share GAAP Results $ 2,079,532 $ 148,538 $ 61,471 $ 49,114 $ 12,357 $ 0.21 Plus: Special Items Acima equity consideration vesting — 143,210 143,210 15,431 127,779 2.16 Acima acquired assets depreciation and amortization(1) (2,853) 77,939 77,939 8,397 69,542 1.18 IT asset disposals — 5,808 5,808 626 5,182 0.09 Cost savings initiatives — 1,726 1,726 186 1,540 0.03 Store closure costs — 1,368 1,368 147 1,221 0.02 Retail partner conversion losses — 1,169 1,169 126 1,043 0.02 State tax audit assessment reserves — 1,165 1,165 126 1,039 0.02 Hurricane impacts — 249 249 27 222 — Acima transaction costs — 187 187 20 167 — Legal settlements — (181) (181) (20) (161) — Other — (210) (210) (23) (187) — Discrete income tax items — — — 1,532 (1,532) (0.03) Non-GAAP Adjusted Results $ 2,076,679 $ 380,968 $ 293,901 $ 75,689 $ 218,212 $ 3.70 (1) Includes amortization of approximately $64.9 million related to the total fair value of acquired intangible assets, incremental depreciation of approximately $15.9 million related to the fair value increase over net book value for acquired software assets, and a depreciation credit adjustment of approximately $(2.9) million related to a step-down of estimated fair value below net book value for acquired lease merchandise. 17
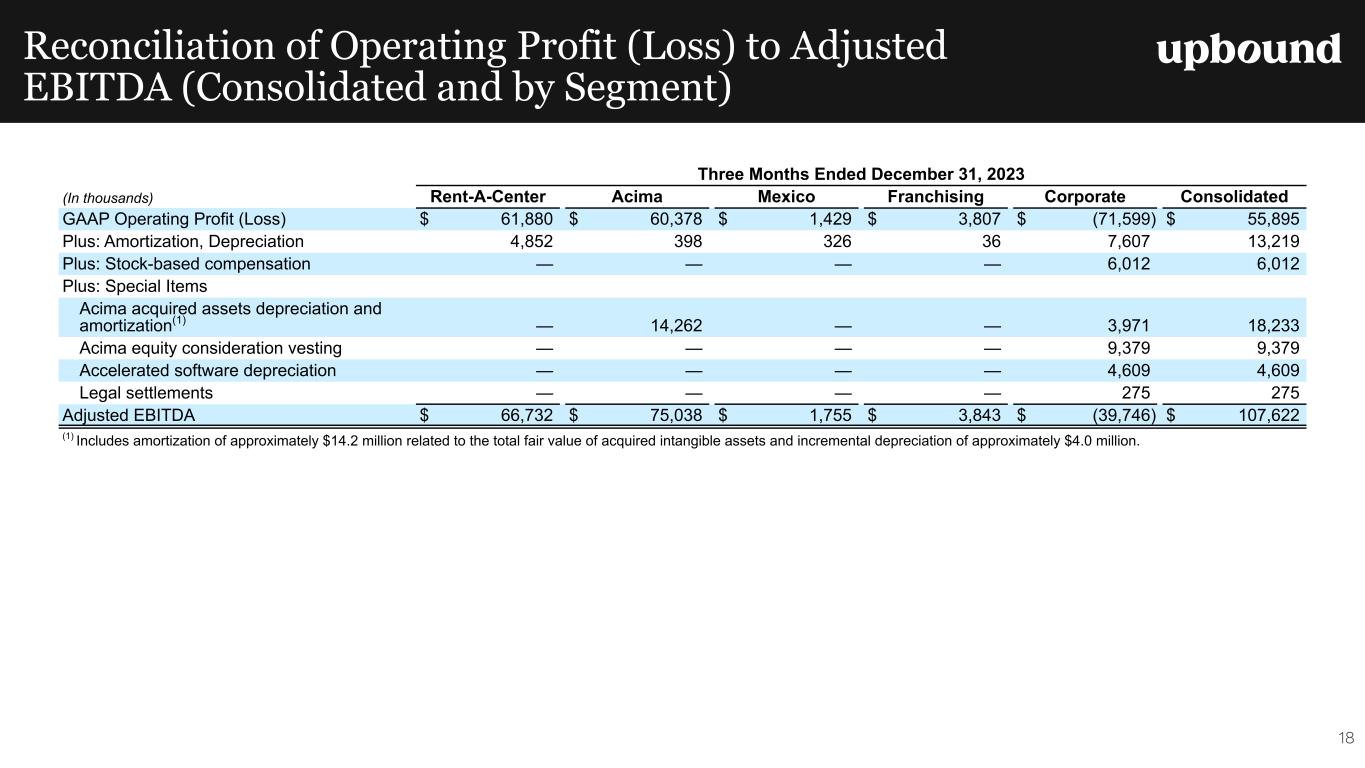
Reconciliation of Operating Profit (Loss) to Adjusted EBITDA (Consolidated and by Segment) Three Months Ended December 31, 2023 (In thousands) Rent-A-Center Acima Mexico Franchising Corporate Consolidated GAAP Operating Profit (Loss) $ 61,880 $ 60,378 $ 1,429 $ 3,807 $ (71,599) $ 55,895 Plus: Amortization, Depreciation 4,852 398 326 36 7,607 13,219 Plus: Stock-based compensation — — — — 6,012 6,012 Plus: Special Items Acima acquired assets depreciation and amortization(1) — 14,262 — — 3,971 18,233 Acima equity consideration vesting — — — — 9,379 9,379 Accelerated software depreciation — — — — 4,609 4,609 Legal settlements — — — — 275 275 Adjusted EBITDA $ 66,732 $ 75,038 $ 1,755 $ 3,843 $ (39,746) $ 107,622 (1) Includes amortization of approximately $14.2 million related to the total fair value of acquired intangible assets and incremental depreciation of approximately $4.0 million. 18
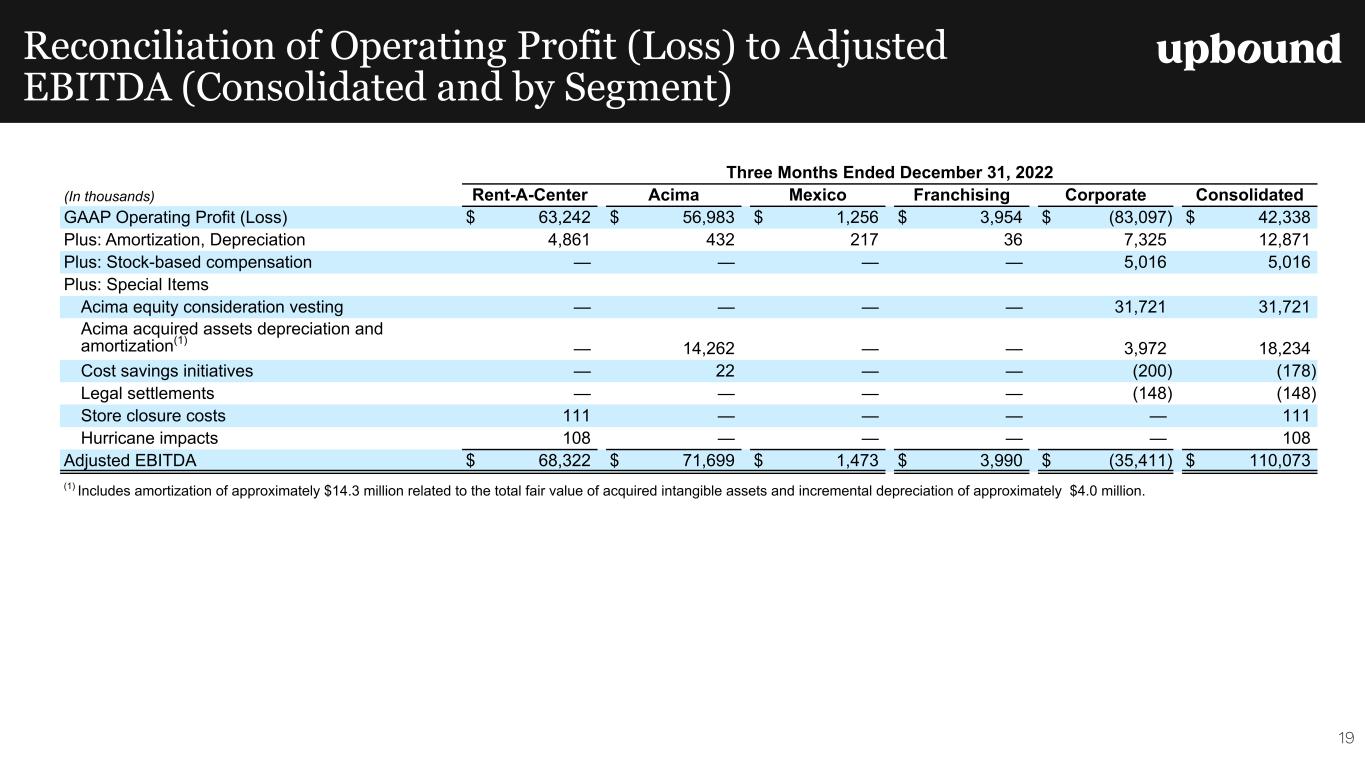
Reconciliation of Operating Profit (Loss) to Adjusted EBITDA (Consolidated and by Segment) Three Months Ended December 31, 2022 (In thousands) Rent-A-Center Acima Mexico Franchising Corporate Consolidated GAAP Operating Profit (Loss) $ 63,242 $ 56,983 $ 1,256 $ 3,954 $ (83,097) $ 42,338 Plus: Amortization, Depreciation 4,861 432 217 36 7,325 12,871 Plus: Stock-based compensation — — — — 5,016 5,016 Plus: Special Items Acima equity consideration vesting — — — — 31,721 31,721 Acima acquired assets depreciation and amortization(1) — 14,262 — — 3,972 18,234 Cost savings initiatives — 22 — — (200) (178) Legal settlements — — — — (148) (148) Store closure costs 111 — — — — 111 Hurricane impacts 108 — — — — 108 Adjusted EBITDA $ 68,322 $ 71,699 $ 1,473 $ 3,990 $ (35,411) $ 110,073 (1) Includes amortization of approximately $14.3 million related to the total fair value of acquired intangible assets and incremental depreciation of approximately $4.0 million. 19
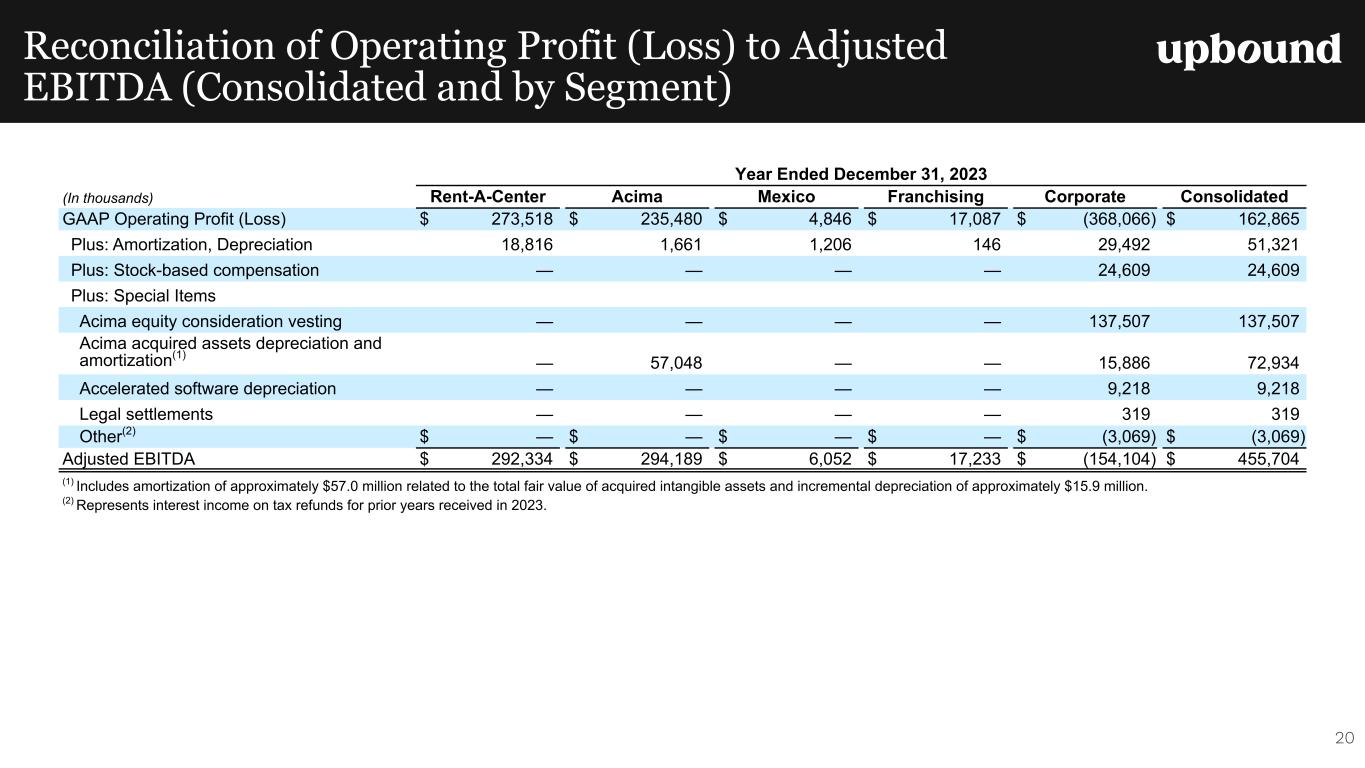
Reconciliation of Operating Profit (Loss) to Adjusted EBITDA (Consolidated and by Segment) Year Ended December 31, 2023 (In thousands) Rent-A-Center Acima Mexico Franchising Corporate Consolidated GAAP Operating Profit (Loss) $ 273,518 $ 235,480 $ 4,846 $ 17,087 $ (368,066) $ 162,865 Plus: Amortization, Depreciation 18,816 1,661 1,206 146 29,492 51,321 Plus: Stock-based compensation — — — — 24,609 24,609 Plus: Special Items Acima equity consideration vesting — — — — 137,507 137,507 Acima acquired assets depreciation and amortization(1) — 57,048 — — 15,886 72,934 Accelerated software depreciation — — — — 9,218 9,218 Legal settlements — — — — 319 319 Other(2) $ — $ — $ — $ — $ (3,069) $ (3,069) Adjusted EBITDA $ 292,334 $ 294,189 $ 6,052 $ 17,233 $ (154,104) $ 455,704 (1) Includes amortization of approximately $57.0 million related to the total fair value of acquired intangible assets and incremental depreciation of approximately $15.9 million. (2) Represents interest income on tax refunds for prior years received in 2023. 20
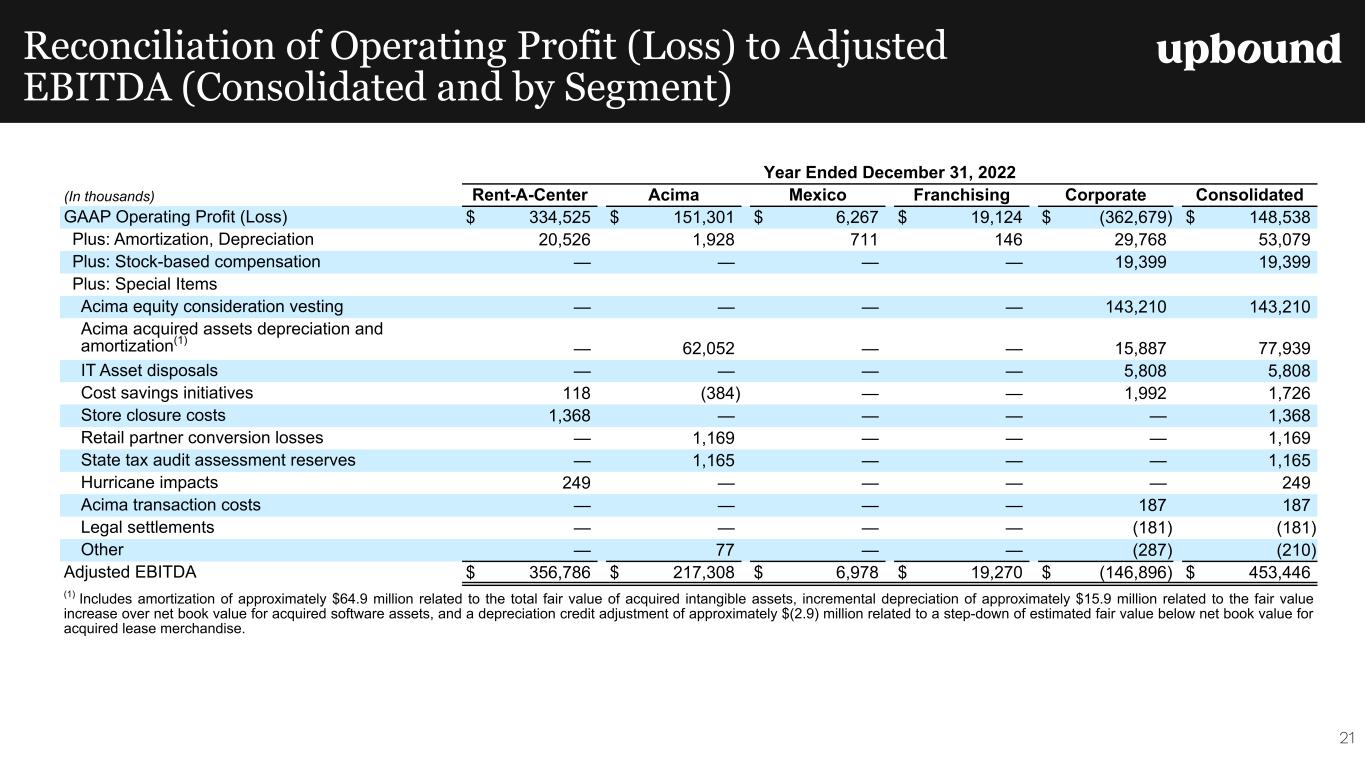
Reconciliation of Operating Profit (Loss) to Adjusted EBITDA (Consolidated and by Segment) Year Ended December 31, 2022 (In thousands) Rent-A-Center Acima Mexico Franchising Corporate Consolidated GAAP Operating Profit (Loss) $ 334,525 $ 151,301 $ 6,267 $ 19,124 $ (362,679) $ 148,538 Plus: Amortization, Depreciation 20,526 1,928 711 146 29,768 53,079 Plus: Stock-based compensation — — — — 19,399 19,399 Plus: Special Items Acima equity consideration vesting — — — — 143,210 143,210 Acima acquired assets depreciation and amortization(1) — 62,052 — — 15,887 77,939 IT Asset disposals — — — — 5,808 5,808 Cost savings initiatives 118 (384) — — 1,992 1,726 Store closure costs 1,368 — — — — 1,368 Retail partner conversion losses — 1,169 — — — 1,169 State tax audit assessment reserves — 1,165 — — — 1,165 Hurricane impacts 249 — — — — 249 Acima transaction costs — — — — 187 187 Legal settlements — — — — (181) (181) Other — 77 — — (287) (210) Adjusted EBITDA $ 356,786 $ 217,308 $ 6,978 $ 19,270 $ (146,896) $ 453,446 (1) Includes amortization of approximately $64.9 million related to the total fair value of acquired intangible assets, incremental depreciation of approximately $15.9 million related to the fair value increase over net book value for acquired software assets, and a depreciation credit adjustment of approximately $(2.9) million related to a step-down of estimated fair value below net book value for acquired lease merchandise. 21
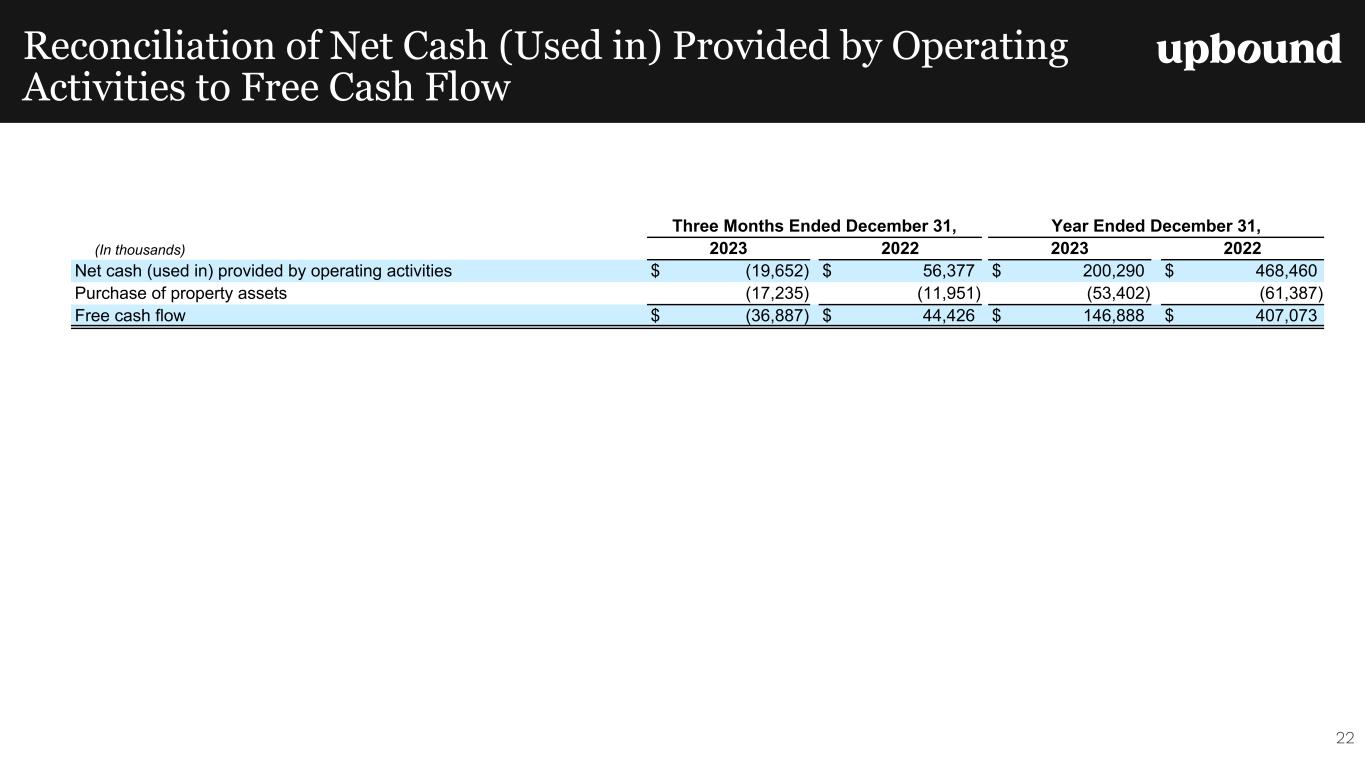
Reconciliation of Net Cash (Used in) Provided by Operating Activities to Free Cash Flow Three Months Ended December 31, Year Ended December 31, (In thousands) 2023 2022 2023 2022 Net cash (used in) provided by operating activities $ (19,652) $ 56,377 $ 200,290 $ 468,460 Purchase of property assets (17,235) (11,951) (53,402) (61,387) Free cash flow $ (36,887) $ 44,426 $ 146,888 $ 407,073 22
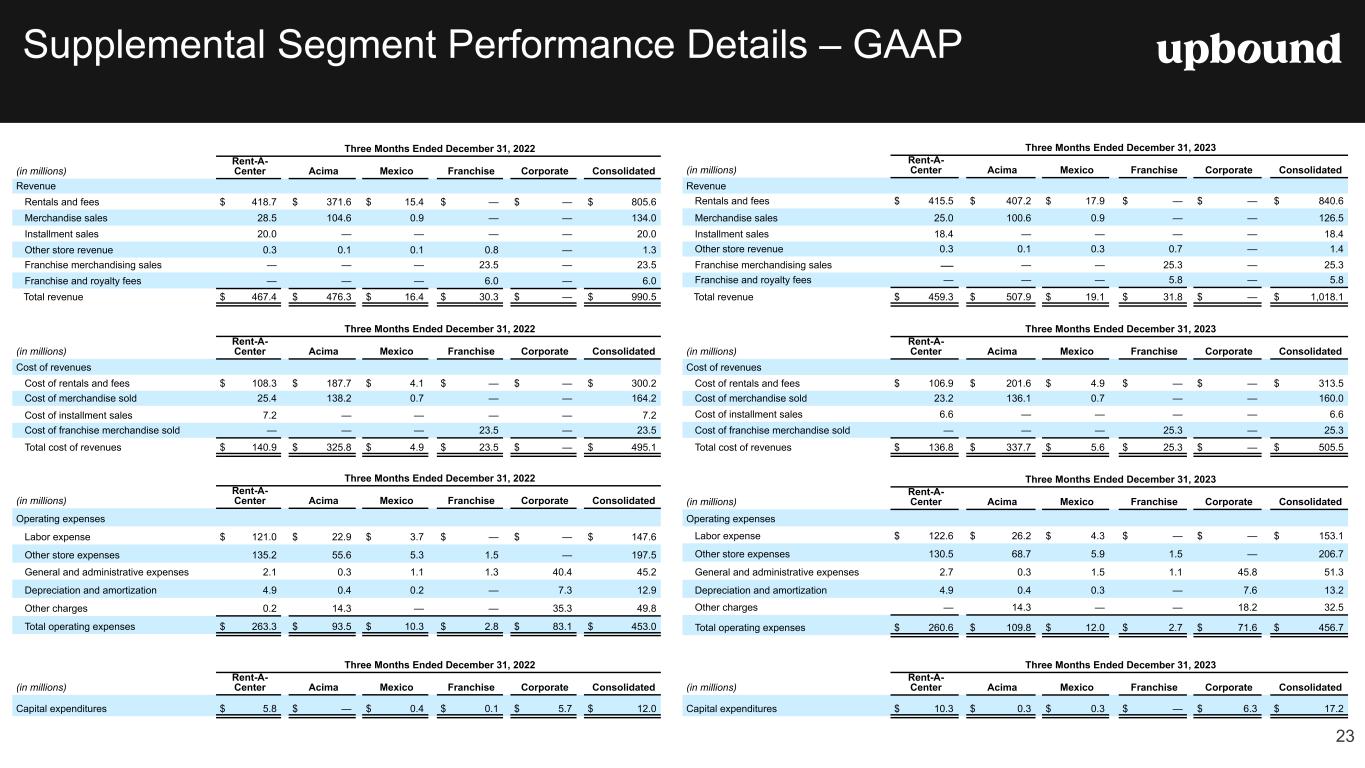
Supplemental Segment Performance Details – GAAP 23 Three Months Ended December 31, 2022 (in millions) Rent-A- Center Acima Mexico Franchise Corporate Consolidated Revenue Rentals and fees $ 418.7 $ 371.6 $ 15.4 $ — $ — $ 805.6 Merchandise sales 28.5 104.6 0.9 — — 134.0 Installment sales 20.0 — — — — 20.0 Other store revenue 0.3 0.1 0.1 0.8 — 1.3 Franchise merchandising sales — — — 23.5 — 23.5 Franchise and royalty fees — — — 6.0 — 6.0 Total revenue $ 467.4 $ 476.3 $ 16.4 $ 30.3 $ — $ 990.5 Three Months Ended December 31, 2022 (in millions) Rent-A- Center Acima Mexico Franchise Corporate Consolidated Cost of revenues Cost of rentals and fees $ 108.3 $ 187.7 $ 4.1 $ — $ — $ 300.2 Cost of merchandise sold 25.4 138.2 0.7 — — 164.2 Cost of installment sales 7.2 — — — — 7.2 Cost of franchise merchandise sold — — — 23.5 — 23.5 Total cost of revenues $ 140.9 $ 325.8 $ 4.9 $ 23.5 $ — $ 495.1 Three Months Ended December 31, 2022 (in millions) Rent-A- Center Acima Mexico Franchise Corporate Consolidated Operating expenses Labor expense $ 121.0 $ 22.9 $ 3.7 $ — $ — $ 147.6 Other store expenses 135.2 55.6 5.3 1.5 — 197.5 General and administrative expenses 2.1 0.3 1.1 1.3 40.4 45.2 Depreciation and amortization 4.9 0.4 0.2 — 7.3 12.9 Other charges 0.2 14.3 — — 35.3 49.8 Total operating expenses $ 263.3 $ 93.5 $ 10.3 $ 2.8 $ 83.1 $ 453.0 Three Months Ended December 31, 2022 (in millions) Rent-A- Center Acima Mexico Franchise Corporate Consolidated Capital expenditures $ 5.8 $ — $ 0.4 $ 0.1 $ 5.7 $ 12.0 Three Months Ended December 31, 2023 (in millions) Rent-A- Center Acima Mexico Franchise Corporate Consolidated Revenue Rentals and fees $ 415.5 $ 407.2 $ 17.9 $ — $ — $ 840.6 Merchandise sales 25.0 100.6 0.9 — — 126.5 Installment sales 18.4 — — — — 18.4 Other store revenue 0.3 0.1 0.3 0.7 — 1.4 Franchise merchandising sales — — — 25.3 — 25.3 Franchise and royalty fees — — — 5.8 — 5.8 Total revenue $ 459.3 $ 507.9 $ 19.1 $ 31.8 $ — $ 1,018.1 Three Months Ended December 31, 2023 (in millions) Rent-A- Center Acima Mexico Franchise Corporate Consolidated Cost of revenues Cost of rentals and fees $ 106.9 $ 201.6 $ 4.9 $ — $ — $ 313.5 Cost of merchandise sold 23.2 136.1 0.7 — — 160.0 Cost of installment sales 6.6 — — — — 6.6 Cost of franchise merchandise sold — — — 25.3 — 25.3 Total cost of revenues $ 136.8 $ 337.7 $ 5.6 $ 25.3 $ — $ 505.5 Three Months Ended December 31, 2023 (in millions) Rent-A- Center Acima Mexico Franchise Corporate Consolidated Operating expenses Labor expense $ 122.6 $ 26.2 $ 4.3 $ — $ — $ 153.1 Other store expenses 130.5 68.7 5.9 1.5 — 206.7 General and administrative expenses 2.7 0.3 1.5 1.1 45.8 51.3 Depreciation and amortization 4.9 0.4 0.3 — 7.6 13.2 Other charges — 14.3 — — 18.2 32.5 Total operating expenses $ 260.6 $ 109.8 $ 12.0 $ 2.7 $ 71.6 $ 456.7 Three Months Ended December 31, 2023 (in millions) Rent-A- Center Acima Mexico Franchise Corporate Consolidated Capital expenditures $ 10.3 $ 0.3 $ 0.3 $ — $ 6.3 $ 17.2
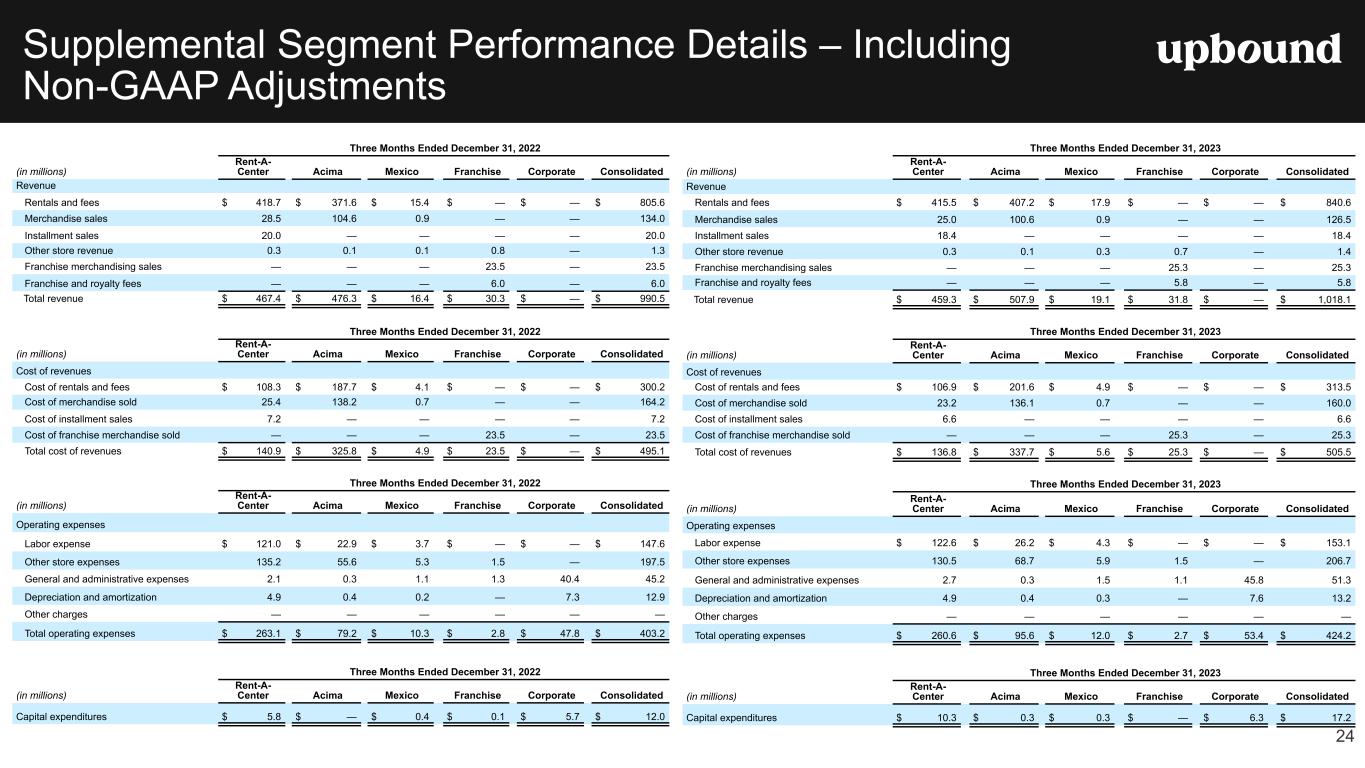
Supplemental Segment Performance Details – Including Non-GAAP Adjustments 24 Three Months Ended December 31, 2022 (in millions) Rent-A- Center Acima Mexico Franchise Corporate Consolidated Revenue Rentals and fees $ 418.7 $ 371.6 $ 15.4 $ — $ — $ 805.6 Merchandise sales 28.5 104.6 0.9 — — 134.0 Installment sales 20.0 — — — — 20.0 Other store revenue 0.3 0.1 0.1 0.8 — 1.3 Franchise merchandising sales — — — 23.5 — 23.5 Franchise and royalty fees — — — 6.0 — 6.0 Total revenue $ 467.4 $ 476.3 $ 16.4 $ 30.3 $ — $ 990.5 Three Months Ended December 31, 2022 (in millions) Rent-A- Center Acima Mexico Franchise Corporate Consolidated Cost of revenues Cost of rentals and fees $ 108.3 $ 187.7 $ 4.1 $ — $ — $ 300.2 Cost of merchandise sold 25.4 138.2 0.7 — — 164.2 Cost of installment sales 7.2 — — — — 7.2 Cost of franchise merchandise sold — — — 23.5 — 23.5 Total cost of revenues $ 140.9 $ 325.8 $ 4.9 $ 23.5 $ — $ 495.1 Three Months Ended December 31, 2022 (in millions) Rent-A- Center Acima Mexico Franchise Corporate Consolidated Operating expenses Labor expense $ 121.0 $ 22.9 $ 3.7 $ — $ — $ 147.6 Other store expenses 135.2 55.6 5.3 1.5 — 197.5 General and administrative expenses 2.1 0.3 1.1 1.3 40.4 45.2 Depreciation and amortization 4.9 0.4 0.2 — 7.3 12.9 Other charges — — — — — — Total operating expenses $ 263.1 $ 79.2 $ 10.3 $ 2.8 $ 47.8 $ 403.2 Three Months Ended December 31, 2022 (in millions) Rent-A- Center Acima Mexico Franchise Corporate Consolidated Capital expenditures $ 5.8 $ — $ 0.4 $ 0.1 $ 5.7 $ 12.0 Three Months Ended December 31, 2023 (in millions) Rent-A- Center Acima Mexico Franchise Corporate Consolidated Revenue Rentals and fees $ 415.5 $ 407.2 $ 17.9 $ — $ — $ 840.6 Merchandise sales 25.0 100.6 0.9 — — 126.5 Installment sales 18.4 — — — — 18.4 Other store revenue 0.3 0.1 0.3 0.7 — 1.4 Franchise merchandising sales — — — 25.3 — 25.3 Franchise and royalty fees — — — 5.8 — 5.8 Total revenue $ 459.3 $ 507.9 $ 19.1 $ 31.8 $ — $ 1,018.1 Three Months Ended December 31, 2023 (in millions) Rent-A- Center Acima Mexico Franchise Corporate Consolidated Cost of revenues Cost of rentals and fees $ 106.9 $ 201.6 $ 4.9 $ — $ — $ 313.5 Cost of merchandise sold 23.2 136.1 0.7 — — 160.0 Cost of installment sales 6.6 — — — — 6.6 Cost of franchise merchandise sold — — — 25.3 — 25.3 Total cost of revenues $ 136.8 $ 337.7 $ 5.6 $ 25.3 $ — $ 505.5 Three Months Ended December 31, 2023 (in millions) Rent-A- Center Acima Mexico Franchise Corporate Consolidated Operating expenses Labor expense $ 122.6 $ 26.2 $ 4.3 $ — $ — $ 153.1 Other store expenses 130.5 68.7 5.9 1.5 — 206.7 General and administrative expenses 2.7 0.3 1.5 1.1 45.8 51.3 Depreciation and amortization 4.9 0.4 0.3 — 7.6 13.2 Other charges — — — — — — Total operating expenses $ 260.6 $ 95.6 $ 12.0 $ 2.7 $ 53.4 $ 424.2 Three Months Ended December 31, 2023 (in millions) Rent-A- Center Acima Mexico Franchise Corporate Consolidated Capital expenditures $ 10.3 $ 0.3 $ 0.3 $ — $ 6.3 $ 17.2
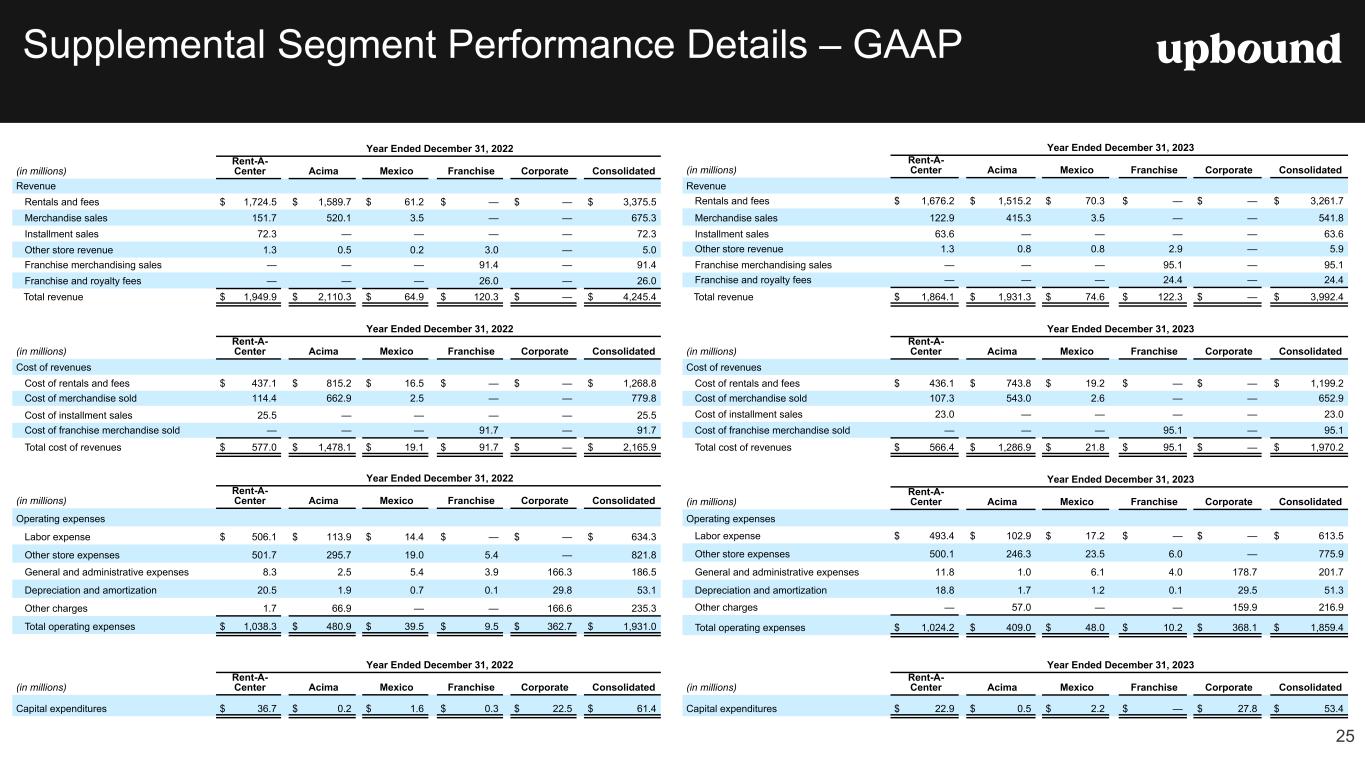
Supplemental Segment Performance Details – GAAP 25 Year Ended December 31, 2022 (in millions) Rent-A- Center Acima Mexico Franchise Corporate Consolidated Revenue Rentals and fees $ 1,724.5 $ 1,589.7 $ 61.2 $ — $ — $ 3,375.5 Merchandise sales 151.7 520.1 3.5 — — 675.3 Installment sales 72.3 — — — — 72.3 Other store revenue 1.3 0.5 0.2 3.0 — 5.0 Franchise merchandising sales — — — 91.4 — 91.4 Franchise and royalty fees — — — 26.0 — 26.0 Total revenue $ 1,949.9 $ 2,110.3 $ 64.9 $ 120.3 $ — $ 4,245.4 Year Ended December 31, 2022 (in millions) Rent-A- Center Acima Mexico Franchise Corporate Consolidated Cost of revenues Cost of rentals and fees $ 437.1 $ 815.2 $ 16.5 $ — $ — $ 1,268.8 Cost of merchandise sold 114.4 662.9 2.5 — — 779.8 Cost of installment sales 25.5 — — — — 25.5 Cost of franchise merchandise sold — — — 91.7 — 91.7 Total cost of revenues $ 577.0 $ 1,478.1 $ 19.1 $ 91.7 $ — $ 2,165.9 Year Ended December 31, 2022 (in millions) Rent-A- Center Acima Mexico Franchise Corporate Consolidated Operating expenses Labor expense $ 506.1 $ 113.9 $ 14.4 $ — $ — $ 634.3 Other store expenses 501.7 295.7 19.0 5.4 — 821.8 General and administrative expenses 8.3 2.5 5.4 3.9 166.3 186.5 Depreciation and amortization 20.5 1.9 0.7 0.1 29.8 53.1 Other charges 1.7 66.9 — — 166.6 235.3 Total operating expenses $ 1,038.3 $ 480.9 $ 39.5 $ 9.5 $ 362.7 $ 1,931.0 Year Ended December 31, 2022 (in millions) Rent-A- Center Acima Mexico Franchise Corporate Consolidated Capital expenditures $ 36.7 $ 0.2 $ 1.6 $ 0.3 $ 22.5 $ 61.4 Year Ended December 31, 2023 (in millions) Rent-A- Center Acima Mexico Franchise Corporate Consolidated Revenue Rentals and fees $ 1,676.2 $ 1,515.2 $ 70.3 $ — $ — $ 3,261.7 Merchandise sales 122.9 415.3 3.5 — — 541.8 Installment sales 63.6 — — — — 63.6 Other store revenue 1.3 0.8 0.8 2.9 — 5.9 Franchise merchandising sales — — — 95.1 — 95.1 Franchise and royalty fees — — — 24.4 — 24.4 Total revenue $ 1,864.1 $ 1,931.3 $ 74.6 $ 122.3 $ — $ 3,992.4 Year Ended December 31, 2023 (in millions) Rent-A- Center Acima Mexico Franchise Corporate Consolidated Cost of revenues Cost of rentals and fees $ 436.1 $ 743.8 $ 19.2 $ — $ — $ 1,199.2 Cost of merchandise sold 107.3 543.0 2.6 — — 652.9 Cost of installment sales 23.0 — — — — 23.0 Cost of franchise merchandise sold — — — 95.1 — 95.1 Total cost of revenues $ 566.4 $ 1,286.9 $ 21.8 $ 95.1 $ — $ 1,970.2 Year Ended December 31, 2023 (in millions) Rent-A- Center Acima Mexico Franchise Corporate Consolidated Operating expenses Labor expense $ 493.4 $ 102.9 $ 17.2 $ — $ — $ 613.5 Other store expenses 500.1 246.3 23.5 6.0 — 775.9 General and administrative expenses 11.8 1.0 6.1 4.0 178.7 201.7 Depreciation and amortization 18.8 1.7 1.2 0.1 29.5 51.3 Other charges — 57.0 — — 159.9 216.9 Total operating expenses $ 1,024.2 $ 409.0 $ 48.0 $ 10.2 $ 368.1 $ 1,859.4 Year Ended December 31, 2023 (in millions) Rent-A- Center Acima Mexico Franchise Corporate Consolidated Capital expenditures $ 22.9 $ 0.5 $ 2.2 $ — $ 27.8 $ 53.4
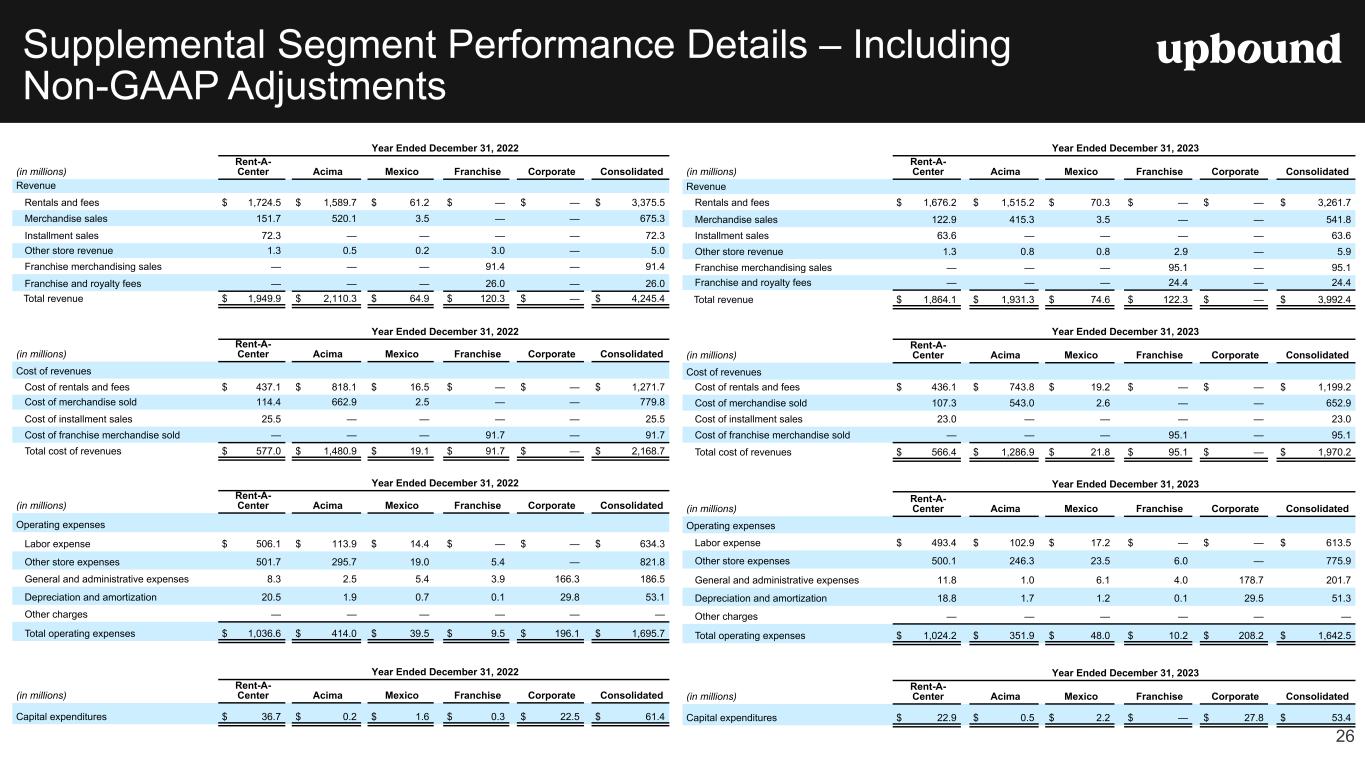
Supplemental Segment Performance Details – Including Non-GAAP Adjustments 26 Year Ended December 31, 2022 (in millions) Rent-A- Center Acima Mexico Franchise Corporate Consolidated Revenue Rentals and fees $ 1,724.5 $ 1,589.7 $ 61.2 $ — $ — $ 3,375.5 Merchandise sales 151.7 520.1 3.5 — — 675.3 Installment sales 72.3 — — — — 72.3 Other store revenue 1.3 0.5 0.2 3.0 — 5.0 Franchise merchandising sales — — — 91.4 — 91.4 Franchise and royalty fees — — — 26.0 — 26.0 Total revenue $ 1,949.9 $ 2,110.3 $ 64.9 $ 120.3 $ — $ 4,245.4 Year Ended December 31, 2022 (in millions) Rent-A- Center Acima Mexico Franchise Corporate Consolidated Cost of revenues Cost of rentals and fees $ 437.1 $ 818.1 $ 16.5 $ — $ — $ 1,271.7 Cost of merchandise sold 114.4 662.9 2.5 — — 779.8 Cost of installment sales 25.5 — — — — 25.5 Cost of franchise merchandise sold — — — 91.7 — 91.7 Total cost of revenues $ 577.0 $ 1,480.9 $ 19.1 $ 91.7 $ — $ 2,168.7 Year Ended December 31, 2022 (in millions) Rent-A- Center Acima Mexico Franchise Corporate Consolidated Operating expenses Labor expense $ 506.1 $ 113.9 $ 14.4 $ — $ — $ 634.3 Other store expenses 501.7 295.7 19.0 5.4 — 821.8 General and administrative expenses 8.3 2.5 5.4 3.9 166.3 186.5 Depreciation and amortization 20.5 1.9 0.7 0.1 29.8 53.1 Other charges — — — — — — Total operating expenses $ 1,036.6 $ 414.0 $ 39.5 $ 9.5 $ 196.1 $ 1,695.7 Year Ended December 31, 2022 (in millions) Rent-A- Center Acima Mexico Franchise Corporate Consolidated Capital expenditures $ 36.7 $ 0.2 $ 1.6 $ 0.3 $ 22.5 $ 61.4 Year Ended December 31, 2023 (in millions) Rent-A- Center Acima Mexico Franchise Corporate Consolidated Revenue Rentals and fees $ 1,676.2 $ 1,515.2 $ 70.3 $ — $ — $ 3,261.7 Merchandise sales 122.9 415.3 3.5 — — 541.8 Installment sales 63.6 — — — — 63.6 Other store revenue 1.3 0.8 0.8 2.9 — 5.9 Franchise merchandising sales — — — 95.1 — 95.1 Franchise and royalty fees — — — 24.4 — 24.4 Total revenue $ 1,864.1 $ 1,931.3 $ 74.6 $ 122.3 $ — $ 3,992.4 Year Ended December 31, 2023 (in millions) Rent-A- Center Acima Mexico Franchise Corporate Consolidated Cost of revenues Cost of rentals and fees $ 436.1 $ 743.8 $ 19.2 $ — $ — $ 1,199.2 Cost of merchandise sold 107.3 543.0 2.6 — — 652.9 Cost of installment sales 23.0 — — — — 23.0 Cost of franchise merchandise sold — — — 95.1 — 95.1 Total cost of revenues $ 566.4 $ 1,286.9 $ 21.8 $ 95.1 $ — $ 1,970.2 Year Ended December 31, 2023 (in millions) Rent-A- Center Acima Mexico Franchise Corporate Consolidated Operating expenses Labor expense $ 493.4 $ 102.9 $ 17.2 $ — $ — $ 613.5 Other store expenses 500.1 246.3 23.5 6.0 — 775.9 General and administrative expenses 11.8 1.0 6.1 4.0 178.7 201.7 Depreciation and amortization 18.8 1.7 1.2 0.1 29.5 51.3 Other charges — — — — — — Total operating expenses $ 1,024.2 $ 351.9 $ 48.0 $ 10.2 $ 208.2 $ 1,642.5 Year Ended December 31, 2023 (in millions) Rent-A- Center Acima Mexico Franchise Corporate Consolidated Capital expenditures $ 22.9 $ 0.5 $ 2.2 $ — $ 27.8 $ 53.4