Pay vs Performance Disclosure - USD ($)
|
12 Months Ended |
Dec. 31, 2023 |
Dec. 31, 2022 |
Dec. 31, 2021 |
Dec. 31, 2020 |
| Pay vs Performance Disclosure |
|
|
|
|
| Pay vs Performance Disclosure, Table |
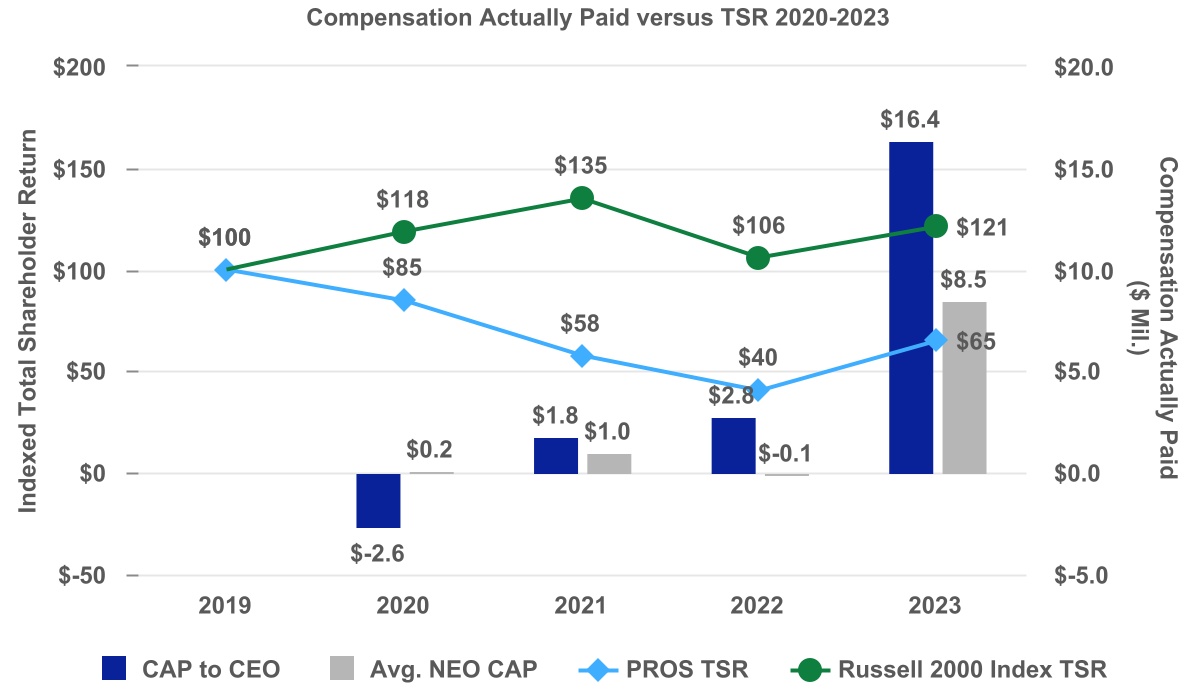
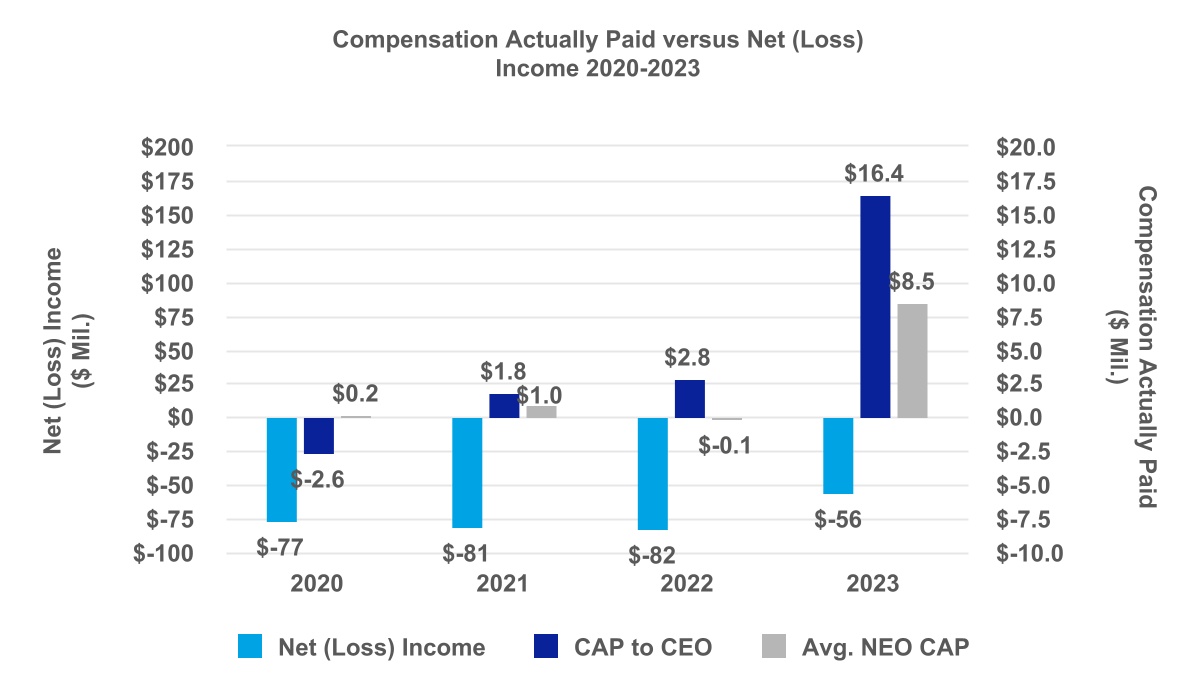
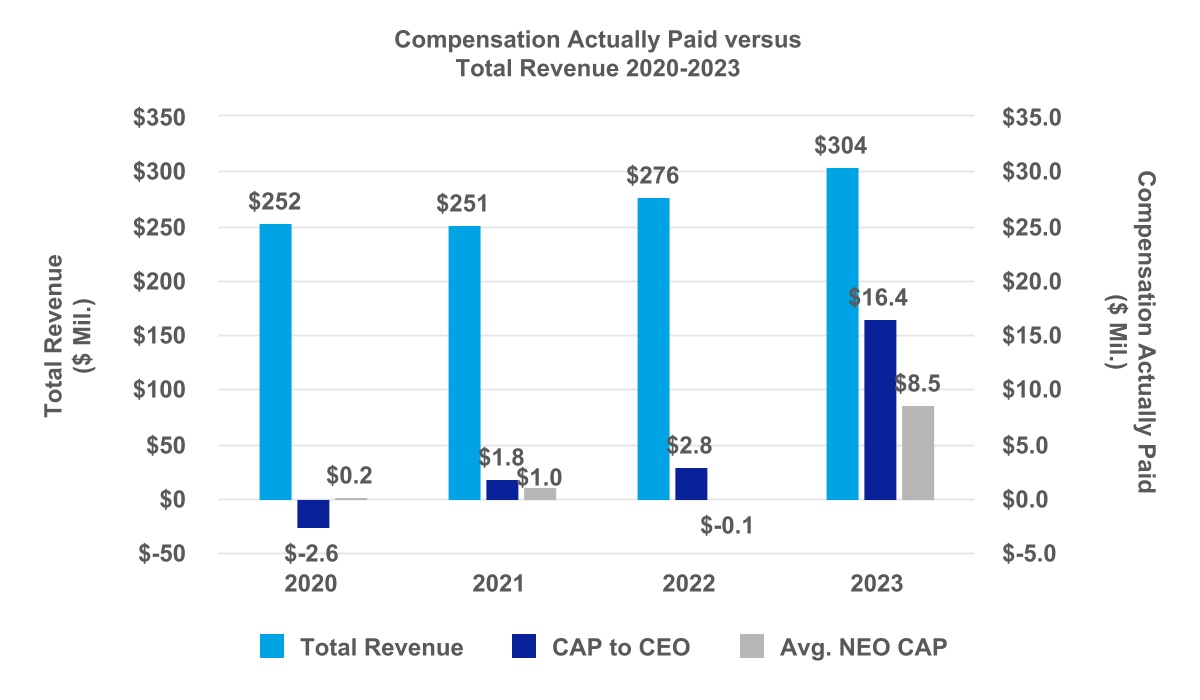
| | | | | | | | | | | | | | | | | | | | | | | | | | | | | | | Year | | SCT Total Compensation for CEO | Compensation Actually Paid to CEO (1) | Average SCT Total Compensation for Other NEOs (2) | Average Compensation Actually Paid to Other NEOs (1)(2) | Value of Initial Fixed $100 Investment Based On: | Net (Loss) Income (in millions) | Total Revenue (in millions) | | PROS Cumulative TSR | Peer Group Cumulative TSR (3) | | | | | | | | | | | | 2023 | | $ | 7,554,450 | | $ | 16,408,590 | | $ | 4,142,805 | | $ | 8,476,831 | | $ | 65 | | $ | 121 | | $ | (56) | | $ | 304 | | | 2022 | | $ | 6,702,001 | | $ | 2,824,846 | | $ | 2,673,432 | | $ | (112,975) | | $ | 40 | | $ | 106 | | $ | (82) | | $ | 276 | | | 2021 | | $ | 7,339,632 | | $ | 1,811,242 | | $ | 3,628,443 | | $ | 997,555 | | $ | 58 | | $ | 135 | | $ | (81) | | $ | 251 | | | 2020 | | $ | 5,463,012 | | $ | (2,648,100) | | $ | 2,727,907 | | $ | 159,042 | | $ | 85 | | $ | 118 | | $ | (77) | | $ | 252 | |
|
|
|
|
| Company Selected Measure Name |
Total Revenue
|
|
|
|
| Named Executive Officers, Footnote |
(2) For 2023, includes Stefan Schulz, CFO. For 2022, includes Stefan Schulz, CFO, and Leslie Rechan, former COO. For 2021, this includes Stefan Schulz, Leslie Rechan, and Roberto Reiner, former Chief Technology Officer. For 2020, includes Stefan Schulz, Leslie Rechan, Roberto Reiner, and Thomas Dziersk, former EVP, Worldwide Sales.
|
|
|
|
| Peer Group Issuers, Footnote |
(3) For purposes of this table, the Peer Group used is the Russell 2000 Index.
|
|
|
|
| PEO Total Compensation Amount |
$ 7,554,450
|
$ 6,702,001
|
$ 7,339,632
|
$ 5,463,012
|
| PEO Actually Paid Compensation Amount |
$ 16,408,590
|
2,824,846
|
1,811,242
|
(2,648,100)
|
| Adjustment To PEO Compensation, Footnote |
| | | | | | | | | | | | | | | | | | | | | | | | | | | | CEO | | 2020 | | 2021 | | 2022 | | 2023 | | Summary Compensation Table Total | $ | 5,463,012 | | | $ | 7,339,632 | | | $ | 6,702,001 | | | $ | 7,554,450 | | | Less: | Grant Date Fair Value of Stock Awards | $ | (4,766,465) | | | $ | (6,102,556) | | | $ | (5,970,413) | | | $ | (6,219,177) | | | Plus: | Fair Value at Year-End of Unvested Stock Awards Granted in the Covered Year* | $ | 2,005,415 | | | $ | 3,334,886 | | | $ | 4,223,767 | | | $ | 11,112,544 | | | Change in Fair Value of Unvested Stock Awards Granted in Prior Years* | $ | (2,953,760) | | | $ | (2,298,431) | | | $ | (1,632,905) | | | $ | 3,890,738 | | | Change in Fair Value of Stock Awards From Prior Years that Vested in the Covered Year* | $ | (2,396,302) | | | $ | (462,289) | | | $ | (497,604) | | | $ | 70,035 | | | = | Compensation Actually Paid | $ | (2,648,100) | | | $ | 1,811,242 | | | $ | 2,824,846 | | | $ | 16,408,590 | | | | | | | | | | |
|
|
|
|
| Non-PEO NEO Average Total Compensation Amount |
$ 4,142,805
|
2,673,432
|
3,628,443
|
2,727,907
|
| Non-PEO NEO Average Compensation Actually Paid Amount |
$ 8,476,831
|
(112,975)
|
997,555
|
159,042
|
| Adjustment to Non-PEO NEO Compensation Footnote |
| | | | | | | | | | | | | | | | | | | | | | | | | | | | Average of Other NEOs | | | 2020 | | 2021 | | 2022 | | 2023 | | Summary Compensation Table Total | $ | 2,727,907 | | | $ | 3,628,443 | | | $ | 2,673,432 | | | $ | 4,142,805 | | | Less: | Grant Date Fair Value of Stock Awards | $ | (2,320,434) | | | $ | (2,872,977) | | | $ | (1,335,528) | | | $ | (3,302,199) | | | Plus: | Fair Value at Year-End of Unvested Stock Awards Granted in the Covered Year* | $ | 2,174,301 | | | $ | 1,660,435 | | | $ | 956,604 | | | $ | 5,900,641 | | | Change in Fair Value of Unvested Stock Awards Granted in Prior Years* | $ | (485,114) | | | $ | (1,177,223) | | | $ | (417,568) | | | $ | 1,697,984 | | | Change in Fair Value of Stock Awards From Prior Years that Vested in the Covered Year* | $ | (907,038) | | | $ | (241,123) | | | $ | (206,936) | | | $ | 37,600 | | | Less: | Fair Value of Stock Awards Forfeited During the Covered Year | $ | (1,030,580) | | | $ | — | | | $ | (1,782,979) | | | $ | — | | | = | Compensation Actually Paid | $ | 159,042 | | | $ | 997,555 | | | $ | (112,975) | | | $ | 8,476,831 | | | | | | | | | | |
*All Market Stock Unit (MSU) valuations included in "Compensation Actually Paid" values were performed using the Monte Carlo probability model in a manner consistent with the process used to determine MSU grant date fair values under ASC718 (refer to our 2023 10-K for additional detail).
|
|
|
|
| Compensation Actually Paid vs. Total Shareholder Return |
|
|
|
|
| Compensation Actually Paid vs. Net Income |
|
|
|
|
| Compensation Actually Paid vs. Company Selected Measure |
|
|
|
|
| Tabular List, Table |
| | | | | | | | | | The following measures in our assessment represent the most important financial performance measures that link compensation actually paid to our NEOs for 2023 to our performance: | | | | | | ü | Total Revenue | | | | | | ü | Free Cash Flow - Net cash provided by (used in) operating activities, excluding severance payments, less capital expenditures and capitalized internal-use software development costs. | | | | | | ü | Our Stock Price | |
|
|
|
|
| Total Shareholder Return Amount |
$ 65
|
40
|
58
|
85
|
| Peer Group Total Shareholder Return Amount |
121
|
106
|
135
|
118
|
| Net Income (Loss) |
$ (56,000,000)
|
$ (82,000,000)
|
$ (81,000,000)
|
$ (77,000,000)
|
| Company Selected Measure Amount |
304,000,000
|
276,000,000
|
251,000,000
|
252,000,000
|
| Additional 402(v) Disclosure |
(1) To calculate Compensation Actually Paid, the following amounts were deducted from and added to the applicable Summary Compensation Table (SCT) total compensation:
|
|
|
|
| Measure:: 1 |
|
|
|
|
| Pay vs Performance Disclosure |
|
|
|
|
| Name |
Total Revenue
|
|
|
|
| Measure:: 2 |
|
|
|
|
| Pay vs Performance Disclosure |
|
|
|
|
| Name |
Free Cash Flow - Net cash provided by (used in) operating activities, excluding severance payments, less capital expenditures and capitalized internal-use software development costs.
|
|
|
|
| Measure:: 3 |
|
|
|
|
| Pay vs Performance Disclosure |
|
|
|
|
| Name |
Our Stock Price
|
|
|
|
| PEO | Equity Awards Reported Value [Member] |
|
|
|
|
| Pay vs Performance Disclosure |
|
|
|
|
| Adjustment to Compensation, Amount |
$ (6,219,177)
|
$ (5,970,413)
|
$ (6,102,556)
|
$ (4,766,465)
|
| PEO | Equity Awards Granted During the Year, Unvested [Member] |
|
|
|
|
| Pay vs Performance Disclosure |
|
|
|
|
| Adjustment to Compensation, Amount |
11,112,544
|
4,223,767
|
3,334,886
|
2,005,415
|
| PEO | Equity Awards Granted in Prior Years, Unvested [Member] |
|
|
|
|
| Pay vs Performance Disclosure |
|
|
|
|
| Adjustment to Compensation, Amount |
3,890,738
|
(1,632,905)
|
(2,298,431)
|
(2,953,760)
|
| PEO | Equity Awards Granted in Prior Years, Vested [Member] |
|
|
|
|
| Pay vs Performance Disclosure |
|
|
|
|
| Adjustment to Compensation, Amount |
70,035
|
(497,604)
|
(462,289)
|
(2,396,302)
|
| Non-PEO NEO | Equity Awards Reported Value [Member] |
|
|
|
|
| Pay vs Performance Disclosure |
|
|
|
|
| Adjustment to Compensation, Amount |
(3,302,199)
|
(1,335,528)
|
(2,872,977)
|
(2,320,434)
|
| Non-PEO NEO | Equity Awards Granted During the Year, Unvested [Member] |
|
|
|
|
| Pay vs Performance Disclosure |
|
|
|
|
| Adjustment to Compensation, Amount |
5,900,641
|
956,604
|
1,660,435
|
2,174,301
|
| Non-PEO NEO | Equity Awards Granted in Prior Years, Unvested [Member] |
|
|
|
|
| Pay vs Performance Disclosure |
|
|
|
|
| Adjustment to Compensation, Amount |
1,697,984
|
(417,568)
|
(1,177,223)
|
(485,114)
|
| Non-PEO NEO | Equity Awards Granted in Prior Years, Vested [Member] |
|
|
|
|
| Pay vs Performance Disclosure |
|
|
|
|
| Adjustment to Compensation, Amount |
37,600
|
(206,936)
|
(241,123)
|
(907,038)
|
| Non-PEO NEO | Equity Awards that Failed to Meet Vesting Conditions [Member] |
|
|
|
|
| Pay vs Performance Disclosure |
|
|
|
|
| Adjustment to Compensation, Amount |
$ 0
|
$ (1,782,979)
|
$ 0
|
$ (1,030,580)
|