Pay vs Performance Disclosure - USD ($)
Dec. 31, 2023
Dec. 31, 2022
Dec. 31, 2021
Dec. 31, 2020
Year (a) | Summary Compensation Table Total for PEO (b)(1)(2) | Compensation Actually Paid to PEO (c)(3) | Average Summary Compensation Table Total for Non-PEO NEOs (d)(1)(2) | Average Compensation Actually Paid to Non-PEO NEOs (e)(4) | Value of Initial Fixed $100 Investment Based on: | Net Income (Loss) (h)(7) | Company-Selected Measure: Revenue (i)(8) | |||||||||||||||||||||||||||||||||||||||||||
| Total Shareholder Return (f)(5) | Peer Group Total Shareholder Return (g)(6) | |||||||||||||||||||||||||||||||||||||||||||||||||
| (in thousands) | ||||||||||||||||||||||||||||||||||||||||||||||||||
| 2023 | $ | 8,570,853 | $ | 13,736,333 | $ | 3,051,458 | $ | 4,358,810 | $ | 51 | $ | 211 | $ | (9,109) | $ | 758,740 | ||||||||||||||||||||||||||||||||||
| 2022 | 9,836,606 | 2,854,125 | 4,048,809 | 1,835,658 | 38 | 135 | (929,413) | 719,367 | ||||||||||||||||||||||||||||||||||||||||||
| 2021 | 23,576,716 | 17,991,135 | 4,482,514 | 1,644,792 | 57 | 190 | (51,408) | 718,632 | ||||||||||||||||||||||||||||||||||||||||||
| 2020 | 25,488,862 | 2,386,691 | 7,907,678 | 3,883,965 | 81 | 142 | 158,475 | 716,770 | ||||||||||||||||||||||||||||||||||||||||||
•2023: J. Barton Kalsu, Jason W. Bliss, Rohini Kasturi, Andrea Webb
•2022: J. Barton Kalsu, Jason W. Bliss, Rohini Kasturi, Andrea Webb
•2021: J. Barton Kalsu, David Gardiner, Jason W. Bliss, John Pagliuca
•2020: J. Barton Kalsu, David Gardiner, Jason W. Bliss, John Pagliuca, Woong Joseph Kim
compensation for each covered fiscal year to determine the “compensation actually paid” to each such PEO for such year.
| PEO | K. Thompson | S. Ramakrishna | |||||||||||||||||||||||||||
| 2020 | 2021 | 2022 | 2023 | ||||||||||||||||||||||||||
| Summary Compensation Table - Total Compensation | (a) | $ | 25,488,862 | $ | 23,576,716 | $ | 9,836,606 | $ | 8,570,853 | ||||||||||||||||||||
| — | Grant Date Fair Value of Stock Awards and Option Awards Granted in Fiscal Year | (b) | 23,902,462 | 21,699,121 | 9,074,406 | 6,772,653 | |||||||||||||||||||||||
| + | Fair Value at Fiscal Year End of Outstanding and Unvested Stock Awards and Option Awards Granted in Fiscal Year | (c) | — | 16,113,540 | 5,989,876 | 8,642,630 | |||||||||||||||||||||||
| + | Change in Fair Value of Outstanding and Unvested Stock Awards and Option Awards Granted in Prior Fiscal Years | (d) | (94,946) | — | (3,085,167) | 2,082,799 | |||||||||||||||||||||||
| + | Fair Value at Vesting of Stock Awards and Option Awards Granted in Fiscal Year That Vested During Fiscal Year | (e) | 3,149,427 | — | — | 746,841 | |||||||||||||||||||||||
| + | Change in Fair Value as of Vesting Date of Stock Awards and Option Awards Granted in Prior Fiscal Years For Which Applicable Vesting Conditions Were Satisfied During Fiscal Year | (f) | (2,254,190) | — | (812,783) | 465,863 | |||||||||||||||||||||||
| — | Fair Value as of Prior Fiscal Year End of Stock Awards and Option Awards Granted in Prior Fiscal Years That Failed to Meet Applicable Vesting Conditions During Fiscal Year | (g) | — | — | — | — | |||||||||||||||||||||||
| = | Compensation Actually Paid | $ | 2,386,691 | $ | 17,991,135 | $ | 2,854,125 | $ | 13,736,333 | ||||||||||||||||||||
(a) Represents Total Compensation as reported in the Summary Compensation Table for the indicated fiscal year.
(b) Represents the aggregate grant date fair value of the stock awards granted to Sudhakar Ramakrishna or Kevin B. Thompson, as applicable, during the indicated fiscal year, computed in accordance with FASB ASC Topic 718. Amounts shown are the amounts reported in the Summary Compensation Table. The grant date fair value for 2021 reflects the new hire CEO compensation package of Sudhakar Ramakrishna.
(c) Represents the aggregate fair value as of the indicated fiscal year-end of Sudhakar Ramakrishna’s or Kevin B. Thompson’s, as applicable, outstanding and unvested stock awards granted during such fiscal year, computed in accordance with FASB ASC Topic 718.
(d) Represents the aggregate change in fair value during the indicated fiscal year (from the end of the prior fiscal year) of the outstanding and unvested stock awards held by Sudhakar Ramakrishna or Kevin B. Thompson, as applicable, as of the last day of the indicated fiscal year granted in any prior fiscal year, computed in accordance with FASB ASC Topic 718.
(e) Represents the fair value as of the vesting of the stock awards granted to Sudhakar Ramakrishna or Kevin B. Thompson, as applicable, that were granted and vested in the same indicated fiscal year, as computed in accordance with FASB ASC Topic 718.
(f) Represents the aggregate change in fair value, measured from the prior fiscal year-end to the vesting date, of each stock award held by Sudhakar Ramakrishna or Kevin B. Thompson, as applicable, that was granted in a prior fiscal year and which satisfied all applicable vesting conditions during the indicated fiscal year, computed in accordance with FASB ASC Topic 718.
(g) Represents the aggregate fair value as of the last day of the prior fiscal year of each stock award held by Sudhakar Ramakrishna or Kevin B. Thompson, as applicable, that was granted in a prior fiscal year and which failed to meet the applicable vesting conditions in the indicated fiscal year, computed in accordance with FASB ASC Topic 718.
| Non-PEO NEO Average | |||||||||||||||||||||||||||||
| 2020 | 2021 | 2022 | 2023 | ||||||||||||||||||||||||||
| Summary Compensation Table - Total Compensation | (a) | $ | 7,907,678 | $ | 4,482,514 | $ | 4,048,809 | $ | 3,051,458 | ||||||||||||||||||||
| — | Grant Date Fair Value of Stock Awards and Option Awards Granted in Fiscal Year | (b) | 7,151,877 | 3,775,015 | 3,603,067 | 2,239,333 | |||||||||||||||||||||||
| + | Fair Value at Fiscal Year End of Outstanding and Unvested Stock Awards and Option Awards Granted in Fiscal Year | (c) | 3,895,246 | 2,937,742 | 2,378,329 | 2,473,086 | |||||||||||||||||||||||
| + | Change in Fair Value of Outstanding and Unvested Stock Awards and Option Awards Granted in Prior Fiscal Years | (d) | (609,634) | (2,110,807) | (749,254) | 596,768 | |||||||||||||||||||||||
| + | Fair Value at Vesting of Stock Awards and Option Awards Granted in Fiscal Year That Vested During Fiscal Year | (e) | — | — | — | 246,939 | |||||||||||||||||||||||
| + | Change in Fair Value as of Vesting Date of Stock Awards and Option Awards Granted in Prior Fiscal Years For Which Applicable Vesting Conditions Were Satisfied During Fiscal Year | (f) | (157,448) | 110,360 | (239,159) | 229,893 | |||||||||||||||||||||||
| — | Fair Value as of Prior Fiscal Year End of Stock Awards and Option Awards Granted in Prior Fiscal Years That Failed to Meet Applicable Vesting Conditions During Fiscal Year | (g) | — | — | — | — | |||||||||||||||||||||||
| = | Compensation Actually Paid | $ | 3,883,965 | $ | 1,644,792 | $ | 1,835,658 | $ | 4,358,810 | ||||||||||||||||||||
See note (1) above for the NEOs included in the average for each applicable covered fiscal year.
(a) Represents the average Total Compensation as reported in the Summary Compensation Table for our Non-PEO NEOs as a group in the indicated fiscal year.
(b) Represents the average aggregate grant date fair value of the stock awards and option awards granted to our Non-PEO NEOs as a group during the indicated fiscal year, computed in accordance with FASB ASC Topic 718. Amounts shown are the amounts reported in the Summary Compensation Table.
(c) Represents the average aggregate fair value as of the indicated fiscal year-end of the outstanding and unvested stock awards and option awards of our Non-PEOs NEOs as a group granted during such fiscal year, computed in accordance with FASB ASC Topic 718.
(d) Represents the average aggregate change in fair value during the indicated fiscal year (from the end of the prior fiscal year) of the outstanding and unvested stock awards and option awards held by our Non-PEO NEOs as a group as of the last day of the indicated fiscal year granted in any prior fiscal year, computed in accordance with FASB ASC Topic 718.
(e) Represents the average aggregate fair value as of the vesting of the stock awards and option awards that were granted to our Non-PEO NEOs as a group that were granted and vested in the same indicated fiscal year, computed in accordance with FASB ASC Topic 718.
(f) Represents the average aggregate change in fair value, measured from the prior fiscal year-end to the vesting date, of each stock award and option award held by our Non-PEO NEOs as a group that was granted in a prior fiscal year and which satisfied all applicable vesting conditions during the indicated fiscal year, computed in accordance with FASB ASC Topic 718.
(g) Represents the average aggregate fair value as of the last day of the prior fiscal year of the stock awards and option awards held by our Non-PEO NEOs as a group that were granted in a prior fiscal year and which failed to meet the applicable vesting conditions in the indicated fiscal year, computed in accordance with FASB ASC Topic 718.
In 2021 and 2020 modifications were made to the annual equity awards to account for uncertainty in our business from external factors, each of which are referenced in the “Executive Compensation—Compensation Discussion and Analysis” section of our proxy statement for the applicable year.
In June 2020, as a result of the impacts of the COVID-19 pandemic, the compensation committee made modifications to outstanding equity awards to remove the performance-based conditions of outstanding equity awards such that the awards would be subject solely to time-based vesting schedules. The Company recognized incremental fair value on the date of such modifications.
In July 2021, connection with the spin-off of the N-able business in all of our outstanding equity awards were equitably adjusted, to reflect the impact of the spin-off and preserve the value of the awards. Outstanding SolarWinds RSUs were adjusted by a conversion ratio of 1.5744 per 1 RSU then held. Although the spin-off adjustment was a modification for accounting purposes, it did not result in the recognition of any incremental fair value on the date of the modification. Effective as of July 30, 2021, we effected a reverse stock split of the issued and outstanding shares of our common stock, at a ratio of one share for two shares. Pursuant to the 2018 Plan, all outstanding equity awards were adjusted to give effect to such reverse split. On July 30, 2021, our Board declared a special cash dividend of $1.50 per share which was paid on August 24, 2021 to stockholders of record at the close of business on August 9, 2021. In connection with the special dividend and in accordance with the terms of the 2018 Plan, all outstanding equity awards were equitably adjusted to reflect the impact of the special dividend and preserve the value of the awards. Outstanding RSUs awards were adjusted by a conversion ratio of 1.0862 per 1 RSU then held. The Company recognized incremental fair value on the date of the special dividend adjustment.
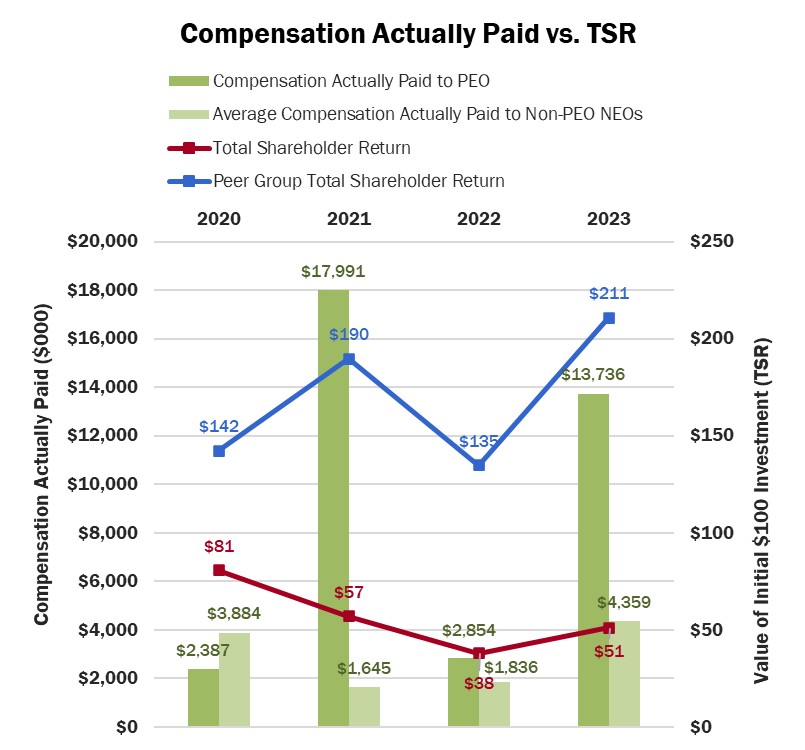
Relationship Between Compensation Paid to the PEO and Average Other NEOs and the Company’s Cumulative TSR
Our PEO’s “compensation actually paid” was generally impacted by our TSR performance, given the leverage of our compensation program towards equity compensation. However, “compensation actually paid” to our PEO for 2021 was anomalously greater as a result of one-time new hire equity awards granted to Sudhakar Ramakrishna. The average “compensation actually paid” for our other NEOs was also similarly impacted by our TSR performance.
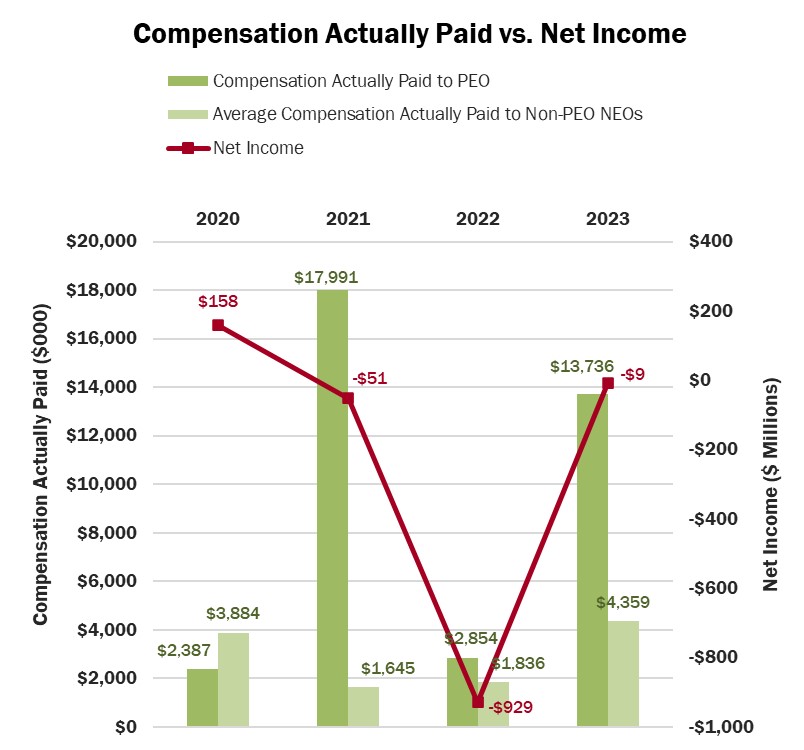
Relationship Between Compensation Paid to the PEO and Average Other NEOs and the Company’s Net Income (Loss)
We do not use GAAP or non-GAAP net income (loss) as a financial performance measure in our overall executive compensation program. Please refer to our 2203 Annual Report for further information on our net income.
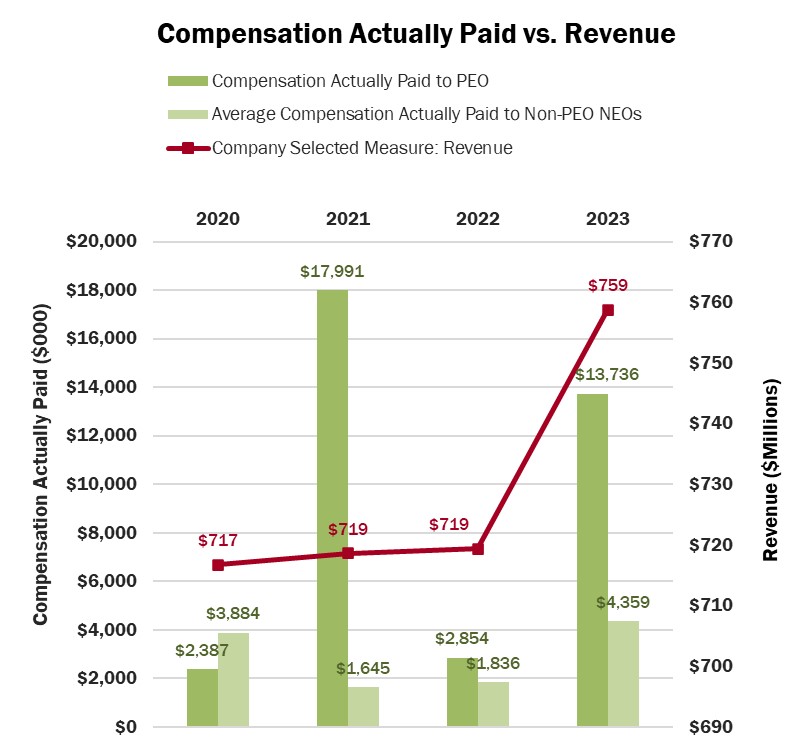
Relationship Between Compensation Paid to the PEO and Average Other NEOs and the Company’s Revenue
As described further above, revenue is a key driver of the Company’s performance and stockholder value creation and represented an important part of the corporate performance component of our 2023 Incentive Plan (50% of the overall plan payout) and is a performance component for vesting of our 2023 PSUs.
•Adjusted EBITDA
•Subscription Annual Recurring Revenue