Pay vs Performance Disclosure - USD ($)
Dec. 31, 2023
Dec. 31, 2022
Dec. 31, 2021
Dec. 31, 2020
Pay Versus Performance
Pay Versus Performance Table
In accordance with the rules adopted by the Securities and Exchange Commission pursuant to the Dodd-Frank Wall Street Reform and Consumer Protection Act, we are providing the following information regarding the relationship between the “Compensation Actually Paid” to our CEO (also referred to as our “PEO”) and our other named executive officers (together, our “NEOs”) and certain financial performance measures for the Company. This information includes compensation information for our PEO and our NEOs, as well as information on our cumulative total shareholder return (“TSR”), the cumulative TSR of our peer group, our net income and our product revenues, net for the fiscal years listed below. For purposes of this section, “peer group” is defined as the Nasdaq Biotechnology Index, as further detailed in footnote 7 below.
| Year | | | Summary Compensation Table Total for PEO ($)(1) | | | Compensation Actually Paid to PEO ($)(2)(3) | | | Average Summary Compensation Table Total for Non-PEO Named Executive Officers ($)(4) | | | Average Compensation Actually Paid to Non-PEO Named Executive Officers ($)(2)(5) | | | Value of Initial Fixed $100 Investment Based on: | | | Net Income ($ M) | | | Total Product Revenues ($ M)(8) | | |||||||||||||||||||||||||||
| | Total Shareholder Return ($)(6) | | | Peer Group Total Shareholder Return ($)(7) | | ||||||||||||||||||||||||||||||||||||||||||||
| 2023 | | | | | 16,659,526 | | | | | | 7,842,731 | | | | | | 7,843,705 | | | | | | 6,405,428 | | | | | | 71.91 | | | | | | 115.42 | | | | | | 597.6 | | | | | | 3,165.2 | | |
| 2022 | | | | | 16,669,368 | | | | | | 15,972,264 | | | | | | 5,750,911 | | | | | | 5,496,116 | | | | | | 91.98 | | | | | | 113.65 | | | | | | 340.7 | | | | | | 2,746.9 | | |
| 2021 | | | | | 14,444,265 | | | | | | 6,228,229 | | | | | | 5,217,889 | | | | | | 1,847,797 | | | | | | 84.06 | | | | | | 126.45 | | | | | | 948.6 | | | | | | 2,322.0 | | |
| 2020 | | | | | 16,378,192 | | | | | | 13,448,394 | | | | | | 3,725,684 | | | | | | 3,748,945 | | | | | | 99.61 | | | | | | 126.42 | | | | | | (295.7) | | | | | | 2,068.7 | | |
(1)
The dollar amounts reported are the amounts reported in the “Total” column of the Summary Compensation Table for Hervé Hoppenot, our CEO.
(2)
The amounts shown for “Compensation Actually Paid “ (CAP) have been calculated in accordance with SEC rules and represent amounts reported in the Summary Compensation Table with certain adjustments as described in footnotes 3 and 5 below.
(3)
The following table sets forth the adjustments made to the information provided in the Summary Compensation Table to arrive at the “Compensation Actually Paid” for our PEO for each of the years presented:
| Year | | | Reported Summary Compensation Table Total for PEO ($) | | | Reported Value of Equity Awards ($) | | | CAP of Equity Vesting during FY ($) | | | CAP of Unvested Equity at FYE granted prior to the current FY ($) | | | CAP of Unvested Equity at FYE granted during the current FY ($) | | | Compensation Actually Paid to PEO ($)* | | ||||||||||||||||||
| 2023 | | | | | 16,659,526 | | | | | | (13,759,707) | | | | | | (2,202,340) | | | | | | (1,080,176) | | | | | | 8,225,428 | | | | | | 7,842,731 | | |
| 2022 | | | | | 16,669,368 | | | | | | (13,783,149) | | | | | | 1,005,994 | | | | | | 2,981,288 | | | | | | 9,098,763 | | | | | | 15,972,264 | | |
| 2021 | | | | | 14,444,265 | | | | | | (12,088,636) | | | | | | (606,066) | | | | | | (1,960,844) | | | | | | 6,439,510 | | | | | | 6,228,229 | | |
| 2020 | | | | | 16,378,192 | | | | | | (13,832,247) | | | | | | 2,043,085 | | | | | | 127,113 | | | | | | 8,732,251 | | | | | | 13,448,394 | | |
*
Due to calculation errors, the Compensation Actually Paid to our PEO for each of 2022, 2021 and 2020 as reported in our 2023 Proxy Statement (stated therein as $16,903,544, $6,852,226 and $14,694,652, respectively) was overstated. The Compensation Actually Paid to our PEO for each of these years has been corrected in the table set forth above.
(4)
Our non-PEO Named Executive Officers for 2023 are comprised of Ms. Stamoulis, Dr. Cagnoni, Dr. Stein, and Dr. Flannelly. Our non-PEO Named Executive Officers for 2021 and 2022 were comprised of Ms. Stamoulis, Dr. Stein, Ms. Maria E. Pasquale and Dr. Flannelly. Our non-PEO Named Executive Officers for 2020 were comprised of Ms. Stamoulis, Dr. Stein, Dr. Flannelly and Dr. Vijay Iyengar.
(5)
The following table sets forth the adjustments made to the information provided in the Summary Compensation Table to arrive at the Average Compensation Actually Paid for our non-PEO Named Executive Officers for each of the years presented:
| Year | | | Reported Summary Compensation Table Total for Non-PEO NEOs ($) | | | Reported Value of Equity Awards ($) | | | CAP of Equity Vesting during FY ($) | | | CAP of Unvested Equity at FYE granted prior to the current FY ($) | | | CAP of Unvested Equity at FYE granted during the current FY ($) | | | Compensation Actually Paid to Non-PEO NEOs ($)* | | ||||||||||||||||||
| 2023 | | | | | 7,843,705 | | | | | | (6,458,845) | | | | | | (291,967) | | | | | | 203,007 | | | | | | 5,109,528 | | | | | | 6,405,428 | | |
| 2022 | | | | | 5,750,911 | | | | | | (4,652,030) | | | | | | 182,351 | | | | | | 644,655 | | | | | | 3,570,229 | | | | | | 5,496,116 | | |
| 2021 | | | | | 5,217,889 | | | | | | (4,302,448) | | | | | | (213,819) | | | | | | (837,071) | | | | | | 1,983,246 | | | | | | 1,847,797 | | |
| 2020 | | | | | 3,725,684 | | | | | | (2,791,502) | | | | | | 218,828 | | | | | | 534,106 | | | | | | 2,061,829 | | | | | | 3,748,945 | | |
*
Due to calculation errors, the Average Compensation Actually Paid to our non-PEO Named Executive Officers for each of 2022, 2021 and 2020 as reported in our 2023 Proxy Statement (stated therein as $5,661,324, $1,954,190 and $3,908,344, respectively) was overstated. The Average Compensation Actually Paid to our non-PEO Named Executive Officers for each of these years has been corrected in the table set forth above.
(6)
Total Shareholder Return is calculated as the sum of the difference between our share price at the end of each year shown and the beginning of the measurement period plus the cumulative amount of dividends for the investment period, assuming dividend reinvestment, divided by our share price at the beginning of the measurement period. The beginning of the measurement period for each year in the table is December 31, 2019.
(7)
The peer group used for calculating Peer Group Total Shareholder Return is the Nasdaq Biotechnology Index, which is used for determining performance of the relative total shareholder return component for the performance shares awards to the NEOs.
(8)
Represents total product revenues, net, as disclosed in the Consolidated Statements of Operations in our Annual Reports on Form 10-K for the years ended December 31, 2023, 2022, 2021 and 2020.
(1)
The dollar amounts reported are the amounts reported in the “Total” column of the Summary Compensation Table for Hervé Hoppenot, our CEO.
(4)
Our non-PEO Named Executive Officers for 2023 are comprised of Ms. Stamoulis, Dr. Cagnoni, Dr. Stein, and Dr. Flannelly. Our non-PEO Named Executive Officers for 2021 and 2022 were comprised of Ms. Stamoulis, Dr. Stein, Ms. Maria E. Pasquale and Dr. Flannelly. Our non-PEO Named Executive Officers for 2020 were comprised of Ms. Stamoulis, Dr. Stein, Dr. Flannelly and Dr. Vijay Iyengar.
(7)
The peer group used for calculating Peer Group Total Shareholder Return is the Nasdaq Biotechnology Index, which is used for determining performance of the relative total shareholder return component for the performance shares awards to the NEOs.
(3)
The following table sets forth the adjustments made to the information provided in the Summary Compensation Table to arrive at the “Compensation Actually Paid” for our PEO for each of the years presented:
| Year | | | Reported Summary Compensation Table Total for PEO ($) | | | Reported Value of Equity Awards ($) | | | CAP of Equity Vesting during FY ($) | | | CAP of Unvested Equity at FYE granted prior to the current FY ($) | | | CAP of Unvested Equity at FYE granted during the current FY ($) | | | Compensation Actually Paid to PEO ($)* | | ||||||||||||||||||
| 2023 | | | | | 16,659,526 | | | | | | (13,759,707) | | | | | | (2,202,340) | | | | | | (1,080,176) | | | | | | 8,225,428 | | | | | | 7,842,731 | | |
| 2022 | | | | | 16,669,368 | | | | | | (13,783,149) | | | | | | 1,005,994 | | | | | | 2,981,288 | | | | | | 9,098,763 | | | | | | 15,972,264 | | |
| 2021 | | | | | 14,444,265 | | | | | | (12,088,636) | | | | | | (606,066) | | | | | | (1,960,844) | | | | | | 6,439,510 | | | | | | 6,228,229 | | |
| 2020 | | | | | 16,378,192 | | | | | | (13,832,247) | | | | | | 2,043,085 | | | | | | 127,113 | | | | | | 8,732,251 | | | | | | 13,448,394 | | |
*
Due to calculation errors, the Compensation Actually Paid to our PEO for each of 2022, 2021 and 2020 as reported in our 2023 Proxy Statement (stated therein as $16,903,544, $6,852,226 and $14,694,652, respectively) was overstated. The Compensation Actually Paid to our PEO for each of these years has been corrected in the table set forth above.
(5)
The following table sets forth the adjustments made to the information provided in the Summary Compensation Table to arrive at the Average Compensation Actually Paid for our non-PEO Named Executive Officers for each of the years presented:
| Year | | | Reported Summary Compensation Table Total for Non-PEO NEOs ($) | | | Reported Value of Equity Awards ($) | | | CAP of Equity Vesting during FY ($) | | | CAP of Unvested Equity at FYE granted prior to the current FY ($) | | | CAP of Unvested Equity at FYE granted during the current FY ($) | | | Compensation Actually Paid to Non-PEO NEOs ($)* | | ||||||||||||||||||
| 2023 | | | | | 7,843,705 | | | | | | (6,458,845) | | | | | | (291,967) | | | | | | 203,007 | | | | | | 5,109,528 | | | | | | 6,405,428 | | |
| 2022 | | | | | 5,750,911 | | | | | | (4,652,030) | | | | | | 182,351 | | | | | | 644,655 | | | | | | 3,570,229 | | | | | | 5,496,116 | | |
| 2021 | | | | | 5,217,889 | | | | | | (4,302,448) | | | | | | (213,819) | | | | | | (837,071) | | | | | | 1,983,246 | | | | | | 1,847,797 | | |
| 2020 | | | | | 3,725,684 | | | | | | (2,791,502) | | | | | | 218,828 | | | | | | 534,106 | | | | | | 2,061,829 | | | | | | 3,748,945 | | |
*
Due to calculation errors, the Average Compensation Actually Paid to our non-PEO Named Executive Officers for each of 2022, 2021 and 2020 as reported in our 2023 Proxy Statement (stated therein as $5,661,324, $1,954,190 and $3,908,344, respectively) was overstated. The Average Compensation Actually Paid to our non-PEO Named Executive Officers for each of these years has been corrected in the table set forth above.
Compensation Actually Paid Versus Total Shareholder Return 2020-2023
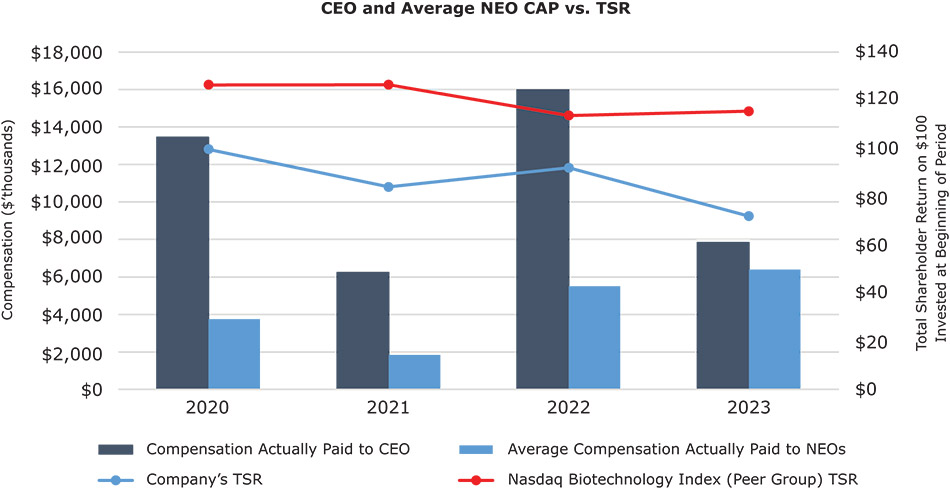
TSR is based on the Nasdaq Biotechnology Index, which is the peer group used for the relative TSR component of our Performance Shares awarded to our CEO and other NEOs. It is also the peer group used in the Stock Price Performance Graph furnished with our Annual Report that is delivered to our stockholders together with this Proxy Statement in connection with our Annual Meeting of Stockholders. Compensation Actually Paid is highly correlated with TSR, given that the values of the components of our executive equity compensation (stock options, restricted stock units and a portion of our performance share goals), depend on our stock price performance.
Compensation Actually Paid Versus Net Income (Loss) 2020-2023
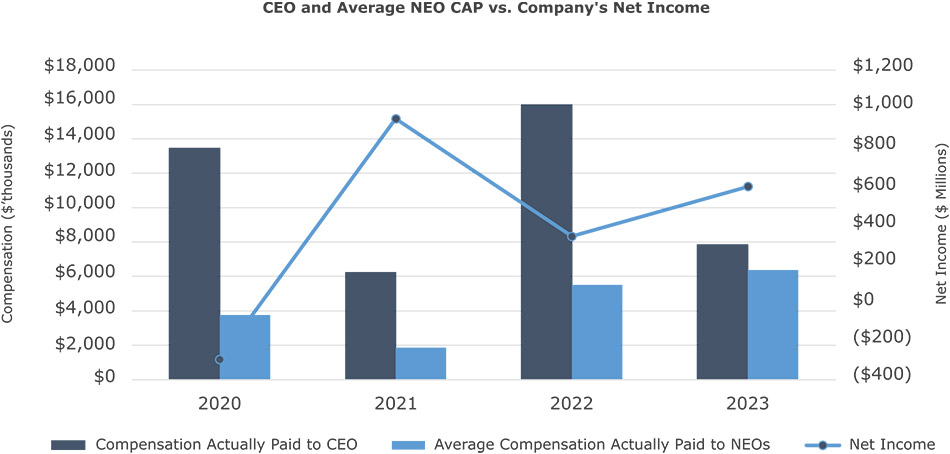
Incyte does not currently utilize GAAP net income (loss) as a metric in its incentive programs, given that it may include certain one-time/non-recurring items that could make it not reflective of the underlying performance of our business.
Compensation Actually Paid Versus Total Products Revenues, 2020-2023
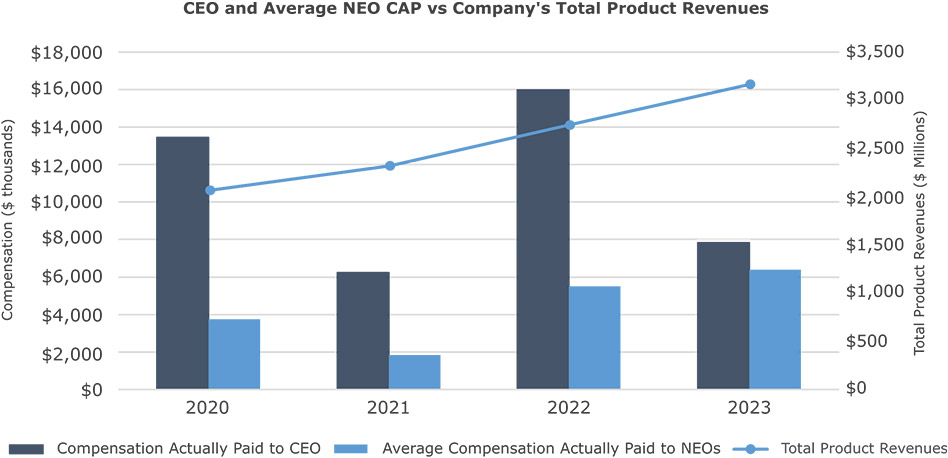
As previously discussed, our CEO and other NEOs’ Compensation Actually Paid is highly dependent on the absolute and relative stock price performance due to the significant portion of our compensation program linked to equity incentives. In addition, other metrics such as total product revenues, (which account for a significant portion (40%) of the performance goals for our performance share (PSU) component of our executive officers’ equity compensation in 2021, 2022 and 2023), pipeline progression and regulatory approvals, are also important performance measures that we use to link our performance to compensation actually paid to our executive officers.
Financial Performance Measures
The following table lists the most important performance measures that we used to link our performance to compensation actually paid to our named executive officers for the most recently completed fiscal year:
| Most Important Performance Measures | |
| Total product revenues | |
| Pipeline development and progression | |
| Total shareholder return (TSR) | |
(8)
Represents total product revenues, net, as disclosed in the Consolidated Statements of Operations in our Annual Reports on Form 10-K for the years ended December 31, 2023, 2022, 2021 and 2020.