Putnam VT Core Equity Fund seeks capital appreciation.
The following table describes the fees and expenses you may pay if you buy, hold and sell shares of the fund. You may pay other fees, such as brokerage commissions and other fees to financial intermediaries, which are not reflected in the tables and examples below. The fees and expenses information does not reflect insurance-related charges or expenses borne by contract holders indirectly investing in the fund. If it did, expenses would be higher.
Annual Fund Operating Expenses - Putnam VT Core Equity Fund |
Class IA C000010855 |
Class IB C000010856 |
|---|---|---|
| Management Fees (as a percentage of Assets) | 0.55% | 0.55% |
| Distribution and Service (12b-1) Fees | none | 0.25% |
| Other Expenses (as a percentage of Assets): | 0.15% | 0.15% |
| Expenses (as a percentage of Assets) | 0.70% | 0.95% |
The following hypothetical example is intended to help you compare the cost of investing in the fund with the cost of investing in other funds. The example does not reflect insurance-related charges or expenses. If it did, expenses would be higher. It assumes that you invest $10,000 in the fund for the time periods indicated and then redeem or hold all your shares at the end of those periods. It assumes a 5% return on your investment each year and that the fund’s operating expenses remain the same. Your actual costs may be higher or lower.
Expense Example - Putnam VT Core Equity Fund - USD ($) |
Expense Example, with Redemption, 1 Year |
Expense Example, with Redemption, 3 Years |
Expense Example, with Redemption, 5 Years |
Expense Example, with Redemption, 10 Years |
|---|---|---|---|---|
| Class IA C000010855 | 72 | 224 | 390 | 871 |
| Class IB C000010856 | 97 | 303 | 525 | 1,166 |
The fund pays transaction-related costs, such as commissions, when it buys and sells securities (or “turns over” its portfolio). A higher turnover rate may indicate higher transaction costs. These costs, which are not reflected in annual fund operating expenses or the above example, affect fund performance. The fund’s turnover rate in the most recent fiscal year was 17%.
Investments
We invest mainly in common stocks (growth or value stocks or both) of U.S. companies of any size that we believe have favorable investment potential. For example, we may purchase stocks of companies with stock prices that reflect a value lower than that which we place on the company. We may also consider other factors we believe will cause the stock price to rise. We may consider, among other factors, a company’s valuation, financial strength, growth potential, competitive position in its industry, projected future earnings, cash flows and dividends when deciding whether to buy or sell investments. Under normal circumstances, we invest at least 80% of the fund’s net assets (plus the amount of any borrowings for investment purposes) in equity investments, including common stocks, preferred stocks, convertible securities, warrants, American Depositary Receipts (ADRs) and Global Depositary Receipts (GDRs). This policy may be changed only after 60 days’ notice to shareholders.
It is important to understand that you can lose money by investing in the fund.
The value of investments in the fund’s portfolio may fall or fail to rise over extended periods of time for a variety of reasons, including general economic, political or financial market conditions, investor sentiment and market perceptions, government actions, geopolitical events or changes, outbreaks of infectious illnesses or other widespread public health issues, and factors related to a specific issuer, geography, industry or sector. These and other factors may lead to increased volatility and reduced liquidity in the fund’s portfolio holdings, may negatively impact the fund’s performance, and may exacerbate other risks to which the fund is subject. Growth stocks may be more susceptible to earnings disappointments, and value stocks may fail to rebound. These risks are generally greater for small and midsize companies.
There is no guarantee that the investment techniques, analyses, or judgments that we apply in making investment decisions for the fund will produce the intended outcome or that the investments we select for the fund will perform as well as other securities that were not selected for the fund. We, or the fund’s other service providers, may experience disruptions or operating errors that could negatively impact the fund.
The fund may be an investment option for mutual funds that are managed by Franklin Resources, Inc. (Franklin Templeton) and its affiliates as “funds of funds” and other investors with substantial investments in the fund. Such shareholders may at times be considered to control the fund. Dispositions of a large number of shares by these shareholders may adversely affect the fund’s liquidity and net assets. These redemptions may also force the fund to sell securities, which may increase the fund’s brokerage costs.
The fund may not achieve its goal, and it is not intended to be a complete investment program. An investment in the fund is not insured or guaranteed by the Federal Deposit Insurance Corporation or any other government agency.
The performance information below gives some indication of the risks associated with an investment in the fund by showing the fund’s performance year to year and over time. Before June 30, 2018, the fund was managed with a materially different investment strategy and may have achieved materially different performance results under its current investment strategy from
that shown for periods before this date. The performance information does not reflect insurance-related charges or expenses. If it did, performance would be lower. Please remember that past performance is not necessarily an indication of future results.
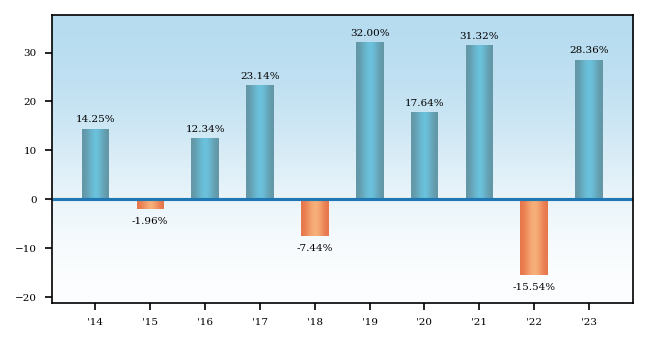
Average Annual Total Returns - Putnam VT Core Equity Fund |
1 Year |
5 Years |
10 Years |
|---|---|---|---|
| Class IA C000010855 | 28.36% | 17.19% | 12.23% |
| Class IB C000010856 | 28.08% | 16.90% | 11.95% |
| Russell 3000® Index (no deduction for fees, expenses or taxes) | 25.96% | 15.16% | 11.48% |
| Frank Russell Company is the source and owner of the trademarks, service marks and copyrights related to the Russell Indexes. Russell® is a trademark of Frank Russell Company. |
Putnam VT Diversified Income Fund seeks as high a level of current income as Putnam Investment Management, LLC believes is consistent with preservation of capital.
The following table describes the fees and expenses you may pay if you buy, hold and sell shares of the fund. You may pay other fees, such as brokerage commissions and other fees to financial intermediaries, which are not reflected in the tables and examples below. The fees and expenses information does not reflect insurance-related charges or expenses borne by contract holders indirectly investing in the fund. If it did, expenses would be higher.
Annual Fund Operating Expenses - Putnam VT Diversified Income Fund |
Class IA C000010881 |
Class IB C000010882 |
|
|---|---|---|---|
| Management Fees (as a percentage of Assets) | 0.54% | 0.54% | |
| Distribution and Service (12b-1) Fees | none | 0.25% | |
| Other Expenses (as a percentage of Assets): | 0.35% | 0.35% | |
| Acquired Fund Fees and Expenses | 0.01% | 0.01% | |
| Expenses (as a percentage of Assets) | 0.90% | 1.15% | |
| Fee Waiver or Reimbursement | [1] | (0.08%) | (0.08%) |
| Net Expenses (as a percentage of Assets) | 0.82% | 1.07% | |
| [1] | Reflects Putnam Investment Management, LLC’s contractual obligation to limit certain fund expenses through 4/30/25. This obligation may be modified or discontinued only with approval of the fund’s Board of Trustees. |
The following hypothetical example is intended to help you compare the cost of investing in the fund with the cost of investing in other funds. The example does not reflect insurance-related charges or expenses. If it did, expenses would be higher. It assumes that you invest $10,000 in the fund for the time periods indicated and then redeem or hold all your shares at the end of those periods. It assumes a 5% return on your investment each year and that the fund’s operating expenses remain the same. Your actual costs may be higher or lower.
Expense Example - Putnam VT Diversified Income Fund - USD ($) |
Expense Example, with Redemption, 1 Year |
Expense Example, with Redemption, 3 Years |
Expense Example, with Redemption, 5 Years |
Expense Example, with Redemption, 10 Years |
|---|---|---|---|---|
| Class IA C000010881 | 84 | 279 | 491 | 1,101 |
| Class IB C000010882 | 109 | 358 | 626 | 1,391 |
The fund pays transaction-related costs, such as commissions, when it buys and sells securities (or “turns over” its portfolio). A higher turnover rate may indicate higher transaction costs. These costs, which are not reflected in annual fund operating expenses or the above example, affect fund performance. The fund’s turnover rate in the most recent fiscal year was 1395%.
Investments
We invest mainly in bonds that are securitized debt instruments (such as mortgage-backed investments) and related derivative instruments, and other obligations of companies and governments worldwide, including bank loans, that are either investment-grade or below-investment-grade in quality (sometimes referred to as “junk bonds”) and have intermediate- to long-term maturities (three years or longer). The fund currently has significant investment exposure to residential and commercial mortgage-backed securities.
We may consider, among other factors, credit, interest rate and prepayment risks, as well as general market conditions, when deciding whether to buy or sell investments. We typically use to a significant extent derivatives, including credit default swaps, interest rate swaps, total return swaps, to-be-announced (TBA) commitments, futures, options and swaptions on mortgage-backed securities and indices, and certain foreign currency transactions and credit default, total return and interest rate swap contracts for both hedging and non-hedging purposes, including to obtain or adjust exposure to mortgage-backed investments.
It is important to understand that you can lose money by investing in the fund.
The value of investments in the fund’s portfolio may fall or fail to rise over extended periods of time for a variety of reasons, including general economic, political or financial market conditions, investor sentiment and market perceptions, government actions, geopolitical events or changes, outbreaks of infectious illnesses or other widespread public health issues, and factors related to a specific issuer, geography, industry or sector. These and other factors may lead to increased volatility and reduced liquidity in the fund’s portfolio holdings, may negatively impact the fund’s performance, and may exacerbate other risks to which the fund is subject.
The risks associated with bond investments include interest rate risk, which is the risk that the value of the fund’s investments is likely to fall if interest rates rise. Bond investments are also subject to credit risk, which is the risk that the issuer of a bond may default on payment of interest or principal. Bond investments may be more susceptible to downgrades or defaults during economic downturns or other periods of economic stress. Interest rate risk is generally greater for longer-term bonds, and credit risk is generally greater for below-investment-grade bonds (a significant part of the fund’s investments), which can be more sensitive to changes in markets, credit conditions, and interest rates and may be considered speculative. Mortgage-backed investments, unlike traditional debt investments, are also subject to prepayment risk, which means that they may increase in value less than other bonds when interest rates decline and decline in value more than other bonds when interest rates rise. We may have to invest the
proceeds from prepaid investments, including mortgage-backed investments, in other investments with less attractive terms and yields. The fund’s investments in mortgage-backed securities, and in certain other securities and derivatives, may be or become illiquid. The fund currently has significant investment exposure to privately issued residential and commercial mortgage-backed securities and mortgage-backed securities issued or guaranteed by the U.S. government or its agencies or instrumentalities, which may make the fund’s net asset value more susceptible to economic, market, political and other developments affecting the residential and commercial real estate markets and the servicing of mortgage loans secured by real estate properties. During periods of difficult economic conditions, delinquencies and losses on commercial mortgage-backed investments in particular generally increase, including as a result of the effects of those conditions on commercial real estate markets, the ability of commercial tenants to make loan payments, and the ability of a property to attract and retain commercial tenants. The value of international investments traded in foreign currencies may be adversely impacted by fluctuations in exchange rates. International investments, particularly investments in emerging markets, may carry risks associated with potentially less stable economies or governments (such as the risk of seizure by a foreign government, the imposition of currency or other restrictions, or high levels of inflation), and may be or become illiquid.
Our use of derivatives may increase the risks of investing in the fund by increasing investment exposure (which may be considered leverage) or, in the case of many over-the-counter instruments, because of the potential inability to terminate or sell derivative positions and the potential failure of the other party to the instrument to meet its obligations. The risk of a party failing to meet its obligations may increase if the fund has significant exposure to that counterparty. The value of derivatives may move in unexpected ways due to unanticipated market movements, the use of leverage, imperfect correlation between the derivative instrument and the reference asset or other factors, especially in unusual market conditions, and volatility in the value of derivatives could adversely impact the fund’s returns, obligations and exposures. Derivatives are also subject to other risks, including liquidity risk (e.g., liquidity demands arising from the requirement to make payments to a derivative counterparty), operational risk (e.g., settlement issues or system failures) and legal risk (e.g., insufficient legal documentation or contract enforceability issues).
The fund expects to engage in frequent trading. Funds with high turnover may incur higher transaction costs than funds with relatively lower turnover, which may detract from performance.
There is no guarantee that the investment techniques, analyses, or judgments that we apply in making investment decisions for the fund will produce the intended outcome or that the investments we select for the fund will perform as well as other securities that were not selected for the fund. We, or the fund’s other service providers, may experience disruptions or operating errors that could negatively impact the fund.
The fund may be an investment option for mutual funds that are managed by Franklin Resources, Inc. (Franklin Templeton) and its affiliates as “funds of funds” and other investors with substantial investments in the fund. Such shareholders may at times be considered to control the fund. Dispositions of a large number of shares by these shareholders may adversely affect the fund’s liquidity and net assets. These redemptions may also force the fund to sell securities, which may increase the fund’s brokerage costs.
The fund may not achieve its goal, and it is not intended to be a complete investment program. An investment in the fund is not insured or guaranteed by the Federal Deposit Insurance Corporation or any other government agency.
The performance information below gives some indication of the risks associated with an investment in the fund by showing the fund’s performance year to year and over time. The performance information does not reflect insurance-related charges or expenses. If it did, performance would be lower. Please remember that past performance is not necessarily an indication of future results.
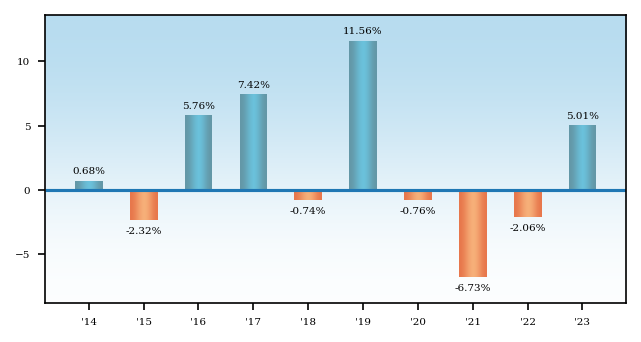
Average Annual Total Returns - Putnam VT Diversified Income Fund |
1 Year |
5 Years |
10 Years |
|---|---|---|---|
| Class IA C000010881 | 5.01% | 1.21% | 1.65% |
| Class IB C000010882 | 4.82% | 0.98% | 1.41% |
| ICE BofA U.S. Treasury Bill Index (no deduction for fees, expenses or taxes) | 5.08% | 1.90% | 1.26% |
| Bloomberg U.S. Aggregate Bond Index (no deduction for fees, expenses or taxes) | 5.53% | 1.10% | 1.81% |
| ICE BofA Indexes: ICE Data Indices, LLC (“ICE BofA”), used with permission. ICE BofA permits use of the ICE BofA indices and related data on an “as is” basis; makes no warranties regarding same; does not guarantee the suitability, quality, accuracy, timeliness, and/or completeness of the ICE BofA indices or any data included in, related to, or derived therefrom; assumes no liability in connection with the use of the foregoing; and does not sponsor, endorse, or recommend Putnam Investments or Franklin Templeton, or any of their products or services. |
| All Bloomberg indices are provided by Bloomberg Index Services Limited. |
| BLOOMBERG® is a trademark and service mark of Bloomberg Finance L.P. and its affiliates (collectively “Bloomberg”). Bloomberg or Bloomberg’s licensors, own all proprietary rights in the Bloomberg Indices. Neither Bloomberg nor Bloomberg’s licensors approve or endorse this material, or guarantee the accuracy or completeness of any information herein, or make any warranty, express or implied, as to the results to be obtained therefrom, and to the maximum extent allowed by law, neither shall have any liability or responsibility for injury or damages arising in connection therewith. |
Putnam VT Emerging Markets Equity Fund seeks long-term capital appreciation.
The following table describes the fees and expenses you may pay if you buy, hold and sell shares of the fund. You may pay other fees, such as brokerage commissions and other fees to financial intermediaries, which are not reflected in the tables and examples below. The fees and expenses information does not reflect insurance-related charges or expenses borne by contract holders indirectly investing in the fund. If it did, expenses would be higher.
Annual Fund Operating Expenses - Putnam VT Emerging Markets Equity Fund |
Class IA C000010853 |
Class IB C000010854 |
|
|---|---|---|---|
| Management Fees (as a percentage of Assets) | 0.92% | 0.92% | |
| Distribution and Service (12b-1) Fees | none | 0.25% | |
| Other Expenses (as a percentage of Assets): | 0.63% | 0.63% | |
| Expenses (as a percentage of Assets) | 1.55% | 1.80% | |
| Fee Waiver or Reimbursement | [1] | (0.46%) | (0.46%) |
| Net Expenses (as a percentage of Assets) | 1.09% | 1.34% | |
| [1] | Reflects Putnam Investment Management, LLC’s contractual obligation to limit certain fund expenses through 4/30/25. This obligation may be modified or discontinued only with approval of the fund’s Board of Trustees. |
The following hypothetical example is intended to help you compare the cost of investing in the fund with the cost of investing in other funds. The example does not reflect insurance-related charges or expenses. If it did, expenses would be higher. It assumes that you invest $10,000 in the fund for the time periods indicated and then redeem or hold all your shares at the end of those periods. It assumes a 5% return on your investment each year and that the fund’s operating expenses remain the same. Only the first year of each period in the example takes into account the expense reimbursement described above. Your actual costs may be higher or lower.
Expense Example - Putnam VT Emerging Markets Equity Fund - USD ($) |
Expense Example, with Redemption, 1 Year |
Expense Example, with Redemption, 3 Years |
Expense Example, with Redemption, 5 Years |
Expense Example, with Redemption, 10 Years |
|---|---|---|---|---|
| Class IA C000010853 | 111 | 444 | 801 | 1,806 |
| Class IB C000010854 | 136 | 522 | 932 | 2,078 |
The fund pays transaction-related costs, such as commissions, when it buys and sells securities (or “turns over” its portfolio). A higher turnover rate may indicate higher transaction costs. These costs, which are not reflected in annual fund operating expenses or the above example, affect fund performance. The fund’s turnover rate in the most recent fiscal year was 53%.
Investments
We invest mainly in common stocks (growth or value stocks or both) of emerging market companies of any size that we believe have favorable investment potential. For example, we may purchase stocks of companies with stock prices that reflect a value lower than that which we place on the company. We may also consider other factors that we believe will cause the stock price to rise. Under normal circumstances, we invest at least 80% of the fund’s net assets in equity securities of emerging market companies. This policy may be changed only after 60 days’ notice to shareholders.
Emerging markets include countries in the MSCI Emerging Market Index or that we consider to be emerging markets based on our evaluation of their level of economic development or the size and nature of their securities markets. We may consider, among other factors, a company’s valuation, financial strength, growth potential, competitive position in its industry, projected future earnings, cash flows and dividends when deciding whether to buy or sell investments. We may also use derivatives, such as futures, options, warrants and swap contracts, for both hedging and non-hedging purposes.
The fund is "non-diversified," which means it may invest a greater percentage of its assets in fewer issuers than a "diversified" fund.
It is important to understand that you can lose money by investing in the fund.
The value of investments in the fund’s portfolio may fall or fail to rise over extended periods of time for a variety of reasons, including general economic, political or financial market conditions, investor sentiment and market perceptions, government actions, geopolitical events or changes, outbreaks of infectious illnesses or other widespread public health issues, and factors related to a specific issuer, geography, industry or sector. These and other factors may lead to increased volatility and reduced liquidity in the fund's portfolio holdings, may negatively impact the fund’s performance, and may exacerbate other risks to which the fund is subject.
Growth stocks may be more susceptible to earnings disappointments, and value stocks may fail to rebound. These risks are generally greater for small and midsize companies. From time to time, the fund may invest a significant portion of its assets in companies in one or more related industries, sectors or geographic regions, such as Asian or Pacific Basin countries, which would make the fund more vulnerable to adverse developments affecting those regions, industries or sectors.
The value of international investments traded in foreign currencies may be adversely impacted by fluctuations in exchange rates. International investments, particularly investments in emerging markets, may carry risks associated with potentially less stable
economies or governments (such as the risk of seizure by a foreign government, the imposition of currency or other restrictions, or high levels of inflation), and may be or become illiquid.
As a non-diversified fund, the fund may invest in fewer issuers and is more vulnerable than a more broadly diversified fund to fluctuations in the values of the securities it holds.
Our use of derivatives may increase the risks of investing in the fund by increasing investment exposure (which may be considered leverage) or, in the case of many over-the-counter instruments, because of the potential inability to terminate or sell derivative positions and the potential failure of the other party to the instrument to meet its obligations. The risk of a party failing to meet its obligations may increase if the fund has significant exposure to that counterparty. The value of derivatives may move in unexpected ways due to unanticipated market movements, the use of leverage, imperfect correlation between the derivative instrument and the reference asset or other factors, especially in unusual market conditions, and volatility in the value of derivatives could adversely impact the fund’s returns, obligations and exposures. Derivatives are also subject to other risks, including liquidity risk (e.g., liquidity demands arising from the requirement to make payments to a derivative counterparty), operational risk (e.g., settlement issues or system failures), and legal risk (e.g., insufficient legal documentation or contract enforceability issues).
There is no guarantee that the investment techniques, analyses, or judgments that we apply in making investment decisions for the fund will produce the intended outcome or that the investments we select for the fund will perform as well as other securities that were not selected for the fund. We, or the fund's other service providers, may experience disruptions or operating errors that could negatively impact the fund.
The fund may be an investment option for mutual funds that are managed by Franklin Resources, Inc. (Franklin Templeton) and its affiliates as “funds of funds” and other investors with substantial investments in the fund. Such shareholders may at times be considered to control the fund. Dispositions of a large number of shares by these shareholders may adversely affect the fund's liquidity and net assets. These redemptions may also force the fund to sell securities, which may increase the fund's brokerage costs.
The fund may not achieve its goal, and it is not intended to be a complete investment program. An investment in the fund is not insured or guaranteed by the Federal Deposit Insurance Corporation or any other government agency.
The performance information below gives some indication of the risks associated with an investment in the fund by showing the fund’s performance year to year and over time. Before April 30, 2020, the fund was managed with a different investment strategy and may have achieved different performance results under its current strategy from that shown for periods before this date. The performance information does not reflect insurance-related charges or expenses. If it did, performance would be lower. Please remember that past performance is not necessarily an indication of future results.
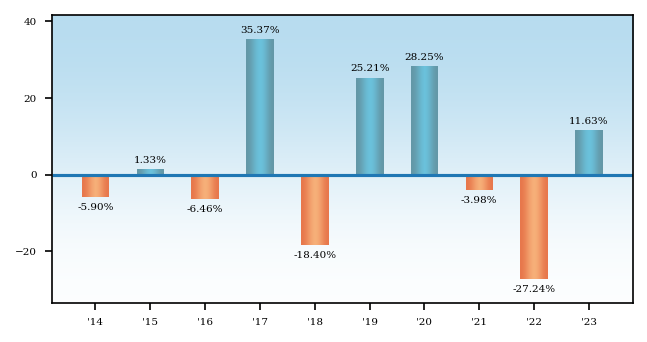
Average Annual Total Returns - Putnam VT Emerging Markets Equity Fund |
1 Year |
5 Years |
10 Years |
|---|---|---|---|
| Class IA C000010853 | 11.63% | 4.60% | 2.12% |
| Class IB C000010854 | 11.39% | 4.35% | 1.87% |
| MSCI Emerging Markets Index (ND) (no deduction for fees, expenses or taxes, other than withholding taxes on reinvested dividends) | 9.83% | 3.68% | 2.66% |
| Putnam VT Emerging Markets Equity Linked Benchmark (no deduction for fees, expenses or taxes, other than withholding taxes on reinvested dividends) | 9.83% | 6.69% | 4.12% |
| The Putnam VT Emerging Markets Equity Linked Benchmark represents the performance of the MSCI EAFE Growth Index (ND) through April 29, 2020, and the performance of the MSCI Emerging Markets Index (ND) thereafter. |
| All MSCI indices are provided by MSCI. |
| MSCI makes no warranties and shall have no liability with respect to any MSCI data reproduced herein. No further redistribution or use is permitted. This report is not prepared or endorsed by MSCI. Important data provider notices and terms available at www.franklintempletondatasources.com. You cannot invest directly in an index. |
Putnam VT Focused International Equity Fund seeks capital appreciation.
The following table describes the fees and expenses you may pay if you buy, hold and sell shares of the fund. You may pay other fees, such as brokerage commissions and other fees to financial intermediaries, which are not reflected in the tables and examples below. The fees and expenses information does not reflect insurance-related charges or expenses borne by contract holders indirectly investing in the fund. If it did, expenses would be higher.
Annual Fund Operating Expenses - Putnam VT Focused International Equity Fund |
Class IA C000010889 |
Class IB C000010890 |
|
|---|---|---|---|
| Management Fees (as a percentage of Assets) | 0.69% | 0.69% | |
| Distribution and Service (12b-1) Fees | none | 0.25% | |
| Other Expenses (as a percentage of Assets): | 0.18% | 0.18% | |
| Expenses (as a percentage of Assets) | 0.87% | 1.12% | |
| Fee Waiver or Reimbursement | [1] | (0.05%) | (0.05%) |
| Net Expenses (as a percentage of Assets) | 0.82% | 1.07% | |
| [1] | Reflects Putnam Investment Management, LLC’s contractual obligation to limit certain fund expenses through 4/30/25. This obligation may be modified or discontinued only with approval of the fund’s Board of Trustees. |
The following hypothetical example is intended to help you compare the cost of investing in the fund with the cost of investing in other funds. The example does not reflect insurance-related charges or expenses. If it did, expenses would be higher. It assumes that you invest $10,000 in the fund for the time periods indicated and then redeem or hold all your shares at the end of those periods. It assumes a 5% return on your investment each year and that the fund’s operating expenses remain the same. Only the first year of each period in the example takes into account the expense reimbursement described above. Your actual costs may be higher or lower.
Expense Example - Putnam VT Focused International Equity Fund - USD ($) |
Expense Example, with Redemption, 1 Year |
Expense Example, with Redemption, 3 Years |
Expense Example, with Redemption, 5 Years |
Expense Example, with Redemption, 10 Years |
|---|---|---|---|---|
| Class IA C000010889 | 84 | 273 | 477 | 1,068 |
| Class IB C000010890 | 109 | 351 | 612 | 1,359 |
The fund pays transaction-related costs, such as commissions, when it buys and sells securities (or “turns over” its portfolio). A higher turnover rate may indicate higher transaction costs. These costs, which are not reflected in annual fund operating expenses or the above example, affect fund performance. The fund’s turnover rate in the most recent fiscal year was 17%.
Investments
We invest mainly in common stocks (growth or value stocks or both) of companies of any size outside the United States that we believe have favorable investment potential. We consider a company to be located outside the United States if the company’s securities trade outside the United States, the company is headquartered or organized outside the United States or the company derives a majority of its revenues or profits outside the United States. Under normal circumstances, we invest at least 80% of the fund’s net assets in equity investments. This policy may be changed only after 60 days’ notice to shareholders. The fund’s equity investments may include common stocks, preferred stocks, convertible securities, warrants, American Depositary Receipts (ADRs) and Global Depositary Receipts (GDRs). We invest in both developed countries and in emerging markets.
We may consider, among other factors, a company’s valuation, financial strength, growth potential, competitive position in its industry, projected future earnings, cash flows and dividends when deciding whether to buy or sell investments. We may also consider other factors that we believe will cause the stock price to rise. We may also use derivatives, such as futures, options, warrants and swap contracts, for both hedging and non-hedging purposes.
The fund is “non-diversified,” which means it may invest a greater percentage of its assets in fewer issuers than a “diversified” fund. The fund expects to invest in a limited number of issuers.
It is important to understand that you can lose money by investing in the fund.
The value of investments in the fund’s portfolio may fall or fail to rise over extended periods of time for a variety of reasons, including general economic, political or financial market conditions, investor sentiment and market perceptions, government actions, geopolitical events or changes, outbreaks of infectious illnesses or other widespread public health issues, and factors related to a specific issuer, geography, industry or sector. These and other factors may lead to increased volatility and reduced liquidity in the fund’s portfolio holdings, may negatively impact the fund’s performance, and may exacerbate other risks to which the fund is subject. The fund will be more susceptible to these risks than other funds because it invests in a limited number of issuers, industries or sectors, and the fund may perform poorly as a result of adverse developments affecting those issuers, industries or sectors.
The value of international investments traded in foreign currencies may be adversely impacted by fluctuations in exchange rates. International investments, particularly investments in emerging markets, may carry risks associated with potentially less stable economies or governments (such as the risk of seizure by a foreign government, the imposition of currency or other restrictions, or high levels of inflation), and may be or become illiquid.
Investments focused in a single region may be affected by common economic forces and other factors. In addition, events in any one country within the region may impact the other countries or the region as a whole. Because the fund currently invests, and may in the future invest, significantly in European and Asian companies, the fund is particularly susceptible to economic, political, regulatory and other events or conditions affecting issuers in Europe and Asia. European financial markets have in recent years experienced increased volatility due to concerns with some countries’ high levels of sovereign debt, budget deficits, and unemployment. Asia includes countries in various stages of economic development, from emerging market economies to the highly developed economy of Japan. Some parts of Asia may be subject to a greater degree of economic, political and social instability than is the case in the United States.
As a non-diversified fund, the fund invests in fewer issuers and is more vulnerable than a more broadly diversified fund to fluctuations in the values of the securities it holds.
Our use of derivatives may increase the risks of investing in the fund by increasing investment exposure (which may be considered leverage) or, in the case of many over-the-counter instruments, because of the potential inability to terminate or sell derivative positions and the potential failure of the other party to the instrument to meet its obligations. The risk of a party failing to meet its obligations may increase if the fund has significant exposure to that counterparty. The value of derivatives may move in unexpected ways due to unanticipated market movements, the use of leverage, imperfect correlation between the derivative instrument and the reference asset or other factors, especially in unusual market conditions, and volatility in the value of derivatives could adversely impact the fund’s returns, obligations and exposures. Derivatives are also subject to other risks, including liquidity risk (e.g., liquidity demands arising from the requirement to make payments to a derivative counterparty), operational risk (e.g., settlement issues or system failures), and legal risk (e.g., insufficient legal documentation or contract enforceability issues).
There is no guarantee that the investment techniques, analyses, or judgments that we apply in making investment decisions for the fund will produce the intended outcome or that the investments we select for the fund will perform as well as other securities that were not selected for the fund. We, or the fund’s other service providers, may experience disruptions or operating errors that could negatively impact the fund.
The fund may be an investment option for mutual funds that are managed by Franklin Resources, Inc. (Franklin Templeton) and its affiliates as “funds of funds” and other investors with substantial investments in the fund. Such shareholders may at times be considered to control the fund. Dispositions of a large number of shares by these shareholders may adversely affect the fund’s liquidity and net assets. These redemptions may also force the fund to sell securities, which may increase the fund’s brokerage costs.
The fund may not achieve its goal, and it is not intended to be a complete investment program. An investment in the fund is not insured or guaranteed by the Federal Deposit Insurance Corporation or any other government agency.
The performance information below gives some indication of the risks associated with an investment in the fund by showing the fund’s performance year to year and over time. Before April 30, 2021, the fund was managed with a materially different investment strategy and may have achieved materially different performance results under its current investment strategy from that shown for periods before this date. The performance information does not reflect insurance-related charges or expenses. If it did, performance would be lower. Please remember that past performance is not necessarily an indication of future results.
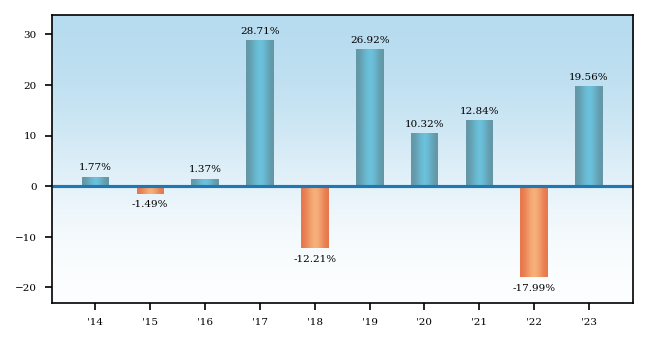
Average Annual Total Returns - Putnam VT Focused International Equity Fund |
1 Year |
5 Years |
10 Years |
|---|---|---|---|
| Class IA C000010889 | 19.56% | 9.15% | 5.93% |
| Class IB C000010890 | 19.25% | 8.88% | 5.66% |
| MSCI ACWI ex USA Index (ND) (no deduction for fees, expenses or taxes, other than withholding taxes on reinvested dividends) | 15.62% | 7.08% | 3.83% |
| Putnam VT Focused International Equity Linked Benchmark (no deduction for fees, expenses or taxes, other than withholding taxes on reinvested dividends) | 15.62% | 9.76% | 7.13% |
| The Putnam VT Focused International Equity Linked Benchmark represents the performance of the MSCI World Index (ND) through April 29, 2021, and the performance of the MSCI ACWI ex USA Index (ND) thereafter. |
| All MSCI indices are provided by MSCI. |
| MSCI makes no warranties and shall have no liability with respect to any MSCI data reproduced herein. No further redistribution or use is permitted. This report is not prepared or endorsed by MSCI. Important data provider notices and terms available at www.franklintempletondatasources.com. You cannot invest directly in an index. |
Putnam VT George Putnam Balanced Fund seeks to provide a balanced investment composed of a well-diversified portfolio of stocks and bonds which produce both capital growth and current income.
The following table describes the fees and expenses you may pay if you buy, hold and sell shares of the fund. You may pay other fees, such as brokerage commissions and other fees to financial intermediaries, which are not reflected in the tables and examples below. The fees and expenses information does not reflect insurance-related charges or expenses borne by contract holders indirectly investing in the fund. If it did, expenses would be higher.
Annual Fund Operating Expenses - Putnam VT George Putnam Balanced Fund |
Class IA C000010885 |
Class IB C000010886 |
|---|---|---|
| Management Fees (as a percentage of Assets) | 0.52% | 0.52% |
| Distribution and Service (12b-1) Fees | none | 0.25% |
| Other Expenses (as a percentage of Assets): | 0.15% | 0.15% |
| Expenses (as a percentage of Assets) | 0.67% | 0.92% |
The following hypothetical example is intended to help you compare the cost of investing in the fund with the cost of investing in other funds. The example does not reflect insurance-related charges or expenses. If it did, expenses would be higher. It assumes that you invest $10,000 in the fund for the time periods indicated and then redeem or hold all your shares at the end of those periods. It assumes a 5% return on your investment each year and that the fund’s operating expenses remain the same. Your actual costs may be higher or lower.
Expense Example - Putnam VT George Putnam Balanced Fund - USD ($) |
Expense Example, with Redemption, 1 Year |
Expense Example, with Redemption, 3 Years |
Expense Example, with Redemption, 5 Years |
Expense Example, with Redemption, 10 Years |
|---|---|---|---|---|
| Class IA C000010885 | 68 | 214 | 373 | 835 |
| Class IB C000010886 | 94 | 293 | 509 | 1,131 |
The fund pays transaction-related costs, such as commissions, when it buys and sells securities (or “turns over” its portfolio). A higher turnover rate may indicate higher transaction costs. These costs, which are not reflected in annual fund operating expenses or the above example, affect fund performance. The fund’s turnover rate in the most recent fiscal year was 47%.
Investments
We invest mainly in a combination of bonds and common stocks (growth or value stocks or both) of large U.S. companies, with a greater focus on common stocks. For example, we may purchase stocks of companies with stock prices that reflect a value lower than that which we place on the company. We may also consider other factors that we believe will cause the stock price to rise. We buy bonds of governments and private companies that are mostly investment-grade in quality with intermediate- to long-term maturities (three years or longer). We may consider, among other factors, a company's valuation, financial strength, growth potential, competitive position in its industry, projected future earnings, cash flows and dividends when deciding whether to buy or sell equity investments, and, among other factors, credit, interest rate and prepayment risks, as well as general market conditions, when deciding whether to buy or sell fixed-income investments. We may also use derivatives, such as futures, options, warrants and swap contracts, for both hedging and non-hedging purposes.
It is important to understand that you can lose money by investing in the fund.
The value of investments in the fund’s portfolio may fall or fail to rise over extended periods of time for a variety of reasons, including general economic, political or financial market conditions, investor sentiment and market perceptions, government actions, geopolitical events or changes, outbreaks of infectious illnesses or other widespread public health issues, and factors related to a specific issuer, geography, industry or sector. These and other factors may lead to increased volatility and reduced liquidity in the fund’s portfolio holdings, may negatively impact the fund’s performance, and may exacerbate other risks to which the fund is subject. Growth stocks may be more susceptible to earnings disappointments, and value stocks may fail to rebound.
Bond investments are subject to interest rate risk, which is the risk that the value of the fund’s bond investments is likely to fall if interest rates rise. Bond investments also are subject to credit risk, which is the risk that the issuer of the bond may default on payment of interest or principal. Bond investments may be more susceptible to downgrades or defaults during economic downturns or other periods of economic stress. Interest rate risk is generally greater for longer-term bonds, and credit risk is generally greater for below-investment-grade bonds (sometimes referred to as "junk bonds"), which can be more sensitive to changes in markets, credit conditions, and interest rates and may be considered speculative. Our use of derivatives may increase the risks of investing in the fund by increasing investment exposure (which may be considered leverage) or, in the case of many over-the-counter instruments, because of the potential inability to terminate or sell derivatives positions and the potential failure of the other party to the instrument to meet its obligations. The risk of a party failing to meet its obligations may increase if the fund has significant investment exposure to that counterparty. The value of derivatives may move in unexpected ways due to unanticipated market movements, the use of leverage, imperfect correlation between the derivative instrument and the reference asset, or other factors, especially in unusual market conditions,
and volatility in the value of derivatives could adversely impact the fund’s returns, obligations and exposures. Derivatives are also subject to other risks, including liquidity risk (e.g., liquidity demands arising from the requirement to make payments to a derivative counterparty), operational risk (e.g., settlement issues or system failures), and legal risk (e.g., insufficient legal documentation or contract enforceability issues).
There is no guarantee that the investment techniques, analyses, or judgments that we apply in making investment decisions for the fund will produce the intended outcome or that the investments we select for the fund will perform as well as other securities that were not selected for the fund. We, or the fund's other service providers, may experience disruptions or operating errors that could negatively impact the fund.
The fund may be an investment option for mutual funds that are managed by Franklin Resources, Inc. (Franklin Templeton) and its affiliates as “funds of funds” and other investors with substantial investments in the fund. Such shareholders may at times be considered to control the fund. Dispositions of a large number of shares by these shareholders may adversely affect the fund's liquidity and net assets. These redemptions may also force the fund to sell securities, which may increase the fund's brokerage costs.
The fund may not achieve its goal, and it is not intended to be a complete investment program. An investment in the fund is not insured or guaranteed by the Federal Deposit Insurance Corporation or any other government agency.
The performance information below gives some indication of the risks associated with an investment in the fund by showing the fund’s performance year to year and over time. The performance information does not reflect insurance-related charges or expenses. If it did, performance would be lower. Please remember that past performance is not necessarily an indication of future results.
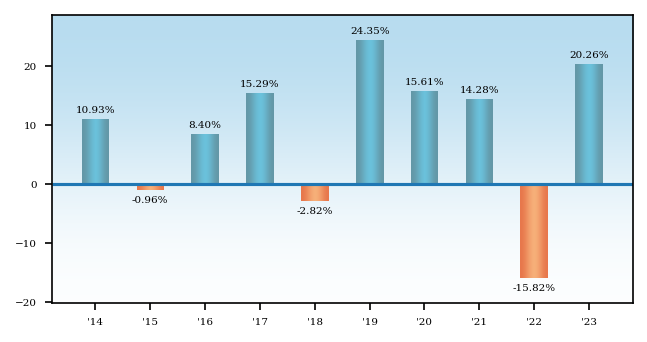
Average Annual Total Returns - Putnam VT George Putnam Balanced Fund |
1 Year |
5 Years |
10 Years |
|---|---|---|---|
| Class IA C000010885 | 20.26% | 10.71% | 8.30% |
| Class IB C000010886 | 19.90% | 10.43% | 8.03% |
| George Putnam Blended Index (no deduction for fees, expenses or taxes) | 17.82% | 10.25% | 8.27% |
| S&P 500 Index (no deduction for fees, expenses or taxes) | 26.29% | 15.69% | 12.03% |
| Bloomberg U.S. Aggregate Bond Index (no deduction for fees, expenses or taxes) | 5.53% | 1.10% | 1.81% |
| The fund's performance is compared to the George Putnam Blended Index, an unmanaged index administered by Putnam Management, 60% of which is the S&P 500 Index and 40% of which is the Bloomberg U.S. Aggregate Bond Index. The fund's performance is also compared to the S&P 500 Index, an unmanaged index of large U.S. company stocks. In addition, the fund's performance is compared to the Bloomberg U.S. Aggregate Bond Index, an unmanaged index of U.S. investment-grade fixed income securities. |
| All Bloomberg indices are provided by Bloomberg Index Services Limited. |
| BLOOMBERG® is a trademark and service mark of Bloomberg Finance L.P. and its affiliates (collectively “Bloomberg”). Bloomberg or Bloomberg’s licensors, own all proprietary rights in the Bloomberg Indices. Neither Bloomberg nor Bloomberg’s licensors approve or endorse this material, or guarantee the accuracy or completeness of any information herein, or make any warranty, express or implied, as to the results to be obtained therefrom, and to the maximum extent allowed by law, neither shall have any liability or responsibility for injury or damages arising in connection therewith. |
Putnam VT Global Asset Allocation Fund seeks long-term return consistent with preservation of capital.
The following table describes the fees and expenses you may pay if you buy, hold and sell shares of the fund. You may pay other fees, such as brokerage commissions and other fees to financial intermediaries, which are not reflected in the tables and examples below. The fees and expenses information does not reflect insurance-related charges or expenses borne by contract holders indirectly investing in the fund. If it did, expenses would be higher.
Annual Fund Operating Expenses - Putnam VT Global Asset Allocation Fund |
Class IA C000010887 |
Class IB C000010888 |
|
|---|---|---|---|
| Management Fees (as a percentage of Assets) | 0.59% | 0.59% | |
| Distribution and Service (12b-1) Fees | none | 0.25% | |
| Other Expenses (as a percentage of Assets): | 0.34% | 0.34% | |
| Expenses (as a percentage of Assets) | 0.93% | 1.18% | |
| Fee Waiver or Reimbursement | [1] | (0.07%) | (0.07%) |
| Net Expenses (as a percentage of Assets) | 0.86% | 1.11% | |
| [1] | Reflects Putnam Investment Management, LLC’s contractual obligation to limit certain fund expenses through 4/30/25. This obligation may be modified or discontinued only with approval of the fund’s Board of Trustees. |
The following hypothetical example is intended to help you compare the cost of investing in the fund with the cost of investing in other funds. The example does not reflect insurance-related charges or expenses. If it did, expenses would be higher. It assumes that you invest $10,000 in the fund for the time periods indicated and then redeem or hold all your shares at the end of those periods. It assumes a 5% return on your investment each year and that the fund’s operating expenses remain the same. Only the first year of each period in the example takes into account the expense reimbursement described above. Your actual costs may be higher or lower.
Expense Example - Putnam VT Global Asset Allocation Fund - USD ($) |
Expense Example, with Redemption, 1 Year |
Expense Example, with Redemption, 3 Years |
Expense Example, with Redemption, 5 Years |
Expense Example, with Redemption, 10 Years |
|---|---|---|---|---|
| Class IA C000010887 | 88 | 289 | 508 | 1,137 |
| Class IB C000010888 | 113 | 368 | 642 | 1,426 |
The fund pays transaction-related costs, such as commissions, when it buys and sells securities (or “turns over” its portfolio). A higher turnover rate may indicate higher transaction costs. These costs, which are not reflected in annual fund operating expenses or the above example, affect fund performance. The fund’s turnover rate in the most recent fiscal year was 262%.
Investments
We invest a majority of the fund’s assets in a diversified portfolio of equity securities (growth or value stocks or both) of both U.S. and foreign companies of any size. We may consider, among other factors, a company’s valuation, financial strength, growth potential, competitive position in its industry, projected future earnings, cash flows and dividends when deciding whether to buy or sell equity investments. We also invest in a diversified portfolio of fixed-income investments, including both U.S. and foreign government obligations, corporate obligations and securitized debt instruments (such as mortgage-backed investments). We may consider, among other factors, credit, interest rate and prepayment risks, as well as general market conditions, when deciding whether to buy or sell fixed income investments. We may also select other investments that do not fall within these asset classes. We may also use to a significant extent derivatives, such as futures, options, certain foreign currency transactions, warrants and swap contracts, for both hedging and non-hedging purposes.
It is important to understand that you can lose money by investing in the fund.
Our allocation of assets among asset classes may hurt performance, and our efforts to diversify risk through the use of leverage and allocation decisions may not be successful. If the quantitative models or data that are used in managing the fund prove to be incorrect or incomplete, investment decisions made in reliance on the models or data may not produce the desired results and the fund may realize losses.
The value of investments in the fund’s portfolio may fall or fail to rise over extended periods of time for a variety of reasons, including general economic, political or financial market conditions, investor sentiment and market perceptions, government actions, geopolitical events or changes, outbreaks of infectious illnesses or other widespread public health issues, and factors related to a specific issuer, geography, industry or sector. These and other factors may lead to increased volatility and reduced liquidity in the fund’s portfolio holdings, may negatively impact the fund’s performance, and may exacerbate other risks to which the fund is subject. Growth stocks may be more susceptible to earnings disappointments, and value stocks may fail to rebound. These risks are generally greater for small and midsize companies.
Bond investments are subject to interest rate risk, which is the risk that the value of the fund’s bond investments is likely to fall if interest rates rise. Bond investments also are subject to credit risk, which is the risk that the issuer of the bond may default on payment of interest or principal. Bond investments may be more susceptible to downgrades or default during economic downturns or other periods of economic stress. Interest rate risk is generally greater for longer-term bonds, and credit risk is generally greater for below-investment-grade bonds (sometimes
referred to as “junk bonds”), which can be more sensitive to changes in markets, credit conditions, and interest rates, and may be considered speculative. Mortgage-backed investments, unlike traditional debt investments, are also subject to prepayment risk, which means that they may increase in value less than other bonds when interest rates decline and decline in value more than other bonds when interest rates rise. We may have to invest the proceeds from prepaid investments, including mortgage- and asset-backed investments, in other investments with less attractive terms and yields.
The value of international investments traded in foreign currencies may be adversely impacted by fluctuations in exchange rates. International investments, particularly investments in emerging markets, may carry risks associated with potentially less stable economies or governments (such as the risk of seizure by a foreign government, the imposition of currency or other restrictions, or high levels of inflation), and may be or become illiquid.
Our use of derivatives may increase the risks of investing in the fund by increasing investment exposure (which may be considered leverage) or, in the case of many over-the-counter instruments, because of the potential inability to terminate or sell derivative positions and the potential failure of the other party to the instrument to meet its obligations. The risk of a party failing to meet its obligations may increase if the fund has significant investment exposure to that counterparty. The value of derivatives may move in unexpected ways due to unanticipated market movements, the use of leverage, imperfect correlation between the derivative instrument and the reference asset, or other factors, especially in unusual market conditions, and volatility in the value of derivatives could adversely impact the fund’s returns, obligations and exposures. Derivatives are also subject to other risks, including liquidity risk (e.g., liquidity demands arising from the requirement to make payments to a derivative counterparty), operational risk (e.g., settlement issues or system failures), and legal risk (e.g., insufficient legal documentation or contract enforceability issues).
There is no guarantee that the investment techniques, analyses, or judgments that we apply in making investment decisions for the fund will produce the intended outcome or that the investments we select for the fund will perform as well as other securities that were not selected for the fund. We, or the fund’s other service providers, may experience disruptions or operating errors that could negatively impact the fund.
The fund may be an investment option for mutual funds that are managed by Franklin Resources, Inc. (Franklin Templeton) and its affiliates as “funds of funds” and other investors with substantial investments in the fund. Such shareholders may at times be considered to control the fund. Dispositions of a large number of shares by these shareholders may adversely affect the fund’s liquidity and net assets. These redemptions may also force the fund to sell securities, which may increase the fund’s brokerage costs.
The fund may not achieve its goal, and it is not intended to be a complete investment program. An investment in the fund is not insured or guaranteed by the Federal Deposit Insurance Corporation or any other government agency.
The performance information below gives some indication of the risks associated with an investment in the fund by showing the fund’s performance year to year and over time. The performance information does not reflect insurance-related charges or expenses. If it did, performance would be lower. Please remember that past performance is not necessarily an indication of future results.
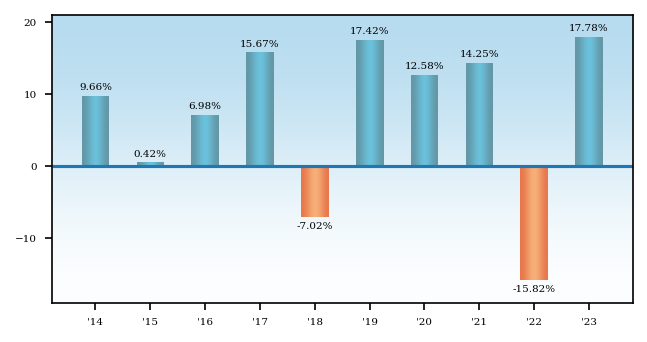
Average Annual Total Returns - Putnam VT Global Asset Allocation Fund |
1 Year |
5 Years |
10 Years |
|---|---|---|---|
| Class IA C000010887 | 17.78% | 8.41% | 6.61% |
| Class IB C000010888 | 17.48% | 8.14% | 6.35% |
| Russell 3000® Index (no deduction for fees, expenses or taxes) | 25.96% | 15.16% | 11.48% |
| Putnam Balanced Blended Benchmark (no deduction for fees, expenses or taxes, other than withholding taxes on reinvested dividends in the case of the MSCI EAFE Index (ND)) | 17.21% | 9.24% | 7.22% |
| Putnam Balanced Blended Benchmark is an unmanaged index administered by Putnam Investment Management, LLC, 50% of which is the Russell 3000® Index, 35% of which is the Bloomberg U.S. Aggregate Bond Index, 10% of which is the MSCI EAFE Index (ND) and 5% of which is the JPMorgan Developed High Yield Index. |
| Frank Russell Company is the source and owner of the trademarks, service marks and copyrights related to the Russell Indexes. Russell® is a trademark of Frank Russell Company. |
| All Bloomberg indices are provided by Bloomberg Index Services Limited. |
| BLOOMBERG® is a trademark and service mark of Bloomberg Finance L.P. and its affiliates (collectively “Bloomberg”). Bloomberg or Bloomberg’s licensors, own all proprietary rights in the Bloomberg Indices. Neither Bloomberg nor Bloomberg’s licensors approve or endorse this material, or guarantee the accuracy or completeness of any information herein, or make any warranty, express or implied, as to the results to be obtained therefrom, and to the maximum extent allowed by law, neither shall have any liability or responsibility for injury or damages arising in connection therewith. |
| All MSCI indices are provided by MSCI. |
| MSCI makes no warranties and shall have no liability with respect to any MSCI data reproduced herein. No further redistribution or use is permitted. This report is not prepared or endorsed by MSCI. Important data provider notices and terms available at www.franklintempletondatasources.com. You cannot invest directly in an index. |
Putnam VT Global Health Care Fund seeks capital appreciation.
The following table describes the fees and expenses you may pay if you buy, hold and sell shares of the fund. You may pay other fees, such as brokerage commissions and other fees to financial intermediaries, which are not reflected in the tables and examples below. The fees and expenses information does not reflect insurance-related charges or expenses borne by contract holders indirectly investing in the fund. If it did, expenses would be higher.
Annual Fund Operating Expenses - Putnam VT Global Health Care Fund |
Class IA C000010843 |
Class IB C000010844 |
|---|---|---|
| Management Fees (as a percentage of Assets) | 0.62% | 0.62% |
| Distribution and Service (12b-1) Fees | none | 0.25% |
| Other Expenses (as a percentage of Assets): | 0.14% | 0.14% |
| Expenses (as a percentage of Assets) | 0.76% | 1.01% |
The following hypothetical example is intended to help you compare the cost of investing in the fund with the cost of investing in other funds. The example does not reflect insurance-related charges or expenses. If it did, expenses would be higher. It assumes that you invest $10,000 in the fund for the time periods indicated and then redeem or hold all your shares at the end of those periods. It assumes a 5% return on your investment each year and that the fund’s operating expenses remain the same. Your actual costs may be higher or lower.
Expense Example - Putnam VT Global Health Care Fund - USD ($) |
Expense Example, with Redemption, 1 Year |
Expense Example, with Redemption, 3 Years |
Expense Example, with Redemption, 5 Years |
Expense Example, with Redemption, 10 Years |
|---|---|---|---|---|
| Class IA C000010843 | 78 | 248 | 422 | 942 |
| Class IB C000010844 | 103 | 322 | 558 | 1,236 |
The fund pays transaction-related costs, such as commissions, when it buys and sells securities (or “turns over” its portfolio). A higher turnover rate may indicate higher transaction costs. These costs, which are not reflected in annual fund operating expenses or the above example, affect fund performance. The fund’s turnover rate in the most recent fiscal year was 35%.
Investments
For this non-diversified fund concentrating in the health care industries, we invest mainly in common stocks (growth or value stocks or both) of large and midsize companies worldwide that we believe have favorable investment potential. Under normal circumstances, we invest at least 80% of the fund’s net assets in securities of companies in the health care industries. This policy may be changed only after 60 days’ notice to shareholders. Potential investments include companies that manufacture health care supplies or provide health care-related services, and companies in the research, development, production and marketing of pharmaceuticals and biotechnology products. We may purchase stocks of companies with stock prices that reflect a value lower than that which we place on the company. We may consider, among other factors, a company’s valuation, financial strength, growth potential, competitive position in its industry, projected future earnings, cash flows and dividends when deciding whether to buy or sell investments. We may also consider other factors that we believe will cause the stock price to rise. We may also use derivatives, such as certain foreign currency transactions, futures, options, warrants and swap contracts, for both hedging and non-hedging purposes, and may engage in short sales of securities. For example, we typically use foreign currency forward contracts in connection with the fund’s investments in foreign securities in order to hedge the fund’s currency exposure relative to the fund’s benchmark index.
The use of the term “global” in the fund’s name is meant to emphasize that we look for investment opportunities on a worldwide basis and that our investment strategies are not constrained by the countries or regions in which companies are located. Under normal market conditions, the fund intends to invest in at least five different countries and at least 40% of its net assets in securities of foreign companies (or, if less, at least the percentage of net assets that is ten percentage points less than the percentage of the fund’s benchmark represented by foreign companies, as determined by the providers of the benchmark).
It is important to understand that you can lose money by investing in the fund.
The value of investments in the fund’s portfolio may fall or fail to rise over extended periods of time for a variety of reasons, including general economic, political or financial market conditions, investor sentiment and market perceptions, government actions, geopolitical events or changes, outbreaks of infectious illnesses or other widespread public health issues, and factors related to a specific issuer, geography, industry or sector. These and other factors may lead to increased volatility and reduced liquidity in the fund’s portfolio holdings, may negatively impact the fund’s performance, and may exacerbate other risks to which the fund is subject. Growth stocks may be more susceptible to earnings disappointments, and value stocks may fail to rebound. These risks are generally greater for small and midsize companies. The health care industries may be affected by product obsolescence, dependence on patents and intellectual property rights, expenses and losses from product liability and similar claims, changes in government programs or regulatory requirements (including approval policies for drugs, medical devices or procedures), and pricing pressures (including as a result of increased competition, changes in governmental and private reimbursement rates and payment systems, or other reforms).
Our policy of concentrating on a limited group of industries and the fund’s “non-diversified” status, which means the fund may invest a greater percentage of its assets in fewer issuers than a “diversified fund,” can increase the fund’s vulnerability to adverse developments affecting a single industry or issuer, which may result in greater losses and volatility for the fund. The value of international investments traded in foreign currencies may be adversely impacted by fluctuations in exchange rates. International investments, particularly investments in emerging markets, may carry risks associated with potentially less stable economies or governments (such as the risk of seizure by a foreign government, the imposition of currency or other restrictions, or high levels of inflation), and may be or become illiquid.
Our use of derivatives may increase the risks of investing in the fund by increasing investment exposure (which may be considered leverage) or, in the case of many over-the-counter instruments, because of the potential inability to terminate or sell derivative positions and the potential failure of the other party to the instrument to meet its obligations. The risk of a party failing to meet its obligations may increase if the fund has significant exposure to that counterparty. The value of derivatives may move in unexpected ways due to unanticipated market movements, the use of leverage, imperfect correlation between the derivative instrument and the reference asset, or other factors, especially in unusual market conditions, and volatility in the value of derivatives could adversely impact the fund’s returns, obligations and exposures. Derivatives are also subject to other risks, including liquidity risk (e.g., liquidity demands arising from the requirement to make payments to a derivative counterparty), operational risk (e.g., settlement issues or system failures), and legal risk (e.g., insufficient legal documentation or contract enforceability issues). Our use of short selling may result in losses if the securities appreciate in value.
There is no guarantee that the investment techniques, analyses, or judgments that we apply in making investment decisions for the fund will produce the intended outcome or that the investments we select for the fund will perform as well as other securities that were not selected for the fund. We, or the fund’s other service providers, may experience disruptions or operating errors that could negatively impact the fund.
The fund may be an investment option for mutual funds that are managed by Franklin Resources, Inc. (Franklin Templeton) and its affiliates as “funds of funds” and other investors with substantial investments in the fund. Such shareholders may at times be considered to control the fund. Dispositions of a large number of shares by these shareholders may adversely affect the fund’s liquidity and net assets. These redemptions may also force the fund to sell securities, which may increase the fund’s brokerage costs.
The fund may not achieve its goal, and it is not intended to be a complete investment program. An investment in the fund is not insured or guaranteed by the Federal Deposit Insurance Corporation or any other government agency.
The performance information below gives some indication of the risks associated with an investment in the fund by showing the fund’s performance year to year and over time. The performance information does not reflect insurance-related charges or expenses. If it did, performance would be lower. Please remember that past performance is not necessarily an indication of future results.
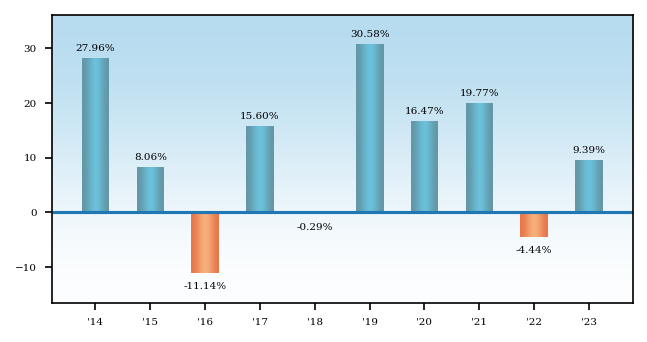
Average Annual Total Returns - Putnam VT Global Health Care Fund |
1 Year |
5 Years |
10 Years |
|---|---|---|---|
| Class IA C000010843 | 9.39% | 13.75% | 10.43% |
| Class IB C000010844 | 9.13% | 13.48% | 10.16% |
| MSCI World Health Care Index (ND) (no deduction for fees, expenses or taxes, other than withholding taxes on reinvested dividends) | 3.76% | 10.47% | 9.01% |
| All MSCI indices are provided by MSCI. |
| MSCI makes no warranties and shall have no liability with respect to any MSCI data reproduced herein. No further redistribution or use is permitted. This report is not prepared or endorsed by MSCI. Important data provider notices and terms available at www.franklintempletondatasources.com. You cannot invest directly in an index. |
Putnam VT Government Money Market Fund seeks as high a rate of current income as Putnam Investment Management, LLC believes is consistent with preservation of capital and maintenance of liquidity.
The following table describes the fees and expenses you may pay if you buy, hold and sell shares of the fund. You may pay other fees, such as brokerage commissions and other fees to financial intermediaries, which are not reflected in the tables and examples below. The fees and expenses information does not reflect insurance-related charges or expenses borne by contract holders indirectly investing in the fund. If it did, expenses would be higher.
Annual Fund Operating Expenses - Putnam VT Government Money Market Fund |
Class IA C000010859 |
Class IB C000010860 |
|---|---|---|
| Management Fees (as a percentage of Assets) | 0.28% | 0.28% |
| Distribution and Service (12b-1) Fees | none | 0.25% |
| Other Expenses (as a percentage of Assets): | 0.19% | 0.19% |
| Expenses (as a percentage of Assets) | 0.47% | 0.72% |
The following hypothetical example is intended to help you compare the cost of investing in the fund with the cost of investing in other funds. The example does not reflect insurance-related charges or expenses. If it did, expenses would be higher. It assumes that you invest $10,000 in the fund for the time periods indicated and then redeem or hold all your shares at the end of those periods. It assumes a 5% return on your investment each year and that the fund’s operating expenses remain the same. Your actual costs may be higher or lower.
Expense Example - Putnam VT Government Money Market Fund - USD ($) |
Expense Example, with Redemption, 1 Year |
Expense Example, with Redemption, 3 Years |
Expense Example, with Redemption, 5 Years |
Expense Example, with Redemption, 10 Years |
|---|---|---|---|---|
| Class IA C000010859 | 48 | 151 | 263 | 591 |
| Class IB C000010860 | 74 | 230 | 401 | 894 |
Investments
We invest at least 99.5 percent of the fund’s total assets in cash, U.S. government securities and repurchase agreements that are fully collateralized by U.S. government securities or cash. We invest mainly in debt securities that are obligations of the U.S. government, its agencies and instrumentalities and accordingly are backed by the full faith and credit of the United States (e.g., U.S. Treasury bills) or by the credit of a federal agency or government-sponsored entity (e.g., securities issued by Fannie Mae and Freddie Mac). The U.S. government securities in which we invest may also include variable and floating rate instruments and when-issued and delayed delivery securities (i.e., payment or delivery of the securities occurs at a future date for a predetermined price). Under normal circumstances, we invest at least 80% of the fund’s net assets in U.S. government securities and repurchase agreements that are fully collateralized by U.S. government securities. This policy may be changed only after 60 days’ notice to shareholders. The securities purchased by the fund are subject to quality, maturity, diversification and other requirements pursuant to rules promulgated by the Securities and Exchange Commission. We may consider, among other factors, credit and interest rate risks and characteristics of the issuer or counterparty, as well as general market conditions, when deciding whether to buy or sell investments.
The value of investments in the fund’s portfolio may fall or fail to rise over extended periods of time for a variety of reasons, including general economic, political or financial market conditions, investor sentiment and market perceptions, government actions, geopolitical events or changes, outbreaks of infectious illnesses or other widespread public health issues, and factors related to a specific issuer, geography, industry or sector. These and other factors may lead to increased volatility and reduced liquidity in the fund’s portfolio holdings, may negatively impact the fund’s performance, and may exacerbate other risks to which the fund is subject.
The values of money market investments usually rise and fall in response to changes in interest rates. Interest rate risk is generally lowest for investments with short maturities (a significant part of the fund’s investments). Changes in the financial condition of an issuer or counterparty, changes in specific economic or political conditions that affect a particular type of issuer, and changes in general economic or political conditions can increase the risk of default by an issuer or counterparty, which can affect a security’s or instrument’s credit quality or value. Certain securities in which the fund may invest, including securities issued by certain U.S. government agencies and U.S. government sponsored enterprises, are not guaranteed by the U.S. government or supported by the full faith and credit of the United States.
There is no guarantee that the investment techniques, analyses, or judgments that we apply in making investment decisions for the fund will produce the intended outcome or that the investments we select for the fund will perform as well as other securities that were not selected for the fund. We, or the fund’s other service providers, may experience disruptions or operating errors that could negatively impact the fund.
The fund may be an investment option for mutual funds that are managed by Franklin Resources, Inc. (Franklin Templeton) and its affiliates as “funds of funds” and other investors with substantial investments in the fund. Such shareholders may at times be considered to control the fund. Dispositions of a large number of shares by these shareholders may adversely affect the fund’s liquidity and net assets. These redemptions may also force the fund to sell securities, which may increase the fund’s brokerage costs.
The fund may not achieve its goal, and is not intended to be a complete investment program. You could lose money by investing in the fund. Although the fund seeks to preserve the value of your investment at $1.00 per share, it cannot guarantee it will do so. An investment in the fund is not a bank account and is not insured or guaranteed by the Federal Deposit Insurance Corporation or any other government agency. The fund’s sponsor is not required to reimburse the fund for losses, and you should not expect that the sponsor will provide financial support to the fund at any time, including during periods of market stress.
The performance information below gives some indication of the risks associated with an investment in the fund by showing the fund’s performance year to year and over time. Please remember that past performance is not necessarily an indication of future results.
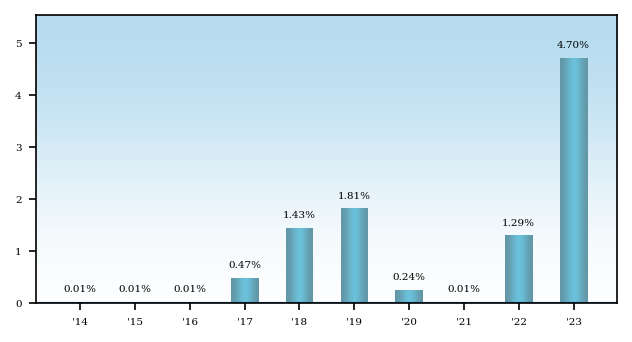
Average Annual Total Returns - Putnam VT Government Money Market Fund |
1 Year |
5 Years |
10 Years |
|---|---|---|---|
| Class IA C000010859 | 4.70% | 1.60% | 0.99% |
| Class IB C000010860 | 4.44% | 1.45% | 0.87% |
Putnam VT High Yield Fund seeks high current income. Capital growth is a secondary goal when consistent with achieving high current income.
The following table describes the fees and expenses you may pay if you buy, hold and sell shares of the fund. You may pay other fees, such as brokerage commissions and other fees to financial intermediaries, which are not reflected in the tables and examples below. The fees and expenses information does not reflect insurance-related charges or expenses borne by contract holders indirectly investing in the fund. If it did, expenses would be higher.
Annual Fund Operating Expenses - Putnam VT High Yield Fund |
Class IA C000010845 |
Class IB C000010846 |
|---|---|---|
| Management Fees (as a percentage of Assets) | 0.56% | 0.56% |
| Distribution and Service (12b-1) Fees | none | 0.25% |
| Other Expenses (as a percentage of Assets): | 0.19% | 0.19% |
| Expenses (as a percentage of Assets) | 0.75% | 1.00% |
The following hypothetical example is intended to help you compare the cost of investing in the fund with the cost of investing in other funds. The example does not reflect insurance-related charges or expenses. If it did, expenses would be higher. It assumes that you invest $10,000 in the fund for the time periods indicated and then redeem or hold all your shares at the end of those periods. It assumes a 5% return on your investment each year and that the fund’s operating expenses remain the same. Your actual costs may be higher or lower.
Expense Example - Putnam VT High Yield Fund - USD ($) |
Expense Example, with Redemption, 1 Year |
Expense Example, with Redemption, 3 Years |
Expense Example, with Redemption, 5 Years |
Expense Example, with Redemption, 10 Years |
|---|---|---|---|---|
| Class IA C000010845 | 77 | 240 | 417 | 930 |
| Class IB C000010846 | 102 | 318 | 552 | 1,225 |
The fund pays transaction-related costs, such as commissions, when it buys and sells securities (or “turns over” its portfolio). A higher turnover rate may indicate higher transaction costs. These costs, which are not reflected in annual fund operating expenses or the above example, affect fund performance. The fund’s turnover rate in the most recent fiscal year was 45%.
Investments
We invest mainly in bonds that are obligations of U.S. companies, are below investment-grade in quality (sometimes referred to as “junk bonds”), and have intermediate- to long-term maturities (three years or longer). Under normal circumstances, we invest at least 80% of the fund’s net assets in securities rated below investment-grade. This policy may be changed only after 60 days’ notice to shareholders. We may also invest in other debt instruments, including loans.
We may consider, among other factors, credit, interest rate and prepayment risks, as well as general market conditions, when deciding whether to buy or sell investments. We may also use derivatives, such as futures, options, certain foreign currency transactions, total return, interest rate and credit default swap contracts, for both hedging and non-hedging purposes.
It is important to understand that you can lose money by investing in the fund.
The value of investments in the fund’s portfolio may fall or fail to rise over extended periods of time for a variety of reasons, including general economic, political or financial market conditions, investor sentiment and market perceptions, government actions, geopolitical events or changes, outbreaks of infectious illnesses or other widespread public health issues, and factors related to a specific issuer, geography, industry, or sector. These and other factors may lead to increased volatility and reduced liquidity in the fund’s portfolio holdings, may negatively impact the fund’s performance, and may exacerbate other risks to which the fund is subject.
The risks associated with bond investments include interest rate risk, which is the risk that the value of the fund’s investments is likely to fall if interest rates rise. Bond investments are also subject to credit risk, which is the risk that the issuer of a bond may default on payment of interest or principal. Bond investments may be more susceptible to downgrades or defaults during economic downturns or other periods of economic stress. Interest rate risk is generally greater for longer-term bonds, and credit risk is generally greater for below-investment-grade bonds (a significant part of the fund’s investments), which can be more sensitive to changes in markets, credit conditions, and interest rates, and may be considered speculative.
Our use of derivatives may increase the risks of investing in the fund by increasing investment exposure (which may be considered leverage) or, in the case of many over-the-counter instruments, because of the potential inability to terminate or sell derivative positions and the potential failure of the other party to the instrument to meet its obligations. The risk of a party failing to meet its obligations may increase if the fund has significant exposure to that counterparty. The value of derivatives may move in unexpected ways due to unanticipated market movements, the use of leverage, imperfect correlation between the derivative instrument and the reference asset, or other factors, especially in unusual market conditions, and volatility in the value of derivatives could adversely impact the fund’s returns, obligations and exposures. Derivatives are also subject to other risks, including liquidity risk (e.g., liquidity demands arising from the requirement to make payments to a derivative counterparty),
operational risk (e.g., settlement issues or system failures), and legal risk (e.g., insufficient legal documentation or contract enforceability issues).
There is no guarantee that the investment techniques, analyses, or judgments that we apply in making investment decisions for the fund will produce the intended outcome or that the investments we select for the fund will perform as well as other securities that were not selected for the fund. We, or the fund’s other service providers, may experience disruptions or operating errors that could negatively impact the fund.
The fund may be an investment option for mutual funds that are managed by Franklin Resources, Inc. (Franklin Templeton) and its affiliates as “funds of funds” and other investors with substantial investments in the fund. Such shareholders may at times be considered to control the fund. Dispositions of a large number of shares by these shareholders may adversely affect the fund’s liquidity and net assets. These redemptions may also force the fund to sell securities, which may increase the fund’s brokerage costs.
The fund may not achieve its goal, and it is not intended to be a complete investment program. An investment in the fund is not insured or guaranteed by the Federal Deposit Insurance Corporation or any other government agency.
The performance information below gives some indication of the risks associated with an investment in the fund by showing the fund’s performance year to year and over time. The performance information does not reflect insurance-related charges or expenses. If it did, performance would be lower. Please remember that past performance is not necessarily an indication of future results.
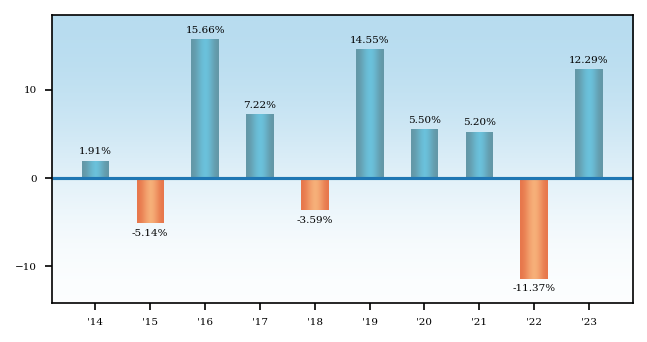
Average Annual Total Returns - Putnam VT High Yield Fund |
1 Year |
5 Years |
10 Years |
|---|---|---|---|
| Class IA C000010845 | 12.29% | 4.82% | 3.87% |
| Class IB C000010846 | 12.13% | 4.60% | 3.62% |
| JPMorgan Developed High Yield Index (no deduction for fees, expenses or taxes) | 13.77% | 5.43% | 4.68% |
Putnam VT Income Fund seeks high current income consistent with what Putnam Investment Management, LLC believes to be prudent risk.
The following table describes the fees and expenses you may pay if you buy, hold and sell shares of the fund. You may pay other fees, such as brokerage commissions and other fees to financial intermediaries, which are not reflected in the tables and examples below. The fees and expenses information does not reflect insurance-related charges or expenses borne by contract holders indirectly investing in the fund. If it did, expenses would be higher.
Annual Fund Operating Expenses - Putnam VT Income Fund |
Class IA C000010847 |
Class IB C000010848 |
|---|---|---|
| Management Fees (as a percentage of Assets) | 0.39% | 0.39% |
| Distribution and Service (12b-1) Fees | none | 0.25% |
| Other Expenses (as a percentage of Assets): | 0.25% | 0.25% |
| Expenses (as a percentage of Assets) | 0.64% | 0.89% |
The following hypothetical example is intended to help you compare the cost of investing in the fund with the cost of investing in other funds. The example does not reflect insurance-related charges or expenses. If it did, expenses would be higher. It assumes that you invest $10,000 in the fund for the time periods indicated and then redeem or hold all your shares at the end of those periods. It assumes a 5% return on your investment each year and that the fund’s operating expenses remain the same. Your actual costs may be higher or lower.
Expense Example - Putnam VT Income Fund - USD ($) |
Expense Example, with Redemption, 1 Year |
Expense Example, with Redemption, 3 Years |
Expense Example, with Redemption, 5 Years |
Expense Example, with Redemption, 10 Years |
|---|---|---|---|---|
| Class IA C000010847 | 65 | 205 | 357 | 798 |
| Class IB C000010848 | 91 | 284 | 493 | 1,096 |
The fund pays transaction-related costs, such as commissions, when it buys and sells securities (or “turns over” its portfolio). A higher turnover rate may indicate higher transaction costs. These costs, which are not reflected in annual fund operating expenses or the above example, affect fund performance. The fund’s turnover rate in the most recent fiscal year was 890%.
Investments
We invest mainly in bonds that are securitized debt instruments (such as mortgage-backed investments) and related derivative instruments, and other obligations of companies and governments worldwide denominated in U.S. dollars or (to a lesser extent) foreign currencies, are either investment-grade or below-investment-grade in quality (sometimes referred to as “junk bonds”) and have intermediate- to long-term maturities (three years or longer). The fund currently has significant investment exposure to residential and commercial mortgage-backed securities.
We may consider, among other factors, credit, interest rate and prepayment risks, as well as general market conditions, when deciding whether to buy or sell investments. We typically use to a significant extent derivatives, including credit default swaps, interest rate swaps, total return swaps, to-be-announced (TBA) commitments, futures, options and swaptions, including on mortgage-backed securities and indices, and certain foreign currency transactions, for both hedging and non-hedging purposes, including to obtain or adjust exposure to mortgage-backed investments.
It is important to understand that you can lose money by investing in the fund.
The value of investments in the fund’s portfolio may fall or fail to rise over extended periods of time for a variety of reasons, including general economic, political or financial market conditions, investor sentiment and market perceptions, government actions, geopolitical events or changes, outbreaks of infectious illnesses or other widespread public health issues, and factors related to a specific issuer, geography, industry or sector. These and other factors may lead to increased volatility and reduced liquidity in the fund’s portfolio holdings, may negatively impact the fund’s performance, and may exacerbate other risks to which the fund is subject.
The risks associated with bond investments include interest rate risk, which is the risk that the value of the fund’s investments is likely to fall if interest rates rise. Bond investments are also subject to credit risk, which is the risk that the issuer of a bond may default on payment of interest or principal. Bond investments may be more susceptible to downgrades or defaults during economic downturns or other periods of economic stress. Interest rate risk is generally greater for longer-term bonds, and credit risk is generally greater for below-investment-grade bonds (a significant part of the fund’s investments), which can be more sensitive to changes in markets, credit conditions, and interest rates and may be considered speculative.
Mortgage-backed investments, unlike traditional debt investments, are also subject to prepayment risk, which means that they may increase in value less than other bonds when interest rates decline and decline in value more than other bonds when interest rates rise. We may have to invest the proceeds from prepaid investments, including mortgage-backed investments, in other investments with less attractive terms and yields. The fund’s investments in mortgage-backed securities and asset-backed securities, and in certain other securities and derivatives, may be
or become illiquid. The fund’s investments in mortgage-backed securities may make the fund’s net asset value more susceptible to economic, market, political and other developments affecting the residential and commercial real estate markets and the servicing of mortgage loans secured by real estate properties. During periods of difficult economic conditions, delinquencies and losses on commercial mortgage-backed investments in particular generally increase, including as a result of the effects of those conditions on commercial real estate markets, the ability of commercial tenants to make loan payments, and the ability of a property to attract and retain commercial tenants.
Our use of derivatives may increase the risks of investing in the fund by increasing investment exposure (which may be considered leverage) or, in the case of many over-the-counter instruments, because of the potential inability to terminate or sell derivative positions and the potential failure of the other party to the instrument to meet its obligations. The risk of a party failing to meet its obligations may increase if the fund has significant exposure to that counterparty. The value of derivatives may move in unexpected ways due to unanticipated market movements, the use of leverage, imperfect correlation between the derivative instrument and the reference asset, or other factors, especially in unusual market conditions, and volatility in the value of derivatives could adversely impact the fund’s returns, obligations and exposures. Derivatives are also subject to other risks, including liquidity risk (e.g., liquidity demands arising from the requirement to make payments to a derivative counterparty), operational risk (e.g., settlement issues or system failures) and legal risk (e.g., insufficient legal documentation or contract enforceability issues).
The fund expects to engage in frequent trading. Funds with high turnover may incur higher transaction costs than funds with relatively lower turnover, which may detract from performance.
There is no guarantee that the investment techniques, analyses, or judgments that we apply in making investment decisions for the fund will produce the intended outcome or that the investments we select for the fund will perform as well as other securities that were not selected for the fund. We, or the fund’s other service providers, may experience disruptions or operating errors that could negatively impact the fund.
The fund may be an investment option for mutual funds that are managed by Franklin Resources, Inc. (Franklin Templeton) and its affiliates as “funds of funds” and other investors with substantial investments in the fund. Such shareholders may at times be considered to control the fund. Dispositions of a large number of shares by these shareholders may adversely affect the fund’s liquidity and net assets. These redemptions may also force the fund to sell securities, which may increase the fund’s brokerage costs.
The fund may not achieve its goal, and it is not intended to be a complete investment program. An investment in the fund is not insured or guaranteed by the Federal Deposit Insurance Corporation or any other government agency.
The performance information below gives some indication of the risks associated with an investment in the fund by showing the fund’s performance year to year and over time. The performance information does not reflect insurance-related charges or expenses. If it did, performance would be lower. Please remember that past performance is not necessarily an indication of future results.
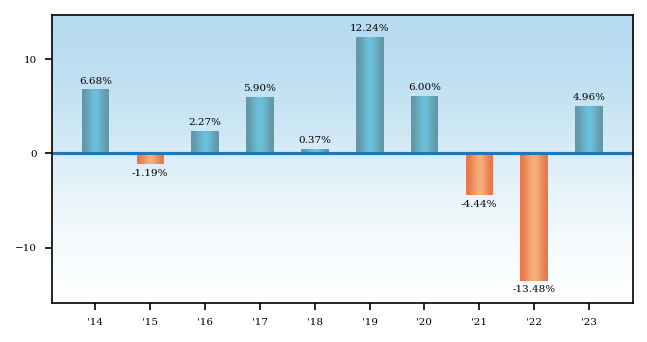
Average Annual Total Returns - Putnam VT Income Fund |
1 Year |
5 Years |
10 Years |
|---|---|---|---|
| Class IA C000010847 | 4.96% | 0.64% | 1.70% |
| Class IB C000010848 | 4.69% | 0.37% | 1.43% |
| Bloomberg U.S. Aggregate Bond Index (no deduction for fees, expenses or taxes) | 5.53% | 1.10% | 1.81% |
| All Bloomberg indices are provided by Bloomberg Index Services Limited. |
| BLOOMBERG® is a trademark and service mark of Bloomberg Finance L.P. and its affiliates (collectively “Bloomberg”). Bloomberg or Bloomberg’s licensors, own all proprietary rights in the Bloomberg Indices. Neither Bloomberg nor Bloomberg’s licensors approve or endorse this material, or guarantee the accuracy or completeness of any information herein, or make any warranty, express or implied, as to the results to be obtained therefrom, and to the maximum extent allowed by law, neither shall have any liability or responsibility for injury or damages arising in connection therewith. |
Putnam VT International Equity Fund seeks capital appreciation..
The following table describes the fees and expenses you may pay if you buy, hold and sell shares of the fund. You may pay other fees, such as brokerage commissions and other fees to financial intermediaries, which are not reflected in the tables and examples below. The fees and expenses information does not reflect insurance-related charges or expenses borne by contract holders indirectly investing in the fund. If it did, expenses would be higher.
Annual Fund Operating Expenses - Putnam VT International Equity Fund |
Class IA C000010849 |
Class IB C000010850 |
|---|---|---|
| Management Fees (as a percentage of Assets) | 0.69% | 0.69% |
| Distribution and Service (12b-1) Fees | none | 0.25% |
| Other Expenses (as a percentage of Assets): | 0.16% | 0.16% |
| Expenses (as a percentage of Assets) | 0.85% | 1.10% |
The following hypothetical example is intended to help you compare the cost of investing in the fund with the cost of investing in other funds. The example does not reflect insurance-related charges or expenses. If it did, expenses would be higher. It assumes that you invest $10,000 in the fund for the time periods indicated and then redeem or hold all your shares at the end of those periods. It assumes a 5% return on your investment each year and that the fund’s operating expenses remain the same. Your actual costs may be higher or lower.
Expense Example - Putnam VT International Equity Fund - USD ($) |
Expense Example, with Redemption, 1 Year |
Expense Example, with Redemption, 3 Years |
Expense Example, with Redemption, 5 Years |
Expense Example, with Redemption, 10 Years |
|---|---|---|---|---|
| Class IA C000010849 | 87 | 271 | 471 | 1,049 |
| Class IB C000010850 | 112 | 350 | 606 | 1,340 |
The fund pays transaction-related costs, such as commissions, when it buys and sells securities (or “turns over” its portfolio). A higher turnover rate may indicate higher transaction costs. These costs, which are not reflected in annual fund operating expenses or the above example, affect fund performance. The fund’s turnover rate in the most recent fiscal year was 68%.
Investments
We invest mainly in common stocks (growth or value stocks or both) of large and midsize companies outside the United States that we believe have favorable investment potential. For example, we may purchase stocks of companies with stock prices that reflect a value lower than that which we place on the company. Under normal circumstances, we invest at least 80% of the fund’s net assets in equity investments. This policy may be changed only after 60 days’ notice to shareholders. We may consider, among other factors, a company’s valuation, financial strength, growth potential, competitive position in its industry, projected future earnings, cash flows and dividends when deciding whether to buy or sell investments. We may also consider other factors that we believe will cause the stock price to rise. We invest mainly in developed countries but may invest in emerging markets. We may also use derivatives, such as certain foreign currency transactions, futures, options, warrants and swap contracts, for both hedging and non-hedging purposes. For example, we typically use foreign currency forward contracts in connection with the fund’s investments in foreign securities in order to hedge the fund’s currency exposure relative to the fund’s benchmark index.
It is important to understand that you can lose money by investing in the fund.
The value of investments in the fund’s portfolio may fall or fail to rise over extended periods of time for a variety of reasons, including general economic, political or financial market conditions, investor sentiment and market perceptions, government actions, geopolitical events or changes, outbreaks of infectious illnesses or other widespread public health issues, and factors related to a specific issuer, geography, industry or sector. These and other factors may lead to increased volatility and reduced liquidity in the fund’s portfolio holdings, may negatively impact the fund’s performance, and may exacerbate other risks to which the fund is subject. Growth stocks may be more susceptible to earnings disappointments, and value stocks may fail to rebound. These risks are generally greater for small and midsize companies. The value of international investments traded in foreign currencies may be adversely impacted by fluctuations in exchange rates. International investments, particularly investments in emerging markets, may carry risks associated with potentially less stable economies or governments (such as the risk of seizure by a foreign government, the imposition of currency or other restrictions, or high levels of inflation), and may be or become illiquid.
Investments focused in a single region may be affected by common economic forces and other factors. In addition, events in any one country within the region may impact the other countries or the region as a whole. Because the fund currently invests, and may in the future invest, significantly in European and Asian companies, the fund is particularly susceptible to economic, political, regulatory and other events or conditions affecting issuers in Europe and Asia. European financial markets have in recent years experienced increased volatility due to concerns with some countries’ high levels of sovereign debt, budget deficits, and unemployment. Asia includes countries in various stages of economic development, from emerging market economies to the highly developed economy of Japan. Some parts of Asia may be subject to a greater degree of economic, political and social instability than is the case in the United States.
Our use of derivatives may increase the risks of investing in the fund by increasing investment exposure (which may be considered leverage) or, in the case of many over-the-counter instruments, because of the potential inability to terminate or sell derivative positions and the potential failure of the other party to the instrument to meet its obligations. The risk of a party failing to meet its obligations may increase if the fund has significant exposure to that counterparty. The value of derivatives may move in unexpected ways due to unanticipated market movements, the use of leverage, imperfect correlation between the derivative instrument and the reference asset, or other factors, especially in unusual market conditions, and volatility in the value of derivatives could adversely impact the fund’s returns, obligations and exposures. Derivatives are also subject to other risks, including liquidity risk (e.g., liquidity demands arising from the requirement to make payments to a derivative counterparty), operational risk (e.g., settlement issues or system failures), and legal risk (e.g., insufficient legal documentation or contract enforceability issues).
There is no guarantee that the investment techniques, analyses, or judgments that we apply in making investment decisions for the fund will produce the intended outcome or that the investments we select for the fund will perform as well as other securities that were not selected for the fund. We, or the fund’s other service providers, may experience disruptions or operating errors that could negatively impact the fund.
The fund may be an investment option for mutual funds that are managed by Franklin Resources, Inc. (Franklin Templeton) and its affiliates as “funds of funds” and other investors with substantial investments in the fund. Such shareholders may at times be considered to control the fund. Dispositions of a large number of shares by these shareholders may adversely affect the fund’s liquidity and net assets. These redemptions may also force the fund to sell securities, which may increase the fund’s brokerage costs.
The fund may not achieve its goal, and it is not intended to be a complete investment program. An investment in the fund is not insured or guaranteed by the Federal Deposit Insurance Corporation or any other government agency.
The performance information below gives some indication of the risks associated with an investment in the fund by showing the fund’s performance year to year and over time. The performance information does not reflect insurance-related charges or expenses. If it did, performance would be lower. Please remember that past performance is not necessarily an indication of future results.
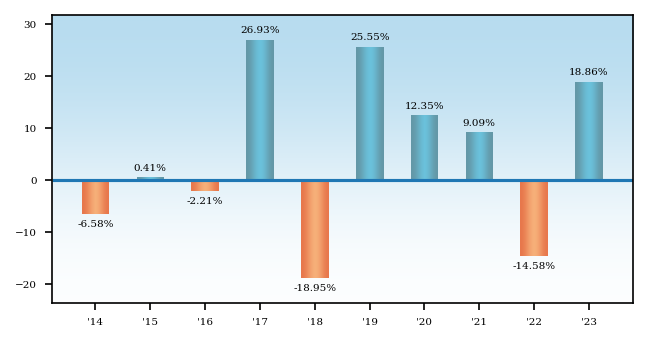
Average Annual Total Returns - Putnam VT International Equity Fund |
1 Year |
5 Years |
10 Years |
|---|---|---|---|
| Class IA C000010849 | 18.86% | 9.33% | 3.96% |
| Class IB C000010850 | 18.51% | 9.05% | 3.70% |
| MSCI EAFE Index (ND) (no deduction for fees, expenses or taxes, other than withholding taxes on reinvested dividends) | 18.24% | 8.16% | 4.28% |
| All MSCI indices are provided by MSCI. |
| MSCI makes no warranties and shall have no liability with respect to any MSCI data reproduced herein. No further redistribution or use is permitted. This report is not prepared or endorsed by MSCI. Important data provider notices and terms available at www.franklintempletondatasources.com. You cannot invest directly in an index. |
Putnam VT International Value Fund seeks capital growth. Current income is a secondary objective.
The following table describes the fees and expenses you may pay if you buy, hold and sell shares of the fund. You may pay other fees, such as brokerage commissions and other fees to financial intermediaries, which are not reflected in the tables and examples below. The fees and expenses information does not reflect insurance-related charges or expenses borne by contract holders indirectly investing in the fund. If it did, expenses would be higher.
Annual Fund Operating Expenses - Putnam VT International Value Fund |
Class IA C000010851 |
Class IB C000010852 |
|---|---|---|
| Management Fees (as a percentage of Assets) | 0.69% | 0.69% |
| Distribution and Service (12b-1) Fees | none | 0.25% |
| Other Expenses (as a percentage of Assets): | 0.19% | 0.19% |
| Expenses (as a percentage of Assets) | 0.88% | 1.13% |
The following hypothetical example is intended to help you compare the cost of investing in the fund with the cost of investing in other funds. The example does not reflect insurance-related charges or expenses. If it did, expenses would be higher. It assumes that you invest $10,000 in the fund for the time periods indicated and then redeem or hold all your shares at the end of those periods. It assumes a 5% return on your investment each year and that the fund’s operating expenses remain the same. Your actual costs may be higher or lower.
Expense Example - Putnam VT International Value Fund - USD ($) |
Expense Example, with Redemption, 1 Year |
Expense Example, with Redemption, 3 Years |
Expense Example, with Redemption, 5 Years |
Expense Example, with Redemption, 10 Years |
|---|---|---|---|---|
| Class IA C000010851 | 90 | 281 | 488 | 1,084 |
| Class IB C000010852 | 115 | 359 | 622 | 1,375 |
The fund pays transaction-related costs, such as commissions, when it buys and sells securities (or “turns over” its portfolio). A higher turnover rate may indicate higher transaction costs. These costs, which are not reflected in annual fund operating expenses or the above example, affect fund performance. The fund’s turnover rate in the most recent fiscal year was 15%.
Investments
We invest mainly in common stocks of large and midsize companies outside the United States, with a focus on value stocks. Value stocks are those that we believe are currently undervalued by the market. If we are correct and other investors ultimately recognize the value of the company, the price of its stock may rise. We invest mainly in developed countries, but may invest in emerging markets. We may consider, among other factors, a company’s valuation, financial strength, growth potential, competitive position in its industry, projected future earnings, cash flows and dividends when deciding whether to buy or sell investments. We may also use derivatives, such as certain foreign currency transactions, futures, options, warrants and swap contracts, for both hedging and non-hedging purposes. For example, we typically use foreign currency forward contracts in connection with the fund’s investments in foreign securities in order to hedge the fund’s currency exposure relative to the fund’s benchmark index.
It is important to understand that you can lose money by investing in the fund.
The value of investments in the fund’s portfolio may fall or fail to rise over extended periods of time for a variety of reasons, including general economic, political or financial market conditions, investor sentiment and market perceptions, government actions, geopolitical events or changes, outbreaks of infectious illnesses or other widespread public health issues, and factors related to a specific issuer, geography, industry or sector. These and other factors may lead to increased volatility and reduced liquidity in the fund’s portfolio holdings, may negatively impact the fund’s performance, and may exacerbate other risks to which the fund is subject. Value stocks may fail to rebound, and the market may not favor value-style investing. These risks are generally greater for small and midsize companies. From time to time, the fund may invest a significant portion of its assets in companies in one or more related industries or sectors, which would make the fund more vulnerable to adverse developments affecting those industries or sectors.
The value of international investments traded in foreign currencies may be adversely impacted by fluctuations in exchange rates. International investments, particularly investments in emerging markets, may carry risks associated with potentially less stable economies or governments (such as the risk of seizure by a foreign government, the imposition of currency or other restrictions, or high levels of inflation), and may be or become illiquid.
Investments focused in a single region may be affected by common economic forces and other factors. In addition, events in any one country within the region may impact the other countries or the region as a whole. Because the fund currently invests, and may in the future invest significantly in European and Asian companies, the fund is particularly susceptible to economic, political, regulatory and other events or conditions affecting issuers in Europe and Asia. European financial markets have in recent years experienced increased volatility due to concerns with some countries’ high levels of sovereign debt, budget deficits, and unemployment. Asia includes countries in various stages of economic development, from emerging market economies to the highly developed economy of Japan. Some parts of Asia may be subject to a greater degree of economic, political and social instability than is the case in the United States.
Our use of derivatives may increase the risks of investing in the fund by increasing investment exposure (which may be considered leverage) or, in the case of many over-the-counter instruments, because of the potential inability to terminate or sell derivative positions and the potential failure of the other party to the instrument to meet its obligations. The risk of a party failing to meet its obligations may increase if the fund has significant investment exposure to that counterparty. The value of derivatives may move in unexpected ways due to unanticipated market movements, the use of leverage, imperfect correlation between the derivative instrument and the reference asset, or other factors, especially in unusual market conditions, and volatility in the value of derivatives could adversely impact the fund’s returns, obligations and exposures. Derivatives are also subject to other risks, including liquidity risk (e.g., liquidity demands arising from the requirement to make payments to a derivative counterparty), operational risk (e.g., settlement issues or system failures), and legal risk (e.g., insufficient legal documentation or contract enforceability issues).
There is no guarantee that the investment techniques, analyses, or judgments that we apply in making investment decisions for the fund will produce the intended outcome or that the investments we select for the fund will perform as well as other securities that were not selected for the fund. We, or the fund’s other service providers, may experience disruptions or operating errors that could negatively impact the fund.
The fund may be an investment option for mutual funds that are managed by Franklin Resources, Inc. (Franklin Templeton) and its affiliates as “funds of funds” and other investors with substantial investments in the fund. Such shareholders may at times be considered to control the fund. Dispositions of a large number of shares by these shareholders may adversely affect the fund’s liquidity and net assets. These redemptions may also force the fund to sell securities, which may increase the fund’s brokerage costs.
The fund may not achieve its goal, and it is not intended to be a complete investment program. An investment in the fund is not insured or guaranteed by the Federal Deposit Insurance Corporation or any other government agency.
The performance information below gives some indication of the risks associated with an investment in the fund by showing the fund’s performance year to year and over time. The performance information does not reflect insurance-related charges or expenses. If it did, performance would be lower. Please remember that past performance is not necessarily an indication of future results.
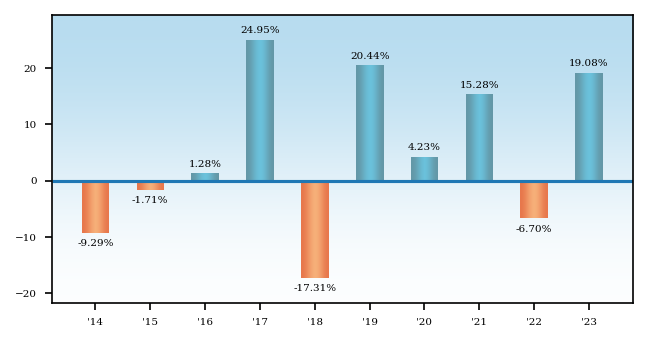
Average Annual Total Returns - Putnam VT International Value Fund |
1 Year |
5 Years |
10 Years |
|---|---|---|---|
| Class IA C000010851 | 19.08% | 9.96% | 4.14% |
| Class IB C000010852 | 18.68% | 9.70% | 3.88% |
| MSCI EAFE Value Index (ND) (no deduction for fees, expenses or taxes, other than withholding taxes on reinvested dividends) | 18.95% | 7.08% | 3.16% |
| All MSCI indices are provided by MSCI. |
| MSCI makes no warranties and shall have no liability with respect to any MSCI data reproduced herein. No further redistribution or use is permitted. This report is not prepared or endorsed by MSCI. Important data provider notices and terms available at www.franklintempletondatasources.com. You cannot invest directly in an index. |
Putnam VT Large Cap Growth Fund seeks capital appreciation.
The following table describes the fees and expenses you may pay if you buy, hold and sell shares of the fund. You may pay other fees, such as brokerage commissions and other fees to financial intermediaries, which are not reflected in the tables and examples below. The fees and expenses information does not reflect insurance-related charges or expenses borne by contract holders indirectly investing in the fund. If it did, expenses would be higher.
Annual Fund Operating Expenses - Putnam VT Large Cap Growth Fund |
Class IA C000010841 |
Class IB C000010842 |
|---|---|---|
| Management Fees (as a percentage of Assets) | 0.55% | 0.55% |
| Distribution and Service (12b-1) Fees | none | 0.25% |
| Other Expenses (as a percentage of Assets): | 0.10% | 0.10% |
| Expenses (as a percentage of Assets) | 0.65% | 0.90% |
The following hypothetical example is intended to help you compare the cost of investing in the fund with the cost of investing in other funds. The example does not reflect insurance-related charges or expenses. If it did, expenses would be higher. It assumes that you invest $10,000 in the fund for the time periods indicated and then redeem or hold all your shares at the end of those periods. It assumes a 5% return on your investment each year and that the fund’s operating expenses remain the same. Your actual costs may be higher or lower.
Expense Example - Putnam VT Large Cap Growth Fund - USD ($) |
Expense Example, with Redemption, 1 Year |
Expense Example, with Redemption, 3 Years |
Expense Example, with Redemption, 5 Years |
Expense Example, with Redemption, 10 Years |
|---|---|---|---|---|
| Class IA C000010841 | 66 | 208 | 362 | 810 |
| Class IB C000010842 | 92 | 287 | 498 | 1,108 |
The fund pays transaction-related costs, such as commissions, when it buys and sells securities (or “turns over” its portfolio). A higher turnover rate may indicate higher transaction costs. These costs, which are not reflected in annual fund operating expenses or the above example, affect fund performance. The fund’s turnover rate in the most recent fiscal year was 31%.
Investments
We invest mainly in common stocks of large U.S. companies, with a focus on growth stocks. Growth stocks are stocks of companies whose earnings are expected to grow faster than those of similar firms, and whose business growth and other characteristics may lead to an increase in stock price. We may consider, among other factors, a company’s valuation, financial strength, growth potential, competitive position in its industry, projected future earnings, cash flows and dividends when deciding whether to buy or sell investments. Under normal circumstances, we invest at least 80% of the fund’s net assets (plus the amount of any borrowings for investment purposes) in companies of a size similar to those in the Russell 1000 Growth Index. This policy may be changed only after 60 days’ notice to shareholders.
The fund is “non-diversified,” which means it may invest in a greater percentage of its assets in fewer issuers than a “diversified” fund.
It is important to understand that you can lose money by investing in the fund.
The value of investments in the fund’s portfolio may fall or fail to rise over extended periods of time for a variety of reasons, including general economic, political or financial market conditions, investor sentiment and market perceptions, government actions, geopolitical events or changes, outbreaks of infectious illnesses or other widespread public health issues, and factors related to a specific issuer, geography, industry or sector. These and other factors may lead to increased volatility and reduced liquidity in the fund’s portfolio holdings, may negatively impact the fund’s performance, and may exacerbate other risks to which the fund is subject. Companies whose stocks we believe are undervalued by the market may have experienced adverse business developments or may be subject to special risks that have caused their stocks to be out of favor. Growth stocks may be more susceptible to earnings disappointments, and the market may not favor growth-style investing. From time to time, the fund may invest a significant portion of its assets in companies in one or more related industries or sectors, which would make the fund more vulnerable to adverse developments affecting those companies, industries or sectors. For example, the fund may invest a significant portion of its assets in companies in the information technology sector that may be significantly affected by technological obsolescence or innovation, short product cycles, falling prices and profits, competitive pressures and general market conditions.
As a non-diversified fund, the fund may invest in fewer issuers and is more vulnerable than a more broadly diversified fund to fluctuations in the values of the securities it holds.
There is no guarantee that the investment techniques, analyses, or judgments that we apply in making investment decisions for the fund will produce the intended outcome or that the investments we select for the fund will perform as well as other securities that were not selected for the fund. We, or the fund’s other service providers, may experience disruptions or operating errors that could negatively impact the fund.
The fund may be an investment option for mutual funds that are managed by Franklin Resources, Inc. (Franklin Templeton) and its affiliates as “funds of funds” and other investors with substantial investments in the fund. Such shareholders may at
| 2 Prospectus of the Trust |
times be considered to control the fund. Dispositions of a large number of shares by these shareholders may adversely affect the fund’s liquidity and net assets. These redemptions may also force the fund to sell securities, which may increase the fund’s brokerage costs.
The fund may not achieve its goal, and it is not intended to be a complete investment program. An investment in the fund is not insured or guaranteed by the Federal Deposit Insurance Corporation or any other government agency.
The performance information below gives some indication of the risks associated with an investment in the fund by showing the fund’s performance year to year and over time. The performance information does not reflect insurance-related charges or expenses. If it did, performance would be lower. Please remember that past performance is not necessarily an indication of future results.
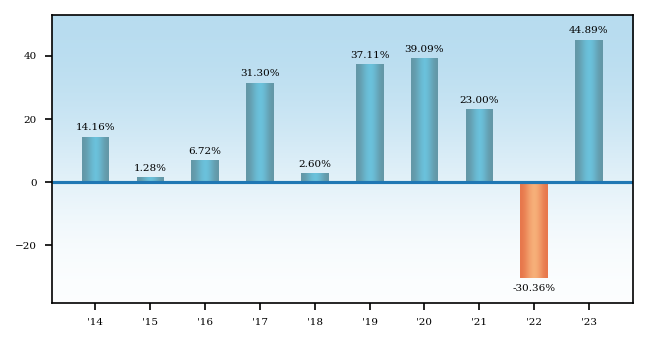
Average Annual Total Returns - Putnam VT Large Cap Growth Fund |
1 Year |
5 Years |
10 Years |
|---|---|---|---|
| Class IA C000010841 | 44.89% | 18.80% | 14.68% |
| Class IB C000010842 | 44.47% | 18.49% | 14.39% |
| Russell 1000® Growth Index (no deduction for fees, expenses or taxes) | 42.68% | 19.50% | 14.86% |
| Frank Russell Company is the source and owner of the trademarks, service marks and copyrights related to the Russell Indexes. Russell® is a trademark of Frank Russell Company. |
Putnam VT Large Cap Value Fund seeks capital growth and current income.
The following table describes the fees and expenses you may pay if you buy, hold and sell shares of the fund. You may pay other fees, such as brokerage commissions and other fees to financial intermediaries, which are not reflected in the tables and examples below. The fees and expenses information does not reflect insurance-related charges or expenses borne by contract holders indirectly investing in the fund. If it did, expenses would be higher.
Annual Fund Operating Expenses - Putnam VT Large Cap Value Fund |
Class IA C000010883 |
Class IB C000010884 |
|---|---|---|
| Management Fees (as a percentage of Assets) | 0.47% | 0.47% |
| Distribution and Service (12b-1) Fees | none | 0.25% |
| Other Expenses (as a percentage of Assets): | 0.10% | 0.10% |
| Expenses (as a percentage of Assets) | 0.57% | 0.82% |
The following hypothetical example is intended to help you compare the cost of investing in the fund with the cost of investing in other funds. The example does not reflect insurance-related charges or expenses. If it did, expenses would be higher. It assumes that you invest $10,000 in the fund for the time periods indicated and then redeem or hold all your shares at the end of those periods. It assumes a 5% return on your investment each year and that the fund’s operating expenses remain the same. Your actual costs may be higher or lower.
Expense Example - Putnam VT Large Cap Value Fund - USD ($) |
Expense Example, with Redemption, 1 Year |
Expense Example, with Redemption, 3 Years |
Expense Example, with Redemption, 5 Years |
Expense Example, with Redemption, 10 Years |
|---|---|---|---|---|
| Class IA C000010883 | 58 | 183 | 318 | 714 |
| Class IB C000010884 | 84 | 262 | 455 | 1,014 |
The fund pays transaction-related costs, such as commissions, when it buys and sells securities (or “turns over” its portfolio). A higher turnover rate may indicate higher transaction costs. These costs, which are not reflected in annual fund operating expenses or the above example, affect fund performance. The fund’s turnover rate in the most recent fiscal year was 20%.
Investments
We invest mainly in common stocks of U.S. companies, with a focus on value stocks that offer the potential for capital growth, current income, or both. Under normal circumstances, we invest at least 80% of the fund’s net assets in large-cap companies, which, for purposes of this policy, are of a size similar to those in the Russell 1000 Value Index. This policy may be changed only after 60 days’ notice to shareholders. As of March 31, 2024, the index was composed of companies having market capitalizations of between approximately $351.9 million to $908.9 billion. We may also invest in midsize companies. Value stocks are issued by companies that we believe are currently undervalued by the market. If we are correct and other investors ultimately recognize the value of the company, the price of its stock may rise. We may consider, among other factors, a company’s valuation, financial strength, growth potential, competitive position in its industry, projected future earnings, cash flows and dividends when deciding whether to buy or sell investments.
It is important to understand that you can lose money by investing in the fund.
The value of investments in the fund’s portfolio may fall or fail to rise over extended periods of time for a variety of reasons, including general economic, political or financial market conditions, investor sentiment and market perceptions, government actions, geopolitical events or changes, outbreaks of infectious illnesses or other widespread public health issues, and factors related to a specific issuer, geography, industry or sector. These and other factors may lead to increased volatility and reduced liquidity in the fund’s portfolio holdings, may negatively impact the fund’s performance, and may exacerbate other risks to which the fund is subject. Companies whose stocks we believe are undervalued by the market may have experienced adverse business developments or may be subject to special risks that have caused their stocks to be out of favor. Value stocks may fail to rebound, and the market may not favor value-style investing. Income provided by the fund may be reduced by changes in the dividend policies of, and the capital resources available at, the companies in which the fund invests.
There is no guarantee that the investment techniques, analyses, or judgments that we apply in making investment decisions for the fund will produce the intended outcome or that the investments we select for the fund will perform as well as other securities that were not selected for the fund. We, or the fund’s other service providers, may experience disruptions or operating errors that could negatively impact the fund.
The fund may be an investment option for mutual funds that are managed by Franklin Resources, Inc. (Franklin Templeton) and its affiliates as “funds of funds” and other investors with substantial investments in the fund. Such shareholders may at times be considered to control the fund. Dispositions of a large number of shares by these shareholders may adversely affect the fund’s liquidity and net assets. These redemptions may also force the fund to sell securities, which may increase the fund’s brokerage costs.
The fund may not achieve its goal, and it is not intended to be a complete investment program. An investment in the fund is not insured or guaranteed by the Federal Deposit Insurance Corporation or any other government agency.
The performance information below gives some indication of the risks associated with an investment in the fund by showing the fund’s performance year to year and over time. The performance information does not reflect insurance-related charges or expenses. If it did, performance would be lower. Please remember that past performance is not necessarily an indication of future results.
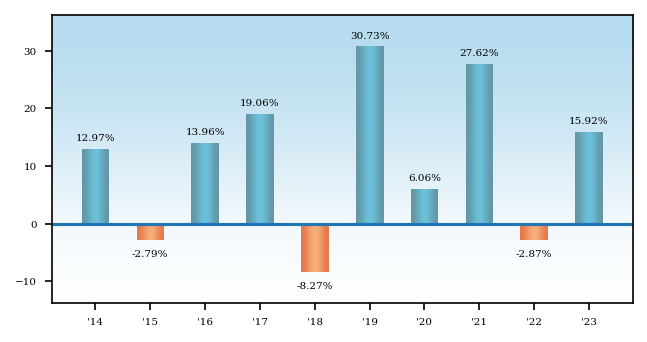
Average Annual Total Returns - Putnam VT Large Cap Value Fund |
1 Year |
5 Years |
10 Years |
|---|---|---|---|
| Class IA C000010883 | 15.92% | 14.78% | 10.54% |
| Class IB C000010884 | 15.67% | 14.50% | 10.26% |
| Russell 1000® Value Index (no deduction for fees, expenses or taxes) | 11.46% | 10.91% | 8.40% |
| Frank Russell Company is the source and owner of the trademarks, service marks and copyrights related to the Russell Indexes. Russell® is a trademark of Frank Russell Company. |
Putnam VT Mortgage Securities Fund seeks as high a level of current income as Putnam Investment Management, LLC believes is consistent with preservation of capital.
The following table describes the fees and expenses you may pay if you buy, hold and sell shares of the fund. You may pay other fees, such as brokerage commissions and other fees to financial intermediaries, which are not reflected in the tables and examples below. The fees and expenses information does not reflect insurance-related charges or expenses borne by contract holders indirectly investing in the fund. If it did, expenses would be higher.
Annual Fund Operating Expenses - Putnam VT Mortgage Securities Fund |
Class IA C000010837 |
Class IB C000010838 |
|
|---|---|---|---|
| Management Fees (as a percentage of Assets) | 0.39% | 0.39% | |
| Distribution and Service (12b-1) Fees | none | 0.25% | |
| Other Expenses (as a percentage of Assets): | 0.64% | 0.64% | |
| Expenses (as a percentage of Assets) | 1.03% | 1.28% | |
| Fee Waiver or Reimbursement | [1] | (0.53%) | (0.53%) |
| Net Expenses (as a percentage of Assets) | 0.50% | 0.75% | |
| [1] | Reflects Putnam Investment Management, LLC’s contractual obligation to limit certain fund expenses through 4/30/25. This obligation may be modified or discontinued only with approval of the fund’s Board of Trustees. |
The following hypothetical example is intended to help you compare the cost of investing in the fund with the cost of investing in other funds. The example does not reflect insurance-related charges or expenses. If it did, expenses would be higher. It assumes that you invest $10,000 in the fund for the time periods indicated and then redeem or hold all your shares at the end of those periods. It assumes a 5% return on your investment each year and that the fund’s operating expenses remain the same. Only the first year of each period in the example takes into account the expense reimbursement described above. Your actual costs may be higher or lower.
Expense Example - Putnam VT Mortgage Securities Fund - USD ($) |
Expense Example, with Redemption, 1 Year |
Expense Example, with Redemption, 3 Years |
Expense Example, with Redemption, 5 Years |
Expense Example, with Redemption, 10 Years |
|---|---|---|---|---|
| Class IA C000010837 | 51 | 275 | 517 | 1,211 |
| Class IB C000010838 | 77 | 353 | 651 | 1,499 |
The fund pays transaction-related costs, such as commissions, when it buys and sells securities (or “turns over” its portfolio). A higher turnover rate may indicate higher transaction costs. These costs, which are not reflected in annual fund operating expenses or the above example, affect fund performance. The fund’s turnover rate in the most recent fiscal year was 1,865%.
Investments
We invest mainly in mortgages, mortgage-related fixed income securities and related derivatives that are either investment-grade or below-investment-grade in quality (sometimes referred to as “junk bonds”). Under normal circumstances, we invest at least 80% of the fund’s net assets (plus any borrowings for investment purposes) in mortgages, mortgage-related fixed income securities and related derivatives (i.e., derivatives used to acquire exposure to, or whose underlying securities are, mortgages or mortgage-related securities). The fund generally uses the net unrealized gain or loss, or market value, of mortgage-related derivatives for purposes of this policy, but may use the notional value of a derivative if that is determined to be a more appropriate measure of the fund’s investment exposure. This policy may be changed only after 60 days’ notice to shareholders.
We expect to invest in mortgage-backed investments that are obligations of U.S. government agencies and instrumentalities and accordingly are backed by the full faith and credit of the United States (e.g., Ginnie Mae mortgage-backed bonds) as well as in mortgage-backed investments that are backed by only the credit of a federal agency or government-sponsored entity (e.g., Fannie Mae and Freddie Mac mortgage-backed bonds), and that have short- to long-term maturities.
We also expect to invest in lower-rated, higher-yielding mortgage-backed securities, including non-agency residential mortgage-backed securities (which may be backed by non-qualified or “sub-prime” mortgages), commercial mortgage-backed securities, and collateralized mortgage obligations (including interest only, principal only, and other prepayment derivatives). Non-agency (i.e., privately issued) securities typically are lower-rated and higher yielding than securities issued or backed by agencies such as Ginnie Mae, Fannie Mae or Freddie Mac. The fund currently has significant investment exposure to commercial mortgage-backed securities. While our emphasis will be on mortgage-backed securities, we may also invest to a lesser extent in other types of asset-backed securities.
We may consider, among other factors, credit, interest rate, prepayment and liquidity risks, as well as general market conditions, when deciding whether to buy or sell investments. We typically use to a significant extent derivatives, including credit
default swaps, interest rate swaps, total return swaps, to-be-announced (TBA) commitments, futures, options and swaptions, including on mortgage-backed securities and indices, for both hedging and non-hedging purposes, including to obtain or adjust exposure to mortgage-backed investments.
It is important to understand that you can lose money by investing in the fund.
The value of investments in the fund’s portfolio may fall or fail to rise over extended periods of time for a variety of reasons, including general economic, political or financial market conditions, investor sentiment and market perceptions, government actions, geopolitical events or changes, outbreaks of infectious illnesses or other widespread public health issues, and factors related to a specific issuer, geography, industry or sector, such as the housing or real estate markets. These and other factors may lead to increased volatility and reduced liquidity in the fund’s portfolio holdings, may negatively impact the fund’s performance, and may exacerbate other risks to which the fund is subject.
The risks associated with bond investments include interest rate risk, which is the risk that the value of the fund’s investments is likely to fall if interest rates rise. Bond investments are also subject to credit risk, which is the risk that issuers of the fund’s investments may default on payment of interest or principal. Bond investments may be more susceptible to downgrades or defaults during economic downturns or other periods of economic stress. Default risk is generally higher for non-qualified mortgages. Interest rate risk is generally greater for longer-term bonds, and credit risk is generally greater for below-investment grade bonds, which can be more sensitive to changes in markets, credit conditions, and interest rates, and may be considered speculative. Mortgage- and asset-backed investments, unlike traditional debt investments, are also subject to prepayment risk, which means that they may increase in value less than other bonds when interest rates decline and decline in value more than other bonds when interest rates rise. We may have to invest the proceeds from prepaid investments, including mortgage- and asset-backed investments, in other investments with less attractive terms and yields. The fund’s investments in mortgage-backed securities and asset-backed securities, and in certain other securities and derivatives, may be or become illiquid.
The fund’s concentration in an industry group composed of privately issued residential and commercial mortgage-backed securities and mortgage-backed securities issued or guaranteed by the U.S. government or its agencies or instrumentalities may make the fund’s net asset value more susceptible to economic, market, political and other developments affecting the residential and commercial real estate markets, and the servicing of mortgage loans secured by real estate properties. During periods of difficult economic conditions, delinquencies and losses on commercial mortgage-backed investments in particular generally increase, including as a result of the effects of those conditions on commercial real estate markets, the ability of commercial tenants to make loan payments, and the ability of a property to attract and retain commercial tenants.
Our use of derivatives may increase the risks of investing in the fund by increasing investment exposure (which may be considered leverage) or, in the case of many over-the-counter instruments, because of the potential inability to terminate or sell derivative positions and the potential failure of the other party to the instrument to meet its obligations. The risk of a party failing to meet its obligations may increase if the fund has significant exposure to that counterparty. The value of derivatives may move in unexpected ways due to unanticipated market movements, the use of leverage, imperfect correlation between the derivative instrument and the reference asset, or other factors, especially in unusual market conditions, and volatility in the value of derivatives could adversely impact the fund’s returns, obligations and exposures. Derivatives are also subject to other risks, including liquidity risk (e.g., liquidity demands arising from the requirement to make payments to a derivative counterparty), operational risk (e.g., settlement issues or system failures) and legal risk (e.g., insufficient legal documentation or contract enforceability issues).
There is no guarantee that the investment techniques, analyses, or judgments that we apply in making investment decisions for the fund will produce the intended outcome or that the investments we select for the fund will perform as well as other securities that were not selected for the fund. We, or the fund’s other service providers, may experience disruptions or operating errors that could negatively impact the fund.
The fund may be an investment option for mutual funds that are managed by Franklin Resources, Inc. (Franklin Templeton) and its affiliates as “funds of funds” and other investors with substantial investments in the fund. Such shareholders may at times be considered to control the fund. Dispositions of a large number of shares by these shareholders may adversely affect the fund’s liquidity and net assets. These redemptions may also force the fund to sell securities, which may increase the fund’s brokerage costs.
The fund may not achieve its goal, and it is not intended to be a complete investment program. An investment in the fund is not insured or guaranteed by the Federal Deposit Insurance Corporation or any other government agency.
The performance information below gives some indication of the risks associated with an investment in the fund by showing the fund’s performance year to year and over time. Before April 30, 2018, the fund was managed with a materially different investment strategy and may have achieved materially different performance results under its current investment strategy from that shown for periods before this date. The performance information does not
reflect insurance-related charges or expenses. If it did, performance would be lower. Please remember that past performance is not necessarily an indication of future results.
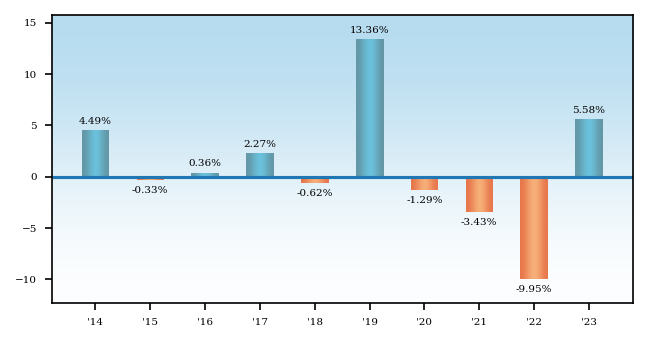
Average Annual Total Returns - Putnam VT Mortgage Securities Fund |
1 Year |
5 Years |
10 Years |
|---|---|---|---|
| Class IA C000010837 | 5.58% | 0.54% | 0.88% |
| Class IB C000010838 | 5.27% | 0.30% | 0.63% |
| Bloomberg U.S. MBS Index (no deduction for fees, expenses or taxes) | 5.05% | 0.25% | 1.38% |
| Putnam VT Mortgage Securities Linked Benchmark (no deduction for fees, expenses or taxes) | 5.05% | 0.25% | 1.10% |
| The Putnam VT Mortgage Securities Linked Benchmark represents the performance of the Bloomberg Government Bond Index through April 29, 2018, and the performance of the Bloomberg U.S. MBS Index thereafter. |
| All Bloomberg indices are provided by Bloomberg Index Services Limited. |
| BLOOMBERG® is a trademark and service mark of Bloomberg Finance L.P. and its affiliates (collectively “Bloomberg”). Bloomberg or Bloomberg’s licensors, own all proprietary rights in the Bloomberg Indices. Neither Bloomberg nor Bloomberg’s licensors approve or endorse this material, or guarantee the accuracy or completeness of any information herein, or make any warranty, express or implied, as to the results to be obtained therefrom, and to the maximum extent allowed by law, neither shall have any liability or responsibility for injury or damages arising in connection therewith. |
Putnam VT Research Fund seeks capital appreciation.
The following table describes the fees and expenses you may pay if you buy, hold and sell shares of the fund. You may pay other fees, such as brokerage commissions and other fees to financial intermediaries, which are not reflected in the tables and examples below. The fees and expenses information does not reflect insurance-related charges or expenses borne by contract holders indirectly investing in the fund. If it did, expenses would be higher.
Annual Fund Operating Expenses - Putnam VT Research Fund |
Class IA C000010869 |
Class IB C000010870 |
|---|---|---|
| Management Fees (as a percentage of Assets) | 0.55% | 0.55% |
| Distribution and Service (12b-1) Fees | none | 0.25% |
| Other Expenses (as a percentage of Assets): | 0.19% | 0.19% |
| Expenses (as a percentage of Assets) | 0.74% | 0.99% |
The following hypothetical example is intended to help you compare the cost of investing in the fund with the cost of investing in other funds. The example does not reflect insurance-related charges or expenses. If it did, expenses would be higher. It assumes that you invest $10,000 in the fund for the time periods indicated and then redeem or hold all your shares at the end of those periods. It assumes a 5% return on your investment each year and that the fund’s operating expenses remain the same. Your actual costs may be higher or lower.
Expense Example - Putnam VT Research Fund - USD ($) |
Expense Example, with Redemption, 1 Year |
Expense Example, with Redemption, 3 Years |
Expense Example, with Redemption, 5 Years |
Expense Example, with Redemption, 10 Years |
|---|---|---|---|---|
| Class IA C000010869 | 76 | 237 | 411 | 918 |
| Class IB C000010870 | 101 | 315 | 547 | 1,213 |
The fund pays transaction-related costs, such as commissions, when it buys and sells securities (or “turns over” its portfolio). A higher turnover rate may indicate higher transaction costs. These costs, which are not reflected in annual fund operating expenses or the above example, affect fund performance. The fund’s turnover rate in the most recent fiscal year was 34%.
Investments
We invest mainly in common stocks (growth or value stocks or both) of large U.S. companies that we believe have favorable investment potential. For example, we may purchase stocks of companies with stock prices that reflect a value lower than that which we place on the company. We may also consider other factors we believe will cause the stock price to rise. We may consider, among other factors, a company’s valuation, financial strength, growth potential, competitive position in its industry, projected future earnings, cash flows and dividends when deciding whether to buy or sell investments.
It is important to understand that you can lose money by investing in the fund.
The value of investments in the fund’s portfolio may fall or fail to rise over extended periods of time for a variety of reasons, including general economic, political or financial market conditions, investor sentiment and market perceptions, government actions, geopolitical events or changes, outbreaks of infectious illnesses or other widespread public health issues, and factors related to a specific issuer, geography, industry or sector. These and other factors may lead to increased volatility and reduced liquidity in the fund’s portfolio holdings, may negatively impact the fund’s performance, and may exacerbate other risks to which the fund is subject. Companies whose stocks we believe are undervalued by the market may have experienced adverse business developments or may be subject to special risks that have caused their stocks to be out of favor. Growth stocks may be more susceptible to earnings disappointments, and value stocks may fail to rebound. From time to time, the fund may invest a significant portion of its assets in companies in one or more related industries or sectors, which would make the fund more vulnerable to adverse developments affecting those companies, industries or sectors.
There is no guarantee that the investment techniques, analyses, or judgments that we apply in making investment decisions for the fund will produce the intended outcome or that the investments we select for the fund will perform as well as other securities that were not selected for the fund. We, or the fund’s other service providers, may experience disruptions or operating errors that could negatively impact the fund.
The fund may be an investment option for mutual funds that are managed by Franklin Resources, Inc. (Franklin Templeton) and its affiliates as “funds of funds” and other investors with substantial investments in the fund. Such shareholders may at times be considered to control the fund. Dispositions of a large number of shares by these shareholders may adversely affect the fund’s liquidity and net assets. These redemptions may also force the fund to sell securities, which may increase the fund’s brokerage costs.
The fund may not achieve its goal, and it is not intended to be a complete investment program. An investment in the fund is not insured or guaranteed by the Federal Deposit Insurance Corporation or any other government agency.
The performance information below gives some indication of the risks associated with an investment in the fund by showing the fund’s performance year to year and over time. The performance information does not reflect insurance-related charges or expenses. If it did, performance would be lower. Please remember that past performance is not necessarily an indication of future results.
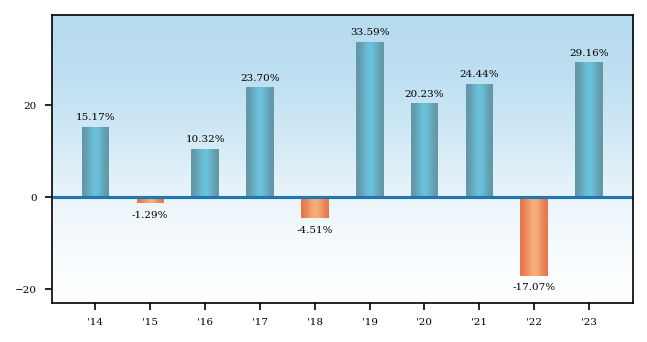
Average Annual Total Returns - Putnam VT Research Fund |
1 Year |
5 Years |
10 Years |
|---|---|---|---|
| Class IA C000010869 | 29.16% | 16.45% | 12.24% |
| Class IB C000010870 | 28.86% | 16.15% | 11.95% |
| S&P 500 Index (no deduction for fees, expenses or taxes) | 26.29% | 15.69% | 12.03% |
Putnam VT Small Cap Growth Fund seeks capital appreciation.
The following table describes the fees and expenses you may pay if you buy, hold and sell shares of the fund. You may pay other fees, such as brokerage commissions and other fees to financial intermediaries, which are not reflected in the tables and examples below. The fees and expenses information does not reflect insurance-related charges or expenses borne by contract holders indirectly investing in the fund. If it did, expenses would be higher.
Annual Fund Operating Expenses - Putnam VT Small Cap Growth Fund |
Class IA C000010861 |
Class IB C000010862 |
|
|---|---|---|---|
| Management Fees (as a percentage of Assets) | 0.62% | 0.62% | |
| Distribution and Service (12b-1) Fees | none | 0.25% | |
| Other Expenses (as a percentage of Assets): | 0.37% | 0.37% | |
| Expenses (as a percentage of Assets) | 0.99% | 1.24% | |
| Fee Waiver or Reimbursement | [1] | (0.10%) | (0.10%) |
| Net Expenses (as a percentage of Assets) | 0.89% | 1.14% | |
| [1] | Reflects Putnam Investment Management, LLC’s contractual obligation to limit certain fund expenses through 4/30/25. This obligation may be modified or discontinued only with approval of the fund’s Board of Trustees. |
The following hypothetical example is intended to help you compare the cost of investing in the fund with the cost of investing in other funds. The example does not reflect insurance-related charges or expenses. If it did, expenses would be higher. It assumes that you invest $10,000 in the fund for the time periods indicated and then redeem or hold all your shares at the end of those periods. It assumes a 5% return on your investment each year and that the fund’s operating expenses remain the same. Only the first year of each period in the example takes into account the expense reimbursement described above. Your actual costs may be higher or lower.
Expense Example - Putnam VT Small Cap Growth Fund - USD ($) |
Expense Example, with Redemption, 1 Year |
Expense Example, with Redemption, 3 Years |
Expense Example, with Redemption, 5 Years |
Expense Example, with Redemption, 10 Years |
|---|---|---|---|---|
| Class IA C000010861 | 91 | 305 | 537 | 1,204 |
| Class IB C000010862 | 116 | 384 | 671 | 1,491 |
The fund pays transaction-related costs, such as commissions, when it buys and sells securities (or “turns over” its portfolio). A higher turnover rate may indicate higher transaction costs. These costs, which are not reflected in annual fund operating expenses or the above example, affect fund performance. The fund’s turnover rate in the most recent fiscal year was 58%.
Investments
We invest mainly in common stocks of small U.S. companies, with a focus on growth stocks. Growth stocks are stocks of companies whose earnings are expected to grow faster than those of similar firms, and whose business growth and other characteristics may lead to an increase in stock price. Under normal circumstances, we invest at least 80% of the fund’s net assets in companies of a size similar to those in the Russell 2000® Growth Index. This policy may be changed only after 60 days’ notice to shareholders. As of March 31, 2024, the index was composed of companies having market capitalizations of between approximately $16.6 million and $59.1 billion.
We may consider, among other factors, a company’s valuation, financial strength, growth potential, competitive position in its industry, projected future earnings, cash flows and dividends when deciding whether to buy or sell investments.
It is important to understand that you can lose money by investing in the fund.
The value of investments in the fund’s portfolio may fall or fail to rise over extended periods of time for a variety of reasons, including general economic, political or financial market conditions, investor sentiment and market perceptions, government actions, geopolitical events or changes, outbreaks of infectious illnesses or other widespread public health issues, and factors related to a specific issuer, geography, industry or sector. These and other factors may lead to increased volatility and reduced liquidity in the fund’s portfolio holdings, may negatively impact the fund’s performance, and may exacerbate other risks to which the fund is subject. Companies whose stocks we believe are undervalued by the market may have experienced adverse business developments or may be subject to special risks that have caused their stocks to be out of favor. Growth stocks may be more susceptible to earnings disappointments, and the market may not favor growth-style investing. These risks are generally greater for small and midsize companies. From time to time, the fund may invest a significant portion of its assets in companies in one or more related industries or sectors, which would make the fund more vulnerable to adverse developments affecting those companies, industries or sectors.
There is no guarantee that the investment techniques, analyses, or judgments that we apply in making investment decisions for the fund will produce the intended outcome or that the investments we select for the fund will perform as well as other securities that were not selected for the fund. We, or the fund’s other service providers, may experience disruptions or operating errors that could negatively impact the fund.
The fund may be an investment option for mutual funds that are managed by Franklin Resources, Inc. (Franklin Templeton) and its affiliates as “funds of funds” and other investors with substantial investments in the fund. Such shareholders may at times be considered to control the fund. Dispositions of a large number of shares by these shareholders may adversely affect the fund’s liquidity and net assets. These redemptions may also force the fund to sell securities, which may increase the fund’s brokerage costs.
The fund may not achieve its goal, and it is not intended to be a complete investment program. An investment in the fund is not insured or guaranteed by the Federal Deposit Insurance Corporation or any other government agency.
The performance information below gives some indication of the risks associated with an investment in the fund by showing the fund’s performance year to year and over time. Before September 17, 2018, the fund was managed with a materially different investment strategy and may have achieved materially different performance results under its current investment strategy from that shown for periods before this date. The performance information does not reflect insurance-related charges or expenses. If it did, performance would be lower. Please remember that past performance is not necessarily an indication of future results.
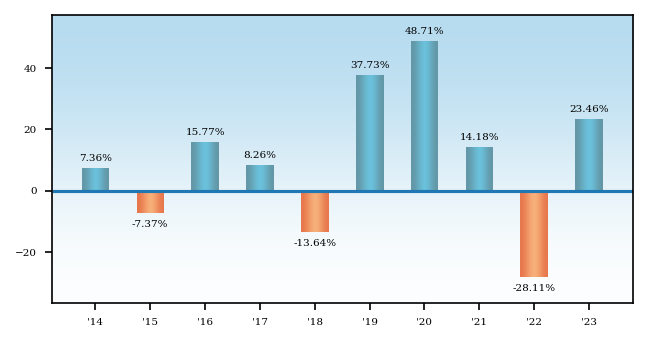
Average Annual Total Returns - Putnam VT Small Cap Growth Fund |
1 Year |
5 Years |
10 Years |
|---|---|---|---|
| Class IA C000010861 | 23.46% | 15.72% | 8.37% |
| Class IB C000010862 | 23.14% | 15.44% | 8.10% |
| Russell 2000® Growth Index (no deduction for fees, expenses or taxes) | 18.66% | 9.22% | 7.16% |
| Frank Russell Company is the source and owner of the trademarks, service marks and copyrights related to the Russell Indexes. Russell ® is a trademark of Frank Russell Company. |
Putnam VT Small Cap Value Fund seeks capital appreciation.
The following table describes the fees and expenses you may pay if you buy, hold and sell shares of the fund. You may pay other fees, such as brokerage commissions and other fees to financial intermediaries, which are not reflected in the tables and examples below. The fees and expenses information does not reflect insurance-related charges or expenses borne by contract holders indirectly investing in the fund. If it did, expenses would be higher.
Annual Fund Operating Expenses - Putnam VT Small Cap Value Fund |
Class IA C000010871 |
Class IB C000010872 |
|---|---|---|
| Management Fees (as a percentage of Assets) | 0.62% | 0.62% |
| Distribution and Service (12b-1) Fees | none | 0.25% |
| Other Expenses (as a percentage of Assets): | 0.16% | 0.16% |
| Expenses (as a percentage of Assets) | 0.78% | 1.03% |
The following hypothetical example is intended to help you compare the cost of investing in the fund with the cost of investing in other funds. The example does not reflect insurance-related charges or expenses. If it did, expenses would be higher. It assumes that you invest $10,000 in the fund for the time periods indicated and then redeem or hold all your shares at the end of those periods. It assumes a 5% return on your investment each year and that the fund’s operating expenses remain the same. Your actual costs may be higher or lower.
Expense Example - Putnam VT Small Cap Value Fund - USD ($) |
Expense Example, with Redemption, 1 Year |
Expense Example, with Redemption, 3 Years |
Expense Example, with Redemption, 5 Years |
Expense Example, with Redemption, 10 Years |
|---|---|---|---|---|
| Class IA C000010871 | 80 | 249 | 433 | 966 |
| Class IB C000010872 | 105 | 328 | 569 | 1,259 |
The fund pays transaction-related costs, such as commissions, when it buys and sells securities (or “turns over” its portfolio). A higher turnover rate may indicate higher transaction costs. These costs, which are not reflected in annual fund operating expenses or the above example, affect fund performance. The fund’s turnover rate in the most recent fiscal year was 80%.
Investments
We invest mainly in common stocks of small U.S. companies, with a focus on value stocks. Value stocks are issued by companies that we believe are currently undervalued by the market. If we are correct and other investors ultimately recognize the value of the company, the price of its stock may rise. Under normal circumstances, we invest at least 80% of the fund’s net assets in companies of a size similar to those in the Russell 2000 Value Index. This policy may be changed only after 60 days’ notice to shareholders. As of March 31, 2024, the index was composed of companies having market capitalizations of between approximately $18.3 million and $16.9 billion. We may consider, among other factors, a company’s valuation, financial strength, growth potential, competitive position in its industry, projected future earnings, cash flows and dividends when deciding whether to buy or sell investments.
It is important to understand that you can lose money by investing in the fund.
The value of investments in the fund’s portfolio may fall or fail to rise over extended periods of time for a variety of reasons, including general economic, political or financial market conditions, investor sentiment and market perceptions, government actions, geopolitical events or changes, outbreaks of infectious illnesses or other widespread public health issues, and factors related to a specific issuer, geography, industry or sector. These and other factors may lead to increased volatility and reduced liquidity in the fund’s portfolio holdings, may negatively impact the fund’s performance, and may exacerbate other risks to which the fund is subject. Companies whose stocks we believe are undervalued by the market may have experienced adverse business developments or may be subject to special risks that have caused their stocks to be out of favor. Value stocks may fail to rebound, and the market may not favor value-style investing. These risks are generally greater for small and midsize companies. From time to time, the fund may invest a significant portion of its assets in companies in one or more related industries or sectors, which would make the fund more vulnerable to adverse developments affecting those industries or sectors.
There is no guarantee that the investment techniques, analyses, or judgments that we apply in making investment decisions for the fund will produce the intended outcome or that the investments we select for the fund will perform as well as other securities that were not selected for the fund. We, or the fund’s other service providers, may experience disruptions or operating errors that could negatively impact the fund.
The fund may be an investment option for mutual funds that are managed by Franklin Resources, Inc. (Franklin Templeton) and its affiliates as “funds of funds” and other investors with substantial investments in the fund. Such shareholders may at times be considered to control the fund. Dispositions of a large number of shares by these shareholders may adversely affect the fund’s liquidity and net assets. These redemptions may also force the fund to sell securities, which may increase the fund’s brokerage costs.
The fund may not achieve its goal, and it is not intended to be a complete investment program. An investment in the fund is not insured or guaranteed by the Federal Deposit Insurance Corporation or any other government agency.
The performance information below gives some indication of the risks associated with an investment in the fund by showing the fund’s performance year to year and over time. The performance information does not reflect insurance-related charges or expenses. If it did, performance would be lower. Please remember that past performance is not necessarily an indication of future results.
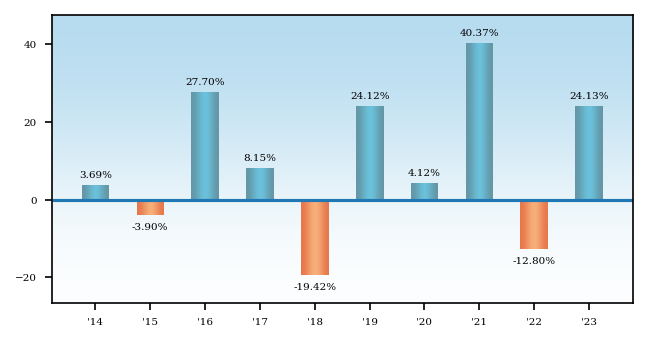
Average Annual Total Returns - Putnam VT Small Cap Value Fund |
1 Year |
5 Years |
10 Years |
|---|---|---|---|
| Class IA C000010871 | 24.13% | 14.45% | 8.09% |
| Class IB C000010872 | 23.75% | 14.17% | 7.82% |
| Russell 2000® Value Index (no deduction for fees, expenses or taxes) | 14.65% | 10.00% | 6.76% |
| Frank Russell Company is the source and owner of the trademarks, service marks and copyrights related to the Russell Indexes. Russell® is a trademark of Frank Russell Company. |
Putnam VT Sustainable Future Fund seeks long-term capital appreciation.
The following table describes the fees and expenses you may pay if you buy, hold and sell shares of the fund. You may pay other fees, such as brokerage commissions and other fees to financial intermediaries, which are not reflected in the tables and examples below. The fees and expenses information does not reflect insurance-related charges or expenses borne by contract holders indirectly investing in the fund. If it did, expenses would be higher.
Annual Fund Operating Expenses - Putnam VT Sustainable Future Fund |
Class IA C000010857 |
Class IB C000010858 |
|
|---|---|---|---|
| Management Fees (as a percentage of Assets) | 0.55% | 0.55% | |
| Distribution and Service (12b-1) Fees | none | 0.25% | |
| Other Expenses (as a percentage of Assets): | 0.33% | 0.33% | |
| Expenses (as a percentage of Assets) | 0.88% | 1.13% | |
| Fee Waiver or Reimbursement | [1] | (0.06%) | (0.06%) |
| Net Expenses (as a percentage of Assets) | 0.82% | 1.07% | |
| [1] | Reflects Putnam Investment Management, LLC’s contractual obligation to limit certain fund expenses through 4/30/25. This obligation may be modified or discontinued only with approval of the fund’s Board of Trustees. |
The following hypothetical example is intended to help you compare the cost of investing in the fund with the cost of investing in other funds. The example does not reflect insurance-related charges or expenses. If it did, expenses would be higher. It assumes that you invest $10,000 in the fund for the time periods indicated and then redeem or hold all your shares at the end of those periods. It assumes a 5% return on your investment each year and that the fund’s operating expenses remain the same. Your actual costs may be higher or lower.
Expense Example - Putnam VT Sustainable Future Fund - USD ($) |
Expense Example, with Redemption, 1 Year |
Expense Example, with Redemption, 3 Years |
Expense Example, with Redemption, 5 Years |
Expense Example, with Redemption, 10 Years |
|---|---|---|---|---|
| Class IA C000010857 | 84 | 275 | 482 | 1,079 |
| Class IB C000010858 | 109 | 353 | 616 | 1,369 |
The fund pays transaction-related costs, such as commissions, when it buys and sells securities (or “turns over” its portfolio). A higher turnover rate may indicate higher transaction costs. These costs, which are not reflected in annual fund operating expenses or the above example, affect fund performance. The fund’s turnover rate in the most recent fiscal year was 44%.
Investments
We invest mainly in common stocks of U.S. companies of any size, with a focus on companies whose products and services we believe provide solutions that directly contribute to sustainable social, environmental and economic development (Solutions Companies). Stocks of this type of company are typically, but not always, considered to be growth stocks. Growth stocks are stocks of companies whose revenues, earnings, or cash flows are expected to grow faster than those of similar firms, and whose business growth and other characteristics may lead to an increase in stock price. We may consider, among other factors, a company’s impact on sustainable environmental, social and economic development (as described below), valuation, financial strength, growth potential, competitive position in its industry, projected future earnings, cash flows and dividends when deciding whether to buy or sell investments. We may also invest in non-U.S. companies.
Our approach to sustainable investing incorporates fundamental research together with consideration of sustainable environmental, social and economic development impact. We believe that companies whose products and services produce positive environmental, social and economic development impact also often demonstrate potential for strong financial growth. Under normal circumstances, the fund invests at least 80% of the value of its net assets in securities that meet our sustainability criteria. These criteria are based on a proprietary sustainability solutions map that links to the United Nations Sustainable Development Goals (SDGs). In applying these criteria, we will assign each company a proprietary environmental, social and/or corporate governance (ESG) rating ranging from 1 to 4 (1 indicating the highest (best) ESG rating and 4 indicating the lowest (worst) ESG rating). In order to meet our sustainability criteria for purposes of this investment policy, a company must be rated 2 or 1 by us. This policy is non-fundamental and may be changed only after 60 days’ notice to shareholders. In selecting each investment, we consider the extent to which a company’s products or services may provide solutions to forward-looking sustainability needs, creating positive impact in environmental, social and economic development areas. Environmental impacts may include, for example, reduction of carbon emissions and improved water quality. Social impacts may include, for example, improvements in employee well-being, supplier standards, or access to products, information, or security. Economic development impacts may include, for example, stakeholder analysis and shared value approaches to business practices, access to economic opportunity, or improvements in operational effectiveness or efficiency.
It is important to understand that you can lose money by investing in the fund.
The value of investments in the fund’s portfolio may fall or fail to rise over extended periods of time for a variety of reasons, including general economic, political or financial market conditions, investor sentiment and market perceptions, government actions, geopolitical events or changes, outbreaks of infectious illnesses or other widespread public health issues, and factors related to a specific issuer, geography, industry or sector. These and other factors may lead to increased volatility and reduced liquidity in the fund’s portfolio holdings, may negatively impact the fund’s performance, and may exacerbate other risks to which the fund is subject.
The value of a company’s stock may fall or fail to rise as a result of factors directly relating to that company, such as decisions made by its management or lower demand for the company’s products or services. A stock’s value may also fall because of factors affecting not just the company, but also other companies in the same industry or in a number of different industries, such as increases in production costs.
Growth stocks may be more susceptible to earnings disappointments and the market may not favor growth-style investing. These risks are generally greater for small and midsized companies. From time to time, the fund may invest a significant portion of its assets in companies in one or more related industries or sectors, which would make the fund more vulnerable to adverse developments affecting those companies, industries or sectors.
The value of international investments traded in foreign currencies may be adversely impacted by fluctuations in exchange rates. International investments, particularly investments in emerging markets, may carry risks associated with potentially less stable economies or governments (such as the risk of seizure by a foreign government, the imposition of currency or other restrictions, or high levels of inflation), and may be or become illiquid.
Investing with a focus on Solutions Companies, whose products and services may provide solutions that directly impact sustainable environmental, social and economic development, may result in the fund investing in certain types of companies, industries or sectors that the market may not favor. In evaluating an investment opportunity, we may make investment decisions based on information and data that is incomplete or inaccurate. Sustainability and ESG factors are not uniformly defined and applying such factors involves subjective assessments. Sustainability and ESG scorings and assessments of issuers can vary across third-party data providers and may change over time. In addition, a company’s business practices, products or services may change over time. As a result of these possibilities, among others, the fund may temporarily hold securities that are inconsistent with the fund’s sustainable investment criteria. Regulatory changes or interpretations regarding the definitions and/or use of ESG or other sustainability criteria could have a material adverse effect on the fund’s ability to invest in accordance with its investment policies and/or achieve its investment objective, as well as the ability of certain classes of investors to invest in funds, such as the fund, whose strategies include ESG or other sustainability criteria.
There is no guarantee that the investment techniques, analyses, or judgments that we apply in making investment decisions for the fund will produce the intended outcome or that the investments we select for the fund will perform as well as other securities that were not selected for the fund. We, or the fund’s other service providers, may experience disruptions or operating errors that could negatively impact the fund.
The fund may be an investment option for mutual funds that are managed by Franklin Resources, Inc. (Franklin Templeton) and its affiliates as “funds of funds” and other investors with substantial investments in the fund. Such shareholders may at times be considered to control the fund. Dispositions of a large number of shares by these shareholders may adversely affect the fund’s liquidity and net assets. These redemptions may also force the fund to sell securities, which may increase the fund’s brokerage costs.
The fund may not achieve its goal, and it is not intended to be a complete investment program. An investment in the fund is not insured or guaranteed by the Federal Deposit Insurance Corporation or any other government agency.
The performance information below gives some indication of the risks associated with an investment in the fund by showing the fund’s performance year to year and over time. Before April 30, 2018, the fund was managed with a materially different investment strategy and may have achieved materially different performance results under its current investment strategy from that shown for periods before this date. The performance information does not reflect insurance-related charges or expenses. If it did, performance would be lower. Please remember that past performance is not necessarily an indication of future results.
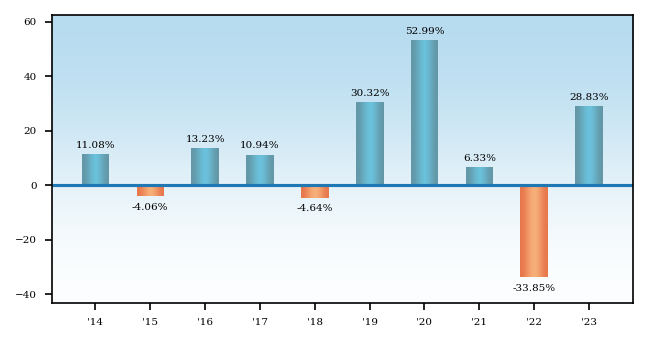
Average Annual Total Returns - Putnam VT Sustainable Future Fund |
1 Year |
5 Years |
10 Years |
|---|---|---|---|
| Class IA C000010857 | 28.83% | 12.56% | 8.72% |
| Class IB C000010858 | 28.52% | 12.28% | 8.44% |
| Russell MidCap Growth Index (no deduction for fees, expenses or taxes) | 25.87% | 13.81% | 10.57% |
| Putnam VT Sustainable Future Linked Benchmark (no deduction for fees, expenses or taxes) | 25.87% | 13.81% | 9.79% |
| Frank Russell Company is the source and owner of the trademarks, service marks and copyrights related to the Russell Indexes. Russell® is a trademark of Frank Russell Company. |
| The Putnam VT Sustainable Future Linked Benchmark represents the performance of the Russell 3000® Value Index through April 29, 2018, and the performance of the Russell Midcap® Growth Index thereafter. |
Putnam VT Sustainable Leaders Fund seeks long-term capital appreciation.
The following table describes the fees and expenses you may pay if you buy, hold and sell shares of the fund. You may pay other fees, such as brokerage commissions and other fees to financial intermediaries, which are not reflected in the tables and examples below. The fees and expenses information does not reflect insurance-related charges or expenses borne by contract holders indirectly investing in the fund. If it did, expenses would be higher.
Annual Fund Operating Expenses - Putnam VT Sustainable Leaders Fund |
Class IA C000010863 |
Class IB C000010864 |
|---|---|---|
| Management Fees (as a percentage of Assets) | 0.55% | 0.55% |
| Distribution and Service (12b-1) Fees | none | 0.25% |
| Other Expenses (as a percentage of Assets): | 0.10% | 0.10% |
| Expenses (as a percentage of Assets) | 0.65% | 0.90% |
The following hypothetical example is intended to help you compare the cost of investing in the fund with the cost of investing in other funds. The example does not reflect insurance-related charges or expenses. If it did, expenses would be higher. It assumes that you invest $10,000 in the fund for the time periods indicated and then redeem or hold all your shares at the end of those periods. It assumes a 5% return on your investment each year and that the fund’s operating expenses remain the same. Your actual costs may be higher or lower.
Expense Example - Putnam VT Sustainable Leaders Fund - USD ($) |
Expense Example, with Redemption, 1 Year |
Expense Example, with Redemption, 3 Years |
Expense Example, with Redemption, 5 Years |
Expense Example, with Redemption, 10 Years |
|---|---|---|---|---|
| Class IA C000010863 | 66 | 208 | 362 | 810 |
| Class IB C000010864 | 92 | 287 | 498 | 1,108 |
The fund pays transaction-related costs, such as commissions, when it buys and sells securities (or “turns over” its portfolio). A higher turnover rate may indicate higher transaction costs. These costs, which are not reflected in annual fund operating expenses or the above example, affect fund performance. The fund’s turnover rate in the most recent fiscal year was 21%.
Investments
We invest mainly in common stocks of U.S. companies of any size, with a focus on companies that we believe exhibit a commitment to financially material sustainable business practices. We may also invest in non-U.S. companies. In evaluating investments for the fund, we view “financially material sustainable business practices” as business practices that we believe are reasonably likely to impact the financial condition or operating performance of a company and that relate to environmental, social, or corporate governance (“ESG”) issues. We identify relevant ESG issues on a sector-specific basis using an internally developed materiality map, which is informed by the industry-specific financial materiality framework of the Sustainability Accounting Standards Board (“SASB,” now incorporated in the International Financial Reporting Standards Foundation). As part of this analysis, we may utilize metrics and information such as emissions data, carbon intensity, sources of energy used for operations, water use and re-use, water generation, waste diversion from landfill, employee safety and diversity data, supplier audits, product safety, board composition, and incentive compensation structures. Stocks of companies that exhibit a commitment to financially material sustainable business practices are typically, but not always, considered to be growth stocks. Growth stocks are stocks of companies whose revenues, earnings, or cash flows are expected to grow faster than those of similar firms, and whose business growth and other characteristics may lead to an increase in stock price. We may consider, among other factors, a company’s sustainable business practices (as described above), valuation, financial strength, growth potential, competitive position in its industry, projected future earnings, cash flows and dividends when deciding whether to buy or sell investments.
Under normal circumstances, the fund invests at least 80% of the value of its net assets in securities that meet our sustainability criteria. These criteria are based on a proprietary materiality map that is informed by the industry-specific financial materiality framework of SASB. In applying these criteria, we will assign each company a proprietary ESG rating ranging from 1 to 4 (1 indicating the highest (best) ESG rating and 4 indicating the lowest (worst) ESG rating). In order to meet our sustainability criteria for purposes of this investment policy, a company must be rated 2 or 1 by us. This policy is non-fundamental and may be changed only after 60 days’ notice to shareholders. In selecting each investment, we focus on companies that have a demonstrated commitment to sustainable business practices in areas that are relevant and material to their long-term financial returns and risk profiles. We believe that companies that have exhibited such a commitment also often demonstrate potential for strong financial growth. This commitment may be reflected through ESG policies, practices, or outcomes. The fund’s approach to sustainable investing incorporates fundamental research together with consideration of ESG factors. Environmental factors include, for example, a company’s carbon intensity and use of resources like water or minerals. Sustainability measures in this area might include plans to reduce waste, increase recycling, raise the proportion of energy supply from renewable sources, or improve product design to be less resource intensive. Social factors include, for example, labor practices and supply chain management. Sustainability measures in this area might include programs to improve employee well-being, commitment to workplace equality and diversity, or improved stewardship of
supplier relationships and working conditions. Corporate governance factors include, for example, board composition and executive compensation. Sustainability measures in this area might include improvements in board independence or diversity, or alignment of management incentives with the company’s strategic sustainability objectives. Our integrated approach combines analysis of the growing body of ESG data and deep fundamental analysis and looks for companies that demonstrate leadership, beyond compliance, on relevant sustainability issues. The characteristics that we may use when considering sustainability leadership include:
(1) Material. Focused on strategic, business-relevant issues.
(2) Proactive. Actions that go beyond basic requirements to create potential business benefit.
(3) Transparent. Reporting that is relevant, timely, and candid.
(4) Effective. Creating benefits both within the firm and beyond its corporate borders.
It is important to understand that you can lose money by investing in the fund.
The value of investments in the fund’s portfolio may fall or fail to rise over extended periods of time for a variety of reasons, including general economic, political or financial market conditions, investor sentiment and market perceptions, government actions, geopolitical events or changes, outbreaks of infectious illnesses or other widespread public health issues, and factors related to a specific issuer, geography, industry or sector. These and other factors may lead to increased volatility and reduced liquidity in the fund’s portfolio holdings, may negatively impact the fund’s performance, and may exacerbate other risks to which the fund is subject.
The value of a company’s stock may fall or fail to rise as a result of factors directly relating to that company, such as decisions made by its management or lower demand for the company’s products or services. A stock’s value may also fall because of factors affecting not just the company, but also other companies in the same industry or in a number of different industries, such as increases in production costs.
Growth stocks may be more susceptible to earnings disappointments, and the market may not favor growth-style investing. These risks are generally greater for small and midsize companies. From time to time, the fund may invest a significant portion of its assets in companies in one or more related industries or sectors, which would make the fund more vulnerable to adverse developments affecting those industries or sectors.
The value of international investments traded in foreign currencies may be adversely impacted by fluctuations in exchange rates. International investments, particularly investments in emerging markets, may carry risks associated with potentially less stable economies or governments (such as the risk of seizure by a foreign government, the imposition of currency or other restrictions, or high levels of inflation), and may be or become illiquid.
Investing with a focus on companies that exhibit a commitment to sustainable practices may result in the fund investing in certain types of companies, industries or sectors that the market may not favor. In evaluating an investment opportunity, we may make investment decisions based on information and data that is incomplete or inaccurate. Sustainability and ESG metrics are not uniformly defined and applying such metrics involves subjective assessments. Sustainability and ESG scorings and assessments of issuers can vary across third-party data providers and may change over time. In /addition, a company’s business practices, products or services may change over time. As a result of these possibilities, among others, the fund may temporarily hold securities that are inconsistent with the fund’s sustainable investment criteria. Regulatory changes or interpretations regarding the definitions and/or use of ESG or other sustainability criteria could have a material adverse effect on the fund’s ability to invest in accordance with its investment policies and/or achieve its investment objective, as well as the ability of certain classes of investors to invest in funds, such as the fund, whose strategies include ESG or other sustainability criteria.
There is no guarantee that the investment techniques, analyses, or judgments that we apply in making investment decisions for the fund will produce the intended outcome or that the investments we select for the fund will perform as well as other securities that were not selected for the fund. We, or the fund’s other service providers, may experience disruptions or operating errors that could negatively impact the fund.
The fund may be an investment option for mutual funds that are managed by Franklin Resources, Inc. (Franklin Templeton) and its affiliates as “funds of funds” and other investors with substantial investments in the fund. Such shareholders may at times be considered to control the fund. Dispositions of a large number of shares by these shareholders may adversely affect the fund’s liquidity and net assets. These redemptions may also force the fund to sell securities, which may increase the fund’s brokerage costs.
The fund may not achieve its goal, and it is not intended to be a complete investment program. An investment in the fund is not insured or guaranteed by the Federal Deposit Insurance Corporation or any other government agency.
The performance information below gives some indication of the risks associated with an investment in the fund by showing the fund’s performance year to year and over time. Before April 30, 2018, the fund was managed with a materially different investment strategy and may have achieved materially different performance results under its current investment strategy from that shown for periods before this date. The performance information does not
reflect insurance-related charges or expenses. If it did, performance would be lower. Please remember that past performance is not necessarily an indication of future results.
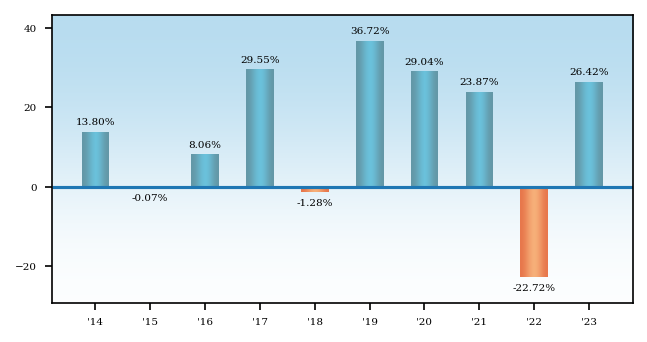
Average Annual Total Returns - Putnam VT Sustainable Leaders Fund |
1 Year |
5 Years |
10 Years |
|---|---|---|---|
| Class IA C000010863 | 26.42% | 16.38% | 12.87% |
| Class IB C000010864 | 26.11% | 16.09% | 12.59% |
| S&P 500 Index (no deduction for fees, expenses or taxes) | 26.29% | 15.69% | 12.03% |
| Putnam VT Sustainable Leaders Linked Benchmark | 26.29% | 16.55% | 13.22% |
| The Putnam VT Sustainable Leaders Linked Benchmark represents the performance of the Russell 3000® Growth Index through August 31, 2019, and the performance of the S&P 500® Index thereafter. |
| Frank Russell Company is the source and owner of the trademarks, service marks and copyrights related to the Russell Indexes. Russell® is a trademark of Frank Russell Company. |