This table describes the fees and expenses that you may pay if you buy and hold shares of the Global Content & Connectivity Fund. You may pay other fees, such as brokerage commissions and other fees to financial intermediaries, which are not reflected in the tables and examples below. You may qualify for sales charge discounts on Class A shares if you and your family invest, or agree to invest in the future, at least $50,000 in Class A shares of the Gabelli family of mutual funds when and if initial investments into Class A shares are reopened. More information about these and other discounts is available from your financial professional and in the section entitled “Classes of Shares” on page 60 of the prospectus and in Appendix A, “Sales Charge Reductions and Waivers Available through Certain Intermediaries,” attached to the Global Content & Connectivity Fund’s prospectus and “Distribution Plans” on page 48 of the Fund’s statement of additional information.
Shareholder Fees - GABELLI GLOBAL CONTENT & CONNECTIVITY FUND - USD ($) |
GABELLI GLOBAL CONTENT & CONNECTIVITY FUND CLASS AAA |
GABELLI GLOBAL CONTENT & CONNECTIVITY FUND CLASS A |
GABELLI GLOBAL CONTENT & CONNECTIVITY FUND CLASS I |
|---|---|---|---|
| Maximum Sales Charge (Load) Imposed on Purchases (as a percentage of offering price) | none | 5.75% | none |
| Maximum Deferred Sales Charge (Load) (as a percentage of redemption price) | none | none | none |
| Maximum Sales Charge (Load) Imposed on Reinvested Dividends (as a percentage of amount invested) | none | none | none |
| Redemption Fee (as a percentage of amount redeemed for shares held 7 days or less) | 2.00% | 2.00% | 2.00% |
| Exchange Fee | none | none | none |
Annual Fund Operating Expenses - GABELLI GLOBAL CONTENT & CONNECTIVITY FUND |
GABELLI GLOBAL CONTENT & CONNECTIVITY FUND CLASS AAA |
GABELLI GLOBAL CONTENT & CONNECTIVITY FUND CLASS A |
GABELLI GLOBAL CONTENT & CONNECTIVITY FUND CLASS I |
|
|---|---|---|---|---|
| Management Fees | 1.00% | 1.00% | 1.00% | |
| Distribution and Service (Rule 12b-1) Fees | 0.25% | 0.25% | none | |
| Other Expenses | 0.65% | 0.65% | 0.65% | |
| Total Annual Fund Operating Expenses | [1] | 1.90% | 1.90% | 1.65% |
| Fee Waiver and/or Expense Reimbursement | [1] | (0.99%) | (0.99%) | (0.74%) |
| Total Annual Fund Operating Expenses After Fee Waiver and/or Expense Reimbursement | 0.91% | 0.91% | 0.91% | |
| [1] | The Adviser has contractually agreed to waive its investment advisory fees and/or to reimburse expenses of the Global Content & Connectivity Fund to the extent necessary to maintain the Total Annual Fund Operating Expenses After Fee Waiver and Expense Reimbursement (excluding brokerage costs, acquired fund fees and expenses, interest, taxes, and extraordinary expenses) at no more than an annual rate of 0.90% for all classes of shares. Under this same arrangement, the Global Content & Connectivity Fund has also agreed, during the two year period following the year of any such waiver or reimbursement by the Adviser, to repay such amount, but only to the extent the Global Content & Connectivity Fund’s adjusted Total Annual Fund Operating Expenses would not exceed an annual rate of 0.90% for the applicable class of shares, after giving effect to the repayments. This arrangement is in effect through April 30, 2025, and may be terminated only by the Board of Directors of the Corporation (the “Board”) before such time. The Global Content & Connectivity Fund will carry forward any fees and expenses in excess of the expense limitation and repay the Adviser such amount provided the Global Content & Connectivity Fund is able to do so without exceeding the lesser of (1) the expense limit in effect at the time of the waiver or reimbursement, as applicable, or (2) the expense limit in effect at the time of recoupment after giving effect to the repayment. |
This example is intended to help you compare the cost of investing in the Global Content & Connectivity Fund with the cost of investing in other mutual funds.
The example assumes that you invest $10,000 in the Global Content & Connectivity Fund for the time periods indicated and then redeem all of your shares at the end of those periods. The example assumes a waiver of expenses through the date of the expiration of the waiver, and reflects Total Annual Fund Operating Expenses following the date of the expiration of the waiver. The example also assumes that your investment has a 5% return each year and that the Global Content & Connectivity Fund’s operating expenses remain the same. Although your actual costs may be higher or lower, based on these assumptions your costs would be:
Expense Example - GABELLI GLOBAL CONTENT & CONNECTIVITY FUND - USD ($) |
Expense Example, with Redemption, 1 Year |
Expense Example, with Redemption, 3 Years |
Expense Example, with Redemption, 5 Years |
Expense Example, with Redemption, 10 Years |
|---|---|---|---|---|
| GABELLI GLOBAL CONTENT & CONNECTIVITY FUND CLASS AAA | 93 | 501 | 934 | 2,142 |
| GABELLI GLOBAL CONTENT & CONNECTIVITY FUND CLASS A | 663 | 1,047 | 1,456 | 2,593 |
| GABELLI GLOBAL CONTENT & CONNECTIVITY FUND CLASS I | 93 | 448 | 827 | 1,892 |
You would pay the following expenses if you did not redeem your shares of the Global Content & Connectivity Fund:
Expense Example, No Redemption - GABELLI GLOBAL CONTENT & CONNECTIVITY FUND - USD ($) |
Expense Example, No Redemption, 1 Year |
Expense Example, No Redemption, 3 Years |
Expense Example, No Redemption, 5 Years |
Expense Example, No Redemption, 10 Years |
|---|---|---|---|---|
| GABELLI GLOBAL CONTENT & CONNECTIVITY FUND CLASS AAA | 93 | 501 | 934 | 2,142 |
| GABELLI GLOBAL CONTENT & CONNECTIVITY FUND CLASS A | 663 | 1,047 | 1,456 | 2,593 |
| GABELLI GLOBAL CONTENT & CONNECTIVITY FUND CLASS I | 93 | 448 | 827 | 1,892 |
The Global Content & Connectivity Fund pays transaction costs, such as commissions, when it buys and sells securities (or “turns over” its portfolio). A higher portfolio turnover rate may indicate higher transaction costs and may result in higher taxes when the Global Content & Connectivity Fund’s shares are held in a taxable account. These costs, which are not reflected in the annual fund operating expenses or in the example, affect the Global Content & Connectivity Fund’s performance. During the most recent fiscal year, the Global Content & Connectivity Fund’s portfolio turnover rate was 11% of the average value of its portfolio.
Under normal market conditions, the Global Content & Connectivity Fund will invest its net assets in common stocks of companies in the telecommunications, media, and information technology industries which Gabelli Funds, LLC, the Global Content & Connectivity Fund’s investment adviser (the “Adviser”), believes are likely to have rapid growth in revenues and earnings and potential for above average capital appreciation or are undervalued. The Global Content & Connectivity Fund invests primarily in common stocks of foreign and domestic small capitalization, mid capitalization, and large capitalization issuers. As a “global” fund, the Global Content & Connectivity Fund invests in securities of issuers, or related investments thereof, located in at least three countries, and at least 40% of the Global Content & Connectivity Fund’s total net assets is invested in securities of non-U.S. issuers or related investments thereof. In selecting investments, the Adviser also considers the market price of the issuer’s securities, its balance sheet characteristics and the perceived strength of its management. In accordance with its existing concentration policy, the Global Content & Connectivity Fund will continue to invest at least 25% of the value of its total assets in the telecommunications-related industry, and not invest more than 25% of the value of its total assets in any other particular industry.
The companies in which the Global Content & Connectivity Fund may invest are engaged in the following products, services, or activities: telecommunications services (including data, video, voice, advanced IP-based services, corporate networking solutions, messaging and other communication and connectivity applications based on established and emerging technologies); telecommunications infrastructure and equipment; media & entertainment (including television; radio; cable networks; filmed, live, and digital entertainment; advertising; publishing; emerging forms of digital and interactive content; eSports; and eGaming); consumer electronics; e-commerce & information technology (including Internet software and services; application, systems, and home entertainment software; IT consulting, data processing, and technology hardware and equipment). Additional cross-industry investment focus areas include: cloud computing, The Internet of Things (“IoT”) (including solutions related to connected vehicle, connected home, smart city, smart grid), Big Data, artificial intelligence, machine learning, robotics, cybersecurity, virtual reality, augmented reality, digital convergence, biometric and wearable devices, eHealth, eGovernment, financial technology, over-the-top (“OTT”) content and applications, and software-as-a-service (“SaaS”).
The bar chart and table that follow provide an indication of the risks of investing in the Global Content & Connectivity Fund by showing changes in the Global Content & Connectivity Fund’s performance from year to year and by showing how the Global Content & Connectivity Fund’s average annual returns for one year, five years, and ten years compared with those of broad based securities market indices. As with all mutual funds, the Global Content & Connectivity Fund’s past performance (before and after taxes) does not predict how the Global Content & Connectivity Fund will perform in the future. Updated information on the Global Content & Connectivity Fund’s results can be obtained by visiting www.gabelli.com.
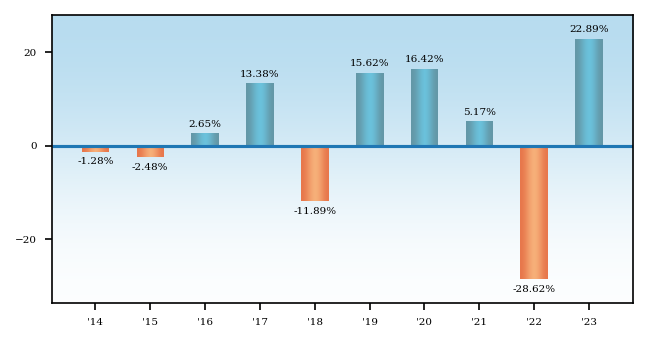
During the calendar years shown in the bar chart, the was (quarter ended ), and the was (quarter ended ).
Average Annual Total Returns - GABELLI GLOBAL CONTENT & CONNECTIVITY FUND |
1 Year |
5 Years |
10 Years |
|---|---|---|---|
| GABELLI GLOBAL CONTENT & CONNECTIVITY FUND CLASS AAA | 22.89% | 4.43% | 2.06% |
| GABELLI GLOBAL CONTENT & CONNECTIVITY FUND CLASS AAA | Return After Taxes on Distributions | 22.71% | 3.45% | 0.91% |
| GABELLI GLOBAL CONTENT & CONNECTIVITY FUND CLASS AAA | Return After Taxes on Distributions and Sale of Fund Shares | 13.57% | 3.36% | 1.51% |
| GABELLI GLOBAL CONTENT & CONNECTIVITY FUND CLASS A | 15.85% | 3.21% | 1.44% |
| GABELLI GLOBAL CONTENT & CONNECTIVITY FUND CLASS I | 22.90% | 4.57% | 2.36% |
| MSCI AC World Communication Services Index (reflects no deduction for fees, expenses, or taxes) | 38.13% | 8.98% | 4.47% |
| MSCI AC World Index (reflects no deduction for fees, expenses, or taxes) | 22.81% | 12.27% | 8.48% |
After-tax returns are calculated using the historical highest individual federal marginal income tax rates and do not reflect the impact of state and local taxes. In some instances, the “Return After Taxes on Distributions and Sale of Fund Shares” may be greater than the “Return After Taxes on Distributions” because the investor is assumed to be able to use the capital loss from the sale of Fund shares to offset other taxable gains. Actual after-tax returns depend on an investor’s tax situation and may differ from those shown. After-tax returns shown are not relevant to investors who hold their Fund shares through tax deferred arrangements, such as 401(k) plans or individual retirement accounts, including Roth IRAs and SEP IRAs (collectively, “IRAs”). After-tax returns are shown only for Class AAA shares. Actual after-tax returns for other classes will vary due to the differences in expenses.
You may want to invest in the Global Content & Connectivity Fund if:
| ● | you are a long term investor |
| ● | you seek growth of capital |
| ● | you seek to diversify your investments outside the U.S. |
The Global Content & Connectivity Fund’s share price will fluctuate with changes in the market value of the Global Content & Connectivity Fund’s portfolio securities. Stocks are subject to market, economic, and business risks that may cause their prices to fluctuate. An investment in the Global Content & Connectivity Fund is not a deposit of a bank and is not insured or guaranteed by the Federal Deposit Insurance Corporation or any other government agency. When you sell Global Content & Connectivity Fund shares, they may be worth less than what you paid for them; you may lose money by investing in the Global Content & Connectivity Fund.
In addition to the risks generally applicable to all Funds set forth in the Prospectus and SAI, investing in the Global Content & Connectivity Fund will particular involve the following risks:
| ● | Concentration Risk. Because the Global Content & Connectivity Fund will invest at least 25% of its total assets in securities of companies in the telecommunications related industry, and will otherwise focus its investments in the media and information technology industries, the Global Content & Connectivity Fund may be subject to greater volatility with respect to its portfolio securities than a fund that is more broadly diversified. Accordingly, the Global Content & Connectivity Fund is subject to the risk that its performance may be hurt disproportionately by the poor performance of relatively few securities. |
| ● | Equity Risk. Equity risk is the risk that the prices of the securities held by the Global Content & Connectivity Fund will change due to general market and economic conditions, perceptions regarding the industries in which the companies issuing the securities participate and the issuer company’s particular circumstances. |
| ● | Inflation Risk. Inflation risk is the risk that the value of assets or income from investments will be worth less in the future as inflation decreases the value of money. This risk may be elevated compared to historical market conditions because of recent monetary policy measures and the current interest rate environment. As inflation increases, the real value of the Fund’s shares and distributions therefore may decline. Inflation may result in losses to Fund shareholders. |
| ● | Foreign Securities Risk. Investments in foreign securities involve risks relating to political, social, and economic developments abroad, as well as risks resulting from the differences between the regulations to which U.S. and foreign issuers and markets are subject. These risks include expropriation, differing accounting and disclosure standards, currency exchange risks, settlement difficulties, market illiquidity, difficulties enforcing legal rights, and greater transaction costs. |
| ● | Emerging Markets Risk. The above listed foreign securities risks are more pronounced in the securities of companies located in emerging markets. |
| ● | Interest Rate Risk. The Fund is subject to a greater risk of rising interest rates due to the recent period of rising interest rates. Central banks such as the Federal Reserve Bank have been increasing interest rates, though this trend has tempered recently as the rate of inflation slows. There is a risk that heightened interest rates may cause the economy to enter a recession. Any such recession would negatively impact the Fund and the investments held by the Fund. |
| ● | Currency Risk. Fluctuations in exchange rates between the U.S. dollar and foreign currencies may negatively affect an investment. Adverse changes in exchange rates may erode or reverse any gains produced by foreign currency denominated investments and may widen any losses. The Global Content & Connectivity Fund may, but is not required to, seek to reduce currency risk by hedging part or all of its exposure to various foreign currencies. In addition, the Global Content & Connectivity Fund’s investments could be adversely affected by delays in, or a refusal to grant, repatriation of funds or conversion of emerging market currencies. |
| ● | Depositary Receipts. The Global Content & Connectivity Fund may invest in non-U.S. equity securities through depositary receipts, including American Depositary Receipts (“ADRs”), European Depositary Receipts (“EDRs”) and Global Depositary Receipts (“GDRs”) and other similar global instruments. While ADRs, EDRs and GDRs may not necessarily be denominated in the same currency as the securities into which they may be converted, many of the risks associated with foreign (non-U.S.) securities may also apply to ADRs, EDRs and GDRs. In addition, the underlying issuers of certain depositary receipts, particularly unsponsored or unregistered depositary receipts, are under no obligation to distribute shareholder communications to the holders of such receipts, or to pass through to them any voting rights with respect to the deposited securities. Depositary receipts that are not sponsored by the issuer may be less liquid and there may be less readily available public information about the issuer. |
| ● | Industry Risk. Telecommunications — The telecommunications industry is subject to governmental regulation and a greater price volatility than the overall market, and telecommunications companies can be adversely affected by, among other things, changes in government regulation, intense competition, dependency on patent protection, significant capital expenditures, heavy debt burdens, rapid obsolescence of products and services due to product compatibility or changing consumer preferences and strong market reactions to technological developments throughout the industry, among other things. In addition, companies in which the Global Content & Connectivity Fund invests may be adversely affected by lack of commercial acceptance of a new product or process or by technological change and obsolescence. |
Media — Companies engaged in the design, production or distribution of goods or services for the media industry may become obsolete quickly. Media companies are subject to risks that include cyclicality of revenues and earnings, a decrease in the discretionary income of targeted individuals, changing consumer tastes and interests, fierce competition in the industry and the potential for increased government regulation. Additionally, intellectual property rights are very important to many media companies and the expiration of intellectual property rights or other events that adversely affect a media company’s intellectual property rights may materially and adversely affect the value of its securities.
Information Technology — The market prices of technology and technology-related stocks tend to exhibit a greater degree of market risk and price volatility than other types of investments. These stocks also may be affected adversely by changes in technology, consumer and business purchasing patterns, short product cycles, falling prices and profits, government regulation, lack of standardization or compatibility with existing technologies, intense competition, aggressive pricing, dependence on copyright and/or patent protection and/or obsolete products or services. As a result, these factors may negatively affect the performance of the Global Content & Connectivity Fund.
These risks may be heightened for telecommunications, media, and technology companies in foreign markets.
| ● | Growth Stock Risk. Securities of growth companies may be more volatile since such companies usually invest a high portion of earnings in their business, and they may lack the dividends of value stocks that can cushion stock prices in a falling market. |
| ● | Issuer Risk. The value of a security may decline for a number of reasons that directly relate to an issuer, such as management performance, financial leverage, and reduced demand for the issuer’s goods or services, as well as the historical and prospective earnings of the issuer and the value of its assets or factors unrelated to the issuer’s value, such as investor perception. |
| ● | Management Risk. If the portfolio managers are incorrect in their assessment of the growth prospects of the securities the Global Content & Connectivity Fund holds, then the value of the Global Content & Connectivity Fund’s shares may decline. |
| ● | Non-Diversification Risk. As a non-diversified mutual fund, more of the Global Content & Connectivity Fund’s assets may be focused in the common stocks of a small number of issuers, which may make the value of the Global Content & Connectivity Fund’s shares more sensitive to changes in the market value of a single issuer or industry and more susceptible to risks associated with a single economic, political, or regulatory event than a diversified fund. |
| ● | Smaller Capitalization Risk. Risk is greater for the securities of smaller capitalization companies (including small unseasoned companies that have been in operation for less than three years) because they generally are more vulnerable than larger companies to adverse business or economic developments and they may have more limited resources. |
| ● | Large Capitalization Companies Risk. Companies with $10 billion or more in market capitalization are considered by the Adviser to be large capitalization companies. Large capitalization companies generally experience slower rates of growth in earnings per share than do mid and small capitalization companies. |
| ● | Market Risk. General economic and market conditions, such as interest rates, availability of credit, inflation rates, economic uncertainty, supply chain disruptions, labor shortages, energy and other resource shortages, changes in laws, trade barriers, currency exchange controls and national and international political circumstances (including governmental responses to public health crises or the spread of infectious diseases), may have long-term negative effects on the U.S. and worldwide financial markets and economy, and thus the Fund. |
This table describes the fees and expenses that you may pay if you buy and hold shares of the Global Growth Fund. You may qualify for sales charge discounts on Class A shares if you and your family invest, or agree to invest in the future, at least $50,000 in Class A shares of the Gabelli family of mutual funds. More information about these and other discounts is available from your financial professional and in the section entitled “Classes of Shares” on page 60 of the prospectus and in Appendix A, “Sales Charge Reductions and Waivers Available through Certain Intermediaries,” attached to the Global Growth Fund’s prospectus and “Distribution Plans” on page 48 of the Fund’s statement of additional information.
Shareholder Fees - The Gabelli Global Growth Fund - USD ($) |
The Gabelli Global Growth Fund Class AAA |
The Gabelli Global Growth Fund Class A |
The Gabelli Global Growth Fund Class I |
|---|---|---|---|
| Maximum Sales Charge (Load) Imposed on Purchases (as a percentage of offering price) | none | 5.75% | none |
| Maximum Deferred Sales Charge (Load) (as a percentage of redemption price) | none | none | none |
| Maximum Sales Charge (Load) Imposed on Reinvested Dividends (as a percentage of amount invested) | none | none | none |
| Redemption Fee (as a percentage of amount redeemed for shares held 7 days or less) | 2.00% | 2.00% | 2.00% |
| Exchange Fee | none | none | none |
Annual Fund Operating Expenses - The Gabelli Global Growth Fund |
The Gabelli Global Growth Fund Class AAA |
The Gabelli Global Growth Fund Class A |
The Gabelli Global Growth Fund Class I |
|
|---|---|---|---|---|
| Management Fees | 1.00% | 1.00% | 1.00% | |
| Distribution and Service (Rule 12b-1) Fees | 0.25% | 0.25% | none | |
| Other Expenses | 0.36% | 0.36% | 0.36% | |
| Total Annual Fund Operating Expenses | [1] | 1.61% | 1.61% | 1.36% |
| Fee Waiver and/or Expense Reimbursement | [1] | (0.71%) | (0.71%) | (0.46%) |
| Total Annual Fund Operating Expenses After Fee Waiver and/or Expense Reimbursement | 0.90% | 0.90% | 0.90% | |
| [1] | The Adviser has contractually agreed to waive its investment advisory fees and/or to reimburse expenses of the Global Growth Fund to the extent necessary to maintain the Total Annual Fund Operating Expenses After Fee Waiver and Expense Reimbursement (excluding brokerage costs, acquired fund fees and expenses, interest, taxes, and extraordinary expenses) at no more than an annual rate of 0.90% for all classes of shares. Under this same arrangement, the Global Growth Fund has also agreed, during the two year period following the year of any such waiver or reimbursement by the Adviser, to repay such amount, but only to the extent the Global Growth Fund’s adjusted Total Annual Fund Operating Expenses would not exceed an annual rate of 0.90% for the applicable class of shares, after giving effect to the repayments. This arrangement is in effect through April 30, 2025, and may be terminated only by the Board of Directors of the Corporation (the “Board”) before such time. The Global Growth Fund will carry forward any fees and expenses in excess of the expense limitation and repay the Adviser such amount provided the Global Growth Fund is able to do so without exceeding the lesser of (1) the expense limit in effect at the time of the waiver or reimbursement, as applicable, or (2) the expense limit in effect at the time of recoupment after giving effect to the repayment. |
This example is intended to help you compare the cost of investing in the Global Growth Fund with the cost of investing in other mutual funds.
The example assumes that you invest $10,000 in the Global Growth Fund for the time periods indicated and then redeem all of your shares at the end of those periods. The example assumes a waiver of expenses through the date of the expiration of the waiver, and reflects Total Annual Fund Operating Expenses following the date of the expiration of the waiver. The example also assumes that your investment has a 5% return each year and that the Global Growth Fund’s operating expenses remain the same. Although your actual costs may be higher or lower, based on these assumptions your costs would be:
Expense Example - The Gabelli Global Growth Fund - USD ($) |
Expense Example, with Redemption, 1 Year |
Expense Example, with Redemption, 3 Years |
Expense Example, with Redemption, 5 Years |
Expense Example, with Redemption, 10 Years |
|---|---|---|---|---|
| The Gabelli Global Growth Fund Class AAA | 92 | 439 | 809 | 1,851 |
| The Gabelli Global Growth Fund Class A | 662 | 988 | 1,338 | 2,320 |
| The Gabelli Global Growth Fund Class I | 92 | 385 | 701 | 1,595 |
You would pay the following expenses if you did not redeem your shares of the Global Growth Fund:
Expense Example, No Redemption - The Gabelli Global Growth Fund - USD ($) |
Expense Example, No Redemption, 1 Year |
Expense Example, No Redemption, 3 Years |
Expense Example, No Redemption, 5 Years |
Expense Example, No Redemption, 10 Years |
|---|---|---|---|---|
| The Gabelli Global Growth Fund Class AAA | 92 | 439 | 809 | 1,851 |
| The Gabelli Global Growth Fund Class A | 662 | 988 | 1,338 | 2,320 |
| The Gabelli Global Growth Fund Class I | 92 | 385 | 701 | 1,595 |
The Global Growth Fund pays transaction costs, such as commissions, when it buys and sells securities (or “turns over” its portfolio). A higher portfolio turnover rate may indicate higher transaction costs and may result in higher taxes when the Global Growth Fund’s shares are held in a taxable account. These costs, which are not reflected in the annual fund operating expenses or in the example, affect the Global Growth Fund’s performance. During the most recent fiscal year, the Global Growth Fund’s portfolio turnover rate was 37% of the average value of its portfolio.
Under normal market conditions, the Global Growth Fund will invest at least 65% of its total assets in common stocks of companies which the portfolio manager believes are likely to have rapid growth in revenues and earnings and potential for above average capital appreciation or are undervalued. The Global Growth Fund invests primarily in common stocks of foreign and domestic small capitalization, mid capitalization, and large capitalization issuers. As a “global” fund, the Global Growth Fund invests in securities of issuers, or related investments thereof, located in at least three countries, and at least 40% of the Global Growth Fund’s total net assets is invested in securities of non-U.S. issuers or related investments thereof.
To achieve the Global Growth Fund’s primary objective of capital appreciation, the Adviser employs a disciplined investment program focusing on the globalization and interactivity of the world’s market place. The Global Growth Fund invests in companies at the forefront of accelerated growth.
The Global Growth Fund invests primarily in common stocks of foreign and domestic mid capitalization and large capitalization issuers. In addition to growth rates, stock valuation levels are important in the stock selection process as the Global Growth Fund seeks stocks that are attractively priced relative to their projected growth rates. The Global Growth Fund seeks to build a portfolio diversified by geographic region, industry sectors and individual issues within industry sectors. The Global Growth Fund invests primarily in developed markets but may invest in emerging markets as well. The Global Growth Fund invests in companies with a wide range in market capitalizations, from small to large.
The bar chart and table that follow provide an indication of the risks of investing in the Global Growth Fund by showing changes in the Global Growth Fund’s performance from year to year and by showing how the Global Growth Fund’s average annual returns for one year, five years, and ten years compared with those of a broad based securities market index and with the returns of an index of funds with similar investment objectives. As with all mutual funds, the Global Growth Fund’s past performance (before and after taxes) does not predict how the Global Growth Fund will perform in the future. Updated information on the Global Growth Fund’s results can be obtained by visiting www.gabelli.com.
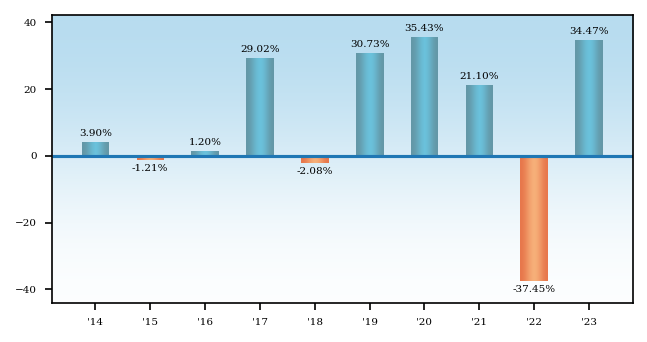
During the calendar years shown in the bar chart, the was (quarter ended ), and the was (quarter ended ).
Average Annual Total Returns - The Gabelli Global Growth Fund |
1 Year |
5 Years |
10 Years |
|---|---|---|---|
| The Gabelli Global Growth Fund Class AAA | 34.47% | 12.51% | 8.92% |
| The Gabelli Global Growth Fund Class AAA | Return After Taxes on Distributions | 34.37% | 11.66% | 7.74% |
| The Gabelli Global Growth Fund Class AAA | Return After Taxes on Distributions and Sale of Fund Shares | 20.47% | 9.94% | 6.95% |
| The Gabelli Global Growth Fund Class A | 26.76% | 11.18% | 8.27% |
| The Gabelli Global Growth Fund Class I | 34.48% | 12.57% | 9.26% |
| MSCI AC World Index (reflects no deduction for fees, expenses, or taxes) | 22.81% | 12.27% | 8.48% |
| Lipper Global Large Cap Growth Fund Classification | 26.74% | 12.55% | 8.78% |
After-tax returns are calculated using the historical highest individual federal marginal income tax rates and do not reflect the impact of state and local taxes. In some instances, the “Return After Taxes on Distributions and Sale of Fund Shares” may be greater than the “Return After Taxes on Distributions” because the investor is assumed to have sufficient capital gains of the same character from other investments to offset any capital losses from the redemption so that the taxpayer may deduct the capital losses in full. Actual after-tax returns depend on an investor’s tax situation and may differ from those shown. After-tax returns shown are not relevant to investors who hold their Global Growth Fund shares through tax deferred arrangements, such as 401(k) plans or individual retirement accounts, including Roth IRAs and SEP IRAs (collectively, “IRAs”). After-tax returns are shown only for Class AAA shares. Actual after-tax returns for other classes will vary due to the differences in expenses.
You may want to invest in the Global Growth Fund if:
| ● | you are a long term investor |
| ● | you seek growth of capital |
| ● | you seek to diversify your investments outside the U.S. |
The Global Growth Fund’s share price will fluctuate with changes in the market value of the Global Growth Fund’s portfolio securities. Stocks are subject to market, economic, and business risks that may cause their prices to fluctuate. An investment in the Global Growth Fund is not a deposit of a bank and is not insured or guaranteed by the Federal Deposit Insurance Corporation or any other government agency. When you sell Global Growth Fund shares, they may be worth less than what you paid for them; you may lose money by investing in the Global Growth Fund.
Investing in the Global Growth Fund involves the following risks:
| ● | Equity Risk. Equity risk is the risk that the prices of the securities held by the Global Growth Fund will change due to general market and economic conditions, perceptions regarding the industries in which the companies issuing the securities participate and the issuer company’s particular circumstances. |
| ● | Inflation Risk. Inflation risk is the risk that the value of assets or income from investments will be worth less in the future as inflation decreases the value of money. This risk may be elevated compared to historical market conditions because of recent monetary policy measures and the current interest rate environment. As inflation increases, the real value of the Fund’s shares and distributions therefore may decline. Inflation may result in losses to Fund shareholders. |
| ● | Foreign Securities Risk. Investments in foreign securities involve risks relating to political, social, and economic developments abroad, as well as risks resulting from the differences between the regulations to which U.S. and foreign issuers and markets are subject. These risks include expropriation, differing accounting and disclosure standards, currency exchange risks, settlement difficulties, market illiquidity, difficulties enforcing legal rights, and greater transaction costs. |
| ● | Emerging Markets Risk. The above listed foreign securities risks are more pronounced in the securities of companies located in emerging markets. |
| ● | Interest Rate Risk. The Fund is subject to a greater risk of rising interest rates due to the recent period of rising interest rates. Central banks such as the Federal Reserve Bank have been increasing interest rates, though this trend has tempered recently as the rate of inflation slows. There is a risk that heightened interest rates may cause the economy to enter a recession. Any such recession would negatively impact the Fund and the investments held by the Fund. |
| ● | Currency Risk. Fluctuations in exchange rates between the U.S. dollar and foreign currencies may negatively affect an investment. Adverse changes in exchange rates may erode or reverse any gains produced by foreign currency denominated investments and may widen any losses. The Global Growth Fund may, but is not required to, seek to reduce currency risk by hedging part or all of its exposure to various foreign currencies. In addition, the Global Growth Fund’s investments could be adversely affected by delays in, or a refusal to grant, repatriation of funds or conversion of emerging market currencies. |
| ● | Depositary Receipts. Global Growth Fund may invest in non-U.S. equity securities through depositary receipts, including ADRs, EDRs, GDRs and other similar global instruments. While ADRs, EDRs and GDRs may not necessarily be denominated in the same currency as the securities into which they may be converted, many of the risks associated with foreign (non-U.S.) securities may also apply to ADRs, EDRs and GDRs. In addition, the underlying issuers of certain depositary receipts, particularly unsponsored or unregistered depositary receipts, are under no obligation to distribute shareholder communications to the holders of such receipts, or to pass through to them any voting rights with respect to the deposited securities. Depositary receipts that are not sponsored by the issuer may be less liquid and there may be less readily available public information about the issuer. |
| ● | Growth Stock Risk. Securities of growth companies may be more volatile since such companies usually invest a high portion of earnings in their business, and they may lack the dividends of value stocks that can cushion stock prices in a falling market. |
| ● | Issuer Risk. The value of a security may decline for a number of reasons that directly relate to an issuer, such as management performance, financial leverage, and reduced demand for the issuer’s goods or services, as well as the historical and prospective earnings of the issuer and the value of its assets or factors unrelated to the issuer’s value, such as investor perception. |
| ● | Management Risk. If the portfolio managers are incorrect in their assessment of the growth prospects of the securities the Global Growth Fund holds, then the value of the Global Growth Fund’s shares may decline. |
| ● | Non-Diversification Risk. As a non-diversified mutual fund, more of the Global Growth Fund’s assets may be focused in the common stocks of a small number of issuers, which may make the value of the Global Growth Fund’s shares more sensitive to changes in the market value of a single issuer or industry and more susceptible to risks associated with a single economic, market, political or regulatory occurrence than shares of a diversified mutual fund. |
| ● | Smaller Capitalization Risk. Risk is greater for the securities of smaller capitalization companies (including small unseasoned companies that have been in operation for less than three years) because such companies generally are more vulnerable than larger companies to adverse business or economic developments and they may have more limited resources. |
| ● | Large Capitalization Companies Risk. Companies with $10 billion or more in market capitalization are considered by the Adviser to be large capitalization companies. Large capitalization companies generally experience slower rates of growth in earnings per share than do mid and small capitalization companies. |
This table describes the fees and expenses that you may pay if you buy and hold shares of the International Small Cap Fund. You may qualify for sales charge discounts on Class A shares if you and your family invest, or agree to invest in the future, at least $50,000 in Class A shares of the Gabelli family of mutual funds when and if initial investments into Class A shares are reopened. More information about these and other discounts is available from your financial professional and in the section entitled “Classes of Shares” on page 60 of the prospectus and in Appendix A, “Sales Charge Reductions and Waivers Available through Certain Intermediaries,” attached to the prospectus and “Distribution Plans” on page 48 of the Fund’s statement of additional information.
Shareholder Fees - GABELLI INTERNATIONAL SMALL CAP FUND - USD ($) |
GABELLI INTERNATIONAL SMALL CAP FUND CLASS AAA |
GABELLI INTERNATIONAL SMALL CAP FUND CLASS A |
GABELLI INTERNATIONAL SMALL CAP FUND CLASS I |
|---|---|---|---|
| Maximum Sales Charge (Load) Imposed on Purchases (as a percentage of offering price) | none | 5.75% | none |
| Maximum Deferred Sales Charge (Load) (as a percentage of redemption price) | none | none | none |
| Maximum Sales Charge (Load) Imposed on Reinvested Dividends (as a percentage of amount invested) | none | none | none |
| Redemption Fee (as a percentage of amount redeemed for shares held 7 days or less) | 2.00% | 2.00% | 2.00% |
| Exchange Fee | none | none | none |
Annual Fund Operating Expenses - GABELLI INTERNATIONAL SMALL CAP FUND |
GABELLI INTERNATIONAL SMALL CAP FUND CLASS AAA |
GABELLI INTERNATIONAL SMALL CAP FUND CLASS A |
GABELLI INTERNATIONAL SMALL CAP FUND CLASS I |
|
|---|---|---|---|---|
| Management Fees | 1.00% | 1.00% | 1.00% | |
| Distribution and Service (Rule 12b-1) Fees | 0.25% | 0.25% | none | |
| Other Expenses | 2.77% | 2.77% | 2.77% | |
| Total Annual Fund Operating Expenses | [1] | 4.02% | 4.02% | 3.77% |
| Fee Waiver and/or Expense Reimbursement | [1] | (3.09%) | (3.09%) | (2.84%) |
| Total Annual Fund Operating Expenses After Fee Waiver and/or Expense Reimbursement | 0.93% | 0.93% | 0.93% | |
| [1] | The Adviser has contractually agreed to waive its investment advisory fees and/or to reimburse expenses of the International Small Cap Fund to the extent necessary to maintain the Total Annual Fund Operating Expenses After Fee Waiver and Expense Reimbursement (excluding brokerage costs, acquired fund fees and expenses, interest, taxes, and extraordinary expenses) at no more than an annual rate of 0.90% for all classes of shares. Under this same arrangement, the International Small Cap Fund has also agreed, during the two year period following the year of any such waiver or reimbursement by the Adviser, to repay such amount, but only to the extent the International Small Cap Fund’s adjusted Total Annual Fund Operating Expenses would not exceed an annual rate of 0.90% for the applicable class of shares, after giving effect to the repayments. This arrangement is in effect through April 30, 2025, and may be terminated only by the Board of Directors of the Corporation (the “Board”) before such time. The International Small Cap Fund will carry forward any fees and expenses in excess of the expense limitation and repay the Adviser such amount provided the International Small Cap Fund is able to do so without exceeding the lesser of (1) the expense limit in effect at the time of the waiver or reimbursement, as applicable, or (2) the expense limit in effect at the time of recoupment after giving effect to the repayment. |
This example is intended to help you compare the cost of investing in the International Small Cap Fund with the cost of investing in other mutual funds.
The example assumes that you invest $10,000 in the International Small Cap Fund for the time periods indicated and then redeem all of your shares at the end of those periods. The example assumes a waiver of expenses through the date of the expiration of the waiver, and reflects Total Annual Fund Operating Expenses following the date of the expiration of the waiver. The example also assumes that your investment has a 5% return each year and that the International Small Cap Fund’s operating expenses remain the same. Although your actual costs may be higher or lower, based on these assumptions your costs would be:
Expense Example - GABELLI INTERNATIONAL SMALL CAP FUND - USD ($) |
Expense Example, with Redemption, 1 Year |
Expense Example, with Redemption, 3 Years |
Expense Example, with Redemption, 5 Years |
Expense Example, with Redemption, 10 Years |
|---|---|---|---|---|
| GABELLI INTERNATIONAL SMALL CAP FUND CLASS AAA | 95 | 940 | 1,801 | 4,030 |
| GABELLI INTERNATIONAL SMALL CAP FUND CLASS A | 664 | 1,461 | 2,273 | 4,374 |
| GABELLI INTERNATIONAL SMALL CAP FUND CLASS I | 95 | 889 | 1,703 | 3,828 |
You would pay the following expenses if you did not redeem your shares of the International Small Cap Fund:
Expense Example, No Redemption - GABELLI INTERNATIONAL SMALL CAP FUND - USD ($) |
Expense Example, No Redemption, 1 Year |
Expense Example, No Redemption, 3 Years |
Expense Example, No Redemption, 5 Years |
Expense Example, No Redemption, 10 Years |
|---|---|---|---|---|
| GABELLI INTERNATIONAL SMALL CAP FUND CLASS AAA | 95 | 940 | 1,801 | 4,030 |
| GABELLI INTERNATIONAL SMALL CAP FUND CLASS A | 664 | 1,461 | 2,273 | 4,374 |
| GABELLI INTERNATIONAL SMALL CAP FUND CLASS I | 95 | 889 | 1,703 | 3,828 |
The International Small Cap Fund pays transaction costs, such as commissions, when it buys and sells securities (or “turns over” its portfolio). A higher portfolio turnover rate may indicate higher transaction costs and may result in higher taxes when the International Small Cap Fund’s shares are held in a taxable account. These costs, which are not reflected in annual fund operating expenses or in the example, affect the International Small Cap Fund’s performance. During the most recent fiscal year, the International Small Cap Fund’s portfolio turnover rate was 6% of the average value of its portfolio.
The International Small Cap Fund will invest primarily in a portfolio of common stocks of non-U.S. companies. In determining whether an issuer is a U.S. or non-U.S. company, the International Small Cap Fund will consider various factors including its country of domicile, the primary stock exchange on which it trades, the location from which the majority of its revenue comes, and its reporting currency. Under normal market conditions, the International Small Cap Fund will invest at least 80% of its net assets (plus any borrowings for investment purposes) in the stocks of “small cap companies.” The Adviser currently characterizes small capitalization companies as those with total common stock market values of $3 billion or less at the time of investment. The investment policy of the International Small Cap Fund relating to the type of securities in which 80% of the International Small Cap Fund’s net assets must be invested may be changed by the Board without shareholder approval. Shareholders will, however, receive at least sixty days notice prior to any change in this policy.
The International Small Cap Fund may invest in non-U.S. markets throughout the world, including emerging markets. The International Small Cap Fund considers emerging markets to be markets located in countries classified as emerging or frontier markets by MSCI, and are generally located in the Asia-Pacific region, Eastern Europe, the Middle East, Central and South America, and Africa. Ordinarily, the International Small Cap Fund will invest in the securities of issuers located in at least five countries outside the U.S. There are no geographic limits on the International Small Cap Fund’s non-U.S. investments.
In selecting investments, the Adviser seeks issuers with a dominant market share or niche franchise in growing and/or consolidating industries. The Adviser considers for purchase the stocks of small capitalization (capitalization is the price per share multiplied by the number of shares outstanding) companies with experienced management, strong balance sheets, and rising free cash flow and earnings. The Adviser’s goal is to invest long term in the stocks of companies trading at reasonable market valuations relative to perceived economic worth.
Frequently, smaller capitalization companies exhibit one or more of the following traits:
| ● | New products or technologies |
| ● | New distribution methods |
| ● | Rapid changes in industry conditions due to regulatory or other developments |
| ● | Changes in management or similar characteristics that may result not only in expected growth in revenues but in an accelerated or above average rate of earnings growth, which would usually be reflected in capital appreciation. |
In addition, because smaller capitalization companies are less actively followed by stock analysts and less information is available on which to base stock price evaluations, the market may overlook favorable trends in particular smaller growth companies and then adjust its valuation more quickly once investor interest is gained.
The bar chart and table that follow provide an indication of the risks of investing in the International Small Cap Fund by showing changes in the International Small Cap Fund’s performance from year to year and by showing how the International Small Cap Fund’s average annual returns for one year, five years, and ten years compared with those of a broad based securities market index. As with all mutual funds, the International Small Cap Fund’s past performance (before and after taxes) does not predict how the International Small Cap Fund will perform in the future. Updated information on the International Small Cap Fund’s results can be obtained by visiting www.gabelli.com.
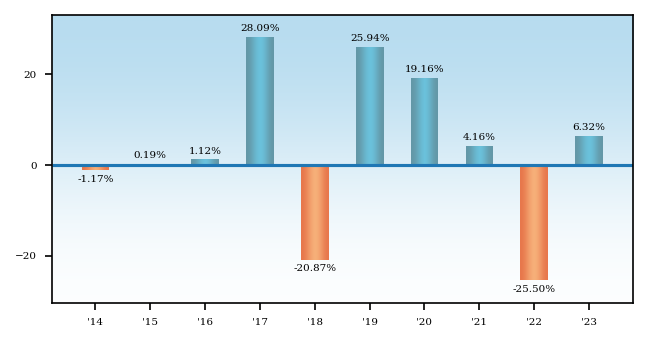
During the calendar years shown in the bar chart, the was (quarter ended ), and the was (quarter ended ).
Average Annual Total Returns - GABELLI INTERNATIONAL SMALL CAP FUND |
1 Year |
5 Years |
10 Years |
|---|---|---|---|
| GABELLI INTERNATIONAL SMALL CAP FUND CLASS AAA | 6.32% | 4.36% | 2.31% |
| GABELLI INTERNATIONAL SMALL CAP FUND CLASS AAA | Return After Taxes on Distributions | 6.00% | 3.89% | 0.43% |
| GABELLI INTERNATIONAL SMALL CAP FUND CLASS AAA | Return After Taxes on Distributions and Sale of Fund Shares | 4.15% | 3.52% | 1.77% |
| GABELLI INTERNATIONAL SMALL CAP FUND CLASS A | 0.22% | 2.96% | 1.47% |
| GABELLI INTERNATIONAL SMALL CAP FUND CLASS I | 6.41% | 4.37% | 2.57% |
| MSCI EAFE Small Cap Index (reflects no deduction for fees, expenses, or taxes) | 13.16% | 6.58% | 4.80% |
After-tax returns are calculated using the historical highest individual federal marginal income tax rates and do not reflect the impact of state and local taxes. In some instances, the “Return After Taxes on Distributions and Sale of Fund Shares” may be greater than the “Return After Taxes on Distributions” because the investor is assumed to have sufficient capital gains of the same character from other investments to offset any capital losses from the redemption so that the taxpayer may deduct the capital losses in full. Actual after-tax returns depend on an investor’s tax situation and may differ from those shown. After-tax returns shown are not relevant to investors who hold their International Small Cap Fund shares through tax deferred arrangements, such as 401(k) plans or individual retirement accounts, including Roth IRAs and SEP IRAs (collectively, “IRAs”). After-tax returns are shown only for Class AAA shares. After-tax returns for other classes will vary due to the differences in expenses.
You may want to invest in the International Small Cap Fund if:
| ● | you are a long term investor |
| ● | you seek growth of capital |
| ● | you seek to diversify your investments outside the U.S. |
The International Small Cap Fund’s share price will fluctuate with changes in the market value of the International Small Cap Fund’s portfolio securities. Stocks are subject to market, economic, and business risks that may cause their prices to fluctuate. An investment in the International Small Cap Fund is not a deposit of a bank and is not insured or guaranteed by the Federal Deposit Insurance Corporation or any other government agency. When you sell International Small Cap Fund shares, they may be worth less than what you paid for them; you may lose money by investing in the International Small Cap Fund.
Investing in the International Small Cap Fund involves the following risks:
| ● | Equity Risk. Equity risk is the risk that the prices of the securities held by the International Small Cap Fund will change due to general market and economic conditions, perceptions regarding the industries in which the companies issuing the securities participate and the issuer company’s particular circumstances. |
| ● | Inflation Risk. Inflation risk is the risk that the value of assets or income from investments will be worth less in the future as inflation decreases the value of money. This risk may be elevated compared to historical market conditions because of recent monetary policy measures and the current interest rate environment. As inflation increases, the real value of the Fund’s shares and distributions therefore may decline. Inflation may result in losses to Fund shareholders. |
| ● | Foreign Securities Risk. Investments in foreign securities involve risks relating to political, social, and economic developments abroad, as well as risks resulting from the differences between the regulations to which U.S. and foreign issuers and markets are subject. These risks include expropriation, differing accounting and disclosure standards, currency exchange risks, settlement difficulties, market illiquidity, difficulties enforcing legal rights, and greater transaction costs. |
| ● | Emerging Markets Risk. The above listed foreign securities risks are more pronounced in the securities of companies located in emerging markets. |
| ● | Interest Rate Risk. The Fund is subject to a greater risk of rising interest rates due to the recent period of rising interest rates. Central banks such as the Federal Reserve Bank have been increasing interest rates, though this trend has tempered recently as the rate of inflation slows. There is a risk that heightened interest rates may cause the economy to enter a recession. Any such recession would negatively impact the Fund and the investments held by the Fund. |
| ● | Currency Risk. Fluctuations in exchange rates between the U.S. dollar and foreign currencies may negatively affect an investment. Adverse changes in exchange rates may erode or reverse any gains produced by foreign currency denominated investments and may widen any losses. The International Small Cap Fund may, but is not required to, seek to reduce currency risk by hedging part or all of its exposure to various foreign currencies. In addition, the International Small Cap Fund’s investments could be adversely affected by delays in, or a refusal to grant, repatriation of funds or conversion of emerging market currencies. |
| ● | Depositary Receipts. The International Small Cap Fund may invest in non-U.S. equity securities through depositary receipts, including ADRs, EDRs, GDRs and other similar global instruments. While ADRs, EDRs and GDRs may not necessarily be denominated in the same currency as the securities into which they may be converted, many of the risks associated with foreign (non-U.S.) securities may also apply to ADRs, EDRs and GDRs. In addition, the underlying issuers of certain depositary receipts, particularly unsponsored or unregistered depositary receipts, are under no obligation to distribute shareholder communications to the holders of such receipts, or to pass through to them any voting rights with respect to the deposited securities. Depositary receipts that are not sponsored by the issuer may be less liquid and there may be less readily available public information about the issuer. |
| ● | Growth Stock Risk. Securities of growth companies may be more volatile since such companies usually invest a high portion of earnings in their business, and they may lack the dividends of value stocks that can cushion stock prices in a falling market. |
| ● | Issuer Risk. The value of a security may decline for a number of reasons that directly relate to an issuer, such as management performance, financial leverage, and reduced demand for the issuer’s goods or services, as well as the historical and prospective earnings of the issuer and the value of its assets or factors unrelated to the issuer’s value, such as investor perception. |
| ● | Management Risk. If the portfolio manager is incorrect in his assessment of the growth prospects of the securities the International Small Cap Fund holds, then the value of the International Small Cap Fund’s shares may decline. |
| ● | Non-Diversification Risk. As a non-diversified mutual fund, more of the International Small Cap Fund’s assets may be focused in the common stocks of a small number of issuers, which may make the value of the International Small Cap Fund’s shares more sensitive to changes in the market value of a single issuer or industry and more susceptible to risks with a single economic, market, political or regulatory occurrence than shares of a diversified mutual fund.
Although the International Small Cap Fund is registered as a non-diversified fund, it has operated as a diversified fund for over three years. Therefore, the Investment Company Act of 1940, as amended (the “1940 Act”) obliges the International Small Cap Fund to continue to operate as a diversified fund unless it obtains shareholder approval to operate as a non-diversified fund. |
| ● | Smaller Capitalization Risk. Risk is greater for the securities of smaller capitalization companies (including small unseasoned companies that have been in operation for less than three years) because such companies generally are more vulnerable than larger companies to adverse business or economic developments and they may have more limited resources. |
| ● | Market Risk. General economic and market conditions, such as interest rates, availability of credit, inflation rates, economic uncertainty, supply chain disruptions, labor shortages, energy and other resource shortages, changes in laws, trade barriers, currency exchange controls and national and international political circumstances (including governmental responses to public health crises or the spread of infectious diseases), may have long-term negative effects on the U.S. and worldwide financial markets and economy, and thus the Fund. |
The GRID Fund seeks to provide investors with a high level of total return through a combination of current income and appreciation of capital.
This table describes the fees and expenses that you may pay if you buy and hold shares of the GRID Fund. You may qualify for sales charge discounts on Class A shares if you and your family invest, or agree to invest in the future, at least $50,000 in Class A shares of the Gabelli family of mutual funds when and if initial investments into Class A shares are reopened. More information about these and other discounts is available from your financial professional and in the section entitled “Classes of Shares” on page 60 of the prospectus and in Appendix A, “Sales Charge Reductions and Waivers Available through Certain Intermediaries,” attached to the GRID Fund’s prospectus and “Distribution Plans” on page 48 of the Fund’s statement of additional information.
Shareholder Fees - The Gabelli Global Rising Income and Dividend Fund - USD ($) |
The Gabelli Global Rising Income and Dividend Fund Class AAA |
The Gabelli Global Rising Income and Dividend Fund Class A |
The Gabelli Global Rising Income and Dividend Fund Class I |
|---|---|---|---|
| Maximum Sales Charge (Load) Imposed on Purchases (as a percentage of offering price) | none | 5.75% | none |
| Maximum Deferred Sales Charge (Load) (as a percentage of redemption price) | none | none | none |
| Maximum Sales Charge (Load) Imposed on Reinvested Dividends (as a percentage of amount invested) | none | none | none |
| Redemption Fee (as a percentage of amount redeemed for shares held 7 days or less) | 2.00% | 2.00% | 2.00% |
| Exchange Fee | none | none | none |
Annual Fund Operating Expenses - The Gabelli Global Rising Income and Dividend Fund |
The Gabelli Global Rising Income and Dividend Fund Class AAA |
The Gabelli Global Rising Income and Dividend Fund Class A |
The Gabelli Global Rising Income and Dividend Fund Class I |
|
|---|---|---|---|---|
| Management Fees | 1.00% | 1.00% | 1.00% | |
| Distribution and Service (Rule 12b-1) Fees | 0.25% | 0.25% | none | |
| Other Expenses | 0.46% | 0.46% | 0.46% | |
| Total Annual Fund Operating Expenses | [1] | 1.71% | 1.71% | 1.46% |
| Fee Waiver and/or Expense Reimbursement | [1] | (0.81%) | (0.81%) | (0.56%) |
| Total Annual Fund Operating Expenses After Fee Waiver and/or Expense Reimbursement | 0.90% | 0.90% | 0.90% | |
| [1] | The Adviser has contractually agreed to waive its investment advisory fees and/or to reimburse expenses of the GRID Fund to the extent necessary to maintain the Total Annual Fund Operating Expenses After Fee Waiver and Expense Reimbursement (excluding brokerage costs, acquired fund fees and expenses, interest, taxes, and extraordinary expenses) at no more than an annual rate of 0.90% for all classes of shares. Under this same arrangement, the GRID Fund has also agreed, during the two year period following the year of any such waiver or reimbursement by the Adviser, to repay such amount, but only to the extent the GRID Fund’s adjusted Total Annual Fund Operating Expenses would not exceed an annual rate of 0.90% for the applicable class of shares, after giving effect to the repayments. This arrangement is in effect through April 30, 2025, and may be terminated only by the Board of Directors of the Corporation (the “Board”) before such time. The GRID Fund will carry forward any fees and expenses in excess of the expense limitation and repay the Adviser such amount provided the GRID Fund is able to do so without exceeding the lesser of (1) the expense limit in effect at the time of the waiver or reimbursement, as applicable, or (2) the expense limit in effect at the time of recoupment after giving effect to the repayment. |
This example is intended to help you compare the cost of investing in the GRID Fund with the cost of investing in other mutual funds.
The example assumes that you invest $10,000 in the GRID Fund for the time periods indicated and then redeem all of your shares at the end of those periods. The example assumes a waiver of expenses through the date of the expiration of the waiver, and reflects Total Annual Fund Operating Expenses following the date of the expiration of the waiver. The example also assumes that your investment has a 5% return each year and that the GRID Fund’s operating expenses remain the same. Although your actual costs may be higher or lower, based on these assumptions your costs would be:
Expense Example - The Gabelli Global Rising Income and Dividend Fund - USD ($) |
Expense Example, with Redemption, 1 Year |
Expense Example, with Redemption, 3 Years |
Expense Example, with Redemption, 5 Years |
Expense Example, with Redemption, 10 Years |
|---|---|---|---|---|
| The Gabelli Global Rising Income and Dividend Fund Class AAA | 92 | 460 | 852 | 1,952 |
| The Gabelli Global Rising Income and Dividend Fund Class A | 662 | 1,008 | 1,378 | 2,415 |
| The Gabelli Global Rising Income and Dividend Fund Class I | 92 | 407 | 744 | 1,698 |
You would pay the following expenses if you did not redeem your shares of the GRID Fund:
Expense Example, No Redemption - The Gabelli Global Rising Income and Dividend Fund - USD ($) |
Expense Example, No Redemption, 1 Year |
Expense Example, No Redemption, 3 Years |
Expense Example, No Redemption, 5 Years |
Expense Example, No Redemption, 10 Years |
|---|---|---|---|---|
| The Gabelli Global Rising Income and Dividend Fund Class AAA | 92 | 460 | 852 | 1,952 |
| The Gabelli Global Rising Income and Dividend Fund Class A | 662 | 1,008 | 1,378 | 2,415 |
| The Gabelli Global Rising Income and Dividend Fund Class I | 92 | 407 | 744 | 1,698 |
The GRID Fund pays transaction costs, such as commissions, when it buys and sells securities (or “turns over” its portfolio). A higher portfolio turnover rate may indicate higher transaction costs and may result in higher taxes when the GRID Fund’s shares are held in a taxable account. These costs, which are not reflected in annual fund operating expenses or in the example, affect the GRID Fund’s performance. During the most recent fiscal year, the GRID Fund’s portfolio turnover rate was 9% of the average value of its portfolio.
The GRID Fund will attempt to achieve its investment objective by investing, under normal circumstances, at least 80% of its net assets in dividend paying securities (such as common and preferred stock) or other income producing securities (such as fixed income securities and securities that are convertible into common stock). The GRID Fund will primarily invest in common stocks of foreign and domestic issuers that the GRID Fund’s portfolio manager believes are likely to pay dividends and income and have the potential for above average capital appreciation and dividend increases. To this end, the portfolio manager may invest in stocks that pay and increase dividends over time that can potentially provide “rising income.” Rising income stocks historically have provided a better total return over time, potentially combat inflation and offer the opportunity to potentially take advantage of compounding through dividend and income reinvestment. Under normal circumstances, the GRID Fund intends to invest in at least three countries, including the United States, and will invest at least 40% of its total assets in countries other than the United States.
The GRID Fund invests in companies whose stocks the Adviser believes are selling at a significant discount to their “private market value.” Private market value is the value the Adviser believes informed investors would be willing to pay to acquire the entire company. If investor attention is focused on the underlying asset value of a company due to expected or actual developments or other catalysts, an investment opportunity to realize this private market value may exist.
The GRID Fund may utilize certain “arbitrage” strategies. The GRID Fund’s use of arbitrage may be described as investing in “event” driven situations such as announced mergers, acquisitions, and reorganizations. When a company agrees to be acquired by another company, its stock price often quickly rises to just below the stated acquisition price. If the Adviser, through extensive research, determines that the acquisition is likely to be consummated on schedule at the stated acquisition price, then the GRID Fund may purchase the selling company’s securities, offering the GRID Fund the possibility of generous returns relative to cash equivalents with a limited risk of excessive loss of capital.
The GRID Fund may invest in convertible securities, which include bonds, debentures, corporate notes, preferred stocks, and other similar securities which are convertible or exchangeable for common stock within a particular time period at a specified price or formula, of foreign and domestic companies with no target maturity range. Because many convertible securities are rated below investment grade, the GRID Fund may invest without limit in convertible securities rated lower than “BBB” by Standard & Poor’s Rating Services (“S&P”) or “Baa” or lower by Moody’s Investors Service, Inc. (“Moody’s”), or, if unrated, are of comparable quality as determined by the Adviser, including up to 5% of its assets in convertible securities of issuers in default. The GRID Fund also may invest up to 25% of its assets in non-convertible fixed income securities that are below investment grade, including up to 5% of its assets in non-convertible fixed income securities of issuers that are in default.
The bar chart and table that follow provide an indication of the risks of investing in the GRID Fund by showing changes in the GRID Fund’s performance from year to year and by showing how the GRID Fund’s average annual returns for one year, five years, and ten years compared with those of a broad based securities market index. Substantially all of the GRID Fund’s operating history and performance results have been achieved implementing different investment strategies under the GRID Fund’s previous names, the GAMCO Vertumnus Fund and the GAMCO Global Convertible Securities Fund, and as such, the GRID Fund’s past performance (before and after taxes) does not predict how the GRID Fund will perform in the future. Updated information on the GRID Fund’s results can be obtained by visiting www.gabelli.com.
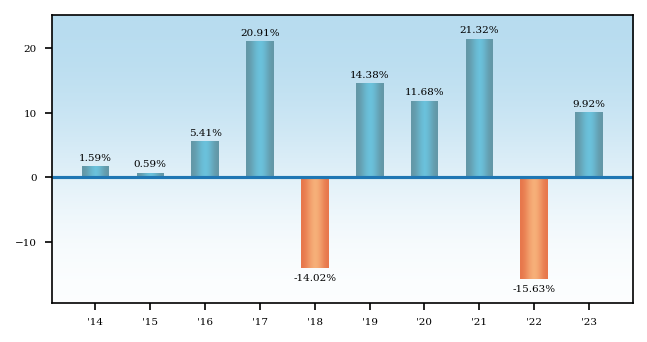
During the calendar years shown in the bar chart, the was (quarter ended ), and the was (quarter ended ).
Average Annual Total Returns - The Gabelli Global Rising Income and Dividend Fund |
1 Year |
5 Years |
10 Years |
|---|---|---|---|
| The Gabelli Global Rising Income and Dividend Fund Class AAA | 9.92% | 7.52% | 4.87% |
| The Gabelli Global Rising Income and Dividend Fund Class AAA | Return After Taxes on Distributions | 9.48% | 7.19% | 4.55% |
| The Gabelli Global Rising Income and Dividend Fund Class AAA | Return After Taxes on Distributions and Sale of Fund Shares | 6.34% | 5.99% | 3.89% |
| The Gabelli Global Rising Income and Dividend Fund Class A | 3.58% | 6.25% | 4.23% |
| The Gabelli Global Rising Income and Dividend Fund Class I | 9.91% | 7.67% | 5.15% |
| MSCI World Index (reflects no deduction for fees, expenses, or taxes) | 24.42% | 13.37% | 9.18% |
After-tax returns are calculated using the historical highest individual federal marginal income tax rates and do not reflect the impact of state and local taxes. In some instances, the “Return After Taxes on Distributions and Sale of Fund Shares” may be greater than the “Return After Taxes on Distributions” because the investor is assumed to have sufficient capital gains of the same character from other investments to offset any capital losses from the redemption so that the taxpayer may deduct the capital losses in full. Actual after-tax returns depend on an investor’s tax situation and may differ from those shown. After-tax returns shown are not relevant to investors who hold their GRID Fund shares through tax deferred arrangements, such as 401(k) plans or individual retirement accounts, including Roth IRAs and SEP IRAs (collectively, “IRAs”). After-tax returns are shown only for Class AAA shares. After-tax returns for other classes will vary due to the differences in expenses.
You may want to invest in the GRID Fund if:
| ● | you are a long term investor |
| ● | you seek growth of capital |
| ● | you seek to diversify your investments outside the U.S. |
The GRID Fund’s share price will fluctuate with changes in the market value of the GRID Fund’s portfolio securities. Stocks are subject to market, economic, and business risks that may cause their prices to fluctuate. Holders of common stocks only have rights to the value in the company after all debts have been paid, and they could lose their entire investment in a company that encounters financial difficulty. In addition, the GRID Fund’s portfolio companies may reduce or eliminate the dividend rate on the securities held by the GRID Fund. Preferred stock and debt securities convertible into or exchangeable for common or preferred stock also are subject to interest rate risk and/or credit risk. When interest rates rise, the value of such securities generally declines. It is also possible that the issuer of a security will not be able to make interest and principal payments when due. In addition, the GRID Fund may invest in lower credit quality securities which may involve major risk exposures such as increased sensitivity to interest rate and economic changes and limited liquidity. An investment in the GRID Fund is not a deposit of a bank and is not insured or guaranteed by the Federal Deposit Insurance Corporation or any other government agency. When you sell GRID Fund shares, they may be worth less than what you paid for them; you may lose money by investing in the GRID Fund.
Investing in the GRID Fund involves the following risks:
| ● | Equity Risk. Equity risk is the risk that the prices of the securities held by the GRID Fund will change due to general market and economic conditions, perceptions regarding the industries in which the companies issuing the securities participate and the issuer company’s particular circumstances. Dividends on common equity securities are not fixed but are declared at the discretion of an issuer’s board of directors. Companies that have historically paid dividends on their securities are not required to continue to pay dividends on such securities. There is no guarantee that the issuers of the common equity securities will declare dividends in the future or that, if declared, they will remain at current levels or increase over time. Therefore, there is the possibility that such companies could reduce or eliminate the payment of dividends in the future. The GRID Fund’s investments in dividend producing equity securities may also limit its potential for appreciation during a broad market advance. The prices of dividend producing
|
equity securities can be highly volatile. Investors should not assume that the GRID Fund’s investments in these securities will necessarily reduce the volatility of the GRID Fund’s NAV or provide “protection,” compared to other types of equity securities, when markets perform poorly.
| ● | Inflation Risk. Inflation risk is the risk that the value of assets or income from investments will be worth less in the future as inflation decreases the value of money. This risk may be elevated compared to historical market conditions because of recent monetary policy measures and the current interest rate environment. As inflation increases, the real value of the Fund’s shares and distributions therefore may decline. Inflation may result in losses to Fund shareholders. |
| ● | Foreign Securities Risk. Investments in foreign securities involve risks relating to political, social, and economic developments abroad, as well as risks resulting from the differences between the regulations to which U.S. and foreign issuers and markets are subject. These risks include expropriation, differing accounting and disclosure standards, currency exchange risks, settlement difficulties, market illiquidity, difficulties enforcing legal rights, and greater transaction costs. |
| ● | Emerging Markets Risk. The above listed foreign securities risks are more pronounced in the securities of companies located in emerging markets. |
| ● | Interest Rate Risk. The primary risk associated with dividend- and interest-paying securities is interest rate risk. A decrease in interest rates will generally result in an increase in the investment value of such securities, while increases in interest rates will generally result in a decline in its investment value. This effect is generally more pronounced for fixed rate securities than for securities whose income rate is periodically reset. The GRID Fund is subject to a greater risk of rising interest rates due to the recent period of rising interest rates. Central banks such as the Federal Reserve Bank have been increasing interest rates, though this trend has tempered recently as the rate of inflation slows. There is a risk that heightened interest rates may cause the economy to enter a recession. Any such recession would negatively impact the GRID Fund and the investments held by the GRID Fund. |
| ● | Currency Risk. Fluctuations in exchange rates between the U.S. dollar and foreign currencies may negatively affect an investment. Adverse changes in exchange rates may erode or reverse any gains produced by foreign currency denominated investments and may widen any losses. The GRID Fund may, but is not required to, seek to reduce currency risk by hedging part or all of its exposure to various foreign currencies. In addition, the GRID Fund’s investments could be adversely affected by delays in, or a refusal to grant, repatriation of funds or conversion of emerging market currencies. |
| ● | Depositary Receipts. The GRID Fund may invest in non-U.S. equity securities through depositary receipts, including ADRs, EDRs, GDRs and other similar global instruments. While ADRs, EDRs and GDRs may not necessarily be denominated in the same currency as the securities into which they may be converted, many of the risks associated with foreign (non-U.S.) securities may also apply to ADRs, EDRs and GDRs. In addition, the underlying issuers of certain depositary receipts, particularly unsponsored or unregistered depositary receipts, are |
under no obligation to distribute shareholder communications to the holders of such receipts, or to pass through to them any voting rights with respect to the deposited securities. Depositary receipts that are not sponsored by the issuer may be less liquid and there may be less readily available public information about the issuer.
| ● | Growth Stock Risk. Securities of growth companies may be more volatile since such companies usually invest a high portion of earnings in their business, and they may lack the dividends of value stocks that can cushion stock prices in a falling market. |
| ● | Issuer Risk. The value of a security may decline for a number of reasons that directly relate to an issuer, such as management performance, financial leverage, and reduced demand for the issuer’s goods or services, as well as the historical and prospective earnings of the issuer and the value of its assets or factors unrelated to the issuer’s value, such as investor perception. |
| ● | Management Risk. If the portfolio manager is incorrect in his assessment of the growth prospects of the securities the GRID Fund holds, then the value of the GRID Fund’s shares may decline. |
| ● | Non-Diversification Risk. As a non-diversified mutual fund, more of the GRID Fund’s assets may be focused in the common stocks of a small number of issuers, which may make the value of the GRID Fund’s shares more sensitive to changes in the market value of a single issuer or industry and more susceptible to risks associated with a single economic, market, political or regulatory occurrence than shares of a diversified mutual fund. | |
| Although the GRID Fund is registered as a non-diversified fund, it has operated as a diversified fund for over three years. Therefore, the 1940 Act obliges the GRID Fund to continue to operate as a diversified fund unless it obtains shareholder approval to operate as a non-diversified fund. |
| ● | Market Risk. General economic and market conditions, such as interest rates, availability of credit, inflation rates, economic uncertainty, supply chain disruptions, labor shortages, energy and other resource shortages, changes in laws, trade barriers, currency exchange controls and national and international political circumstances (including governmental responses to public health crises or the spread of infectious diseases), may have long-term negative effects on the U.S. and worldwide financial markets and economy, and thus the Fund. |
| ● | Convertible Securities. Convertible securities provide higher yields than the underlying common stock, but generally offer lower yields than nonconvertible securities of similar quality. The value of convertible securities fluctuates in relation to changes in the interest rates and, in addition, fluctuates in relation to the underlying common stock. |
| ● | Credit Risk for Convertible Securities and Fixed Income Securities. Many convertible securities are not investment grade, that is, not rated within the four highest categories by S&P and Moody’s. To the extent that the GRID Fund’s convertible securities and any other fixed income securities are rated lower than investment grade or are not rated, there would be a greater risk as to the timely repayment of the principal of, and timely payment of interest or dividends on, those securities. |
| ● | Event Driven Risk. Event driven investments involve the risk that certain of the events driving the investment may not happen or the market may react differently than expected to the anticipated transaction. In addition, although an event may occur or is announced, it may be renegotiated, terminated or involve a longer time frame than originally contemplated. Event driven investment transactions are also subject to the risk of overall market movements. Any one of these risks could cause the GRID Fund to experience investment losses impacting its shares negatively. |
| ● | Lower Rated Securities. Lower rated securities may involve major risk exposures such as increased sensitivity to interest rate and economic changes, and the market to sell such securities may be limited. Such lower rated securities are considered speculative investments with increased credit risk and are generally known as “junk bonds” or “high yield securities”. Investments in lower rated securities may also include securities of issuers that are in default. Investments in securities of issuers in default present even greater risk exposure for the GRID Fund. |
The Global Mini Mites Fund primarily seeks to provide investors with long term capital appreciation.
This table describes the fees and expenses that you may pay if you buy and hold shares of the Global Mini Mites Fund. You may qualify for sales charge discounts on Class A shares if you and your family invest, or agree to invest in the future, at least $50,000 in Class A shares of the Gabelli family of mutual funds when and if initial investments into Class A shares are reopened. More information about these and other discounts is available from your financial professional and in the section entitled “Classes of Shares” on page 60 of the prospectus and in Appendix A, “Sales Charge Reductions and Waivers Available through Certain Intermediaries,” attached to the Global Mini Mites Fund’s prospectus and “Distribution Plans” on page 48 of the Fund’s statement of additional information.
Shareholder Fees - Gabelli Global Mini Mites Fund - USD ($) |
Gabelli Global Mini Mites Fund Class AAA |
Gabelli Global Mini Mites Fund Class A |
Gabelli Global Mini Mites Fund Class I |
|---|---|---|---|
| Maximum Sales Charge (Load) Imposed on Purchases (as a percentage of offering price) | none | 5.75% | none |
| Maximum Deferred Sales Charge (Load) (as a percentage of redemption price) | none | none | none |
| Maximum Sales Charge (Load) Imposed on Reinvested Dividends (as a percentage of amount invested) | none | none | none |
| Redemption Fee (as a percentage of amount redeemed for shares held 7 days or less) | 2.00% | 2.00% | 2.00% |
| Exchange Fee | none | none | none |
Annual Fund Operating Expenses - Gabelli Global Mini Mites Fund |
Gabelli Global Mini Mites Fund Class AAA |
Gabelli Global Mini Mites Fund Class A |
Gabelli Global Mini Mites Fund Class I |
|
|---|---|---|---|---|
| Management Fees | 1.00% | 1.00% | 1.00% | |
| Distribution and Service (Rule 12b-1) Fees | 0.25% | 0.25% | none | |
| Other Expenses | 2.12% | 2.12% | 2.12% | |
| Total Annual Fund Operating Expenses | [1] | 3.37% | 3.37% | 3.12% |
| Fee Waiver and/or Expense Reimbursement | [1] | (2.47%) | (2.47%) | (2.22%) |
| Total Annual Fund Operating Expenses After Fee Waiver and/or Expense Reimbursement | 0.90% | 0.90% | 0.90% | |
| [1] | The Adviser has contractually agreed to waive its investment advisory fees and/or to reimburse expenses of the Global Mini Mites Fund to the extent necessary to maintain the Total Annual Fund Operating Expenses After Fee Waiver and Expense Reimbursement (excluding brokerage costs, acquired fund fees and expenses, interest, taxes, and extraordinary expenses) at no more than an annual rate of 0.90% for all classes of shares. Under this same arrangement, the Global Mini Mites Fund has also agreed, during the two year period following the year of any such waiver or reimbursement by the Adviser, to repay such amount, but only to the extent the Global Mini Mites Fund’s adjusted Total Annual Fund Operating Expenses would not exceed an annual rate of 0.90% for the applicable class of shares, after giving effect to the repayments. This arrangement is in effect through April 30, 2025, and may be terminated only by the Board of Directors of the Corporation before such time. The Global Mini Mites Fund will carry forward, for a period not to exceed two years from the date that an amount is waived, any fees and expenses in excess of the expense limitation and repay the Adviser such amount provided the Global Mini Mites Fund is able to do so without exceeding the lesser of (1) the expense limit in effect at the time of the waiver or reimbursement, as applicable, or (2) the expense limit in effect at the time of recoupment after giving effect to the repayment. |
This example is intended to help you compare the cost of investing in the Global Mini Mites Fund with the cost of investing in other mutual funds.
The example assumes that you invest $10,000 in the Global Mini Mites Fund for the time periods indicated and then redeem all of your shares at the end of those periods. The example assumes a waiver of expenses through the date of the expiration of the waiver, and reflects Total Annual Fund Operating Expenses following the date of the expiration of the waiver. The example also assumes that your investment has a 5% return each year and that the Global Mini Mites Fund’s operating expenses remain the same. Although your actual costs may be higher or lower, based on these assumptions your costs would be:
Expense Example - Gabelli Global Mini Mites Fund - USD ($) |
Expense Example, with Redemption, 1 Year |
Expense Example, with Redemption, 3 Years |
Expense Example, with Redemption, 5 Years |
Expense Example, with Redemption, 10 Years |
|---|---|---|---|---|
| Gabelli Global Mini Mites Fund Class AAA | 92 | 805 | 1,542 | 3,491 |
| Gabelli Global Mini Mites Fund Class A | 662 | 1,334 | 2,028 | 3,865 |
| Gabelli Global Mini Mites Fund Class I | 92 | 754 | 1,441 | 3,274 |
You would pay the following expenses if you did not redeem your shares of the Global Mini Mites Fund:
Expense Example, No Redemption - Gabelli Global Mini Mites Fund - USD ($) |
Expense Example, No Redemption, 1 Year |
Expense Example, No Redemption, 3 Years |
Expense Example, No Redemption, 5 Years |
Expense Example, No Redemption, 10 Years |
|---|---|---|---|---|
| Gabelli Global Mini Mites Fund Class AAA | 92 | 805 | 1,542 | 3,491 |
| Gabelli Global Mini Mites Fund Class A | 662 | 1,334 | 2,028 | 3,865 |
| Gabelli Global Mini Mites Fund Class I | 92 | 754 | 1,441 | 3,274 |
The Global Mini Mites Fund pays transaction costs, such as commissions, when it buys and sells securities (or “turns over” its portfolio). A higher portfolio turnover rate may indicate higher transaction costs and may result in higher taxes when the Global Mini Mites Fund’s shares are held in a taxable account. These costs, which are not reflected in the annual fund operating expenses or in the example, affect the Global Mini Mites Fund’s performance. During the most recent fiscal year, the Global Mini Mites Fund’s portfolio turnover rate was 42% of the average value of its portfolio.
The Global Mini Mites Fund primarily invests in equity securities of micro-cap companies, which the Global Mini Mites Fund defines as companies that have a market capitalization (defined as shares outstanding multiplied by the current market price) of $250 million or less at the time of the Global Mini Mites Fund’s investment. Equity securities include common stocks (including indirect holdings of common stock through depositary receipts), as well as other equity securities such as preferred stocks and convertible securities. Micro-cap companies may be engaged in new and emerging industries. Microcap companies are generally not well-known to investors and have less of an investor following than larger companies.
As a “global” fund, the Global Mini Mites Fund invests in securities of issuers, or related investments thereof, located in at least three countries, and at least 40% of the Global Mini Mites Fund’s total net assets are invested in securities of non-U.S. issuers or related investments thereof (such as depositary receipts and derivative instruments). The Global Mini Mites Fund may invest in companies located in developed or emerging markets as well as in non-equity securities, such as corporate bonds or other debt securities or financial instruments, including foreign debt securities.
The Adviser’s investment philosophy with respect to buying and selling equity securities is to identify assets that are selling in the public market at a discount to their private market value (“PMV”), and the Global Mini Mites Fund focuses on micro-cap companies that appear to be underpriced relative to their PMV. PMV is the value the Adviser believes informed purchasers would be willing to pay to acquire a company or other assets with similar characteristics. The Adviser considers factors such as price, earnings expectations, earnings and price histories, balance sheet characteristics, and perceived management skills. The Adviser also considers changes in economic and political outlooks as well as individual corporate developments. Further, the Adviser looks for catalysts, factors indigenous to the company, its industry or geographic positioning that may surface additional value, including, but not limited to, industry developments, regulatory changes, changes in management, sale or spin-off of a division, or the development of a profitable new business.
Additionally, the Adviser may also consider the securities of companies that appear to have favorable yet undervalued prospects for earnings growth and price appreciation. In this regard, the Adviser may invest the Global Mini Mites Fund’s assets in companies that it believes have above average or expanding market shares, profit margins, and returns on equity. In evaluating growth prospects, the Adviser uses fundamental security analysis to develop earnings forecasts for companies and to identify investment opportunities. The Adviser bases its analysis on general economic and industry data provided by the U.S. Government, various trade associations and other sources, and published corporate financial data such as annual reports and quarterly statements as well as direct interviews with company management. When applying a growth strategy, the Adviser seeks to invest in companies with high future earnings potential relative to their current market valuations.
The Adviser expects to seek to sell investments that lose their perceived value relative to other investments, which could occur because of, among other things, a security reaching a predetermined price target, a change to a company’s fundamentals that make the risk/reward profile unattractive, or a need to improve the overall risk/reward profile of the Global Mini Mites Fund.
The Global Mini Mites Fund may invest in non-U.S. equity securities through depositary receipts, including American Depositary Receipts (“ADRs”), European Depositary Receipts (“EDRs”), Global Depositary Receipts (“GDRs”) and other similar global instruments, which are generally subject to risks associated with equity securities and investments in foreign (non-U.S.) securities. ADRs are receipts issued by U.S. banks or trust companies in respect of securities of foreign issuers held on deposit for use in the U.S. securities markets. EDRs, which are sometimes referred to as Continental Depositary Receipts, are receipts issued in Europe, typically by non-U.S. banks and trust companies, that evidence ownership of either non-U.S. or domestic underlying securities. GDRs are depositary receipts structured like global debt issues to facilitate trading on an international basis. ADRs are usually denominated in U.S. dollars and dividends and other payments from the issuer are converted by the custodian into U.S. dollars before payment to receipt holders. In most other respects, ADRs, EDRs and GDRs for foreign securities have the same characteristics as the underlying securities.
The bar chart and table that follow provide an indication of the risks of investing in the Global Mini Mites Fund by showing changes in the Global Mini Mites Fund’s performance from year to year and by showing how the Global Mini Mites Fund’s average annual returns for one year compared with those of a broad based securities market index. As with all mutual funds, the Global Mini Mites Fund’s past performance (before and after taxes) does not predict how the Global Mini Mites Fund will perform in the future. Updated information on the Global Mini Mites Fund’s results can be obtained by visiting www.gabelli.com
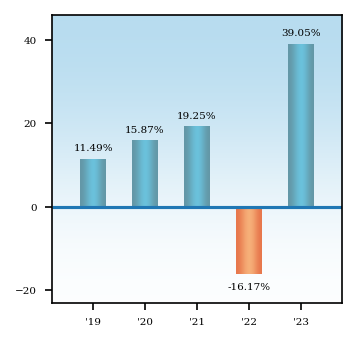
During the calendar years shown in the bar chart, the was (quarter ended ) and the was (quarter ended ).
Average Annual Total Returns - Gabelli Global Mini Mites Fund |
1 Year |
5 Years |
Since Inception |
Inception Date |
|---|---|---|---|---|
| Gabelli Global Mini Mites Fund Class AAA | 39.05% | 12.42% | 8.70% | Oct. 01, 2018 |
| Gabelli Global Mini Mites Fund Class AAA | Return After Taxes on Distributions | 34.81% | 10.09% | 6.54% | Oct. 01, 2018 |
| Gabelli Global Mini Mites Fund Class AAA | Return After Taxes on Distributions and Sale of Fund Shares | 24.55% | 9.15% | 6.16% | Oct. 01, 2018 |
| Gabelli Global Mini Mites Fund Class A | 30.94% | 11.08% | 7.46% | Oct. 01, 2018 |
| Gabelli Global Mini Mites Fund Class I | 39.05% | 12.49% | 8.76% | Oct. 01, 2018 |
| S&P Developed SmallCap Index (reflects no deduction for fees, expenses or taxes) | 15.90% | 9.83% | 5.35% | Oct. 01, 2018 |
After-tax returns are calculated using the historical highest individual federal marginal income tax rates and do not reflect the impact of state and local taxes. In some instances, the “Return After Taxes on Distributions and Sale of Fund Shares” may be greater than the “Return After Taxes on Distributions” because the investor is assumed to have sufficient capital gains of the same character from other investments to offset any capital losses from the redemption so that the taxpayer may deduct the capital losses in full. Actual after-tax returns depend on an investor’s tax situation and may differ from those shown. After-tax returns shown are not relevant to investors who hold their Global Mini Mites Fund shares through tax deferred arrangements, such as 401(k) plans or individual retirement accounts, including Roth IRAs and SEP IRAs (collectively, “IRAs”). After-tax returns are shown only for Class AAA shares. After-tax returns for other classes will vary due to the differences in expenses.
You may want to invest in the Global Mini Mites Fund if:
| ● | you seek to diversify your investments outside the U.S. |
| ● | you seek exposure to the micro-capitalization market segment despite the potential volatility of micro-capitalization stocks. |
| ● | you are a long term investor. |
| ● | you seek long term growth of capital. |
The Global Mini Mites Fund’s share price will fluctuate with changes in the market value of its portfolio securities. Stocks are subject to market, economic, and business risks that may cause their prices to fluctuate. An investment in the Global Mini Mites Fund is not a deposit of a bank and is not insured or guaranteed by the Federal Deposit Insurance Corporation or any other government agency. When you sell Global Mini Mites Fund shares, they may be worth less than what you paid for them; you may lose money by investing in the Global Mini Mites Fund.
Investing in the Global Mini Mites Fund involves the following risks:
| ● | Inflation Risk. Inflation risk is the risk that the value of assets or income from investments will be worth less in the future as inflation decreases the value of money. This risk may be elevated compared to historical market conditions because of recent monetary policy measures and the current interest rate environment. As inflation increases, the real value of the Fund’s shares and distributions therefore may decline. Inflation may result in losses to Fund shareholders. |
| ● | Foreign Securities Risk. Investments in foreign securities involve risks relating to political, social, and economic developments abroad, as well as risks resulting from the differences between the regulations to which U.S. and foreign issuers and markets are subject. These risks |
include expropriation, tariffs or punitive taxation, differing accounting and disclosure standards, currency exchange risks, settlement difficulties, market illiquidity, difficulties enforcing legal rights, and greater transaction costs.
| ● | Emerging Markets Risk. The above listed foreign securities risks are more pronounced in the securities of companies located in emerging markets. |
| ● | Interest Rate Risk. The Fund is subject to a greater risk of rising interest rates due to the recent period of rising interest rates. Central banks such as the Federal Reserve Bank have been increasing interest rates, though this trend has tempered recently as the rate of inflation slows. There is a risk that heightened interest rates may cause the economy to enter a recession. Any such recession would negatively impact the Fund and the investments held by the Fund. |
| ● | Currency Risk. Fluctuations in exchange rates between the U.S. dollar and foreign currencies may negatively affect an investment. Adverse changes in exchange rates may erode or reverse any gains produced by foreign currency denominated investments and may widen any losses. The Global Mini Mites Fund may, but is not required to, seek to reduce currency risk by hedging part or all of its exposure to various foreign currencies. In addition, the Global Mini Mites Fund’s investments could be adversely affected by delays in, or a refusal to grant, repatriation of funds or conversion of emerging market currencies. |
| ● | Depositary Receipts. The Global Mini Mites Fund may invest in non-U.S. equity securities through depositary receipts, including ADRs, EDRs, GDRs and other similar global instruments. While ADRs, EDRs and GDRs may not necessarily be denominated in the same currency as the securities into which they may be converted, many of the risks associated with foreign (non-U.S.) securities may also apply to ADRs, EDRs and GDRs. In addition, the underlying issuers of certain depositary receipts, particularly unsponsored or unregistered depositary receipts, are under no obligation to distribute shareholder communications to the holders of such receipts, or to pass through to them any voting rights with respect to the deposited securities. Depositary receipts that are not sponsored by the issuer may be less liquid and there may be less readily available public information about the issuer. |
| ● | Growth Stock Risk. Securities of growth companies may be more volatile since such companies usually invest a high portion of earnings in their business, and they may lack the dividends of value stocks that can cushion stock prices in a falling market. |
| ● | Issuer Risk. The value of a security may decline for a number of reasons that directly relate to an issuer, such as management performance, financial leverage, and reduced demand for the issuer’s goods or services, as well as the historical and prospective earnings of the issuer and the value of its assets or factors unrelated to the issuer’s value, such as investor perception. |
| ● | Management Risk. If the portfolio managers are incorrect in their assessment of the growth prospects of the securities the Global Mini Mites Fund holds, then the value of the Global Mini Mites Fund’s shares may decline. |
| ● | Non-Diversification Risk. As a non-diversified mutual fund, more of the Global Mini Mites Fund’s assets may be focused in the common stocks of a small number of issuers, which may make the value of the Global Mini Mites Fund’s shares more sensitive to changes in the market value of a single issuer or industry and more susceptible to risks associated with a single economic, political, or regulatory event than a diversified fund. |
| ● | Market Risk. General economic and market conditions, such as interest rates, availability of credit, inflation rates, economic uncertainty, supply chain disruptions, labor shortages, energy and other resource shortages, changes in laws, trade barriers, currency exchange controls and national and international political circumstances (including governmental responses to public health crises or the spread of infectious diseases), may have long-term negative effects on the U.S. and worldwide financial markets and economy, and thus the Fund. |
| ● | Equity Market Risk. The price of equity securities may rise or fall because of changes in the broad market or changes in a company’s financial condition, sometimes rapidly or unpredictably. These price movements may result from factors affecting individual companies, sectors or industries selected for the Global Mini Mites Fund’s portfolio or the securities market as a whole, such as changes in economic or political conditions. When the value of the Global Mini Mites Fund’s securities goes down, your investment in the Global Mini Mites Fund decreases in value. |
| ● | Micro-Cap Company Risk. Although micro-cap companies may offer greater potential for capital appreciation than larger companies, investing in securities of such companies may involve greater risks than investing in larger, more established companies, including the risk of loss and the risk that the Global Mini Mites Fund’s returns may differ significantly from returns of funds investing in larger-cap companies or other asset classes. Micro-cap companies may be new or unseasoned companies which are in their very early stages of development. Micro-cap companies generally have limited product lines, markets, management personnel, competitive strengths, research, and financial resources, and may be more vulnerable to adverse business or market developments. Their securities may trade less frequently and in more limited volume, and are subject to more abrupt or erratic market price movements, than the securities of larger, more established companies. The Global Mini Mites Fund may be able to deal with only a few market-makers when purchasing and selling micro-cap securities, and may need a considerable amount of time to purchase or sell its positions in these securities. Also, micro-cap companies are typically subject to greater changes in earnings and business prospects than larger companies. Consequently, micro-cap company stock prices tend to rise and fall in value |
more than other stock prices. Micro-cap securities are highly volatile, and these companies may fail to execute their business plans and go out of business. Micro-cap companies carry additional risks because of the tendency of their earnings and revenues to be less predictable. Micro-cap companies may be more vulnerable than larger companies to key personnel losses due to reliance on a smaller number of management personnel. These conditions, which create greater opportunities to find securities trading below the Adviser’s estimate of the company’s current worth, also involve increased risk. The shares of micro-cap companies may require fair-value pricing, which is subjective and requires judgment by the Adviser, and may be at risk for de-listing from a securities exchange, making it difficult for the Global Mini Mites Fund to buy and sell shares of a particular company. The actual market prices for a security may differ from the fair value of that security as determined by the Adviser, and there is no assurance that the Global Mini Mites Fund will realize fair valuation upon the sale of a security. In addition, there may be less public information available about micro-cap companies. It may take a long time before the Global Mini Mites Fund realizes a gain, if any, on an investment in a micro-cap company. Micro-cap companies may have limited financial resources and little or no access to additional credit and therefore may be more susceptible to market downturns or rising credit costs than larger, more established companies. The risks of investing in micro-cap companies are even greater than those of investing in small-cap companies, which may have market capitalizations of up to $3 billion at the time of investment.
| ● | Liquidity Risk. Liquidity risk is the risk that certain of the Global Mini Mites Fund’s securities holdings may be considered to be illiquid, which means that they may become difficult to value, purchase, or sell. This could prevent the Global Mini Mites Fund from purchasing or selling such illiquid securities at an advantageous time or price, and could require the Global Mini Mites Fund to dispose of other investments at unfavorable times or prices in order to satisfy its obligations. |
Because the trading market for micro and nano-cap stocks is generally more volatile, thin, and unpredictable relative to larger capitalization stocks, the Global Mini Mites Fund is subject to greater liquidity risk than a fund that invests in larger capitalization stocks.
| ● | Limited Operating History. The Global Mini Mites Fund commenced operations on October 1, 2018 and therefore has a limited operating history and may have higher expenses (although the Global Mini Mites Fund expects that such expenses would be limited under its Expense Deferral Agreement with the Adviser). There can be no assurance that the Global Mini Mites Fund will grow to or maintain an economically viable size. The Global Mini Mites Fund could cease operations, and investors may be required to liquidate or transfer their assets at a loss. |