Total | ||||||||||||||||||
|---|---|---|---|---|---|---|---|---|---|---|---|---|---|---|---|---|---|---|
| Class 1 Shares Prospectus | Growth Fund | ||||||||||||||||||
| Growth Fund | ||||||||||||||||||
| Investment objective | ||||||||||||||||||
The fund’s investment objective is to provide growth of capital. | ||||||||||||||||||
| Fees and expenses of the fund | ||||||||||||||||||
This table describes the fees and expenses that you may pay if you buy, hold and sell an interest in Class 1 shares of the fund. You may pay other fees, such as insurance contract fees and expenses, which are not reflected in the tables and examples below. If insurance contract fees and expenses were reflected, expenses shown would be higher. | ||||||||||||||||||
| Annual fund operating expenses (expenses that you pay each year as a percentage of the value of your investment) | ||||||||||||||||||
| ||||||||||||||||||
| Example | ||||||||||||||||||
This example is intended to help you compare the cost of investing in Class 1 shares of the fund with the cost of investing in other mutual funds. The example assumes that you invest $10,000 in the fund for the time periods indicated and then redeem or hold all of your shares at the end of those periods. The example also assumes that your investment has a 5% return each year and that the fund’s operating expenses remain the same. The example does not reflect insurance contract expenses. If insurance contract expenses were reflected, expenses shown would be higher. No sales charge (load) or other fees are charged by the fund upon redemption, so you would incur these hypothetical costs whether or not you were to redeem your shares at the end of the given period. | ||||||||||||||||||
| Although your actual costs may be higher or lower, based on these assumptions your costs would be: | ||||||||||||||||||
| ||||||||||||||||||
| Portfolio turnover | ||||||||||||||||||
The fund pays transaction costs, such as commissions, when it buys and sells securities (or “turns over” its portfolio). A higher portfolio turnover rate may indicate higher transaction costs. These costs, which are not reflected in annual fund operating expenses or in the example, affect the fund’s investment results. During the most recent fiscal year, the fund’s portfolio turnover rate was 23% of the average value of its portfolio. | ||||||||||||||||||
| Principal investment strategies | ||||||||||||||||||
The fund invests primarily in common stocks and seeks to invest in companies that appear to offer superior opportunities for growth of capital. The fund may invest up to 25% of its assets in common stocks and other securities outside the United States. The investment adviser uses a system of multiple portfolio managers in managing the fund’s assets. Under this approach, the portfolio of the fund is divided into segments managed by individual managers. The fund relies on the professional judgment of its investment adviser to make decisions about the fund’s portfolio investments. The basic investment philosophy of the investment adviser is to seek to invest in attractively valued companies that, in its opinion, represent good, long-term investment opportunities. Securities may be sold when the investment adviser believes that they no longer represent relatively attractive investment opportunities. | ||||||||||||||||||
| Principal risks | ||||||||||||||||||
| Investment results | ||||||||||||||||||
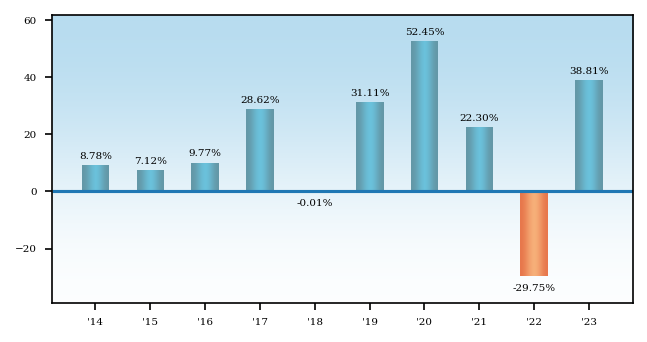
The following bar chart shows how the investment results of the Class 1 shares of the fund have varied from year to year, and the following table shows how the fund’s average annual total returns for various periods compare with a broad measure of securities market results. This information provides some indication of the risks of investing in the fund. Past investment results (before and after taxes) are not predictive of future investment results. Figures shown reflect fees and expenses associated with an investment in the fund, but do not reflect insurance contract fees and expenses. If insurance contract fees and expenses were included, results would have been lower. Updated information on the fund’s investment results can be obtained by visiting capitalgroup.com/afis. | ||||||||||||||||||
The following bar chart shows how the investment results of the Class 1 shares of the fund have varied from year to year, and the following table shows how the fund’s average annual total returns for various periods compare with a broad measure of securities market results.
| ||||||||||||||||||
| Calendar year total returns | ||||||||||||||||||
| ||||||||||||||||||
Highest/Lowest quarterly results during this period were:
Highest 28.73% (quarter ended June 30, 2020)
Lowest -23.00% (quarter ended June 30, 2022) | ||||||||||||||||||
| Average annual total returns For the periods ended December 31, 2023: | ||||||||||||||||||
|
| X | ||||||||||
- Definition Contains a command for the SEC Viewer for the role corresponding to OperatingExpensesData. No definition available.
|
| X | ||||||||||
- Definition If the Fund has annual returns for at least one calendar year, provide a bar chart showing the Fund's annual total returns for each of the last 10 calendar years (or for the life of the Fund if less than 10 years), but only for periods subsequent to the effective date of the Fund's registration statement. Present the corresponding numerical return adjacent to each bar. If the Fund's fiscal year is other than a calendar year, include the year-to-date return information as of the end of the most recent quarter in a footnote to the bar chart. Following the bar chart, disclose the Fund's highest and lowest return for a quarter during the 10 years or other period of the bar chart. When a Multiple Class Fund offers more than one Class in the prospectus, provide annual total returns in the bar chart for only one of those Classes. The Fund can select which Class to include (e.g., the oldest Class, the Class with the greatest net assets). Reference 1: http://www.xbrl.org/2003/role/presentationRef
|
| X | ||||||||||
- Definition If the Fund has annual returns for at least one calendar year, provide a bar chart showing the Fund's annual total returns for each of the last 10 calendar years (or for the life of the Fund if less than 10 years), but only for periods subsequent to the effective date of the Fund's registration statement. Present the corresponding numerical return adjacent to each bar. If the Fund's fiscal year is other than a calendar year, include the year-to-date return information as of the end of the most recent quarter in a footnote to the bar chart. Following the bar chart, disclose the Fund's highest and lowest return for a quarter during the 10 years or other period of the bar chart. When a Multiple Class Fund offers more than one Class in the prospectus, provide annual total returns in the bar chart for only one of those Classes. The Fund can select which Class to include (e.g., the oldest Class, the Class with the greatest net assets). Reference 1: http://www.xbrl.org/2003/role/presentationRef
|
| X | ||||||||||
- Definition If the Fund has annual returns for at least one calendar year, provide a bar chart showing the Fund's annual total returns for each of the last 10 calendar years (or for the life of the Fund if less than 10 years), but only for periods subsequent to the effective date of the Fund's registration statement. Present the corresponding numerical return adjacent to each bar. If the Fund's fiscal year is other than a calendar year, include the year-to-date return information as of the end of the most recent quarter in a footnote to the bar chart. Following the bar chart, disclose the Fund's highest and lowest return for a quarter during the 10 years or other period of the bar chart. When a Multiple Class Fund offers more than one Class in the prospectus, provide annual total returns in the bar chart for only one of those Classes. The Fund can select which Class to include (e.g., the oldest Class, the Class with the greatest net assets). Reference 1: http://www.xbrl.org/2003/role/presentationRef
|
| X | ||||||||||
- Definition If the Fund has annual returns for at least one calendar year, provide a bar chart showing the Fund's annual total returns for each of the last 10 calendar years (or for the life of the Fund if less than 10 years), but only for periods subsequent to the effective date of the Fund's registration statement. Present the corresponding numerical return adjacent to each bar. If the Fund's fiscal year is other than a calendar year, include the year-to-date return information as of the end of the most recent quarter in a footnote to the bar chart. Following the bar chart, disclose the Fund's highest and lowest return for a quarter during the 10 years or other period of the bar chart. When a Multiple Class Fund offers more than one Class in the prospectus, provide annual total returns in the bar chart for only one of those Classes. The Fund can select which Class to include (e.g., the oldest Class, the Class with the greatest net assets). Reference 1: http://www.xbrl.org/2003/role/presentationRef
|
| X | ||||||||||
- Definition If the Fund has annual returns for at least one calendar year, provide a bar chart showing the Fund's annual total returns for each of the last 10 calendar years (or for the life of the Fund if less than 10 years), but only for periods subsequent to the effective date of the Fund's registration statement. Present the corresponding numerical return adjacent to each bar. If the Fund's fiscal year is other than a calendar year, include the year-to-date return information as of the end of the most recent quarter in a footnote to the bar chart. Following the bar chart, disclose the Fund's highest and lowest return for a quarter during the 10 years or other period of the bar chart. When a Multiple Class Fund offers more than one Class in the prospectus, provide annual total returns in the bar chart for only one of those Classes. The Fund can select which Class to include (e.g., the oldest Class, the Class with the greatest net assets). Reference 1: http://www.xbrl.org/2003/role/presentationRef
|
| X | ||||||||||
- Definition If the Fund has annual returns for at least one calendar year, provide a bar chart showing the Fund's annual total returns for each of the last 10 calendar years (or for the life of the Fund if less than 10 years), but only for periods subsequent to the effective date of the Fund's registration statement. Present the corresponding numerical return adjacent to each bar. If the Fund's fiscal year is other than a calendar year, include the year-to-date return information as of the end of the most recent quarter in a footnote to the bar chart. Following the bar chart, disclose the Fund's highest and lowest return for a quarter during the 10 years or other period of the bar chart. When a Multiple Class Fund offers more than one Class in the prospectus, provide annual total returns in the bar chart for only one of those Classes. The Fund can select which Class to include (e.g., the oldest Class, the Class with the greatest net assets). Reference 1: http://www.xbrl.org/2003/role/presentationRef
|
| X | ||||||||||
- Definition If the Fund has annual returns for at least one calendar year, provide a bar chart showing the Fund's annual total returns for each of the last 10 calendar years (or for the life of the Fund if less than 10 years), but only for periods subsequent to the effective date of the Fund's registration statement. Present the corresponding numerical return adjacent to each bar. If the Fund's fiscal year is other than a calendar year, include the year-to-date return information as of the end of the most recent quarter in a footnote to the bar chart. Following the bar chart, disclose the Fund's highest and lowest return for a quarter during the 10 years or other period of the bar chart. When a Multiple Class Fund offers more than one Class in the prospectus, provide annual total returns in the bar chart for only one of those Classes. The Fund can select which Class to include (e.g., the oldest Class, the Class with the greatest net assets). Reference 1: http://www.xbrl.org/2003/role/presentationRef
|
| X | ||||||||||
- Definition If the Fund has annual returns for at least one calendar year, provide a bar chart showing the Fund's annual total returns for each of the last 10 calendar years (or for the life of the Fund if less than 10 years), but only for periods subsequent to the effective date of the Fund's registration statement. Present the corresponding numerical return adjacent to each bar. If the Fund's fiscal year is other than a calendar year, include the year-to-date return information as of the end of the most recent quarter in a footnote to the bar chart. Following the bar chart, disclose the Fund's highest and lowest return for a quarter during the 10 years or other period of the bar chart. When a Multiple Class Fund offers more than one Class in the prospectus, provide annual total returns in the bar chart for only one of those Classes. The Fund can select which Class to include (e.g., the oldest Class, the Class with the greatest net assets). Reference 1: http://www.xbrl.org/2003/role/presentationRef
|
| X | ||||||||||
- Definition If the Fund has annual returns for at least one calendar year, provide a bar chart showing the Fund's annual total returns for each of the last 10 calendar years (or for the life of the Fund if less than 10 years), but only for periods subsequent to the effective date of the Fund's registration statement. Present the corresponding numerical return adjacent to each bar. If the Fund's fiscal year is other than a calendar year, include the year-to-date return information as of the end of the most recent quarter in a footnote to the bar chart. Following the bar chart, disclose the Fund's highest and lowest return for a quarter during the 10 years or other period of the bar chart. When a Multiple Class Fund offers more than one Class in the prospectus, provide annual total returns in the bar chart for only one of those Classes. The Fund can select which Class to include (e.g., the oldest Class, the Class with the greatest net assets). Reference 1: http://www.xbrl.org/2003/role/presentationRef
|
| X | ||||||||||
- Definition If the Fund has annual returns for at least one calendar year, provide a bar chart showing the Fund's annual total returns for each of the last 10 calendar years (or for the life of the Fund if less than 10 years), but only for periods subsequent to the effective date of the Fund's registration statement. Present the corresponding numerical return adjacent to each bar. If the Fund's fiscal year is other than a calendar year, include the year-to-date return information as of the end of the most recent quarter in a footnote to the bar chart. Following the bar chart, disclose the Fund's highest and lowest return for a quarter during the 10 years or other period of the bar chart. When a Multiple Class Fund offers more than one Class in the prospectus, provide annual total returns in the bar chart for only one of those Classes. The Fund can select which Class to include (e.g., the oldest Class, the Class with the greatest net assets). Reference 1: http://www.xbrl.org/2003/role/presentationRef
|
| X | ||||||||||
- Definition This item represents Average Annual Total Returns. If a Multiple Class Fund offers a Class in the prospectus that converts into another Class after a stated period, compute average annual total returns in the table by using the returns of the other Class for the period after conversion. Reference 1: http://www.xbrl.org/2003/role/presentationRef
|
| X | ||||||||||
- Definition Risk/Return Bar Chart and Table. Reference 1: http://www.xbrl.org/2003/role/presentationRef
|
| X | ||||||||||
- Definition If the Fund has annual returns for at least one calendar year, provide a bar chart showing the Fund's annual total returns for each of the last 10 calendar years (or for the life of the Fund if less than 10 years), but only for periods subsequent to the effective date of the Fund's registration statement. Present the corresponding numerical return adjacent to each bar. If the Fund's fiscal year is other than a calendar year, include the year-to-date return information as of the end of the most recent quarter in a footnote to the bar chart. Following the bar chart, disclose the Fund's highest and lowest return for a quarter during the 10 years or other period of the bar chart. Reference 1: http://www.xbrl.org/2003/role/presentationRef
|
| X | ||||||||||
- Definition Risk/Return Bar Chart and Table. Reference 1: http://www.xbrl.org/2003/role/presentationRef
|
| X | ||||||||||
- Definition Provide a brief explanation of how the information illustrates the variability of the Fund's returns (e.g., by stating that the information provides some indication of the risks of investing in the Fund by showing changes in the Fund's performance from year to year and by showing how the Fund's average annual returns for 1, 5, and 10 years compare with those of a broad measure of market performance). Provide a statement to the effect that the Fund's past performance (before and after taxes) is not necessarily an indication of how the Fund will perform in the future. Reference 1: http://www.xbrl.org/2003/role/presentationRef
|
| X | ||||||||||
- Definition Contains a command for the SEC Viewer for the role corresponding to BarChartData. No definition available.
|
| X | ||||||||||
- Definition The Example assumes that you invest $10,000 in the Fund for the time periods indicated and then you redeem all of your shares at the end of those periods. The Example also assumes that your investment has a 5% return per year and that the Fund's operating expenses remained the same. Although your actual costs may be higher or lower. Reference 1: http://www.xbrl.org/2003/role/presentationRef
|
| X | ||||||||||
- Definition Heading for Expense Example. Reference 1: http://www.xbrl.org/2003/role/presentationRef
|
| X | ||||||||||
- Definition The Example is intended to help you compare the cost of investing in the Fund with the cost of investing in other mutual funds. Reference 1: http://www.xbrl.org/2003/role/presentationRef
|
| X | ||||||||||
- Definition Contains a command for the SEC Viewer for the role corresponding to ExpenseExample. No definition available.
|
| X | ||||||||||
- Definition Risk/Return Summary Fee Table Includes the following information, in plain English under rule 421(d) under the Securities Act, after Item 2 Fees and expenses of the Fund This table describes the fees and expenses that you may pay if you buy and hold shared of the Fund. You may qualify for sales charge discounts if you and your family invest, or agree to invest in the future, at least $[_____] in [name of fund family] funds. Shareholder Fees (fees paid directly from your investment) Example This Example is intended to help you compare the cost of investing in the Fund with the cost of investing in other mutual funds. The Example assumes that you invest $10,000 in the Fund for the time periods indicated and then you redeem all of your shares at the end of those periods. The Example also assumes that your investment has a 5% return per year and that the Fund's operating expenses remained the same. Although your actual costs may be higher or lower, based on these assumptions your costs would be You would pay the following expenses if you did not redeem your shares The Example does not reflect sales charges (loads) on reinvested dividends [and other distributions]. If these sales charges (loads) were included, your costs would be higher. Portfolio Turnover The Fund pays transaction costs, such as commissions, when it buys and sells securities (or "turns over" its portfolio). A higher portfolio turnover may indicate higher transaction costs. These costs, which are not reflected in annual fund operating expenses or in the example, affect the Fund's performance. During the most recent fiscal year, the Fund's portfolio turnover rate was __% of the average value of its whole portfolio. Instructions. A.3.instructions.6 New Funds. For purposes of this Item, a "New Fund" is a Fund that does not include in Form N-1A financial statements reporting operating results or that includes financial statements for the Fund's initial fiscal year reporting operating results for a period of 6 months or less. The following Instructions apply to New Funds. Reference 1: http://www.xbrl.org/2003/role/presentationRef
|
| X | ||||||||||
- Definition This table describes the fees and expenses that you may pay if you buy, hold, and sell shares of the Fund. You may pay other fees, such as brokerage commissions and other fees to financial intermediaries, which are not reflected in the tables and examples below. You may qualify for sales charge discounts if you and your family invest, or agree to invest in the future, at least $[ ] in [name of fund family] funds. More information about these and other discounts is available from your financial intermediary and in [identify section heading and page number] of the Fund's prospectus and [identify section heading and page number] of the Fund's statement of additional information Reference 1: http://www.xbrl.org/2003/role/presentationRef
|
| X | ||||||||||
- Definition Total Annual Fund Operating Expenses. If the Fund is a Feeder Fund, reflect the aggregate expenses of the Feeder Fund and the Master Fund in a single fee table using the captions provided. In a footnote to the fee table, state that the table and Example reflect the expenses of both the Feeder and Master Funds. If the prospectus offers more than one Class of a Multiple Class Fund or more than one Feeder Fund that invests in the same Master Fund, provide a separate response for each Class or Feeder Fund. Base the percentages of "Annual Fund Operating Expenses" on amounts incurred during the Fund's most recent fiscal year, but include in expenses amounts that would have been incurred absent expense reimbursement or fee waiver arrangements. If the Fund has changed its fiscal year and, as a result, the most recent fiscal year is less than three months, use the fiscal year prior to the most recent fiscal year as the basis for determining "Annual Fund Operating Expenses." Reference 1: http://www.xbrl.org/2003/role/presentationRef
|
| X | ||||||||||
- Definition Management Fees include investment advisory fees (including any fees based on the Fund's performance), any other management fees payable to the investment adviser or its affiliates, and administrative fees payable to the investment adviser or its affiliates that are not included as "Other Expenses." Reference 1: http://www.xbrl.org/2003/role/presentationRef
|
| X | ||||||||||
- Definition Investment Objectives/Goals. Disclose the Fund's investment objectives or goals. A Fund also may identify its type or category (e.g., that it is a Money Market Fund or a balanced fund). Reference 1: http://www.xbrl.org/2003/role/presentationRef
|
| X | ||||||||||
- Definition Investment Objectives/Goals. Disclose the Fund's investment objectives or goals. A Fund also may identify its type or category (e.g., that it is a Money Market Fund or a balanced fund). Reference 1: http://www.xbrl.org/2003/role/presentationRef
|
| X | ||||||||||
- Definition Annual Fund Operating Expenses (ongoing expenses that you pay each year as a percentage of the value of your investment) Reference 1: http://www.xbrl.org/2003/role/presentationRef
|
| X | ||||||||||
- Definition "Other Expenses" include all expenses not otherwise disclosed in the table that are deducted from the Fund's assets or charged to all shareholder accounts. The amount of expenses deducted from the Fund's assets are the amounts shown as expenses in the Fund's statement of operations (including increases resulting from complying with paragraph 2(g) of rule 6-07 of Regulation S-X [17 CFR 210.6-07]). "Other Expenses" do not include extraordinary expenses as determined under generally accepted accounting principles (see Accounting Principles Board Opinion No. 30). If extraordinary expenses were incurred that materially affected the Fund's "Other Expenses," disclose in a footnote to the table what "Other Expenses" would have been had the extraordinary expenses been included. Reference 1: http://www.xbrl.org/2003/role/presentationRef
|
| X | ||||||||||
- Definition Risk/Return Bar Chart and Table. Reference 1: http://www.xbrl.org/2003/role/presentationRef
|
| X | ||||||||||
- Definition Contains a command for the SEC Viewer for the role corresponding to PerformanceTableData. No definition available.
|
| X | ||||||||||
- Definition Disclose the portfolio turnover rate provided in response to Item 14(a) for the most recent fiscal year (or for such shorter period as the Fund has been in operation). Disclose the period for which the information is provided if less than a full fiscal year. A Fund that is a Money Market Fund may omit the portfolio turnover information required by this Item. Reference 1: http://www.xbrl.org/2003/role/presentationRef
|
| X | ||||||||||
- Definition Disclose the portfolio turnover rate provided in response to Item 14(a) for the most recent fiscal year (or for such shorter period as the Fund has been in operation). Disclose the period for which the information is provided if less than a full fiscal year. A Fund that is a Money Market Fund may omit the portfolio turnover information required by this Item. Reference 1: http://www.xbrl.org/2003/role/presentationRef
|
| X | ||||||||||
- Definition Narrative Risk Disclosure. Reference 1: http://www.xbrl.org/2003/role/presentationRef
|
| X | ||||||||||
- Definition Risk/Return Summary Investment Objectives/Goals Include the following information, in plain English under rule 421(d) under the Securities Act, in the order and subject matter indicated Reference 1: http://www.xbrl.org/2003/role/presentationRef
|
| X | ||||||||||
- Definition Principal investment strategies of the Fund. Summarize how the Fund intends to achieve its investment objectives by identifying the Fund's principal investment strategies (including the type or types of securities in which the Fund invests or will invest principally) and any policy to concentrate in securities of issuers in a particular industry or group of industries. Reference 1: http://www.xbrl.org/2003/role/presentationRef
|
| X | ||||||||||
- Definition Principal investment strategies of the Fund. Summarize how the Fund intends to achieve its investment objectives by identifying the Fund's principal investment strategies (including the type or types of securities in which the Fund invests or will invest principally) and any policy to concentrate in securities of issuers in a particular industry or group of industries. Reference 1: http://www.xbrl.org/2003/role/presentationRef
|
| X | ||||||||||
- Details
|
| X | ||||||||||
- Details
|
| X | ||||||||||
- Details
|
| X | ||||||||||
- Details
|