The fund’s investment objective is to provide as high a level of current income as is consistent with the preservation of capital.
This table describes the fees and expenses that you may pay if you buy, hold and sell an interest in Class 1A shares of the fund. You may pay other fees, such as insurance contract fees and expenses, which are not reflected in the tables and examples below. If insurance contract fees and expenses were reflected, expenses shown would be higher.
Annual Fund Operating Expenses |
Class 1A Shares Prospectus
The Bond Fund of America
Class 1A
|
|
|---|---|---|
| Management fee | 0.35% | |
| Other expenses | 0.28% | |
| Total annual fund operating expenses | 0.63% | |
| Fee waiver | 0.15% | [1] |
| Total annual fund operating expenses after fee waiver | 0.48% | |
| [1] | The investment adviser is currently waiving a portion of its management fee equal to .15% of the fund's net assets. This waiver will be in effect through at least May 1, 2025. The waiver may only be modified or terminated with the approval of the fund’s board. |
This example is intended to help you compare the cost of investing in Class 1A shares of the fund with the cost of investing in other mutual funds.
The example assumes that you invest $10,000 in the fund for the time periods indicated and then redeem or hold all of your shares at the end of those periods. The example also assumes that your investment has a 5% return each year and that the fund’s operating expenses remain the same. The example does not reflect insurance contract expenses. If insurance contract expenses were reflected, expenses shown would be higher. The example reflects the fee waiver described above through the expiration date of such waiver and total annual fund operating expenses thereafter. No sales charge (load) or other fees are charged by the fund upon redemption, so you would incur these hypothetical costs whether or not you were to redeem your shares at the end of the given period.
Expense Example |
1 year |
3 years |
5 years |
10 years |
|---|---|---|---|---|
| Class 1A Shares Prospectus | The Bond Fund of America | Class 1A | USD ($) | 49 | 187 | 336 | 772 |
The fund pays transaction costs, such as commissions, when it buys and sells securities (or “turns over” its portfolio). A higher portfolio turnover rate may indicate higher transaction costs. These costs, which are not reflected in annual fund operating expenses or in the example, affect the fund’s investment results. During the most recent fiscal year, the fund’s portfolio turnover rate was 545% of the average value of its portfolio.
The fund seeks to maximize your level of current income and preserve your capital by investing primarily in bonds. Normally the fund invests at least 80% of its assets in bonds and other debt securities, which may be represented by derivatives. The fund invests at least 60% of its assets in debt securities (excluding derivatives) rated A3 or better or A- or better by Nationally Recognized Statistical Ratings Organizations designated by the fund’s investment adviser, or in debt securities that are unrated but determined to be of equivalent quality by the fund’s investment adviser, and in U.S. government securities, money market instruments, cash or cash equivalents.
The fund may invest in debt securities and mortgage-backed securities issued by government-sponsored entities and federal agencies and instrumentalities that are not backed by the full faith and credit of the U.S. government.
The fund may invest in inflation-linked bonds issued by U.S. and non-U.S. governments, their agencies or instrumentalities, and corporations. Inflation-linked bonds are structured to protect against inflation by linking the bond’s principal and interest payments to an inflation index, such as the Consumer Price Index for Urban Consumers, so that principal and interest adjust to reflect changes in the index.
The fund may invest in futures contracts and swaps, which are types of derivatives. A derivative is a financial contract, the value of which is based on the value of an underlying financial asset (such as a stock, bond or currency), a reference rate or a market index.
The fund may invest up to 5% of its assets in debt securities rated Ba1 or below and BB+ or below by Nationally Recognized Statistical Ratings Organizations designated by the fund’s investment adviser, or in debt securities that are unrated but determined to be of equivalent quality by the fund’s investment adviser. Securities rated Ba1 or below and BB+ or below are sometimes referred to as “junk bonds.”
The investment adviser uses a system of multiple portfolio managers in managing the fund’s assets. Under this approach, the portfolio of the fund is divided into segments managed by individual managers.
The fund relies on the professional judgment of its investment adviser to make decisions about the fund’s portfolio investments. The basic investment philosophy of the investment adviser is to seek to invest in attractively priced securities that, in its opinion, represent good, long-term investment opportunities. Securities may be sold when the investment adviser believes that they no longer represent relatively attractive investment opportunities.
The following bar chart shows how the investment results of the Class 1A shares of the fund have varied from year to year, and the following table shows how the fund’s average annual total returns for various periods compare with a broad measure of securities market results and other applicable measures of market results. This information provides some indication of the risks of investing in the fund. The Lipper Core Bond Funds Average includes mutual funds that disclose investment objectives and/or strategies reasonably comparable to those of the fund. Past investment results (before and after taxes) are not predictive of future investment results. Figures shown reflect fees and expenses associated with an investment in the fund, but do not reflect insurance contract fees and expenses. If insurance contract fees and expenses were included, results would have been lower. Updated information on the fund’s investment results can be obtained by visiting capitalgroup.com/afis.
The following bar chart shows how the investment results of the Class 1A shares of the fund have varied from year to year, and the following table shows how the fund’s average annual total returns for various periods compare with a broad measure of securities market results and other applicable measures of market results.
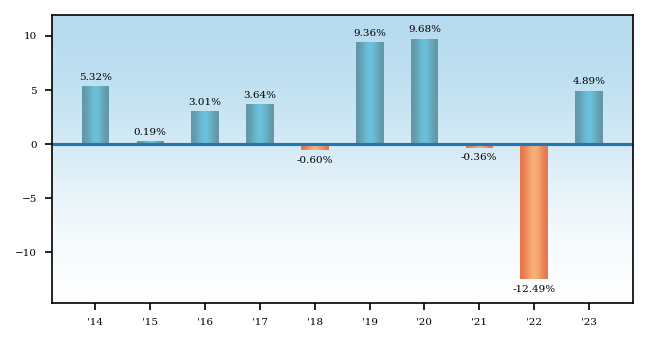
* Lifetime returns are from January 2, 1996, the date the fund began investment operations. Class 1A shares began investment operations on January 6, 2017; therefore, returns for the fund prior to that date assume a hypothetical investment in Class 1 shares, but reflect the .25% annual expense that applies to Class 1A shares and is described in the “Fund expenses” section of the prospectus. Returns for Class 1 shares are comparable to those of Class 1A shares because both classes invest in the same portfolio of securities.
Highest/Lowest quarterly results during this period were:
Highest 6.59% (quarter ended December 31, 2023)
Lowest -5.29% (quarter ended March 31, 2022)
Average Annual Returns - Class 1A Shares Prospectus - The Bond Fund of America |
Average Annual Returns, 1 Year |
Average Annual Returns, 5 Years |
[1] | Average Annual Returns, 10 Years |
[1] | Average Annual Returns, Since Inception |
[1] | Average Annual Returns, Inception Date |
|---|---|---|---|---|---|---|---|---|
| Class 1A | 4.89% | 1.87% | 2.08% | 3.83% | Jan. 06, 2017 | |||
| Bloomberg U.S. Aggregate Index (reflects no deduction for sales charges, account fees, expenses or U.S. federal income taxes) | 5.53% | 1.10% | 1.81% | 4.21% | ||||
| Lipper Core Bond Funds Average (reflects no deduction for sales charges, account fees or U.S. federal income taxes) | 5.84% | 1.24% | 1.73% | 4.01% | ||||
| [1] | Lifetime returns are from January 2, 1996, the date the fund began investment operations. Class 1A shares began investment operations on January 6, 2017; therefore, returns for the fund prior to that date assume a hypothetical investment in Class 1 shares, but reflect the .25% annual expense that applies to Class 1A shares and is described in the “Fund expenses” section of the prospectus. Returns for Class 1 shares are comparable to those of Class 1A shares because both classes invest in the same portfolio of securities. |