UNITED STATES
SECURITIES AND EXCHANGE COMMISSION
WASHINGTON, D.C. 20549
FORM
CERTIFIED SHAREHOLDER REPORT OF REGISTERED MANAGEMENT
INVESTMENT COMPANIES
Investment Company Act file number: 811-21532
(Exact Name of Registrant as Specified in Charter)
781 Crandon Blvd. Unit 602
Key Biscayne, FL 33149
(Address of Principal Executive Offices) (Zip Code)
Brian J. Frank, Frank Capital Partners LLC
781 Crandon Blvd. Unit 602
Key Biscayne, FL 33149
(Name and Address of Agent for Service)
With copy to:
JoAnn M. Strasser, Thompson Hine LLP
312 Walnut Street, 14th Floor, Cincinnati, Ohio 45202
Registrant’s Telephone Number, including Area Code: 973-887-7698
Date of fiscal year end: June 30
Date of reporting period:
Form N-CSR is to be used by management investment companies to file reports with the Commission not later than 10 days after the transmission to stockholders of any report that is required to be transmitted to stockholders under Rule 30e-1 under the Investment Company Act of 1940 (17 CFR 270.30e-1). The Commission may use the information provided on Form N-CSR in its regulatory, disclosure review, inspection and policymaking roles.
A registrant is required to disclose the information specified by Form N-CSR, and the Commission will make this information public. A registrant is not required to respond to the collection of information contained in Form N-CSR unless the Form displays a currently valid Office of Management and Budget ("OMB") control number. Please direct comments concerning the accuracy of the information collection burden estimate and any suggestions for reducing the burden to Secretary, Securities and Exchange Commission, 450 Fifth Street, NW, Washington, DC 20549-0609. The OMB has reviewed this collection of information under the clearance requirements of 44 U.S.C. § 3507.
Item 1. Reports to Stockholders.
ANNUAL SHAREHOLDER REPORT
June 30, 2024
expense Information
What were the Fund costs for the past year?
(based on a hypothetical $10,000 investment)
| Fund Name | Costs of a $10,000 investment | Costs paid as a percentage of a $10,000 investment |
| Frank Value Fund – Investor Class | $ |
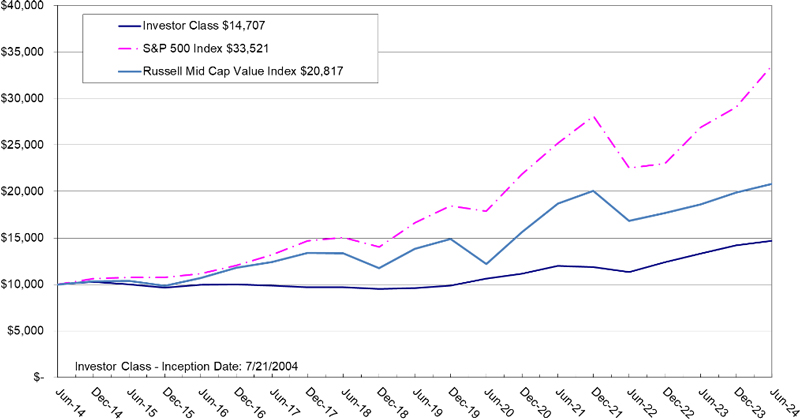
Performance graph
AVERAGE ANNUAL RETURNS
| One Year | Five Year | Ten Year | |
| Frank Value Fund – Investor Class | |||
| S&P 500 Total Return Index | |||
| Russell Mid Cap Value Index |
Cumulative Performance Comparison of
$10,000 Investment
FUND STATISTICS
|
NET ASSETS: |
PORTFOLIO HOLDINGS: |
PORTFOLIO TURNOVER: |
ADVISORY FEES PAID BY FUND: |
| $ |
$ |
ADDITIONAL INFORMATION
managment’s discussion of fund performance
Frank Value Fund Letter to Shareholders
The Frank Value Fund enjoyed positive returns for the year ended June 30, 2024, benefiting from favorable market conditions.
Strategy
Frank Capital Partners, LLC, the advisor to the Frank Value Fund, employs a focused strategy targeting small and mid-cap equities trading at low absolute valuations while growing earnings and/or possessing a catalyst to raise the valuation. The advisor searches for qualitative metrics such as excellent management teams, high marginal returns on capital, sustainable competitive advantages, and shareholder friendliness. Value-unlocking catalysts include material share repurchases, sustainably high dividend yields, potential for merger or acquisition, and index addition.
Techniques
The advisor’s security selection approach of low-valuation, high-quality, and unlocking catalysts also boosted returns. Information below provides some more detailed descriptions of catalyst-driven allocations employed during the year.
NRG Energy
The advisor initiated a position in NRG in July of 2023 at an average price of $37. The market valued the company at $8 billion. Management committed to a $2.7 billion stock repurchase for 2024 and 2025, roughly 11% of shares outstanding per year, in addition to paying a 4% dividend. This combines to a greater than 15% “share holder yield” which is superior to most other investment opportunities and a focus of Frank Capital Partners’ strategy. As of June 30, 2024, NRG trades at $77.86, returning about 110% for the Frank Value Fund. The advisor has trimmed NRG but currently maintains a core position.
Ebay
The advisor initiated a position in Ebay in December 2023 at an initial price of $41. The market valued the company at $21 billion, while waiting for a $4 billion asset sale to close. Additionally, Ebay produces upwards of $2 billion of free cash flow per year, and management is extremely shareholder friendly, repurchasing nearly 8% of shares outstanding and paying over a 2% dividend yield. This combines to a greater-than 10% “shareholder yield” which is superior to most other investment opportunities and a focus of Frank Capital Partners’ strategy. As of June 30, 2024, Ebay traded at $53.72, returning about 30% for the Frank Value Fund. The advisor is maintaining its position in Ebay currently.
We sincerely thank you for being a shareholder of the Frank Value Fund and look forward to working for you in the future.
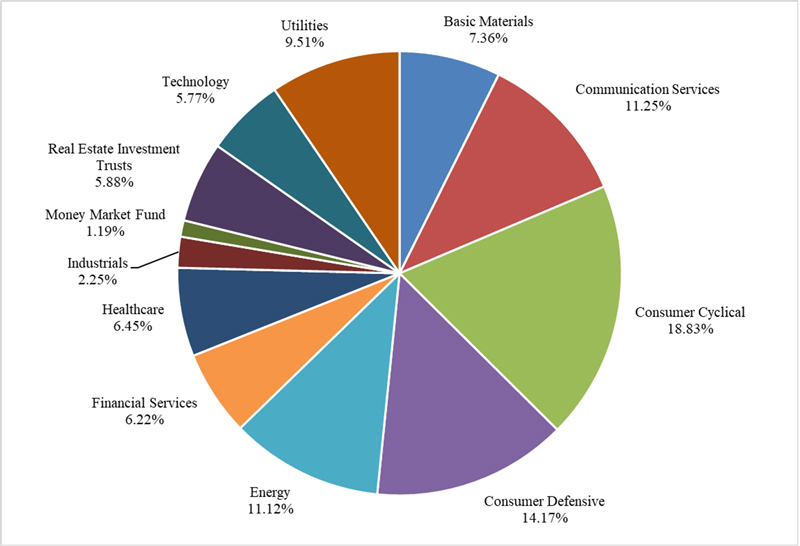
PORTFOLIO ILLUSTRATION
The following chart gives a visual breakdown of the Fund by the sectors the underlying securities represent as a percentage of the portfolio of investments.

Sectors are based on Morningstar® classifications.
Portfolio composition subject to change.
top ten holdings
| 1. | NRG Energy, Inc. | |
| 2. | CRH plc | |
| 3. | Viatris Inc. | |
| 4. | Calumet, Inc. | |
| 5. | Energy Transfer LP | |
| 6. | Nintendo Co., Ltd. | |
| 7. | Altria Group, Inc. | |
| 8. | eBay Inc. | |
| 9. | Philip Morris International Inc. | |
| 10. | Starbucks Corp. | |
| Total % of Net Assets |
How has the fund changed
The Fund has not had any material changes during the year ended
Householding
To reduce Fund expenses, only one copy of most shareholder documents may be mailed to shareholders with multiple accounts at the same address (Householding). If you would prefer that your Fund documents not be householded, please contact Frank Value Fund at 1-888-217-5426, or contact your financial intermediary. Your instructions will typically be effective within 30 days of receipt by the Fund or your financial intermediary.
For additional information about the Fund; including its prospectus, financial information, holdings and proxy information, visit https://frankfunds.com or contact us at 1-888-217-5426.
ANNUAL SHAREHOLDER REPORT
June 30, 2024
expense Information
What were the Fund costs for the past year?
(based on a hypothetical $10,000 investment)
| Fund Name | Costs of a $10,000 investment | Costs paid as a percentage of a $10,000 investment |
| Frank Value Fund – Class C | $ |
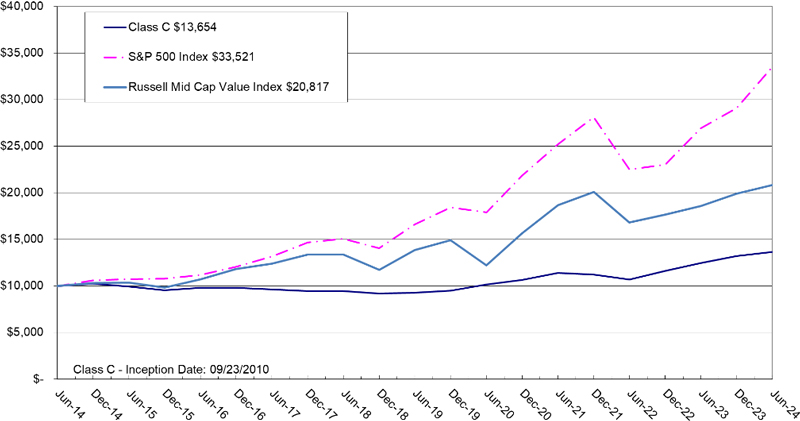
Performance graph
AVERAGE ANNUAL RETURNS
| One Year | Five Year | Ten Year | |
| Frank Value Fund – Class C | |||
| S&P 500 Total Return Index | |||
| Russell Mid Cap Value Index |
Cumulative Performance Comparison of
$10,000 Investment
FUND STATISTICS
|
NET ASSETS: |
PORTFOLIO HOLDINGS: |
PORTFOLIO TURNOVER: |
ADVISORY FEES PAID BY FUND: |
| $ |
$ |
ADDITIONAL INFORMATION
managment’s discussion of fund performance
Frank Value Fund Letter to Shareholders
The Frank Value Fund enjoyed positive returns for the year ended June 30, 2024, benefiting from favorable market conditions.
Strategy
Frank Capital Partners, LLC, the advisor to the Frank Value Fund, employs a focused strategy targeting small and mid-cap equities trading at low absolute valuations while growing earnings and/or possessing a catalyst to raise the valuation. The advisor searches for qualitative metrics such as excellent management teams, high marginal returns on capital, sustainable competitive advantages, and shareholder friendliness. Value-unlocking catalysts include material share repurchases, sustainably high dividend yields, potential for merger or acquisition, and index addition.
Techniques
The advisor’s security selection approach of low-valuation, high-quality, and unlocking catalysts also boosted returns. Information below provides some more detailed descriptions of catalyst-driven allocations employed during the year.
NRG Energy
The advisor initiated a position in NRG in July of 2023 at an average price of $37. The market valued the company at $8 billion. Management committed to a $2.7 billion stock repurchase for 2024 and 2025, roughly 11% of shares outstanding per year, in addition to paying a 4% dividend. This combines to a greater than 15% “share holder yield” which is superior to most other investment opportunities and a focus of Frank Capital Partners’ strategy. As of June 30, 2024, NRG trades at $77.86, returning about 110% for the Frank Value Fund. The advisor has trimmed NRG but currently maintains a core position.
Ebay
The advisor initiated a position in Ebay in December 2023 at an initial price of $41. The market valued the company at $21 billion, while waiting for a $4 billion asset sale to close. Additionally, Ebay produces upwards of $2 billion of free cash flow per year, and management is extremely shareholder friendly, repurchasing nearly 8% of shares outstanding and paying over a 2% dividend yield. This combines to a greater-than 10% “shareholder yield” which is superior to most other investment opportunities and a focus of Frank Capital Partners’ strategy. As of June 30, 2024, Ebay traded at $53.72, returning about 30% for the Frank Value Fund. The advisor is maintaining its position in Ebay currently.
We sincerely thank you for being a shareholder of the Frank Value Fund and look forward to working for you in the future.
PORTFOLIO ILLUSTRATION
The following chart gives a visual breakdown of the Fund by the sectors the underlying securities represent as a percentage of the portfolio of investments.

Sectors are based on Morningstar® classifications.
Portfolio composition subject to change.
top ten holdings
| 1. | NRG Energy, Inc. | |
| 2. | CRH plc | |
| 3. | Viatris Inc. | |
| 4. | Calumet, Inc. | |
| 5. | Energy Transfer LP | |
| 6. | Nintendo Co., Ltd. | |
| 7. | Altria Group, Inc. | |
| 8. | eBay Inc. | |
| 9. | Philip Morris International Inc. | |
| 10. | Starbucks Corp. | |
| Total % of Net Assets |
How has the fund changed
The Fund has not had any material changes during the year ended
Householding
To reduce Fund expenses, only one copy of most shareholder documents may be mailed to shareholders with multiple accounts at the same address (Householding). If you would prefer that your Fund documents not be householded, please contact Frank Value Fund at 1-888-217-5426, or contact your financial intermediary. Your instructions will typically be effective within 30 days of receipt by the Fund or your financial intermediary.
For additional information about the Fund; including its prospectus, financial information, holdings and proxy information, visit https://frankfunds.com or contact us at 1-888-217-5426.
ANNUAL SHAREHOLDER REPORT
June 30, 2024
expense Information
What were the Fund costs for the past year?
(based on a hypothetical $10,000 investment)
| Fund Name | Costs of a $10,000 investment | Costs paid as a percentage of a $10,000 investment |
| Frank Value Fund – Institutional Class | $ |
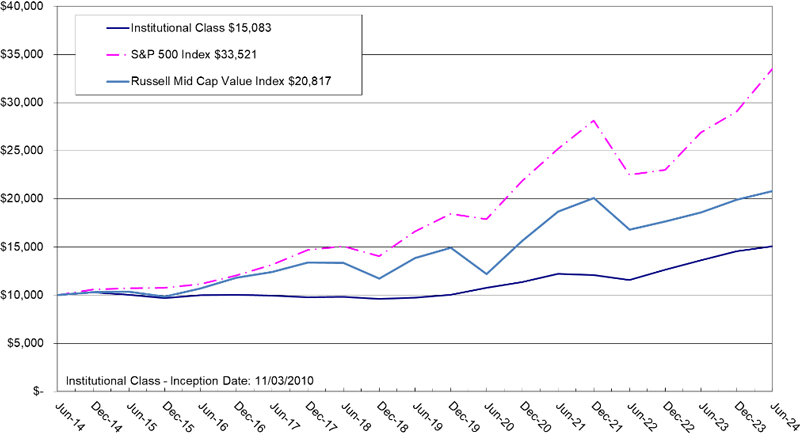
Performance graph
AVERAGE ANNUAL RETURNS
| One Year | Five Year | Ten Year | |
| Frank Value Fund – Institutional Class | |||
| S&P 500 Total Return Index | |||
| Russell Mid Cap Value Index |
Cumulative Performance Comparison of
$10,000 Investment
FUND STATISTICS
|
NET ASSETS: |
PORTFOLIO HOLDINGS: |
PORTFOLIO TURNOVER: |
ADVISORY FEES PAID BY FUND: |
| $ |
$ |
ADDITIONAL INFORMATION
managment’s discussion of fund performance
Frank Value Fund Letter to Shareholders
The Frank Value Fund enjoyed positive returns for the year ended June 30, 2024, benefiting from favorable market conditions.
Strategy
Frank Capital Partners, LLC, the advisor to the Frank Value Fund, employs a focused strategy targeting small and mid-cap equities trading at low absolute valuations while growing earnings and/or possessing a catalyst to raise the valuation. The advisor searches for qualitative metrics such as excellent management teams, high marginal returns on capital, sustainable competitive advantages, and shareholder friendliness. Value-unlocking catalysts include material share repurchases, sustainably high dividend yields, potential for merger or acquisition, and index addition.
Techniques
The advisor’s security selection approach of low-valuation, high-quality, and unlocking catalysts also boosted returns. Information below provides some more detailed descriptions of catalyst-driven allocations employed during the year.
NRG Energy
The advisor initiated a position in NRG in July of 2023 at an average price of $37. The market valued the company at $8 billion. Management committed to a $2.7 billion stock repurchase for 2024 and 2025, roughly 11% of shares outstanding per year, in addition to paying a 4% dividend. This combines to a greater than 15% “share holder yield” which is superior to most other investment opportunities and a focus of Frank Capital Partners’ strategy. As of June 30, 2024, NRG trades at $77.86, returning about 110% for the Frank Value Fund. The advisor has trimmed NRG but currently maintains a core position.
Ebay
The advisor initiated a position in Ebay in December 2023 at an initial price of $41. The market valued the company at $21 billion, while waiting for a $4 billion asset sale to close. Additionally, Ebay produces upwards of $2 billion of free cash flow per year, and management is extremely shareholder friendly, repurchasing nearly 8% of shares outstanding and paying over a 2% dividend yield. This combines to a greater-than 10% “shareholder yield” which is superior to most other investment opportunities and a focus of Frank Capital Partners’ strategy. As of June 30, 2024, Ebay traded at $53.72, returning about 30% for the Frank Value Fund. The advisor is maintaining its position in Ebay currently.
We sincerely thank you for being a shareholder of the Frank Value Fund and look forward to working for you in the future.
PORTFOLIO ILLUSTRATION
The following chart gives a visual breakdown of the Fund by the sectors the underlying securities represent as a percentage of the portfolio of investments.
Sectors are based on Morningstar® classifications.
Portfolio composition subject to change.
top ten holdings
| 1. | NRG Energy, Inc. | |
| 2. | CRH plc | |
| 3. | Viatris Inc. | |
| 4. | Calumet, Inc. | |
| 5. | Energy Transfer LP | |
| 6. | Nintendo Co., Ltd. | |
| 7. | Altria Group, Inc. | |
| 8. | eBay Inc. | |
| 9. | Philip Morris International Inc. | |
| 10. | Starbucks Corp. | |
| Total % of Net Assets |
How has the fund changed
The Fund has not had any material changes during the year ended
Householding
To reduce Fund expenses, only one copy of most shareholder documents may be mailed to shareholders with multiple accounts at the same address (Householding). If you would prefer that your Fund documents not be householded, please contact Frank Value Fund at 1-888-217-5426, or contact your financial intermediary. Your instructions will typically be effective within 30 days of receipt by the Fund or your financial intermediary.
For additional information about the Fund; including its prospectus, financial information, holdings and proxy information, visit https://frankfunds.com or contact us at 1-888-217-5426.

ANNUAL SHAREHOLDER REPORT
June 30, 2024
expense Information
What were the Fund costs for the past year?
(based on a hypothetical $10,000 investment)
| Fund Name | Costs of a $10,000 investment | Costs paid as a percentage of a $10,000 investment |
| West Hills Core Fund | $ |
Performance graph
AVERAGE ANNUAL RETURNS
| One Year | Five Year | Ten Year | |
| West Hills Core Fund | |||
| S&P 500 Total Return Index |
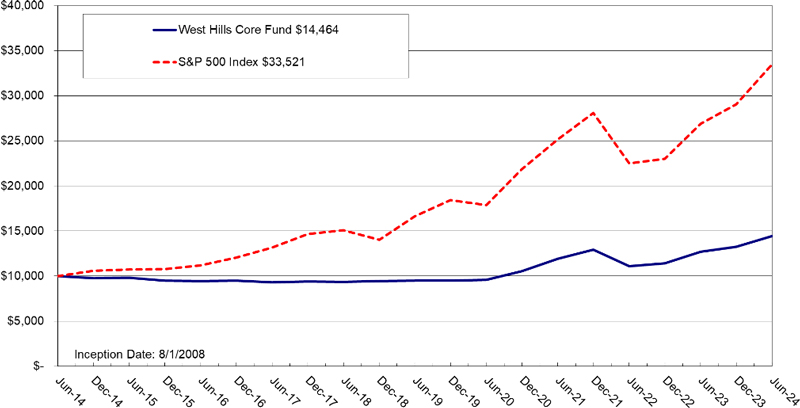
Cumulative Performance Comparison of
$10,000 Investment
FUND STATISTICS
|
NET ASSETS: |
PORTFOLIO HOLDINGS: |
PORTFOLIO TURNOVER: |
ADVISOR REIMBURSED THE FUND: |
| $ |
$ ( |
ADDITIONAL INFORMATION
managment’s discussion of fund performance
West Hills Core Fund Letter to Shareholders
The West Hills Core Fund enjoyed positive returns for the year ended June 30, 2024, benefiting from favorable market conditions.
Strategy
Frank Capital Partners, LLC, the advisor to the West Hills Core Fund, employs an indexed strategy to the S&P 500 while hedging risk with listed options. The Fund sells out of the money call options and purchases put options with the proceeds.
Techniques
The advisor uses options trading to reduce draw-downs relative to the S&P 500 Index. Exchange traded put options are purchased to provide downside protection, while exchange traded call options are sold to capture implied volatility premiums. The options portfolio is actively managed to maintain a consistent market exposure.
We sincerely thank you for being a shareholder of the West Hills Core Fund and look forward to working for you in the future.
PORTFOLIO ILLUSTRATION
The following chart gives a visual breakdown of the Fund by the sectors or investment type, while the underlying securities represent as a percentage of the portfolio of investments.

Sectors are based on Morningstar® classifications.
Portfolio composition subject to change.
Excludes written options.
top holdings
| 1. | SPDR S&P 500 ETF Trust | |
| 2. | SPDR S&P 500 ETF Trust, August 16, 2024, Put @ $515.00 | |
| Total % of Net Assets |
How has the fund changed
The Fund has not had any material changes during the year ended
Householding
To reduce Fund expenses, only one copy of most shareholder documents may be mailed to shareholders with multiple accounts at the same address (Householding). If you would prefer that your Fund documents not be householded, please contact West Hills Core Fund at 1-888-217-5426, or contact your financial intermediary. Your instructions will typically be effective within 30 days of receipt by the Fund or your financial intermediary.
For additional information about the Fund; including its prospectus, financial information, holdings and proxy information, visit https://westhillscorefund.com/ or contact us at 1-888-217-5426.

ANNUAL SHAREHOLDER REPORT
June 30, 2024
expense Information
What were the Fund costs for the past year?
(based on a hypothetical $10,000 investment)
| Fund Name | Costs of a $10,000 investment | Costs paid as a percentage of a $10,000 investment |
| Camelot Event-Drive Fund – Class A | $ |
Performance graph
AVERAGE ANNUAL RETURNS
|
One Year |
Five Year |
Ten Year | |
| Camelot Event Driven Fund - Class A (with load) | - |
||
| Camelot Event Driven Fund - Class A (without load) | |||
| S&P 500 Total Return Index | |||
| HFRX Equity Market Neutral Index |
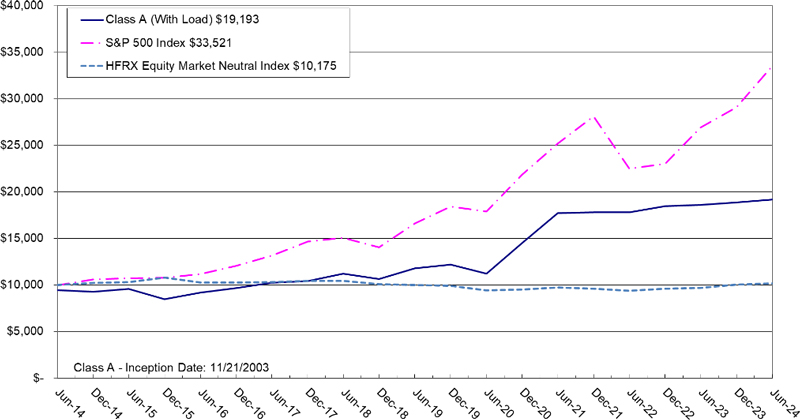
Cumulative Performance Comparison of
$10,000 Investment
FUND STATISTICS
|
NET ASSETS: |
PORTFOLIO HOLDINGS: |
PORTFOLIO TURNOVER: |
ADVISORY FEES PAID BY FUND: |
| $ |
$ |
ADDITIONAL INFORMATION
managment’s discussion of fund performance
Camelot Event-Driven Fund Letter to Shareholders
The Camelot Event-Driven Fund Class A returned 3.07% for the fiscal year ended June 30, 2024, compared to 24.56% for the S&P 500 Total Return Index.
The Fund maintained a cautious positioning throughout the year, employing hedges in its activist and special situations substrategy while also holding treasury securities, whose yield compared favorably with the opportunities available in merger arbitrage but without the downside associated with deal risk.
Strategy
Camelot Event-Driven Advisors, LLC, the advisor to the Camelot Event-Driven Fund, employs an event-driven strategy targeting pricing inefficiencies created by several types of company-specific events.
The fund maintained its largest allocations to activist investments and special situations throughout the year. Activist activity remained variable throughout the period yet providing sufficient investment opportunities.
Merger arbitrage remains a relatively small allocation compared to allocations in the past. The risk/return profile of this strategy still has not reached a level where larger allocations would be warranted. In fact, Treasury yields have increased to a level where government bonds are an attractive substitute for a merger arbitrage allocation. The fund has also exercised appraisal rights in a number of its portfolio holdings.
Similarly, distressed opportunities remain a small albeit increasing fraction of the portfolio. During the year, the team has made a small allocation to the distressed bonds of Chinese real estate developers, who, in the opinion of the team, are experiencing a liquidity crunch rather than a solvency crisis and provide unusually asymmetric risk/return profiles.
I thank all of our investors for your continued support and investment and wish you a prosperous year.
Camelot Event-Driven Fund Portfolio Manager
Thomas Kirchner
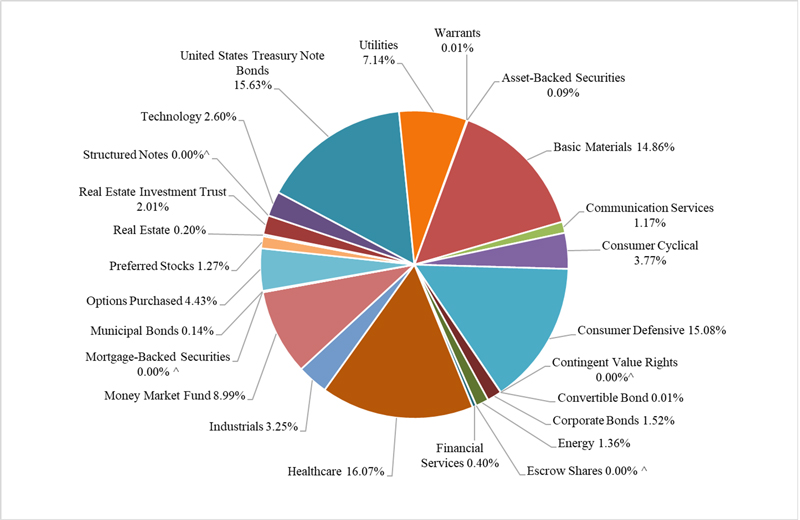
PORTFOLIO ILLUSTRATION
The following chart gives a visual breakdown of the Fund by the sectors or investment type, while the underlying securities represent as a percentage of the portfolio of investments.

| ^ |
Categorizations above are made using Morningstar® classifications.
Portfolio composition is subject to change.
Excludes written options.
top ten holdings
| 1. | Goldman Sachs Tr Financial Square Government Fund - Institutional Class | |
| 2. | Colgate-Palmolive Company | |
| 3. | Humana Inc. | |
| 4. | PPL Corporation | |
| 5. | US Treasury Note 4.50% 11/15/2033 | |
| 6. | Newmont Corporation | |
| 7. | International Flavors & Fragrances, Inc. | |
| 8. | Johnson & Johnson | |
| 9. | The J. M. Smucker Co. | |
| 10. | Illumina, Inc. | |
| Total % of Net Assets |
How has the fund changed
The Fund has not had any material changes during the year ended
Householding
To reduce Fund expenses, only one copy of most shareholder documents may be mailed to shareholders with multiple accounts at the same address (Householding). If you would prefer that your Fund documents not be householded, please contact Camelot Event-Drive Fund at 1-866-706-9790, or contact your financial intermediary. Your instructions will typically be effective within 30 days of receipt by the Fund or your financial intermediary.
For additional information about the Fund; including its prospectus, financial information, holdings and proxy information, visit http://cameloteventdrivenfund.com or contact us at 1-866-706-9790.
ANNUAL SHAREHOLDER REPORT
June 30, 2024
expense Information
What were the Fund costs for the past year?
(based on a hypothetical $10,000 investment)
| Fund Name | Costs of a $10,000 investment | Costs paid as a percentage of a $10,000 investment |
| Camelot Event-Drive Fund – Institutional Class | $ |
Performance graph
AVERAGE ANNUAL RETURNS
| One Year | Five Year | Ten Year | |
| Camelot Event Driven Fund - Institutional Class | |||
| S&P 500 Total Return Index | |||
| HFRX Equity Market Neutral Index |
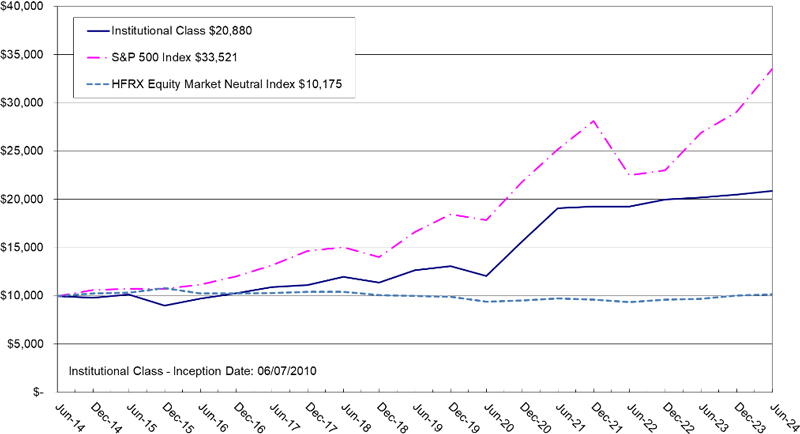
Cumulative Performance Comparison of
$10,000 Investment
FUND STATISTICS
|
NET ASSETS: |
PORTFOLIO HOLDINGS: |
PORTFOLIO TURNOVER: |
ADVISORY FEES PAID BY FUND: |
| $ |
$ |
ADDITIONAL INFORMATION
managment’s discussion of fund performance
Camelot Event-Driven Fund Letter to Shareholders
The Camelot Event-Driven Fund Institutional Class returned 3.34% for the fiscal year ended June 30, 2024, compared to 24.56% for the S&P 500 Total Return Index.
The Fund maintained a cautious positioning throughout the year, employing hedges in its activist and special situations substrategy while also holding treasury securities, whose yield compared favorably with the opportunities available in merger arbitrage but without the downside associated with deal risk.
Strategy
Camelot Event-Driven Advisors, LLC, the advisor to the Camelot Event-Driven Fund, employs an event-driven strategy targeting pricing inefficiencies created by several types of company-specific events.
The fund maintained its largest allocations to activist investments and special situations throughout the year. Activist activity remained variable throughout the period yet providing sufficient investment opportunities.
Merger arbitrage remains a relatively small allocation compared to allocations in the past. The risk/return profile of this strategy still has not reached a level where larger allocations would be warranted. In fact, Treasury yields have increased to a level where government bonds are an attractive substitute for a merger arbitrage allocation. The fund has also exercised appraisal rights in a number of its portfolio holdings.
Similarly, distressed opportunities remain a small albeit increasing fraction of the portfolio. During the year, the team has made a small allocation to the distressed bonds of Chinese real estate developers, who, in the opinion of the team, are experiencing a liquidity crunch rather than a solvency crisis and provide unusually asymmetric risk/return profiles.
I thank all of our investors for your continued support and investment and wish you a prosperous year.
Camelot Event-Driven Fund Portfolio Manager
Thomas Kirchner
PORTFOLIO ILLUSTRATION
The following chart gives a visual breakdown of the Fund by the sectors or investment type, while the underlying securities represent as a percentage of the portfolio of investments.
| ^ |
Categorizations above are made using Morningstar® classifications.
Portfolio composition is subject to change.
Excludes written options.
top ten holdings
| 1. | Goldman Sachs Tr Financial Square Government Fund - Institutional Class | |
| 2. | Colgate-Palmolive Company | |
| 3. | Humana Inc. | |
| 4. | PPL Corporation | |
| 5. | US Treasury Note 4.50% 11/15/2033 | |
| 6. | Newmont Corporation | |
| 7. | International Flavors & Fragrances, Inc. | |
| 8. | Johnson & Johnson | |
| 9. | The J. M. Smucker Co. | |
| 10. | Illumina, Inc. | |
| Total % of Net Assets |
How has the fund changed
The Fund has not had any material changes during the year ended
Householding
To reduce Fund expenses, only one copy of most shareholder documents may be mailed to shareholders with multiple accounts at the same address (Householding). If you would prefer that your Fund documents not be householded, please contact Camelot Event-Drive Fund at 1-866-706-9790, or contact your financial intermediary. Your instructions will typically be effective within 30 days of receipt by the Fund or your financial intermediary.
For additional information about the Fund; including its prospectus, financial information, holdings and proxy information, visit http://cameloteventdrivenfund.com or contact us at 1-866-706-9790.
Item 2. Code of Ethics.
The registrant has adopted a code of ethics that applies to the registrant's principal executive officer and the principal financial officer. The registrant has not made any amendments to its code of ethics during the covered period. The registrant has not granted any waivers from any provisions of the code of ethics during the covered period. A copy of the registrant’s Code of Ethics is filed herewith.
Item 3. Audit Committee Financial Expert.
The registrant’s board of trustees has determined that the registrant does not have an audit committee financial expert. This is because the registrant believes that the experience provided by each member of the audit committee together offers the registrant adequate oversight for the registrant's level of financial complexity.
Item 4. Principal Accountant Fees and Services.
(a)
Audit Fees
| FY 2024 | $ 45,500 |
| FY 2023 | $ 43,500 |
(b)
Audit-Related Fees
| Registrant | Adviser | |
| FY 2024 | $ 0 | $ 0 |
| FY 2023 | $ 0 | $ 0 |
(c)
Tax Fees
| Registrant | Adviser | |
| FY 2024 | $ 8,100 | $ 0 |
| FY 2023 | $ 7,500 | $ 0 |
| Nature of the fees: | Preparation of tax returns |
(d)
All Other Fees
| Registrant | Adviser | |
| FY 2024 | $ 0 | $ 0 |
| FY 2023 | $ 0 | $ 0 |
(e)
(1)
Audit Committee’s Pre-Approval Policies
The audit committee has not adopted pre-approval policies and procedures described in paragraph (c)(7) of Rule 2-01 of Regulation S-X.
(2)
Percentages of Services Approved by the Audit Committee
None of the services described in paragraph (b) through (d) of this Item were approved by the audit committee pursuant to paragraph (c)(7)(i)(C) of Rule 2-01 of Regulation S-X.
(f) During audit of registrant's financial statements for the most recent fiscal year, less than 50 percent of the hours expended on the principal accountant's engagement were attributed to work performed by persons other than the principal accountant's full-time, permanent employees.
(g) The aggregate non-audit fees billed by the registrant's accountant for services rendered to the registrant, and rendered to the registrant's investment adviser (not including any sub-adviser whose role is primarily portfolio management and is subcontracted with or overseen by another investment adviser), and any entity controlling, controlled by, or under common control with the adviser that provides ongoing services to the registrant:
| Registrant | Adviser | |
| FY 2024 | $ 8,100 | $ 0 |
| FY 2023 | $ 7,500 | $ 0 |
(h) Not Applicable. The auditor performed no services for the registrant's investment adviser or any entity controlling, controlled by, or under common control with the investment adviser that provides ongoing services to the registrant.
(i) Not Applicable.
(j) Not Applicable.
Item 5. Audit Committee of Listed Companies. Not applicable.
Item 6. Schedule of Investments. Not applicable – Schedule filed with Item 7.
Item 7. Financial Statements and Financial Highlights for Open-End Management Companies.
FRANK FUNDS
FRANK VALUE FUND
Investor Class – FRNKX
Class C – FNKCX
Institutional Class – FNKIX
WEST HILLS CORE FUND – LEBOX
CAMELOT EVENT DRIVEN FUND
Class A - EVDAX
Institutional Class - EVDIX
ANNUAL REPORT
June 30, 2024
Value Fund
SCHEDULE OF INVESTMENTS
JUNE 30, 2024
| Shares | Fair Value | |||||||
| COMMON STOCKS - 92.83% | ||||||||
| Bottled & Canned Soft Drinks & Carbonated Waters - 2.83% | ||||||||
| 6,455 | Coca-Cola FEMSA S.A.B de C.V. Series L ADR | $ | 554,097 | |||||
| Cement, Hydraulic - 7.35% | ||||||||
| 19,189 | CRH PLC | 1,438,791 | ||||||
| Cigarettes - 9.06% | ||||||||
| 22,416 | Altria Group, Inc. | 1,021,049 | ||||||
| 7,418 | Philip Morris International, Inc. | 751,666 | ||||||
| 1,772,715 | ||||||||
| Electric Services - 9.50% | ||||||||
| 23,864 | NRG Energy, Inc. | 1,858,051 | ||||||
| Functions Related To Depository Banking - 3.38% | ||||||||
| 6,382 | Euronet Worldwide, Inc. * | 660,537 | ||||||
| Motor Vehicle Parts& Accessories - 3.01% | ||||||||
| 68,654 | Garrett Motion, Inc. (Switzerland) * | 589,738 | ||||||
| Natural Gas Transmission - 5.54% | ||||||||
| 66,841 | Energy Transfer LP | 1,084,161 | ||||||
| Petroleum Refining - 5.57% | ||||||||
| 67,930 | Calumet, Inc. * | 1,090,277 | ||||||
| Pharmaceutical Preparations - 6.45% | ||||||||
| 118,699 | Viatris, Inc. | 1,261,770 | ||||||
| Retail-Eating & Drinking Places - 3.46% | ||||||||
| 8,700 | Starbucks Corp. | 677,295 | ||||||
| Retail-Eating Places - 2.84% | ||||||||
| 61,655 | Arcos Dorados Holdings, Inc. (Uruguay) Class A | 554,895 | ||||||
| Retail-Variety Stores - 2.26% | ||||||||
| 3,346 | Dollar General Corp. | 442,442 | ||||||
| Services-Business Services - 12.65% | ||||||||
| 14,775 | Ebay, Inc. | 793,713 | ||||||
| 22,423 | International Money Express, Inc. * | 467,295 | ||||||
| 10,408 | PayPal Holdings, Inc. * | 603,976 | ||||||
| 50,000 | Western Union Co. | 611,000 | ||||||
| 2,475,984 | ||||||||
| Services-Computer Rental & Leasing - 3.07% | ||||||||
| 103,990 | Bragg Gaming Group, Inc. * | 600,022 | ||||||
The accompanying notes are an integral part of these financial statements.
Annual Report | 1
Value Fund
SCHEDULE OF INVESTMENTS (CONTINUED)
JUNE 30, 2024
| Shares | Fair Value | |||||||
| Services-Management Services - 2.24% | ||||||||
| 14,804 | Rentokil Initial PLC (United Kingdom) | $ | 438,939 | |||||
| Services-Miscellaneous Amusement & Recreation - 2.38% | ||||||||
| 57,080 | Codere Online Luxembourg SA (Luxembourg) * | 465,202 | ||||||
| Services-Prepackaged Software - 2.85% | ||||||||
| 39,682 | Opera Ltd. ADR | 557,135 | ||||||
| Television Broadcasting Stations - 3.09% | ||||||||
| 43,368 | Tegna, Inc. | 604,550 | ||||||
| Video Game Equipment - 5.30% | ||||||||
| 78,040 | Nintendo Co. Ltd. ADR | 1,037,932 | ||||||
| TOTAL FOR COMMON STOCKS (Cost $15,654,434) - 92.83% | 18,164,533 | |||||||
| REAL ESTATE INVESTMENT TRUSTS - 5.88% | ||||||||
| 44,105 | Easterly Government Properties, Inc. | 545,579 | ||||||
| 24,547 | Net Lease Office Properties | 604,347 | ||||||
| TOTAL FOR REAL ESTATE INVESTMENT TRUSTS (Cost $1,083,224) - 5.88% | 1,149,926 | |||||||
| MONEY MARKET FUND - 1.18% | ||||||||
| 231,823 | Morgan Stanley Institutional Liquidity Funds - Treasury Portfolio 5.07% ** | 231,823 | ||||||
| TOTAL FOR MONEY MARKET FUND (Cost $231,823) - 1.18% | 231,823 | |||||||
| TOTAL INVESTMENTS (Cost $16,969,481) *** - 99.89% | 19,546,282 | |||||||
| ASSETS IN EXCESS OF LIABILITIES, NET - 0.11% | 21,448 | |||||||
| NET ASSETS - 100.00% | $ | 19,567,730 | ||||||
| * | Non-income producing securities during the period. |
| ** | Variable rate security; the coupon rate shown represents the yield at June 30, 2024. |
| *** | Refer to Note 11 for tax cost. |
ADR - American Depositary Receipt.
LP - Limited Partnership.
PLC - Public Limited Company.
SA - Société Anonyme - French term for Public Limited Company.
The accompanying notes are an integral part of these financial statements.
Annual Report | 2
West Hills Fund
SCHEDULE OF INVESTMENTS
JUNE 30, 2024
| Shares | Fair Value | |||||||
| EXCHANGE TRADED FUND - 101.40% | ||||||||
| 14,866 | SPDR S&P 500 ETF Trust (a) | $ | 8,090,375 | |||||
| TOTAL FOR EXCHANGE TRADED FUND (Cost $5,835,479) - 101.40% | 8,090,375 | |||||||
| INVESTMENTS IN PURCHASED OPTIONS, AT VALUE (Premiums Paid $55,394) - 0.28% | 22,200 | |||||||
| TOTAL INVESTMENTS (Cost $5,890,873) *** - 101.68% | 8,112,575 | |||||||
| INVESTMENTS IN WRITTEN OPTIONS, AT VALUE (Premiums Received $91,686) - (2.72%) | (217,310 | ) | ||||||
| ASSETS IN EXCESS OF LIABILITIES, NET - 1.04% | 83,219 | |||||||
| NET ASSETS - 100.00% | $ | 7,978,484 | ||||||
| (a) | Subject to written option contracts. |
| *** | Refer to Note 11 for tax cost. |
The accompanying notes are an integral part of these financial statements.
Annual Report | 3
West Hills Fund
SCHEDULE OF PURCHASED OPTIONS
JUNE 30, 2024
PUT OPTIONS - 0.28% *
| Underlying Security | Counterparty | Contracts + | Notional Amount** | Exercise Price | Expiration | Fair Value | ||||||||||||
| SPDR S&P 500 ETF Trust | Interactive Brokers | 120 | $ | 6,180,000 | $ | 515 | 8/16/2024 | $ | 22,200 | |||||||||
| Total Put Options (Premiums Paid $55,394) - 0.28% | $ | 22,200 | ||||||||||||||||
| TOTAL PURCHASED OPTIONS (Premiums Paid $55,394) - 0.28% | $ | 22,200 | ||||||||||||||||
| * | Non-income producing securities during the period. |
| ** | The notional amount is calculated by multiplying outstanding contracts by the exercise price at June 30, 2024. |
| + | Each option contract allows the holder of the option to purchase or sell 100 shares of the underlying security. |
ETF - Exchange Traded Funds
The accompanying notes are an integral part of these financial statements.
Annual Report | 4
West Hills Fund
SCHEDULE OF WRITTEN OPTIONS
JUNE 30, 2024
CALL OPTIONS - (2.68)% *
| Underlying Security | Counterparty | Contracts + | Notional Amount** | Exercise Price | Expiration | Fair Value | ||||||||||||
| SPDR S&P 500 ETF Trust | Interactive Brokers | (145) | $ | (7,830,000 | ) | $ | 540 | 8/16/2024 | $ | (214,310 | ) | |||||||
| Total Call Options (Premiums Received $53,695) - (2.68)% | $ | (214,310 | ) | |||||||||||||||
PUT OPTIONS - (0.04)% *
| Underlying Security | Counterparty | Contracts + | Notional Amount** | Exercise Price | Expiration | Fair Value | ||||||||||||
| SPDR S&P 500 ETF Trust | Interactive Brokers | (120) | $ | (5,220,000 | ) | $ | 435 | 8/16/2024 | $ | (3,000 | ) | |||||||
| Total Put Options (Premiums Received $37,991) - (0.04)% | $ | (3,000 | ) | |||||||||||||||
| TOTAL WRITTEN OPTIONS (Premiums Received $91,686) - (2.72)% | $ | (217,310 | ) | |||||||||||||||
| * | Non-income producing securities during the period. |
| ** | The notional amount is calculated by multiplying outstanding contracts by the exercise price at June 30, 2024. |
| + | Each option contract allows the holder of the option to purchase or sell 100 shares of the underlying security. |
ETF - Exchange Traded Funds
The accompanying notes are an integral part of these financial statements.
Annual Report | 5
Camelot Fund
SCHEDULE OF INVESTMENTS
JUNE 30, 2024
| Shares | Fair Value | |||||||
| COMMON STOCKS - 67.81% | ||||||||
| Automotive - 0.00% | ||||||||
| 5,926 | Exide Technologies ^ † * | $ | 0 | |||||
| 101,663 | Flyht Aerospace Solutions, Inc. (Canada) ^ † * | 0 | ||||||
| 0 | ||||||||
| Bakery Products - 0.39% | ||||||||
| 479,411 | Bab, Inc. | 373,845 | ||||||
| Biotech & Pharma - 0.00% | ||||||||
| 167,850 | Inyx, Inc. ● * | 17 | ||||||
| Canned, Frozen & Preserved Fruit, Veg & Food Specialties - 2.81% | ||||||||
| 25,000 | J.M. Smucker Co. (a) (b) | 2,726,000 | ||||||
| Communication Services - 0.10% | ||||||||
| 4,675 | Intelsat Emergence SA (Luxembourg) ● | 98,175 | ||||||
| Construction & Engineering - 0.06% | ||||||||
| 25,935 | WeBuild SpA ADR | 56,912 | ||||||
| Drilling Oil & Gas Wells - 0.00% | ||||||||
| 2 | Seadrill Ltd. (Bermuda) * | 103 | ||||||
| Electric & Other Services Combines - 1.78% | ||||||||
| 60,000 | NiSource, Inc. (a) | 1,728,600 | ||||||
| Electric Services - 5.57% | ||||||||
| 195,000 | PPL Corp. (a) | 5,391,750 | ||||||
| Electrical Industrial Apparatus - 0.45% | ||||||||
| 20,000 | Hollysys Automation Technologies Ltd. (China) * | 432,800 | ||||||
| Farm Machinery & Equipment - 0.00% | ||||||||
| 5,500 | Nature's Miracle Holding, Inc. * | 3,010 | ||||||
| Fats & Oils - 1.56% | ||||||||
| 25,000 | Archer-Daniels-Midland Co. (a) | 1,511,250 | ||||||
| Financial Services - 0.05% | ||||||||
| 300,000 | Sunac China Holdings Ltd. (China) * | 44,181 | ||||||
| Federal & Federally-Sponsored Credit Agencies - 0.15% | ||||||||
| 100,000 | Federal National Mortgage Association * | 143,000 | ||||||
| Gaming, Lodging & Restaurants - 0.09% | ||||||||
| 10,000 | Guoco Group Ltd. (China) | 89,514 | ||||||
The accompanying notes are an integral part of these financial statements.
Annual Report | 6
Camelot Fund
SCHEDULE OF INVESTMENTS (CONTINUED)
JUNE 30, 2024
| Shares | Fair Value | |||||||
| Gold and Silver Ores - 11.14% | ||||||||
| 37,500 | Agnico Eagle Mines Ltd. (Canada) (a) (b) | $ | 2,452,500 | |||||
| 440,000 | B2Gold Corp. (Canada) (a) | 1,188,000 | ||||||
| 55,000 | Barrick Gold Corp. (Canada) (a) (b) | 917,400 | ||||||
| 89,000 | Newmont Corp. (a) (b) | 3,726,430 | ||||||
| 130,000 | NovaGold Resources, Inc. * | 449,800 | ||||||
| 150,000 | Seabridge Gold, Inc. (Canada) (a) * | 2,053,500 | ||||||
| 10,787,630 | ||||||||
| Grain Mill Products - 1.67% | ||||||||
| 10,000 | Kellanova (a) | 576,800 | ||||||
| 10,000 | Post Holdings, Inc. (a) (b) * | 1,041,600 | ||||||
| 1,618,400 | ||||||||
| Hospital & Medical Service Plans - 6.17% | ||||||||
| 16,000 | Humana, Inc. (a) (b) | 5,978,400 | ||||||
| Industrial Organic Chemicals - 3.64% | ||||||||
| 37,000 | International Flavors & Fragrances, Inc. (a) (b) | 3,522,770 | ||||||
| Industrial Products - 2.61% | ||||||||
| 3,200 | Gates Industrial Corp. PLC * | 50,592 | ||||||
| 91,769 | Mercury Systems, Inc. (a) * | 2,476,845 | ||||||
| 2,527,437 | ||||||||
| Industrial Services - 0.05% | ||||||||
| 1,022,580 | Astaldi SpA SPF (Italy) † ● * | 50,618 | ||||||
| Internet Content & Information - 0.12% | ||||||||
| 1,500 | Scout24 SE ADR | 114,436 | ||||||
| Investment Advice - 0.03% | ||||||||
| 600 | TPG, Inc. Class A * | 24,870 | ||||||
| Investment Companies - 0.24% | ||||||||
| 15,000 | A SPAC II Acquisition Corp. (China) ● * | 162,600 | ||||||
| 3,100 | Ares Acquisition Corp. II Class A * | 33,170 | ||||||
| 3,600 | Nabors Energy Transition Corp II * | 38,088 | ||||||
| 7,300 | Northern Star Investment Corp. III Class A * | 0 | ||||||
| 233,858 | ||||||||
| Laboratory Analytical Instruments - 2.69% | ||||||||
| 25,000 | Illumina, Inc. (a) (b) * | 2,609,500 | ||||||
| Media - 0.50% | ||||||||
| 50,000 | Apogee 21 Holdings, Inc. * | 0 | ||||||
| 11,249 | Clear Channel Outdoor Holdings, Inc. * | 15,861 | ||||||
| 65,388 | Prosus N.V. ADR * | 466,870 | ||||||
| 482,731 | ||||||||
| Metals & Mining - 0.00% | ||||||||
| 109,444 | Sacre-Coeur Minerals Ltd. (Canada) ^ † * | 0 | ||||||
The accompanying notes are an integral part of these financial statements.
Annual Report | 7
Camelot Fund
SCHEDULE OF INVESTMENTS (CONTINUED)
JUNE 30, 2024
| Shares | Fair Value | |||||||
| Mineral Royalty Traders - 0.52% | ||||||||
| 4,000 | Royal Gold, Inc. (a) | $ | 500,640 | |||||
| Oil, Gas & Coal - 0.65% | ||||||||
| 4,000 | Chevron Corp. (a) (b) | 625,680 | ||||||
| Perfumes, Cosmetics & Other Toilet Preparations - 7.91% | ||||||||
| 79,000 | Colgate-Palmolive Co. (a) (b) | 7,666,160 | ||||||
| Petroleum Refining - 0.75% | ||||||||
| 4,000 | Marathon Petroleum Corp. (a) | 693,920 | ||||||
| 800 | Suncor Energy, Inc. (Canada) (a) | 30,480 | ||||||
| 724,400 | ||||||||
| Pharmaceutical Preparations - 5.33% | ||||||||
| 23,456 | BioMarin Pharmaceutical, Inc. (a) * | 1,931,132 | ||||||
| 30,000 | Emisphere Technologies, Inc. Δ ● * | 234,300 | ||||||
| 20,500 | Johnson & Johnson (a) (b) | 2,996,280 | ||||||
| 5,161,712 | ||||||||
| Radio & TV Broadcasting & Communications Equipment - 0.93% | ||||||||
| 194,684 | KVH Industries, Inc. (b) * | 905,281 | ||||||
| Radio Broadcasting Stations - 0.00% | ||||||||
| 4,610 | iHeartMedia, Inc. Class A * | 5,025 | ||||||
| Real Estate - 0.04% | ||||||||
| 20,000 | Greentown China Holdings Ltd. (China) | 15,726 | ||||||
| 150,000 | Ronshine China Holdings Ltd. (China) * | 3,266 | ||||||
| 500,000 | Times China Holdings Ltd. (China) * | 17,288 | ||||||
| 36,280 | ||||||||
| Retail - 1.10% | ||||||||
| 10,000 | Dollar Tree, Inc. (a) (b) * | 1,067,700 | ||||||
| Retail - Department Stores - 0.04% | ||||||||
| 791 | Neiman-Marcus Group Parent LLC † ● Δ * | 39,550 | ||||||
| Retail - Drug Stores and Proprietary Stores - 0.61% | ||||||||
| 10,000 | CVS Health Corp. (a) | 590,600 | ||||||
| Retail - Eating Places - 2.24% | ||||||||
| 20,000 | Cracker Barrel Old Country Store, Inc. (a) | 843,200 | ||||||
| 43,000 | Yum China Holdings, Inc. (a) | 1,326,120 | ||||||
| 2,169,320 | ||||||||
| Retail - Retail Stores - 1.60% | ||||||||
| 60,000 | JD.com, Inc. (China) (a) | 1,550,400 | ||||||
| Semiconductors & Related Devices - 0.47% | ||||||||
| 20,000 | Wolfspeed, Inc. (a) | 455,200 | ||||||
The accompanying notes are an integral part of these financial statements.
Annual Report | 8
Camelot Fund
SCHEDULE OF INVESTMENTS (CONTINUED)
JUNE 30, 2024
| Shares | Fair Value | |||||||
| Services-Computer Processing & Data Preparation - 0.42% | ||||||||
| 29,000 | Sohu.com Ltd. ADR * | $ | 403,680 | |||||
| Services-Educational Services - 0.07% | ||||||||
| 59,708 | TCTM Kids IT Education, Inc. (China) * | 72,247 | ||||||
| Services-Employment Agencies - 0.07% | ||||||||
| 15,400 | 51job, Inc. ADR ● Δ * | 71,148 | ||||||
| Services-Medical Laboratories - 0.07% | ||||||||
| 4,167 | Grail, Inc. (b) | 64,042 | ||||||
| Services-Nursing & Personal Care Facilities - 0.73% | ||||||||
| 166,176 | Chindata Group Holdings Ltd. (China) ● Δ * | 710,402 | ||||||
| Services-Prepackaged Software - 0.54% | ||||||||
| 15,000 | Everbridge, Inc. * | 524,850 | ||||||
| Surgical & Medical Instruments & Apparatus - 1.67% | ||||||||
| 48,000 | Baxter International, Inc. (b) | 1,605,600 | ||||||
| 3,000 | DIH Holding US, Inc. Class A * | 8,010 | ||||||
| 1,613,610 | ||||||||
| Telecommunications - 0.02% | ||||||||
| 44,529 | NII Holdings, Inc. ^ Δ * | 22,264 | ||||||
| Television Broadcasting Stations - 0.16% | ||||||||
| 7,000 | Liberty Media Corp. - Liberty SiriusXM Series A (a) * | 155,050 | ||||||
| Waste & Environmental Services & Equipment - 0.00% | ||||||||
| 43,000 | Strategic Environmental & Energy Resources, Inc. ^ † # * | 2,464 | ||||||
| TOTAL FOR COMMON STOCKS (Cost $68,558,137) - 67.81% | 65,687,512 | |||||||
| REAL ESTATE INVESTMENT TRUST - 2.07% | ||||||||
| 20,500 | Crown Castle International Corp. (a) (b) | 2,002,850 | ||||||
| TOTAL FOR REAL ESTATE INVESTMENT TRUST (Cost $3,455,624) - 2.07% | 2,002,850 | |||||||
| ESCROW SHARES - 0.00% | ||||||||
| 1,777 | Exide Technologies ^ † * | 0 | ||||||
| 33,000 | Pershing Square Tontine Holdings Ltd. | 0 | ||||||
| TOTAL FOR ESCROW SHARES (Cost $1,687) - 0.00% | 0 | |||||||
| ASSET-BACKED SECURITIES - 0.09% | ||||||||
| 2,846 | AFC Home Equity Loan Trust Series 2000-02 Class 1A, 6.23% (1 Month SOFR USD + 0.90448%), 6/25/2030 ** ● | 2,710 | ||||||
| 79,024 | Citigroup Mortgage Loan Trust, Inc. Series 2005-OPT1 Class M3, 4.19% (1 Month SOFR USD + 0.81948%), 2/25/2035 ** ● | 73,328 | ||||||
| 396,368 | Countrywide Asset-Backed Certificates Series 2007-11 Class 2M2, 4.18% (1 Month SOFR USD + 0.43448%), 6/25/2047 ** ● | 14,483 | ||||||
| TOTAL FOR ASSET-BACKED SECURITIES (Cost $108,556) - 0.09% | 90,521 | |||||||
The accompanying notes are an integral part of these financial statements.
Annual Report | 9
Camelot Fund
SCHEDULE OF INVESTMENTS (CONTINUED)
JUNE 30, 2024
| Shares | Fair Value | |||||||
| CONTINGENT VALUE RIGHTS - 0.00% | ||||||||
| Investment Companies - 0.00% | ||||||||
| 5,000 | AIB Acquisition Corp. Class A | $ | 0 | |||||
| 10,000 | Blue World Acquisition Corp. Class A | 2,600 | ||||||
| 2,600 | ||||||||
| Radio & TV Broadcasting & Communications Equipment - 0.00% | ||||||||
| 145,009 | KVH Industries, Inc. | 0 | ||||||
| TOTAL FOR CONTINGENT VALUE RIGHTS (Cost $0) - 0.00% | 2,600 | |||||||
| CONVERTIBLE BONDS - 0.01% | ||||||||
| Radio Telephone Communications - 0.01% | ||||||||
| 92,684 | Digicel Group 0.5 Ltd. Private Placement Series 144A Conv. (Bermuda) 7.00% Perpetual # ● | 4,912 | ||||||
| TOTAL FOR CONVERTIBLE BONDS (Cost $15,261) - 0.01% | 4,912 | |||||||
| CORPORATE BONDS - 1.57% | ||||||||
| Automotive - 0.00% | ||||||||
| 546,810 | Exide Technologies 11.00%, 4/30/2022 + † ^ # | 0 | ||||||
| Financial Services - 0.59% | ||||||||
| 1,000,000 | CIFI Holdings Group 6.55%, 03/28/2024 + ● | 108,350 | ||||||
| 5,000,000 | Hejun Shunzie Investment, 11.00%, 6/4/2022 + ● | 50,050 | ||||||
| 5,000,000 | Hellas Telecommunication Luxembourg II SCA Series 144a (United Kingdom) 6.054%, (3 Month LIBOR USD + 5.75%) 1/15/2015 + ^ # † | 6,250 | ||||||
| 100,000 | Lehman Brothers Holdings, Inc. Series LEHN 5.50%, 02/27/2020 + ● | 30 | ||||||
| 130,000 | Lehman Brothers Holdings, Inc. Series MTNG 0.00% (1 Month CPI YOY + 2.25%), 07/08/2014 ** + ● | 39 | ||||||
| 4,400,000 | Red Sun Properties Group 7.50%, 01/13/2025 + ● | 33,000 | ||||||
| 4,145,000 | Sunac China Holdings Ltd. 7.25%, 09/30/2030 (China) ● | 373,050 | ||||||
| 570,769 | ||||||||
| Oil, Gas & Coal - 0.18% | ||||||||
| 172,095 | Paratus Energy Services Ltd. Series 144A (United Kingdom) 10.00%, 07/15/2026 ● | 171,368 | ||||||
| Radio Telephone Communications - 0.01% | ||||||||
| 56,915 | Digicel Group 0.5 Ltd. Private Placement Series 144A (Bermuda) 8.00%, 04/01/2025 + # ● | 10,463 | ||||||
| Retail-Grocery Stores - 0.00% | ||||||||
| 50,000 | Winn Dixie Stores, Inc. 8.875%, 4/01/2008 ● | 0 | ||||||
The accompanying notes are an integral part of these financial statements.
Annual Report | 10
Camelot Fund
SCHEDULE OF INVESTMENTS (CONTINUED)
JUNE 30, 2024
| Shares | Fair Value | |||||||
| Real Estate - 0.72% | ||||||||
| 239,850 | CFLD Cayman Investment (China) 2.50%, 01/31/2031 ● | $ | 5,972 | |||||
| 5,000,000 | Jingrui Holdings Ltd. (China) 12.75%, 09/09/2023 + ● | 51,000 | ||||||
| 3,000,000 | Kaisa Group Holdings Ltd. (China) 9.375%, 6/30/2024 + ● | 108,750 | ||||||
| 2,000,000 | KWG Group Holdings Ltd. (China)7.40%, 01/13/2027 + ● | 123,700 | ||||||
| 3,000,000 | Redco Properties Group Ltd. (China) 11.00%, 08/06/2023 + ● | 18,000 | ||||||
| 1,200,001 | RongChangDa Development (Bvi) Ltd. (China) 3.00%, 03/29/2028 ● * | 12,000 | ||||||
| 249,999 | RongChangDa Development (Bvi) Ltd. (China) 3.00%, 03/29/2028 ● * | 2,500 | ||||||
| 3,000,000 | Ronshine China Holdings Ltd. (China) 8.75%, 10/25/2022 + ● | 31,800 | ||||||
| 1,000,000 | Ronshine China Holdings Ltd. (China) 7.35%, 12/15/2023 + ● | 11,430 | ||||||
| 1,808,000 | Shimao Group Holdings Ltd. ADR 5.20%, 01/30/2025 + ● | 90,400 | ||||||
| 1,500,000 | Shimao Group Holdings Ltd. ADR 5.20%, 01/16/2027 + ● | 77,625 | ||||||
| 3,000,000 | Sino-Ocean Land Holdings Ltd. 6.946% (H15TY + 3.256%), Perpetual ● * | 68,010 | ||||||
| 2,000,000 | Times China Holdings Ltd. (China) 5.75%, 01/14/2027 + ● | 47,500 | ||||||
| 505,000 | Yuzhou Group Holdings Co. Ltd. (China) 5.370% (H15T5Y + 8.527%), Perpetual +● | 11,363 | ||||||
| 6,000,000 | Zhenro Properties Group 14.724% (H15T3Y + 13.414%), Perpetual +● | 30,000 | ||||||
| 500,000 | Zhenro Properties Group 6.63%, 01/07/2026 + ● | 5,625 | ||||||
| 695,675 | ||||||||
| Sovereign - 0.07% | ||||||||
| 1,000,000 | Lebanese Republic Series GMTN (Lebanon) 6.15%, 6/19/2020 + ● | 70,740 | ||||||
| Venture Capital - 0.00% | ||||||||
| 25,000 | Infinity Capital Group 7.00%, 12/31/2049 + ^ † # | 0 | ||||||
| TOTAL FOR CORPORATE BONDS (Cost $3,064,024) - 1.57% | 1,519,015 | |||||||
| MORTGAGE-BACKED SECURITIES - 0.00% | ||||||||
| 75,454 | GNR Government National Mortgage Series 2019-108 Class NI, 4.00%, 8/20/2049 ~ ● | 2,141 | ||||||
| 39,456 | GSR Mortgage Loan Trust Series 2005-5F Class B2, 5.74%, 6/25/2035 ~ ● | 0 | ||||||
| TOTAL FOR MORTGAGE-BACKED SECURITIES (Cost $31,658) - 0.00% | 2,141 | |||||||
| MUNICIPAL BONDS - 0.15% | ||||||||
| Puerto Rico - 0.15% | ||||||||
| 17,074 | Puerto Rico Commonwealth Restructured Series A1 4.00%, 7/01/2037 ● | 16,436 | ||||||
| 24,036 | Puerto Rico Commonwealth Restructured Series A1 5.625%, 7/01/2029 ● | 25,779 | ||||||
| 10,000 | Puerto Rico Electric Power Authority Series CCC 4.25%, 7/01/2021 + ● | 5,013 | ||||||
| 10,000 | Puerto Rico Electric Power Authority Series CCC 4.25%, 7/01/2023 + ● | 5,012 | ||||||
| 75,000 | Puerto Rico Electric Power Authority Series DDD 3.50%, 7/01/2020 + ● | 37,594 | ||||||
| 30,000 | Puerto Rico Electric Power Authority Series DDD 3.625%, 7/01/2021 + ● | 15,037 | ||||||
| 55,000 | Puerto Rico Electric Power Authority Series TT 5.00%, 7/01/2020 + ● | 27,569 | ||||||
| 15,000 | Puerto Rico Electric Power Authority Series WW 5.50%, 7/01/2019 + ● | 7,519 | ||||||
| 139,959 | ||||||||
| TOTAL FOR MUNICIPAL BONDS (Cost $186,135) - 0.15% | 139,959 | |||||||
The accompanying notes are an integral part of these financial statements.
Annual Report | 11
Camelot Fund
SCHEDULE OF INVESTMENTS (CONTINUED)
JUNE 30, 2024
| Shares | Fair Value | |||||||
| PREFERRED STOCKS - 1.31% | ||||||||
| Government Agencies - 1.30% | ||||||||
| 19,000 | Federal Home Loan Mortgage Corp. Series B 0.00%, (3 Month LIBOR USD + 0.1377%) Perpetual ** ∞ * | $ | 130,150 | |||||
| 4,500 | Federal Home Loan Mortgage Corp. Series F 5.00%, Perpetual ∞ * | 32,625 | ||||||
| 55,000 | Federal Home Loan Mortgage Corp. Series H 5.10%, Perpetual ∞ * | 374,000 | ||||||
| 10,600 | Federal Home Loan Mortgage Corp. Series M 0.00%, (2 Year CMT + 0.10%) Perpetual ** ∞ * | 74,094 | ||||||
| 42,879 | Federal Home Loan Mortgage Corp. Series Q 0.00%, (2 Year CMT + 0.20%) Perpetual ** ∞ * | 291,577 | ||||||
| 25,000 | Federal Home Loan Mortgage Corp. Series S 0.00%, (3 Month LIBOR USD + 0.50%) Perpetual ** ∞ * | 178,750 | ||||||
| 5,500 | Federal National Mortgage Corp. Series H 5.81%, Perpetual ∞ * | 41,250 | ||||||
| 700 | Federal National Mortgage Corp. Series I 5.375%, Perpetual ∞ * | 5,341 | ||||||
| 4,440 | Federal National Mortgage Corp. Series M 4.75%, Perpetual ∞ * | 32,412 | ||||||
| 360 | Federal National Mortgage Corp. Series N 5.50%, Perpetual ∞ * | 2,743 | ||||||
| 20,000 | Federal National Mortgage Corp. Series T 8.25%, Perpetual ∞ * | 94,000 | ||||||
| 1,256,942 | ||||||||
| Real Estate - 0.01% | ||||||||
| 722 | Brookfield Property Partners LP, 6.25%, 7/26/2081 (Bermuda) | 10,599 | ||||||
| TOTAL FOR PREFERRED STOCKS (Cost $1,291,235) - 1.31% | 1,267,541 | |||||||
| STRUCTURED NOTES - 0.00% | ||||||||
| Financial Services - 0.00% | ||||||||
| 200,000 | Lehman Brothers Holdings, Inc. Series MTN 8.75%, 2/14/2023 + **● | 60 | ||||||
| 110,000 | Lehman Brothers Holdings, Inc. Series MTN1 0.00%, (1 Month CPI YOY + 2.25%) 2/17/2015 + **● | 33 | ||||||
| 100,000 | Lehman Brothers Holdings, Inc. Series MTNG 7.00%, 1/28/2020 + **● | 30 | ||||||
| 100,000 | Lehman Brothers Holdings, Inc. Series MTNH, 8.25%, 9/23/2020 + **● | 30 | ||||||
| TOTAL FOR STRUCTURED NOTES (Cost $0) - 0.00% | 153 | |||||||
| UNITED STATES TREASURY NOTE BONDS - 16.09% | ||||||||
| 2,000,000 | U.S. Treasury Note, 2.75%, 08/15/2032 ● | 1,782,734 | ||||||
| 2,000,000 | U.S. Treasury Note, 1.125%, 1/15/2025 ● | 1,955,957 | ||||||
| 2,000,000 | U.S. Treasury Note, 1.50%, 11/30/2024 ● | 1,968,633 | ||||||
| 2,000,000 | U.S. Treasury Note, 2.25%, 11/15/2024 ● | 1,976,875 | ||||||
| 2,000,000 | U.S. Treasury Note, 3.375%, 05/15/2033 ● | 1,857,188 | ||||||
| 4,000,000 | U.S. Treasury Note, 4.50%, 11/15/2033 ● | 4,045,625 | ||||||
| 2,000,000 | U.S. Treasury Note, 4.375%, 10/31/2024 ● | 1,993,125 | ||||||
| TOTAL FOR UNITED STATES TREASURY NOTE BONDS (Cost $15,734,025) - 16.09% | 15,580,137 | |||||||
The accompanying notes are an integral part of these financial statements.
Annual Report | 12
Camelot Fund
SCHEDULE OF INVESTMENTS (CONTINUED)
JUNE 30, 2024
| Shares | Fair Value | |||||||
| WARRANTS - 0.00% (c) | ||||||||
| Communication Services - 0.00% | ||||||||
| 6 | Intelsat Emergence SA, 2/17/2027 @ $60.15 (Notional Value $0) (Luxembourg) * | $ | 0 | |||||
| Farm Machinery & Equipment - 0.00% | ||||||||
| 2,500 | Nature's Miracle Holding, Inc., 03/12/2029 @ $11.50 (Notional Value $1,368) * | 58 | ||||||
| Investment Companies - 0.00% | ||||||||
| 5,000 | Blue World Acquisition Corp., 01/10/2029 @ $11.50 (Notional Value $43,500) * | 400 | ||||||
| 3,500 | Investcorp Europe Acquisition Corp. I Class A, 11/23/2028 @ $11.50 (Notional Value $39,725) (Cayman Islands) * | 254 | ||||||
| 1,216 | Northern Star Investment Corp. III Class A, 02/25/2028 @ $11.50 (Notional Value $61) * | 0 | ||||||
| 1,216 | Northern Star Investment Corp. IV Class A, 12/31/2027 @ $11.50 (Notional Value $61) * | 0 | ||||||
| 24,700 | OceanTech Acquisitions I Corp. Class A, 05/10/2026 @ $11.50 (Notional Value $251,940) * | 1,850 | ||||||
| 2,504 | ||||||||
| Miscellaneous Electrical Machinery, Equipment & Supplies - 0.00% | ||||||||
| 2,000 | Captivision, Inc., 11/16/2028 @ $11.50 (Notional Value $5,340) (Korea) * | 154 | ||||||
| Services-Automotive Repair, Services & Parking - 0.00% | ||||||||
| 300 | SunCar Technology Group, Inc. Class A, 05/18/2028 @ $11.50 (Notional Value $2,733) (China) * | 52 | ||||||
| Services-Prepackaged Software - 0.00% | ||||||||
| 6,500 | Airship AI Holdings, Inc. 12/31/2028 @ $11.50 (Notional Value $23,335) * | 2,340 | ||||||
| Services-Computer Integrated Systems Design - 0.00% | ||||||||
| 2,066 | Brand Engagement Network, Inc., 03/14/2029 @ $11.50 (Notional Value $7,128) * | 65 | ||||||
| Services-Computer Programming Services - 0.00% | ||||||||
| 375 | Semantix, Inc. Class A, 08/04/2027 @ $11.50 (Notional Value $15) (Brazil) * | 0 | ||||||
| Surgical & Medical Instruments & Apparatus - 0.00% | ||||||||
| 30,000 | DIH Holding US, Inc., 02/07/2028 @$11.50 (Notional Value $80,100) * | 1,200 | ||||||
| TOTAL FOR WARRANTS (Cost $0) - 0.00% | 6,373 | |||||||
The accompanying notes are an integral part of these financial statements.
Annual Report | 13
Camelot Fund
SCHEDULE OF INVESTMENTS (CONTINUED)
JUNE 30, 2024
| Shares | Fair Value | |||||||
| INVESTMENTS IN PURCHASED OPTIONS, AT VALUE (Premiums Paid $5,552,587) - 4.56% | $ | 4,415,775 | ||||||
| MONEY MARKET FUND - 9.25% | ||||||||
| 8,961,785 | Goldman Sachs Tr Financial Square Government Fund – Institutional Class 5.14% ** | 8,961,785 | ||||||
| TOTAL FOR MONEY MARKET FUND (Cost $8,961,785) - 9.25% | 8,961,785 | |||||||
| TOTAL INVESTMENTS (Cost $106,960,714) *** - 102.91% | 99,681,274 | |||||||
| INVESTMENTS IN WRITTEN OPTIONS, AT VALUE (Premiums Received $7,989,809) - (9.28%) | (8,984,513 | ) | ||||||
| ASSETS IN EXCESS OF LIABILITIES, NET - 6.37% | 6,169,629 | |||||||
| NET ASSETS - 100.00% | $ | 96,866,390 | ||||||
| * | Non-income producing securities during the period. |
| ** | Variable rate security; the coupon rate shown represents the yield at June 30, 2024. |
| *** | Refer to Note 11 for tax cost. |
ADR - American Depositary Receipt.
SpA - "Società per Azioni," which is an Italian term for a public limited company.
| (a) | Subject to written option contracts. |
| (b) | All or a portion of this security is held as collateral for written options. Total value of collateral for written options is $29,644,939 representing 30.60% of net assets. |
| (c) | The notional amount is calculated by multiplying outstanding shares by the spot price at June 30, 2024. |
| + | Default Bonds |
| ∞ | Distressed Securities |
| ● | Level 2 Security |
| ~ | Variable Rate Security. The coupon is based on an underlying pool of loans. |
| ^ | Indicates a fair valued security. Total market value for fair valued securities is $30,978 representing 0.03% of net assets and Level 3 securities. |
| # | Denotes a restricted security that may be sold without restriction to "qualified institutional buyers" as defined in Rule 144A under the Securities Act of 1933, as amended, is $24,089 representing 0.02% of net assets. |
| † | Indicates an illiquid security. Total market value for illiquid securities is $98,882 representing 0.10% of net assets. |
| Δ | Indicates a delisted security. Total market value for delisted securities is $1,077,664 representing 1.11% of net assets. |
The accompanying notes are an integral part of these financial statements.
Annual Report | 14
Camelot Fund
SCHEDULE OF PURCHASED OPTIONS
JUNE 30, 2024
CALL OPTIONS - 0.93% *
| Underlying Security | Counterparty | Contracts + | Notional Amount** | Exercise Price | Expiration | Fair Value | ||||||||||||
| Newmont Corp. | Susquehanna | 590 | $ | 1,770,000 | $ | 30 | 1/17/2025 | $ | 753,725 | |||||||||
| Royal Gold, Inc. ● | Susquehanna | 40 | 420,000 | 105 | 1/17/2025 | 95,600 | ||||||||||||
| Seabridge Gold, Inc. (Canada) | Susquehanna | 500 | 650,000 | 13 | 7/19/2024 | 47,500 | ||||||||||||
| Total Call Options (Premiums Paid $366,295) - 0.93% | $ | 896,825 | ||||||||||||||||
PUT OPTIONS - 3.63% *
| Underlying Security | Counterparty | Contracts + | Notional Amount** | Exercise Price | Expiration | Fair Value | ||||||||||||
| Agnico Eagle Mines Ltd. (Canada) ● | Susquehanna | 200 | $ | 1,000,000 | $ | 50 | 1/17/2025 | $ | 17,500 | |||||||||
| Archer-Daniels-Midland Co. ● | Susquehanna | 250 | 1,312,500 | 53 | 1/17/2025 | 35,625 | ||||||||||||
| Barrick Gold Corp. (Canada) | Susquehanna | 400 | 680,000 | 17 | 1/16/2026 | 96,000 | ||||||||||||
| Biomarin Pharmaceutical, Inc. ● | Susquehanna | 210 | 1,575,000 | 75 | 1/16/2026 | 143,850 | ||||||||||||
| Chevron Corp. ● | Susquehanna | 40 | 620,000 | 155 | 6/20/2025 | 47,000 | ||||||||||||
| Colgate-Palmolive Co. ● | Susquehanna | 300 | 2,250,000 | 75 | 1/17/2025 | 24,000 | ||||||||||||
| Colgate-Palmolive Co. | Susquehanna | 420 | 3,360,000 | 80 | 1/17/2025 | 23,100 | ||||||||||||
| Colgate-Palmolive Co. ● | Susquehanna | 70 | 665,000 | 95 | 1/16/2026 | 39,900 | ||||||||||||
| Cracker Barrel Old Country Store, Inc. ● | Susquehanna | 200 | 1,300,000 | 65 | 11/15/2024 | 462,000 | ||||||||||||
| Crown Castle International, Inc. ● | Susquehanna | 205 | 2,152,500 | 105 | 1/17/2025 | 239,850 | ||||||||||||
| CVS Health Corp. | Susquehanna | 100 | 550,000 | 55 | 6/20/2025 | 49,000 | ||||||||||||
| Dollar Tree, Inc. ● | Susquehanna | 100 | 1,050,000 | 105 | 1/16/2026 | 134,750 | ||||||||||||
| Humana, Inc. | Susquehanna | 50 | 1,800,000 | 360 | 1/17/2025 | 101,500 | ||||||||||||
| Humana, Inc. | Susquehanna | 20 | 600,000 | 300 | 6/20/2025 | 21,240 | ||||||||||||
| Humana, Inc. ● | Susquehanna | 40 | 1,320,000 | 330 | 6/20/2025 | 75,000 | ||||||||||||
| Humana, Inc. ● | Susquehanna | 50 | 1,750,000 | 350 | 6/20/2025 | 126,750 | ||||||||||||
| International Flavors & Fragrances, Inc. ● | Susquehanna | 70 | 490,000 | 70 | 12/20/2024 | 4,725 | ||||||||||||
| International Flavors & Fragrances, Inc. ● | Susquehanna | 300 | 2,400,000 | 80 | 12/20/2024 | 63,000 | ||||||||||||
| Invesco QQQ Trust, Series 1 | Susquehanna | 50 | 2,425,000 | 485 | 12/20/2024 | 107,400 | ||||||||||||
The accompanying notes are an integral part of these financial statement.
Annual Report | 15
Camelot Fund
SCHEDULE OF PURCHASED OPTIONS (CONTINUED)
JUNE 30, 2024
| Underlying Security | Counterparty | Contracts + | Notional Amount** | Exercise Price | Expiration Fair Value | |||||||||||||
| JD.com, Inc. (China) ● | Susquehanna | 600 | 1,350,000 | 23 | 1/16/2026 $ | 188,100 | ||||||||||||
| J.M. Smucker Co. ● | Susquehanna | 250 | 3,125,000 | 125 | 1/17/2025 | 441,250 | ||||||||||||
| Johnson & Johnson | Susquehanna | 50 | 750,000 | 150 | 1/17/2025 | 41,000 | ||||||||||||
| Johnson & Johnson | Susquehanna | 130 | 2,080,000 | 160 | 1/17/2025 | 181,350 | ||||||||||||
| Johnson & Johnson | Susquehanna | 25 | 362,500 | 145 | 6/20/2025 | 19,550 | ||||||||||||
| Marathon Petroleum Corp. ● | Susquehanna | 40 | 680,000 | 170 | 6/20/2025 | 66,000 | ||||||||||||
| Newmont Corp. ● | Susquehanna | 300 | 900,000 | 30 | 1/16/2026 | 45,000 | ||||||||||||
| NiSource, Inc. ● | Susquehanna | 600 | 1,500,000 | 25 | 7/19/2024 | 3,000 | ||||||||||||
| Post Holdings, Inc. ● | Susquehanna | 100 | 800,000 | 80 | 12/20/2024 | 27,000 | ||||||||||||
| PPL Corp. ● | Susquehanna | 1,650 | 4,125,000 | 25 | 1/17/2025 | 82,500 | ||||||||||||
| SPDR S&P 500 ETF Trust | Susquehanna | 50 | 2,725,000 | 545 | 12/20/2024 | 80,950 | ||||||||||||
| SPDR S&P 500 ETF Trust | Susquehanna | 85 | 3,952,500 | 465 | 12/20/2024 | 29,580 | ||||||||||||
| SPDR S&P 500 ETF Trust | Susquehanna | 100 | 5,350,000 | 535 | 6/20/2025 | 205,800 | ||||||||||||
| SPDR S&P 500 ETF Trust | Susquehanna | 90 | 4,860,000 | 540 | 6/20/2025 | 198,630 | ||||||||||||
| Suncor Energy, Inc. (Canada) ● | Susquehanna | 1,100 | 3,080,000 | 28 | 7/19/2024 | 18,150 | ||||||||||||
| Yum China Holdings, Inc. | Susquehanna | 150 | 525,000 | 35 | 1/17/2025 | 78,900 | ||||||||||||
| Total Put Options (Premiums Paid $5,186,292) - 3.63%% | $ | 3,518,950 | ||||||||||||||||
| TOTAL PURCHASED OPTIONS (Premiums Paid $5,552,587) - 4.56% | $ | 4,415,775 | ||||||||||||||||
| * | Non-income producing securities during the period. |
| ** | The notional amount is calculated by multiplying outstanding contracts by the exercise price at June 30, 2024. |
| + | Each option contract allows the holder of the option to purchase or sell 100 shares of the underlying security. |
| ● | Level 2 Security |
The accompanying notes are an integral part of these financial statement.
Annual Report | 16
Camelot Fund
SCHEDULE OF WRITTEN OPTIONS
JUNE 30, 2024
| Underlying Security | Counterparty | Contracts + | Notional Amount** | Exercise Price | Expiration | Fair Value | ||||||||||||
| Agnico Eagle Mines Ltd. (Canada) ● | Susquehanna | (200) | $ | (1,000,000 | ) | $ | 50 | 1/17/2025 | $ | (354,000 | ) | |||||||
| Agnico Eagle Mines Ltd. (Canada) ● | Susquehanna | (175) | (875,000 | ) | 50 | 8/16/2024 | (285,250 | ) | ||||||||||
| Archer-Daniels-Midland Co. ● | Susquehanna | (250) | (1,312,500 | ) | 53 | 1/17/2025 | (238,750 | ) | ||||||||||
| B2Gold Corp. (Canada) | Susquehanna | (1,000) | (300,000 | ) | 3 | 1/16/2026 | (56,000 | ) | ||||||||||
| Barrick Gold Corp. (Canada) | Susquehanna | (400) | (680,000 | ) | 17 | 1/16/2026 | (113,600 | ) | ||||||||||
| Barrick Gold Corp. (Canada) | Susquehanna | (150) | (300,000 | ) | 20 | 1/17/2025 | (10,200 | ) | ||||||||||
| Biomarin Pharmaceutical, Inc. ● | Susquehanna | (210) | (1,575,000 | ) | 75 | 1/16/2026 | (406,350 | ) | ||||||||||
| Biomarin Pharmaceutical, Inc. ● | Susquehanna | (24) | (180,000 | ) | 75 | 10/18/2024 | (24,960 | ) | ||||||||||
| Chevron Corp. | Susquehanna | (40) | (620,000 | ) | 155 | 6/20/2025 | (60,600 | ) | ||||||||||
| Colgate-Palmolive Co. | Susquehanna | (70) | (665,000 | ) | 95 | 1/16/2026 | (85,750 | ) | ||||||||||
| Colgate-Palmolive Co. ● | Susquehanna | (420) | (3,360,000 | ) | 80 | 1/17/2025 | (787,500 | ) | ||||||||||
| Colgate-Palmolive Co. ● | Susquehanna | (300) | (2,250,000 | ) | 75 | 1/17/2025 | (717,000 | ) | ||||||||||
| Cracker Barrel Old Country, Inc. ● | Susquehanna | (200) | (1,300,000 | ) | 65 | 11/15/2024 | (30,500 | ) | ||||||||||
| Crown Castle, Inc. | Susquehanna | (205) | (2,152,500 | ) | 105 | 1/17/2025 | (90,200 | ) | ||||||||||
| CVS Health Corp. | Susquehanna | (100) | (550,000 | ) | 55 | 6/20/2025 | (91,000 | ) | ||||||||||
| Dollar Tree, Inc. ● | Susquehanna | (100) | (1,050,000 | ) | 105 | 1/16/2026 | (231,750 | ) | ||||||||||
| Humana, Inc. ● | Susquehanna | (50) | (1,800,000 | ) | 360 | 1/17/2025 | (214,250 | ) | ||||||||||
| Humana, Inc. ● | Susquehanna | (20) | (600,000 | ) | 300 | 6/20/2025 | (197,100 | ) | ||||||||||
| Humana, Inc. ● | Susquehanna | (40) | (1,320,000 | ) | 330 | 6/20/2025 | (306,200 | ) | ||||||||||
| Humana, Inc. | Susquehanna | (50) | (1,750,000 | ) | 350 | 6/20/2025 | (313,500 | ) | ||||||||||
| Illumina, Inc. ● | Susquehanna | (200) | (2,000,000 | ) | 100 | 12/20/2024 | (375,000 | ) | ||||||||||
| Illumina, Inc. ● | Susquehanna | (50) | (575,000 | ) | 115 | 12/20/2024 | (57,500 | ) | ||||||||||
| International Flavors & Fragrances, Inc. ● | Susquehanna | (70) | (490,000 | ) | 70 | 12/20/2024 | (195,300 | ) | ||||||||||
| International Flavors & Fragrances, Inc. ● | Susquehanna | (300) | (2,400,000 | ) | 80 | 12/20/2024 | (574,500 | ) | ||||||||||
| J.M. Smucker Co. ● | Susquehanna | (250) | (3,125,000 | ) | 125 | 1/17/2025 | (61,875 | ) | ||||||||||
| JD.com, Inc. (China) | Susquehanna | (600) | (1,350,000 | ) | 23 | 1/16/2026 | (436,800 | ) | ||||||||||
| Johnson & Johnson | Susquehanna | (50) | (750,000 | ) | 150 | 1/17/2025 | (30,000 | ) | ||||||||||
| Johnson & Johnson | Susquehanna | (130) | (2,080,000 | ) | 160 | 1/17/2025 | (31,330 | ) | ||||||||||
| Johnson & Johnson ● | Susquehanna | (25) | (362,500 | ) | 145 | 6/20/2025 | (29,063 | ) | ||||||||||
| Kellanova | Susquehanna | (100) | (575,000 | ) | 58 | 9/20/2024 | (24,400 | ) | ||||||||||
The accompanying notes are an integral part of these financial statements.
Annual Report | 17
Camelot Fund
SCHEDULE OF WRITTEN OPTIONS (CONTINUED)
JUNE 30, 2024
| Underlying Security | Counterparty | Contracts + | Notional Amount** | Exercise Price | Expiration | Fair Value | ||||||||||||
| Liberty Media Corp. - Liberty SiriusXM Series A ● | Susquehanna | (70) | (157,500 | ) | 23 | 7/19/2024 | $ | (4,900 | ) | |||||||||
| Marathon Petroleum Corp. ● | Susquehanna | (40) | (680,000 | ) | 170 | 6/20/2025 | (98,700 | ) | ||||||||||
| Mercury Systems, Inc. ● | Susquehanna | (660) | (2,475,000 | ) | 38 | 7/19/2024 | (6,600 | ) | ||||||||||
| Mercury Systems, Inc. ● | Susquehanna | (157) | (510,250 | ) | 33 | 7/19/2024 | (34,540 | ) | ||||||||||
| Mercury Systems, Inc. ● | Susquehanna | (100) | (300,000 | ) | 30 | 12/20/2024 | (25,750 | ) | ||||||||||
| Newmont Corp. | Susquehanna | (300) | (900,000 | ) | 30 | 1/16/2026 | (432,000 | ) | ||||||||||
| Newmont Corp. | Susquehanna | (1,180) | (5,310,000 | ) | 45 | 1/17/2025 | (363,440 | ) | ||||||||||
| NiSource, Inc. ● | Susquehanna | (600) | (1,500,000 | ) | 25 | 7/19/2024 | (177,000 | ) | ||||||||||
| Post Holdings, Inc. ● | Susquehanna | (100) | (800,000 | ) | 80 | 12/20/2024 | (270,000 | ) | ||||||||||
| PPL Corp. ● | Susquehanna | (1,650) | (4,125,000 | ) | 25 | 1/17/2025 | (631,125 | ) | ||||||||||
| PPL Corp. | Susquehanna | (300) | (810,000 | ) | 27 | 10/18/2024 | (43,500 | ) | ||||||||||
| Royal Gold, Inc. | Susquehanna | (80) | (960,000 | ) | 120 | 1/17/2025 | (115,040 | ) | ||||||||||
| Seabridge Gold, Inc. (Canada) | Susquehanna | (1,000) | (1,500,000 | ) | 15 | 7/19/2024 | (10,000 | ) | ||||||||||
| Seabridge Gold, Inc. (Canada) | Susquehanna | (1,000) | (1,700,000 | ) | 17 | 7/19/2024 | (5,000 | ) | ||||||||||
| Suncor Energy, Inc. (Canada) ● | Susquehanna | (8) | (24,000 | ) | 30 | 7/19/2024 | (6,440 | ) | ||||||||||
| Wolfspeed, Inc. ● | Susquehanna | (200) | (450,000 | ) | 23 | 12/19/2025 | (170,000 | ) | ||||||||||
| Yum China Holdings, Inc. | Susquehanna | (150) | (525,000 | ) | 35 | 1/17/2025 | (28,500 | ) | ||||||||||
| Yum China Holdings, Inc.. ● | Susquehanna | (180) | (540,000 | ) | 30 | 12/19/2025 | (119,700 | ) | ||||||||||
| Total Call Options (Premiums Received $7,947,434) - (9.27)% | $ | (8,972,463 | ) | |||||||||||||||
PUT OPTIONS - (0.01)% *
| Underlying Security | Counterparty | Contracts + | Notional Amount** | Exercise Price | Expiration | Fair Value | ||||||||||||
| Humana, Inc. | Susquehanna | (50) | $ | (1,300,000 | ) | $ | 260 | 1/17/2025 | $ | (12,050 | ) | |||||||
| Total Put Options (Premiums Recieved $42,375) - (0.01)% | $ | (12,050 | ) | |||||||||||||||
| TOTAL WRITTEN OPTIONS (Premiums Received $7,989,809) - (9.28)% | $ | (8,984,513 | ) | |||||||||||||||
| * | Non-income producing securities during the period. |
| ** | The notional amount is calculated by multiplying outstanding contracts by the exercise price at June 30, 2024. |
| + | Each option contract allows the holder of the option to purchase or sell 100 shares of the underlying security. |
| ● | Level 2 Security |
The accompanying notes are an integral part of these financial statements.
Annual Report | 18
Frank Funds
STATEMENTS OF ASSETS AND LIABILITIES
JUNE 30, 2024
| Value Fund | West Hills Fund | Camelot Fund | ||||||||||
| Assets: | ||||||||||||
| Investments in Securities, at Fair Value (Cost $16,969,481, $5,890,873 and $106,960,714, respectively) | $ | 19,546,282 | $ | 8,112,575 | $ | 99,681,274 | ||||||
| Cash | 4,309 | - | 869,232 | |||||||||
| Due from Broker | 585 | 2,734 | 4,890,864 | |||||||||
| Receivables: | ||||||||||||
| Dividends and Interest | 42,952 | 26,404 | 245,826 | |||||||||
| Shareholder Subscriptions | - | 63,010 | 382,144 | |||||||||
| Portfolio Securities Sold | - | 54,843 | - | |||||||||
| Due from Adviser | - | 2,878 | - | |||||||||
| Prepaid Expenses | - | 2,467 | 19,526 | |||||||||
| Total Assets | 19,594,128 | 8,264,911 | 106,088,866 | |||||||||
| Liabilities: | ||||||||||||
| Covered Call Options Written at Fair Value (Premiums received $0, $91,686 and $7,989,809, respectively) | - | 217,310 | 8,984,513 | |||||||||
| Due to Custodian | - | 35,706 | - | |||||||||
| Payables: | ||||||||||||
| Advisory Fees | 14,579 | - | 96,677 | |||||||||
| Administrative Fees | 3,389 | 936 | 13,292 | |||||||||
| Interest | - | 3,801 | - | |||||||||
| Shareholder Redemptions | - | - | 75,631 | |||||||||
| Portfolio Securities Purchased | - | 6,479 | - | |||||||||
| Chief Compliance Officer Fees | - | 2,630 | 2,731 | |||||||||
| Distribution Fees | 8,430 | - | 7,602 | |||||||||
| Trustee Fees | - | 210 | 210 | |||||||||
| Accrued Expenses | - | 19,355 | 41,820 | |||||||||
| Total Liabilities | 26,398 | 286,427 | 9,222,476 | |||||||||
| Net Assets | $ | 19,567,730 | $ | 7,978,484 | $ | 96,866,390 | ||||||
| Net Assets Consist of: | ||||||||||||
| Paid In Capital | $ | 16,479,331 | $ | 7,071,062 | $ | 104,760,539 | ||||||
| Distributable Earnings (Deficit) | 3,088,399 | 907,422 | (7,894,149 | ) | ||||||||
| Net Assets | $ | 19,567,730 | $ | 7,978,484 | $ | 96,866,390 | ||||||
| Shares outstanding (unlimited number of shares authorized with no par value) | 772,823 | |||||||||||
| Net Asset Value Per Share | $ | 10.32 | ||||||||||
| Redemption Price Per Share ($10.32 x 0.98) * | $ | 10.12 | ||||||||||
| Investor Class: | ||||||||||||
| Net Assets | $ | 3,941,780 | ||||||||||
| Shares outstanding (unlimited number of shares authorized with no par value) | 271,809 | |||||||||||
| Net Asset Value | $ | 14.50 | ||||||||||
| Redemption Price Per Share ($14.50 x 0.98) * | $ | 14.21 | ||||||||||
| Class A: | ||||||||||||
| Net Assets | $ | 9,679,827 | ||||||||||
| Shares outstanding (unlimited number of shares authorized with no par value) | 496,812 | |||||||||||
| Net Asset Value | $ | 19.48 | ||||||||||
| Offering Price Per Share ($19.48 / 94.50%) (Note 2) | $ | 20.61 | ||||||||||
| Redemption Price Per Share ($19.48 x 0.98) * | $ | 19.09 | ||||||||||
| Class C: | ||||||||||||
| Net Assets | $ | 891,847 | ||||||||||
| Shares outstanding (unlimited number of shares authorized with no par value) | 67,781 | |||||||||||
| Net Asset Value | $ | 13.16 | ||||||||||
| Redemption Price Per Share ($13.16 x 0.98) * | $ | 12.90 | ||||||||||
| Institutional Class: | ||||||||||||
| Net Assets | $ | 14,734,103 | $ | 87,186,563 | ||||||||
| Shares outstanding (unlimited number of shares authorized with no par value) | 988,535 | 4,365,829 | ||||||||||
| Net Asset Value | $ | 14.90 | $ | 19.97 | ||||||||
| Redemption Price Per Share ($14.90 x 0.98 & $19.97 x 0.98) * | $ | 14.60 | $ | 19.57 | ||||||||
| * | The Funds will impose a 2% redemption fee on shares redeemed within 5 business days of purchase for the Value, West Hills, and Camelot Funds. |
The accompanying notes are an integral part of these financial statements.
Annual Report | 19
Frank Funds
STATEMENTS OF OPERATIONS
FOR THE YEAR ENDED JUNE 30, 2024
| Value Fund | West Hills Fund | Camelot Fund | ||||||||||
| Investment Income: | ||||||||||||
| Dividends (a) | $ | 566,060 | $ | 100,281 | $ | 1,878,655 | ||||||
| Interest | 79,717 | 944 | 1,469,308 | |||||||||
| Total Investment Income | 645,777 | 101,225 | 3,347,963 | |||||||||
| Expenses: | ||||||||||||
| Advisory Fees | 174,625 | 72,950 | 1,403,600 | |||||||||
| Administration Fees | 40,298 | 15,480 | 181,942 | |||||||||
| Accounting Fees | - | 25,168 | 52,644 | |||||||||
| Servicing Account Fees | - | - | 106,913 | |||||||||
| Transfer Agent Fees | - | - | 23,691 | |||||||||
| Chief Compliance Officer Fees | - | 32,087 | 32,088 | |||||||||
| Audit Fees | - | 17,699 | 23,580 | |||||||||
| Distribution Fees | 19,037 | - | 25,519 | |||||||||
| Legal Fees | - | 3,122 | 10,067 | |||||||||
| Custody Fees | - | 12,783 | 27,515 | |||||||||
| Trustee Fees | - | 2,625 | 2,612 | |||||||||
| Printing and Mailing Expense | - | 399 | 10,316 | |||||||||
| Interest Expense | - | 37,152 | - | |||||||||
| Miscellaneous Fees | - | 11,487 | 62,163 | |||||||||
| Registration Fees | - | 5,294 | 55,174 | |||||||||
| Total Expenses | 233,960 | 236,246 | 2,017,824 | |||||||||
| Fees Waived and/or Reimbursed by the Adviser | - | (89,697 | ) | (81,782 | ) | |||||||
| Net Expenses | 233,960 | 146,549 | 1,936,042 | |||||||||
| Net Investment Income (Loss) | 411,817 | (45,324 | ) | 1,411,921 | ||||||||
| Realized Gain (Loss) on: | ||||||||||||
| Investments and Foreign Currency Transactions | 800,138 | (100,310 | ) | (2,637,717 | ) | |||||||
| Written Options | - | (291,170 | ) | 3,087,854 | ||||||||
| Securities Sold Short | - | - | (73,899 | ) | ||||||||
| Net Realized Gain (Loss) on Investments, Proceeds from Litigation, Written Options, Securities Sold Short and Foreign Currency Transactions | 800,138 | (391,480 | ) | 376,238 | ||||||||
| Net Change in Unrealized Appreciation (Depreciation) on: | ||||||||||||
| Investments and Foreign Currency Transactions | 720,429 | 1,443,571 | 3,016,072 | |||||||||
| Written Options | - | (27,275 | ) | (1,419,002 | ) | |||||||
| Securities Sold Short | - | - | 64,980 | |||||||||
| Net Change in Unrealized Appreciation on Investments, Options and Foreign Currency Transactions | 720,429 | 1,416,296 | 1,662,050 | |||||||||
| Realized and Unrealized Gain on Investments, Proceeds from Litigation, Options, Securities Sold Short and Foreign Currency Transactions | 1,520,567 | 1,024,816 | 2,038,288 | |||||||||
| Net Increase in Net Assets Resulting from Operations | $ | 1,932,384 | $ | 979,492 | $ | 3,450,209 | ||||||
| (a) Foreign withholding taxes on dividends. | $ | 2,580 | $ | - | $ | - | ||||||
The accompanying notes are an integral part of these financial statements.
Annual Report | 20
Value Fund
STATEMENTS OF CHANGES IN NET ASSETS
| Year Ended 6/30/2024 | Year Ended 6/30/2023 | |||||||
| Increase in Net Assets From Operations: | ||||||||
| Net Investment Income | $ | 411,817 | $ | 485,020 | ||||
| Net Realized Gain on: | ||||||||
| Investments and Foreign Currency Transactions | 800,138 | 1,405,874 | ||||||
| Unrealized Appreciation on: | ||||||||
| Investments and Foreign Currency Transactions | 720,429 | 930,062 | ||||||
| Net Increase in Net Assets Resulting from Operations | 1,932,384 | 2,820,956 | ||||||
| Distributions to Shareholders: | ||||||||
| Distributions | ||||||||
| Investor Class | (386,904 | ) | (405,516 | ) | ||||
| Class C | (74,893 | ) | (60,848 | ) | ||||
| Institutional Class | (1,242,997 | ) | (984,218 | ) | ||||
| Total Distributions Paid to Shareholders | (1,704,794 | ) | (1,450,582 | ) | ||||
| Capital Share Transactions | 471,449 | 2,003,498 | ||||||
| Total Increase in Net Assets | 699,039 | 3,373,872 | ||||||
| Net Assets: | ||||||||
| Beginning of Year | 18,868,691 | 15,494,819 | ||||||
| End of Year | $ | 19,567,730 | $ | 18,868,691 | ||||
The accompanying notes are an integral part of these financial statements.
Annual Report | 21
West Hills Fund
STATEMENTS OF CHANGES IN NET ASSETS
| Year Ended 6/30/2024 | Year Ended 6/30/2023 | |||||||
| Increase (Decrease) in Net Assets From Operations: | ||||||||
| Net Investment Loss | $ | (45,324 | ) | $ | (2,515 | ) | ||
| Net Realized Gain (Loss) on: | ||||||||
| Investments | (100,310 | ) | (311,556 | ) | ||||
| Written Options | (291,170 | ) | 248,800 | |||||
| Unrealized Appreciation (Depreciation) on: | ||||||||
| Investments | 1,443,571 | 1,076,235 | ||||||
| Written Options | (27,275 | ) | (118,838 | ) | ||||
| Net Increase in Net Assets Resulting from Operations | 979,492 | 892,126 | ||||||
| Distributions to Shareholders: | ||||||||
| Distributions | - | - | ||||||
| Total Distributions Paid to Shareholders | - | - | ||||||
| Capital Share Transactions | (56,863 | ) | 211,865 | |||||
| Total Increase in Net Assets | 922,629 | 1,103,991 | ||||||
| Net Assets: | ||||||||
| Beginning of Year | 7,055,855 | 5,951,864 | ||||||
| End of Year | $ | 7,978,484 | $ | 7,055,855 | ||||
The accompanying notes are an integral part of these financial statements.
Annual Report | 22
Camelot Fund
STATEMENTS OF CHANGES IN NET ASSETS
| Year Ended 6/30/2024 | Year Ended 6/30/2023 | |||||||
| Increase (Decrease) in Net Assets From Operations: | ||||||||
| Net Investment Income | $ | 1,411,921 | $ | 591,361 | ||||
| Net Realized Gain (Loss) on: | ||||||||
| Investments | (2,641,292 | ) | 1,830,445 | |||||
| Proceeds from Securities Litigation | 3,575 | 5,756 | ||||||
| Written Options | 3,087,854 | 4,029,600 | ||||||
| Securities Sold Short | (73,899 | ) | (7,032 | ) | ||||
| Unrealized Appreciation (Depreciation) on: | ||||||||
| Investments | 3,016,072 | (2,986,369 | ) | |||||
| Written Options | (1,419,002 | ) | (600,056 | ) | ||||
| Securities Sold Short | 64,980 | (64,980 | ) | |||||
| Net Increase in Net Assets Resulting from Operations | 3,450,209 | 2,798,725 | ||||||
| Distributions to Shareholders: | ||||||||
| Distributions: | ||||||||
| Class A | (640,894 | ) | (1,019,462 | ) | ||||
| Institutional Class | (5,929,321 | ) | (4,922,587 | ) | ||||
| Total Distributions Paid to Shareholders | (6,570,215 | ) | (5,942,049 | ) | ||||
| Capital Share Transactions | (14,987,533 | ) | 48,307,457 | |||||
| Total Increase (Decrease) in Net Assets | (18,107,539 | ) | 45,164,133 | |||||
| Net Assets: | ||||||||
| Beginning of Year | 114,973,929 | 69,809,796 | ||||||
| End of Year | $ | 96,866,390 | $ | 114,973,929 | ||||
The accompanying notes are an integral part of these financial statements.
Annual Report | 23
Value Fund – Investor Class
FINANCIAL HIGHLIGHTS
Selected data for a share outstanding throughout each year.
| Years Ended | ||||||||||||||||||||
| 6/30/2024 | 6/30/2023 | 6/30/2022 | 6/30/2021 | 6/30/2020 | ||||||||||||||||
| Net Asset Value, at Beginning of Year | $ | 14.48 | $ | 13.36 | $ | 14.85 | $ | 13.13 | $ | 11.91 | ||||||||||
| Income (Loss) From Investment Operations: | ||||||||||||||||||||
| Net Investment Income * | 0.29 | 0.34 | 0.08 | 0.05 | 0.02 | |||||||||||||||
| Net Gain (Loss) on Securities (Realized and Unrealized) | 1.15 | 1.87 | (0.88 | ) | 1.67 | 1.23 | ||||||||||||||
| Total from Investment Operations | 1.44 | 2.21 | (0.80 | ) | 1.72 | 1.25 | ||||||||||||||
| Distributions: | ||||||||||||||||||||
| Net Investment Income | (0.54 | ) | (0.09 | ) | (0.16 | ) | - | (a) | (0.03 | ) | ||||||||||
| Realized Gains | (0.88 | ) | (1.00 | ) | (0.53 | ) | - | - | ||||||||||||
| Total from Distributions | (1.42 | ) | (1.09 | ) | (0.69 | ) | - | (0.03 | ) | |||||||||||
| Redemption Fees *** | - | - | - | - | - | |||||||||||||||
| Net Asset Value, at End of Year | $ | 14.50 | $ | 14.48 | $ | 13.36 | $ | 14.85 | $ | 13.13 | ||||||||||
| Total Return ** | 10.42 | % | 17.36 | % | (5.51 | )% | 13.10 | % | 10.50 | % | ||||||||||
| Ratios/Supplemental Data: | ||||||||||||||||||||
| Net Assets at End of Year (Thousands) | $ | 3,942 | $ | 5,066 | $ | 4,377 | $ | 5,011 | $ | 6,763 | ||||||||||
| Ratio of Expenses to Average Net Assets | 1.37 | % | 1.37 | % | 1.37 | % | 1.46 | % | 1.49 | % | ||||||||||
| Ratio of Net Investment Income to Average Net Assets | 2.02 | % | 2.39 | % | 0.54 | % | 0.36 | % | 0.13 | % | ||||||||||
| Portfolio Turnover | 100.08 | % | 109.16 | % | 104.17 | % | 54.94 | % | 64.60 | % | ||||||||||
| * | Per share net investment income (loss) has been determined on the basis of average shares outstanding during the period. |
| ** | Assumes reinvestment of dividends. |
| *** | The Fund will impose a 2% redemption fee on shares redeemed within 5 business days of purchase. |
| (a) | Amount calculated is less than $0.005 |
The accompanying notes are an integral part of these financial statements.
Annual Report | 24
Value Fund – Class C
FINANCIAL HIGHLIGHTS
Selected data for a share outstanding throughout each year.
| Years Ended | ||||||||||||||||||||
| 6/30/2024 | 6/30/2023 | 6/30/2022 | 6/30/2021 | 6/30/2020 | ||||||||||||||||
| Net Asset Value, at Beginning of Year | $ | 13.09 | $ | 12.18 | $ | 13.62 | $ | 12.13 | $ | 11.06 | ||||||||||
| Income (Loss) From Investment Operations: | ||||||||||||||||||||
| Net Investment Income (Loss) * | 0.16 | 0.20 | (0.03 | ) | (0.04 | ) | (0.07 | ) | ||||||||||||
| Net Gain (Loss) on Securities (Realized and Unrealized) | 1.05 | 1.71 | (0.80 | ) | 1.53 | 1.14 | ||||||||||||||
| Total from Investment Operations | 1.21 | 1.91 | (0.83 | ) | 1.49 | 1.07 | ||||||||||||||
| Distributions: | ||||||||||||||||||||
| Net Investment Income | (0.26 | ) | - | (0.08 | ) | - | (a) | - | ||||||||||||
| Realized Gains | (0.88 | ) | (1.00 | ) | (0.53 | ) | - | - | ||||||||||||
| Total from Distributions | (1.14 | ) | (1.00 | ) | (0.61 | ) | - | - | ||||||||||||
| Redemption Fees *** | - | - | - | - | - | |||||||||||||||
| Net Asset Value, at End of Year | $ | 13.16 | $ | 13.09 | $ | 12.18 | $ | 13.62 | $ | 12.13 | ||||||||||
| Total Return ** | 9.66 | % | 16.44 | % | (6.23 | )% | 12.29 | % | 9.67 | % | ||||||||||
| Ratios/Supplemental Data: | ||||||||||||||||||||
| Net Assets at End of Year (Thousands) | $ | 892 | $ | 848 | $ | 818 | $ | 1,061 | $ | 1,071 | ||||||||||
| Ratio of Expenses to Average Net Assets | 2.12 | % | 2.12 | % | 2.12 | % | 2.20 | % | 2.24 | % | ||||||||||
| Ratio of Net Investment Income (Loss) to Average Net Assets | 1.26 | % | 1.53 | % | (0.24 | )% | (0.28 | )% | (0.62 | )% | ||||||||||
| Portfolio Turnover | 100.08 | % | 109.16 | % | 104.17 | % | 54.94 | % | 64.60 | % | ||||||||||
| * | Per share net investment income (loss) has been determined on the basis of average shares outstanding during the period. |
| ** | Assumes reinvestment of dividends. |
| *** | The Fund will impose a 2% redemption fee on shares redeemed within 5 business days of purchase. |
| (a) | Amount calculated is less than $0.005 |
The accompanying notes are an integral part of these financial statements.
Annual Report | 25
Value Fund – Institutional Class
FINANCIAL HIGHLIGHTS
Selected data for a share outstanding throughout each year.
| Years Ended | ||||||||||||||||||||
| 6/30/2024 | 6/30/2023 | 6/30/2022 | 6/30/2021 | 6/30/2020 | ||||||||||||||||
| Net Asset Value, at Beginning of Year | $ | 14.74 | $ | 13.58 | $ | 15.08 | $ | 13.29 | $ | 12.07 | ||||||||||
| Income (Loss) From Investment Operations: | ||||||||||||||||||||
| Net Investment Income * | 0.33 | 0.37 | 0.12 | 0.14 | 0.05 | |||||||||||||||
| Net Gain (Loss) on Securities (Realized and Unrealized) | 1.17 | 1.91 | (0.90 | ) | 1.65 | 1.24 | ||||||||||||||
| Total from Investment Operations | 1.50 | 2.28 | (0.78 | ) | 1.79 | 1.29 | ||||||||||||||
| Distributions: | ||||||||||||||||||||
| Net Investment Income | (0.46 | ) | (0.12 | ) | (0.19 | ) | - | (a) | (0.07 | ) | ||||||||||
| Realized Gains | (0.88 | ) | (1.00 | ) | (0.53 | ) | - | - | ||||||||||||
| Total from Distributions | (1.34 | ) | (1.12 | ) | (0.72 | ) | - | (0.07 | ) | |||||||||||
| Redemption Fees *** | - | - | - | - | - | |||||||||||||||
| Net Asset Value, at End of Year | $ | 14.90 | $ | 14.74 | $ | 13.58 | $ | 15.08 | $ | 13.29 | ||||||||||
| Total Return ** | 10.64 | % | 17.66 | % | (5.29 | )% | 13.47 | % | 10.76 | % | ||||||||||
| Ratios/Supplemental Data: | ||||||||||||||||||||
| Net Assets at End of Year (Thousands) | $ | 14,734 | $ | 12,955 | $ | 10,299 | $ | 11,139 | $ | 4,757 | ||||||||||
| Ratio of Expenses to Average Net Assets | 1.12 | % | 1.12 | % | 1.12 | % | 1.18 | % | 1.24 | % | ||||||||||
| Ratio of Net Investment Income to Average Net Assets | 2.24 | % | 2.62 | % | 0.79 | % | 0.99 | % | 0.38 | % | ||||||||||
| Portfolio Turnover | 100.08 | % | 109.16 | % | 104.17 | % | 54.94 | % | 64.60 | % | ||||||||||
| * | Per share net investment income (loss) has been determined on the basis of average shares outstanding during the period. |
| ** | Assumes reinvestment of dividends. |
| *** | The Fund will impose a 2% redemption fee on shares redeemed within 5 business days of purchase. |
| (a) | Amount calculated is less than $0.005 |
The accompanying notes are an integral part of these financial statements.
Annual Report | 26
West Hills Fund
FINANCIAL HIGHLIGHTS
Selected data for a share outstanding throughout each year.
| Years Ended | ||||||||||||||||||||
| 6/30/2024 | 6/30/2023 | 6/30/2022 + | 6/30/2021 ^ | 6/30/2020 | ||||||||||||||||
| Net Asset Value, at Beginning of Year | $ | 9.06 | $ | 7.91 | $ | 8.50 | $ | 6.88 | $ | 6.87 | ||||||||||
| Income From Investment Operations: | ||||||||||||||||||||
| Net Investment Income (Loss) * | (0.06 | ) | - (c) | (0.01 | ) | 0.01 | 0.08 | |||||||||||||
| Net Gain (Loss) on Securities (Realized and Unrealized) | 1.32 | 1.15 | (0.58 | ) | 1.65 | - | ||||||||||||||
| Total from Investment Operations | 1.26 | 1.15 | (0.59 | ) | 1.66 | 0.08 | ||||||||||||||
| Distributions: | ||||||||||||||||||||
| Net Investment Income | - | - | - | (0.04 | ) | (0.07 | ) | |||||||||||||
| Realized Gains | - | - | - | - | - | |||||||||||||||
| Total from Distributions | - | - | - | (0.04 | ) | (0.07 | ) | |||||||||||||
| Redemption Fees *** | - | - | - | - | - | |||||||||||||||
| Net Asset Value, at End of Year | $ | 10.32 | $ | 9.06 | $ | 7.91 | $ | 8.50 | $ | 6.88 | ||||||||||
| Total Return ** | 13.91 | % | 14.54 | % | (6.94 | )% | 24.17 | % | 1.19 | % | ||||||||||
| Ratios/Supplemental Data: | ||||||||||||||||||||
| Net Assets at End of Year (Thousands) | $ | 7,978 | $ | 7,056 | $ | 5,952 | $ | 4,380 | $ | 141 | ||||||||||
| Before Reimbursement: | ||||||||||||||||||||
| Ratio of Expenses to Average Net Assets (a) | 3.21 | % | 2.96 | % | 3.04 | % | 4.84 | % | 4.55 | % | ||||||||||
| Ratio of Net Investment Loss to Average Net Assets | (1.83 | )% | (1.34 | )% | (1.66 | )% | (3.16 | )% | (2.42 | )% | ||||||||||
| After Reimbursement: | ||||||||||||||||||||
| Ratio of Expenses to Average Net Assets (b) | 1.99 | % | 1.66 | % | 1.55 | % | 1.56 | % | 1.00 | % | ||||||||||
| Ratio of Net Investment Income (Loss) to Average Net Assets | (0.62 | )% | (0.04 | )% | (0.17 | )% | 0.13 | % | 1.13 | % | ||||||||||
| Portfolio Turnover | 20.43 | % | 9.46 | % | 1.82 | % | 24.54 | % | 1276.41 | % | ||||||||||
| * | Per share net investment income has been determined on the basis of average shares outstanding during the period. |
| ** | Assumes reinvestment of dividends. |
| *** | The Fund will impose a 2% redemption fee on shares redeemed within 5 business days of purchase. |
| (a) | Expenses before reimbursements (excluding interest expense for options trading) was 2.70% for the year ended June 30, 2024, 2.79% for the year ended June 30, 2023, 2.98% for the year ended June 30, 2022, and 4.75% for the year ended June 30, 2021. |
| (b) | Expenses after reimbursements (excluding interest expense for options trading) was 1.48% for the year ended June 30, 2024, and 1.49% for the years ended June 30, 2023, 2022, and 1.47% for the year ended June 30, 2021. |
| (c) | Amount calculated is less than $0.005 |
| + | On November 1, 2021, the West Hills Tactical Core Fund was renamed to West Hills Core Fund. |
| ^ | On September 22, 2020, the Leigh Baldwin Total Return Fund was renamed to West Hills Tactical Core Fund. |
The accompanying notes are an integral part of these financial statements.
Annual Report | 27
Camelot Fund - Class A
FINANCIAL HIGHLIGHTS
Selected data for a share outstanding throughout each year.
| Years Ended | ||||||||||||||||||||
| 6/30/2024 | 6/30/2023 | 6/30/2022 | 6/30/2021 | 6/30/2020 | ||||||||||||||||
| Net Asset Value, at Beginning of Year | $ | 20.11 | $ | 21.02 | $ | 20.92 | $ | 13.39 | $ | 14.24 | ||||||||||
| Income (Loss) From Investment Operations: | ||||||||||||||||||||
| Net Investment Income (Loss) * | 0.21 | 0.09 | (0.13 | ) | (0.15 | ) | 0.05 | |||||||||||||
| Net Gain (Loss) on Securities (Realized and Unrealized) | 0.39 | 0.88 | 0.23 | (g) | 7.85 | (0.76 | ) | |||||||||||||
| Total from Investment Operations | 0.60 | 0.97 | 0.10 | 7.70 | (0.71 | ) | ||||||||||||||
| Distributions: | ||||||||||||||||||||
| Net Investment Income | (0.22 | ) | - | - | (0.17 | ) | (0.14 | ) | ||||||||||||
| Realized Gains | (1.01 | ) | (1.88 | ) | - | - | - | |||||||||||||
| Total from Distributions | (1.23 | ) | (1.88 | ) | - | (0.17 | ) | (0.14 | ) | |||||||||||
| Redemption Fees *** | - | (f) | - | - | (f) | - | (f) | - | (f) | |||||||||||
| Net Asset Value, at End of Year | $ | 19.48 | $ | 20.11 | $ | 21.02 | $ | 20.92 | $ | 13.39 | ||||||||||
| Total Return ** | 3.07 | % | 4.65 | % | 0.48 | % | 57.83 | % | (5.09 | )% | ||||||||||
| Ratios/Supplemental Data: | ||||||||||||||||||||
| Net Assets at End of Year (Thousands) | $ | 9,680 | $ | 11,314 | $ | 10,007 | $ | 7,159 | $ | 5,475 | ||||||||||
| Before Reimbursement: | ||||||||||||||||||||
| Ratio of Expenses to Average Net Assets (a) (b) | 2.11 | % | 2.15 | % | 2.22 | % | 2.65 | % | 2.57 | % | ||||||||||
| Ratio of Net Investment Income (Loss) to Average Net Assets (a) (d) | 0.98 | % | 0.27 | % | (0.81 | )% | (1.47 | )% | (0.11 | )% | ||||||||||
| After Reimbursement: | ||||||||||||||||||||
| Ratio of Expenses to Average Net Assets (a) (c) | 2.02 | % | 2.00 | % | 2.00 | % | 2.04 | % | 2.09 | % (e) | ||||||||||
| Ratio of Net Investment Income (Loss) to Average Net Assets (a) (d) | 1.07 | % | 0.42 | % | (0.59 | )% | (0.86 | )% | 0.37 | % | ||||||||||
| Portfolio Turnover | 48 | % | 102 | % | 122 | % | 287 | % | 291 | % | ||||||||||
| * | Per share net investment income (loss) has been determined on the basis of average shares outstanding during the period. |
| ** | Assumes reinvestment of dividends. |
| *** | The Fund will impose a 2% redemption fee on shares redeemed within 5 business days of purchase. |
| (a) | Expense waived or reimbursed reflect reductions to total expenses, as discussed in the notes to the financial statements. These amounts would increase the net investment loss ratio or decrease the net investment income ratio, as applicable, had such reductions not occurred. |
| (b) | Expenses before reimbursements (excluding dividend and interest expense for securities sold short) were 2.11%, 2.15%, 2.21%, 2.61%, and 2.51% for the years ended June 30, 2024, 2023, 2022, 2021, and 2020, respectively. |
| (c) | Expenses after reimbursements (excluding dividend and interest expense for securities sold short) were 2.02%, 2.00%, 1.99%, 2.00%, and 2.04% for the years ended June 30, 2024, 2023, 2022, 2021, and 2020, respectively. |
| (d) | The net investment income (loss) ratios include dividends on short positions, if applicable. |
| (e) | Expense includes 0.05% of litigation fees for the year ended June 30, 2020. After reimbursement ratio of expenses to average net assets excluding litigation fees is 1.99%. |
| (f) | Amount calculated is less than $0.005 |
| (g) | Realized and unrealized gains and losses per share in this caption are balancing amounts necessary to reconcile to the change in net asset value for the period and may not reconcile with the aggregate gains and losses in the statement of operations due to share transactions for the period. |
The accompanying notes are an integral part of these financial statements.
Annual Report | 28
Camelot Fund - Institutional Class
FINANCIAL HIGHLIGHTS
Selected data for a share outstanding throughout each year.
| Years Ended | ||||||||||||||||||||
| 6/30/2024 | 6/30/2023 | 6/30/2022 | 6/30/2021 | 6/30/2020 | ||||||||||||||||
| Net Asset Value, at Beginning of Year | $ | 20.58 | $ | 21.41 | $ | 21.25 | $ | 13.55 | $ | 14.37 | ||||||||||
| Income (Loss) From Investment Operations: | ||||||||||||||||||||
| Net Investment Income (Loss) * | 0.27 | 0.17 | (0.07 | ) | (0.09 | ) | 0.11 | |||||||||||||
| Net Gain (Loss) on Securities (Realized and Unrealized) | 0.39 | 0.88 | 0.23 | (g) | 7.97 | (0.79 | ) | |||||||||||||
| Total from Investment Operations | 0.66 | 1.05 | 0.16 | 7.88 | (0.68 | ) | ||||||||||||||
| Distributions: | ||||||||||||||||||||
| Net Investment Income | (0.26 | ) | - | - | (0.18 | ) | (0.14 | ) | ||||||||||||
| Realized Gains | (1.01 | ) | (1.88 | ) | - | - | - | |||||||||||||
| Total from Distributions | (1.27 | ) | (1.88 | ) | - | (0.18 | ) | (0.14 | ) | |||||||||||
| Redemption Fees *** | - | (f) | - | (f) | - | (f) | - | (f) | - | (f) | ||||||||||
| Net Asset Value, at End of Year | $ | 19.97 | $ | 20.58 | $ | 21.41 | $ | 21.25 | $ | 13.55 | ||||||||||
| Total Return ** | 3.34 | % | 4.95 | % | 0.75 | % | 58.44 | % | (4.81 | )% | ||||||||||
| Ratios/Supplemental Data: | ||||||||||||||||||||
| Net Assets at End of Year (Thousands) | $ | 87,187 | $ | 103,660 | $ | 59,802 | $ | 29,971 | $ | 16,492 | ||||||||||
| Before Reimbursement: | ||||||||||||||||||||
| Ratio of Expenses to Average Net Assets (a) (b) | 1.84 | % | 1.89 | % | 2.07 | % | 2.39 | % | 2.30 | % | ||||||||||
| Ratio of Net Investment Income (Loss) to Average Net Assets (a) (d) | 1.26 | % | 0.65 | % | (0.65 | )% | (1.14 | )% | 0.35 | % | ||||||||||
| After Reimbursement: | ||||||||||||||||||||
| Ratio of Expenses to Average Net Assets (a) (c) | 1.77 | % | 1.75 | % | 1.75 | % | 1.79 | % | 1.83 | % (e) | ||||||||||
| Ratio of Net Investment Income (Loss) to Average Net Assets (a) (d) | 1.33 | % | 0.79 | % | (0.33 | )% | (0.54 | )% | 0.81 | % | ||||||||||
| Portfolio Turnover | 48 | % | 102 | % | 122 | % | 287 | % | 291 | % | ||||||||||
| * | Per share net investment income (loss) has been determined on the basis of average shares outstanding during the period. |
| ** | Assumes reinvestment of dividends. |
| *** | The Fund will impose a 2% redemption fee on shares redeemed within 5 business days of purchase. |
| (a) | Expense waived or reimbursed reflect reductions to total expenses, as discussed in the notes to the financial statements. These amounts would increase the net investment loss ratio or decrease the net investment income ratio, as applicable, had such reductions not occurred. |
| (b) | Expenses before reimbursements (excluding dividend and interest expense for securities sold short) were 1.84%, 1.89%, 2.05%, 2.35%, and 2.26% for the years ended June 30, 2024, 2023, 2022, 2021, and 2020, respectively. |
| (c) | Expenses after reimbursements (excluding dividend and interest expense for securities sold short) were 1.77%, 1.75%, 1.74%, 1.75%, and 1.79% for the year ended June 30, 2024, 2023, 2022, 2021, and 2020, respectively. |
| (d) | The net investment income (loss) ratios include dividends on short positions, if applicable. |
| (e) | Expense includes 0.05% of litigation fees for the year ended June 30, 2020. After reimbursement ratio of expenses to average net assets excluding litigation fees is 1.74%. |
| (f) | Amount calculated is less than $0.005 |
| (g) | Realized and unrealized gains and losses per share in this caption are balancing amounts necessary to reconcile to the change in net asset value for the period and may not reconcile with the aggregate gains and losses in the statement of operations due to share transactions for the period. |
The accompanying notes are an integral part of these financial statements.
Annual Report | 29
Frank Funds
NOTES TO FINANCIAL STATEMENTS
JUNE 30, 2024
Note 1. Organization
Frank Funds (the “Trust”), is an open-end regulated investment company that was organized as an Ohio business trust on February 12, 2004. The Trust is permitted to issue an unlimited number of shares of beneficial interest of separate series, each series representing a distinct fund with its own investment objective and policies. At present, there are three series authorized by the Trust, the Frank Value Fund (the “Value Fund”), the West Hills Core Fund (the “West Hills Fund”) (formerly West Hills Tactical Core Fund) (formerly Leigh Baldwin Total Return Fund), and the Camelot Event Driven Fund (the “Camelot Fund”) (each a “Fund” and collectively the “Funds”). Frank Capital Partners LLC (“FCP”) is the adviser to the Value Fund and West Hills Fund, and Camelot Event Driven Advisors, LLC (“Camelot Advisors”) is the adviser to the Camelot Fund.
The Value Fund’s investment objective is to provide long-term capital appreciation. The Value Fund’s principal investment strategy is value investing. The Value Fund commenced operations on July 21, 2004. The Value Fund currently has 3 classes of shares; Investor Class shares, Class C shares, and Institutional Class shares. The share classes vary in distribution (12b-1) fee accruals and minimum initial investment required.
The West Hills Fund’s investment objective is to provide long-term capital appreciation. The West Hills Fund seeks to achieve its investment objective by investing at least 50% of net assets in common stocks or exchange traded funds (“ETFs”) included in the S&P 500 Index®, which broadly represents the performance of common stocks publicly traded in the United States. The West Hills Fund may also hold up to 50% of net assets in cash and cash equivalents as a means of reducing the Fund’s volatility when the Adviser’s view of volatility indexes mandates. The West Hills Fund commenced operations on August 1, 2008 and was originally known as the Leigh Baldwin Total Return Fund and was advised by Leigh Baldwin & Co., LLC (“LBC”). The Leigh Baldwin Total Return Fund changed its name to West Hills Tactical Core Fund as of September 22, 2020. As of November 1, 2021, West Hills Tactical Core Fund was renamed to West Hills Core Fund.
The Camelot Fund’s investment objective is to provide long-term growth of capital. The Camelot Fund seeks to achieve its investment objective by investing in the securities of publicly traded companies involved in mergers, takeovers, tender offers, leveraged buyouts, spin-offs, liquidations, or similar events (“corporate reorganizations”). The Camelot Fund currently has 2 classes of shares; Class A shares and Institutional shares. Class A shares are charged a front-end sales charge and a distribution and servicing fee; and Institutional Class shares bear no front-end sales charge or CDSC, but have higher minimum investment thresholds.
Note 2. Summary of Significant Accounting Policies
The following is a summary of the significant accounting policies followed by the Funds in the preparation of their financial statements. The Funds are each a series of an investment company that follows the accounting and reporting guidance of Accounting Standards Codification Topic 946 and Accounting Standards Update 2013-08 applicable to investment companies.
Securities Valuations - All investments in securities are recorded at their estimated fair value, as described in Note 3.
Share Valuation - The price (net asset value) of the shares of each Fund is normally determined as of 4:00 p.m., Eastern time on each day the Funds are open for business and on any other day on which there is sufficient trading in the Funds’ securities to materially affect the net asset value. The Funds are normally open for business on every day except Saturdays, Sundays and the following holidays: New Year’s Day, Martin Luther King Day, Presidents’ Day, Good Friday, Memorial Day, Independence Day, Labor Day, Thanksgiving and Christmas.
Annual Report | 30
Frank Funds
NOTES TO FINANCIAL STATEMENTS (CONTINUED)
JUNE 30, 2024
Short Sales of Investments - Certain Funds may make short sales of investments, which are transactions in which a Fund sells a security it does not own in anticipation of a decline in the fair value of that security. To complete such a transaction, the Fund must borrow the security to make delivery to the buyer. The Fund is then obligated to replace the security borrowed by purchasing it at the market price at the time of replacement. The broker retains the proceeds of short sales to the extent necessary to meet margin requirements until the short position is closed out.
If a security pays a dividend while the Fund holds it short, the Fund will need to pay the dividend to the original owner of the security. Since the Fund borrowed the shares and sold them to a third party, the third party will receive the dividend from the security and the Fund will pay the original owner the dividend directly. The Fund is not entitled to the dividend because it does not own the shares. A gain, limited to the price at which the Fund sold the security short, or a loss, unlimited in size, will be recognized upon the termination of a short sale.
Futures Contracts - Certain Funds may enter into financial futures contracts, to the extent permitted by their investment policies and objectives, for bona fide hedging and other permissible risk management purposes including protecting against anticipated changes in the value of securities a Fund intends to purchase. Upon entering into a financial futures contract, a Fund is required to deposit cash or securities as initial margin.
Additional securities are also segregated as collateral up to the current market value of the financial futures contracts. Subsequent payments, known as variation margin, are made or received by the Fund, depending on the fluctuation in the value of the underlying financial instruments. The Fund recognizes an unrealized gain or loss equal to the variation margin. When the financial futures contracts are closed, a realized gain or loss is recognized equal to the difference between the proceeds from (or cost of) the closing transactions and the Fund’s basis in the contracts. The risks associated with entering into financial futures contracts include the possibility that a change in the value of the contract may not correlate with the changes in the value of the underlying instruments. In addition, investing in financial futures contracts involves the risk that the Fund could lose more than the original margin deposit and subsequent payments required for a futures transaction. Risks may also arise upon entering into these contracts from the potential inability of the counterparties to meet the terms of their contracts.
Foreign Currency Transactions - Securities and other assets and liabilities denominated in foreign currencies are converted each business day into U.S. dollars based on the prevailing rates of exchange. Purchases and sales of portfolio securities and income and expenses are converted into U.S. dollars on the respective dates of such transactions.
Gains and losses resulting from changes in exchange rates applicable to foreign securities are not reported separately from gains and losses arising from movements in securities prices.
Net realized foreign exchange gains and losses include gains and losses from sales and maturities of foreign currency exchange contracts, gains and losses realized between the trade and settlement dates of foreign securities transactions, and the difference between the amount of dividends, interest and foreign withholding taxes on the Funds’ books and the U.S. dollar equivalent of the amounts actually received. Net unrealized foreign exchange gains and losses include gains and losses from changes in the fair value of assets and liabilities denominated in foreign currencies other than portfolio securities, resulting from changes in exchange rates.
Forward Foreign Currency Contracts - Certain Funds may enter into forward foreign currency contracts to hedge against foreign currency exchange rate risk on their non-U.S. dollar denominated securities or to facilitate settlement of foreign currency denominated portfolio transactions. A forward foreign currency contract is an agreement between two parties to buy and sell a currency at a set price on a future date. The contract is marked-to-market daily and the change in value is recorded by a Fund as an unrealized gain or loss. When a forward foreign currency contract is extinguished, through either delivery or offset by entering into another forward foreign currency contract, the Fund records a realized gain or loss equal to the difference between the value of the contract at the time it was opened and the value of the contract at the time it was extinguished.
Annual Report | 31
Frank Funds
NOTES TO FINANCIAL STATEMENTS (CONTINUED)
JUNE 30, 2024
Forward foreign currency contracts involve elements of market risk in excess of the amounts reflected in the Statements of Assets and Liabilities. The Fund bears the risk of an unfavorable change in the foreign exchange rate underlying the forward foreign currency contract. Risks may also arise upon entering into these contracts from the potential inability of the counterparties to meet the terms of their contracts.
Redemption Fee - To discourage short-term trades by investors, the Value, West Hills, and Camelot Funds will impose a redemption fee of 2.00% of the total redemption amount (calculated at market value) if shares are redeemed within five business days of purchase. See Note 7 for additional disclosure on redemption fees for each Fund.
Security Transactions Timing - Security transactions are recorded on the dates transactions are entered into (the trade dates). Dividend income and distributions to shareholders are recognized on the ex-dividend date. Interest income is recognized on an accrual basis. The Funds use the identified cost basis in computing gain or loss on sale of investment securities. Discounts and premiums on securities purchased are amortized over the life of the respective securities. Withholding taxes on foreign dividends are provided for in accordance with the Funds’ understanding of the applicable country’s tax rules and rates.
Federal Income Taxes - The Funds make no provision for federal income or excise tax. The Funds intend to qualify each year as “regulated investment companies” (“RIC”) under subchapter M of the Internal Revenue Code of 1986, as amended, by complying with the requirements applicable to RICs and by distributing substantially all of their taxable income. The Funds also intend to distribute sufficient net investment income and net capital gains, if any, so that they will not be subject to excise tax on undistributed income and gains. If the required amount of net investment income or gains is not distributed, the Funds could incur a tax expense. Therefore, no federal income tax or excise provision is required.
The Funds recognize the tax benefits of uncertain tax positions only when the position is more likely than not to be sustained, assuming examination by tax authorities. Management has analyzed the Funds’ tax positions and concluded that no liability for unrecognized tax benefits should be recorded related to uncertain tax positions taken on returns filed for open tax years (2021-2023) or expected to be taken in the Funds’ 2024 tax returns. The Funds identify their major tax jurisdiction as U.S. Federal, however the Funds are not aware of any tax positions for which it is reasonably possible that the total amounts of unrecognized tax benefits will change materially in the next 12 months.
The Funds recognize interest and penalties, if any, related to unrecognized tax benefits as income tax expense in the Statement of Operations. During the year ended June 30, 2024, the Funds did not incur any interest or penalties.
Distributions to Shareholders - The Funds intend to distribute to their shareholders substantially all of their net realized capital gains and net investment income, if any, at year-end. Distributions will be recorded on ex-dividend date.
Annual Report | 32
Frank Funds
NOTES TO FINANCIAL STATEMENTS (CONTINUED)
JUNE 30, 2024
Derivative Transactions - The Funds may invest in put and call options. When a Fund writes an option, an amount equal to the premium received by the Fund is recorded as a liability and is subsequently adjusted to the current fair value of the option written. Premiums received from writing options that expire unexercised are treated by the Funds on the expiration date as realized gains. The difference between the premium and the amount paid on effecting a closing purchase transaction, including brokerage commissions, is also treated as a realized gain, or, if the premium is less than the amount paid for the closing purchase transaction, as a realized loss. If a call option is exercised, the premium is added to the proceeds from the sale of the underlying security or currency in determining if the Fund has a realized gain or loss. If a put option is exercised, the premium reduces the cost basis of the securities purchased by the Fund. The Fund(s) as writer of an option bears the market risk of an unfavorable change in the price of the security underlying the written option.
The Camelot Fund may invest in structured notes. A structured note is a type of derivative security for which the amount of principal repayments and/or interest payments is based upon the movement of one or more “factors.” The impact of the movements of these factors may increase or decrease through the use of multipliers or deflators. Structured notes may be designed to have particular quality and maturity characteristics and may vary from money market quality to below investment grade.
The Camelot Fund may also invest in warrants. Warrants provide the Camelot Fund with exposure and potential gains upon equity appreciation of the underlying company’s share price. The value of a warrant has two components: time value and intrinsic value. A warrant has a limited life and expires on a certain date. As the expiration date of a warrant approaches, the time value of a warrant will decline. In addition, if the stock underlying the warrant declines in price, the intrinsic value of an in-the-money warrant will decline. Further, if the price of the stock underlying the warrant does not exceed the strike price of the warrant on the expiration date, the warrant will expire worthless. As a result, the Camelot Fund could potentially lose its entire investment in a warrant. See Note 8 for additional information on derivative transactions in the Funds.
Share class accounting – Investment income, common expenses and realized/unrealized gains (losses) on investments are allocated to the three classes of shares of the Value Fund on the basis of the daily net assets of each class. Investment income, common expenses and realized/unrealized gains (losses) on investments are allocated to the two classes of shares of the Camelot Fund on the basis of the daily net assets of each class. Fees relating to a specific class are charged directly to that share class.
Use of Estimates - The preparation of financial statements in conformity with GAAP requires management to make estimates and assumptions that affect the reported amounts of assets and liabilities and disclosure of contingent assets and liabilities at the date of the financial statements and the reported amounts of increases and decreases in net assets during the reporting period. Actual results could differ from those estimates.
Note 3. Securities Valuations
Processes and Structure
The Trust’s Board of Trustees has adopted guidelines for valuing securities including in circumstances in which market quotes are not readily available and has delegated to the respective adviser the responsibility for determining fair value prices, subject to review by the Board of Trustees.
Annual Report | 33
Frank Funds
NOTES TO FINANCIAL STATEMENTS (CONTINUED)
JUNE 30, 2024
In accordance with the Trust’s good faith pricing guidelines, the respective adviser is required to consider all appropriate factors relevant to the value of securities for which it has determined other pricing sources are not available or reliable as described above. No single standard for determining fair value exists since fair value depends upon the circumstances of each individual case. As a general principle, the current fair value of an issue of securities being valued by the adviser would appear to be the amount which the owner might reasonably expect to receive for them upon their current sale. Methods which are in accord with this principle may, for example, be based on (i) a multiple of earnings; (ii) a discount from market of a similar freely traded security (including a derivative security or a basket of securities traded on other markets, exchanges or among dealers); or (iii) yield to maturity with respect to debt issues, or a combination of these and other methods.
Hierarchy of Fair Value Inputs
The Funds utilize various methods to measure the fair value of most of their investments on a recurring basis. GAAP establishes a hierarchy that prioritizes inputs to valuation techniques used to measure fair value. The three levels of inputs are as follows:
| · | Level 1. Unadjusted quoted prices in active markets for identical assets or liabilities that the company has the ability to access. |
| · | Level 2. Observable inputs other than quoted prices included in Level 1 that are observable for the asset or liability either directly or indirectly. These inputs may include quoted prices for the identical instrument on an inactive market, prices for similar instruments, interest rates, prepayment speeds, credit risk, yield curves, default rates, and similar data. |
| · | Level 3. Unobservable inputs for the asset or liability to the extent that relevant observable inputs are not available, representing the company's own assumptions about the assumptions that a market participant would use in valuing the asset or liability, and that would be based on the best information available. |
The availability of observable inputs can vary from security to security and is affected by a wide variety of factors, including, for example, the type of security, whether the security is new and not yet established in the marketplace, the liquidity of markets, and other characteristics particular to the security. To the extent that valuation is based on models or inputs that are less observable or unobservable in the market, the determination of fair value requires more judgment. Accordingly, the degree of judgment exercised in determining fair value is greatest for instruments categorized in Level 3.
The inputs used to measure fair value may fall into different levels of the fair value hierarchy. In such cases, for disclosure purposes, the level in the fair value hierarchy within which the fair value measurement falls in its entirety is determined based on the lowest level input that is significant to the fair value measurement in its entirety.
A Fund may hold securities, some of which are classified as Level 3 investments (as defined below). Level 3 investments have significant unobservable inputs, as they trade infrequently. In determining the fair value of these investments, management uses the profitability expected return, vendor pricing and market approaches, which includes as the primary input the capital balance reported; however, adjustments to the reported capital balance may be made based on various factors, including, but not limited to, the attributes of the interest held, including the rights and obligations, and any restrictions or illiquidity of such interests, and the fair value of these securities.
Annual Report | 34
Frank Funds
NOTES TO FINANCIAL STATEMENTS (CONTINUED)
JUNE 30, 2024
Fair Value Measurements
A description of the valuation techniques applied to the company's major categories of assets and liabilities measured at fair value on a recurring basis follows.
Equity securities (common and preferred stocks, real estate investment trusts, and exchange traded funds). Securities traded on a national securities exchange (or reported on the NASDAQ national market) are stated at the last reported sales price on the day of valuation. To the extent these securities are actively traded, and valuation adjustments are not applied, they are categorized in Level 1 of the fair value hierarchy. Certain foreign securities may be fair valued using a pricing service that considers the correlation of the trading patterns of the foreign security to the intraday trading in the U.S. markets for investments such as american depositary receipts, financial futures, exchange traded funds, and the movement of the certain indexes of securities based on a statistical analysis of the historical relationship and that are categorized in Level 2. Preferred stock and other equities traded on inactive markets or valued by reference to similar instruments are also categorized in Level 2.
Debt and other fixed income investments – Fixed income securities are valued at the last quoted bid price and/or by using a combination of daily quotes and matrix evaluations provided by an independent pricing service (which reflect such factors as security prices, yields, maturities, ratings, and dealer and exchange quotations), the use of which has been approved by the Board.
U.S. government obligations - U.S. government securities are normally valued using a model that incorporates market observable data, such as reported sales of similar securities, broker quotes, yields, bids, offers, and reference data. Certain securities are valued principally using dealer quotations. U.S. government securities are categorized in Level 1 or Level 2 of the fair value hierarchy, depending on the inputs used and market activity levels for specific securities.
Short term investments - Short term investments are valued using amortized cost, which approximates fair value. These securities will be categorized in Level 1 of the fair value hierarchy.
Derivative instruments (structured notes, warrants and options) – Derivative transactions which are actively traded and to which valuation adjustments are not applied are categorized in Level 1 of the fair value hierarchy. Derivative transactions traded on inactive markets or valued by reference to similar instruments are categorized in Level 2 of the fair value hierarchy. Options are valued at the last sales prices on the valuation date if the last sales price is between the closing bid and asked prices. Otherwise, options are valued at the closing bid price. These securities will be categorized in Level 2 of the fair value hierarchy if valued at other than closing price.
The following tables summarize the inputs used to value each Fund’s assets and liabilities measured at fair value as of June 30, 2024:
| Value Fund | Financial Instruments - Assets | |||||||||||||||
| Level 1 | Level 2 | Level 3 | Total | |||||||||||||
| Common Stocks * | $ | 18,164,533 | $ | - | $ | - | $ | 18,164,533 | ||||||||
| Real Estate Investment Trust | 1,149,926 | - | - | 1,149,926 | ||||||||||||
| Money Market Fund | 231,823 | - | - | 231,823 | ||||||||||||
| Total | $ | 19,546,282 | $ | - | $ | - | $ | 19,546,282 | ||||||||
Annual Report | 35
Frank Funds
NOTES TO FINANCIAL STATEMENTS (CONTINUED)
JUNE 30, 2024
| West Hills Fund | Financial Instruments - Assets | |||||||||||||||
| Level 1 | Level 2 | Level 3 | Total | |||||||||||||
| Exchange Traded Fund | $ | 8,090,375 | $ | - | $ | - | $ | 8,090,375 | ||||||||
| Purchased Options | ||||||||||||||||
| Put Options | 22,200 | - | - | 22,200 | ||||||||||||
| Total | $ | 8,112,575 | $ | - | $ | - | $ | 8,112,575 | ||||||||
| Financial Instruments - Liabilities | ||||||||||||||||
| Level 1 | Level 2 | Level 3 | Total | |||||||||||||
| Written Options: | ||||||||||||||||
| Call Options | $ | (214,310 | ) | $ | - | $ | - | $ | (214,310 | ) | ||||||
| Put Options | (3,000 | ) | (3,000 | ) | ||||||||||||
| Total | $ | (217,310 | ) | $ | - | $ | - | $ | (217,310 | ) | ||||||
| Camelot Fund | Financial Instruments - Assets | |||||||||||||||
| Level 1 | Level 2 | Level 3 | Total | |||||||||||||
| Common Stocks * | $ | 64,295,974 | $ | 1,366,810 | $ | 24,728 | $ | 65,687,512 | ||||||||
| Real Estate Investment Trust | 2,002,850 | - | - | 2,002,850 | ||||||||||||
| Escrow Shares | - | - | - | - | ||||||||||||
| Asset-Backed Securities | - | 90,521 | - | 90,521 | ||||||||||||
| Contingent Value Rights | 2,600 | - | - | 2,600 | ||||||||||||
| Convertible Bonds * | - | 4,912 | - | 4,912 | ||||||||||||
| Corporate Bonds * | - | 1,512,765 | 6,250 | 1,519,015 | ||||||||||||
| Mortgage-Backed Securities * | - | 2,141 | - | 2,141 | ||||||||||||
| Municipal Bonds | - | 139,959 | - | 139,959 | ||||||||||||
| Preferred Stocks * | 1,267,541 | - | - | 1,267,541 | ||||||||||||
| Structured Notes | - | 153 | - | 153 | ||||||||||||
| United States Treasury Note Bonds | - | 15,580,137 | - | 15,580,137 | ||||||||||||
| Warrants * | 6,373 | - | - | 6,373 | ||||||||||||
| Purchased Options | ||||||||||||||||
| Call Options | 801,225 | 95,600 | - | 896,825 | ||||||||||||
| Put Options | 1,234,000 | 2,284,950 | - | 3,518,950 | ||||||||||||
| Money Market Fund | 8,961,785 | - | - | 8,961,785 | ||||||||||||
| Total | $ | 78,572,348 | $ | 21,077,948 | $ | 30,978 | $ | 99,681,274 | ||||||||
| Financial Instruments - Liabilities | ||||||||||||||||
| Level 1 | Level 2 | Level 3 | Total | |||||||||||||
| Written Options: | ||||||||||||||||
| Call Options | $ | (2,340,860 | ) | $ | (6,631,603 | ) | $ | - | $ | (8,972,463 | ) | |||||
| Put Options | (12,050 | ) | - | - | (12,050 | ) | ||||||||||
| Total | $ | (2,352,910 | ) | $ | (6,631,603 | ) | $ | - | $ | (8,984,513 | ) | |||||
| * | Industry classifications for these categories are detailed on the Schedule of Investments of each Fund. |
The Value and West Hills Funds did not hold any Level 3 assets during the year ended June 30, 2024. It is each of the Fund’s policy to recognize transfers into and out of Level 1, Level 2 and Level 3 at the end of the reporting period. There have been no transfers in and out of Level 1 and Level 2 fair value measurements as of June 30, 2024 for the Value and West Hills Funds. There were no transfers between Level 1, Level 2 and Level 3 for the Camelot Fund. The Fund's policy is to recognize transfers in and transfers out as of the end of the reporting period.
Annual Report | 36
Frank Funds
NOTES TO FINANCIAL STATEMENTS (CONTINUED)
JUNE 30, 2024
The following is a reconciliation of Camelot Fund’s Level 3 investments for which significant unobservable inputs were used in determining value. See Schedules of Investments for industry breakouts:
| Balance as of June 30, 2023 | Purchases | Sales | Realized Gain/ (Loss) | Net Unrealized Appreciation/ (Depreciation) | Transfers in to Level 3 | Balance as of June 30, 2024 | ||||||||||||||||||||||
| Common Stocks | $ | 27,527 | $ | - | $ | - | $ | - | $ | (2,799 | ) | $ | - | $ | 24,728 | |||||||||||||
| Corporate Bonds | 6,250 | - | - | - | - | - | 6,250 | |||||||||||||||||||||
| $ | 33,777 | $ | - | $ | - | $ | - | $ | (2,799 | ) | $ | - | $ | 30,978 | ||||||||||||||
The following presents information about significant unobservable inputs related to Level 3 investments at June 30, 2024:
Camelot Fund
| Asset | Fair Value at | Valuation | Unobservable | Input | ||||||||
| Categories | June 30, 2024 | Technique | Input | Values | ||||||||
| Common Stocks | ||||||||||||
| Automotive | $ | 0 | Market approach | Last traded price of pre-conversion bonds | $ | 0.00 | ||||||
| Metals & Mining | 0 | Profitability expected return method | Uncertainty of any additional future payout | $ | 0.00 | |||||||
| Telecom | 22,264 | Profitability expected return method | Uncertainty of any additional future payout | $ | 0.50 | |||||||
| Waste & Environmental Services & Equip. | 2,464 | Market approach | Last traded price of non-restricted shares less a % discount | 28.00 | % | |||||||
| Escrow Shares | 0 | Profitability expected return method | Uncertainty of any additional future payout | $ | 0.00 | |||||||
| Corporate Bonds | 0 | Vendor pricing | Single broker quote | $ | 0.00 | |||||||
| Automotive | 0 | Profitability expected return method | Liquidation value of asset | $ | 0.00 | |||||||
| Financial Services | 6,250 | Vendor pricing | Single broker quote | $ | 0.13 | |||||||
| Venture Capital | 0 | Profitability expected return method | Uncertainty of any additional future payout | $ | 0.00 | |||||||
Note 4. Investment Management and Administrative Agreements
Value Fund
The Trust has a “Management Agreement” with FCP, with respect to the Value Fund. Under the terms of the Management Agreement, FCP manages the investment portfolio of the Value Fund, subject to policies adopted by the Trust’s Board of Trustees. Under the Management Agreement, FCP, at its own expense and without reimbursement from the Trust, furnishes office space and all necessary office facilities, and pays fees and expenses incurred by the Value Fund, including but not limited to, legal, auditing, accounting, and expenses of the custodian, along with equipment and executive personnel necessary for managing the assets of the Value Fund. FCP also pays the salaries and fees of all its officers and employees that serve as officers and trustees of the Trust. FCP pays all ordinary operating expenses of the Value Fund except brokerage fees and commissions, taxes, borrowing costs (such as (a) interest and (b) dividend expenses on securities sold short), Rule 12b-1 fees, acquired fund fees and expenses, and extraordinary expenses. For its services and the payment of Value Fund ordinary operating expenses, FCP receives an annual investment management fee of 0.91% of the average daily net assets of the Value Fund. For the year ended June 30, 2024, FCP earned management fees of $174,625 from the Value Fund. As of June 30, 2024, the Value Fund owed FCP $14,579 for management fees.
Annual Report | 37
Frank Funds
NOTES TO FINANCIAL STATEMENTS (CONTINUED)
JUNE 30, 2024
FCP also provides administrative services to the Value Fund under an Administration Agreement and receives a fee of 0.21% of the Value Fund's average daily net assets for those services. This fee was permanently reduced from 0.25% when the Value Fund’s net assets exceeded $15 million in April 2021. Under the Administration Agreement, FCP pays all of the operating expenses of the Value Fund except management fees, Rule 12b-1 fees, brokerage, taxes, borrowing costs (such as interest and dividend expense of securities sold short), and extraordinary expenses. For the year ended June 30, 2024, the Value Fund accrued $40,298 in administrative fees. At June 30, 2024, the Value Fund owed $3,389 in administrative fees.
West Hills Fund
The Trust has a “Management Agreement” with FCP with respect to the West Hills Fund. Under the terms of the Management Agreement, FCP manages the investment portfolio of the West Hills Fund, subject to policies adopted by the Trust's Board of Trustees. Under the terms of the Management Agreement with the Fund, the Adviser manages the Fund’s investments subject to oversight of the Board; furnishes investment advice to the Fund on the basis of a continuous review of the portfolio; and recommends to the Fund when and to what extent securities should be purchased or sold. As compensation for its management services, the Fund is obligated to pay the Adviser a fee computed and accrued daily and paid monthly at an annual rate of 0.99% of the average daily net assets of the Fund. For the year ended June 30, 2024, FCP’s fee of $72,950 was accrued by the West Hills Fund for advisory fees.
The Adviser has contractually agreed to defer its fees and to reimburse expenses, exclusive of any front-end or contingent deferred loads, taxes, leverage interest, brokerage commissions, expenses incurred in connection with any merger or reorganization, dividend expense on securities sold short, underlying fund fees, 12b-1 fees and expenses or extraordinary expenses such as litigation, at least until August 31, 2026, so that the Fund’s total annual operating expenses will not exceed 1.49%, subject to possible recoupment from the Fund in future years on a rolling 3-year basis (within the 3 years after the fees have been deferred or reimbursed) if such recoupment can be achieved within the foregoing expense limits. The agreement can be terminated at any time by the Board. FCP waived $72,950 of advisory fees and reimbursed the West Hills Fund $16,747 for expenses during the year ended June 30, 2024. As of June 30, 2024, FCP owed the West Hills Fund $2,878 for reimbursement of expenses. At June 30, 2024, the amounts subject to future recoupment total $258,547 and are as follows:
| Fiscal Year Ended | Recoverable Through | Amount | ||||
| June 30, 2022 | June 30, 2025 | $ | 84,372 | |||
| June 30, 2023 | June 30, 2026 | $ | 84,478 | |||
| June 30, 2024 | June 30, 2027 | $ | 89,697 | |||
Annual Report | 38
Frank Funds
NOTES TO FINANCIAL STATEMENTS (CONTINUED)
JUNE 30, 2024
FCP also provides administrative services to the West Hills Fund under an Administration Agreement and receives a fee equal to 0.21% of the West Hills Fund’s average daily net assets for those services. For the year ended June 30, 2024, the West Hills Fund accrued $15,480 in administrative fees. At June 30, 2024, the West Hills Fund owed $936 in administrative fees.
As of October 7, 2020, FCP also provides compliance services to the West Hills Fund for which it is paid $32,000 per year. At June 30, 2024, the West Hills Fund owed $2,630 in compliance fees.
Camelot Fund
Camelot Advisors (“Adviser”) serves as the investment adviser to the Camelot Fund. Under the terms of the “Management Agreement” the Adviser manages the Fund’s investments subject to approval of the Board of Trustees; furnishes investment advice to the Fund on the basis of a continuous review of the portfolio; and recommends to the Fund when and to what extent securities should be purchased or sold. As compensation for its management services, the Fund is obligated to pay the Adviser a fee computed and accrued daily and paid monthly at an annual rate of 1.30% of the average daily net assets of the Fund. For the year ended June 30, 2024, Camelot Advisors earned management fees of $1,403,600 from the Camelot Fund. As of June 30, 2024, the Camelot Fund owed Camelot Advisors $96,677 for management fees.
Camelot Advisors has contractually agreed to waive their management fees and/or assume expenses to the extent necessary to reduce the Total Annual Fund Operating Expenses (exclusive of any front-end or contingent deferred loads, taxes, all interest, brokerage commissions, expenses incurred in connection with any merger or reorganization, dividend expense on securities sold short, underlying fund fees, 12b-1 fees and expenses, and extraordinary expenses such as litigation) when they exceed 1.74% of the Fund’s average daily net assets. This agreement will continue in effect until October 31, 2024. Any waivers and reimbursements made by the Adviser to the Fund are subject to recoupment by the Adviser within three (3) fiscal years following the date of such waiver or reimbursement, provided that such recoupment does not cause the Total Annual Fund Operating Expenses to exceed the Annualized Expense Ratio in effect at the time of the (i) fee waiver and/or expense assumption, or (ii) the fee recoupment. Camelot Advisors waived $9,718 for Class A and $72,064 for Institutional Class, respectively, in total of $81,782 of advisory fees for the year ended June 30, 2024. At June 30, 2024, the amounts subject to future recoupment total $338,885 and are as follows:
| Fiscal Year Ended | Recoverable Through | Amount | ||||
| June 30, 2022 | June 30, 2025 | $ | 146,030 | |||
| June 30, 2023 | June 30, 2026 | $ | 111,073 | |||
| June 30, 2024 | June 30, 2027 | $ | 81,782 | |||
FCP also provides administrative services to the Camelot Fund under an Administration Agreement and receives a fee equal to 0.21% of the Camelot Fund’s average daily net assets for those services. For the year ended June 30, 2024, the Camelot Fund accrued $181,942 in administrative fees. At June 30, 2024, the Camelot Fund owed $13,292 in administrative fees.
FCP also provides compliance services to the Camelot Fund for which it is paid $32,000 per year. At June 30, 2024, the Camelot Fund owed $2,731 in compliance fees.
Note 5. Distribution and Service Fees
The Trust, with respect to the Value Fund has adopted plans under Rule 12b-1 that allow the Fund to pay distribution fees for the sale and distribution of its Investor Class and Class C shares as well as shareholder services. Investor Class and Class C shareholders of the Fund may pay annual 12b-1 expenses of up to 0.25% and 1.00%, respectively, of each class’s average daily net assets. For the year ended June 30, 2024, the Investor Class accrued $10,322 in distribution fees and Class C accrued $8,715 in distribution fees. At June 30, 2024, the Value Fund owed $8,430 in distribution fees.
Annual Report | 39
Frank Funds
NOTES TO FINANCIAL STATEMENTS (CONTINUED)
JUNE 30, 2024
The Trust, with respect to the West Hills Fund has adopted a plan under Rule 12b-1 of the 1940 Act that allows the Fund to pay distribution and service fees annually for the sale and distribution of shares and servicing of shareholders (“12b-1 fees”). As of June 30, 2024, no fees have been accrued.
The Trust, with respect to the Camelot Fund Class A has adopted plans under Rule 12b-1 of the 1940 Act that allow the Camelot Fund to pay distribution and service fees annually for the sale and distribution of shares and servicing of shareholders (“12b-1 fees”). The Fund pays distribution fees of 0.25% of the Fund’s average daily net assets to Arbor Court Capital LLC, as the Fund’s distributor, and other brokers. For the year ended June 30, 2024, the Camelot Fund accrued $25,519 in 12b-1 fees. At June 30, 2024, the Camelot Fund owed $7,602 in distribution fees.
Note 6. Related Party Transactions
Brian J. Frank and Monique Weiss are the control persons of FCP. Brian Frank also serves as a trustee of the Trust, and both Mr. Frank and Ms. Weiss serve as officers of the Trust. Mr. Frank and Ms. Weiss receive benefits from FCP resulting from management fees paid to FCP by the Value Fund and West Hills Fund.
Note 7. Capital Share Transactions
The Trust is authorized to issue an unlimited number of shares of separate series. Transactions in capital were as follows:
| Value Fund – Investor Class | July 1, 2023 through June 30, 2024 | July 1, 2022 through June 30, 2023 | ||||||||||||||
| Shares | Amount | Shares | Amount | |||||||||||||
| Shares sold | 9,969 | $ | 140,427 | 269,716 | $ | 3,821,861 | ||||||||||
| Shares reinvested | 26,634 | 368,082 | 18,963 | 249,362 | ||||||||||||
| Shares redeemed | (114,670 | ) | (1,632,589 | ) | (266,377 | ) | (3,748,381 | ) | ||||||||
| Net Increase (Decrease) | (78,067 | ) | $ | (1,124,080 | ) | 22,302 | $ | 322,842 | ||||||||
| Value Fund – Class C | July 1, 2023 through June 30, 2024 | July 1, 2022 through June 30, 2023 | ||||||||||||||
| Shares | Amount | Shares | Amount | |||||||||||||
| Shares sold | 1,269 | $ | 16,945 | 1,535 | $ | 19,345 | ||||||||||
| Shares reinvested | 5,427 | 68,328 | 4,615 | 55,053 | ||||||||||||
| Shares redeemed | (3,687 | ) | (47,549 | ) | (8,582 | ) | (111,979 | ) | ||||||||
| Net Increase (Decrease) | 3,009 | $ | 37,724 | (2,432 | ) | $ | (37,581 | ) | ||||||||
| Value Fund – Institutional Class | July 1, 2023 through June 30, 2024 | July 1, 2022 through June 30, 2023 | ||||||||||||||
| Shares | Amount | Shares | Amount | |||||||||||||
| Shares sold | 121,476 | $ | 1,790,247 | 354,852 | $ | 5,093,477 | ||||||||||
| Shares reinvested | 84,588 | 1,199,457 | 71,106 | 949,967 | ||||||||||||
| Shares redeemed | (96,626 | ) | (1,431,899 | ) | (305,374 | ) | (4,325,207 | ) | ||||||||
| Net Increase | 109,438 | $ | 1,557,805 | 120,584 | $ | 1,718,237 | ||||||||||
Annual Report | 40
Frank Funds
NOTES TO FINANCIAL STATEMENTS (CONTINUED)
JUNE 30, 2024
| West Hills Fund | July 1, 2023 through June 30, 2024 | July 1, 2022 through June 30, 2023 | ||||||||||||||
| Shares | Amount | Shares | Amount | |||||||||||||
| Shares sold | 57,524 | $ | 552,045 | 36,894 | $ | 303,004 | ||||||||||
| Shares reinvested | - | - | - | - | ||||||||||||
| Shares redeemed | (63,316 | ) | (608,908 | ) | (10,780 | ) | (91,139 | ) | ||||||||
| Net Increase (Decrease) | (5,792 | $ | (56,863 | 26,114 | $ | 211,865 | ||||||||||
| Camelot Fund – Class A | July 1, 2023 through June 30, 2024 | July 1, 2022 through June 30, 2023 | ||||||||||||||
| Shares | Amount | Shares | Amount | |||||||||||||
| Shares sold | 101,728 | $ | 2,007,299 | 227,577 | $ | 4,770,017 | ||||||||||
| Shares reinvested | 28,654 | 548,430 | 41,294 | 825,884 | ||||||||||||
| Redemption fees | - | 239 | - | - | ||||||||||||
| Shares redeemed | (196,241 | ) | (3,856,136 | ) | (182,175 | ) | (3,732,639 | ) | ||||||||
| Net Increase (Decrease) | (65,859 | ) | $ | (1,300,168 | ) | 86,696 | $ | 1,863,262 | ||||||||
| Camelot Fund – Institutional Class | July 1, 2023 through June 30, 2024 | July 1, 2022 through June 30, 2023 | ||||||||||||||
| Shares | Amount | Shares | Amount | |||||||||||||
| Shares sold | 2,018,140 | $ | 40,454,065 | 3,512,438 | $ | 73,720,632 | ||||||||||
| Shares reinvested | 285,479 | 5,592,543 | 220,575 | 4,506,358 | ||||||||||||
| Redemption fees | - | 825 | - | 846 | ||||||||||||
| Shares redeemed | (2,975,864 | ) | (59,734,798 | ) | (1,487,913 | ) | (31,783,641 | ) | ||||||||
| Net Increase (Decrease) | (672,245 | ) | $ | (13,687,365 | ) | 2,245,100 | $ | 46,444,195 | ||||||||
Shareholders of the Funds are subject to a Redemption Fee on redemptions and exchanges equal to 2.00% of the net asset value of Fund shares redeemed within 5 days after their purchase. The tables above reflect the redemption fees collected from shareholders of the Funds and reclassified to paid-in-capital.
Note 8. Derivative Transactions
The Funds consider the average quarter-end notional amounts during the period, categorized by primary underlying risk, to be representative of it's derivative activities during the year ended June 30, 2024.
West Hills Fund
Average notional value of:
| Call Options Purchased | $ | - | ||
| Put Options Purchased | $ | 5,354,425 | ||
| Written Call Options | $ | (6,142,875 | ) | |
| Written Put Options | $ | (4,781,450 | ) |
Annual Report | 41
Frank Funds
NOTES TO FINANCIAL STATEMENTS (CONTINUED)
JUNE 30, 2024
Camelot Fund
Average notional value of:
| Warrants | $ | 612,162 | ||
| Call Options Purchased | $ | 4,999,375 | ||
| Put Options Purchased | $ | 81,173,125 | ||
| Written Call Options | $ | (69,621,163 | ) | |
| Written Put Options | $ | (19,042,500 | ) |
The Funds have adopted amendments to authoritative guidance on disclosures about derivative instruments and hedging activities which require that the Funds disclose: a) how and why an entity uses derivative instruments; and b) how derivative instruments and related hedged items affect an entity’s financial position, financial performance and cash flows.
The Funds may trade financial instruments where they are considered to be a seller of credit derivatives in accordance with authoritative guidance under GAAP on derivatives and hedging.
West Hills Fund
As of June 30, 2024, the Statement of Assets and Liabilities included the following financial derivative instrument fair values:
| Assets | Equity Contracts | |||
| Purchased Options | $ | 22,200 | ||
| Total Assets | $ | 22,200 | ||
| Liabilities | Equity Contracts | |||
| Written Options | $ | (217,310 | ) | |
| Total Liabilities | $ | (217,310 | ) | |
For the year ended June 30, 2024, financial derivative instruments had the following effect on the Statement of Operations:
| Net change in unrealized appreciation (depreciation) on: | Equity Contracts | Total | ||||||
| Purchased Options | $ | (5,088 | ) | $ | (5,088 | ) | ||
| Written Options | (27,275 | ) | (27,275 | ) | ||||
| $ | (32,363 | ) | $ | (32,363 | ) | |||
| Net realized gain (loss) on: | Equity Contracts | Total | ||||||
| Purchased Options | $ | (167,463 | ) | $ | (167,463 | ) | ||
| Written Options | (291,170 | ) | (291,170 | ) | ||||
| $ | (458,633 | ) | $ | (458,633 | ) | |||
Annual Report | 42
Frank Funds
NOTES TO FINANCIAL STATEMENTS (CONTINUED)
JUNE 30, 2024
Camelot Fund
As of June 30, 2024, the Statement of Assets and Liabilities included the following financial derivative instrument fair values:
| Assets | Derivatives | |||
| Purchased Options – equity contracts | $ | 4,415,775 | ||
| Warrants – equity contracts | 6,373 | |||
| Structured Notes | 153 | |||
| Total Assets | $ | 4,422,301 | ||
| Liabilities | Equity Contracts | |||
| Written Options | $ | (8,984,513 | ) | |
| Total Liabilities | $ | (8,894,513 | ) | |
For the year ended June 30, 2024, financial derivative instruments had the following effect on the Statement of Operations:
| Net change in unrealized appreciation (depreciation) on: | Equity Contracts | Total | ||||||
| Purchased Options | $ | 2,243,712 | $ | 2,243,712 | ||||
| Written Options | (1,419,002 | ) | (1,419,002 | ) | ||||
| Structured Notes | (212 | ) | (212 | ) | ||||
| Warrants | 2,084 | 2,084 | ||||||
| $ | 826,582 | $ | 826,582 | |||||
| Net realized gain (loss) on: | Equity Contracts | Total | ||||||
| Purchased Options | $ | (3,431,633 | ) | $ | (3,431,633 | ) | ||
| Written Options | 3,087,854 | 3,087,854 | ||||||
| Structured Notes | - | - | ||||||
| Warrants | - | - | ||||||
| $ | (343,779 | ) | $ | (343,779 | ) | |||
The selling of written call options may tend to reduce the volatility of the Funds because the premiums received from selling the options will reduce any losses on the underlying securities, but only by the amount of the premiums. However, selling the options may also limit the Funds’ gain on the underlying securities. Written call options expose the Funds to minimal counterparty risk since they are exchange-traded and the exchange’s clearing house guarantees the options against default.
The Funds engage in option transactions involving individual securities and stock indexes. An option involves either: (a) the right or the obligation to buy or sell a specific instrument at a specific price until the expiration date of the option; or (b) the right to receive payments or the obligation to make payments representing the difference between the closing price of a stock index and the exercise price of the option expressed in dollars times a specified multiple until the expiration date of the option. The Funds may purchase and write options. Options are sold (written) on securities and stock indexes. The purchaser of an option on a security pays the seller (the writer) a premium for the right granted but is not obligated to buy or sell the underlying security. The purchaser of an option on a stock index pays the seller a premium for the right granted, and in return the seller of such an option is obligated to make the payment. A writer of an option may terminate the obligation prior to expiration of the option by making an offsetting purchase of an identical option. Options are traded on organized exchanges and in the over-the-counter market. To cover the potential obligations involved in writing options, a Fund will either: (a) own the underlying security, or in the case of an option on a market index, will hold a portfolio of stocks substantially replicating the movement of the index; or (b) the Fund will segregate with the custodian high grade liquid assets sufficient to purchase the underlying security or equal to the market value of the stock index option, marked to market daily.
Annual Report | 43
Frank Funds
NOTES TO FINANCIAL STATEMENTS (CONTINUED)
JUNE 30, 2024
The purchase of options limits a Fund's potential loss to the amount of the premium paid and can afford the Fund the opportunity to profit from favorable movements in the price of an underlying security to a greater extent than if transactions were effected in the security directly. However, the purchase of an option could result in the Fund losing a greater percentage of its investment than if the transaction were effected directly. When a Fund writes a call option, it will receive a premium, but it will give up the opportunity to profit from a price increase in the underlying security above the exercise price as long as its obligation as a writer continues, and it will retain the risk of loss should the price of the security decline. When a Fund writes a put option, it will assume the risk that the price of the underlying security or instrument will fall below the exercise price, in which case a Fund may be required to purchase the security or instrument at a higher price than the market price of the security or instrument. In addition, there can be no assurance that the Fund can affect a closing transaction on a particular option it has written. Further, the total premium paid for any option may be lost if a Fund does not exercise the option.
The Funds engage in option transactions involving securities and stock indices in order to gain exposure to particular securities or markets, in connection with hedging transactions, or to try to enhance returns. Options require additional skills and techniques beyond normal portfolio management. The Funds’ use of options involves risk that such instruments may not work as intended due to unanticipated developments, especially in abnormal market conditions, or if the adviser makes an error in judgment, or other causes. The use of options may magnify the increase or decrease in the performance of the Funds, and may also subject the Funds to higher price volatility.
The premiums paid for the options represent the cost of the investment and the options are valued daily at their closing price. The Funds recognize a realized gain or loss when the option is sold or expired. Option holdings within the Funds, which may include put options and call options, are subject to loss of value with the passage of time, and may experience a total loss of value upon expiration. With options, there is minimal counterparty risk to the Funds since they are exchange traded.
Note 9. Offsetting Assets and Liabilities
The West Hills Fund and the Camelot Fund are subject to various Master Netting Arrangements (“MNA”), which govern the terms of certain transactions with select counterparties. The MNA allows the Funds to close out and net its total exposure to a counterparty in the event of a default with respect to all the transactions governed under a single agreement with a counterparty. The MNA also specifies collateral posting arrangements at pre-arranged exposure levels. Under the MNA, collateral is routinely transferred if the total net exposure to certain transactions (net of existing collateral already in place) governed under the relevant MNA with a counterparty in a given account exceeds a specified threshold depending on the counterparty and the type of MNA.
Annual Report | 44
Frank Funds
NOTES TO FINANCIAL STATEMENTS (CONTINUED)
JUNE 30, 2024
The following is a summary of the Assets and Liabilities for the West Hills Fund and the Camelot Fund subject to offsets as of June 30, 2024:
| Gross | Net | ||||||||||||||||||||||||||
| Gross | Amounts | Amounts | Gross Amounts Not | ||||||||||||||||||||||||
| Amounts | Offset | Presented | Offset in the Statements | ||||||||||||||||||||||||
| Recognized in | in the | in the | of Assets and Liabilities | ||||||||||||||||||||||||
| the Statement | Statements | Statements | Collateral | ||||||||||||||||||||||||
| of Assets and | of Assets | of Assets | Financial | Pledged | Net | ||||||||||||||||||||||
| Description | Counterparty | Liabilities | and Liabilities | and Liabilities | Instruments | (Received) | Amount | ||||||||||||||||||||
| West Hills Fund | |||||||||||||||||||||||||||
| Assets: | |||||||||||||||||||||||||||
| Purchased Options | Interactive | $ | 22,200 | $ | — | $ | 22,200 | $ | — | $ | 22,200 | $ | — | ||||||||||||||
| Brokers | |||||||||||||||||||||||||||
| Liabilities: | |||||||||||||||||||||||||||
| Written Options | Interactive | $ | (217,310 | ) | $ | — | $ | (217,310 | ) | $ | — | $ | (217,310 | ) | $ | — | |||||||||||
| Brokers | |||||||||||||||||||||||||||
| Camelot Fund | |||||||||||||||||||||||||||
| Assets: | |||||||||||||||||||||||||||
| Purchased Options | Susquehanna | $ | 4,415,775 | $ | — | $ | 4,415,775 | $ | — | $ | 4,415,775 | $ | — | ||||||||||||||
| Liabilities: | |||||||||||||||||||||||||||
| Written Options | Susquehanna | $ | (8,984,513 | ) | $ | — | $ | (8,984,513 | ) | $ | — | $ | (8,984,513 | ) | $ | — | |||||||||||
Note 10. Investment Transactions
For the year ended June 30, 2024, purchases and sales of investment securities other than U.S. Government obligations, and short-term investments for the Value Fund aggregated $18,322,517 and $17,998,487, respectively. Purchases and sales of U.S. Government obligations aggregated $0 and $759,230, respectively.
For the year ended June 30, 2024, purchases and sales of investment securities other than U.S. Government obligations, and short-term investments for the West Hills Fund aggregated $1,510,237 and $2,017,072, respectively.
For the year ended June 30, 2024, purchases and sales of investment securities other than U.S. Government obligations, and short-term investments for the Camelot Fund aggregated $45,981,298 and $62,734,244, respectively.
Annual Report | 45
Frank Funds
NOTES TO FINANCIAL STATEMENTS (CONTINUED)
JUNE 30, 2024
Note 11. Tax Matters
As of June 30, 2024, the tax basis components of distributable earnings, unrealized appreciation (depreciation) and cost of investment securities were as follows:
| Value Fund | West Hills Fund | Camelot Fund | ||||||||||
| Gross unrealized appreciation on investment securities | $ | 2,870,618 | $ | 2,289,887 | $ | 9,653,923 | ||||||
| Gross unrealized depreciation on investment securities | (299,102 | ) | (1,353,974 | ) | (19,231,159 | ) | ||||||
| Net unrealized appreciation (depreciation) on investment securities | $ | 2,571,516 | $ | 935,913 | $ | (9,577,236 | ) | |||||
| Cost of investment securities, including short-term investments * | $ | 16,974,766 | $ | 6,959,352 | $ | 100,273,997 | ||||||
Income and long-term capital gain distributions are determined in accordance with Federal income tax regulations, which may differ from accounting principles generally accepted in the United States. The Funds’ tax basis capital gains and losses and undistributed ordinary income are determined at the end of each fiscal year. As of June 30, 2024 the Funds’ most recent fiscal year-end, components of distributable earnings on a tax basis were as follows:
| Value Fund | West Hills Fund | Camelot Fund | ||||||||||
| Unrealized appreciation (depreciation) | $ | 2,571,516 | $ | 935,913 | $ | (9,577,236 | ) | |||||
| Post December net-investment loss deferral | - | (28,491 | ) | - | ||||||||
| Undistributed ordinary income (loss) | 168,772 | - | 1,683,087 | |||||||||
| Accumulated undistributed long-term capital gain | 348,111 | - | - | |||||||||
| Total Distributable earnings/(deficit) | $ | 3,088,399 | $ | 907,422 | $ | (7,894,149 | ) | |||||
| * | The difference between book and tax cost represents disallowed wash sales and straddles for tax purposes for the West Hills and Camelot Funds and disallowed wash sales for the Value Fund. |
The capital gains (losses) shown may differ from corresponding accumulated net realized gain (loss) reported on the statement of assets and liabilities due to certain temporary book/tax differences due to temporary book/tax differences due to the deferral of losses on wash sales and straddles. Under current tax law, net capital losses realized after October 31st and net ordinary losses incurred after December 31st may be deferred and treated as occurring on the first day of the following fiscal year and net capital losses may be carried forward indefinitely, and their character is retained as short-term and/or long-term. The West Hills Fund utilized $129,273 of its capital loss carryforward during the year ended June 30, 2024.
Permanent book and tax differences relating to shareholder distributions may result in reclassifications to paid in capital and may affect the per-share allocation between net investment income and realized and unrealized gain/loss. Undistributed net investment income and accumulated undistributed net realized gain/loss on investment transactions may include temporary book and tax differences which reverse in subsequent periods. Any taxable income or gain remaining at fiscal year end is distributed in the following year.
The West Hills Fund has recorded a reclassification in their capital account. As of June 30, 2024, the West Hills Fund recorded permanent book/tax differences of $2,595 from net investment loss to paid-in-capital. This reclassification has no impact on the net asset value of the West Hills Fund.
Annual Report | 46
Frank Funds
NOTES TO FINANCIAL STATEMENTS (CONTINUED)
JUNE 30, 2024
The Funds paid the following distributions for the years ended June 30, 2024 and 2023:
| Value Fund | ||||||
| Period/Year Ended | $ Amount | Tax Character | ||||
| Investor Class | ||||||
| 6/30/2024 | $ | 145,887 | Ordinary income | |||
| 6/30/2024 | $ | 241,016 | Long-term capital gain | |||
| 6/30/2023 | $ | 35,016 | Ordinary income | |||
| 6/30/2023 | $ | 370,500 | Long-term capital gain | |||
| Class C | ||||||
| 6/30/2024 | $ | 16,960 | Ordinary income | |||
| 6/30/2024 | $ | 57,933 | Long-term capital gain | |||
| 6/30/2023 | $ | 60,848 | Long-term capital gain | |||
| Institutional Class | ||||||
| 6/30/2024 | $ | 422,944 | Ordinary income | |||
| 6/30/2024 | $ | 820,053 | Long-term capital gain | |||
| 6/30/2023 | $ | 111,499 | Ordinary income | |||
| 6/30/2023 | $ | 872,719 | Long-term capital gain | |||
The West Hills Fund did not pay any distributions for the years ended June 30, 2024 and 2023.
| Camelot Fund | ||||||
| Period/Year Ended | $ Amount | Tax Character | ||||
| Class A | ||||||
| 6/30/2024 | $ | 640,894 | Ordinary income | |||
| 6/30/2023 | $ | 57,603 | Ordinary income | |||
| 6/30/2023 | $ | 961,859 | Long-term capital gain | |||
| Institutional Class | ||||||
| 6/30/2024 | $ | 5,929,321 | Ordinary income | |||
| 6/30/2023 | $ | 278,142 | Ordinary income | |||
| 6/30/2023 | $ | 4,644,445 | Long-term capital gain | |||
Note 12. Control and Ownership
The beneficial ownership, either directly or indirectly, of more than 25% of the voting securities of a fund creates a presumption of control of the fund, under Section 2(a)(9) of the Investment Company Act of 1940, as amended. As of June 30, 2024, NFS, LLC owned approximately 43% of the Value Fund, for the benefit of others, and may be deemed to control the Value Fund. As of June 30, 2024, NFS, LLC owned approximately 82% of the West Hills Fund, for the benefit of others, and may be deemed to control the West Hills Fund. As of June 30, 2024, Charles Schwab & Co., Inc. owned approximately 37% of the Camelot Fund, for the benefit of others, and may be deemed to control the Camelot Fund.
Note 13. Indemnifications
In the normal course of business, the Funds enter into contracts that contain general indemnification to other parties. The Funds’ maximum exposure under these contracts is unknown as this would involve future claims that may be made against the Funds that have not yet occurred. The Funds expect the risk of loss to be remote.
Annual Report | 47
Frank Funds
NOTES TO FINANCIAL STATEMENTS (CONTINUED)
JUNE 30, 2024
Note 14. Market Risk and Geopolitical Risk
Overall market risks may also affect the value of the Funds. Factors such as domestic economic growth and market conditions, interest rate levels and political events affect the securities markets. Local, regional or global events such as war, acts of terrorism, the spread of infectious illness or other public health issue, recessions and depressions, or other events could have a significant impact on the Funds and its investments and could result in increased premiums or discounts to the Funds’ net asset value, and may impair market liquidity, thereby increasing liquidity risk. The Funds could lose money over short periods due to short-term market movements and over longer periods during more prolonged market downturns. During a general market downturn, multiple asset classes may be negatively affected. Changes in market conditions and interest rates can have the same impact on all types of securities and instruments.
Note 15. New Accounting Pronouncements
In September 2023, the SEC adopted a final rule relating to “Names Rule” under the 1940 Act. The amendments expanded the rule to require more funds to adopt an 80 percent investment policy, including funds with names suggesting a focus in investments with particular characteristics (e.g., growth or value) or with terms that reference a thematic investment focus (e.g., environmental, social, or governance factors). The amendments will require that a fund review its name for compliance with the rule. If needed, a fund may need to adopt an 80 percent investment policy and review its portfolio assets' treatment under such policy at least quarterly. The rule also requires additional prospectus disclosure and reporting and record keeping requirements. The amendments will become effective on April 9, 2024. The compliance date is February 9, 2026 for Funds with more than $1 billion in assets and August 9, 2026 for Funds with less than $1 billion in assets. The Funds are in compliance with this new rule.
Note 16. Subsequent Events
Management has evaluated the impact of all subsequent events on the Funds through the issuance date of these financial statements and has noted no such events requiring disclosure.
Annual Report | 48
Report of Independent Registered Public Accounting firm
To the Shareholders and Board of Trustees
of Frank Value Fund, West Hills Core Fund and Camelot Event Driven Fund,
each a Series of the Frank Funds
Opinion on the Financial Statements
We have audited the accompanying statements of assets and liabilities of Frank Value Fund, ("Value Fund"), West Hills Core Fund (“West Hills Fund”), and the Camelot Event Driven Fund (“Camelot Fund”), each a series of the Frank Funds (the “Funds”), including the schedules of investments, purchased options, written options and securities sold short as of June 30, 2024 and the related statements of operations for the year then ended, the statements of changes in net assets for each of the two years in the period then ended, and the related notes (collectively referred to as the “financial statements”) and the financial highlights for each of the five years in the period then ended. In our opinion, the financial statements and financial highlights present fairly, in all material respects, the financial position of the Funds as of June 30, 2024, the results of their operations for the year then ended, the changes in their net assets for each of the two years in the period then ended, and the financial highlights for each of the five years in the period then ended, in conformity with accounting principles generally accepted in the United States of America.
Basis for Opinion
These financial statements and financial highlights are the responsibility of the Funds’ management. Our responsibility is to express an opinion on these financial statements and financial highlights based on our audits. We are a public accounting firm registered with the Public Company Accounting Oversight Board (United States) (PCAOB) and are required to be independent with respect to the Funds in accordance with the U.S. federal securities laws and the applicable rules and regulations of the Securities and Exchange Commission and the PCAOB.
We conducted our audits in accordance with the standards of the PCAOB. Those standards require that we plan and perform the audit to obtain reasonable assurance about whether the financial statements and financial highlights are free of material misstatement, whether due to error or fraud. The Funds are not required to have, nor were we engaged to perform, an audit of their internal control over financial reporting. As part of our audits, we are required to obtain an understanding of internal control over financial reporting but not for the purpose of expressing an opinion on the effectiveness of the Funds’ internal control over financial reporting. Accordingly, we express no such opinion.
Our audits included performing procedures to assess the risk of material misstatement of the financial statements and financial highlights, whether due to error or fraud, and performing procedures that respond to those risks. Such procedures included examining, on a test basis, evidence regarding the amounts and disclosures in the financial statements and financial highlights. Our procedures included confirmation of securities and cash owned as of June 30, 2024, by correspondence with the custodians and brokers. Our audits also included evaluating the accounting principles used and significant estimates made by management, as well as evaluating the overall presentation of the financial statements and financial highlights. We believe that our audits provide a reasonable basis for our opinion.

We have served as the Funds’ auditors since 2005
Abington, Pennsylvania
August 28, 2024
Annual Report | 49
Frank Funds
ADDITIONAL INFORMATION
JUNE 30, 2024 (UNAUDITED)
Each Fund’s Statement of Additional Information ("SAI") includes additional information about the trustees and is available, without charge, upon request. You may call toll-free (888) 217-5426 to request a copy of the SAI or to make shareholder inquiries.
A description of the policies and procedures that each Fund uses to determine how to vote proxies relating to portfolio securities and information regarding how each Fund voted proxies during the most recent 12-month period ended June 30 are available without charge upon request by (1) calling (888) 217-5426 and (2) from the documents filed with the Securities and Exchange Commission ("SEC") on the SEC's website at www.sec.gov.
Each Fund files a complete schedule of investments with the SEC for the first and third quarter of each fiscal year on Form N-PORT. The Funds’ first and third fiscal quarters end on September 30 and March 31. The Form N-PORT filing must be made within 60 days of the end of the quarter. The Funds’ Forms N-PORT are available on the SEC’s website at http://sec.gov, or they may be reviewed and copied at the SEC’s Public Reference Room in Washington, DC (call 1-800-732-0330 for information on the operation of the Public Reference Room). You may also obtain copies by calling (888) 217-5426.
Advisory Renewal Agreement
Frank Fund
The Management Agreement between the Trust and Frank Capital Partners LLC (“Frank Capital”) as to the Frank Value Fund was approved by the Board of Trustees (the “Trustees”), including a majority of the Trustees who are not interested persons of the Trust or interested parties to the Management Agreement (collectively, the “Independent Trustees”), at an in-person meeting held on June 27, 2024. The Trustees reviewed a memorandum describing the Trustees’ duties when considering the Management Agreement renewal.
As to the nature, extent, and quality of the services provided by Frank Capital Partners LLC, the Board considered Frank Capital Partners LLC’s investment philosophy. In addition, the Trustees reviewed Frank Capital Partners LLC’s Form ADV Parts I and II which described the operations and policies of Frank Capital Partners LLC. The Trustees reviewed a report prepared by Frank Capital Partners LLC for the Trustees with information relevant to their deliberations (the “Report”). The Report included information regarding, among other things, the personnel of Frank Capital Partners LLC and Frank Capital Partners LLC’s compliance activities. Mr. Brian Frank of Frank Capital Partners LLC certified to the Board that it had complied with the Trust’s Code of Ethics. Based on this information and their discussions with Mr. Brian Frank, the President of Frank Funds, the Trustees concluded that the nature, quality, and extent of the advisory services that Frank Capital Partners LLC has provided were reasonable and consistent with the Board’s expectations. The Board also noted there has been consistent management, ready access to the principles of the firm, and no compliance or litigation issues.
Annual Report | 50
Frank Funds
ADDITIONAL INFORMATION (CONTINUED)
JUNE 30, 2024 (UNAUDITED)
As to the Frank Value Fund’s performance, the Trustees reviewed information in the Report regarding the Frank Value Fund’s returns since inception and for the year ended March 31, 2024. The Frank Value Fund’s performance was compared to the Russell Mid Cap Value Index and the S&P 500 Index. The Board noted that the Frank Value Fund’s performance outperformed the Russell Mid cap Value Index and Peer Group in the three years ending 3/31/24. The Board reviewed the Russell Mid Cap Value Index and agreed it was reasonable for a long-only fund like the Frank Value Fund.
The Trustees then reviewed information in the Report comparing the expense ratio of the Frank Value Fund to those of the peer group. Mr. Brian Frank noted that the Report indicates the Institutional Share Class had a total expense ratio of 1.12%, which is more than the 0.91% peer group average and more than the 0.85% peer group median. Management Fees for the Frank Value Fund are 0.91% while the peer group average is 0.70% and the median is 0.75%. The Board agreed that both the total expense ratio and the management fee compared favorably to the peer group and that the management fee was fair and reasonable considering the assets in the Frank Value Fund as well as the outperformance of the benchmark after fees.
As to profits realized by Frank Capital Partners LLC, the Board reviewed information regarding Frank Capital Partners LLC’s income and expense for calendar year 2023. The Board noted that although Frank Capital Partners LLC receives a Management Fee from the Frank Value Fund, the Administrative Fee is not enough to cover imputed costs. Thus, a portion of the Management Fee is used to pay Fund expenses. The Board then discussed additional benefits received by Frank Capital Partners LLC from the Frank Value Fund, and agreed there were none. They concluded that Frank Capital Partners LLC was not excessively profitable in relation to the Frank Value Fund.
As a result of their deliberations, the Trustees, including the Independent Trustees, determined that the overall arrangement provided under the terms of the Management Agreement was a reasonable business arrangement, and that the renewal of the Management Agreement was in the best interests of the Trust and the Frank Value Fund’s shareholders. Accordingly, they approved the continuation of the Management Agreement for an additional year.
West Hills Fund
The Management Agreement between the Trust and Frank Capital Partners LLC (“Frank Capital”) as to the West Hills Tactical Core Fund was approved by the Board of Trustees (the “Trustees”), including a majority of the Trustees who are not interested persons of the Trust or interested parties to the Management Agreement (collectively, the “Independent Trustees”), at an in-person meeting held on June 27, 2024. The Trustees reviewed a memorandum describing the Trustees’ duties when considering the Management Agreement renewal.
As to the nature, extent, and quality of the services provided by Frank Capital Partners LLC, the Board considered Frank Capital Partners LLC’s investment philosophy. In addition, the Trustees reviewed Frank Capital Partners LLC’s Form ADV Parts I and II which described the operations and policies of Frank Capital Partners LLC. The Trustees reviewed a report prepared by Frank Capital Partners LLC for the Trustees with information relevant to their deliberations (the “Report”). The Report included information regarding, among other things, the personnel of Frank Capital Partners LLC and Frank Capital Partners LLC’s compliance activities. Mr. Brian Frank of Frank Capital Partners LLC certified to the Board that it had complied with the Trust’s Code of Ethics. Based on this information and their discussions with Mr. Brian Frank, the President of Frank Funds, the Trustees concluded that the nature, quality, and extent of the advisory services that Frank Capital Partners LLC has provided were reasonable and consistent with the Board’s expectations. The Board also noted there has been consistent management, ready access to the principles of the firm, and no compliance or litigation issues.
Annual Report | 51
Frank Funds
ADDITIONAL INFORMATION (CONTINUED)
JUNE 30, 2024 (UNAUDITED)
As to the West Hills Fund’s performance, Mr. Frank presented a comparison of the Morningstar peer group. Though the West Hills Fund has underperformed its benchmark, the S&P 500 Total Return Index in the YTD and since inception as of 3/31/24.
The Trustees then reviewed information in the Report comparing the proposed expense ratio of the West Hills Fund to those of the peer group. Mr. Brian Frank noted that the Report shows the West Hills Fund has a total expense ratio cap of 1.49%, which is above the peer group average of 1.16% and median of 1.01%. Management Fees for the West Hills Fund are 0.99% while the peer group average is 0.82% and the median is 0.75%. The Board agreed that both the total expense ratio and the management fee compared favorably to the peer group and that the management fee was fair and reasonable considering an asset level of less than $15 million.
As to profits realized by Frank Capital Partners LLC, the Board reviewed information regarding Frank Capital Partners LLC’s income and expense for calendar year 2023. The Board noted that although Frank Capital Partners LLC will receive a Management Fee from the West Hills Fund, the Administrative Fee is not enough to cover costs. Thus, a portion of the Management Fee will be used to pay Fund expenses. The Board then discussed additional benefits received by Frank Capital Partners LLC from the West Hills Fund and agreed there were none. They concluded that Frank Capital Partners LLC is not be excessively profitable in relation to the West Hills Fund. As a result of their deliberations, the Trustees, including the Independent Trustees, determined that the overall arrangement provided under the terms of the Management Agreement was a reasonable business arrangement, and that the renewal of the Management Agreement was in the best interests of the Trust and the West Hills Core Fund’s shareholders. Accordingly, they approved the continuation of the Management Agreement for an additional year.
Camelot Fund
The Management Agreement between the Trust and Camelot Event-Driven Advisors LLC (“CEDA”) as to the Camelot Event-Driven Fund was approved by the Board of Trustees (the “Trustees”), including a majority of the Trustees who are not interested persons of the Trust or interested parties to the Management Agreement (collectively, the “Independent Trustees”), at an in-person meeting held on June 27, 2024. The Trustees reviewed a memorandum describing the Trustees’ duties when considering the Management Agreement renewal.
As to the nature, extent, and quality of the services provided by Camelot Event-Driven Advisors LLC, the Board considered Camelot Event-Driven Advisors LLC’s investment philosophy. In addition, the Trustees reviewed Camelot Event-Driven Advisors LLC’s Form ADV Parts I and II which described the operations and policies of Camelot Event-Driven Advisors LLC. The Trustees reviewed a report prepared by Camelot Event-Driven Advisors LLC for the Trustees with information relevant to their deliberations (the “Report”). The Report included information regarding, among other things, the personnel of Camelot Event-Driven Advisors LLC and Camelot Event-Driven Advisors LLC’s compliance activities. Mr. Thomas Kirchner of Camelot Event-Driven Advisors LLC certified to the Board that it had complied with the Trust’s Code of Ethics. Based on this information and their discussions with Mr. Brian Frank, the President of Frank Funds, the Trustees concluded that the nature, quality, and extent of the advisory services that Camelot Event-Driven Advisors LLC has provided were reasonable and consistent with the Board’s expectations. The Board also noted there has been consistent management, ready access to the principles of the firm, and no compliance or litigation issues.
Annual Report | 52
Frank Funds
ADDITIONAL INFORMATION (CONTINUED)
JUNE 30, 2024 (UNAUDITED)
As to the Camelot Event-Driven Fund’s performance, the Trustees reviewed information in the Report regarding the Camelot Fund’s returns since inception and for the year ended March 31, 2024. The Camelot Fund’s performance was compared to the S&P 500 Index and the Event-Driven Morningstar Category. The Board noted that the Camelot Fund’s performance trailed the performance of the S&P 500 Index in the three years ending March 31, 2024, but outperformed the Morningstar Peer Group. The Board reviewed the long-only index like the S&P 500 Index and agreed the Morningstar Peer Group of Event-Driven is appropriate for the Camelot Fund.
As to profits realized by Camelot Event-Driven Advisors LLC, the Board reviewed information regarding Camelot Event-Driven Advisors LLC’s income and expense for calendar year 2023. The Board noted that although Camelot Event-Driven Advisors LLC receives a Management Fee from the Camelot Fund, the fee is not enough to cover imputed costs. Thus, a portion of the Management Fee is waived to pay Fund expenses. The Board then discussed additional benefits received by Camelot Event-Driven Advisors LLC from the Camelot Fund, and agreed there were none. They concluded that Camelot Event-Driven Advisors LLC was not excessively profitable in relation to the Camelot Fund.
Mr. Frank stated he believed economies of scale would be achievable at $150 million of assets under management. At the time of the meeting the Camelot Fund’s AUM was $100 Million, thus a discussion of economies of scale was not relevant at this time due to the small size of the Fund. As a result of their deliberations, the Trustees, including the Independent Trustees, determined that the overall arrangement provided under the terms of the Management Agreement was a reasonable business arrangement, and that the renewal of the Management Agreement was in the best interests of the Trust and the Camelot Event-Driven Fund’s shareholders. Accordingly, they approved the continuation of the Management Agreement for an additional year.
Annual Report | 53
This Page Was Left Blank Intentionally
Annual Report | 54
Board of Trustees
Brian J. Frank
Jason W. Frey
Andrea Nitta
Hemanshu Patel
Jeffry Brown
Investment Advisers
Frank Capital Partners, LLC
781 Crandon Blvd., Unit 602
Key Biscayne, FL 33149
Camelot Event-Driven Advisors, LLC
1700 Woodlands Dr., Suite 100
Maumee, OH 43537
Dividend Paying Agent,
Shareholders’ Servicing Agent,
Transfer Agent
Mutual Shareholder Services, LLC
Custodian
UMB Financial Corporation
Independent Registered Public Accounting Firm
Sanville & Company
Legal Counsel
Thompson Hine LLP
This report is provided for the general information of the shareholders of the Value Fund, the West Hills Fund, and the Camelot Fund. This report is not intended for distribution to prospective investors in the Funds, unless preceded or accompanied by an effective prospectus.
Item 8. Changes in and Disagreements with Accountants for Open-End Management Investment Companies. Not applicable.
Item 9. Proxy Disclosures for Open-End Management Investment Companies. Not applicable.
Item 10. Remuneration Paid to Directors, Officers, and Others of Open-End Management Investment Companies. The information is included as part of the material filed under Item 7 of this Form.
Item 11. Statement Regarding Basis for Approval of Investment Advisory Contract. The information is included as part of the material filed under Item 7 of this Form.
Item 12. Disclosure of Proxy Voting Policies and Procedures for Closed-End Funds. Not applicable.
Item 13. Portfolio Managers of Closed-End Funds. Not applicable.
Item 14. Purchases of Equity Securities by Closed-End Funds. Not applicable.
Item 15. Submission of Matters to a Vote of Security Holders.
The registrant has not adopted procedures by which shareholders may recommend nominees to the registrant's board of trustees.
Item 16. Controls and Procedures.
| (a) | Disclosure Controls & Procedures. Principal executive and financial officers have concluded that Registrant’s disclosure controls & procedures are effective based on their evaluation as of a date within 90 days of the filing date of this report. |
| (b) | There were no significant changes in the registrant’s internal control over financial reporting that occurred during the period covered by this report that have materially affected, or are reasonably likely to materially affect, the registrant’s internal control over financial reporting. |
Item 17. Disclosure of Securities Lending Activities for Closed-End Management Investment Companies. Not applicable.
Item 18. Recovery of Erroneously Awarded Compensation.
(a) Not applicable.
(b) Not applicable.
Item 19. Exhibits.
(a)(1)
EX-99.CODE ETH. Filed herwith.
(a)(2)
EX-99.CERT. Filed herewith.
(a)(3)
Any written solicitation to purchase securities under Rule 23c-1 under the Act (17 CFR 270.23c-1) sent or given during the period covered by the report by or on behalf of the registrant to 10 or more persons. Not applicable.
(b)
EX-99.906CERT. Filed herewith.
SIGNATURES
Pursuant to the requirements of the Securities Exchange Act of 1934 and the Investment Company Act of 1940, the registrant has duly caused this report to be signed on its behalf by the undersigned, thereunto duly authorized.
FRANK FUNDS
| By | /s/ Brian J. Frank | |
| Brian J. Frank | ||
| President & Treasurer | ||
| Date: | September 9, 2024 |
Pursuant to the requirements of the Securities Exchange Act of 1934 and the Investment Company Act of 1940, this report has been signed below by the following persons on behalf of the registrant and in the capacities and on the dates indicated.
| By | /s/ Brian J. Frank | |
| Brian J. Frank | ||
| President & Treasurer | ||
| Date: | September 9, 2024 |