Shareholder Report
Jul. 31, 2024
USD ($)
Holding
What were the fund costs during the last year?
(Based on a hypothetical $10,000 investment)
| Fund (Class) | Costs of a $10,000 investment | Costs paid as a percentage of a $10,000 investment |
| Fundamental All Cap Core Fund (Class A/JFCAX) |
$127 | 1.13% |
Management’s Discussion of Fund Performance
SUMMARY OF RESULTS
Fundamental All Cap Core Fund (Class A/JFCAX) returned 24.58% (excluding sales charges) for the year ended July 31, 2024. The U.S. economy’s resilience, stabilized and potentially lower interest rates, plus investor enthusiasm for artificial intelligence (AI) helped fuel the market and fund’s gain.
TOP PERFORMANCE CONTRIBUTORS
The information technology sector was among the strongest performers in the portfolio in the annual period | A sizable stake in semiconductor company NVIDIA Corp., a leader in AI, surged, boosting the fund’s result.
The financials sector also stood out to the upside | An allocation to private equity company KKR & Co., Inc., which rallied sharply, notably aided fund performance.
The consumer discretionary sector further boosted the fund’s result | A sizable position in e-commerce leader Amazon.com, Inc. posted a steep gain.
TOP PERFORMANCE DETRACTORS
Consumer staples stocks generated a weak return in the fund | Of note was a position in natural foods and organic personal products company Hain Celestial Group, Inc., which plunged during the period.
Certain consumer discretionary stocks notably detracted from performance | They included recreational vehicle company Polaris, Inc. and luxury winter clothing company Canada Goose Holdings, Inc., each of which fell sharply.
The views expressed in this report are exclusively those of the portfolio management team at Manulife Investment Management (US) LLC, and are subject to change. They are not meant as investment advice.
Fund Performance
The following graph compares the initial and subsequent account values at the end of each of the most recently completed 10 fiscal years of the fund (or for the life of the fund, if shorter). It assumes a $10,000 initial investment in the fund and in an appropriate, broad-based securities market index for the same period.
GROWTH OF $10,000
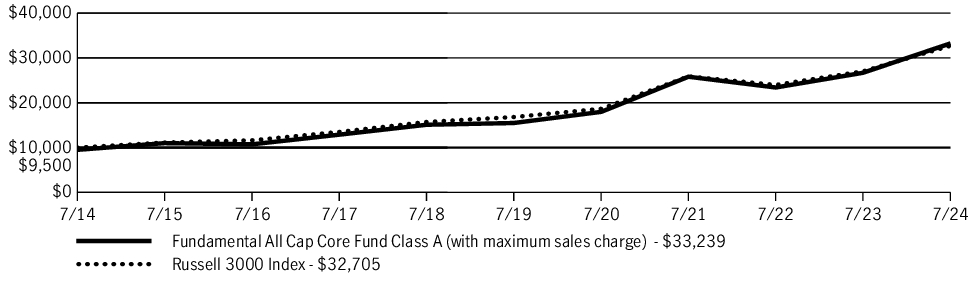
| AVERAGE ANNUAL TOTAL RETURN | 1 Year | 5 Years | 10 Years |
| Fundamental All Cap Core Fund (Class A/JFCAX) | 18.33% | 15.32% | 12.77% |
| Fundamental All Cap Core Fund (Class A/JFCAX)—excluding sales charge | 24.58% | 16.50% | 13.34% |
| Russell 3000 Index | 21.07% | 14.23% | 12.58% |
Fund Statistics
| Fund net assets | $540,770,122 |
| Total number of portfolio holdings | 49 |
| Total advisory fees paid (net) | $2,425,688 |
| Portfolio turnover rate | 12% |
Graphical Representation of Holdings
The tables below show the investment makeup of the fund, representing percentage of the total net assets of the fund.
Top Ten Holdings
| Amazon.com, Inc. | 7.3% |
| NVIDIA Corp. | 6.8% |
| Alphabet, Inc., Class A | 5.7% |
| Lennar Corp., Class A | 4.5% |
| KKR & Company, Inc. | 4.3% |
| Apple, Inc. | 4.1% |
| Morgan Stanley | 3.8% |
| Cheniere Energy, Inc. | 3.4% |
| First Hawaiian, Inc. | 3.4% |
| Analog Devices, Inc. | 3.1% |
Sector Composition
| Information technology | 26.2% |
| Consumer discretionary | 22.3% |
| Financials | 15.9% |
| Communication services | 9.7% |
| Health care | 7.1% |
| Industrials | 6.1% |
| Energy | 4.9% |
| Real estate | 3.5% |
| Consumer staples | 1.4% |
| Materials | 1.0% |
| Short-term investments and other | 1.9% |
Holdings may not have been held by the fund for the entire period and are subject to change without notice. Portfolio composition is subject to review in accordance with the fund’s investment strategy and may vary in the future. Current and future portfolio holdings are subject to risk and may change at any time.
Top Ten Holdings
| Amazon.com, Inc. | 7.3% |
| NVIDIA Corp. | 6.8% |
| Alphabet, Inc., Class A | 5.7% |
| Lennar Corp., Class A | 4.5% |
| KKR & Company, Inc. | 4.3% |
| Apple, Inc. | 4.1% |
| Morgan Stanley | 3.8% |
| Cheniere Energy, Inc. | 3.4% |
| First Hawaiian, Inc. | 3.4% |
| Analog Devices, Inc. | 3.1% |
What were the fund costs during the last year?
(Based on a hypothetical $10,000 investment)
| Fund (Class) | Costs of a $10,000 investment | Costs paid as a percentage of a $10,000 investment |
| Fundamental All Cap Core Fund (Class C/JFCCX) |
$205 | 1.83% |
Management’s Discussion of Fund Performance
SUMMARY OF RESULTS
Fundamental All Cap Core Fund (Class C/JFCCX) returned 23.70% (excluding sales charges) for the year ended July 31, 2024. The U.S. economy’s resilience, stabilized and potentially lower interest rates, plus investor enthusiasm for artificial intelligence (AI) helped fuel the market and fund’s gain.
TOP PERFORMANCE CONTRIBUTORS
The information technology sector was among the strongest performers in the portfolio in the annual period | A sizable stake in semiconductor company NVIDIA Corp., a leader in AI, surged, boosting the fund’s result.
The financials sector also stood out to the upside | An allocation to private equity company KKR & Co., Inc., which rallied sharply, notably aided fund performance.
The consumer discretionary sector further boosted the fund’s result | A sizable position in e-commerce leader Amazon.com, Inc. posted a steep gain.
TOP PERFORMANCE DETRACTORS
Consumer staples stocks generated a weak return in the fund | Of note was a position in natural foods and organic personal products company Hain Celestial Group, Inc., which plunged during the period.
Certain consumer discretionary stocks notably detracted from performance | They included recreational vehicle company Polaris, Inc. and luxury winter clothing company Canada Goose Holdings, Inc., each of which fell sharply.
The views expressed in this report are exclusively those of the portfolio management team at Manulife Investment Management (US) LLC, and are subject to change. They are not meant as investment advice.
Fund Performance
The following graph compares the initial and subsequent account values at the end of each of the most recently completed 10 fiscal years of the fund (or for the life of the fund, if shorter). It assumes a $10,000 initial investment in the fund and in an appropriate, broad-based securities market index for the same period.
GROWTH OF $10,000
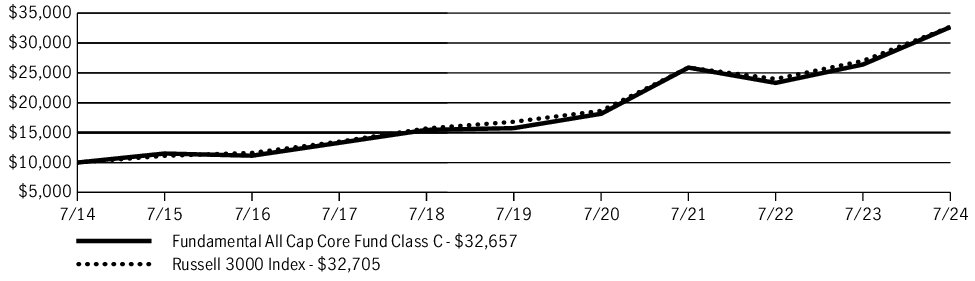
| AVERAGE ANNUAL TOTAL RETURN | 1 Year | 5 Years | 10 Years |
| Fundamental All Cap Core Fund (Class C/JFCCX) | 22.70% | 15.69% | 12.56% |
| Fundamental All Cap Core Fund (Class C/JFCCX)—excluding sales charge | 23.70% | 15.69% | 12.56% |
| Russell 3000 Index | 21.07% | 14.23% | 12.58% |
Fund Statistics
| Fund net assets | $540,770,122 |
| Total number of portfolio holdings | 49 |
| Total advisory fees paid (net) | $2,425,688 |
| Portfolio turnover rate | 12% |
Graphical Representation of Holdings
The tables below show the investment makeup of the fund, representing percentage of the total net assets of the fund.
Top Ten Holdings
| Amazon.com, Inc. | 7.3% |
| NVIDIA Corp. | 6.8% |
| Alphabet, Inc., Class A | 5.7% |
| Lennar Corp., Class A | 4.5% |
| KKR & Company, Inc. | 4.3% |
| Apple, Inc. | 4.1% |
| Morgan Stanley | 3.8% |
| Cheniere Energy, Inc. | 3.4% |
| First Hawaiian, Inc. | 3.4% |
| Analog Devices, Inc. | 3.1% |
Sector Composition
| Information technology | 26.2% |
| Consumer discretionary | 22.3% |
| Financials | 15.9% |
| Communication services | 9.7% |
| Health care | 7.1% |
| Industrials | 6.1% |
| Energy | 4.9% |
| Real estate | 3.5% |
| Consumer staples | 1.4% |
| Materials | 1.0% |
| Short-term investments and other | 1.9% |
Holdings may not have been held by the fund for the entire period and are subject to change without notice. Portfolio composition is subject to review in accordance with the fund’s investment strategy and may vary in the future. Current and future portfolio holdings are subject to risk and may change at any time.
Top Ten Holdings
| Amazon.com, Inc. | 7.3% |
| NVIDIA Corp. | 6.8% |
| Alphabet, Inc., Class A | 5.7% |
| Lennar Corp., Class A | 4.5% |
| KKR & Company, Inc. | 4.3% |
| Apple, Inc. | 4.1% |
| Morgan Stanley | 3.8% |
| Cheniere Energy, Inc. | 3.4% |
| First Hawaiian, Inc. | 3.4% |
| Analog Devices, Inc. | 3.1% |
What were the fund costs during the last year?
(Based on a hypothetical $10,000 investment)
| Fund (Class) | Costs of a $10,000 investment | Costs paid as a percentage of a $10,000 investment |
| Fundamental All Cap Core Fund (Class I/JFCIX) |
$93 | 0.83% |
Management’s Discussion of Fund Performance
SUMMARY OF RESULTS
Fundamental All Cap Core Fund (Class I/JFCIX) returned 24.95% for the year ended July 31, 2024. The U.S. economy’s resilience, stabilized and potentially lower interest rates, plus investor enthusiasm for artificial intelligence (AI) helped fuel the market and fund’s gain.
TOP PERFORMANCE CONTRIBUTORS
The information technology sector was among the strongest performers in the portfolio in the annual period | A sizable stake in semiconductor company NVIDIA Corp., a leader in AI, surged, boosting the fund’s result.
The financials sector also stood out to the upside | An allocation to private equity company KKR & Co., Inc., which rallied sharply, notably aided fund performance.
The consumer discretionary sector further boosted the fund’s result | A sizable position in e-commerce leader Amazon.com, Inc. posted a steep gain.
TOP PERFORMANCE DETRACTORS
Consumer staples stocks generated a weak return in the fund | Of note was a position in natural foods and organic personal products company Hain Celestial Group, Inc., which plunged during the period.
Certain consumer discretionary stocks notably detracted from performance | They included recreational vehicle company Polaris, Inc. and luxury winter clothing company Canada Goose Holdings, Inc., each of which fell sharply.
The views expressed in this report are exclusively those of the portfolio management team at Manulife Investment Management (US) LLC, and are subject to change. They are not meant as investment advice.
Fund Performance
The following graph compares the initial and subsequent account values at the end of each of the most recently completed 10 fiscal years of the fund (or for the life of the fund, if shorter). It assumes a $250,000 initial investment in the fund and in an appropriate, broad-based securities market index for the same period.
GROWTH OF $250,000
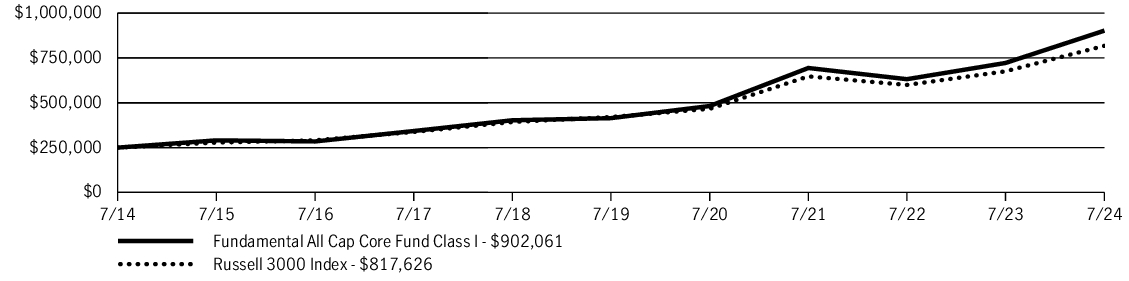
| AVERAGE ANNUAL TOTAL RETURN | 1 Year | 5 Years | 10 Years |
| Fundamental All Cap Core Fund (Class I/JFCIX) | 24.95% | 16.84% | 13.69% |
| Russell 3000 Index | 21.07% | 14.23% | 12.58% |
Fund Statistics
| Fund net assets | $540,770,122 |
| Total number of portfolio holdings | 49 |
| Total advisory fees paid (net) | $2,425,688 |
| Portfolio turnover rate | 12% |
Graphical Representation of Holdings
The tables below show the investment makeup of the fund, representing percentage of the total net assets of the fund.
Top Ten Holdings
| Amazon.com, Inc. | 7.3% |
| NVIDIA Corp. | 6.8% |
| Alphabet, Inc., Class A | 5.7% |
| Lennar Corp., Class A | 4.5% |
| KKR & Company, Inc. | 4.3% |
| Apple, Inc. | 4.1% |
| Morgan Stanley | 3.8% |
| Cheniere Energy, Inc. | 3.4% |
| First Hawaiian, Inc. | 3.4% |
| Analog Devices, Inc. | 3.1% |
Sector Composition
| Information technology | 26.2% |
| Consumer discretionary | 22.3% |
| Financials | 15.9% |
| Communication services | 9.7% |
| Health care | 7.1% |
| Industrials | 6.1% |
| Energy | 4.9% |
| Real estate | 3.5% |
| Consumer staples | 1.4% |
| Materials | 1.0% |
| Short-term investments and other | 1.9% |
Holdings may not have been held by the fund for the entire period and are subject to change without notice. Portfolio composition is subject to review in accordance with the fund’s investment strategy and may vary in the future. Current and future portfolio holdings are subject to risk and may change at any time.
Top Ten Holdings
| Amazon.com, Inc. | 7.3% |
| NVIDIA Corp. | 6.8% |
| Alphabet, Inc., Class A | 5.7% |
| Lennar Corp., Class A | 4.5% |
| KKR & Company, Inc. | 4.3% |
| Apple, Inc. | 4.1% |
| Morgan Stanley | 3.8% |
| Cheniere Energy, Inc. | 3.4% |
| First Hawaiian, Inc. | 3.4% |
| Analog Devices, Inc. | 3.1% |
What were the fund costs during the last year?
(Based on a hypothetical $10,000 investment)
| Fund (Class) | Costs of a $10,000 investment | Costs paid as a percentage of a $10,000 investment |
| Fundamental All Cap Core Fund (Class R2/JFACX) |
$136 | 1.21% |
Management’s Discussion of Fund Performance
SUMMARY OF RESULTS
Fundamental All Cap Core Fund (Class R2/JFACX) returned 24.49% for the year ended July 31, 2024. The U.S. economy’s resilience, stabilized and potentially lower interest rates, plus investor enthusiasm for artificial intelligence (AI) helped fuel the market and fund’s gain.
TOP PERFORMANCE CONTRIBUTORS
The information technology sector was among the strongest performers in the portfolio in the annual period | A sizable stake in semiconductor company NVIDIA Corp., a leader in AI, surged, boosting the fund’s result.
The financials sector also stood out to the upside | An allocation to private equity company KKR & Co., Inc., which rallied sharply, notably aided fund performance.
The consumer discretionary sector further boosted the fund’s result | A sizable position in e-commerce leader Amazon.com, Inc. posted a steep gain.
TOP PERFORMANCE DETRACTORS
Consumer staples stocks generated a weak return in the fund | Of note was a position in natural foods and organic personal products company Hain Celestial Group, Inc., which plunged during the period.
Certain consumer discretionary stocks notably detracted from performance | They included recreational vehicle company Polaris, Inc. and luxury winter clothing company Canada Goose Holdings, Inc., each of which fell sharply.
The views expressed in this report are exclusively those of the portfolio management team at Manulife Investment Management (US) LLC, and are subject to change. They are not meant as investment advice.
Fund Performance
The following graph compares the initial and subsequent account values at the end of each of the most recently completed 10 fiscal years of the fund (or for the life of the fund, if shorter). It assumes a $10,000 initial investment in the fund and in an appropriate, broad-based securities market index for the same period.
GROWTH OF $10,000
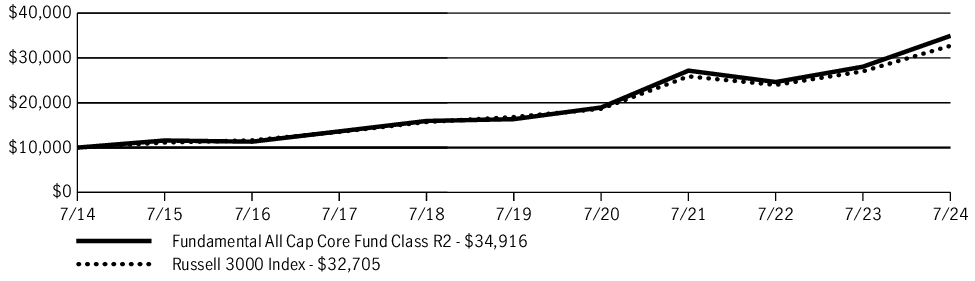
| AVERAGE ANNUAL TOTAL RETURN | 1 Year | 5 Years | 10 Years |
| Fundamental All Cap Core Fund (Class R2/JFACX) | 24.49% | 16.39% | 13.32% |
| Russell 3000 Index | 21.07% | 14.23% | 12.58% |
Fund Statistics
| Fund net assets | $540,770,122 |
| Total number of portfolio holdings | 49 |
| Total advisory fees paid (net) | $2,425,688 |
| Portfolio turnover rate | 12% |
Graphical Representation of Holdings
The tables below show the investment makeup of the fund, representing percentage of the total net assets of the fund.
Top Ten Holdings
| Amazon.com, Inc. | 7.3% |
| NVIDIA Corp. | 6.8% |
| Alphabet, Inc., Class A | 5.7% |
| Lennar Corp., Class A | 4.5% |
| KKR & Company, Inc. | 4.3% |
| Apple, Inc. | 4.1% |
| Morgan Stanley | 3.8% |
| Cheniere Energy, Inc. | 3.4% |
| First Hawaiian, Inc. | 3.4% |
| Analog Devices, Inc. | 3.1% |
Sector Composition
| Information technology | 26.2% |
| Consumer discretionary | 22.3% |
| Financials | 15.9% |
| Communication services | 9.7% |
| Health care | 7.1% |
| Industrials | 6.1% |
| Energy | 4.9% |
| Real estate | 3.5% |
| Consumer staples | 1.4% |
| Materials | 1.0% |
| Short-term investments and other | 1.9% |
Holdings may not have been held by the fund for the entire period and are subject to change without notice. Portfolio composition is subject to review in accordance with the fund’s investment strategy and may vary in the future. Current and future portfolio holdings are subject to risk and may change at any time.
Top Ten Holdings
| Amazon.com, Inc. | 7.3% |
| NVIDIA Corp. | 6.8% |
| Alphabet, Inc., Class A | 5.7% |
| Lennar Corp., Class A | 4.5% |
| KKR & Company, Inc. | 4.3% |
| Apple, Inc. | 4.1% |
| Morgan Stanley | 3.8% |
| Cheniere Energy, Inc. | 3.4% |
| First Hawaiian, Inc. | 3.4% |
| Analog Devices, Inc. | 3.1% |
What were the fund costs during the last year?
(Based on a hypothetical $10,000 investment)
| Fund (Class) | Costs of a $10,000 investment | Costs paid as a percentage of a $10,000 investment |
| Fundamental All Cap Core Fund (Class R4/JFARX) |
$100 | 0.89% |
Management’s Discussion of Fund Performance
SUMMARY OF RESULTS
Fundamental All Cap Core Fund (Class R4/JFARX) returned 24.85% for the year ended July 31, 2024. The U.S. economy’s resilience, stabilized and potentially lower interest rates, plus investor enthusiasm for artificial intelligence (AI) helped fuel the market and fund’s gain.
TOP PERFORMANCE CONTRIBUTORS
The information technology sector was among the strongest performers in the portfolio in the annual period | A sizable stake in semiconductor company NVIDIA Corp., a leader in AI, surged, boosting the fund’s result.
The financials sector also stood out to the upside | An allocation to private equity company KKR & Co., Inc., which rallied sharply, notably aided fund performance.
The consumer discretionary sector further boosted the fund’s result | A sizable position in e-commerce leader Amazon.com, Inc. posted a steep gain.
TOP PERFORMANCE DETRACTORS
Consumer staples stocks generated a weak return in the fund | Of note was a position in natural foods and organic personal products company Hain Celestial Group, Inc., which plunged during the period.
Certain consumer discretionary stocks notably detracted from performance | They included recreational vehicle company Polaris, Inc. and luxury winter clothing company Canada Goose Holdings, Inc., each of which fell sharply.
The views expressed in this report are exclusively those of the portfolio management team at Manulife Investment Management (US) LLC, and are subject to change. They are not meant as investment advice.
Fund Performance
The following graph compares the initial and subsequent account values at the end of each of the most recently completed 10 fiscal years of the fund (or for the life of the fund, if shorter). It assumes a $10,000 initial investment in the fund and in an appropriate, broad-based securities market index for the same period.
GROWTH OF $10,000
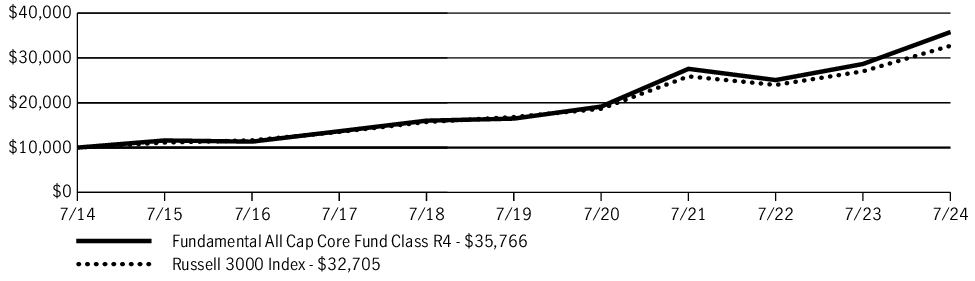
| AVERAGE ANNUAL TOTAL RETURN | 1 Year | 5 Years | 10 Years |
| Fundamental All Cap Core Fund (Class R4/JFARX) | 24.85% | 16.78% | 13.59% |
| Russell 3000 Index | 21.07% | 14.23% | 12.58% |
Fund Statistics
| Fund net assets | $540,770,122 |
| Total number of portfolio holdings | 49 |
| Total advisory fees paid (net) | $2,425,688 |
| Portfolio turnover rate | 12% |
Graphical Representation of Holdings
The tables below show the investment makeup of the fund, representing percentage of the total net assets of the fund.
Top Ten Holdings
| Amazon.com, Inc. | 7.3% |
| NVIDIA Corp. | 6.8% |
| Alphabet, Inc., Class A | 5.7% |
| Lennar Corp., Class A | 4.5% |
| KKR & Company, Inc. | 4.3% |
| Apple, Inc. | 4.1% |
| Morgan Stanley | 3.8% |
| Cheniere Energy, Inc. | 3.4% |
| First Hawaiian, Inc. | 3.4% |
| Analog Devices, Inc. | 3.1% |
Sector Composition
| Information technology | 26.2% |
| Consumer discretionary | 22.3% |
| Financials | 15.9% |
| Communication services | 9.7% |
| Health care | 7.1% |
| Industrials | 6.1% |
| Energy | 4.9% |
| Real estate | 3.5% |
| Consumer staples | 1.4% |
| Materials | 1.0% |
| Short-term investments and other | 1.9% |
Holdings may not have been held by the fund for the entire period and are subject to change without notice. Portfolio composition is subject to review in accordance with the fund’s investment strategy and may vary in the future. Current and future portfolio holdings are subject to risk and may change at any time.
Top Ten Holdings
| Amazon.com, Inc. | 7.3% |
| NVIDIA Corp. | 6.8% |
| Alphabet, Inc., Class A | 5.7% |
| Lennar Corp., Class A | 4.5% |
| KKR & Company, Inc. | 4.3% |
| Apple, Inc. | 4.1% |
| Morgan Stanley | 3.8% |
| Cheniere Energy, Inc. | 3.4% |
| First Hawaiian, Inc. | 3.4% |
| Analog Devices, Inc. | 3.1% |
What were the fund costs during the last year?
(Based on a hypothetical $10,000 investment)
| Fund (Class) | Costs of a $10,000 investment | Costs paid as a percentage of a $10,000 investment |
| Fundamental All Cap Core Fund (Class R6/JFAIX) |
$81 | 0.72% |
Management’s Discussion of Fund Performance
SUMMARY OF RESULTS
Fundamental All Cap Core Fund (Class R6/JFAIX) returned 25.10% for the year ended July 31, 2024. The U.S. economy’s resilience, stabilized and potentially lower interest rates, plus investor enthusiasm for artificial intelligence (AI) helped fuel the market and fund’s gain.
TOP PERFORMANCE CONTRIBUTORS
The information technology sector was among the strongest performers in the portfolio in the annual period | A sizable stake in semiconductor company NVIDIA Corp., a leader in AI, surged, boosting the fund’s result.
The financials sector also stood out to the upside | An allocation to private equity company KKR & Co., Inc., which rallied sharply, notably aided fund performance.
The consumer discretionary sector further boosted the fund’s result | A sizable position in e-commerce leader Amazon.com, Inc. posted a steep gain.
TOP PERFORMANCE DETRACTORS
Consumer staples stocks generated a weak return in the fund | Of note was a position in natural foods and organic personal products company Hain Celestial Group, Inc., which plunged during the period.
Certain consumer discretionary stocks notably detracted from performance | They included recreational vehicle company Polaris, Inc. and luxury winter clothing company Canada Goose Holdings, Inc., each of which fell sharply.
The views expressed in this report are exclusively those of the portfolio management team at Manulife Investment Management (US) LLC, and are subject to change. They are not meant as investment advice.
Fund Performance
The following graph compares the initial and subsequent account values at the end of each of the most recently completed 10 fiscal years of the fund (or for the life of the fund, if shorter). It assumes a $1,000,000 initial investment in the fund and in an appropriate, broad-based securities market index for the same period.
GROWTH OF $1,000,000
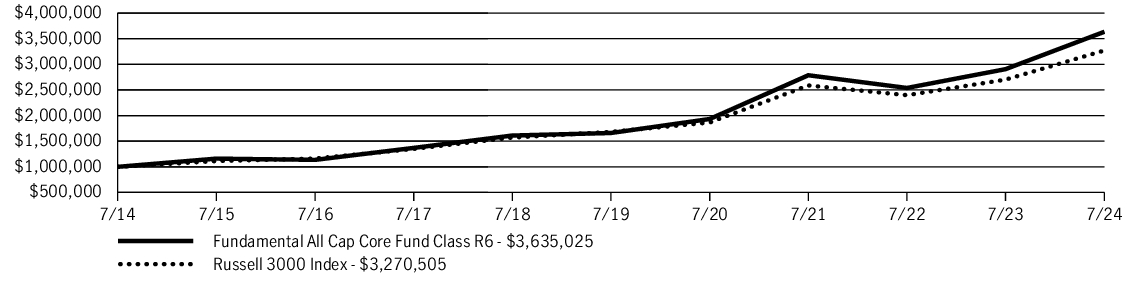
| AVERAGE ANNUAL TOTAL RETURN | 1 Year | 5 Years | 10 Years |
| Fundamental All Cap Core Fund (Class R6/JFAIX) | 25.10% | 16.97% | 13.78% |
| Russell 3000 Index | 21.07% | 14.23% | 12.58% |
Fund Statistics
| Fund net assets | $540,770,122 |
| Total number of portfolio holdings | 49 |
| Total advisory fees paid (net) | $2,425,688 |
| Portfolio turnover rate | 12% |
Graphical Representation of Holdings
The tables below show the investment makeup of the fund, representing percentage of the total net assets of the fund.
Top Ten Holdings
| Amazon.com, Inc. | 7.3% |
| NVIDIA Corp. | 6.8% |
| Alphabet, Inc., Class A | 5.7% |
| Lennar Corp., Class A | 4.5% |
| KKR & Company, Inc. | 4.3% |
| Apple, Inc. | 4.1% |
| Morgan Stanley | 3.8% |
| Cheniere Energy, Inc. | 3.4% |
| First Hawaiian, Inc. | 3.4% |
| Analog Devices, Inc. | 3.1% |
Sector Composition
| Information technology | 26.2% |
| Consumer discretionary | 22.3% |
| Financials | 15.9% |
| Communication services | 9.7% |
| Health care | 7.1% |
| Industrials | 6.1% |
| Energy | 4.9% |
| Real estate | 3.5% |
| Consumer staples | 1.4% |
| Materials | 1.0% |
| Short-term investments and other | 1.9% |
Holdings may not have been held by the fund for the entire period and are subject to change without notice. Portfolio composition is subject to review in accordance with the fund’s investment strategy and may vary in the future. Current and future portfolio holdings are subject to risk and may change at any time.
Top Ten Holdings
| Amazon.com, Inc. | 7.3% |
| NVIDIA Corp. | 6.8% |
| Alphabet, Inc., Class A | 5.7% |
| Lennar Corp., Class A | 4.5% |
| KKR & Company, Inc. | 4.3% |
| Apple, Inc. | 4.1% |
| Morgan Stanley | 3.8% |
| Cheniere Energy, Inc. | 3.4% |
| First Hawaiian, Inc. | 3.4% |
| Analog Devices, Inc. | 3.1% |
What were the fund costs during the last year?
(Based on a hypothetical $10,000 investment)
| Fund (Class) | Costs of a $10,000 investment | Costs paid as a percentage of a $10,000 investment |
| Multi-Asset Absolute Return Fund (Class A/JHAAX) |
$164 | 1.61% |
Management’s Discussion of Fund Performance
SUMMARY OF RESULTS
Multi-Asset Absolute Return Fund (Class A/JHAAX) returned 3.18% (excluding sales charges) for the year ended July 31, 2024. The most significant factors affecting fund performance during the period included a meaningful rally in global equity markets, led primarily by growth-oriented stocks in developed markets, and a shift from interest-rate increases to easier monetary policy by many of the world’s central banks—with notable exceptions in the U.S. and Japan.
TOP PERFORMANCE CONTRIBUTORS
Developed market stocks | Equities in developed countries were among the best performers, adding to the fund's performance.
Cash | A small cash and cash-equivalents position provided a noteworthy level of interest income.
Credit-related bonds | Selected, tactical positions in credit contributed modestly to performance.
TOP PERFORMANCE DETRACTORS
Defensive equity strategy | This strategy, which includes long positions in lower-risk stocks and short positions in broad equity indexes, detracted from performance as lower-risk stocks underperformed the broader market.
Foreign currency exposure | The fund’s defensive long/short positions in high-quality foreign currencies were a drag on performance, due in large part to the Japanese yen’s depreciation against most major currencies.
The views expressed in this report are exclusively those of the portfolio management team at Nordea Investment Management North America, Inc., and are subject to change. They are not meant as investment advice.
Fund Performance
The following graph compares the initial and subsequent account values at the end of each of the most recently completed 10 fiscal years of the fund (or for the life of the fund, if shorter). It assumes a $10,000 initial investment in the fund and in an appropriate, broad-based securities market index for the same period.
GROWTH OF $10,000
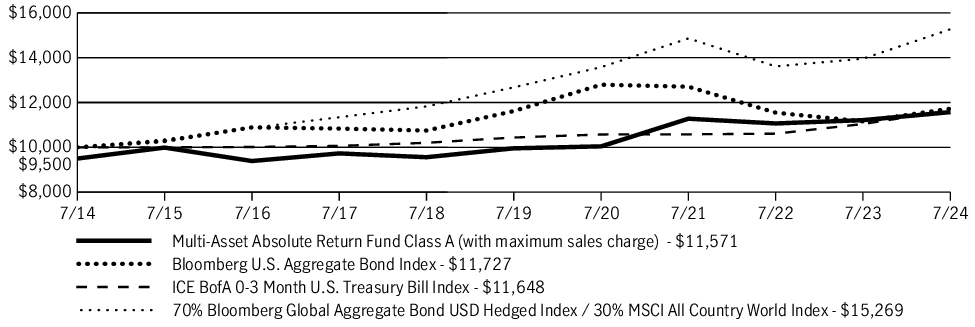
| AVERAGE ANNUAL TOTAL RETURN | 1 Year | 5 Years | 10 Years |
| Multi-Asset Absolute Return Fund (Class A/JHAAX) | (1.95)% | 2.01% | 1.47% |
| Multi-Asset Absolute Return Fund (Class A/JHAAX)—excluding sales charge | 3.18% | 3.05% | 1.99% |
| Bloomberg U.S. Aggregate Bond Index | 5.10% | 0.19% | 1.61% |
| ICE BofA 0-3 Month U.S. Treasury Bill Index | 5.50% | 2.22% | 1.54% |
| 70% Bloomberg Global Aggregate Bond USD Hedged Index / 30% MSCI All Country World Index | 9.43% | 3.79% | 4.32% |
Fund Statistics
| Fund net assets | $332,854,409 |
| Total number of portfolio holdings | 341 |
| Total advisory fees paid (net) | $3,836,333 |
| Portfolio turnover rate | 47% |
Graphical Representation of Holdings
The tables below show the investment makeup of the fund, representing percentage of the total net assets of the fund.
Portfolio Composition
| Common stocks | 88.5% |
| Information technology | 16.6% |
| Consumer staples | 14.5% |
| Health care | 14.2% |
| Consumer discretionary | 12.4% |
| Financials | 11.2% |
| Communication services | 9.4% |
| Industrials | 6.8% |
| Utilities | 2.7% |
| Materials | 0.6% |
| Real estate | 0.1% |
| Corporate bonds | 3.4% |
| U.S. Government | 2.9% |
| Other assets and liabilities, net | 5.2% |
Country Composition
| United States | 76.0% |
| Denmark | 4.5% |
| United Kingdom | 2.9% |
| France | 2.5% |
| Ireland | 1.9% |
| Taiwan | 1.7% |
| China | 1.7% |
| Germany | 1.5% |
| South Korea | 1.4% |
| Japan | 1.3% |
| Other countries | 4.6% |
Holdings may not have been held by the fund for the entire period and are subject to change without notice. Portfolio composition is subject to review in accordance with the fund’s investment strategy and may vary in the future. Current and future portfolio holdings are subject to risk and may change at any time.
What were the fund costs during the last year?
(Based on a hypothetical $10,000 investment)
| Fund (Class) | Costs of a $10,000 investment | Costs paid as a percentage of a $10,000 investment |
| Multi-Asset Absolute Return Fund (Class C/JHACX) |
$234 | 2.31% |
Management’s Discussion of Fund Performance
SUMMARY OF RESULTS
Multi-Asset Absolute Return Fund (Class C/JHACX) returned 2.45% (excluding sales charges) for the year ended July 31, 2024. The most significant factors affecting fund performance during the period included a meaningful rally in global equity markets, led primarily by growth-oriented stocks in developed markets, and a shift from interest-rate increases to easier monetary policy by many of the world’s central banks—with notable exceptions in the U.S. and Japan.
TOP PERFORMANCE CONTRIBUTORS
Developed market stocks | Equities in developed countries were among the best performers, adding to the fund's performance.
Cash | A small cash and cash-equivalents position provided a noteworthy level of interest income.
Credit-related bonds | Selected, tactical positions in credit contributed modestly to performance.
TOP PERFORMANCE DETRACTORS
Defensive equity strategy | This strategy, which includes long positions in lower-risk stocks and short positions in broad equity indexes, detracted from performance as lower-risk stocks underperformed the broader market.
Foreign currency exposure | The fund’s defensive long/short positions in high-quality foreign currencies were a drag on performance, due in large part to the Japanese yen’s depreciation against most major currencies.
The views expressed in this report are exclusively those of the portfolio management team at Nordea Investment Management North America, Inc., and are subject to change. They are not meant as investment advice.
Fund Performance
The following graph compares the initial and subsequent account values at the end of each of the most recently completed 10 fiscal years of the fund (or for the life of the fund, if shorter). It assumes a $10,000 initial investment in the fund and in an appropriate, broad-based securities market index for the same period.
GROWTH OF $10,000
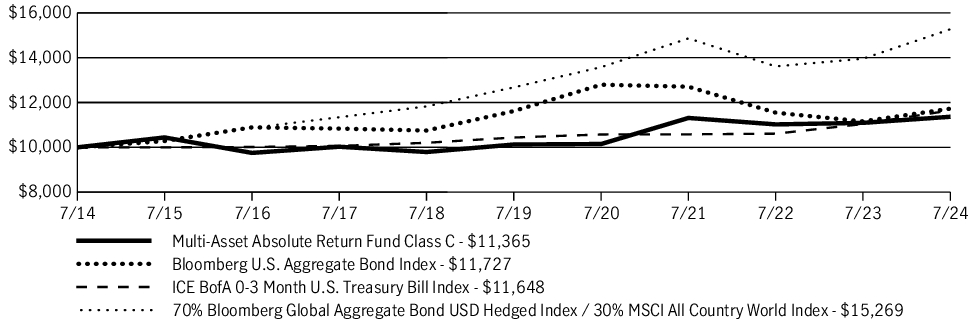
| AVERAGE ANNUAL TOTAL RETURN | 1 Year | 5 Years | 10 Years |
| Multi-Asset Absolute Return Fund (Class C/JHACX) | 1.45% | 2.33% | 1.29% |
| Multi-Asset Absolute Return Fund (Class C/JHACX)—excluding sales charge | 2.45% | 2.33% | 1.29% |
| Bloomberg U.S. Aggregate Bond Index | 5.10% | 0.19% | 1.61% |
| ICE BofA 0-3 Month U.S. Treasury Bill Index | 5.50% | 2.22% | 1.54% |
| 70% Bloomberg Global Aggregate Bond USD Hedged Index / 30% MSCI All Country World Index | 9.43% | 3.79% | 4.32% |
Fund Statistics
| Fund net assets | $332,854,409 |
| Total number of portfolio holdings | 341 |
| Total advisory fees paid (net) | $3,836,333 |
| Portfolio turnover rate | 47% |
Graphical Representation of Holdings
The tables below show the investment makeup of the fund, representing percentage of the total net assets of the fund.
Portfolio Composition
| Common stocks | 88.5% |
| Information technology | 16.6% |
| Consumer staples | 14.5% |
| Health care | 14.2% |
| Consumer discretionary | 12.4% |
| Financials | 11.2% |
| Communication services | 9.4% |
| Industrials | 6.8% |
| Utilities | 2.7% |
| Materials | 0.6% |
| Real estate | 0.1% |
| Corporate bonds | 3.4% |
| U.S. Government | 2.9% |
| Other assets and liabilities, net | 5.2% |
Country Composition
| United States | 76.0% |
| Denmark | 4.5% |
| United Kingdom | 2.9% |
| France | 2.5% |
| Ireland | 1.9% |
| Taiwan | 1.7% |
| China | 1.7% |
| Germany | 1.5% |
| South Korea | 1.4% |
| Japan | 1.3% |
| Other countries | 4.6% |
Holdings may not have been held by the fund for the entire period and are subject to change without notice. Portfolio composition is subject to review in accordance with the fund’s investment strategy and may vary in the future. Current and future portfolio holdings are subject to risk and may change at any time.
What were the fund costs during the last year?
(Based on a hypothetical $10,000 investment)
| Fund (Class) | Costs of a $10,000 investment | Costs paid as a percentage of a $10,000 investment |
| Multi-Asset Absolute Return Fund (Class I/JHAIX) |
$133 | 1.31% |
Management’s Discussion of Fund Performance
SUMMARY OF RESULTS
Multi-Asset Absolute Return Fund (Class I/JHAIX) returned 3.42% for the year ended July 31, 2024. The most significant factors affecting fund performance during the period included a meaningful rally in global equity markets, led primarily by growth-oriented stocks in developed markets, and a shift from interest-rate increases to easier monetary policy by many of the world’s central banks—with notable exceptions in the U.S. and Japan.
TOP PERFORMANCE CONTRIBUTORS
Developed market stocks | Equities in developed countries were among the best performers, adding to the fund's performance.
Cash | A small cash and cash-equivalents position provided a noteworthy level of interest income.
Credit-related bonds | Selected, tactical positions in credit contributed modestly to performance.
TOP PERFORMANCE DETRACTORS
Defensive equity strategy | This strategy, which includes long positions in lower-risk stocks and short positions in broad equity indexes, detracted from performance as lower-risk stocks underperformed the broader market.
Foreign currency exposure | The fund’s defensive long/short positions in high-quality foreign currencies were a drag on performance, due in large part to the Japanese yen’s depreciation against most major currencies.
The views expressed in this report are exclusively those of the portfolio management team at Nordea Investment Management North America, Inc., and are subject to change. They are not meant as investment advice.
Fund Performance
The following graph compares the initial and subsequent account values at the end of each of the most recently completed 10 fiscal years of the fund (or for the life of the fund, if shorter). It assumes a $250,000 initial investment in the fund and in an appropriate, broad-based securities market index for the same period.
GROWTH OF $250,000
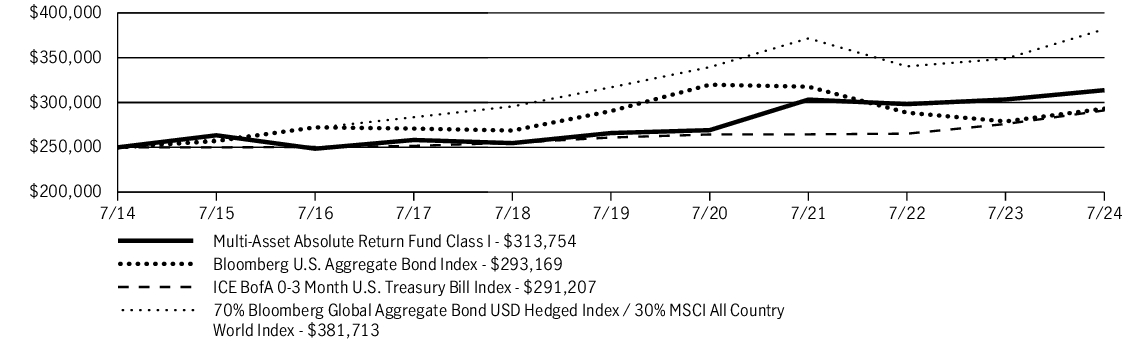
| AVERAGE ANNUAL TOTAL RETURN | 1 Year | 5 Years | 10 Years |
| Multi-Asset Absolute Return Fund (Class I/JHAIX) | 3.42% | 3.36% | 2.30% |
| Bloomberg U.S. Aggregate Bond Index | 5.10% | 0.19% | 1.61% |
| ICE BofA 0-3 Month U.S. Treasury Bill Index | 5.50% | 2.22% | 1.54% |
| 70% Bloomberg Global Aggregate Bond USD Hedged Index / 30% MSCI All Country World Index | 9.43% | 3.79% | 4.32% |
Fund Statistics
| Fund net assets | $332,854,409 |
| Total number of portfolio holdings | 341 |
| Total advisory fees paid (net) | $3,836,333 |
| Portfolio turnover rate | 47% |
Graphical Representation of Holdings
The tables below show the investment makeup of the fund, representing percentage of the total net assets of the fund.
Portfolio Composition
| Common stocks | 88.5% |
| Information technology | 16.6% |
| Consumer staples | 14.5% |
| Health care | 14.2% |
| Consumer discretionary | 12.4% |
| Financials | 11.2% |
| Communication services | 9.4% |
| Industrials | 6.8% |
| Utilities | 2.7% |
| Materials | 0.6% |
| Real estate | 0.1% |
| Corporate bonds | 3.4% |
| U.S. Government | 2.9% |
| Other assets and liabilities, net | 5.2% |
Country Composition
| United States | 76.0% |
| Denmark | 4.5% |
| United Kingdom | 2.9% |
| France | 2.5% |
| Ireland | 1.9% |
| Taiwan | 1.7% |
| China | 1.7% |
| Germany | 1.5% |
| South Korea | 1.4% |
| Japan | 1.3% |
| Other countries | 4.6% |
Holdings may not have been held by the fund for the entire period and are subject to change without notice. Portfolio composition is subject to review in accordance with the fund’s investment strategy and may vary in the future. Current and future portfolio holdings are subject to risk and may change at any time.
What were the fund costs during the last year?
(Based on a hypothetical $10,000 investment)
| Fund (Class) | Costs of a $10,000 investment | Costs paid as a percentage of a $10,000 investment |
| Multi-Asset Absolute Return Fund (Class NAV) |
$122 | 1.20% |
Management’s Discussion of Fund Performance
SUMMARY OF RESULTS
Multi-Asset Absolute Return Fund (Class NAV) returned 3.61% for the year ended July 31, 2024. The most significant factors affecting fund performance during the period included a meaningful rally in global equity markets, led primarily by growth-oriented stocks in developed markets, and a shift from interest-rate increases to easier monetary policy by many of the world’s central banks—with notable exceptions in the U.S. and Japan.
TOP PERFORMANCE CONTRIBUTORS
Developed market stocks | Equities in developed countries were among the best performers, adding to the fund's performance.
Cash | A small cash and cash-equivalents position provided a noteworthy level of interest income.
Credit-related bonds | Selected, tactical positions in credit contributed modestly to performance.
TOP PERFORMANCE DETRACTORS
Defensive equity strategy | This strategy, which includes long positions in lower-risk stocks and short positions in broad equity indexes, detracted from performance as lower-risk stocks underperformed the broader market.
Foreign currency exposure | The fund’s defensive long/short positions in high-quality foreign currencies were a drag on performance, due in large part to the Japanese yen’s depreciation against most major currencies.
The views expressed in this report are exclusively those of the portfolio management team at Nordea Investment Management North America, Inc., and are subject to change. They are not meant as investment advice.
Fund Performance
The following graph compares the initial and subsequent account values at the end of each of the most recently completed 10 fiscal years of the fund (or for the life of the fund, if shorter). It assumes a $10,000 initial investment in the fund and in an appropriate, broad-based securities market index for the same period.
GROWTH OF $10,000
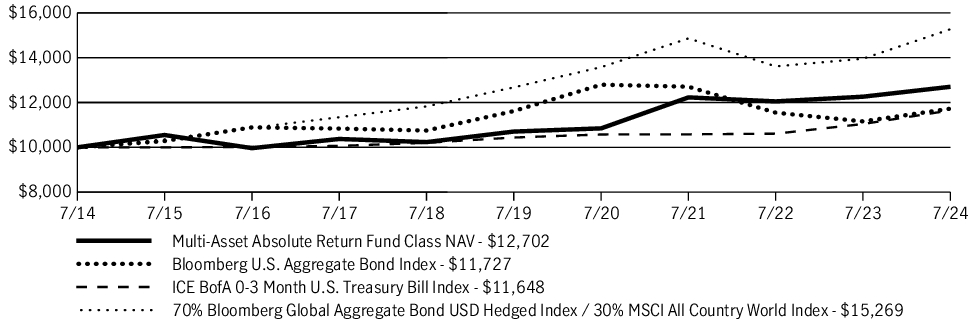
| AVERAGE ANNUAL TOTAL RETURN | 1 Year | 5 Years | 10 Years |
| Multi-Asset Absolute Return Fund (Class NAV) | 3.61% | 3.48% | 2.42% |
| Bloomberg U.S. Aggregate Bond Index | 5.10% | 0.19% | 1.61% |
| ICE BofA 0-3 Month U.S. Treasury Bill Index | 5.50% | 2.22% | 1.54% |
| 70% Bloomberg Global Aggregate Bond USD Hedged Index / 30% MSCI All Country World Index | 9.43% | 3.79% | 4.32% |
Fund Statistics
| Fund net assets | $332,854,409 |
| Total number of portfolio holdings | 341 |
| Total advisory fees paid (net) | $3,836,333 |
| Portfolio turnover rate | 47% |
Graphical Representation of Holdings
The tables below show the investment makeup of the fund, representing percentage of the total net assets of the fund.
Portfolio Composition
| Common stocks | 88.5% |
| Information technology | 16.6% |
| Consumer staples | 14.5% |
| Health care | 14.2% |
| Consumer discretionary | 12.4% |
| Financials | 11.2% |
| Communication services | 9.4% |
| Industrials | 6.8% |
| Utilities | 2.7% |
| Materials | 0.6% |
| Real estate | 0.1% |
| Corporate bonds | 3.4% |
| U.S. Government | 2.9% |
| Other assets and liabilities, net | 5.2% |
Country Composition
| United States | 76.0% |
| Denmark | 4.5% |
| United Kingdom | 2.9% |
| France | 2.5% |
| Ireland | 1.9% |
| Taiwan | 1.7% |
| China | 1.7% |
| Germany | 1.5% |
| South Korea | 1.4% |
| Japan | 1.3% |
| Other countries | 4.6% |
Holdings may not have been held by the fund for the entire period and are subject to change without notice. Portfolio composition is subject to review in accordance with the fund’s investment strategy and may vary in the future. Current and future portfolio holdings are subject to risk and may change at any time.
What were the fund costs during the last year?
(Based on a hypothetical $10,000 investment)
| Fund (Class) | Costs of a $10,000 investment | Costs paid as a percentage of a $10,000 investment |
| Multi-Asset Absolute Return Fund (Class R2/JHARX) |
$166 | 1.63% |
Management’s Discussion of Fund Performance
SUMMARY OF RESULTS
Multi-Asset Absolute Return Fund (Class R2/JHARX) returned 3.20% for the year ended July 31, 2024. The most significant factors affecting fund performance during the period included a meaningful rally in global equity markets, led primarily by growth-oriented stocks in developed markets, and a shift from interest-rate increases to easier monetary policy by many of the world’s central banks—with notable exceptions in the U.S. and Japan.
TOP PERFORMANCE CONTRIBUTORS
Developed market stocks | Equities in developed countries were among the best performers, adding to the fund's performance.
Cash | A small cash and cash-equivalents position provided a noteworthy level of interest income.
Credit-related bonds | Selected, tactical positions in credit contributed modestly to performance.
TOP PERFORMANCE DETRACTORS
Defensive equity strategy | This strategy, which includes long positions in lower-risk stocks and short positions in broad equity indexes, detracted from performance as lower-risk stocks underperformed the broader market.
Foreign currency exposure | The fund’s defensive long/short positions in high-quality foreign currencies were a drag on performance, due in large part to the Japanese yen’s depreciation against most major currencies.
The views expressed in this report are exclusively those of the portfolio management team at Nordea Investment Management North America, Inc., and are subject to change. They are not meant as investment advice.
Fund Performance
The following graph compares the initial and subsequent account values at the end of each of the most recently completed 10 fiscal years of the fund (or for the life of the fund, if shorter). It assumes a $10,000 initial investment in the fund and in an appropriate, broad-based securities market index for the same period.
GROWTH OF $10,000
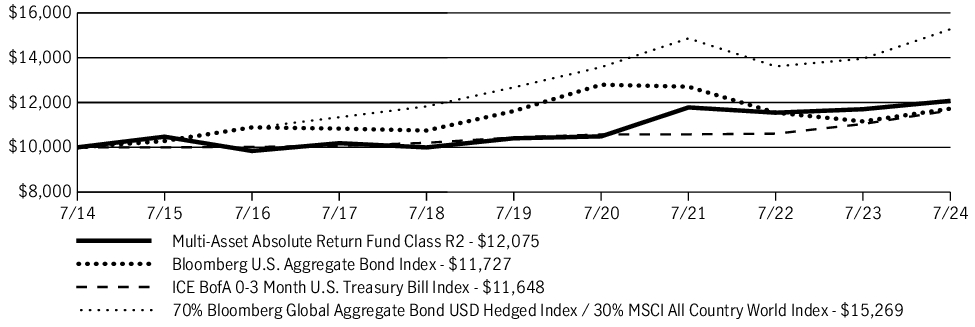
| AVERAGE ANNUAL TOTAL RETURN | 1 Year | 5 Years | 10 Years |
| Multi-Asset Absolute Return Fund (Class R2/JHARX) | 3.20% | 3.02% | 1.90% |
| Bloomberg U.S. Aggregate Bond Index | 5.10% | 0.19% | 1.61% |
| ICE BofA 0-3 Month U.S. Treasury Bill Index | 5.50% | 2.22% | 1.54% |
| 70% Bloomberg Global Aggregate Bond USD Hedged Index / 30% MSCI All Country World Index | 9.43% | 3.79% | 4.32% |
Fund Statistics
| Fund net assets | $332,854,409 |
| Total number of portfolio holdings | 341 |
| Total advisory fees paid (net) | $3,836,333 |
| Portfolio turnover rate | 47% |
Graphical Representation of Holdings
The tables below show the investment makeup of the fund, representing percentage of the total net assets of the fund.
Portfolio Composition
| Common stocks | 88.5% |
| Information technology | 16.6% |
| Consumer staples | 14.5% |
| Health care | 14.2% |
| Consumer discretionary | 12.4% |
| Financials | 11.2% |
| Communication services | 9.4% |
| Industrials | 6.8% |
| Utilities | 2.7% |
| Materials | 0.6% |
| Real estate | 0.1% |
| Corporate bonds | 3.4% |
| U.S. Government | 2.9% |
| Other assets and liabilities, net | 5.2% |
Country Composition
| United States | 76.0% |
| Denmark | 4.5% |
| United Kingdom | 2.9% |
| France | 2.5% |
| Ireland | 1.9% |
| Taiwan | 1.7% |
| China | 1.7% |
| Germany | 1.5% |
| South Korea | 1.4% |
| Japan | 1.3% |
| Other countries | 4.6% |
Holdings may not have been held by the fund for the entire period and are subject to change without notice. Portfolio composition is subject to review in accordance with the fund’s investment strategy and may vary in the future. Current and future portfolio holdings are subject to risk and may change at any time.
What were the fund costs during the last year?
(Based on a hypothetical $10,000 investment)
| Fund (Class) | Costs of a $10,000 investment | Costs paid as a percentage of a $10,000 investment |
| Multi-Asset Absolute Return Fund (Class R6/JHASX) |
$122 | 1.20% |
Management’s Discussion of Fund Performance
SUMMARY OF RESULTS
Multi-Asset Absolute Return Fund (Class R6/JHASX) returned 3.51% for the year ended July 31, 2024. The most significant factors affecting fund performance during the period included a meaningful rally in global equity markets, led primarily by growth-oriented stocks in developed markets, and a shift from interest-rate increases to easier monetary policy by many of the world’s central banks—with notable exceptions in the U.S. and Japan.
TOP PERFORMANCE CONTRIBUTORS
Developed market stocks | Equities in developed countries were among the best performers, adding to the fund's performance.
Cash | A small cash and cash-equivalents position provided a noteworthy level of interest income.
Credit-related bonds | Selected, tactical positions in credit contributed modestly to performance.
TOP PERFORMANCE DETRACTORS
Defensive equity strategy | This strategy, which includes long positions in lower-risk stocks and short positions in broad equity indexes, detracted from performance as lower-risk stocks underperformed the broader market.
Foreign currency exposure | The fund’s defensive long/short positions in high-quality foreign currencies were a drag on performance, due in large part to the Japanese yen’s depreciation against most major currencies.
The views expressed in this report are exclusively those of the portfolio management team at Nordea Investment Management North America, Inc., and are subject to change. They are not meant as investment advice.
Fund Performance
The following graph compares the initial and subsequent account values at the end of each of the most recently completed 10 fiscal years of the fund (or for the life of the fund, if shorter). It assumes a $1,000,000 initial investment in the fund and in an appropriate, broad-based securities market index for the same period.
GROWTH OF $1,000,000
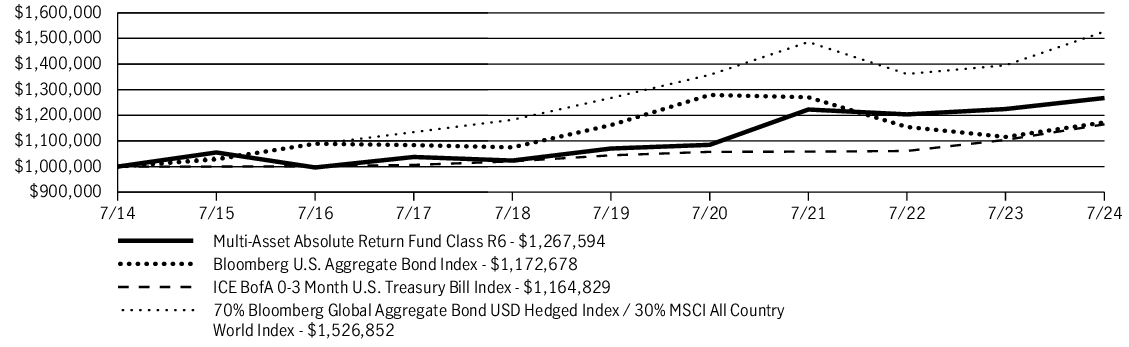
| AVERAGE ANNUAL TOTAL RETURN | 1 Year | 5 Years | 10 Years |
| Multi-Asset Absolute Return Fund (Class R6/JHASX) | 3.51% | 3.44% | 2.40% |
| Bloomberg U.S. Aggregate Bond Index | 5.10% | 0.19% | 1.61% |
| ICE BofA 0-3 Month U.S. Treasury Bill Index | 5.50% | 2.22% | 1.54% |
| 70% Bloomberg Global Aggregate Bond USD Hedged Index / 30% MSCI All Country World Index | 9.43% | 3.79% | 4.32% |
Fund Statistics
| Fund net assets | $332,854,409 |
| Total number of portfolio holdings | 341 |
| Total advisory fees paid (net) | $3,836,333 |
| Portfolio turnover rate | 47% |
Graphical Representation of Holdings
The tables below show the investment makeup of the fund, representing percentage of the total net assets of the fund.
Portfolio Composition
| Common stocks | 88.5% |
| Information technology | 16.6% |
| Consumer staples | 14.5% |
| Health care | 14.2% |
| Consumer discretionary | 12.4% |
| Financials | 11.2% |
| Communication services | 9.4% |
| Industrials | 6.8% |
| Utilities | 2.7% |
| Materials | 0.6% |
| Real estate | 0.1% |
| Corporate bonds | 3.4% |
| U.S. Government | 2.9% |
| Other assets and liabilities, net | 5.2% |
Country Composition
| United States | 76.0% |
| Denmark | 4.5% |
| United Kingdom | 2.9% |
| France | 2.5% |
| Ireland | 1.9% |
| Taiwan | 1.7% |
| China | 1.7% |
| Germany | 1.5% |
| South Korea | 1.4% |
| Japan | 1.3% |
| Other countries | 4.6% |
Holdings may not have been held by the fund for the entire period and are subject to change without notice. Portfolio composition is subject to review in accordance with the fund’s investment strategy and may vary in the future. Current and future portfolio holdings are subject to risk and may change at any time.