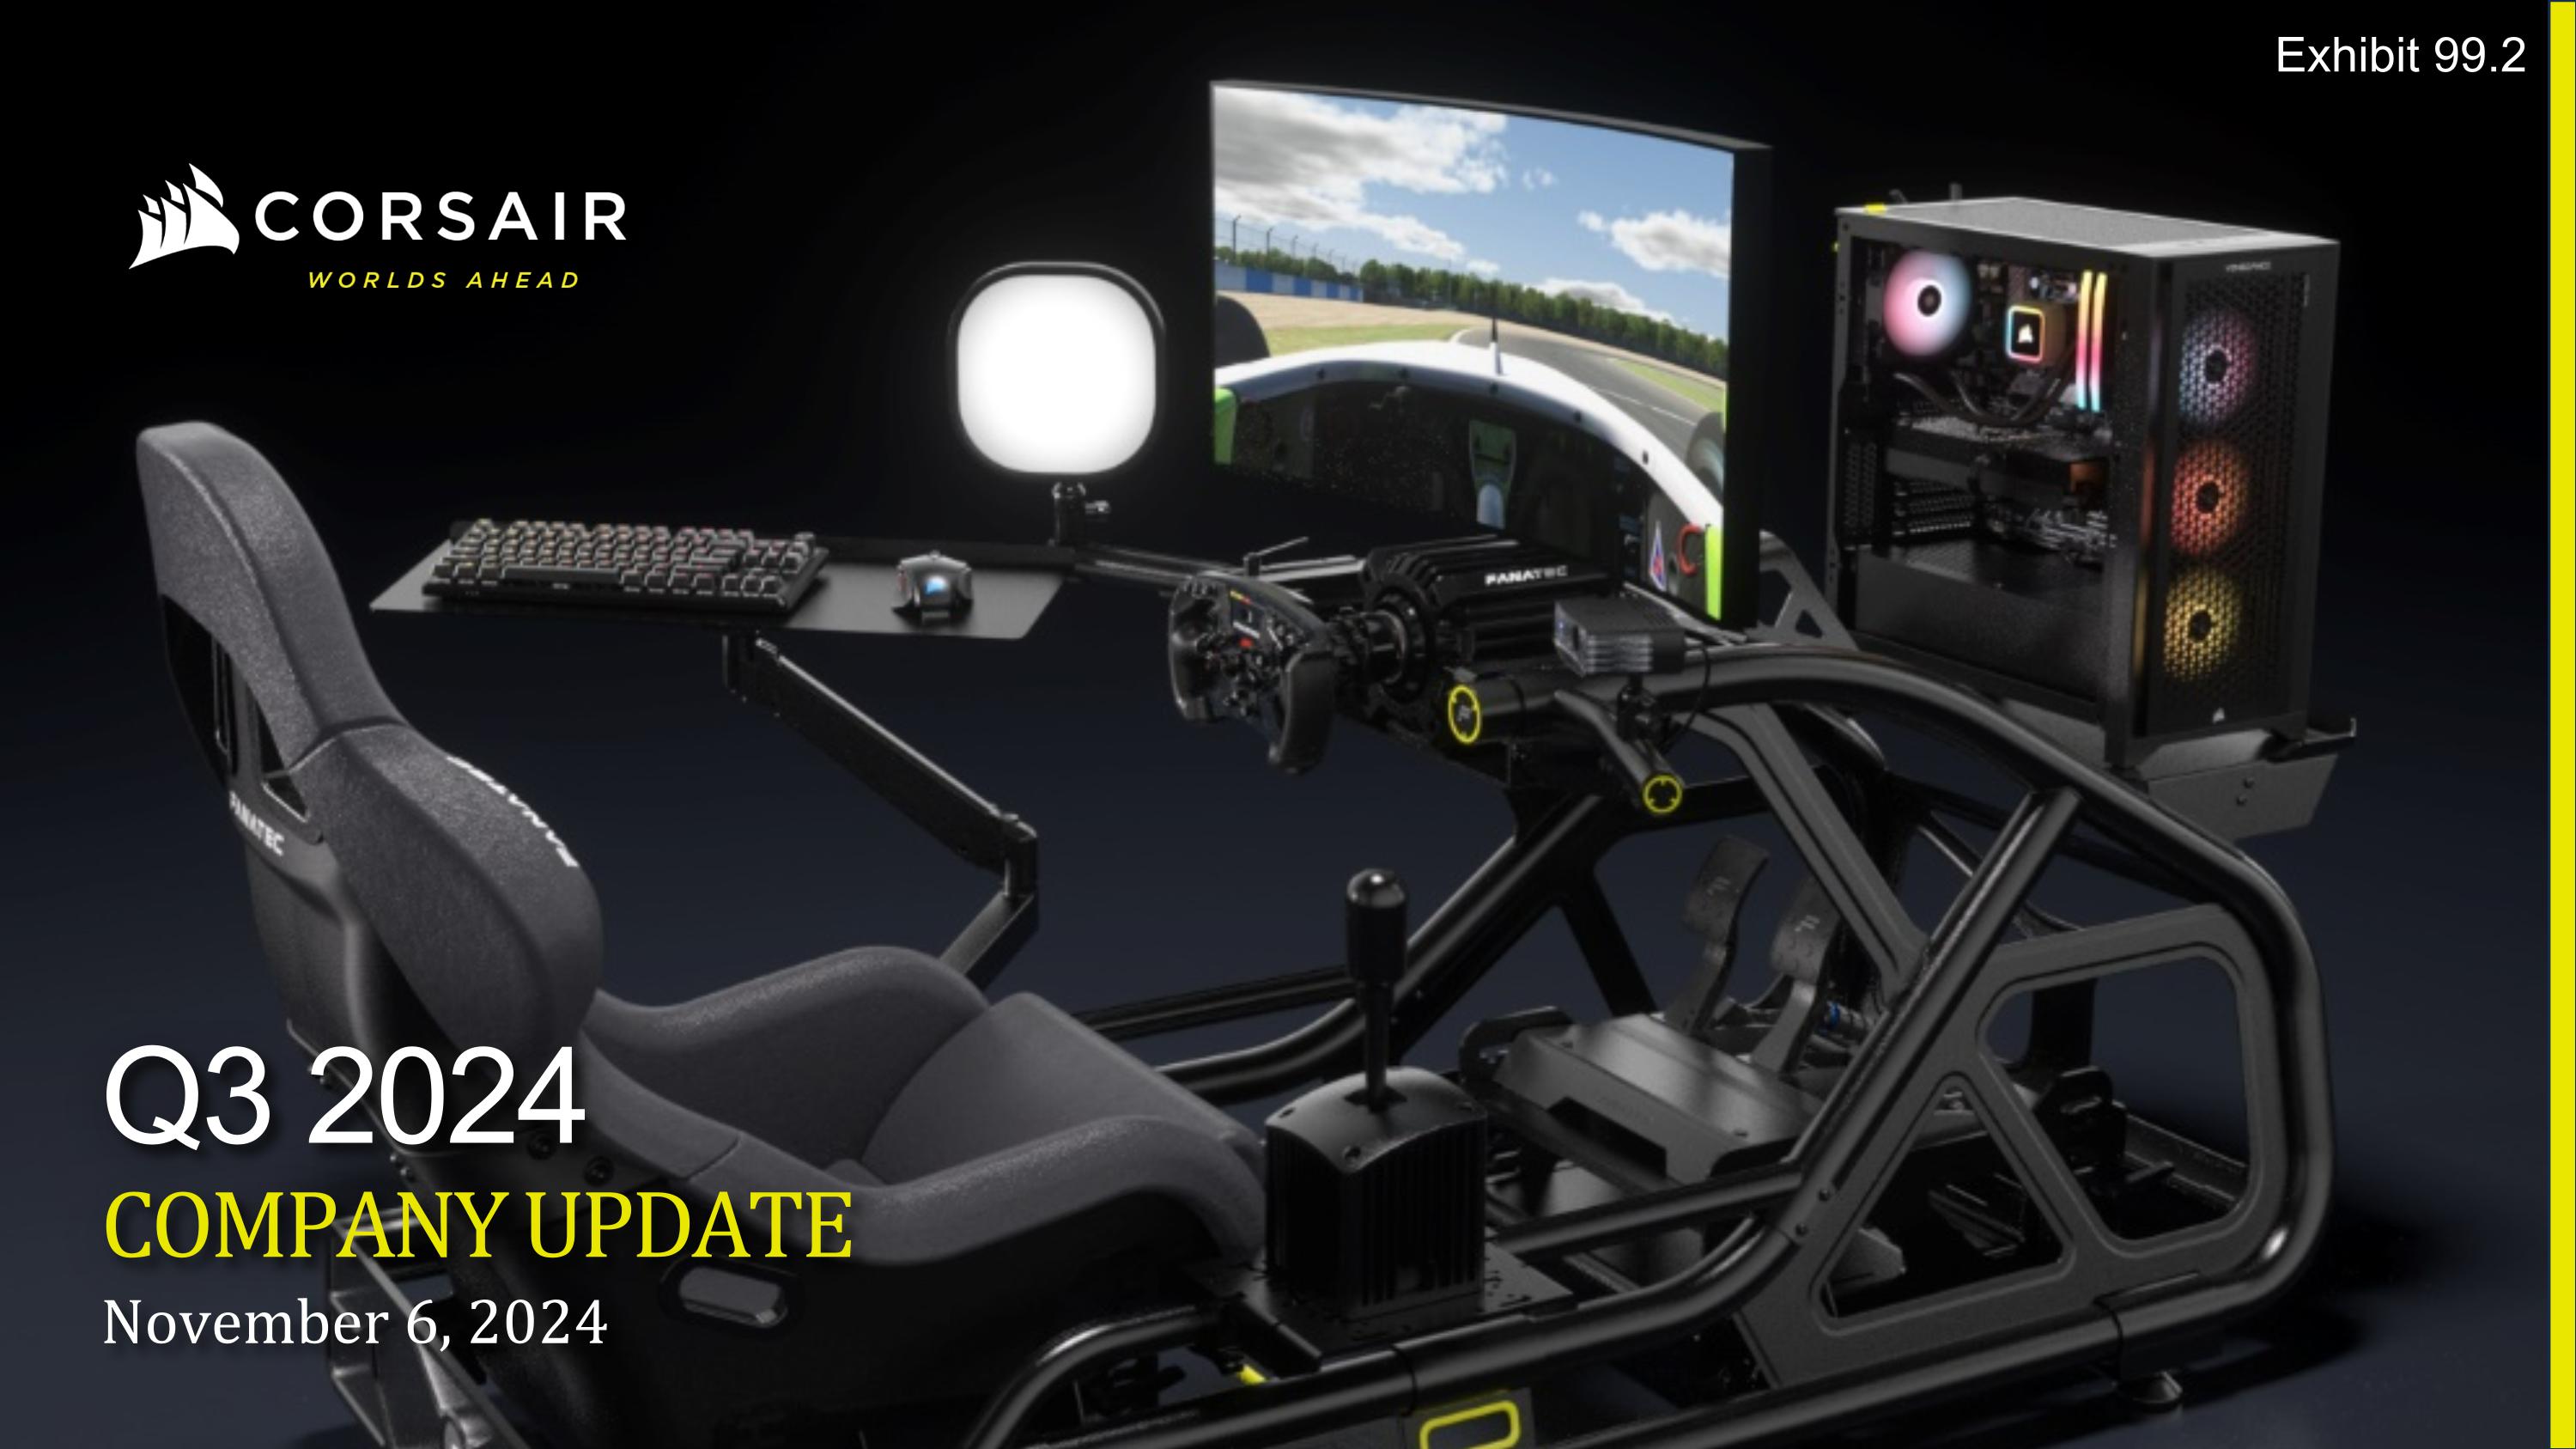
November 6, 2024 Q3 2024 COMPANY UPDATE Exhibit 99.2
DISCLAIMER Forward Looking Statements This presentation contains forward looking statements that involve risks, uncertainties and assumptions. If the risks or uncertainties ever materialize or the assumptions prove incorrect, the Company's results may differ materially from those expressed or implied by such forward-looking statements. All statements other than statements of historical fact could be deemed forward-looking statements, including, but not limited to: information or predictions concerning the Company's future financial performance (including its FY2024 guidance and long-term goals), business plans and objectives, potential growth opportunities, potential market leadership, technological, industry or market trends (including assumptions regarding the market in late 2024 and 2025 market) and potential market opportunities. These statements are based on estimates and information available to the Company at the time of this presentation and are not guarantees of future performance. Actual results could differ materially from the Company's current expectations as a result of many factors, including, but not limited to: current macroeconomic conditions, including but not limited to the impacts of high inflation and the risk of a recession on demand for our products, consumer confidence and financial markets generally; the Company’s ability to build and maintain the strength of its brand among gaming and streaming enthusiasts and its ability to continuously develop and successfully market new gear and improvements to existing gear; the introduction and success of new third-party high-performance computer hardware, particularly graphics processing units and central processing units, as well as sophisticated new video games; fluctuations in operating results; the risk that the Company is not able to compete with competitors and/or that the gaming industry, including streaming and eSports, does not grow as expected or declines; the loss or inability to attract and retain key management; the impact of global instability, such as the war between Russia and Ukraine or any conflict between China and Taiwan, and any sanctions or other geopolitical tensions that may result therefrom; the impacts from any pandemic, including any lingering impacts from the COVID-19 pandemic; delays or disruptions at manufacturing and distribution facilities of the Company or third parties; the Company's ability to successfully integrate any companies or assets it may acquire; currency exchange rate fluctuations or international trade disputes resulting in the Company’s gear becoming relatively more expensive to its overseas customers or resulting in an increase in the Company’s manufacturing costs; and the other factors described under the heading "Risk Factors" in the Company's Annual Report on Form 10-K for the year ended December 31, 2023 filed with the Securities and Exchange Commission ("SEC") and its subsequent filings with the SEC. The Company assumes no obligation, and does not intend, to update these forward-looking statements, except as required by law. Investors are urged to review in detail the risks and uncertainties outlined in Corsair’s SEC filings. You may get these SEC documents for free by visiting EDGAR on the SEC website at http://www.sec.gov. Non-GAAP Financial Measures Included in this presentation are certain non-GAAP financial measures, including Adjusted Operating Income (Loss), Adjusted EBITDA, Adjusted EBITDA Margin, Adjusted Net Income (Loss) and Adjusted Net Earnings (Loss) Per Share, which are not recognized under the generally accepted accounting principles (“GAAP”) in the United States and designed to complement the financial information presented in accordance with GAAP in the United States because management believes such measures are useful to investors. The non-GAAP measures have limitations as analytical tools and you should not consider them in isolation of, or as an alternative to, measures prepared in accordance with U.S. GAAP. The non-GAAP measures used by the Company may differ from the non-GAAP measures used by other companies. The Company urges you to review the reconciliation of its non-GAAP financial measures to the most directly comparable U.S. GAAP financial measures set forth in the Appendix to this presentation, and not to rely on any single financial measure to evaluate the Company's business. Market & Industry Data This presentation also contains estimates and other statistical data made by independent parties and by the Company relating to the Company’s industry, the Company’s business and the market for the Company’s products and its future growth. This data involves a number of assumptions and limitations, and you are cautioned not to give undue weight to such estimates. In addition, projections, assumptions, and estimates of the Company’s future performance and the future performance of the market for its products are necessarily subject to a high degree of uncertainty and risk.
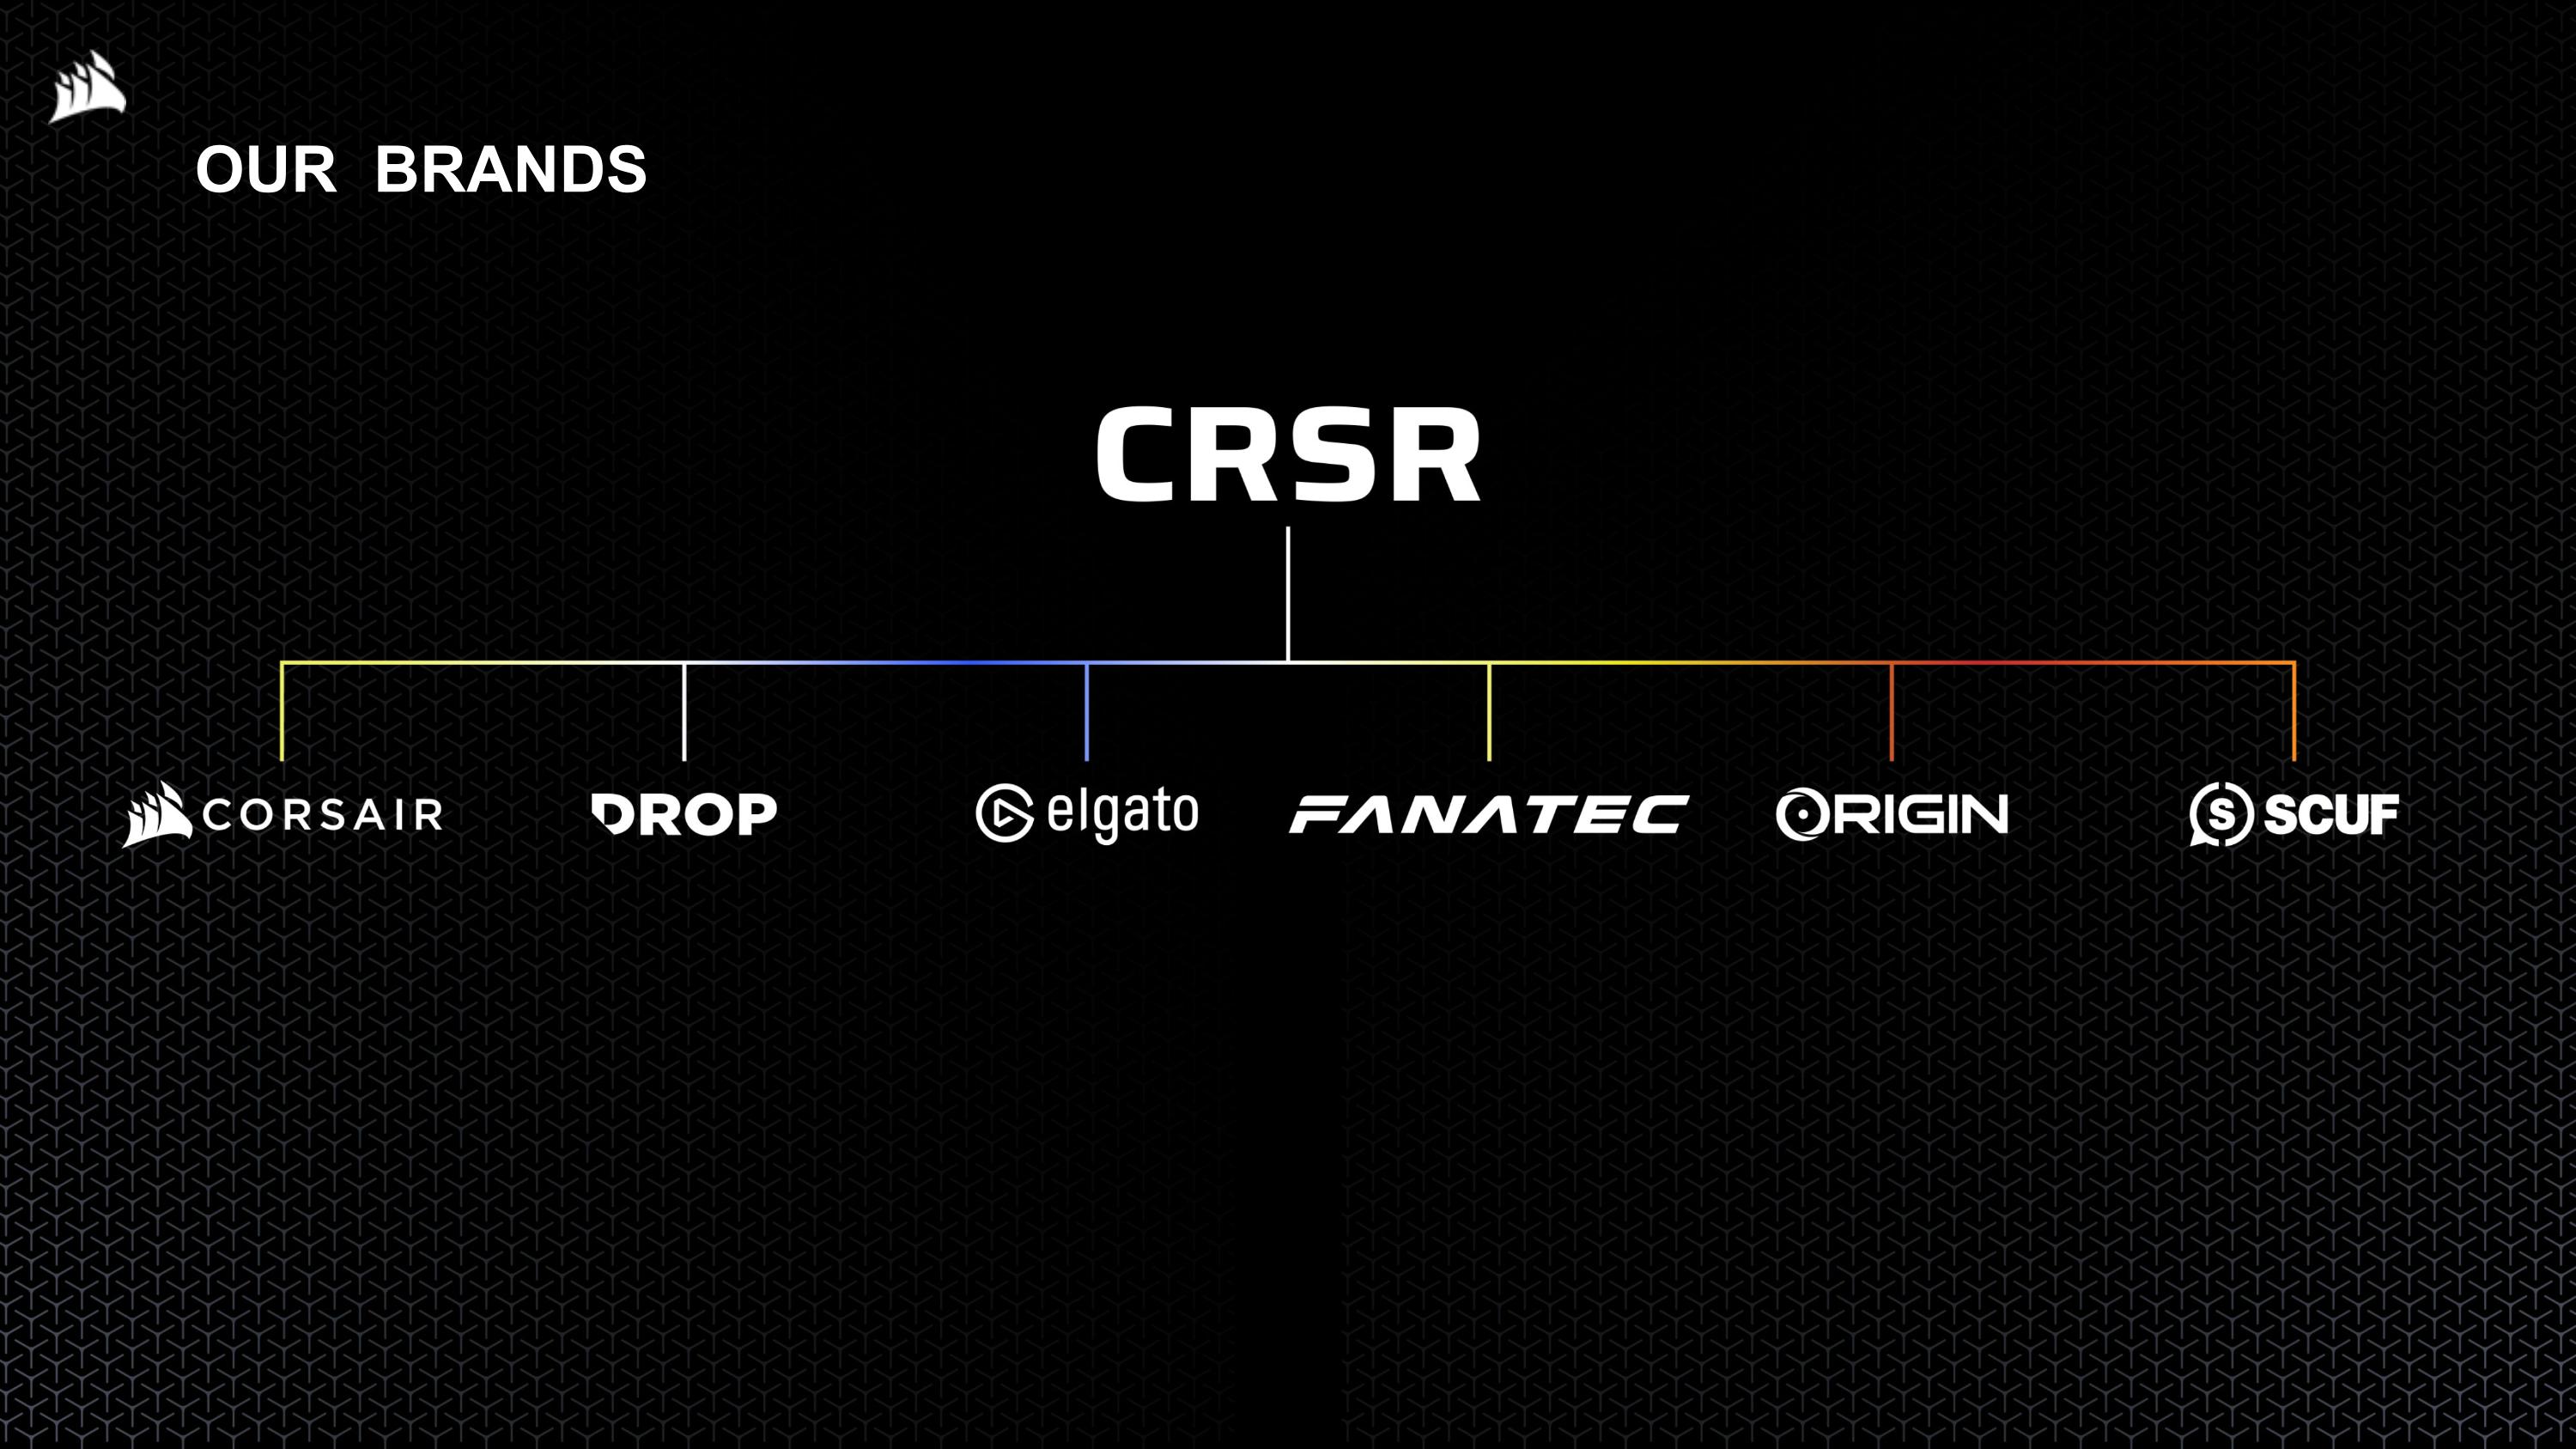
OUR BRANDS
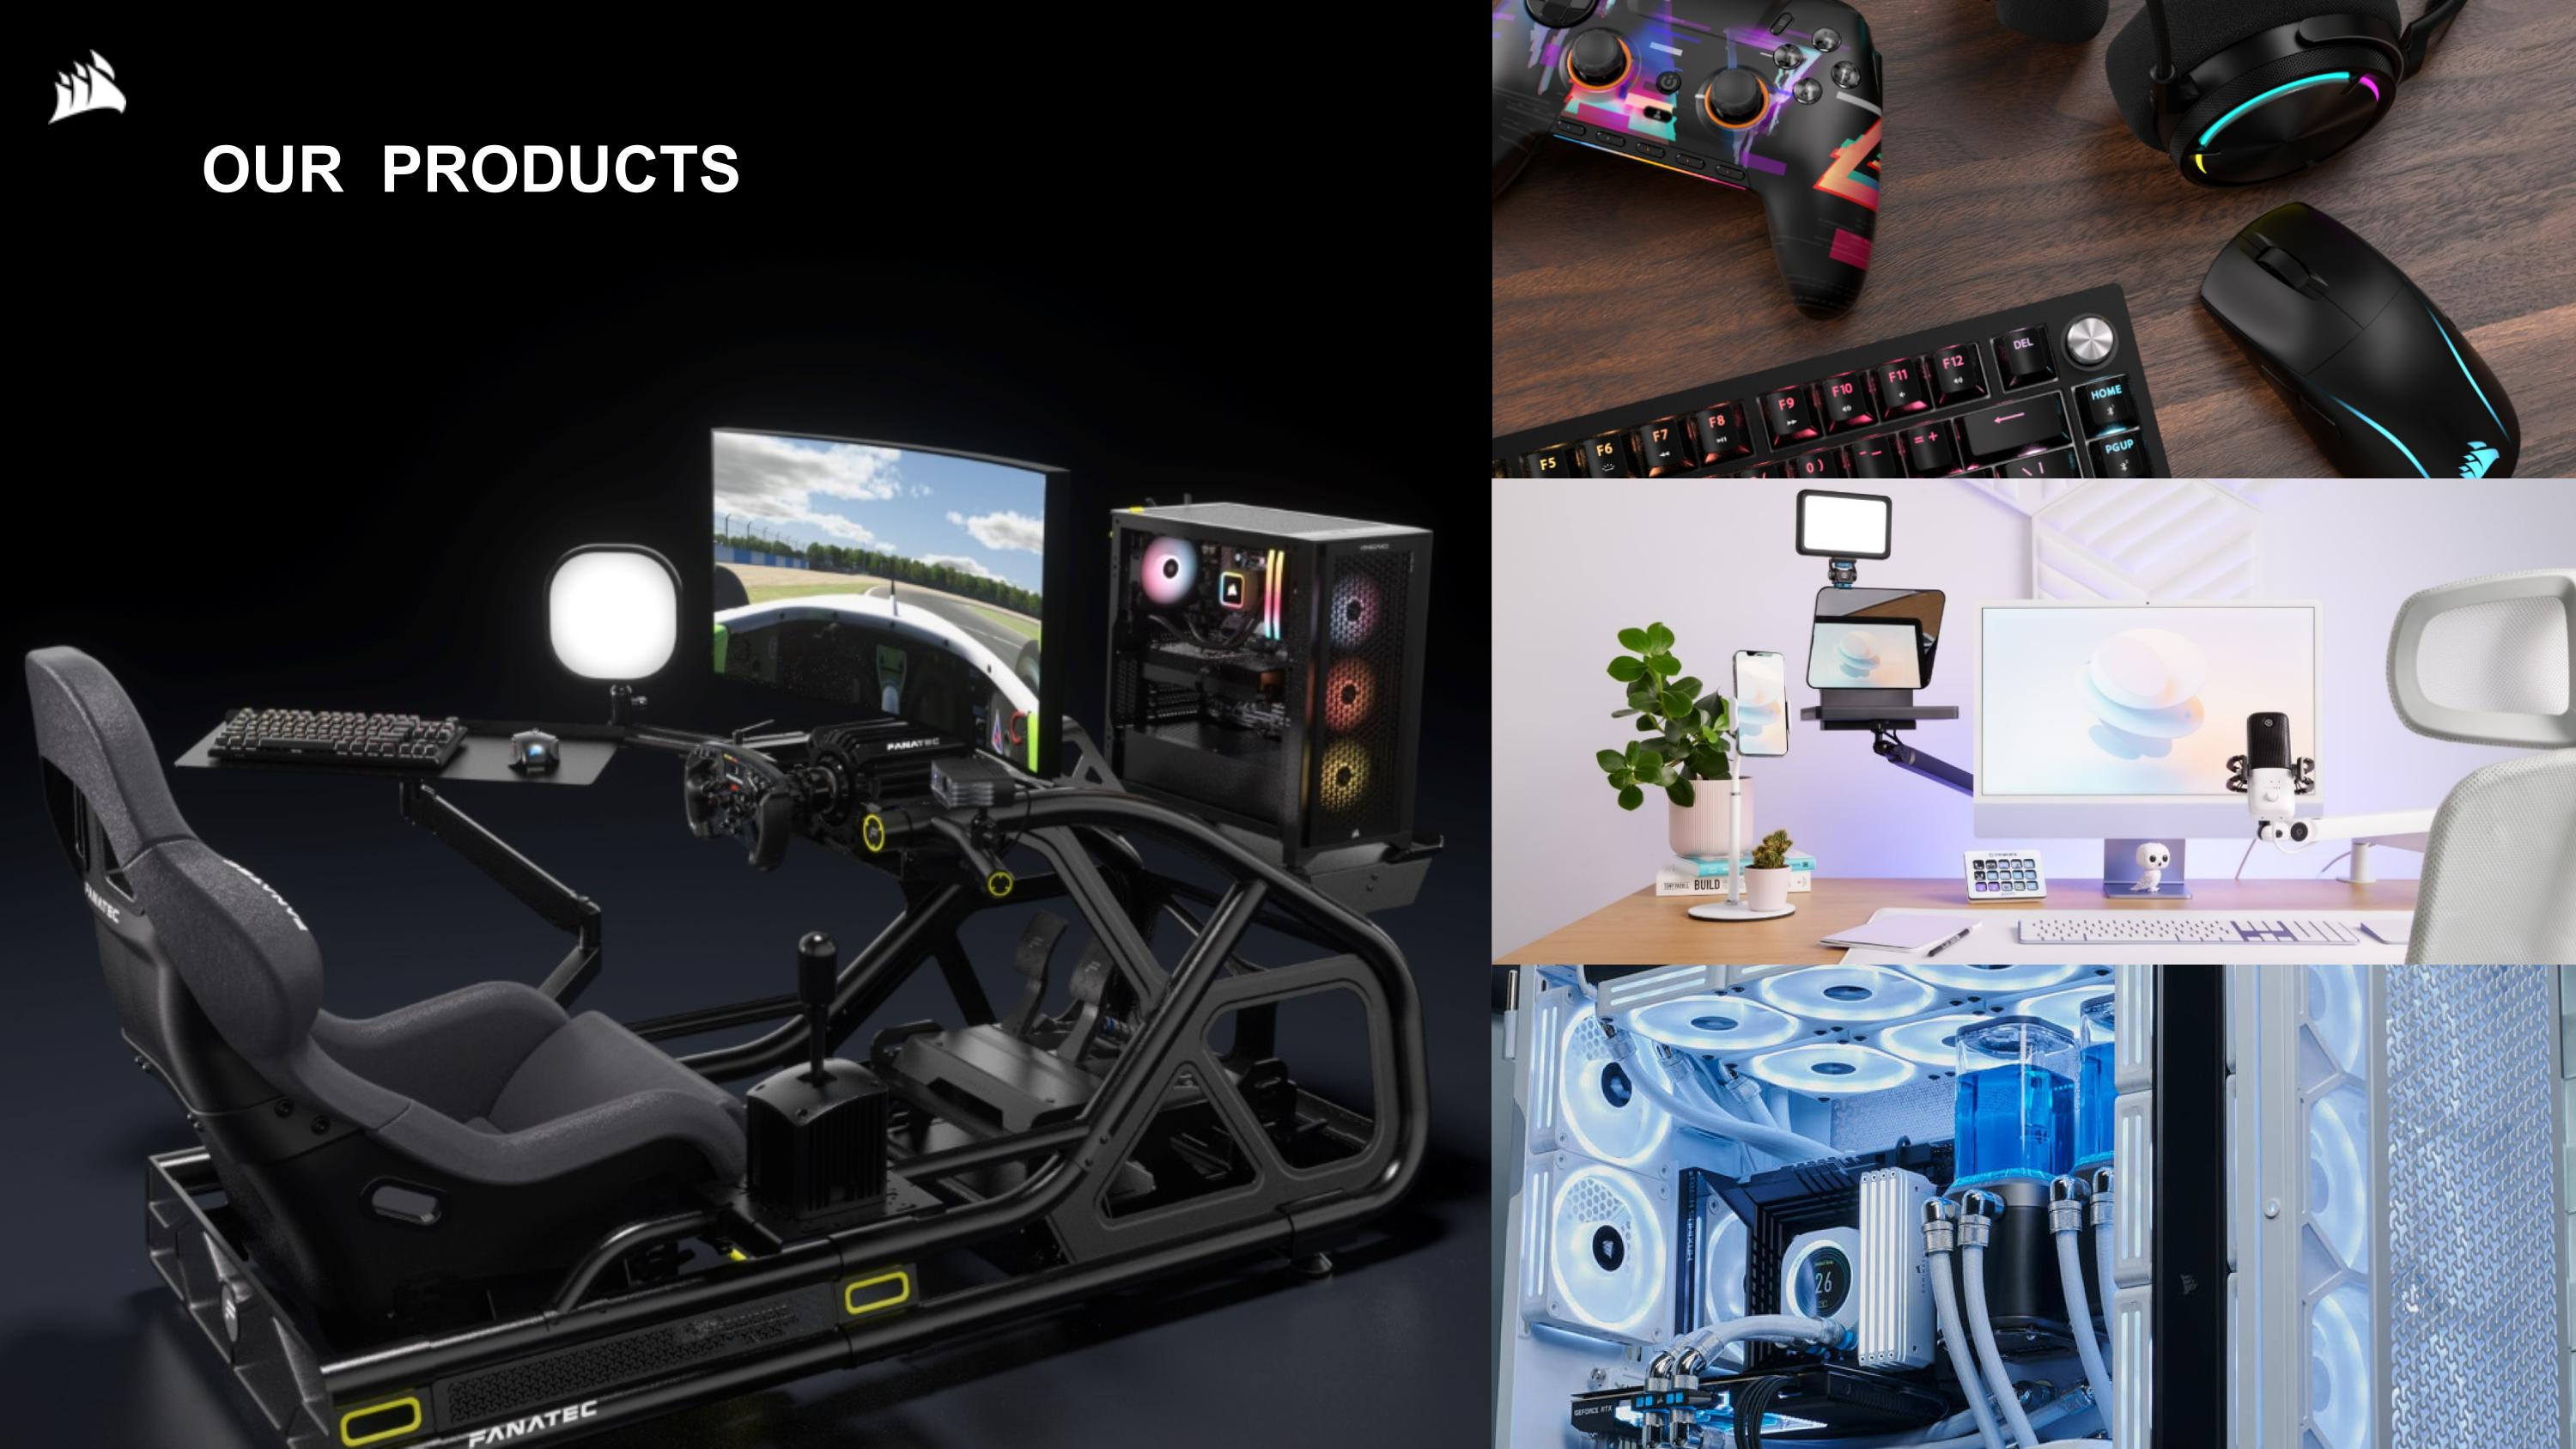
OUR PRODUCTS
GENERAL UPDATE
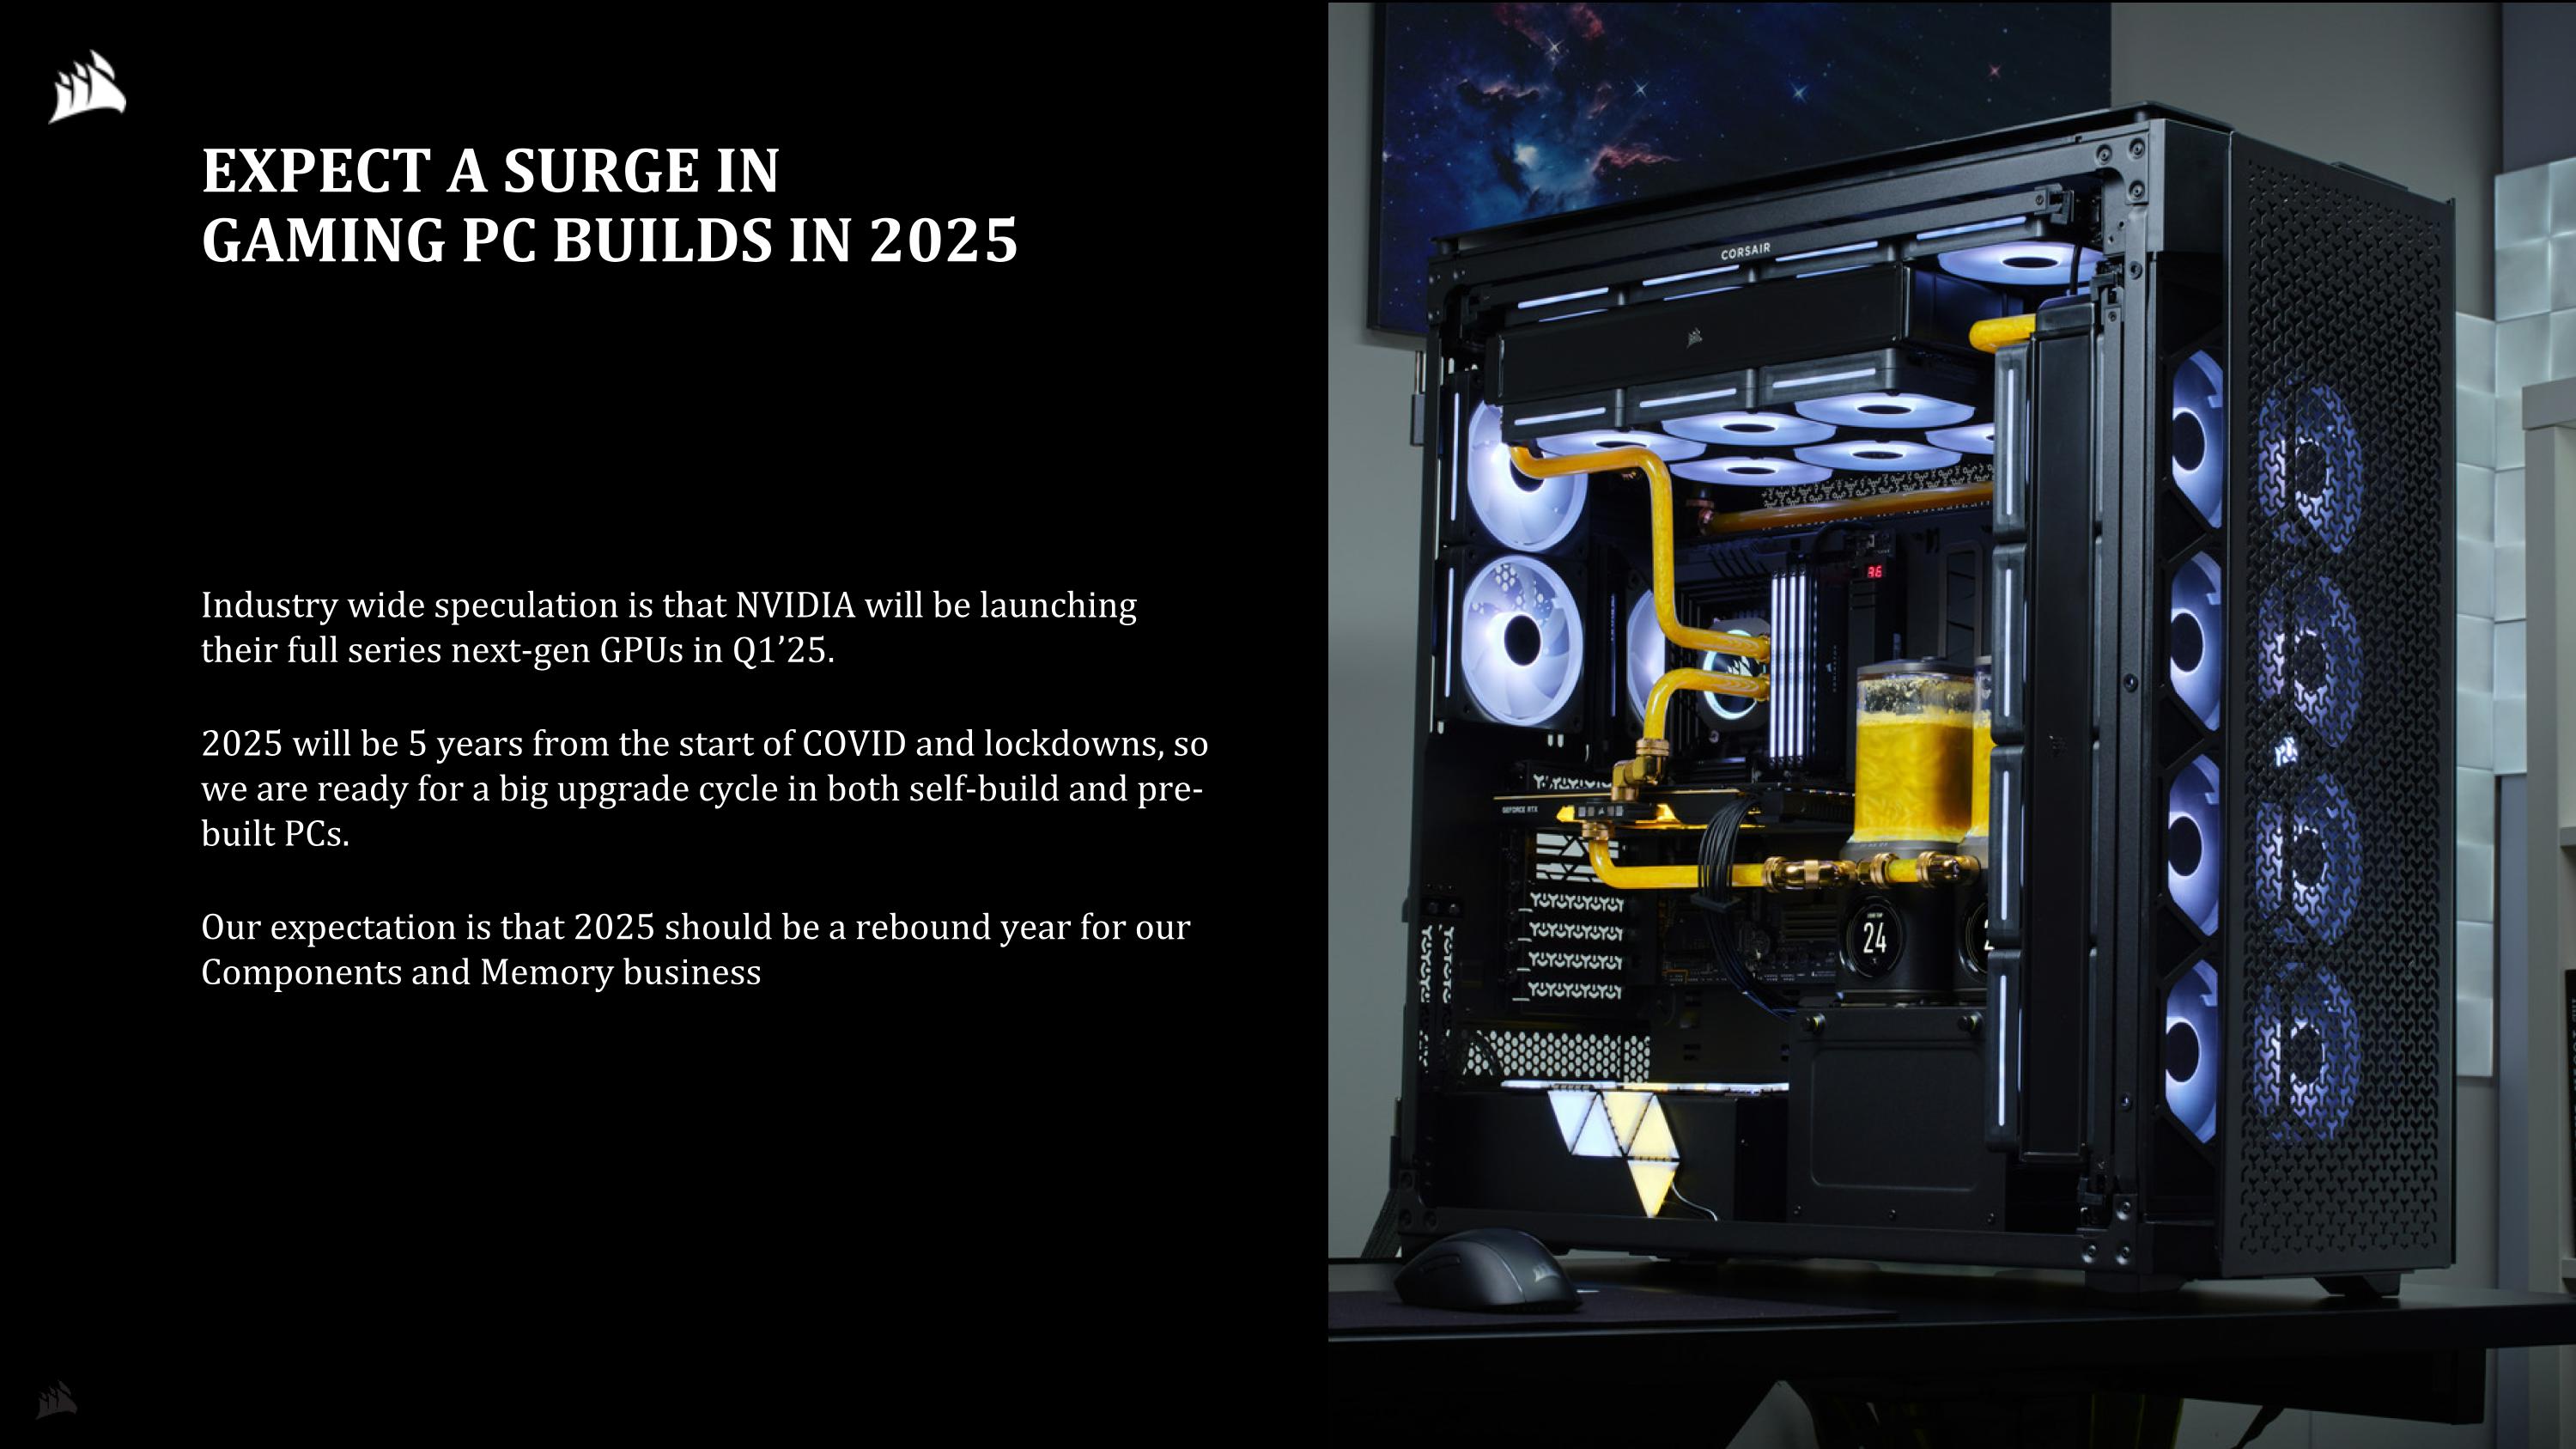
EXPECT A SURGE IN GAMING PC BUILDS IN 2025 Industry wide speculation is that NVIDIA will be launching their full series next-gen GPUs in Q1’25. 2025 will be 5 years from the start of COVID and lockdowns, so we are ready for a big upgrade cycle in both self-build and pre-built PCs. Our expectation is that 2025 should be a rebound year for our Components and Memory business
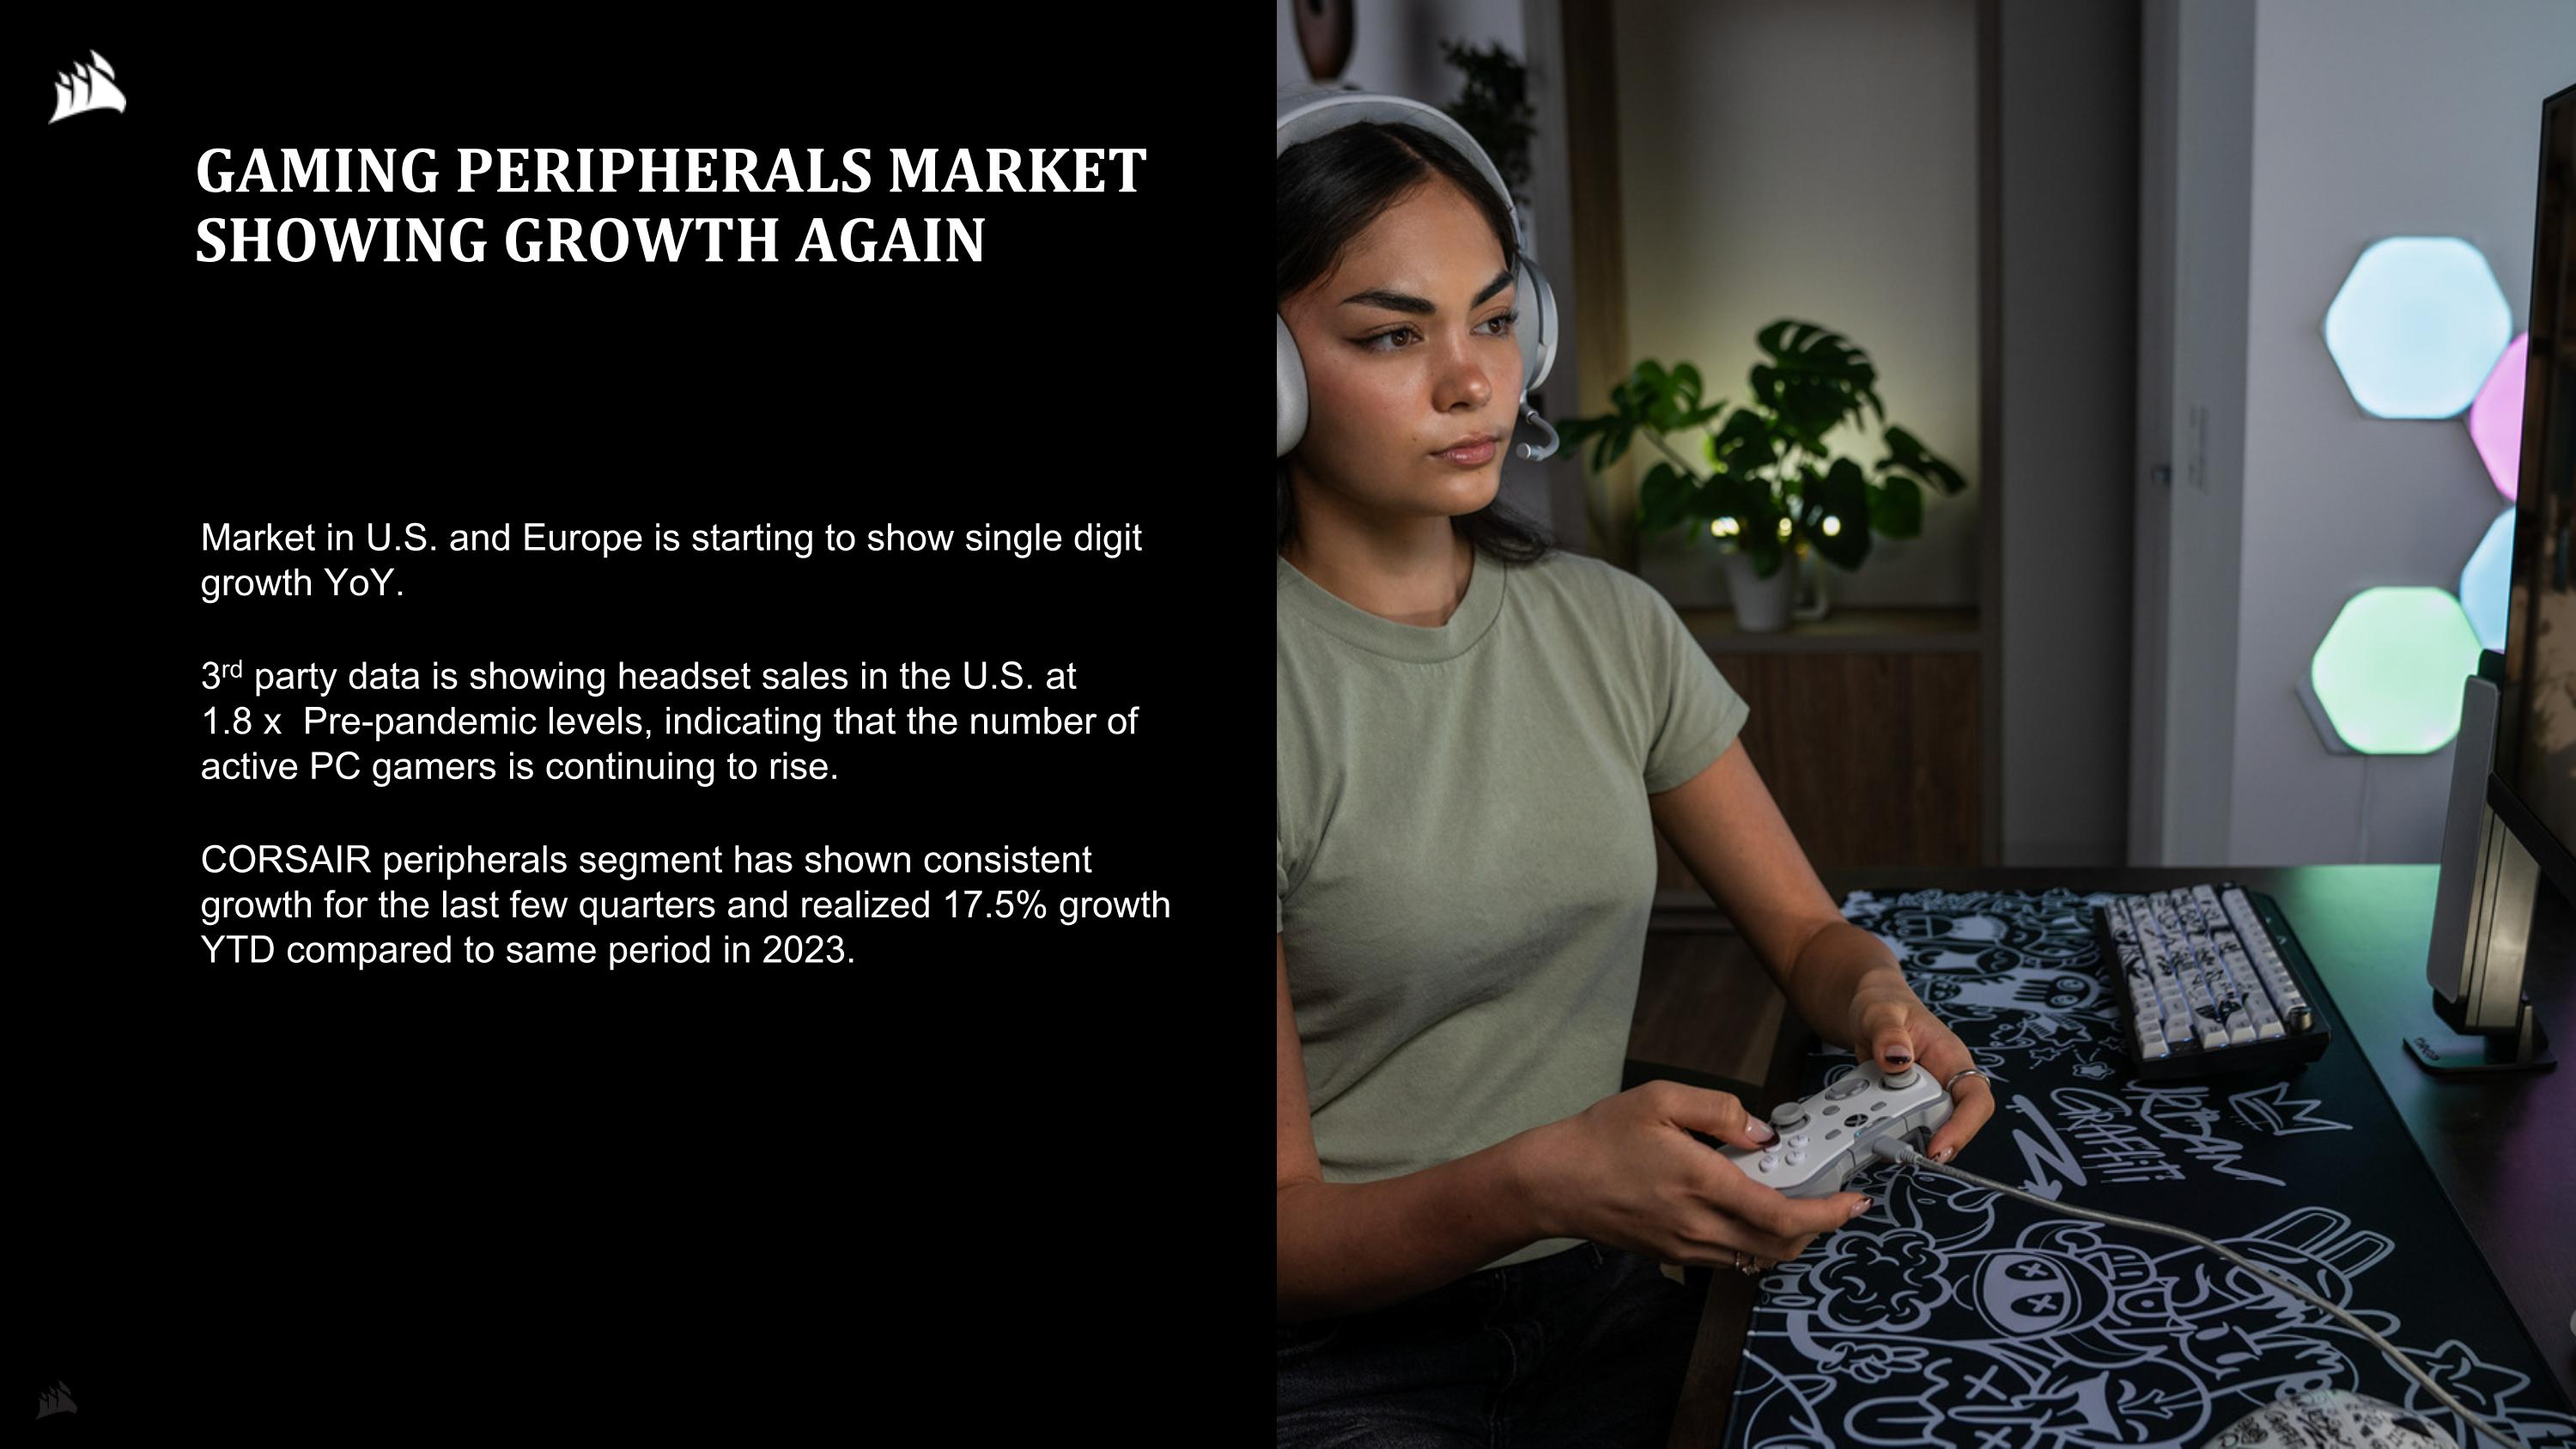
GAMING PERIPHERALS MARKET SHOWING GROWTH AGAIN Market in U.S. and Europe is starting to show single digit growth YoY. 3rd party data is showing headset sales in the U.S. at 1.8 x Pre-pandemic levels, indicating that the number of active PC gamers is continuing to rise. CORSAIR peripherals segment has shown consistent growth for the last few quarters and realized 17.5% growth YTD compared to same period in 2023.
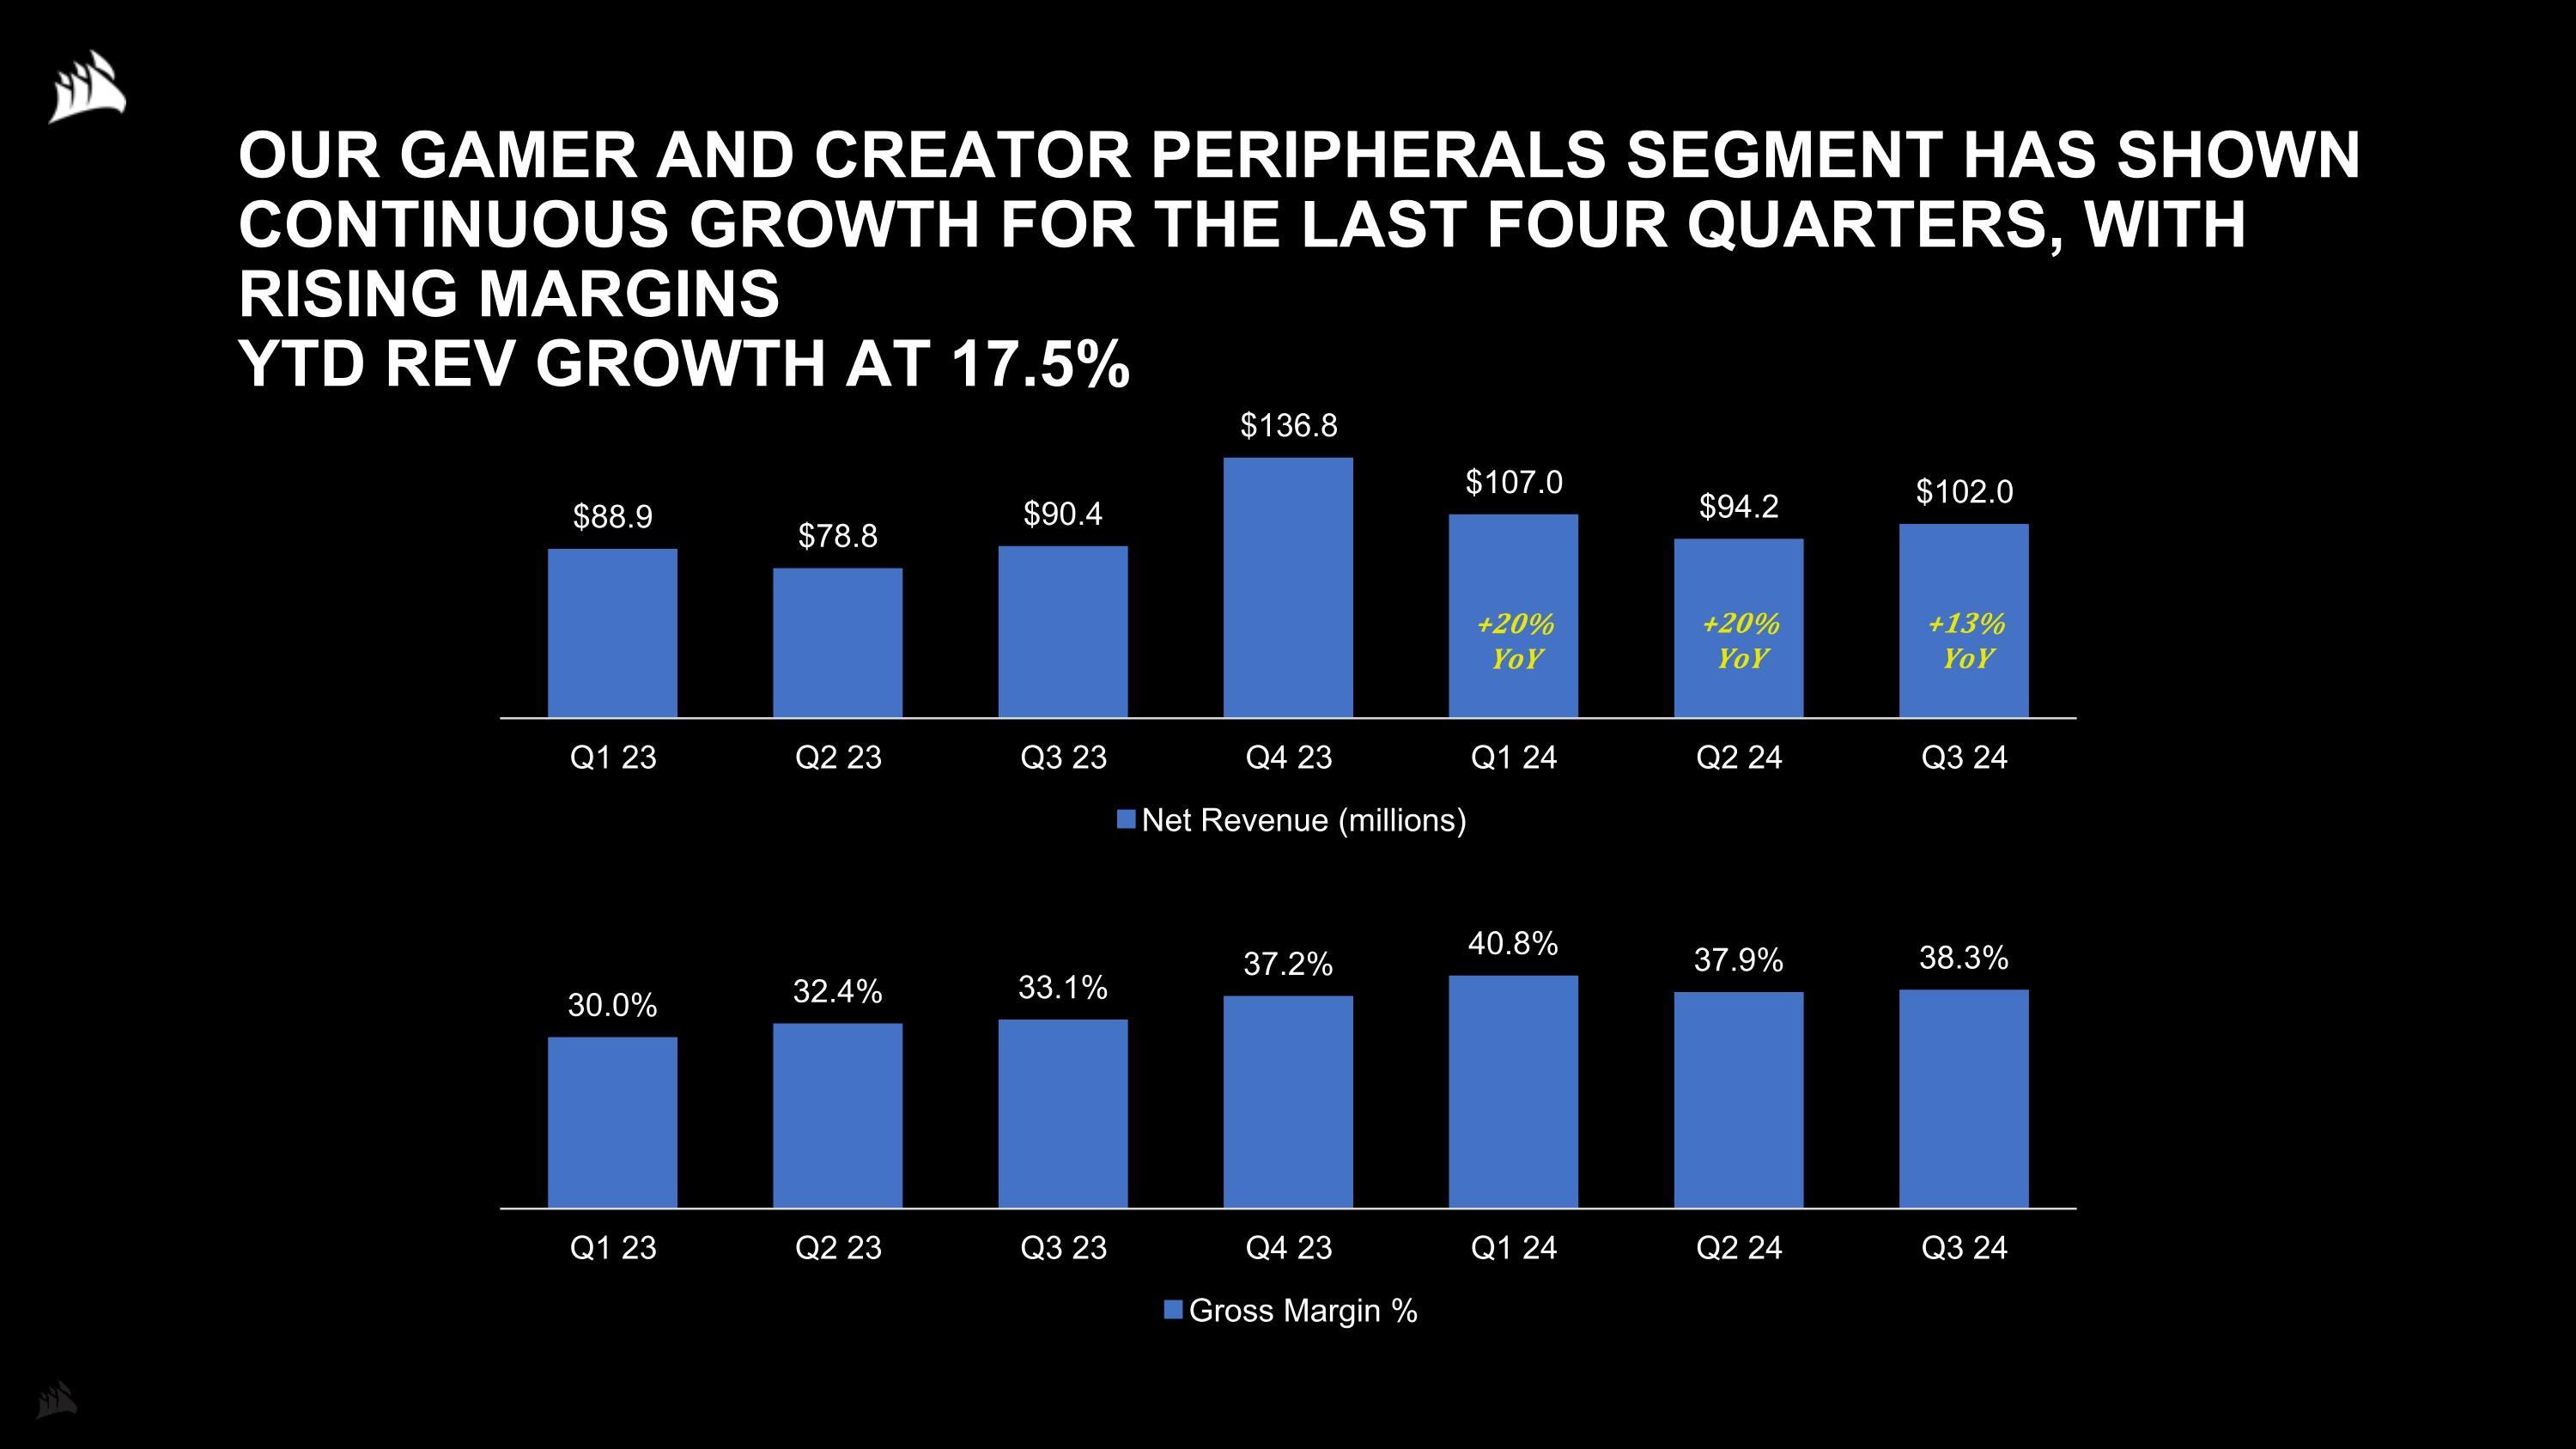
OUR GAMER AND CREATOR PERIPHERALS SEGMENT HAS SHOWN CONTINUOUS GROWTH FOR THE LAST FOUR QUARTERS, WITH RISING MARGINS YTD REV GROWTH AT 17.5% +20% YoY +20% YoY +13% YoY

KEY NEW PARTNERSHIPS AND PRODUCTS
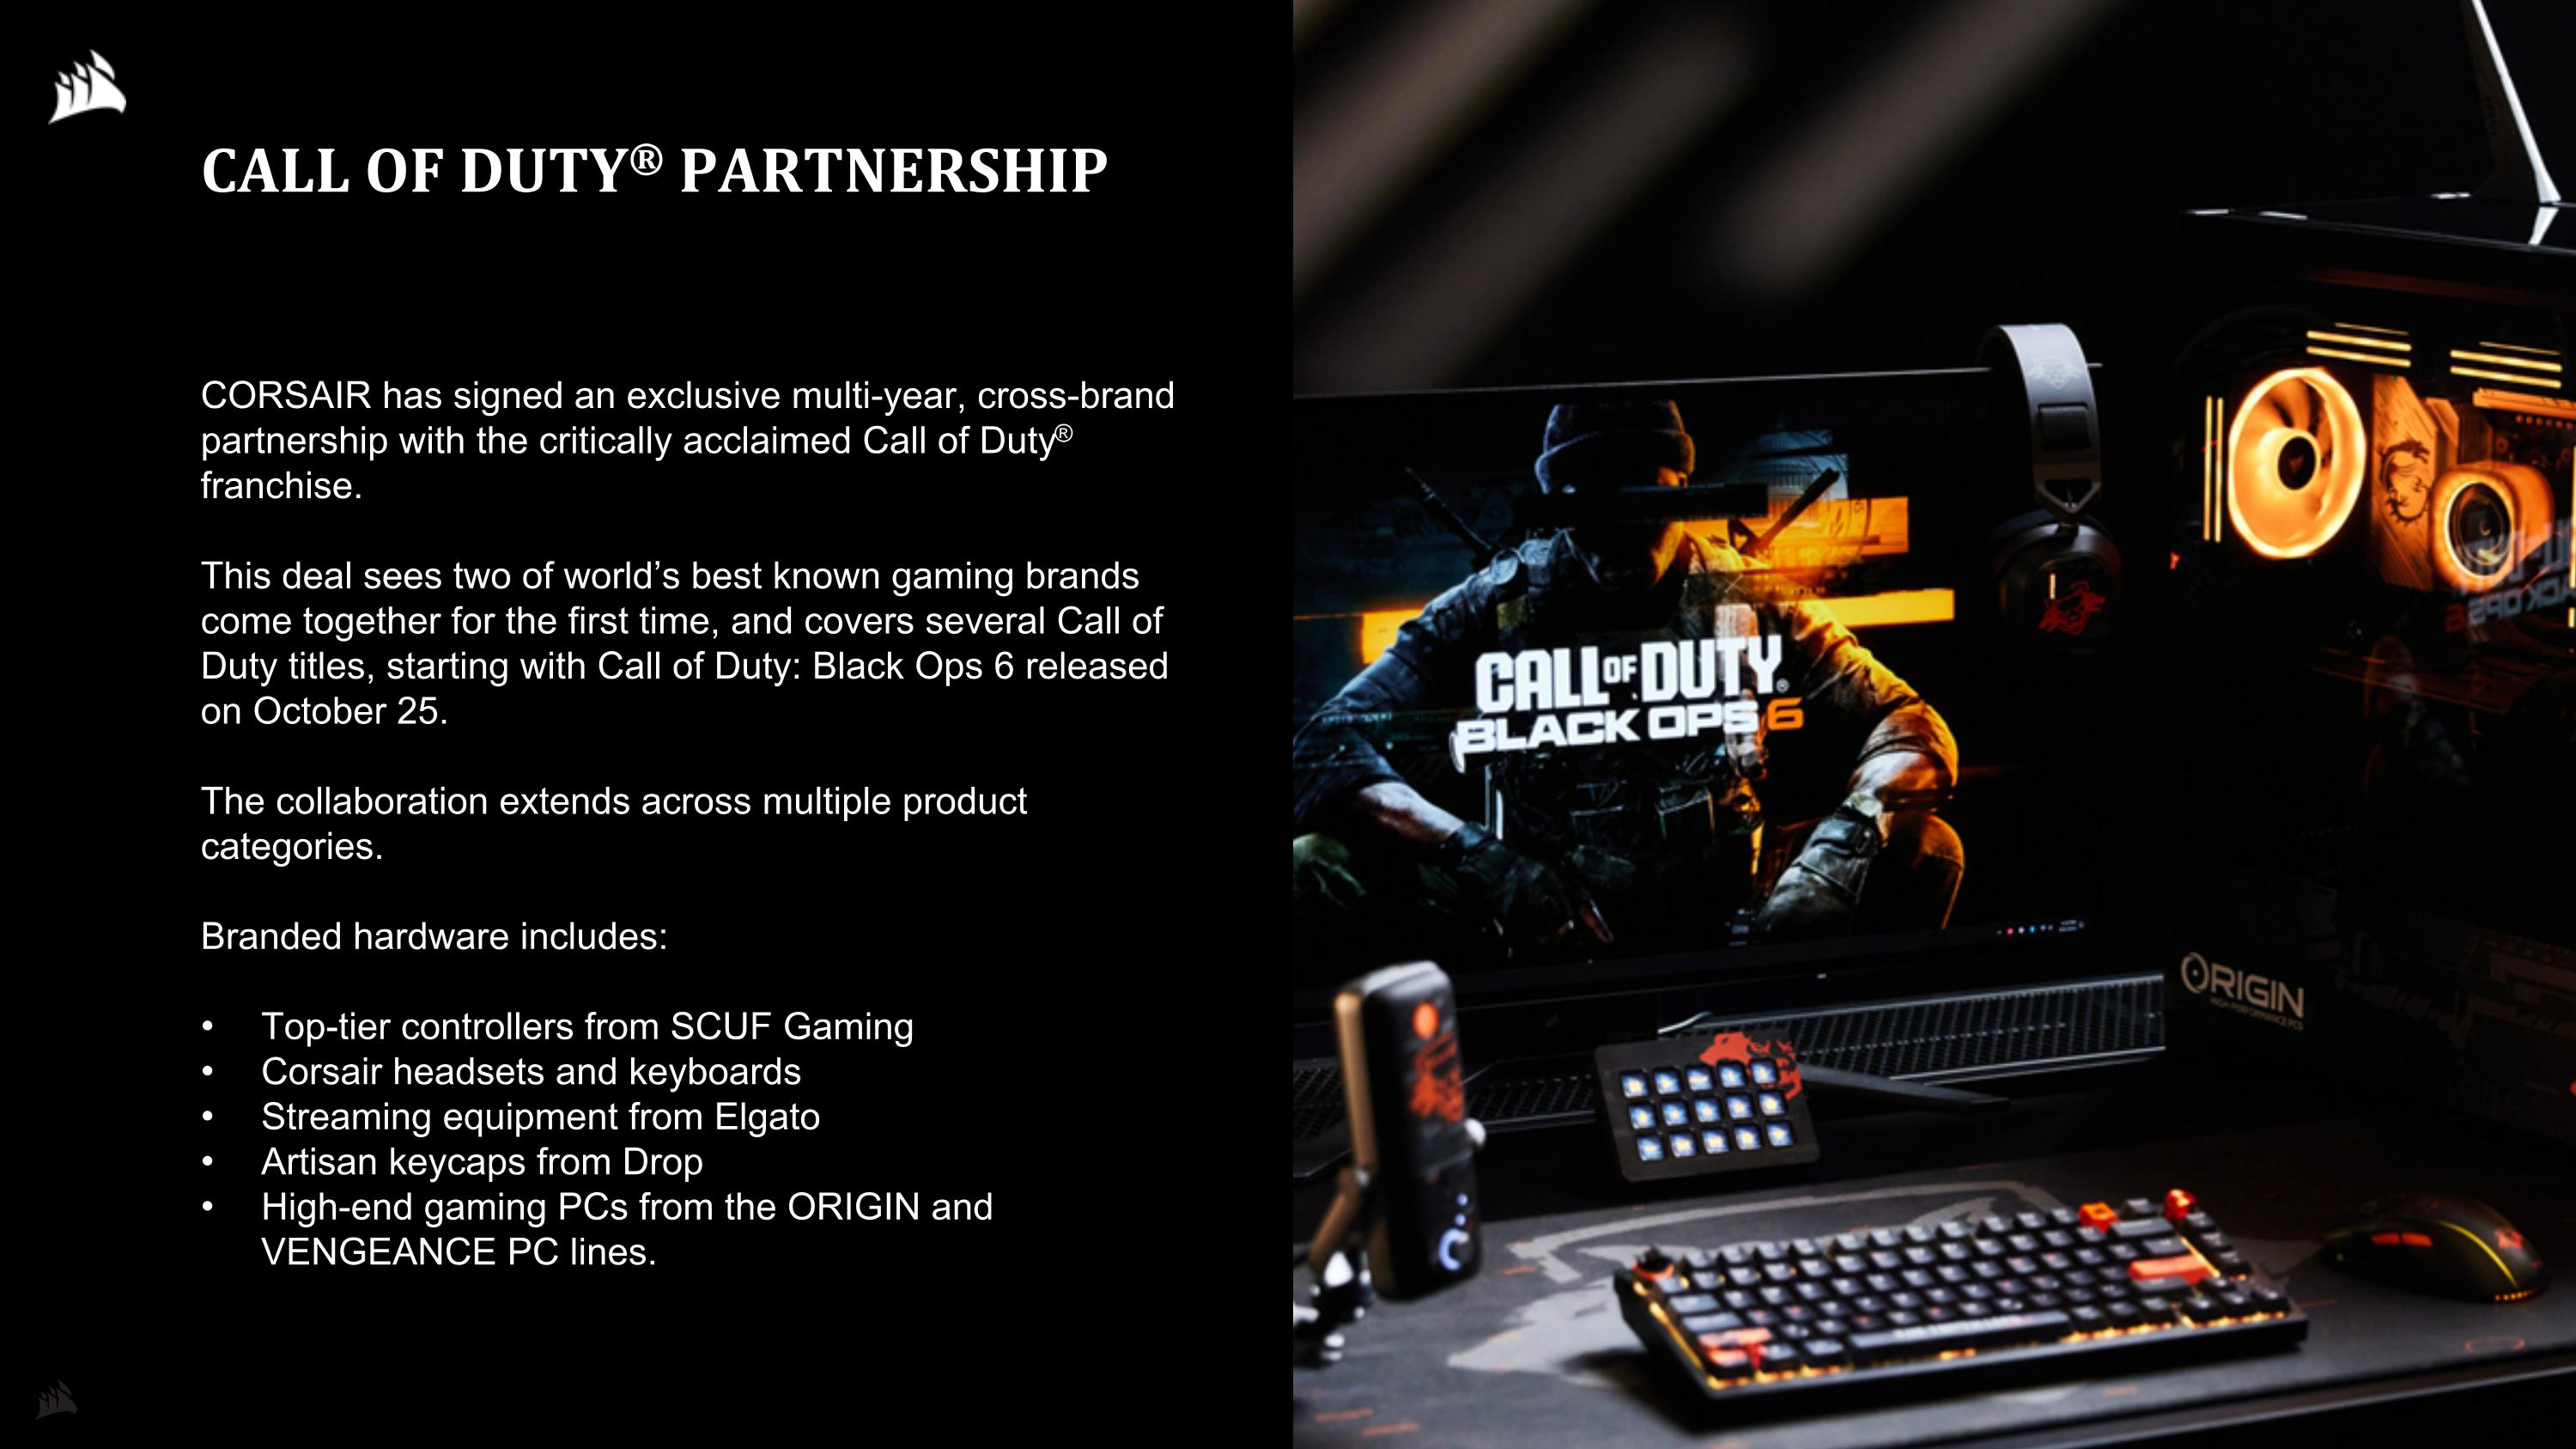
CALL OF DUTY® PARTNERSHIP CORSAIR has signed an exclusive multi-year, cross-brand partnership with the critically acclaimed Call of Duty® franchise. This deal sees two of world’s best known gaming brands come together for the first time, and covers several Call of Duty titles, starting with Call of Duty: Black Ops 6 released on October 25. The collaboration extends across multiple product categories. Branded hardware includes: Top-tier controllers from SCUF Gaming Corsair headsets and keyboards Streaming equipment from Elgato Artisan keycaps from Drop High-end gaming PCs from the ORIGIN and VENGEANCE PC lines.
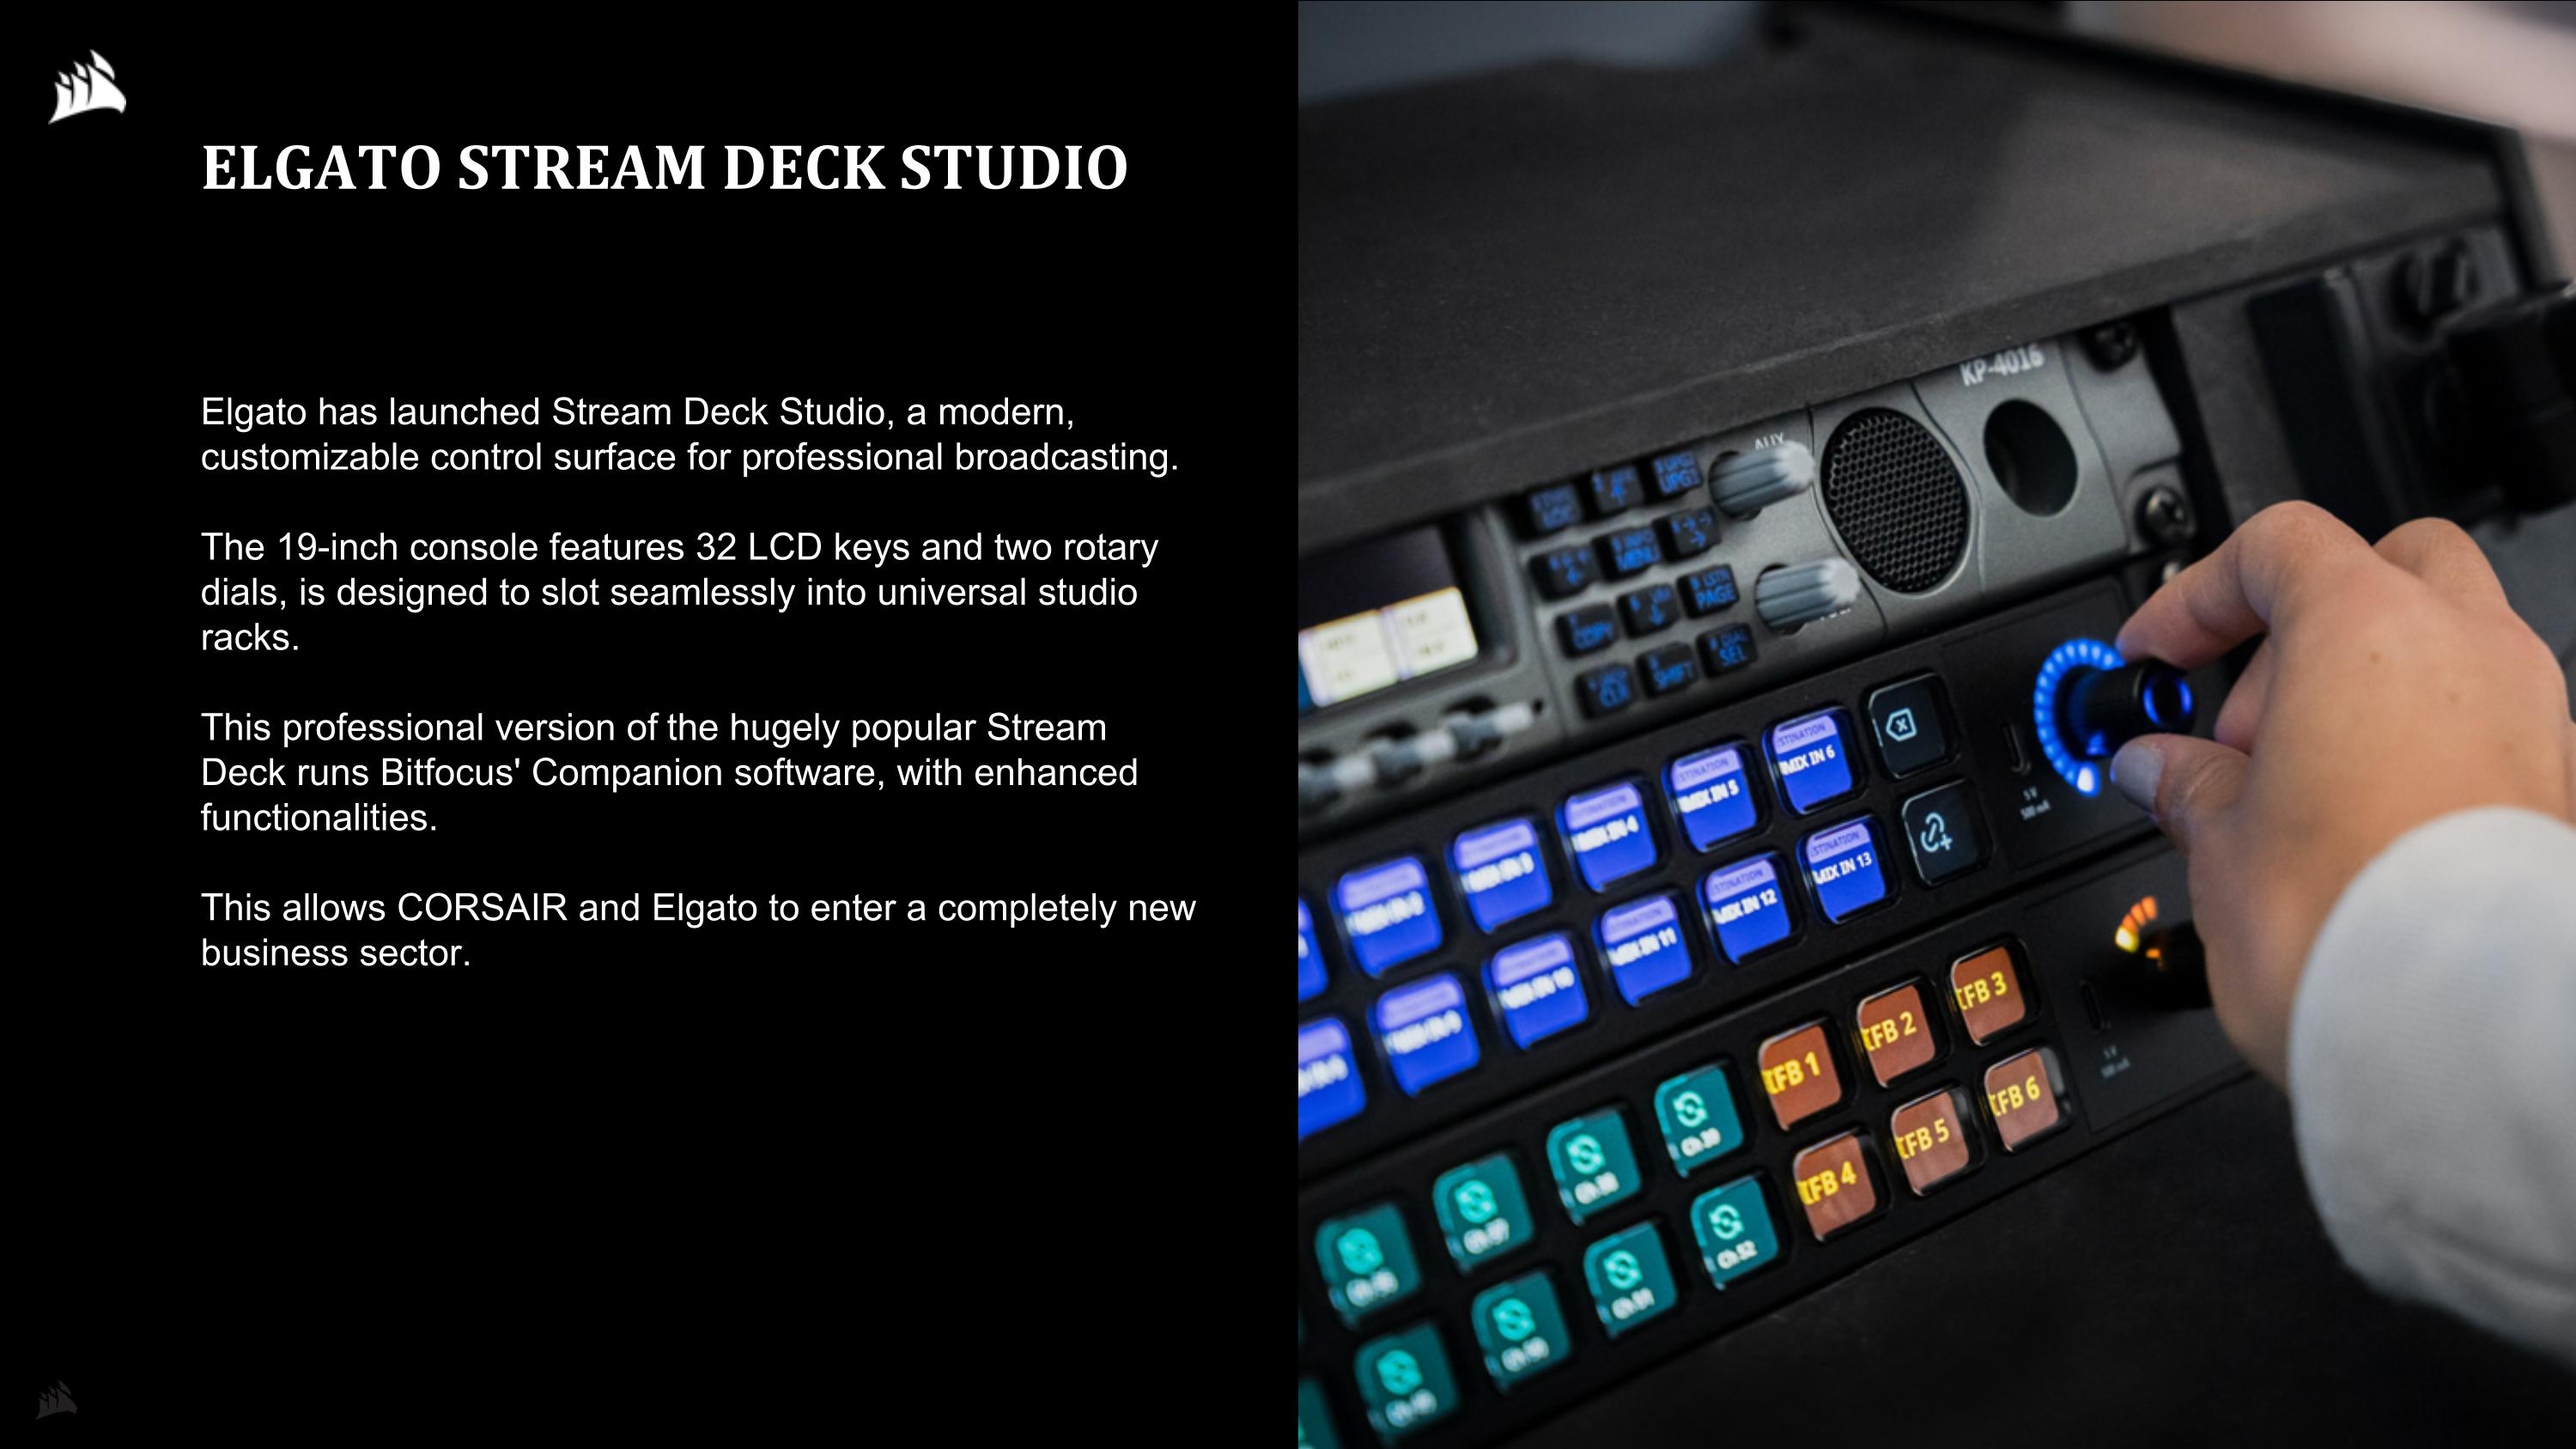
ELGATO STREAM DECK STUDIO Elgato has launched Stream Deck Studio, a modern, customizable control surface for professional broadcasting. The 19-inch console features 32 LCD keys and two rotary dials, is designed to slot seamlessly into universal studio racks. This professional version of the hugely popular Stream Deck runs Bitfocus' Companion software, with enhanced functionalities. This allows CORSAIR and Elgato to enter a completely new business sector.
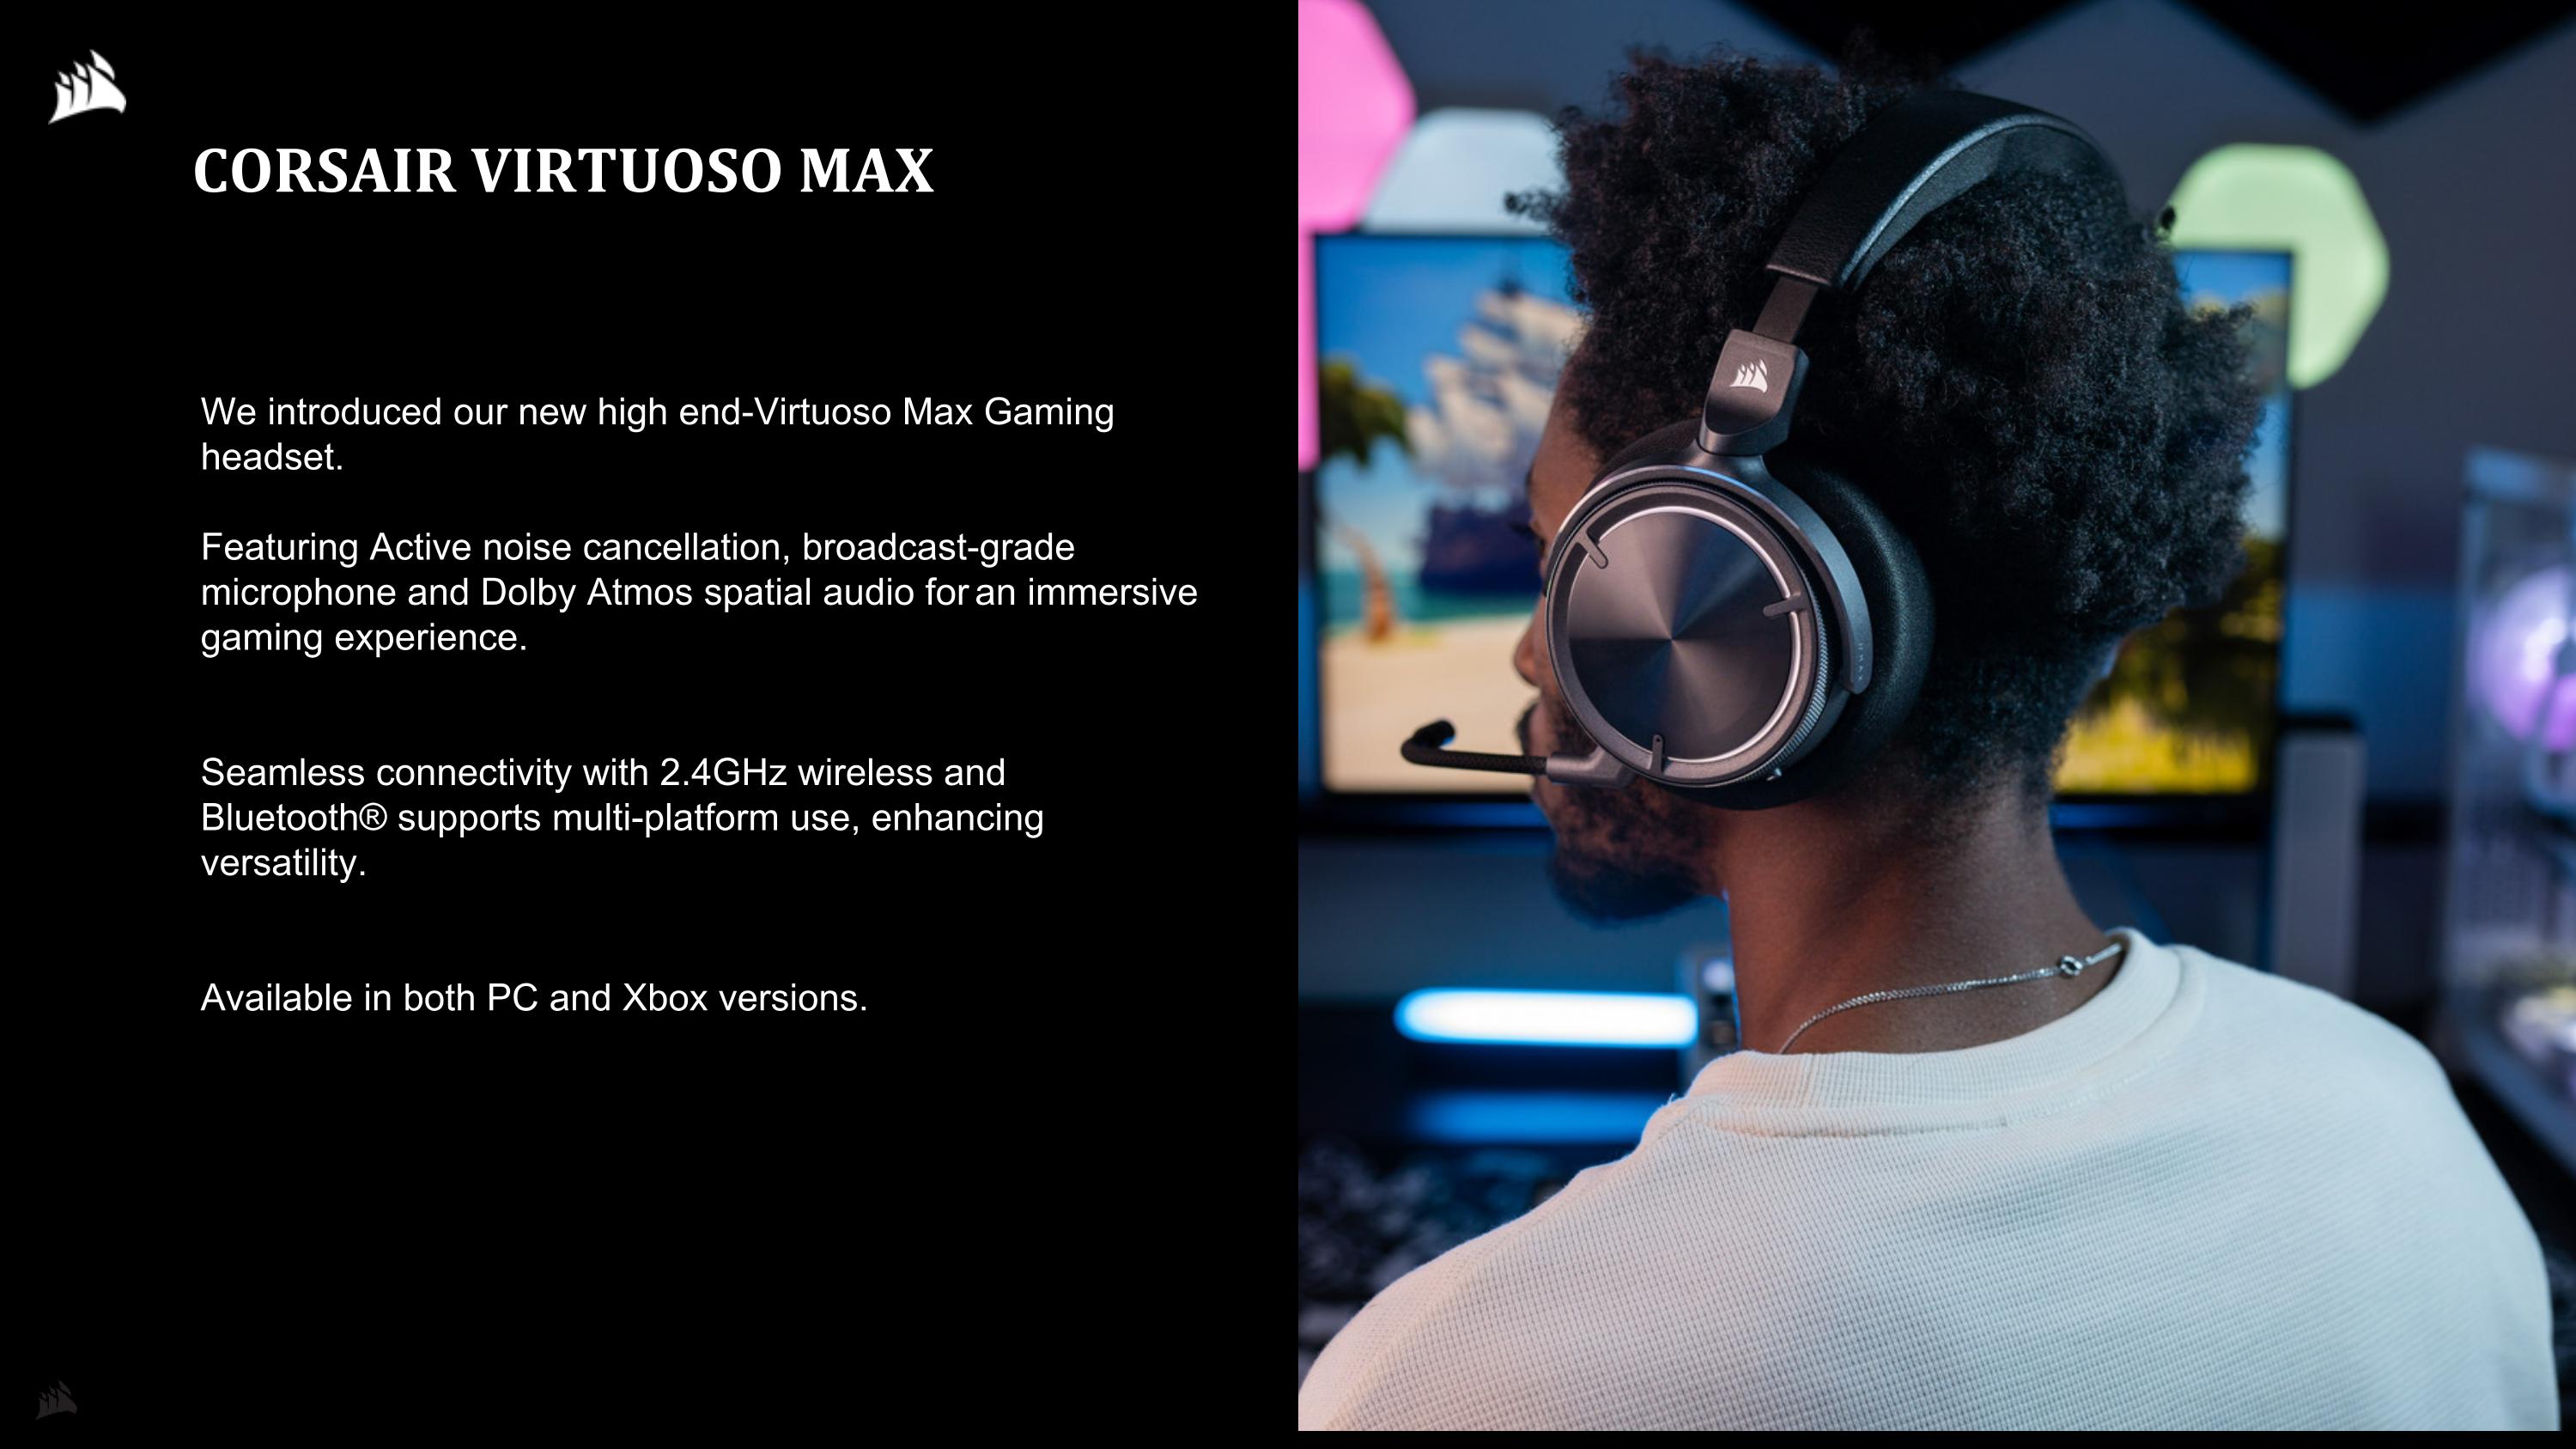
CORSAIR VIRTUOSO MAX We introduced our new high end-Virtuoso Max Gaming headset. Featuring Active noise cancellation, broadcast-grade microphone and Dolby Atmos spatial audio for an immersive gaming experience. Seamless connectivity with 2.4GHz wireless and Bluetooth® supports multi-platform use, enhancing versatility. Available in both PC and Xbox versions.
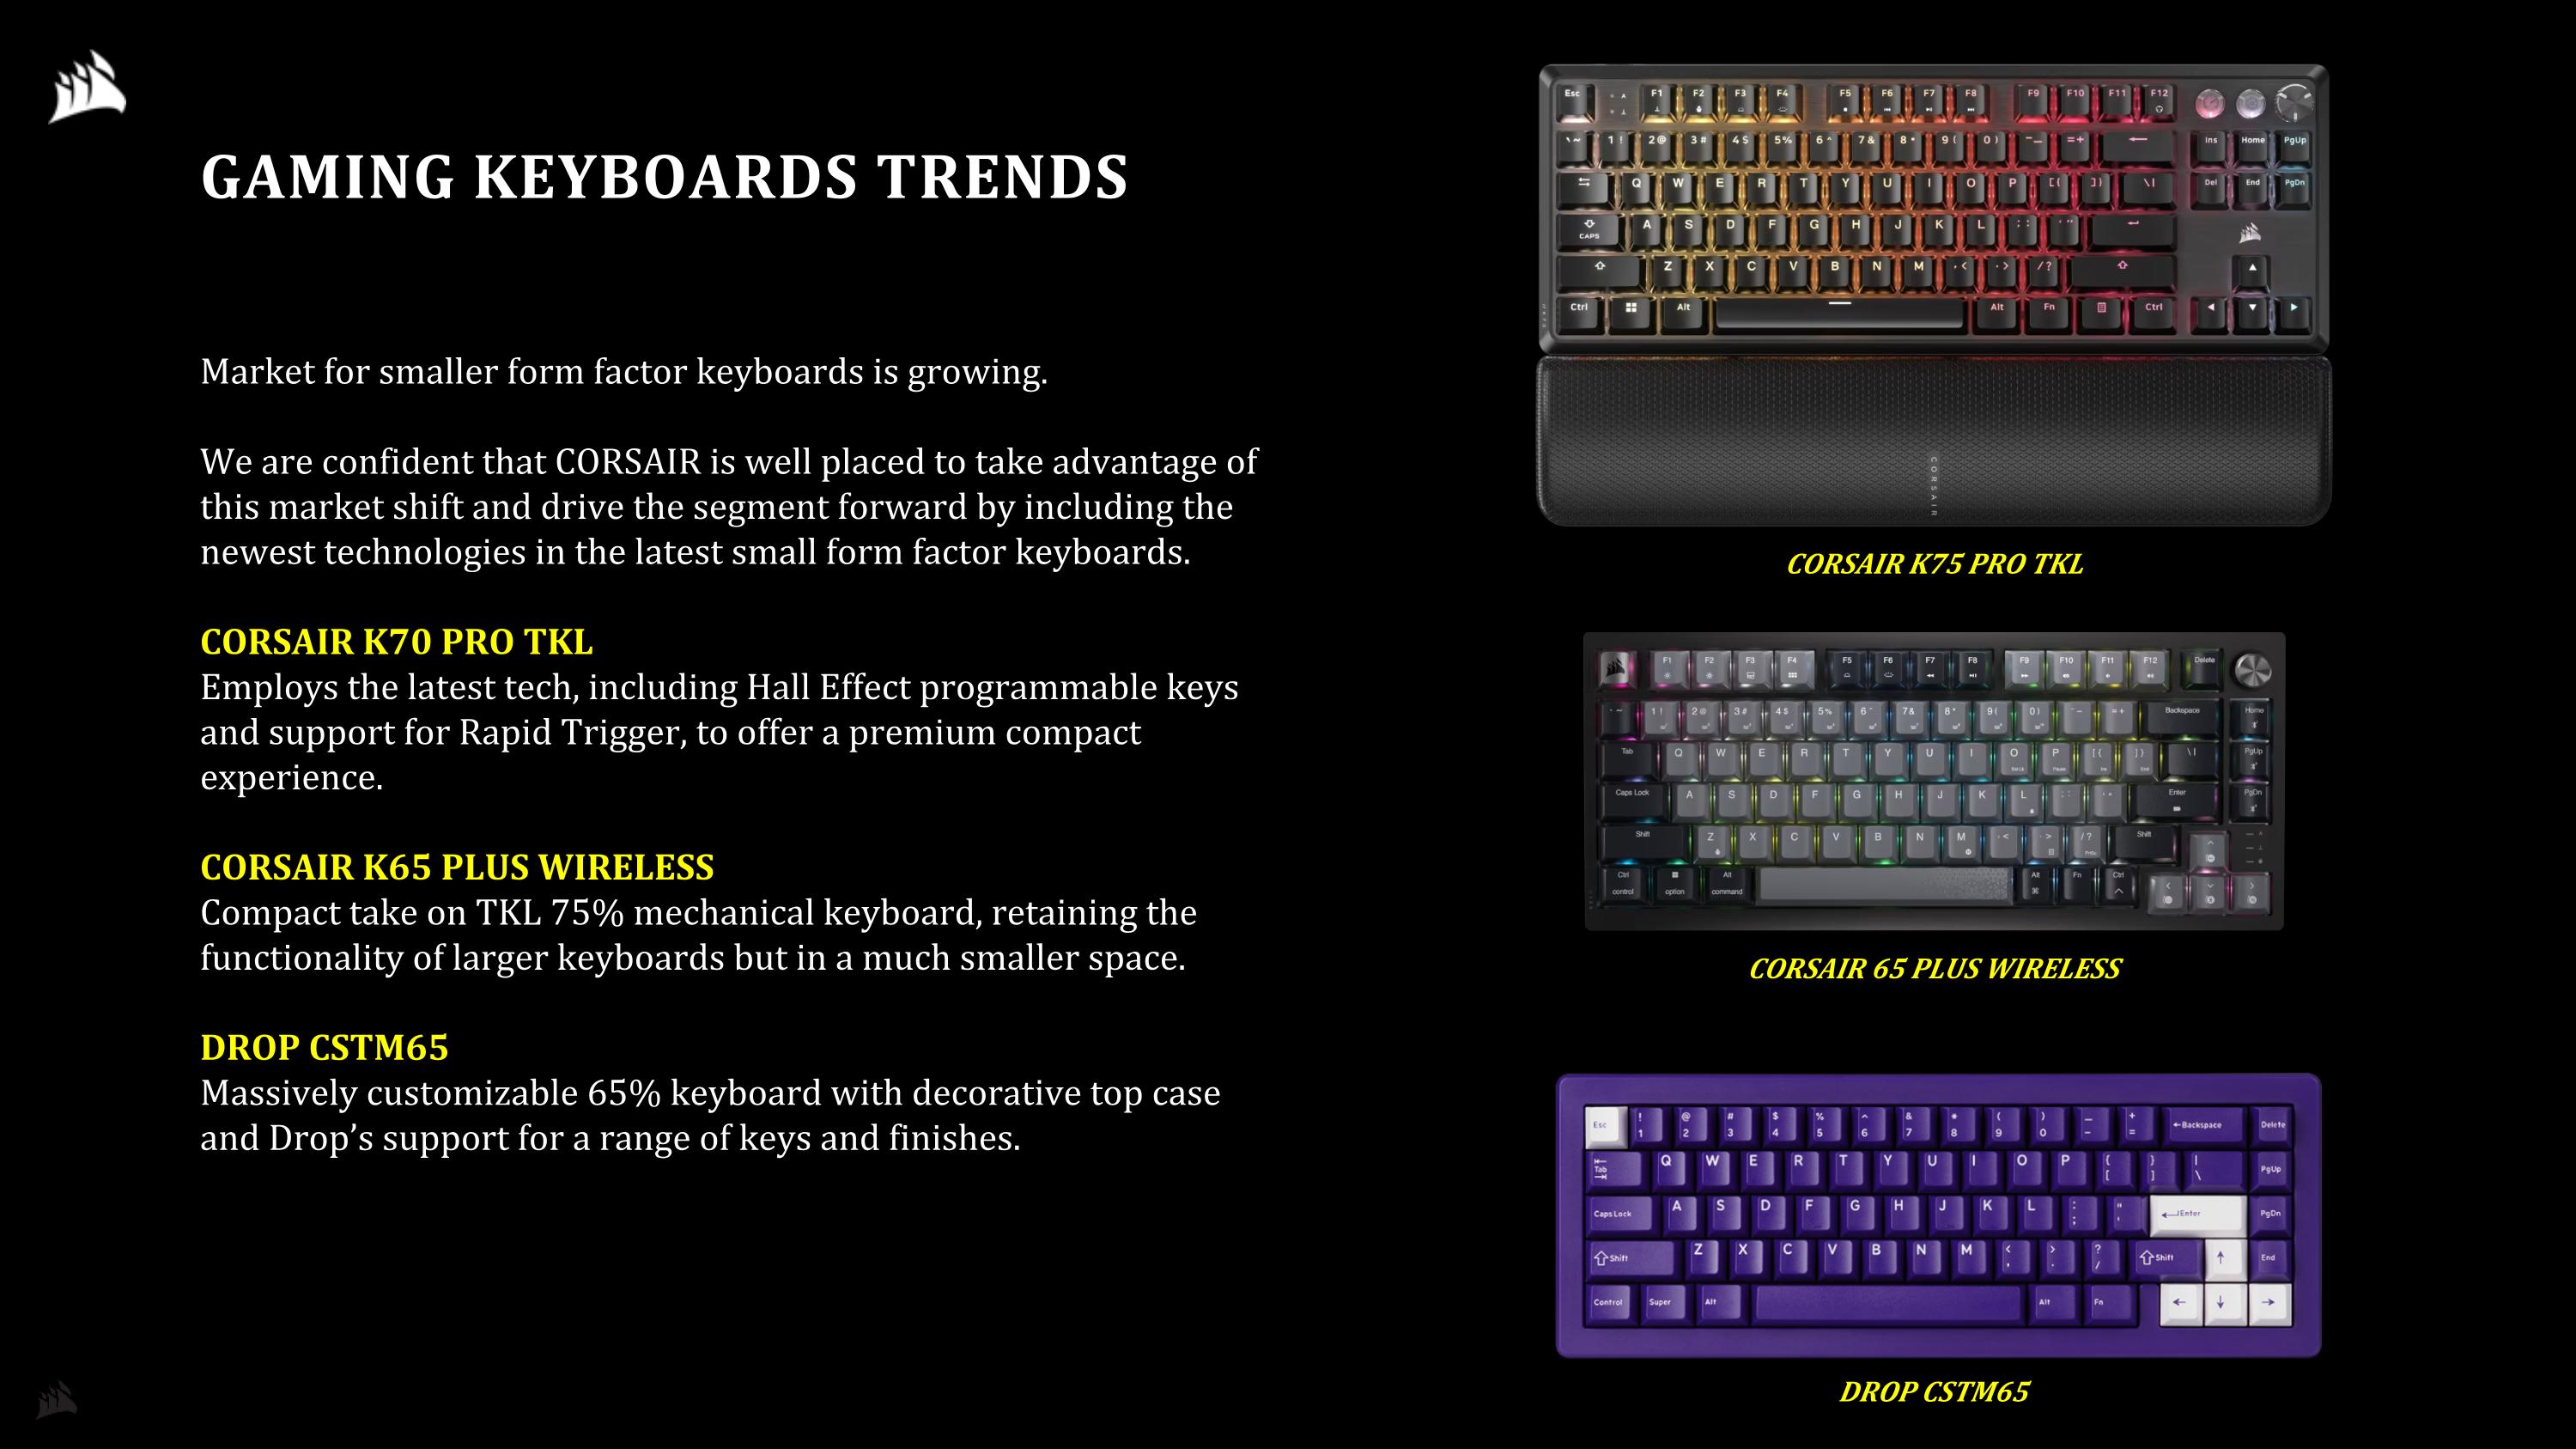
GAMING KEYBOARDS TRENDS Market for smaller form factor keyboards is growing. We are confident that CORSAIR is well placed to take advantage of this market shift and drive the segment forward by including the newest technologies in the latest small form factor keyboards. CORSAIR K70 PRO TKL Employs the latest tech, including Hall Effect programmable keys and support for Rapid Trigger, to offer a premium compact experience. CORSAIR K65 PLUS WIRELESS Compact take on TKL 75% mechanical keyboard, retaining the functionality of larger keyboards but in a much smaller space. DROP CSTM65 Massively customizable 65% keyboard with decorative top case and Drop’s support for a range of keys and finishes. DROP CSTM65 CORSAIR 65 PLUS WIRELESS CORSAIR K75 PRO TKL
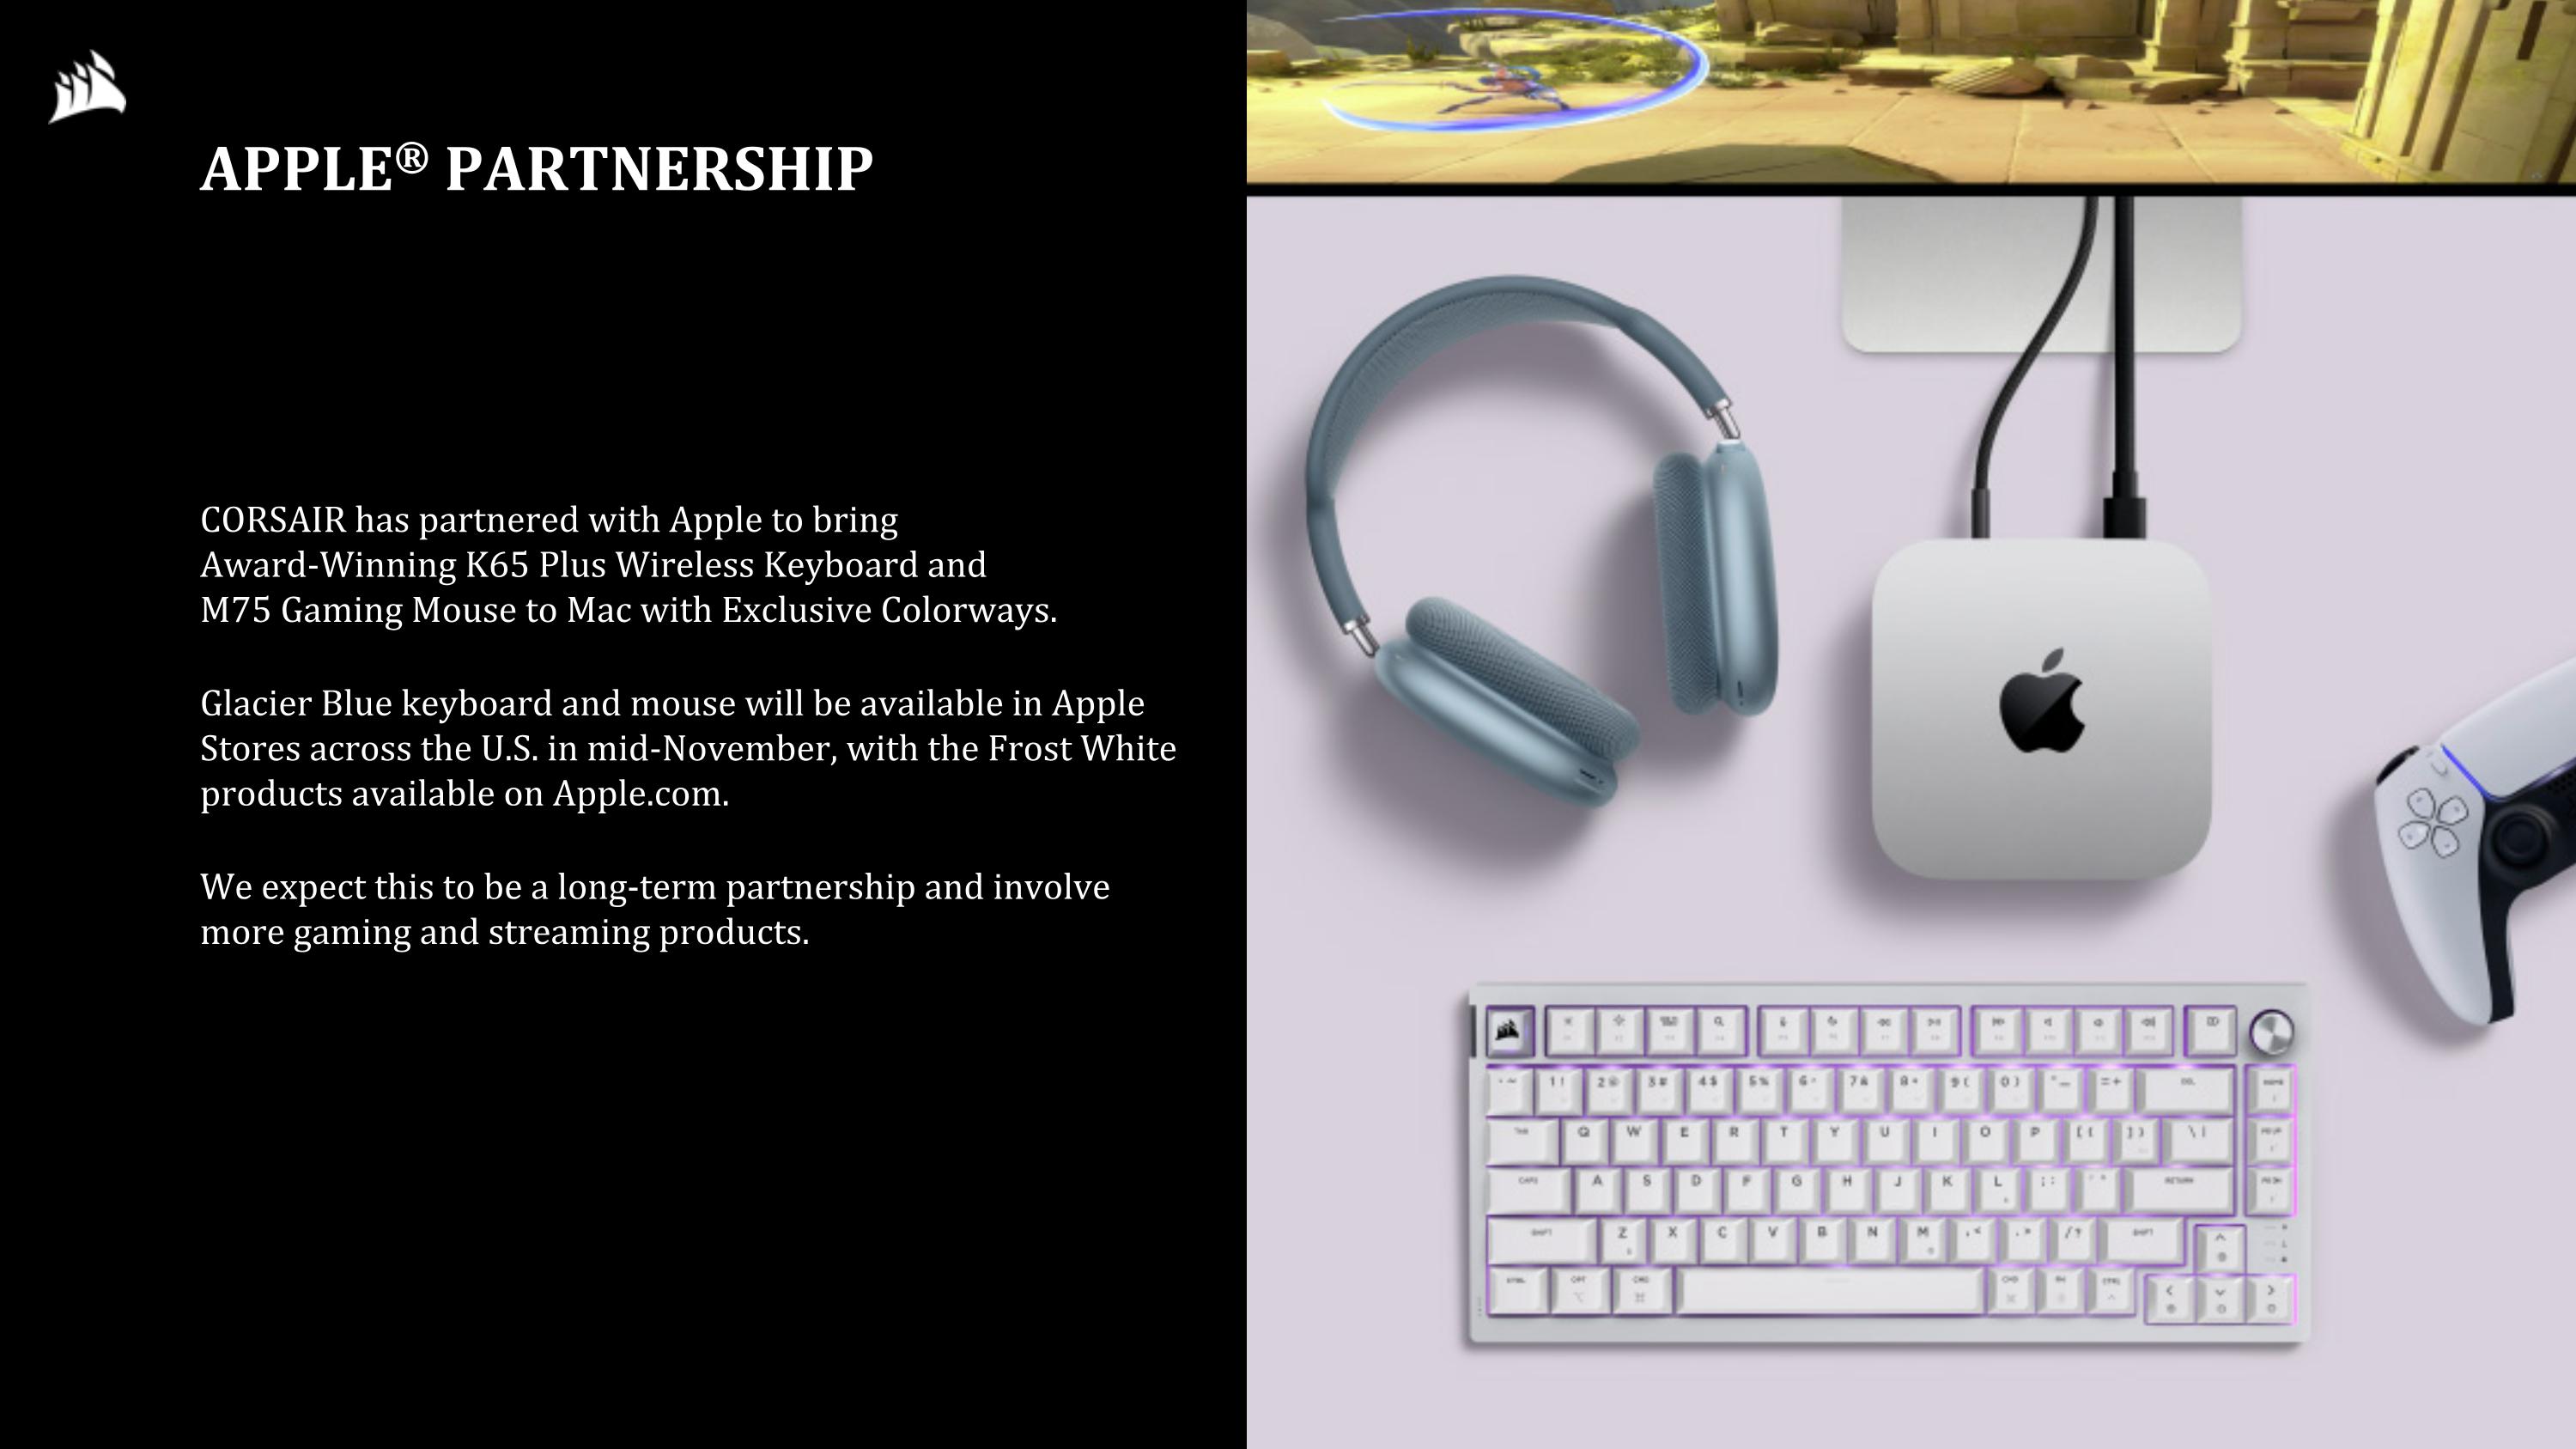
CORSAIR has partnered with Apple to bring Award-Winning K65 Plus Wireless Keyboard and M75 Gaming Mouse to Mac with Exclusive Colorways. Glacier Blue keyboard and mouse will be available in Apple Stores across the U.S. in mid-November, with the Frost White products available on Apple.com. We expect this to be a long-term partnership and involve more gaming and streaming products. APPLE® PARTNERSHIP

M&A UPDATE
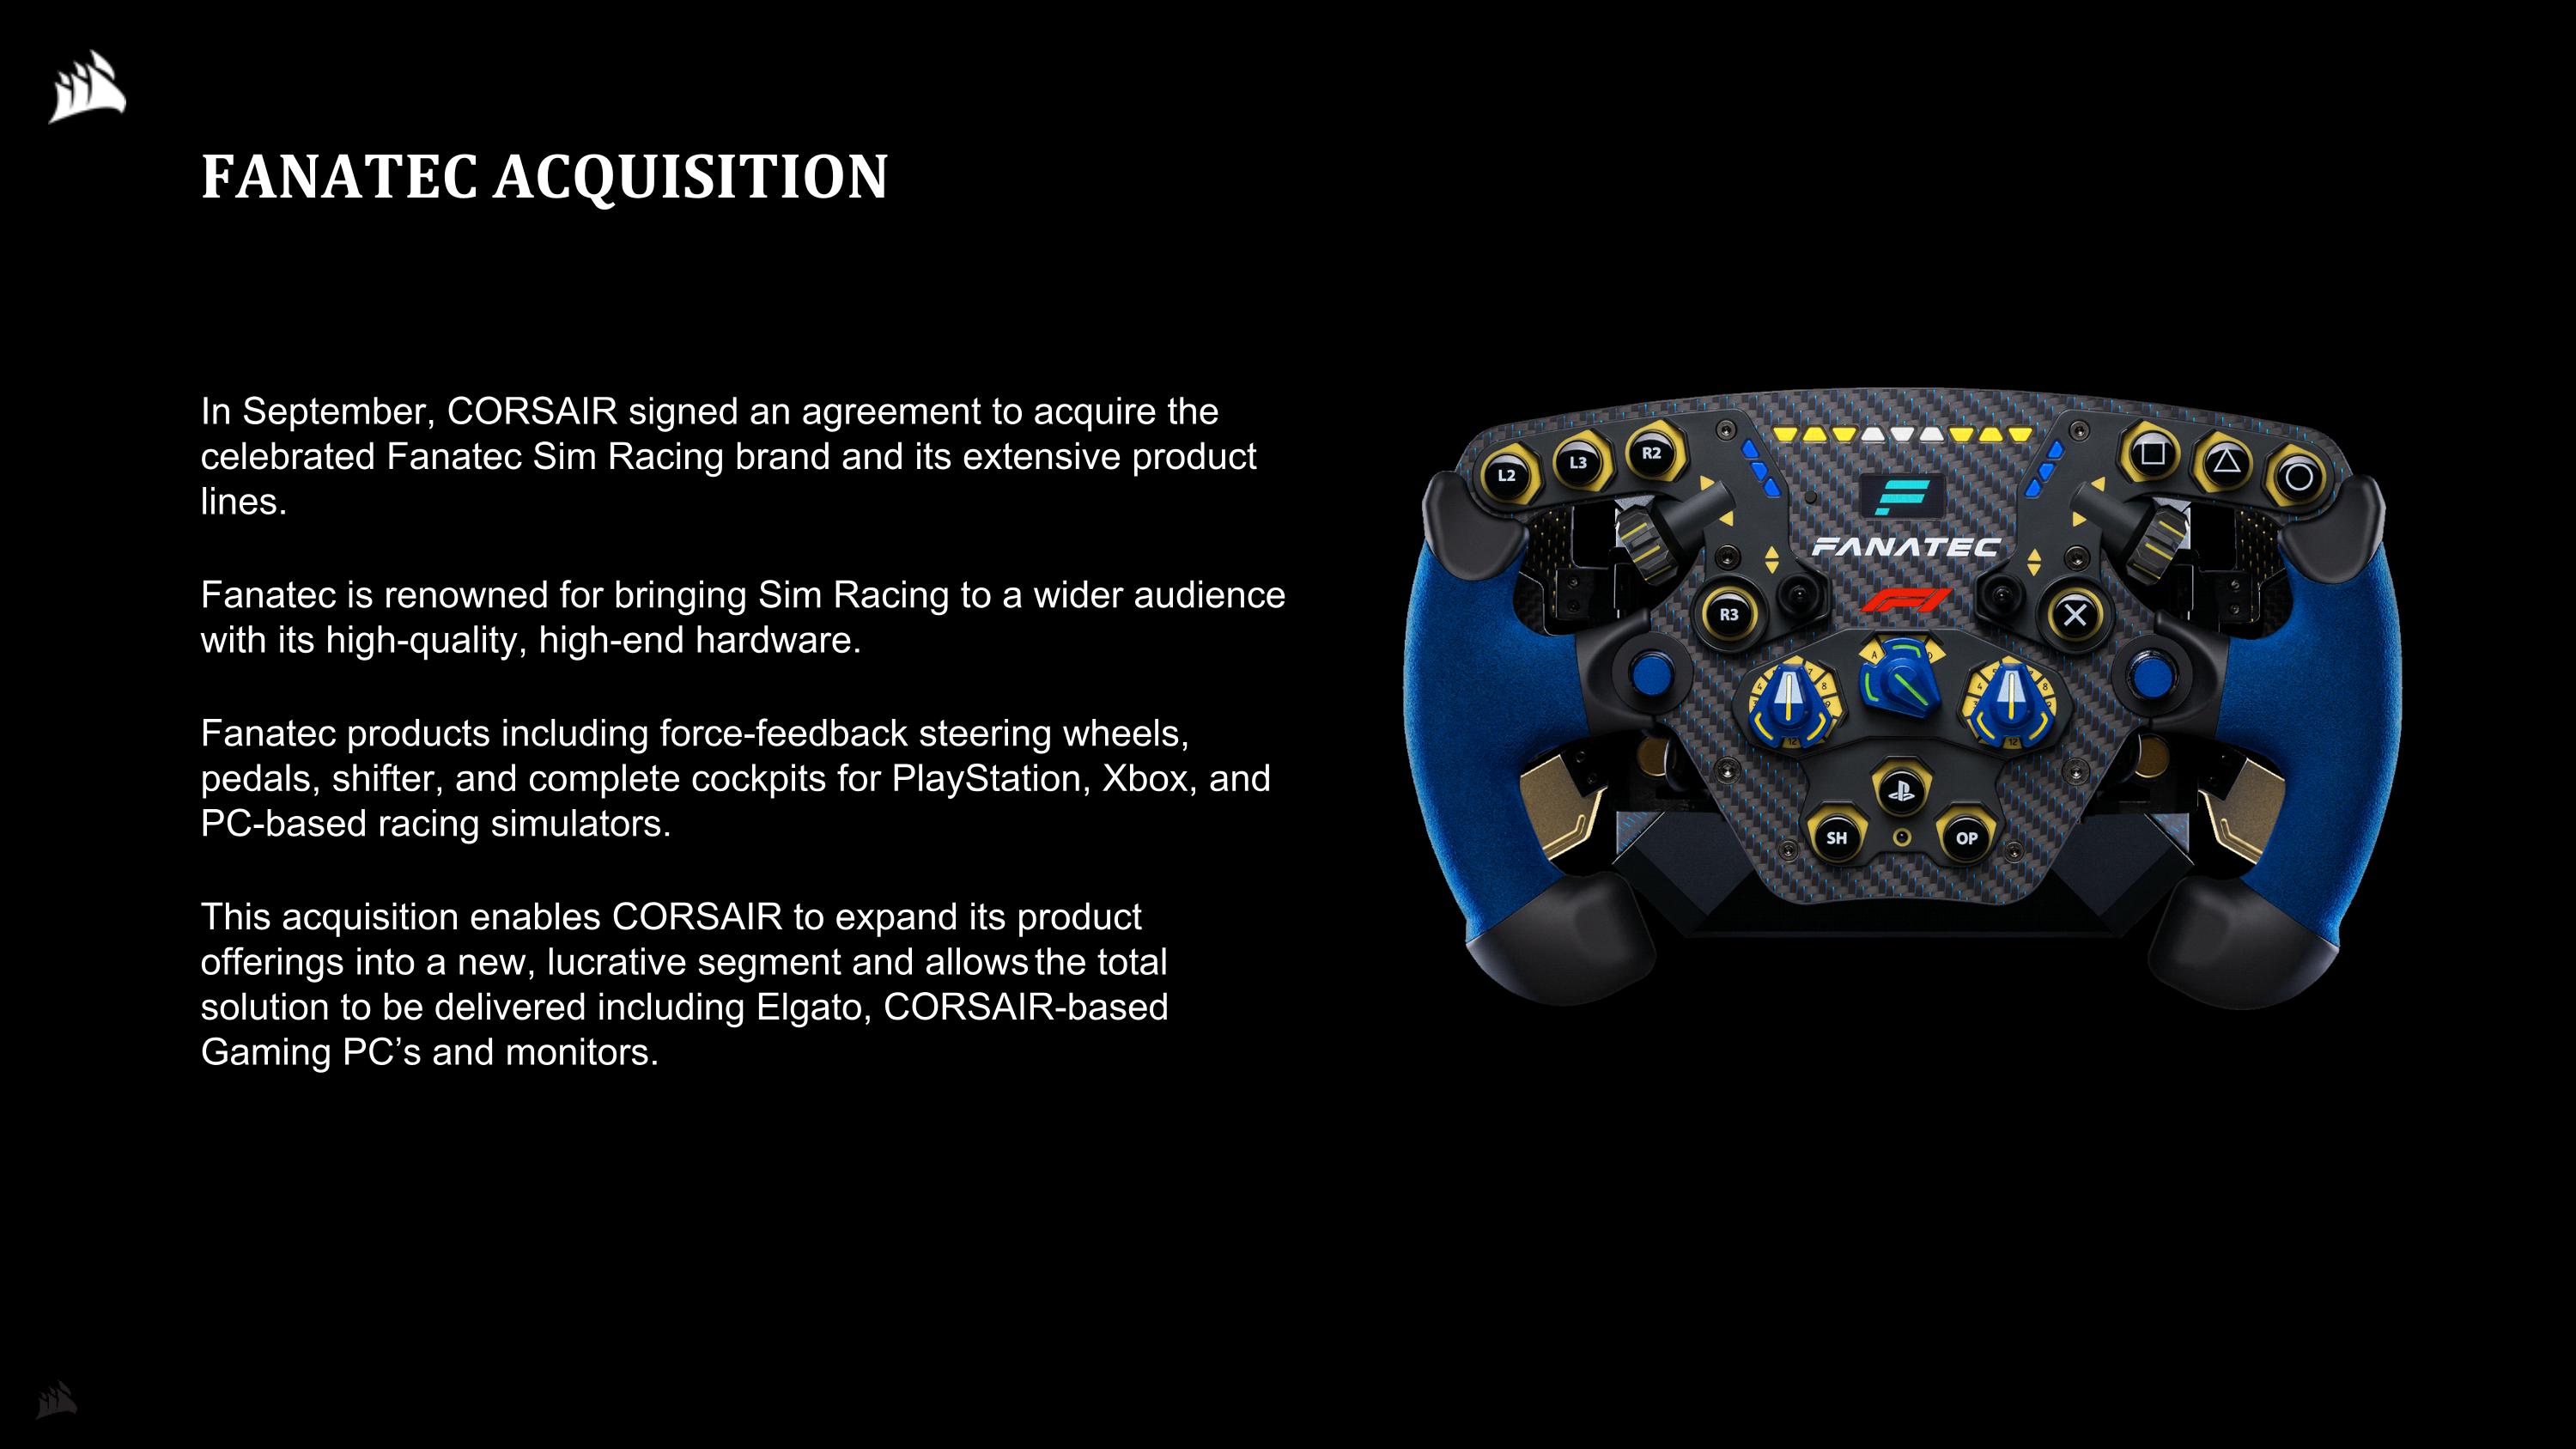
FANATEC ACQUISITION In September, CORSAIR signed an agreement to acquire the celebrated Fanatec Sim Racing brand and its extensive product lines. Fanatec is renowned for bringing Sim Racing to a wider audience with its high-quality, high-end hardware. Fanatec products including force-feedback steering wheels, pedals, shifter, and complete cockpits for PlayStation, Xbox, and PC-based racing simulators. This acquisition enables CORSAIR to expand its product offerings into a new, lucrative segment and allows the total solution to be delivered including Elgato, CORSAIR-based Gaming PC’s and monitors.

FINANCIAL RESULTS
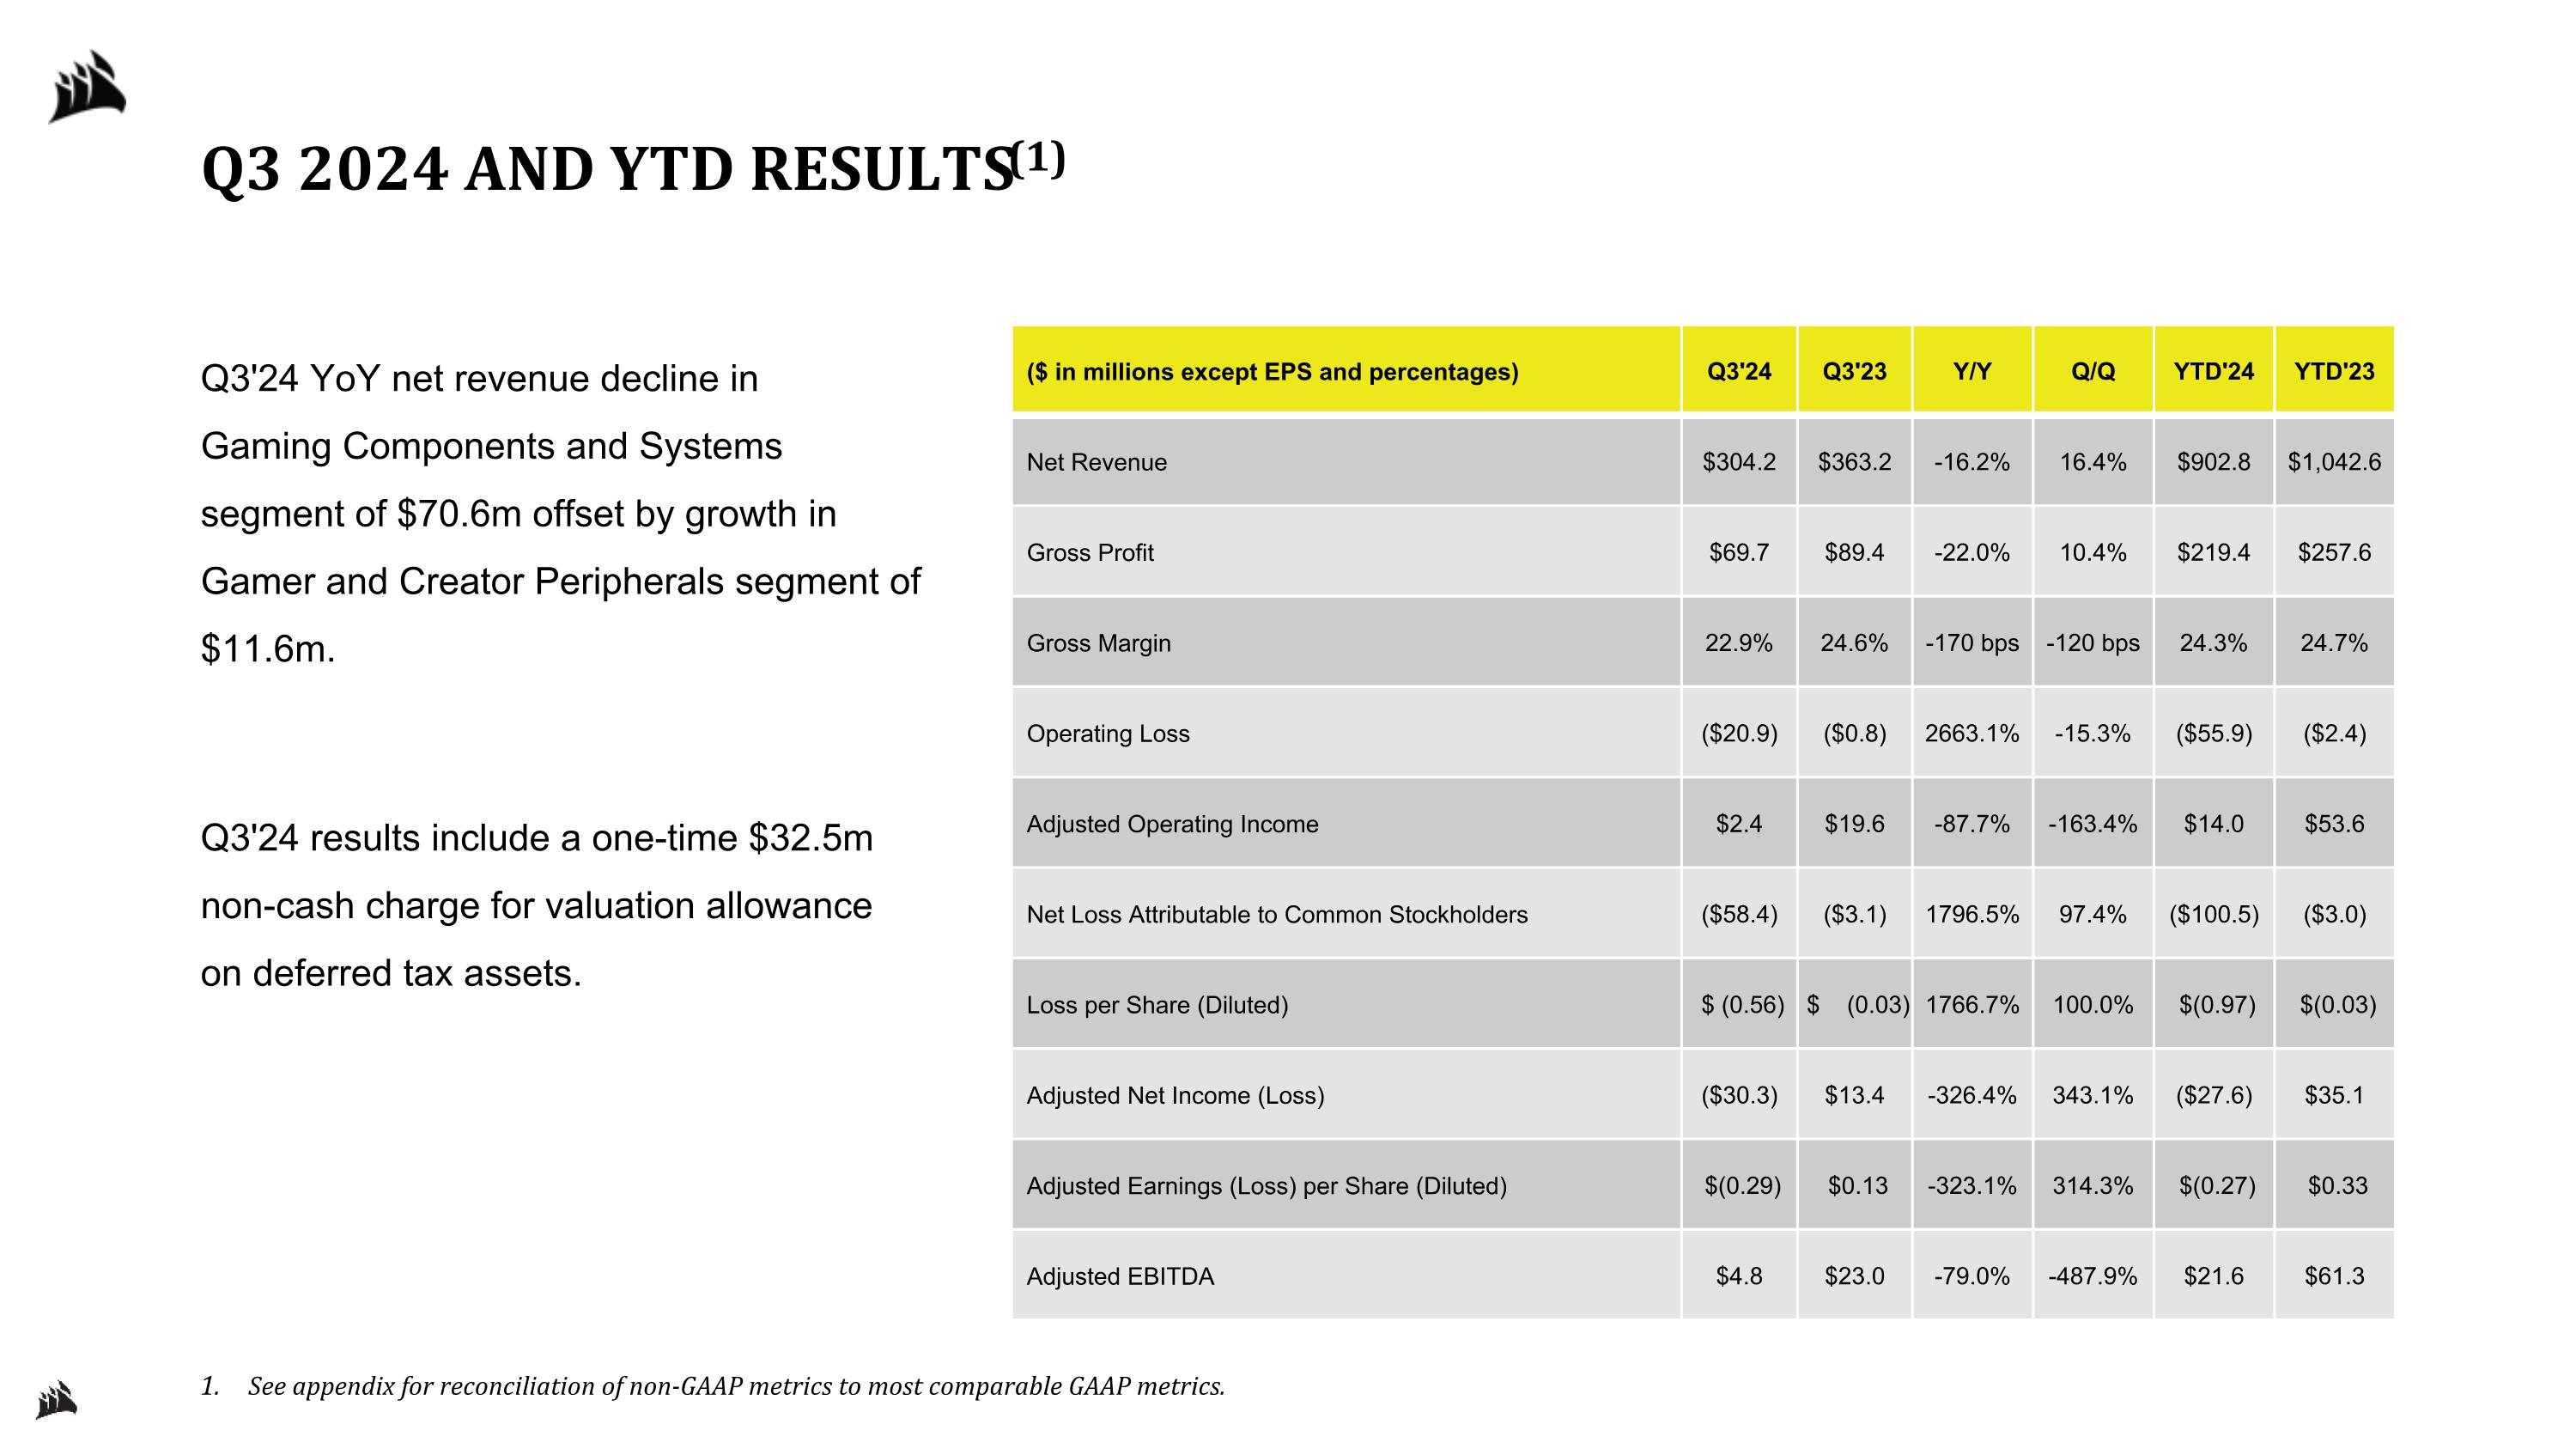
Q3 2024 AND YTD RESULTS(1) Q3'24 YoY net revenue decline in Gaming Components and Systems segment of $70.6m offset by growth in Gamer and Creator Peripherals segment of $11.6m. Q3'24 results include a one-time $32.5m non-cash charge for valuation allowance on deferred tax assets. See appendix for reconciliation of non-GAAP metrics to most comparable GAAP metrics. ($ in millions except EPS and percentages) Q3'24 Q3'23 Y/Y Q/Q YTD'24 YTD'23 Net Revenue $304.2 $363.2 -16.2% 16.4% $902.8 $1,042.6 Gross Profit $69.7 $89.4 -22.0% 10.4% $219.4 $257.6 Gross Margin 22.9% 24.6% -170 bps -120 bps 24.3% 24.7% Operating Loss ($20.9) ($0.8) 2663.1% -15.3% ($55.9) ($2.4) Adjusted Operating Income $2.4 $19.6 -87.7% -163.4% $14.0 $53.6 Net Loss Attributable to Common Stockholders ($58.4) ($3.1) 1796.5% 97.4% ($100.5) ($3.0) Loss per Share (Diluted) $ (0.56) $ (0.03) 1766.7% 100.0% $(0.97) $(0.03) Adjusted Net Income (Loss) ($30.3) $13.4 -326.4% 343.1% ($27.6) $35.1 Adjusted Earnings (Loss) per Share (Diluted) $(0.29) $0.13 -323.1% 314.3% $(0.27) $0.33 Adjusted EBITDA $4.8 $23.0 -79.0% -487.9% $21.6 $61.3
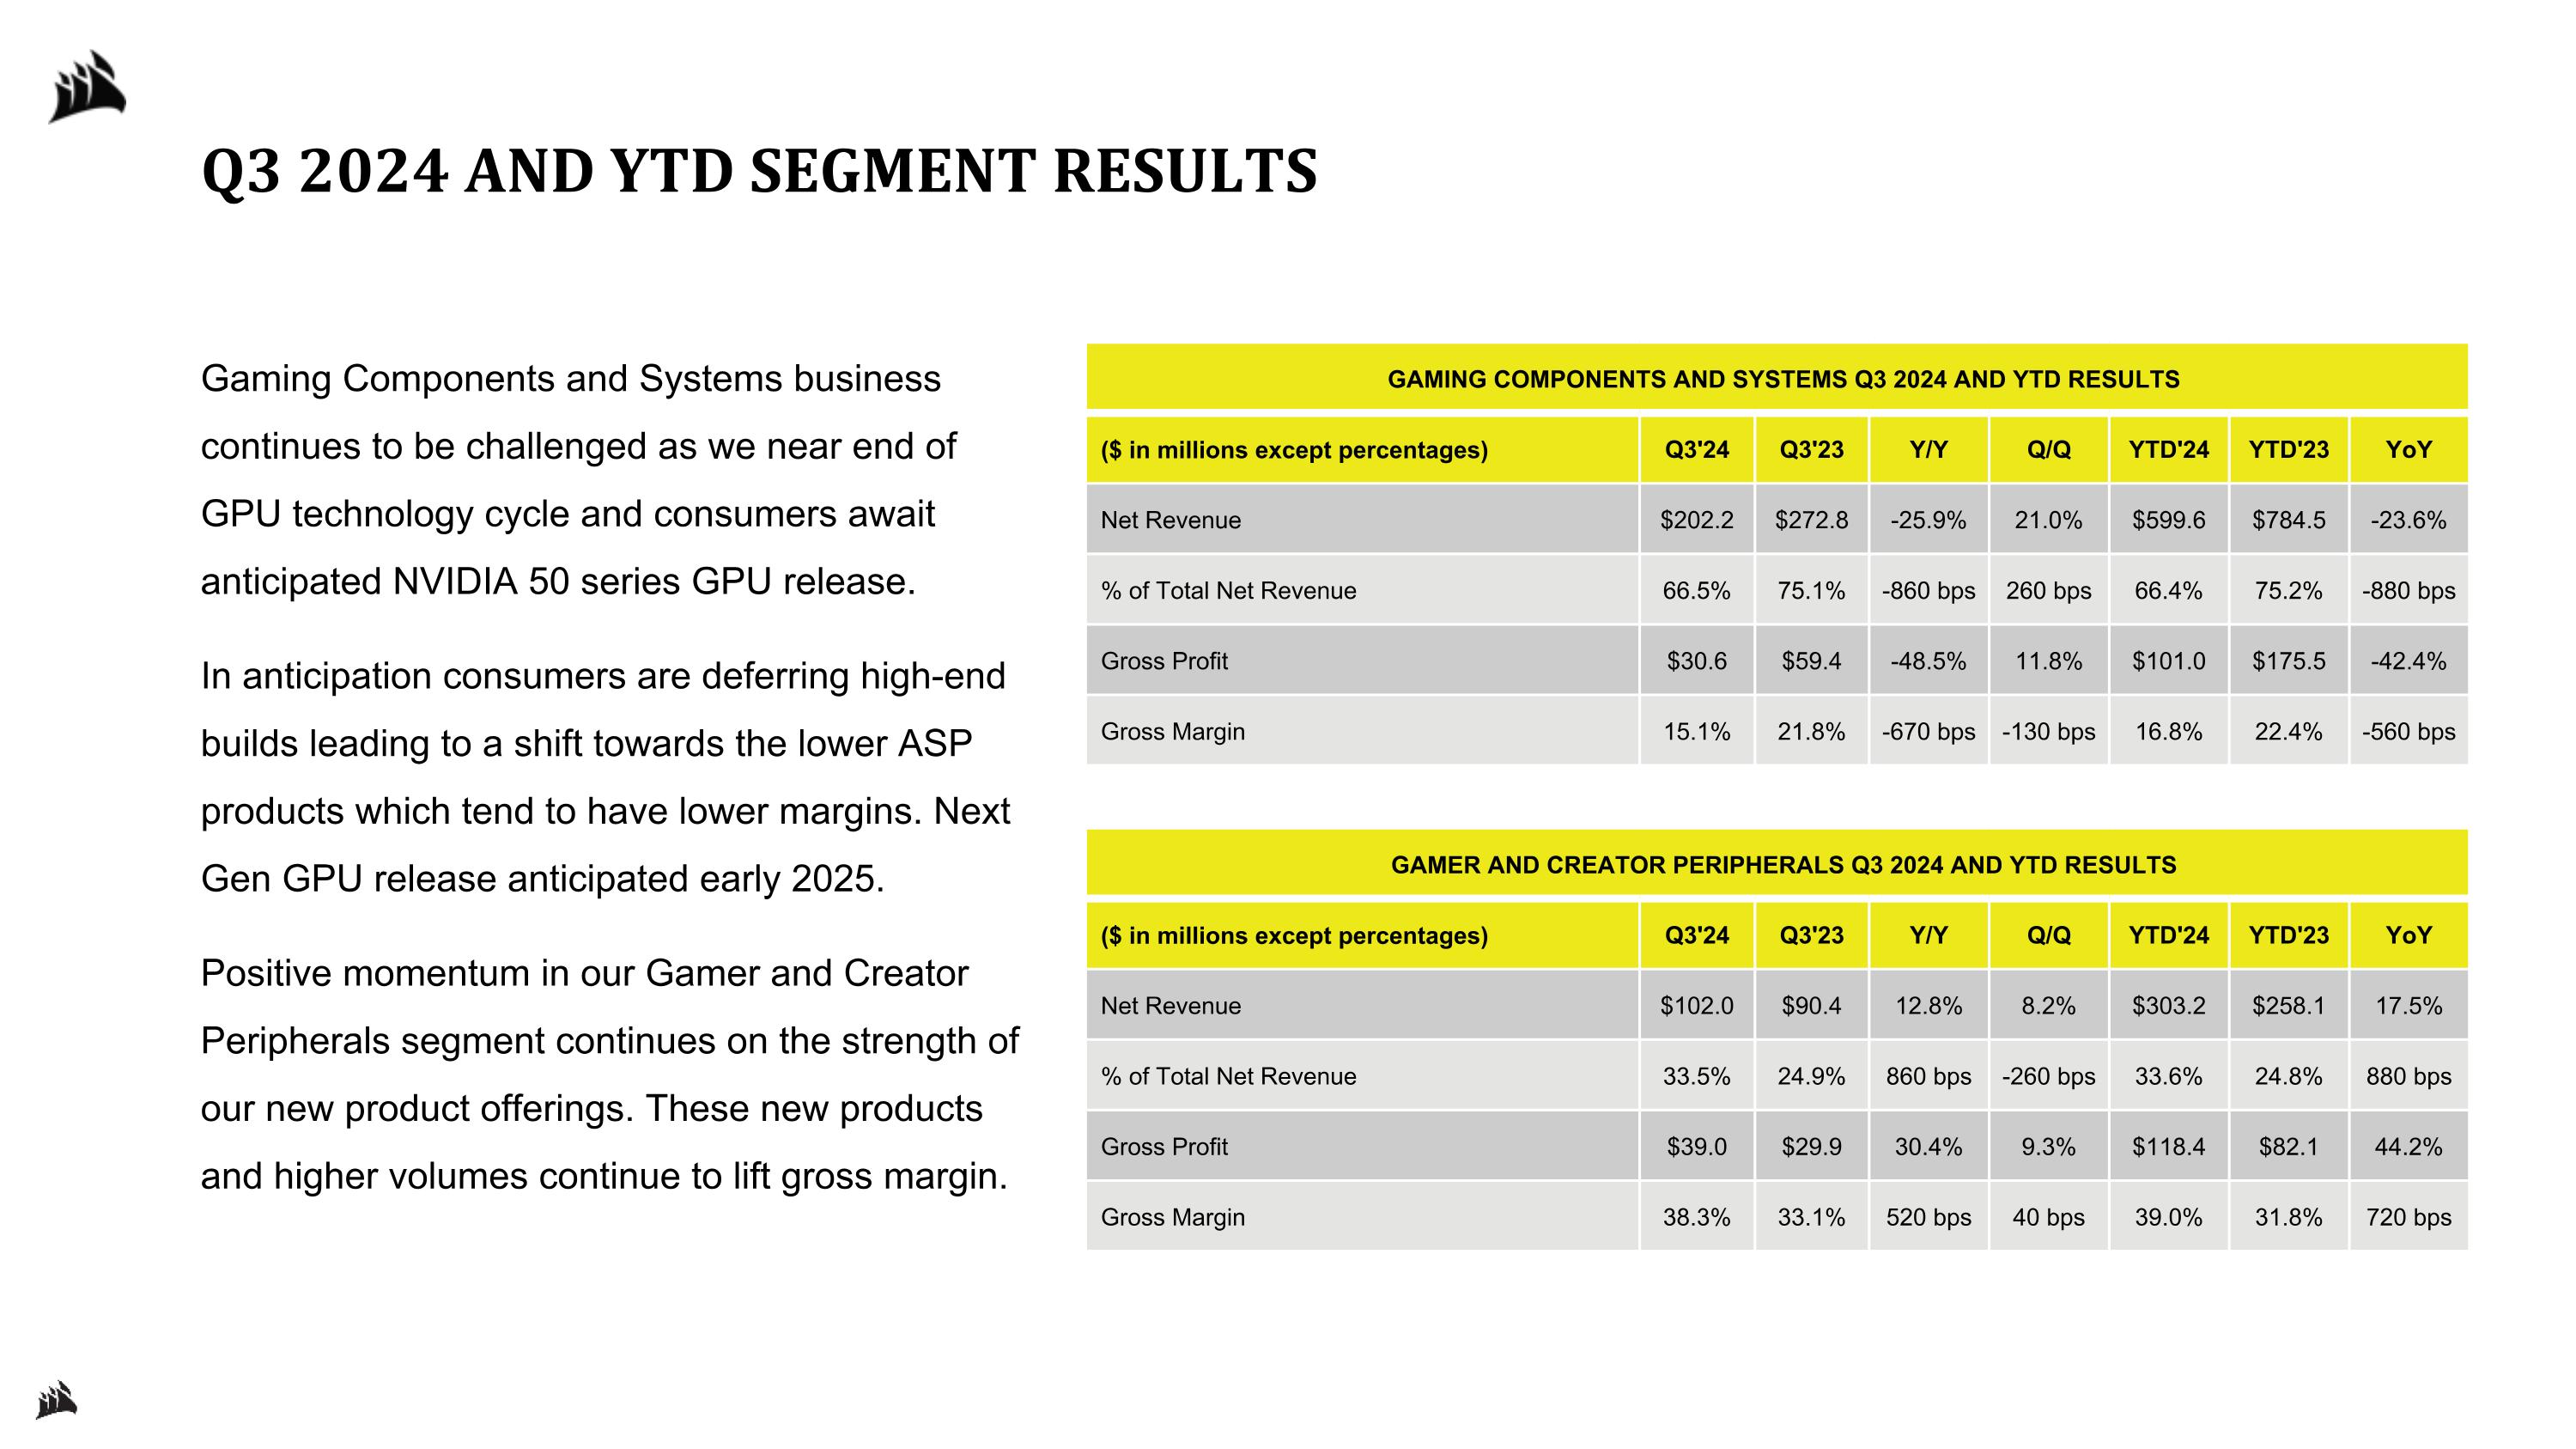
Q3 2024 AND YTD SEGMENT RESULTS GAMING COMPONENTS AND SYSTEMS Q3 2024 AND YTD RESULTS ($ in millions except percentages) Q3'24 Q3'23 Y/Y Q/Q YTD'24 YTD'23 YoY Net Revenue $202.2 $272.8 -25.9% 21.0% $599.6 $784.5 -23.6% % of Total Net Revenue 66.5% 75.1% -860 bps 260 bps 66.4% 75.2% -880 bps Gross Profit $30.6 $59.4 -48.5% 11.8% $101.0 $175.5 -42.4% Gross Margin 15.1% 21.8% -670 bps -130 bps 16.8% 22.4% -560 bps GAMER AND CREATOR PERIPHERALS Q3 2024 AND YTD RESULTS ($ in millions except percentages) Q3'24 Q3'23 Y/Y Q/Q YTD'24 YTD'23 YoY Net Revenue $102.0 $90.4 12.8% 8.2% $303.2 $258.1 17.5% % of Total Net Revenue 33.5% 24.9% 860 bps -260 bps 33.6% 24.8% 880 bps Gross Profit $39.0 $29.9 30.4% 9.3% $118.4 $82.1 44.2% Gross Margin 38.3% 33.1% 520 bps 40 bps 39.0% 31.8% 720 bps Gaming Components and Systems business continues to be challenged as we near end of GPU technology cycle and consumers await anticipated NVIDIA 50 series GPU release. In anticipation consumers are deferring high-end builds leading to a shift towards the lower ASP products which tend to have lower margins. Next Gen GPU release anticipated early 2025. Positive momentum in our Gamer and Creator Peripherals segment continues on the strength of our new product offerings. These new products and higher volumes continue to lift gross margin.
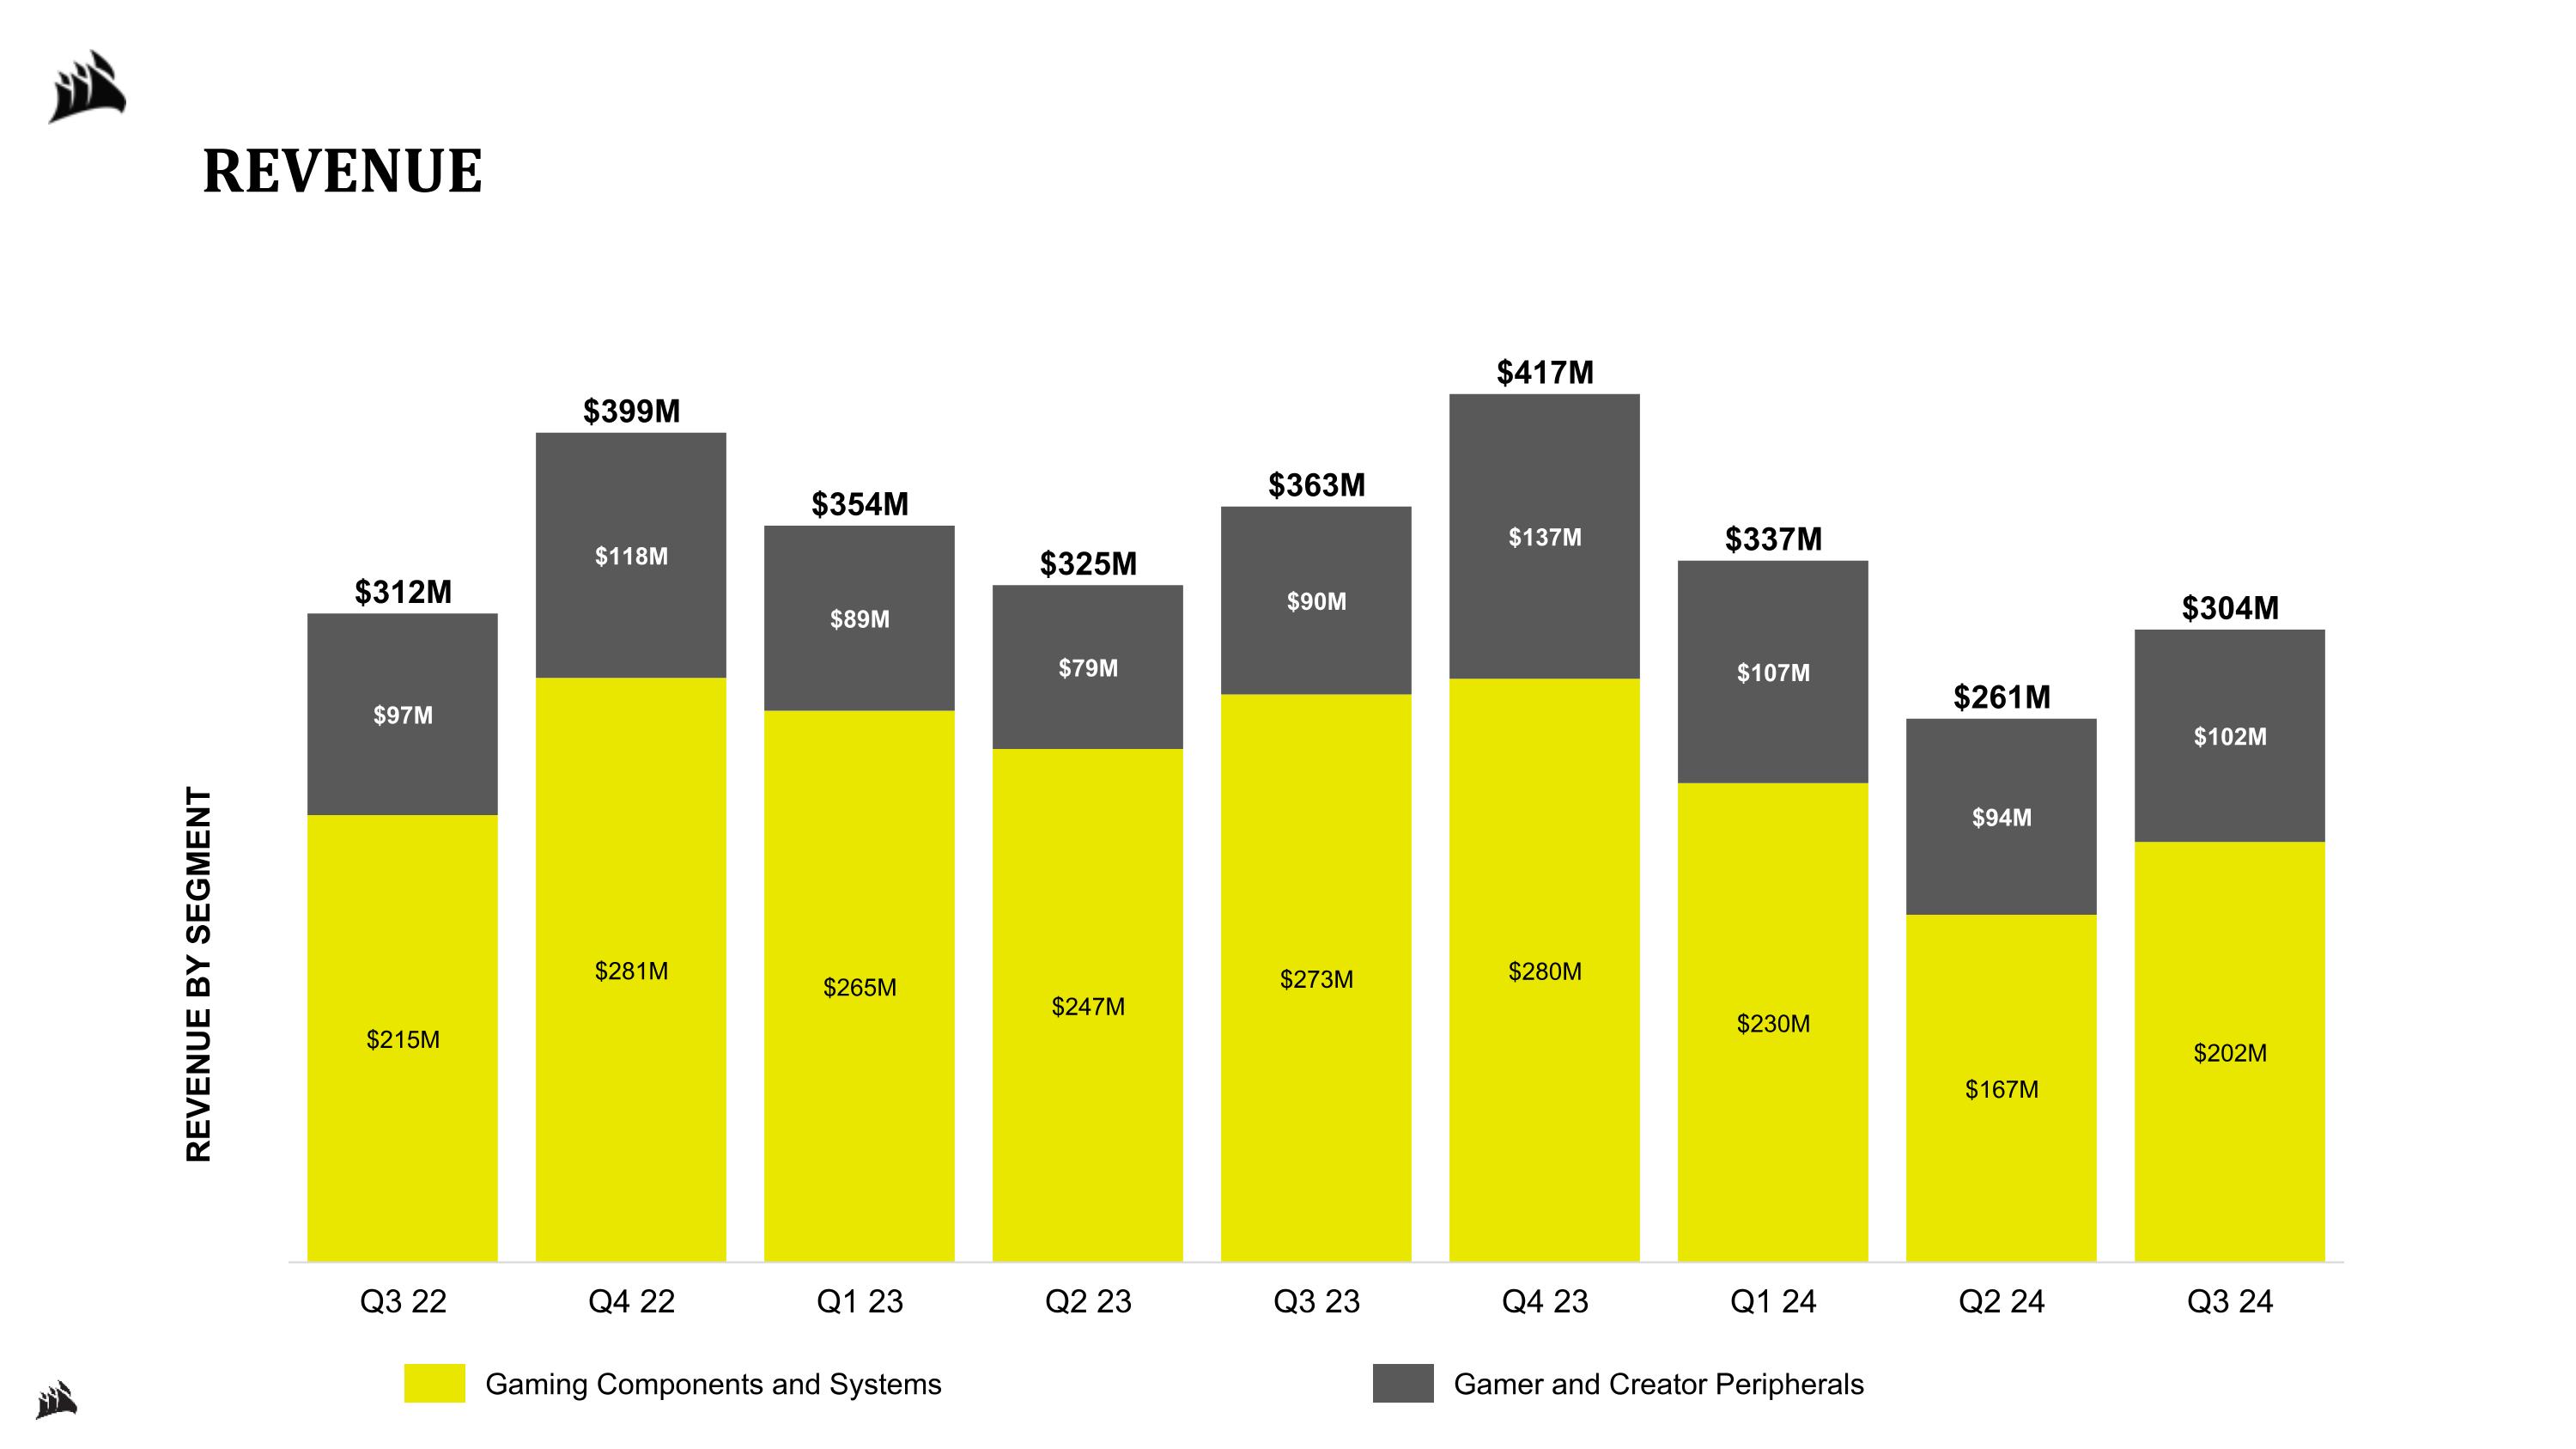
REVENUE BY SEGMENT Gaming Components and Systems Gamer and Creator Peripherals REVENUE
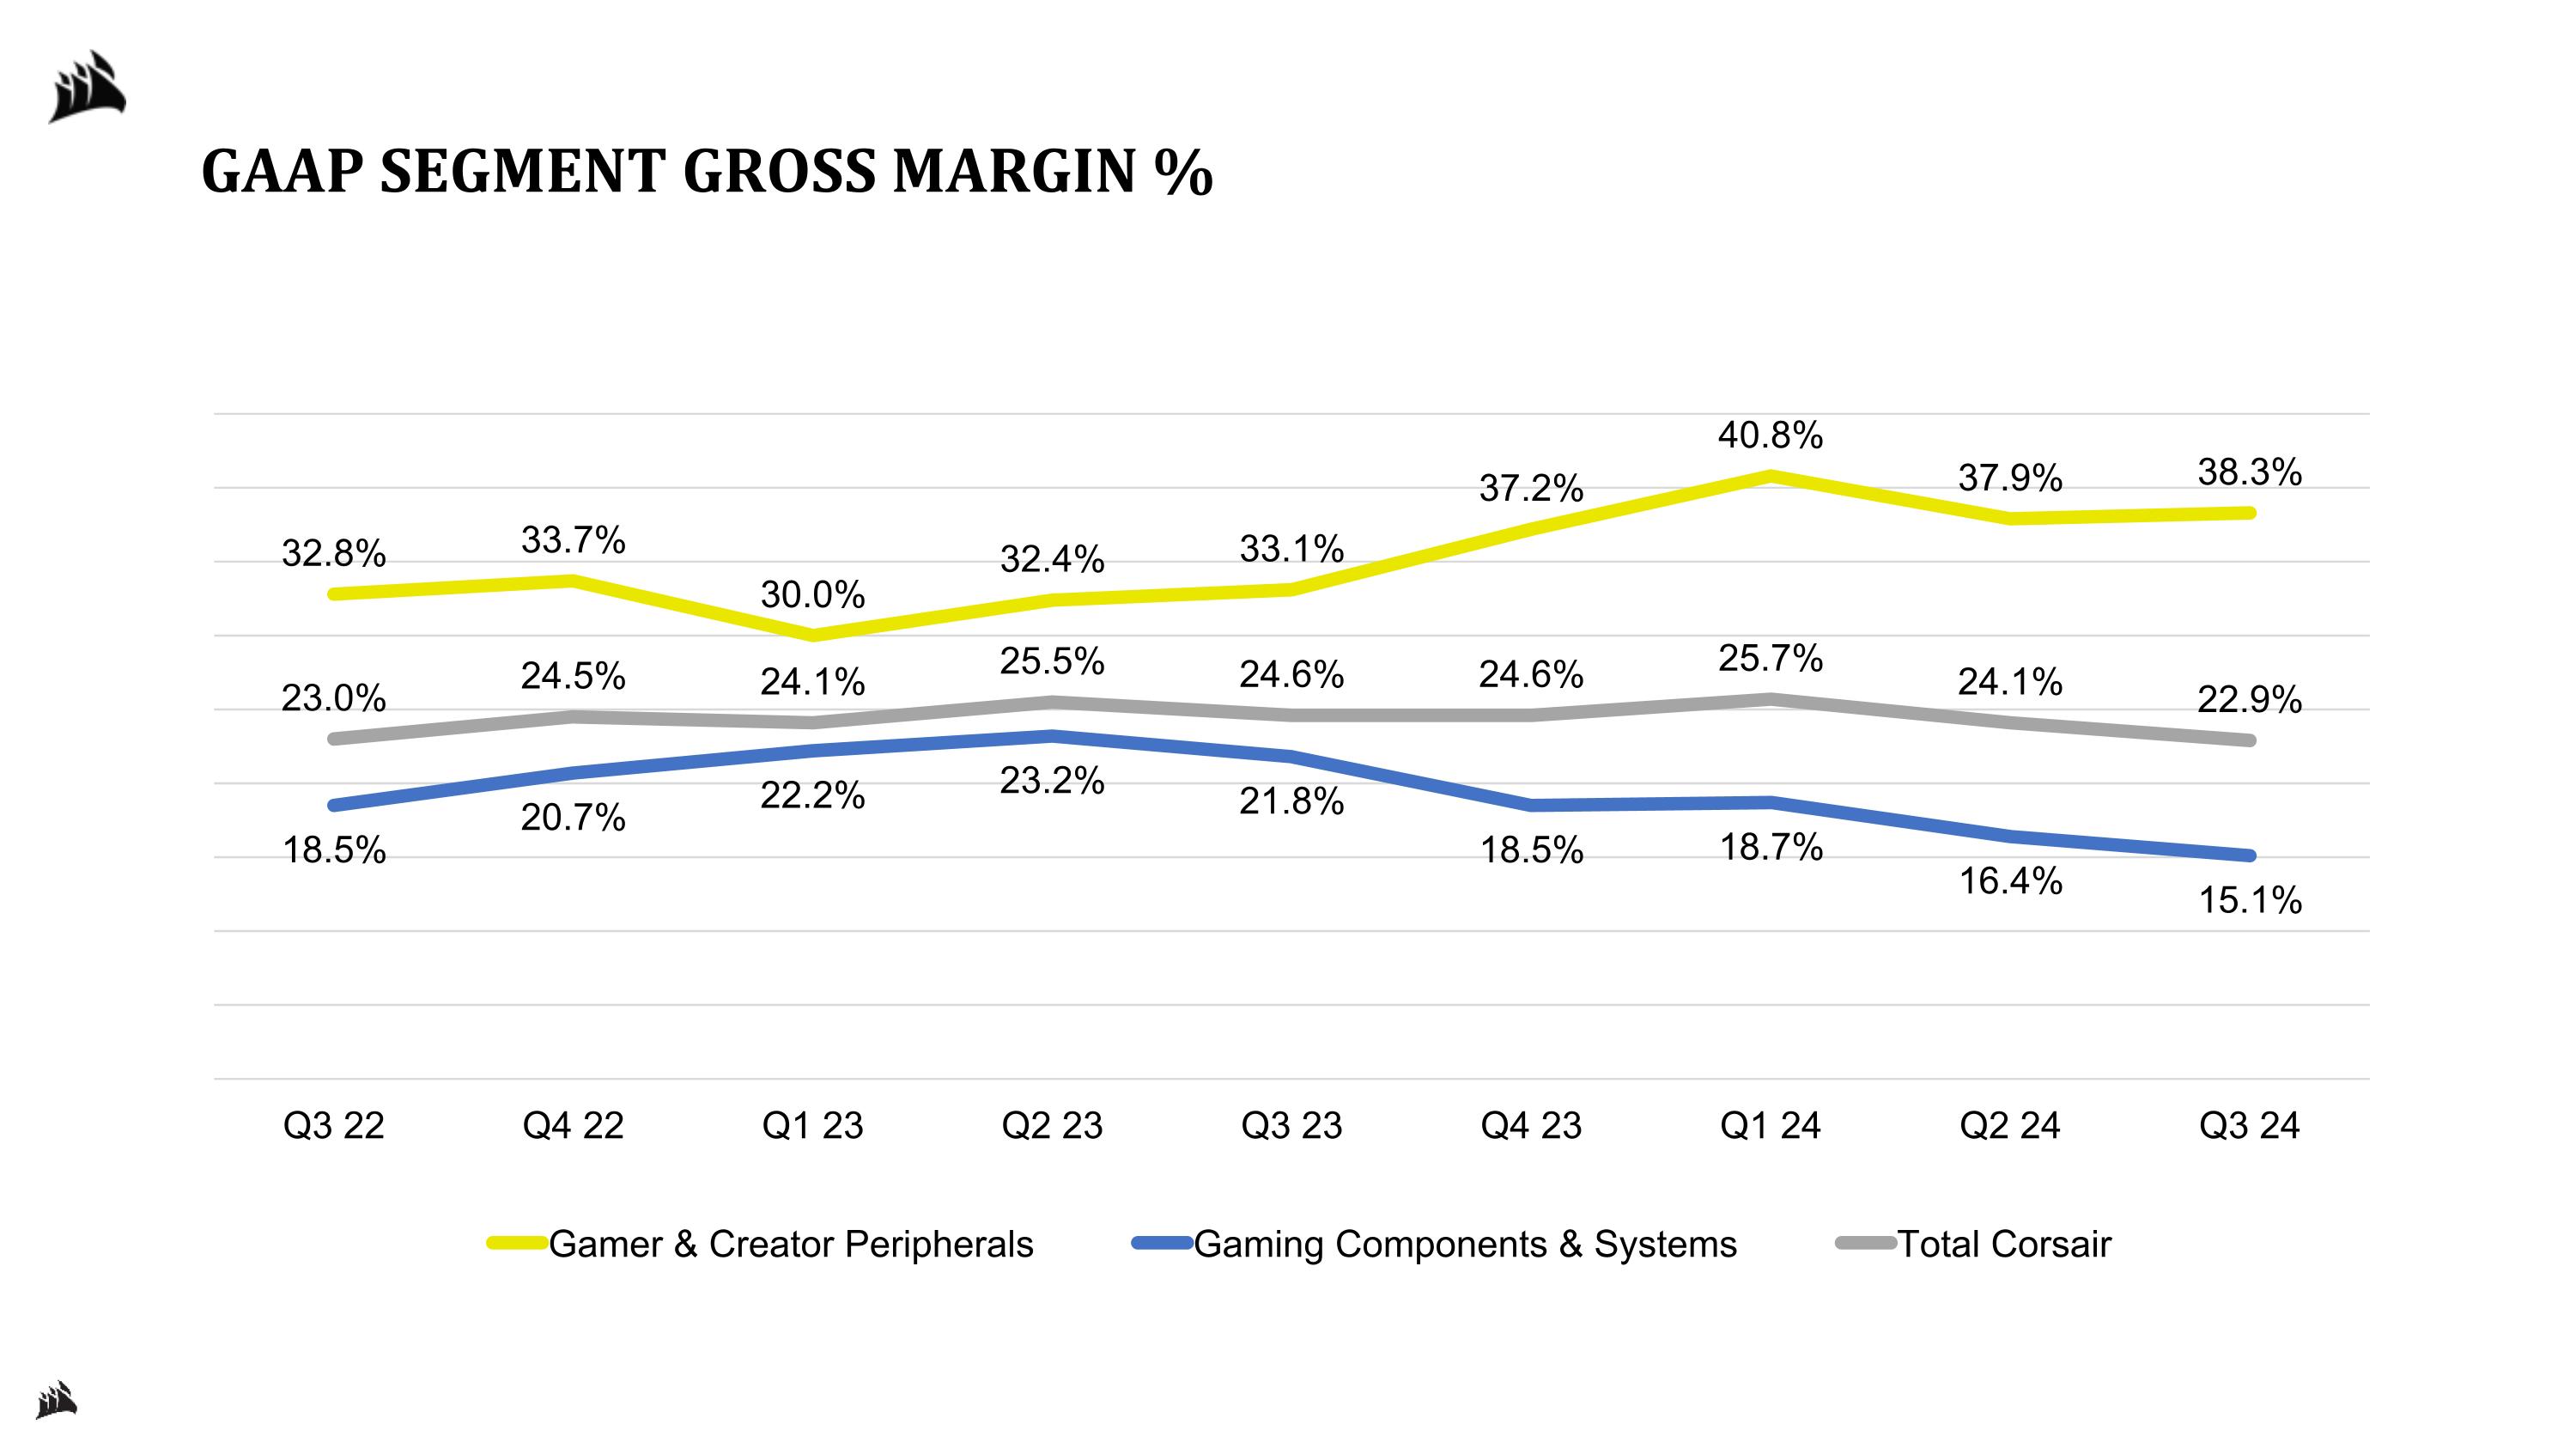
GAAP SEGMENT GROSS MARGIN %
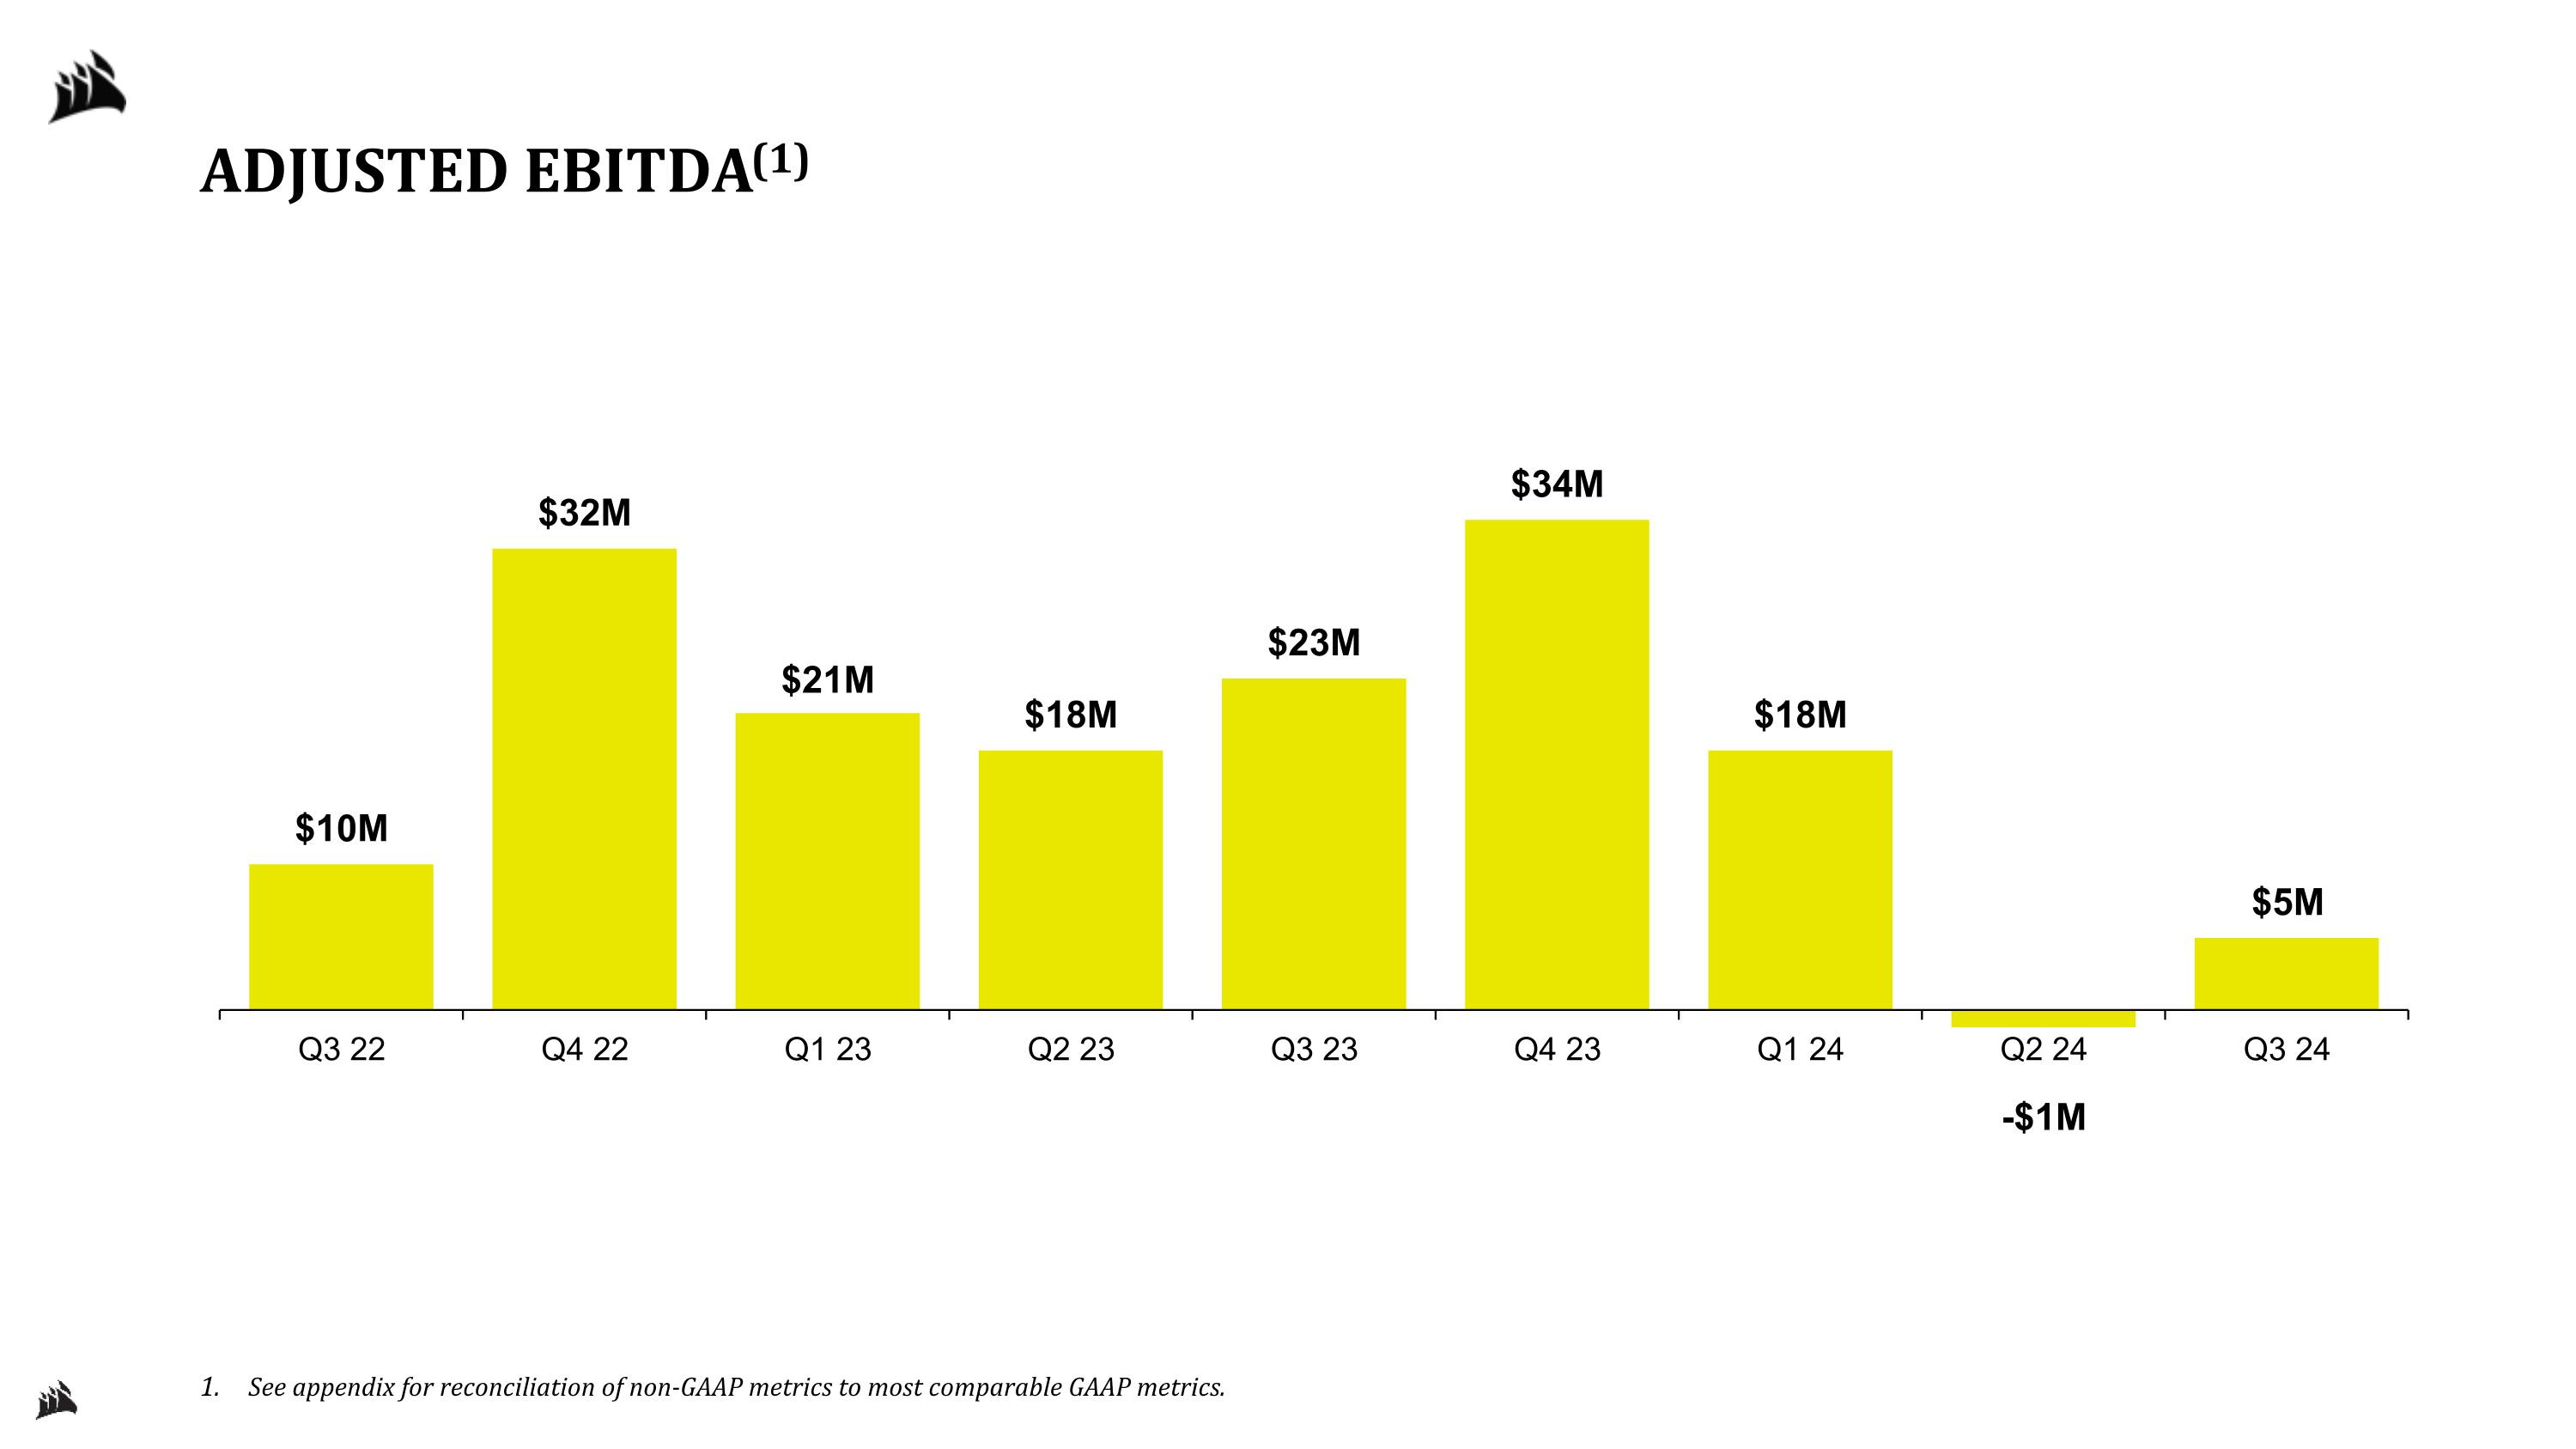
ADJUSTED EBITDA(1) See appendix for reconciliation of non-GAAP metrics to most comparable GAAP metrics.
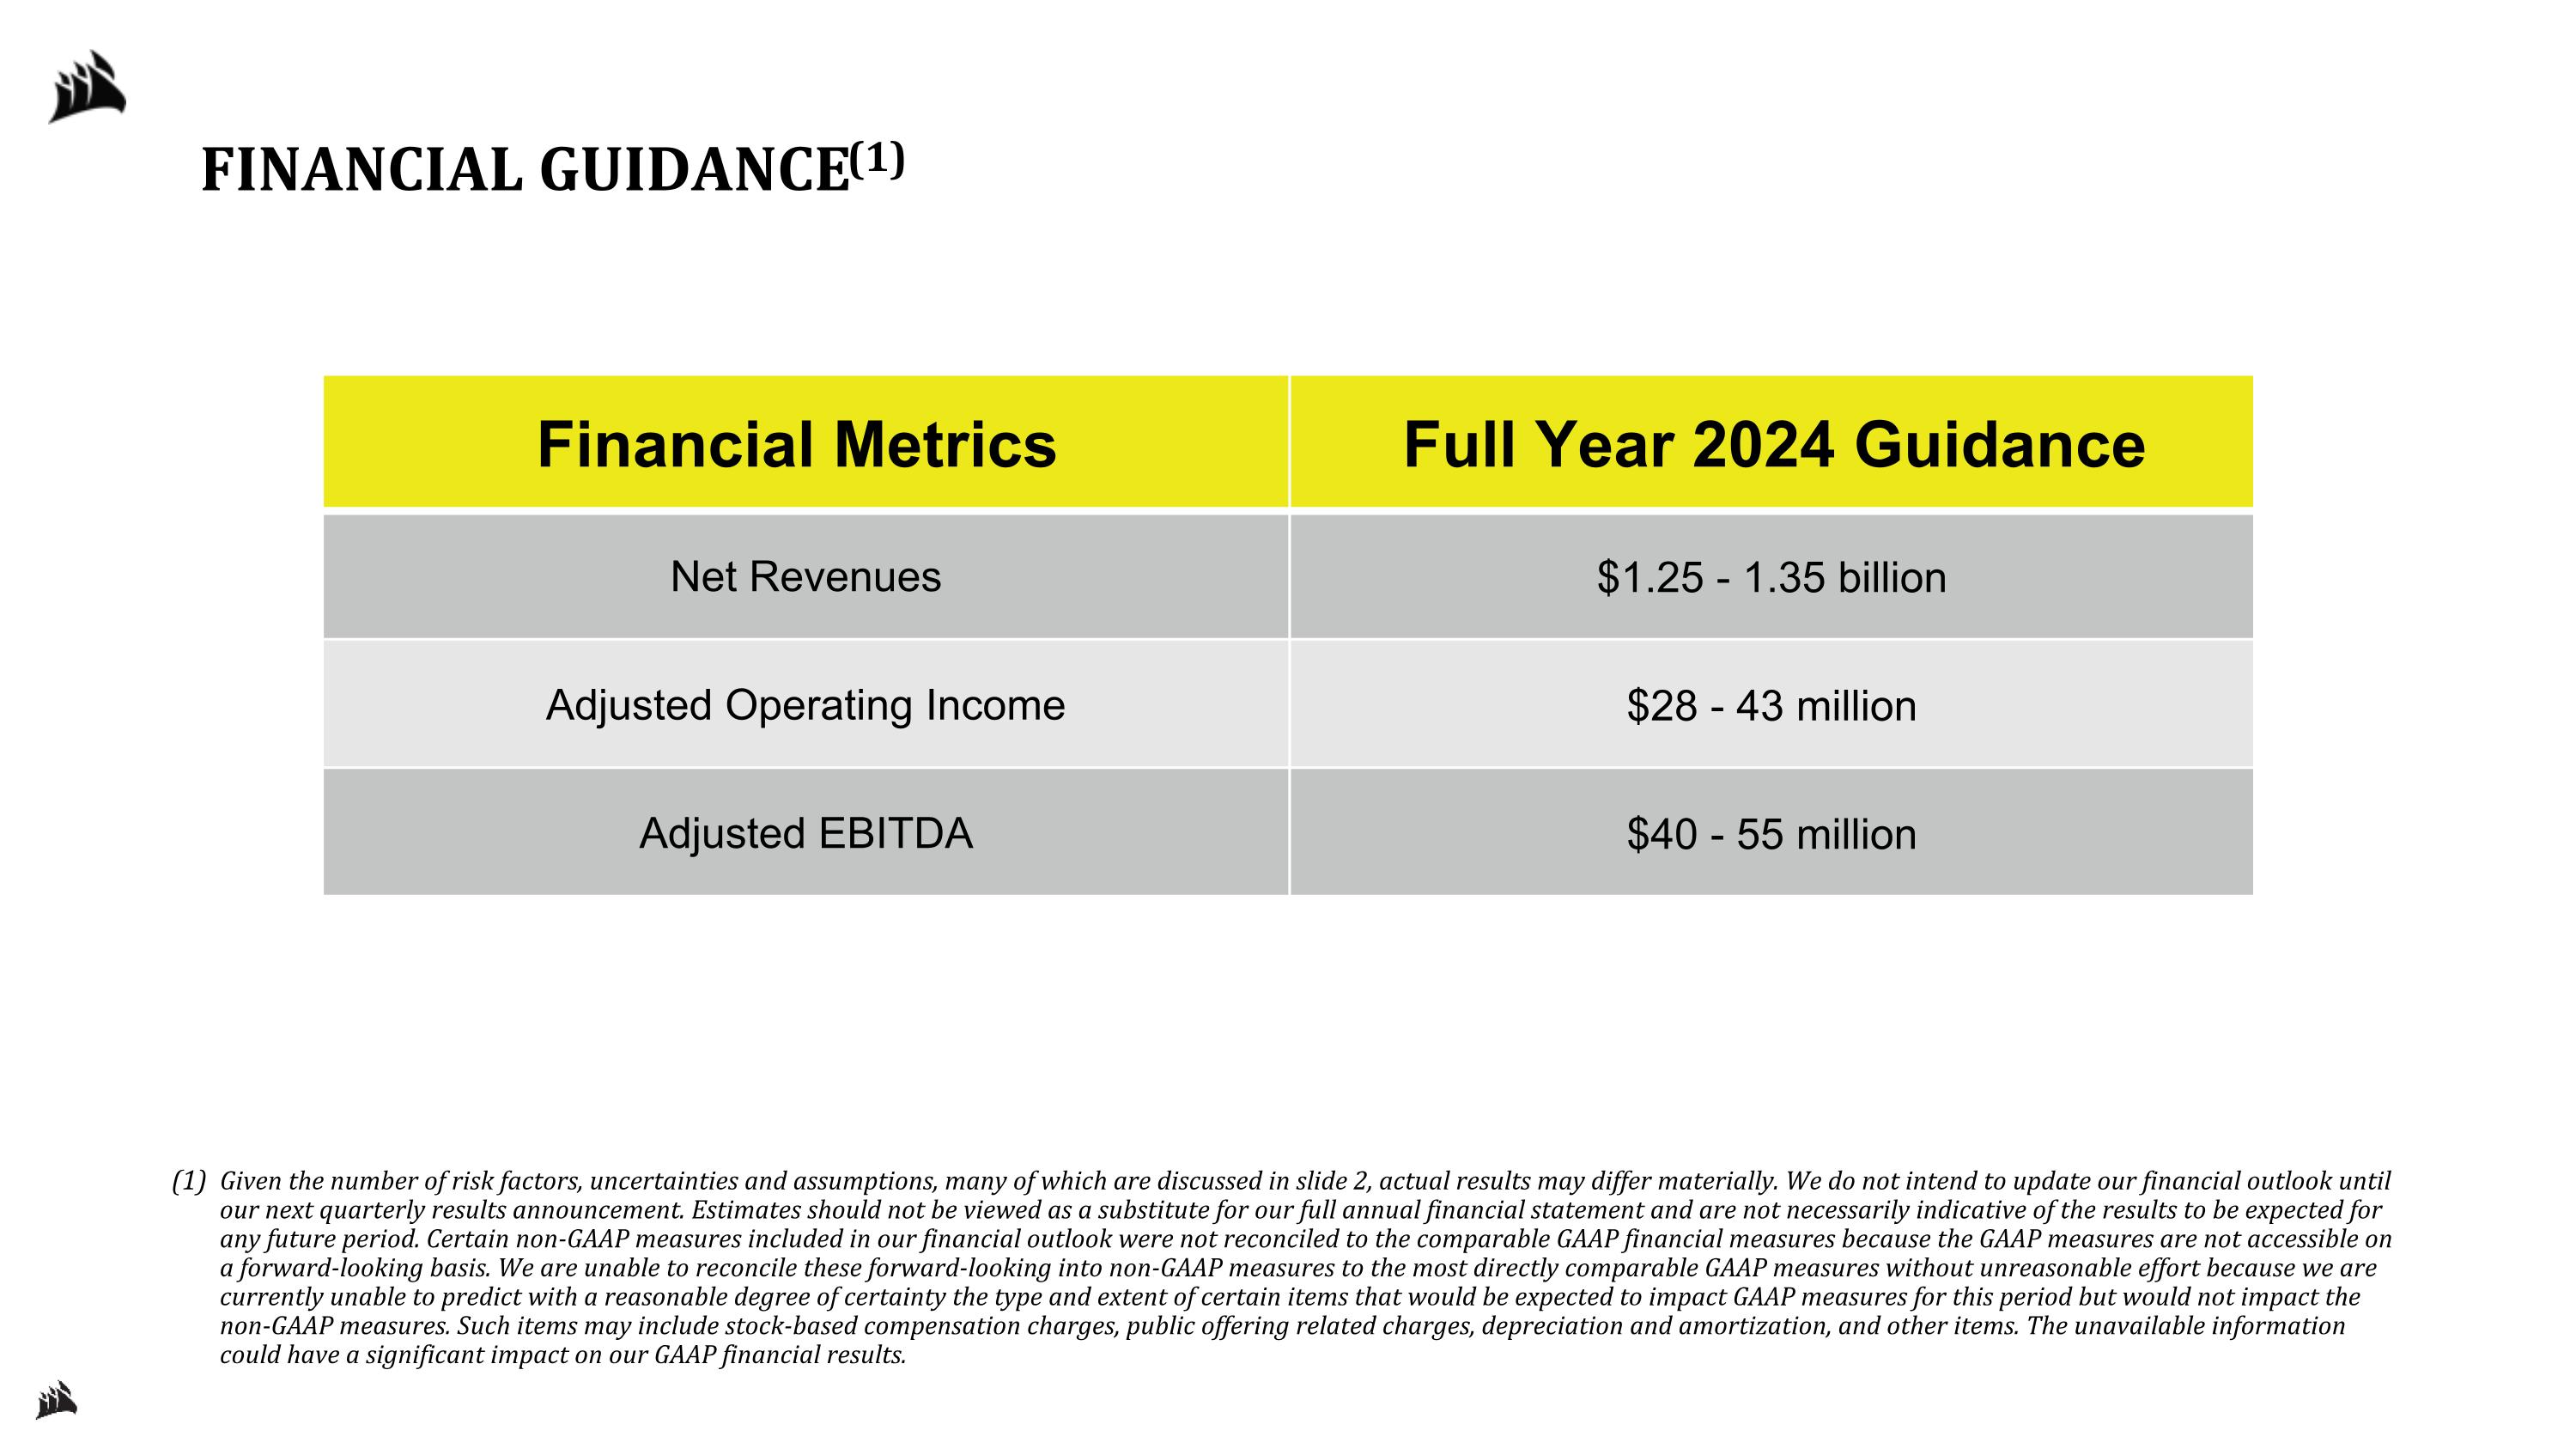
FINANCIAL GUIDANCE(1) Given the number of risk factors, uncertainties and assumptions, many of which are discussed in slide 2, actual results may differ materially. We do not intend to update our financial outlook until our next quarterly results announcement. Estimates should not be viewed as a substitute for our full annual financial statement and are not necessarily indicative of the results to be expected for any future period. Certain non-GAAP measures included in our financial outlook were not reconciled to the comparable GAAP financial measures because the GAAP measures are not accessible on a forward-looking basis. We are unable to reconcile these forward-looking into non-GAAP measures to the most directly comparable GAAP measures without unreasonable effort because we are currently unable to predict with a reasonable degree of certainty the type and extent of certain items that would be expected to impact GAAP measures for this period but would not impact the non-GAAP measures. Such items may include stock-based compensation charges, public offering related charges, depreciation and amortization, and other items. The unavailable information could have a significant impact on our GAAP financial results. Financial Metrics Full Year 2024 Guidance Net Revenues $1.25 - 1.35 billion Adjusted Operating Income $28 - 43 million Adjusted EBITDA $40 - 55 million
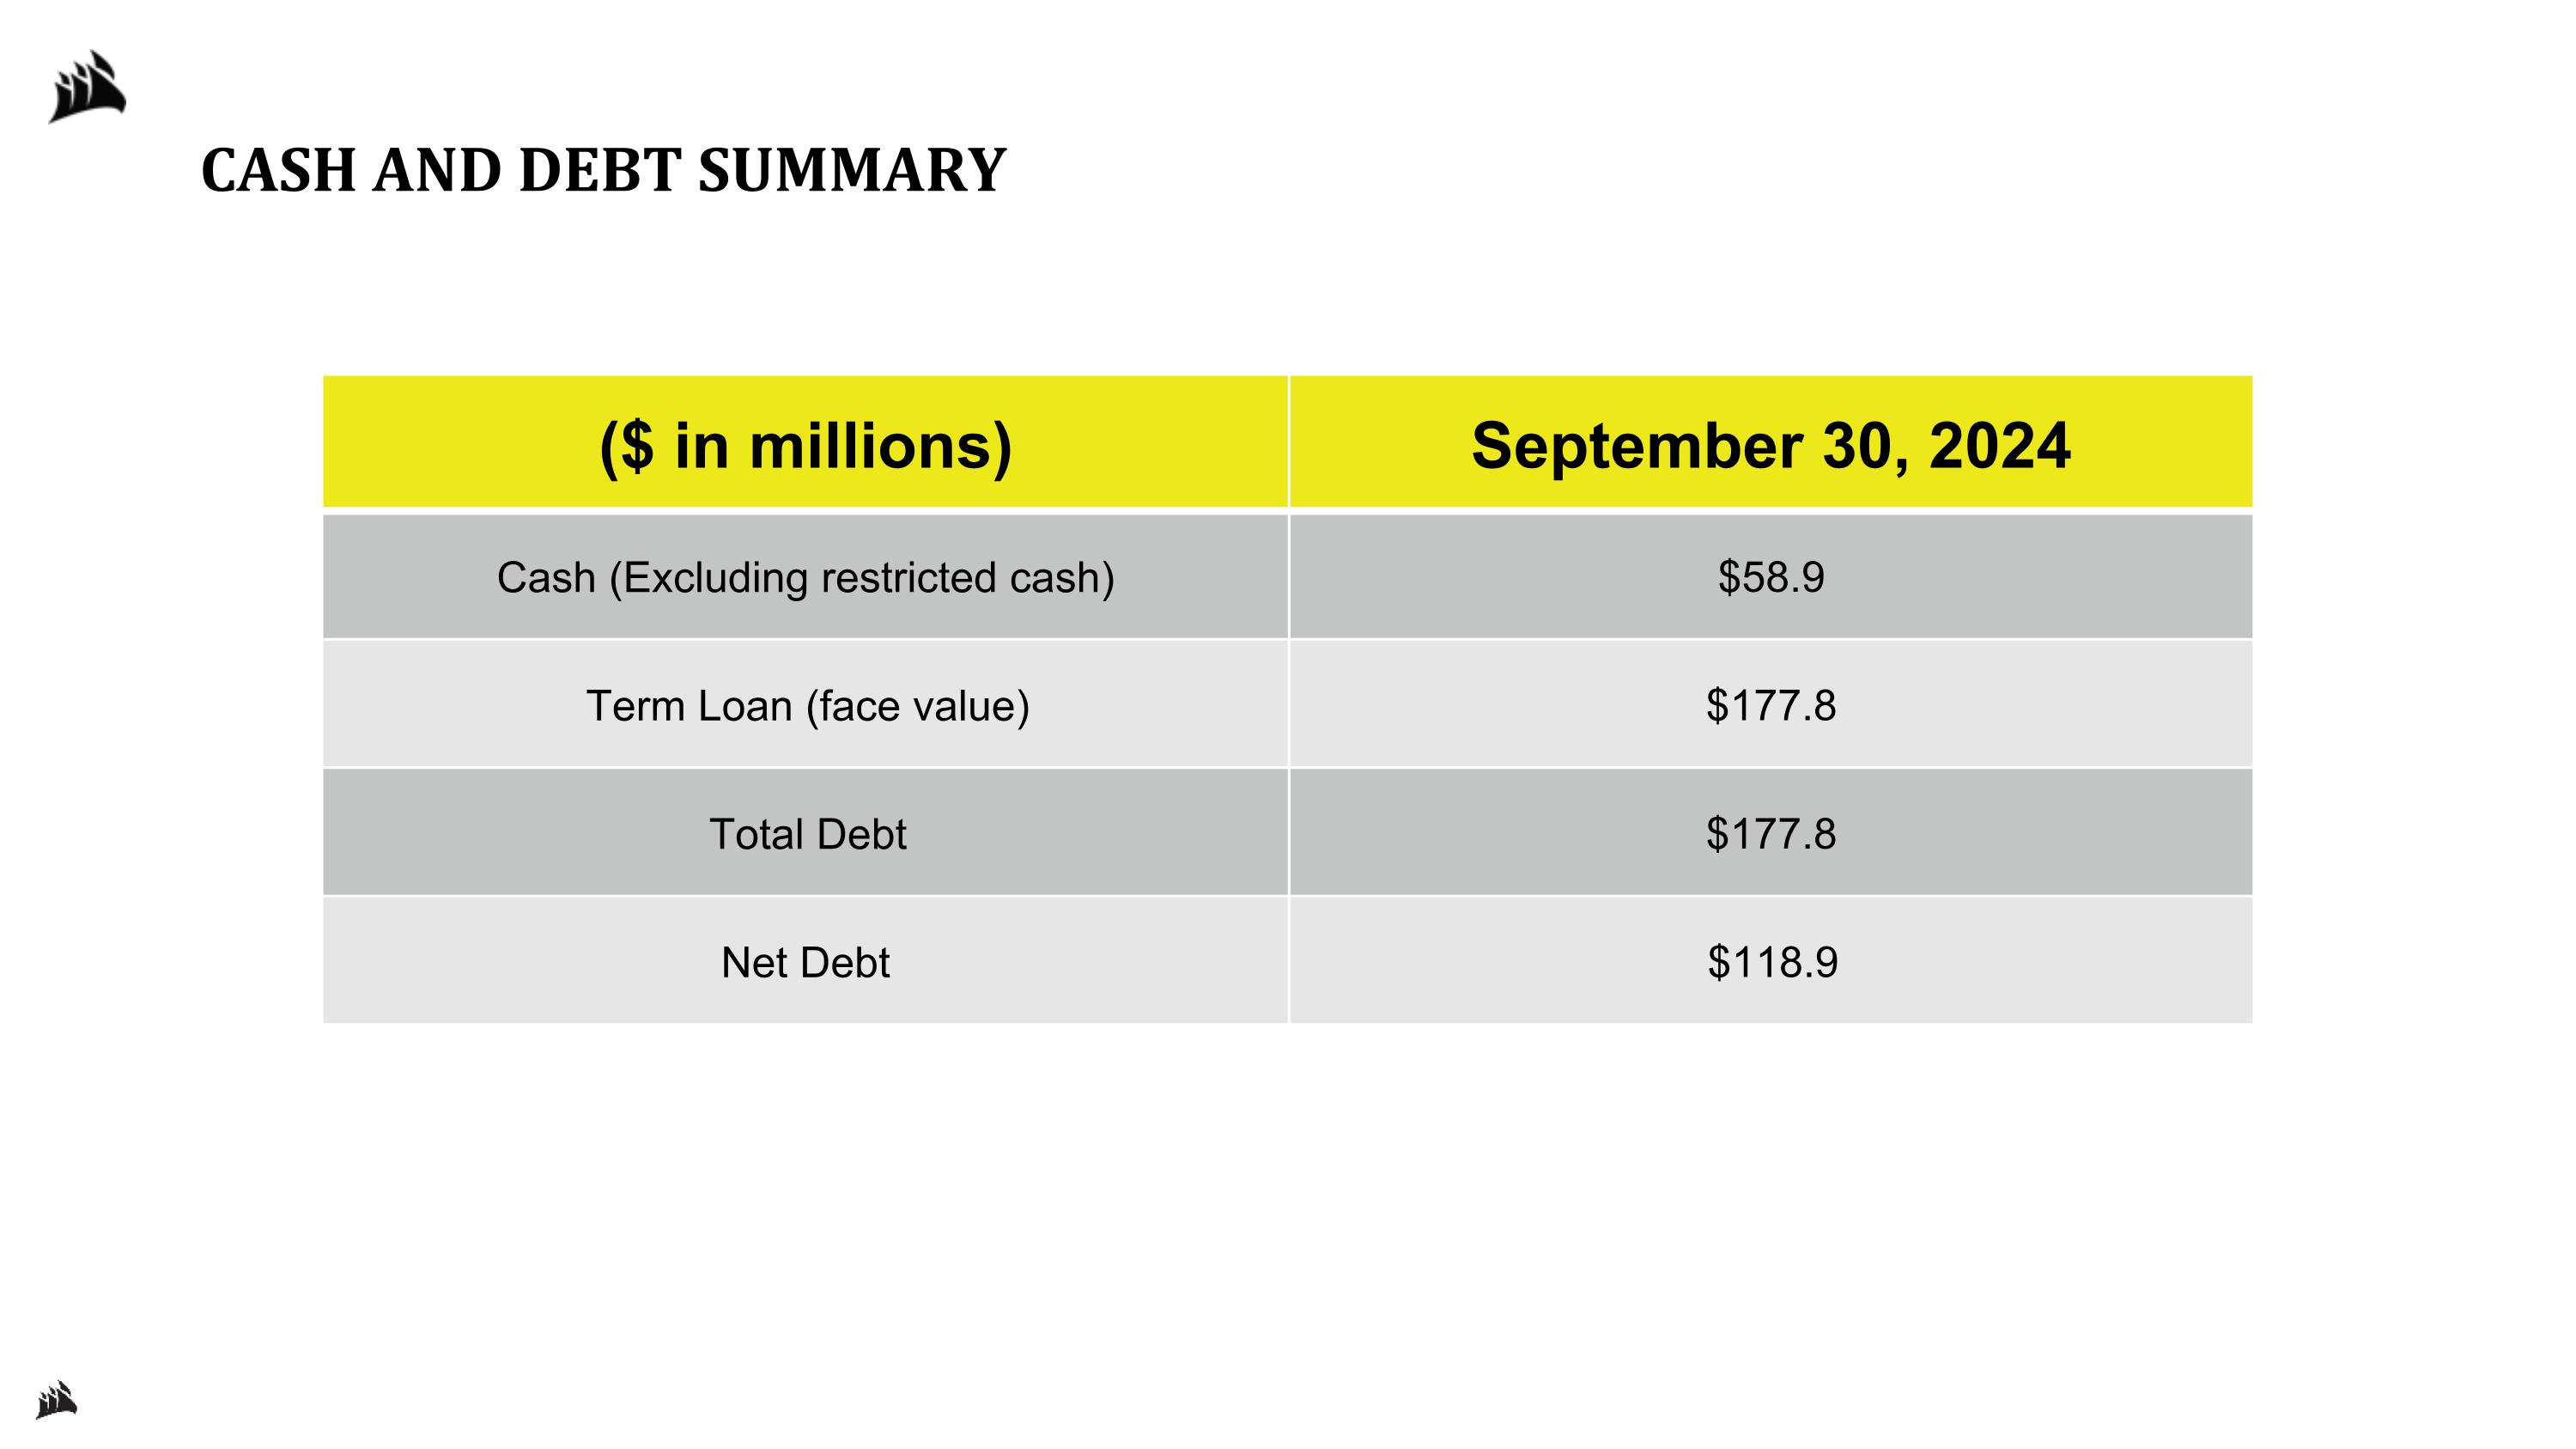
CASH AND DEBT SUMMARY ($ in millions) September 30, 2024 Cash (Excluding restricted cash) $58.9 Term Loan (face value) $177.8 Total Debt $177.8 Net Debt $118.9

APPENDIX
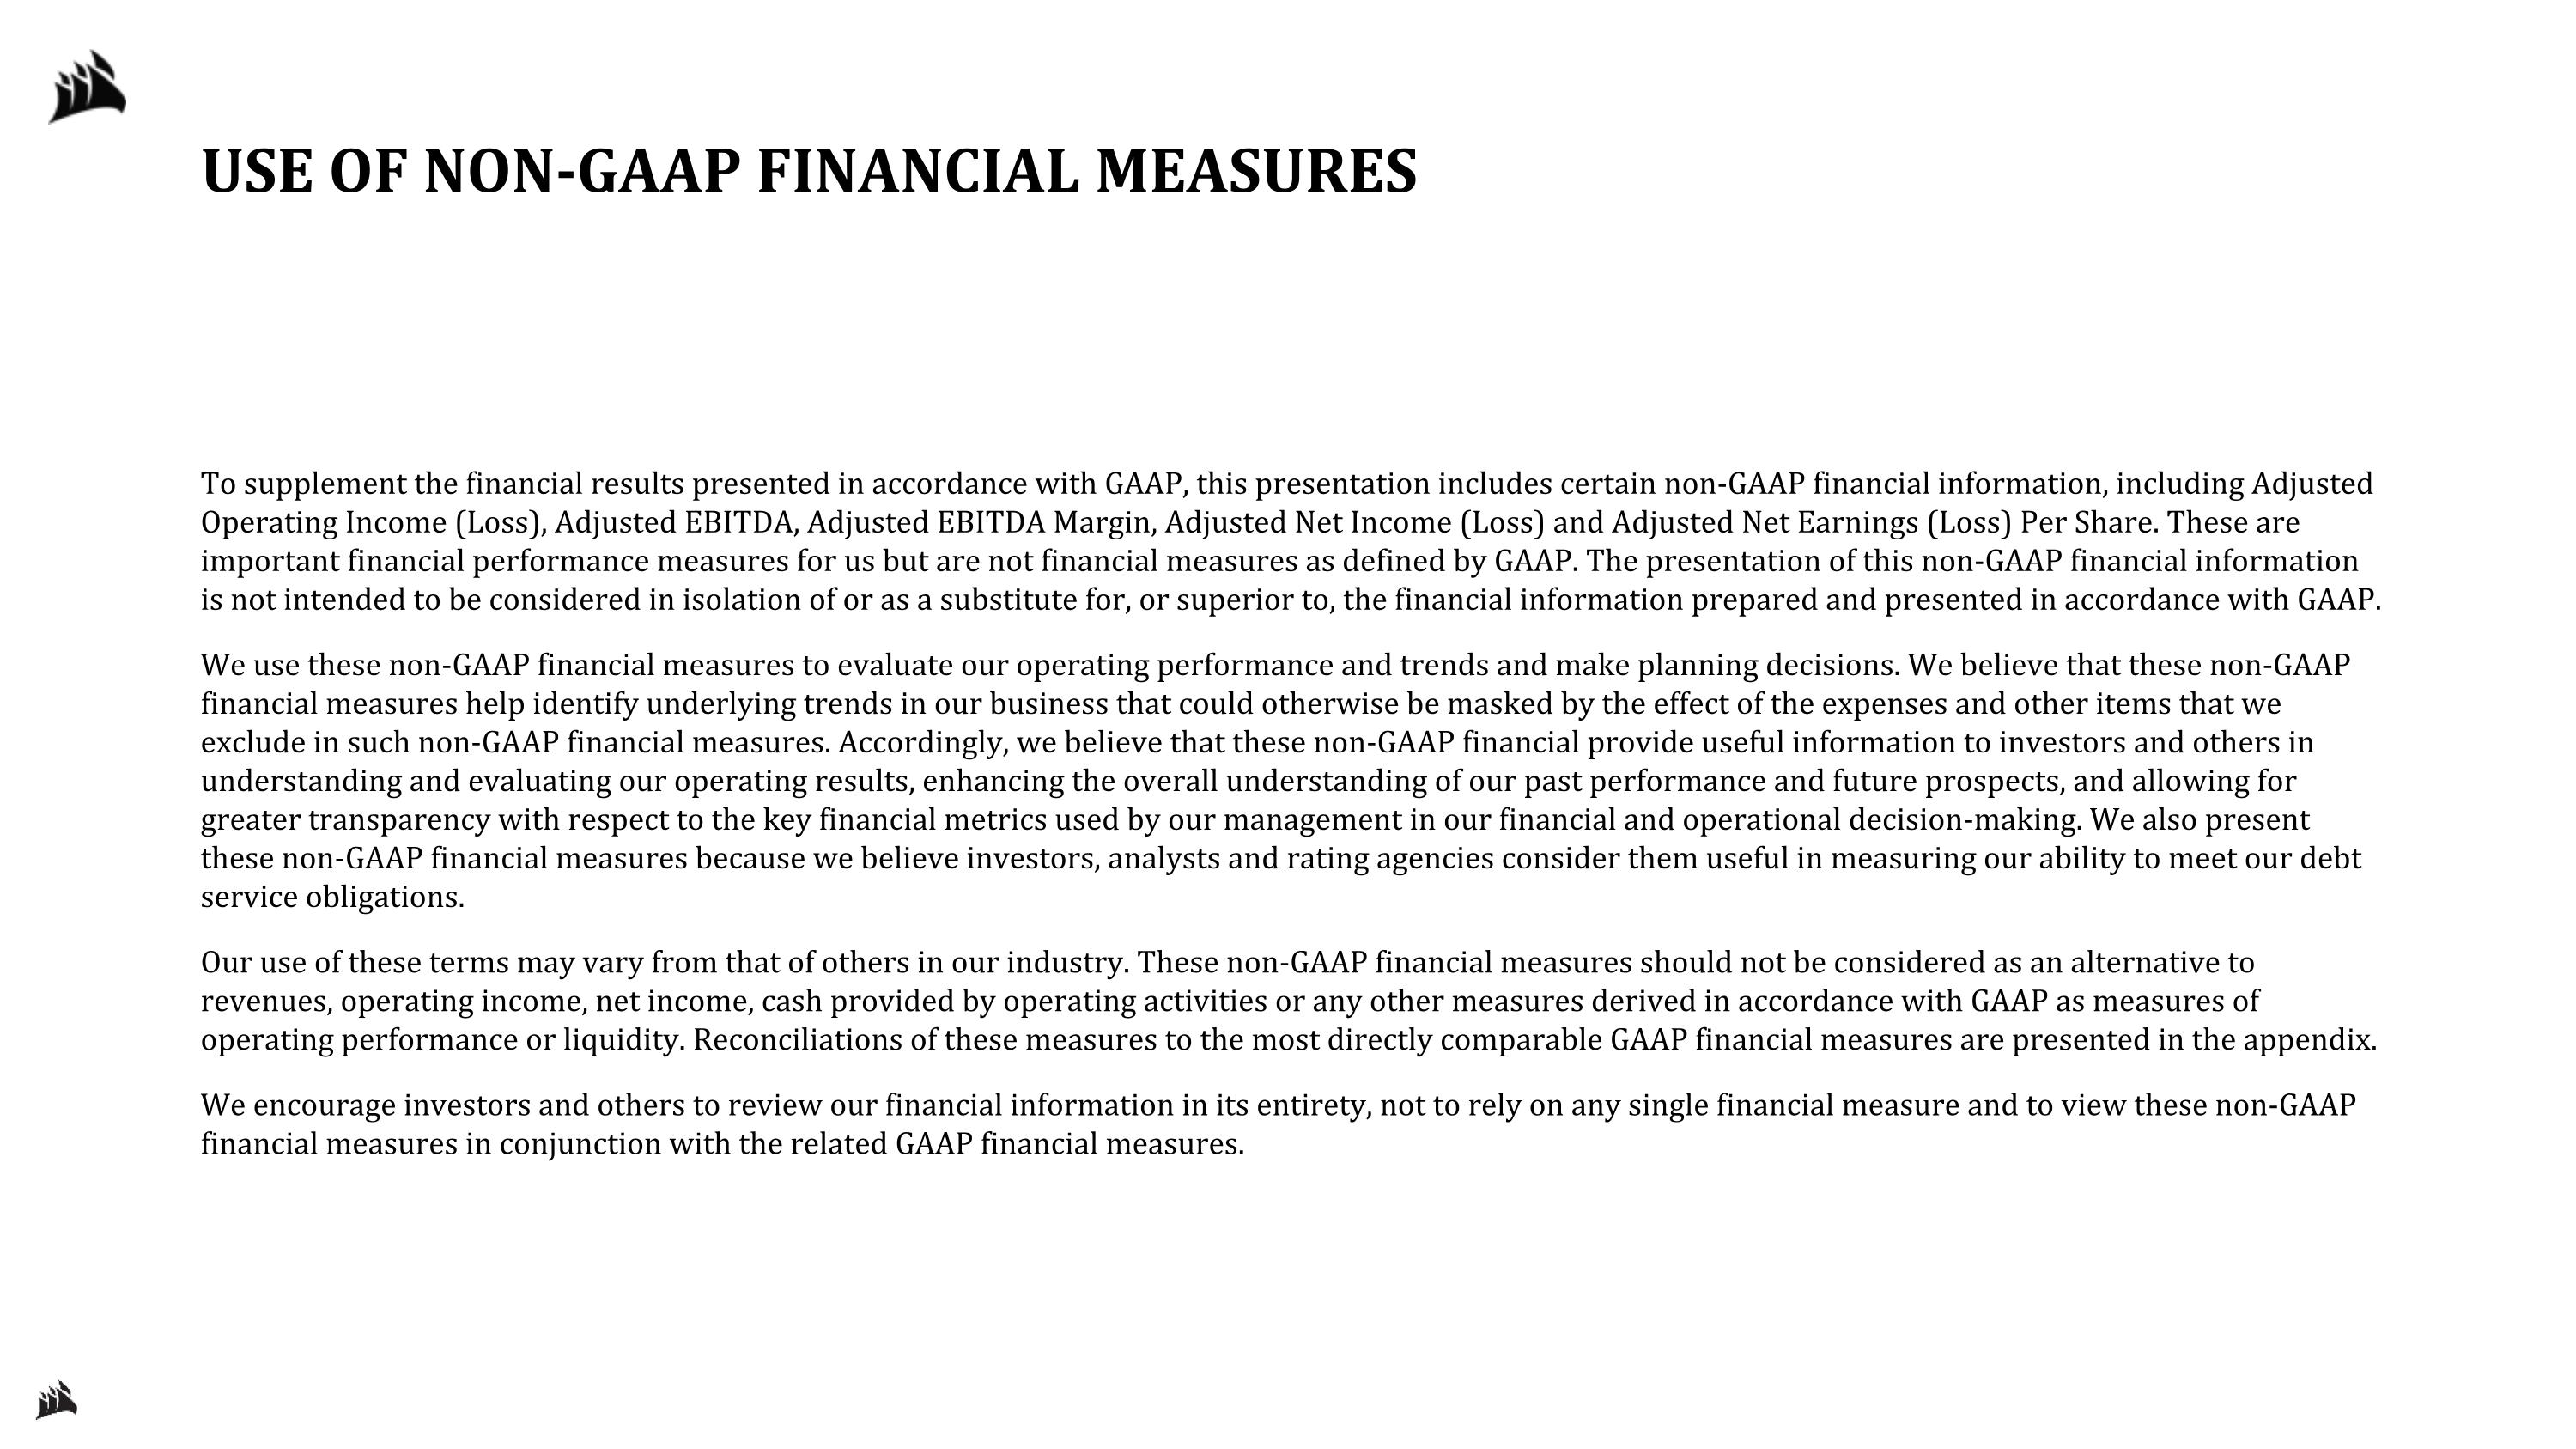
USE OF NON-GAAP FINANCIAL MEASURES To supplement the financial results presented in accordance with GAAP, this presentation includes certain non-GAAP financial information, including Adjusted Operating Income (Loss), Adjusted EBITDA, Adjusted EBITDA Margin, Adjusted Net Income (Loss) and Adjusted Net Earnings (Loss) Per Share. These are important financial performance measures for us but are not financial measures as defined by GAAP. The presentation of this non-GAAP financial information is not intended to be considered in isolation of or as a substitute for, or superior to, the financial information prepared and presented in accordance with GAAP. We use these non-GAAP financial measures to evaluate our operating performance and trends and make planning decisions. We believe that these non-GAAP financial measures help identify underlying trends in our business that could otherwise be masked by the effect of the expenses and other items that we exclude in such non-GAAP financial measures. Accordingly, we believe that these non-GAAP financial provide useful information to investors and others in understanding and evaluating our operating results, enhancing the overall understanding of our past performance and future prospects, and allowing for greater transparency with respect to the key financial metrics used by our management in our financial and operational decision-making. We also present these non-GAAP financial measures because we believe investors, analysts and rating agencies consider them useful in measuring our ability to meet our debt service obligations. Our use of these terms may vary from that of others in our industry. These non-GAAP financial measures should not be considered as an alternative to revenues, operating income, net income, cash provided by operating activities or any other measures derived in accordance with GAAP as measures of operating performance or liquidity. Reconciliations of these measures to the most directly comparable GAAP financial measures are presented in the appendix. We encourage investors and others to review our financial information in its entirety, not to rely on any single financial measure and to view these non-GAAP financial measures in conjunction with the related GAAP financial measures.
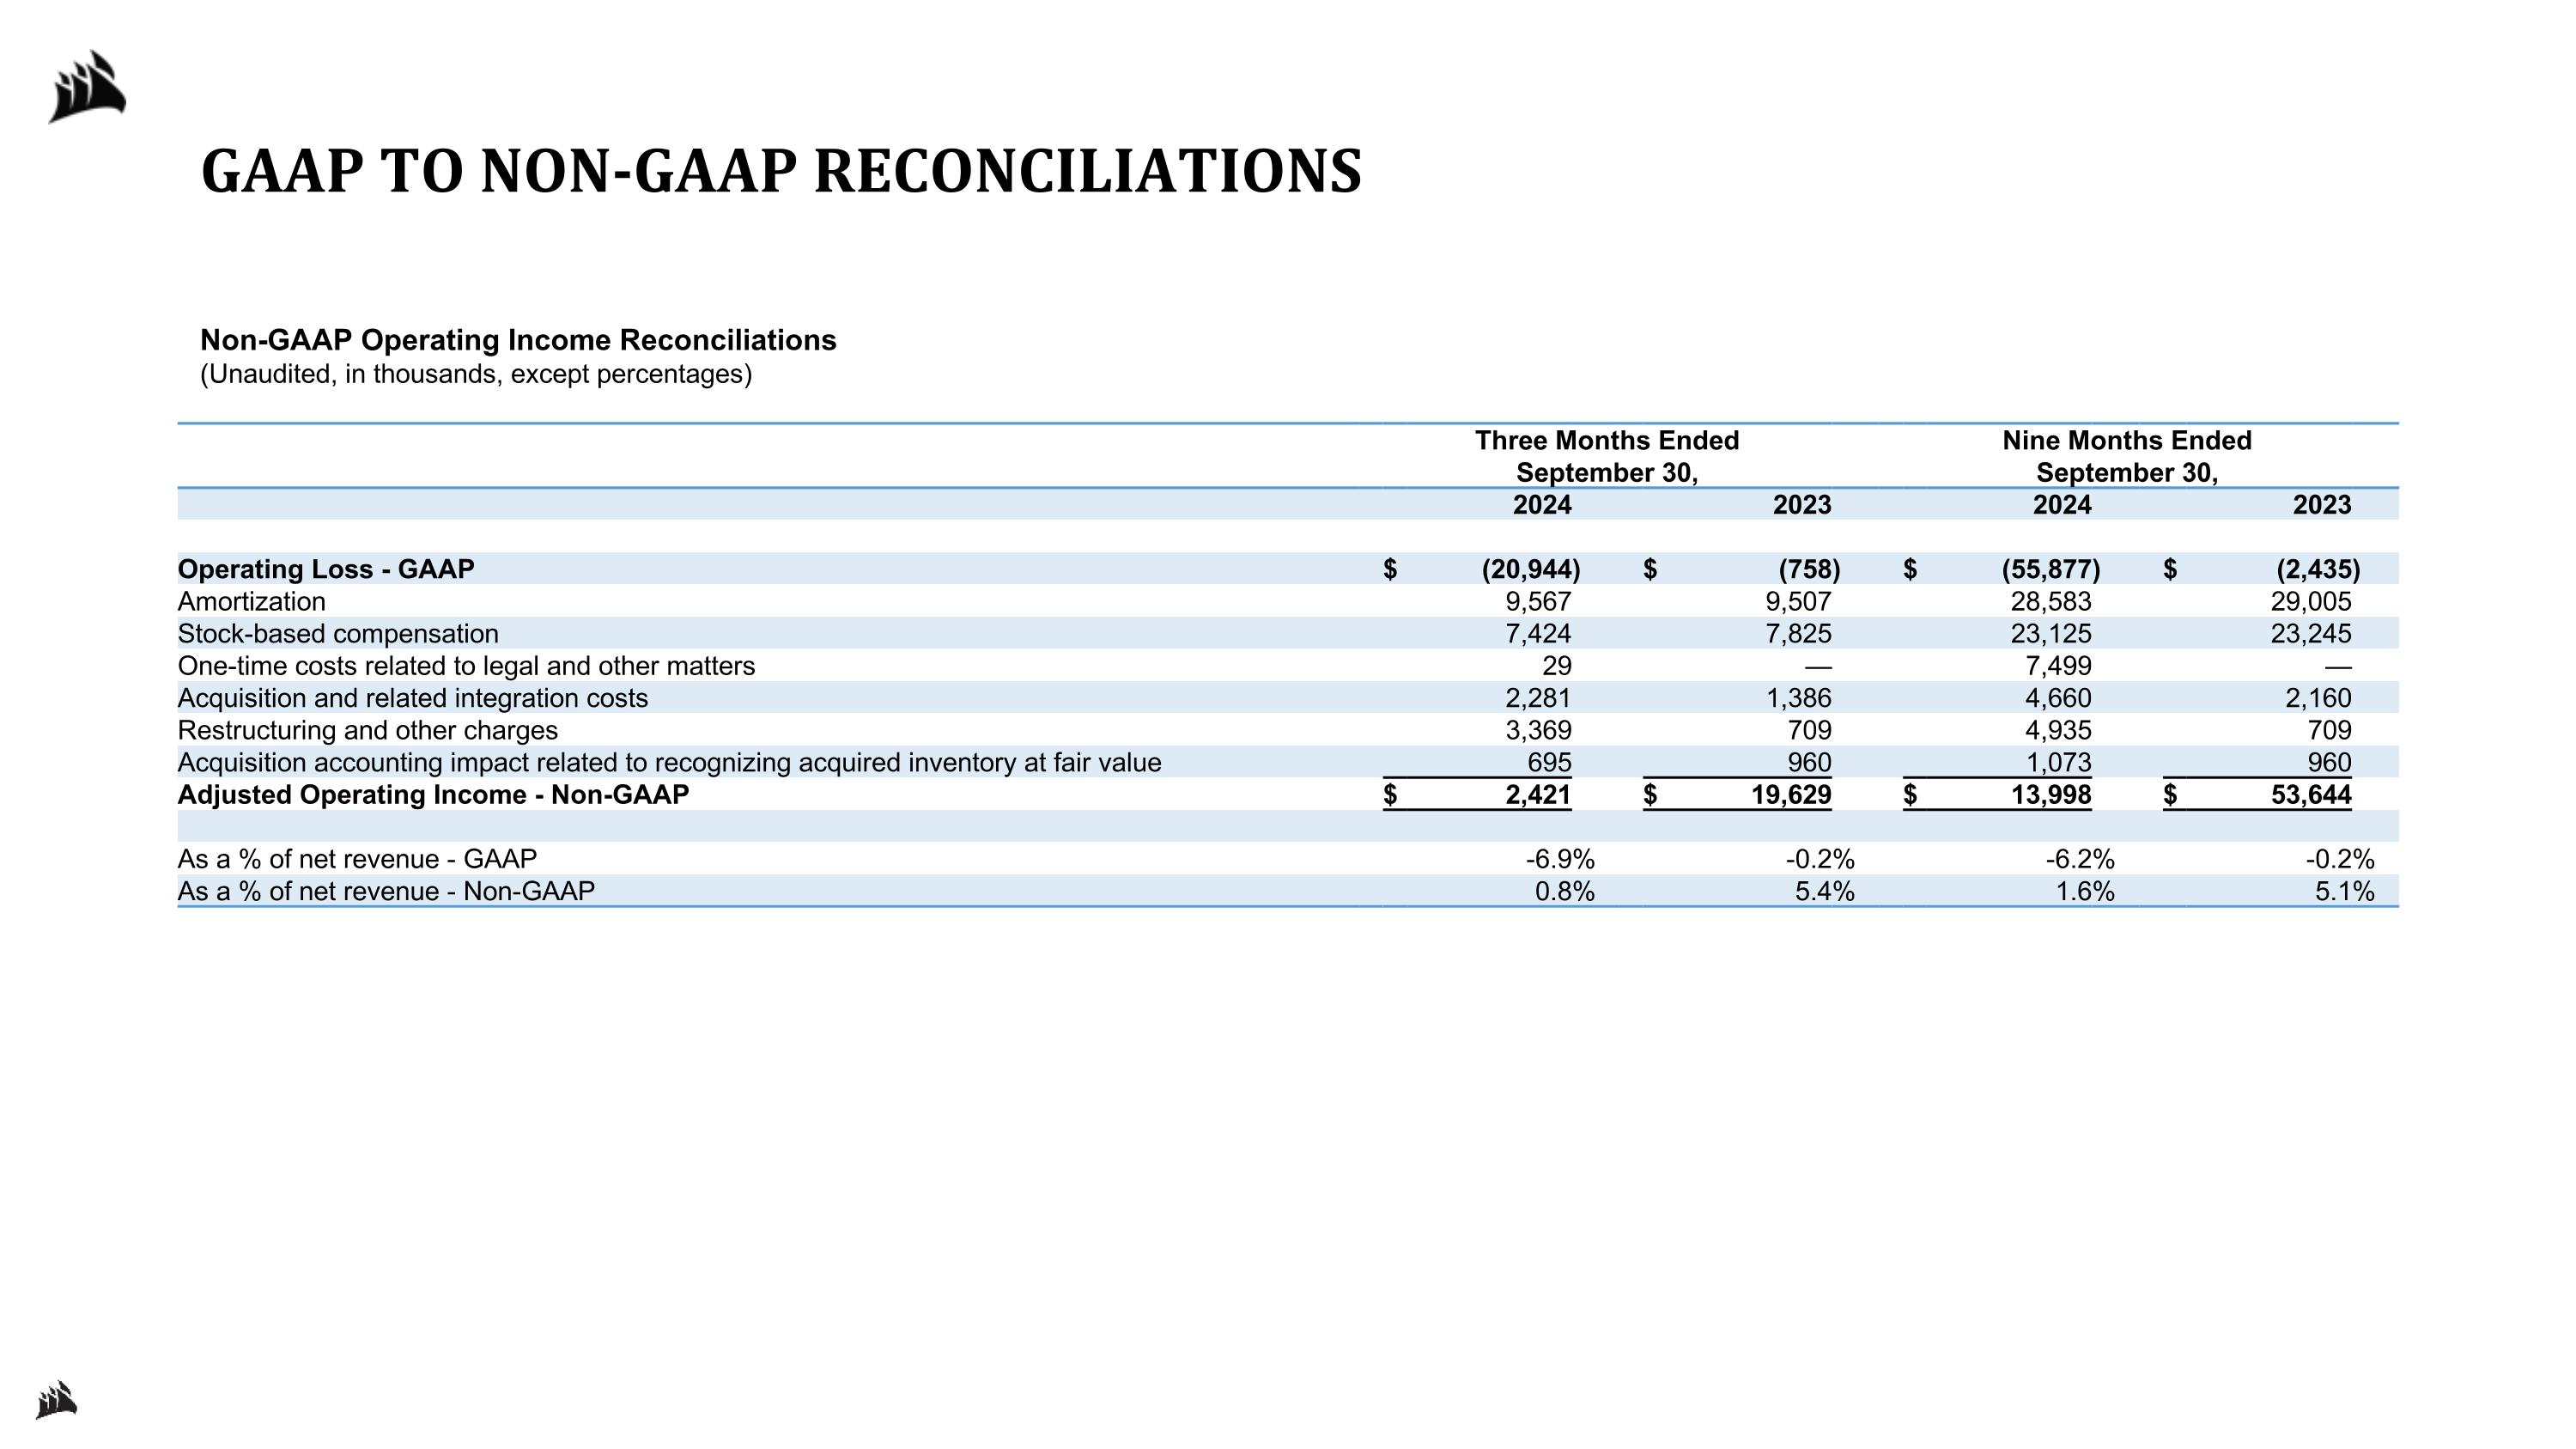
GAAP TO NON-GAAP RECONCILIATIONS Non-GAAP Operating Income Reconciliations (Unaudited, in thousands, except percentages) Three Months Ended September 30, Nine Months Ended September 30, 2024 2023 2024 2023 Operating Loss - GAAP $ (20,944 ) $ (758 ) $ (55,877 ) $ (2,435 ) Amortization 9,567 9,507 28,583 29,005 Stock-based compensation 7,424 7,825 23,125 23,245 One-time costs related to legal and other matters 29 — 7,499 — Acquisition and related integration costs 2,281 1,386 4,660 2,160 Restructuring and other charges 3,369 709 4,935 709 Acquisition accounting impact related to recognizing acquired inventory at fair value 695 960 1,073 960 Adjusted Operating Income - Non-GAAP $ 2,421 $ 19,629 $ 13,998 $ 53,644 As a % of net revenue - GAAP -6.9 % -0.2 % -6.2 % -0.2 % As a % of net revenue - Non-GAAP 0.8 % 5.4 % 1.6 % 5.1 %
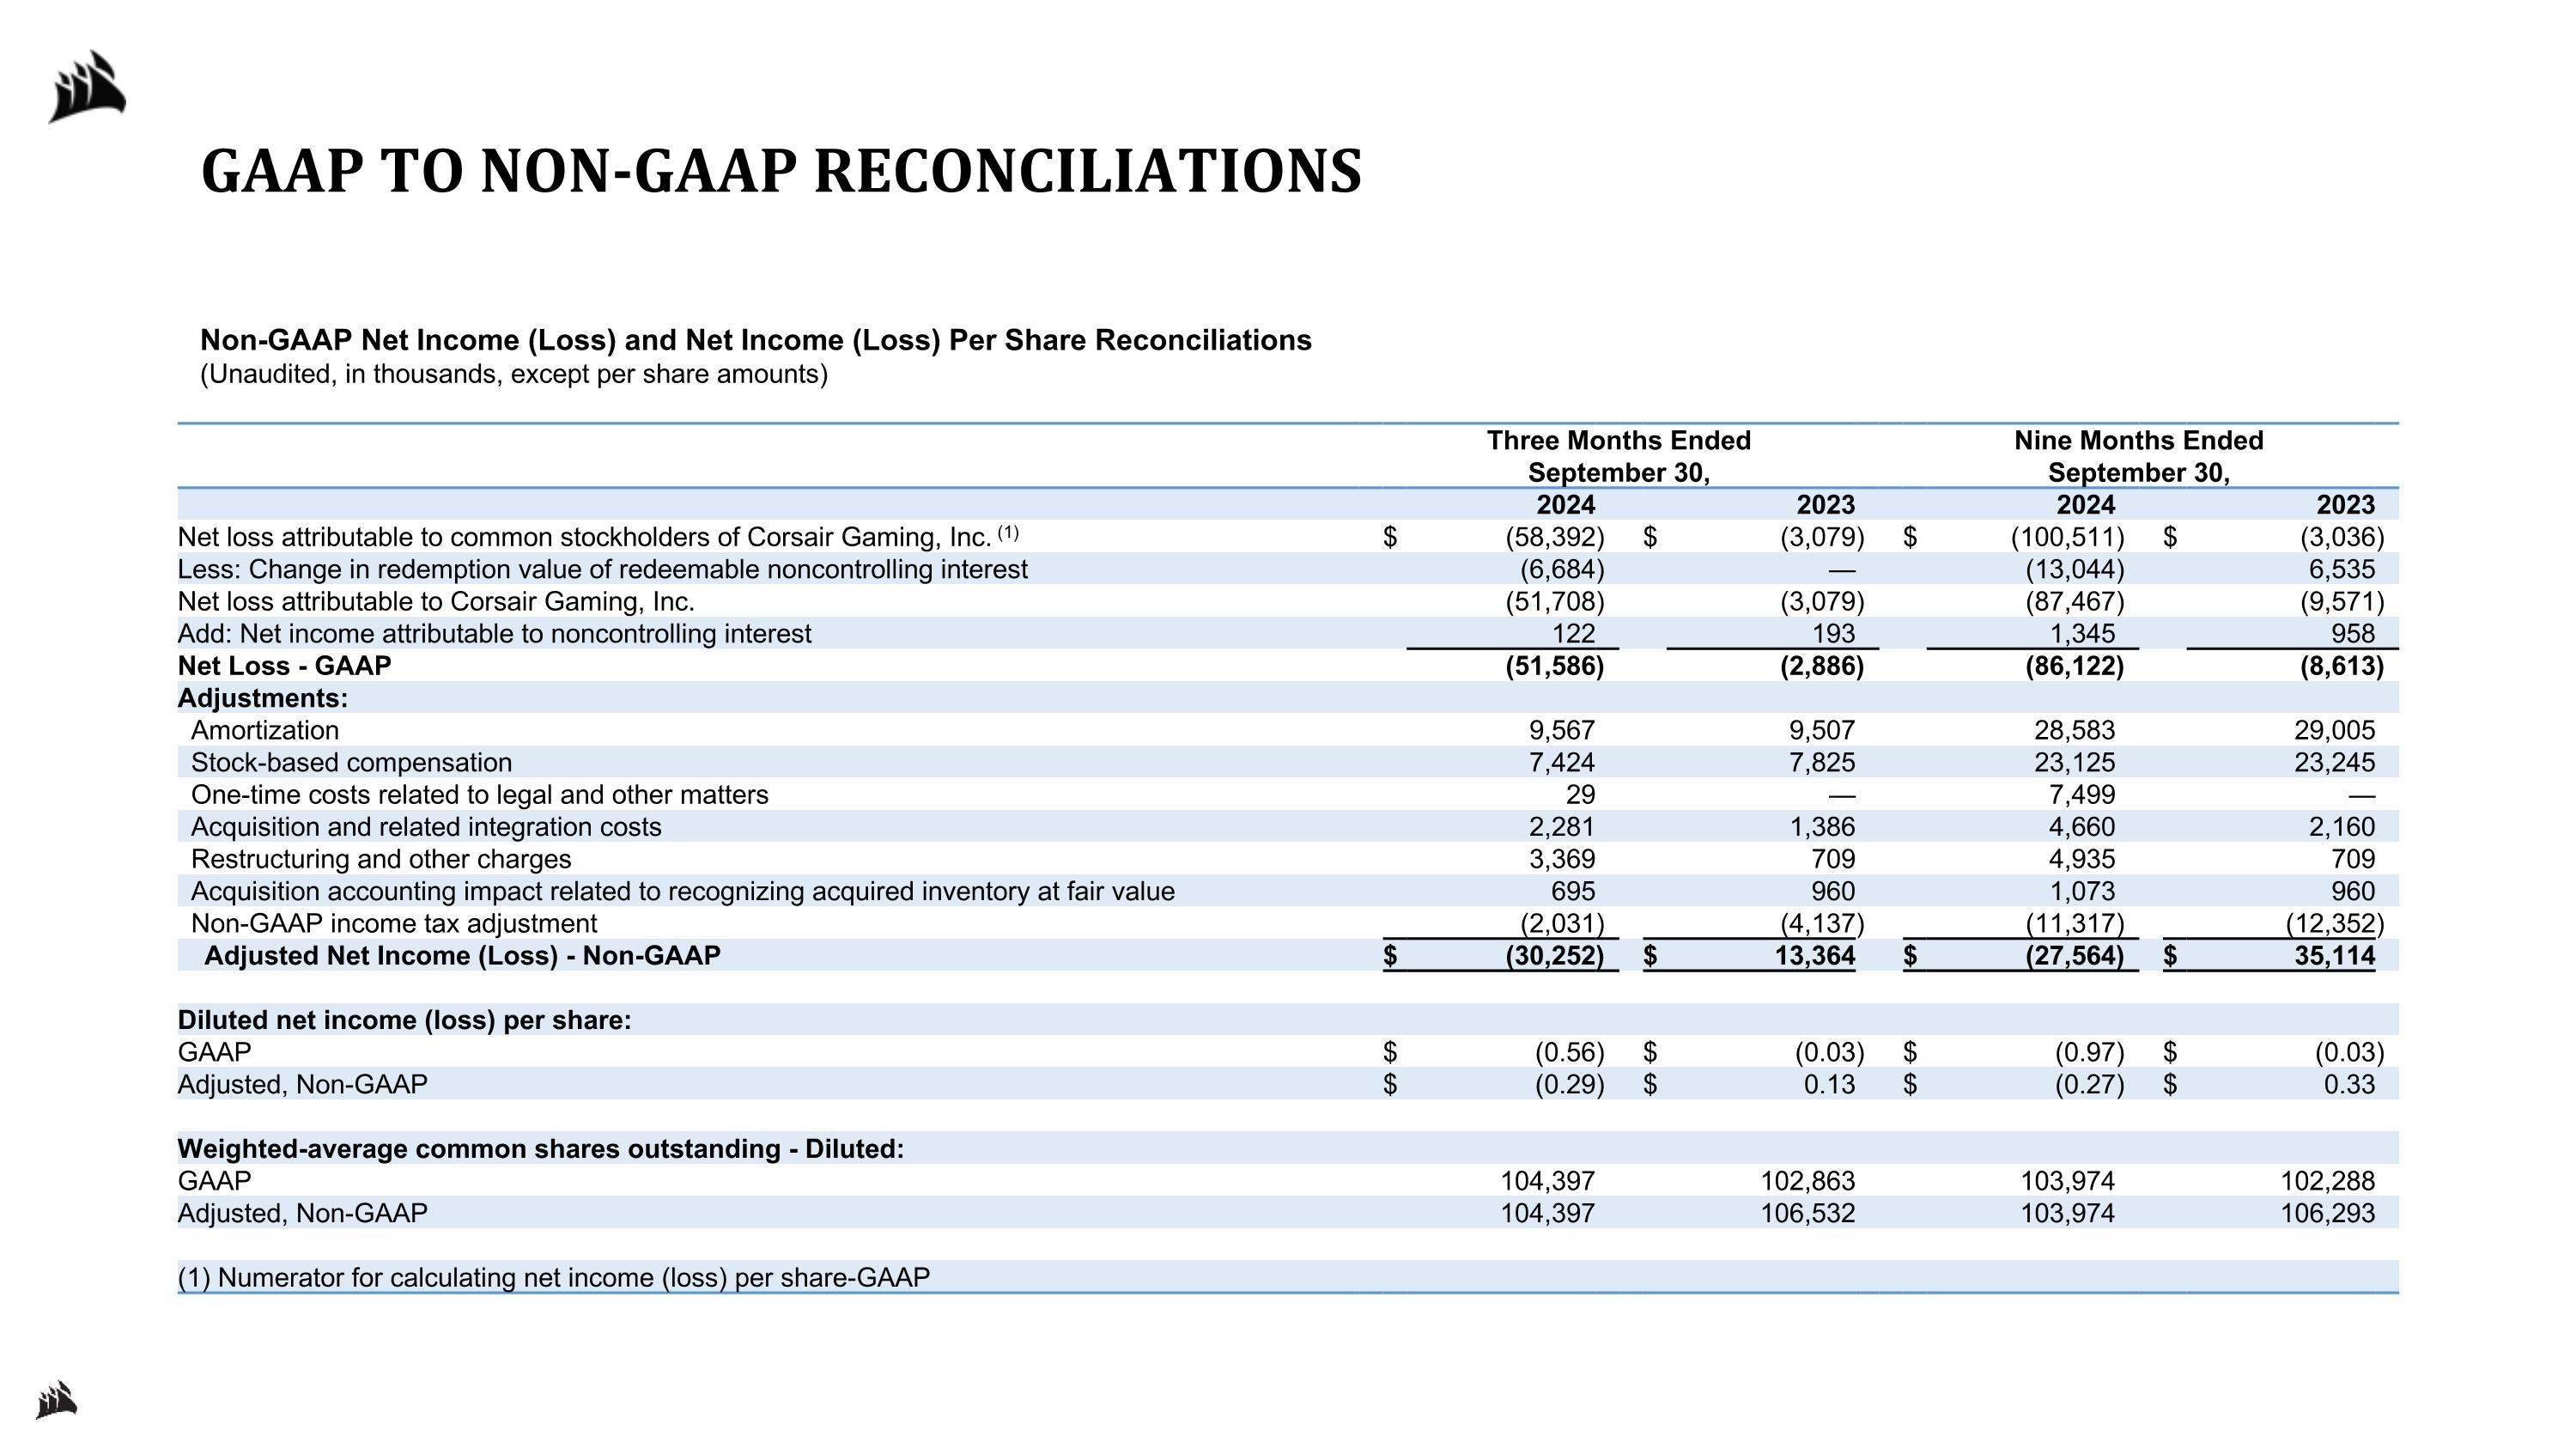
Non-GAAP Net Income (Loss) and Net Income (Loss) Per Share Reconciliations (Unaudited, in thousands, except per share amounts) Three Months Ended September 30, Nine Months Ended September 30, 2024 2023 2024 2023 Net loss attributable to common stockholders of Corsair Gaming, Inc. (1) $ (58,392 ) $ (3,079 ) $ (100,511 ) $ (3,036 ) Less: Change in redemption value of redeemable noncontrolling interest (6,684 ) — (13,044 ) 6,535 Net loss attributable to Corsair Gaming, Inc. (51,708 ) (3,079 ) (87,467 ) (9,571 ) Add: Net income attributable to noncontrolling interest 122 193 1,345 958 Net Loss - GAAP (51,586 ) (2,886 ) (86,122 ) (8,613 ) Adjustments: Amortization 9,567 9,507 28,583 29,005 Stock-based compensation 7,424 7,825 23,125 23,245 One-time costs related to legal and other matters 29 — 7,499 — Acquisition and related integration costs 2,281 1,386 4,660 2,160 Restructuring and other charges 3,369 709 4,935 709 Acquisition accounting impact related to recognizing acquired inventory at fair value 695 960 1,073 960 Non-GAAP income tax adjustment (2,031 ) (4,137 ) (11,317 ) (12,352 ) Adjusted Net Income (Loss) - Non-GAAP $ (30,252 ) $ 13,364 $ (27,564 ) $ 35,114 Diluted net income (loss) per share: GAAP $ (0.56 ) $ (0.03 ) $ (0.97 ) $ (0.03 ) Adjusted, Non-GAAP $ (0.29 ) $ 0.13 $ (0.27 ) $ 0.33 Weighted-average common shares outstanding - Diluted: GAAP 104,397 102,863 103,974 102,288 Adjusted, Non-GAAP 104,397 106,532 103,974 106,293 (1) Numerator for calculating net income (loss) per share-GAAP GAAP TO NON-GAAP RECONCILIATIONS
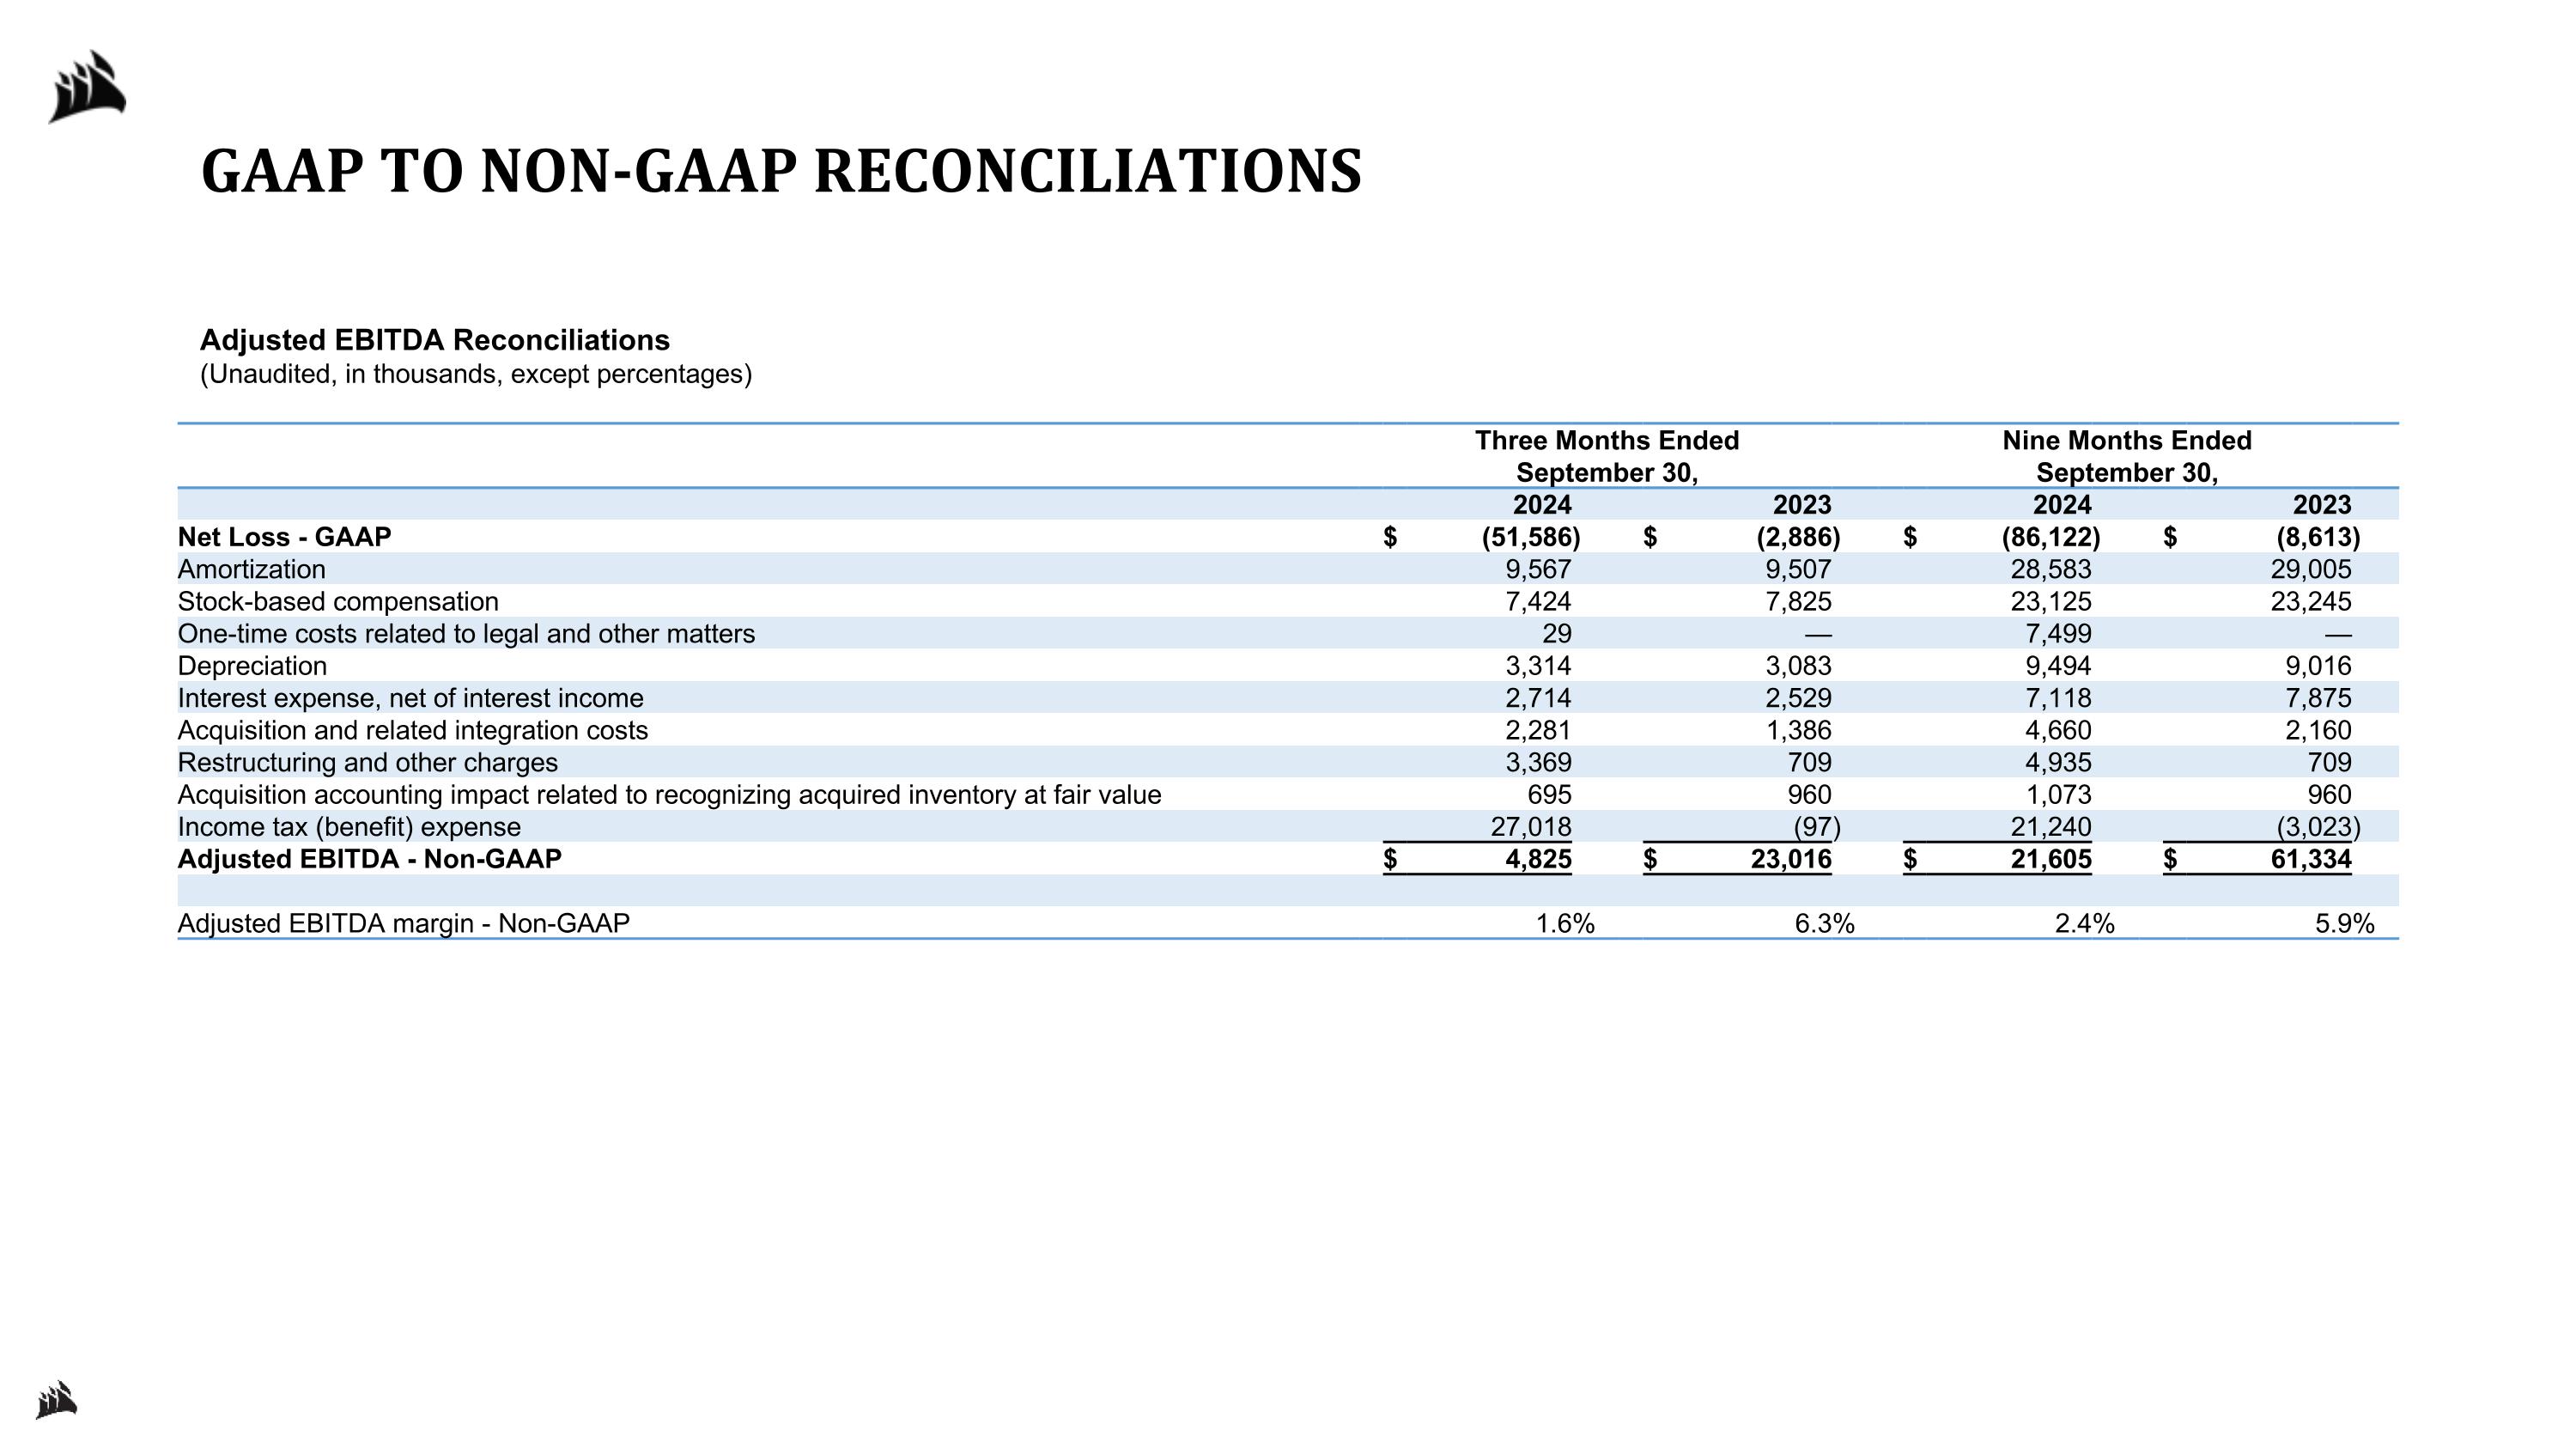
Adjusted EBITDA Reconciliations (Unaudited, in thousands, except percentages) Three Months Ended September 30, Nine Months Ended September 30, 2024 2023 2024 2023 Net Loss - GAAP $ (51,586 ) $ (2,886 ) $ (86,122 ) $ (8,613 ) Amortization 9,567 9,507 28,583 29,005 Stock-based compensation 7,424 7,825 23,125 23,245 One-time costs related to legal and other matters 29 — 7,499 — Depreciation 3,314 3,083 9,494 9,016 Interest expense, net of interest income 2,714 2,529 7,118 7,875 Acquisition and related integration costs 2,281 1,386 4,660 2,160 Restructuring and other charges 3,369 709 4,935 709 Acquisition accounting impact related to recognizing acquired inventory at fair value 695 960 1,073 960 Income tax (benefit) expense 27,018 (97 ) 21,240 (3,023 ) Adjusted EBITDA - Non-GAAP $ 4,825 $ 23,016 $ 21,605 $ 61,334 Adjusted EBITDA margin - Non-GAAP 1.6 % 6.3 % 2.4 % 5.9 % GAAP TO NON-GAAP RECONCILIATIONS