As filed with the Securities and Exchange Commission on November 6, 2024
File No. 000-56566
Maryland | 88-0870670 | ||
(State or other jurisdiction of incorporation or organization) | (I.R.S. Employer Identification No.) | ||
9 West 57th Street, 40th Floor, New York, NY | 10019 | ||
(Address of principal executive offices) | (Zip Code) | ||
Registrant’s telephone number including area code | (212) 790-0000 | ||
Title of each class to be so registered | Name of each exchange on which each class is to be registered | ||
None | None | ||
Large accelerated filer | ☐ | Accelerated filer | ☐ | ||||||
Non-accelerated filer | ☒ | Smaller reporting company | ☒ | ||||||
Emerging growth company | ☒ | ||||||||
• | We have limited prior operating history, and there is no assurance that we will achieve our investment objectives. |
• | We have made a limited number of investments to date, and you will not have the opportunity to evaluate our investments before we make them. |
• | Since there is no public trading market for shares of our common stock, repurchase of shares by us will likely be the only way to dispose of your shares. Our share repurchase plan provides stockholders with the opportunity to request that we repurchase their shares on a monthly basis, but we are not obligated to repurchase any shares and may choose to repurchase only some, or even none, of the shares that have been requested to be repurchased in any particular month in our discretion. In addition, repurchases will be subject to available liquidity and other significant restrictions. Further, our board of directors may make exceptions to, modify, suspend or terminate our share repurchase plan if in its reasonable judgment it deems a suspension to be in our best interest, such as when a repurchase request would place an undue burden on our liquidity, adversely affect our operations or risk having an adverse impact on the Company that would outweigh the benefit of the repurchase offer. As a result, our shares should be considered as having only limited liquidity and at times may be illiquid. |
• | We cannot guarantee that we will make distributions, and if we do, we may fund such distributions from sources other than cash flow from operations, including, without limitation, the sale of our assets, borrowings or offering proceeds, and we have no limits on the amounts we may pay from such sources. |
• | The purchase and repurchase price for shares of our common stock will generally be based on our prior month’s net asset value (“NAV”) and will not be based on any public trading market. Although there will be independent valuations of our properties from time to time, the valuation of properties is inherently subjective and our NAV may not accurately reflect the actual price at which our properties could be liquidated on any given day. |
• | Other than eleven employees of CapGrow (defined below) who operate the CapGrow business, we have no employees, and are dependent on our Adviser to conduct our operations. Our Adviser will face conflicts of interest as a result of, among other things, the allocation of investment opportunities among us and Other Sculptor Accounts (defined below), the allocation of time of its investment professionals and the level of fees that we will pay to our Adviser. |
• | If we are not able to raise a substantial amount of capital in the near term, our ability to achieve our investment objectives could be adversely affected. |
• | On acquiring shares, you will experience immediate dilution in the net tangible book value of your investment. |
• | Principal and interest payments on any borrowings will reduce the amount of funds available for distribution or investment in additional real estate assets. |
• | There are limits on the ownership and transferability of our shares. See Item 11, “Description of Registrant’s Securities to be Registered—Restrictions on Ownership and Transfer.” |
• | If we fail to qualify as a REIT and no relief provisions apply, our NAV and cash available for distribution to our stockholders could materially decrease. |
• | The acquisition of investment properties may be financed in substantial part by borrowing, which increases our exposure to loss. The use of leverage involves a high degree of financial risk and will increase the exposure of the investments to adverse economic factors. |
• | Investing in commercial real estate assets involves certain risks, including but not limited to tenants’ inability to pay rent (whether due to property-specific factors, sector-level issues, or broader macroeconomic conditions), increases in interest rates and lack of availability of financing, tenant turnover and vacancies and changes in supply of or demand for similar properties in a given market. |
BUSINESS. |
• | provide attractive current income in the form of regular, stable cash distributions; |
• | preserve and protect invested capital; |
• | realize appreciation in NAV from proactive investment management and asset management; and |
• | provide an investment alternative for stockholders seeking to allocate a portion of their long-term investment portfolios to commercial real estate with lower volatility than listed public real estate companies. |
• | at least 80% of our assets in private real estate equity and debt investments; and |
• | up to 20% of our assets in liquid real estate equity and debt securities. |
• | Financial Due Diligence. A preliminary review of each opportunity is conducted in order to screen the attractiveness of each transaction. The preliminary review is followed by an initial financial projection based on macro- and micro-economic analyses. Projection assumptions generally are developed from analysis of historical operating performance, discussions with local real estate contacts or sector experts and a review of published sources and data from Sculptor’s other portfolios. If our Adviser deems appropriate, further due diligence will be conducted, as described below, to confirm the initial financial review. Our Adviser will forecast expected cash flows and analyze various scenarios and exit strategies utilizing its proprietary models and the financial information received. We believe that our Adviser’s approach to the analysis of potential investment opportunities will provide us with a competitive advantage. |
• | Books and Records. Third-party accounting consultants will be used as necessary to review relevant books and records (for example, comparing rent rolls to leases for office buildings), confirm cash flow information provided by the seller and conduct other similar types of analysis. |
• | Physical Due Diligence. This primarily will involve an analysis of environmental and engineering matters by third-party consultants. Conclusions will be incorporated from environmental/engineering reports into the financial projection analysis. Additionally, our Adviser will investigate each potential investment and comparable properties to assess relative market position, functionality and obsolescence. |
• | Legal and Tax Due Diligence. Our Adviser will work closely with outside counsel to review, diligence and negotiate applicable legal and property specific documents pertaining to an investment (e.g., joint venture agreements, loan documents, leases, management agreements, purchase contracts, etc.). Additionally, our Adviser will work with internal and external tax advisors to structure investments in an efficient manner. |
• | We will not make investments in unimproved real property or indebtedness secured by a deed of trust or mortgage loans on unimproved real property in excess of 10% of our total assets. Unimproved real property means a property in which we have an equity interest that was not acquired for the purpose of producing rental or other income, that has no development or construction in process and for which no development or construction is planned, in good faith, to commence within one year; |
• | We will not invest in commodities or commodity futures contracts (which term does not include derivatives related to non-commodity investments, including futures contracts when used solely for the purpose of hedging in connection with our ordinary business of investing in real estate assets, mortgages and real estate related securities); |
• | We will not invest in real estate contracts of sale, otherwise known as land sale contracts, unless the contract is in recordable form and is appropriately recorded in the chain of title; |
• | Without the approval of a majority of our directors (including a majority of independent directors) not otherwise interested in the transaction, we will not make or invest in mortgage loans that are subordinate to any lien or other indebtedness or equity interest of any of our directors, our sponsor, our Adviser or their affiliates; |
• | We will not issue (1) equity securities redeemable solely at the option of the holder (except that stockholders may offer their shares of our common stock to us pursuant to our share repurchase plan), (2) debt securities unless the historical debt service coverage (in the most recently completed fiscal year) as adjusted for known changes is anticipated to be sufficient to properly service that higher level of debt, (3) equity securities on a deferred payment basis or under similar arrangements or (4) options or warrants to the directors, our sponsor, our Adviser, or any of their affiliates, except on the terms approved by a majority of the independent directors. Options or warrants may be issued to persons other than the directors, our sponsor, our Adviser, or any of their affiliates, but not at exercise prices less than the fair value of the underlying securities on the date of grant and not for consideration (which may include services) that in the judgment of the independent directors has a fair value less than the value of the option or warrant on the date of grant; |
• | We will not engage in the business of underwriting or the agency distribution of securities issued by other persons; |
• | We will not acquire interests or equity securities in any entity holding investments or engaging in activities prohibited by our corporate governance guidelines except for investments in which we hold a non-controlling interest or investments in any entity having securities listed on a national securities exchange or included for quotation on an interdealer quotation system; and |
• | We will not engage in any purchase, sale, lease, loan or other transaction involving us and one or more of Sculptor, our Adviser, our directors or any of their affiliates without the approval of a majority of disinterested directors. |
• | combines the capital of many investors to acquire or provide financing for real estate assets; |
• | offers the benefits of a real estate portfolio under professional management; |
• | satisfies the various requirements of the Internal Revenue Code of 1986, as amended (the “Code”), including a requirement to distribute to stockholders at least 90% of its REIT taxable income each year; and |
• | is generally not subject to U.S. federal corporate income taxes on its net taxable income that it currently distributes to its stockholders, which substantially eliminates the “double taxation” (i.e., taxation at both the corporate and stockholder levels) that generally results from investments in a “C” corporation. |
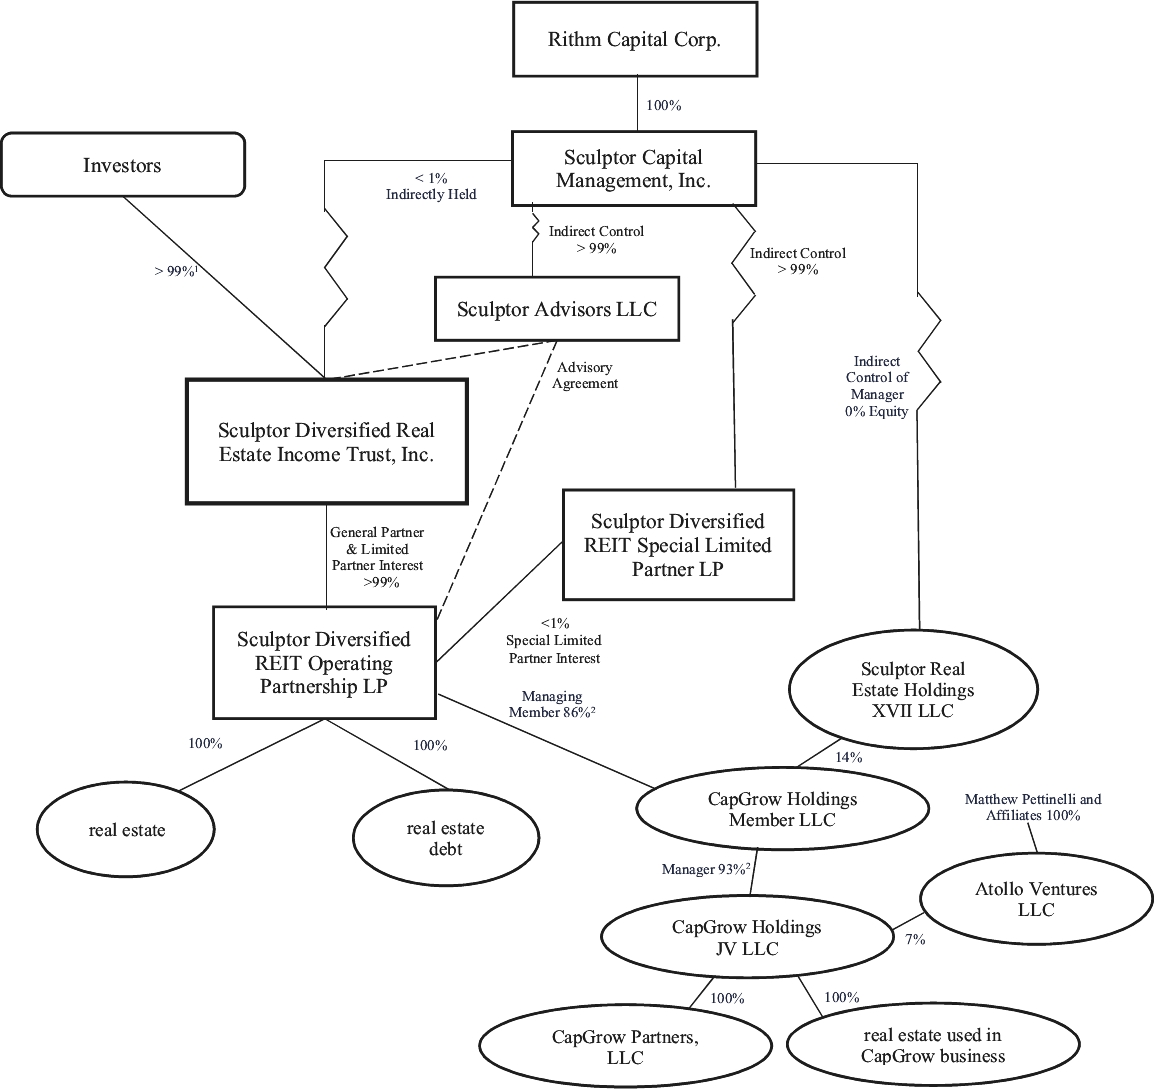
1 | As of the date of this filing, 60% of these shares are owned by Founding Investor. Except for 9.9% of Founding Investor’s shares and as otherwise described under “—Founding Investor’s Investment in the Company” below, Founding Investor has agreed to vote its shares in a “neutral” manner for a period of time. |
2 | As of the date of the filing, as a result of Sculptor Diversified REIT Operating Partnership LP’s 86% interest in CapGrow Holdings Member LLC’s 93% interest in CapGrow Holdings JV LLC, Sculptor Diversified REIT Operating Partnership LP effectively owns 80% of CapGrow Holdings JV LLC. |
Type of Compensation and Recipient | Determination of Amount | ||
Organization and Offering Expense Reimbursement—Our Adviser | Through March 2024, our Adviser advanced all expenses on our behalf in connection with our formation and the raising (or attempted raise) of equity capital, but excluding upfront selling commissions and distribution fees. The costs of an audit of our financial statements for the year ended December 31, 2022 are considered an organization expense for this purpose as are all costs associated with raising $150 million in December of 2022 and the costs associated with our efforts to register a public offering with the SEC and the states (including, without limitation, filing fees with the states and FINRA and related legal fees), which efforts were not pursued after we decided to conduct our offering privately. We will reimburse our Adviser for all such advanced expenses ratably over the 60 months following March 2024 except our Adviser has indicated that it does not intend to seek reimbursement for certain costs associated with our pursuit of a public offering, such as state and FINRA filing fees. The reimbursement of such expenses is allocated pro rata on a class-specific basis except that we have capped the amount of such expenses to be borne by Class F and Class FF shares. See Item 11, “Description of Registrant’s Securities to be Registered—Common Stock—Class F and Class FF Shares.” Commencing April 2024, we began reimbursing our Adviser for any organization and offering expenses that it incurs on our behalf as and when incurred. During the six months ended June 30, 2024, the Company incurred additional organization and offering costs of $0.2 million. As of June 30, 2024, the Company owed the Adviser organization and offering costs of $3.3 million. | ||
Acquisition Expense Reimbursement—Our Adviser | We do not intend to pay our Adviser any acquisition, financing (except interest payments to the lender in cases where the lender is an affiliate of our Adviser) or other similar fees in connection with making investments. We will, however, reimburse our Adviser for out-of-pocket expenses in connection with the selection and acquisition of properties and real estate related securities, whether or not such investments are acquired, and make payments to third parties in connection with making investments. | ||
Management Fee and Expense Reimbursements—Our Adviser | We pay our Adviser an annual management fee (payable monthly in arrears) of 0.50% of aggregate NAV represented by the Company’s Class F and Class FF shares, 0.75% of aggregate NAV of our Class A and Class AA shares and 1.25% of aggregate NAV of our other share classes (to the extent outstanding). Additionally, to the extent that our Operating Partnership issues Operating Partnership units to parties other than us, our Operating Partnership will pay our Adviser a management fee equal to 1.25% of the aggregate NAV of the Operating Partnership attributable to such Operating Partnership units not held by us per annum payable monthly in arrears. No management fee will be paid with respect to Class E shares or Class E units of our Operating Partnership. | ||
Type of Compensation and Recipient | Determination of Amount | ||
The management fee may be paid, at our Adviser’s election, in cash, Class E shares or Class E units of our Operating Partnership. If our Adviser elects to receive any portion of its management fee in our Class E shares or Class E units of our Operating Partnership, we may be obligated to repurchase such Class E shares or Class E units from our Adviser at a later date. Such repurchases will be outside our share repurchase plan and thus will not be subject to the plan’s repurchase limits or Early Repurchase Deduction. Any Class E shares paid as a management fee (or received upon conversion of Class E units paid as a management fee) will have registration rights if our shares are listed on a national securities exchange. During the six months ended June 30, 2024, the Company incurred management fees of $0.6 million. As of June 30, 2024, the management fee due to the Adviser was $0.2 million. In addition to the organization and offering expense and acquisition expense reimbursements described above, we will reimburse our Adviser for out-of-pocket costs and expenses it incurs in connection with the services it provides to us, including, but not limited to, (i) the actual cost of goods and services used by us and obtained from third parties, including fees paid to administrators, consultants, attorneys, technology providers and other service providers, and brokerage fees paid in connection with the purchase and sale of investments and securities, and (ii) expenses of managing and operating our properties, whether payable to an affiliate or a non-affiliated person. See Item 7, “Certain Relationships and Related Transactions, and Director Independence—The Advisory Agreement—Management Fee, Performance Participation and Expense Reimbursements.” As of June 30, 2024, the Company owed the Adviser $0.8 million for expenses paid on our behalf. | |||
Performance Participation Allocation—The Special Limited Partner | So long as the Advisory Agreement has not been terminated (including by means of non-renewal), the Special Limited Partner will hold a performance participation interest in the Operating Partnership, which has three components: a performance allocation with respect to the Class D units, Class I units and Class S units (the “Performance Allocation”); a performance allocation with respect to the Class A units and Class AA units (the “Class A Performance Allocation”); and a performance allocation with respect to the Class F units and Class FF units (the “Class F Performance Allocation”). The Performance Allocation entitles the Special Limited Partner to receive an allocation from our Operating Partnership equal to 12.5% of the Total Return, subject to a 5% Hurdle Amount and a High-Water Mark, with a Catch-Up; the Class A Performance Allocation entitles the Special Limited Partner to receive an allocation equal to 10.0% of the Class A Total Return, subject to a 7% Class A Hurdle Amount and a High-Water Mark, with a 50% Catch-Up; and the Class F Performance Allocation entitles the Special Limited Partner to receive an allocation equal to 6.25% of the Class F Total Return, subject to a 7% Class F Hurdle Amount and a High-Water Mark, with a 50% Catch-Up (each term as defined under “Summary of our Operating Partnership Agreement—Special Limited Partner Interest”). Such allocations will be made annually and accrue monthly. | ||
Type of Compensation and Recipient | Determination of Amount | ||
The Special Limited Partner will also be allocated a performance participation with respect to all Operating Partnership units that are repurchased at the end of any month (in connection with repurchases of our shares in our share repurchase plan) in an amount calculated as described above with the relevant period being the portion of the year for which such unit was outstanding, and proceeds for any such unit repurchase will be reduced by the amount of any such performance participation. Distributions on the performance participation interest may be payable in cash or Class E units at the election of the Special Limited Partner. If the Special Limited Partner elects to receive such distributions in Class E units, the Special Limited Partner may request that we repurchase such units from the Special Limited Partner for cash or (at the Special Limited Partner’s election) Class E shares of our common stock. Such repurchases will be outside our share repurchase plan and thus will not be subject to the plan’s repurchase limits or Early Repurchase Deduction. During the six months ended and as of June 30, 2024, the Company had not accrued a performance participation allocation. During the period from January 4, 2023 through December 31, 2023, performance participation allocation was $1.6 million. For a detailed explanation of how the performance participation allocation is calculated, see Item 11, “Description of Registrant’s Securities to be Registered—Summary of Our Operating Partnership Agreement—Special Limited Partner Interest.” | |||
• | “Total Operating Expenses” are all costs and expenses paid or incurred by us, as determined under generally accepted accounting principles, including the management fee and the performance participation, but excluding: (i) the expenses of raising capital such as organization and offering expenses, legal, audit, accounting, underwriting, brokerage, listing, registration and other fees, printing, and other such expenses and taxes incurred in connection with the issuance, distribution, transfer, registration and listing of our capital stock, (ii) interest payments, (iii) taxes, (iv) non-cash expenditures such as depreciation, amortization and bad debt reserves, (v) incentive fees or performance allocations made in compliance with our corporate governance guidelines or made in accordance with terms previously approved by a majority of the directors (including a majority of the independent directors), (vi) acquisition fees and acquisition expenses related to the selection and acquisition of assets, whether or not a property is actually acquired, (vii) real estate commissions on the sale of property and (viii) other fees and expenses connected with the acquisition, disposition, management and ownership of real estate interests, mortgage loans or other property (including the costs of foreclosure, insurance premiums, legal services, maintenance, repair and improvement of property). |
• | “Average Invested Assets” means, for any period, the average of the aggregate book value of our assets, invested, directly or indirectly, in equity interests in and loans secured by real estate, including all |
• | “Net Income” means, for any period, total revenues applicable to such period, less the total expenses applicable to such period other than additions to, or allowances for, non-cash charges such as depreciation, amortization, impairments and reserves for bad debt or other similar non-cash reserves. |
A. | Beginning NAV | $175,000,000 | ||||
B. | Loss Carryforward Amount | — | ||||
C. | Net proceeds from new issuances | — | ||||
D. | Distributions paid (in twelve equal monthly installments) | $10,208,000 | ||||
E. | Change in NAV required to meet 7% annualized internal rate of return(1) | $1,682,000 | ||||
F. | Hurdle Amount(1) (D plus E) | $11,890,000 | ||||
G. | Actual change in NAV | $15,000,000 | ||||
H. | Annual Total Return prior to performance participation allocation (D plus G) | $25,208,000 | ||||
I. | Excess Profits (H minus the sum of B and F) | $13,318,000 | ||||
J. | Performance participation allocation is equal to 6.25% of annual Total Return (H) because the annual Total Return exceeds the Hurdle Rate (F) plus loss carryforward account balance (B) with enough Excess Profits (I) to achieve the full Catch-Up | $1,576,000 | ||||
(1) | Amounts rounded to the nearest thousands. The Hurdle Amount for any period is that amount that results in a 7% annualized internal rate of return on the NAV of the units outstanding at the end of the period. An internal rate of return reflects the timing and amount of all distributions accrued or paid (without duplication) and any issuances or repurchases of such units during the period. Internal rate of return is a metric used in business and asset management to measure the profitability of an investment, and is calculated according to a standard formula that determines the total return provided by gains on an investment over time. We believe our fee structure described herein, including the requirement that a minimum internal rate of return be achieved before the Adviser is entitled to any performance allocation, aligns the interests of our stockholders with the Adviser. |
• | under Section 3(a)(1)(A), it is, or holds itself out as being, engaged primarily, or proposes to engage primarily, in the business of investing, reinvesting or trading in securities; or |
• | under Section 3(a)(1)(C), it is engaged, or proposes to engage, in the business of investing, reinvesting, owning, holding or trading in securities and owns, or proposes to acquire, “investment securities” having a value exceeding 40% of the value of its total assets (exclusive of government securities and cash items) on an unconsolidated basis, which we refer to as the “40% test.” The term “investment securities” generally includes all securities except U.S. government securities and securities of majority-owned subsidiaries that are not themselves investment companies and are not relying on the exemption from the definition of investment company under Section 3(c)(1) or Section 3(c)(7) of the Investment Company Act. |
• | 9.9% of Founding Investor’s shares are not subject to the neutral voting requirement. |
• | There are no restrictions on Founding Investor’s ability to vote its shares on any proposal to amend our organizational documents if such amendment would adversely affect Founding Investor’s economic, governance, information or liquidity rights as a holder of Class F shares relative to the rights of holders of another class of shares. |
• | There are no restrictions on Founding Investor’s ability to vote its shares on our dissolution pursuant to Section 11.10 of our charter, which provides for a possible stockholder vote with respect to dissolution if we have not raised $450 million in gross proceeds from the sale of capital stock before December 31, 2024. |
• | Founding Investor will be free to vote all of its shares without restriction if: |
○ | We have not raised another $150 million (in addition to the $150 million raised from Founding Investor) in gross proceeds from the sale of capital stock by March 22, 2025 or |
○ | Founding Investor’s shares constitute 9.9% or less of our outstanding common stock. |
FINANCIAL INFORMATION. |
• | The Company acquired 10 vacant homes through CapGrow at an aggregate purchase price of $3.5 million during the six months ended June 30, 2024, which were leased to tenants following their acquisitions. |
• | The Company sold 10 CapGrow homes for an aggregate net proceeds of $3.1 million during the six months ended June 30, 2024. |
• | The Company invested $1.9 million in connection with the acquisition of the Newport Portfolio. |
• | The Company declared monthly distributions totaling $8.4 million for the six months ended June 30, 2024. During the six months ended June 30, 2024, our investment in CapGrow and University Courtyard produced operating earnings and distributions that contributed to our total return. The details of the annualized distribution rate and total returns are shown in the following table: |
Class F | Class FF | Class E | Class AA | |||||||||
Annualized Distribution Rate(1) | 6.98% | 6.56% | 6.93% | 6.53% | ||||||||
Year-to-Date Total Return, without upfront selling commissions(2) | 3.16% | 2.95% | 4.80% | 1.90% | ||||||||
Year-to-Date Total Return, assuming maximum upfront selling commissions(2)(3) | 1.10% | 0.89% | 4.80% | (0.14)% | ||||||||
Inception-to-Date Total Return, without upfront selling commissions(2) | 11.39% | 8.90% | 4.33% | 1.90% | ||||||||
Inception-to-Date Total Return, assuming maximum upfront selling commissions(2)(3) | 9.92% | 7.05% | 4.33% | (0.14)% | ||||||||
(1) | The annualized distribution rate is calculated as the June distribution annualized and divided by the prior month’s net asset value, which is inclusive of all fees and expenses. The Company believes the annualized distribution rate is a useful measure of overall investment performance of our shares. |
(2) | Total return is calculated as the change in NAV per share during the respective periods plus any distributions per share declared in the period and assumes any distributions are reinvested in accordance with our distribution reinvestment plan. Total return for periods greater than one year are annualized. The Company believes total return is a useful measure of the overall investment performance of our shares. Class F shares, Class FF shares and Class AA shares were first issued to third parties on December 27, 2022, May 1, 2023 and February 1, 2024, respectively. Class E shares were first issued to our Adviser on December 1, 2023. |
(3) | There were no selling commissions charged in respect of the Class F and E shares. |
• | During the six months ended June 30, 2024, the Company raised $14.9 million in proceeds from the sale of our common shares, including proceeds from our distribution reinvestment plan, and did not receive any repurchase requests for our common shares. |
• | CapGrow incurred additional borrowings of $2.0 million from the revolving credit facility to partly fund CapGrow’s asset acquisitions during the six months ended June 30, 2024. |
• | CapGrow repaid $2.1 million of its mortgage loans as part of its scheduled debt service payments and as a result of asset sales during the six months ended June 30, 2024. |
Property Type | Number of Properties (1) | Sq. Feet / Units/ Beds / Homes | Occupancy Rate(2) | Average Effective Annual Base Rent Per Leased Square Foot/ Units/Keys(3) | Gross Asset Value ($ in thousands)(4) | Segment Revenue ($ in thousands)(5) | Percentage of Total Segment Revenue | ||||||||||||||
Residential (Business)(6) | n/a | 1,059 | 99% | $14,536 | $480,000 | $18,549 | 83% | ||||||||||||||
Student Housing | 1 | 792 | 94% | $11,788 | 61,400 | 3,697 | 17% | ||||||||||||||
Total | 1 | $541,400 | $22,246 | 100% | |||||||||||||||||
(1) | Single family homes are accounted for in the number of units and are not reflected in the number of properties. |
(2) | For single family rental properties, occupancy is defined as the percentage of occupied homes as of June 30, 2024. For student housing, occupancy is defined as the percentage of occupied beds as of June 30, 2024. |
(3) | Average effective annual base rent represents the base rent for the year ended June 30, 2024 per leased unit, and excludes tenant recoveries, straight line rent, and above-market and below-market lease amortization. |
(4) | Based on fair value as of June 30, 2024. |
(5) | Segment revenue is presented for the six-months ended June 30, 2024. |
(6) | Under the business combination, CapGrow was acquired as a business. CapGrow owns primarily single family homes across the United States with a total square footage of 2.4 million. |
Segment and Investment | Number of Properties | Location | Acquisition Date(s) | Ownership Interest(1) | Purchase Price ($ in thousands) | Sq. Feet / Units/ Beds / Homes | Occupancy Rate(2) | ||||||||||||||
Business: | |||||||||||||||||||||
CapGrow(3) | n/a | Various | January, July and October 2023 | 79.93% | $465,000 | 1,059 | 99% | ||||||||||||||
Student Housing: | |||||||||||||||||||||
University Courtyard | 1 | Texas | October 2023 | 90.00% | 58,000 | 792 | 94% | ||||||||||||||
Total | 1 | $523,000 | |||||||||||||||||||
(1) | Ownership interest as June 30, 2024. Certain of the joint venture agreements entered into by us provide the other partner a profits interest based on certain internal rate of return hurdles being achieved. Such investments are consolidated by us and any interests due to the other partner will be reported within non-controlling interests in consolidated joint ventures on our condensed consolidated balance sheets. |
(2) | The occupancy rate is defined as the number of leased units/homes divided by the total units/homes as of June 30, 2024. For student housing, occupancy is defined as the percentage of occupied beds as of June 30, 2024. |
(3) | As of June 30, 2024, the Company owned a 79.93% effective equity interest in CapGrow. The Company has the right to buy the remaining interests in CapGrow Member from Sculptor RE Holdings XVII LLC (“Seller”) by January 3, 2025 at a price (i) for the first 12 months following the initial sale to the Company, that is based on a 6.5% capitalization rate on net operating income excluding corporate general and administrative expenses (“pre-corporate G&A NOI”) calculated at the time of the subsequent purchase; and (ii) for the second year following the initial sale to the Company, that is equal to a 6.0% capitalization rate on pre-corporate G&A NOI calculated at the time of purchase. As the managing member of CapGrow Member, the Company has near absolute control over CapGrow, including the ability at all times on or after the initial sale to the Company to force a sale of CapGrow Member, its interest in CapGrow or 100% of CapGrow itself. However, if the Company has not exercised its option to acquire a 100% ownership interest in CapGrow Member within 24 months of the initial sale to the Company (i.e., by January 3, 2025), then Seller can also force a sale of CapGrow Member, its interest in CapGrow or 100% of CapGrow. The Company’s affiliate transaction committee, which is comprised solely of the Company’s independent directors, approved the Company’s purchase of additional ownership interests in one or more transactions (no more than once monthly) until January 3, 2024 in CapGrow Member from Seller on the previously negotiated terms as fair and reasonable to the Company. |
Year | Number of Expiring Leases | Annualized Base Rent(1) | % of Total Annualized Base Rent Expiring | Square Feet | % of Total Square Feet Expiring | ||||||||||
2024 (six months) | 61 | $1,489 | 5% | 128 | 5% | ||||||||||
2025 | 132 | 3,069 | 10% | 248 | 10% | ||||||||||
2026 | 160 | 4,474 | 14% | 394 | 17% | ||||||||||
2027 | 498 | 12,957 | 41% | 997 | 42% | ||||||||||
2028 | 69 | 2,949 | 9% | 168 | 7% | ||||||||||
2029 | 50 | 1,458 | 5% | 98 | 4% | ||||||||||
2030 | 23 | 752 | 2% | 79 | 3% | ||||||||||
2031 | 21 | 1,444 | 5% | 87 | 4% | ||||||||||
2032 | 11 | 2,204 | 7% | 124 | 6% | ||||||||||
2033 | 3 | 91 | —% | 8 | —% | ||||||||||
Thereafter | 13 | 714 | 2% | 50 | 2% | ||||||||||
Total | 1,041 | $31,601 | 100% | 2,381 | 100% | ||||||||||
(1) | Annualized base rent represents the amount of lease revenue that our portfolio would have generated in monthly contractual rent under existing leases as of June 30, 2024 multiplied by 12. The Company had not entered into any tenant concessions or rent abatements as of June 30, 2024. Amount excludes tenant recoveries, straight-line rent, and above-market and below-market lease amortization. |
• | for the six months ended June 30, 2024 (the “2024 Successor Interim Period”); |
• | for the period from January 4, 2023 through June 30, 2023 (the “2023 Successor Interim Period”); |
• | for the period from January 1, 2023 through January 3, 2023 (the “2023 Predecessor Interim Period”); |
• | for the period from January 4, 2023 through December 31, 2023 (the “2023 Successor Period”); |
• | for the period from January 1 through January 3, 2023 (the “2023 Predecessor Period”); |
• | year ended December 31, 2022 (the “2022 Predecessor Period”). |
Three Months Ended June 30, 2024 | Three Months Ended June 30, 2023 | 2024 vs 2023 | |||||||
Revenues | |||||||||
Rental revenue | $10,739 | $9,005 | $1,734 | ||||||
Other revenue | 272 | 294 | (22) | ||||||
Total revenues | 11,011 | 9,299 | 1,712 | ||||||
Expenses | |||||||||
Property operating expenses | 1,041 | 96 | 945 | ||||||
Management fees | 318 | 207 | 111 | ||||||
Performance participation allocation | (285) | 277 | (562) | ||||||
General and administrative | 2,067 | 1,567 | 500 | ||||||
Organization and transaction costs | 60 | 495 | (435) | ||||||
Depreciation and amortization | 6,344 | 4,088 | 2,256 | ||||||
Total expenses | 9,545 | 6,730 | 2,815 | ||||||
Operating income | 1,466 | 2,569 | (1,103) | ||||||
Three Months Ended June 30, 2024 | Three Months Ended June 30, 2023 | 2024 vs 2023 | |||||||
Other income (expense): | |||||||||
Interest expense, net | (3,013) | (2,625) | (388) | ||||||
Impairment of investments in real estate | (580) | (909) | 329 | ||||||
Income (loss) from an unconsolidated entity | 18 | — | 18 | ||||||
Unrealized gain (loss) on derivative instruments | (61) | — | (61) | ||||||
Gain (loss) on sale of real estate | 34 | — | 34 | ||||||
Total other income (expense) | (3,602) | (3,534) | (68) | ||||||
Net income (loss) | (2,136) | (965) | $(1,171) | ||||||
Net income (loss) attributable to non-controlling interest in the consolidated subsidiaries | 67 | (144) | |||||||
Net income (loss) attributable to non-controlling interest in the Operating Partnership | 16 | — | |||||||
Net income (loss) attributable to SDREIT stockholders | $(2,053) | $(1,109) | |||||||
Net income (loss) per common share - basic and diluted | $(0.09) | $(0.11) | |||||||
Weighted-average common shares outstanding - basic and diluted | 23,225,630 | 15,736,037 | |||||||
Successor | Predecessor | |||||||||||
Six Months Ended June 30, 2024 | Period from January 4, 2023 through June 30, 2023 | Period from January 1, 2023 through January 3, 2023 | 2024 vs 2023 | |||||||||
Revenues | ||||||||||||
Rental revenue | $21,690 | $17,615 | $323 | $4,075 | ||||||||
Other revenue | 556 | 558 | — | (2) | ||||||||
Total revenues | 22,246 | 18,173 | 323 | 4,073 | ||||||||
Expenses | ||||||||||||
Property operating expenses | 2,023 | 312 | 29 | 1,711 | ||||||||
Management fees | 620 | 390 | — | 230 | ||||||||
Performance participation allocation | — | 723 | — | (723) | ||||||||
General and administrative | 4,078 | 2,801 | — | 1,277 | ||||||||
Organization and transaction costs | 172 | 1,909 | — | (1,737) | ||||||||
Depreciation and amortization | 12,906 | 7,974 | — | 4,932 | ||||||||
Total expenses | 19,799 | 14,109 | 29 | 5,690 | ||||||||
Operating income | 2,447 | 4,064 | 294 | (1,617) | ||||||||
Successor | Predecessor | |||||||||||
Six Months Ended June 30, 2024 | Period from January 4, 2023 through June 30, 2023 | Period from January 1, 2023 through January 3, 2023 | 2024 vs 2023 | |||||||||
Other income (expense): | ||||||||||||
Interest expense, net | (6,051) | (5,242) | (114) | (809) | ||||||||
Impairment of investments in real estate | (1,022) | (2,400) | — | 1,378 | ||||||||
Income (loss) from an unconsolidated entity | 10 | — | — | 10 | ||||||||
Unrealized gain (loss) on derivative instruments | 138 | — | — | 138 | ||||||||
Gain (loss) on sale of real estate | 34 | — | — | 34 | ||||||||
Total other income (expense) | (6,891) | (7,642) | (114) | 751 | ||||||||
Net income (loss) | (4,444) | (3,578) | $180 | $(866) | ||||||||
Net income (loss) attributable to non-controlling interest in the consolidated subsidiaries | 61 | 317 | ||||||||||
Net income (loss) attributable to non-controlling interest in the Operating Partnership | 29 | — | ||||||||||
Net income (loss) attributable to SDREIT stockholders | $(4,354) | $(3,261) | ||||||||||
Net income (loss) per common share - basic and diluted | $(0.19) | $(0.21) | ||||||||||
Weighted-average common shares outstanding - basic and diluted | 22,770,531 | 15,379,897 | ||||||||||
(1) | These financial statements are not comparable between the Predecessor and Successor periods due to a difference in the basis of accounting between the periods; the Predecessor periods were prepared under the provisions of Rule 3-05 of Regulation S-X, while the Successor period has been presented for the consolidated operations of SDREIT. Since SDREIT consolidates CapGrow (as it is the primary beneficiary of CapGrow Member) and accounts for this acquisition transaction as a business, SDREIT recognizes all of the tangible and intangible assets acquired, the liabilities assumed and noncontrolling interest in CapGrow Member and CapGrow at the acquisition-date fair value. |
Successor | Predecessor | |||||||||||
Period from January 4, 2023 through December 31, 2023 | Period from January 1, 2023 through January 3, 2023 | Year Ended December 31, 2022 | 2023 vs. 2022(4) | |||||||||
Revenues | ||||||||||||
Rental revenue | $37,623 | $323 | $28,765 | $8,858 | ||||||||
Other revenue | 1,220 | — | 1,193 | 27 | ||||||||
Total revenues | 38,843 | 323 | 29,958 | 8,885 | ||||||||
Expenses | ||||||||||||
Property operating expenses | 1,189 | 29 | 866 | 323 | ||||||||
Management fees(2) | 946 | — | — | 946 | ||||||||
Performance participation allocation(2) | 1,566 | — | — | 1,566 | ||||||||
General and administrative | 6,877 | — | 2,742 | 4,135 | ||||||||
Organizational and transaction costs | 2,450 | — | — | 2,450 | ||||||||
Depreciation and amortization | 18,276 | — | 8,533 | 9,743 | ||||||||
Total expenses | 31,304 | 29 | 12,141 | 19,163 | ||||||||
Operating income | 7,539 | 294 | 17,817 | (10,278) | ||||||||
Other income (expense): | ||||||||||||
Interest expense, net | (10,371) | (114) | (9,615) | (756) | ||||||||
Impairment of investments in real estate | (3,998) | — | — | (3,998) | ||||||||
Unrealized gain (loss) on derivative instruments | (798) | — | — | (798) | ||||||||
Gain on sale of real estate | — | — | 2,422 | (2,422) | ||||||||
Total other income (expense) | (15,167) | (114) | (7,193) | (7,974) | ||||||||
Net income (loss) | $(7,628) | $180 | $10,624 | (18,252) | ||||||||
Net income attributable to non-controlling interest in the consolidated subsidiary | 236 | |||||||||||
Net loss attributable to non-controlling interest in the Operating Partnership | — | |||||||||||
Net loss attributable to SDREIT stockholders | $(7,392) | |||||||||||
Net loss per common share - basic and diluted(3) | $(0.41) | |||||||||||
Weighted-average common shares outstanding - basic and diluted | 17,814,156 | |||||||||||
(1) | These financial statements are not comparable between the Successor and Predecessor periods due to a difference in the basis of accounting between the periods presented; the Predecessor periods were prepared under the provisions of Rule 3-05 of Regulation S-X, while the Successor period has been presented for the consolidated results of operations of SDREIT. Since SDREIT consolidates CapGrow as it is the primary beneficiary of CapGrow Member and accounts for this acquisition transaction as a business, SDREIT recognizes all of the tangible and intangible assets acquired, the liabilities assumed and noncontrolling interest in CapGrow Member and CapGrow at the acquisition-date fair value. |
(2) | Management fees and performance participation allocation are not presented in the Predecessor periods due to the fact that the Predecessor period is prepared under the provisions of Rule 3-05 of Regulation S-X. |
(3) | All classes of common shares are allocated net income/(loss) at the same rate per share (in respect of each class's proportionate share of net asset value) and receive the same gross distribution per share. Note that net loss per share of common shares is not presented for the Predecessor periods as the Predecessor was not unitized. |
(4) | The results of operations of the Predecessor for the Period from January 1, 2023 through January 3, 2023 were immaterial and were excluded from the 2023 vs 2022 analysis below. |
Components of NAV | June 30, 2024 | December 31, 2023 | ||||
Investments in real estate (including goodwill) | $541,400 | $535,700 | ||||
Investment in an unconsolidated entity | 1,858 | — | ||||
Cash and cash equivalents | 26,374 | 16,696 | ||||
Restricted cash | 8,779 | 6,406 | ||||
Receivables | 692 | 439 | ||||
Other assets | 3,000 | 3,321 | ||||
Mortgages and other notes payable, net | (258,452) | (258,662) | ||||
Accounts payable and other liabilities | (10,355) | (6,543) | ||||
Management fee payable | (214) | (199) | ||||
Due to related parties | (882) | (427) | ||||
Accrued performance participation allocation | — | (1,566) | ||||
Noncontrolling interest in the consolidated subsidiaries | (58,990) | (58,122) | ||||
Noncontrolling interest in the Operating Partnership | — | (2) | ||||
Net Asset Value | $253,210 | $237,041 | ||||
Number of outstanding shares/units | 23,669,268 | 22,071,854 | ||||
NAV per share | Class F Shares | Class FF Shares | Class E Shares | Class AA Shares | Operating Partnership Units | Total | ||||||||||||
NAV | $172,350 | $65,671 | $2,118 | $11,469 | $1,602 | $253,210 | ||||||||||||
Number of outstanding shares/ units | 16,059,358 | 6,188,299 | 196,207 | 1,076,927 | 148,477 | 23,669,268 | ||||||||||||
NAV Per Share/Unit | $10.7321 | $10.6121 | $10.7929 | $10.6497 | $10.7929 | $10.6978 | ||||||||||||
Investment Type | Discount Rate | Exit Capitalization Rate | ||||
Residential (Business) | 8.5% | 7.0% | ||||
Student Housing | 11.0% | 6.3% | ||||
Input | Hypothetical Change | Residential (Business) | Student Housing | ||||||
Discount Rate (weighted average) | 0.25% decrease | 1.5% | 1.0% | ||||||
Discount Rate (weighted average) | 0.25% increase | (1.3)% | (1.0)% | ||||||
Exit Capitalization Rate (weighted average) | 0.25% decrease | 3.8% | 5.0% | ||||||
Exit Capitalization Rate (weighted average) | 0.25% increase | (3.3)% | (4.5)% | ||||||
Debt Type | Contracted Interest Rates | Market Interest Rate | ||||
Fixed rate mortgages (weighted average) | 4.51% | 6.54% | ||||
Input | Hypothetical Change | Residential (Business) | Student Housing | ||||||
Mortgage Interest Rates (weighted average) | 0.25% Decrease | 0.60% | 0.40% | ||||||
Mortgage Interest Rates (weighted average) | 0.25% Increase | (0.60)% | (0.40)% | ||||||
June 30, 2024 | |||
Shareholders’ equity | $203,051 | ||
Redeemable non-controlling interest in SDREIT Operating Partnership | 1,602 | ||
Total SDREIT stockholders' equity and SDREIT Operating Partnership partners' capital under GAAP | $204,653 | ||
Adjustments: | |||
Accrued organizational and offering costs | 3,339 | ||
Accumulated depreciation and amortization under GAAP | 26,014 | ||
Straight line rent receivable | (1,196) | ||
Unrealized net real estate appreciation | 20,263 | ||
Accrued distribution fees | 136 | ||
Unvested dividends reinvestment | 1 | ||
NAV | $253,210 | ||
• | The Adviser agreed to advance certain organization and offering costs on our behalf through March 31, 2024. Such costs will be reimbursed to the Adviser on a pro-rata basis over a 60-month period beginning March 31, 2024. Under GAAP, organization costs are expensed as incurred. For purposes of calculating NAV, such costs will be recognized as paid over the 60-month reimbursement period. |
• | We depreciate our investments in real estate and amortize certain other assets and liabilities (i.e., above- and below-market leases, in-place lease costs and deferred commissions) in accordance with GAAP. Such depreciation and amortization is not recorded for purposes of calculating our NAV. |
• | Our investments in real estate are presented at their depreciated cost basis in our GAAP condensed consolidated financial statements. Additionally, our mortgage loans, and revolving credit facility (“Debt”) are presented at their amortized cost basis in our condensed consolidated GAAP financial statements. As such, any increases or decreases in the fair market value of our investments in real estate or our Debt are not included in our GAAP results. For purposes of calculating our NAV, our investments in real estate and our Debt are recorded at fair value. |
• | We recognize rental revenue on a straight-line basis under GAAP. Such straight-line rent adjustments are excluded for purposes of calculating NAV. |
• | Accrued distribution fees represent the accrual for the cost of the distribution fees for Class FF. Under GAAP, we accrued the annual cost of the distribution fees payable as an offering cost at the time we sold Class FF shares. For purposes of calculating NAV, we recognize the distribution fees as a reductions of NAV on a monthly basis when such fees are paid. |
• | We accrue dividends on unvested restricted stock in accordance with GAAP. For purposes of calculating our NAV, we exclude these accrued unvested dividends until the vesting period associated to the underlying restricted stock expires. |
Declaration Date | Class F Shares | Class FF Shares | Class E Shares | Class AA Shares | ||||||||
March 31, 2023 | $0.0588 | $— | $— | $— | ||||||||
April 30, 2023 | 0.0588 | — | — | — | ||||||||
May 31, 2023 | 0.0609 | 0.0609 | — | — | ||||||||
June 30, 2023 | 0.0611 | 0.0611 | — | — | ||||||||
July 31, 2023 | 0.0611 | 0.0611 | — | — | ||||||||
August 31, 2023 | 0.0628 | 0.0628 | — | — | ||||||||
September 30, 2023 | 0.0625 | 0.0625 | — | — | ||||||||
October 31, 2023 | 0.0622 | 0.0577 | — | — | ||||||||
November 30, 2023 | 0.0628 | 0.0584 | — | — | ||||||||
December 31, 2023 | 0.0633 | 0.0587 | 0.0633 | — | ||||||||
January 31, 2024 | 0.0627 | 0.0582 | 0.0627 | — | ||||||||
February 29, 2024 | 0.0631 | 0.0589 | 0.0631 | 0.0588 | ||||||||
March 31, 2024 | 0.0629 | 0.0584 | 0.0629 | 0.0584 | ||||||||
April 20, 2024 | 0.0627 | 0.0583 | 0.0627 | 0.0583 | ||||||||
May 31, 2024 | 0.0628 | 0.0583 | 0.0628 | 0.0583 | ||||||||
June 30, 2024 | 0.0627 | 0.0583 | 0.0627 | 0.0583 | ||||||||
Total | $0.9912 | $0.8336 | $0.4402 | $0.2921 | ||||||||
Amount | Percentage | |||||
Distributions | ||||||
Payable in cash | $6,891 | 82% | ||||
Reinvested in shares | 1,544 | 18% | ||||
Total distributions | $8,435 | 100% | ||||
Sources of Distributions | ||||||
Cash flows from operating activities | $8,435 | 100% | ||||
Offering proceeds | — | —% | ||||
Total Sources of distribution | $8,435 | 100% | ||||
Cash flows from operating activities | $9,125 | |||||
Funds from operations(1) | $5,523 | |||||
Adjusted funds from operations(1) | $7,223 | |||||
(1) | See “Funds from Operations, Adjusted Funds from Operations and Funds Available for Distribution” below for a description of Funds from Operations and Adjusted Funds from Operations. Refer to the below for reconciliations of these amounts to GAAP net loss attributable to SDREIT shareholders and for considerations on how to review these metrics. |
Three Months Ended June 30, 2024 | Three Months Ended June 30, 2023 | Six Months Ended June 30, 2024 | Period from January 4, 2023 through June 30, 2023 | |||||||||
Net income (loss) attributable to SDREIT shareholders | $(2,053) | $(1,109) | $(4,354) | $(3,261) | ||||||||
Adjustments to arrive at FFO: | — | — | — | — | ||||||||
Depreciation and amortization | 6,344 | 4,088 | 12,906 | 7,974 | ||||||||
Gain (loss) on the sale of real estate | (34) | — | (34) | — | ||||||||
Impairment on investments in real estate | 580 | 909 | 1,022 | 2,400 | ||||||||
Amount attributable to non-controlling interests in the consolidated subsidiary for above adjustments | (1,614) | (1,913) | (2,326) | (3,972) | ||||||||
Unconsolidated entities depreciation and noncontrolling interests adjustments | 6 | — | 9 | — | ||||||||
Amount attributable to investment in unconsolidated affiliate | — | — | — | — | ||||||||
FFO attributable to SDREIT shareholders | $3,229 | $1,975 | $7,223 | $3,141 | ||||||||
Adjustments to arrive at AFFO: | 0 | 0 | 0 | 0 | ||||||||
Straight-line rental income and expense | (126) | (226) | (285) | (504) | ||||||||
Amortization of below-market lease intangibles | (1,034) | (1,077) | (2,300) | (2,068) | ||||||||
Amortization of discount on mortgage and other loans payable | 69 | 70 | 139 | 135 | ||||||||
Amortization of deferred financing fees - property level | 77 | 0 | 124 | 0 | ||||||||
Amortization of restricted stock awards | 4 | 173 | 91 | 193 | ||||||||
Organizational costs and transaction costs | 60 | 495 | 172 | 1,909 | ||||||||
Non-cash performance participation allocation | (285) | 0 | 0 | 0 | ||||||||
Unrealized (gain) loss from changes in the fair value of financial instruments | 61 | 0 | (138) | 0 | ||||||||
Amount attributable to unconsolidated entities for above adjustments | 3 | 0 | 3 | 0 | ||||||||
Amount attributable to non-controlling interests for above adjustments | 59 | 472 | 494 | 600 | ||||||||
AFFO attributable to SDREIT shareholders | $2,117 | $1,882 | $5,523 | $3,406 | ||||||||
Recurring tenant improvements and other capital expenditures | — | — | — | — | ||||||||
Management fee | 318 | 207 | 620 | 390 | ||||||||
Stockholder distribution fees paid | (90) | — | (171) | — | ||||||||
FAD attributable to SDREIT shareholders | $2,345 | $2,089 | $5,972 | $3,796 | ||||||||
Indebtedness | Weighted Average Interest Rate | Weighted Average Maturity Date(1) | Maximum Facility Size | Principal Balance Outstanding | ||||||||
Mortgages and other loans payable(2) | 4.76% | March 2031 | n/a | $232,390 | ||||||||
Revolving credit facility(3) | 8.85% | February 2024 | $50,000 | 12,093 | ||||||||
Financing obligations(4) | 23,200 | |||||||||||
Discount and deferred financing costs, net | (3,599) | |||||||||||
Total indebtedness | $264,084 | |||||||||||
(1) | For loans where the Company, at its sole discretion, has extension options, the maximum maturity date has been assumed. |
(2) | Mortgages and other loans payable bear varying fixed rates and maturities ranging from July 2024 through February 2039. There were no extension options for any of our loans. |
(3) | The revolving credit facility bears interest equal to Term SOFR plus 3.5% per annum. The weighted average interest rate for the revolving credit facility for the six months ended June 30, 2024, was 8.85%. The revolving credit facility provides a one-year extension option subject to an extension fee of 0.30% of the total loan commitment. The maturity date was extended to February 2025 as a result of the Company exercising its one-year extension option. |
(4) | This financing obligation is related to the sale and leaseback transaction of University Courtyard, which is accounted for as a failed and leaseback transaction because the lease is classified as a finance lease. Accordingly, the underlying land is still included in the investments in real estate in the condensed consolidated balance sheet as of June 30, 2024 and the proceeds from the sale are accounted for as a financing obligation. The rental payment under the lease will be allocated between interest expense and principal repayment of the financing obligation using the effective interest method and amortize over the 99-yeaar lease term. The total principal payments will not exceed the difference between the gross proceeds from the sale of the $23.2 million and the initial carrying value of the land of $4.1 million, resulting in maximum principal payments of $19.1 million. |
Six Months Ended June 30, 2024 | Period from January 4, 2023 through June 30, 2023 | Difference | |||||||
Cash flows provided by operating activities | $9,125 | $6,425 | $2,700 | ||||||
Cash flows used in investing activities | (3,674) | (134,240) | 130,566 | ||||||
Cash flows provided by financing activities | 6,600 | 15,686 | (9,086) | ||||||
Net change in cash and cash equivalents and restricted cash | $12,051 | $(112,129) | $124,180 | ||||||
Successor | Predecessor | 2023 vs. 2022 | |||||||
Period from January 4, 2023 through December 31, 2023 | Year Ended December31, 2022 | ||||||||
Cash flows provided by operating activities | $13,768 | $16,361 | $(2,593) | ||||||
Cash flows used in investing activities | (202,180) | (45,919) | (156,261) | ||||||
Cash flows provided by financing activities | 61,228 | 29,255 | 31,973 | ||||||
Net change in cash and cash equivalents and restricted cash | $(127,184) | $(303) | $(126,881) | ||||||
Total | Less than 1 year | 1-3 years | 3-5 years | More than 5 years | |||||||||||
Indebtedness (1) | $263,626 | $2,204 | $25,611 | $30,453 | $205,358 | ||||||||||
Organization and offering costs(2) | 3,328 | 408 | 1,374 | 1,374 | 172 | ||||||||||
Total | $266,954 | $2,612 | $26,985 | $31,827 | $205,530 | ||||||||||
(1) | Loan maturities are based on the contractual maturity dates. |
(2) | Includes $3.3 million of amounts owed to our Adviser as of June 30, 2024. |
PROPERTIES. |
State | Number of Homes Owned | ||
Minnesota | 281 | ||
Texas | 204 | ||
Ohio | 128 | ||
Arizona | 79 | ||
Pennsylvania | 59 | ||
Wisconsin | 40 | ||
Indiana | 38 | ||
Michigan | 32 | ||
Florida | 19 | ||
New Jersey | 19 | ||
Lessee | Annualized Rent $000s | Percentage of CapGrow Rental Income | ||||
Sevita(1) | $18,237 | 49.4% | ||||
Caregiver | $3,852 | 10.4% | ||||
Dungarvin | $1,995 | 5.4% | ||||
Lighthouse | $1,878 | 5.1% | ||||
(1) | Approximately 44 subsidiaries of Sevita have leased 511 of CapGrow’s properties. Sevita has entered into separate guarantees for each applicable lease with respect to 421 properties. For more information regarding Sevita, see Item 2, “Financial Information – Investment Portfolio.” |
Year | Number of Homes Acquired | Acquisition Volume $000s | ||||
2019 | 107 | $33,726 | ||||
2020 | 380 | $107,309 | ||||
2021 | 110 | $43,430 | ||||
2022 | 141 | $53,085 | ||||
2023 | 36 | $19,557 | ||||
SECURITY OWNERSHIP OF CERTAIN BENEFICIAL OWNERS AND MANAGEMENT. |
Name of Beneficial Owner | Number of Shares Beneficially Owned(1) | Percent of All Shares | ||||
Directors and Officers | ||||||
Steven Orbuch | — | — | ||||
Nicholas Hecker | — | — | ||||
Herbert A. Pollard | — | — | ||||
Scott Ciccone | — | — | ||||
Cory Perlstein | — | — | ||||
Julie Siegel | — | — | ||||
David Zeiden | — | — | ||||
Andrew Cohen | — | — | ||||
Mark Schwartz | — | — | ||||
Anshu Kalhan | — | — | ||||
John Jenks(2) | 20,186 | —%* | ||||
Jonathan G. Geanakos(2) | 16,181 | —%* | ||||
Kristi Jackson(2) | 23,876 | —%* | ||||
Robert Winston(2) | 32,376 | —%* | ||||
All directors and executive officers as a group | 92,619 | —%* | ||||
5% Stockholders | ||||||
Founding Investor(3) | 15,000,000 | 60% | ||||
* | Represents less than 1% |
(1) | Except for Founding Investor who owns Class F shares, all shares listed in the table above are Class E shares. |
(2) | Shares owned includes a grant of restricted stock in June 2024 that is subject to vesting and settlement provisions as detailed within the Company's independent director compensation plan. |
(3) | Founding Investor’s address is Office of the Oregon Treasurer, 16290 SW Upper Boones Ferry Road Tigard, OR 97224. |
DIRECTORS AND EXECUTIVE OFFICERS. |
Name | Age* | Position | ||||
Steven Orbuch | 58 | Chairman of the Board and Chief Executive Officer | ||||
Nicholas Hecker | 48 | President and Director | ||||
Herbert A. Pollard | 46 | Chief Financial Officer, Treasurer and Director | ||||
Scott Ciccone | 65 | Chief Accounting Officer | ||||
Cory Perlstein | 45 | Chief Investment Officer | ||||
Julie Siegel | 57 | Chief Legal Officer and Secretary | ||||
Colleen Kilfoyle | 44 | Chief Compliance Officer | ||||
Andrew Cohen | 58 | Chief Operating Officer | ||||
Mark Schwartz | 40 | Head of Acquisitions | ||||
Anshu Kalhan | 43 | Head of Asset Management | ||||
John Jenks | 65 | Independent Director | ||||
Robert Winston | 63 | Independent Director | ||||
Jonathan G. Geanakos | 62 | Independent Director | ||||
Kristi Jackson | 56 | Independent Director | ||||
* | As of November 1, 2024. |
• | our accounting and financial reporting processes, |
• | the integrity and audits of our financial statements, |
• | our compliance with legal and regulatory requirements, |
• | the qualifications and independence of our independent auditors and |
• | the performance of our internal and independent auditors. |
• | assists our board of directors in identifying individuals qualified to become members of our board of directors; |
• | recommends candidates to our board of directors to fill vacancies on the board; |
• | recommends committee assignments for directors to the full board; |
• | periodically assesses the performance of our board of directors; |
• | reviews the compensation and benefits paid by us to our independent directors; and |
• | reviews and recommends appropriate corporate governance policies and procedures to our board of directors. |
EXECUTIVE COMPENSATION. |
Name | Fees Earned or Paid in Cash ($) | Stock Awards ($)(1) | Total ($) | ||||||
Steven Orbuch | — | — | — | ||||||
Nicholas Hecker | — | — | — | ||||||
Herbert A. Pollard | — | — | — | ||||||
John Jenks | 75,394 | 125,000 | 200,394 | ||||||
Jonathan G. Geanakos | 70,959 | 125,000 | 195,959 | ||||||
Kristi Jackson | 35,479 | 169,384 | 204,863 | ||||||
Robert Winston | — | 208,219 | 208,219 | ||||||
(1) | Includes the total value in restricted stock granted to each of our independent directors and cash compensation paid in the form of restricted shares of our common stock during the year ended December 31, 2023, excluding any shares earned under the distribution reinvestment plan. The grants of Class F restricted shares were made in March 2023 and April 2023 and vest in February 2024 and March 2024, respectively. The grants were valued based on a NAV per share of our Class F shares at the date of the grant. In April 2024, our Board of Directors unanimously approved the issuance of Class E shares to our independent directors in exchange for Class F shares previously issued to them. |
CERTAIN RELATIONSHIPS AND RELATED TRANSACTIONS, AND DIRECTOR INDEPENDENCE. |
• | serving as an advisor to us and the Operating Partnership with respect to the establishment and periodic review of our investment guidelines and our and the Operating Partnership’s investments, financing activities and operations; |
• | sourcing, evaluating and monitoring our and Operating Partnership’s investment opportunities and executing the acquisition, management, financing and disposition of our and Operating Partnership’s assets, in accordance with our investment guidelines, policies and objectives and limitations, subject to oversight by our board of directors; |
• | with respect to prospective acquisitions, purchases, sales, exchanges or other dispositions of investments, conducting negotiations on our and Operating Partnership’s behalf with sellers, purchasers, and other counterparties and, if applicable, their respective agents, advisors and representatives, and determining the structure and terms of such transactions; |
• | providing us with portfolio management and other related services; |
• | serving as our advisor with respect to decisions regarding any of our financings, hedging activities or borrowings; and |
• | engaging and supervising, on our and Operating Partnership’s behalf and at our and the Operating Partnership’s expense, various service providers. |
• | by the Adviser immediately upon a “change of control” of us or our Operating Partnership; |
• | by the Adviser immediately upon a material breach of the Advisory Agreement by us or the Operating Partnership; |
• | immediately by us for “cause” or upon the bankruptcy of our Adviser; |
• | upon 60 days’ written notice by us without cause or penalty upon the vote of a majority of our independent directors; or |
• | upon 60 days’ written notice by our Adviser. |
• | the amount of fees paid to our Adviser in relation to the size, composition and performance of our investments; |
• | the success of our Adviser in generating investments that meet our investment objectives; |
• | rates charged to other externally advised REITs and other similar investment entities by advisors performing similar services; |
• | additional revenues realized by our Adviser and its affiliates through their advisory relationship with us (including the performance participation allocation paid to the Special Limited Partner); |
• | the quality and extent of the services and advice furnished by our Adviser; |
• | the performance of the assets, including income, conservation or appreciation of capital, frequency of problem investments and competence in dealing with distress situations; and |
• | the quality of our portfolio in relationship to the investments generated by our Adviser for its own account. |
• | the continuation, renewal or enforcement of our agreements with our Adviser and its affiliates, including the Advisory Agreement; |
• | equity offerings by us, including using our securities to acquire portfolios or other companies, which would entitle our Adviser to additional asset management fees, which are based on our aggregate NAV irrespective of stockholder returns; |
• | the recommendation of higher-yielding but riskier investments, which may be encouraged by the Special Limited Partner’s performance participation interest in our Operating Partnership, which is based on our total distributions plus the change in NAV per share; |
• | recommendations to our board of directors with respect to developing, overseeing, implementing, coordinating and determining our NAV and our NAV procedures, the provision of forward-looking property-level information to the independent valuation advisor or the decision to adjust the value of certain of our assets or liabilities in connection with the determination of our NAV, especially given that the advisory fees we pay our Adviser and the Special Limited Partner’s performance participation allocation are based on our NAV; |
• | share repurchases, which have the effect of reducing asset management fees payable to our Adviser; |
• | asset sales, which have the effect of reducing asset management fees if the proceeds are distributed to our stockholders rather than reinvested; and |
• | whether we engage affiliates of our Adviser for other services, which affiliates may receive fees in connection with the services regardless of the quality of the services provided to us. |
• | the allocation of investment opportunities among programs and accounts managed by our Adviser and its affiliates (see “—Allocation of Investment Opportunities” below); |
• | the allocation of personnel and time among programs and accounts managed or sponsored by our Adviser and its affiliates; |
• | the acquisition of assets from, or the sale of assets to, other Sculptor-managed programs and accounts; and |
• | competition from other Sculptor-managed programs or accounts when leasing a property or selling an asset or hiring service providers. |
• | the amount of the fees and any other compensation, including stock-based compensation, paid to our Adviser and its affiliates in relation to the size, composition and performance of our investments; |
• | whether the total fees and expenses incurred by us are reasonable in light of our investment performance, net assets, net income and the fees and expenses of other comparable unaffiliated REITs; |
• | the success of our Adviser in generating appropriate investment opportunities for us; |
• | the rates charged to other companies, including other REITs, by advisors performing similar services; |
• | additional revenues realized by our Adviser and its affiliates through their relationship with us, including whether we pay them or they are paid by others with whom we do business; |
• | the quality and extent of service and advice furnished by our Adviser and its affiliates; |
• | the performance of our investment portfolio; and |
• | the quality of our portfolio relative to the investments generated by our Adviser and its affiliates for their own account. |
• | the ratio of the costs of raising capital during the year to the capital raised; |
• | the aggregate amount of advisory fees and the aggregate amount of other fees paid to our Adviser and any affiliates of our Adviser by us or third parties doing business with us during the year; |
• | our Total Operating Expenses for the year stated as a percentage of our average invested assets and as a percentage of our net income; |
• | a report from our independent directors that our policies are in the best interests of our common stockholders and the basis for such determination; and |
• | a separately stated, full disclosure of all material terms, factors and circumstances surrounding any and all transactions involving us and our Adviser, a director or any affiliate thereof during the year, which disclosure has been examined and commented upon in the report by our independent directors with regard to the fairness of such transactions. |
LEGAL PROCEEDINGS. |
MARKET PRICE OF AND DIVIDENDS ON THE REGISTRANT’S COMMON EQUITY AND RELATED STOCKHOLDER MATTERS. |
• | a stockholder would be able to realize the NAV per share for the class of shares a stockholder owns if the stockholder attempts to sell its shares; |
• | a stockholder would ultimately realize distributions per share equal to the NAV per share for the class of shares it owns upon liquidation of our assets and settlement of our liabilities or a sale of our company; |
• | shares of our common stock would trade at their NAV per share on a national securities exchange; |
• | a third party would offer the NAV per share for each class of shares in an arm’s-length transaction to purchase all or substantially all of our shares; or |
• | the NAV per share would equate to a market price of an open-ended real estate fund. |
RECENT SALES OF UNREGISTERED SECURITIES. |
DESCRIPTION OF REGISTRANT’S SECURITIES TO BE REGISTERED. |
• | 9.9% of Founding Investor’s shares are not subject to the neutral voting requirement. |
• | There are no restrictions on Founding Investor’s ability to vote its shares on any proposal to amend the Company’s organizational documents if such amendment would adversely affect Founding Investor’s economic, governance, information or liquidity rights as a holder of Class F shares relative to the rights of holders of another class of shares. |
• | There are no restrictions on Founding Investor’s ability to vote its shares on a dissolution of the Company pursuant to Section 11.10 of the Company’s charter, which provides for a possible stockholder vote with respect to dissolution if the Company has not raised $450 million in gross proceeds from the sale of capital stock before December 31, 2024. |
• | Founding Investor will be free to vote all of its shares without restriction if: |
○ | the Company has not raised another $150 million (in addition to the $150 million raised from Founding Investor) in gross proceeds from the sale of capital stock by March 22, 2025 or |
○ | Founding Investor’s shares constitute 9.9% or less of the Company’s outstanding common stock. |
Maximum Upfront Selling Commissions as a % of Transaction Price | |||
Class A shares | up to 2.0% | ||
Class AA shares | up to 2.0% | ||
Class D shares | up to 1.5% | ||
Class F shares | up to 2.0% | ||
Class FF shares | up to 2.0% | ||
Class I shares | None | ||
Class S shares | up to 3.5% | ||
Annual Distribution Fee as a % of NAV | |||
Class A shares | None | ||
Class AA shares | 0.50% | ||
Class D shares | 0.25% | ||
Class F shares | None | ||
Class FF shares | 0.50% | ||
Class I shares | None | ||
Class S shares | 0.85% | ||
• | a transaction involving our securities that have been for at least 12 months listed on a national securities exchange; or |
• | a transaction involving our conversion to a corporate, trust, or association form if, as a consequence of the transaction, there will be no significant adverse change in any of the following: stockholder voting rights; the term of our existence; compensation to our Adviser; or our investment objectives. |
• | accepting the securities of a Roll-up Entity offered in the proposed Roll-up Transaction; or |
• | one of the following: |
○ | remaining as holders of our stock and preserving their interests therein on the same terms and conditions as existed previously; or |
○ | receiving cash in an amount equal to the stockholder’s pro rata share of the appraised value of our net assets. |
• | that would result in the common stockholders having democracy rights in a Roll-up Entity that are less than those provided in our charter and corporate governance guidelines; |
• | that includes provisions that would operate to materially impede or frustrate the accumulation of shares of stock by any purchaser of the securities of the Roll-up Entity, except to the minimum extent necessary to preserve the tax status of the Roll-up Entity, or which would limit the ability of an investor to exercise the voting rights of its securities of the Roll-up Entity on the basis of the number of shares of stock held by that investor; |
• | in which investors’ rights to access of records of the Roll-up Entity will be less than those provided in our charter and the corporate governance guidelines; or |
• | in which any of the costs of the Roll-up Transaction would be borne by us if the Roll-up Transaction is rejected by our common stockholders. |
• | Certain broker-dealers require that their clients process repurchases through their broker-dealer, which may impact the time necessary to process such repurchase request, impose more restrictive deadlines than described under our share repurchase plan, impact the timing of a stockholder receiving repurchase proceeds and require different paperwork or process than described in our share repurchase plan. Stockholders should contact their broker-dealer first if they want to request the repurchase of their shares. |
• | Under our share repurchase plan, to the extent we choose to repurchase shares in any particular month we will only repurchase shares as of the opening of the last calendar day of that month (a “Repurchase Date”). To have their shares repurchased, a stockholder’s repurchase request and required documentation must be received in good order by 4:00 p.m. (Eastern time) on the second to last business day of the applicable month. Settlements of share repurchases will generally be made within three business days of the Repurchase Date. Repurchase requests received and processed by our transfer agent will be effected at a repurchase price equal to the transaction price on the applicable Repurchase Date (which will generally be equal to our prior month’s NAV per share), subject to any Early Repurchase Deduction. |
• | A stockholder may withdraw his or her repurchase request by notifying the transfer agent, directly or through the stockholder’s financial intermediary, on our toll-free, automated telephone line, 844-700-1420. The line is open on each business day between the hours of 9:00 a.m. and 6:00 p.m. (Eastern time). Repurchase requests must be cancelled before 4:00 p.m. (Eastern time) on the last business day of the applicable month. |
• | If a repurchase request is received after 4:00 p.m. (Eastern time) on the second to last business day of the applicable month, the repurchase request will be executed, if at all, on the next month’s Repurchase Date at the transaction price applicable to that month (subject to any Early Repurchase Deduction), unless such request is withdrawn prior to the repurchase. Repurchase requests received and processed by our transfer agent on a business day, but after the close of business on that day or on a day that is not a business day, will be deemed received on the next business day. All questions as to the form and validity (including time of receipt) of repurchase requests and notices of withdrawal will be determined by us, in our sole discretion, and such determination shall be final and binding. |
• | Repurchase requests may be made by mail or by contacting your financial intermediary, both subject to certain conditions described herein. If making a repurchase request by contacting their financial intermediary, a stockholder may be required by their financial intermediary to provide certain documentation or information. If making a repurchase request by mail to the transfer agent, a stockholder must complete and sign a repurchase authorization form, which can be found in our share repurchase plan, which is available through financial representatives. Written requests should be sent to the transfer agent at the following address: |
• | For processed repurchases, stockholders may request that repurchase proceeds are to be paid by mailed check provided that the check is mailed to an address on file with the transfer agent for at least 30 days. Stockholders should check with their broker-dealer that such payment may be made via check or wire transfer, as further described below. |
• | Stockholders may also receive repurchase proceeds via wire transfer, provided that wiring instructions for their brokerage account or designated U.S. bank account are provided. For all repurchases paid via wire transfer, the funds will be wired to the account on file with the transfer agent or, upon instruction, to another financial institution provided that the stockholder has made the necessary funds transfer arrangements. The customer service representative can provide detailed instructions on establishing funding arrangements and designating a bank or brokerage account on file. Funds will be wired only to U.S. financial institutions (ACH network members). |
• | A medallion signature guarantee will be required in certain circumstances. The medallion signature process protects stockholders by verifying the authenticity of a signature and limiting unauthorized fraudulent transactions. A medallion signature guarantee may be obtained from a domestic bank or trust company, broker-dealer, clearing agency, savings association or other financial institution which participates in a medallion program recognized by the Securities Transfer Association. The three recognized medallion programs are the Securities Transfer Agents Medallion Program, the Stock Exchanges Medallion Program and the New York Stock Exchange, Inc. Medallion Signature Program. Signature guarantees from financial institutions that are not participating in any of these medallion programs will not be accepted. A notary public cannot provide signature guarantees. We reserve the right to amend, waive or discontinue this policy at any time and establish other criteria for verifying the authenticity of any repurchase or transaction request. We may require a medallion signature guarantee if, among other reasons: (1) the amount of the repurchase request is over $500,000; (2) a stockholder wishes to have repurchase proceeds transferred by wire to an account other than the designated bank or brokerage account on file for at least 30 days or sent to an address other than your address of record for the past 30 days; or (3) our transfer agent cannot confirm a stockholder’s identity or suspects fraudulent activity. |
• | If a stockholder has made multiple purchases of shares of our common stock, any repurchase request will be processed on a first in/first out basis unless otherwise requested in the repurchase request. |
• | repurchases resulting from death, qualifying disability or divorce; |
• | in the event that a stockholder’s shares are repurchased because the stockholder has failed to maintain the $500 minimum account balance; or |
• | due to trade or operational error. |
• | if they are requesting that some but not all of their shares be repurchased, keep their balance above $500 to avoid minimum account repurchase, if applicable; |
• | they will not receive interest on amounts represented by uncashed repurchase checks; |
• | under applicable anti-money laundering regulations and other federal regulations, repurchase requests may be suspended, restricted or canceled and the proceeds may be withheld; and |
• | all shares of our common stock requested to be repurchased must be beneficially owned by the stockholder of record making the request or his or her estate, heir or beneficiary, or the party requesting the repurchase must be authorized to do so by the stockholder of record of the shares or his or her estate, heir or beneficiary, and such shares of common stock must be fully transferable and not subject to any liens or encumbrances. In certain cases, we may ask the requesting party to provide evidence satisfactory to us that the shares requested for repurchase are not subject to any liens or encumbrances. If we determine that a lien exists against the shares, we will not be obligated to repurchase any shares subject to the lien. |
• | any stockholder who requests that we repurchase its shares of our common stock within 30 calendar days of the purchase of such shares; |
• | transactions deemed harmful or excessive by us (including, but not limited to, patterns of purchases and repurchases), in our sole discretion; and |
• | transactions initiated by financial advisors, among multiple stockholder accounts, that in the aggregate are deemed harmful or excessive. |
• | purchases and requests for repurchase of our shares in the amount of $2,500 or less; |
• | purchases or repurchases initiated by us; and |
• | transactions subject to the trading policy of an intermediary that we deem materially similar to our policy. |
• | any person who beneficially owns, directly or indirectly, 10.0% or more of the voting power of the corporation’s outstanding voting stock; or |
• | an affiliate or associate of the corporation who, at any time within the two-year period prior to the date in question, was the beneficial owner, directly or indirectly, of 10.0% or more of the voting power of the then outstanding stock of the corporation. |
• | 80.0% of the votes entitled to be cast by holders of outstanding shares of voting stock of the corporation; and |
• | two-thirds of the votes entitled to be cast by holders of voting stock of the corporation other than shares of stock held by the interested stockholder with whom or with whose affiliate the business combination is to be effected or held by an affiliate or associate of the interested stockholder. |
• | one-tenth or more but less than one-third; |
• | one-third or more but less than a majority; or |
• | a majority or more of all voting power. |
• | a classified board of directors; |
• | a two-thirds vote requirement for removing a director; |
• | a requirement that the number of directors be fixed only by vote of the directors; |
• | a requirement that a vacancy on the board of directors be filled only by the remaining directors and for the remainder of the full term of the class of directors in which the vacancy occurred; and |
• | a majority requirement for the calling of a stockholder-requested special meeting of stockholders. |
• | First, if the Total Return for the applicable period exceeds the sum of (i) the Hurdle Amount for that period and (ii) the Loss Carryforward Amount (any such excess, “Excess Profits”), 100% of such Excess Profits until the total amount allocated to the Special Limited Partner equals 12.5% of the sum of (x) the Hurdle Amount for that period and (y) any amount allocated to the Special Limited Partner pursuant to this clause (this is commonly referred to as a “Catch-Up”); and |
• | Second, to the extent there are remaining Excess Profits, 12.5% of such remaining Excess Profits. |
(i) | all distributions accrued or paid (without duplication) on the Class D, I and S units outstanding at the end of such period since the beginning of the then-current calendar year plus |
(ii) | the change in aggregate NAV of such units since the beginning of the year, before giving effect to (x) changes resulting solely from the proceeds of issuances of such units, (y) the Performance Allocation (and any accrual thereof) and (z) any applicable distribution fees. |
• | First, if the Class A Total Return for the applicable period exceeds the sum of (i) the Class A Hurdle Amount for that period and (ii) the Class A Loss Carryforward Amount (any such excess, “Class A Excess Profits”), 50% of such Class A Excess Profits until the total amount allocated to the Special Limited Partner equals 10.0% of the sum of (x) the Class A Hurdle Amount for that period and (y) any amount allocated to the Special Limited Partner pursuant to this clause (this is commonly referred to as a “Catch-Up”); and |
• | Second, to the extent there are remaining Class A Excess Profits, 10.0% of such remaining Class A Excess Profits. |
(i) | all distributions accrued or paid (without duplication) on all Class A and Class AA units outstanding at the end of such period since the beginning of the then-current calendar year plus |
(ii) | the change in aggregate NAV of such units since the beginning of the year, before giving effect to (x) changes resulting solely from the proceeds of issuances of such units, (y) the Class A Performance Allocation (and any accrual thereof) and (z) any applicable distribution fee expenses. |
• | First, if the Class F Total Return for the applicable period exceeds the sum of (i) the Class F Hurdle Amount for that period and (ii) the Class F Loss Carryforward Amount (any such excess, “Class F Excess Profits”), 50% of such Class F Excess Profits until the total amount allocated to the Special Limited Partner equals 6.25% of the sum of (x) the Class F Hurdle Amount for that period and (y) any amount allocated to the Special Limited Partner pursuant to this clause (this is commonly referred to as a “Catch-Up”); and |
• | Second, to the extent there are remaining Class F Excess Profits, 6.25% of such remaining Class F Excess Profits. |
(i) | all distributions accrued or paid (without duplication) on the Class F and Class FF units outstanding at the end of such period since the beginning of the then-current calendar year plus |
(ii) | the change in aggregate NAV of such Class F and Class FF units since the beginning of the year, before giving effect to (x) changes resulting solely from the proceeds of issuances of Class F and Class FF units and (y) any allocation/accrual to the Class F performance participation interest. |
INDEMNIFICATION OF DIRECTORS AND OFFICERS. |
• | an act or omission of the director or officer was material to the cause of action adjudicated in the proceeding, and was committed in bad faith or was the result of active and deliberate dishonesty; |
• | the director or officer actually received an improper personal benefit in money, property or services; or |
• | with respect to any criminal proceeding, the director or officer had reasonable cause to believe his or her act or omission was unlawful. |
FINANCIAL STATEMENTS AND SUPPLEMENTARY DATA. |
CHANGES IN AND DISAGREEMENTS WITH ACCOUNTANTS ON ACCOUNTING AND FINANCIAL DISCLOSURES. |
FINANCIAL STATEMENTS AND EXHIBITS. |
Exhibits No. | Description | ||
Second Articles of Amendment and Restatement of Sculptor Diversified Real Estate Income Trust, Inc. (the “Registrant”), effective as of March 3, 2023 (filed as Exhibit 3.1 to the Company’s Registration Statement on Form 10-12G (File No. 000-56566) filed on July 5, 2023 and incorporated herein by reference) | |||
Second Amended and Restated Bylaws of the Registrant, dated of as March 7, 2023 (filed as Exhibit 3.2 to the Company’s Registration Statement on Form 10-12G (File No. 000-56566) filed on July 5, 2023 and incorporated herein by reference) | |||
Amended and Restated Distribution Reinvestment Plan (filed as Exhibit 4.1 to the Company’s Current Report on Form 8-K filed on November 5, 2024 and incorporated herein by reference) | |||
Share Repurchase Plan (filed as Exhibit 4.2 to the Company’s Registration Statement on Form 10-12G filed on July 5, 2023 and incorporated herein by reference) | |||
Second Amended and Restated Advisory Agreement among the Registrant, Sculptor Diversified REIT Operating Partnership LP, and Sculptor Advisors LLC, dated as of June 21, 2023 (filed as Exhibit 10.1 to the Company’s Registration Statement on Form 10-12G (File No. 000-56566) filed on July 5, 2023 and incorporated herein by reference) | |||
Amended and Restated Limited Partnership Agreement of Sculptor Diversified REIT Operating Partnership LP, dated as of February 9, 2023 (filed as Exhibit 10.2 to the Company’s Registration Statement on Form 10-12G (File No. 000-56566) filed on July 5, 2023 and incorporated herein by reference) | |||
Trademark License Agreement between the Registrant and Sculptor Capital LP, dated as of February 10, 2023 (filed as Exhibit 10.3 to the Company’s Registration Statement on Form 10-12G (File No. 000-56566) filed on July 5, 2023 and incorporated herein by reference) | |||
Form of Indemnification Agreement (filed as Exhibit 10.4 to the Company’s Registration Statement on Form 10-12G (File No. 000-56566) filed on July 5, 2023 and incorporated herein by reference) | |||
Second Amended and Restated Independent Director Compensation Plan, dated as of August 9, 2023 (filed as Exhibit 10.5 to the Company’s Registration Statement on Form 10-12G/A (File No. 000-56566) filed on August 15, 2023 and incorporated herein by reference) | |||
Form of Grant Notice and Restricted Stock Award Agreement (filed as Exhibit 10.6 to the Company’s Registration Statement on Form 10-12G (File No. 000-56566) filed on July 5, 2023 and incorporated herein by reference) | |||
Voting Agreement between the Registrant and Founding Investor, dated as of December 22, 2022 (filed as Exhibit 10.7 to the Company’s Registration Statement on Form 10-12G (File No. 000-56566) filed on July 5, 2023 and incorporated herein by reference) | |||
CapGrow Holdings JV LLC Second Amended and Restated Limited Liability Company Agreement, dated as of January 4, 2023 (filed as Exhibit 10.8 to the Company’s Registration Statement on Form 10-12G (File No. 000-56566) filed on July 5, 2023 and incorporated herein by reference) | |||
CapGrow Holdings Member LLC Amended and Restated Limited Liability Company Agreement, dated as of January 4, 2023 (filed as Exhibit 10.9 to the Company’s Registration Statement on Form 10-12G (File No. 000-56566) filed on July 5, 2023 and incorporated herein by reference) | |||
Membership Interest Purchase Agreement between Sculptor RE Holdings XVII LLC and Sculptor Diversified REIT Operating Partnership LP, dated as of January 4, 2023 (filed as Exhibit 10.10 to the Company’s Registration Statement on Form 10-12G (File No. 000-56566) filed on July 5, 2023 and incorporated herein by reference) | |||
Membership Interest Purchase Agreement between Sculptor RE Holdings XVII LLC and Sculptor Diversified REIT Operating Partnership LP, dated as of July 5, 2023 (filed as Exhibit 10.11 to the Company’s Registration Statement on Form 10-12G/A (File No. 000-56566) filed on August 15, 2023 and incorporated herein by reference) | |||
Exhibits No. | Description | ||
Membership Interest Purchase Agreement between Sculptor RE Holdings XVII LLC and Sculptor Diversified REIT Operating Partnership LP, dated as of October 2, 2023 (filed as Exhibit 10.12 to the Company’s Annual Report on Form 10-K filed on April 1, 2024 and incorporated herein by reference) | |||
Subsidiaries of the Registrant* | |||
Consolidated Financial Statements for National Mentor Holdings, Inc. as of and for the years ended September 30, 2023 and 2022 | |||
* | Filed herewith. |
Sculptor Diversified Real Estate Income Trust, Inc. (Successor) | |||
Unaudited Interim Condensed Financial Statements | |||
Audited Consolidated Financial Statements | |||
Schedules | |||
June 30, 2024 | December 31, 2023 | |||||
Assets | ||||||
Investments in real estate, net | $463,341 | $470,783 | ||||
Investment in an unconsolidated entity | 1,897 | — | ||||
Cash and cash equivalents | 26,374 | 16,696 | ||||
Restricted cash | 8,779 | 6,406 | ||||
Deferred rent and other receivables | 1,864 | 1,326 | ||||
Goodwill | 34,458 | 34,458 | ||||
Lease intangible assets, net | 38,668 | 44,783 | ||||
Other assets | 5,612 | 4,563 | ||||
Total assets | $580,993 | $579,015 | ||||
Liabilities and Equity | ||||||
Liabilities | ||||||
Mortgages and other loans payable, net | $228,463 | $230,386 | ||||
Revolving credit facility, net | 11,957 | 10,139 | ||||
Accounts payable and other liabilities | 11,551 | 7,798 | ||||
Financing obligation, net | 22,951 | 22,951 | ||||
Due to related parties | 4,364 | 5,586 | ||||
Lease intangible liabilities, net | 51,506 | 54,252 | ||||
Total liabilities | 330,792 | 331,112 | ||||
Commitment and contingencies | ||||||
Redeemable noncontrolling interest in the Operating Partnership | 1,602 | — | ||||
Equity | ||||||
Common stock, Class F shares, $0.01 par value per share, 300,000,000 shares authorized; 16,059,357 and 16,058,619 shares issued and outstanding, respectively | 161 | 161 | ||||
Common stock, Class FF shares, $0.01 par value per share, 300,000,000 shares authorized; 6,188,300 and 5,943,910 shares issued and outstanding, respectively | 62 | 58 | ||||
Common stock, Class E shares, $0.01 par value per share, 100,000,000 shares authorized; 196,207 and 69,325 shares issued and outstanding, respectively | 2 | 1 | ||||
Common stock, Class AA shares, $0.01 par value per share, 300,000,000 shares authorized, 1,076,927 and no shares issued and outstanding, respectively | 11 | — | ||||
Preferred stock, $0.01 par value per share, 100,000,000 shares authorized, no shares issued and outstanding | — | — | ||||
Additional paid-in capital | 236,062 | 221,253 | ||||
Accumulated deficit and cumulative distributions | (33,247) | (20,458) | ||||
Total stockholders’ and members’ equity | 203,051 | 201,015 | ||||
Non-controlling interests in the consolidated subsidiaries | 45,548 | 46,886 | ||||
Non-controlling interests in the Operating Partnership | — | 2 | ||||
Total equity | 248,599 | 247,903 | ||||
Total liabilities and equity | $580,993 | $579,015 | ||||
Three Months Ended June 30, | ||||||
2024 | 2023 | |||||
Revenues | ||||||
Rental revenue | $10,739 | $9,005 | ||||
Other revenue | 272 | 294 | ||||
Total revenues | 11,011 | 9,299 | ||||
Expenses | ||||||
Property operating expenses | 1,041 | 96 | ||||
Management fees | 318 | 207 | ||||
Performance participation allocation | (285) | 277 | ||||
General and administrative | 2,067 | 1,567 | ||||
Organization and transaction costs | 60 | 495 | ||||
Depreciation and amortization | 6,344 | 4,088 | ||||
Total expenses | 9,545 | 6,730 | ||||
Operating income | 1,466 | 2,569 | ||||
Other income (expense): | ||||||
Interest expense, net | (3,013) | (2,625) | ||||
Impairment of investments in real estate | (580) | (909) | ||||
Income (loss) from an unconsolidated entity | 18 | — | ||||
Unrealized gain (loss) on derivative instruments | (61) | — | ||||
Gain (loss) on sale of real estate | 34 | — | ||||
Total other income (expense) | (3,602) | (3,534) | ||||
Net income (loss) | (2,136) | (965) | ||||
Net income (loss) attributable to non-controlling interest in the consolidated subsidiaries | 67 | (144) | ||||
Net income (loss) attributable to redeemable non-controlling interest in the Operating Partnership | 16 | — | ||||
Net income (loss) attributable to SDREIT stockholders | (2,053) | (1,109) | ||||
Net income (loss) per common share - basic and diluted | (0.09) | (0.11) | ||||
Weighted-average common shares outstanding - basic and diluted | 23,225,630 | 15,736,037 | ||||
Successor | Predecessor | ||||||||
Six Months Ended June 30, 2024 | Period from January 4, 2023 through June 30, 2023 | Period from January 1, 2023 through January 3, 2023 | |||||||
Revenues | |||||||||
Rental revenue | $21,690 | $17,615 | $323 | ||||||
Other revenue | 556 | 558 | — | ||||||
Total revenues | 22,246 | 18,173 | 323 | ||||||
Expenses | |||||||||
Property operating expenses | 2,023 | 312 | 29 | ||||||
Management fees | 620 | 390 | — | ||||||
Performance participation allocation | — | 723 | — | ||||||
General and administrative | 4,078 | 2,801 | — | ||||||
Organization and transaction costs | 172 | 1,909 | — | ||||||
Depreciation and amortization | 12,906 | 7,974 | — | ||||||
Total expenses | 19,799 | 14,109 | 29 | ||||||
Operating income | 2,447 | 4,064 | 294 | ||||||
Other income (expense): | |||||||||
Interest expense, net | (6,051) | (5,242) | (114) | ||||||
Impairment of investments in real estate | (1,022) | (2,400) | — | ||||||
Income (loss) from an unconsolidated entity | 10 | — | — | ||||||
Unrealized gain (loss) on derivative instruments | 138 | — | — | ||||||
Gain (loss) on sale of real estate | 34 | — | — | ||||||
Total other income (expense) | (6,891) | (7,642) | (114) | ||||||
Net income (loss) | (4,444) | (3,578) | $180 | ||||||
Net income attributable to non-controlling interest in the consolidated subsidiaries | 61 | 317 | |||||||
Net loss attributable to redeemable non-controlling interest in the Operating Partnership | 29 | — | |||||||
Net loss attributable to SDREIT stockholders | $(4,354) | $(3,261) | |||||||
Net loss per common share - basic and diluted | $(0.19) | $(0.21) | |||||||
Weighted-average common shares outstanding - basic and diluted | 22,770,531 | 15,379,897 | |||||||
Three Months Ended June 30, 2024 | ||||||||||||||||||||||||||||||
Par Value | ||||||||||||||||||||||||||||||
Common Stock Class F | Common Stock Class FF | Common Stock Class E | Common Stock Class AA | Additional Paid-in Capital | Members’ Equity | Accumulated Deficit and Cumulative Distributions | Total Stockholders’ and Members’ Equity | Non- controlling interests in the consolidated subsidiaries | Total Equity | |||||||||||||||||||||
Successor: | ||||||||||||||||||||||||||||||
Balance at March 31, 2024 | $161 | $61 | $1 | $2 | $225,843 | $— | $(26,900) | $199,168 | $46,489 | $245,657 | ||||||||||||||||||||
Common stock issued | — | — | — | 9 | 9,555 | — | — | 9,564 | — | 9,564 | ||||||||||||||||||||
Distribution reinvestment | — | 1 | — | — | 807 | — | — | 808 | — | 808 | ||||||||||||||||||||
Exchange of common stock | (1) | — | 1 | — | — | — | — | — | — | — | ||||||||||||||||||||
Offering costs | — | — | — | — | (108) | — | — | (108) | — | (108) | ||||||||||||||||||||
Amortization of compensation awards | 1 | — | — | — | 3 | — | — | 4 | — | 4 | ||||||||||||||||||||
Distributions declared on common stock | — | — | — | — | — | — | (4,294) | (4,294) | — | (4,294) | ||||||||||||||||||||
Contributions from non-controlling interests | — | — | — | — | — | — | — | — | 174 | 174 | ||||||||||||||||||||
Distributions to non-controlling interests | — | — | — | — | — | — | — | — | (1,048) | (1,048) | ||||||||||||||||||||
Adjustment to carrying value of redeemable equity instruments | — | — | — | — | (38) | — | — | (38) | — | (38) | ||||||||||||||||||||
Net income (loss) | — | — | — | — | — | — | (2,053) | (2,053) | (67) | (2,120) | ||||||||||||||||||||
Balance at June 30, 2024 | $161 | $62 | $2 | $11 | $236,062 | $— | $(33,247) | $203,051 | $45,548 | $248,599 | ||||||||||||||||||||
Three Months Ended June 30, 2023 | ||||||||||||||||||||||||||||||
Par Value | ||||||||||||||||||||||||||||||
Common Stock Class F | Common Stock Class FF | Common Stock Class E | Common Stock Class AA | Additional Paid-in Capital | Members’ Equity | Accumulated Deficit and Cumulative Distributions | Total Stockholders’ and Members’ Equity | Non- controlling interests in the consolidated subsidiaries | Total Equity | |||||||||||||||||||||
Successor: | ||||||||||||||||||||||||||||||
Balance at March 31, 2023 | $150 | $— | $— | $— | $150,068 | $— | $(4,811) | $145,407 | $86,488 | $231,895 | ||||||||||||||||||||
Common stock issued | — | 17 | — | — | 17,393 | — | — | 17,410 | — | 17,410 | ||||||||||||||||||||
Distribution reinvestment | — | — | — | — | 5 | — | — | 5 | — | 5 | ||||||||||||||||||||
Amortization of compensation awards | — | — | — | — | 173 | — | — | 173 | — | 173 | ||||||||||||||||||||
Distributions declared on common stock | — | — | — | — | — | — | (2,860) | (2,860) | — | (2,860) | ||||||||||||||||||||
Contributions from non-controlling interests | — | — | — | — | — | — | — | — | — | |||||||||||||||||||||
Distributions to non-controlling interests | — | — | — | — | — | — | — | — | (1,787) | (1,787) | ||||||||||||||||||||
Net income (loss) | — | — | — | — | — | — | (1,109) | (1,109) | 144 | (965) | ||||||||||||||||||||
Balance at June 30, 2023 | $150 | $17 | $— | $— | $167,639 | $— | $(8,780) | $159,026 | $84,845 | $243,871 | ||||||||||||||||||||
Successor: | ||||||||||||||||||||||||||||||
Six Months Ended June 30, 2024 | ||||||||||||||||||||||||||||||
Par Value | ||||||||||||||||||||||||||||||
Common Stock Class F | Common Stock Class FF | Common Stock Class E | Common Stock Class AA | Additional Paid-in Capital | Members’ Equity | Accumulated Deficit and cumulative distributions | Total Stockholders’ and Members’ Equity | Non- controlling interests in the consolidated subsidiaries | Total Equity | |||||||||||||||||||||
Successor: | ||||||||||||||||||||||||||||||
Balance at December 31, 2023 | $161 | $59 | $1 | $— | $221,253 | $— | $(20,457) | $201,017 | $46,886 | $247,903 | ||||||||||||||||||||
Common stock issued | — | 1 | — | 11 | 13,463 | — | — | 13,475 | — | 13,475 | ||||||||||||||||||||
Distribution reinvestment | — | 2 | — | — | 1,516 | — | — | 1,518 | — | 1,518 | ||||||||||||||||||||
Exchange of common stock | (1) | — | 1 | — | — | — | — | — | — | — | ||||||||||||||||||||
Offering costs | — | — | — | — | (187) | — | — | (187) | — | (187) | ||||||||||||||||||||
Amortization of compensation awards | 1 | — | — | — | 90 | — | — | 91 | — | 91 | ||||||||||||||||||||
Distributions declared on common stock | — | — | — | — | — | — | (8,436) | (8,436) | — | (8,436) | ||||||||||||||||||||
Contributions from non-controlling interests | — | — | — | — | — | — | — | — | 686 | 686 | ||||||||||||||||||||
Distributions to non-controlling interests | — | — | — | — | — | — | — | — | (1,963) | (1,963) | ||||||||||||||||||||
Adjustment to carrying value of redeemable equity instruments | — | — | — | — | (73) | — | — | (73) | — | (73) | ||||||||||||||||||||
Net income (loss) | — | — | — | — | — | — | (4,354) | (4,354) | (61) | (4,415) | ||||||||||||||||||||
Balance at June 30, 2024 | $161 | $62 | $2 | $11 | $236,062 | $— | $(33,247) | $203,051 | $45,548 | $248,599 | ||||||||||||||||||||
Period from January 1, 2023 through January 3, 2023 (Predecessor) and Period from January 4, 2023 through June 30, 2023 (Successor) | ||||||||||||||||||||||||||||||
Par Value | ||||||||||||||||||||||||||||||
Common Stock Class F | Common Stock Class FF | Common Stock Class E | Common Stock Class AA | Additional Paid-in Capital | Members’ Equity | Accumulated Deficit and cumulative distributions | Total Stockholders’ and Members’ Equity | Non- controlling interests in the consolidated subsidiaries | Total Equity | |||||||||||||||||||||
Predecessor: | ||||||||||||||||||||||||||||||
Balance at December 31, 2022 | $— | $— | $— | $— | $— | $78,518 | $— | $78,518 | $— | $78,518 | ||||||||||||||||||||
Net income (loss) | — | — | — | — | — | 180 | — | 180 | — | 180 | ||||||||||||||||||||
Balance at January 3, 2023 | $— | $— | $— | $— | $— | $78,698 | $— | $78,698 | $— | $78,698 | ||||||||||||||||||||
Successor: | ||||||||||||||||||||||||||||||
Balance at January 4, 2023 | $— | $— | $— | $— | $— | $— | $— | $— | $— | $— | ||||||||||||||||||||
Rollover equity in Company parent | 150 | — | — | — | 150,048 | — | (1,773) | 148,425 | — | 148,425 | ||||||||||||||||||||
Common stock issued | — | 17 | — | — | 17,393 | — | — | 17,410 | — | 17,410 | ||||||||||||||||||||
Distribution reinvestment | — | — | — | — | 5 | — | — | 5 | — | 5 | ||||||||||||||||||||
Amortization of restricted stock grants | — | — | — | — | 193 | — | — | 193 | — | 193 | ||||||||||||||||||||
Distributions declared on common stock | — | — | — | — | — | — | (3,746) | (3,746) | — | (3,746) | ||||||||||||||||||||
Contributions from non-controlling interests | — | — | — | — | — | — | — | — | 88,864 | 88,864 | ||||||||||||||||||||
Distributions to non-controlling interests | — | — | — | — | — | — | — | — | (3,702) | (3,702) | ||||||||||||||||||||
Net income (loss) | — | — | — | — | — | — | (3,261) | (3,261) | (317) | (3,578) | ||||||||||||||||||||
Balance at June 30, 2023 | $150 | $17 | $— | $— | $167,639 | $— | $(8,780) | $159,026 | $84,845 | $243,871 | ||||||||||||||||||||
Successor | Predecessor | ||||||||
Six Months Ended June 30, 2024 | Period from January 4, 2023 through June 30, 2023 | Period from January 1, 2023 through January 3, 2023 | |||||||
Cash Flows from Operating Activities: | |||||||||
Net income (loss) | $(4,444) | $(3,578) | $180 | ||||||
Adjustments to reconcile net income (loss) to net cash provided by operating activities: | |||||||||
Depreciation and amortization | 12,906 | 7,974 | — | ||||||
Amortization of discounts and deferred financing costs | 263 | 135 | — | ||||||
Impairment of investments in real estate | 1,022 | 2,400 | — | ||||||
(Gain) loss on sale of real estate | (34) | — | — | ||||||
Straight-line rent adjustment | (285) | (504) | — | ||||||
Amortization of above- and below-market leases | (2,300) | (2,068) | — | ||||||
Amortization of share-based compensation | 91 | 193 | — | ||||||
Unrealized loss on interest rate cap | (138) | — | — | ||||||
Loss on an unconsolidated entity | (10) | — | — | ||||||
Other reconciling items | 45 | 2 | — | ||||||
Changes in operating assets and liabilities: | |||||||||
Deferred rent and other receivables | (297) | 1,575 | 559 | ||||||
Other assets | 426 | 49 | (2) | ||||||
Accounts payable and other liabilities | 1,464 | (924) | 287 | ||||||
Due to related parties | 416 | 1,171 | — | ||||||
Net cash provided by operating activities | 9,125 | 6,425 | 1,024 | ||||||
Cash Flows From Investing Activities: | |||||||||
Acquisition of a business | — | (132,775) | — | ||||||
Acquisition of real estate | (3,562) | (10,384) | — | ||||||
Additions to real estate | (1,388) | (126) | — | ||||||
Deposit on real estate acquisition, net of refunds | 48 | — | — | ||||||
Proceeds from sale of real estate | 3,115 | 9,045 | — | ||||||
Investment in an unconsolidated entity | (1,935) | — | — | ||||||
Distributions in excess of cumulative earnings from an unconsolidated entity | 48 | — | — | ||||||
Net cash used in investing activities | (3,674) | (134,240) | — | ||||||
Cash Flows from Financing Activities: | |||||||||
Repayments of mortgages and other loans payable | (2,070) | (7,165) | (140) | ||||||
Proceeds from revolving credit facility | 1,954 | 7,246 | — | ||||||
Payment of deferred financing costs | (252) | (65) | — | ||||||
Deferred offering costs | (249) | — | — | ||||||
Due to related parties | (72) | 1,064 | — | ||||||
Subscriptions received in advance | 2,575 | 2,580 | — | ||||||
Issuance of common stock | 12,873 | 17,410 | — | ||||||
Distribution to shareholders | (6,882) | (2,707) | — | ||||||
Contribution by noncontrolling interests in the consolidated subsidiaries | 686 | 1,025 | — | ||||||
Distribution to noncontrolling interests in the consolidated subsidiary | (1,963) | (3,702) | — | ||||||
Net cash provided by (used in) financing activities | 6,600 | 15,686 | (140) | ||||||
Successor | Predecessor | ||||||||
Six Months Ended June 30, 2024 | Period from January 4, 2023 through June 30, 2023 | Period from January 1, 2023 through January 3, 2023 | |||||||
Net change in cash and cash equivalents and restricted cash | 12,051 | (112,129) | 884 | ||||||
Cash and cash equivalents and restricted cash at beginning of period | 23,102 | 150,286 | 7,488 | ||||||
Cash and cash equivalents and restricted cash at end of period | $35,153 | $38,157 | $8,372 | ||||||
Reconciliation of Cash and Cash Equivalents and Restricted Cash: | |||||||||
Cash and cash equivalents | $26,374 | $30,503 | $3,049 | ||||||
Restricted cash | 8,779 | 7,654 | 5,323 | ||||||
Total cash and cash equivalents and restricted cash | $35,153 | $38,157 | $8,372 | ||||||
Supplemental Information: | |||||||||
Interest paid | $5,690 | $5,270 | $188 | ||||||
Supplemental Disclosure of Noncash Investing and Financing Activities: | |||||||||
Mortgage and other notes payable assumed at acquisition | $— | $190,832 | $— | ||||||
Revolving credit facility assumed at acquisition | $— | $30,284 | $— | ||||||
Dividends unpaid | $1,454 | $1,034 | $— | ||||||
Distribution reinvestment | $1,516 | $5 | $— | ||||||
Contribution by noncontrolling interests in a consolidated subsidiary | $— | $87,839 | $— | ||||||
Contributions by noncontrolling interests in the Operating Partnership | $1,566 | $— | $— | ||||||
Distributions to noncontrolling interests in the Operating Partnership | $10 | $— | $— | ||||||
Transfer to assets held for sale | $1,385 | $1,325 | $— | ||||||
Transfer of mortgages related to assets held for sale | $— | $1,092 | $— | ||||||
Management fee paid in shares | $605 | $— | $— | ||||||
Performance allocation paid in Operating Partnership units | $1,566 | $— | $— | ||||||
Accrued distribution fee | $61 | $— | $— | ||||||
Adjustment to carrying value of redeemable common stock | $73 | $— | $— | ||||||
• | for the six months ended June 30, 2024 (the “2024 Successor Interim Period”) |
• | for the period from January 4, 2023 through June 30, 2023 (the “2023 Successor Interim Period”) |
• | for the period from January 1, 2023 through January 3, 2023 (the “2023 Predecessor Interim Period”) |
June 30, 2024 | December 31, 2023 | |||||
Land and land improvements | $75,537 | $75,885 | ||||
Building and improvements | 405,927 | 406,090 | ||||
Furniture, fixtures and equipment | 1,206 | 1,197 | ||||
Total real estate properties, at cost | 482,670 | 483,172 | ||||
Less: accumulated depreciation | (19,329) | (12,389) | ||||
Investments in real estate, net | $463,341 | $470,783 | ||||
Consideration transferred: | |||
Cash | $141,147 | ||
Acquisition-related costs (included in organization and transaction costs) | 870 | ||
Assets acquired and liabilities assumed: | |||
Property level cash | 3,049 | ||
Restricted cash | 5,323 | ||
Receivables | 1,739 | ||
Other assets | 58 | ||
Investments in real estate | 424,999 | ||
Intangible assets | 46,904 | ||
Mortgages and notes payable | (190,832) | ||
Revolving credit facility | (30,284) | ||
Accounts payable and other liabilities | (4,656) | ||
Intangible liabilities | (61,772) | ||
Total identifiable net assets | 194,528 | ||
Fair value of noncontrolling interest in CapGrow | (87,839) | ||
Goodwill | 34,458 | ||
$141,147 | |||
Three Months Ended June 30, 2024 | Three Months Ended June 30, 2023 | |||||
Impairment loss - assets sold | $204 | $1,123 | ||||
Impairment loss - held for sale and vacant(1) | 376 | (214) | ||||
$580 | $909 | |||||
(1) | Amount is net of impairment loss reclassified to Impairment loss - assets sold during the three months ended June 30, 2023. |
Six Months Ended June 30, 2024 | Period from January 4, 2023 through June 30, 2023 | |||||
Impairment loss - assets sold | $398 | $1,644 | ||||
Impairment loss - held for sale and vacant | 624 | 756 | ||||
$1,022 | $2,400 | |||||
June 30, 2024 | |||||||||
Cost | Accumulated Amortization | Net | |||||||
Intangible assets, net: | |||||||||
Above-market lease intangibles | $3,153 | $(990) | $2,163 | ||||||
In-place lease intangibles | 13,627 | (6,388) | 7,239 | ||||||
Leasing commissions | 33,356 | (4,090) | 29,266 | ||||||
Total intangible assets | $50,136 | $(11,468) | $38,668 | ||||||
Intangible liabilities, net: | |||||||||
Below-market lease intangibles | $(58,370) | $6,864 | $(51,506) | ||||||
December 31, 2023 | |||||||||
Cost | Accumulated Amortization | Net | |||||||
Intangible assets, net: | |||||||||
Above-market lease intangibles | $3,153 | $(658) | $2,495 | ||||||
In-place lease intangibles | 13,701 | (2,310) | 11,391 | ||||||
Leasing commissions | 33,650 | (2,753) | 30,897 | ||||||
Total intangible assets | $50,504 | $(5,721) | $44,783 | ||||||
Intangible liabilities, net: | |||||||||
Below-market lease intangibles | $(58,900) | $4,648 | $(54,252) | ||||||
Above-market Lease Intangibles | In-place Lease Intangibles | Leasing Commissions | Below-market Lease Intangibles | |||||||||
2024 (6 months) | $325 | $470 | $1,372 | $(2,306) | ||||||||
2025 | 640 | 897 | 2,729 | (4,551) | ||||||||
2026 | 511 | 788 | 2,619 | (4,421) | ||||||||
2027 | 343 | 689 | 2,501 | (4,264) | ||||||||
2028 | 94 | 577 | 2,338 | (4,100) | ||||||||
Thereafter | 250 | 3,818 | 17,707 | (31,864) | ||||||||
$2,163 | $7,239 | $29,266 | $(51,506) | |||||||||
June 30, 2024 | December 31, 2023 | |||||
Derivative assets | $2,630 | $2,492 | ||||
Assets held for sale | 2,222 | 837 | ||||
Prepaid insurance | 82 | 390 | ||||
Right of use asset - operating lease | 269 | 302 | ||||
Deferred costs | 121 | 102 | ||||
Prepaid ground rent | 93 | 93 | ||||
Pre-acquisition costs | 68 | 116 | ||||
Other | 127 | 231 | ||||
Total | $5,612 | $4,563 | ||||
June 30, 2024 | December 31, 2023 | |||||
Tenant security deposits | $2,422 | $2,440 | ||||
Accounts payable and accrued expenses | 4,021 | 2,333 | ||||
Distribution payable | 1,454 | 1,408 | ||||
Liabilities related to assets held for sale | 713 | 713 | ||||
Deferred income | 93 | 355 | ||||
Lease liability - operating lease | 273 | 306 | ||||
Subscriptions received in advance | 2,575 | 125 | ||||
Due to seller | — | 118 | ||||
Total | $11,551 | $7,798 | ||||
June 30, 2024 | December 31, 2023 | Interest Rate | Initial Maturity Date | |||||||||
Mortgage note payable(1)(2) | $5,386 | $5,485 | 7.50% | October 2026 | ||||||||
Mortgage note payable(2) | 9,154 | 9,356 | 5.19% | June 2027 | ||||||||
Mortgage note payable(2) | 8,858 | 8,987 | 3.75% | April 2028 | ||||||||
Mortgage note payable(2) | 7,517 | 7,589 | 5.59% | April 2028 | ||||||||
Mortgage note payable(2) | 18,270 | 18,427 | 4.28% | November 2029 | ||||||||
Mortgage note payable(3) | 48,629 | 49,087 | 3.59% | September 2030 | ||||||||
Mortgage note payable(4) | 38,236 | 38,573 | 3.85% | January 2031 | ||||||||
Mortgage note payable(2) | 1,997 | 2,024 | 4.35% | February 2031 | ||||||||
Mortgage note payable(5) | 24,982 | 24,982 | 4.01% | January 2032 | ||||||||
Mortgage note payable(2) | 14,086 | 14,266 | 4.00% | March 2032 | ||||||||
Mortgage note payable(6) | 32,241 | 32,241 | 6.60% | September 2033 | ||||||||
Mortgage note payable(7) | 20,880 | 20,880 | 7.88% | November 2033 | ||||||||
Mortgage note payable(2) | 1,239 | 1,324 | 5.63% to 6.40% | February 2037 through 2039 | ||||||||
Notes payable(8) | 915 | 1,239 | 7.00% | various | ||||||||
Total | 232,390 | 234,460 | ||||||||||
Discounts and deferred financing costs, net | (3,214) | (3,361) | ||||||||||
Total mortgages and other loans payable, net | $229,176 | $231,099 | ||||||||||
(1) | Includes one mortgage loan related to assets held for sale amounting to $0.7 million at June 30, 2024 and December 31, 2023, which is included in accounts payable and other liabilities on the condensed consolidated balance sheets. On June 28, 2024, the Company entered into a modification and extension agreement which provides, among other items, the extension of the original maturity date from June 28, 2024 to October 31, 2026 and an increase in interest rate from 5% to 7.5%. |
(2) | These loans are subject to monthly principal and interest payments through maturity date. |
(3) | Interest only payment loan through September 2023, at which time, monthly principal and interest payments are due through maturity date. |
(4) | Interest only payment loan through January 2024, at which time, monthly principal and interest payments are due through maturity date. |
(5) | Interest only payment loan through January 2025, at which time, monthly principal and interest payments are due through maturity date. |
(6) | Interest only payment loan through September 2026, at which time, monthly principal and interest payments are due through maturity date. |
(7) | The acquisition of University Courtyard was funded partly by equity, a $20.8 million leasehold mortgage and $23.2 million of financing proceeds derived from a failed sale and leaseback transaction. This leasehold mortgage bears interest based on SOFR plus 2.56% per annum and is subject to interests only payment through November 2028, at which time, monthly principal and interest payments are due through maturity date. In connection with this leasehold mortgage, University Courtyard entered into a 5-year interest rate cap agreement which caps SOFR at 1% per annum. Refer to “Financing Obligation, net” below for additional information relating to the failed sale and leaseback transaction. Refer to Note 11, “Fair Value Measurement,” for additional information related to this interest rate cap. |
(8) | These loans, which are owed to private parties, bear interest rates at 7%. Monthly principal and interest payments are due through maturity date beginning May 2024 through July 2027. |
Year Ending | Mortgages and Other Loans Payable | Credit Facility | Financing Obligation | Total | ||||||||
December 31, 2024 (6 months) | $2,203 | $— | $— | $2,203 | ||||||||
December 31, 2025 | 4,222 | 12,093 | 2 | 16,317 | ||||||||
December 31, 2026 | 9,291 | — | 3 | 9,294 | ||||||||
December 31, 2027 | 11,984 | — | 5 | 11,989 | ||||||||
December 31, 2028 | 18,457 | — | 7 | 18,464 | ||||||||
Thereafter | 186,233 | — | 19,126 | 205,359 | ||||||||
$232,390 | $12,093 | $19,143 | $263,626 | |||||||||
Number of Shares | Par Value per Share | |||||
Class F Shares | 300,000,000 | $0.01 | ||||
Class FF Shares | 300,000,000 | $0.01 | ||||
Class S Shares | 300,000,000 | $0.01 | ||||
Class D Shares | 300,000,000 | $0.01 | ||||
Class I Shares | 300,000,000 | $0.01 | ||||
Class A Shares | 300,000,000 | $0.01 | ||||
Class AA Shares | 300,000,000 | $0.01 | ||||
Class E Shares | 100,000,000 | $0.01 | ||||
Total | 2,200,000,000 | |||||
Preferred Stock | 100,000,000 | $0.01 | ||||
2,300,000,000 | ||||||
Three Months Ended June 30, 2024 | |||||||||||||||
Class F | Class FF | Class E | Class AA | Total | |||||||||||
March 31, 2024 | 16,103,030 | 6,115,489 | 98,612 | 220,393 | 22,537,524 | ||||||||||
Common stock issued | — | 9,358 | 27,993 | 849,206 | 886,557 | ||||||||||
Distribution reinvestment | 2,162 | 63,453 | 2,657 | 7,328 | 75,600 | ||||||||||
Shares exchanged | (67,152) | — | 66,945 | — | (207) | ||||||||||
Restricted stock grant(1) | 21,317 | — | — | — | 21,317 | ||||||||||
June 30, 2024 | 16,059,357 | 6,188,300 | 196,207 | 1,076,927 | 23,520,791 | ||||||||||
Six Months Ended June 30, 2024 | |||||||||||||||
Class F | Class FF | Class E | Class AA | Total | |||||||||||
December 31, 2023 | 16,058,619 | 5,943,910 | 69,325 | — | 22,071,854 | ||||||||||
Common stock issued | — | 119,511 | 55,898 | 1,069,472 | 1,244,881 | ||||||||||
Distribution reinvestment | 5,479 | 124,879 | 4,039 | 7,455 | 141,852 | ||||||||||
Shares exchanged | (67,152) | — | 66,945 | — | (207) | ||||||||||
Restricted stock grant(1) | 62,411 | — | — | — | 62,411 | ||||||||||
June 30, 2024 | 16,059,357 | 6,188,300 | 196,207 | 1,076,927 | 23,520,791 | ||||||||||
(1) | Represents the vested portion of the shares granted in 2023. |
Three Months Ended June 30, 2024 | ||||||||||||
Class F | Class FF | Class E | Class AA | |||||||||
Aggregate gross distributions declared per share of common stock | $0.1882 | $0.1882 | $0.1882 | $0.1882 | ||||||||
Distribution fee per share of common stock | — | (0.0133) | — | (0.0133) | ||||||||
Net distributions declared per share of common stock | $0.1882 | $0.1749 | $0.1882 | $0.1749 | ||||||||
Six Months Ended June 30, 2024 | ||||||||||||
Class F | Class FF | Class E | Class AA | |||||||||
Aggregate gross distributions declared per share of common stock | $0.3769 | $0.3769 | $0.3769 | $0.3142 | ||||||||
Distribution fee per share of common stock | — | (0.0266) | — | (0.0221) | ||||||||
Net distributions declared per share of common stock | $0.3769 | $0.3503 | $0.3769 | $0.2921 | ||||||||
June 30, 2024 | December 31, 2023 | |||||
December 31, 2023 | $2 | $2 | ||||
Settlement of 2023 performance participation allocation | 1,611 | — | ||||
Distributions | (55) | — | ||||
GAAP income allocation | (29) | — | ||||
Adjustment to carrying value of redeemable equity instrument | 73 | — | ||||
June 30, 2024 | $1,602 | $2 | ||||
June 30, 2024 | December 31, 2023 | |||||
Accrued management fee | $214 | $199 | ||||
Accrued performance participation allocation | — | 1,566 | ||||
Due to Adviser | 781 | 377 | ||||
Advanced organization costs | 3,324 | 3,396 | ||||
Due to affiliates | 45 | 48 | ||||
$4,364 | $5,586 | |||||
Notional Value | Index | Strike Rate | Effective Date | Expiration Date | June 30, 2024 | December 31, 2023 | |||||||||||||||
Interest rate cap | $20,880 | SOFR | 1% | October 2023 | November 2028 | $2,630 | $2,492 | ||||||||||||||
$2,630 | $2,492 | ||||||||||||||||||||
June 30, 2024 | December 31, 2023 | |||||||||||
Carrying Value(1) | Estimated Fair Value | Carrying Value(1) | Estimated Fair Value | |||||||||
Mortgages and other loans payable | $232,390 | $223,159 | $234,460 | $225,323 | ||||||||
Revolving credit facility | 12,093 | 12,093 | 10,139 | 10,139 | ||||||||
Financing obligation | 23,200 | 23,200 | 23,200 | 23,200 | ||||||||
$267,683 | $258,452 | $267,799 | $258,662 | |||||||||
(1) | The carrying value of these loans do not include unamortized debt issuance costs. |
Year Ending | |||
December 31, 2024 (six months) | $16,102 | ||
December 31, 2025 | 29,260 | ||
December 31, 2026 | 25,808 | ||
December 31, 2027 | 18,915 | ||
December 31, 2028 | 8,446 | ||
Thereafter | 18,989 | ||
$117,520 | |||
Three Months Ended June 30, 2024 | Three Months Ended June 30, 2023 | |||||
Fixed lease payments | $10,691 | $8,950 | ||||
Variable lease payments | 48 | 55 | ||||
$10,739 | $9,005 | |||||
Successor | Predecessor | ||||||||
Six Months Ended June 30, 2024 | Period from January 4, 2023 through June 30, 2023 | Period from January 1, 2023 through January 3, 2023 | |||||||
Fixed lease payments | $21,603 | $17,500 | $320 | ||||||
Variable lease payments | 87 | 115 | 3 | ||||||
$21,690 | $17,615 | $323 | |||||||
Year Ending | |||
December 31, 2024 (six months) | $39 | ||
December 31, 2025 | 79 | ||
December 31, 2026 | 80 | ||
December 31, 2027 | 82 | ||
December 31, 2028 | 14 | ||
Total minimum lease payments | 294 | ||
Imputed interest | (21) | ||
Total operating lease liabilities | $273 | ||
June 30, 2024 | December 31, 2023 | |||||
Residential (Business) | $496,950 | $501,980 | ||||
Student Housing | 58,630 | 62,207 | ||||
Other (Corporate) | 25,413 | 14,828 | ||||
Total assets | $580,993 | $579,015 | ||||
Residential (Business) | Student Housing | Other (Corporate) | Total | |||||||||
Revenues | ||||||||||||
Rental revenue | $9,127 | $1,612 | $— | $10,739 | ||||||||
Other revenue | 43 | 229 | — | 272 | ||||||||
Total revenues | 9,170 | 1,841 | — | 11,011 | ||||||||
Expenses | ||||||||||||
Property operating expenses | 239 | 802 | — | 1,041 | ||||||||
General and administrative | 853 | 229 | 985 | 2,067 | ||||||||
Total expenses | 1,092 | 1,031 | 985 | 3,108 | ||||||||
Income from an unconsolidated joint venture | 18 | — | — | 18 | ||||||||
Segment net operating income (loss) | $8,096 | $810 | $(985) | $7,921 | ||||||||
Depreciation and amortization | (4,124) | (2,220) | — | (6,344) | ||||||||
Organization and transaction costs | (60) | |||||||||||
Management fees | (318) | |||||||||||
Performance participation allocation | 285 | |||||||||||
Interest expense, net | (3,013) | |||||||||||
Unrealized gain (loss) on derivative instruments | (61) | |||||||||||
Impairment of investments in real estate | (580) | |||||||||||
Gain on sale of real estate | 34 | |||||||||||
Net income (loss) | (2,136) | |||||||||||
Net income attributable to non-controlling interest in the consolidated subsidiary | 67 | |||||||||||
Net income attributable to non-controlling interest in the Operating Partnership | 16 | |||||||||||
Net loss attributable to SDREIT stockholders | $(2,053) | |||||||||||
Residential (Business) | Student Housing | Other (Corporate) | Total | |||||||||
Revenues | ||||||||||||
Rental revenue | $18,449 | $3,241 | $— | $21,690 | ||||||||
Other revenue | 100 | 456 | — | 556 | ||||||||
Total revenues | 18,549 | 3,697 | — | 22,246 | ||||||||
Expenses | ||||||||||||
Property operating expenses | 458 | 1,565 | — | 2,023 | ||||||||
General and administrative | 1,708 | 394 | 1,976 | 4,078 | ||||||||
Total expenses | 2,166 | 1,959 | 1,976 | 6,101 | ||||||||
Income from an unconsolidated joint venture | 10 | — | — | 10 | ||||||||
Segment net operating income (loss) | $16,393 | $1,738 | $(1,976) | $16,155 | ||||||||
Depreciation and amortization | (8,367) | (4,539) | — | (12,906) | ||||||||
Organization and transaction costs | (172) | |||||||||||
Management fees | (620) | |||||||||||
Performance participation allocation | — | |||||||||||
Interest expense, net | (6,051) | |||||||||||
Unrealized gain (loss) on derivative instruments | 138 | |||||||||||
Impairment of investments in real estate | (1,022) | |||||||||||
Gain on sale of real estate | 34 | |||||||||||
Net income (loss) | (4,444) | |||||||||||
Net income attributable to non-controlling interest in the consolidated subsidiary | 61 | |||||||||||
Net income attributable to non-controlling interest in the Operating Partnership | 29 | |||||||||||
Net loss attributable to SDREIT stockholders | $(4,354) | |||||||||||
Number of Shares Issued | Gross Proceeds (in thousands) | |||||
Class E Shares(1) | 19,783 | $214 | ||||
Class FF Shares | 2,356 | 25 | ||||
Class AA Shares(2) | 477,761 | 5,166 | ||||
Class A Shares | 27,202 | 291 | ||||
Total | 527,102 | $5,696 | ||||
(1) | Class E shares were issued to the Adviser as payment for accrued management fees. |
(2) | Includes sales load fees of $60.9 thousand for Class AA Shares. |
Declaration Date | Record Date | Class F Shares | Class FF Shares | Class E Shares | Class AA Shares | Payment Date | ||||||||||||
June 30, 2024 | June 30, 2024 | $0.0627 | $0.0583 | $0.0627 | $0.0583 | July 12, 2024 | ||||||||||||
July 31, 2024 | July 31, 2024 | $0.0624 | $0.0579 | $0.0624 | $0.0579 | August 12, 2024 | ||||||||||||
Successor | Predecessor | |||||
December 31, 2023 | December 31, 2022 | |||||
Assets | ||||||
Investments in real estate, net | $470,783 | $289,915 | ||||
Cash and cash equivalents | 16,696 | 2,417 | ||||
Restricted cash | 6,406 | 5,071 | ||||
Deferred rent and other receivables | 1,326 | 2,441 | ||||
Goodwill | 34,458 | — | ||||
Lease intangible assets, net | 44,783 | — | ||||
Other assets | 4,563 | 2,716 | ||||
Total assets | $579,015 | $302,560 | ||||
Liabilities and Equity | ||||||
Liabilities | ||||||
Mortgages and other loans payable, net | $230,386 | $188,524 | ||||
Revolving credit facility, net | 10,139 | 30,147 | ||||
Accounts payable and other liabilities | 7,798 | 5,371 | ||||
Financing obligation, net | 22,951 | — | ||||
Lease intangible liabilities, net | 54,252 | — | ||||
Due to related parties | 5,586 | — | ||||
Total liabilities | 331,112 | 224,042 | ||||
Commitments and contingencies | ||||||
Equity | ||||||
Common stock, Class F shares, $0.01 par value per share, 300,000,000 shares authorized, 16,058,619 shares issued and outstanding | 161 | — | ||||
Common stock, Class FF shares, $0.01 par value per share, 300,000,000 shares authorized, 5,943,910 shares issued and outstanding | 58 | — | ||||
Common stock, Class E shares, $0.01 par value per share, 100,000,000 shares authorized, 69,325 shares issued and outstanding | 1 | — | ||||
Preferred stock, $0.01 par value per share, 100,000,000 shares authorized, no shares issued and outstanding | — | — | ||||
Additional paid-in capital | 221,253 | — | ||||
Accumulated deficit and cumulative distributions | (20,458) | — | ||||
Members’ equity | — | 78,518 | ||||
Total stockholders’ and members’ equity | 201,015 | 78,518 | ||||
Non-controlling interests in the consolidated subsidiaries | 46,886 | — | ||||
Non-controlling interests in the Operating Partnership | 2 | — | ||||
Total equity | 247,903 | 78,518 | ||||
Total liabilities and equity | $579,015 | $302,560 | ||||
Successor | Predecessor | ||||||||
Period from January 4, 2023 through December 31, 2023 | Period from January 1, 2023 through January 3, 2023 | Year Ended December 31, 2022 | |||||||
Revenues | |||||||||
Rental revenue | $37,623 | $323 | $28,765 | ||||||
Other revenue | 1,220 | — | 1,193 | ||||||
Total revenues | 38,843 | 323 | 29,958 | ||||||
Expenses | |||||||||
Property operating expenses | 1,189 | 29 | 866 | ||||||
Management fees | 946 | — | — | ||||||
Performance participation allocation | 1,566 | — | — | ||||||
General and administrative | 6,877 | — | 2,742 | ||||||
Organization and transaction costs | 2,450 | — | — | ||||||
Depreciation and amortization | 18,276 | — | 8,533 | ||||||
Total expenses | 31,304 | 29 | 12,141 | ||||||
Operating income | 7,539 | 294 | 17,817 | ||||||
Other income (expense): | |||||||||
Interest expense, net | (10,371) | (114) | (9,615) | ||||||
Impairment of investments in real estate | (3,998) | — | — | ||||||
Unrealized loss on derivative instruments | (798) | — | — | ||||||
Gain on sale of real estate | — | — | 2,422 | ||||||
Total other income (expense) | (15,167) | (114) | (7,193) | ||||||
Net income (loss) | (7,628) | $180 | $10,624 | ||||||
Net income attributable to non-controlling interest in the consolidated subsidiaries | 236 | ||||||||
Net loss attributable to non-controlling interest in the Operating Partnership | — | ||||||||
Net loss attributable to SDREIT stockholders | $(7,392) | ||||||||
Net loss per common share - basic and diluted | $(0.41) | ||||||||
Weighted-average common shares outstanding - basic and diluted | 17,814,156 | ||||||||
Par Value | ||||||||||||||||||||||||||||||
Common Stock Class F | Common Stock Class FF | Common Stock Class E | Additional Paid-in Capital | Members’ Equity | Accumulated deficit and cumulative distributions | Total Stockholders’ and Members’ Equity | Non- controlling interests in the consolidated subsidiaries | Non- controlling interests in the Operating Partnership | Total Equity | |||||||||||||||||||||
Predecessor: | ||||||||||||||||||||||||||||||
Balance at December 31, 2021 | — | — | — | — | 70,184 | — | $70,184 | — | — | $70,184 | ||||||||||||||||||||
Contributions to members | — | — | — | — | 15,908 | — | 15,908 | — | — | 15,908 | ||||||||||||||||||||
Distributions to members | — | — | — | — | (18,198) | — | (18,198) | — | — | (18,198) | ||||||||||||||||||||
Net income | — | — | — | — | 10,624 | — | 10,624 | — | — | 10,624 | ||||||||||||||||||||
Balance at December 31, 2022 | — | — | — | — | 78,518 | — | $78,518 | — | — | $78,518 | ||||||||||||||||||||
Net income | — | — | — | — | 180 | — | 180 | — | — | 180 | ||||||||||||||||||||
Balance at January 3, 2023 | $— | $— | $— | $— | $78,698 | $— | $78,698 | $— | $— | $78,698 | ||||||||||||||||||||
Period from January 4, 2023 to December 31, 2023 | ||||||||||||||||||||||||||||||
Par Value | ||||||||||||||||||||||||||||||
Common Stock Class F | Common Stock Class FF | Common Stock Class E | Additional Paid-in Capital | Members’ Equity | Accumulated deficit and cumulative distributions | Total Stockholders’ and Members’ Equity | Non- controlling interests in the consolidated subsidiaries | Non- controlling interests in the Operating Partnership | Total Equity | |||||||||||||||||||||
Successor: | ||||||||||||||||||||||||||||||
Balance at January 4, 2023 | $— | $— | $— | $— | $— | $— | $— | $— | $— | $— | ||||||||||||||||||||
Rollover equity in Company parent | 150 | — | — | 150,048 | — | (1,773) | 148,425 | — | 2 | 148,427 | ||||||||||||||||||||
Common stock issued | 10 | 58 | 1 | 74,331 | — | — | 74,400 | — | — | 74,400 | ||||||||||||||||||||
Distribution reinvestment | — | 1 | — | 844 | — | — | 845 | — | — | 845 | ||||||||||||||||||||
Offering costs | — | — | — | (922) | — | — | (922) | — | — | (922) | ||||||||||||||||||||
Amortization of compensation awards | — | — | — | 540 | — | — | 540 | — | — | 540 | ||||||||||||||||||||
Distributions declared on common stock | — | — | — | — | — | (11,293) | (11,293) | — | — | (11,293) | ||||||||||||||||||||
Contributions from non-controlling interests | — | — | — | — | — | — | — | 92,194 | — | 92,194 | ||||||||||||||||||||
Distributions to non-controlling interests | — | — | — | — | — | — | — | (5,660) | — | (5,660) | ||||||||||||||||||||
Noncontrolling interest acquired | — | — | — | (3,588) | — | — | (3,588) | (39,412) | — | (43,000) | ||||||||||||||||||||
Net loss | — | — | — | — | — | (7,392) | (7,392) | (236) | — | (7,628) | ||||||||||||||||||||
Balance at December 31, 2023 | $160 | $59 | $1 | $221,253 | $— | $(20,458) | $201,015 | $46,886 | $2 | $247,903 | ||||||||||||||||||||
Successor | Predecessor | ||||||||
Period from January 4, 2023 through December 31, 2023 | Period from January 1, 2023 through January 3, 2023 | Year Ended December 31, 2022 | |||||||
Cash Flows from Operating Activities: | |||||||||
Net income (loss) | $(7,628) | $180 | $10,624 | ||||||
Adjustments to reconcile net income (loss) to net cash provided by operating activities: | |||||||||
Depreciation and amortization | 18,276 | — | 8,533 | ||||||
Amortization of discounts and deferred financing costs | 307 | — | 451 | ||||||
Impairment of investments in real estate | 3,998 | — | — | ||||||
Loss on sale of real estate | — | — | (2,422) | ||||||
Straight-line rent adjustment | (888) | — | (324) | ||||||
Amortization of above- and below-market leases | (5,037) | — | — | ||||||
Amortization of share-based compensation | 540 | — | — | ||||||
Unrealized loss on interest rate cap | 798 | — | — | ||||||
Other reconciling items | 10 | — | 5 | ||||||
Changes in operating assets and liabilities: | |||||||||
Deferred rent and other receivables | 1,295 | 559 | (66) | ||||||
Other assets | (550) | (2) | (290) | ||||||
Accounts payable and other liabilities | 674 | 287 | (150) | ||||||
Due to related parties | 1,973 | — | — | ||||||
Net cash provided by operating activities | 13,768 | 1,024 | 16,361 | ||||||
Cash Flows From Investing Activities: | |||||||||
Acquisition of a business | (132,775) | — | — | ||||||
Acquisition of real estate | (78,991) | — | (53,918) | ||||||
Additions to real estate | (256) | — | (339) | ||||||
Deposit on real estate acquisition | (116) | — | — | ||||||
Proceeds from sale of real estate | 9,958 | — | 8,338 | ||||||
Net cash used in investing activities | (202,180) | — | (45,919) | ||||||
Cash Flows from Financing Activities: | |||||||||
Proceeds from mortgages and other loans payable | 53,121 | — | 14,700 | ||||||
Repayments of mortgages and other loans payable | (11,930) | (140) | (6,041) | ||||||
Borrowings from financing obligation | 23,200 | — | — | ||||||
Proceeds from revolving credit facility | 12,723 | — | 23,316 | ||||||
Repayments of revolving credit facility | (32,868) | — | — | ||||||
Payment of deferred financing costs | (1,374) | — | (430) | ||||||
Purchase of interest rate cap | (3,290) | — | — | ||||||
Deferred offering costs | (650) | — | — | ||||||
Due to related parties | 1,863 | — | — | ||||||
Subscriptions received in advance | 125 | — | — | ||||||
Contributions from members | — | — | 15,908 | ||||||
Distributions to members | — | — | (18,198) | ||||||
Issuance of common stock | 73,654 | — | — | ||||||
Distribution to shareholders | (9,041) | — | — | ||||||
Acquisition of noncontrolling interest in consolidated subsidiaries | (43,000) | — | — | ||||||
Contribution by noncontrolling interests in a consolidated subsidiary | 4,355 | — | — | ||||||
Distribution to noncontrolling interests in a consolidated subsidiary | (5,660) | — | — | ||||||
Net cash provided by (used in) financing activities | 61,228 | (140) | 29,255 | ||||||
Successor | Predecessor | ||||||||
Period from January 4, 2023 through December 31, 2023 | Period from January 1, 2023 through January 3, 2023 | Year Ended December 31, 2022 | |||||||
Net change in cash and cash equivalents and restricted cash | (127,184) | 884 | (303) | ||||||
Cash and cash equivalents and restricted cash at beginning of period | 150,286 | 7,488 | 7,791 | ||||||
Cash and cash equivalents and restricted cash at end of period | $23,102 | $8,372 | $7,488 | ||||||
Reconciliation of Cash and Cash Equivalents and Restricted Cash: | |||||||||
Cash and cash equivalents | $16,696 | $3,049 | $2,417 | ||||||
Restricted cash | 6,406 | 5,323 | 5,071 | ||||||
Total cash and cash equivalents and restricted cash | $23,102 | $8,372 | $7,488 | ||||||
Supplemental Information: | |||||||||
Interest paid | $10,679 | $188 | $9,227 | ||||||
Supplemental Disclosure of Noncash Investing and Financing Activities: | |||||||||
Capital expenditure payable | $— | $— | $21 | ||||||
Mortgage and other notes payable assumed at acquisition | $190,832 | $— | $— | ||||||
Revolving credit facility assumed at acquisition | $30,284 | $— | $— | ||||||
Dividends unpaid | $1,408 | $— | $— | ||||||
Distribution reinvestment | $844 | $— | $— | ||||||
Contribution by noncontrolling interests in a consolidated subsidiary | $87,839 | $— | $— | ||||||
Transfer to assets held for sale | $837 | $— | $1,866 | ||||||
Transfer of mortgages related to assets held for sale | $713 | $— | $2,007 | ||||||
Management fee paid in shares | $747 | $— | $— | ||||||
Accrued stockholder distribution fees | $272 | $— | $— | ||||||
Accrued offering costs due to affiliate | $— | $— | $— | ||||||
• | for the period from January 4, 2023 through December 31, 2023 (the “2023 Successor Period”), |
• | for the period from January 1 through January 3, 2023 (the “2023 Predecessor Period”), |
• | for the period from February 11, 2022 (inception date) through December 31, 2022 (the “2022 Successor Period”), and |
• | year ended December 31, 2022 (the “2022 Predecessor Period”). |
Successor | Predecessor | |||||
December 31, 2023 | December 31, 2022 | |||||
Land and land improvements | $75,885 | $48,922 | ||||
Building and improvements | 406,090 | 267,924 | ||||
Furniture, fixtures and equipment | 1,197 | 22 | ||||
Total real estate properties, at cost | 483,172 | 316,868 | ||||
Less: accumulated depreciation | (12,389) | (26,953) | ||||
Investments in real estate, net | $470,783 | $289,915 | ||||
Consideration transferred: | |||
Cash | $141,147 | ||
Acquisition-related costs (included in organization and transaction costs) | 870 | ||
Assets acquired and liabilities assumed: | |||
Property level cash | 3,049 | ||
Restricted cash | 5,323 | ||
Receivables | 1,739 | ||
Other assets | 58 | ||
Investments in real estate | 424,999 | ||
Intangible assets | 46,904 | ||
Mortgages and notes payable | (190,832) | ||
Revolving credit facility | (30,284) | ||
Accounts payable and other liabilities | (4,656) | ||
Intangible liabilities | (61,772) | ||
Total identifiable net assets | 194,528 | ||
Fair value of noncontrolling interest in CapGrow | (87,839) | ||
Goodwill | 34,458 | ||
$141,147 | |||
Successor | Predecessor | |||||
Period from January 4, 2023 through December 31, 2023 | Year Ended December 31, 2022 | |||||
Actual revenues since acquisition | $37,500 | $— | ||||
Actual net income (loss) since acquisition | $751 | $— | ||||
Pro forma revenues | $— | $37,043 | ||||
Pro forma net income attributable to common stockholders | $— | $5,723 | ||||
Year Ended December 31, 2023 | Student Housing | ||
Building and improvements | $47,473 | ||
Land and land improvements | 5,712 | ||
In-place lease intangibles | 4,940 | ||
Furniture, fixtures and equipment | 1,192 | ||
Total purchase price | $59,317 | ||
Successor | |||||||||
Cost | Accumulated Amortization | Net | |||||||
Intangible assets, net: | |||||||||
Above-market lease intangibles | $3,153 | $(658) | $2,495 | ||||||
In-place lease intangibles | 13,701 | (2,310) | 11,391 | ||||||
Leasing commissions | 33,650 | (2,753) | 30,897 | ||||||
Total intangible assets | $50,504 | $(5,721) | $44,783 | ||||||
Intangible liabilities, net: | |||||||||
Below-market lease intangibles | $(58,900) | $4,648 | $(54,252) | ||||||
Above-market Lease Intangibles | In-place Lease Intangibles | Leasing Commissions | Below-market Lease Intangibles | |||||||||
2024 | $658 | $4,570 | $2,776 | $(4,676) | ||||||||
2025 | 640 | 903 | 2,754 | (4,591) | ||||||||
2026 | 511 | 794 | 2,644 | (4,462) | ||||||||
2027 | 343 | 695 | 2,526 | (4,304) | ||||||||
2028 | 94 | 583 | 2,362 | (4,141) | ||||||||
Thereafter | 249 | 3,846 | 17,835 | (32,078) | ||||||||
$2,495 | $11,391 | $30,897 | $(54,252) | |||||||||
Successor | Predecessor | |||||
December 31, 2023 | December 31, 2022 | |||||
Derivatives assets | $2,492 | $— | ||||
Assets held for sale | 837 | 1,866 | ||||
Prepaid insurance | 390 | — | ||||
Right of use asset - operating lease | 302 | 282 | ||||
Deferred costs | 102 | 501 | ||||
Prepaid ground rent | 93 | — | ||||
Pre-acquisition costs | 233 | — | ||||
Other | 114 | 67 | ||||
Total | $4,563 | $2,716 | ||||
Successor | Predecessor | |||||
December 31, 2023 | December 31, 2022 | |||||
Tenant security deposits | $2,440 | $2,153 | ||||
Accounts payable | 177 | 73 | ||||
Accrued expenses | 2,156 | 549 | ||||
Distribution payable | 1,408 | — | ||||
Liabilities related to assets held for sale | 713 | 2,007 | ||||
Deferred income | 355 | 295 | ||||
Lease liability - operating lease | 306 | 294 | ||||
Subscriptions received in advance | 125 | — | ||||
Due to seller | 118 | — | ||||
Total | $7,798 | $5,371 | ||||
Successor | Predecessor | |||||||||||
December 31, 2023 | December 31, 2022 | Fixed Interest Rate | Initial Maturity Date | |||||||||
Mortgage note payable(1)(4) | $5,485 | $6,251 | 5.00% | June 2024 | ||||||||
Mortgage note payable(2)(4) | 9,356 | 11,526 | 5.19% | June 2027 | ||||||||
Mortgage note payable(4) | 8,987 | 9,238 | 3.75% | April 2028 | ||||||||
Mortgage note payable(2)(4) | 7,589 | 12,402 | 5.59% | April 2028 | ||||||||
Mortgage note payable(8) | 18,427 | 19,633 | 4.28% | November 2029 | ||||||||
Mortgage note payable(5) | 49,087 | 49,635 | 3.59% | September 2030 | ||||||||
Mortgage note payable(2)(3) | 38,573 | 40,072 | 3.85% | January 2031 | ||||||||
Mortgage note payable(4) | 2,024 | 2,077 | 4.35% | February 2031 | ||||||||
Successor | Predecessor | |||||||||||
December 31, 2023 | December 31, 2022 | Fixed Interest Rate | Initial Maturity Date | |||||||||
Mortgage note payable(6) | 24,982 | 24,982 | 4.01% | January 2032 | ||||||||
Mortgage note payable(4) | 14,266 | 14,610 | 4.00% | March 2032 | ||||||||
Mortgage note payable(9) | 32,241 | — | 6.60% | September 2033 | ||||||||
Mortgage note payable(10) | 20,880 | — | 3.56% | November 2033 | ||||||||
Mortgage note payable(4) | 1,324 | 1,566 | 5.63% to 6.40% | February 2037 through 2039 | ||||||||
Notes payable(7) | 1,239 | 1,414 | 7.00% | various | ||||||||
Total | 234,460 | 193,406 | ||||||||||
Discounts and deferred financing costs, net | (3,361) | (2,875) | ||||||||||
Total mortgages and other loans payable, net | $231,099 | $190,531 | ||||||||||
(1) | Includes one mortgage loan related to assets held for sale amounting to $0.7 million at December 31, 2023. |
(2) | Includes mortgage loans related to assets held for sale amounting to $0.2 million, $1.5 million, and $0.3 million, at December 31, 2022, respectively. |
(3) | Interest only payment loan through January 2024, at which time, monthly principal and interest payments will be due through maturity date. |
(4) | These loans are subject to monthly principal and interest payments through maturity date. |
(5) | Interest only payment loan through September 2023, at which time, monthly principal and interest payments are due through maturity date. |
(6) | Interest only payment loan through January 2025, at which time, monthly principal and interest payments will be due through maturity date. |
(7) | These loans, which are owed to private parties, bear interest rates of 7%. Monthly principal and interest payments are due through maturity date beginning May 2024 through July 2027. |
(8) | Interest only payment loan through November 2022, at which time, monthly principal and interest payments are due through maturity date. |
(9) | Interest only payment loan through September 2026, at which time, monthly principal and interest payments are due through maturity date. |
(10) | The acquisition of University Courtyard was funded partly by equity, a $20.8 million leasehold mortgage and a $23.2 million of financing proceeds derived from a failed sale and leaseback transaction. This leasehold mortgage bears interest based on SOFR plus 2.56% per annum and is subject to interest only payments through November 2028, at which time, monthly principal and interest payments are due through maturity date. In connection with this leasehold mortgage, University Courtyard entered into a 5-year interest rate cap agreement which caps SOFR at 1% per annum. Refer to “Financing Obligation, net” below for additional information relating to the failed sale and leaseback transaction. Refer to Note 10, “Fair Value Measurement,” for additional information related to this interest rate cap. |
Year Ending | Mortgages and Other Loans Payable | Credit Facility | Financing Obligation | Total | ||||||||
December 31, 2024 | $9,485 | $10,139 | $— | $19,624 | ||||||||
December 31, 2025 | 4,125 | — | 2 | 4,127 | ||||||||
December 31, 2026 | 4,107 | — | 3 | 4,110 | ||||||||
December 31, 2027 | 12,104 | — | 5 | 12,109 | ||||||||
December 31, 2028 | 18,485 | — | 7 | 18,492 | ||||||||
Thereafter | 186,154 | — | 19,126 | 205,280 | ||||||||
$234,460 | $10,139 | $19,143 | $263,742 | |||||||||
Number of Shares | Par Value per Share | |||||
Class F Shares | 300,000,000 | $0.01 | ||||
Class FF Shares | 300,000,000 | $0.01 | ||||
Class S Shares | 300,000,000 | $0.01 | ||||
Class D Shares | 300,000,000 | $0.01 | ||||
Class I Shares | 300,000,000 | $0.01 | ||||
Class A Shares | 300,000,000 | $0.01 | ||||
Class AA Shares | 300,000,000 | $0.01 | ||||
Class E Shares | 100,000,000 | $0.01 | ||||
Total | 2,200,000,000 | |||||
Preferred Stock | 100,000,000 | $0.01 | ||||
2,300,000,000 | ||||||
Year Ended December 31, 2023 | ||||||||||||
Class F | Class FF | Class E | Total | |||||||||
December 31, 2022 | — | — | — | — | ||||||||
Rollover equity in Company parent | 15,019,800 | — | — | 15,019,800 | ||||||||
Common stock issued | 1,037,760 | 5,865,262 | 69,325 | 6,972,347 | ||||||||
Distribution reinvestment | 1,059 | 78,648 | — | 79,707 | ||||||||
December 31, 2023 | 16,058,619 | 5,943,910 | 69,325 | 22,071,854 | ||||||||
Year Ended December 31, 2023 | |||||||||
Class F | Class FF | Class E | |||||||
Aggregate gross distributions declared per share of common stock | $0.6143 | $0.4967 | $0.0633 | ||||||
Distribution fee per share of common stock | — | (0.0135) | — | ||||||
Net distributions declared per share of common stock | $0.6143 | $0.4832 | $0.0633 | ||||||
Successor | |||
December 31, 2023 | |||
Advanced organization costs | $3,396 | ||
Accrued performance participation allocation | 1,566 | ||
Due to Adviser | 377 | ||
Accrued management fee | 199 | ||
Due to affiliate | 48 | ||
Total | $5,586 | ||
Notional Value | Index | Strike Rate | Effective Date | Expiration Date | Fair Value | |||||||||||||
Interest rate cap | $20,880 | SOFR | 1% | October 2023 | November 2028 | $2,492 | ||||||||||||
$2,492 | ||||||||||||||||||
Carrying Value(1) | Estimated Fair Value | |||||
Mortgages and other loans payable | $234,460 | $225,323 | ||||
Revolving credit facility | 10,139 | 10,139 | ||||
Financing obligation, net | 23,200 | 23,200 | ||||
$267,799 | $258,662 | |||||
(1) | The carrying value of these loans do not include unamortized debt issuance costs. |
Year Ending | |||
December 31, 2024 | $34,068 | ||
December 31, 2025 | 27,216 | ||
December 31, 2026 | 23,764 | ||
December 31, 2027 | 16,899 | ||
December 31, 2028 | 6,514 | ||
Thereafter | 15,700 | ||
$124,161 | |||
Successor | Predecessor | ||||||||
Period from January 4, 2023 through December 31, 2023 | Period from January 1, 2023 through January 3, 2023 | Year Ended December 31, 2022 | |||||||
Fixed lease payments | $37,428 | $320 | $28,448 | ||||||
Variable lease payments | 195 | 3 | 317 | ||||||
$37,623 | $323 | $28,765 | |||||||
Year Ending | |||
December 31, 2024 | $77 | ||
December 31, 2025 | 79 | ||
December 31, 2026 | 80 | ||
December 31, 2027 | 82 | ||
December 31, 2028 | 14 | ||
Thereafter | 0 | ||
Total minimum lease payments | 332 | ||
Imputed interest | (26) | ||
Total operating lease liabilities | $306 | ||
December 31, 2023 | |||
Residential | $501,980 | ||
Student Housing | 62,207 | ||
Other (Corporate) | 14,828 | ||
Total assets | $579,015 | ||
Residential (Business) | Student Housing | Other (Corporate) | Total | |||||||||
Revenues | ||||||||||||
Rental revenue | $36,428 | $1,195 | $— | $37,623 | ||||||||
Other revenue | 1,075 | 145 | — | 1,220 | ||||||||
Total revenues | 37,503 | 1,340 | — | 38,843 | ||||||||
Expenses | ||||||||||||
Property operating expenses | 659 | 530 | — | 1,189 | ||||||||
General and administrative | 3,670 | 337 | 2,870 | 6,877 | ||||||||
Total expenses | 4,329 | 867 | 2,870 | 8,066 | ||||||||
Segment net operating income (loss) | $33,174 | $473 | $(2,870) | 30,777 | ||||||||
Depreciation and amortization | (16,606) | (1,670) | — | (18,276) | ||||||||
Organization and transaction costs | (2,450) | |||||||||||
Management fees | (946) | |||||||||||
Performance participation allocation | (1,566) | |||||||||||
Interest expense, net | (10,371) | |||||||||||
Unrealized gain (loss) on derivative instruments | (798) | |||||||||||
Impairment of investments in real estate | (3,998) | |||||||||||
Net loss | (7,628) | |||||||||||
Net income attributable to non-controlling interest in the consolidated subsidiary | 236 | |||||||||||
Net loss attributable to non-controlling interest in the Operating Partnership | — | |||||||||||
Net loss attributable to SDREIT stockholders | $(7,392) | |||||||||||
Number of Shares Issued | Gross Proceeds | |||||
Class E Shares(1) | 27,905 | $301 | ||||
Class FF Shares(2) | 110,153 | 1,190 | ||||
Class AA Shares(2) | 220,266 | 2420 | ||||
Total | 358,324 | $3,911 | ||||
(1) | Class E shares were issued to the Adviser as payment for accrued management fees. |
(2) | Includes sales load fees of $15 thousand for Class FF Shares and $45 thousand for Class AA Shares, respectively. |
Declaration Date | Record Date | Class F Shares | Class FF Shares | Class E Shares | Class AA Shares | Payment Date | ||||||||||||
January 31, 2024 | January 31, 2024 | $0.0627 | $0.0582 | $0.0627 | $— | February 12, 2024 | ||||||||||||
February 29, 2024 | February 29, 2024 | $0.0631 | $0.0589 | $0.0631 | $0.0588 | March 12, 2024 | ||||||||||||
Initial Cost | Costs Capitalized Subsequent to Acquisition | Gross Amounts at which Carried at the Close of Period(1) | ||||||||||||||||||||||||||||||||||
Description | Location | Number of Properties | Encumbrances | Land and Land Improvements | Building and Building Improvements | Land and Land Improvements | Building and Building Improvements | Land and Land Improvements | Building and Building Improvements | Total | Accumulated Depreciation(2) | Year Acquired | ||||||||||||||||||||||||
Residential (Business): | ||||||||||||||||||||||||||||||||||||
Alabama | 1 | $101 | $35 | $172 | $— | $— | $35 | $172 | $207 | $6 | 2023 | |||||||||||||||||||||||||
Arizona | 85 | 14,256 | 5,478 | 29,684 | 9 | 51 | 5,487 | 29,735 | 35,222 | 960 | 2023 | |||||||||||||||||||||||||
California | 5 | 1,878 | 814 | 4,139 | — | — | 814 | 4,139 | 4,953 | 143 | 2023 | |||||||||||||||||||||||||
Colorado | 4 | 1,584 | 432 | 2,098 | 78 | 444 | 510 | 2,542 | 3,052 | 77 | 2023 | |||||||||||||||||||||||||
Connecticut | 8 | 1,618 | 598 | 3,587 | — | 15 | 598 | 3,602 | 4,200 | 123 | 2023 | |||||||||||||||||||||||||
Delaware | 1 | 133 | 52 | 288 | — | — | 52 | 288 | 340 | 10 | 2023 | |||||||||||||||||||||||||
Florida | 17 | 5,153 | 2,149 | 12,000 | (205) | (1,001) | 1,944 | 10,999 | 12,943 | 378 | 2023 | |||||||||||||||||||||||||
Georgia | 2 | 290 | 95 | 491 | — | — | 95 | 491 | 586 | 17 | 2023 | |||||||||||||||||||||||||
Idaho | 4 | 395 | 363 | 1,982 | (135) | (657) | 228 | 1,325 | 1,553 | 45 | 2023 | |||||||||||||||||||||||||
Illinois | 12 | 1,499 | 381 | 1,763 | 27 | 153 | 408 | 1,916 | 2,324 | 66 | 2023 | |||||||||||||||||||||||||
Indiana | 38 | 5,634 | 1,814 | 9,714 | — | — | 1,814 | 9,714 | 11,528 | 334 | 2023 | |||||||||||||||||||||||||
Iowa | 9 | 2,298 | 707 | 3,698 | (23) | (112) | 684 | 3,586 | 4,270 | 124 | 2023 | |||||||||||||||||||||||||
Kansas | 1 | 118 | 32 | 150 | — | — | 32 | 150 | 182 | 5 | 2023 | |||||||||||||||||||||||||
Kentucky | 2 | 394 | 128 | 577 | — | — | 128 | 577 | 705 | 20 | 2023 | |||||||||||||||||||||||||
Louisiana | 1 | 1,293 | 347 | 1,370 | (49) | (239) | 298 | 1,131 | 1,429 | 40 | 2023 | |||||||||||||||||||||||||
Maryland | 10 | 2,325 | 731 | 3,536 | — | — | 731 | 3,536 | 4,267 | 122 | 2023 | |||||||||||||||||||||||||
Massachusetts | 2 | 457 | 166 | 970 | — | — | 166 | 970 | 1,136 | 33 | 2023 | |||||||||||||||||||||||||
Michigan | 31 | 21,454 | 5,513 | 24,740 | — | — | 5,513 | 24,740 | 30,253 | 859 | 2023 | |||||||||||||||||||||||||
Minnesota | 281 | 67,445 | 16,993 | 83,268 | 1,877 | 10,854 | 18,870 | 94,122 | 112,992 | 3,068 | 2023 | |||||||||||||||||||||||||
Nebraska | 1 | 181 | 53 | 262 | — | — | 53 | 262 | 315 | 9 | 2023 | |||||||||||||||||||||||||
Nevada | 8 | 1,941 | 625 | 3,314 | — | — | 625 | 3,314 | 3,939 | 114 | 2023 | |||||||||||||||||||||||||
New Hampshire | 1 | 383 | 139 | 821 | — | — | 139 | 821 | 960 | 28 | 2023 | |||||||||||||||||||||||||
New Jersey | 15 | 4,111 | 1,119 | 5,612 | 167 | 961 | 1,286 | 6,573 | 7,859 | 213 | 2023 | |||||||||||||||||||||||||
New Mexico | 2 | 317 | 105 | 503 | — | — | 105 | 503 | 608 | 17 | 2023 | |||||||||||||||||||||||||
New York | 1 | — | 66 | 330 | — | — | 66 | 330 | 396 | 11 | 2023 | |||||||||||||||||||||||||
North Carolina | 6 | 1,051 | 263 | 1,326 | 60 | 339 | 323 | 1,665 | 1,988 | 46 | 2023 | |||||||||||||||||||||||||
North Dakota | 10 | 2,171 | 663 | 3,545 | — | — | 663 | 3,545 | 4,208 | 122 | 2023 | |||||||||||||||||||||||||
Ohio | 128 | 18,513 | 4,864 | 21,477 | 47 | 325 | 4,911 | 21,802 | 26,713 | 748 | 2023 | |||||||||||||||||||||||||
Oregon | 3 | 359 | 231 | 1,172 | — | 11 | 231 | 1,183 | 1,414 | 41 | 2023 | |||||||||||||||||||||||||
Pennsylvania | 59 | 10,433 | 3,553 | 19,596 | 188 | 1,062 | 3,741 | 20,658 | 24,399 | 687 | 2023 | |||||||||||||||||||||||||
South Carolina | 11 | 3,107 | 836 | 4,232 | — | — | 836 | 4,232 | 5,068 | 146 | 2023 | |||||||||||||||||||||||||
Tennessee | 12 | 1,468 | 558 | 2,763 | — | — | 558 | 2,763 | 3,321 | 95 | 2023 | |||||||||||||||||||||||||
Texas | 205 | 30,630 | 11,469 | 62,839 | (708) | (4,621) | 10,761 | 58,218 | 68,979 | 2,003 | 2023 | |||||||||||||||||||||||||
Utah | 1 | 1,277 | 606 | 3,552 | — | — | 606 | 3,552 | 4,158 | 122 | 2023 | |||||||||||||||||||||||||
Virginia | 7 | 2,187 | 665 | 3,127 | — | — | 665 | 3,127 | 3,792 | 108 | 2023 | |||||||||||||||||||||||||
Washington | 12 | 2,761 | 1,784 | 9,161 | (459) | (2,228) | 1,325 | 6,933 | 8,258 | 239 | 2023 | |||||||||||||||||||||||||
West Virginia | 12 | 2,137 | 663 | 3,650 | — | — | 663 | 3,650 | 4,313 | 126 | 2023 | |||||||||||||||||||||||||
Wisconsin | 40 | 6,770 | 2,731 | 13,902 | (426) | (2,043) | 2,305 | 11,859 | 14,164 | 407 | 2023 | |||||||||||||||||||||||||
Washington DC | 11 | 5,597 | 1,902 | 9,864 | 1 | (1) | 1,903 | 9,863 | 11,766 | 341 | 2023 | |||||||||||||||||||||||||
Student Housing: | ||||||||||||||||||||||||||||||||||||
Denton, Texas | 1 | 20,880 | 5,712 | 47,473 | — | 29 | 5,712 | 47,502 | 53,214 | 305 | 2023 | |||||||||||||||||||||||||
$244,599 | $75,435 | $402,748 | $449 | $3,342 | $75,884 | $406,090 | $481,974 | $12,358 | ||||||||||||||||||||||||||||
(1) | As of December 31, 2023, the aggregate cost basis for tax purposes was $379 million. |
(2) | Refer to Note 2, “Summary of Significant Accounting Policies” to our consolidated financial statements for details of depreciable lives. |
December 31, 2023 | |||
Balance at beginning of year | $— | ||
Property acquisitions | 497,858 | ||
Improvements | 251 | ||
Retirements/disposals/deconsolidation | (16,135) | ||
Balance at end of year | $481,974 | ||
December 31, 2023 | |||
Balance at beginning of year | $— | ||
Depreciation for year | 12,494 | ||
Retirements/disposals/deconsolidation | (136) | ||
Balance at end of year | $12,358 | ||
SCULPTOR DIVERSIFIED REAL ESTATE INCOME TRUST, INC. | |||
(Registrant) | |||
November 6, 2024 | /s/ Steven Orbuch | ||
Steven Orbuch | |||
Chairman of the Board and Chief Executive Officer | |||