The Manteio Multialternative Strategy Fund (the “Fund”) seeks positive absolute returns.
This table describes the fees and expenses that you may pay if you buy, hold, and sell shares of the Fund. You may pay other fees, such as brokerage commissions and other fees to financial intermediaries, which are not reflected in the table and example below. You may qualify for sales charge discounts if you and your family invest, or agree to invest in the future, at least $50,000 in Class A Shares of the Fund. More information about these fees and other discounts is available from your financial professional and in the section titled “Purchase of Shares” on page 37 of the Prospectus and under “Waivers and Discounts Available from Intermediaries and Conversion Policies” on page 59 the Prospectus.
Shareholder Fees - MANTEIO MULTIALTERNATIVE STRATEGY FUND |
Class A Shares |
Class I Shares |
|
|---|---|---|---|
| Maximum Sales Charge (Load) Imposed on purchases (as a percentage of offering price) | 5.25% | none | |
| Maximum Deferred Sales Charge (Load) (as a percentage of purchase price) | none | [1] | none |
| [1] | Purchases of Class A shares of $1 million or more may be subject to a 1.00% deferred sales charge on redemptions within 12 months of purchase. |
Annual Fund Operating Expenses - MANTEIO MULTIALTERNATIVE STRATEGY FUND |
Class A Shares |
Class I Shares |
|
|---|---|---|---|
| Management Fees | 1.04% | 1.04% | |
| Distribution and/or Service (12b-1) Fees | 0.25% | none | |
| Other Expenses | [1] | 0.13% | 0.13% |
| Acquired Fund Fees and Expenses | [2] | 0.05% | 0.05% |
| Total Annual Fund Operating Expenses | 1.47% | 1.22% | |
| Fees Waived and/or Expenses Reimbursed | [3] | (0.32%) | (0.32%) |
| Total Annual Fund Operating Expenses After Waiving Fees and/or Reimbursing Expenses | [1],[2],[3] | 1.15% | 0.90% |
| [1] | The Fund invests in a wholly-owned subsidiary of the Fund organized under the laws of the Cayman Islands. “Other expenses” include expenses of both the Fund and the wholly-owned subsidiary. “Other Expenses” are estimated for the current fiscal year. Actual expenses may differ from estimates. |
| [2] | “Acquired Fund Fees and Expenses” reflect the expenses incurred indirectly by the Fund as a result of the Fund’s investments in underlying money market funds, exchange-traded funds or other pooled investment vehicles. “Acquired Fund Fees and Expenses” are estimated for the current fiscal year. Actual expenses may differ from estimates. |
| [3] | The Fund’s advisor has contractually agreed to waive its fees and/or pay for operating expenses of the Fund to ensure that total annual fund operating expenses (excluding any taxes, leverage interest, brokerage commissions, dividend and interest expenses on short sales, acquired fund fees and expenses (as determined in accordance with SEC Form N-1A), professional fees related to services for the collection of foreign tax reclaims, expenses incurred in connection with any merger or reorganization, and extraordinary expenses such as litigation expenses) do not exceed 1.10% and 0.85% of the average daily net assets of Class A shares and Class I shares, respectively, of the Fund. This agreement is in effect for a period of two years from the date of the reorganization (i.e., through November 22, 2026), and it may be terminated before that date only by the Trust’s Board of Trustees. The Fund’s advisor is permitted to seek reimbursement from the Fund, subject to certain limitations, of fees waived or payments made by the advisor to the Fund for a period ending three years after the date of the waiver or payment. Such reimbursement may be requested from the Fund if the reimbursement will not cause the Fund’s annual expense ratio to exceed the lesser of (a) the expense limitation in effect at the time such fees were waived or payments made, or (b) the expense limitation in effect at the time of the reimbursement. Reimbursements of fees waived or payments made will be made on a “first in, first out” basis so that the oldest fees waived or payments are satisfied first. |
This example is intended to help you compare the cost of investing in the Fund with the cost of investing in other mutual funds. The example assumes that you invest $10,000 in the Fund for the time periods indicated and then redeem all of your shares at the end of those periods. The example also assumes that your investment has a 5% return each year and that the Fund’s operating expenses remain the same. The example reflects the Fund’s contractual fee waiver and/or expense reimbursement only for the term of the contractual fee waiver and/or expense reimbursement.
Expense Example - MANTEIO MULTIALTERNATIVE STRATEGY FUND - USD ($) |
One Year |
Three Years |
Five Years |
Ten Years |
|---|---|---|---|---|
| Class A Shares | 636 | 904 | 1,226 | 2,137 |
| Class I Shares | 92 | 322 | 607 | 1,419 |
The Fund pays transaction costs, such as commissions, when it buys and sells securities (or “turns over” its portfolio). A higher portfolio turnover may indicate higher transaction costs and may result in higher taxes when Fund shares are held in a taxable account. These costs, which are not reflected in annual fund operating expenses or in the example, affect the Fund’s performance. During the fiscal year ended October 31, 2023, the portfolio turnover rate for the Predecessor Fund (defined below) was 375% of the average value of its portfolio.
The Fund seeks to achieve its investment objective by utilizing a macro-aware investment process to allocate capital across a range of investment strategies. The Fund may invest in a broad range of instruments, including equities, American Depositary Receipts (“ADRs”) and Global Depositary Receipts (“GDRs”), other mutual funds, exchange-traded funds (“ETFs”), warrants, bonds (both investment grade and below investment grade (commonly referred to as “high yield securities” or “junk bonds”)), currencies, commodities, futures, exchange-traded and over-the-counter put and call options (both covered and uncovered) and total return and excess return swaps. The Fund may invest in such instruments directly or, in the case of commodities and certain commodity-linked instruments, indirectly, by investing in its wholly-owned subsidiary organized under the laws of the Cayman Islands (the “Subsidiary”) which invests in such commodities and commodity-linked instruments. When used in this Prospectus, the term “Fund” includes the Subsidiary and the term “invest” includes investments the Fund makes directly and through the Subsidiary. The Fund also may invest in cash and cash equivalents. As a result of the Fund’s use of derivatives, the Fund may hold significant amounts of high-quality, short-term securities, including U.S. Treasuries, shares of money market funds and repurchase agreements. The Fund may also invest in high-yield securities to earn income, as well as to achieve its investment objective. The Fund may invest in bonds of any maturity and duration. The Fund may invest globally (including in emerging markets) and there are no geographic limits on the Fund’s holdings.
The Fund’s advisor primarily, but not exclusively, allocates the Fund’s assets to directional positions (i.e., positions that depend upon an up or down price move in an instrument or market for success) and/or relative value positions (i.e., positions that depend on price relationships between various instruments or markets and seek to profit from pricing inefficiencies) through long and/or short exposures in instruments across all major asset classes. The instruments in
which the Fund may invest may be U.S. dollar or non-U.S. dollar denominated. The Fund may have exposure to issuers of any size and credit quality. The percentage of the Fund’s portfolio exposed to an asset class and geographic region will vary from time to time. The Fund intends to engage in active and frequent trading.
The Fund’s advisor utilizes a process-driven approach that blends its proprietary quantitative techniques with disciplined oversight in an effort to deliver positive absolute returns. The advisor’s investment process begins with statistical research and fundamental analysis of various investment strategies spanning all major public markets. The advisor applies its proprietary quantitative models to arrive at a subset of liquid investment strategies that the advisor believes are suitable for the Fund. These investment strategies include, among others, those that are Fundamental, which focus on price and relative price determinants such as measures of carry (i.e., the yield differences between one instrument and another) and appraisal of fair value, and Tactical, which focus on market structure and the behavior of market agents including lead-lag effects (i.e., time dependent correlation relationships), liquidity provisioning and buffering, and positioning dynamics (i.e., exposure patterns or sensitivities). The advisor also employs macroeconomic and probabilistic modeling to guide its allocation decisions and select investments that the advisor believes will promote the maintenance of a balanced and efficient Fund risk profile by explicitly considering how the evolution of markets and the behavior of market participants impact the performance and interaction of strategies.
The Fund may sell call options pursuant to which the purchaser pays the Fund a premium in exchange for the right to purchase the security underlying the option at a specified price (the “strike price”) within a specified time period or at a specified future date. The call options the Fund sells may either be covered (i.e., where the Fund holds the underlying security) or uncovered (i.e., where the Fund does not hold the underlying security). The seller of an uncovered call option assumes the risk of a theoretically unlimited increase in the market price of the underlying security above the strike price of the option, and thus the seller’s potential for loss is unlimited.
The Fund will primarily gain exposure to commodities and commodity-linked instruments through investments in the Subsidiary. The Subsidiary will invest in (long and short) commodity-linked futures and swaps, as well as certain money market instruments, including U.S. government securities, money market fund shares, repurchase agreements and other high-quality, short-term fixed income instruments. The primary purpose of the money market instruments held by the Subsidiary will be to serve as collateral for the Subsidiary’s derivative positions; however, these instruments may also earn income for the Subsidiary. The Subsidiary is managed by the advisor and has the same investment objective as the Fund. The Fund may invest up to 25% of its total assets in the Subsidiary. Investment in the Subsidiary is expected to provide the Fund with commodity exposure within the limitations of the U.S. federal tax requirements that apply to regulated investment companies. Investments in other funds managed by the Fund’s advisor may provide the Fund with exposure to other securities and financial instruments in addition to commodities and commodity-linked instruments.
The Fund is “non-diversified,” meaning that a relatively high percentage of its assets may be invested in a limited number of issuers of securities.
The bar chart and table below provide some indication of the risks of investing in the Fund by showing changes in the performance of the Credit Suisse Multialternative Strategy Fund, a series of Credit Suisse Opportunity Funds (the “Predecessor Fund”), from year to year for Class A Shares and by showing how the average annual total returns of each class of the Predecessor Fund compare with the average annual total returns of the Bloomberg US Aggregate Bond Index, a broad-based securities market index, and the ICE BofA US 3-Month Treasury Bill Index. Performance for classes other than those shown may vary from the performance shown to the extent the expenses for those classes differ. The Predecessor Fund’s past performance, before and after taxes, is not necessarily an indication of how the Fund will perform in the future. Updated performance information is available at the Fund’s website www.mastfunds.com, or by calling the Fund at 1-833-829-0010.
The Fund expects to commence operations following the reorganization of the Predecessor Fund, which is expected to occur on November 22, 2024. As a result of the reorganization, the Fund has adopted the accounting and performance history of the Predecessor Fund. Performance results shown in the bar chart and performance table below for the periods prior to November 22, 2024, reflect the performance of the Predecessor Fund prior to the commencement of the Fund’s operations.
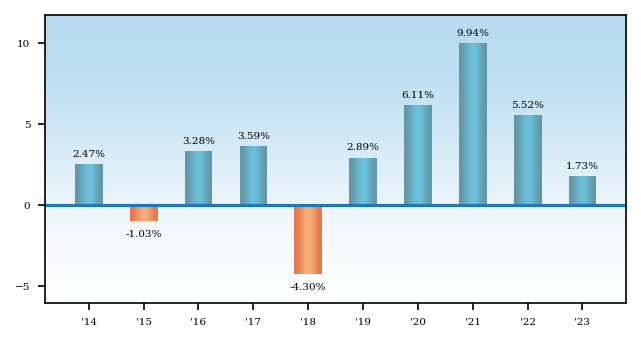
The Predecessor Fund’s year-to-date return as of September 30, 2024, was (1.94)%.
| Highest Calendar Quarter Return at NAV | 4.69% | Quarter Ended 3/31/2021 |
| Lowest Calendar Quarter Return at NAV | (3.82)% | Quarter Ended 12/31/2018 |
Average Annual Returns - MANTEIO MULTIALTERNATIVE STRATEGY FUND |
Label |
1 Year |
5 Years |
10 Years |
|||
|---|---|---|---|---|---|---|---|
| Class A Shares | Class A – Return Before Taxes | (3.60%) | 4.06% | 2.40% | |||
| Class A Shares | Return After Taxes on Distributions | Class A – Return After Taxes on Distributions | (4.62%) | [1] | 1.56% | [1] | 0.72% | [1] |
| Class A Shares | Return After Taxes on Distributions and Sale of Fund Shares | Class A – Return After Taxes on Distributions and Sale of Fund Shares | (2.11%) | [1] | 2.02% | [1] | 1.10% | [1] |
| Class I Shares | Class I – Return Before Taxes | 1.95% | 5.48% | 3.21% | |||
| Bloomberg US Aggregate Bond Index (reflects no deduction for fees, expenses or taxes) | Bloomberg US Aggregate Bond Index (reflects no deduction for fees, expenses or taxes) | 5.53% | 1.10% | 1.81% | |||
| ICE BofA US 3-Month Treasury Bill Index (reflects no deduction for fees, expenses or taxes) | ICE BofA US 3-Month Treasury Bill Index (reflects no deduction for fees, expenses or taxes) | 5.01% | 1.88% | 1.25% | |||
| [1] | After-tax returns are calculated using the historical highest individual federal marginal income tax rates and do not reflect the impact of state and local taxes. Actual after-tax returns depend on an investor’s tax situation and may differ from those shown, and after-tax returns shown are not relevant to investors who hold their fund shares through tax-deferred arrangements, such as 401(k) plans or individual retirement accounts. |