The Manteio Managed Futures Strategy Fund (the “Fund”) seeks to achieve positive absolute returns that have a low correlation to the returns of broad stock and bond markets.
This table describes the fees and expenses that you may pay if you buy, hold, and sell shares of the Fund. You may pay other fees, such as brokerage commissions and other fees to financial intermediaries, which are not reflected in the table and example below. You may qualify for sales charge discounts if you and your family invest, or agree to invest in the future, at least $50,000 in Class A Shares of the Fund. More information about these fees and other discounts is available from your financial professional and in the section titled “Purchase of Shares” on page 37 of the Prospectus and under “Waivers and Discounts Available from Intermediaries and Conversion Policies” on page 59 the Prospectus.
Shareholder Fees - MANTEIO MANAGED FUTURES STRATEGY FUND |
Class A Shares |
Class C Shares |
Class I Shares |
||
|---|---|---|---|---|---|
| Maximum Sales Charge (Load) Imposed on purchases (as a percentage of offering price) | 5.25% | none | none | ||
| Maximum Deferred Sales Charge (Load) (as a percentage of purchase price) | none | [1] | 1.00% | [2] | none |
| [1] | Purchases of Class A shares of $1 million or more may be subject to a 1.00% deferred sales charge on redemptions within 12 months of purchase. |
| [2] | Purchases of Class C shares are subject to a 1.00% deferred sales charge on redemptions within 12 months of purchase. |
Annual Fund Operating Expenses - MANTEIO MANAGED FUTURES STRATEGY FUND |
Class A Shares |
Class C Shares |
Class I Shares |
|
|---|---|---|---|---|
| Management Fees | 1.04% | 1.04% | 1.04% | |
| Distribution and/or Service (12b-1) Fees | 0.25% | 1.00% | none | |
| Other Expenses | [1] | 0.37% | 0.37% | 0.37% |
| Acquired Fund Fees and Expenses | [2] | 0.03% | 0.03% | 0.03% |
| Total Annual Fund Operating Expenses | 1.69% | 2.44% | 1.44% | |
| Fees Waived and/or Expenses Reimbursed | [3] | (0.11%) | (0.11%) | (0.11%) |
| Total Annual Fund Operating Expenses After Waiving Fees and/or Reimbursing Expenses | [1],[2],[3] | 1.58% | 2.33% | 1.33% |
| [1] | The Fund invests in a wholly-owned subsidiary of the Fund organized under the laws of the Cayman Islands. “Other Expenses” include expenses of both the Fund and the wholly-owned subsidiary. “Other Expenses” are estimated for the current fiscal year. Actual expenses may differ from estimates. |
| [2] | Acquired Fund Fees and Expenses” reflect the expenses incurred indirectly by the Fund as a result of the Fund’s investments in underlying money market funds, exchange-traded funds or other pooled investment vehicles. “Acquired Fund Fees and Expenses” are estimated for the current fiscal year. Actual expenses may differ from estimates. |
| [3] | The Fund’s advisor has contractually agreed to waive its fees and/or pay for operating expenses of the Fund to ensure that total annual fund operating expenses (excluding any taxes, leverage interest, brokerage commissions, dividend and interest expenses on short sales, acquired fund fees and expenses (as determined in accordance with SEC Form N-1A), professional fees related to services for the collection of foreign tax reclaims, expenses incurred in connection with any merger or reorganization, and extraordinary expenses such as litigation expenses) do not exceed 1.55%, 2.30%, and 1.30% of the average daily net assets of Class A shares, Class C shares and Class I shares, respectively, of the Fund. This agreement is in effect for a period of two years from the date of the reorganization (i.e., through November 22, 2026), and it may be terminated before that date only by the Trust’s Board of Trustees. The Fund’s advisor is permitted to seek reimbursement from the Fund, subject to certain limitations, of fees waived or payments made by the advisor to the Fund for a period ending three years after the date of the waiver or payment. Such reimbursement may be requested from the Fund if the reimbursement will not cause the Fund’s annual expense ratio to exceed the lesser of (a) the expense limitation in effect at the time such fees were waived or payments made, or (b) the expense limitation in effect at the time of the reimbursement. Reimbursements of fees waived or payments made will be made on a “first in, first out” basis so that the oldest fees waived or payments are satisfied first. |
This example is intended to help you compare the cost of investing in the Fund with the cost of investing in other mutual funds. The example assumes that you invest $10,000 in the Fund for the time periods indicated and then redeem all of your shares at the end of those periods. The example also assumes that your investment has a 5% return each year and that the Fund’s operating expenses remain the same. The example reflects the Fund’s contractual fee waiver and/or expense reimbursement only for the term of the contractual fee waiver and/or expense reimbursement.
Expense Example - MANTEIO MANAGED FUTURES STRATEGY FUND - USD ($) |
One Year |
Three Years |
Five Years |
Ten Years |
|---|---|---|---|---|
| Class A Shares | 677 | 1,009 | 1,375 | 2,400 |
| Class C Shares | 336 | 739 | 1,280 | 2,759 |
| Class I Shares | 135 | 433 | 765 | 1,705 |
Expense Example No Redemption |
One Year |
Three Years |
Five Years |
Ten Years |
|---|---|---|---|---|
| MANTEIO MANAGED FUTURES STRATEGY FUND | Class C Shares | USD ($) | 236 | 750 | 1,291 | 2,768 |
The Fund pays transaction costs, such as commissions, when it buys and sells securities (or “turns over” its portfolio). A higher portfolio turnover may indicate higher transaction costs and may result in higher taxes when Fund shares are held in a taxable account. These costs, which are not reflected in annual fund operating expenses or in the example, affect the Fund’s performance. During the fiscal year ended October 31, 2023, the portfolio turnover rate for the Predecessor Fund (defined below) was 0% of the average value of its portfolio.
The Fund seeks diverse exposure to significant price trends, both up and down, across asset classes, geographies and time horizons. The Fund may take long and/or short positions in asset classes, and the Fund’s advisor dynamically adjusts its exposure to individual asset classes based on a trend-following approach. As a component of its overall investment process, the Fund’s advisor may utilize certain quantitative models and methodologies to guide its investment approach or security selection although the use of such models and methodologies may vary based on market factors and economic trends as determined by the advisor.
The Fund seeks to achieve its investment objective by investing directly and/or indirectly through its wholly-owned subsidiary organized under the laws of the Cayman Islands (the “Subsidiary”) in securities and derivative instruments including, but not limited to, equity index futures and options, swaps on equity index futures, equity swaps, interest rate futures and options, fixed income futures and options, swaps on fixed income futures, commodity and commodity index-linked futures and options, swaps on commodity and commodity index-linked futures, currency futures and options, swaps on currency futures, currency forwards and equity-, fixed income-, and commodity-notes. When used in this Prospectus, the term “Fund” includes the Subsidiary and the term “invest” includes investments the Fund makes directly and through the Subsidiary. There are no geographic limits on the Fund’s holdings and the Fund will have exposure to U.S. and non-U.S. securities and currencies.
In addition, the Fund may have exposure to issuers of any size and credit quality. The Fund also invests a significant portion of its assets in investment grade money market instruments, which may include, but are not limited to, U.S. government securities, U.S. government agency securities, short-term fixed income securities, repurchase agreements, money market mutual fund shares, and cash and cash equivalents. The Fund’s money market instrument holdings may serve as collateral for the Fund’s derivative positions and may also earn income for the fund. The Fund’s return is expected to be derived principally from changes in the value of securities and its portfolio is expected to consist principally of securities.
The Fund’s use of futures, forwards, swaps and certain other financial instruments will have the economic effect of financial leverage. Financial leverage magnifies the exposure to the swings in prices of an asset class underlying a financial instrument and results in increased volatility, which means that the Fund has the potential for greater gains and losses, than if the Fund did not use financial instruments with leverage. A decline in the Fund’s assets due to losses magnified by the financial instruments providing leveraged exposure may require the Fund to liquidate portfolio positions when it may not be advantageous to do so in order to satisfy its obligations, to meet redemption requests or to meet the applicable requirements of the 1940 Act, and the rules thereunder.
The Fund will enter into short positions, and it may use futures and swaps or sell a security short to do so. For example, the Fund may enter into a futures contract pursuant to which it agrees to sell an asset (that it does not currently own) at a specified price at a specified point in the future. This gives the Fund a short position with respect to the asset. At times, the Fund may have significant short positions.
The Fund intends to make investments through the Subsidiary and may invest up to 25% of its total assets in the Subsidiary. The Fund will invest in the Subsidiary primarily to gain exposure to the commodities markets within the limitations of the U.S. federal tax laws, rules and regulations that apply to regulated investment companies. Generally, the Subsidiary will invest in long and short commodity-linked futures and swaps, but it may also invest in other types of futures, swaps and options, as well as certain money market instruments, including U.S. government securities, money market fund shares, repurchase agreements and other high-quality, short-term fixed income instruments. The primary purpose of the money market instruments held by the Subsidiary will be to serve as collateral for the Subsidiary’s derivative positions; however, these instruments may also earn income for the Subsidiary. The Subsidiary is managed by the advisor and has the same objective as the Fund.
The Fund is “non-diversified,” meaning that a relatively high percentage of its assets may be invested in a limited number of issuers of securities.
The bar chart and table below provide some indication of the risks of investing in the Fund by showing changes in the performance of the Credit Suisse Managed Futures Strategy Fund, a series of Credit Suisse Opportunity Funds (the “Predecessor Fund”), from year to year for Class A Shares and by showing how the average annual total returns of each class of the Predecessor Fund compare with the average annual total returns of the Bloomberg Global Aggregate Bond Index, a broad-based securities market index, and the Credit Suisse Managed Futures Liquid Index. Performance for classes other than those shown may vary from the performance shown to the extent the expenses for those classes differ. The Predecessor Fund’s past performance, before and after taxes, is not necessarily an indication of how the Fund will perform in the future. Updated performance information is available at the Fund’s website www.mastfunds.com, or by calling the Fund at 1-833-829-0010.
The Fund expects to commence operations following the reorganization of the Predecessor Fund, which is expected to occur on November 22, 2024. As a result of the reorganization, the Fund has adopted the accounting and performance history of the Predecessor Fund. Performance results shown in the bar chart and performance table below for the periods prior to November 22, 2024, reflect the performance of the Predecessor Fund prior to the commencement of the Fund’s operations.
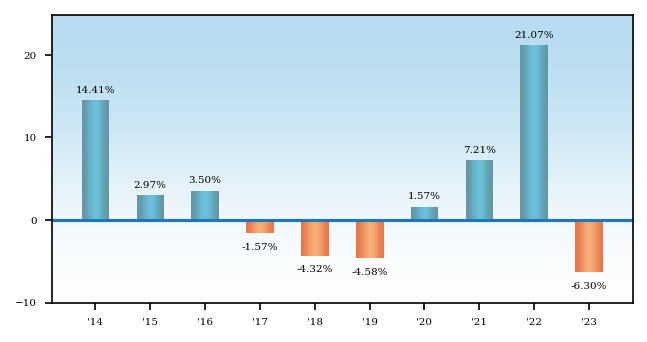
The Predecessor Fund’s year-to-date return as of September 30, 2024, was 0.22%.
| Highest Calendar Quarter Return at NAV | 13.44% | Quarter Ended 3/31/2022 |
| Lowest Calendar Quarter Return at NAV | (7.43)% | Quarter Ended 6/30/2015 |
Average Annual Returns - MANTEIO MANAGED FUTURES STRATEGY FUND |
Label |
1 Year |
5 Years |
10 Years |
|||
|---|---|---|---|---|---|---|---|
| Class A Shares | Class A – Return Before Taxes | (11.20%) | 2.24% | 2.52% | |||
| Class A Shares | Return After Taxes on Distributions | Class A – Return After Taxes on Distributions | (11.30%) | [1] | 0.35% | [1] | 1.02% | [1] |
| Class A Shares | Return After Taxes on Distributions and Sale of Fund Shares | Class A – Return After Taxes on Distributions and Sale of Fund Shares | (6.63%) | [1] | 1.09% | [1] | 1.45% | [1] |
| Class C Shares | Class C – Return Before Taxes | (7.82%) | 2.58% | 2.31% | |||
| Class I Shares | Class I – Return Before Taxes | (6.16%) | 3.58% | 3.33% | |||
| Bloomberg Global Aggregate Bond Index (reflects no deduction for fees, expenses or taxes) | Bloomberg Global Aggregate Bond Index (reflects no deduction for fees, expenses or taxes) | 5.72% | (0.32%) | 0.38% | |||
| Credit Suisse Managed Futures Liquid Index (reflects no deduction for fees, expenses or taxes) | Credit Suisse Managed Futures Liquid Index (reflects no deduction for fees, expenses or taxes) | (5.92%) | 3.72% | 3.43% | |||
| [1] | After-tax returns are calculated using the historical highest individual federal marginal income tax rates and do not reflect the impact of state and local taxes. Actual after-tax returns depend on an investor’s tax situation and may differ from those shown, and after-tax returns shown are not relevant to investors who hold their fund shares through tax-deferred arrangements, such as 401(k) plans or individual retirement accounts. |