The 3D Printing ETF (“Fund”) seeks to provide investment results that closely correspond, before fees and expenses, to the performance of the Total 3D-Printing Index (“Index”).
The table below describes the fees and expenses that you pay if you buy, hold and sell shares of the Fund (“Shares”). Investors may pay other fees, such as brokerage commissions and other fees to financial intermediaries on their purchases and sales of Shares, which are not reflected in the tables and examples below.
Shareholder Fees |
The 3D Printing ETF
The 3D Printing ETF
USD ($)
|
|---|---|
| Shareholder Fees (fees paid directly from your investment) | none |
Annual Fund Operating Expenses |
The 3D Printing ETF
The 3D Printing ETF
|
|
|---|---|---|
| Management Fee | 0.65% | |
| Distribution and/or Service (12b-1) Fees | none | |
| Other Expenses | 0.01% | [1] |
| Total Annual Fund Operating Expenses | 0.66% | |
| [1] | Pursuant to a Supervision Agreement, ARK Investment Management LLC (“Adviser”) pays all other expenses of the Fund (other than acquired fund fees and expenses, taxes and governmental fees, brokerage fees, commissions and other transaction expenses, certain foreign custodial fees and expenses, costs of borrowing money, including interest expenses, and extraordinary expenses (such as litigation and indemnification expenses)). |
This example is intended to help you compare the cost of investing in the Fund with the cost of investing in other funds. This example does not take into account brokerage commissions that you pay when purchasing or selling Shares.
The example assumes that you invest $10,000 in the Fund for the time periods indicated and then redeem all of your Shares at the end of those periods. The example also assumes that your investment has a 5% annual return and that the Fund’s operating expenses remain the same. Although your actual costs may be higher or lower, based on these assumptions, your costs would be:
Expense Example |
The 3D Printing ETF
The 3D Printing ETF
USD ($)
|
|---|---|
| 1 | $ 67 |
| 3 | 211 |
| 5 | 368 |
| 10 | $ 822 |
The Fund pays transaction costs, such as commissions, when it purchases and sells securities (or “turns over” its portfolio). A higher portfolio turnover rate may result in higher transaction costs and higher taxes when Shares are held in a taxable account. These costs, which are not reflected in annual fund operating expenses or in the example, may affect the Fund’s performance. During the most recent fiscal year, the Fund’s portfolio turnover rate was 39% of the average value of its portfolio.
The Fund normally invests at least 80% of its total assets in securities that are included in the Fund’s benchmark Index, depositary receipts representing securities included in the Index or underlying stocks in respect of depositary receipts included in the Index. This 80% investment policy is non-fundamental and may be changed without shareholder approval upon 60 days’ prior written notice to shareholders.
The Index is designed to track the price movements of stocks of companies involved in the 3D printing industry. The Index has been created and licensed to the Fund by ARK’s Index Products Group and is calculated, published and distributed by Solactive AG (“Solactive”). Information regarding the Index is available at http://www.solactive.com. The Index is composed of equity securities and depositary receipts of exchange listed companies from the U.S., non-U.S. developed markets and Taiwan that are engaged in 3D printing related businesses within the following business lines: (i) 3D printing hardware, (ii) computer aided design (“CAD”) and 3D printing simulation software, (iii) 3D printing centers, (iv) scanning and measurement and (v) 3D printing materials. The Index assigns a pre-determined weighting to each business line and all companies within each business line are equally weighted within the business line. As of November 12, 2024, the Index included 52 securities of companies with a market capitalization range of between approximately $139 million and $198 billion and a weighted average market capitalization of $21 billion.
At least 80% of the companies in the Index derive at least 50% of their earnings or revenues or at least 50% of their assets are devoted to the development or distribution of equipment, materials and software primarily used in 3D printing or 3D printed products. In addition, at least 80% of the assets of the Fund will be comprised of companies that derive at least 50% of their earnings or revenues or at least 50% of their assets are devoted to the development or distribution of equipment, materials and software primarily used in 3D printing or 3D printed products.
The Fund, using an indexing investment approach, attempts to approximate, before fees and expenses, the investment performance of the Index by investing in a portfolio of securities that generally replicates the Index. The Fund generally will use a replication strategy. A replication strategy is an indexing strategy that involves investing in the securities of the Index in approximately the same proportions as in the Index. However, the Fund may utilize a representative sampling strategy with respect to the Index when it might not be possible or practicable to purchase all of the securities of the Index in approximately the same proportions as in the Index, such as when there are practical difficulties or substantial costs involved in compiling a portfolio of securities to replicate the Index, in instances in which a security in the Index becomes temporarily illiquid, unavailable or less liquid, or as a result of legal restrictions or limitations (such as tax diversification requirements) that apply to the Fund but not the Index. There also may be instances in which the Adviser may choose to underweight or overweight a security in the Index, purchase securities not in the Index that the Adviser believes are appropriate to substitute for certain securities in the Index or utilize various combinations of other available investment techniques in seeking to replicate as closely as possible, before fees and expenses, the performance of the Index. The Fund may sell securities that are represented in the Index in anticipation of their removal from the Index or purchase securities not represented in the Index in anticipation of their addition to the Index. The Fund does not take temporary defensive positions when markets decline or appear overvalued.
If the Fund uses a replication strategy, it can be expected to have greater correlation to the Index than if it uses a representative sampling strategy.
The Fund may concentrate its investments in a particular industry or group of industries to the extent that the Index concentrates in an industry or group of industries. Based on the composition of the Index as of November 12, 2024, the Software, Machinery, Electronic Equipment, Instruments & Components industries represented a significant portion of the Index. The Fund may invest in foreign securities listed on foreign exchanges as well as American Depositary Receipts (“ADRs”) and Global Depositary Receipts (“GDRs”).
The following bar chart and table provide some indication of the risks of investing in the Fund. The bar chart shows changes in the Fund’s performance from year to year. The table shows how the Fund’s average annual returns for 1 year, 5 years and since the Fund’s inception compare with those of the Index, the S&P 500 Index and the MSCI World Index. The S&P 500 Index is a widely recognized capitalization-weighted index that measures the performance of the large-capitalization sector of the U.S. stock market. The MSCI World Index represents large and mid-cap equity performance across 23 developed markets countries. Returns shown for the MSCI World Index are net of foreign withholding taxes applicable to U.S. investors. The Fund’s past performance (before and after taxes) is not necessarily an indication of how the Fund will perform in the future. Updated performance information is available at no cost by visiting http://ark-funds.com or by calling (727) 810-8160.
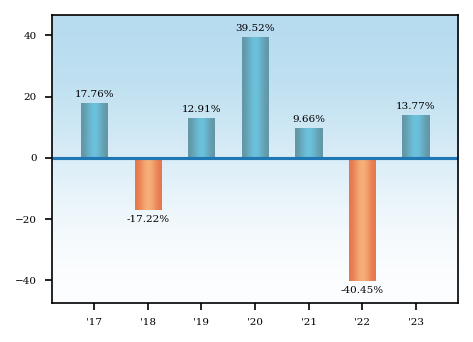
The Fund’s year-to-date total return as of October 31, 2024 was -14.15%.
| Best and Worst Quarter Returns (for the period reflected in the bar chart above) | Return | Quarter/Year | |||
| Highest Return | 31.83 | % | 12/31/2020 | ||
| Lowest Return | -27.85 | % | 6/30/2022 | ||
Average Annual Returns - The 3D Printing ETF |
Label |
1 Year |
5 Years |
Since Inception |
[1] | Inception Date |
||
|---|---|---|---|---|---|---|---|---|
| The 3D Printing ETF | Returns Before Taxes | 13.77% | 3.20% | 2.51% | Jul. 19, 2016 | |||
| The 3D Printing ETF | Returns After Taxes on Distributions | Returns After Taxes on Distributions | 13.77% | [2] | 3.19% | [2] | 2.35% | [2] | Jul. 19, 2016 |
| The 3D Printing ETF | Returns After Taxes on Distributions and Sale of Fund Shares | Returns After Taxes on Distributions and Sale of Fund Shares | 8.15% | [2] | 2.47% | [2] | 1.88% | [2] | Jul. 19, 2016 |
| The Total 3D-Printing Index | The Total 3D-Printing Index | 13.95% | 3.64% | 3.13% | Jul. 19, 2016 | |||
| S&P 500 Index (reflects no deduction for fees, expenses or taxes) | S&P 500 Index (reflects no deduction for fees, expenses or taxes) | 26.29% | 15.69% | 13.22% | Jul. 19, 2016 | |||
| MSCI World Index (reflects no deduction for fees, expenses or taxes) | S&P 500 Index (reflects no deduction for fees, expenses or taxes) | 23.79% | 12.80% | 10.59% | Jul. 19, 2016 | |||
| [1] | The Fund commenced operations on July 19, 2016. |
| [2] | After-tax returns are calculated using the highest historical individual federal marginal income tax rates and do not reflect the impact of state and local taxes. Actual after-tax returns depend on your tax situation and may differ from those shown and are not relevant if you hold your shares through tax-deferred arrangements, such as 401(k) plans or individual retirement accounts. |